The Joint Development of Hemispheric Lateralization for Words and Faces

(This is a sample cover image for this issue. The actual cover is not yet available at this time.)
This article appeared in a journal published by Elsevier. The attachedcopy is furnished to the author for internal non-commercial researchand education use, including for instruction at the authors institution
and sharing with colleagues.
Other uses, including reproduction and distribution, or selling orlicensing copies, or posting to personal, institutional or third party
websites are prohibited.
In most cases authors are permitted to post their version of thearticle (e.g. in Word or Tex form) to their personal website orinstitutional repository. Authors requiring further information
regarding Elsevier’s archiving and manuscript policies areencouraged to visit:
http://www.elsevier.com/copyright

Author's personal copy
Journal of Neuroscience Methods 204 (2012) 383– 388
Contents lists available at SciVerse ScienceDirect
Journal of Neuroscience Methods
jou rna l h om epa ge: www.elsev ier .com/ locate / jneumeth
Basic Neuroscience
dopOSCCI: A functional transcranial Doppler ultrasonography summary suite forthe assessment of cerebral lateralization of cognitive function
Nicholas A. Badcocka,b,∗, Georgina Holta, Anneka Holdena, Dorothy V.M. Bishopa,b
a Department of Experimental Psychology, University of Oxford, Oxford, United Kingdomb ARC Centre of Excellence in Cognition and its Disorders, Macquarie University, Sydney, Australia
a r t i c l e i n f o
Article history:Received 1 September 2011Received in revised form 9 November 2011Accepted 12 November 2011
Keywords:Functional transcranial DopplerultrasonographyImagingBlood flow velocityMethodsMatlab
a b s t r a c t
We present a description of a new software package, ‘dopOSCCI’, which summarises data from experimen-tal studies where functional transcranial Doppler ultrasonography (fTCD) is used to compare hemisphericrates of blood flow in order to assess lateralization of a cognitive process. The software provides a graph-ical user interface to summarise analogue and digital data collected using Multi-Dop Doppler Ultrasounddevices (DWL Multidop T2: manufacturer, DWL Elektronische Systeme, Singen, Germany). The uniqueaspects of dopOSCCI allow multi-file processing, multi-event marker processing, behavioural and multi-session summaries, image file data visualization, and tab-delimited output files which includes split-half,single-trial summaries and data quality variables. The Matlab based software is available under the GNUGPL license and can be accessed online at https://databank.ora.ox.ac.uk/general/datasets/dopOSCCI, theOxford University DataBank.
© 2011 Elsevier B.V. All rights reserved.
1. Introduction
Functional transcranial Doppler ultrasonography (fTCD) is anon-invasive imaging technique which assesses changes in bloodflow velocity in the cerebral arteries with high temporal res-olution (Aaslid et al., 1982). While more complex techniques(e.g., functional Magnetic Resonance Imaging, fMRI or Magnetoen-cephalography) allow for relatively precise localization of activity,fTCD simply measures blood flow in a particular artery. Onecommon application for fTCD is the assessment of language lateral-ization (for a review of applications see Stroobant and Vingerhoets,2000), which may be for pre-surgical determination or psycholog-ical research. Functional lateralization is assessed by concurrentmeasurement of blood flow velocity in homologue cerebral arteriesin the two hemispheres. Hemispheric lateralization of a cognitivedomain is assumed if a greater increase in blood flow velocity canbe reliably observed within one hemisphere during a domain spe-cific task. The technique has good test–retest reliability (Knechtet al., 1998b; Stroobant and Vingerhoets, 2001) and provides resultswhich are comparable to the Wada procedure (Knecht et al., 1998a;Knake et al., 2003) as well as fMRI (Knecht et al., 1999; Somers et al.,2011). Because fTCD is non-invasive, inexpensive, and portable,
∗ Corresponding author at: CCD, Macquarie University, Balaclava Road, NorthRyde, New South Wales, Australia. Tel.: +61 2 9850 4067.
E-mail addresses: [email protected], [email protected](N.A. Badcock).
it is becoming more popular for psychological research compar-ing lateralization in special conditions such as Specific LanguageImpairment, autism, and dyslexia (Whitehouse and Bishop, 2008;Illingworth and Bishop, 2009), as well as children (Bishop et al.,2009; Stroobant et al., 2010; Haag et al., 2010). In this paper wereport on a newly developed, open source, software package forprocessing fTCD data.
The standard fTCD paradigm for the assessment of languagelateralisation is word generation introduced by Knecht et al.(1996,1998b), which has also been used successfully in fMRI(Benson et al., 1999). Participants are then asked to verbally reportthe generated words to confirm task compliance and following this,a rest period is required to return blood flow to baseline levels. Dur-ing a series of such trials, Doppler probes, held in place at a positionover the temporal window of the skull, insonate the middle cerebralarteries within the left and right hemispheres. Offline, the recordedblood flow velocity can be analysed to determine an individual’scerebral dominance for a particular task (for a detailed account seeRingelstein et al., 1990). Language tasks have also been developedfor children (Lohmann et al., 2005; Bishop et al., 2009) and a videodescription of Bishop et al.’s technique is available (Bishop et al.,2010).
The basic processing paradigm was developed by Deppe et al.(1997) and is demonstrated in their software AVERAGE. Througha series of steps, AVERAGE normalizes the left and right signals,marks potential artefacts, integrates variation due to the cardiaccycle, adjusts for baseline activity, and averages the resulting sig-nals over the series of suitable epochs. Using these averages, a
0165-0270/$ – see front matter © 2011 Elsevier B.V. All rights reserved.doi:10.1016/j.jneumeth.2011.11.018

Author's personal copy
384 N.A. Badcock et al. / Journal of Neuroscience Methods 204 (2012) 383– 388
Fig. 1. Example data for a fTCD word generation task. Upper panel displays the base-line corrected left and right Doppler velocity signals and the lower panel displaysthe left minus right difference (with standard error bars) as a function of trial timein seconds. Time zero indicates the presentation of the stimulus letter. Baseline andperiod of interest (poi) intervals are indicated by shaded sections. These data are theaverages from 22 adults created using a dopOSCCI output file in Prism (GraphPadSoftware Inc., La Jolla, CA, USA). Four characteristic peaks are evident in the left andright signals (upper panel). These reflect (1) a generalized task preparation (to a‘Ready’ signal), (2) a silent word generation at which point the left signal is greaterthan the right (language processes), (3) verbal report, and (4) the start of relaxationat which point the right signal is greater (potentially reflecting suppression of theverbal material).
difference signal is calculated as the left minus right signals. Withina specified period of interest, the peak difference is located. Thesum of the left minus right difference over a 2 s period surroundingthis peak is taken as an estimate of lateralization or the lateralityindex (LI). Positive numbers correspond to leftward lateralizationand negative numbers to rightward.
Example left, right, and difference signals for the word gener-ation task in 22 adults are presented in Fig. 1. During the periodof interest (POI; i.e., the silent word generation) relatively highercerebral blood flow velocity in the left compared to the right arterycan be seen (Fig. 1, upper panel). This indicates leftward dominance,typical of participants engaging in a language task. As can be seenin the lower panel of Fig. 1, the standard error of the averaged bloodflow is small, not overlapping with zero, indicating that the changesin blood flow were reliable across task repetitions and participants.
1.1. Introducing dopOSCCI
dopOSCCI has been developed to simplify the analysis offTCD data collected using two probes in an event-related exper-imental procedure. The major advantages include multi-fileprocessing (Section 2.2), multi-event marker processing (Sec-tion 2.4.3), behavioural (Section 2.6.3) and multi-session (Section2.6.4) summaries, image file data visualization (Section 3.1), andtab-delimited output files which includes split-half, single-trialsummaries (Section 3.2.2), and data quality variables (Section3.2.3).
2. Materials and methods
We have developed a Matlab (Mathworks, Natick, MA, USA)based software package called ‘dopOSCCI’. The software includes aseries of Matlab functions as well as a user-friendly graphical userinterface. All necessary functionality can be achieved through theinterface; therefore, knowledge of Matlab is not necessary to usethe software.1
1 dopOSCCI does operate at the command line. However, unlike the flexibilityenabled through toolboxes like EEGLAB (Delorme and Makeig, 2004), due to the
Fig. 2. dopOSCCI Data tab of the graphical user interface. This tab allows for thespecification of data directory, file selection, signal channels of left and right bloodflow velocity data in data file, the number of events, marker height, down sampleHertz, activation rejection range, and acceptable activation separation, as well as thechoice of epoch trimming, epoch normalization, and inclusion of data short epochin the final summaries.
2.1. Data processing
The basic data processing steps are based upon Michael Deppe’swork (Deppe et al., 1997, 2004a; Knecht et al., 2001) and personalcorrespondence.
2.2. File selection
dopOSCCI handles files from two different software pack-ages: Multi-flow (Multi-dop X4 by DWL Elektronische SystemeGmbH) and QL Monitoring Software (DWL, Compumedics GermanyGmbH). Two of the files created by the Multi-Flow software are pro-cessed in dopOSCCI: ‘.TX’ and ‘.TW’. ‘.TX’ files hold session statisticswhereas ‘.TW’ files hold blood flow velocity recordings as well asexternal channels inputs. Recordings made using the QL Monitor-ing Software are saved as ‘.EXP’ which include session informationin the headers of the file along with left and right blood flow veloc-ity, a series of optional outputs, and, when included, an analogueevent maker. Raw data files are summarised and results collatedusing batch processing so that a collection of files are processedin a single step. It is also possible to select an individual file from afolder list which can be useful for data inspection and exploration ofparameter settings. The data directory specification and file selec-tion, as well as the data handling specification options as availablein the graphical user interface can be seen in Fig. 2.
2.3. Data handling specifications
The dopOSCCI Data tab (see Fig. 2) houses a series of optionsthat control the initial handling of the raw data including import,normalization, and unacceptable signal detection.
2.3.1. Signal channelsThe raw data output of the analogue Doppler systems is typ-
ically organised with the left and right blood flow velocity savedin channels 1 and 2 (the default dopOSCCI settings). The newerdigital systems commonly default to columns 3 and 4; therefore,specification of this information can be made.
encapsulated nature of current fTCD analysis, function level operations add little tothe analysis other than low-level data exploration.

Author's personal copy
N.A. Badcock et al. / Journal of Neuroscience Methods 204 (2012) 383– 388 385
2.3.2. Event markersFor the purpose of fTCD, cues are required to be stored in the data
file in order to time-lock the task-related activity. These are com-monly sent via the parallel port. The Doppler hardware allows forthe specification of the height and width of these markers or pulses;however, the dopOSCCI method for detecting these markers sim-ply records the onset of a marker of any width, above a specifiedmarker height setting. This is, anything above the specified valuewill be treated as a marker and anything below that value will beignored. As for the signal channels, it is critical to specify the loca-tion of the event channel in the raw output file. This is done on theEvent tab (see below).
2.3.3. Down samplingThe Doppler hardware is capable of recording high frequency
data, sometimes recording velocities 100 times per second (i.e.,100 Hz). This results in samples every 10 ms which may be consid-ered unnecessary for assessing a response in the range of 5–10 s(Aaslid, 1987; Rosengarten et al., 2002). For this and historicalcomputational power limitations, the data is downsampled whichinvolves maintaining a reduced number of the available samples.For example, if the data were recorded at 100 Hz and are to bedownsampled to 25 Hz, then every 4th sample is maintained in theanalysis and all others dropped.
2.3.4. NormalizationDue to potential difference in the recorded left and right blood
flow velocities arising from measurement artefacts such as probeangle (see Deppe et al., 2004b), i.e., the signal for the left maybe quantitatively higher than the right, the left and right dataare normalized to a mean of 100 using the following equation(100 × data)/mean (data): where data refers to a collection of bloodflow velocities values. These values could be for the entire left orright recordings or from subsections of these recordings (see Sec-tion 2.3.5). The formula shifts the average level of the signal whilemaintaining the variance.
2.3.5. Data trim and epoch normalizationAt the beginning, rest breaks, or end of an fTCD task, there is
often wide variation in the recorded activity due to participantmovement. Rather than include this activity in the normalizationof the data, dopOSCCI provides the Data Trim option. This optionremoves data preceding and following that specified by the eventepoch settings (see below) before the normalization adjustment.
Across an experimental session, the probe position may bemodified either through gross movements made by participants,adjustments made by the experimenter in response to participantmovements or general signal changes, or signal loss due to probe‘drift’, i.e., gradual, subtle movement of the probe. In some casessuch changes are difficult to monitor in an online testing environ-ment, especially with children, and are therefore only evident atthe analysis stage. At worst, drift can bias LI calculation on a trial bytrial basis. Normalizing the data by epoch removes these artefacts,setting the left and right values to equivalent levels within eachepoch based upon event timings (see Section 2.4.2).
2.3.6. Heart cycle exclusionOne major physiological activity that affects the measured
blood flow velocity is the involuntary cardiac cycle. This variationinterferes with examination of the task-related signal. An elegantcorrection for this variation is to take an average of the activitywithin a single heart cycle, resulting in a step-like summary of theactivity as opposed to a widely varying heart beat (Deppe et al.,1997). This technique is employed in dopOSCCI.
Fig. 3. dopOSCCI Event tab of the graphical user interface. This tab allows for thespecification of event related information including the event name, data channel orcolumn in data file, the number of epochs, the temporal separation between epochmarkers, the length of the activation window, the temporal position of the epoch,baseline, and period of interest settings with respect to the epoch markers.
2.3.7. Epoch rejectionFollowing normalization, the data within each epoch are
screened for variation due to measurement artefact. dopOSCCI con-siders two forms of this variation: range and signal separation. Withrespect to the range, epochs with left or right signal values outsidethe set upper and lower acceptable values can be excluded fromlater stages of analysis. Epochs with values less than or greater than30–50% of mean activation are commonly excluded.
With respect to left–right signal separation, in certain circum-stances a single channel may be disrupted resulting in a substantialdrop in signal level; however, this drop does not result in valuesoutside the lower limit of the activation rejection range. Settingthe acceptable activation separation creates an upper limit on theeffect of these disturbances.
2.4. Event specification
The dopOSCCI Event tab (see Fig. 3) houses a series of options tospecify the event details; most notably, the event timings for epoch,baseline, and period of interest (POI) intervals.
2.4.1. Epoch definition: number and separationdopOSCCI searches for a specified number of epochs separated
by a specified time interval. It assumes the final marker is a truemarker and examines the temporal difference between markersin reverse order; i.e., from the last marker working towards thefirst marker. Event markers that occur at less than the specifiedseparation, e.g., 50 s, will be ignored in favour of the next marker.The process continues until the specified number of epochs isfound or the available number of event markers has been exam-ined. This process is useful in dealing with spurious event markerswhich are sometimes found in fTCD files. These may occur throughthe sending of markers during a practice phase of the task orthrough hardware communication error. In our experience extra-neous markers occur at the beginning of the data files, thereforeexamining the markers in reverse order overcomes is issue.
2.4.2. Event timingsUpper and lower values for epoch, baseline, and period of inter-
est timings should be specified with respect to the event markerwhich is set as time 0. Using the example of the word genera-tion task, if the event marker reflects the onset of the letter, thenthe epoch could be set from −20 to 30 s; baseline −15 to −5; and
Author's personal copy
386 N.A. Badcock et al. / Journal of Neuroscience Methods 204 (2012) 383– 388
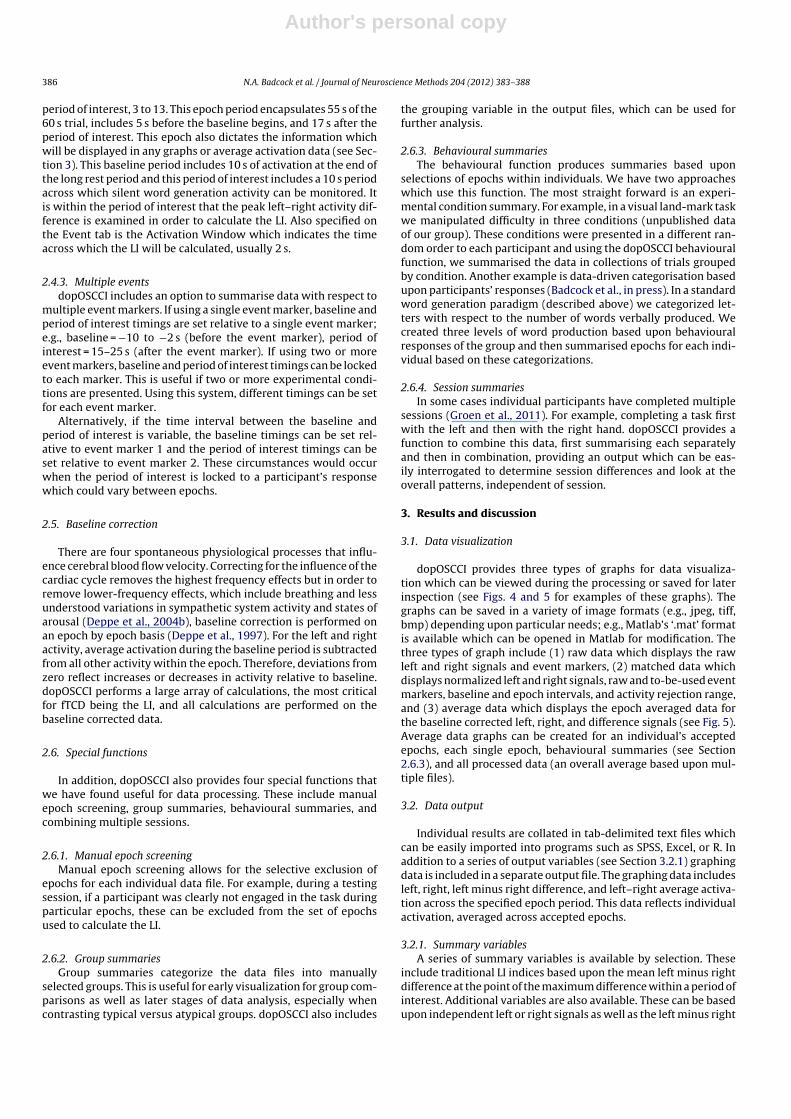
period of interest, 3 to 13. This epoch period encapsulates 55 s of the60 s trial, includes 5 s before the baseline begins, and 17 s after theperiod of interest. This epoch also dictates the information whichwill be displayed in any graphs or average activation data (see Sec-tion 3). This baseline period includes 10 s of activation at the end ofthe long rest period and this period of interest includes a 10 s periodacross which silent word generation activity can be monitored. Itis within the period of interest that the peak left–right activity dif-ference is examined in order to calculate the LI. Also specified onthe Event tab is the Activation Window which indicates the timeacross which the LI will be calculated, usually 2 s.
2.4.3. Multiple eventsdopOSCCI includes an option to summarise data with respect to
multiple event markers. If using a single event marker, baseline andperiod of interest timings are set relative to a single event marker;e.g., baseline = −10 to −2 s (before the event marker), period ofinterest = 15–25 s (after the event marker). If using two or moreevent markers, baseline and period of interest timings can be lockedto each marker. This is useful if two or more experimental condi-tions are presented. Using this system, different timings can be setfor each event marker.
Alternatively, if the time interval between the baseline andperiod of interest is variable, the baseline timings can be set rel-ative to event marker 1 and the period of interest timings can beset relative to event marker 2. These circumstances would occurwhen the period of interest is locked to a participant’s responsewhich could vary between epochs.
2.5. Baseline correction
There are four spontaneous physiological processes that influ-ence cerebral blood flow velocity. Correcting for the influence of thecardiac cycle removes the highest frequency effects but in order toremove lower-frequency effects, which include breathing and lessunderstood variations in sympathetic system activity and states ofarousal (Deppe et al., 2004b), baseline correction is performed onan epoch by epoch basis (Deppe et al., 1997). For the left and rightactivity, average activation during the baseline period is subtractedfrom all other activity within the epoch. Therefore, deviations fromzero reflect increases or decreases in activity relative to baseline.dopOSCCI performs a large array of calculations, the most criticalfor fTCD being the LI, and all calculations are performed on thebaseline corrected data.
2.6. Special functions
In addition, dopOSCCI also provides four special functions thatwe have found useful for data processing. These include manualepoch screening, group summaries, behavioural summaries, andcombining multiple sessions.
2.6.1. Manual epoch screeningManual epoch screening allows for the selective exclusion of
epochs for each individual data file. For example, during a testingsession, if a participant was clearly not engaged in the task duringparticular epochs, these can be excluded from the set of epochsused to calculate the LI.
2.6.2. Group summariesGroup summaries categorize the data files into manually
selected groups. This is useful for early visualization for group com-parisons as well as later stages of data analysis, especially whencontrasting typical versus atypical groups. dopOSCCI also includes
the grouping variable in the output files, which can be used forfurther analysis.
2.6.3. Behavioural summariesThe behavioural function produces summaries based upon
selections of epochs within individuals. We have two approacheswhich use this function. The most straight forward is an experi-mental condition summary. For example, in a visual land-mark taskwe manipulated difficulty in three conditions (unpublished dataof our group). These conditions were presented in a different ran-dom order to each participant and using the dopOSCCI behaviouralfunction, we summarised the data in collections of trials groupedby condition. Another example is data-driven categorisation basedupon participants’ responses (Badcock et al., in press). In a standardword generation paradigm (described above) we categorized let-ters with respect to the number of words verbally produced. Wecreated three levels of word production based upon behaviouralresponses of the group and then summarised epochs for each indi-vidual based on these categorizations.
2.6.4. Session summariesIn some cases individual participants have completed multiple
sessions (Groen et al., 2011). For example, completing a task firstwith the left and then with the right hand. dopOSCCI provides afunction to combine this data, first summarising each separatelyand then in combination, providing an output which can be eas-ily interrogated to determine session differences and look at theoverall patterns, independent of session.
3. Results and discussion
3.1. Data visualization
dopOSCCI provides three types of graphs for data visualiza-tion which can be viewed during the processing or saved for laterinspection (see Figs. 4 and 5 for examples of these graphs). Thegraphs can be saved in a variety of image formats (e.g., jpeg, tiff,bmp) depending upon particular needs; e.g., Matlab’s ‘.mat’ formatis available which can be opened in Matlab for modification. Thethree types of graph include (1) raw data which displays the rawleft and right signals and event markers, (2) matched data whichdisplays normalized left and right signals, raw and to-be-used eventmarkers, baseline and epoch intervals, and activity rejection range,and (3) average data which displays the epoch averaged data forthe baseline corrected left, right, and difference signals (see Fig. 5).Average data graphs can be created for an individual’s acceptedepochs, each single epoch, behavioural summaries (see Section2.6.3), and all processed data (an overall average based upon mul-tiple files).
3.2. Data output
Individual results are collated in tab-delimited text files whichcan be easily imported into programs such as SPSS, Excel, or R. Inaddition to a series of output variables (see Section 3.2.1) graphingdata is included in a separate output file. The graphing data includesleft, right, left minus right difference, and left–right average activa-tion across the specified epoch period. This data reflects individualactivation, averaged across accepted epochs.
3.2.1. Summary variablesA series of summary variables is available by selection. These
include traditional LI indices based upon the mean left minus rightdifference at the point of the maximum difference within a period ofinterest. Additional variables are also available. These can be basedupon independent left or right signals as well as the left minus right

Author's personal copy
N.A. Badcock et al. / Journal of Neuroscience Methods 204 (2012) 383– 388 387
Fig. 4. Example raw (upper panel) and normalized (lower panel) graphs produced by dopOSCCI. These are based upon word generation data from a single individual. Theraw graph displays the raw left and right blood flow velocity recordings as well as any event markers recorded in the external channels. The normalized graph displays theleft and right blood flow velocity after basic data processing (described in Section 2.3). This graph also displays event markers, epoch and baseline divisions, and activationrejection limits.
difference or the left–right average signals. The available descrip-tive statistics include the mean, standard deviation, standard errorof the mean, 95% confidence interval, minimum, maximum, rootmean square, median, and inter-quartile range. These variablescan be calculated with respect to fixed periods such as the base-line or period of interest as well as surrounding calculated periodssuch as the maximum or minimum value within a fixed period. Forexample, one could extract the maximum left–right averaged sig-nal within the period of interest in order to determine the point atwhich the overall haemodynamic response was greatest. The arrayof summary variables provides a large degree of flexibility for theexploration of Doppler data. Further to this, the significance of the LIcoefficients can be examined using parametric and non-parametric,single- and two-sample inferential tests. For single-sample tests, LIvalues are examined against 0, and for the two-sample tests, left
and right averages are compared. Inferential outputs include teststatistics, p-values, and effect sizes.
For the purposes of demonstrating a few of the summary vari-ables, the processing was run on the data from a single participantcompleting the word generation task (displayed visually in Fig. 5).The LI for the 23 averaged trials is 4.23 (SD = 3.13, Cohen’s d = 1.23),reflecting significant left lateralization. Calculations based upon theaverage of the left and right signals indicate that activation peakedat 17.68 s after visual letter presentation (i.e., during verbal report)with an average change in blood flow velocity of 7.68% (SD = 2.31)of baseline blood flow velocity. Further to this, each of these calcu-lations can also be performed for each epoch; for example, the LIrange calculated for individual epochs is −6.12 to 10.9. This reflectsa large variation which can be readily explored by examining graphsfor individual epochs.
Fig. 5. Example of an average graph produced by dopOSCCI. These are based upon word generation data from a single individual, averaged across 23 trials. The upperpanel displays the left and right baseline corrected percentage change in blood flow velocity and the lower panel displays the difference between the left and right baselinecorrected blood flow velocities. The baseline runs from −15 to −5 s relative to the visual letter presentation, and the period of interest (POI) runs from 3 to 13 s following thevisual letter presentation. The time point of the peak difference is displayed in both panels, surrounded by a 2-s activation window across which the laterality index (LI) iscalculated. In the lower panel, the 95% confidence interval of the LI calculations is also displayed along with the LI value, the LI standard error of the mean, and the numberof epochs averaged within the graph.

Author's personal copy
388 N.A. Badcock et al. / Journal of Neuroscience Methods 204 (2012) 383– 388
3.2.2. Task reliability calculationsThe internal reliability of fTCD results can be estimated by cal-
culating the LI for the odd and even epochs and correlating thesewithin a set of group results: the split-half reliability (as in Bishopet al., 2009). In dopOSCCI, additional options are available to outputthe LIs for odd versus even epochs as well as a random half-split ofepochs. However, a more accurate estimate of internal reliabilityis Cronbach’s alpha (Cronbach, 1957) which uses all split-half iter-ations to provide an estimate of reliability. An optional dopOSCCIoutput provides the LI for each epoch (as used in Whitehouse et al.,2009) which can be used to calculate Cronbach’s alpha.
3.2.3. Data quality variablesMaintaining suitable left and right fTCD signals with adults can
be difficult. However, the biggest challenge we have experiencedhas been with children who tend to be more active which oftendisrupts the signal. In order to assess this disruption an optionaldopOSCCI output is signal dropout. This can be used to excludeindividual data or epochs.
The second data quality variable available in dopOSCCI is theGoodness of Recording assessment introduced by Knecht et al.(2001). This statistic provides an estimate of the variability (rootmean square) in the baseline period which can be compared againsta criterion to exclude individual data files. Knecht et al. suggest leftor right signal variation greater than 2% of average baseline activity(normalized to 100) as a criterion for data exclusion.
4. Conclusion
The use of fTCD to assess cerebral dominance of cognitivefunctions is becoming increasingly popular and therefore, devel-oping tools to simplify the processing will be useful. We havedescribed a new software package, dopOSCCI, which summarisesDoppler data in an efficient manner allowing researchers tovisualize and interrogate data through new and innovative meth-ods. The software is open source and can be accessed onlineat https://databank.ora.ox.ac.uk/general/datasets/dopOSCCI, theOxford University DataBank.
Acknowledgements
We would like to acknowledge the work of Rune Aaslid, Huber-tus Lohmann, Michael Deppe, and Stefan Knecht, the support ofMichael Deppe, Stefan Knecht, and Mihaela Duta, MargrietGroen’sand Yong Xiang Yeo’s patience, persistence, and feedback, andfinally FMRIB’s FSL analysis group for inspiration. We would alsolike to thank our anonymous reviewers for their informative input.This research was supported by a programme grant from the Well-come Trust (ref 082498/Z/07/Z).
References
Aaslid R. Visually evoked dynamic blood flow response of the human cerebral cir-culation. Stroke 1987;18:771–5.
Aaslid R, Markwalder TM, Nornes H. Noninvasive transcranial Doppler ultra-sound recording of flow velocity in basal cerebral arteries. J Neurosurg1982;57:769–74.
Badcock NA, Nye A, Bishop DVM. Using functional transcranial Doppler ultrasonog-raphy to assess language lateralization: influence of task and difficulty level.Laterality, in press.
Benson RR, FitzGerald DB, LeSueur LL, Kennedy DN, Kwong KK, Buchbinder BR, et al.Language dominance determined by whole brain functional MRI in patients withbrain lesions. Neurology 1999;52:798–809.
Bishop DVM, Badcock NA, Holt G. Assessment of cerebral lateralization in childrenusing functional transcranial Doppler ultrasound (fTCD). JOVE 2010;43.
Bishop DVM, Watt H, Papadatou-Pastou M. An efficient and reliable method formeasuring cerebral lateralization during speech with functional transcranialDoppler ultrasound. Neuropsychologia 2009;47:587–90.
Cronbach LJ. The two disciplines of scientific psychology. Am Psychol1957;12:671–84.
Delorme A, Makeig S. EEGLAB: an open source toolbox for analysis of single-trialEEG dynamics including independent component analysis. J Neurosci Methods2004;134:9–21.
Deppe M, Knecht S, Henningsen H, Ringelstein EB. AVERAGE: a Windows® programfor automated analysis of event related cerebral blood flow. J Neurosci Methods1997;75:147–54.
Deppe M, Knecht S, Lohmann H, Ringelstein EB. A method for the automated assess-ment of temporal characteristics of functional hemispheric lateralization bytranscranial Doppler sonography. J Neuroimaging 2004a;14:226–30.
Deppe M, Ringelstein EB, Knecht S. The investigation of functional brainlateralization by transcranial Doppler sonography. NeuroImage 2004b;21:1124–46.
Groen MA, Whitehouse AJO, Badcock NA, Bishop DVM. Where were those rabbits?A new paradigm to determine cerebral lateralisation of visuospatial memoryfunction in children. Neuropsychologia 2011;49:3265–71.
Haag A, Moeller N, Knake S, Hermsen A, Oertel WH, Rosenow F, et al. Languagelateralization in children using functional transcranial Doppler sonography. DevMed Child Neurol 2010;52:331–6.
Illingworth S, Bishop DVM. A typical cerebral lateralisation in adults with com-pensated developmental dyslexia demonstrated using functional transcranialDoppler ultrasound. Brain Lang 2009;111:61–5.
Knake S, Haag A, Hamer HM, Dittmer C, Bien S, Oertel WH, et al. Languagelateralization in patients with temporal lobe epilepsy: a comparison of func-tional transcranial Doppler sonography and the Wada test. NeuroImage2003;19:1228–32.
Knecht S, Deppe M, Ringelstein EB. Determination of cognitive hemispheric later-alization by functional transcranial Doppler cross-validated by functional MRI.Stroke 1999;30:2491–2.
Knecht S, Deppe M, Ebner A, Henningsen H, Huber T, Jokeit H, et al. Noninva-sive determination of language lateralization by functional transcranial Dopplersonography: a comparison with the Wada test. Stroke 1998a;29:82–6.
Knecht S, Deppe M, Ringelstein EB, Wirtz M, Lohmann H, Dräger B, et al.Reproducibility of functional transcranial Doppler sonography in determininghemispheric language lateralization. Stroke 1998b;29:1155–9.
Knecht S, Dräger B, Flöel A, Lohmann H, Breitenstein C, Deppe M, et al.Behavioural relevance of atypical language lateralization in healthy subjects.Brain 2001;124:1657–65.
Knecht S, Henningsen H, Deppe M, Huber T, Ebner A, Ringelstein EB. Successive acti-vation of both cerebral hemispheres during cued word generation. Neuroreport1996;7:820–4.
Lohmann H, Drager B, Muller-Ehrenberg S, Deppe M, Knecht S. Language lateraliza-tion in young children assessed by functional transcranial Doppler sonography.NeuroImage 2005;24:780–90.
Ringelstein EB, Kahlscheuer B, Niggemeyer E, Otis SM. Transcranial Doppler sonog-raphy: anatomical landmarks and normal velocity values. Ultrasound Med Biol1990;16:745–61.
Rosengarten B, Osthaus S, Kaps M. Overshoot and undershoot: control system anal-ysis of haemodynamics in a functional transcranial Doppler test. CerebrovascDis 2002;14:148–52.
Somers M, Neggers SF, Kahn RS, Sommer IE. The measurement of language lat-eralization with functional transcranial Doppler and functional MRI: a criticalevaluation. Front Hum Neurosci 2011;5:31.
Stroobant N, Vingerhoets G. Transcranial Doppler ultrasonography monitoring ofcerebral hemodynamics during performance of cognitive tasks: a review. Neu-ropsychol Rev 2000;10:213–31.
Stroobant N, Vingerhoets G. Test–retest reliability of functional transcranial Dopplerultrasonography. Ultrasound Med Biol 2001;27:509–14.
Stroobant N, Van Boxstael J, Vingerhoets G. Language lateralization in children:a functional transcranial Doppler reliability study. J Neurolinguist 2010;24:14–24.
Whitehouse AJO, Bishop DVM. Cerebral dominance for language function in adultswith specific language impairment or autism. Brain 2008;131:3193–200.
Whitehouse AJO, Badcock NA, Groen MA, Bishop DVM. Reliability of a novelparadigm for determining hemispheric lateralization of visuospatial function.J Int Neuropsychol Soc 2009;15:1028–32.
Copyright © 2022 FDOKUMEN