Does nicotine influence cytokine profile and subsequent cell cycling/apoptotic responses in...
14
ORIGINAL ARTICLE Does Nicotine Influence Cytokine Profile and Subsequent Cell Cycling/Apoptotic Responses in Inflammatory Bowel Disease? Marian C. Aldhous, PhD,* Robin J. Prescott, PhD, † Simon Roberts, MB BS,* Kay Samuel, BSc (Hons), ‡ Martin Waterfall, PhD, ‡ and Jack Satsangi, DPhil* Background: Smoking differentially influences susceptibility to the inflammatory bowel diseases (IBDs) Crohn’s disease (CD) and ulcerative colitis (UC). We investigated the effects of nicotine on cytokine, cell cycle, and apoptotic responses in peripheral blood mononuclear cells (PBMCs) from IBD patients and healthy controls (HCs). Methods: PBMCs from IBD patients and HC were stimulated with lipopolysaccharide (LPS; 1 g/mL) or phytohemagglutinin (PHA, 5 or 0.5 g/mL), nicotine (1, 10, 100 g/mL). Cytokines (IL1, IL2, IL10, IL12/IL23p40, TGF, TNF) were measured in supernatants at 24 hours. After 72 hours cells were analyzed by flow cytometry for cell cycle and apoptosis. Statistical modeling was used to identify interactions between cytokines and cell cycle / apoptosis and minimize confounding effects. Results: Stimulation by LPS and PHA (5 g/mL) increased IL12/IL23p40 production from CD and UC versus HC (P 0.05); PHA (0.5 g/mL) increased IL1 in UC and decreased TGF from CD and UC (P 0.01). In all groups, nicotine reduced LPS- and PHA (0.5 g/mL)-stimulated production of IL1, IL10, TGF, and TNF (P 0.001). Cell cycle analysis showed that PHA, but not LPS, induced proliferation and decreased G 0 /G 1 resting cells in CD and UC versus HC (P 0.001). Nicotine decreased PHA-stimulated S-phase proliferation and increased G 0 /G 1 resting cells (P 0.01). Modeling showed independent associations between IL12/IL23p40 and apoptosis (P 0.01), IL1 and resting cells (P 0.006), TNF and proliferating cells (P 0.001). Disease activity and smoking habit had no effect. Conclusions: Dysregulated cytokine profiles in UC and CD are associated with specific alterations in cell cycle responses; these effects may be modified by nicotine, and potentially by anticytokine therapies. (Inflamm Bowel Dis 2008;14:1469 –1482) Key Words: cytokines, cell cycle, inflammatory bowel disease T he inflammatory bowel diseases (IBDs) Crohn’s disease (CD) and ulcerative colitis (UC) are common causes of chronic gastrointestinal disease in the Western world, with a combined prevalence of 1 in 250 in the UK. 1 Genetic 2 and environmental 3,4 factors contribute to the immunopathogen- esis of IBD. 5 CD and UC are considered to be related poly- genic disorders, but with a stronger environmental contribu- tion in UC than CD. Dysregulated cytokine production is a prominent feature of CD (excess production of IL1, IL12, TNF) 6 and UC (excess production of IL13), 7 although the model of CD as a T-helper (Th)-1-driven illness and UC as a Th2-biased response may now be oversimplistic, with an emerging role for the Th17 cell lineage producing IL23 and IL17. 8,9 The balance between immune cell proliferation and apoptosis is important for the maintenance of homeostasis. Apoptosis of gut lamina propria T cells, a mechanism by which the intestinal immune system maintains its unrespon- siveness to antigens, has been shown to be reduced in CD 10 –13 ; data in UC are less consistent, as T-cell apoptosis has been reported to be reduced 10,13,14 or increased. 11,12,15 Changes in cell cycle kinetics of mucosal T cells have also been reported to underlie the functional irregularities in IBD: higher pro- portions of lamina propria T cells from CD patients undergo proliferation than from UC patients or controls. 11,12 Smoking is the best-known environmental factor im- plicated in the pathogenesis of IBD, 16 with contrasting effects on disease history in both CD and UC: in CD, smoking defines the disease location and subsequent disease course 17 ; in UC, heavier smokers tended to have healthy colons, while light smokers had extensive disease. 18 Of the 4000 chem- icals in cigarette smoke, nicotine has been studied as a constituent potentially affecting intestinal inflammation. Received for publication December 14, 2007; Accepted May 2, 2008. From the *Gastrointestinal Unit, School of Clinical and Molecular Med- icine, † Medical Statistics Unit, School of Clinical Sciences and Community Health, ‡ John Hughes Bennett Laboratory, Division of Oncology, University of Edinburgh, Western General Hospital, Edinburgh, Scotland, UK. Supported by grants from the National Association for Crohn’s and Colitis and the Chief Scientist’s Office of the Scottish Executive. Reprints: Dr. Marian C. Aldhous, Gastrointestinal Unit, 2nd Floor, Mo- lecular Medicine Centre, University of Edinburgh, Western General Hospi- tal, Edinburgh. EH4 2XU Scotland, UK (e-mail: [email protected]). Copyright © 2008 Crohn’s & Colitis Foundation of America, Inc. DOI 10.1002/ibd.20523 Published online 10 July 2008 in Wiley InterScience (www.interscience. wiley.com). Inflamm Bowel Dis ● Volume 14, Number 11, November 2008 1469
Transcript of Does nicotine influence cytokine profile and subsequent cell cycling/apoptotic responses in...

ORIGINAL ARTICLE
Does Nicotine Influence Cytokine Profile and SubsequentCell Cycling/Apoptotic Responses in Inflammatory BowelDisease?Marian C. Aldhous, PhD,* Robin J. Prescott, PhD,† Simon Roberts, MB BS,* Kay Samuel, BSc (Hons),‡
Martin Waterfall, PhD,‡ and Jack Satsangi, DPhil*
Background: Smoking differentially influences susceptibility tothe inflammatory bowel diseases (IBDs) Crohn’s disease (CD) andulcerative colitis (UC). We investigated the effects of nicotine oncytokine, cell cycle, and apoptotic responses in peripheral bloodmononuclear cells (PBMCs) from IBD patients and healthy controls(HCs).
Methods: PBMCs from IBD patients and HC were stimulatedwith lipopolysaccharide (LPS; 1 �g/mL) or phytohemagglutinin(PHA, 5 or 0.5 �g/mL), � nicotine (1, 10, 100 �g/mL). Cytokines(IL1�, IL2, IL10, IL12/IL23p40, TGF�, TNF�) were measured insupernatants at 24 hours. After 72 hours cells were analyzed by flowcytometry for cell cycle and apoptosis. Statistical modeling was usedto identify interactions between cytokines and cell cycle / apoptosisand minimize confounding effects.
Results: Stimulation by LPS and PHA (5 �g/mL) increasedIL12/IL23p40 production from CD and UC versus HC (P � 0.05);PHA (0.5 �g/mL) increased IL1� in UC and decreased TGF� fromCD and UC (P � 0.01). In all groups, nicotine reduced LPS- andPHA (0.5 �g/mL)-stimulated production of IL1�, IL10, TGF�, andTNF� (P � 0.001). Cell cycle analysis showed that PHA, but notLPS, induced proliferation and decreased G0/G1 resting cells in CDand UC versus HC (P � 0.001). Nicotine decreased PHA-stimulatedS-phase proliferation and increased G0/G1 resting cells (P � 0.01).Modeling showed independent associations between IL12/IL23p40and apoptosis (P � 0.01), IL1� and resting cells (P � 0.006), TNF�
and proliferating cells (P � 0.001). Disease activity and smokinghabit had no effect.
Conclusions: Dysregulated cytokine profiles in UC and CD areassociated with specific alterations in cell cycle responses; theseeffects may be modified by nicotine, and potentially by anticytokinetherapies.
(Inflamm Bowel Dis 2008;14:1469–1482)
Key Words: cytokines, cell cycle, inflammatory bowel disease
The inflammatory bowel diseases (IBDs) Crohn’s disease(CD) and ulcerative colitis (UC) are common causes of
chronic gastrointestinal disease in the Western world, with acombined prevalence of 1 in 250 in the UK.1 Genetic2 andenvironmental3,4 factors contribute to the immunopathogen-esis of IBD.5 CD and UC are considered to be related poly-genic disorders, but with a stronger environmental contribu-tion in UC than CD. Dysregulated cytokine production is aprominent feature of CD (excess production of IL1�, IL12,TNF�)6 and UC (excess production of IL13),7 although themodel of CD as a T-helper (Th)-1-driven illness and UC as aTh2-biased response may now be oversimplistic, with anemerging role for the Th17 cell lineage producing IL23 andIL17.8,9
The balance between immune cell proliferation andapoptosis is important for the maintenance of homeostasis.Apoptosis of gut lamina propria T cells, a mechanism bywhich the intestinal immune system maintains its unrespon-siveness to antigens, has been shown to be reduced in CD10–13;data in UC are less consistent, as T-cell apoptosis has beenreported to be reduced10,13,14 or increased.11,12,15 Changes incell cycle kinetics of mucosal T cells have also been reportedto underlie the functional irregularities in IBD: higher pro-portions of lamina propria T cells from CD patients undergoproliferation than from UC patients or controls.11,12
Smoking is the best-known environmental factor im-plicated in the pathogenesis of IBD,16 with contrasting effectson disease history in both CD and UC: in CD, smokingdefines the disease location and subsequent disease course17;in UC, heavier smokers tended to have healthy colons, whilelight smokers had extensive disease.18 Of the �4000 chem-icals in cigarette smoke, nicotine has been studied as aconstituent potentially affecting intestinal inflammation.
Received for publication December 14, 2007; Accepted May 2, 2008.From the *Gastrointestinal Unit, School of Clinical and Molecular Med-
icine, †Medical Statistics Unit, School of Clinical Sciences and CommunityHealth, ‡John Hughes Bennett Laboratory, Division of Oncology, Universityof Edinburgh, Western General Hospital, Edinburgh, Scotland, UK.
Supported by grants from the National Association for Crohn’s and Colitisand the Chief Scientist’s Office of the Scottish Executive.
Reprints: Dr. Marian C. Aldhous, Gastrointestinal Unit, 2nd Floor, Mo-lecular Medicine Centre, University of Edinburgh, Western General Hospi-tal, Edinburgh. EH4 2XU Scotland, UK (e-mail: [email protected]).
Copyright © 2008 Crohn’s & Colitis Foundation of America, Inc.DOI 10.1002/ibd.20523Published online 10 July 2008 in Wiley InterScience (www.interscience.
wiley.com).
Inflamm Bowel Dis ● Volume 14, Number 11, November 2008 1469

Studies of transdermal nicotine therapy suggest that this maybe effective in UC patients with active disease.19,20
The mechanisms whereby nicotine may influence in-testinal inflammation are poorly characterized. Nicotine hasbeen shown to affect cytokine production from monocytesand dendritic cells and/or their ability to induce T-cell pro-liferation.21–26 Nicotine may prevent27 or induce apoptosis,28
but reported differences may depend on cell type and stimu-lus. However, for all the clinical interest in nicotine in IBD,there are few studies of the effects of nicotine on the cellularresponses of IBD patients, especially CD. In mouse models ofIBD, nicotine had differential effects on the small and largebowel,29,30 with increased jejunal inflammation and decreasedcolonic inflammation together with inhibition of proinflam-matory cytokines.31 An inhibitory effect of nicotine wasshown on IL10 in peripheral blood32 without any effect onIL2 and TNF�, whereas others suggested that nicotine re-duced TNF� release from monocytic cells.33
In this study we investigated the effects of nicotine onperipheral blood mononuclear cell (PBMC) responses fromIBD patients and healthy controls (HCs). To investigatewhether monocyte-induced and monocyte-independent pe-ripheral T-lymphocyte cell cycling was differentially affectedby nicotine in IBD, we used lipopolysaccharide (LPS) as amonocyte-mediated stimulus and a plant lectin (phytohemag-glutinin, PHA) as a direct T-cell stimulus. PHA mimics manyof the same pathways initiated by T-cell receptor engagementof the antigen-MHC complex. We measured cytokine re-sponses and cell cycling to see whether specific cytokineswere involved in driving specific parts of the cell cycleresponse, or whether these responses were affected by coin-cubation with nicotine.
MATERIALS AND METHODS
Patients and ControlsThe Medicine/Oncology Subcommittee of the Lothian
Research Ethics Committee approved the study protocol.Consenting patients with a definite diagnosis34 of CD (n� 20) or UC (n � 17) were recruited from the IBD clinic atthe Western General Hospital, Edinburgh. Patients were re-cruited from morning clinics to reduce potential circadianvariation. Clinical information, including smoking habit, wasobtained from the case notes or the patient at the time ofsampling. IBD disease location/extent was defined accordingto the Montreal Classification.35 HCs (n � 17) were unrelatedspouses/friends of IBD patients invited to attend for veni-puncture at the same time as patients or healthy volunteersamong the lab staff. None of the controls had IBD or anotherinflammatory condition. Following informed consent, bloodsamples were collected for isolation of PBMCs for culture.Percentage of lymphocytes and monocytes were available forpatients but not controls and, with the demographics of thesubject groups, are included in Table 1.
PBMC Isolation and StimulationAll reagents were supplied by Sigma (Poole, UK) un-
less otherwise stated. PBMCs were isolated by Ficoll-Hypaque separation. PBMCs were resuspended in RPMI1640 medium containing 100 U/mL penicillin/streptomycin,2 mM glutamine, and 10% fetal bovine serum (FBS) at 1� 106 cells / 2 mL, and plated into 24-well plates. Cells werestimulated with LPS (E. coli 0111:B4, 1 �g/mL) and PHA asa mitogen acting directly on T cells. Based on preliminarydata, previous experience, and a study of lymphocyte immunefunction,36 we used 2 doses of PHA to examine whether cellsfrom patients or HC were more responsive to a suboptimal(0.5 �g/mL [denoted PHA0.5]) than an optimal (5 �g/mL[PHA5]) dose. A medium (unstimulated) control was in-cluded. Cells were costimulated with nicotine to investigatewhether this environmental factor modified the unstimulatedor stimulated responses. Different doses (1, 10, 100 �g/mL)were used to see if any response was dose-dependent and thelowest concentration is on the order of that found in the bloodof heavy smokers.37 Cells were harvested after 24 hours forcytokine production36 or 72 hours for cell cycle analysis. Dueto variability of numbers of cells obtained, not all stimuliwere used for all subjects.
Cytokine AnalysisCytokines (IL1�, IL2, IL10, IL12/IL23p40, TGF�, and
TNF�) in the 24-hour culture supernatants were measured induplicate by enzyme-linked immunosorbent assay (ELISA),using Cytoset kits from Biosource (Belgium), according tothe manufacturers’ protocol.
Cell Cycle AnalysisAfter 72 hours cells were harvested, centrifuged for 5
minutes, permeabilized with 50% FBS in phosphate-bufferedsaline (PBS; 300 �L) and 70% ethanol (900 �L), and incu-bated overnight at 4°C. Cells were washed with 5 mM EDTAin PBS, resuspended in propidium iodide (PI) solution (PBScontaining 100 �g/mL PI, 100 �g/mL RNAse), and incu-bated for 1 hour in the dark at room temperature. Cell cycleprofile was obtained on a FACSCalibur (Becton Dickinson,UK) flow cytometer. Data for 10,000–40,000 cells wereacquired, with the FL2 channel set on linear gain. Analysiswas performed using CellQuest software (Becton Dickinson,UK); the operator was blinded to the clinical details of thesample. Profiles of the cells were processed, gating out celldebris, and the percentage of cells in apoptosis and eachphase of the cell cycle were obtained (Fig. 1). Resting cellswere denoted G0/G1, proliferating cells in S-phase were de-noted S-phase, and proliferating cells in G2 or M phase weredenoted G2/M.
Statistical AnalysisThe raw data were transformed prior to comparison
between subject groups. For the cytokine data, a y
Aldhous et al Inflamm Bowel Dis ● Volume 14, Number 11, November 2008
1470

� log(10�y) transformation was used to account for zerovalues and to normalize the data. Cell cycle data were ana-lyzed using a y � log(y/100-y) transformation to account forthe skewed distribution. Comparisons were made by one-wayanalysis of variance (ANOVA) on the transformed data forsubject group.
Due to the nature of the data, correlations betweenobservations on samples obtained from the same subject wereanticipated, along with extra correlations between observa-tions obtained from the same stimulus and with the same doseof nicotine. To allow for these correlations a set of mixed
models were fitted with random effects for patients, patientby stimulus, and patient by nicotine dose. These models alsoaccount appropriately for any missing values in the data.Initial models were fitted separately for each of the cytokinesat 24 hours and each of the cell cycle variables after 72 hours.The results were used to derive 2 common models that wereapplied to each of the cell cycle variables and each of thecytokine variables. The models allowed for the possibility ofinteractions between the stimulus, nicotine dose, disease, andsmoking status, with nonsignificant higher-order interactionsbeing successively removed from the model. In the presen-
TABLE 1. Demographics Disease, Drug Therapy, and Smoking Habit and Percentage of Cells of the Patients and Controls
Disease Group
CD (N�20) UC (N�17) HC (N�17)
Sex (M:F) 8:12 10:7 6:11Age (years): median (range)
● At diagnosis 26 (8–73) 37 (9–69) NA● At sampling 41 (18–84) 48 (23–80) 46 (25–71)● Disease duration 11 (3–31) 7 (1–36) NA
Disease activitya
● Active 10 7 NA● Inactive 10 10
IBD drug therapy b
● 5-ASA drugs 6 15 NA● Immunomodulators 6 4● Steroids 6 3● Biologicals 6 0● NSAIDS 2 1● Questran resin 2 0
Disease location/extentc
CD ileal disease (L1) 5 NAcolonic disease (L2) 7ileocolonic (L3) 8Any upper GI (L4) involvement 1
UC rectal disease (E1) 4left-sided disease (E2) 6extensive disease (E3) 7
Smoking habitd
● Current 6 1 4● Non 7 7 11● Ex 7 9 2
% blood cells at sampling: median (IQR) ND (normal range)● % Lymphocytes 22.2 (17.5–31.5) 23.9 (19.7–30.5) 20%–45%● % Monocytes 7.40 (6.25–8.85) 8.85 (7.15–9.70) 2%–6%
aDisease activity was defined from the clinical notes at the time of sampling.bPatients were treated with combinations of drugs. Only 1 CD and 3 UC patients were not undergoing any therapy at the time of sampling.cDisease location was defined according to the Montreal Classification.31
dSmoking habit was self-defined by the patient or from the notes at the time of sampling.NA � not applicable.ND � not done.
Inflamm Bowel Dis ● Volume 14, Number 11, November 2008 Nicotine Influence in IBD
1471

tation of the results from the models, we show the leastsquares means for the effects fitted. These can be interpretedas average values, taking into account the effect of the othervariables in the model.
The relationship between each of the cell cycle vari-ables on day 3 and the cytokines on day 1 was investigatedusing multiple regression methods, but with allowance forcorrelation between observations, as described above. For allmodels the results are presented without adjustment for mul-tiple testing. Results are described as statistically significantwhen P � 0.05.
RESULTS
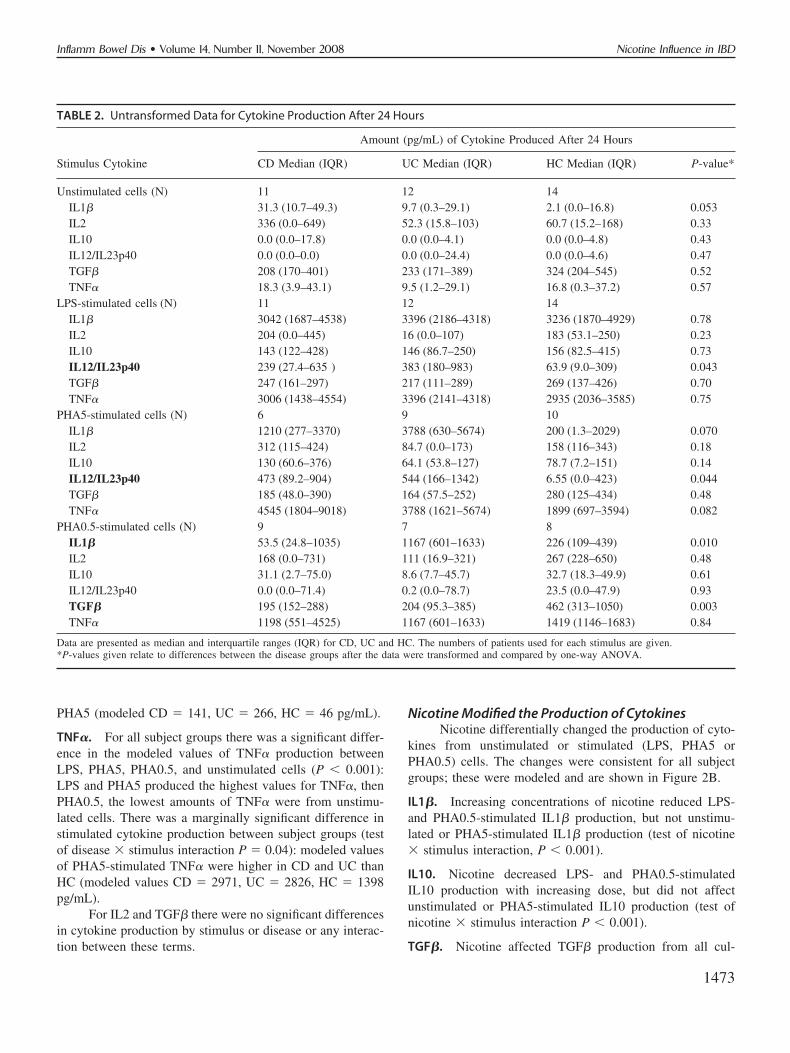
Cytokine ProductionThe untransformed data for the 24-hour cytokine pro-
duction in response to all stimuli are shown in Table 2.Univariate analysis by one-way ANOVA on the transformeddata showed no significant differences in cytokine productionfrom unstimulated cultures between the subject groups (CD,UC, HC).
Cytokine Production in Response to LPS or PHAStimulation
LPS- and PHA-stimulated cytokine production datawere transformed and compared by 1-way ANOVA betweenthe subject groups. In response to LPS, significant differenceswere seen for IL12/IL23p40 production (P � 0.043, Table 2),with more IL12/IL23p40 produced in CD and UC than HC.In response to PHA5, significant differences were seen forIL12/IL23p40 production (P � 0.044, Table 2), again withmore IL12/IL23p40 produced in CD and UC than HC. In
response to PHA0.5, significant differences were seen forIL1� production (P � 0.010, Table 2), with higher levels ofIL1� found in UC than CD and HC. Significant differenceswere also seen for TGF� production in response to PHA0.5(P � 0.003, Table 2), with lower levels of TGF� produced inCD and UC patients than HC.
Effects of Stimulus, Disease, and Nicotine on CommonModels of Cytokine Production
To investigate the effects of nicotine and to control forother factors that might affect cytokine production, statisticalmodels were constructed. There was no effect of smokinghabit or disease activity and these factors were removed.Nicotine dose did not affect any interactions between subjectgroup and stimulus, nor were there interactions betweendisease and nicotine dose. Other interactions and the maineffects were included in the models.
Unstimulated and Stimulated Cytokine ProductionDiffered in CD, UC, and HC
The estimated values from the final model of interac-tions between subject groups and stimulus for all cytokinesare presented in Figure 2A.
IL1�. For all subject groups there was a significant differ-ence in IL1� between LPS, PHA5, PHA0.5, and unstimulatedcells (P � 0.001): LPS produced the highest levels of IL1�,then PHA5 and PHA0.5, while unstimulated cells producedthe lowest amounts of IL1�. The amount of IL1� produceddiffered between CD, UC, and HC (test of disease � stimulusinteraction, P � 0.008) in response to each stimulus: IL1�production in UC patients was higher than in CD and HC inresponse to PHA5 (modeled values CD � 732, UC � 1190,HC � 235 pg/mL) and PHA0.5 (modeled values CD � 114,UC � 740, HC � 146 pg/mL).
IL10. For all subject groups there was a significant differ-ence in IL10 between LPS, PHA5, PHA0.5, and unstimulatedcells (P � 0.001): LPS produced the highest values for IL10,then PHA5 and PHA0.5, while unstimulated cells producedthe lowest amounts of IL10. There was no significant differ-ence in the amount of IL10 produced between any of thesubject groups (test of disease � stimulus interaction P� 0.83), in response to any stimulus.
IL12/IL23p40. For all subject groups there was a significantdifference in IL12/IL23p40 between LPS-, PHA5-, PHA0.5-stimulated, and unstimulated cells (P � 0.001): IL12/IL23p40 production was highest in response to LPS andPHA5, then PHA0.5 and unstimulated cells. A marginallysignificant difference in stimulated cytokine production be-tween subject groups was seen (test of disease � stimulusinteraction P � 0.04): modeled values of IL12/IL23p40 pro-duction were higher for UC patients in response to LPS(modeled values CD � 144, UC � 382, HC � 76 pg/mL) and
FIGURE 1. Histogram of propidium iodide (PI)-stained PBMCs.The number of cells against PI staining are shown, which corre-lates with DNA content. Cell debris was gated out. The gatedregions (M1–M5) show the patterns associated with differentphases of the cell cycle. M1: hypodiploid peak associated withapoptotic cells; M2: PBMCs in the G0 and G1 phases of the cellcycle; M3: PBMCs in S-phase; M4: PBMCs in G2 and M phases; M5:clustered cells.
Aldhous et al Inflamm Bowel Dis ● Volume 14, Number 11, November 2008
1472
PHA5 (modeled CD � 141, UC � 266, HC � 46 pg/mL).
TNF�. For all subject groups there was a significant differ-ence in the modeled values of TNF� production betweenLPS, PHA5, PHA0.5, and unstimulated cells (P � 0.001):LPS and PHA5 produced the highest values for TNF�, thenPHA0.5, the lowest amounts of TNF� were from unstimu-lated cells. There was a marginally significant difference instimulated cytokine production between subject groups (testof disease � stimulus interaction P � 0.04): modeled valuesof PHA5-stimulated TNF� were higher in CD and UC thanHC (modeled values CD � 2971, UC � 2826, HC � 1398pg/mL).
For IL2 and TGF� there were no significant differencesin cytokine production by stimulus or disease or any interac-tion between these terms.
Nicotine Modified the Production of CytokinesNicotine differentially changed the production of cyto-
kines from unstimulated or stimulated (LPS, PHA5 orPHA0.5) cells. The changes were consistent for all subjectgroups; these were modeled and are shown in Figure 2B.
IL1�. Increasing concentrations of nicotine reduced LPS-and PHA0.5-stimulated IL1� production, but not unstimu-lated or PHA5-stimulated IL1� production (test of nicotine� stimulus interaction, P � 0.001).
IL10. Nicotine decreased LPS- and PHA0.5-stimulatedIL10 production with increasing dose, but did not affectunstimulated or PHA5-stimulated IL10 production (test ofnicotine � stimulus interaction P � 0.001).
TGF�. Nicotine affected TGF� production from all cul-
TABLE 2. Untransformed Data for Cytokine Production After 24 Hours
Stimulus Cytokine
Amount (pg/mL) of Cytokine Produced After 24 Hours
CD Median (IQR) UC Median (IQR) HC Median (IQR) P-value*
Unstimulated cells (N) 11 12 14IL1� 31.3 (10.7–49.3) 9.7 (0.3–29.1) 2.1 (0.0–16.8) 0.053IL2 336 (0.0–649) 52.3 (15.8–103) 60.7 (15.2–168) 0.33IL10 0.0 (0.0–17.8) 0.0 (0.0–4.1) 0.0 (0.0–4.8) 0.43IL12/IL23p40 0.0 (0.0–0.0) 0.0 (0.0–24.4) 0.0 (0.0–4.6) 0.47TGF� 208 (170–401) 233 (171–389) 324 (204–545) 0.52TNF� 18.3 (3.9–43.1) 9.5 (1.2–29.1) 16.8 (0.3–37.2) 0.57
LPS-stimulated cells (N) 11 12 14IL1� 3042 (1687–4538) 3396 (2186–4318) 3236 (1870–4929) 0.78IL2 204 (0.0–445) 16 (0.0–107) 183 (53.1–250) 0.23IL10 143 (122–428) 146 (86.7–250) 156 (82.5–415) 0.73IL12/IL23p40 239 (27.4–635 ) 383 (180–983) 63.9 (9.0–309) 0.043TGF� 247 (161–297) 217 (111–289) 269 (137–426) 0.70TNF� 3006 (1438–4554) 3396 (2141–4318) 2935 (2036–3585) 0.75
PHA5-stimulated cells (N) 6 9 10IL1� 1210 (277–3370) 3788 (630–5674) 200 (1.3–2029) 0.070IL2 312 (115–424) 84.7 (0.0–173) 158 (116–343) 0.18IL10 130 (60.6–376) 64.1 (53.8–127) 78.7 (7.2–151) 0.14IL12/IL23p40 473 (89.2–904) 544 (166–1342) 6.55 (0.0–423) 0.044TGF� 185 (48.0–390) 164 (57.5–252) 280 (125–434) 0.48TNF� 4545 (1804–9018) 3788 (1621–5674) 1899 (697–3594) 0.082
PHA0.5-stimulated cells (N) 9 7 8IL1� 53.5 (24.8–1035) 1167 (601–1633) 226 (109–439) 0.010IL2 168 (0.0–731) 111 (16.9–321) 267 (228–650) 0.48IL10 31.1 (2.7–75.0) 8.6 (7.7–45.7) 32.7 (18.3–49.9) 0.61IL12/IL23p40 0.0 (0.0–71.4) 0.2 (0.0–78.7) 23.5 (0.0–47.9) 0.93TGF� 195 (152–288) 204 (95.3–385) 462 (313–1050) 0.003TNF� 1198 (551–4525) 1167 (601–1633) 1419 (1146–1683) 0.84
Data are presented as median and interquartile ranges (IQR) for CD, UC and HC. The numbers of patients used for each stimulus are given.*P-values given relate to differences between the disease groups after the data were transformed and compared by one-way ANOVA.
Inflamm Bowel Dis ● Volume 14, Number 11, November 2008 Nicotine Influence in IBD
1473
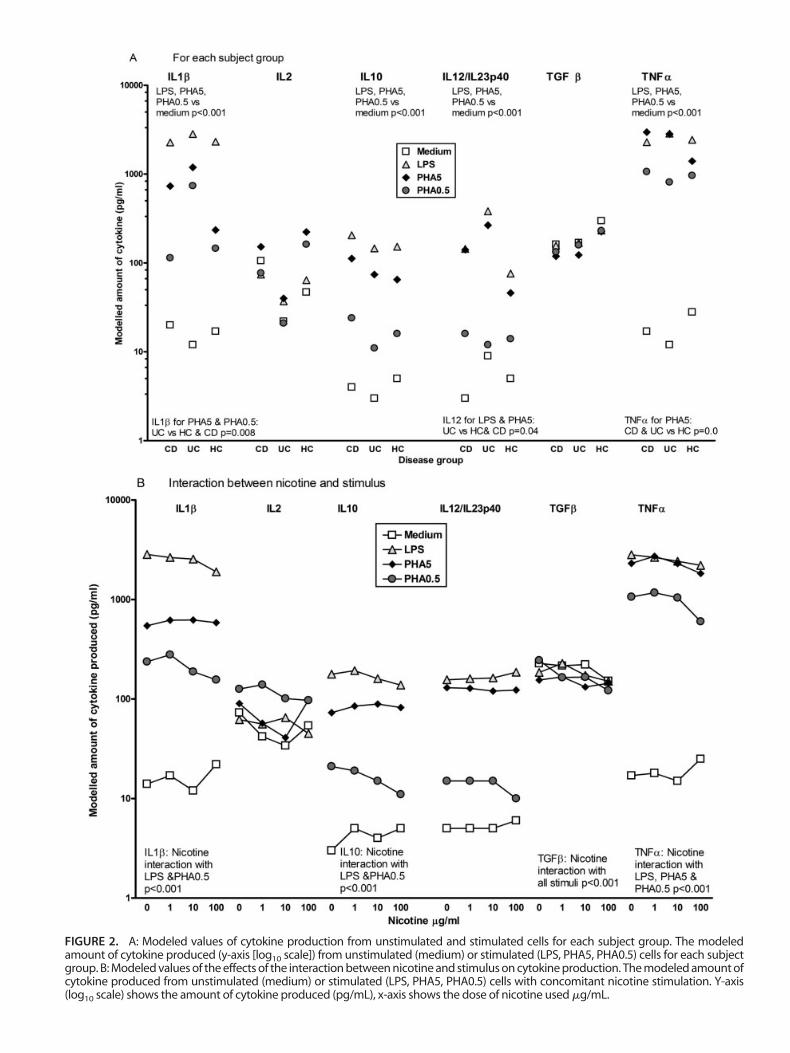
FIGURE 2. A: Modeled values of cytokine production from unstimulated and stimulated cells for each subject group. The modeledamount of cytokine produced (y-axis [log10 scale]) from unstimulated (medium) or stimulated (LPS, PHA5, PHA0.5) cells for each subjectgroup. B: Modeled values of the effects of the interaction between nicotine and stimulus on cytokine production. The modeled amount ofcytokine produced from unstimulated (medium) or stimulated (LPS, PHA5, PHA0.5) cells with concomitant nicotine stimulation. Y-axis(log10 scale) shows the amount of cytokine produced (pg/mL), x-axis shows the dose of nicotine used �g/mL.

tures, such that TGF� production decreased with costimula-tion with increased nicotine concentrations (P � 0.001).
TNF�. Nicotine differentially affected stimulated TNF�production (test of nicotine � stimulus interaction, P� 0.001): TNF� levels in response to LPS decreased withincreasing nicotine dose, with a less consistent decrease inPHA-stimulated TNF� production. Only the highest nicotinedose increased TNF� levels from unstimulated cells.
There was no effect from nicotine dose on IL2 orIL12/IL23p40 production.
Apoptosis and Cell Cycle
Apoptosis and Cell Cycle in Unstimulated andStimulated Cells.
The percentages of lymphocytes and monocytes in pe-ripheral blood for IBD patients (Table 1) were within normalranges, with no significant differences between patients withUC and CD.
The untransformed data for the percentage of cells inany part of the cell cycle and apoptosis in response to allstimuli are shown in Table 3. The data for cell cycle weretransformed using a log(y/100-y) transformation and com-
pared by one-way ANOVA. For unstimulated cells a signif-icant difference in apoptosis between subject groups was seen(P � 0.042, Table 3), with higher percentages of apoptoticcells in CD and UC patients than HC. There were no signif-icant differences in the percentage of cells in any other part ofthe cell cycle.
Similarly, the stimulated cell cycle data were transformedand compared by 1-way ANOVA for subject group. For cellsstimulated with PHA5 there was a significant difference inpercentage of resting (G0/G1) cells between CD, UC, and HC (P� 0.020, Table 3), with a lower percentage of resting cells in CDthan UC or HC. There was a significant difference in percentageof cells in G2/M phase proliferation between CD, UC, and HC(P � 0.023) with lower percentages of G2/M proliferation in CDand UC than HC. There were no significant differences in thepercentages of cells in apoptosis or S-phase proliferation, nor inany part of the cell cycle between subject groups for the LPS- orPHA0.5-stimulated cells.
Effects of Stimulus and Disease Group on CommonStatistical Models of Apoptosis and Cell Cycle
Analysis of the cell cycle/apoptosis data using mixed-model methods showed that smoking habit or disease activity
TABLE 3. Untransformed Data for Apoptosis and Cell Cycle After 72 Hours
Stimulus Response
Percentage of Cells in Cell Cycle After 72 Hours
CD UC HCP-value*Median (IQR) Median (IQR) Median (IQR)
Unstimulated cells (N) 18 15 12Apoptosis 5.5 (3.8–8.5) 4.8 (3.4–7.8) 3.5 (1.2–4.8) 0.042G0/G1 resting cells 54.7 (40.3–75.8) 66.3 (48.3–71.1) 70.4 (65.6–74.2) 0.056S phase proliferation 0.9 (0.6–1.1) 0.7 (0.4–1.1) 0.8 (0.5–1.3) 0.65G2/M proliferation 1.8 (1.3–2.5) 1.6 (1.3–2.8) 2.7 (1.9–3.4) 0.17
LPS-stimulated cells (N) 18 14 12Apoptosis 8.4 (6.3–11.9) 6.4 (3.6–10.4) 5.6 (4.1–8.1) 0.10G0/G1 resting cells 44.2 (31.9–67.3) 51.6 (38.7–59.5) 51.7 (43.3–63.3) 0.23S phase proliferation 0.9 (0.5–1.3) 0.6 (0.4–1.0) 0.8 (0.5–1.0) 0.16G2/M proliferation 1.6 (1.3–2.2) 1.2 (1.0–1.8) 1.5 (1.3–2.7) 0.33
PHA5-stimulated cells (N) 9 8 8Apoptosis 7.1 (4.4–9.7) 6.3 (4.8–7.5) 6.36 (3.4–10.8) 0.67G0/G1 resting cells 18.6 (7.6–30.8) 28.9 (25.8–46.1) 32.4 (28.5–39.3) 0.02S phase proliferation 4.6 (3.5–6.8) 6.4 (5.0–7.2) 10.3 (7.5–11.5) 0.19G2/M proliferation 5.9 (3.2–10.1) 8.7 (8.2–9.4) 12.7 (9.4–15.8) 0.02
PHA0.5-stimulated cells (N) 11 8 9Apoptosis 6.2 (4.1–8.7) 3.6 (2.9–6.9) 5.7 (3.3–6.3) 0.59G0/G1 resting cells 26.3 (12.6–32.6) 29.4 (26.3–36.1) 26.4 (24.0–32.7) 0.29S phase proliferation 3.5 (1.7–6.2) 3.7 (3.2–5.8) 4.3 (3.5–5.5) 0.82G2/M proliferation 8.1 (3.0–11.1) 5.8 (4.6–9.6) 8.2 (5.7–10.3) 0.66
Data are presented as median and interquartile ranges (IQR) for CD, UC, and HC. The numbers of patients used for each stimulus are given.*P-values given relate to differences between the disease groups when the data were transformed and compared by one-way ANOVA.
Inflamm Bowel Dis ● Volume 14, Number 11, November 2008 Nicotine Influence in IBD
1475
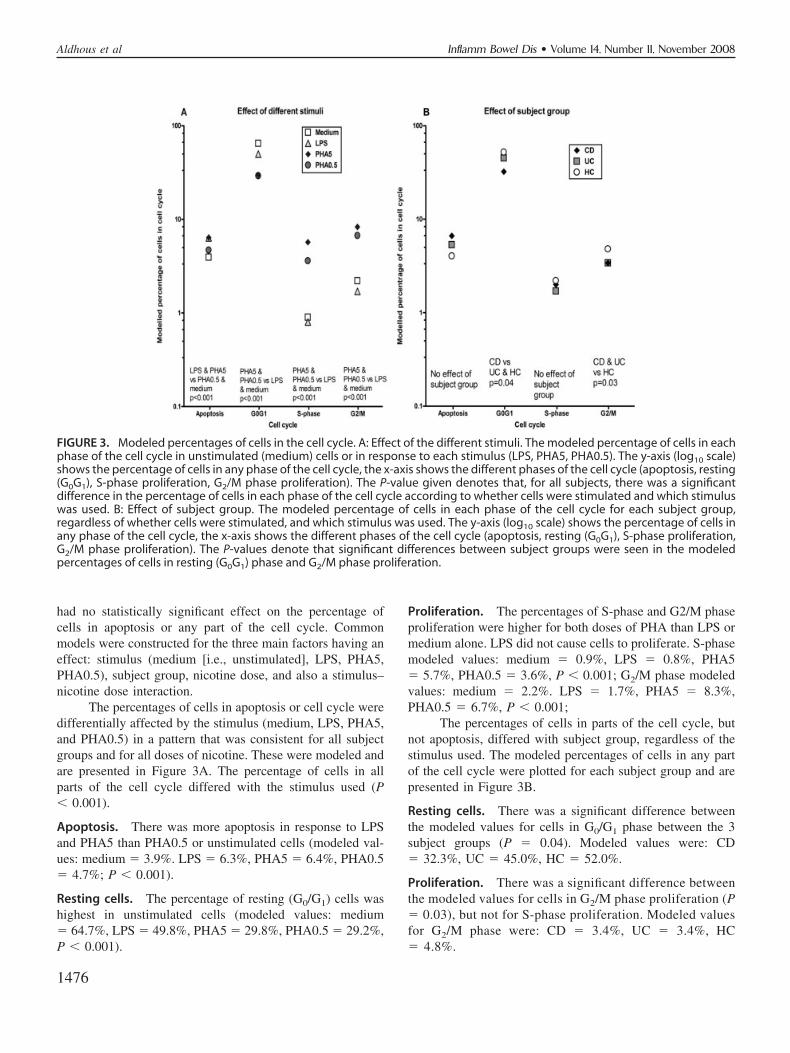
had no statistically significant effect on the percentage ofcells in apoptosis or any part of the cell cycle. Commonmodels were constructed for the three main factors having aneffect: stimulus (medium [i.e., unstimulated], LPS, PHA5,PHA0.5), subject group, nicotine dose, and also a stimulus–nicotine dose interaction.
The percentages of cells in apoptosis or cell cycle weredifferentially affected by the stimulus (medium, LPS, PHA5,and PHA0.5) in a pattern that was consistent for all subjectgroups and for all doses of nicotine. These were modeled andare presented in Figure 3A. The percentage of cells in allparts of the cell cycle differed with the stimulus used (P� 0.001).
Apoptosis. There was more apoptosis in response to LPSand PHA5 than PHA0.5 or unstimulated cells (modeled val-ues: medium � 3.9%. LPS � 6.3%, PHA5 � 6.4%, PHA0.5� 4.7%; P � 0.001).
Resting cells. The percentage of resting (G0/G1) cells washighest in unstimulated cells (modeled values: medium� 64.7%, LPS � 49.8%, PHA5 � 29.8%, PHA0.5 � 29.2%,P � 0.001).
Proliferation. The percentages of S-phase and G2/M phaseproliferation were higher for both doses of PHA than LPS ormedium alone. LPS did not cause cells to proliferate. S-phasemodeled values: medium � 0.9%, LPS � 0.8%, PHA5� 5.7%, PHA0.5 � 3.6%, P � 0.001; G2/M phase modeledvalues: medium � 2.2%. LPS � 1.7%, PHA5 � 8.3%,PHA0.5 � 6.7%, P � 0.001;
The percentages of cells in parts of the cell cycle, butnot apoptosis, differed with subject group, regardless of thestimulus used. The modeled percentages of cells in any partof the cell cycle were plotted for each subject group and arepresented in Figure 3B.
Resting cells. There was a significant difference betweenthe modeled values for cells in G0/G1 phase between the 3subject groups (P � 0.04). Modeled values were: CD� 32.3%, UC � 45.0%, HC � 52.0%.
Proliferation. There was a significant difference betweenthe modeled values for cells in G2/M phase proliferation (P� 0.03), but not for S-phase proliferation. Modeled valuesfor G2/M phase were: CD � 3.4%, UC � 3.4%, HC� 4.8%.
FIGURE 3. Modeled percentages of cells in the cell cycle. A: Effect of the different stimuli. The modeled percentage of cells in eachphase of the cell cycle in unstimulated (medium) cells or in response to each stimulus (LPS, PHA5, PHA0.5). The y-axis (log10 scale)shows the percentage of cells in any phase of the cell cycle, the x-axis shows the different phases of the cell cycle (apoptosis, resting(G0G1), S-phase proliferation, G2/M phase proliferation). The P-value given denotes that, for all subjects, there was a significantdifference in the percentage of cells in each phase of the cell cycle according to whether cells were stimulated and which stimuluswas used. B: Effect of subject group. The modeled percentage of cells in each phase of the cell cycle for each subject group,regardless of whether cells were stimulated, and which stimulus was used. The y-axis (log10 scale) shows the percentage of cells inany phase of the cell cycle, the x-axis shows the different phases of the cell cycle (apoptosis, resting (G0G1), S-phase proliferation,G2/M phase proliferation). The P-values denote that significant differences between subject groups were seen in the modeledpercentages of cells in resting (G0G1) phase and G2/M phase proliferation.
Aldhous et al Inflamm Bowel Dis ● Volume 14, Number 11, November 2008
1476

Nicotine Affected Unstimulated and PHA-stimulatedCell Cycle Responses
Nicotine differentially interacted with the stimulus (me-dium, LPS, PHA5, PHA0.5) in ways that were consistent forall subject groups. These were modeled and presented inFigure 4.
Apoptosis. There were no significant interactions on thepercentages of cells in apoptosis, as shown by the almostparallel lines across nicotine concentrations.
Resting cells. A significant interaction was seen with themodeled percentages of G0/G1 cells in response to differentstimuli (P � 0.002): the modeled percent resting cells fromPHA-stimulation (both doses) showed a small increase withincreasing nicotine dose, but not for LPS or unstimulated cells.
Proliferation. Nicotine differentially affected the mod-eled percentage of cells in S-phase proliferation in re-sponse to different stimuli (P � 0.001): for PHA5- andPHA0.5-stimulated cells, the percentage of cells in S-phase decreased with increasing nicotine dose, whereas forLPS-stimulated and unstimulated cells there was littlevariation.
There were no significant effects of nicotine dose on thepercentages of cells in G2/M phase proliferation produced byany stimulus.
Nicotine Differentially Affected Apoptosis in DifferentSubject Groups
A significant 3-way interaction between the subjectgroup, the stimulus, and the nicotine dose was found forapoptosis (test of 3-way interaction P � 0.007), but not forany other part of the cell cycle. The modeled estimatedpercentages of cells in apoptosis are shown in Figure 5. Theseshow the different patterns of apoptotic responses, whichdepend on the subject group (CD, UC, HC), which stimuluswas used, and the concomitant dose of nicotine.
In CD patients the modeled difference in the amount ofapoptosis in cells was in response to different stimuli, withthe highest apoptosis in response to LPS (estimated values:unstimulated � 5.8%, LPS � 8.4%, PHA5 � 7.0%, PHA0.5� 5.6%). Nicotine reduced the amount of apoptosis in re-sponse to LPS, but differences in values were small (nicotinedose 1 � 8.5%, 10 � 8.1%, 100 � 6.5%). Nicotine did notaffect apoptosis from unstimulated cells or in response toPHA.
In UC a difference was seen in the percentage ofapoptotic cells in response to different stimuli, with the mostapoptosis in response to LPS and PHA5 (estimated values:unstimulated � 4.3%, LPS � 6.2%, PHA5 � 6.9%, PHA0.5� 3.8%). These values were marginally lower than those forCD. Nicotine did not modify unstimulated or stimulatedresponses.
In HC there was a difference in the percentage of
FIGURE 4. Model of the interaction between stimulus and con-comitant nicotine dose. The modeled values of cells in differentphases of the cell cycle (apoptosis, resting (G0G1), S-phase pro-liferation, G2/M phase proliferation) from unstimulated (me-dium) and stimulated cells, and the effect of co-stimulation withnicotine on those responses. The y-axis (log10 scale) shows thepercentage of cells in any phase of the cell cycle, the x-axisshows the nicotine concentrations used for costimulation (0, 1,10, 100 �g/mL).
FIGURE 5. Model of the 3-way interaction between disease,stimulus, and nicotine dose for apoptosis. The modeled valuesof apoptotic cells from unstimulated (medium) and stimulatedcells, the effect of costimulation with nicotine on those re-sponses, for each subject group. The y-axis (log10 scale) showsthe percentage of cells in any phase of the cell cycle, the x-axisshows the nicotine concentrations used for costimulation (0, 1,10, 100 �g/mL). The P-value denotes that the pattern of apop-tosis, in response to each combination of stimulus and costimu-lation by nicotine, differs in each subject group.
Inflamm Bowel Dis ● Volume 14, Number 11, November 2008 Nicotine Influence in IBD
1477

apoptotic cells in response to different stimuli, with the mostapoptosis in response to PHA5 (estimated values: unstimu-lated � 2.3%, LPS � 5.3%, PHA5 � 7.5%, PHA0.5� 3.8%). These values were lower than those for CD or UC.Nicotine reduced the amount of apoptosis in response toPHA5, but differences in values were small (nicotine dose 1� 6.4%, 10 � 4.7%, 100 � 5.6%). Nicotine did not affectunstimulated apoptosis or in response to LPS or PHA0.5.
Relationship Between Cytokine Production andSubsequent Cell Cycle/Apoptosis Response
We analyzed whether cytokine production at 24 hoursrelated to the subsequent percentage of cells in the cell cycleafter 72 hours. Initial models included stimulus, nicotinedose, and disease state but stimulus was found to dominate,with little contribution from the cytokines. If stimulus wasremoved the effects of the cytokines could be modeled.Although patient, stimulus, and nicotine dose effects were notdirectly modeled, allowance was made for the correlation
between observations on the same patient and with the samestimulus and nicotine dose. Subject group made no significantcontribution to any of the models. The results of the modelsare shown in Table 4.
In univariate analyses, IL1�, IL10, IL12/IL23p40, andTNF� all affected apoptosis (P � 0.001), with positive re-gression coefficient values (i.e., if the cytokine increased, sodid the amount of apoptosis). Increased IL1� or TNF� pro-duction led to decreased percentage of resting cells (P� 0.006 and P � 0.001, respectively). Increased IL1� (P� 0.004) and TNF� (P � 0.001) increased S-phase prolif-eration and for G2/M proliferation, increased TNF� led toincreased proliferation (P � 0.02).
In the multivariate models the IL12/IL23p40 inde-pendently increased apoptosis (P � 0.01); TNF� inhibitedresting cells (P � 0.001), whereas IL1� increased thepercentage of resting (Go/G1) cells (P � 0.006). TNF�independently increased both S-phase (P � 0.005) andG2/M phase proliferation (P � 0.001), while IL1� had a
TABLE 4. Regression Coefficients and P-values from the Models of Cytokine Production and Cell Cycle
Cell Cycle (Day 3) Cytokine (Day 1)
Univariate Analysis Multivariate Analysis
Coefficient P-value Coefficient P-value
Apoptosis IL1� �0.073 �0.001 �0.005 0.91IL2 �0.027 0.22 �0.027 0.23
IL10 �0.119 �0.001 �0.011 0.84IL12/IL23p40 �0.084 �0.001 �0.079 0.01
TGF� �0.019 0.53 �0.021 0.64TNF� �0.071 �0.001 �0.010 0.83
G0G1 Resting cells IL1� �0.074 0.006 �0.162 0.006IL2 �0.032 0.17 �0.027 0.25IL10 �0.088 0.054 �0.044 0.49
IL12/IL23p40 �0.027 0.29 �0.016 0.63TGF� �0.022 0.54 �0.029 0.56TNF� �0.144 �0.001 �0.343 <0.001
S-phaseProliferation IL1� �0.090 0.004 �0.035 0.62
IL2 �0.014 0.60 �0.024 0.36IL10 �0.067 0.19 �0.016 0.83
IL12/IL23p40 �0.010 0.73 �0.066 0.06TGF� �0.005 0.89 �0.055 0.27TNF� �0.139 �0.001 �0.255 0.005
G2/M Proliferation IL1� �0.007 0.79 �0.193 0.003IL2 �0.003 0.91 �0.000 0.99
IL10 �0.024 0.59 �0.061 0.36IL12/IL23p40 �0.002 0.93 �0.031 0.32
TGF� �0.003 0.92 �0.003 0.94TNF� �0.069 0.02 �0.249 <0.001
The transformed cell cycle variables (after 72 hours) were the dependent variables and the transformed cytokine variables (at 24 hours) were the independentvariables. Cytokines that had a significant effect in the multivariate analyses for each part of the cell cycle are highlighted in bold.
Aldhous et al Inflamm Bowel Dis ● Volume 14, Number 11, November 2008
1478

significant (P � 0.003) inhibitory effect on G2/M phaseproliferation.
DISCUSSIONSmoking has been shown to have profound effects on
susceptibility and disease history of both CD and UC.16–18
Whether nicotine is the active ingredient by which smokinghas its effect has yet to be shown conclusively and themechanisms involved remain uncertain.38 The present studyaimed to investigate the effects of nicotine on cytokine andcell cycle responses in IBD patients. We hypothesized thatnicotine may differentially affect unstimulated and stimulatedcytokine production in PBMCs from CD and UC patients,which then may have an effect on the cell cycle and apopto-sis. Our results showed that LPS-stimulated cytokine produc-tion from PBMCs on in vitro stimulation was dysregulated inIBD. Similarly, PHA-stimulated cell cycle responses weredysregulated, with altered proportions of cells in the restingand proliferative phases, especially in CD patients; whether adisproportionate number of cells in these patients are under-going cell death via necrosis rather than apoptosis would needfurther investigation. From our results, specific cytokine pro-files at 24 hours were independently associated with thesubsequent proportions of cells in the cell cycle, regardless ofdisease status. Nicotine affected these specific cytokine andcell cycle responses with similar magnitude and direction ofeffect in UC and CD.
The relationships between cytokine profiles and cellcycling or apoptotic events are intriguing. The monocyte-derived cytokines (IL1�, IL10, TNF�) were highly correlatedwith IL12/IL23p40, which our data modeling studies suggestas the critical cytokine driving apoptosis. IL12 and IL23overlap in their distribution on leukocytes and have distinctbut complementary actions: IL12 is involved in antimicrobialresponses to intracellular pathogens, whereas IL23 is impor-tant for the induction of chronic inflammation and granulomaformation.39 Both IL12 and IL23 are increased in CD.40,41 Ina mouse model, T-cell-mediated colitis was driven by IL23,but not IL12, via IL17 and IL6,9 leading to the suggestion thatthe Th17 pathway is important in the initiation and perpetu-ation of innate and T-cell-mediated forms of IBD.8 Theproapoptotic effect of IL12/IL34p40 demonstrated here doesnot explain those studies that showed that anti-IL12p40monoclonal antibodies reduce both IL12 and IL23 levels42
and induced a clinical response in active CD,43 as reducedT-cell apoptosis is characteristic of CD.11
Both TNF� and IL1� are inflammatory mediatorsraised in both CD and UC in response to stimulation,6,44,45 asalso seen in this study. Through data modeling TNF� wasfound to have pro-proliferative effects, which concurs withresults from anti-TNF� therapies, e.g., Infliximab, Adali-mumab and Etanercept, which have been shown to induceapoptosis in monocytes and T-cells,46–48 while Infliximab has
also been shown to promote G0/G1 cell cycle arrest.49 IL1�was produced in response to LPS in all subjects; in responseto PHA, IL1� was increased in CD and UC patients, but notHC, suggesting that, in IBD, T cells might be more respon-sive to stimulation than in controls. IL1� had an inhibitoryeffect on G2/M phase proliferation and promoted cells intoG0/G1. G0/G1 cells are not only resting cells, but may also beterminally differentiated effector cells; thus, IL1� may pro-mote this differentiation. While IL1� is a proinflammatorycytokine and would normally be thought of as pro-prolifera-tive, 2 recent reports have also suggested that IL1� may playa role in decreasing proliferation of different cell types.50,51 Ifnicotine reduces the production of cytokines such as IL1�and TNF�, which then changes the proportion of cells in thecell cycle, then this may explain the therapeutic efficacy ofnicotine therapy in UC.19
The balance between cell proliferation and apoptosis isimportant in maintenance of homeostasis. In CD there werefewer resting (G0/G1) cells than UC or HC, and fewer cellsundergoing G2/M proliferation in CD and UC. Differences inunstimulated apoptosis seen between IBD patients and con-trols were not maintained in the models once putative con-founding factors were taken into account. These results con-trast with studies which found more proliferating cells butless apoptosis in CD11 and less proliferation and more apop-tosis in UC patients,11,52 but could be explained by differ-ences between peripheral and mucosal T-cell responses.13
Lamina propria and peripheral blood T cells go through thecell cycle at different rates in response to the same anddifferent stimuli.53 Other studies of peripheral T cells haveshown that mitogenic responses were impaired in CD54 andUC,55 confirmed in this study by reduced proliferation inresponse to PHA.
What of nicotine? There is real uncertainty in the literatureas to the importance of nicotine in the smoking-related patho-genesis of UC and CD,19,20,38,56 and the mechanisms involvedare unclear. The assumption has been made that CD is exacer-bated by nicotine, though few studies have investigated this. Weaddressed these issues directly in this study by assessing theeffects of nicotine on cytokine production and cell cycling inIBD patients. We found no differential effect of nicotine on theresponses from UC and CD patients, although data from the CDpatients were not stratified according to disease location, as thiswould have made the patient groups too small to model. Differ-ential effects of nicotine in small and large bowel have beenshown in mouse models29,30 whereby nicotine exacerbated jeju-nal but healed colonic inflammation, perhaps explaining ourprevious clinical study showing an association between smokingand small bowel location of CD.17 Nicotine might also affectother cellular mechanisms, e.g., expression of tight junctionproteins leading to decreased epithelial cell permeability.57 Arecent interesting study showed that stimulation of lamina pro-pria T cells for 9 days with nicotine led to a change in cellular
Inflamm Bowel Dis ● Volume 14, Number 11, November 2008 Nicotine Influence in IBD
1479

expression of transcription factors, suggesting a shift toward aTh1 phenotype of these cells58 and potentially the developmentof chronic autoimmune or inflammatory diseases.59 Altered tran-scription factor expression might have occurred in this study,leading to the decrease in IL10 production, although the time-scales were different, though others have found IL10 to bereduced by nicotine.32 Other studies have shown that nicotinedecreases IL1�, TNF�, and TGF� production.22,24–26,60
The �-7 nicotinic acetyl choline receptor (�7-nAChR),through which nicotine has its effect, is expressed on periph-eral blood monocytes and lymphocytes61,62; in this study bothcell types were affected by nicotine, with perhaps a strongereffect on monocyte-derived cytokines, especially in responseto LPS, as there was no effect on the specific T-cell cytokineIL2. Conversely, for the cell cycle, nicotine had no effect onLPS-stimulated responses, but increased resting cells andreducing S-phase proliferation in response to PHA, concur-ring with previous studies demonstrating that nicotine in-duced G0/G1 cell cycle arrest in T cells.63 In vivo, nicotinemay affect gut cytokine responses from macrophages throughthe gut-brain axis via the vagal nerve and �7-nAChRs.58,64,65
Is nicotine really the only active agent? Smoking maydirectly affect the gut through swallowed cigarette smokeproducts rather than via dissolved products in the blood.Cigarette smoke contains �4700 compounds, of which nic-otine is the best characterized. From our data it may besuggested that nicotine is not the active ingredient differen-tially affecting IBD patients, but this needs to be confirmed infurther studies. Other constituents might be important in theetiology of IBD, e.g., 4-(methylnitrosamino)-1-(3-pyridyl)-1-butanone (NNK), a carcinogen in cigarette smoke that affectscytokine production from alveolar macrophages of smok-ers66,67; carbon monoxide has been shown to have an anti-inflammatory effect on a mouse model of colitis.68 Extra-intestinal manifestations occur in both UC and CD69
indicating that systemic immunity is affected in IBD. In UC,extra-intestinal manifestations may be associated with smok-ing,70 but the cytokine and cell cycle models were not af-fected by smoking habit.
Statistical modeling of the data is a key strength of ourstudy, and was applied both in order to evaluate factors thatmight affect the results in this study and to distinguish thosewhich had an effect. Standard statistical models assume thatthe error terms are independent. In this study such assump-tions were unrealistic, as we expected correlations betweenresults obtained from the same subject, the same stimulus,and the same dose of nicotine. The models fitted allowed forthese correlations and also accounted appropriately for anymissing values in the data. Many different factors affectimmune responses in vivo; indeed, this is a feature of com-plex diseases such as IBD where genetic and environmentalfactors contribute to the immunopathogenesis.3,5 Due to thelimited number of subjects, the between-group analyses may
be underpowered for detecting differences between diseasegroups. However, there are stronger grounds for detectingassociations within individuals and the within-group analyseswould have allowed small differences to be identified.
In conclusion, we propose that specific cytokines maydrive specific parts of the cell cycle and apoptosis; furtherfunctional work is required to verify this suggestion. IL12/IL23p40 was associated with apoptosis, TNF� with increasedproliferation, and IL1� with resting/differentiated cells. Wehave shown that various factors can be taken into account inthe analysis of an immune response through statistical mod-eling, which will be important as more potential geneticdeterminants for IBD are discovered2 and is a major strengthof the present study. While we observed several clear effectsof nicotine on LPS-induced cytokine production and T cellproliferation, no differential effects of nicotine were seen onthese mechanisms in CD and UC. There is still a need toinvestigate further the effects of other smoke-related productson cellular responses in both CD and UC patients.
ACKNOWLEDGMENTSWe thank Mrs. Janice Fennell for recruiting patients
and Mrs. Hazel Drummond for phenotyping of patients. Wethank Professor Sarah Howie, Centre for Inflammation Re-search, University of Edinburgh, and Dr. Ian Arnott, GI Unit,Western General Hospital for comments on the article.
REFERENCES1. Rubin GP, Hungin AP, Kelly PJ, et al. Inflammatory bowel disease:
epidemiology and management in an English general practice popula-tion. Aliment Pharmacol Ther. 2000;14:1553–1559.
2. Mathew CG. New links to the pathogenesis of Crohn disease providedby genome-wide association scans. Nat Rev Genet. 2008;9:9–14.
3. Armitage EL, Aldhous MC, Anderson N, et al. Incidence of juvenile-onset Crohn’s disease in Scotland: association with northern latitude andaffluence. Gastroenterol. 2004;127:1051–1057.
4. Halfvarson J, Jess T, Magnuson A, et al. Environmental factors ininflammatory bowel disease: a co-twin control study of a Swedish-Danish twin population. Inflamm Bowel Dis. 2006;12:925–933.
5. Xavier RJ, Podolsky DK. Unravelling the pathogenesis of inflammatorybowel disease. Nature. 2007;448:427–434.
6. Cobrin GM, Abreu MT. Defects in mucosal immunity leading toCrohn’s disease. Immunol Rev. 2005;206:277–295.
7. Targan SR, Karp LC. Defects in mucosal immunity leading to ulcerativecolitis. Immunol Rev. 2005;206:296–305.
8. Neurath MF. IL-23: a master regulator in Crohn disease. Nat Med.2007;13:26–28.
9. Yen D, Cheung J, Scheerens H, et al. IL-23 is essential for T cell-mediated colitis and promotes inflammation via IL-17 and IL-6. J ClinInvest. 2006;116:1310–1316.
10. Bu P, Keshavarzian A, Stone DD, et al. Apoptosis: one of the mecha-nisms that maintains unresponsiveness of the intestinal mucosal immunesystem. J Immunol. 2001;166:6399–6403.
11. Sturm A, Leite AZA, Danese S, et al. Divergent cell cycle kineticsunderlie the distinct functional capacity of mucosal T cells in Crohn’sdisease and ulcerative colitis. Gut. 2004;53:1624–1631.
12. Ina K, Itoh J, Fukushima K, et al. Resistance of Crohn’s disease T cellsto multiple apoptotic signals is associated with a bcl-2/bax mucosalimbalance. J Immunol. 1999;163:1081–1090.
13. Doering J, Begue B, Lentze MJ, et al. Induction of T lymphocyteapoptosis by sulphasalazine in patients with Crohn’s disease. Gut. 2004;53:1632–1638.
Aldhous et al Inflamm Bowel Dis ● Volume 14, Number 11, November 2008
1480

14. Fayad R, Brand MI, Stone D, et al. Apoptosis resistance in ulcerativecolitis: High expression of decoy receptors by lamina propria T cells.Eur J Immunol. 2006;36:2215–2222.
15. Begue B, Wajant H, Bambou J-C, et al. Implication of TNF-relatedapoptosis-inducing ligand in inflammatory intestinal epithelial lesions.Gastroenterol. 2006;130:1962–1974.
16. Birrenbach T, Bocker U. Inflammatory bowel disease and smoking: areview of epidemiology, pathophysiology, and therapeutic implications.Inflamm Bowel Dis. 2004;10:848–859.
17. Aldhous MC, Drummond HE, Anderson N, et al. Does cigarette smok-ing influence the phenotype of Crohn’s disease? Analysis using theMontreal classification. Am J Gastroenterol. 2007;102:577–588.
18. Aldhous MC, Drummond HE, Anderson N, et al. Smoking habit andload influence age at diagnosis and disease extent in ulcerative colitis.Am J Gastroenterol. 2007;102:589–597.
19. Pullan RD, Rhodes J, Ganesh S, et al. Transdermal nicotine for activeulcerative colitis. N Engl J Med. 1994;330:811–815.
20. McGrath J, McDonald JWD, McDonald JK. Transdermal nicotine forinduction of remission in ulcerative colitis (Review). Cochrane Data-base System Rev. 2004;4:CD004722.
21. Guinet E, Yoshida K, Nouri-Shirazi M. Nicotinic environment affectsthe differentiation and functional maturation of monocytes derived den-dritic cells (DCs). Immunol Lett. 2004;95:45–55.
22. Mamata Y, Hakki A, Yamamoto Y, et al. Nicotine modulates cytokineproduction by Chlamydia pneumoniae infected human peripheral bloodcells. Int Immunopharmacol. 2005;5:749–756.
23. Aicher A, Heeschen C, Mohaupt M, et al. Nicotine strongly activatesdendritic cell-mediated adaptive immunity: potential role for progressionof atherosclerotic lesions. Circulation. 2003;107:604–611.
24. Matsunaga K, Klein TW, Friedman H, et al. Involvement of nicotinicacetylcholine receptors in suppression of antimicrobial activity andcytokine responses of alveolar macrophages to Legionella pneumophilainfection by nicotine. J Immunol. 2001;167:6518–6524.
25. Madretsma GS, Donze GJ, van Dijk APM, et al. Nicotine inhibits the invitro production of interleukin 2 and tumour necrosis factor-� by humanmononuclear cells. Immunopharmacology. 1996;35:47–51.
26. van Dijk APM, Meijssen MAC, Brouwer AJBW, et al. Transdermalnicotine inhibits interleukin 2 synthesis by mononuclear cells derivedfrom healthy volunteers. Eur J Clin Invest. 1998;28:664–671.
27. Sugano N, Ito K. Nicotine switches the form of H2O2-induced cell deathfrom apoptosis to necrosis in U937 cells. Immunol Lett. 2000;72:163–166.
28. Crowley-Weber CL, Dvorakova K, Crowley C, et al. Nicotine increasesoxidative stress, activates NF-kappaB and GRP78, induces apoptosisand sensitizes cells to genotoxic/xenobiotic stresses by a multiple stressinducer, deoxycholate: relevance to colon carcinogenesis. Chem BiolInteract. 2003;145:53–66.
29. Eliakim R, Fan QX, Babyatsky MW. Chronic nicotine administrationdifferentially alters jejunal and colonic inflammation in interleukin-10deficient mice. Eur J Gastroenterol Hepatol. 2002;14:607–614.
30. Eliakim R, Karmeli F, Cohen P, et al. Dual effect of chronic nicotineadministration: augmentation of jejunitis and amelioration of colitisinduced by iodoacetamide in rats. Int J Colorectal Dis. 2001;16:14–21.
31. Van Dijk JPM, Madretsma GS, Keuskamp ZJ, et al. Nicotine inhibitscytokine synthesis by mouse colonic mucosa. Eur J Pharmacol. 1995;278:R11–R12.
32. Madretsma S, Wolters LM, van Dijk JP, et al. In-vivo effect of nicotineon cytokine production by human non-adherent mononuclear cells. EurJ Gastroenterol Hepatol. 1996;8:1017–1020.
33. Sykes AP, Brampton C, Klee S, et al. An investigation into the effect andmechanisms of action of nicotine in inflammatory bowel disease. In-flamm Res. 2000;49:311–319.
34. Lennard-Jones JE. Classification of inflammatory bowel disease. ScandJ Gastroenterol. 1989;24(suppl):2–6.
35. Silverberg MS, Satsangi J, Ahmad T, et al. Toward an integratedclinical, molecular and serological classification of inflammatory boweldisease: report of a Working Party of the 2005 Montreal World Congressof Gastroenterology. Can J Gastroenterol. 2005;19(suppl A):5A–36A.
36. Reddy M, Eirikis E, Davis C, et al. Comparative analysis of lymphocyteactivation marker expression and cytokine secretion profile in stimulated
human peripheral blood mononuclear cell cultures: an in vitro model tomonitor cellular immune function. J Immunol Methods. 2004;293:127–142.
37. Geng Y, Savage SM, Johnson LJ, et al. Effects of nicotine on theimmune response. I Chronic exposure to nicotine impairs antigen recep-tor-mediated signal transduction in lymphocytes. Toxicol Appl Pharma-col. 1995;135:268–278.
38. McGilligan VE, Wallace JMW, Heavey PM, et al. Hypothesis aboutmechanisms through which nicotine might exert its effect on the inter-dependence of inflammation and gut barrier function in ulcerative colitis.Inflamm Bowel Dis. 2007;13:108–115.
39. Langrish CL, McKenzie BS, Wilson NJ, et al. IL-12 and IL-23: masterregulators of innate and adaptive immunity. Immunol Rev. 2004;202:96–105.
40. Stallmach A, Giese T, Schmidt C, et al. Cytokine/chemokine transcriptprofiles reflect mucosal inflammation in Crohn’s disease. Int J Colorec-tal Dis. 2004;19:308–315.
41. Schmidt C, Giese T, Ludwig B, et al. Expression of interleukin-12-related cytokine transcripts in inflammatory bowel disease: elevatedinterleukin-23p19 and interleukin-27p28 in Crohn’s disease but not inulcerative colitis. Inflamm Bowel Dis. 2005;11:16–23.
42. Fuss IJ, Becker C, Yang Z, et al. Both IL-12p70 and IL-23 are synthe-sized during active Crohn’s disease and are down-regulated by treatmentwith anti-IL-12 p40 monoclonal antibody. Inflamm Bowel Dis. 2006;12:9–15.
43. Mannon PJ, Fuss IJ, Mayer L, et al. Anti-interleukin-12 antibody foractive Crohn’s disease. N Engl J Med. 2004;351:2069–2079.
44. Gotteland M, Lopez M, Munoz C, et al. Local and systemic liberation ofproinflammatory cytokines in ulcerative colitis. Dig Dis Sci. 1999;44:830–835.
45. Elsasser-Beile U, von Kleist S, Gerlach S, et al. Cytokine production inwhole blood cell cultures of patients with Crohn’s disease and ulcerativecolitis. J Clin Lab Anal. 1994;8:447–451.
46. Lugering A, Schmidt M, Lugering N, et al. Infliximab induces apoptosisin monocytes from patients with chronic active Crohn’s disease by usinga caspase-dependent pathway. Gastroenterol. 2001;121:1145–1157.
47. di Sabatino A, Ciccocioppo R, Cinque B, et al. Defective mucosal T celldeath is sustainably reverted by infliximab in a caspase dependentpathway in Crohn’s disease. Gut. 2004;53:70–77.
48. Nesbitt A, Fossati G, Bergin M, et al. Mechanism of action of Certoli-zumab Pegol (CDP870): in vitro comparison with other anti-tumornecrosis factor � agents. Inflamm Bowel Dis. 2007;13:1323–1332.
49. Mitoma H, Horiuchi T, Hatta N, et al. Infliximab induces potent anti-inflammatory responses by outside-to-inside signals through transmem-brane TNF-�. Gastroenterology. 2005;128:376–392.
50. Nilkaeo A, Bhuvanath S. Interleukin-1 modulation of human placentaltrophoblast proliferation. Mediators Inflamm. 2006;2:79359.
51. Kaneko N, Kudo K, Mabuchi T, et al. Suppression of cell proliferationby interferon-alpha through interleukin-1 production in adult rat dentategyrus. Neuropsychopharmacology. 2006;31:2619–2626.
52. Heller F, Florian P, Bojarski C, et al. Interleukin-13 is the key effectorTh2 cytokine in ulcerative colitis that affects epithelial tight junctions,apoptosis, and cell restitution. Gastroenterol. 2005;129:550–564.
53. Sturm A, Itoh J, Jacobberger JW, et al. p53 negatively regulates intes-tinal immunity by delaying mucosal T cell cycling. J Clin Invest.2002;109:1481–1492.
54. Stio M, Treves C, Martinesi M, et al. Effect of anti-TNF therapy andvitamin D derivatives on the proliferation of peripheral blood mononu-clear cells in Crohn’s disease. Dig Dis Sci. 2004;49:328–335.
55. Perez-Machado MA, Manzano Espinosa L, De La Morena MadrigalEJ, et al. Impaired mitogenic response of peripheral blood T cells inulcerative colitis is not due to apoptosis. Dig Dis Sci. 1999;44:2530 –2537.
56. Thomas GAO, Rhodes J, Mani V, et al. Transdermal nicotine as main-tenance therapy for ulcerative colitis. N Engl J Med. 1995;332:988–992.
57. McGilligan VE, Wallace JMW, Heavey PM, et al. The effect of nicotinein vitro on the integrity of tight junctions in Caco-2 cell monolayers.Food Chem Toxicol. 2007;45:1593–1598.
58. Kikuchi H, Itoh J, Fukuda S. Chronic nicotine stimulation modulates theimmune response of mucosal T cells to Th1-dominant pattern vianAChR by upregulation of Th1-specific transcriptional factor. NeurosciLett. 2008;432:217–221.
Inflamm Bowel Dis ● Volume 14, Number 11, November 2008 Nicotine Influence in IBD
1481

59. Afzali B, Lombardi G, Lechler RI, et al. The role of T helper 17 (Th17)and regulatory T cells (Treg) in human organ transplantation and auto-immune disease. Clin Exp Immunol. 2007;148:32–46.
60. Yoshikawa H, Kurokawa M, Ozaki N, et al. Nicotine inhibits theproduction of proinflammatory mediators in human monocytes by sup-pression of I�B phosphorylation and nuclear factor-�B transcriptionalactivity through nicotinic acetylcholine receptor-�7. Clin Exp Immunol.2006;146:116–123.
61. Takahashi HK, Iwagaki H, Hamano R, et al. alpha7 Nicotinic acetyl-choline receptor stimulation inhibits lipopolysaccharide-induced inter-leukin-18 and -12 production in monocytes. J Pharmacol Sci. 2006;102:143–146.
62. Sato KZ, Fujii T, Watanabe Y, et al. Diversity of mRNA expression formuscarinic acetylcholine receptor subtypes and neuronal nicotinic ace-tylcholine receptor subunits in human mononuclear leukocytes andleukemic cell lines. Neurosci Lett. 1999;266:17–20.
63. Geng Y, Savage SM, Razani-Boroujerdi S, et al. Effects of nicotine onthe immune response. II. Chronic nicotine treatment induces T cellanergy. J Immunol. 1996;156:2384–2390.
64. Ingram JR, Thomas GA, Rhodes J, et al. A randomized trial of nicotine
enemas for active ulcerative colitis. Clin Gastroenterol Hepatol. 2005;3:1107–1114.
65. Ghia JE, Blennerhassett P, Kumar-Ondiveeran H, et al. The vagus nerve:a tonic inhibitory influence associated with inflammatory bowel diseasein a murine model. Gastroenterology. 2006;131:1122–1130.
66. Proulx L-I, Castonguay A, Bissonnette EY. Cytokine production byalveolar macrophages is down regulated by the a-methylhydroxylationpathway of 4-(methylnitrosamino)-1-(3-pyridyl)-1-butanone (NNK).Carcinogenesis. 2004;25:997–1003.
67. Therriault M-J, Proulx L-I, Castonguay A, et al. Immunomodulatoryeffects of the tobacco-specific carcinogen, NNK, on alveolar macro-phages. Clin Exp Immunol. 2003;132:232–238.
68. Hegazi RA, Rao KN, Mayle A, et al. Carbon monoxide ameliorateschronic murine colitis through a heme oxygenase 1-dependent pathway.J Exp Med. 2005;202:1703–1713.
69. Bernstein CN, Blanchard JF, Rawsthorne P, et al. The prevalence ofextraintestinal diseases in inflammatory bowel disease: a population-based study. Am J Gastroenterol. 2001;96:1116–1122.
70. Manguso F, Sanges M, Staiano T, et al. Cigarette smoking and appen-dectomy are risk factors for extraintestinal manifestations in ulcerativecolitis. Am J Gastroenterol. 2004;99:327–334.
Aldhous et al Inflamm Bowel Dis ● Volume 14, Number 11, November 2008
1482