Does Good Governance Create Value for International Acquirers in Africa: evidence from US...
27
N o 143- December 2011 Does Good Governance Create Value for International Acquirers in Africa: evidence from US acquisitions Thouraya Triki and Olfa Maalaoui Chun
Transcript of Does Good Governance Create Value for International Acquirers in Africa: evidence from US...
No 143- December 2011
Does Good Governance Create Value for International Acquirers in Africa: evidence from US acquisitions
Thouraya Triki and Olfa Maalaoui Chun
Correct citation: Triki, Thouraya; and Maalaoui Chun, Olfa. (2011), Does Good Governance Create Value for International Acquirers in Africa: evidence from US acquisitions, Working Paper Series N° 143, African Development Bank, Tunis, Tunisia.
Vencatachellum, Désiré (Chair) Anyanwu, John C. Shimeles, Abebe Faye, Issa Verdier-Chouchane, Audrey Ngaruko, Floribert Salami, Adeleke
Coordinator
Working Papers are available online at
http:/www.afdb.org/
Copyright © 2011
African Development Bank
Angle des l’avenue du Ghana et des rues
Pierre de Coubertin et Hédi Nouira
BP 323 -1002 TUNIS Belvédère (Tunisia)
Tel: +216 71 333 511
Fax: +216 71 351 933
E-mail: [email protected]
Salami, Adeleke
Editorial Committee Rights and Permissions
All rights reserved.
The text and data in this publication may be
reproduced as long as the source is cited.
Reproduction for commercial purposes is
forbidden.
The Working Paper Series (WPS) is produced
by the Development Research Department
of the African Development Bank. The WPS
disseminates the findings of work in progress,
preliminary research results, and development
experience and lessons, to encourage the
exchange of ideas and innovative thinking
among researchers, development
practitioners, policy makers, and donors. The
findings, interpretations, and conclusions
expressed in the Bank’s WPS are entirely
those of the author(s) and do not necessarily
represent the view of the African Development
Bank, its Board of Directors, or the countries
they represent.
Does Good Governance Create Value for International
Acquirers in Africa: evidence from US acquisitions
Thouraya Triki and Olfa Maalaoui Chun1
1 Thouraya Triki and Olfa Maalaoui Chun are respectively Principal Research Economist,
Development Research Department, African Development Bank ( [email protected]) and
Assistant Professor, KAIST Graduate School of Finance, [email protected]. The
authors are very grateful to Ines Mahjoub and Riadh ben Massoud for excellent research
assistance, and Molly Mahar and two anonymous referees for comments provided on an earlier
version of the paper. The authors also benefited from comments made by participants to the 15th
African Econometric Society annual conference held in Cairo, Egypt and AfDB informal
research seminar.
AFRICAN DEVELOPMENT BANK GROUP
Working Paper No. 143
December 2011
Office of the Chief Economist
-4-
Abstract
Using a sample of US acquisitions in
Africa over the last 2 decades, we assess
the long term performance of
international acquisitions in Africa, and
the impact of firm and country level
governance characteristics on reported
performance. We show that acquirers do
not benefit from these transactions. We
also find that acquisitions made in
countries characterized by strong and
impartial legal systems lead to higher
returns, while those observed in unstable
economies generate lower returns.
Interestingly, the level of corruption does
not affect reported performance. Previous
experience in Africa and the acquirer’s
board size seem to be significant
determinants of reported performance as
well. Our results contrasts with the view
that a strong legal framework reduces
acquirers’ ability to make large returns
by turning around poorly governed firms.
Keywords: Governance, Mergers, Africa, Acquisitions, Financial performance.
JEL codes: G30, G34, G38
5
1. Introduction
Mergers and acquisitions (M&A) remain a highly popular form of corporate reorganization and
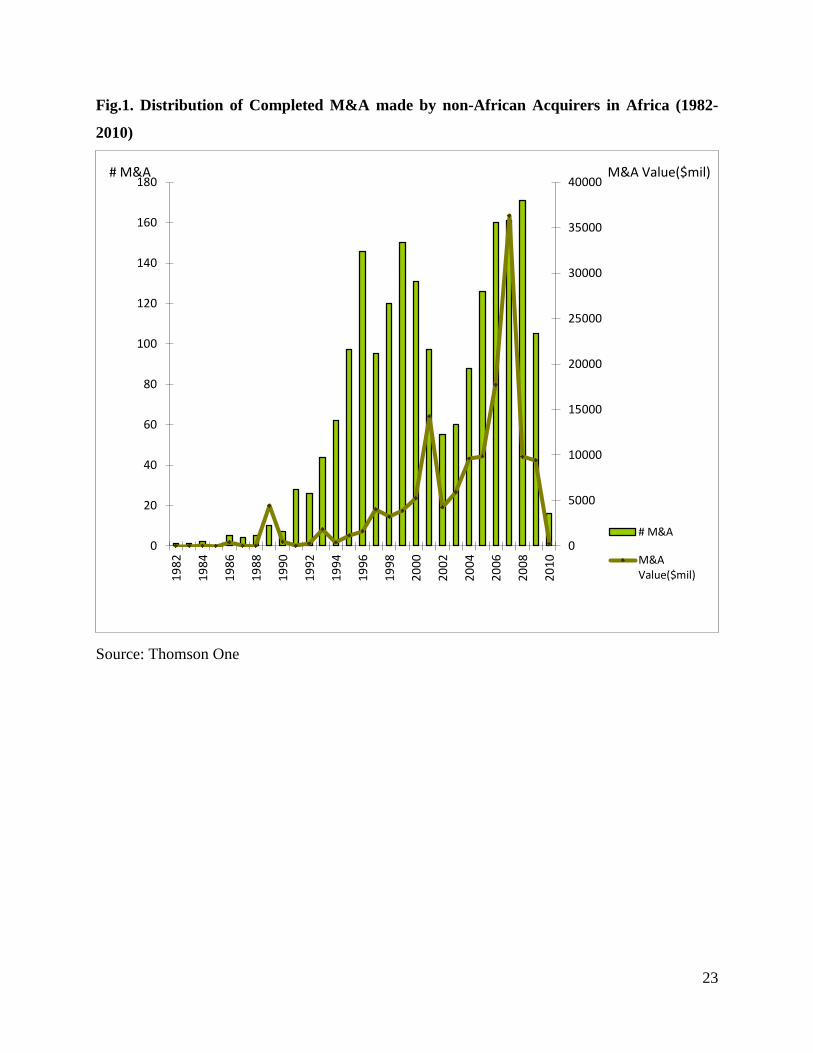
growth, globally and in Africa. Over the last two decades, there has been a dramatic rise in the
number of acquisitions of African businesses by foreign companies. For instance, during the
period 2003-2008, the number of completed M&A transactions targeting African firms and
involving non-African acquirers more than doubled while the value of those transactions
increased seven fold (Figure 1). According to Thomson One2, the most active non regional
acquirers in Africa over the period 1982-2010 were the United Kingdom, the United States and
Canada, both in terms of transaction value and number of deals.
M&A transactions are commonly expected to increase firm value through geographical
diversification, synergies, economies of scale, or diversification of cash flow streams. Yet, M&A
may also destroy value if they are motivated by managerial empire building attitude, commonly
referred to, as managerial hubris (Roll, 1986). Economic theory suggests that effective
governance mechanisms at the firm level might help curb managerial opportunistic behavior,
reducing the likelihood that firms undertake unprofitable acquisitions. Moreover, evidence
suggests that acquirers are more likely to report successful M&A transactions when targeted
countries maintain a legal framework that promotes institutional stability, fairness and
accountability. The legal environment encompasses investor protection, transparency and overall
quality of accounting standards. Rossi and Volpin (2004), and Moeller and Schlingemann (2005)
show that these factors are significant determinants of M&A. This view contrasts with the
argument that a strong legal framework reduces M&A opportunities where acquirers could make
large returns by turning around poorly governed firms.
The M&A literature remains heavily focused on US markets and to a lesser extent on UK
markets. Very few studies looked at the profitability of M&A in Africa which is largely a
function of the limited availability of reliable data on those transactions. Collectively, research
on the M&A market in Africa has sought to explain the determinants of FDIs flows (Kamaly,
2007) or to study the short term market reaction to M&A announcements in South Africa, with
the notable exception of Smit and Ward (2007) and Wimberely and Negash (2004) who explored
the long term stock and operating performance of south African deals, respectively.
This paper addresses this gap in the literature by studying the long term stock performance of
M&A targeting African firms and the determinants of the observed returns. To the best of our
knowledge, we provide the first study of the effect of internal governance (at the firm level) and
external governance (at the country level) characteristics on the performance of acquirers who
targeted African firms. To do so, we focus on US acquisitions in Africa for two main reasons: a)
US acquirers are the second most active in Africa both in terms of transactions number and
value, and b) Detailed data on the governance and ownership structure of US publicly traded
companies is available in the proxy statements published annually by those companies. This
makes the study of the governance structure at acquirers’ level possible.
Overall, the paper answers the following questions: (1) What are the important trends in the
M&A market between the US and Africa? (2) Are shareholders of US acquirers benefiting from
2 Formerly SDC platinum.
6
their acquisitions in Africa in the long run, and what affects reported returns? (3) What
governance reforms are needed in order to enhance Africa’s attractiveness for international
investors? Studying the effect of governance on the performance of international acquisitions in
Africa is of particular interest for regulatory purposes. Indeed, empirical evidence that links
weak governance to higher returns for acquirers will support the argument that international
acquirers are able to extract high returns thanks to the weak governance that some African
countries suffer from. This will highlight the need to offer more protection to local businesses
while not hindering FDI. Conversely, a positive relation between governance and returns will
illustrate the need to strengthen foreign investors’ protection in order to attract more FDI.
Despite several reforms aimed at promoting sound corporate governance on the continent such as
the “King report on Corporate Governance in South Africa”, Africa still has a reputation of
maintaining poor economic and political governance structures. This may have undermined its
attractiveness as a destination for direct acquisitions. High levels of corruption reported in
several African countries exacerbate this reputation problem.
Our results suggest that US acquirers do not benefit from their African acquisitions and report
negative returns following these transactions. This finding supports the accepted idea in the
literature that M&A are not value creating for acquirers, and shows that Africa is not an
exception. The empirical findings drawn from the multivariate analysis suggest that acquisitions
of South African targets or in countries with strong and impartial legal systems lead to higher
performance while those observed in countries with high economic instability generate lower
returns. Surprisingly, the level of corruption does not affect observed returns. Additionally,
acquirers with previous experience in Africa and those with small board size are more likely to
outperform. These results suggest that African countries should target enhanced macroeconomic
stability and strengthen foreign investor’s protection in order to attract more FDI. While our
results should be interpreted with caution given the small size of our sample, we believe they still
provide new insights about the level and determinants of M&A performance in Africa.
The remainder of the text is structured as follows. Section 2 reviews the literature on the
performance of M&A globally and in Africa. Section 3 describes our dataset while Section 4
provides stylized facts about the market for M&A between the US and Africa. Section 5 and 6
report our results describing the performance of US acquisitions and the determinants of
observed returns, respectively. Section 7 summarizes our robustness checks while section 8
concludes the paper.
2. Related literature
The literature on M&A has been piling up over the last two decades and yielded useful insights
about the profitability of these transactions, and how their returns are distributed between the
acquiring and targeted companies. Overall, three approaches are used in the literature to assess
whether M&A create value for shareholders of acquiring and targeted firms namely i) abnormal
returns drawn from event studies over the period surrounding the announcement of the
transaction, ii) change in profitability measured by comparing pre and post acquisitions values of
accounting ratios (e.g. the return on equity, growth rate or return on assets) and iii) Long-run
stock returns following the transaction measured by the cumulative average abnormal returns
(CAAR), the buy and hold returns or the calendar time approach. Collectively the empirical
evidence suggests that target shareholders unambiguously earn positive returns from such
7
transactions, while there is no consensus about the value enhancing effect of M&A for
shareholders of acquiring firms. This paper fits within the third approach. The remainder of this
section discusses the main empirical findings in relation with our research focus.
Despite M&A popularity, the question of long term post acquisition profitability to acquiring
firms remains an important, but largely unresolved empirical issue. Using data from the US
market, Rau and Vermaelen (1998) report significant CAAR ranging between -4% for mergers,
to 9% for tender offers over the 3 years following M&A announcement, while Loughran and
Vijh (1997) empirical findings suggest that bidders experience buy and hold returns ranging
from -14.2% for mergers, to 61.3% for tender offers over the 5 years following the acquisition.
Returns following mergers are statically significant but only marginally significant following
tender offers. Gregory (1997) finds similar results for the UK market with significant CAAR
ranging between -18% and 11.82% over the 2 years following the acquisitions. However, his
sample does not separate mergers from tender offers. Agrawal and Jaffee (2000) conclude that, at
best, shareholders of acquiring firms are not worse off in tender offers but often experience
negative returns in mergers. Yet, these returns are not necessarily statistically different from
zero. Furthermore, acquirers that pay cash seem to experience higher returns than those who pay
with stocks.
The research on the profitability of African acquisitions mainly focuses on the short term market
reaction to M&A announcements. The evidence reported for the South African market supports
the general conclusion that targets earn positive returns while acquirers earn negative or
statistically non-significant positive returns over the period surrounding the announcement
(Mushidzhi and Ward, 2004; Smit and Ward, 2007). To the best of our knowledge, Wimberley
and Negash (2004) provide the only study that looks at the long term stock performance of M&A
undertaken by South African industrial companies. The study covers the period 1989-1998 and
shows a negative and significant CAAR of -10.5% over the 3 years following the acquisition,
which is consistent with Agrawal et al. (1992) findings (-12.4%) and exceed the abnormal
returns reported in Rau and Vermaelen (1998) for the US market (-4.9%). Interestingly,
Wimberley and Negash (2004) report positive CAAR after the first year suggesting that the
market might be overoptimistic at the announcement but later adjusts stock prices downwards.
Using a sample of 27 South African M&A, over the period 2000-2002, Smit and Ward (2007)
report positive but not statistically significant abnormal cash flow returns on assets, over the 2
years following the transactions. No difference in performance was observed between cash-
funded and share-funded transactions. On the medium term, De Jaeger (2008) report statistically
negative returns for a sample of 12 acquiring companies involved in cross-border M&A into sub-
Saharan Africa. The negative performance reported in De Jaeger (2008) could also be driven by
the higher cost of cross-border transactions. According to Rossi and Volpin (2004), acquiring firms
pay on average an additional 3% in premium for cross-border transactions.
Based on the above review, we develop the following hypotheses:
Hypothesis 1: shareholders of US companies involved in acquisitions of African targets are
expected, at best, not lose money from these transactions.
Hypothesis 2: shareholders of US companies involved in cash-funded acquisitions of African
companies should benefit from higher returns.
8
3. Data
The initial dataset includes all M&A involving African targets between January 1970 and March
2010 available from Thomson One.3 This leads to a total of 9,643 observations, out which 457
deals correspond to transactions where the acquirer is a US company. We subsequently applied
the following filters: transactions must be “completed”, and acquiring firms must be a non-
financial institution. Given the unique nature of financial institutions, we decided to focus only
on transactions related to the real sector that are not focusing on value creation through financial
engineering. This led to a sub-sample of 255 transactions completed by US non-financial firms.
In order to spot potential errors in Thomson One, we hand-checked the information reported for
each transaction by screening the acquirers’ annual and quarterly reports as well as news releases
published around the date of the acquisition. This screening resulted in the elimination of 15
additional observations. Our usable sample comprises 240 M&A transactions, out of which 131
involve South African targets.
In order to study the determinants of acquirers’ performance we collected stock prices adjusted
for dividends and splits from Datastream for publicly traded US acquirers. Information about the
deal characteristics and acquirers’ book to market ratio were collected from Thomson One.
Governance and capital structure variables for acquiring companies were hand collected from
proxy statements and annual reports. Measures of the target institutional environment are from
Political Risk Services' International Country Risk Guide (ICRG). We use returns on the size,
industry and book to market portfolios available on the website of Kenneth French to implement
our calendar time approach. Given the large number of missing observations for certain variables
provided by Thomson One, we checked manually annual and quarterly reports, newswires,
specialized magazines and newspapers articles, for information describing the deal, the acquirer
and the target to increase our sample size. Our final sample includes 64 transactions conducted in
Algeria, Angola, Cameroon, Egypt, Gabon, Ghana, Guinea, Kenya, Morocco, Nigeria, and South
Africa; out of which 36 correspond to South African targets.
4. Stylized facts about US acquisitions in Africa
This section discusses stylized facts drawn from the 240 transactions completed by US acquirers
in Africa. Companies involved in African M&A are quite advanced in their life cycle. The
average age for acquirers is 58 years compared to 23 years for targets. Over two third of
acquirers are publicly traded. Very few transactions are triggered by privatizations (8%) or
mergers initiatives (6%); and 35% of them involve companies that already had business
relationships. Cash seems to be the common way of paying for African acquisitions, with only
14% of the transactions paid with stocks and 9% paid with a mix of instruments. 57% of
observed M&A lead to sector diversification and 80% to change in control (average shares
acquired is 75.47%).
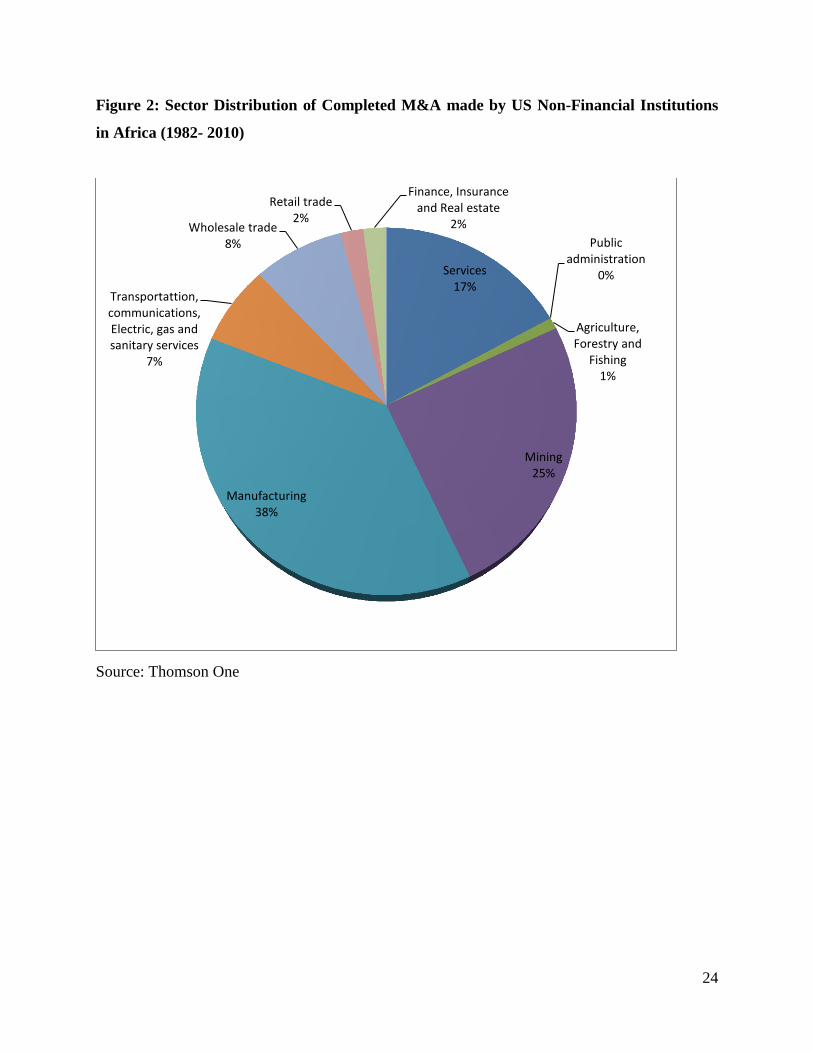
Table 1 lists the five most attractive target countries for US firms while Figure 2 provides a
distribution of targeted sectors. Not surprisingly, South Africa is the most attractive country for
US companies, followed by North Africa (Egypt, Morocco and Tunisia). These countries have
stable economies, advanced financial systems and business environments that are friendly for
3 Even though the data request starts in 1970, the first transaction in the sample starts in March 1982
9
foreign investors. All deals observed in Angola are related to the oil sector while those in
Zimbabwe were observed for the consumer goods sector. This illustrates the heterogeneity of the
transactions included in our sample. Interestingly the manufacturing sector attracted the highest
number of acquisitions (38%) followed by mining (25%) and services (17%). To a certain extent,
this finding contrasts with the traditional belief that foreign companies are mainly interested in
taking control of African resources.
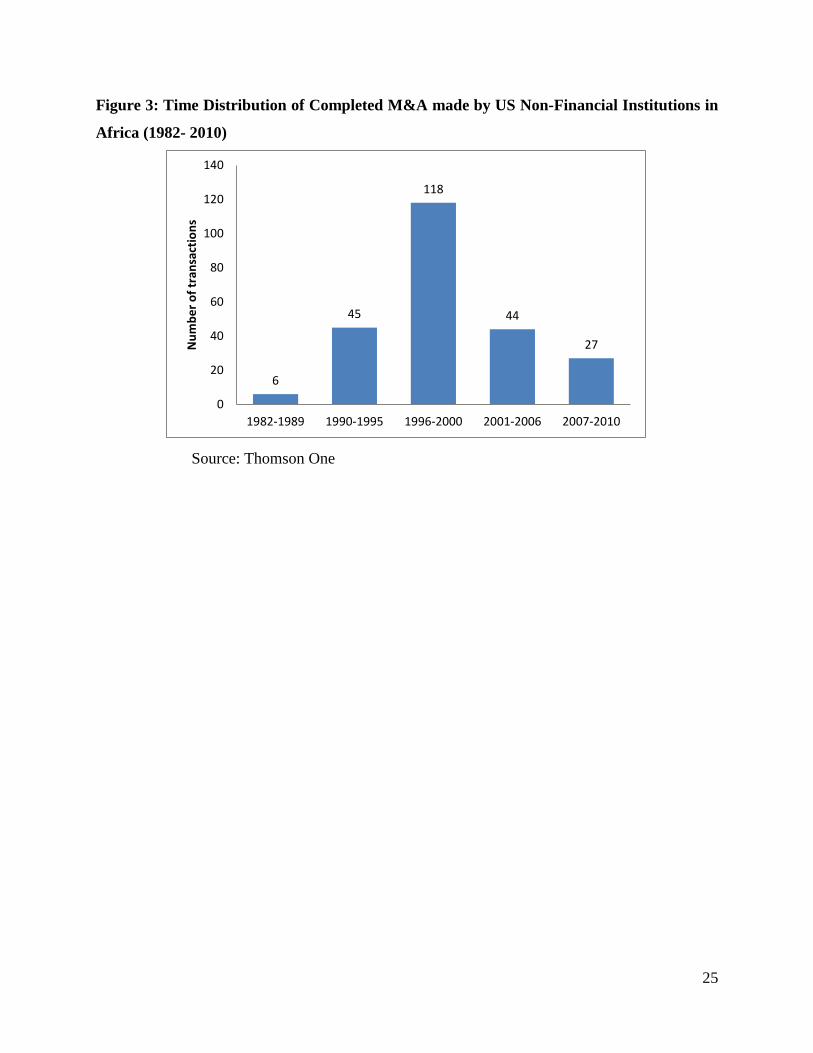
Figure 3 draws a time distribution of US acquisitions in Africa over the period 1982-2010. The
graph shows a limited number of transactions over the period 1982-1989 mainly due to the Anti-
Apartheid Act that was passed in 1986 and prohibited US firms from investing or doing business
in South Africa. The lifting of US sanctions in July 1991 helped catalyze some acquisitions in
Africa but the effect remained limited due to the criticism over the US administration’s decision
and tension following the indictment of the Armaments Corporation of South Africa (Armscor)
by a US court. The number of US acquisitions peeked over the period 1996-2000 following the
return of several US companies to South Africa and the reforms undertaken elsewhere on the
continent to improve the business environment. As a matter of fact, 7% of South African targets
in our sample used to be local subsidiaries of the US acquirers before the commercial sanctions.
The number of acquisitions dropped twofold during the period 2007-2010, probably as a result of
the financial crisis.
The deal value was available for 118 transactions and shows relatively small transaction sizes
with average and medium values standing at USD 62 million and US 13.5 million, respectively.
The largest deal realized by a US non-financial firm over our sample period was the acquisition
of CMS' ownership interests in Equatorial Guinea by Marathon Oil for approximately USD 1
billion in 2002.
5. Long term performance of US acquisitions in Africa
We measure acquirers’ long term performance by the buy and hold returns (BHR) on an
unadjusted and adjusted base by subtracting from the corresponding BHR, the return on the
S&P500 index. Table 2 summarizes the 1-year BHR and the 1 year- market adjusted BHAR for
our sample of US publicly traded acquirers. Results suggest that US acquirers report on average
positive returns of 16.3% one year after the transaction. This return outperforms the market,
leading to an adjusted 1-year BHR of 11.6%. Findings in Panel B show that South African
acquisitions generate higher gross returns for US acquirers but not always when adjusted for the
market performance. Yet, the difference between both groups is statistically not significant.
Results in Panel C are consistent with previous conclusions in the literature related to the
superior performance of cash-funded transactions. Again, the difference is not statistically
significant which does not support our second hypothesis H2. Our conclusions remain
unchanged when we consider the 2-year buy and hold returns. In unreported results we also
compare the financial returns registered by acquirers before and after the financial crisis. The
mean 1-year BHR for transactions observed prior to the financial crisis is 20.73% while the
same return for transactions observed post crisis is -25.9%. Interestingly, the t-test value shows
that this difference is statistically significant at the 99% level.
(Table 2)
10
Results reported in Table 2 correspond to simple descriptive statistics which might not be robust
and particularly sensitive to the selected market benchmark. In order to conduct a more robust
assessment the performance of US acquisitions, we use a calendar–time approach based on the
Fama-French three factor model as in Mitchell and Stafford (2000). For each calendar month of
our sample period, we form a portfolio using the sample of all acquirers which undertook a
M&A transaction over the last three years. Excess returns are then regressed on the Fama-French
3-factor model to control for size, market movement and book to market.4
Rpt – Rft = α + βm(Rmt- Rft) + βsSMBt + βhHMLt + εt, (1)
Where Rpt is the portfolio return of active acquirers in month t, Rft is the risk-free interest rate,
Rmt is the market return, SMBt and HMLt are the difference in returns between a portfolio of
small companies (high book-to market), and large companies (low book-to-market), respectively.
The intercept, α, captures abnormal returns that are experienced by acquirers.
Table 3 summarizes results computed with the three-factor model. They show a negative and
significant intercept α, thus contradicting our conclusions from the univariate analysis. This
result supports our first hypothesis H1 and is consistent with Wimberley and Negash (2004)
conclusion for South African targets and De Jaeger (2008) for sub-Saharan African targets. It
also supports the general idea that acquirers do not benefit from their acquisitions and show that
Africa is not an exception.
(Table 3)
6. Determinants of the post-acquisition performance of US M&A in Africa
6.1 . Model
Despite the large body of literature that studied M&A profitability, key factors for success or
failure remain poorly understood. This section provides potential explanations of the observed
performance registered by US acquirers following their acquisitions in Africa. Our measure of
acquirers’ long term performance is the 1-year BHR.5 The model controls for three set of
arguments namely deal characteristics, acquirer’s governance structure and target institutional
environment.
6.1.1. Deal characteristics
Diversification effect: Berger and Ofek (1995) and Maquieira et al. (1998) show that
diversification destroys value for the bidder while focusing transactions tend to produce positive
returns. Doukas and Land (2003) find similar results in the case of FDI. This is probably due to
the fact that focusing deals are more likely to produce synergies and savings to the bidder. We
include a dummy variable (Focus) that equals one if the target and the bidder have identical 4-
digit SIC codes, zero otherwise and expect this variable to have a positive coefficient.
4 Our results remain unchanged when we include the momentum factor.
5 We use the 1-year BHR in order to maximize our sample size.
11
Glamour deals: Rau and Vermaelen (1998) conclude that low book to market “glamour” bidders
underperform value bidders (companies with high book-to-market firms) on the long run which
is consistent with the hubris hypothesis. The market and management might be extrapolating the
bidder's past performance (as reflected in the book-to-market ratio), causing investors and
management to be overly optimistic about the outcome of the acquisition. Wimberley and
Negash (2004) findings support this conclusion for the South African market. We control for this
argument by including the book to market ratio (BTM) and expect this variable to have a positive
coefficient.
Method of payment: According to the information asymmetry theory developed by Myers and
Majluf (1984), using stocks to pay for acquisitions could signal that the stock of the acquiring
firm is overvalued which leads the stock price to adjust downwards. Asquith et al. (1983), Dong
et al. (2006), Sudarsanam and Mahate (2003) and more recently Kyriazis (2008) find that cash-
based deals outperform stock based deals. Conversely, Wimberley and Negash (2004) findings
for South African acquirers do not support this conclusion. We use a dummy variable equals to 1
if the transaction is paid cash (Cash) and expect this variable to have a positive coefficient6.
Change in control: taking controlling stakes in the target firm allows the bidder to exercise
greater control on operations. We include a dummy variable indicating whether the transaction
leads to a change in control (Control) as a control variable and expect it to have a positive
coefficient.
Culture fit: According to Stahl and Voight (2008), cultural differences can represent major
obstacles to successful acquisitions. Their results suggest a significant negative relation between
culture differences and long term performance of acquisitions. Acquirers who have previous
business experience in Africa should be more comfortable in dealing with local business
conditions. We control for the cultural fit between the target and the acquiring firm by including
a dummy variable that equals to one if the acquirer has previous business experience in Africa
(Experience). We expect this variable to have a positive coefficient.
South African targets: South Africa is one of the most advanced and dynamic economies on the
continent and offers a friendly business environment for acquirers. This should foster successful
acquisitions. The culture barrier between the US and South Africa is also less important than
other regions of the continent, at least language wise. However, given the high competiveness in
the South African market, there might be less room to buy attractive targets at cheap prices. We
control for the South African effect by including a dummy equals to one if the target home
country is South Africa (South Africa) and we do not offer any expectations on the sign of this
variable.
6.1.2. Acquirer’s governance structure
Strong governance at the acquirer level should reduce the probability of undertaking M&A that
are not value creating. We use three variables to control for the governance structure of the
6 Given that most of our transactions correspond to tender offers, we were not able to control for the type of
acquisitions. Based on the evidence reported in the literature, tender offers are expected to lead to higher returns
than mergers. The same argument applies for the acquisition of private targets.
12
acquiring company, namely the percentage of shares held by outside block holders (Block), the
percentage of board members that are independent (IND board) and the size of the board of
directors (BOD size). Outside block holders will bear a larger cost of unsuccessful acquisitions
than small shareholders which provide them with the financial incentive to exercise better
monitoring. They also have the capacity to exercise a stronger monitoring. Large boards are also
expected to exercise more control over the firm’s management as long as the size does not hinder
communication between board members. Finally, Fama and Jensen (1983) emphasize the
importance of outside directors in monitoring the firm’s management. Outside directors are
expected to exercise better monitoring because they do not depend on existing management and
are interested in building a reputation in the market to receive more directorship nominations.
Accordingly, the three variables are expected to have positive coefficients.
6.1.3. Target institutional environment
Rossi and Volpin (2004) findings suggest that acquirers involved in cross-border transactions
often come from countries with stronger investor protection than targets, and conclude that cross
border M&A could serve as channels to achieve worldwide convergence in governance
standards. Alba et al. (2009) argue that acquisition of targets in countries characterized by weak
governance environment offers attractive opportunities to achieve higher returns by
strengthening the governance structure of the target. Their evidence suggests that improvements
in corporate governance in the US reduced the attractiveness of US firms for Japanese FDI in the
form of M&A. This result could also reflect the larger premium paid for targets in countries with
strong shareholders protection reported in Rossi and Volpin (2004). Strong governance at the
target country level could also be value enhancing for acquirers if it helps protect their rights. We
control for the target institutional environment by using the following variables i) Law and Order
which measures the strength, impartiality and respect of the law in the country (higher values
imply a better legal system), ii) The economic risk rating (ERR) which measures the economic
stability in the country. This rating uses information about the country’s foreign debt as a % of
GDP, current account as a % of imports and exports, exchange rate stability and country’s
liquidity as months of imports cover and iii) Corruption which measures the extent of financial
corruption, excessive patronage, 'favor-for-favors', and suspicious ties between politics and
business (higher values imply a more corrupted system). The ERR variable is expected to have a
negative coefficient. Strong legal systems (weak corruption level) should help enforce
agreements and make M&A more profitable. Conversely, a weak legal system (strong
corruption) could lead to badly governed firms and offer US acquirers more attractive investment
opportunities. Accordingly, we do not offer any expectations on the sign of Law and order and
Corruption.
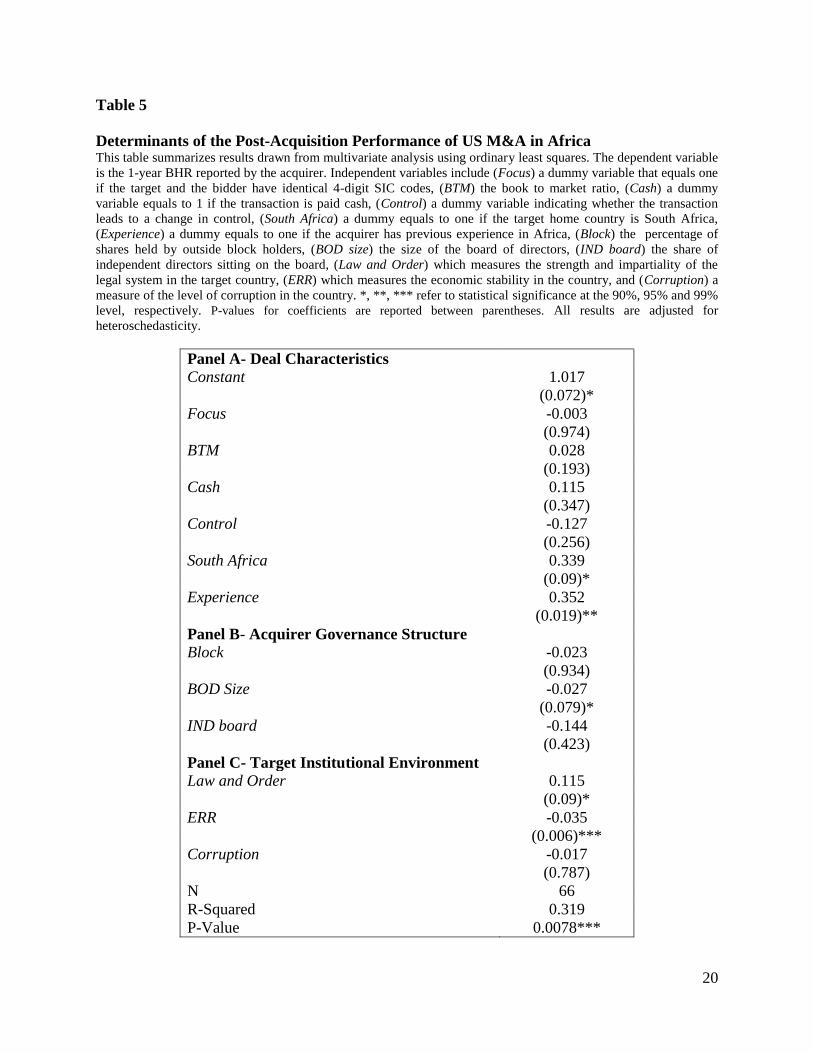
6.2 . Multivariate results
Table 4 and 5 report respectively descriptive statistics and results drawn from the multivariate
analysis. Our findings show that deal characteristics, namely the diversification effect, the
method of payment, the change in control and glamour transactions do not significantly affect
the performance of acquirers. This conclusion does not support our second hypothesis H2.
Conversely, US acquirers with previous experience in Africa report higher performance (the
coefficients is positive and significant at the 95%). Acquisitions of South African targets also
lead to higher performance. This result could be driven either by i) the higher culture fit between
13
South Africa and the US, or ii) the well-structured and dynamic business environment offered by
South Africa. Board size has a negative and significant coefficient at the 90% level. This result is
consistent with Yermack (1996) conclusion on the superior monitoring performed by smaller
boards. In our case, large boards seem to be unable to prevent US acquirers from undertaking
unsuccessful acquisitions in Africa.
(Table 4, 5)
Our control variables for the target legal environment and economic stability are both significant
at the 90% and 99%, respectively. This result suggests that acquisitions in countries with
unstable economic environments lead to lower performance for acquirers, while those observed
in countries with a strong legal system generate a higher performance. Our findings show that
acquisitions are more successful when the target country offers a legal environment that protects
investors’ rights which is consistent with Rossi and Volpin (2004). Surprisingly, the variable
controlling for corruption does not affect the return reported by US acquirers contradicting the
general belief that corruption might help foreign companies generate higher returns by use
“unconventional” business practices.
7. Robustness checks
In order to test the robustness of our results we run additional tests to control for the following
arguments:
Sustained M&A programs: Frequent acquirers are more likely to create value through
acquisitions because they have the necessary experience to successfully integrate the target’s
activities into their existing businesses. Asquith et al. (1983) and Gregory (1997) report evidence
showing a positive relation between stock price and the announcement of series of acquisitions
while Wimberley and Negash (2004) show that South African firms engaging in multiple
acquisitions generate larger negative returns. Hence, our results could be driven by subsequent
acquisitions conducted by acquirers. We control for this argument by running two additional
specifications: one including a dummy variable that equals one if the acquirer undertakes
additional M&A transactions in Africa (FreqAfrica) during the year following the deal, and a
second one including a dummy variable equals one if the acquirer undertakes additional M&A
transactions anywhere in the world (FreqWorldwide) during the year following the deal. As long
as acquisitions lead to learning effects, we expect these variables to have positive coefficients.
Table 6 summarizes our results. Overall, the addition of these variables to the model does not
affect our main findings. The dummy variables controlling for frequent acquisitions in Africa
and Worldwide have non-significant coefficients which suggest that our results are not driven by
this effect.
(Table 6)
Financial crisis effect: Univariate analysis reported in Table 2 suggested that the financial crisis
might have a significant effect on the observed returns. In order to make sure that our results are
not driven by the financial crisis, we performed a regression similar to the one reported in Table
5 that includes a dummy variable (Crisis) indicating whether the deal took place after the
14
subprime crisis that started in July 2007. Our results are reported in the last column of Table 6.
The financial crisis variable has a negative coefficient but it is not significant while our results
remain stable.
Industry and time effect: Inspection of our data shows that a large share of transactions included
in our sample took place in the manufacturing and mining sectors. Thus, our results could be
driven by industry effects. In order to address this issue, we rerun the same model than in Table 5
while including dummies to control for industry. Our results remain unchanged, with the
exception of the board size variable which loses its significance. We also rerun the same model
than in Table 5 while adding year dummies to make sure that our results are not driven by time
effect. Again, the variables South Africa, Experience, BOD size, Law and order and ERR have
significant coefficients with identical signs to Table 5 while corruption remains non-significant.7
8. Conclusion
The objective of this paper is to empirically examine the profitability of US acquisitions in
Africa and the impact of firm level and country level governance characteristics on the long term
performance of acquiring companies. Our results suggest that US acquirers do not benefit from
their African acquisitions and report negative returns following the acquisitions,
underperforming the market. Multivariate analysis suggests that deal characteristics namely
diversification effect, change in control, method of payment and glamour deals do not affect the
performance of US acquirers while acquisitions of South African targets seem to lead to higher
returns. Our results also show the importance of the target institutional environment and cultural
fit in shaping the success of a transaction. Acquisitions in countries with strong legal systems
and/or low economic instability and those realized by acquirers with previous experience in
Africa lead to higher performance. Similarly, smaller boards at the acquirer level are associated
with higher returns. Interestingly, the level of corruption does not seem to affect observed returns
which contrasts with the general belief that corruption in Africa allows foreign investors to
extract higher returns. Our results are robust to control for time and industry effects, subsequent
acquisitions, and the financial crisis effect.
Overall, our findings highlight the need for African countries to implement reforms aimed at
fostering economic stability and strong foreign investors’ protection. Yet, these conclusions
should be interpreted with a pint of salt given the small size of our sample. Future research
should seek to include other acquiring countries in the analysis.
References
Agrawal, A., Jaffee, J., 2000. The post merger performance puzzle. Advances in Mergers and
Acquisitions. 1, 119-156.
Agrawal, A., Jaffee, J., Mandelker, G., 1992. The post merger performance of acquiring firms: A
reexamination of an anomaly. Journal of Financial Economics. 47 (4), 1605-1621.
7 For sake of brevity, these results are not reported in the paper but are available from the author upon request.
15
Alba, J., Park, D., Wang, P., 2009. Corporate governance and merger and acquisition (M&A)
FDI: firm-level evidence from Japanese FDI into the US. Journal of Multinational Financial
Management. 19, 1-11.
Asquith, P., Bruner, R., Mullins, D., 1983. The gains to bidding firms from merger. Journal of
Financial Economics. 11, 121-139.
Berger, P., Ofek, E., 1995. Diversification effect on firm value. Journal of Financial Economics.
37, 39-65.
DeJaeger, P., 2008. The medium-long term impact of cross-border investments into Sub-Saharan
Africa by listed South African companies. Working paper, Gordon Institute of business science,
University of Pretoria.
Dong, M., Hirschleifer, D., Richardson, S., Teoh, S.H., 2006. Does investor misvaluation drive
the takeover market ? Journal of Finance. 61(2), 725-762.
Doukas, J., Land, L., 2003. Foreign direct investment, diversification and firm performance.
Journal of International Business Studies. 34, 153-172.
Fama, E., Jensen, M., 1983. Separation of ownership and control. Journal of Law and
Economics. 26, 301-325.
Gregory, A., 1997. An examination of the long run performance of UK acquiring firms. Journal
of Business Finance and Accounting. 24, 971-1002
Kamaly, A., 2007. Trends and determinants of mergers and acquisitions in developing Countries
in the 1990s. International Research Journal of Finance and Economics. 8, 16-30.
Kyriazis, D., 2008. The determinants of wealth gains in Greek takeover bids. International
Research, Journal of Finance and Economics. 2, 162-177.
Loughran, T., Vijh, A., 1997. Do long term shareholders benefit from corporate acquisitions.
Journal of Finance. 52, 1765-1790.
Maquieira, C., Megginson, W., Nail, L., 1998. Wealth creation versus wealth redistributions in
pure stock-for-stock mergers. Journal of Financial Economics. 48, 3-33.
Mitchell, M., Stafford, E., 2000. Managerial decisions and long term stock price performance.
Journal of Business. 73 (3), 287-329.
Moeller, S., Schlingemann, F., 2005. Global diversification and bidder gains: A comparison
between cross-border and domestic acquisitions. Journal of Banking and Finance. 29, 533-564.
Mushidzhi, T., Ward, M., 2004. Abnormal returns for cash versus share funded acquisitions.
Investment Analysts Journal. 60, 17-31.
16
Myers, S., Majluf, N., 1984. Corporate financing and investment decisions when firms have
information that investors do not have. Journal of Financial Economics. 13, 187-221.
Rau, P., Vermaelen, T., 1998. Glamour, value, and the post-acquisition performance of acquiring
firms. Journal of Financial Economics. 49, 223–253
Roll, R., 1986. The hubris hypothesis of corporate takeovers. Journal of Business. 59, 197-216.
Rossi, S., Volpin, P., 2004. Cross country determinants of mergers and acquisitions. Journal of
Financial Economics. 74, 277-304.
Smit, C., Ward, M., 2007. The impact of large acquisitions on the share price and operating
financial performance of acquiring companies listed on the JSE. Investment Analysts Journal,
65, 5-14.
Stahl, G., Voight, A., 2008. Do cultural differences matter in mergers and acquisitions? A
tentative model for examination. Organization Science, 19, 160 - 176.
Sudarsanam, P., Mahate, A., 2003. Glamour acquirers, method of payment and post-acquisition
performance: The UK evidence. Journal of Business Finance and Accounting. 30, 299-341.
Wimberely, T., Negash, M., 2004. The value creation effects of mergers and acquisitions:
evidence from the JSE securities exchange South Africa. Investment Analysts Journal. 59, 31-40.
Yermack, D., 1996. Higher Valuation of Companies with a Small Board of Directors. Journal of
Financial Economics. 40, 185-211.
17
Table 1
Completed M&A by US Non-Financial Acquirers in Africa: Top 5 Targeted Countries
(1982- 2010)
Target nation Number of deals
South Africa 131
Egypt 28
Gabon/ Zimbabwe/Angola 16
Morocco/Tunisia 15
Ghana 6
Table 2
Long Term Performance of US M&A in Africa -Univariate Analysis This table reports the one-year Buy and Hold returns (BHR 1yr) and the market adjusted one-year buy and hold
returns (BHAR 1yr), for the entire sample as well as for subsamples of South African and non South African targets,
transactions paid cash and those paid with other methods. P-values for the test of difference are obtained with a t-test
(for mean equality) and a Wilcoxon Rank-Sum test (for median equality). *, **, *** refer to statistical significance
at the 90%, 95% and 99% level, respectively.
BHR 1yr BHAR 1yr
Panel A- Acquirers' long run performance
Mean 0.163 0.116
Median 0.160 0.100
N 96 96
Panel B- Acquirers' long run performance by target origin
SA
Target
Other
Targets
P-value
for test of
difference
SA
Target
Other
Targets
P-value
for test of
difference
Mean 0.180 0.143 0.676 0.106 0.129 0.794
Median 0.175 0.160 0.612 0.120 0.055 0.814
N 52 44 52 44
Panel C- Acquirers' long run performance by method of payment
Cash
Payment
Other
payment
methods
P-value
for test of
difference
Cash
Payment
Other
payment
methods
P-value
for test of
difference
Mean 0.166 -0.055 0.214 0.114 -0.055 0.218
Median 0.157 -0.077 0.149 0.033 0.022 0.277
N 61 13 61 13
18
Table 3
Long Term Performance of US M&A in Africa –Calendar Time Approach This table summarizes results drawn from the calendar time approach based on a three factor model estimated using
ordinary least squares. The dependent variable is Rpt which is equal to the return on a portfolio of acquiring firms during
month t, Rft is the risk-free interest rate, (Rmt- Rft) is the excess return of the market, SMBt and HMLt are the difference
in returns between a portfolio of small (high book-to market), and big (low book-to-market) stocks, respectively. The
intercept (α) captures the monthly abnormal return for acquiring firms. *, **, *** refer to statistical significance at the
90%, 95% and 99% level, respectively. P-values for coefficients are reported between parentheses.
βm -0.002
(0.460)
βs 0.013
(0.001)**
βh 0.004
(0.263)
α -0.381
(0.000)***
R-Squared 0.0396
N 284
P-value 0.01***
19
Table 4
Descriptive Statistics This table summarizes descriptive statistics of the variables used in the multivariate analysis. (Focus) is a dummy
variable that equals one if the target and the bidder have identical 4-digit SIC codes, zero otherwise, (BTM) is the
book to market ratio, (Cash) is a dummy variable equals to 1 if the transaction is paid cash, (Control) is a dummy
variable indicating whether the transaction leads to a change in control, (South Africa) is a dummy equals to one if
the target home country is South Africa, (Experience) is a dummy equals to one if the acquirer has previous
experience in Africa, (Block) is the percentage of shares held by outside block holders, (BOD size) is the size of the
board of directors, (IND board) is the share of independent directors sitting on the board, (Law and Order) measures
the strength and impartiality of the legal system in the target country, (ERR) measures the economic stability in the
country, and (Corruption) measures the level of corruption in the country.
Variable N Mean Median Std. dev.
Panel A- Deal Characteristics
Focus 96 0.479 0.000 0.502
BTM 95 0.685 0.277 1.236
Cash 74 0.824 1.000 0.383
Control 96 0.708 1.000 0.456
South Africa 96 0.542 1.000 0.501
Experience 91 0.802 1.000 0.401
Panel B- Acquiers Governance Structure
Block 93 0.060 0.000 0.162
BOD Size 93 10.419 11.000 3.780
IND board 93 0.728 0.8 0.228
Panel C- Target Institutional Environment
Law and Order 93 3.108 3.000 1.005
ERR 93 36.860 38.000 4.717
Corruption 93 3.01 3 1.246
20
Table 5
Determinants of the Post-Acquisition Performance of US M&A in Africa This table summarizes results drawn from multivariate analysis using ordinary least squares. The dependent variable
is the 1-year BHR reported by the acquirer. Independent variables include (Focus) a dummy variable that equals one
if the target and the bidder have identical 4-digit SIC codes, (BTM) the book to market ratio, (Cash) a dummy
variable equals to 1 if the transaction is paid cash, (Control) a dummy variable indicating whether the transaction
leads to a change in control, (South Africa) a dummy equals to one if the target home country is South Africa,
(Experience) a dummy equals to one if the acquirer has previous experience in Africa, (Block) the percentage of
shares held by outside block holders, (BOD size) the size of the board of directors, (IND board) the share of
independent directors sitting on the board, (Law and Order) which measures the strength and impartiality of the
legal system in the target country, (ERR) which measures the economic stability in the country, and (Corruption) a
measure of the level of corruption in the country. *, **, *** refer to statistical significance at the 90%, 95% and 99%
level, respectively. P-values for coefficients are reported between parentheses. All results are adjusted for
heteroschedasticity.
Panel A- Deal Characteristics
Constant 1.017
(0.072)*
Focus -0.003
(0.974)
BTM 0.028
(0.193)
Cash 0.115
(0.347)
Control -0.127
(0.256)
South Africa 0.339
(0.09)*
Experience 0.352
(0.019)**
Panel B- Acquirer Governance Structure
Block -0.023
(0.934)
BOD Size -0.027
(0.079)*
IND board -0.144
(0.423)
Panel C- Target Institutional Environment
Law and Order 0.115
(0.09)*
ERR -0.035
(0.006)***
Corruption -0.017
(0.787)
N 66
R-Squared 0.319
P-Value 0.0078***

21
Table 6
Robustness Checks This table summarizes results drawn from our robustness checks for frequent acquisitions and the effect of the
financial crisis using ordinary least squares. The dependent variable is the 1-year BHR reported by the acquirer.
Independent variables include (Focus) a dummy variable that equals one if the target and the bidder have identical
4-digit SIC codes, zero otherwise, (BTM) the book to market ratio, (Cash) a dummy variable equals to 1 if the
transaction is paid cash, (Control) a dummy variable indicating whether the transaction leads to a change in control,
(South Africa) a dummy equals to one if the target home country is South Africa, (Experience) a dummy equals to
one if the acquirer has previous experience in Africa, (FreqAfrica) a dummy equals one if the acquirer undertakes
additional M&A in Africa during the year following the transaction, (FreqWorldwide) a dummy equals one if the
acquirer undertakes additional M&A anywhere in the world during the year following the transaction, (Crisis) is a
dummy equal one if the transaction took place after the financial crisis, (Block) the percentage of shares held by
outside block holders, (BOD size) the size of the board of directors, (IND board) the share of independent directors
sitting on the board, (Law and Order) which measures the strength and impartiality of the legal system in the target
country, (ERR) which measures the economic stability in the country, and (Corruption) a measure of the level of
corruption in the country. *, **, *** refer to statistical significance at the 90%, 95% and 99% level, respectively. P-
values for coefficients are reported between parentheses. All results are adjusted for heteroschedasticity.
Basic model (1) (2) (3)
Panel A-Deal Characteristics
Constant 1.017
(0.072)*
1.072
(0.054)*
1.24
(0.03)**
0.965
(0.077)*
Focus -0.003
(0.974)
-0.002
(0.977)
-0.0004
(0.996)
-0.001
(0.994)
BTM Ratio 0.028
(0.193)
0.027
(0.213)
0.022
( 0.344)
0.030
(0.409)
Cash 0.115
(0.347)
0.126
(0.298)
0.136
(0.277)
0.120
(0.407)
Control -0.127
(0.256)
-0.133
(0.224)
-0.114
(0.294)
-0.129
(0.197)
South Africa 0.339
(0.09)*
0.362
(0.101)
0.328
( 0.091)*
0.332
(0.046)**
Experience 0.352
(0.019)**
0.348
(0.016)**
0.342
(0.016)**
0.342
(0.007)***
FreqWorldwide
-0.138
(0.334)
FreqAfrica
-0.174
(0.165)
Crisis
-0.074
(0.711)
Panel B-Acquirer governance structure Block -0.024
(0.943)
-0.089
(0.796)
-0.112
(0.736)
-0.012
(0.967)
BOD Size -0.027
(0.079)*
-0.024
(0.099)*
-0.024
(0.107)
-0.027
(0.071)*
IND board -0.144
(0.423)
-0.090
(0.608)
-0.151
(0.392)
-0.129
(0.566)
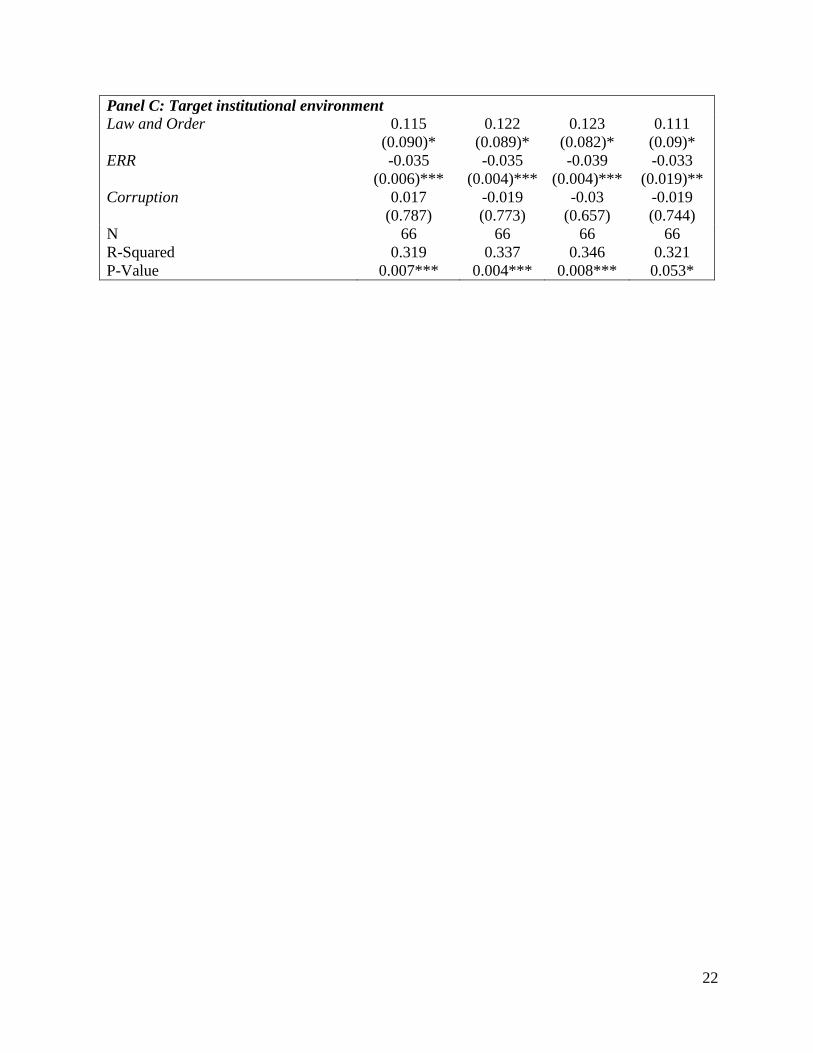
22
Panel C: Target institutional environment Law and Order 0.115
(0.090)*
0.122
(0.089)*
0.123
(0.082)*
0.111
(0.09)*
ERR -0.035
(0.006)***
-0.035
(0.004)***
-0.039
(0.004)***
-0.033
(0.019)**
Corruption 0.017
(0.787)
-0.019
(0.773)
-0.03
(0.657)
-0.019
(0.744)
N 66 66 66 66
R-Squared 0.319 0.337 0.346 0.321
P-Value 0.007*** 0.004*** 0.008*** 0.053*
23
Fig.1. Distribution of Completed M&A made by non-African Acquirers in Africa (1982-
2010)
Source: Thomson One
0
5000
10000
15000
20000
25000
30000
35000
40000
0
20
40
60
80
100
120
140
160
1801
98
2
19
84
19
86
19
88
19
90
19
92
19
94
19
96
19
98
20
00
20
02
20
04
20
06
20
08
20
10
M&A Value($mil) # M&A
# M&A
M&AValue($mil)
24
Figure 2: Sector Distribution of Completed M&A made by US Non-Financial Institutions
in Africa (1982- 2010)
Source: Thomson One
Services 17%
Public administration
0%
Agriculture, Forestry and
Fishing 1%
Mining 25%
Manufacturing 38%
Transportattion, communications, Electric, gas and sanitary services
7%
Wholesale trade 8%
Retail trade 2%
Finance, Insurance and Real estate
2%
25
Figure 3: Time Distribution of Completed M&A made by US Non-Financial Institutions in
Africa (1982- 2010)
Source: Thomson One
6
45
118
44
27
0
20
40
60
80
100
120
140
1982-1989 1990-1995 1996-2000 2001-2006 2007-2010
Nu
mb
er
of
tran
sact
ion
s
26
Recent Publications in the Series
nº Year Author(s) Title
142 2011 Thouraya Triki and Issa Faye Africa’s Quest for Development: Can Sovereign Wealth
Funds help?
141 2011 Guy Blaise NKAMLEU, Ignacio
TOURINO and James EDWIN
Always Late: Measures and Determinants of Disbursement
Delays at the African Development Bank
140 2011
Adeleke Salami, Marco Stampini, Abdul
Kamara, Caroline Sullivan and Regassa Namara
Development Aid and Access to Water and Sanitation in
sub-Saharan Africa
139 2011 Giovanni Caggiano and Pietro Calice The Macroeconomic Impact Of Higher Capital Ratios On
African Economies
138 2011 Cédric Achille MBENG MEZUI
Politique Economique Et Facteurs Institutionnels Dans Le
Développement Des Marchés Obligataires Domestiques De
La Zone CFA
137 2011 Thierry Kangoye Does Aid Unpredictability Weaken Governance?
New Evidence from Developing Countries
136 2011 John C. Anyanwu Determinants Of Foreign Direct Investment Inflows To
Africa, 1980-2007
135 2011 John C. Anyanwu International Remittances and Income Inequality in Africa
134 2011 Mthuli Ncube and Eliphas Ndou Inflation targeting, exchange rate shocks and output:
Evidence from South Africa
133 2011 Mthuli Ncube and Eliphas Ndou Monetary Policy Transmission, House Prices and Consumer
Spending in South Africa: An SVAR Approach

27