Does control-ownership divergence impair market liquidity in an emerging market? Evidence from China...
58
Does control-ownership divergence impair market liquidity in an emerging market? Evidence from China Abstract This paper examines how institutional characteristics of emerging economies influence the effect of control-ownership divergence on market liquidity. We find that the divergence is negatively associated with liquidity, and that this negative relationship is more pronounced in firms with more severe agency problems and information asymmetry. We argue that in an emerging market, the negative effect of the divergence on liquidity is worsened by state ownership and poorer shareholder protection, both of which result in more severe agency conflicts; we also find, however, that this effect is alleviated by the NTS reform, which aligns the interest of different shareholders. Keywords: Control-ownership divergence; market liquidity; emerging markets; state ownership; Chinese NTS reform. 1
Transcript of Does control-ownership divergence impair market liquidity in an emerging market? Evidence from China...

Does control-ownership divergence impair market liquidity in
an emerging market? Evidence from China
Abstract
This paper examines how institutional characteristics of emerging
economies influence the effect of control-ownership divergence on
market liquidity. We find that the divergence is negatively
associated with liquidity, and that this negative relationship is
more pronounced in firms with more severe agency problems and
information asymmetry. We argue that in an emerging market, the
negative effect of the divergence on liquidity is worsened by state
ownership and poorer shareholder protection, both of which result in
more severe agency conflicts; we also find, however, that this
effect is alleviated by the NTS reform, which aligns the interest of
different shareholders.
Keywords: Control-ownership divergence; market liquidity; emerging
markets; state ownership; Chinese NTS reform.
1

JEL: G14;G32;G34
2

1. Introduction
The negative effect that control-ownership divergence of ultimate
owners (the divergence between their control rights and cash-flow
rights, also called excess control rights) has on firm value has
been widely documented by previous studies1. This value-destroying
effect is especially severe in countries with weak protection for
minority shareholders2. Only recently have some studies begun to
examine the effect of control-ownership divergence on market
liquidity, although there is abundant evidence that direct ownership
(such as block, institutional, and insider ownership) affects market
liquidity (Bolton and Von Thadden, 1998; Stoll, 2000; Cao et al.,
2004; Rubin, 2007; Brockman et al., 2009). Attig et al. (2006) show
that control-ownership divergence in Canadian firms is negatively
related to market liquidity because ultimate owners of firms with
excess control rights tend to disclose poor information, as they
tend to have selfish agendas due to higher agency costs in those
firms.
Nevertheless, there is still no direct evidence on how control-
ownership divergence affects market liquidity in emerging markets
such as China, where legal protection for minority shareholders is
1 Previous studies include Faccio and Lang (2002), Lins (2003), Lemmon and Lins(2003), Maury and Pajuste (2004), Bennedsen and Nielsen (2006), Gompers et al.(2010), and Lin et al. (2011).2 For example, Claessens et al. (2000, 2002), Faccio et al. (2001, 2010).
3

weak. Particularly, there is no comprehensive analysis showing how
the relationship between control-ownership divergence and stock
liquidity is influenced by the unique institutional features in
these emerging markets, which differ from those in a developed
market as examined by Attig et al. (2006). First, state-owned
enterprises (SOEs) and privately owned firms (so-called non-SOEs)
coexist. Compared to non-SOEs, SOEs have a more complex principal-
agent relationship chain, which may result in more severe agency
issue. Second, the legal system in China is weak, and the
implementation of the legal system differs greatly across regions.
Given that a better legal system can reduce information asymmetry,
the variation in the legal system results in a variation in
information asymmetry and agency problems in firms in different
regions. Finally, Chinese firms have experienced an important market
transformation (from the split share structure to a fully tradable
share structure) through the non-tradable share (NTS) reform. The
reform aligns the interests of different shareholders because it
allows the originally non-tradable shares held by large shareholders
to be tradable. Given that state ownership, a poorer legal system in
some regions and the split share structure (before the NTS reform)
are all associated with greater agency problems between controlling
and minority shareholders (Shleifer and Vishny, 1997; Demirguc-Kunt
and Maksimovic, 1999; Beltratti et al., 2011; Campello et al., 2011;
4

Liu and Tian, 2012; Chen et al., 2012), those institutional features
in China provide a unique settings to verify Attig et al. (2006)’s
conjecture that the negative relationship between control-ownership
divergence and stock liquidity is mainly caused by information
asymmetry and agency conflicts between controlling and minority
shareholders. This paper examines how the relationship between
control-ownership divergence and stock liquidity varies across firms
with and without state ownership; in regions with stronger or poorer
legal systems; and before and after the NTS reform. Furthermore, the
results by Attig et al. (2006) may be influenced by an endogeneity
issue because there may be uncontrolled factors that jointly affect
control-ownership divergence and stock liquidity. The NTS reform in
China provides an ideal event to address the endogeneity issue
because it was implemented by the Chinese government, and has thus
been an exogenous shock to all Chinese firms.
Using a sample from Chinese listed firms from 2005 to 2009, our
paper first confirms that control-ownership divergence has a
negative impact on market liquidity, which is consistent with Attig
et al. (2006). We also provide direct evidence that firms with
control-ownership divergence have higher information asymmetry by
using stock-price synchronicity as a measure of the information
environment. In addition, we find that the negative effect of
5

control-ownership divergence on market liquidity is greater in firms
with severe agency problems and information asymmetry: SOEs and
firms that locate in regions with weak protection for minority
shareholders. This study thus documents that both the weak corporate
governance mechanism in SOEs and the weak protection of minority
shareholders worsen the negative effect that control-ownership
divergence has on stock liquidity. We further provide evidence that
the negative relationship between control-ownership divergence and
stock liquidity is greatly weakened after the NTS reform, especially
in firms with more-severe agency conflicts. Our results are
supported when liquidity variables are measured by low-frequency
data. Our additional evidence shows the negative relationship
between control-ownership divergence and stock liquidity and the
reduction of the negative relationship after the NTS reform are both
more pronounced in SOEs controlled by local governments than in SOEs
controlled by the central government.
By providing empirical evidence for the impact of control-ownership
divergence on stock liquidity, this study contributes to the current
literature in several ways. First, this study extends the paper by
Attig et al. (2006) by exploring institutional features in an
emerging market (in this case, China) such as state ownership, the
legal environment and market reforms, that influence the negative
6

relationship between control-ownership divergence and market
liquidity. We provide direct evidence that control-ownership
divergence's negative effect on market liquidity is worsened by
increased agency problems caused by both state ownership and weak
protection for minority shareholders. Our study therefore
contributes to agency theory and literature on the implications of
control-ownership divergence for the stock market. In addition,
literature on the effect of control-ownership divergence on stock
liquidity may suffer from the potential endogeneity issue. This
study provides fresh evidence that is less likely to be influenced
by the endogeneity issue, as the study uses a natural-experiment
method. Furthermore, the financial market in emerging markets is
usually underdeveloped and hampered by various policy barriers for
historical reasons; our study confirms that the importance of a
proper privatisation process (such as the NTS reform) for an
emerging market that aims to remove those barriers can greatly
improve market liquidity. Therefore, this current study also has
implications for market-oriented reforms in transition economies.
Finally, one of the major consequences of the recent global
financial crisis is that markets overall have become severely
illiquid, which prolongs their recovery even further. Therefore, our
study will have significant and timely policy implications for
regulatory authorities in emerging markets.
7

We organise the remainder of this paper as follows: Section 2
introduces the controlling structures and institutional environment
in China, reviews the relevant literature, and develops testable
hypotheses. Section 3 describes the sample selection, variable
definition, and regression models. Section 4 discusses the results
of our main empirical and robustness tests. Section 5 concludes the
paper.
2 Institutional environment, literature review, and hypotheses
development
2.1 Controlling structures and institutional environment in China
This study has chosen to examine Chinese firms because of their
specific controlling structures and institutional environment,
resulting in different agency conflicts and corporate governance in
firms with different types of controlling shareholders, those in
different regions, and those before and after the NTS reform.
Over the past three decades, China has moved toward a market economy
where ownership structures of Chinese corporations have been
transformed from nearly 100% state-owned to a relatively diversified
ownership. Initially, all Chinese listed firms were ultimately owned
by the state. Over time, private entities or individuals have been
8

allowed to become controlling shareholders in some listed firms
through MBOs, or through mergers and acquisitions (Chow, 2007).
Although the government still maintains its control or influence
over SOEs through substantial ownership (Chen et al., 2008), non-
SOEs established by entrepreneurs and other individual entities have
also been encouraged to list their shares on Chinese stock markets
in recent years. Therefore, a typical characteristic of the Chinese
stock market is the co-existence of SOEs and non-SOEs. In the
meantime, most Chinese corporations (both SOEs and non-SOEs) have a
pyramid ownership structure established by the controlling
shareholders with relatively low cash-flow rights (Fan et al.,
2007). Therefore, there is sufficient variation of ownership to
examine whether the relationship between control-ownership
divergence and market liquidity varies between SOEs and non-SOEs.
In addition, an important feature of the Chinese institutional
environment is that the legal system is still quite weak and
minority shareholders are weakly protected (Peng, 2001; Kato and
Long, 2005). Nevertheless, although the legal system within China
does not differ much from region to region, its implementation
9

does3, which results in unequal protection for minority shareholders
in different regions. China provides a unique dataset to examine
whether the effect of control-ownership divergence on stock
liquidity is affected by different levels of protection for minority
shareholders within one country.
For historical reasons, a split share structure was established in
the Chinese capital market, whereby tradable shares were mostly held
by individual investors and non-tradable shares (NTS) were mostly
held by large shareholders before the NTS reform, which caused
severe agency conflict and information asymmetry between majority
and minority shareholders. The NTS reform, which was implemented
from 2005 to 2007, required large shareholders to convert their
shareholdings to tradable shares. By removing a significant market
friction, the reform greatly reduced the agency conflict between
large and minority shareholders, because their interests were now
aligned. Therefore, the effect of control-ownership divergence on
stock liquidity can be examined from a vertical frame; that is, to
3 As a typical example, according to the Supreme Court's judicialinterpretation, the right of jurisdiction over all listed companies asdefendants in a civil action belongs to the regional People’s IntermediateCourt. In this situation, the implementation of the legal system depends onwhether the region has a well-developed free market with less governmentintervention in the economy. In regions that do not have a well-developedfree-market economy, listed companies are more likely to influence thelocal judicial department (the regional People’s Intermediate Court)through networks or relationships, which dominate the Chinese economy. Forexample, Shanghai is considered to better implement the legal system thanTibet due to the former's freer market and better-developed economy.
10

see whether the effect of control-ownership divergence on liquidity
changes when the agency issue between shareholders is alleviated.
2.2 Literature review
2.2.1 Ownership structure and stock liquidity
Prior studies show that corporate ownership structure has a great
impact on stock liquidity, especially under a concentrated-ownership
structure. Theoretical works by Bolton et al. (1998) and Maug (1998)
indicate that block ownership may influence firms’ stock liquidity
through two major mechanisms: the trading-activity effect and the
informed-trading effect. The trading-activity effect argues that if
a large shareholder is present, the availability of shares is
limited and fewer shareholders can trade the stock, which reduces
the trade frequency (Demsetz, 1968); and discourages the acquisition
and production of information (Holmstrom and Tirole, 1993). The
informed-trading effect indicates that because large shareholders
usually have private information about the firm's value, the higher
probability of informed trading decreases the liquidity.
Empirical studies in recent years have attempted to investigate the
relationship between ownership structure and stock liquidity by
distinguishing the two effects. For example, Rubin (2007) finds that
stock liquidity is positively related to total institutional
11

ownership (a proxy for trading activity) but negatively related to
institutional block holdings (a proxy for informed trading).
Similarly, Brockman et al. (2009) find that block ownership is
detrimental to stock liquidity, and that the relative lack of
trading, rather than the threat of informed trading, better explains
the negative relationship between block ownership and stock
liquidity.
2.2.2 The effect of control-ownership divergence
After Claessens et al.'s (2000) seminal paper, which identifies the
pyramiding ownership structure in eight East Asian economies,
control-ownership divergence has been found to be associated with
more-severe information asymmetry and agency conflicts between large
controlling and minority shareholders, and that this impairs firm
value (Claessens et al., 2002; Faccio and Lang, 2002; Lemmon and
Lins, 2003; Lins, 2003; Maury and Pajuste, 2004; Gompers et al.,
2009) or results in value-destroying financial policies (Faccio et
al., 2010; Liu and Tian, 2012). A few studies in recent years have
also linked control-ownership divergence to stock liquidity. Attig
et al. (2006) is the first of these to examine the relationship
between control-ownership divergence and stock liquidity. Using a
sample of Canadian publicly traded firms for the year 1996, they
find that greater control-ownership divergence results in more
12

severe information asymmetry and wider bid-ask spreads. They further
argue that ultimate owners of firms with control-ownership
divergence usually have a strong incentive to adopt a poor
information-disclosure policy to pursue their private benefit.
Similarly, Ginglinger and Hamon (2010) confirm Attig et al. (2006)’s
argument using a sample of French firms, reporting that control-
ownership divergence inherited in a pyramid structure impairs market
liquidity, but double voting rights increase stock liquidity.
To sum up, the literature indicates that firms’ ownership structure
does have an impact on market liquidity, but the few studies
examining the effect of control-ownership divergence on stock
liquidity are all based on developed markets. This study attempts to
complement the current literature by investigating the relationship
between control-ownership divergence and liquidity in an emerging
market with a unique institutional setting.
2.3 Hypothesis development
2.3.1 Control-ownership divergence and market liquidity
As mentioned above, the literature implies that control-ownership
divergence is associated with poor stock liquidity because the
ultimate owners in these firms become entrenched, and they usually
disclose inadequate information so they can pursue their private
13

benefit (Attig et al., 2006). The conflict of interest between the
ultimate owners and minority shareholders is particularly severe in
transition economies like China, where protection for minority
shareholders is still quite weak (Shleifer and Vishny, 1997; Kato
and Long, 2005; Lin et al., 2011). Under this circumstance, ultimate
owners with more excess-control rights may have a stronger incentive
to minimise and delay the disclosure of information in an emerging
market, which is harmful to market liquidity. Therefore we expect
that the negative relationship between control-ownership divergence
and stock liquidity also exists in Chinese firms. Thus our first
hypothesis is that:
H1: Control-ownership divergence is negatively (positively) related to market liquidity
(bid-ask spread or adverse selection cost) of Chinese firms.
2.3.2 Control-ownership divergence, agency problem and stock
liquidity
However, the relationship between control-ownership divergence and
liquidity may differ between SOEs and non-SOEs because their
corporate governance mechanisms differ. In particular, the property
rights of non-SOEs in China are naturally personal or family-based,
which is similar to firms in the west, but SOEs have a specific
corporate governance model with a multilayered principal-agent
framework and an unclear clarification of ultimate property rights.
Local and central government officials serving as principals hold
14

the control rights in the name of the state, but they are not the
residual claimants. Thus, no one in the principal-agent relationship
chain has any incentive to maximise profits for the actual principal
(Liu et al., 2011). This means that everyone in the chain may have a
strong incentive to pursue their own personal benefit, which results
in a much more severe agency problem and information asymmetry in
SOEs. Chung et al. (2010) find that better stock liquidity is
positively related to firms’ corporate governance. Thus, we expect
that this poor corporate governance and the severe agency problem in
SOEs strengthen the negative relationship between control-ownership
divergence and stock liquidity. Thus we propose the following
hypothesis:
H2a: The interaction of control-ownership divergence and the SOE dummy is
negatively (positively) related to stock liquidity (bid-ask spread or adverse selection
cost).
If the negative relationship between control-ownership divergence
and liquidity stems from a firm’ poorer information disclosure
(Attig et al., 2006), it is reasonable to expect that this
relationship is particularly strong in regions where the minority
shareholders are poorly protected. This is because the legal system
operating in regions with strong protection for minority
shareholders can reduce opportunism and asymmetric information
15
(Demirguc-Kunt and Maksimovic, 1999). Therefore, we expect that the
negative relationship between control-ownership divergence and
liquidity is stronger in regions with poorer protection for
shareholders and vice-versa, and propose the following hypothesis:
H2b: The interaction of control-ownership divergence and the poor legal system
dummy is negatively (positively) related to stock liquidity (bid-ask spread or adverse
selection cost).
2.3.3 Control-ownership divergence, NTS reform, and stock liquidity
As discussed above, the split share structure harmed market
liquidity because it increased the agency conflict between
controlling shareholders and minority shareholders. However, after
the NTS reform, shares held by large shareholders gradually become
tradable, which aligned the interests of large and minority
shareholders by linking large shareholders’ wealth directly to share
prices. Thus we propose the following hypothesis to provide evidence
for this expectation:
H3a: The interaction of control-ownership divergence and NTS reform is positively
(negatively) associated to stock liquidity (bid-ask spread or adverse selection cost).
If, as expected, the agency problems are more severe in SOEs and
firms in regions with a weak legal system, and such agency problems
are alleviated after the NTS reform, it would be reasonable to argue
16

that the negative relationship between control-ownership divergence
and stock liquidity is weakened more significantly in SOEs and firms
in regions with a weak legal system. Thus we hypothesise that:
H3b: The interaction of control-ownership divergence and NTS reform has a stronger
positive (negative) effect on stock liquidity (bid-ask spread or adverse selection cost)
in SOEs or firms that locate in regions with a poor legal system that provides weak
protection for investors.
3. Research design
3.1 Data collection and sample selection
Our data is collected mainly from the CSMAR database. Particularly,
the spread of information is collected from the High Frequency
Database of Chinese Listed Firms (2005–2009); the information
regarding firms’ ownership structure (including proportion of
tradable in each year) is collected from the Chinese Listed Firm
Shareholder Research Database (2005–2009); and the NTS reform
information is collected from the Chinese Listed Firms Non-Tradable
Share Reform Database (2005–2009).
To calculate market liquidity, we exclude (1) data observations that
are not during normal trading times (i.e., 9:30-11:30 and 13:00-
17

15:00)4; and (2) the volume, price, and quote non-positive data
records. In addition, we exclude ‘ST’ or negative-equity firms
(financially distressed firms) because these shares are traded
according to different rules. The final sample consists of 1,718
observations of 345 firms’ panel data from 2005 to 20095.
3.2 Measuring variables
3.2.1 Dependent variables
In accordance with Brockman, Chung, and Yan (2009), we calculate two
variables to measure stock liquidity using high-frequency data. The
first is the bid-ask effective spread (BAES)6, which is defined as
the absolute value of twice the difference between the transaction
4 Stock exchanges in China operate five days a week, except for holidays.The normal trading hours are 9:30 AM to 11:30 AM and 13:00 PM to 15:00 PM.There is also a pre-trading session from 9:00 AM to 9:30 AM each day.However the pre-trading session uses a periodic call auction, which is adifferent method from that used during the normal trading hours (thecontinuous, discriminating auction) (Xu, 2000). 5 There are two Securities Exchanges in China: the Shanghai SecuritiesExchange (SHSE) and the Shenzhen Securities Exchange (SZSE). A significantdifference between the two stock exchanges is the sizes of the listedcompanies. In addition, the closing price for stock on the Shanghai StockExchange is the last traded price of a continuous transaction. In contrast,the closing price of stock on the Shenzhen Stock Exchange is determinedusing the call auction, whose closing time is three minutes (that is, from14:57 to 15:00). Apart from that, there is no other significant differencebetween them; they are both typical, pure order-driven markets that haveadopted a centralised, scriptless, computerised order matching system whichhas functioned remarkably well. Due to the availability of data, we onlyincluded those firms listed on the SZSE.6 We also calculate the bid-ask quoted spread (BAQS), which is defined asthe daily average value of the difference between the bid price and the askprice, and conduct regressions using this variable as measure of stockliquidity. The regression results are not reported in the study becausethey are very much similar to the results using BAES as dependent variable.Both variables are highly correlated.
18

price and the mid-price recorded at the time of the transaction.
Second, according to Glosten and Harris (1988), information
asymmetry is another important component for measuring stock
liquidity, so we further calculate the adverse selection cost (ADSC-
GH) as a proxy for information friction7. As our regressions are
based on years, we use the annual average of the above two measures
of liquidity to reduce the errors associated with a single day, and
obtain a single observation for each firm in each year.
Stock-price synchronicity (SYNCH) is also calculated in this paper
to measure the information asymmetry of individual firms. Following
Morck et al. (2000), we first estimate the following regression:
Ri,t=βi0+βi1Rm,t+εi,t Equation
(1)
where Ri,t is the return of stock i at day t, and Rm,t is the market
return at day t. The variable SYNCH is defined as:
7 Based on Glosten and Harris (1988), the total adverse selection costpercentage is 2(z0+z1 )/[2(z0+z1 )+2(c0+c1 )]. Where the numerator isinformation asymmetry or adverse selection component, and the denominatoris the sum of the order processing component and the inventory holdingcomponent. In this formula, is the average share volume, while z0, z1, c0,and c1 are estimated from the following equation: △Pt = c0△Qt + c1△QtVt
+z0Qt + z1QtVt + et. Where Pt is the trade price at time t; Qt = +1 if thetrade at time t is buyer-initiated and Qt = -1 if it is seller-initiated,and Vt is the number of shares traded per transaction at time t △Pt and △Qt
are the change of Pt and Qt at time r; and et is the error item.
19
Equation (2)
where R2 is the coefficient of determination from the estimation of
Eq (1). We then calculate the annual average of the daily SYNCH to
obtain a single observation for each firm in each year.
For robust results, we further calculate three low-frequency
liquidity measures: trading volume (VOLUME), turnover ratio
(TURNOVER), and illiquidity ratio (ILLIQUIDITY). VOLUME and TURNOVER
are defined as the yearly average trading volume (turnover ratio),
while ILLIQUIDITY is the yearly average daily illiquidity ratio, which
is defined as the average ratio of the daily absolute return to the
(dollar) trading volume on that day (Amihud, 2002).
3.2.2 Independent variables
Control-ownership divergence (DIVERGENCE) is defined in this paper,
as in Lin et al. (2011), as the difference between the control
rights and cash-flow rights of the ultimate owners8. Cash-flow
rights are measured by the sum of the products of the proportion of
ownership along the control chains, while control rights are the
minimum proportion of ownership along the control chains.
8 According to the CSRC definition, the “ultimate owner” of a listedcompany is: (1) the largest shareholder, or (2) the shareholder with morevoting rights than the largest shareholder, or (3) the shareholder withshareholding or voting rights above 30% of the total shares or votingrights in the company, or (4) the shareholder who can determine over halfof the board members.
20
NTS reform (REFORM) is defined in this paper as a dummy variable
that equals 1 for a firm-year observation in the post-reform period,
and 0 for observations before or in the NTS reform year.
We also define a dummy variable (SOE) that equals 1 if the firm is
ultimately owned by Chinese central or local governments and 0
otherwise. Within the SOEs sample, a dummy variable (CENTRALSOE) is
further defined if the SOE is ultimately controlled by the central
government.
According to Liu et al. (2011), the regional-division criterion
widely used to measure variations in institutional development in
China is the division between the eastern (coastal) region and the
non-eastern region, including both the central and western regions.
The eastern region (the coastal provinces) is considered to protect
its minority shareholders better due to its advantageous
geographical positioning, as well as its well-established market
economy and effective legal system9. Thus, we define a region dummy
variable (POORREGION) that equals 1 if the firm is registered in the
9 The eastern region covers Beijing, Tianjin, Hebei, Liaoning, Shanghai,Jiangsu, Zhejiang, Fujian, Shandong, Guangdong, and Hainan. The central andwest regions include Shanxi, Jilin, Heilongjiang, Anhui, Jiangxi, Henan,Hubei, Hunan, Inner Mongolia, Guangxi, Sichuan, Chongqing, Guizhou, Yunnan,Shaanxi, Gansu, Qinghai, Ningxia, Xinjiang, and Tibet.
21

central or western regions and 0 otherwise.
Finally, to control the effect of other factors that have an impact
on market liquidity, we also include several control variables. The
percentage of tradable shares, institutional ownership, stock
closing price, total market capitalisation, and trading risk are
included to control the effect of firm-specific factors, while
market return and market trading volume are there to control the
potential effect of market conditions (Chordia et al., 2001; Rosch
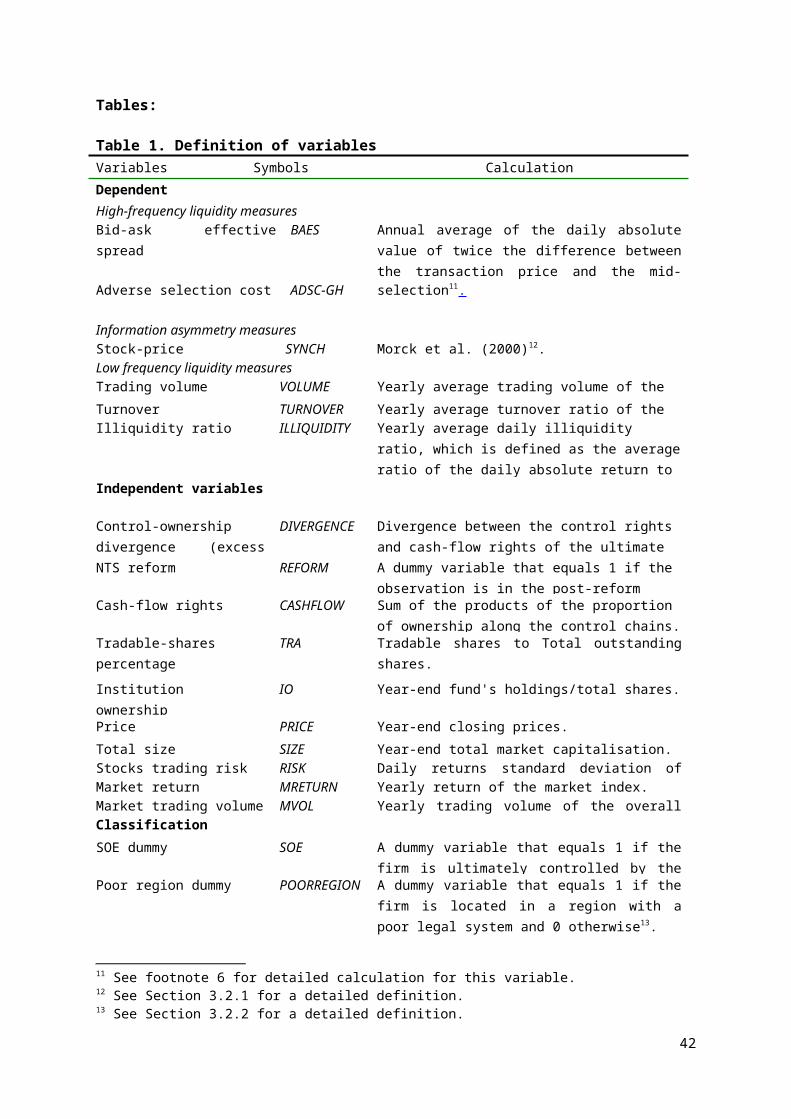
and Kaserer, 2013; Qian et al., 2013). Table 1 defines in detail all
variables used in this paper.
<Table 1>
3.3 Regression models
Our base regression models are as follows:
Equation (3)
Equation
(4)
In Equations (3) and (4), i and t represent the firm and year, and
is the error term. The dependent variables Y are proxies for market
liquidity and information asymmetry, which includes bid-ask
effective spreads (BAES), adverse selection cost (ADSC-GH), trading
22

volume (VOLUME), turnover ratio (TURNOVER), illiquidity ratio
(ILLIQUIDITY), and stock-price synchronicity (SYNCH). The key
independent variables are control-ownership divergence (DIVERGENCE),
NTS reform (REFORM), and their interaction term, while X is a vector
of control variables.
4. Empirical results
4.1 Sample description and univariate tests
The descriptive statistics and univariate test results are reported
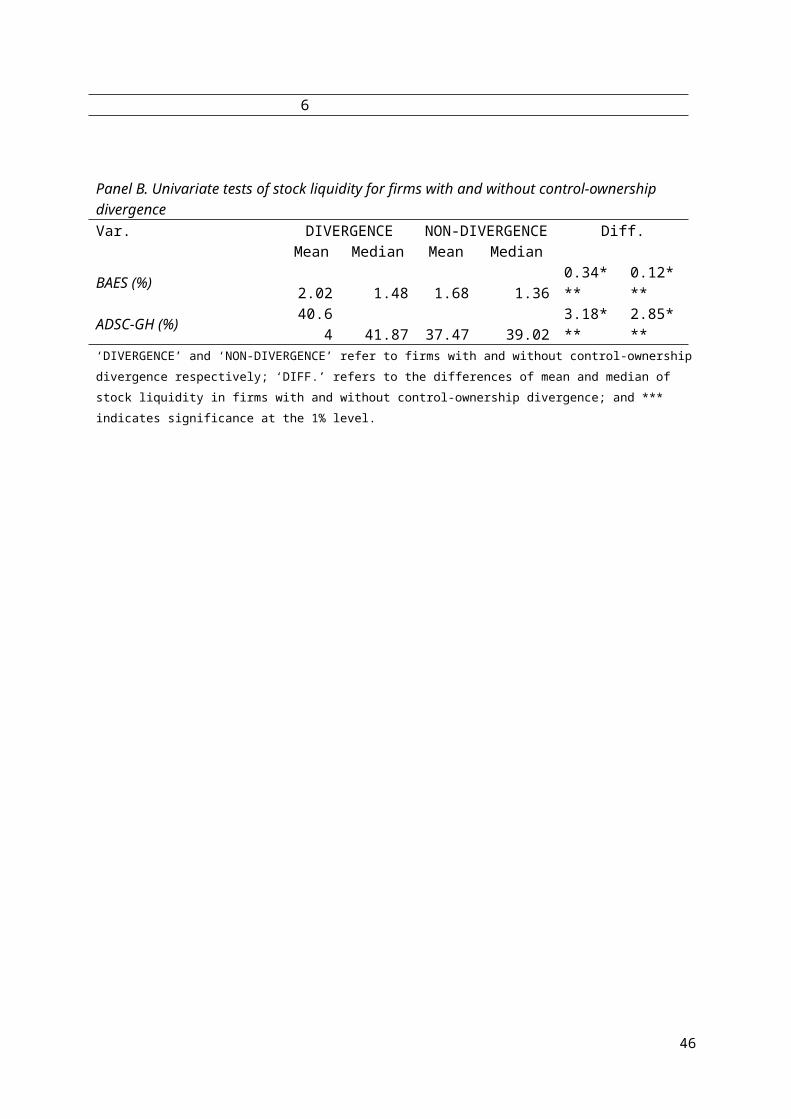
in Table 2, of which panel A gives the summary statistics; panel B
presents the results for univariate tests of stock liquidity based
on whether the firms have control-ownership divergence or not; and
panel C presents the results for difference-in-difference tests of
stock liquidity of firms with and without control-ownership
divergence, and with different levels of agency problems. Lastly,
panel D presents the results for difference-in-difference tests of
stock liquidity in firms with and without control-ownership
divergence and before and after the NTS reform.
Panel A shows that the average effective spread in the Chinese stock
market is 0.02 RMB, and the adverse selection costs account for
39.1% of spread, on average. In addition, the average stock-price
synchronicity is -0.12, which is close to the -0.23 reported by
23

Hasan et al. (2013) for Chinese markets, but much higher than the -
1.74 reported for the US market (Piotroski and Roulstone, 2004).
Consistent with Hasan et al. (2013), our results indicate that the
information-asymmetry problem in the Chinese market is more severe
than in the US because the stock price in the Chinese market is more
likely to co-move with the market index. Our low-frequency
measurements of market liquidity show that the average trading
volume, turnover ratio, and illiquidity are 81.90 million RMB, 3%,
and 0.04 (×10 Million) respectively. Regarding the independent
variables, we find that the average control-ownership divergence of
our sample firms is around 6%, with controlling shareholders’ cash-
flow rights of 39%.
Panel B shows that firms with control-ownership divergence have a
higher bid-ask effective spread (BAES) and adverse selection cost
(ADSC-GH) than firms without it, and the differences are
statistically significant in terms of both mean and median. As high
BAES and ADSC-GH both indicate poor stock liquidity, our results
provide evidence that control-ownership divergence has a negative
impact on stock liquidity.
As expected, panel C shows that SOEs with control-ownership
divergence have significantly higher BAES and ADSC-GH (poor
24

liquidity), indicating that control-ownership divergence has a
significantly negative impact on stock liquidity. Similarly,
control-ownership divergence is found to have a significantly
negative effect on stock liquidity for firms in regions with a poor
legal system. However, no significant relationship between control-
ownership divergence and stock liquidity is found for non-SOEs or
firms in regions with an effective legal system (only one out of
four tests of difference is significant). In contrast, the
difference-in-difference test results are all significant,
indicating that the interaction effect of SOE (POORREGION) and
control-ownership divergence is also significantly associated to
stock liquidity.
Panel D shows that the BAES and ADSC-GH both decrease significantly
after the NTS reform in firms with control-ownership divergence
only, suggesting that the stock liquidity in those firms is greatly
improved after the NTS reform. The difference-in-difference test
results are both significant, which confirms that the interaction of
control-ownership divergence and NTS reform have a negative
(positive) effect on the study's dependent variables (stock
liquidity).
We also conduct correlation-coefficient tests between independent
25
variables, but the results are not reported to save space. Our
correlation matrix results indicate that our results do not suffer
from serious multi-collinearity problems.
<Table 2>
4.2 Control-ownership divergence and market liquidity
Table 3 presents the regression results of control-ownership
divergence on market liquidity using BAES and ADSC-GH as measures of
market liquidity.
Consistent with our expectation and the results from the univariate
test, the coefficients of DIVERGENCE are consistently positive and
significant in both economic magnitude and statistical significance,
when stock liquidity is measured using BAES or ADSC-GH as dependent
variables. Specifically, we suggest that a 1% increase in control-
ownership divergence by the controlling shareholders results in an
increase of 0.017% in bid-ask spreads, and 0.195% in adverse
selection cost. Therefore, the overall results in Table 3 support
our hypothesis H1, indicating that control-ownership divergence has
a negative impact on stock liquidity.
In addition, the results show that the ultimate owners’ cash-flow
rights have a negative impact on stock liquidity. The proportion of
tradable shares is negatively related to both the bid-ask spread and
26

adverse selection cost, which indicates that there is a positive
relationship between the proportion of tradable shares and market
liquidity. This result is consistent with our expectation that
firms’ stock liquidity increases when the proportion of tradable
shares increases after the NTS reform. Furthermore, we show that
bid-ask spreads and adverse selection costs (stock liquidity) are
negatively associated with institutional ownership, and that the
year-end closing price and stock trading risk are positively related
to stock liquidity, while firms with large market capitalisation
have better liquidity. This confirms previous studies from Attig et
al. (2006), Rubin (2007), and Brockman et al. (2009). Finally,
similar to Qian et al. (2013), the results confirm that the market-
commonality component has strong explanatory power for individual
stocks by showing that stock liquidity increases when the market
return is higher.
<Table 3>
4.3 The effect of control-ownership divergence on liquidity of firms with different levels of
agency problems
We have shown that control-ownership divergence has a negative
effect on market liquidity. If, as expected, the negative
relationship between control-ownership divergence and stock market
liquidity stems from the agency problem and its induced poor
27

information disclosure, this negative relationship should be
strengthened in SOEs and firms in regions with poor legal systems,
both of which suffer from more-severe agency problems. In this
subsection, we attempt to examine the effect of control-ownership
divergence on stock liquidity in firms with different levels of
agency problems.
Table 4 presents the regression results on the interaction effect of
DIVERGENCE and the SOE dummy (POORREGION dummy) on stock liquidity.
The results in columns 1 and 2 of Table 4 show that the interaction
term of DIVERGENCE and the SOE dummy are statistically and
economically related in a significantly positive way to adverse
selection cost. Thus our results suggest that the positive
(negative) relationship between control-ownership divergence and
adverse selection costs (stock liquidity) is weakened in SOEs, which
is consistent with our hypothesis H2a.
Columns 3 and 4 present the effect of control-ownership divergence
and regional legal system on stock liquidity. We expect that
control-ownership divergence should have a stronger positive impact
on bid-ask spread and adverse selection cost in firms in regions
with poor legal systems. Not surprisingly, our results confirm that
the interaction of DIVERGENCE and the POORREGION dummy is
28

significantly positively associated with our dependent variables.
Therefore our hypothesis H2b is also proven, indicating that the
negative impact of the control-ownership divergence on stock
liquidity is exaggerated by a poor legal system.
<Table 4>
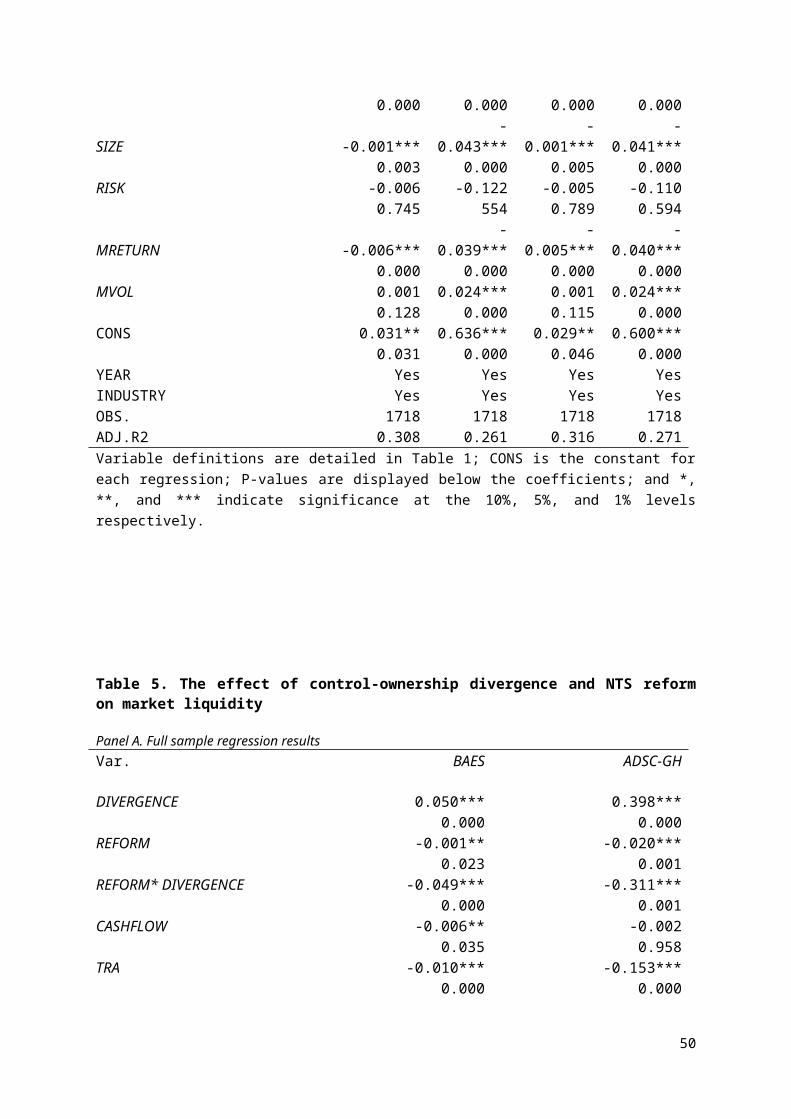
4.4 The effect of control-ownership divergence and NTS reform on stock liquidity
To investigate whether the negative impact of the control-ownership
divergence on market liquidity is alleviated when controlling
shareholders’ incentive to expropriate is reduced after the NTS
reform, the interaction effect of control-ownership divergence and
NTS reform on stock liquidity is examined. Our expectation is that
the negative effect of control-ownership divergence on stock
liquidity should be weakened after the NTS reform, particularly in
firms with severe agency problems. The results are reported in Table
5, of which panel A reports the full sample regression results,
while panels B and C report the regression results based on
different subsamples.
The results in panel A show that the interaction of DIVERGENCE and
the REFORM dummy is significantly negatively related to the study's
dependent variables. This confirms that the positive (negative)
effect of control-ownership divergence on both bid-ask spread and
29

adverse selection cost (liquidity) are weakened after the NTS
reform. These results are also consistent with our hypothesis H3a.
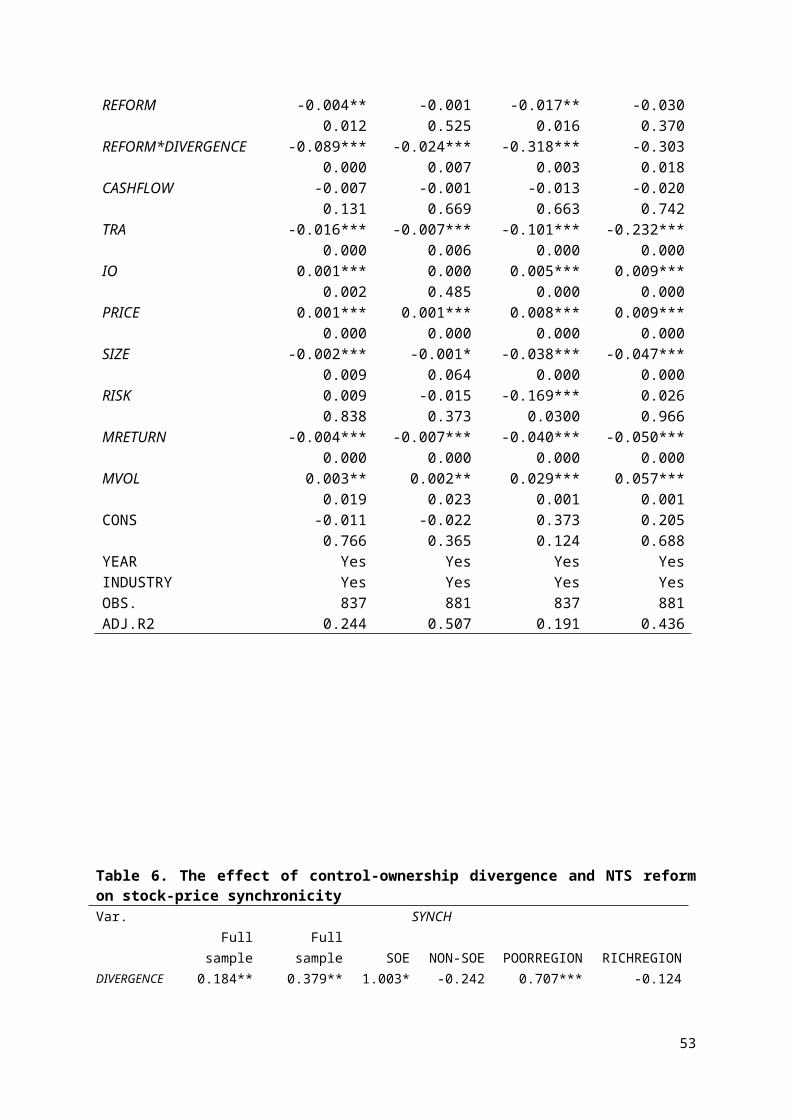
Panels B and C show that the interaction of control-ownership
divergence and NTS reform has a statistically significantly negative
effect only on the adverse selection cost of firms with severe
agency problems; that is, SOEs and firms in regions with a poor
legal-protection system, although it has a similar effect on the
bid-ask spread of firms with different levels of agency problems.
The results confirm that the positive (negative) relationship
between control-ownership divergence and adverse selection cost
(stock liquidity) is weakened more significantly in firms with more-
severe agency problems.
<Table 5>
4.5 The effect of control-ownership divergence on information asymmetry
So far we have provided evidence that control-ownership divergence
does have a negative impact on stock liquidity, and conjectured that
the negative impact is caused by information asymmetry and agency
problems. However, we have not had direct evidence about whether
control-ownership divergence has an effect on information asymmetry
that can be directly measured by stock-price synchronicity. Thus, in
this section we examine the effect of control-ownership divergence
(and NTS reform) on stock-price synchronicity.
30
Columns 1 and 2 of Table 6 present the results based on the full
sample. We find that DIVERGENCE is positively associated with stock-
price synchronicity, indicating that the information asymmetry in
firms with higher control-ownership divergence is higher than that
in firms with lower or no divergence; this is consistent with our
expectation. Further, we show that the interaction of DIVERGENCE and
NTS reform is significantly negatively associated with firms with
severe agency problems; that is, SOEs and firms in regions with poor
legal systems. This indicates that the information asymmetry in
firms with more-severe agency problems is significantly reduced
after the NTS reform. Overall, the results in Table 6 confirm our
argument that information asymmetry is the channel through which
control-ownership divergence affects stock liquidity.
<Table 6>
4.6 Additional tests
This section provides robustness test results for our main results.
First, we conduct a change regression to see whether the control-
ownership divergence before the NTS reform is associated with a
31

greater change in stock liquidity10; second, we repeat our main test
using a low-frequency measurement of stock liquidity; and finally,
we further examine whether control-ownership divergence's impact on
the liquidity of SOEs controlled by central governments is different
from its impact on the liquidity of those controlled by local
governments.
4.6.1 The effect of control-ownership divergence on change of stock
liquidity after the NTS reform
Table 7 gives the regression results on the effect of control-
ownership divergence (before the NTS reform) on the change of stock
liquidity after the NTS reform. The bid-ask spread and adverse
selection cost of firms with higher control-ownership divergence
fall significantly after the NTS reform, which is consistent with
the findings in Table 5. We also conduct regressions on the effect
of DIVERGENCE and NTS reform on change of stock liquidity for firms
with different levels of agency problems. The results are also quite
similar to the results in Table 5, and are thus not reported here to
save space.
<Table 7>
10 Normally the change of stock liquidity after the NTS reform should beused to regress on the change of all independent variables, includingchange in DIVERGENCE and change in TRA; however, there are very few changesof DIVERGENCE and TRA during the lock-up period. So we examine the effect ofthe average value of DIVERGENCE and TRA before the NTS reform on the changeof stock liquidity.
32
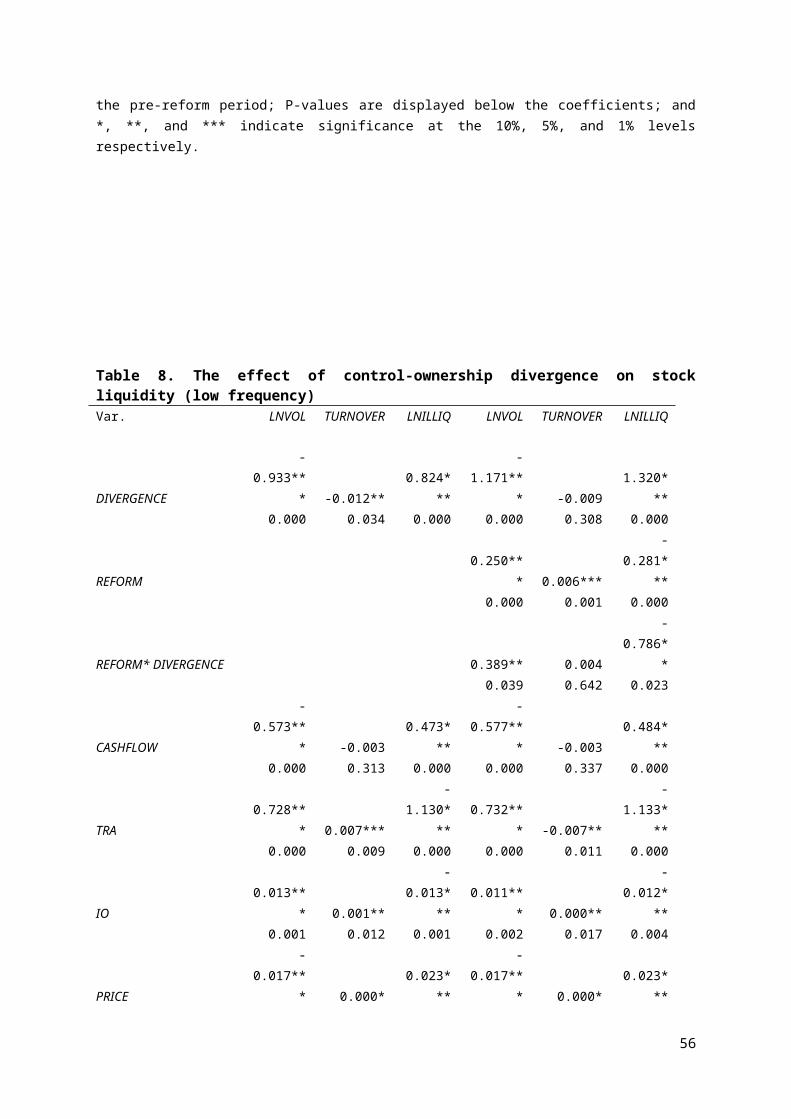
4.6.2 The effect of control-ownership divergence on stock liquidity
(low-frequency data)
Table 8 presents the results showing the effect of control-ownership
divergence, NTS reform, and their interaction on stock liquidity using
low-frequency data to measure stock liquidity. Following Amihud (2002),
we adopt trading volume (VOLUME), turnover ratio (TURNOVER), and
illiquidity ratio (ILLIQUIDITY) as low-frequency liquidity measures.
Columns 1 to 3 of Table 8 show that control-ownership divergence is
significantly negatively associated with trading volume, and
significantly positively associated with illiquidity ratio. This
indicates that firms with more control-ownership divergence usually
have poorer market liquidity. The interaction of DIVERGENCE and NTS
reform is significantly positively (negatively) associated with trading
volume (illiquidity ratio), which implies that the negative (positive)
relationship between control-ownership divergence and trading volume
(illiquidity ratio) is weakened significantly after the NTS reform.
Thus our main results are confirmed by the results shown in Table 8.
<Table 8>
4.6.3 The effect of control-ownership divergence and NTS reform on
stock liquidity of SOEs controlled by central and local governments
Recent studies by Chen et al. (2009) and Cheung et al. (2012) find
33

that local and central government ownership have different impacts
on firm performance. In particular, SOEs controlled by local
governments usually perform worse than those controlled by the
central government due to weak monitoring and supervision from the
government. This suggests that the negative relationship between
control-ownership divergence and stock liquidity should be more
pronounced in local SOEs due to weaker monitoring and supervision
leading to their more-severe agency problems. Not surprisingly, the
results in Table 9 do show that DIVERGENCE is significantly
positively associated with bid-ask spread and adverse selection cost
of SOEs controlled by local governments. In addition, we find the
positive impact of control-ownership divergence on bid-ask spread
and adverse selection cost is weakened more significantly in local
SOEs after the NTS reform.
<Table 9>
5. Conclusion
This paper examines the effect of control-ownership divergence on
market liquidity using a unique sample of Chinese listed firms. We
find that firms with larger control-ownership divergence have higher
bid-ask spreads and adverse selection costs – i.e., poorer market
liquidity – than firms with smaller divergence. We further show that
the negative impact of control-ownership divergence on stock
liquidity is exaggerated by the more-severe agency problems in SOEs
34
and firms in regions with poor legal systems that provide weak
protection for minority shareholders. Moreover, using the NTS reform
as an exogenous shock, we find that the negative (positive)
relationship between control-ownership divergence and stock
liquidity (stock-price synchronicity) is alleviated after the NTS
reform which has greatly reduced the agency conflicts between
controlling and minority shareholders, particularly in firms with
severe agency problems. Our additional evidence supports our
findings by showing that firms with larger control-ownership
divergence are associated with greater reduction in bid-ask spread
and adverse selection cost after the NTS reform; control-ownership
divergence is associated with greater stock illiquidity, measured by
low-frequency data; and the negative relationship between control-
ownership divergence and stock liquidity is more pronounced in local
SOEs than in central SOEs.
Overall, this study provides evidence from an emerging market for a
negative effect of control-ownership divergence on market liquidity.
The results are consistent with previous literature from Attig et
al. (2006) for developed markets. More importantly, we provide
further evidence that in emerging markets such as China, the
negative impact of control-ownership divergence on market liquidity
is exacerbated by both state ownership and weak protection for
35

minority shareholders, both of which increase information asymmetry
and agency conflict between controlling shareholders and minority
shareholders. However, the NTS reform, which aims to improve the
efficiency of capital markets and align the interests of controlling
shareholders and minority shareholders, has reduced the negative
impact that control-ownership divergence has on market liquidity.
Our results suggest that in emerging markets, institutional
features, such as state ownership, regional development, and market
reform, play important roles in the effect of control-ownership
divergence on market liquidity.
References
Amihud, Y., 2002. Illiquidity and stock returns: cross-section and
time-series effects, Journal of Financial Markets, 5, 31–56.
Attig, N., Fong, W. M., Gadhoum, Y., Lang, Larry H.P., 2006. Effects
of large shareholding on information asymmetry and stock liquidity,
Journal of Banking & Finance, 30, 2875–2892.
Beltratti, A., Bortolitti, B., Casscvaio, M., 2011. Fiat privatization: The
non-tradable share reform and stock market fundamentals in China, Working paper.
Bennedsen, M., Nielsen, K.M., 2006. The principle of proportional
ownership, investor protection and firm value in Western Europe,
SSRN working paper.
36

Bolton, P., Von Thadden, E.-L., 1998. Blocks, liquidity and
corporate control, Journal of Finance, 53, 1–26.
Brockman, P., Chung, D.Y., Yan, X., 2009. Block ownership, trading
activity, and market liquidity, Journal of Financial and Quantitative Analysis,
44, 1403–1426.
Campello, M., Ribas, R.P., Wang, A., 2011. Is the stock market just a side
show? Evidence from a structural reform, Working paper.
Cao, C., Field, L.C., Hanka, G., 2004. Does insider trading impair
market liquidity? Evidence from IPO lockup expirations, Journal of
Financial and Quantitative Analysis, 39, 25–46.
Chen, G. M., Firth, M., Xin, Y., Xu, L., 2008. Control transfers,
privatization, and corporate performance: Efficiency gains in
China’s listed companies, Journal of Financial and Quantitative Analysis, 43,
161–190.
Chen, G. M., Firth, L., Xu, L., 2009. Does the type of ownership
control matter? Evidence from China’s listed companies, Journal of
Banking &Finance, 33, 171–181.
Chen, Q., Chen, X., Schipper, K., Xu, Y., Xue, J., 2012. The
sensitivity of corporate cash holdings to corporate governance, The
Review of Financial Studies, 25, 3610–3644.
Cheung, W., Lam, K.S.K., Tam, L.H.K., 2012. Blockholding and market
reactions to equity offerings in China, Pacific-Basin Finance Journal, 20,
459–482.
37

Chordia, T., Roll, R., Subrahmanyam, A., 2001. Market liquidity and
trading activity. The Journal of Finance, 56, 501–530.
Chow, G.C., 2007. China’s Economic Transformation, 2nd edition, New York:
Wiley-Blackwell.
Chung, K.H., Elder, J., Kim, J.C., 2010. Corporate governance and
liquidity, Journal of Financial and Quantitative Analysis, 45, 265–291.
Claessens, S., Djankov S., Lang H.P., 2000. The separation of
ownership and control in East Asian corporation, Journal of Financial
Economics, 58, 81–112.
Claessens, S., Djankov, S. Fan, J.P.H., Lang, H. P., 2002.
Disentangling the incentive and entrenchment effects of large
shareholdings, Journal of Finance, 57, 2741–2771.
Demirguc-Kunt, A. Maksimovic, V., 1999. Institutions, financial
markets, and firm debt maturity. Journal of Financial Economics, 54, 295–
336.
Demsetz, H., 1968. The cost of transactions. Quarterly Journal of
Economics, 20, 267– 291.
Faccio, M., Lang, L.H.P., Young, L. 2001. Dividends and
expropriation. The American Economic Review, 91, 54–78.
Faccio M., Lang H.P., 2002. The ultimate ownership of Western
European corporations, Journal of Financial Economics, 65, 365–395.
Faccio M., Lang H. P., Young L., 2010. Pyramiding vs leverage in
corporate groups: International evidence, Journal of International Business
38
Studies, 41, 88–104.
Fan, J.P.H., Wong, T.J., Zhang, T.Y., 2007. The Emergence of Corporate
Pyramids in China, SSRN working paper.
Ginglinger, E., Hamon, J., 2010. Ownership, control and market liquidity,
SSRN working paper.
Glosten, L.R., Harris, L., 1988. Estimating the components of the
bid-ask spread. Journal of Financial Economics, 21, 123–142.
Gompers, P., Ishii, J., Metrick, A., 2010. Extreme governance: An
analysis of dual-class firms in the United States, Review of Financial
Studies, 23, 1051–1088.
Hasan, I., Song, L., Wachtel, P., 2013. Institutional development
and stock price synchronicity: evidence from China, SSRN working
paper.
Holmstrom, B. Tirole, J., 1993. Market liquidity and performance
monitoring. Journal of Political Economy, 101, 678–709.
Kato, T., Long, C., 2005. Executive compensation, firm performance
and corporate governance in China: evidence from firms listed in the
Shanghai and Shenzhen stock exchange. Economic Development and Cultural
Change, 54, 39–81.
Lemmon, M. L., Lins, K., 2003. Ownership structure, corporate
governance, and firm value: Evidence from the East Asian financial
crisis, Journal of Finance, 58, 1445–1468.
Lin, C., Ma, Y., Malatesta, P., Xuan, Y., 2011. Ownership structure
39

and the cost of corporate borrowing, Journal of Financial Economics, 100,
1–23.
Lins, K. V. 2003. Equity ownership and firm value in emerging
markets, Journal of Financial and Quantitative Analysis, 38, 159–84.
Liu, Q., Tian, G., 2012. Controlling shareholder, expropriations and
firm’s leverage decision: Evidence from Chinese non-tradable share
reform, Journal of Corporate Finance, 18, 782–803.
Liu, Q., Tian, G., Wang, X., 2011. The effect of ownership structure
on leverage decision: new evidence from Chinese listed firms. Journal
of the Asia Pacific Economy, 16 (2), 254–276.
Maug, E., 1998. Large shareholders as monitors: Is there a trade-off
between liquidity and control? Journal of Finance, 53, 65–98.
Maury, B., A. Pajuste, A., 2004. Multiple controlling shareholders
and firm value, Journal of Banking and Finance, 29, 1813–1834.
Peng, M.W., 2001. How entrepreneurs create wealth in transition
economies. Academy of Management Executive, 15(1), 95–110.
Rosch, C.G., Kaserer, C., 2013. Market liquidity in the financial
crisis: The role of liquidity commonality and flight-to-quality.
Journal of Banking & Finance 37, 2284–2302.
Qian, X., Tam, L.H.K., Zhang, B., 2013. Systematic liquidity and the
funding liquidity hypothesis. Journal of Banking & Finance, forthcoming.
Rubin, A., 2007. Ownership level, ownership concentration and
liquidity. Journal of Financial Markets, 10, 219–248.
40

Shleifer, A., Vishny, R.W., 1997. A survey of corporate governance.
Journal of Finance, 52 (2), 737–783.
Stoll, H. R., 2000. Friction, Journal of Finance 55, 1479–1514.
Xu. C.K., 2000. The microstructure of the Chinese stock market, China
Economic Review 11, 79–97.
41
Tables:
Table 1. Definition of variablesVariables Symbols CalculationDependentvariablesHigh-frequency liquidity measuresBid-ask effectivespread
BAES Annual average of the daily absolutevalue of twice the difference betweenthe transaction price and the mid-
Adverse selection cost ADSC-GH selection11.
Information asymmetry measuresStock-price SYNCH Morck et al. (2000)12.Low frequency liquidity measuresTrading volume VOLUME Yearly average trading volume of the
stock.Turnover TURNOVER Yearly average turnover ratio of the Illiquidity ratio ILLIQUIDITY Yearly average daily illiquidity
ratio, which is defined as the averageratio of the daily absolute return to
Independent variables
Control-ownershipdivergence (excess
DIVERGENCE Divergence between the control rights and cash-flow rights of the ultimate
NTS reform REFORM A dummy variable that equals 1 if the observation is in the post-reform
Cash-flow rights CASHFLOW Sum of the products of the proportion of ownership along the control chains.
Tradable-shares percentage
TRA Tradable shares to Total outstandingshares.
Institutionownership
IO Year-end fund's holdings/total shares.
Price PRICE Year-end closing prices.Total size SIZE Year-end total market capitalisation.Stocks trading risk RISK Daily returns standard deviation ofMarket return MRETURN Yearly return of the market index.Market trading volume MVOL Yearly trading volume of the overallClassificationvariablesSOE dummy SOE A dummy variable that equals 1 if the
firm is ultimately controlled by thePoor region dummy POORREGION A dummy variable that equals 1 if the
firm is located in a region with apoor legal system and 0 otherwise13.
11 See footnote 6 for detailed calculation for this variable.12 See Section 3.2.1 for a detailed definition.13 See Section 3.2.2 for a detailed definition.
42

Central SOEs dummy CENTRALSOE A dummy variable that equals 1 if theSOE is ultimately controlled by thecentral government and 0 if the SOE is
In regression analysis, natural logarithms of VOLUME, ILLIQUIDITY,and SIZE are used to eliminate extreme values.
43

44

Table 2. Descriptive statisticsPanel A. Summary statistics
Variable Obs MeanMedia
nStd.Dev. Min Max
BAES (RMB)1718 0.02 0.14 0.02 0.01 0.21
ADSC-GH1723 0.39 0.40 0.18 -3.19 1.85
SYNCH1725 -0.12 -0.10 0.42 -3.26 0.91
VOLUME (Million RMB)
1725 81.90 43.60 139.00 0.09 2120.00
TURNOVER1725 0.03 0.03 0.02 0.00 0.25
ILLIQUIDITY (10 Million)
1725 0.04 0.01 0.28 0.00 10.6
DIVERGENCE1720 0.06 0.00 0.08 0.00 0.38
REFORM1725 0.66 1.00 0.47 0.00 1.00
CASHFLOW1720 0.31 0.28 0.17 0.01 0.85
TRA1725 0.59 0.56 0.21 0.06 1.00
IO1718 0.05 0.00 0.08 0.00 0.67
PRICE1718 9.74 7.05 9.17 1.65 85.60
SIZE (Million RMB)1725 5933.57
2511.27
12619.84 263.47
208502.00
RISK1718 0.04 0.04 0.02 0.01 0.62
MRETURN1725 0.62 1.03 0.85 -0.63 1.68
MVOL (Billion RMB)1725 1807.29
1795.99 1290.70 190.79 3453.64
SOE1725 0.72 1.00 0.45 0.00 1.00
REGION1725 0.49 0.00 0.50 0.00 1.00
CENTRAL 123 0.28 0.00 0.45 0.00 1.00
45
6
Panel B. Univariate tests of stock liquidity for firms with and without control-ownership divergenceVar. DIVERGENCE NON-DIVERGENCE Diff.
Mean Median Mean Median
BAES (%) 2.02 1.48 1.68 1.360.34***
0.12***
ADSC-GH (%) 40.64 41.87 37.47 39.02
3.18***
2.85***
‘DIVERGENCE’ and ‘NON-DIVERGENCE’ refer to firms with and without control-ownershipdivergence respectively; ‘DIFF.’ refers to the differences of mean and median of stock liquidity in firms with and without control-ownership divergence; and *** indicates significance at the 1% level.
46

Panel C. Difference-in-difference test for stock liquidity of firms with and without control-ownership divergence in firms with different levels of agency conflictVar. SOEs NON-SOEs Diff.
BAES (%) DIVERGENCE 2.12 1.93 0.19NON-DIVERGENCE 1.65 1.97 -0.32***Diff. 0.47*** -0.04 0.51***
ADSC-GH (%) DIVERGENCE 41.73 39.56 2.17NON-DIVERGENCE 37.31 39.03 -1.72Diff. 4.42*** 0.53 3.89***
POORREGION RICHREGION Diff.
BAES (%) DIVERGENCE 2.09 1.96 0.13NON-DIVERGENCE 1.63 1.72 0.09Diff. 0.46*** 0.24** 0.22*
ADSC-GH (%) DIVERGENCE 41.9 38.4 3.50***NON-DIVERGENCE 37.77 37.17 0.6Diff. 4.13*** 1.23 2.90***
‘DIVERGENCE’ and ‘NON-DIVERGENCE’ represent firms with and without control-ownership divergence respectively; ‘SOEs’ and ‘NON-SOEs’ represent firms that are ultimately controlled by the government or not; ‘POORREGION’ and ‘RICHREGION’ represent firms located in regions with poor or strong legal systems; ‘DIFF.’ refers to the difference-in-difference tests of mean; and *, **, and *** indicate significance at the 10%, 5%, and 1% levels, respectively.
Panel D. Difference-in-difference test for stock liquidity of firms with and without control-ownership divergence before and after NTS reform
PRE-REFORM POST-REFORM Diff.
BAES (%) DIVERGENCE 2.25 1.92 0.33**NON-DIVERGENCE 1.77 1.79 -0.02
Diff. 0.48*** 0.13* 0.35***
ADSC-GH (%) DIVERGENCE 43.42 39.31 4.11**NON-DIVERGENCE 37.81 37.28 0.53
Diff. 5.61*** 2.03*** 3.58**‘DIVERGENCE’ and ‘NON-DIVERGENCE’ represent firms with and without control-ownership divergence respectively; ‘PRE-REFORM’ and ‘POST-REFORM’ represent the pre- and post-NTS reform periods; ‘DIFF.’ refers to the difference-in-difference tests of mean; and *, **, and *** indicate significance at the 10%, 5%, and 1% levels, respectively.
47

Table 3. The effect of control-ownership divergence on stockliquidityVar. BAES ADSC-GH
DIVERGENCE 0.017*** 0.195***0.000 0.000
CASHFLOW -0.007** -0.0090.013 0.763
TRA -0.011*** -0.159***0.000 0.000
IO 0.000 0.006***0.128 0.000
PRICE 0.001*** 0.008***0.000 0.000
SIZE -0.001*** -0.042***0.003 0.000
RISK -0.005 -0.1120.766 0.587
MRETURN -0.005*** -0.039***0.000 0.000
MVOL 0.001 0.024***0.127 0.000
CONS 0.031*** 0.620***0.000 0.000
YEAR Yes YesINDUSTRY Yes YesOBS. 1718 1718ADJ.R2 0.308 0.260Dependent variables are bid-ask effective spreads (BAES) and adverseselection costs (ADSC-GH). Variable definitions are detailed in Table1; CONS is the constant for each regression; P-values are displayedbelow the coefficients; and ** and *** indicate significance at the 5%and 1% levels respectively.
48

Table 4. The effect of control-ownership divergence and agencyproblem on stock market liquidity Var. BAES ADSC-GH BAES ADSC-GH
DIVERGENCE 0.012* 0.099 0.005 0.140**0.096 0.263 0.408 0.037
SOE -0.001 -0.0040.591 0.767
SOE* DIVERGENCE 0.008 0.153**0.393 0.021
POORREGION -0.001 0.0040.640 0.673
POORREGION* DIVERGENCE 0.031*** 0.135*0.000 0.055
CASHFLOW -0.007** -0.014 -0.006** -0.0070.019 0.661 0.024 0.842
TRA -0.011***-
0.160***-
0.012***-
0.163***0.000 0.000 0.000 0.000
IO 0.000*** 0.006*** 0.000 0.005***0.126 0.000 0.153 0.000
PRICE 0.001*** 0.008*** 0.001*** 0.008***
49
0.000 0.000 0.000 0.000
SIZE -0.001***-
0.043***-
0.001***-
0.041***0.003 0.000 0.005 0.000
RISK -0.006 -0.122 -0.005 -0.1100.745 554 0.789 0.594
MRETURN -0.006***-
0.039***-
0.005***-
0.040***0.000 0.000 0.000 0.000
MVOL 0.001 0.024*** 0.001 0.024***0.128 0.000 0.115 0.000
CONS 0.031** 0.636*** 0.029** 0.600***0.031 0.000 0.046 0.000
YEAR Yes Yes Yes YesINDUSTRY Yes Yes Yes YesOBS. 1718 1718 1718 1718ADJ.R2 0.308 0.261 0.316 0.271Variable definitions are detailed in Table 1; CONS is the constant foreach regression; P-values are displayed below the coefficients; and *,**, and *** indicate significance at the 10%, 5%, and 1% levelsrespectively.
Table 5. The effect of control-ownership divergence and NTS reformon market liquidity
Panel A. Full sample regression resultsVar. BAES ADSC-GH
DIVERGENCE 0.050*** 0.398***0.000 0.000
REFORM -0.001** -0.020***0.023 0.001
REFORM* DIVERGENCE -0.049*** -0.311***0.000 0.001
CASHFLOW -0.006** -0.0020.035 0.958
TRA -0.010*** -0.153***0.000 0.000
50

IO 0.001** 0.006***0.042 0.000
PRICE 0.001*** 0.008***0.000 0.000
SIZE -0.002*** -0.042***0.001 0.000
RISK -0.008 -0.1410.651 0.491
MRETURN -0.006*** -0.044***0.000 0.000
MVOL 0.002*** 0.041***0.006 0.000
CONS -0.009 0.1310.697 0.620
YEAR Yes YesINDUSTRY Yes YesOBS. 1718 1718ADJ.R2 0.325 0.267Panel A presents the full sample regression results. Panel B presents theregression results on the SOE and non-SOE subsamples. Panel C presents theregression results on firms in regions with poor and strong legal systems.Variable definitions are detailed in Table 1; CONS is the constant for eachregression; P-values are displayed below the coefficients; and *, **, and*** indicate significance at the 10%, 5%, and 1% levels respectively.
Panel B. The effect of control-ownership divergence and NTS reform on liquidity in SOEs andnon-SOEsVar. BAES ADSC-GH
SOE NON-SOE SOE NON-SOEDIVERGENCE 0.058*** 0.041*** 0.614*** 0.051
0.000 0.004 0.000 0.795
REFORM -0.002** -0.004-
0.004*** -0.0900.036 0.189 0.000 0.116
REFORM*DIVERGENCE -0.053*** -0.053***-
0.488*** 0.0290.000 0.002 0.000 0.906
CASHFLOW -0.007** -0.001 -0.011 -0.029
51

0.022 0.898 0.699 0.750
TRA -0.009*** -0.013**-
0.119*** -0.261***0.000 0.014 0.000 0.000
IO 0.000** 0.000 0.006*** 0.007*0.02 0.675 0.000 0.080
PRICE 0.001*** 0.001*** 0.009*** 0.007***0.000 0.000 0.000 0.000
SIZE -0.001** -0.002*-
0.041*** -0.054***0.027 0.082 0.000 0.001
RISK 0.001 -0.0067 -0.165 -0.0370.963 0.198 0.346 0.959
MRETURN -0.005*** -0.006***-
0.046*** -0.043**0.000 0.000 0.000 0.011
MVOL 0.002*** 0.002 0.029*** 0.079***0.009 0.302 0.000 0.003
CONS -0.019 0.014 0.479** -0.8130.448 0.803 0.043 0.291
YEAR Yes Yes Yes YesINDUSTRY Yes Yes Yes YesOBS. 1232 486 1232 486ADJ.R2 0.312 0.355 0.395 0.155
Panel C. The effect of control-ownership divergence and NTS reform on liquidity in firms withpoor and strong legal systemsvar. BAES ADSC-GH
POORREGION RICHREGION POORREGION RICHREGIONDIVERGENCE 0.093*** 0.021*** 0.365*** 0.436***
0.000 0.005 0.000 0.007
52
REFORM -0.004** -0.001 -0.017** -0.0300.012 0.525 0.016 0.370
REFORM*DIVERGENCE -0.089*** -0.024*** -0.318*** -0.3030.000 0.007 0.003 0.018
CASHFLOW -0.007 -0.001 -0.013 -0.0200.131 0.669 0.663 0.742
TRA -0.016*** -0.007*** -0.101*** -0.232***0.000 0.006 0.000 0.000
IO 0.001*** 0.000 0.005*** 0.009***0.002 0.485 0.000 0.000
PRICE 0.001*** 0.001*** 0.008*** 0.009***0.000 0.000 0.000 0.000
SIZE -0.002*** -0.001* -0.038*** -0.047***0.009 0.064 0.000 0.000
RISK 0.009 -0.015 -0.169*** 0.0260.838 0.373 0.0300 0.966
MRETURN -0.004*** -0.007*** -0.040*** -0.050***0.000 0.000 0.000 0.000
MVOL 0.003** 0.002** 0.029*** 0.057***0.019 0.023 0.001 0.001
CONS -0.011 -0.022 0.373 0.2050.766 0.365 0.124 0.688
YEAR Yes Yes Yes YesINDUSTRY Yes Yes Yes YesOBS. 837 881 837 881ADJ.R2 0.244 0.507 0.191 0.436
Table 6. The effect of control-ownership divergence and NTS reformon stock-price synchronicityVar. SYNCH
Fullsample
Fullsample SOE NON-SOE POORREGION RICHREGION
DIVERGENCE 0.184** 0.379** 1.003* -0.242 0.707*** -0.124
53

**0.013 0.04 0.000 0.428 0.007 0.638
REFORM -0.068*
-0.312*
**
-0.404**
* -0.359*** -0.312***0.089 0.000 0.000 0.000 0.000
REFORM*DIVERGENCE -0.298
-0.948*
** 0.169 -0.827** 0.3310.156 0.001 0.653 0.006 0.255
CASHFLOW 0.047 0.041 0.099 0.008 0.068 0.0200.497 0.466 0.247 0.953 0.503 0.834
TRA 0.004 0.003 0.028 0.147 0.080 0.0670.942 0.959 0.699 0.189 0.362 0.443
IO -0.001 -0.001 -0.000 -0.007 -0.004 0.0030.606 0.637 0.930 0.325 0.259 0.291
PRICE-
0.011*** -0.011***
-0.012*
**
-0.009**
* -0.012*** -0.010***0.000 0.000 0.000 0.000 0.000 0.000
SIZE 0.010 0.008 0.008 -0.004 -0.014 0.030*0.379 0.488 0.566 0.863 0.431 0.069
RISK-
3.509*** -3.480***
-2.489*
**
-8.025**
* -2.470*** -7.378***0.000 0.000 0.000 0.000 0.000 0.000
MRETURN-
0.222*** -0.217***
-0.212*
**
-0.228**
* -0.209*** -0.236***0.000 0.000 0.000 0.000 0.000 0.000
MVOL 0.195*** 0.174***0.181*
**0.154**
* 0.186*** 0.178***0.000 0.000 0.000 0.000 0.000 0.000
CONS-
5.860*** -5.246***
-5.408*
**
-4.618**
* -5.157*** -5.670***0.000 0.000 0.000 0.000 0.000 0.000
YEAR Yes Yes Yes Yes Yes YesINDUSTRY Yes Yes Yes Yes Yes YesOBS. 1718 1718 1232 486 837 881ADJ.R2 0.316 0.316 0.309 0.195 0.313 0.347Variable definitions are detailed in Table 1; CONS is the constant for eachregression; P-values are displayed below the coefficients; and *, **, and
54

*** indicate significance at the 10%, 5%, and 1% levels respectively.
Table 7. The effect of control-ownership divergence (before the NTSreform) on change of stock liquidity after the NTS reformVar. ΔBAES ΔADSC-GH
DIVERGENCE -0.036** -0.174**0.026 0.037
CASHFLOW 0.013 0.278***0.172 0.008
TRA 0.006 0.360***0.507 0.002
IO 0.001 0.0020.124 0.470
PRICE 0.000*** -0.0010.005 0.365
SIZE -0.002 0.0210.142 0.189
RISK 0.037 0.3470.288 0.364
MRETURN 0.004 0.286*0.807 0.088
MVOL -0.006 -0.2090.643 0.16
CONS 0.212 5.0320.583 0.239
YEAR Yes YesINDUSTRY Yes YesOBS. 345 345ADJ.R2 0.086 0.067ΔBAES and ΔADSC-GH represent the change in the bid-ask spread and adverseselection cost after the NTS reform, which equals the average BAES and ADSC-GH in the post-NTS reform period minus the average of the pre-NTS reformperiod. Variable definitions are detailed in Table 1; CONS is the constantfor each regression; all independent variables are the average value during
55
the pre-reform period; P-values are displayed below the coefficients; and*, **, and *** indicate significance at the 10%, 5%, and 1% levelsrespectively.
Table 8. The effect of control-ownership divergence on stockliquidity (low frequency)Var. LNVOL TURNOVER LNILLIQ LNVOL TURNOVER LNILLIQ
DIVERGENCE
-0.933**
* -0.012**0.824*
**
-1.171**
* -0.0091.320*
**0.000 0.034 0.000 0.000 0.308 0.000
REFORM0.250**
* 0.006***
-0.281*
**0.000 0.001 0.000
REFORM* DIVERGENCE 0.389** 0.004
-0.786*
*0.039 0.642 0.023
CASHFLOW
-0.573**
* -0.0030.473*
**
-0.577**
* -0.0030.484*
**0.000 0.313 0.000 0.000 0.337 0.000
TRA0.728**
* 0.007***
-1.130*
**0.732**
* -0.007**
-1.133*
**0.000 0.009 0.000 0.000 0.011 0.000
IO0.013**
* 0.001**
-0.013*
**0.011**
* 0.000**
-0.012*
**0.001 0.012 0.001 0.002 0.017 0.004
PRICE
-0.017**
* 0.000*0.023*
**
-0.017**
* 0.000*0.023*
**
56

0.000 0.069 0.000 0.000 0.091 0.000
SIZE0.772**
*-
0.004***
-0.879*
**0.768**
*-
0.004***
-0.876*
**0.000 0.000 0.000 0.000 0.000 0.000
RISK3.195**
* 0.042**7.643*
**3.272**
* 0.044**7.547*
**0.000 0.044 0.000 0.000 0.037 0.000
MRETURN 0.001 0.009***
-0.194*
** 0.033* 0.010***
-0.233*
**0.965 0.000 0.000 0.079 0.000 0.000
MVOL0.568**
* 0.010***
-0.331*
**0.456**
* 0.008***
-0.196*
**0.000 0.000 0.000 0.000 0.000 0.000
CONS
-16.356*
**-
0.178***8.288*
**
-13.070*
**-
0.107***4.343*
**0.000 0.000 0.000 0.000 0.000 0.000
YEAR Yes Yes Yes Yes Yes YesINDUSTRY Yes Yes Yes Yes Yes YesOBS. 1718 1718 1718 1718 1718 1718ADJ.R2 0.853 0.405 0.816 0.855 0.408 0.820Variable definitions are detailed in Table 1; CONS is the constant for eachregression; P-values are displayed below the coefficients; and *, **, and*** indicate significance at the 10%, 5%, and 1% levels respectively.
57

Table 9. The effect of control-ownership divergence and NTS reform on stockliquidity of SOEs controlled by central and local governmentsVar. BAES ADSC-GH
CENTRALSOE LOCALSOE CENTRALSOE LOCALSOEDIVERGENCE -0.008 0.075*** 0.110 0.683***
0.313 0.000 0.334 0.000REFORM -0.001 0.001 -0.026 0.006***
0.410 0.573 0.194 0.003REFORM* DIVERGENCE 0.002 -0.071*** -0.073 -0.591***
0.779 0.000 0.562 0.000CASHFLOW -0.000 -0.014*** 0.037 -0.067*
0.969 0.004 0.380 0.074TRA -0.008*** -0.015*** -0.109*** -0.244***
0.000 0.000 0.001 0.000IO -0.000 0.000*** 0.001 0.006***
0.729 0.004 0.399 0.000PRICE 0.001*** 0.001*** 0.011*** 0.010***
0.000 0.000 0.000 0.000SIZE -0.003*** -0.000 -0.043*** -0.043***
0.000 0.914 0.000 0.000RISK 0.114** 0.012 4.203*** -0.013
0.015 0.576 0.000 0.951MRETURN -0.004*** -0.004*** -0.043*** -0.066***
0.000 0.000 0.000 0.000MVOL 0.001 0.001 -0.024** 0.025**
0.248 0.556 0.032 0.017CONS 0.045** 0.007 1.918*** 0.733**
0.040 0.823 0.000 0.016YEAR Yes Yes Yes YesINDUSTRY Yes Yes Yes YesOBS. 350 881 350 881ADJ.R2 0.630 0.275 0.544 0.332‘CENTRALSOE’ and ‘LOCALSOE’ represent SOEs controlled by the centralgovernment and local governments respectively. Variable definitions aredetailed in Table 1; CONS is the constant for each regression; P-values aredisplayed below the coefficients; and *, **, and *** indicate significanceat the 10%, 5%, and 1% levels respectively.
58