DIFFICULT MARKET CONDITIONS:
20
Journal of Air Transportation Vol. 10, No. I - 2005 I CONFIDENCE IN AIRLINE PERFORMANCE IN ANALYSIS OF JETBLUE’S FINANCIAL DIFFICULT MARKET CONDITIONS: AN MARKET RESULTS . - Triant Flouris Concordia University Thomas Walker Concordia University Montreal, Quebec, Canada ABSTRACT This paper examines the stock market’s reaction to JetBlue’s Initial Public Offering (1PO) and subsequent price movements of the stock. In particular, w’e examine whether the euphoria surrounding JetBlue’s IPO carried over to other firms in the sector by testing whether the shares of JetBlue’s competitors showed a significant price reaction to JetBlue’s IPO. JetBlue’s IPO tooh place just a few months following September II, 2001. These events resulted in dramatic changes in the airline industry and had significant implications on the economic gains of airlines. We examine JetBlue’s accounting and stock performance and compare it to the relative performance of Southwest Airlines (SWA), a representative of the loa-cost carrier group. In addition, we compare both JetBlue’s and SWA’s financial condition and the relative performance of their stock to two mainline US. carriers, Continental and Northwest. representatives of the conventional-cost carrier group. We analyze whether there are any performance differences among the low-cost carriers and between low-cost carriers and conventional-cost carriers. In particular, w’e examine whether low-cost carriers were able to sustain the economic impacts of 9/11 better than the conventional-cost carriers. Triant Flouris is Director of the International Aviation MBA Program and associate professor in the Decision Sciences and Management Information Systems Department. Flouris holds a Ph.D. from the University of South Carolina and is a Commercial Pilot and Certified Flight Instructor. Prior to starting his academic career he worked as a management consultant for a leading international firm. His research interests are aviation management, strategic management and airline finance. Thomas Walker graduated from Washington State University in Pullman, Washington, with a Ph.D. in Finance and an MBA in Finance and International Business. He worked for several years in the German consulting and industrial sector at such firms as Mercedes Benz, Utility Consultants International, Lahmeyer International, Telenet, and KPMG Peat Manvick. His research interests are in initial public offerings, securities regulation and litigation, institutional ownership, insider trading and airline finance.
-
Upload
khangminh22 -
Category
Documents
-
view
2 -
download
0
Transcript of DIFFICULT MARKET CONDITIONS:
Journal of Air Transportation Vol. 10, No. I - 2005
I
CONFIDENCE IN AIRLINE PERFORMANCE IN
ANALYSIS OF JETBLUE’S FINANCIAL DIFFICULT MARKET CONDITIONS: AN
MARKET RESULTS
. -
Triant Flouris Concordia University
Thomas Walker Concordia University
Montreal, Quebec, Canada
ABSTRACT
This paper examines the stock market’s reaction to JetBlue’s Initial Public Offering (1PO) and subsequent price movements of the stock. In particular, w’e examine whether the euphoria surrounding JetBlue’s IPO carried over to other firms in the sector by testing whether the shares of JetBlue’s competitors showed a significant price reaction to JetBlue’s IPO. JetBlue’s IPO tooh place just a few months following September I I , 2001. These events resulted in dramatic changes in the airline industry and had significant implications on the economic gains of airlines. We examine JetBlue’s accounting and stock performance and compare it to the relative performance of Southwest Airlines (SWA), a representative of the loa-cost carrier group. In addition, we compare both JetBlue’s and SWA’s financial condition and the relative performance of their stock to two mainline U S . carriers, Continental and Northwest. representatives of the conventional-cost carrier group. We analyze whether there are any performance differences among the low-cost carriers and between low-cost carriers and conventional-cost carriers. In particular, w’e examine whether low-cost carriers were able to sustain the economic impacts of 9/11 better than the conventional-cost carriers.
Triant Flouris is Director of the International Aviation MBA Program and associate professor in the Decision Sciences and Management Information Systems Department. Flouris holds a Ph.D. from the University of South Carolina and is a Commercial Pilot and Certified Flight Instructor. Prior to starting his academic career he worked as a management consultant for a leading international firm. His research interests are aviation management, strategic management and airline finance. Thomas Walker graduated from Washington State University in Pullman, Washington, with a Ph.D. in Finance and an MBA in Finance and International Business. He worked for several years in the German consulting and industrial sector at such firms as Mercedes Benz, Utility Consultants International, Lahmeyer International, Telenet, and KPMG Peat Manvick. His research interests are in initial public offerings, securities regulation and litigation, institutional ownership, insider trading and airline finance.
Floicris and Walker 39
“Keep an eye on JelBlue. That could prove to be a successful operation” Herb Kelleher, Co-founder, Southwest Airlines (Top Entrepreneurs, 200 I , p. 84)
INTRODUCTION
JetBlue Airways was one of the best-funded start-up airlines in U.S. aviation history. Its initial capitalization was $130 million. The airline was founded in early 1999 by David Neelman, who is currently its Chief Executive Officer. Before JetBlue David Neelman founded Morris Air and after selling Morris Air to Southwest Airlines (SWA) served as an executive vice president of SWA. He also worked as a consultant for West Jet Airlines.
JetBlue started operations in February 2000 and went public in April 2002, in what was described as one of the most successful initial public offerings (IPO) of the year. Following a very successful road show for its IPO, JetBlue, in connection with its lead underwriters Morgan Stanley and Merrill Lynch, filed several amendments to its initial S-I filing with the Securities and Exchange Commission (SEC), in which it revised its offering price upward from an initial price range of $22 - $24 to $27 per share. JetBlue sold 5.87 million shares at this price, raising more than $158 million for the firm. Despite the upward revisions in the firm’s offering price, JetBlue’s stock soared another 67 percent and closed at $45 on its first day of trading (Boorstin, 2002).
During 2001, JetBlue’s second year of operation, and arguably one of the worst in U.S. aviation history, the airline turned profitable, earning $38.5 million on revenues of $320 million. This fact alone may explain why JetBlue’s shares were in very high demand. Only two other airlines in the U.S. were also profitable in 2001: SWA and AirTran. Although experiencing a stock price deciine since its highs in June 2002, jetfiiue has stood up weii to its expectations, increasing sales in 2002 to $635 million with a year-end profit of $49 million.
This paper examines the stock market’s reaction to JetBlue’s IPO and subsequent price movements of the stock through the present. In particular, we look at whether the euphoria surrounding JetBlue’s IPO carried over to other firms in the sector by examining whether the shares of JetBlue’s competitors showed a significant price reaction to JetBlue’s successful IPO. We focus on the relative performance of the stock and compare it with the stock performance of a similarly successful low-cost carrier, SWA, and two mainline full-service U.S. carriers, Continental and Northwest. These airlines are used as comparison baselines. The mainline full-service carriers were picked randomly and based on the fact that, to date, neither has filed for bankruptcy protection as a result of the systemic shocks of the events of September 1 1,2001 (9/11).
40 Journal of Air Transportatioii
We find JetBlue’s accounting and stock performance to be significantly better than that of its mainline conventional-cost rivals, Continental and Northwest, but in similar lines with its low-cost rival SWA. Based on this finding, we assert that there is something unique to the low-cost model, which both SWA and JetBlue follow, that sets them apart from their conventional-cost competitors and renders them more successful in difficult market conditions. We do not advocate that the low-cost model is monolithic. In many ways JetBlue resembles a younger, smaller version of SWA (Boorstin, 2002). Like SWA, JetBlue flies busy routes between secondary airports, has a low-cost structure, and emphasizes customer service. But while SWA usually sticks to a single region, JetBlue flies cross- country. And while SWA is based at Dallas’ smaller airport, Love Field, JetBlue is based at New York’s Kennedy International Airport (JFK). Furthermore, SWA can be characterized as a low-frills airline, whereas JetBlue is a lifestyle seller with more finesse, even though both are low-fare.
Our argument is that the low-cost model, in its generic manifestation, can be differentiated from the conventional-cost model along three dimensions. These dimensions, coupled with some unique operational features that low-cost airlines have (which will be identified in the next paragraph), help explain, theoretically, why low-cost carriers outperform their conventional-cost rivals. These dimensions are: (a) adopting a viable strategic position, (b) leveraging organizational capabilities, and (c) re- conceiving the value equation (Lawton, 2002).
Low-cost airlines establish a viable strategic position in the market by finding an appropriate strategy that acts as a mediating force between them and the environment in which they operate. For example, both SWA and JetBlue serve price- and convenience-sensitive passengers only. Low-cost airlines, once they establish their position, move toward securing their competitive advantage by capitalizing on capabilities that cannot be used by rivals. These capabilities are quality in customer service, operational efficiency, innovation, and responsiveness to customers.
Zom (200 1) advances the argument that low-cost carriers are more resilient than conventional-cost carriers in times of economic downturn. Our analysis focusing on JetBlue’s performance validates this point, and Zorn’s analysis helps us demonstrate it theoretically. Zorn cites several reasons for the resilience of low-cost carriers in times of recession: first, lower overall and more variable cost structures; second, lower breakeven load factors; and, third, business and leisure traveler migration from conventional-cost airlines to low-cost airlines. Our financial analysis substantiates this point to its fullest. We found that markets value low-cost airline stocks (focusing on JetBlue and SWA) as growth stocks, whereas conventional-cost airline stocks are treated as cyclical. Even though affected, low-cost carriers emerged from 9/1 I in a stronger market position than their full-fare rivals.
Flouris and Walker 41
What interests us from an academic point of view is the relative confidence of the public in JetBlue’s stock (as measured by price movements) right after the IPO, as compared to both SWA and the mainline carriers. We build a model, test several hypotheses on why there was stock performance divergence, and explain these differences based on the data, controlling for extraneous variables.
The paper is organized as follows. The first section briefly describes the series of events surrounding our period of analysis and sets the stage for our analysis. The second section discusses JetBlue’s strategy and the state of the airline industry in the U.S. during the period of our analysis. The third section describes the data. The fourth section explains the methodology used to test several hypotheses concerning the performance of JetBlue’s stock. The results are presented in the fifth section and the findings are summarized in the final section.
JETBLUE AND THE STATE OF THE AIRLINE INDUSTRY
JetBlue’s strategy is to combine common sense with strategic and operational innovation through the use of the most appropriate technology to “bring humanity back to air travel” (Gittell & O’Reilly, 2001, p. 2). To accomplish this, JetBlue aimed to be one of the first completely paperless airlines, deploying information technology for every single aspect of its operations from flight operations and maintenance to ticketing and reservations. The two pillars of JetBlue’s strategy are efficiency and service. According to its founder, David Neelman, “We like to think of ourselves as customer advocates. We believe that all travelers should have access to high quality airline service at affordable fares” (Gittell & O’Reilly, 2001, p. 2). JetBlue’s hub city, New York City, represents a very large population center at the heart of several underserved markets. More specifically, New York City lacked the service by a low-cost carrier; therefore, fares were, on average, quite high and its true traffic potential unrealized. JetBlue chose JFK, a slot controlled and heavily used airport, as its hub, which was quite an unconventional choice for a low-cost, start-up carrier that would normally opt for a smaller airport as its basis of operations. When JetBlue moved to JFK, the slot controls were only in effect from 3:OO p.m. to 8:OO p.m., while the rest of the day JFK was underutilized. Furthermore, more terminal space was opening up at the airport due to TWA’s reduction of operations at JFK. Thus, JetBlue was able to secure slots, through political concessions, without going through the process of purchasing them from one of the airlines already holding these slots.
JetBlue operates a single-type aircraft, the A320 series made by Airbus Industries. Through the use of a single-type aircraft, JetBlue realizes operational savings in the areas of maintenance and crew training. Every JetBlue mechanic can work on any aircraft and every pilot can fly any of
42 Journal of Air Transportation
JetBlue’s planes. JetBlue’s operational strategy includes quick aircraft turnarounds, which help in improving operational performance and, thus, efficiency by maximizing aircraft utilization. JetBlue keeps its planes in the air longer than any other airline, more than 12 hours a day. Only SWA comes close to this, with about 1 1 hours of block time.
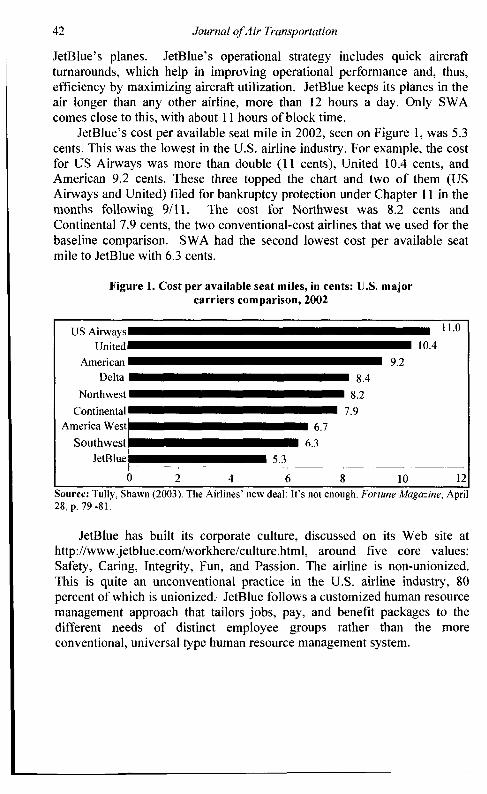
JetBlue’s cost per available seat mile in 2002, seen on Figure 1, was 5.3 cents. This was the lowest in the US. airline industry. For example, the cost for US Airways was more than double (11 cents), United 10.4 cents, and American 9.2 cents. These three topped the chart and two of them (US Airways and United) filed for bankruptcy protection under Chapter 11 in the months following 9/11. The cost for Northwest was 8.2 cents and Continental 7.9 cents, the two conventional-cost airlines that we used for the baseline comparison. SWA had the second lowest cost per available seat mile to JetBlue with 6.3 cents.
US Airways United
American
Figure 1. Cost per available seat miles, in cents: U.S. major carriers comparison, 2002
1 1 0 10 4
9 2
JetBlue has built its corporate culture, discussed on its Web site at http://www.jetblue.com/workhere/culture.html, around five core values: Safety, Caring, Integrity, Fun, and Passion. The airline is non-unionized. This is quite an unconventional practice in the U.S. airline industry, 80 percent of which is unionized.. JetBlue follows a customized human resource management approach that tailors jobs, pay, and benefit packages to the different needs of distinct employee groups rather than the more conventional, universal type human resource management system.
Flouris and Walker 43
DATA
We use accounting data from January 1996 to March 2003. We collected this data from quarterly lOQ filings’, which are available online through the SEC’s “Edgar Online” database (http://www.edgar-online.com). For our analysis of relative stock performances pre- and post-JetBlue’s IPO, we use daily price data (adjusted for dividends and stock splits) from January 2000 to April 2003, which we retrieved from the Center for Research in Security Prices (CRSP) database from the University of Chicago Graduate School of Business (http://gsbwww.uchicago.edu/research/crsp). To measure market performance during our sample period, we use the CRSP value- weighted market index.
Finally, we use weekly 3-month Treasury Security indexes as calculated by the Treasury Department and reported by the Federal Reserve in publication H. 15 as a proxy for the risk-free interest rate during our sample period (http://www.federalreserve.gov/releases/h 15). Since August 2 1, 2000, the Federal Reserve’s Publication H. 15 no longer reports yield data for the 13-week (3-month) U.S. Treasury Bill auction average. Starting from this date, we use Treasury security yields adjusted to a constant maturity of 3 months, as provided by the Treasury’s Public Debt Web site (http://www.publicdebt.treas.gov).
METHODOLOGY
Financial markets bring together potential investors who vote every day on the future profitability of the firm and the relative merits of managers’ strategic decisions. Simply put, if investors think that corporate decisions wiii iead to increases in iong-run profitabiiity, news of events such as a takeover will cause a firm’s stock price to rise. Conversely, news that investors believe will lower future profits will result in a fall in a f m ’ s equity value.
The finance literature refers to the idea that news is quickly impounded in security market prices as the efficient market hypothesis, first described by Fama, Fisher, and Jensen (1969). The assumption that markets are efficient implies that security prices reflect all relevant information known to investors and thus provide us with the best estimate of a firm’s future profitability. There is significant empirical support of the efficient market
’ IOQ filings are quarterly company reports filed with the Securities and Exchange Commission. IOQ reports provide detailed information on a firm’s quarterly earnings results and must be sent to the Securities and Exchange Conitnission within 45 days of the end of the quarter.

44 Journal of Air Transportation
hypothesis including the Carter and Simpkins’ (2002) study of airline stocks following 911 1.
If we assume that markets are efficient, and therefore set rational prices, we can measure whether the corporate strategy of such low-cost carriers as JetBlue and SWA, post-9/1 1, was in the best interest of shareholders by examining the firms’ profitability and stock price performance in the months after 911 1 and compare them to the performance of other airlines that follow a conventional-cost business model (Continental, Northwest). Our methodology follows the event study procedure described in Brown and Warner (1989, Peterson (1989), and Schweitzer (1989). Event study methodology measures the abnormal return of the stock, the difference between the actual return and the expected return, around the time of the event. If an announcement such as news of increased profits is taken as good news, abnormal returns will be positive, signaling the market’s belief that firm value has increased. A negative abnormal return is evidence of bad news, indicating that the market believes the event will decrease the firm’s future profitability.
To estimate the abnormal return of a stock on day t, we subtract the expected return on the stock from its actual return on that day:
Where: AR, is the abnormal stock return; R, is the actual stock return; and E(RJ is the expected stock return, all on day t.
In turn, we assume that the return of a stock is conditional on the return of the market and model E(R,) as:
Where: E(Rm,t) is the expected return of the market on day t; RJt represents the risk-free rate as measured by the return on 90-day
t is the estimated slope coefficient from a linear regression of the stock’s U.S. Treasury Bills on day t ; and
past returns on the returns of the market.
Equation 2 is also called the capital asset pricing model (CAPM) and is based on Sharpe (1964) and Lintner (1965). In this paper, we estimate the CAPM using both 60 and 360 daily returns that precede our event window. We employ a linear market model that illustrates the relationship between
Flouris and Walker 45
JetBlue’s stock return and the market (as proxied by the CRSP value- weighted market index) during a normal period.
We calculate daily abnormal returns for JetBlue and the other three airlines following JetBlue’s IPO on April 12,2002. In addition, we measure cumulative abnormal returns, CARrrrn, the sum of abnormal returns over a window of n days:
Cumulative abnormal returns enable us to measure the market’s reaction to the performance of the airline in a time frame that encompasses the entire period from the event under study to the present.
Earlier industry research has largely focused on airline stock returns following a plane crash. Davidson, Chandy, and Cross (1987) find statistically significant negative returns for airlines on the day of the crash. This appears to be a short-term effect, however, and is reversed on the days following the event. Chance and Ferris (1987) examined 46 plane crashes, and discovered that in 29 cases the carrier had a significant negative return. A crash does not appear to have an effect beyond the initial reaction, nor does it affect the stock price of the airline’s competitors. Chance and Ferris also found a negative correlation between the airline’s abnormal return and the number of fatalities in the crash.
More recently, Carter and Simpkins (2002) investigated the stock market’s reaction to the tragedies of 9/11. They noted the potential psychological effects of the attack and tested whether financial markets reacted rritirimally tc news of the event. Carte: am! Simpkins faund that despite the psychological horrors the market was able to discern among airlines based on fm characteristics, including the ability to cover short- term obligations. Their results support rational pricing and have important implications for our work, which seeks to examine JetBlue’s financial performance and stock performance in the aftermath of 9/1 1.
To serve as a hrther control in estimating the market’s reaction to JetBlue’s performance post 911 1, the analysis compares the abnormal returns of JetBlue’s stock to the abnormal returns of SWA, on one hand, and Northwest and Continental, on the other hand. We choose SWA because it uses a low-cost business model similar to that of JetBlue, and Continental and Northwest because they use a conventional-cost business model and have done so quite successfully. These firms should provide a good benchmark for examining the industry’s reaction to JetBlue’s successful IPO and help us answer the question of whether JetBlue’s IPO was able to instill new hope in an industry sector that was otherwise devastated by the events
46 Journal of Air Transportation
of 9/11. We do not consider United Airlines and US Airways since they weathered financial difficulties and eventually filed for bankruptcy protection under Chapter 11 during our sample period. American Airlines, too, came very close to filing for Chapter 1 1.
Adjusting for Risk: The use of Beta as a Measure of Systematic Risk In considering risk changes, we calculate beta, the part of a firm’s risk
that is related to changes in the market. Beta is a measure of systematic risk, the risk that investors must be compensated for, and, thus, is related to a firm’s cost of capital. If 9/11 led to the airline industry being a more risky business, we would expect the betas of airline stocks to increase after 9/11. The calculation of each airline’s beta, can be found from the following formula:
Where:
cOv(r; ’ ) is the covariance between firm i’s returns and returns on the market; and
is the variance of market returns.
Cornell, Hirshleifer, and James (1997) reviewed several practical issues in beta selection and the application of regression-based asset-pricing models to estimating equity cost of capital. They provide assistance for resolving many of the conventional problems with beta estimation, such as selection of the risk-free rate, the time period for estimation, and the inclusion or exclusion of dividends.
Corgel and Djoganopoulos (2000) perform direct statistical comparisons of beta estimates calculated by large financial data vendors such as Bloomberg, Compustat, Dow Jones, and Ibbotson, They find that the different procedures used by these commercial services produce the same results when simple tests of differences of means are used to evaluate them. They observe that most data vendors use ordinary least squares regressions of the returns of the firm against those of the market, where the security’s return serves as the dependent variable, and the independent variable is a user-selected index. They point out, however, that users of financial software packages typically have some flexibility and can select the time period for estimation, the market index against which they want to measure returns, the data frequency (daily, weekly, monthly, etc.), and whether they want to include dividends or not.
Because the fmance literature is divided on the issue whether short-term or long-term estimates should be used in CAPM estimation, we use a rolling
Flouris and Walker 47
window of both 60 and 360 calendar day returns to calculate covariances and variances. Although there is no consensus on what time period should be used to estimate beta, most authors and financial data vendors use long-term betas calculated over periods of three and more years. However, given the limited data availability for young firms such as JetBlue and the rapidly changing environment for the airline industry, we found short-term estimates to be more appropriate.
Expected Market Returns: Historical versus Prospective Estimates Before we can address the question of how we estimate expected market
returns, we have to define what we mean by market. In his famous critique of CAPM testing, Richard Roll (1977) indicates that the market portfolio to be used in CAPM estimation should contain all financial and non-financial assets available to investors and states that an accurate test of the CAPM will never be possible because of this requirement.
Despite Roll’s criticism, most authors and financial data services use only U.S. common stocks to proxy for the market portfolio and rely heavily on the Standard and Poor’s 500 (S&P 500) index to represent the market. Because Taylor and Paolone (1997) and Corgel and Djoganopoulos (2000) observe that the power of the regressions producing the betas improve noticeably when a broader market index than the S&P 500 is used, we decided to use the CRSP value-weighted market index for calculating both our beta estimates and market returns. The CRSP value weights index covers more than 10,000 publicly traded U.S. firms, and is extensively used in the financial literature.
Furthermore, when developing an estimate of the expected market return E(R,,J, one has to decide whether to use historical data, assuming that past performance is the best predictor of future performance, or make an attempt to forecast a return for the market, which would require an accurate estimate of future dividend growth. As with most other studies in this field, we do not consider ourselves wise enough to forecast future market returns, but rather we rely on past returns as an estimate of future returns. Another question we had to address in our estimation was which time period to use to calculate past market returns. Given the fact that both the events of 9/11 and JetBlue’s IPO occurred relatively recently and that our return data after both events is limited, we decided to use the geometric average of market returns during the past 360 calendar days as an estimate of future market returns. To test the robustness of our results, we also calculated 60-calendar-day returns, but arrived at the same conclusions as we did with our long-term estimates.
In a long-term study of historical market risk premiums, Ibbotson and Sinquefield (1976) find that the average risk premium for the S&P 500 index during the period from 1929 to 1976 was about 8.4 percent. During our sample period from January 1996 to April 2003, we find a similar market risk premium of 8.15 percent. A closer examination reveals, however, that
48 Journal of Air Transportation
the market risk premium pre-9/11 was 14.9 percent, influenced in part by the booming economy during the 1990s and the 199912000 stock market bubble, and that it dropped to - 19.4 percent after 91 1 1.
RESULTS
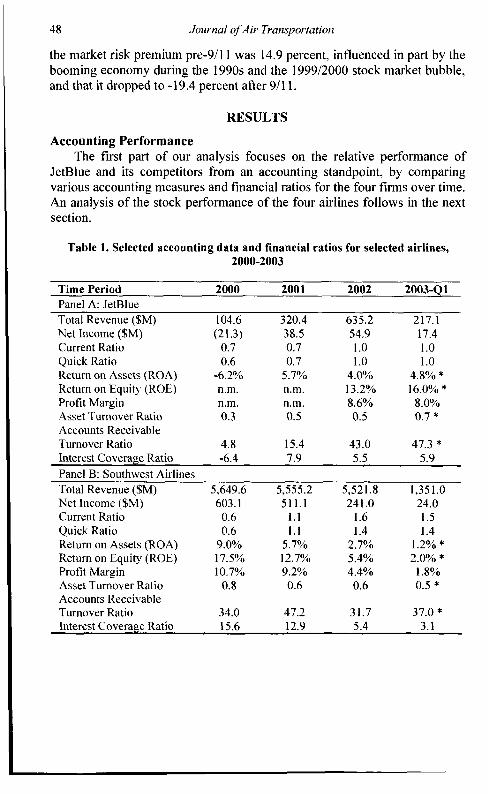
Accounting Performance The first part of our analysis focuses on the relative performance of
JetBlue and its competitors from an accounting standpoint, by comparing various accounting measures and financial ratios for the four firms over time. An analysis of the stock performance of the four airlines follows in the next section.
Table 1. Selected accounting data and financial ratios for selected airlines, 2000-2003
Time Period 2000 200 1 2002 2003-Ql Panel A: JetBlue Total Revenue ($M) 104.6 320.4 635.2 217.1 Net Income ($M) (21.3) 38.5 54.9 17.4 Current Ratio 0.7 0.7 1 .0 1.0 Quick Ratio 0.6 0.7 1 .0 1 .0 Return on Assets (ROA) -6.2% 5.7% 4.0% 4.8% * Return on Equity (ROE) n.m. n.m. 13.2% 16.0% * Profit Margin n.m. n.m. 8.6% 8.0% Asset Turnover Ratio 0.3 0.5 0.5 0.7 * Accounts Receivable Turnover Ratio 4.8 15.4 43.0 47.3 * Interest Coverage Ratio -6.4 7.9 5.5 5.9 Panel B: Southwest Airlines Total Revenue ($M) 5,649.6 5,555.2 5,521.8 1.35 1.0 Net Income ($M) Current Ratio Quick Ratio Return on Assets (ROA) Return on Equity (ROE) Profit Margin Asset Turnover Ratio Accounts Receivable Turnover Ratio Interest Coverage Ratio
603.1 0.6 0.6
9.0% 17.5% 10.7%
0.8
34.0 15.6
511.1 241.0 1.1 1.6 1.1 1.4 5.7% 2.7% 12.7% 5.4% 9.2% 4.4% 0.6 0.6
47.2 31.7 12.9 5.4
24.0 1.5 1.4
1.2% * 2.0% * 1.8% 0.5 *
37.0 * 3.1
Flouris and Walker 49
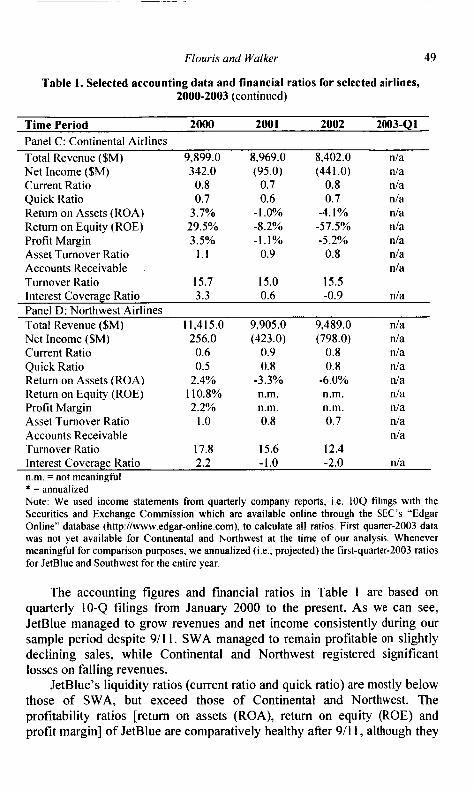
Table 1. Selected accounting data and financial ratios for selected airlines, 2000-2003 (continued)
Time Period 2000 2001 2002 2003-41 Panel C: Continental Airlines Total Revenue ($M) 9,899.0 8,969.0 8,402.0 nla Net Income ($M) Current Ratio Quick Ratio Return on Assets (ROA) Return on Equity (ROE) Profit Margin Asset Turnover Ratio Accounts Receivable Turnover Ratio
342.0 0.8 0.7
3.7% 29.5% 3.5%
1.1
15.7
(95.0) 0.7 0.6
- I .O% -8.2% -1 .1%
0.9
15.0
(441.0) 0.8 0.7
-4. I % -57.5% -5.2%
0.8
15.5
n/a nla nla n/a nla nla nla nla
Interest Coverage Ratio 3.3 0.6 -0.9 nla Panel D: Northwest Airlines Total Revenue ($M) 11,415.0 9,905.0 9,489.0 nla Net Income ($M) 256.0 (423.0) (798.0) n/a Current Ratio 0.6 0.9 0.8 nla Quick Ratio 0.5 0.8 0.8 nla Return on Assets (ROA) 2.4% -3.3% -6.0% n/a Return on Equity (ROE) 1 10.8% n.m. n.m. nla Profit Margin 2.2% n.m. n.m. nla Asset Turnover Ratio 1 .o 0.8 0.7 nla Accounts Receivable nla Turnover Ratio 17.8 15.6 12.4 Interest Coverage Ratio 2.2 -1.0 -2.0 nla n.m. =not meaningful * = annualized Note: We used income statements from quarterly company reports, 1.e. I O Q tilings with the Securities and Exchange Commission which are available online through the SEC’s “Edgar Online” database (http://www.edgar-online.com), to calculate all ratios. First quarter-2003 data was not yet available for Continental and Northwest at the time of our analysis. Whenever meaningful for comparison purposes, we annualized (Le., projected) the first-quarter-2003 ratios for JetBlue and Southwest for the entire year.
The accounting figures and financial ratios in Table 1 are based on quarterly IO-Q filings from January 2000 to the present. As we can see, JetBlue managed to grow revenues and net income consistently during our sample period despite 9/11. SWA managed to remain profitable on slightly declining sales, while Continental and Northwest registered significant losses on falling revenues.
JetBlue’s liquidity ratios (current ratio and quick ratio) are mostly below those of SWA, but exceed those of Continental and Northwest. The profitability ratios [return on assets (ROA), return on equity (ROE) and profit margin] of JetBlue are comparatively healthy after 9/1 I , although they
50 Journal of Air Transportation
remain below the profitability levels that SWA showed in 2000 before 9/11. SWA experienced a considerable decline in its profitability after 911 1, while Continental and Northwest show very strong signs of weakening.
JetBlue’s activity ratios (asset turnover and accounts receivable turnover) increased significantly during our sample period, while they deteriorated somewhat for the other three airlines. JetBlue remains well able to cover its interest expenses, as is reflected by its interest coverage ratio that remains well above 5 after 9/11. While SWA’s interest coverage ratio drops significantly during our sample period (from 15.6 in 2000 to 5.4 in 2002), the financial impact of 9/11 on Continental and Northwest’s ability to make their interest payments is tremendous: both airlines have negative ratios in 2002, indicating that both airlines have significant difficulties making their interest payments.
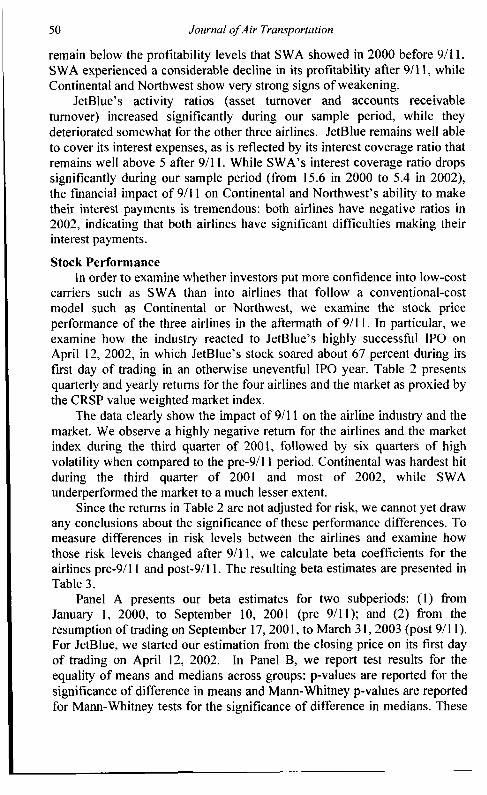
Stock Performance In order to examine whether investors put more confidence into low-cost
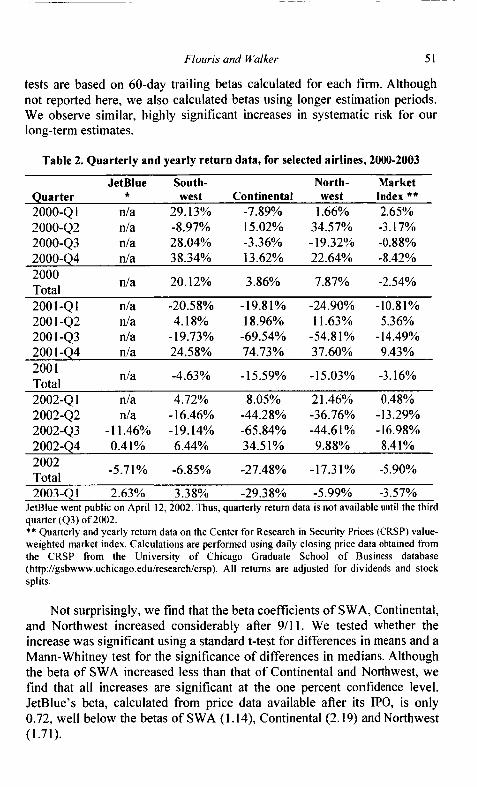
carriers such as SWA than into airlines that follow a conventional-cost model such as Continental or Northwest, we examine the stock price performance of the three airlines in the aftermath of 9/11. In particular, we examine how the industry reacted to JetBlue’s highly successful IPO on April 12, 2002, in which JetBlue’s stock soared about 67 percent during its first day of trading in an otherwise uneventful IPO year. Table 2 presents quarterly and yearly returns for the four airlines and the market as proxied by the CRSP value weighted market index.
The data clearly show the impact of 911 1 on the airline industry and the market. We observe a highly negative return for the airlines and the market index during the third quarter of 2001, followed by six quarters of high volatility when compared to the pre-9/11 period. Continental was hardest hit during the third quarter of 2001 and most of 2002, while SWA underperformed the market to a much lesser extent.
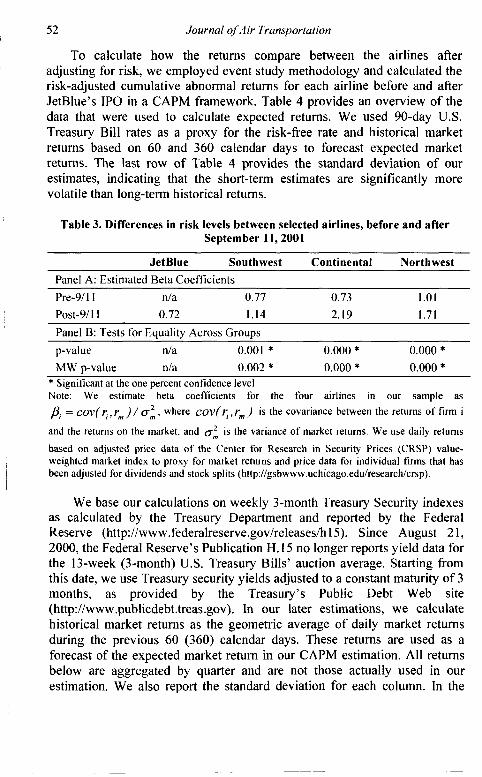
Since the returns in Table 2 are not adjusted for risk, we cannot yet draw any conclusions about the significance of these performance differences. To measure differences in risk levels between the airlines and examine how those risk levels changed after 911 I , we calculate beta coefficients for the airlines pre-9/11 and post-9/11. The resulting beta estimates are presented in Table 3.
Panel A presents our beta estimates for two subperiods: ( I ) fiom January I , 2000, to September I O , 2001 (pre 9/1 I ) ; and (2) fiom the resumption of trading on September 17,2001, to March 3 I , 2003 (post 9/1 I ) . For JetBlue, we started our estimation from the closing price on its first day of trading on April 12, 2002. In Panel B, we report test results for the equality of means and medians across groups: p-values are reported for the significance of difference in means and Mann-Whitney p-values are reported for Mann-Whitney tests for the significance of difference in medians. These
Flouris and Walker 5 1
tests are based on 60-day trailing betas calculated for each firm. Although not reported here, we also calculated betas using longer estimation periods. We observe similar, highly significant increases in systematic risk for our long-term estimates.
Table 2. Quarterly and yearly return data, for selected airlines, 2000-2003
JetBlue South- North- Market Quarter west Continental west Index ** 2000-4 1 nla 29.13% -7.89% 1.66% 2.65%
*
2000-42 nla -8.97% 15.02% 34.57% -3.17% 2000-43 nla 28.04% -3.36% -19.32% -0.88% 2000-44 nla 38.34% 13.62% 22.64% -8.42%
nla 20.12% 3.86% 7.87% -2.54% 2000 Total 200 1 -4 1 n/a -20.58% -19.81% -24.90% -10.81% 200 1-42 nla 4.18% 18.96% 11.63% 5.36% 200 1-43 nla -19.73% -69.54% -54.81% -14.49% 200 1-44 nla 24.58% 74.73% 37.60% 9.43%
nla -4.63% -15.59% -15.03% -3.16% 200 1 Total 2002-4 1 nla 4.72% 8.05% 2 1.46% 0.48% 2002-42 nla -16.46% -44.28% -36.76% -13.29% 2002-43 - 1 1.46% -19.14% -65.84% -44.61% -16.98% 2002-44 0.4 1% 6.44% 34.51% 9.88% 8.41%
-5.71% -6.85% -27.48% -17.3 1% -5.90% 2002 Total 2003-QI 2.63% 3.38% -29.38% -5.99% -3.57%
JetBlue went public on April 12, 2002. Thus, quarterly return data is not available until the third quarter (43) of 2002. ** Quarterly and yearly return data on the Center for Research in Security Prices (CRSP) value- weighted market index. Calculations are performed using daily closing price data obtained from the CRSP from the University of Chicago Graduate School o f Business database (http://gsbwww.uchicago.edu/research/crsp). All returns are adjusted for dividends and stock splits.
Not surprisingly, we find that the beta coefficients of SWA, Continental, and Northwest increased considerably after 911 1. We tested whether the increase was significant using a standard t-test for differences in means and a Mann-Whitney test for the significance of differences in medians. Although the beta of SWA increased less than that of Continental and Northwest, we find that all increases are significant at the one percent confidence level. JetBlue’s beta, calculated from price data available after its IPO, is only 0.72, well below the betas of SWA ( I . 14), Continental (2.19) and Northwest (1.71).
52 Journal of Air Transportation
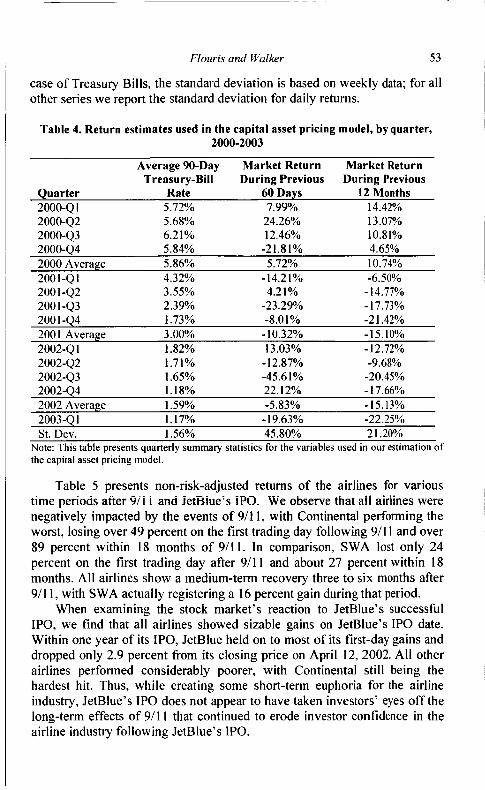
To calculate how the returns compare between the airlines after adjusting for risk, we employed event study methodology and calculated the risk-adjusted cumulative abnormal returns for each airline before and after JetBlue’s IPO in a CAPM framework. Table 4 provides an overview of the data that were used to calculate expected returns. We used 90-day U.S. Treasury Bill rates as a proxy for the risk-free rate and historical market returns based on 60 and 360 calendar days to forecast expected market returns. The last row of Table 4 provides the standard deviation of our estimates, indicating that the short-term estimates are significantly more volatile than long-term historical returns.
Table 3. Differences in risk levels between selected airlines, before and after September 11,2001
JetBlue Southwest Continental Northwest Panel A: Estimated Beta Coefficients
Pre-9il I nla 0.77 0.73 1.01 Post-91 1 1 0.72 1.14 2.19 1.71
Panel B: Tests for Equality Across Groups
p-value n/a 0.001 * 0.000 * 0.000 * MW p-value nia 0.002 * 0.000 * 0.000 *
* Signilicant at the one percent confidence level Note: We estimate beta coefficients for the four airlines in our sample as p, = cov( q , y, ) / g:, where cov( r, , r, ) is the covariance between the returns of firm i
and the returns on the market, and 0: is the variance of market returns. We use daily returns
based on adjusted price data of the Center for Research in Security Prices (CRSP) value- weighted market index to proxy for market returns and price data for individual firms that has been adjusted for dividends and stock splits (http:llgsbwvw.uchicago.edu/research/crsp),
~
We base our calculations on weekly 3-month Treasury Security indexes as calculated by the Treasury Department and reported by the Federal Reserve (http://www.federalreserve.gov/releases/h 15). Since August 2 1, 2000, the Federal Reserve’s Publication H. 15 no longer reports yield data for the 13-week (3-month) US. Treasury Bills’ auction average. Starting from this date, we use Treasury security yields adjusted to a constant maturity of 3 months, as provided by the Treasury’s Public Debt Web site (http://www.publicdebt.treas.gov). In our later estimations, we calculate historical market returns as the geometric average of daily market returns during the previous 60 (360) calendar days. These returns are used as a forecast of the expected market return in our CAPM estimation. All returns below are aggregated by quarter and are not those actually used in our estimation. We also report the standard deviation for each column. In the
Flouris and Walker 53
case of Treasury Bills, the standard deviation is based on weekly data; for all other series we report the standard deviation for daily returns.
Table 4. Return estimates used in the capital asset pricing model, by quarter, I
2000-2003
Average 90-Day Market Return Market Return Treasury-Bill During Previous During Previous
Quarter Rate 60 Days 12 Months 2000-4 1 5.72% 7.99% 14.42% 2000-Q2 5.68% 24.26% 13.07%
2000-Q4 5.84% -2 I . 8 1 YO 4.65% 2000-43 6.21% 12.46% 10.81%
2000 Average 5.86% 5.72% 10.74% 2001-Q 1 4.32% - 14.2 1 % -6.50% 200 1 -Q2 3.55% 4.21% - 14.77% 200 1-03 2.39% -23.29% -17.73% 200 1-Q4 1.73% -8.01% -2 1.42% 2001 Average 3.00% - 10.32% - 15.10% 2002-4 1 1.82% 13.03% - 12.72% 2002-42 1.71% -12.87% -9.68% 2002-43 1.65% -45.61% -20.45% 2002-44 1.18% 22.12% - 17.66% 2002 Average 1.59% -5.83% - I 5.13% 2003-4 1 1.17% - 19.63% -22.25% St. Dev. 1.56% 45.80% 2 1.20%
Note: This table presents quarterly summary statistics for the variables used in our estimation of the capital asset pricing model.
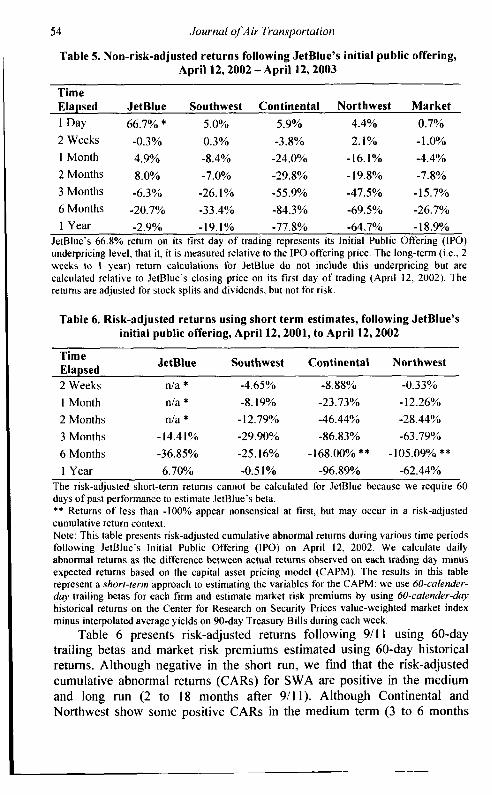
Table 5 presents non-risk-adjusted returns of the airlines for various time periods after 4ii i and JetBiue’s PO. We observe tinat aii airiines were negatively impacted by the events of 9/11, with Continental performing the worst, losing over 49 percent on the first trading day following 9/11 and over 89 percent within 18 months of 911 1. In comparison, SWA lost only 24 percent on the first trading day after 9/11 and about 27 percent within 18 months. All airlines show a medium-term recovery three to six months after 9/11, with SWA actually registering a 16 percent gain during that period.
When examining the stock market’s reaction to JetBlue’s successful IPO, we find that all airlines showed sizable gains on JetBlue’s IPO date. Within one year of its IPO, JetBlue held on to most of its first-day gains and dropped only 2.9 percent from its closing price on April 12, 2002. All other airlines performed considerably poorer, with Continental still being the hardest hit. Thus, while creating some short-term euphoria for the airline industry, JetBlue’s IPO does not appear to have taken investors’ eyes off the long-term effects of 9/11 that continued to erode investor confidence in the airline industry following JetBlue’s IPO.
54 Journal ofAir Transportation
Table 5. Non-risk-adjusted returns following JetBlue’s initial public offering, April 12,2002 -April 12,2003
Time Elapsed JetBlue Southwest Continental Northwest Market 1 Day 66.7% * 5.0% 5.9% 4.4% 0.7% 2 Weeks -0.3% 0.3% -3.8% 2.1% -1.0% 1 Month 4.9% -8.4% -24.0% -16.1% -4.4% 2 Months 8.0% -7.0% -29.8% - 19.8% -7.8% 3 Months -6.3% -26.1% -55.9% -47.5% -15.7% 6 Months -20.7% -33.4% -84.3% -69.5% -26.7% I Year -2.9% -19.1% -77.8% -64.7% - 18.9%
JetBlue’s 66.8% return on its first day of trading represents its Initial Public Offering (IPO) underpricing level, that it, it is measured relative to the IPO offering price. The long-term (Le., 2 weeks to I year) return calculations for JetBlue do not include this underpricing but are calculated relati\e to JetBlue‘s closing price on its first da) of trading (April 12, 2002). The returns are adjusted for stock splits and dividends, but not for risk
Table 6. Risk-adjusted returns using short term estimates, following JetBlue’s initial public offering, April 12,2001, to April 12,2002
JetBlue Southwest Continental Northwest Time Elapsed 2 Weeks d a * -4.65% -8.88% -0.33% 1 Month nla * -8.19% -23.73% - 12.26% 2 Months nla * - 12.79% -46.44% -28.44% 3 Months - I 4.4 1 Yo -29.90% -86.83% -63.79% 6 Months -36.85% -25.16% -168.00% * * -1O5.09% ** 1 Year 6.70% -0.51% -96.89% -62.44%
The risk-adjusted short-term returns cannot be calculated for JetBlue because we require 60 days of past performance to estimate JetBlue’s beta. ** Returns of less than -100% appear nonsensical at first, but may occur in a risk-adjusted cumulative return context. Note: This table presents risk-adjusted cumulative abnormal returns during various time periods following JetBlue’s Initial Public Offering (IPO) on April 12, 2002. We calculate daily abnormal returns as the difference between actual returns observed on each trading day minus expected returns based on the capital asset pricing model (CAPM). The results in this table represent a shorr-rum approach to estimating the variables for the CAPM: we use 60-calender- duy trailing betas for each firm and estimate market risk premiums by using 60-calender-day historical returns on the Center for Research on Security Prices value-weighted market index minus interpolated average yields on 90-day Treasury Bills during each week.
Table 6 presents risk-adjusted returns following 911 1 using 60-day trailing betas and market risk premiums estimated using 60-day historical returns. Although negative in the short run, we find that the risk-adjusted cumulative abnormal returns (CARs) for SWA are positive in the medium and long run (2 to 18 months after 9/11). Although Continental and Northwest show some positive CARs in the medium term (3 to 6 months
Flouris and Walker 55
after 911 I), they become negative in the long run. Following JetBlue’s IPO, we find that JetBlue and SWA again outperformed Continental and Northwest, with JetBlue actually having positive CARS within one year of its IPO.
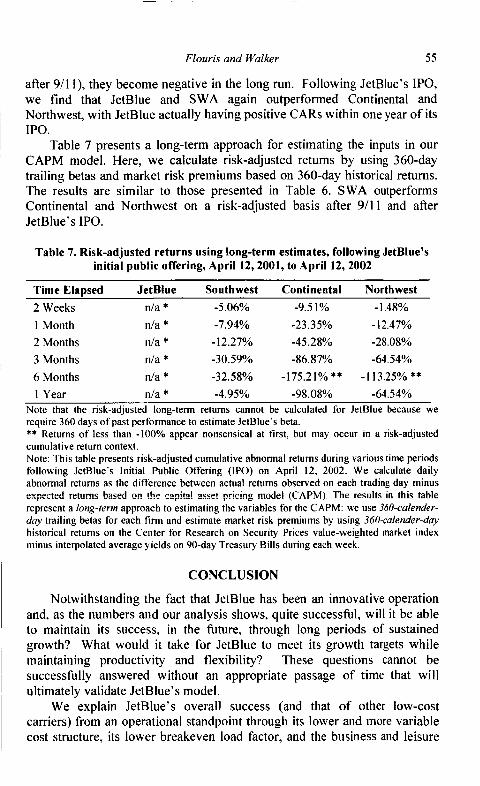
Table 7 presents a long-term approach for estimating the inputs in our CAPM model. Here, we calculate risk-adjusted retums by using 360-day trailing betas and market risk premiums based on 360-day historical returns. The results are similar to those presented in Table 6. SWA outperforms Continental and Northwest on a risk-adjusted basis after 911 1 and after JetBlue’s IPO.
Table 7. Risk-adjusted returns using long-term estimates, following JetBlue’s initial public offering, April 12,2001, to April 12, 2002
Time Elapsed JetBlue Southwest Continental Northwest 2 Weeks n/a * -5.06% -9.5 1 Yo - 1.48% 1 Month n/a * -7.94% -23.35% -12.47% 2 Months n/a * -12.27% -45.28% -28.08% 3 Months n/a * -30.59% -86.87% -64.54% 6 Months n/a * -32.58% -175.21% ** -113.25% ** 1 Year nla * -4.95% -98.08% -64.54%
Note that the risk-adjusted long-term returns cannot be calculated for JetBlue because we require 360 days of past performance to estimate JetBlue‘s beta. ** Returns of less than -100% appear nonsensical at first, but may occur in a risk-adjusted cumulative return context. Note: This table presents risk-adjusted cumulative abnormal returns during various time periods following JetBlue’s Initial Public Offering (IPO) on April 12, 2002. We calculate daily abnormal returns as the difference between actual returns observed on each trading day minus expec!ed i e h m s hsed on !he c~pi!.! ISSP! pricing mode! (CAPM) The rezults in this table represent a long-/erm approach to estimating the variables for the CAPM: we use 360-calender- day trailing betas for each firm and estimate market risk premiums by using 360-calender-day historical returns on the Center for Research on Security Prices value-weighted market index minus interpolated average yields on 90-day Treasury Bills during each week.
CONCLUSION
Notwithstanding the fact that JetBlue has been an innovative operation and, as the numbers and our analysis shows, quite successfd, will it be able to maintain its success, in the future, through long periods of sustained growth? What would it take for JetBlue to meet its growth targets while maintaining productivity and flexibility? These questions cannot be successfully answered without an appropriate passage of time that will ultimately validate JetBlue’s model.
We explain JetBlue’s overall success (and that of other low-cost carriers) from an operational standpoint through its lower and more variable cost structure, its lower breakeven load factor, and the business and leisure
56 Journal of Air Transportation
traveler migration from conventional-cost airlines to low-cost airlines. Our financial analysis substantiates this point to its fullest. We find that markets value low-cost airline stocks as growth stocks, whereas conventional-cost airline stocks are treated as cyclical. Even though affected, low-cost carriers emerged after 9/11 in a stronger market position than their conventional-cost rivals. From a management standpoint, we believe that adopting a viable strategic position, leveraging organizational capabilities, and re-conceiving the value equation are critical in defining the comparative advantage of low- cost carriers.
REFERENCES
Boorstin, J. (2002). Final boarding call-JetBlue’s IPO takes off. Fortune Magazine,
Brown, S . & Warner, J. (1985). Using daily stock returns: The case of event studies.
Carter, D. & Simkins, B (2002). The market’s reaction to unexpected, catastrophic events: The case of airline stock returns and the September I l l h attacks. Department of Finance working paper. Stillwater: Oklahoma State University.
Chance, D. & Ferris. S. (1987). The effect of aviation disasters on the air transport industry: A financial market perspective. Journal of Transport Economics and Policy, May, 15 1 - 165.
Corgel, John B. & Djoganopoulos, Chris. (2000). Equity RElT beta estimation. Financial Analysts Journal, 56(1), 70-80.
Comell, B., Hirshleifer, J. & James, E.P. (1997). Estimating the cost of equity capital. Contemporary Finunce Digest, 1 (I), 5-26.
Davidson, W., Chandy, P.R. & Cross, M. (1987). Large losses, risk management and stock returns in the airline industry. Journal ofRisk and Insurance, 54, 162-172.
Fama, E., Fisher, L. & Jensen, M.C. (1969). The adjustment of stock prices to new information. International Economic Review, 10(1), 1-2 1.
Gittell, J. & 0’ Reilly, C. (2001). JetBlue Airways: Starting from scratch. Boston:
Ibbotson, R. G. & Sinquefield, R. A. (1976). Stocks, bonds, bills and inflation: Year-
Lawton, T. C. (2002). Cleared for take-ofl Structure and strategy in the low fare airline business. London: Ashgate Publishers Limited.
Lintner, J . (1965). The valuation of risk assets and the selection of risky investments in stock portfolios and capital budgets. Review of Economics and Statistics, 47,
April 29, 150-1 54.
Journal of Financial Economics, 14, 3-3 I .
I
i
Harvard Business School.
, by-year historical returns (1926-1974). The Journal of Business, 49(1), 1 1-47.
13-37.
Flouris and Walker 57
Peterson, P. (1989). Event studies: A review of issues and rncthodology. Quarterly
Roll, Richard. (1977). A critique of the asset pricing theory’s tests-Part I: On past and
Schweitzer, R. (1989). How do stock returns react to special events. Business Review,
Sharpe, W.F. (1964). Capital asset prices: A theory of market equilibrium under
Taylor, L.W. & Paolone, A. (1997). REITs and the Russell 2000. Real Estate
Tully, S. (2003). The Airlines’ new deal: It’s not enough. Fortune Magcine, April
Top entrepreneurs. (200 I ) . Business Week, January 8, 82-84.
Zorn, B. (2001). Comparing low cost markets in the USA, UK, and Europe. Aviation
Journal of Business and Economics, 36-66.
potential testability of the theory. Journal of Financial Economics, 4, 129- 176.
July/August, 17-26.
conditions of risk. Journal of Finance, 19, 425-442.
Finance Journal, 13(3), 80-84.
28, 79-8 I .
presentation. Amsterdam, February 27.