The effect of retinal pigment epithelial cell patch size on growth factor expression
Upload
independentCategory
view
1download
0
LRH: Winter et al.
RRH: Does density response vary due to body size?
DOES BODY SIZE AFFECT A BIRD’S SENSITIVITY TO PATCH SIZE AND
LANDSCAPE STRUCTURE?
MAIKEN WINTER1,4, DOUGLAS H. JOHNSON2, AND JILL A. SHAFFER3
1 State University of New York, College of Environmental Sciences and Forestry, 1 Forestry
Drive, Syracuse, NY 13210, USA.
2 U.S. Geological Survey; Department of Fisheries, Wildlife, and Conservation,Biology 204;
Hodson Hall, 1980 Folwell Ave., University of Minnesota, St. Paul, MN 55108,
USA.
3 U.S. Geological Survey, Northern Prairie Wildlife Research Center, 8711 37th Street SE,
Jamestown, ND 58401, USA
4 Current address and address of the corresponding author: Cornell University, Laboratory of
Ornithology, 159 Sapsucker Woods Rd., Ithaca, NY 14850, USA. email:
[email protected]; phone: (607) 254-2476
Winter
Abstract. Larger birds are generally more strongly affected by habitat loss and fragmentation
than are smaller ones because they require more resources and thus larger habitat patches.
Consequently, conservation actions often favor the creation or protection of larger over
smaller patches. However, in grassland systems the boundaries between a patch and the
surrounding landscape, and thus the perceived size of a patch, can be indistinct. Using eight
grassland bird species with different body sizes, we investigated whether these species
perceived variation in patch size and in landscape structure in a consistent manner. Data
were collected from surveys conducted on 44 patches of northern tallgrass prairie during
1998-2001. The response to patch size was very similar among species regardless of body
size (density gradually increased with patch size), except for Greater Prairie-Chicken
(Tympanuchus cupido), which showed a threshold effect and was not found in patches
smaller than 140 ha. In landscapes containing 0-30% woody vegetation, smaller species
responded more negatively to increases in woody vegetation than larger species, but above an
apparent threshold of 30% woody vegetation, larger species were not detected. Further
analyses revealed that the observed variation in the response to patch size and landscape
structure among species was not solely due to body size per se, but to other differences
among species. These results indicate that a stringent application of concepts that require
larger habitat patches appears to limit the number of grassland habitats that can be protected
and may not always be the most effective conservation strategy.
Keywords: Body size, conservation, grassland bird, landscape, patch size, umbrella
species.
22
Winter
INTRODUCTION
Larger-bodied animals are known to have lower densities and larger home ranges than
smaller-bodied animals – a pattern that is consistent across many animal taxa (Schmid et al.
2000, Haskell et al. 2002). The main reasons for this pattern are greater energy needs of and
lower density of food resources for larger species (Jetz et al. 2004). It is thus not surprising
that larger species are generally more sensitive to habitat loss and fragmentation than are
smaller species (Haskell et al. 2002). Consequently, creating or maintaining larger habitat
patches is of high priority in many conservation plans. Because conservation plans for larger
species can also protect other species inhabiting the same habitat, larger species are often
used as umbrella species (Poiani et al. 2001, Suter et al. 2002). However, using larger-
bodied species to determine optimal patch size and landscape structure is complicated by
several factors:
1) A species’ patch-size requirement can vary with resource availability within a habitat
patch (Haskell et al. 2002) and with the structure of the surrounding landscape (Bakker et
al. 2002, Fletcher and Koford 2002, Cunningham and Johnson in press, Winter et al. in
press). It is therefore not possible to generalize patch-size requirements across even a
single species’ breeding range.
2) It is more difficult to collect reliable distribution data on rare species than on abundant
species (Seoane et al. 2005). Data on the distribution of smaller species – if they are
more abundant – might therefore be a more reliable indicator of habitat needs of a
community..
3) The size of a habitat patch as defined by humans might not reflect an animal’s perception
of a patch. This is especially true for species that inhabit open habitats such as native
33
Winter
grasslands within agricultural areas, where the edge of a patch is less clearly defined than
in patches of other habitat types.
Grassland birds have been the focus of intensive research and conservation because of
their consistent and steep population declines in many parts of the world (Peterjohn and
Sauer 1999, Donald et al. 2000, Newton 2004). In North America, the Bird Conservation
Area (BCA) concept (Henderson and Sample 1995; <http://www.iowadnr.com/wildlife/files/
BCA_index.html> [20 November 2005]) involves guidelines for grassland bird conservation:
ideally, managers should establish large core areas (> 700 ha) of high-quality grassland
habitat surrounded by larger expanses of non-forested habitats, such as smaller-grain
cropland or hayland. This habitat configuration is based on the requirements of Greater
Prairie-Chicken (Tympanuchus cupido), a species that is mostly absent from smaller
grassland patches and from patches that are surrounded by forested habitat (Ryan et al. 1998,
Merrill et al. 1999, Winter and Faaborg 1999), and therefore serves as an umbrella species
for the protection of many other grassland birds. However, even though it is desirable to
protect larger habitat patches in the form of BCAs, such protection might not be the most
cost-effective practice with which to protect grassland birds throughout their range (Davis
2004, Winter et al. in press).
Recently, we demonstrated that two passerine species nesting in northern tallgrass
prairies did not respond consistently to the size of grassland patches, whereas an increasing
percentage of woody vegetation surrounding a grassland patch consistently resulted in lower
species’ densities (Winter et al. in press, also see Grant et al. 2004). The lack of a consistent
patch-size effect may have been caused by the smaller home-range sizes of the focal species.
In contrast, larger-bodied non-passerine species might respond more strongly to patch size as
44
Winter
well as to the structure (e.g., percentage of trees and tall shrubs) of the surrounding
landscape. If larger species were more sensitive to patch size and the percentage of woody
vegetation structure, then a conservation focus on larger prairie patches would be justified.
However, if such a pattern were not generally true, and larger species would also use smaller
habitat patches, then the conservation of smaller prairie patches could benefit both smaller
and larger species. If in certain settings smaller and larger species responded similarly to
variation in patch size, then it would be more efficient to monitor smaller species (found at
higher densities) to make management decisions regarding larger-bodied species. In this
paper we determined whether eight species of tallgrass prairie birds, four passerines and four
non-passerines, showed similar responses to variation in patch size and percent woody
vegetation in the landscape, and whether differences among species were largely the result of
variation in body size.
METHODS
Between 1998 and 2001 we conducted bird surveys in 44 study plots located in three regions:
within Sheyenne National Grassland in southeastern North Dakota and two regions in
northwestern Minnesota close to the cities of Crookston and Glyndon (for a detailed
description of study sites and methods see Winter et al. 2005a, b). Study plots were located
within prairie patches that ranged between 2.4 and 1245.6 ha ( x = 214.0 ha), and the
percentage of woody vegetation within a 200-m buffer of the study plots ranged between 1
and 46% ( x = 13.1 %). The sizes of prairie patches were not strongly correlated with the
percentage of woody vegetation within a 200-m buffer (r = -0.20, P = 0.18, n = 44). The size
of study plots within the fragments varied between 1.5 and 20 ha ( x = 10.5 ha), depending on
the size of the prairie patch within which the study plot was embedded. Study plots were
55
Winter
marked with flags or wooden laths at 50-m intervals along transects that were 100 m apart.
Bird censuses were conducted twice a year between the end of May and early July between
05:00 and 10:00 CDT, and under conditions of low-to-moderate wind speeds (≤ 35 km/h), no
precipitation, and good visibility. The annual maximum count of a species on a plot was
used to determine its annual density (number of males/100 ha). A single observer conducted
all counts within a year, with two observers (MW and JAS) alternating in successive years.
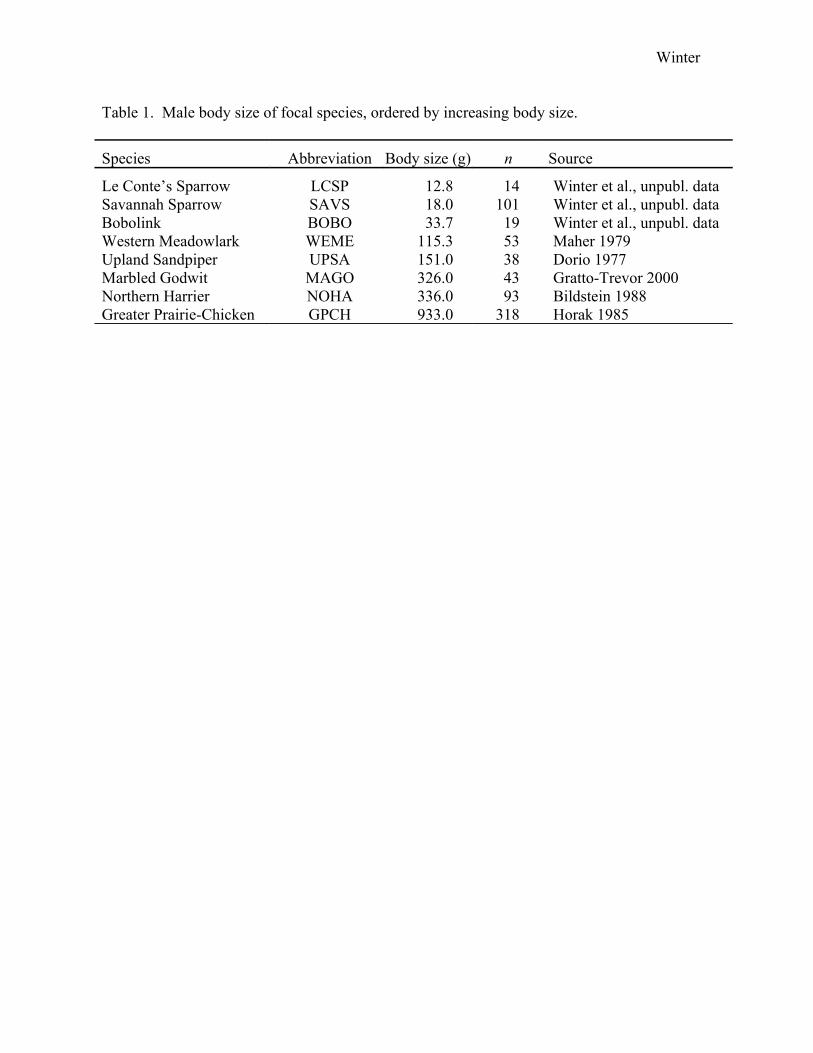
As an index of body size, we used a species’ mass (g) that was derived either from
our own study or from studies closest to our sites (Table 1). Species are: Le Conte’s Sparrow
(Ammodramus leconteii), Savannah Sparrow (Passerculus sandwichensis), Bobolink
(Dolichonyx oryzivorus), Western Meadowlark (Sturnella neglecta), Northern Harrier
(Circus cyaneus), Upland Sandpiper (Bartramia longicauda), Marbled Godwit (Limosa
fedoa), and Greater Prairie-Chicken. For each species, we used male body size for analysis.
A contiguous grassland patch was defined following Winter et al. (2005a). The size
of the grassland patch in which study plots were located was determined from digital
orthophoto quads (DOQs) that were imported into Map and Image Processing System,
versions 6.6 and 6.7 (<http://www.microimages.com> [20 November 2005]). The DOQs
were from 1991 for Minnesota and from 1997 for North Dakota. We also used these images
to determine the percentage of shrubs and trees within 200-m and 1-km buffer zones, where
buffer zones included the study plot. Within a 200-m buffer zone the percentage of shrubs
and trees was highly correlated with the percentage of shrubs and trees within a 1-km buffer
zone (r = 0.78, P < 0.001, n = 44 study plots). Assuming that the percentage of shrubs and
trees closest to the study plots had a larger effect on the distribution of birds within the study
66
Winter
plots than the percentage of shrubs and trees at farther distances, we used only the percentage
of shrubs and trees within a 200-m buffer zone in all analyses and refer to it as “landscape.”
STATISTICAL ANALYSES
Because models included both fixed effects (body size, patch size, and landscape) and
random effects (prairie), we analyzed data with PROC MIXED in SAS 8.2 (SAS 1999,
Littell et al. 1996). Density data were log-transformed in all analyses with logcount =
ln(count +1). Maximum likelihood was used to fit models, in order to appropriately penalize
AIC values for increasing numbers of both random and fixed effects. Previous analyses
indicated that grassland bird density varied greatly among prairies (Winter et al. 2005b). We
therefore included prairie as random effect in each of the statistical models.
To reduce the number of models tested, we conducted our analyses in two steps
(Winter et al. 2005a, b). In a first step, we determined if body size (continuous variable)
influenced the effect of patch size on bird density by comparing five models with the
following sets of explanatory variables: (1) patch size; (2) body size; (3) patch size and body
size; (4) patch size × body size; and (5) patch size, body size, and patch size × body size. We
then used the body-size model that best fit the data, based on Akaike’s Information Criterion
corrected for smaller sample sizes (AICC: Burnham and Anderson 2002), as the base model
for a second set of analyses. If more than one model was supported (∆AICC < 4), then we
used the most inclusive model as the base model, i.e., the model that included the largest
number of variables. In the second step we determined if the density response to the
percentage of woody vegetation in the surrounding landscape was influenced by body size –
given the previously determined effect of patch size – by comparing four models: (1) base
model (from step 1); (2) base model with landscape variable; (3) base model with landscape
77
Winter
× body size interaction; and (4) base model with landscape and landscape × body size
interaction. From these, we determined the best-supported model as the final model.
Variation in the response of density to patch size and the percentage of woody
vegetation structure among birds with different body sizes might not be due to body size per
se, but possibly due to differences in ecology and behavior. We investigated this possibility
using a similar two-step analysis as described above, but included species as a categorical
variable instead of body size as a continuous variable. We compared AICC between the body
size and species models, and graphically illustrated the outcome of the two sets of analyses
(body size and species models) by plotting the estimated densities derived from each base
and final model (Fig. 1). The magnitude of the response to patch size and landscape structure
seems much greater in species that have high densities than in rare species, because absolute
changes in numbers and thus slopes are greater in abundant species. These absolute changes
in density do not give a clear impression of the magnitude of patch size and landscape effects
relative to other species. We therefore also plotted the relative changes in density between
maximum and minimum patch size or percentage woody cover by dividing the estimated
maximum by the estimated minimum densities as derived from the base or final models,
separately for each body size and species model (Fig. 2).
RESULTS
Models that included species as a categorical variable fit the data better than models that
included body size (∆AICC > 600). Thus, changes in density with patch size and landscape
structure cannot be predicted based simply on body size, but vary with the species in
question. For example, the body-size model predicted that the three smallest species would
respond similarly to changes in landscape structure (Fig. 1b); in reality, Savannah Sparrows
88
Winter
and Bobolinks were more strongly affected by landscape structure than were Le Conte’s
Sparrows (Fig. 1d, 2).
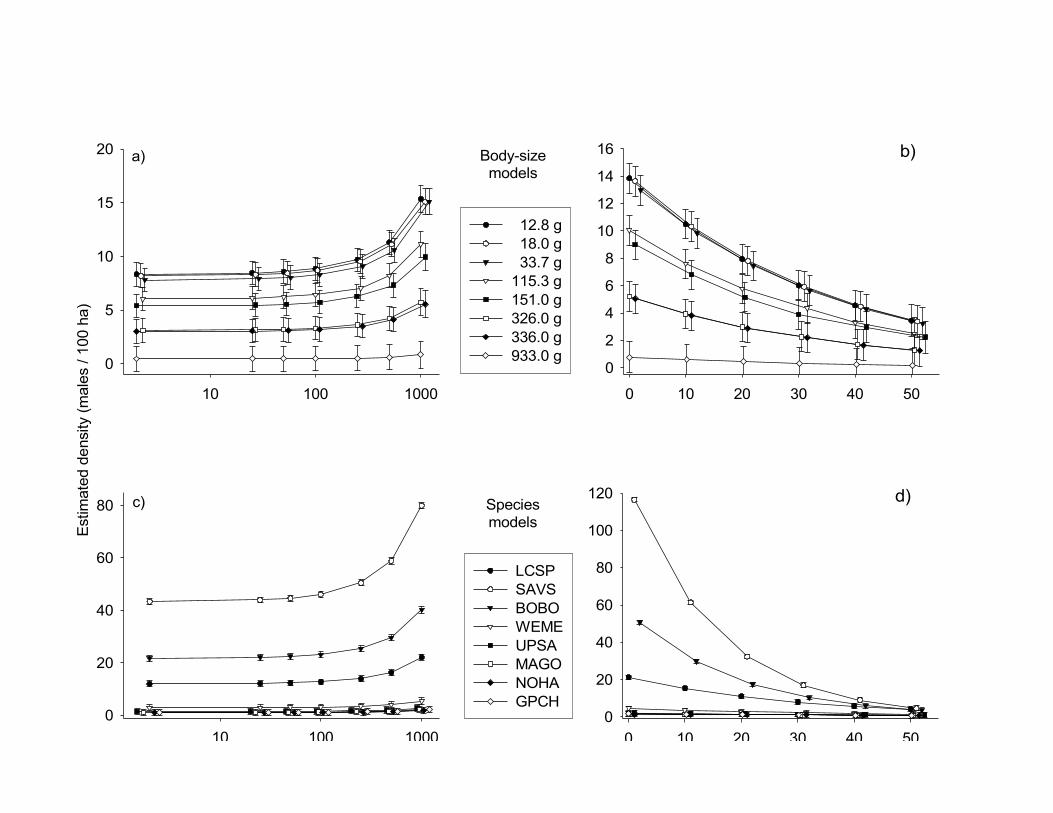
Patch size had a negligible effect on bird density (slope: 0.0006 ± 0.0002), especially
at patch sizes below 500 ha (Fig. 1a). A 1000-ha increase in patch size only roughly doubled
the density of most species (Fig. 1a, c). Even larger-bodied species (Northern Harrier,
Marbled Godwit, and Upland Sandpiper) occurred in relatively small patches (<20 ha) with
the exception of Greater Prairie-Chicken: this species was absent from prairie patches smaller
than 140 ha. Neither body size nor inter-specific variation had much influence on this
response to patch size: the best-supported body size and species models did not include an
interactive effect with patch size (Table 2).
The addition of landscape to patch-size models greatly improved the fit of both the
body size and species models (∆AICC = 26 and 27, respectively). Density decreased with
increasing percentage of woody vegetation within a 200-m buffer (Fig. 1b, d). The estimated
rate of this decrease did not vary with body size, but did vary by species (Table 2, Fig. 2).
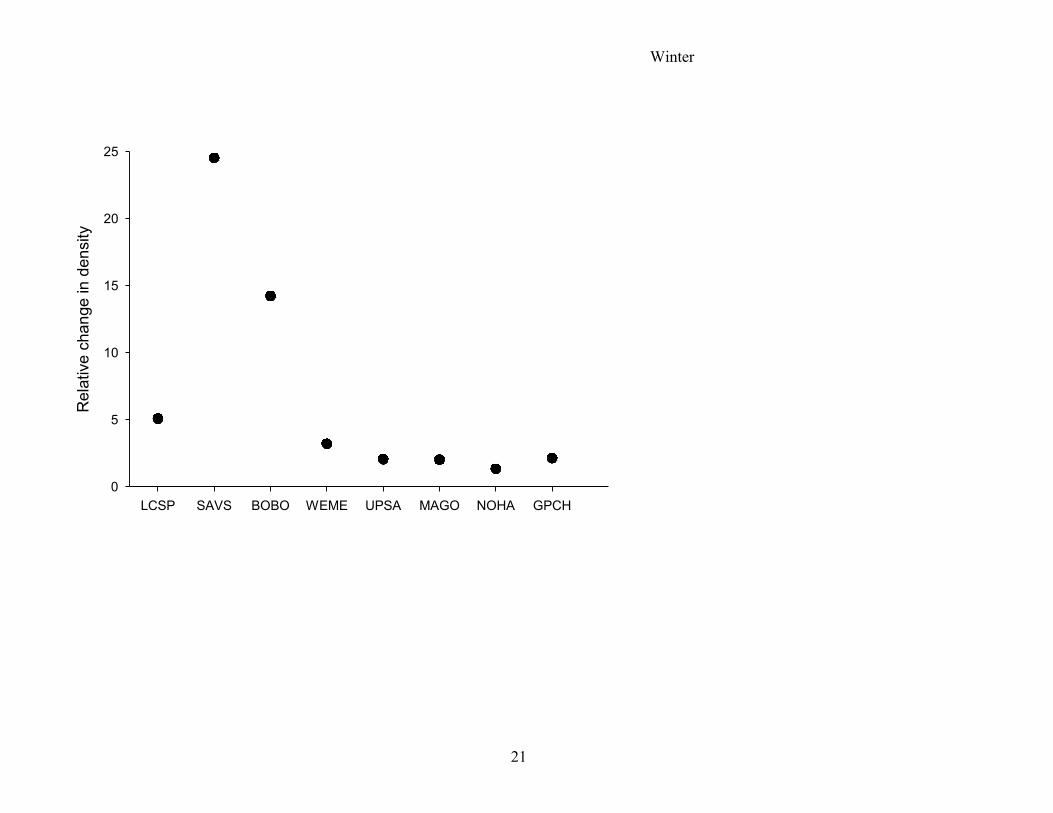
Smaller species appeared more sensitive to changes in the percentage of woody vegetation,
because a 50% decrease in woody cover within a 200-m buffer caused an increase in density
that varied by 3-25% in smaller species, whereas the same decrease changed the density of
any larger species by less than 2.2% (Fig. 2). However, if woody cover exceeded 30%
within a 200-m buffer, larger species disappeared. Thus, an apparent threshold in woody
cover exists for larger species, above which these species did not occur.
DISCUSSION
Our results showed that we cannot assume that larger species always require larger habitat
patches and more open landscapes than smaller species, because models that included body
99
Winter
size received less support than models that included species. In fact, within a certain range of
percentage woody cover, smaller species were more strongly affected by changes in
landscape than larger species. Thus, in some circumstances, providing suitable habitat for
smaller-bodied species can also ensure the protection of larger-bodied species. A single,
larger-bodied umbrella species, therefore, might not always be the ideal subject to guide
community-wide conservation decisions (Andelman and Fagan 2000, Roberge and
Angelstam 2004), but management recommendations need to be adapted to the specific
settings of the area to be managed.
Our findings have several important implications to the conservation of grassland
birds in northern tallgrass prairies, and might also be applicable to other systems:
(1) In open landscapes, patch size variation is of relatively little importance even for larger-
bodied species. All species but Greater Prairie-Chicken were found in prairie patches smaller
than 20 ha. Thus, the protection and management of even smaller prairie patches can be
worthwhile not only for passerine birds (Davis 2004, Winter et al. in press), but also for
several larger-bodied, non-passerine species. However, to ensure the occurrence of Greater
Prairie-Chicken, some grassland patches need to be at least 140 ha in size even if the patch is
located in relatively open landscape.
(2) The response to patch size can be very similar among species. Thus, using larger-bodied
species as umbrella species might not always be necessary. Relying on the response of
smaller species instead would have the benefit of more accurate density estimation, because
larger animals are estimated with lower accuracy (Seoane et al. 2005).
(3) Even a seemingly small amount of woody vegetation can greatly reduce the number of
individuals of a species present in a grassland patch. Any reduction of woody vegetation can
101
Winter
thus be beneficial to grassland birds. This observation seems to constitute a general pattern
for grassland birds in the northern prairies, since studies elsewhere reported similar results
(Bakker et al. 2002, Fletcher and Koford 2002, Grant et al. 2004, Cunningham and Johnson
in press).
Related to this last point, a reduction of woody vegetation surrounding prairie patches
would also ensure safer nesting sites. Nesting success may be lower for nests placed close to
woody vegetation (Temple and Johnson 1990, Winter et al. 2000). In addition, Herkert et al.
(2003) showed that grassland bird nesting success is higher in larger fragments. In the
current study, we were not able to compare nesting success between passerine and non-
passerine species because of small sample sizes for non-passerine nests. However, analyses
of the effect of patch size and landscape on nesting success of several passerines did not
indicate any influence of these factors on nesting success in northern tallgrass prairie (Winter
et al. in press), indicating that in open landscapes nesting success may not be as severely
influenced by patch size as in more forested regions.
Effective grassland bird conservation requires a balance between the time and money
required and the degree to which high-quality refuges for grassland species can be obtained.
In an open agricultural landscape such as our study area, we suggest that a mix of both
smaller and larger (>140 ha) prairie patches will likely support all grassland-nesting species.
Certainly, the protection of larger continuous areas will always be optimal. However, a
stringent application of concepts that involve only larger habitat patches appears to limit the
number of grassland habitats that can be protected and may not always be the most effective
conservation strategy during times of limited financial support for conservation.
111
Winter
ACKNOWLEDGMENTS
We thank the more than 40 field assistants whose efforts we greatly appreciate. W. D.
Svedarsky of the University of Minnesota in Crookston, R. Julian of the U.S. Fish and
Wildlife Service, B. M. and S. Winter and the late G. Yalch of The Nature Conservancy, and
B. Stotts of the U.S. Forest Service provided logistical help. The Nature Conservancy, U.S.
Fish and Wildlife Service, USDA Forest Service, and the Minnesota Department of Natural
Resources allowed us access to the study sites. J. E. Austin, the late D. P. Fellows, P. J.
Pietz, and M. A. Sovada of the Northern Prairie Wildlife Research Center loaned equipment
and supplies. B. R. Euliss provided the patch size and data on the percentage of woody
vegetation. The Cornell Laboratory of Ornithology provided working facilities for the first
author. The manuscript was greatly improved by comments from Todd Grant, Wesley
Hochachka, and … The study was funded by the U.S. Geological Survey; the U.S. Fish and
Wildlife Service, Regions 3 and 6; the American Bird Conservancy; and the Northwest
Research and Outreach Center at the University of Minnesota, Crookston.
121
Winter
LITERATURE CITED
Andelman, S. J., and W. F. Fagan. 2000. Umbrellas and flagships: efficient conservation
surrogates or expensive mistakes? Proceedings of the National Academy of Sciences
97:5954-5959.
Bakker, K. K., D. E. Naugle, and K. F. Higgins. 2002. Incorporating landscape attributes
into models for migratory grassland bird conservation. Conservation Biology
16:1638-1646.
Bildstein, K. L. 1988. Northern Harrier Circus cyaneus. p. 251–303. In R. S. Palmer [ed.],
Handbook of North American birds, Vol. 4. Yale University Press, New Haven, CT.
Cunningham, M. A., and D. H. Johnson. In press. Proximate and landscape factors
influence grassland bird distributions. Ecological Applications.
Davis, S. K. 2004. Area sensitivity in grassland passerines: effects of patch size, patch
shape, and vegetation structure on bird abundance and occurrence in southern
Saskatchewan. Auk 121:1130-1145.
Donald, P. F., R. E. Green, and M. F. Heath. 2000. Agricultural intensification and the
collapse of Europe’s farmland bird populations. Proceedings of the Royal Society of
London 268:25-29.
Dorio, J. C. 1977. Nesting and brood rearing habitat of the Upland Sandpiper in central
Minnesota. M.A. thesis, St. Cloud State University, St. Cloud, MN.
Fletcher, R. J., and R. R. Koford. 2002. Habitat and landscape associations of breeding birds
in native and restored grasslands. Journal of Wildlife Management 66:1011-1022.
131
Winter
Grant, T. A., E. Madden, and G. B. Berkey. 2004. Tree and shrub invasion in northern
mixed-grass prairie: implications for breeding birds. Wildlife Society Bulletin
32:807-818.
Gratto-Trevor, C. L. 2000. Marbled Godwit (Limosa fedoa). In A. Poole and F. Gill [eds.],
The Birds of North America, No. 492. The Birds of North America, Inc.,
Philadelphia, PA.
Haskell, J. P., M. E. Ritchle, and H. Olff. 2002. Fractal geometry predicts varying body size
relationships for mammal and bird home ranges. Nature 418:527-530.
Henderson, R. A., and D. W. Sample. 1995. Grassland communities. p. 116-129. In J.
Addis [ed.]. Wisconsin’s biodiversity as a management issue: a report to Department
of Natural Resources’ managers. Wisconsin Department of Natural Resources,
Madison, WI, USA.
Herkert, J. R., D. L. Reinking, D. A. Wiedenfeld, M. Winter, J. L. Zimmerman, W. E.
Jensen, E. J. Finck, R. R. Koford, D. H. Wolfe, S. K. Sherrod, M. A. Jenkins, J.
Faaborg, and S. K. Robinson. 2003. Effects of prairie fragmentation on the nest
success of breeding birds in the mid-continental United States. Conservation Biology
17:587-594.
Horak, G. J. 1985. Kansas prairie chickens. Kansas Fish Game Community Wildlife Bulletin
No. 3.
Jetz, W., C. Carbone, J. Fulford, and J. H. Brown. 2004. The scaling of animal space use.
Science 306:266-268.
Maher, W. J. 1979. Nestling diets of prairie passerine birds at Matador, Saskatchewan,
Canada. Ibis 121:437–452.
141
Winter
Merril, M. D., K. A. Chapman, K. A. Poiani, and B. Winter. 1999. Land-use patterns
surrounding Greater Prairie-Chicken leks in northwestern Minnesota. Journal of
Wildlife Management 63:189-198.
Newton, I. 2004. The recent decline of farmland bird populations in Britain: an appraisal of
causal factors and conservation actions. Ibis 146:579-600.
Peterjohn, B. G., and J. R. Sauer. 1999. Population status of North American grassland birds
from the North American breeding bird survey, 1966-1996. p. 27-44. In P. D.
Vickery and J. R. Herkert [eds.]. Ecology and conservation of grassland birds of the
western hemisphere. Studies in Avian Biology 19.
Poiani, K. A., M. D. Merrill, and K. A. Chapman. 2001. Identifying conservation-priority
areas in a fragmented Minnesota landscape based on the umbrella species concept and
selection of larger patches of natural vegetation. Conservation Biology 15:513-522.
Roberge, J. M., and P. Angelstam. 2004. Usefulness of the umbrella species concept as a
conservation tool. Conservation Biology 18:76-85.
Ryan, M. R., L. W. Burger, D. P. Jones, and A. P. Wywialowski. 1998. Breeding ecology of
Greater Prairie-Chickens (Tympanuchus cupido) in relation to prairie landscape
configuration. American Midland Naturalist 140:111-121.
SAS Institute. 1999. The SAS system for Windows, version 8.0. SAS Institute Inc., Cary,
NC, USA.
Seoane, J., L. M. Carrascal, C. L. Alonso, and D. Palomino. 2005. Species-specific traits
associated to prediction errors in bird habitat suitability modeling. Ecological
Modelling 185:299-308.
151
Winter
Suter, W., R. F. Graf, and R. Hess. 2002. Capercaillie (Tetrao urogallus) and avian
biodiversity: testing the umbrella-species concept. Conservation Biology 16:778-788.
Winter, M., and J. Faaborg. 1999. Patterns of area sensitivity in grassland-nesting birds.
Conservation Biology 13:1424-1436.
Winter, M., D. H. Johnson, and J. Faaborg. 2000. Evidence of edge effects on multiple
levels in tallgrass prairie. Condor 102:256-266.
Winter, M., D. H. Johnson, and J. A. Shaffer. 2005a. Natural history of Le Conte’s sparrows
in the northern tallgrass prairie. Journal of Field Ornithology 76:61-71.
Winter, M., D. H. Johnson, and J. A. Shaffer. 2005b. Variability in vegetation effects on
density and nesting success of grassland birds. Journal of Wildlife Management
69:185-197.
Winter, M., D. H. Johnson, J. A. Shaffer, T. M. Donovan, and W. D. Svedarsky. In press.
Patch size and landscape effects on density and nesting success of grassland birds.
Journal of Wildlife Management.
161
Winter
Table 1. Male body size of focal species, ordered by increasing body size.
Species Abbreviation Body size (g) n Source
Le Conte’s Sparrow LCSP 12.8 14 Winter et al., unpubl. dataSavannah Sparrow SAVS 18.0 101 Winter et al., unpubl. dataBobolink BOBO 33.7 19 Winter et al., unpubl. dataWestern Meadowlark WEME 115.3 53 Maher 1979Upland Sandpiper UPSA 151.0 38 Dorio 1977Marbled Godwit MAGO 326.0 43 Gratto-Trevor 2000Northern Harrier NOHA 336.0 93 Bildstein 1988Greater Prairie-Chicken GPCH 933.0 318 Horak 1985
Winter
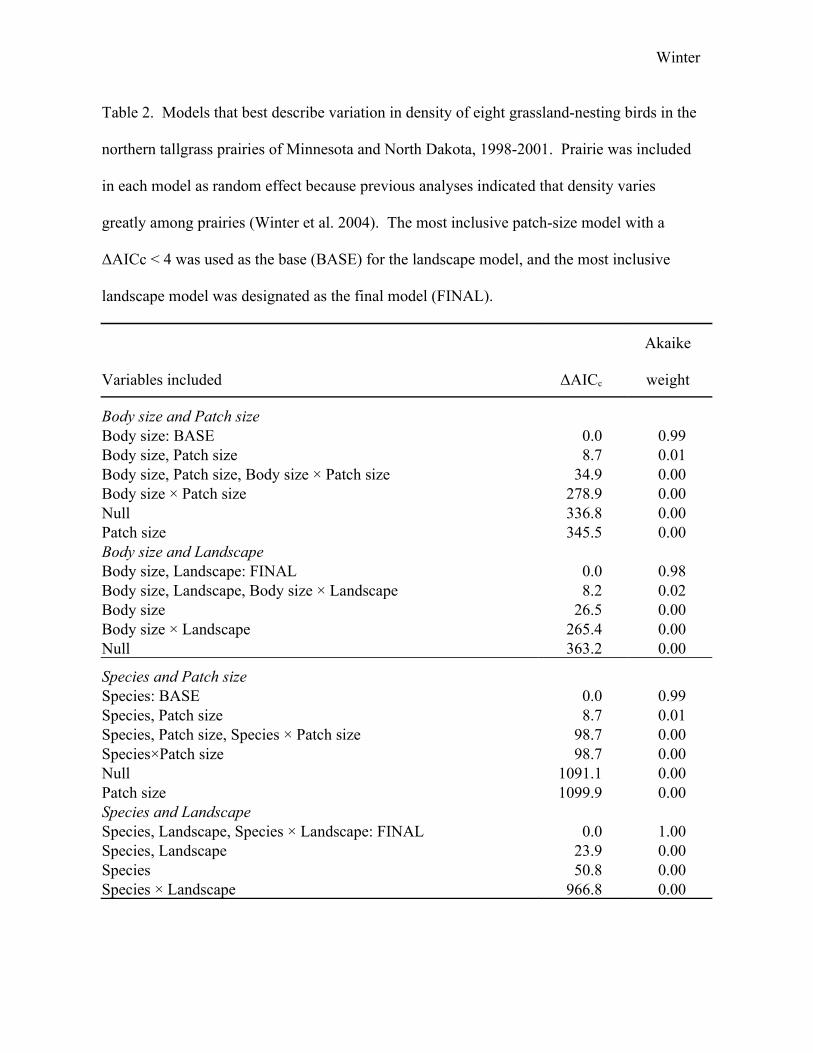
Table 2. Models that best describe variation in density of eight grassland-nesting birds in the
northern tallgrass prairies of Minnesota and North Dakota, 1998-2001. Prairie was included
in each model as random effect because previous analyses indicated that density varies
greatly among prairies (Winter et al. 2004). The most inclusive patch-size model with a
ΔAICc < 4 was used as the base (BASE) for the landscape model, and the most inclusive
landscape model was designated as the final model (FINAL).
Variables included ΔAICc
Akaike
weight
Body size and Patch sizeBody size: BASE 0.0 0.99Body size, Patch size 8.7 0.01Body size, Patch size, Body size × Patch size 34.9 0.00Body size × Patch size 278.9 0.00Null 336.8 0.00Patch size 345.5 0.00Body size and LandscapeBody size, Landscape: FINAL 0.0 0.98Body size, Landscape, Body size × Landscape 8.2 0.02Body size 26.5 0.00Body size × Landscape 265.4 0.00Null 363.2 0.00
Species and Patch sizeSpecies: BASE 0.0 0.99Species, Patch size 8.7 0.01Species, Patch size, Species × Patch size 98.7 0.00Species×Patch size 98.7 0.00Null 1091.1 0.00Patch size 1099.9 0.00Species and LandscapeSpecies, Landscape, Species × Landscape: FINAL 0.0 1.00Species, Landscape 23.9 0.00Species 50.8 0.00Species × Landscape 966.8 0.00
Winter
FIGURE LEGENDS
Figure 1. Estimated densities of bird species nesting in northern tallgrass prairies between
1998 and 2001 increase (males/100 ha ± SE) with patch size (a and c) and decrease with
increasing percentage of woody vegetation within a 200-m buffer zone (b and d). Variations
in these patch size and landscape effects are better explained by inherent differences among
species (c and d) than by body size per se (a and b). Estimated values were derived from the
base and final models shown in Table 2. For species’ name abbreviations see Table 1.
Figure 2. Relative change in species’ density with percentage of woody vegetation
(estimated density at lowest woody percentage / estimated density at highest woody
percentage) in northern tallgrass prairies, 1998-2001. For species’ name abbreviations see
Table 1.
10 100 1000
Est
imat
ed d
ensi
ty (m
ales
/ 10
0 ha
)
0
5
10
15
20
12.8 g 18.0 g 33.7 g115.3 g151.0 g326.0 g336.0 g933.0 g
Woody cover within a 200 m buffer (%)
0 10 20 30 40 50
0
2
4
6
8
10
12
14
16
Patch size (log-scale)10 100 1000
0
20
40
60
80
LCSPSAVSBOBOWEMEUPSAMAGONOHAGPCH
0 10 20 30 40 500
20
40
60
80
100
120
Body-sizemodels
Speciesmodels
a) b)
c) d)
Winter
LCSP SAVS BOBO WEME UPSA MAGO NOHA GPCH
Rel
ativ
e ch
ange
in d
ensi
ty
0
5
10
15
20
25
21
Copyright © 2022 FDOKUMEN