document de travail - International Nuclear Information System ...
295
Accès à l’électricité en Afrique subsaharienne : retours d’expérience et approches innovantes Anjali Shanker (IED) avec les contributions de Patrick Clément (Axenne), Daniel Tapin et Martin Buchsenschutz (Nodalis Conseil) Contact : Valérie Reboud, département Technique opérationnel, division Environnement et Equipement ([email protected]) 122 Agence Française de Développement Direction de la Stratégie Département de la Recherche 5 rue Roland Barthes 75012 Paris - France www.afd.fr Département de la Recherche document de travail Agence Française de Développement Avril 2012
-
Upload
khangminh22 -
Category
Documents
-
view
1 -
download
0
Transcript of document de travail - International Nuclear Information System ...

Accès à l’électricité en Afrique subsaharienne :
retours d’expérience et approches innovantes
Anjali Shanker (IED) avec les contributions de Patrick Clément (Axenne), DanielTapin et Martin Buchsenschutz (Nodalis Conseil)
Contact : Valérie Reboud, département Technique opérationnel, divisionEnvironnement et Equipement ([email protected])
Age
nce
Fra
nçai
se d
e D
ével
oppe
men
t
122
Age
nce
Fra
nçai
se d
e D
ével
oppe
men
t
Agence Française de Développement
Direction de la Stratégie
Département de la Recherche
5 rue Roland Barthes
75012 Paris - France
www.afd.fr
Département de la Recherche
documentde travail
Age
nce
Fra
nçai
se d
e D
ével
oppe
men
t
Avril 2012

Mise en page : Eric Thauvin
Directeur de la publication : Dov ZERAH
Directeur de la rédaction : Robert PECCOUD
ISSN : 1958-539X
Dépôt légal : 2ème trimestre 2012.
Avertissement
Les analyses et conclusions de ce document sont formulées sous la responsabilité de son auteur. Elles ne reflètent pas néces-
sairement le point de vue de l’AFD ou des institutions partenaires.

Remerciements
© AFD Document de travail n° 122 • Accès à l’électricité en Afrique subsaharienne • avril 2012
3
La présente étude a été réalisée pour l’Agence Française de Développement (AFD) par le consortium Innovation énergie
développement (IED), Axenne et Nodalis Conseil.
Ce document a été rédigé par Anjali Shanker, directrice générale déléguée (IED) avec les contributions de Patrick Clément
(Axenne), Daniel Tapin et Martin Buchsenschutz (Nodalis Conseil). Le rédacteur tient à remercier tous ceux qui ont contribué
à ce travail, et en particulier Valérie Reboud, Christian de Gromard, Laurence Breton-Moyet et Carl Bernadac (AFD), ainsi que
Denis Rambaud-Méasson (IED).
Un comité de pilotage s’est réuni à plusieurs reprises ; ses apports, lors de séances de travail, ont permis d’élaborer la
substance de ce texte. Nous tenons donc à remercier tous les membres pour leurs précieuses contributions : l’Agence de
l’environnement et de la maîtrise de l’énergie (ADEME), Electricité de France (EDF), Electriciens sans frontières (ESF), l’Ecole
nationale des ponts et chaussées, la fondation Energie pour le monde, et Total énergies renouvelables.


Sommaire
Résumé exécutif 7
Introduction 17
1 L’accès aux services électriques en Afrique subsaharienne : enjeux et approche methodologique 21
1.1 Des infrastructures et des systèmes électriques insuffisants pour sous tendre un développement
économique et social durable : les défis à relever 21
1.2 Systématiser une vision et une planification opérationnelle globale : l’accès pour quoi faire, et avec quels moyens ? 27
1.3 Analyse et enseignements des impacts des programmes passés 29
1.4 Des dynamiques d’accès impactées par les réformes sectorielles 34
1.5 Etablir des prérogatives claires pour chacun des acteurs 37
2 Un continuum de solutions technico-économiques et organisationnelles 45
2.1 Cadrage technico-économique 45
2.2 Des solutions techniques complémentaires au réseau interconnecté 53
2.3 Distribution et gestion clientèle : des marges de manœuvre importantes 67
3 Un besoin de financements structurés 77
3.1 Pour généraliser l’accès aux services électriques, des montants de financement requis au-delàdes ordres de grandeur des flux de la coopération internationale 77
3.2 Principes historiques 79
3.3 Quelques clés pour fixer les niveaux tarifaires 81
3.4 Mettre en place les mécanismes de financement nécessaires pour garantir l’accès à un service 85électrique pour tous
Bibliographie 93
Liste des sigles et abréviations 97
© AFD Document de travail n° 122 • Accès à l’électricité en Afrique subsaharienne • avril 2012
5


Cette étude a été réalisée dans l’objectif de développer de
nouvelles approches et une capitalisation méthodologique
sur la thématique de l’accès pour tous aux services
électriques en Afrique subsaharienne.
La première partie de cette étude est consacrée à une
analyse des enjeux : le faible niveau de taux d’accès en
Afrique subsaharienne doit être mis en perspective avec la
nécessité de concevoir l’équipement et l’aménagement des
territoires en tenant compte des dynamiques de
développements économique et social, ainsi que des
impacts des programmes et des réformes sectorielles
entrepris dans le passé.
La deuxième partie se focalise sur des propositions
opérationnelles basées sur une revue des différentes
options techniques de production – notamment en matière
d’énergies renouvelables – dont les récentes évolutions
présentent, certes, un fort potentiel mais également des
difficultés. L’enjeu essentiel que représente la distribution
est également abordé dans ses multiples dimensions.
La troisième et dernière section porte sur les enjeux
financiers : mobiliser des financements nationaux, reflet
d’un engagement politique fort, est une nécessité ; faire le
meilleur usage possible des rares dons disponibles, un
enjeu majeur. L’analyse fine de la perception des risques
de projet et de la qualité des porteurs permet d’apporter un
éclairage sur des orientations possibles d’une ingénierie
financière à fort impact.
Résumé exécutif
1 Les enjeux de l’accès à une énergie moderne en Afrique subsaharienne
1.1 Des systèmes électriques insuffisants pour sous-tendre un développement
économique et social durable
Actuellement, le taux moyen d’accès à un service
électrique1 dans les pays d’Afrique subsaharienne2 est de
16 % des foyers au total, et moins de 5 % en zones rurales.
Depuis les années 1990, si le pourcentage a favorablement
évolué, le nombre de personnes n’ayant pas accès à l’élec-
tricité a quant à lui augmenté, en raison de la croissance
démographique.
Ainsi l’infrastructure électrique, n’atteint généralement que
moins de 20 % des localités, et ne permet donc pas de sou-
tenir un développement économique et social durable des
usages productifs (irrigation pour l’agriculture, réfrigération,
force motrice, etc.) ni des services sociaux de base (dis-
pensaires) sur l’ensemble du territoire.
La question démographique et migratoire rend cet enjeu de
l’accès à l’énergie moderne d’autant plus complexe que les
populations vivant dans des petites localités isolées et coû-
teuses à électrifier, vont tendre à s’établir dans des villes
secondaires, dotées d’infrastructures économiques et
sociales.
1 Par population ayant accès à l’électricité, on entend généralement, dans les statistiques, lespopulations ayant dans leur maison un accès à l’électricité vendue commercialement. Dansune définition plus élargie, un service par recharge de batteries ou kits solaires peut éventuel-lement être considéré comme un accès au service électrique.
2 Cette étude porte sur l’accès à l’électricité dans les pays d’Afrique subsaharienne. Les paysd’Afrique du Nord – Algérie, Egypte, Libye, Maroc et Tunisie – ne sont pas pris en comptedans les chiffres présentés.
© AFD Document de travail n° 122 • Accès à l’électricité en Afrique subsaharienne • avril 2012
7

La rentabilité potentielle d’un programme d’accès aux
services oblige à distinguer un programme d’accès visant à
équiper un territoire donné d’une infrastructure essentielle
au développement économique de la zone (où l’on trouverait
donc des centres secondaires à « potentiel économique »)
de la fourniture d’un service généralisé à l’ensemble des
habitants d’une zone, et en particulier aux plus pauvres (qui
peuvent correspondre à des populations périurbaines, à 40
voire 60 % des ménages des localités même importantes
d’un pays), ou aux populations vivant dans des petits
villages ou habitations très isolées.
Ces deux approches se basent sur deux motivations
distinctes, à savoir : une volonté de développement écono-
mique et d’aménagement du territoire pour la première ; un
objectif social, d’équité et d’équilibre géographique pour la
seconde (qui présente un coût élevé).
Se focaliser sur les « pôles de développement » en vue
d’aménager le territoire et de doter les populations d’une
infrastructure de base permet une certaine rentabilité du
service électrique grâce à la fois à la présence d’activités
économiques ainsi qu’à un certain niveau de densité de
population.
Ces villes moyennes doivent donc être considérées comme
prioritaires afin qu’elles puissent devenir de véritables
« pôles de développement » et en vue de maximiser l’im-
pact des rares ressources disponibles pour l’électrification
rurale.
Pour cela, il importe que l’aménagement du territoire s’ac-
compagne d’une vision politique claire des objectifs
(sociaux, économiques) et d’un engagement politique en
matière d’allocation des ressources.
La réponse à la question « l’accès pour quoi faire, et avec
quels moyens ? » ne doit pas pour autant en rester au plan
politique, mais conduire à une priorisation et à la déclinai-
son de plans d’actions opérationnels et réalistes, tenant
compte des réalités financières, organisationnelles et
technologiques du pays.
1.2 Le rôle clé des « pôles de développement »
1.3 Un bénéfice économique réel pour les populations
Les analyses rétrospectives ne sont que peu nombreuses,
mais un certain nombre d’idées phares en ressortent :
• les populations non raccordées au réseau paient – à utili-
sation équivalente d’électricité fournie à partir du kérosène,
de piles et batteries rechargeables – un prix de l’énergie qui
représente plusieurs fois celui des populations raccordées,
atteignant souvent 10 USD par mois. Il existe donc une
réelle capacité à payer le service électrique ;
• le coût de raccordement s’élève souvent à des montants
rédhibitoires de 100 à 300 USD, difficiles à mobiliser en une
seule fois ;
• avec le raccordement, on observe généralement un mon-
tant de dépenses constant, et donc de la consommation,
pour des prix unitaires plus faibles ; ceci est à la fois un
avantage et un frein : c’est un avantage certain pour le petit
commerce et l’artisanat, préalablement utilisateurs d’électri-
cité et donc équipés, mais le coût d’acquisition des équipe-
ments d’usages pour les nouveaux clients demeure un frein
aux consommations ;
• l’accès à l’énergie a des impacts sociaux et économiques
significatifs (éclairage public, services de santé, etc.),
même s’il est difficile de distinguer avec précision le rôle de
l’électricité de celui des autres infrastructures dans cette
amélioration des conditions de vie de la population.
Si la rentabilité économique est réelle, ce qui est en soi un
fort élément de confort dans l’allocation de ressources à ce
secteur, les questions de financement restent à résoudre.
En effet, un pays qui a encore, en milieux industriel et
© AFD Document de travail n° 122 • Accès à l’électricité en Afrique subsaharienne • avril 2012
8
urbain aisé, un faible taux d’accès à l’électricité, une
qualité de service médiocre et un besoin de financement
récurrent pour couvrir les coûts d’exploitation et d’entretien,
ne pourra que très difficilement faire de l’accès en zones
rurales et périurbaines une priorité nationale.
1.4 Des dynamiques d’accès impactées par les réformes sectorielles
Au milieu des années 1990, face au constat de l’inefficaci-
té générale des compagnies d’électricité du secteur public,
une vague de réformes systématique a été lancée, appe-
lant de ses vœux une plus forte participation du secteur
privé.
Aujourd’hui, le modèle institutionnel d’une agence et/ou un
fonds chargé(e) selon les cas, de concevoir, développer
et/ou exploiter des systèmes électriques en milieu rural
et/ou semi urbain s’est imposé. On observe néanmoins que
les pays africains ayant conservé leur société nationale
d’électricité historique présentent aujourd’hui les taux d’ac-
cès à l’électricité les plus élevés : Côte d’Ivoire, 39 % ;
Ghana, 60 % (82 % en zone urbaine et 29 % en zones
rurales) ; Afrique du Sud, 70 %. L’équilibre entre zones ren-
tables (villes, côtes densément peuplées) et zones peu ren-
tables (rurales) semble facilité par une gestion globale
unique. Faut-il pour autant à nouveau concentrer tous les
efforts sur les compagnies nationales d’électricité ? Une
réponse positive serait particulièrement discutable dans un
contexte où une rentabilité financière leur est souvent
demandée, et où l’électrification rurale et périurbaine peut
parfois sortir de leur mandat et de leurs priorités. Il faut lais-
ser aux nouvelles structures et organisations le temps
nécessaire à leur maturation avant de tirer des conclusions
définitives.
En ce qui concerne les opérateurs privés, on ne peut que
constater qu’ils ont peu de raisons de s’intéresser à l’éner-
gie en zone rurale, ce créneau étant peu rentable et com-
plexe à gérer, à moins d’un fort taux de cofinancement par
l’Etat, qui permettrait une certaine rentabilité de la conces-
sion. Toutefois, de nombreuses structures non gouverne-
mentales ont acquis une grande expérience des milieux
ruraux africains et jouent un rôle pionnier dans l’émergen-
ce de solutions techniques et organisationnelles innovantes ;
elles peuvent être des opérateurs potentiels des zones à
faibles revenus et à consommation énergétique peu éle-
vée, en collaboration étroite avec les organisations locales
d’usagers, les municipalités et les collectivités locales.
1.5 Etablir des prérogatives claires pour chacun des acteurs
La multiplication des structures – compagnie nationale,
fonds/agence, régulateur, ministère – en préalable à des
réalisations significatives, n’assure pas forcément les trois
fonctions de financement, de régulation et de mise en
œuvre. Force est de constater qu’elle engendre souvent
une dispersion des compétences et une concurrence entre
institutions pour l’appropriation de projets dotés de budgets
et pour occuper des responsabilités aux « frontières » de
ces trois fonctions.
Fonction de financement : si la large majorité des pays
d’Afrique subsaharienne sont maintenant dotés de fonds
d’électrification rurale (depuis que la compagnie d’électrici-
té n’assure plus le financement de ce sous-secteur), ces
derniers ne sont souvent que des comptes par lesquels
transitent les maigres subventions recueillies au niveau de
la coopération internationale et n’offrent pas des méca-
nismes de financement aboutis. Le rôle croissant des col-
lectivités locales pourra favoriser un changement.
Fonction de régulation : in fine, la question à laquelle le
régulateur devra répondre est celle du caractère suffisam-
ment incitatif et transparent pour attirer des investissements
du secteur privé, et dans quelles proportions. Est-il réaliste
© AFD Document de travail n° 122 • Accès à l’électricité en Afrique subsaharienne • avril 2012
9

d’envisager des concessions d’électrification rurale (avec
des investissements privés) ou faut-il plutôt envisager des
franchises, voire un affermage dans un premier temps,
avec un investissement public largement majoritaire, et un
gestionnaire privé ? Comment gérer la question de la régu-
lation tarifaire, de la péréquation ou non ? Le simple fait de
créer une agence de régulation ad hoc ne permettra pas
forcément la formulation et la mise en vigueur d’un cadre
clair et crédible.
Fonction industrielle/mise en œuvre : la compagnie
nationale a, dans le passé, joué un rôle central en agissant
à la fois en tant que société d’électricité, qui a la réelle
capacité technique et organisationnelle de réaliser un pro-
gramme d’envergure, et également en tant que contrepartie,
qui présente un bilan et un compte de résultat qui lui per-
mettent d’être un emprunteur (certes public et souvent avec
la garantie de l’Etat) sur le long terme. Le désengagement
de la compagnie nationale des géographies rurales pose la
question du développement du savoir-faire en ingénierie et
de la supervision des travaux, indispensable pour maintenir
une fourniture de qualité, sur l’ensemble du territoire.
Ces questions sont d’autant plus essentielles que les
options technologiques pour répondre aux demandes se
multiplient et se complexifient.
© AFD Document de travail n° 122 • Accès à l’électricité en Afrique subsaharienne • avril 2012
10

Historiquement, la situation d’économies d’échelle des
grands ouvrages et des interconnections légitimait une
organisation en monopole public. Ce contexte a amené à
structurer les modes et outils de financement sur de
grandes opérations en prêtant directement aux Etats, ou
avec la garantie de l’Etat. Or, depuis les années 1990, le
paradigme des technologies et de la situation financière
des contreparties a évolué.
La plupart des pays africains connaissent un important
retard d’investissement dans les grands ouvrages et
réseaux interconnectés très capitalistiques, qui s’amortis-
sent sur une longue période (en raison de la crise financiè-
re générale qui a démarré dans les années 1980) ; ce
retard affecte tant la qualité de contrepartie des compa-
gnies d’électricité que des Etats eux-mêmes.
Bon nombre de pays, bien que riches en ressources natu-
relles, se trouvent contraints d’effectuer des investisse-
ments thermiques (turbines à gaz ou fioul lourd), peu coû-
teux en capital et à temps de construction rapide, mais qui
subissent aujourd’hui de plein fouet l’augmentation du
cours des hydrocarbures.
Le paradigme des énergies renouvelables s’en trouve com-
plètement transformé :
• la production d’électricité de petite et moyenne puissance,
à partir de technologies anciennes, à base d’énergies
renouvelables, devient compétitive (c’est le cas de la petite
hydro, des gazogènes ou de la cogénération) ;
• l’industrialisation de nouvelles filières, suite à des décen-
nies de recherche, connaît un nouveau dynamisme, ren-
dant ces technologies plus fiables et baissant les coûts d’in-
vestissements (c’est le cas du photovoltaïque3 et du biogaz
industriel) ;
• les récentes évolutions de l’électrotechnique permettent
de gérer de la production distribuée sur les réseaux, en
symbiose avec un suivi fin de la demande conduisant à des
réseaux « intelligents » (smart grids) ;
• les solutions hybrides, qui permettent de combiner la
flexibilité de production d’un groupe diesel avec le faible
coût de production à long terme des énergies renouve-
lables, offrent une solution pour s’affranchir des problèmes
d’intermittence des ressources renouvelables
Ainsi, en Afrique subsaharienne, étant donné les deux
tendances actuelles à la fois de difficultés à mobiliser des
sommes importantes pour des ouvrages de production
significatifs4, et d’évolution de l’électrotechnique (qui per-
met aujourd’hui d’envisager un réseau électrique important
alimenté en de multiples points par des centrales de taille
moyenne), on s’oriente peut être vers un nouveau schéma
de production avec plus d’ouvrages de taille moyenne et
répartis, intégrés dans des réseaux « intelligents », dans un
contexte où les économies d’échelle ne jouent plus le
même rôle qu’autrefois.
Si l’extension du réseau est la première des options pour
étendre l’accès – dès lors que des ouvrages importants à
faible coût de kWh et les réseaux existent – la petite pro-
duction locale avec un réseau de distribution associé offre
de plus en plus de perspectives dans un contexte où ces
dorsales de transport de l’énergie électrique n’existent pas
encore, qui plus est avec le désengagement de la compa-
2 Un continuum de solutions techniques et organisationnelles
2.1 Cadrage technico-économique
3 Le kWh PV pour des unités de plus de 5 MW était annoncé par les constructeurs en 2009à moins de 25 cents / kWh et aux environs de 3 000 EUR/kW crête installé à l’investissementen Europe.4 A l’heure actuelle, 93 % du potentiel en énergie hydraulique économiquement réalisable surle continent africain (estimé à 937 TWh/an, soit un dixième du total mondial) reste inexploité.
© AFD Document de travail n° 122 • Accès à l’électricité en Afrique subsaharienne • avril 2012
11

gnie nationale. On dispose donc d’une « boite à outils des
technologies » très diversifiée, qui permet de répondre de
manière plus fine aux caractéristiques des demandes
rurales : extension du réseau vers des zones ayant des
besoins importants et justifiant le coût d’investissement
élevé dans les lignes ; mini réseaux avec une production
locale thermique ou hybride si la ressource est disponible,
dans les localités ayant les niveaux de demande corres-
pondants ; petite production (individuelle) répartie pour les
populations et les petits villages très isolés.
Cette évolution technologique impose aussi de faire
progresser les cadres organisationnels et contractuels qui
les portent : autoriser l’autoproduction industrielle pour ses
besoins propres et la revente de l’excédent à un tarif
intéressant ; permettre la production par des petits produc-
teurs privés indépendants, qui implique d’autoriser ces tiers
à accéder au réseau (afin de transporter l’électricité du
point de production aux lieux de consommation) et de fixer
clairement les modalités du tarif d’achat. Ces dispositions
d’un cadre réglementaire clair sont un prérequis à l’engage-
ment des opérateurs pour développer l’accès à l’énergie en
zones rurales. Pour autant, la question de la capacité à
assurer la maintenance et la mise en œuvre de ces techno-
logies au niveau local reste posée.
2.2 Des solutions techniques complémentaires au réseau interconnecté
L’électronique permet aujourd’hui l’intégration d’une
production distribuée, mobilisant les ressources locales ;
cette nouvelle possibilité impose de bien comprendre les
atouts et les faiblesses de ces filières technologiques, ainsi
que les opportunités qu’elles offrent. Il est central de
confronter cette analyse aux caractéristiques de la deman-
de, ainsi que du contexte technique et social local, car il n’y
a pas de solution idéale unique, mais bien des solutions
plus ou moins appropriées à un contexte donné.
Historiquement, en raison du coût d’investissement faible,
de la simplicité de la technologie et du court temps des
travaux, les groupes diesel ont été très largement installés
pour l’électrification des centres ruraux, ainsi que des
centres secondaires éloignés du réseau interconnecté.
Aujourd’hui, ces localités souffrent de l’explosion du prix du
carburant, tendance qui ne va pas en s’améliorant.
Paradoxe ultime : à force de maximiser la mise en place
rapide d’un service universel, ce sont les solutions
thermiques, qui sont aujourd’hui les moins coûteuses à l’in-
vestissement et les plus maîtrisés localement, qui sont
favorisées.
A contrario, malgré un fort potentiel, le très faible nombre
d’installations de pico (individuelle), micro (villageoise :
10 kW à 200-500 kW) ou mini hydro (200/500 kW à 5/15
MW) est saisissant en comparaison avec le continent asia-
tique. On dénombre très peu d’unités de fabrication de tur-
bines sur le continent africain (quelques ateliers en Ethiopie
et au Nigéria), mais de nombreux pays disposent d’une
base industrielle pour assurer la maintenance de telles ins-
tallations. Les études sont longues et coûteuses, les
risques d’hydrologie et de génie civil nécessitant des
études souvent complexes. Amortir des ouvrages de mini
ou micro hydro nécessite un certain niveau de demande, ou
la proximité du réseau auquel revendre. Cependant, une
fois l’ouvrage mis en service, il fonctionne pour ainsi dire
tout seul et à coût pratiquement nul pour une décennie à un
demi-siècle.
Tout comme l’hydroélectricité, la production d’électricité à
partir de biomasse dépend de la disponibilité locale de la
ressource. Pour ce qui est de la production d’électricité
pour les services ruraux, il existe essentiellement quatre
filières distinctes : la cogénération5, le biogaz6, le biodiesel7
et la gazéification8. Toutes, contrairement à l’hydroélectricité5 Production combinée de chaleur et d’électricité.6 Production d’un gaz pauvre pour la combustion à partir de fermentation anaérobie, qui peutéventuellement s’injecter dans un groupe diesel rectifié.7 Production de biodiesel en cycle court à partir d’oléagineux, utilisable dans des moteurs diesel.8 Pyrolyse du résidu agricole : combustion partielle et lente qui permet de produire un gaz uti-lisable dans un moteur diesel rectifié.
© AFD Document de travail n° 122 • Accès à l’électricité en Afrique subsaharienne • avril 2012
12

nécessitent au quotidien des opérateurs qualifiés et une
maintenance régulière et assez lourde des équipements. Il
convient aussi de distinguer, d’une part, le développement
de plantations dédiées à la production d’électricité, qui va
toucher à une problématique agricole et de développement
rural et, d’autre part, la valorisation de résidus agricoles ou
d’une agro-industrie. Dans la pratique, le choix de filière est
fonction du contexte : la présence d’une agroindustrie, et
donc d’une maîtrise technologique locale avec revente d’un
excédent pour l’électrification rurale, offrira des avantages
certains au plan de la maîtrise locale, alors que l’installation
d’une multiplicité de petits systèmes villageois va nécessi-
ter le développement de savoir-faire locaux.
Le photovoltaïque connait des baisses de coût de produc-
tion qui rendent le kWh PV (photovoltaïque) de plus en plus
souvent compétitif par rapport aux autres modes de
production en Afrique (en particulier les réseaux alimentés
par sources thermiques). Ainsi, alors que pendant plusieurs
décennies, les applications du PV en Afrique étaient
limitées au kit solaire ou aux applications communautaires
(santé, pompage, etc.) pour des régions isolées, cette
technologie offre des perspectives à fort impact pour
l’accès durable aux services électriques par l’alimentation
de mini réseaux (hybrides).
Poussés par les grands programmes européens, japonais
et américains qui ont engendré des investissements impor-
tants dans les capacités de production ainsi que dans
l’électronique d’intégration des renouvelables aux réseaux
(smart grids), les industriels ont largement développé leur
capacité de production et ont désormais atteint le « un euro
du Watt crête » pour les panneaux. Ce pourrait bien
devenir la première option d’hybridation car l’ensoleille-
ment, constant sur le territoire, est une ressource moins
difficile à mobiliser que la biomasse ou l’hydraulique. Les
points faibles du PV demeurent sa production nécessaire-
ment diurne (alors qu’en zones rurales, la demande est
souvent nocturne), ainsi que son coût d’investissement
particulièrement élevé, qui nécessite une ingénierie
financière complexe.
2.3 Distribution et gestion clientèle : des marges de manœuvre importantes
Une fois le choix du mode de production effectué (énergies
renouvelables, extension réseau, groupe diesel), se pose la
question de la distribution vers les foyers et de la gestion
clientèle. Soulignons que l’objectif d’accès pour tous
n’implique pas automatiquement un même niveau de
service pour tous, car tous les usagers n’ont pas les mêmes
besoins en quantité d’énergie (moteurs ou éclairage) ou en
qualité de service (service 24h/24 ou quelques heures par
jour). La mise en place de systèmes de pico-électrification9
permet aux populations sans connexion individuelle mais
établies dans la « zone de couverture », d’accéder à un
service minimal ; si ces systèmes permettent de diminuer
l’exclusion de certaines populations, il serait erroné de les
considérer comme étant forcément couvertes et donc non
éligibles à un service « plein ».
Il existe un fort potentiel de diminution des coûts ; encore
faut-il prendre le temps de bien choisir parmi les options
offertes. En effet, outre la question de l’adaptation des
normes à la demande, les pratiques usuelles conduisent
souvent à surestimer cette dernière et, donc, à surdimen-
sionner les réseaux (section des câbles, capacités des
transformateurs). On peut arriver à une diminution pouvant
9 Par pico-électrification, on entend des services de recharge de batterie ou encore des sys-tèmes portables faisant appel à des équipements (lampes, etc.) très efficaces et parfois asso-ciés à un petit panneau individuel.
© AFD Document de travail n° 122 • Accès à l’électricité en Afrique subsaharienne • avril 2012
13
aller jusqu’à 30 % des coûts d’investissements, en faisant
évoluer ces pratiques ainsi que les politiques d’achat et la
gestion des programmes.
En matière de gestion, la distribution par le réseau corres-
pond à une vente unitaire d’énergie (compteur), alors que
la distribution d’électricité dans des zones à faibles
demandes correspond souvent à une vente de service
(nombre de points lumineux, heures de service, etc.). De
plus en plus, en zones rurales, la société civile et les ONG
locales ou organisations villageoises prennent en charge la
gestion de la clientèle, voire de la distribution. Cette
évolution convient bien à la société d’électricité qui
l’appelle souvent de ses vœux, car elle préfère en effet
vendre en gros à un seul distributeur. On observe actuelle-
ment un foisonnement d’innovations contractuelles en la
matière. L’innovation peut ainsi ne pas être technique mais
fondée sur des dispositifs sociaux qui permettront de
faciliter l’accès. En outre, certains outils et méthodes
(compteurs intelligents, à prépaiement, ou collectifs) per-
mettent d’améliorer l’efficacité de la gestion et d’augmenter
le taux de couverture de la clientèle.
© AFD Document de travail n° 122 • Accès à l’électricité en Afrique subsaharienne • avril 2012
14

Les évolutions technologiques impliquent de nouveaux
schémas techniques et d’organisation ; ces changements,
nous l’avons vu, engendrent des configurations de risques
de projet et de contrepartie, ainsi que des profils de
rentabilité et de cash flow différents que par le passé. Qui
plus est, dans la mesure où l’on cherche à mobiliser des
investisseurs privés, il est clair que leurs attentes en termes
de rentabilité et leur perception des risques seront très
différentes de celles d’une structure de service public.
L’opérateur privé, suivant qu’il est une entreprise ou la
communauté locale, aura aussi certaines attentes
concernant sa rémunération. Les instruments de finance-
ment doivent ainsi être repensés afin d’offrir, entre autres,
des maturités plus longues et des mécanismes de partage
des risques suffisamment attractifs pour mobiliser les
acteurs visés.
3 Un besoin de financements structurés
3.1 Pour généraliser l’accès, mobiliser des montants de financement supérieurs aux flux
actuels de la coopération internationale
L’Agence internationale de l’énergie (AIE) estime qu’avec
un investissement de 35 Md USD/an (soit 6 % de l’investis-
sement prévu dans le secteur de l’électricité), la question
de l’accès de près de 1,6 milliard de personnes à l’énergie
moderne serait résolue à l’horizon 2030. On est bien loin de
ces ordres de grandeur, à en juger par une revue de la
Banque mondiale sur son propre portefeuille, où l’on
constate que les flux annuels se limitent à 500 M EUR.
Rappelons toutefois qu’aucun pays n’a atteint des taux
d’accès significatifs sans un effort national conséquent ;
il serait donc illusoire de ne compter que sur les flux
internationaux pour résoudre le problème.
3.2 Pierres d’achoppement : péréquation tarifaire et modes de subvention
Le secteur électrique en lui-même est loin de générer les
surplus permettant d’autofinancer les investissements
nécessaires à l’extension du service. Le taux d’électrifica-
tion initial étant très faible en Afrique subsaharienne (10 à
20 %), les subventions croisées ne permettront pas à elles
seules d’atteindre des taux d’accès d’envergure.
Dans les zones rurales et périurbaines, le poids des clients
domestiques dans la tranche sociale (généralement à
niveau tarifaire faible) ainsi que les coûts d’investissement
élevés (dus à l’isolement rural), impliquent des coûts du
kWh beaucoup plus élevés qu’en zone urbaine mixte. Afin
de mieux refléter les coûts, et arguant des dépenses
énergétiques élevées avant électrification (kérosène, piles,
etc.), certains pays justifient et appliquent la différentiation
des tarifs sur le territoire en fonction des coûts. Même si ces
tarifs demeurent inférieurs à une solution hors réseau, cette
application ne résout pas pour autant la question de l’ac-
ceptabilité sociale de ces tarifs différenciés. Cette question
est renforcée par le fait que, dans les pays fortement
dépendants aux hydrocarbures, les distributeurs sont de
plus en plus autorisés à effectuer des ajustements tarifaires
pour refléter leurs coûts de carburants.
© AFD Document de travail n° 122 • Accès à l’électricité en Afrique subsaharienne • avril 2012
15

Il est, à l’évidence, nécessaire de repenser l’approche
même du financement de l’électrification rurale, et certaine-
ment d’envisager des approches innovantes fondées sur
une nouvelle relation entre technologie, organisation et
financement.
On ne peut se passer de financements à très long terme
(trente ans et plus), voire d’une subvention10 initiale, pour
le financement des investissements en milieu rural (ce qui
a été, et demeure parfois encore, le cas de l’ensemble des
pays de l’Organisation de coopération et de développement
économiques – OCDE). L’implication de l’Etat, qui peut se
refinancer, est nécessaire.
Dans ce contexte, les fonds d’électrification rurale doivent
être amenés à jouer le rôle de véritables intermédiaires
financiers : ils doivent impérativement être plus qu’une
simple caisse par laquelle transitent les dons, ne serait-ce
que parce que les montants disponibles sont très loin d’être
à la hauteur des investissements nécessaires. L’utilisation
de ces dons (précieux et rares) comme catalyseur de prêts
apparaît comme une évidence : en bonification de prêts
(allongement du terme suivant le profil des cash flows des
projets ou de la baisse du taux) ; en préparation de projets
de qualités pour conforter investisseurs et financeurs ; en
garantie partielle pour mieux partager les risques de projet
et de contrepartie, et donc mobiliser des financements
privés et bancaires ; etc. Les banques locales, qui n’offrent
de concours que sur des périodes de l’ordre de cinq ans au
maximum, ne souhaitent en réalité pas s’engager sur ce
secteur à faible rentabilité, sauf dans le cas de banques de
développement à mandat particulier. Les investisseurs,
quant à eux, sont réticents à mobiliser un capital sur des
projets qui ne permettent que des temps de retour sur
investissement long, dans des contextes où les cadres
réglementaires et politiques restent à stabiliser. Sur ce type
d’investissements de long terme, le partage des risques est
bien au cœur de la problématique de mobilisation de
l’épargne nationale et, plus largement, des investisse-
ments.
3.3 Adapter les mécanismes de financement au profil de risque et de rentabilité des
projets d’accès
© AFD Document de travail n° 122 • Accès à l’électricité en Afrique subsaharienne • avril 2012
16
10 Ou, plus généralement, d’emprunts concessionnels.

Tableau 1. Financements AFD et FFEM (1993-2008) dans le domaine de l’électrification rurale (M EUR)*
AFD FFEM
Burkina 0,38 0,22
Mauritanie 2,21 0,76
Tunisie 13,72
Maroc - PERG prêt 1 30,49
Maroc - PERG prêt 2 45,73
Maroc - PERG prêt 3 50,00
Maroc - PERG solaire
Maroc - PERG prêt 5 45,00
Afrique du Sud 41,44
Kenya - urbain 25,00
Kenya - rural 30,00284,00 1,00
Total 284,95100 %
Moyenne annuelle 18,9 0,10
Afrique subsaharienne 57,60 1,00
Lecture du tableau. Si l’on inclut le Maroc, la Tunisie et
l’Afrique du Sud, les financements dans le domaine de l’ac-
cès aux services électriques ont totalisé un investissement
global de 284 M EUR sur le continent africain au cours des
15 dernières années (1993-2008), et seulement 57,6 M EUR
en Afrique subsaharienne – soit moins de 4 M EUR/an.
Ils se concentrent sur trois pays d’ Afrique subsaharienne :
Le Burkina Faso, le Kenya, la Mauritanie et l’électrification
rurale dite « décentralisée » ne représente que 1 % des
engagements financiers globaux de l’AFD dans le secteur.
* PERG : Programme d'électrification rural global.
Source : auteurs.
© AFD Document de travail n° 122 • Accès à l’électricité en Afrique subsaharienne • avril 2012
17
Introduction
Le développement de l’accès11 à un service énergétique
moderne fait partie des domaines d’intervention de l’AFD,
qui inscrit ses interventions de financement dans le cadre
des objectifs du Millénaire pour le développement (OMD).
Ceux-ci visent à soutenir la croissance économique,
réduire la pauvreté et favoriser la préservation de
l’environnement.
Les orientations stratégiques actuelles de l’AFD et le consen-
sus mondial sur l’enjeu de l’accès à un service énergétique
moderne, en lien avec les OMD (cf. encadré 1), ont conduit
cette institution à retenir ce domaine d’intervention comme un
secteur d’importance croissante et, dans le cadre du présent
travail, à se focaliser sur l’accès au service électrique.
Cette étude a été réalisée dans l’objectif de développer de
nouvelles approches et une capitalisation méthodologique
sur la thématique de l’accès pour tous aux services
électriques en Afrique subsaharienne. C’est pourquoi
l’analyse rétrospective, déjà largement documentée, ne
fera l’objet que de passages succincts servant de base à la
formulation d’approches concrètes. Si l’expérience de
l’AFD dans le secteur a été largement analysée, pour
autant, les projets de l’AFD dans le domaine de l’accès au
service électrique ne représentent, à ce jour, qu’une partie
modeste à la fois de son propre portefeuille et de l’en-
semble des projets d’accès aux services électriques en
Afrique subsaharienne.
11 Par accès on entend à la fois en zones rurales et urbaines.

© AFD Document de travail n° 122 • Accès à l’électricité en Afrique subsaharienne • avril 2012
18
Objectif 1 - Réduire l'extrême pauvreté et la faim
Réduire de moitié, entre 1990 et 2015, la part de la population dont le revenu est inférieur à un dollar par jour.
Réduire de moitié, entre 1990 et 2015, la part de la population qui souffre de la faim.
L’accès à des services énergétiques abordables permet le développement des entreprises.
L’éclairage permet de prolonger l’activité commerciale au-delà des heures d’éclairage naturel.
L’utilisation de machines améliore la productivité.
La fourniture d’énergie peut être assurée par des entreprises locales de petite taille, créatrices d’emploi.
La privatisation des services énergétiques peut lever des fonds gouvernementaux pour l’investissement dans les services sociaux.
Les combustibles propres et efficaces réduisent la part importante des revenus des ménages dépensés pour la cuisson, l’éclairage et le
chauffage.
95 % des aliments de base doivent être cuits avant d’être consommés, et nécessitent de l’eau pour leur cuisson.
Pertes d’après récolte réduites grâce à une meilleure conservation : séchage/fumage/réfrigération/ congélation.
L’énergie pour l’irrigation permet d’améliorer la production de nourriture et l’accès à une meilleure nutrition.
Objectif 2 - Assurer l’éducation primaire pour tous
D’ici à 2015, donner à tous les enfants, garçons et filles, partout dans le monde, les moyens d’achever un cycle complet d’études primaires.
L’énergie permet l’accès à l’eau, l’hygiène, l’éclairage et des espaces chauffés/tempérés, participant à la réduction des taux d’absentéisme
et d’abandon par la création d’un meilleur environnement pour les enfants et les enseignants.
L’électricité permet l’accès dans les écoles et les foyers aux médias à des fins de communication et d’éducation (éducation à distance).
L’accès à l’énergie permet l’utilisation d’équipements utiles à l’enseignement : rétroprojecteurs, ordinateurs, imprimantes, photocopieurs,
équipements scientifiques, etc.
Les systèmes énergétiques modernes et les bâtiments à conception efficace réduisent les coûts énergétiques et, par conséquent, le coût de
l’école, permettant aux familles les plus pauvres un meilleur accès à l’éducation.
Objectif 3 - Promouvoir l’égalité des sexes et l’autonomisation des femmes
Éliminer les disparités entre les sexes dans les enseignements primaire et secondaire d’ici à 2005 si possible et à tous les niveaux de l’en-seignement en 2015 au plus tard.
La disponibilité de services énergétiques modernes libère les filles et les jeunes femmes du temps alloué aux activités de survie (collecte de
bois de chauffe, d’eau, cuisson inefficace, récoltes manuelles).
Les équipements de cuisson propres réduisent l’exposition à la pollution de l’air et les effets néfastes sur la santé.
Les éclairages de qualité permettent d’étudier à la maison et de suivre des cours du soir ; l’éclairage public améliore la sécurité des femmes ;
des services énergétiques abordables et de qualité ouvrent la voie aux entreprises féminines.
Objectif 4 - Améliorer la santé maternelle
Réduire de trois quarts, entre 1990 et 2015, le taux de mortalité maternelle.
Les services énergétiques sont requis pour permettre l’accès à de meilleurs services médicaux pour les mères, tels que la réfrigération des
médicaments, la stérilisation des équipements et des salles d’opérations
Le travail excessif et de lourds travaux manuels peuvent endommager la santé générale d’une femme enceinte.
Encadré 1. Le rôle de l’énergie dans l’atteinte des OMD

© AFD Document de travail n° 122 • Accès à l’électricité en Afrique subsaharienne • avril 2012
19
La Banque mondiale est la principale institution internatio-
nale engagée dans le financement de l’accès aux services
énergétiques modernes. Ses financements dédiés à l’accès
(Banque internationale pour la reconstruction et le dévelop-
pement – BIRD, Association internationale de développe-
ment – IDA et Fonds pour l’environnement mondial – FEM)
s’inscrivent dans un financement global du secteur
électrique comprenant la production, le transport et la
distribution. Pour la période 2000-2008, environ 35 % des
montants alloués avaient une composante « accès au
service électrique ». Le total des financements s’élevait à
5,6 Md USD, soit une moyenne annuelle de 627 M USD qui
s’est accélérée sur la période, passant d’environ 500
M USD/an entre 2000 et 2005 à environ 800 M USD/an
entre 2005 et 2008. Une analyse plus fine montre que deux
pays (l’Ethiopie et le Ghana) ont reçu presque la moitié des
financements alloués à l’« accès au service électrique »,
soit plus de 400 M USD/an. A titre de comparaison, ce
montant est similaire aux financements alloués par l’AFD à
l’Office national de l’électricité (ONE) pour le Programme
d'électrification rural global (PERG) durant une dizaine
d’années.
L’Union européenne est devenue un acteur important du
financement de l’accès à l’énergie et des projets d’énergies
renouvelables sur le continent africain : outre la réalisation
de projets dans le cadre des programmations nationales ou
régionales, elle a lancé en 2006 un programme sectoriel
– la Facilité énergie – qui concerne spécifiquement la
problématique de l’accès. Entre fin 2007 et mi-2008,
75 conventions ont été signées pour un budget global
consolidé de 435 M EUR, dont 45 % (198 M EUR) financés
en subvention par la Facilité énergie. Une seconde tranche
d’un montant équivalent a été lancée pour la période
2010-2011. Notons aussi que la coopération bilatérale
allemande joue également un rôle significatif dans le
domaine des énergies renouvelables.
La première partie de cette étude sera consacrée à une
analyse des enjeux de l’accès aux services électriques en
Afrique subsaharienne, à partir de laquelle une approche
sera élaborée afin d’aboutir à des propositions opération
nelles. On ne peut que constater le faible niveau de taux
d’accès, mais que dire des dynamiques économiques et
sociales dans une perspective d’équipement du territoire ?
Nous chercherons à tirer les enseignements d’une analyse
des impacts des programmes passés, ainsi que des
réformes sectorielles pour proposer une approche
méthodologique qui sera fonctionnelle.
La deuxième partie de l’étude est consacrée à des proposi-
tions opérationnelles, basées sur une revue des différentes
options de production. Seront particulièrement analysés les
évolutions remarquables des énergies renouvelables et les
enjeux essentiels de la distribution.
La troisième et dernière section portera sur les questions
de financement, la nécessité de mobiliser des
financements nationaux et de faire levier sur les dons.
Objectif 5 - Combattre le VIH/SIDA, le paludisme et d’autres maladies
D’ici 2015, avoir stoppé la propagation du SIDA, du paludisme et autres maladies majeures, et commencé à inverser la tendance.
L’électricité dans les dispensaires permet leur ouverture la nuit, la rétention du personnel qualifié, l’utilisation d’équipements spéciaux
(stérilisation, réfrigération des médicaments), l’entreposage des vaccins et des médicaments.
L’énergie est requise pour le développement, la fabrication et la distribution de médicaments et vaccins.


1.1.1 En Afrique, les taux d’accès des
populations restent faibles après plusieurs
décennies de progression décevante
Défi pour le développement, infrastructure reconnue néces-
saire pour atteindre les OMD, l’accès aux services
électriques occupe une place de plus en plus importante
dans les politiques de développement des Etats africains et
dans la stratégie d’appui au développement de la
communauté internationale.
Actuellement, le taux moyen d’accès des foyers à un servi-
ce électrique12 dans les pays d’Afrique subsaharienne13
est de 16 %, et de moins de 5 % en zones rurales. Depuis
les années 1990 environ, si le pourcentage a favorable-
ment évolué, le nombre de personnes sans accès à un ser-
vice électrique a, quant à lui, augmenté, en raison de la
croissance démographique.
1 L’accès aux services électriques en Afrique subsaharienne : enjeux etapproche méthodologique
1.1 Des infrastructures et des systèmes électriques insuffisants pour sous-tendre un
développement économique et social durable : les défis à relever
Carte 1. Taux d’accès aux services électriques sur le continent africain
Source : auteurs.
12 Tout au long de ce document, par population ayant accès à l’électricité, on entend lespopulations ayant dans leur maison un accès à l’électricité vendue commercialement.13 Cette étude porte sur l’accès à l’électricité dans les pays d’Afrique subsaharienne. Les
pays d’Afrique du Nord – Maroc, Algérie, Tunisie, Libye et Egypte – ne sont pas pris en comp-te dans les chiffres présentés.
Population ayant accès à l’électricité
(% de la population totale)
Pas de données<1010...2020...3030...50>50
© AFD Document de travail n° 122 • Accès à l’électricité en Afrique subsaharienne • avril 2012
21

Ce pourcentage doit cependant être relativisé. Un foyer
branché au réseau peut en effet en faire bénéficier
plusieurs autres, par branchement plus ou mois « pirate » ;
les services de recharge de batteries permettent un service
minimal d’éclairage et d’accès à l’audiovisuel aux ménages
non raccordés ou vivant dans des localités aux alentours.
Le défi à relever est de taille : les pays d’Afrique subsaha-
rienne ont, par rapport au reste du monde, les taux les plus
faibles d’accès à l’électricité, tant en matière d’accès des
personnes à un service à leur domicile, qu’en matière de
taux d’électrification des localités. A titre d’exemple, en
Inde, si le taux d’accès de la population se limite à 40 % en
zones rurales et à 60 % en zones urbaines, plus de 95 %
des localités sont desservies. L’infrastructure permet ainsi
des usages productifs (irrigation pour l’agriculture) et le
fonctionnement des services de sociaux de base (dispen-
saires) sur l’ensemble du territoire. C’est loin d’être le cas
en Afrique subsaharienne, où l’infrastructure électrique,
bien moins étendue, n’atteint généralement que moins de
20 % des localités.
Angola 16 13 7,4 15
Bénin 9 79 60,2 22 26
Botswana 1,758 3 42,6 39 27 2
Burkina Faso 14 50 82,1 17 75 3 1
Burundi 8 305 90,3
Cap-Vert 0,518 129 42,7
Cameroun 17 36 46,3 47 5 20
RCA 4 7 62,1 <1 0,2
Tchad 10 8 75,1 1
Comores 0,614 275 63 50
Congo (Rép. dém.) 59 26 68,4 6 20 1 1
Congo RDC 4 12 40,2 20 44,6 5,6
Côte d'Ivoire 18 58 55,4 39 8 26
Djibouti 0,806 35 13,9
Guinée équatoriale 0,515 18 61,1
Erythrée 5 45 80,9 20 82 2
Ethiopie 73 73 84,2 22 22 <1
Gabon 1,406 5 16,4 48
Gambie 1,553 155 46,1 5
Ghana 23 99 53 49 82
Guinée 9 37 67,4 6 35 1
Guinée-Bissau 1,633 58 70,4 5
Kenya 35 62 79,5 14 29 6,8
Lesotho 1,789 59 81,3 11
Liberia 3,38 35 59,5
Madagascar 19 33 73,4 1 5 4
Malawi 13 140 83,2 7 30 1
Mali 14 11 70,0 16 30 5
Tableau 2. Taux d’accès au service électrique et d’électrification dans les zones urbaines et rurales de 48 pays
d’Afrique subsaharienne (en 2004, 2005, 2006, 2008 et 2009)
Pays
Population
totale (millions)
Densité
(hab./km²)
Pourcentage de la
population vivant
en zone rurale
Pourcentage de la
population ayant
accès à l'électricité
Pourcentage de la
population ayant
accès à l'électricité
en zone urbaine
Pourcentage de la
population ayant
accès à l'électricité
en zone rurale
Pourcentage des
localités alimentées
© AFD Document de travail n° 122 • Accès à l’électricité en Afrique subsaharienne • avril 2012
22

Mauritanie 3 3 59,7
Maurice 1,253 617 57,6 94
Mozambique 20 26 66,3 6 17 0,6
Namibie 2 2 65,4 34
Niger 14 11 83,3 8 30 0,1 1
Nigeria 145 159 52,7 20
Rwanda 9 375 81,8 <1
Sao Tomé et Principe 0,16 167 42,0
Sénégal 12 62 58,6 32 67 4,5 15
Seychelles 0,86 186 47,1 <1
Sierra Leone 6 79 60 5
Somalie 8,485 14 36,1
Afrique du Sud 47 39 41,2 70 85 52
Soudan 37 16 60,1 15
Swaziland 1,126 65 75,9 1
Tanzanie 38,5 25 76,2 11 36 2
Togo 6 116 60,6 12 17 3 18
Ouganda 30 152 87,5 9 21 2,1
Zambie 12 16 65 19 25 1,4
Zimbabwe 13 34 64,5 34 80 18
Sources : Banque mondiale (2008), PNUD (2007), CEDEAO et UEMOA (2006), Review of national framework for involvement of agro-industries in rural electri-fication, projet PACEAA (Poverty Alleviation through Cleaner Energy for Agro-Industry in Africa), 2009, Mostert (2008), African Energy Policy Research Network(AFREPEN), 2004, données récoltées dans le cadre du Club des agences d’électrification rurale, enquête congolaise des ménages (2005), ministère de l’Energieérythréen, Réseau international d’accès aux énergies durables (RIAED), 2005.
© AFD Document de travail n° 122 • Accès à l’électricité en Afrique subsaharienne • avril 2012
23
Pays
Population
totale (millions)
Densité
(hab./km²)
Pourcentage de la
population vivant
en zone rurale
Pourcentage de la
population ayant
accès à l'électricité
Pourcentage de la
population ayant
accès à l'électricité
en zone urbaine
Pourcentage de la
population ayant
accès à l'électricité
en zone rurale
Pourcentage des
localités alimentées

Carte 2. Part de la population rurale dans la population en Afrique subsaharienne
<5050...70>70
Population rurale% de la population totale
Source : PNUD (2008).
Ce sont, entre autres, l’absence de services publics de
base (eau, électricité, accès aux soins), la pénibilité et les
aléas des activités rurales, ainsi que le manque
d’alternatives qui poussent les populations à quitter les
campagnes. Les infrastructures urbaines ploient sous cette
pression démographique et l’absence de plans
d’urbanisation et d’aménagement (ou, lorsqu’ils existent, le
manque de volonté politique et de moyens pour les mettre
en œuvre et les respecter) conduit à la multiplication des
zones d’habitats précaires et/ou non contrôlées. Dans
© AFD Document de travail n° 122 • Accès à l’électricité en Afrique subsaharienne • avril 2012
24
1.1.2 Maximiser l’impact économique et social
dans une dynamique d’urbanisation accélérée :
les pôles de développement
“African urbanization is a poverty-driven process and not
the industrialization-induced socio-economic transition it
represented in the world’s other major regions”14
(L’urbanisation africaine est un processus engendré par la
pauvreté, et non la transition socioéconomique, induite par
l’industrialisation, comme cela a été le cas dans les autres
grandes régions du monde), UN-Habitat, 2008.
Quels sont les défis principaux à relever pour aboutir à des
avancées réelles ? Si l’Afrique est encore le continent le
moins urbanisé au monde, le taux d’urbanisation est déjà
supérieur à 60 % dans une vingtaine de pays.
Entre 1980 et 2030, le Programme des Nations unies pour
le développement (PNUD) prévoit que la population
africaine totale sera multipliée par 3 ; la population rurale
par 2 ; la population urbaine par 7. Ainsi, alors que le
pourcentage de la population urbaine est déjà passé de 24 %
à 33 % entre 1980 et 2000, il devrait continuer de croître
jusqu’à atteindre 48 % en 2030.
14 PNUD (2008),“The State of African Cities”.

quinze grandes villes africaines, l’accès à l’électricité dans
les bidonvilles est en moyenne de 11 %15.
Contrairement à l’histoire de l’électrification dans les pays
industrialisés, ce ne sont pas la croissance économique et
l’emploi générés par l’industrialisation qui engendrent la
migration rurale (avec un bassin de population ayant des
revenus et une richesse globale permettant d’investir dans
les infrastructures). Ce sont en effet bien souvent
l’insécurité, la précarité économique et le rêve d’un
« eldorado urbain » qui poussent les populations hors des
zones rurales vers zones urbaines précaires.
D'une analyse de la répartition de la population selon la
taille des localités16, il ressort qu’il existe un stade
intermédiaire entre la grande ville et les zones rurales
isolées, qui rassemblent encore un pourcentage non
négligeable de la population totale.
Graphique 1. Répartition de la population en fonctionde la taille des localités
Source : auteurs d’après CEMAC, CEDEAO.
Lecture du graphique. Plus d’un quart de la population d’un
échantillon de pays des zones de la Communauté écono-
mique et monétaire d'Afrique centrale (CEMAC) et de la
Communauté économique des pays d'Afrique de l'Ouest
(CEDEAO) vit dans des agglomérations de plus de 2 000
habitants. C’est (en moyenne) le cas pour 27 % de la popu-
lation du Burkina Faso, du Mali, du Niger et de la
République de Côte d’Ivoire (RCI) ; 32 % vivent dans des
localités de plus de 10 000 habitats (i.e. en zone urbaine,
sur le graphique). Dans les pays de la CEMAC (Cameroun,
Congo, Gabon, Guinée équatoriale et Tchad), 30 % de la
population vit dans des localités de plus de 1 000 habitants
(en moyenne), et 51 % en zone urbaine.
Une étude, menée17 en Amérique latine sur la place des
villes intermédiaires dans l’urbanisation globale, met en évi-
dence l’attraction des mégalopoles (i.e. villes de plus d’un
million d’habitants) et leur rapidité d’expansion : leur
nombre est passé de 83 à 325 durant la deuxième moitié du
XXe siècle, au détriment de la croissance des villes d’impor-
tance secondaire. Pourtant, par leurs liens plus étroits avec
les zones rurales, et les services proposés non seulement
aux citadins, mais également aux populations rurales envi-
ronnantes, ces centres intermédiaires représentent une
opportunité dans les interactions entre zones urbaines et
zones rurales. Il est donc crucial de donner à ces localités
les moyens de jouer ce rôle charnière, et de développer leur
attractivité pour les populations qui n’envisagent plus leur
avenir en zones rurales.
De plus, la présence d’activités économiques et de niveaux
de population importants et concentrés permettent, dans
une certaine mesure, une rentabilité du service électrique.
Deux possibilités techniques sont alors envisageables :
l’extension du réseau pour les centres proches du réseau
existant, ou bien la production isolée, avec le développe-
ment d’un mini réseau pour desservir la zone définie.
1.1.3 La question du service aux localités
isolées
L’électrification des localités isolées représente un investis-
sement important, pour un faible nombre de clients, dispo-
sant généralement d’une capacité à payer très limitée. Ces
localités ne présentant généralement pas de perspective de
création de richesse, se posent alors les questions de ren-
tabilité et de pérennisation (qui imposent un recours majeur
à l’aide publique, limitée et aléatoire, qui nuit gravement à
la pérennité des projets). Qui plus est, les densités de popu-
15 PNUD (2008), ibid.16 Etudes menées dans les zones de la CEMAC et de la CEDEAO/IED.17 Cf. Bolay et Rabinovich (2004).
© AFD Document de travail n° 122 • Accès à l’électricité en Afrique subsaharienne • avril 2012
25

lation sont faibles en Afrique subsaharienne, comparées à
la densité de la France (100 hab/km²) et de l’Europe en
général (115 hab/km2) ; les densités sont particulièrement
faibles en Afrique centrale. Or, plus la densité est faible,
plus le coût de connexion d’un foyer est élevé, comme
l’illustre l’évolution des coûts du PERG au Maroc (gra-
phique 3).
Carte 3. Densités de population en Afrique
<10
10...30
30...70
70...150
>150
Ces larges zones peu denses et coûteuses à desservir, où
vivent des populations ayant de faibles revenus, ne sont
donc pas rentables. Et les populations vivant dans ces loca-
lités très dispersées vont inexorablement être amenées à
se concentrer quelque peu. La responsabilité revient donc
au politique et au planificateur de décider, en toute connais-
sance de cause, de l’allocation des ressources vers telle ou
telle zone et d’effectuer le choix de la technologie la plus
appropriée, en se focalisant en priorité sur les « pôles de
développement ».
"In the foreseeable future, the intermediate cities (towns
with less than 500,000 inhabitants) will be the localities
where two-thirds of all African urban growth is occurring.
With most of its rapid urban growth adding to the
populations of its intermediate-size cities, Africa needs to
focus on building capacity among its small and medium-
sized cities to deliver and facilitate adequate housing,
livelihoods and services for spiralling numbers of poor urban
dwellers." 18
(Dans un futur proche, les villes intermédiaires – i.e. de
moins de 500 000 habitants – seront les lieux où se produi-
ront les deux tiers de la croissance urbaine de toute
l’Afrique. Compte tenu de la croissance démographique de
ses villes intermédiaires, exacerbée par la rapide croissan-
ce urbaine, l’Afrique doit se concentrer sur le renforcement
des capacités de ses villes de petite et moyenne taille pour
offrir et faciliter la disponibilité de logements, de moyens de
subsistance et de services pour les cohortes d’urbains
pauvres.)
18 Source : UN-Habitat (2008).
Source : PNUD (2008).
© AFD Document de travail n° 122 • Accès à l’électricité en Afrique subsaharienne • avril 2012
26
Densité de la populationHabitants au Km 2

Pour que les ressources disponibles, mais rares, aient un
impact maximal, il est essentiel d’avoir une vision politique
claire des objectifs (sociaux, économiques) et de s’engager
politiquement, tout en s’assurant que l’on dispose effective-
ment des opérateurs qui puissent fonctionner dans un
cadre contractuel clair.
Conjuguant le choix technico-économique et l’opérateur
responsable, on peut distinguer les segments suivants :
1- l’extension du réseau électrique dans le cadre de la
concession nationale de la compagnie d’électricité (natio-
nale ou privatisée) ;
2- l’électrification des bourgs et des centres secondaires et,
plus largement, des pôles de développement hors de la
concession nationale de la compagnie d’électricité : d’un
point de vue technique, ces localités peuvent être
alimentées par le réseau national ou par des moyens de
production locaux avec un réseau de distribution moyenne
tension (MT) et basse tension (BT) associé qui peut
intégrer une seule ou plusieurs localités ;
3- l’électrification des localités très isolées et de petite taille,
où l’extension du réseau serait très coûteuse, se fait
généralement par des systèmes individuels ou limités aux
services communs – typiquement le PV, ou encore par
réseaux villageois (généralement diesel) – ;
4- l’électrification périurbaine, c’est à dire des quartiers
situés à la périphérie des grandes agglomérations et, plus
largement, la question de la densification des connections,
qui est donc celle de l’accès généralisé des populations,
une fois le service disponible dans la zone.
En conjuguant option technico-économique et institution en
charge, on aboutit à la segmentation suivante (tableau 3) :
1.2 Systématiser une vision et une planification opérationnelle globale : l’accès pour
quoi faire, et avec quels moyens ?
Viable économiquement
Non rentable, nécessite un
soutien public
Grisé : peut être assuré par
l’opérateur national
Tableau 3. Segmentation des contextes d’accès au service électrique
Source : auteurs.
Lecture du tableau. Les schémas A et B sont partie intégrante d’une politique de développement d’un pays et de l’amé-
nagement de son territoire ; les schémas C et E se conçoivent dans une logique de complément spatial au schéma B
(et fonction des ressources disponibles) ; les schémas D et F ont des coûts d’investissement et de gestion importants
qu’il faut chercher à maîtriser (on mettra en évidence leurs spécificités organisationnelles et techniques).
* Agence d’électricité rurale ou Fonds d’électricité rurale
© AFD Document de travail n° 122 • Accès à l’électricité en Afrique subsaharienne • avril 2012
27
Compagnie d’électricité
(Publique ou privée)AER ou FER*
Opérateurs spécialisés
(ONGs, ministères…)
Electrification des pôles de
développement à l’intérieur des zones
de concession principale
Viable
A
Electrification des pôles en dehors des
zones de concession principales
Viable
BViable
Localités isoléesNon rentable Non rentable
C
Non rentable
E
Zones périurbainesNon rentable
D
Non rentable
F

Il importe d’être lucide quant à la rentabilité potentielle d’un
programme d’accès aux services et donc de distinguer19 :
1- un programme d’accès visant à équiper un territoire
donné d’une infrastructure essentielle au développement
économique de la zone, où l’on trouverait donc des centres
secondaires à « potentiel économique ». Un tel programme
« d’aménagement du territoire » se caractérise par des
niveaux de consommation unitaires plus importants et une
capacité à payer plus élevée qui, associés à une densité
plus élevée de population (et donc à des coûts d’investisse-
ments mieux maîtrisés), présentent une certaine
perspective de rentabilité. On ne cherchera pas forcément
à ce stade à connecter 100 % de la population ;
2- le fait d’apporter un service généralisé à l’ensemble des
habitants d’une zone, et en particulier aux plus pauvres, i.e.
les populations périurbaines, 40 à 60 % des ménages des
localités (même importantes) d’un pays et les populations
vivant dans des petits villages ou des habitations très
isolées. Les niveaux de consommation de ces clients ne
sauraient dépasser 50 kWh/mois, et représentent des
dépenses maximales de 5 EUR/mois. A ceci s’ajoute le fait
que, plus la population est dispersée, plus le coût d’inves-
tissement par connexion sera élevé. Dans ces zones, le
paradigme de base est une subvention totale des
investissements et un tarif qui permet de couvrir les frais de
fonctionnement.
Ces deux approches tiennent de deux motivations
distinctes, à savoir : une volonté de développement
économique et d’aménagement du territoire pour la
première ; un objectif social d’équité et d’équilibre
géographique pour la seconde (qui présente un coût élevé).
C’est au niveau politique que doit être apportée la réponse
en termes de priorité d’allocation de ressources rares
(cf. encadré 2).
Encadré 2. Equiper l’ensemble d’un territoire d’une infrastructure productive : un enjeu politique en Inde et au Maroc
L’Inde a aujourd’hui pratiquement terminé l’électrification de l’ensemble des localités de son territoire. Pour les 5 % des localités restantes,
et 40 % de la population qui n’est pas encore connectée, le gouvernement indien a mis en place un programme, très clairement social, qui
subventionne à 90 % le coût d’alimentation des localités et à 100 % le coût de branchement des ménages. Ceci vient pratiquement un demi-
siècle après le lancement du programme d’électrification rurale, qui avait pour objectif d’apporter une énergie bon marché aux agriculteurs
pour leur permettre d’irriguer leurs cultures et atteindre ainsi l’autosuffisance alimentaire ; l’objectif premier du programme avait été une éner-
gie pour l’industrie.
Le Maroc a, lui aussi, lancé son programme d’électrification rurale à une époque de grande sécheresse, conjointement avec un programme
d’accès à l’eau potable. Le premier objectif visé était de fournir une infrastructure aux localités.
En réalité, bien que la plupart des pays aient atteint un
certain niveau d’accessibilité, ils ont à l’origine opté pour
électrifier en priorité les pôles de développement. Ce choix
semble logique : il permet au secteur de dégager une
certaine rentabilité, pour atteindre un équilibre financier
sectoriel avec des subventions croisées entre segments.
Notons que les expériences d’électrification des popula-
tions et des sites isolés, en particulier par kits solaires, ont
montré des limites intrinsèques en Afrique subsaharienne.
En effet, dans les pays engagés dans des projets majeurs
d’électrification rurale, ce schéma d’électrification est un
complément aux schémas A et B (ex : Laos, Maroc et
Sénégal). Ces programmes importants d’accès des popula-
tions isolées à travers les kits solaires demeurent
confrontés à deux questions majeures :
- des usages générateurs de revenus marginaux, en
conséquence de quoi on se trouve à cibler des clients d’un
© AFD Document de travail n° 122 • Accès à l’électricité en Afrique subsaharienne • avril 2012
28
19 La segmentation proposée ne doit pas conduire à opposer les schémas d’électrification“hors conception” et “par extension du réseau de la concession nationale”, comme certainesanalyses actuelles tendent à le faire, mais bien à illustrer leur complémentarité.

niveau de revenu d’entrée assez élevé ou à subventionner
considérablement l’investissement ;
- la question du coût réel de maintenance du parc à long
terme (gestion financière et technique), qui ne doit pas être
sous estimée.
Pour ce qui est de l’électrification périurbaine ou de la
population rurale domestique la plus isolée ou la plus
pauvre, l’analyse se focalisera sur les montages
organisationnels visant à diminuer les coûts de gestion et
les pertes. On touche ici d’ores et déjà du doigt l’impérieu-
se nécessité d’une vision claire des objectifs d’un program-
me d’électrification, de son coût, d’une programmation réa-
liste des investissements et des choix techniques, et des
impacts recherchés. Le graphique 3 présente, à travers le
cas du Burkina Faso, un exemple des moyens nécessaires
à un tel exercice.
Graphique 2. Les ressources nécessaires au développement d’une démarche planifiée et coordonnée – l’exemple
du Burkina Faso
En 2008-2009, au Burkina Faso (15 millions d’habitants répartis dans 8 000 localités), la réalisation d’un plan national
d’électrification rurale coordonné par la direction générale de l’Energie (DGE) a pris 12 mois, plus 6 mois de dissémi-
nation. Ce plan a permis une implication multisectorielle. Son budget global était de 400 000 EUR.
Source : IED.
L’étude précise et la quantification des impacts socio-
économiques et financiers de l’électrification rurale sont
relativement récentes. En effet, jusqu’à la fin des années
1990, ni les décideurs nationaux, ni les bailleurs de fonds
ne s’interrogeaient sur les coûts et les bénéfices de l’élec-
trification rurale, cette activité étant considérée dans les
politiques nationales comme une infrastructure nécessaire
au développement et un service public qui devait être
accessible au plus grand nombre, dont les retombées
socioéconomiques bénéfiques étaient évidentes, et qui
devait donc être généralisé. On ne trouve ainsi que peu
d’études d’envergure sur le sujet20 , la question étant le
plus souvent abordée sous l’angle de l’intensité capitalis-
tique des investissements et des bénéfices attendus (diffi-
ciles à évaluer). Ce n’est que récemment que l’anticipation
de l’impact sur la pauvreté est devenue un critère d’évalua-
tion à moyen et long terme des actions de développement
et des programmes d’électrification. L’indice de développe-
ment humain (IDH) ou les OMD, quant à eux, ne tiennent
pas directement compte de l’accès à l’énergie. Dès lors, la
problématique de l’accès à l’énergie tourne autour de
plusieurs questions : les bénéfices engendrés par les
1.3 Analyse et enseignements des impacts des programmes passés
20 Banque mondiale et Fondation de l’Institut politique de développement et de managementde la recherche aux Philippines, 2001 - Banque Mondiale et Agence suédoise de développe-ment international, 2005 - ONE/AFD, 2003 - IEG-World Bank, 2008
© AFD Document de travail n° 122 • Accès à l’électricité en Afrique subsaharienne • avril 2012
29
Enquêtes et collecte de données
Définition pôles de développement (Régions)
Construction de la «vision» nationale
Réalisation des plans d’électrification (Process)
Restitution / validation (Régions)
Animation Comité National de Coordination
Formation aux outils / démarche

programmes d’accès en zones rurales et urbaines sont-ils
quantifiables et si oui, comment ? L’accès à l’électricité est-
il un catalyseur de croissance économique pour les zones
rurales d’Afrique subsaharienne ? L’électrification rurale
et/ou les programmes d’accès (urbains et ruraux) doivent-
ils être érigés en priorité nationale ?
1.3.1 Un accès difficile et coûteux mais une
réelle capacité à payer
Le milieu « rural pauvre » est peu attractif pour les opéra-
teurs, qui privilégient naturellement la desserte aux clients
les plus « rentables », notamment ceux dont la desserte est
la moins coûteuse (car plus proche du réseau) et les plus
gros consommateurs. Ils adoptent ainsi une approche
extensive de l’électrification, ne cherchant que rarement
– et c’est une préoccupation très récente – à densifier la
clientèle (pauvre) autour d’une infrastructure existante. On
observe ainsi souvent des réseaux qui passent à côté de
clients « pauvres » pour aller chercher un « gros client ». On
peut s’interroger sur la logique du distributeur qui aurait
peut-être intérêt à densifier pour mieux amortir son investis-
sement. De plus, dans une communauté reliée au réseau,
on constate que de nombreux foyers ne sont pas en mesu-
re de supporter le paiement des coûts de raccordement, qui
s’élèvent parfois à des montants rédhibitoires de 100 à 300
USD, difficiles à mobiliser en une seule fois (cf. carte 4), en
dépit d’une capacité avérée à payer la facture mensuelle
d’électricité. En effet, les populations non raccordées au
réseau paient, à utilisation équivalente d’électricité fournie à
partir du kérosène, de piles et batteries rechargeables, un
prix de l’énergie qui représente plusieurs fois celui des
populations raccordées, tant en valeur absolue qu’en
équivalent kWh. Ce prix s’élève assez communément de
3 à 10 USD/mois. Les dépenses énergétiques représentent
un pourcentage bien plus élevé des revenus des popula-
tions d’Afrique subsaharienne que des populations des
pays de l’OCDE. C’est ainsi que, paradoxalement, les taux
de connexion dans des zones électrifiées ont tendance à
« saturer » assez rapidement.
Carte 4. Population vivant avec mois de 1 dollar par jour et par personne, Afrique
Source : PNUD (2008).
Lecture de la carte. En Afrique subsaharienne, environ 300 millions de personnes (sur 680 millions) vivent avec l’équi-
valent d’un dollar par jour. Ce pourcentage est supérieur à 60 % dans sept pays parmi les 31 renseignés ; il est le plus
faible en Afrique du Sud, où il atteint pourtant déjà 10 %. Ainsi, sur la base d’un tarif de 0,12 USD/kWh (domestique,
sur le réseau interconnecté), on obtient pour 100 kWh de consommation mensuelle une facture de 12 USD, soit 9 %
du revenu de cinq personnes (un foyer). Ce tarif moyen est souvent supérieur à 0,50 USD en zone rurale.
© AFD Document de travail n° 122 • Accès à l’électricité en Afrique subsaharienne • avril 2012
30
<15
15...30
30...45
70...150
>150

1.3.2 Evolution des dépenses des ménages :
une consommation plus importante à des prix
unitaires plus faibles
Dès lors que les ménages ont les moyens de se raccorder,
l’accès à l’électricité favorise, dans un premier temps, la
substitution quasi totale des usages immédiatement
concernés (piles, bougies, pétrole lampant, recharges de
batteries) et, donc, une réduction des dépenses énergé-
tiques. Dans un second temps, les classes moyennes et
pauvres voient leurs dépenses d’électricité augmenter en
raison d’un plus large recours à l’utilisation d’équipements
électriques : le taux d’équipement en téléviseur est multiplié
par deux la première année d’électrification, alors que l’on
constate une diminution des dépenses énergétiques pour
les catégories riches, déjà équipées (cf. graphique 3).
Graphique 3. Les impacts de l’électrification rurale – l’exemple du Maroc (2010)
NE : Non électrifié, V : Village, PV : Photovoltaïque
1.3.3 Un avantage certain pour le petit
commerce et l’artisanat préalablement
utilisateurs d’électricité
Les ménages qui voient leurs revenus augmenter sont ceux
qui possèdent déjà un capital productif qui se trouve valori-
sé par l’utilisation de l’électricité. Ainsi, 70 % des activités
commerciales constatent un accroissement de leur chiffre
d’affaires (Groupe indépendant d’évaluation – IEG, Banque
mondiale, 2008), et l’impact est bien entendu conséquent
sur le développement des activités artisanales nécessitant
l’utilisation d’appareils électriques productifs. En revanche,
l’artisanat traditionnel est peu touché. Pour ce type d’activi-
tés, l’impact est perçu notamment en termes de rallonge-
ment du temps de travail, qui permet une amélioration de
leur niveau de productivité. Une revue des études de cas ne
montre pas non plus d’effets d’industrialisation significatifs.
En effet, pour les petits entrepreneurs déjà équipés, chan-
ger leur outil de production implique un investissement sup-
plémentaire qui, en général, ne se fait pas avant que le
renouvellement ne soit nécessaire.
© AFD Document de travail n° 122 • Accès à l’électricité en Afrique subsaharienne • avril 2012
31
Electrifié NE dans VE NE dans V NE NE dans V PV PV dans V PV Total
Source : Axenne.
Gaz pour réfrigérateur
Recharge de batterie pour TV
Piles pour radio
Bougies
Piles pour lampe torche
Gaz pour lampe
Pétrole pour lampe

C’est dans le domaine social que les projets d’électrification
rurale ont un impact significatif : sur la santé, l’éducation,
les migrations et sur la condition des femmes.
► Les impacts sur la santé sont principalement liés au
respect de la chaîne du froid (vaccins, médicaments) et à
l’extension des horaires d’ouverture des centres de santé
(particulièrement pour les accouchements)21. Il convient
également de mentionner d’autres bénéfices liés (i) à
l’amélioration des connaissances sanitaires par le
développement de l’accès à l’information télévisuelle, et (ii)
à l’amélioration des conditions sanitaires de stockage de la
nourriture grâce à la réfrigération. On observe également
une corrélation positive avec la disponibilité en eau potable
tout au long de l’année, élément fondamental de santé, en
particulier des enfants, dans des contextes où les diarrhées
et autres maladies générées par l’eau demeurent encore
aujourd’hui une cause essentielle de mortalité infantile.
► Les impacts sur l’éducation sont principalement liés à
l’amélioration de la qualité de l’accueil et de l’enseignement :
un bon enseignant est plus enclin à accepter un poste dans
une zone électrifiée que dans une zone qui ne l’est pas. De
même, les enfants vivant dans un foyer électrifié ont géné-
ralement un meilleur niveau scolaire car ils peuvent étudier
le soir, après l’école22.
► L’impact de l’électrification sur les flux migratoires et
l’exode rural est beaucoup plus difficile à apprécier.
Différentes études ont cependant montré qu’elle permettait
de réduire l’émigration et l’exode vers les grandes villes, et
d’augmenter l’attractivité des centres secondaires équipés
(qualifiés de ruraux ou non). Elle renforce également le
sentiment de sécurité dans les villages et permet une
meilleure cohésion sociale grâce à l’éclairage public.
1.3.4 Des impacts sociaux et d’aménagement significatifs
Tableau 4. Impacts de l’électrification sur la santé – l’exemple du Maroc (2010)
Village non électrifié Village électrifié
Réfrigérateurs électrifiés 50 % 100 %
Conservation de vaccins 60 % 95 %
Passage régulier d’un médecin 40 % 85 %
Pratique d’accouchements médicalisés 0 % 42 %
Source : Axenne.
21 Pour rappel, la réduction des mortalités infantile et maternelle figure dans les quatrième etcinquième OMD.22 Source : étude ESMAP Philippines (2003)
Encadré 3. Impact de l’électrification sur les flux migratoires et l’exode rural
En raison des critères de sélection généralement appliqués, la mise en œuvre du PERG aurait facilité le regroupement des populations. La
part de l'habitat dispersé aurait été réduite de 35 à 28 %, et celle de l'habitat éclaté, divisée par trois, passant de 6 à 2 %. Les programmes
d'électrification rurale auraient ainsi eu un impact important sur la réorganisation spatiale des villages. Dans une certaine mesure, avec sa
politique de construction de « dorsales », l'ONE encourage ce réaménagement de l'espace et ce regroupement de populations à proximité
du réseau interconnecté.
© AFD Document de travail n° 122 • Accès à l’électricité en Afrique subsaharienne • avril 2012
32

► L’impact de l’électrification sur les femmes est lié au fait
qu’elles sont les premières bénéficiaires du développement
du petit commerce. Au Ghana, des groupes de femmes se
sont organisés pour fabriquer et vendre des repas sur les
lieux de fréquentation de la télévision communautaire. En
Afrique du Sud, des groupes de femmes gèrent et dévelop-
pent une activité de location d’espaces réfrigérés.
L’électrification permet un allongement de la durée journa-
lière de travail des femmes et favorise donc, dans certains
cas, leur émancipation économique.
► Plus largement, l’électrification engendre une véritable
transformation sociale liée à la connectivité, et à l’accès à
l’information et à la formation grâce à l’audiovisuel. La
diffusion massive des moyens de communication audiovi-
suels, facilitée par l’électrification, permet d’atteindre plus
largement le monde rural ; des programmes éducatifs
permettent aux populations d’acquérir, à travers l’image,
une connaissance plus large du monde. L’explosion des
cybercafés et de la connectivité par Internet (à des niveaux
de pénétration inattendus dans les zones rurales) engendre
des transformations que l’on a encore du mal à appréhender.
1.3.5 Quelle rentabilité économique pour laNation ?
Tenter de définir un principe général ou des règles à propos
des impacts quantitatifs et qualitatifs des programmes
d’électrification (rurale) est difficile : la plupart du temps, les
approches coûts et bénéfices sont fonction d’un contexte
spécifique et leur évaluation, puis traduction en « équiva-
lent monétaire », est un exercice coûteux et quelque peu
subjectif.
Dans le cadre du programme marocain d’électrification
rurale, le taux de rentabilité économique global est de
l’ordre de 8 %, en retenant les paramètres suivants (étude
PERG 2004) :
• le taux de croissance de la consommation individuelle et
les dynamiques d’équipement ;
• les dépenses d’équipement induites et leur rentabilité pour
le consommateur ;
• la rentabilité financière du programme (opérateur
électrique).
Ce taux passe à environ 20 % en intégrant les externalités
positives (plus difficiles à chiffrer) :
• les avantages sociaux en termes de santé, éducation, et
de satisfaction des usagers ;
• les avantages environnementaux ;
• les avantages économiques locaux en termes de création
d’emplois ;
• les avantages économiques globaux (macroscopiques) en
termes de création d’emplois par le processus d’électrification.
Ces taux de rentabilité économique, que l’on retrouve dans
d’autres pays (cf. tableau 5), conjugués avec une volonté à
payer supérieure au prix de l’électricité, ne suffisent para-
doxalement pas à mobiliser les investissements requis pour
la mise en œuvre de programmes d’envergure.
Tableau 5. Taux de rentabilité économique de neuf programmes d’électrification rurale
Taux de rentabilité économique des composants d'électrification rurale
Pays Projet Extension de réseau Décentralisé collectif Décentralisé individuel
Cambodge Rural Electrification and Transmission 19,80 22,30 11
Honduras Rural Infrastructure Project 33 20 30
Inde Renewable Resources Development 14 41
Laos Southern Provinces Rural Electrification 60,50 26
Mozambique Energy reform and acces 22,70 14,50
Nicaragua Rural Electrification 40 23 27
Pérou Rural Electrification Project 22,60 23,80
Philippines Rural Power Project 26,40 21,50 48
Sri Lanka Renewable energy for Rural Energy 15,20 10,90
Source : IEG (2008).
© AFD Document de travail n° 122 • Accès à l’électricité en Afrique subsaharienne • avril 2012
33

La ressource n’est pas forcément disponible : un pays qui
a encore, en milieu industriel et urbain aisé, un faible taux
d’accès à l’électricité, une qualité de service médiocre et
un besoin de financement récurrent pour couvrir les coûts
d’exploitation et d’entretien, pourra très difficilement faire
de l’accès en zones rurales et périurbaines une priorité
nationale. La réussite d’une politique nationale d’accès à
l’électricité en milieu rural et périurbain (accès pour tous,
avec de fortes considérations sociales) dépend fortement
de la situation du secteur de l’électricité en milieu urbain
et industriel.
Or, dans la quasi-totalité des pays d’Afrique
subsaharienne, l’Etat – avec l’appui du secteur privé – ne
parvient pas à offrir à l’industrie et aux consommateurs
aisés l’énergie électrique dont ils ont besoin ; on constate
même une tendance à une dégradation du service et à
une augmentation des coupures.
Cette question nous ramène ainsi au choix de la population
cible et à la question de la vision. Dans plusieurs projets
d’électrification rurale, l’objectif consistant à atteindre « les
plus pauvres des plus pauvres »23 a conduit à l’échec, à
cause de l’insuffisante solvabilité des bénéficiaires et du trop
faible impact économique de l’électricité, incapable d’amélio-
rer cette solvabilité à court ou moyen terme. Ce débat sur le
choix des populations cibles est loin d’être clos ; il est systé-
matique dans les approches Output-Based Aid (OBA). Dans
les analyses effectuées à l’échelle régionale ou nationale, il
est devenu courant d’identifier les « gros consommateurs »
potentiels qui pourraient permettre d’assurer un niveau mini-
mum de revenus à l’opérateur, et ceux qui apportent un
impact économique et social significatif. Il s’avère toutefois
souvent que hôpital, l’administration, l’école, etc. sont les
plus mauvais payeurs ; or, desservir les industriels exige de
pouvoir offrir une certaine qualité de service.
1.4 Des dynamiques d’accès impactées par les réformes sectorielles
Au milieu des années 1990, face au constat de
l’inefficacité générale des compagnies d’électricité du
secteur public, de nombreuses réformes ont été lancées.
Pour le sujet qui nous intéresse, sur plus de 40 pays
d’Afrique subsaharienne, près de la moitié se sont engagés
dans la création d’une agence et/ou d’un fonds d’électrifica-
tion rurale (AER, FER). Sur la vingtaine de pays ayant opté
pour une organisation du secteur électrique partagée entre
une compagnie d’électricité (nationale ou privatisée) et un
FER/AER la quasi-totalité a bénéficié d’un appui de la
Banque mondiale pour sa mise en place. Ainsi, un modèle
institutionnel a émergé des différentes initiatives dont le
point focal est cette AER et/ou ce FER, chargé(e) selon les
cas, de concevoir, développer et exploiter des systèmes
électriques en milieux rural et semi urbain.
Leur action s’inscrit dans le cadre d’un « périmètre »
d’électrification rurale et semi ou péri urbaine aux contours
mal définis, le plus souvent simplement juxtaposé à celui
des systèmes électriques urbains. Ceci a pour
conséquence de rendre difficile la nécessaire coordination
de la fonction de planification des deux secteurs, la
recherche de synergies et d’une efficience globale – qui
devraient être de la responsabilité d’un ministère fort. Pour
autant, ces deux périmètres régis par des règlementations
(différentes ou communes) connaissent des évolutions
respectives qui influent les unes sur les autres (extension
du réseau, domaine réservé exclusivement au « hors
concession », etc.). Ces évolutions et leur interface (tarif de
rachat et de revente au réseau, indemnisation des opéra-
teurs/investisseurs en cas d’extension de la « Concession
nationale ») constituent des éléments clés de la cohérence
des politiques nationales d’extension de l’accès au service
électrique. Mal clarifiés, ils peuvent être un blocage à
l’extension du service.
Il y a lieu, aujourd’hui, de s’interroger sur la capacité de ce
modèle institutionnel à accélérer ou à favoriser l’accès aux
services électriques, qui n’a pas significativement évolué
dans le passé récent, que ce soit en termes d’accès des
populations dans les zones électrifiées ou, en termes de
pourcentage, des localités couvertes par le réseau.
23 Objectif jugé comme prioritaire par les bailleurs de fonds dans le cadre de la stratégiemondiale de lutte contre la pauvreté.
© AFD Document de travail n° 122 • Accès à l’électricité en Afrique subsaharienne • avril 2012
34

1.4.1 Constat du rôle clé d’un opérateur central,
« le champion » public
On observe que les pays africains ayant conservé leur
société nationale d’électricité historique présentent aujour-
d’hui les taux d’accès à l’électricité les plus élevés : Afrique
du Sud : 70 % ; Côte d’Ivoire : 39 % ; Ghana : 60 % (82 %
en zone urbaine et 29 % en zones rurales). L’équilibre entre
zones rentables (i.e. villes et côtes densément peuplées) et
zones peu rentables (i.e. rurales) semble facilité par une
gestion globale unique.
L’organisation institutionnelle du Maroc et la Tunisie, qui ont
aujourd’hui électrifié tout leur territoire, partagent les
caractéristiques suivantes :
• un opérateur unique qui a pendant longtemps constitué
l’instrument privilégié de développement de l’accès à
l’électricité ;
• une centralisation/déconcentration sans faille de l’admi-
nistration ;
• une approche, jusqu’à un passé très récent, strictement
publique ;
• une très forte volonté politique de développer l’électrifica-
tion par extension du réseau de l’opérateur unique ou domi-
nant, mais aussi par le recours aux autres modes d’électri-
fication ;
• une absence de distinguo entre l’urbain et le rural, l’en-
semble étant inclus dans le périmètre d’intervention de
l’opérateur dominant ;
• l’absence, pendant longtemps, d’instrument de formalisa-
tion d’une stratégie sectorielle et de régulateur.
La volonté politique et la mobilisation de ressources natio-
nales ont, dans ces deux pays, joué un rôle fondamental,
relayées et mises en œuvre par un opérateur public unique
relativement efficace.
Pendant de nombreuses années, des pays à développe-
ment économique intermédiaire, tels le Cameroun ou la
Côte d’Ivoire, ont adopté la même stratégie que le Maroc et
la Tunisie. Les pays n’ont pas fait de distinction entre
l’urbain et le rural, même si l’opérateur de distribution
dispose d’un périmètre d’intervention bien défini et s’ouvre
à l’intervention alternative des collectivités territoriales sur
le financement des infrastructures. L’évolution s’est ensuite
infléchie vers la libéralisation progressive du secteur et les
adaptations institutionnelles qui ont découlé de cette libéra-
lisation (un régulateur, des privatisations, des sociétés de
patrimoine, une AER). Si ces situations comportent des
dynamiques certaines, l’absence d’un encadrement rigou-
reux et d’un cadre réglementaire clair, en d’autres termes
d’un pilote légitime, conduit à des situations de blocage.
1.4.2 Un « trop plein » d’acteurs institutionnels
aussi inefficace que leur absence
Dans un certain nombre de cas, les environnements institu-
tionnels sont sans doute trop « riches » en intervenants, ce
qui dénote une absence de décantation et/ou de simplifica-
tion post-réforme sectorielle.
Ainsi la Mauritanie a été, sur le plan institutionnel, un « bon
élève » des bailleurs de fonds. Le secteur de l’électricité y
dispose d’une lettre de politique sectorielle, d’un code de
l’électricité prônant une ouverture complète du secteur,
d’un ministère affichant un organigramme assez exemplai-
re, d’un opérateur public que l’on a (vainement) tenté de
privatiser, d’une autorité de régulation, d’une AER et d’une
agence pour l’accès universel aux services de base
(APAUS). On constate cependant un décalage considé-
rable entre les textes, les faits, l’existence et le fonctionne-
ment des institutions. Le concept d’APAUS retenu aurait dû
entrainer tout à la fois une optimisation de la coordination,
de la création et de la gestion des services de base en
même temps qu’une recherche visant une réduction systé-
matique des coûts (quant à l’utilisation des énergies
domestiques et renouvelables, au choix des investisse-
ments à réaliser et à la gestion des systèmes). Or, dans les
faits, le dispositif entraîne une concurrence avec les
agences sectorielles – de l’eau ou de l’électrification rurale –
pour la réalisation de projets et l’appropriation budgétaire.
1.4.3 Une adéquation nécessaire entre le
marché de l’électricité rural et le nombre, la
taille et l’efficacité des opérateurs
Le Sénégal, exemplaire dans la démarche conceptuelle,
dispose d’un arsenal institutionnel qui a su prendre en
compte l’exhaustivité d’une vision prospective – les lettres
© AFD Document de travail n° 122 • Accès à l’électricité en Afrique subsaharienne • avril 2012
35

de politique sectorielles; les leçons de tentatives infruc-
tueuses de réformes – privatisation de la Société nationale
d’électricité du Sénégal (SENELEC) ; les fonctions de la
Commission de régulation du secteur de l’électricité, de
plus en plus crédible; l’existence d’un opérateur dominant
(SENELEC) ; le rôle d’une AER qui s’efforce de développer
une démarche de partenariat public-privé (PPP) et dont le
dispositif intègre à la fois les mécanismes et les outils
économiques, financiers, juridiques et fiscaux nécessaires
à une attraction renforcée des opérateurs pour le sous-
secteur, SENELEC, PPP.
Des études menées sur une période de 10 ans ont conduit
à diminuer le nombre de concessions de 20 à 11 pour
qu’elles puissent présenter un certain niveau de rentabilité.
Peu de candidats se sont montrés intéressés par le premier
appel d’offres de concession, remporté par la société
nationale marocaine, l’ONE.
On doit dès lors s’interroger sur l’existence d’un « marché »
d’opérateurs disposant de la taille et des moyens critiques
pour soumissionner. Promotion insuffisante du sous
secteur et/ou absence d’un « champion » ? Attente trop
importante quant à l’intérêt et la capacité du secteur privé à
prendre des risques, notamment en matière d’investisse-
ments, sur un secteur financièrement sinistré ?
A l’inverse, les schémas burkinabè et malien privilégient les
petits opérateurs nationaux villageois, ce qui nécessite en
contrepartie de très fortes subventions à l’investissement
(environ 80 %), ces opérateurs se situant dans un complé-
ment de démarche globale. En effet, si plus de 60 projets
de candidature spontanée d’électrification rurale (PCASER)
financés par l’Agence malienne pour le développement de
l'énergie domestique et l'électrification rurale (AMADER)
desservent les zones rurales maliennes, leur taille unitaire
est de moins de 250 kW et ils ne sauraient, seuls, résoudre
la question de l’accès à l’électricité sur l’ensemble du terri-
toire national.
Si la démarche institutionnelle est prospective et peut être
ambitieuse, elle doit cependant être le fruit d’une recherche
d’un optimum entre la réalité du secteur, ses moyens et ses
ressources, ses capacités d’évolution et les objectifs qui lui
sont assignés. De plus, la démarche doit être exhaustive
quant à l’affectation des rôles et des responsabilités et doit
permettre d’assurer l’exercice optimal des fonctions
nécessaires au développement et à la bonne marche du
sous-secteur.
1.4.4 Une sophistication de la structure
n’assure pas forcément les trois fonctions :
financement, régulation et industrielle
Dans la majorité des pays africains, les principales caracté-
ristiques de l’organisation de l’électrification rurale et de
l’accès post-réforme sont :
• un repositionnement de l’Etat sur ses fonctions
régaliennes : réglementation, promotion, protection de
l’intérêt général, création de la fonction de régulation ;
• les AER, et une reconnaissance timide de ce besoin de
subvention croisée ;
• une segmentation du système électrique pour permettre
l’introduction de la concurrence, notamment sur la produc-
tion ;
• un accès des entreprises privées à ces activités sous
réserve de l’obtention d’autorisations, de licences ou de
concessions, et de leur existence réelle.
Malheureusement, la création de structures pour l’électrifi-
cation n’a souvent pas été accompagnée, ni par les
politiques nationales, ni par une dotation de ressources
financières et humaines qui permette réellement d’atteindre
les objectifs qui leur étaient fixés.
Les règles du jeu sont trop souvent mal définies et les
moyens trop faibles pour entraîner un développement
conséquent. Ces agences peuvent jouer plusieurs rôles :
projet pilote d’électrification décentralisée, appel d’offre à
gérer des concessions, incitateur pour les opérateurs pri-
vés souhaitant investir dans un projet d’électrification
décentralisée, planification de l’extension du réseau
(Association des énergies renouvelables – ADER, à
Madagascar) éventuellement en finançant ce volet.
On constate que la multiplication des structures, en
préalable à des réalisations significatives, aboutit à une
dispersion des compétences et à une concurrence entre
institutions pour occuper des responsabilités « frontières ».
© AFD Document de travail n° 122 • Accès à l’électricité en Afrique subsaharienne • avril 2012
36

Cette concurrence ne permet pas de réunir les moyens
humains, techniques et politiques nécessaires pour
atteindre l’objectif commun : mener des réalisations
ambitieuses tout en s’assurant que les fonctions
nécessaires pour atteindre les objectifs des programmes
d’accès soient assurées (fonction de financement,
industrielle et de régulation).
1.5 Etablir des prérogatives claires pour chacun des acteurs
Aboutir à des réalisations effectives nécessite une cohéren-
ce de la politique nationale d’accès à l’électricité avec l’en-
vironnement institutionnel et réglementaire qui l’accom-
pagne (fonction de régulation). Il s’agit donc de disposer
(i) d’une réelle volonté politique de soutenir les projets
d’électrification et d’en assurer la pérennité, (ii) d’orienta-
tions économiques claires et de moyens financiers suffi-
sants (fonction de financement), (iii) ainsi que des struc-
tures capables d’assurer la fourniture, l’installation et l’opé-
ration des ouvrages (fonction industrielle).
1.5.1 Financement de l’accès : comment
mobiliser les fonds nécessaires pour atteindre
les objectifs politiques ?
Etant donné leurs niveaux de rentabilité et leurs temps de
retour, les projets d’électrification, en particulier rurale,
nécessitent l’apport de subventions publiques. On
considère que 50 % du financement de l’électrification
rurale en France s’est fait sous forme de subvention. Si il y
a une volonté politique de desservir les populations rurales
et périurbaines, la fonction de financement doit être réflé-
chie avec lucidité, et en tenant compte de différents
paramètres :
- le profil des investissements : ils sont certes économique-
ment rentables, mais sur le long terme (au minimum au
bout de 10 ou 30 ans). Les risques peuvent être non négli-
geables, liés d’une part au pouvoir d’achat des populations
(pauvres) et, d’autre part, à la connaissance des technolo-
gies de production ;
- il est évidemment illusoire d’attendre d’un investisseur
privé qu’il s’implique dans un tel investissement à long
terme ;
- les montants nécessaires pour équiper un territoire sont
très importants, et exigent une mobilisation très significati-
ve de ressources nationales, qui pourront ensuite faire
levier sur des financements internationaux. A l’échelle du
continent, ce n’est certainement pas à raison de projets de
quelques dizaines de millions d’euros de dons que l’on
résoudra la question de l’accès pour le plus grand nombre.
Comme l’illustrent les montants mobilisés au Maroc au
Kenya ou au Ghana (cf. encadré 4), il faut souligner l’impor-
tance historique (i) des montants en jeu, qui relèvent d’un
vrai choix politique en matière d’allocation des ressources
nationales, et (ii) du rôle central de la compagnie nationale,
qui agit à la fois en tant que société d’électricité (qui a la
réelle capacité technique et organisationnelle de réaliser un
programme d’une telle envergure) et qui présente un bilan
et un compte de résultat qui lui permet d’être un emprunteur
– certes public et souvent avec la garantie de l’Etat – sur le
long terme.
Force est de constater que les pays présentant une organi-
sation « post réformes » (i.e. la large majorité des pays
d’Afrique subsaharienne, dotés maintenant de fonds d’élec-
trification rurale) sont dans des situations « non abouties »
en matière de mécanismes de financement. En général,
ces « fonds » ne sont que des comptes par lesquels transi-
tent les maigres subventions recueillies au niveau de la
coopération internationale.
© AFD Document de travail n° 122 • Accès à l’électricité en Afrique subsaharienne • avril 2012
37

Si la création de fonds spécialisés peut constituer une
étape importante de la pérennisation des ressources
nécessaires au développement et à la consolidation du
sous-secteur, il est aujourd’hui avéré que la taille de ces
fonds et le montant de leurs ressources sont trop
modestes, et leurs sources et leurs modes de financement
trop aléatoires. Faire de ces fonds des établissements
financiers (droit de prêter et d’emprunter) spécialisés,
élargir leur domaine d’action aux garanties d’un certain
nombre d’opérations et aux financements de petits opéra-
teurs locaux (qui ne pourraient, sans l’intervention de ce
fonds, accéder aux concours des banques commerciales)
sont des fonctions de financement qui restent souvent à
remplir.
Encadré 4. La mobilisation de financements pour l’électrification d’un territoire – exemples du Maroc et du Ghana
Le Maroc, qui compte 32,2 millions d’habitants, a réussi l’électrification quasi globale de son territoire (plus de 90 % des 30 000 localités),
en l’espace de 15 ans. Le budget engagé à fin 2008 était de l’ordre de 1 770 M EUR, dont 53 % en mobilisation de fonds nationaux (fonds
propres, FP) et le solde en prêts concessionnels à moyen/long termes (47 %). Concernant la part nationale, 55 % a été mobilisée par l’ONE
(sur ses fonds propres), 20 % par les budgets des communes et 25 % en contribution des usagers. Ces sommes – 230 EUR/connexion pour
les foyers et 190 EUR/connexion pour les communes – peuvent bénéficier d’un versement échelonné accordé par l’ONE.
Au Ghana, pays de 22 millions d’habitants, une aide financière importante et continue de la Banque mondiale (IDA), complétée par le
soutien de partenaires bilatéraux24, a permis au pays de passer d’un taux d’électrification de l’ordre de 15 % en 1989 à 60 % en 2009. Le
budget consacré à l’électrification rurale au cours de la dernière décennie est de l’ordre de 2 Md USD, avec une participation des finance-
ments nationaux et locaux de l’ordre de 15 %. Dans le cadre du programme autonome d’électrification rurale (Ghana's Self-Help
Electrification Programme, SHEP) piloté par le ministère de l’Energie (avec le soutien technique de la société d’électricité du Ghana -
Electricity Company of Ghana, ECG), l’objectif est d’atteindre un taux d’électrification de 80 % en 2010 et de garantir pour toutes les
communautés (4 220 villages de plus de 500 habitants) un approvisionnement en électricité à l’horizon 2015. Le coût moyen par foyer est
de l’ordre de 250 EUR (avec possibilité d’échelonner les paiements).
Graphique 4. Mobiliser des fonds au sein d’une compagnie d’électricité: exemple de l’ONE, Maroc
Source : auteurs.
24 Allemagne, Commission européenne, Espagne, Etats-Unis, France, Italie, Royaume-Uniet Suisse.
© AFD Document de travail n° 122 • Accès à l’électricité en Afrique subsaharienne • avril 2012
38
FP
53%
KFW
1%
AFD
14%
BID
8%
JBIC
8%
BEI
9%
FADES
4%
FK
3%

Notons ici l’évolution du rôle des collectivités locales qui
jouent un rôle central dans des pays comme la France, où
elles demeurent propriétaires des réseaux de distribution :
ces entités bénéficient de responsabilités croissantes liées,
notamment, au mouvement de décentralisation administra-
tive qui gagne de nombreux pays en Afrique. En outre, de
plus en plus de programmes d'électrification intègrent des
composantes de promotion des usages productifs de l'élec-
tricité (au Burkina ou au Sénégal, par exemple) ; celle-ci
apparaît sans doute comme l’une des nouvelles priorités
des secteurs électriques en développement. Elle requiert
un appui public qui peut être porté par la collectivité locale,
dont la responsabilité est, dans ce cas, d'associer, dans le
cadre de partenariats innovants, des acteurs privés aux
intérêts communs : l'usager rural, le distributeur
d'électricité, l'équipementier électrique et le partenaire
financier. On l’a vu, les collectivités locales ont joué un rôle
central dans le cas du PERG Marocain, et historiquement
en France, où elles demeurent propriétaires des réseaux
de distribution dont elles confient l’opération à un
concessionnaire (EDF).
1.5.2 Régulation économique et financière :
politique tarifaire et cadre contractuel pour
mobiliser les acteurs privés
Au sein de ce thème très « général » de régulation, on peut
intégrer des thématiques très différentes les unes des
autres :
• les mécanismes de révision, le suivi-évaluation, le
contrôle, les sanctions, le règlement des différents dans
leurs aspects juridiques, techniques et économiques ;
• l’adaptation de la qualité du service à la demande en
zones rurales et, donc, le recours à des normes et des
standards techniques, ainsi que des pratiques appropriées,
déterminant pour optimiser les coûts d’investissement
(à hauteur du tiers du montant de l’investissement de distri-
bution ; cette dernière thématique sera traitée dans la
partie technique) ;
• le choix, la formation, les contrôles (et, donc, les sanc-
tions) de la structure en charge de la régulation ;
Force est de constater que les pays qui ont réussi l’électri-
fication de leur territoire ne se sont engagés dans la
création d’une agence de régulation qu’une fois une solide
infrastructure électrique en place. Ce n’est qu’ensuite
qu’ont été abordées les questions liés à la multiplicité
d’opérateurs et à la fin du monopole intégré (production,
transport, distribution), nécessitant la mise en place de
règles (en France, en Inde, au Maroc, etc.). Souvent, dans
un premier temps, le ministère peut cumuler les fonctions
de planification et de formulation de politiques ainsi que de
régulation. La compagnie publique étant dominante, c’est
elle qui, de facto, édicte souvent les règles de la régulation.
Le fait de créer une agence de régulation ad hoc ne suffira
pas à garantir le bon fonctionnement de la régulation.
On examinera ci-après deux composantes : une première,
tenant de la viabilité économique et financière ; une secon-
de, liée au cadre contractuel nécessaire pour favoriser la
mobilisation des partenaires privés
►Questions relatives à la viabilité économique et financière
- Financement des investissements : la viabilité et la
pertinence du modèle par rapport aux ressources finan-
cières disponibles (générées par le service électrique lui-
même et externes à ce dernier) ; le niveau de subvention à
l’investissement qui permet une rentabilité suffisamment
attractive pour un opérateur privé (Notons par exemple le
cas du Cambodge, qui vient d’abandonner cette voie pour
opter pour des franchises sur investissements nationaux).
- Financement de l’exploitation, de l’entretien et de la main-
tenance des équipements (qui doivent, en principe, être
couverts par les recettes tarifaires) ; il s’avère quasiment
impossible dans des contextes dépendant du thermique.
- Subventions croisées entre différents clients, et donc caté-
gories tarifaires, mais au sein même du secteur électrique :
l’équilibre est-il possible, ou faut-il des ressources exté-
rieures au secteur ?
- Principes tarifaires : péréquation, i.e. peut-on se permettre
un même tarif pour une catégorie de clients où que l’on soit
sur le territoire, avec des coûts très différents, sans
© AFD Document de travail n° 122 • Accès à l’électricité en Afrique subsaharienne • avril 2012
39
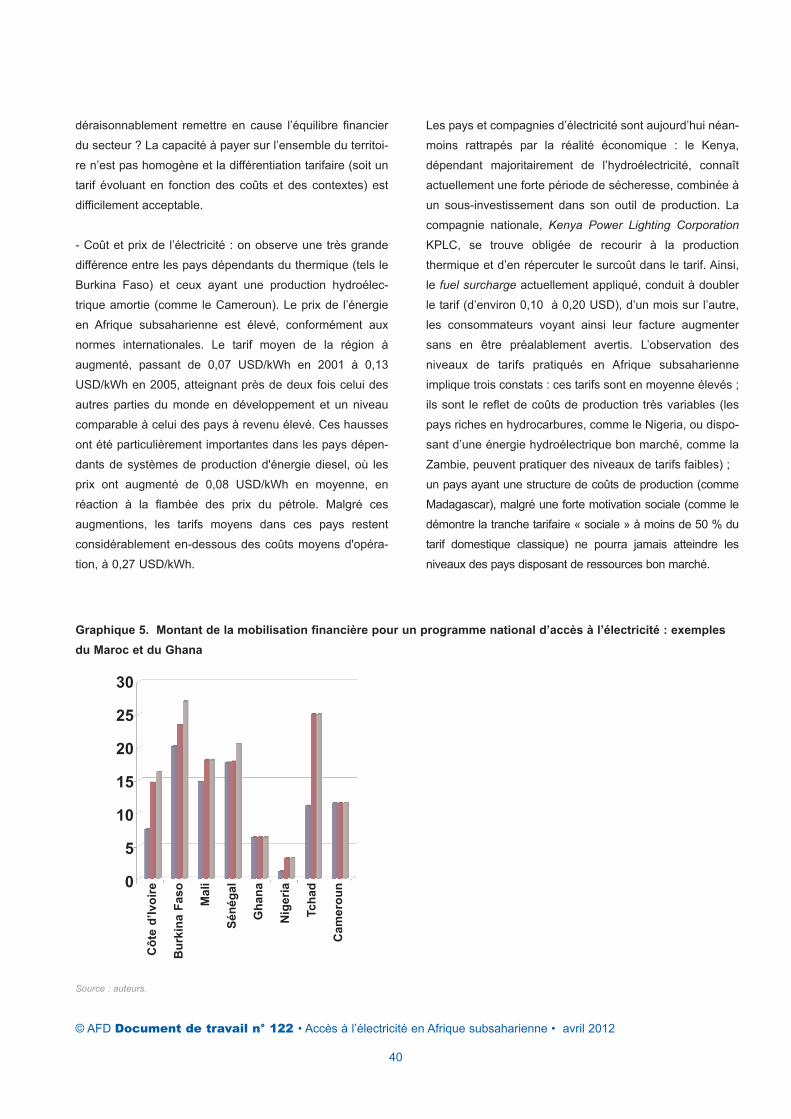
déraisonnablement remettre en cause l’équilibre financier
du secteur ? La capacité à payer sur l’ensemble du territoi-
re n’est pas homogène et la différentiation tarifaire (soit un
tarif évoluant en fonction des coûts et des contextes) est
difficilement acceptable.
- Coût et prix de l’électricité : on observe une très grande
différence entre les pays dépendants du thermique (tels le
Burkina Faso) et ceux ayant une production hydroélec-
trique amortie (comme le Cameroun). Le prix de l’énergie
en Afrique subsaharienne est élevé, conformément aux
normes internationales. Le tarif moyen de la région à
augmenté, passant de 0,07 USD/kWh en 2001 à 0,13
USD/kWh en 2005, atteignant près de deux fois celui des
autres parties du monde en développement et un niveau
comparable à celui des pays à revenu élevé. Ces hausses
ont été particulièrement importantes dans les pays dépen-
dants de systèmes de production d'énergie diesel, où les
prix ont augmenté de 0,08 USD/kWh en moyenne, en
réaction à la flambée des prix du pétrole. Malgré ces
augmentions, les tarifs moyens dans ces pays restent
considérablement en-dessous des coûts moyens d'opéra-
tion, à 0,27 USD/kWh.
Les pays et compagnies d’électricité sont aujourd’hui néan-
moins rattrapés par la réalité économique : le Kenya,
dépendant majoritairement de l’hydroélectricité, connaît
actuellement une forte période de sécheresse, combinée à
un sous-investissement dans son outil de production. La
compagnie nationale, Kenya Power Lighting Corporation
KPLC, se trouve obligée de recourir à la production
thermique et d’en répercuter le surcoût dans le tarif. Ainsi,
le fuel surcharge actuellement appliqué, conduit à doubler
le tarif (d’environ 0,10 à 0,20 USD), d’un mois sur l’autre,
les consommateurs voyant ainsi leur facture augmenter
sans en être préalablement avertis. L’observation des
niveaux de tarifs pratiqués en Afrique subsaharienne
implique trois constats : ces tarifs sont en moyenne élevés ;
ils sont le reflet de coûts de production très variables (les
pays riches en hydrocarbures, comme le Nigeria, ou dispo-
sant d’une énergie hydroélectrique bon marché, comme la
Zambie, peuvent pratiquer des niveaux de tarifs faibles) ;
un pays ayant une structure de coûts de production (comme
Madagascar), malgré une forte motivation sociale (comme le
démontre la tranche tarifaire « sociale » à moins de 50 % du
tarif domestique classique) ne pourra jamais atteindre les
niveaux des pays disposant de ressources bon marché.
Graphique 5. Montant de la mobilisation financière pour un programme national d’accès à l’électricité : exemples
du Maroc et du Ghana
Source : auteurs.
© AFD Document de travail n° 122 • Accès à l’électricité en Afrique subsaharienne • avril 2012
40
30
25
20
15
10
5
0
Cô
te d
’Iv
oir
e
Bu
rkin
a F
as
o
Ma
li
Sé
né
ga
l
Gh
an
a
Nig
eri
a
Tc
ha
d
Ca
me
rou
n

- Coût du branchement : le niveau des tarifs de l’électricité
reflète ces structures de coûts très contrastés et
l’expérience montre que la principale barrière à l’accès est
celle des coûts de branchement élevés, qui sont à la
charge des usagers : des coûts de 100 à 300 EUR s’obser-
vent couramment en Afrique subsaharienne : ils sont à
comparer aux dépenses énergétiques annuelles moyennes
qui sont en général inférieures à 50 EUR. Le « montage
financier » d’un projet ou d’un programme d’électrification
rurale (notamment le niveau de subvention retenu pour
couvrir ces frais de branchement) a une incidence très
importante sur le prix du service. En outre, un coût de bran-
chement excessif génère (i) des phénomènes de « toile
d’araignée », i.e. de branchements « pirates » (Bénin), (ii)
un faible taux de connexion (Bénin et Kenya) et (iii), lorsqu’il
est associé à une sous-optimisation technique, un ralentis-
sement de la densification de la clientèle (Kenya).
Les pays sérieusement engagés dans une densification
développent une réflexion sur le coût initial de connexion :
• subvention par l’intermédiaire d’un FER (Burkina Faso,
Ouganda, Sénégal, etc.) ;
• partage des coûts d’investissements (coûts de raccorde-
ment) entre les différents acteurs : foyers bénéficiaires,
autorités locales, gouvernement, opérateur privé, etc. ;
• emprunt auprès de banques commerciales, de banques
villageoises ou d’institutions de microfinance pour le finan-
cement du coût de connexion (Kenya) ;
• épargne préalable (République centrafricaine, RCA) ;
• fonds spécifique géré par la compagnie d’électricité, doté
par un bailleur de fonds et dédié au financement des coûts
de raccordement. Ce fonds, basé sur un mécanisme
revolving permet ainsi à l’usager d’étaler dans le temps le
paiement du coût de connexion ; la reconstitution du fonds
ainsi alimenté permet de multiplier les raccordements.
► Questions relatives au cadre contractuel, pour favoriser
la mobilisation des partenaires privés
Le secteur ne parvenant pas à dégager les ressources
nécessaires pour réaliser des programmes d’accès
exhaustifs, et l’Etat ne disposant pas des moyens
nécessaires, c’est vers les investisseurs privés que s’orien-
te la recherche de financement. L’instrument de régulation
financière peut largement varier suivant les contextes :
- système de cost plus : le concessionnaire déclare ses
coûts et une marge déterminée sur coût est autorisée ;
- régulation du retour sur investissement : le concessionnai-
re déclare ses coûts et les prix de vente sont autorisés en
fonction d’un taux de retour sur investissement (TRI) prédé-
terminé ;
- niveau des prix de vente autorisés : tarifs de vente dans
le cadre d’une concession de distribution ;
- termes du contrat de rachat d’énergie produite par l’unité
de génération25 : par le distributeur national, ou par de gros
clients situés à une certaine distance (ce qui nécessite la
permission de l’accès des tiers au réseau, ATR) ;
- participation aux investissements par un fonds public et
modalités (par branchement, par kW, etc.).
In fine, la question à laquelle le régulateur devra répondre
est celle du caractère suffisamment incitatif et transparent
du cadre pour attirer des investissements du secteur privé,
et dans quelles proportions : est-il réaliste d’envisager des
concessions d’électrification rurale (avec des investisse-
ments privés) ou faut-il plutôt envisager des franchises,
voire un affermage dans un premier temps, avec un inves-
tissement public et un gestionnaire privé ? Suit une autre
question, qui concerne la propriété de l’infrastructure, bien
souvent floue dans les programmes d’accès : elle devrait
certainement rester publique mais de multiples options sont
envisageables, depuis une société de patrimoine nationale
jusqu’à la municipalité locale.
► Questions relatives aux caractéristiques de la demande
Les caractéristiques de la demande et sa dynamique ont
évidemment un impact central sur la rentabilité économique
et financière des investissements de production et de distri-
bution. On observe généralement, en zones rurales
(et périurbaines), une demande majoritairement domes-
tique et faible par ménage, dominée par des besoins
d’audiovisuel et d’éclairage. Cette consommation est
caractérisée par une « pointe » très importante le soir,
parfois 3 à 4 fois supérieure à celle du matin, avec une
base de jour très faible. Le développement de cette
25 Ces termes doivent être différentiés, notamment dans les contextes caractérisés par unedisponibilité de ressources hydroélectriques et de biomasse, à temps de retour long ; il en estde même pour les conditions de raccordement, qui sont souvent contraignantes.
© AFD Document de travail n° 122 • Accès à l’électricité en Afrique subsaharienne • avril 2012
41

demande de jour est central pour la rentabilité des
systèmes, afin de mieux rentabiliser les investissements à
travers un taux d’utilisation plus important. Qui plus est,
dans de telles zones, la demande sature bien souvent avec
des taux de connexion de l’ordre de 50 % des foyers, voire
moins en raison de coûts de branchement élevés. La
demande unitaire des foyers ne peut augmenter qu’avec
leur équipement en électroménager et, donc, l’accroisse-
ment de leurs revenus. L’augmentation des usages produc-
tifs et commerciaux, elle-même positivement corrélée avec
le développement économique et l’augmentation des
revenus, va de pair avec l’amélioration de la rentabilité des
programmes d’accès.
1.5.3 La fonction industrielle et de services :
quels opérateurs pour réaliser les programmes
d’accès ?
(Extrait d’un document de la GTZ) :
“(…) the efficiency / know how objective of Private Sector
Participation (PSP) deserves attention. If infrastructure sec-
tors are to benefit from the creativity, flexibility and efficien-
cy of private sector players, and if local private sector capa-
city and public sector governance are preventing success
on this account, then the aim for PSP translates into a need
for Private sector Development on local level. Developing a
functioning private sector in turn requires building capacity
on micro, meso as well as macro level. What’s more, if
improved efficiency, accountability and creativity are the pri-
mary goal of reform, then PSP would even include the
improvement of public utilities by applying private sector
based management best practices (covering issues such
as salary structure, transparent incentives, competition and
benchmarking).”
L’efficacité et/ou le savoir-faire de la participation du secteur
privé (PSP) mérite que l’on y prête attention. Si les secteurs
de l’infrastructure doivent bénéficier de la créativité, de la
flexibilité et de l’efficacité des acteurs du secteur privé, et si
c’est pour cette raison que la capacité du secteur privé local
et la gouvernance du secteur public en empêchent la réus-
site, alors le but de la PSP se traduit par un nécessaire
développement du secteur privé au niveau local.
Ceci nécessite, à son tour, un renforcement des capacités
aux niveaux micro, meso mais également macro. Enfin, si
les premiers objectifs de la réforme sont le renforcement de
l’efficacité, de la redevabilité et de la créativité, alors la PSP
devrait inclure l’amélioration de services publics via l’appli-
cation des “best practices” de gestion issues du privé
(concernant des domaines tels que la structure salariale,
la transparence des incentives, la compétition et le bench-
marking).
Le premier bilan tiré aujourd’hui des contrats de conces-
sions et/ou de privatisations mis en œuvre dans le secteur
de l’électricité urbaine est pour le moins mitigé. Les objec-
tifs minima à atteindre par les concessionnaires œuvrant
dans des zones rentables (en application des dispositions
des contrats de concession) devaient être de les obliger et
de les inciter à investir dans l’outil de production (et, donc,
de mobiliser des financements à relativement long terme)
et d’assurer la desserte des populations les plus pauvres,
en particulier en zones périurbaines. Or, dans la grande
majorité des cas, les concessionnaires n’ont pas atteint ces
objectifs. Le bilan révèle que le niveau d’investissement
réalisé est plus modeste que celui initialement prévu et que
les populations les plus démunies restent encore dans l’at-
tente d’un service sécurisé. En revanche les projets de type
Build Operate Transfer (BOT, de production pure) ou
Independent Power Producer (IPP, producteur indépen-
dant), dans lesquels l’investisseur privé négocie un contrat
de rachat d’énergie électrique avec la compagnie d’électri-
cité, connaissent un plus grand succès. On retrouve trois
opérateurs potentiels.
1. L’opérateur historique (compagnie nationale publique ou
privé) : suite à la vague des réformes du secteur, peu de
pays africains ont conservé leur système centralisé. Les
plus cités sont le Maroc (pour ses résultats d’électrification
exceptionnels ces dernières années), la Tunisie, le Kenya,
le Ghana (qui affichent un taux de couverture relativement
élevé) et, dans une certaine mesure, la Côte d’Ivoire, le
Gabon et le Cameroun. Dans ces pays, la société nationa-
le s’est souvent préoccupée de l’extension du réseau,
même dans les zones les plus reculées, en allouant une
© AFD Document de travail n° 122 • Accès à l’électricité en Afrique subsaharienne • avril 2012
42

part de son budget dans les projets d’électrification rurales
non rentables, financés en partie par des taxes sur les
consommations (partiellement par des apports de l’Etat ou
des collectivités locales). L’intensification, tant en zones
rurales que périurbaines, vient dans un second temps.
2. Les opérateurs privés : ils ont peu de raisons de s’inté-
resser à l’énergie en zone rurale, ce créneau étant peu ren-
table, à moins d’un fort taux de cofinancement par l’Etat, qui
permet une certaine rentabilité de la concession, générale-
ment mixte (production et distribution). Le territoire est alors
divisé (i) en plusieurs concessions géographiques, l’Etat
proposant chaque concession au plus offrant (Sénégal), et
(ii) en zones non électrifiées, rurales, où l’absence de ren-
tabilité oblige l’Etat à mettre en place une AER gérant un
FER. Ces deux organes (parfois fusionnés en un seul) sont
chargés de gérer et financer des projets qui sont étudiés au
cas par cas, financés selon les fonds disponibles et l’éven-
tuelle planification du ministère. C’est par exemple le cas des
PCASER, au Mali, où des petites et moyennes entreprises
(PME) prennent en concession un village donné, prenant en
charge la production d’électricité et la distribution, avec une
subvention à l’investissement de 75 % accordée par l’AER
(AMADER). Dans le cas de la Mauritanie, c’est l’AER qui, en
pratique, garde la responsabilité d’assurer elle-même la
maintenance des kits solaires ou groupes diesel.
3. Structures non gouvernementales : disposant d’une
grande expérience des milieux ruraux africains, ces entités
sont des opérateurs potentiels des zones à faibles revenus
et à consommation énergétique peu élevée. Les ONG ont,
de plus, de réelles capacités à définir des montages
organisationnels innovants et de s’appuyer sur des
partenariats locaux solides. On observe ainsi de plus en
plus, dans le domaine de la gestion de la distribution,
l’émergence de structures très locales, qu’il s’agisse de
revendeurs locaux ou de structures coopératives, qui opè-
rent tant en zones périurbaines que dans des villages. Par
ailleurs, si l’évolution de la fonction confirme une présence
de plus en plus régulière d’entreprises privées, notons que
leurs rôle et responsabilité varient. Cette variation est
directement liée à la réticence qu’ont les opérateurs publics
et les agences spécialisées à confier l’intégralité de la
gestion des systèmes électriques à des opérateurs privés.
Elle s’explique également, pour les petits systèmes et
réseaux, par le manque d’expérience et de capacité tech-
nique des entreprises candidates à la gestion de ces
systèmes. Avec le désengagement de la compagnie
nationale des géographies rurales, se pose la question du
développement du savoir-faire en ingénierie, supervision
des travaux indispensable pour maintenir une fourniture de
qualité et d’envergure nationale.
Schéma 1. Les opérateurs potentiels de l’accès à l’électricité
Source : auteurs.
© AFD Document de travail n° 122 • Accès à l’électricité en Afrique subsaharienne • avril 2012
43
• Opérateur historique
→ Vente en gros→ Vente au détail
• Concessionnaire
→ Géographique→ Technologique
• Coopératives villageoises
• Collectivités locales
• Compagnies de services à l’énergie
(ESCO)
• Associations et ONG
• Revendeurs privés locaux de systèmes
autonomes
Electrification centralisée
Electrification décentralisée
Caractère primordial de la
maintenance


Extrait de ESMAP26 (2007)
“Today’s levels of energy services fail to meet the needs of
the poor. Worldwide, two billion people rely on traditional
biomass fuels for cooking and 1.6 billion people do not have
access to electricity. (…) This lack of access to quality ener-
gy services, especially electricity, is a situation which
entrenches poverty, constrains the delivery of social
services, limits opportunities for women and girls, and
erodes environmental sustainability at the local, national
and global levels. Ignoring the situation will undermine
economic growth and exacerbate the health and
environmental problems now experienced in many parts of
the world.”
Les niveaux de services énergétiques actuels ne satisfont
pas les besoins des pauvres. Dans le monde, 2 milliards
dépendent des bio combustibles traditionnels pour cuisiner
et 1,6 milliard n’ont pas accès à l’électricité. (…) Ce
manque d’accès à des services énergétiques de qualité,
surtout à l’électricité, est une situation qui aggrave la pau-
vreté, entrave la fourniture de services sociaux, limite les
opportunités pour les femmes et les filles, et détériore la
soutenabilité environnementale (qui freine la protection de
l’environnement) aux niveaux local, national et mondial.
Ignorer cette situation va ébranler la croissance écono-
mique et exacerber les problèmes actuellement rencontrés,
dans de nombreuses régions du mode, dans les secteurs
de la santé et de l’environnement.
La mise en place d’une infrastructure d’électrification rurale
est un enjeu central pour permettre le développement. Si
les cadres institutionnel et organisationnel nécessaires se
mettent peu à peu en place, de quelles options technolo-
giques disposons-nous aujourd’hui pour relever cet enjeu ?
2 Un continuum de solutions technico-économiques et organisationnelles
2.1 Cadrage technico-économique
2.1.1 Grande production centralisée ou
production répartie, évolution du coût des
énergies renouvelables
Compte tenu de la faible étendue des réseaux dans les
pays d’Afrique subsaharienne, un programme visant à
maximiser l’accès au service électrique peut, suivant les
contextes, aussi bien consister en :
1. l’extension et/ou le renforcement d’un réseau MT pour
atteindre des localités prioritaires. Pour pouvoir alimenter
ce réseau, encore faut-il qu’il y ait une production d’énergie
en quantité et qualité suffisantes et à un prix abordable ;
2. l’investissement dans une unité de production (renouve-
lable ou diesel) de 500 kW à quelques MW pour desservir
une région et, éventuellement, être raccordée au réseau
pour la vente d’excédents, que l’on appelle souvent « pro-
duction répartie » ;
26 Energy Sector Management Assistance Program.
© AFD Document de travail n° 122 • Accès à l’électricité en Afrique subsaharienne • avril 2012
45

3. la création d’un réseau isolé avec sa production propre
(généralement en dessous de 500 kW) pour une petite
localité ou une grappe de localités (« réseaux villageois ») ;
4. la mise en place d’un parc d’unités PV, pico hydro,
petits moteurs, individuels ou reliant quelques familles, i.e.
« production individuelle répartie » (généralement en des-
sous de 5kW) ;
5. la densification des connexions au niveau de réseaux
existants.
Le paradigme technologique est en pleine évolution. Sur
les vastes territoires peu densément peuplés où vit encore
près de la moitié de la population africaine, étendre le
réseau, à partir de sources de production de plusieurs
dizaines, voire centaines, de MW est une option très capi-
talistique. Avec la baisse des coûts d’investissements, la
production locale (hydroélectricité, biomasse-électricité,
PV) offre de nouvelles perspectives : la taille unitaire des
capacités de production est plus petite, ce qui permet de
diminuer les investissements unitaires. Outre la question du
coût d’investissement initial, on se doit de tenir compte de
celui du kWh en intégrant les coûts variables de production
et de maintenance sur la durée de vie de l’équipement. En
effet, alors que la production thermique par groupes diesel
offre la très importante flexibilité de pouvoir être générée
sur le lieu de consommation (et donc de s’affranchir du coût
du transport de l’électricité et des pertes), les énergies
renouvelables doivent se rentabiliser dans un contexte plus
difficile :
- le potentiel de production (hydroélectricité, éolien, bio-
masse, etc.) doit être localisé à proximité de la demande
ou, à défaut, le coût supplémentaire de la ligne pour trans-
porter l’électricité devra être intégré ;
- la production est intermittente (heures du jour pour le
solaire ou fonction du vent pour l’éolien) et connait des
variations saisonnières : niveau d’ensoleillement, disponibi-
lité de la biomasse, hydrologie variable selon la saison (des
pluies / sèche). Celles-ci peuvent nécessiter la mise en
place du stockage, ou d’un back up de production diesel27.
Le coût de production de l’électricité va donc très largement
dépendre du facteur d’utilisation de l’ouvrage, i.e. son fac-
teur de charge. En effet, le coût du kWh produit va beau-
coup varier suivant qu’un investissement donné fonctionne
à pleine capacité (1 000 heures ou 7 000 heures par an).
Enfin, l’arbitrage entre production à partir d’énergies renou-
velables ou production thermique fossile (charbon ou fioul)
revient bien souvent à arbitrer entre un investissement très
capitalistique mais à faible coût de fonctionnement, et un
investissement peu coûteux mais lourd en charges
annuelles.
Bien souvent, les solutions les moins coûteuses en termes
de coût du kWh actualisé ne sont pas mises en œuvre, tant
pour des raisons de maîtrise des technologies que de
barrière à l’investissement initial. Par ailleurs, en raison du
retard accumulé dans les investissements, pris par l’urgen-
ce, bien des pays (même dotés de ressources naturelles et
donc de potentiels de production d’énergie peu coûteux)
n’ont d’autre choix que d’investir dans des ouvrages
rapides à mettre en service et à faible coût d’investissement
initial, même s’ils s’en trouvent très rapidement pénalisés
en termes de coût du kWh (cf. encadré 5).
Encadré 5. Conséquence du retard pris dans les investissements sur les coûts de production moyens – l’exemple du Cameroun
Au Cameroun, les centrales aujourd’hui existantes sur le Réseau interconnecté Sud (RIS) sont au nombre de neuf : deux centrales hydro-
électriques (Edéa et Song Loulou) et sept centrales thermiques (Limbé, Oyomabang 1 et 2, Logbada, Bassa 2 et 3 et Bafoussam). Alors que
de nombreuses centrales hydroélectriques de taille diverses ont été étudiées dans le passé, selon l’Agence de régulation du secteur élec-
trique (ARSEL), les centrales qui verront le jour à l’horizon 2010 sont les centrales thermiques de Dibamba (en service en 2009) et de Kribi
(en service en 2010), la centrale thermique au gaz de Kribi avec un contrat take or pay et la centrale thermique à fuel lourd de Dibamba.
Aucune donnée prévisionnelle n’est aujourd’hui disponible.
27 Groupe diesel de secours, que l’on démarre lorsque la production par énergies renouve-lables n’est pas possible.
© AFD Document de travail n° 122 • Accès à l’électricité en Afrique subsaharienne • avril 2012
46

Soulignons ici l’évolution très rapide des technologies : le
kWh PV pour des unités de plus de 5 MW était annoncé par
les constructeurs en 2009 à moins de 0,25 EUR/kWh et aux
environs de 3 000 EUR/kW installé à l’investissement en
Europe. Avec l’évolution des prix du fioul, l’électrification PV,
biomasse ou hydroélectrique est maintenant compétitive.
Choisir une technologie de production et l’organisation de
l’électrification est donc de plus en plus compliqué : de
nouvelles options arrivent à maturité technologique et en
phase de production de masse, les incertitudes sur les prix
du pétrole augmentent, et de multiples risques (dont clima-
tiques) apparaissent. De plus, la production répartie peut
être bien mieux gérée grâce aux évolutions de l’électrotech-
nique. Ainsi, alors que, jusqu’à présent, les compagnies
d’électricité étaient réticentes à intégrer plus de 30 % de
cette production, cette limite évolue rapidement, grâce aux
smart grids.
2.1.2 Production centralisée et réseaux
Avant de pouvoir parler d’accès des populations les plus
pauvres, encore faut-il qu’il y ait une énergie disponible en
quantité suffisante, à un coût raisonnable et avec une
qualité de service adéquate28, car les niveaux tarifaires
reflètent avant tout les coûts.
La grande hydraulique est aujourd’hui freinée en raison des
débats sur les impacts environnementaux. Si cette situation
évolue positivement, des incertitudes croissantes
émergent, liées aux changements climatiques et à la
mobilisation financière. La géothermie pourrait également
connaitre un renouveau : l'expansion de la géothermie le
long du Rift (qui s'entend du Mozambique, au sud, à
Djibouti, au nord) laisse augurer d’importantes perspectives
en termes de ressource potentielle énergétique (le potentiel
global est de l’ordre de 7 000 MW). On observe aussi un
intérêt grandissant pour l’éolien.
Cela étant, les grands IPP qui se mettent en place sont
essentiellement au gaz ou au fioul lourd (barges d’urgence
ou groupes mobiles). Ce sont la production de charbon
propre et les nouvelles technologies de gaz (Integrated
Gasification in Combined Cycle – IGCC, i.e. centrale
thermique à gazéification de charbon intégrée à un cycle
combiné) qui offrent les perspectives les plus importantes.
Ces transactions sont longues et complexes : une fois le
cadre légal ouvert, les PPA se négocient au coup par coup,
avec de très importants coûts de transaction que l’on ne
peut pas amortir sur des petits investissements.
Historiquement, en Europe, la baisse du coût du kWh livré
s’est faite dans un paradigme de grande production
centralisée et de réseaux interconnectés (et d’économies
d’échelle rendues possible dans un contexte de monopole).
Aujourd’hui, un consensus se dégage sur la pertinence à
développer une production indépendante répartie,
raccordée au réseau électrique national. Les raisons sont
multiples : enjeux environnementaux et d’indépendance
énergétique, valorisation des ressources locales (vent, eau,
biomasse), réduction des pertes de transport et de distribu-
tion, baisse des coûts d’investissement des options
techniques de production locale, plus grande sécurité
d’approvisionnement en rapprochant les lieux de produc-
tion et de consommation, etc.
Pour éviter de se retrouver dans ce genre de situation, le Sénégal envisage sérieusement de développer des sources de production d’élec-
tricité qui pourraient être intégrées sur le réseau électrique interconnecté et non-interconnecté à partir d’énergies renouvelables (hors gran-
de hydroélectricité). Les principales filières étudiées sont l’éolien, la biomasse (bagasse de canne à sucre) et le solaire PV.
28 C’est-à-dire sans trop de coupures quand il s’agit d’une demande industrielle ou de déles-tages trop longs pour la production agricole, mais également sans un niveau de fiabilité trèscouteux à garantir, qui ne correspondra pas aux caractéristiques d’une demande rurale.
© AFD Document de travail n° 122 • Accès à l’électricité en Afrique subsaharienne • avril 2012
47

Graphique 6. Coût du kWh actualisé de différentes options de production (en cents EUR/kWh)
Graphique 7. Evolution des coûts d’investissement de 2005 à 2015
Source : ESMAP (2007)
© AFD Document de travail n° 122 • Accès à l’électricité en Afrique subsaharienne • avril 2012
48
Wind 100MV 2005
(CF-30%) 2015
Solar thermal with storage 2005
30 MW (CF-50 %) 2015
Biomass Steam 50 MW 2005
CF-80 %) 2015
MSW Landfill Gas 5 MW 2005
CF-80 %) 2015
Geothermal 50 MW 2005
CF-89 %) 2015
Mini hydro 5 MW 2005
CF-45%) 2015
Large hydro 100 MW 2005
CF-50%) 2015
Diesel generator (Base) 2005
CF-50%) 2015
Gas Combined Turbines (Peak) 2005
CF-10%) 2015
Gas Combined Cycle 2005
CF-10%) 2015
Coal Steam 300 MW 2005
CF-80%) 2015
Coal AFBC 300 MW 2005
CF-80%) 2015
Coal IGCC 300 MW 2005
CF-80%) 2015
Oil Steam 300 MW 2005
CF-80%) 20150 2 4 6 8 10 12 14 16 18
Cycle combiné : 5.1 cents / kWh
Diesel 5 MW base et pointe
100
90
80
70
60
50
40
30
20
10
0
cts
€/k
Wh
Sol
aire
PV
0,0
5 kW
0,3
kW
25 k
W
5 00
0 kW
Win
d 0,
3 kW
100
kW
1 00
0 kW
10 0
00K
W
PV
-win
d-hy
brid
0,3
kW
100
kW
Sol
aire
ther
miq
ue a
vec
stoc
kage
sans
sto
ckag
e
Géo
ther
miq
ue 2
00 k
W
20 0
00 k
W
Fla
sh 5
0 00
0kW
Gaz
éific
atio
n bi
omas
se 1
00 k
W
20 0
00 k
W
Bio
mas
se v
apeu
r 50
000
kW
Bio
gas/
déch
ets
50 0
00 k
W
Bio
gas
60 k
W
Pic
o/M
icro
-hyd
ro 0
,3 k
W
1 kW
100
kW
Min
i-hyd
ro 1
00 0
00kW
Larg
e-hy
dro
100
000
kW
Pum
ped
Sto
rage
150
000
kW
Source : ESMAP (2007)

En Afrique subsaharienne, étant donné les deux tendances
actuelles concernant les difficultés à mobiliser des sommes
importantes pour des ouvrages de production significa-
tifs29, et l’évolution de l’électrotechnique (qui permet
d’envisager un réseau électrique important alimenté en de
multiples points par des centrales de taille moyenne), on
s’oriente peut être vers un nouveau schéma de production
avec plus d’ouvrages de taille moyenne et répartis, dans un
contexte où les économies d’échelle ne jouent plus le
même rôle que dans le passé.
Si maîtriser les coûts de production est une condition
nécessaire, elle n’est pas suffisante. En effet, les coûts du
transport HT ou MT et de la distribution MT et BT pour par-
venir à donner accès aux populations nécessite de rajouter
jusqu’à 50 %, voire 100 % sur l’investissement de
production.
Encadré 6. La part de la production dans le coût kWh – l’exemple du Cambodge
Au Cambodge, où moins de 10 % de la population a accès au service électrique, le coût moyen de production d’EDC (compagnie d’électri-
cité) et d’achat aux IPP (gaz et fioul lourd) est de 0,15 USD/kWh et les importations du Vietnam (IGCC) coûtent environ 0, 8 USD/kWh. Le
coût moyen s’élève donc à environ 0,11 USD/kWh. En considérant que les foyers ruraux à proximité consommeront 50 kWh par mois à un
facteur de charge de 30 %, le coût moyen estimé du transport et de la distribution supplémentaire (ainsi que les pertes techniques) est 0,13
USD/kWh. La production ne compte donc que pour la moitié du coût du kWh.
2.1.3 La production décentralisée : des enjeux
réglementaires et d’organisation complexes
Pour desservir des clients, il faut bien distinguer l’activité de
distribution de celle de production. En outre, dans de nom-
breux cas, les opérateurs en charge des deux tâches sont
bien distincts. Comme le montre le schéma 2, le distributeur
va donc être amené à acheter en gros l’énergie soit :
A - au réseau interconnecté au niveau d’une sous-station
ou d’un transformateur ;
B - à un producteur indépendant (500 kW à 15 MW) qui
exploite une production locale répartie et qui va vendre à un
ou plusieurs des clients suivants : la société de distribution
rurale ; le réseau interconnecté ; un /des gros consomma-
teur(s) ;
C - à une industrie qui fait de l’autoproduction pour
sécuriser son alimentation et qui revend l’excédent.
Les deux autres cas de figure sont les suivants :
D - un concessionnaire unique fait de la production et de la
distribution au sein d’une ou plusieurs localités, et donc de
l’électrification villageoise (généralement de moins de 500
kW) ; de très nombreux mini réseaux diesel dans cette
configuration existent en Afrique ;
E - la gestion d’un parc de solutions dîtes « individuelles
réparties », c'est-à-dire où le générateur est localisé sur le
lieu de l’usager, et où on fait donc l’économie d’un réseau
de distribution (typiquement le kit solaire individuel ou de la
pico hydro).
29 A l’heure actuelle, 93 % du potentiel en énergie hydraulique réalisable économiquementsur le continent africain (estimé à 937 TWh/an, soit un dixième du total mondial) resteinexploité.
© AFD Document de travail n° 122 • Accès à l’électricité en Afrique subsaharienne • avril 2012
49

Nous nous intéressons, dans cette sous-partie, à la petite
production répartie et aux réseaux villageois (B, C et D
dans la liste ci-avant), dont les cadres réglementaires peu-
vent être variés, avec des sources de production différentes
(groupes diesel, énergies renouvelables).
La production isolée du réseau principal n’est pas toujours
mise en œuvre par la compagnie d’électricité qui se
consacre plutôt à des ouvrages de taille plus importante et
centralisés. Il s’agit donc d’opportunités pour le PPP, avec
des investissements unitaires moins élevés mais qui vont
nécessiter la mise en place d’un cadre de réglementation
pour apporter aux investisseurs les garanties nécessaires à
leur engagement (sur des investissements qui demeurent
de long terme, i.e. plus de 5 ans).
La première étape consiste souvent à autoriser la produc-
tion pour les besoins propres de l’industrie (sécurité,
qualité d’approvisionnement, éloignement du réseau
national), l’autoproduction, puis éventuellement la revente
d’excédents. Cette possibilité va être potentiellement très
importante pour la rentabilité de l’agroindustrie, ou repré-
senter une diversification importante pour la rentabilité de
l’autoproducteur, suivant les conditions de rachat autori-
sées par réglementation. En tant que telle, la revente
d’excédents n’est porteuse de solution à la problématique
de l’accès que si il s’avère que l’acheteur est un distributeur
rural, ou si le distributeur national va mobiliser cette éner-
gie pour la desserte rurale.
La seconde étape consiste à autoriser la production d’élec-
tricité par le secteur privé ; en définir le cadre est souvent
laborieux et complexe, et contribue (ou pas) à l’accès des
populations aux services, suivant différents cas de figure.
- Un producteur indépendant, pour rentabiliser son investis-
sement, peut chercher à revendre l’énergie à une société
de son groupe, ou à un client extérieur, à un prix négocié
entre les deux parties et dans un cadre réglementaire rela-
tivement flexible. Toutefois, ceci nécessite que le propriétai-
re des réseaux autorise l’utilisation du réseau, ou encore
l’ATR ; en Inde, ce wheeling scheme, où le transporteur
prélève un pourcentage de l’énergie transitée, fût un des
déclencheurs de la production indépendante. de même,
avec cette ouverture, les cimentiers marocains sont deve-
nus des développeurs de centrales éoliennes dans le nord
du pays pour alimenter des usines situées dans le sud. Ce
schéma résulte généralement d’une volonté d’intégrer un
certain pourcentage de production renouvelable; elle ne
contribue pas directement à l’accès des populations, mais
à celle de l’industrie, qui génère des emplois.
- Si la réglementation ne permet que le rachat par la com-
pagnie d’électricité, il est essentiel que les modalités du
Schéma 2. Sources d’alimentation possible pour un distributeur.
Source : auteurs.
© AFD Document de travail n° 122 • Accès à l’électricité en Afrique subsaharienne • avril 201250

Power Purchase Agreement (PPA), soient claires. En effet,
il ne suffit pas qu’elle soit autorisée, encore faut-il qu’il y ait
engagement de rachat sur une durée suffisemment longue
pour permettre le remboursement des prêts (et non limité à
un an renouvelable comme en Indonésie). Il faut également
que le mode de calcul du tarif de rachat soit clairement défi-
ni, les deux schémas de base étant le cost plus et le coût
évité de la compagnie nationale acheteuse (et non comme
au Kenya où, pour l’heure, seul un tarif maximal est publié).
Comme dans le cas de la revente d’excédents, ce schéma
n’est pas directement porteur de contribution à l’électrifica-
tion rurale, sauf si la compagnie d’électricité va opérer des
extensions pour desservir des zones non desservies, grâce
à cette énergie.
- En revanche, si l’acheteur est un distributeur (ou la compa-
gnie nationale qui va entreprendre un programme rural), la
contribution à l’accès est évidente. Encore faut-il que de tels
distributeurs ruraux existent, et que le producteur indépen-
dant soit prêt à leur vendre sa production, au vu de la quali-
té de la contrepartie qu’ils représentent. Un distributeur rural
(coopérative coopérative ou association villageoise) n’est en
effet pas forcément considéré comme un client de première
catégorie par un investisseur. Se pose ensuite la question de
savoir comment le prix d’achat du distributeur est déterminé,
car il est lui-même généralement contraint par une grille tari-
faire aux usagers déterminée par la réglementation. Le sys-
tème est donc complexe, et ce genre de cadre n’en est qu’au
stade embryonnaire en Afrique.
Encadré 7. Quels acheteurs pour rentabiliser la petite production indépendante privée ? Illustrations en Inde, en Indonésie et aux
Philippines
En Inde, où l’offre nationale est déficitaire, des conditions de rachat ont été mises en places pour permettre à une sucrerie de rentabiliser un
surcoût d’investissement de cogénération. Ainsi, toutes les sucreries du pays disposent de cogénérations permettant de tirer le meilleur parti
du résidu de biomasse. En Indonésie, la revente d’excédents n’est permise qu’au coût variable de production, et avec des contrats s’étalant
sur une période d’un an. Résultat : aucun autoproducteur ne s’engage dans cette voie.
Aux Philippines, ce sont des coopératives qui sont en charge de la distribution rurale. Elles appliquent la tarification imposée par le régula-
teur et rachètent l’électricité en gros à ce tarif, moins un certain pourcentage qui doit couvrir l’amortissement du réseau de distribution, les
pertes techniques et leur marge. Si ce prix de rachat est inférieur pour le producteur au coût de l’énergie livré au point d’achat, le produc-
teur doit justifier de son coût de production au régulateur, ce qui lui donne droit à une compensation de manière à pouvoir maintenir une
certaine rentabilité.
Schéma 3. Coopératives et petite industrie : l’enjeu de la rentabilité
Source : auteurs.
© AFD Document de travail n° 122 • Accès à l’électricité en Afrique subsaharienne • avril 2012
51
- L’électrification par mini réseaux villageois par un opéra-
teur unique en charge de la production et de la distribution
est un cas de figure aujourd’hui assez fréquent, lorsqu’il est
opéré à partir de groupes diesel (cf. 2.1.4). Il s’agit toutefois
d’une configuration complexe quand on raisonne à partir
d’énergies renouvelables :
• le juste dimensionnement de la production par rapport à la
demande est essentiel, étant donné les coûts d’investisse-
ments importants, pour éviter une sous utilisation de l’équi-
pement qui conduit à un coût élevé du kWh ;
• les études (hydrologie, saisonnalité de la biomasse, etc.)
sont longues et coûteuses et donc proportionnellement
d’autant plus chères que l’investissement relatif est modes-
te ; on n’est pour l’heure généralement pas dans une confi-
guration où les compétences nationales, voire locales, sont
suffisantes pour les réaliser ;
• souvent, pour assurer une continuité de service, on est
amené à surdimensionner l’investissement, ou à s’équiper
d’un groupe diesel de secours ;
• l’arbitrage coût d’investissement et coût du kWh demeure
complexe.
2.1.4 Production thermique ou renouvelable, la
place des solutions hybrides.
Compte tenu du cadre contractuel complexe ayant servi de
base à cette analyse, il convient de situer à nouveau la rai-
son pour laquelle cette étude s’intéresse à cette production
répartie : 50 % de la population vit loin des réseaux exis-
tants et, même dans les cas où elle se situe à leur proximi-
té, ceux-ci sont bien souvent insuffisamment alimentés
pour satisfaire la demande en bout de ligne. Dès lors, quel-
le source de production choisir ?
- La production locale par groupe diesel et/ou fioul lourd est
très largement répandue et reste la technologie de référen-
ce ; elle est maîtrisée et s’installe rapidement n’importe où.
- L’investissement dans une source de production d’énergie
renouvelable est bien plus complexe : la ressource (rivière,
biomasse, site éolien) n’est pas forcément située à proximi-
té du point de consommation. La production est intermitten-
te (i.e. connait des variations instantanées – vent, journa-
lières – soleil, et saisonnières – pluies) ; les études et le
temps de préparation sont donc plus longs.
- En revanche, si l’investissement est plus coûteux, les
coûts de fonctionnement sont ensuite très faibles sur la
durée de vie de l’ouvrage (qui s’étend de 15 à 50 ans
suivant la technologie). Encore faut-il avoir les moyens
d’investir aujourd’hui en prévision d’une production de si
long terme.
La réalité de la situation nous le montre bien : la plupart des
capitales provinciales non raccordées au réseau sont
alimentées par des groupes fioul ou diesel. Il n’y a en
réalité que très peu de petites centrales hydroélectriques et
de cogénération en fonctionnement en Afrique ; lorsqu’elles
fonctionnent, elles répondent à des besoins essentielle-
ment (voire totalement) d’autoproduction industrielle.
Paradoxe ultime : à maximiser la mise en place rapide d’un
service universel, on en vient à privilégier les solutions
thermiques. Les solutions hybrides, c'est-à-dire combinant
la flexibilité de production d’un groupe diesel avec le faible
coût de production à long terme des énergies renouve-
lables, permet de s’affranchir des problèmes d’intermitten-
ce de la production et offre aujourd’hui des perspectives
extrêmement prometteuses (cf. tableau 6).
- Pour une production « en base » hydro ou cogénération,
on évite un problème de surdimensionnement, de barrage
(retenue) ou de stockage coûteux, avec un back up diesel.
- Pour un mini réseau alimenté principalement avec un
générateur diesel, injecter des kWh PV lorsqu’ils sont
produits pendant la journée, permet de réduire les coûts du
diesel et la dépendance aux fluctuations de coûts ;
- Pour un mini réseau alimenté principalement avec un
générateur diesel, on peut directement substituer une par-
tie du fioul consommé, en injectant du biodiesel ou du gaz
(pour 40 à 80 %) à la place du diesel.
© AFD Document de travail n° 122 • Accès à l’électricité en Afrique subsaharienne • avril 2012
52

2.2.1 La production par groupes diesel :
scénario par défaut
Historiquement, en raison de son coût d’investissement
faible, de la simplicité de sa technologie et du court temps
de travaux, cette option technique a été la plus favorisée,
tant pour l’électrification des centres ruraux que celle des
centres secondaires. Dans bien des pays, la faiblesse de la
charge dans ces bourgs et petits centres, ainsi que la faible
densité de population ne pouvaient justifier d’étendre le
réseau interconnecté. C’est ainsi que, typiquement, dans
des zones sahéliennes telles qu’au Burkina Faso, au Mali
ou en Mauritanie, le groupe électrogène demeure le choix
technique de base pour l’électrification rurale, même si, sur
une durée de vie de 20 ans, l’option diesel est coûteuse.
Ainsi, le coût du kWh d’un groupe électrogène, est lié jus-
qu’à 80 % au coût du diesel, rendant cette option moins
rentable, a fortiori en prenant en compte les frais de trans-
port du carburant dans les zones isolées. A un euro par
litre, le coût du carburant sur 5 à 10 ans dépasse l’amortis-
sement de panneaux solaires aux prix actuels.
Les raisons principales du choix du diesel comme solution
de référence sont les suivantes :
- le faible coût d’investissement pour une unité de produc-
tion : environ 600 EUR/kW, lorsqu’une option PV représen-
te un investissement dix fois supérieur, c'est-à-dire un
nombre de connexions immédiates dix fois moindre. Dans
cette situation, les sociétés d’électrification préfèrent justi-
fier les emprunts nécessaires par un grand nombre de
connexions ;
- le fait que la technologie est éprouvée et que les compé-
tences nécessaires à l’entretien sont présentes partout, ce
qui évite les coûts de formation nécessaires pour l’implan-
tation de technologies moins développées (solaire, gazéifi-
cation, etc.).
Même dans des pays riches en ressources naturelles
comme le Cameroun, l’Ouganda, la RCA et la République
démocratique du Congo (RDC), les contextes politiques et
économiques nationaux n’ont pas permis la conduite de
grands programmes de valorisation de la biomasse ou de
la petite hydro-électricité (faute de financements et d’incita-
Tableau 6 Les énergies renouvelables : coûts d’investissement et de kWh
Source : Global Chance 2007.
2.2 Des solutions techniques complémentaires au réseau interconnecté
© AFD Document de travail n° 122 • Accès à l’électricité en Afrique subsaharienne • avril 2012
53
Filière Invest. EUR/kW Coût ct EUR/kWh Capacité mondiale installée Fonctionmt (h/an)
Photovoltaïque
-Sur réseau 3 000-7 000 20 - 40
-Isolé 7 000-12 000 35 - 100
Eolien
-Terrestre 1 000 4 - 8 94 GW 2 000-2 500
-Off shore 1 200-1 500 4 - 8 1,2 GW 2 500-3 000
Hydraulique
-Grande 1 400-2 000 2 - 8 3 000-8 000
-Petite <10MW 900-4 000 1 - 9,5 48 GW 3 000-8 000
Géothermie 1 000-3 900 1,2 - 9 8,9 GW 8 000
Charbon 900-1 400 4,2 - 5,6 8 000
Fuel / diesel 400-1 500 15 - 20 indifférent

tions). On reste encore bien souvent dans la situation où, à
budget fixe, un opérateur (compagnie nationale d’électricité
ou concessionnaire) sera plus évalué sur le nombre de
connections immédiatement réalisées que sur le coût à
long terme du service rendu. Dans un avenir proche, le
groupe électrogène restera donc incontournable. Toutefois,
avec l’augmentation du prix du carburant, les solutions à
privilégier doivent en premier lieu viser la baisse de la
consommation de diesel, en intégrant systématiquement
l’efficacité des équipements d’usage et saisir toute opportu-
nité d’hybridation.
2.2.2 La petite hydro : importants besoins en
capital financier et savoir-faire
Dans de nombreux pays, les ressources hydrauliques sont
abondantes et offrent des opportunités de développement
multiples, couvrant toutes les gammes de puissance, de
quelques centaines de watts à quelques mégawatts. Le très
faible nombre d’installations de pico (individuelle), micro
(villageoise, 10 kW à 200-500 kW) ou mini hydro (200/500
kW à 5/15 MW) est flagrant, en comparaison avec le conti-
nent asiatique.
On dénombre très peu d’unités de fabrication de turbines
sur le continent africain (quelques ateliers en Ethiopie et au
Nigéria), mais de nombreux pays disposent d’une base
industrielle pour assurer la maintenance de telles installa-
tions. Des expériences de promotion de la filière hydro,
couvrant un large éventail de puissance, peuvent servir de
base d’enseignement pour l’Afrique subsaharienne : projet
GTZ micro hydro en Indonésie (développement de la fabri-
cation locale ; gamme < 100 kW), ou encore développe-
ment au Sri Lanka à travers un dispositif incitatif de tarif de
rachat. Sur le continent africain, une initiative de dévelop-
pement des petites centrales hydroélectriques pour les
usines de thé a été lancée en Afrique de l’Est avec l’appui
du Global Environment Facility (GEF) du Programme des
Nations unies pour l’environnement (PNUE) dans laquelle
le consultant intervient (unités hydro électriques de 500 kW
à 5 MW) ; une initiative régionale, au stade d’identification
de sites (PNUD, GEF en Afrique de l’Ouest et centrale) ;
des projets pilote menées en Afrique australe (Rwanda,
Tanzanie, Zambie) par l’Organisation des Nations unies
pour le développement industriel (ONUDI) et des
coopérations bilatérales.
► Mini hydro (200/500 kW – 5/15 MW) : enjeux de renta-
bilité technico-économique et impact sur l’accès
Ces projets sont d’autant plus difficiles à mettre en œuvre
qu’ils sont souvent surdimensionnés pour une demande
rurale locale. L’amortissement est impossible sur la deman-
de domestique uniquement (< 100kWh/mois par foyer). La
rentabilité du projet dépend alors de la présence de clients
importants (type industriel) ou bien de la possibilité de
revente au réseau. Ces clients, gros consommateurs et
disposant de capacités de payer importantes, permettent
d’amortir l’investissement et de couvrir les coûts de fonc-
tionnement afin de développer une composante rurale à un
tarif plus faible. Ce montage n’est possible qu’en présence
d’un cadre institutionnel et d’une législation clairs pour la
revente au réseau, comme décrit ci-avant.
Dans les zones abondamment dotées en eau, la production
d’hydroélectricité se justifie dans la mesure où les coûts de
fonctionnement sont quasiment nuls (car réduits à l’entre-
tien de la turbine). Les obstacles majeurs sont l’importance
des coûts d’investissement et la complexité des études de
conception (voir ci-après). En ordre de grandeur, suivant la
turbine, la partie électromécanique d’un ouvrage va coûter
500 à 1 500 USD/kW, la partie du génie civil pouvant varier
de 500 à 3 000 USD/kW.
Suivant le site, le génie civil nécessaire peut être plus ou
moins coûteux (i.e. conduite d’eau, bassin de décantation,
conduite forcée, prise d’eau et, plus rarement, retenue
d’autant plus importante que l’on voudra stocker de l’eau
pour une durée longue ; bâtiment abritant le générateur ;
etc.). S’y ajoutent les coûts liés aux études nécessaires
concernant l’identification de sites et la conception des
ouvrages ou d’hydrologie, qui requièrent également des
compétences peu présentes localement, en Afrique.
La réalisation de ces différentes étapes implique également
un temps de gestation très long qui rend plus difficile l’ad-
hésion des partenaires sur toute la vie du projet, qui peut
s’étendre sur plusieurs années (cf. tableau 7).
© AFD Document de travail n° 122 • Accès à l’électricité en Afrique subsaharienne • avril 2012
54

La production d’hydro-électricité au fil de l’eau est constan-
te au cours d’une journée, contrairement à la demande. Si
l’offre doit suivre la demande, il faut un ouvrage de stocka-
ge (coûteux) pour pouvoir turbiner le soir. Au-delà de ce
stockage journalier, la production sur l’année est dépen-
dante de l’hydrologie et de ses variations saisonnières.
Faut-il donc s’engager dans des ouvrages de génie civil
important pour assurer une garantie de puissance sur
l’année ?
La présence d’un back up (source thermique non dépen-
dante de la ressource naturelle) peut être nécessaire à un
service fiable, et une alternative intéressante aux impor-
tants ouvrages de génie civil : dimensionner un ouvrage
pour qu’il ne soit que peu utilisé sur une année conduit à un
coût du kWh élevé.
► Hydroélectricité villageoise (micro, de 10 à 100 ou
500 kW) : de nombreuses contraintes
Pour de plus petits ouvrages dits « villageois », il n’est pas
envisageable de se lancer dans des études longues et
complexes, à coûts élevés, à amortir sur un peu de kWh. Il
n’est possible de développer l’hydroélectricité au niveau vil-
lageois, pour alimenter un mini-réseau que dès lors qu’il est
au fil de l’eau (sans stockage d’eau) et de conception
simple. Le génie civil est réduit (il suffit d’une conduite d’eau
et d’un petit bâtiment pour la turbine) et les études néces-
saires bien moindres. Le génie civil peut être majoritaire-
ment local, en formant les acteurs concernés pour, dans un
premier temps, assurer l’entretien de la centrale et éviter
ainsi l’abandon du projet dès la première panne. Dans un
second temps, on peut développer une filière locale de
production de turbines pour minimiser les importations qui
génèrent des coûts importants, et favoriser ainsi le dévelop-
pement local.
Ce schéma nécessite toutefois de pouvoir être largement
répliqué (pour amortir les coûts de formation), de disposer
d’un véritable savoir-faire et d’être facilité par une législa-
tion claire. Il faut bénéficier de soutiens aux niveaux (i) du
développement de compétences, (ii) de l’investissement et
(iii) lors de la définition des conditions de tarification. Il s’agit
donc d’une démarche de longue haleine qui requiert un réel
engagement politique au niveau de l’Etat, comme cela a pu
être le cas au Sri Lanka.
► La pico hydro : un transfert de compétences nécessaire
La pico hydro est l’utilisation de la force hydraulique par des
turbines de faible puissance (typiquement inférieures à
5 kW), à usage individuel ou partagé entre quelques
familles à l’instar des systèmes PV. Les turbines néces-
saires présentent la caractéristique d’allier la partie méca-
nique et la partie électronique en une seule pièce.
L’utilisation de cette technologie est donc accessible à tous.
Les turbines peuvent être installées avec une petite dériva-
tion d’eau pour créer un dénivelé, mais également directe-
ment dans le courant d’une rivière. Leur utilisation deman-
de donc très peu de savoir-faire. Cependant, elles ne peu-
vent turbiner ni dans des périodes d’étiage, ni dans le cas
d’une trop grande hydrologie. Pour maintenir des prix de
vente bas, la plupart des équipements chinois et vietna-
miens ne disposent ni de régulation ni de protection, ce qui
pose des problèmes de sécurité aux équipements d’usage
et aux utilisateurs.
© AFD Document de travail n° 122 • Accès à l’électricité en Afrique subsaharienne • avril 2012
55
Durée - dates Coûts Financeur Nombre de sites
Etude de cadrage 4 mois GEF, PNUE, Banque africaine 8 pays
Préfaisabilités Nov. 05 – mars 06 178 000 EUR de développement (BAD) 19 sites
Faisabilités 5 mois 180 000 EUR GEF, UNEP, BAD 2 sites
Oct. 07 - mars 08
Etudes de la composante 3 ans 272 000 EUR GEF, UNEP, BAD 4 sites
électrification rurale Jan 07 – dec 2010
Réalisations 1 site en cours de réalisation 1 site (génie civil, électromécanique,1 site en discussion réseau de distribution, supervision) : GEF, UNEP, BAD 6 sites4 études de faisabilités en cours 5,5 M EUR (2,833 MW)
Tableau 7. Calendrier et coûts de la conception de sites hydro-électriques
Source : auteurs.

De nombreux pays d’Afrique présentent une hydrologie
permettant l’installation de pico hydro dans les villages iso-
lés. Le développement de cette filière, actuellement non
exploitée sur le continent, peut donc se faire soit via l’impor-
tation des turbines asiatiques, soit via le développement
d’une filière locale. Un transfert de technologie entre les
deux continents semble donc approprié et nécessaire au
développement d’un marché. Une fois la fabrication assu-
rée, le coût d’une turbine est accessible même aux popula-
tions rurales à faibles revenus puisque – pour les matériels
d’entrée de gamme – on trouve dans les zones rurales du
Laos des turbines « cotées » 200 W pour un prix de 30 USD.
© AFD Document de travail n° 122 • Accès à l’électricité en Afrique subsaharienne • avril 2012
56
Encadré 8. Pico hydro au Laos
La pico hydro s’est développée de façon très spontanée en Asie. Au Laos, même s’il est difficile de donner un nombre certain, on estime
qu’il existe 60 000 turbines. Une filière de production s’est développée, en Chine et au Viêtnam en particulier. Les turbines produites sont
souvent d’une qualité moyenne, et leur durée de vie est évaluée à 3 ans environ. Mais il est possible de contrôler la production, comme l’AER
a tenté de le faire au Viêtnam (en plaçant sur le marché des turbines de meilleure qualité à des prix compétitifs) ou aux Philippines (qui ont
développé leur marché en important ces turbines de meilleure qualité que celles venant de Chine). L’électricité produite est instable, et les
appareils ménagers reliés à cette source voient leur durée de vie diminuer dans ces conditions, puisque les utilisateurs n’installent pas spon-
tanément un régulateur. Au Laos, par exemple, les ménages remplacent leur ampoules jusqu’à trois fois par mois.
Enfin, si la facilité de mise en œuvre de la pico hydro représente un avantage pour l’électrification rurale (la mise en place d’une turbine étant
simple), l’utilisation d’électricité par des personnes manquant de sensibilisation sur ses dangers, couplée au manque de protection des ins-
tallations, exposent les utilisateurs à de nombreux risques. Les discussions avec ces derniers font ainsi état de plusieurs accidents. Le déve-
loppement de la pico hydro doit donc se faire parallèlement à une sensibilisation des utilisateurs à son utilisation.
Les coûts se situent entre 20 EUR pour quelques centaines de Watts, et 500 à 1 000 EUR pour quelques kW30.
2.2.3 La bioélectricité : des filières techniques
et des problématiques d’accès à différencier
► La production d’électricité à partir de biomasse :
ressources et filières
Tout comme l’hydroélectricité, la production d’électricité à
partir de biomasse dépend de la disponibilité locale de la
ressource. Il convient dès lors de bien distinguer, d’une
part, le développement de plantations dédiées à la
production d’électricité, qui va toucher à une problématique
agricole et de développement rural et, d’autre part, la
valorisation de résidus agricoles ou d’une agroindustrie.
Il serait néanmoins erroné de systématiquement considé-
rer cette ressource comme gratuite car les usages concur-
rentiels se développent (briquettes de balle de riz, produc-
tion de papier, usages pour la cuisson, etc.). La production
de biocarburants à grande échelle pour le transport ou le
petit biogaz individuel ou communautaire pour la cuisson
ne seront pas examinés ici.
Pour ce qui est de la production d’électricité pour les ser-
vices ruraux, quatre filières essentielles doivent être distin-
guées :
30 Pour plus d’informations, visiter le site du projet Village Off-Grid Promotion and Support,mené par le gouvernement du Laos : www.vopslaos.org

- la cogénération
- le biogaz
- le biodiesel
- la gazéification
► Cogénération autour d’une agroindustrie
Une cogénération (production combinée de chaleur et
d’électricité) est particulièrement pertinente dans l’agroin-
dustrie où il existe des besoins de chaleur (typiquement les
sucreries). Elle n’est appropriée qu’à partir de 500 kW, voire
du MW. Il est bien sûr possible de se limiter à la production
d’électricité et de ne pas valoriser la production de chaleur
si ce n’est pas nécessaire au processus.
Cette filière est technologiquement très largement
répandue et éprouvée en Asie et en Amérique latine, où
toutes les sucreries d’Inde, du Brésil et de la Thaïlande en
particulier sont équipées de telles unités. Elle s’applique de
plus en plus à des domaines tels que la production d’huile
de palme, les unités de décorticage de riz ou l’industrie de
transformation du bois. Peu de projets existent en Afrique
subsaharienne, en dehors de quelques installations en
Afrique du Sud, en Ouganda, en Tanzanie et au Zimbabwe.
Un programme ambitieux est cependant actuellement
lancé avec le soutien du PNUE/GEF afin de développer la
cogénération en Ethiopie, au Kenya, au Malawi, en
Ouganda, au Soudan, au Swaziland et en Tanzanie (pro-
gramme Cogen for Africa, coordonné par l’ONG
Afrepren/FWD31).
Traditionnellement, les unités agroindustrielles sont dotées
de chaudières basse température et basse pression, et
sont autosuffisantes. La même quantité de résidu, avec une
chaudière haute pression et haute température, permet de
produire significativement plus d’électricité. Mais le surcoût
d’investissement ne pourra se justifier pour l’agroindustrie
que si elle peut revendre cette électricité à un prix suffisam-
ment attractif pour rentabiliser son investissement.
En Afrique subsaharienne, le potentiel est considérable,
que ce soit dans les zones sucrières ou dans les unités de
transformation du bois. C’est cependant le cadre réglemen-
taire – et la proximité du réseau électrique – qui inciteront
au développement de cette filière : à moins d’un tarif de
rachat attractif pour alimenter le réseau ou les localités
avoisinantes, les industriels se contenteront d’utiliser une
chaudière de base pour leur propre consommation.
La cogénération s’est essentiellement développée de façon
autarcique depuis plusieurs décennies. Les rendements
des chaudières évoluent, le développement du réseau
électrique également, et c’est aujourd’hui une filière
mature, dont le potentiel s’étend puisque la revente au
réseau devient de plus en plus fréquemment possible. Les
quantités de biomasse disponibles permettent de produire
un surplus d’électricité, vendu à l’extérieur. Une partie peut
être envoyée sur le réseau (s’il existe) au tarif national, afin
de rémunérer l’agroindustrie, une autre peut également
cibler des villages aux alentours, à un tarif plus bas, (dès
lors qu’il existe une structure de distribution pour acheter).
Pour permettre la mise en place d’un tel schéma, contri-
buant à l’accès des populations (qui se situeront logique-
ment à proximité des bassins d’emploi où se trouvent les
agroindustries), il est impératif de disposer d’un cadre insti-
tutionnel clair car la technologie est maintenant mature et
ne pose pas de difficultés. Le développement de la filière
est cependant d’abord motivé par la rentabilisation pour les
agroindustries, ce qui est d’ailleurs au plan mondial un fac-
teur clé dans la détermination du prix du sucre, par
exemple.
► Du biogaz individuel au biogaz industriel
Le biogaz consiste en la fermentation anaérobie de déchets
plus ou moins liquides, qui permet de produire du méthane,
que l’on peut utiliser en combustion directe (éclairage,
cuisson) ou en mélange dans un groupe diesel ou dans une
petite turbine. Il existe des installations électriques jusqu’à
plusieurs MW dans des unités d’élevage de cochons et de
volailles en Asie du Sud Est. Des dizaines d’unités sont
d’ores et déjà en fonctionnement en Malaisie et en
Thaïlande et, si le processus de méthanisation (digestion
anaérobie) exige un certain entourage technologique, ces
unités n’en fonctionnent pas moins depuis plusieurs
années. L’adéquation au contexte de l’Afrique subsaharien-
ne est certainement plus lointaine du fait du faible nombre
© AFD Document de travail n° 122 • Accès à l’électricité en Afrique subsaharienne • avril 2012
57
31 Energy, Environment and Development Network for Africa, ONG basée à Nairobi.

d’élevages de taille importante. En revanche, le biogaz
« individuel » (pour production de gaz de cuisson ou éclai-
rage individuel) ou de taille moyenne (permettant de faire
fonctionner un moteur de quelques dizaines de kW jusqu’à
500 kW intermittent) a un fort potentiel. Soulignons que
l’ajustement peut être délicat, en fonction de la
température, de l’humidité et du résidu utilisé.
Il existe aujourd’hui des millions de biogaz dits « individuels
ou communautaires » en Inde et en Chine qui permettent
aux paysans de produire, à partir de deux têtes de bétail, le
gaz nécessaire à leurs besoins de cuisson et d’éclairage.
La filière dite de « biogaz industriel », qui consiste à valori-
ser les déchets d’élevages intensifs, est très largement éta-
blie dans des pays comme le Danemark, où ce gaz satisfait
plus de 15 % des besoins de chauffage et de la production
d’électricité. Aux Philippines, où il existe des normes envi-
ronnementales strictes concernant le traitement des
effluents liquides, les biogaz sont systématiquement inté-
grés dans les unités d’élevage d’ovins, ce qui permet de
traiter à la fois la question de la pollution locale (effluents
liquide) et d’améliorer la rentabilité de l’opération à travers
la valorisation du gaz en électricité. Si cette filière présente
un intérêt évident pour augmenter la part des renouvelables
dans le mix énergétique, le lien avec la problématique d’ac-
cès n’est pas direct.
La taille qui nous semble la plus porteuse de potentiel pour
l’accès rural, dès lors que la législation permet la revente à
des conditions attractives, est celle des biogaz permettant
de produire 50 à 500 kW électriques, à partir de déchets
d’agroindustries, voire de plantations. La complexité de
cette filière ne doit pas être sous-estimée, car le processus
de « digestion anaérobie » est à adapter suivant le type de
biomasse et son niveau de liquidité. Néanmoins, on com-
mence à voir quelques projets émerger en Afrique, comme
au Kenya par exemple.
► Biocarburants en filière courte et gazéification : diminuer
la part du fioul dans les consommations des groupes
La gazéification permet de valoriser des résidus de biomas-
se en les transformant par pyrolyse en gaz utilisable dans
un moteur classique, de même que le biodiesel peut se
mélanger au diesel. La gazéification de résidus bois, balle
de riz, coquille de noix de coco, café, palmeraies, coupes et
élagage de plantation de hévéas présente un potentiel très
important allant de quelques dizaines de kW à 1 ou 2 MW.
Le processus de gazéification (pyrolyse) est spécifique à
chaque résidu, d’où une certaine délicatesse du processus
d’industrialisation. Celle-ci s’est jusqu’à présent surtout
appuyée sur des structures universitaires avant de passer
à un stade d’industrialisation (en particulier en Inde) et la
réplication est moins aisée que pour le groupe électrogène
« universel » : elle demande en effet une certaine capacité
du tissu industriel local. Cependant, des programmes de
transfert de savoir-faire et de diffusion ciblés sont tout à fait
possibles et sont actuellement initiés, comme par exemple
un transfert depuis l’Inde vers le Cambodge pour les gazo-
gènes utilisant la balle de riz pour des capacités de 100 à
300 kW. Dans le contexte africain, on s’intéressera plus
particulièrement à l’injection de ce gaz dans les groupes
électrogènes plutôt que la production de gaz seul, risquée
du point de vue de la continuité du service.
En pratique, le gazogène permet de rendre autonome un
village ayant un potentiel de biomasse suffisant. La filière
gazéification connaît quelques exemples dans l’électrifica-
tion rurale (à Madagascar, ou à travers un projet d’envergu-
re nationale en Inde). Le problème le plus largement
rencontré est celui de la maintenance d’une telle unité, qui
demande des compétences locales : qualité du combus-
tible, apports d’air et gestion de la température, filtration du
gaz. Un transfert local de la technologie permet de diminuer
les coûts, le gazogène pouvant être réalisé à partir de
matériaux locaux. En l’état actuel de maîtrise des filières
dans les contextes qui nous intéressent, il est préférable
d’utiliser ces filières en hybride diesel plutôt qu’en tant que
combustible unique.
Au niveau des biocarburants, les agrocarburants dits
« de première génération » ont atteint une maturité techno-
logique et représentent une source d’énergie qui peut être
développée localement. On distingue plusieurs voies :
- l’éthanol obtenu par fermentation et distillation de biomas-
se riche en sucre, amidon ou cellulose (canne à sucre, sor-
gho doux/maïs, blé, manioc). Il doit être utilisé en mélange
ou bien, comme les huiles végétales, dans des moteurs
© AFD Document de travail n° 122 • Accès à l’électricité en Afrique subsaharienne • avril 2012
58

adaptés. Sa transformation est coûteuse et concerne sur-
tout les transports ;
- les huiles végétales pures, obtenues par presse de
biomasse oléagineuse (en Afrique, huile de palme, jatro-
pha, colza, soja, algues, etc.), peuvent être utilisées dans
des tracteurs ou moteurs fixes avec des contraintes au
démarrage ;
- le biodiesel, obtenu par estérification de ces huiles végé-
tales peut être utilisé dans tout moteur diesel (< 30 %, plus
avec des adaptations simples).
On en est encore aujourd’hui à des approches pilote, des
questions ouvertes en matière de superficie, d’intrants, de
rendements et de puissance. Les premières analyses
conduisent à penser que, dans de bonnes conditions (ren-
dements raisonnables sans besoin de trop d’intrants), le
biodiesel serait compétitif avec le diesel à partir de 70
USD/baril, dans des zones isolées.
Ces options offrent une grande flexibilité, puisque biogaz et
biocarburants sont injectés sans modification dans le grou-
pe diesel, et parce que toute fluctuation dans la production
de biomasse est compensée par un apport diesel plus
important (cf. encadré 9). Les difficultés vont provenir des
questions concernant :
- la fiabilité de l’approvisionnement en biomasse (résidus,
usages concurrentiels, saisonnalité) et, en cas de planta-
tions dédiées, la question de la gestion de la plantation ;
- la compétence technique, qui doit être présente au niveau
de chaque village et qui nécessite la mise en place d’un
véritable réseau de techniciens locaux, ce qui, dans le
cadre d’un programme d’envergure, doit s’envisager en
partenariat avec une AER.
© AFD Document de travail n° 122 • Accès à l’électricité en Afrique subsaharienne • avril 2012
59
Encadré 9. Exemples de projets de biodiesel et de gazéification
L’université de Louvain a réalisé une étude de faisabilité d’un projet biomasse-électricité en milieu rural au Burkina Faso. Se basant sur
différents types de biomasses disponibles et sur plusieurs technologies différentes, l’étude a montré que le rendement dépendait de la bio-
masse utilisée, et que le bois restait le meilleur candidat à la gazéification (même si les tiges de coton, entre autres, permettent également
des rendements intéressants). L’option « tout bois » demande un investissement initial plus cher, mais permet de produire un kWh moins
cher qu’une option « dual fuel » (utilisant 20 % de diesel et 80 % de bois).
Quelle que soit l’option retenue, le coût du kWh produit est 25 à 33 % inférieur à celui issu de la filière classique. Les chercheurs ont égale-
ment développé un type de gazogène en béton, facile à mettre en œuvre.
Si le combustible bois est le plus répandu, et si l’on peut considérer que la gazéification bois est compétitive avec le diesel dès lors qu’il
coûte plus de 0,90 USD/litre, la filière balle de riz se développe également. Ainsi, la PME Cambodia commercialise des gazogènes balle de
riz Angkur (Inde) aux prix de 65 000 USD pour 150 kW et 75 000 USD pour 200 kW.
Au Mali, le Programme national de valorisation énergétique de la plante pourghère (PNVEP) a pour objectif le développement de l’utilisation
de l’huile de pourghère pour l’électrification rurale et le carburant des véhicules. La première phase (2004-2008) prévoyait l’installation de
cinq groupes électrogènes ainsi alimentés, pour un budget de 700 millions FCFA. Le village pilote de Kéléya a ainsi vu la mise en service
d’un groupe électrogène de 50 kW, avec une unité d’extraction d’huile de pourghère et la culture de 0,5 ha de cette plante. Vingt abonnés
(incluant la majorité des bâtiments administratifs) ont ainsi pu être connectés sur un réseau de 2 km. A plus grande échelle, on pourrait
imaginer que l’AMADER (qui a financé plusieurs groupes et petits réseaux diesel) appuie la mise en place d’une unité de production de
biodiesel avec une obligation d’achat de la part des PCASER financés.

2.2.4 Le Photovoltaïque (PV) : une baisse des
prix assurée ?
La chute tant attendue du prix du panneau PV est, depuis
début 2009, sérieusement amorcée. Alors qu’il y a quelques
années, un kit solaire de 50 Wc valait 500 USD, on trouve
aujourd’hui des équipements fabriqués en Asie (et certifiés en
Europe) pour moins de la moitié de ce prix. Poussés par les
grands programmes européens, japonais et américains qui
ont engendré des investissements importants dans les capa-
cités de production ainsi que dans l’électronique d’intégration
des renouvelables aux réseaux (smart grids), les industriels
ont largement développé leur capacité de production, et le
« un Euro du Watt crête », tant attendu, sera bientôt atteint. Il
est certes essentiel de ne pas confondre prix du panneau et
coût total du système, notamment pour les systèmes isolés,
pour lesquels il faut rajouter le coût du stockage de l’énergie
électrique produite pendant la journée (batteries pour l’éclai-
rage ou château d’eau pour le pompage).
► Mini réseaux PV-diesel hybrides : une filière à très fort
potentiel
Le PV pourrait bien devenir la première option d’hybridation :
l’ensoleillement est constant sur le territoire et la ressource
moins difficile à mobiliser que la biomasse ou l’hydraulique.
Le point faible du PV est sa production nécessairement
diurne, alors qu’en zones rurales, la demande est souvent
nocturne. Le stockage de l’électricité en batteries reste très
coûteux, alors qu’en injection directe sur le (mini) réseau
pendant la journée (donc nécessairement sur un réseau
fonctionnant 24h/24), il est compétitif par rapport au diesel,
comme le montre l’exemple de la Mauritanie (cf. encadré
10). De plus, dès lors que l’on injecte moins de 20 % d’élec-
tricité solaire, la gestion de la production intermittente ne
pose pas problème.
© AFD Document de travail n° 122 • Accès à l’électricité en Afrique subsaharienne • avril 2012
60
Schéma 4. Les étapes d’un projet de biodiesel et de gazéification
Source : auteurs.

► Kits solaires : les leçons tirées des programmes
Les projets de kits solaires se sont rapidement développés
depuis 20 ans et ont été à un moment donné porteurs de
l’espoir d’une électrification « totale » des zones rurales. S’il
est vrai que le prix du kit solaire domestique « typique » de
50 Wc (éclairage et audiovisuel pour 3 à 6 h par jour) a
diminué de près de 50 % en l’espace de 15 ans, ce sché-
ma d’électrification n’a pas apporté l’impact escompté, en
particulier pour les raisons suivantes :
- le service apporté se limite à l’éclairage, la téléphonie et
l’audiovisuel et (pour quelques heures par jour et pour les
systèmes les plus puissants) peut inclure la ventilation et un
peu de réfrigération. Si la « connectivité » devient un
facteur clé du développement, on n’en constate pas moins
que, si elles doivent choisir entre du PV maintenant et le
réseau plus tard, les populations préfèrent souvent attendre
quelques années supplémentaires pour avoir le « vrai »
service électrique de puissance ;
- la gestion technique et financière (maintenance de l’élec-
tronique, remplacement des batteries et des lampes basse
consommation - LBC, collecte des paiements) s’avère bien
plus coûteuse qu’escompté à l’origine. On ne peut « amor-
tir » le coût d’un gestionnaire local que sur un grand
© AFD Document de travail n° 122 • Accès à l’électricité en Afrique subsaharienne • avril 2012
61
Schéma 5. Les étapes du projet
Source : AIE PVPS Tâche 9.
Encadré 10. Exemple d’un projet hybride PV-diesel en Mauritanie
La ville de M’Bout en Mauritanie est actuellement alimentée par une centrale thermique de 280 kW. Une étude a été menée pour l’installa-
tion d’un réseau hybride PV-diesel, avec une injection de 20 kW PV. L’injection est réalisée en faible quantité afin de diminuer la consom-
mation de diesel, mais sans nécessiter de batterie pour le stockage de l’énergie solaire.
Le calcul des coûts a montré que la production d’électricité PV (en prenant un investissement PV à 7 000 EUR du Wc) reviendrait au même
coût que l’électricité diesel à partir de 0,75 EUR/l diesel. Le prix étant à 0,83 EUR/l en novembre 2008, l’investissement PV était ainsi à
l’époque rentable.
Les coûts d’investissement baissent, ici coûts
conservateurs pour petites opérations isolées

nombre de systèmes dans le rayon le plus limité possible.
Or, il est évident que si les populations sont concentrées,
on préfèrera des options de mini réseaux. Ainsi, en particu-
lier avec la flambée des prix du pétrole, le coût du transport
vient à représenter un poids considérable dans les coûts
récurrents des programmes. Et dans la réalité, plus le
programme est important, plus on va vers des zones
reculées (donc dispersées et à faible revenu), plus les
coûts de gestion augmentent. Il s’agit donc de « désécono-
mies » d’échelle. Si le prépaiement (cf. 2.3.2) peut présen-
ter une option intéressante (au moins pour les paiements
mensuels), le compteur à prépaiement ne peut s’amortir
que sur un système de taille relativement importante (plus
de 100 Wc).
Une littérature foisonnante a été produite sur ces sujets
(voir AIE Photovoltaic Power Systems: Deployment in
Developing Regions)32.
On distingue trois principaux schémas de diffusion de kits
solaires.
► Une approche « commerciale », où les usagers paient
l’intégralité du prix du système ; cette approche présente
les caractéristiques suivantes :
● des facilités de paiement peuvent être accordées par les
installateurs ou par une structure de (micro) crédit locale.
Pour ce faire, les installateurs (qui sont en général des PME
locales) doivent pouvoir bénéficier d’un refinancement; la
rareté de ce type de facilités est un blocage à la diffusion
du système ;
● les facilités de paiement ne s’étendent pas sur plus de 3
ans, et les usagers versent des mensualités de 8 à 15 USD
par mois (pour les systèmes individuels domestiques), ce
qui ne permet l’accès qu’au segment de population le plus
aisé ;
● une fois l’installation faite, ou le crédit remboursé, l’usa-
ger est propriétaire du système solaire et doit assumer la
responsabilité de sa maintenance ;
● l’installateur ne mettra en place une antenne locale pour
la maintenance que si le « marché » le justifie (Bien
souvent, cela se fait à travers des boutiques de vente de
matériel électrique et électronique au niveau des districts
ou des provinces) ;
● ce marché est florissant, par exemple en Afrique de l’Est,
où il existe de nombreux riches propriétaires agricoles qui
s’équipent de systèmes PV significatifs ; il ne concerne pas
les travailleurs agricoles ni les petits propriétaires ;
● pour que les populations moins aisées puissent bénéfi-
cier de ce service, une subvention importante à l’investisse-
ment est nécessaire (50 % du coût), qui peut être considé-
rée comme prioritaire sur les ressources publiques, ou pas.
► Une approche de service dite “fee for service” : le client
paie une somme initiale lors de l’installation (équivalent, par
exemple, à un coût de connexion dans le cas d’un service
en réseau) puis une redevance fixe mensuelle, et le presta-
taire se charge du fonctionnement et de la maintenance.
Pour certains programmes, la propriété des équipements
revient à l’usager au bout de 10 ans par exemple ; pour
d’autres, le concessionnaire doit s’assurer du renouvelle-
ment (dans le cas de figure où le réseau ne serait pas
arrivé) ; enfin, dans de nombreux cas, cette question de
propriété reste floue. De nombreux programmes de ce type
ont maintenant été mis en œuvre, et l’on bénéficie d’un
retour d’expérience de plusieurs années. La conclusion est
relativement unanime : le potentiel de ce type d’approche
est tout à fait considérable, et le développement d’équipe-
ments d’usages de plus en plus efficaces permet d’amélio-
rer le service offert par l’électricité d’origine PV (qui reste
chère). Cependant, on n’atteint une viabilité globale qu’à
partir du moment où le fonctionnement est totalement local,
et à des coûts locaux. Les compétences se développent et
la démultiplication nationale passera par une volonté
politique de diffuser ce type de schéma et les compétences
nécessaires : les niveaux des redevances mensuelles peu-
vent, suivant les cas et le choix des politiques, ne couvrir
que le fonctionnement et le remplacement de l’électronique
© AFD Document de travail n° 122 • Accès à l’électricité en Afrique subsaharienne • avril 2012
62
32 Une dizaine de guides pratiques depuis le financement jusqu’à l’accréditation des forma-teurs y figurent. www.iea-pvps.org –Tasks – Ongoing – Task 9.

(batteries, onduleur, régulateur) de tous les panneaux (ou
une partie seulement). La coopération internationale
demeure largement présente sur ce créneau, notamment à
travers des ONG et fondations, qui ont l’habitude de tra-
vailler en forte symbiose avec les communautés locales.
► PV pour des usages communautaires, sociaux, voire
productifs :
● Par usages communautaires, on entend des services tels
que l’éclairage public ou l’éclairage d’une salle commune,
qui sont souvent appréciés dans la dynamique villageoise.
Le prix doit en être couvert par la communauté villageoise;
● Les usages productifs sont très rares pour des applica-
tions solaires en raison du coût élevé du kWh solaire qui ne
permet pas véritablement des usages de puissance. On
observe néanmoins, dans des zones où l’eau est rare, l’uti-
lisation de l’électricité solaire pour l’irrigation au goutte à
goutte (impliquant peu de déplacement d’eau);
● Il faut distinguer de ces usages dits « productifs », les ser-
vices directement ou indirectement générateurs de revenus :
recharge de téléphone portable, éclairage de nuit permet-
tant aux femmes d’augmenter les heures de tissage, etc.
● Le PV permet également de satisfaire certains usages
sociaux essentiels, tels que la mise en place de systèmes
de pompage pour l’eau potable, l’éclairage de dispensaires,
la réfrigération de vaccins. Se pose toujours, pour ces
applications, la question du financement de l’investisse-
ment : en général, le secteur électrique ne prend pas la res-
ponsabilité de ces investissements, et ils doivent être sup-
portés par les structures et/ou les ministères en charge de
la santé ou du développement rural par exemple, voire les
communautés elles-mêmes, ce qui n’est pas forcément
chose aisée. En effet, les programmes ont pour habitude
de financer l’investissement initial pour un groupe diesel, et
c’est ensuite bien souvent à la communauté locale d’assu-
mer les coûts récurrents, ce qui pose de sérieux problèmes.
Passer à un investissement solaire implique que le finan-
ceur de l’investissement soit prêt à un investissement bien
plus important et se dote des moyens de maîtriser cette
technologie. On s’oriente d’ailleurs de plus en plus vers des
services payants pour pouvoir couvrir les frais de fonction-
nement a minima.
© AFD Document de travail n° 122 • Accès à l’électricité en Afrique subsaharienne • avril 2012
63

© AFD Document de travail n° 122 • Accès à l’électricité en Afrique subsaharienne • avril 2012
64
Technologie
mature et
réparable
localement
Fourniture aisée,
nombreux représen-
tants locaux
Travaux de
construction
maitrisés
Rapiditité
des travaux
et de mise en
service
Nombreux techni-
ciens formés pou-
vant assurer la main-
tenance
Coût d'in-
vestisse-
ment
Coût d'exploita-
tion
Simplicité du
montage financier
Impact environ-
nemental
Diesel SS SS S SS SS S WW S WW
Hydro - avec retenue SS S S WW W W SS W W
Option au fil de l'eau
(peu Génie civil) S S
Besoin de formation
Co-génération (> 500
kW, galment >2MW) SS S S S SS S S SS S
biogaz industriel >
500 kW SS WW W S S S S SS S
Généralement
associé à une
agro-industrie
Chaudières, moteurs
disponible, pb est
l'ingénierie et le
rachat d'excédents
Localisation près d'une
agro-industrie - donc
d'ingénieurs et une
demande
Industriel porteur du
projet
Permet de valoriser
les déchets
gazogène 20 - 500 kW WW W S W S W W W
Portage en zones
rurales difficile Effluents
Solaire - systèmes PV
domestiques et com-
munautaires isolés, le
PV diesel hybride en
mini réseau, le PV rac-
cordé au réseau. SS SS SS S S WW SS WW SS
Réseaux PV et PV-
diesel SS W S S W WW S WW SS
Dès lors que
les pièces de
rechange sont
disponibles
Tableau 8. Analyse SWOT des options techniques
Strengths, Weaknesses, Opportunities, Threats : forces, faiblesses, opportunités, menaces
forces et faiblesses

© AFD Document de travail n° 122 • Accès à l’électricité en Afrique subsaharienne • avril 201265
Variabilité du coût
du kWh
Coût du kWh à
Long terme
Configuration de
production qui
s'adapte à la
demande
Localisation de la
production /
demande
Solutions hybrides
pour augmenter
l'optimum global
Sensibilité aux
facteurs
externes
Lourdeur de la
procédure admini-
trative
Cadre réglemen-
taire stable et for-
mulé
Diesel TT TT SS SS O TT
Hydro - avec
retenue S SS S WW O O TT O
Option au fil de
l'eau (peu Génie
civil) W OO T
Production en un site
spécifique possibilité
du réseau Hydrologie Démarre ds qq pays
Co-génération (>
500 kW, galment
>2MW) S S S S T T T
biogaz industriel >
500kW S S S S O T T T
Usages concur-
rents de la bio-
mass
Pour revente d'excé-
dents
Peu ou pas de pays
ont une politique
gazogène 20 -
500kW S S S S OO T T T
Collecte, plantations
Nécessité contrats
LT
Peu ou pas de pays
ont une politique
Solaire - systèmes
PV domestiques et
communautaires
isolés, le PV diesel
hybride en mini
réseau, le PV rac-
cordé au réseau. SS S S SS O OO O O
Réseaux PV et PV-
diesel SS S W SS O OO T T
Compétitif sur cer-
tains segments, et
qui s'améliore
Production diurne
pose problème stock-
age / demande noc-
turne
Modularité vz aug-
mentation demande
Importation des com-
posants à haute
technicité
Simple car en
général pas de con-
nection réseau début
de politiques d'incita-
tions fiscales
opportunités (o) et menaces

© AFD Document de travail n° 122 • Accès à l’électricité en Afrique subsaharienne • avril 2012
66
Potentiel dans le conti-
nent
Appétit investisseurs -
risques maitrisés
Appétit investiss - temps
de retour sur invest
Appétit investiss -
rentabilité à LT
Savoirs faire d'ingénierie
technique nationale Fabrication nationale
Diesel OO O TT T
Hydro - avec retenue OO TT TT OO TT O
Option au fil de l'eau
(peu Génie civil) T O
Variations géog. Formation au due diligence
Besoin d'ingé. Financière
innovante
Besoin d'ingé. Financière
innovante
Besoin formation et con-
trôle qualité
Petites turbines avec le
marché…
Co-génération
(> 500 kW, galment
>2 MW) O O O OO T O
biogaz industriel >
500 kW 0 T O O TT TT
Besoin d'information et for-
mation (biogaz)
gazogène 20 - 500 kW OO T OO O TT T
Solaire - systèmes PV
domestiques et commu-
nautaires isolés, le PV
diesel hybride en mini
réseau, le PV raccordé
au réseau. OO O T T OO O
Réseaux PV et PV-diesel OO O TT O O O
Au plan technologique, les
pb sont connus et la
ressource maîtrisable
Grand intérêt des investis-
seurs et industriels malgre
investissements de petite
taille
Ingénierie à batir, facile-
ment transférable
La qualification d'opportu-
nité se limite ici à
l'assemblage
Source : auteurs.
opportunités (o) et menaces

2.3.1 Un potentiel important de diminution des
coûts… en se donnant le temps du choix des
options
Les techniques de distribution ont un impact sur les coûts
d’investissements et, donc, sur la rentabilité du secteur.
Des approches innovantes peuvent également permettre
d’atteindre un segment de clientèle jugé a priori non
rentable (cas des foyers ruraux et périurbains). Le mode
d’électrification doit être par conséquent conçu de manière
intégrée pour optimiser non seulement les coûts d’investis-
sement mais aussi les coûts d’opération et de maintenance
ainsi que les frais de gestion de la clientèle.
Les pratiques usuelles conduisent souvent à surestimer la
demande et, par conséquent, à surdimensionner les
réseaux (section des câbles, capacités des transforma-
teurs). Ces pratiques sont souvent la conséquence d’un
manque d’ouverture aux technologies alternatives et d’une
certaine méfiance vis-à vis des technologies légères,
considérées comme dévalorisantes. Cependant, en matiè-
re de normes et standards, l’utilisation plus généralisée de
réseaux monophasés, un dimensionnement plus serré des
transformateurs, l’adaptation des contraintes sur les
poteaux, l’acceptation de sections de câbles adaptées en
fonction de la demande effective sont autant de moyens qui
permettent une réduction significative des coûts d’investis-
sements. Très fréquemment, les études se limitent à
reproduire des habitudes de choix d’équipements héritées
des pratiques sans réel dimensionnement spécifique alors
qu’un juste dimensionnement implique de (i) fixer les pers-
pectives et définir les prévisions de charge, (ii) spécifier les
limites techniques (surcharges, chutes de tension, démar-
rage de moteur) et de (iii) renforcer les sections amont des
réseaux et réduire les sections aval
Il s’agit de solutions structurelles, qui nécessitent de chan-
ger fondamentalement les pratiques et sont, de ce fait,
souvent difficiles à mettre en œuvre. Une approche optimi-
sée de la dimension technologique peut permettre des
économies globales de l’ordre de 30 % par rapport à des
pratiques habituelles, ou de prolonger de 10 ans la durée
de vie des réseaux. La réduction des coûts est un proces-
sus long, qui nécessite l’adhésion de tous les acteurs et
une forte volonté politique pour changer des habitudes
établies depuis longtemps.
Des marges de manœuvre existent également en termes
de gestion de programme, et plus particulièrement dans les
politiques d’achat et de mise en œuvre des installations :
alors que les pratiques usuelles reposent sur des contrats
clés en main qui évitent la mise en place de structures de
maîtrise d‘œuvre, passer par une centrale d’achat et
segmenter les approvisionnements peut réduire de 20 à
30 % le coût d’acquisition des fournitures.
Bien entendu cette implication locale nécessite un renforce-
ment de la capacité de maîtrise d’ouvrage/maîtrise d’œuvre
pour garantir la qualité des approvisionnements ainsi que
des installations. Ce renforcement implique des coûts qui
absorbent une partie des gains : la mise en place de telles
capacités ne peut bien entendu se réaliser que dans le
cadre d’un programme d’électrification d’envergure.
Restituer la maîtrise d’œuvre au niveau national doit égale-
ment permettre de réviser les coûts d’installation et de pose
du matériel électrique. Dans certains programmes d’électri-
fication réalisés clés en main, le coût de la pose peut
atteindre 50 % du coût global : une maîtrise d’œuvre natio-
nale veillera à réduire ce type de coûts en créant une
concurrence sur l’activité de pose. L’organisation de négo-
ciations avec les entreprises, un travail de recherche de
nouveaux fournisseurs et un nouvel appel d’offres dans le
cadre d’un programme d’électrification rurale au Burkina
Faso ont permis de baisser le coût total de réalisation de
deux mini réseaux de près de 35 %.
© AFD Document de travail n° 122 • Accès à l’électricité en Afrique subsaharienne • avril 2012
67
2.3 Distribution et gestion clientèle : des marges de manœuvre importantes

Une nouvelle approche dans la mise en œuvre d’un
programme peut également, et ce n’est pas là le moindre
intérêt de la solution, inciter au développement d’une filière
nationale regroupant des entreprises capables d’intervenir
directement sur le programme d’électrification (dimension-
nement, pose, etc.), ou indirectement (fourniture de
poteaux bois, équipements électriques, etc.). Il en est de
même pour les entreprises appelées à intervenir en
exploitation, en entretien et en maintenance préventive sur
les installations. Un travail de recensement national favori-
sera la création et la mise à jour d’un vivier d’entreprises
opératrices et de fournisseurs d’équipements potentiels.
2.3.2 Adapter la gestion clientèle aux contextes
locaux
► Coûts et organisation
Les deux principaux modèles de base de tarification sont
liés aux techniques de distribution : paiement au forfait pour
un service électrique (ex : fee-for-service, montant en
fonction d’un nombre de lampes ou d’une durée d’usage)
ou limiteur de puissance ; paiement au prorata des quanti-
tés d’électricité consommées dans une logique réseau
(compteur). L’approche usuelle peut se résumer ainsi :
- réseau de distribution électrique = vente unitaire d’énergie
- électrification à faibles demandes = vente de service.
© AFD Document de travail n° 122 • Accès à l’électricité en Afrique subsaharienne • avril 2012
68
Encadré 11. Réduire les coûts grâce à une optimisation, en amont, des choix techniques et du dimensionnement – Bénin
Grâce aux optimisations décrites ci-après, le projet permet d’électrifier, à coût constant, 102 localités au lieu des 56 initialement prévues.
- Dérivation biphasée : gain de 20 % par rapport à une dérivation triphasée.
- Utilisation du Single Wire Earth Return (SWER) : gain jusqu’à 70 % par rapport à une antenne triphasée. L’introduction du SWER doit
nécessairement passer par un minimum d'étapes d’appropriation nationale afin de s'assurer que les projets puissent être réalisés d’une
façon aussi flexible que possible.
- Utilisation systématique des poteaux bois partout où cela est techniquement possible et économiquement rentable (gain de 5 à 15 % sur
la ligne).
- Utilisation d’un logiciel de calcul mécanique des réseaux aériens (en particulier pour l’optimisation des lignes en technique suspendue).
- Dans le cadre d’un projet, la segmentation des approvisionnements a permis une réduction conséquente du prix du km de ligne : de 12
MFCFA à 10 MFCFA (-20 %).
- Approvisionnement sur les marchés internationaux pour chaque composant (câbles, transformateurs, …) et sous-traitement de la pose seu-
lement : les prix y sont très inférieurs à tous les autres pays d’Afrique centrale.
Source : IED – Projet d’électrification rurale au Bénin, financement GTZ-AFD-facilité Energie de la Commission européenne.

Les compagnies d’électricité, gouvernées par des cultures
de l’offre, sont donc engagées dans des logiques de
gestion de la clientèle assise sur la vente unitaire de l’éner-
gie qui se concrétise par le cycle suivant : comptage de
l’énergie-facturation-recouvrement.
En Afrique, les pertes dites « non techniques » sur les
réseaux de distribution d’électricité sont souvent
supérieures à 10 % (fraude, vol, etc.). S’y ajoutent les
impayés, qui représentent eux aussi souvent plus de 10 %
de l’électricité distribuée, si bien que les pertes totales
(incluant également les pertes techniques liées à l’état du
réseau) pour les compagnies d’électricité peuvent parfois
atteindre ou dépasser 30 %. L’amélioration de la gestion de
la clientèle passe notamment par un meilleur recouvrement
de la facturation. Celle-ci se heurte à des limites financières
évidentes : les compagnies d’électricité ne peuvent se per-
mettre d’augmenter leurs coûts de recouvrement des fac-
tures ( qui atteignent en moyenne 10 % du chiffre d’affaires)
par une augmentation du personnel dédié à la collecte des
règlements, unitairement faibles dans des zones à faibles
revenus.
Face à ces contraintes, des nouvelles approches organisa-
tionnelles de la gestion clientèle se développent. Ces
nouveaux schémas reposent sur une meilleure prise en
compte des caractéristiques socioéconomiques de la clien-
tèle, ce qui représente une évolution importante dans les
compagnies électriques, souvent caractérisées par un
faible intérêt pour les interfaces avec le client. Ainsi, on évo-
lue vers des schémas organisationnels variés qui visent à
l’allègement des coûts de relevés de consommation et de
traitement de la facturation : mise en place de compteurs
groupés (un compteur pour plusieurs clients), et vente
forfaitaire mensuelle dans les zones périurbaines caractéri-
sées par des demandes en énergie faibles.
Ces approches requièrent l’implication des communautés
locales (traditionnelles, coopératives). En Erythrée, par
exemple, chaque village se dote d’un comité d’électrification
en charge du suivi de la clientèle à l’intérieur du village. La
compagnie électrique vend ainsi l’énergie en gros au village
qui est en charge de la distribution de détail et, donc, de la col-
lecte du paiement correspondant auprès de chaque usager.
Cependant, lorsque les concessionnaires principaux se
désengagent de l’interface client, se pose la question de la
responsabilité de la qualité du service en bout de ligne : com-
ment le concessionnaire peut-il être responsable de la quali-
té de service offert par la coopérative en bout de ligne ?
► Un outil de gestion clientèle à suivre : le prépaiement
Le prépaiement est un mode de gestion commercial qui
vise à faire payer au client un service avant que ce service
soit utilisé. C’est un mode de paiement très pratiqué dans
la téléphonie sans fil (rechargement de téléphones
portables avec des cartes) et de plus en plus dans d’autres
secteurs marchands comme le gaz et même l’eau. Cette
recharge de crédit peut être achetée chez le distributeur
d’électricité, chez un revendeur agréé, par l’intermédiaire
d’un dispositif de vente automatique ou même par télépho-
ne portable (voire, dans certains cas, via Internet). Le
prépaiement électrique est connu depuis longtemps,
notamment en Angleterre où il dessert 50 % de la popula-
tion. En Afrique du Sud, la plupart des villes ont été
équipées de prépaiement électrique dans le cadre du pro-
gramme national d’équipement appelé “Power for All”
(électricité pour tous). Des pays africains, tels que le Maroc,
le Sénégal, le Gabon ou la Côte d’Ivoire, ont lancé des
projets de prépaiement en raison des problèmes de recou-
vrement que connaissent les compagnies d’électricité
nationales. A ce jour, on estime qu’il y a plus de 4 millions
de compteurs installés en Afrique du Sud, 50 000 au
Nigéria, 40 000 en Namibie, 10 000 en Côte d’Ivoire et au
Sénégal.
Le prépaiement est basé sur le précomptage de l’électrici-
té. Ainsi le compteur à prépaiement mesure l’énergie
consommée et la compare au niveau de crédit disponible
acheté par le client. Ce compteur suspend l’alimentation en
cas d’épuisement du crédit ou de dépassement de puissan-
ce souscrite.
Si le prépaiement rencontre aujourd’hui un réel succès,
c’est qu’il présente de nombreux avantages :
- pour la compagnie de distribution électrique, le prépaie-
ment permet d’améliorer la trésorerie (puisque les clients
paient avant d’utiliser l’électricité), de limiter les défauts de
© AFD Document de travail n° 122 • Accès à l’électricité en Afrique subsaharienne • avril 2012
69

recouvrement (puisque le client ne reçoit pas d’électricité
s’il n’a pas payé par avance), de diminuer les frais de
relevé de compteur et de limiter les fraudes quand on
utilise des compteurs split (cf. ci-après) ;
- pour le client, le prépaiement permet d’anticiper sa
consommation, de payer au fur et à mesure de ses capaci-
tés financières, d’ajuster sa consommation et d’éviter des
factures « imprévues ».
On distingue deux types de systèmes de prépaiement :
- le prépaiement unidirectionnel : les consommateurs
achètent un crédit d’électricité à l’aide d’une clé, d’un code
ou d’une carte à puce selon le type de compteur ; le
montant correspondant est alors crédité sur leur compteur.
Les informations ne circulent que dans un seul sens :
vendeur-compteur ;
- le prépaiement bidirectionnel, plus complexe : si le crédit
d’électricité s’acquiert, là aussi, à l’aide d’une clé, d’un code
ou d’une carte à puce (selon le type de compteur), une fois
le code saisi, les informations circulent dans les deux sens,
depuis le compteur et vers le compteur. Ce dernier est
crédité et fournit à la fois des données telles que les
relevés, les codes d’erreur, etc. Lorsque le support est
rechargé par le point de vente, les données stockées sont
transmises au système de gestion centrale. Ce système
permet au distributeur de récupérer des informations du
compteur qui pourront l’aider à mieux gérer sa production :
consommation du client, fraude, comparaison de la puis-
sance appelée et souscrite.
Alors que le post paiement nécessite un grand nombre d’in-
terventions (notamment en cas de problème de recouvre-
ment), le prépaiement réduit les opérations et les interac-
tions entre le distributeur et le client ; ce dernier point est
d’ailleurs l’objet de critiques.
Dans le cycle du prépaiement, la trésorerie du distributeur
est toujours excédentaire (énergie payée > énergie
consommée) alors que, dans le cas du paiement
conventionnel, elle est toujours déficitaire33, car même au
moment de la facture d’une tranche, la consommation de la
période suivante a débuté, et a remis la trésorerie du distri-
buteur en négatif vis-à-vis du client (énergie consommée >
énergie payée).
Le prépaiement est un outil permettant l’amélioration du
recouvrement, puisque l’énergie n’est dispensée qu’une
fois payée. Suivant différents distributeurs électriques afri-
cains, le prépaiement permettrait de couvrir les 15 % de
créances annuelles qui ne sont jamais payées34. Le pré-
paiement n’est cependant pas, à lui seul, un outil de lutte
contre la fraude. Il aurait même tendance à l’encourager,
dans la mesure où les contrôles physiques sont moins fré-
quents puisqu’il n’y a plus de relevés de compteur. Certains
clients peuvent lors être tentés de « shunter » le compteur
(i.e. se connecter au réseau en mettant un câble avant le
compteur)35.
Le prépaiement est souvent vu comme un moyen de dis-
penser de l’énergie pour les plus pauvres car les distribu-
teurs peuvent équiper des zones commercialement ris-
quées sans crainte de non paiement massif. Pour être un
outil de lutte contre la pauvreté, il convient toutefois d’appli-
quer à ces zones pauvres des tarifs équivalents aux tarifs
conventionnels, notamment le tarif social, ce qui est main-
tenant possible grâce à de nombreux logiciels de gestion
de prépaiement36.
Au-delà de l’avantage incontestable de l’amélioration des
taux de recouvrement, le prépaiement ne saurait être
considéré comme la réponse universelle aux dysfonction-
nements de la gestion de la distribution, auxquels doit faire
face une compagnie d’électricité dans un pays en dévelop-
pement. La mise en place d’un système de prépaiement
doit être évaluée et appréciée à la lumière des éléments
suivants :
- l’évolution des tâches : le prépaiement introduit des chan-
gements multiples dans les organisations de distribution, à
commencer par la diminution des relevés de compteurs.
Cette innovation, qui peut permettre un redéploiement des
fonctions chez le distributeur voire une réduction des
effectifs, repose cependant sur des technologies plus
© AFD Document de travail n° 122 • Accès à l’électricité en Afrique subsaharienne • avril 2012
70
33 A l’exception de l’avance de paiement (caution). 34 Dans certains pays, les clients institutionnels (administrations, police) ont tendance à nepas payer leurs factures. La mise en place du prépaiement est une mesure possible pour lesmettre devant leurs responsabilités.35 Cependant, les systèmes de prépaiement proposent diverses techniques antifraude : l’ins-tallation de compteurs split (clavier d’enregistrement des coupons et compteur séparés), avecle compteur installé sur le poteau, ce qui rend plus difficile la dérivation des compteurs : l’ins-tallation de câbles coaxiaux inviolables entre le poteau et le compteur (dans le cas des comp-teurs monoblocs). Cette solution est relativement chère, et ne peut s’appliquer que dans lescas de distance faible entre le poteau et le compteur, et de risque élevé de fraude.36 La différenciation des tarifs de l’énergie a longtemps représenté un obstacle technique, carles premiers systèmes de prépaiement n’étaient pas capables de gérer différents tarifs.

complexes que le comptage traditionnel, qui nécessitent
des compétences plus élevées et une adaptation sensible
des personnels existants, notamment en ce qui concerne
l’installation des compteurs et des systèmes informatiques
de gestion ;
- une fraude toujours possible : le prépaiement n’implique
pas automatiquement une diminution des pratiques
frauduleuses liée à l’absence de présence physique des
releveurs de compteurs ;
- les coûts d’investissement : même s’ils peuvent être
rapidement rentabilisés par les gains en termes de recou-
vrement et d’amélioration de la trésorerie, il demeure que
les compteurs à prépaiement sont plus chers que les
compteurs traditionnels ( de l’ordre de 30 à 40 %) ;
- une consommation réduite : différents travaux ont mis en
évidence une diminution moyenne de la consommation
électrique par foyer de l’ordre de 20 % lors de la mise en
place d’un système de prépaiement ;
- une clientèle qui doit être diversifiée : le prépaiement ne
doit pas s’adresser uniquement à une clientèle pauvre ;
pour assurer sa rentabilité et bénéficier de ses effets
positifs pour le distributeur (réduction des frais de gestion,
économie de trésorerie, réduction du non-paiement), il se
doit d’être valorisé sur les clientèles les plus aisées et les
petits industriels, plus susceptibles d’entraîner des effets
d’échelle ;
- une introduction en zones rurales qui demeure délicate :
dans certaines régions rurales, les distances aux points de
vente sont pénalisantes, la téléphonie mobile, quand la
couverture existe, offrant des perspectives intéressantes
© AFD Document de travail n° 122 • Accès à l’électricité en Afrique subsaharienne • avril 2012
71
Encadré 12. Prépaiement : retours d’expérience au Sénégal, en Côte d’Ivoire et en Afrique du Sud
Introduit à partir de 2006 au Sénégal, le prépaiement a rencontré un réel succès notamment dans la capitale. Dans ce pays, les clients ont
le choix de garder leur ancien compteur ou de recourir au prépaiement. Le nouveau compteur électrique se présente sous la forme d’une
unité centrale munie d’un clavier (qui permet de taper le code inscrit sur le ticket de rechargement) et d’un écran (pour suivre la consomma-
tion). La première tranche d’investissement s’élève à 450 000 EUR, représentant 75 000 EUR d’équipements système et 375 000 EUR
d’achat de 5 000 compteurs. Du côté de la SENELEC, à volume de client constant, on constate que le nouveau système améliore la
trésorerie de la compagnie à hauteur de 30 %, alors que dans le même cadre d’analyse on constate une économie de 15 % dans la
consommation d’énergie des ménages. Du côté des consommateurs, le nouveau système est plutôt bien accueilli et les raisons qui
poussent les clients à se connecter relèvent de plusieurs aspects :
- plus de flexibilité et de visibilité dans la gestion du budget électricité ;
- des temps d’accès aux comptoirs plus courts (les comptoirs prépaiement sont prioritaires et moins surchargés) ;
- un avantage tarifaire : le système de facturation mis en place au Sénégal prévoit que les premiers kWh sont les plus chers, et que leur prix
ne cesse ensuite de décroître (tarif par bloc descendant). Ainsi les clients achètent de quoi combler les premières tranches, puis massive-
ment dans la troisième tranche en fin de mois, ce qui leur permet de couvrir leur besoin en électricité pour les deux mois suivants au tarif de
la troisième tranche de la période précédente.
Depuis la fin des années 1990 en Côte d’Ivoire, la Compagnie ivoirienne d’électricité (CIE) réfléchit à l’intégration des compteurs à prépaie-
ment dans son système de gestion de la distribution. Ainsi, dès 2000, une expérimentation a été initiée par la compagnie qui a mis en place
environ 5 000 compteurs à prépaiement. Ils se sont très rapidement révélés peu performants et la CIE a décidé, en 2004, de lancer une nou-
velle campagne de test en utilisant un nouveau modèle de compteur fabriqué en Afrique du Sud. Actuellement, plus de 30 000 compteurs
de nouvelle génération sont en cours d’expérimentation. Actuellement, la diffusion massive des compteurs à prépaiement n’est pas autori-
sée par le gouvernement, qui attend un avis de l’Autorité nationale de régulation du secteur de l'électricité (ANARE) pour définitivement adop-
ter ce système de comptage. Cette nouvelle approche de la distribution s'appuie principalement sur certaines agences de la CIE et sur les
critères suivants : les quartiers à forte expansion, les quartiers précaires et les résiliés débiteurs (fraudeurs).

Concernant cette expérimentation, la CIE souhaite souligner les impacts suivants : une baisse remarquable des créances douteuses ; une
réelle possibilité de redéployer un personnel pléthorique employé aux opérations de facturation et de recouvrement ; une amélioration de la
trésorerie sur les zones concernées de l’ordre de 20 %. La CIE déplore cependant la permanence des cas de fraude, et notamment les
opérations de détournement de réseau en amont du compteur (Notons que, pour protester contre la mise en place des nouveaux
compteurs, de nouveaux types de sabotage des installations sont apparus).
Du côté des utilisateurs et des consommateurs, les éléments d’appréciation sont les suivants : un abonnement rapide et peu coûteux ; pas
de remise de caution à l'abonnement ; pas de coupures pour impayés ; un retour du service immédiat après recharge ; des difficultés d'approvi-
sionnement en crédit d'énergie dans certaines agences CIE (générant des files d'attente) ; une trop grande utilisation de termes anglo-saxons
dans les informations affichées par le compteur Taurus ; une nécessaire formation à l’utilisation du prépaiement (savoir lire les codes, etc.).
Engagé depuis 1992 dans le programme Energy for All, l’Afrique du Sud a très vite développé le recours au prépaiement. On compte ainsi,
à ce jour, plus de 4 millions de compteurs à prépaiement mis en place sur l’ensemble du pays, principalement dans les zones périurbaines
(townships). En effet, la volonté politique d’étendre ce nouveau système de gestion de la distribution reposait sur un principe fort, interdisant
les impayés : fonctionnant comme un système d’avance sur consommation, ce type de compteur ne peut pas créer de « débranchés ». Ce
système permet donc a priori aux ménages pauvres d’éviter la spirale vers l’exclusion plus ou moins définitive du service et les saisies mobi-
lières puis immobilières. Le compteur à prépaiement limite, en quelque sorte, pour les ménages défavorisés, les conséquences possibles
du non-paiement. Cette nouvelle technologie a été également motivée par le moyen de rendre accessible l'électricité dans les zones où le
comptage de l’énergie, la facturation et le recouvrement s’avéraient particulièrement difficiles. Au-delà de ces zones difficiles d’accès, la nou-
velle approche a rapidement concerné d’autres contextes géographiques et socioéconomiques (centres urbains, zones rurales). Toutefois,
les premières expériences de prépaiement se sont révélées peu concluantes : au début des années 1990, la société nationale d'électricité
Eskom a enregistré entre 40 et 60 % de compteurs défectueux, entraînant des pertes de recettes et des coûts de remplacement importants.
Les systèmes initiaux fonctionnant avec une carte magnétique ont été remplacés par des systèmes bidirectionnels qui se sont révélés beau-
coup plus fiables. Le coût moyen actuel d’un compteur à prépaiement est de l’ordre de 50 EUR (soit trois fois plus que le coût d’un comp-
teur conventionnel).
Les principaux constats, soulignés par différents travaux d’évaluation, sont les suivants : hausse significative des recettes liées à la vente
d’énergie ; amélioration de la trésorerie de 20 à 70 % selon les zones géographiques (une zone de consommation d’énergie importante
implique une amélioration de la trésorerie plus importante qu’ une zone de faible consommation) ; accroissement de l'efficacité opération-
nelle (réduction des coûts de lecture de compteur, de facturation et d’encaissement [MRBC] de l’ordre de 10 % ; suppression des coûts de
déconnexion et connexion ; bonne acceptation du système par les consommateurs qui apprécient de pouvoir contrôler leur consommation
d'électricité en fonction de leur capacité à payer ; nombreuses pratiques frauduleuses au sein du système d’encaissement des paiements
(durant les premières années de mise en place du système) : nombre de vendeurs disparaissaient avec la recette liée à la vente de cartes
prépayées (grâce à des processus de gestion concertés et à la mise en place de circuits de vente innovants37, ces incidents ont été
progressivement réduits) ; dans les zones à faible niveau de consommation électrique le retour sur investissement sur les compteurs de
prépaiement est faible ; le recul temporel montre que les conditions de succès de la mise place d’un système de prépaiement ne dépendent
pas uniquement de la technologie de comptage déployée, mais aussi des compétences et des implications de l'équipe de gestion du site
concerné.
Les autorités sud-africaines ont mis en place un important programme d’électrification décentralisée basé sur la diffusion de kits PV. Ainsi
KES, société de services décentralisés (SSD) créée par EDF et Total, met en œuvre un programme d’électrification rurale décentralisée sur
la province du KwaZulu-Natal Central qui desservira 15 000 clients. Le mode de gestion retenu est une redevance basée sur un forfait
mensuel avec un compteur à prépaiement. Ce type de système de prépaiement en milieu rural connaît des dysfonctionnements inattendus.
En effet, chaque client doit se rendre à un point de vente relativement éloigné de son domicile, ce qui génère des coûts de déplacement non
négligeables pour un foyer dont les revenus sont peu élevés. Face à cette contrainte, le choix du consommateur est d’abandonner progres-
sivement l’utilisation de son générateur PV. On mesure ainsi l’effet pervers d’un système qui protège le maître d’ouvrage de nombreux
impayés, mais qui génère une perte implicite de clientèle.
© AFD Document de travail n° 122 • Accès à l’électricité en Afrique subsaharienne • avril 2012
72
37 Revendeur GSM en Afrique du Sud : ce mode de vente est utilisé par des revendeurs qui, disposant d’un compte d’avance basé dans un serveur de vente, transmettent les ordres d’achat decrédit par SMS et reçoivent, par le même canal, le code à 20 chiffres à transmettre au client, sur un carnet à souche. Pour cela, le revendeur doit déposer un fonds d’avance ; sa marge est ensui-te de 5 % sur toutes les transactions.

© AFD Document de travail n° 122 • Accès à l’électricité en Afrique subsaharienne • avril 2012
73
2.3.3 Points spécifiques au périurbain
En Afrique, le nombre de villes millionnaires ne cesse
d’augmenter. En 2000, sur l'ensemble du continent, une
trentaine d'agglomérations urbaines comptaient plus d'un
million d'habitants. Ce phénomène de croissance urbaine,
essentiellement lié à l’exode rural causé par la pauvreté,
pose de nombreux problèmes de gestion, d’autant qu’une
proportion importante de l’habitat est précaire, dans des
zones non viabilisées – les bidonvilles –, où le service est
souvent piraté. La ville africaine est dévoreuse d'espace et,
au fur et à mesure de son extension, les charges des diffé-
rents équipements urbains deviennent très lourdes du fait
de la longueur des réseaux (eau, assainissement, électrici-
té, voies publiques, transports). Le phénomène urbain
constitue une préoccupation majeure, même dans le cas
des centres urbains moins peuplés, car le rythme de leur
croissance démographique est sans rapport avec celui du
développement des capacités de production économique.
Un accès élargi aux services d'électricité proposé à des
coûts réduits peut conduire à améliorer la santé, la sécuri-
té, et la génération de revenus au sein des communautés
des bidonvilles. La population des quartiers périurbains
pauvres est toutefois marginalisée par l’opérateur
électrique qui a une perception négative de ce segment de
marché, pour plusieurs raisons socioéconomiques et
techniques, parmi lesquelles :
- la faible consommation unitaire de ces ménages, qui les
rend non prioritaires ;
- le caractère informel de l’habitat et, plus généralement, le
problème foncier dans les bidonvilles (non pas l’habitat
social) : les résidents sont locataires auprès de grands
propriétaires riches qui n’habitent jamais le quartier et sont
soit difficiles à identifier et à atteindre, soit squatteurs ;
- la faible capacité de paiement des ménages, et plus parti-
culièrement l’impossibilité de payer les coûts de connexion ;
- les problèmes de sécurité au niveau de l’accès des agents
de la compagnie d’électricité et les risques de piratage des
connexions et de vandalisme des installations (transforma-
teur, câble en cuivre, etc.).
Pour résoudre ces problèmes, différentes expériences ont
été menées sur plusieurs continents. Au-delà des particula-
rismes locaux, les recommandations communes suivantes
peuvent permettre d’atteindre des objectifs d’électrification
périurbaine :
- mettre en place chez l’opérateur une ingénierie sociale
solide capable d'étudier et d'organiser la communauté, et
s’appuyer sur des interfaces éventuelles (ONG, coopéra-
tives, organisations de quartier) entre la communauté et
l’opérateur ;
- développer des partenariats avec les organisations et les
institutions locales déjà actives dans l'amélioration des
conditions de vie des populations ;
- définir une approche technique spécifique du réseau
fondée sur la réduction des coûts ainsi que sur la sécurisa-
tion de celui-ci ;
- définir des tarifs ainsi que des conditions de paiement
adaptés à la sociologie du bidonville (introduction des
tranches 1 ampère) ;
- identifier et établir des relations avec des groupes de
femmes : celles-ci sont souvent perçues dans les commu-
nautés des bidonvilles comme étant plus dignes de
confiance et capables de faire passer efficacement des
messages ;
- si la décision d’électrifier un quartier est prise, viser à
l’électrification du plus grand nombre possible de ménages
(taux de raccordement de 50 % au moins) afin de limiter les
candidats au branchement pirate.
Si les initiatives et les innovations se multiplient, la systé-
matisation du cadre juridique (franchises locales ?) et des
responsabilités reste une question en suspens.

© AFD Document de travail n° 122 • Accès à l’électricité en Afrique subsaharienne • avril 2012
74
Encadré 13. Le cas de l’électrification des quartiers périphériques au Kenya
Il n’existe pas de statistiques officielles concernant la population des quartiers périurbains pauvres qui se sont développés autour des
grandes villes, notamment Nairobi. Toutefois, une analyse menée en 2006 sur la base de combinaison de critères de densité de population
et de taux de pauvreté a permis d’estimer le nombre d’habitants des bidonvilles à environ 2,5 millions, soit près de 0,7 million de ménages38 .
Des enquêtes menées dans les quartiers périurbains de Nairobi révèlent des revenus monétaires des ménages très faibles : environ 315
USD/habitant/an
Ces enquêtes montrent également que les dépenses énergétiques constituent une part importante dans le budget de ces ménages, estimé
en moyenne à 30 % des revenus monétaires dans les quartiers périurbains pauvres. La part des dépenses substituables par l’électricité
représente 16 % des revenus dans les bidonvilles, et 8 % dans les zones rurales.
Le faible niveau de revenus, qui implique la faible capacité de paiement des ménages, constitue une forte contrainte pour l’accès à l’électri-
cité, tant au niveau des frais de connexion exigés par la compagnie d’électricité (35 000 ksh, soit environ 500 USD), qu’au niveau de la
facture mensuelle d’électricité (en moyenne 0,12 USD/kWh, sans le coût d’ajustement des variations de prix du combustible qui peut
doubler le prix du kWh).
Compte tenu de leurs spécificités socioéconomiques (faible demande, solvabilité, densité, caractère informel de l’habitat, insécurité, etc.),
ces quartiers se sont retrouvés à la marge de tous les programmes et stratégies officiels de connexion électrique. De ce fait, les populations
se rabattent souvent sur une offre informelle chère et non sécurisée. Alors qu’une nouvelle politique de connexion a été adoptée en 2005
avec l’objectif de connecter 150 000 nouveaux clients par an jusqu’en 2010, la compagnie nationale, KPLC, a dû mettre en place progres-
sivement les outils nécessaires pour atteindre cet objectif :
- une nouvelle approche de tarification des coûts de raccordement, plus juste et plus transparente, notamment en ce qui concerne les nou-
velles zones urbaines concernées par l’extension du réseau ;
- une stratégie marketing plus proactive et orientée vers le client qui intègre également les quartiers périurbains pauvres. Pour mobiliser
concrètement ce marché, des arrangements administratifs ont toutefois dû être trouvés, notamment en ce qui concerne la connexion des
logements informels sans tenir compte des titres de propriété ou de location.
Ainsi KPLC a lancé en 2008 un projet pilote dans le quartier périurbain pauvre de Kibera pour tester de nouvelles options techniques et de
distribution avant de la diffuser à grande échelle :
- normes techniques de réseau MT allégées ;
- boîtes de connexion posées en haut de poteaux en bois. Chacune comprend dix contrôleurs de charge (disjoncteurs miniatures) calibrés
pour se déclencher lorsque la charge dépasse 1,5 kVa dans l’objectif de limiter la charge demandée au niveau de chaque connexion ;
- les clients finaux ne disposent pas de compteurs : leur point d'alimentation est un tableau métallique standard composé d’une prise
électrique, d’un interrupteur avec le point lumineux associé et d’un fusible ; la prise de terre est de la responsabilité des utilisateurs finaux ;
- compte tenu de la nature de la solution technique adoptée, les coûts de connexion sont moins élevés que les solutions classiques. Par
ailleurs, afin d’encourager les ménages des zones des quartiers périurbains pauvres à se raccorder, KPLC a fixé les frais de connexion à
environ 220 USD, au lieu de 500 USD ;
- l’énergie est facturée de manière forfaitaire (5 USD par mois pour les clients résidentiels) estimée sur la base d’un nombre d’heures moyen
d’utilisation de puissance disponible (40 kWh par mois en moyenne) ;
- un client principal est responsable de la collecte des paiements des forfaits mensuels auprès des clients de son groupe d’utilisateurs finaux,
de la même manière qu’il le pratique d’ores et déjà pour la collecte des loyers des logements. Cette responsabilité fait l’objet d’un contrat
entre le propriétaire (ou mandataire du propriétaire) du groupe de logements et KPLC ;
- dans le cas où un client final ne paie pas sa facture, KPLC procède à la coupure du service électrique sur l’ensemble du groupe de clients
auquel il appartient, et ce à partir de la boîte de connexion (située en haut du poteau électrique).
38 International Livestock Research Institute, 2004.
Source : Annexe.

© AFD Document de travail n° 122 • Accès à l’électricité en Afrique subsaharienne • avril 2012
75
2.3.4 La pico électrification : un complément
pour maximiser l’impact d’un investissement
d’accès
Un plan directeur d’électrification doit, au-delà de la dimen-
sion réseau/hors réseau, considérer scrupuleusement le
segment de marché qui ne peut supporter les coûts, soit de
connexion soit de service énergétique, comme par exemple
un kit solaire individuel (solar home system). Ce segment
représente la partie la plus pauvre de la population qui a
cependant des dépenses énergétiques qui correspondent
au prix payé pour l’éclairage (bougies, torches, lampes à
pétrole, etc.), pour l’audiovisuel (piles pour la radio), ainsi
que de plus en plus fréquemment, pour l’usage ponctuel de
la téléphonie mobile. Le pétrole lampant et les piles sèches
représentent en effet des couts monétaires élevés, de
l’ordre de 40 à 80 EUR par an. De plus, l’usage de la lampe
à pétrole génère des impacts conséquents en termes de
santé et d’environnement : d’après une étude de la GTZ39,
on estime que l’équivalent de 1,3 million de barils sont
consommés chaque jour ; cette consommation, qui
représente 190 millions de tonnes de CO2 par an,
engendre des risques sanitaires et de sécurité (incendie)
très élevés.
Pour atteindre les plus pauvres, de nouvelles approches
technologiques se développent autour du concept de pico
électrification. Ces développements concernent la pico
hydro ainsi que les petits systèmes PV dont la puissance
nominale est inférieure à 30 Wc regroupés sous l’appella-
tion « pico électrification » (plus largement applicable à
toute forme de recharge de batterie40). Ces systèmes se
démarquent de la lanterne solaire classique car ils visent
une utilisation multifonctionnelle : en plus de l’éclairage, qui
bénéficie du développement rapide des diodes électrolumi-
nescentes (Light-Emitting Diode, LED41), ces systèmes
permettent des recharges de piles et de batteries en inté-
grant des prises 12 V et des contrôleurs de charge – ce qui
permet donc également d’avoir un service informatique.
Une étude de la GTZ, datée de 2009, estime ainsi que le coût
moyen d’une lampe solaire multifonctionnelle est de 7
EUR/mois sur 2 ans (pour un investissement de 170 USD), alors
que les dépenses traditionnelles typiques sont de 12 EUR/mois,
soit 280 EUR environ sur 2 ans, dont 120 pour l’éclairage.
Si le coût initial d’acquisition demeure une barrière
majeure, la valeur de cet investissement relève typique-
ment du périmètre d’intervention des organismes de micro-
crédit. Dans le cadre d’un programme d’envergure, il sera
opportun d’impliquer ces organismes dans un mécanisme
de distribution de petits systèmes assis sur des crédits de
faible montant et de durée courte (6 mois à 2 ans). On peut
aussi s’appuyer sur la présence ou la mise en place
d’opérateurs locaux, qui pourront développer des systèmes
de location de lampe solaire multifonctionnelle (franchise).
Dans ces deux approches (location ou vente à crédit), la
marge possible de l’intermédiaire réside dans la différence
entre la dépense substituable et le coût d’usage mensuel
du petit système. Etant donné la quantité très faible
d’énergie requise pour ce type de service, il serait judicieux
de systématiser cette composante de pico électrification en
bout de ligne de chaque réseau en attachant la plus
grande importance à l’efficacité des équipements d’usage
pour maximiser la portée des faibles consommations
d’énergie. Ceci permettrait à la fois d’assurer un service
minimum pour les populations isolées (mais localisées
dans la « zone d’influence » du mini réseau), et de générer
une activité locale.
De toute évidence, les marges que l’opérateur de ce type
de service peut espérer réaliser sont très faibles, et le
service doit être assuré par des structures localement
implantées. Aujourd’hui, les populations bénéficiant de ce
type de service ne sont pas comptabilisées comme ayant
accès à un service électrique, car il est tout à fait minimal et
ne permet que de satisfaire de très faibles puissances, qui
ne sauraient entrainer un développement quelconque.
39 Etude GTZ : www.gtz.de/de/dokumente/gtz2010-en-picopv-booklet.pdf40 Un marché de la très faible puissance se développe autour de la lampe torche alimentéepar un petit module PV (5 Wc) ou par une dynamo. Ce produit, dont le prix de vente est del’ordre de 10 EUR, est peu fiable, et son efficacité lumineuse demeure faible.41 L’utilisation de technologie LED joue un rôle important en réduisant la consommationd'énergie dans l'éclairage. L’avantage de l’association des cellules photovoltaïques et de LEDréside dans la combinaison aisée des deux produits car les tensions cellules photovoltaïqueset tension LED peuvent être facilement assorties. La technologie LED offre une luminositéplus de huit fois supérieure à celle des lampes incandescentes.

© AFD Document de travail n° 122 • Accès à l’électricité en Afrique subsaharienne • avril 2012
76
Encadré 14. Exemples de services de recharge de batteries - Cambodge et Laos
Au Cambodge, la recharge de batterie (service complémentaire fourni par les opérateurs de mini réseaux diesel) est largement répandue.
Elle permet aux foyers situés dans la périphérie du réseau de « payer ce qu’ils consomment » ; et à ceux vivant hors du village, mais qui s’y
rendent les jours de marché, de faire recharger leur batteries.
Le coût (commercial) de la recharge sur des groupes diesel est de 0,25 USD par recharge pour une batterie de 40 Ah, et de 0,50 USD pour
une batterie de 150 Ah.
Au Laos, un programme mené sur cinq villages de recharge de lampes LED sur des systèmes PV est facturé 1 USD/mois aux usagers, et
permet de rembourser l’investissement en 18 mois. La rémunération de l’opérateur villageois est minimale, son engagement vis-à-vis de la
communauté primant sur sa rémunération.
Source : IED.

Pour permettre l’accès de tous au service électrique, la
première étape consiste à produire de l’énergie électrique
en quantité suffisante pour satisfaire les besoins écono-
miques et sociaux, à un coût suffisamment abordable pour
permettre un équilibre économique du programme d’accès.
L’atteinte de cet équilibre ne signifie pas nécessairement
que les usagers soient en mesure de payer l’intégralité du
coût du service, mais que les finances publiques soient en
mesure de supporter la différence entre ce coût du service
livré et le tarif pratiqué, et que ce coût, tant en investisse-
ment qu’en fonctionnement et maintenance dans la durée,
ait été correctement appréhendé ex ante, lors de la concep-
tion même du programme.
A l’échelle mondiale, les besoins d’investissements sont
considérables. L’AIE, dans son rapport World Energy
Outlook publié en 2009, estime que la demande mondiale
d’électricité va continuer à croitre à un taux annuel de
2,5 % d’ici 2030, et que 80 % de la croissance interviendra
dans les pays hors OCDE. L’augmentation de la capacité
électrique installée représente 4 800 GW (soit 5 fois le parc
existant aux Etats-Unis), dont 28 % aura lieu en Chine. La
part des énergies renouvelables dans la production totale
passera de 2,5 à 8,6 % en 2030, alors que la part de
l’hydroélectricité diminuera de 16 à 14 %, celle du charbon
restant dominante à 44 %.
Face aux besoins, qui demeurent colossaux, un constat est
pour le moins inquiétant : les investissements dans le
secteur énergétique se sont effondrés en 2009 dans le
contexte de crise économique. Celui-ci concerne autant
l’exploration pétrolière par les multinationales que les
ménages, qui achètent moins d’équipements neufs et
performants. Ceci aura des répercussions importantes sur
l’efficacité énergétique à long terme. Fin 2008 et début
2009, l’investissement dans les énergies renouvelables a
diminué davantage proportionnellement à celui dans les
autres types de production électrique ; il a chuté de près
d’un cinquième en 2009 – et aurait atteint une diminution de
30 % sans les plans de soutien gouvernementaux.
Le repli de l’investissement dans le secteur énergétique
aura des conséquences potentiellement graves pour la
sécurité énergétique, le changement climatique et la
pauvreté énergétique. Freiner l’augmentation des capacités
à moyen terme pour les projets ayant des temps de gesta-
tion longs conduira à des déficits à long terme, et risque de
mener à une flambée des prix au moment où la demande
se redressera. Pourra-t-on mobiliser les financements
requis ? Ils sont estimés, dans le scénario de base de l’AIE,
à 1 100 Md USD annuellement d’ici 2030, dont 600 Md/an
pour le secteur électrique, et environ 300 Md/an dans les
pays en développement.
Ce scénario de référence, nous amène inexorablement
vers une concentration de carbone de plus de 1 000 ppm
de CO² équivalent, jugée très dangereuse car entraînant
une augmentation moyenne des températures de 6°C. Le
scénario de 450 ppm, soit 2°C d’augmentation des tempé-
ratures moyennes avec une probabilité de 50 %, sobre en
carbone, développé par l’AIE, implique un investissement
supplémentaire de 10 000 Md USD d’ici 2030. Celui-ci
serait compensé par des gains économiques, dans le
domaine de la santé entre autres, et une diminution de la
facture énergétique dans les bâtiments, les transports, …
© AFD Document de travail n° 122 • Accès à l’électricité en Afrique subsaharienne • avril 2012
77
3 Un besoin de financements structurés
3.1 Pour généraliser l’accès aux services électriques, des montants de financement
requis au-delà des ordres de grandeur des flux de la coopération internationale.

Dans ce contexte, améliorer l’accès de près de 1,6 Md de
personnes à l’énergie moderne, soit un cinquième de la
population mondiale, reste une gageure. 85 % de ces per-
sonnes vivent en milieu rural, en Afrique subsaharienne et
en Asie du Sud. Dans le scénario de référence de l’AIE, leur
nombre ne diminuerait que de 200 millions à l’horizon 2030,
et augmenterait sur le continent africain. L’AIE estime
qu’avec un investissement de 35Md USD/an, soit 6 %
de l’investissement global prévu dans le secteur de
l’électricité, la question serait résolue à l’horizon 2030. On
est bien loin de ces ordres de grandeur, à en juger par une
revue de la Banque mondiale sur son propre portefeuille,
où l’on constate que les flux se limitent à 500 M EUR
annuellement (cf. tableau 9).
© AFD Document de travail n° 122 • Accès à l’électricité en Afrique subsaharienne • avril 2012
78
Tableau 9. Investissement de la Banque mondiale dans des programmes d’accès (2003-2005) – en M USD
Région Grid Grid Rural Off-grid Rural Energy Total
Peri-urban Electrification Electrification Fund
Afrique $76,60 $35,20 $30,20 $31,20 $173,20
Asie orientale Pacifique $0,00 $235,00 $3,70 $8,30 $247,00
Am. latine Caraïbes $0,00 $3,00 $7,00 $0,00 $10,00
Asie du Sud $26,00 $0,00 $5,50 $24,60 $56,10
Afrique du Nord Médit. $0,00 $0,00 $0,00 $0,00 $0,00
Europe orientale Can. $0,00 $0,00 $0,00 $0,00 $0,00
Total $102,60 $273,20 $46,40 $64,10 $486,30
Source : ESMAP 2007.
A l’évidence, on ne pourra se contenter de la coopération
internationale pour financer les programmes d’accès : de
manière schématique, les projets d’accès font intervenir,
outre l’usager, l’Etat, l’opérateur (privé ou public) et les
organismes de financement (cf. schéma 6).
Bien évidemment, la structure de financement d’un projet
ou d’un programme d’électrification rurale, et notamment le
« coût moyen pondéré du capital » ainsi que la durée des
emprunts, les éventuelles périodes de grâce, la durée du
projet (notamment par rapport à la rémunération du capital)
ont une incidence très importante sur le prix du service.
Schéma 6. Acteurs et circuits de financement de l’électrification rurale
Source : auteurs.

• Les institutions financières multilatérales ou bilatérales
octroient des prêts concessionnels ou des dons aux Etats ;
ils sont alloués au financement des infrastructures élec-
triques, généralement sous forme de prêt ou de subvention,
ou encore d’apport en capital à l’opérateur électrique.
• Ces mêmes institutions peuvent parfois accorder des con-
cours aux opérateurs, généralement avec la garantie de
l’Etat.
• Les Etats participent au financement des infrastructures
électriques à travers leur propre budget d’investissement
(hors aides extérieures).
• Les banques privées nationales ou internationales peu-
vent également accorder des prêts ou apporter une part de
capital à l’opérateur électrique.
• Enfin l’usager paie le service à travers le tarif, augmenté
généralement de redevances spécifiques pour couvrir une
partie du remboursement des investissements. Plus glob-
alement, les paiements des usagers se décomposent en
trois parties : (i) une contribution initiale au branchement ;
(ii) une prime fixe qui dépend de l’abonnement (niveau de
puissance souscrite et qui doit amortir l’investissement de
l’opérateur) et (iii) une part variable qui est fonction de la
consommation.
Pour établir un lien plus direct entre la politique tarifaire et
le montant de subvention requis, il convient de déterminer
quel est l’équilibre financier visé par les tarifs appliqués. Il y
a schématiquement trois niveaux d’équilibre visés :
■ le « petit équilibre » : les recettes tirées des ventes
permettent de couvrir les dépenses de fonctionnement et
d’exploitation courante du service ;
■ l’« équilibre d’exploitation » : les recettes permettent de
couvrir non seulement le fonctionnement et l’exploitation
courante mais également toutes les opérations de mainte-
nance et de renouvellement courantes ;
■ le « grand équilibre » : les recettes permettent de couvrir
toutes les charges, i.e. les charges d’exploitation et finan-
cières liées notamment aux investissements.
Les mécanismes de subvention permettent de compenser
l’écart entre l’équilibre atteint effectivement par les recettes
du service, par application de la grille tarifaire (redevances
incluses), et le « grand équilibre ». Se pose la question de
la capacité au global, de l’Etat, de payer cette subvention.
© AFD Document de travail n° 122 • Accès à l’électricité en Afrique subsaharienne • avril 2012
79
3.2 Principes historiques
Un principe de base d’équité, dit de la « péréquation » est
que pour tout consommateur d’une certaine catégorie
(niveau de consommation, caractéristiques socioéco-
nomiques, i.e. client domestique ou industriel, etc.) un kWh
doit être payé le même prix, où que l’on se trouve sur le ter-
ritoire national, donc quel que soit le coût de ce kWh sur le
territoire. Ce principe n’est tenable que dès lors que les
bénéfices réalisés dans certains lieux ou sur certaines
tranches tarifaires permettent de compenser au global les
pertes en d’autres lieux ; ou alors, que l’Etat ait les moyens,
au niveau macroéconomique, de payer la différence.
Un recul sur l’histoire de l’électrification dans les pays
industrialisés nous rappelle que dans la première phase
d’électrification au cours de la première moitié du XXe
siècle, le service électrique était assuré par des opérateurs
privés, pour les besoins de l’industrie, et donc à des prix
différenciés, reflétant les coûts. Certains opérateurs ont
ensuite progressivement desservi les populations dans le
« bassin d’emploi » de ces industries. Le principe de péré-
quation n’a été appliqué que bien plus tard, lors de la natio-
nalisation et de l’intégration de ces différentes compagnies
en une structure nationale : on a pu « se payer » ce princi-
pe d’équité grâce à un socle de ventes profitables exis-
tantes, et un appui très significatif de l’Etat à l’investisse-
ment.
Cet appui à l’investissement par des financements à long
terme et publics est parfaitement logique dans une structu-
re industrielle d’économies d’échelles, où plus l’investisse-
ment est important, plus le coût moyen est faible.
Concrètement, dans ce schéma, l’intérêt général est d’avoir

de grands ouvrages qui irriguent l’ensemble du territoire par
un réseau interconnecté. De ce schéma très intensif en
capital découle la structuration du secteur en un « monopo-
le naturel » et, qui plus est, public.
Dans les contextes de certains pays d’Afrique subsaharien-
ne, la première étape (de production locale pour satisfaire
des besoins industriels rentables) n’a pas encore été
franchie. Peut-on alors, dès à présent, « se payer » la péré-
quation, ou ne viendra-t-elle peut-être que dans un second
temps, comme en France (cf. encadré 15) ? Un argument
en faveur de la « différentiation tarifaire » est que, dans des
zones non électrifiées, les populations ont des factures
mensuelles à partir de ressources traditionnelles (lampes à
kérosène, piles sèches, petits moteurs pétrole individuels,
etc.) élevées, et donc souvent une vraie capacité à payer.
S’il peut paraître tout à fait injuste de faire payer à un « rural
pauvre » beaucoup plus cher qu’à un « urbain riche », peut
être vaut-il quand même mieux un service cher en zones
rurales que pas de service du tout, ou un secteur en faillite ?
Mais ceci relève d’arbitrages politiques nationaux qu’il
importe de faire en connaissance de cause, et avec prag-
matisme.
Par ailleurs, les évolutions technologiques actuelles engen-
drent des schémas industriels où des ouvrages de taille
moyenne/petite sont parfois (voire souvent) les plus appro-
priés, ce qui affaiblit la légitimité du monopole naturel de
production et ouvre voie à une structuration plus éclatée, où
l’investissement privé de taille moyenne retrouve toute sa
place avec toute la problématique des smart grids. Cette
évolution ne nous dédouane pas pour autant de la nécessi-
té d’une très forte coordination nationale, d’une part
technique (programmation de la production et des réseaux
de transport eux relèvent encore tout à fait du monopole
naturel) et d’autre part financière pour assurer une mobili-
sation financière suffisante.
© AFD Document de travail n° 122 • Accès à l’électricité en Afrique subsaharienne • avril 2012
80
Encadré 15. Petite histoire de l’électrification en France : le rôle du Fonds d'amortissement des charges d'électrification (FACE)
En France, la mise en place de l’infrastructure nationale s’est faite à travers une forte implication étatique par la nationalisation, en 1936, de
plusieurs structures privées qui étaient dédiées à la production d’électricité pour des zones industrielles. EDF ainsi créée a pu, d’une part,
mobiliser une taxe sur les ventes de kWh pour financer ce programme d’accès (dont il existait un volume significatif au préalable à l’électri-
fication des populations rurales et périurbaines) et, d’autre part, mobiliser des financements à long terme et à faible taux d’intérêts grâce à
la garantie de l’Etat.
Le poids relatif des populations urbaines et rurales et celui des consommations respectives permettaient, dès 1937, de bâtir un système de
péréquation efficace, c'est-à-dire qui soit à la fois une charge acceptable par les consommateurs des villes et suffisamment productif pour
financer significativement les investissements ruraux. En 1937, avec 90 % de la population nationale électrifiée et une consommation d'élec-
tricité basse tension de 3,1 milliards de kWh en 1938 (contre 1,8 milliard en 1926), les prélèvements sur le kWh basse tension permettent
en effet de supporter l'effort public d'investissement électrique.
Au fur et à mesure que se développe l'électrification rurale, le produit financier de cette péréquation augmente en proportion directe avec le
nombre de kWh consommés, tandis que la demande de financement diminue. On dispose ainsi d'un mécanisme durable d'autofinancement
du réseau électrique par ses clients : le Fonds d'amortissement des charges d'électrification - FACE.
En France, les taux de prélèvement sur les kWh ont été ajustés en fonction des besoins de financement, tout en respectant jusqu'à

3.3.1 Le poids des clients domestiques
Dans le cadre de programmes d’accès, les clients sont très
majoritairement domestiques et à niveaux de consomma-
tion unitaire faible : gérer de nombreux petits consomma-
teurs a évidemment un coût pour la compagnie de service
et les faibles marges sont peu incitatives.
Outre la question spatiale, avec un éloignement et une
faible densité qui viennent augmenter les coûts d’investis-
sement et de fonctionnement, une forme de subvention
croisée est généralement pratiquée entres catégories
sociales : les clients BT, et plus particulièrement la catégo-
rie dite « sociale », représentent généralement le plus
grand nombre de consommateurs pour des consomma-
tions unitaires modestes, donc des recettes proportionnel-
lement faibles pour l’opérateur, comme l’illustre la réparti-
tion des consommateurs de KPLC (Kenya), où la tranche
domestique représente 25 % des ventes pour 85 % des
clients à gérer. On comprend que la compagnie d’électrici-
té soit bien plus intéressée par les consommateurs
industriels où, comme à Madagascar, les clients MT/HT
représentent plus de 40 % des ventes pour moins de 1 %
des clients à gérer.
L’analyse tarifaire et de profitabilité doit néanmoins se faire
de manière fine, en tenant notamment compte de la prime
fixe, qui peut représenter 50 % du prix du kWh pour les
ménages qui consomment peu. On se rend ainsi compte
qu’au Kenya, les ménages de la tranche inférieure à 50
kWh mensuels paient leur kWh plus cher que ceux de la
tranche 51 à 300 kWh.
© AFD Document de travail n° 122 • Accès à l’électricité en Afrique subsaharienne • avril 2012
81
aujourd'hui le rapport de 1 à 5 entre les clients ruraux et urbains. Fixés en 1937 à 2,80 % en zone urbaine et 0,56 % en zone rurale, ils seront
d'abord augmentés en 1954 à 3,80 % en ville et 0,75 % dans les campagnes, avant de diminuer régulièrement au fur et à mesure
qu'augmentent les consommations, pour atteindre en 2000 2,3 %, pour le taux maximal applicable dans les communes urbaines, et 0,46 %,
pour le taux minimal applicable dans les communes rurales.
Le FACE apporte encore aujourd’hui une aide financière aux maîtres d'ouvrage des réseaux des communes sous régime électrification rura-
le. Cette aide correspond à 65 % du montant TTC des travaux d'extension, de renforcement ou d'intégration des réseaux dans l'environne-
ment, les réseaux concernés étant les réseaux basse tension (BT) et les extensions moyenne tension (HTA) nécessaires à l'alimentation des
nouvelles zones BT desservies. Ce sont les collectivités locales – ou les communes pour la distribution, qui décident des investissements
locaux, apportent leur part de financement, et les réseaux de distribution leur appartiennent. Le budget annuel d'aides FACE était d'environ
345 M EUR en 2008. En ce qui concerne la contribution au service public de l’électricité (CSPE) dans les zones non interconnectées
(ZNI : DOM TOM et Corse), elle a été de près de 667 M EUR en 2008 (pour 3 millions d'habitants).
Ces subventions "croisées" méritent d'être mises en regard des exigences de rentabilité que l’on a pour les programmes d’équipement en
Afrique.
Source : GRET (2005).
3.3 Quelques clés pour fixer les niveaux tarifaires

© AFD Document de travail n° 122 • Accès à l’électricité en Afrique subsaharienne • avril 2012
82
Tableau 10. Kenya (2008)
Tableau 11. Jirama - Madagascar (2007)
Tableau 12. Côte d’Ivoire
Tarif Type de consommateurs Nb d'abonnés 2008 % Consommations 2008 - MWh %
A0 Domestique 895 043 84,41 1 255 24,92
A1 Petits commerciaux 158 676 14,96 590 11,72
B Irrigation 3 738 0,35 996 19,78
C Grands commerciaux 518 0,05 2 108 41,86
D Off peak 668 0,06 74 1,47
E Eclairage public 1 740 0,16 13 0,26
Total 1 060 383 100 5 036 100
Source : KPLC Annual Report 2007-2008.
Source : Jirama.
Type de consommateurs Nb abonnés 2007 % Ventes 2007 (MWh) %
MT/HT 899 0,23 340 339 42,35
Particuliers BT 383 559 96,9 408 159 50,78
Administrations BT 1 977 0,5 11 918 1,48 -
Collectivités 1 661 0,42 9 415 1,17
Cessions JIRAMA 7 753 1,96 33 889 4,22
BT 463 383 57,65
Total 395 849 100 803 722 100
Le cas de la Côte d’Ivoire illustre également cette inégale répartition de la consommation sur le territoire national : les zones urbaines y
enregistrent dix fois plus d'abonnés que les zones rurales. La capitale économique, Abidjan, regroupe à elle seule 40 % des abonnements
et 70 % de la consommation totale, alors que cette ville ne compte que 20 % de la population du pays. En plus de cette disparité, la consom-
mation d'un abonné rural représente moins de 40 % de celle d'un abonné urbain.
Total Rural
Taux d’accès 24 % (38 % avec fraude) 6 %
Population ayant accès 4 320 000 594 000 = 13 % des abonnés
Consommation moyenne / habitant 300 kWh 150 kWh
Consommation totale 1 296 GWh 89,1GWh = 6,8 % de la consommation totale
Source : auteurs.
Encadré 16. Kenya, Madagascar : répartition des consommations par catégorie tarifaire

3.3.2 Péréquation tarifaire : quel coût pour la
nation ?
Dans le schéma dit de « péréquation », les usagers situés
dans les zones les moins coûteuses à électrifier vont
couvrir, de fait, une partie des coûts d’électrification des
zones les plus coûteuses, d’abord en exploitation et ensui-
te en investissement si cela est possible. Au Maroc, les
tarifs de vente de l’électricité sont fixés par l’Etat et sont
uniformes sur tout le périmètre de distribution de l’ONE, qui
compte à la fois des villes et des villages.
La contribution des usagers et des collectivités est la même
sur tout le périmètre rural visé par le PERG, et est indépen-
dante du coût de revient de l’électrification du village consi-
déré. L’ONE applique donc un système de péréquation,
non seulement sur le tarif de vente de l’électricité, mais
également sur cette participation aux investissements des
usagers et des collectivités bénéficiaires. Pour la consom-
mation moyenne d’un ménage rural (52 kWh/mois), la fac-
ture d’électricité atteint 53 DH par mois, auxquels se rajou-
tent 40 DH de redevance PERG.
A la suite de cet ambitieux programme d’électrification rura-
le, la rentabilité de l’ONE paraît affaiblie pour les raisons
suivantes :
- les coûts de distribution en milieu rural sont 2,5 fois plus
élevés que ceux du milieu urbain ;
- les consommations d’énergie en milieu rural sont faibles,
tandis que le nombre d’abonnés ruraux augmente ;
- les tarifs BT ont très peu augmenté depuis 1996, alors que
les tarifs MT et HT ont connu une baisse sensible.
Le PERG a donc eu un impact défavorable sur les résultats
de l’ONE alors même que s’amorce l’électrification des
ménages les plus « chers » à raccorder, c’est-à-dire ceux
situés dans les zones les plus faiblement peuplées.
Au Mozambique, afin de pouvoir assurer sa fonction socia-
le, EdM pratique deux types de subventions croisées entre
des groupes de consommateurs individuels :
- une subvention croisée géographique entre les zones
rurales (particulièrement septentrionales) et les zones
urbaines (principalement Maputo) ;
- une subvention croisée qui s’opère à travers un système
tarifaire variable par paliers ; ainsi, les plus gros consom-
mateurs (généralement les ménages les plus riches) paient
plus cher par unité d’électricité que plus petits (les ménages
les plus pauvres).
EdM fait une distinction de tarifs entre la basse/moyenne
tension (essentiellement les ménages et les petites entre-
prises) et la haute tension (les affaires et l’industrie). Les
utilisateurs de haute tension peuvent obtenir des tarifs indi-
viduels négociés en fonction du volume de consommation
et des périodes d’utilisation (heures de pointe ou creuses).
© AFD Document de travail n° 122 • Accès à l’électricité en Afrique subsaharienne • avril 2012
83
Tableau 13. Programme de branchements périurbains au Kenya, prévisions pour
les 750 000 branchements sur 5 ans
Catégories Clients(%)
Cons
moy.
kW/m
Ventes
énergie
(%)
Recettes
(MkSh)
Bénéfice
d'expl.
(MKsh)
Domestique (AO) 90 117 64 924 227
<50 kWh/mois 35 15 3 133 -145
51-300 kWh/mois 55 107 30 649 242
301- 3 000 kWh/mois 9 525 29 129 119
3 000-7 000 kWh/mois 0,1 3 549 2 13 11
Petits commerces A1 10 428 36 643 190
Source : auteurs.

EdM dispose également d’un programme pour attirer
l’investissement privé, notamment à travers un système
d’incitation et de prix spéciaux pour les entreprises et les
industries de l’agroindustrie, ce qui permet de faire de la
tarification un instrument d’aménagement du territoire et du
développement économique.
© AFD Document de travail n° 122 • Accès à l’électricité en Afrique subsaharienne • avril 2012
84
Tableau 14. Répartition des consommations au Mozambique - EdM (2006)
Tarifs Consommation (GWh) % Nb abonnés %
Commercial BT 183,2 10,06 38 790 9,33
Gros consommateurs BT 88,5 4,86 1 477 0,36
Domestiques BT 516,5 28,36 373 795 89,93
Agriculture BT 0,07 0 24 0,01
MT – HT 534,8 29,36 1 581 0,38
Export 498,3 27,36
Total 1821,37 100 415 667 100
Source : EdM.
Aujourd’hui, le niveau tarifaire moyen est de 8 cents par
kWh, tandis que le tarif de coût marginal à long terme
(CMLT) est de 9,1 cents par kWh. EdM peut procéder à des
ajustements tarifaires de manière indépendante dans les
limites de son contrat de concession conclu avec le gouver-
nement. Les ajustements tarifaires non prévus dans le
contrat doivent être approuvés par le gouvernement.
3.3.3 Différentiation des tarifs
Le cas de l’électrification rurale au Mali est une illustration
particulièrement intéressante de la différentiation des tarifs.
L’Etat malien a amorcé la libéralisation du secteur de
l’électricité en 200042. L’AMADER (AER) régule, contrôle
et participe au financement du développement de l’activité
d’électrification rurale, notamment dans toutes les localités
où la puissance installée est inférieure ou égale à 250 kW43.
Ainsi, des opérateurs publics ou privés locaux qui souhai-
tent fournir un service public de l’électricité peuvent, à leur
initiative, soumettre un PCASER à l’AMADER pour deman-
der une autorisation et une subvention, limitée à 80 % des
coûts d’investissements. Les tarifs et formules tarifaires
sont libres, mais approuvés et publiés par l'AMADER sur la
base d’un plan d’affaires prévisionnel présenté par l’opéra-
teur. Le tarif de l’électricité couvre les charges d’exploitation
et les charges financières, et inclut également un retour sur
investissement pour l’opérateur sur les 15 années que dure
l’autorisation. Le taux communément admis est de l’ordre
de 8 % en réel, ce qui est faible comparativement aux
grands projets d’infrastructures où il est généralement de
l’ordre de 15 % ; l’opérateur se rémunère sous forme de
« dividendes actionnaires ». L’AMADER a prévu un proces-
sus de révision tarifaire qui tient compte de l’évolution des
conditions économiques et techniques et de leur impact sur
le coût du service.
Sur quatre cas étudiés44, en estimant la consommation
d’énergie correspondant au forfait, la fourchette tarifaire
s’établit à 350-700 FCFA/kWh (hors frais de raccordement)
– soit entre 0,55 EUR et plus d’1 EUR. Seul le village de
Koumantou, qui a bénéficié de subventions de l’AMADER,
pratique le prix minimum observé, alors que le tarif social
de l’électricité sur le périmètre EDM-SA était de 59
FCFA/kWh en 2007.
Actuellement, en réalité, les tarifs pratiqués par les PCA-
SER atteignent des niveaux de plus de 0,50 EUR/kWh,
bien au-dessus de la capacité à payer des usagers ruraux.
Ceci est dû à la flambée du prix du gasoil que la subvention
42 Modalités prévues dans une loi n° 00-019/P-RM du 15 mars 2000. 43 La Commission de régulation de l’électricité et de l’eau (CREE) détermine la politique tari-faire44 Cf. Ease et Improves (2007).

presque totale de l’investissement initial n’arrive pas à
compenser, ce qui milite pour la mobilisation d’énergies
renouvelables. Ainsi, l’AMADER, refinancée par l’Etat, se
voit obligée aujourd’hui d’accorder une subvention à l’ex-
ploitation aux PCASER, sous forme d’exonération de taxes
sur le gasoil.
Plus généralement, dans les pays fortement dépendants
des hydrocarbures, les distributeurs sont, dans le cadre de
leurs concessions, de plus en plus autorisés à effectuer des
ajustements tarifaires pour refléter leurs coûts. Ainsi, au
Kenya, les soucis d’hydrologie sur le parc de production
interconnecté ont obligé KPLC à mobiliser des groupes
thermiques coûteux, ce qui les amène à appliquer une sur-
taxe temporaire (fuel surcharge) qui augmente actuelle-
ment le tarif de 50 %, d’un mois sur l’autre
© AFD Document de travail n° 122 • Accès à l’électricité en Afrique subsaharienne • avril 2012
85
3.4 Mettre en place les mécanismes de financement nécessaires pour garantir l’accès à
un service électrique pour tous
Le taux d’électrification initial étant très faible en Afrique
subsaharienne (10 à 20 %), les subventions croisées ne
permettront pas, à elles seules, d’atteindre des taux d’ac-
cès d’envergure. On ne peut se passer d’une subvention
initiale (ou, plus généralement, d’emprunts concessionnels)
pour financer des investissements en milieu rural, ou de
financements sur 30 ans, mobilisés sur deniers de l’Etat,
qui peut lui-même se refinancer. Lorsque l’on part de taux
d’équipements en infrastructure faibles, se pose la question
des zones/clients à desservir en priorité, ainsi que celle
d’un rythme d’équipement qui se doit d’être à la mesure des
financements effectivement mobilisables.
La flambée du prix du baril, les risques climatiques, ainsi
que les avancées des avancées technologiques sont autant
de facteurs qui accroissent l’intérêt des énergies renouve-
lables, malgré le coût élevé du premier investissement.
L’heure est clairement aux innovations financières pour
mieux cerner et partager les risques, de manière aussi à
mobiliser les investissements privés.
En outre, la clé de voute de l’équipement d’un territoire
national, en particulier en infrastructure électrique, est de
pouvoir s’appuyer sur une structure capable de mobiliser,
puis d’organiser la mise en œuvre des fonds requis.
3.4.1 Bien mesurer l’envergure des
financements requis et ne pas sous-estimer
l’importance de l’apport national et d’une
contrepartie d’envergure et de qualité
Le Maroc, qui compte 30 millions d’habitants, a réussi
l’exploit majeur de passer à un taux d’électrification des
localités de 15 % à plus de 90 % en 15 ans, ce qui a néces-
sité un investissement de près de 2 Md EUR sur la période.
Rappelons que près de la moitié provient de ressources
nationales (25 % financés par les bénéficiaires et 20 % par
les communes) ; l’ONE finance le solde à travers une taxe
sur les ventes de kWh qui a rapporté, en 15 ans, environ
500 M EUR (soit 30 M EUR par an). Evidemment, sans cet
apport national, les bailleurs de fonds internationaux ne se
seraient pas engagés dans cet ambitieux programme. Les
montants levés en prêt atteignent ainsi une moyenne de 70
M EUR par an, grâce au fait qu’une structure nationale cré-
dible – l’ONE – se porte emprunteur. Ainsi, au fil du temps,
les bailleurs peuvent envisager des prêts non souverains,
en prenant donc directement le risque sur l’ONE.
Au Sénégal, le périmètre rural a été découpé en douze
« concessions d’électrification rurale ». Chacune d’elle sera
attribuée à un opérateur unique, dans le cadre d’un appel
d’offres international. L’opérateur unique est tenu d’appli-
quer une tarification identique à service identique sur

l’ensemble de sa concession et ce, indépendamment des
techniques d’électrification utilisées. Les subventions sont
comprises entre 50 et 80 % du montant total des investis-
sements, et financées sur fonds nationaux ou mobilisation
de bailleurs de fonds. Au lancement de l’appel d’offres,
l’ASER précise le montant de subvention disponible et les
opérateurs soumissionnaires sont sélectionnés sur la base
(i) du nombre de branchements qu’ils s’engagent à réaliser,
(ii) du prix et, indirectement, (iii) des financements addition-
nels qu’ils apportent sous forme de fonds propres et d’em-
prunts.
La première concession, située dans la région de Saint-
Louis-Dagana-Podor (nord, superficie de 19 000 km2,
362 000 habitants et 41 000 ménages), a été attribuée à
l'ONE après un appel d'offres international, pour une durée
de 25 ans. Un prêt de 5 M USD de la Banque mondiale est
utilisé comme subvention de base du gouvernement séné-
galais au concessionnaire. L'investissement total est 14,9
M USD sur 3 ans. Dans son offre, l’ONE a proposé 2,3 fois
plus de raccordements que ce qui était demandé dans l’ap-
pel d’offres, et 50 % de plus que son concurrent. Pour cela,
il a proposé un plan de financement incluant une large part
d’emprunt, qui a été possible grâce au fait que l’ONE dispo-
se déjà de références (track record) significatives d’emprunts
auprès de bailleurs de fonds internationaux, contractés pour
l’électrification de leur propre territoire national. On s’interroge
légitimement sur la possibilité de répliquer un tel schéma…
Qu’en est-il des dynamiques actuelles en Afrique subsaha-
rienne ? Une revue des programmes en cours montre que
les volumes les plus importants sont mobilisés dans les
pays ayant des structures nationales porteuses. En se
focalisant sur la Banque mondiale, on fait les observations
suivantes :
• les prêts sont, pour la quasi-totalité, octroyés aux Etats qui
ensuite rétrocèdent aux différentes structures nationales
sous forme de dons ou de prêts. Les volumes les plus
importants des concours pour des programmes d’accès
(urbains ou ruraux) sont dans les pays dotés de compa-
gnies d’électricité d’envergure, qui ont donc la capacité de
les absorber et de les rembourses. Il est intéressant d’ob-
server le montant du prêt en mobilisation annuelle au
regard de la population du pays, en gardant à l’esprit que le
Maroc a eu besoin d’emprunter 70 M EUR/an sur une
période de 15 ans, avec des maturités de plus de dix ans,
pour équiper un pays d’environ 30 millions d’habitants ;
voici quelques exemples :
- Ethiopie : 60 millions d’habitants ; 5 ans (2003) ; 133 M
EUR, soit 27 M EUR/an ; seulement 35 M pour l’accès, dont
80 % en extension du réseau ; rôle central de EEPCo ;
- Ghana : 20 millions d’habitants ; 5 ans (2008) ; 135 M
EUR, soit 27 M EUR/an ; 35 % pour l’extension du réseau
et volonté de travailler avec des banques de développe-
ment nationales ;
- Mozambique : 20 millions d’habitants ; 4 ans (2003) ;
54 M EUR, soit 13 M EUR/an ; 50 % pour le réseau périur-
bain, rôle central d’EDM ;
• un second groupe de concours se focalise sur les FER ;
la grande limite de ce schéma est que l’Etat fait un don au
fonds, qui lui-même n’a souvent de fonds que le nom. Ce
dernier est en réalité un compte bancaire qui va faire tran-
siter une subvention à l’investissement à un opérateur, qui
n’a généralement aucune ou de très partielles et rares obli-
gations de remboursement :
- Cameroun : 16 millions d’habitants ; 6 ans (2008) ; 47 M
EUR, soit 8 M EUR/an, pour l’essentiel dédié au « fonds »
qui a mis près d’une décennie à se mettre en place ;
- Guinée : 8 millions d’habitants ; 4 ans (2003) ; 11 M EUR,
soit 3 M EUR/an – doté pour l’essentiel à un « fonds » qui
n’avait pas le droit de prêter ; un partenariat a été recher-
ché avec une banque, rémunérée, mais qui a refusé de
prendre un risque de prêt et s’est limitée à faire transiter la
subvention ;
- Mali : 10 millions d’habitants ; 5 ans (2005) ; 25 M EUR,
soit 5 M EUR/an – à l’AMADER pour l’essentiel qui transite
les subventions à l’investissement ;
- Ouganda : 23 millions d’habitants ; 5 ans (2009) ; 62 M
EUR, soit 12 M EUR/an (dont un tiers pour l’extension du
réseau à la compagnie d’électricité, et un tiers pour des pro-
grammes intersectoriels gérés par des ministères usagers
en subvention).
On déduit de ces observations que les pays ayant réussi un
changement d’échelle sont aussi ceux qui ont un opérateur
central crédible, tant techniquement que financièrement.
La Banque mondiale utilise des instruments type Adaptable
© AFD Document de travail n° 122 • Accès à l’électricité en Afrique subsaharienne • avril 2012
86

Programme Loan (APL) ou Special Impact Loan (SIL) qui
s’inscrivent généralement dans la durée et méritent atten-
tion: les maturités des prêts mentionnées ci-dessus sont
celles d’une première tranche, qui, si elle est réalisée avec
succès45, entraîne la mobilisation d’une seconde tranche.
De tels programmes peuvent faire l’objet d’accords sur 10
ou 20 ans.
3.4.2 Intérêt de structurer les FER comme de
véritables intermédiaires financiers
Une revue des structures existantes nous amène à conclu-
re qu’aujourd’hui, les FER en Afrique subsaharienne ne
sont pas structurés comme intermédiaires financiers. Ils ne
peuvent donc pas (i) emprunter, (ii) se refinancer à travers
l’émission d’obligations, (iii) prêter aux opérateurs locaux,
ni (iv) mobiliser les banques nationales avec des instru-
ments de mitigation des risques.
Pour ce qui concerne les banques locales, en réalité elles
ne souhaitent pas s’engager sur ce secteur méconnu et à
faible rentabilité, sauf dans le cas de banques de dévelop-
pement à mandat particulier. Ainsi, les fonds sont générale-
ment un compte pour transférer des subventions, et les
agences internationales octroient des prêts sectoriels aux
gouvernements qui en rétrocèdent une partie comme don
au FER. Il n’y a aucun effet de levier sur don dans les sous-
secteurs de l’électrification rurale ou périurbaine.
Naturellement, les montants de dons mobilisables au
niveau de la coopération internationale ne représentent pas
des sommes à la hauteur des enjeux.
Il est crucial de changer de paradigme pour faire levier sur
les montants de dons, qui resteront modestes au regard
des enjeux. Il est donc essentiel de suivre les recomman-
dations suivantes :
• établir la structure légale du fonds en tant qu’institution
financière à part entière, ou encore coupler ce fonds avec
une structure de financement dédiée, agrée comme telle
par la réglementation bancaire nationale ;
• doter cette structure des capacités techniques et
financières en matière d’évaluation de projet et de prépara-
tion de pipeline de projets ;
• formuler le plan d’affaires du fonds, fondé sur un plan à
long terme qui propose un mix de projets avec différents
niveaux de rentabilité pour permettre un certain niveau de
subventions croisées, et qui s’engage à soutenir les
premiers porteurs de projets pour créer un effet de démons-
tration ;
• faire une dotation de démarrage, dans la perspective d’un
fonds revolving pour des études préparatoires en particulier ;
• impliquer les banques en évaluant leur appétence et leur
perception du risque pour ensuite mettre en place des
mécanismes de partage de risque adéquat (cofinancement,
contre-garanties, etc.) ;
• avoir une vision de pérennisation à long terme du méca-
nisme de financement, avec l’augmentation progressive de
la contribution nationale (émission d’obligation, taxe au
kWh, etc.).
Pour illustrer ces recommandations, trois schémas sont ici
proposés :
- Schéma 1 = situation actuelle : le FER reçoit de la part de
l’Etat des dons qui peuvent provenir du budget de l’Etat ou
d’opérations de la coopération internationale (rétrocession
de prêts/dons à l’Etat – généralement sous forme de dons).
Il est rare que l’institution de coopération effectue une
transaction directe avec le fonds (dont les statuts ne le per-
mettent pas forcément). Le FER peut être doté de capaci-
tés techniques, évalue des projets d’électrification rurale et
les subventionne suivant des règles qui lui sont propres. On
espère que les opérateurs ayant bénéficié de subventions
puissent ensuite arriver à équilibrer leur opération. Bien
souvent, ce n’est cependant pas le cas : au Burkina Faso,
malgré une subvention de 80 % à l’investissement, des
subventions au fonctionnement ont dû être mises en place.
Dans cette situation, le rôle du fonds se limite, au plan
financier, à verser des subventions.
- Schéma 2 = évolutions à court terme : le fonds devient le
bras financier d’une AER et développe une planification de
l’électrification rurale, où apparaissent des opérations qui
peuvent présenter une certaine rentabilité : centres secon-
daires, agroindustries, etc. On fait émerger un portefeuille
© AFD Document de travail n° 122 • Accès à l’électricité en Afrique subsaharienne • avril 2012
87
45 Cette réalisation est évaluée par certains indicateurs établis au préalable, comme la miseen place d’une loi de PPA ou le nombre de localités connectées.

d’opérations qui nécessitent des niveaux de subventions
plus ou moins importants. Le fonds se dote de statuts lui
donnant une autonomie financière et la capacité d’intermé-
diation financière au titre de la législation nationale. Ainsi,
dès lors qu’il se trouve doté de fonds nationaux réguliers
(une taxe affectée, par exemple), qu’il peut prêter à des
opérateurs, même avec un fort taux de concession (et donc
produire des recettes), on en vient à avoir comme interlocu-
teur une structure avec un bilan, à laquelle les institutions
peuvent donc prêter, avec laquelle des fonds (nationaux ou
internationaux de placement) peuvent dialoguer et des
banques nationales de développement peuvent interagir,
notamment en partage des risques. Ainsi, banques nationales
et investisseurs développent un certain niveau de confiance.
- A moyen terme, le fonds en vient à confirmer son autono-
mie de gestion, sa crédibilité et son fonctionnement en tant
que structure de financement spécialisée. Des opérations
pilote ayant été démontrées, les banques nationales vien-
nent également participer au tour de table et financer des
opérateurs. Pour mobiliser ces crédits, voire des investisse-
ments nationaux, le fonds peut aussi être amené à dévelop-
per des instruments de garantie ou de partage du risque
afin de maximiser la participation de ces sources de finan-
cement privé. A terme, le fonds doit envisager lui-même de
lever des financements sur les marchés obligataires natio-
naux ou internationaux, et progressivement se libérer des
besoins de financement de la coopération internationale.
© AFD Document de travail n° 122 • Accès à l’électricité en Afrique subsaharienne • avril 2012
88
Schéma 7. Etapes de structuration d’un fonds d’électrification rurale

Si cette vision peut paraître utopique, c’est la seule qui
permette réellement de mobiliser des financements à la
hauteur des enjeux de l’électrification rurale dans les pays.
A titre d’exemple et de comparaison, l’Inde s’est clairement
engagée dans cette voie il y a 50 ans, avec la création
d’une entreprise (financière) spécialisée, la Rural
Electrification Corporation (cf. encadré 17), qui s’est
d’abord consacrée à financer les extensions de réseaux et
devenir le véritable centre de formation et de recherche sur
les techniques adaptées au contexte indien. Etant arrivée à
la fin du programme d’électrification, elle alloue des fonds
aux programmes plus décentralisés. Suivant la même
logique, un département des Energies renouvelables a vu
le jour en 1982, pour devenir ministère en I992, cette struc-
ture politique et de planification se dotant, dès 1987, d’une
institution financière spécialisée dans le financement des
énergies renouvelables : l’Indian Renewable Energy
Development Agency (IREDA)46. Grâce à ces deux
structures, plus de 95 % des localités sont aujourd’hui
couvertes (60 % d’électrification des ménages), et l’Inde
figure parmi les leaders mondiaux de l’éolien.
En 2010, le pays a lancé un très ambitieux programme
solaire visant :
- 1 100 MW de grandes centrales et PV dans le bâti d’ici
2013, puis 20 000 MW en 2022 ;
- 200 MW de PV hors réseau y compris hybrides pour 2013
et 2 000 MW pour 2022.
C’est grâce aux outils de financement disponibles, et à leur
ancienneté, que des investisseurs privés, tant indiens qu’in-
ternationaux, ainsi que la Banque asiatique de développe-
ment (avec tous ses instruments : assistance technique,
prêts concessionnels et commerciaux) se positionnent sur
le programme.
Cet exemple illustre l’importance cruciale d’affecter de
manière fine les dons et les prêts concessionnels et com-
merciaux aux bons segments afin de maximiser leur impact
et leur effet de levier.
© AFD Document de travail n° 122 • Accès à l’électricité en Afrique subsaharienne • avril 2012
89
Source : auteurs.
46 http://www.ireda.gov.in

Encadré 17. Le financement de l’électrification rurale en Inde : la Rural Electrification
Corporation – REC
La REC a été constituée en 1969 en tant que société de financement. C’est aujourd’hui une entreprise publique d’Etat, cotée en bourse,
d’une valeur nette de 750 M EUR. Sa raison sociale est le financement et la promotion de projets d’électrification rurale sur le territoire natio-
nal. Elle apporte des concours financiers aux compagnies d’électricité des différents Etats de l’Union indienne, aux coopératives d’électrifi-
cation rurale, sociétés privées et publiques. La REC dispose de bureaux dans la capitale centrale (New Delhi) et dans les capitales provin-
ciales qui ont pour mandat de coordonner les bouclages financiers avec les collectivités territoriales et autres financeurs locaux, appuyer la
formulation de projets et programmes, suivre le décaissement et la mise en œuvre de projets. Elle est également dotée d’un centre impor-
tant de recherche et de formation.
La mission de la REC est formulée comme suit (2009) :
« Faciliter la mise à disposition d’un service électrique pour le développement et l’amélioration des conditions de vie des populations ruraleset semi-urbaines.
Agir comme un organisme de développement efficace et compétitif, à l’écoute de ses clients pour le financement et la promotion de projetsde production d’électricité, économies d’électricité et de renforcement des réseaux de distribution à travers le territoire national. »
Historiquement, la REC, en application de la politique nationale, s’est consacrée à l’électrification villageoise et à la mise en place de pompes
pour l’irrigation, considérées alors comme priorités. Une localité était définie comme étant électrifiée dès lors qu’un usage de l’électricité y
était constaté, quelle que soit sa localisation sur le territoire. Ainsi, en 2005, 81 % des localités du pays étaient électrifiées, et plus de 110
000 villages devaient encore l’être ; 12 millions de pompes électrifiées permettaient d’irriguer 34 millions d’hectares.
Ce n’est qu’en un second temps, et après trois décennies, que l’on s’est véritablement intéressé à la question de l’accès des populations à
un service. En 2004, deux critères supplémentaires apparurent pour qu’une localité puisse être définie comme électrifiée : les services
publics (santé, centres communautaires, écoles, etc.) devaient l’être, ainsi qu’au moins 10 % de la population.
En effet, au début du XXe siècle et avec une consommation par habitant qui est passée de 15kWh/ habitant en 1950 à 600 kWh par
habitant en 2005, l’accès au service électrique moderne est nécessaire pour atteindre des taux de croissance économiques de 8 à 10 % par
an, et pour toute la population. Ainsi, l’accès des 50 % de foyers ruraux, soit quelque 60 millions de foyers, est devenu un objectif.
La REC octroie essentiellement des prêts à long terme (15 à 35 ans) aux compagnies d’électricité publiques et privées pour la production
(renouvelable ou non), le transport et la distribution. Les taux d’intérêts en 2009 étaient de 10 à 12 %, révisables annuellement ou tous les
3 ans, mais il faut tenir compte d’une inflation qui est passée de 4 % à près de 13 %.
Pour donner accès à l’ensemble de la population et aux villages encore non desservis, un programme spécifique a été formulé en 2005 : le
Rajiv Gandhi Grameen Vidyutikaran Yojana (RGGVY) ; en voici les principales composantes :
- renforcement des réseaux de distribution MT, création des infrastructures MT, distribution, production décentralisée et réseaux locaux : ces
investissements, qui doivent être présentés sous forme de projets, peuvent bénéficier de subventions à l’investissement à hauteur de 90 % ;
- financement d’infrastructures productives et sociales : pompes d’irrigation, PME, artisanat local, chaînes de froid, santé, éducation et com-
munication ; présentés sous forme de projets, ils peuvent également bénéficier des mêmes taux de subvention ;
- subvention de 100 % accordée pour le branchement de base l(éclairage, audiovisuel) aux foyers vivant sous le seuil de pauvreté (i.e. avec
moins de 2 USD par jour) ;
- développement de franchises de distribution, où une structure locale (privée, associative ou coopérative) assume la responsabilité du servi-
ce de distribution sur un territoire irrigué par un transformateur ; ces franchises bénéficient également des mêmes soutiens à l’investissement.
© AFD Document de travail n° 122 • Accès à l’électricité en Afrique subsaharienne • avril 2012
90

Les besoins de financements sont estimés comme suit, la part de subvention provenant des taxes sur l’ER et d’allocations gouvernemen-
tales (sur une période théorique de 5 ans) :
- électrification des villages isolés et renforcement des réseaux : 1 160 M EUR
- électrification des foyers sous le seuil de pauvreté : 500 M EUR
- renforcement des réseaux en zones déjà électrifiées : 670 M EUR
TOTAL 2 330 M EUR
dont 90 % de subvention (solde financé sur FP ou par REC) 2 100 M EUR
supplément de 1 % pour appuis de formation ou recherche 230 M EUR
Si ces sommes peuvent impressionner au premier abord, il importe de les relativiser par rapport aux performances, à l’expérience et au bilan
de la REC.
En 2008, la REC a été classée parmi les compagnies étatiques les plus performantes de l’Inde, et ses performances qualifiées comme «
excellentes » par l’auditeur public depuis 1993. Elle envisage maintenant d’exporter ses services et son savoir-faire.
Quelques chiffres clés pour 2007-2008 (taux de conversion : 70 INR/EUR) :
capitaux propres 122 M EUR
emprunts au gouvernement 11 M EUR
emprunts à Life Insurance Company 500 M EUR
emprunts par émissions d’obligations 3 200 M EUR
emprunts auprès d’autres banques (dont coopération) 600 M EUR
nombre de projets évalués et approuvés dans l’année : environ 750
total des prêts en cours 5 500 M EUR
intérêts collectés sur l’année 505 M EUR
bénéfices avant impôts 187 M EUR
bénéfices après impôts 123 M EUR
distribution de dividendes 37 M EUR
© AFD Document de travail n° 122 • Accès à l’électricité en Afrique subsaharienne • avril 2012
91
3.4.3 Combiner de manière innovante prêts et
dons pour mieux partager les risques des
projets et maximiser l’effet de levier à partir
des rares ressources disponibles en subvention
Compte tenu des caractéristiques économiques des projets
d’accès, la bonification des financements est une nécessi-
té, avec la composante subvention visant plus particulière-
ment :
• le renforcement de capacités : cadres institutionnel et
réglementaire ; capacités sur les nouvelles technologies ;
capacités de gestion d’opérations locales ; formations des
banques ;
• les études amont et la planification stratégique; l’inventaire
des ressources ; les études de faisabilité (quitte à en réin-
tégrer le coût dans le financement du projet si celui-ci en
vient à se réaliser) ;
• le soutien à la mise en œuvre : montage financier, études
d’ingénierie et d’exécution, maîtrise d’œuvre, renforcement
de capacités des opérateurs ;
• le soutien à l’investissement : partage des risques, adap-
tation des termes des concours financiers aux profils
économique et financier des projets (durée, taux, période
de grâce), subventions à l’investissement.
Les incertitudes et risques liés aux projets d’accès, d’élec-
trification rurale, et faisant appel à des énergies renouve-
lables sont d’ordre multiples.

- Pour le risque projet, les risques liés au projet lui-même
sont d'ordre techniques : le premier concerne la disponibili-
té de la ressource et ses aléas (hydrologie, météo, vent,
ensoleillement, disponibilité de la biomasse). Des études
(souvent longues et coûteuses) sont donc nécessaires pour
prendre en compte ces aspects et permettre une mise en
œuvre de projets d'énergie renouvelables. Le second
risque technique est lié à la construction, en particulier le
génie civil pour l'hydroélectricité notamment. Ce risque de
construction fait porter un risque réel de dépassement des
coûts initialement prévus.
- Pour le risque lié au contexte du projet, la demande anti-
cipée et la vitesse de son développement doivent être ana-
lysées avec prudence. En effet, les cadres réglementaires
de tarifs de rachat ou d'accès des tiers au réseau n'offrent
souvent de la visibilité que sur quelques années, alors que
le temps de retour du projet est supérieur à cinq ans et qu'il
faut attendre 8 ou 10 ans pour une rentabilité intéressante.
Enfin, un dernier risque du projet est lié à la faible expé-
rience, au niveau technique comme au niveau de la gestion
de projets, des opérateurs locaux qui se lancent dans ce
type de nouvelles opérations…
- ce qui nous amène au risque de contrepartie : compte
tenu des éléments listés ci-avant, les banques commer-
ciales ou de développement classiques sont réticentes face
à ces nouveaux projets, et ne disposent pas des compé-
tences requises, voire des instruments de prêt à long
terme, pour évaluer les projets et les financer. Elles en vien-
nent donc à se focaliser sur la qualité des contreparties et
à demander de forts niveaux de garantie à partir d’une ana-
lyse classique du bilan des entreprises à qui il faut prêter.
Il incombe donc aux structures du financement de l’accès
ou aux FER de chercher à mobiliser des prêts et d’affecter
les dons afin d'améliorer le niveau de rentabilité du projet,
et ainsi augmenter son attractivité pour le bailleur.
Pour ce faire, il est nécessaire d’établir, en premier lieu, et
en coordination avec le planificateur, une liste de projets
prioritaires (tant pour des raisons économiques que
sociales ou d’aménagement du territoire) et analyser leur
rentabilité ainsi que leur « portage », de manière à décider
de manière réaliste, étant données les ressources dispo-
nibles, quel portefeuille il est possible de développer et de
soutenir. Il faudra certainement, initialement au moins,
subventionner/pré financer les études dont le coût peut être
réintégré dans le financement du projet. On pourra égale-
ment utilement mener des analyses stratégiques d’opportu-
nité sur de nouvelles technologies (telles que le PV diesel
hybride ou le biodiesel en tant que carburant pour l’électri-
fication rurale) pour afficher des priorités aux investisseurs,
et donc subventionner au niveau nécessaire des projets
innovants à caractère démonstratifs ou d’apprentissage, en
escomptant une baisse des coûts dans la durée. Des sub-
ventions seront nécessaires pour les projets sociaux, en ayant
conscience du caractère à « fonds perdus » de ces opérations.
La formation des banquiers, opérateurs, prestataires
nationaux, etc. doit également accompagner la mise en
place d’instruments de garanties partielles, qui les encoura-
geraient à s’engager sur le long terme et à prendre des
risques de projet ou de contrepartie (qu’ils refuseraient
sinon). Dans des contextes d’investissements privés, où
c’est l’apport en capital (equity) qui fait défaut, on pourra
envisager d’investir au capital de certaines opérations.
Au regard des enjeux du développement de l'accès et des
perspectives de financements qui pourraient lui être
alloués, il convient donc de repenser la structuration des
projets d'électrification rurale et périurbains pour parvenir à
une utilisation de la subvention la plus efficace possible
(cette dernière étant nécessaire pour ce type de projets qui,
même bien structurés, ne peuvent atteindre les niveaux de
rentabilité possibles en milieux urbain et industriel).
Actuellement rares, les subventions doivent être utilisées
de manière raisonnée et ciblée sur le financement des
actions non rentables du projet afin de permettre la conci-
liation de la péréquation et de l'équilibre financier.
© AFD Document de travail n° 122 • Accès à l’électricité en Afrique subsaharienne • avril 2012
92

Bibliographie
AFD (2004), Compte-rendu du Conseil de surveillance - Renforcement de la distribution électrique à Nairobi et Mombasa,
Paris.
AFD (2005), Compte-rendu du Conseil de surveillance - Extension du réseau électrique dans six provinces rurales du Kenya,
Paris.
AFD (2008a), Aide-mémoire, Identification du projet d’électrification rurale Mauritanie CMR3009, Paris.
AFD (2008b), Aide-mémoire, Projet de fourniture de services énergétiques, Mission d’appui pour l’élaboration des procédures
de gestion du fonds d’électrification rurale, Paris.
AFD (2008c), Compte rendu de mission, Identification du projet d’électrification rurale, Mauritanie CMR3009, Paris.
AIE (2009), World Energy Outlook 2009, Paris.
BANQUE MONDIALE (2008a) World Development Report, Washington DC.
BANQUE MONDIALE (2008b), Designing Sustainable Off-Grid Rural Electrification Projects: Principles and Practices,
Operational Guidance for World Bank Group Staff, Washington DC.
BANQUE MONDIALE (2006), An investment Framework for Clean Energy and Development: A progress Report, Washington, DC.
BOLAY, C et A. RABINOVICH (2004), Intermediate Cities in Latin America, Risk and Opportunities of Coherent Urban
Development, Elsevier, Londres.
BPOBA (2007), OBA in Senegal, Designing Technology-Neutral Concessions for Rural Electrification, Banque mondiale,
Washington DC.
BURGEAP (2006), The Elaboration of a National Rural Electrification Framework in Ghana, Inception Report, Concept Note
and Workshop, Boulogne-Billancourt.
CBS - INTERNATIONAL LIVESTOCK RESEARCH INSTITUTE (2004), The Geographic Dimensions of Well-Being in Kenya:
Where are the Poor?
CEDEAO et UEMOA (2006), Livre blanc pour une politique régionale sur l’accès aux services énergétiques des populations
rurales et périurbaines pour l’atteinte des objectifs du Millénaire pour le développement.
CRE (2005), « La péréquation des tarifs d’utilisation des réseaux nécessite un outil adapté : le fonds de péréquation de l’élec-
tricité » fiche n° 4, Paris.
EASE et IMPROVES (2007), Opérateurs électriques en milieu rural au Mali et au Burkina Faso.
EDF, Study of Non-Electrified Households in Electrified Areas in Kenya, Rapport interne.
GRET (2005), « Comment se sont-ils électrifiés ? Deux études de cas de politique nationale d'électrification : France, Etats-
Unis », Etudes et travaux en ligne n°3, Paris.
IED (2004), Rapport de synthèse sur les prix obtenus dans le cadre de l’appel d’offres pour l’électrification de six localités en
Mauritanie – étude comparative.
IEG (2008), The Welfare Impact of Rural Electrification: a Reassessment of the Costs and Benefits, Banque mondiale,
Washington DC.
MASSE, R. (2008), Evaluation des SSD au Mali, Maroc et Afrique du Sud – Rapport de synthèse, GRET, Paris.
MASSE, R. (2005), Histoire de l’électrification rurale en France, GRET, Paris.
MASSE, R. (2004), Financer le développement de l’électrification rurale, GRET, Paris.
© AFD Document de travail n° 122 • Accès à l’électricité en Afrique subsaharienne • avril 2012
93

MINISTERE DES MINES, DE L’ENERGIE ET DE L’HYDRAULIQUE, (2005), Programme d’action pour l’électrification des localités
rurales du Bénin, ABERME, Paris.
ONU (2008), Renforcer l’épargne intérieure en Afrique, Afrique Renouveau, Vol. 22#3, New York.
PNUD (2008), Rapport mondial sur le développement humain 2007-2008, PNUD, New York.
PRAXIS (2008), Harmonisation de la méthodologie d’élaboration des plans locaux d’électrification rurale des concessions,
Rapport final.
UN-HABITAT (2008), The State of African Cities, A Framework for Addressing Urban Challenges in Africa, UN-HABITAT, Nairobi.
Rapports internes / Documents de programmes
ADEDJOUMON, C. (2008), Capitalisation de projets d’électrification rurale financés par l’AFD en Afrique de 1994 à 2008,
Rapport interne.
AFD (2005), Evaluation rétrospective d’un projet d’électrification rurale dans le Ganzourgou (Burkina Faso), Rapport interne
EDF, Study to Identify Scope of Works for a Rural Electrification Project in Kenya, Rapport interne.
EDF, AXENNE et ABERDARE, Review of Customer Connection Policy, « Renforcement de la distribution électrique à Nairobi et
Mombasa »; Rapport interne.
HEURAUX, C. (2009), Présentation de l’enquête SSD, EDF,, Rapport interne.
KOTY, C. (2007), Situation du secteur de l’énergie et perspectives, ministère des Mines, de l'Energie et de l'Eau du Bénin,
Rapport interne.
MINISTÈRE DE L’ENERGIE, KENYA (2005), Road Map for Reform of the Rural Electrification Programme, Rapport interne.
MMEE, GTZ, AFD et CE (2008), Document de programme, Programme d’électrification rurale par raccordement au réseau.
MOSTERT, W. (2008), Review of Experiences with Rural Electrification Agencies - Lessons for Africa, Draft Report prepared for
the European Union Energy Initiative-Partnership Dialogue Facility (EUEI-PDF), EUEI-PDF, Rapport interne.
NIANG, A., « La stratégie de développement de l’électrification rurale », présentation ASER, Dakar, Rapport interne.
Etudes de projets
CEMAC, CEDEAO, IED (2006) : études menées dans les zones de la CEMAC (Cameroun, RCA, Congo, Gabon, Guinée
équatoriale, Tchad) et de la CEDEAO (Bénin, Burkina Faso, Cap Vert, Côte d’Ivoire, Gambie, Ghana, Guinée, Guinée Bissau),
IED.
Etude réalisée en 2001 aux Philippines dans le cadre d’un partenariat entre la Banque mondiale et la Fondation de l’Institut
de politique de développement et de management de la recherche aux Philippines.
Etude réalisée au Vietnam en 2005, à l’initiative de la Banque mondiale et de l’Agence suédoise de développement interna-
tional venant en accompagnement d’un projet d’électrification de 150 M USD.
ONE, en partenariat avec l’AFD (2003) : étude d’impact des effets de l’électrification selon ses différentes formes, sur les
ménages et les usagers non domestiques. La Banque mondiale a publié une étude d’impact à partir de données de différents
continents, les localités rurales et sur l’environnement naturel.
© AFD Document de travail n° 122 • Accès à l’électricité en Afrique subsaharienne • avril 2012
94

Banque mondiale (2008), PNUD (2007), CEDEAO et UEMOA (2006), Review of national framework for involvement of agro-
industries in rural electrification, projet PACEAA (poverty alleviation through cleaner energy for agro-industry in Africa), 2009 ,
Mostert (2008), African Energy Policy Research Network (AFREPEN), 2004,, données récoltées dans le cadre du Club des
agences d’électrification rurale, enquête congolaise des ménages (2005 ) ministère de l’Energie érythréen, Réseau interna-
tional d’accès aux énergies durables (RIAED), 2005
© AFD Document de travail n° 122 • Accès à l’électricité en Afrique subsaharienne • avril 2012
95


Liste des sigles et abréviations
ADEME Agence de l’environnement et de la maîtrise de l’énergie
ADER Association des énergies renouvelables
AER Agence d’électrification rurale
AFD Agence Française de Développement
AFREPEN African Energy Policy Research Network
AIE Agence internationale de l’énergie
AMADER Agence malienne pour le développement de l'énergie domestique et l'électrification rurale
ANARE Autorité nationale de régulation du secteur de l'électricité
APAUS Agence pour l’accès universel aux services
APL Adaptable Programme Loan
ARSEL Agence de régulation du secteur électrique
ATR Accès des tiers au réseau
BAD Banque africaine de développement
BIRD Banque internationale pour la reconstruction et le développement
BOT Build Operate Transfer
BT Basse tension
CEDEAO Communauté économique des Etats de l'Afrique de l'Ouest
CEMAC Communauté économique et monétaire d'Afrique centrale
CIE Compagnie ivoirienne d’électricité
CMLT Coût marginal à long terme
CREE Commission de régulation de l’électricité et de l’eau
CSPE Contribution au service public de l’électricité
DGE Direction générale de l’Energie
ECG Electricity Company of Ghana
EDF Electricité de France
EdM Electricité du Mali
ERD Electrification rurale décentralisée
ESF Electriciens sans frontières
ESMAP Energy Sector Management Assistance Program
FACE Fonds d’amortissement des charges d’électrification
FEM Fonds pour l’environnement mondial
FER Fonds d’électrification rurale
FFEM Fonds français pour l’environnement mondial
FP Fonds propres
GEF Global Environment Facility
GRET Groupe de recherche et d'échanges technologiques
GTZ Deutsche Gesellschaft für Technische Zusammenarbeit
IDA International Development Association
IDH Indicateurs du développement humain
IED Innovation énergie développement (consortium)
IEG Groupe indépendant d'évaluation
© AFD Document de travail n° 122 • Accès à l’électricité en Afrique subsaharienne • avril 2012
97

IGCC Integrated Gasification in Combined Cycle
IPP Independant Power Producer
IREDA Indian Renewable Energy Development Agency
KES Société de services décentralisés
KPLC Kenya Power Lighting Corporation
LBC Lampe basse consommation
LED Light-Emitting Diode
MRBC Meter Reading, Billing and Collection
MT Moyenne tension
OBA Output-Based Aid
OCDE Organisation de coopération et de développement économiques
OMD Objectifs du Millénaire pour le développement
ONE Office national de l’électricité
ONG Organisation non gouvernementale
ONUDI Organisation des Nations unies pour le développement industriel
PACEAA Alleviation through Cleaner Energy for Agro-Industry in Africa
PCASER Projet de candidature spontanée d’électrification rurale
PCH Petites centrales hydroélectriques
PERG Programme d’électrification rural global
PME Petites et moyennes entreprises
PNUD Programme des Nations unies pour le développement
PNUE Programme des Nations unies pour l'environnement
PNVEP Programme national de valorisation énergétique de la plante pourghère
PPA Power Purchase Agreement
PPP Partenariat public-privé
PSP Participation du secteur privé
PV Photovoltaïque
PVPS Photovoltaic Power Systems Programme
RCA République centrafricaine
RCI République de Côte d’Ivoire
RDC République démocratique du Congo
REC Rural Electrification Corporation
RGGVY Rajiv Gandhi Grameen Vidyutikaran Yojana
RIAED Réseau international d’accès aux énergies durables
RIS Réseau interconnecté Sud
SENELEC Société nationale d'électricité du Sénégal.
SHEP Self-Help Electrification Programme (Ghana)
SIL Special Impact Loan
SSD Société de services décentralisés
SWER Single Wire Earth Return
SWOT Strengths, Weaknesses, Opportunities, Threats
TRI Taux de retour sur investissement
UEMOA Union économique et monétaire ouest-africaine
WEO World Energy Outlook
ZNI Zones non interconnectées
© AFD Document de travail n° 122 • Accès à l’électricité en Afrique subsaharienne • avril 2012
98

© AFD Document de travail n° 122 • Accès à l’électricité en Afrique subsaharienne • avril 2012
99
Série Documents de travail / Working Papers SeriesPubliés depuis janvier 2009 / published since January 2009
Les numéros antérieurs sont consultables sur le site : http://recherche.afd.fr
Previous publications can be consulted online at: http://recherche.afd.fr
N° 78 « L’itinéraire professionnel du jeune Africain » Les résultats d’une enquête auprès de jeunes leaders Africains sur
les « dispositifs de formation professionnelle post-primaire »
Richard Walther, consultant ITG, Marie Tamoifo, porte-parole de la jeunesse africaine et de la diaspora
Contact : Nicolas Lejosne, département de la Recherche, AFD - janvier 2009.
N° 79 Le ciblage des politiques de lutte contre la pauvreté : quel bilan des expériences dans les pays en développement ?
Emmanuelle Lavallée, Anne Olivier, Laure Pasquier-Doumer, Anne-Sophie Robilliard, DIAL - février 2009.
N° 80 Les nouveaux dispositifs de formation professionnelle post-primaire. Les résultats d’une enquête terrain au Cameroun,
Mali et Maroc
Richard Walther, Consultant ITG
Contact : Nicolas Lejosne, département de la Recherche, AFD - mars 2009.
N° 81 Economic Integration and Investment Incentives in Regulated Industries
Emmanuelle Auriol, Toulouse School of Economics, Sara Biancini, Université de Cergy-Pontoise, THEMA,
Comments by : Yannick Perez and Vincent Rious - April 2009.
N° 82 Capital naturel et développement durable en Nouvelle-Calédonie - Etude 1. Mesures de la « richesse totale »
et soutenabilité du développement de la Nouvelle-Calédonie
Clément Brelaud, Cécile Couharde, Vincent Géronimi, Elodie Maître d’Hôtel, Katia Radja, Patrick Schembri,
Armand Taranco, Université de Versailles - Saint-Quentin-en-Yvelines, GEMDEV
Contact : Valérie Reboud, département de la Recherche, AFD - juin 2009.
N° 83 The Global Discourse on “Participation” and its Emergence in Biodiversity Protection
Olivier Charnoz. - July 2009.
N° 84 Community Participation in Biodiversity Protection: an Enhanced Analytical Framework for Practitioners
Olivier Charnoz - August 2009.
N° 85 Les Petits opérateurs privés de la distribution d’eau à Maputo : d’un problème à une solution ?
Aymeric Blanc, Jérémie Cavé, LATTS, Emmanuel Chaponnière, Hydroconseil
Contact : Aymeric Blanc, département de la recherche, AFD - août 2009.
N° 86 Les transports face aux défis de l’énergie et du climat
Benjamin Dessus, Global Chance.
Contact : Nils Devernois, département de la Recherche, AFD - septembre 2009.
N° 87 Fiscalité locale : une grille de lecture économique
Guy Gilbert, professeur des universités à l’Ecole normale supérieure (ENS) de Cachan
Contact : Réjane Hugounenq, département de la Recherche, AFD - septembre 2009.
N° 88 Les coûts de formation et d’insertion professionnelles - Conclusions d’une enquête terrain en Côte d’Ivoire
Richard Walther, expert AFD avec la collaboration de Boubakar Savadogo (Akilia) et de Borel Foko (Pôle de Dakar)
Contact : Nicolas Lejosne, département de la Recherche, AFD - octobre 2009.
N° 89 Présentation de la base de données. Institutional Profiles Database 2009 (IPD 2009)
Institutional Profiles Database III - Presentation of the Institutional Profiles Database 2009 (IPD 2009)
Denis de Crombrugghe, Kristine Farla, Nicolas Meisel, Chris de Neubourg, Jacques Ould Aoudia, Adam Szirmai
Contact : Nicolas Meisel, département de la Recherche, AFD - décembre 2009.

N° 90 Migration, santé et soins médicaux à Mayotte
Sophie Florence, Jacques Lebas, Pierre Chauvin, Equipe de recherche sur les déterminants sociaux de la santé et
du recours aux soins UMRS 707 (Inserm - UPMC)
Contact : Christophe Paquet, département Technique opérationnel (DTO), AFD - janvier 2010.
N° 91 Capital naturel et developpement durable en Nouvelle-Calédonie - Etude 2. Soutenabilité de la croissance néo-
calédonienne : un enjeu de politiques publiques
Cécile Couharde, Vincent Géronimi, Elodie Maître d’Hôtel, Katia Radja, Patrick Schembri, Armand Taranco
université de Versailles – Saint-Quentin-en-Yvelines, GEMDEV
Contact : Valérie Reboud, département Technique opérationnel, AFD - janvier 2010.
N° 92 Community Participation Beyond Idealisation and Demonisation: Biodiversity Protection in Soufrière, St. Lucia
Olivier Charnoz, Research Department, AFD - January 2010.
N° 93 Community participation in the Pantanal, Brazil: containment games and learning processes
Participation communautaire dans le Pantanal au Brésil : stratégies d’endiguement et processus d’apprentissage
Olivier Charnoz, département de la Recherche, AFD - février 2010.
N° 94 Développer le premier cycle secondaire : enjeu rural et défis pour l'Afrique subsaharienne
Alain Mingat et Francis Ndem, IREDU, CNRS et université de Bourgogne
Contact : Jean-Claude Balmès, département Education et formation professionnelle, AFD - avril 2010
N° 95 Prévenir les crises alimentaires au Sahel : des indicateurs basés sur les prix de marché
Catherine Araujo Bonjean, Stéphanie Brunelin, Catherine Simonet, CERDI - mai 2010.
N° 96 La Thaïlande : premier exportateur de caoutchouc naturel grâce à ses agriculteurs familiaux
Jocelyne Delarue, Département de la Recherche, AFD - mai 2010.
N° 97 Les réformes curriculaires par l’approche par compétences en Afrique
Francoise Cros, Jean-Marie de Ketele, Martial Dembélé, Michel Develay, Roger-François Gauthier, Najoua Ghriss,
Yves Lenoir, Augustin Murayi, Bruno Suchaut, Valérie Tehio - juin 2010.
N° 98 Les coûts de formation et d’insertion professionnelles - Les conclusions d’une enquête terrain au Burkina Faso
Richard Walther, Boubakar Savadogo, consultants en partenariat avec le Pôle de Dakar/UNESCO-BREDA.
Contact : Nicolas Lejosne, département de la Recherche, AFD - juin 2010.
N° 99 Private Sector Participation in the Indian Power Sector and Climate Change
Shashanka Bhide, Payal Malik, S.K.N. Nair, Consultants, NCAER
Contact : Aymeric Blanc, Research Department, AFD - June 2010.
N° 100 Normes sanitaires et phytosanitaires : accès des pays de l’Afrique de l’Ouest au marché européen - Une étude empirique
Abdelhakim Hammoudi, Fathi Fakhfakh, Cristina Grazia, Marie-Pierre Merlateau.
Contact : Marie-Cécile Thirion, département de la Recherche, AFD - juillet 2010.
N° 101 Hétérogénéité internationale des standards de sécurité sanitaire des aliments : Quelles stratégies pour les filières
d’exportation des PED ? - Une analyse normative
Abdelhakim Hammoudi, Cristina Grazia, Eric Giraud-Héraud, Oualid Hamza.
Contact : Marie-Cécile Thirion, département de la Recherche, AFD - juillet 2010.
N° 102 Développement touristique de l’outre-mer et dépendance au carbone
Jean-Paul Ceron, Ghislain Dubois et Louise de Torcy.
Contact : Valérie Reboud, AFD - octobre 2010.
N° 103 Les approches de la pauvreté en Polynésie française : résultats et apports de l’enquête sur les conditions de vie en 2009
Javier Herrera, IRD-DIAL, Sébastien Merceron, Insee - novembre 2010.
Contact : Cécile Valadier, département de la Recherche
N° 104 La gestion des déchets à Coimbatore (Inde) : frictions entre politique publique et initiatives privées
Jérémie Cavé, Laboratoire Techniques, Territoires et Sociétés (LATTS), CNRS - décembre 2010.
© AFD Document de travail n° 122 • Accès à l’électricité en Afrique subsaharienne • avril 2012
100

N° 105 Migrations et soins en Guyane - Rapport final à l’Agence Française de Développement dans le cadre du contrat
AFD-Inserm
Anne Jolivet, Emmanuelle Cadot, Estelle Carde, Sophie Florence, Sophie Lesieur, Jacques Lebas, Pierre Chauvin
Contact : Christophe Paquet, département Technique opérationnel (DTO), AFD - décembre 2010.
N° 106 Les enjeux d'un bon usage de l'électricité : Chine, Etats-Unis, Inde et Union européenne
Benjamin Dessus et Bernard Laponche avec la collaboration de Sophie Attali (Topten International Services),
Robert Angioletti (Ademe), Michel Raoust (Terao)
Contact : Nils Devernois, département de la Recherche, AFD - février 2011.
N° 107 Hospitalisation des patients des pays de l’Océan indien - Prises en charges spécialisées dans les hôpitaux de la Réunion
Catherine Dupilet, Dr Roland Cash, Dr Olivier Weil et Dr Georges Maguerez (cabinet AGEAL)
En partenariat avec le Centre Hospitalier Régional de la Réunion et le Fonds de coopération régionale de la Réunion
Contact : Philippe Renault, AFD - février 2011.
N° 108 Peasants against Private Property Rights: A Review of the Literature
Thomas Vendryes, Paris School of Economics - February 2011.
N° 109 Le mécanisme REDD+ de l’échelle mondiale à l’échelle locale - Enjeux et conditions de mise en oeuvre
ONF International
Tiphaine Leménager, département de la Recherche, AFD - mars 2011.
N° 110 L’aide au Commerce : état des lieux et analyse
Aid for trade: A survey
Mariana Vijil, Marilyne Huchet-Bourdon et Chantal Le Mouël
AGROCAMPUS OUEST, INRA, Rennes - avril 2011.
N° 111 Métiers porteurs : le rôle de l’entrepreneuriat, de la formation et de l'insertion professionnelle
Sandra Barlet et Christian Baron, GRET
Nicolas Lejosne, département de la Recherche, AFD ([email protected]) - avril 2011.
N° 112 Charbon de bois et sidérurgie en Amazonie brésilienne : quelles pistes d’améliorations environnementales ?
L’exemple du pôle de Carajas
Ouvrage collectif sous la direction de Marie-Gabrielle Piketty, Cirad, UMR Marchés,
Contact : Tiphaine Leménager, département de la Recherche, AFD ([email protected]) - avril 2011.
N° 113 Gestion des risques agricoles par les petits producteurs Focus sur l'assurance-récolte indicielle et le warrantage
Guillaume Horréard, Bastien Oggeri, Ilan Rozenkopf sous l’encadrement de :
Anne Chetaille, Aurore Duffau, Damien Lagandré
Contact : Bruno Vindel, département des Politiques alimentaires, AFD - mai 2011.
N° 114 Analyse de la cohérence des politiques commerciales en Afrique de l’Ouest
Jean-Pierre Rolland, Arlène Alpha, GRET
Contact : Jean-René Cuzon ([email protected]), département PSP, AFD - juin 2011
N° 115 L’accès à l’eau et à l’assainissement pour les populations en situation de crise :
comment passer de l’urgence à la reconstruction et au développement ?
Julie Patinet (Groupe URD) et Martina Rama (Académie de l’eau),
sous la direction de François Grünewald (Groupe URD)
Contact : Thierry Liscia ([email protected]), département du Pilotage stratégique et de la Prospective,
N° 116 Formation et emploi au Maroc : état des lieux et recommandations
Jean-Christophe Maurin ([email protected]) et Thomas Mélonio ([email protected]), AFD - septembre 2011.
N° 117 Student Loans : Liquidity Constraint and Higher Education in South Africa
Marc Gurgand, Adrien Lorenceau, Paris School of Economics
Contact : Thomas Mélonio ([email protected]), Research Department, AFD - September 2011.
© AFD Document de travail n° 122 • Accès à l’électricité en Afrique subsaharienne • avril 2012
101

N° 118 Quelle(s) classe(s) moyenne(s) en Afrique ? Une revue de littérature
Dominique Darbon, IEP Bordeaux, Comi Toulabor, LAM Bordeaux
Contacts : Virginie Diaz et Thomas Mélonio, département de la Recherche, AFD
N° 119 Les réformes de l’aide au développement en perspective de la nouvelle gestion publique
Jean-David Naudet, division Evaluation et Capitalisation, AFD
N° 120 Fostering low-carbon growth initiatives in Thailand
EDDEN Research Unit of CNRS (French National Research Center) at the University of Grenoble : Prof. Patrick
Criqui (CNRS, Scientific Director), Dr. Pierre-Olivier Peytral (EDDEN Lab, Economist) Dr. Jean-Christophe Simon
(IRD, Senior Economist)
Contact : Cécile Valadier, Research Department, AFD ([email protected])
N°121 Interventionnisme public et handicaps de compétitivité : analyse du cas polynésien
Florent Venayre, Maître de conférences en sciences économiques, université de la Polynésie française et
LAMETA, université de Montpellier
Contact : Cécile Valadier, département de la Recherche, AFD
© AFD Document de travail n° 122 • Accès à l’électricité en Afrique subsaharienne • avril 2012
102


Access to Electricity in Sub-Saharan Africa:Lessons Learned and Innovative Approaches
Anjali Shanker (IED) with the contribution from Patrick Clément (Axenne),Daniel Tapin et Martin Buchsenschutz (Nodalis Conseil)
Contact: Valérie Reboud, (AFD) Technical Operations Department,Environment and Equipment Division ([email protected])
Age
nce
Fran
çais
e de
Dév
elop
pem
ent
122
Age
nce
Fran
çais
e de
Dév
elop
pem
ent
Agence Française de DéveloppementDirection de la StratégieDépartement de la Recherche
5 rue Roland Barthes75012 Paris - Francewww.afd.fr
Research Department
WorkingPaper
Age
nce
Fran
çais
e de
Dév
elop
pem
ent
October 2013

Layout: Eric Thauvin
Publication Director: Anne PAUGAM
Editorial Director: Alain HENRY
ISSN: 1958-539X
Copyright registration: 3rd Quarter 2013
Disclaimer
The analyses and conclusions in this working paper are the authors’ own. They do not necessarily reflect the point of view of
Agence Française de Développement or its partner institutions.

Acknowledgements
© AFD Working Paper n° 122 • Access to Electricity in Sub-Saharan Africa • October 2013
3
This study was conducted for Agence Française de Développement (AFD) by the Innovation Energie Développement (IED)
consortium, Axenne and Nodalis Conseil.
This paper was written by Anjali Shanker, Managing Director (IED), with contributions from Patrick Clément (Axenne),
Daniel Tapin and Martin Buchsenschutz (Nodalis Conseil). The author wishes to thank all those who have contributed to this
work, and in particular Valérie Reboud, Christian de Gromard, Laurence Breton Moyet and Carl Bernadac (AFD), as well as
Denis Rambaud-Méasson (IED).
A Steering Committee met several times and the substance of this text has been defined thanks to its contributions during the
working sessions. We would therefore like to thank all the members for their invaluable contributions: The French Environment
and Energy Agency (ADEME), Electricité de France (EDF), Electricians without Borders (ESF), the École des Ponts ParisTech,
the Énergies pour le Monde foundation and Total Renewable Energies.


Contents
Executive summary 7Introduction 17
1 Access to electricity services in Sub-Saharan Africa: Challenges and methodological approach 211.1 Power systems insufficient to underpin sustainable economic and social development 211.2 Develop a systematic vision and overall operational planning: Access for what purpose and
with what resources? 271.3 Analysis and lessons learned from the impact of past programs 291.4 Access dynamics affected by sector reforms 341.5 Establish clear prerogatives for each stakeholder 37
2 A continuum of technical, economic and organizational solutions 452.1 Technical and economic framework 452.2 Complementary technical solutions for the interconnected grid 532.3 Distribution and customer management: Substantial leeway 67
3 A need for structured financing 773.1 Widespread access to electricity services: The need to mobilize more financing than
the current flows from international cooperation 773.2 Historical principles 793.3 Keys for setting tariff levels 813.4 Establishing the financing mechanisms required to guarantee access to an electricity service for all 85
List of acronyms and abbreviations 93
References 97
© AFD Working Paper n° 122 • Access to Electricity in Sub-Saharan Africa • October 2013
5


This study was conducted with the aim of developing new
approaches and a methodological capitalization on the
topic of access to electricity services for all in Sub-Saharan
Africa.
The first section of the study analyzes the challenges
involved. The low level of access rates in Sub-Saharan
Africa must be put into perspective with the need for
equipment design and territorial development. This, in turn,
must consider the dynamics of economic and social
development, as well as the impact of past programs and
sector reforms.
The second section focuses on operational proposals,
based on a review of the various technical options for
power generation, especially for renewable energy, whose
recent advances certainly have strong potential but also
difficulties. The key challenge for distribution is addressed
in its multiple dimensions.
The third and last section concerns the financial challenges:
there is a need to mobilize national financing, which reflects
a strong political commitment, and to make the best
possible use of the scarce grants available, which is a major
challenge. An in-depth analysis of how the project risks and
quality of the promoter are perceived may provide insight
into possible future directions for high-impact financial
engineering.
Executive summary
1 1. The challenges for access to modern energy in Sub-Saharan Africa
1.1 Power systems insufficient to underpin sustainable economic and social development
In Sub-Saharan African countries1, the average rate of
access to an electricity supply2 stands at 16% of the total
number of households and less than 5% in rural areas.
While this percentage has improved since the 1990s, the
number of people without access to electricity has actually
risen due to population growth.
Less than 20% of communities are generally connected to
power infrastructure. It therefore does not support the
sustainable economic and social development of sources of
production (irrigation, refrigeration, motive power, etc.), or
of basic social services (health centers) throughout the
region.
Demographic and migratory issues make this challenge of
access to modern energy even more complex. Indeed,
communities living in small remote villages – where
electrification is costly – will tend to migrate to secondary
cities, which have economic and social infrastructure.
1 This study focuses on access to electricity in Sub-Saharan African countries. North Africancountries – Algeria, Egypt, Libya, Morocco and Tunisia – are not included in these figures.
2 In statistics, this generally indicates the share of the population with access tocommercially sold electricity at home. In a broader definition, a battery recharge or solar kitservice may also be considered as access to an electricity service.
© AFD Working Paper n° 122 • Access to Electricity in Sub-Saharan Africa • October 2013
7

Defining the potential profitability of a program to provide
access to electricity services requires making a distinction
between two types of program. The first aims at equipping
a given area (where there are secondary centers with
"economic potential") with essential infrastructure for its
economic development. The second aims at providing
a widespread service to all the residents of an area,
especially the poorest (this may be peri-urban communities,
which account for 40 to 60% of households, even in a
country’s cities), or communities living in small villages or
very remote dwellings.
The rationale behind these two approaches is different: the
aim of the first is economic development and spatial
planning; the second has a social target of equity and
geographical balance (which comes at a high cost).
Focusing on "development centers" for spatial planning and
the provision of basic infrastructure for communities allows
a certain level of profitability to be achieved for electricity
services, as these centers have both economic activities
and a certain level of population density.
These medium-sized cities should thus be considered as
priorities in order for them to become fully-fledged "deve-
lopment centers" and to maximize the impact of the scarce
resources available for rural electrification.
To this end, spatial planning must go hand-in-hand with a
clear political vision of the social and economic objectives,
along with a political commitment to resource allocation.
However, the answer to the question "access for what
reason and with what means?" should not remain at a
political level. It must lead to a prioritization and to the
implementation of realistic and operational action plans that
fully take account of the financial, organizational and
technological realities of the country.
1.2 The key role of "development centers"
1.3 A real economic benefit for communities
Few ex post analyses are available, but they do bring to
light a number of key facts:
• Communities not connected to the power grid pay – for an
equivalent use of electricity supplied by kerosene or
(rechargeable) batteries – an energy price that is several
times higher than connected communities. It is often as
much as USD 10 per month. There is consequently a real
ability to pay for electricity services;
• The connection fee often stands at between USD 100 and
USD 300 – a prohibitive amount that is difficult to pay as a
lump sum;
• Once the connection is made, the expenditure – and
therefore consumption – generally remains stable with
lower unit prices. This is both an advantage and an
impediment, as it is clearly an advantage for small shops
and craft trades, which were already electricity users and
are thus equipped, but the cost of acquiring electrical
equipment for new clients stems consumption;
• Access to energy has a significant social and economic
impact (street lighting, health services, etc.), although it is
difficult to clearly identify the role played by electricity in
improving living conditions for communities compared to
other infrastructure.
© AFD Working Paper n° 122 • Access to Electricity in Sub-Saharan Africa • October 2013
8

While there is clearly economic profitability, which in itself is
extremely reassuring for the allocation of resources to this
sector, the issue of financing still needs to be resolved.
Indeed, a country where the access rate to electricity in
affluent industrial and urban areas remains low, with poor
service quality and a need for recurrent financing to cover
operating and maintenance costs, will find it very difficult to
make access in rural and peri-urban areas a national
priority.
1.4 Access dynamics affected by sector reforms
In the mid-1990s, the general inefficiency of electricity
companies in the public sector prompted a wave of
reforms, calling for greater private sector participation.
Today, the institutional model that has become the norm is
that of an agency and/or fund to design, develop and/or
operate power systems in rural or peri-urban areas.
However, African countries that have maintained their tradi-
tional national power companies today have the highest
access rates to electricity: Côte d’Ivoire, 39%; Ghana, 60%
(82% in urban areas and 29% in rural areas); South Africa,
70%. The balance between profitable areas (towns and
densely populated coastal areas) and unprofitable (rural)
areas would appear to be easier to achieve in the case of a
single overall management. Does this mean that all efforts
should, once again, focus on national power companies? A
positive answer would be particularly questionable in view
of the fact that they are often required to be financially pro-
fitable, and that rural and peri-urban electrification may fall
outside their remit and their priorities. The new entities and
organizations should be given the time they need to reach
maturity before drawing any definitive conclusions.
As far as private operators are concerned, it is clear that
they have few reasons to take an interest in energy supply
to rural areas. Indeed, this niche has low profit levels and is
difficult to manage, unless there is a high level of State
cofinancing, which would give the concession a certain
degree of profitability. However, many non-governmental
entities have acquired extensive experience in Africa’s rural
areas and play a pioneering role in developing innovative
technical and organizational solutions. They can be potential
operators in low-income areas with low energy consumption,
working closely with local users’ organizations, municipa-
lities and local government.
1.5 Establish clear prerogatives for each stakeholder
The multiplication of entities – national companies,
funds/agencies, regulators, ministries – prior to implementing
large-scale projects, does not necessarily provide the three
functions of financing, regulation and implementation. It is
clear that this often leads to a fragmentation of compe tencies,
as well as competition between institutions to take owner-
ship of projects that have budgets and to hold responsibilities
at the “frontiers" of these three functions.
Financing function: While most Sub-Saharan African
countries today have rural electrification funds (since power
companies stopped financing this sub-sector), they are
generally mere accounts through which the meager grants
from international cooperation are transferred and they do
not have well-developed financing mechanisms. The increa-
singly important role of local authorities could bring about
changes to this.
© AFD Working Paper n° 122 • Access to Electricity in Sub-Saharan Africa • October 2013
9

Regulation function: A regulator must ultimately answer the
following questions: Does the project have sufficient
incentives and is it transparent enough to attract private
sector investment, and if so, to what extent? Is it realistic to
envisage rural electrification concessions (with private
investment), or should franchises or affermage with mainly
public investment and a private manager initially be
planned? Should the question of tariff regulation involve
equalization or not? The simple fact of creating an ad hoc
regulatory agency does not necessarily allow a clear and
credible framework to be defined and implemented.
Industrial/implementation function: In the past, the national
company played a central role as it was both a power
company, which has the real technical and organizational
capability to carry out a large-scale program, and a
counterpart, which publishes a balance sheet and
profit-and-loss account, allowing it to be a long-term
borrower (public, of course, and often with a State
guarantee). The withdrawal of national companies from
rural areas may have an adverse effect on the development
of expertise in engineering and works supervision, which is
essential in order to maintain a quality nationwide power
supply.
These issues are becoming even more essential with the
multiplication of ever more complex technological options to
meet electricity demand.
© AFD Working Paper n° 122 • Access to Electricity in Sub-Saharan Africa • October 2013
10

Historically, the economies of scale of large-scale infra-
structure and interconnections justified a public monopoly
situation. This context led to a structuring of the ways and
means of financing such large operations by lending
directly to the State, or with a State guarantee. However,
since the 1990s the paradigm of technologies and the
financial situation of counterparts has evolved.
Most African countries have a serious investment shortfall
in both large-scale infrastructure and in highly capital-
intensive interconnected power grids, which must be
amortized over a long period due to the general financial
crisis that started in the 1980s. This shortfall affects both the
quality of the counterparts of electricity companies and the
States themselves.
Despite being rich in natural resources, a number of
countries are obliged to invest in thermal power (gas turbines
or heavy fuel oil). It may come at a low cost in terms of
capital and can be rapidly built, but is today feeling the full
brunt of the increase in the price of hydrocarbons.
The paradigm of renewable energy has been completely
transformed:
• Small- and medium-power generation, using old
technology based on renewable energy sources, is
becoming competitive (this is the case for small hydro-
power plants, gasifiers and cogeneration);
• The industrial development of new sectors, after
decades of research, is experiencing a new dynamism,
which makes these technologies more reliable and
lowers investment costs (this is the case for photo -
voltaics3 and industrial biogas);
• Recent developments in electrical engineering allow the
production distributed on the grids to be managed, in
conjunction with a close monitoring of demand, which
leads to "smart grids";
• Hybrid solutions, combining the production flexibility of
a diesel generator with the low, long-term generation
cost of renewable energy, offer an alternative to overco-
me the problems of intermittency found in renewable
energy sources.
Consequently, given the two main current trends in
Sub-Saharan Africa – difficulties in raising large amounts of
financing for large-scale generation facilities4 and the
development of electrical engineering (which today offers
the possibility of a major power grid supplied at several
points by medium-sized power plants) – there may be a
shift towards a new generation scheme. This would involve
geographically distributed medium-sized facilities
integrated into smart grids, in a context where economies of
scale no longer play the same role that they used to.
While grid extensions are the first option for scaling up
access – provided there are large-scale plants with a low
cost per kWh and grids – there is increasing scope for
small-scale local generation with the associated distribution
grid. This is in a context whereby the main power
transmission grids do not yet exist and, moreover, the
national power company has left the playing field. We thus
have a highly diversified "technological toolbox" that allows
2. A continuum of technical and organizational solutions
2.1 Technical and economic framework
3 In 2009, the kWh for units over 5 MW was announced by manufacturers at less than EUR0.25/kWh, with a cost of about EUR 3,000/kW installed peak power at the time of investmentin Europe.4 Today, 93% of the economically feasible hydropower available in Africa (estimated at937 TWh/year, i.e. 10% of the world total) remains untapped.
© AFD Working Paper n° 122 • Access to Electricity in Sub-Saharan Africa • October 2013
11

a more targeted response to the characteristics of rural
demand. This includes: grid extensions to areas with strong
demand, thus justifying the high investment cost in
the power lines; mini grids with local thermal or hybrid
production – if the resource is available – in areas that have
corresponding levels of demand; small-scale (stand-alone)
generation geographically distributed for very remote
communities and small villages.
This technological development also requires progress in
the relevant organizational and contractual frameworks:
authorize industrial self-generation for own needs and the
resale of the surplus at an attractive tariff; allow power
generation by small independent private producers, which
implies authorizing access to the grid by these third-parties
(for power transmission from the generation point to the
consumption site), and clearly define the conditions for
the feed-in tariff. These provisions of a clear regulatory
framework are a prerequisite for the commitment by
operators to develop access to energy in rural areas.
However, the question remains over the capacity to ensure
the maintenance and implementation of these technologies
at the local level.
2.2 Complementary technical solutions for the interconnected grid
Electronics today allows the integration of distributed
generation mobilizing local resources; this new possibility
requires a sound understanding of the strengths and
weaknesses of these technology sectors, as well as of the
opportunities they offer. It is important to compare this
analysis with the characteristics of the demand, and with
the local technical and social context, as no single ideal
solution exists, but several more-or-less suitable solutions
for a given context.
Historically, diesel generators were widely installed for the
electrification of rural centers and small towns far from
the interconnected grid, due to their low investment cost,
technological simplicity and rapid installation. Today,
however, these areas suffer from skyrocketing fuel prices; a
trend that is not improving. The ultimate paradox is that,
by means of maximizing the rapid installation of a universal
service, it is thermal solutions that are favored today, as
they have the lowest investment cost and are the most
effectively controlled locally.
In contrast, despite their high potential, the very small
number of pico (stand-alone), micro (village-size: 10 to
200-500 kW), or mini hydropower plants (200-500 kW to
5-15 MW) is striking in comparison with Asia. Africa has
very few turbine manufacturers (there are a few workshops
in Ethiopia and Nigeria), but many countries have the
industrial basis to provide the maintenance of such
facilities. Studies are long and costly, as the hydrological
and civil engineering risks often require complex
investigations. The amortization of mini- or micro-hydro
plants requires a certain level of demand, or the proximity
of a grid to sell to. Nevertheless, once such a plant has
been commissioned, it operates virtually alone and at a cost
that is practically nil, and this for a decade to half century.
Like hydropower, power generation from biomass depends
upon the local availability of the resource. In terms of power
generation for rural services, there are mainly four
distinct sectors: cogeneration5, biogas6, biodiesel7 and
gasification8. Unlike hydropower, they all need qualified
operators on a daily basis and regular intensive maintenance
of the equipment. A distinction should also be made between
the development of plantations destined for power gene -
ration, involving agricultural and rural development issues,
5 Combined generation of heat and electricity.6 Generation of low-grade gas for combustion from anaerobic fermentation, which may beinjected into a rectified diesel engine.7 Generation of biodiesel in a short cycle from oilseeds, usable in diesel engines.8 Pyrolysis of agricultural residue: partial / slow combustion producing gas for use in arectified diesel engine.
© AFD Working Paper n° 122 • Access to Electricity in Sub-Saharan Africa • October 2013
12
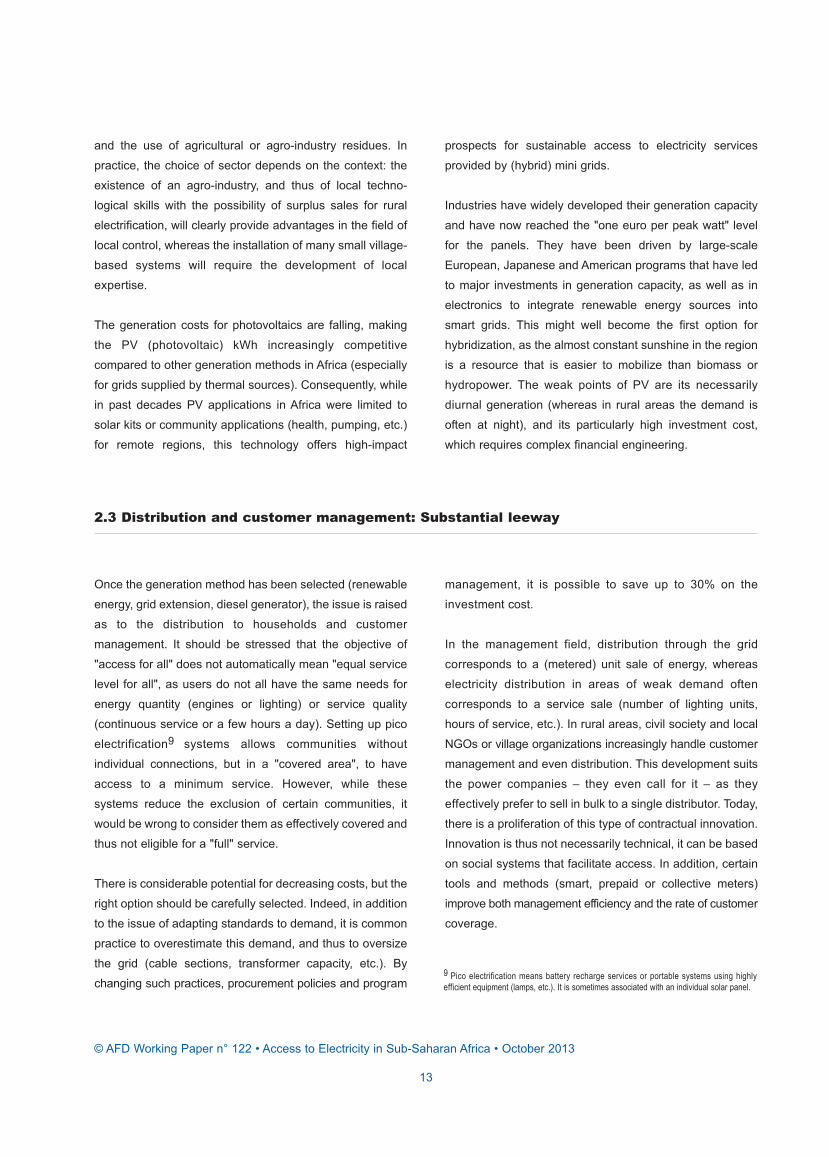
and the use of agricultural or agro-industry residues. In
practice, the choice of sector depends on the context: the
existence of an agro-industry, and thus of local techno -
logical skills with the possibility of surplus sales for rural
electrification, will clearly provide advantages in the field of
local control, whereas the installation of many small village-
based systems will require the development of local
expertise.
The generation costs for photovoltaics are falling, making
the PV (photovoltaic) kWh increasingly competitive
compared to other generation methods in Africa (especially
for grids supplied by thermal sources). Consequently, while
in past decades PV applications in Africa were limited to
solar kits or community applications (health, pumping, etc.)
for remote regions, this technology offers high-impact
prospects for sustainable access to electricity services
provided by (hybrid) mini grids.
Industries have widely developed their generation capacity
and have now reached the "one euro per peak watt" level
for the panels. They have been driven by large-scale
European, Japanese and American programs that have led
to major investments in generation capacity, as well as in
electronics to integrate renewable energy sources into
smart grids. This might well become the first option for
hybridization, as the almost constant sunshine in the region
is a resource that is easier to mobilize than biomass or
hydropower. The weak points of PV are its necessarily
diurnal generation (whereas in rural areas the demand is
often at night), and its particularly high investment cost,
which requires complex financial engineering.
2.3 Distribution and customer management: Substantial leeway
Once the generation method has been selected (renewable
energy, grid extension, diesel generator), the issue is raised
as to the distribution to households and customer
management. It should be stressed that the objective of
"access for all" does not automatically mean "equal service
level for all", as users do not all have the same needs for
energy quantity (engines or lighting) or service quality
(continuous service or a few hours a day). Setting up pico
electrification9 systems allows communities without
individual connections, but in a "covered area", to have
access to a minimum service. However, while these
systems reduce the exclusion of certain communities, it
would be wrong to consider them as effectively covered and
thus not eligible for a "full" service.
There is considerable potential for decreasing costs, but the
right option should be carefully selected. Indeed, in addition
to the issue of adapting standards to demand, it is common
practice to overestimate this demand, and thus to oversize
the grid (cable sections, transformer capacity, etc.). By
changing such practices, procurement policies and program
management, it is possible to save up to 30% on the
investment cost.
In the management field, distribution through the grid
corresponds to a (metered) unit sale of energy, whereas
electricity distribution in areas of weak demand often
corresponds to a service sale (number of lighting units,
hours of service, etc.). In rural areas, civil society and local
NGOs or village organizations increasingly handle customer
management and even distribution. This development suits
the power companies – they even call for it – as they
effectively prefer to sell in bulk to a single distributor. Today,
there is a proliferation of this type of contractual innovation.
Innovation is thus not necessarily technical, it can be based
on social systems that facilitate access. In addition, certain
tools and methods (smart, prepaid or collective meters)
improve both management efficiency and the rate of customer
coverage.
9 Pico electrification means battery recharge services or portable systems using highlyefficient equipment (lamps, etc.). It is sometimes associated with an individual solar panel.
© AFD Working Paper n° 122 • Access to Electricity in Sub-Saharan Africa • October 2013
13

Technological developments require new technical and
organizational plans. We have seen that such changes lead
to different project and counterpart risk configurations and
profitability and cash flow profiles than in the past.
Moreover, as the aim is to mobilize private investors, it is
clear that their expectations in terms of profitability and their
risk perception are very different from those of a public
service entity. The private operator, depending on whether
it is an enterprise or a local community, will also have
certain expectations in terms of its remuneration. The
financing instruments must thus be redesigned in order to
offer, among other things, longer maturities and risk-sharing
mechanisms that are sufficiently attractive to mobilize the
targeted stakeholders.
3 A need for structured financing
3.1 Widespread access to electricity services: The need to mobilize more financing thanthe current flows from international cooperation
The International Energy Agency (IEA) estimates that, with
an investment of USD 35bn a year (i.e. 6% of the planned
investment in the power sector), the challenge of access to
modern energy for almost 1.6 billion people will be resolved
by 2030. Judging by a World Bank review of its own port -
folio that mentions an annual flow limited to EUR 500m, we
are far from the IEA's order of magnitude. However, it
should be borne in mind that no country has reached
significant access rates without a major national effort. It
would thus be unrealistic to rely solely on international flows
to resolve the problem.
3.2 Stumbling blocks: Tariff equalization and subsidy methods
The power sector in itself is far from generating the surplus
required to self-finance the investments needed for service
extension. As the initial rate of electrification in
Sub-Saharan Africa is very low (10 to 20%), cross subsidies
alone will not be sufficient to reach very high access rates.
In rural and peri-urban areas, the weight of domestic
customers in the social bracket (generally with a low tariff
level), as well as the high investment costs (due to rural iso-
lation), imply much higher kWh costs than in mixed urban
areas. In order to better reflect costs, some countries use
the argument of the high energy expenditure prior to
electrification (kerosene, batteries, etc.) to justify and apply
a tariff differentiation based on costs. Even if these tariffs
remain lower than an off-grid solution, this application does
not solve the issue of the social acceptability of these
differentiated tariffs. This issue is exacerbated by the fact
that in countries highly dependent upon hydrocarbons,
distributors are increasingly authorized to make tariff
adjustments in order to reflect their fuel costs.
© AFD Working Paper n° 122 • Access to Electricity in Sub-Saharan Africa • October 2013
15

It is obviously necessary to rethink the approach to
financing rural electrification itself, and certainly to envisage
innovative approaches based on a new relationship
between technology, organization and financing.
Very long-term financing (30 years or more), or even an
initial subsidy10, are essential to finance investments in
rural areas (which has been, and occasionally still is, the
case for all member countries of the Organisation of
Economic Co-operation and Development – OECD). The
involvement of the State, which can refinance itself, is
required.
In this context, rural electrification funds must play a role as
real financial intermediaries: it is vital for them to be more
than a simple bank through which grants transit, if only
because the amounts available are very far from the
required investments. The use of such invaluable and
scarce grants as a catalyst for loans seems evident: for
subsidized loans (longer maturities based on the cash flow
profile of projects or the lower interest); for the preparation
of high quality projects to secure investors and financiers;
for partial guarantees to enhance the distribution of project
and counterpart risks and thus help raise private and bank
funds; etc. Local banks, which generally lend for a
maximum 5-year period, in reality do not want to invest in
this low-profit sector, with the exception of development
banks with a specific mandate. Investors, for their part, are
reluctant to invest capital in projects with a long return on
investment period, in a context where the regulatory and
political frameworks have not yet been stabilized. For this
type of long-term investment, risk sharing lies at the core
of the issue of mobilizing national savings and, more
generally, investments.
3.3 Keys for setting tariff levels
© AFD Working Paper n° 122 • Access to Electricity in Sub-Saharan Africa • October 2013
16
10 Or, more generally, concessional loans.

Table 1. AFD and FGEF rural electrification financing (1993-2008) (EUR M)
AFD FGEFBurkina-Faso 0,38 0,22Mauritania 2,21 0,76Tunisia 13,72Morocco - PERG loan 1 30,49Morocco - PERG loan 2 45,73Morocco - PERG loan 3 50,00Morocco - PERG solarMorocco - PERG loan 5 45,00South Africa 41,44Kenya - urban 25,00Kenya - rural 30,00
284,00 1,00Total 284,95
100 %Annual average 18,90 0,10Sub-Saharan Africa 57,60 1,00
Explanation of Table. When Morocco, Tunisia and South
Africa are included, financing for access to electricity
services has accounted for a total investment of EUR 284m
in Africa over the past 15 years (1993-2008) and only EUR
57.6m in Sub-Saharan Africa – i.e. less than EUR 4m a
year.
It focuses on three Sub-Saharan African countries:
Burkina Faso, Kenya and Mauritania. "Decentralized" rural
electrification only accounts for 1% of AFD’s total financial
commitments in the sector.
*PERG: Global Rural Electrification Program. Source: Authors.
© AFD Working Paper n° 122 • Access to Electricity in Sub-Saharan Africa • October 2013
17
Introduction
The development of access11 to modern energy services is
one of AFD's fields of action; its financing operations fall
within the framework of the Millennium Development Goals
(MDGs), which aim to support economic growth, reduce
poverty and promote the conservation of the environment.
AFD’s present strategic orientations and the worldwide
consensus on the issue of access to modern energy
services, in connection with the MDGs (see Box 1), have
led the institution to define this area of operation as a
sector of increasing importance and, as discussed in this
paper, to focus on access to electricity services.
This study was carried out with the objective of developing
new approaches and a methodological capitalization on the
topic of access to electricity services for all in Sub-Saharan
Africa. It is for this reason that the already widely docu -
mented ex post analysis will only be covered in a few
succinct passages, which will serve as the basis for the
definition of concrete approaches. While AFD's experience
in this sector has been widely analyzed, its projects in the
field of access to electricity services today only account for
a small share of both its own portfolio and of all the projects
for access to electricity services in Sub-Saharan Africa.
11 “Access” means in both rural and urban areas.

© AFD Working Paper n° 122 • Access to Electricity in Sub-Saharan Africa • October 2013
18
Goal 1 – Reduce Extreme Poverty and Hunger
Halve, between 1990 and 2015, the proportion of people whose income is less than $1 a day
Halve, between 1990 and 2015, the proportion of people who suffer from hunger
Access to affordable energy services allows the development of companies.
Lighting allows commercial activities to continue beyond daylight hours.
The use of machines improves productivity.
Small, job-creating local companies can supply energy.
Privatizing energy services can free up government funds for investments in social services.
Clean and efficient fuels reduce high domestic expenditure for cooking, lighting and heating.
95% of basic food has to be cooked before consumption and needs water to be cooked.
Better conservation reduces post-harvesting food loss: drying/smoking/cooling/freezing.
Energy for irrigation improves food production and access to better nutrition.
Goal 2 – Achieve Universal Primary Education
Ensure that, by 2015, children everywhere, boys and girls alike, will be able to complete a full course of primary schooling
Energy gives access to water, hygiene, lighting and heated/cooled spaces, which helps reduce absenteeism and dropout rates by creatinga better environment for children and teachers.
Electricity allows schools and households to access media for communication and education purposes (distance learning).
Access to energy allows useful equipment for teaching to be used: overhead projectors, computers, printers, photocopiers, scientificequipment, etc.
Modern energy systems and efficiently designed buildings reduce energy costs and therefore schooling costs, providing better accessto education for the poorest.
Goal 3 – Promote Gender Equality and Empower Women
Eliminate gender disparity in primary and secondary education, preferably by 2005, and in all levels of education no later than 2015
Modern energy services liberate girls and young women from the time allocated to survival activities (collecting firewood and water,inefficient cooking, manual harvesting).
Clean cooking equipment reduces exposure to air pollution and its harmful effects on health.
Quality lighting allows home study and evening classes to be attended; public lighting increases the safety of women; affordable andquality energy services pave the way for women’s entrepreneurship
Goal 4 – Improve Maternal Health
Reduce by three-quarters, between 1990 and 2015, the maternal mortality ratio
Energy services are needed to provide access to better medical services for mothers, such as drug refrigeration, equipment sterilization andoperating theaters.
Excessive and heavy manual work can damage the general health of pregnant women.
Box 1. The role of energy in achieving the MDGs

© AFD Working Paper n° 122 • Access to Electricity in Sub-Saharan Africa • October 2013
19
The World Bank is the main international institution
engaged in financing access to modern energy services. Its
financing for access (International Bank for Reconstruction
and Development – IBRD, International Development
Association – IDA, and Global Environmental Facility –
GEF) is part of the overall financing of the electricity sector,
including generation, transmission and distribution. For
2000-2008, about 35% of amounts allocated had an
"access to electricity services" component. Total financing
amounted to USD 5.6bn, i.e. an annual average of USD
627m. It was scaled up during this period, from about USD
500m a year from 2000 to 2005 to about USD 800m a year
between 2005 and 2008. Closer analysis shows that two
countries (Ethiopia and Ghana) received almost half of the
financing allocated to "access to electricity services", i.e.
over USD 400m a year. By way of comparison, this amount
is similar to the funds allocated by AFD to Morocco’s
National Electricity Authority (ONE) for its Global Rural
Electrification Program (PERG) for a ten-year period.
The European Union has become a major stakeholder in
financing access to energy and renewable energy projects
in Africa. In addition to projects carried out as part of
national or regional programming, in 2006, it launched a
sector program – the Energy Facility –, which specifically
concerns the issue of access. Between late 2007 and
mid-2008, 75 agreements were signed for an overall conso-
lidated budget of EUR 435m, including 45% (EUR 198m)
financed by an Energy Facility grant. A second tranche for
an equivalent amount was launched for 2010-2011. Finally,
it should be noted that German bilateral cooperation also
plays a major role in the field of renewable energy.
The first section of this study analyzes the challenges of
access to electricity services in Sub-Saharan Africa. An
approach leading to operational proposals is formulated on
the basis of this analysis. It is clear that the rate of access
is low, but what can be said about the economic and social
dynamics from a perspective of territorial equipment? We
seek to learn lessons from an analysis of the impact of both
past programs and sector reforms, in order to propose a
functional methodological approach.
The second section of this study covers operational
proposals, based on a review of the different production
options. The analysis will specifically focus on the
remarkable development of renewable energy and the
critical issues related to distribution.
The third and last section addresses issues related to
financing and the need to mobilize national funds and
leverage grants.
Goal 5 - Combat HIV/AIDS, Malaria and other Diseases
Have halted by 2015 the spread of AIDS, malaria and other major diseases and begun to reverse the trend
Electricity in health centers allows them to open at night, qualified staff are retained, special equipment can be used (sterilization, drugrefrigeration), vaccines and drugs can be stored.
Energy is needed to develop, manufacture and distribute drugs and vaccines.

1.1.1 In Africa, access rates for communitiesremain low after several decades ofdisappointing progress
As a development challenge and as infrastructure
recognized as being necessary for the achievement of
the MDGs, access to electricity services is becoming
increasingly central to the development policies of African
States and to the international community’s development
support strategy.
Today, the average rate of access to an electricity service12
for households in Sub-Saharan African13 countries stands
at 16%, but less than 5% in rural areas. While the trend for
this percentage has been positive since around the 1990s,
the number of people without access to an electricity
service has increased due to population growth.
1 Access to electricity services in Sub-Saharan Africa: Challenges andmethodological approach
1.1 Power systems insufficient to underpin sustainable economic and social development:The challenges to be met
Map 1. Rate of access to electricity services in Africa
Source: Authors.
12 Throughout this document, "population having access to electricity" means people whohave access to commercially sold electricity at home. 13 This study covers access to electricity in the Sub-Saharan African countries. The NorthAfrican countries – Algeria, Egypt, Libya Morocco and Tunisia – are not considered in thefigures presented.
Population with access to electricity(% of total population)
No data<1010...2020...3030...50>50
© AFD Working Paper n° 122 • Access to Electricity in Sub-Saharan Africa • October 2013
21

This percentage should, however, be put into perspective.
A household connected to the grid may well let others
benefit through more-or-less illegal hook-ups; battery
recharge services provide a minimum lighting service and
access to audiovisual content for households that are not
connected or live in outlying areas.
There is a major challenge ahead: Sub-Saharan African
countries have the lowest access rates to electricity in the
world, both in terms of direct access to a service at home
for people, and the electrification rate for communities. For
instance, in India, while the access rate of the population is
only 40% in rural areas and 60% in urban areas, over 95%
of communities are connected. The infrastructure thus
allows productive activities (irrigation for agriculture) and
basic social services (health centers) to operate throughout
the country. This is far from being the case in Sub-Saharan
Africa, where the much less extensive power infrastructure
generally reaches less than 20% of communities.
Angola 16 13 7,4 15Bénin 9 79 60,2 22 26Botswana 1,758 3 42,6 39 27 2Burkina Faso 14 50 82,1 17 75 3 1Burundi 8 305 90,3Cape-Verde 0,518 129 42,7Cameroon 17 36 46,3 47 5 20Central African Rep 4 7 62,1 <1 0,2 Chad 10 8 75,1 1Comoros 0,614 275 63 50Congo (Dem Rep.) 59 26 68,4 6 20 1 1Congo 4 12 40,2 20 44,6 5,6 Côte d'Ivoire 18 58 55,4 39 8 26Djibouti 0,806 35 13,9 Equatorial Guinea 0,515 18 61,1Erytrea 5 45 80,9 20 82 2Ethiopia 73 73 84,2 22 22 <1Gabon 1,406 5 16,4 48Gambia 1,553 155 46,1 5Ghana 23 99 53 49 82Guinea 9 37 67,4 6 35 1Guinea-Bissau 1,633 58 70,4 5Kenya 35 62 79,5 14 29 6,8Lesotho 1,789 59 81,3 11Liberia 3,38 35 59,5Madagascar 19 33 73,4 1 5 4 Malawi 13 140 83,2 7 30 1Mali 14 11 70,0 16 30 5
Table 2. Rate of access to electricity and electrification services in the urban and rural areas of 48 Sub-SaharanAfrican countries (in 2004, 2005, 2006, 2008 and 2009)
CountriesTotal
population(millions)
Populationdensity
(inhab./km²)
Percentage ofthe populationliving inrural areas
Percentage ofthe populationhaving accessto electricity
Percentage ofthe populationhaving accessto electricityin urban areas
Percentage ofthe populationhaving accessto electricityin rural areas
Percentageof areas withpower supply6
© AFD Working Paper n° 122 • Access to Electricity in Sub-Saharan Africa • October 2013
22

Mauritania 3 3 59,7Maurice 1,253 617 57,6 94Mozambique 20 26 66,3 6 17 0,6Namibia 2 2 65,4 34Niger 14 11 83,3 8 30 0,1 1Nigeria 145 159 52,7 20Rwanda 9 375 81,8 <1Sao Tomé et Principe 0,16 167 42,0Senegal 12 62 58,6 32 67 4,5 15Seychelles 0,86 186 47,1 <1 Sierra Leone 6 79 60 5Somalia 8,485 14 36,1South Africa 47 39 41,2 70 85 52 Sudan 37 16 60,1 15Swaziland 1,126 65 75,9 1Tanzania 38,5 25 76,2 11 36 2Togo 6 116 60,6 12 17 3 18Uganda 30 152 87,5 9 21 2,1Zambia 12 16 65 19 25 1,4Zimbabwe 13 34 64,5 34 80 18
Sources: World Bank (2008); UNDP (2007); ECOWAS and WAEMU (2006); Review of national framework for involvement of agro-industries in rural electrifi cation,PACEAA project (2009); Mostert (2008); African Energy Policy Research Grid (2004); data collected by the Club of Rural Electrification Agencies, Congolese hou-sehold survey (2005); Eritrean Ministry of Energy; RIAED (2005).
© AFD Working Paper n° 122 • Access to Electricity in Sub-Saharan Africa • October 2013
23
CountriesTotal
population(millions)
Populationdensity
(inhab./km²)
Percentage ofthe populationliving inrural areas
Percentage ofthe populationhaving accessto electricity
Percentage ofthe populationhaving accessto electricityin urban areas
Percentage ofthe populationhaving accessto electricityin rural areas
Percentageof areas withpower supply6

Map 2. Share of the rural population in Sub-Saharan Africa
<5050...70>70
Rural population% of total population
Source: UNDP (2008).
The reasons why people leave the countryside are, among
others, the absence of basic public services (water,
electricity, healthcare), the hardship and hazards of rural
life, and the lack of alternatives. This population pressure
and the absence of urbanization and development plans
place an excessive burden on urban infrastructure.
Even when such planning exists, the lack of political will
and resources to implement and respect such plans, often
leads to a proliferation of areas with precarious and/or
uncontrolled housing. In fifteen major African cities,
access to electricity in slums stands at 11%15 on
average.
© AFD Working Paper n° 122 • Access to Electricity in Sub-Saharan Africa • October 2013
24
1.1.2 Maximizing economic and social impactswithin a process of accelerated urbanization:Development centers
“African urbanization is a poverty-driven process and
not the industrialization-induced socio-economic transition
it represented in the world’s other major regions”,14 UN-
Habitat, 2008.
What are the main challenges for achieving real headway?
While Africa is still the least urbanized continent in the
world, the urbanization rate is already over 60% in about
twenty countries.
The United Nations Development Programme (UNDP)
forecasts that between 1980 and 2030, Africa’s total
population will see a threefold increase, the rural
population a twofold increase, and the urban population a
sevenfold increase. Consequently, while the percentage
for the urban population had already grown from 24% to
33% between 1980 and 2000, it is expected to increase
to 48% by 2030.
14 UNDP (2008), “The State of African Cities”. 15 UNDP (2008), ibid.
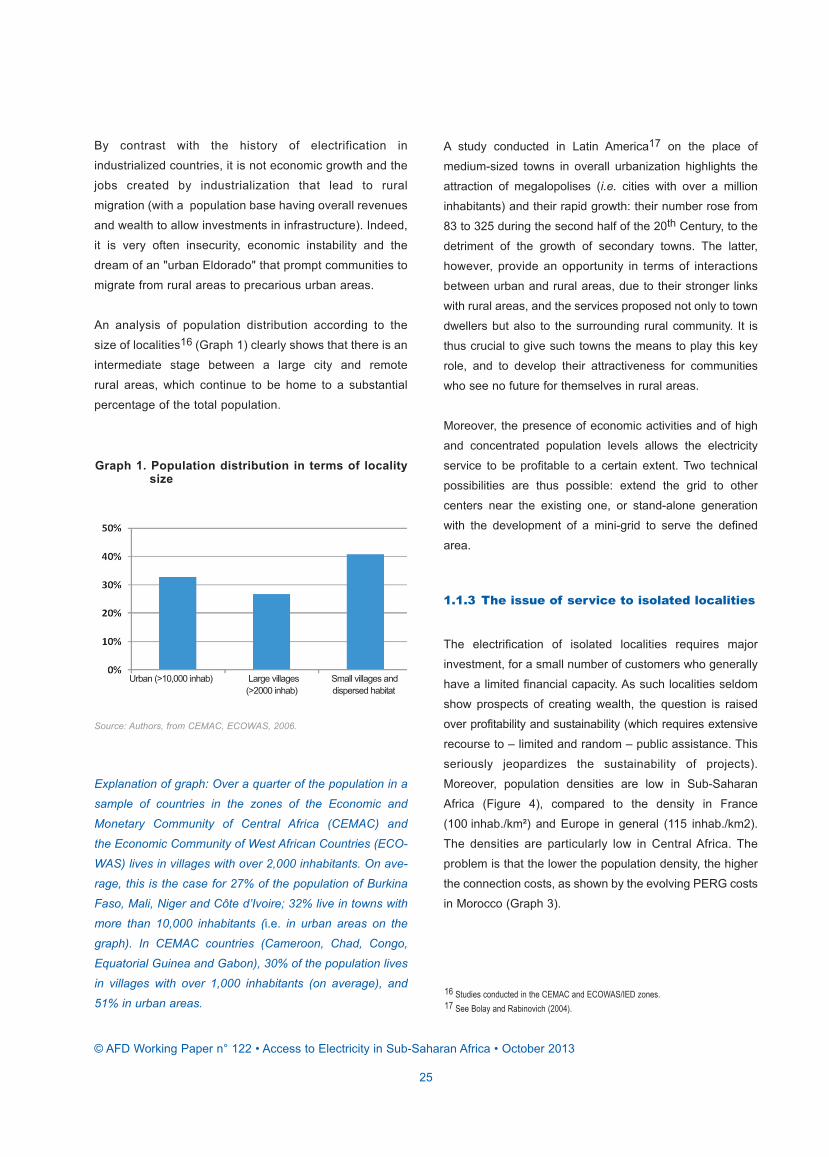
By contrast with the history of electrification in
industrialized countries, it is not economic growth and the
jobs created by industrialization that lead to rural
migration (with a population base having overall revenues
and wealth to allow investments in infrastructure). Indeed,
it is very often insecurity, economic instability and the
dream of an "urban Eldorado" that prompt communities to
migrate from rural areas to precarious urban areas.
An analysis of population distribution according to the
size of localities16 (Graph 1) clearly shows that there is an
intermediate stage between a large city and remote
rural areas, which continue to be home to a substantial
percentage of the total population.
Graph 1. Population distribution in terms of localitysize
Source: Authors, from CEMAC, ECOWAS, 2006.
Explanation of graph: Over a quarter of the population in a
sample of countries in the zones of the Economic and
Monetary Community of Central Africa (CEMAC) and
the Economic Community of West African Countries (ECO-
WAS) lives in villages with over 2,000 inhabitants. On ave-
rage, this is the case for 27% of the population of Burkina
Faso, Mali, Niger and Côte d’Ivoire; 32% live in towns with
more than 10,000 inhabitants (i.e. in urban areas on the
graph). In CEMAC countries (Cameroon, Chad, Congo,
Equatorial Guinea and Gabon), 30% of the population lives
in villages with over 1,000 inhabitants (on average), and
51% in urban areas.
A study conducted in Latin America17 on the place of
medium-sized towns in overall urbanization highlights the
attraction of megalopolises (i.e. cities with over a million
inhabitants) and their rapid growth: their number rose from
83 to 325 during the second half of the 20th Century, to the
detriment of the growth of secondary towns. The latter,
however, provide an opportunity in terms of interactions
between urban and rural areas, due to their stronger links
with rural areas, and the services proposed not only to town
dwellers but also to the surrounding rural community. It is
thus crucial to give such towns the means to play this key
role, and to develop their attractiveness for communities
who see no future for themselves in rural areas.
Moreover, the presence of economic activities and of high
and concentrated population levels allows the electricity
service to be profitable to a certain extent. Two technical
possibilities are thus possible: extend the grid to other
centers near the existing one, or stand-alone generation
with the development of a mini-grid to serve the defined
area.
1.1.3 The issue of service to isolated localities
The electrification of isolated localities requires major
investment, for a small number of customers who generally
have a limited financial capacity. As such localities seldom
show prospects of creating wealth, the question is raised
over profitability and sustainability (which requires extensive
recourse to – limited and random – public assistance. This
seriously jeopardizes the sustainability of projects).
Moreover, population densities are low in Sub-Saharan
Africa (Figure 4), compared to the density in France
(100 inhab./km²) and Europe in general (115 inhab./km2).
The densities are particularly low in Central Africa. The
problem is that the lower the population density, the higher
the connection costs, as shown by the evolving PERG costs
in Morocco (Graph 3).
16 Studies conducted in the CEMAC and ECOWAS/IED zones.17 See Bolay and Rabinovich (2004).
© AFD Working Paper n° 122 • Access to Electricity in Sub-Saharan Africa • October 2013
25
Urban (>10,000 inhab) Large villages Small villages and (>2000 inhab) dispersed habitat

Map 3. Population densities in Sub-Saharan Africa
<1010...3030...7070...150>150
These vast low-density areas, where low-income
communities live, are costly to serve and are thus
unprofitable. However, the communities living in such
highly dispersed locations will inexorably need to densify to
some extent. The responsibility thus lies with politicians and
planners to decide, with full knowledge of the facts,
which areas to allocate resources to and to select the most
appropriate technology, focusing on the "development
centers" as a priority.
"In the foreseeable future, the intermediate cities (towns
with less than 500,000 inhabitants) will be the localities
where two-thirds of all African urban growth is occurring.
With most of its rapid urban growth adding to the popula-
tions of its intermediate-size cities, Africa needs to focus on
building capacity among its small and medium-sized cities
to deliver and facilitate adequate housing, livelihoods and
services for spiraling numbers of poor urban dwellers."18
18 Source: UN-Habitat (2008).
Source: UNDP (2008).
© AFD Working Paper n° 122 • Access to Electricity in Sub-Saharan Africa • October 2013
26
Population densityInhabitants per km²

In order for the available – but scarce – resources to have
the highest possible impact, it is essential to have a clear
political vision of the social and economic objectives and to
make a political commitment, while ensuring that operators
are available who can function in a clear contractual
framework.
When the technical-economic choice and the operator
responsible are combined, the following segments can be
distinguished:
1- Extension of the power grid as part of the national
concession of the (public or private) electricity company;
2- Electrification of villages and secondary centers and,
more generally, of the development centers outside the
national concession of the electricity company: technically
speaking, these localities can be supplied by the national
grid, or by local generation capacity with an associated
medium-voltage (MV) and low-voltage (LV) distribution grid
that can serve one or more localities;
3- Electrification of very isolated and small localities, where
extending the grid will be very costly. It is generally imple-
mented with systems that are stand-alone or limited to
common services, typically PV, or via village grids
(generally diesel-powered);
4- Peri-urban electrification, i.e. neighborhoods located
around the major conurbations and, more generally, the
issue of densifying connections, and therefore that of
widespread access for communities once the service is
available in the area.
Combining the technical-economic option and the institution
responsible thus leads to the following segmentation
(Table 3):
1.2 Develop a systematic vision and overall operational planning: Access for what purposeand with what resources?
Table 3. Segmentation of contexts of access to the electricity service
Explanation of Table. Options A and B are integral parts of a country's development and spatial planning policy; options
C and E must be seen as a spatial complement to option B (and in terms of the available resources); options D and F
have high investment and management costs that need to be controlled (their organizational and technical specificities
will be discussed later).
© AFD Working Paper n° 122 • Access to Electricity in Sub-Saharan Africa • October 2013
27
Electricity company(public or private) REA or REF* Specialized operators
(NGOs, ministries, etc.)
Electrification of development centersinside the main concession areas
ViableA
Electrification of centers outside themain concession areas
ViableB
Viable
Isolated localities Not profitableNot profitable
CNot profitable
E
Outlying urban areasNot profitable
DNot profitable
F
Source: Authors

It is important to be lucid about the potential profitability of a
service access program and make a distinction between:19
1- An access program to equip a given area with the
essential infrastructure for its economic development,
where there are therefore secondary centers with
"economic potential". This type of "territorial development"
program is characterized by higher unit energy
consumption levels and a greater ability to pay which,
combined with a higher population density (and therefore
better controlled investment costs), offers some prospects
of profitability. At this stage, the aim is not necessarily to
connect the entire population;
2- The provision of a universal service to all the residents of
an area, and in particular to the poorest, i.e. peri-urban
communities, 40 to 60% of households in villages and even
quite large towns in a country, and communities living in
small villages or isolated dwellings. The consumption levels
of such customers will not exceed 50 kWh/month,
representing maximum expenses of EUR 5/month. In
addition, the more dispersed the population, the higher the
investment cost per connection will be. In these areas, the
basic paradigm is a complete subsidy of the investments
and a tariff that covers operating costs.
These two approaches are based on two distinct objectives:
economic and territorial development for the first, and social
equity and geographical balance for the second (which has
a high cost).
The response in terms of the priority of allocating scarce
resources must come from the political level (see Box 2).
Box 2. Equipping an entire territory with productive infrastructure: A political issue in India and Morocco
Today, India has virtually finished the electrification of all its localities. For the 5% of remaining localities, and the 40% of the population that is not yet connected,
the Indian government has set up a very clearly social program, which subsidizes 90% of the supply cost for localities and 100% of household connection fees.
This comes almost half a century after launching a rural electrification program that aimed to supply cheap energy to farmers to allow them to irrigate their crops
and thus achieve food self-sufficiency. The initial objective of the program had been energy for industry.
Morocco also launched its rural electrification program during a period of severe drought, together with a program for access to drinking water. The primary
objective was to provide infrastructure to the localities.
In reality, despite the fact that most countries have reached
a certain level of access for all, they started out with a
priority aim of electrifying the development centers. This
seems a logical choice, as it allows the sector to show
some profits and thus reach a financial equilibrium with
cross subsidies between segments.
It should be noted that the experience of electrification for
isolated communities and sites, in particular with solar kits,
has shown intrinsic limits in Sub-Saharan Africa. Indeed, in
countries engaged in major rural electrification projects, this
electrification scheme is a complement to schemes A and B
(e.g. Laos, Morocco and Senegal). These major programs
to give isolated communities access to electricity through
solar kits face two main issues:
© AFD Working Paper n° 122 • Access to Electricity in Sub-Saharan Africa • October 2013
28
19 The proposed segmentation must not lead to opposing "off-design" and "extending thenational concession grid" electrification schemes, as certain analyses today tend to do. It mustillustrate their complementary character.

- Electricity use will generate a marginal level of income,
which means that either customers with a fairly high
income will be targeted, or that the investment has to be
quite heavily subsidized;
- The actual long-term maintenance cost of the facilities
(technical and financial management) should not be unde-
restimated.
Graph 2. The resources required to develop a planned and coordinated approach – the example of Burkina Faso
In 2008-2009, in Burkina Faso (15 million inhabitants in over 8,000 localities), the implementation of a national rural
electrification plan coordinated by the Direction Générale de l’Energie (DGE) took 12 months, plus 6 months of
dissemination. The plan included multi-sector involvement and its overall budget stood at EUR 400,000.
Source: IED.
The detailed study and quantification of the socioeconomic
and financial impacts of rural electrification are relatively
recent. Indeed, until the late 1990s, neither national
decision-makers nor donors questioned the costs and
benefits of rural electrification. The reason for this was
that this activity was considered in national policies as
infrastructure required for development, as well as a public
service that should be accessible to the majority. In short, its
beneficial socio-economic spin-offs were evident and there-
fore had to be made generally available. Consequently,
there are few comprehensive studies available on this
subject.20 The issue is also generally addressed from a
viewpoint of the capital intensity of the investments and the
expected benefits (difficult to assess). It is only recently that
the anticipation of the impact on poverty has become
an assessment criterion for medium- and long-term
development actions and electrification programs. Neither
the Human Development Index (HDI) nor the MDGs, for
their part, directly consider access to energy. The issue of
access to energy therefore revolves around several
1.3 Analysis and lessons learned from the impact of past programs
20 World Bank and Foundation of the Political Institute for Research Development andManagement of the Philippines, 2001; ONE/AFD, 2003; World Bank and SwedishInternational Development Agency, 2005; IEG-World Bank, 2008.
© AFD Working Paper n° 122 • Access to Electricity in Sub-Saharan Africa • October 2013
29
Surveys and data collection
Definition of the regional development center (Regions)
Construction of the national "vision"
Implementation of the electrification plans (Process)
Feedback / validation Regions)
Activities National Coordination Committee
Training in handling tools
As far as the electrification of peri-urban areas or of the
most isolated and poorest rural domestic communities is
concerned, the analysis should focus on the organizational
arrangements that aim at reducing management costs and
losses. This points to the vital importance of having a clear
vision of the objectives of an electrification program and its
cost, of realistic programming for the investments and tech-
nical choices and of the targeted impacts. Graph 2 shows
an example of the means required for this type of exercise
via the case of Burkina Faso.

questions: Are the benefits generated by energy access
programs in rural and urban areas quantifiable, and, if so,
how? Is access to electricity a catalyst for economic growth
in the rural areas of Sub-Saharan Africa? Must rural electri-
fication and/or energy access programs (urban and rural)
be made a national priority?
1.3.1 Difficult and costly access, but a realability to pay
The "rural poor" environment holds little attraction for
operators, who naturally prefer to supply more "profitable"
customers, especially those whose energy supply involves
the lowest cost (as they are close to the grid) and who
consume the most. They therefore adopt an extensive
approach to electrification and only rarely seek to densify
(poor) customers around existing infrastructure, and even
this is a very recent concern. Grids thus often bypass "poor"
customers and seek out the "big customers”. This type of
operator logic is potentially questionable, as their interest
might also lie in densifying the grid in order to amortize its
investment more effectively. Moreover, in a community
already hooked up to the grid, many households cannot
afford to pay the connection fees. They can be at the
prohibitive amount of between USD 100 and USD 300,
which may be difficult to raise in a lump sum (see Map 4),
even though there is clearly the ability to pay the monthly
electricity bill. Indeed, communities which are not connec-
ted to the grid often pay – for equivalent uses of the electri-
city supplied from kerosene, standard batteries and rechar-
geable batteries – an energy price several times higher than
the connected communities, both in absolute terms and in
equivalent kWh. This cost is generally between USD 3 and
USD 10 a month. Energy expenditure represents a much
higher percentage of the incomes of populations in Sub-
Saharan Africa than for populations in OECD countries.
This is why, paradoxically, connection rates in electrified
areas tend to "saturate" fairly rapidly.
Map 4. Population living with <1 dollar/day/person, Africa (in population percentage)
Source: UNDP (2008).
Explanation of map. In Sub-Saharan Africa, about 300 million people (out of 680 million) live with the equivalent of one
dollar a day. This percentage is over 60% in seven of the 31 countries surveyed. It is the lowest in South Africa, where
it still is as much as 10%. Thus, based on a tariff of USD 0.12/kWh (domestic, on the interconnected grid), the bill for a
monthly consumption of 100 kWh will be for USD 12, i.e. 9% of the income of five people (a household). However, the
average tariff is often over USD 0.50 in rural areas.
© AFD Working Paper n° 122 • Access to Electricity in Sub-Saharan Africa • October 2013
30
no data< 1515...3030...4545...60> 60

1.3.2 Trends in household expenditure: Higherconsumption with lower unit costs
As soon as households can afford to be connected, access
to electricity initially promotes an almost complete
replacement for the immediately concerned uses (batteries,
candles, lamp oil, battery recharges) and thus a reduction
of energy expenditure. The middle classes and poor
subsequently see their electricity expenditure increase due
to an increased use of electrical equipment: television sales
double in the first year after electrification, while energy
expenditure often drops among the rich categories that are
already equipped (see Graph 3).
Graph 3. The impact of rural electrification - The example of Morocco (2010)
E: Electrified, NE: Not electrified, V: Village, PV: Photovoltaics.
1.3.3 A definite advantage for small shops andcraft businesses already using electricity
The households whose income will increase are those
whose existing productive capital will increase in value
because of electricity use. For instance, 70% of commercial
activities note an increase in their turnover (IEG, World
Bank 2008), and there will obviously be a major impact for
the development of craft activities requiring the use of
productive electrical apparatus. However, traditional craft
activities are only marginally affected, as the impact for this
type of activity mainly lies in the possibility of longer working
hours, thus raising productivity.
A review of case studies does not show significant
industrial ization effects either. Indeed, for small entrepreneurs
who are already equipped, changing their production facilities
requires additional investment and they generally will not do
so until renewal is necessary.
© AFD Working Paper n° 122 • Access to Electricity in Sub-Saharan Africa • October 2013
31
Electrified NE in E V NE in NE V NE in PV V PV in PV V Total
Source: Axenne.
Refrigerator gas
Battery recharge for TV use
Batteries for radios
Candles
Batteries for electric torches
Gas for lamps
Lamp oil
Dh

It is in the social sector that rural electrification projects
have a significant impact: on health, education, migration
and the status of women.
► The impacts on health are mainly related to the continui-
ty of the cold chain (vaccines, drugs) and to longer opening
hours at health centers (in particular for childbirth).21
Other benefits worth noting relate to (i) improved health
knowledge through the development of access to television
information, and (ii) improved health conditions for food
storage thanks to refrigeration. We also see a positive
correlation with the availability of drinking water throughout
the year, a fundamental factor for public health, especially
for children, in a context where diarrhea and other
water-borne diseases are today still one of the main causes
of child mortality.
► The impacts on education mainly concern the
improvement in the quality of intake and education: a good
teacher will be more inclined to accept a position in an area
with electricity than an area without. Similarly, children living
in a home with electricity generally have a better grade level
as they can study in the evening after school.22
► The impact of electrification on migratory flows and the
rural exodus is much more difficult to evaluate. Various
studies have, however, shown that it reduces migrations to
major cities, and increases the attractiveness of secondary
towns with an electricity service, whether or not they are
qualified as rural. It also strengthens the feeling of safety in
villages and fosters greater social cohesion thanks to public
lighting.
1.3.4 Significant social and development impacts
Table 4. Impacts of electrification on health – The example of Morocco (2010)
Village without electricity Village with electricityElectrical refrigerators 50 % 100 %
Conservation of vaccines 60 % 95 %Regular visits by a doctor 40 % 85 %
Medically assisted childbirth 0 % 42 %
Source: Axenne.
21 As a reminder, the reduction of infant and maternal mortality is part of the fourth and fifthMDG.22 Source: ESMAP Philippines (2003).
Box 3. Impact of electrification on migratory flows and rural exodus in Morocco
The implementation of the Global Rural Electrification Program (PERG) is thought to have facilitated the regrouping of communities, due tothe selection criteria generally applied. Dispersed housing was reduced from 35% to 28%, and that of scattered dwellings was divided bythree, falling from 6% to 2%. The rural electrification programs thus had a major impact on the spatial reorganization of villages. To a certaindegree, ONE, with its policy of constructing "backbone" grids, promotes this spatial redevelopment and the regrouping of communities nearthe interconnected grid.
© AFD Working Paper n° 122 • Access to Electricity in Sub-Saharan Africa • October 2013
32
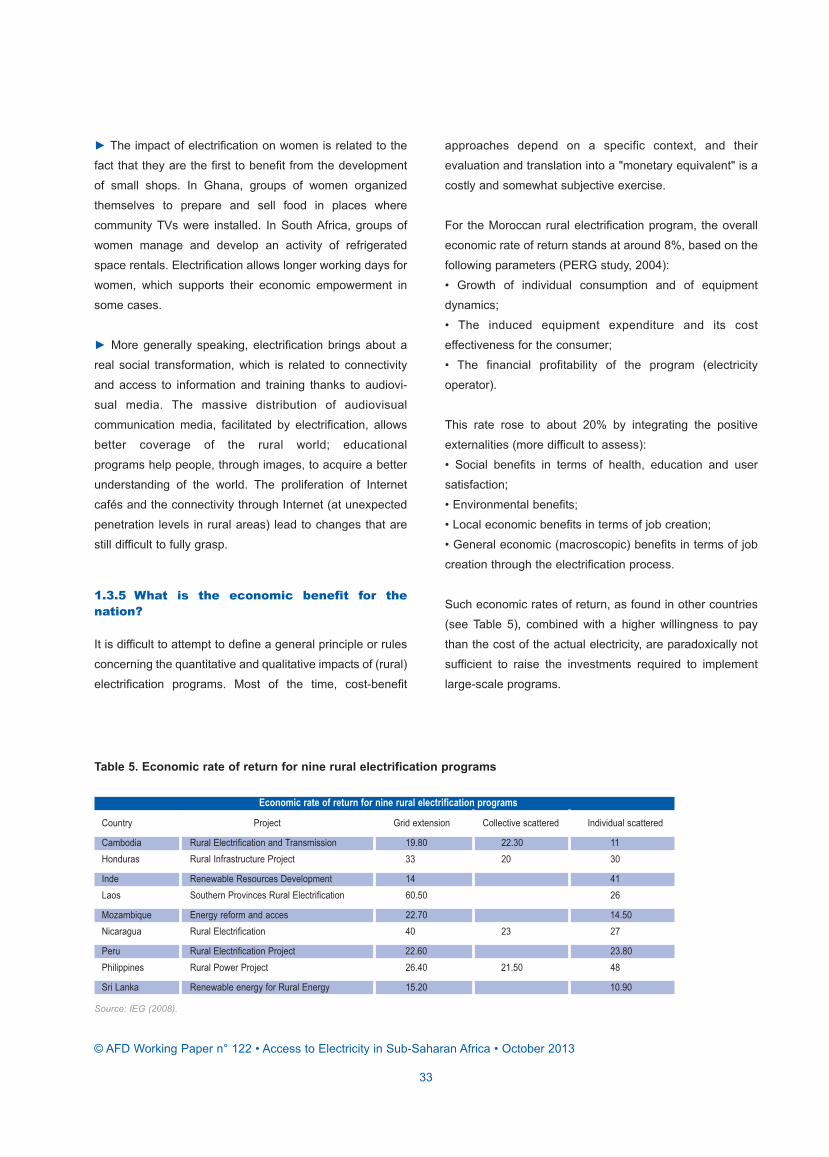
► The impact of electrification on women is related to the
fact that they are the first to benefit from the development
of small shops. In Ghana, groups of women organized
themselves to prepare and sell food in places where
community TVs were installed. In South Africa, groups of
women manage and develop an activity of refrigerated
space rentals. Electrification allows longer working days for
women, which supports their economic empowerment in
some cases.
► More generally speaking, electrification brings about a
real social transformation, which is related to connectivity
and access to information and training thanks to audiovi-
sual media. The massive distribution of audiovisual
communication media, facilitated by electrification, allows
better coverage of the rural world; educational
programs help people, through images, to acquire a better
understanding of the world. The proliferation of Internet
cafés and the connectivity through Internet (at unexpected
penetration levels in rural areas) lead to changes that are
still difficult to fully grasp.
1.3.5 What is the economic benefit for thenation?
It is difficult to attempt to define a general principle or rules
concerning the quantitative and qualitative impacts of (rural)
electrification programs. Most of the time, cost-benefit
approaches depend on a specific context, and their
evaluation and translation into a "monetary equivalent" is a
costly and somewhat subjective exercise.
For the Moroccan rural electrification program, the overall
economic rate of return stands at around 8%, based on the
following parameters (PERG study, 2004):
• Growth of individual consumption and of equipment
dynamics;
• The induced equipment expenditure and its cost
effectiveness for the consumer;
• The financial profitability of the program (electricity
operator).
This rate rose to about 20% by integrating the positive
externalities (more difficult to assess):
• Social benefits in terms of health, education and user
satisfaction;
• Environmental benefits;
• Local economic benefits in terms of job creation;
• General economic (macroscopic) benefits in terms of job
creation through the electrification process.
Such economic rates of return, as found in other countries
(see Table 5), combined with a higher willingness to pay
than the cost of the actual electricity, are paradoxically not
sufficient to raise the investments required to implement
large-scale programs.
Table 5. Economic rate of return for nine rural electrification programs
Economic rate of return for nine rural electrification programs
Country Project Grid extension Collective scattered Individual scattered
Cambodia Rural Electrification and Transmission 19.80 22.30 11Honduras Rural Infrastructure Project 33 20 30
Inde Renewable Resources Development 14 41Laos Southern Provinces Rural Electrification 60.50 26
Mozambique Energy reform and acces 22.70 14.50 Nicaragua Rural Electrification 40 23 27
Peru Rural Electrification Project 22.60 23.80Philippines Rural Power Project 26.40 21.50 48
Sri Lanka Renewable energy for Rural Energy 15.20 10.90
Source: IEG (2008).
© AFD Working Paper n° 122 • Access to Electricity in Sub-Saharan Africa • October 2013
33

The resource is not necessarily available: a country that
still has a low access rate to electricity, poor service
quality and a recurrent need for financing to cover its ope-
rating and maintenance costs in its affluent industrial and
urban areas would have great difficulty in making access
to electricity in rural and peri-urban areas a national
priority. The success of a national policy for access in rural
and peri-urban areas (access for all, with major social
considerations) strongly depends on the situation of the
electricity sector in urban and industrial areas.
However, in almost all Sub-Saharan African countries, the
State – with private sector support – does not manage to
offer industry and its affluent customers the electricity they
need. In fact, there is even a trend of service deterioration
and an increase in the number of power cuts.
This issue thus brings us to the choice of target population
and the question of objectives. In several rural
electrification projects, the objective of reaching
the "poorest of the poorest"23 has failed due to the
insufficient solvency of the beneficiaries and to the fact
that the economic impact of electricity is too low and is
unable to improve this solvency in the short or medium
term.
This debate on the choice of target populations is far from
closed, and is systematic in Output-Based Aid (OBA)
approaches. In regional or national-scale analyses, it now
is common to identify the potential "large customers" that
might ensure a minimum revenue for the operator, and
those that have a significant economic and social impact.
However, the reality is often that hospitals, adminis -
trations, schools, etc. are the worst payers, whereas serving
industry requires that a certain quality of service needs to
be maintained.
1.4 Access dynamics affected by sector reforms
In the mid-1990s, many reforms were launched due to the
general inefficiency of public sector electricity companies.
With regard to the focus of our topic, out of more than
40 Sub-Saharan African countries, almost half have set up
a rural electrification agency (REA) and/or rural electrifi -
cation fund (REF). Out of the twenty or so countries that
opted for an organization of the electricity sector shared
between a national or privatized electricity company and an
REF/REA, almost all benefited from World Bank assistance
for its establishment. This created an institutional model for
the various initiatives, whose focal point is this REA and/or
REF, in charge of – as the case may be – designing,
developing and operating power systems in rural and semi-
urban areas.
Their action falls within a “perimeter” of rural and semi- or
peri-urban electrification with poorly defined contours, most
often simply juxtaposed to that of urban power systems.
The necessary coordination of the planning function of
both sectors and efforts to seek synergies and general
efficiency, which should be the responsibility of a strong
ministry, are thus made difficult. Nevertheless, these two
perimeters, which are governed by different or common
regulations, are experiencing respective developments that
influence each other (grid extensions, area exclusively
reserved for the “off-concession”, etc.). These develop-
ments and their interface (feed-in and resale tariff to the
grid, compensation for operators/investors in case of an
extension of the "national concession") are key elements for
coherent national policies to extend access to electricity
services. If they are poorly defined, they can block the
service extension.
Today, we should question whether this institutional model
has the capacity to accelerate or promote access to electri-
city services. It has not changed significantly in the recent
past, either in terms of access for communities in electrified
areas, or in terms of the percentage of localities covered by
the grid. 23 Objective considered by donors as a high priority item in the global poverty reduction strategy.
© AFD Working Paper n° 122 • Access to Electricity in Sub-Saharan Africa • October 2013
34

1.4.1 The key role of a central operator as a"public champion"
We see that the African countries that kept their traditional
national electricity company today have the highest access
rates to electricity: South Africa: 70%, Côte d’Ivoire: 39%,
Ghana: 60% (82% in urban areas and 29% in rural areas).
The equilibrium between profitable areas (i.e. towns
and densely populated coastal areas) and areas of low
profitability (i.e. rural areas) seems facilitated by a single
overall management system.
The institutional organization in Morocco and Tunisia, both
of which today have nationwide electrification, shares the
following characteristics:
• A single operator that has for a long time been the main
instrument for developing access to electricity;
• A clear centralization/deconcentration of the administration;
• A strictly public approach until quite recently;
• A very strong political will to develop electrification by
extending the grid of the single or dominant operator, but
also by using other electrification methods;
• No distinction between urban and rural areas, all being
included within the area of activity of the dominant operator;
• The lack, for a long time, of an instrument to formalize a
sectoral and regulatory strategy.
In both these countries, the political will and mobilization of
national resources have played a key role. This is relayed
and implemented by a relatively efficient single public
operator.
For many years, some countries with an intermediate
economic development, such as Cameroon or Côte
d’Ivoire, adopted the same strategy as Morocco and
Tunisia. They made no distinction between urban and rural,
even if the distribution operator had a well-defined field of
action and had opened to the alternative intervention by
local and regional authorities for infrastructure financing.
Since then, the sector has moved towards a progressive
liberalization and its resulting institutional changes (a regu-
lator, privatizations, asset holding companies, REAs). While
such situations may have their own dynamics, the absence
of a rigorous oversight and clear regulatory framework – in
other words of a legitimate manager – often leads to
situations of deadlock.
1.4.2 Too many institutional stakeholders arejust as inefficient as too few
In some cases, the institutional environment has too many
stakeholders, which is shown by the fact that there is no
clarification and/or simplification following a sector reform.
Mauritania, for instance, has been a “good pupil” in the eyes
of its donors from an institutional perspective. The
electricity sector has a sectoral policy letter, an electricity
code advocating the complete opening of the sector, a
ministry with a rather exemplary organization chart, a public
operator, which has been subject to privatization attempts
(in vain), a regulatory authority, an REA, and an agency for
universal access to basic services (APAUS). We see,
however, quite a gap between the texts, the facts, and the
existence and functioning of the institutions. The APAUS
concept that has been defined should have led to optimal
coordination, the creation and management of basic
services, and to efforts to achieve systematic cost reduction
(for the use of domestic and renewable energies, the
choice of future investments, and system management). In
reality, however, the system has led to competition with the
sectoral agencies – for water and rural electrification – for
project implementation and budget allocation.
1.4.3 A necessary match between the ruralelectricity market and the number, size andefficiency of operators
Senegal’s conceptual approach is exemplary and it has an
institutional arsenal that has fully taken account of a
forward-looking vision – the sectoral policy letters; lessons
learned from fruitless reform attempts – privatization of the
national electricity company (SENELEC); the functions of
the Electricity Sector Regulatory Commission, which is
increasingly credible; the existence of a dominant operator
© AFD Working Paper n° 122 • Access to Electricity in Sub-Saharan Africa • October 2013
35

(SENELEC); the role of an REA, which is seeking to
develop a public-private partnership (PPP) under a
mechanism integrating the economic, financial, legal and
fiscal tools required to enhance the attractiveness for
operators of the sub-sector, SENELEC and PPPs.
Studies covering a period of 10 years have led to a
reduction in the number of concessions from 20 to 11 to
allow them to have a certain level of profitability. Few
candidates were interested in the first bid invitation for
concessions, which was won by ONE, Morocco’s national
electricity company.
This raises the question as to whether a "market" of
operators exists with the critical size and means to submit
bids. Is it due to an insufficient promotion of the sub-sector
and/or the absence of a "champion"? Are expectations too
great concerning the interest and capacity of the private
sector to take risks, especially for investments, in a
financially depressed sector?
Conversely, the frameworks in Burkina Faso and Mali
favor small and local national village operators. However,
this requires heavy investment subsidies (about 80%), as
the operators work in conjunction with an overall
approach. Indeed, while over 60 projects for spontaneous
applications for rural electrification (PCASER), financed
by the Malian agency for the Development of Household
Energy and Rural Electrification (AMADER), supply Mali’s
rural areas, their unit size is generally below 250 kW and,
by themselves, they would never be able to resolve the
issue of nationwide access to electricity for all.
While the institutional approach is forward-looking and
maybe ambitious, it must, however, result from a search
for an optimum between the reality of the sector, its means
and its resources, its capacity to develop, and the
objectives assigned to it. Moreover, the approach must be
exhaustive in terms of assigning roles and responsibilities,
and must ensure the optimal exercise of the functions
required for the development and smooth running of the
sub-sector.
1.4.4 A sophisticated structure does notnecessarily fulfill the three financing,regulatory and industrial functions
In most African countries, the main characteristics of the
organization of post-reform rural electrification and access
are:
• A repositioning of the State for its sovereign functions:
regulation, promotion, protection of the general interest,
creation of the regulatory function;
• REAs, and a tentative recognition of the need for cross
subsidies;
• A segmentation of the power system to allow the
introduction of competition, particularly for generation;
• Access by private enterprises to these activities provided
they obtain authorizations, licenses or concessions, and
that they actually exist.
Unfortunately, the creation of entities for electrification has
often not been supported, either by national policies, or by
an allocation of financial and human resources that would
really allow them to achieve the objectives assigned to
them.
The rules of the game are too often poorly defined and the
resources too few to create significant development. These
agencies may play several roles: running a pilot project for
decentralized electrification, organizing a bid invitation for
concession management, giving incentives to private
operators that wish to invest in a decentralized electrifi -
cation project, and planning grid extensions (Renewable
Energy Association, ADER, in Madagascar), possibly by
financing this component.
We see that the multiplication of entities, prior to
the creation of large-scale infrastructure, leads to a
fragmentation of competences and competition between
institutions to hold “borderline” responsibilities. This
© AFD Working Paper n° 122 • Access to Electricity in Sub-Saharan Africa • October 2013
36

competition makes it impossible to gather the human,
technical and political means required to achieve the
common objective: implement ambitious projects, while
ensuring that the functions required to achieve the
objectives of access programs are available (financing,
industrial and regulatory functions).
1.5 Establish clear prerogatives for each stakeholder
Achieving effective results requires a coherent national
policy for access to electricity, with the corresponding insti-
tutional and regulatory environment (regulation function). It
is thus necessary to have: (i) a real political will to support
electrification projects and ensure they are sustainable,
(ii) clear economic orientations and sufficient financial
resources (financing function), and (iii) structures that can
provide, install and operate the infrastructure (industrial
function).
1.5.1 Financing access: How to mobilize thefunds required to achieve the politicalobjectives?
Given their level of profitability and their return on
investment time, electrification projects, especially rural
projects, require the provision of public subsidies. It is esti-
mated that about 50% of rural electrification financing in
France was through subsidies. While there is the political
will to provide rural and peri-urban communities with
an electricity service, the financing function must be
considered with lucidity, and by taking account of the
following parameters:
- The investment profile: investments are certainly econo -
mically profitable, but in the long term (a minimum of
between 10 and 30 years). The risks can be non-negligible
and are related to both the purchasing power of (poor)
communities, as well as to the understanding of generation
technologies;
- It is obviously unrealistic to expect private investors to
get involved in this type of long-term investment;
- Substantial amounts are needed to equip a territory. This
requires a large-scale mobilization of national resources
that can subsequently leverage international financing. At
the level of the continent, the issue of universal access will
certainly not be resolved through projects with grants of a
few tens of millions of euros.
As illustrated by the amounts mobilized in Morocco,
Kenya and Ghana (see Box 4), we must stress the
historical importance of: (i) the amounts involved that stem
from a real political choice in terms of national resource
allocation, and (ii) the central role of the national company,
which acts as an electricity company (with a real technical
and organizational capacity to implement a program of
this size) and publishes a balance sheet and profit-and-
loss account. This allows it to be a long-term borrower,
admittedly public and often with a State guarantee.
It is clear that the countries with a "post-reform"
organization (i.e. most Sub-Saharan African countries,
which now have a rural electrification fund) are in an
"unfinished" situation in terms of funding mechanisms. In
general, these "funds" are simply accounts through which
the meager grants from international cooperation transit.
© AFD Working Paper n° 122 • Access to Electricity in Sub-Saharan Africa • October 2013
37
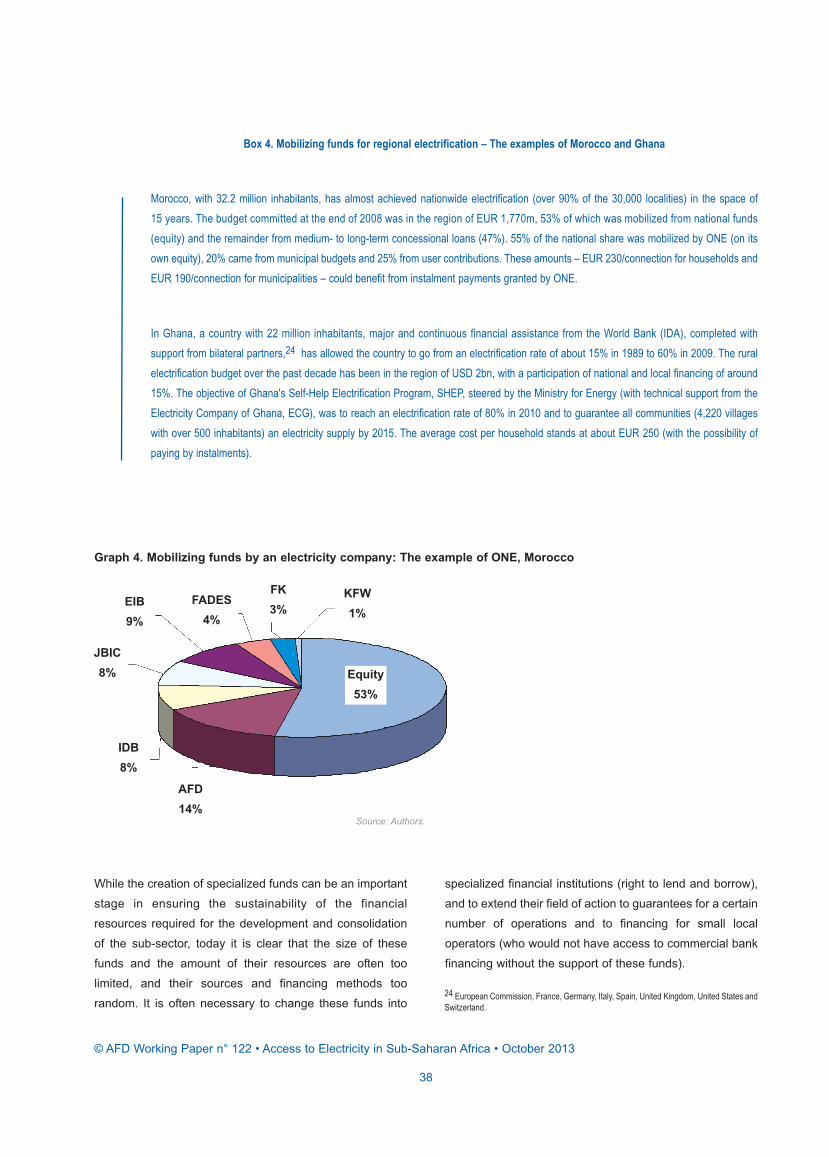
While the creation of specialized funds can be an important
stage in ensuring the sustainability of the financial
resources required for the development and consolidation
of the sub-sector, today it is clear that the size of these
funds and the amount of their resources are often too
limited, and their sources and financing methods too
random. It is often necessary to change these funds into
specialized financial institutions (right to lend and borrow),
and to extend their field of action to guarantees for a certain
number of operations and to financing for small local
operators (who would not have access to commercial bank
financing without the support of these funds).
Box 4. Mobilizing funds for regional electrification – The examples of Morocco and Ghana
Morocco, with 32.2 million inhabitants, has almost achieved nationwide electrification (over 90% of the 30,000 localities) in the space of15 years. The budget committed at the end of 2008 was in the region of EUR 1,770m, 53% of which was mobilized from national funds(equity) and the remainder from medium- to long-term concessional loans (47%). 55% of the national share was mobilized by ONE (on itsown equity), 20% came from municipal budgets and 25% from user contributions. These amounts – EUR 230/connection for households andEUR 190/connection for municipalities – could benefit from instalment payments granted by ONE.
In Ghana, a country with 22 million inhabitants, major and continuous financial assistance from the World Bank (IDA), completed withsupport from bilateral partners,24 has allowed the country to go from an electrification rate of about 15% in 1989 to 60% in 2009. The ruralelectrification budget over the past decade has been in the region of USD 2bn, with a participation of national and local financing of around15%. The objective of Ghana's Self-Help Electrification Program, SHEP, steered by the Ministry for Energy (with technical support from theElectricity Company of Ghana, ECG), was to reach an electrification rate of 80% in 2010 and to guarantee all communities (4,220 villageswith over 500 inhabitants) an electricity supply by 2015. The average cost per household stands at about EUR 250 (with the possibility ofpaying by instalments).
Graph 4. Mobilizing funds by an electricity company: The example of ONE, Morocco
Source: Authors.
24 European Commission, France, Germany, Italy, Spain, United Kingdom, United States andSwitzerland.
© AFD Working Paper n° 122 • Access to Electricity in Sub-Saharan Africa • October 2013
38
Equity53%
KFW1%
AFD14%
IDB8%
JBIC8%
EIB9%
FADES4%
FK3%
We should note here the changing role of local authorities,
which play a central role in countries like France, where
they remain owners of the distribution grids. These entities
benefit from increasing responsibilities, related especially to
the administrative decentralization movements, which are
gaining momentum in a number of African countries.
Moreover, an increasing number of electrification programs
integrate components to promote productive uses of
electricity (Burkina Faso and Senegal, for example). This
clearly appears to be one of the new priorities of the deve-
loping electricity sectors. It requires public assistance,
which may be provided by the local authority, which is
responsible, in this case, for associating private players
with common interests via innovative partnerships: the rural
user, electricity distributor, electrical equipment supplier
and financial partner. In the case of the Moroccan PERG
and, historically, France, local authorities have played a
central role while remaining owners of the distribution grids
whose operation they entrust to a licensee (EDF in France).
1.5.2 Economic and financial regulation: tariffpolicy and contractual framework for themobilization of private stakeholders
Themes that are all different from each other can be
included in this very "general" topic of regulation:
• Mechanisms for review, monitoring-evaluation, control,
sanctions and settling the legal, technical and economic
aspects of disputes;
• Adapting service quality to demand in rural areas, thus
using appropriate technical standards and practices that
will be decisive factors for optimizing investment costs (up
to a third of the amount invested in distribution; this topic
will be discussed in the technical section);
• The selection, training and control (and therefore sanctions)
of the regulatory entity.
It is clear that the countries that have succeeded in
the electrification of their territory only set up a regulatory
agency once a sound electricity infrastructure was in place.
It was only after that issues concerning the plethora of
operators and the end of the integrated monopoly (gene-
ration, transmission, distribution) were addressed, requiring
the introduction of rules (in France, India, Morocco, etc.).
Initially, the ministry can often cumulate the functions of
planning, policy formulation and regulation. As the public
company is dominant, it often edicts de facto rules and
regulations. The fact of creating an ad hoc regulatory
agency will not be sufficient to ensure that the regulation
functions correctly.
Two components will be analyzed below. The first concerns
economic and financial viability; the second relates to the
contractual framework required to foster the mobilization of
private partners.
► Issues concerning economic and financial viability
- Investment financing: the viability and relevance of
the model compared to the available financial resources
(generated by the electricity service itself and external to it);
the subsidy level for the investment that allows a sufficient-
ly attractive profitability for a private operator (for example,
we can note the case of Cambodia that has abandoned this
path and has opted for franchises on national investments);
- Financing the operation, servicing and maintenance of
facilities (which should in principle be covered by tariff
revenues); this is almost impossible in cases depending on
thermal power generation;
- Cross subsidies between different customers, and thus
tariff categories, but within the electricity sector itself: is
equilibrium possible, or are resources external to the sector
needed?
- Tariff principles: equalization, i.e. can one apply the same
tariff for a customer category regardless of its geographical
location, with very different costs, without unreasonably
jeopardizing the financial equilibrium of the sector? The
ability to pay is not the same nationwide and a tariff
differentiation (i.e. a tariff that changes depending on costs
and context) is difficult to accept;
© AFD Working Paper n° 122 • Access to Electricity in Sub-Saharan Africa • October 2013
39

- Cost and price of electricity: there is a considerable
difference between countries that depend on thermal
generation (such as Burkina Faso) and those with
amortized hydropower (such as Cameroon). The energy
price in Sub-Saharan Africa is high, reflecting international
standards. The average tariff in the region rose from USD
0.07/kWh in 2001 to USD 0.13/kWh in 2005, reaching
almost twice the level in other parts of the developing world
and a level comparable to that of high-income countries.
These increases were particularly high in countries depen-
ding on diesel-generated power, where prices rose by USD
0.08/kWh on average, in reaction to skyrocketing oil prices.
Yet, despite these increases, the average tariffs in the
region remain considerably below average operating costs,
at USD 0.27/kWh.
However, both States and power companies have been
caught up by economic reality: Kenya, which mainly
relies on hydropower, is currently experiencing a period of
prolonged drought, combined with underinvestment in its
production facilities. The national company, Kenya Power
Lighting Corporation (KPLC), thus finds itself obliged to
resort to thermal power generation and to pass on this extra
cost in the tariff. The fuel surcharge currently applied
doubles the tariff (roughly between USD 0.10 and USD
0.20) from one month to the next. Consumers thus receive
a much higher bill without prior notice. An analysis of
the electricity tariff levels applied in Sub-Saharan Africa
therefore leads to three observations: these tariffs are, on
average, high; they reflect highly variable generation costs
(countries with abundant hydrocarbon reserves, such as
Nigeria, or that have cheap hydropower, such as Zambia,
can afford to apply low tariffs); a country with a structure of
generation costs (like Madagascar), despite a strong social
motivation (as shown by a "social" tariff block at less than
50% of the normal domestic tariff) will never be able to
reach the levels of countries that have cheap resources;
Graph 5. Amount of financial mobilization for a national electricity access program: The examples of Morocco andGhana compared with other African countries
Source: Authors.
© AFD Working Paper n° 122 • Access to Electricity in Sub-Saharan Africa • October 2013
40
30
25
20
15
10
5
0
RC
I
Bur
kina
Fas
o
Mal
i
Sene
gal
Gha
na
Nig
eria
Cha
d
Cam
eroo
n25
20
15
10
5
0
Mor
occo
Tuni
sia
Alg
eria
Libi
a
Egyp
t
Uga
nda
Ken
ya
Ethi
opia
Zam
bia
RSA
Mad
agas
car
<100 kWh / m
<200 kWh / m,2k W
4k W

- Connection fee: the level of electricity tariffs reflects these
structures with highly contrasting fees, and experience
shows that the main barrier to access is the high
connection fees to be paid by customers. Fees of EUR 100
to EUR 300 are quite normal in Sub-Saharan Africa, which
should be compared with an average yearly energy bill that
generally is less than EUR 50. The "financial package" of
a rural electrification project or program (especially the
subsidy level retained to cover these connection fees) has
a very strong impact on the price of the service. Moreover,
excessive connecting fees generate (i) "spider-web"
phenomena, i.e. “pirate” connections (Benin); (ii) a low
connection rate (Benin and Kenya); and (iii) when associa-
ted with a sub-optimal technique, a slowdown in customer
densification (Kenya).
Countries firmly engaged in grid densification generally
develop reflection on the initial connection fee:
Subsidies through an REF (Burkina Faso, Uganda,
Senegal, etc.);
• Sharing the investment cost (connection cost) between
the different stakeholders: beneficiary households, local
authorities, government, private operators, etc.
• Loans from commercial banks, village banks or micro -
finance institutions to finance the connection fee
(Kenya);
• Prior savings (Central African Republic);
• A specific fund managed by the electricity company,
endowed by donors and dedicated to financing
connection fees. This fund, based on a revolving
mechanism, allows the user to pay for the connection in
instalments; the replenishment of the fund in this way
allows the number of connections to be scaled up.
► Questions concerning the contractual framework to
promote the mobilization of private partners
As the sector cannot earn the resources required to
implement exhaustive access programs, and the State
does not have the necessary means, the search for
financing has been oriented towards private investors. The
instrument for financial regulation can vary depending on
the context:
- Cost-plus system: the licensee declares its costs and a
margin determined on the cost authorized;
- Return on investment regulation: the licensee declares
its costs and the sales prices are authorized according to
a pre-determined rate of return on investment (RRI);
- Authorized sales price level: sales tariffs as part of a
distribution concession;
- Terms of the buy-back contract for energy produced by
the generation unit:25 by the national distributor, or by
major customers located at a certain distance (which
requires permission for access to the grid by third parties);
- Participation in the investments by a public fund and
operating procedures (per connection, per kWh, etc.).
The question the regulator needs to answer is whether the
framework provides sufficient incentives and is sufficiently
transparent to attract private sector investment, and to what
extent: is it realistic to envisage rural electrification conces-
sions (with private investment), or would it not be better to
initially envisage franchises, or an affermage, with public
investment and private management? The next question is
that of the ownership of the infrastructure, which is too often
unclear in access programs: it should certainly remain
public, but a whole host of options are possible, from a
national asset holding company to a local municipality.
► Questions concerning the characteristics of the demand
The characteristics of the demand and its dynamics
obviously have an important impact on the economic
and financial profitability of generation and distribution
investments. In rural (and peri-urban) areas, we generally
see a mostly domestic and weak demand per household,
dominated by audiovisual and lighting needs. This
consumption is characterized by a major evening "peak",
sometimes 3 to 4 times higher than the morning peak, with
a very low daily basis. Developing such daily demand is an
essential point for the profitability of systems in order25 These terms must be differentiated, especially in contexts characterized by theavailability of hydropower and biomass resources with a long return time; the same is true forconnection conditions, which are often binding.
© AFD Working Paper n° 122 • Access to Electricity in Sub-Saharan Africa • October 2013
41

to increase the profitability of the investments through
stronger demand. Moreover, demand in such areas often
saturates with connection rates of about 50% of house-
holds, or even less, due to the high connection fees.
Household unit demand can only increase through a rise in
equipment of domestic appliances and, thus, higher
domestic income levels. The increase in productive and
commercial uses, which is itself positively correlated with
economic development and higher incomes, goes hand-in-
hand with improving the profitability of access programs.
1.5.3 Questions concerning the contractualframework to promote the mobilization ofprivate partners
(Excerpt from a GTZ document)
"(…) the efficiency / knowhow objective of Private Sector
Participation (PSP) deserves attention. If infrastructure
sectors are to benefit from the creativity, flexibility and effi-
ciency of private sector players, and if local private sector
capacity and public sector governance are preventing
success on this account, then the aim for PSP translates
into a need for Private Sector Development on local level.
Developing a functioning private sector in turn requires buil-
ding capacity on micro, meso as well as macro level.
What’s more, if improved efficiency, accountability and
creativity are the primary goal of reform, then PSP would
even include the improvement of public utilities by applying
private sector based management best practices (covering
issues such as salary structure, transparent incentives,
competition and benchmarking)."
Today, a first assessment of the concession and/or privati-
zation contracts used in the urban electricity sector is
mixed, to say the least. The minimum objectives to achieve
for licensees operating in profitable areas (as set out in the
provisions of concession contracts) should have been to
oblige and encourage them to invest in production facilities
(and therefore to mobilize relatively long-term financing)
and to supply the poorest communities, especially in peri-
urban areas. In most cases, however, the licensees have
not achieved these objectives. The assessment shows that
the actual investment level is lower than initially planned,
and that the poorest communities are still waiting for a
secure service. In contrast, Build Operate Transfer (BOT) or
Independent Power Producer (IPP) projects, where a
private investor negotiates an electricity buy-back
agreement with the electricity company, have met with
more success. There are three potential operators:
1. The traditional operator (national public or private
company): Following the wave of sector reforms, few
African countries kept their centralized system. The best
known are Morocco (for its exceptional electrification results
these past years), Tunisia, Kenya and Ghana (which have
a relatively high coverage rate), and, to a certain extent,
Côte d’Ivoire, Gabon and Cameroon. In these countries, the
national company often handled grid extension, even in the
most outlying areas, allocating part of its budget to non-
profitable rural electrification projects, which were partly
financed by taxes on consumption (partly by contributions
from the State or local authorities). Intensification, in both
rural and peri-urban areas, comes later.
2. Private operators: They have little reason to be
interested in energy in rural areas, a niche promising little
profit, except in the case of a high level of co-financing by
the State. This allows a certain degree of profitability for the
concession, which is generally mixed (generation and
distribution). The territory is thus divided into: (i) several
geographical concessions, proposed by the State to the
highest bidder (Senegal), and (ii) non-electrified rural areas
where the absence of profitability obliges the State to set up
an REA managing an REF. These two entities (sometimes
merged into one) are in charge of managing and financing
projects that are studied case-by-case and financed from
available funds, including potential funds from the ministry.
This is, for instance, the case of PCASER in Mali, where
small and medium-sized enterprises (SMEs) take a conces-
sion for a given village, covering power generation and
distribution, with a 75% investment subsidy provided by the
REA (AMADER). In Mauritania, it is the REA that in practice
remains responsible for solar kit or diesel generator
maintenance.
© AFD Working Paper n° 122 • Access to Electricity in Sub-Saharan Africa • October 2013
42

3. Non-governmental entities: With their extensive
experience of Africa’s rural environment, these entities are
potential operators in low-income areas with low energy
consumption. Moreover, NGOs have a real capacity to
define innovative organizational arrangements and to rely
on strong local partners. In the field of energy distribution
management, we increasingly see the emergence of
very local entities, such as local resellers or cooperative
structures, which operate in both peri-urban areas and
villages. Furthermore, while with the development of
the function there are an increasing number of private
enterprises, it should be noted that their roles and
responsibilities vary. This variation is directly related to the
reluctance on the part of public operators and specialized
agencies to entrust the entire management of power
systems to private operators. For small systems and grids,
it can also be explained by the lack of experience and
technical capacity of the candidate companies to manage
these systems. With the national company withdrawing
from rural areas, the question now is how to develop the
expertise in engineering and works supervision that is
essential for maintaining a high-quality nationwide supply.
Diagram 1. Potential operators for providing access to electricity
Source: Authors
© AFD Working Paper n° 122 • Access to Electricity in Sub-Saharan Africa • October 2013
43
• Historical operator→ Bulk sales→ Retail sales
• Licensee→ Geographical→ Technological
• Village cooperatives • Local authorities• Energy service companies
(ESCOs)• Associations and NGOs• Local private resellers of autonomous sytems
Centralized electrification
Decentralized electrification
Essential character of
maintenance

Excerpt from ESMAP26 (2007)
"Today’s levels of energy services fail to meet the needs of
the poor. Worldwide, two billion people rely on traditional
biomass fuels for cooking and 1.6 billion people do not have
access to electricity. (…) This lack of access to quality energy
services, especially electricity, is a situation which
entrenches poverty, constrains the delivery of social
services, limits opportunities for women and girls, and
erodes environmental sustainability at the local, national
and global levels. Ignoring the situation will undermine
economic growth and exacerbate the health and environ-
mental problems now experienced in many parts of the
world."
Creating infrastructure for rural electrification is a key issue
for development. While the necessary institutional and
organizational frameworks are gradually being established,
what technological options are today available to address
this challenge?
2 A continuum of technical, economic and organizational solutions
2.1 Technical and economic framework
2.1.1 Large-scale centralized generation ordistributed generation: Trends in the cost ofrenewable energies
In view of the low coverage rate of power grids in
Sub-Saharan Africa, a program to maximize access to the
electricity service can, depending on the context, consist of:
1. The extension and/or reinforcement of an MV grid to
reach priority localities. However, to supply this grid, power
generation in sufficient quantity and quality, and at an
affordable cost, is needed;
2. Investment in a renewable or diesel generating unit from
500 kW to several MW to supply a region and, if possible,
be connected to the grid to sell surplus production, which is
commonly called "distributed generation";
26 Energy Sector Management Assistance Program.
© AFD Working Paper n° 122 • Access to Electricity in Sub-Saharan Africa • October 2013
45

- Generation is intermittent (daylight hours for solar, or wind
availability for wind) and experiences seasonal variations:
level of sunshine, availability of biomass, variable
hydrology depending on the season (rainy/dry). This may
require the installation of storage facilities or of a diesel
generation back-up.27
The cost of power generation will thus very much depend
on the load factor of the facilities. Indeed, the cost of a kWh
generated will vary enormously depending on whether a
given investment operates at full capacity or not (1,000 or
7,000 hours a year).
Finally, the choice between generation using renewable
energy or thermal sources (coal or fuel oil) is often based on
a choice between a highly capital-intensive investment, but
with a low operating cost, and a cheap investment with high
annual charges.
The cheapest solutions in terms of the levelized cost per
kWh are often not implemented for reasons of technological
expertise and due to the barriers to the initial investment.
Furthermore, due to delays in investments, many countries
faced with urgent demand (even countries with natural
resources and thus potential for cheap power generation)
have no other choice than to invest in facilities that
are commissioned very quickly and have a low initial
investment cost, even if this very rapidly penalizes them in
terms of the cost per kWh (see Box 5).
Box 5. The consequence of investment delays on average generation costs – The example of Cameroon.
In Cameroon, there are currently nine power plants on the Southern Interconnected Grid (SIG): two hydropower plants (Edea and SongLoulou) and seven thermal power plants (Limbé, Oyomabang 1 and 2, Logbada, Bassa 2 and 3 and Bafoussam). While many hydropowerplant sites with varying sizes were studied in the past, according to the Electricity Sector Regulatory Agency (ARSEL), the plants planned forstart-up by 2010 are the thermal plants in Dibamba (commissioned in 2009) and Kribi (commissioned in 2010), the gas-fired thermal plant inKribi with a "take or pay" contract and the heavy fuel oil-fired plant in Dibamba. No forecast data are currently available.
27 Back-up diesel generator, switched on when renewable energy generation is not possible.
© AFD Working Paper n° 122 • Access to Electricity in Sub-Saharan Africa • October 2013
46
3. The creation of a stand-alone grid with its own generation
(generally below 500 kW) for a small locality or cluster of
localities ("village grids");
4. The creation of a park of PV, pico hydro and small-
engine units, either stand-alone or connecting several
families, i.e. "stand-alone distributed generation" (usually
below 5 kW);
5. The densification of connections to existing grids.
The technological paradigm is constantly changing.
Extending the grid over the vast and sparsely populated
areas where almost half of the African population still lives,
using generation sources of tens or hundreds of MW,
is a highly capital-intensive option. Local generation (hydro-
power, biomass-electricity, PV), with its lower investment
costs, offers new opportunities: the unit size of the
generation capacity is smaller, which reduces unit
investments. In addition to the issue of the initial investment
cost, it is necessary to take account of the cost per kWh, by
integrating the variable generation and maintenance
costs over the equipment lifespan. Indeed, while thermal
generation by diesel generators offers the considerable
flexibility of being able to be generated on the consumption
site (thus avoiding the cost of power transmission and
losses), renewable energy has to be made profitable in a
much more difficult context:
- The generation potential (hydropower, wind, biomass,
etc.) must be located near the demand or, if this is not
possible, the additional cost of the power transmission line
must be integrated;

The extremely rapid development of technologies should be
emphasized here: in 2009, manufacturers announced a PV
cost per kWh for units of over 5 MW at less than EUR
0.25/kWh and at about EUR 3,000 per installed kW at the
time of investment in Europe. With recent diesel fuel rises,
PV, biomass and hydroelectric electrification have become
competitive.
It is therefore becoming increasingly complicated to select a
generation technology and organize electrification: new
options are reaching technological maturity and the mass
production phase, uncertainties are growing over oil price
hikes, and a whole host of risks (including climate risk) are
appearing. In addition, distributed generation can be more
effectively managed thanks to new advances in electrical
engineering. Consequently, while up until recently electricity
companies were reluctant to integrate over 30% of this
production, this limit is rapidly increasing thanks to smart
grids.
2.1.2 Centralized generation and grids
Before being able to speak about access for the poorest
communities, energy must be available in sufficient
quantities, at a reasonable cost and with adequate service
quality,28 as tariff levels above all reflect the costs.
Large-scale hydropower projects are today hampered by
debate over environmental impacts. While this situation
is moving in the right direction, there are increasing
uncertainties related to climate change and financial
mobilization. Geothermal energy may also see a revival:
the expansion of geothermal energy along the Rift (which
stretches from Mozambique in the south to Djibouti in
the north) offers major opportunities in terms of potential
energy resources (the overall potential is in the region of
7,000 MW). There is also a growing interest in wind power.
However, the large-scale IPPs that are established today
mainly use gas or heavy fuel oil (emergency barges or
mobile generators). Clean coal generation or the new gas
technologies (Integrated Gasification in Combined Cycle –
IGCC) offer the best opportunities. These transactions are
long and complex: once the legal framework is open, the
PPAs are negotiated on a case-by-case basis, with very
high transaction costs that cannot be amortized on small
investments.
Historically, in Europe, the reduction in the cost per kWh
delivered took place within a paradigm of large centralized
production and interconnected grids (and economies of
scale made possible by a monopoly situation). Today, there
is growing consensus on the relevance of developing
distributed independent generation, connected to the
national power grid. There are many reasons for this:
environmental issues and energy independence, use
of local resources (wind, water, biomass), reduction of
transmission and distribution losses, lower investment
costs for the technical options of local generation, greater
security of supply by reducing the distance between
generation and consumption sites, etc.
Senegal, to avoid finding itself in this type of situation, is seriously considering developing power generation sources that can be integratedinto the interconnected and non-interconnected grids using renewable energy (excluding large hydro). The main sectors studied are wind,biomass (sugarcane bagasse) and PV solar.
28 I.e. without too many power cuts in the case of industrial demand or prolonged load-shedding in the case of agricultural production, but also without having to guarantee a verycostly level of reliability, which would not correspond to the characteristics of rural demand.
© AFD Working Paper n° 122 • Access to Electricity in Sub-Saharan Africa • October 2013
47
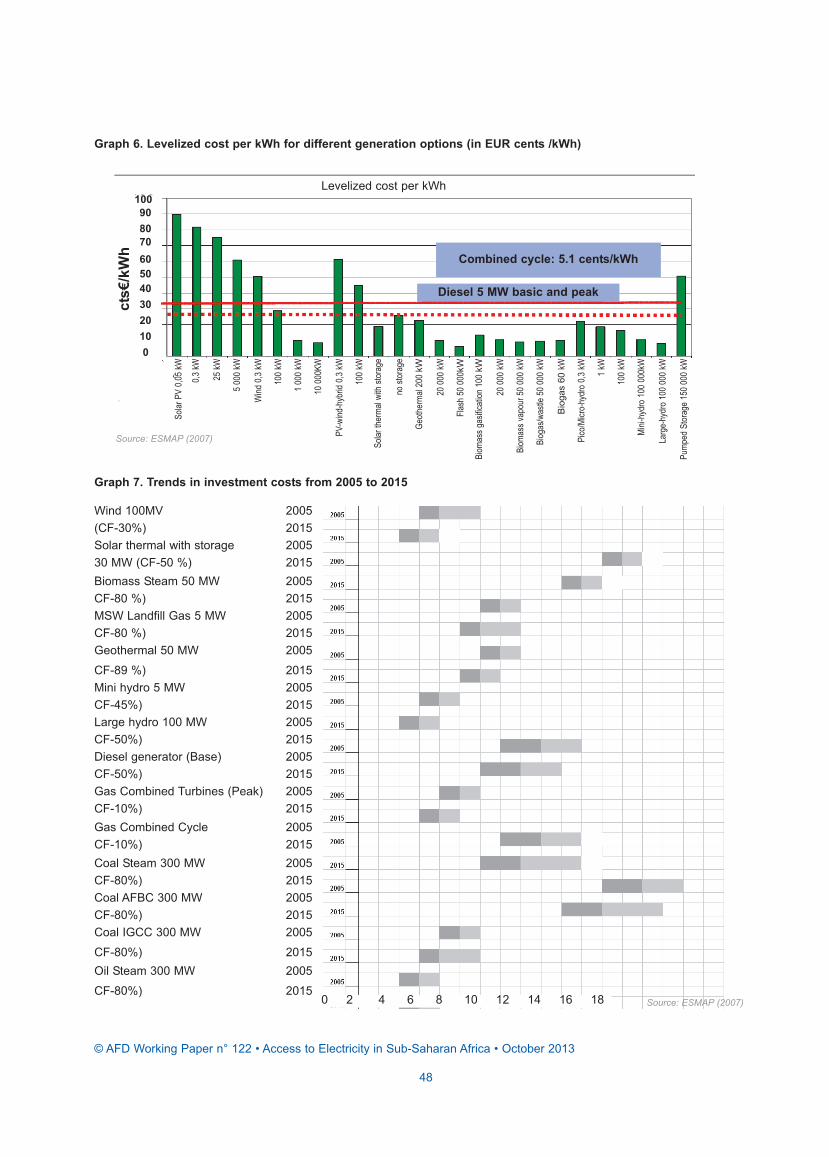
Graph 6. Levelized cost per kWh for different generation options (in EUR cents /kWh)
Graph 7. Trends in investment costs from 2005 to 2015
Source: ESMAP (2007)
© AFD Working Paper n° 122 • Access to Electricity in Sub-Saharan Africa • October 2013
48
Wind 100MV 2005(CF-30%) 2015Solar thermal with storage 200530 MW (CF-50 %) 2015Biomass Steam 50 MW 2005CF-80 %) 2015MSW Landfill Gas 5 MW 2005CF-80 %) 2015Geothermal 50 MW 2005
CF-89 %) 2015Mini hydro 5 MW 2005CF-45%) 2015Large hydro 100 MW 2005CF-50%) 2015Diesel generator (Base) 2005CF-50%) 2015Gas Combined Turbines (Peak) 2005CF-10%) 2015Gas Combined Cycle 2005CF-10%) 2015Coal Steam 300 MW 2005CF-80%) 2015Coal AFBC 300 MW 2005CF-80%) 2015Coal IGCC 300 MW 2005
CF-80%) 2015Oil Steam 300 MW 2005
CF-80%) 20150 2 4 6 8 10 12 14 16 18
Levelized cost per kWh
Combined cycle: 5.1 cents/kWh
Diesel 5 MW basic and peak
1009080706050403020100
cts€
/kW
h
Solar PV 0,05 kW
0,3 kW
25 kW
5 000 kW
Wind 0,3 kW
100 kW
1 000 kW
10 000KW
PV-wind-hybrid 0,3 kW
100 kW
Solar thermal with storage
no storage
Geothermal 200 k
W
20 000 kW
Flash 50 000k
W
Biomass gasification 100 k
W
20 000 kW
Biomass vapour 50 000 kW
Biogas/wastle 50 000 kW
Bio
gas
60 kW
Pico/Micro-hydro 0,3 kW 1 kW
100 kW
Mini-hydro 100 000kW
Large-hydro 100 000 kW
Pumped Storage 150 000 kW
Source: ESMAP (2007)

In Sub-Saharan Africa, given the two current trends –
the difficulty to raise significant amounts for large-scale
generation infrastructure,29 and the development in
electrical engineering (which means that a sizeable power
grid fed by multipoint medium-sized power plants can
be envisaged) – there is a possible shift towards a
new generation scheme, with more medium-sized and
distributed plants, in a context where economies of scale no
longer play the same role as in the past.
Controlling generation costs may be a prerequisite, but it is
not sufficient. Indeed, the cost of HV or MV transmission
and of MV and LV distribution to provide access to commu-
nities requires adding up to 50%, or even 100%, to the
production investment.
Box 6. The share of generation in the cost per kWh – The example of Cambodia
In Cambodia, where less than 10% of the population has access to the electricity service, the average generation cost of EDC (electricitycompany) and for buying from IPPs (gas and heavy fuel oil) stands at USD 0.15/kWh. Imports from Vietnam (IGCC) cost about USD0.08/kWh. The average cost thus stands at about USD 0.11/kWh. In view of the fact that nearby rural households consume 50 kWh per monthwith a load factor of 30%, the average cost for additional transmission and distribution (as well as for technical losses) is USD 0.13/kWh.Generation thus only accounts for half of the kWh cost.
2.1.3 Decentralized generation: Complexregulatory and organizational issues
In order to serve customers, it is important to distinguish
between the distribution activity and the generation activity.
Moreover, in many cases, the operators in charge of these
two tasks are completely separate. As shown in Diagram 2,
the distributor will thus be required to purchase bulk energy
from:
A - The interconnected grid, at a sub-station or transformer;
B - An independent producer (500 kW to 15 MW), which
exploits distributed local generation and sells to one
or more of the following customers: the rural distribution
company; the interconnected grid; one or more major
consumers;
C - An industry that produces its own energy to secure its
supply and sells the surplus.
The two other cases are:
D - A single licensee produces and distributes in one or
several localities – it is therefore village electrification
(generally less than 500 kW); numerous diesel mini-grids
with this configuration are found in Africa;
E – The management of a park of "distributed stand-alone"
solutions, where the generator is located on the site of the
user, thus avoiding the need for a distribution grid (typically,
an individual solar kit or pico hydro).
29 Today, 93% of the economically feasible hydro energy potential in Africa (estimated at937 TWh/year, i.e. one-tenth of the world total), remains unexploited.
© AFD Working Paper n° 122 • Access to Electricity in Sub-Saharan Africa • October 2013
49

In this subsection, we will look at small-scale distributed
generation and at village grids (B, C and D in the list
above), which may have various regulatory frameworks,
with different generation sources (diesel generators,
renewable energy).
Generation isolated from the main grid is not always used
by the electricity company, which focuses more on larger
and centralized infrastructure. Consequently, there are
opportunities for PPPs, with lower unit investments, but
which will require the implementation of a regulatory
framework to give the investors the guarantees they
require for their involvement (for investments that remain
long-term, i.e. over 5 years).
The first stage often involves authorizing industry to
generate for its own needs (security, quality of supply,
distance from national grid), self-generation, with the
possible sale of surplus energy. This possibility may be
very important for the profitability of the agro-industry, or
represent a major diversification for the profitability of the
self-producer, based on the resale conditions authorized
by the regulations. As such, surplus resales will
only solve the problem of access if the buyer is a rural
distributor, or if the national distributor will mobilize this
energy for rural supply.
The second stage involves authorizing power generation
by the private sector; defining the framework for this is
often laborious and complex, and it contributes (or not) to
access to services for communities on various bases:
- For an independent producer to make its investment
profitable, it may seek to resell energy to a company in its
group, or to an external customer, at a price negotiated
by both parties and within a relatively flexible regulatory
framework. This, however, requires that the grid owner
authorizes the use of the grid, or the TPA. In India, this
wheeling scheme, where the carrier levies a percentage
of the energy carried, was one of the triggers of independent
generation.
Similarly, this opportunity turned Moroccan cement
manufacturers into wind farm developers in the north of
the country in order to supply their factories in the south.
Generally, this system results from the aim of integrating
a certain percentage of renewable energy generation;
it does not directly contribute to access for communities,
but for industry, which creates employment.
- If regulations do not allow buy-back by the electricity
company, it is essential that the provisions of the Power
Purchase Agreement (PPA) are clear. Indeed, authorizing
Diagram 2. Possible supply sources for a distributor
Source: Authors.
© AFD Working Paper n° 122 • Access to Electricity in Sub-Saharan Africa • October 2013
50
Economically viableConcessional credit line
Agricultural residue
Electricity company
Rural electrification
Power generation(500kw 10MVV)
Agro-industry
UnprofitableSubsidized investment

it is not enough ; there needs to be a buy-back agreement
over a sufficiently long period to allow the repayment of
loans (it should not be restricted to a single renewable
year as in Indonesia). The calculation method for the buy-
back tariff must also be clearly defined, the two basic
systems being the cost plus system and the cost avoided
by the purchasing national company (and not, as in
Kenya, where at present only a maximum tariff is pub -
lished). As in the case of surplus resales, this system
does not directly contribute to rural electrification, unless
the electricity company carries out grid extensions to sup-
ply unserved areas using this energy.
- However, if the purchaser is a distributor (or the national
company, which will launch a rural program), there is clearly
a contribution to access. But this does require the existence
of such rural distributors and the independent producer must
be willing to sell them its production, depending on their
quality as a counterpart. A rural distributor (cooperative or
village association) is not necessarily considered as a first-
class customer by an investor. There is then the issue of how
the distributor’s purchase price is determined, as it is itself
generally constrained by a tariff structure for users set by
regulation. The system is thus complex and this type of
framework is only in its infancy in Africa.
Box 7. Which buyers can make small-scale private independent generation profitable?Examples from India, Indonesia and the Philippines
In India, where the national electricity supply is insufficient, buy-back conditions have been established to allow a sugar refinery to make anadditional cogeneration investment profitable. Consequently, all the country’s sugar refineries now have cogeneration units, which allow themto optimize the use of biomass residue. In Indonesia, surplus resales are only authorized at a variable generation cost, and with 1-yearcontracts, meaning that none of the self-producers take up this option.
In the Philippines, cooperatives are in charge of rural distribution. They apply tariffs imposed by the regulator and buy back bulk electricity atthis tariff, less a certain percentage that covers the amortization of the distribution grid, technical losses and their margin. If this buy-backprice for the producer is lower than the cost of the energy delivered to the purchase point, the producer must justify its generation cost to theregulator. This entitles it to compensation to allow it to maintain a certain level of profitability.
Diagram 3. Cooperatives and small-scale industry: The stakes of profitability
Source: Authors.
© AFD Working Paper n° 122 • Access to Electricity in Sub-Saharan Africa • October 2013
51
Captivebuyers:private grid
Power generation100 kW to 15 MW
Access to gridby third parties?
Hydrological risk
: Electricity company
Rural electrification Hydro site

- Electrification via mini village grids by a single operator in
charge of generation and distribution is fairly common
today, when it is operated using diesel generators (see
2.1.4). However, in terms of renewable energy it is a
complex configuration:
• It is essential to correctly size generation in terms of
demand, given the substantial investment costs, in
order to ensure the facilities are not underused, which
leads to a high cost per kWh;
• Studies (hydrology, seasonal availability of biomass,
etc.) are long and costly, and thus proportionally even
more expensive since the investment is relatively low;
the expertise required to implement them does not
currently exist at the national or local levels;
• To guarantee service continuity, it is often necessary to
oversize the investment or to acquire a stand-by diesel
generator;
• The decision between the investment cost and the cost
per kWh remains complex.
2.1.4 Thermal or renewable generation: Therole of hybrid solutions.
In view of the complex contractual framework on which this
analysis is based, it is important to reiterate why this
study focuses on this distributed generation: 50% of the
population lives far from existing grids and, even if a grid is
nearby, it is generally not sufficiently supplied to meet
demand at the end of the line. Which generation source
should therefore be selected?
- Local generation by a diesel and/or heavy fuel oil
generator is very widespread and remains the reference
technology; it is controlled and can be rapidly installed
anywhere;
- Investment in a renewable energy generation source is
much more complex: the resource (river, biomass, wind
farm site) is not necessarily located near the consumption
point. Generation is intermittent (i.e. is subject to sudden
changes – wind, daily – sun, and seasonal changes – rain-
fall); the studies and preparation time are thus longer;
- By contrast, while the investment cost is higher, the
subsequent operating costs are very low over the lifespan
of a facility (15 to 50 years, depending on the technology).
However, it is necessary to have the means to invest today
with a view to such long-term generation.
The reality of the situation clearly shows that most off-grid
provincial capitals are supplied by fuel oil or diesel
generators. There are, in fact, very few small-scale hydro-
power or cogeneration plants in operation in Sub-Saharan
Africa; when they operate, they mainly (or fully) meet the
needs of industrial self-generation. The ultimate paradox is
that by maximizing the rapid implementation of a universal
service, thermal solutions are chosen. Hybrid solutions,
combining the flexibility of generation from a diesel
generator with the low, long-term cost of renewable energy
generation, make it possible to avoid the problems of
intermittent generation and today offer highly promising
prospects (see Table 6):
- For “basic” hydro or cogeneration generation, a problem
of oversizing, of dams (reservoirs) or of costly storage is
avoided with a back-up diesel generator;
- For a mini-grid that is mainly supplied by a diesel
generator, the injection of PV kWh when they are
generated during the day reduces diesel costs and the
dependence on cost fluctuations;
- For a mini-grid that is mainly supplied by a diesel
generator, part of the fuel consumed can be directly
substituted by using biodiesel or gas (40 to 80%) instead of
diesel.
© AFD Working Paper n° 122 • Access to Electricity in Sub-Saharan Africa • October 2013
52

2.2.1 Generation by diesel generators: Defaultscenario
Historically, this option for the electrification of both rural
centers and small towns was favored because of its low
investment cost, the simple technology and the rapidly
implemented works. In many countries, low demand
and low population density did not justify extending the
interconnected grid. For this reason, in many Sahel areas,
such as in Burkina Faso, Mali and Mauritania, the
generator remains the basic technical choice for rural
electrification, despite the fact that with a lifespan of
20 years, the diesel option is expensive. For example,
diesel costs account for up to 80% of the cost per kWh of
a generator, making this option even less attractive
considering the fuel transportation costs in isolated areas.
Even at EUR 1 per litre, the cost of fuel over 5 to 10 years
is higher than the amortization cost of solar panels at
present day prices.
The main reasons for choosing diesel as a reference
solution are:
- The low investment cost for a generation unit: about
EUR 600/kW, whereas a PV option requires an investment
ten times higher, i.e. ten times fewer immediate connections.
In this situation, electrification companies prefer to justify
the loans required by making a large number of
connections;
- The fact that this is mature technology and that the
competencies required for maintenance can be found
everywhere. This avoids the training costs required to
introduce less developed technologies (photovoltaics,
gasification, etc.).
Even in countries rich in natural resources such as
Cameroon, Central African Republic (CAR), the Democratic
Republic of Congo (DRC) and Uganda, national political
Table 6. Renewable energy: Investment and kWh costs
Source: Global Chance 2007.
2.2 Complementary technical solutions for the interconnected grid
© AFD Working Paper n° 122 • Access to Electricity in Sub-Saharan Africa • October 2013
53
System Invest. EUR/kW Cost EUR ct /kWh Global installed capacity Operation (hrs/year)
Photovoltaics
On grid 3,000 - 7,000 20 - 40
Isolated 7,000 - 12,000 35 - 100
Wind
On land 1,000 4 - 8 94 GW 2 000-2 500
Off shore 1,200 - 1,500 4 - 8 1,2 GW 2 500-3 000
Water power
Major 1,400 - 2,000 2 - 8 3 000-8 000
Small <10 MW 900 - 4 000 1 - 9,5 48 GW 3 000-8 000
Geothermal 1,000 - 3,900 1,2 - 9 8,9 GW 8 000
Coal 900 - 1,400 4,2 - 5,6 8 000
Fuel / diesel 400 - 1 500 15 - 20 indifferent

and economic contexts have not permitted the imple -
mentation of major programs to develop biomass or small
hydropower (mostly through lack of financing and
incentives). We are too often still in the situation whereby
an operator (national power company or licensee)
with a fixed budget, will be assessed on the number of
connections immediately made, rather than on
the long-term cost of the service provided. The diesel
generator will thus still be essential in the immediate future.
However, with rising fuel prices, the solutions to be applied
should first and foremost aim at lowering diesel
consumption, by systematically integrating the efficiency
of the equipment used and seizing all opportunities for
hybridization.
2.2.2 Small hydropower: Major needs forfinancial capital and know-how
Water resources are abundant in many countries, offering a
whole host of development opportunities and covering the
entire power range, from a few hundred watts to several
megawatts. The very small number of pico (stand-alone),
micro (village, 10 to 200-500 kW) or mini hydro
(200/500 kW to 5/15 MW) facilities is evident when compared
with Asia.
There are very few turbine manufacturing units in Africa
(there are a few workshops in Ethiopia and Nigeria), but
many countries have the industrial base to provide the
maintenance for this equipment. Experiences in promoting
hydropower can serve as examples for Sub-Saharan Africa:
the GTZ micro hydro project in Indonesia (development of
local manufacturing; range <100 kW), or development in Sri
Lanka through a buy-back tariff incentive system. In Africa,
an initiative to develop small hydropower plants for tea
factories was launched in East Africa with the support of
Global Environment Facility (GEF) of the United Nations
Environment Programme (UNEP), in which the consultant
is involved (500 kW to 5 MW hydropower units); a regional
initiative at the stage of site identification (UNDP, GEF in
West and Central Africa); pilot projects are being conducted
in Southern Africa (Rwanda, Tanzania, Zambia) by the
United Nations Industrial Development Organization
(UNIDO) and bilateral cooperation.
► Mini hydropower plants (200/500 kW – 5/15 MW): Issues
related to technical-economic profitability and the impact on
access.
These projects are especially difficult to implement
because they are often oversized for local rural demand.
Amortization is impossible from domestic demand alone
(<100 kWh/month per household). Project profitability
consequently depends on the presence of major customers
(industries, for example), or on the possibility of selling to
the grid. These customers, who are large consumers with a
high ability to pay, allow the investment to be amortized and
the operating costs to be covered in order to develop a rural
component at a lower tariff. This arrangement is only
possible if there is a clear institutional framework and
legislation for resale to the grid, as explained above.
In areas with abundant water resources, hydropower
generation is justified by the fact that operating costs are
almost nil (as they simply concern turbine maintenance).
The major obstacles are the scale of the investment costs
and the complexity of the design studies (see below). As
an order of magnitude, and depending on the turbine, the
electromechanical component of a plant will cost between
USD 500 and USD 1,500/kW and the civil engineering
component can vary between USD 500 and USD 3,000/kW.
Depending on the site, the civil engineering required can be
more or less costly (i.e. water pipes, settling pond,
penstock, water intake and, more rarely, a dam, the size of
which depends on how long the water has to be stored;
turbine house, etc.). There is, in addition, the cost of the
studies required to identify sites and for the design of the
infrastructure and hydrology. This also requires expertise
that is rarely found in Africa.
The implementation of these various stages also implies a
long gestation period. This makes it more difficult to ensure
the support of partners over the entire project life, which
may cover several years (see Table 7).
© AFD Working Paper n° 122 • Access to Electricity in Sub-Saharan Africa • October 2013
54

Run-of-River hydropower is continuous throughout the day,
unlike demand. While supply must follow demand, storage
facilities (costly) are required to be able to turbine in the
evening. In addition to this daily storage, generation over
the year depends on hydrology and its seasonal variations.
Consequently, is it necessary to launch major civil
engineering works to guarantee a capacity throughout the
year?
The presence of a back-up (thermal source independent of
the natural resource) may be necessary to ensure a reliable
service, and provide an interesting alternative to major civil
engineering works, as sizing infrastructure that will be used
little throughout the year leads to a high cost per kWh.
► Village hydropower (micro, 10 to 100 or 500 kW): Many
constraints
For smaller, so-called "village" facilities, it is not possible to
consider launching long, complex and costly studies that
have to be amortized on a few kWh. Hydropower at the
village level to feed a mini-grid is only possible if it is run-of-
river (without water storage) and of simple design. The civil
engineering is reduced (all that is needed is a water pipe
and a small building for the turbine) and many fewer studies
are required. Most of the civil engineering can be handled
locally, by training the relevant stakeholders, initially in
plant maintenance, thus ensuring the project will not be
abandoned at the first breakdown. As a second step, a local
turbine production industry can be set up to minimize
imports, which generate high costs, and thus promote local
development.
However, this system needs to be widely replicated (to
amortize the training costs), to benefit from real know-how
and to be facilitated by clear legislation. Support is required
at the level of (i) the development of local skills, (ii) investment
and (iii) during the definition of the tariff conditions. It is
therefore a long-term process, which requires a real political
commitment from the State, as was the case in Sri Lanka.
► Pico hydro: Skills transfer required
Pico hydro is the use of hydropower by low-power turbines
(typically less than 5 kW) for individual use or shared
between a few families, similar to PV systems. The required
turbines combine the mechanical part and electronic part
in a single part. The use of this technology is therefore
accessible to all. The turbines can be installed with a small
water diversion in order to create a difference in height, but
also directly in a river current. It therefore does not require
much know-how to use them. However, they cannot turbine
during low-water periods, or when there are high water
levels. To maintain low sales prices, most of the Chinese
and Vietnamese equipment has neither regulation nor
protection, which poses safety problems for both the
equipment used and the users.
Many African countries have a hydrology that allows pico
hydro to be installed in isolated villages. This sector, which
is currently not exploited in Africa, can thus be developed
either by importing Asian turbines, or via the development
of a local industry. A technology transfer between the two
continents would therefore appear appropriate and
necessary for the development of a market. Once
© AFD Working Paper n° 122 • Access to Electricity in Sub-Saharan Africa • October 2013
55
Scoping study Duration and dates Costs Financier Number of sitesPre-feasibility 4 months GEF, UNEP, African 8 COUNTRIES
Nov. 05 – March 06 EUR 178, 000 developpement Bank (ADB) 19 sitesFeasibility 5 months EUR 180, 000 GEF, UNEP, ADB 2 sites
Oct. 07 - March 08Studies for the rural 3 years EUR 272, 000 GEF, UNEP, ADB 4 siteselectrification component Jan 07 – Dec 2010Works 1 site under construction 1 site (civil engineering,
1 site under discussion electromechanics, distribution grid GEF, UNEP, ADB 6 sites4 feasability studies of sites supervision): EUR 5.5m (2833 MW)
Table 7. Timetable and design costs for hydropower sites
Source: Authors.

manufacturing is on stream, the cost of a turbine is
affordable, even for low-income rural communities, since –
for low-end material – in the rural areas of Laos, turbines
"rated" 200 W can be found for USD 30.
© AFD Working Paper n° 122 • Access to Electricity in Sub-Saharan Africa • October 2013
56
Box 8. Pico hydro in Laos
Pico hydro developed spontaneously in Asia. In Laos, about 60,000 turbines are operational, although it is difficult to give an exact figure,
and a manufacturing industry has developed, in particular in China and Vietnam. These turbines are often of an average quality and their
lifespan is estimated at about three years. However, it is possible to control production, as the REA attempted to do in Vietnam (by putting
higher quality turbines on the market at competitive prices), or as in the Philippines (which developed their market by importing higher
quality turbines than those from China). The electricity generated is unstable and the lifespan of domestic appliances connected to this
source is shortened in these conditions, as the users do not spontaneously install a regulator. In Laos, for instance, households replace their
light bulbs up to three times a month.
Finally, while the fact that pico hydro is easy to implement is an advantage for rural electrification (it is simple to install a turbine), the use of
electricity by people who are unaware of its dangers, combined with a lack of protection of the facilities, exposes users to a number of risks.
During discussions with these users, they mentioned several accidents. The development of pico hydro must therefore go hand in hand with
awareness-raising for users in terms of how to use it.
Costs range between EUR 20 for a few hundred watts and EUR 500 to EUR 1,000 EUR for a few kW.30
2.2.3 Bioelectricity: Technical sectors andaccess issues to differentiate
► Biomass-based power generation: Resources and
sectors
Like hydropower, biomass-based power generation
depends on the local availability of the resource. It is
thus necessary to make a clear distinction between the
development of plantations for power generation, involving
agricultural and rural development issues, on the one hand,
and the use of agricultural or agro-industry residues, on the
other hand. It would, however, be wrong to systematically
consider this resource as free, as competitive, commercial
uses are being developed (rice husk briquettes, paper
manufacturing, uses for cooking, etc.) Large-scale biofuel
generation for transportation, or small individual or commu-
nity biogas facilities for cooking, will not be discussed here.
Four main power generation sectors for rural services
should be distinguished:
- Cogeneration
- Biogas
- Biodiesel
- Gasification.
30 For more information, visit the site of the Off-Grid Promotion and Support village project,implemented by the government of Laos: www.vopslaos.org

► Agro-industry cogeneration
Cogeneration (the combined production of heat and
electricity) is particularly relevant in the agro-industry,
where there is a need for heat (typically sugar refineries). It
is only appropriate above 500 kW or even one MW. It is, of
course, possible to only produce electricity and not develop
heat production, if it is not required for the process.
This industry is technologically very widespread and proven
in Asia and Latin America, where all the sugar refineries in
India, Brazil and Thailand in particular are equipped with
these units. It is increasingly applied to sectors such
as palm oil production, rice husking plants or the wood
processing industry. There are few projects in Sub-Saharan
Africa, apart from a few facilities in South Africa, Uganda,
Tanzania and Zimbabwe. An ambitious program is,
however, currently being launched, with the support of
UNEP/GEF, to develop cogeneration in Ethiopia, Kenya,
Malawi, Sudan, Swaziland, Tanzania and Uganda (Cogen
for Africa program, coordinated by the NGO
Afrepren/FWD).31
Traditionally, agro-industrial units have low-
temperature/low-pressure boilers and are self-sufficient.
The same quantity of residue, with a high-
temperature/high-pressure boiler, allows a much higher
level of electricity to be generated, but the additional invest-
ment will only be justified for the agro-industry if it can sell
this electricity at a sufficiently attractive price to amortize its
investment.
In Sub-Saharan Africa, the potential is considerable, both in
sugar production areas and wood processing units. It is,
however, the regulatory framework – and the proximity of
an electricity grid – that would provide incentives to develop
this sector. Without an attractive buy-back tariff to supply
the grid or nearby localities, industries will make do with a
basic boiler for their own consumption.
Cogeneration has mainly developed in a self-sufficient
manner over the past decades. Boiler efficiency has impro-
ved, so has the development of the power grid, and it is
today a mature sector with a growing potential, as resale to
the grid is becoming increasingly possible. The available
quantities of biomass produce an electricity surplus, which
is sold externally. A part of it can be fed into the grid (if there
is one) at the national tariff in order to remunerate the
agro-industry, and a part can also target surrounding
villages at a lower tariff (provided a distribution structure
exists to purchase the electricity). In order to establish
this type of scheme, which contributes to access
for communities (who will logically be located near
employment areas where the agro-industries are), it is
essential to have a clear institutional framework, as the
technology is now mature and no longer poses difficulties.
However, the development of the system is primarily
motivated by profitability for agro-industries, which is in any
case a key factor at the worldwide level for determining
sugar prices, for instance.
► From individual biogas to industrial biogas
Biogas is the product of the anaerobic fermentation of
more-or-less liquid waste. The resulting methane can be
used for direct combustion (lighting, cooking), or as mixed
fuel in a diesel generator or small turbine. Electrical
facilities generating up to several MW exist in pig and
chicken farms in Southeast Asia. Dozens of units are
now operating in Malaysia and Thailand, and while the
methanization process (anaerobic digestion) requires a
certain technological supervision, these units have been
operating for several years. The suitability to the context of
Sub-Saharan Africa is certainly farther away, because
of the small number of large livestock farms. However,
"individual" biogas (to produce gas for cooking or lighting at
home) or medium-sized (to run an engine from a few dozen
kW to up to 500 kW, intermittent) has great potential.
However, it should be noted that the adjustment can be
difficult as it depends on the temperature, humidity and the
residue used.
Today, millions of "individual" or community” biogas units
exist in India and China, allowing farmers to produce the
gas required for cooking and lighting from two cow heads.
The so-called "industrial" biogas sector, which uses waste
© AFD Working Paper n° 122 • Access to Electricity in Sub-Saharan Africa • October 2013
57
31 Energy, Environment and Development Network for Africa, ONG basée à Nairobi.
from intensive farming, is widely established in countries
like Denmark, where this gas covers over 15% of heating
needs and power generation. In the Philippines, where
there are strict environmental standards concerning
the treatment of liquid effluents, biogas generation is
systematically integrated into sheep farms, which solves
both the problem of local pollution (liquid effluents) and
improves the profitability of the operation by using this
gas for power generation. While this sector has clear
advantages in terms of increasing the renewable share in
the energy mix, there is no direct link with the issue of
access.
The size that we feel probably has the best potential for
rural access, when legislation allows its resale under
attractive conditions, is that of biogas producing 50 to
500 kW from agro-industry waste or plantations. However,
the complexity of this sector should not be underestimated,
as the "anaerobic digestion" process must be adapted to
the type of biomass and its degree of liquidity.
Nevertheless, some projects are beginning to emerge in
Africa, in Kenya for instance.
► Short supply chains of biofuel and gasification: Reducing
the share of fuel oil in generator consumption
Gasification allows biomass residues to be used by
transforming them through pyrolysis into a gas that can be
used in a standard engine, just as biodiesel can be mixed
with diesel. The gasification of wood, rice hulks, coconut
shells, coffee, palm oil and rubber plantation pruning
residue presents a huge potential that ranges from several
tens of kW to between 1 and 2 MW. The gasification
process (pyrolysis) is specific for each residue, which
makes its industrial application somewhat difficult. Until
now, it has been especially supported by academic
structures before passing to an industrial stage (especially
in India). Replication of the process is thus not as easy as
for a "universal" generator, as it requires a certain capabi-
lity of the local industrial base. However, targeted skills
transfers and dissemination programs are quite feasible
and are in fact ongoing, such as the transfer of knowledge
from India to Cambodia for gasifiers using rice hulks for a
generation capacity of between 100 and 300 kW. In the
African context, the focus will be more on the injection of
this gas into generators rather than gas production alone,
which is risky in terms of service continuity.
In practice, gasifiers can make villages that have sufficient
biomass potential self-sufficient. There are some examples
of gasification rural electrification (in Madagascar, or via a
nationwide project in India). The most commonly encountered
problem is that of the maintenance of this type of unit, which
requires local skills: quality of the fuel, air supply and
temperature management, gas filtration. A local technology
transfer reduces costs, as the gasifier can be made using
local materials. With the current level of command of these
sectors in the contexts we are considering, it is preferable
to use hybrid diesel in these sectors rather than a single-
fuel source.
In terms of biofuels, the so-called “first-generation”
agrofuels have reached technological maturity and are an
energy source than can be developed locally. There are
several options:
- Ethanol obtained from the fermentation and distillation of
biomass rich in sugar, starch or cellulose (sugarcane, sweet
sorghum or maize, wheat, manioc). It has to be used either
mixed or in specially adapted engines, just like vegetable
oils. Its transformation is expensive, especially due to
transportation costs;
- Pure vegetable oils, obtained from pressing oil-rich bio-
mass (in Africa, palm oil, jatropha, rape seed, soy, algae,
etc.), can be used in tractors or stationary engines, with
special precautions when starting up the engines;
- Biodiesel, obtained from the esterification of such
vegetable oils, can be used in any diesel engine (<30%, or
more after simple modifications).
Today, we are still in the pilot stages of such uses, with
open-ended questions concerning surfaces areas, inputs,
yields and capacity. The initial analyses seem to indicate
that under good conditions (reasonable yields without the
need for too many inputs), biodiesel might be competitive
with diesel above USD 70/barrel in isolated areas.
© AFD Working Paper n° 122 • Access to Electricity in Sub-Saharan Africa • October 2013
58

These options offer a high level of flexibility, because
biogas and biofuels are injected into diesel generators
without being modified, and any fluctuation in biomass
generation can be offset by increasing diesel input (see
Box 9). The difficulties will come from issues concerning:
- The reliability of biomass supply (residues, competitive
uses, seasonal variations) and, in the case of dedicated
plantations, the question of plantation management;
- Technical skills, which have to be found in each village
and require establishing an effective regional network of
local technicians. This has to be planned in partnership
with an REA as part of a large-scale program.
© AFD Working Paper n° 122 • Access to Electricity in Sub-Saharan Africa • October 2013
59
Box 9. Examples of biodiesel and gasification projects
The University of Louvain, Belgium, has conducted a feasibility study for a biomass-electricity project in rural areas in Burkina Faso. Based
on various available types of biomass and on several different technologies, the study showed that yields depended on the biomass used,
and that wood was the best candidate for gasification (although cotton stalks, among others, also gave interesting yields). The "all wood"
option requires a higher initial investment, but produces a cheaper kWh than a "dual fuel" option (using 20% diesel and 80% wood).
Whatever the option selected, the cost per kWh produced is 25 to 33% lower than the kWh produced by a standard system. Researchers
have also developed an easily built concrete gasifier.
While wood is the most common fuel, and we can consider that wood gasification is competitive with diesel when it costs over USD 0.90/litre,
the rice hulk sector is also being developed. Cambodia, for instance, sells its Angkur rice-hulk gasifiers in India at USD 65,000 for a 150 kW
unit and USD 75,000 for a 200 kW unit.
In Mali, the national program to exploit the jatropha (pourghere) plant for energy use (PNVEP) aims to develop the use of jatropha oil for rural
electrification and vehicle fuel. The first phase (2004-2008) installed five generators using this fuel, for a budget of FCFA 700m. A 50 kW
generator was commissioned in the pilot village Kéléya, with a jatropha oil extraction unit and the cultivation of 0.5 ha of this plant. Twenty
subscribers (including most of the administrative buildings) were thus connected to a 2 km grid. On a larger scale, AMADER (which has
already financed several diesel generators and small grids) could support the installation of a biodiesel production unit, with an obligation to
purchase for the PCASER that are financed.

2.2.4 Photovoltaics (PV): Are prices sure to fall?
The much expected reduction in the price of photovoltaic
panels has been well underway since early 2009. While only
a few years ago, a 50 Wc solar kit cost USD 500, today this
equipment, which is manufactured in Asia (and certified in
Europe), can be found for less than half that price. Industry –
driven by major European, Japanese and American pro-
grams, which have led to large-scale investments in genera-
tion capacity and in electronics to integrate renewable energy
into smart grids – has scaled up its generation capacity, and
the eagerly awaited "One Euro per Peak Watt" will soon be
reached. It is essential, however, not to confuse panel price
and the total cost of the system, especially for stand-alone
systems, for which there is also the cost of storing the power
produced during daylight hours (batteries for lighting or water
tower for pumping).
► Hybrid PV/diesel mini grids: A sector with great potential
Photovoltaics might well become the first hybridization option:
sunshine is almost constant in the country and a resource
much easier to mobilize than biomass or water. The weak
point of PV is its necessarily diurnal production, whereas in
rural areas the demand is often nocturnal. Electricity storage
in batteries remains very expensive, whereas in direct
injection into the (mini) grid during the day, it is competitive
with diesel, as is shown by the example of Mauritania
(Box 10). Moreover, as long as less than 20% of solar energy
is injected, there is no problem to manage the intermittent
production.
© AFD Working Paper n° 122 • Access to Electricity in Sub-Saharan Africa • October 2013
60
Diagram 4. The stages of a biodiesel and gasification project
Source: Authors
PLEASER unable to cover
operating costs
Local operator,
Mali : PCASER
Competencepole
Investmentgrant...~ 80%
biodiesel
Rural electrification agency/fund(AMADER)
Technical Financial support

► Solar kits: Lessons learned from programs
Solar kit projects have rapidly developed over the past
two decades and, for a time, gave hope for the "total"
electrification of rural areas. While it is true that the cost of
a "typical" domestic solar kit of 50 Wc (lighting, radio and
TV for 3 to 6 hours a day) has decreased by almost 50%
in 15 years, this electrification scheme has not had the
expected impact, in particular for the following reasons:
- The service provided is limited to lighting, the telephone
and radio/TV (for a few hours a day and for the most
powerful systems). It can include ventilation and some
refrigeration. While "connectivity" is becoming a key
factor of development, we can nevertheless see that if
communities have to choose PV now and the grid later,
they often prefer to wait a few years more to have the "real"
powerful electricity service;
© AFD Working Paper n° 122 • Access to Electricity in Sub-Saharan Africa • October 2013
61
Diagram 5. The various stages of a project for PV electricity injection
Source: AIE PVPS Task 9.
Box 10. Example of a hybrid PV-diesel project in Mauritania
Today, the town of M’Bout in Mauritania is supplied by a 280 kW thermal power plant. A study was conducted for the installation of a hybridPV/diesel grid, injecting 20 kW PV. The injection is made in small quantities in order to reduce diesel consumption, but without requiring abattery to store the solar energy.
The cost calculation showed that the power generation from photovoltaics, (based on a PV investment of EUR 7,000 per Wc) would costthe same as diesel electricity with a diesel cost starting at EUR 0.75/litre. As its price in November 2008 stood at EUR 0.83/litre, the PVinvestment was profitable at the time.
Lower investment costs can be borne by
small stand-alone operators
Source: IEA PVPS Task 9.
National power company
Borrows and maximizes thenumber of connections overthe short term
But has high operating costsin the long term
National power company
Does not want to use itsborrowing capacity forfew connections per $
Despite the guaranteedlong-term sustainability
Investment EUR 700 /kWkW cost: 80% fuelDiesel at 90 cents/litreCost >30 cents/kWh
Investment EUR 8,000/kWCost: 20-25 cents/kWh with long-term financing and no battery storage
Solar energy injection
Generator

- The technical and financial management (maintenance of
the electronics, replacement of batteries and low-energy
light bulbs – LELBs, payment collection) is much more
costly than initially expected. The cost of local management
can only be "amortized" over a large number of systems in
the smallest possible area. However, it is clear that where
communities are concentrated, the option of mini grids will
be selected. Consequently, and especially since the rise in
oil prices, transportation costs represent a considerable
part of the recurrent costs of programs. In reality, the larger
the program, the more it extends to remote areas
(which are scattered with low incomes), and the more the
management costs will increase. Here we are thus dealing
with "dis-economies" of scale. While prepayment (see
2.3.2) can be an interesting option (at least for monthly
payments), the prepaid meter can only be amortized over a
relatively large system (>100 Wc).
A rich literature exists on these subjects (see IEA
Photovoltaic Power Systems: Deployment in Developing
Regions).32
There are three main methods for distributing solar kits:
► A "commercial" approach, where the users pay the
entire price of the system; this approach has the following
characteristics:
• Installers or a local (micro)-credit structure can grant
payment facilities. To do so, the installers (generally local
SMEs) must be able to benefit from refinancing. However,
the scarcity of this type of facility blocks the dissemination
of the system;
• Payment facilities are for a maximum of three years, and
the users have monthly payments of USD 8 to USD 15
(for individual domestic systems), meaning that only the
wealthiest part of the population will have access;
• Once the installation has been made, or the credit paid
back, the user owns the solar system and is responsible for
its maintenance;
• The installer will only set up a local maintenance office if it
is justified by the "market" (this is commonly done through
shops selling electrical and electronic equipment in districts
or provinces);
• This is a booming market, for example in East Africa,
where many wealthy landowners install large-scale PV
systems; it does not concern agricultural laborers or small
owners;
• For the poorer population segments to benefit from this
service, a major investment subsidy is necessary (50% of
the cost). This may, or may not, be considered as a priority
for public resources.
► A so-called "fee for service" approach: The customer
pays an initial sum at the installation (equivalent, for
instance, to the connection fee for a grid service) and then
a fixed monthly fee, and the supplier handles operations
and maintenance. In certain programs, the user becomes
the owner of the equipment after a certain period, for
instance after 10 years; in others, the licensee must renew
the equipment (in cases where the grid has not yet arrived);
finally, in many cases this question of ownership remains
vague. Many such programs are now operational, and we
can benefit from information feedback covering several
years. The conclusion is relatively unanimous: this type of
approach has considerable potential, and the development
of equipment for increasingly efficient uses makes it
possible to improve the service provided by PV-based
electricity (which remains expensive). However, overall
viability is only reached when operations become entirely
local and with local costs. Skills are being developed and
national scaling up will involve a political will to disseminate
this type of set-up and develop the required expertise.
Monthly fees may, depending on the case and/or for poli -
tical reasons, cover just operation and the replacement of
the electronic components (batteries, rectifier, regulator) of
all the PV panels (or only part of them). International
cooperation is strongly represented in this niche, especially
through NGOs and foundations, which are used to working
closely with local communities.
© AFD Working Paper n° 122 • Access to Electricity in Sub-Saharan Africa • October 2013
62
32 Contains a dozen practical guides, ranging from financing to trainer accreditation.www.iea-pvps.org –Tasks – Ongoing – Task 9.

► PV for community, social or productive uses:
• Community uses include services such as streetlights or
lighting for a village hall. This is often appreciated in village
dynamics. Its cost should be covered by the community;
• Productive uses are very rare for solar applications
because of the high cost of solar kWh, which does not
really allow power uses. However, in areas where water is
scarce, solar energy can be used for drip irrigation (which
involves little water displacement);
• These so-called "productive" uses are different from
services that directly or indirectly generate revenue:
recharging cell phones or night lighting, allowing women to
extend their weaving hours, etc.
• PV also serves certain essential social uses, such as
installing drinking water pumping systems, lighting in
health centers, or the refrigeration of vaccines. However,
for these applications the recurrent question is: Who
finances the investment? In general, the electricity sector
does not pay the cost of these investments, which must be
borne by the structures and/or ministries in charge of health
or rural development, for instance, or even the communities
themselves, which may be difficult. In fact, such programs
generally finance the initial investment for a diesel
generator, and the local community then has to cover the
recurring costs, which can create serious problems.
Changing to a solar investment requires the investor to be
willing to make a much higher investment and to have the
means to command this technology. For this reason, we
increasingly see the use of paid-for services to cover a
minimum of the operating costs.
© AFD Working Paper n° 122 • Access to Electricity in Sub-Saharan Africa • October 2013
63

© AFD Working Paper n° 122 • Access to Electricity in Sub-Saharan Africa • October 2013
64
Mature
technology,
can be locally
repaired
Easy supply,
many local
representatives
Construction
work well
understood
Rapidity of
works and
of coming
on stream
Many technicians
trained who can
ensure maintenance
Investment
costOperating cost
Simplicity
of financial
arrangement
Environmental
impact
Diesel SS SS S SS SS S WW S WW
Hydro with dam SS S S WW W W SS W W
Run-of-river turbine
(little civil engineering)S S
Need for training
Co-generation (>500
kW <2 MW)SS S S S SS S S SS S
Industrial biogas
>500 kWSS WW W S S S S SS S
Generally
associated with
agro-industry
Boilers and engines
available; problem
is engineering and
buy-back of surplus
Located near
agro-industry,
i.e. engineers
and demand
Industry leads
project
Allows waste
re-use
Gasifier
20 to 500 kWWW W S W S W W W
Difficult
to implement
in rural areas
Effluents
Isolated domestic
and community PV
solar systems, hybrid
PV-diesel in mini grid,
PV connected to grid
SS SS SS S S WW SS WW SS
PV and PV-diesel grids SS W S S W WW S WW SS
As soon as
spare parts
are available
Table 8. SWOT* analysis of the technical options * Strengths, Weaknesses, Opportunities, Threats
STRENGTHS (S) and WEAKNESSES (W)

© AFD Working Paper n° 122 • Access to Electricity in Sub-Saharan Africa • October 2013
65
Variability of
kWh cost
Long-term
kWh cost
Generation
configuration that
can be adapted to
demand
Location of
generation and
demand
Hybrid solutions
to increase the
overall optimum
Sensitivity to
external factors
Cumbersome
nature of the
administrative
procedure
Stable and
well-formulated
regulatory
framework
Diesel TT TT SS SS O TT
Hydro with dam S SS S WW O O TT O
Run-of-river turbine
(little civil
engineering)
W OO T
Generation on
a specific site
Possibility of a grid
HydrologyStarting
in a few countries
Co-generation
(>500 kW <2 MW)S S S S T T T
Industrial biogas
>500 kWS S S S O T T T
Competing uses
of biomass
For resale
of surplus
Few or no countries
have a specific policy
Gasifier
20 to 500 kWS S S S OO T T T
Collection,
plantations
Requires
contracts LT
Few or no countries
have a specific policy
Isolated domestic
and community
PV solar systems,
hybrid PV-diesel
in mini grid,
PV connected
to grid.
SS S S SS O OO O O
PV and
PV-diesel gridsSS S W SS O OO T T
Competitive in
some segments,
and improving
Diurnal generation
is a problem,
requiring storage
for nocturnal
demand
Modularity versus
increasing demand
Have to import
sophisticated
components
Simple as,
generally,
no connection
to a grid.
Start of fiscal
incentive policies
OPPORTUNITIES (O) and THREATS (T)

© AFD Working Paper n° 122 • Access to Electricity in Sub-Saharan Africa • October 2013
66
Potential on the
continent
Investors’ appetite –
risks controlled
Investors’ appetite – time
for return on investment
Investors’ appetite –
LT profitability
Engineering expertise
national technique
Manufactured
nationally
Diesel OO O TT T
Hydro with dam OO TT TT OO TT O
Run-of-river option
(little civil engineering)T O
Geographical
variations
Training
in due diligence
Need for innovative
financial engineering
Need for innovative
financial engineering
Need for training
and quality control
Small turbines
with the market
Co-generation
(>500 kW <2 MW)O O O OO T O
Industrial biogas
>500 kW0 T O O TT TT
Need for information
and training (biogas)
Gasifier
20 to 500 kWOO T OO O TT T
Isolated domestic
and community PV
solar systems, hybrid
PV-diesel in mini grid,
PV connected to grid
OO O T T OO O
PV and PV-diesel grids OO O TT O O O
Technologically,
the problems are known
and the resource
controllable
Strong interest
from investors
and industry,
despite small size
of investments
Engineering to be built,
easily transferrable
The definition
of opportunity
is restricted
to assembly here
Source: Authors.
OPPORTUNITIES (O) and THREATS (T)

2.3.1 Significant potential for lowering costs bytaking the time to choose options
Electricity distribution techniques have an impact on
investment costs and, thus, on the profitability of the sector.
Innovative approaches can also help to reach an a priori
non-profitable customer segment (such as rural or
peri-urban households). Electrification systems should thus
be designed in an integrated manner in order to optimize
not only the investment, but also the operating,
maintenance and customer management costs.
Usual practice often leads to overestimating demand and,
consequently, to oversizing the grids (cable sections,
transformer capacity). This practice is often the result of a
lack of openness to alternative technology and a certain
mistrust of light technologies, which are considered as
downgrading. However, in terms of norms and standards,
a more widespread use of single-phase grids, a
more controlled sizing of transformer specifications,
adapting constraints to the poles, and accepting cable
sections that match effective demand, are all ways to
significantly reduce investment costs. Very often, studies
reproduce the usual equipment choices based on practice,
without any specific sizing, whereas a correct sizing
involves: (i) defining the prospects and forecasting the
loads, (ii) specifying the technical limits (overloads, voltage
drops, engine start-ups), and (iii) reinforcing upstream grid
sections and reducing the downstream sections.
These structural solutions require a fundamental change
in practices and, for this reason, are often difficult to
implement. An optimized approach to the technological
dimension can lead to overall savings of around 30%
compared to usual practices, or can extend the lifespan of
the grids by 10 years. Cost reduction is a lengthy process
that requires the support of all stakeholders and a strong
political will to change long-established habits.
Further flexibility exists in terms of program management,
and more specifically in policies for procurement and the
implementation of facilities, whereas usual practice is
based on turnkey contracts that avoid setting up project
management structures. Using a central procurement
service and segmenting supplies can reduce procurement
costs by 20 to 30%.
This local involvement obviously requires building the
capacities of the contracting authority/project management
in order to guarantee the quality of supplies and facilities.
This strengthening implies costs that absorb part of
the gains. This capacity building can, of course, only
be achieved within the framework of a large-scale
electrification program.
Restoring project management to a national level should
also allow a cost review for the installation of electrical
equipment. In certain turnkey electrification programs,
installation costs can be as much as 50% of the overall
cost: national management will ensure that this type of cost
is reduced by creating competition in the installation sector.
The organization of negotiations with companies, the
search for new suppliers and a new bid invitation as part of
a rural electrification program in Burkina Faso led to a
reduction in the total installation cost of two mini grids of
almost 35%.
A new approach to program implementation can also, and
this is the major interest of this solution, give incentives to
set up a national system of companies with a capacity
to directly work on the electrification program (sizing,
installation, etc.) or indirectly (supply of wooden poles, elec-
trical equipment, etc.). The same is true for companies
called on for the operation and preventive maintenance of
the facilities. A national survey will establish and update a
pool of potential operators and equipment suppliers.
© AFD Working Paper n° 122 • Access to Electricity in Sub-Saharan Africa • October 2013
67
2.3 Distribution and customer management: Substantial leeway

2.3.2 Adapting customer management to localconditions
► Costs and organization
The two main basic pricing models are related to
distribution techniques: a lump-sum payment for an
electricity service (e.g. fee-for-service, an amount based
on the number of lamps or a duration of use) or a power
limiter; payment in proportion to the amount of electricity
consumed based on a grid approach (meter). The usual
approach can be summarized as follows:
• Power distribution grid = unit sale of energy,
• Electrification for low demand = sale of service.
Electricity companies, governed by a supply culture, thus
operate from a customer-management logic based on the
unit sale of energy that is materialized by the following
cycle: energy metering-billing-collection.
In Africa, so-called "non-technical" losses on power
distribution grids are often in excess of 10% (fraud, theft,
etc.). There are, in addition, unpaid bills, which are also
often in excess of 10% of the distributed electricity,
meaning that total losses (also including technical losses
due to the state of the grid condition) for electricity
companies can sometimes reach or exceed 30%.
Improving customer management in particular requires
improving billing collection. However, this comes up
against obvious financial limits: the electricity companies
cannot afford to increase their billing collection costs (on
average 10% of turnover) by increasing the number of
staff for payment collection, which on a unitary basis is low
in low-income areas.
Faced with these constraints, new organizational
approaches to customer management are being
developed. These new systems are based on taking more
account of the socio-economic characteristics of
© AFD Working Paper n° 122 • Access to Electricity in Sub-Saharan Africa • October 2013
68
Box 11. Cost reductions in Benin thanks to upstream optimization of technical and sizing choices
Thanks to the optimization described below, the project has allowed 102 localities to be connected instead of the 56 initially planned, at
constant cost:
- Two-phase derivation: 20% gain compared to a three-phase derivation;
- Use of Single Wire Earth Return (SWER): gain of up to 70% compared to a three-phase antenna. Introducing SWER requires a minimum
of steps to ensure it is appropriated at national level. This ensures that the projects can be implemented in as flexible a way as possible;
- Systematic use of wooden poles wherever it is technically possible and economically profitable (gain of 5% to 15% on the line);
- Use of mechanical calculation software for overhead grids (particularly to optimize lines using the suspended technique);
- As part of a project, segmenting supplies substantially reduced the cost per km of a line: from FCFA 12m to FCFA 10m (-20%);
- Supplies from international markets for each component (cables, transformers, etc.) and only the installation was subcontracted locally, as
the prices are much lower than in all the other Central African countries.
Source: IED – Rural electrification project in Benin, financed GTZ-AFD – European Commission Energy Facility.

customers. This constitutes a major change in electricity
companies, which often have little interest in interfacing
with customers. Consequently, there is a move towards a
variety of organizational approaches, which aim to lower
costs for meter reading and bill processing: installation of
collective meters (one meter for several customers), and
monthly flat-fee sales in peri-urban areas where there is
low energy demand.
These approaches require the involvement of local
communities (traditional, cooperatives). In Eritrea, for
instance, each village sets up an electrification committee
in charge of customer relations inside the village. The
electricity company sells bulk energy to the village, which
is in charge of retail distribution and, thus, of collecting the
corresponding payment from each user.
However, when the main licensees withdraw from the cus-
tomer interface, the question is raised as to service quali-
ty at the end of the line: How can the licensee be respon-
sible for the service quality provided by the cooperative at
the end of the line?
► Prepayment: An interesting customer management tool
Prepayment is a commercial management method that
aims to charge the customer for a service before this
service is used. It is a very practical payment method
for cell phones (cell phone recharge with cards) and
increasingly in other market sectors, such as gas and even
water. This credit recharge can be bought from an electri-
city distributor, from an official sales point, via an automa-
tic sales system, or even with a cell phone (or, in certain
cases, via Internet). Electricity prepayment has existed for
a long time, especially in England where it serves about
half the population. In South Africa, most towns were
equipped with prepaid electricity as part of the national
"Power for All" equipment program. African countries, such
as Côte d’Ivoire, Gabon, Morocco and Senegal have
launched prepayment projects due to the bill collection
problems faced by national electricity companies. Today, it
is estimated that there are over 4 million meters installed in
South Africa, 50,000 in Nigeria, 40,000 in Namibia, and
10,000 in Côte d’Ivoire and Senegal.
Prepayment is based on pre-metering electricity. The
prepayment meter measures the energy consumed and
compares it with the available credit level purchased by
the customer. The meter stops the supply when the credit
is exhausted or when the subscribed power level is
exceeded.
Prepayment is successful today because it offers several
advantages:
- For the electricity distribution company, prepayment
improves cash flow (as customers pay before using the
electricity); it reduces bill collection problems (as the
customer does not get electricity if it has not paid in
advance); it reduces meter-reading costs and limits fraud
when split meters are used (see below);
- For customers, prepayment makes it possible to
anticipate their consumption, “pay as you go” depending
on what they can afford, adapt their consumption and
avoid "unforeseen" bills.
There are two types of prepayment system:
- One-way prepayment: Consumers buy an electricity credit
using a key, code, or smart card, depending on the type of
meter; the corresponding amount is then credited on their
meter. Data only move in one way, from seller to meter;
- Two-way prepayment, which is more complex: while this
electricity credit is again purchased by means of a key,
code, or smart card (depending on the type of meter),
once the code has been entered, the data flow in both
directions, from and to the meter. The meter is credited
and supplies data such as the meter reading, error codes,
etc. When the support is recharged by the sales point, the
data stored are transmitted to the central management
system. This system allows the distributor to recover
meter data that can help it to more effectively manage
generation: customer consumption, fraud, and a
comparison of the subscribed and used power.
While postpayment requires a large number of operations
(especially in the case of collection problems),
© AFD Working Paper n° 122 • Access to Electricity in Sub-Saharan Africa • October 2013
69

prepayment reduces such operations and interactions
between the distributor and customer; this last point,
however, is subject to criticism.
In the prepayment cycle, the distributor's cash flow is
always positive (paid energy > consumed energy)
whereas in the case of conventional payment, it is always
negative33, as even at the moment of billing for a period,
consumption for the next period has already started,
returning the distributor's cash flow to negative towards
the customer (consumed energy > paid energy).
Prepayment is a tool that improves collection, as the
energy is only distributed once it has been paid for.
According to several African electricity distributors,
prepayment covers the 15% of annual debts that are
never paid.34 Prepayment is, however, not a tool to
combat fraud by itself. In fact, it tends to encourage it,
because physical controls are less frequent as there are
no longer meters to read. Certain customers can thus be
tempted to “shunt” the meter, i.e. hook up to the grid by
putting a cable before the meter.35
Prepayment is commonly seen as a means of supplying
energy to the poorest, as the distributors can equip
commercially risky areas without fears of massive
non-payment. However, to be a tool to fight against
poverty, these poor areas need tariffs that are equivalent
to the conventional ones, especially the social tariff, which
has now become possible thanks to many prepayment
management software packages.36
Beyond the unquestionable advantage of improving the
collection rate, prepayment should not be seen as the
panacea for all the distribution management dysfunctions
a power company needs to face in a developing country.
Setting up a prepayment system must be evaluated and
assessed in the light of the following elements:
- Changes in tasks: Prepayment introduces many
changes in the organization of distribution, starting with
fewer meter readings. This innovation, which can allow a
reassignment of tasks at the distributor’s or even a staff
reduction, is, however, based on technologies that are
more complex than traditional meter reading. This
requires a higher level of skills and a major adaptation of
existing staff, especially concerning meter installation and
computer management systems;
- Fraud remains possible: Prepayment does not
automatically imply fewer fraudulent practices because of
the physical absence of meter readers;
- Investment costs: Even though prepayment meters can
be rapidly amortized due to the gains in terms of collection
and the improvement in cash flow, they are more
expensive than traditional meters (about 30 to 40%);
- Reduced consumption: Various studies have shown
an average decrease in electricity consumption per
household of about 20% when a prepayment system is
installed;
- Customer base must be diversified: Prepayment should
not only address poor customers; in order to ensure that it
is profitable and the distributor benefits from its positive
effects (reduced management costs, cash flow savings,
fewer unpaid bills), it must also be developed for more
affluent customers and small industry, which are more
likely to cause scale effects;
- Introduction in rural areas remains difficult: In some rural
areas, the distance to a sales point is penalizing; when
coverage exists, cell phones offer interesting prospects.
© AFD Working Paper n° 122 • Access to Electricity in Sub-Saharan Africa • October 2013
70
33 Except in the case of advance payment (guarantee). 34 In some countries, institutional customers (administrations, police) tend not to pay theirbills. Setting up prepayment is one of the possible measures to make them face theirresponsibility.35 Prepayment systems propose various anti-fraud techniques: installation of split meters(keyboard to enter coupons and meter are separate), with the meter installed on the pole,which makes bypassing meters more difficult; installation of tamper-proof coaxial cablesbetween the pole and the meter (in the case of monoblock meters). This solution is relativelyexpensive and is only possible when there is a short distance between the pole and the meterand the risk of fraud is high.36 The differentiation of energy tariffs has long been a technical obstacle, as the first pre-payment systems were unable to manage different tariffs.

© AFD Working Paper n° 122 • Access to Electricity in Sub-Saharan Africa • October 2013
71
Box 12. Prepayment: Lessons learned in Senegal, Côte d’Ivoire and South Africa
In Senegal, prepayment was introduced in 2006, where it met with real success, particularly in the capital. In this country, customers canchoose between keeping their old meter or opting for prepayment. The new electricity meter is in the form of a central unit with akeyboard (to enter the code on the recharge ticket) and a screen (to follow consumption). The first tranche of the investment amountedto EUR 450,000, representing EUR 75,000 of system equipment and EUR 375,000 for the procurement of 5,000 meters. For a constantcustomer volume, the new system improved company SENELEC’s cash flow by about 30%, whereas in the same analytical framework,household energy consumption dropped by about 15%. On the consumer side, the new system has been quite well received. Severalreasons give customers incentives to subscribe to a connection:
- More flexibility and visibility in managing the electricity budget;
- Shorter access time to the meters (prepayment meters have priority and are less overloaded);
- A tariff advantage, as the billing system in Senegal has a first block of more expensive kWh that subsequently decreases for eachfollowing block. Consequently, customers buy enough to fill the first blocks, and then massively in the third block by the end of themonth, allowing them to cover their electricity needs for the two following months at the tariff for the third block of the preceding month.
In Côte d’Ivoire, the Compagnie ivoirienne d'électricité (CIE) started planning the integration of prepayment meters into its distributionmanagement system in the late 1990s. In 2000, the company installed about 5,000 prepayment meters as an experiment. However, itrapidly became clear that they were not efficient and in 2004 CIE decided to launch a new test campaign, using a new model of metermanufactured in South Africa. Today, over 30,000 new generation meters are being tested. However, the large-scale distribution ofprepayment meters is not currently authorized by the Government, which is waiting for an opinion from the National Electricity SectorRegulatory Agency (ANARE) before the final adoption of this metering system. This new approach to distribution mainly relies on certainCIE branches and on the following criteria: Rapidly expanding districts, precarious districts, and debtors who have been cut-off for unpaidbills (fraudsters).
CIE wishes to stress the following impacts in terms of this experiment: a remarkable drop in unpaid bills; a real possibility of redeployingthe large numbers of staff working on billing and collection; improved cash flow in the areas in question of about 20%. However, CIEdeplores the persistent fraud, especially hook-ups before the meter. (It should be noted that as a protest against the installation of thenew meters, new types of sabotage of the equipment have appeared.)
Users and consumers evaluate the new meters as follows: rapid and low-cost subscription; no guarantee required for the subscription;no power cuts because of non-payment; immediate service resumption after recharge; difficulties to top up on energy credit in some CIEagencies (creating queues); too many English terms in information displayed on the “Taurus” meter; training required in how to use theprepayment system (to be able to read the codes, etc.).

In South Africa, the “Energy for All” program was launched in 1992 and very rapidly started using prepayment. Today, over 4 millionprepayment meters have been installed nationwide, mainly in the peri-urban townships. Indeed, the political will to extend this newdistribution management system was based on a strong principle that did not allow for unpaid bills. As it operates as a system ofadvance on consumption, this type of meter cannot create "disconnected" people. It therefore a priori allows poor households to avoidthe spiral towards more-or-less permanent exclusion from the service and the seizure of furniture and subsequently property. Theprepayment meter thus to some extent limits the possible consequences of non-payment for poor households. This new technologywas further driven by the fact that it made access to electricity possible in areas where energy metering, billing and collection wereparticularly difficult. Beyond these areas that are difficult to access, the new approach rapidly started covering other geographic andsocioeconomic situations (urban centers, rural areas). Nevertheless, the first prepayment experiences were not convincing: in the early1990s, the national power company Eskom recorded between 40 and 60% of defective meters, causing a major loss of income and highreplacement costs. The initial systems that worked with a magnetic card were replaced by two-way systems, which proved to be muchmore reliable. The average cost of a prepayment meter today is about EUR 50 (three times more than a conventional meter).
The main conclusions from various evaluation studies are as follows: a significant increase in income related to energy sales; improvedcash flow of 20 to 70% depending on the geographical area (an area of high energy consumption increases cash flow more than an areaof weak consumption); increased operational efficiency (reduction of about 10% in meter reading, billing and collection costs – MRBC);suppression of disconnection and connection costs; good acceptance of the system by the consumers, who appreciate the possibility ofcontrolling their electricity consumption depending on their ability to pay; numerous fraudulent practices in the payment collection system(during the first years when the system was set up): many vendors disappeared with the takings from prepaid card sales (thanks toconcerted management processes and the introduction of innovative sales circuits,37 these incidents have gradually been reduced); inareas with low electricity consumption, the return on investment for the prepayment meters is low; hindsight shows that the preconditionsfor the success of installing a prepayment system do not only depend upon the metering technology used, but also on the skills andinvolvement of the management team at the site in question.
The South African authorities have set up a major decentralized electrification program based on the distribution of PV kits. KES, adecentralized-services company (DSC) created by EDF and Total, is implementing a decentralized rural electrification program in theprovince of KwaZulu-Natal Central that will serve 15,000 customers. The management method adopted is that of a fee based on a fixedmonthly price with a prepayment meter. However, this type of prepayment system in a rural environment faces unexpected problems,as each customer must go to a sales point that is relatively far from his home, generating non-negligible travel costs for a low-incomehousehold. Faced with this constraint, the consumer often chooses to gradually abandon the use of his PV generator. This shows theadverse effects of a system that protects the owner against numerous unpaid bills, but which generates an implicit loss for the customer.
© AFD Working Paper n° 122 • Access to Electricity in Sub-Saharan Africa • October 2013
72
37GSM seller in South Africa: this type of sale is used by vendors who, as they have an advance account based in a sales server, transmit the credit purchase orders by text message and receivein return the 20-digit code to be given to the customer on a counterfoil book. For this, the vendor must deposit an advance fund; his margin is then 5% on all transactions.
2.3.3 Specific points in peri-urban areas
In Africa, the number of million-inhabitant cities is
constantly growing, and in the year 2000 there were
about thirty such conurbations on the continent. This
phenomenon of urban growth, essentially due to the rural
exodus caused by poverty, poses many management
problems, especially because much of this housing is
precarious and in unserviced areas – slums – where the
service is often pirated. African cities devour space and
as they expand, the load on the various urban equipment
components becomes very heavy due to the length of
the networks (water, sanitation, electricity, roads,
transportation). The urban phenomenon is a major concern,
even in the case of less-populated urban centers, as the
pace of population growth is disconnected from that of
developing the capacity of economic production. Wider

© AFD Working Paper n° 122 • Access to Electricity in Sub-Saharan Africa • October 2013
73
access to electricity services at a reduced cost can lead to
improvements in health, security, and the generation of
income within slum communities. However, communities in
poor peri-urban districts are often marginalized by power
companies, which have a negative perception of this
market segment, for several socioeconomic and technical
reasons, including:
- The low unit consumption of these households, which
makes them low-priority;
- The informal character of the housing and, more
generally, the land tenure problem in slums (excluding
social housing): residents are either tenants of wealthy
absentee landlords, who are often difficult to identify and
reach, or squatters;
- The low level of households’ ability to pay, and in
particular the impossibility of paying connection fees;
- Security problems for access by electricity company staff
and the risk of pirated connections and vandalized facilities
(transformers, copper cables, etc.).
To resolve these problems, different experiments have
been carried out worldwide. Beyond local specificities, the
following common recommendations may help in reaching
the objectives of peri-urban electrification:
- Set up a strong social-engineering unit at the operator,
with a capacity to study and organize the community,
assisted by other possible interfaces (NGOs, cooperatives,
neighborhood organizations) between the community and
the operator;
- Develop partnerships with local organizations and insti -
tutions already active in improving living conditions for
communities;
- Design a specific technical approach to the grid, based on
cost reduction and securing the grid;
- Define suitable tariffs and payment conditions for slum
sociology (introduction of 1-ampere blocks);
- Identify and establish relations with women’s groups, who
are often seen in slum communities as being trustworthy
and capable of effectively passing on messages;
- If the decision to electrify a district is taken, target the
largest possible number of households (connection rate
of at least 50%) in order to limit candidates for pirate
connections.
While there are an increasing number of such initiatives and
innovations, the systematization of the legal framework
(local franchises?) and responsibilities is held in abeyance.
Box 13. The case of electrification in Kenya’s outlying districts
No official statistics are available for the population of poor peri-urban districts that have developed around the main cities, in particularNairobi. Nevertheless, an analysis conducted in 2006, based on combining criteria of population density and poverty level, led to anestimate of about 2.5 million slum dwellers, i.e. almost 0.7 million households.38 Surveys conducted in the Nairobi slums show very lowhousehold monetary incomes of around USD 315 per person per year.
These surveys also show that energy expenditure accounts for a large share of these households’ budgets, estimated on average at 30% ofmonetary income in the poor outlying urban districts. The share of expenditure substitutable by electricity accounts for 16% of income inslums and 8% in rural areas.
38 International Livestock Research Institute, 2004.

© AFD Working Paper n° 122 • Access to Electricity in Sub-Saharan Africa • October 2013
74
This low income level, with its concomitant low ability of households to pay, is a major barrier to access to electricity, both for the connectionfee demanded by the electricity company (KSh 35,000, i.e. about USD 500), and for the monthly electricity bill (on average USD 0.12/kWh,without cost adjustments for fuel price variations, which can double the price per kWh).
Given their socioeconomic specificities (low demand, creditworthiness, density, informal character of the housing, insecurity, etc.), thesedistricts have found themselves excluded from all official electricity connection programs and strategies. Consequently, communities oftenfall back on an expensive and unsafe informal supply. While in 2005, a new connection policy was adopted with the objective of connecting150,000 new customers per year until 2010, the national company, KPLC, progressively had to set up the necessary tools to achieve thisobjective:
- A new fairer and more transparent approach to the price structure for connection fees, especially for the new urban areas concerned bysuch grid extensions;
- A more proactive and customer-oriented marketing strategy that also covers the poor peri-urban districts. In order to actually mobilize thismarket, administrative arrangements had to be made, especially for the connection of informal dwellings, without taking account of owner-ship or rental documents.
In 2008, KPLC launched a pilot project in the Kibera slum to test new technical and distribution options prior to rolling them out:
- Lighter technical standards for the MV grid;
- Junction boxes fitted high on wooden poles, each containing ten charge controllers (miniature circuit breakers) set to be triggered whenthe load exceeds 1.5 kVa, with the objective of limiting the load demanded by each connection;
- The final customers do not have meters: their supply point is a standard metal panel with a socket, a switch with an associated light pointand a fuse; grounding is the responsibility of the final users;
- In view of the technical solution adopted, the connection costs are lower than for classic solutions. In addition, to encourage householdsin poor peri-urban areas to connect up, KPLC has set the connection fee at about USD 220, instead of USD 500;
- Energy is billed as a flat fee (USD 5 USD/month for residential customers), based on an average number of hours of use of available power(40 kWh per month on average);
- A main customer is in charge of collecting the monthly flat fees from the customers in his group of final users, as he already did in the pastfor collecting rents. This responsibility comes under a contract between the owner (or the owner’s representative) of the group of dwellingsand KPLC;
- When a final customer does not pay his bill, KPLC cuts the electricity service at the junction box (located at the top of the power pole) forthe whole group of customers to which he belongs,
Source: Axenne.
2.3.4 Pico electrification: A complement tomaximize the impact of access investment
An electrification master plan must, beyond its on-grid/off-
grid dimension, very carefully consider the market segment
that cannot bear the costs either of connection or the
energy service itself, such as a solar-power home system.
This segment represents the poorest part of the population
that, nevertheless, has energy expenses, which correspond
to the price paid for lighting (candles, flashlights, oil lamps,
etc.), for audiovisual equipment (radio batteries) and,
increasingly, for the occasional use of mobile phones. Lamp
oil and dry batteries are effectively expensive items with an
annual cost of EUR 40 to EUR 80. Moreover, the use of oil
lamps has a considerable impact on health and the environ-
ment: a GTZ39 study estimated that this consumes the
equivalent of 1.3 million barrels every day, which, repre-
senting 190 million tons of CO2 per year, causes very high
health and safety (fire) risks.
39 GTZ study: www.gtz.de/de/dokumente/gtz2010-en-picopv-booklet.pdf.

© AFD Working Paper n° 122 • Access to Electricity in Sub-Saharan Africa • October 2013
75
To reach the poorest, new technological approaches
are being developed based on the concept of pico
electrification. These developments concern pico hydro, as
well as small PV systems with a nominal power of less than
30 Wc, grouped under the name "pico electrification" (more
widely applicable to all types of battery recharging).40
These systems differ from the standard solar lantern in that
they have a multifunctional use: in addition to lighting, which
benefits from the rapid development of light-emitting
diodes, LEDs,41 they allow wet- and dry battery recharge
by integrating 12 V sockets and charge controllers, thus
allowing computer use.
A 2009 GTZ study estimated that the average cost of a
multi-function solar lamp is EUR 7/month over two years
(for an investment of USD 170 ), whereas the typical
traditional expenditure stands at EUR 12/month, or about
EUR 280 over two years, including EUR 120 for lighting.
While the initial acquisition cost remains a major barrier, the
amount of this investment typically falls within the sphere of
microfinance institutions. As part of a large-scale program,
it might be appropriate to involve such institutions in a
distribution mechanism for small systems, based on
low-value and short-term (6 to 24 months) credits. Another
possibility is to use local operators or set up operators, who
could develop franchise systems for the rental of multi-
function solar lamps.
In both these approaches (rental or sale on credit), the
possible profit margin for the middleman lies in the
difference between the substitutable expense and the
monthly cost of using the small system. In view of the very
small quantity of energy required for this type of service, it
would make sense to systematize this pico electrification
component at the extremity of each grid, attaching the
greatest importance to the efficiency of user equipment in
order to maximize the scope of low energy consumption.
This would both ensure a minimum service for isolated
populations (but located in the "area of influence" of the
mini grid) and generate a local activity.
In any case, the profit margin that an operator of this type
of service can expect is very small, and the service must
be provided by locally established structures. Today,
communities that benefit from this type of service are not
considered as having access to an electricity service, as it
is very minimal and only provides very low power that will
not result in any development.
Box 14. Examples of battery recharge services – Cambodia and Laos
In Cambodia, battery recharge (an additional service provided by diesel mini-grid operators) is widespread. It allows households on the edgeof the grid to "pay for what they consume", and those living outside the village, but who go there during market days, to have their batteriesrecharged.
The (commercial) cost of the recharge by diesel generators is USD 0.25 for a 40 Ah battery and USD 0.50 USD for a 150 Ah battery.
In Laos, a program conducted in five villages to recharge LED lamps from PV systems is billed USD 1/month to users and allows theinvestment to be repaid in 18 months. The remuneration of the village operator is minimal, as his duty to the community is more importantthan his pay.
Source: IED.40 A very low-power market is being developed for flashlights powered by a small PVmodule (5 Wc) or a dynamo. This product, sold for about EUR 10, is not very reliable, and itslight efficiency remains low.41 The use of LED technology plays an important role by reducing energy consumption inlighting. The advantage of associating photovoltaic cells and LEDs resides in the easycombination of the two products, as their two voltages of photovoltaic cells and LED voltagecan be easily combined. LED technology offers a luminosity more than eight times that ofincandescent lamps.

To provide access to an electricity service for all, the first
step is to produce a sufficient quantity of power to meet
economic and social needs, at a sufficiently affordable cost
to ensure the economic equilibrium of the access program.
Reaching this equilibrium does not necessarily mean that
users are able to pay the entire service cost, but that public
finances can bear the difference between the cost of the
delivered service and the tariff applied. This cost, both
in terms of investment and long-term operation and
maintenance, must also have been correctly assessed
beforehand when the program was designed.
On a worldwide scale, there are considerable investment
needs. In its 2009 World Energy Outlook, the IEA estimates
that global electricity demand will continue to increase at an
annual rate of 2.5% until 2030, and that 80% of this growth
will occur in countries outside the OECD. The increase in
installed power capacity represents 4,800 GW (or five times
the existing park in the United States), 28% of which will be
in China. The share of renewable energy in total generation
will rise from 2.5% to 8.6% by 2030, whereas the share of
hydropower will decrease from 16% to 14%, that of coal will
remain dominant at 44%.
Faced with such needs, which remain colossal, there is a
rather disturbing fact: in 2009, investments in the energy
sector collapsed due to the economic crisis. This concerns
both oil and gas exploration by multinationals as well as
households, which buy less new and efficient equipment.
This will have major repercussions on long-term energy
efficiency. In late 2008 and early 2009, investment in
renewable energy proportionally decreased more than in
the other types of power generation; in 2009, it fell by
almost 20% and would have decreased by 30% without the
government support plans.
This decline in investment in the energy sector will have
potentially serious consequences for energy security,
climate change and energy poverty. Reducing the capacity
increase in the medium term for projects that have a long
gestation period will lead to long-term shortages, and may
well lead to price increases when demand recovers. Will
it be possible to raise the required financing? In the IEA
baseline scenario, it is estimated at USD 1,100bn a year
until 2030, with USD 600bn a year for the electricity sector
and about EUR 300bn a year in developing countries.
This reference scenario inexorably takes us towards a
carbon concentration of over 1,000 ppm CO2 equivalent,
deemed very dangerous as it leads to a potential average
temperature increase of 6 °C. The low-carbon 450 ppm
scenario as developed by the IEA, with a 50% probability
of a 2 °C increase in average temperature, involves an
additional investment of USD 10,000bn by 2030. This
would be compensated by economic gains, in the health
sector among others, and by a lower energy bill for
buildings, transportation, etc.
© AFD Working Paper n° 122 • Access to Electricity in Sub-Saharan Africa • October 2013
77
3. A need for structured financing
3.1 Widespread access to electricity services: The need to mobilize more financing thanthe current flows from international cooperation

In this context, improving access to modern energy for
nearly 1.6 billion people, or one-fifth of the world’s popu-
lation, remains a challenge. Almost 85% of these people
live in rural areas in Sub-Saharan Africa and South Asia. In
the IEA reference scenario, the number would only be
reduced by 200 million by 2030 and would increase in
Africa. IEA estimates that with an investment of USD 35bn
a year, i.e. 6% of the total planned investment in the
electricity sector, the question would be resolved by 2030.
However, we are way off such orders of magnitude, judging
by a World Bank review of its own portfolio, which notes that
flows are limited to EUR 500m a year (Table 9).
© AFD Working Paper n° 122 • Access to Electricity in Sub-Saharan Africa • October 2013
78
Table 9. World Bank investment in access programs (2003-2005) – in USD M
Région Grid Grid Rural Off-grid Rural Energy Total
Peri-urban Electrification Electrification Fund
Africa $76,60 $35,20 $30,20 $31,20 $173,20
E Asia Pacific $0,00 $235,00 $3,70 $8,30 $247,00
L America Car $0,00 $3,00 $7,00 $0,00 $10,00
South Asia $26,00 $0,00 $5,50 $24,60 $56,10
E Europe CA $0,00 $0,00 $0,00 $0,00 $0,00
N Africa Med $0,00 $0,00 $0,00 $0,00 $0,00
Total $102,60 $273,20 $46,40 $64,10 $486,30
Source: ESMAP 2007.
International cooperation will clearly not be sufficient to
finance access programs. Schematically, in addition to
the user, access projects involve the State, the operator
(private or public) and financial institutions (see Diagram 6).
The financing structure of a rural electrification project
or program, and especially the "weighted average cost of
capital", loan duration, any grace periods, and project
duration (especially in terms of return on capital) obviously
also have a major impact on the service price.
Diagram 6. Stakeholders and financing circuits in rural electrification
Source: Authors.
STATELoan or subsidy or
equity contribution
Loan or grantLoan or capital contribution
FINANCIALINSTITUTION
Tariffs and fees
OPERATOR
SERVICE USER

• Multilateral or bilateral financial institutions award conces-
sional loans or grants to States; they are allocated to
finance power infrastructure, generally in the form of a loan
or grant, or as an equity contribution to the power operator;
• The same institutions can sometimes allocate financing to
operators, generally with a State guarantee;
• States participate in financing power infrastructure via their
own investment budgets (excluding external assistance);
• Private national or international banks can also allocate loans,
or make an equity investment in the power operator's capital;
• The user, finally, pays for the service via the tariff,
generally with additional specific fees to cover part of the
investment repayment. More generally, user payments
break down into three parts: (i) an initial contribution at
the connection; (ii) a fixed premium, which depends on the
subscription (power level subscribed to and which must
amortize the operator's investment); (iii) a variable share
depending on consumption.
To establish a more direct link between the tariff policy
and the amount of subsidy required, it is necessary to
determine the financial equilibrium targeted by the tariffs
applied. Schematically, there are three equilibrium levels:
■ "Minor equilibrium": the income from sales covers the
operating and day-to-day running costs of the service;
■ "Operational equilibrium": the income covers not only
operating and day-to-day running, but also all routine
maintenance and replacement operations;
■ "Major equilibrium": the income covers all charges, i.e.
both operating and financial costs, particularly those related
to investments.
Subsidy mechanisms offset the difference between the
effective equilibrium achieved from service income, by the
application of the tariff schedule (including fees), and "major
equilibrium". The question is raised as to whether the State
has the overall capacity to pay this subsidy.
© AFD Working Paper n° 122 • Access to Electricity in Sub-Saharan Africa • October 2013
79
3.2 Historical principles
A basic principle of equity, called "equalization", is that
each consumer of a certain category (consumption level,
socioeconomic characteristics, i.e. domestic or industrial
customer, etc.) pays the same for a kWh, wherever their
location in the country and thus regardless of the cost per
kWh in their area. This principle is only feasible when the
profits from certain areas or from tariff levels can generally
offset losses in other places, or if the State has the means,
at the macroeconomic level, to pay the difference.
When we look at the history of electrification in
industrialized countries, we see that during the first
electrification phase in the first half of the 20th century, the
electricity service was provided by private operators for the
needs of industry, therefore at different prices that reflected
costs. Certain operators then progressively started serving
communities in the "labor pool" area of these industries.
The equalization principle was only applied much later,
at the time of the nationalization and integration of these
different companies into a national structure. This principle
of equity became "affordable" thanks to a base of existing
profitable sales, and to very substantial State support for
investments.
This support for investment through long-term and public
financing is perfectly logical in an industrial structure of
economies of scale, where the larger the investment, the
smaller its average cost. In practical terms, in this set-up,
the general interest is to have large-scale infrastructure that
serves the entire country through an interconnected grid.

The structuring of the sector into a "natural monopoly",
which is moreover public, results from this highly
capital-intensive set-up.
In the context of certain Sub-Saharan African countries, the
first step (for local generation to meet profitable industrial
needs) has not yet been reached. Consequently, can they
afford equalization at this stage, or will this only be possible
later, as in France (see Box 15)? An argument in favor
of “tariff differentiation” is that in non-electrified areas,
communities have high monthly bills for traditional
resources (kerosene lamps, dry batteries, small individual
oil motors, etc.), and thus often have a real ability to pay.
While it might seem completely unjust to make the "rural
poor" pay more than the "urban rich", is it still not better to
have an expensive service in rural areas than no service
at all, or a bankrupt sector? However, this is a matter for
national political choices that must be informed and made
pragmatically.
Furthermore, today's technological developments lead
to industrial configurations where small-to-medium size
infrastructure is sometimes (even often) the most
appropriate solution. This undermines the legitimacy of the
natural monopoly for generation and paves the way for a
more fragmented structure, where medium-size private
investment has it place with all the issues related to smart
grids. However, this development certainly does not do
away with the need for strong national coordination, both
technical (programming for generation and transmission
grids is still fully within the natural monopoly) and financial
to ensure that sufficient funds are raised.
© AFD Working Paper n° 122 • Access to Electricity in Sub-Saharan Africa • October 2013
80
Box 15. Brief history of electrification in France: The role of the Fund for the Amortization of Electrification Charges (FACE)
In France, the national infrastructure was created via strong State involvement, with the nationalization of several private structures in 1936,
which generated electricity for industrial areas. EDF was thus created and could not only levy a tax on kWh sales to finance this access
program (a significant part of which had already existed from the electrification for rural and peri-urban communities), but could also raise
long-term financing at low interest rates, thanks to the State guarantee.
The relative weight of urban and rural communities, and of their respective consumption levels, made it possible to build an efficient equali-
zation system as early as in 1937, i.e. one that had acceptable charges for city consumers, as well as being sufficiently productive to
finance significant rural investments. In 1937, with 90% of the French population hooked up and a low-voltage electricity consumption of
3.1 billion kWh in 1938 (against 1.8 billion in 1926), the LV kWh fees effectively supported the public effort for investment in electricity.
As rural electrification developed, the financial income from this equalization increased in direct proportion to the amount of kWh consumed,
while demand for financing decreased. There was thus a sustainable mechanism for the self-financing of the power grid by its customers:
the Fund for the Amortization of Electrification Charges – FACE.
In France, the levy rates on kWh have been adjusted in terms of financing needs, while respecting until now the ratio of 1 to 5 between rural
and urban customers. In 1937, they were set at 2.80% in urban areas and 0.56% in rural areas. They were first increased in 1954 to 3.80%

3.3.1 The weight of domestic customers
In the case of access programs, the vast majority of
customers are domestic with low unit consumption levels.
Managing a host of such small consumers obviously has a
cost for the service company and the small margins offer
little incentive.
In addition to the spatial issue, with distance and low
density increasing the investment and operating costs, a
form of cross subsidy is generally applied between social
categories: LV customers, especially the so-called “social”
category, generally account for the largest number of
clients, albeit with modest unit consumptions and therefore
proportionally low revenues for the operator. This is shown
by the consumer breakdown of KPLC (Kenya), where
the domestic bracket represents 25% of sales for 85%
of customers to manage. It is understandable that the
electricity company is much more interested in industrial
consumers where, as in Madagascar, MV/HV customers
account for over 40% of sales for less than 1% of
customers.
However, it is necessary to make a detailed analysis of
tariffs and profitability, in particular by considering the fixed
tariff, which can be as much 50% of the price per kWh for
households that have a low level of consumption. It is thus
seen that in Kenya, the households of the lower bracket of
up to 50 kWh a month pay more for their kWh than those in
the 51 to 300 kWh bracket.
© AFD Working Paper n° 122 • Access to Electricity in Sub-Saharan Africa • October 2013
81
in cities and to 0.75% in rural areas, prior to regularly decreasing as consumption increased, to reach 2.3% in 2000, for the maximum rate
applicable in urban communities, and 0.46% for the minimum rate applicable in rural communities.
Even today, FACE still provides financial assistance to municipal power grid owners under rural electrification regimes. This aid corresponds
to 65% of the full cost, inclusive of tax, of extension, reinforcement or integration works for grids in the relevant area. The grids in question
are the low-voltage (LV) grids and medium-voltage (MV) extensions required to supply the new served LV areas. It is the local authorities –
or municipalities for distribution – that make local investment decisions and contribute their share of financing, and they own the distribution
grids. The annual budget of FACE’s aid stood at about EUR 345m in 2008. The public service contribution for electricity in non-
interconnected zones (NIZs: overseas departments and territories and Corsica) was close to EUR 667m in 2008 (for 3 million inhabitants).
These cross subsidies may be compared with the profitability requirements established for equipment programs in Africa.
Source: GRET (2005).
3.3 Keys for setting tariff levels

© AFD Working Paper n° 122 • Access to Electricity in Sub-Saharan Africa • October 2013
82
Table 10. Kenya (2008)
Table 11. Jirama - Madagascar (2007)
Table 12. Côte d’Ivoire
Tariff Type of consumer N° of customers 2008 % 2008 consumption (MWh) %
A0 Domestic 895,043 84.41 1,255 24.92
A1 Small shops 158,676 14.96 590 11.72B Irrigation 3,738 0.35 996 19.78C Large trades 518 0.05 2,108 41.86D Off peak 668 0.06 74 1.47E Street lighting 1,740 0.16 13 0.26Total 1,060,383 100.00 5,036 100.00
Source: KPLC Annual Report 2007-2008.
Source: Jirama.
Type of consumer N° of customers 2007 % 2007 sales (MWh) %
MV/HV 899 0.23 340,339 42.35
LV private customers 383,559 96.90 408,159 50.78
LV administrations 1,977 0.50 11,918 1.48
Communities 1,661 0.42 9,415 1.17
Jirama transfers 7,753 1.96 33,889 4.22
LV 463,383 57.65
Total 395,849 100.00 803,722 100.00
The case of Côte d’Ivoire also shows this unequal nationwide distribution of consumption: urban areas have ten times as many customersas rural areas. The economic capital, Abidjan, accounts for 40% of subscriptions and 70% of total consumption, whereas this city only has20% of the Ivorian population. In addition to this disparity, a rural subscriber consumes 60% less than an urban subscriber.
Total Rural
Access rate 24 % (38 % with fraud) 6 %
Population with access 4 320 000 594 000 = 13 % of subscribers
Average per capita consumption 300 kWh 150 kWh
Total consumption 1 296 GWh 89,1GWh = 6,8 % of total consumption
Source: Authors.
Box 16. Kenya, Madagascar: Breakdown of consumption by tariff category

3.3.2. Tariff equalization: What cost for thenation?
In the so-called “equalization” system, users in areas that
are less expensive to electrify will effectively cover part of
the electrification costs in the most expensive areas, first
of all for operation and, if possible, also for investment. In
Morocco, electricity sale tariffs are set by the State and
are the same over the entire distribution area of ONE,
which includes both towns and villages.
The contribution by users and communities is the same
in the entire rural area covered by the PERG, and is
independent of the cost price of electrification for the
relevant village. ONE thus applies an equalization system,
not only on the electricity sale tariffs, but also on this
participation in the investments by beneficiary users and
communities. For the average consumption of a rural
household (52 kWh/month), the electricity bill is MAD 53
month, with an additional MAD 40 of PERG fees.
Following this ambitious rural electrification program,
ONE’s profitability would appear to have fallen for the
following reasons:
- Distribution costs in rural areas are 2.5 times higher than
in urban areas;
- Energy consumption in rural areas is low, while the
number of subscribers is increasing;
- LV tariffs have increased very little since 1996, whereas
MV and HV tariffs have fallen sharply.
The PERG has thus had an unfavorable impact on ONE’s
financial results, just at the time where the electrification
of the most “expensive” households to connect is starting,
i.e. those in the least densely populated areas.
In Mozambique, EdM applies two types of cross subsidy
between groups of individual consumers in order to be
able to fulfill its social function:
- Geographical cross subsidies between rural areas
(especially in the north) and urban areas (mainly Maputo);
- Cross subsidies via a variable stepped tariff system;
consequently, the largest consumers, (generally the
richest households) pay more for an electricity unit than
the smallest (the poorest households).
EdM makes a tariff distinction between low-to-medium
voltage (mainly for households and small enterprises) and
high voltage (business and industry). High voltage users
can obtain individually negotiated tariffs depending on the
volume consumed and periods of use (peak or off-peak
© AFD Working Paper n° 122 • Access to Electricity in Sub-Saharan Africa • October 2013
83
Table 13. Peri-urban connection program in Kenya, forecasts for the 750,000 connectionsover 5 years
Categories Customers(%)
Average
consommation
kW/m
Energy
sales
(%)
Revenues
(MkSh)
Operator
profits
(MKsh)
Domestic (AO) 90 117 64 924 227
<50 kWh/month 35 15 3 133 -145
51-300 kWh/month 55 107 30 649 242
301- 3 000 kWh/month 9 525 29 129 119
3 000-7 000 kWh/month 0,1 3 549 2 13 11
Small shops A1 10 428 36 643 190
Source: Authors.

hours). EdM also has a program to attract private
investment, in particular via an incentive system and
special prices for agro-businesses and industries, which
allows tariffs to be used as an instrument for territorial and
economic development.
© AFD Working Paper n° 122 • Access to Electricity in Sub-Saharan Africa • October 2013
84
Table 14. Breakdown of consumption in Mozambique - EdM (2006)
Tariffs Consumption (GWh) % N° of subscribers %
Commercial LV 183.20 10.06 38,790 9.33
Large LV consumers 88.50 4.86 1,477 0.36
Domestic LV consumers 516.50 28.36 373,795 89.93
LV agricultural consumption 0.07 0 24 0.01
MV – HV 534.80 29.36 1,581 0.38
Export 498.30 27.36 24 0.01
Total 1,821.37 100.00 415,667 100.00
Source: EdM.
Today, the average tariff level is 8 cents/kWh, whereas the
long-run marginal cost (LRMC) tariff is 9.1 cents/kWh.
EdM can apply independent tariff adjustments within the
limits of its concession contract with the government. Tariff
adjustments that are not provided for in the contract must
be approved by the government.
3.3.3. Tariff differentiation
The case of rural electrification in Mali is a particularly
interesting illustration of tariff differentiation. The State of
Mali started liberalizing the electricity sector in 2000.42
AMADER (REA) regulates, controls and participates in
the financing of the development of rural electrification
activities, especially in all localities where the installed
capacity is less than or equal to 250 kW.43
Consequently, local public or private operators that wish to
supply a public electricity service are free to submit a
PCASER to AMADER to request an authorization and a
subsidy, limited to 80% of the investment costs. Both
tariffs and tariff schedules are free, but are approved and
published by AMADER, based on a provisional business
plan presented by the operator. The electricity tariff covers
operating costs and financial costs, and also includes a
return on investment for the operator over the 15 years
covered by the authorization. The commonly accepted
rate is around 8%, which is low compared to major
infrastructure projects where it is generally around 15%;
the operator is remunerated by “shareholder dividends”.
AMADER has a tariff review process based on changes in
technical and economic conditions and their impact on the
service cost.
Of the four cases studied,44 and by estimating an energy
consumption corresponding to the flat rate, the tariff range
is FCFA 350-700/kWh (excluding connection fees), i.e.
between EUR 0.55 and over EUR 1. Only the village of
Koumantou, which benefited from AMADER subsidies,
applies the minimum rate, whereas the social electricity
tariff within the EDM-SA perimeter stood at FCFA 59/kWh
in 2007.
Today, in reality, the tariffs set by PCASER reach levels of
over EUR 0.50/kWh, which is well above the ability to pay
of most rural users. This is due to the hike in diesel prices,
which is not even offset by almost the entire subsidy for
the initial investment. This is an argument in favor of
42 As provided for in Law n° 00-019/P-RM of 15 March 2000.43The Electricity and Water Regulatory Commission (CREE) sets the tariff policy.44 See Ease and Improves (2007).

renewable energy. AMADER, refinanced by the State,
today thus finds itself obliged to allocate an operating sub-
sidy to PCASER, in the form of an exemption on diesel
taxes.
More generally, in countries that are highly dependent
upon hydrocarbons, distributors are – under their
concessions – increasingly authorized to make tariff
adjustments to reflect their costs. In Kenya for instance,
hydrology problems affecting the interconnected generation
park have obliged KPLC to mobilize expensive diesel
generators. This has meant they have had to apply a
temporary fuel surcharge, which is currently increasing
the tariff by 50% from one month to the next.
© AFD Working Paper n° 122 • Access to Electricity in Sub-Saharan Africa • October 2013
85
3.4 Establishing the financing mechanisms required to guarantee access to an electricityservice for all
As the initial electrification rate is very low in Sub-Saharan
Africa (10 to 20%), cross subsidies alone are not sufficient
to achieve substantial access rates. An initial subsidy is
essential (or more generally concessional loans) to
finance investments in rural areas, or financing over
30 years with funds from the State, which can refinance
itself. When the initial infrastructure equipment rate is low,
the question is raised as to which areas or customers to
serve first. There is also the question of the equipment
rate, which must be proportionate to the funding that can
actually be raised.
Oil price hikes, climate risks and technological advances
are all factors that increase the interest of renewable
energy, despite the high costs of the initial investment.
The time is clearly ripe for financial innovation, in order to
better identify and share risks and also to mobilize private
investment.
In addition, the cornerstone of the equipment of a country,
especially for power infrastructure, is to be to be able to
rely on a structure capable of raising and organizing the
implementation of the required funds.
3.4.1 Effectively gauge the scale of financingrequired, without underestimating theimportance of a national contribution and of amajor, high-quality counterpart
Morocco, with 30 million inhabitants, has succeeded the
remarkable feat of increasing the electrification rate of
localities from 15% to over 90% in 15 years, requiring an
investment of almost EUR 2bn over this period. It should
be remembered that almost half came from national
resources (25% financed by the beneficiaries and 20% by
municipalities). ONE financed the remainder through a tax
on kWh sales which, in 15 years, generated about
EUR 500m (i.e. EUR 30m a year). Without this national
contribution, international donors would obviously not
have participated in this ambitious program. The amounts
raised thus reached an average of EUR 70m a year,
thanks to the fact that a credible national entity – ONE –
was the borrower. The lenders could thus envisage non-
sovereign loans over time by directly taking the risk on
ONE.
In Senegal, rural areas were subdivided into twelve "rural
electrification concessions". Each area was attributed to a
single operator via an international bid invitation. The

single operator was obliged to apply an identical tariff over
its entire concession, independently of the electrification
techniques used. Subsidies covered between 50% and
80% of total investments, and were financed by national
funds or mobilized by donors. At the launch of the
bid invitation, ASER specified the amount of available
subsidies and the bidding operators were selected on the
basis of: (i) the number of connections they undertook
to make, (ii) the price and, indirectly, (iii) the additional
financing they could provide via equity and loans.
The first concession, located in the Saint-Louis-Dagana-
Podor region (north, surface area of 19,000 km2, 362,000
inhabitants and 41,000 households), was attributed to
ONE for 25 years, following an international bid invitation.
The Senegalese Government used a USD 5m World Bank
loan as the basic subsidy to the concessionaire. The total
investment stood at USD 14.9m over 3 years. In its bid,
ONE proposed 2.3 times the number of connections
required by the bid invitation, and 50% more than its
competitor. To achieve this, it proposed a financing plan
including a large loan portion, which was possible as ONE
already had a significant track record for borrowing from
international donors to finance the electrification of its own
national territory. One wonders, legitimately, whether such
a scheme might be reproducible…
What can be said about the present-day dynamics in
Sub-Saharan Africa? A review of ongoing programs shows
that the largest volumes are mobilized in countries with
favorable national structures. Focusing on World Bank
data, the following observations can be made:
• Almost all loans are allocated to States, which then
reallocate the financing to various national structures as
grants or loans. The largest volumes of financing for urban
or rural access programs are in countries with large
electricity companies, which have the capacity to absorb
and pay back the financing. It is interesting to analyze the
loan amount mobilized annually in terms of the national
population, bearing in mind that Morocco had to borrow
EUR 70m a year over a period of 15 years with maturities
of over ten years, to equip a country of some 30 million
inhabitants. Below are a few other examples:
- Ethiopia: 60 million inhabitants; 5 years (2003);
EUR 133m, i.e. EUR 27m a year; only EUR 35m for
access, including 80% for grid extension; central role of
EEPCo;
- Ghana: 20 million inhabitants; 5 years (2008); EUR
135m, i.e. EUR 27m a year; 35% for grid extension and
aims to work with national development banks;
- Mozambique: 20 million inhabitants; 4 years (2003);
EUR 54m, i.e. EUR 13m a year; 50% for the peri-urban
grid; central role of EDM;
• A second group of financing focuses on REFs. The main
limitation of this arrangement is that the State provides
a grant for a fund that is often a fund in name only. In
reality, it is a bank account through which an investment
subsidy will transit to an operator, which generally has
only very partial and few obligations to repay:
- Cameroon: 16 million inhabitants; 6 years (2008); EUR
47m, i.e. EUR 8m a year, mainly for a “fund” that took
almost a decade to set up;
- Guinea: 8 million inhabitants; 4 years (2003); EUR 11m,
i.e. EUR 3m a year, mainly for a “fund” that was not
authorized to lend; a remunerated partnership was sought
with a bank, which refused to take a lending risk and thus
limited itself to channeling the subsidy;
- Mali: 10 million inhabitants; 5 years (2005); EUR 25m,
i.e. EUR 5m a year; mainly to AMADER, which channels
the investment subsidies;
- Uganda: 23 million inhabitants; 5 years (2009); EUR
62m, i.e. EUR 12m a, (including a third for grid extension
to the electricity company, and a third for inter-sectoral
programs managed by the ministries using the subsidy).
These observations show that the countries that have
succeeded in scaling up access to electricity are also
those with a technically and financially credible central
operator. The World Bank uses instruments such as the
Adaptable Program Loan (APL) or Special Impact Loan
(SIL), which are generally long-term and merit attention:
the above-mentioned loan maturities are those of a first
tranche which, if successfully implemented, triggers45 the
© AFD Working Paper n° 122 • Access to Electricity in Sub-Saharan Africa • October 2013
86
45 This implementation is assessed by means of previously established indicators, such asthe creation of a PPA law or the number of localities connected.

mobilization of a second tranche. These programs can be
subject to 10- to 20-year agreements.
3.4.2 The interest of structuring REFs as truefinancial intermediaries
A review of existing entities leads to the conclusion that
REFs in Sub-Saharan Africa are currently not structured
as financial intermediaries. Consequently, they cannot
(i) borrow, (ii) refinance themselves via bond issues,
(iii) lend to local operators, or (iv) mobilize national banks
with risk mitigation instruments.
Local banks, for their part, in reality do not wish to
venture into this unknown and low-profitability sector,
except in the case of development banks with a specific
mandate. The funds are generally thus bank accounts to
transfer grants, and the international agencies allocate
sectoral loans to governments, which reallocate part of the
amounts as grants to REFs. There is no leverage on
grants in the rural or peri-urban electrification sub-sectors.
Naturally, the amounts of the grants that can be mobilized
at the level of international cooperation are seldom
sufficient to address the challenges.
It is crucial to change paradigm in order to increase grant
amounts, which will remain modest compared to the
challenges. It is thus essential to follow these
recommendations:
• Establish the legal structure of the fund as a full-fledged
financial institution, or combine this fund with a dedicated
financing entity, approved as such by national banking
regulations;
• Give this structure the technical and financial capacities
to appraise projects and prepare a project pipeline;
• Define the fund’s business plan, based on a long-term
plan proposing a mix of projects with different profitability
levels in order to allow a certain level of cross subsidies.
It should also undertake to support the first project deve-
lopers in order to create a demonstration effect;
• Provide a start-up budget with a view to a revolving fund,
especially for preparatory studies;
• Involve banks by assessing their interest and their
perception of the risk in order to subsequently establish
adequate risk-sharing mechanisms (co-financing,
counter-guarantees, etc.);
• Have a long-term sustainability vision of the financing
mechanism, with a progressive increase of the national
contribution (bond issues, kWh tax, etc.).
The three stages below illustrate these recommendations:
- Stage 1 = initial situation: The REF receives grants from
the State that may come from the State budget or from
international cooperation operations (reallocation of
loans/grants to the State – generally in the form of grants).
The cooperation institution rarely makes a direct transaction
with the fund (which may not necessarily be authorized by
its statutes). The REF can be given the technical capacity
to appraise rural electrification projects and subsidizes
them according to its own rules. It is hoped that the
operators that have benefited from these subsidies can
subsequently balance their operation. However, this is
often not the case: in Burkina Faso, despite an 80%
investment subsidy, operating subsidies were necessary.
In this situation, in financial terms, the role of the fund is
confined to paying the subsidies.
- Stage 2 = short-term developments: The fund becomes
the financial arm of an REA and develops rural
electrification planning, which includes operations that
can present a certain level of profitability: secondary
centers, agro-industries, etc. A portfolio of operations is
built up, which require different levels of subsidy. The fund
adopts statutes that give it financial autonomy and
the capacity for financial intermediation under national
legislation. Consequently, as soon as it is allocated
regular national funds (an earmarked tax, for example),
which it can lend to operators, even with a highly conces-
sional rate (and thus generate income), it becomes
a structured partner with a balance sheet. As such,
institutions can lend to it, funds (national or international)
© AFD Working Paper n° 122 • Access to Electricity in Sub-Saharan Africa • October 2013
87

can dialogue with it, and national development banks
can interact with it, especially for risk sharing. National
banks and investors thus develop a certain amount of
confidence.
- In the medium term: The fund confirms its management
autonomy, its credibility and its functioning as a
specialized financing entity. Once pilot operations have
been successfully demonstrated, the national banks also
join the investment round and finance operators. To
mobilize these credits, or even national investments, the
fund may also develop guarantee or risk-sharing
instruments in order to maximize the participation of these
private financing sources. The fund should eventually
envisage raising funds itself on national or international
bond markets and free itself from the need for financing
from international cooperation.
© AFD Working Paper n° 122 • Access to Electricity in Sub-Saharan Africa • October 2013
88
Diagram 7. Stages in the structuring of a rural electrification fund
InitialSituation
Manufacturer
Manufacturer
Company
Company
Operators
Operators
Fund Transfers
Grant
Grant
National Government
National Government
Concessional loan
Concessional loan
Developmentbanks & agencies
Developmentbanks & agencies
Stage 2
Fund Transfers
Concessionalfinancing
Concessional loans, grants
Rural electrificationfund/agency
Rural electrificationfund/agency
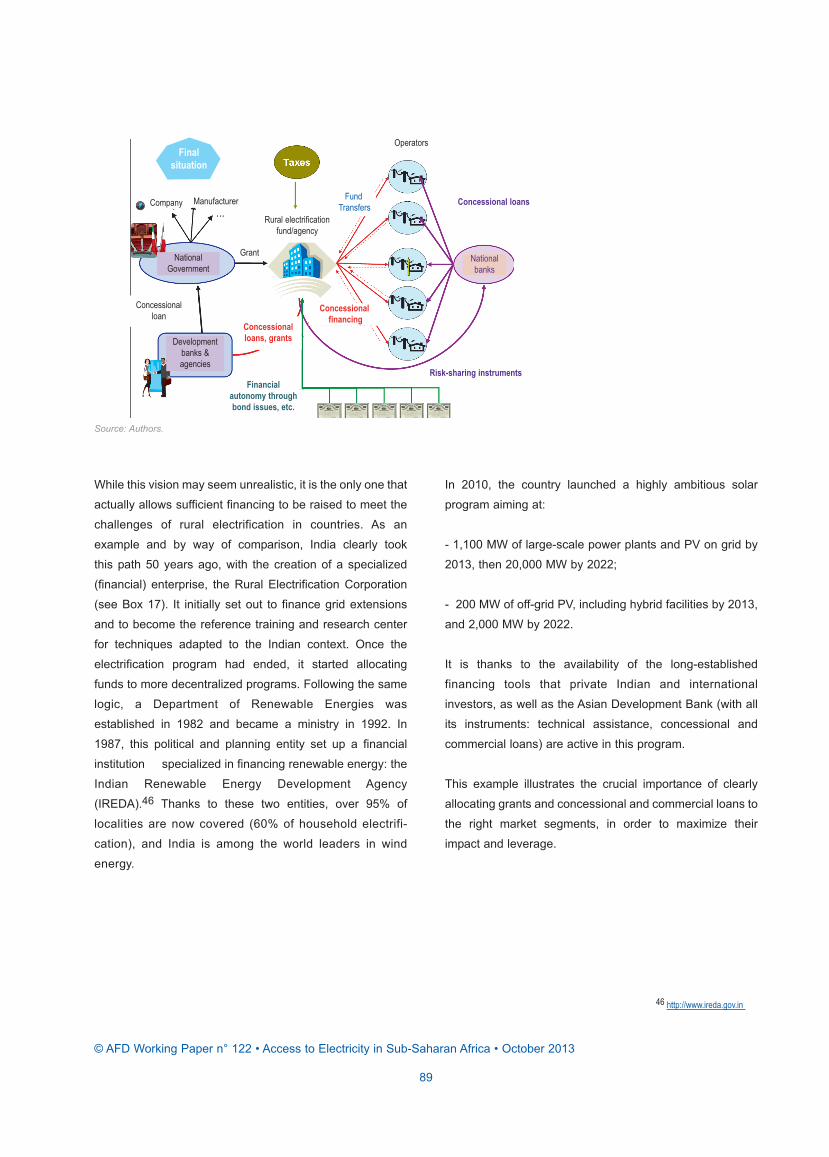
While this vision may seem unrealistic, it is the only one that
actually allows sufficient financing to be raised to meet the
challenges of rural electrification in countries. As an
example and by way of comparison, India clearly took
this path 50 years ago, with the creation of a specialized
(financial) enterprise, the Rural Electrification Corporation
(see Box 17). It initially set out to finance grid extensions
and to become the reference training and research center
for techniques adapted to the Indian context. Once the
electrification program had ended, it started allocating
funds to more decentralized programs. Following the same
logic, a Department of Renewable Energies was
established in 1982 and became a ministry in 1992. In
1987, this political and planning entity set up a financial
institution specialized in financing renewable energy: the
Indian Renewable Energy Development Agency
(IREDA).46 Thanks to these two entities, over 95% of
localities are now covered (60% of household electrifi-
cation), and India is among the world leaders in wind
energy.
In 2010, the country launched a highly ambitious solar
program aiming at:
- 1,100 MW of large-scale power plants and PV on grid by
2013, then 20,000 MW by 2022;
- 200 MW of off-grid PV, including hybrid facilities by 2013,
and 2,000 MW by 2022.
It is thanks to the availability of the long-established
financing tools that private Indian and international
investors, as well as the Asian Development Bank (with all
its instruments: technical assistance, concessional and
commercial loans) are active in this program.
This example illustrates the crucial importance of clearly
allocating grants and concessional and commercial loans to
the right market segments, in order to maximize their
impact and leverage.
© AFD Working Paper n° 122 • Access to Electricity in Sub-Saharan Africa • October 2013
89
Source: Authors.
46 http://www.ireda.gov.in
Manufacturer Company
Operators
GrantNational Government
Concessional loan
Developmentbanks & agencies
Fund Transfers
Concessionalfinancing
Concessional loans, grants
Rural electrificationfund/agency
Concessional loans
Risk-sharing instrumentsFinancial
autonomy throughbond issues, etc.
National banks
Finalsituation

Box 17. Financing rural electrification in India: The Rural Electrification Corporation – REC
REC was created in 1969 as a finance company. Today, it is a listed public enterprise, with a net value of EUR 750m. Its function is tofinance and promote rural electrification projects in India. It provides financial support to electricity companies in the different States of theIndian Union, to rural electrification cooperatives, and private and public companies. REC has offices in the central capital (New Delhi) andin the provincial capitals, which have a mandate to coordinate financial closure with territorial authorities and other local financiers, assist inprogram and project definition, and monitor disbursements and project implementation. It also has a large research and training center.
REC's mandate was defined as follows in 2009:
"Facilitate the provision of an electricity service for the development and improvement of living conditions for rural and semi-urbancommunities.
Act as an effective and competitive development institution, responsive to its customers for the financing and promotion of power generationprojects, electricity savings and reinforcement of distribution grids throughout the country."
Historically, REC, in application of national policy, focused on village electrification and the installation of pumps for irrigation, considered aspriorities at the time. A locality was defined as electrified as soon as electricity use was observed, regardless of its location in the country.Thus, in 2005, 81% of the country's localities were electrified, and over 110,000 villages were awaiting electrification; 12 million electricalpumps irrigated 34 million hectares.
It was only at a second stage, and after three decades, that attention really began to focus on the issue of access to a service forcommunities. In 2004, two additional criteria were introduced for a village to be defined as being electrified: public services (health,community centers, schools, etc.) had to be electrified, as well as at least 10% of the population.
Indeed, at the turn of the 21st Century, and with a per capita consumption that had risen from 15 kWh in 1950 to 600 kWh in 2005, accessto a modern electricity service is necessary in order to achieve an economic growth rate of 8 to 10% a year, and for the entire population.Consequently, access for 50% of rural households, i.e. some 60 million households, has become an objective.
REC mainly allocates long-term loans (15 to 35 years) to public and private electricity companies for generation (renewable or not),transmission and distribution. In 2009, interest rates stood at 10 to 12%, reviewable annually or every three years, but inflation must be takeninto account, which has risen from 4% to almost 13%.
To provide access to the entire population and to villages that are still unserved, a specific program, the Rajiv Gandhi Grameen VidyutikaranYojana (RGGVY), was defined in 2005, with the following main components:
- Strengthen the MV distribution grids, create MV infrastructure, distribution, decentralized generation and local grids: these investments,which must be presented as projects, can benefit from investment subsidies of up to 90%;
- Finance productive and social infrastructure: irrigation pumps, SMEs, local craft industries, cold chains, health, education andcommunication; when presented as projects, they can benefit from the same subsidy levels;
- 100% subsidy for basic connections (lighting, audiovisual) for households living below the poverty line (i.e. with less than USD 2 per day);
- Develop distribution franchises whereby a local entity (private, association or cooperative) takes charge of the distribution service within anarea supplied by a transformer; these franchises again benefit from the same investment support.
© AFD Working Paper n° 122 • Access to Electricity in Sub-Saharan Africa • October 2013
90

Financing needs are estimated as follows, the subsidy portion comes from taxes on RE and Government allocations (over a theoreticalperiod of 5 years):
- Electrification of isolated villages and grid reinforcement: EUR 1,160m- Electrification for households below the poverty line: EUR 500m- Reinforcement of grids in already electrified areas: EUR 670mTOTAL EUR 2,330m
including a 90% subsidy (balance from own capital or REC) EUR 2,100m1% supplement for training support or research EUR 230m
While these amounts may seem impressive at first sight, they should be seen against REC’s performance, experience and balance sheet.
In 2008, REC was ranked among India’s best performing State companies and its performance has been qualified as "excellent" by the publicauditor since 1993. REC now plans to export its services and know-how.
A few key figures for 2007-2008 (exchange rate: INR 70 = EUR 1):Number of projects appraised and approved per year about 750Capital EUR 122mLoans from the government EUR 11mLoans from Life Insurance Company EUR 500mLoans through bond issues EUR 3,200mLoans from other banks (including cooperation) EUR 600mTotal outstanding loans EUR 5,500mInterest collected over the year EUR 505mPre-tax profits EUR 187mAfter-tax profits EUR 123mDistribution of dividends EUR 37m
© AFD Working Paper n° 122 • Access to Electricity in Sub-Saharan Africa • October 2013
91
3.4.3 Innovative loan/grant blending to enhanceproject risk-sharing and maximize leveragefrom the scarce grant resources available
Subsidized financing is a necessity in view of the economic
characteristics of access projects. The grant component
should specifically target:
• Capacity building: institutional and regulatory frameworks;
capacity for new technologies; capacity to manage local
operations; training of bank staff;
• Preliminary studies and strategic planning; resource
inventories; feasibility studies (even if this means reinte-
grating the cost into the project financing if the project is
implemented);
• Support for implementation: financial arrangements,
engineering and implementation studies, project
management, capacity building for operators;
• Investment support: risk sharing, adapting the terms of
financial support to the economic and financial profiles
of projects (maturity, rate, grace period), investment
subsidies.

© AFD Working Paper n° 122 • Access to Electricity in Sub-Saharan Africa • October 2013
92
There are a whole host of uncertainties and risks related
to projects for access and rural electrification that use
renewable energy sources:
- Project risks: The risks related to the project itself are of
a technical nature. The first concerns the availability of the
resource and its uncertainties (hydrology, weather, wind,
sunshine, availability of biomass). Studies (often long and
costly) are thus needed to take account of these aspects
and allow renewable energy projects to be implemented.
The second technical risk is related to construction,
in particular to civil engineering for hydropower. This
construction risk carries a real risk of cost overruns;
- Risks related to the project context: It is necessary to
carefully analyze the anticipated demand and the speed
of its development. Indeed, regulatory frameworks for
buy-back tariffs or access by third parties to the grid often
only give a visibility for a few years, whereas the return on
a project takes over five years and it is necessary to wait
eight to ten years for significant profitability.
Finally, a last project risk is related to the low level of expe-
rience, both technical and for project management, of local
operators that launch into this type of new operation...
- This leads us to the counterpart risk: In view of the list of
elements above, classic commercial or development banks
are reluctant when faced with these new projects. They do
not have the required expertise, or the instruments for
long-term loans, to appraise projects and finance them.
They then focus on counterpart quality and demand high
levels of guarantee based on a standard analysis of the
balance sheets of the companies requesting loans.
It is therefore up to the entities that finance access or to the
REFs to seek to mobilize loans and allocate grants, in order
to improve the profitability level of the project, and thus
make it more attractive to donors.
To do so, it is first necessary to draw up a list of priority
projects (for economic and social reasons or for spatial
planning reasons), in coordination with the planner, and
analyze their profitability and how they will be led, in order
to make a realistic decision about which portfolio can be
developed and supported given the available resources.
Initially at least, it will certainly be necessary to
subsidize/pre-finance studies, the cost of which can be rein-
tegrated into the project financing. In addition, it would be
useful to carry out strategic opportunity analyses of new
technologies (such as hybrid PV-diesel, or biodiesel as a
fuel for rural electrification). This will show the priorities to
potential investors and allow innovative projects with a
demonstration or pedagogical nature to be subsidized at a
suitable level, while counting on a reduction in costs over
the long term. Grants will be required for social projects,
while being aware that these are operations where funds
are “lost”.
The implementation of partial guarantee instruments must
be combined with training for bankers, operators, national
providers, etc. This would encourage them to become
involved over the long term and to take project or counter-
part risks (which they would otherwise refuse). In a context
of private investment, where equity contributions are
lacking, it might be conceivable to invest in the capital of
certain operations.
In view of the challenges of developing access and the
financing that may be allocated to it, it is thus necessary to
rethink the structuring of rural and peri-urban electrification
projects in order to achieve the most effective use of grants
(as the latter are necessary for this type of project which,
even when it is well structured, cannot reach the levels of
profitability that are possible in urban and industrial areas).
Grants are currently scarce and must be used in a
reasoned and targeted manner to finance the unprofitable
aspects of the project in order to reconcile equalization and
financial balance.

List of acronyms and abbreviations
ADEME Agence de l’environnement et de la maîtrise de l’énergie (French Environment and Energy Management Agency)
ADER Association des énergies renouvelables (Renewable Energy Association, France)
AFD Agence Française de Développement
AFREPEN African Energy Policy Research Network
AMADER Agence malienne pour le développement de l'énergie domestique et électrification rurale (Agency for the
Development of Domestic Energy and Rural Electrification, Mali)
ANARE Autorité nationale de régulation du secteur d'électricité (National Electricity Sector Regulatory Authority)
APAUS Agence pour accès universel aux services (Agency for Universal Access to Services)
APL Adaptable Program Loan
ARSEL Agence de régulation du secteur électrique (Electricity Sector Regulatory Agency)
ADB African Development Bank
BOT Build Operate Transfer
CAR Central African Republic
CEMAC Central African Economic and Monetary Community
CIE Compagnie Ivoirienne d'Electricité Electricity Company of Cote d'Ivoire
CREE Commission de Régulation de l'Electricité et de l'Eau (Electricity and Water Regulatory Commission)
DGE Direction générale de l’Energie (General Directorate for Energy)
DRC Democratic Republic of the Congo
DRE Decentralized Rural Electrification
DSC Decentralized Services Company
ECOWAS Economic Community of West African States
EDF Électricité de France
EdM Électricité du Mali
ESF Électriciens sans frontières (Electricians without Borders)
ESMAP Energy Sector Management Assistance Program
FACE Fonds d’amortissement des charges d’électrification (Fund for the Amortization of Electrification Charges)
FGEF French Global Environment Facility
GEF Global Environment Facility
GRET Groupe de recherche and d'échanges technologiques
GIZ/GTZ Deutsche Gesellschaft für Internationale Zusammenarbeit
HDI Human Development Indicators
IBRD International Bank for Reconstruction and Development
IDA International Development Association
IEA International Energy Agency
IED Innovation énergie développement
IEG Independent Evaluation Group
IGCC Integrated Gasification in Combined Cycle
© AFD Working Paper n° 122 • Access to Electricity in Sub-Saharan Africa • October 2013
93

IPP Independent Power Producer
IREDA Indian Renewable Energy Development Agency
KPLC Kenya Power Lighting Corporation
LED Light-Emitting Diode
LELB Low Energy Light Bulb
LRMC Long-Run Marginal Cost
LV Low Voltage
MDGs Millennium Development Goals
MRBC Meter Reading, Billing and Collection
MV Medium Voltage
NGO Non-Governmental Organization
NIZ Non-Interconnected Zones
OBA Output-Based Aid
OECD Organisation for Economic Co-operation and Development
ONE Office national d'électricité
PACEAA Poverty Alleviation through Cleaner Energy for Agro-Industry in Africa
PCASER Projet de candidature spontanée d’électrification rurale (Project for Spontaneous Applications for Rural
Electrification)
PERG Programme d’électrification rurale global (Global Rural Electrification Program)
PPA Power Purchase Agreement
PPP Public-Private Partnership
PSP Private-Sector Participation
PV Photovoltaics
PVPS Photo-Voltaic Power Systems
REA Rural Electrification Agency
REC Rural Electrification Corporation
REF Rural Electrification Fund
RGGVY Rajiv Gandhi Grameen Vidyutikaran Yojana
RIAED Réseau international d’accès aux énergies durables (International Network for Access to Renewable Energy)
RRI Rate of Return on Investment
SENELEC Société nationale d'électricité du Senegal
SHEP Self-Help Electrification Program
SIG Southern Interconnected Grid
SIL Special Impact Loan
SMEs Small and Medium-Sized Enterprises
SWER Single Wire Earth Return
SWOT Strengths, Weaknesses, Opportunities, Threats
TPA Third-Party Access
UNDP United Nations Development Programme
UNEP United Nations Environment Programme
UNIDO United Nations Industrial Development Organization
WAEMU West African Monetary and Economic Union
WEO World Energy Outlook
© AFD Working Paper n° 122 • Access to Electricity in Sub-Saharan Africa • October 2013
94

Internal reports / Program documents
ADEDJOUMON, C. (2008), Capitalization of rural electrification projects financed by AFD in Africa from 1994 to 2008 (in French), Internal
Report.
AFD (2005), Retrospective evaluation of a rural electrification project in the Ganzourgou (Burkina Faso) (in French), Internal Report.
EDF, Study to identify scope of works for a rural electrification project in Kenya, Internal Report.
EDF, AXENNE and ABERDARE, Review of customer connection policy, "Strengthening the electricity distribution in Nairobi and Mombasa",
Internal Report.
HEURAUX, C. (2009), Presentation of the SSD survey, EDF (in French), Internal Report.
KOTY, C. (2007), Situation of the energy sector and perspectives (in French), Ministry of Mines, Energy and Water of Benin, Internal Report.
Ministry for Energy, Kenya (2005), Road map for reform of the rural electrification programme, Internal Report.
MMEE, GTZ, AFD and CE (2008), Program document, rural electrification program through network connection.
MOSTERT, W. (2008), Review of experiences with rural electrification agencies - Lessons for Africa, Draft Report prepared for the European
Union Energy Initiative-Partnership Dialogue Facility (EUEI-PDF), EUEI-PDF, Internal Report.
NIANG, A., "The strategy of the development of rural electrification" (in French), ASER presentation, Dakar, Internal Report.
Project studies
CEMAC, ECOWAS, 2006 IED: Studies carried out in the CEMAC (Cameroon, CAR, Chad, Congo, Gabon, Equatorial Guinea,)
and ECOWAS (Benin, Burkina Faso, Cape Verde, Côte d’Ivoire, Gambia, Ghana, Guinea, Guinea Bissau) areas.
Study carried out in 2001 in the Philippines as part of a partnership between the World Bank and the Foundation of the Institute
for Development Policy and Research Management in the Philippines.
Study carried out in Vietnam in 2005, at the initiative of the World Bank and the Swedish International Development Agency
accompanying an electrification project of USD 150m.
ONE, in partnership with the AFD (2003): Impact study of the effects of electrification in its different forms, on households and
non-domestic users. The World Bank has published an impact study based on data from different continents, rural locations
and on the natural environment.
World Bank (2008), UNDP (2007), ECOWAS and UEMOA (2006), Review of national framework for involvement of agro-
industries in rural electrification, project PACEAA (poverty alleviation through cleaner energy for agro-industry in Africa), 2009,
Mostert (2008), African Energy Policy Research Network (AFREPEN), 2004, data collected in the scope of the Club of
agencies of rural electrification, Congolese household survey (2005), Eritrean Ministry of Energy, International network of
access to sustainable energy (RIAED), 2005.
© AFD Working Paper n° 122 • Access to Electricity in Sub-Saharan Africa • October 2013
95

References
AFD (2004), Supervisory Board Report - Renforcement de la distribution électrique à Nairobi et Mombasa, Paris.
AFD (2005), Supervisory Board Report - Extension du réseau électrique dans six provinces rurales du Kenya, Paris.
AFD (2008a), Aide-mémoire, Identification du projet d’électrification rurale, Mauritanie CMR3009, Paris.
AFD (2008b), Aide-mémoire, Projet de fourniture de services énergétiques, Mission d’appui pour l’élaboration des procédures
de gestion du fonds d’électrification rurale, Paris.
AFD (2008c), Mission Report, Identification du projet d’électrification rurale, Mauritanie CMR3009, Paris.
IEA (2009), World Energy Outlook 2009, Paris.
BOLAY, C and A. RABINOVICH (2004), Intermediate Cities in Latin America, Risk and Opportunities of Coherent Urban
Development, Elsevier, London.
BPOBA (2007), OBA in Senegal, designing technology-neutral concessions for rural electrification, World Bank, Washington
DC.
BURGEAP (2006), The elaboration of a National Rural Electrification Framework in Ghana, Inception Report, Concept Note
and Workshop, Boulogne-Billancourt.
CBS – International Livestock Research Institute (2004), The Geographic Dimensions of Well-Being in Kenya: Where are the
Poor?
ECOWAS and WAEMU (2006), Livre blanc pour une politique régionale sur accès aux services énergétiques des populations
rurales and périurbaines pour l’atteinte des objectifs du Millénaire pour le développement.
CRE (2005), "La péréquation des tarifs d’utilisation des réseaux nécessite un outil adapté: le fonds de péréquation de électri-
cité" Fiche n° 4, Paris.
EASE and IMPROVES (2007), Opérateurs électriques en milieu rural au Mali and au Burkina Faso.
EDF, Study of non-electrified households in electrified areas in Kenya, Internal Report.
GRET (2005), "Comment se sont-ils électrifiés ? Deux études de cas de politique nationale d'électrification: France, United
States", On-line studies and works n° 3, Paris.
IED (2004), Rapport de synthèse sur les prix obtenus dans le cadre de l’appel d’offres pour l’électrification de six localités en
Mauritanie – Comparative study.
IEG (2008), The welfare impact of rural electrification: a reassessment of the costs and benefits, World Bank, Washington DC.
MASSE, R. (2008), Évaluation des SSD au Mali, Maroc and Afrique du Sud – Final report, GRET, Paris.
MASSE, R. (2005), Histoire de l'électrification rurale en France, GRET, Paris.
MASSE, R. (2004), Financer le développement de l’électrification rurale, GRET, Paris.
Ministry of Mines, Energy and Water, France (2005), Programme d’action pour l’électrification des localités rurales du Bénin,
ABERME, Paris.
UNDP (2008), Human development report 2007-2008, UNDP, New York.
PRAXIS (2008), Harmonisation de la méthodologie d’élaboration des plans locaux électrification des concessions, Final
Report.
UN-HABITAT (2008), The state of African cities, a framework for addressing urban challenges in Africa, UN-HABITAT, Nairobi.
UN (2008), Renforcer l’épargne intérieure en Afrique, Afrique Renouveau, Vol. 22#3, New York.
WORLD BANK (2008a), World Development Report, Washington, DC.
WORLD BANK (2008b), Designing sustainable off-grid rural electrification projects: principles and practices, operational
guidance for World Bank Group staff, Washington, DC.
WORLD BANK (2006), An investment framework for clean energy and development: A progress report, Washington, DC.
© AFD Working Paper n° 122 • Access to Electricity in Sub-Saharan Africa • October 2013
97

© AFD Working Paper n° 122 • Access to Electricity in Sub-Saharan Africa • October 2013
99
Série Documents de travail / Working Papers SeriesPubliés depuis janvier 2009 / published since January 2009
Les numéros antérieurs sont consultables sur le site : http://recherche.afd.fr
Previous publications can be consulted online at: http://recherche.afd.fr
N° 78 « L’itinéraire professionnel du jeune Africain » Les résultats d’une enquête auprès de jeunes leaders Africains sur
les « dispositifs de formation professionnelle post-primaire »
Richard Walther, consultant ITG, Marie Tamoifo, porte-parole de la jeunesse africaine et de la diaspora
Contact : Nicolas Lejosne, département de la Recherche, AFD - janvier 2009.
N° 79 Le ciblage des politiques de lutte contre la pauvreté : quel bilan des expériences dans les pays en développement ?
Emmanuelle Lavallée, Anne Olivier, Laure Pasquier-Doumer, Anne-Sophie Robilliard, DIAL - février 2009.
N° 80 Les nouveaux dispositifs de formation professionnelle post-primaire. Les résultats d’une enquête terrain au Cameroun,
Mali et Maroc
Richard Walther, Consultant ITG
Contact : Nicolas Lejosne, département de la Recherche, AFD - mars 2009.
N° 81 Economic Integration and Investment Incentives in Regulated Industries
Emmanuelle Auriol, Toulouse School of Economics, Sara Biancini, Université de Cergy-Pontoise, THEMA,
Comments by : Yannick Perez and Vincent Rious - April 2009.
N° 82 Capital naturel et développement durable en Nouvelle-Calédonie - Etude 1. Mesures de la « richesse totale »
et soutenabilité du développement de la Nouvelle-Calédonie
Clément Brelaud, Cécile Couharde, Vincent Géronimi, Elodie Maître d’Hôtel, Katia Radja, Patrick Schembri,
Armand Taranco, Université de Versailles - Saint-Quentin-en-Yvelines, GEMDEV
Contact : Valérie Reboud, département de la Recherche, AFD - juin 2009.
N° 83 The Global Discourse on “Participation” and its Emergence in Biodiversity Protection
Olivier Charnoz. - July 2009.
N° 84 Community Participation in Biodiversity Protection: an Enhanced Analytical Framework for Practitioners
Olivier Charnoz - August 2009.
N° 85 Les Petits opérateurs privés de la distribution d’eau à Maputo : d’un problème à une solution ?
Aymeric Blanc, Jérémie Cavé, LATTS, Emmanuel Chaponnière, Hydroconseil
Contact : Aymeric Blanc, département de la recherche, AFD - août 2009.
N° 86 Les transports face aux défis de l’énergie et du climat
Benjamin Dessus, Global Chance.
Contact : Nils Devernois, département de la Recherche, AFD - septembre 2009.
N° 87 Fiscalité locale : une grille de lecture économique
Guy Gilbert, professeur des universités à l’Ecole normale supérieure (ENS) de Cachan
Contact : Réjane Hugounenq, département de la Recherche, AFD - septembre 2009.
N° 88 Les coûts de formation et d’insertion professionnelles - Conclusions d’une enquête terrain en Côte d’Ivoire
Richard Walther, expert AFD avec la collaboration de Boubakar Savadogo (Akilia) et de Borel Foko (Pôle de Dakar)
Contact : Nicolas Lejosne, département de la Recherche, AFD - octobre 2009.
N° 89 Présentation de la base de données. Institutional Profiles Database 2009 (IPD 2009)
Institutional Profiles Database III - Presentation of the Institutional Profiles Database 2009 (IPD 2009)
Denis de Crombrugghe, Kristine Farla, Nicolas Meisel, Chris de Neubourg, Jacques Ould Aoudia, Adam Szirmai
Contact : Nicolas Meisel, département de la Recherche, AFD - décembre 2009.

N° 90 Migration, santé et soins médicaux à Mayotte
Sophie Florence, Jacques Lebas, Pierre Chauvin, Equipe de recherche sur les déterminants sociaux de la santé et
du recours aux soins UMRS 707 (Inserm - UPMC)
Contact : Christophe Paquet, département Technique opérationnel (DTO), AFD - janvier 2010.
N° 91 Capital naturel et developpement durable en Nouvelle-Calédonie - Etude 2. Soutenabilité de la croissance néo-
calédonienne : un enjeu de politiques publiques
Cécile Couharde, Vincent Géronimi, Elodie Maître d’Hôtel, Katia Radja, Patrick Schembri, Armand Taranco
université de Versailles – Saint-Quentin-en-Yvelines, GEMDEV
Contact : Valérie Reboud, département Technique opérationnel, AFD - janvier 2010.
N° 92 Community Participation Beyond Idealisation and Demonisation: Biodiversity Protection in Soufrière, St. Lucia
Olivier Charnoz, Research Department, AFD - January 2010.
N° 93 Community participation in the Pantanal, Brazil: containment games and learning processes
Participation communautaire dans le Pantanal au Brésil : stratégies d’endiguement et processus d’apprentissage
Olivier Charnoz, département de la Recherche, AFD - février 2010.
N° 94 Développer le premier cycle secondaire : enjeu rural et défis pour l'Afrique subsaharienne
Alain Mingat et Francis Ndem, IREDU, CNRS et université de Bourgogne
Contact : Jean-Claude Balmès, département Education et formation professionnelle, AFD - avril 2010
N° 95 Prévenir les crises alimentaires au Sahel : des indicateurs basés sur les prix de marché
Catherine Araujo Bonjean, Stéphanie Brunelin, Catherine Simonet, CERDI - mai 2010.
N° 96 La Thaïlande : premier exportateur de caoutchouc naturel grâce à ses agriculteurs familiaux
Jocelyne Delarue, Département de la Recherche, AFD - mai 2010.
N° 97 Les réformes curriculaires par l’approche par compétences en Afrique
Francoise Cros, Jean-Marie de Ketele, Martial Dembélé, Michel Develay, Roger-François Gauthier, Najoua Ghriss,
Yves Lenoir, Augustin Murayi, Bruno Suchaut, Valérie Tehio - juin 2010.
N° 98 Les coûts de formation et d’insertion professionnelles - Les conclusions d’une enquête terrain au Burkina Faso
Richard Walther, Boubakar Savadogo, consultants en partenariat avec le Pôle de Dakar/UNESCO-BREDA.
Contact : Nicolas Lejosne, département de la Recherche, AFD - juin 2010.
N° 99 Private Sector Participation in the Indian Power Sector and Climate Change
Shashanka Bhide, Payal Malik, S.K.N. Nair, Consultants, NCAER
Contact : Aymeric Blanc, Research Department, AFD - June 2010.
N° 100 Normes sanitaires et phytosanitaires : accès des pays de l’Afrique de l’Ouest au marché européen - Une étude empirique
Abdelhakim Hammoudi, Fathi Fakhfakh, Cristina Grazia, Marie-Pierre Merlateau.
Contact : Marie-Cécile Thirion, département de la Recherche, AFD - juillet 2010.
N° 101 Hétérogénéité internationale des standards de sécurité sanitaire des aliments : Quelles stratégies pour les filières
d’exportation des PED ? - Une analyse normative
Abdelhakim Hammoudi, Cristina Grazia, Eric Giraud-Héraud, Oualid Hamza.
Contact : Marie-Cécile Thirion, département de la Recherche, AFD - juillet 2010.
N° 102 Développement touristique de l’outre-mer et dépendance au carbone
Jean-Paul Ceron, Ghislain Dubois et Louise de Torcy.
Contact : Valérie Reboud, AFD - octobre 2010.
N° 103 Les approches de la pauvreté en Polynésie française : résultats et apports de l’enquête sur les conditions de vie en 2009
Javier Herrera, IRD-DIAL, Sébastien Merceron, Insee - novembre 2010.
Contact : Cécile Valadier, département de la Recherche
N° 104 La gestion des déchets à Coimbatore (Inde) : frictions entre politique publique et initiatives privées
Jérémie Cavé, Laboratoire Techniques, Territoires et Sociétés (LATTS), CNRS - décembre 2010.
© AFD Working Paper n° 122 • Access to Electricity in Sub-Saharan Africa • October 2013
100

N° 105 Migrations et soins en Guyane - Rapport final à l’Agence Française de Développement dans le cadre du contrat
AFD-Inserm
Anne Jolivet, Emmanuelle Cadot, Estelle Carde, Sophie Florence, Sophie Lesieur, Jacques Lebas, Pierre Chauvin
Contact : Christophe Paquet, département Technique opérationnel (DTO), AFD - décembre 2010.
N° 106 Les enjeux d'un bon usage de l'électricité : Chine, Etats-Unis, Inde et Union européenne
Benjamin Dessus et Bernard Laponche avec la collaboration de Sophie Attali (Topten International Services),
Robert Angioletti (Ademe), Michel Raoust (Terao)
Contact : Nils Devernois, département de la Recherche, AFD - février 2011.
N° 107 Hospitalisation des patients des pays de l’Océan indien - Prises en charges spécialisées dans les hôpitaux de la Réunion
Catherine Dupilet, Dr Roland Cash, Dr Olivier Weil et Dr Georges Maguerez (cabinet AGEAL)
En partenariat avec le Centre Hospitalier Régional de la Réunion et le Fonds de coopération régionale de la Réunion
Contact : Philippe Renault, AFD - février 2011.
N° 108 Peasants against Private Property Rights: A Review of the Literature
Thomas Vendryes, Paris School of Economics - February 2011.
N° 109 Le mécanisme REDD+ de l’échelle mondiale à l’échelle locale - Enjeux et conditions de mise en oeuvre
ONF International
Tiphaine Leménager, département de la Recherche, AFD - mars 2011.
N° 110 L’aide au Commerce : état des lieux et analyse
Aid for trade: A survey
Mariana Vijil, Marilyne Huchet-Bourdon et Chantal Le Mouël
AGROCAMPUS OUEST, INRA, Rennes - avril 2011.
N° 111 Métiers porteurs : le rôle de l’entrepreneuriat, de la formation et de l'insertion professionnelle
Sandra Barlet et Christian Baron, GRET
Nicolas Lejosne, département de la Recherche, AFD ([email protected]) - avril 2011.
N° 112 Charbon de bois et sidérurgie en Amazonie brésilienne : quelles pistes d’améliorations environnementales ?
L’exemple du pôle de Carajas
Ouvrage collectif sous la direction de Marie-Gabrielle Piketty, Cirad, UMR Marchés,
Contact : Tiphaine Leménager, département de la Recherche, AFD ([email protected]) - avril 2011.
N° 113 Gestion des risques agricoles par les petits producteurs Focus sur l'assurance-récolte indicielle et le warrantage
Guillaume Horréard, Bastien Oggeri, Ilan Rozenkopf sous l’encadrement de :
Anne Chetaille, Aurore Duffau, Damien Lagandré
Contact : Bruno Vindel, département des Politiques alimentaires, AFD - mai 2011.
N° 114 Analyse de la cohérence des politiques commerciales en Afrique de l’Ouest
Jean-Pierre Rolland, Arlène Alpha, GRET
Contact : Jean-René Cuzon ([email protected]), département PSP, AFD - juin 2011
N° 115 L’accès à l’eau et à l’assainissement pour les populations en situation de crise :
comment passer de l’urgence à la reconstruction et au développement ?
Julie Patinet (Groupe URD) et Martina Rama (Académie de l’eau),
sous la direction de François Grünewald (Groupe URD)
Contact : Thierry Liscia ([email protected]), département du Pilotage stratégique et de la Prospective,
N° 116 Formation et emploi au Maroc : état des lieux et recommandations
Jean-Christophe Maurin ([email protected]) et Thomas Mélonio ([email protected]), AFD - septembre 2011.
N° 117 Student Loans : Liquidity Constraint and Higher Education in South Africa
Marc Gurgand, Adrien Lorenceau, Paris School of Economics
Contact : Thomas Mélonio ([email protected]), Research Department, AFD - September 2011.
© AFD Working Paper n° 122 • Access to Electricity in Sub-Saharan Africa • October 2013
101

N° 118 Quelle(s) classe(s) moyenne(s) en Afrique ? Une revue de littérature
Dominique Darbon, IEP Bordeaux, Comi Toulabor, LAM Bordeaux
Contacts : Virginie Diaz et Thomas Mélonio, département de la Recherche, AFD
N° 119 Les réformes de l’aide au développement en perspective de la nouvelle gestion publique
Jean-David Naudet, division Evaluation et Capitalisation, AFD
N° 120 Fostering low-carbon growth initiatives in Thailand
EDDEN Research Unit of CNRS (French National Research Center) at the University of Grenoble : Prof. Patrick
Criqui (CNRS, Scientific Director), Dr. Pierre-Olivier Peytral (EDDEN Lab, Economist) Dr. Jean-Christophe Simon
(IRD, Senior Economist)
Contact : Cécile Valadier, Research Department, AFD ([email protected])
N°121 Interventionnisme public et handicaps de compétitivité : analyse du cas polynésien
Florent Venayre, Maître de conférences en sciences économiques, université de la Polynésie française et
LAMETA, université de Montpellier
Contact : Cécile Valadier, département de la Recherche, AFD
© AFD Working Paper n° 122 • Access to Electricity in Sub-Saharan Africa • October 2013
102

Access to Electricity in Sub-Saharan Africa:Lessons Learned and Innovative Approaches
Anjali Shanker (IED) with the contribution from Patrick Clément (Axenne),Daniel Tapin et Martin Buchsenschutz (Nodalis Conseil)
Contact: Valérie Reboud, (AFD) Technical Operations Department,Environment and Equipment Division ([email protected])
Age
nce
Fran
çais
e de
Dév
elop
pem
ent
122
Age
nce
Fran
çais
e de
Dév
elop
pem
ent
Agence Française de DéveloppementDirection de la StratégieDépartement de la Recherche
5 rue Roland Barthes75012 Paris - Francewww.afd.fr
Research Department
WorkingPaper
Age
nce
Fran
çais
e de
Dév
elop
pem
ent
October 2013

Layout: Eric Thauvin
Publication Director: Anne PAUGAM
Editorial Director: Alain HENRY
ISSN: 1958-539X
Copyright registration: 3rd Quarter 2013
Disclaimer
The analyses and conclusions in this working paper are the authors’ own. They do not necessarily reflect the point of view of
Agence Française de Développement or its partner institutions.

Acknowledgements
© AFD Working Paper n° 122 • Access to Electricity in Sub-Saharan Africa • October 2013
3
This study was conducted for Agence Française de Développement (AFD) by the Innovation Energie Développement (IED)
consortium, Axenne and Nodalis Conseil.
This paper was written by Anjali Shanker, Managing Director (IED), with contributions from Patrick Clément (Axenne),
Daniel Tapin and Martin Buchsenschutz (Nodalis Conseil). The author wishes to thank all those who have contributed to this
work, and in particular Valérie Reboud, Christian de Gromard, Laurence Breton Moyet and Carl Bernadac (AFD), as well as
Denis Rambaud-Méasson (IED).
A Steering Committee met several times and the substance of this text has been defined thanks to its contributions during the
working sessions. We would therefore like to thank all the members for their invaluable contributions: The French Environment
and Energy Agency (ADEME), Electricité de France (EDF), Electricians without Borders (ESF), the École des Ponts ParisTech,
the Énergies pour le Monde foundation and Total Renewable Energies.


Contents
Executive summary 7Introduction 17
1 Access to electricity services in Sub-Saharan Africa: Challenges and methodological approach 211.1 Power systems insufficient to underpin sustainable economic and social development 211.2 Develop a systematic vision and overall operational planning: Access for what purpose and
with what resources? 271.3 Analysis and lessons learned from the impact of past programs 291.4 Access dynamics affected by sector reforms 341.5 Establish clear prerogatives for each stakeholder 37
2 A continuum of technical, economic and organizational solutions 452.1 Technical and economic framework 452.2 Complementary technical solutions for the interconnected grid 532.3 Distribution and customer management: Substantial leeway 67
3 A need for structured financing 773.1 Widespread access to electricity services: The need to mobilize more financing than
the current flows from international cooperation 773.2 Historical principles 793.3 Keys for setting tariff levels 813.4 Establishing the financing mechanisms required to guarantee access to an electricity service for all 85
List of acronyms and abbreviations 93
References 97
© AFD Working Paper n° 122 • Access to Electricity in Sub-Saharan Africa • October 2013
5


This study was conducted with the aim of developing new
approaches and a methodological capitalization on the
topic of access to electricity services for all in Sub-Saharan
Africa.
The first section of the study analyzes the challenges
involved. The low level of access rates in Sub-Saharan
Africa must be put into perspective with the need for
equipment design and territorial development. This, in turn,
must consider the dynamics of economic and social
development, as well as the impact of past programs and
sector reforms.
The second section focuses on operational proposals,
based on a review of the various technical options for
power generation, especially for renewable energy, whose
recent advances certainly have strong potential but also
difficulties. The key challenge for distribution is addressed
in its multiple dimensions.
The third and last section concerns the financial challenges:
there is a need to mobilize national financing, which reflects
a strong political commitment, and to make the best
possible use of the scarce grants available, which is a major
challenge. An in-depth analysis of how the project risks and
quality of the promoter are perceived may provide insight
into possible future directions for high-impact financial
engineering.
Executive summary
1 1. The challenges for access to modern energy in Sub-Saharan Africa
1.1 Power systems insufficient to underpin sustainable economic and social development
In Sub-Saharan African countries1, the average rate of
access to an electricity supply2 stands at 16% of the total
number of households and less than 5% in rural areas.
While this percentage has improved since the 1990s, the
number of people without access to electricity has actually
risen due to population growth.
Less than 20% of communities are generally connected to
power infrastructure. It therefore does not support the
sustainable economic and social development of sources of
production (irrigation, refrigeration, motive power, etc.), or
of basic social services (health centers) throughout the
region.
Demographic and migratory issues make this challenge of
access to modern energy even more complex. Indeed,
communities living in small remote villages – where
electrification is costly – will tend to migrate to secondary
cities, which have economic and social infrastructure.
1 This study focuses on access to electricity in Sub-Saharan African countries. North Africancountries – Algeria, Egypt, Libya, Morocco and Tunisia – are not included in these figures.
2 In statistics, this generally indicates the share of the population with access tocommercially sold electricity at home. In a broader definition, a battery recharge or solar kitservice may also be considered as access to an electricity service.
© AFD Working Paper n° 122 • Access to Electricity in Sub-Saharan Africa • October 2013
7

Defining the potential profitability of a program to provide
access to electricity services requires making a distinction
between two types of program. The first aims at equipping
a given area (where there are secondary centers with
"economic potential") with essential infrastructure for its
economic development. The second aims at providing
a widespread service to all the residents of an area,
especially the poorest (this may be peri-urban communities,
which account for 40 to 60% of households, even in a
country’s cities), or communities living in small villages or
very remote dwellings.
The rationale behind these two approaches is different: the
aim of the first is economic development and spatial
planning; the second has a social target of equity and
geographical balance (which comes at a high cost).
Focusing on "development centers" for spatial planning and
the provision of basic infrastructure for communities allows
a certain level of profitability to be achieved for electricity
services, as these centers have both economic activities
and a certain level of population density.
These medium-sized cities should thus be considered as
priorities in order for them to become fully-fledged "deve-
lopment centers" and to maximize the impact of the scarce
resources available for rural electrification.
To this end, spatial planning must go hand-in-hand with a
clear political vision of the social and economic objectives,
along with a political commitment to resource allocation.
However, the answer to the question "access for what
reason and with what means?" should not remain at a
political level. It must lead to a prioritization and to the
implementation of realistic and operational action plans that
fully take account of the financial, organizational and
technological realities of the country.
1.2 The key role of "development centers"
1.3 A real economic benefit for communities
Few ex post analyses are available, but they do bring to
light a number of key facts:
• Communities not connected to the power grid pay – for an
equivalent use of electricity supplied by kerosene or
(rechargeable) batteries – an energy price that is several
times higher than connected communities. It is often as
much as USD 10 per month. There is consequently a real
ability to pay for electricity services;
• The connection fee often stands at between USD 100 and
USD 300 – a prohibitive amount that is difficult to pay as a
lump sum;
• Once the connection is made, the expenditure – and
therefore consumption – generally remains stable with
lower unit prices. This is both an advantage and an
impediment, as it is clearly an advantage for small shops
and craft trades, which were already electricity users and
are thus equipped, but the cost of acquiring electrical
equipment for new clients stems consumption;
• Access to energy has a significant social and economic
impact (street lighting, health services, etc.), although it is
difficult to clearly identify the role played by electricity in
improving living conditions for communities compared to
other infrastructure.
© AFD Working Paper n° 122 • Access to Electricity in Sub-Saharan Africa • October 2013
8

While there is clearly economic profitability, which in itself is
extremely reassuring for the allocation of resources to this
sector, the issue of financing still needs to be resolved.
Indeed, a country where the access rate to electricity in
affluent industrial and urban areas remains low, with poor
service quality and a need for recurrent financing to cover
operating and maintenance costs, will find it very difficult to
make access in rural and peri-urban areas a national
priority.
1.4 Access dynamics affected by sector reforms
In the mid-1990s, the general inefficiency of electricity
companies in the public sector prompted a wave of
reforms, calling for greater private sector participation.
Today, the institutional model that has become the norm is
that of an agency and/or fund to design, develop and/or
operate power systems in rural or peri-urban areas.
However, African countries that have maintained their tradi-
tional national power companies today have the highest
access rates to electricity: Côte d’Ivoire, 39%; Ghana, 60%
(82% in urban areas and 29% in rural areas); South Africa,
70%. The balance between profitable areas (towns and
densely populated coastal areas) and unprofitable (rural)
areas would appear to be easier to achieve in the case of a
single overall management. Does this mean that all efforts
should, once again, focus on national power companies? A
positive answer would be particularly questionable in view
of the fact that they are often required to be financially pro-
fitable, and that rural and peri-urban electrification may fall
outside their remit and their priorities. The new entities and
organizations should be given the time they need to reach
maturity before drawing any definitive conclusions.
As far as private operators are concerned, it is clear that
they have few reasons to take an interest in energy supply
to rural areas. Indeed, this niche has low profit levels and is
difficult to manage, unless there is a high level of State
cofinancing, which would give the concession a certain
degree of profitability. However, many non-governmental
entities have acquired extensive experience in Africa’s rural
areas and play a pioneering role in developing innovative
technical and organizational solutions. They can be potential
operators in low-income areas with low energy consumption,
working closely with local users’ organizations, municipa-
lities and local government.
1.5 Establish clear prerogatives for each stakeholder
The multiplication of entities – national companies,
funds/agencies, regulators, ministries – prior to implementing
large-scale projects, does not necessarily provide the three
functions of financing, regulation and implementation. It is
clear that this often leads to a fragmentation of compe tencies,
as well as competition between institutions to take owner-
ship of projects that have budgets and to hold responsibilities
at the “frontiers" of these three functions.
Financing function: While most Sub-Saharan African
countries today have rural electrification funds (since power
companies stopped financing this sub-sector), they are
generally mere accounts through which the meager grants
from international cooperation are transferred and they do
not have well-developed financing mechanisms. The increa-
singly important role of local authorities could bring about
changes to this.
© AFD Working Paper n° 122 • Access to Electricity in Sub-Saharan Africa • October 2013
9

Regulation function: A regulator must ultimately answer the
following questions: Does the project have sufficient
incentives and is it transparent enough to attract private
sector investment, and if so, to what extent? Is it realistic to
envisage rural electrification concessions (with private
investment), or should franchises or affermage with mainly
public investment and a private manager initially be
planned? Should the question of tariff regulation involve
equalization or not? The simple fact of creating an ad hoc
regulatory agency does not necessarily allow a clear and
credible framework to be defined and implemented.
Industrial/implementation function: In the past, the national
company played a central role as it was both a power
company, which has the real technical and organizational
capability to carry out a large-scale program, and a
counterpart, which publishes a balance sheet and
profit-and-loss account, allowing it to be a long-term
borrower (public, of course, and often with a State
guarantee). The withdrawal of national companies from
rural areas may have an adverse effect on the development
of expertise in engineering and works supervision, which is
essential in order to maintain a quality nationwide power
supply.
These issues are becoming even more essential with the
multiplication of ever more complex technological options to
meet electricity demand.
© AFD Working Paper n° 122 • Access to Electricity in Sub-Saharan Africa • October 2013
10

Historically, the economies of scale of large-scale infra-
structure and interconnections justified a public monopoly
situation. This context led to a structuring of the ways and
means of financing such large operations by lending
directly to the State, or with a State guarantee. However,
since the 1990s the paradigm of technologies and the
financial situation of counterparts has evolved.
Most African countries have a serious investment shortfall
in both large-scale infrastructure and in highly capital-
intensive interconnected power grids, which must be
amortized over a long period due to the general financial
crisis that started in the 1980s. This shortfall affects both the
quality of the counterparts of electricity companies and the
States themselves.
Despite being rich in natural resources, a number of
countries are obliged to invest in thermal power (gas turbines
or heavy fuel oil). It may come at a low cost in terms of
capital and can be rapidly built, but is today feeling the full
brunt of the increase in the price of hydrocarbons.
The paradigm of renewable energy has been completely
transformed:
• Small- and medium-power generation, using old
technology based on renewable energy sources, is
becoming competitive (this is the case for small hydro-
power plants, gasifiers and cogeneration);
• The industrial development of new sectors, after
decades of research, is experiencing a new dynamism,
which makes these technologies more reliable and
lowers investment costs (this is the case for photo -
voltaics3 and industrial biogas);
• Recent developments in electrical engineering allow the
production distributed on the grids to be managed, in
conjunction with a close monitoring of demand, which
leads to "smart grids";
• Hybrid solutions, combining the production flexibility of
a diesel generator with the low, long-term generation
cost of renewable energy, offer an alternative to overco-
me the problems of intermittency found in renewable
energy sources.
Consequently, given the two main current trends in
Sub-Saharan Africa – difficulties in raising large amounts of
financing for large-scale generation facilities4 and the
development of electrical engineering (which today offers
the possibility of a major power grid supplied at several
points by medium-sized power plants) – there may be a
shift towards a new generation scheme. This would involve
geographically distributed medium-sized facilities
integrated into smart grids, in a context where economies of
scale no longer play the same role that they used to.
While grid extensions are the first option for scaling up
access – provided there are large-scale plants with a low
cost per kWh and grids – there is increasing scope for
small-scale local generation with the associated distribution
grid. This is in a context whereby the main power
transmission grids do not yet exist and, moreover, the
national power company has left the playing field. We thus
have a highly diversified "technological toolbox" that allows
2. A continuum of technical and organizational solutions
2.1 Technical and economic framework
3 In 2009, the kWh for units over 5 MW was announced by manufacturers at less than EUR0.25/kWh, with a cost of about EUR 3,000/kW installed peak power at the time of investmentin Europe.4 Today, 93% of the economically feasible hydropower available in Africa (estimated at937 TWh/year, i.e. 10% of the world total) remains untapped.
© AFD Working Paper n° 122 • Access to Electricity in Sub-Saharan Africa • October 2013
11

a more targeted response to the characteristics of rural
demand. This includes: grid extensions to areas with strong
demand, thus justifying the high investment cost in
the power lines; mini grids with local thermal or hybrid
production – if the resource is available – in areas that have
corresponding levels of demand; small-scale (stand-alone)
generation geographically distributed for very remote
communities and small villages.
This technological development also requires progress in
the relevant organizational and contractual frameworks:
authorize industrial self-generation for own needs and the
resale of the surplus at an attractive tariff; allow power
generation by small independent private producers, which
implies authorizing access to the grid by these third-parties
(for power transmission from the generation point to the
consumption site), and clearly define the conditions for
the feed-in tariff. These provisions of a clear regulatory
framework are a prerequisite for the commitment by
operators to develop access to energy in rural areas.
However, the question remains over the capacity to ensure
the maintenance and implementation of these technologies
at the local level.
2.2 Complementary technical solutions for the interconnected grid
Electronics today allows the integration of distributed
generation mobilizing local resources; this new possibility
requires a sound understanding of the strengths and
weaknesses of these technology sectors, as well as of the
opportunities they offer. It is important to compare this
analysis with the characteristics of the demand, and with
the local technical and social context, as no single ideal
solution exists, but several more-or-less suitable solutions
for a given context.
Historically, diesel generators were widely installed for the
electrification of rural centers and small towns far from
the interconnected grid, due to their low investment cost,
technological simplicity and rapid installation. Today,
however, these areas suffer from skyrocketing fuel prices; a
trend that is not improving. The ultimate paradox is that,
by means of maximizing the rapid installation of a universal
service, it is thermal solutions that are favored today, as
they have the lowest investment cost and are the most
effectively controlled locally.
In contrast, despite their high potential, the very small
number of pico (stand-alone), micro (village-size: 10 to
200-500 kW), or mini hydropower plants (200-500 kW to
5-15 MW) is striking in comparison with Asia. Africa has
very few turbine manufacturers (there are a few workshops
in Ethiopia and Nigeria), but many countries have the
industrial basis to provide the maintenance of such
facilities. Studies are long and costly, as the hydrological
and civil engineering risks often require complex
investigations. The amortization of mini- or micro-hydro
plants requires a certain level of demand, or the proximity
of a grid to sell to. Nevertheless, once such a plant has
been commissioned, it operates virtually alone and at a cost
that is practically nil, and this for a decade to half century.
Like hydropower, power generation from biomass depends
upon the local availability of the resource. In terms of power
generation for rural services, there are mainly four
distinct sectors: cogeneration5, biogas6, biodiesel7 and
gasification8. Unlike hydropower, they all need qualified
operators on a daily basis and regular intensive maintenance
of the equipment. A distinction should also be made between
the development of plantations destined for power gene -
ration, involving agricultural and rural development issues,
5 Combined generation of heat and electricity.6 Generation of low-grade gas for combustion from anaerobic fermentation, which may beinjected into a rectified diesel engine.7 Generation of biodiesel in a short cycle from oilseeds, usable in diesel engines.8 Pyrolysis of agricultural residue: partial / slow combustion producing gas for use in arectified diesel engine.
© AFD Working Paper n° 122 • Access to Electricity in Sub-Saharan Africa • October 2013
12

and the use of agricultural or agro-industry residues. In
practice, the choice of sector depends on the context: the
existence of an agro-industry, and thus of local techno -
logical skills with the possibility of surplus sales for rural
electrification, will clearly provide advantages in the field of
local control, whereas the installation of many small village-
based systems will require the development of local
expertise.
The generation costs for photovoltaics are falling, making
the PV (photovoltaic) kWh increasingly competitive
compared to other generation methods in Africa (especially
for grids supplied by thermal sources). Consequently, while
in past decades PV applications in Africa were limited to
solar kits or community applications (health, pumping, etc.)
for remote regions, this technology offers high-impact
prospects for sustainable access to electricity services
provided by (hybrid) mini grids.
Industries have widely developed their generation capacity
and have now reached the "one euro per peak watt" level
for the panels. They have been driven by large-scale
European, Japanese and American programs that have led
to major investments in generation capacity, as well as in
electronics to integrate renewable energy sources into
smart grids. This might well become the first option for
hybridization, as the almost constant sunshine in the region
is a resource that is easier to mobilize than biomass or
hydropower. The weak points of PV are its necessarily
diurnal generation (whereas in rural areas the demand is
often at night), and its particularly high investment cost,
which requires complex financial engineering.
2.3 Distribution and customer management: Substantial leeway
Once the generation method has been selected (renewable
energy, grid extension, diesel generator), the issue is raised
as to the distribution to households and customer
management. It should be stressed that the objective of
"access for all" does not automatically mean "equal service
level for all", as users do not all have the same needs for
energy quantity (engines or lighting) or service quality
(continuous service or a few hours a day). Setting up pico
electrification9 systems allows communities without
individual connections, but in a "covered area", to have
access to a minimum service. However, while these
systems reduce the exclusion of certain communities, it
would be wrong to consider them as effectively covered and
thus not eligible for a "full" service.
There is considerable potential for decreasing costs, but the
right option should be carefully selected. Indeed, in addition
to the issue of adapting standards to demand, it is common
practice to overestimate this demand, and thus to oversize
the grid (cable sections, transformer capacity, etc.). By
changing such practices, procurement policies and program
management, it is possible to save up to 30% on the
investment cost.
In the management field, distribution through the grid
corresponds to a (metered) unit sale of energy, whereas
electricity distribution in areas of weak demand often
corresponds to a service sale (number of lighting units,
hours of service, etc.). In rural areas, civil society and local
NGOs or village organizations increasingly handle customer
management and even distribution. This development suits
the power companies – they even call for it – as they
effectively prefer to sell in bulk to a single distributor. Today,
there is a proliferation of this type of contractual innovation.
Innovation is thus not necessarily technical, it can be based
on social systems that facilitate access. In addition, certain
tools and methods (smart, prepaid or collective meters)
improve both management efficiency and the rate of customer
coverage.
9 Pico electrification means battery recharge services or portable systems using highlyefficient equipment (lamps, etc.). It is sometimes associated with an individual solar panel.
© AFD Working Paper n° 122 • Access to Electricity in Sub-Saharan Africa • October 2013
13

Technological developments require new technical and
organizational plans. We have seen that such changes lead
to different project and counterpart risk configurations and
profitability and cash flow profiles than in the past.
Moreover, as the aim is to mobilize private investors, it is
clear that their expectations in terms of profitability and their
risk perception are very different from those of a public
service entity. The private operator, depending on whether
it is an enterprise or a local community, will also have
certain expectations in terms of its remuneration. The
financing instruments must thus be redesigned in order to
offer, among other things, longer maturities and risk-sharing
mechanisms that are sufficiently attractive to mobilize the
targeted stakeholders.
3 A need for structured financing
3.1 Widespread access to electricity services: The need to mobilize more financing thanthe current flows from international cooperation
The International Energy Agency (IEA) estimates that, with
an investment of USD 35bn a year (i.e. 6% of the planned
investment in the power sector), the challenge of access to
modern energy for almost 1.6 billion people will be resolved
by 2030. Judging by a World Bank review of its own port -
folio that mentions an annual flow limited to EUR 500m, we
are far from the IEA's order of magnitude. However, it
should be borne in mind that no country has reached
significant access rates without a major national effort. It
would thus be unrealistic to rely solely on international flows
to resolve the problem.
3.2 Stumbling blocks: Tariff equalization and subsidy methods
The power sector in itself is far from generating the surplus
required to self-finance the investments needed for service
extension. As the initial rate of electrification in
Sub-Saharan Africa is very low (10 to 20%), cross subsidies
alone will not be sufficient to reach very high access rates.
In rural and peri-urban areas, the weight of domestic
customers in the social bracket (generally with a low tariff
level), as well as the high investment costs (due to rural iso-
lation), imply much higher kWh costs than in mixed urban
areas. In order to better reflect costs, some countries use
the argument of the high energy expenditure prior to
electrification (kerosene, batteries, etc.) to justify and apply
a tariff differentiation based on costs. Even if these tariffs
remain lower than an off-grid solution, this application does
not solve the issue of the social acceptability of these
differentiated tariffs. This issue is exacerbated by the fact
that in countries highly dependent upon hydrocarbons,
distributors are increasingly authorized to make tariff
adjustments in order to reflect their fuel costs.
© AFD Working Paper n° 122 • Access to Electricity in Sub-Saharan Africa • October 2013
15
It is obviously necessary to rethink the approach to
financing rural electrification itself, and certainly to envisage
innovative approaches based on a new relationship
between technology, organization and financing.
Very long-term financing (30 years or more), or even an
initial subsidy10, are essential to finance investments in
rural areas (which has been, and occasionally still is, the
case for all member countries of the Organisation of
Economic Co-operation and Development – OECD). The
involvement of the State, which can refinance itself, is
required.
In this context, rural electrification funds must play a role as
real financial intermediaries: it is vital for them to be more
than a simple bank through which grants transit, if only
because the amounts available are very far from the
required investments. The use of such invaluable and
scarce grants as a catalyst for loans seems evident: for
subsidized loans (longer maturities based on the cash flow
profile of projects or the lower interest); for the preparation
of high quality projects to secure investors and financiers;
for partial guarantees to enhance the distribution of project
and counterpart risks and thus help raise private and bank
funds; etc. Local banks, which generally lend for a
maximum 5-year period, in reality do not want to invest in
this low-profit sector, with the exception of development
banks with a specific mandate. Investors, for their part, are
reluctant to invest capital in projects with a long return on
investment period, in a context where the regulatory and
political frameworks have not yet been stabilized. For this
type of long-term investment, risk sharing lies at the core
of the issue of mobilizing national savings and, more
generally, investments.
3.3 Keys for setting tariff levels
© AFD Working Paper n° 122 • Access to Electricity in Sub-Saharan Africa • October 2013
16
10 Or, more generally, concessional loans.

Table 1. AFD and FGEF rural electrification financing (1993-2008) (EUR M)
AFD FGEFBurkina-Faso 0,38 0,22Mauritania 2,21 0,76Tunisia 13,72Morocco - PERG loan 1 30,49Morocco - PERG loan 2 45,73Morocco - PERG loan 3 50,00Morocco - PERG solarMorocco - PERG loan 5 45,00South Africa 41,44Kenya - urban 25,00Kenya - rural 30,00
284,00 1,00Total 284,95
100 %Annual average 18,90 0,10Sub-Saharan Africa 57,60 1,00
Explanation of Table. When Morocco, Tunisia and South
Africa are included, financing for access to electricity
services has accounted for a total investment of EUR 284m
in Africa over the past 15 years (1993-2008) and only EUR
57.6m in Sub-Saharan Africa – i.e. less than EUR 4m a
year.
It focuses on three Sub-Saharan African countries:
Burkina Faso, Kenya and Mauritania. "Decentralized" rural
electrification only accounts for 1% of AFD’s total financial
commitments in the sector.
*PERG: Global Rural Electrification Program. Source: Authors.
© AFD Working Paper n° 122 • Access to Electricity in Sub-Saharan Africa • October 2013
17
Introduction
The development of access11 to modern energy services is
one of AFD's fields of action; its financing operations fall
within the framework of the Millennium Development Goals
(MDGs), which aim to support economic growth, reduce
poverty and promote the conservation of the environment.
AFD’s present strategic orientations and the worldwide
consensus on the issue of access to modern energy
services, in connection with the MDGs (see Box 1), have
led the institution to define this area of operation as a
sector of increasing importance and, as discussed in this
paper, to focus on access to electricity services.
This study was carried out with the objective of developing
new approaches and a methodological capitalization on the
topic of access to electricity services for all in Sub-Saharan
Africa. It is for this reason that the already widely docu -
mented ex post analysis will only be covered in a few
succinct passages, which will serve as the basis for the
definition of concrete approaches. While AFD's experience
in this sector has been widely analyzed, its projects in the
field of access to electricity services today only account for
a small share of both its own portfolio and of all the projects
for access to electricity services in Sub-Saharan Africa.
11 “Access” means in both rural and urban areas.

© AFD Working Paper n° 122 • Access to Electricity in Sub-Saharan Africa • October 2013
18
Goal 1 – Reduce Extreme Poverty and Hunger
Halve, between 1990 and 2015, the proportion of people whose income is less than $1 a day
Halve, between 1990 and 2015, the proportion of people who suffer from hunger
Access to affordable energy services allows the development of companies.
Lighting allows commercial activities to continue beyond daylight hours.
The use of machines improves productivity.
Small, job-creating local companies can supply energy.
Privatizing energy services can free up government funds for investments in social services.
Clean and efficient fuels reduce high domestic expenditure for cooking, lighting and heating.
95% of basic food has to be cooked before consumption and needs water to be cooked.
Better conservation reduces post-harvesting food loss: drying/smoking/cooling/freezing.
Energy for irrigation improves food production and access to better nutrition.
Goal 2 – Achieve Universal Primary Education
Ensure that, by 2015, children everywhere, boys and girls alike, will be able to complete a full course of primary schooling
Energy gives access to water, hygiene, lighting and heated/cooled spaces, which helps reduce absenteeism and dropout rates by creatinga better environment for children and teachers.
Electricity allows schools and households to access media for communication and education purposes (distance learning).
Access to energy allows useful equipment for teaching to be used: overhead projectors, computers, printers, photocopiers, scientificequipment, etc.
Modern energy systems and efficiently designed buildings reduce energy costs and therefore schooling costs, providing better accessto education for the poorest.
Goal 3 – Promote Gender Equality and Empower Women
Eliminate gender disparity in primary and secondary education, preferably by 2005, and in all levels of education no later than 2015
Modern energy services liberate girls and young women from the time allocated to survival activities (collecting firewood and water,inefficient cooking, manual harvesting).
Clean cooking equipment reduces exposure to air pollution and its harmful effects on health.
Quality lighting allows home study and evening classes to be attended; public lighting increases the safety of women; affordable andquality energy services pave the way for women’s entrepreneurship
Goal 4 – Improve Maternal Health
Reduce by three-quarters, between 1990 and 2015, the maternal mortality ratio
Energy services are needed to provide access to better medical services for mothers, such as drug refrigeration, equipment sterilization andoperating theaters.
Excessive and heavy manual work can damage the general health of pregnant women.
Box 1. The role of energy in achieving the MDGs

© AFD Working Paper n° 122 • Access to Electricity in Sub-Saharan Africa • October 2013
19
The World Bank is the main international institution
engaged in financing access to modern energy services. Its
financing for access (International Bank for Reconstruction
and Development – IBRD, International Development
Association – IDA, and Global Environmental Facility –
GEF) is part of the overall financing of the electricity sector,
including generation, transmission and distribution. For
2000-2008, about 35% of amounts allocated had an
"access to electricity services" component. Total financing
amounted to USD 5.6bn, i.e. an annual average of USD
627m. It was scaled up during this period, from about USD
500m a year from 2000 to 2005 to about USD 800m a year
between 2005 and 2008. Closer analysis shows that two
countries (Ethiopia and Ghana) received almost half of the
financing allocated to "access to electricity services", i.e.
over USD 400m a year. By way of comparison, this amount
is similar to the funds allocated by AFD to Morocco’s
National Electricity Authority (ONE) for its Global Rural
Electrification Program (PERG) for a ten-year period.
The European Union has become a major stakeholder in
financing access to energy and renewable energy projects
in Africa. In addition to projects carried out as part of
national or regional programming, in 2006, it launched a
sector program – the Energy Facility –, which specifically
concerns the issue of access. Between late 2007 and
mid-2008, 75 agreements were signed for an overall conso-
lidated budget of EUR 435m, including 45% (EUR 198m)
financed by an Energy Facility grant. A second tranche for
an equivalent amount was launched for 2010-2011. Finally,
it should be noted that German bilateral cooperation also
plays a major role in the field of renewable energy.
The first section of this study analyzes the challenges of
access to electricity services in Sub-Saharan Africa. An
approach leading to operational proposals is formulated on
the basis of this analysis. It is clear that the rate of access
is low, but what can be said about the economic and social
dynamics from a perspective of territorial equipment? We
seek to learn lessons from an analysis of the impact of both
past programs and sector reforms, in order to propose a
functional methodological approach.
The second section of this study covers operational
proposals, based on a review of the different production
options. The analysis will specifically focus on the
remarkable development of renewable energy and the
critical issues related to distribution.
The third and last section addresses issues related to
financing and the need to mobilize national funds and
leverage grants.
Goal 5 - Combat HIV/AIDS, Malaria and other Diseases
Have halted by 2015 the spread of AIDS, malaria and other major diseases and begun to reverse the trend
Electricity in health centers allows them to open at night, qualified staff are retained, special equipment can be used (sterilization, drugrefrigeration), vaccines and drugs can be stored.
Energy is needed to develop, manufacture and distribute drugs and vaccines.

1.1.1 In Africa, access rates for communitiesremain low after several decades ofdisappointing progress
As a development challenge and as infrastructure
recognized as being necessary for the achievement of
the MDGs, access to electricity services is becoming
increasingly central to the development policies of African
States and to the international community’s development
support strategy.
Today, the average rate of access to an electricity service12
for households in Sub-Saharan African13 countries stands
at 16%, but less than 5% in rural areas. While the trend for
this percentage has been positive since around the 1990s,
the number of people without access to an electricity
service has increased due to population growth.
1 Access to electricity services in Sub-Saharan Africa: Challenges andmethodological approach
1.1 Power systems insufficient to underpin sustainable economic and social development:The challenges to be met
Map 1. Rate of access to electricity services in Africa
Source: Authors.
12 Throughout this document, "population having access to electricity" means people whohave access to commercially sold electricity at home. 13 This study covers access to electricity in the Sub-Saharan African countries. The NorthAfrican countries – Algeria, Egypt, Libya Morocco and Tunisia – are not considered in thefigures presented.
Population with access to electricity(% of total population)
No data<1010...2020...3030...50>50
© AFD Working Paper n° 122 • Access to Electricity in Sub-Saharan Africa • October 2013
21

This percentage should, however, be put into perspective.
A household connected to the grid may well let others
benefit through more-or-less illegal hook-ups; battery
recharge services provide a minimum lighting service and
access to audiovisual content for households that are not
connected or live in outlying areas.
There is a major challenge ahead: Sub-Saharan African
countries have the lowest access rates to electricity in the
world, both in terms of direct access to a service at home
for people, and the electrification rate for communities. For
instance, in India, while the access rate of the population is
only 40% in rural areas and 60% in urban areas, over 95%
of communities are connected. The infrastructure thus
allows productive activities (irrigation for agriculture) and
basic social services (health centers) to operate throughout
the country. This is far from being the case in Sub-Saharan
Africa, where the much less extensive power infrastructure
generally reaches less than 20% of communities.
Angola 16 13 7,4 15Bénin 9 79 60,2 22 26Botswana 1,758 3 42,6 39 27 2Burkina Faso 14 50 82,1 17 75 3 1Burundi 8 305 90,3Cape-Verde 0,518 129 42,7Cameroon 17 36 46,3 47 5 20Central African Rep 4 7 62,1 <1 0,2 Chad 10 8 75,1 1Comoros 0,614 275 63 50Congo (Dem Rep.) 59 26 68,4 6 20 1 1Congo 4 12 40,2 20 44,6 5,6 Côte d'Ivoire 18 58 55,4 39 8 26Djibouti 0,806 35 13,9 Equatorial Guinea 0,515 18 61,1Erytrea 5 45 80,9 20 82 2Ethiopia 73 73 84,2 22 22 <1Gabon 1,406 5 16,4 48Gambia 1,553 155 46,1 5Ghana 23 99 53 49 82Guinea 9 37 67,4 6 35 1Guinea-Bissau 1,633 58 70,4 5Kenya 35 62 79,5 14 29 6,8Lesotho 1,789 59 81,3 11Liberia 3,38 35 59,5Madagascar 19 33 73,4 1 5 4 Malawi 13 140 83,2 7 30 1Mali 14 11 70,0 16 30 5
Table 2. Rate of access to electricity and electrification services in the urban and rural areas of 48 Sub-SaharanAfrican countries (in 2004, 2005, 2006, 2008 and 2009)
CountriesTotal
population(millions)
Populationdensity
(inhab./km²)
Percentage ofthe populationliving inrural areas
Percentage ofthe populationhaving accessto electricity
Percentage ofthe populationhaving accessto electricityin urban areas
Percentage ofthe populationhaving accessto electricityin rural areas
Percentageof areas withpower supply6
© AFD Working Paper n° 122 • Access to Electricity in Sub-Saharan Africa • October 2013
22

Mauritania 3 3 59,7Maurice 1,253 617 57,6 94Mozambique 20 26 66,3 6 17 0,6Namibia 2 2 65,4 34Niger 14 11 83,3 8 30 0,1 1Nigeria 145 159 52,7 20Rwanda 9 375 81,8 <1Sao Tomé et Principe 0,16 167 42,0Senegal 12 62 58,6 32 67 4,5 15Seychelles 0,86 186 47,1 <1 Sierra Leone 6 79 60 5Somalia 8,485 14 36,1South Africa 47 39 41,2 70 85 52 Sudan 37 16 60,1 15Swaziland 1,126 65 75,9 1Tanzania 38,5 25 76,2 11 36 2Togo 6 116 60,6 12 17 3 18Uganda 30 152 87,5 9 21 2,1Zambia 12 16 65 19 25 1,4Zimbabwe 13 34 64,5 34 80 18
Sources: World Bank (2008); UNDP (2007); ECOWAS and WAEMU (2006); Review of national framework for involvement of agro-industries in rural electrifi cation,PACEAA project (2009); Mostert (2008); African Energy Policy Research Grid (2004); data collected by the Club of Rural Electrification Agencies, Congolese hou-sehold survey (2005); Eritrean Ministry of Energy; RIAED (2005).
© AFD Working Paper n° 122 • Access to Electricity in Sub-Saharan Africa • October 2013
23
CountriesTotal
population(millions)
Populationdensity
(inhab./km²)
Percentage ofthe populationliving inrural areas
Percentage ofthe populationhaving accessto electricity
Percentage ofthe populationhaving accessto electricityin urban areas
Percentage ofthe populationhaving accessto electricityin rural areas
Percentageof areas withpower supply6

Map 2. Share of the rural population in Sub-Saharan Africa
<5050...70>70
Rural population% of total population
Source: UNDP (2008).
The reasons why people leave the countryside are, among
others, the absence of basic public services (water,
electricity, healthcare), the hardship and hazards of rural
life, and the lack of alternatives. This population pressure
and the absence of urbanization and development plans
place an excessive burden on urban infrastructure.
Even when such planning exists, the lack of political will
and resources to implement and respect such plans, often
leads to a proliferation of areas with precarious and/or
uncontrolled housing. In fifteen major African cities,
access to electricity in slums stands at 11%15 on
average.
© AFD Working Paper n° 122 • Access to Electricity in Sub-Saharan Africa • October 2013
24
1.1.2 Maximizing economic and social impactswithin a process of accelerated urbanization:Development centers
“African urbanization is a poverty-driven process and
not the industrialization-induced socio-economic transition
it represented in the world’s other major regions”,14 UN-
Habitat, 2008.
What are the main challenges for achieving real headway?
While Africa is still the least urbanized continent in the
world, the urbanization rate is already over 60% in about
twenty countries.
The United Nations Development Programme (UNDP)
forecasts that between 1980 and 2030, Africa’s total
population will see a threefold increase, the rural
population a twofold increase, and the urban population a
sevenfold increase. Consequently, while the percentage
for the urban population had already grown from 24% to
33% between 1980 and 2000, it is expected to increase
to 48% by 2030.
14 UNDP (2008), “The State of African Cities”. 15 UNDP (2008), ibid.

By contrast with the history of electrification in
industrialized countries, it is not economic growth and the
jobs created by industrialization that lead to rural
migration (with a population base having overall revenues
and wealth to allow investments in infrastructure). Indeed,
it is very often insecurity, economic instability and the
dream of an "urban Eldorado" that prompt communities to
migrate from rural areas to precarious urban areas.
An analysis of population distribution according to the
size of localities16 (Graph 1) clearly shows that there is an
intermediate stage between a large city and remote
rural areas, which continue to be home to a substantial
percentage of the total population.
Graph 1. Population distribution in terms of localitysize
Source: Authors, from CEMAC, ECOWAS, 2006.
Explanation of graph: Over a quarter of the population in a
sample of countries in the zones of the Economic and
Monetary Community of Central Africa (CEMAC) and
the Economic Community of West African Countries (ECO-
WAS) lives in villages with over 2,000 inhabitants. On ave-
rage, this is the case for 27% of the population of Burkina
Faso, Mali, Niger and Côte d’Ivoire; 32% live in towns with
more than 10,000 inhabitants (i.e. in urban areas on the
graph). In CEMAC countries (Cameroon, Chad, Congo,
Equatorial Guinea and Gabon), 30% of the population lives
in villages with over 1,000 inhabitants (on average), and
51% in urban areas.
A study conducted in Latin America17 on the place of
medium-sized towns in overall urbanization highlights the
attraction of megalopolises (i.e. cities with over a million
inhabitants) and their rapid growth: their number rose from
83 to 325 during the second half of the 20th Century, to the
detriment of the growth of secondary towns. The latter,
however, provide an opportunity in terms of interactions
between urban and rural areas, due to their stronger links
with rural areas, and the services proposed not only to town
dwellers but also to the surrounding rural community. It is
thus crucial to give such towns the means to play this key
role, and to develop their attractiveness for communities
who see no future for themselves in rural areas.
Moreover, the presence of economic activities and of high
and concentrated population levels allows the electricity
service to be profitable to a certain extent. Two technical
possibilities are thus possible: extend the grid to other
centers near the existing one, or stand-alone generation
with the development of a mini-grid to serve the defined
area.
1.1.3 The issue of service to isolated localities
The electrification of isolated localities requires major
investment, for a small number of customers who generally
have a limited financial capacity. As such localities seldom
show prospects of creating wealth, the question is raised
over profitability and sustainability (which requires extensive
recourse to – limited and random – public assistance. This
seriously jeopardizes the sustainability of projects).
Moreover, population densities are low in Sub-Saharan
Africa (Figure 4), compared to the density in France
(100 inhab./km²) and Europe in general (115 inhab./km2).
The densities are particularly low in Central Africa. The
problem is that the lower the population density, the higher
the connection costs, as shown by the evolving PERG costs
in Morocco (Graph 3).
16 Studies conducted in the CEMAC and ECOWAS/IED zones.17 See Bolay and Rabinovich (2004).
© AFD Working Paper n° 122 • Access to Electricity in Sub-Saharan Africa • October 2013
25
Urban (>10,000 inhab) Large villages Small villages and (>2000 inhab) dispersed habitat

Map 3. Population densities in Sub-Saharan Africa
<1010...3030...7070...150>150
These vast low-density areas, where low-income
communities live, are costly to serve and are thus
unprofitable. However, the communities living in such
highly dispersed locations will inexorably need to densify to
some extent. The responsibility thus lies with politicians and
planners to decide, with full knowledge of the facts,
which areas to allocate resources to and to select the most
appropriate technology, focusing on the "development
centers" as a priority.
"In the foreseeable future, the intermediate cities (towns
with less than 500,000 inhabitants) will be the localities
where two-thirds of all African urban growth is occurring.
With most of its rapid urban growth adding to the popula-
tions of its intermediate-size cities, Africa needs to focus on
building capacity among its small and medium-sized cities
to deliver and facilitate adequate housing, livelihoods and
services for spiraling numbers of poor urban dwellers."18
18 Source: UN-Habitat (2008).
Source: UNDP (2008).
© AFD Working Paper n° 122 • Access to Electricity in Sub-Saharan Africa • October 2013
26
Population densityInhabitants per km²

In order for the available – but scarce – resources to have
the highest possible impact, it is essential to have a clear
political vision of the social and economic objectives and to
make a political commitment, while ensuring that operators
are available who can function in a clear contractual
framework.
When the technical-economic choice and the operator
responsible are combined, the following segments can be
distinguished:
1- Extension of the power grid as part of the national
concession of the (public or private) electricity company;
2- Electrification of villages and secondary centers and,
more generally, of the development centers outside the
national concession of the electricity company: technically
speaking, these localities can be supplied by the national
grid, or by local generation capacity with an associated
medium-voltage (MV) and low-voltage (LV) distribution grid
that can serve one or more localities;
3- Electrification of very isolated and small localities, where
extending the grid will be very costly. It is generally imple-
mented with systems that are stand-alone or limited to
common services, typically PV, or via village grids
(generally diesel-powered);
4- Peri-urban electrification, i.e. neighborhoods located
around the major conurbations and, more generally, the
issue of densifying connections, and therefore that of
widespread access for communities once the service is
available in the area.
Combining the technical-economic option and the institution
responsible thus leads to the following segmentation
(Table 3):
1.2 Develop a systematic vision and overall operational planning: Access for what purposeand with what resources?
Table 3. Segmentation of contexts of access to the electricity service
Explanation of Table. Options A and B are integral parts of a country's development and spatial planning policy; options
C and E must be seen as a spatial complement to option B (and in terms of the available resources); options D and F
have high investment and management costs that need to be controlled (their organizational and technical specificities
will be discussed later).
© AFD Working Paper n° 122 • Access to Electricity in Sub-Saharan Africa • October 2013
27
Electricity company(public or private) REA or REF* Specialized operators
(NGOs, ministries, etc.)
Electrification of development centersinside the main concession areas
ViableA
Electrification of centers outside themain concession areas
ViableB
Viable
Isolated localities Not profitableNot profitable
CNot profitable
E
Outlying urban areasNot profitable
DNot profitable
F
Source: Authors

It is important to be lucid about the potential profitability of a
service access program and make a distinction between:19
1- An access program to equip a given area with the
essential infrastructure for its economic development,
where there are therefore secondary centers with
"economic potential". This type of "territorial development"
program is characterized by higher unit energy
consumption levels and a greater ability to pay which,
combined with a higher population density (and therefore
better controlled investment costs), offers some prospects
of profitability. At this stage, the aim is not necessarily to
connect the entire population;
2- The provision of a universal service to all the residents of
an area, and in particular to the poorest, i.e. peri-urban
communities, 40 to 60% of households in villages and even
quite large towns in a country, and communities living in
small villages or isolated dwellings. The consumption levels
of such customers will not exceed 50 kWh/month,
representing maximum expenses of EUR 5/month. In
addition, the more dispersed the population, the higher the
investment cost per connection will be. In these areas, the
basic paradigm is a complete subsidy of the investments
and a tariff that covers operating costs.
These two approaches are based on two distinct objectives:
economic and territorial development for the first, and social
equity and geographical balance for the second (which has
a high cost).
The response in terms of the priority of allocating scarce
resources must come from the political level (see Box 2).
Box 2. Equipping an entire territory with productive infrastructure: A political issue in India and Morocco
Today, India has virtually finished the electrification of all its localities. For the 5% of remaining localities, and the 40% of the population that is not yet connected,
the Indian government has set up a very clearly social program, which subsidizes 90% of the supply cost for localities and 100% of household connection fees.
This comes almost half a century after launching a rural electrification program that aimed to supply cheap energy to farmers to allow them to irrigate their crops
and thus achieve food self-sufficiency. The initial objective of the program had been energy for industry.
Morocco also launched its rural electrification program during a period of severe drought, together with a program for access to drinking water. The primary
objective was to provide infrastructure to the localities.
In reality, despite the fact that most countries have reached
a certain level of access for all, they started out with a
priority aim of electrifying the development centers. This
seems a logical choice, as it allows the sector to show
some profits and thus reach a financial equilibrium with
cross subsidies between segments.
It should be noted that the experience of electrification for
isolated communities and sites, in particular with solar kits,
has shown intrinsic limits in Sub-Saharan Africa. Indeed, in
countries engaged in major rural electrification projects, this
electrification scheme is a complement to schemes A and B
(e.g. Laos, Morocco and Senegal). These major programs
to give isolated communities access to electricity through
solar kits face two main issues:
© AFD Working Paper n° 122 • Access to Electricity in Sub-Saharan Africa • October 2013
28
19 The proposed segmentation must not lead to opposing "off-design" and "extending thenational concession grid" electrification schemes, as certain analyses today tend to do. It mustillustrate their complementary character.

- Electricity use will generate a marginal level of income,
which means that either customers with a fairly high
income will be targeted, or that the investment has to be
quite heavily subsidized;
- The actual long-term maintenance cost of the facilities
(technical and financial management) should not be unde-
restimated.
Graph 2. The resources required to develop a planned and coordinated approach – the example of Burkina Faso
In 2008-2009, in Burkina Faso (15 million inhabitants in over 8,000 localities), the implementation of a national rural
electrification plan coordinated by the Direction Générale de l’Energie (DGE) took 12 months, plus 6 months of
dissemination. The plan included multi-sector involvement and its overall budget stood at EUR 400,000.
Source: IED.
The detailed study and quantification of the socioeconomic
and financial impacts of rural electrification are relatively
recent. Indeed, until the late 1990s, neither national
decision-makers nor donors questioned the costs and
benefits of rural electrification. The reason for this was
that this activity was considered in national policies as
infrastructure required for development, as well as a public
service that should be accessible to the majority. In short, its
beneficial socio-economic spin-offs were evident and there-
fore had to be made generally available. Consequently,
there are few comprehensive studies available on this
subject.20 The issue is also generally addressed from a
viewpoint of the capital intensity of the investments and the
expected benefits (difficult to assess). It is only recently that
the anticipation of the impact on poverty has become
an assessment criterion for medium- and long-term
development actions and electrification programs. Neither
the Human Development Index (HDI) nor the MDGs, for
their part, directly consider access to energy. The issue of
access to energy therefore revolves around several
1.3 Analysis and lessons learned from the impact of past programs
20 World Bank and Foundation of the Political Institute for Research Development andManagement of the Philippines, 2001; ONE/AFD, 2003; World Bank and SwedishInternational Development Agency, 2005; IEG-World Bank, 2008.
© AFD Working Paper n° 122 • Access to Electricity in Sub-Saharan Africa • October 2013
29
Surveys and data collection
Definition of the regional development center (Regions)
Construction of the national "vision"
Implementation of the electrification plans (Process)
Feedback / validation Regions)
Activities National Coordination Committee
Training in handling tools
As far as the electrification of peri-urban areas or of the
most isolated and poorest rural domestic communities is
concerned, the analysis should focus on the organizational
arrangements that aim at reducing management costs and
losses. This points to the vital importance of having a clear
vision of the objectives of an electrification program and its
cost, of realistic programming for the investments and tech-
nical choices and of the targeted impacts. Graph 2 shows
an example of the means required for this type of exercise
via the case of Burkina Faso.

questions: Are the benefits generated by energy access
programs in rural and urban areas quantifiable, and, if so,
how? Is access to electricity a catalyst for economic growth
in the rural areas of Sub-Saharan Africa? Must rural electri-
fication and/or energy access programs (urban and rural)
be made a national priority?
1.3.1 Difficult and costly access, but a realability to pay
The "rural poor" environment holds little attraction for
operators, who naturally prefer to supply more "profitable"
customers, especially those whose energy supply involves
the lowest cost (as they are close to the grid) and who
consume the most. They therefore adopt an extensive
approach to electrification and only rarely seek to densify
(poor) customers around existing infrastructure, and even
this is a very recent concern. Grids thus often bypass "poor"
customers and seek out the "big customers”. This type of
operator logic is potentially questionable, as their interest
might also lie in densifying the grid in order to amortize its
investment more effectively. Moreover, in a community
already hooked up to the grid, many households cannot
afford to pay the connection fees. They can be at the
prohibitive amount of between USD 100 and USD 300,
which may be difficult to raise in a lump sum (see Map 4),
even though there is clearly the ability to pay the monthly
electricity bill. Indeed, communities which are not connec-
ted to the grid often pay – for equivalent uses of the electri-
city supplied from kerosene, standard batteries and rechar-
geable batteries – an energy price several times higher than
the connected communities, both in absolute terms and in
equivalent kWh. This cost is generally between USD 3 and
USD 10 a month. Energy expenditure represents a much
higher percentage of the incomes of populations in Sub-
Saharan Africa than for populations in OECD countries.
This is why, paradoxically, connection rates in electrified
areas tend to "saturate" fairly rapidly.
Map 4. Population living with <1 dollar/day/person, Africa (in population percentage)
Source: UNDP (2008).
Explanation of map. In Sub-Saharan Africa, about 300 million people (out of 680 million) live with the equivalent of one
dollar a day. This percentage is over 60% in seven of the 31 countries surveyed. It is the lowest in South Africa, where
it still is as much as 10%. Thus, based on a tariff of USD 0.12/kWh (domestic, on the interconnected grid), the bill for a
monthly consumption of 100 kWh will be for USD 12, i.e. 9% of the income of five people (a household). However, the
average tariff is often over USD 0.50 in rural areas.
© AFD Working Paper n° 122 • Access to Electricity in Sub-Saharan Africa • October 2013
30
no data< 1515...3030...4545...60> 60

1.3.2 Trends in household expenditure: Higherconsumption with lower unit costs
As soon as households can afford to be connected, access
to electricity initially promotes an almost complete
replacement for the immediately concerned uses (batteries,
candles, lamp oil, battery recharges) and thus a reduction
of energy expenditure. The middle classes and poor
subsequently see their electricity expenditure increase due
to an increased use of electrical equipment: television sales
double in the first year after electrification, while energy
expenditure often drops among the rich categories that are
already equipped (see Graph 3).
Graph 3. The impact of rural electrification - The example of Morocco (2010)
E: Electrified, NE: Not electrified, V: Village, PV: Photovoltaics.
1.3.3 A definite advantage for small shops andcraft businesses already using electricity
The households whose income will increase are those
whose existing productive capital will increase in value
because of electricity use. For instance, 70% of commercial
activities note an increase in their turnover (IEG, World
Bank 2008), and there will obviously be a major impact for
the development of craft activities requiring the use of
productive electrical apparatus. However, traditional craft
activities are only marginally affected, as the impact for this
type of activity mainly lies in the possibility of longer working
hours, thus raising productivity.
A review of case studies does not show significant
industrial ization effects either. Indeed, for small entrepreneurs
who are already equipped, changing their production facilities
requires additional investment and they generally will not do
so until renewal is necessary.
© AFD Working Paper n° 122 • Access to Electricity in Sub-Saharan Africa • October 2013
31
Electrified NE in E V NE in NE V NE in PV V PV in PV V Total
Source: Axenne.
Refrigerator gas
Battery recharge for TV use
Batteries for radios
Candles
Batteries for electric torches
Gas for lamps
Lamp oil
Dh

It is in the social sector that rural electrification projects
have a significant impact: on health, education, migration
and the status of women.
► The impacts on health are mainly related to the continui-
ty of the cold chain (vaccines, drugs) and to longer opening
hours at health centers (in particular for childbirth).21
Other benefits worth noting relate to (i) improved health
knowledge through the development of access to television
information, and (ii) improved health conditions for food
storage thanks to refrigeration. We also see a positive
correlation with the availability of drinking water throughout
the year, a fundamental factor for public health, especially
for children, in a context where diarrhea and other
water-borne diseases are today still one of the main causes
of child mortality.
► The impacts on education mainly concern the
improvement in the quality of intake and education: a good
teacher will be more inclined to accept a position in an area
with electricity than an area without. Similarly, children living
in a home with electricity generally have a better grade level
as they can study in the evening after school.22
► The impact of electrification on migratory flows and the
rural exodus is much more difficult to evaluate. Various
studies have, however, shown that it reduces migrations to
major cities, and increases the attractiveness of secondary
towns with an electricity service, whether or not they are
qualified as rural. It also strengthens the feeling of safety in
villages and fosters greater social cohesion thanks to public
lighting.
1.3.4 Significant social and development impacts
Table 4. Impacts of electrification on health – The example of Morocco (2010)
Village without electricity Village with electricityElectrical refrigerators 50 % 100 %
Conservation of vaccines 60 % 95 %Regular visits by a doctor 40 % 85 %
Medically assisted childbirth 0 % 42 %
Source: Axenne.
21 As a reminder, the reduction of infant and maternal mortality is part of the fourth and fifthMDG.22 Source: ESMAP Philippines (2003).
Box 3. Impact of electrification on migratory flows and rural exodus in Morocco
The implementation of the Global Rural Electrification Program (PERG) is thought to have facilitated the regrouping of communities, due tothe selection criteria generally applied. Dispersed housing was reduced from 35% to 28%, and that of scattered dwellings was divided bythree, falling from 6% to 2%. The rural electrification programs thus had a major impact on the spatial reorganization of villages. To a certaindegree, ONE, with its policy of constructing "backbone" grids, promotes this spatial redevelopment and the regrouping of communities nearthe interconnected grid.
© AFD Working Paper n° 122 • Access to Electricity in Sub-Saharan Africa • October 2013
32

► The impact of electrification on women is related to the
fact that they are the first to benefit from the development
of small shops. In Ghana, groups of women organized
themselves to prepare and sell food in places where
community TVs were installed. In South Africa, groups of
women manage and develop an activity of refrigerated
space rentals. Electrification allows longer working days for
women, which supports their economic empowerment in
some cases.
► More generally speaking, electrification brings about a
real social transformation, which is related to connectivity
and access to information and training thanks to audiovi-
sual media. The massive distribution of audiovisual
communication media, facilitated by electrification, allows
better coverage of the rural world; educational
programs help people, through images, to acquire a better
understanding of the world. The proliferation of Internet
cafés and the connectivity through Internet (at unexpected
penetration levels in rural areas) lead to changes that are
still difficult to fully grasp.
1.3.5 What is the economic benefit for thenation?
It is difficult to attempt to define a general principle or rules
concerning the quantitative and qualitative impacts of (rural)
electrification programs. Most of the time, cost-benefit
approaches depend on a specific context, and their
evaluation and translation into a "monetary equivalent" is a
costly and somewhat subjective exercise.
For the Moroccan rural electrification program, the overall
economic rate of return stands at around 8%, based on the
following parameters (PERG study, 2004):
• Growth of individual consumption and of equipment
dynamics;
• The induced equipment expenditure and its cost
effectiveness for the consumer;
• The financial profitability of the program (electricity
operator).
This rate rose to about 20% by integrating the positive
externalities (more difficult to assess):
• Social benefits in terms of health, education and user
satisfaction;
• Environmental benefits;
• Local economic benefits in terms of job creation;
• General economic (macroscopic) benefits in terms of job
creation through the electrification process.
Such economic rates of return, as found in other countries
(see Table 5), combined with a higher willingness to pay
than the cost of the actual electricity, are paradoxically not
sufficient to raise the investments required to implement
large-scale programs.
Table 5. Economic rate of return for nine rural electrification programs
Economic rate of return for nine rural electrification programs
Country Project Grid extension Collective scattered Individual scattered
Cambodia Rural Electrification and Transmission 19.80 22.30 11Honduras Rural Infrastructure Project 33 20 30
Inde Renewable Resources Development 14 41Laos Southern Provinces Rural Electrification 60.50 26
Mozambique Energy reform and acces 22.70 14.50 Nicaragua Rural Electrification 40 23 27
Peru Rural Electrification Project 22.60 23.80Philippines Rural Power Project 26.40 21.50 48
Sri Lanka Renewable energy for Rural Energy 15.20 10.90
Source: IEG (2008).
© AFD Working Paper n° 122 • Access to Electricity in Sub-Saharan Africa • October 2013
33

The resource is not necessarily available: a country that
still has a low access rate to electricity, poor service
quality and a recurrent need for financing to cover its ope-
rating and maintenance costs in its affluent industrial and
urban areas would have great difficulty in making access
to electricity in rural and peri-urban areas a national
priority. The success of a national policy for access in rural
and peri-urban areas (access for all, with major social
considerations) strongly depends on the situation of the
electricity sector in urban and industrial areas.
However, in almost all Sub-Saharan African countries, the
State – with private sector support – does not manage to
offer industry and its affluent customers the electricity they
need. In fact, there is even a trend of service deterioration
and an increase in the number of power cuts.
This issue thus brings us to the choice of target population
and the question of objectives. In several rural
electrification projects, the objective of reaching
the "poorest of the poorest"23 has failed due to the
insufficient solvency of the beneficiaries and to the fact
that the economic impact of electricity is too low and is
unable to improve this solvency in the short or medium
term.
This debate on the choice of target populations is far from
closed, and is systematic in Output-Based Aid (OBA)
approaches. In regional or national-scale analyses, it now
is common to identify the potential "large customers" that
might ensure a minimum revenue for the operator, and
those that have a significant economic and social impact.
However, the reality is often that hospitals, adminis -
trations, schools, etc. are the worst payers, whereas serving
industry requires that a certain quality of service needs to
be maintained.
1.4 Access dynamics affected by sector reforms
In the mid-1990s, many reforms were launched due to the
general inefficiency of public sector electricity companies.
With regard to the focus of our topic, out of more than
40 Sub-Saharan African countries, almost half have set up
a rural electrification agency (REA) and/or rural electrifi -
cation fund (REF). Out of the twenty or so countries that
opted for an organization of the electricity sector shared
between a national or privatized electricity company and an
REF/REA, almost all benefited from World Bank assistance
for its establishment. This created an institutional model for
the various initiatives, whose focal point is this REA and/or
REF, in charge of – as the case may be – designing,
developing and operating power systems in rural and semi-
urban areas.
Their action falls within a “perimeter” of rural and semi- or
peri-urban electrification with poorly defined contours, most
often simply juxtaposed to that of urban power systems.
The necessary coordination of the planning function of
both sectors and efforts to seek synergies and general
efficiency, which should be the responsibility of a strong
ministry, are thus made difficult. Nevertheless, these two
perimeters, which are governed by different or common
regulations, are experiencing respective developments that
influence each other (grid extensions, area exclusively
reserved for the “off-concession”, etc.). These develop-
ments and their interface (feed-in and resale tariff to the
grid, compensation for operators/investors in case of an
extension of the "national concession") are key elements for
coherent national policies to extend access to electricity
services. If they are poorly defined, they can block the
service extension.
Today, we should question whether this institutional model
has the capacity to accelerate or promote access to electri-
city services. It has not changed significantly in the recent
past, either in terms of access for communities in electrified
areas, or in terms of the percentage of localities covered by
the grid. 23 Objective considered by donors as a high priority item in the global poverty reduction strategy.
© AFD Working Paper n° 122 • Access to Electricity in Sub-Saharan Africa • October 2013
34

1.4.1 The key role of a central operator as a"public champion"
We see that the African countries that kept their traditional
national electricity company today have the highest access
rates to electricity: South Africa: 70%, Côte d’Ivoire: 39%,
Ghana: 60% (82% in urban areas and 29% in rural areas).
The equilibrium between profitable areas (i.e. towns
and densely populated coastal areas) and areas of low
profitability (i.e. rural areas) seems facilitated by a single
overall management system.
The institutional organization in Morocco and Tunisia, both
of which today have nationwide electrification, shares the
following characteristics:
• A single operator that has for a long time been the main
instrument for developing access to electricity;
• A clear centralization/deconcentration of the administration;
• A strictly public approach until quite recently;
• A very strong political will to develop electrification by
extending the grid of the single or dominant operator, but
also by using other electrification methods;
• No distinction between urban and rural areas, all being
included within the area of activity of the dominant operator;
• The lack, for a long time, of an instrument to formalize a
sectoral and regulatory strategy.
In both these countries, the political will and mobilization of
national resources have played a key role. This is relayed
and implemented by a relatively efficient single public
operator.
For many years, some countries with an intermediate
economic development, such as Cameroon or Côte
d’Ivoire, adopted the same strategy as Morocco and
Tunisia. They made no distinction between urban and rural,
even if the distribution operator had a well-defined field of
action and had opened to the alternative intervention by
local and regional authorities for infrastructure financing.
Since then, the sector has moved towards a progressive
liberalization and its resulting institutional changes (a regu-
lator, privatizations, asset holding companies, REAs). While
such situations may have their own dynamics, the absence
of a rigorous oversight and clear regulatory framework – in
other words of a legitimate manager – often leads to
situations of deadlock.
1.4.2 Too many institutional stakeholders arejust as inefficient as too few
In some cases, the institutional environment has too many
stakeholders, which is shown by the fact that there is no
clarification and/or simplification following a sector reform.
Mauritania, for instance, has been a “good pupil” in the eyes
of its donors from an institutional perspective. The
electricity sector has a sectoral policy letter, an electricity
code advocating the complete opening of the sector, a
ministry with a rather exemplary organization chart, a public
operator, which has been subject to privatization attempts
(in vain), a regulatory authority, an REA, and an agency for
universal access to basic services (APAUS). We see,
however, quite a gap between the texts, the facts, and the
existence and functioning of the institutions. The APAUS
concept that has been defined should have led to optimal
coordination, the creation and management of basic
services, and to efforts to achieve systematic cost reduction
(for the use of domestic and renewable energies, the
choice of future investments, and system management). In
reality, however, the system has led to competition with the
sectoral agencies – for water and rural electrification – for
project implementation and budget allocation.
1.4.3 A necessary match between the ruralelectricity market and the number, size andefficiency of operators
Senegal’s conceptual approach is exemplary and it has an
institutional arsenal that has fully taken account of a
forward-looking vision – the sectoral policy letters; lessons
learned from fruitless reform attempts – privatization of the
national electricity company (SENELEC); the functions of
the Electricity Sector Regulatory Commission, which is
increasingly credible; the existence of a dominant operator
© AFD Working Paper n° 122 • Access to Electricity in Sub-Saharan Africa • October 2013
35

(SENELEC); the role of an REA, which is seeking to
develop a public-private partnership (PPP) under a
mechanism integrating the economic, financial, legal and
fiscal tools required to enhance the attractiveness for
operators of the sub-sector, SENELEC and PPPs.
Studies covering a period of 10 years have led to a
reduction in the number of concessions from 20 to 11 to
allow them to have a certain level of profitability. Few
candidates were interested in the first bid invitation for
concessions, which was won by ONE, Morocco’s national
electricity company.
This raises the question as to whether a "market" of
operators exists with the critical size and means to submit
bids. Is it due to an insufficient promotion of the sub-sector
and/or the absence of a "champion"? Are expectations too
great concerning the interest and capacity of the private
sector to take risks, especially for investments, in a
financially depressed sector?
Conversely, the frameworks in Burkina Faso and Mali
favor small and local national village operators. However,
this requires heavy investment subsidies (about 80%), as
the operators work in conjunction with an overall
approach. Indeed, while over 60 projects for spontaneous
applications for rural electrification (PCASER), financed
by the Malian agency for the Development of Household
Energy and Rural Electrification (AMADER), supply Mali’s
rural areas, their unit size is generally below 250 kW and,
by themselves, they would never be able to resolve the
issue of nationwide access to electricity for all.
While the institutional approach is forward-looking and
maybe ambitious, it must, however, result from a search
for an optimum between the reality of the sector, its means
and its resources, its capacity to develop, and the
objectives assigned to it. Moreover, the approach must be
exhaustive in terms of assigning roles and responsibilities,
and must ensure the optimal exercise of the functions
required for the development and smooth running of the
sub-sector.
1.4.4 A sophisticated structure does notnecessarily fulfill the three financing,regulatory and industrial functions
In most African countries, the main characteristics of the
organization of post-reform rural electrification and access
are:
• A repositioning of the State for its sovereign functions:
regulation, promotion, protection of the general interest,
creation of the regulatory function;
• REAs, and a tentative recognition of the need for cross
subsidies;
• A segmentation of the power system to allow the
introduction of competition, particularly for generation;
• Access by private enterprises to these activities provided
they obtain authorizations, licenses or concessions, and
that they actually exist.
Unfortunately, the creation of entities for electrification has
often not been supported, either by national policies, or by
an allocation of financial and human resources that would
really allow them to achieve the objectives assigned to
them.
The rules of the game are too often poorly defined and the
resources too few to create significant development. These
agencies may play several roles: running a pilot project for
decentralized electrification, organizing a bid invitation for
concession management, giving incentives to private
operators that wish to invest in a decentralized electrifi -
cation project, and planning grid extensions (Renewable
Energy Association, ADER, in Madagascar), possibly by
financing this component.
We see that the multiplication of entities, prior to
the creation of large-scale infrastructure, leads to a
fragmentation of competences and competition between
institutions to hold “borderline” responsibilities. This
© AFD Working Paper n° 122 • Access to Electricity in Sub-Saharan Africa • October 2013
36

competition makes it impossible to gather the human,
technical and political means required to achieve the
common objective: implement ambitious projects, while
ensuring that the functions required to achieve the
objectives of access programs are available (financing,
industrial and regulatory functions).
1.5 Establish clear prerogatives for each stakeholder
Achieving effective results requires a coherent national
policy for access to electricity, with the corresponding insti-
tutional and regulatory environment (regulation function). It
is thus necessary to have: (i) a real political will to support
electrification projects and ensure they are sustainable,
(ii) clear economic orientations and sufficient financial
resources (financing function), and (iii) structures that can
provide, install and operate the infrastructure (industrial
function).
1.5.1 Financing access: How to mobilize thefunds required to achieve the politicalobjectives?
Given their level of profitability and their return on
investment time, electrification projects, especially rural
projects, require the provision of public subsidies. It is esti-
mated that about 50% of rural electrification financing in
France was through subsidies. While there is the political
will to provide rural and peri-urban communities with
an electricity service, the financing function must be
considered with lucidity, and by taking account of the
following parameters:
- The investment profile: investments are certainly econo -
mically profitable, but in the long term (a minimum of
between 10 and 30 years). The risks can be non-negligible
and are related to both the purchasing power of (poor)
communities, as well as to the understanding of generation
technologies;
- It is obviously unrealistic to expect private investors to
get involved in this type of long-term investment;
- Substantial amounts are needed to equip a territory. This
requires a large-scale mobilization of national resources
that can subsequently leverage international financing. At
the level of the continent, the issue of universal access will
certainly not be resolved through projects with grants of a
few tens of millions of euros.
As illustrated by the amounts mobilized in Morocco,
Kenya and Ghana (see Box 4), we must stress the
historical importance of: (i) the amounts involved that stem
from a real political choice in terms of national resource
allocation, and (ii) the central role of the national company,
which acts as an electricity company (with a real technical
and organizational capacity to implement a program of
this size) and publishes a balance sheet and profit-and-
loss account. This allows it to be a long-term borrower,
admittedly public and often with a State guarantee.
It is clear that the countries with a "post-reform"
organization (i.e. most Sub-Saharan African countries,
which now have a rural electrification fund) are in an
"unfinished" situation in terms of funding mechanisms. In
general, these "funds" are simply accounts through which
the meager grants from international cooperation transit.
© AFD Working Paper n° 122 • Access to Electricity in Sub-Saharan Africa • October 2013
37

While the creation of specialized funds can be an important
stage in ensuring the sustainability of the financial
resources required for the development and consolidation
of the sub-sector, today it is clear that the size of these
funds and the amount of their resources are often too
limited, and their sources and financing methods too
random. It is often necessary to change these funds into
specialized financial institutions (right to lend and borrow),
and to extend their field of action to guarantees for a certain
number of operations and to financing for small local
operators (who would not have access to commercial bank
financing without the support of these funds).
Box 4. Mobilizing funds for regional electrification – The examples of Morocco and Ghana
Morocco, with 32.2 million inhabitants, has almost achieved nationwide electrification (over 90% of the 30,000 localities) in the space of15 years. The budget committed at the end of 2008 was in the region of EUR 1,770m, 53% of which was mobilized from national funds(equity) and the remainder from medium- to long-term concessional loans (47%). 55% of the national share was mobilized by ONE (on itsown equity), 20% came from municipal budgets and 25% from user contributions. These amounts – EUR 230/connection for households andEUR 190/connection for municipalities – could benefit from instalment payments granted by ONE.
In Ghana, a country with 22 million inhabitants, major and continuous financial assistance from the World Bank (IDA), completed withsupport from bilateral partners,24 has allowed the country to go from an electrification rate of about 15% in 1989 to 60% in 2009. The ruralelectrification budget over the past decade has been in the region of USD 2bn, with a participation of national and local financing of around15%. The objective of Ghana's Self-Help Electrification Program, SHEP, steered by the Ministry for Energy (with technical support from theElectricity Company of Ghana, ECG), was to reach an electrification rate of 80% in 2010 and to guarantee all communities (4,220 villageswith over 500 inhabitants) an electricity supply by 2015. The average cost per household stands at about EUR 250 (with the possibility ofpaying by instalments).
Graph 4. Mobilizing funds by an electricity company: The example of ONE, Morocco
Source: Authors.
24 European Commission, France, Germany, Italy, Spain, United Kingdom, United States andSwitzerland.
© AFD Working Paper n° 122 • Access to Electricity in Sub-Saharan Africa • October 2013
38
Equity53%
KFW1%
AFD14%
IDB8%
JBIC8%
EIB9%
FADES4%
FK3%

We should note here the changing role of local authorities,
which play a central role in countries like France, where
they remain owners of the distribution grids. These entities
benefit from increasing responsibilities, related especially to
the administrative decentralization movements, which are
gaining momentum in a number of African countries.
Moreover, an increasing number of electrification programs
integrate components to promote productive uses of
electricity (Burkina Faso and Senegal, for example). This
clearly appears to be one of the new priorities of the deve-
loping electricity sectors. It requires public assistance,
which may be provided by the local authority, which is
responsible, in this case, for associating private players
with common interests via innovative partnerships: the rural
user, electricity distributor, electrical equipment supplier
and financial partner. In the case of the Moroccan PERG
and, historically, France, local authorities have played a
central role while remaining owners of the distribution grids
whose operation they entrust to a licensee (EDF in France).
1.5.2 Economic and financial regulation: tariffpolicy and contractual framework for themobilization of private stakeholders
Themes that are all different from each other can be
included in this very "general" topic of regulation:
• Mechanisms for review, monitoring-evaluation, control,
sanctions and settling the legal, technical and economic
aspects of disputes;
• Adapting service quality to demand in rural areas, thus
using appropriate technical standards and practices that
will be decisive factors for optimizing investment costs (up
to a third of the amount invested in distribution; this topic
will be discussed in the technical section);
• The selection, training and control (and therefore sanctions)
of the regulatory entity.
It is clear that the countries that have succeeded in
the electrification of their territory only set up a regulatory
agency once a sound electricity infrastructure was in place.
It was only after that issues concerning the plethora of
operators and the end of the integrated monopoly (gene-
ration, transmission, distribution) were addressed, requiring
the introduction of rules (in France, India, Morocco, etc.).
Initially, the ministry can often cumulate the functions of
planning, policy formulation and regulation. As the public
company is dominant, it often edicts de facto rules and
regulations. The fact of creating an ad hoc regulatory
agency will not be sufficient to ensure that the regulation
functions correctly.
Two components will be analyzed below. The first concerns
economic and financial viability; the second relates to the
contractual framework required to foster the mobilization of
private partners.
► Issues concerning economic and financial viability
- Investment financing: the viability and relevance of
the model compared to the available financial resources
(generated by the electricity service itself and external to it);
the subsidy level for the investment that allows a sufficient-
ly attractive profitability for a private operator (for example,
we can note the case of Cambodia that has abandoned this
path and has opted for franchises on national investments);
- Financing the operation, servicing and maintenance of
facilities (which should in principle be covered by tariff
revenues); this is almost impossible in cases depending on
thermal power generation;
- Cross subsidies between different customers, and thus
tariff categories, but within the electricity sector itself: is
equilibrium possible, or are resources external to the sector
needed?
- Tariff principles: equalization, i.e. can one apply the same
tariff for a customer category regardless of its geographical
location, with very different costs, without unreasonably
jeopardizing the financial equilibrium of the sector? The
ability to pay is not the same nationwide and a tariff
differentiation (i.e. a tariff that changes depending on costs
and context) is difficult to accept;
© AFD Working Paper n° 122 • Access to Electricity in Sub-Saharan Africa • October 2013
39

- Cost and price of electricity: there is a considerable
difference between countries that depend on thermal
generation (such as Burkina Faso) and those with
amortized hydropower (such as Cameroon). The energy
price in Sub-Saharan Africa is high, reflecting international
standards. The average tariff in the region rose from USD
0.07/kWh in 2001 to USD 0.13/kWh in 2005, reaching
almost twice the level in other parts of the developing world
and a level comparable to that of high-income countries.
These increases were particularly high in countries depen-
ding on diesel-generated power, where prices rose by USD
0.08/kWh on average, in reaction to skyrocketing oil prices.
Yet, despite these increases, the average tariffs in the
region remain considerably below average operating costs,
at USD 0.27/kWh.
However, both States and power companies have been
caught up by economic reality: Kenya, which mainly
relies on hydropower, is currently experiencing a period of
prolonged drought, combined with underinvestment in its
production facilities. The national company, Kenya Power
Lighting Corporation (KPLC), thus finds itself obliged to
resort to thermal power generation and to pass on this extra
cost in the tariff. The fuel surcharge currently applied
doubles the tariff (roughly between USD 0.10 and USD
0.20) from one month to the next. Consumers thus receive
a much higher bill without prior notice. An analysis of
the electricity tariff levels applied in Sub-Saharan Africa
therefore leads to three observations: these tariffs are, on
average, high; they reflect highly variable generation costs
(countries with abundant hydrocarbon reserves, such as
Nigeria, or that have cheap hydropower, such as Zambia,
can afford to apply low tariffs); a country with a structure of
generation costs (like Madagascar), despite a strong social
motivation (as shown by a "social" tariff block at less than
50% of the normal domestic tariff) will never be able to
reach the levels of countries that have cheap resources;
Graph 5. Amount of financial mobilization for a national electricity access program: The examples of Morocco andGhana compared with other African countries
Source: Authors.
© AFD Working Paper n° 122 • Access to Electricity in Sub-Saharan Africa • October 2013
40
30
25
20
15
10
5
0
RC
I
Bur
kina
Fas
o
Mal
i
Sene
gal
Gha
na
Nig
eria
Cha
d
Cam
eroo
n25
20
15
10
5
0
Mor
occo
Tuni
sia
Alg
eria
Libi
a
Egyp
t
Uga
nda
Ken
ya
Ethi
opia
Zam
bia
RSA
Mad
agas
car
<100 kWh / m
<200 kWh / m,2k W
4k W

- Connection fee: the level of electricity tariffs reflects these
structures with highly contrasting fees, and experience
shows that the main barrier to access is the high
connection fees to be paid by customers. Fees of EUR 100
to EUR 300 are quite normal in Sub-Saharan Africa, which
should be compared with an average yearly energy bill that
generally is less than EUR 50. The "financial package" of
a rural electrification project or program (especially the
subsidy level retained to cover these connection fees) has
a very strong impact on the price of the service. Moreover,
excessive connecting fees generate (i) "spider-web"
phenomena, i.e. “pirate” connections (Benin); (ii) a low
connection rate (Benin and Kenya); and (iii) when associa-
ted with a sub-optimal technique, a slowdown in customer
densification (Kenya).
Countries firmly engaged in grid densification generally
develop reflection on the initial connection fee:
Subsidies through an REF (Burkina Faso, Uganda,
Senegal, etc.);
• Sharing the investment cost (connection cost) between
the different stakeholders: beneficiary households, local
authorities, government, private operators, etc.
• Loans from commercial banks, village banks or micro -
finance institutions to finance the connection fee
(Kenya);
• Prior savings (Central African Republic);
• A specific fund managed by the electricity company,
endowed by donors and dedicated to financing
connection fees. This fund, based on a revolving
mechanism, allows the user to pay for the connection in
instalments; the replenishment of the fund in this way
allows the number of connections to be scaled up.
► Questions concerning the contractual framework to
promote the mobilization of private partners
As the sector cannot earn the resources required to
implement exhaustive access programs, and the State
does not have the necessary means, the search for
financing has been oriented towards private investors. The
instrument for financial regulation can vary depending on
the context:
- Cost-plus system: the licensee declares its costs and a
margin determined on the cost authorized;
- Return on investment regulation: the licensee declares
its costs and the sales prices are authorized according to
a pre-determined rate of return on investment (RRI);
- Authorized sales price level: sales tariffs as part of a
distribution concession;
- Terms of the buy-back contract for energy produced by
the generation unit:25 by the national distributor, or by
major customers located at a certain distance (which
requires permission for access to the grid by third parties);
- Participation in the investments by a public fund and
operating procedures (per connection, per kWh, etc.).
The question the regulator needs to answer is whether the
framework provides sufficient incentives and is sufficiently
transparent to attract private sector investment, and to what
extent: is it realistic to envisage rural electrification conces-
sions (with private investment), or would it not be better to
initially envisage franchises, or an affermage, with public
investment and private management? The next question is
that of the ownership of the infrastructure, which is too often
unclear in access programs: it should certainly remain
public, but a whole host of options are possible, from a
national asset holding company to a local municipality.
► Questions concerning the characteristics of the demand
The characteristics of the demand and its dynamics
obviously have an important impact on the economic
and financial profitability of generation and distribution
investments. In rural (and peri-urban) areas, we generally
see a mostly domestic and weak demand per household,
dominated by audiovisual and lighting needs. This
consumption is characterized by a major evening "peak",
sometimes 3 to 4 times higher than the morning peak, with
a very low daily basis. Developing such daily demand is an
essential point for the profitability of systems in order25 These terms must be differentiated, especially in contexts characterized by theavailability of hydropower and biomass resources with a long return time; the same is true forconnection conditions, which are often binding.
© AFD Working Paper n° 122 • Access to Electricity in Sub-Saharan Africa • October 2013
41

to increase the profitability of the investments through
stronger demand. Moreover, demand in such areas often
saturates with connection rates of about 50% of house-
holds, or even less, due to the high connection fees.
Household unit demand can only increase through a rise in
equipment of domestic appliances and, thus, higher
domestic income levels. The increase in productive and
commercial uses, which is itself positively correlated with
economic development and higher incomes, goes hand-in-
hand with improving the profitability of access programs.
1.5.3 Questions concerning the contractualframework to promote the mobilization ofprivate partners
(Excerpt from a GTZ document)
"(…) the efficiency / knowhow objective of Private Sector
Participation (PSP) deserves attention. If infrastructure
sectors are to benefit from the creativity, flexibility and effi-
ciency of private sector players, and if local private sector
capacity and public sector governance are preventing
success on this account, then the aim for PSP translates
into a need for Private Sector Development on local level.
Developing a functioning private sector in turn requires buil-
ding capacity on micro, meso as well as macro level.
What’s more, if improved efficiency, accountability and
creativity are the primary goal of reform, then PSP would
even include the improvement of public utilities by applying
private sector based management best practices (covering
issues such as salary structure, transparent incentives,
competition and benchmarking)."
Today, a first assessment of the concession and/or privati-
zation contracts used in the urban electricity sector is
mixed, to say the least. The minimum objectives to achieve
for licensees operating in profitable areas (as set out in the
provisions of concession contracts) should have been to
oblige and encourage them to invest in production facilities
(and therefore to mobilize relatively long-term financing)
and to supply the poorest communities, especially in peri-
urban areas. In most cases, however, the licensees have
not achieved these objectives. The assessment shows that
the actual investment level is lower than initially planned,
and that the poorest communities are still waiting for a
secure service. In contrast, Build Operate Transfer (BOT) or
Independent Power Producer (IPP) projects, where a
private investor negotiates an electricity buy-back
agreement with the electricity company, have met with
more success. There are three potential operators:
1. The traditional operator (national public or private
company): Following the wave of sector reforms, few
African countries kept their centralized system. The best
known are Morocco (for its exceptional electrification results
these past years), Tunisia, Kenya and Ghana (which have
a relatively high coverage rate), and, to a certain extent,
Côte d’Ivoire, Gabon and Cameroon. In these countries, the
national company often handled grid extension, even in the
most outlying areas, allocating part of its budget to non-
profitable rural electrification projects, which were partly
financed by taxes on consumption (partly by contributions
from the State or local authorities). Intensification, in both
rural and peri-urban areas, comes later.
2. Private operators: They have little reason to be
interested in energy in rural areas, a niche promising little
profit, except in the case of a high level of co-financing by
the State. This allows a certain degree of profitability for the
concession, which is generally mixed (generation and
distribution). The territory is thus divided into: (i) several
geographical concessions, proposed by the State to the
highest bidder (Senegal), and (ii) non-electrified rural areas
where the absence of profitability obliges the State to set up
an REA managing an REF. These two entities (sometimes
merged into one) are in charge of managing and financing
projects that are studied case-by-case and financed from
available funds, including potential funds from the ministry.
This is, for instance, the case of PCASER in Mali, where
small and medium-sized enterprises (SMEs) take a conces-
sion for a given village, covering power generation and
distribution, with a 75% investment subsidy provided by the
REA (AMADER). In Mauritania, it is the REA that in practice
remains responsible for solar kit or diesel generator
maintenance.
© AFD Working Paper n° 122 • Access to Electricity in Sub-Saharan Africa • October 2013
42

3. Non-governmental entities: With their extensive
experience of Africa’s rural environment, these entities are
potential operators in low-income areas with low energy
consumption. Moreover, NGOs have a real capacity to
define innovative organizational arrangements and to rely
on strong local partners. In the field of energy distribution
management, we increasingly see the emergence of
very local entities, such as local resellers or cooperative
structures, which operate in both peri-urban areas and
villages. Furthermore, while with the development of
the function there are an increasing number of private
enterprises, it should be noted that their roles and
responsibilities vary. This variation is directly related to the
reluctance on the part of public operators and specialized
agencies to entrust the entire management of power
systems to private operators. For small systems and grids,
it can also be explained by the lack of experience and
technical capacity of the candidate companies to manage
these systems. With the national company withdrawing
from rural areas, the question now is how to develop the
expertise in engineering and works supervision that is
essential for maintaining a high-quality nationwide supply.
Diagram 1. Potential operators for providing access to electricity
Source: Authors
© AFD Working Paper n° 122 • Access to Electricity in Sub-Saharan Africa • October 2013
43
• Historical operator→ Bulk sales→ Retail sales
• Licensee→ Geographical→ Technological
• Village cooperatives • Local authorities• Energy service companies
(ESCOs)• Associations and NGOs• Local private resellers of autonomous sytems
Centralized electrification
Decentralized electrification
Essential character of
maintenance

Excerpt from ESMAP26 (2007)
"Today’s levels of energy services fail to meet the needs of
the poor. Worldwide, two billion people rely on traditional
biomass fuels for cooking and 1.6 billion people do not have
access to electricity. (…) This lack of access to quality energy
services, especially electricity, is a situation which
entrenches poverty, constrains the delivery of social
services, limits opportunities for women and girls, and
erodes environmental sustainability at the local, national
and global levels. Ignoring the situation will undermine
economic growth and exacerbate the health and environ-
mental problems now experienced in many parts of the
world."
Creating infrastructure for rural electrification is a key issue
for development. While the necessary institutional and
organizational frameworks are gradually being established,
what technological options are today available to address
this challenge?
2 A continuum of technical, economic and organizational solutions
2.1 Technical and economic framework
2.1.1 Large-scale centralized generation ordistributed generation: Trends in the cost ofrenewable energies
In view of the low coverage rate of power grids in
Sub-Saharan Africa, a program to maximize access to the
electricity service can, depending on the context, consist of:
1. The extension and/or reinforcement of an MV grid to
reach priority localities. However, to supply this grid, power
generation in sufficient quantity and quality, and at an
affordable cost, is needed;
2. Investment in a renewable or diesel generating unit from
500 kW to several MW to supply a region and, if possible,
be connected to the grid to sell surplus production, which is
commonly called "distributed generation";
26 Energy Sector Management Assistance Program.
© AFD Working Paper n° 122 • Access to Electricity in Sub-Saharan Africa • October 2013
45

- Generation is intermittent (daylight hours for solar, or wind
availability for wind) and experiences seasonal variations:
level of sunshine, availability of biomass, variable
hydrology depending on the season (rainy/dry). This may
require the installation of storage facilities or of a diesel
generation back-up.27
The cost of power generation will thus very much depend
on the load factor of the facilities. Indeed, the cost of a kWh
generated will vary enormously depending on whether a
given investment operates at full capacity or not (1,000 or
7,000 hours a year).
Finally, the choice between generation using renewable
energy or thermal sources (coal or fuel oil) is often based on
a choice between a highly capital-intensive investment, but
with a low operating cost, and a cheap investment with high
annual charges.
The cheapest solutions in terms of the levelized cost per
kWh are often not implemented for reasons of technological
expertise and due to the barriers to the initial investment.
Furthermore, due to delays in investments, many countries
faced with urgent demand (even countries with natural
resources and thus potential for cheap power generation)
have no other choice than to invest in facilities that
are commissioned very quickly and have a low initial
investment cost, even if this very rapidly penalizes them in
terms of the cost per kWh (see Box 5).
Box 5. The consequence of investment delays on average generation costs – The example of Cameroon.
In Cameroon, there are currently nine power plants on the Southern Interconnected Grid (SIG): two hydropower plants (Edea and SongLoulou) and seven thermal power plants (Limbé, Oyomabang 1 and 2, Logbada, Bassa 2 and 3 and Bafoussam). While many hydropowerplant sites with varying sizes were studied in the past, according to the Electricity Sector Regulatory Agency (ARSEL), the plants planned forstart-up by 2010 are the thermal plants in Dibamba (commissioned in 2009) and Kribi (commissioned in 2010), the gas-fired thermal plant inKribi with a "take or pay" contract and the heavy fuel oil-fired plant in Dibamba. No forecast data are currently available.
27 Back-up diesel generator, switched on when renewable energy generation is not possible.
© AFD Working Paper n° 122 • Access to Electricity in Sub-Saharan Africa • October 2013
46
3. The creation of a stand-alone grid with its own generation
(generally below 500 kW) for a small locality or cluster of
localities ("village grids");
4. The creation of a park of PV, pico hydro and small-
engine units, either stand-alone or connecting several
families, i.e. "stand-alone distributed generation" (usually
below 5 kW);
5. The densification of connections to existing grids.
The technological paradigm is constantly changing.
Extending the grid over the vast and sparsely populated
areas where almost half of the African population still lives,
using generation sources of tens or hundreds of MW,
is a highly capital-intensive option. Local generation (hydro-
power, biomass-electricity, PV), with its lower investment
costs, offers new opportunities: the unit size of the
generation capacity is smaller, which reduces unit
investments. In addition to the issue of the initial investment
cost, it is necessary to take account of the cost per kWh, by
integrating the variable generation and maintenance
costs over the equipment lifespan. Indeed, while thermal
generation by diesel generators offers the considerable
flexibility of being able to be generated on the consumption
site (thus avoiding the cost of power transmission and
losses), renewable energy has to be made profitable in a
much more difficult context:
- The generation potential (hydropower, wind, biomass,
etc.) must be located near the demand or, if this is not
possible, the additional cost of the power transmission line
must be integrated;

The extremely rapid development of technologies should be
emphasized here: in 2009, manufacturers announced a PV
cost per kWh for units of over 5 MW at less than EUR
0.25/kWh and at about EUR 3,000 per installed kW at the
time of investment in Europe. With recent diesel fuel rises,
PV, biomass and hydroelectric electrification have become
competitive.
It is therefore becoming increasingly complicated to select a
generation technology and organize electrification: new
options are reaching technological maturity and the mass
production phase, uncertainties are growing over oil price
hikes, and a whole host of risks (including climate risk) are
appearing. In addition, distributed generation can be more
effectively managed thanks to new advances in electrical
engineering. Consequently, while up until recently electricity
companies were reluctant to integrate over 30% of this
production, this limit is rapidly increasing thanks to smart
grids.
2.1.2 Centralized generation and grids
Before being able to speak about access for the poorest
communities, energy must be available in sufficient
quantities, at a reasonable cost and with adequate service
quality,28 as tariff levels above all reflect the costs.
Large-scale hydropower projects are today hampered by
debate over environmental impacts. While this situation
is moving in the right direction, there are increasing
uncertainties related to climate change and financial
mobilization. Geothermal energy may also see a revival:
the expansion of geothermal energy along the Rift (which
stretches from Mozambique in the south to Djibouti in
the north) offers major opportunities in terms of potential
energy resources (the overall potential is in the region of
7,000 MW). There is also a growing interest in wind power.
However, the large-scale IPPs that are established today
mainly use gas or heavy fuel oil (emergency barges or
mobile generators). Clean coal generation or the new gas
technologies (Integrated Gasification in Combined Cycle –
IGCC) offer the best opportunities. These transactions are
long and complex: once the legal framework is open, the
PPAs are negotiated on a case-by-case basis, with very
high transaction costs that cannot be amortized on small
investments.
Historically, in Europe, the reduction in the cost per kWh
delivered took place within a paradigm of large centralized
production and interconnected grids (and economies of
scale made possible by a monopoly situation). Today, there
is growing consensus on the relevance of developing
distributed independent generation, connected to the
national power grid. There are many reasons for this:
environmental issues and energy independence, use
of local resources (wind, water, biomass), reduction of
transmission and distribution losses, lower investment
costs for the technical options of local generation, greater
security of supply by reducing the distance between
generation and consumption sites, etc.
Senegal, to avoid finding itself in this type of situation, is seriously considering developing power generation sources that can be integratedinto the interconnected and non-interconnected grids using renewable energy (excluding large hydro). The main sectors studied are wind,biomass (sugarcane bagasse) and PV solar.
28 I.e. without too many power cuts in the case of industrial demand or prolonged load-shedding in the case of agricultural production, but also without having to guarantee a verycostly level of reliability, which would not correspond to the characteristics of rural demand.
© AFD Working Paper n° 122 • Access to Electricity in Sub-Saharan Africa • October 2013
47

Graph 6. Levelized cost per kWh for different generation options (in EUR cents /kWh)
Graph 7. Trends in investment costs from 2005 to 2015
Source: ESMAP (2007)
© AFD Working Paper n° 122 • Access to Electricity in Sub-Saharan Africa • October 2013
48
Wind 100MV 2005(CF-30%) 2015Solar thermal with storage 200530 MW (CF-50 %) 2015Biomass Steam 50 MW 2005CF-80 %) 2015MSW Landfill Gas 5 MW 2005CF-80 %) 2015Geothermal 50 MW 2005
CF-89 %) 2015Mini hydro 5 MW 2005CF-45%) 2015Large hydro 100 MW 2005CF-50%) 2015Diesel generator (Base) 2005CF-50%) 2015Gas Combined Turbines (Peak) 2005CF-10%) 2015Gas Combined Cycle 2005CF-10%) 2015Coal Steam 300 MW 2005CF-80%) 2015Coal AFBC 300 MW 2005CF-80%) 2015Coal IGCC 300 MW 2005
CF-80%) 2015Oil Steam 300 MW 2005
CF-80%) 20150 2 4 6 8 10 12 14 16 18
Levelized cost per kWh
Combined cycle: 5.1 cents/kWh
Diesel 5 MW basic and peak
1009080706050403020100
cts€
/kW
h
Solar PV 0,05 kW
0,3 kW
25 kW
5 000 kW
Wind 0,3 kW
100 kW
1 000 kW
10 000KW
PV-wind-hybrid 0,3 kW
100 kW
Solar thermal with storage
no storage
Geothermal 200 k
W
20 000 kW
Flash 50 000k
W
Biomass gasification 100 k
W
20 000 kW
Biomass vapour 50 000 kW
Biogas/wastle 50 000 kW
Bio
gas
60 kW
Pico/Micro-hydro 0,3 kW 1 kW
100 kW
Mini-hydro 100 000kW
Large-hydro 100 000 kW
Pumped Storage 150 000 kW
Source: ESMAP (2007)

In Sub-Saharan Africa, given the two current trends –
the difficulty to raise significant amounts for large-scale
generation infrastructure,29 and the development in
electrical engineering (which means that a sizeable power
grid fed by multipoint medium-sized power plants can
be envisaged) – there is a possible shift towards a
new generation scheme, with more medium-sized and
distributed plants, in a context where economies of scale no
longer play the same role as in the past.
Controlling generation costs may be a prerequisite, but it is
not sufficient. Indeed, the cost of HV or MV transmission
and of MV and LV distribution to provide access to commu-
nities requires adding up to 50%, or even 100%, to the
production investment.
Box 6. The share of generation in the cost per kWh – The example of Cambodia
In Cambodia, where less than 10% of the population has access to the electricity service, the average generation cost of EDC (electricitycompany) and for buying from IPPs (gas and heavy fuel oil) stands at USD 0.15/kWh. Imports from Vietnam (IGCC) cost about USD0.08/kWh. The average cost thus stands at about USD 0.11/kWh. In view of the fact that nearby rural households consume 50 kWh per monthwith a load factor of 30%, the average cost for additional transmission and distribution (as well as for technical losses) is USD 0.13/kWh.Generation thus only accounts for half of the kWh cost.
2.1.3 Decentralized generation: Complexregulatory and organizational issues
In order to serve customers, it is important to distinguish
between the distribution activity and the generation activity.
Moreover, in many cases, the operators in charge of these
two tasks are completely separate. As shown in Diagram 2,
the distributor will thus be required to purchase bulk energy
from:
A - The interconnected grid, at a sub-station or transformer;
B - An independent producer (500 kW to 15 MW), which
exploits distributed local generation and sells to one
or more of the following customers: the rural distribution
company; the interconnected grid; one or more major
consumers;
C - An industry that produces its own energy to secure its
supply and sells the surplus.
The two other cases are:
D - A single licensee produces and distributes in one or
several localities – it is therefore village electrification
(generally less than 500 kW); numerous diesel mini-grids
with this configuration are found in Africa;
E – The management of a park of "distributed stand-alone"
solutions, where the generator is located on the site of the
user, thus avoiding the need for a distribution grid (typically,
an individual solar kit or pico hydro).
29 Today, 93% of the economically feasible hydro energy potential in Africa (estimated at937 TWh/year, i.e. one-tenth of the world total), remains unexploited.
© AFD Working Paper n° 122 • Access to Electricity in Sub-Saharan Africa • October 2013
49
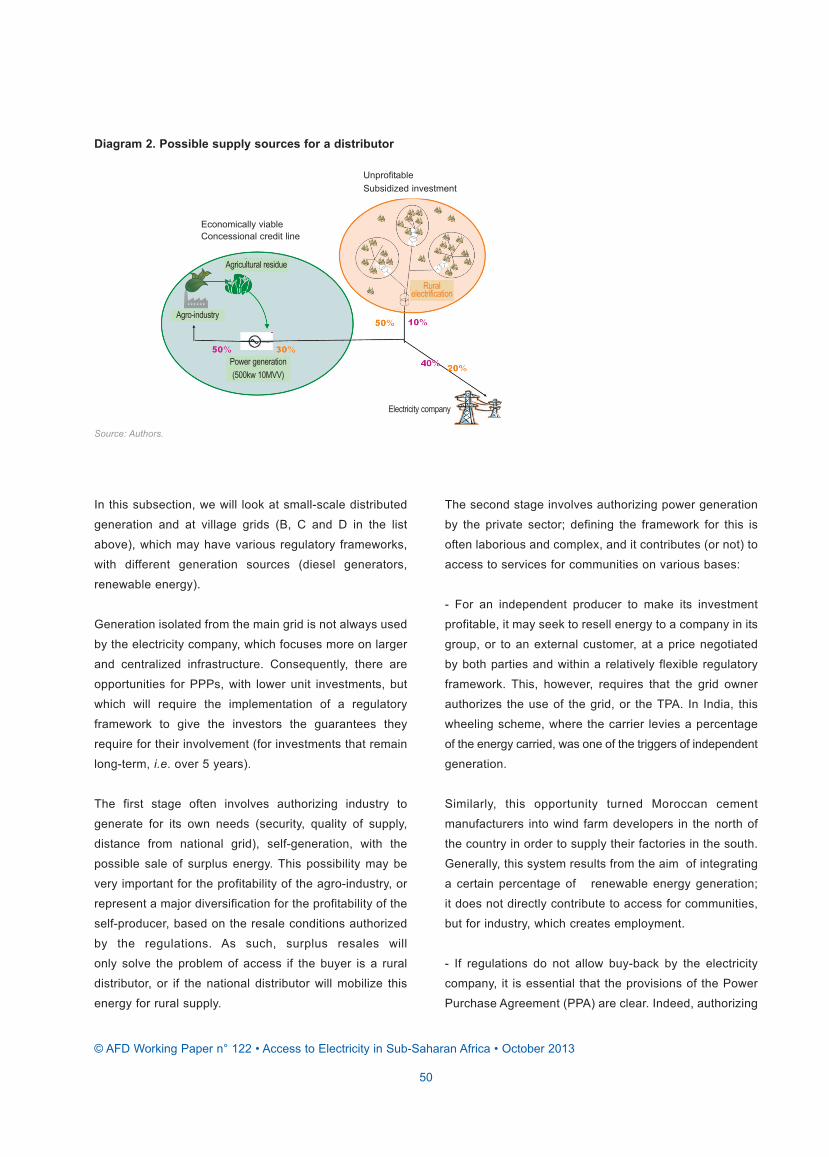
In this subsection, we will look at small-scale distributed
generation and at village grids (B, C and D in the list
above), which may have various regulatory frameworks,
with different generation sources (diesel generators,
renewable energy).
Generation isolated from the main grid is not always used
by the electricity company, which focuses more on larger
and centralized infrastructure. Consequently, there are
opportunities for PPPs, with lower unit investments, but
which will require the implementation of a regulatory
framework to give the investors the guarantees they
require for their involvement (for investments that remain
long-term, i.e. over 5 years).
The first stage often involves authorizing industry to
generate for its own needs (security, quality of supply,
distance from national grid), self-generation, with the
possible sale of surplus energy. This possibility may be
very important for the profitability of the agro-industry, or
represent a major diversification for the profitability of the
self-producer, based on the resale conditions authorized
by the regulations. As such, surplus resales will
only solve the problem of access if the buyer is a rural
distributor, or if the national distributor will mobilize this
energy for rural supply.
The second stage involves authorizing power generation
by the private sector; defining the framework for this is
often laborious and complex, and it contributes (or not) to
access to services for communities on various bases:
- For an independent producer to make its investment
profitable, it may seek to resell energy to a company in its
group, or to an external customer, at a price negotiated
by both parties and within a relatively flexible regulatory
framework. This, however, requires that the grid owner
authorizes the use of the grid, or the TPA. In India, this
wheeling scheme, where the carrier levies a percentage
of the energy carried, was one of the triggers of independent
generation.
Similarly, this opportunity turned Moroccan cement
manufacturers into wind farm developers in the north of
the country in order to supply their factories in the south.
Generally, this system results from the aim of integrating
a certain percentage of renewable energy generation;
it does not directly contribute to access for communities,
but for industry, which creates employment.
- If regulations do not allow buy-back by the electricity
company, it is essential that the provisions of the Power
Purchase Agreement (PPA) are clear. Indeed, authorizing
Diagram 2. Possible supply sources for a distributor
Source: Authors.
© AFD Working Paper n° 122 • Access to Electricity in Sub-Saharan Africa • October 2013
50
Economically viableConcessional credit line
Agricultural residue
Electricity company
Rural electrification
Power generation(500kw 10MVV)
Agro-industry
UnprofitableSubsidized investment

it is not enough ; there needs to be a buy-back agreement
over a sufficiently long period to allow the repayment of
loans (it should not be restricted to a single renewable
year as in Indonesia). The calculation method for the buy-
back tariff must also be clearly defined, the two basic
systems being the cost plus system and the cost avoided
by the purchasing national company (and not, as in
Kenya, where at present only a maximum tariff is pub -
lished). As in the case of surplus resales, this system
does not directly contribute to rural electrification, unless
the electricity company carries out grid extensions to sup-
ply unserved areas using this energy.
- However, if the purchaser is a distributor (or the national
company, which will launch a rural program), there is clearly
a contribution to access. But this does require the existence
of such rural distributors and the independent producer must
be willing to sell them its production, depending on their
quality as a counterpart. A rural distributor (cooperative or
village association) is not necessarily considered as a first-
class customer by an investor. There is then the issue of how
the distributor’s purchase price is determined, as it is itself
generally constrained by a tariff structure for users set by
regulation. The system is thus complex and this type of
framework is only in its infancy in Africa.
Box 7. Which buyers can make small-scale private independent generation profitable?Examples from India, Indonesia and the Philippines
In India, where the national electricity supply is insufficient, buy-back conditions have been established to allow a sugar refinery to make anadditional cogeneration investment profitable. Consequently, all the country’s sugar refineries now have cogeneration units, which allow themto optimize the use of biomass residue. In Indonesia, surplus resales are only authorized at a variable generation cost, and with 1-yearcontracts, meaning that none of the self-producers take up this option.
In the Philippines, cooperatives are in charge of rural distribution. They apply tariffs imposed by the regulator and buy back bulk electricity atthis tariff, less a certain percentage that covers the amortization of the distribution grid, technical losses and their margin. If this buy-backprice for the producer is lower than the cost of the energy delivered to the purchase point, the producer must justify its generation cost to theregulator. This entitles it to compensation to allow it to maintain a certain level of profitability.
Diagram 3. Cooperatives and small-scale industry: The stakes of profitability
Source: Authors.
© AFD Working Paper n° 122 • Access to Electricity in Sub-Saharan Africa • October 2013
51
Captivebuyers:private grid
Power generation100 kW to 15 MW
Access to gridby third parties?
Hydrological risk
: Electricity company
Rural electrification Hydro site

- Electrification via mini village grids by a single operator in
charge of generation and distribution is fairly common
today, when it is operated using diesel generators (see
2.1.4). However, in terms of renewable energy it is a
complex configuration:
• It is essential to correctly size generation in terms of
demand, given the substantial investment costs, in
order to ensure the facilities are not underused, which
leads to a high cost per kWh;
• Studies (hydrology, seasonal availability of biomass,
etc.) are long and costly, and thus proportionally even
more expensive since the investment is relatively low;
the expertise required to implement them does not
currently exist at the national or local levels;
• To guarantee service continuity, it is often necessary to
oversize the investment or to acquire a stand-by diesel
generator;
• The decision between the investment cost and the cost
per kWh remains complex.
2.1.4 Thermal or renewable generation: Therole of hybrid solutions.
In view of the complex contractual framework on which this
analysis is based, it is important to reiterate why this
study focuses on this distributed generation: 50% of the
population lives far from existing grids and, even if a grid is
nearby, it is generally not sufficiently supplied to meet
demand at the end of the line. Which generation source
should therefore be selected?
- Local generation by a diesel and/or heavy fuel oil
generator is very widespread and remains the reference
technology; it is controlled and can be rapidly installed
anywhere;
- Investment in a renewable energy generation source is
much more complex: the resource (river, biomass, wind
farm site) is not necessarily located near the consumption
point. Generation is intermittent (i.e. is subject to sudden
changes – wind, daily – sun, and seasonal changes – rain-
fall); the studies and preparation time are thus longer;
- By contrast, while the investment cost is higher, the
subsequent operating costs are very low over the lifespan
of a facility (15 to 50 years, depending on the technology).
However, it is necessary to have the means to invest today
with a view to such long-term generation.
The reality of the situation clearly shows that most off-grid
provincial capitals are supplied by fuel oil or diesel
generators. There are, in fact, very few small-scale hydro-
power or cogeneration plants in operation in Sub-Saharan
Africa; when they operate, they mainly (or fully) meet the
needs of industrial self-generation. The ultimate paradox is
that by maximizing the rapid implementation of a universal
service, thermal solutions are chosen. Hybrid solutions,
combining the flexibility of generation from a diesel
generator with the low, long-term cost of renewable energy
generation, make it possible to avoid the problems of
intermittent generation and today offer highly promising
prospects (see Table 6):
- For “basic” hydro or cogeneration generation, a problem
of oversizing, of dams (reservoirs) or of costly storage is
avoided with a back-up diesel generator;
- For a mini-grid that is mainly supplied by a diesel
generator, the injection of PV kWh when they are
generated during the day reduces diesel costs and the
dependence on cost fluctuations;
- For a mini-grid that is mainly supplied by a diesel
generator, part of the fuel consumed can be directly
substituted by using biodiesel or gas (40 to 80%) instead of
diesel.
© AFD Working Paper n° 122 • Access to Electricity in Sub-Saharan Africa • October 2013
52

2.2.1 Generation by diesel generators: Defaultscenario
Historically, this option for the electrification of both rural
centers and small towns was favored because of its low
investment cost, the simple technology and the rapidly
implemented works. In many countries, low demand
and low population density did not justify extending the
interconnected grid. For this reason, in many Sahel areas,
such as in Burkina Faso, Mali and Mauritania, the
generator remains the basic technical choice for rural
electrification, despite the fact that with a lifespan of
20 years, the diesel option is expensive. For example,
diesel costs account for up to 80% of the cost per kWh of
a generator, making this option even less attractive
considering the fuel transportation costs in isolated areas.
Even at EUR 1 per litre, the cost of fuel over 5 to 10 years
is higher than the amortization cost of solar panels at
present day prices.
The main reasons for choosing diesel as a reference
solution are:
- The low investment cost for a generation unit: about
EUR 600/kW, whereas a PV option requires an investment
ten times higher, i.e. ten times fewer immediate connections.
In this situation, electrification companies prefer to justify
the loans required by making a large number of
connections;
- The fact that this is mature technology and that the
competencies required for maintenance can be found
everywhere. This avoids the training costs required to
introduce less developed technologies (photovoltaics,
gasification, etc.).
Even in countries rich in natural resources such as
Cameroon, Central African Republic (CAR), the Democratic
Republic of Congo (DRC) and Uganda, national political
Table 6. Renewable energy: Investment and kWh costs
Source: Global Chance 2007.
2.2 Complementary technical solutions for the interconnected grid
© AFD Working Paper n° 122 • Access to Electricity in Sub-Saharan Africa • October 2013
53
System Invest. EUR/kW Cost EUR ct /kWh Global installed capacity Operation (hrs/year)
Photovoltaics
On grid 3,000 - 7,000 20 - 40
Isolated 7,000 - 12,000 35 - 100
Wind
On land 1,000 4 - 8 94 GW 2 000-2 500
Off shore 1,200 - 1,500 4 - 8 1,2 GW 2 500-3 000
Water power
Major 1,400 - 2,000 2 - 8 3 000-8 000
Small <10 MW 900 - 4 000 1 - 9,5 48 GW 3 000-8 000
Geothermal 1,000 - 3,900 1,2 - 9 8,9 GW 8 000
Coal 900 - 1,400 4,2 - 5,6 8 000
Fuel / diesel 400 - 1 500 15 - 20 indifferent

and economic contexts have not permitted the imple -
mentation of major programs to develop biomass or small
hydropower (mostly through lack of financing and
incentives). We are too often still in the situation whereby
an operator (national power company or licensee)
with a fixed budget, will be assessed on the number of
connections immediately made, rather than on
the long-term cost of the service provided. The diesel
generator will thus still be essential in the immediate future.
However, with rising fuel prices, the solutions to be applied
should first and foremost aim at lowering diesel
consumption, by systematically integrating the efficiency
of the equipment used and seizing all opportunities for
hybridization.
2.2.2 Small hydropower: Major needs forfinancial capital and know-how
Water resources are abundant in many countries, offering a
whole host of development opportunities and covering the
entire power range, from a few hundred watts to several
megawatts. The very small number of pico (stand-alone),
micro (village, 10 to 200-500 kW) or mini hydro
(200/500 kW to 5/15 MW) facilities is evident when compared
with Asia.
There are very few turbine manufacturing units in Africa
(there are a few workshops in Ethiopia and Nigeria), but
many countries have the industrial base to provide the
maintenance for this equipment. Experiences in promoting
hydropower can serve as examples for Sub-Saharan Africa:
the GTZ micro hydro project in Indonesia (development of
local manufacturing; range <100 kW), or development in Sri
Lanka through a buy-back tariff incentive system. In Africa,
an initiative to develop small hydropower plants for tea
factories was launched in East Africa with the support of
Global Environment Facility (GEF) of the United Nations
Environment Programme (UNEP), in which the consultant
is involved (500 kW to 5 MW hydropower units); a regional
initiative at the stage of site identification (UNDP, GEF in
West and Central Africa); pilot projects are being conducted
in Southern Africa (Rwanda, Tanzania, Zambia) by the
United Nations Industrial Development Organization
(UNIDO) and bilateral cooperation.
► Mini hydropower plants (200/500 kW – 5/15 MW): Issues
related to technical-economic profitability and the impact on
access.
These projects are especially difficult to implement
because they are often oversized for local rural demand.
Amortization is impossible from domestic demand alone
(<100 kWh/month per household). Project profitability
consequently depends on the presence of major customers
(industries, for example), or on the possibility of selling to
the grid. These customers, who are large consumers with a
high ability to pay, allow the investment to be amortized and
the operating costs to be covered in order to develop a rural
component at a lower tariff. This arrangement is only
possible if there is a clear institutional framework and
legislation for resale to the grid, as explained above.
In areas with abundant water resources, hydropower
generation is justified by the fact that operating costs are
almost nil (as they simply concern turbine maintenance).
The major obstacles are the scale of the investment costs
and the complexity of the design studies (see below). As
an order of magnitude, and depending on the turbine, the
electromechanical component of a plant will cost between
USD 500 and USD 1,500/kW and the civil engineering
component can vary between USD 500 and USD 3,000/kW.
Depending on the site, the civil engineering required can be
more or less costly (i.e. water pipes, settling pond,
penstock, water intake and, more rarely, a dam, the size of
which depends on how long the water has to be stored;
turbine house, etc.). There is, in addition, the cost of the
studies required to identify sites and for the design of the
infrastructure and hydrology. This also requires expertise
that is rarely found in Africa.
The implementation of these various stages also implies a
long gestation period. This makes it more difficult to ensure
the support of partners over the entire project life, which
may cover several years (see Table 7).
© AFD Working Paper n° 122 • Access to Electricity in Sub-Saharan Africa • October 2013
54

Run-of-River hydropower is continuous throughout the day,
unlike demand. While supply must follow demand, storage
facilities (costly) are required to be able to turbine in the
evening. In addition to this daily storage, generation over
the year depends on hydrology and its seasonal variations.
Consequently, is it necessary to launch major civil
engineering works to guarantee a capacity throughout the
year?
The presence of a back-up (thermal source independent of
the natural resource) may be necessary to ensure a reliable
service, and provide an interesting alternative to major civil
engineering works, as sizing infrastructure that will be used
little throughout the year leads to a high cost per kWh.
► Village hydropower (micro, 10 to 100 or 500 kW): Many
constraints
For smaller, so-called "village" facilities, it is not possible to
consider launching long, complex and costly studies that
have to be amortized on a few kWh. Hydropower at the
village level to feed a mini-grid is only possible if it is run-of-
river (without water storage) and of simple design. The civil
engineering is reduced (all that is needed is a water pipe
and a small building for the turbine) and many fewer studies
are required. Most of the civil engineering can be handled
locally, by training the relevant stakeholders, initially in
plant maintenance, thus ensuring the project will not be
abandoned at the first breakdown. As a second step, a local
turbine production industry can be set up to minimize
imports, which generate high costs, and thus promote local
development.
However, this system needs to be widely replicated (to
amortize the training costs), to benefit from real know-how
and to be facilitated by clear legislation. Support is required
at the level of (i) the development of local skills, (ii) investment
and (iii) during the definition of the tariff conditions. It is
therefore a long-term process, which requires a real political
commitment from the State, as was the case in Sri Lanka.
► Pico hydro: Skills transfer required
Pico hydro is the use of hydropower by low-power turbines
(typically less than 5 kW) for individual use or shared
between a few families, similar to PV systems. The required
turbines combine the mechanical part and electronic part
in a single part. The use of this technology is therefore
accessible to all. The turbines can be installed with a small
water diversion in order to create a difference in height, but
also directly in a river current. It therefore does not require
much know-how to use them. However, they cannot turbine
during low-water periods, or when there are high water
levels. To maintain low sales prices, most of the Chinese
and Vietnamese equipment has neither regulation nor
protection, which poses safety problems for both the
equipment used and the users.
Many African countries have a hydrology that allows pico
hydro to be installed in isolated villages. This sector, which
is currently not exploited in Africa, can thus be developed
either by importing Asian turbines, or via the development
of a local industry. A technology transfer between the two
continents would therefore appear appropriate and
necessary for the development of a market. Once
© AFD Working Paper n° 122 • Access to Electricity in Sub-Saharan Africa • October 2013
55
Scoping study Duration and dates Costs Financier Number of sitesPre-feasibility 4 months GEF, UNEP, African 8 COUNTRIES
Nov. 05 – March 06 EUR 178, 000 developpement Bank (ADB) 19 sitesFeasibility 5 months EUR 180, 000 GEF, UNEP, ADB 2 sites
Oct. 07 - March 08Studies for the rural 3 years EUR 272, 000 GEF, UNEP, ADB 4 siteselectrification component Jan 07 – Dec 2010Works 1 site under construction 1 site (civil engineering,
1 site under discussion electromechanics, distribution grid GEF, UNEP, ADB 6 sites4 feasability studies of sites supervision): EUR 5.5m (2833 MW)
Table 7. Timetable and design costs for hydropower sites
Source: Authors.

manufacturing is on stream, the cost of a turbine is
affordable, even for low-income rural communities, since –
for low-end material – in the rural areas of Laos, turbines
"rated" 200 W can be found for USD 30.
© AFD Working Paper n° 122 • Access to Electricity in Sub-Saharan Africa • October 2013
56
Box 8. Pico hydro in Laos
Pico hydro developed spontaneously in Asia. In Laos, about 60,000 turbines are operational, although it is difficult to give an exact figure,
and a manufacturing industry has developed, in particular in China and Vietnam. These turbines are often of an average quality and their
lifespan is estimated at about three years. However, it is possible to control production, as the REA attempted to do in Vietnam (by putting
higher quality turbines on the market at competitive prices), or as in the Philippines (which developed their market by importing higher
quality turbines than those from China). The electricity generated is unstable and the lifespan of domestic appliances connected to this
source is shortened in these conditions, as the users do not spontaneously install a regulator. In Laos, for instance, households replace their
light bulbs up to three times a month.
Finally, while the fact that pico hydro is easy to implement is an advantage for rural electrification (it is simple to install a turbine), the use of
electricity by people who are unaware of its dangers, combined with a lack of protection of the facilities, exposes users to a number of risks.
During discussions with these users, they mentioned several accidents. The development of pico hydro must therefore go hand in hand with
awareness-raising for users in terms of how to use it.
Costs range between EUR 20 for a few hundred watts and EUR 500 to EUR 1,000 EUR for a few kW.30
2.2.3 Bioelectricity: Technical sectors andaccess issues to differentiate
► Biomass-based power generation: Resources and
sectors
Like hydropower, biomass-based power generation
depends on the local availability of the resource. It is
thus necessary to make a clear distinction between the
development of plantations for power generation, involving
agricultural and rural development issues, on the one hand,
and the use of agricultural or agro-industry residues, on the
other hand. It would, however, be wrong to systematically
consider this resource as free, as competitive, commercial
uses are being developed (rice husk briquettes, paper
manufacturing, uses for cooking, etc.) Large-scale biofuel
generation for transportation, or small individual or commu-
nity biogas facilities for cooking, will not be discussed here.
Four main power generation sectors for rural services
should be distinguished:
- Cogeneration
- Biogas
- Biodiesel
- Gasification.
30 For more information, visit the site of the Off-Grid Promotion and Support village project,implemented by the government of Laos: www.vopslaos.org

► Agro-industry cogeneration
Cogeneration (the combined production of heat and
electricity) is particularly relevant in the agro-industry,
where there is a need for heat (typically sugar refineries). It
is only appropriate above 500 kW or even one MW. It is, of
course, possible to only produce electricity and not develop
heat production, if it is not required for the process.
This industry is technologically very widespread and proven
in Asia and Latin America, where all the sugar refineries in
India, Brazil and Thailand in particular are equipped with
these units. It is increasingly applied to sectors such
as palm oil production, rice husking plants or the wood
processing industry. There are few projects in Sub-Saharan
Africa, apart from a few facilities in South Africa, Uganda,
Tanzania and Zimbabwe. An ambitious program is,
however, currently being launched, with the support of
UNEP/GEF, to develop cogeneration in Ethiopia, Kenya,
Malawi, Sudan, Swaziland, Tanzania and Uganda (Cogen
for Africa program, coordinated by the NGO
Afrepren/FWD).31
Traditionally, agro-industrial units have low-
temperature/low-pressure boilers and are self-sufficient.
The same quantity of residue, with a high-
temperature/high-pressure boiler, allows a much higher
level of electricity to be generated, but the additional invest-
ment will only be justified for the agro-industry if it can sell
this electricity at a sufficiently attractive price to amortize its
investment.
In Sub-Saharan Africa, the potential is considerable, both in
sugar production areas and wood processing units. It is,
however, the regulatory framework – and the proximity of
an electricity grid – that would provide incentives to develop
this sector. Without an attractive buy-back tariff to supply
the grid or nearby localities, industries will make do with a
basic boiler for their own consumption.
Cogeneration has mainly developed in a self-sufficient
manner over the past decades. Boiler efficiency has impro-
ved, so has the development of the power grid, and it is
today a mature sector with a growing potential, as resale to
the grid is becoming increasingly possible. The available
quantities of biomass produce an electricity surplus, which
is sold externally. A part of it can be fed into the grid (if there
is one) at the national tariff in order to remunerate the
agro-industry, and a part can also target surrounding
villages at a lower tariff (provided a distribution structure
exists to purchase the electricity). In order to establish
this type of scheme, which contributes to access
for communities (who will logically be located near
employment areas where the agro-industries are), it is
essential to have a clear institutional framework, as the
technology is now mature and no longer poses difficulties.
However, the development of the system is primarily
motivated by profitability for agro-industries, which is in any
case a key factor at the worldwide level for determining
sugar prices, for instance.
► From individual biogas to industrial biogas
Biogas is the product of the anaerobic fermentation of
more-or-less liquid waste. The resulting methane can be
used for direct combustion (lighting, cooking), or as mixed
fuel in a diesel generator or small turbine. Electrical
facilities generating up to several MW exist in pig and
chicken farms in Southeast Asia. Dozens of units are
now operating in Malaysia and Thailand, and while the
methanization process (anaerobic digestion) requires a
certain technological supervision, these units have been
operating for several years. The suitability to the context of
Sub-Saharan Africa is certainly farther away, because
of the small number of large livestock farms. However,
"individual" biogas (to produce gas for cooking or lighting at
home) or medium-sized (to run an engine from a few dozen
kW to up to 500 kW, intermittent) has great potential.
However, it should be noted that the adjustment can be
difficult as it depends on the temperature, humidity and the
residue used.
Today, millions of "individual" or community” biogas units
exist in India and China, allowing farmers to produce the
gas required for cooking and lighting from two cow heads.
The so-called "industrial" biogas sector, which uses waste
© AFD Working Paper n° 122 • Access to Electricity in Sub-Saharan Africa • October 2013
57
31 Energy, Environment and Development Network for Africa, ONG basée à Nairobi.

from intensive farming, is widely established in countries
like Denmark, where this gas covers over 15% of heating
needs and power generation. In the Philippines, where
there are strict environmental standards concerning
the treatment of liquid effluents, biogas generation is
systematically integrated into sheep farms, which solves
both the problem of local pollution (liquid effluents) and
improves the profitability of the operation by using this
gas for power generation. While this sector has clear
advantages in terms of increasing the renewable share in
the energy mix, there is no direct link with the issue of
access.
The size that we feel probably has the best potential for
rural access, when legislation allows its resale under
attractive conditions, is that of biogas producing 50 to
500 kW from agro-industry waste or plantations. However,
the complexity of this sector should not be underestimated,
as the "anaerobic digestion" process must be adapted to
the type of biomass and its degree of liquidity.
Nevertheless, some projects are beginning to emerge in
Africa, in Kenya for instance.
► Short supply chains of biofuel and gasification: Reducing
the share of fuel oil in generator consumption
Gasification allows biomass residues to be used by
transforming them through pyrolysis into a gas that can be
used in a standard engine, just as biodiesel can be mixed
with diesel. The gasification of wood, rice hulks, coconut
shells, coffee, palm oil and rubber plantation pruning
residue presents a huge potential that ranges from several
tens of kW to between 1 and 2 MW. The gasification
process (pyrolysis) is specific for each residue, which
makes its industrial application somewhat difficult. Until
now, it has been especially supported by academic
structures before passing to an industrial stage (especially
in India). Replication of the process is thus not as easy as
for a "universal" generator, as it requires a certain capabi-
lity of the local industrial base. However, targeted skills
transfers and dissemination programs are quite feasible
and are in fact ongoing, such as the transfer of knowledge
from India to Cambodia for gasifiers using rice hulks for a
generation capacity of between 100 and 300 kW. In the
African context, the focus will be more on the injection of
this gas into generators rather than gas production alone,
which is risky in terms of service continuity.
In practice, gasifiers can make villages that have sufficient
biomass potential self-sufficient. There are some examples
of gasification rural electrification (in Madagascar, or via a
nationwide project in India). The most commonly encountered
problem is that of the maintenance of this type of unit, which
requires local skills: quality of the fuel, air supply and
temperature management, gas filtration. A local technology
transfer reduces costs, as the gasifier can be made using
local materials. With the current level of command of these
sectors in the contexts we are considering, it is preferable
to use hybrid diesel in these sectors rather than a single-
fuel source.
In terms of biofuels, the so-called “first-generation”
agrofuels have reached technological maturity and are an
energy source than can be developed locally. There are
several options:
- Ethanol obtained from the fermentation and distillation of
biomass rich in sugar, starch or cellulose (sugarcane, sweet
sorghum or maize, wheat, manioc). It has to be used either
mixed or in specially adapted engines, just like vegetable
oils. Its transformation is expensive, especially due to
transportation costs;
- Pure vegetable oils, obtained from pressing oil-rich bio-
mass (in Africa, palm oil, jatropha, rape seed, soy, algae,
etc.), can be used in tractors or stationary engines, with
special precautions when starting up the engines;
- Biodiesel, obtained from the esterification of such
vegetable oils, can be used in any diesel engine (<30%, or
more after simple modifications).
Today, we are still in the pilot stages of such uses, with
open-ended questions concerning surfaces areas, inputs,
yields and capacity. The initial analyses seem to indicate
that under good conditions (reasonable yields without the
need for too many inputs), biodiesel might be competitive
with diesel above USD 70/barrel in isolated areas.
© AFD Working Paper n° 122 • Access to Electricity in Sub-Saharan Africa • October 2013
58

These options offer a high level of flexibility, because
biogas and biofuels are injected into diesel generators
without being modified, and any fluctuation in biomass
generation can be offset by increasing diesel input (see
Box 9). The difficulties will come from issues concerning:
- The reliability of biomass supply (residues, competitive
uses, seasonal variations) and, in the case of dedicated
plantations, the question of plantation management;
- Technical skills, which have to be found in each village
and require establishing an effective regional network of
local technicians. This has to be planned in partnership
with an REA as part of a large-scale program.
© AFD Working Paper n° 122 • Access to Electricity in Sub-Saharan Africa • October 2013
59
Box 9. Examples of biodiesel and gasification projects
The University of Louvain, Belgium, has conducted a feasibility study for a biomass-electricity project in rural areas in Burkina Faso. Based
on various available types of biomass and on several different technologies, the study showed that yields depended on the biomass used,
and that wood was the best candidate for gasification (although cotton stalks, among others, also gave interesting yields). The "all wood"
option requires a higher initial investment, but produces a cheaper kWh than a "dual fuel" option (using 20% diesel and 80% wood).
Whatever the option selected, the cost per kWh produced is 25 to 33% lower than the kWh produced by a standard system. Researchers
have also developed an easily built concrete gasifier.
While wood is the most common fuel, and we can consider that wood gasification is competitive with diesel when it costs over USD 0.90/litre,
the rice hulk sector is also being developed. Cambodia, for instance, sells its Angkur rice-hulk gasifiers in India at USD 65,000 for a 150 kW
unit and USD 75,000 for a 200 kW unit.
In Mali, the national program to exploit the jatropha (pourghere) plant for energy use (PNVEP) aims to develop the use of jatropha oil for rural
electrification and vehicle fuel. The first phase (2004-2008) installed five generators using this fuel, for a budget of FCFA 700m. A 50 kW
generator was commissioned in the pilot village Kéléya, with a jatropha oil extraction unit and the cultivation of 0.5 ha of this plant. Twenty
subscribers (including most of the administrative buildings) were thus connected to a 2 km grid. On a larger scale, AMADER (which has
already financed several diesel generators and small grids) could support the installation of a biodiesel production unit, with an obligation to
purchase for the PCASER that are financed.

2.2.4 Photovoltaics (PV): Are prices sure to fall?
The much expected reduction in the price of photovoltaic
panels has been well underway since early 2009. While only
a few years ago, a 50 Wc solar kit cost USD 500, today this
equipment, which is manufactured in Asia (and certified in
Europe), can be found for less than half that price. Industry –
driven by major European, Japanese and American pro-
grams, which have led to large-scale investments in genera-
tion capacity and in electronics to integrate renewable energy
into smart grids – has scaled up its generation capacity, and
the eagerly awaited "One Euro per Peak Watt" will soon be
reached. It is essential, however, not to confuse panel price
and the total cost of the system, especially for stand-alone
systems, for which there is also the cost of storing the power
produced during daylight hours (batteries for lighting or water
tower for pumping).
► Hybrid PV/diesel mini grids: A sector with great potential
Photovoltaics might well become the first hybridization option:
sunshine is almost constant in the country and a resource
much easier to mobilize than biomass or water. The weak
point of PV is its necessarily diurnal production, whereas in
rural areas the demand is often nocturnal. Electricity storage
in batteries remains very expensive, whereas in direct
injection into the (mini) grid during the day, it is competitive
with diesel, as is shown by the example of Mauritania
(Box 10). Moreover, as long as less than 20% of solar energy
is injected, there is no problem to manage the intermittent
production.
© AFD Working Paper n° 122 • Access to Electricity in Sub-Saharan Africa • October 2013
60
Diagram 4. The stages of a biodiesel and gasification project
Source: Authors
PLEASER unable to cover
operating costs
Local operator,
Mali : PCASER
Competencepole
Investmentgrant...~ 80%
biodiesel
Rural electrification agency/fund(AMADER)
Technical Financial support

► Solar kits: Lessons learned from programs
Solar kit projects have rapidly developed over the past
two decades and, for a time, gave hope for the "total"
electrification of rural areas. While it is true that the cost of
a "typical" domestic solar kit of 50 Wc (lighting, radio and
TV for 3 to 6 hours a day) has decreased by almost 50%
in 15 years, this electrification scheme has not had the
expected impact, in particular for the following reasons:
- The service provided is limited to lighting, the telephone
and radio/TV (for a few hours a day and for the most
powerful systems). It can include ventilation and some
refrigeration. While "connectivity" is becoming a key
factor of development, we can nevertheless see that if
communities have to choose PV now and the grid later,
they often prefer to wait a few years more to have the "real"
powerful electricity service;
© AFD Working Paper n° 122 • Access to Electricity in Sub-Saharan Africa • October 2013
61
Diagram 5. The various stages of a project for PV electricity injection
Source: AIE PVPS Task 9.
Box 10. Example of a hybrid PV-diesel project in Mauritania
Today, the town of M’Bout in Mauritania is supplied by a 280 kW thermal power plant. A study was conducted for the installation of a hybridPV/diesel grid, injecting 20 kW PV. The injection is made in small quantities in order to reduce diesel consumption, but without requiring abattery to store the solar energy.
The cost calculation showed that the power generation from photovoltaics, (based on a PV investment of EUR 7,000 per Wc) would costthe same as diesel electricity with a diesel cost starting at EUR 0.75/litre. As its price in November 2008 stood at EUR 0.83/litre, the PVinvestment was profitable at the time.
Lower investment costs can be borne by
small stand-alone operators
Source: IEA PVPS Task 9.
National power company
Borrows and maximizes thenumber of connections overthe short term
But has high operating costsin the long term
National power company
Does not want to use itsborrowing capacity forfew connections per $
Despite the guaranteedlong-term sustainability
Investment EUR 700 /kWkW cost: 80% fuelDiesel at 90 cents/litreCost >30 cents/kWh
Investment EUR 8,000/kWCost: 20-25 cents/kWh with long-term financing and no battery storage
Solar energy injection
Generator

- The technical and financial management (maintenance of
the electronics, replacement of batteries and low-energy
light bulbs – LELBs, payment collection) is much more
costly than initially expected. The cost of local management
can only be "amortized" over a large number of systems in
the smallest possible area. However, it is clear that where
communities are concentrated, the option of mini grids will
be selected. Consequently, and especially since the rise in
oil prices, transportation costs represent a considerable
part of the recurrent costs of programs. In reality, the larger
the program, the more it extends to remote areas
(which are scattered with low incomes), and the more the
management costs will increase. Here we are thus dealing
with "dis-economies" of scale. While prepayment (see
2.3.2) can be an interesting option (at least for monthly
payments), the prepaid meter can only be amortized over a
relatively large system (>100 Wc).
A rich literature exists on these subjects (see IEA
Photovoltaic Power Systems: Deployment in Developing
Regions).32
There are three main methods for distributing solar kits:
► A "commercial" approach, where the users pay the
entire price of the system; this approach has the following
characteristics:
• Installers or a local (micro)-credit structure can grant
payment facilities. To do so, the installers (generally local
SMEs) must be able to benefit from refinancing. However,
the scarcity of this type of facility blocks the dissemination
of the system;
• Payment facilities are for a maximum of three years, and
the users have monthly payments of USD 8 to USD 15
(for individual domestic systems), meaning that only the
wealthiest part of the population will have access;
• Once the installation has been made, or the credit paid
back, the user owns the solar system and is responsible for
its maintenance;
• The installer will only set up a local maintenance office if it
is justified by the "market" (this is commonly done through
shops selling electrical and electronic equipment in districts
or provinces);
• This is a booming market, for example in East Africa,
where many wealthy landowners install large-scale PV
systems; it does not concern agricultural laborers or small
owners;
• For the poorer population segments to benefit from this
service, a major investment subsidy is necessary (50% of
the cost). This may, or may not, be considered as a priority
for public resources.
► A so-called "fee for service" approach: The customer
pays an initial sum at the installation (equivalent, for
instance, to the connection fee for a grid service) and then
a fixed monthly fee, and the supplier handles operations
and maintenance. In certain programs, the user becomes
the owner of the equipment after a certain period, for
instance after 10 years; in others, the licensee must renew
the equipment (in cases where the grid has not yet arrived);
finally, in many cases this question of ownership remains
vague. Many such programs are now operational, and we
can benefit from information feedback covering several
years. The conclusion is relatively unanimous: this type of
approach has considerable potential, and the development
of equipment for increasingly efficient uses makes it
possible to improve the service provided by PV-based
electricity (which remains expensive). However, overall
viability is only reached when operations become entirely
local and with local costs. Skills are being developed and
national scaling up will involve a political will to disseminate
this type of set-up and develop the required expertise.
Monthly fees may, depending on the case and/or for poli -
tical reasons, cover just operation and the replacement of
the electronic components (batteries, rectifier, regulator) of
all the PV panels (or only part of them). International
cooperation is strongly represented in this niche, especially
through NGOs and foundations, which are used to working
closely with local communities.
© AFD Working Paper n° 122 • Access to Electricity in Sub-Saharan Africa • October 2013
62
32 Contains a dozen practical guides, ranging from financing to trainer accreditation.www.iea-pvps.org –Tasks – Ongoing – Task 9.

► PV for community, social or productive uses:
• Community uses include services such as streetlights or
lighting for a village hall. This is often appreciated in village
dynamics. Its cost should be covered by the community;
• Productive uses are very rare for solar applications
because of the high cost of solar kWh, which does not
really allow power uses. However, in areas where water is
scarce, solar energy can be used for drip irrigation (which
involves little water displacement);
• These so-called "productive" uses are different from
services that directly or indirectly generate revenue:
recharging cell phones or night lighting, allowing women to
extend their weaving hours, etc.
• PV also serves certain essential social uses, such as
installing drinking water pumping systems, lighting in
health centers, or the refrigeration of vaccines. However,
for these applications the recurrent question is: Who
finances the investment? In general, the electricity sector
does not pay the cost of these investments, which must be
borne by the structures and/or ministries in charge of health
or rural development, for instance, or even the communities
themselves, which may be difficult. In fact, such programs
generally finance the initial investment for a diesel
generator, and the local community then has to cover the
recurring costs, which can create serious problems.
Changing to a solar investment requires the investor to be
willing to make a much higher investment and to have the
means to command this technology. For this reason, we
increasingly see the use of paid-for services to cover a
minimum of the operating costs.
© AFD Working Paper n° 122 • Access to Electricity in Sub-Saharan Africa • October 2013
63

© AFD Working Paper n° 122 • Access to Electricity in Sub-Saharan Africa • October 2013
64
Mature
technology,
can be locally
repaired
Easy supply,
many local
representatives
Construction
work well
understood
Rapidity of
works and
of coming
on stream
Many technicians
trained who can
ensure maintenance
Investment
costOperating cost
Simplicity
of financial
arrangement
Environmental
impact
Diesel SS SS S SS SS S WW S WW
Hydro with dam SS S S WW W W SS W W
Run-of-river turbine
(little civil engineering)S S
Need for training
Co-generation (>500
kW <2 MW)SS S S S SS S S SS S
Industrial biogas
>500 kWSS WW W S S S S SS S
Generally
associated with
agro-industry
Boilers and engines
available; problem
is engineering and
buy-back of surplus
Located near
agro-industry,
i.e. engineers
and demand
Industry leads
project
Allows waste
re-use
Gasifier
20 to 500 kWWW W S W S W W W
Difficult
to implement
in rural areas
Effluents
Isolated domestic
and community PV
solar systems, hybrid
PV-diesel in mini grid,
PV connected to grid
SS SS SS S S WW SS WW SS
PV and PV-diesel grids SS W S S W WW S WW SS
As soon as
spare parts
are available
Table 8. SWOT* analysis of the technical options * Strengths, Weaknesses, Opportunities, Threats
STRENGTHS (S) and WEAKNESSES (W)

© AFD Working Paper n° 122 • Access to Electricity in Sub-Saharan Africa • October 2013
65
Variability of
kWh cost
Long-term
kWh cost
Generation
configuration that
can be adapted to
demand
Location of
generation and
demand
Hybrid solutions
to increase the
overall optimum
Sensitivity to
external factors
Cumbersome
nature of the
administrative
procedure
Stable and
well-formulated
regulatory
framework
Diesel TT TT SS SS O TT
Hydro with dam S SS S WW O O TT O
Run-of-river turbine
(little civil
engineering)
W OO T
Generation on
a specific site
Possibility of a grid
HydrologyStarting
in a few countries
Co-generation
(>500 kW <2 MW)S S S S T T T
Industrial biogas
>500 kWS S S S O T T T
Competing uses
of biomass
For resale
of surplus
Few or no countries
have a specific policy
Gasifier
20 to 500 kWS S S S OO T T T
Collection,
plantations
Requires
contracts LT
Few or no countries
have a specific policy
Isolated domestic
and community
PV solar systems,
hybrid PV-diesel
in mini grid,
PV connected
to grid.
SS S S SS O OO O O
PV and
PV-diesel gridsSS S W SS O OO T T
Competitive in
some segments,
and improving
Diurnal generation
is a problem,
requiring storage
for nocturnal
demand
Modularity versus
increasing demand
Have to import
sophisticated
components
Simple as,
generally,
no connection
to a grid.
Start of fiscal
incentive policies
OPPORTUNITIES (O) and THREATS (T)

© AFD Working Paper n° 122 • Access to Electricity in Sub-Saharan Africa • October 2013
66
Potential on the
continent
Investors’ appetite –
risks controlled
Investors’ appetite – time
for return on investment
Investors’ appetite –
LT profitability
Engineering expertise
national technique
Manufactured
nationally
Diesel OO O TT T
Hydro with dam OO TT TT OO TT O
Run-of-river option
(little civil engineering)T O
Geographical
variations
Training
in due diligence
Need for innovative
financial engineering
Need for innovative
financial engineering
Need for training
and quality control
Small turbines
with the market
Co-generation
(>500 kW <2 MW)O O O OO T O
Industrial biogas
>500 kW0 T O O TT TT
Need for information
and training (biogas)
Gasifier
20 to 500 kWOO T OO O TT T
Isolated domestic
and community PV
solar systems, hybrid
PV-diesel in mini grid,
PV connected to grid
OO O T T OO O
PV and PV-diesel grids OO O TT O O O
Technologically,
the problems are known
and the resource
controllable
Strong interest
from investors
and industry,
despite small size
of investments
Engineering to be built,
easily transferrable
The definition
of opportunity
is restricted
to assembly here
Source: Authors.
OPPORTUNITIES (O) and THREATS (T)

2.3.1 Significant potential for lowering costs bytaking the time to choose options
Electricity distribution techniques have an impact on
investment costs and, thus, on the profitability of the sector.
Innovative approaches can also help to reach an a priori
non-profitable customer segment (such as rural or
peri-urban households). Electrification systems should thus
be designed in an integrated manner in order to optimize
not only the investment, but also the operating,
maintenance and customer management costs.
Usual practice often leads to overestimating demand and,
consequently, to oversizing the grids (cable sections,
transformer capacity). This practice is often the result of a
lack of openness to alternative technology and a certain
mistrust of light technologies, which are considered as
downgrading. However, in terms of norms and standards,
a more widespread use of single-phase grids, a
more controlled sizing of transformer specifications,
adapting constraints to the poles, and accepting cable
sections that match effective demand, are all ways to
significantly reduce investment costs. Very often, studies
reproduce the usual equipment choices based on practice,
without any specific sizing, whereas a correct sizing
involves: (i) defining the prospects and forecasting the
loads, (ii) specifying the technical limits (overloads, voltage
drops, engine start-ups), and (iii) reinforcing upstream grid
sections and reducing the downstream sections.
These structural solutions require a fundamental change
in practices and, for this reason, are often difficult to
implement. An optimized approach to the technological
dimension can lead to overall savings of around 30%
compared to usual practices, or can extend the lifespan of
the grids by 10 years. Cost reduction is a lengthy process
that requires the support of all stakeholders and a strong
political will to change long-established habits.
Further flexibility exists in terms of program management,
and more specifically in policies for procurement and the
implementation of facilities, whereas usual practice is
based on turnkey contracts that avoid setting up project
management structures. Using a central procurement
service and segmenting supplies can reduce procurement
costs by 20 to 30%.
This local involvement obviously requires building the
capacities of the contracting authority/project management
in order to guarantee the quality of supplies and facilities.
This strengthening implies costs that absorb part of
the gains. This capacity building can, of course, only
be achieved within the framework of a large-scale
electrification program.
Restoring project management to a national level should
also allow a cost review for the installation of electrical
equipment. In certain turnkey electrification programs,
installation costs can be as much as 50% of the overall
cost: national management will ensure that this type of cost
is reduced by creating competition in the installation sector.
The organization of negotiations with companies, the
search for new suppliers and a new bid invitation as part of
a rural electrification program in Burkina Faso led to a
reduction in the total installation cost of two mini grids of
almost 35%.
A new approach to program implementation can also, and
this is the major interest of this solution, give incentives to
set up a national system of companies with a capacity
to directly work on the electrification program (sizing,
installation, etc.) or indirectly (supply of wooden poles, elec-
trical equipment, etc.). The same is true for companies
called on for the operation and preventive maintenance of
the facilities. A national survey will establish and update a
pool of potential operators and equipment suppliers.
© AFD Working Paper n° 122 • Access to Electricity in Sub-Saharan Africa • October 2013
67
2.3 Distribution and customer management: Substantial leeway

2.3.2 Adapting customer management to localconditions
► Costs and organization
The two main basic pricing models are related to
distribution techniques: a lump-sum payment for an
electricity service (e.g. fee-for-service, an amount based
on the number of lamps or a duration of use) or a power
limiter; payment in proportion to the amount of electricity
consumed based on a grid approach (meter). The usual
approach can be summarized as follows:
• Power distribution grid = unit sale of energy,
• Electrification for low demand = sale of service.
Electricity companies, governed by a supply culture, thus
operate from a customer-management logic based on the
unit sale of energy that is materialized by the following
cycle: energy metering-billing-collection.
In Africa, so-called "non-technical" losses on power
distribution grids are often in excess of 10% (fraud, theft,
etc.). There are, in addition, unpaid bills, which are also
often in excess of 10% of the distributed electricity,
meaning that total losses (also including technical losses
due to the state of the grid condition) for electricity
companies can sometimes reach or exceed 30%.
Improving customer management in particular requires
improving billing collection. However, this comes up
against obvious financial limits: the electricity companies
cannot afford to increase their billing collection costs (on
average 10% of turnover) by increasing the number of
staff for payment collection, which on a unitary basis is low
in low-income areas.
Faced with these constraints, new organizational
approaches to customer management are being
developed. These new systems are based on taking more
account of the socio-economic characteristics of
© AFD Working Paper n° 122 • Access to Electricity in Sub-Saharan Africa • October 2013
68
Box 11. Cost reductions in Benin thanks to upstream optimization of technical and sizing choices
Thanks to the optimization described below, the project has allowed 102 localities to be connected instead of the 56 initially planned, at
constant cost:
- Two-phase derivation: 20% gain compared to a three-phase derivation;
- Use of Single Wire Earth Return (SWER): gain of up to 70% compared to a three-phase antenna. Introducing SWER requires a minimum
of steps to ensure it is appropriated at national level. This ensures that the projects can be implemented in as flexible a way as possible;
- Systematic use of wooden poles wherever it is technically possible and economically profitable (gain of 5% to 15% on the line);
- Use of mechanical calculation software for overhead grids (particularly to optimize lines using the suspended technique);
- As part of a project, segmenting supplies substantially reduced the cost per km of a line: from FCFA 12m to FCFA 10m (-20%);
- Supplies from international markets for each component (cables, transformers, etc.) and only the installation was subcontracted locally, as
the prices are much lower than in all the other Central African countries.
Source: IED – Rural electrification project in Benin, financed GTZ-AFD – European Commission Energy Facility.

customers. This constitutes a major change in electricity
companies, which often have little interest in interfacing
with customers. Consequently, there is a move towards a
variety of organizational approaches, which aim to lower
costs for meter reading and bill processing: installation of
collective meters (one meter for several customers), and
monthly flat-fee sales in peri-urban areas where there is
low energy demand.
These approaches require the involvement of local
communities (traditional, cooperatives). In Eritrea, for
instance, each village sets up an electrification committee
in charge of customer relations inside the village. The
electricity company sells bulk energy to the village, which
is in charge of retail distribution and, thus, of collecting the
corresponding payment from each user.
However, when the main licensees withdraw from the cus-
tomer interface, the question is raised as to service quali-
ty at the end of the line: How can the licensee be respon-
sible for the service quality provided by the cooperative at
the end of the line?
► Prepayment: An interesting customer management tool
Prepayment is a commercial management method that
aims to charge the customer for a service before this
service is used. It is a very practical payment method
for cell phones (cell phone recharge with cards) and
increasingly in other market sectors, such as gas and even
water. This credit recharge can be bought from an electri-
city distributor, from an official sales point, via an automa-
tic sales system, or even with a cell phone (or, in certain
cases, via Internet). Electricity prepayment has existed for
a long time, especially in England where it serves about
half the population. In South Africa, most towns were
equipped with prepaid electricity as part of the national
"Power for All" equipment program. African countries, such
as Côte d’Ivoire, Gabon, Morocco and Senegal have
launched prepayment projects due to the bill collection
problems faced by national electricity companies. Today, it
is estimated that there are over 4 million meters installed in
South Africa, 50,000 in Nigeria, 40,000 in Namibia, and
10,000 in Côte d’Ivoire and Senegal.
Prepayment is based on pre-metering electricity. The
prepayment meter measures the energy consumed and
compares it with the available credit level purchased by
the customer. The meter stops the supply when the credit
is exhausted or when the subscribed power level is
exceeded.
Prepayment is successful today because it offers several
advantages:
- For the electricity distribution company, prepayment
improves cash flow (as customers pay before using the
electricity); it reduces bill collection problems (as the
customer does not get electricity if it has not paid in
advance); it reduces meter-reading costs and limits fraud
when split meters are used (see below);
- For customers, prepayment makes it possible to
anticipate their consumption, “pay as you go” depending
on what they can afford, adapt their consumption and
avoid "unforeseen" bills.
There are two types of prepayment system:
- One-way prepayment: Consumers buy an electricity credit
using a key, code, or smart card, depending on the type of
meter; the corresponding amount is then credited on their
meter. Data only move in one way, from seller to meter;
- Two-way prepayment, which is more complex: while this
electricity credit is again purchased by means of a key,
code, or smart card (depending on the type of meter),
once the code has been entered, the data flow in both
directions, from and to the meter. The meter is credited
and supplies data such as the meter reading, error codes,
etc. When the support is recharged by the sales point, the
data stored are transmitted to the central management
system. This system allows the distributor to recover
meter data that can help it to more effectively manage
generation: customer consumption, fraud, and a
comparison of the subscribed and used power.
While postpayment requires a large number of operations
(especially in the case of collection problems),
© AFD Working Paper n° 122 • Access to Electricity in Sub-Saharan Africa • October 2013
69

prepayment reduces such operations and interactions
between the distributor and customer; this last point,
however, is subject to criticism.
In the prepayment cycle, the distributor's cash flow is
always positive (paid energy > consumed energy)
whereas in the case of conventional payment, it is always
negative33, as even at the moment of billing for a period,
consumption for the next period has already started,
returning the distributor's cash flow to negative towards
the customer (consumed energy > paid energy).
Prepayment is a tool that improves collection, as the
energy is only distributed once it has been paid for.
According to several African electricity distributors,
prepayment covers the 15% of annual debts that are
never paid.34 Prepayment is, however, not a tool to
combat fraud by itself. In fact, it tends to encourage it,
because physical controls are less frequent as there are
no longer meters to read. Certain customers can thus be
tempted to “shunt” the meter, i.e. hook up to the grid by
putting a cable before the meter.35
Prepayment is commonly seen as a means of supplying
energy to the poorest, as the distributors can equip
commercially risky areas without fears of massive
non-payment. However, to be a tool to fight against
poverty, these poor areas need tariffs that are equivalent
to the conventional ones, especially the social tariff, which
has now become possible thanks to many prepayment
management software packages.36
Beyond the unquestionable advantage of improving the
collection rate, prepayment should not be seen as the
panacea for all the distribution management dysfunctions
a power company needs to face in a developing country.
Setting up a prepayment system must be evaluated and
assessed in the light of the following elements:
- Changes in tasks: Prepayment introduces many
changes in the organization of distribution, starting with
fewer meter readings. This innovation, which can allow a
reassignment of tasks at the distributor’s or even a staff
reduction, is, however, based on technologies that are
more complex than traditional meter reading. This
requires a higher level of skills and a major adaptation of
existing staff, especially concerning meter installation and
computer management systems;
- Fraud remains possible: Prepayment does not
automatically imply fewer fraudulent practices because of
the physical absence of meter readers;
- Investment costs: Even though prepayment meters can
be rapidly amortized due to the gains in terms of collection
and the improvement in cash flow, they are more
expensive than traditional meters (about 30 to 40%);
- Reduced consumption: Various studies have shown
an average decrease in electricity consumption per
household of about 20% when a prepayment system is
installed;
- Customer base must be diversified: Prepayment should
not only address poor customers; in order to ensure that it
is profitable and the distributor benefits from its positive
effects (reduced management costs, cash flow savings,
fewer unpaid bills), it must also be developed for more
affluent customers and small industry, which are more
likely to cause scale effects;
- Introduction in rural areas remains difficult: In some rural
areas, the distance to a sales point is penalizing; when
coverage exists, cell phones offer interesting prospects.
© AFD Working Paper n° 122 • Access to Electricity in Sub-Saharan Africa • October 2013
70
33 Except in the case of advance payment (guarantee). 34 In some countries, institutional customers (administrations, police) tend not to pay theirbills. Setting up prepayment is one of the possible measures to make them face theirresponsibility.35 Prepayment systems propose various anti-fraud techniques: installation of split meters(keyboard to enter coupons and meter are separate), with the meter installed on the pole,which makes bypassing meters more difficult; installation of tamper-proof coaxial cablesbetween the pole and the meter (in the case of monoblock meters). This solution is relativelyexpensive and is only possible when there is a short distance between the pole and the meterand the risk of fraud is high.36 The differentiation of energy tariffs has long been a technical obstacle, as the first pre-payment systems were unable to manage different tariffs.

© AFD Working Paper n° 122 • Access to Electricity in Sub-Saharan Africa • October 2013
71
Box 12. Prepayment: Lessons learned in Senegal, Côte d’Ivoire and South Africa
In Senegal, prepayment was introduced in 2006, where it met with real success, particularly in the capital. In this country, customers canchoose between keeping their old meter or opting for prepayment. The new electricity meter is in the form of a central unit with akeyboard (to enter the code on the recharge ticket) and a screen (to follow consumption). The first tranche of the investment amountedto EUR 450,000, representing EUR 75,000 of system equipment and EUR 375,000 for the procurement of 5,000 meters. For a constantcustomer volume, the new system improved company SENELEC’s cash flow by about 30%, whereas in the same analytical framework,household energy consumption dropped by about 15%. On the consumer side, the new system has been quite well received. Severalreasons give customers incentives to subscribe to a connection:
- More flexibility and visibility in managing the electricity budget;
- Shorter access time to the meters (prepayment meters have priority and are less overloaded);
- A tariff advantage, as the billing system in Senegal has a first block of more expensive kWh that subsequently decreases for eachfollowing block. Consequently, customers buy enough to fill the first blocks, and then massively in the third block by the end of themonth, allowing them to cover their electricity needs for the two following months at the tariff for the third block of the preceding month.
In Côte d’Ivoire, the Compagnie ivoirienne d'électricité (CIE) started planning the integration of prepayment meters into its distributionmanagement system in the late 1990s. In 2000, the company installed about 5,000 prepayment meters as an experiment. However, itrapidly became clear that they were not efficient and in 2004 CIE decided to launch a new test campaign, using a new model of metermanufactured in South Africa. Today, over 30,000 new generation meters are being tested. However, the large-scale distribution ofprepayment meters is not currently authorized by the Government, which is waiting for an opinion from the National Electricity SectorRegulatory Agency (ANARE) before the final adoption of this metering system. This new approach to distribution mainly relies on certainCIE branches and on the following criteria: Rapidly expanding districts, precarious districts, and debtors who have been cut-off for unpaidbills (fraudsters).
CIE wishes to stress the following impacts in terms of this experiment: a remarkable drop in unpaid bills; a real possibility of redeployingthe large numbers of staff working on billing and collection; improved cash flow in the areas in question of about 20%. However, CIEdeplores the persistent fraud, especially hook-ups before the meter. (It should be noted that as a protest against the installation of thenew meters, new types of sabotage of the equipment have appeared.)
Users and consumers evaluate the new meters as follows: rapid and low-cost subscription; no guarantee required for the subscription;no power cuts because of non-payment; immediate service resumption after recharge; difficulties to top up on energy credit in some CIEagencies (creating queues); too many English terms in information displayed on the “Taurus” meter; training required in how to use theprepayment system (to be able to read the codes, etc.).

In South Africa, the “Energy for All” program was launched in 1992 and very rapidly started using prepayment. Today, over 4 millionprepayment meters have been installed nationwide, mainly in the peri-urban townships. Indeed, the political will to extend this newdistribution management system was based on a strong principle that did not allow for unpaid bills. As it operates as a system ofadvance on consumption, this type of meter cannot create "disconnected" people. It therefore a priori allows poor households to avoidthe spiral towards more-or-less permanent exclusion from the service and the seizure of furniture and subsequently property. Theprepayment meter thus to some extent limits the possible consequences of non-payment for poor households. This new technologywas further driven by the fact that it made access to electricity possible in areas where energy metering, billing and collection wereparticularly difficult. Beyond these areas that are difficult to access, the new approach rapidly started covering other geographic andsocioeconomic situations (urban centers, rural areas). Nevertheless, the first prepayment experiences were not convincing: in the early1990s, the national power company Eskom recorded between 40 and 60% of defective meters, causing a major loss of income and highreplacement costs. The initial systems that worked with a magnetic card were replaced by two-way systems, which proved to be muchmore reliable. The average cost of a prepayment meter today is about EUR 50 (three times more than a conventional meter).
The main conclusions from various evaluation studies are as follows: a significant increase in income related to energy sales; improvedcash flow of 20 to 70% depending on the geographical area (an area of high energy consumption increases cash flow more than an areaof weak consumption); increased operational efficiency (reduction of about 10% in meter reading, billing and collection costs – MRBC);suppression of disconnection and connection costs; good acceptance of the system by the consumers, who appreciate the possibility ofcontrolling their electricity consumption depending on their ability to pay; numerous fraudulent practices in the payment collection system(during the first years when the system was set up): many vendors disappeared with the takings from prepaid card sales (thanks toconcerted management processes and the introduction of innovative sales circuits,37 these incidents have gradually been reduced); inareas with low electricity consumption, the return on investment for the prepayment meters is low; hindsight shows that the preconditionsfor the success of installing a prepayment system do not only depend upon the metering technology used, but also on the skills andinvolvement of the management team at the site in question.
The South African authorities have set up a major decentralized electrification program based on the distribution of PV kits. KES, adecentralized-services company (DSC) created by EDF and Total, is implementing a decentralized rural electrification program in theprovince of KwaZulu-Natal Central that will serve 15,000 customers. The management method adopted is that of a fee based on a fixedmonthly price with a prepayment meter. However, this type of prepayment system in a rural environment faces unexpected problems,as each customer must go to a sales point that is relatively far from his home, generating non-negligible travel costs for a low-incomehousehold. Faced with this constraint, the consumer often chooses to gradually abandon the use of his PV generator. This shows theadverse effects of a system that protects the owner against numerous unpaid bills, but which generates an implicit loss for the customer.
© AFD Working Paper n° 122 • Access to Electricity in Sub-Saharan Africa • October 2013
72
37GSM seller in South Africa: this type of sale is used by vendors who, as they have an advance account based in a sales server, transmit the credit purchase orders by text message and receivein return the 20-digit code to be given to the customer on a counterfoil book. For this, the vendor must deposit an advance fund; his margin is then 5% on all transactions.
2.3.3 Specific points in peri-urban areas
In Africa, the number of million-inhabitant cities is
constantly growing, and in the year 2000 there were
about thirty such conurbations on the continent. This
phenomenon of urban growth, essentially due to the rural
exodus caused by poverty, poses many management
problems, especially because much of this housing is
precarious and in unserviced areas – slums – where the
service is often pirated. African cities devour space and
as they expand, the load on the various urban equipment
components becomes very heavy due to the length of
the networks (water, sanitation, electricity, roads,
transportation). The urban phenomenon is a major concern,
even in the case of less-populated urban centers, as the
pace of population growth is disconnected from that of
developing the capacity of economic production. Wider

© AFD Working Paper n° 122 • Access to Electricity in Sub-Saharan Africa • October 2013
73
access to electricity services at a reduced cost can lead to
improvements in health, security, and the generation of
income within slum communities. However, communities in
poor peri-urban districts are often marginalized by power
companies, which have a negative perception of this
market segment, for several socioeconomic and technical
reasons, including:
- The low unit consumption of these households, which
makes them low-priority;
- The informal character of the housing and, more
generally, the land tenure problem in slums (excluding
social housing): residents are either tenants of wealthy
absentee landlords, who are often difficult to identify and
reach, or squatters;
- The low level of households’ ability to pay, and in
particular the impossibility of paying connection fees;
- Security problems for access by electricity company staff
and the risk of pirated connections and vandalized facilities
(transformers, copper cables, etc.).
To resolve these problems, different experiments have
been carried out worldwide. Beyond local specificities, the
following common recommendations may help in reaching
the objectives of peri-urban electrification:
- Set up a strong social-engineering unit at the operator,
with a capacity to study and organize the community,
assisted by other possible interfaces (NGOs, cooperatives,
neighborhood organizations) between the community and
the operator;
- Develop partnerships with local organizations and insti -
tutions already active in improving living conditions for
communities;
- Design a specific technical approach to the grid, based on
cost reduction and securing the grid;
- Define suitable tariffs and payment conditions for slum
sociology (introduction of 1-ampere blocks);
- Identify and establish relations with women’s groups, who
are often seen in slum communities as being trustworthy
and capable of effectively passing on messages;
- If the decision to electrify a district is taken, target the
largest possible number of households (connection rate
of at least 50%) in order to limit candidates for pirate
connections.
While there are an increasing number of such initiatives and
innovations, the systematization of the legal framework
(local franchises?) and responsibilities is held in abeyance.
Box 13. The case of electrification in Kenya’s outlying districts
No official statistics are available for the population of poor peri-urban districts that have developed around the main cities, in particularNairobi. Nevertheless, an analysis conducted in 2006, based on combining criteria of population density and poverty level, led to anestimate of about 2.5 million slum dwellers, i.e. almost 0.7 million households.38 Surveys conducted in the Nairobi slums show very lowhousehold monetary incomes of around USD 315 per person per year.
These surveys also show that energy expenditure accounts for a large share of these households’ budgets, estimated on average at 30% ofmonetary income in the poor outlying urban districts. The share of expenditure substitutable by electricity accounts for 16% of income inslums and 8% in rural areas.
38 International Livestock Research Institute, 2004.

© AFD Working Paper n° 122 • Access to Electricity in Sub-Saharan Africa • October 2013
74
This low income level, with its concomitant low ability of households to pay, is a major barrier to access to electricity, both for the connectionfee demanded by the electricity company (KSh 35,000, i.e. about USD 500), and for the monthly electricity bill (on average USD 0.12/kWh,without cost adjustments for fuel price variations, which can double the price per kWh).
Given their socioeconomic specificities (low demand, creditworthiness, density, informal character of the housing, insecurity, etc.), thesedistricts have found themselves excluded from all official electricity connection programs and strategies. Consequently, communities oftenfall back on an expensive and unsafe informal supply. While in 2005, a new connection policy was adopted with the objective of connecting150,000 new customers per year until 2010, the national company, KPLC, progressively had to set up the necessary tools to achieve thisobjective:
- A new fairer and more transparent approach to the price structure for connection fees, especially for the new urban areas concerned bysuch grid extensions;
- A more proactive and customer-oriented marketing strategy that also covers the poor peri-urban districts. In order to actually mobilize thismarket, administrative arrangements had to be made, especially for the connection of informal dwellings, without taking account of owner-ship or rental documents.
In 2008, KPLC launched a pilot project in the Kibera slum to test new technical and distribution options prior to rolling them out:
- Lighter technical standards for the MV grid;
- Junction boxes fitted high on wooden poles, each containing ten charge controllers (miniature circuit breakers) set to be triggered whenthe load exceeds 1.5 kVa, with the objective of limiting the load demanded by each connection;
- The final customers do not have meters: their supply point is a standard metal panel with a socket, a switch with an associated light pointand a fuse; grounding is the responsibility of the final users;
- In view of the technical solution adopted, the connection costs are lower than for classic solutions. In addition, to encourage householdsin poor peri-urban areas to connect up, KPLC has set the connection fee at about USD 220, instead of USD 500;
- Energy is billed as a flat fee (USD 5 USD/month for residential customers), based on an average number of hours of use of available power(40 kWh per month on average);
- A main customer is in charge of collecting the monthly flat fees from the customers in his group of final users, as he already did in the pastfor collecting rents. This responsibility comes under a contract between the owner (or the owner’s representative) of the group of dwellingsand KPLC;
- When a final customer does not pay his bill, KPLC cuts the electricity service at the junction box (located at the top of the power pole) forthe whole group of customers to which he belongs,
Source: Axenne.
2.3.4 Pico electrification: A complement tomaximize the impact of access investment
An electrification master plan must, beyond its on-grid/off-
grid dimension, very carefully consider the market segment
that cannot bear the costs either of connection or the
energy service itself, such as a solar-power home system.
This segment represents the poorest part of the population
that, nevertheless, has energy expenses, which correspond
to the price paid for lighting (candles, flashlights, oil lamps,
etc.), for audiovisual equipment (radio batteries) and,
increasingly, for the occasional use of mobile phones. Lamp
oil and dry batteries are effectively expensive items with an
annual cost of EUR 40 to EUR 80. Moreover, the use of oil
lamps has a considerable impact on health and the environ-
ment: a GTZ39 study estimated that this consumes the
equivalent of 1.3 million barrels every day, which, repre-
senting 190 million tons of CO2 per year, causes very high
health and safety (fire) risks.
39 GTZ study: www.gtz.de/de/dokumente/gtz2010-en-picopv-booklet.pdf.

© AFD Working Paper n° 122 • Access to Electricity in Sub-Saharan Africa • October 2013
75
To reach the poorest, new technological approaches
are being developed based on the concept of pico
electrification. These developments concern pico hydro, as
well as small PV systems with a nominal power of less than
30 Wc, grouped under the name "pico electrification" (more
widely applicable to all types of battery recharging).40
These systems differ from the standard solar lantern in that
they have a multifunctional use: in addition to lighting, which
benefits from the rapid development of light-emitting
diodes, LEDs,41 they allow wet- and dry battery recharge
by integrating 12 V sockets and charge controllers, thus
allowing computer use.
A 2009 GTZ study estimated that the average cost of a
multi-function solar lamp is EUR 7/month over two years
(for an investment of USD 170 ), whereas the typical
traditional expenditure stands at EUR 12/month, or about
EUR 280 over two years, including EUR 120 for lighting.
While the initial acquisition cost remains a major barrier, the
amount of this investment typically falls within the sphere of
microfinance institutions. As part of a large-scale program,
it might be appropriate to involve such institutions in a
distribution mechanism for small systems, based on
low-value and short-term (6 to 24 months) credits. Another
possibility is to use local operators or set up operators, who
could develop franchise systems for the rental of multi-
function solar lamps.
In both these approaches (rental or sale on credit), the
possible profit margin for the middleman lies in the
difference between the substitutable expense and the
monthly cost of using the small system. In view of the very
small quantity of energy required for this type of service, it
would make sense to systematize this pico electrification
component at the extremity of each grid, attaching the
greatest importance to the efficiency of user equipment in
order to maximize the scope of low energy consumption.
This would both ensure a minimum service for isolated
populations (but located in the "area of influence" of the
mini grid) and generate a local activity.
In any case, the profit margin that an operator of this type
of service can expect is very small, and the service must
be provided by locally established structures. Today,
communities that benefit from this type of service are not
considered as having access to an electricity service, as it
is very minimal and only provides very low power that will
not result in any development.
Box 14. Examples of battery recharge services – Cambodia and Laos
In Cambodia, battery recharge (an additional service provided by diesel mini-grid operators) is widespread. It allows households on the edgeof the grid to "pay for what they consume", and those living outside the village, but who go there during market days, to have their batteriesrecharged.
The (commercial) cost of the recharge by diesel generators is USD 0.25 for a 40 Ah battery and USD 0.50 USD for a 150 Ah battery.
In Laos, a program conducted in five villages to recharge LED lamps from PV systems is billed USD 1/month to users and allows theinvestment to be repaid in 18 months. The remuneration of the village operator is minimal, as his duty to the community is more importantthan his pay.
Source: IED.40 A very low-power market is being developed for flashlights powered by a small PVmodule (5 Wc) or a dynamo. This product, sold for about EUR 10, is not very reliable, and itslight efficiency remains low.41 The use of LED technology plays an important role by reducing energy consumption inlighting. The advantage of associating photovoltaic cells and LEDs resides in the easycombination of the two products, as their two voltages of photovoltaic cells and LED voltagecan be easily combined. LED technology offers a luminosity more than eight times that ofincandescent lamps.

To provide access to an electricity service for all, the first
step is to produce a sufficient quantity of power to meet
economic and social needs, at a sufficiently affordable cost
to ensure the economic equilibrium of the access program.
Reaching this equilibrium does not necessarily mean that
users are able to pay the entire service cost, but that public
finances can bear the difference between the cost of the
delivered service and the tariff applied. This cost, both
in terms of investment and long-term operation and
maintenance, must also have been correctly assessed
beforehand when the program was designed.
On a worldwide scale, there are considerable investment
needs. In its 2009 World Energy Outlook, the IEA estimates
that global electricity demand will continue to increase at an
annual rate of 2.5% until 2030, and that 80% of this growth
will occur in countries outside the OECD. The increase in
installed power capacity represents 4,800 GW (or five times
the existing park in the United States), 28% of which will be
in China. The share of renewable energy in total generation
will rise from 2.5% to 8.6% by 2030, whereas the share of
hydropower will decrease from 16% to 14%, that of coal will
remain dominant at 44%.
Faced with such needs, which remain colossal, there is a
rather disturbing fact: in 2009, investments in the energy
sector collapsed due to the economic crisis. This concerns
both oil and gas exploration by multinationals as well as
households, which buy less new and efficient equipment.
This will have major repercussions on long-term energy
efficiency. In late 2008 and early 2009, investment in
renewable energy proportionally decreased more than in
the other types of power generation; in 2009, it fell by
almost 20% and would have decreased by 30% without the
government support plans.
This decline in investment in the energy sector will have
potentially serious consequences for energy security,
climate change and energy poverty. Reducing the capacity
increase in the medium term for projects that have a long
gestation period will lead to long-term shortages, and may
well lead to price increases when demand recovers. Will
it be possible to raise the required financing? In the IEA
baseline scenario, it is estimated at USD 1,100bn a year
until 2030, with USD 600bn a year for the electricity sector
and about EUR 300bn a year in developing countries.
This reference scenario inexorably takes us towards a
carbon concentration of over 1,000 ppm CO2 equivalent,
deemed very dangerous as it leads to a potential average
temperature increase of 6 °C. The low-carbon 450 ppm
scenario as developed by the IEA, with a 50% probability
of a 2 °C increase in average temperature, involves an
additional investment of USD 10,000bn by 2030. This
would be compensated by economic gains, in the health
sector among others, and by a lower energy bill for
buildings, transportation, etc.
© AFD Working Paper n° 122 • Access to Electricity in Sub-Saharan Africa • October 2013
77
3. A need for structured financing
3.1 Widespread access to electricity services: The need to mobilize more financing thanthe current flows from international cooperation

In this context, improving access to modern energy for
nearly 1.6 billion people, or one-fifth of the world’s popu-
lation, remains a challenge. Almost 85% of these people
live in rural areas in Sub-Saharan Africa and South Asia. In
the IEA reference scenario, the number would only be
reduced by 200 million by 2030 and would increase in
Africa. IEA estimates that with an investment of USD 35bn
a year, i.e. 6% of the total planned investment in the
electricity sector, the question would be resolved by 2030.
However, we are way off such orders of magnitude, judging
by a World Bank review of its own portfolio, which notes that
flows are limited to EUR 500m a year (Table 9).
© AFD Working Paper n° 122 • Access to Electricity in Sub-Saharan Africa • October 2013
78
Table 9. World Bank investment in access programs (2003-2005) – in USD M
Région Grid Grid Rural Off-grid Rural Energy Total
Peri-urban Electrification Electrification Fund
Africa $76,60 $35,20 $30,20 $31,20 $173,20
E Asia Pacific $0,00 $235,00 $3,70 $8,30 $247,00
L America Car $0,00 $3,00 $7,00 $0,00 $10,00
South Asia $26,00 $0,00 $5,50 $24,60 $56,10
E Europe CA $0,00 $0,00 $0,00 $0,00 $0,00
N Africa Med $0,00 $0,00 $0,00 $0,00 $0,00
Total $102,60 $273,20 $46,40 $64,10 $486,30
Source: ESMAP 2007.
International cooperation will clearly not be sufficient to
finance access programs. Schematically, in addition to
the user, access projects involve the State, the operator
(private or public) and financial institutions (see Diagram 6).
The financing structure of a rural electrification project
or program, and especially the "weighted average cost of
capital", loan duration, any grace periods, and project
duration (especially in terms of return on capital) obviously
also have a major impact on the service price.
Diagram 6. Stakeholders and financing circuits in rural electrification
Source: Authors.
STATELoan or subsidy or
equity contribution
Loan or grantLoan or capital contribution
FINANCIALINSTITUTION
Tariffs and fees
OPERATOR
SERVICE USER

• Multilateral or bilateral financial institutions award conces-
sional loans or grants to States; they are allocated to
finance power infrastructure, generally in the form of a loan
or grant, or as an equity contribution to the power operator;
• The same institutions can sometimes allocate financing to
operators, generally with a State guarantee;
• States participate in financing power infrastructure via their
own investment budgets (excluding external assistance);
• Private national or international banks can also allocate loans,
or make an equity investment in the power operator's capital;
• The user, finally, pays for the service via the tariff,
generally with additional specific fees to cover part of the
investment repayment. More generally, user payments
break down into three parts: (i) an initial contribution at
the connection; (ii) a fixed premium, which depends on the
subscription (power level subscribed to and which must
amortize the operator's investment); (iii) a variable share
depending on consumption.
To establish a more direct link between the tariff policy
and the amount of subsidy required, it is necessary to
determine the financial equilibrium targeted by the tariffs
applied. Schematically, there are three equilibrium levels:
■ "Minor equilibrium": the income from sales covers the
operating and day-to-day running costs of the service;
■ "Operational equilibrium": the income covers not only
operating and day-to-day running, but also all routine
maintenance and replacement operations;
■ "Major equilibrium": the income covers all charges, i.e.
both operating and financial costs, particularly those related
to investments.
Subsidy mechanisms offset the difference between the
effective equilibrium achieved from service income, by the
application of the tariff schedule (including fees), and "major
equilibrium". The question is raised as to whether the State
has the overall capacity to pay this subsidy.
© AFD Working Paper n° 122 • Access to Electricity in Sub-Saharan Africa • October 2013
79
3.2 Historical principles
A basic principle of equity, called "equalization", is that
each consumer of a certain category (consumption level,
socioeconomic characteristics, i.e. domestic or industrial
customer, etc.) pays the same for a kWh, wherever their
location in the country and thus regardless of the cost per
kWh in their area. This principle is only feasible when the
profits from certain areas or from tariff levels can generally
offset losses in other places, or if the State has the means,
at the macroeconomic level, to pay the difference.
When we look at the history of electrification in
industrialized countries, we see that during the first
electrification phase in the first half of the 20th century, the
electricity service was provided by private operators for the
needs of industry, therefore at different prices that reflected
costs. Certain operators then progressively started serving
communities in the "labor pool" area of these industries.
The equalization principle was only applied much later,
at the time of the nationalization and integration of these
different companies into a national structure. This principle
of equity became "affordable" thanks to a base of existing
profitable sales, and to very substantial State support for
investments.
This support for investment through long-term and public
financing is perfectly logical in an industrial structure of
economies of scale, where the larger the investment, the
smaller its average cost. In practical terms, in this set-up,
the general interest is to have large-scale infrastructure that
serves the entire country through an interconnected grid.

The structuring of the sector into a "natural monopoly",
which is moreover public, results from this highly
capital-intensive set-up.
In the context of certain Sub-Saharan African countries, the
first step (for local generation to meet profitable industrial
needs) has not yet been reached. Consequently, can they
afford equalization at this stage, or will this only be possible
later, as in France (see Box 15)? An argument in favor
of “tariff differentiation” is that in non-electrified areas,
communities have high monthly bills for traditional
resources (kerosene lamps, dry batteries, small individual
oil motors, etc.), and thus often have a real ability to pay.
While it might seem completely unjust to make the "rural
poor" pay more than the "urban rich", is it still not better to
have an expensive service in rural areas than no service
at all, or a bankrupt sector? However, this is a matter for
national political choices that must be informed and made
pragmatically.
Furthermore, today's technological developments lead
to industrial configurations where small-to-medium size
infrastructure is sometimes (even often) the most
appropriate solution. This undermines the legitimacy of the
natural monopoly for generation and paves the way for a
more fragmented structure, where medium-size private
investment has it place with all the issues related to smart
grids. However, this development certainly does not do
away with the need for strong national coordination, both
technical (programming for generation and transmission
grids is still fully within the natural monopoly) and financial
to ensure that sufficient funds are raised.
© AFD Working Paper n° 122 • Access to Electricity in Sub-Saharan Africa • October 2013
80
Box 15. Brief history of electrification in France: The role of the Fund for the Amortization of Electrification Charges (FACE)
In France, the national infrastructure was created via strong State involvement, with the nationalization of several private structures in 1936,
which generated electricity for industrial areas. EDF was thus created and could not only levy a tax on kWh sales to finance this access
program (a significant part of which had already existed from the electrification for rural and peri-urban communities), but could also raise
long-term financing at low interest rates, thanks to the State guarantee.
The relative weight of urban and rural communities, and of their respective consumption levels, made it possible to build an efficient equali-
zation system as early as in 1937, i.e. one that had acceptable charges for city consumers, as well as being sufficiently productive to
finance significant rural investments. In 1937, with 90% of the French population hooked up and a low-voltage electricity consumption of
3.1 billion kWh in 1938 (against 1.8 billion in 1926), the LV kWh fees effectively supported the public effort for investment in electricity.
As rural electrification developed, the financial income from this equalization increased in direct proportion to the amount of kWh consumed,
while demand for financing decreased. There was thus a sustainable mechanism for the self-financing of the power grid by its customers:
the Fund for the Amortization of Electrification Charges – FACE.
In France, the levy rates on kWh have been adjusted in terms of financing needs, while respecting until now the ratio of 1 to 5 between rural
and urban customers. In 1937, they were set at 2.80% in urban areas and 0.56% in rural areas. They were first increased in 1954 to 3.80%

3.3.1 The weight of domestic customers
In the case of access programs, the vast majority of
customers are domestic with low unit consumption levels.
Managing a host of such small consumers obviously has a
cost for the service company and the small margins offer
little incentive.
In addition to the spatial issue, with distance and low
density increasing the investment and operating costs, a
form of cross subsidy is generally applied between social
categories: LV customers, especially the so-called “social”
category, generally account for the largest number of
clients, albeit with modest unit consumptions and therefore
proportionally low revenues for the operator. This is shown
by the consumer breakdown of KPLC (Kenya), where
the domestic bracket represents 25% of sales for 85%
of customers to manage. It is understandable that the
electricity company is much more interested in industrial
consumers where, as in Madagascar, MV/HV customers
account for over 40% of sales for less than 1% of
customers.
However, it is necessary to make a detailed analysis of
tariffs and profitability, in particular by considering the fixed
tariff, which can be as much 50% of the price per kWh for
households that have a low level of consumption. It is thus
seen that in Kenya, the households of the lower bracket of
up to 50 kWh a month pay more for their kWh than those in
the 51 to 300 kWh bracket.
© AFD Working Paper n° 122 • Access to Electricity in Sub-Saharan Africa • October 2013
81
in cities and to 0.75% in rural areas, prior to regularly decreasing as consumption increased, to reach 2.3% in 2000, for the maximum rate
applicable in urban communities, and 0.46% for the minimum rate applicable in rural communities.
Even today, FACE still provides financial assistance to municipal power grid owners under rural electrification regimes. This aid corresponds
to 65% of the full cost, inclusive of tax, of extension, reinforcement or integration works for grids in the relevant area. The grids in question
are the low-voltage (LV) grids and medium-voltage (MV) extensions required to supply the new served LV areas. It is the local authorities –
or municipalities for distribution – that make local investment decisions and contribute their share of financing, and they own the distribution
grids. The annual budget of FACE’s aid stood at about EUR 345m in 2008. The public service contribution for electricity in non-
interconnected zones (NIZs: overseas departments and territories and Corsica) was close to EUR 667m in 2008 (for 3 million inhabitants).
These cross subsidies may be compared with the profitability requirements established for equipment programs in Africa.
Source: GRET (2005).
3.3 Keys for setting tariff levels

© AFD Working Paper n° 122 • Access to Electricity in Sub-Saharan Africa • October 2013
82
Table 10. Kenya (2008)
Table 11. Jirama - Madagascar (2007)
Table 12. Côte d’Ivoire
Tariff Type of consumer N° of customers 2008 % 2008 consumption (MWh) %
A0 Domestic 895,043 84.41 1,255 24.92
A1 Small shops 158,676 14.96 590 11.72B Irrigation 3,738 0.35 996 19.78C Large trades 518 0.05 2,108 41.86D Off peak 668 0.06 74 1.47E Street lighting 1,740 0.16 13 0.26Total 1,060,383 100.00 5,036 100.00
Source: KPLC Annual Report 2007-2008.
Source: Jirama.
Type of consumer N° of customers 2007 % 2007 sales (MWh) %
MV/HV 899 0.23 340,339 42.35
LV private customers 383,559 96.90 408,159 50.78
LV administrations 1,977 0.50 11,918 1.48
Communities 1,661 0.42 9,415 1.17
Jirama transfers 7,753 1.96 33,889 4.22
LV 463,383 57.65
Total 395,849 100.00 803,722 100.00
The case of Côte d’Ivoire also shows this unequal nationwide distribution of consumption: urban areas have ten times as many customersas rural areas. The economic capital, Abidjan, accounts for 40% of subscriptions and 70% of total consumption, whereas this city only has20% of the Ivorian population. In addition to this disparity, a rural subscriber consumes 60% less than an urban subscriber.
Total Rural
Access rate 24 % (38 % with fraud) 6 %
Population with access 4 320 000 594 000 = 13 % of subscribers
Average per capita consumption 300 kWh 150 kWh
Total consumption 1 296 GWh 89,1GWh = 6,8 % of total consumption
Source: Authors.
Box 16. Kenya, Madagascar: Breakdown of consumption by tariff category

3.3.2. Tariff equalization: What cost for thenation?
In the so-called “equalization” system, users in areas that
are less expensive to electrify will effectively cover part of
the electrification costs in the most expensive areas, first
of all for operation and, if possible, also for investment. In
Morocco, electricity sale tariffs are set by the State and
are the same over the entire distribution area of ONE,
which includes both towns and villages.
The contribution by users and communities is the same
in the entire rural area covered by the PERG, and is
independent of the cost price of electrification for the
relevant village. ONE thus applies an equalization system,
not only on the electricity sale tariffs, but also on this
participation in the investments by beneficiary users and
communities. For the average consumption of a rural
household (52 kWh/month), the electricity bill is MAD 53
month, with an additional MAD 40 of PERG fees.
Following this ambitious rural electrification program,
ONE’s profitability would appear to have fallen for the
following reasons:
- Distribution costs in rural areas are 2.5 times higher than
in urban areas;
- Energy consumption in rural areas is low, while the
number of subscribers is increasing;
- LV tariffs have increased very little since 1996, whereas
MV and HV tariffs have fallen sharply.
The PERG has thus had an unfavorable impact on ONE’s
financial results, just at the time where the electrification
of the most “expensive” households to connect is starting,
i.e. those in the least densely populated areas.
In Mozambique, EdM applies two types of cross subsidy
between groups of individual consumers in order to be
able to fulfill its social function:
- Geographical cross subsidies between rural areas
(especially in the north) and urban areas (mainly Maputo);
- Cross subsidies via a variable stepped tariff system;
consequently, the largest consumers, (generally the
richest households) pay more for an electricity unit than
the smallest (the poorest households).
EdM makes a tariff distinction between low-to-medium
voltage (mainly for households and small enterprises) and
high voltage (business and industry). High voltage users
can obtain individually negotiated tariffs depending on the
volume consumed and periods of use (peak or off-peak
© AFD Working Paper n° 122 • Access to Electricity in Sub-Saharan Africa • October 2013
83
Table 13. Peri-urban connection program in Kenya, forecasts for the 750,000 connectionsover 5 years
Categories Customers(%)
Average
consommation
kW/m
Energy
sales
(%)
Revenues
(MkSh)
Operator
profits
(MKsh)
Domestic (AO) 90 117 64 924 227
<50 kWh/month 35 15 3 133 -145
51-300 kWh/month 55 107 30 649 242
301- 3 000 kWh/month 9 525 29 129 119
3 000-7 000 kWh/month 0,1 3 549 2 13 11
Small shops A1 10 428 36 643 190
Source: Authors.

hours). EdM also has a program to attract private
investment, in particular via an incentive system and
special prices for agro-businesses and industries, which
allows tariffs to be used as an instrument for territorial and
economic development.
© AFD Working Paper n° 122 • Access to Electricity in Sub-Saharan Africa • October 2013
84
Table 14. Breakdown of consumption in Mozambique - EdM (2006)
Tariffs Consumption (GWh) % N° of subscribers %
Commercial LV 183.20 10.06 38,790 9.33
Large LV consumers 88.50 4.86 1,477 0.36
Domestic LV consumers 516.50 28.36 373,795 89.93
LV agricultural consumption 0.07 0 24 0.01
MV – HV 534.80 29.36 1,581 0.38
Export 498.30 27.36 24 0.01
Total 1,821.37 100.00 415,667 100.00
Source: EdM.
Today, the average tariff level is 8 cents/kWh, whereas the
long-run marginal cost (LRMC) tariff is 9.1 cents/kWh.
EdM can apply independent tariff adjustments within the
limits of its concession contract with the government. Tariff
adjustments that are not provided for in the contract must
be approved by the government.
3.3.3. Tariff differentiation
The case of rural electrification in Mali is a particularly
interesting illustration of tariff differentiation. The State of
Mali started liberalizing the electricity sector in 2000.42
AMADER (REA) regulates, controls and participates in
the financing of the development of rural electrification
activities, especially in all localities where the installed
capacity is less than or equal to 250 kW.43
Consequently, local public or private operators that wish to
supply a public electricity service are free to submit a
PCASER to AMADER to request an authorization and a
subsidy, limited to 80% of the investment costs. Both
tariffs and tariff schedules are free, but are approved and
published by AMADER, based on a provisional business
plan presented by the operator. The electricity tariff covers
operating costs and financial costs, and also includes a
return on investment for the operator over the 15 years
covered by the authorization. The commonly accepted
rate is around 8%, which is low compared to major
infrastructure projects where it is generally around 15%;
the operator is remunerated by “shareholder dividends”.
AMADER has a tariff review process based on changes in
technical and economic conditions and their impact on the
service cost.
Of the four cases studied,44 and by estimating an energy
consumption corresponding to the flat rate, the tariff range
is FCFA 350-700/kWh (excluding connection fees), i.e.
between EUR 0.55 and over EUR 1. Only the village of
Koumantou, which benefited from AMADER subsidies,
applies the minimum rate, whereas the social electricity
tariff within the EDM-SA perimeter stood at FCFA 59/kWh
in 2007.
Today, in reality, the tariffs set by PCASER reach levels of
over EUR 0.50/kWh, which is well above the ability to pay
of most rural users. This is due to the hike in diesel prices,
which is not even offset by almost the entire subsidy for
the initial investment. This is an argument in favor of
42 As provided for in Law n° 00-019/P-RM of 15 March 2000.43The Electricity and Water Regulatory Commission (CREE) sets the tariff policy.44 See Ease and Improves (2007).

renewable energy. AMADER, refinanced by the State,
today thus finds itself obliged to allocate an operating sub-
sidy to PCASER, in the form of an exemption on diesel
taxes.
More generally, in countries that are highly dependent
upon hydrocarbons, distributors are – under their
concessions – increasingly authorized to make tariff
adjustments to reflect their costs. In Kenya for instance,
hydrology problems affecting the interconnected generation
park have obliged KPLC to mobilize expensive diesel
generators. This has meant they have had to apply a
temporary fuel surcharge, which is currently increasing
the tariff by 50% from one month to the next.
© AFD Working Paper n° 122 • Access to Electricity in Sub-Saharan Africa • October 2013
85
3.4 Establishing the financing mechanisms required to guarantee access to an electricityservice for all
As the initial electrification rate is very low in Sub-Saharan
Africa (10 to 20%), cross subsidies alone are not sufficient
to achieve substantial access rates. An initial subsidy is
essential (or more generally concessional loans) to
finance investments in rural areas, or financing over
30 years with funds from the State, which can refinance
itself. When the initial infrastructure equipment rate is low,
the question is raised as to which areas or customers to
serve first. There is also the question of the equipment
rate, which must be proportionate to the funding that can
actually be raised.
Oil price hikes, climate risks and technological advances
are all factors that increase the interest of renewable
energy, despite the high costs of the initial investment.
The time is clearly ripe for financial innovation, in order to
better identify and share risks and also to mobilize private
investment.
In addition, the cornerstone of the equipment of a country,
especially for power infrastructure, is to be to be able to
rely on a structure capable of raising and organizing the
implementation of the required funds.
3.4.1 Effectively gauge the scale of financingrequired, without underestimating theimportance of a national contribution and of amajor, high-quality counterpart
Morocco, with 30 million inhabitants, has succeeded the
remarkable feat of increasing the electrification rate of
localities from 15% to over 90% in 15 years, requiring an
investment of almost EUR 2bn over this period. It should
be remembered that almost half came from national
resources (25% financed by the beneficiaries and 20% by
municipalities). ONE financed the remainder through a tax
on kWh sales which, in 15 years, generated about
EUR 500m (i.e. EUR 30m a year). Without this national
contribution, international donors would obviously not
have participated in this ambitious program. The amounts
raised thus reached an average of EUR 70m a year,
thanks to the fact that a credible national entity – ONE –
was the borrower. The lenders could thus envisage non-
sovereign loans over time by directly taking the risk on
ONE.
In Senegal, rural areas were subdivided into twelve "rural
electrification concessions". Each area was attributed to a
single operator via an international bid invitation. The
single operator was obliged to apply an identical tariff over
its entire concession, independently of the electrification
techniques used. Subsidies covered between 50% and
80% of total investments, and were financed by national
funds or mobilized by donors. At the launch of the
bid invitation, ASER specified the amount of available
subsidies and the bidding operators were selected on the
basis of: (i) the number of connections they undertook
to make, (ii) the price and, indirectly, (iii) the additional
financing they could provide via equity and loans.
The first concession, located in the Saint-Louis-Dagana-
Podor region (north, surface area of 19,000 km2, 362,000
inhabitants and 41,000 households), was attributed to
ONE for 25 years, following an international bid invitation.
The Senegalese Government used a USD 5m World Bank
loan as the basic subsidy to the concessionaire. The total
investment stood at USD 14.9m over 3 years. In its bid,
ONE proposed 2.3 times the number of connections
required by the bid invitation, and 50% more than its
competitor. To achieve this, it proposed a financing plan
including a large loan portion, which was possible as ONE
already had a significant track record for borrowing from
international donors to finance the electrification of its own
national territory. One wonders, legitimately, whether such
a scheme might be reproducible…
What can be said about the present-day dynamics in
Sub-Saharan Africa? A review of ongoing programs shows
that the largest volumes are mobilized in countries with
favorable national structures. Focusing on World Bank
data, the following observations can be made:
• Almost all loans are allocated to States, which then
reallocate the financing to various national structures as
grants or loans. The largest volumes of financing for urban
or rural access programs are in countries with large
electricity companies, which have the capacity to absorb
and pay back the financing. It is interesting to analyze the
loan amount mobilized annually in terms of the national
population, bearing in mind that Morocco had to borrow
EUR 70m a year over a period of 15 years with maturities
of over ten years, to equip a country of some 30 million
inhabitants. Below are a few other examples:
- Ethiopia: 60 million inhabitants; 5 years (2003);
EUR 133m, i.e. EUR 27m a year; only EUR 35m for
access, including 80% for grid extension; central role of
EEPCo;
- Ghana: 20 million inhabitants; 5 years (2008); EUR
135m, i.e. EUR 27m a year; 35% for grid extension and
aims to work with national development banks;
- Mozambique: 20 million inhabitants; 4 years (2003);
EUR 54m, i.e. EUR 13m a year; 50% for the peri-urban
grid; central role of EDM;
• A second group of financing focuses on REFs. The main
limitation of this arrangement is that the State provides
a grant for a fund that is often a fund in name only. In
reality, it is a bank account through which an investment
subsidy will transit to an operator, which generally has
only very partial and few obligations to repay:
- Cameroon: 16 million inhabitants; 6 years (2008); EUR
47m, i.e. EUR 8m a year, mainly for a “fund” that took
almost a decade to set up;
- Guinea: 8 million inhabitants; 4 years (2003); EUR 11m,
i.e. EUR 3m a year, mainly for a “fund” that was not
authorized to lend; a remunerated partnership was sought
with a bank, which refused to take a lending risk and thus
limited itself to channeling the subsidy;
- Mali: 10 million inhabitants; 5 years (2005); EUR 25m,
i.e. EUR 5m a year; mainly to AMADER, which channels
the investment subsidies;
- Uganda: 23 million inhabitants; 5 years (2009); EUR
62m, i.e. EUR 12m a, (including a third for grid extension
to the electricity company, and a third for inter-sectoral
programs managed by the ministries using the subsidy).
These observations show that the countries that have
succeeded in scaling up access to electricity are also
those with a technically and financially credible central
operator. The World Bank uses instruments such as the
Adaptable Program Loan (APL) or Special Impact Loan
(SIL), which are generally long-term and merit attention:
the above-mentioned loan maturities are those of a first
tranche which, if successfully implemented, triggers45 the
© AFD Working Paper n° 122 • Access to Electricity in Sub-Saharan Africa • October 2013
86
45 This implementation is assessed by means of previously established indicators, such asthe creation of a PPA law or the number of localities connected.

mobilization of a second tranche. These programs can be
subject to 10- to 20-year agreements.
3.4.2 The interest of structuring REFs as truefinancial intermediaries
A review of existing entities leads to the conclusion that
REFs in Sub-Saharan Africa are currently not structured
as financial intermediaries. Consequently, they cannot
(i) borrow, (ii) refinance themselves via bond issues,
(iii) lend to local operators, or (iv) mobilize national banks
with risk mitigation instruments.
Local banks, for their part, in reality do not wish to
venture into this unknown and low-profitability sector,
except in the case of development banks with a specific
mandate. The funds are generally thus bank accounts to
transfer grants, and the international agencies allocate
sectoral loans to governments, which reallocate part of the
amounts as grants to REFs. There is no leverage on
grants in the rural or peri-urban electrification sub-sectors.
Naturally, the amounts of the grants that can be mobilized
at the level of international cooperation are seldom
sufficient to address the challenges.
It is crucial to change paradigm in order to increase grant
amounts, which will remain modest compared to the
challenges. It is thus essential to follow these
recommendations:
• Establish the legal structure of the fund as a full-fledged
financial institution, or combine this fund with a dedicated
financing entity, approved as such by national banking
regulations;
• Give this structure the technical and financial capacities
to appraise projects and prepare a project pipeline;
• Define the fund’s business plan, based on a long-term
plan proposing a mix of projects with different profitability
levels in order to allow a certain level of cross subsidies.
It should also undertake to support the first project deve-
lopers in order to create a demonstration effect;
• Provide a start-up budget with a view to a revolving fund,
especially for preparatory studies;
• Involve banks by assessing their interest and their
perception of the risk in order to subsequently establish
adequate risk-sharing mechanisms (co-financing,
counter-guarantees, etc.);
• Have a long-term sustainability vision of the financing
mechanism, with a progressive increase of the national
contribution (bond issues, kWh tax, etc.).
The three stages below illustrate these recommendations:
- Stage 1 = initial situation: The REF receives grants from
the State that may come from the State budget or from
international cooperation operations (reallocation of
loans/grants to the State – generally in the form of grants).
The cooperation institution rarely makes a direct transaction
with the fund (which may not necessarily be authorized by
its statutes). The REF can be given the technical capacity
to appraise rural electrification projects and subsidizes
them according to its own rules. It is hoped that the
operators that have benefited from these subsidies can
subsequently balance their operation. However, this is
often not the case: in Burkina Faso, despite an 80%
investment subsidy, operating subsidies were necessary.
In this situation, in financial terms, the role of the fund is
confined to paying the subsidies.
- Stage 2 = short-term developments: The fund becomes
the financial arm of an REA and develops rural
electrification planning, which includes operations that
can present a certain level of profitability: secondary
centers, agro-industries, etc. A portfolio of operations is
built up, which require different levels of subsidy. The fund
adopts statutes that give it financial autonomy and
the capacity for financial intermediation under national
legislation. Consequently, as soon as it is allocated
regular national funds (an earmarked tax, for example),
which it can lend to operators, even with a highly conces-
sional rate (and thus generate income), it becomes
a structured partner with a balance sheet. As such,
institutions can lend to it, funds (national or international)
© AFD Working Paper n° 122 • Access to Electricity in Sub-Saharan Africa • October 2013
87

can dialogue with it, and national development banks
can interact with it, especially for risk sharing. National
banks and investors thus develop a certain amount of
confidence.
- In the medium term: The fund confirms its management
autonomy, its credibility and its functioning as a
specialized financing entity. Once pilot operations have
been successfully demonstrated, the national banks also
join the investment round and finance operators. To
mobilize these credits, or even national investments, the
fund may also develop guarantee or risk-sharing
instruments in order to maximize the participation of these
private financing sources. The fund should eventually
envisage raising funds itself on national or international
bond markets and free itself from the need for financing
from international cooperation.
© AFD Working Paper n° 122 • Access to Electricity in Sub-Saharan Africa • October 2013
88
Diagram 7. Stages in the structuring of a rural electrification fund
InitialSituation
Manufacturer
Manufacturer
Company
Company
Operators
Operators
Fund Transfers
Grant
Grant
National Government
National Government
Concessional loan
Concessional loan
Developmentbanks & agencies
Developmentbanks & agencies
Stage 2
Fund Transfers
Concessionalfinancing
Concessional loans, grants
Rural electrificationfund/agency
Rural electrificationfund/agency

While this vision may seem unrealistic, it is the only one that
actually allows sufficient financing to be raised to meet the
challenges of rural electrification in countries. As an
example and by way of comparison, India clearly took
this path 50 years ago, with the creation of a specialized
(financial) enterprise, the Rural Electrification Corporation
(see Box 17). It initially set out to finance grid extensions
and to become the reference training and research center
for techniques adapted to the Indian context. Once the
electrification program had ended, it started allocating
funds to more decentralized programs. Following the same
logic, a Department of Renewable Energies was
established in 1982 and became a ministry in 1992. In
1987, this political and planning entity set up a financial
institution specialized in financing renewable energy: the
Indian Renewable Energy Development Agency
(IREDA).46 Thanks to these two entities, over 95% of
localities are now covered (60% of household electrifi-
cation), and India is among the world leaders in wind
energy.
In 2010, the country launched a highly ambitious solar
program aiming at:
- 1,100 MW of large-scale power plants and PV on grid by
2013, then 20,000 MW by 2022;
- 200 MW of off-grid PV, including hybrid facilities by 2013,
and 2,000 MW by 2022.
It is thanks to the availability of the long-established
financing tools that private Indian and international
investors, as well as the Asian Development Bank (with all
its instruments: technical assistance, concessional and
commercial loans) are active in this program.
This example illustrates the crucial importance of clearly
allocating grants and concessional and commercial loans to
the right market segments, in order to maximize their
impact and leverage.
© AFD Working Paper n° 122 • Access to Electricity in Sub-Saharan Africa • October 2013
89
Source: Authors.
46 http://www.ireda.gov.in
Manufacturer Company
Operators
GrantNational Government
Concessional loan
Developmentbanks & agencies
Fund Transfers
Concessionalfinancing
Concessional loans, grants
Rural electrificationfund/agency
Concessional loans
Risk-sharing instrumentsFinancial
autonomy throughbond issues, etc.
National banks
Finalsituation

Box 17. Financing rural electrification in India: The Rural Electrification Corporation – REC
REC was created in 1969 as a finance company. Today, it is a listed public enterprise, with a net value of EUR 750m. Its function is tofinance and promote rural electrification projects in India. It provides financial support to electricity companies in the different States of theIndian Union, to rural electrification cooperatives, and private and public companies. REC has offices in the central capital (New Delhi) andin the provincial capitals, which have a mandate to coordinate financial closure with territorial authorities and other local financiers, assist inprogram and project definition, and monitor disbursements and project implementation. It also has a large research and training center.
REC's mandate was defined as follows in 2009:
"Facilitate the provision of an electricity service for the development and improvement of living conditions for rural and semi-urbancommunities.
Act as an effective and competitive development institution, responsive to its customers for the financing and promotion of power generationprojects, electricity savings and reinforcement of distribution grids throughout the country."
Historically, REC, in application of national policy, focused on village electrification and the installation of pumps for irrigation, considered aspriorities at the time. A locality was defined as electrified as soon as electricity use was observed, regardless of its location in the country.Thus, in 2005, 81% of the country's localities were electrified, and over 110,000 villages were awaiting electrification; 12 million electricalpumps irrigated 34 million hectares.
It was only at a second stage, and after three decades, that attention really began to focus on the issue of access to a service forcommunities. In 2004, two additional criteria were introduced for a village to be defined as being electrified: public services (health,community centers, schools, etc.) had to be electrified, as well as at least 10% of the population.
Indeed, at the turn of the 21st Century, and with a per capita consumption that had risen from 15 kWh in 1950 to 600 kWh in 2005, accessto a modern electricity service is necessary in order to achieve an economic growth rate of 8 to 10% a year, and for the entire population.Consequently, access for 50% of rural households, i.e. some 60 million households, has become an objective.
REC mainly allocates long-term loans (15 to 35 years) to public and private electricity companies for generation (renewable or not),transmission and distribution. In 2009, interest rates stood at 10 to 12%, reviewable annually or every three years, but inflation must be takeninto account, which has risen from 4% to almost 13%.
To provide access to the entire population and to villages that are still unserved, a specific program, the Rajiv Gandhi Grameen VidyutikaranYojana (RGGVY), was defined in 2005, with the following main components:
- Strengthen the MV distribution grids, create MV infrastructure, distribution, decentralized generation and local grids: these investments,which must be presented as projects, can benefit from investment subsidies of up to 90%;
- Finance productive and social infrastructure: irrigation pumps, SMEs, local craft industries, cold chains, health, education andcommunication; when presented as projects, they can benefit from the same subsidy levels;
- 100% subsidy for basic connections (lighting, audiovisual) for households living below the poverty line (i.e. with less than USD 2 per day);
- Develop distribution franchises whereby a local entity (private, association or cooperative) takes charge of the distribution service within anarea supplied by a transformer; these franchises again benefit from the same investment support.
© AFD Working Paper n° 122 • Access to Electricity in Sub-Saharan Africa • October 2013
90

Financing needs are estimated as follows, the subsidy portion comes from taxes on RE and Government allocations (over a theoreticalperiod of 5 years):
- Electrification of isolated villages and grid reinforcement: EUR 1,160m- Electrification for households below the poverty line: EUR 500m- Reinforcement of grids in already electrified areas: EUR 670mTOTAL EUR 2,330m
including a 90% subsidy (balance from own capital or REC) EUR 2,100m1% supplement for training support or research EUR 230m
While these amounts may seem impressive at first sight, they should be seen against REC’s performance, experience and balance sheet.
In 2008, REC was ranked among India’s best performing State companies and its performance has been qualified as "excellent" by the publicauditor since 1993. REC now plans to export its services and know-how.
A few key figures for 2007-2008 (exchange rate: INR 70 = EUR 1):Number of projects appraised and approved per year about 750Capital EUR 122mLoans from the government EUR 11mLoans from Life Insurance Company EUR 500mLoans through bond issues EUR 3,200mLoans from other banks (including cooperation) EUR 600mTotal outstanding loans EUR 5,500mInterest collected over the year EUR 505mPre-tax profits EUR 187mAfter-tax profits EUR 123mDistribution of dividends EUR 37m
© AFD Working Paper n° 122 • Access to Electricity in Sub-Saharan Africa • October 2013
91
3.4.3 Innovative loan/grant blending to enhanceproject risk-sharing and maximize leveragefrom the scarce grant resources available
Subsidized financing is a necessity in view of the economic
characteristics of access projects. The grant component
should specifically target:
• Capacity building: institutional and regulatory frameworks;
capacity for new technologies; capacity to manage local
operations; training of bank staff;
• Preliminary studies and strategic planning; resource
inventories; feasibility studies (even if this means reinte-
grating the cost into the project financing if the project is
implemented);
• Support for implementation: financial arrangements,
engineering and implementation studies, project
management, capacity building for operators;
• Investment support: risk sharing, adapting the terms of
financial support to the economic and financial profiles
of projects (maturity, rate, grace period), investment
subsidies.

© AFD Working Paper n° 122 • Access to Electricity in Sub-Saharan Africa • October 2013
92
There are a whole host of uncertainties and risks related
to projects for access and rural electrification that use
renewable energy sources:
- Project risks: The risks related to the project itself are of
a technical nature. The first concerns the availability of the
resource and its uncertainties (hydrology, weather, wind,
sunshine, availability of biomass). Studies (often long and
costly) are thus needed to take account of these aspects
and allow renewable energy projects to be implemented.
The second technical risk is related to construction,
in particular to civil engineering for hydropower. This
construction risk carries a real risk of cost overruns;
- Risks related to the project context: It is necessary to
carefully analyze the anticipated demand and the speed
of its development. Indeed, regulatory frameworks for
buy-back tariffs or access by third parties to the grid often
only give a visibility for a few years, whereas the return on
a project takes over five years and it is necessary to wait
eight to ten years for significant profitability.
Finally, a last project risk is related to the low level of expe-
rience, both technical and for project management, of local
operators that launch into this type of new operation...
- This leads us to the counterpart risk: In view of the list of
elements above, classic commercial or development banks
are reluctant when faced with these new projects. They do
not have the required expertise, or the instruments for
long-term loans, to appraise projects and finance them.
They then focus on counterpart quality and demand high
levels of guarantee based on a standard analysis of the
balance sheets of the companies requesting loans.
It is therefore up to the entities that finance access or to the
REFs to seek to mobilize loans and allocate grants, in order
to improve the profitability level of the project, and thus
make it more attractive to donors.
To do so, it is first necessary to draw up a list of priority
projects (for economic and social reasons or for spatial
planning reasons), in coordination with the planner, and
analyze their profitability and how they will be led, in order
to make a realistic decision about which portfolio can be
developed and supported given the available resources.
Initially at least, it will certainly be necessary to
subsidize/pre-finance studies, the cost of which can be rein-
tegrated into the project financing. In addition, it would be
useful to carry out strategic opportunity analyses of new
technologies (such as hybrid PV-diesel, or biodiesel as a
fuel for rural electrification). This will show the priorities to
potential investors and allow innovative projects with a
demonstration or pedagogical nature to be subsidized at a
suitable level, while counting on a reduction in costs over
the long term. Grants will be required for social projects,
while being aware that these are operations where funds
are “lost”.
The implementation of partial guarantee instruments must
be combined with training for bankers, operators, national
providers, etc. This would encourage them to become
involved over the long term and to take project or counter-
part risks (which they would otherwise refuse). In a context
of private investment, where equity contributions are
lacking, it might be conceivable to invest in the capital of
certain operations.
In view of the challenges of developing access and the
financing that may be allocated to it, it is thus necessary to
rethink the structuring of rural and peri-urban electrification
projects in order to achieve the most effective use of grants
(as the latter are necessary for this type of project which,
even when it is well structured, cannot reach the levels of
profitability that are possible in urban and industrial areas).
Grants are currently scarce and must be used in a
reasoned and targeted manner to finance the unprofitable
aspects of the project in order to reconcile equalization and
financial balance.

List of acronyms and abbreviations
ADEME Agence de l’environnement et de la maîtrise de l’énergie (French Environment and Energy Management Agency)
ADER Association des énergies renouvelables (Renewable Energy Association, France)
AFD Agence Française de Développement
AFREPEN African Energy Policy Research Network
AMADER Agence malienne pour le développement de l'énergie domestique et électrification rurale (Agency for the
Development of Domestic Energy and Rural Electrification, Mali)
ANARE Autorité nationale de régulation du secteur d'électricité (National Electricity Sector Regulatory Authority)
APAUS Agence pour accès universel aux services (Agency for Universal Access to Services)
APL Adaptable Program Loan
ARSEL Agence de régulation du secteur électrique (Electricity Sector Regulatory Agency)
ADB African Development Bank
BOT Build Operate Transfer
CAR Central African Republic
CEMAC Central African Economic and Monetary Community
CIE Compagnie Ivoirienne d'Electricité Electricity Company of Cote d'Ivoire
CREE Commission de Régulation de l'Electricité et de l'Eau (Electricity and Water Regulatory Commission)
DGE Direction générale de l’Energie (General Directorate for Energy)
DRC Democratic Republic of the Congo
DRE Decentralized Rural Electrification
DSC Decentralized Services Company
ECOWAS Economic Community of West African States
EDF Électricité de France
EdM Électricité du Mali
ESF Électriciens sans frontières (Electricians without Borders)
ESMAP Energy Sector Management Assistance Program
FACE Fonds d’amortissement des charges d’électrification (Fund for the Amortization of Electrification Charges)
FGEF French Global Environment Facility
GEF Global Environment Facility
GRET Groupe de recherche and d'échanges technologiques
GIZ/GTZ Deutsche Gesellschaft für Internationale Zusammenarbeit
HDI Human Development Indicators
IBRD International Bank for Reconstruction and Development
IDA International Development Association
IEA International Energy Agency
IED Innovation énergie développement
IEG Independent Evaluation Group
IGCC Integrated Gasification in Combined Cycle
© AFD Working Paper n° 122 • Access to Electricity in Sub-Saharan Africa • October 2013
93

IPP Independent Power Producer
IREDA Indian Renewable Energy Development Agency
KPLC Kenya Power Lighting Corporation
LED Light-Emitting Diode
LELB Low Energy Light Bulb
LRMC Long-Run Marginal Cost
LV Low Voltage
MDGs Millennium Development Goals
MRBC Meter Reading, Billing and Collection
MV Medium Voltage
NGO Non-Governmental Organization
NIZ Non-Interconnected Zones
OBA Output-Based Aid
OECD Organisation for Economic Co-operation and Development
ONE Office national d'électricité
PACEAA Poverty Alleviation through Cleaner Energy for Agro-Industry in Africa
PCASER Projet de candidature spontanée d’électrification rurale (Project for Spontaneous Applications for Rural
Electrification)
PERG Programme d’électrification rurale global (Global Rural Electrification Program)
PPA Power Purchase Agreement
PPP Public-Private Partnership
PSP Private-Sector Participation
PV Photovoltaics
PVPS Photo-Voltaic Power Systems
REA Rural Electrification Agency
REC Rural Electrification Corporation
REF Rural Electrification Fund
RGGVY Rajiv Gandhi Grameen Vidyutikaran Yojana
RIAED Réseau international d’accès aux énergies durables (International Network for Access to Renewable Energy)
RRI Rate of Return on Investment
SENELEC Société nationale d'électricité du Senegal
SHEP Self-Help Electrification Program
SIG Southern Interconnected Grid
SIL Special Impact Loan
SMEs Small and Medium-Sized Enterprises
SWER Single Wire Earth Return
SWOT Strengths, Weaknesses, Opportunities, Threats
TPA Third-Party Access
UNDP United Nations Development Programme
UNEP United Nations Environment Programme
UNIDO United Nations Industrial Development Organization
WAEMU West African Monetary and Economic Union
WEO World Energy Outlook
© AFD Working Paper n° 122 • Access to Electricity in Sub-Saharan Africa • October 2013
94

Internal reports / Program documents
ADEDJOUMON, C. (2008), Capitalization of rural electrification projects financed by AFD in Africa from 1994 to 2008 (in French), Internal
Report.
AFD (2005), Retrospective evaluation of a rural electrification project in the Ganzourgou (Burkina Faso) (in French), Internal Report.
EDF, Study to identify scope of works for a rural electrification project in Kenya, Internal Report.
EDF, AXENNE and ABERDARE, Review of customer connection policy, "Strengthening the electricity distribution in Nairobi and Mombasa",
Internal Report.
HEURAUX, C. (2009), Presentation of the SSD survey, EDF (in French), Internal Report.
KOTY, C. (2007), Situation of the energy sector and perspectives (in French), Ministry of Mines, Energy and Water of Benin, Internal Report.
Ministry for Energy, Kenya (2005), Road map for reform of the rural electrification programme, Internal Report.
MMEE, GTZ, AFD and CE (2008), Program document, rural electrification program through network connection.
MOSTERT, W. (2008), Review of experiences with rural electrification agencies - Lessons for Africa, Draft Report prepared for the European
Union Energy Initiative-Partnership Dialogue Facility (EUEI-PDF), EUEI-PDF, Internal Report.
NIANG, A., "The strategy of the development of rural electrification" (in French), ASER presentation, Dakar, Internal Report.
Project studies
CEMAC, ECOWAS, 2006 IED: Studies carried out in the CEMAC (Cameroon, CAR, Chad, Congo, Gabon, Equatorial Guinea,)
and ECOWAS (Benin, Burkina Faso, Cape Verde, Côte d’Ivoire, Gambia, Ghana, Guinea, Guinea Bissau) areas.
Study carried out in 2001 in the Philippines as part of a partnership between the World Bank and the Foundation of the Institute
for Development Policy and Research Management in the Philippines.
Study carried out in Vietnam in 2005, at the initiative of the World Bank and the Swedish International Development Agency
accompanying an electrification project of USD 150m.
ONE, in partnership with the AFD (2003): Impact study of the effects of electrification in its different forms, on households and
non-domestic users. The World Bank has published an impact study based on data from different continents, rural locations
and on the natural environment.
World Bank (2008), UNDP (2007), ECOWAS and UEMOA (2006), Review of national framework for involvement of agro-
industries in rural electrification, project PACEAA (poverty alleviation through cleaner energy for agro-industry in Africa), 2009,
Mostert (2008), African Energy Policy Research Network (AFREPEN), 2004, data collected in the scope of the Club of
agencies of rural electrification, Congolese household survey (2005), Eritrean Ministry of Energy, International network of
access to sustainable energy (RIAED), 2005.
© AFD Working Paper n° 122 • Access to Electricity in Sub-Saharan Africa • October 2013
95

References
AFD (2004), Supervisory Board Report - Renforcement de la distribution électrique à Nairobi et Mombasa, Paris.
AFD (2005), Supervisory Board Report - Extension du réseau électrique dans six provinces rurales du Kenya, Paris.
AFD (2008a), Aide-mémoire, Identification du projet d’électrification rurale, Mauritanie CMR3009, Paris.
AFD (2008b), Aide-mémoire, Projet de fourniture de services énergétiques, Mission d’appui pour l’élaboration des procédures
de gestion du fonds d’électrification rurale, Paris.
AFD (2008c), Mission Report, Identification du projet d’électrification rurale, Mauritanie CMR3009, Paris.
IEA (2009), World Energy Outlook 2009, Paris.
BOLAY, C and A. RABINOVICH (2004), Intermediate Cities in Latin America, Risk and Opportunities of Coherent Urban
Development, Elsevier, London.
BPOBA (2007), OBA in Senegal, designing technology-neutral concessions for rural electrification, World Bank, Washington
DC.
BURGEAP (2006), The elaboration of a National Rural Electrification Framework in Ghana, Inception Report, Concept Note
and Workshop, Boulogne-Billancourt.
CBS – International Livestock Research Institute (2004), The Geographic Dimensions of Well-Being in Kenya: Where are the
Poor?
ECOWAS and WAEMU (2006), Livre blanc pour une politique régionale sur accès aux services énergétiques des populations
rurales and périurbaines pour l’atteinte des objectifs du Millénaire pour le développement.
CRE (2005), "La péréquation des tarifs d’utilisation des réseaux nécessite un outil adapté: le fonds de péréquation de électri-
cité" Fiche n° 4, Paris.
EASE and IMPROVES (2007), Opérateurs électriques en milieu rural au Mali and au Burkina Faso.
EDF, Study of non-electrified households in electrified areas in Kenya, Internal Report.
GRET (2005), "Comment se sont-ils électrifiés ? Deux études de cas de politique nationale d'électrification: France, United
States", On-line studies and works n° 3, Paris.
IED (2004), Rapport de synthèse sur les prix obtenus dans le cadre de l’appel d’offres pour l’électrification de six localités en
Mauritanie – Comparative study.
IEG (2008), The welfare impact of rural electrification: a reassessment of the costs and benefits, World Bank, Washington DC.
MASSE, R. (2008), Évaluation des SSD au Mali, Maroc and Afrique du Sud – Final report, GRET, Paris.
MASSE, R. (2005), Histoire de l'électrification rurale en France, GRET, Paris.
MASSE, R. (2004), Financer le développement de l’électrification rurale, GRET, Paris.
Ministry of Mines, Energy and Water, France (2005), Programme d’action pour l’électrification des localités rurales du Bénin,
ABERME, Paris.
UNDP (2008), Human development report 2007-2008, UNDP, New York.
PRAXIS (2008), Harmonisation de la méthodologie d’élaboration des plans locaux électrification des concessions, Final
Report.
UN-HABITAT (2008), The state of African cities, a framework for addressing urban challenges in Africa, UN-HABITAT, Nairobi.
UN (2008), Renforcer l’épargne intérieure en Afrique, Afrique Renouveau, Vol. 22#3, New York.
WORLD BANK (2008a), World Development Report, Washington, DC.
WORLD BANK (2008b), Designing sustainable off-grid rural electrification projects: principles and practices, operational
guidance for World Bank Group staff, Washington, DC.
WORLD BANK (2006), An investment framework for clean energy and development: A progress report, Washington, DC.
© AFD Working Paper n° 122 • Access to Electricity in Sub-Saharan Africa • October 2013
97

© AFD Working Paper n° 122 • Access to Electricity in Sub-Saharan Africa • October 2013
99
Série Documents de travail / Working Papers SeriesPubliés depuis janvier 2009 / published since January 2009
Les numéros antérieurs sont consultables sur le site : http://recherche.afd.fr
Previous publications can be consulted online at: http://recherche.afd.fr
N° 78 « L’itinéraire professionnel du jeune Africain » Les résultats d’une enquête auprès de jeunes leaders Africains sur
les « dispositifs de formation professionnelle post-primaire »
Richard Walther, consultant ITG, Marie Tamoifo, porte-parole de la jeunesse africaine et de la diaspora
Contact : Nicolas Lejosne, département de la Recherche, AFD - janvier 2009.
N° 79 Le ciblage des politiques de lutte contre la pauvreté : quel bilan des expériences dans les pays en développement ?
Emmanuelle Lavallée, Anne Olivier, Laure Pasquier-Doumer, Anne-Sophie Robilliard, DIAL - février 2009.
N° 80 Les nouveaux dispositifs de formation professionnelle post-primaire. Les résultats d’une enquête terrain au Cameroun,
Mali et Maroc
Richard Walther, Consultant ITG
Contact : Nicolas Lejosne, département de la Recherche, AFD - mars 2009.
N° 81 Economic Integration and Investment Incentives in Regulated Industries
Emmanuelle Auriol, Toulouse School of Economics, Sara Biancini, Université de Cergy-Pontoise, THEMA,
Comments by : Yannick Perez and Vincent Rious - April 2009.
N° 82 Capital naturel et développement durable en Nouvelle-Calédonie - Etude 1. Mesures de la « richesse totale »
et soutenabilité du développement de la Nouvelle-Calédonie
Clément Brelaud, Cécile Couharde, Vincent Géronimi, Elodie Maître d’Hôtel, Katia Radja, Patrick Schembri,
Armand Taranco, Université de Versailles - Saint-Quentin-en-Yvelines, GEMDEV
Contact : Valérie Reboud, département de la Recherche, AFD - juin 2009.
N° 83 The Global Discourse on “Participation” and its Emergence in Biodiversity Protection
Olivier Charnoz. - July 2009.
N° 84 Community Participation in Biodiversity Protection: an Enhanced Analytical Framework for Practitioners
Olivier Charnoz - August 2009.
N° 85 Les Petits opérateurs privés de la distribution d’eau à Maputo : d’un problème à une solution ?
Aymeric Blanc, Jérémie Cavé, LATTS, Emmanuel Chaponnière, Hydroconseil
Contact : Aymeric Blanc, département de la recherche, AFD - août 2009.
N° 86 Les transports face aux défis de l’énergie et du climat
Benjamin Dessus, Global Chance.
Contact : Nils Devernois, département de la Recherche, AFD - septembre 2009.
N° 87 Fiscalité locale : une grille de lecture économique
Guy Gilbert, professeur des universités à l’Ecole normale supérieure (ENS) de Cachan
Contact : Réjane Hugounenq, département de la Recherche, AFD - septembre 2009.
N° 88 Les coûts de formation et d’insertion professionnelles - Conclusions d’une enquête terrain en Côte d’Ivoire
Richard Walther, expert AFD avec la collaboration de Boubakar Savadogo (Akilia) et de Borel Foko (Pôle de Dakar)
Contact : Nicolas Lejosne, département de la Recherche, AFD - octobre 2009.
N° 89 Présentation de la base de données. Institutional Profiles Database 2009 (IPD 2009)
Institutional Profiles Database III - Presentation of the Institutional Profiles Database 2009 (IPD 2009)
Denis de Crombrugghe, Kristine Farla, Nicolas Meisel, Chris de Neubourg, Jacques Ould Aoudia, Adam Szirmai
Contact : Nicolas Meisel, département de la Recherche, AFD - décembre 2009.

N° 90 Migration, santé et soins médicaux à Mayotte
Sophie Florence, Jacques Lebas, Pierre Chauvin, Equipe de recherche sur les déterminants sociaux de la santé et
du recours aux soins UMRS 707 (Inserm - UPMC)
Contact : Christophe Paquet, département Technique opérationnel (DTO), AFD - janvier 2010.
N° 91 Capital naturel et developpement durable en Nouvelle-Calédonie - Etude 2. Soutenabilité de la croissance néo-
calédonienne : un enjeu de politiques publiques
Cécile Couharde, Vincent Géronimi, Elodie Maître d’Hôtel, Katia Radja, Patrick Schembri, Armand Taranco
université de Versailles – Saint-Quentin-en-Yvelines, GEMDEV
Contact : Valérie Reboud, département Technique opérationnel, AFD - janvier 2010.
N° 92 Community Participation Beyond Idealisation and Demonisation: Biodiversity Protection in Soufrière, St. Lucia
Olivier Charnoz, Research Department, AFD - January 2010.
N° 93 Community participation in the Pantanal, Brazil: containment games and learning processes
Participation communautaire dans le Pantanal au Brésil : stratégies d’endiguement et processus d’apprentissage
Olivier Charnoz, département de la Recherche, AFD - février 2010.
N° 94 Développer le premier cycle secondaire : enjeu rural et défis pour l'Afrique subsaharienne
Alain Mingat et Francis Ndem, IREDU, CNRS et université de Bourgogne
Contact : Jean-Claude Balmès, département Education et formation professionnelle, AFD - avril 2010
N° 95 Prévenir les crises alimentaires au Sahel : des indicateurs basés sur les prix de marché
Catherine Araujo Bonjean, Stéphanie Brunelin, Catherine Simonet, CERDI - mai 2010.
N° 96 La Thaïlande : premier exportateur de caoutchouc naturel grâce à ses agriculteurs familiaux
Jocelyne Delarue, Département de la Recherche, AFD - mai 2010.
N° 97 Les réformes curriculaires par l’approche par compétences en Afrique
Francoise Cros, Jean-Marie de Ketele, Martial Dembélé, Michel Develay, Roger-François Gauthier, Najoua Ghriss,
Yves Lenoir, Augustin Murayi, Bruno Suchaut, Valérie Tehio - juin 2010.
N° 98 Les coûts de formation et d’insertion professionnelles - Les conclusions d’une enquête terrain au Burkina Faso
Richard Walther, Boubakar Savadogo, consultants en partenariat avec le Pôle de Dakar/UNESCO-BREDA.
Contact : Nicolas Lejosne, département de la Recherche, AFD - juin 2010.
N° 99 Private Sector Participation in the Indian Power Sector and Climate Change
Shashanka Bhide, Payal Malik, S.K.N. Nair, Consultants, NCAER
Contact : Aymeric Blanc, Research Department, AFD - June 2010.
N° 100 Normes sanitaires et phytosanitaires : accès des pays de l’Afrique de l’Ouest au marché européen - Une étude empirique
Abdelhakim Hammoudi, Fathi Fakhfakh, Cristina Grazia, Marie-Pierre Merlateau.
Contact : Marie-Cécile Thirion, département de la Recherche, AFD - juillet 2010.
N° 101 Hétérogénéité internationale des standards de sécurité sanitaire des aliments : Quelles stratégies pour les filières
d’exportation des PED ? - Une analyse normative
Abdelhakim Hammoudi, Cristina Grazia, Eric Giraud-Héraud, Oualid Hamza.
Contact : Marie-Cécile Thirion, département de la Recherche, AFD - juillet 2010.
N° 102 Développement touristique de l’outre-mer et dépendance au carbone
Jean-Paul Ceron, Ghislain Dubois et Louise de Torcy.
Contact : Valérie Reboud, AFD - octobre 2010.
N° 103 Les approches de la pauvreté en Polynésie française : résultats et apports de l’enquête sur les conditions de vie en 2009
Javier Herrera, IRD-DIAL, Sébastien Merceron, Insee - novembre 2010.
Contact : Cécile Valadier, département de la Recherche
N° 104 La gestion des déchets à Coimbatore (Inde) : frictions entre politique publique et initiatives privées
Jérémie Cavé, Laboratoire Techniques, Territoires et Sociétés (LATTS), CNRS - décembre 2010.
© AFD Working Paper n° 122 • Access to Electricity in Sub-Saharan Africa • October 2013
100

N° 105 Migrations et soins en Guyane - Rapport final à l’Agence Française de Développement dans le cadre du contrat
AFD-Inserm
Anne Jolivet, Emmanuelle Cadot, Estelle Carde, Sophie Florence, Sophie Lesieur, Jacques Lebas, Pierre Chauvin
Contact : Christophe Paquet, département Technique opérationnel (DTO), AFD - décembre 2010.
N° 106 Les enjeux d'un bon usage de l'électricité : Chine, Etats-Unis, Inde et Union européenne
Benjamin Dessus et Bernard Laponche avec la collaboration de Sophie Attali (Topten International Services),
Robert Angioletti (Ademe), Michel Raoust (Terao)
Contact : Nils Devernois, département de la Recherche, AFD - février 2011.
N° 107 Hospitalisation des patients des pays de l’Océan indien - Prises en charges spécialisées dans les hôpitaux de la Réunion
Catherine Dupilet, Dr Roland Cash, Dr Olivier Weil et Dr Georges Maguerez (cabinet AGEAL)
En partenariat avec le Centre Hospitalier Régional de la Réunion et le Fonds de coopération régionale de la Réunion
Contact : Philippe Renault, AFD - février 2011.
N° 108 Peasants against Private Property Rights: A Review of the Literature
Thomas Vendryes, Paris School of Economics - February 2011.
N° 109 Le mécanisme REDD+ de l’échelle mondiale à l’échelle locale - Enjeux et conditions de mise en oeuvre
ONF International
Tiphaine Leménager, département de la Recherche, AFD - mars 2011.
N° 110 L’aide au Commerce : état des lieux et analyse
Aid for trade: A survey
Mariana Vijil, Marilyne Huchet-Bourdon et Chantal Le Mouël
AGROCAMPUS OUEST, INRA, Rennes - avril 2011.
N° 111 Métiers porteurs : le rôle de l’entrepreneuriat, de la formation et de l'insertion professionnelle
Sandra Barlet et Christian Baron, GRET
Nicolas Lejosne, département de la Recherche, AFD ([email protected]) - avril 2011.
N° 112 Charbon de bois et sidérurgie en Amazonie brésilienne : quelles pistes d’améliorations environnementales ?
L’exemple du pôle de Carajas
Ouvrage collectif sous la direction de Marie-Gabrielle Piketty, Cirad, UMR Marchés,
Contact : Tiphaine Leménager, département de la Recherche, AFD ([email protected]) - avril 2011.
N° 113 Gestion des risques agricoles par les petits producteurs Focus sur l'assurance-récolte indicielle et le warrantage
Guillaume Horréard, Bastien Oggeri, Ilan Rozenkopf sous l’encadrement de :
Anne Chetaille, Aurore Duffau, Damien Lagandré
Contact : Bruno Vindel, département des Politiques alimentaires, AFD - mai 2011.
N° 114 Analyse de la cohérence des politiques commerciales en Afrique de l’Ouest
Jean-Pierre Rolland, Arlène Alpha, GRET
Contact : Jean-René Cuzon ([email protected]), département PSP, AFD - juin 2011
N° 115 L’accès à l’eau et à l’assainissement pour les populations en situation de crise :
comment passer de l’urgence à la reconstruction et au développement ?
Julie Patinet (Groupe URD) et Martina Rama (Académie de l’eau),
sous la direction de François Grünewald (Groupe URD)
Contact : Thierry Liscia ([email protected]), département du Pilotage stratégique et de la Prospective,
N° 116 Formation et emploi au Maroc : état des lieux et recommandations
Jean-Christophe Maurin ([email protected]) et Thomas Mélonio ([email protected]), AFD - septembre 2011.
N° 117 Student Loans : Liquidity Constraint and Higher Education in South Africa
Marc Gurgand, Adrien Lorenceau, Paris School of Economics
Contact : Thomas Mélonio ([email protected]), Research Department, AFD - September 2011.
© AFD Working Paper n° 122 • Access to Electricity in Sub-Saharan Africa • October 2013
101

N° 118 Quelle(s) classe(s) moyenne(s) en Afrique ? Une revue de littérature
Dominique Darbon, IEP Bordeaux, Comi Toulabor, LAM Bordeaux
Contacts : Virginie Diaz et Thomas Mélonio, département de la Recherche, AFD
N° 119 Les réformes de l’aide au développement en perspective de la nouvelle gestion publique
Jean-David Naudet, division Evaluation et Capitalisation, AFD
N° 120 Fostering low-carbon growth initiatives in Thailand
EDDEN Research Unit of CNRS (French National Research Center) at the University of Grenoble : Prof. Patrick
Criqui (CNRS, Scientific Director), Dr. Pierre-Olivier Peytral (EDDEN Lab, Economist) Dr. Jean-Christophe Simon
(IRD, Senior Economist)
Contact : Cécile Valadier, Research Department, AFD ([email protected])
N°121 Interventionnisme public et handicaps de compétitivité : analyse du cas polynésien
Florent Venayre, Maître de conférences en sciences économiques, université de la Polynésie française et
LAMETA, université de Montpellier
Contact : Cécile Valadier, département de la Recherche, AFD
© AFD Working Paper n° 122 • Access to Electricity in Sub-Saharan Africa • October 2013
102