Do Physical Activity, Sedentary Behaviors, and Nutrition Affect
170
Graduate Theses, Dissertations, and Problem Reports 2016 Do Physical Activity, Sedentary Behaviors, and Nutrition Affect Do Physical Activity, Sedentary Behaviors, and Nutrition Affect Healthy Weight in Middle School Students in an Appalachian Healthy Weight in Middle School Students in an Appalachian Community? Children's Health Opportunities Involving Community? Children's Health Opportunities Involving Coordinated Efforts in Schools (CHOICES) Project Coordinated Efforts in Schools (CHOICES) Project Kibum Cho Follow this and additional works at: https://researchrepository.wvu.edu/etd Recommended Citation Recommended Citation Cho, Kibum, "Do Physical Activity, Sedentary Behaviors, and Nutrition Affect Healthy Weight in Middle School Students in an Appalachian Community? Children's Health Opportunities Involving Coordinated Efforts in Schools (CHOICES) Project" (2016). Graduate Theses, Dissertations, and Problem Reports. 5358. https://researchrepository.wvu.edu/etd/5358 This Dissertation is protected by copyright and/or related rights. It has been brought to you by the The Research Repository @ WVU with permission from the rights-holder(s). You are free to use this Dissertation in any way that is permitted by the copyright and related rights legislation that applies to your use. For other uses you must obtain permission from the rights-holder(s) directly, unless additional rights are indicated by a Creative Commons license in the record and/ or on the work itself. This Dissertation has been accepted for inclusion in WVU Graduate Theses, Dissertations, and Problem Reports collection by an authorized administrator of The Research Repository @ WVU. For more information, please contact [email protected].
-
Upload
khangminh22 -
Category
Documents
-
view
0 -
download
0
Transcript of Do Physical Activity, Sedentary Behaviors, and Nutrition Affect
Graduate Theses, Dissertations, and Problem Reports
2016
Do Physical Activity, Sedentary Behaviors, and Nutrition Affect Do Physical Activity, Sedentary Behaviors, and Nutrition Affect
Healthy Weight in Middle School Students in an Appalachian Healthy Weight in Middle School Students in an Appalachian
Community? Children's Health Opportunities Involving Community? Children's Health Opportunities Involving
Coordinated Efforts in Schools (CHOICES) Project Coordinated Efforts in Schools (CHOICES) Project
Kibum Cho
Follow this and additional works at: https://researchrepository.wvu.edu/etd
Recommended Citation Recommended Citation Cho, Kibum, "Do Physical Activity, Sedentary Behaviors, and Nutrition Affect Healthy Weight in Middle School Students in an Appalachian Community? Children's Health Opportunities Involving Coordinated Efforts in Schools (CHOICES) Project" (2016). Graduate Theses, Dissertations, and Problem Reports. 5358. https://researchrepository.wvu.edu/etd/5358
This Dissertation is protected by copyright and/or related rights. It has been brought to you by the The Research Repository @ WVU with permission from the rights-holder(s). You are free to use this Dissertation in any way that is permitted by the copyright and related rights legislation that applies to your use. For other uses you must obtain permission from the rights-holder(s) directly, unless additional rights are indicated by a Creative Commons license in the record and/ or on the work itself. This Dissertation has been accepted for inclusion in WVU Graduate Theses, Dissertations, and Problem Reports collection by an authorized administrator of The Research Repository @ WVU. For more information, please contact [email protected].

Do Physical Activity, Sedentary Behaviors, and Nutrition Affect Healthy Weight in Middle School Students in an Appalachian Community? Children's Health Opportunities
Involving Coordinated Efforts in Schools (CHOICES) Project
Kibum Cho, M.S.
Dissertation submitted to the College of Physical Activity and Sport Sciences
at West Virginia University
in partial fulfillment of the requirements for the degree of
Doctor of Philosophy in Kinesiology
Emily Jones, Ph.D., Chair Sean Bulger, Ed.D.
Andrea Taliaferro, Ph.D. William Neal, MD.
Alfgeir Kristjansson, Ph.D. Christa Lilly, Ph.D.
Department of Coaching and Teaching Studies
Morgantown, West Virginia 2016
Keywords: physical activity, sedentary behaviors, nutrition, obesity, middle school
Copyright 2016 Kibum Cho

ABSTRACT
Do Physical Activity, Sedentary Behaviors, and Nutrition Affect Healthy Weight in Middle School Students in Appalachian Community: Children's Health Opportunities Involving
Coordinated Efforts in Schools (CHOICES) Project
Kibum Cho, M.S.
Background/Purpose: The study was a three-year, multi-component, school-based health programs implemented in two middle schools in an Appalachian county. The purpose of this study was to: (a) examine the association between healthy weight and physical activity, sedentary behavior, and nutrition and (b) explore predictors affecting changes in physical activity, sedentary behaviors, and nutrition. Methods: The sample consisted 1,620 subjects with 3,263 observations aged 11 to 16 years, who enrolled in the Children's Health Opportunities Involving Coordinated Efforts in Schools (CHOICES) Project in 2012-2014. Each subject was observed at least one time point. Two main analyses were conducted, a logistic regression and linear mixed model. All data were analyzed using the SAS program (version: 9.4). Results: Gender, Moderate to Vigorous Physical Activity (MVPA), and nutrition were associated with healthy weight, while grade, year, screen time were not associate with healthy weight. Boys increased time spent in physical activity over time while girls had no change in physical activity. Girls decreased screen time over time, while boys slightly increased screen time. Girls and boys decreased screen time as BMI percentile increased. Girls and boys increased school work (homework) as BMI percentile increased. None of the variables were significantly related to total consumption of vegetables and fruits. Conclusion: This study indicates the importance of Social Ecological Model (SEM) for assessment of obesity prevalence by emphasizing individual, interpersonal, organizational, and community level and it is recommended that school-based interventions and programming consider those levels to promote behavioral changes for adolescent health in the Appalachian region.

iii
Dedications
To my family (wife and new baby) and parents whom I love with all my heart,
Youna Choi, James Zion Cho, Kwangsik Cho, and Soonok Cho

iv
Acknowledgements
I am forever grateful to Dr.Jones, who is my advisor and mentor. I could never have
achieved my goals without her great support. She directly provided me innumerous help from the
beginning and till the end of the program: provided amazing opportunities for Greenbrier
CHOICES Project and CARDIAC Project, encouraged me to improve English skills, helped me
to create research ideas, and even advised me to manage both family and work. I know the time
to say good-bye is fast approaching, but I will never forget your guidance and support.
My thanks also go to the other dissertation committee members: Dr. Sean Bulger, for
encouraging me during challenging moments and providing future advice. Dr. Andrea Taliaferro,
for your kindness and willingness to help. Dr. William Neal, for providing your professional
knowledge and experiences for health. Dr. Alfgeir Kristjansson, for providing your lectures and
warm words. Dr. Christa Lilly, for spending your time for statistics and always being available to
discuss my study.
Special thanks to Greenbrier CHOICES Project and CARDIAC Project staff. I could
experience school-based comprehensive programs and health screenings, by spending a lot of
time with physical education teachers and program coordinators. Their enthusiasm and efforts in
each project always provided positive energy to me.

v
Table of Contents
LIST OF TABLES ...................................................................................................................... vii LIST OF FIGURES ................................................................................................................... viii CHAPTER 1: INTRODUCTION ................................................................................................ 1
PURPOSE OF STUDY ..................................................................................................................... 7 RESEARCH QUESTIONS ................................................................................................................ 7 SIGNIFICANCE OF STUDY ............................................................................................................. 8 CONCEPTUAL FRAMEWORK ......................................................................................................... 9 KEY TERMS ................................................................................................................................ 13
CHAPTER 2: REVIEW OF THE LITERATURE.................................................................. 15 CHILDHOOD AND ADOLESCENT OBESITY ................................................................................... 15
Trend in Obesity. .................................................................................................................. 15 Consequences of Obesity. ..................................................................................................... 19
Impact on Global Health. ................................................................................................. 19 Impact on Global Economy .............................................................................................. 20 Impact on Social Consequences........................................................................................ 21
School-Based Health Interventions for Obesity Prevention. ................................................ 22 PHYSICAL ACTIVITY/INACTIVITY IN ADOLESCENTS .................................................................. 26
Trends in Physical Activity/Inactivity. ................................................................................. 26 SEDENTARY BEHAVIORS IN ADOLESCENTS ................................................................................ 31
Trends in Sedentary Behaviors. ............................................................................................ 31 NUTRITION IN ADOLESCENTS ..................................................................................................... 34
Trends in Nutrition. ............................................................................................................... 34 RELATIONSHIP BETWEEN HEALTH OUTCOMES AND OBESITY .................................................... 39
Relationship between Physical Activity/Inactivity and Obesity. .......................................... 39 Relationship between Sedentary Behaviors and Obesity...................................................... 41 Relationship between Nutrition and Obesity. ....................................................................... 42 Relationship between Multi-Component and Obesity. ......................................................... 43
CHAPTER 3: METHODS ......................................................................................................... 45 DESCRIPTION OF THE GREENBRIER CHOICES PROJECT ............................................................ 45 SETTING AND SAMPLING ............................................................................................................ 47 DATA COLLECTION .................................................................................................................... 48 INSTRUMENTS AND VARIABLES ................................................................................................. 49
Instruments. ........................................................................................................................... 49 3 Day Physical Activity Recall. ......................................................................................... 50 Progressive Cardiovascular Endurance Run. .................................................................. 51 School Physical Activity and Nutrition Questionnaire. .................................................... 51
Variables. .............................................................................................................................. 52 Physical Activity................................................................................................................ 52 Sedentary Behaviors. ........................................................................................................ 53 Nutrition. ........................................................................................................................... 53

vi
Obesity. ............................................................................................................................. 54 Adolescents’ Characteristics. ........................................................................................... 55
METHODS OF ANALYSIS ............................................................................................................. 55 Research Question 1 ............................................................................................................. 57 Research Question 2 ............................................................................................................. 58
CHAPTER 4: RESULTS ........................................................................................................... 63 DESCRIPTION OF POPULATION ................................................................................................... 63
Summary of Major Findings. ................................................................................................ 72 RESEARCH QUESTION 1 ............................................................................................................. 75
Logistic Regression to Predict the Odds of Healthy Weight. ............................................... 75 RESEARCH QUESTION 2 ............................................................................................................. 76
Linear Mixed Model to Determine Changes in Dependent Variables over time. ................ 77 Changes of Physical Activity. ........................................................................................... 78 Changes of Sedentary Behaviors. ..................................................................................... 79 Changes of Nutrition. ........................................................................................................ 81
CHAPTER 5: DISCUSSION ..................................................................................................... 83 EXPLORING INDIVIDUAL HEALTH BEHAVIORS THROUGH THE LENS OF COMMUNITY LEVEL INFLUENCERS ............................................................................................................................. 83
Physical Activity. .................................................................................................................. 85 Sedentary Behavior. .............................................................................................................. 87 Nutrition. ............................................................................................................................... 88
EXPLORING CHANGES IN INDIVIDUAL HEALTH BEHAVIORS OVER TIME THROUGH THE LENS OF INTERPERSONAL AND ORGANIZATIONAL LEVEL INFLUENCES ................................................... 89
Change in Individual Level Over Time ................................................................................ 90 Change in Interpersonal Level Over Time............................................................................ 91 Change in Organizational Level Over Time. ........................................................................ 93
CONCLUSION ........................................................................................................................... 98 LIMITATIONS ......................................................................................................................... 100 RECCOMMENDATION FOR FURTHER RESEARCH .................................................... 101 REFERENCES .......................................................................................................................... 102 APPENDIX ................................................................................................................................ 149
AFTER SCHOOL PROGRAMMING CALENDAR IN GREENBRIER CHOICES PROJECT .................. 149 GREENBRIER CHOICES ACTIVITYGRAM ACTIVITY LOG ........................................................ 150 THE PACER INDIVIDUAL SCORE SHEET .................................................................................. 153 SCHOOL PHYSICAL ACTIVITY AND NUTRITION SURVEY .......................................................... 154 FIGURES (3 TO 10) FROM RESEARCH QUESTION 2 .................................................................... 158

vii
List of Tables
TABLE 1. INTRODUCTION OF NATIONAL SURVEILLANCES ......................................... 16 TABLE 2. NUMBER OF PARTICIPANTS FOR THIS STUDY IN 2012-2014 ........................ 48 TABLE 3. INSTRUMENTS AND VARIABLES........................................................................ 49 TABLE 4. COMPARISON BETWEEN THE PDPAR, 3DPAR, AND 3DPAR FITNESS ACTIVITYGRAM ........................................................................................................................ 50 TABLE 5. SPAN QUESTIONS IN THIS STUDY ...................................................................... 52 TABLE 6. ADJUSTED ANSWER FOR NUTRITION QUESTIONS IN SPAN ....................... 54 TABLE 7. CATEGORIZED BMI GROUPS ............................................................................... 55 TABLE 8. SUMMARY OF ANALYSES BY RESEARCH QUESTION .................................. 57 TABLE 9. GENDER, GRADE, AND SCHOOL OF THE SAMPLE ......................................... 63 TABLE 10. FREQUENCY AND PERCENTAGE AT EACH COLLECTION PERIOD .......... 64 TABLE 11. PHYSICAL CHARACTERISTICS OF THE SAMPLE .......................................... 65 TABLE 12. PHYSICAL ACTIVITY, SEDENTARY BEHAVIORS, AND NUTRITION AT GENDER (N=1,620) .................................................................................................................... 66 TABLE 13. PHYSICAL ACTIVITY, SEDENTARY BEHAVIORS, AND NUTRITION AT GRADE ......................................................................................................................................... 68 TABLE 14. PHYSICAL ACTIVITY, SEDENTARY BEHAVIORS, AND NUTRITION AT YEAR ............................................................................................................................................ 69 TABLE 15. ACTIVITY LOG IN 3DPAR (7AM TO 11PM) ...................................................... 70 TABLE 16. CORRELATION COEFFICIENTS FOR RELATIONSHIPS BETWEEN BMI PERCENTILE, PHYSICAL ACTIVITY, SEDENTARY BEHAVIORS, AND NUTRITION FACTORS..................................................................................................................................... 72 TABLE 17. LOGISTIC REGRESSION PREDICTING HEALTHY WEIGHT ......................... 76 TABLE 18. PREDICTORS OF PHYSICAL ACTIVITY ............................................................ 78 TABLE 19. PREDICTORS OF SEDENTARY BEHAVIORS (TOTAL SD TIME) .................. 79 TABLE 20. PREDICTORS OF SEDENTARY BEHAVIORS (SCREEN TIME) ...................... 80 TABLE 21. PREDICTORS OF SEDENTARY BEHAVIORS (SCHOOL WORK AND EATING TIME)............................................................................................................................ 81 TABLE 22. PREDICTORS OF NUTRITION ............................................................................. 82

viii
List of Figures
FIGURE 1. THEORETICAL MODEL FOR FACTORS AFFECTING OBESITY IN AN APPALACHIAN REGION .......................................................................................................... 13 FIGURE 2. GREENBRIER COUNTY IN WEST VIRGINIA .................................................... 47 FIGURE 3. TOTAL PA TIME AND YEAR BY GENDER ...................................................... 158 FIGURE 4. TOTAL PA TIME, YEAR, AND BMI PERCENTILE BY GIRLS ....................... 158 FIGURE 5. TOTAL PA TIME, YEAR, AND BMI PERCENTILE BY BOYS ........................ 159 FIGURE 6. TOTAL SCREEN TIME AND YEAR BY GENDER............................................ 159 FIGURE 7. TOTAL SCREEN TIME AND BMI PERCENTILE BY GENDER ...................... 160 FIGURE 8. TOTAL SCREEN TIME, YEAR, AND BMI PERCENTILE BY GIRLS ............. 160 FIGURE 9. TOTAL SCREEN TIME, YEAR, AND BMI PERCENTILE BY BOYS.............. 161 FIGURE 10. TOTAL SCHOOL WORK AND BMI PERCENTILE BY GENDER ................. 161

Do Physical Activity, Sedentary Behaviors, and Nutrition Affect Healthy Weight 1
CHAPTER 1
INTRODUCTION
The prevalence of obesity in adult and youth populations has held the attention of
national and international researchers since the early twentieth century. Seminal work conducted
by Joslin (1921) examined the weight status of diabetes patients and revealed a link between
obesity and diabetes that remains constant today. Obesity and overweight have been identified as
risk factors for not only diabetes, but other chronic health conditions such as cardiovascular
diseases, cancers, and hypertension. In the United States, obesity rates of adults reached 35.8%
in 2009-2010 (Flegal, Carroll, Kit, & Ogden, 2012) and 16.9% of children and adolescents in
2007-2008 (Ogden, Carroll, Curtin, Lamb, & Flegal, 2010). The economic impact of rising
obesity rates in both adult and youth populations was reported in 2009 to constitute 8.5-12.9% of
U.S. healthcare costs (Finkelstein, Trogdon, Cohen, & Dietz, 2009), which does not include
indirect costs such as absenteeism, presentism, disability, and premature mortality (Hammond &
Levine, 2010). Thus, researchers noted that obesity has become an important threat to public
health (Doak, Visscher, Renders, & Seidell, 2006).
Studies have linked genetics, metabolism, poor nutrition, physical inactivity, and
environment as known contributing factors to obesity (Jebb, 2004). Obesity is defined as body
fat over a body fat standard (Flegal & Ogden, 2011) and is commonly measured using a
calculation of weight and height which is referred to as Body Mass Index (BMI). The terms
overweight and obese refer to classifications of a range of BMI values; for instance, BMI values
of adults between 25.0 and 29.9 are classified as overweight, and values over 30.0 are classified
as obese. Obesity rates of both men and women (≥18 years) in the U.S. have increased an
average 0.37% every year from 1988 to 2010 in the U.S using National Health and Nutrition

Do Physical Activity, Sedentary Behaviors, and Nutrition Affect Healthy Weight 2
Examination Survey (NHANES) data, resulting in changes of 24.9% to 35.4% prevalence of
obesity in women and 19.9% to 34.6% prevalence of obesity in men (Ladabaum, Mannalithara,
Myer, & Singh, 2014). The increased obesity rate in adults appears to be related to childhood and
adolescent obesity. In fact, obesity in adolescents (12-19 years) in the U.S. has increased on
average 0.5% every year from 1980 to 2012, resulting in 5% in 1980 to 21% in 2012 (Ogden,
Carroll, Kit, & Flegal, 2014). Similarly, the obesity prevalence of children (6-11 years) has also
increased on average 0.34% every year, resulting in 6.5% in 1980 to 19.6% in 2012 (Fryar,
Carroll, & Ogden, 2012).
With the increases in child and adolescent obesity from 1980 to 2012, researchers have
examined the adverse effects of obesity on psychosocial health (e.g., Ebbeling, Pawlak, &
Ludwig, 2002). Children who are overweight have been reported to be more likely to have lower
self-esteem and to report being targets of discrimination (Dietz, 1998). In addition, society’s
negative view toward those who are overweight and obese was described with such terms as
ugly, mean, stupid, and lazy (Latner & Stunkard, 2003; Wardle, Volz, & Golding, 1995).
Obesity and overweight in children are associated with poor nutrition, inadequate
physical activity, and excessive time spent in sedentary behaviors (Kraak, Liverman, & Koplan,
2005; McCambridge et al., 2006). Wang and Lobstein (2006) suggested dietary factors and food
habits are of greatest significance in obesity in children and adolescents. Relative to dietary
behaviors, sugar-sweetened beverage consumption has been linked to negative health outcomes
such as incidence of obesity, diabetes and cardiovascular diseases (Malik, Schulze, & Hu, 2006).
According to the 2010 National Youth Physical Activity and Nutrition Study, 65% of high
school students in U.S. drank sugar-sweetened beverages (SSBs) at least once or more every day,

Do Physical Activity, Sedentary Behaviors, and Nutrition Affect Healthy Weight 3
and 22% of them drank SSBs at least three times or more every day (Park, Blanck, Sherry,
Brener, & O’Toole, 2012).
Regular participation in health-enhancing physical activity has been associated with
obesity prevention and treatment in youth and adult populations. However, data suggested only
24.8% of youth aged 12 to 15 years engaged in the recommended 60 minutes of daily physical
activity (Fakhouri et al., 2014). The Youth Risk Behavior Surveillance System (YRBSS)
announced that across 41 states, 25.4% of youth aged 12 to 15 did not participate in at least 60
minutes of physical activity on all seven days (Kann et al., 2014). In West Virginia, state
regulations for childcare facilities (children age birth to 13) met only 8.5% of the federal
standards for physical activity and sedentary behaviors (CDC, 2014).
Sedentary behaviors, such as watching television, playing games, using computers, and
sitting have been positively correlated with increased weight status in children and adults.
According to Sallis et al. (1997), children ages 6-11 spent 7.1 hours a day in sedentary behaviors,
while adolescents aged 16-19 spent 8.3 hours a day. The 2011 YRBSS report suggested that
31.1% and 32.4% of high school students in U.S. spend more than 2 hours watching television
and playing computer games (Eaton et al., 2012). In West Virginia, 32.2% of high school
students spend more than 3 hours playing computer games, and 31.2% spend more than 3 hours
watching television per day, which is more than the national average (Eaton et al., 2012).
Although physical activity, nutrition, and sedentary behaviors have been associated with
obesity, researchers speculate much greater complexity. Numerous theories and models have
been developed and applied to research aimed to explore obesity prevention and treatment. The
most commonly used models and theories in obesity prevention research include those that
propose a self-contained explanation of behaviors, while others emphasize the individual,

Do Physical Activity, Sedentary Behaviors, and Nutrition Affect Healthy Weight 4
interpersonal relationship, and social environments as contributing factors to behavior and
behavior change. The theories include knowledge-attitude-behavior model (Bettinghaus, 1986),
Health Belief Model (Janz & Becker, 1984), Social Cognitive Theory (SCT) (Bandura, 2001),
Theory of Reasoned Action or Theory of Planned Behavior (Madden, Ellen, & Ajzen, 1992),
Transtheoretical Model (Prochaska & Velicer, 1997), and Social Ecological Model (SEM)
developed by Bronfenbrenner (1977). Among them, the Social Cognitive Theory and the Social
Ecological Model appear to be the most popular frameworks for obesity prevention and
intervention (Leroux, Moore, & Dubé, 2013; O'Dea & Eriksen, 2010). A well-documented
example of a school-based intervention that was conceptualized around the Social Cognitive
Theory is Planet Health (Gortmaker et al., 1999). Planet Health integrated four behavioral
change concepts within middle school settings to promote students’ health behaviors including:
a) decreasing time in television viewing, b) increasing moderate or vigorous physical activity, c)
reducing the consumption of fast-foods, and d) increasing consumption of fruits and vegetables
(Gentile et al., 2004; U.S. Department of Health and Human Services, 2000).
Another framework that has informed the development of numerous obesity prevention
and treatment initiatives is the Social Ecological Model. The Social Ecological Model
emphasizes the influence and interplay of societal factors such as interpersonal, organizational,
community, and policy have on individuals and has been used to examine the prevention of
obesity (Lytle, 2009). Examining obesity from an ecological perspective suggests that one’s
weight status is affected by not only one’s own decisions, but decisions of those around them, the
environment, and even social norms. Given the impact that parents and guardians can have on a
child’s weight status and home environment, the Social Ecological Model informed the
development of a resource for physicians to communicate with parents and guardians about

Do Physical Activity, Sedentary Behaviors, and Nutrition Affect Healthy Weight 5
obesity prevention and treatment. The 5-2-1-0 guidelines is a nationwide health education
marketing campaign that emphasizes specific behaviors including the consumption of five or
more fruits and vegetables, two hours or less time spent in screen time, one or more hour of daily
physical activity, and little to no consumption of sugar-sweetened beverages (Rogers et al.,
2013).
Federal agencies, educational institutions and professional organizations (e.g., World
Health Organization, American Academy of Pediatrics, American Heart Association, Center for
Disease Control and Prevention, Society for Health and Physical Education America (SHAPE)–
formerly National Association for Sport and Physical Education) have acknowledged the adverse
effects of obesity and have issued recommendations for prevention and treatment, many of which
include individual behavior change, and family and environmental components. School-based
obesity interventions focus on school, family, community, and policy-related issues. In
particular, the role of schools in low-income and rural settings that cannot provide enough
recreation facilities (Hannon et al., 2006) is important because children in rural areas have 25%
higher BMI than their metropolitan peers (Lutfiyya, Lipsky, Wisdom‐Behounek, & Inpanbutr‐
Martinkus, 2007). The school environment can encourage students to make individual changes in
areas such as emotional and mental health, and in academic achievement (Cohen, McCabe,
Michelli, & Pickeral, 2009). School-based physical activity programs and interventions are
viable strategies for improved child and adolescent health, and have been associated with
decreases in drop-out rates, improved student self-esteem, and enhanced classroom environments
(Mahar et al., 2006). In addition, one study revealed that many studies found that school-based
physical activity interventions, decreased screen time, improved VO2 max (Dobbins, Husson,
DeCorby, & LaRocca, 2013), and reduced body weight (Gortmaker et al., 1999). The strengths

Do Physical Activity, Sedentary Behaviors, and Nutrition Affect Healthy Weight 6
of school-based physical activity interventions helped schools improve their environments and
educational curricula. Malik, Willett, and Hu (2013) suggested that schools can emphasize
nutritional education, provide healthy school meals, and change vending machines contents to
favor students’ health by developing policy strategies. However, expensive equipment (Hesketh,
Waters, Green, Salmon, & Williams, 2005), unsafe facilities for physical activities (Cohen et al.,
2006) and low support from parents (Bauer, Nelson, Boutlelle, & Neumark-Sztainer, 2008) are
common barriers to implementing various types of school-based physical activity interventions.
Although much has been written about the complexity and causes and effects of obesity
in adolescents throughout the United States, little is known about the effects of school-based
multi-component approaches, such as physical activity, sedentary behavior, and nutrition to
obesity treatment and prevention in adolescents, rural areas, especially mountainous areas. In
fact, one meta-analysis of school-based interventions including physical activity, sedentary
behavior, and nutrition revealed that only 4 (9.3%) of all 43 published studies used all three
components in school-based intervention (Lavelle, Mackay, & Pell, 2012), while most studies
only used a single or two components because multi-component approaches are time consuming
and often complicated (Mariani et al., 2015). Particularly in school settings, regional limitations,
such as unsafe sidewalk and lack of facilities, cause to obstruct the use of multi-component
approaches for obesity prevention. This study focuses on a rural, Appalachian county. West
Virginia is the second most rural state in the U.S. and the only state entirely classified as
Appalachia (Alkadry, Wilson, & Nicholas, 2006). These features not only affect the individual
development process, but decrease access to healthcare services affecting the quality of life
(Chenoweth & Galliher, 2004). In addition, some studies found that people in rural areas met
unique challenges that may cause prevalence of obesity, such as lack of physical education

Do Physical Activity, Sedentary Behaviors, and Nutrition Affect Healthy Weight 7
classes, nutrition education, and sidewalks, exercise facilities, and food availability (Reed,
Patterson, & Wasserman, 2011; Tai-Seale & Chandler, 2010). Therefore, the efforts for school-
based obesity prevention in rural areas are important and should be studied. That is, additional
study is needed to understand health behaviors for obesity prevention in school settings and
develop targeted health messages for adolescents and their parents within the Appalachian
region. This study will help expand existing results of school-based approaches for adolescents’
obesity prevention in the Appalachian region.
Purpose of Study
The purpose of this study is (a) to examine the association between healthy weight and
physical activity, sedentary behavior, and nutrition and (b) to explore predictors affecting
changes in physical activity, sedentary behaviors, and nutrition across a three-year, multi-
component, school-based health efforts.
Research Questions
The proposed study aims to examine the following questions:
1. Are physical activity, sedentary behavior, and nutrition in middle school students
associated with BMI percentile?
2. Are changes in physical activity, sedentary behavior, and nutrition over time
associated with changes in BMI percentile over time, controlling for grade and
gender?

Do Physical Activity, Sedentary Behaviors, and Nutrition Affect Healthy Weight 8
Significance of Study
One of strengths of this study can be characterized by multiple measurements. Multiple
measurements include: (a) physical activity and sedentary behaviors are measured via the Three
Day Physical Activity Recall (3DPAR); (b) nutrition is measured via the School Physical
Activity and Nutrition (SPAN); and (c) obesity is measured via Body Mass Index (BMI). These
measurements will help explore not only how nutritional factors (fruits and vegetables), physical
activity factors (physical activity, moderate to vigorous physical activity, and PACER), and
sedentary behavior factors (school work, eating/resting, and screen time) independently affect
changes of BMI over a period of three years, but also how strongly those factors are intertwined
across the time period.
Further, this study is based on a three-year, school-based multi components for middle
school students in a rural, Appalachian county. The thirteen collection periods including baseline
for three years helped find the changes in BMI, making it possible to explore what factors are
strongly associated with changes in BMI. There have been considerable evidence to suggest that
obesity prevention initiatives can change children's behaviors and weight over time; however,
there has been far less evidence on which to judge the impact over the longer term (Jones et al.,
2011). According to a systematic review of school-based obesity prevention (Lavelle et al.,
2012), studies with investigation period over one year were only 10 (23.3%) from 1991 to 2010.
Also, the same study revealed that 26 (60%) published studies were based in the primary school
settings, which suggests that students at the secondary level are relatively less studied. Therefore,
the current study will help expand knowledge about complicated relationships between obesity
and obesity-related health risk behaviors, provide unique results for a rural, Appalachian-county,
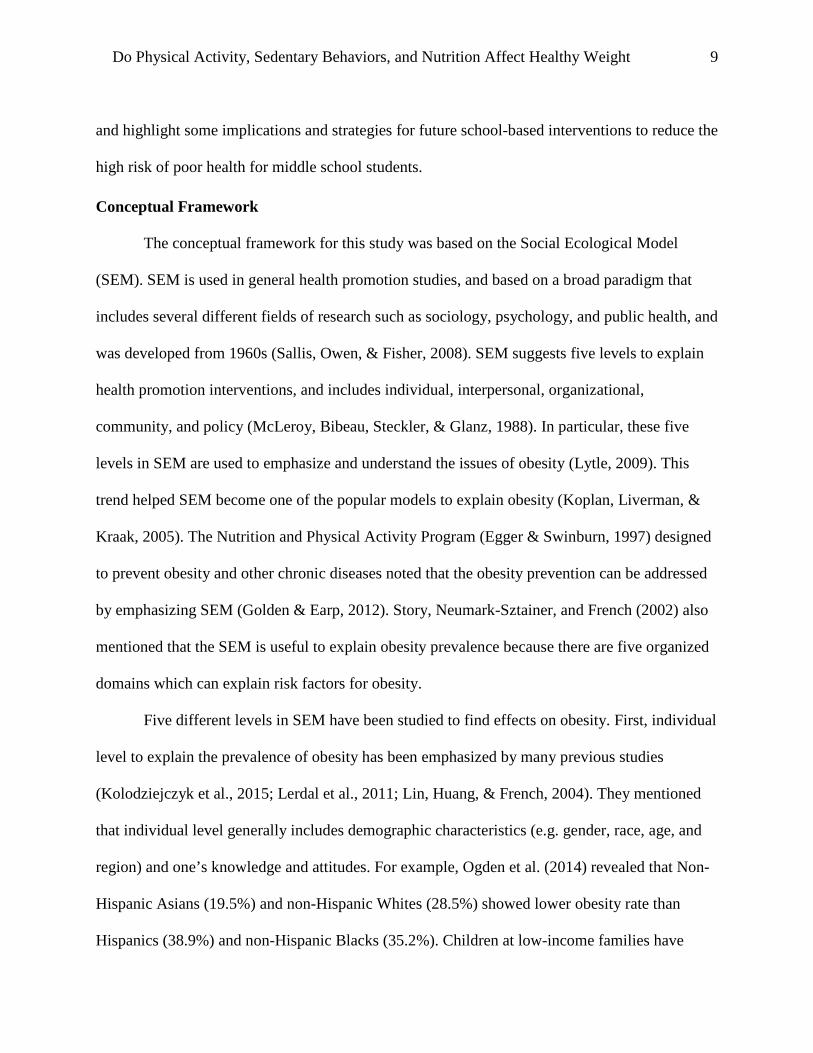
Do Physical Activity, Sedentary Behaviors, and Nutrition Affect Healthy Weight 9
and highlight some implications and strategies for future school-based interventions to reduce the
high risk of poor health for middle school students.
Conceptual Framework
The conceptual framework for this study was based on the Social Ecological Model
(SEM). SEM is used in general health promotion studies, and based on a broad paradigm that
includes several different fields of research such as sociology, psychology, and public health, and
was developed from 1960s (Sallis, Owen, & Fisher, 2008). SEM suggests five levels to explain
health promotion interventions, and includes individual, interpersonal, organizational,
community, and policy (McLeroy, Bibeau, Steckler, & Glanz, 1988). In particular, these five
levels in SEM are used to emphasize and understand the issues of obesity (Lytle, 2009). This
trend helped SEM become one of the popular models to explain obesity (Koplan, Liverman, &
Kraak, 2005). The Nutrition and Physical Activity Program (Egger & Swinburn, 1997) designed
to prevent obesity and other chronic diseases noted that the obesity prevention can be addressed
by emphasizing SEM (Golden & Earp, 2012). Story, Neumark-Sztainer, and French (2002) also
mentioned that the SEM is useful to explain obesity prevalence because there are five organized
domains which can explain risk factors for obesity.
Five different levels in SEM have been studied to find effects on obesity. First, individual
level to explain the prevalence of obesity has been emphasized by many previous studies
(Kolodziejczyk et al., 2015; Lerdal et al., 2011; Lin, Huang, & French, 2004). They mentioned
that individual level generally includes demographic characteristics (e.g. gender, race, age, and
region) and one’s knowledge and attitudes. For example, Ogden et al. (2014) revealed that Non-
Hispanic Asians (19.5%) and non-Hispanic Whites (28.5%) showed lower obesity rate than
Hispanics (38.9%) and non-Hispanic Blacks (35.2%). Children at low-income families have

Do Physical Activity, Sedentary Behaviors, and Nutrition Affect Healthy Weight 10
limited opportunities for healthy foods and physical activity, so multifaceted interventions (e.g.
policy changes and financial support) should be preceded for obesity prevention (Addy et al.,
2004; Economos et al., 2001). Also, body image dissatisfaction caused overweight and obesity
negatively (Saloumi & Plourde, 2010). Second, interpersonal level at SEM generally includes the
interaction with friends and families. Harris and Neal (2009) found that only 23% of parents with
obese child were concerned about their child’s high BMI, so obese children are less likely to
realize their health problem. Some studies revealed that family members who suffer from an
obesity problem caused their children to be highly likely to increase obesity (Freeman et al.,
2012; Pryor et al., 2011). Lindsay, Sussner, Kim, and Gortmaker (2006) found that parents can
be an important role that their children pursue healthy eating by cooking at home. Third, the
importance of organization factors in SEM was emphasized. Among organization factors,
schools are an important place to affect adolescent obesity because 95% of adolescents are
enrolled in school (CDC, 2013a). Foulk (2004) found that school nutrition, vending machines,
and physical education classes are considered as factors causing adolescent obesity in schools.
Drake et al. (2012) revealed that physical education classes were associated with increased
physical activity and decreased obesity rate. Also, improved school nutrition is important for
adolescents to reduce their body weight because adolescents consumed at least 19 to 50 percent
of their total daily calories in schools (Gleason & Suitor, 2001). Therefore, Stone, McKenzie,
Welk, and Booth (1998) said that school-based health interventions based on the five levels in
SEM were continually developed and emphasized. Allensworth and Kolbe (1987) claimed that
since the 1900’s, school-based health interventions generally focused on health education, health
service, and healthy school environment. The comprehensive school physical activity program
(CSPAP), for example, used SEM framework for impacting students’ health (McLeroy et al.,
Do Physical Activity, Sedentary Behaviors, and Nutrition Affect Healthy Weight 11
1988). Application of a social ecological model in CSPAP enabled school-based health
interventions to design school-based physical activity programs that emphasize the interrelation
between individuals and their environments (Carson, Castelli, Beighle, & Erwin, 2014).
The last two factors in SEM are community and policy. Researchers may pay no attention
to these factors for obesity prevention because these are broader and hard to measure. However,
Zenk, Schulz, and Odoms-Young (2009) mentioned that environmental disparities, such as the
availability and accessibility of healthful foods, may be an important issue to maintain body
weight. Curry (2005) said that vehicle traffic and unsafe facilities in community affected
physical activity, eating behaviors, and sedentary behaviors that contribute to obesity. Adding on
to the importance of community factors, Frieden, Dietz, and Collins (2010) also emphasized that
policy changes are necessary to prevent obesity and should be achieved from local to national
levels. Specifically, there were relatively many fast food restaurants in low-income
neighborhoods, so it potentially contributes to obesity (Thornton, Lamb, & Ball, 2016). Also,
lack of policies and funding may be an obstacle to securing walkability that causes the time spent
in physical activity negatively (Allender et al., 2009). Therefore, Brownell and Frieden (2009)
pointed out that governments need to control food prices by decreasing healthy food prices and
increasing unhealthy food prices.
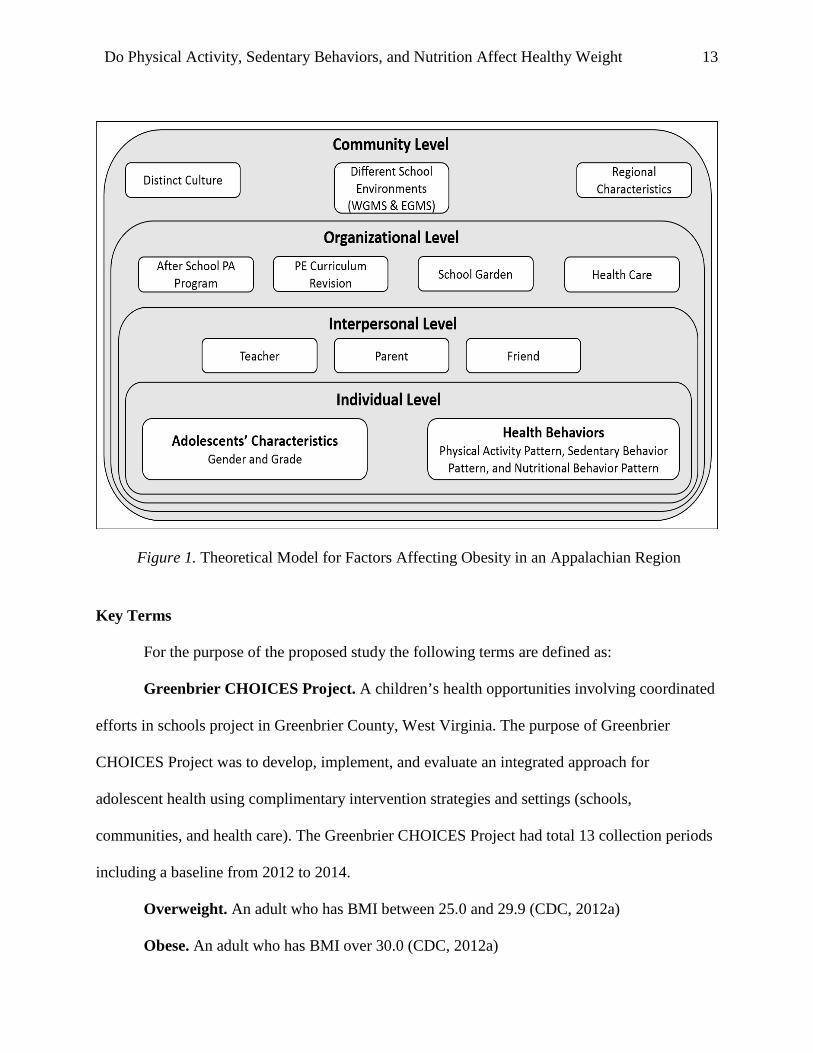
As SEM emphasized the importance of five levels to explain health behaviors, this model
is based on the assumption that influences on health behaviors interact across these five different
levels (Glanz, Rimer, & Viswanath, 2008). Therefore, this study explored all levels except for
policy level in SEM. Specifically, first, students went through the adolescent stage of
development. During this stage, physical, cognitive, and social-emotional development were
affected by interpersonal (e.g., teachers), and organizational (e.g., school-based programs) levels.

Do Physical Activity, Sedentary Behaviors, and Nutrition Affect Healthy Weight 12
Second, teachers experienced professional development by enhancing PE curriculum. PE
teachers managed PE classes and physical activity related programs in school. Third, after school
PA programs were provided in year 2. After-School PA programs offered students’ opportunities
to build their interests and skills in areas such as: archery, mountain-biking, walking, slack-
lining, Zumba, land-paddling and yoga. Fourth, PE curriculum enhancements were provided in
year 2-3. PE curriculum enhancements developed standards-based health and physical education
curricula and integrated culturally-relevant lifetime activities in PE. Fifth, school garden was
provided in year 1-3. School garden was designed to allow students to learn by doing and
explore nutritious options that might increase their awareness and promote healthy eating. Sixth,
school-based health care was provided in year 1-3. Greenbrier County Schools has partnered
with local medical practitioners and existing school-based health centers to provide support and
resources for students and their families about obesity awareness and prevention, and facilitate
goal-setting related to healthy lifestyle habits and decisions. Students within a specific BMI
percentage are invited to participate in the one-on-one interactions with healthcare providers as
well as programs designed to promote healthy eating and physical activity. However, the
analysis for school-based health care component was not included in this study because this
component was used for a small number of participants. Figure 1 introduced factors affecting
obesity in an Appalachian region.
Do Physical Activity, Sedentary Behaviors, and Nutrition Affect Healthy Weight 13
Figure 1. Theoretical Model for Factors Affecting Obesity in an Appalachian Region
Key Terms
For the purpose of the proposed study the following terms are defined as:
Greenbrier CHOICES Project. A children’s health opportunities involving coordinated
efforts in schools project in Greenbrier County, West Virginia. The purpose of Greenbrier
CHOICES Project was to develop, implement, and evaluate an integrated approach for
adolescent health using complimentary intervention strategies and settings (schools,
communities, and health care). The Greenbrier CHOICES Project had total 13 collection periods
including a baseline from 2012 to 2014.
Overweight. An adult who has BMI between 25.0 and 29.9 (CDC, 2012a)
Obese. An adult who has BMI over 30.0 (CDC, 2012a)

Do Physical Activity, Sedentary Behaviors, and Nutrition Affect Healthy Weight 14
Physical Activity. Human movements with energy expenditure such as walking, jogging,
or running (Katzmarzyk et al., 2008).
School-Based Health Intervention. Programs, campaigns, classes, and policies, which
encourage students not only to improve health-related knowledge about nutrition and well-being,
but also promote physical activity (Morgan et al., 2014).
School Physical Activity and Nutrition (SPAN). This is a survey which addresses
school physical activity and nutrition, and is based on School-Based Nutrition Monitoring
(SBNM) questionnaire developed by Hoelscher, Day, Kelder, and Ward (2003). The purpose of
this survey is to assess physical activity and eating behaviors in children and adolescents.
Sedentary Behaviors. Resting behaviors showing low energy expenditure (less than
1.5METs) including computer use, television viewing, sitting, reading, and school-work
(Ainsworth et al., 2000).
Social Ecological Model. Based on ecological perspective developed by Urie
Brofenbrenner, the social ecological model was developed by McLeroy et al. (1988). The main
concept of this model is that individual behavior not only causes multiple domains of influence,
but is caused by them.
3‐Day Physical Activity Recall (3DPAR). This is a self-report developed by Pate, Ross,
Dowda, Trost, and Sirard (2003), and based on the based on the Previous Day Physical Activity
Recall (PDPAR). The purpose of this report is for the subject to evaluate his or her the time spent
in physical activity and type of physical activity in the last 3 days (one weekend and two
weekdays).

Do Physical Activity, Sedentary Behaviors, and Nutrition Affect Healthy Weight 15
CHAPTER 2
REVIEW OF THE LITERATURE
Childhood and Adolescent Obesity
Trend in Obesity. The development of industry, such as transportation and
communication technology, affects human life, allowing us to reduce the need for physical labor
and movements (Hallal et al., 2012). Conveniences provide people with time- and money-saving,
but the effects do not directly benefit the function of the human body. In other words, while the
quality of our lives continues to develop, the human body does not develop unless it is activated
through bodily activities (Booth, Laye, Lees, Rector, & Thyfault, 2008).
The obesity problem is no longer an individual problem, but a global problem. The
obesity epidemic increased in most developed countries from 1970 to 1990 (Sassi, Devaux,
Cecchini, & Rusticelli, 2009), and many developing countries have also seen an increase in
obesity prevalence since 1990 (Finucane et al., 2011). The World Health Organization (WHO)
alerted that over 2 billion overweight people aged 15 years would exist, and 700 million obese
people in the world would also exist by 2015 (WHO, 2010a). According to an update report on
obesity by Organization for Economic Co-operation and Development (OECD) (2014), the
obesity rate of adults in OECD countries was less than 10% until 1980, while the obesity rate of
adults in 2012 was 18.4%. As a result of world trends in obesity, one noticeable fact was that the
obesity rates of the United States, Australia, and England rapidly increased since the 1990s,
while the increase of the obesity rates in other countries maintained a more stable pace. In fact, a
recent study explained that in 2009-2010, the obesity rate of adults in U.S was 35.5-35.8%
(Flegal et al., 2012). Although the obesity rate between the mid-2000’s and 2010 was not
significantly increased, the obesity rate in the United States is still highest in the world.

Do Physical Activity, Sedentary Behaviors, and Nutrition Affect Healthy Weight 16
Olshansky et al. (2005) mentioned that the obesity problem can be one of the leading causes of
decreased life expectancy, and there are no countries that are not in danger of an increased
obesity problem.
The U.S. Government has collected and presented data to emphasize the seriousness of
the obesity problem by using reliable national surveillances. The popular surveillances are
Behavioral Risk Factor Surveillance System (BRFSS), National Health Interview Survey
(NHIS), and National Health and Nutrition Examination Survey (NHANES) (Whitt-Glover,
Taylor, Heath, & Macera, 2007) (Table 1). The resulting data on the obesity rate through these
surveillances indicated a 26.8%-35.7% increase in 2008-2011, which shows similar results to
data from worldwide organizations such as WHO or OECD.
Table 1
Introduction of National Surveillances BRFSS NHIS NHANES
Type of
Survey
Telephone Home-based interview Combining interviews,
physical examinations,
and laboratory testing
Questions Current health-related
perceptions, behaviors,
and socio-demographic
questions
Chronic conditions,
health behaviors, and
health status questions
Socio-demographic,
socio-economic,
nutritional, and health
behavior questions
Response
Rate
53.3% in 2008 60.8% in 2010 72.6% (Interview) and
69.5% (Examination) in
2011-2012
Result Adult aged 18 and older:
26.8% (BMI≥30) in 2008
Adult aged 18 and older:
28% (BMI≥30) in 2011
Adult aged 18 and older:
35.7% (BMI≥30) in 2010

Do Physical Activity, Sedentary Behaviors, and Nutrition Affect Healthy Weight 17
Specifically, based on the BRFSS in 2009-2010, Finkelstein et al. (2012) expected that
obese people will comprise 51% of the entire population in the U.S. by 2030, calculated by using
regression modeling based on explanatory variables such as the price of food market or
individual-level variables affecting obesity prevalence. Compared to the result of BRFSS in
1990, 2000 and 2008, the currency of obesity in 2008 was much severer than in 1990, increasing
from 11.1% to 26.8% (BMI≥30), and from 0.8% to 3.5% (BMI≥40) (Finkelstein et al., 2012).
Based on BRFSS results, Prospective Studies Collaboration (2009) reported that the continuous
increase of obesity rate, especially those who have over 40 BMI, will have a shorter life
expectancy and higher medical costs for treatment, resulting in a low quality of life. 2011 NHIS
report revealed that 34% of adults (≥18 years) were overweight and 28% were obese (Gu,
Charles, Andrew, Ma, & Burchfiel, 2013). Also, the percentage of underweight women was
more than twice the percentage of underweight men although the obesity rates of men and
women were almost the same (Gu et al., 2013). Lastly, the result of the 2009-2010 NHANES
report indicated that obese adults comprised 35.7% and obese children and adolescents, 16.9%
(Flegal et al., 2012). The American Heart Association (2013a) analyzed data that indicated the
obesity rate in male youth in 2010 increased by 5% compared to 2000, although there was no
difference in female youth.
More seriously, the obesity rate in West Virginia (WV) was 33.5%, which is 8% higher
than the nationwide average (Herath & Brown, 2013). In 2005, West Virginia’s Healthy
Lifestyle Act revealed the obesity rate (BMI equal to or greater than 95 percentile) in 2007-2009
comprised 18.5% of students in kindergarten, 22.1% of second graders, and 29.6% of fifth
graders (Tomblin & Lewis, 2011). According to WV Coronary Artery Risk Detection in
Appalachian Communities (CARDIAC) Project (2002-2006), the obesity rate (BMI at ≥ 85

Do Physical Activity, Sedentary Behaviors, and Nutrition Affect Healthy Weight 18
percentile) of fifth graders in WV was 48.1%, and the obesity rate of children with overweight
rose from kindergarten (35%) to second graders (37.8%) (Harris & Neal, 2009). In addition, the
obesity rate (BMI equal to or greater than 95 percentile) of the eligible fifth grade population was
an average of 28.3% from 1998 to 2012, which was similar to results (29.6%) reported in data
from West Virginia’s Healthy Lifestyle Act in 2007-2009.
The CDC announced that West Virginia is one of the states with the most obesity in the
United States; it has a 35.5% obesity rate among children ages 10-17 (Eaton et al., 2012).
According to West Virginia’s and the United States BRFSS report, the obesity problem in West
Virginia has been always more serious than the nationwide average since 1995 (Tomblin &
Lewis, 2011). The high obesity rate in West Virginia causes serious adult diabetes and heart
disease (Kung, Hoyert, Xu, & Murphy, 2008). Amarasinghe, Brown, D’Souza, and Borisova
(2006) revealed that some variables causing obesity in West Virginia could be poor accessibility
to food stores and gyms, lack of education, inconvenient public transportation, and low income.
In addition, despite the high risk of obesity in West Virginia, two thirds of the population in
West Virginia lives in rural areas residing wholly within Appalachia, making it difficult to access
healthcare (Retrieved from http://muafind.hrsa.gov/index.aspx). This environmental barrier can
be overcome by a state-wide network in the areas that allows for the sharing of information and
cooperation between counties. Considering the regional limitations and lower income than other
states, health surveys in West Virginia should be more developed and have an important value to
provide appropriate interventions.

Do Physical Activity, Sedentary Behaviors, and Nutrition Affect Healthy Weight 19
Consequences of Obesity. The terms overweight and obesity refer to increased amounts
of body fat, generally measured by the body-mass index (BMI). Obesity is commonly associated
with negative effects on health, economy, and social consequences, including discrimination
(Wellman & Friedberg, 2002).
Impact on Global Health. Caloric imbalance is the main cause of being obese (Karnik &
Kanekar, 2012). The popularity of processed food and the high prevalence of physical inactivity
have caused a distinct growth of heart disease, various cancers and other health problems in all
countries regardless of developed and developing status (Vucenik & Stains, 2012; Popkin, 2003).
In addition, stress can cause increased food intake: thus, obesity is affected not only by
imbalance between calorie intake and calories consumed, but also by psychological problems
such as stress (Epel et al., 2004).
Obesity causes cardiovascular diseases and various mental health problems (Reilly et al.,
2003). People who are obese and overweight have a high risk of hypertension, dyslipidemia,
insulin resistance, and diabetes mellitus, compared to those of lower weight status (Poirier et al.,
2006). Obesity is also associated with Type 2 diabetes. If fact, more than 80% of patients with
Type 2 diabetes are also obese (Wild, Roglic, Green, Sicree, & King, 2004). Lastly, obesity is
strongly related to mental health problems although obesity is not a direct psychological disease.
In fact, obesity is generally referred as important stressor in people’s life (Gundersen, Mahatmya,
Garasky, & Lohman, 2011).
Many societies are faced with early mortality and morbidity linked to chronic diseases,
due to the obesity epidemic. Nations need to address this concern by providing adequate public
policies and health services, which require discretionary effort and resources that are often
lacking or non-existent (Rokholm, Baker, & Sørensen, 2010).

Do Physical Activity, Sedentary Behaviors, and Nutrition Affect Healthy Weight 20
Impact on Global Economy. Nguyen and El-Serag (2010) claimed that the obesity
epidemic causes serious damage to economies due to healthcare costs, and will be one of the
most crucial global issues during the next several decades. Furthermore, obesity imposes a
considerable economic burden; billions of dollars every year are spent on health care costs,
threatening the long-term viability of the global economy (Cawley, 2010; Yach, Stuckler, &
Brownell, 2006). The McKinsey Global Institute (MGI) reported that obesity impact is $2.0
trillion, or 2.8% of the whole global economy, which has a similar economic impact as smoking
(Dobbs et al., 2014). The burden of healthcare in developing countries is serious. For example,
people in Tanzania, a developing country, have had to spend 25% of individual income for
healthcare (Neuhann, Warter-Neuhann, Lyaruu, & Msuya, 2002)
Both direct and indirect costs should be examined to determine total medical costs. Direct
costs, which include prevention, diagnosis, and treatment in medical institutions (Friedman &
Fanning, 2004), have the biggest impact on the economy (Hammond & Levine, 2010). The sum
of $75 billion was assessed as the additional medical costs of obesity every year in the U.S.,
constituting 4-7% of whole healthcare expenses (Finkelstein, Fiebelkorn, & Wang, 2004). This
burden has caused 46% increased inpatient costs compared to healthcare costs of normal-weight
people (Finkelstein et al., 2009). Many studies predicted that if obesity continues to increase as
fast as it is now, society would suffer considerable indirect costs from obesity due to early
retirement, resulting in higher costs than medical costs (Finkelstein, Dibonaventura, Burgess, &
Hale, 2010; Trogdon, Finkelstein, Hylands, Dellea, & Kamal‐Bahl, 2008).
Another impact of obesity includes significant productivity costs. Hammond and Levine
(2010) suggested that there are four different factors due to obesity that affect productivity
negatively, including absenteeism, presenteeism, disability, and premature mortality. Another
Do Physical Activity, Sedentary Behaviors, and Nutrition Affect Healthy Weight 21
indirect financial consequence of weight gain is additional airline fuel, calculated to be almost
300 million dollars in the year 2000 (Dannenberg, Burton, & Jackson, 2004).
Impact on Social Consequences. It is not easy to determine whether social and
psychosocial variables have an impact on increased obesity because the previous research has
depended on short-term studies (Scott, Melhorn, & Sakai, 2012). In recent years, however, some
studies revealed that adults with low social support caused ≥10% body mass index (BMI), and
even growth in their waist circumferences (Kouvonen et al., 2011). This means that low social
support affects potential variables which cause obesity, such as lack of information or eating
excessively, resulting in negative effects on health. In addition, the discrimination caused by
obesity at school, in the workplace, and even at home is one of the serious social problems.
Many people tend to think that obese people are lazy, because having a beautiful, slim body is
considered important in a competitive society, causing socially and psychologically large
burdens to obese people (Wellman & Friedberg, 2002).
Psychosocial impacts caused by obesity generally include the realms of socioeconomic
status, self-esteem, social support, and personal relationships with friends and family (Russell-
Mayhew, McVey, Bardick, & Ireland, 2012). First, the association between obesity and
socioeconomic status is complicated; one study found that it is not clear that there are differences
between obesity prevalence and socioeconomic status (Zaninotto, Head, Stamatakis, Wardle, &
Mindell, 2009). In addition, studies related to the effects of geographical neighborhood are also
limited because it is not easy to gather data regarding participants’ neighborhood conditions
(Singh, Kogan, Van Dyck, & Siahpush, 2008). In contrast, an inverse relationship between self-
esteem and obesity is relatively clear (Wang & Veugelers, 2008). Puhl and Latner (2007) found
that there was a significant difference between obese and normal weight children in terms of

Do Physical Activity, Sedentary Behaviors, and Nutrition Affect Healthy Weight 22
self-esteem. Despite the controversial relationship between obesity prevalence and psychosocial
variables, if these psychosocial variables are formed as stressors, they will lead to increased
weight gain (Cohen, 2005; Steptoe et al., 2002). For example, low income was related to higher
risk of childhood overweight and obesity (Gundersen et al., 2011; O’Dea, Hoang, & Dibley,
2011). Also, obesity prevalence has caused negative emotional conditions such as worries,
loneliness, and high-risk behaviors, which affect the quality for a healthy life (Tsiros et al., 2009)
causing a high risk of suicide (Heneghan, Heinberg, Windover, Rogula, & Schauer, 2012). As
mentioned above, psychosocial impacts caused by obesity are so complicated that approaches to
deal with obesity should be discretely provided. In fact, the improvement of psychosocial
outcomes was achieved by approaches that emphasized weight-neutral meaning a person does
not gain or drop, rather than weight-loss (Bacon & Aphramor, 2011).
School-Based Health Interventions for Obesity Prevention. There have been many
family-, school-, community-, and hospital-based interventions to deal with obesity problems
(Karnik & Kanekar, 2012). Some studies examined interventions for obesity prevention, and
observed that most interventions were school-based (Hollar et al., 2010). They mentioned that
school-based health interventions not only are cost-effective, but can use both physical activity
and nutritional interventions at the same place (Hollar et al., 2010). According to the systematic
review of Brown and Summerbell (2009), there were 38 studies focusing on school-based
interventions such as exercise, nutrition, and combined diet and exercise. Targets for health-
related interventions generally focused on young students at schools because healthy conditions
at a young age positively contribute to adult life (Branscum & Sharma, 2012). Sharma (2006)
investigated school-based health interventions conducted between 1999 and 2004. He found that
most of the interventions focused on the individual level for health promotion, rather than policy

Do Physical Activity, Sedentary Behaviors, and Nutrition Affect Healthy Weight 23
changes. Also, half the interventions focused on both physical activity and eating behaviors,
while 27% of interventions only focused on one component such as decreasing sweetened
beverages, decreasing television viewing, or increasing physical activity. Through these school-
based interventions, previous studies revealed that school-based physical activity interventions
decreased screen time and improved VO2 max (Dobbins et al., 2013), as well as reducing body
weight (Gortmaker et al., 1999).
One of the reasons to emphasize the importance of school-based health interventions is
that schools can provide more varied equipment or resources such as gymnasiums and green
spaces than any other facility (Branscum & Sharma, 2012). In addition, schools provide secured
places. In fact, the importance of school-based physical activity intervention is not only
explained by the health improvement for children and adolescents, but emphasized by positive
contributions such as decreasing drop-out rates, higher self-esteem, and improved classroom
environments (Mahar et al., 2006). However, in several developed countries, physical education
classes in schools have decreased since 1990 (Knuth & Hallal, 2009). Also, only 4.2% of
elementary schools in the United States encouraged all students to participate in daily physical
education (Kann, Brener, & Wechsler, 2007). Although the purpose of schools is not only to
improve students’ health, the fact that the obesity issue causes a huge burden on society
challenges schools to provide opportunities for preventing of obesity (Story, 1999). Resnicow
(1993) also pointed out that most students aged 5 to 17 are enrolled in school, making it possible
to follow students for over ten years although many parents still consider clinics to be institutions
which monitor their children’s health.
Most of school-based interventions to prevent obesity actively use school facilities such
as school grounds. Students spend most of their time exercising on school grounds or in the
Do Physical Activity, Sedentary Behaviors, and Nutrition Affect Healthy Weight 24
gymnasium during break time as well as lunch hour (Cradock, Melly, Allen, Morris, &
Gortmaker, 2007). Therefore, studies emphasized providing both proper hard playgrounds and
green areas because sports appropriate for hard courts and sports for green surfaces are different.
Jones et al. (2010) found that playgrounds, such as the surface or slope of playgrounds, designed
appropriately by each sport’s characteristics increased moderate to vigorous physical activity
(MVPA). The increased school facilities and equipment were also positively correlated with time
spent in physical activity (Haug, Torsheim, Sallis, & Samdal, 2010). Especially, availability of
game equipment during break time or lunch hour increased time spent in physical activity as well
as MVPA (Haerens et al., 2007).
After school programs are one of the representative interventions for obesity prevention
in school. Smith (2007) found that almost 6.6 million youth participate in after school programs
and 22 million parents were interested in the programs. According to a meta-analysis analyzing
studies published between 1980 and 2008, large numbers of studies recognized physical activity
in schools as after school programs and they found that after school programs improved physical
activity level as well as health-related aspects (Beets, Beighle, Erwin, & Huberty, 2009).
Similarly, the popularity of school garden programs for obesity prevention is also growing
because many previous studies found that health eating is strongly associated with obesity
prevention as well as improved quality of life (Blair, 2009). Ratcliffe, Merrigan, Rogers, and
Goldberg (2011) suggested several advantages of school garden programs. Specifically, schools
can improve existing curriculum by integrating with nutrition, environmental studies, or physical
education, making it possible for teachers to teach students effectively. Also, they mentioned that
students can understand knowledge of healthy eating and nutrition more easily by experiencing

Do Physical Activity, Sedentary Behaviors, and Nutrition Affect Healthy Weight 25
planting, nurturing, and harvesting fruits and vegetables in the school garden. This direct
experience encourages students to increase healthy eating’s interest.
Among school-based health interventions developed by Allensworth and Kolbe (1987),
family and community linkages are also a noteworthy component. Family and community
linkages include parental involvement, incorporating individuals (friends, teachers, and parents)
in the students’ environment, and incorporating environments (home, school, and community).
Story (1999) said that the collaboration between school, parent, and community is essential for
students in order to increase physical activity and change eating behaviors. He also said that the
effects of school-based health intervention may be decreased if only intervention in school
settings is emphasized. Interestingly, there was no difference in the amount of time spent in
physical activity in school between overweight, obese, and even normal-weight children,
meaning that the time difference for physical activity between them is caused by their families at
home (Hunter, Steele, & Steele, 2008). Therefore, understanding the relationship between
school, parent, and community can be a first step to using interventions for students effectively.
Lastly, the legislation addressing children and adolescents’ health at schools is one of the
effective interventions to prevent obesity. Direct or indirect forms can be included in the
legislation. For example, schools can provide increased physical education classes and ample
sport experiences based on direct legislation, they can not only encourage students to increase
their health-related knowledge, but build environments to secure safety for after- and before-
school physical activity programs recommended by indirect forms of legislation (Katzmarzyk et
al., 2008).

Do Physical Activity, Sedentary Behaviors, and Nutrition Affect Healthy Weight 26
Physical Activity/Inactivity in Adolescents
Trends in Physical Activity/Inactivity. Physical activity is one of the most important
solutions to overcome the obesity epidemic world-wide (Barreto, 2013) because it is an
inexpensive and easily accessible solution to prevent obesity, while physical inactivity is one of
the main reasons of death throughout the world (Kohl et al., 2012). Currently, one third of
children and adolescents are physically inactive (Ekelund et al., 2012), and 58% of people in the
world do not meet the physical activity guidelines which recommend spending 150 minutes with
in moderate-intensity physical activity a week (U.S. Department of Health and Human Services,
2008a). In 2002, physical inactivity led to 1.2 million deaths (Brownson, Boehmer, & Luke,
2005), and currently leads to approximately 3.2 million deaths annually (Church et al., 2011),
resulting in physical inactivity being the fourth leading risk factor for mortality (WHO, 2003). In
fact, 6-10% of all deaths from non-communicable diseases (Das & Horton, 2012), 20% of
cardiovascular diseases, and 10% of strokes (WHO, 2002) were caused by physical inactivity.
According to one study dealing with physical inactivity in 76 countries, the prevalence (27.8%)
of physical inactivity in most developed countries was much higher than the less developed
countries (18.7%), and physical inactivity of women (23.7%) and elderly individuals were also
much more prevalent than for men (18.9%) and young individuals (Dumith, Hallal, Reis, & Kohl
III, 2011).
The U.S. government leads three representative surveillances for public health including
the Behavioral Risk Factor Surveillance System (BRFSS), National Health Interview Survey
(NHIS), and National Health and Nutrition Examination Survey (NHANES). According to these
surveillances, those who participated in 150 minutes per week were 51.6% (CDC, 2013b). The
other two surveillances also reported that those who are physically active were 30.2% (NHIS,

Do Physical Activity, Sedentary Behaviors, and Nutrition Affect Healthy Weight 27
1998-2007) and 33.5% (NHANES, 1999-2006) (Li et al., 2012). The reason for the difference
between surveillances is that each process and questionnaire for the surveillances were
conducted differently. West Virginia is a unique state because most parts of this state are covered
by the Appalachian Mountain. This regional characteristic causes environmental limitations for
physical activity. According to WV Health Statistics Center (2011), people (n=2,100) in West
Virginia (WV), who participated in 150 minutes per week, were only 43.0% while other states
were average 51.6%. CDC (2012b) also reported that only 22.6% of adolescents in WV
exercised 60 minutes per day with a moderate to vigorous intensity level. In this overall
perspective, it is remarkable that the prevalence of physical inactivity (not participating in any
physical activity for one week before an interview), reported by Youth Risk Behavior
Surveillance System (YRBSS) in 2009, has decreased to 17.3% in 2009 since 24.3% of all
students in the 2005 survey (Tomblin & Lewis, 2011). Recently, the WV Health Statistics Center
(2012) showed that 31% of adults in WV had no physical activity or exercise, which was one of
the highest states in the United States (national average: 23.5%). More specifically, 14.8% of
persons aged 18-24 engaged in no physical activity, compared to 35.2% of those aged 55-64.
We know physical activity positively affects our bodies, while physical inactivity, which
is sedentary behavior, negatively causes not only health conditions such as obesity and coronary
heart diseases (Lee et al., 2012), but a decrease in cognitive function, and lower academic
achievement among children and adolescents (Burkhalter & Hillman, 2011). The relationship
between physical activity, physical inactivity, and sedentary behavior is a little unclear. First of
all, physical activity and physical inactivity have an inverse relationship. Physical activity
generally means human movements with energy expenditure, such as walking, jogging, or
running. Physical inactivity means that one does not meet minimum physical activity guidelines
Do Physical Activity, Sedentary Behaviors, and Nutrition Affect Healthy Weight 28
or requirements (Katzmarzyk et al., 2008). Physical inactivity and sedentary behavior are
broadly similar. However, physical inactivity is mentioned as insufficient amounts of moderate-
to-vigorous physical activity (MVPA) (Katz et al., 2011), while sedentary behaviors include,
specific activities such as sleeping, playing computer games, or watching television, which are
considered activities at a resting level (Pate, O'Neill, & Lobelo, 2008).
Physical activity is important for both adults and children, but physical activity for
children may be emphasized more than adults because children’s behaviors or attitudes for
physical activity directly affect their future lives (Laguna et al., 2013). Therefore, the prevalence
of physical inactivity throughout the world increases the need for developed policies and action
plans for health. (Twisk, Kemper, & Mechelen, 1997). Kohl et al. (2012) said that 73% of
countries have plans, interventions, and policies to improve the level of physical activity for
people’s health. Also, WHO emphasized the importance of school-based intervention, and
considered the school curriculum, educational policy, and guidelines as key points to improve
children and adolescents’ health; WHO reported almost half of children and adolescents did not
meet current guidelines for physical activity participation (WHO, 2004).
Harrison and Jones (2012) emphasized environmental changes to promote physical
activity. One example of intervention associated with physical activity environment is the
development of roads between schools and homes (Sluijs et al., 2011). They pointed out that
road networks securing safety between school and home can encourage students to walk and use
bicycles, resulting in promoting health as well as preventing environmental pollution. However,
Ham, Martin, and Kohl (2008) found that only 16.2% of students aged 5 to 18 walked or biked to
travel to their schools in 2001, compared to 42% in 1969. The reason showing low percentage of
walking or biking during before and after school is that parents were uncertain about road safety
Do Physical Activity, Sedentary Behaviors, and Nutrition Affect Healthy Weight 29
because of complex crossroads and narrow walkways (Timperio, Salmon, Telford, & Crawford,
2005). Therefore, schools and communities need to secure road safety as well as parents’ traffic
guidance for students to travel to their schools. As introduced above, walking is one of the
popular examples used to promote physical activity. It is easy to do, is not interrupted by
facilities or places, and is economical exercise (Monteiro et al., 2003). Although it is already
known that walking is the most effective and convenient intervention for health, only 64.1% of
adults walked for minimum 10 minutes every day (Hallal et al., 2012). Specifically, they
reported that while adults in the Americas (66.9%) and Europe (66.8%) had at least 10-minute
walk, adults in Africa were only 57%. These results mean that over one third of the adults in the
world do not meet a 10-minnute walk for per day. Active transportation is one of the easiest
ways to achieve 10-minute walk for per day (Manson et al., 1999). In fact, the importance of
active transportation has been emphasized when children and adolescents go to school and come
home from school (McDonald, 2007). Some studies reported that active transportation to school
was an effective way to reduce BMI and cardiovascular risk factors although removing factors
which threaten the security of active transportation should be the first priority of schools and
communities (Andersen, Lawlor, Cooper, Froberg, & Anderssen, 2009).
For promoting physical activity, several physical activity guidelines for children include:
1) Healthy People 2010 (U.S. Department of Health and Human Services, 2000), which suggests
that childhood and adolescents should participate in vigorous physical activity at least three or
more days per week with a minimum of 20 minutes per occasion, 2) The 2008 Physical Activity
Guideline for Americans, which recommends that time spent doing physical activity with
moderate and vigorous intensity should be at least 150 minutes a week, and doing muscle-
strengthening activities should be at least 2 days a week for adults (Carlson, Fulton, Schoenborn,
Do Physical Activity, Sedentary Behaviors, and Nutrition Affect Healthy Weight 30
& Loustalot, 2010), 3) Healthy People 2020, which mentioned that at least an hour of daily
aerobic activity is recommended for adolescents (U.S. Department of Health and Human
Services, and Office of Disease Prevention and Health Promotion, 2012), and 4) the CDC
(2011a), which also announces that children and adolescents should spend an hour a day in
physical activity.
To evaluate physical activity guidelines, related questionnaires have been developed.
Most questionnaires before the 1990s only measured physical activity during leisure time or at
school or in the workplace. These questionnaires could not exactly estimate daily physical
activity because each movement has different types and intensities of physical activity
(Hagströmer, Oja, & Sjöström, 2006). However, the technology for physical activity assessment,
as well as the importance of health, have developed sedentary behavior, and nutrition assessment
tools since 1990s (Vanhees et al., 2005). In the late 1990s, an International Consensus Group
developed the international physical activity questionnaire (IPAQ) to measure physical activity
worldwide, and the validity and reliability of the questionnaire throughout 12 countries was
assessed (Booth et al., 2003). The IPAQ is a self-report, is divided into two forms (short and
long), for people aged 15 to 69 as the target population, and includes questions about physical
activity and sitting time. The only difference between two forms is the number of questions
(short: 7, long: 27) (IPAQ Research Committee, 2005). The reason why the IPAQ is more
valuable is that researchers was able to first start measuring global patterns of physical activity
and sedentary behaviors (Bauman et al., 2011). The three day physical activity recall (3DPAR) is
more specific questionnaire which can measure physical activities performed for the past three
days (Weston, Petosa, & Pate, 1997). The 3DPAR was developed by Pate et al., (2003) and
includes: 59 activities such as homework, basketball, eating, and sleeping; 4 different intensities

Do Physical Activity, Sedentary Behaviors, and Nutrition Affect Healthy Weight 31
such as rest, light, moderate, and vigorous; and 34 blocks of time (30 minutes per block) from 7
a.m. to midnight. The 3DPAR is a self-report instrument, so students record what they did during
the three days prior to reporting (one weekend and two weekdays) (Stanley, Boshoff, &
Dollman, 2007). Unlike self-report instruments such as questionnaires, technological
developments generate more objective and observable instruments through computer or video
(Tudor-Locke, Ainsworth, Thompson, & Matthews, 2002). Accelerometers are one of the
instruments to use technologies, and make it possible to measure the frequency, duration, and
intensity of physical activity more objectively, as well as remove recall bias that is the limitation
of self-report instruments (Chen, Chou, Yu, & Cheng, 2008). Although accelerometers are
widely used because of their ability to gather and monitor physical activity objectively, they are
relatively expensive and require technical skills to manage, update, and analyze (Tudor-Locke &
Myers, 2001). Pedometers can be considered as an alternative to accelerometers. Pedometers are
much less expensive than accelerometers and can be used simply, though they cannot measure
intensity and type of physical activity (Tudor-Locke et al., 2002). The accuracy of the pedometer
to explain physical activity has already been proved by many studies (Bassett et al., 1996;
Hendelman, Miller, Baggett, Debold., & Freedson, 2000), so researchers can use either the
accelerometer or pedometer to monitor physical activity according to financial or environmental
situations.
Sedentary Behaviors in Adolescents
Trends in Sedentary Behaviors. With technology advancing at a fast rate, industrial
automation and mechanization decrease physical labor and increase office work, resulting in a
proliferation of sedentary behaviors (Lanningham-Foster, Nysse, & Levine, 2003). Hallal et al.
(2012) reported 41.5% of adults in the world spent 4 or more hours sitting for a day. Specifically,

Do Physical Activity, Sedentary Behaviors, and Nutrition Affect Healthy Weight 32
adults in Europe (64.1%) and the Americas (55.2%) spent 4 or more hours sitting for a day,
while adults in Southeast Asia spent 23.8%. Sedentary behaviors are generally defined as low
energy expenditure (≤1.5 METs: desk work, light housework, or washing clothes) or lack of
physical activity (Sedentary Behavior Research Network, 2012). Sedentary behaviors include all
behaviors at the level of rest, such as: computer/video games, sitting, reading, watching
television, sleeping, or driving a car (Owen, Healy, Mathews, & Dunstan, 2010). However,
sedentary behaviors are not the opposite of physical activity because sedentary behaviors are
determined by the intensity of behaviors (Katzmarzyk et al., 2008).
As many studies reported, people in the United States spend much time in sedentary
behaviors. Although the Bar-On et al. (2001) recommends children aged 2 years and older spend
less than 2 hours per day on screening time, approximately half the children in the United States
spend more than 2 hours watching television per day (Council on Communications and Media,
2011). Specifically, children aged 6-11 spent 7.1 hours in sedentary behaviors, while adolescents
aged 16-19 spent 8.3 hours (Sallis et al., 1997). This result indicated that the time spent in
sedentary behaviors increased as children got older. The 2011 Youth Risk Behavior Surveillance
System (YRBSS) announced that high school students in the U.S. spend more than 2 hours daily
watching television and playing computer games, 31.1% and 32.4%, respectively (Eaton et al.,
2012). This result means that one third of high school student spend considerable time with
computer and television at home after school. The American Academic of Pediatrics (AAP)
emphasizes that the children’s parents can play an important role in reducing sedentary behaviors
such as screen time and computer use because most sedentary behaviors occur at home (Council
on Communications and Media, 2011).

Do Physical Activity, Sedentary Behaviors, and Nutrition Affect Healthy Weight 33
West Virginia is one state where people spend much more time in sedentary behaviors
than people in other states. The 2011 Youth Risk Behavior Survey showed that 32.2% of high
school students in West Virginia spent more than 3 hours playing computer games, and 31.2% of
them spent more than 3 hours watching television per day, while the national average for playing
computer games and watching television was each 28.8% and 29.5%, lower than in West
Virginia (Eaton et al., 2012). In addition, the National Resource Center for Health and Safety in
Child Care and Early Education (2013) found that of childcare facilities in West Virginia state
childcare facilities, only 8.5% met standards for physical activity and sedentary behaviors,
recommended by several associations such as the American Public Health Association.
Sedentary behaviors are not a minor problem because sedentary behaviors in the United
States have had a negative effect on social and health problems (Owen et al., 2010). For
example, time spent in sedentary behaviors is associated with a level of depression and low
satisfaction with life (Rhodes, Mark, & Temmel, 2012). 5.9% of all deaths could even be
explained by sedentary behaviors such as sitting time, which means that this result is relatively
higher than deaths caused by obesity (5%) (Chau et al., 2013). Of sedentary behaviors, television
viewing has been the most studied behavior, followed by sitting and computer/video games
(Rhodes et al., 2012). Specifically, time spent viewing television is strongly related to increased
BMI (Danner, 2008), and is associated with a lower than recommended levels of physical
activity (Sugiyama, Healy, Dunstan, Salmon, & Owen, 2008).
Recently, many studies based on the ecological framework suggest strategies or
interventions to reduce time spent in sedentary behaviors. Healy et al. (2008) found that the
relationship between sedentary behaviors and light-intensity physical activity was negatively
correlated, suggesting that the best way to discourage sedentary behaviors may be to recommend

Do Physical Activity, Sedentary Behaviors, and Nutrition Affect Healthy Weight 34
light-intensity physical activity. In addition, sit-stand workstations for workers results in
reduction in sitting time (Pronk, Katz, Lowry, & Payfer, 2012). Most studies for interventions to
decrease sedentary behaviors have focused more on childhood and adolescents than adults
(Salmon, Tremblay, Marshall, & Hume, 2011). The prevalence of a sedentary lifestyle on
children and adolescents is globally increasing because childhood and adolescents are generally
sensitive to the latest trends and fashions, so that they sit at the computer and television to obtain
social information (Kautiainen, Koivusilta, Lintonen, Virtanen, & Rimpela, 2005). School-based
interventions can also be effective. Educational messages or curricula about turning off
television or improving physical activity may be a good approach to prevent childhood obesity
(Robinson, 1999).
Nutrition in Adolescents
Trends in Nutrition. National Health and Nutrition Examination Survey (NHANES)
announced that energy intake increased 168 kcal/d for men, and 335 kcal/d for women, between
1971 and 2000 (Hill, Wyatt, & Peters, 2012). The increased energy intake means the change of
dietary patterns. Dietary patterns have been rapidly changing for the past few decades in the
world; the changes include increased intake of fat, sugar, and edible oil (Popkin, 2001). For
example, sweetener consumption showed 74kcal/d increase between 1962 and 2000 (Popkin &
Nielsen, 2003). Western-style fast food is considered nutrition which causes obesity, diabetes,
and cardiovascular diseases (Pan, Malik, & Hu, 2012). CDC (2012b) showed that 71.9% of
adolescents in West Virginia had fruit consumption including 100% fruit juice less than twice a
week, and 34.5 of them drank sweetened beverages at least one or more times for a day. These
eating behaviors in West Virginia led to its designation as one of the top unhealthy states in the
United States (Pan et al., 2012). According to 2010 Dietary Guidelines for Americans, the
Do Physical Activity, Sedentary Behaviors, and Nutrition Affect Healthy Weight 35
recommendation is to eat 5 to 13 servings of fruits and vegetables per day, and to avoid soft
drinks.
Sugar-Sweetened Beverages (SSB) consumption is the strongest and the most serious
issue to have a negative influence on health such as obesity, diabetes and cardiovascular diseases
(Malik et al., 2006). It is hard to find non-SSB around us because SSB can include soda,
sweetened waters and teas, sports and energy drinks, and fruit juice (not 100% juice), which are
substantial contributors to calorie intake (Reedy & Krebs-Smith, 2010). In fact, Block (2004)
mentioned that SSB consumption for both children and adults has shown a 500% increase
between 1947 and 1999, and overtook milk consumption in the late 1990s. The age group which
most frequently drinks SSB is adolescents aged 12-19 years. 70% of boys and 60% of girls drink
SSB every day (Ogden, Kit, Carroll, & Park, 2012). Another result revealed that 65% of high
school students in U.S. drank SSB at least once or more every day, and even 22% of adolescents
drank SSB three times or more every day (Park et al., 2012).
According to CDC, 79% of middle and high schools in 27 states of U.S. offer school
vending machines which sell sugar-sweetened beverages (SSB) (Kann, Grunbaum, McKenna,
Wechsler, & Galuska, 2005). In addition, School Health Profiles 2010 (Brener et al., 2011)
showed that over 50% of schools in West Virginia still permitted advertising and promotion of
poor nutritional foods such as fast foods or sweetened beverages. Staten et al. (2005) mentioned
that simply eliminating or decreasing the vending machines in schools may be the solution to
decrease SSB, but it is not easy for schools to follow the solution because the profits from the
vending machines are generally used to provide food service, club activities, or school events
such as graduation ceremonies. For these reasons, school policies have improved, showing the

Do Physical Activity, Sedentary Behaviors, and Nutrition Affect Healthy Weight 36
removal of vending machines and the prohibition of unhealthy foods in the school cafeteria, as
well as offering nutrition education (Lucarelli et al., 2014).
Generally, poor eating behaviors in children and adolescents are influenced by their
homes, schools, and communities (Glanz, Sallis, Saelens, & Frank, 2005). For example,
students’ accessibility to healthy foods at home affected less fat intake (Zive et al., 1998) and
more fruits and vegetables consumption (Larson et al., 2008). However, many studies
emphasized the importance of schools for good eating habits because 54% of students in U.S. ate
school breakfast or lunch in 2004 (United States Department of Agriculture, 2007). Specifically,
47% of the calories required for a day are generally consumed during school hours (Briefel &
Wilson, 2009). According to Hider (2001), one third of studies collecting data on environment-
based interventions to reduce energy intake were school-based, which mean that schools are an
important place for affecting children. Swinburn, Caterson, Seidell, and James (2004) introduced
several elements to contribute to the school food environment: school food policies, teacher and
staff training, offering recommendations for school food and drink choices, and health education.
Among these elements, policy changes at school settings are considered as one of the important
interventions to deal with the prevalence of obesity (Gostin, 2007). For example, a total of 34
states received legislation to restrict sale of foods and beverages based on Federal Government
regulation (Jaime & Lock, 2009), so soda sales in high schools were steadily decreased from
53.6% in 2006–07 to 25.3% in 2010–11 (Terry-McElrath, Johnston, & O’Malley, 2012). West
Virginia passed one of the most competitive foods standards laws in 1993. The standards
emphasized not only the restriction of food or drinks that contains 40% or more sugar by weight,
but the restriction of the increased vending machines and school events (Mello, Pomeranz, &
Moran, 2008). West Virginia now prohibits the sale of soft drinks through vending machines,

Do Physical Activity, Sedentary Behaviors, and Nutrition Affect Healthy Weight 37
school stores, or onsite fundraisers during the school day in areas accessible to students in
elementary and middle or junior high schools. During the school day, these schools are permitted
to sell only “healthy beverages,” defined as water, 100 percent fruit and vegetable juice, low-fat
milk, and other juice beverages with at least 20 percent real juice. For high schools that permit
the sale of soft drinks, the law also requires that “healthy beverages” must account for at least 50
percent of the total beverages offered and must be located near the vending machines containing
soft drinks.
Food environments around a school are as important as schools to determine health
behaviors. For example, Davis and Carpenter (2009) found that students ate less healthy food if
fast-food restaurants were around the school. Schools cannot control the number of fast-food
restaurants outside of schools. The barriers for students to obtain healthy foods were choice,
price, time, and accessibility (McKinley et al., 2005). Before schools provide healthy foods in
school canteens, they should encourage students to increase recognition of healthy foods.
Installing and managing school gardens can be a good example to promote changing nutritional
perception (Morris, Neustadter, & Zindenberg-Cherr, 2001). According to Morris and
Zidenberg-Cherr (2002), nutritional education using school gardens increased students’
preference for vegetables and fruits, resulting in promoting fruit and vegetable intake. However,
expensive equipment (Hesketh et al., 2005), unsafe facilities for physical activities (Cohen et al.,
2006) and low support from parents (Baue, Yang, & Austin, 2004) were critical barriers to
implementing school-based physical activity interventions. Additionally, the development of
mass media has worsened eating behaviors in children and adolescents. Kotz and Story (1994)
revealed that half of the advertisements such as television and radio were related to foods which
are high in calories, salt, and sugar. Through the advertisements, young children were more

Do Physical Activity, Sedentary Behaviors, and Nutrition Affect Healthy Weight 38
likely to acquire poor eating behaviors and wrong nutritional knowledge (Signorielli & Staples,
1997).
These poor school and home environments which increase the SSBs consumption have
rapidly increased in the past few decades, particularly due to the access and affordability of
sugar-sweetened beverages at fast-food restaurants (Han-Markey et al., 2012). Fast food intake is
a key contributor to explain the prevalence of obesity because fast food mostly has poor quality
nutrition, high calories, and much sodium (O'Donnell, Hoerr, Mendoza, & Goh, 2008). There are
almost 38,000 fast food restaurants such as KFC and McDonalds throughout the world,
contributing in no small part to the consumption of sodas which increased 12.6% between 1997
and 2007 (Pan et al., 2012). Even worse, the frequent fast-food restaurant visits with friends
make students’ health worse by drinking SSB at the restaurants (Wiecha, Finkelstein, Troped,
Fragala, & Peterson, 2006). Individual eating behaviors such as fast-food restaurant visits are
generally formed by friends because children’s and adolescents’ friendships play an important
role in forming health behaviors (Gifford-Smith, Dodge, Dishion, & McCord, 2005). The reason
the role of friends in adolescents cannot be overlooked is that lifelong eating patterns are formed
during adolescence (Ilich & Brownbill, 2010). Fast food intake is also affected by the family
dinner which is associated with healthy eating patterns (Gillman et al., 2000). Taveras et al.
(2005) said that there was the positive relationship between eating family dinner and low fat
intake because family members are able to become interested in other members’ foods, resulting
in their pursuing healthier foods as compared to habits of those eating alone.

Do Physical Activity, Sedentary Behaviors, and Nutrition Affect Healthy Weight 39
Relationship between Health Outcomes and Obesity
Relationship between Physical Activity/Inactivity and Obesity. Physical activity is
necessary for the normal growth of children. Many studies have emphasized the importance of
physical activity because it helps prevent obesity and reduce high risks of cardiovascular
diseases in children (Powell, Thompson, Caspersen, & Kendrick, 1987) and have revealed
several findings: boys spent more time in physical activity than girls (Sherman & Ruiz, 2001)
and obese and overweight children spent less time in physical activity and more time in
sedentary behaviors than normal-weight counterparts (Janssen et al., 2005). It is clear that
physical activity is positively associated with health, so recent physical activity guidelines
specifically focus on time spent in physical activities, as well as frequency and intensity. For
example, 2008 Physical Activity Guidelines for Americans recommended that youth participate
in at least an hour of physical activity daily by following physical activities: an hour a day of
moderate to vigorous intensity aerobic physical activity; an hour of muscle-strengthening
physical activity on at least 3 days of the week; and an hour of bone-strengthening physical
activity on at least 3 days a week. Despite nationally known guidelines, rapidly changing
environments and limited school facilities contribute to the reduction of physical activities,
resulting in obesity (U.S. Department of Health and Human services, 2008b).
Physical activity is mainly considered as one important factor causing obesity and has
been studied for decades by researchers although the relationship between physical activity and
energy expenditure directly affecting the development of obesity is still unclear (Cordain,
Gotshall, Eaton, & Eaton, 1998; DeLany, Kelley, Hames, Jakicic, & Goodpaster, 2014; Reilly et
al., 2004). For example, Maffeis, Zaffanello, Pinelli, and Schutz (1996) found that obese children
(BMI > 97th percentile) spent 100 minutes a day less being physically active than non-obese

Do Physical Activity, Sedentary Behaviors, and Nutrition Affect Healthy Weight 40
children. Laurson et al. (2008) found that children who did not meet physical activity
recommendations were three or four times more likely to be overweight than children of normal
weight. DeLany, Kelley, Hames, Jakicic, and Goodpaster (2013) found that individuals who
spent less time in MVPA decreased energy expenditure and gained more weight than normal
groups. Hughes, Henderson, Ortiz-Rodriguez, Artinou, and Reilly (2006) used accelerometers to
measure physical activity level, and found that total activity time (counts/min.) in obese children
(BMI > 98th percentile) was less 80 counts/min. than non-obese children. In contrast, Goran,
Reynolds, and Lindquist (1999) found that the relationship between physical activity and obesity
in cross-sectional design has been unclear because the amount of body fat is continually
changing during the growing process. Also, the common assessments used for physical activity
measurements are based on subjective forms (e.g., self-report and logs), which can have potential
limitations affecting results. For this reason, Gazzaniga and Burns (1993) found that obese
adolescents were more active than their counterparts. Also, some studies in cross-sectional
design showed various results by gender: BMI was negatively related to physical activity in only
boys (Ekelund et al., 2005) and only girls (Klein-Platat et al., 2005). Even so, some studies were
interested in level of physical activity in family members, rather than the children themselves.
For example, Fogelholm, Nuutinen, Pasanen, Myöhänen, and Säätelä (1999) found that high
level of physical activity in a family positively influences their children’s activity, resulting in
preventing obesity because family members can be a good models to encourage their children to
be active. These mixed results mean that researchers have to consider not only physical activity
type, intensity, and time, but biological and social influences such as family background,
simultaneously (H. Prentice-Dunn & S. Prentice-Dunn, 2012).
Do Physical Activity, Sedentary Behaviors, and Nutrition Affect Healthy Weight 41
Relationship between Sedentary Behaviors and Obesity. Sedentary behaviors have
been increasingly studied and are considered as an important risk factor for adolescent obesity.
In particular, increased sedentary behaviors among children continued after they reach
adolescence (Matthews et al., 2008). Robinson (1999) revealed that physical activity level was
not increased after sedentary behavior decreased, which means that sedentary behaviors can be
an independent factor in causing obesity. Many studies found that there was a positive
correlation between sedentary behaviors such as screen time and obesity. For example,
Sonneville and Gortmaker (2008) found that an hour increase in television viewing increased
106 kcal per hour in total energy intake in adolescents. Specifically, Anderson, Economos, and
Must (2008) found that overweight children spent more than 2 hours on screen time. Mitchell,
Pate, Beets, and Nader (2013) observed that increased time spent in sedentary behaviors was
associated with considerable increases in BMI from ages 9 to 15 years. In a birth cohort study
from New Zealand (Hancox, Milne, & Poulton, 2004), researchers found that when children
from ages 5 to 15 years spent additional an hour screen time per day, BMI was increased by 0.5
units at age 26 years. Graf et al. (2004) revealed that obese children spent 30% more time on
screen time than other children. Also, Hu, Li, Colditz, Willett, & Manson (2003) found that those
who spent over 40 hours per week in sitting were associated with increased BMI. Interestingly,
Oliver, Schluter, Rush, Schofield, and Paterson (2011) found that watching television every day
was associated with increased BMI, but the time spent in watching television was not related to
BMI. Also, Davison, Marshall, and Birch (2006) found that there was no significant relationship
between television viewing and BMI, but there was significant difference between them when
the data were analyzed longitudinally. For such studies, some studies showed mixed results or a
weak relationship between sedentary behaviors and obesity. Aires et al. (2010) used an

Do Physical Activity, Sedentary Behaviors, and Nutrition Affect Healthy Weight 42
accelerometer to measure sedentary behaviors and found that there was no difference between
overweigh and other children. Kautiainen et al. (2005) found a weak relationship between
increased time spent in playing computer and BMI. Therefore, Marshall, Biddle, Gorely,
Cameron, and Murdey (2004) mentioned that sedentary behaviors are multifaceted and may not
be accurately measured by one sedentary behavior such as television viewing.
Relationship between Nutrition and Obesity. Nutritional issues such as dietary factors
and food habits are among the important factors relating to obesity in children and adolescents
(Wang & Lobstein, 2006). In particular, the relationship between Sugar-Sweetened Beverages
(SSB) consumption and weight gain has been studied. Ariza, Chen, Binns, and Christoffel
(2004) found that 37% of non-obese children consumed soda at least one time a day, while 67%
of obese children consumed soda at least one time a day. Giammattei, Blix, Marshak, Wollitzer,
and Pettitt (2003) found that children who consumed soda more than 3 times a day had 4.4%
more body fat than their counterparts. Woodward-Lopez, Kao, and Ritchie (2011) analyzed 56
observational studies and found that about 75% of all studies (longitudinal and cross-sectional)
revealed the positive relationship between SSB and obesity. One longitudinal study conducted by
Mozaffarian, Hao, Rimm, Willett, and Hu (2011) investigated 120,000 people for 20 years. They
revealed that those who increased SSB consumption gained an extra pound every 4 years on
average. Ludwig, Peterson, and Gortmaker (2001) found that the risk of being overweight
increased 1.6 times for each additional SSB a day.
However, some studies still pointed out that the relationship between fruits/vegetables
consumption and obesity remain unclear. Wang, Ge, and Popkin (2003) found that only one
fourth of longitudinal studies showed inverse association between fruit/vegetable consumption
and obesity. Gibson (2008) also found no significant association between BMI and SSB. Dietary

Do Physical Activity, Sedentary Behaviors, and Nutrition Affect Healthy Weight 43
behaviors are multifaceted like sedentary behaviors, so it is hard to evaluate the association
between BMI and dietary behaviors accurately. In particular, self-evaluation for measuring
dietary behaviors is generally used, so more accurate evaluation systems to measure dietary
behaviors should be developed and applied.
Relationship between Multi-Component and Obesity. The relationship between health
behaviors and obesity has been studied a lot although personal characteristics (e.g., gender, age,
or region) in each study were differently examined. In particular, physical activity, sedentary
behaviors, and nutrition for behavior changes were emphasized by studies that focused on
obesity prevention because there is good evidence that these behaviors are strongly associated
with obesity and formed in the early life stages (Sanchez et al., 2007). Besides, many adolescents
do not meet recommendations for physical activity, sedentary behaviors, and nutrition, so the
importance of multiple health behaviors is continually growing (Hardy et al., 2012). Various
studies examined combined patterns between physical activity, sedentary behaviors, and
nutrition. Prochaska, Spring, and Nigg (2008) mentioned that interventions using multiple health
behaviors may be more cost-effective and maximize the effect on obesity prevention. National
Heart, Lung, and Blood Institute (2012) emphasized that a combination of increased physical
activity, reduced sedentary behaviors, and improved eating behaviors should be required to
decrease the risk of cardiovascular diseases as well as obesity. For example, sedentary-snaking
pattern increased the risk of obesity (Gubbels et al., 2012) and high level of physical activity
with healthy diet decreased the risk of obesity (Lioret, Touvier, Lafay, Volatier, & Maire, 2008).
Iannotti and Wang (2013) found that students who meet recommendations for physical activity
and sedentary behaviors consumed more vegetables and fruits than other students who do not
meet recommendations. However, Leech, McNaughton, and Timperio (2014) revealed that

Do Physical Activity, Sedentary Behaviors, and Nutrition Affect Healthy Weight 44
compared with studies using single intervention, studies dealing with multiple health
interventions led to inconsistent findings and found that results varied due to age, gender, or
personal characteristics. In fact, Iannotti and Wang (2013) mentioned that health minorities can
be the potential contribution of obesity, affecting healthy patterns of physical activity, sedentary
behaviors, and nutrition regardless of the effect of health-related interventions. Furthermore,
there was also evidence that many studies using multiple health interventions assessed only one
measure (e.g., minutes of physical activity) of each behavior, so it was hard to clearly determine
the relationship between health behaviors and obesity (Yannakoulia, Ntalla, Papoutsakis,
Farmaki, & Dedoussis, 2010).
All things considered, previous studies revealed that the factors affecting obesity may be
different for different gender, age, areas, and investigation period, so various types of school-
based obesity prevention studies have been documenting.

Do Physical Activity, Sedentary Behaviors, and Nutrition Affect Healthy Weight 45
CHAPTER 3
METHODS
This study was based on the data of the Greenbrier CHOICES (Children’s Health
Opportunities Involving Coordinated Efforts in Schools) Project, funded by the Carol M. White
Physical Education Program (PEP) grant from U.S. Department of Education in 2011. Using
three-year data of physical activity, sedentary, and nutrition behaviors of adolescents in two
middle schools from southern West Virginia, the current study examined: (a) the association
between healthy weight (5th to less than the 85th BMI percentile) and physical activity, sedentary
and nutrition behaviors and (b) whether physical activity, sedentary, and nutrition behaviors were
affected by changes in adolescents’ BMI across the three-year, multi-component, school-based
efforts. Data for the Greenbrier CHOICES Project (2012-2014) were collected per collection
period from over 300 middle school students aged 10 through 16. This chapter includes a
description of the Greenbrier CHOICES Project, setting and sampling, data collection,
instrumentation and variables, and methods of analysis for the current study.
Description of the Greenbrier CHOICES Project
Schools provide numerous opportunities for students to achieve health-related
recommendations regarding amounts of physical activity and healthy eating (CDC, 2011b). In
particular, reasons why many studies have recommended school-based interventions as the best
place became students spend a lot of time in schools, the interventions in school settings are
cost-effective, and it is easier to receive permission from students’ parents than in out-of-school
settings (Karnik & Kanekar, 2012). In addition, school-based interventions can be applied
consistently, making it possible for schools to not only develop interventions based on the
Do Physical Activity, Sedentary Behaviors, and Nutrition Affect Healthy Weight 46
changes of student behavior, but to overcome environmental barriers inside and outside of
schools (Kriemler et al., 2011).
The purpose of Greenbrier CHOICES Project was to develop, implement, and evaluate an
integrated approach for adolescent health using complimentary intervention strategies and
settings (schools, communities, and health care). The Greenbrier CHOICES Project had a total of
13 data collection periods including a baseline from 2012 to 2014. This project team measured
progress toward adolescents’ physical activity, nutrition, and health-related fitness using multiple
methods such as seven-day, 24 hours a day pedometer, 3 Day Physical Activity Recall (3DPAR),
School Physical Activity and Nutrition (SPAN), and Progressive Cardiovascular Endurance Run
(PACER). However, the data acquired seven-day pedometer was not used in this study because
the project team recognized that students did not comply with the guideline. For example, there
were missing data during seven days, so it was not enough to receive reliable data from students.
Also, it failed to control pedometer wear after school.
The school component focused on the development of a standards-based, middle school
curriculum in health and physical education (PE) that included frequent opportunities for PA
before, during, and after school (see Appendix A). The community component complimented
school health and PE through the identification of available resources, formation of collaborative
partnerships, and initiation of joint-access agreements regarding facility and equipment use. The
health care component provided a mechanism for monitoring risk of chronic disease and
provided families with prevention and treatment strategies according to standardized national
protocol. This study is used as a secondary data analysis in Greenbrier CHOICES Project.

Do Physical Activity, Sedentary Behaviors, and Nutrition Affect Healthy Weight 47
Setting and Sampling
The setting of the Greenbrier CHOICES Project included two middle schools from Greenbrier
County in West Virginia. Greenbrier County is the second largest county in West Virginia by
geographic area. Over 5,000 children in this county are enrolled in public schools. Although
agriculture has been a main industry in this county, some population growth and industrial
development are causing significant changes (West Virginia Department of Agriculture, 2014).
Figure 2 indicates Greenbrier County in WV where there are two middle schools for the
Greenbrier CHOICES Project in 2012-2014.
Figure 2. Greenbrier County in West Virginia (Retrieved from http://wvpublic.org/post/truck-
explodes-greenbrier-county)
Participants for the Greenbrier CHOICES Project were recruited from the two public
middle schools in Greenbrier County, West Virginia. Approximately 30% of the eligible
participants were randomly selected each collection period from a master list for the Greenbrier
CHOICES Project. A total of 1,864 10-16 year-old adolescents participated in the Greenbrier
CHOICES Project, with a total of 4,621 observations in 2012-2014. Among the 1,864 students,
there were 1,620 students (86.9%), with a total of 3,263 observation, who provided at least one
piece of information (e.g., BMI, PA, sedentary behavior, or nutrition behavior), while 195
students (10.5%) did not provide any information and 49 (2.6%) students provided incorrect

Do Physical Activity, Sedentary Behaviors, and Nutrition Affect Healthy Weight 48
information (e.g., out of range answers). Table 2 shows the number of participants included in
this study.
Table 2
Number of Participants for This Study in 2012-2014 School year
Year 1 Year 2 Year 3
Collection
Period
1 2** 3 4 5 6** 7 8 9 10** 11 12 13 Total
Date 2/22
/12
3/21
/12
4/08
/12
5/09
/12
9/27
/12
10/07
/12
02/13
/13
3/20
/13
4/17
/13
9/25
/13
11/20
/13
3/27
/14
4/09
/14
Observation 364 364 364 360 368 313 356 356 352 355 349 360 360 4621
Valid Obs 272 283 215 144 47 213 276 305 291 314 295 298 310 3263
1620*
Note. * Primary case (Unique Adolescents), ** BMI done on all children, assigned to collection periods 2, 6, and 10
Data Collection
The data used for this study were collected during 2012-2014 school years. If selected,
adolescents in each grade level (6, 7, and 8th grade) gathered in the school gym for evaluation at
the appointed time. Students filled in the School Physical Activity and Nutrition Questionnaire
(SPAN) survey under Greenbrier CHOICES Project members’ supervision. Those who finished
the SPAN then filled in the 3 Day Physical Activity Recall (3DPAR). The school teacher and
Greenbrier CHOICES Project members not only encouraged students to finish the 3DPAR, and
helped them fill in the 3DPAR correctly. After students completed SPAN and 3DPAR, about 10-
15 students completed the 20 meter PACER test under controlled conditions which was developed
by Fitnessgram and the Cooper Institute. Peer students observed and recorded the PACER laps
conducted. During the PACER test, school teachers and instructors did not actively intervene in
the test.

Do Physical Activity, Sedentary Behaviors, and Nutrition Affect Healthy Weight 49
Instruments and Variables
Instruments. The 3 Day Physical Activity Recall (3DPAR), School Physical Activity
and Nutrition Questionnaire (SPAN), and Progressive Cardiovascular Endurance Run (PACER)
were used to measure physical activity, sedentary, and nutrition behaviors at multiple time
points. Table 3 specifically shows variables and instruments for this study.
Table 3
Instruments and Variables Construct Concept Instrument Variables
Health
Behaviors
Physical Activity
3-Day Physical Activity Recall (3DPAR)
Total minutes spent in PA and MVPA: -Minutes spent in lifestyle activities -Minutes spent in aerobic activities -Minutes spent in aerobic sports -Minutes spent in muscular activities -Minutes spent in flexibility activities
Progressive Cardiovascular Endurance Run (PACER)
Total laps for 20-meter distance
Sedentary Behaviors
3-Day Physical Activity Recall (3DPAR)
Total minutes spent in Sedentary Behaviors: -Minutes spent in school(home)work: -Minutes spent in video or computer -Minutes spent in eating and resting
Nutrition School Physical Activity and Nutrition (SPAN)
Total servings of fruits and vegetables:
Health Outcome
Obesity CARDIAC school-based health screening
BMI Percentile Healthy Weight (5th percentile to less than the 85th percentile)
Adolescents’
Characteristics
Demographics
WVEIS school database Greenbrier
Gender Grade
Personal Information
CHOICES data Year

Do Physical Activity, Sedentary Behaviors, and Nutrition Affect Healthy Weight 50
3 Day Physical Activity Recall. The 3DPAR is a self-report developed by Pate et al.
(2003), and based on the Previous Day Physical Activity Recall (PDPAR) (Weston et al., 1997).
The PDPAR includes 59 activities, 4 different intensities, and 34 blocks of time (30 minutes per
block) from 7am to midnight. The 3DPAR (Pate et al., 2003) added 11 activities based on the
PDPAR. The 3DPAR was developed by 3DPAR Fitness Activitygram (The Cooper Institute,
2010) and included: 30 activities, 4 different intensities, and 32 blocks of time from 7 a.m. to 11
p.m. The new 3DPAR has collapsed activities into certain groupings to reduce length and
redundancy. Table 4 represents the comparison between the PDPAR, 3DPAR, and 3DPAR
Fitness Activitygram. This study used 3DPAR Fitness Activitygram for measuring physical
activity and sedentary behavior.
Table 4
Comparison between the PDPAR, 3DPAR, and 3DPAR Fitness Activitygram PDPAR 3DPAR 3DPAR Fitness
Activitygram The number of activities 59 70 30
The number of blocks
34
(7am-midnight)
34
(7am-midnight)
32
(7am-11pm)
The number of intensities 4
(Light, Moderate, Hard, Very Hard)
4
(Light, Moderate, Hard, Very Hard)
4
(Rest, Light, Moderate, Vigorous)
For accurate measurement, each day was segmented into 32 30-minute time blocks, and
performed activities were grouped into 30 categories (25 physical activities, 5 sedentary
behaviors). Specifically, the 3DPAR was divided into two steps. Step 1 was to determine the
primary activity students participated in during each 30-minute interval. Among 30 different

Do Physical Activity, Sedentary Behaviors, and Nutrition Affect Healthy Weight 51
activities, students entered the related number in the Activity column. Step 2 was to circle an
intensity level that best describes how hard the activity felt in the intensity column (Rest:
"Resting", such as sleeping; Light: “Easy”; Moderate: “Not too tiring”; Vigorous: “Very tiring”)
(see Appendix B).
Progressive Cardiovascular Endurance Run. The PACER test, a 20-meter shuttle run,
developed by the Cooper Institute (2010) was used to measure aerobic capacity. The 20-meter
PACER is an aerobic capacity test within the Fitnessgram’sTM battery of physical fitness tests.
FitnessgramTM is a valid and reliable assessment to determine muscle fitness, aerobic capacity, and
body composition (Welk, Morrow, & Falls, 2002). The PACER is scored by the number of
completed laps. Completed PACER laps are recorded by an observer on designed scoring sheets.
A single score is assigned to participants based upon the number of PACER laps completed (see
Appendix C). The recorded score is the total number of laps completed by participants.
School Physical Activity and Nutrition Questionnaire. The SPAN is a self-report which
addresses school physical activity and nutrition, and is based on School-Based Nutrition
Monitoring (SBNM) questionnaire developed by Hoelscher et al. (2003). The SPAN choice
options were modified by the Greenbrier CHOICES Project team in year 2, and included 16
questions: 11 nutrition-related questions, 3 physical activity-related questions, and 2 sedentary
behavior-related questions (see Appendix D). Five of the questions in the SPAN were used for
the current study (Table 5).

Do Physical Activity, Sedentary Behaviors, and Nutrition Affect Healthy Weight 52
Table 5
SPAN Questions in this study Category Questions Response Options
Vegetables/
Fruits
1. How many times did you eat any orange vegetables like carrots, squash, or sweet potatoes?
a) 0 time b) 1 time c) 2 times d) 3 times
e) 4 or more times
2. How many times did you eat a salad made with lettuce, or any green vegetables like spinach, green beans, broccoli, or other greens? 3. How many times did you eat any other vegetables like peppers, tomatoes, zucchini, asparagus, cabbage, cauliflower, cucumbers, mushrooms, eggplant, celery or artichokes? 4. How many times did you eat fruit?
5. How many times did you drink 100% fruit juice?
Variables. Physical activity, sedentary behaviors, nutrition, obesity, and adolescents’
characteristics were main variables for this study.
Physical Activity. As measured by the 3DPAR, physical activity was defined as total
minutes spent in physical activities in the category of 3DPAR. The activities included lifestyle
activity, aerobic activity, aerobic sport, muscular activity, and flexibility activity. According to
intensity level, this study included total time in physical activity well as in MVPA. To obtain
the total minutes of PA, the time spent for three days in those activities was summed. Then, the
average minutes per day were calculated and included: the hours spent during school days and
the hours spent during non-school days. Recommendations from the Physical Activity
Guidelines Advisory Committee (2008), and WHO (2010b) are 60 minutes of MVPA daily.
Possible range for total hours per day spent in physical activity was 0 to 16 because the 3DPAR
instrument only included 16 hours (7am to 11pm).
The PACER test was also used to support physical activity. The PACER test consisted
of running a 20-meter shuttle run with 1-minute paced stages at an initial running speed of

Do Physical Activity, Sedentary Behaviors, and Nutrition Affect Healthy Weight 53
8.5km/h with an increasing speed of 0.5km/h per stage (Leger, Mercier, Gadoury, & Lambert,
1988). For ease in administration, it is acceptable to count the first miss (not making it to the
line by the beep).
Sedentary Behaviors. As measured by the 3DPAR, sedentary behaviors were defined as
total minutes spent in non-activity, and were summed time of three activities in 3DPAR which
include: schoolwork, homework, or reading; computer games or TV/videos; and eating, resting,
listening to music, riding bus. As one of the sedentary behaviors, sleeping time in 3DPAR was
removed because the 3DPAR only included time range between 7am and 11pm, so it could not
measure correctly unless participants slept before 11pm on wake up after 7am. The possible
range for total hours per day spent in sedentary behaviors was 0 to 16.
Nutrition. As measured by the SPAN questionnaire, nutrition was defined as the total
servings of fruits and vegetables reported within the past day. Participants were asked to
respond to the following 5 questions: “How many times did you eat any orange vegetables like
carrots, squash, or sweet potatoes?”, “How many times did you eat a salad made with lettuce, or
any green vegetables like spinach, green beans, broccoli, or other greens?”, “How many times
did you eat any other vegetables like peppers, tomatoes, zucchini, asparagus, cabbage,
cauliflower, cucumbers, mushrooms, eggplant, celery or artichokes?”, “How many times did
you eat fruit?”, and “How many times did you drink 100% fruit juice?”. As indicated by Table
6, participants responded by circling an answer from 0 to 5 times. However, the answer choices
in the 2012 SPAN were between “0-1 time,” “2 times,” “3 times,” “4 times,” and “5 or more
times.”, while the answer in 2013-2014 SPAN was selected between “0 time,” “1 times,” “2
times,” “3 times,” and “4 or more times.” Therefore, coding for each answer was adjusted by
experts (Table 6). Recommendations from the 2010 Dietary Guidelines for Americans (U.S.

Do Physical Activity, Sedentary Behaviors, and Nutrition Affect Healthy Weight 54
Department of Agriculture and U.S. Department of Health and Human Services, 2010) and
CDC (2005) are 5 servings of fruits and vegetables daily for healthy eating. The possible range
for nutrition was 2.5 to 27.5.
Table 6
Adjusted Answer for Nutrition Questions in SPAN 2012 2013-2014
Original Answer Adjusted Answer Original Answer Adjusted Answer 0-1 times 0.5 times 0 time 0.5 times 2 times 2 times 1 time 0.5 times 3 times 3 times 2 times 2 times 4 times 4 times 3 times 3 times
5 or more times 5.5 times 4 or more times 4.5 times
Obesity. For research question 1, the healthy weight variable categorized by BMI
percentile was used to explain relationship between physical activity, sedentary, and nutrition
behaviors. For research question 2, the BMI percentile variable was used to explain changes in
physical activity, sedentary, and nutrition behaviors over time associated with changes over
time. Although determining health problems caused by the excess weight needs additional
assessments such as skinfold thickness measurements, family history, or eating behaviors, the
results of BMI can predict people’s potential health problems (Garrow & Webster, 1985).
Therefore, BMI for this study was used as the prediction of possible weight problems such as
physical activity, sedentary behavior, and nutrition for students. BMI is generally defined as
measurement to determine possible weight problems (Mei et al., 2002). BMI measurements for
this study were provided from WV Coronary Artery Risk Detection in Appalachian
Communities (CARDIAC) school-based health screening and measured as weight (kg) divided
by squared height (meters). Based on individual BMI, BMI percentiles were used for this study
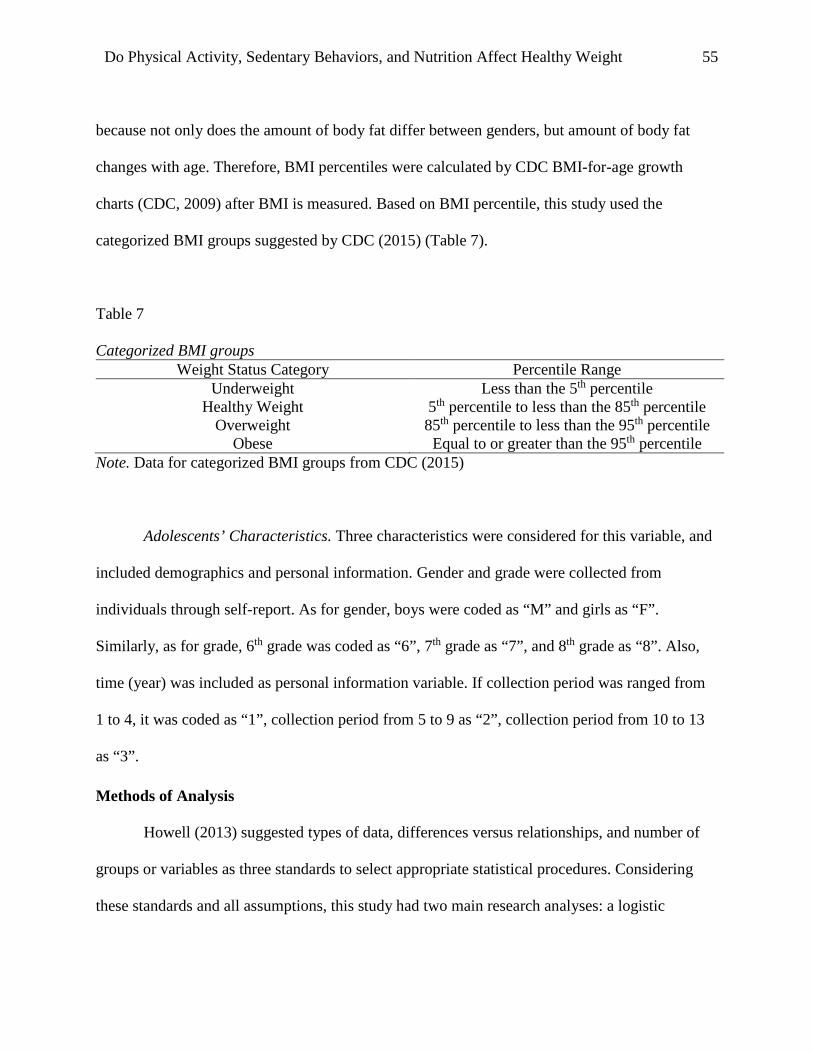
Do Physical Activity, Sedentary Behaviors, and Nutrition Affect Healthy Weight 55
because not only does the amount of body fat differ between genders, but amount of body fat
changes with age. Therefore, BMI percentiles were calculated by CDC BMI-for-age growth
charts (CDC, 2009) after BMI is measured. Based on BMI percentile, this study used the
categorized BMI groups suggested by CDC (2015) (Table 7).
Table 7
Categorized BMI groups Weight Status Category Percentile Range
Underweight Less than the 5th percentile Healthy Weight 5th percentile to less than the 85th percentile
Overweight 85th percentile to less than the 95th percentile Obese Equal to or greater than the 95th percentile
Note. Data for categorized BMI groups from CDC (2015)
Adolescents’ Characteristics. Three characteristics were considered for this variable, and
included demographics and personal information. Gender and grade were collected from
individuals through self-report. As for gender, boys were coded as “M” and girls as “F”.
Similarly, as for grade, 6th grade was coded as “6”, 7th grade as “7”, and 8th grade as “8”. Also,
time (year) was included as personal information variable. If collection period was ranged from
1 to 4, it was coded as “1”, collection period from 5 to 9 as “2”, collection period from 10 to 13
as “3”.
Methods of Analysis
Howell (2013) suggested types of data, differences versus relationships, and number of
groups or variables as three standards to select appropriate statistical procedures. Considering
these standards and all assumptions, this study had two main research analyses: a logistic

Do Physical Activity, Sedentary Behaviors, and Nutrition Affect Healthy Weight 56
regression and linear mixed model. All data were analyzed using the SAS program (version:
9.4).
This study was based on a planned missing data design (PMDD) to reduce missing data
by randomly selecting 30% of participants in master list each collection period. PMDDs have
become more universal in recent years (Plamer & Royall, 2010). The purpose of using this
design is to decrease missing not at random (MNAR), by allowing missing completely at random
(MCAR) or missing at random (MAR) assumptions to stay true (Baraldi & Enders, 2010). This
design did not require any students to complete all evaluation periods. Participants who opted out
of the Greenbrier CHOICES Project during collection periods were removed from the master list
for the next collection period. Since the data for this study included total 13 collection periods in
2012-2014, there were some participants who were entering or leaving the targeted middle
schools during 13 collection periods. Therefore, the data for each participant could range from
one to eight times of participation because of the use of PMDDs. In other words, PMDDs do not
require all students to complete all measures.
The analysis section is divided into 2 sections that outline the statistical analyses used in
each research question. Descriptive statistics, such as mean and standard deviation of continuous
variables, and frequency and percentage of dichotomous variables, were provided. Table 8
represents predictors, outcomes, and type of analysis used for each research question.

Do Physical Activity, Sedentary Behaviors, and Nutrition Affect Healthy Weight 57
Table 8
Summary of Analyses by Research Question Research question Predictors Outcomes Type of analysis Question 1 Physical activity, sedentary
behaviors, nutrition, and personal information
Healthy weight Logistic regression
Question 2
BMI percentiles and personal information
Physical activity, sedentary behaviors, and nutrition
Linear mixed model
Research Question 1: Are physical activity, sedentary, and nutrition behaviors in
middle school students associated with BMI?
Logistic Regression was used to explain the relationship between variables for research
question 1 in this study. The purpose of logistic regression is to measure the probability that a
particular event will occur through the relationship between independent and dependent
variables. The dependent variable should be binary (e.g., meeting or not meeting guideline) or
ordinal (e.g., extreme, normal, or light). Logistic regression is generally used in many application
areas such as health-related research (Healy, 2006). Logistic regression is recommended when
assumptions are violated (Healy, 2006). Compared to other analyses, logistic regression is less
restrictive in terms of required assumptions. Although normal distribution and homogeneity of
variance are not required (Anderson, 1982), three assumptions are required and were met;
dependent variable is on a dichotomous scale; variables have independence of observations and
have mutually exhaustive category; and the Hosmer-Lemeshow test is performed to assess the
model fit. The model used in this study was acceptable because a p-value was greater than 0.05.
Specifically, logistic regression was used to determine whether a statistically significant
relationship existed between independent variables (physical activity, sedentary behavior, and

Do Physical Activity, Sedentary Behaviors, and Nutrition Affect Healthy Weight 58
nutrition) and the dependent variable (healthy weight) after controlling for the influence of
covariates (gender, grade, and year). If healthy weight was met, it was coded to 1. If the
requirement was not met, it was coded to 0. As a dependent variable, healthy weight was defined
as BMI from 5th percentile to less than the 85th percentile provided from CDC (2015).
Independent variables are physical activity (total minutes spent in MVPA), sedentary behavior
(total minutes spent in screen time), and nutrition (total servings of fruits and vegetables). For
this research question, the first observation of each participant was selected. Therefore, the
number of participants for this research question is 1,620 middle school students who had at least
one or more opt-in of Greenbrier CHOICES project between 2012 and 2014 (Table 2).
Research Question 2: Are changes in physical activity, sedentary behavior, and nutrition
over time associated with changes in BMI percentile over time controlling for grade and gender?
Linear mixed model (LMM) was another analysis technique for research question 2 in
this study. LMM develops the linear model, and includes random effects as well as fixed effects
in the linear predictors (McCulloch & Neuhaus, 2001). LMM is generally used for the physical,
biological and social sciences (Ghodsypour & O'Brien, 1998), and is also useful in longitudinal
studies where repeated measurements are made on the same statistical units (Laird, 1988). LMM
includes continuous outcome variables (e.g., physical activity, sedentary behavior, and nutrition)
in which residuals are normally distributed.
One advantage of LMM is that it allows for subjects with unequal measurements over
time, so this model is appropriate for this study with missing data. Missing data are a common
problem in a longitudinal study because of randomly selected participants or refusal to fill out
surveys. Although missing data is not a rare problem, it can lead to biased statistical inferences.
Therefore, it is important to suggest the appropriate method to deal with missing data. Dropping

Do Physical Activity, Sedentary Behaviors, and Nutrition Affect Healthy Weight 59
missing values by using listwise or pairwise may be not preferred because these techniques
decrease sample size. This study is based on planned missing data design, which allow two types
[missing completely at random (MCAR) and missing at random (MAR)] of missing data.
Missing data techniques based on planned missing data design are Full Information Maximum
Likelihood (FIML) (Enders, 2001), Restricted Maximum Likelihood (REML) (Thompson &
Sharp, 1999), Ignorable Likelihood (IL) (Little & Raghunathan, 1999), and Multiple Imputation
(MI). These techniques for the fitting of linear mixed models can improve the power of lost data,
reduce error inflation, and avoid bias (Graham, 2009). This study used REML, which is the most
common method of estimating covariance parameters (Gurka, 2006). REML is one of the most
common methods, especially as alternative to maximum likelihood (ML), to deal with missing
data (MAR and MCAR) in mixed model treating time (Hox & Roberts, 2011). In addition, the
REML can deal with the bias from the ML which cannot account for the degrees of freedom lost
by the fixed effects (West, Welch, & Galecki, 2014). The Best Linear Unbiased Prediction
(BLUP) was also used for the estimation of random effects. The use of LMM with BLUP
function is distinguished from conventional linear model provides the ability to estimate random
effects. Therefore, BLUP is not only a technique to estimate random effects, but is unbiased and
has minimal mean squared errors (Robinson, 1991).
LMM is a statistical technique that is developed from a standard regression model. A
standard regression model assumes that a continuous outcome variable Y can be analyzed by one
or more predictor variables of X (equation 1).
Y= Xβ + e (Equation 1),
where Y is a dependent variable for a subject, X is an independent variable for a subject, β is a
regression coefficient for independent variable X, and e is an error for a subject (Nelder &

Do Physical Activity, Sedentary Behaviors, and Nutrition Affect Healthy Weight 60
Wedderburn, 1972). The error term e not only is assumed to be independent and to vary
randomly, but follows normal distribution with mean of [N(0,𝜎𝜎2)]. However, longitudinal data
violate the independence assumption for error variance because observations within a subject are
correlated over time. Therefore, a linear mixed model breaks the error term based on equation (1)
by forming random effects in addition to the fixed effects β. Finally, equation (2) based on
equation (1) can be suggested:
Y = Xβ + Zγ + e* (Equation 2),
where Y, Xβ, Zγ, and e denotes respectively the n-dimensional response vector, the fixed
components (X: n*p0 fixed effects design matrix and β: p0-dimensional vector of fixed effects
parameters), random components (Z: n*m random effects design matrix and γ: m-dimensional
random effects vectors), and the error term (Verbeke & Molenderghs, 2009). For this study with
longitudinal data, a typical Z covariate would be each subject. In other words, an effect of
subject (correlation over time) clarifies part of the variability of Y. However, this subject effect
is considered as random because subjects are a sample randomly selected from all possible
subjects, and each individual subject effect is not the research interest. Thus, subject effect is to
be adjusted in LMM.
Y = β0 + Xβ* + Zγ* + e** (Equation 3),
where β0+ Xβ* means a fixed effect (β0: intercept of population) and Zγ* + e** means a random
effect. Fixed effects are the independent covariates (e.g., BMI) in LMM, and are population
slopes for a set of considered covariates, while the random effects are quantitative variable
whose levels are randomly sampled from individual experimental units in outcome and in
changes over time (Gelman, 2005). For this research question, fixed effects were BMI, gender,
and grade, while a random effect was the year. Random effects were used to model between-

Do Physical Activity, Sedentary Behaviors, and Nutrition Affect Healthy Weight 61
subject variation and the correlation generated by this variation. Among two forms of LMMs,
random intercept and slope models explain subjects having different slopes (e.g., not all students
had the same year point). Thus, equation (3) was used for research question 2.
LMM assumes that the covariance structure is correctly specified. The structure of the
covariance matrix is employed to determine the assumptions about the repeated measures error
covariance, with different assumptions influencing the calculation of estimates, and generally
includes autoregressive [AR (1)), compound symmetry (CS), unstructured (UN), toeplitz
(TOEP), etc. According to Littell, Stroup, Milliken, Wolfinger, & Schabenberger (2006), it is
recommended that determining the appropriate structure of covariance should be conducted
before conducting LMM, and the determination can be found by comparing the Akaike
Information Criterion (AIC) (Akaike, 1974), and Schwarz Bayesian Criterion (BIC) (Schwarz,
1978) values as information criteria for model selection. Both criteria are based on various
assumptions and asymptotic approximations. AIC means a model is considered to be closer to
the truth, while BIC means that a model is considered to be more likely to be the true model.
Also, the penalty for additional parameters is more in BIC than AIC. Generally, the most
common structure of the covariance is UN, and BIC is more preferred than AIC as information
criteria for model selection. The current study fitted models repeatedly using AR, CS, UN, and
TOEP covariance structure. Then fit statistics were measured and we found that UN was the
most appropriate covariance structure in this model because UN had the lowest BIC. Finally, the
results shown in this study came from UN covariance structure.
The three key assumptions for the standard linear mixed model are suggested (Gelman &
Hill, 2006; Tabachnick & Fidell, 2013), and were examined to ensure satisfaction of
assumptions. The assumptions include: 1) linearity for each variable, 2) absence of collinearity,

Do Physical Activity, Sedentary Behaviors, and Nutrition Affect Healthy Weight 62
and 3) homoscedasticity of the error. The changes in physical activity, sedentary behavior, and
nutrition were measured using the MIXED procedures of SAS (version 9.4).
Among 1,620 students with 3,263 observations, 668 students with 668 observations were
removed because the students who participated only once were not available for analysis of liner
mixed model. Therefore, a total 952 students who had participated two or more times with 2,595
observations were selected for this research question.

Do Physical Activity, Sedentary Behaviors, and Nutrition Affect Healthy Weight 63
CHAPTER 4
RESULTS
Description of Population
There were 3,263 observations for this study. Among them, the first valid data for each
subject was used for the description of population because 3,263 observations included same
subjects repeatedly. Therefore, a total of 1,620 students who provided BMI and at least one piece
of information (e.g., BMI, physical activity, sedentary behavior, or nutrition behavior) at two
middle schools were used for the description of population. These participants comprised 51
percent girls and 49 percent boys. 37 percent were 6th grade, 33 percent were 7th grade, and 30
percent 8th grade. Lastly, participants in Eastern Greenbrier middle school were 74 percent and
participants in Western Greenbrier middle school were 26 percent (Table 9).
Table 9
Gender, Grade, and School of the Sample
N % Gender Girls Boys
833 787
51.4 48.6
Grade 6th 7th 8th
602 533 485
37.2 32.9 29.9
School Eastern Greenbrier Western Greenbrier
1196 424
73.8 26.2

Do Physical Activity, Sedentary Behaviors, and Nutrition Affect Healthy Weight 64
About 34% of subjects were gathered in Year 1, 29% of subjects in Year 2, and 39% of
subjects in Year 3 (Table 10). The total number of subjects between collection periods greatly
differed because the first valid data of each subject were randomly included at least collection
period. That is, the data for the description of the population only included the first valid data
point of each subject, not all observations.
Table 10
Frequency and Percentage at Each Collection Period
N (1,620) %
Year1
Collection Period 1
Collection Period 2
Collection Period 3
Collection Period 4
173
174
128
72
10.7
10.8
7.9
4.4
Total (Year 1) 547 33.8
Year2
Collection Period 5
Collection Period 6
Collection Period 7
Collection Period 8
Collection Period 9
23
69
134
78
134
1.4
4.3
8.3
4.8
8.1
Total (Year 2) 438 28.9
Year3
Collection Period 10
Collection Period 11
Collection Period 12
Collection Period 13
152
142
168
173
9.4
8.8
10.4
10.7
Total (Year 3) 635 39.3

Do Physical Activity, Sedentary Behaviors, and Nutrition Affect Healthy Weight 65
Physical characteristics of the sample are presented in Table 11. The average age was
13.08 ± 1 year old. The mean BMI percentile was approximately the 70th percentage for both
girls and boys. Based on individual BMI percentile, the healthy weight (BMI 5th percentile to
less than the 85th percentile) was approximately 57 percent for girls and 51 percent for boys.
Although the average of BMI for girls and boys did not differ, the percentage of healthy weight
between girls (57.07%) and boys (50.98%) was different.
Table 11
Physical Characteristics of the Sample
Means and standard deviations of physical activity, sedentary behaviors, and nutrition by
gender are presented in Table 12. Boys spent 15-20 minutes more in daily physical activity than
girls. The average of total minutes in MVPA showed 20-25 minutes difference between gender
(boys >girls) regardless of whether it was on a weekday or weekend. Also, although girls had a
higher average of total minutes in sedentary behaviors, boys spent 30-40 minutes more on screen
time. Girls and boys both consumed fruits and vegetables approximately 6-7 times a day.
Total
(n=1,620)
Girls
(n=833)
Boys
(n=787)
Age (yrs)
Height (inches)
Weight (lb)
BMI (kg/m2)
BMI Percentile
Mean (SD)
13.08 (.98)
62.48 (3.73)
127.51 (36.91)
22.75 (5.37)
70.98 (27.38)
Min-Max
10.66-16.22
51-72.75
66-329
15.07-45.56
2.23-99.82
Mean (SD)
12.99 (.95)
62.01 (3.13)
126.43 (34.78)
22.97 (5.53)
71.23 (25.75)
Mean (SD)
13.18 (1)
62.95 (4.21)
128.59 (38.98)
22.52 (5.2)
70.71 (28.99)
Healthy Weight (%) 54.03% 57.07% 50.98%

Do Physical Activity, Sedentary Behaviors, and Nutrition Affect Healthy Weight 66
Table 12
Physical Activity, Sedentary Behaviors, and Nutrition at Gender (N=1,620) Girls (n=833) Boys (n=787)
Mean (SD) Mean (SD)
Physical Activity (hour/day)
Total PA 4.86 (2.93) 5.13 (3.39)
Weekday 4.28 (3.23) 4.56 (3.67)
Weekend 6.32 (3.58) 6.56 (4.11)
Total MVPA 2.02 (1.9) 2.38 (2.28)
Weekday 1.76 (1.94) 2.03 (2.28)
Weekend 2.66 (2.74) 3.25 (3.31)
PACER Laps 19.52(12.22) 29.52(19.11)
Sedentary Behaviors (hour/day)
Total SD 8.98 (3.03) 8.71 (3.57)
School(Home)-Work 4.62 (2.32) 4.37 (2.55)
Computer/TV 1.1 (1.33) 1.68 (2.01)
Eating/Resting 2.39 (1.85) 1.93 (1.81)
Other .87 (1.33) .74 (1.39)
Nutrition (consumption/day)
Total Fruits/Vegetables 6.02 (3.64) 6.76 (4.22)
Orange Vegetables .87 (.92) .97 (.99)
Salad .94 (.89) 1.02 (1.07)
Other Vegetables 1.12 (1.07) 1.28 (1.26)
Fruit 1.9 (1.36) 2.05 (1.53)
100% Fruit Juice 1.22 (1.2) 1.46 (1.47)
Means and standard deviation of physical activity, sedentary behaviors, and nutrition by
grade are presented in Table 13. The average of total minutes in physical activity did not differ

Do Physical Activity, Sedentary Behaviors, and Nutrition Affect Healthy Weight 67
between 6th, 7th, and 8th grade, while the average of total hours in moderate-vigorous physical
activity decreased as students got older (6th: 2.38 hours; 8th: 2.12 hours). The average of total
hours in sedentary behaviors was no different between each grade (6th: 8.79 hours; 8th: 8.91
hours). Among sedentary behaviors, time spent in screen time increased as students got older
(6th: 1.29 hours; 8th: 1.43 hours). However, time spent in eating/resting decreased as students got
older (6th: 2.23 hours; 8th: 2.06 hours). In nutrition, total consumption of vegetables and fruits did
not differ between 6th, 7th, and 8th grade.
Means and standard deviation of physical activity, sedentary behaviors, and nutrition at
each time point (year) are presented in Table 14. The average of total hours in physical activity
increased from year 1 (4.87 hours) to year 3 (5 hours) and the average of total hours in MVPA
also increased from year 1 (1.67 hours) to year 3 (2.45 hours). Both the average of total minutes
in physical activity and in MVPA increased from year 1 to year 3. In particular, the average of
total minutes in physical activity and in MVPA for the weekend rapidly from year 1 to year 3
(PA: 50-60 mins; MVPA: 100-110 mins). In contrast, the average of total minutes in sedentary
behaviors showed no difference between years 1, 2, and 3. In nutrition, total consumption of
vegetables and fruits decreased from year 1 (7.93 times) to year 3 (5.53 times).

Do Physical Activity, Sedentary Behaviors, and Nutrition Affect Healthy Weight 68
Table 13
Physical Activity, Sedentary Behaviors, and Nutrition at Grade 6th (n=602) 7th (n=533) 8th (n=485)
Mean (SD) Mean (SD) Mean (SD)
Physical Activity (hour/day)
Total PA 5.06 (3.13) 4.96 (3.17) 4.93 (3.2)
Weekday 4.44 (3.47) 4.4 (3.44) 4.4 (3.43)
Weekend 6.62 (3.69) 6.38 (3.91) 6.26 (3.93)
Total MVPA 2.38 (2.11) 2.04 (1.97) 2.12 (2.2)
Weekday 1.97 (2.12) 1.8 (2.04) 1.88 (2.17)
Weekend 3.39 (3.08) 2.64 (2.77) 2.72 (3.21)
PACER Laps 24.66 (14.97) 24.32 (16.87) 25.31 (19.64)
Sedentary Behaviors (hour/day)
Total SD 8.79 (3.27) 8.91 (3.28) 8.87 (3.35)
School(Home)-Work 4.44 (2.46) 4.55 (2.35) 4.53 (2.5)
Computer/TV 1.29 (1.56) 1.41 (1.84) 1.43 (1.75)
Eating/Resting 2.23 (1.88) 2.2 (1.85) 2.06 (1.8)
Other .82 (1.42) .75 (1.21) .85 (1.44)
Nutrition (consumption/day)
Total Fruits/Vegetables 6.51 (4.02) 6.29 (3.76) 6.29 (4.05)
Orange Vegetables .9 (.94) .91 (.95) .94 (.98)
Salad .96 (.97) .96 (.95) 1.02 (1.02)
Other Vegetables 1.22 (1.19) 1.17 (1.12) 1.18 (1.18)
Fruit 2.04 (1.5) 1.99 (1.44) 1.87 (1.38)
100% Fruit Juice 1.39 (1.43) 1.3 (1.28) 1.3 (1.27)

Do Physical Activity, Sedentary Behaviors, and Nutrition Affect Healthy Weight 69
Table 14
Physical Activity, Sedentary Behaviors, and Nutrition at Year Year 1 (n=547) Year 2 (n=438) Year 3 (n=635)
Mean (SD) Mean (SD) Mean (SD)
Physical Activity (hour/day)
Total PA 4.87 (2.89) 5.12 (3.38) 5 (3.23)
Weekday 4.48 (3.1) 4.49 (3.66) 4.31 (3.57)
Weekend 5.85 (3.78) 6.7 (4.06) 6.74 (3.7)
Total MVPA 1.67 (1.88) 2.43 (2.17) 2.45 (2.14)
Weekday 1.63 (1.98) 2.05 (2.22) 2 (2.13)
Weekend 1.79 (2.44) 3.39 (3.19) 3.59 (3.11)
PACER Laps 26.12 (15.71) 22.92 (16.83) 24.81 (17.59)
Sedentary Behaviors (hour/day)
Total SD 8.82 (3.21) 8.75 (3.34) 8.94 (3.35)
School(Home)-Work 4.44 (2.48) 4.29 (2.45) 4.67 (2.38)
Computer/TV 1.5 (1.73) 1.38 (1.71) 1.27 (1.69)
Eating/Resting 1.96 (1.72) 2.3 (1.94) 2.27 (1.87)
Other .92 (1.3) .79 (1.45) .73 (1.34)
Nutrition (consumption/day)
Total Fruits/Vegetables 7.93 (4.27) 5.63 (3.55) 5.53 (3.48)
Orange Vegetables 1.11 (1.13) .84 (.89) .79 (.79)
Salad 1.19 (1.1) .88 (.93) .86 (.86)
Other Vegetables 1.5 (1.34) 1 (1.02) 1.05 (1.03)
Fruit 2.35 (1.46) 1.76 (1.43) 1.79 (1.37)
100% Fruit Juice 1.79 (1.53) 1.17 (1.18) 1.04 (1.13)
Table 15 represents number of observations on the activity log in 3DPAR. The total
minutes spent in lifestyle activities such as housework or walking were 2 hours and 51 minutes,
while 37 minutes were spent on muscular activity, 23 minutes on aerobic activity, and 24

Do Physical Activity, Sedentary Behaviors, and Nutrition Affect Healthy Weight 70
minutes on flexibility activity. Among physical activity types, 1 hour and 5 minutes spent in
aerobic sports such as field sport (baseball, softball, football, or soccer) were the highest.
Table 15
Activity Log in 3DPAR (7am to 11pm) N % Mins
per day
Lifestyle Activity
Walking, bicycling, or skateboarding for transportation
Housework or yard work
Playing active games or dancing
Work- active job
Other
Total
8350
4389
2978
2212
4213
22142
6.72
3.53
2.4
1.78
3.39
17.83
65
34
23
17
32
171
Aerobic Activity
Aerobic dance activity
Aerobic gym equipment
Aerobic activity
Aerobic activity in physical education
Other
Total
598
348
1098
298
628
2970
0.48
0.28
0.88
0.24
0.51
2.39
5
3
8
2
5
23
Aerobic Sport
Field sports
Court sports
Racket sports
Sports during physical education
Other
Total
4328
2149
236
745
977
8435
3.48
1.73
0.19
0.6
0.79
6.79
33
17
2
6
7
65

Do Physical Activity, Sedentary Behaviors, and Nutrition Affect Healthy Weight 71
Muscular Activity
Gymnastics, cheer, dance or drill teams
Track and field sports
Weightlifting or calisthenics
Wrestling or martial arts
Other
Total
1493
1223
759
385
918
4778
1.2
0.98
0.61
0.31
0.74
3.85
11
10
6
3
7
37
Flexibility Activity
Martial arts
Stretching
Yoga
Ballet
Other
Total
308
1050
398
308
1094
3158
0.25
0.85
0.32
0.25
0.88
2.54
2
8
3
2
8
24
Rest
Schoolwork, homework, or reading
Computer games or TV/videos
Eating, resting, listening to music, riding bus
Sleeping
Other
Total
31908
10566
16729
16131
7394
82728
25.69
8.51
13.47
12.99
5.95
66.6
246
82
129
125
57
639
Pearson correlations among the variables of physical activity (MVPA), sedentary
behaviors (television/computer), nutrition (vegetable and fruit), and BMI percentile are shown in
Table 16. The variables of BMI percentile and PACER laps were negatively correlated (r= -.25,
p< .001). The time in MVPA was positively correlated with PACER laps (r= .2, p< .001), while
it was negatively correlated with time in television/computer (r= -.29, p< .001). Also, the

Do Physical Activity, Sedentary Behaviors, and Nutrition Affect Healthy Weight 72
variables of PACER laps were positively correlated with the consumption of vegetables and
fruits (r= .14, p< .001).
Table 16
Correlation Coefficients for Relationships between BMI Percentile, Physical activity, Sedentary Behaviors, and Nutrition Factors
Note. **p < .001 level (2-tailed)
Summary of Major Findings. This study provides some meaningful results through
description of the population. First of all, the proportion of healthy weight in adolescents was
54%. Healthy weight is defined as BMI 5th percentile to less than the 85th percentile (CDC,
2015). This study revealed that 57% of girls were in the category of healthy weight, while boys
were 51%.
This study found a difference between gender, year, and grade in terms of physical
activity, sedentary behaviors, and nutrition. First of all, a gender difference for health behaviors
was found in this study. The basic finding was that boys (5.13 hours/day) spent more time in
physical activity than girls (4.86 hours/day), while girls (8.98 hours/day) spent more time in
sedentary behavior than boys (8.71 hours/day). The gender difference was caused by school
(home) work and eating/resting in sedentary behaviors, and physical activity. That is, regardless
Variables 1 2 3 4 5
1. BMI Percentile −─ -.01 -.25** -.14 -.05
2. MVPA −─ .2** -.29** -.05
3. PACER Laps −─ -.1 .14**
4. Television/Computer −─ -.06
5. Fruit/Vegetable −─

Do Physical Activity, Sedentary Behaviors, and Nutrition Affect Healthy Weight 73
of weekday or weekend, boys spent more time in physical activity than girls. In addition,
sedentary behaviors each gender prefers are clearly different and can be explained by lifestyles.
For example, girls spent more time in school (home) work (4.62 hours/day) and eating/resting
(2.39 hours/day) than boys (school work: 4.37 and eating/resting: 1.93 hours/day), while boys
spent more time on screen time than girls. Also, the PACER score for boys (29.52 laps) was
higher than for girls (19.52 laps), and PACER scores increased as students grew older due to the
differences (e.g., weight and height changes) in physical abilities (6th: 24.66; 8th: 25.31 laps).
Lastly, boys (6.76 times) consumed more fruits and vegetables than girls (6.02 times) although
the proportion of healthy weight in girls was higher than boys.
Differences in students’ grade in school regarding health behaviors were found in this
study. Although the result did not show a significant difference between graders, the average of
total hours in sedentary behaviors in 7th (8.91 hours) and 8th (8.87 hours) graders was relatively
higher than 6th graders (8.79 hours). This may mean that it is more difficult for higher graders to
meet recommendations for health. In fact, the obesity rate caused by unhealthy behaviors (e.g.,
sedentary behavior) generally increased as individuals grew older. According to Ogden et al.
(2016), children aged 6 to 11 years showed 17.5% obesity rate, but adolescents aged 12 to 19
years had 20.5%, which shows a 3% gap between children and adolescents. Lastly, this study
found yearly differences for health behaviors. The most interesting result was that the average of
total hours in physical activity had no difference between year 1 (4.87 hours) and year 3 (5
hours), while the average of total hours in MVPA increased from year 1 (1.67 hours) to year 3
(2.45 hours). It may mean that physical activity programs provided by Greenbrier CHOICES
Project focused on the increase of MVPA rather than the increase of physical activity.
Do Physical Activity, Sedentary Behaviors, and Nutrition Affect Healthy Weight 74
This study analyzed activity log of 3 Day Physical Activity Recall (3DPAR) and found
that lifestyle activities (2 hours and 51 minutes) were the longest time period spent per day in the
physical activity categories, while flexibility activities (24 minutes) and aerobic activities (23
minutes) were the shortest time spent per day. This results means that students spent
considerable time in lifestyle activities (walking and bicycling for transportation: 65minutes;
housework: 34 minutes). In contrast, time spent in aerobic activity, big muscle activity, and
flexibility activity recommended by many institutions was relatively lower than lifestyle
activities. Therefore, creative physical activities during housework and transportation need to be
developed. In fact, American Heart Association (2013b) emphasized physical activities around
the house and provided ways to be physically active at home.
This study found some relationship between BMI percentile and health behaviors through
Pearson correlation. First of all, time in MVPA was negatively correlated with time in
television/computer (r= -.29, p< .001). That is, as previous studies have emphasized, time spent
in MVPA can have a good influence on decreased screen time and improved health (e.g.,
cardiovascular health and diabetes). Also, this study found the importance of PACER laps. First,
BMI percentile and PACER laps variable were negatively correlated (r = -.25, p< .001). That is,
those who are in healthy weight are highly likely to have more PACER laps than other BMI
groups. Second, PACER laps variable was positively correlated with the consumption of
vegetables and fruits (r= .14, p< .001) and MVPA (r= .2, p< .001). The positive relationship
between PACER score and health behaviors has an important meaning in schools. Compared
with skinfold thickness and BMI measures, PACER test can be effectively used by teachers as a
reliable and noninvasive measurement to turn out changes in BMI (Le Masurier & Corbin,
2012). In addition, PACER test can be motivation of students to achieve good records, is an easy
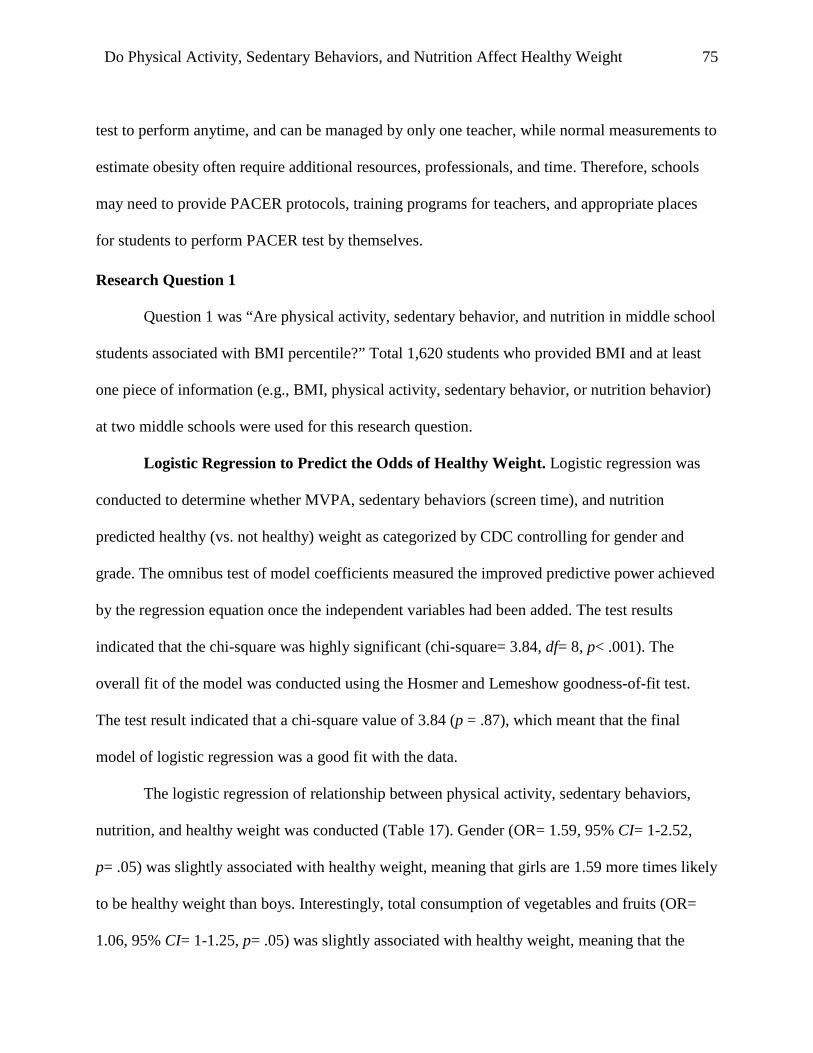
Do Physical Activity, Sedentary Behaviors, and Nutrition Affect Healthy Weight 75
test to perform anytime, and can be managed by only one teacher, while normal measurements to
estimate obesity often require additional resources, professionals, and time. Therefore, schools
may need to provide PACER protocols, training programs for teachers, and appropriate places
for students to perform PACER test by themselves.
Research Question 1
Question 1 was “Are physical activity, sedentary behavior, and nutrition in middle school
students associated with BMI percentile?” Total 1,620 students who provided BMI and at least
one piece of information (e.g., BMI, physical activity, sedentary behavior, or nutrition behavior)
at two middle schools were used for this research question.
Logistic Regression to Predict the Odds of Healthy Weight. Logistic regression was
conducted to determine whether MVPA, sedentary behaviors (screen time), and nutrition
predicted healthy (vs. not healthy) weight as categorized by CDC controlling for gender and
grade. The omnibus test of model coefficients measured the improved predictive power achieved
by the regression equation once the independent variables had been added. The test results
indicated that the chi-square was highly significant (chi-square= 3.84, df= 8, p< .001). The
overall fit of the model was conducted using the Hosmer and Lemeshow goodness-of-fit test.
The test result indicated that a chi-square value of 3.84 (p = .87), which meant that the final
model of logistic regression was a good fit with the data.
The logistic regression of relationship between physical activity, sedentary behaviors,
nutrition, and healthy weight was conducted (Table 17). Gender (OR= 1.59, 95% CI= 1-2.52,
p= .05) was slightly associated with healthy weight, meaning that girls are 1.59 more times likely
to be healthy weight than boys. Interestingly, total consumption of vegetables and fruits (OR=
1.06, 95% CI= 1-1.25, p= .05) was slightly associated with healthy weight, meaning that the
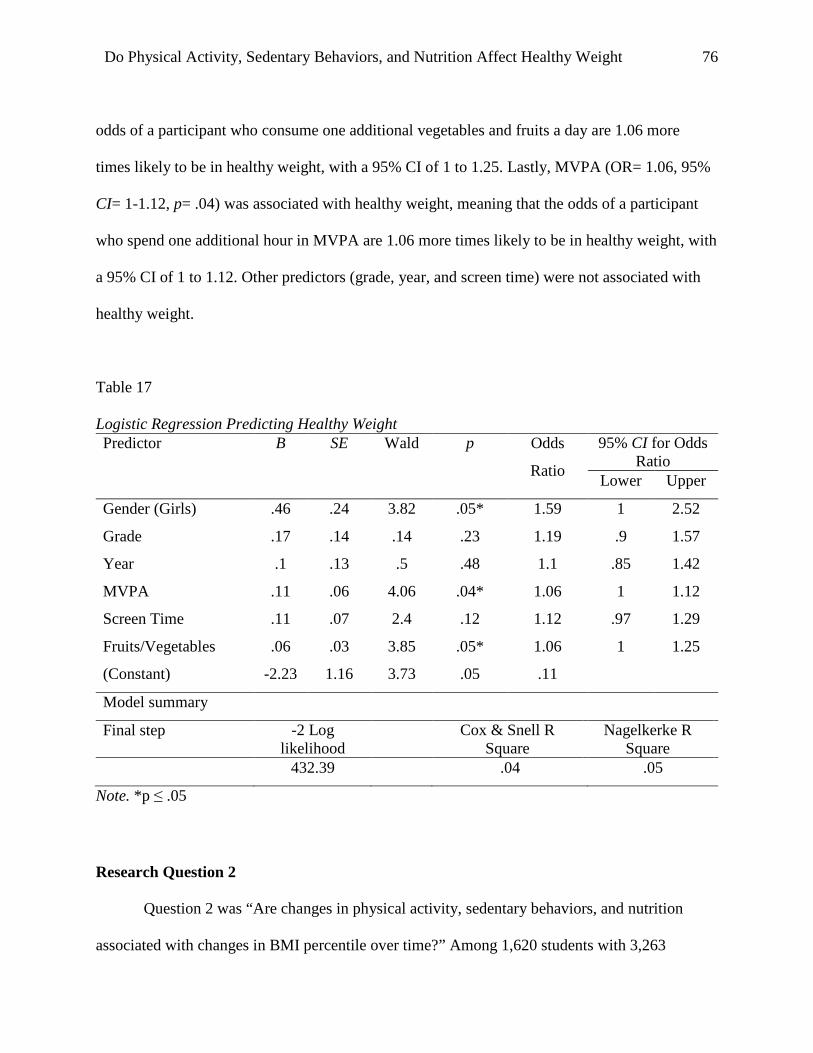
Do Physical Activity, Sedentary Behaviors, and Nutrition Affect Healthy Weight 76
odds of a participant who consume one additional vegetables and fruits a day are 1.06 more
times likely to be in healthy weight, with a 95% CI of 1 to 1.25. Lastly, MVPA (OR= 1.06, 95%
CI= 1-1.12, p= .04) was associated with healthy weight, meaning that the odds of a participant
who spend one additional hour in MVPA are 1.06 more times likely to be in healthy weight, with
a 95% CI of 1 to 1.12. Other predictors (grade, year, and screen time) were not associated with
healthy weight.
Table 17
Logistic Regression Predicting Healthy Weight
Note. *p ≤ .05
Research Question 2
Question 2 was “Are changes in physical activity, sedentary behaviors, and nutrition
associated with changes in BMI percentile over time?” Among 1,620 students with 3,263
Predictor B SE Wald p Odds
Ratio
95% CI for Odds Ratio
Lower Upper
Gender (Girls) .46 .24 3.82 .05* 1.59 1 2.52
Grade .17 .14 .14 .23 1.19 .9 1.57
Year .1 .13 .5 .48 1.1 .85 1.42
MVPA .11 .06 4.06 .04* 1.06 1 1.12
Screen Time .11 .07 2.4 .12 1.12 .97 1.29
Fruits/Vegetables .06 .03 3.85 .05* 1.06 1 1.25
(Constant) -2.23 1.16 3.73 .05 .11
Model summary
Final step -2 Log likelihood
Cox & Snell R Square
Nagelkerke R Square
432.39 .04 .05

Do Physical Activity, Sedentary Behaviors, and Nutrition Affect Healthy Weight 77
observations, 668 students with 668 observations were removed from the analysis of liner mixed
model. Therefore, a total of 952 students with 2,595 observations who had participated two or
more times were used for this research question.
Linear Mixed Model to Determine Changes in Dependent Variables over time. A
linear mixed model was conducted to determine changes in physical activity, sedentary behavior,
and nutrition associated with changes in BMI percentile over time, controlling for gender and
grade. A linear mixed model is a type of hierarchical model that develops the linear regression
model. It includes fixed effects (e.g., gender and BMI percentile) and random effects (e.g., year)
for a continuous outcome (e.g., physical activity, sedentary behaviors, and nutrition). The
changes in physical activity, sedentary behavior, and nutrition were evaluated using a linear
mixed model as implemented in the MIXED procedure of SAS (version 9.4) with a restricted
maximum likely estimation (REML). Fixed effects were gender, and BMI, while the random
effect was year.
Different covariance structures (i.e. CS, AR, and UN) were used, and UN was determined
to be the best structure for this question due to the lowest BIC among other covariance
structures. Based on the results of covariance parameter estimates for each outcome variable,
random slopes in physical activity and sedentary behaviors were removed because the random
effects of intercept and slope were not significant.
Three important assumptions for linear mixed model were measured prior to analysis.
First, the residual plots for four predictors (physical activity, sedentary behavior, and nutrition)
showed a curve, meeting the assumption of linearity. Second, predictor variables should not be
highly correlated (< 0.9) to meet the multicollinearity assumption. This study included
relationships between three predictors (i.e. gender, year, and BMI percentile), which were not

Do Physical Activity, Sedentary Behaviors, and Nutrition Affect Healthy Weight 78
highly correlated. Third, predictors met the assumption of homoscedasticity although some
predictors were skewed, especially sedentary behavior. However, in general, residual plots
looked acceptable. All tables that reflect physical activity, sedentary behaviors, and nutrition are
shown, but all figures (3-10) are in Appendix E.
Changes of Physical Activity. The final BIC was 2,749 for total physical activity time,
and 2,367 for moderate-vigorous time. The analysis was done using linear mixed model (Proc
Mixed). Time spent in physical activity was significantly associated with the interaction between
gender and year (estimate=1.96, p=.03) (Table 18); boys increased time spent in physical activity
over time while girls had no change in physical activity over time (Figure 3 in Appendix E).
Table 18
Predictors of Physical Activity Outcome: Total PA time MVPA time
BIC: 2749, Chi-Square: 1.55 BIC: 2367, Chi-Square: 0
Estimate SE Estimate SE
Intercept 6.72 1.48 Intercept 1.91 1.03
Gender(boys) -2.63 2.07 Gender(boys) .53 1.44
Year -.97 .62 Year .07 .43
BMI_P -.02 .02 BMI_P <.01 .01
Gender×Year* 1.96 .88 Gender×Year .03 .61
Gender×BMI_P .03 .03 Gender×BMI_P -.01 .02
Year×BMI_P .01 <.01 Year×BMI_P <.01 <.01
Gender×Year×
BMI_P*
-.024 .01 Gender×Year×
BMI_P
<.01 <.01
Note. *p < .05

Do Physical Activity, Sedentary Behaviors, and Nutrition Affect Healthy Weight 79
Also, time spent in physical activity was significantly associated with another interaction
between gender, year, and BMI percentile (estimate=-.02, p=.05); girls in the healthy weight
category decreased time spent in physical activity over time while boys in same category
increased over time (Figure 4 in Appendix E); girls in the obese category increased time spent in
physical activity over time while boys in the same category decreased over time (Figure 5 in
Appendix E). However, none of the variables were significantly related to time spent in
moderate-vigorous physical activity over time (Table 18).
Changes of Sedentary Behaviors. For a better model fit, random slopes were removed,
and final the BIC was 2,796 for time in sedentary behaviors. The analysis was done using linear
mixed model (Proc Mixed). None of the variables were significantly related to total time spent in
sedentary behaviors (Table 19).
Table 19
Predictors of Sedentary Behaviors (Total SD Time) Outcome: Total SD Time
BIC: 2796, Chi-Square: 1.47
Estimate SE
Intercept 7.18 1.54
Gender(boys) .81 2.16
Year 1.04 .65
BMI_P .02 .02
Gender×Year -1.38 .92
Gender×BMI_P -.01 .03
Year×BMI_P -.01 <.01
Gender×Year×BMI_P .02 .01

Do Physical Activity, Sedentary Behaviors, and Nutrition Affect Healthy Weight 80
There are three types of sedentary behaviors: schoolwork, screen time, and eating. Screen
time was significantly associated with gender, the interaction between gender and year, the
interaction between gender and BMI percentile, and the interaction between gender, year, and
BMI percentile (Table 20). Specifically, boys had more time in screen time (estimate= 3.16,
p< .01). Girls decreased screen time over time while boys slightly increased screen time over
time (estimate= -1.22, p< .01) (Figure 6 in Appendix E). Also, girls showed a greater decrease in
hours of screen time than boys as BMI percentile increased (estimate= -.04, p< .01) (Figure 7 in
Appendix E). Girls in overweight and obese category increased over time while boys in
overweight and obese category decreased over time (estimate= .02, p< .01) (Figure 8 and 9 in
Appendix E).
Table 20
Predictors of Sedentary Behaviors (Screen Time) Screen Time
BIC: 2044, Chi-Square: 3.94*
Estimate SE
Intercept .32 .75
Gender(boys)** 3.16 1.05
Year .4 .31
BMI_P .01 .01
Gender×Year** -1.22 .44
Gender×BMI_P** -.04 .01
Year×BMI_P <-.01 <.01
Gender×Year×BMI_P** .02 <.01
Note. *p < .05, **p < .01

Do Physical Activity, Sedentary Behaviors, and Nutrition Affect Healthy Weight 81
School work (homework) was significantly associated with BMI percentile (Table 21);
boys and girls increased school work (homework) as BMI percentile increased (estimate= .03,
p= .04) (Figure 10 in Appendix E).
Table 21
Predictors of Sedentary Behaviors (School Work and Eating Time) School Work Eating Time
BIC: 2452, Chi-Square: 0.53 BIC: 2128, Chi-Square: 2.89
Estimate SE Estimate SE
Intercept 2.41 1.11 Intercept 1.96 .81
Gender(boys) -.81 1.56 Gender(boys) .1 1.14
Year .8 .47 Year .44 .34
BMI_P* .03 .02 BMI_P -.01 .01
Gender×Year <.01 .66 Gender×Year -.59 .48
Gender×BMI_P <.01 .02 Gender×BMI_P <.01 .02
Year×BMI_P -.01 <.01 Year×BMI_P <.01 <.01
Gender×Year×
BMI_P
<.01 <.01 Gender×Year×
BMI_P
<.01 <.01
Note. *p < .05
Changes of Nutrition. Nutrition included total consumption of vegetables and fruits. This
study found that none of the variables were significantly related to total consumption of
vegetables and fruits (Table 22).

Do Physical Activity, Sedentary Behaviors, and Nutrition Affect Healthy Weight 82
Table 22
Predictors of Nutrition Outcome: Nutrition
BIC: 3122, Chi-Square: 13.07**
Estimate SE
Intercept 6.49 1.78
Gender(boys) .36 2.58
Year -.74 .74
BMI_P .03 .02
Gender×Year .66 1.07
Gender×BMI_P <.01 .03
Year×BMI_P <-.01 .01
Gender×Year×BMI_P <-.01 .01
Note. **p < .01

Do Physical Activity, Sedentary Behaviors, and Nutrition Affect Healthy Weight 83
CHAPTER 5
DISCUSSION
This study examined: (a) the relationship between BMI percentile and health behaviors
(physical activity, sedentary behaviors, and nutrition) and (b) changes in three health behaviors
over time associated with changes in BMI percentile over time when controlled for covariates of
grade and gender. A Social Ecological Model (SEM) perspective provided the conceptual
framework for this study. Using the SEM as a framework helped to explore the significant
interactions between targeted health behaviors and gender, year, and BMI percentile by including
individual, interpersonal, organizational, and community levels.
Obesity is multi-faceted issue and it is necessary to emphasize various levels of SEM
simultaneously (Sallis et al., 2008). Designated levels of the SEM served to explore factors in the
community level (distinct culture, different school environments, and regional characteristics) for
research question 1, and in individual (the adolescent stage of development), interpersonal
(teacher) and organizational level (after school PA program, PE curriculum revision, school
garden, and healthcare) for research question 2. This chapter includes discussion of the findings,
limitations, and suggestions for future studies.
Exploring Individual Health Behaviors through the Lens of Community Level Influencers
The relationship between physical activity (MVPA), sedentary behaviors (screen time),
and nutrition (vegetables and fruits), and healthy weight was conducted using logistic regression.
From an ecological perspective, community influences foster the cultural and social expectations
of those living and interacting within the community. The social norms of communities can have
influence on what opportunities are available and perceived to have value (Emmons, 2000; Sallis
et al., 2008). A community is described as a larger societal construct comprised, in varying
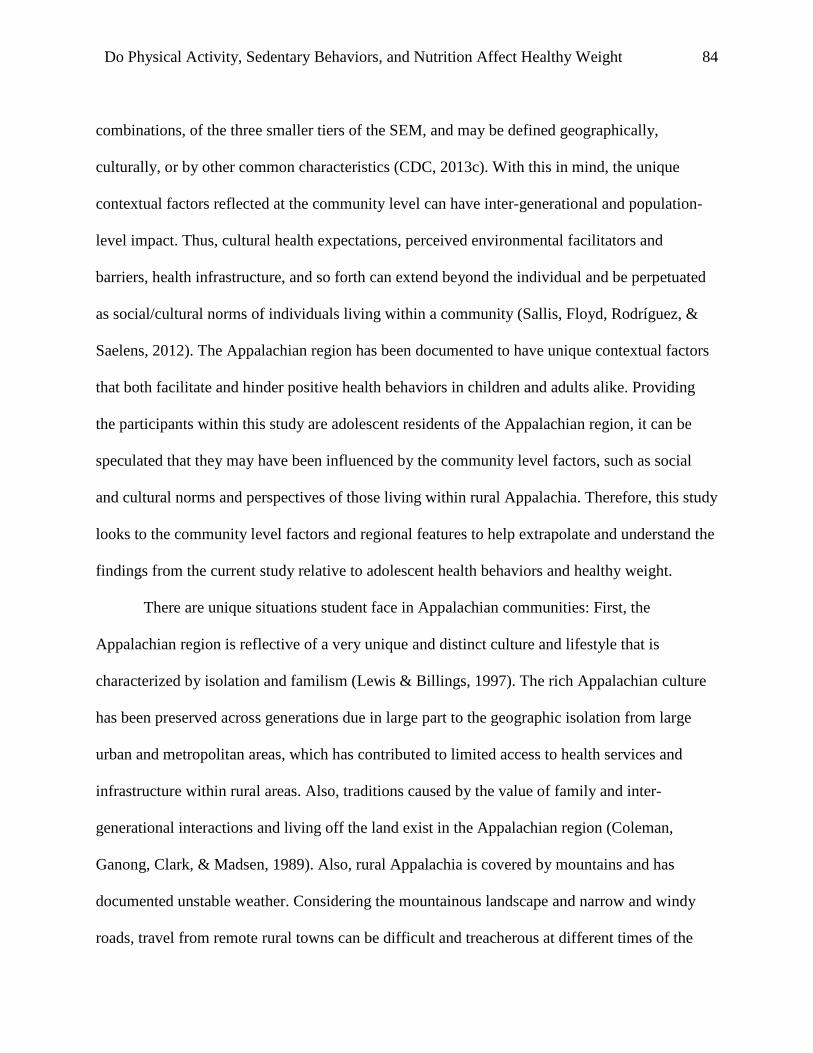
Do Physical Activity, Sedentary Behaviors, and Nutrition Affect Healthy Weight 84
combinations, of the three smaller tiers of the SEM, and may be defined geographically,
culturally, or by other common characteristics (CDC, 2013c). With this in mind, the unique
contextual factors reflected at the community level can have inter-generational and population-
level impact. Thus, cultural health expectations, perceived environmental facilitators and
barriers, health infrastructure, and so forth can extend beyond the individual and be perpetuated
as social/cultural norms of individuals living within a community (Sallis, Floyd, Rodríguez, &
Saelens, 2012). The Appalachian region has been documented to have unique contextual factors
that both facilitate and hinder positive health behaviors in children and adults alike. Providing
the participants within this study are adolescent residents of the Appalachian region, it can be
speculated that they may have been influenced by the community level factors, such as social
and cultural norms and perspectives of those living within rural Appalachia. Therefore, this study
looks to the community level factors and regional features to help extrapolate and understand the
findings from the current study relative to adolescent health behaviors and healthy weight.
There are unique situations student face in Appalachian communities: First, the
Appalachian region is reflective of a very unique and distinct culture and lifestyle that is
characterized by isolation and familism (Lewis & Billings, 1997). The rich Appalachian culture
has been preserved across generations due in large part to the geographic isolation from large
urban and metropolitan areas, which has contributed to limited access to health services and
infrastructure within rural areas. Also, traditions caused by the value of family and inter-
generational interactions and living off the land exist in the Appalachian region (Coleman,
Ganong, Clark, & Madsen, 1989). Also, rural Appalachia is covered by mountains and has
documented unstable weather. Considering the mountainous landscape and narrow and windy
roads, travel from remote rural towns can be difficult and treacherous at different times of the

Do Physical Activity, Sedentary Behaviors, and Nutrition Affect Healthy Weight 85
year. These characteristics in community level are not generally changed over time. Therefore,
the unique contextual features of rural Appalachia will assist in the discussion of adolescent
health behaviors presented in this study.
Although this study showed a small association between gender and healthy weight, the
data indicated that more girls participants were within the healthy weight category than their
boys counterparts (OR=1.59, p=.05). Previous studies supported these results, specifically
according to NHANES 2009-2010, about 30% of adolescent girls and 33% of adolescent boys
were classified as overweight or obese (Flegal et al., 2012). However, other studies presented no
difference between BMI percentile and gender, and in some instances, there were reversed
results. For example, Sardinha et al. (2016) presented that BMI was not different between boys
(19.9 kg/m2) and girls (20 kg/m2) aged 8 to 17. Saxena, Ambler, Cole, and Majeed (2004)
mentioned that girls were more overweight than boys aged 2-20 years (24% and 22%
respectively).
Physical Activity. Among the health behaviors of interest, physical activity and nutrition
predictors were associated with healthy weight. Specifically, MVPA was more likely to result in
healthy weight within this sample (OR=1.06, p=.04). Similar results can be found in previous
studies (DeLany et al., 2014; Reilly et al., 2004). DeLany et al. (2013) found that individuals
who spent less time in physical activity decreased their energy expenditure, resulting in weight
gain. The Physical Activity Guidelines Advisory Committee (2008) and the World Health
Organization (WHO, 2010b) recommend at least 60 minutes of MVPA most days of the week.
Based on the present study, participants adhered to the physical activity guidelines of 60-minutes
per day, however differences across grade level were observed. For instance, time spent engaged
in MVPA per day was reported to be less in 8th grade participants as compared to 6th grade

Do Physical Activity, Sedentary Behaviors, and Nutrition Affect Healthy Weight 86
participants (2.12 hr/day and 2.38 hr/day respectively). This finding is consistent with previous
research that has demonstrated declines in self-reported physical activity across adolescence
(Caspersen, Pereira, & Curran, 2000).
Physical activity levels of those living within the Appalachian region has been
documented to be lower than those living outside of the region (Swanson, Schoenberg, Erwin, &
Davis, 2013). Factors that contribute to these low levels of physical activity include regional
characteristics such as limited access to PA facilities and programming, a lack of walkable
communities, and unpredictable weather due to the mountainous terrain (Martin et al., 2005;
Sloane et al., 2006). Findings from this study build upon previous work that indicate positive
relationships between participation in physical activity (MVPA) and healthy weight. A result
from this study indicated that the most time spent in physical activity was reported within the
lifestyle physical activity category (e.g., housework and transportation). This may suggest that it
is difficult for students to spend time in other types of physical activity (e.g., aerobic or muscular
activity) outside the school day, thus validating the need for physical activity-related
programming and initiatives for adolescents within this region. Efforts at the community level
may include changes that capitalize on existing infrastructure and environments where physical
activity programming could be offered, such as schools (e.g., gymnasiums, tracks, or playing
fields), community parks, and recreation spaces. Therefore, joint-use agreements which allow
community-wide use of school facilities may be important (Swanson et al., 2013). For example,
schools allow parents with their children to use the closest school’s facilities (e.g., tracks or
playing fields) after school hours and during the weekends. This opportunity, which expands
physical activity in school, helps students increase aerobic or muscular activities recommended
by many educational institutions during the school day. Additionally, considering the remote

Do Physical Activity, Sedentary Behaviors, and Nutrition Affect Healthy Weight 87
location of many residents in rural Appalachia and extensive travel time to get to and from
school, physical programming within the school day (before, during, or after) would allow all
students to engage in health-enhancing programming. Those living in the Appalachian region
have a lack of sharing information and limited opportunities for social interaction due to slow-
speed Internet service (Strover & Mun, 2006) and houses far away from a school. In fact, some
areas in the eastern and western regions of the county had uncovered or unstable internet
services. Therefore, attractive guide books for physical activity available around the house may
be realistic interventions to increase MVPA. For example, Gulley and Boggs (2014)
recommended that writing exercise diaries may be a good intervention to increase physical
activity for adolescents in the Appalachian region. Also, motivational messages via a cell phone
which are provided by health professionals can increase self-efficacy, resulting in improving
physical activity (Richardson, 2013). Lastly, culturally relevant lifelong physical activities such
as a small-game hunting, fishing, and folk dance may be more appealing to adolescents in the
Appalachian region (Kruger et al., 2012) than health-enhancing physical activities. Gulley (2011)
suggested that Appalachian youth lack self-motivation necessary to engage in physical activity.
Sedentary Behavior. Unlike the physical activity variable of MVPA, the sedentary
behavior variable of screen time was not associated with healthy weight. Basically, participants
who spent more time in sedentary behaviors were likely to be classified as overweight or obese
(Hancox et al., 2004; Hu et al., 2003; Mitchell et al., 2013). Yet, some studies found no
relationship between sedentary behaviors and weight status (Davison et al., 2006; Oliver et al.,
2011). These studies indicate that measuring time spent in sedentary behaviors should be
longitudinal rather than cross-sectional to account for physical condition, weather, examination
period, and even interscholastic sport seasons that can interfere with representative measures of

Do Physical Activity, Sedentary Behaviors, and Nutrition Affect Healthy Weight 88
sedentary behavior patterns. In this study, only the first row of data was selected for each
participant and therefore represented a cross-sectional data set to examine these variables. Fulton
et al. (2009) suggested that some health disparities experienced by children in Appalachia may
be associated with the lack of physical activity facilities and insufficient physical activity that
contribute to increased sedentary behavior and screen time at home. Regardless of healthy or
unhealthy weight, most students in the Appalachian region may spend much time in television or
computer, whether it is deliberate or not (Hortz, Stevents, Holden, and Petosa, 2009). For
example, lack of street lights and the sun going down earlier may lead students to return to home
early after school hours. In fact, this study indicated that 53% of participants spent at least two
hours in television/computer games a day, which was 6% higher than national average (Sisson et
al., 2009). That is, regional characteristics may increase sedentary behaviors regardless of
healthy weight.
Nutrition. Results from this study indicated that total consumption of vegetables and
fruits positively affected healthy weight (OR=1.06, p=.05), however there was a small
association between nutrition and healthy weight. This finding supported the conclusions of
some previous studies. For example, Bertoia et al. (2015) found that increased consumption of
fruits and vegetables produced weight changes of -0.25 lb. (vegetables) and -0.53 lb. (fruits) per
daily serving over four years. Azagba and Sharaf (2012) revealed that the association between
consumption of vegetables and fruits and BMI was negatively correlated, so they concluded that
increased consumption of vegetables and fruits may be an effective strategy to lose weight. From
a community-level perspective, Hortz et al. (2009) found that poor nutrition was one of the main
factors affecting obesity in the Appalachian region. CDC (2012b) showed that 71.9% of
adolescents in West Virginia consumed fruit fewer than two times per week less than twice a

Do Physical Activity, Sedentary Behaviors, and Nutrition Affect Healthy Weight 89
week. Residents in the Appalachian region tend to prefer meats, biscuits, and fried foods to
vegetables and fruits because of lack of high-quality grocery stores, affordable dollar menus,
limited time to cook at home, and many fast-food restaurants (Bovell-Benjamin, Hathorn,
Ibrahim, Gichuhi, & Bromfield, 2009; Brown and Wenrich, 2012; Sohn, 2001; Webber &
Quintiliani, 2011). In fact, fast-food restaurants could be easily seen around the two middle
schools where the study took place.
To some extent, residents in the Appalachian region experience physical isolation and
poor living conditions, which can contribute to limited-knowledge of nutrition information,
access to fresh foods, and healthy cooking and food preparation practices. However, Quandt,
Popyach, and Dewalt (1994) suggested that residents in Appalachia are familiar with family
gardening and food preservation, which have continued to be important characteristics of
Appalachian-culture. Therefore, farm-to-school programs may be a good intervention for
Appalachian adolescents. It connects schools with fresh, local food grown by family farmers.
Through partnerships between a school and family, family farmers can provide students with
information about vegetables and fruits. In addition, students have an opportunity to buy family
farmers’ products at an affordable price, making it possible for their parents to cook with fresh
products at home.
Exploring Changes in Individual Health Behaviors Over Time through the Lens of
Interpersonal and Organizational Level Influences
Individual health behavior has been documented by researchers as being highly
influenced by interacting social and environmental constructs (Glanz et al., 2008). The SEM
places the individual in the center of the model with multiple levels of social influence
surrounding and extending beyond the center. As the model describes, individual beliefs,

Do Physical Activity, Sedentary Behaviors, and Nutrition Affect Healthy Weight 90
behaviors, and attitudes are continually shaped and influenced by the interactive nature of the
individual and the surrounding social constructs. This study attempted to measure predictive
changes in adolescent health behaviors over time. Using the SEM as a framework to explore the
documented effects, this study looked to the three innermost levels within the model (individual,
interpersonal, and organization) to help contextualize and extrapolate the findings. The selection
of the three levels was based upon the context of the intervention that was imposed upon the
organization and interpersonal levels across a three-year period. This study has not attempted to
document direct effects of the intervention components, however it remains difficult to separate
the adolescent participant data collected and analyzed from the organizational changes occurring
as a function of Greenbrier CHOICES. Therefore, this section discusses the significant results
from the linear mixed model analysis alongside the intervention components as a way to connect
and explain how changes over time may be associated with developmental factors and
interacting social influencers.
Change in Individual Level Over Time. The individual level within the SEM is based
on the assumption that an individual’s beliefs, behaviors, and attitudes are continually shaped
and developed based upon interactive effects of their surrounding social influences. Additionally,
the physical, cognitive, and emotional developmental phases that individuals experience,
particularly during early and mid-adolescence, can be instructive in understanding health
behavior changes over time. However, it is not easy to determine what changes through growth
can be linked to health behaviors because there are many possible factors within the individual
level.
This study included participants 11-16 years of age which classifies them at the early and
middle stages of adolescence. These stages of adolescent development may affect the changes in

Do Physical Activity, Sedentary Behaviors, and Nutrition Affect Healthy Weight 91
health behaviors (physical activity, sedentary behaviors, and nutrition). For example, during
these stages, boys show tremendous physical growth and the gap in physical abilities may begin
to widen. In fact, our result found that boys in the obese group decreased time spent in physical
activity and increased sedentary behaviors across the intervention; while boys in other BMI
groups increased time spent in physical activity and decreased sedentary behaviors. For this
reason, obese boys may lose interest in being active, while healthy boys may gain confidence in
being active. Therefore, schools may need to develop physical activity programs for obese group.
Interestingly, the result for girls within the healthy weight category trended in the same
pattern as boys in the obese group (i.e., decreased physical activity and increased sedentary
behaviors). Girls in early and middle stages of adolescence reportedly develop self-esteem and
are affected by physical self-concept (Siegel, Yancey, Aneshensel, & Schuler, 1999).
Interestingly, the poor physical self-concept (body image) and self-esteem resulted in being
inactive due to low motivation for physical activity (Strickland, 2004). Therefore, schools may
need to develop factors such as physical activity programs difficulty or interest which affects low
motivation and encourage students to join an exercise group or class with friends.
Change in Interpersonal Level Over Time. At the interpersonal level, formal and
informal social support systems that can affect students’ health behaviors, including teachers,
parents, and friends. This study considered teachers as a main role in interpersonal level even
though some students may be affected by their parents or friends because adolescents tend to
depend on their past experiences and personal characteristics when they want to pursue health
behaviors, so it is critical for teachers to provide the right information about health behaviors
(Moreland, Raup-Krieger, Hecht, & Miller-Day, 2013). Also, Moreland et al. (2013) found that
living in a small community often contributes to students’ development of strong relationship

Do Physical Activity, Sedentary Behaviors, and Nutrition Affect Healthy Weight 92
with teachers or coaches who advise against risky behaviors. In some cases, PE teachers spend
more time with students than other teachers because of their involvement in extracurricular
activities such as sports, clubs, and after school programs. For this reason, the role of the PE
teacher may serve as an important factor in creating and promoting health and physical activity
opportunities for adolescents before, during, and after school within the Appalachian region.
As part of the intervention, the PE teachers developed the PE curriculum and delivered
some of the after school programs. A primary goal of the curricular revisions was to provide
students with opportunities to engage in high levels of MVPA and experience culturally-and
geographically-relevant lifetime activities that they could enjoy participating in outside of the
school day. However, this study found that none of the variables (gender, year, and BMI) were
significantly related to MVPA. The U.S. Department of Health and Human Services (USDHHS)
(2010) suggested that students engage in MVPA during at least 50% of physical education
classes. Compared with light intensity physical activity, MVPA can effectively promote
cardiovascular endurance, muscle, and bone strength, making it possible to maximize motor and
psychological development (Strong et al, 2005). However, time devoted to class management,
attendance checks, and non-teaching functions can decrease academic learning time in Physical
Education (Jago et al, 2009). Based on the recommendations of USDHHS (2010) to increase
MVPA, the study suggested that teachers should implement a well-designed PE content that
applies to school as well as home. In this study, the teachers focused on PE curriculum
enhancements and after school PA programs that not only promoted skill development, but also
encouraged participation in the new lifestyle physical activities within the community and
outside the school environment.

Do Physical Activity, Sedentary Behaviors, and Nutrition Affect Healthy Weight 93
Therefore, schools may provide teachers with related training and supervision so they can
develop economical and effective tools to implement MVPA at school as well as home. For
example, trainings can include ways to reduce classroom management and transitions,
instructional strategies to provide appropriate feedback, and professional development
opportunities to improve instructional skills by using physical activity programs such as the
Coordinated Approach to Child Health (CATCH) and Sports, Play, and Active Recreation for
Kids (SPARK) programs (McKenzie et al., 2003; Sallis, et al., 1997). These programs were
effective to increase students’ physical activity levels as well as teachers’ knowledge about
physical activities (McKenzie et al., 1996; Stone et al., 1998).
Change in Organizational Level Over Time. This study considered the school as the
main component in the organizational level and was based on the assumption that students spend
considerable time in school and receive most information from school. Schools can provide
students with nutrition and physical activity knowledge and help them make better personal
choices by including after school PA programs, PE curriculum revisions, school gardens, and
school-based health care in this study. Deschesnes, Martin, and Hill (2003) mentioned that
changes in the school environment can improve students’ health. Further, Sallis and colleagues
(2012) noted that without modifications to the school environment, attempts to impact the
obesity levels in children will be ineffective. Based on this premise, organizational changes
within the school environment were a primary focus of the intervention and were designed with
the intent of improving adolescent health behaviors. Organizational changes that were made to
the school environment across the intervention included the addition of after school PA
programs, revisions to the physical education curriculum, and the development of school
gardens.

Do Physical Activity, Sedentary Behaviors, and Nutrition Affect Healthy Weight 94
First, after school PA programs allowed students to build their interests and skills in
archery, mountain-biking, walking, slack-lining, Zumba, land-paddling, and yoga for across 5-
weeks period (see Appendix A). According to a meta-analysis on school-based health
interventions, 16 of the 24 studies showed statistically significant effects on the reduction of
screen time (-25 minutes/day) when interventions included some aspect of after school
programming (Friedrich, Polet, Schuch, & Wagner, 2014). Interestingly, a notable result from
the current study was that there were no changes in physical activity reported by girls whereas,
boys reported increased time spent in physical activity over time. This result may be explained
by time spent for a day. This study indicated that girls spent 11.7% in aerobic activity, aerobic
sport, and muscular activity for a day, while boys spent 14.3%. Most after school PA programs
for this study were related to active exercise which emphasizes MVPA, so the gender difference
of changes in physical activity over time may be because boys prefer active exercise, while girls
prefer static exercise. In fact, this study found that girls spent more than twice boys in stretching.
Thus, practitioners and researchers may need to consider both active and static exercise to
promote motivation for physical activity when developing after school PA programs. Also, this
study found that the interaction between gender and BMI percentile was significantly associated
with changes over time in screen time. Specifically, both girls and boys decreased time spent on
screen time as BMI percentile increased. Although gender was not a primary variable in this
study, this finding was interesting because screen time was negatively associated with BMI
percentile. However, considering screen time as a predictive variable to obesity is a controversial
topic. Anderson et al. (2008) found that overweight children spent more than two hours per day
on screen time, but other studies revealed that there was no significant relationship between
television viewing and BMI (Aires et al., 2010; Davison et al., 2006; Mitchell et al., 2013). This

Do Physical Activity, Sedentary Behaviors, and Nutrition Affect Healthy Weight 95
study also found that BMI percentile was not correlated with screen time. An explanation of this
may be other factors which are not possible to measure. The factors may affect the negative
relationship between screen time and BMI percentile stronger than after school PA programs, PE
curriculum revisions, and school garden programs. In fact, Huang, Gao, Hannon, Shultz,
Newton, and Jenson (2012) mentioned that school-based programs alone cannot solve the
problems caused by chronic sedentary behaviors. Therefore, schools may need to promote
various school-based PA programs as well as collaborate with parents to decrease their child’s
sedentary behaviors at home.
Second, PE curriculum revisions were performed by PE teachers. They collaborated with
their students to select new units and equipment needed to address the identified areas of
improvement. The enhanced PE curriculum focuses on lifetime physical activities rather than
traditional sports, and has the potential to evoke a love for physical activity that extends beyond
skill performance. One of the main goals in this work was to increase the level of MVPA.
However, none of the variables (gender, year, and BMI) were significantly related to MVPA
over time. It may be hard for adolescents to meet physical activity recommendations promoted
by PE curriculum revisions. The actual time spent in MVPA is small although individuals
participate in physical activities or sports with moderate to vigorous intensity. Luke, Dugas,
Durazo-Arvizu, Cao, and Cooper (2011) revealed that more than 75% of adults lasted only one
minute in bouts of vigorous activity, and 35 minutes in moderate activity. They also revealed that
only 0.3% of them met 60 minutes with MVPA when they used 10-minute blocks in self-report.
Therefore, from an organizational level perspective, PE curriculum revisions may need to
include sports or programming that can consistently resulted in MVPA during classes by using
modified games or rules.
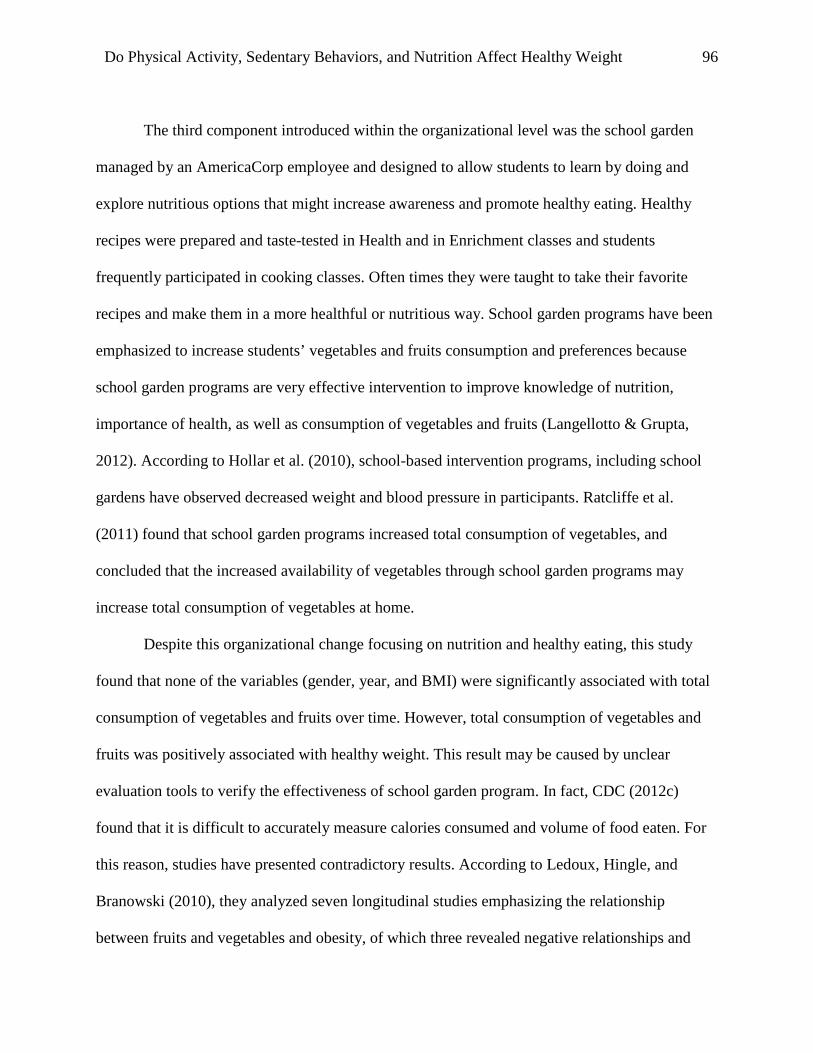
Do Physical Activity, Sedentary Behaviors, and Nutrition Affect Healthy Weight 96
The third component introduced within the organizational level was the school garden
managed by an AmericaCorp employee and designed to allow students to learn by doing and
explore nutritious options that might increase awareness and promote healthy eating. Healthy
recipes were prepared and taste-tested in Health and in Enrichment classes and students
frequently participated in cooking classes. Often times they were taught to take their favorite
recipes and make them in a more healthful or nutritious way. School garden programs have been
emphasized to increase students’ vegetables and fruits consumption and preferences because
school garden programs are very effective intervention to improve knowledge of nutrition,
importance of health, as well as consumption of vegetables and fruits (Langellotto & Grupta,
2012). According to Hollar et al. (2010), school-based intervention programs, including school
gardens have observed decreased weight and blood pressure in participants. Ratcliffe et al.
(2011) found that school garden programs increased total consumption of vegetables, and
concluded that the increased availability of vegetables through school garden programs may
increase total consumption of vegetables at home.
Despite this organizational change focusing on nutrition and healthy eating, this study
found that none of the variables (gender, year, and BMI) were significantly associated with total
consumption of vegetables and fruits over time. However, total consumption of vegetables and
fruits was positively associated with healthy weight. This result may be caused by unclear
evaluation tools to verify the effectiveness of school garden program. In fact, CDC (2012c)
found that it is difficult to accurately measure calories consumed and volume of food eaten. For
this reason, studies have presented contradictory results. According to Ledoux, Hingle, and
Branowski (2010), they analyzed seven longitudinal studies emphasizing the relationship
between fruits and vegetables and obesity, of which three revealed negative relationships and

Do Physical Activity, Sedentary Behaviors, and Nutrition Affect Healthy Weight 97
four showed mixed results or no difference. Also, Ledoux et al. (2010) mentioned that multiple
behavioral changes (i.e. parental eating behaviors or school garden program) may contribute to
the unclear relationship between consumption of vegetables and fruits and obesity. Therefore,
this study may suggest that schools need to set clear criteria for the evaluation of school garden
programs, so they need to decide whether calories consumed should be measured or volume of
food eaten should be measured to determine the effectiveness of school garden program.
In addition to three organizational level changes, this study found that BMI percentile
was associated with time spent in school work, specifically homework over time. That is, both
girls and boys increased BMI percentile as homework increased. Some studies did not recognize
homework as one of the sedentary behaviors (Hamilton, Healy, Dunstan, Zderic, & Owen, 2008;
Pate et al, 2008) and mainly included watching television and playing video/computer games.
However, the U.S. Department of Health (2010) considers homework as one of the sedentary
behaviors and referred to homework as productive sedentary behavior. Feldman, Barnett, Shrier,
Rossignol, and Abenhaim, (2003) mentioned that productive sedentary behaviors were not
associated with obesity, compared with other leisure-time sedentary behaviors (e.g., watching
TV and playing computer). Although the relationship between leisure-time sedentary behaviors
and productive sedentary behaviors was not documented (Sisson et al., 2009), this study may
conclude that homework can be included as one of the major sedentary behaviors in the
Appalachian region and too much time spending homework may affect obesity negatively.

Do Physical Activity, Sedentary Behaviors, and Nutrition Affect Healthy Weight 98
CONCLUSION
Findings from this study emphasized the importance of physical activity, sedentary
behaviors, and nutrition for obesity prevention, and were characterized as a comprehensive,
three-year, rural area, middle school-based study with large sample. This is the study to examine
the relationship between health behaviors and obesity of middle school students in the
Appalachian region. From an ecological perspective, the relationship between adolescent obesity
and health behaviors was explained by: (a) individual level (stages of adolescent development),
(b) interpersonal level (teachers), (c) organizational level (after school PA program, PE
curriculum revisions, and school garden), and (d) community level (regional characteristics and
distinct cultures). These four levels in SEM facilitated explanation about the obesity prevalence
in the Appalachian region and revealed several important results. First, MVPA was more likely
to result in healthy weight within this sample, especially time spent in MVPA was reported to be
less in 8th graders as compared to 6th graders. Interventions or programming to prevent students
from decreasing physical activity across adolescence may be needed. This study also indicated
that the most time spent in physical activity was reported within the lifestyle physical activity
category (e.g., housework and transportation), so the importance of community-wide use of
school facilities, attractive guide books for physical activity available around the house,
motivational messages via a cell phone, and culturally relevant lifelong physical activities could
be emphasized. Second, this study indicated that total consumption of vegetables and fruits
positively affected healthy weight. Residents in Appalachia are familiar with family gardening
and food preservation, which has continued to be an important characteristics of Appalachian-
culture. Farm-to-school program may be a good intervention for Appalachian adolescents. Third,
this study indicated that girls were reported to have no changes in physical activity over time, but

Do Physical Activity, Sedentary Behaviors, and Nutrition Affect Healthy Weight 99
girls in healthy weight category decreased time spent in physical activity. The poor physical self-
concept (body image) and self-esteem may result in being inactive due to low motivation for
physical activity. Therefore, schools may need to develop factors such as physical activity
programs difficulty or interest which affects low motivation and encourage students to join an
exercise group or class with friends.
Fourth, there were no changes in physical activity reported by girls whereas, boys
reported increased time spent in physical activity over time. The gender difference of changes in
physical activity over time may be because boys prefer active exercise, while girls prefer static
exercise. Thus, practitioners and researchers may need to consider both active and static exercise
to promote motivation for physical activity when developing after school PA programs.
Fifth, this study found that both girls and boys increased BMI percentile as homework
increased. Although the relationship between leisure-time sedentary behaviors and productive
sedentary behaviors was not documented, this study may conclude that homework can be
included as one of the major sedentary behaviors in the Appalachian region and too much time
spending homework may affect obesity negatively.
All things considered, this study indicates the importance of Social Ecological Model
(SEM) for assessment of obesity prevalence by emphasizing individual, interpersonal,
organizational, and community level and it is recommended that school-based interventions and
programming consider those levels to promote behavioral changes for adolescent health in the
Appalachian region.

Do Physical Activity, Sedentary Behaviors, and Nutrition Affect Healthy Weight 100
LIMITATIONS
This study has several limitations. First, BMI measurement was not conducted every
collection period while measurements for outcomes (physical activity, sedentary behaviors, and
nutrition) were conducted every collection period. That is, participants measured their BMI at
collection periods 2 (year 1), 6 (year 2), and 10 (year 3), which means that BMI was measured
once a year. Therefore, there was a time interval between BMI measurement and other outcomes
for up to 6 months.
Second, the PACER test was run by adolescents in a ‘volunteer-based’ setting which
meant their efforts may not have truly reflected their cardiovascular fitness, and confounding
factors (that were not measured) are degree of peer influence, amotivation (lack of motivation),
and assessment fatigue (data collection windows punctuated every other month due to mandated
schedule).
Third, the sample consisted of middle school students (6th to 8th grades) in West Virginia
and heavily Caucasian population (approximately 90%). That is, it is not a representative sample
of US adolescents. Therefore, it is not appropriate for generalization to US populations.
Do Physical Activity, Sedentary Behaviors, and Nutrition Affect Healthy Weight 101
RECCOMMENDATION FOR FURTHER RESEARCH
From the results of this study, several recommendations for future studies are suggested.
First, PACER record may be an indicator for students’ healthy or unhealthy behaviors. This
study found PACER record was positively correlated with physical activity and nutrition, and
negatively correlated with sedentary behaviors. The results mean that health behaviors may be
reliably measured by fitness tests. Therefore, further research is needed to reveal whether other
physical fitness tests such as sit-up can also be an indicator for healthy behaviors.
Second, students spent much time in lifestyle activity in this study. This activity generally
includes housework and transportation. Students, who spent much time in this activity, are likely
not to meet an intensity level recommended by PA guidelines because most lifestyle activities
generally has light intensity. Therefore, further research is needed to develop interventions to
transfer lifestyle activity to moderate-vigorous lifestyle activities.
Third, much time spent in productive sedentary behavior (e.g., school work) affected
obesity in this study. However, it is still unclear how various purposes of sedentary behaviors
affect obesity. For example, online-based education using online materials or social media is
developing rapidly, so simply measuring time spent in computer use without confirming the
purpose of use may lead to inaccurate results. Therefore, further research is needed to develop
surveys to measure sedentary behaviors that include the detailed purposes (e.g., computer use for
online education) rather than traditional sedentary behaviors (e.g., computer use).

Do Physical Activity, Sedentary Behaviors, and Nutrition Affect Healthy Weight 102
REFERENCES
Addy, C. L., Wilson, D. K., Kirtland, K. A., Ainsworth, B. E., Sharpe, P., & Kimsey, D. (2004).
Associations of perceived social and physical environmental supports with physical activity
and walking behavior. American journal of public health, 94(3), 440-443.
Agriculture%20PPWVSF2014pdf.pdf
Ainsworth, B. E., Haskell, W. L., Whitt, M. C., Irwin, M. L., Swartz, A. M., Strath, S. J., . . .
Emplaincourt, P. O. (2000). Compendium of physical activities: An update of activity codes
and MET intensities. Medicine and Science in Sports and Exercise, 32(Suppl 9), S498-S504.
Aires, L., Silva, P., Silva, G., Santos, M. P., Ribeiro, J. C., & Mota, J. (2010). Intensity of
physical activity, cardiorespiratory fitness, and body mass index in youth. Journal of
Physical Activity & Health, 7(1), 54.
Akaike, H. (1974). A new look at the statistical model identification. Automatic Control, IEEE
Transactions on, 19(6), 716-723.
Alkadry, M. G., Wilson, C., & Nicholas, D. (2006). Stroke awareness among rural residents: the
case of West Virginia. Social Work in Health Care, 42(2), 73-92.
Allender, S., Gleeson, E., Crammond, B., Sacks, G., Lawrence, M., Peeters, A., . . . Swinburn, B.
(2009). Moving beyond'rates, roads and rubbish': How do local governments make choices
about healthy public policy to prevent obesity?. Australia and New Zealand Health Policy,
6(1), 1.
Allensworth, D. D., & Kolbe, L. J. (1987). The comprehensive school health program: Exploring
an expanded concept. Journal of School Health, 57(10), 409-412.

Do Physical Activity, Sedentary Behaviors, and Nutrition Affect Healthy Weight 103
Amarasinghe, A., Brown, C., D’Souza, G., & Borisova, T. (2006). The impact of county level
factors on obesity in West Virginia, (No. Working Paper 2006-14). Retrieved from
http://www.rri.wvu.edu/wp-content/uploads/2012/11/wp2006-141.pdf
American Heart Association. (2013a). Statistical fact sheet 2013 update. Retrieved from
https://www.heart.org/idc/groups/heartpublic/@wcm/@sop/@smd.documents/downloadable
/ucm_319588.pdf
American Heart Association. (2013b). Physical Activity around the house. Retrieved from
https://www.heart.org/HEARTORG/HealthyLiving/HealthyKids/HowtoMakeaHealthyHom
e/Physical-Activity-Around-the-House_UCM_310806_Article.jsp
Andersen, L. B., Lawlor, D. A., Cooper, A. R., Froberg, K., & Anderssen, S. A. (2009). Physical
fitness in relation to transport to school in adolescents: The danish youth and sports study.
Scandinavian Journal of Medicine & Science in Sports, 19(3), 406-411.
Anderson, J. (1982). Logistic discrimination. In Krishnaiah, P. R. Editor & Kanal, L. N. Editor,
Handbook of Statistics (169-191). Amsterdam; North-Holland Publishing Co.
Anderson, S. E., Economos, C. D., & Must, A. (2008). Active play and screen time in US
children aged 4 to 11 years in relation to sociodemographic and weight status characteristics
: a nationally representative cross-sectional analysis. BMC Public health, 8(1), 1.
Ariza, A. J., Chen, E. H., Binns, H. J., & Christoffel, K. K. (2004). Risk factors for overweight in
five-to six-year-old Hispanic-American children: a pilot study. Journal of Urban Health,
81(1), 150-161.
Azagba, S., & Sharaf, M. F. (2012). Fruit and vegetable consumption and body mass index a
quantile regression approach. Journal of Primary Care & Community Health, 3(3), 210-220.

Do Physical Activity, Sedentary Behaviors, and Nutrition Affect Healthy Weight 104
Bacon, L., & Aphramor, L. (2011). Weight science: Evaluating the evidence for a paradigm
shift. Nutrition Journal, 10(9), 2-13.
Bandura, A. (2001). Social cognitive theory: An agentic perspective. Annual Review of
Psychology, 52(1), 1-26.
Baraldi, A. N., & Enders, C. K. (2010). An introduction to modern missing data analyses.
Journal of School Psychology, 48(1), 5-37.
Bar-On, M. E., Broughton, D. D., Buttross, S., Corrigan, S., Gedissman, A., González De Rivas,
M. R., ... Hogan, M. (2001). Children, adolescents, and television. Pediatrics, 107(2), 423-
426.
Barreto, P. S. (2013). Why are we failing to promote physical activity globally?. Bulletin of the
World Health Organization, 91(6), 390-390A.
Bassett, D. R., Ainsworth, B. E., Leggett, S. R., Mathien, C. A., Main, J. A., Hunter, D. C., &
Duncan, G. E. (1996). Accuracy of five electronic pedometers for measuring distance
walked. Medicine and Science in Sports and Exercise, 28(8), 1071-1077.
Bauer, K. W., Nelson, M. C., Boutelle, K. N., & Neumark-Sztainer, D. (2008). Parental
influences on adolescents' physical activity and sedentary behavior: Longitudinal findings
from project EAT-II. The International Journal of Behavioral Nutrition and Physical
Activity, 5, 12-5868-5-12. doi:10.1186/1479-5868-5-12
Bauman, A., Ainsworth, B. E., Sallis, J. F., Hagströmer, M., Craig, C. L., Bull, F. C., . . .
Sjöström, M. (2011). The descriptive epidemiology of sitting: A 20-country comparison
using the international physical activity questionnaire (IPAQ). American Journal of
Preventive Medicine, 41(2), 228-235.

Do Physical Activity, Sedentary Behaviors, and Nutrition Affect Healthy Weight 105
Beets, M. W., Beighle, A., Erwin, H. E., & Huberty, J. L. (2009). After-school program impact
on physical activity and fitness: a meta-analysis. American Journal of Preventive Medicine,
36(6), 527-537.
Bertoia, M. L., Mukamal, K. J., Cahill, L. E., Hou, T., Ludwig, D. S., Mozaffarian, D., ... Rimm,
E. B. (2015). Changes in intake of fruits and vegetables and weight change in United States
men and women followed for up to 24 years: analysis from three prospective cohort studies.
PLOS Medicine, 12(9), e1001878.
Bettinghaus, E. P. (1986). Health promotion and the knowledge-attitude-behavior continuum.
Preventive Medicine, 15(5), 475-491.
Blair, D. (2009). The child in the garden: An evaluative review of the benefits of school
gardening. The Journal of Environmental Education, 40(2), 15-38.
Block, G. (2004). Foods contributing to energy intake in the US: Data from NHANES III and
NHANES 1999–2000. Journal of Food Composition and Analysis, 17(3), 439-447.
Booth, F. W., Laye, M. J., Lees, S. J., Rector, R. S., & Thyfault, J. P. (2008). Reduced physical
activity and risk of chronic disease: The biology behind the consequences. European
Journal of Applied Physiology, 102(4), 381-390.
Booth, M. L., Ainsworth, B. E., Pratt, M., Ekelund, U., Yngve, A., Sallis, J. F., & Oja, P. (2003).
International physical activity questionnaire: 12-country reliability and validity. Medicine &
Science in Sports & Exercise, 195(9131/03), 1381-1395.
Bovell-Benjamin, A. C., Hathorn, C. S., Ibrahim, S., Gichuhi, P. N., & Bromfield, E. M. (2009).
Healthy food choices and physical activity opportunities in two contrasting Alabama cities.
Health & Place, 15(2), 429-438.

Do Physical Activity, Sedentary Behaviors, and Nutrition Affect Healthy Weight 106
Branscum, P., & Sharma, M. (2012). After-school based obesity prevention interventions: A
comprehensive review of the literature. International Journal of Environmental Research
and Public Health, 9(4), 1438-1457.
Brener, N., D, Demissie, Z., Foti, K., McManus, T., Shanklin, S., Hawkins, J., & Kann, L.
(2011). School health profiles 2010: Characteristics of health programs among secondary
schools. Retrieved from http://www.cdc.gov/healthyyouth/profiles/2010/profiles_report.pdf
Briefel, R. R., Wilson, A., & Gleason, P. M. (2009). Consumption of low-nutrient, energy-dense
foods and beverages at school, home, and other locations among school lunch participants
and nonparticipants. Journal of the American Dietetic Association, 109(2), S79-S90.
Bronfenbrenner, U. (1977). Toward an experimental ecology of human development. American
Psychologist, 32(7), 513.
Brown, J. L., & Wenrich, T. R. (2012). Intra-family role expectations and reluctance to change
identified as key barriers to expanding vegetable consumption patterns during interactive
family-based program for Appalachian low-income food preparers. Journal of the Academy
of Nutrition and Dietetics, 112(8), 1188-1200.
Brown, T., & Summerbell, C. (2009). Systematic review of school-based interventions that focus
on changing dietary intake and physical activity levels to prevent childhood obesity: An
update to the obesity guidance produced by the national institute for health and clinical
excellence. Obesity Reviews, 10(1), 110-141.
Brownell, K. D., & Frieden, T. R. (2009). Ounces of prevention—the public policy case for taxes
on sugared beverages. New England Journal of Medicine, 360(18), 1805-1808.
Brownson, R. C., Boehmer, T. K., & Luke, D. A. (2005). Declining rates of physical activity in
the united states: What are the contributors?. Annual Review of Public Health, 26, 421-443.

Do Physical Activity, Sedentary Behaviors, and Nutrition Affect Healthy Weight 107
Burkhalter, T. M., & Hillman, C. H. (2011). A narrative review of physical activity, nutrition,
and obesity to cognition and scholastic performance across the human lifespan. Advances in
Nutrition (Bethesda, Md.), 2(2), 201S-6S. doi:10.3945/an.111.000331
Carlson, S. A., Fulton, J. E., Schoenborn, C. A., & Loustalot, F. (2010). Trend and prevalence
estimates based on the 2008 physical activity guidelines for Americans. American Journal
of Preventive Medicine, 39(4), 305-313.
Carson, R. L., Castelli, D. M., Beighle, A., & Erwin, H. (2014). School-based physical activity
promotion: A conceptual framework for research and practice. Childhood Obesity, 10(2),
100-106.
Caspersen, C. J., Pereira, M. A., & Curran, K. M. (2000). Changes in physical activity patterns in
the United States, by sex and cross-sectional age. Medicine and Science in Sports and
Exercise, 32(9), 1601-1609.
Cawley, J. (2010). The economics of childhood obesity. Health Affairs, 29(3), 364-371.
Centers for Disease Control and Prevention (CDC). (2005). 5 A day works!. Retrieved from
www.cdc.gov/nccdphp/dnpa/nutrition/health_professionals/programs/5aday_works.pdf
Centers for Disease Control and Prevention (CDC). (2009). Clinical growth charts. Retrieved
from http://www.cdc.gov/growthcharts/clinical_charts.htm
Centers for Disease Control and Prevention (CDC). (2011a). School health guidelines to promote
healthy eating and physical activity. Retrieved from
http://www.cdc.gov/mmwr/preview/mmwrhtml/rr6005a1.htm
Centers for Disease Control and Prevention (CDC). (2011b). The CDC guide to strategies to
increase the consumption of fruits and vegetables. Retrieved from
http://www.cdc.gov/obesity/downloads/fandv_2011_web_tag508.pdf

Do Physical Activity, Sedentary Behaviors, and Nutrition Affect Healthy Weight 108
Centers for Disease Control and Prevention (CDC). (2012a). Defining adult overweight and
obesity. Retrieved from http://www.cdc.gov/obesity/adult/defining.html
Centers for Disease Control and Prevention (CDC). (2012b). West Virginia state nutrition,
physical activity, and obesity profile. Retrieved from http://www.cdc.gov/obesity/
Centers for Disease Control and Prevention (CDC). (2012c). Can eating fruits and vegetables
help people to manage their weight?. Retrieved from
http://www.cdc.gov/nccdphp/dnpa/nutrition/pdf/rtp_practitioner_10_07.pdf
Centers for Disease Control and Prevention (CDC). (2013a). Make a difference at your school.
Retrieved from http://digitalcommons.hsc.unt.edu/cgi/viewcontent.cgi?article=1030&
Centers for Disease Control and Prevention (CDC). (2013b). Adult participation in aerobic and
muscle-strengthening physical activities - United States, 2011. Retrieved from
https://www.cdc.gov/mmwr/preview/mmwrhtml/mm6217a2.htm
Centers for Disease Control and Prevention (CDC). (2013c). Framing the Issue. Retrieved from
http://www.cdc.gov/nccdphp/dnpao/state-local-programs/health-equity/framing-the-
issue.html
Centers for Disease Control and Prevention (CDC). (2014). Prevention status reports 2013:
Nutrition, physical activity, and obesity —West Virginia. Retrieved from
https://www.cdc.gov/psr/2013/npao/2013/wv-npao.pdf
Centers for Disease Control and Prevention (CDC). (2015). About child & teen BMI. Retrieved
from www.cdc.gov/healthyweight/assessing/bmi/childrens_bmi/about_childrens_bmi.html
Centers for Disease Control and Prevention (CDC). (2016). Positive parenting tips for healthy
child development. Retrieved from http://www.cdc.gov/ncbddd/childdevelopment/positivep
arenting/pdfs/young-teen-12-14-w-npa.pdf

Do Physical Activity, Sedentary Behaviors, and Nutrition Affect Healthy Weight 109
Chau, J. Y., Grunseit, A. C., Chey, T., Stamatakis, E., Brown, W. J., Matthews, C. E., ... van der
Ploeg, H. P. (2013). Daily sitting time and all-cause mortality: a meta-analysis. PLoS ONE,
8(11): e80000. doi:10.1371/journal.pone.0080000
Chen, I., Chou, C., Yu, S., & Cheng, S. (2008). Health services utilization and cost utility
analysis of a walking program for residential community elderly. Nursing Economics, 26(4),
263-269.
Chenoweth, E., & Galliher, R. V. (2004). Factors influencing college aspirations of rural West
Virginia high school students. Journal of Research in Rural Education, 19(2), 1-14.
Church, T. S., Thomas, D. M., Tudor-Locke, C., Katzmarzyk, P. T., Earnest, C. P., Rodarte, R.
Q., … Bouchard, C. (2011). Trends over 5 decades in US occupation-related physical
activity and their associations with obesity. PloS One, 6(5), e19657.
Cohen, D. A., Ashwood, J. S., Scott, M. M., Overton, A., Evenson, K. R., Staten, L. K., …
Catellier, D. (2006). Public parks and physical activity among adolescent girls. Pediatrics,
118(5), e1381-9. doi:118/5/e1381
Cohen, J., McCabe, L., Michelli, N. M., & Pickeral, T. (2009). School climate: Research, policy,
practice, and teacher education. The Teachers College Record, 111(1), 180-213.
Cohen, S. (2005). The pittsburgh common cold studies: Psychosocial predictors of susceptibility
to respiratory infectious illness. International Journal of Behavioral Medicine, 12(3), 123.
Coleman, M., Ganong, L. H., Clark, J. M., & Madsen, R. (1989). Parenting perceptions in rural
and urban families: Is there a difference?. Journal of Marriage and the Family, 51(2), 329-
335.

Do Physical Activity, Sedentary Behaviors, and Nutrition Affect Healthy Weight 110
Cordain, L., Gotshall, R. W., Eaton, S. B., & Eaton S. B. (1998). Physical activity, energy
expenditure and fitness: an evolutionary perspective. International Journal of Sports
Medicine, 19(5), 328-335.
Council on Communications and Media. (2011). Children, adolescents, obesity, and the media.
Pediatrics, 128(1), 201-208. doi:10.1542/peds.2011-1066
Cradock, A. L., Melly, S. J., Allen, J. G., Morris, J. S., & Gortmaker, S. L. (2007).
Characteristics of school campuses and physical activity among youth. American Journal of
Preventive Medicine, 33(2), 106-113.
Curry, L. (2005). The Future of the Public's Health in the 21st Century. Generations, 29(2), 82.
Dannenberg, A. L., Burton, D. C., & Jackson, R. J. (2004). Economic and environmental costs of
obesity: The impact on airlines. American Journal of Preventive Medicine, 27(3), 264.
Danner, F. W. (2008). A national longitudinal study of the association between hours of TV
viewing and the trajectory of BMI growth among US children. Journal of Pediatric
Psychology, 33(10), 1100-1107. doi:10.1093/jpepsy/jsn034
Das, P., & Horton, R. (2012). Rethinking our approach to physical activity. The Lancet,
380(9838), 189-190. doi:10.1016/S0140-6736(12)61024-1
Davis, B., & Carpenter, C. (2009). Proximity of fast-food restaurants to schools and adolescent
obesity. American Journal of Public Health, 99(3), 505-510. Doi:10.2105/ajph.2008.137638
Davison, K. K., Marshall, S. J., & Birch, L. L. (2006). Cross-sectional and longitudinal
associations between TV viewing and girls’ body mass index, overweight status, and
percentage of body fat. The Journal of Pediatrics, 149(1), 32-37.

Do Physical Activity, Sedentary Behaviors, and Nutrition Affect Healthy Weight 111
DeLany, J. P., Kelley, D. E., Hames, K. C., Jakicic, J. M., & Goodpaster, B. H. (2013). High
energy expenditure masks low physical activity in obesity. International Journal of Obesity,
37(7), 1006-1011.
DeLany, J. P., Kelley, D. E., Hames, K. C., Jakicic, J. M., & Goodpaster, B. H. (2014). Effect of
physical activity on weight loss, energy expenditure, and energy intake during diet induced
weight loss. Obesity, 22(2), 363-370.
Department of Health (2010). Sedentary Behaviour and Obesity: Review of the Current Scientific
Evidence. Retrieved from: http://www.gov.uk/government/uploads/system/uploads/
Deschesnes, M., Martin, C., & Hill, A. J. (2003). Comprehensive approaches to school health
promotion: how to achieve broader implementation?. Health Promotion International,
18(4), 387-396.
Dietz, W. H. (1998). Health consequences of obesity in youth: Childhood predictors of adult
disease. Pediatrics, 101(Suppl 2), 518-525.
Doak, C., Visscher, T., Renders, C., & Seidell, J. (2006). The prevention of overweight and
obesity in children and adolescents: A review of interventions and programmes. Obesity
Reviews, 7(1), 111-136.
Dobbins, M., Husson, H., DeCorby, K., & LaRocca, R. L. (2013). School-based physical activity
programs for promoting physical activity and fitness in children and adolescents aged 6 to
18. Cochrane Database Systematic Reviews, 2(2), 1-260. doi: 10.1002/14651858
Dobbs, R., Sawers, C., Thompson, F., Manyika, J., Woetzel, J., Child, P., . . . Spatharou, A.
(2014). Overcoming obesity: An initial economic analysis. (Discussion Paper). McKinsey
Global Institute: McKinsey & Company.

Do Physical Activity, Sedentary Behaviors, and Nutrition Affect Healthy Weight 112
Drake, K. M., Beach, M. L., Longacre, M. R., MacKenzie, T., Titus, L. J., Rundle, A. G., &
Dalton, M. A. (2012). Influence of sports, physical education, and active commuting to
school on adolescent weight status. Pediatrics, 130(2), e296-e304.
Dumith, S. C., Hallal, P. C., Reis, R. S., & Kohl, H. W. (2011). Worldwide prevalence of
physical inactivity and its association with human development index in 76 countries.
Preventive Medicine, 53(1), 24-28.
Eaton, D. K., Kann, L., Kinchen, S., Shanklin, S., Flint, K. H., Hawkins, J., . . . Centers for
Disease Control and Prevention (CDC). (2012). Youth risk behavior surveillance - United
States, 2011. Morbidity and Mortality Weekly Report, 61(4), 1-162. doi:ss6104a1
Ebbeling, C. B., Pawlak, D. B., & Ludwig, D. S. (2002). Childhood obesity: Public-health crisis,
common sense cure. The Lancet, 360(9331), 473-482.
Economos, C. D., Brownson, R. C., DeAngelis, M. A., Foerster, S. B., Foreman, C. T., Gregson,
J., ... Pate, R. R. (2001). What lessons have been learned from other attempts to guide social
change?. Nutrition Reviews, 59(3), S40-S56.
Egger, G., & Swinburn, B. (1997). An "ecological" approach to the obesity pandemic. British
Medical Journal, 315(7106), 477-480.
Ekelund, U. L. F., Neovius, M., Linné, Y., Brage, S., Wareham, N. J., & Rössner, S. (2005).
Associations between physical activity and fat mass in adolescents: the Stockholm Weight
Development Study. The American Journal of Clinical Nutrition, 81(2), 355-360.
Ekelund, U., Luan, J., Sherar, L. B., Esliger, D. W., Griew, P., Cooper, A., & International
Children's Accelerometry Database (ICAD) Collaborators. (2012). Moderate to vigorous
physical activity and sedentary time and cardiometabolic risk factors in children and
adolescents. The Journal of American Medical Association, 307(7), 704-712.

Do Physical Activity, Sedentary Behaviors, and Nutrition Affect Healthy Weight 113
Emmons, K. M. (2000). Health Behaviors in a Social Context. In Berkman, L. F., & Kawachi, I
(Eds.), Social Epidemiology (pp. 242-266). New York: Oxford University Press.
Enders, C. K. (2001). The impact of nonnormality on full information maximum-likelihood
estimation for structural equation models with missing data. Psychological Methods, 6(4),
352.
Epel, E., Jimmenes, S., Brownell, K., Stroud, L., Stoney, C., & Niaura, R. (2004). Are stress
eaters at risk for the metabolic syndrome?. Annals of the New York Academy of Sciences,
1032(1), 208-210.
Fakhouri, T. H., Hughes, J. P., Burt, V. L., Song, M., Fulton, J. E., & Ogden, C. L. (2014).
Physical activity in U.S. youth aged 12-15 years, 2012. NCHS Data Brief, 141, 1-8.
Feldman, D. E., Barnett, T., Shrier, I., Rossignol, M., & Abenhaim, L. (2003). Is physical
activity differentially associated with different types of sedentary pursuits?. Archives of
Pediatrics & Adolescent Medicine, 157(8), 797-802.
Finkelstein, E. A., DiBonaventura, M., Burgess, S. M., & Hale, B. C. (2010). The costs of
obesity in the workplace. Journal of Occupational and Environmental Medicine / American
College of Occupational and Environmental Medicine, 52(10), 971-976.
doi:10.1097/JOM.0b013e3181f274d2
Finkelstein, E. A., Fiebelkorn, I. C., & Wang, G. (2004). State-Level estimates of annual medical
expenditures attributable to obesity. Obesity Research, 12(1), 18-24.
Finkelstein, E. A., Khavjou, O. A., Thompson, H., Trogdon, J. G., Pan, L., Sherry, B., & Dietz,
W. (2012). Obesity and severe obesity forecasts through 2030. American Journal of
Preventive Medicine, 42(6), 563-570.

Do Physical Activity, Sedentary Behaviors, and Nutrition Affect Healthy Weight 114
Finkelstein, E. A., Trogdon, J. G., Cohen, J. W., & Dietz, W. (2009). Annual medical spending
attributable to obesity: Payer-and service-specific estimates. Health Affairs (Project Hope),
28(5), w822-31. doi:10.1377/hlthaff.28.5.w822
Finucane, M. M., Stevens, G. A., Cowan, M. J., Danaei, G., Lin, J. K., Paciorek, C. J., . . .
Bahalim, A. N. (2011). National, regional, and global trends in body-mass index since 1980:
Systematic analysis of health examination surveys and epidemiological studies with 960
country-years and 9· 1 million participants. The Lancet, 377(9765), 557-567.
Flegal, K. M., & Ogden, C. L. (2011). Childhood obesity: Are we all speaking the same
language?. Advances in Nutrition (Bethesda, Md.), 2(2), S159-S166.
doi:10.3945/an.111.000307
Flegal, K. M., Carroll, M. D., Kit, B. K., & Ogden, C. L. (2012). Prevalence of obesity and
trends in the distribution of body mass index among US adults, 1999-2010. The Journal of
American Medical Association, 307(5), 491-497.
Fogelholm, M., Nuutinen, O., Pasanen, M., Myöhänen, E., & Säätelä, T. (1999). Parent-child
relationship of physical activity patterns and obesity. International Journal of Obesity, 23,
1262-1268.
Foulk, D. (2004). The school as a contributing factor to adolescent obesity. National Institute of
Environmental Health Sciences. Retrieved from http://www.niehs.nih.gov/about/events/
pastmtg/assets/docs_c_e/conference_summary_report_508.pdf#page=43
Freeman, E., Fletcher, R., Collins, C. E., Morgan, P. J., Burrows, T., & Callister, R. (2012).
Preventing and treating childhood obesity: time to target fathers. International Journal of
Obesity, 36(1), 12-15.

Do Physical Activity, Sedentary Behaviors, and Nutrition Affect Healthy Weight 115
Frieden, T. R., Dietz, W., & Collins, J. (2010). Reducing childhood obesity through policy
change: acting now to prevent obesity. Health Affairs, 29(3), 357-363.
Friedman, N., & Fanning, E. L. (2004). Overweight and obesity: An overview of prevalence,
clinical impact, and economic impact. Disease Management, 7, S1-S6.
Friedrich, R. R., Polet, J. P., Schuch, I., & Wagner, M. B. (2014). Effect of intervention
programs in schools to reduce screen time: a meta-analysis. Jornal de Pediatria, 90(3), 232-
241.
Fryar, C. D., Carroll, M. D., & Ogden, C. L. (2012). Prevalence of obesity among children and
adolescents: United States, trends 1963–1965 through 2009–2010. National Center for
Health Statistics. Retrieved from
http://www.cdc.gov/nchs/data/hestat/obesity_obesity_child_09_10/obesity_child_09_10.pdf
Fulton, J. E., Wang, X., Yore, M. M., Carlson, S. A., Galuska, D. A., & Caspersen, C. J. (2009).
Television viewing, computer use, and BMI among US children and adolescents. Journal of
physical activity & health, 6(1), S28.
Garrow, J. S., & Webster, J. (1985). Quetelet's index (W/H2) as a measure of fatness.
International Journal of Obesity, 9(2), 147-153.
Gazzaniga, J. M., & Burns, T. L. (1993). Relationship between diet composition and body
fatness, with adjustment for resting energy expenditure and physical activity, in
preadolescent children. The American Journal of Clinical Nutrition, 58(1), 21-28.
Gelman, A. (2005). Analysis of variance—why it is more important than ever. The Annals of
Statistics, 33(1), 1-53.

Do Physical Activity, Sedentary Behaviors, and Nutrition Affect Healthy Weight 116
Gelman, A., & Hill, J. (2006). Data analysis using regression and multilevel/hierarchical
models. Cambridge University Press.
Gentile, D. A., Oberg, C., Sherwood, N. E., Story, M., Walsh, D. A., & Hogan, M. (2004). Well-
child visits in the video age: Pediatricians and the American academy of pediatrics’
guidelines for children's media use. Pediatrics, 114(5), 1235-1241.
Ghodsypour, S. H., & O'Brien, C. (1998). A decision support system for supplier selection using
an integrated analytic hierarchy process and linear programming. International Journal of
Production Economics, 56, 199-212.
Giammattei, J., Blix, G., Marshak, H. H., Wollitzer, A. O., & Pettitt, D. J. (2003). Television
watching and soft drink consumption: associations with obesity in 11-to 13-year-old
schoolchildren. Archives of Pediatrics & Adolescent Medicine, 157(9), 882-886.
Gibson, S. (2008). Sugar-sweetened soft drinks and obesity: a systematic review of the evidence
from observational studies and interventions. Nutrition Research Reviews, 21(2), 134-147.
Gifford-Smith, M., Dodge, K. A., Dishion, T. J., & McCord, J. (2005). Peer influence in children
and adolescents: Crossing the bridge from developmental to intervention science. Journal of
Abnormal Child Psychology, 33(3), 255-265.
Gillman, M. W., Rifas-Shiman, S. L., Frazier, A. L., Rockett, H. R., Camargo, C. A.,Jr, Field, A.
E., . . . Colditz, G. A. (2000). Family dinner and diet quality among older children and
adolescents. Archives of Family Medicine, 9(3), 235-240.
Glanz, K., Rimer, B. K., & Viswanath, K. (Eds.). (2008). Health behavior and health education:
theory, research, and practice. John Wiley & Sons.
Glanz, K., Sallis, J. F., Saelens, B. E., & Frank, L. D. (2005). Healthy nutrition environments:
Concepts and measures. American Journal of Health Promotion, 19(5), 330-333.

Do Physical Activity, Sedentary Behaviors, and Nutrition Affect Healthy Weight 117
Gleason, P., & Suitor, C. (2001). Children's diets in the mid-1990s: dietary intake and its
relationship with school meal participation. U.S. Department of Agriculture, Food and
Nutrition Service. Retrieved from http://www.fns.usda.gov/sites/default/files/ChilDiet.pdf
Golden, S. D., & Earp, J. A. (2012). Social ecological approaches to individuals and their
contexts: Twenty years of health education & behavior health promotion interventions.
Health Education & Behavior: The Official Publication of the Society for Public Health
Education, 39(3), 364-372. doi:10.1177/1090198111418634
Goran, M. I., Reynolds, K. D., & Lindquist, C. H. (1999). Role of physical activity in the
prevention of obesity in children. International Journal of Obesity, 23, S18-S33.
Gortmaker, S. L., Peterson, K., Wiecha, J., Sobol, A. M., Dixit, S., Fox, M. K., & Laird, N.
(1999). Reducing obesity via a school-based interdisciplinary intervention among youth:
Planet health. Archives of Pediatrics & Adolescent Medicine, 153(4), 409-418.
Gostin, L. O. (2007). Law as a tool to facilitate healthier lifestyles and prevent obesity. Journal
of the American Medical Association, 297(1), 87-90.
Graf, C., Koch, B., Dordel, S., Schindler-Marlow, S., Icks, A., Schüller, A., ... Predel, H. G.
(2004). Physical activity, leisure habits and obesity in first-grade children. European
Journal of Cardiovascular Prevention & Rehabilitation, 11(4), 284-290.
Graham, J. W. (2009). Missing data analysis: Making it work in the real world. Annual Review of
Psychology, 60, 549-576.
Gu, J., Charles, L., Andrew, M., Ma, C., & Burchfiel, C. (2013). Prevalence and trends of
obesity by US occupational group: The national health interview survey (NHIS), 2004-
2011. Annals of Epidemiology, 9(23), 595-596.

Do Physical Activity, Sedentary Behaviors, and Nutrition Affect Healthy Weight 118
Gubbels, J. S., Kremers, S. P., Stafleu, A., Goldbohm, R. A., de Vries, N. K., & Thijs, C. (2012).
Clustering of energy balance-related behaviors in 5-year-old children: Lifestyle patterns and
their longitudinal association with weight status development in early childhood.
International Journal of Behavioral Nutrition and Physical Activity, 9(1), 1.
Gulley, T. (2011). The influence of time perspective on physical activity intentions and behaviors
among adolescents residing in central Appalachia (Unpublished doctoral dissertation). East
Tennessee State University, TN.
Gulley, T., & Boggs, D. (2014). Time perspective and the theory of planned behavior: moderate
predictors of physical activity among central Appalachian adolescents. Journal of Pediatric
Health Care, 28(5), e41-e47.
Gundersen, C., Mahatmya, D., Garasky, S., & Lohman, B. (2011). Linking psychosocial
stressors and childhood obesity. Obesity Reviews, 12(5), e54-e63.
Gurka, M. J. (2006). Selecting the best linear mixed model under REML. The American
Statistician, 60(1), 19-26.
Haerens, L., De Bourdeaudhuij, I., Maes, L., Vereecken, C., Brug, J., & Deforche, B. (2007).
The effects of a middle-school healthy eating intervention on adolescents' fat and fruit
intake and soft drinks consumption. Public Health Nutrition, 10(5), 443-449.
Hagströmer, M., Oja, P., & Sjöström, M. (2006). The international physical activity
questionnaire (IPAQ): A study of concurrent and construct validity. Public Health Nutrition,
9(6), 755-762.
Hallal, P. C., Andersen, L. B., Bull, F. C., Guthold, R., Haskell, W., Ekelund, U., & Lancet
Physical Activity Series Working Group. (2012). Global physical activity levels:
Surveillance progress, pitfalls, and prospects. The Lancet, 380(9838), 247-257.

Do Physical Activity, Sedentary Behaviors, and Nutrition Affect Healthy Weight 119
Ham, S. A., Martin, S., & Kohl, H. W. (2008). Changes in the percentage of students who walk
or bike to school-united states, 1969 and 2001. Journal of Physical Activity & Health, 5(2),
205.
Hamilton, M. T., Healy, G. N., Dunstan, D. W., Zderic, T. W., & Owen, N. (2008). Too little
exercise and too much sitting: inactivity physiology and the need for new recommendations
on sedentary behavior. Current Cardiovascular Risk Reports, 2(4), 292-298.
Hammond, R. A., & Levine, R. (2010). The economic impact of obesity in the United States.
Diabetes, Metabolic Syndrome and Obesity: Targets and Therapy, 3, 285-295.
doi:10.2147/DMSOTT.S7384
Hancox, R. J., Milne, B. J., & Poulton, R. (2004). Association between child and adolescent
television viewing and adult health: a longitudinal birth cohort study. The Lancet,
364(9430), 257-262.
Han-Markey, T., Wang, L., Schlotterbeck, S., Jackson, E., Gurm, R., Leidal, A., & Eagle, K.
(2012). A public school district's vending machine policy and changes over a 4-year period:
Implementation of a national wellness policy. Public Health, 126(4), 335-337.
Hannon, C., Cradock, A., Gortmaker, S. L., Wiecha, J. L., El Ayadi, A., Keefe, L., & Harris, A.
(2006). Play Across Boston: A Community Initiative to Reduce Disparities in Access to
After-School Physical Activity Programs for Inner-city Youths. Preventing Chronic
Disease, 3(3), A100.
Hardy, L. L., Grunseit, A., Khambalia, A., Bell, C., Wolfenden, L., & Milat, A. J. (2012). Co-
occurrence of obesogenic risk factors among adolescents. Journal of Adolescent Health,
51(3), 265-271.

Do Physical Activity, Sedentary Behaviors, and Nutrition Affect Healthy Weight 120
Harris, C. V., & Neal, W. A. (2009). Assessing BMI in West Virginia schools: Parent
perspectives and the influence of context. Pediatrics, 124(Suppl 1), S63-S72.
doi:10.1542/peds.2008-3586I
Harrison, F., & Jones, A. P. (2012). A framework for understanding school based physical
environmental influences on childhood obesity. Health & Place, 18(3), 639-648.
Haug, E., Torsheim, T., Sallis, J. F., & Samdal, O. (2010). The characteristics of the outdoor
school environment associated with physical activity. Health Education Research, 25(2),
248-256. doi:10.1093/her/cyn050
Healy, G. N., Wijndaele, K., Dunstan, D. W., Shaw, J. E., Salmon, J., Zimmet, P. Z., & Owen,
N. (2008). Objectively measured sedentary time, physical activity, and metabolic risk: The
Australian diabetes, obesity and lifestyle study. Diabetes Care, 31(2), 369-371. doi:dc07-
1795
Healy, L. M. (2006). Logistic regression: An overview. Eastern Michigan University, College of
Technology. In Proceeding of COT, 7(11), 30-37.
Hendelman, D., Miller, K., Baggett, C., Debold, E., & Freedson, P. (2000). Validity of
accelerometry for the assessment of moderate intensity physical activity in the field.
Medicine and Science in Sports and Exercise, 32(Suppl 9), S442-S449.
Heneghan, H. M., Heinberg, L., Windover, A., Rogula, T., & Schauer, P. R. (2012). Weighing
the evidence for an association between obesity and suicide risk. Surgery for Obesity and
Related Diseases, 8(1), 98-107.
Herath, J., & Brown, C. (2013). Obesity in West Virginia: Control and costs. American Journal
of Public Health Research, 1(8), 203-208.

Do Physical Activity, Sedentary Behaviors, and Nutrition Affect Healthy Weight 121
Hesketh, K., Waters, E., Green, J., Salmon, L., & Williams, J. (2005). Healthy eating, activity
and obesity prevention: A qualitative study of parent and child perceptions in Australia.
Health Promotion International, 20(1), 19-26. doi: dah503
Hider, P. (2001). Environmental interventions to reduce energy intake or density. A critical
appraisal of the literature. New Zealand Health Technology Assessment Report, 4(2).
Hill, J. O., Wyatt, H. R., & Peters, J. C. (2012). Energy balance and obesity. Circulation, 126(1),
126-132.
Hoelscher, D. M., Day, R. S., Kelder, S. H., & Ward, J. L. (2003). Reproducibility and validity
of the secondary level school-based nutrition monitoring student questionnaire. Journal of
the American Dietetic Association, 103(2), 186-194.
Hollar, D., Messiah, S. E., Lopez-Mitnik, G., Hollar, T. L., Almon, M., & Agatston, A. S.
(2010). Healthier options for public schoolchildren program improves weight and blood
pressure in 6-to 13-year-olds. Journal of the American Dietetic Association, 110(2), 261-
267.
Hortz, B., Stevens, E., Holden, B., & Petosa, R. L. (2009). Rates of physical activity among
Appalachian adolescents in Ohio. The Journal of Rural Health, 25(1), 58-61.
Howell, D. (2013). Fundamental statistics for the behavioral sciences. Cengage Learning.
Hox, J., & Roberts, J. K. (2011). Handbook of advanced multilevel analysis. Psychology Press.
Hu, F. B., Li, T. Y., Colditz, G. A., Willett, W. C., & Manson, J. E. (2003). Television watching
and other sedentary behaviors in relation to risk of obesity and type 2 diabetes mellitus in
women. Journal of the American Medical Association, 289(14), 1785-1791.
Huang, C., Gao, Z., Hannon, J. C., Schultz, B., Newton, M., & Jenson, W. (2012). Impact of an
after-school physical activity program on youth's physical activity correlates and behavior.

Do Physical Activity, Sedentary Behaviors, and Nutrition Affect Healthy Weight 122
The ICHPER-SD Journal of Research in Health, Physical Education, Recreation, Sport &
Dance, 7(2), 18.
Hughes, A. R., Henderson, A., Ortiz-Rodriguez, V., Artinou, M. L., & Reilly, J. J. (2006).
Habitual physical activity and sedentary behaviour in a clinical sample of obese children.
International Journal of Obesity, 30(10), 1494-1500.
Hunter, H. L., Steele, R. G., & Steele, M. M. (2008). Family-based treatment for pediatric
overweight: Parental weight loss as a predictor of children's treatment success. Children's
Health Care, 37(2), 112-125.
Iannotti, R. J., & Wang, J. (2013). Patterns of physical activity, sedentary behavior, and diet in
US adolescents. Journal of Adolescent Health, 53(2), 280-286.
Ilich, J. Z., & Brownbill, R. A. (2010). Nutrition through the life span: Needs and health
concerns in critical periods, Handbook of stressful transitions across the lifespan (625-641)
Springer.
IPAQ Research Committee. (2005). Guidelines for data processing and analysis of the
international physical activity questionnaire (IPAQ)–short and long forms. Retrieved from
https://sites.google.com/site/theipaq/scoring-protocol
Jago, R., McMurray, R. G., Bassin, S., Pyle, L., Bruecker, S., Jakicic, J. M., ... Volpe, S. L.
(2009). Modifying middle school physical education: piloting strategies to increase physical
activity. Pediatric Exercise Science, 21(2), 171.
Jaime, P. C., & Lock, K. (2009). Do school based food and nutrition policies improve diet and
reduce obesity?. Preventive Medicine, 48(1), 45-53.
Janssen, I., Katzmarzyk, P. T., Boyce, W. F., Vereecken, C., Mulvihill, C., Roberts, C., ...
Pickett, W. (2005). Comparison of overweight and obesity prevalence in school-aged youth
Do Physical Activity, Sedentary Behaviors, and Nutrition Affect Healthy Weight 123
from 34 countries and their relationship with physical activity and dietary patterns. Obesity
Reviews, 6(2), 123-132.
Janz, N. K., & Becker, M. H. (1984). The health belief model: A decade later. Health Education
& Behavior, 11(1), 1-47.
Jebb, S. (2004). Obesity: Causes and consequences. Women's Health Medicine, 1(1), 38-41.
Jones, N. R., Jones, A., van Sluijs, E. M., Panter, J., Harrison, F., & Griffin, S. J. (2010). School
environments and physical activity: The development and testing of an audit tool. Health &
Place, 16(5), 776-783.
Jones, R. A., Sinn, N., Campbell, K. J., Hesketh, K., Denney-Wilson, E., Morgan, P. J., . . .
Magarey, A. (2011). The importance of long-term follow-up in child and adolescent obesity
prevention interventions. International Journal of Pediatric Obesity, 6(3-4), 178-181.
Joslin, E. P. (1921). The prevention of diabetes mellitus. Journal of the American Medical
Association, 76(2), 79-84.
Kann, L., Brener, N. D., & Wechsler, H. (2007). Overview and summary: School health policies
and programs study 2006. Journal of School Health, 77(8), 385-397.
Kann, L., Grunbaum, J., McKenna, M., Wechsler, H., & Galuska, D. (2005). Competitive foods
and beverages available for purchase in secondary schools—selected sites, United States,
2004. Journal of School Health, 75(10), 370-374.
Kann, L., Kinchen, S., Shanklin, S. L., Flint, K. H., Kawkins, J., Harris, W. A., . . . Chyen, D.
(2014). Youth risk behavior surveillance—United States, 2013. MMWR Surveillance
Summaries, 63(Suppl 4), 1-168.
Karnik, S., & Kanekar, A. (2012). Childhood obesity: A global public health crisis. International
Journal of Preventive Medicine, 3(1), 1-7.

Do Physical Activity, Sedentary Behaviors, and Nutrition Affect Healthy Weight 124
Katz, P., Chen, H., Omachi, T. A., Gregorich, S. E., Julian, L., Cisternas, M., . . . Blanc, P. D.
(2011). The role of physical inactivity in increasing disability among older adults with
obstructive airway disease. Journal of Cardiopulmonary Rehabilitation and Prevention,
31(3), 193-197. doi:10.1097/HCR.0b013e3181fc09b7
Katzmarzyk, P. T., Baur, L. A., Blair, S. N., Lambert, E. V., Oppert, J., Riddoch, C., . . . Blair, S.
N. (2008). International conference on physical activity and obesity in children: Summary
statement and recommendations. International Journal of Pediatric Obesity, 3(1), 3-21.
Kautiainen, S., Koivusilta, L., Lintonen, T., Virtanen, S. M., & Rimpelä, A. (2005). Use of
information and communication technology and prevalence of overweight and obesity
among adolescents. International Journal of Obesity, 29(8), 925-933.
Klein-Platat, C., Oujaa, M., Wagner, A., Haan, M. C., Arveiler, D., Schlienger, J. L., & Simon,
C. (2005). Physical activity is inversely related to waist circumference in 12-y-old French
adolescents. International Journal of Obesity, 29(1), 9-14.
Knuth, A. G., & Hallal, P. C. (2009). Temporal trends in physical activity: A systematic review.
Journal of Physical Activity & Health, 6(5), 548-559.
Kohl, H. W., Craig, C. L., Lambert, E. V., Inoue, S., Alkandari, J. R., Leetongin, G., . . . Lancet
Physical Activity Series Working Group. (2012). The pandemic of physical inactivity:
Global action for public health. The Lancet, 380(9838), 294-305.
Kolodziejczyk, J. K., Gutzmer, K., Wright, S. M., Arredondo, E. M., Hill, L., Patrick, K., ...
Norman, G. J. (2015). Influence of specific individual and environmental variables on the
relationship between body mass index and health-related quality of life in overweight and
obese adolescents. Quality of Life Research, 24(1), 251-261.

Do Physical Activity, Sedentary Behaviors, and Nutrition Affect Healthy Weight 125
Koplan, J., Liverman, C., & Kraak, V. (2005). Preventing childhood obesity: health in the
balance: executive summary. Journal of the American Dietetic Association, 105(1), 131-
138.
Kotz, K., & Story, M. (1994). Food advertisements during children's Saturday morning
television programming: Are they consistent with dietary recommendations?. Journal of the
American Dietetic Association, 94(11), 1296-1300.
Kouvonen, A., Stafford, M., De Vogli, R., Shipley, M. J., Marmot, M. G., Cox, T., . . . Singh-
Manoux, A. (2011). Negative aspects of close relationships as a predictor of increased body
mass index and waist circumference: The whitehall II study. American Journal of Public
Health, 101(8), 1474-1480.
Kraak, V. A., Liverman, C. T., & Koplan, J. P. (2005). Preventing childhood obesity: Health in
the balance. National Academies Press.
Kriemler, S., Meyer, U., Martin, E., van Sluijs, E. M., Andersen, L. B., & Martin, B. W. (2011).
Effect of school-based interventions on physical activity and fitness in children and
adolescents: A review of reviews and systematic update. British Journal of Sports Medicine,
45(11), 923-930. doi:10.1136/bjsports-2011-090186
Kruger, T. M., Swanson, M., Davis, R. E., Wright, S., Dollarhide, K., & Schoenberg, N. E.
(2012). Formative research conducted in rural Appalachia to inform a community physical
activity intervention. American Journal of Health Promotion, 26(3), 143-151.
Kung, H. C., Hoyert, D. L., Xu, J., & Murphy, S. L. (2008). Deaths: Final data for 2005.
National Vital Statistics Reports, 56(10), 1-120.

Do Physical Activity, Sedentary Behaviors, and Nutrition Affect Healthy Weight 126
Ladabaum, U., Mannalithara, A., Myer, P. A., & Singh, G. (2014). Obesity, abdominal obesity,
physical activity, and caloric intake in US adults: 1988 to 2010. The American Journal of
Medicine, 127(8), 717-727.
Laguna, M., Ruiz, J. R., Gallardo, C., García‐Pastor, T., Lara, M., & Aznar, S. (2013). Obesity
and physical activity patterns in children and adolescents. Journal of Paediatrics and Child
Health, 49(11), 942-949.
Laird, N. M. (1988). Missing data in longitudinal studies. Statistics in Medicine, 7(1‐2), 305-315.
Langellotto, G. A., & Gupta, A. (2012). Gardening increases vegetable consumption in school-
aged children: A meta-analytical synthesis. Horttechnology, 22(4), 430-445.
Lanningham-Foster, L., Nysse, L. J., & Levine, J. A. (2003). Labor saved, calories lost: The
energetic impact of domestic labor-saving devices. Obesity Research, 11(10), 1178-1181.
doi:10.1038/oby.2003.162
Larson, N. I., Neumark-Sztainer, D. R., Harnack, L. J., Wall, M. M., Story, M. T., & Eisenberg,
M. E. (2008). Fruit and vegetable intake correlates during the transition to young adulthood.
American Journal of Preventive Medicine, 35(1), 33-37. e3.
Latner, J. D., & Stunkard, A. J. (2003). Getting worse: The stigmatization of obese children.
Obesity Research, 11(3), 452-456.
Laurson, K. R., Eisenmann, J. C., Welk, G. J., Wickel, E. E., Gentile, D. A., & Walsh, D. A.
(2008). Combined influence of physical activity and screen time recommendations on
childhood overweight. The Journal of Pediatrics, 153(2), 209-214.
Lavelle, H. V., Mackay, D. F., & Pell, J. P. (2012). Systematic review and meta-analysis of
school-based interventions to reduce body mass index. Journal of public health, 34(3), 360-
369.

Do Physical Activity, Sedentary Behaviors, and Nutrition Affect Healthy Weight 127
Le Masurier, G. C., & Corbin, C. B. (2012). Steps counts among middle school students vary
with aerobic fitness level. Research Quarterly for Exercise Sport, 77(1), 14-22.
Ledoux, T. A., Hingle, M. D., & Baranowski, T. (2011). Relationship of fruit and vegetable
intake with adiposity: a systematic review. Obesity Reviews, 12(5), e143-e150.
Lee, I., Shiroma, E. J., Lobelo, F., Puska, P., Blair, S. N., Katzmarzyk, P. T., & Lancet Physical
Activity Series Working Group. (2012). Effect of physical inactivity on major non-
communicable diseases worldwide: An analysis of burden of disease and life expectancy.
The Lancet, 380(9838), 219-229.
Leech, R. M., McNaughton, S. A., & Timperio, A. (2014). The clustering of diet, physical
activity and sedentary behavior in children and adolescents: a review. International Journal
of Behavioral Nutrition and Physical Activity, 11(1), 1.
Leger, L. A., Mercier, D., Gadoury, C., & Lambert, J. (1988). The multistage 20 metre shuttle
run test for aerobic fitness. Journal of Sports Sciences, 6(2), 93-101.
Lerdal, A., Andenæs, R., Bjørnsborg, E., Bonsaksen, T., Borge, L., Christiansen, B., ...
Fagermoen, M. S. (2011). Personal factors associated with health-related quality of life in
persons with morbid obesity on treatment waiting lists in Norway. Quality of Life Research,
20(8), 1187-1196.
Leroux, J. S., Moore, S., & Dubé, L. (2013). Beyond the “I” in the obesity epidemic: A review of
social relational and network interventions on obesity. Journal of Obesity, 2013. doi:
10.1155/2013/348249
Lewis, R. L., & Billings, D. B. (1997). Appalachian culture and economic development: A
retrospective view on the theory and literature. Journal of Appalachian Studies, 3(1), 3-42.

Do Physical Activity, Sedentary Behaviors, and Nutrition Affect Healthy Weight 128
Li, C., Balluz, L. S., Ford, E. S., Okoro, C. A., Zhao, G., & Pierannunzi, C. (2012). A
comparison of prevalence estimates for selected health indicators and chronic diseases or
conditions from the behavioral risk factor surveillance system, the national health interview
survey, and the national health and nutrition examination survey, 2007–2008. Preventive
Medicine, 54(6), 381-387.
Lin, B. H., Huang, C. L., & French, S. A. (2004). Factors associated with women's and children's
body mass indices by income status. International Journal of Obesity, 28(4), 536-542.
Lindsay, A. C., Sussner, K. M., Kim, J., & Gortmaker, S. (2006). The role of parents in
preventing childhood obesity. The Future of Children, 169-186.
Lioret, S., Touvier, M., Lafay, L., Volatier, J. L., & Maire, B. (2008). Dietary and physical
activity patterns in French children are related to overweight and socioeconomic status. The
Journal of Nutrition, 138(1), 101-107.
Littell, R. C., Stroup, W. W., Milliken, G. A., Wolfinger, R. D., & Schabenberger, O. (2006).
SAS for mixed models. SAS institute.
Little, R. J., & Raghunathan, T. (1999). On summary measures analysis of the linear mixed
effects model for repeated measures when data are not missing completely at random.
Statistics in Medicine, 18(1718), 2465-2478.
Lucarelli, J. F., Alaimo, K., Mang, E., Martin, C., Miles, R., Bailey, D., . . . Liu, H. (2014).
Facilitators to promoting health in schools: Is school health climate the key?. Journal of
School Health, 84(2), 133-140.
Ludwig, D. S., Peterson, K. E., & Gortmaker, S. L. (2001). Relation between consumption of
sugar-sweetened drinks and childhood obesity: a prospective, observational analysis. The
Lancet, 357(9255), 505-508.

Do Physical Activity, Sedentary Behaviors, and Nutrition Affect Healthy Weight 129
Luke, A., Dugas, L. R., Durazo-Arvizu, R. A., Cao, G., & Cooper, R. S. (2011). Assessing
physical activity and its relationship to cardiovascular risk factors: NHANES 2003-2006.
BMC Public Health, 11(1), 1.
Lutfiyya, M. N., Lipsky, M. S., Wisdom‐Behounek, J., & Inpanbutr‐Martinkus, M. (2007). Is
rural residency a risk factor for overweight and obesity for US children?. Obesity, 15(9),
2348-2356.
Lytle, L. A. (2009). Examining the etiology of childhood obesity: The IDEA study. American
Journal of Community Psychology, 44(3-4), 338-349.
Madden, T. J., Ellen, P. S., & Ajzen, I. (1992). A comparison of the theory of planned behavior
and the theory of reasoned action. Personality and Social Psychology Bulletin, 18(1), 3-9.
Maffeis, C., Zaffanello, M., Pinelli, L., & Schutz, Y. (1996). Total energy expenditure and
patterns of activity in 8-10-year-old obese and nonobese children. Journal of Pediatric
Gastroenterology and Nutrition, 23(3), 256-261.
Mahar, M. T., Murphy, S. K., Rowe, D. A., Golden, J., Shields, A. T., & Raedeke, T. D. (2006).
Effects of a classroom-based program on physical activity and on-task behavior. Medicine
and Science in Sports and Exercise, 38(12), 2086.
Malik, V. S., Schulze, M. B., & Hu, F. B. (2006). Intake of sugar-sweetened beverages and
weight gain: A systematic review. The American Journal of Clinical Nutrition, 84(2), 274-
288. doi:84/2/274
Malik, V. S., Willett, W. C., & Hu, F. B. (2013). Global obesity: Trends, risk factors and policy
implications. Nature Reviews Endocrinology, 9(1), 13-27.
Manson, J. E., Hu, F. B., Rich-Edwards, J. W., Colditz, G. A., Stampfer, M. J., Willett, W. C., . .
. Hennekens, C. H. (1999). A prospective study of walking as compared with vigorous

Do Physical Activity, Sedentary Behaviors, and Nutrition Affect Healthy Weight 130
exercise in the prevention of coronary heart disease in women. New England Journal of
Medicine, 341(9), 650-658.
Mariani, S., Watanabe, M., Lubrano, C., Basciani, S., Migliaccio, S., & Gnessi, L. (2015).
Interdisciplinary approach to obesity. In Lenzi, A., Migli Accio, S & Donini, L (Eds.),
Multidisciplinary approach to obesity (pp. 337-342), Springer.
Marshall, S. J., Biddle, S. J., Gorely, T., Cameron, N., & Murdey, I. (2004). Relationships
between media use, body fatness and physical activity in children and youth: a meta-
analysis. International Journal of Obesity, 28(10), 1238-1246
Martin, S. L., Kirkner, G. J., Mayo, K., Matthews, C. E., Durstine, J. L., & Hebert, J. R. (2005).
Urban, rural, and regional variations in physical activity. The Journal of Rural Health,
21(3), 239-244.
Matthews, C. E., Chen, K. Y., Freedson, P. S., Buchowski, M. S., Beech, B. M., Pate, R. R., &
Troiano, R. P. (2008). Amount of time spent in sedentary behaviors in the United States,
2003–2004. American Journal of Epidemiology, 167(7), 875-881.
McCambridge, T., Bernhardt, D., Brenner, J., Congeni, J., Gomez, J., Gregory, A., . . . Rice, S.
(2006). Active healthy living: Prevention of childhood obesity through increased physical
activity. Pediatrics, 117(5), 1834-1842.
McCulloch, C. E., & Neuhaus, J. M. (2001). Generalized linear mixed models. Wiley Online
Library.
McDonald, N. C. (2007). Active transportation to school: Trends among US schoolchildren,
1969–2001. American Journal of Preventive Medicine, 32(6), 509-516.

Do Physical Activity, Sedentary Behaviors, and Nutrition Affect Healthy Weight 131
McKenzie, T. L., Li, D., Derby, C. A., Webber, L. S., Luepker, R. V., & Cribb, P. (2003).
Maintenance of effects of the CATCH Physical Education Program: results from the
CATCH-ON Study. Health Education & Behavior, 30(4), 447-462.
McKenzie, T. L., Nader, P. R., Strikmiller, P. K., Yang, M., Stone, E. J., Perry, C. L., ... Kelder,
S. H. (1996). School physical education: effect of the Child and Adolescent Trial for
Cardiovascular Health. Preventive Medicine, 25(4), 423-431.
McKinley, M., Lowis, C., Robson, P., Wallace, J., Morrissey, M., Moran, A., & Livingstone, M.
(2005). It's good to talk: Children's views on food and nutrition. European Journal of
Clinical Nutrition, 59(4), 542-551.
McLeroy, K. R., Bibeau, D., Steckler, A., & Glanz, K. (1988). An ecological perspective on
health promotion programs. Health Education & Behavior, 15(4), 351-377.
Mei, Z., Grummer-Strawn, L. M., Pietrobelli, A., Goulding, A., Goran, M. I., & Dietz, W. H.
(2002). Validity of body mass index compared with other body-composition screening
indexes for the assessment of body fatness in children and adolescents. The American
Journal of Clinical Nutrition, 75(6), 978-985.
Mello, M. M., Pomeranz, J., & Moran, P. (2008). The interplay of public health law and industry
self-regulation: The case of sugar-sweetened beverage sales in schools. American Journal of
Public Health, 98(4), 595-604. doi:AJPH.2006.107680
Mitchell, J. A., Pate, R. R., Beets, M. W., & Nader, P. R. (2013). Time spent in sedentary
behavior and changes in childhood BMI: a longitudinal study from ages 9 to 15 years.
International Journal of Obesity, 37(1), 54-60.

Do Physical Activity, Sedentary Behaviors, and Nutrition Affect Healthy Weight 132
Monteiro, C. A., Conde, W. L., Matsudo, S. M., Matsudo, V. R., Bonseñor, I. M., & Lotufo, P.
A. (2003). A descriptive epidemiology of leisure-time physical activity in Brazil, 1996-
1997. Revista Panamericana De Salud Publica, 14(4), 246-254.
Moreland, J. J., Raup-Krieger, J. L., Hecht, M. L., & Miller-Day, M. M. (2013). The
conceptualization and communication of risk among rural Appalachian adolescents. Journal
of Health Communication, 18(6), 668-685.
Morgan, A. Z., Ulrich, P., Simmons, K. P., Gropper, S. S., Connell, L. J., Daniels, M. K., . . .
Keiley, M. K. (2014). Effectiveness of a multi-faceted, school-based health intervention
program with 4th graders in Alabama. Children and Youth Services Review, 37, 46-54.
Morris, J. L., & Zidenberg-Cherr, S. (2002). Garden-enhanced nutrition curriculum improves
fourth-grade school children's knowledge of nutrition and preferences for some vegetables.
Journal of the American Dietetic Association, 102(1), 91-93.
Morris, J., Neustadter, A., & Zidenberg-Cherr, S. (2001). First-grade gardeners more likely to
taste vegetables. California Agriculture, 55(1), 43-46.
Mozaffarian, D., Hao, T., Rimm, E. B., Willett, W. C., & Hu, F. B. (2011). Changes in diet and
lifestyle and long-term weight gain in women and men. New England Journal of Medicine,
364(25), 2392-2404.
National Heart, Lung, and Blood Institute (2012 October). Expert Panel on Integrated
Guidelines for Cardiovascular Health and Risk Reduction in Children and Adolescents.
Retrieved from https://www.nhlbi.nih.gov/files/docs/guidelines/peds_guidelines_full.pdf
National Resource Center for Health and Safety in Child Care and Early Education. (2013).
Achieving a state of healthy weight: 2012 update. Retrieved from http://mrckids.org/default/
/assets/file/products/ashw/ashw%202012%20final%20report%209-18-13%20reduced%20
Do Physical Activity, Sedentary Behaviors, and Nutrition Affect Healthy Weight 133
Nelder, J. A., & Wedderburn, R. J. (1972). Generalized linear models. Journal of the Royal
Statistical Society, 135(3), 370-384.
Neuhann, H., Warter‐Neuhann, C., Lyaruu, I., & Msuya, L. (2002). Diabetes care in kilimanjaro
region: Clinical presentation and problems of patients of the diabetes clinic at the regional
referral hospital—an inventory before structured intervention. Diabetic Medicine, 19(6),
509-513.
Nguyen, D. M., & El-Serag, H. B. (2010). The epidemiology of obesity. Gastroenterology
Clinics of North America, 39(1), 1-7.
O’Dea, J. A., Hoang, T. D. N., & Dibley, M. J. (2011). Plateau in obesity and overweight in a
cross sectional study of low, middle and high socioeconomic status schoolchildren between
2004 and 2009. International Journal of Public Health, 56(6), 663-667.
O'Dea, J. A., & Eriksen, M. P. (2010). Childhood obesity prevention: International research,
controversies, and interventions. Oxford University Press.
O'Donnell, S. I., Hoerr, S. L., Mendoza, J. A., & Tsuei Goh, E. (2008). Nutrient quality of fast
food kids meals. The American Journal of Clinical Nutrition, 88(5), 1388-1395.
doi:88/5/1388
Ogden, C. L., Carroll, M. D., Curtin, L. R., Lamb, M. M., & Flegal, K. M. (2010). Prevalence of
high body mass index in US children and adolescents, 2007-2008. Journal of the American
Medical Association, 303(3), 242-249.
Ogden, C. L., Carroll, M. D., Kit, B. K., & Flegal, K. M. (2014). Prevalence of childhood and
adult obesity in the United States, 2011-2012. Journal of the American Medical Association,
311(8), 806-814.

Do Physical Activity, Sedentary Behaviors, and Nutrition Affect Healthy Weight 134
Ogden, C. L., Carroll, M. D., Lawman, H. G., Fryar, C. D., Kruszon-Moran, D., Kit, B. K., &
Flegal, K. M. (2016). Trends in obesity prevalence among children and adolescents in the
United States, 1988-1994 through 2013-2014. Journal of the American Medical Association,
315(21), 2292-2299.
Ogden, C., Kit, B., Carroll, M., & Park, S. (2012). Consumption of sugar drinks in the United
States, 2005–2008, Centers for Disease Control and Prevention. Retrieved from
http://www.cdc.gov/nchs/products/databriefs/db71.htm
Oliver, M., Schluter, P. J., Rush, L., Schofield, G. M., & Paterson, J. (2011). Physical activity,
sedentariness, and body fatness in a sample of 6-year-old Pacific children. International
Journal of Pediatric Obesity, 6(suppl 3), e565-573.
Olshansky, S. J., Passaro, D. J., Hershow, R. C., Layden, J., Carnes, B. A., Brody, J., . . .
Ludwig, D. S. (2005). A potential decline in life expectancy in the United States in the 21st
century. New England Journal of Medicine, 352(11), 1138-1145.
Organization for Economic Co-operation and Development (OECD). (2014). Obesity Update.
Retrieved from http://www.oecd.org/health/Obesity-Update-2014.pdf
Owen, N., Healy, G. N., Matthews, C. E., & Dunstan, D. W. (2010). Too much sitting: The
population health science of sedentary behavior. Exercise and Sport Sciences Reviews,
38(3), 105-113. doi:10.1097/JES.0b013e3181e373a2
Pan, A., Malik, V. S., & Hu, F. B. (2012). Exporting diabetes mellitus to Asia: The impact of
western-style fast food. Circulation, 126(2), 163-165. doi:10.1161/circulationaha.112.11592
Park, S., Blanck, H. M., Sherry, B., Brener, N., & O'Toole, T. (2012). Factors associated with
sugar-sweetened beverage intake among United States high school students. The Journal of
Nutrition, 142(2), 306-312. doi:10.3945/jn.111.148536

Do Physical Activity, Sedentary Behaviors, and Nutrition Affect Healthy Weight 135
Pate, R. R., O'Neill, J. R., & Lobelo, F. (2008). The evolving definition of "sedentary". Exercise
and Sport Sciences Reviews, 36(4), 173-178. doi:10.1097/JES.0b013e3181877d1a
Pate, R. R., Ross, R., Dowda, M., Trost, S. G., & Sirard, J. R. (2003). Validation of a 3-day
physical activity recall instrument in female youth. Pediatric Exercise Science, 15(3), 257.
Physical Activity Guidelines Advisory Committee. (2008). Physical activity guidelines for
Americans. Retrieved from https://health.gov/paguidelines/pdf/paguide.pdf
Plamer, R. F., & Royall, D. R. (2010). Missing data? Plan on it!. Journal of the American
Geriatrics Society, 58(suppl 2), S343-S348.
Poirier, P., Giles, T. D., Bray, G. A., Hong, Y., Stern, J. S., Pi-Sunyer, F. X., . . . Obesity
Committee of the Council on Nutrition, Physical Activity, and Metabolism. (2006). Obesity
and cardiovascular disease: Pathophysiology, evaluation, and effect of weight loss: An
update of the 1997 American heart association scientific statement on obesity and heart
disease from the obesity committee of the council on nutrition, physical activity, and
metabolism. Circulation, 113(6), 898-918. doi:CIRCULATIONAHA.106.171016
Popkin, B. M. (2001). The nutrition transition and obesity in the developing world. The Journal
of Nutrition, 131(3), S871-S873.
Popkin, B. M. (2003). The nutrition transition in the developing world. Development Policy
Review, 21(5‐6), 581-597.
Popkin, B. M., & Nielsen, S. J. (2003). The sweetening of the world's diet. Obesity Research,
11(11), 1325-1332.
Powell, K. E., Thompson, P. D., Caspersen, C. J., & Kendrick, J. S. (1987). Physical activity and
the incidence of coronary heart disease. Annual Review of Public Health, 8(1), 253-287.

Do Physical Activity, Sedentary Behaviors, and Nutrition Affect Healthy Weight 136
Prentice-Dunn, H., & Prentice-Dunn, S. (2012). Physical activity, sedentary behavior, and
childhood obesity: a review of cross-sectional studies. Psychology, Health & Medicine,
17(3), 255-273.
Prochaska, J. J., Spring, B., & Nigg, C. R. (2008). Multiple health behavior change research: an
introduction and overview. Preventive Medicine, 46(3), 181-188.
Prochaska, J. O., & Velicer, W. F. (1997). The transtheoretical model of health behavior change.
American Journal of Health Promotion, 12(1), 38-48.
Pronk, N. P., Katz, A. S., Lowry, M., & Payfer, J. R. (2012). Reducing occupational sitting time
and improving worker health: The take-a-stand project, 2011. Preventing Chronic Disease,
9, E154. doi:10.5888.pcd9.110323
Prospective Studies Collaboration. (2009). Body-mass index and cause-specific mortality in 900
000 adults: Collaborative analyses of 57 prospective studies. The Lancet, 373(9669), 1083-
1096.
Pryor, L. E., Tremblay, R. E., Boivin, M., Touchette, E., Dubois, L., Genolini, C., ... Côté, S. M.
(2011). Developmental trajectories of body mass index in early childhood and their risk
factors: an 8-year longitudinal study. Archives of Pediatrics & Adolescent Medicine,
165(10), 906-912.
Puhl, R. M., & Latner, J. D. (2007). Stigma, obesity, and the health of the nation's children.
Psychological Bulletin, 133(4), 557.
Quandt, S. A., Popyach, J. B., & DeWalt, K. M. (1994). Home gardening and food preservation
practices of the elderly in rural Kentucky. Ecology of Food and Nutrition, 31(3-4), 183-199.

Do Physical Activity, Sedentary Behaviors, and Nutrition Affect Healthy Weight 137
Ratcliffe, M. M., Merrigan, K. A., Rogers, B. L., & Goldberg, J. P. (2011). The effects of school
garden experiences on middle school-aged students’ knowledge, attitudes, and behaviors
associated with vegetable consumption. Health Promotion Practice, 12(1), 36-43.
Reed, D. B., Patterson, P. J., & Wasserman, N. (2011). Obesity in rural youth: Looking beyond
nutrition and physical activity. Journal of Nutrition Education and Behavior, 43(5), 401-
408.
Reedy, J., & Krebs-Smith, S. M. (2010). Dietary sources of energy, solid fats, and added sugars
among children and adolescents in the United States. Journal of the American Dietetic
Association, 110(10), 1477-1484.
Reilly, J. J., Jackson, D. M., Montgomery, C., Kelly, L. A., Slater, C., Grant, S., & Paton, J. Y.
(2004). Total energy expenditure and physical activity in young Scottish children: mixed
longitudinal study. The Lancet, 363(9404), 211-212.
Reilly, J. J., Methven, E., McDowell, Z. C., Hacking, B., Alexander, D., Stewart, L., & Kelnar,
C. J. (2003). Health consequences of obesity. Archives of Disease in Childhood, 88(9), 748-
752.
Resnicow, K. (1993). School‐based obesity prevention. Annals of the New York Academy of
Sciences, 699(1), 154-166.
Rhodes, R. E., Mark, R. S., & Temmel, C. P. (2012). Adult sedentary behavior: A systematic
review. American Journal of Preventive Medicine, 42(3), e3-e28.
Richardson, C. R. (2013). Objective monitoring and automated coaching: a powerful
combination in physical activity interventions. Physical Therapy Reviews, 15(3), 154-162
Robinson, G. K. (1991). That BLUP is a good thing: The estimation of random effects.
Statistical Science, 6(1), 15-32.

Do Physical Activity, Sedentary Behaviors, and Nutrition Affect Healthy Weight 138
Robinson, T. N. (1999). Reducing children's television viewing to prevent obesity: a randomized
controlled trial. Journal of the American Medical Association, 282(16), 1561-1567.
Rogers, V. W., Hart, P. H., Motyka, E., Rines, E. N., Vine, J., & Deatrick, D. A. (2013). Impact
of let's go! 5-2-1-0: A community-based, multisetting childhood obesity prevention
program. Journal of Pediatric Psychology, 38(9), 1010-1020. doi:10.1093/jpepsy/jst057
Rokholm, B., Baker, J. L., & Sørensen, T. I. A. (2010). The levelling off of the obesity epidemic
since the year 1999–a review of evidence and perspectives. Obesity Reviews, 11(12), 835-
846.
Russell-Mayhew, S., McVey, G., Bardick, A., & Ireland, A. (2012). Mental health, wellness, and
childhood overweight/obesity. Journal of Obesity, 2012. doi: 10.1155/2012/281801
Sallis, J. F., Floyd, M. F., Rodríguez, D. A., & Saelens, B. E. (2012). Role of built environments
in physical activity, obesity, and cardiovascular disease. Circulation, 125(5), 729-737.
Sallis, J. F., McKenzie, T. L., Alcaraz, J. E., Kolody, B., Faucette, N., & Hovell, M. F. (1997).
The effects of a 2-year physical education program (SPARK) on physical activity and
fitness in elementary school students: Sports, play and active recreation for kids. American
Journal of Public Health, 87(8), 1328-1334.
Sallis, J. F., Owen, N., & Fisher, E. B. (2008). Ecological models of health behavior. Health
Behavior and Health Education: Theory, Research, and Practice, 4, 465-486.
Salmon, J., Tremblay, M. S., Marshall, S. J., & Hume, C. (2011). Health risks, correlates, and
interventions to reduce sedentary behavior in young people. American Journal of Preventive
Medicine, 41(2), 197-206.

Do Physical Activity, Sedentary Behaviors, and Nutrition Affect Healthy Weight 139
Saloumi, C., & Plourde, H. (2010). Differences in psychological correlates of excess weight
between adolescents and young adults in Canada. Psychology, Health & Medicine, 15(3),
314-325.
Sanchez, A., Norman, G. J., Sallis, J. F., Calfas, K. J., Cella, J., & Patrick, K. (2007). Patterns
and correlates of physical activity and nutrition behaviors in adolescents. American Journal
of Preventive Medicine, 32(2), 124-130.
Sardinha, L. B., Santos, D. A., Silva, A. M., Grøntved, A., Andersen, L. B., & Ekelund, U.
(2016). A comparison between BMI, waist Circumference, and waist-to-height ratio for
identifying cardio-metabolic risk in children and adolescents. PloS one, 11(2), e0149351.
Sassi, F., Devaux, M., Cecchini, M., & Rusticelli, E. (2009). The obesity epidemic: Analysis of
past and projected future trends in selected OECD countries. OECD Publishing. Retrieved
from http://www.researchgate.net/profile/Marion_Devaux2/publication/46456903_The_
Obesity_Epidemic_Analysis_of_Past_and_Projected_Future_Trends_in_Selected_OECD_C
ountries/links/0c96052a861395ba53000000.pdf
Saxena, S., Ambler, G., Cole, T. J., & Majeed, A. (2004). Ethnic group differences in overweight
and obese children and young people in England: cross sectional survey. Archives of
Disease in Childhood, 89(1), 30-36.
Schwarz, G. (1978). Estimating the dimension of a model. The Annals of Statistics, 6(2), 461-
464.
Scott, K. A., Melhorn, S. J., & Sakai, R. R. (2012). Effects of chronic social stress on obesity.
Current Obesity Reports, 1(1), 16-25.

Do Physical Activity, Sedentary Behaviors, and Nutrition Affect Healthy Weight 140
Sedentary Behavior Research Network (2012). Letter to the editor: Standardized use of the terms
“sedentary” and “sedentary behaviours”. Applied Physiology Nutrition, and Metabolism,
37(3), 540-542. doi: 10.1139/h2012-024
Sharma, M. (2006). School‐based interventions for childhood and adolescent obesity. Obesity
Reviews, 7(3), 261-269.
Sherman, N. W., & Ruiz, A. (2001). Do children meet existing physical activity
recommendations?. Journal of Physical Education, Recreation & Dance, 72(8), 8.
Siegel, J. M., Yancey, A. K., Aneshensel, C. S., & Schuler, R. (1999). Body image, perceived
pubertal timing, and adolescent mental health. Journal of Adolescent Health, 25(2), 155-
165.
Signorielli, N., & Staples, J. (1997). Television and children's conceptions of nutrition. Health
Communication, 9(4), 289-301.
Singh, G. K., Kogan, M. D., Van Dyck, P. C., & Siahpush, M. (2008). Racial/ethnic,
socioeconomic, and behavioral determinants of childhood and adolescent obesity in the
United States: Analyzing independent and joint associations. Annals of Epidemiology, 18(9),
682-695.
Sisson, S. B., Church, T. S., Martin, C. K., Tudor-Locke, C., Smith, S. R., Bouchard, C., ...
Katzmarzyk, P. T. (2009). Profiles of sedentary behavior in children and adolescents: the
US National Health and Nutrition Examination Survey, 2001–2006. International Journal of
Pediatric Obesity, 4(4), 353-359.
Sloane, D., Nascimento, L., Flynn, G., Lewis, L., Guinyard, J. J., Galloway-Gilliam, L., ...
Yancey, A. K. (2006). Assessing resource environments to target prevention interventions in

Do Physical Activity, Sedentary Behaviors, and Nutrition Affect Healthy Weight 141
community chronic disease control. Journal of Health Care for the Poor and Underserved,
17(2), 146-158.
Sluijs, E., M, Jones, N., R, Jones, A., P, Sharp, S., J, Harrison, F., & Griffin, S., J. (2011).
School‐level correlates of physical activity intensity in 10‐year‐old children. International
Journal of Pediatric Obesity, 6(suppl 3), e574-e581.
Smith, E. P. (2007). The role of afterschool settings in positive youth development. The Journal
of Adolescent Health, 41(3), 219.
Sohn, M. F. (2001). Appalachian food: culture, history, diversity. Mountain Promise: The
Newsletter of the Brushy Fork Institute, 12(1), 2-6.
Sonneville, K. R., & Gortmaker, S. L. (2008). Total energy intake, adolescent discretionary
behaviors and the energy gap. International Journal of Obesity, 32(suppl 6), S19-S27.
Stanley, R., Boshoff, K., & Dollman, J. (2007). The concurrent validity of the 3‐day physical
activity recall questionnaire administered to female adolescents aged 12–14 years.
Australian Occupational Therapy Journal, 54(4), 294-302.
Staten, L. K., Teufel-Shone, N., I, Steinfelt, V., E, Ortega, N., Halverson, K., Flores, C., &
Lebowitz, M., D. (2005). The school health index as an impetus for change. Preventing
Chronic Disease, 2(1), 1-9.
Steptoe, A., Feldman, P., Kunz, S., Owen, N., Willemsen, G., & Marmot, M. (2002). Stress
responsivity and socioeconomic status. European Heart Journal, 23(22), 1757-1763.
Stone, E. J., McKenzie, T. L., Welk, G. J., & Booth, M. L. (1998). Effects of physical activity
interventions in youth: Review and synthesis. American Journal of Preventive Medicine,
15(4), 298-315.

Do Physical Activity, Sedentary Behaviors, and Nutrition Affect Healthy Weight 142
Story, M. (1999). School-based approaches for preventing and treating obesity. International
Journal of Obesity, 23, S43-S51.
Story, M., Neumark-Sztainer, D., & French, S. (2002). Individual and environmental influences
on adolescent eating behaviors. Journal of the American Dietetic Association, 102(3), S40-
S51.
Strickland, A. (2004). Body image and self-esteem: a study of relationships and comparisons
between more and less physically active college women (Unpublished doctoral dissertation).
Florida State University, FL.
Strong, W. B., Malina, R. M., Blimkie, C. J., Daniels, S. R., Dishman, R. K., Gutin, B., ...
Rowland, T. (2005). Evidence based physical activity for school-age youth. The Journal of
Pediatrics, 146(6), 732-737.
Strover, S., & Mun, S. H. (2006). Wireless broadband, communities, and the shape of things to
come. Government Information Quarterly, 23(3), 348-358.
Sugiyama, T., Healy, G. N., Dunstan, D. W., Salmon, J., & Owen, N. (2008). Is television
viewing time a marker of a broader pattern of sedentary behavior?. Annals of Behavioral
Medicine, 35(2), 245-250.
Swanson, M., Schoenberg, N. E., Erwin, H., & Davis, R. E. (2013). Perspectives on physical
activity and exercise among Appalachian youth. Journal of Physical Activity & Health,
10(1), 42.
Swinburn, B. A., Caterson, I., Seidell, J. C., & James, W. P. (2004). Diet, nutrition and the
prevention of excess weight gain and obesity. Public Health Nutrition, 7(1a), 123-146.
Tabachnick, B. G., & Fidell, L. S. (2013). Using multivariate statistics (6th ed.). Boston: Pearson
Education.

Do Physical Activity, Sedentary Behaviors, and Nutrition Affect Healthy Weight 143
Tai-Seale, T., & Chandler, C. (2010). Nutrition and overweight concerns in rural areas: a
literature review. Rural Healthy People, 2.
Taveras, E. M., Rifas‐Shiman, S. L., Berkey, C. S., Rockett, H. R., Field, A. E., Frazier, A. L., ...
Gillman, M. W. (2005). Family dinner and adolescent overweight. Obesity Research, 13(5),
900-906.
Terry-McElrath, Y. M., Johnston, L. D., & O’Malley, P. M. (2012). Trends in competitive venue
beverage availability: Findings from US secondary schools. Archives of Pediatrics &
Adolescent Medicine, 166(8), 776-778.
The Cooper Institute. (2010). Fitnessgram and activitygram test administration manual-updated
4th edition. Human Kinetics.
Thompson, S. G., & Sharp, S. J. (1999). Explaining heterogeneity in meta‐analysis: A
comparison of methods. Statistics in Medicine, 18(20), 2693-2708.
Thornton, L. E., Lamb, K. E., & Ball, K. (2016). Fast food restaurant locations according to
socioeconomic disadvantage, urban–regional locality, and schools within Victoria,
Australia. SSM-Population Health, 2, 1-9.
Timperio, A., Salmon, J., Telford, A., & Crawford, D. (2005). Perceptions of local
neighbourhood environments and their relationship to childhood overweight and obesity.
International Journal of Obesity, 29(2), 170-175.
Tomblin, E. R., & Lewis, M. J. (2011). Obesity in West Virginia. West Virginia Department of
Health & Human Resources. Retrieved from http://www.wvdhhr.org/bph/hsc/pubs/other/
Trogdon, J., Finkelstein, E., Hylands, T., Dellea, P., & Kamal‐Bahl, S. (2008). Indirect costs of
obesity: A review of the current literature. Obesity Reviews, 9(5), 489-500.

Do Physical Activity, Sedentary Behaviors, and Nutrition Affect Healthy Weight 144
Tsiros, M. D., Olds, T., Buckley, J. D., Grimshaw, P., Brennan, L., Walkley, J., . . . Coates, A.
M. (2009). Health-related quality of life in obese children and adolescents. International
Journal of Obesity, 33(4), 387-400.
Tudor-Locke, C. E., & Myers, A. M. (2001). Methodological considerations for researchers and
practitioners using pedometers to measure physical (ambulatory) activity. Research
Quarterly for Exercise and Sport, 72(1), 1-12.
Tudor-Locke, C., Ainsworth, B. E., Thompson, R. W., & Matthews, C. E. (2002). Comparison of
pedometer and accelerometer measures of free-living physical activity. Medicine and
Science in Sports and Exercise, 34(12), 2045-2051.
Twisk, J. W., Kemper, H. C., van Mechelen, W., & Post, G. B. (1997). Tracking of risk factors
for coronary heart disease over a 14-year period: A comparison between lifestyle and
biologic risk factors with data from the Amsterdam growth and health study. American
Journal of Epidemiology, 145(10), 888-898.
U.S. Department of Agriculture and U.S. Department of Health and Human Services. (2010).
Dietary guidelines for Americans 2010. Washington, DC: Government Printing Office.
U.S. Department of Health and Human services (2008a). 2008 Physical Activity Guidelines for
Americans. Retrieved from http://health.gov/paguidelines/pdf/paguide.pdf
U.S. Department of Health and Human Services (2010). Strategies to Improve the Quality of
Physical Education. Retrieved from www.cdc.gov/healthyschools/pecat/quality_pe.pdf
U.S. Department of Health and Human Services. (2000). Healthy People 2010: Understanding
and Improving Health. 2nd ed. Washington, DC: U.S. Government Printing Office.
U.S. Department of Health and Human Services. (2008b). Physical activity guidelines advisory
committee report. Washington, DC: US Department of Health and Human Services.
Do Physical Activity, Sedentary Behaviors, and Nutrition Affect Healthy Weight 145
U.S. Department of Health and Human Services., & Office of Disease Prevention and Health
Promotion. (2012). Healthy People 2020. Washington, DC: U.S. Government Printing
Office.
United States Department of Agriculture. (2007). School breakfast program participation and
meals served. Retrieved from http://www.fns.usda.gov/pd/sbsummar.htm
Vanhees, L., Lefevre, J., Philippaerts, R., Martens, M., Huygens, W., Troosters, T., & Beunen,
G. (2005). How to assess physical activity? How to assess physical fitness?. European
Journal of Cardiovascular Prevention and Rehabilitation, 12(2), 102-114.
Verbeke, G., & Molenderghs, G. (2009). Linear mixed models for longitudinal data. Springer
Science & Business Media.
Vucenik, I., & Stains, J. P. (2012). Obesity and cancer risk: Evidence, mechanisms, and
recommendations. Annals of the New York Academy of Sciences, 1271(1), 37-43.
Wang, F., & Veugelers, P. J. (2008). Self‐esteem and cognitive development in the era of the
childhood obesity epidemic. Obesity Reviews, 9(6), 615-623.
Wang, Y., & Lobstein, T. (2006). Worldwide trends in childhood overweight and obesity.
International Journal of Pediatric Obesity, 1(1), 11-25.
Wang, Y., Ge, K., & Popkin, B. M. (2003). Why do some overweight children remain
overweight, whereas others do not?. Public Health Nutrition, 6(6), 549-558.
Wardle, J., Volz, C., & Golding, C. (1995). Social variation in attitudes to obesity in children.
International Journal of Obesity and Related Metabolic Disorders, 19(8), 562-569.
Webber, K. H., & Quintiliani, L. (2011). Development of a weight loss program for Appalachian
Kentucky adults: a formative research survey. Family and Consumer Sciences Research
Journal, 40(1), 74-84.

Do Physical Activity, Sedentary Behaviors, and Nutrition Affect Healthy Weight 146
Welk, G. J., Morrow, J. R. J., & Falls, H. B. (2002). Fitnessgram reference guide. Dallas, TX:
The Cooper Institute.
Wellman, N. S., & Friedberg, B. (2002). Causes and consequences of adult obesity: Health,
social and economic impacts in the United States. Asia Pacific Journal of Clinical Nutrition,
11(Suppl 8), S705-S709.
West Virginia Department of Agriculture. (2014). West Virginia Agriculture State Profile 2014.
Retrieved from http://www.agriculture.wv.gov/media/documents/west%virginia%20
West, B. T., Welch, K. B., & Galecki, A. T. (2014). Linear mixed models: A practical guide
using statistical software. CRC Press.
Weston, A. T., Petosa, R., & Pate, R. R. (1997). Validation of an instrument for measurement of
physical activity in youth. Medicine & Science in Sports & Exercise, 29(1), 138-143.
Whitt-Glover, M. C., Taylor, W. C., Heath, G. W., & Macera, C. A. (2007). Self-reported
physical activity among blacks: Estimates from national surveys. American Journal of
Preventive Medicine, 33(5), 412-417.
Wiecha, J. L., Finkelstein, D., Troped, P. J., Fragala, M., & Peterson, K. E. (2006). School
vending machine use and fast-food restaurant use are associated with sugar-sweetened
beverage intake in youth. Journal of the American Dietetic Association, 106(10), 1624-
1630.
Wild, S., Roglic, G., Green, A., Sicree, R., & King, H. (2004). Global prevalence of diabetes:
Estimates for the year 2000 and projections for 2030. Diabetes Care, 27(5), 1047-1053.
Woodward-Lopez, G., Kao, J., & Ritchie, L. (2011). To what extent have sweetened beverages
contributed to the obesity epidemic?. Public Health Nutrition, 14(3), 499-509.

Do Physical Activity, Sedentary Behaviors, and Nutrition Affect Healthy Weight 147
World Health Organization. (2002). The world health report 2002: Reducing risks, promoting
healthy life. World Health Organization.
World Health Organization. (2003). Global strategy on diet, physical activity and health.
Retrieved from apps.who.int/iris/bitstream/10665/67433/1/who_nmh_exr.02.2_rev.1.pdf
World Health Organization. (2004). Young people's health in context: Health behaviour in
school-aged children (HBSC) study: International report from the 2001/2002 survey. Health
Policy for Children and Adolescents, 4, 110-119.
World Health Organization. (2010a). Obesity and overweight. Fact sheet no. 311. Retrieved
from http://www.who.int/mediacentre/factsheets/fs311/en/
World Health Organization. (2010b). Global recommendations on physical activity for health.
Retrieved from http://apps.who.int/iris/bitstream/10665/44399/1/9789241599979_eng.pdf
WV Health Statistics Center. (2011). West Virginia behavioral risk factor surveillance system
report. Charleston, WV: West Virginia Department of Health & Human Resources.
WV Health Statistics Center. (2012). West Virginia behavioral risk factor surveillance system
report. Charleston, WV: West Virginia Department of Health & Human Resources.
Yach, D., Stuckler, D., & Brownell, K. D. (2006). Epidemiologic and economic consequences of
the global epidemics of obesity and diabetes. Nature Medicine, 12(1), 62-66.
Yannakoulia, M., Ntalla, I., Papoutsakis, C., Farmaki, A. E., & Dedoussis, G. V. (2010).
Consumption of vegetables, cooked meals, and eating dinner is negatively associated with
overweight status in children. The Journal of Pediatrics, 157(5), 815-820.
Zaninotto, P., Head, J., Stamatakis, E., Wardle, H., & Mindell, J. (2009). Trends in obesity
among adults in England from 1993 to 2004 by age and social class and projections of
prevalence to 2012. Journal of Epidemiology and Community Health, 63(2), 140-146.
Do Physical Activity, Sedentary Behaviors, and Nutrition Affect Healthy Weight 148
Zenk, S. N., Schulz, A. J., & Odoms-Young, A. (2009). How neighborhood environments
contribute to obesity. The American Journal of Nursing, 109(7), 61.
Zive, M. M., Frank-Spohrer, G. C., Sallis, J. F., Mckenzie, T. L., Elder, J. P., Berry, C. C., . . .
Nader, P. R. (1998). Determinants of dietary intake in a sample of white and Mexican-
American children. Journal of the American Dietetic Association, 98(11), 1282-1289.

Do Physical Activity, Sedentary Behaviors, and Nutrition Affect Healthy Weight 149
Appendix A After School Programming Calendar in Greenbrier CHOICES Project
Data
Collection
School
Eastern Western
Y1(BL)
Y1(2)
Y1(3)
Y1(4)
Y1(5)
Y2(6) -After School Mt. Biking (10days)
-After School Zumba (13days)
-After School Gardening & Healthy
Cooking (2days)
-After School Gladiator Training
(3days)
-Before School Walking (6 days)
-After School Mt. Biking (12days)
-After School Gardening & Healthy
Cooking (4days)
-After School Zumba (7days)
Y2(7) -After School Gladiator Training
(4days)
-After School Gardening & Healthy
Cooking (2days)
-After School Mt. Biking (4days)
-After School Gardening & Healthy
Cooking (1days)
Y2(8) -After School Gardening & Healthy
Cooking (3days)
-After School Gardening & Healthy
Cooking (2days)
Y2(9) -After School Gardening & Healthy
Cooking (6days)
-After School Gardening & Healthy
Cooking (7days)
Y3(10)
Y3(11)
Y3(12)
Y3(13)

Do Physical Activity, Sedentary Behaviors, and Nutrition Affect Healthy Weight 150
Appendix B Greenbrier CHOICES Activitygram Activity Log
Instructions: Use the charts below to track your physical activity across the past three (3) days. You must include two (2) school days, and one (1) weekend day. Follow these steps to complete the charts: STEP 1: Determine the primary activity you did during each 30-minute interval using the list of activities at the side of the page and enter the related number in the Activity column. Be sure there is a number in each row on all three sheets. STEP 2: Circle an intensity level that best describes how hard the activity felt in the Intensity column (Rest: "Resting", such as sleeping; Light: “Easy”; Moderate: “Not too tiring”; Vigorous: “Very tiring”).
IMPORTANT: If you fill in activity numbers that are from the Resting category (#26, 27, 28, 29, 30) the only thing that should be circled in the Intensity column is Rest.
Here is a sample of a completed log sheet. Notice how there is a day of the week circled, an activity number written in each row, and an intensity level circled in each row.

Do Physical Activity, Sedentary Behaviors, and Nutrition Affect Healthy Weight 151
Name: _________________________ Grade in School: ______________ School: _______________ Day of the Week (circle one): MON TUE WEN THR FRI SAT SUN
Lifestyle activity- “Activities that I do as part of my normal day” 1.Walking, bicycling, or skateboarding for transportation 2.Housework or yard work (chores, cleaning room, mowing lawn) 3.Playing active games or dancing 4.Work – active job 5.Other
Aerobic activity- “Activities that I do for aerobic fitness” 6.Aerobic dance activity 7.Aerobic gym equipment (stair climber, treadmill, etc.) 8.Aerobic activity (bicycling, running, skating, etc.) 9.Aerobic activity in physical education 10.Other Aerobic sport- “Activities that I do for sport and recreation” 11.Field sports (baseball, softball, football, soccer, etc.) 12.Court sports (basketball, volleyball, hockey, etc.) 13.Racket sports (tennis, racquetball, etc.) 14.Sports during physical education 15.Other Muscular activity- “Activities that I do for muscular fitness” 16.Gymnastics, cheer, dance or drill teams 17.Track and field sports (jumping, throwing, etc.) 18.Weightlifting or calisthenics (push-ups, sit-ups, etc.) 19.Wrestling or martial arts (karate, aikido) 20.Other Flexibility activity- “Activities that I do for flexibility and fun” 21.Martial arts (Tai Chi) 22.Stretching 23.Yoga 24.Ballet 25.Other Rest- “Things I do when I am not active” 26.School-work, home-work, or reading 27.Computer games or TV/videos 28.Eating, resting, listening to music, riding bus, car, dirt bike, ATV 29.Sleeping 30.Other
TIME OF DAY
STEP 1 Activity Number
STEP 2 Intensity
Rest Light Moderate Vigorous
Morning Rest Light Moderate Vigorous 7:00 AM R L M V 7:30 R L M V 8:00 R L M V 8:30 R L M V 9:00 R L M V 9:30 R L M V 10:00 R L M V 10:30 R L M V 11:00 R L M V 11:30 R L M V Afternoon 12:00 PM R L M V 12:30 R L M V 1:00 R L M V 1:30 R L M V 2:00 R L M V 2:30 R L M V 3:00 R L M V 3:30 R L M V 4:00 R L M V 4:30 R L M V Evening 5:00 R L M V 5:30 R L M V 6:00 R L M V 6:30 R L M V 7:00 R L M V 7:30 R L M V 8:00 R L M V 8:30 R L M V 9:00 R L M V 9:30 R L M V 10:00 R L M V 10:30 R L M V

Do Physical Activity, Sedentary Behaviors, and Nutrition Affect Healthy Weight 152
Sample Activities within each Activity Category
Muscular Activity- "Activities I do for muscular fitness"
Flexibility Activity- "Activities I do for flexibility and fun"
Lifestyle Activity- "Activities I do as part of my normal day"
Aerobic Activity- "Activities I do for aerobic fitness"
Aerobic Sport- "Activities I do for sport and recreation"
Rest- "Things I do when I'm not active"

Do Physical Activity, Sedentary Behaviors, and Nutrition Affect Healthy Weight 153
Appendix C The PACER Individual Score Sheet

Do Physical Activity, Sedentary Behaviors, and Nutrition Affect Healthy Weight 154
Appendix D School Physical Activity and Nutrition Survey
Instructions: Using a #2 pencil fill in the bubbles for the following information: 1) Last and First Name; 2) Birthdate; and 3) Identification Number (get this from the Evaluation Team Member). Indicate your responses to the following questions on the blue scantron sheet.
1. Yesterday, how many times did you drink any kind of milk? (INCLUDE chocolate or other
flavored milk, milk on cereal, and drinks made with milk.) a) 0 times b) 1 time c) 2 times d) 3 times e) 4 or more times
2. Yesterday, how many times did you eat any starchy vegetables like potatoes, corn, or peas?
(DO NOT COUNT French fries or chips.) a) 0 times b) 1 time c) 2 times d) 3 times a) 4 or more times
3. Yesterday, how many times did you eat any orange vegetables like carrots, squash, or sweet
potatoes? a) 0 times b) 1 time c) 2 times d) 3 times e) 4 or more times
4. Yesterday, how many times did you eat a salad made with lettuce, or any green vegetables
like spinach, green beans, broccoli, or other greens? a) 0 times b) 1 time c) 2 times d) 3 times e) 4 or more times

Do Physical Activity, Sedentary Behaviors, and Nutrition Affect Healthy Weight 155
5. Yesterday, how many times did you eat any other vegetables like peppers, tomatoes, zucchini, asparagus, cabbage, cauliflower, cucumbers, mushrooms, eggplant, celery or artichokes? a) 0 times b) 1 time c) 2 times d) 3 times e) 4 or more times
6. Yesterday, how many times did you eat fruit? Fruits are all fresh, frozen, canned, or dried fruits. (DO NOT COUNT juice.) a) 0 times b) 1 time c) 2 times d) 3 times e) 4 or more times
7. Yesterday, how many times did you drink fruit juice? Fruit juice is a 100% juice drink like
orange juice, apple juice, or grape juice. (DO NOT COUNT punch, Kool-Aid®, sports drinks, and other fruit-flavored drinks.) a) 0 times b) 1 time c) 2 times d) 3 times e) 4 or more times
8. Yesterday, how many times did you drink any punch, Kool-Aid®, sports drinks, or other
fruit-flavored drinks? (DO NOT COUNT 100% fruit juice.) a) 0 times b) 1 time c) 2 times d) 3 times e) 4 or more times
9. Yesterday, how many times did you drink any regular (NOT diet) sodas or soft drinks?
a) 0 times b) 1 time c) 2 times d) 3 times e) 4 or more times

Do Physical Activity, Sedentary Behaviors, and Nutrition Affect Healthy Weight 156
10. Yesterday, how many times did you drink any diet sodas or soft drinks? a) 0 times b) 1 time c) 2 times d) 3 times e) 4 or more times
11. Yesterday, how many times did you drink a bottle or glass of water? (INCLUDE sparkling
or any other water drink that has 0 calories.) a) 0 times b) 1 time c) 2 times d) 3 times e) 4 or more times
12. During the past 7 days, on how many days were you physically active for a total of at least
60 minutes per day? (Add up all the time you spent in any kind of physical activity that increased your heart rate and made you breathe hard some of the time.) a) 0 days b) 1-2 days c) 3-4 days d) 5-6 days e) 7 days
13. On an average school day, how many hours do you watch TV?
a) I do not watch TV on an average school day b) Less than 1 hour per day c) 1-2 hours per day d) 3-4 hours per day e) 5 or more hours per day
14. On an average school day, how many hours do you play video or computer games or use a
computer for something that is not school work? (Include activities such as Xbox, PlayStation, Nintendo DS, iPod touch, Facebook, and the Internet.) a) I do not play video or computer games or use a computer for something that is not school
work b) Less than 1 hour per day c) 1-2 hours per day d) 3-4 hours per day

Do Physical Activity, Sedentary Behaviors, and Nutrition Affect Healthy Weight 157
e) 5 or more hours per day
15. In an average week when you are in school, on how many days do you go to physical education (PE) classes? a) 0 days b) 1-2 days c) 3-4 days d) 5-6 days e) 7 days
16. During the past 12 months, on how many sports teams did you play? (Count any teams run
by your school or community groups.) a) 0 teams b) 1 team c) 2 teams d) 3 or more teams
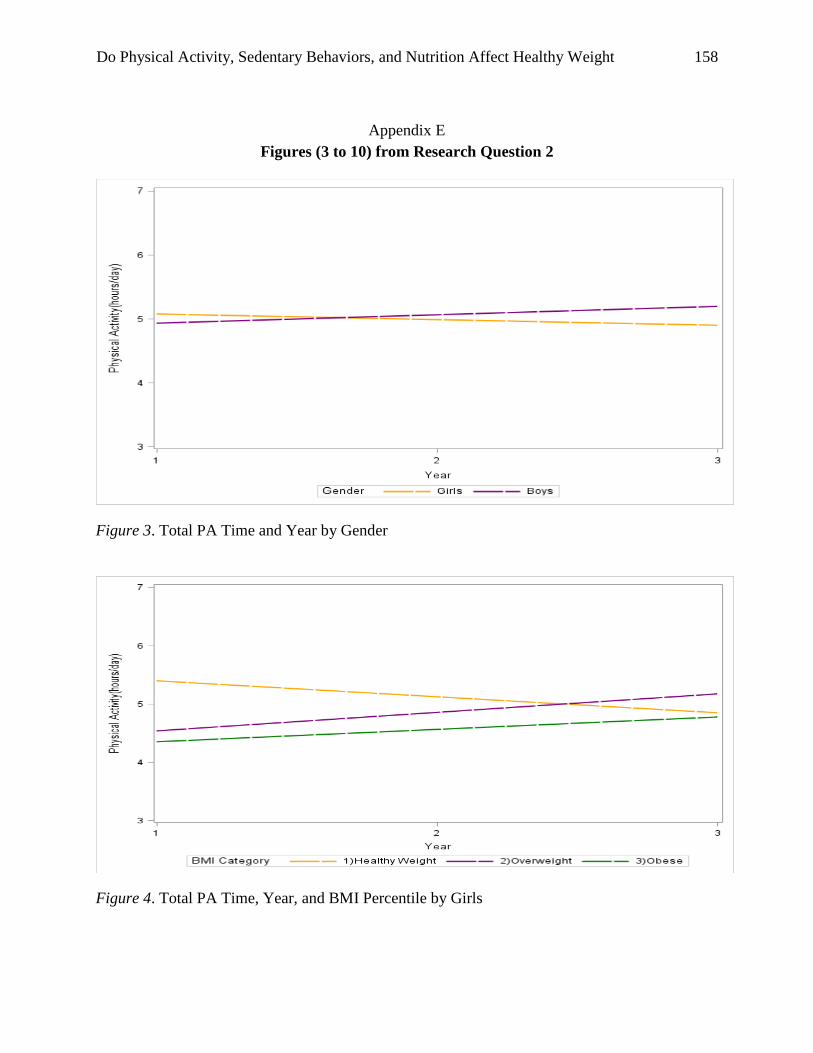
Do Physical Activity, Sedentary Behaviors, and Nutrition Affect Healthy Weight 158
Appendix E Figures (3 to 10) from Research Question 2
Figure 3. Total PA Time and Year by Gender
Figure 4. Total PA Time, Year, and BMI Percentile by Girls

Do Physical Activity, Sedentary Behaviors, and Nutrition Affect Healthy Weight 159
Figure 5. Total PA Time, Year, and BMI Percentile by Boys
Figure 6. Total Screen Time and Year by Gender

Do Physical Activity, Sedentary Behaviors, and Nutrition Affect Healthy Weight 160
Figure 7. Total Screen Time and BMI Percentile by Gender
Figure 8. Total Screen Time, Year, and BMI Percentile by Girls

Do Physical Activity, Sedentary Behaviors, and Nutrition Affect Healthy Weight 161
Figure 9. Total Screen Time, Year, and BMI Percentile by Boys
Figure 10. Total School Work and BMI Percentile by Gender