Do equity financing cycles matter? evidence from biotechnology alliances
36
Journal of Financial Economics 67 (2003) 411–446 Do equity financing cycles matter? evidence from biotechnology alliances $ Josh Lerner a,b, *, Hilary Shane c , Alexander Tsai d a Graduate School of Business Administration, Harvard University, Boston MA 02163, USA b National Bureau of Economic Research, Cambridge, MA 02138, USA c FNY Millennium Global Offshore Ltd., New York, NY, 10022 USA d Case Western University, Cleveland, OH 44106, USA Received 12 June 2001; accepted 21 January 2002 Abstract In periods characterized by diminished public market financing, small biotechno- logy firms appear to be more likely to fund R&D through alliances with major corpo- rations rather than with internal funds (raised through the capital markets). We consider 200 alliance agreements entered into by biotechnology firms between 1980 and 1995. Agreements signed during periods of limited external equity financing are more likely to assign the bulk of the control to the larger corporate partner, and are significantly less successful than other alliances. These agreements are also $ Mark Edwards made this project possible by allowing generous access to the Recombinant Capital database; Toby Stuart provided supplemental data. Alper Afya, Chris Allen, Tiffany Lin, John Seeg, Evan Wamsley, and Elizabeth Whitburn provided research assistance. We thank George Baker, Ron Gilson, Paul Gompers, Rebecca Henderson, Tom Hubbard, Robert Merges, Lisa Meulbroek, David Rothman, Scott Stern, Toby Stuart, Bill Schwert (the editor), Jean Tirole, an anonymous referee, a number of practitioners, and participants in formal seminars and informal workshops at the American Law and Economics Association annual meetings, Chicago, Columbia, Harvard, Irvine, the NBER, Northwestern, Toulouse, UCLA, and the Western Finance Association meetings for helpful suggestions. The Consortium on Competitiveness and Cooperation, Harvard Business School’s Division of Research, and the NBER Project on Industrial Technology and Productivity, with support of the Alfred P. Sloan Foundation provided financial support. An earlier version of this paper was titled ‘‘Financing R&D through Alliances.’’ All errors remain our responsibility. *Corresponding author. Graduate School of Business Administration, Harvard University, Boston, MA 02163, USA. Tel.: +1-617-495-6065; fax: +1-617-495-3817. E-mail address: [email protected] (J. Lerner). 0304-405X/02/$ - see front matter r 2002 Elsevier Science B.V. All rights reserved. PII:S0304-405X(02)00256-8
Transcript of Do equity financing cycles matter? evidence from biotechnology alliances

Journal of Financial Economics 67 (2003) 411–446
Do equity financing cycles matter?evidence from biotechnology alliances$
Josh Lernera,b,*, Hilary Shanec, Alexander Tsaid
aGraduate School of Business Administration, Harvard University, Boston MA 02163, USAbNational Bureau of Economic Research, Cambridge, MA 02138, USAcFNY Millennium Global Offshore Ltd., New York, NY, 10022 USA
dCase Western University, Cleveland, OH 44106, USA
Received 12 June 2001; accepted 21 January 2002
Abstract
In periods characterized by diminished public market financing, small biotechno-
logy firms appear to be more likely to fund R&D through alliances with major corpo-
rations rather than with internal funds (raised through the capital markets). We
consider 200 alliance agreements entered into by biotechnology firms between 1980 and
1995. Agreements signed during periods of limited external equity financing are
more likely to assign the bulk of the control to the larger corporate partner, and
are significantly less successful than other alliances. These agreements are also
$Mark Edwards made this project possible by allowing generous access to the Recombinant
Capital database; Toby Stuart provided supplemental data. Alper Afya, Chris Allen, Tiffany Lin,
John Seeg, Evan Wamsley, and Elizabeth Whitburn provided research assistance. We thank
George Baker, Ron Gilson, Paul Gompers, Rebecca Henderson, Tom Hubbard, Robert Merges, Lisa
Meulbroek, David Rothman, Scott Stern, Toby Stuart, Bill Schwert (the editor), Jean Tirole, an
anonymous referee, a number of practitioners, and participants in formal seminars and informal
workshops at the American Law and Economics Association annual meetings, Chicago, Columbia,
Harvard, Irvine, the NBER, Northwestern, Toulouse, UCLA, and the Western Finance Association
meetings for helpful suggestions. The Consortium on Competitiveness and Cooperation, Harvard
Business School’s Division of Research, and the NBER Project on Industrial Technology and
Productivity, with support of the Alfred P. Sloan Foundation provided financial support. An earlier
version of this paper was titled ‘‘Financing R&D through Alliances.’’ All errors remain our
responsibility.
*Corresponding author. Graduate School of Business Administration, Harvard University, Boston,
MA 02163, USA. Tel.: +1-617-495-6065; fax: +1-617-495-3817.
E-mail address: [email protected] (J. Lerner).
0304-405X/02/$ - see front matter r 2002 Elsevier Science B.V. All rights reserved.
PII: S 0 3 0 4 - 4 0 5 X ( 0 2 ) 0 0 2 5 6 - 8

disproportionately likely to be renegotiated if financial market conditions subsequently
improve.
r 2002 Elsevier Science B.V. All rights reserved.
JEL classification: G32; E32; L22
Keywords: Strategic alliances; Product market-financial market interactions; Initial public offerings;
Venture capital
1. Introduction
The clustering of equity offerings in ‘‘hot issue’’ markets has been documented inthe academic literature since Hickman (1953). Theoreticians have suggested thatexternal financing is an important driver of organizational structure and managerialbehavior. Yet the implications of variations in equity financing activity for theallocation of resources to firms and their subsequent performance have been littleexplored empirically. This paper takes an initial step towards understanding howchanges in financing availability affect organizational structure and outcomes.Rather than studying the impact of financing conditions in a variety of industries,however, we examine a single arena: technology alliances between smallbiotechnology firms and larger corporations.
While this approach restricts the generality of the results, it has three advantages:
* First, the theoretical literature makes specific predictions as to the effects offinancing availability fluctuations on the biotechnology industry. Aghion andTirole (1994) argue that in settings where the R&D firm does not have initialbargaining power, an ideal allocation of control rights might not occur. If it isdesirable for control to be transferred to the R&D firm, the best outcome will notbe achieved: the financing firm might be willing to transfer control, but the R&Dfirm will not have enough resources to compensate the financing firm. Aninefficient allocation of the ownership and control results.
* Second, equity financing of biotechnology firms has undergone dramaticvariations over the years. These shifts have been largely in the nature ofindustrywide shocks. In the years under study, relatively few biotechnology drugshad been approved. Unexpected events occurring at a single biotechnology firm—e.g., the rejection of a promising drug candidate—had dramatic effects, all firms’abilities to raise equity.
* Finally, a great deal of information is available about biotechnology projects. Thebio-engineered compounds that are the subject of the alliance agreements mustundergo a rigorous and well-documented regulatory review process. Due to theimportance of the alliance agreements as financing sources, almost all importantbiotechnology alliances are publicly filed. Other critical factors can also beidentified and controlled for.
J. Lerner et al. / Journal of Financial Economics 67 (2003) 411–446412

We first consider why increases in information asymmetries might lead youngfirms to increasingly rely on large corporations for financing. Large corporationscould have the specialized knowledge and expertise to finance younger firms, evenwhen information asymmetries deter public market investors from providing equity.This possibility is borne out in an analysis of the financing choices of a panel of 49biotechnology firms. While the regressions in this section are statistically significant,their economic significance is less impressive.
We then consider the alliance agreements themselves. We show that in periodswhen public equity financing is readily available, the agreements are more likely togrant key control rights to the R&D firm. This pattern—consistent with theory—holds even after controlling for variations in the quality of the technology in theagreement.
We then examine whether the agreements are successful in terms of the progress ofthe product under development. Alliances that grant the bulk of the control to theR&D firm are more successful, an effect that is more pronounced in weak financingmarkets, as Aghion and Tirole (1994) predict.
We finally examine the likelihood of renegotiation. If it would have maximizedinnovative output to assign control to the small biotechnology company, but thisallocation of control was precluded by financial market conditions, then we shouldsee a distinct pattern in renegotiations. In particular, when financing conditions forbiotechnology firms improve, the agreements that assign the bulk of the control tothe financing firm should be disproportionately renegotiated. The empirical resultsare consistent with this pattern.
This paper is at the intersection of two bodies of literature. A substantial body ofwork examines the implications of financing availability: for instance, how financingconstraints affect the investment policies of firms (Hubbard, 1998) and the relationbetween financial market development and aggregate economic growth (Levine,1997). Similarly, organizational structure and its implications have been extensivelyscrutinized in the industrial organization literature (see, for instance, Milgrom andRoberts, 1992). Bolton and Scharfstein (1990) show that when young firms do nothave ‘‘deep pockets’’—in particular, when they rely on outside financiers for supportas the firm evolves—concerns about predatory behavior by rivals may have asubstantial impact. In particular, these worries lead financiers to lower the sensitivityof the refinancing decision to performance, thereby weakening managers’ incentivesto succeed. Still, little empirical attention has been devoted to these issues.
This paper is also related to the literature on the variation in equity issuances overtime, which emphasizes the importance of information asymmetries. Mackie-Masonand Jeftrey (1990) shows that information problems appear to influence publiclytraded firms’ choices between private and public equity. Similarly, Korajczyk et al.(1991) demonstrate how the timing of earnings announcements affects when firmsissue equity. Bayless and Chaplinsky (1996) show that the price reaction to equityissue announcements in periods of high equity issue volume is less negative onaverage than in periods of low equity issue volume, which they argue reflects reducedinformation asymmetries between issuers and investors. This paper suggests thatthese variations have real effects on firm performance.
J. Lerner et al. / Journal of Financial Economics 67 (2003) 411–446 413

The organization of the paper is as follows. Section 2 discusses the theoreticalrationales for the empirical analysis. Section 3 provides a brief introduction to therole of R&D alliances in the biotechnology industry, and the evidence suggestingthat there is a close mapping between the theoretical work and reality. Section 4describes the data sets and the analyses are presented in Section 5. The final sectionconcludes the paper.
2. Theoretical perspectives
2.1. The determinants of equity market cycles
Leland and Pyle (1977) and Myers and Majluf (1984) were among the first tosuggest that information asymmetries can preclude firms from financing positive netpresent value projects. Even if the entrepreneur understands the value of theopportunity, the project will go unfinanced if he or she cannot convey thisinformation to a potential financier. These information problems are most severe forfirms in the early stages of development. In such settings, there is often littleverifiable information. Even if audited financial statements are available, accountingdata may not provide much information about an early stage firm.
In many studies of information and managerial decision-making, shifts in theinformation environment are presumed to be firm specific. But in industries withunproven prospects, changes in information asymmetries surrounding individualfirms may be positively correlated. If many publicly traded companies have still notproven themselves to be profitable—such as was true in biotechnology in the 1980sand 1990s and electronic commerce in the 1990s—new information about one firmcan change the evaluation of many similar firms. Similarly, economywide shocks canshift investors’ evaluation of information problems surrounding a whole class offirms, or even firms in all industries (Bayless and Chaplinsky, 1996).1
The role of intermediaries who finance young firms has been increasinglyunderstood in light of these information problems. Financial economists emphasizethe intensive ex ante due diligence and monitoring activities in connection with afinancing provided by commercial banks (Diamond, 1991), private placementinvestors (Hertzel and Smith, 1993), or venture capitalists (Chan, 1983). Theseactivities enable the investments to be made, even in settings with substantialinformation problems. Intermediaries provide other benefits as well. For instance, anintermediary such as a venture capitalist may have extensive experience in anindustry, and can provide the firm’s management with strategic guidance.Alternatively, the intermediary might own complementary assets (e.g., a productionfacility or a sales force in the case of a corporate partner) that make the young firmmore effective.
1Other factors may also affect the decision to issue equity. Many papers suggest that firms issue equity
when they are overvalued (or expect to be overvalued): examples include Baker and Wurgler (2000), Lee
et al. (1991), Lerner (1994), Lowry (2001), and Pagano et al. (1998). Many of these studies suggest that
there is an industry component to this investor sentiment.
J. Lerner et al. / Journal of Financial Economics 67 (2003) 411–446414

At the same time, these activities are not costless. The human capital required toassess and monitor investments is likely to take years to develop. The allianceagreements themselves are time-consuming and costly to negotiate and implement.As a result, the intermediaries require a return that compensates them for theirinvestment of both financial and human capital. Once firms have resolved the initialinformation problems, they are likely to shift to public investors, who do notdemand as great a premium. As the marginal benefits of obtaining external financingfrom knowledgeable intermediaries declines, the higher cost of their funds are likelyto drive firms to the public markets. Because of the importance of complementaryassets, however, we expect to see some alliances being formed even when publicfinancial markets are readily accessible.
2.2. The impact of public market shifts
The literature review above suggests some reasons why the financing of firms bythe public markets and informed private investors may shift over time. We nowconsider a theoretical depiction of how these shifts can affect one set of economicinteractions: the relationship between small and large firms in strategic alliances.
Numerous models, beginning with Grossman and Hart (1986) and Hart andMoore (1988), consider incomplete contracting between a principal and an agent. Atypical assumption is that it is impossible for the two parties to write a verifiablecontract, enforceable in a court of law, that specifies the effort and final output of thetwo parties. This is because there are many possible contingencies, not all of whichcan be anticipated at the time the contract is drafted. Due to this nonverifiabilityproblem, these models suggest that it is optimal for ownership of the project to beassigned to the party with the greatest marginal ability to affect the outcome. Thisparty, who will retain the right to make the decisions that cannot be specified in thecontract, should also receive any surplus that results from the project. Because of thisincentive, the party will make the decisions that maximize—or come close tomaximizing—the returns from the project.
Aghion and Tirole (1994) adapt this general model to an R&D alliance betweentwo firms. In their basic model, the authors assume that the research unit is withoutfinancial resources of its own, cannot borrow any funds, and has no ability tocommercialize the innovation itself. As a result, it turns for financing to a customer,a firm that may intend to use the product itself or to resell it to others but cannotmake the discovery independently. The success of the research project is anincreasing function, though at a decelerating rate, of both the effort provided by theresearch unit and the resources provided by the customer.
Developing a contract between the two parties is challenging. While the ownershipof the product can be specified in an enforceable contract, and the resourcesprovided by the customer can also be so specified, uncertainty precludes writing acontract for the delivery of a specific innovation. Similarly, an enforceable contractcannot be written that specifies the level of effort that the research unit will provide.
Aghion and Tirole (1994) consider two polar cases: when the research unit has theex ante bargaining power, and when the customer does. When the research unit has
J. Lerner et al. / Journal of Financial Economics 67 (2003) 411–446 415

the bargaining power, the ownership of the research output will be efficientlyallocated. If the marginal impact of the research unit’s effort on the innovativeoutput is greater than the marginal impact of the customer’s investment, then theresearch unit will receive the property rights. If not, the research unit will transferownership to the customer in exchange for a cash payment. This result is similar tothat of Grossman and Hart (1986).
When the customer has the bargaining power, however, a different patternemerges. If it is optimal for the customer to own the project, it will retain the project.If, however, it would maximize innovation for the property rights to be transferredto the research unit, the ideal outcome will not be achieved. The customer will bewilling to transfer ownership, but the cash-constrained research unit will not haveenough resources to compensate the customer. As a result, an inefficient allocationof the property rights occurs, with the customer retaining the rights to the invention.
While Aghion and Tirole (1994) do not explicitly depict a role for the publicmarket, it is reasonable to believe that variations in the availability of publicfinancing will affect the bargaining power of R&D firms. During periods whenpublic financial markets are readily accessible, these firms may be able to financeprojects through either public equity issues or alliances. But during periods whenequity issues are more difficult, R&D firms may have few alternatives to undertakingalliances. In the latter periods, it is also reasonable to assume that the R&D firm’sbargaining power will be considerably reduced.
The claim that control rights are more likely to be transferred to the financing firmduring periods of diminished public equity market activity is also supported byrelated models. Holmstrom and Tirole (1997) depict a setting where an economicshock affects the disbursement of capital by both public investors and inter-mediaries. Transposed to our setting, after a negative shock in the public equitymarket, the share of projects that can be directly financed through public investorswill fall. More firms—particularly those with the greatest need for capital—will turnto intermediaries that can provide intensive oversight along with the needed capital,or else not be financed at all. In these cases, the intermediaries will insist on morestringent conditions in exchange for their capital. Aghion and Bolton (1992) showthat when entrepreneurs have insufficient income to pledge to investors, they mayonly be able to raise financing by giving investors a control right (e.g., the right toterminate a project). While it can reduce the net present value of the project (theaction may be sufficiently painful to the firm’s employees and managers that socialwelfare is harmed, even if the firm’s profits are enhanced), the transfer of controlinsures that the investors will receive sufficient proceeds to compensate them for theirinvestment. Firms with financing problems may consequentially grant ‘‘excessive’’(at least relative to the unattainable, first-best outcome) control rights to investors.These two papers also suggest there will be a strong linkage between the transfer ofcontrol and the public equity market conditions.
One way to visualize this prediction is shown in Fig. 1. The curved line depicts thevalue of a project that would ideally be largely in the control of the R&D firm. Inperiods with strong financing markets, the two parties can reach any possiblecontract, and will assign a large fraction of the control of the project to the R&D
J. Lerner et al. / Journal of Financial Economics 67 (2003) 411–446416

firm (Point A). A weak financing market, however, limits the set of contracts that thetwo parties can arrive at. As discussed above, they may negotiate a contract thatdoes not maximize the value of the project (Point B). Fig. 1 treats treat control as acontinuous variable, rather than as an indivisible right. It is unlikely that all controlrights will be allocated to the R&D firm in any alliance, since in many areas (e.g.,marketing) the financing firm will be far more informed.
The model suggests that the marginal impact of providing an additional controlright to the financing firm will be quite different in the two markets. In a strongfinancing market, since the control rights are allocated in a way that maximizesvalue, the addition of a single control right is unlikely to have much impact. In aweak financing market, however, the shift may lead to a substantial decrease invalue.
3. The biotechnology industry as a testing ground
The biotechnology industry originated in the mid-1970s. The many new firms thatwere formed in the subsequent decades sought to commercialize scientificdevelopments in genetic engineering. To this day, the industry remains characterizedby numerous small research-intensive firms, who finance themselves primarilythrough public equity issues and alliances with pharmaceutical companies.
Control Rights of Financing Firm (More to Right)
Val
ue
Cre
ated
by
Alli
ance
Range in favorable equity financing market
Range in unfavorable equity financing market
A B
Fig. 1. Illustration of predicted marginal impact of a shift in the allocation of control rights on the alliance
outcome when equity financial markets are favorable and unfavorable (which affects the range of
contracts that the two parties can reach).
J. Lerner et al. / Journal of Financial Economics 67 (2003) 411–446 417

A natural question is the extent to which the theoretical depictions correspond tothe reality of the biotechnology industry. Lerner and Merges (1998) describe threecase studies of alliances between biotechnology and pharmaceutical firms. Thesestudies highlight three ways in which biotechnology alliances resemble the theory:
* First, the biotechnology industry is characterized by considerable informationasymmetries. Biotechnology-based products frequently take between one and twodecades and many hundreds of millions of dollars to develop. It is frequentlydifficult for investors to assess how the firm is progressing.
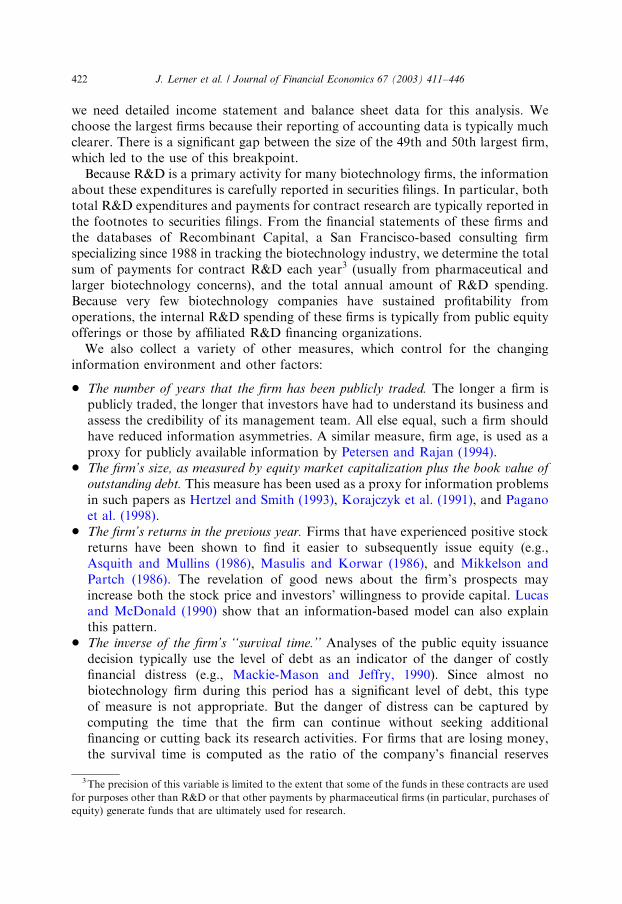
* Second, information problems appear to be correlated across firms. Because thereare so many ambiguities surrounding biotechnology R&D, surprises affecting onefirm can lead investors to reassess their beliefs about the viability of biotechnologyresearch and/or the industry’s commercial prospects. For instance, the announce-ment in January 1993 by Centocor that clinical trials of its flagship Centoxinproduct were being terminated led to dramatic declines in both the share pricesand the equity financing activity of most biotechnology concerns. (Worries aboutthe implications of the Clinton health care plan also had a depressing effect onactivity in the 1992–1994 period.) As a result, the amount of capital raised fromthe public markets has been highly variable (see Fig. 2).
$0.0
$1.0
$2.0
$3.0
$4.0
$5.0
1978 1979 1980 1981 1982 1983 1984 1985 1986 1987 1988 1989 1990 1991 1992 1993 1994 1995
Mill
ion
s o
f 19
95 $
s R
aise
d P
er A
ctiv
e B
iote
chn
olo
gy
Fir
m a
t Y
ear'
s B
egin
nin
g
Other
Follow-On Offerings
IPOs
Venture Financings
Fig. 2. External financing of the US biotechnology industry. The chart depicts the amount raised by US
new biotechnology firms through private venture financings, initial public offerings, follow-on public
equity offerings, and other sources. (Alliance-related financings are excluded.) Amounts are normalized by
the number of firms active in the industry at the beginning of each year.
J. Lerner et al. / Journal of Financial Economics 67 (2003) 411–446418

* Finally, in addition to information asymmetries, there is also a great deal ofuncertainty in biotechnology research. This makes it difficult for contractingparties to specify the features of the product to be developed. Similarly, thecomplexity and unpredictability of biotechnology research present challengesin drafting an enforceable agreement that specifies the contributions of theR&D firm. In particular, firms that contract to perform R&D in alliancesfrequently have ongoing research projects of their own, in addition to thecontracted efforts. In case of a dispute, it may be very difficult for the financingfirm to prove that the R&D firm has employed alliance resources to advance itsown projects.
At the same time, the case studies reveal that biotechnology alliances present amore complex picture than many incomplete contracting models. First, the basicAghion-Tirole model presents a setting where the parties bargain over a single,indivisible ownership right.2 By way of contrast, actual alliances are complexdocuments, often extending for 100 pages or more and assigning a wide variety ofcontrol rights.
Nonetheless, conversations with practitioners identified five control rights as keyto the management of most, though not all, alliances. They are as follows:
1. Management of clinical trials. Not only are applications for regulatory approval ofhuman and agricultural bio-engineered products protracted and costly, they alsoinvolve many decision points. For instance, while a human therapeutic productmay have diverse potential uses, regulatory approval is given only for specificuses. Thus, the financing firm may not wish to apply for approval of a therapeutictreatment for a disease for which it has an existing product, lest it cannibalizeexisting sales, even if its R&D partner believes that this use offers the highestpotential returns.
2. Control of the initial manufacturing process. Often the processes discovered at thetest-tube level must be fundamentally altered as manufacturing is scaled up. Thedevelopment of manufacturing technologies may also require the release ofinformation not protected by patents.
3. Control of manufacturing after product approval. This is a particularly significantright for human therapeutic products. When the US Food and DrugAdministration (FDA) approves a new drug, the approval extends only to theparticular facility where it is being manufactured. If a pharmaceutical companyseeks to move production from the facility of an R&D partner to one of its own, itmust undergo another extensive and time-consuming FDA review. Thus, theassignment of manufacturing rights is frequently an item of contention.
Finally, almost all pharmaceutical firms have large sales forces, which engage in thetime-consuming process of developing personal relationships with doctors and
2The authors also discuss how if there are multiple innovations, the ownership of individual innovations
may be assigned differently, with each party getting property rights to the innovations where it has a
comparative advantage in creating value. This theme is explored in considerably greater depth in Aghion
and Tirole (1997).
J. Lerner et al. / Journal of Financial Economics 67 (2003) 411–446 419

hospital administrators. At least until very recently, most biotechnology firms havesought to develop similar capabilities, in the belief that a sales force would allowthem to enhance their profit margins and their strategic position. The final two keycontrol rights thus relate to the marketing of the bio-engineered product:
1. Retention of all sales categories for financing firm. This control right allows thefinancing firm to have primary responsibility for marketing the product in allmarket segments, whether defined by geography (country) or product (diseaseindication). If the R&D firm retains primary responsibility for some territories, wedo not code the control right as being assigned to the financing firm.
2. Ability to exclude the R&D firm from all aspects of the marketing process. Thiscontrol right allows the financing firm to exclude the R&D firm from all aspects ofthe marketing process—even from supporting roles—in the US (typically thelargest market). Similar to above, if the R&D firm retains some roles, we do notcode the control right as being assigned to the financing firm.
In the bulk of the analyses, we examine how many of these key five control rightsare assigned to the financing firm. This structure for the analysis is suggested by thelegal treatment of technology licenses. Because the licensor (in each case, the R&Dfirm) contributes the critical intellectual property for the alliance, it reserves anyrights that are not explicitly granted to the licensee (Merges, 1995). In somesupplemental analyses, we examine a broader group of 25 rights that appear inbetween 5% and 95% of the agreements. Appendix A lists these additional rights.
The purchase of an equity stake in the R&D firm by the financing firm is notincluded as a key control right because the equity obtained by the financing firm inthese agreements is very modest. In the biotechnology-pharmaceutical firmtransactions between 1978 and 1995 in the Recombinant Capital database wherean equity purchase was disclosed, the average stake is 9%. The value of the meanpurchase ($7.6 million) is very modest relative to the size of the non-equity paymentsfrom the financing firm and (under plausible assumptions) to the expected value ofthe cash flows to the financing firm from the product under development. Thedecision to finance part of the transaction as equity appears to be driven by the factthat the financing firm can write off equity investments over a number of years,unlike R&D payments (which must be expensed).
One concern with our analysis is the extent to which the allocation of individualcontrol rights is independent. If these rights are essentially included on an all-or-nothing basis, it might distort our interpretation of the results. There are relativelyfew cases where two rights appear closely in tandem. Of the 300 pairs, only in tencases does one control right appear at least two-thirds of the time when the othercontrol right does, and vice versa. Correlation coefficients are generally positive butmodest in magnitude. The average correlation coefficient between the five keycontrol rights is 0.026.
Second, the Aghion-Tirole model assumes a one-time contracting process betweenthe two parties. Actual alliances reveal more complex contracting patterns. Forinstance, pairs of firms undertake repeated sets of alliances on different projects.These successive interactions can lead to increased trust between the two parties and
J. Lerner et al. / Journal of Financial Economics 67 (2003) 411–446420

fewer concerns about the R&D firm providing diminished effort (Banerjee andDuflo, 2000). To partially address this situation, we control for alliances in which thefirms have a prior contractual relationship.
Finally, the Aghion-Tirole model assumes that the two parties are sharplydifferentiated. In actuality, some of the alliances are between pairs of biotechnologyconcerns. In such cases, both firms may face financial challenges, and consequentlythese pressures may have no impact on the control right allocation. Furthermore, inthese and other alliances, both firms can contribute knowledge. We control, at leastpartially, for these contingencies by identifying proxies for alliances that are likely tohave such horizontal elements. We also repeat the analysis without these agreements.
We examine four questions suggested by theory:
* Whether during certain periods, the R&D firm has little ability to finance the
research by issuing equity and instead turns to alliance financing.* Whether the allocation of control rights differs in agreements that are signed in
periods with little external equity financing activity. When no external equityfinancing is available, biotechnology firms are likely to have little bargainingpower. As argued above, theory suggests that they will more frequently cedecontrol to the financing firm in these instances.
* Whether success rates differ in agreements that (i) are signed in periods with little
external equity financing availability and (ii) cede the bulk of the control to the
financing firm. The theory suggests that the agreements signed in the periods withlittle external equity financing availability are less likely to maximize innovativeoutput. In particular, in some of the agreements signed during periods with littleexternal equity financing, the R&D firm should cede control when innovationwould have been maximized had it retained control.
* Whether the less attractive agreements are renegotiated. If the availability of equityfrom the external market improves dramatically, we should expect that the subsetof agreements that assign most of the control to the financing firm aredisproportionately renegotiated.
4. The data
4.1. The firm-level data
In the initial analysis, we consider the choice between financing projects throughalliances and the firm’s own funds (raised from the capital markets). To undertakethis analysis, we examine the financing of R&D by 49 biotechnology firms between1981 and 1993. The sample consists of the largest initial public offerings ofpharmaceutical- and therapeutic-oriented biotechnology firms between 1980 and1989 based on inflation-adjusted market capitalization at the close of the first day oftrading. Firms are included in the sample from the year after which they went publiceither until they are acquired or liquidated or until 1993. Thus, we do not believe thatsurvivorship bias is a significant issue. We focus on publicly traded entities because
J. Lerner et al. / Journal of Financial Economics 67 (2003) 411–446 421
we need detailed income statement and balance sheet data for this analysis. Wechoose the largest firms because their reporting of accounting data is typically muchclearer. There is a significant gap between the size of the 49th and 50th largest firm,which led to the use of this breakpoint.
Because R&D is a primary activity for many biotechnology firms, the informationabout these expenditures is carefully reported in securities filings. In particular, bothtotal R&D expenditures and payments for contract research are typically reported inthe footnotes to securities filings. From the financial statements of these firms andthe databases of Recombinant Capital, a San Francisco-based consulting firmspecializing since 1988 in tracking the biotechnology industry, we determine the totalsum of payments for contract R&D each year3 (usually from pharmaceutical andlarger biotechnology concerns), and the total annual amount of R&D spending.Because very few biotechnology companies have sustained profitability fromoperations, the internal R&D spending of these firms is typically from public equityofferings or those by affiliated R&D financing organizations.
We also collect a variety of other measures, which control for the changinginformation environment and other factors:
* The number of years that the firm has been publicly traded. The longer a firm ispublicly traded, the longer that investors have had to understand its business andassess the credibility of its management team. All else equal, such a firm shouldhave reduced information asymmetries. A similar measure, firm age, is used as aproxy for publicly available information by Petersen and Rajan (1994).
* The firm’s size, as measured by equity market capitalization plus the book value of
outstanding debt. This measure has been used as a proxy for information problemsin such papers as Hertzel and Smith (1993), Korajczyk et al. (1991), and Paganoet al. (1998).
* The firm’s returns in the previous year. Firms that have experienced positive stockreturns have been shown to find it easier to subsequently issue equity (e.g.,Asquith and Mullins (1986), Masulis and Korwar (1986), and Mikkelson andPartch (1986). The revelation of good news about the firm’s prospects mayincrease both the stock price and investors’ willingness to provide capital. Lucasand McDonald (1990) show that an information-based model can also explainthis pattern.
* The inverse of the firm’s ‘‘survival time.’’ Analyses of the public equity issuancedecision typically use the level of debt as an indicator of the danger of costlyfinancial distress (e.g., Mackie-Mason and Jeffry, 1990). Since almost nobiotechnology firm during this period has a significant level of debt, this typeof measure is not appropriate. But the danger of distress can be captured bycomputing the time that the firm can continue without seeking additionalfinancing or cutting back its research activities. For firms that are losing money,the survival time is computed as the ratio of the company’s financial reserves
3The precision of this variable is limited to the extent that some of the funds in these contracts are used
for purposes other than R&D or that other payments by pharmaceutical firms (in particular, purchases of
equity) generate funds that are ultimately used for research.
J. Lerner et al. / Journal of Financial Economics 67 (2003) 411–446422

(defined as the sum of cash, long-term liquid assets, and off-balance-sheet cashheld in R&D limited partnerships at the end of the previous calendar year) to theabsolute value of the net income in the previous year. Firms that are profitable orrunning on a breakeven basis are considered to have an infinite survival time(hence, the inverse is zero).
* The volume of equity raised by biotechnology firms in the previous year. Wecompute this in two ways: totaling public equity financings (since this is thealternative most frequently employed by already-public biotechnology concerns)and all equity financing.
Panel A of Table 1 summarizes the firm-level data set. While the average firmfinances twice as much of its R&D on its own as through relationships with otherfirms, the ratio is considerably smaller for the median firm. The financial measuresare quite skewed, with a few R&D firms much more established than the others.
Table 1
Characteristics of the samples
Panel A summarizes the first sample, which consists of a panel of the 49 largest (by inflation-adjusted
market capitalization at the close of the first trading day) pharmaceutical- and therapeutic-oriented
biotechnology firms that went public between 1980 and 1989, observed annually between 1981 and 1993.
Panel B summarizes the second sample, which consists of 200 technology alliances initiated between
biotechnology and pharmaceutical companies or between biotechnology firms in the 1980–1995 period.
The stage of product, focus of alliance, and characteristics of pairs of firms in alliance measures are all
dummy variables. The financial condition, firm value, equity raised, and alliance payment variables are
expressed in millions of 1995 dollars. The date variable is expressed as a decimal (e.g., July 1, 1995 is coded
as 1995.5).
Variable Mean Median Stan. Dev. Minimum Maximum
Panel A: Panel of 49 leading biotechnology firms
R&D funding from other firms in prior year 5.92 2.43 9.71 0.00 64.20
Self-funded R&D in prior year 12.08 3.38 31.47 0.00 265.40
Net income in prior year �2.81 �2.99 31.60 �122.90 466.40
Cash and other liquid assets at end of prior year 25.37 8.67 49.66 0.23 426.00
Firm’s equity return in prior year 0.26 �0.02 0.99 �0.80 7.22
Years firm has been publicly traded 5.32 5 3.15 1 13
Firm value (equity market value plus debt) 321.83 96.21 954.80 0.22 10926.48
Public biotech equity raised in prior year 685 287 1177 0 4598
All biotech equity raised in prior year 1026 612 1253 77 5107
Panel B: 200 technology alliances
Variable
Stage of Lead Product at Time of Alliance:
Discovery/lead molecule 0.64 0 1
Pre-clinical development 0.21 0 1
Undergoing regulatory review 0.15 0 1
Focus of Alliance:
Human therapeutics 0.92 0 1
Human diagnostics 0.04 0 1
Agricultural or chemical applications 0.04 0 1
J. Lerner et al. / Journal of Financial Economics 67 (2003) 411–446 423

4.2. The contract-level data
One advantage of studying biotechnology firms is the degree of disclosure in thisindustry. Publicly traded biotechnology firms, like other concerns, are required bythe US Securities and Exchange Commission (SEC) to file material documents.Biotechnology companies tend to interpret this requirement conservatively, andoften file alliance contracts. This willingness to file reflects the facts thatbiotechnology firms typically derive little income from sales and that payments aspart of alliances represent a large share of their total revenues.
As of December 1998, Recombinant Capital had identified over 7,000biotechnology alliances by examining securities filings with federal and stateauthorities, news accounts, and press releases, and had analyzed about 900 of theapproximately 4,800 alliances that had been filed with the SEC or other governmentbodies. When performing analyses, Recombinant Capital seeks to verify anyinformation obtained from the filed alliances by examining subsequent filings by thefirms. (Firms can request confidential treatment for key information, butnondisclosure can become an issue if the firm is sued for security law violations;shareholder class-action litigation has occurred frequently in high-technologyindustries.) The Recombinant Capital database is typically licensed by major
Table 1 (continued)
Variable Mean Median Stan. Dev. Minimum Maximum
Condition of Financing Firm:
Revenues in prior year 8912 5218 18649 1 179601
R&D expenditures in prior year 588 457 499 2 1958
Net income in prior year 645 473 623 �457 2232
Cash flow from operations in prior year 970 668 943 �448 5234
Cash and equivalents at end of prior year 1048 644 1066 1 4938
Total assets at end of prior year 7765 5716 8210 1 53632
Shareholders’ equity at end of prior year 3738 2851 3569 0 17505
Condition of R&D Firm:
Revenues in prior year 11 0 80 0 1029
R&D expenditures in prior year 9 5 16 0 171
Net income in prior year �6 �5 14 �65 134
Cash flow from operations in prior year �5 �5 18 �62 171
Cash and equivalents at end of prior year 16 8 26 0 229
Total assets at end of prior year 36 14 111 0 1079
Shareholders’ equity at end of prior year 25 11 68 �17 665
Age of R&D firm 5 4 3 0 36
Characteristics of the Alliance
Date of alliance 6/91 12/91 3.1 years 1/80 12/95
Minimum length of R&D alliance (years) 3.79 3.00 2.65 0.75 31.00
Total pre-commercialization payments 29.01 21.42 28.94 0.19 216.28
Payment at the time of signing 1.76 0.51 3.02 0.00 12.00
Previous alliance between firms? 0.06 0 1
Control rights given to financing firm (out of 5) 2.81 3 1.10 0 5
Control rights given to financing firm (out of 25) 9.22 9 2.68 0 16
J. Lerner et al. / Journal of Financial Economics 67 (2003) 411–446424

pharmaceutical, accounting, and law firms for a considerable annual fee, and hadnot been made available to academics prior to the inception of this project
For our analysis, we select a random sample of 200 of the analyzed alliances. Weseek to create a population that avoids undesirable heterogeneity. In particular, weeliminate alliances where:
* One of the parties is a university, medical center, non-profit organization, orgovernment agency.
* One of the parties has a controlling interest in the other, either through a majorityequity stake or through a purchase option (e.g., an alliance between a firm andone of its R&D limited partnerships).
* The two parties have a previous alliance covering the same set of technologies,and consequently are renegotiating the terms of an earlier alliance.
* There is neither a research nor a product development component, but thealliance simply involves the marketing of an existing product.
* More than two firms are involved, making the analysis of the contract lesstractable.
* The agreement as filed contains information on neither the duration of thealliance nor the structure of the payments between the two firms.
* The agreement is signed after 1995, so that it is difficult to analyze allianceoutcomes.
Because determining the circumstances of alliances requires considerable research,we do not eliminate the agreements before assembling the random sample. Rather,we first draw a random sample of agreements. When we discover that an allianceviolates one of the criteria, we eliminate the observation, and randomly drawanother alliance to bring the sample size back up to 200.
Although alliances between two biotechnology companies might be thought to becollaborations between equals rather than transactions with a well-defined financingfirm as the theory depicts, in the median such alliance the larger biotechnology firmhas 138 times the revenues and 40 times the shareholders’ equity of the smaller one.In each case, the cash flows are unidirectional. (One contract adds somecontingencies for the smaller firm subsidizing research at the larger firm; eliminatingthis case has little impact on the results.)
A comparison of the alliances in the sample with the universe of filed agreements,as well as the subset summarized by Recombinant Capital, highlights the fact thatour criteria disproportionately eliminate several classes of agreements. TheRecombinant Capital database includes a variety of contracts, such as licenses ofapproved products and diagnostic kits, which do not meet the definitions above. Theobservations in the sample are concentrated towards the later years of the sample.This reflects not only the increasing level of alliance activity in recent years, but alsoRecombinant Capital’s propensity to summarize more recent alliances, due to theirgreater relevance to its clients. (The 49 firms in the sample discussed in Section 4.1.represent 26% of the alliances in the sample of 200 transactions.)
Using the Recombinant Capital database, we code several variables. The first ofthese is the number of control rights assigned to the financing firm. A value of one
J. Lerner et al. / Journal of Financial Economics 67 (2003) 411–446 425

indicates that the particular right is allocated to the financing firm, and zero if not.We also wish to control for the scale of alliance. We thus compute the sum of all pre-commercial payments that the financing firm commits to make as part of the alliance(some of these may be contingent on the achievement of technological or regulatorytargets), the size of the up-front payment, and the minimum alliance duration.
For each of the 200 alliances, we gather a variety of supplemental data. First, wedetermine from the Recombinant Capital database the nature of the regulatoryreview facing the technology. The review of new human therapeutics by the FDA isfrequently exhaustive, often stretching for a decade or longer. Agricultural andchemical bio-engineered products face somewhat less arduous reviews, as dodiagnostic products.
Second, we identify the progress of the lead product in the alliance. TheRecombinant Capital database identifies—and we corroborate from SEC filingsand press accounts in the LEXIS-NEXIS and Dow Jones News Service databases—the stage of the lead product candidate covered by the alliance in the regula-tory approval process at the time of the signing. (The stages are summarized inAppendix B.)
Third, we examine the prior relationship between the two parties in the alliance.Using Recombinant Capital’s database, which lists all alliances disclosed in securitiesfilings, press releases, or other news accounts, we determine whether the two firmshad any previous alliances. While, as discussed above, we eliminate observationsfrom the sample where the two parties have a previous alliance covering the same setof technologies, in some instances they have an alliance in a different area.4
Fourth, knowledge spillovers from other R&D projects can have an importantimpact on the success of an R&D project. We thus compile the overall researchspending of the R&D firms. We determine these data from the Compustat andWorldscope databases for the end of the fiscal year immediately prior to the alliance.When this information is not available from Compustat or Worldscope, we gatherthe information from 10-K filings, IPO prospectuses, and other securities filings.
Fifth, to determine the outcome of the lead product in the alliance, we employ avariety of information sources. Recombinant Capital has compiled a large numberof press releases and securities filings about alliances and a database of allpharmaceutical products under development by biotechnology firms. We also searchSEC filings and news stories in the LEXIS-NEXIS and Dow-Jones News Servicedatabases. Finally, we use two specialized databases, IMS and PharmaProjects, thattrack the development of pharmaceutical and bio-engineered products throughmonthly surveys of firms as well as reviews of FDA filings. While these databaseshave some limitations—in particular, firms may not always disclose strategicallyimportant pre-clinical projects—industry executives believe that they give a fairlycomprehensive picture of drugs in the clinical stages of development.
4One concern is that information on earlier transactions might be substantially less complete in the early
years of the sample. Biotechnology firms typically file information about all their earlier alliances when
they go public, allowing Recombinant Capital to accurately ascertain these firms’ previous alliances, even
for the earlier periods when they were not collecting press releases and other information.
J. Lerner et al. / Journal of Financial Economics 67 (2003) 411–446426

We find information on alliance renegotiations in the Recombinant Capitaldatabase (which notes such renegotiations in its alliance summaries and compilespress releases announcing renegotiations), SEC filings, and press accounts in theLEXIS-NEXIS and Dow Jones News Service databases. Using the same sources, aswell as industry-specific directories such as Dibner (1999), Ernst and Young (1996),and Oryx Press (1996), we identify public equity financings by biotechnology firms,and compute the inflation-adjusted amount of funds raised in the quarters prior tothe alliance. We construct two alternative measures of equity financing activity, thedollar volume of all public equity offerings by biotechnology firms and the dollarvolume of all equity raised by biotechnology firms. (The difference between the twoseries is largely due to venture capital transactions.)
Panel B of Table 1 summarizes the alliances and the firms entering into theseagreements. Several patterns can be observed from these summary statistics. Mostalliances are undertaken at a very early stage, well before the commencement ofclinical trials. The disparity between the financial conditions of financing and R&Dfirms is substantial, with the average financing firm having several hundred times therevenues and assets of the mean R&D firm. The mean R&D firm’s operating cashflow is sufficiently negative that it would exhaust its cash and equivalents in aboutthree years’ time (if the losses continue at the same level and no additional financingwere received). The assignment of control rights to the financing firm is highlyvariable.
5. Empirical analyses
5.1. Relation between financial market conditions and subsequent R&D financing
Before considering the predictions of Aghion-Tirole model, it is appropriate toexplore its key assumption. How reasonable is the claim that during periods withlittle external equity financing, the bargaining power in alliance negotiations shifts infavor of pharmaceutical firms?
The analysis in this section is related to the hotly debated topic of the impact ofcapital constraints on investment. Modern studies (reviewed in Hubbard, 1998)typically seek to relate investment to cash flow for subsets of firms that have been apriori identified as capital constrained or unconstrained through some objectivecriteria. The greater sensitivity of the investment by constrained firms to cash flows isinterpreted as indicating that the firms are capital constrained, though thisinterpretation is not uncontroversial (Kaplan and Zingales, 1997). Unfortunately,such an approach would not lend itself to the biotechnology industry. First, it wouldbe difficult to think of criteria that would lead to the identification of a set ofunconstrained biotechnology firms. Moreover, the very notion of cash flow shapinginvestment in this industry does not seem reasonable, since virtually all firms werelosing a substantial amount of money during the 1980s and early 1990s. Rather, therate of R&D is determined by firms’ existing supply of funds and their expectedability to raise capital in the future.
J. Lerner et al. / Journal of Financial Economics 67 (2003) 411–446 427

We thus focus in this analysis on the shifting sources of R&D financing. For ourpanel of 49 biotechnology firms, we divide each firm’s spending on R&D into thatfinanced by pharmaceutical firms and that self-financed on an annual basis.5 Weexamine whether periods with substantial information asymmetries—as proxied byreduced equity offerings—lead firms to shift from relying on the public markets forfinancing to raising capital from informed intermediaries such as pharmaceuticalcompanies.
The first two columns of Table 2 present a regression analysis of the mixture offinancing sources for R&D expenditures. The dependent variable is the share ofR&D funded by pharmaceutical firms. The independent variables are the firm’sfinancial health (measured by the inverse of the survival time), the extent ofinformation asymmetries surrounding the firm (measured by the number of years thefirm has been publicly traded and its size), the firm’s stock return in the past year,and a measure of equity financing raised by biotechnology companies in the previousyear (either the volume of equity raised in the public market by biotechnology firmsor the total equity financing raised by these firms).
The coefficients of the measures of equity raised, �0.04 and �0.04, suggest thatincreases in external equity financing lead firms to increasingly self-finance research,and vice versa. The magnitude of the effect, however, is modest. At the mean of theindependent variables, a doubling of the external financing raised by biotechnologyfirms decreased the predicted share of R&D financed by pharmaceutical companiesin the next year from 44% to 41%. Consistent with the interpretation offered above,characteristics associated with greater firm-level information asymmetries (e.g., firmswith a shorter history as publicly traded entities and of smaller size) also lead to agreater reliance on pharmaceutical firms for financing.
The third and fourth columns report the results of two checks of the robustness ofthe results. We add an estimation using fixed effects, as well as one employing anAR(1) autocorrelation term, which is allowed to take on a different value for eachfirm in the sample. While the sign is the same, the coefficient of the measure of equityfinancing, –0.02, is no longer significant in the regression employing fixed effects,although it remained significant when we added the autocorrelation term.
In unreported regressions, we examine the determinants of the dollar amount ofpharmaceutical- and self-funded research. The amount funded by pharmaceuticalcompanies does not vary significantly with the proxies for information asymmetries:only the measure of financial health (the inverse of the survival time) is significant.Self-financed R&D, on the other hand, varies in a highly significant way with thematurity of the firm and the state of the public equity market. Apparently concernedabout their ability to raise additional capital from public investors in theseenvironments, biotechnology firms cut back on their own financing of R&D.
5Observations at higher frequencies are precluded by the nature of the reporting of these expenditures,
as well as the unevenness in corporate payments. The self-financed portion is largely from the firms’ own
cash reserves, which are typically raised from equity investors. (Some of the funds are from R&D financing
organizations, which, while technically freestanding entities, are controlled by the firm.)
J. Lerner et al. / Journal of Financial Economics 67 (2003) 411–446428

In other unreported analyses, we also show that the results are robust to otherproxies for firm-level information problems. For instance, we demonstratesubstantial differences between cases where the firms have pending applicationswith the FDA (which are likely to have substantial information asymmetries) andthose where new drugs have just been approved (where the gaps are likely to besubstantially lessened). We also rerun the regressions, adding some of the controlsemployed by Choe, Masulis, and Nanda (1993). These changes do not have asignificant impact on the results.
While these findings are suggestive, they are certainly not conclusive. In particular,this empirical pattern could be driven by a mechanical relation in which firms thathave more cash simply finance their R&D internally without considering alternativesources of funding. Such a ‘‘pecking order’’ story would lead to a similar empiricalpattern: after a period of many equity issues, more biotechnology firms would becash-rich, and fund research with internal funds.
Table 2
Sources of R&D funding
The sample consists of a panel of the 49 largest (by inflation-adjusted market capitalization at the close of
the first trading day) pharmaceutical- and therapeutic-oriented biotechnology firms that went public
between 1980 and 1989, observed annually between 1981 and 1993. The dependent variable is the ratio of
pharmaceutical-funded R&D to total R&D expenditures in the calendar year. The independent variables
are the ratio of the absolute value of the firm’s net income in its previous year to its liquid assets at the end
of the year (firms at breakeven or with positive net income at the end of the year are coded as zero), the
company’s stock return in the previous year, the years that the firm had been publicly traded, the firm’s
value (market value of equity and debt) at the end of the previous year, and either the volume of equity
raised in the public market by biotechnology firms in the previous year or the total equity financing raised
by these firms. (The last three are in billions of 1995 dollars). The third regression employs fixed effects; the
fourth regression a firm-specific AR(1) correction. All regressions employ ordinary least squares
specifications. Heteroskedastic-consistent standard errors are in brackets except in the last regression,
where standard errors are reported.
Dependent variable: Ratio of pharmaceutical to total R&D
1/(Survival time) 0.003 [0.004] 0.003 [0.004] *0.01 [0.004] 0.003 [0.003]
Stock return in past year �0.02 [0.02] �0.02 [0.02] �0.03 [0.04] *�0.03 [0.02]
Years firm has been publicly traded **�0.03 [0.01] **�0.02 [0.01] �0.03 [0.02] ***�0.03 [0.01]
Firm value (1995 $ billions) **�0.03 [0.01] **�0.03 [0.01] **�0.06 [0.02] �0.02 [0.03]
Public biotech equity raised (1995 $ billions) **�0.04 [0.02] �0.02 [0.03] **�0.04 [0.02]
Total biotech equity raised (1995 $ billions) **�0.04 [0.02]
Constant ***0.62 [0.08] ***0.63 [0.08] ***0.66[0.07]
R2 0.05 0.05 0.43
p-Value of regression 0.000 0.000 0.000 0.001
Number of observations 309 309 309 307
Fixed effects? No No Yes No
Firm-specific AR(1) term? No No No Yes
Note: The sample size is smaller for the AR(1) specification because two observations are dropped which
were the only observation of that firm. The constant is not reported in the fixed-effects regression, because
its interpretation is unclear.***Significant at 1% confidence level.**Significant at 5% confidence level.*Significant at 10% confidence level.
J. Lerner et al. / Journal of Financial Economics 67 (2003) 411–446 429

5.2. Relation between financial market conditions and control rights
We next examine the allocation of control rights in a regression framework. Thedependent variable is the number of control rights allocated to the financing firm. Asdiscussed above, we focus on five critical control rights.
We employ two specifications for our analysis, estimating both ordinary leastsquares (OLS) and ordered logit regressions. The latter specification avoids some ofthe problems associated with the differing importance of the various control rights.Such a regression methodology treats an alliance assigning four control rights to thefunding party as more favorable to the financing firm than one with two such controlrights, but not necessary twice as favorable.
In the basic specification, we use as independent variables a dummy variabledenoting early stage projects at the time of the alliance signing (those projectsbetween the earliest discovery stage and pre-clinical research), the amount of equitycollectively raised by biotechnology firms from the public markets in the previousquarter, and a measure of the financial resources of the R&D firm (shareholders’equity). All financial variables are expressed in billions of 1995 dollars. (We aremissing balance sheet data for about 10% of the alliances, typically alliances signedwhile the firms were still private.) In supplemental regressions, we add controls forthe nature of the agreement, including dummy variables denoting whether theagreement focused on agricultural, chemical, or diagnostic biotechnology, whetherthe alliance was between two biotechnology firms, and the count of patents in relatedfields awarded to the R&D firm.
The basic analyses are reported in Tables 3. The firm-specific measures suggestthat, consistent with the Aghion-Tirole hypothesis, an R&D firm in a strongerfinancial position retains more of the control rights in the alliance. For example,in the first regression, a one standard deviation increase in the R&D firm’sshareholders’ equity at the mean of the independent variables leads to a drop in thepredicted number of control rights assigned to the financing firm from 2.9 to 2.7rights (two-tenths of a standard deviation of this measure). (This effect is weakerand less significant when additional control variables are added.) Similarly, projectsthat are in their early stages, which are likely to have a greater need for financingand greater information asymmetries that deter uninformed equity investors, areassociated with a significant transfer of control (about one-half of a right) to thefinancing firm.
The measures of external market conditions display a consistent picture with thefirm-level data. During times when public biotechnology equity financing activity inthe previous quarter is greater, fewer control rights are likely to be assigned to thefinancing firm. The coefficients, �0.31 and �0.30 in the OLS regressions and �0.62and �0.59 in the ordered logit estimations, are significant at the 5% confidence levelacross all the regressions. Consistent with the theory and the firm-level patterns,R&D firms in weaker markets cede more control rights. A time trend in controlrights could confound these results. For instance, financiers might have graduallylearned about opportunistic behavior that biotechnology firms could undertake, andadded new protective clauses. In actuality, there is a negative correlation between the
J. Lerner et al. / Journal of Financial Economics 67 (2003) 411–446430

Table
3
Thealloca
tion
ofco
ntrolin
allia
nce
s
Thesa
mple
consistsof200
tech
nolo
gy
allia
nce
sin
itia
ted
bet
wee
nbio
tech
nolo
gy
and
pharm
ace
utica
lco
mpaniesorbet
wee
nbio
tech
nolo
gy
firm
sin
the1980–
1995
per
iod.Thedep
enden
tvariable
isth
enum
ber
ofco
ntrolrights
(outoffiverights
iden
tified
inco
nver
sationswith
pra
ctitio
ner
s)ass
igned
toth
efinancing
firm
.Thein
dep
enden
tvariablesare
adum
my
variable
indicating
ifth
elead
pro
duct
wasnotyet
inclin
icaltria
lsatth
etim
eofth
eallia
nce
,th
esh
are
hold
ers’
equityofth
eR
&D
firm
,and
theto
talvolu
meofpubliceq
uityfinancingra
ised
bybio
tech
nolo
gyfirm
sin
thepre
vio
usquarter
.In
two
supplem
enta
lre
gre
ssio
ns,
additio
nalvariables
include
dum
mies
den
oting
ifth
eagre
emen
tin
volv
edth
edev
elopm
entofan
agricu
ltura
lor
chem
icalpro
duct
,th
edev
elopm
entofa
dia
gnostic
pro
duct
,ortw
obio
tech
nolo
gy
com
panies,
and
thenum
ber
ofre
late
dpate
nts
award
edto
theR
&D
firm
atth
etim
eofth
eagre
emen
t.A
llfinancial
variablesare
inbillionsof1995
dollars.The
firsttw
ore
gre
ssio
nsem
plo
yord
inary
least
square
ssp
ecifi
cations;
the
seco
nd
two,ord
ered
logit
spec
ifica
tions.
Sta
ndard
erro
rsare
inbra
cket
s.
Dep
enden
tvariable:Controlrights
ass
igned
tofinancing
firm
OL
Ssp
ecifi
cati
on
Ord
ered
logit
spec
ifica
tion
Waslead
pro
duct
notyet
inclin
icaltrials
atalliance
signin
g?
**0.5
0[0
.17]
***0.5
5[0
.18]
***0.8
4[0
.32]
***0.9
8[0
.34]
R&
Dfirm
’ssh
are
hold
erseq
uity
(1995
$billions)
**�
1.9
1[0
.86]
�2.2
7[1
.40]
**�
4.1
2[2
.07]
*�
5.9
2[3
.08]
Publiceq
uity
raised
by
bio
tech
nolo
gy
firm
sin
pre
vio
usquarter
(1995
$billions)
**�
0.3
1[0
.14]
**�
0.3
0[0
.14]
**�
0.6
2[0
.27]
**�
0.5
9[0
.26]
Did
agre
emen
tfo
cuson
agricu
ltura
lorch
emicalpro
duct?
0.19
[0.39]
0.29
[0.65]
Did
agre
emen
tfo
cuson
dia
gnostic
pro
duct?
0.3
6[0
.34]
0.8
6[0
.65]
Wasagre
emen
tbet
wee
nbio
tech
nolo
gy
firm
s?�
0.2
2[0
.20]
�0.3
4[0
.39]
Num
ber
ofre
late
dpate
nts
award
edto
R&
Dfirm
0.0
1[0
.02]
0.0
01
[0.0
29]
Constant
***2.6
0[0
.16]
**2.5
7[0
.18]
Adju
sted
R2orPse
udo
R2
0.1
10.1
00.0
40.0
4
p-V
alu
eofre
gre
ssio
n0.000
0.001
0.000
0.001
Num
ber
ofobse
rvations
180
180
180
180
***Sig
nifi
cantat1%
confiden
celevel.
**Sig
nifi
cantat5%
confiden
celevel.
*Sig
nifi
cantat10%
confiden
celevel.
J. Lerner et al. / Journal of Financial Economics 67 (2003) 411–446 431
assignment of control rights to the financing firm and time, although it is not arobust one.
We explore the robustness of these results in several unreported regressions:
* The review process that agricultural, chemical, and diagnostic biotechnologyproducts undergo is quite different from that of therapeutics, which constitute thebulk of the sample. While we attempt to control for these differences in theregression above through the use of dummy variables, it may be inadequate. Werepeat the analysis, simply using therapeutic products.
* We eliminate all agreements between two biotechnology firms, rather thanbetween biotechnology and pharmaceutical concerns, as in these cases theassumption that the financing party only contributes capital to the alliance is lesstenable.
* Because venture financing became increasingly common during this period, itsomission may give a misleading impression. We repeat the analysis, including thevolume of private equity financing in the measure of equity financing cycles.
* The measures above compute financing activity only within the past quarter.Given the ‘‘lumpiness’’ in financing activity (a single offering accounts for thebulk of public equity activity in some quarters), this measure may be prone to anerrors-in-variable problem. We repeat the analyses using financing activity overthe past four quarters.
* Rather than focusing on the five control rights identified in conversations withpractitioners, we repeat the analyses, assuming that all 25 control rights identifiedin Appendix A are equally important.
In all but one case, firm-level financial strength and stronger overall financial marketconditions for biotechnology firms continue to be associated with the biotechnologyfirm retaining more control at least at the 5% level of statistical significance. Whenwe use the measure of 25 control rights, however, the association between strength offinancial markets and control assigned to the biotechnology firm is no longersignificant at conventional confidence levels.
5.3. Relation between financial market conditions and alliance outcomes
We next examine whether agreements that cede the bulk of the control to thefinancing firm and are signed in weak financing markets prove less successful. Byfocusing on the interaction between the financing environment and the control rightallocation, we limit the danger of drawing false inferences. For instance, agreementsassigning the bulk of the control to the R&D firm might be more successful becausethe projects are of higher quality in some unobservable way. Similarly, agreementssigned when substantial external financing is available might be more successful ifthe greater ability of firms to raise equity financing reflects the fact that there aremany attractive opportunities to exploit, or less successful if in these periods,pharmaceutical companies face an adverse selection problem and only are able tofund the less attractive projects, as Pisano (1997) argues. The ability of these
J. Lerner et al. / Journal of Financial Economics 67 (2003) 411–446432

alternative explanations to explain the interaction of these variables, however, is lessobvious.
Table 4 takes a first look at the outcomes of the alliances. Panel A reports thestatus of the lead compound in the alliance as of the end of 1998. Observations aredivided by their status at the time the agreement was signed. Note that the time that
Table 4
Outcome of alliance agreements
The sample consists of 200 technology alliances initiated between biotechnology and pharmaceutical
companies or between biotechnology firms in the 1980–1995 period. Each column of Panel A reports, for
alliances in various stages at the time of the agreement, the progress of the lead product in the alliance at
the end of 1998. Cases where the lead product has already begun field or human trials are excluded from
the ‘‘Not Yet in Trials’’ and ‘‘At Least in Phase I Trials’’ tabulations. In the ‘‘At Least in Phase I Trials’’
tabulation, cases where field or human trials of agricultural, chemical, and diagnostic products where there
is no distinct staging of the trials have begun are also coded in the affirmative. Agreements where the lead
therapeutic product was in Phase III trials or awaiting regulatory approval or involving agricultural,
chemical, or diagnostic products are excluded from the ‘‘At Least in Phase III Trials’’ tabulation. Panels B
and C report the percentage of agreements reaching each stage for alliances where four or more control
rights assigned to the financing firm (out of the key five rights) and three or fewer rights were assigned to
the financing firm, as well as the results of a w2-test assessing the significance of these differences. In Panel
B, the analysis is confined to observations where the level of public equity issuance by biotechnology firms
in the four quarters before the alliance was signed was below the median. In Panel C, the analysis is
confined to those where the equity issuance by biotechnology firms was above the median. In the ‘‘At
Least One Step Further’’ tabulation, cases where the lead product in the alliance began trials (for
agreements where the lead product was not yet in trials at the time of the alliance signing), entered Phase
III trials (for agreements where the lead therapeutic product was in Phase I or II trials), or was approved
(for agreements where the lead therapeutic product was in Phase III trials or awaiting regulatory approval,
or for agricultural, diagnostic, or chemical products undergoing trials) are coded in the affirmative.
Panel A: Summary of entire sample
Status in December 1998
At least in At least in
Not yet Phase I Phase III Number of
Status at Time of Signing in trials trials trials Approved observations
Discovery 69% 31% 12% 5% 86
Lead molecule 38% 62% 10% 10% 42
Pre-clinical or formulation 26% 74% 33% 19% 42
Phase I or II 65% 26% 23
Phase III or under final review 71% 7
Share of possible transactionsa 51% 49% 27% 14%
Number of observations 86 84 52 27 200
Panel B: Agreements signed in unfavorable biotechnology financing markets
Status in December 1998
At least in At least in At least
Phase I Phase III one step
trials trials Approved further
Share successful, ‘‘pro financing firm’’ alliances 47% 22% 16% 50%
Share successful, ‘‘pro R&D firm’’ alliances 67% 42% 23% 70%
w2 statistic from test of difference 3.37 3.73 0.669 3.60
p-Value, w2 test 0.066 0.053 0.413 0.058
J. Lerner et al. / Journal of Financial Economics 67 (2003) 411–446 433

the products had to advance through the approval process differs considerably: whileeach of the agreements had been undertaken at least three years earlier, in somecases, the agreement was signed over a decade before. In a number of cases, theagreements between the R&D and financing firm are terminated by the end of 1998.While in most cases, work on the lead molecule ends after the agreement lapses, insome instances the biotechnology company funds further development itself or findsanother corporate partner. The termination of alliances developing ultimatelysuccessful projects often is a consequence of a corporate merger or shift in strategy.Because of these instances, we measure the ultimate success of the project, ratherthan the duration of the alliance itself.
A complication in this analysis, as well as that reported in Table 5, is introducedby agricultural, diagnostic, and chemical projects for which there is not a clear stageof the regulatory review process corresponding to Phase III for therapeutic products.In these instances, we examine only whether the project enters the regulatory reviewprocess and whether the project is approved. Another complication is the modestnumber of cases in which the lead product is abandoned or de-emphasized in favorof another product that surpasses the lead product in the regulatory review process.In these cases, we track the status of the most advanced product covered by thealliance.
The table highlights the fact that relatively few products had been approved by theend of 1998. In all, 14% of the alliances result in an approved drug (26% of thosethat were in Phase I or Phase II trials at the time the alliance was signed). This lowsuccess rate is consistent with evidence about the success of pharmaceuticals moregenerally: for instance, the Pharmaceutical Research and Manufacturers of America(1998, Fig. 3-1) estimates that for every five drugs that entered Phase I clinical trialsin recent years, only one was ultimately approved for sale by the FDA.
To examine whether the theoretical suggestions regarding alliance success areborne out in the data, we compare the relation between the assignment of controland success in agreements signed during periods with and without substantialexternal equity financing by biotechnology firms. We compare four measures of
Panel C: Agreements signed in favorable biotechnology financing markets
Status in December 1998
At least in At least in At least
Phase I Phase III one step
trials trials Approved further
Share successful, ‘‘pro financing firm’’ alliances 35% 16% 0% 35%
Share successful, ‘‘pro R&D firm’’ alliances 42% 21% 10% 49%
w2-statistic from test of difference 0.41 0.27 3.28 1.66
p-Value, w2 test 0.522 0.601 0.070 0.197
aThe calculation of the share that were not yet in trials in December 1998 excludes those alliances that
were already in clinical trials at the time of the alliance signing. The calculations of the share that were at
least in Phase I and Phase III trials in December 1998 excludes those alliances that had already advanced
to or beyond the stage at the time of the alliance signing.
Table 4 (continued)
J. Lerner et al. / Journal of Financial Economics 67 (2003) 411–446434
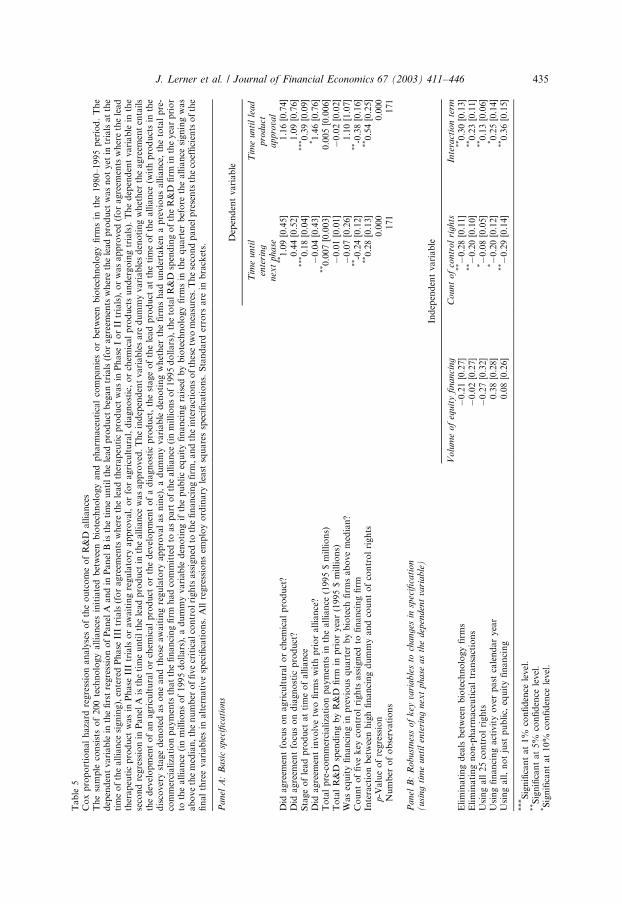
Table
5Cox
pro
portio
nalhaza
rdre
gre
ssio
nanalyse
softh
eoutcom
eofR&D
alliance
sThe
sam
ple
consists
of200
tech
nolo
gy
alliance
sin
itiated
betwee
nbio
tech
nolo
gy
and
pharm
ace
utica
lco
mpanies
or
betwee
nbio
tech
nolo
gy
firm
sin
the
1980–1995
per
iod.The
dep
enden
tvariable
inth
efirstre
gre
ssio
nofPanel
Aand
inPanel
Bis
thetim
euntilth
elead
pro
duct
beg
an
trials
(foragre
emen
tswher
eth
elead
pro
duct
wasnotyet
intrials
atth
etim
eofth
ealliance
signin
g),
entere
dPhase
IIItrials
(foragre
emen
tswher
eth
elead
ther
apeu
ticpro
duct
wasin
Phase
IorII
trials),
orwasappro
ved
(foragre
emen
tswher
eth
elead
ther
apeu
ticpro
duct
wasin
Phase
IIItrials
orawaitin
gre
gulato
ryappro
val,
orfo
ragricu
ltura
l,diagnostic,orch
emicalpro
ductsunder
goin
gtria
ls).
Thedep
enden
tvariable
inth
ese
cond
regre
ssio
nin
Panel
Ais
thetim
euntilth
elead
pro
duct
inth
ealliance
wasappro
ved
.Thein
dep
enden
tvariablesare
dum
my
variablesden
oting
whether
theagre
emen
ten
tails
thedev
elopm
entofan
agricu
ltura
lorch
emicalpro
duct
orth
edev
elopm
entofa
diagnostic
pro
duct,th
estageofth
elead
pro
duct
atth
etim
eofth
eallia
nce
(with
pro
ductsin
the
disco
ver
ystageden
oted
asoneand
those
awaitin
gre
gulato
ryappro
valasnin
e),a
dum
my
variable
den
oting
whether
the
firm
shad
under
taken
apre
vio
usalliance
,th
eto
talpre
-co
mm
ercializa
tion
paym
ents
thatth
efinancing
firm
had
com
mitted
toaspart
ofth
ealliance
(in
millionsof1995dollars),
theto
talR&D
spen
din
gofth
eR
&D
firm
inth
eyea
rprior
toth
ealliance
(in
millionsof1995
dollars),
adum
my
variable
den
oting
ifth
epublic
equity
financing
raised
by
bio
tech
nolo
gy
firm
sin
thequarter
before
thealliance
signin
gwas
aboveth
em
edian,th
enum
ber
offivecr
iticalco
ntrolrights
assigned
toth
efinancingfirm
,and
thein
tera
ctio
nsofth
esetw
om
easu
res.
These
cond
panel
pre
sents
theco
efficien
tsofth
efinalth
ree
variablesin
alter
native
spec
ifica
tions.
All
regre
ssio
nsem
plo
yord
inary
least
square
ssp
ecifi
cations.
Sta
ndard
erro
rsare
inbra
ckets.
Panel
A:
Basi
csp
ecifi
cati
ons
Dep
enden
tvariable
Tim
eunti
lT
ime
unti
lle
ad
ente
ring
pro
duct
nex
tp
hase
appro
val
Did
agre
emen
tfo
cuson
agricu
ltura
lorch
emicalpro
duct?
**1.09
[0.45]
1.16
[0.74]
Did
agre
emen
tfo
cuson
diagnostic
pro
duct?
0.44
[0.52]
1.09
[0.76]
Sta
ge
oflead
pro
duct
attim
eofalliance
***0.18
[0.04]
***0.39
[0.09]
Did
agre
emen
tin
volve
two
firm
swith
prioralliance
?�
0.04
[0.43]
*1.46
[0.76]
Tota
lpre
-com
mer
cializa
tion
paym
ents
inth
ealliance
(1995
$m
illions)
**0.007
[0.003]
0.005
[0.006]
Tota
lR&D
spen
din
gby
R&D
firm
inprioryea
r(1
995
$m
illions)
�0.01
[0.01]
�0.02
[0.02]
Waseq
uity
financing
inpre
vio
usquarter
by
bio
tech
firm
sabove
med
ian?
�0.07
[0.26]
1.10
[1.07]
Countoffive
key
controlrights
assigned
tofinancing
firm
**-0
.24
[0.12]
**-0
.38
[0.16]
Intera
ctio
nbetwee
nhigh
financing
dum
my
and
countofco
ntrolrights
**0.28
[0.13]
**0.54
[0.25]
p-V
alu
eofre
gre
ssio
n0.000
0.000
Num
ber
ofobse
rvations
171
171
Panel
B:
Robust
nes
sof
key
vari
able
sto
changes
insp
ecifi
cati
on
(usi
ng
tim
eunti
len
teri
ng
nex
tphase
as
the
dep
enden
tva
riable
)In
dep
enden
tvariable
Volu
me
of
equit
yfi
nanci
ng
Count
of
contr
ol
rights
Inte
ract
ion
term
Elim
inating
dea
lsbetwee
nbio
tech
nolo
gy
firm
s�
0.21
[0.27]
**�
0.28
[0.11]
**0.30
[0.13]
Elim
inating
non-p
harm
ace
utica
ltransa
ctio
ns
�0.02
[0.27]
**�
0.20
[0.10]
**0.23
[0.11]
Using
all
25
controlrights
�0.27
[0.32]
*�
0.08
[0.05]
**0.13
[0.06]
Using
financing
activity
over
past
calendaryea
r0.38
[0.28]
*�
0.20
[0.12]
*0.25
[0.14]
Using
all,notju
stpublic,
equity
financing
0.08
[0.26]
**�
0.29
[0.14]
**0.36
[0.15]
***Signifi
cantat1%
confiden
celevel.
**Sig
nifi
cantat5%
confiden
celevel.
*Signifi
cantat10%
confiden
celevel.
J. Lerner et al. / Journal of Financial Economics 67 (2003) 411–446 435

success in transactions that are more or less favorable to the R&D firm. We contrastthese differences in alliances signed in periods where the level of external equityfinancing in constant dollars is above or below the median.
The results, reported in Panels B and C, suggest that alliances with the fewestcontrol rights assigned to the financing firm have the greatest success. The differencesare substantial when the agreement is signed in a poor market. The differences inthese four cases average 17% and are statistically significant at the 10% confidencelevel in three out of four cases. (The one case with no significant differences, that ofproduct approvals, is characterized by a modest number of successes.) Foragreements signed in favorable markets, the differences are smaller in magnitude,averaging 9%. The effects are only significant at conventional confidence levels whenwe use the measure of whether a product is approved. In a variety of unreportedtabulations, we explore the robustness of the results to the use of different cutoffpoints. The magnitude of the differences between the effects in favorable andunfavorable markets for biotechnology firms appears to strengthen when we useeither more or less permissive definitions of what constituted a favorable market.When we change the definition of ‘‘pro-R&D firm’’ agreements to includesignificantly more agreements in this categorization, however, the differencesweaken.
While these tabulations can be interpreted as providing some support for thehypotheses in Aghion and Tirole (1994), the comparisons might be misleading due tothe different ‘‘vintages’’ of the projects. Consider the possibility that the allocation ofcontrol rights in alliances changes over time. A disproportionate number of olderalliances, in which the lead product had more time to progress through regulatoryreviews, might have assigned few control rights to the financing firms. Clearly, thisand other effects can only be addressed through regression analyses.
In addition to the differences in alliance ‘‘vintage,’’ a variety of other factors canaffect the success of bio-engineered products. We address a variety of concerns:
* As noted above, the review process of agricultural, diagnostic, and chemicalproducts is frequently less rigorous.
* The probability of ultimate approval, as Table 4 suggests, should increase as theproduct progresses through the review process. Controlling for the stage of thelead product at the time of the initiation of the alliance is important.
* As noted above, instances where the two parties have undertaken a previousalliance may be subtly different: in particular, the two parties may have morereputational capital at stake, leading to greater effort and more success.
* Finally, Henderson and Cockburn (1996) show—consistent with the well-understood problems in creating markets in innovative products—that economiesof scale and scope play an important role in determining the success ofpharmaceutical R&D projects. Their empirical and clinical research suggests thatnot only are larger projects more successful, but so are those at firms with multipleresearch projects in different areas. We employ two control variables in thereported regressions: the total dollar amount that the financing firm commits tothe alliance, as well as the overall R&D expenditures of the R&D firm.
J. Lerner et al. / Journal of Financial Economics 67 (2003) 411–446436

Table 5 presents a variety of regression analyses. In each case, we hypothesize thatnew biotechnology products are generated through a production function, Y ¼F ðx; bÞ; where Y is the probability that a given product is developed, x is a vector ofinputs or attributes that influence the discovery process, and b is a vector ofcoefficients. Since our observations consist of the time until a given productcommences trials or is approved, we use a survival model.
We employ a Cox proportional hazard specification, in which the dependentvariable is the time until a given outcome. An alliance is assumed to have a certainprobability of succeeding in each period. The instantaneous probability of success atany given time t is called the hazard rate, hðtÞ; defined as
hðtÞ ¼Probability of success between t and t þ Dt
Probability of successXt
More specifically, the Cox model assumes that the hazard function has the functionalform hðtÞ ¼ H0ðtÞeb1x1þb2x2þyþbN xN : The model is quite unrestricted in the sense thatno assumptions are made about the function H0ðtÞ; but it does impose some otherrestrictions, as will be discussed below.
The first regression in Panel A of Table 5 and those in Panel B estimate the timeuntil the next major milestone in the approval process. We define these milestones asthe commencement of clinical or field trials for products that are not yet in trials atthe time the alliance is signed, the commencement of Phase III trials for therapeuticsthat are in Phase I and II trials, and regulatory approval for more advanced cases.We do not use the transition from Phase I to Phase II trials as a milestone herebecause the commencement of Phase II trials is often not announced in the pressreleases, securities filings, or in FDA filings. Because Phase III trials are much moreextensive (and hence costly), their commencement is much more frequentlydisclosed. Observations are right-censored at the end of 1998: no data are usedafter this point. The model addresses the possibility that a success is not observedbecause of two reasons: either the outcome occurs in 1999 or thereafter, or no successever occurs. The second regression in Panel A analyzes the time until the approval ofthe product.
Not surprisingly, in each of the regressions, projects that are further along aremore likely to succeed. In the first regression, alliances in which there is a largerfunding commitment by the financing firm are also associated with greater success,consistent with earlier results about the importance of scale in research projects.Finally, alliances that assign more control to the financing firm are less likely to leadto successful outcomes.
The coefficients of the interaction terms are positive and approximately equal inabsolute magnitude to the control right coefficient, consistent with the predictions ofAghion and Tirole (1994). The two coefficients, 0.28 and 0.54, are statisticallysignificant at the 5% confidence level. They are also economically significant.Consider the leftmost regression. In an alliance signed when biotechnology financingactivity is above the median, a shift from three to four control rights assigned to thefinancing firm has a negligible effect on the hazard rate. But in an alliance signedwhen financing is below the median, such a shift in control leads to a 21% reduction
J. Lerner et al. / Journal of Financial Economics 67 (2003) 411–446 437

(eð�0:24Þð1 control rightÞ � 1 ¼ 0:79 � 1) in the hazard rate, or probability of success in agiven period.
The Cox model does, however, constrain the probability that an event occurs atany given time to be proportional. If the probability that a drug is approved is twiceas high in one group as in another, the model assumes that this is the case one, two,or five years after the alliance signing. We examine this assumption of proportionalhazards, both jointly for all variables and for the individual independent variables.In neither regression do we reject the proportional hazard assumption at the 5%confidence level in the joint test, or at the 10% level in the test of the interactionterm. We do, however, reject the proportional hazard assumption at the 10%confidence level for two independent variables. As a robustness check, we re-estimatethese equations using stratified Cox regression estimates, in which we divide theobservations into groups on the basis of the variables whose hazard rates appear tovary across time (‘‘Total pre-commercialization payments in the alliance’’ and‘‘Total R&D spending by R&D firm in prior year’’). Each group is allowed to have adifferent hazard rate. While in some cases, the coefficients of other variables varyacross equations, the differences in the coefficient of the interaction variable areminimal.
As reported in Panel B, we undertake a number of robustness checks:
* We eliminate agreements that are between two biotechnology firms, rather thanbetween biotechnology and pharmaceutical concerns.
* We repeat the analysis, eliminating agricultural, chemical, and diagnosticbiotechnology products, due to the differences in the review process.
* We repeat the analyses assuming that all 25 control rights identified in AppendixA are equally important.
* We repeat the analyses using biotechnology financing activity over the past fourquarters.
* We include the volume of private equity financing in the financing measure.
We present in Panel B the coefficients and standard errors for the three independentvariables of greatest interest: the equity financing measure, the control rightsmeasure, and the interaction between these two terms. In each case, the interactionterm continues to be positive and significant and of about the same absolutemagnitude as the control rights coefficient. Similarly, the control right variableremains negative and of the same magnitude, except when the count of all 25 controlrights is used (when the magnitude of the coefficient drops considerably).
One pattern in these regressions, however, is difficult to explain. Consistentlyacross the regressions, the impact of adding additional control rights to the financingfirm during periods with above-median biotechnology financing activity is positivethough statistically insignificant. (We determine the significance of this effect byexamining the coefficient of the control rights variable in regressions employing thesubset of observations where financing is above the median in the previous quarter,omitting the ‘‘above the median’’ dummy and the interaction term as independentvariables.) This suggests that some parties have not reached the optimalarrangement: these alliances could have been improved by transferring additional
J. Lerner et al. / Journal of Financial Economics 67 (2003) 411–446438

control rights to the financing firm. While the Aghion-Tirole model suggests amechanism that leads to the R&D firm getting too little control in some instances,they do not model a setting where the R&D firm gets too much control. Note,however, that the model makes some stark assumptions, such as the absence of anyinformation asymmetries between the parties at the time of the negotiation.
In unreported regressions, we explore the sensitivity of the results to a variety ofchanges in the specification:
* We include the R&D expenditures of the larger firm as an additional control forthe scope of the project. While this reduces the sample size—many foreign firmsdo not report R&D expenditures—the results are qualitatively similar.
* We address concerns that alliances completed in stronger financing markets arelarger, even after controlling for the stated amount of pre-commercializationpayments. This might be a consequence of measuring the pre-commercializationpayments with error. In particular, some of the contingent milestone paymentsincluded in the total may be conditional on remote contingencies andconsequently have a low expected value. To address this possibility, we add tothe regression two other measures, the minimum period for which the financingfirm committed to provide funding and the size of the up-front payment at thetime of the alliance signing. Longer alliances and those with larger up-frontpayments are likely to be larger, even after controlling for the size of the pre-commercialization payments. If the greater success of alliances signed in periodswith substantial equity financing is due to their greater scale, these alternativemeasures should also have considerable explanatory power. The new variables arealmost uniformly insignificant and variable in sign, however, while the interactionterm is little changed.
* We test whether the results are robust to the addition of a number of variables.We add dummy variables to denote cases in which the financing firm made a priorequity investment into the R&D firm, the location of the firm (to control for thegeographic effects identified by Zucker et al., 1998), and the disease targeted bythe therapeutic alliances. We add measures of the quality of the biotechnologyfirm akin to the market-to-book (Tobin’s q) ratio often used in financialeconomics: the ratio of market capitalization to employment and patents at thebeginning of the year of the alliance. The results are little changed.
5.4. Relation between financial market shifts and alliance renegotiation
A central argument of this paper is that the superior performance of alliancessigned in attractive financing markets reflects the greater flexibility of the contractingparties. When the R&D firm has only weak bargaining power, the control rights maybe assigned to the financing firm even if assigning them to the R&D firm wouldgenerate the most innovation.
One implication relates to the renegotiation of alliances. Agreements in which theoptimal division of control rights cannot be achieved should be more frequentlyrenegotiated if conditions change. This suggests an empirical test based on the
J. Lerner et al. / Journal of Financial Economics 67 (2003) 411–446 439

overall financing environment for biotechnology firms, which, as suggested above, issubject to dramatic changes. We examine whether the agreements are renegotiatedprior to the minimum life stipulated in the agreement. We hypothesize that pro-financing company agreements would be more likely to be renegotiated duringperiods when the external financing environment for biotechnology firms improvesconsiderably, which is likely to be associated with a shift in bargaining power.
The mean (median) minimum contractually specified alliance length is 3.1 (3.0)years for agreements signed in periods when public equity issuance in the previous 12months is above the median. For other agreements, the mean minimum specified lifeis 3.6 (3.0) years. The difference in means is only significant at the 20% confidencelevel. Moreover, two-thirds of this difference is due to a single agreement signed inthe early days of the biotechnology industry, which called for a 31-year alliance.Thus, it appears that the differences in agreements signed in these periods do notaffect the results below.
Table 6 presents two regression analyses of the likelihood of prematurerenegotiation. (Only agreements whose scheduled completion date is prior toJanuary 1, 1999 are included in the regressions, leading to a slightly smaller samplesize.) The dependent variable is a dummy that takes on the value one if the alliance isrenegotiated prior to its scheduled completion date. The first regression employs asindependent variables dummies that denote whether the agreement assigned four ormore key control rights to financing firm, whether there is an above-the-medianimprovement in the financial markets after the agreement is signed (defined as thedifference between the inflation-adjusted dollar volume of equity offerings bybiotechnology firms in the fifth through eighth quarters after the alliance signing andthe four quarters prior to the alliance signing), the interaction between thesevariables, and a variety of controls. The timeframe is motivated by the fact that themean prematurely renegotiated agreement is revised 1.96 years after the originalagreement. The median time is 1.83 years and the inter-quartile range from 1.25 to2.5 years. The table also presents the standard errors of the coefficient, and thecorresponding odds ratio.6
In this regression, the coefficient of the interaction term, 0.40, is significantlypositive: during periods of increased biotechnology financing activity, pro-financingcompany agreements are more likely to be renegotiated. Keeping the otherindependent variables at their means, the predicted probability of renegotiation ofpro-R&D firm agreements when the financing activity does not subsequentlyincrease is 37%. For pro-financing firm agreements that are followed by an upsurgein financing activity, the probability is 58%.
In the regression in the second column of Table 6, we express the external equityfinancing raised (and the interaction term) as continuous variables. Once again, thecoefficient of the interaction term, 0.20, is significantly positive. In the thirdregression, we delete cases in which either the R&D or the financing firm were
6The odds ratio is the number by which we would multiply the odds of an alliance being renegotiated for
each unit increase in the independent variable. An odds ratio greater (less) than one indicates that the
probability increases (decreases) when the independent variable does.
J. Lerner et al. / Journal of Financial Economics 67 (2003) 411–446440

Table
6Logit
regre
ssio
nanaly
sesofth
epre
matu
rere
neg
otiation
ofR
&D
allia
nce
sThe
sam
ple
inth
efirs
ttw
ore
gre
ssio
ns
consists
of
160
tech
nolo
gy
allia
nce
sin
itia
ted
bet
wee
nbio
tech
nolo
gy
and
pharm
ace
utica
lco
mpanies
or
betwee
nbio
tech
nolo
gy
firm
sin
the1980–1995
per
iod,in
which
thesc
hed
uled
expiration
ofth
eallia
nce
wasby
theen
dof1998.Thesa
mple
inth
eth
ird
regre
ssio
nalso
excludes
those
transa
ctio
nswher
eth
efinancing
orR
&D
firm
wasacq
uired
orm
erged
bef
ore
the
min
imum
per
iod
stip
ula
ted
inth
eallia
nce
.The
dep
enden
tvariable
isadum
my,wher
e1.0
den
ote
san
allia
nce
thatwasre
neg
otiated
bef
ore
them
inim
um
per
iod
stip
ula
ted
inth
eco
ntract
.Thein
dep
enden
tvariablesare
adum
my
variable
den
oting
whether
the
agre
emen
tin
volv
edth
eass
ignm
entoffo
urorm
ore
controlrights
toth
efinancing
firm
(outofth
efive
key
rights),
adum
myvariable
den
otingwhether
thech
angein
thefinancialm
ark
etsafter
theagre
emen
t(d
efined
asth
ediffe
rence
bet
wee
nth
ein
flation-a
dju
sted
dollarvolu
me
ofeq
uityoffer
ingsbynew
bio
tech
nolo
gyfirm
sin
thefifth
thro
ugh
eightquarter
safter
theallia
nce
signin
gand
thefo
urquarter
spriorto
theallia
nce
signin
g)was
aboveth
em
edian
orth
edollarvolu
me(in
billionsof1995dollars)ofth
isdiffere
nce
,an
intera
ctio
nbetwee
nth
eco
ntrolrights
variable
and
thefinancingch
ange
variable,th
edate
ofth
eallia
nce
(July
1,1992
expre
ssed
as1992.5
,et
c.),
theageofth
eR
&D
firm
atth
esignin
gofth
eallia
nce
(in
yea
rs),
and
dum
my
variables
den
oting
whether
the
financing
orR
&D
firm
wer
eacq
uired
orm
erged
bef
ore
the
min
imum
per
iod
stip
ula
ted
inth
eallia
nce
,th
eallia
nce
wasbetwee
ntw
obio
tech
nolo
gy
com
panies,
theagre
emen
tin
volv
edth
edev
elopm
entofan
agricu
ltura
lorch
emicalpro
duct
orth
edev
elopm
entofa
dia
gnostic
pro
duct
,th
etw
ofirm
shad
apre
vio
usallia
nce
,and
thelead
pro
duct
wasnotyet
inclin
icaltria
lsatth
etim
eofth
eallia
nce
.There
gre
ssio
nsem
plo
ylo
git
spec
ifica
tions.
Sta
ndard
erro
rsare
inbra
cket
s;oddsra
tiosin
pare
nth
eses
.
Dep
enden
tvariable
Wasagre
emen
tre
neg
otiated
early?
Did
allia
nce
ass
ign
fourorm
ore
key
rights
tofinancing
firm
?0.7
1[0
.46](2
.03)
**0.8
2[0
.41](2
.27)
*0.9
2[0
.50](2
.51)
Did
subse
quen
tyea
rshavehig
hgro
wth
ineq
uity
financing?
�0.2
3[0
.56](0
.79)
0.0
3[0
.63](1
.03)
Gro
wth
inbio
tech
equity
financing
(1995
$billions)
0.09
[0.11](1
.09)
Fourorm
ore
controlrights
*Equity
financing
gro
wth
**0.4
0[0
.15](1
.49)
**0.2
0[0
.09](1
.22)
*0.2
9[0
.17](1
.34)
Date
ofth
eallia
nce
signin
g0.1
1[0
.07](1
.12)
0.1
1[0
.07](1
.12)
*0.1
3[0
.08](1
.14)
Age
ofR
&D
firm
attim
eofallia
nce
signin
g*0.1
4[0
.08](1
.15)
*0.1
5[0
.08](1
.16)
**0.2
0[0
.09](1
.22)
Wasfinancing
firm
acq
uired
priorto
sched
uled
allia
nce
end?
***1.8
5[0
.67](6
.36)
***1.8
0[0
.67](6
.05)
WasR
&D
firm
acq
uired
priorto
sched
uled
allia
nce
end?
**2.3
6[1
.15](1
0.5
9)
**2.3
5[1
.16](1
0.4
9)
Wasagre
emen
tbetwee
nbio
tech
nolo
gy
firm
s?0.3
2[0
.57](1
.38)
0.2
3[0
.57](1
.26)
0.3
5[0
.66](1
.42)
Did
agre
emen
tfo
cuson
agricu
ltura
lorch
emicalpro
duct
?0.8
5[0
.93](2
.34)
0.9
1[0
.93](2
.48)
0.6
0[1
.06](1
.82)
Did
agre
emen
tfo
cuson
dia
gnostic
pro
duct
?1.1
5[0
.86](3
.16)
1.0
8[0
.87](2
.94)
1.2
5[0
.87](3
.49)
Did
agre
emen
tin
volv
etw
ofirm
swith
priorallia
nce
?�
0.1
7[0
.69](0
.84)
�0.1
3[0
.69](0
.88)
�0.2
1[0
.71](0
.81)
Waslead
pro
duct
notyet
inclin
icaltria
lsatallia
nce
signin
g?
0.3
3[0
.59](1
.39)
0.3
2[0
.59](1
.38)
0.1
0[0
.60](1
.11)
Constant
*�
225.90
[138.89]
�211.2
5[138.2
7]
*�
261.44
[150.2
4]
Pse
udo
R2
0.1
40.1
50.0
8p-V
alu
eofre
gre
ssio
n0.0
02
0.0
01
0.2
03
Num
ber
ofobse
rvations
160
160
137
***Sig
nifi
cantat1%
confiden
celevel.
**Sig
nifi
cantat5%
confiden
celevel.
*Sig
nifi
cantat10%
confiden
celevel.
J. Lerner et al. / Journal of Financial Economics 67 (2003) 411–446 441

acquired. The goodness-of-fit and significance of the results are more modest, but thebasic pattern holds.
In unreported regressions, we explore the effects of a variety of changes. Theseinclude the deletion and addition of other independent variables, the calculation ofthe change in biotechnology equity issues over a variety of periods (we compute thechange using the equity issuance in quarters three through six following theagreement and quarters seven through ten), and the use of different cutoff points todemarcate pro-financing firm agreements. The results remain robust to thesechanges.
6. Conclusions
This paper takes a first step in empirically examining how shifts in the ability toissue equity affect firm behavior. The biotechnology industry is an attractive settingbecause of the strong theoretical rationale for financing conditions to affect alliances,the dramatic variation in the ability of all firms in the industry to issue equity, andthe high degree of disclosure about project outcomes and transaction structures.
We first demonstrate that biotechnology firms’ R&D financing decisions doindeed appear to vary with public market conditions. When public markets are poor,biotechnology firms are at least modestly more likely to finance projects throughcontract research with pharmaceutical firms. Consistent with theory, contractssigned at times when biotechnology firms raise little external financing assign themost control rights to the financing company. Furthermore, the alliances undertakenduring these periods and assigning most of the control to the financing firm performsignificantly worse. Evidence regarding the renegotiation of these agreements isbroadly consistent with these results.
The analysis suggests two sets of broader questions. First, to what extent is theexperience of biotechnology representative? As noted above, the biotechnologyindustry has certain economic characteristics that make it particularly vulnerable tothese kinds of distortions. To what extent are these problems seen in otherindustries? Second, how do these patterns impact the long-run industry evolution?Numerous policy studies assert that an inability to access equity financing can havedistorting effects, particularly in high-technology industries. To cite one recentillustration, the National Academy of Sciences (1999) raises the concern that firmshave not been able to finance important innovations in engineering- and physicalscience-based industries. To what extent can these claims be empirically documen-ted?
Appendix A. Definition of Key Control Rights
Alliances to develop new biotechnologies are complex. Many variants of eachcontrol right are found in the alliances. Fully capturing the complexity of these rightsin a quantitative analysis is difficult. We describe here the broad control rights that
J. Lerner et al. / Journal of Financial Economics 67 (2003) 411–446442

appear in between 10 and 190 out of the 200 alliances. In this way, we eliminaterights that provide little variation because they are either standardized ‘‘boilerplate’’and/or exceedingly rare.
The five most important control rights were identified in conversations withpractitioners as key to the management of alliances and are described in the text ofthe paper.
Of the remaining control rights, the first set of control rights addresses alterationsto the scope of the alliance. Several alliances provide the funding firm with the rightto expand the breadth of the alliance, either by adding to the technologies underdevelopment (right #6) or by extending the duration of the project (#7). Nearly allalliances include some provisions for the cancellation of the alliance in particularcircumstances (e.g., the bankruptcy or acquisition of one of the parties). In somecases, however, the financing firm has the right to cancel the alliance without cause(#8) or to terminate particular projects (#9). A related cluster of terms addresses thecontrol of the licensed technologies. In some cases, the firm funding the R&D hasbroad powers to sublicense the technology to other firms (#10) and to continue tosell products developed by the alliance, even after the alliance ends (#11). In manycases, the pharmaceutical company has the right to ‘‘shelve’’ the project, continuingto maintain its exclusive rights even if it decides not to pursue product’s development(#12).
The second cluster of additional control rights relates to intellectual property.Patents and associated scientific knowledge are the most important assets of manybiotechnology firms, so it is not surprising that they are the focus of negotiations.The most crucial of these rights relates to the ownership of the patents generated bythe project. In some cases, the financing firm owns the patents generated by thealliance (#13). A somewhat weaker right (#14) provides at least partial ownership ofthese patents: if not restricted by another agreement, a part-owner can freely licensea patent to other users. Financing firms often demand control of the patent litigationprocess (#15).
Other alliance terms relate to ‘‘know-how’’ (unpatented intellectual property).Some alliances stipulate that the financing firm is entitled to transfers of the R&Dfirm’s know-how (#16). In a few cases, ownership of know-how is assigned to thefinancing firm (#17). The control of the R&D firm’s scientific publications is alsofrequently addressed. Many biotechnology firms recruit academic researchers,who are eager to maintain an active publication record. Publications by smallbiotechnology firms may serve as a favorable signal to the stock market, butpremature publications may jeopardize the ability of the parties to obtain patentprotection. Consequently, the financing firm may delay publications of the R&Dfirm (#18) or even suppress them entirely (#19).
The final set of control rights frequently encountered in these alliances covers thegovernance of the alliance. These alliances typically have one or more oversightboards. While control of the governing board is typically divided evenly between thetwo firms, occasionally the funding firm is assigned the chairmanship or the tie-breaking vote (#20). The firms funding the R&D have also adopted many of thecontrol rights employed by venture capital organizations while financing small
J. Lerner et al. / Journal of Financial Economics 67 (2003) 411–446 443

private firms. These include a seat on the firm’s board (#21), as well as an equitystake in the firm, with the associated voting rights (#22). In many cases, instead ofreceiving common stock, the funding firm receives preferred shares with additionalcontrol rights. Among these are the right to participate in future financings of thefirm on a pro rata basis or anti-dilution provisions, which make it difficult for theR&D-performing firm to sell shares at a lower price (#23). These provisions give thefinancing firm substantial control over the R&D firm’s ability to raise outsidefinancing in the future, and consequently influence the firm’s future direction.Registration rights (#24) can be even more onerous to the R&D firm, since theyprovide a mechanism through which the financing firm can demand that the R&Dfirm arrange for the sale of its shares in the public market. Such a sale may be verycostly or, at times, impossible to arrange. In many cases, the financing firm retainsthe right to purchase additional shares in the public market (#25). This gives thefinancing firm the option to acquire the R&D firm, or preserves the threat of such anacquisition.
Appendix B. Definition of Contract Stage
From federal and corporate documents, Recombinant Capital codes the stage ofthe lead product candidate in the agreement according to a ten-part scheme. Theseare arranged for the purposes of this analysis approximately in the sequence of theapproval process. Discovery research (#1) concerns a research program for which nolead product candidate was identified at the time of the agreement. Lead molecule(#2) concerns a therapeutic discovery program for which a lead product candidatewas identified at the time of the agreement, but no animal testing has beenundertaken. Pre-clinical (#3) concerns a therapeutic discovery program for whichsome animal data had been obtained at the time of the agreement signing, buthuman trials had not yet began. Formulation (#4) and other pre-clinical (#5)concern research programs not yet at the clinical testing stages that do not involvetraditional therapeutic products: formulation refers to the combination of approvedor development stage drugs with a vehicle or agent for the administration of suchdrugs, and other pre-clinical refers to agricultural, diagnostic, or chemical products.(These are ranked after pre-clinical therapeutic discovery programs since the lengthof time to approval is typically shorter in these cases.) Phase I (#6) concerns atherapeutic development program for which Phase I (safety) human testing wasunderway at the time of the agreement. It also includes agreements involvingagricultural, diagnostic, or chemical development programs for which field or humantesting was underway at the time of the agreement. (These tests typically do not havea clearly delineated three-stage structure, as do pharmaceuticals.) Phase II (#7)concerns a therapeutic development program for which Phase II (small-scaleefficacy) human testing was underway at the time of the agreement. Phase III (#8)concerns a therapeutic development program for which Phase III (large-scaleefficacy) human testing was underway at the time of the agreement. Sometimes firmswill undertake joint trials, such as Phase II/III trials. In these cases, the agreement
J. Lerner et al. / Journal of Financial Economics 67 (2003) 411–446444

was coded as being in the more advanced of the two stages. PLA/NDA filed (#9)concerns a research program where testing of the lead product was complete andpending regulatory review at the time of the agreement. Approved (#10) concerns acase where the lead product has already been commercialized at the time of theagreement.
In the tabulations in Table 4, ‘‘Discovery’’ refers to agreements signed at stage #1,‘‘Lead Molecule’’ to #2, ‘‘Pre-Clinical or Formulation’’ refers to #3, #4, and #5,‘‘Phase I or II’’ refers to stages #6 or #7, and ‘‘Phase III or Under Final Review’’refers to #8 and #9. In Table 5, the ‘‘Stage of Lead Product at Time of the Alliance’’is coded using the ordinal ranking in this appendix.
References
Aghion, P., Bolton, P., 1992. An incomplete contract approach to financial contracting. Review of
Economic Studies 59, 473–494.
Aghion, P., Tirole, J., 1994. On the management of innovation. Quarterly Journal of Economics 109,
1185–1207.
Aghion, P., Tirole, J., 1997. Formal and real authority in organizations. Journal of Political Economy 105,
1–29.
Asquith, P., Mullins Jr., D.W., 1986. Equity issues and offering dilution. Journal of Financial Economics
15, 61–89.
Baker, M., Wurgler, J., 2000. The equity share in new issues and aggregate stock returns. Journal of
Finance 55, 2219–2257.
Banerjee, A.V., Duflo, E., 2000. Reputation effects and the limits of contracting: a study of the Indian
software industry. Quarterly Journal of Economics 115, 989–1017.
Bayless, M., Chaplinsky, S., 1996. Is there a window of opportunity for seasoned equity issuance? Journal
of Finance 51, 253–278.
Bolton, P., Scharfstein, D.S., 1990. A theory of predation based on agency problems in financial
contracting. American Economic Review 80, 93–106.
Chan, Y.-S., 1983. On the positive role of financial intermediation in allocation of venture capital in a
market with imperfect information. Journal of Finance 38, 1548–1568.
Choe, H., Masulis, R.W., Nanda, V., 1993. Common stock offerings across the business cycle: theory and
evidence. Journal of Empirical Finance 1, 3–32.
Diamond, D.W., 1991. Monitoring and reputation: the choice between bank loans and directly placed
debt. Journal of Political Economy 99, 688–721.
Dibner, M.D., editor, 1999. Biotechnology Guide USA: Companies, Data and Analysis. Macmillan, New
York (and earlier years).
Ernst & Young, 1996. Biotech ‘96. Ernst & Young, San Francisco (and earlier years).
Grossman, S.J., Hart, O.D., 1986. The costs and benefits of ownership: a theory of lateral and vertical
integration. Journal of Political Economy 94, 691–719.
Hart, O.D., Moore, J., 1988. Incomplete contracts and renegotiation. Econometrica 56, 755–785.
Henderson, R., Cockburn, I., 1996. Scale, scope, and spillovers: the determinants of research productivity
in drug discovery. Rand Journal of Economics 27, 32–59.
Hertzel, M., Smith, R.L., 1993. Market discounts and shareholder gains for placing equity privately.
Journal of Finance 48, 459–485.
Hickman, W.B., 1953. The Volume of Corporate Bond Financing Since 1900. National Bureau of Economic
Research, Financial Research Group, Studies in Corporate Bond Financing, No. 1. Princeton
University Press for the National Bureau of Economic Research, Princeton.
Holmstrom, B., Tirole, J., 1997. Financial intermediation, loanable funds, and the real sector. Quarterly
Journal of Economics 112, 663–691.
J. Lerner et al. / Journal of Financial Economics 67 (2003) 411–446 445

Hubbard, R.G., 1998. Capital market imperfections and investment. Journal of Economic Literature 36,
1193–1225.
Kaplan, S.N., Zingales, L., 1997. Do investment-cash flow sensitivities provide useful measures of
financing constraints? Quarterly Journal of Economics 112, 169–215.
Korajczyk, R.A., Lucas, D.J., McDonald, R.L., 1991. The effect of information releases on the pricing
and timing of equity issues. Review of Financial Studies 4, 685–708.
Lee, C.M.C., Shleifer, A., Thaler, R.H., 1991. Investor sentiment and the closed-end fund puzzle. Journal
of Finance 46, 75–109.
Leland, H., Pyle, D., 1977. Information asymmetries, financial structure, and financial intermediation.
Journal of Finance 32, 371–387.
Lerner, J., 1994. Venture capitalists and the decision to go public. Journal of Financial Economics 35,
293–316.
Lerner, J., Merges, R.P., 1998. The control of technology alliances: an empirical analysis of the
biotechnology industry. Journal of Industrial Economics 46, 125–156.
Levine, R., 1997. Financial development and economic growth: an agenda. Journal of Economic
Literature 35, 688–726.
Lowry, M., 2001. Why does IPO volume fluctuate so much?, Unpublished working paper, Pennsylvania
State University.
Lucas, D.J., McDonald, R.L., 1990. Equity issues and stock price dynamics. Journal of Finance 45,
1019–1043.
Mackie-Mason, J.K., 1990. Do firms care who provides their financing? In: Hubbard, R.G. (Ed.),
Asymmetric Information, Corporate Finance, and Investment. University of Chicago Press for
National Bureau of Economic Research, Chicago, pp. 63–104.
Masulis, R.W., Korwar, A.N., 1986. Seasoned equity offerings: an empirical investigation. Journal of
Financial Economics 15, 91–118.
Merges, R.P., 1995. Intellectual property and the costs of commercial exchange: a review essay. Michigan
Law Review 93, 1570–1615.
Mikkelson, W.H., Partch, M.M., 1986. Valuation effects of security offerings and the issuance process.
Journal of Financial Economics 15, 31–60.
Milgrom, P., Roberts, J., 1992. Economics, Organization, and Management. Prentice-Hall, Englewood
Cliffs, NJ.
Myers, S.C., Majluf, N.S., 1984. Corporate financing and investment decisions when firms have
information investors do not have. Journal of Financial Economics 13, 187–221.
National Academy of Sciences, Board on Science, Technology, and Economic Policy, 1999. Securing
America’s Industrial Strength. National Academy Press, Washington.
Oryx Press, 1996. Bioscan. Oryx Press, Phoenix, Arizona (and earlier years).
Pagano, M., Panetta, F., Zingales, L., 1998. Why do companies go public? an empirical analysis. Journal
of Finance 53, 27–64.
Petersen, M.A., Rajan, R.G., 1994. The benefits of lending relationships: evidence from small business
data. Journal of Finance 49, 3–37.
Pharmaceutical Research and Manufacturers of America, 1998. Industry Profile 1998, http://
www.pharma.org/industry/profile98.
Pisano, G.P., 1997. R&D performance, collaborative arrangements and the market-for-know-how: A test
of the ‘lemons’ hypothesis in biotechnology, Harvard Business School, Working Paper No. 97-105.
Zucker, L.G., Darby, M.R., Brewer, M.B., 1998. Intellectual human capital and the birth of US
biotechnology enterprises. American Economic Review 88, 290–306.
J. Lerner et al. / Journal of Financial Economics 67 (2003) 411–446446