
Do dreams come true? Aspirations and educational ... - GOV.UK
32
Working Paper MARCH 2016 146 www.younglives.org.uk Do dreams come true? Aspirations and educational attainments of Ethiopian boys and girls Marta Favara
-
Upload
khangminh22 -
Category
Documents
-
view
1 -
download
0
Transcript of Do dreams come true? Aspirations and educational ... - GOV.UK

Wo
rkin
g P
aper
MARCH 2016
146
www.younglives.org.uk
Do dreams come true? Aspirations and
educational attainments of Ethiopian boys and girls
Marta Favara

Do Dreams Come True? Aspirations and Educational Attainments of Ethiopian Boys and Girls
Marta Favara
© Young Lives 2016 ISBN 978-1-909403-61-1
A catalogue record for this publication is available from the British Library. All rights reserved. Reproduction, copy, transmission, or translation of any part of this publication may be made only under the following conditions:
• with the prior permission of the publisher; or
• with a licence from the Copyright Licensing Agency Ltd., 90 Tottenham Court Road, London W1P 9HE, UK, or from another national licensing agency; or
• under the terms set out below.
This publication is copyright, but may be reproduced by any method without fee for teaching or non-profit purposes, but not for resale. Formal permission is required for all such uses, but normally will be granted immediately. For copying in any other circumstances, or for re-use in other publications, or for translation or adaptation, prior written permission must be obtained from the publisher and a fee may be payable.
Young Lives, Oxford Department of International Development (ODID), University of Oxford,
Queen Elizabeth House, 3 Mansfield Road, Oxford OX1 3TB, UK
Tel: +44 (0)1865 281751 • E-mail: [email protected]
Funded by
ASPIRATIONS AND EDUCATIONAL ATTAINMENTS OF ETHIOPIAN BOYS AND GIRLS
3
Contents The Author 4
Acknowledgements 4
Summary 5
1. Introduction 6
2. Conceptualising aspirations and their role in decision-making 8
3. Data and descriptive statistics 9
3.1 Data 9
3.2 Descriptive statistics of educational aspirations 10
3.3 Descriptive statistics of educational attainments 12
4. Do parents’ and children’s aspirations predict school attainment? 14
5. Correlates of parents' and children’s aspirations and their transmission 18
5.1 What predicts parental aspirations? Exploring the gender bias 18
5.2 Exploring the intergenerational transmission of aspirations 20
6. Conclusions 23
References 26
Appendix 28

ASPIRATIONS AND EDUCATIONAL ATTAINMENTS OF ETHIOPIAN BOYS AND GIRLS
4
The Author Marta Favara is a Research Officer at Young Lives and an IZA Research Affiliate. Her research is
on applied micro-, behavioural and labour economics in middle and low-income countries. Her
current research interests are in understanding which factors, aside from the purely economic
ones, affect individuals' behaviours and choices. Before joining Young Lives, she worked at the
World Bank.
Acknowledgements I am grateful to Pieter Serneels and Abhijeet Singh for their detailed and helpful feedback. A special thanks to Grace Chang for excellent research assistance. I am also grateful to colleagues at Young Lives for insightful discussions in this research area.
About Young Lives
Young Lives is an international study of childhood poverty, following the lives of 12,000 children in 4 countries (Ethiopia, India, Peru and Vietnam) over 15 years. www.younglives.org.uk
Young Lives is funded by UK aid from the Department for International Development (DFID) and co-funded by Irish Aid from 2014 to 2016.
The views expressed are those of the author(s). They are not necessarily those of, or endorsed by, Young Lives, the University of Oxford, DFID or other funders.

ASPIRATIONS AND EDUCATIONAL ATTAINMENTS OF ETHIOPIAN BOYS AND GIRLS
5
Summary Most economic decisions taken by individuals are forward-looking and are therefore shaped
by the desire or ambition to achieve a goal; but little is known about how aspirations shape decision-making. This paper partly addresses this gap, using a rich longitudinal dataset
following a cohort of children in Ethiopia for more than a decade between the ages of 8 and 19. The paper investigates the role of early aspirations for human-capital investments in a context of poverty, traditional social expectations and gender roles. More specifically, it
focuses on three related questions. First, it examines the relationship between aspirations and boys’ and girls’ educational attainment, as an indicator of cumulative investments in education. Second, it looks at how parents and children form their aspirations and at the
transmission of aspirations from one generation to the other. Third, it explores the gender-based bias in aspirations, and investigates whether an initial bias which favours boys might constitute a source of gender-inequality perpetuation, particularly in a context of extreme
poverty.
The paper presents the following findings:
• Aspirations have a strong predictive power for later educational attainment,
particularly for boys, who are more likely to drop out of school after the age of 15.
• There is a substantial gender gap in aspirations and a steep gradient in aspirations
across wealth.
• Parents ground their aspirations on their expectations about their children’s future
when they are 12 years old.
• Children’s aspirations mirror parental aspirations.
• Initial low aspirations might be a mechanism whereby gender inequality is perpetuated among the poorest segments of the population.
Parents and children revise their aspirations over time, adapting to external circumstances
and social expectations, so that after the age of 15 the pro-boys gender bias in aspirations is reversed.

ASPIRATIONS AND EDUCATIONAL ATTAINMENTS OF ETHIOPIAN BOYS AND GIRLS
6
1. Introduction For many years, poverty-eradication strategies focused on building up people’s assets, in the
form of either human capital or physical and financial capital. These types of policy are founded on the standard economic model which assumes that people become poor and
remain poor solely because of constraints that are external to them.
More recently, behavioural economists have proposed an alternative view which highlights
the role of internal constraints in perpetuating poverty traps. Behavioural biases, such as lack of aspirations, alter people’s decision-making processes, de facto constraining individuals’
abilities to make efficient decisions and take advantage of new opportunities when they become available (Duflo 2003).
According to Appadurai (2004) and Ray (2006), the capacity to aspire is not evenly
distributed in society: 'Aspirations are socially determined, and thus the capacity to aspire is
inherently unequal between rich and poor. This has the consequence that the poor lack the aspirational resources (or capacity) to act and change the conditions of their own poverty'. As a result, a weak capacity to aspire might undermine poor people's efforts and translate into
low or null investments and potentially become a self-perpetuating mechanism for poverty and gender inequalities (Ray 2006; Duflo 2012).
Most economic decisions that individuals take are forward looking and are therefore shaped
by the desire or ambition to achieve a goal. But little is known about how aspirations shape decision-making (Attanasio and Kaufmann 2014; Reuben et al. 2014; Zafar 2013; Dercon
and Singh 2013; Serneels and Dercon 2014; Chiapa et al. 2012; Locke and Latham 2002).
Our paper partly addresses this gap, using a rich longitudinal dataset following a cohort of
children in Ethiopia for more than a decade between the ages of 8 and 19. We investigate the role of early aspirations for human-capital investments in a context of poverty, traditional
social expectations and gender roles. More specifically, we focus on three related questions. First, we investigate the relationship between aspirations and boys’ and girls’ educational attainment, as an indicator of cumulative investments in education. Second, we consider how
parents and children form their aspirations and the transmission of aspirations from one generation to another. Third, we explore the gender-based bias in aspirations and we investigate whether an initial pro-boys aspiration bias might partly explain the perpetuation of
gender inequality, particularly in a context of extreme poverty.
This paper uses Ethiopian findings from the Young Lives research project which tracked two
cohorts of children in Ethiopia, India (Andhra Pradesh and Telangana), Peru and Vietnam through four rounds of data from 2002 and 2014. The Young Lives data are particularly
suitable for this analysis for a number of reasons. First of all, it is a longitudinal dataset, the only one available for Ethiopia. The years covered by the four rounds of data represent a critical decision-making period for the allocation of resources and children’s time use, with
significant implications for child development. Second, rich information at both individual and household levels concerning educational history, parents' and children’s educational aspirations, and parental expectations was collected at different ages, allowing for extensive
analysis of the correlation between early aspirations and later educational outcomes. Third, results of the Peabody Picture Vocabulary Test (PPVT) and a mathematics test, together with information about aspirations, were collected for all children, regardless of whether or

ASPIRATIONS AND EDUCATIONAL ATTAINMENTS OF ETHIOPIAN BOYS AND GIRLS
7
not they were attending school. This feature of the data avoids the selection problem which commonly arises when using school-based data.
The rounds of data cover a life period which spans the child's education cycle from primary-
school enrolment to the transition to post-secondary education or the labour market. Children
in Ethiopia are expected to start school at the age of 7 and to progress through most of primary school by the age of 14. The data collected at the age of 12, 15 and 19 therefore provide valuable snapshots of a child’s schooling history. Furthermore, these are ages when
parents will arguably assume that children are mature enough to commence and increasingly engage in activities other than education, such as household chores and/or outside work and eventually that they are mature enough to start a new family. Expectations unrelated to
education are important in order to understand how parents form their educational aspirations for their offspring and invest in their sons' and daughters' education.
We document (a) that aspirations have a strong predictive power for later educational
attainment, particularly for boys, who are more likely than girls to drop out of school after the
age of 15; (b) that there is a substantial gender gap in aspirations and a steep gradient in aspirations across wealth; (c) that parents ground their aspirations on their expectations for their children’s future when they are 12 years old; (d) that children’s aspirations mirror
parental aspirations; (e) that initial low aspirations might be a mechanism for the perpetuation of gender inequality among the poorest segment of the population; and (f) that parents and children revise their aspirations over time, adapting to external circumstances and social
expectations so that after the age of 15 the pro-boys gender bias in aspirations is reversed.
The rest of the paper is organised as follows: Section 2 briefly conceptualises aspirations and
their role for decision-making; Section 3 describes the data and the main variables used in the paper, together with some initial descriptive statistics on both aspirations and educational outcomes; Section 4 investigates the relationship between aspirations and educational
outcomes; finally, Section 5 looks at how children and parents form their aspirations at different stages.

ASPIRATIONS AND EDUCATIONAL ATTAINMENTS OF ETHIOPIAN BOYS AND GIRLS
8
2. Conceptualising aspirations and their role in decision-making Aspirations are different from hopes. Aspirations combine the wants and preferences of individuals, information about the opportunities available, the expectations formed about the
feasibility of those wants and preferences and the constraints acknowledged by an individual with respect to the future (Bertrand at al. 2004).
As Dalton et al. (2015) argue, the extent of people's aspirations depends on their own beliefs
about what they can achieve with effort, i.e. their own expectations. People would not aspire
to an outcome that is perceived as inaccessible. Thus, in the process of forming aspirations, individuals filter and dismiss some of the unattainable options on the basis of their expectations. For these reasons, it is very difficult to distinguish (empirically) aspirations from
expectations and preferences.
An additional complication for empirical analysis is related to the endogenous nature of
aspirations. Individuals do not form their beliefs and aspirations in isolation, but are influenced by the life experience of those around them, i.e. those who are in their 'cognitive
window' (Ray 2006). The importance of role models, social expectations, and prevailing gender norms in changing individual beliefs and promoting positive behaviours has been quite substantially documented (see, for example, Rao and Walton 2004; Nguyen 2008; La
Ferrara et al. 2012). Experimental evidence suggests that policy interventions providing people with evidence of successful stories concerning others with whom they might identify are an effective instrument for the dismantling of prejudices and that they eventually lead
people to reconsider options that have been filtered out (Beaman et al. 2012; Bernard et al. 2014; Macours and Vakis 2014; Chattopadhyay and Duflo 2004).
Finally, the endogenous nature of aspirations implies that aspirations shift over time in the
measure that a person achieves (or not) the goal that he/she set for him/herself and a new goal is set. Individuals update their efforts and aspirations when they learn that their
outcomes are inconsistent with their own expectations. Nevertheless, individuals have limited capacity to predict that their aspirations might change as consequences of a success. Revising aspirations can be a very slow process, particularly when social expectations and
norms hinder the flow of information and the revision of expectations. Ultimately, the initial pessimistic beliefs which might originally arise from external constraints could become an independent source of disadvantage (Dalton et al. 2015). Thus, for example, parents may
divert resources towards (or away from) a particular child because of their expectations and social norms about gender and gender roles.

ASPIRATIONS AND EDUCATIONAL ATTAINMENTS OF ETHIOPIAN BOYS AND GIRLS
9
3. Data and descriptive statistics
3.1 Data
The data used in this paper come from Young Lives, a longitudinal study following two
cohorts of children – an Older Cohort born in 1994–95 and a Younger Cohort born in 2001–02 – in Ethiopia, India (Andhra Pradesh and Telangana), Peru and Vietnam. The first survey took place in 2002, with three further rounds of data collection in 2006–07, 2009–10 and
2013–14. Attrition rates across the four rounds are relatively low, compared with other longitudinal studies: about 2.2 per cent for the Younger Cohort and 8.4 per cent for the Older Cohort since the start of the study.
In this paper we use data on the Older Cohort from Ethiopia who were interviewed at the
ages of 8, 12, 15 and 19. The sample includes 20 communities in Addis Ababa, Amhara, Oromia, Southern National, Nationalities and People’s Region and Tigray. These regions represent 96 per cent of the total population. Although Young Lives over-samples poor
communities, a careful analysis of the distribution of child characteristics included in the sample suggests that the data cover a wide variety of children and are broadly similar to the findings of the Ethiopian Demographic and Health Surveys 2000 (DHS), which is a nationally
representative dataset (Outes-Leon and Sanchez 2008).
An attractive aspect of the Young Lives data which makes the Older Cohort particularly
suitable for our analysis is that information about aspirations is available at different ages and for both children and their primary caregivers (nearly always the mother). In fact, children are
asked about their educational aspirations from the age of 12 and then again at the ages of 15 and 19. Similarly, parental educational aspirations are recorded when the child is 12 and 15 years old. Having repeated measures of children’s aspirations is one of the main reasons
why we focus on the Older Cohort rather than on the Younger Cohort, for whom information about aspirations is available only at one point in time. Furthermore, the four rounds of data span a critical period for the Older Cohort: from the age of primary-school enrolment to an
age when they typically make their transition into tertiary education (or they have already dropped out of school) and/or enter into the labour market.
Table 1 reports information on some basic characteristics of the sample in Round 4, when
the surveyed children were 19 years old on average. There is a fairly even split between rural (51.2 per cent) and urban (48.8 per cent) households, with an average of five persons per
household. Levels of maternal education are low, and most mothers either did not complete any formal education (49.5 per cent) or have completed primary education only (42.7 per cent). About 8 per cent of mothers have secondary education or above. The pro-poor
sampling is mirrored at the household level. In fact, about 86 per cent of the households lie in the second and third quantile of the wealth-index distribution. Furthermore, one in three households is vulnerable to shocks, having suffered at least one climatic shock in the three
years prior to the interview. Finally, caregivers’ assessments of their well-being reflect the ‘objective’ circumstances in which they live. In terms of expectations, they believe that their children will reach independence (being financially independent, leaving the household,
getting married, supporting their household) between the ages of 23 and 24 on average.
1 The wealth-index indicator and all the variables used in the analysis are described in Table A1 in the Appendix.

ASPIRATIONS AND EDUCATIONAL ATTAINMENTS OF ETHIOPIAN BOYS AND GIRLS
10
Table 1. Descriptive statistics
Variable Mean Std. Dev Obs
Child's individual characteristics
Female 0.463 (0.499) 909
Child’s birth order 3.573 (2.330) 909
Whether child is older sibling 0.237 (0.425) 909
Age of child (in years) 19.082 (0.322) 909
Household characteristics
Urban 0.488 (0.500) 886
Household size 5.413 (2.278) 886
Maternal education level
• None 0.495 (0.500) 885
• Primary 0.427 (0.495) 885
• Secondary or above 0.078 (0.268) 885
Wealth Index quantiles
• First quantile 0.137 (0.345) 902
• Second quantile 0.437 (0.496) 902
• Third quantile 0.426 (0.495) 902
Any climatic shocks suffered (in the past 3 years) 0.299 (0.458) 902
Child’s psychosocial competencies
Agency Index (z-score) 0.005 (0.549) 908
Pride Index (z-score) 0.002 (0.770) 908
Main caregiver's subjective well-being
Subjective well-being (ladder of life 1-9) 3.743 (1.575) 976
Main caregiver's expectations
Educational expectation 0.987 (0.112) 862
Age at which child is expect to start:
• earning money to support the household 22.698 (3.778) 862
• being financially independent 23.517 (3.374) 862
• leaving the household / get married 24.404 (4.017) 862
3.2 Descriptive statistics of educational aspirations
Educational aspirations are defined on the basis of the following questions, asked
respectively of the Young Lives child and his/her main caregiver: 'Imagine you had no constraints and could study for as long as you liked, or go back to school if you have already
left. What level of formal education would you like to complete?' and 'Ideally what level of formal education would you like {child’s name} to complete?'. We define a dummy variable equal to 1 for individuals with high aspirations, i.e. for those parents who aspire for their
children (or for themselves) to go to university and for those children with similar aspirations, and 0 otherwise.
As Figure 1 shows, both parents' and children’s aspirations are high: most parents and
children have university-related aspirations. However, substantial heterogeneities emerge
when comparing individuals along various dimensions, such as age, gender and socio-
2 It is worth noting that educational aspirations are collected for both children and the main caregivers, regardless of whether
the child is still enrolled at school or not.

ASPIRATIONS AND EDUCATIONAL ATTAINMENTS OF ETHIOPIAN BOYS AND GIRLS
11
economic status. In fact, although to complete university studies is the aspiration of the majority of children (and their parents on their behalf), regardless of their socio-economic status, aspirations are positively correlated with the family wealth status. While about 84 per
cent of the children from the richest households aspire to study at university, only 67 per cent of children from the poorest households have the same aspiration. Similarly, 88 per cent and 70 per cent of the parents respectively from the richest and the poorest households aspire to
university for their child. This is consistent with the argument of Appadurai (2004) that people living in poverty have limited capacity to aspire.
Figure 1. Distribution of parents' and children’s aspirations
Furthermore, the gender gap in terms of aspirations is higher among the poorest households:
60 per cent of girls versus 74 per cent of boys aspire to go to university (see Figure A1 in the Appendix). On the contrary, among the richest households there is no significant difference
between girls’ and boys’ aspirations (84 per cent of girls versus 83 per cent of boys) (see Figure A1, Appendix).
Looking at educational aspirations over time provides interesting insights on the extent to
which people revise their aspirations and how. In our sample, about 77 per cent of the
observed variation in children’s aspirations is due to within-child variation. In a seven-year window, between the ages of 12 and 19, children’s aspirations change significantly. In Table 2 we report the proportion of children and parents aspiring to university at different ages. In
the first column we consider all children together; and in the second and third columns, we
3 A t-test for difference between mean values indicates that all means reported are statistically different with significance level of
either 1 per cent or 5 per cent level.
4 Unfortunately, information about parental aspirations was no longer collected in Round 4, when the children were 19 years old.
010
2030
4050
6070
80
None Primary Second. PreUni Vocat. Univ.
Parents' aspiration
010
2030
4050
6070
80
Prop
ortio
n of
chi
ldre
n by
asp
ired
educ
atio
n
None Primary Second. PreUni Vocat. Univ.
Children's aspiration

ASPIRATIONS AND EDUCATIONAL ATTAINMENTS OF ETHIOPIAN BOYS AND GIRLS
12
consider girls and boys separately. The p-value for a t-test for difference in means by gender is reported in the last column. Similarly, we test for a difference in aspirations across time. The p-values are reported at the bottom of the table for both parents' and children's
aspirations.
Table 2. Proportion of children and parents aspiring to university, by gender
All Girls Boys Difference by gender (p-value)
Children's Aspirations
Age 12 0.73 0.68 0.77 0.004
(0.016) (0.024) (0.021)
Age 15 0.78 0.73 0.83 0.000
(0.015) (0.023) (0.019)
Age 19 0.77 0.80 0.75 0.104
(0.015) (0.021) (0.022)
Parental Aspirations
Age 12 0.77 0.74 0.79 0.097
(0.015) (0.023) (0.020)
Age 15 0.81 0.76 0.85 0.003
(0.014) (0.022) (0.018)
Difference in aspirations by age Difference p-value
Children's aspirations
Age12-Age15 0.020 0.191 0.041
Age12-Age19 0.083 0.001 0.343
Age15-Age19 0.548 0.030 0.003
Parental aspirations
Age12-Age15 0.049 0.034 0.034
Note: Average values; standard deviation reported in parentheses. The p-value for a t-test for differences in average aspirations across gender at the age of 12, 15 and 19 is reported in the sixth column. The pvalue for a t-test for differences in average aspirations at different ages is reported at the bottom of the table.
At the ages of 12 and 15, boys have higher aspirations than girls. In fact, about 68 and 73
per cent of girls and 77 and 83 per cent of boys aspire at the ages of 12 and 15 to complete university. Similarly, parents have higher aspirations for their sons than for their daughters at both ages. After the age of 15, the percentage of boys aspiring to university markedly
decreases over time, while it increases for girls (see Figure A2, Appendix). This is mirrored in the higher drop-out rate among boys after the age of 15. By the age of 19, three out of four girls aspire to university and the pro-boys gender gap vanishes.
3.3 Descriptive statistics of educational attainments
Late-age enrolment is quite common in Ethiopia and has become a barrier for meeting age-
appropriate targets, particularly at the primary level of education. In our sample, at the age of
8 only about 71 per cent of children in our sample are enrolled at school (Table 3). This proportion increases over time, and at the age of 12 about 98 per cent of children are finally at school. After the age of 15, children start dropping out of school. Indeed, at the ages of 15
and 19 respectively about 93 and 61 per cent of adolescents are in education. On average, at the age of 19 they have completed about 8–9 years of education.

ASPIRATIONS AND EDUCATIONAL ATTAINMENTS OF ETHIOPIAN BOYS AND GIRLS
13
Table 3. Boys’ and girls’ educational achievements at ages 8, 12, 15 and 19
All Girls Boys t-test t-test
Mean Std.Dev Mean Std.Dev Mean Std.Dev p-values p-values
Age 8
Enrolled 0.71 0.016 0.73 0.023 0.69 0.023 0.086
Yrs school completed 0.52 0.028 0.49 0.039 0.54 0.041 0.610
Age 12
Enrolled 0.98 0.004 0.99 0.005 0.98 0.007 0.084
Yrs school completed 3.41 0.055 3.44 0.078 3.39 0.079 0.423
Math score 58.39 0.880 57.00 1.310 59.64 1.184 0.106
PPVT score (z-score) 0.10 0.035 0.07 0.051 0.13 0.049 0.556 0.556
Age 15
Enrolled 0.93 0.009 0.95 0.012 0.92 0.014 0.058 *
Yrs school completed 5.88 0.064 6.02 0.088 5.76 0.092 0.005 *
Math score 21.05 0.590 18.68 0.785 23.16 0.858 0.000 *
PPVT score (z-score) 0.12 0.034 0.05 0.050 0.19 0.046 0.060
Age 19
Enrolled 0.61 0.017 0.65 0.025 0.58 0.024 0.027 *
Yrs school completed 8.75 0.089 9.09 0.126 8.45 0.123 0.000 *
Math score 49.19 0.704 45.22 1.009 52.75 0.950 0.000 *
N 783 370 413 ***
Note: Average values; standard deviation in parentheses. T-test for differences in mean (p-value reported). Math score: percentage of correct answers.
There are significant gender gaps in enrolment and school attainment favouring girls. Table 3
reports information on the current enrolment status, the number of school years completed, the maths scores and the standardised PPVT scores for boys and girls in our sample at different ages. On average, girls start school earlier and drop out later than boys. At the age
of 19 approximately 65 per cent of girls and 58 per cent of boys are still enrolled at school and by the same age girls have completed a significantly higher number of school years.
The higher enrolment rate among girls can be explained by the division of labour, which in
Ethiopia is markedly gendered: girls do primarily domestic work within the household and
boys tend to work predominantly outside the household, mainly in herding or farming activities. Bevan and Pankhurst (2007) find that, although boys and girls start working from similarly young ages, work becomes increasingly gendered as they grow up. The opportunity
cost of an additional year of education is therefore higher for boys than for girls – who can arrange their school and in-household responsibilities more flexibly (Orkin 2012).
5

ASPIRATIONS AND EDUCATIONAL ATTAINMENTS OF ETHIOPIAN BOYS AND GIRLS
14
4. Do parents’ and children’s aspirations predict school attainment? In this section we investigate the relationship between educational attainment and
educational aspirations. Figure 2 plots the results from a local polynomial regression and shows the estimated conditional mean of the number of school years completed at the age of
19, conditional on parental aspirations and children’s aspirations, both measured when the child is 15 years old. The figure suggests a remarkable positive relationship between early aspirations and later educational attainments.
Figure 2. Parents’ and children’s educational aspirations at age 15 and the maximum grade completed by age 19
Note: local polynomial regression; Kernel: epanechnikov with degree=4 and bandwidth=4
To test this relationship further, we estimate the number of years of education completed at
the ages of 15 and 19, adding one at a time: (a) lagged parental aspirations together with a vector of control and child’s gender (equation 1a); (b) lagged children’s aspirations (equation 1b); (c) the vector of cognitive skills and the vector
of non-cognitive skills (or psychosocial competencies) (equation 1c):
24
68
10
None Primary UniversitySecondary PreUniversity Vocational
Educational Aspirations (age 15)
Parents Children
Number of school years completed and educational aspirations
ASPIRATIONS AND EDUCATIONAL ATTAINMENTS OF ETHIOPIAN BOYS AND GIRLS
15
+ (1a)
(1b)
(1c)
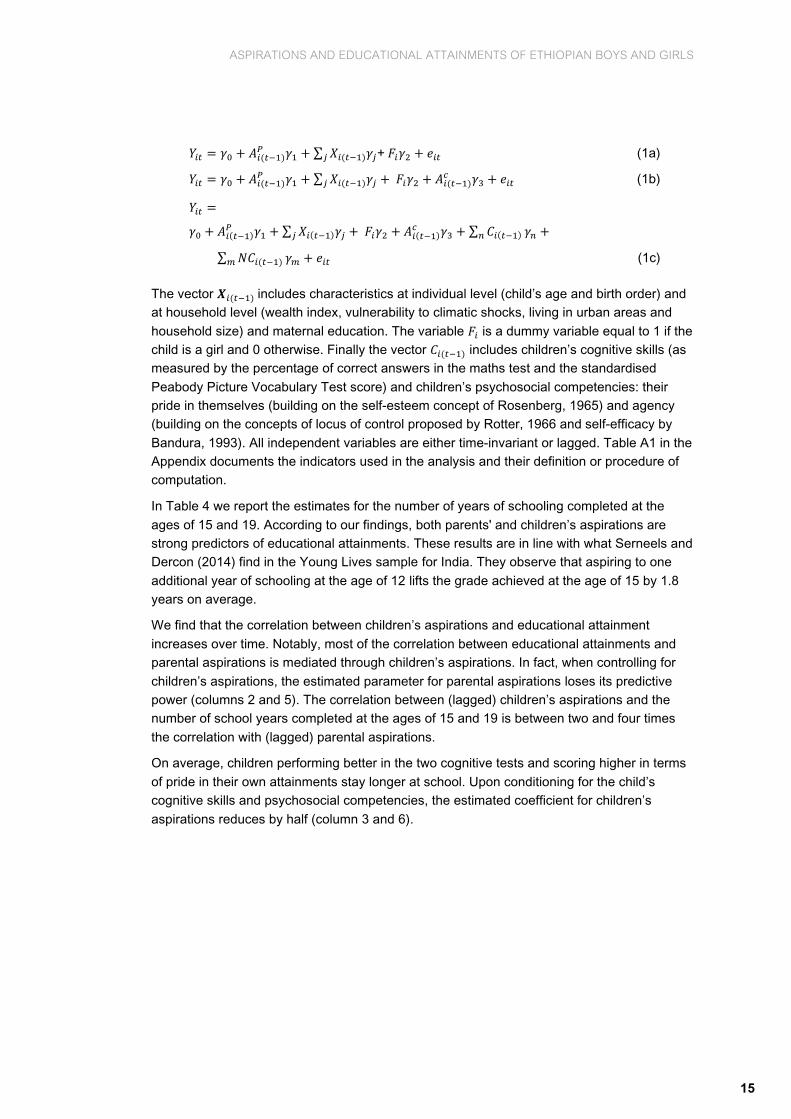
The vector includes characteristics at individual level (child’s age and birth order) and at household level (wealth index, vulnerability to climatic shocks, living in urban areas and
household size) and maternal education. The variable is a dummy variable equal to 1 if the child is a girl and 0 otherwise. Finally the vector includes children’s cognitive skills (as measured by the percentage of correct answers in the maths test and the standardised
Peabody Picture Vocabulary Test score) and children’s psychosocial competencies: their pride in themselves (building on the self-esteem concept of Rosenberg, 1965) and agency (building on the concepts of locus of control proposed by Rotter, 1966 and self-efficacy by
Bandura, 1993). All independent variables are either time-invariant or lagged. Table A1 in the Appendix documents the indicators used in the analysis and their definition or procedure of computation.
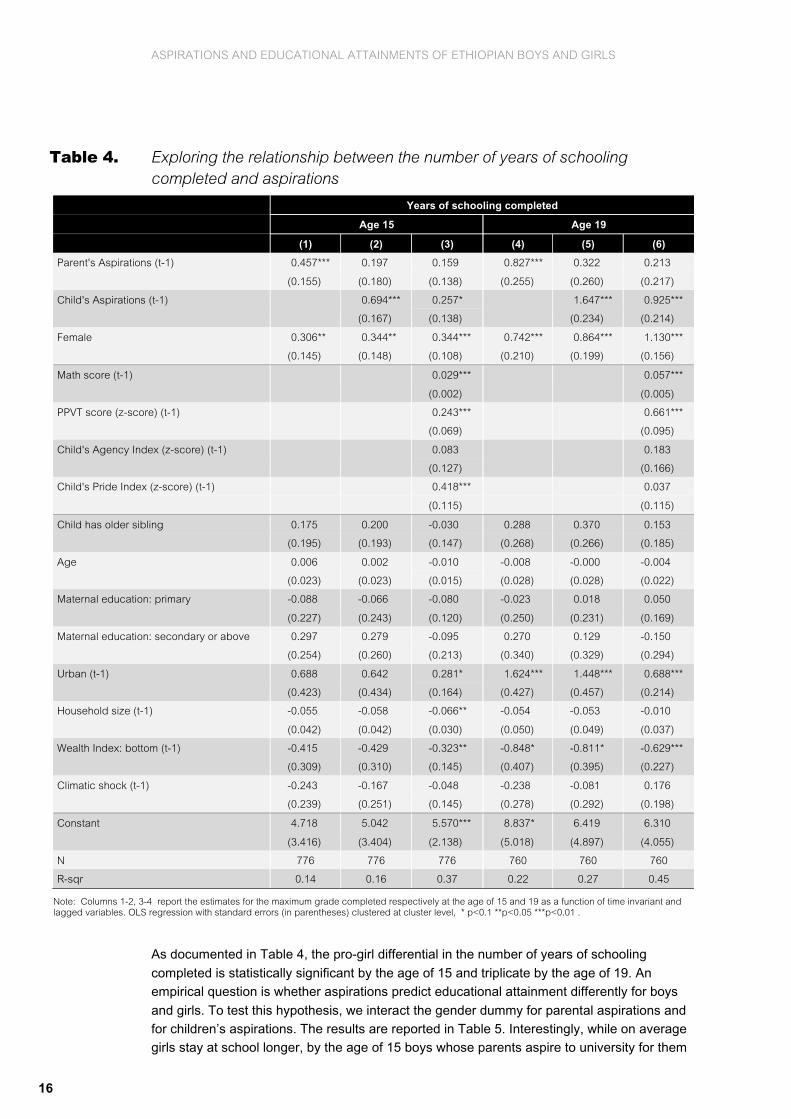
In Table 4 we report the estimates for the number of years of schooling completed at the
ages of 15 and 19. According to our findings, both parents' and children’s aspirations are strong predictors of educational attainments. These results are in line with what Serneels and Dercon (2014) find in the Young Lives sample for India. They observe that aspiring to one
additional year of schooling at the age of 12 lifts the grade achieved at the age of 15 by 1.8 years on average.
We find that the correlation between children’s aspirations and educational attainment
increases over time. Notably, most of the correlation between educational attainments and parental aspirations is mediated through children’s aspirations. In fact, when controlling for
children’s aspirations, the estimated parameter for parental aspirations loses its predictive power (columns 2 and 5). The correlation between (lagged) children’s aspirations and the number of school years completed at the ages of 15 and 19 is between two and four times
the correlation with (lagged) parental aspirations.
On average, children performing better in the two cognitive tests and scoring higher in terms
of pride in their own attainments stay longer at school. Upon conditioning for the child’s cognitive skills and psychosocial competencies, the estimated coefficient for children’s
aspirations reduces by half (column 3 and 6).
ASPIRATIONS AND EDUCATIONAL ATTAINMENTS OF ETHIOPIAN BOYS AND GIRLS
16
Table 4. Exploring the relationship between the number of years of schooling completed and aspirations
Years of schooling completed
Age 15 Age 19
(1) (2) (3) (4) (5) (6)
Parent's Aspirations (t-1) 0.457*** 0.197 0.159 0.827*** 0.322 0.213
(0.155) (0.180) (0.138) (0.255) (0.260) (0.217)
Child's Aspirations (t-1) 0.694*** 0.257* 1.647*** 0.925***
(0.167) (0.138) (0.234) (0.214)
Female 0.306** 0.344** 0.344*** 0.742*** 0.864*** 1.130***
(0.145) (0.148) (0.108) (0.210) (0.199) (0.156)
Math score (t-1) 0.029*** 0.057***
(0.002) (0.005)
PPVT score (z-score) (t-1) 0.243*** 0.661***
(0.069) (0.095)
Child's Agency Index (z-score) (t-1) 0.083 0.183
(0.127) (0.166)
Child's Pride Index (z-score) (t-1) 0.418*** 0.037
(0.115) (0.115)
Child has older sibling 0.175 0.200 -0.030 0.288 0.370 0.153
(0.195) (0.193) (0.147) (0.268) (0.266) (0.185)
Age 0.006 0.002 -0.010 -0.008 -0.000 -0.004
(0.023) (0.023) (0.015) (0.028) (0.028) (0.022)
Maternal education: primary -0.088 -0.066 -0.080 -0.023 0.018 0.050
(0.227) (0.243) (0.120) (0.250) (0.231) (0.169)
Maternal education: secondary or above 0.297 0.279 -0.095 0.270 0.129 -0.150
(0.254) (0.260) (0.213) (0.340) (0.329) (0.294)
Urban (t-1) 0.688 0.642 0.281* 1.624*** 1.448*** 0.688***
(0.423) (0.434) (0.164) (0.427) (0.457) (0.214)
Household size (t-1) -0.055 -0.058 -0.066** -0.054 -0.053 -0.010
(0.042) (0.042) (0.030) (0.050) (0.049) (0.037)
Wealth Index: bottom (t-1) -0.415 -0.429 -0.323** -0.848* -0.811* -0.629***
(0.309) (0.310) (0.145) (0.407) (0.395) (0.227)
Climatic shock (t-1) -0.243 -0.167 -0.048 -0.238 -0.081 0.176
(0.239) (0.251) (0.145) (0.278) (0.292) (0.198)
Constant 4.718 5.042 5.570*** 8.837* 6.419 6.310
(3.416) (3.404) (2.138) (5.018) (4.897) (4.055)
N 776 776 776 760 760 760
R-sqr 0.14 0.16 0.37 0.22 0.27 0.45
Note: Columns 1-2, 3-4 report the estimates for the maximum grade completed respectively at the age of 15 and 19 as a function of time invariant and lagged variables. OLS regression with standard errors (in parentheses) clustered at cluster level, * p<0.1 **p<0.05 ***p<0.01 .
As documented in Table 4, the pro-girl differential in the number of years of schooling
completed is statistically significant by the age of 15 and triplicate by the age of 19. An empirical question is whether aspirations predict educational attainment differently for boys
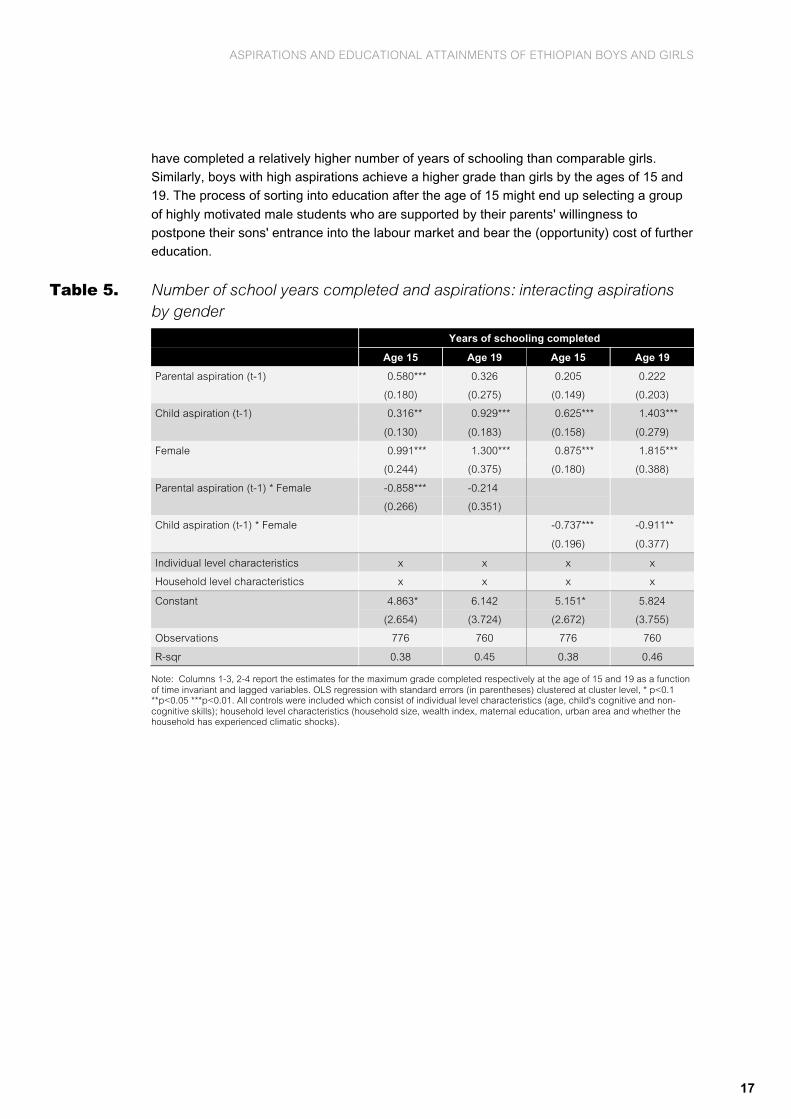
and girls. To test this hypothesis, we interact the gender dummy for parental aspirations and for children’s aspirations. The results are reported in Table 5. Interestingly, while on average girls stay at school longer, by the age of 15 boys whose parents aspire to university for them
ASPIRATIONS AND EDUCATIONAL ATTAINMENTS OF ETHIOPIAN BOYS AND GIRLS
17
have completed a relatively higher number of years of schooling than comparable girls. Similarly, boys with high aspirations achieve a higher grade than girls by the ages of 15 and 19. The process of sorting into education after the age of 15 might end up selecting a group
of highly motivated male students who are supported by their parents' willingness to postpone their sons' entrance into the labour market and bear the (opportunity) cost of further education.
Table 5. Number of school years completed and aspirations: interacting aspirations by gender
Years of schooling completed
Age 15 Age 19 Age 15 Age 19
Parental aspiration (t-1) 0.580*** 0.326 0.205 0.222
(0.180) (0.275) (0.149) (0.203)
Child aspiration (t-1) 0.316** 0.929*** 0.625*** 1.403***
(0.130) (0.183) (0.158) (0.279)
Female 0.991*** 1.300*** 0.875*** 1.815***
(0.244) (0.375) (0.180) (0.388)
Parental aspiration (t-1) * Female -0.858*** -0.214
(0.266) (0.351)
Child aspiration (t-1) * Female -0.737*** -0.911**
(0.196) (0.377)
Individual level characteristics x x x x
Household level characteristics x x x x
Constant 4.863* 6.142 5.151* 5.824
(2.654) (3.724) (2.672) (3.755)
Observations 776 760 776 760
R-sqr 0.38 0.45 0.38 0.46
Note: Columns 1-3, 2-4 report the estimates for the maximum grade completed respectively at the age of 15 and 19 as a function of time invariant and lagged variables. OLS regression with standard errors (in parentheses) clustered at cluster level, * p<0.1 **p<0.05 ***p<0.01. All controls were included which consist of individual level characteristics (age, child's cognitive and non-cognitive skills); household level characteristics (household size, wealth index, maternal education, urban area and whether the household has experienced climatic shocks).

ASPIRATIONS AND EDUCATIONAL ATTAINMENTS OF ETHIOPIAN BOYS AND GIRLS
18
5. Correlates of parents' and children’s aspirations and their transmission In the previous section we presented evidence of the positive correlation between aspirations
and later educational achievements. In this section we consider what predicts aspirations. More specifically, in Section 5.1 we investigate: first, what are the main factors associated
with parental aspirations when the child is 15 years old; second, whether parents have different aspirations for boys and for girls; and finally how expectations about various education and non-educational domains (for example, parental expectations about
childbearing and marriage and financial independence) might explain the gender gap in parental aspirations. Finally, in Section 5.2 we look at the link between parents' and children’s aspirations at different ages.
5.1 What predicts parental aspirations? Exploring the gender bias
To begin with, we assume that at a certain point in time t=1,...,T the main caregiver i=i,...n,
has an underlying, unobservable propensity to aspire to university for his/her daughter or son, denoted as . First of all, we estimate the caregiver's aspirations at time t as a function
of child's cognitive skills , child's gender and a vector of either time-invariant or lagged household and individual characteristics, (equation 2a). Then, we add a vector
of the caregiver's expectations measured at time t-1 (equation 2b). Specifically, the
caregiver's unobserved propensity to report high educational aspirations is:
(2a)
(2b)
The caregiver reports a positive aspiration when her propensity is and equal to 0 otherwise.
We estimate the caregiver's educational aspiration when the child is 15 years old by a linear
probability model with individual clustered standard errors (Table 6). Children’s cognitive skills and all the independent variables in the model are defined as specified in the previous
section of this paper. Additionally, the vector includes the main caregiver’s subjective well-being and psychological competencies when the child is 12 years old, as measured by trust, agency, pride and social discrimination. Finally, is a vector of the caregiver’s
expectations measured when the child is 12 years old. More specifically, it includes the age at which the main caregiver expects her child to start supporting the family financially, to be financially independent, and to leave the household and/or get married.
6 See Table A1 in the Annex for more details.

ASPIRATIONS AND EDUCATIONAL ATTAINMENTS OF ETHIOPIAN BOYS AND GIRLS
19
Table 6. Parental aspirations at age 15
Parental aspirations at age 15: going to University
(1) (2) (3) (4) (5) (6) (7) (8)
Child's gender: Female -0.084** -0.084** -0.095** -0.076** -0.123 -0.313** -0.404* -0.706***
(0.032) (0.031) (0.044) (0.035) (0.094) (0.146) (0.205) (0.210)
Math score (age 12) 0.002*** 0.002*** 0.002*** 0.002*** 0.002* 0.002*** 0.002*** 0.002***
(0.001) (0.001) (0.001) (0.001) (0.001) (0.001) (0.001) (0.001)
PPVT score (z-score) (age 12) -0.008 -0.008 -0.008 -0.008 -0.008 -0.010 -0.010 -0.009
(0.025) (0.025) (0.025) (0.025) (0.025) (0.024) (0.025) (0.024)
Urban (age12) 0.193*** 0.194*** 0.181*** 0.195*** 0.194*** 0.192*** 0.194*** 0.195***
(0.041) (0.043) (0.049) (0.043) (0.043) (0.043) (0.043) (0.044)
Wealth Index: bottom (age12) 0.048 0.047 0.047 0.058 0.047 0.043 0.049 0.049
(0.035) (0.034) (0.034) (0.050) (0.034) (0.033) (0.034) (0.036)
Expected age to support household (age 12)
0.002 0.002 0.003 0.002 -0.001 0.002 0.001
(0.005) (0.005) (0.005) (0.005) (0.005) (0.005) (0.005)
Expected age to be financially independent (age 12)
-0.001 -0.001 -0.001 -0.001 -0.002 -0.007 0.001
(0.006) (0.006) (0.006) (0.006) (0.006) (0.008) (0.005)
Expected age to be married/leave the household (age 12)
-0.001 -0.001 -0.001 -0.001 -0.001 -0.000 -0.012**
(0.005) (0.005) (0.005) (0.005) (0.006) (0.005) (0.006)
Interaction terms: Female x
• Urban (age12) 0.028
(0.056)
• Wealth Index: bottom -0.023
(0.068)
• Math score (age12) 0.001
(0.001)
Expected age for:
• Earning money to support the household (age12)
0.010
(0.006)
• Being financially independent (age12)
0.014
(0.008)
• Leaving the household / Getting married (age12)
0.026***
(0.008)
Individual level characteristics x x x x x x x x
Household level characteristics
x x x x x x x x
Constant 1.149* 1.105* 1.129* 1.109* 1.122* 1.201* 1.280** 1.436**
(0.558) (0.563) (0.550) (0.555) (0.554) (0.585) (0.575) (0.540)
Observations 721 721 721 721 721 721 721 721
R-sqr 0.114 0.115 0.115 0.115 0.115 0.117 0.118 0.130
Note: The table reports the estimates of the linear probability model with standard errors (in parentheses) clustered at cluster level, *p<0.1 **p<0.05 ***p<0.01. All controls were included which consist of individual level characteristics (age, child's cognitive and non-cognitive skills); household level characteristics (household size, wealth index, maternal education, urban area and whether the household has experienced climatic shocks).
ASPIRATIONS AND EDUCATIONAL ATTAINMENTS OF ETHIOPIAN BOYS AND GIRLS
20
Upon conditioning on all individual and household-level characteristics, more educated
caregivers, living in urban areas and in households that experience fewer shocks, are more likely, on average, to aspire to university for their child. Interestingly, parental aspirations are
positively correlated with the child’s maths score when the child is 12 years old. As may be noted, there is a pro-boy bias in parental aspirations (Table 6). In fact, at the age of 15 parents have lower aspirations for their daughters than for their sons and the pro-boys bias is
robust after controlling for individual and household-level characteristics and parental expectations (Table 6).
To further explore the gender bias found at the age of 15, we augment the regression
specification in equation (2b) by interacting the gender dummy variable for the vector of
parental expectations and some of the other dimensions that we found to be predictive for parental aspirations at the same age. A change in the gender bias as a consequence of that would provide us with a hint about its nature (even if not sufficient to infer causality). We
include one at a time the interaction between the gender dummy and each one of the following variables: maths score, urban/rural location of residence and the four variables for parental expectations. In Table 6 (columns 3–8) we report the coefficients on the interactions
terms, together with some of the other independent variables included in the parental aspirations model.
Several findings are noticeable. First, controlling for parental expectations, the gender bias at
the age of 15 does not reduce the pro-boys gender bias in parental aspirations. Second,
parents who expect their children to leave the household and/or get married at more advanced ages are more likely to aspire to university for their daughters than for their sons.
5.2 Exploring the intergenerational transmission of aspirations
In Section 4 we discussed the strong positive association found between parents' and
children’s educational aspirations and schooling attainment. Although the identification of a causal relation between aspirations and the educational outcome considered is well beyond the purpose of this paper, this is undoubtedly an interesting result.
Other empirical evidence discussed so far is the correspondence between parents' and
children’s aspirations particularly at early ages. As documented in Section 3.2, the pro-boys gender bias in children’s aspirations at the age of 15 mirrors the bias in parental aspirations at the same ages. At the age of 19 the gender bias in children’s aspirations is reversed.
Unfortunately, information about parental aspirations is no longer collected at the age of 19.
In this section we investigate the intergenerational transmission of low or biased aspirations
as a potential mechanism leading to poor educational outcomes and reinforcing gender inequalities over the time.
The intergenerational transmission of attitudes is quite a new area of research. The usual practice in economics is to treat individual attitudes as endowments. Recent contributions
endogenise these endowments, assuming that people’s attitudes are influenced by their role models and particularly by their parents’ attitude at young ages. Few empirical studies show that the transmission of attitudes from one generation to the next plays a role in poverty
persistence, gender-inequalities persistence (Fernández et al. 2004) and the persistence of ethnic and cultural differences (Bisin and Verdier 2000; Guiso et al. 2006).
7 Results not reported and available on request.

ASPIRATIONS AND EDUCATIONAL ATTAINMENTS OF ETHIOPIAN BOYS AND GIRLS
21
A recent work by Dercon and Singh (2013) looks into the link between parental aspirations
and child aspirations, using the first three rounds of Young Lives data. Their results are consistent with the idea of a transmission of aspirations from parents to children. In fact, they
find a positive link between parental aspirations at the age of 12 and children’s aspirations at the age of 15. The remaining part of this section contributes to this debate by investigating (a) whether that link persists over time; (b) what other factors (including children’s cognitive
and non-cognitive skills) are correlated with children’s aspirations at different ages; and (c) whether the pro-boys bias in aspirations observed in our data at the age of 15 persists at the age of 19 upon conditioning on a wide set of individual and household characteristics.
As for the parental-aspirations model, we assume that at a point in time t=1,...,T a young
person, i=i,...n, has an underlying, unobservable propensity to aspire to university, denoted as . To begin with, we estimate the pure correlation between children’s aspirations at time t as a function of parental aspirations , as specified in the equation (3a). Then we
augment the regression specification by adding the vector of cognitive skills and the vector of non-cognitive skills as potential mechanisms reinforcing child’s aspirations over time (equation 3b). Finally we condition children’s aspirations on a vector of family and
individual characteristics and the dummy equal to 1 if the child is a girl and 0 otherwise (equation 3c):
(3a)
(3b)
(3c)
We estimate children’s aspirations at the age of 15 and 19 using a linear probability model
with individual clustered standard errors. As documented in Table 7, we find that children’s aspirations at the age of 19 are positively correlated with parental aspirations. At the age of 19, children are between 7 and 14 percentage points more likely to aspire to university if their
parents had the same aspirations for them four years previously.
Cognitive skills predict children’s aspirations. Children performing better in the maths test are
more likely at all ages to aspire to university. Conversely, upon conditioning on individual and household-level characteristics the estimates parameter for the PPVT score loses its
significance at the age of 15. Notably, augmenting the regression by the vector of skills diminishes substantially the correlation between parents' and children’s aspirations.
In terms of gender bias, our findings confirm that boys have higher aspirations than girls at
the age of 15, but by the age of 19 the opposite is true. As discussed, at the age of 15 boys are more likely than girls to drop out of school, which might explain why girls at the age of 19
are more likely to aspire to university than boys.

ASPIRATIONS AND EDUCATIONAL ATTAINMENTS OF ETHIOPIAN BOYS AND GIRLS
22
Table 7. Children’s aspirations at the ages of 15 and 19
Childrens' aspirations: going to University
At age 15 At age 19
(1) (2) (3) (4) (5) (6)
Parental aspiration (t-1) 0.059 0.014 -0.015 0.140*** 0.071 0.076*
(0.042) (0.041) (0.039) (0.038) (0.042) (0.041)
Female -0.110*** 0.076**
(0.034) (0.029)
Math score (t-1) 0.003*** 0.003*** 0.004*** 0.005***
(0.001) (0.001) (0.001) (0.001)
PPVT score (z-score) (t-1) 0.039 0.002 0.067*** 0.064***
(0.028) (0.021) (0.023) (0.021)
Child's Agency Index (t-1) 0.044* 0.044** 0.013 0.007
(0.023) (0.021) (0.029) (0.028)
Child's Pride Index (t-1) 0.043 0.054 -0.049** -0.049**
(0.045) (0.038) (0.021) (0.023)
Child is older sibling -0.046* -0.035
(0.027) (0.039)
Age -0.006 -0.004
(0.005) (0.004)
Maternal education: primary -0.023 -0.023
(0.039) (0.037)
Maternal education: secondary or above 0.085* 0.079*
(0.043) (0.045)
Urban (t-1) 0.129* 0.053
(0.065) (0.059)
Household Size (t-1) -0.005 -0.002
(0.009) (0.008)
Wealth Index: bottom (t-1) -0.061 -0.088
(0.057) (0.058)
Climatic shocks (t-1) -0.019 0.101*
(0.051) (0.052)
Constant 0.713*** 0.565*** 1.609** 0.642*** 0.606*** 1.320
(0.055) (0.065) (0.752) (0.036) (0.038) (0.802)
Observations 786 786 786 754 754 754
R-squared 0.004 0.073 0.135 0.017 0.088 0.115
Note: * p<0.1 ** p<0.05 *** p<0.1. The table reports the estimates of the linear probability model with standard errors (in parentheses) clustered at cluster level, *p<0.1 **p<0.05 ***p<0.01. All control variables included as reported.
We test some of the potential sources of heterogeneity which might explain the gender bias
in children's aspirations at all ages. We do that by interacting the dummy for gender and the dimension that we thought might be the source of the gender bias in aspirations (Table 8). First, given the strong correlation between parents' and children’s aspirations, we test
whether having parents aspiring to university is equally correlated with boys’ and girls’ aspirations and we do not find any substantial gender difference. Second, we check whether living in a poor household is equally detrimental for boys’ and girls’ aspirations. As
mentioned, the gender gap in children's aspirations is greatest among the poorest households, while within the richest households boys and girls have similar aspirations. We

ASPIRATIONS AND EDUCATIONAL ATTAINMENTS OF ETHIOPIAN BOYS AND GIRLS
23
find that at the age of 15 harsh economic conditions are more detrimental for girls' capacity to aspire than it is for boys' capacity to aspire. In fact, our findings suggest that girls living in poor households, when all the other characteristics hold constant, are 12 percentage points
less likely to aspire to university than boys living in similar contexts.
Table 8. Children’s aspirations: heterogeneous capacity to aspire
Childrens' aspirations at age 15 and 19: heterogeneous capacity to aspire
Age 15 Age 19
(1) (2) (3) (4)
Parental aspirations (t-1) -0.042 -0.018 0.028 0.078*
(0.050) (0.038) (0.061) (0.043)
Wealth Index (bottom) (t-1) -0.059 0.001 -0.091* -0.062
(0.041) (0.051) (0.048) (0.067)
Female -0.149** -0.073** 0.002 0.084***
(0.063) (0.033) (0.074) (0.032)
Parental aspirations (t-1)* Female 0.052 . 0.093 .
(0.071) . (0.081) .
Wealth Index (bottom) (t-1) *Female -0.124* -0.051
(0.067) (0.088)
Individual level characteristics x x x x
Household level characteristics x x x x
Constant 1.651*** 1.628*** 1.397* 1.325*
(0.589) (0.582) (0.754) (0.753)
Observations 786 786 754 754
R-squared 0.136 0.139 0.117 0.116
Note: * p<0.1 ** p<0.05 *** p<0.1. The table reports the estimates of the linear probability model with standard errors (in parentheses) clustered at cluster level, *p<0.1 **p<0.05 ***p<0.01. All controls were included which consist of individual level characteristics (age, child's cognitive and non-cognitive skills); household level characteristics (household size, wealth index, maternal education, urban area and whether the household has experienced climatic shocks).
6. Conclusions Although there is an increasing interest in the role of aspirations for economic development,
empirical evidence, particularly from developing countries, is quite scarce. Using Young Lives
data for a cohort of children in Ethiopia, this paper documents a positive correlation between early aspirations and the number of schooling years completed at the ages of 15 and 19. While parental aspirations are found to predict educational attainments particularly in
early/middle childhood, the correlation between children’s aspirations and educational attainment tends to be stronger and to increase over time.
Attainment and aspirations are mutually reinforcing, and it is difficult to state the direction of
causality with certainty. Potential endogeneity problems are partly alleviated by the
longitudinal setting of the data that allow us to disentangle the sequencing, and by the inclusion of a broad set of control variables measured at different points in time. Although a causal interpretation of the finding is not either legitimate or claimed, distinct evidence arises
from our analysis which sheds new light on the role of early aspirations in shaping later

ASPIRATIONS AND EDUCATIONAL ATTAINMENTS OF ETHIOPIAN BOYS AND GIRLS
24
outcomes; on the factors associated with aspirations at different ages; and on the recognition of a gender bias in aspirations as a potential mechanism for the perpetuation of gender inequality over time.
Interestingly, we find that the relationship between aspirations and school achievement is
stronger among boys than among girls, particularly after the age of 15, when the pressures to leave school become more intense as children’s ability to support household livelihoods increases. The opportunity costs of staying in school increase relatively more for boys than
for girls. Boys, who typically spend more time doing paid work or working on the family farm or business, tend to drop out of school earlier than girls. Conversely, girls, who typically spend more time caring for others and on domestic tasks, can be more flexible in combining
studying with responsibilities for in-household chores, and therefore they are more likely to stay in education after the age of 15.
The pressure to earn money pushes low-motivated boys out of school, while only a selected
group of children with high aspirations (or whose caregivers have high aspirations) are able
to stay in education. Boys and girls adapt and change their aspirations over time, in the light of new experiences, choices and information, including their awareness of their own abilities and the perceived social risks and opportunities. According to our findings, boys and girls
tend to revise their own aspirations in opposite directions. On the one hand, boys tend to overestimate their options for the future and end up revising their aspirations downwards. Girls, on the other hand, grow in their aspirations over time.
Expectations about the future of their children shape parental aspirations. Interestingly, the educational aspirations of the parents are responsive to their expectations about the age
when their children will become independent and leave the household and get married. At the age of 15, the pro-boys gender bias in parental aspirations is reversed among those parents who expect their daughter to get married and leave the household at an older age
than their sons.
We document a positive correlation between parental aspirations at the age of 15 and the
child’s aspirations at the age of 19. Parental aspirations together with their social-economic status and the child's cognitive skills are still among the strongest predictors for children’s
aspirations at the age of 19.
The pro-boys gender gap in children’s aspirations documented at the age of 15 mirrors the
bias in parental aspirations in favour of boys. Interestingly, the gender bias in aspirations is stronger among the poorest households. In fact, girls living in poor households are 12
percentage points less likely to aspire to university than boys living in a similar context. Therefore, girls living in poverty might face a higher risk than boys of being trapped in a spiral of low aspirations/low investments, and the initial low aspirations might become a mechanism
for the perpetuation of gender inequality.
So, do people realise their aspirations? Overall, we found a positive correlation between
aspirations at the ages of 12 and 15 and educational attainment at the ages of 15 and 19. However, while on the one hand girls’ achievements exceed their initial aspirations, on the other hand boys who initially aspire to enter university drop out earlier. The context in which
they live, the opportunities available, and the gendered division of roles and responsibilities in their society explain the early drop-out of boys.
Although both boys and girls (and their parents) initially do not expect that aspirations might
evolve, and although they fail to appreciate how circumstances shape their own
achievements, they adjust their aspirations over time in accordance with actual outcomes. In

ASPIRATIONS AND EDUCATIONAL ATTAINMENTS OF ETHIOPIAN BOYS AND GIRLS
25
fact, as psychologists recognise, aspirations are greatly determined by interactions with the social environment and by the acquisition of growing knowledge of self and of the constraints and opportunities available within the individual's cognitive space, influenced by previous
choices and experiences (see, for example, Gottfredson, 1981). Thus, on the one hand, boys revise their aspirations downwards, but on the other hand girls, who initially choose a suboptimal aspiration and filter out 'going to university' as an attainable goal, at the age of 15
start reconsidering university as an attainable goal.
The capacity to aspire is not homogeneously distributed. In fact, initial low aspirations are
more common among children living in poor households, and particularly among children who face multiple barriers, such as girls living in poverty. Because we are not able to
investigate causality, inferences about the role of low aspirations as a trigger of a spiral of low aspirations/low investments/low achievements would be largely speculative. Nevertheless, our findings do not contradict the increasing body of literature documenting the
role of aspirations in the persistence of poverty and gender inequality.

ASPIRATIONS AND EDUCATIONAL ATTAINMENTS OF ETHIOPIAN BOYS AND GIRLS
26
References Appadurai A. (2004) 'The Capacity to Aspire: Culture and the Terms of Recognition' in V.
Rao and M. Walton (eds) Culture and Public Action, Stanford: Stanford University Press, http://www.cultureandpublicaction.org.
Attanasio, O.P. and K.M. Kaufmann (2014) 'Education Choices and Returns to Schooling:
Mothers' and Youths' Subjective Expectations and Their Role by Gender', Journal of Development Economics 109(C): 203–16.
Bandura, A. (1993) 'Perceived Self-efficacy in Cognitive Development and Functioning',
Educational Psychologist 28.2: 117–48.
Beaman, L., E. Duflo, R. Pande and P. Topalova (2012) 'Female Leadership Raises Aspirations and Educational Attainment for Girls: A Policy Experiment in India', Science 335
(6068): 582–6.
Bernard, T., S. Dercon, K. Orkin and A. Seyoum Taffesse (2014) 'The Future in Mind:
Aspirations and Forward-Looking Behaviour in Rural Ethiopia', CSAE Working Paper 2014-16.
Bertrand M., S. Mullainathan and E. Shaor (2004) 'A Behavioral Economics View of Poverty',
American Economic Review 94.2: 419–23.
Bevan, P. and A. Pankhurst (2007) 'Power Structures and Agency in Rural Ethiopia:
Development Lessons from Four Community Case Studies', draft research paper for the Empowerment Section of the World Bank Poverty Reduction Group.
Bisin, A. and T. Verdier (2000) 'Beyond the Melting Pot: Cultural Transmission, Marriage and
the Evolution of Ethnic and Religious Traits', The Quarterly Journal of Economics. 115: 955–
88.
Chattopadhyay, R. and E. Duflo (2004) 'Women as Policy Makers: Evidence from a
Randomized Policy Experiment in India', Econometrica 72.5: 1409–43.
Chiapa, C., J.L. Garrido and S. Prina (2012) 'The Effect of Social Programs and Exposure to
Professionals on the Educational Aspirations of the Poor', Economics of Education Review 31.5: 778–98.
Dalton, P., S. Ghosal and A. Mani (2015) 'Poverty and Aspirations Failure', The Economic
Journal, July.
Dercon S. and A. Singh (2013) 'From Nutrition to Aspirations and Self-Efficacy: Gender Bias
over Time among Children in Four Countries', World Development 45: 31–50.
Duflo, E. (2003) 'Poor but Rational', mimeo, MIT.
Duflo E. (2012) 'Human Values and the Design of the Fight against Poverty', Tanner Lectures
on Human Value, delivered at Harvard University, May 2012.
Fernández R., A. Fogli and C. Olivetti (2004) 'Mothers and Sons: Preference Formation and
Female Labor Force Dynamics', The Quarterly Journal of Economics 119.4.
Gottfredson, L.S. (1981) 'Circumscription and Compromise: A Developmental Theory of
Occupational Aspirations', Journal of Counseling Psychology 28.6: 545–79.
ASPIRATIONS AND EDUCATIONAL ATTAINMENTS OF ETHIOPIAN BOYS AND GIRLS
27
Guiso, L., P. Sapienza and L. Zingales (2006) 'Does Culture Affect Economic Outcomes?',
Journal of Economic Perspectives 20.2: 23–48.
La Ferrara, E., A. Chong and S. Duryea (2012) 'Soap Operas and Fertility: Evidence from
Brazil', American Economic Journal: Applied Economics 4: 1–31.
Locke, E.A. and G.P. Latham (2002) 'Building a Practically Useful Theory of Goal Setting and
Task Motivation: A 35-year Odyssey', American Psychologist 57: 705–17.
Macours, K. and R. Vakis (2014) 'Changing Households’ Investment Behavior through Social
Interactions with Local Leaders: Evidence from a Randomized Transfer Program', Economic Journal 124.576: 607–33.
Nguyen, T. (2008) 'Information, Role Models and Perceived Returns to Education:
Experimental Evidence from Madagascar', Working Paper, Massachusetts Institute of
Technology.
Orkin, K. (2012) 'Are Work and Schooling Complementary or Competitive for Children in
Rural Ethiopia?' in M. Bourdillon and J. Boyden (eds.) Children Growing Up in Poverty: Multidisciplinary Approaches, Basingstoke: Palgrave.
Outes-Leon, I. and A. Sanchez (2008) An Assessment of the Young Lives Sampling Approach in Ethiopia, Technical Note 1, Oxford: Young Lives.
Ray, D. (2006) 'Aspirations, Poverty and Economic Change' in A.V. Banerjee, R. Bénabou
and D. Mookherjee (eds) Understanding Poverty, Oxford: Oxford University Press.
Rao, V. and M. Walton (eds) (2004) Culture and Public Action, Stanford: Stanford University
Press.
Reuben, E., P. Sapienza and L. Zingales (2014) ‘How Stereotypes Impair Women’s Careers
in Science’, Proceedings from the National Academy of Sciences of the USA 111.12: 4403–08.
Rosenberg, M. (1965) Society and the Adolescent Self-image, Princeton, NJ: Princeton
University Press.
Rotter, J.B. (1966) 'Generalized Expectancies for Internal Versus External Control of
Reinforcements', Psychological Monographs 80: 1–28.
Serneels P. and S. Dercon (2014) Aspirations, Poverty and Education. Evidence from India,
Working Paper 125, Oxford: Young Lives.
Zafar B. (2013) 'College Major Choice and the Gender Gap', Journal of Human Resources
48.3: 545–95.

ASPIRATIONS AND EDUCATIONAL ATTAINMENTS OF ETHIOPIAN BOYS AND GIRLS
28
Appendix
Figure A1. Proportion of children aspiring to go to university, by gender and socio-economic status
Figure A2. Proportion of boys and girls aspiring to university at ages 12, 15 and 19
Note: Each point in the graph corresponds to the proportion of children aspiring to go to university enrolled at school or no longer at school at ages 12, 15 and 19.
.6.6
5.7
.75
.8.8
5
Bottom Middle Top
Wealth index
Prop
ortio
n of
chi
ldre
n as
piri
ng to
uni
vers
ity
Female Male
.65
.7.7
5.8
12 15 19Age
All Female Male
Prop
ortio
n of
chi
ldre
n as
piri
ng to
uni
vers
ity

ASPIRATIONS AND EDUCATIONAL ATTAINMENTS OF ETHIOPIAN BOYS AND GIRLS
29
Figure A3. Enrolment by gender
Figure A4. Highest grade completed by gender
.5.6
.7.8
.91
8 12 15 19Age
Prop
ortio
n of
you
ng p
eopl
e en
rolle
dFemales Males
02
46
8
8 12 15 19Age
Females Males
Hig
hest
gra
de c
ompl
eted

ASPIRATIONS AND EDUCATIONAL ATTAINMENTS OF ETHIOPIAN BOYS AND GIRLS
30
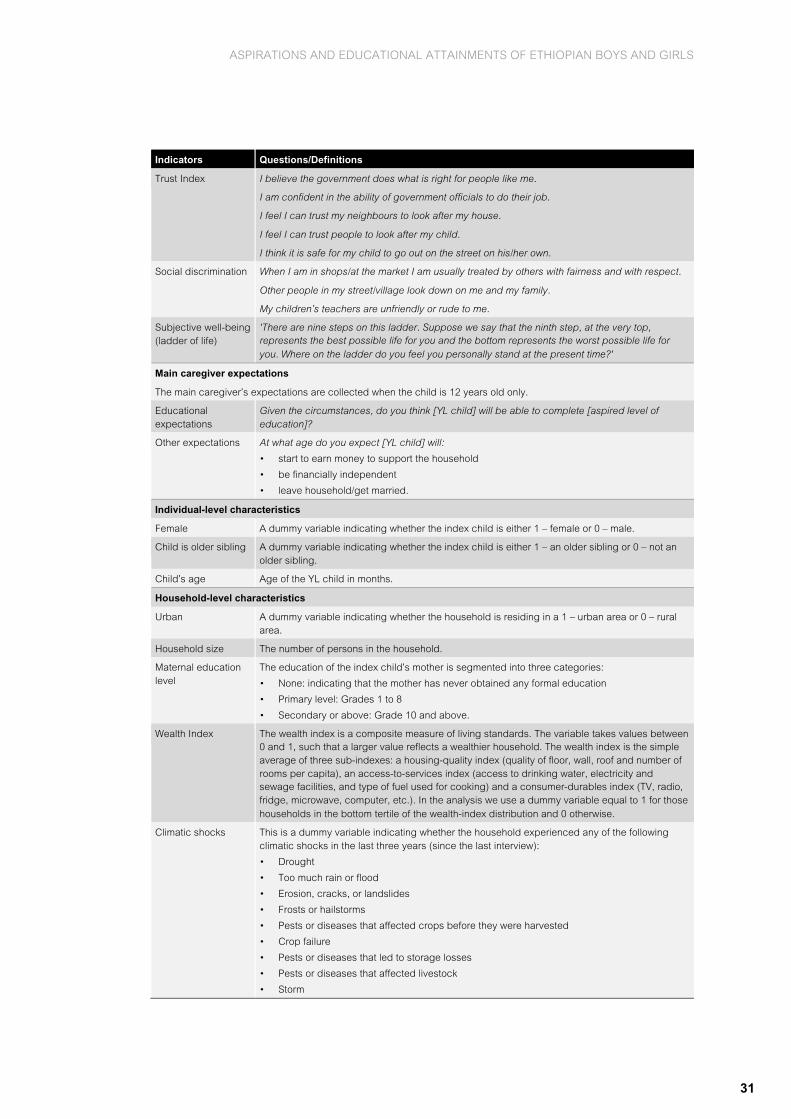
Table A1. Indicators and definitions
Indicators Questions/Definitions
Educational aspirations
Child’s educational aspirations
'Imagine you had no constraints and could study for as long as you liked, or go back to school if you have already left. What level of formal education would you like to complete?'. Child’s educational aspirations are collected at the ages of 12, 15 and 19. We define a dummy variable equal to 1 for those children with high aspirations (aspiring to university) and 0 otherwise.
Main caregiver's/parent's aspiration
'Ideally what level of education would you like [NAME] to complete?' The main caregiver’s educational aspirations are collected when the child is 12 and 15 years old only. As for children’s aspirations, we define a dummy variable equal to 1 for those caregivers with high aspirations (aspiring to university) and 0 otherwise.
Education attainment
Number of years of schooling completed by ages 12, 15 and 19
Child’s non-cognitive skills or psychosocial competencies
This is the procedure adopted to compute the pride and agency score: (i) all relevant questions are recoded to be positive outcomes; (ii) relevant questions are all normalised to z-scores (subtract mean and divide by SD); and then (iii) an average of the relevant z-scores is taken across the non-missing values of the questions. All the questions are on Likert-type scales going from 1 to 4 in Round 2 (R2) and from 1 to 5 in Round 3 (R3). The questions differ a little from round to round, as specified below.
Agency Index If I try hard, I can improve my situation in life.
Other people in my family make all the decisions about how I spend my time.
I like to make plans for my future studies and work.
If I study hard at school, I will be rewarded by a better job in the future.
I have choice about the work I do – I must do this sort of work.
Pride Index I feel proud to show my friends or other visitors where I live (only in Round 2).
I am ashamed of my clothes (Round 2); I am proud of my clothes (Round 3 and Round 4).
I am ashamed of my shoes (Round 2); I am proud of my shoes (or of having shoes) (Round 3 and Round 4).
I feel proud of the job my [insert relationship of household head to the child] does (only in Round 2).
I am often embarrassed because I do not have the right books, pencils and other equipment for school (Round 2); I am never embarrassed because I do not have etc. (Round 3)
I am worried that I don’t have the correct uniform (Round 2); I am proud that I have the correct uniform (Round 3).
I am proud of my achievements at school (only in Round 2).
I am embarrassed by/ashamed of the work I have to do (Round 2); I am proud of the work Ii have to do (Round 3 and Round 4).
I feel my clothing is right for all occasions (Round 3 and Round 4)
Child’s cognitive skills
PPVT z-score Standardised score on the Peabody Picture Vocabulary Test
Maths score Percentage of maths questions answered correctly.
Main caregiver’s psychological competencies
The procedure adopted to compute the caregivers’ agency, pride, trust and social-discrimination indices is the same as explained for the child’s pride and agency index above. The caregiver’s psychological competencies are measured only when the child is 12 years old.
Agency Index If I try hard I can improve my situation in life.
I like to make plans for my future.
I have no choice about which school to send my child to.
If my child gets sick I can do little to help him/her get better.
I can do little to help my child do well in school, no matter how hard I try.
Pride Index I feel proud to show my friends or other visitors where I live.
I am ashamed of my clothes.
I feel proud of the job done by the household head.
The job that I do makes me feel proud.
I feel proud of my children.
ASPIRATIONS AND EDUCATIONAL ATTAINMENTS OF ETHIOPIAN BOYS AND GIRLS
31
Indicators Questions/Definitions
Trust Index I believe the government does what is right for people like me.
I am confident in the ability of government officials to do their job.
I feel I can trust my neighbours to look after my house.
I feel I can trust people to look after my child.
I think it is safe for my child to go out on the street on his/her own.
Social discrimination When I am in shops/at the market I am usually treated by others with fairness and with respect.
Other people in my street/village look down on me and my family.
My children’s teachers are unfriendly or rude to me.
Subjective well-being (ladder of life)
'There are nine steps on this ladder. Suppose we say that the ninth step, at the very top, represents the best possible life for you and the bottom represents the worst possible life for you. Where on the ladder do you feel you personally stand at the present time?'
Main caregiver expectations
The main caregiver’s expectations are collected when the child is 12 years old only.
Educational expectations
Given the circumstances, do you think [YL child] will be able to complete [aspired level of education]?
Other expectations At what age do you expect [YL child] will:
• start to earn money to support the household
• be financially independent
• leave household/get married.
Individual-level characteristics
Female A dummy variable indicating whether the index child is either 1 – female or 0 – male.
Child is older sibling A dummy variable indicating whether the index child is either 1 – an older sibling or 0 – not an older sibling.
Child’s age Age of the YL child in months.
Household-level characteristics
Urban A dummy variable indicating whether the household is residing in a 1 – urban area or 0 – rural area.
Household size The number of persons in the household.
Maternal education level
The education of the index child’s mother is segmented into three categories:
• None: indicating that the mother has never obtained any formal education
• Primary level: Grades 1 to 8
• Secondary or above: Grade 10 and above.
Wealth Index The wealth index is a composite measure of living standards. The variable takes values between 0 and 1, such that a larger value reflects a wealthier household. The wealth index is the simple average of three sub-indexes: a housing-quality index (quality of floor, wall, roof and number of rooms per capita), an access-to-services index (access to drinking water, electricity and sewage facilities, and type of fuel used for cooking) and a consumer-durables index (TV, radio, fridge, microwave, computer, etc.). In the analysis we use a dummy variable equal to 1 for those households in the bottom tertile of the wealth-index distribution and 0 otherwise.
Climatic shocks This is a dummy variable indicating whether the household experienced any of the following climatic shocks in the last three years (since the last interview):
• Drought
• Too much rain or flood
• Erosion, cracks, or landslides
• Frosts or hailstorms
• Pests or diseases that affected crops before they were harvested
• Crop failure
• Pests or diseases that led to storage losses
• Pests or diseases that affected livestock
• Storm
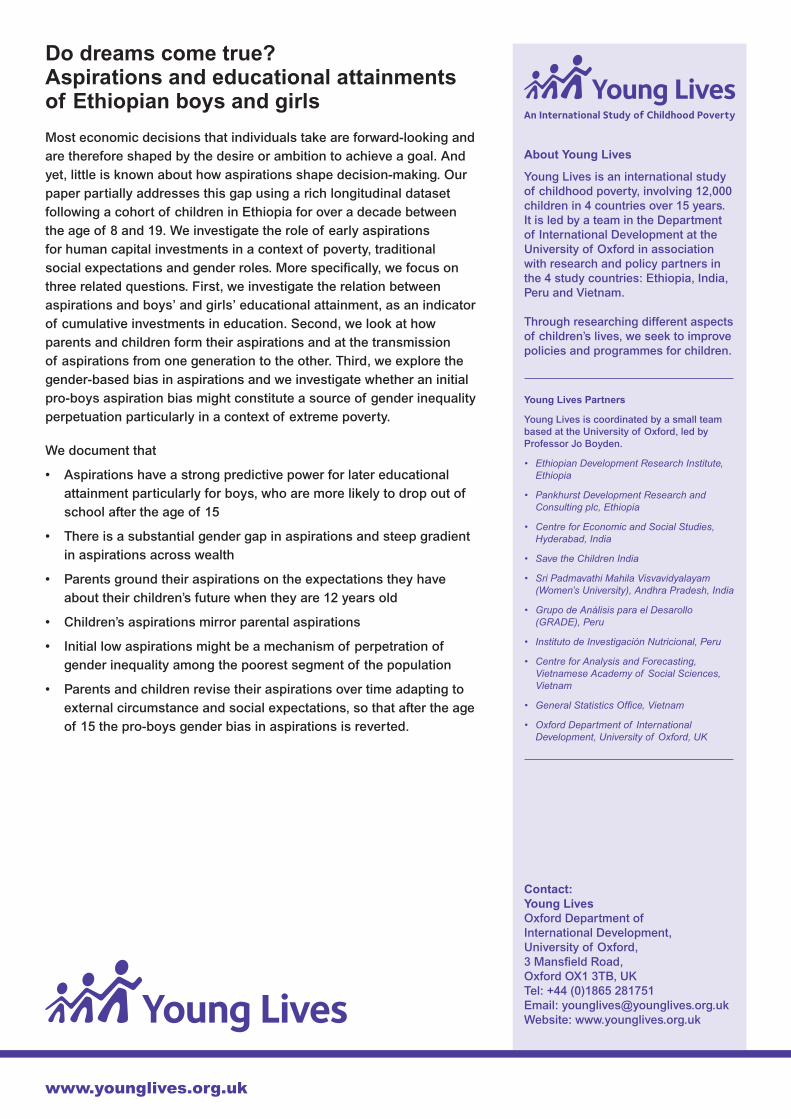
Do dreams come true? Aspirations and educational attainments of Ethiopian boys and girls
Most economic decisions that individuals take are forward-looking and are therefore shaped by the desire or ambition to achieve a goal. And yet, little is known about how aspirations shape decision-making. Our paper partially addresses this gap using a rich longitudinal dataset following a cohort of children in Ethiopia for over a decade between the age of 8 and 19. We investigate the role of early aspirations for human capital investments in a context of poverty, traditional social expectations and gender roles. More specifically, we focus on three related questions. First, we investigate the relation between aspirations and boys’ and girls’ educational attainment, as an indicator of cumulative investments in education. Second, we look at how parents and children form their aspirations and at the transmission of aspirations from one generation to the other. Third, we explore the gender-based bias in aspirations and we investigate whether an initial pro-boys aspiration bias might constitute a source of gender inequality perpetuation particularly in a context of extreme poverty.
We document that
• Aspirations have a strong predictive power for later educational attainment particularly for boys, who are more likely to drop out of school after the age of 15
• There is a substantial gender gap in aspirations and steep gradient in aspirations across wealth
• Parents ground their aspirations on the expectations they have about their children’s future when they are 12 years old
• Children’s aspirations mirror parental aspirations
• Initial low aspirations might be a mechanism of perpetration of gender inequality among the poorest segment of the population
• Parents and children revise their aspirations over time adapting to external circumstance and social expectations, so that after the age of 15 the pro-boys gender bias in aspirations is reverted.
www.younglives.org.uk
About Young Lives
Young Lives is an international study of childhood poverty, involving 12,000 children in 4 countries over 15 years. It is led by a team in the Department of International Development at the University of Oxford in association with research and policy partners in the 4 study countries: Ethiopia, India, Peru and Vietnam.
Through researching different aspects of children’s lives, we seek to improve policies and programmes for children.
Young Lives Partners
Young Lives is coordinated by a small team based at the University of Oxford, led by Professor Jo Boyden.
• Ethiopian Development Research Institute, Ethiopia
• Pankhurst Development Research and Consulting plc, Ethiopia
• Centre for Economic and Social Studies, Hyderabad, India
• Save the Children India
• Sri Padmavathi Mahila Visvavidyalayam (Women’s University), Andhra Pradesh, India
• Grupo de Análisis para el Desarollo (GRADE), Peru
• Instituto de Investigación Nutricional, Peru
• Centre for Analysis and Forecasting, Vietnamese Academy of Social Sciences, Vietnam
• General Statistics Office, Vietnam
• Oxford Department of International Development, University of Oxford, UK
Contact:Young LivesOxford Department of International Development,University of Oxford,3 Mansfield Road,Oxford OX1 3TB, UKTel: +44 (0)1865 281751Email: [email protected]: www.younglives.org.uk