Do best manufacturing practices depend on the plant role in international manufacturing networks?
10
1 Do best manufacturing practices depend on the plant role in international manufacturing networks? Krisztina Demeter ([email protected]) Corvinus University of Budapest, Hungary Levente Szász Babes-Bolyai University, Romania Harry Boer Aalborg University, Denmark Abstract In the last decades several companies have become manufacturing networks of plants, usually in an international context. These plants can serve different purposes and have different level of competences. This diversity has to affect the use and pay off of various operations management practices. This paper investigates the relationship between plant roles and the “goodness” of manufacturing practices using the International Manufacturing Strategy Survey. According to our results plants with higher competence (leaders and contributors) have more best practices than less competent plants. Servers can build their competences through interplant networking activities, while offshore plants utilize servitization to improve performance. Keywords: Manufacturing practices, plant role, manufacturing network, performance Introduction Several papers in the literature argue that international manufacturing networks (IMNs) operate all over the world with different manufacturing plants playing different roles within the network. There is also an impressive body of literature about the use of manufacturing practices in single plants and their impact on performance, referring to the most effective ones as best practices. The question addressed in the paper is whether the “goodness” of manufacturing practices depends on the role a plant plays in an IMN. Since Ferdows’ seminal article (1997) on plant roles, many papers have been published on this topic. As Ferdows argues, sites can improve their competences by building up knowledge not only in the field of production, but also in purchasing, distribution, customer relationships, and innovation, thereby developing themselves toward “higher” roles. Although Ferdows’ original article contains only examples, several papers operationalized his work through case studies (Vereecke and Van Dierdonck, 2002; Miltenburg, 2009; Cheng, 2011; Cheng et al., 2011) and surveys (Feldmann et al., 2009; Turkulainen and Blomqvist, 2011), and basically found the framework to be valid. What these papers did not
-
Upload
independent -
Category
Documents
-
view
0 -
download
0
Transcript of Do best manufacturing practices depend on the plant role in international manufacturing networks?
1
Do best manufacturing practices depend on the plant role
in international manufacturing networks?
Krisztina Demeter ([email protected])
Corvinus University of Budapest, Hungary
Levente Szász
Babes-Bolyai University, Romania
Harry Boer
Aalborg University, Denmark
Abstract
In the last decades several companies have become manufacturing networks of plants,
usually in an international context. These plants can serve different purposes and have
different level of competences. This diversity has to affect the use and pay off of various
operations management practices. This paper investigates the relationship between plant
roles and the “goodness” of manufacturing practices using the International Manufacturing
Strategy Survey. According to our results plants with higher competence (leaders and
contributors) have more best practices than less competent plants. Servers can build their
competences through interplant networking activities, while offshore plants utilize
servitization to improve performance.
Keywords: Manufacturing practices, plant role, manufacturing network, performance
Introduction Several papers in the literature argue that international manufacturing networks (IMNs)
operate all over the world with different manufacturing plants playing different roles within
the network. There is also an impressive body of literature about the use of manufacturing
practices in single plants and their impact on performance, referring to the most effective
ones as best practices. The question addressed in the paper is whether the “goodness” of
manufacturing practices depends on the role a plant plays in an IMN.
Since Ferdows’ seminal article (1997) on plant roles, many papers have been published
on this topic. As Ferdows argues, sites can improve their competences by building up
knowledge not only in the field of production, but also in purchasing, distribution, customer
relationships, and innovation, thereby developing themselves toward “higher” roles.
Although Ferdows’ original article contains only examples, several papers operationalized
his work through case studies (Vereecke and Van Dierdonck, 2002; Miltenburg, 2009;
Cheng, 2011; Cheng et al., 2011) and surveys (Feldmann et al., 2009; Turkulainen and
Blomqvist, 2011), and basically found the framework to be valid. What these papers did not

2
do, however, is look at the manufacturing practices these plants use and their performance
outcomes.
Furthermore, there are some papers that explore the impact of national context on the
use of manufacturing practices (e.g. Cagliano et al., 2001; Vastag and Whybark, 1991;
Oliver et al., 1996; Voss and Blackmon, 1996). However, none of them investigates the
impact of the role these plants play within their IMNs. Following these two observations
we investigate the extent to which plant role affects the goodness of various manufacturing
practices in terms of their performance implications. First we go through the literature.
Then we introduce the database and the research methodology. We analyze data and discuss
our findings. Finally we draw some preliminary conclusions.
Literature review Both plant roles and best practices have been extensively researched in the last decades.
Ferdows (1997) was the first to develop a typology going more deeply into value
creating activities within plants and using the perspective of plants instead of the whole
network. He identified three strategic reasons for choosing a specific site: a) access to low-
cost production, b) access to skills and knowledge, and c) proximity to market. Vereecke
and Van Dierdonck (2002) identified nine potential strategic reasons from the literature, but
exploring an interview-based sample of 59 companies they concluded that the main
location drivers identified by Ferdows (1997) are by far the most important ones.
Ferdows (1997) determined the level of site competence as well. Along the strategic
reasons and site competences, plants can position themselves in six different roles (the list
in Table 1 is ordered from lowest to highest level of competences). As Ferdows argues, sites
can improve their competences, especially by building up knowledge not only in the field
of production, but also in purchasing, distribution, customer relationships (altogether in
SCM), and product/process development, thereby developing themselves toward “higher”
roles. Competence development and roles depend on managerial aspirations as well as on
country level factors. Ferdows does not define a strict relationship between strategic
reasons and competences.
Competences were in the center of analysis in Feldmann et al. (2013). They found three
basic bundles of competences that plants can develop: a) production competence, including
process improvement, technical maintenance and production, b) supply chain competence
containing supplier development, procurement and logistics, and c) development
competence consisting of introduction of new product technologies, product improvement
and introduction of new process technologies. Plant competences are cumulative: plants
with supply chain competences already have production competence, and development
competence is built on production and supply chain competence.
Turkulainen and Blomqvist (2011) also identified three clusters of 101 Finnish
companies based on their level of competences. They used two additional competences
compared to Feldmann et al. (2013): production planning and supplying global markets.
Based on factor analysis of potential competences they identified a forth competences
bundle as compared to Feldmann et al. (2013) by splitting production competence into
process and manufacturing competences. The former contains process improvement and
technical maintenance, while the latter incorporates production planning beside production.
Process and production competence values are very similar in each cluster, so their
separation does not add too much value. Supplying global markets belongs to the
3
development competence bundle. Both Vereecke and Van Dierdonck (2002) and
Turkulainen and Blomqvist (2011) mention that even if some plants were established in
order to serve markets (contributors), through time they became a hub of knowledge,
practically reaching the competence level of leader plants.
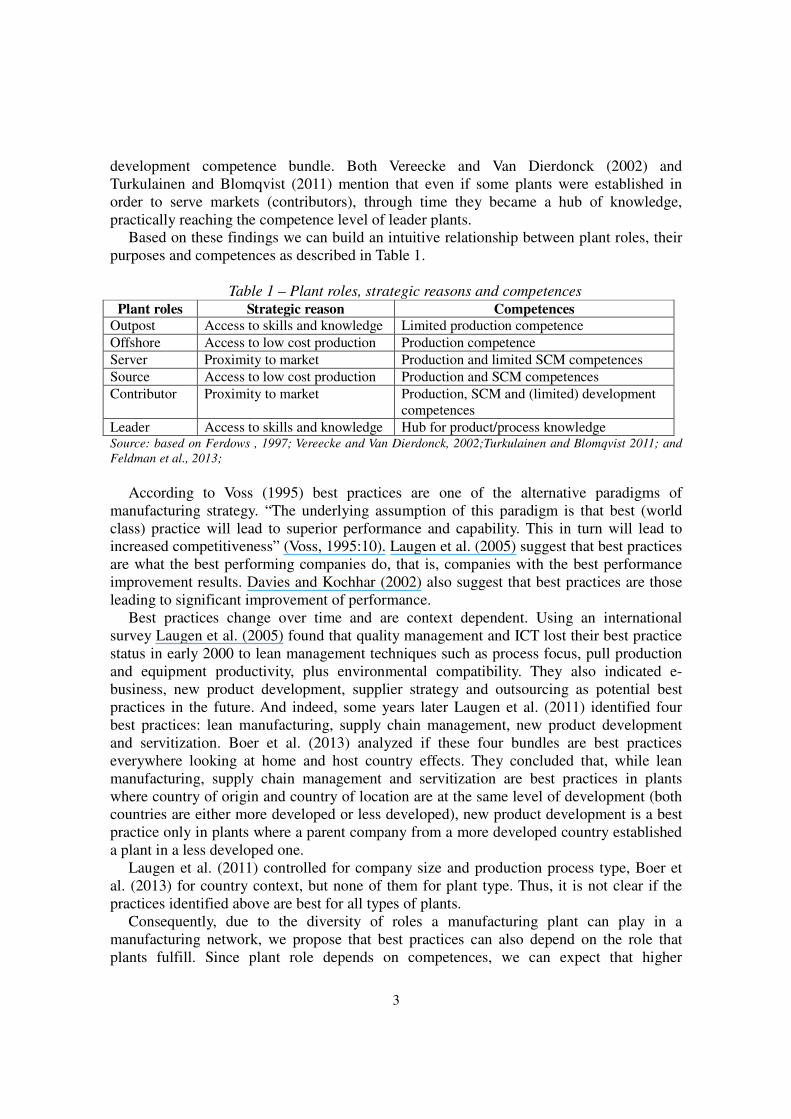
Based on these findings we can build an intuitive relationship between plant roles, their
purposes and competences as described in Table 1.
Table 1 – Plant roles, strategic reasons and competences
Plant roles Strategic reason Competences
Outpost Access to skills and knowledge Limited production competence
Offshore Access to low cost production Production competence
Server Proximity to market Production and limited SCM competences
Source Access to low cost production Production and SCM competences
Contributor Proximity to market Production, SCM and (limited) development
competences
Leader Access to skills and knowledge Hub for product/process knowledge Source: based on Ferdows , 1997; Vereecke and Van Dierdonck, 2002;Turkulainen and Blomqvist 2011; and
Feldman et al., 2013;
According to Voss (1995) best practices are one of the alternative paradigms of
manufacturing strategy. “The underlying assumption of this paradigm is that best (world
class) practice will lead to superior performance and capability. This in turn will lead to
increased competitiveness” (Voss, 1995:10). Laugen et al. (2005) suggest that best practices
are what the best performing companies do, that is, companies with the best performance
improvement results. Davies and Kochhar (2002) also suggest that best practices are those
leading to significant improvement of performance.
Best practices change over time and are context dependent. Using an international
survey Laugen et al. (2005) found that quality management and ICT lost their best practice
status in early 2000 to lean management techniques such as process focus, pull production
and equipment productivity, plus environmental compatibility. They also indicated e-
business, new product development, supplier strategy and outsourcing as potential best
practices in the future. And indeed, some years later Laugen et al. (2011) identified four
best practices: lean manufacturing, supply chain management, new product development
and servitization. Boer et al. (2013) analyzed if these four bundles are best practices
everywhere looking at home and host country effects. They concluded that, while lean
manufacturing, supply chain management and servitization are best practices in plants
where country of origin and country of location are at the same level of development (both
countries are either more developed or less developed), new product development is a best
practice only in plants where a parent company from a more developed country established
a plant in a less developed one.
Laugen et al. (2011) controlled for company size and production process type, Boer et
al. (2013) for country context, but none of them for plant type. Thus, it is not clear if the
practices identified above are best for all types of plants.
Consequently, due to the diversity of roles a manufacturing plant can play in a
manufacturing network, we propose that best practices can also depend on the role that
plants fulfill. Since plant role depends on competences, we can expect that higher
4
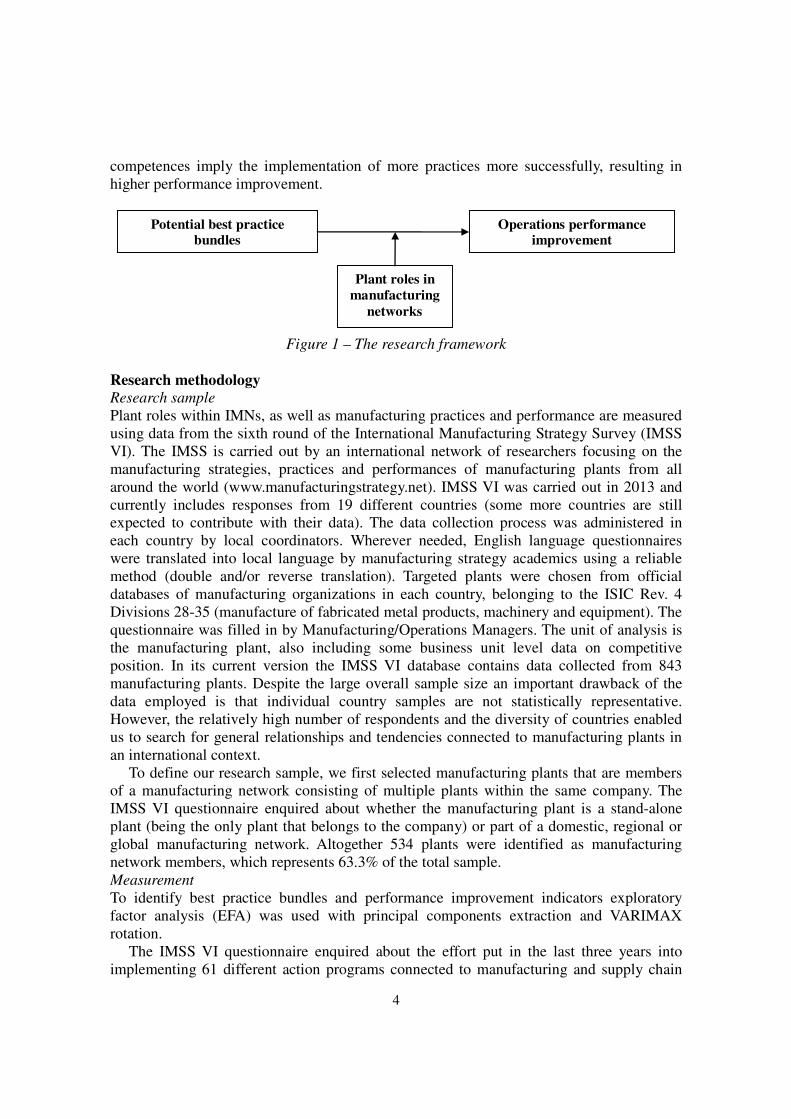
competences imply the implementation of more practices more successfully, resulting in
higher performance improvement.
Plant roles in
manufacturing
networks
Potential best practice
bundles
Operations performance
improvement
Figure 1 – The research framework
Research methodology
Research sample
Plant roles within IMNs, as well as manufacturing practices and performance are measured
using data from the sixth round of the International Manufacturing Strategy Survey (IMSS
VI). The IMSS is carried out by an international network of researchers focusing on the
manufacturing strategies, practices and performances of manufacturing plants from all
around the world (www.manufacturingstrategy.net). IMSS VI was carried out in 2013 and
currently includes responses from 19 different countries (some more countries are still
expected to contribute with their data). The data collection process was administered in
each country by local coordinators. Wherever needed, English language questionnaires
were translated into local language by manufacturing strategy academics using a reliable
method (double and/or reverse translation). Targeted plants were chosen from official
databases of manufacturing organizations in each country, belonging to the ISIC Rev. 4
Divisions 28-35 (manufacture of fabricated metal products, machinery and equipment). The
questionnaire was filled in by Manufacturing/Operations Managers. The unit of analysis is
the manufacturing plant, also including some business unit level data on competitive
position. In its current version the IMSS VI database contains data collected from 843
manufacturing plants. Despite the large overall sample size an important drawback of the
data employed is that individual country samples are not statistically representative.
However, the relatively high number of respondents and the diversity of countries enabled
us to search for general relationships and tendencies connected to manufacturing plants in
an international context.
To define our research sample, we first selected manufacturing plants that are members
of a manufacturing network consisting of multiple plants within the same company. The
IMSS VI questionnaire enquired about whether the manufacturing plant is a stand-alone
plant (being the only plant that belongs to the company) or part of a domestic, regional or
global manufacturing network. Altogether 534 plants were identified as manufacturing
network members, which represents 63.3% of the total sample.
Measurement
To identify best practice bundles and performance improvement indicators exploratory
factor analysis (EFA) was used with principal components extraction and VARIMAX
rotation.
The IMSS VI questionnaire enquired about the effort put in the last three years into
implementing 61 different action programs connected to manufacturing and supply chain

5
operations (1-5 Likert scale: 1=“None”, 5=“High”). Using EFA the multitude of action
programs was reduced to 11 factors, i.e. bundles of manufacturing practices. The resulting
practice bundles are: responsibility and quality, human resource management, technology
improvement, internal integration, customer integration, supplier integration, networking,
risk management, product development, servitization, and lean production. The
components of each factor, as well as factorability and reliability measures are presented in
Appendix 1.
In respect of performance indicators the IMSS VI questionnaire asked respondents to
indicate how their manufacturing performance has changed over the last three years on 18
operational performance indicators. Performance improvement was measured on a 5-point
scale: 1=“Decrease (-5% or worse)”, 2= “Stayed about the same (-5%/+5%)”, 3= “Slightly
increased (+5/+15%)”, 4= “Increased (+15/+25%)”, 5= “Strongly increased (+25% or
better)”. For items where lower values represent better values (e.g. cost, lead time, pollution
emission) a reverse scale was used. Factor analysis resulted in altogether three groups of
performance improvement indicators: differentiation performance, cost performance, and
green performance. The first two factors follow the logic of Porter’s (1985) two main
sources of competitive advantage (differentiation and cost), while the third one emerges as
a relatively new performance indicator (de Burgos Jimenez and Cespedes Lorente, 2001).
Details are presented in Appendix 2.
To identify different plant roles within manufacturing networks, two variables were
used: 1) respondents were asked to indicate on a 1-5 Likert scale to what extent their plant
is responsible for production, supply chain, or development, or is a hub for product/process
knowledge (1= “No responsibility”, 5= “Full responsibility”); 2) respondents also had to
indicate to what extent the following advantages apply to the location of their plant: access
to low cost resources, proximity to market, and access to knowledge and skills (1=
“Strongly disagree”, 5= “Strongly agree”). The first variable is derived from the work of
Feldman et al. (2013), Vereecke and Van Dierdonck (2002), and Turkulainen and Blomqvist
(2011). The second variable corresponds to the possible advantages identified by Ferdows
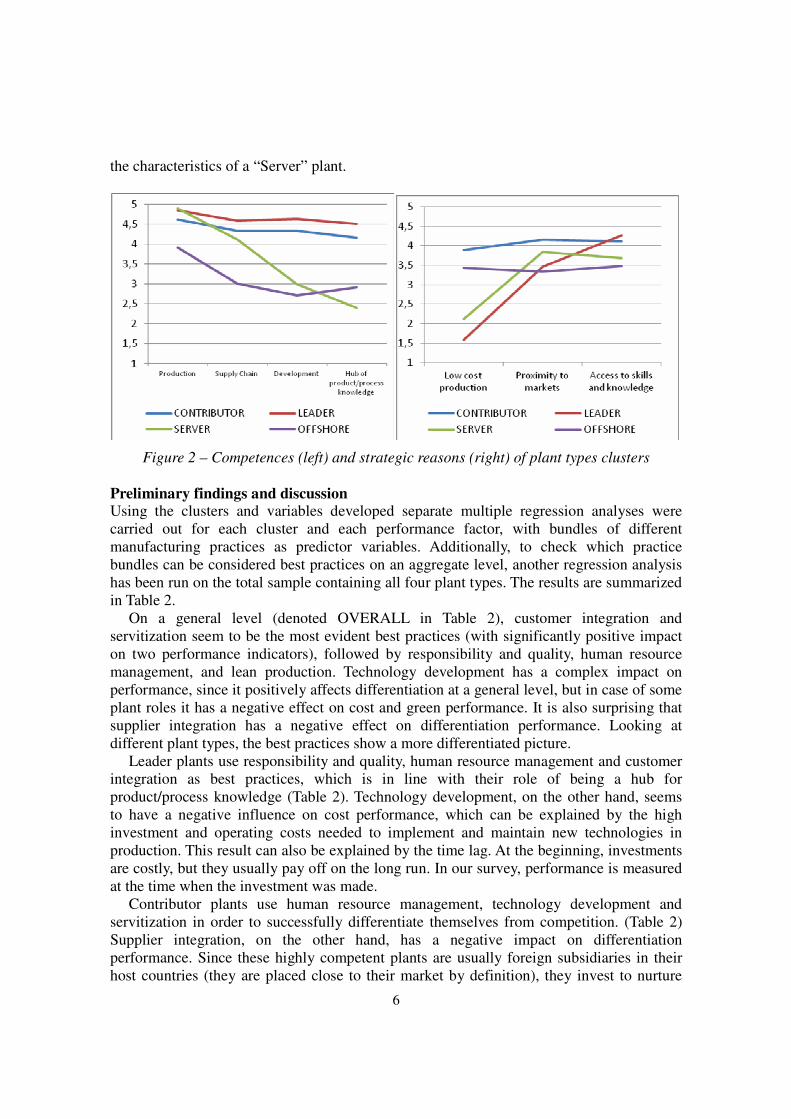
(1997). Using hierarchical cluster analysis with Ward’s method, and subsequent k-means
cluster analyses, the following four plant types (Ferdows, 1997) were identified in our
sample: 1) Leader (N=129), 2) Contributor (N=183), 3) Server (N=89), 4) Offshore
(N=107). The values of the two clustering variables for each cluster are shown in Figure 2.
The first two clusters (red and blue line in Figure 2) have clearly higher competences
than the other two clusters. Although the biggest difference between them is in low cost
motivation, for the blue cluster proximity to markets and access to skills and knowledge are
equally important, scoring highest on the proximity factor. Therefore, this cluster was
termed, based on the literature, “Contributor”. The other highly competent group (red line)
has clearly the highest competencies and is particularly focusing on access to skills and
knowledge, corresponding to the image of a hub for company know-how. Thus, this cluster
was termed “Leader”.
The two other clusters have lower competencies. The main difference is that the purple
cluster (Figure 2) concentrates solely on production, and has far more advantages from low
cost production, which altogether point towards the characteristics of an “Offshore” plant.
The cluster marked with green line has rather high competences not only in production, but
to some extent in supply chain management as well. Low cost reasons do not play an
important role, contrary to the proximity to markets factor, which altogether point towards
6
the characteristics of a “Server” plant.
Figure 2 – Competences (left) and strategic reasons (right) of plant types clusters
Preliminary findings and discussion Using the clusters and variables developed separate multiple regression analyses were
carried out for each cluster and each performance factor, with bundles of different
manufacturing practices as predictor variables. Additionally, to check which practice
bundles can be considered best practices on an aggregate level, another regression analysis
has been run on the total sample containing all four plant types. The results are summarized
in Table 2.
On a general level (denoted OVERALL in Table 2), customer integration and
servitization seem to be the most evident best practices (with significantly positive impact
on two performance indicators), followed by responsibility and quality, human resource
management, and lean production. Technology development has a complex impact on
performance, since it positively affects differentiation at a general level, but in case of some
plant roles it has a negative effect on cost and green performance. It is also surprising that
supplier integration has a negative effect on differentiation performance. Looking at
different plant types, the best practices show a more differentiated picture.
Leader plants use responsibility and quality, human resource management and customer
integration as best practices, which is in line with their role of being a hub for
product/process knowledge (Table 2). Technology development, on the other hand, seems
to have a negative influence on cost performance, which can be explained by the high
investment and operating costs needed to implement and maintain new technologies in
production. This result can also be explained by the time lag. At the beginning, investments
are costly, but they usually pay off on the long run. In our survey, performance is measured
at the time when the investment was made.
Contributor plants use human resource management, technology development and
servitization in order to successfully differentiate themselves from competition. (Table 2)
Supplier integration, on the other hand, has a negative impact on differentiation
performance. Since these highly competent plants are usually foreign subsidiaries in their
host countries (they are placed close to their market by definition), they invest to nurture

7
their suppliers, which is a long-term investment. Like the leader plants, contributor plants
benefit from responsibility and quality practices to improve their “green” performance.
Table 2 – Results of the multiple regression analyses
Performance
Practices
Differentiation
performance Cost performance
“Green”
performance
Responsibility and quality - -
OVERALL***
Contributor**
Leader*
Server*
Human resource management
OVERALL***
Contributor**
Leader*
Leader**
-
Technology development
OVERALL*
Contributor**
- Leader***
- Server*
Internal integration - - -
Customer integration OVERALL***
Leader**
OVERALL**
Leader***
Supplier integration - OVERALL***
- Contributor * - -
Networking Server*
Risk management - - -
Product development - - -
Servitization
OVERALL***
Contributor*
Offshore*
OVERALL**
Server**
Lean production - - OVERALL**
Server*
Server plants use networking as best practice to reach high differentiation performance
improvement, which is not surprising considering that these plants need to develop their
competences (by learning from others) in order to reach higher plant roles. Beside the
negative impact of (the probably not environmentally friendly) technology, server plants
use many different practices to increase their green performance: responsibility and quality,
servitization and lean production.
Offshore plants appear to have few best practices, as their role is to supply the network
with low cost products. Servitization seems to be the only means to differentiate themselves
to some extent from competition, i.e. by not just producing at the lowest possible cost, but
offering services as well alongside its products.
Altogether, at more competent plants (leader and contributor) more operations
management practices pay off, partly because they probably use more of them, and partly
because they implement practices more professionally. This professionalism is supported by
the heavy use of human resource management practices, which can lead to learning
organizations and the utilization of employee intelligence. Server plants seem to pay
8
particular attention to green performance when implementing various practices. Offshore
plants have the most limited toolbox to improve their performance.
Conclusion Using a wider range of countries, industries, and manufacturing practices compared to
previous studies, the preliminary findings of this research reveal that the “goodness” of
manufacturing practices depends on plant role.
The picture emerging from the analysis presented in this paper is that the more
competent leader and contributor plants successfully use a wider set of operations
management practices than the less competent server and offshore plants. Differentiation
and “green” are the hot performance areas, and the more competent plants tend to use
different practices to affect these performance criteria.
Practices that are best for one type of plant are not necessarily best (e.g. human resource
management, networking), and may actually have negative effects (e.g. technology
development), for some or all the other types. Most practices affect one performance
indicator; only two practices, notably human resource management and customer
integration affect two of the three performance indicators – in both cases this concerns the
leaders’ performance. Most of the findings reported above are consistent with the nature of
the types of plants distinguished in this paper.
Finally, internal integration, risk management and product development do not emerge
as best practices for any of the four plant types. This may be due to the relative maturity of
internal integration, the nature of risk management, and the fact companies have only
recently started to offshore product development operations.
Further research will include manufacturing plant level data from countries not yet
included in the IMSS VI database. Furthermore, there are some limitations worth
considering for further research. First, we did not control for some important variables,
such as company size or country. Second, due to the cross-sectional nature of our survey,
the long term impact of some practice implementations cannot be followed, even if the
long-term positive impact of some practices can be far beyond the short term negative
implications. Further research, probably using a longitudinal dataset is needed to reveal
these long-term implications. Such a dataset would also help identify whether there is one
best trajectory for developing a plant to a higher competence level or if any trajectory will
do.
References
Boer, H., Demeter, K., and Szász, L. (2013): Are best manufacturing practices best everywhere? The effects
of country characteristics on manufacturing practices and performance, paper presented at the 20th
EurOMA conference, Dublin.
Cagliano, R., Blackmon, K. and Voss, C. (2001), “Small firms under MICROSCOPE: international
differences in production/operations management practices and performance”, Integrated Manufacturing
Systems, Vol. 12, Nos. 6/7, pp. 469–482.
Cheng, Y. (2011), Strategic role of manufacturing: from reactive to proactive and from plant to network, PhD
dissertation, Center for Industrial Production, Aalborg University.
Cheng, Y. Farooq, S., and Johansen, J. (2011), “Manufacturing network evolution: a manufacturing plant
perspective”, International Journal of Operations and Production Management, Vol. 31, No. 12, pp. 1311-
1331. Davies, A.J. and Kochhar, A.K. (2002), “Manufacturing best practice and performance studies: a critique”,
International Journal of Operations & Production Management, Vol. 22, No. 3, pp. 289-305.

9
De Burgos Jimenez, J. and Cespedes Lorente, J.J. (2001), “Environmental performance as strategic
objective”, International Journal of Operations & Production Management, Vol. 21, No. 12, pp. 1553-
1572.
Feldmann, A., Olhager, J., Fleet, D., and Shi, Y. (2013), “Linking networks and plant roles: the impact of
changing a plant role”, International Journal of Production Research, Vol. 51, No. 19, pp. 5696-5710.
Feldmann, A., Olhager, J. and Persson, F. (2009), "Designing and managing manufacturing networks - a
survey of Swedish plants." Production Planning and Control. Vol. 20, No. 2, pp. 101-112.
Ferdows, K. (1997), “Making the most of foreign factories”, Harvard Business Review, March-April, pp. 73-
88. Laugen, B.T., Acur, N., Boer, H. and Frick, J. (2005), “Best manufacturing practices: what do the best-
performing companies do?”, International Journal of Operations & Production Management, Vol. 25, No.
2, pp. 131-150.
Laugen, B.T., Boer, H. and Acur, N. (2011), “Best manufacturing practices: bundles and performance”,
Proceedings 12th International CINet Conference on Continuous Innovation: Doing more with less,
Aarhus University, Aarhus, Denmark, 11-13 September.
Miltenburg, J. (2009): “Setting manufacturing strategy for a company’s international manufacturing network”,
International Journal of Production Research, Vol. 47, No. 22, pp. 6179-6203.
Oliver, N., Delbridge, R. and Lowe, J. (1996), “The European auto components industry: manufacturing
performance and practice”, International Journal of Operations & Production Management, Vol. 16,
No.11, pp. 85-97.
Porter, M.E. (1985), Competitive advantage: creating and sustaining superior performance, The Free Press,
New York.
Turkulainen, V. and Blomqvist, M. (2011), “Plant roles in high cost countries. A survey analysis of
manufacturing networks in the Northern Europe”, 18th International Annual EurOMA Conference,
Cambridge, UK.
Vastag, G. and Whybark, D. (1991), “Manufacturing practices: differences that matter”, International Journal
of Production Economics, Vol. 23, Nos. 1-3, pp. 251-259.
Vereecke, A. and Van Dierdonck, R. (2002), “The strategic role of the plant: testing Ferdows’s model”,
International Journal of Operations & Production Management, Vol. 22, No. 5, pp. 492-514.
Voss, C.A. (1995), Alternative paradigms for manufacturing strategy, International Journal of Operations &
Production Management, Vol. 15, No. 4, pp. 5-16.
Voss, C. and Blackmon, K. (1996), “The impact of national and parent company origin on world-class
manufacturing: findings from Britain and Germany”, International Journal of Operations & Production
Management, Vol. 16, No. 11, pp. 98-115.
Appendix 1 – Bundles of manufacturing practices
Factor/variables Factor
loading Factor/variables
Factor
loading
Responsibility and quality (α=.923) Customer integration (α=.862)
Environmental certifications .735 Sharing information with customers .718
Social certifications .707 Developing collaborative approaches with
key customers .734
Formal sustainability oriented
communication, training programs .738 System coupling with customers .696
Energy/water consumption reduction .671 Joint decision making with customers .651
Pollution emission reduction and waste
recycling programs .698 System coupling with key suppliers .481
Health and safety management .657 Networking (α=.857)
Work/life balance policies .528 Information sharing in the network .753
Suppliers’ sustainability performance
assessment .480 Joint decision making in network .708
Training/education in sustainability issues
for suppliers’ personnel .461 Innovation sharing in the network .636
Joint efforts with suppliers to improve
their sustainability .460 Communication with other plants .724

10
Improving equipment availability .442 Network performance management .640
Benchmarking/self-assessment .448 Risk management (α=.843)
Human resource management (α=.830) Preventing operations risks .690
Delegation and knowledge .656 Detecting operations risks .699
Open communication between workers
and managers .665 Responding to operations risks .666
Lean organization .669 Recovering from operations risks .648
Continuous improvement programs .581 Product development (α=.859)
Autonomous teams .554 Design integration .464
Workers flexibility .717 Organizational integration .401
Technology development (α=.802) Technological integration .435
Use of advanced processes .700 Integrating tools and techniques .450
“The factory of the future” .650 Communication technologies .564
Process automation programs .586 Forms of process standardization .648
Increasing information integration .405 Servitization (α=.770)
Product/part tracking and tracing .550 Expanding the service offering .810
Internal integration (α=.872) Developing the skills needed for services .766
Sharing information with purchasing
department .793
Designing products so that the after sales
service is easier to manage/offer .600
Joint decision making with purchasing
department .743 Lean production (α=.725)
Sharing information with sales
department .749 Process focus and streamlining .707
Joint decision making with sales
department .762 Implementing pull production .597
Supplier integration (α=.815)
Sharing information with suppliers .600
Developing collaborative approaches
with key suppliers .562
Joint decision making with suppliers .564
International sourcing strategy .401
KMO =.943, Bartlett’s test χ2(1830)=13701.35 with p<.001, factor loadings>.40, TVE=63.14% by 11 factors
Appendix 2 – Factors of performance improvement
Factor/variables Factor
loading Factor/variables
Factor
loading
Differentiation performance (α=.898) Cost performance (α=.752) Quality and reliability .718 Unit manufacturing cost .803
Product assistance/support .714 Manufacturing lead time .757
Delivery reliability .712 Ordering costs .712
Delivery speed .697 Procurement lead time .619
New product introduction .678 Green performance (α=.733) Customer service quality .657 Pollution/waste production .708
Conformance quality .654 Materials/water/energy cons .691
Customization .648 Workers motivation/satisfaction .646 Volume flexibility .634 Mix flexibility .618 Health and safety .615
KMO =.897, Bartlett’s test χ2(153)=5459.7 with p<.001, factor loadings>.60, TVE=55.66% by 3 factors