DNA mismatch repair MSH2 gene-based SNP associated with different populations
19
1 3 Mol Genet Genomics DOI 10.1007/s00438-014-0826-4 ORIGINAL PAPER DNA mismatch repair MSH2 gene‑based SNP associated with different populations Zainularifeen Abduljaleel · Faisal A. Al‑Allaf · Wajahatullah Khan · Mohammad Athar · Naiyer Shahzad · Mohiuddin M. Taher · Mohammed Alanazi · Mohamed Elrobh · Narasimha P. Reddy Received: 3 November 2013 / Accepted: 21 January 2014 © Springer-Verlag Berlin Heidelberg 2014 Chinese in Beijing, China (CHB), and a population of Mex- ican ancestry in Los Angeles, California (MEX). A gene- based SNP association analysis analyzes the combined impact of every variant within the gene while creating referrals to linkage disequilibrium or connections between markers. Our results indicated that among the four popu- lations studied, this association was highest in the MEX population based on the r 2 value; a similar pattern was also observed in the other three populations. The relevant SNP rs748780 in KCNK12 is related to a superfamily of potas- sium channel pore-forming P-domain proteins as well as to other non-pore-forming proteins and has been shown to be relevant to neurological disorder predisposition in MEX as well as in other populations. Keywords Single-nucleotide polymorphisms · MSH2 gene · KCNK12 gene · Association test · DNA mismatch repair gene Introduction DNA mismatch repair (MMR) mechanisms protect cells from genomic instability. Mutations in the human MMR genes MutS homolog 2 (MSH2) and MutL homolog 1 (MLH1) are the cause of most hereditary nonpolyposis colorectal cancers (HNPCCs) (Peltomaki and Vasen 1997). DNA repair mechanisms are fundamental importance for the preservation of genomic stability in opposition to envi- ronmental carcinogens and replication errors, and defects in DNA mismatch repair considerably increase susceptibil- ity to several types of cancer. More than 125 genes have been implicated in DNA damage repair in humans (Hoei- jmakers 2001; Ronen and Glickman 2001). As many as 10 % of colorectal cancers, the second most common cause Abstract We screened for the major essential single- nucleotide polymorphism (SNP) variant that might be associated with the MSH2 gene based on the data available from three types of human tissue samples [156 lympho- blastoid cell variations (LCL), 160 epidermis, 166 fat]. An association analysis confirmed that the KCNK12 SNP vari- ant (rs748780) was highly associated (p value 9 × 10 −4 ) with the MSH2 gene for all three samples. Using SNP iden- tification, we further found that the recognized SNP was also relevant among Hapmap populations. Techniques that display specific SNPs associated with the gene of interest or nearby genes provide more reliable genetic associations than techniques that rely on data from individual SNPs. We investigated the MSH2 gene regional linkage associa- tion with the determined SNP (rs748780), KCNK12 vari- ant (Allele T>C) in the intronic region, in HapMap3 full dataset populations, Yoruba in Ibadan, Nigeria (YRI), Utah residents with ancestry from northern Europe (CEU), Han Communicated by S. Hohmann. Z. Abduljaleel (*) · F. A. Al Allaf · M. Athar · M. M. Taher Department of Medical Genetics, College of Medicine, Umm Al-Qura University, Makkah, Saudi Arabia e-mail: [email protected] W. Khan Department of Basic Sciences, College of Science and Health Professions, King Saud Bin Abdul Aziz University for Health Sciences, Riyadh 11426, Saudi Arabia N. Shahzad Department of Pharmacology and Toxicology, College of Medicine, Umm Al-Qura University, Makkah, Saudi Arabia M. Alanazi · M. Elrobh · N. P. Reddy Genome Research Chair Unit, Department of Biochemistry, College of Science, King Saud University, Riyadh, Saudi Arabia
Transcript of DNA mismatch repair MSH2 gene-based SNP associated with different populations
1 3
Mol Genet GenomicsDOI 10.1007/s00438-014-0826-4
OrIGInal PaPer
DNA mismatch repair MSH2 gene‑based SNP associated with different populations
Zainularifeen Abduljaleel · Faisal A. Al‑Allaf · Wajahatullah Khan · Mohammad Athar · Naiyer Shahzad · Mohiuddin M. Taher · Mohammed Alanazi · Mohamed Elrobh · Narasimha P. Reddy
received: 3 november 2013 / accepted: 21 January 2014 © Springer-Verlag Berlin Heidelberg 2014
Chinese in Beijing, China (CHB), and a population of Mex-ican ancestry in los angeles, California (MeX). a gene-based SnP association analysis analyzes the combined impact of every variant within the gene while creating referrals to linkage disequilibrium or connections between markers. Our results indicated that among the four popu-lations studied, this association was highest in the MeX population based on the r2 value; a similar pattern was also observed in the other three populations. The relevant SnP rs748780 in KCNK12 is related to a superfamily of potas-sium channel pore-forming P-domain proteins as well as to other non-pore-forming proteins and has been shown to be relevant to neurological disorder predisposition in MeX as well as in other populations.
Keywords Single-nucleotide polymorphisms · MSH2 gene · KCnK12 gene · association test · Dna mismatch repair gene
Introduction
Dna mismatch repair (MMr) mechanisms protect cells from genomic instability. Mutations in the human MMr genes MutS homolog 2 (MSH2) and Mutl homolog 1 (MlH1) are the cause of most hereditary nonpolyposis colorectal cancers (HnPCCs) (Peltomaki and Vasen 1997). Dna repair mechanisms are fundamental importance for the preservation of genomic stability in opposition to envi-ronmental carcinogens and replication errors, and defects in Dna mismatch repair considerably increase susceptibil-ity to several types of cancer. More than 125 genes have been implicated in Dna damage repair in humans (Hoei-jmakers 2001; ronen and Glickman 2001). as many as 10 % of colorectal cancers, the second most common cause
Abstract We screened for the major essential single-nucleotide polymorphism (SnP) variant that might be associated with the MSH2 gene based on the data available from three types of human tissue samples [156 lympho-blastoid cell variations (lCl), 160 epidermis, 166 fat]. an association analysis confirmed that the KCNK12 SnP vari-ant (rs748780) was highly associated (p value 9 × 10⁻⁴) with the MSH2 gene for all three samples. Using SnP iden-tification, we further found that the recognized SnP was also relevant among Hapmap populations. Techniques that display specific SnPs associated with the gene of interest or nearby genes provide more reliable genetic associations than techniques that rely on data from individual SnPs. We investigated the MSH2 gene regional linkage associa-tion with the determined SnP (rs748780), KCNK12 vari-ant (allele T>C) in the intronic region, in HapMap3 full dataset populations, Yoruba in Ibadan, nigeria (YrI), Utah residents with ancestry from northern europe (CeU), Han
Communicated by S. Hohmann.
Z. abduljaleel (*) · F. a. al allaf · M. athar · M. M. Taher Department of Medical Genetics, College of Medicine, Umm al-Qura University, Makkah, Saudi arabiae-mail: [email protected]
W. Khan Department of Basic Sciences, College of Science and Health Professions, King Saud Bin abdul aziz University for Health Sciences, riyadh 11426, Saudi arabia
n. Shahzad Department of Pharmacology and Toxicology, College of Medicine, Umm al-Qura University, Makkah, Saudi arabia
M. alanazi · M. elrobh · n. P. reddy Genome research Chair Unit, Department of Biochemistry, College of Science, King Saud University, riyadh, Saudi arabia

Mol Genet Genomics
1 3
of cancer-related deaths in developed countries, occur as a result of major penetrant alleles that are transmitted in an autosomal dominant manner (abdel-rahman et al. 2006; Peltomaki 2001). The key tasks of MMr-related proteins are to detect and repair mismatches, including short inser-tions and deletions, throughout the cell cycle (Iyer et al. 2006). Based on linkage and mutation research, mutations in MSH2 account for a large share of HnPCCs (nystrom-lahti et al. 1994; liu et al. 1996). In the research reported to date, fractions of HnPCC (30 %) do not exhibit germ-line mutations in Dna mismatch repair genes, even when studied by the sophisticated strategies presently avail-able (liu et al. 1996). In the current study, we discovered that a variant of MSH2 is linked with KCNK12, a gene that belongs to a family of potassium channel genes and is approximately 50 kb in length with two exons (Bayliss and Barrett 2008). Despite the fact that KCNK channels were discovered only recently, the known KCNK channels already outnumber a variety of different channel types. KCNK channels possess a distinctive structure in that each of their subunits consists of two pore-forming domains. These channels perform in a unique way via extremely tightly regulated potassium-selective leak channels. KCNK channels have been tested in four independent migraine case and control studies in the netherlands, Germany, and australia; these studies included approximately 2,835 unrelated migraine cases and 2,740 unrelated controls for single-nucleotide polymorphisms (SnPs) within 12 genes (KCNB2, KCNQ3, CLIC5, ATP2C2, CACNA1E, CACNB2, KCNE2, KCNK12, KCNK2, KCNS3, SCN5A, and SCN9A) and found some potential affiliation (0.00041 < p < 0.005) within the Finnish samples (Mochi et al. 1993). KCNK12 genes have been associated with a migraine site (OMIM no. 157300), a typical neurovascular disorder, as a poten-tial genetic marker (Goldstein et al. 2001). no linkages of susceptibility variants for common forms of migraine have been consistently reported despite the fact that genetic vari-ants for Mendelian forms of migraine are well recognized.
The present study examines gene-based SnP asso-ciations based on the collective impact of each variant throughout the MSH2 gene while also accounting for linkage disequilibrium (lD) or correlation among mark-ers. In concept, this approach should detect associations missed by conventional SnP-based genome-wide associa-tion studies (GWaSs). related to this strategy is “multilo-cus fitting”, an emerging area in quantitative genetics that can be used to investigate complex traits. Some multilocus analyses exploit statistical strategies devoted to managing high-dimensional level information, together with regular-ized regression analysis comparable to ridge regression, the Bayesian lasso, and neural network models (Sun et al. 2009; Wu et al. 2009; Ott 2001). By aggregating a number of SnP effects in a single statistical evaluation, gene-based
strategies also reduce the effectual variety of statistical tests. The current examination successfully identified a highly dynamic variant of the MSH2 gene that is associ-ated with an SnP marker in the KCNK12 gene involved in neurological disorder potassium channel activity and con-firmed this association by lD analysis in several popula-tions. Taken together, the results illustrate that this type of analysis may be helpful in high-throughput genotyping, analysis of gene regions with closely spaced SnPs, and research on the association of genetic markers and that it can be utilized to detect variations with the genome.
Results
SnP association based on GWaSs and populations
We investigated expression quantitative trait loci (eQTl) associations within a gene locus of interest in real time as functional variants in a tissue-dependent manner (nica et al. 2011). The MSH2 gene structure was studied for lD patterns with haplotype, and SnP regional association was linked with KCNK12 and potassium channel activity with neurological disorder predisposition in a population of Mexican ancestry in los angeles, California (MeX). a lD report was obtained for the entire MSH2 isoform 1 (~23 kbp) in reverse orientation (3′-5′) on the long arm of chromosome 2. a particular nucleotide polymorphism,
Fig. 1 MSH2 SnPs from our study based on our study population. SnPs of rs748780 (the one from our study is shown in black) with an association p value of 9 × 10⁻⁴ (−log1102) in the MSH2 gene regions are shown based on their relative position in the HapMap MeX dataset (phase 1 and 2, full dataset). The red dots indicate sig-nificant SnPs with p values of 9 × 10⁻⁴; the positions of these SnPs on the lD diagram are indicated by black squares. The y-axis depicts log(10) p values on a minus logarithmic scale; the x-axis signifies the positions of the SnPs along the chromosome. a The lD structure was created with the GOlD heat map Haploview 4.0 color scheme using the standardized disequilibrium coefficient. b and c lD profile of the entire MSH2 isoform 1 spanning approximately 23 kbp. The gene is in reverse orientation (3′ 5′) on the q arm of chromosome 2, and d estimates of the lD parameter (r2); colors are coded according to the scale shown at the bottom left. The ideogram of chromosome 2(P21) indicates the position of MSH2. Genevar conducted a haplo-type association scanning. The red dots indicate the peaks of negative logarithm of p values (log(10)p) of fixed-width window haplotype association. To evaluate the association of sub-haplotypes (subsets of alleles from the full haplotype) with potassium channel susceptibil-ity in the MeX population, we evaluated a window of alleles by slid-ing a fixed-width window (one SnP) across the entire haplotype in a gene. The MSH2 gene structure of lD patterns, together with the results of haplotype and SnP regional association, illustrates a link with KCNK12 and potassium channel activity predisposition with neurological disorder in MeX, a Mexican ancestry population in los angeles, California. note that this method uses one SnP to evaluate the sub-haplotype score and test the significance; the SnP (the sub-haplotype) will have a single p value (color figure online)
▸

Mol Genet Genomics
1 3
rs748780, was confirmed with strong association (p value 7.9 × 10⁻⁴; −log103.102) in MSH2 gene regions based on their implicit position on the HapMap MeX dataset (phase 1 and full dataset) (Fig. 1a–c). The red spots were used to designate peaks associated with detrimental logarithm p
values [−log(10)p] of fixed-width window haplotype asso-ciations. This procedure utilized successive SnPs to study the sub-haplotype ratings and analyze their significance; in this method, the single SnPs (the sub-haplotype) could have a single p value of 7.9 × 10⁻⁴. Haplotype frequencies

Mol Genet Genomics
1 3
of the HapMap were chosen for the SnPs within the MSH2 gene in the MeX population (Fig. 2a–b). The outcome indicates that haplotypes 1 and 87 are highly important var-iation blocks and demonstrates the relative frequency with which a given haplotype is related to the haplotype within the adjoining block (boldface sort indicates frequency of >5 %). Uncontrolled SnPs, although different methods yield different levels of association for a given gene, the results are correlated. Between the three methods to derive pemp values, we observe an average Spearman rank cor-relation coefficient, when considering the top 2 genes (MSH2 and KCnK12). The average Spearman rank corre-lation coefficient between the three methods before deriv-ing pemp values, That was controlling for the number of
variants per gene and linkage disequilibrium was only 0.37, which reflects the different biases introduced by the meth-ods to derive gene-wide test statistics. The pemp values are controlled for the number of SnPs per gene and the cor-relation structure. We convert the combined test statistics to p values assuming test statistics have a χ12 distribution. These uncontrolled p values are plotted against the pemp values for all three methods.
Genetic information networks based on association studies
The initial association study was performed using a genome data network (GIn) program in which the nodes correspond to the biological database. The GIn program
Fig. 2 Haplotype frequencies of the HapMap-selected SnPs in the MSH2 gene in the MeX population. In each haplotype, the blue bars represent allele 1, whereas the red bars represent allele 2 for corre-lated SnPs. The numbers shown next to each haplotype bar are hap-lotype frequencies. The upside-down red triangles indicate SnPs in the populations. In the crossing areas, a value of multiallelic D′
is indicated to signify the level of recombination between the two blocks. a Haplotype 1; b Haplotype 87, a highly significant varia-tion block. The thickness of the lines represents the relative frequency with which a given haplotype is associated with the haplotype in the adjacent block (boldface type = frequency of >5 %) (color figure online)

Mol Genet Genomics
1 3
carries out a process that begins with an SnP and ends at the terminal node with the calculation of the SnP’s gen-eral prioritization score “S”. The general score represents a cumulative measure of biological relevance obtained by combining information across multiple domains. Thus, if an SnP is within one gene, it is linked to the gene nodes; this link enhances its overall score and has the potential to link the gene to a biological phenomenon associated with the disease. The extent of precedence may be achieved on a per-gene basis by using a numeric prioritization score. This score is demonstrated for the original listing of SnPs of the full-length MSH2/KCNK12 gene, which are ranked based primarily on the combination of evidence for their asso-ciation and the extent of their biological relevance. Thus, as a substitute for rating the SnPs solely based on their p values, SnPs specifying genes with missense mutations also have greater precedence. The network scoring was generated based on the set parameters (Table 1). a genome information network created utilizing GraphViz (http://www.graphviz.org) displays how the overall genome infor-mation network prioritization scores for rs748780 were obtained (Fig. 3a, b). In this network, we studied MSH2 and KCNK12 genes separately. We initially targeted MSH2 gene intron function using a score of 1.00 based on the SnP rs748780 calculated by its r2 ratio of 0.95; the lD penalty was 0.90 linked with lD proxy rs2347794. The area linked with the SnP’s lD proxy score was 2.00; calculation of the further interaction with lD indicated that the r2 proxy
rating was 0.90 × 0.95 × 2.00, which equals 1.71 (Fig. 3a). Following KCNK12 gene analysis, the functional intron region was determined in accordance with the 1.00 rating based on the fixed parameter (Fig. 3b). The evolutionar-ily conserved regions (eCrs) were completely different between the two genes; i.e., MSH2 (0.75)/KCNK12 (0.00). Finally, the rs7489780 sum index link rating was 1.56; tra-versing the network diagram from left to proper and adding the scores from numerous nodes computed the total prior-itization rating.
Platform comparisons for MSH2 and KNCK12 genes in different populations
The multilocus lD population information results were based on SnPs (Table 2). The marker density (MD) distri-bution of the MSH2/KCNK12 genes on selected platforms is shown in Table 3. The results of platform comparison (affy6 and ill1M) for the genes MSH2 and KCNK12 based on populations CeU and YrI are shown in Fig. 4a, b. The parameter set for gene MSH2/KCNK12 obtained for SnPs inside the gene and up to 2 kb from the gene, all of which were SnPs with predicted expression p values of <0.001 and >10, also engaged copy number of variants (CnVs) with predicted expression p values of <0.001 for the two populations. We used SCan, a web-based inter-face program featuring a large-scale database, for inher-ited and genomic data information. Because GWaSs
Table 1 Genomic information network scoring parameters
ECRs evolutionary conserved regions, LD linkage disequilibrium (r2 = 1.00); MAX maximum, the default, MIN minimum, SUM, or AVG average
Item Values Description
Gene/function link index—frameshift 3.00 –
Gene/function link index—nonsense 3.00 –
Gene/function link index—missense 2.00 –
Gene/function link index—5′ splice 2.50 –
Gene/function link index—3′ splice 2.50 –
Gene/function link index—coding synonymous 1.50 –
Gene/function link index—5′ UTr 1.50 –
Gene/function link index—3′ UTr 1.50 –
Gene/function link index—intron 1.00 –
Gene/function link index—near gene 5′ 0.75 –
Gene/function link index—near gene 3′ 0.75 –
Using PolyPhen for scoring 1 replaces link index if set
PolyPhen scoring—benign 1.00 –
PolyPhen scoring—possibly damaging 2.00 –
PolyPhen scoring—probably damaging 3.00 –
eCr factor 0.75 –
lD penalty 0.5 –
Default score 1 assigned when a score is missing in the gene/query list
MaX What do to when multiple scores are specified for the same item (MaX, MIn, aVG, SUM)
Mol Genet Genomics
1 3
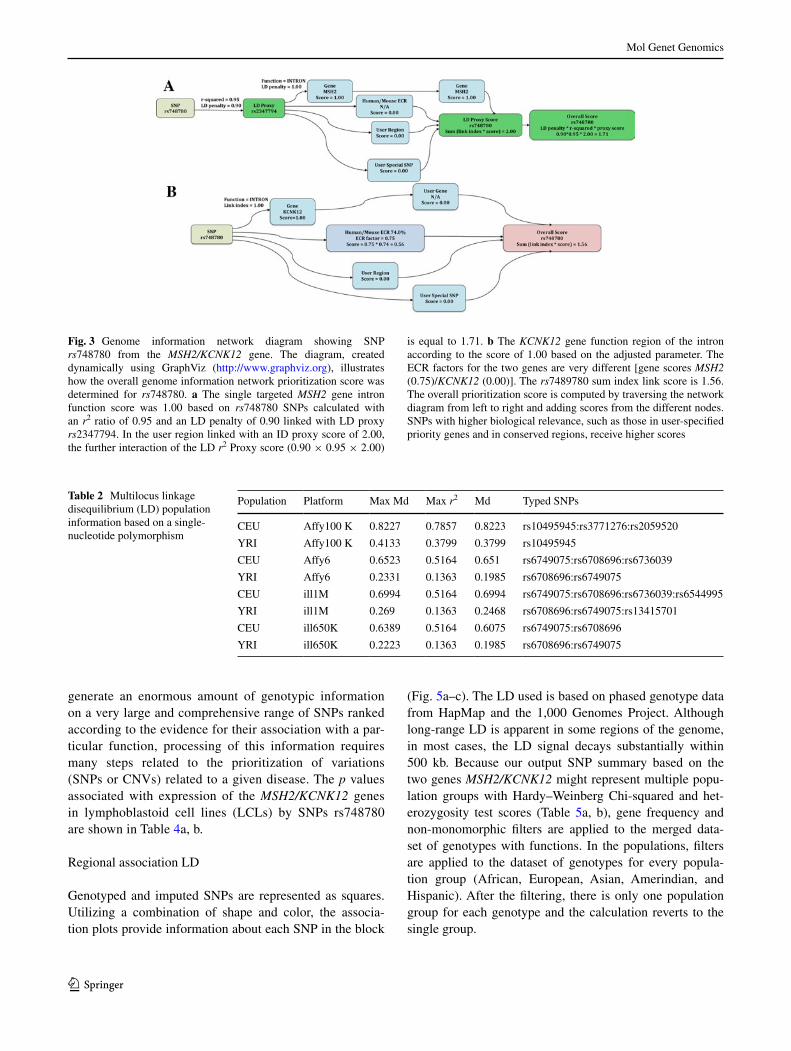
generate an enormous amount of genotypic information on a very large and comprehensive range of SnPs ranked according to the evidence for their association with a par-ticular function, processing of this information requires many steps related to the prioritization of variations (SnPs or CnVs) related to a given disease. The p values associated with expression of the MSH2/KCNK12 genes in lymphoblastoid cell lines (lCls) by SnPs rs748780 are shown in Table 4a, b.
regional association lD
Genotyped and imputed SnPs are represented as squares. Utilizing a combination of shape and color, the associa-tion plots provide information about each SnP in the block
(Fig. 5a–c). The lD used is based on phased genotype data from HapMap and the 1,000 Genomes Project. although long-range lD is apparent in some regions of the genome, in most cases, the lD signal decays substantially within 500 kb. Because our output SnP summary based on the two genes MSH2/KCNK12 might represent multiple popu-lation groups with Hardy–Weinberg Chi-squared and het-erozygosity test scores (Table 5a, b), gene frequency and non-monomorphic filters are applied to the merged data-set of genotypes with functions. In the populations, filters are applied to the dataset of genotypes for every popula-tion group (african, european, asian, amerindian, and Hispanic). after the filtering, there is only one population group for each genotype and the calculation reverts to the single group.
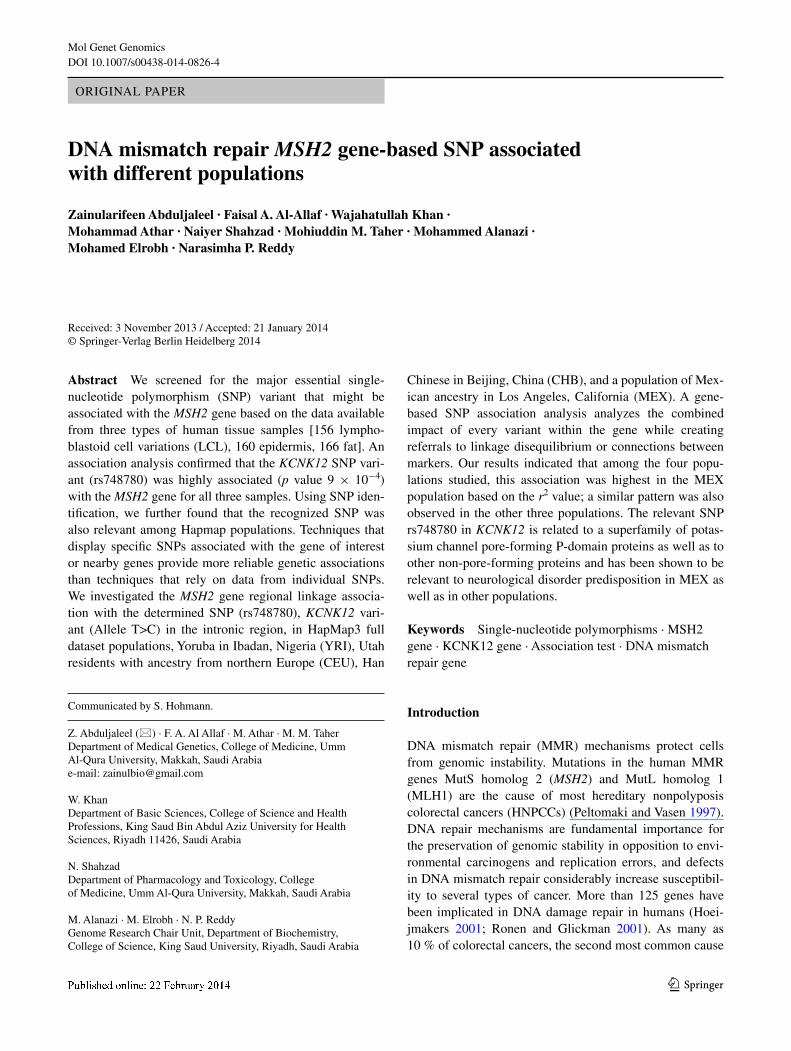
Fig. 3 Genome information network diagram showing SnP rs748780 from the MSH2/KCNK12 gene. The diagram, created dynamically using GraphViz (http://www.graphviz.org), illustrates how the overall genome information network prioritization score was determined for rs748780. a The single targeted MSH2 gene intron function score was 1.00 based on rs748780 SnPs calculated with an r2 ratio of 0.95 and an lD penalty of 0.90 linked with lD proxy rs2347794. In the user region linked with an ID proxy score of 2.00, the further interaction of the lD r2 Proxy score (0.90 × 0.95 × 2.00)
is equal to 1.71. b The KCNK12 gene function region of the intron according to the score of 1.00 based on the adjusted parameter. The eCr factors for the two genes are very different [gene scores MSH2 (0.75)/KCNK12 (0.00)]. The rs7489780 sum index link score is 1.56. The overall prioritization score is computed by traversing the network diagram from left to right and adding scores from the different nodes. SnPs with higher biological relevance, such as those in user-specified priority genes and in conserved regions, receive higher scores
Table 2 Multilocus linkage disequilibrium (lD) population information based on a single-nucleotide polymorphism
Population Platform Max Md Max r2 Md Typed SnPs
CeU affy100 K 0.8227 0.7857 0.8223 rs10495945:rs3771276:rs2059520
YrI affy100 K 0.4133 0.3799 0.3799 rs10495945
CeU affy6 0.6523 0.5164 0.651 rs6749075:rs6708696:rs6736039
YrI affy6 0.2331 0.1363 0.1985 rs6708696:rs6749075
CeU ill1M 0.6994 0.5164 0.6994 rs6749075:rs6708696:rs6736039:rs6544995
YrI ill1M 0.269 0.1363 0.2468 rs6708696:rs6749075:rs13415701
CeU ill650K 0.6389 0.5164 0.6075 rs6749075:rs6708696
YrI ill650K 0.2223 0.1363 0.1985 rs6708696:rs6749075

Mol Genet Genomics
1 3
Discussion
Genome-wide association studies do not involve hypoth-eses and are aimed at the discovery of novel variants that affect human disease. nevertheless, studies of this type typically ignore the wealth of biological data available, such as disease-specific biochemical pathways, known functional properties of SnPs, comparative genomics, prior proof of genetic linkage, and lD data. We introduce a sys-tematic technique for combining SnP data from two genes, MSH2/KCNK12, when selecting SnPs for further research after a GWaS. We then implement this method utilizing a combined GWaS (ripke et al. 2013) and candidate gene analysis (Morak et al. 2008). Importantly, the limited num-ber of pre-malignant lesions analyzed did not allow us to detect specific regions that may be related to this stage of the neurodegenerative disease. nevertheless, candidate genes amplified in one pre-malignant sample and in five invasive tumors were MSH2-KCNK12 (2p22.3–2p22.1).
The MSH2 gene is the human homolog of the E. coli Dna mismatch repair gene mutS and has been found to be mutated in hereditary nonpolyposis colon cancer (Morak et al. 2008). The MMr function is associated with Dna replication, during which it compensates for deficien-cies in the proofreading function of Dna polymerase. a missing gene or mutations in this gene and in other MMr genes (MSH2, MSH6, or PMS2) can lead to microsatellite instability (MSI), and this dysfunction is highly related to HnPCC (also referred to as lynch syndrome) (Bronner et al. 1994).
In the past 5 years, as the cost of genomic technolo-gies declined, and bioinformatics bridges were developed to access genomic information were initiated to develop genetic marker technology platforms for lentil. These tech-nologies will be of great benefit to future genetic improve-ment efforts and to future. Therefore, SnPs have to be assigned to genes and their individual association signals combined. This can be done in different ways and one must
Table 3 Marker density (MD) distribution of MSH2/KCNK12 on different platforms
Platform Population average multilocus lD
Q1 multilocus lD
Median multilocus lD
Q3 multilocus lD
no. of HapMap SnPs (MaF >0.05)
no. of HapMap SnPs (MaF <=0.05)
Md distribution of MSH2
affymetrix6 CeU 0.916 0.929 1 1 50 1
affymetrix6 YrI 0.795 0.705 0.85 0.929 45 1
Illumina1M CeU 0.912 0.929 1 1 50 1
Illumina1M YrI 0.778 0.637 0.824 0.929 45 1
Md distribution of KCNK12
affymetrix6 CeU 0.502 0.319 0.403 0.687 32 5
affymetrix6 YrI 0.431 0.258 0.373 0.508 28 10
Illumina1M CeU 0.596 0.393 0.583 0.788 32 5
Illumina1M YrI 0.478 0.292 0.389 0.72 28 10
Fig. 4 Measurement of high-throughput platform coverage using multilocus lD with com-parison of different platforms. a MSH2; b KCNK12 (CeU = red, YrI = blue)

Mol Genet Genomics
1 3
Table 4 (a) MSH2 SnPs and (B) MSH2 SnPs that predict the expression of the gene in lymphoblastoid cell lines (lCls) and their associated p values
Gene Start end Chromosome SnPs expression SnPs Populations p value
a
MSH2 47483766 47563863 2 rs12612908 rs2123529 YrI 2e-06
rs36225898 rs1453172 YrI 2e-06
rs35385590 rs1530941 YrI 2e-06
rs36225899 rs12694069 YrI 2e-06
rs6757310 rs1031434 YrI 3e-06
rs36225896 rs17043258 YrI 1e-05
rs36225897 rs11897520 YrI 1e-05
rs17224066 rs13429985 YrI 2e-05
rs17224073 rs12464485 YrI 2e-05
rs17217674 rs934264 CeU 4e-05
rs36225562 rs6716501 CeU 4e-05
rs756561 rs7593369 CeU 5e-05
rs36225894 rs13405815 YrI 6e-05
rs36022367 rs1031435 YrI 6e-05
rs17217681 rs9309662 YrI 6e-05
rs1863333 rs1897104 CeU 6e-05
rs756562 rs2887202 CeU 6e-05
rs17217695 rs1453179 YrI 6e-05
rs17224080 rs955896 CeU 7e-05
rs1863332 rs6729039 CeU 7e-05
rs17224094 rs1517325 CeU 7e-05
rs17224101 rs1554239 CeU 7e-05
rs2303425 rs10930318 CeU 7e-05
rs17217709 rs11904323 CeU 7e-05
rs56062561 rs16855212 CeU 7e-05
rs34355730 rs7560589 CeU 8e-05
rs63750466 rs328516 YrI 9e-05
rs56170584 rs543944 YrI 9e-05
rs63750619 rs6547851 YrI 9e-05
rs17217716 rs2037148 YrI 9e-05
rs63751099 rs1446128 CeU 0.0001
rs63750589 rs6732024 CeU 0.0001
rs63750614 rs7609307 YrI 0.0001
rs63749907 rs16853166 YrI 0.0001
rs63750966 rs11096581 YrI 0.0001
rs63750777 rs869034 CeU 0.0001
rs63751091 rs6707619 CeU 0.0001
rs63751246 rs3349 YrI 0.0001
B
KCNK12 47601417 47650973 2 rs12619323 rs3930 CeU 3e-07
rs1863335 rs17045065 CeU 1e-06
rs10197011 rs3770407 CeU 4e-06
rs2278139 rs17045037 CeU 4e-06
rs7586557 rs10490465 CeU 4e-06
rs12612785 rs11900355 CeU 4e-06
rs6744097 rs17045081 CeU 6e-06
rs11125142 rs6733199 CeU 1e-05
rs34222005 rs13390112 CeU 2e-05
rs55667007 rs2176780 CeU 2e-05

Mol Genet Genomics
1 3
Table 4 continued Gene Start end Chromosome SnPs expression SnPs Populations p value
rs7608068 rs2381663 YrI 3e-05
rs10495945 rs7566719 CeU 3e-05
rs58499753 rs11126376 CeU 4e-05
rs57006185 rs6728048 CeU 4e-05
rs60399306 rs3731970 CeU 4e-05
rs12612893 rs17046714 YrI 5e-05
rs58958853 rs9309464 CeU 5e-05
rs34272868 rs11684985 CeU 5e-05
rs60608771 rs1595431 CeU 5e-05
rs11896864 rs13022714 CeU 6e-05
rs9309147 rs6430068 YrI 6e-05
rs9309148 rs1915223 CeU 7e-05
rs34800199 rs3770411 CeU 7e-05
rs57916992 rs4669054 CeU 7e-05
rs35494461 rs355806 CeU 8e-05
rs12621761 rs11689230 CeU 8e-05
rs11675417 rs1915221 CeU 9e-05
rs35032704 rs6758593 CeU 9e-05
rs34388776 rs642652 CeU 9e-05
rs34052789 rs647242 CeU 9e-05
rs35889307 rs2203679 CeU 9e-05
rs13430337 rs1427497 YrI 9e-05
rs61212083 rs653220 CeU 9e-05
rs36101631 rs6714595 YrI 9e-05
rs6751501 rs1427498 CeU 9e-05
rs6722911 rs4384720 YrI 9e-05
rs12994884 rs2901146 CeU 9e-05
rs34742562 rs11902691 CeU 9e-05
rs6726873 rs11125515 CeU 9e-05
rs10184441 rs1597672 YrI 9e-05
rs13002137 rs355802 CeU 0.0001
rs7606984 rs638854 CeU 0.0001
rs13002142 rs680495 CeU 0.0001
rs13001992 rs6752122 CeU 0.0001
rs13003867 rs7583914 CeU 0.0001
rs13029824 rs11126366 CeU 0.0001
rs13003869 rs706625 YrI 0.0001
rs13029835 rs1085461 YrI 0.0001
rs13003873 rs1867842 YrI 0.0001
rs13003520 rs16828287 YrI 0.0001
rs13003691 rs640610 CeU 0.0001
rs58227429 rs689154 CeU 0.0001
rs58661719 rs7594350 CeU 0.0001
rs11406660 rs786487 YrI 0.0001
rs34716447 rs1092395 YrI 0.0001
rs60957343 rs1905347 YrI 0.0001
rs34901455 rs6718158 YrI 0.0001
rs61043433 rs355808 CeU 0.0001
rs61612324 rs766075 CeU 0.0001
rs13017722 rs7558686 CeU 0.0001
Mol Genet Genomics
1 3
Table 4 continued Gene Start end Chromosome SnPs expression SnPs Populations p value
rs11890414 rs13390754 CeU 0.0001
rs17036650 rs786490 YrI 0.0001
rs61743128 rs1365902 YrI 0.0001
rs61744059 rs2037148 YrI 0.0001
rs17036651 rs7577771 YrI 0.0001
rs35833680 rs587744 CeU 0.0001
rs17502941 rs1370669 CeU 0.0001
rs34713419 rs6546764 CeU 0.0001
rs34359297 rs7558919 CeU 0.0001
rs7580217 rs10173381 CeU 0.0001
rs34814802 rs11686877 CeU 0.0001
rs6544994 rs786493 YrI 0.0001
rs6747254 rs10496966 YrI 0.0001
rs748780 rs590252 CeU 0.0001
rs3068956 rs1560370 CeU 0.0001
rs62140878 rs2420444 CeU 0.0001
rs34508631 rs7563054 CeU 0.0001
rs5830962 rs10179485 CeU 0.0001
rs34904392 rs17045048 CeU 0.0001
rs5830963 rs900554 YrI 0.0001
rs62140879 rs10496968 YrI 0.0001
rs57322452 rs598496 CeU 0.0001
rs57948265 rs659833 CeU 0.0001
rs11895238 rs1560371 CeU 0.0001
rs17036653 rs980772 YrI 0.0001
rs62140880 rs1529386 YrI 0.0001
rs35569589 rs4471836 YrI 0.0001
rs17568484 rs12104619 YrI 0.0001
rs62140881 rs628432 CeU 0.0001
rs35474758 rs663218 CeU 0.0001
rs36153443 rs1560372 CeU 0.0001
rs59132408 rs3115351 CeU 0.0001
rs56983268 rs7568803 CeU 0.0001
rs13029485 rs10928730 CeU 0.0001
rs35766028 rs990847 YrI 0.0001
rs7572456 rs1564697 YrI 0.0001
rs10451620 rs4662232 YrI 0.0001
rs7575486 rs12471698 YrI 0.0001
rs10191800 rs355801 CeU 0.0001
rs630241
rs666233
rs6740889
rs7577877
rs12468743
rs706624
rs1085459
rs4662393
rs13015001

Mol Genet Genomics
1 3
take into consideration that the number of SnPs per gene can vary to a great extent. In this work, we systematically compare three methods to analyze GWaS data at the gene level. We also propose a way to control for differences in the number of SnPs per gene based on permutations of the disease status and demonstrate its effectiveness. Based on GWaS data from human tissue samples [156 lympho-blastoid cell variations (lCl), 160 epidermis, 166 fat] by the http://www.sanger.ac.uk/resources/software/genevar. recent advances in throughput genotyping and in the detec-tion of densely packed SnPs and genetic markers allow variations throughout the genome to be identified more effi-ciently. Methods that use combinations of SnPs from iden-tical genes are expected to describe genetic associations
more accurately than strategies that rely only on data from individual SnPs (neale and Sham 2004; Schaid 2004). Our association SnP-based study targets more than 1,000 SnPs from the single full-size gene MSH2, which con-tains 16 exons and is situated on human chromosome 2 at the cytogenetic location 2p22-p21. The association study results indicate that SnP rs748780 is highly related to this gene (p value 7.9 × 10⁻⁴ (−log103.102)) (Fig. 1a–c). The same SnP is associated with the KCNK12 gene (SnP at posi-tion 47617399, gene at position 47483767, and distance 133632). SnP rs748780 is highly correlated with potas-sium channel activity related to neurological disorders. The KCNK12 gene is located on human chromosome 2, where it is encoded from region 47747910 to 47798078 base
Fig. 5 The lD used is based on phased genotype data from HapMap and the 1,000 Genomes Project. The parameter threshold is fixed. The gray bar marks the region of association and facilitates comparisons between images. In general, we rely on release 22 unless release 21 is specifically required because release 22 uses a new genome build (hg19) and includes more overlap with the commercially avail-able genotyping arrays. Genotyped and imputed SnPs are shown as squares whose color is determined by the r hsv function: color = hsv (0, r2, 0). The brightness of each point is proportional to the r2 value for that SnP. although long-range lD is observed in some regions of the genome, in most cases, the lD signal decays considerably within 500 kb. association plots use a combination of shape and color to
provide information about each SnP. There is a maximum distance limit of 500 kb; thus, lD calculations in the HapMap were only per-formed for SnP pairs within 500 kb of one another. Other classes of SnPs are shown as squares. each panel is identified by a different color scheme. a YrI (Yoruba in Ibadan, nigeria) is shown in green, whereas JPT + CHB (Han Chinese in Beijing, China) is pink; b CeU (Utah residents with ancestry from northern and western europe) is shown in red. c The color is determined by the R hsv function color = hsv (base color, r2, 0), r2 is generally preferred to D′ in asso-ciation study mapping and exhibits less inflation than D′ in smaller population surveys
Mol Genet Genomics
1 3
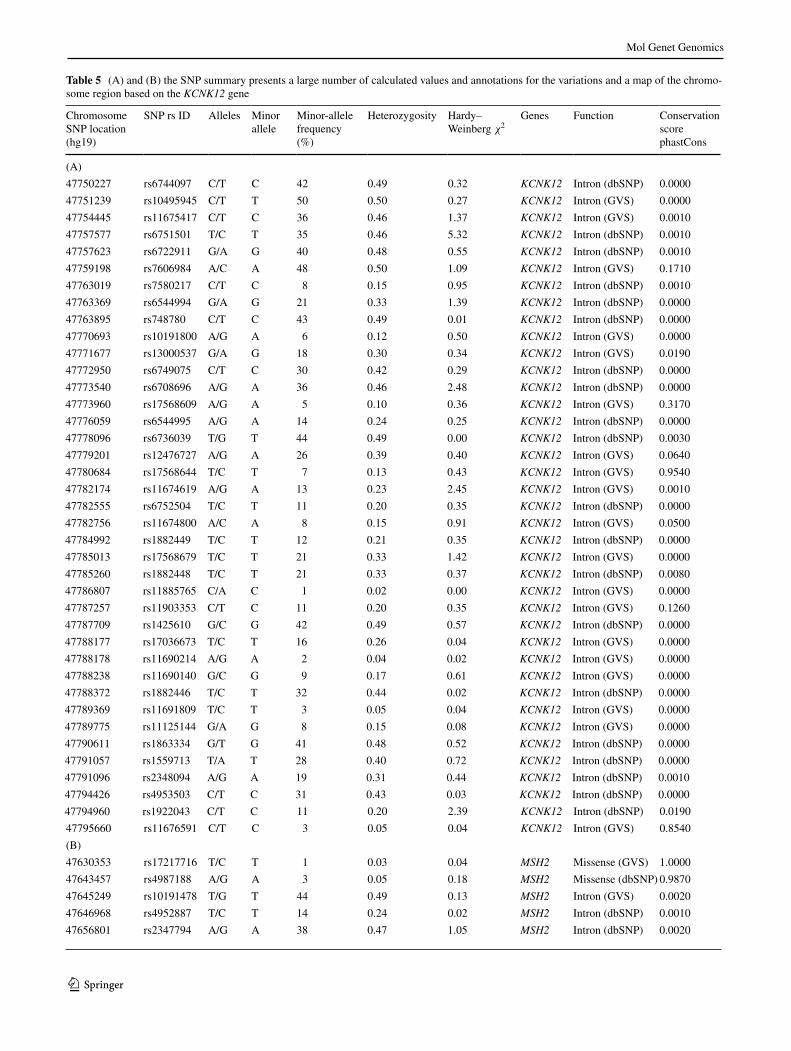
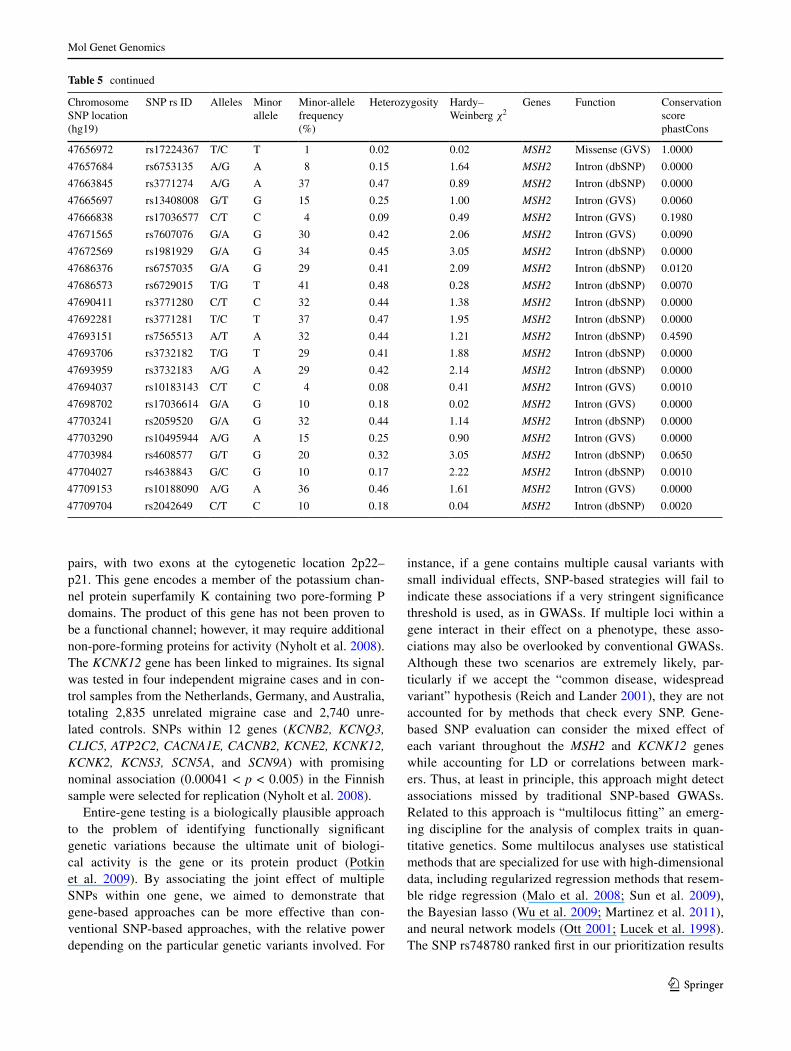
Table 5 (a) and (B) the SnP summary presents a large number of calculated values and annotations for the variations and a map of the chromo-some region based on the KCNK12 gene
Chromosome SnP location (hg19)
SnP rs ID alleles Minor allele
Minor-allele frequency (%)
Heterozygosity Hardy– Weinberg χ2
Genes Function Conservation score phastCons
(a)
47750227 rs6744097 C/T C 42 0.49 0.32 KCNK12 Intron (dbSnP) 0.0000
47751239 rs10495945 C/T T 50 0.50 0.27 KCNK12 Intron (GVS) 0.0000
47754445 rs11675417 C/T C 36 0.46 1.37 KCNK12 Intron (GVS) 0.0010
47757577 rs6751501 T/C T 35 0.46 5.32 KCNK12 Intron (dbSnP) 0.0010
47757623 rs6722911 G/a G 40 0.48 0.55 KCNK12 Intron (dbSnP) 0.0010
47759198 rs7606984 a/C a 48 0.50 1.09 KCNK12 Intron (GVS) 0.1710
47763019 rs7580217 C/T C 8 0.15 0.95 KCNK12 Intron (dbSnP) 0.0010
47763369 rs6544994 G/a G 21 0.33 1.39 KCNK12 Intron (dbSnP) 0.0000
47763895 rs748780 C/T C 43 0.49 0.01 KCNK12 Intron (dbSnP) 0.0000
47770693 rs10191800 a/G a 6 0.12 0.50 KCNK12 Intron (GVS) 0.0000
47771677 rs13000537 G/a G 18 0.30 0.34 KCNK12 Intron (GVS) 0.0190
47772950 rs6749075 C/T C 30 0.42 0.29 KCNK12 Intron (dbSnP) 0.0000
47773540 rs6708696 a/G a 36 0.46 2.48 KCNK12 Intron (dbSnP) 0.0000
47773960 rs17568609 a/G a 5 0.10 0.36 KCNK12 Intron (GVS) 0.3170
47776059 rs6544995 a/G a 14 0.24 0.25 KCNK12 Intron (dbSnP) 0.0000
47778096 rs6736039 T/G T 44 0.49 0.00 KCNK12 Intron (dbSnP) 0.0030
47779201 rs12476727 a/G a 26 0.39 0.40 KCNK12 Intron (GVS) 0.0640
47780684 rs17568644 T/C T 7 0.13 0.43 KCNK12 Intron (GVS) 0.9540
47782174 rs11674619 a/G a 13 0.23 2.45 KCNK12 Intron (GVS) 0.0010
47782555 rs6752504 T/C T 11 0.20 0.35 KCNK12 Intron (dbSnP) 0.0000
47782756 rs11674800 a/C a 8 0.15 0.91 KCNK12 Intron (GVS) 0.0500
47784992 rs1882449 T/C T 12 0.21 0.35 KCNK12 Intron (dbSnP) 0.0000
47785013 rs17568679 T/C T 21 0.33 1.42 KCNK12 Intron (GVS) 0.0000
47785260 rs1882448 T/C T 21 0.33 0.37 KCNK12 Intron (dbSnP) 0.0080
47786807 rs11885765 C/a C 1 0.02 0.00 KCNK12 Intron (GVS) 0.0000
47787257 rs11903353 C/T C 11 0.20 0.35 KCNK12 Intron (GVS) 0.1260
47787709 rs1425610 G/C G 42 0.49 0.57 KCNK12 Intron (dbSnP) 0.0000
47788177 rs17036673 T/C T 16 0.26 0.04 KCNK12 Intron (GVS) 0.0000
47788178 rs11690214 a/G a 2 0.04 0.02 KCNK12 Intron (GVS) 0.0000
47788238 rs11690140 G/C G 9 0.17 0.61 KCNK12 Intron (GVS) 0.0000
47788372 rs1882446 T/C T 32 0.44 0.02 KCNK12 Intron (dbSnP) 0.0000
47789369 rs11691809 T/C T 3 0.05 0.04 KCNK12 Intron (GVS) 0.0000
47789775 rs11125144 G/a G 8 0.15 0.08 KCNK12 Intron (GVS) 0.0000
47790611 rs1863334 G/T G 41 0.48 0.52 KCNK12 Intron (dbSnP) 0.0000
47791057 rs1559713 T/a T 28 0.40 0.72 KCNK12 Intron (dbSnP) 0.0000
47791096 rs2348094 a/G a 19 0.31 0.44 KCNK12 Intron (dbSnP) 0.0010
47794426 rs4953503 C/T C 31 0.43 0.03 KCNK12 Intron (dbSnP) 0.0000
47794960 rs1922043 C/T C 11 0.20 2.39 KCNK12 Intron (dbSnP) 0.0190
47795660 rs11676591 C/T C 3 0.05 0.04 KCNK12 Intron (GVS) 0.8540
(B)
47630353 rs17217716 T/C T 1 0.03 0.04 MSH2 Missense (GVS) 1.0000
47643457 rs4987188 a/G a 3 0.05 0.18 MSH2 Missense (dbSnP) 0.9870
47645249 rs10191478 T/G T 44 0.49 0.13 MSH2 Intron (GVS) 0.0020
47646968 rs4952887 T/C T 14 0.24 0.02 MSH2 Intron (dbSnP) 0.0010
47656801 rs2347794 a/G a 38 0.47 1.05 MSH2 Intron (dbSnP) 0.0020
Mol Genet Genomics
1 3
pairs, with two exons at the cytogenetic location 2p22–p21. This gene encodes a member of the potassium chan-nel protein superfamily K containing two pore-forming P domains. The product of this gene has not been proven to be a functional channel; however, it may require additional non-pore-forming proteins for activity (nyholt et al. 2008). The KCNK12 gene has been linked to migraines. Its signal was tested in four independent migraine cases and in con-trol samples from the netherlands, Germany, and australia, totaling 2,835 unrelated migraine case and 2,740 unre-lated controls. SnPs within 12 genes (KCNB2, KCNQ3, CLIC5, ATP2C2, CACNA1E, CACNB2, KCNE2, KCNK12, KCNK2, KCNS3, SCN5A, and SCN9A) with promising nominal association (0.00041 < p < 0.005) in the Finnish sample were selected for replication (nyholt et al. 2008).
entire-gene testing is a biologically plausible approach to the problem of identifying functionally significant genetic variations because the ultimate unit of biologi-cal activity is the gene or its protein product (Potkin et al. 2009). By associating the joint effect of multiple SnPs within one gene, we aimed to demonstrate that gene-based approaches can be more effective than con-ventional SnP-based approaches, with the relative power depending on the particular genetic variants involved. For
instance, if a gene contains multiple causal variants with small individual effects, SnP-based strategies will fail to indicate these associations if a very stringent significance threshold is used, as in GWaSs. If multiple loci within a gene interact in their effect on a phenotype, these asso-ciations may also be overlooked by conventional GWaSs. although these two scenarios are extremely likely, par-ticularly if we accept the “common disease, widespread variant” hypothesis (reich and lander 2001), they are not accounted for by methods that check every SnP. Gene-based SnP evaluation can consider the mixed effect of each variant throughout the MSH2 and KCNK12 genes while accounting for lD or correlations between mark-ers. Thus, at least in principle, this approach might detect associations missed by traditional SnP-based GWaSs. related to this approach is “multilocus fitting” an emerg-ing discipline for the analysis of complex traits in quan-titative genetics. Some multilocus analyses use statistical methods that are specialized for use with high-dimensional data, including regularized regression methods that resem-ble ridge regression (Malo et al. 2008; Sun et al. 2009), the Bayesian lasso (Wu et al. 2009; Martinez et al. 2011), and neural network models (Ott 2001; lucek et al. 1998). The SnP rs748780 ranked first in our prioritization results
Table 5 continued
Chromosome SnP location (hg19)
SnP rs ID alleles Minor allele
Minor-allele frequency (%)
Heterozygosity Hardy– Weinberg χ2
Genes Function Conservation score phastCons
47656972 rs17224367 T/C T 1 0.02 0.02 MSH2 Missense (GVS) 1.0000
47657684 rs6753135 a/G a 8 0.15 1.64 MSH2 Intron (dbSnP) 0.0000
47663845 rs3771274 a/G a 37 0.47 0.89 MSH2 Intron (dbSnP) 0.0000
47665697 rs13408008 G/T G 15 0.25 1.00 MSH2 Intron (GVS) 0.0060
47666838 rs17036577 C/T C 4 0.09 0.49 MSH2 Intron (GVS) 0.1980
47671565 rs7607076 G/a G 30 0.42 2.06 MSH2 Intron (GVS) 0.0090
47672569 rs1981929 G/a G 34 0.45 3.05 MSH2 Intron (dbSnP) 0.0000
47686376 rs6757035 G/a G 29 0.41 2.09 MSH2 Intron (dbSnP) 0.0120
47686573 rs6729015 T/G T 41 0.48 0.28 MSH2 Intron (dbSnP) 0.0070
47690411 rs3771280 C/T C 32 0.44 1.38 MSH2 Intron (dbSnP) 0.0000
47692281 rs3771281 T/C T 37 0.47 1.95 MSH2 Intron (dbSnP) 0.0000
47693151 rs7565513 a/T a 32 0.44 1.21 MSH2 Intron (dbSnP) 0.4590
47693706 rs3732182 T/G T 29 0.41 1.88 MSH2 Intron (dbSnP) 0.0000
47693959 rs3732183 a/G a 29 0.42 2.14 MSH2 Intron (dbSnP) 0.0000
47694037 rs10183143 C/T C 4 0.08 0.41 MSH2 Intron (GVS) 0.0010
47698702 rs17036614 G/a G 10 0.18 0.02 MSH2 Intron (GVS) 0.0000
47703241 rs2059520 G/a G 32 0.44 1.14 MSH2 Intron (dbSnP) 0.0000
47703290 rs10495944 a/G a 15 0.25 0.90 MSH2 Intron (GVS) 0.0000
47703984 rs4608577 G/T G 20 0.32 3.05 MSH2 Intron (dbSnP) 0.0650
47704027 rs4638843 G/C G 10 0.17 2.22 MSH2 Intron (dbSnP) 0.0010
47709153 rs10188090 a/G a 36 0.46 1.61 MSH2 Intron (GVS) 0.0000
47709704 rs2042649 C/T C 10 0.18 0.04 MSH2 Intron (dbSnP) 0.0020
Mol Genet Genomics
1 3
based on genes MSH2/KCNK12 (Fig. 3a, b) and was the seventh-most biologically related of all common HapMap SnPs. There is now extensive proof from impartial data-sets that this SnP is related to potassium channel activity and closely related neurological dysfunction (Potkin et al. 2009). With the exception of Hung and colleagues, who genotyped and reported an association at rs748780, this SnP was not based on the MSH2 gene; in association stud-ies, it is highly regionally linked with the KCNK12 gene, and the reported associations have been with lD proxies for rs748780. It is extremely interesting to find convinc-ing and replicated proof of association for an SnP with such strong biological relevance. nonetheless, the extent to which known biology can predict variants that affect disease remain unknown. The prioritization methodol-ogy that forms a part of our approach is not designed to act as a predictor, but to preferentially select biologically related signals when resources for genotyping or for func-tional study within the laboratory are limited. In addition, this method does not incorporate information regarding the variety of potential associations detected in or close to a gene. For instance, it is recognized that there are more than 500 different mutant alleles even for the single gene dysfunction of cystic fibrosis (Zielenski and Tsui 1995). Integrating an additional mechanism into the prioritiza-tion process that assigns additional weight to genes with a number of SnP associations could be useful; the selection of such associations would necessitate correction for lD. This topic will be studied in future iterations of the GIn prioritization method.
The results of our analysis can be related to genetics and genomics data obtained from GWaSs. a GWaS generates genotypic data on hundreds of thousands of SnPs that can be ranked in accordance with their evidence for associa-tion with a given trait. Making sense of this information requires many steps associated with the prioritization of variants (SnPs or CnVs) that present an association with a particular disease and can be used as a reference informa-tion set together with the HapMap (release 23) or nCBI (dbSnP 129). For example, the multilocus measure of disequilibrium, MD, used to summarize the reported lD relationships among SnPs and to characterize coverage of genes by product was calculated using TUna (nico-lae 2006; Wen and nicolae 2008) and data from HapMap. Data on the connection between SnPs and expression tran-script levels (Table 4a, b) provided by SCan comes from a series of publications describing research characterizing eQTls in cell lines from HapMap CeU and YrI samples for which transcript levels were assayed using the affym-etrix Human exon 1.0 ST array. HapMap SnPs of up to 2 kb for the MSH2 gene utilized in MD calculations with different platforms and different populations (Table 3) (affy6; CeU; ill1M; YrI), as well as SnPs that predict the
expression of the gene in lymphoblastoid cell lines (lCls) and related p values (Table 4a, b). an average multilocus lD (MD) value of 0.916 was obtained for the CeU popu-lation in the affy6 platform, Q1 multilocus lD 0.929, in no of HapMap SnPs (MaF >0.05) 50. an average multi-locus lD (MD) value of 0.795 was obtained for the CeU population in the affy6 platform, Q1 multilocus lD 0.705, in no of HapMap SnPs (MaF >0.05) 45. an average mul-tilocus lD (MD) value of 0.929 was obtained for the CeU population in the ill1M platform, Q1 multilocus lD 0.929, in no of HapMap SnPs (MaF >0.05) 50. an average multilocus lD (MD) value of 0.778 was obtained for the YrI population in the ill1M platform, Q1 multilocus lD 0.778, in no of HapMap SnPs (MaF >0.05) 45 (Table 5a, b). These results are compared with those obtained for the KCNK12 gene with completely different populations and platforms, HapMap SnPs (as much as 2 kb of KCNK12) used in MD calculations. a common multilocus lD (MD) value of 0.502 was obtained for the CeU population in the affy6 platform, Q1 multilocus lD 0.319, in no of Hap-Map SnPs (MaF >0.05) 32; a common multilocus lD (MD) value of 0.431 was obtained for the YrI popula-tion in the affy6 platform, Q1 multilocus lD 0.258, in no of HapMap SnPs (MaF >0.05) 28. an average multilo-cus lD (MD) value of 0.596 was obtained for the CeU inhabitants in the ill1M platform, Q1 multilocus lD 0.393, in no of HapMap SnPs (MaF >0.05) 32, and an aver-age multilocus lD (MD) value of 0.478 was obtained for the YrI inhabitants in the ill1M platform, Q1 multilocus lD 0.292, in no of HapMap SnPs (MaF >0.05) 10. The comparison indicates that the gene outcomes differ with respect to the number of HapMap SnPs (MaF ≥0.05) in the KCNK12 gene. In the CeU 5 (MaF ≥0.05) and YrI 10 (MaF ≥0.05) populations. In the MSH2 gene, the MD distribution is much smaller (MaF ≥0.05), with different populations having an average of 1 in a variety of HapMap SnPs (MaF ≥0.05).
Our study has some limitations. First, the study’s sam-ple size limits the ability to explore the potassium channel activity of neurological disorders based on only the two genes MSH2/KCNK12; the apparent relationship of these two genes might represent a lifestyle interaction, emphasiz-ing the necessity of increasing the sample size as a way to verify our results. nonetheless, when performed appropri-ately, large and small studies should theoretically result in identical outcomes, with only more precise effects meas-ured in the larger studies (Ioannidis and lau 1996). Sec-ond, the associations we observed in our investigation of particular hypotheses could reflect chance because a variety of comparisons were made; thus, replication in other stud-ies is essential to confirm or disprove our results. another potential disadvantage is that we only analyzed two candi-date loci of MSH2/KCNK12 gene polymorphisms; research
Mol Genet Genomics
1 3
on the connections among genetic variations of other genes in the MMr pathway and even in different pathways is required in the future.
In conclusion, the results of this study indicate that the polymorphism rs748780 allele T>C in the KCNK12 gene may modulate susceptibility to neurological disor-ders in a MeX population, notably in combination with related lifestyle factors. Moreover, we present significant genetic results for this SnP in subjects. Clearly, because our research is based on a limited number of cases, it is important that larger prospective research studies verify our results.
Materials and methods
Dataset
The genotyping array analysis with pairwise lD evaluation was based on genotype data from the International Hap-Map Project (The International HapMap Project 2003) and the 1,000 Genomes Project (http://www.1000genomes.org/; Perkel 2013). Our association research aimed at identify-ing a selected variant of the MSH2 Dna mismatch repair gene that is linked with another gene in different popula-tions. additional research was carried out on the eQTl expression quantitative trait loci associations within the MSH2 gene locus based primarily on gene expression pro-filing and genotypic information available from the Sanger Institute.
SnP association and assortment
We performed gene expression profiling and linkage anal-ysis using genetic variants of SnPs from three cell types of 75 individuals. The samples were explored in depth for the position of cis-regulatory variation based primarily on three human sample tissues: 156 lymphoblastoid cell lines (lCl), 169 epidermis, and 166 fats; these tissues were obtained simultaneously from a subset of well-phenotype female twins through the MuTHer resource. The asso-ciation analyses described in this work used data from the MuTHer Pilot project (nica et al. 2011) to search for MSH2 gene eQTl variants and the markers linked with them in various tissue types. ensemble 50/nCBi36 was chosen as a reference title (Dimas et al. 2009; Yang et al. 2010). after finding the probes, a genotype for expression pairs was selected for various populations (GenCord-F, l, and T), and the genotype (GenCord/nCBi36/Chr1-22 (MaF >5 %) was tested using the expression platform Illumina HumanWG-6 v3 (fibroblasts, lymphoblas-toid cells, and T-cells). The probe end result matched the transcript(s) probe ID IlMn 1737413 and IlMn
2203453. The evaluation parameters were fixed for asso-ciated SnPs for correlation or regression based on Spear-man’s rank correlation coefficient (ρ) by preserving the distance regulated to not more than 1 Mb at a fixed p value threshold of 0.001.
Gene-based association
The ideogram of chromosome 2(P21) provided the posi-tion of MSH2 utilizing Genevar v3.1.1 (Gene expres-sion Variation) (Yang et al. 2010; http://www.sanger.ac.uk/resources/software/genevar) and through haplotype association scanning. each SnP from the genotype data was filtered and annotated within the targeted MSH2 and related KCNK12 genes utilizing linear regression with the SnP-coded additive model. The highly related SnPs from the analysis, as well as the other SnPs from the same gene, were considered. In addition to the highly related SnPs from the analysis, individual tests of association were performed utilizing simple linear regressions for every SnP within the gene (Wang and abbott 2008; Stein et al. 2010). To study the association of sub-haplotypes (subsets of alleles from the full haplotype) with potas-sium channel activity related to neurological dysfunction and elevated susceptibility risk in the MeX population, we considered a “window” of alleles by searching a fixed-width window (one SnP) over the entire haplotype in the gene. In these windows, the y-axis indicated −log (10) p values on a minus logarithmic scale, whereas the x-axis indicated the SnPs present on the chromosome based on their positions.
Genome association network
To prioritize an SnP from a given record of SnPs of the MSH2 gene based on the SnPs data and p values, a statisti-cal check for genetic association was performed. This step was performed to obtain greater priority when choosing SnPs for the study of initial genetic associations beyond the scope of this study (Saccone et al. 2010). after obtain-ing a list of MSH2 SnPs and their p values from the initial association study, we derived a listing of excessive priority genes in which the extent of precedence would be shown on a per-gene basis using a numeric prioritization score. The original record of SnPs can be ranked based on a mix-ture of the evidence for association and the extent of their biological relevance; that is, as an alternative to rating the SnPs solely by p value, SnPs that specify genes with prop-erties resembling missense mutations are assigned an even higher priority. The genomic data network (GDn) method-ology introduced by Saccone et al. (2010) is used to supply a systematic methodology for incorporating specific bio-logical hypotheses into the design of a genetic association.

Mol Genet Genomics
1 3
Study population
Studies of colon cancer in HnPCC families first identified MSH2 mutations in the MMr genes. affected members of this cancer syndrome exhibited germ-line mutations, and individuals with sporadic colon cancer also exhibited somatic mutations in the MMr genes. Between 1990 and 2010, MMr gene mutations were detected in 67 families studied in the Department of Clinical Genetics of the eras-mus MC University Medical Center because of a clinical suspicion for lynch syndrome; data on sex, age, mutation status, and age at diagnosis of both lS-associated and other cancers were collected. Only subjects with proven MSH2 MMr gene mutations were targeted in this study. More than 1,000 SnPs were used in these association analyses. Highly associated SnPs were defined as those within a full-length gene according to the threshold p value. Fur-thermore, we proposed that the study be linked with other populations (MeX, CeU, YrI, and CHB) through the use of the reference HapMap dataset (phases 1 and 2 of the full dataset). The International HapMap Consortium (2005) and The International HapMap Consortium (2007).
lD of proxy SnPs
Single-nucleotide polymorphisms that appeared more than once or that were in tight lD with one another, i.e., r2 > 0.8, in accordance with completely different HapMap populations, were considered to be redundant, and only those with the lowest ra-associated p values were retained for further evaluation (Frazer et al. 2007). This effort reduced the quantity of candidate SnPs to 20, an accept-able proxy. SnPs (lD of r2 > 0.8) were selected through the use of the HapMap-based SnP annotation and Proxy Search (SnaP) (Johnson et al. 2008). Finally, 17 of the candidate SnPs or their proxies were included in our cur-rent GWaS dataset. The fast retrieval of lD proxy SnPs that fixed input of one or more query SnPs was based on empirical annotations from the 1,000 Genomes and Hap-Map Projects. We used a sequence of filters to optionally retrieve outcomes that can be constrained to specific com-binations of genotyping platforms beyond specified pair-wise r2 thresholds or involving a greater distance among proxy SnPs and other queries (andrew et al. 2008). Pair-wise lD can quickly ascertain the lD between two SnPs and reveal which SnPs in an input set are in important lD with one another. The regional lD plots provide a visible representation of the identical types of data provided by the SnaP Proxy function. The left-hand y-axis exhibits values for r2 (andrew et al. 2008). The maximum distance limit is 500 kb; lD calculations in the HapMap were carried out only for SnP pairs within 500 kb of each other. although long-range lD is normally observed in some areas of the
genome, the lD signal decays considerably within 500 kb. association plots use a combination of shape and color to provide details about every SnP. The color is determined by the R hsv perform shade = hsv; r2 is similar to D′ in association examination mapping and exhibits much less inflation than D′ in smaller population surveys. The param-eter threshold is fixed at 0.8.
Haplotype block analysis
regions of study regarding the lD of haplotype blocks were defined by the strategies of Gabriel et al. (2002), Wang et al. (2002). To ensure thorough coverage through-out every haplotype block, our goal was to genotype at least one SnP with minor-allele frequencies of 10 % or more within each block, with a minimal distance among neighboring blocks of <23 kb. each ethnic group was evaluated for the extent of lD that met these block crite-ria. We combined populations to assess the lD structure of the locus; as expected, some population groups displayed less lD given their longer ancestral history. In an effort to more fully characterize variation in the populations, we genotyped additional SnPs in regions in which there were insufficient numbers of SnPs to fulfill our lD criteria. The variation in haplotypes of chosen related SnPs is highly significant within different populations that are at high risk for neurological disorder, indicating that additional alleles could also be observed with further genotyping efforts.
Genotyping
We selected an SnP as our genotype based on the associa-tion end result of characterizing common genetic variation within the upstream MSH2/intron and the KCNK12/intron genes using lD select (Carlson et al. 2004) conducted on the genome variation server (GVS131; Version 6.01) (Howie et al. 2006). The minor-allele frequency is calcu-lated and rounded to the closest integer. When the integer is greater than or equal to the allele frequency cutoff, the SnP is retained. The precise frequency cutoff is thus 0.5 % below the allele frequency cutoff. The cutoff to 5 % results in a precise cutoff of 4.5 %. For genotypes, lD, and SnP, because we screen multiple population groups based on our allele, frequency and non-monomorphic filters are applied to the merged set of genotypes.
Statistical methods
The observed genotype frequencies were compared with the expected frequencies to test for deviations from the Hardy–Weinberg equilibrium using the χ2 test. The SnP frequency of our main analysis was restricted based on (Storey and Tibshirani 2003). The minor-allele frequency

Mol Genet Genomics
1 3
of SnPs from the full-size gene of MSH2/KCNK12 was analyzed. SnP alleles were in Hardy–Weinberg equi-librium by the Chi-squared test except for the link with KCNK12, which was then excluded from the analyses. The use of more than 1,000 SnPs within a single gene was sufficient to provide us with a power of 80 % (probabil-ity of avoiding a type-II error). The false-positive report probability for statistically significant observations was estimated using previously described methods (Wacholder et al. 2004). The lD status among polymorphisms was examined utilizing Haploview (Gabriel et al. 2002; Barrett et al. 2005). Haplotype frequencies were estimated based on a Bayesian algorithm of reconstructing haplotypes from population genotype information through the use of PHaSe 2.1.1 (Stephens et al. 2001; Stephens and Don-nelly 2003). all analyses were performed using the Statis-tical analysis System for linux in Unix platform, Model 2.1.1 (Department of Bioinformatics, University of King Saud, KSa).
System requirements
We incorporate our local server to the Genevar v3.1.1 (Gene expression Variation) database for the integra-tive analysis and visualization of SnP-gene associations in eQTl studies. The Genevar Hibernate library (Tsun et al. 2010) is used to map object-oriented models onto the MySQl database (Wen et al. 2005) within the back end, and an apache CXF framework (http://cxf.apache.org) is used to wrap up database queries and enterprise logics into middle-layer services. a Tomcat server (http://tom-cat.apache.org) is used to supply companies within the entrance end. For a standalone database-mode Genevar, a MySQl database must be installed on the consumer’s local machine. association outcomes are visualized in genomic views by JFree Chart library (http://www.jfree.org/jfreechart/). a gene-centered scatter plot represents SnP–gene associations around genes of interest, and an SnP-centered line chart illustrates observed eQTls sur-rounding SnPs of interest. Tested on a 2.6 GHz Pentium machine with 4 GB of raM in response to set parameters based on load samples, our local server uploaded range additions to a Genevar 75 × 23 k expression dataset onto the database and constructed up indexes in 1 min; another 23 min were required for the 75 × 400 k genotype file. as soon as it is uploaded, our server can fetch SnP-probe pairs from these 75 people in <0.0257 s from the database and calculate Spearman’s rhos and nominal p values for 486 SnP-probe pairs in 3 s.
Acknowledgments The authors extend their appreciation to the Deanship of Scientific research at King Saud University for funding this work through the research group project no. rGP-VPP-200.
References
abdel-rahman WM, Mecklin JP, Peltomaki P (2006) The genetics of HnPCC: application to diagnosis and screening. Crit rev Oncol Hematol 58(3):208–220. doi:10.1016/j.critrevonc.2005.11.001
andrew DJ, robert eH, Sara lP, Marcia Mn, Christopher JO, Paul Wde (2008) SnaP: a web-based tool for identification and annotation of proxy SnPs using HapMap. Bioinformatics 24:2938–2939
Barrett JC, Fry B, Maller J, Daly MJ (2005) Haploview: analysis and visualization of lD and haplotype maps. Bioinformatics 21(2):263–265. doi:10.1093/bioinformatics/bth457
Bayliss Da, Barrett PQ (2008) emerging roles for two-pore-domain potassium channels and their potential therapeutic impact. Trends Pharmacol Sci 29(11):566–575. doi:10.1016/j.tips.2008.07.013
Bronner Ce, Baker SM, Morrison PT, Warren G, Smith lG, lescoe MK, Kane M, earabino C, lipford J, lindblom a et al (1994) Mutation in the Dna mismatch repair gene homologue hMlH1 is associated with hereditary non-polyposis colon cancer. nature 368(6468):258–261. doi:10.1038/368258a0
Carlson CS, eberle Ma, rieder MJ, Yi Q, Kruglyak l, nickerson Da (2004) Selecting a maximally informative set of single-nucleotide polymorphisms for association analyses using linkage disequilib-rium. am J Hum Genet 74(1):106–120. doi:10.1086/381000
Dimas aS, Deutsch S, Stranger Be, Montgomery SB, Borel C, attar-Cohen H, Ingle C, Beazley C, Gutierrez arcelus M, Sekowska M, Gagnebin M, nisbett J, Deloukas P, Dermitzakis eT, antonarakis Se (2009) Common regulatory variation impacts gene expression in a cell type-dependent manner. Science 325(5945):1246–1250. doi:10.1126/science.1174148
Frazer Ka, Ballinger DG, Cox Dr, Hinds Da, Stuve ll, Gibbs ra, Belmont JW, Boudreau a, Hardenbol P, leal SM, Pasternak S, Wheeler Da, Willis TD, Yu F, Yang H, Zeng C, Gao Y, Hu H, Hu W, li C, lin W, liu S, Pan H, Tang X, Wang J, Wang W, Yu J, Zhang B, Zhang Q, Zhao H, Zhou J, Gabriel SB, Barry r, Blumenstiel B, Camargo a, Defelice M, Faggart M, Goyette M, Gupta S, Moore J, nguyen H, Onofrio rC, Parkin M, roy J, Stahl e, Winchester e, Ziaugra l, altshuler D, Shen Y, Yao Z, Huang W, Chu X, He Y, Jin l, liu Y, Sun W, Wang H, Wang Y, Xiong X, Xu l, Waye MM, Tsui SK, Xue H, Wong JT, Galver lM, Fan JB, Gunderson K, Murray SS, Oliphant ar, Chee MS, Montpetit a, Chagnon F, Ferretti V, leboeuf M, Olivier JF, Phillips MS, roumy S, Sallee C, Verner a, Hudson TJ, Kwok PY, Cai D, Kob-oldt DC, Miller rD, Pawlikowska l, Taillon-Miller P, Xiao M, Tsui lC, Mak W, Song YQ, Tam PK, nakamura Y, Kawaguchi T, Kitamoto T, Morizono T, nagashima a, Ohnishi Y, Sekine a, Tanaka T, Tsunoda T, Deloukas P, Bird CP, Delgado M, Dermit-zakis eT, Gwilliam r, Hunt S, Morrison J, Powell D, Stranger Be, Whittaker P, Bentley Dr, Daly MJ, de Bakker PI, Barrett J, Chretien Yr, Maller J, McCarroll S, Patterson n, Pe’er I, Price a, Purcell S, richter DJ, Sabeti P, Saxena r, Schaffner SF, Sham PC, Varilly P, Stein lD, Krishnan l, Smith aV, Tello-ruiz MK, Thorisson Ga, Chakravarti a, Chen Pe, Cutler DJ, Kashuk CS, lin S, abecasis Gr, Guan W, li Y, Munro HM, Qin ZS, Thomas DJ, McVean G, auton a, Bottolo l, Cardin n, eyheramendy S, Freeman C, Marchini J, Myers S, Spencer C, Stephens M, Don-nelly P, Cardon lr, Clarke G, evans DM, Morris aP, Weir BS, Mullikin JC, Sherry ST, Feolo M, Skol a, Zhang H, Matsuda I, Fukushima Y, Macer Dr, Suda e, rotimi Cn, adebamowo Ca, ajayi I, aniagwu T, Marshall Pa, nkwodimmah C, royal CD, leppert MF, Dixon M, Peiffer a, Qiu r, Kent a, Kato K, nii-kawa n, adewole IF, Knoppers BM, Foster MW, Clayton eW, Watkin J, Muzny D, nazareth l, Sodergren e, Weinstock GM, Yakub I, Birren BW, Wilson rK, Fulton ll, rogers J, Burton J, Carter nP, Clee CM, Griffiths M, Jones MC, Mclay K, Plumb

Mol Genet Genomics
1 3
rW, ross MT, Sims SK, Willey Dl, Chen Z, Han H, Kang l, Godbout M, Wallenburg JC, l’archeveque P, Bellemare G, Saeki K, an D, Fu H, li Q, Wang Z, Wang r, Holden al, Brooks lD, Mcewen Je, Guyer MS, Wang VO, Peterson Jl, Shi M, Spiegel J, Sung lM, Zacharia lF, Collins FS, Kennedy K, Jamieson r, Stewart J (2007) a second generation human haplotype map of over 3.1 million SnPs. nature 449 (7164):851–861. doi:10.1038/nature06258
Gabriel SB, Schaffner SF, nguyen H, Moore JM, roy J, Blumenstiel B, Higgins J, DeFelice M, lochner a, Faggart M, liu-Cordero Sn, rotimi C, adeyemo a, Cooper r, Ward r, lander eS, Daly MJ, altshuler D (2002) The structure of haplotype blocks in the human genome. Science 296(5576):2225–2229. doi:10.1126/science.1069424
Goldstein Sa, Bockenhauer D, O’Kelly I, Zilberberg n (2001) Potas-sium leak channels and the KCnK family of two-P-domain subu-nits. nat rev neurosci 2(3):175–184. doi:10.1038/35058574
Hoeijmakers JH (2001) Genome maintenance mecha-nisms for preventing cancer. nature 411(6835):366–374. doi:10.1038/35077232
Howie Bn, Carlson CS, rieder MJ, nickerson Da (2006) efficient selection of tagging single-nucleotide polymorphisms in multiple populations. Hum Genet 120: 58–68
Ioannidis JP, lau J (1996) On meta-analyses of meta-analyses. lancet 348(9029):756. doi:10.1016/S0140-6736(05)65647-4
Iyer rr, Pluciennik a, Burdett V, Modrich Pl (2006) Dna mismatch repair: functions and mechanisms. Chem rev 106(2):302–323. doi:10.1021/cr0404794
Johnson aD, Handsaker re, Pulit Sl, nizzari MM, O’Donnell CJ, de Bakker PI (2008) SnaP: a web-based tool for identification and annotation of proxy SnPs using HapMap. Bioinformatics 24(24):2938–2939. doi:10.1093/bioinformatics/btn564
liu B, Parsons r, Papadopoulos n, nicolaides nC, lynch HT, Wat-son P, Jass Jr, Dunlop M, Wyllie a, Peltomaki P, de la Chapelle a, Hamilton Sr, Vogelstein B, Kinzler KW (1996) analysis of mismatch repair genes in hereditary non-polyposis colorectal cancer patients. nat Med 2(2):169–174
lucek P, Hanke J, reich J, Solla Sa, Ott J (1998) Multi-locus non-parametric linkage analysis of complex trait loci with neural net-works. Hum Hered 48(5):275–284
Malo n, libiger O, Schork nJ (2008) accommodating linkage dis-equilibrium in genetic-association analyses via ridge regression. am J Hum Genet 82(2):375–385. doi:10.1016/j.ajhg.2007.10.012
Martinez JG, Carroll rJ, Muller S, Sampson Jn, Chatterjee n (2011) empirical performance of cross-validation with oracle methods in a genomics context. am Stat 65(4):223–228. doi:10.1198/tas.2011.11052
Mochi M, Sangiorgi S, Cortelli P, Carelli V, Scapoli C, Crisci M, Monari l, Pierangeli G, Montagna P (1993) Testing models for genetic determination in migraine. Cephalalgia 13(6):389–394
Morak M, laner a, Scholz M, Madorf T, Holinski-Feder e (2008) report on de-novo mutation in the MSH2 gene as a rare event in hereditary nonpolyposis colorectal cancer. eur J Gastroenterol Hepatol 20(11):1101–1105. doi:10.1097/MeG.0b013e328305e185
neale BM, Sham PC (2004) The future of association studies: gene-based analysis and replication. am J Hum Genet 75(3):353–362. doi:10.1086/423901
nica aC, Parts l, Glass D, nisbet J, Barrett a, Sekowska M, Trav-ers M, Potter S, Grundberg e, Small K, Hedman aK, Bataille V, Tzenova Bell J, Surdulescu G, Dimas aS, Ingle C, nestle FO, di Meglio P, Min Jl, Wilk a, Hammond CJ, Hassanali n, Yang TP, Montgomery SB, O’rahilly S, lindgren CM, Zonder-van KT, Soranzo n, Barroso I, Durbin r, ahmadi K, Deloukas P, McCarthy MI, Dermitzakis eT, Spector TD (2011) The architec-ture of gene regulatory variation across multiple human tissues:
the MuTHer study. PloS Genet 7(2):e1002003. doi:10.1371/journal.pgen.1002003
nicolae Dl (2006) Quantifying the amount of missing information in genetic association studies. Genet epidemiol 30(8):703–717. doi:10.1002/gepi.20181
nyholt Dr, laForge KS, Kallela M, alakurtti K, anttila V, Farkkila M, Hamalainen e, Kaprio J, Kaunisto Ma, Heath aC, Montgom-ery GW, Gobel H, Todt U, Ferrari MD, launer lJ, Frants rr, Terwindt GM, de Vries B, Verschuren WM, Brand J, Freilinger T, Pfaffenrath V, Straube a, Ballinger DG, Zhan Y, Daly MJ, Cox Dr, Dichgans M, van den Maagdenberg aM, Kubisch C, Martin nG, Wessman M, Peltonen l, Palotie a (2008) a high-density association screen of 155 ion transport genes for involvement with common migraine. Hum Mol Genet 17(21):3318–3331. doi:10.1093/hmg/ddn227
nystrom-lahti M, Parsons r, Sistonen P, Pylkkanen l, aaltonen la, leach FS, Hamilton Sr, Watson P, Bronson e, Fusaro r et al (1994) Mismatch repair genes on chromosomes 2p and 3p account for a major share of hereditary nonpolyposis colo-rectal cancer families evaluable by linkage. am J Hum Genet 55(4):659–665
Ott J (2001) neural networks and disease association studies. am J Med Genet 105(1):60–61
Peltomaki P (2001) Dna mismatch repair and cancer. Mutat res 488(1):77–85
Peltomaki P, Vasen HF (1997) Mutations predisposing to heredi-tary nonpolyposis colorectal cancer: database and results of a collaborative study. The International Collaborative Group on Hereditary nonpolyposis Colorectal Cancer. Gastroenterology 113(4):1146–1158
Perkel J (2013) Finding the true $1000 genome. Biotechniques 54(2):71–74. doi:10.2144/000113988
Potkin SG, Turner Ja, Guffanti G, lakatos a, Torri F, Keator DB, Macciardi F (2009) Genome-wide strategies for discovering genetic influences on cognition and cognitive disorders: method-ological considerations. Cogn neuropsychiatry 14(4–5):391–418. doi:10.1080/13546800903059829
reich De, lander eS (2001) On the allelic spectrum of human dis-ease. Trends Genet 17(9):502–510
ripke S, Wray nr, lewis CM, Hamilton SP, Weissman MM, Breen G, Byrne eM, Blackwood DH, Boomsma DI, Cichon S, Heath aC, Holsboer F, lucae S, Madden Pa, Martin nG, McGuffin P, Muglia P, noethen MM, Penninx BP, Pergadia Ml, Potash JB, rietschel M, lin D, Muller-Myhsok B, Shi J, Steinberg S, Grabe HJ, lichtenstein P, Magnusson P, Perlis rH, Preisig M, Smoller JW, Stefansson K, Uher r, Kutalik Z, Tansey Ke, Teumer a, Vik-torin a, Barnes Mr, Bettecken T, Binder eB, Breuer r, Castro VM, Churchill Se, Coryell WH, Craddock n, Craig IW, Cza-mara D, De Geus eJ, Degenhardt F, Farmer ae, Fava M, Frank J, Gainer VS, Gallagher PJ, Gordon SD, Goryachev S, Gross M, Guipponi M, Henders aK, Herms S, Hickie IB, Hoefels S, Hoogendijk W, Hottenga JJ, Iosifescu DV, Ising M, Jones I, Jones l, Jung-Ying T, Knowles Ja, Kohane IS, Kohli Ma, Korszun a, landen M, lawson WB, lewis G, Macintyre D, Maier W, Mat-theisen M, McGrath PJ, McIntosh a, Mclean a, Middeldorp CM, Middleton l, Montgomery GM, Murphy Sn, nauck M, nolen Wa, nyholt Dr, O’Donovan M, Oskarsson H, Pedersen n, Scheftner Wa, Schulz a, Schulze TG, Shyn SI, Sigurdsson e, Slager Sl, Smit JH, Stefansson H, Steffens M, Thorgeirsson T, Tozzi F, Treutlein J, Uhr M, van den Oord eJ, Van Grootheest G, Volzke H, Weilburg JB, Willemsen G, Zitman FG, neale B, Daly M, levinson DF, Sullivan PF (2013) a mega-analysis of genome-wide association studies for major depressive disorder. Mol Psy-chiatry 18(4):497–511. doi:10.1038/mp.2012.21
ronen a, Glickman BW (2001) Human Dna repair genes. environ Mol Mutagen 37(3):241–283
Mol Genet Genomics
1 3
Saccone SF, Bolze r, Thomas P, Quan J, Mehta G, Deelman e, Tisch-field Ja, rice JP (2010) SPOT: a web-based tool for using bio-logical databases to prioritize SnPs after a genome-wide associa-tion study. nucleic acids res 38:W201–W209. doi:10.1093/nar/gkq513
Schaid DJ (2004) evaluating associations of haplotypes with traits. Genet epidemiol 27(4):348–364. doi:10.1002/gepi.20037
Stein Jl, Hua X, Morra JH, lee S, Hibar DP, Ho aJ, leow aD, Toga aW, Sul JH, Kang HM, eskin e, Saykin aJ, Shen l, Foroud T, Pankratz n, Huentelman MJ, Craig DW, Gerber JD, allen an, Corneveaux JJ, Stephan Da, Webster J, DeChairo BM, Potkin SG, Jack Cr Jr, Weiner MW, Thompson PM (2010) Genome-wide analysis reveals novel genes influencing temporal lobe structure with relevance to neurodegeneration in alzheimer’s disease. neuroimage 51(2):542–554. doi:10.1016/j.neuroimage.2010.02.068
Stephens M, Donnelly P (2003) a comparison of bayesian methods for haplotype reconstruction from population genotype data. am J Hum Genet 73(5):1162–1169. doi:10.1086/379378
Stephens M, Smith nJ, Donnelly P (2001) a new statistical method for haplotype reconstruction from population data. am J Hum Genet 68(4):978–989. doi:10.1086/319501
Storey JD, Tibshirani r (2003) Statistical significance for genom-ewide studies. Proc natl acad Sci U S a 100(16):9440–9445. doi:10.1073/pnas.1530509100
Sun YV, Shedden Ka, Zhu J, Choi nH, Kardia Sl (2009) Identifica-tion of correlated genetic variants jointly associated with rheuma-toid arthritis using ridge regression. BMC Proc 3(Suppl 7):S67
The International HapMap Project (2003) nature 426(6968):789–796. doi:10.1038/nature02168
The International HapMap Consortium (2005) a haplotype map of the human genome. nature 437(7063):1299–1320. doi:10.1038/nature04226
Tsun-Po Y, Claude B, Stephen BM, antigone SD, Maria G, Barbara S, Panos D, emmanouil TD (2010) Genevar: a database and Java application for the analysis and visualization of SnP-gene asso-ciations in eQTl studies 26:2474–2476
Wacholder S, Chanock S, Garcia-Closas M, el Ghormli l, rothman n (2004) assessing the probability that a positive report is false: an approach for molecular epidemiology studies. J natl Cancer Inst 96(6):434–442
Wang K, abbott D (2008) a principal components regression approach to multilocus genetic association studies. Genet epide-miol 32(2):108–118. doi:10.1002/gepi.20266
Wang n, akey JM, Zhang K, Chakraborty r, Jin l (2002) Distribution of recombination crossovers and the origin of haplotype blocks: the interplay of population history, recombination, and mutation. am J Hum Genet 71(5):1227–1234. doi:10.1086/344398
Wen X, nicolae Dl (2008) association studies for untyped mark-ers with TUna. Bioinformatics 24(3):435–437. doi:10.1093/bioinformatics/btm603
Wen J, Zhang Y, Yan Y, Xia S (2005) a web-based examination sys-tem based on PHP + MySQl. Conf Proc Ieee eng Med Biol Soc 3:2882–2885. doi:10.1109/IeMBS.2005.1617076
Wu TT, Chen YF, Hastie T, Sobel e, lange K (2009) Genome-wide association analysis by lasso penalized logistic regression. Bioin-formatics 25(6):714–721. doi:10.1093/bioinformatics/btp041
Yang TP, Beazley C, Montgomery SB, Dimas aS, Gutierrez-arcelus M, Stranger Be, Deloukas P, Dermitzakis eT (2010) Genevar: a database and Java application for the analysis and visualiza-tion of SnP-gene associations in eQTl studies. Bioinformatics 26(19):2474–2476. doi:10.1093/bioinformatics/btq452
Zielenski J, Tsui lC (1995) Cystic fibrosis: genotypic and phenotypic variations. annu rev Genet 29:777–807. doi:10.1146/annurev.ge.29.120195.004021