DM SRFR paper
13
This article appeared in a journal published by Elsevier. The attached copy is furnished to the author for internal non-commercial research and education use, including for instruction at the authors institution and sharing with colleagues. Other uses, including reproduction and distribution, or selling or licensing copies, or posting to personal, institutional or third party websites are prohibited. In most cases authors are permitted to post their version of the article (e.g. in Word or Tex form) to their personal website or institutional repository. Authors requiring further information regarding Elsevier’s archiving and manuscript policies are encouraged to visit: http://www.elsevier.com/copyright
-
Upload
independent -
Category
Documents
-
view
0 -
download
0
Transcript of DM SRFR paper

This article appeared in a journal published by Elsevier. The attachedcopy is furnished to the author for internal non-commercial researchand education use, including for instruction at the authors institution
and sharing with colleagues.
Other uses, including reproduction and distribution, or selling orlicensing copies, or posting to personal, institutional or third party
websites are prohibited.
In most cases authors are permitted to post their version of thearticle (e.g. in Word or Tex form) to their personal website orinstitutional repository. Authors requiring further information
regarding Elsevier’s archiving and manuscript policies areencouraged to visit:
http://www.elsevier.com/copyright

Author's personal copy
Computers and Electronics in Agriculture 74 (2010) 39–50
Contents lists available at ScienceDirect
Computers and Electronics in Agriculture
journa l homepage: www.e lsev ier .com/ locate /compag
Original paper
An integrated model for simulation of border-check irrigateddairy pasture production systems
P. Douglasa,∗, K.B. Dassanayakeb, D.F. Chapmanb, I.R. Johnsonc, M. Khannad, H. Malanod
a Bureau of Meteorology, Victoria Regional Office, PO Box 1636, Melbourne, Victoria 3001, Australiab Melbourne School of Land and Environment, The University of Melbourne, Parkville, Victoria 3010, Australiac IMJ Consultants, PO Box 1590, Armidale, NSW 2350, Australiad Department of Civil and Environmental Engineering, The University of Melbourne, Parkville, Victoria 3010, Australia
a r t i c l e i n f o
Article history:Received 1 July 2009Received in revised form 23 April 2010Accepted 26 May 2010
Keywords:Surface irrigation hydraulicsDairy pasture systemsIntegrated modeling tools
a b s t r a c t
Border-check irrigation is the predominant method of applying water to dairy pastures in Australia. Dairypastures consume 40% of total irrigation water in Australia and, with irrigation water security in Australiaunder threat from climate variability/change and rising demands from other users, socio-economic pres-sure for water savings in the dairying sector are increasing. Currently, there are no simulation tools thatsuccessfully link factors controlling irrigation efficiency at the within-bay scale to management factorsthat drive economic water productivity (principally pasture growth, pasture consumption and animalproduction).
A simulation framework was developed to connect a biophysical research model of weather–soil–plantanimal interaction in dairy systems (‘DairyMod’) to a surface irrigation hydraulic model, SRFR (Simulationof basin, border and furrow irrigations). The connection enabled simulation of the effects of border-checkirrigation scheduling and event management on irrigated pasture production systems. Modificationswere made to DairyMod, in which the paddock surface was represented as a point, so that it couldaccommodate infiltration data in a one-dimensional form, from the surface irrigation model SRFR. Mul-tiple simulations of DairyMod were run each representing different discrete spatial zones within anirrigation bay, and the SRFR routines connect each discrete spatial zone with information on the advancefront water depth.
Model integration and the workings of the integrated model are described, and the process used toverify the integrity of the data transferred between the two models is presented. Comparisons of datainput and output parameters from the stand-alone models and the integrated model confirmed that thedata transfer between the models within the integrated framework did not introduce new sources oferrors.
Preliminary output for a scenario involving three irrigation durations is also presented. The scenariorepresented a perennial ryegrass based pasture on a texture contrast clay loam soil over a period of 10years using measured climate data. Model predictions agreed well with data reported in the literature forannual irrigation amounts and pasture growth. It was demonstrated that the integrated model could beused effectively to determine how pasture production varied with changes in irrigation management suchas irrigation duration. A limitation of the integrated model was its dependence on two sets of infiltrationmodels that were difficult to relate to each other.
© 2010 Elsevier B.V. All rights reserved.
1. Introduction
Australia is a major food provider to the world, with 80% of itsagricultural produce exported to global markets. Although irrigatedagriculture occupies only 0.5% of all agricultural lands in Australia,it contributes 23% of the total gross value of national agriculture,
∗ Corresponding author.E-mail address: [email protected] (P. Douglas).
adding $9.1 billion per annum to the national economy (Year BookAustralia, 2008). Irrigated agriculture is the single largest wateruser in Australia, consuming nearly 70% of total water used nation-ally in 2004 (Meyer et al., 2005). The dairy industry uses 40% ofthe water diverted for agriculture and represents the largest userof irrigation water in Victoria (Bethune and Armstrong, 2004).
The Murray and Murrumbidgee river basins located in northernVictoria and Southern New South Wales represent 49% of Aus-tralia’s irrigated land (Meyer et al., 2005). In 2000/2001, 1.25 millionhectares of land in the region was irrigated of which 0.5 million
0168-1699/$ – see front matter © 2010 Elsevier B.V. All rights reserved.doi:10.1016/j.compag.2010.05.010
Author's personal copy
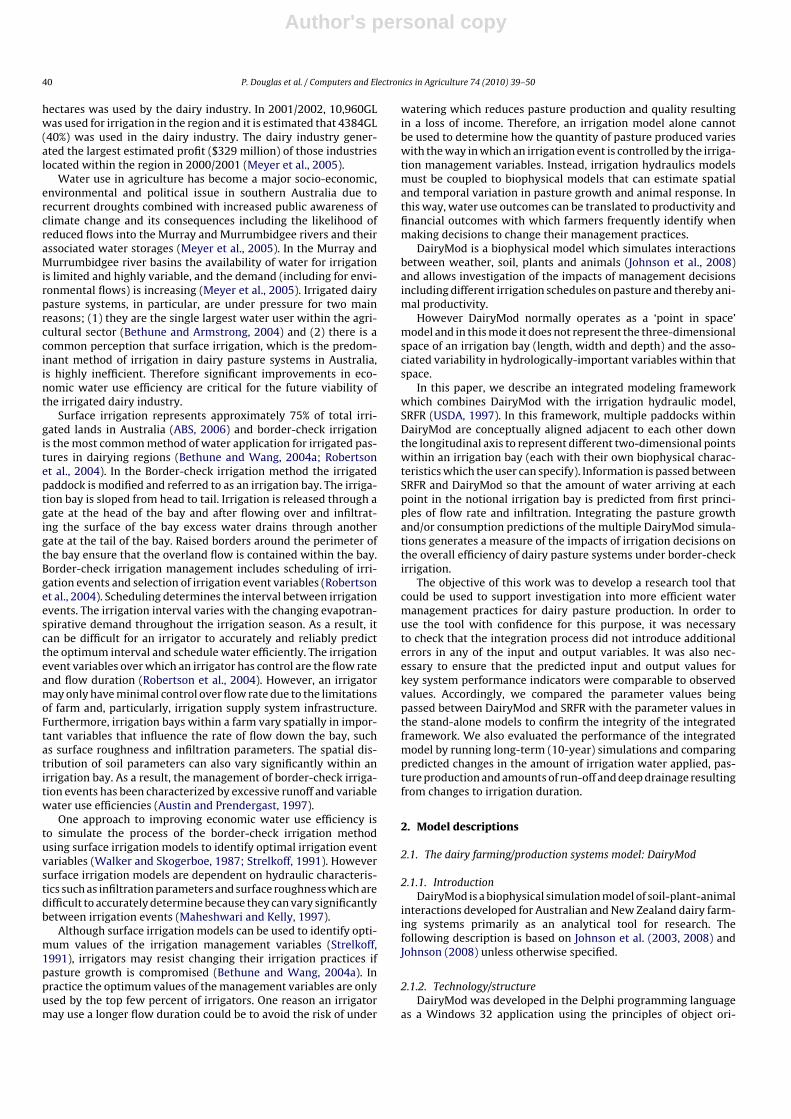
40 P. Douglas et al. / Computers and Electronics in Agriculture 74 (2010) 39–50
hectares was used by the dairy industry. In 2001/2002, 10,960GLwas used for irrigation in the region and it is estimated that 4384GL(40%) was used in the dairy industry. The dairy industry gener-ated the largest estimated profit ($329 million) of those industrieslocated within the region in 2000/2001 (Meyer et al., 2005).
Water use in agriculture has become a major socio-economic,environmental and political issue in southern Australia due torecurrent droughts combined with increased public awareness ofclimate change and its consequences including the likelihood ofreduced flows into the Murray and Murrumbidgee rivers and theirassociated water storages (Meyer et al., 2005). In the Murray andMurrumbidgee river basins the availability of water for irrigationis limited and highly variable, and the demand (including for envi-ronmental flows) is increasing (Meyer et al., 2005). Irrigated dairypasture systems, in particular, are under pressure for two mainreasons; (1) they are the single largest water user within the agri-cultural sector (Bethune and Armstrong, 2004) and (2) there is acommon perception that surface irrigation, which is the predom-inant method of irrigation in dairy pasture systems in Australia,is highly inefficient. Therefore significant improvements in eco-nomic water use efficiency are critical for the future viability ofthe irrigated dairy industry.
Surface irrigation represents approximately 75% of total irri-gated lands in Australia (ABS, 2006) and border-check irrigationis the most common method of water application for irrigated pas-tures in dairying regions (Bethune and Wang, 2004a; Robertsonet al., 2004). In the Border-check irrigation method the irrigatedpaddock is modified and referred to as an irrigation bay. The irriga-tion bay is sloped from head to tail. Irrigation is released through agate at the head of the bay and after flowing over and infiltrat-ing the surface of the bay excess water drains through anothergate at the tail of the bay. Raised borders around the perimeter ofthe bay ensure that the overland flow is contained within the bay.Border-check irrigation management includes scheduling of irri-gation events and selection of irrigation event variables (Robertsonet al., 2004). Scheduling determines the interval between irrigationevents. The irrigation interval varies with the changing evapotran-spirative demand throughout the irrigation season. As a result, itcan be difficult for an irrigator to accurately and reliably predictthe optimum interval and schedule water efficiently. The irrigationevent variables over which an irrigator has control are the flow rateand flow duration (Robertson et al., 2004). However, an irrigatormay only have minimal control over flow rate due to the limitationsof farm and, particularly, irrigation supply system infrastructure.Furthermore, irrigation bays within a farm vary spatially in impor-tant variables that influence the rate of flow down the bay, suchas surface roughness and infiltration parameters. The spatial dis-tribution of soil parameters can also vary significantly within anirrigation bay. As a result, the management of border-check irriga-tion events has been characterized by excessive runoff and variablewater use efficiencies (Austin and Prendergast, 1997).
One approach to improving economic water use efficiency isto simulate the process of the border-check irrigation methodusing surface irrigation models to identify optimal irrigation eventvariables (Walker and Skogerboe, 1987; Strelkoff, 1991). Howeversurface irrigation models are dependent on hydraulic characteris-tics such as infiltration parameters and surface roughness which aredifficult to accurately determine because they can vary significantlybetween irrigation events (Maheshwari and Kelly, 1997).
Although surface irrigation models can be used to identify opti-mum values of the irrigation management variables (Strelkoff,1991), irrigators may resist changing their irrigation practices ifpasture growth is compromised (Bethune and Wang, 2004a). Inpractice the optimum values of the management variables are onlyused by the top few percent of irrigators. One reason an irrigatormay use a longer flow duration could be to avoid the risk of under
watering which reduces pasture production and quality resultingin a loss of income. Therefore, an irrigation model alone cannotbe used to determine how the quantity of pasture produced varieswith the way in which an irrigation event is controlled by the irriga-tion management variables. Instead, irrigation hydraulics modelsmust be coupled to biophysical models that can estimate spatialand temporal variation in pasture growth and animal response. Inthis way, water use outcomes can be translated to productivity andfinancial outcomes with which farmers frequently identify whenmaking decisions to change their management practices.
DairyMod is a biophysical model which simulates interactionsbetween weather, soil, plants and animals (Johnson et al., 2008)and allows investigation of the impacts of management decisionsincluding different irrigation schedules on pasture and thereby ani-mal productivity.
However DairyMod normally operates as a ‘point in space’model and in this mode it does not represent the three-dimensionalspace of an irrigation bay (length, width and depth) and the asso-ciated variability in hydrologically-important variables within thatspace.
In this paper, we describe an integrated modeling frameworkwhich combines DairyMod with the irrigation hydraulic model,SRFR (USDA, 1997). In this framework, multiple paddocks withinDairyMod are conceptually aligned adjacent to each other downthe longitudinal axis to represent different two-dimensional pointswithin an irrigation bay (each with their own biophysical charac-teristics which the user can specify). Information is passed betweenSRFR and DairyMod so that the amount of water arriving at eachpoint in the notional irrigation bay is predicted from first princi-ples of flow rate and infiltration. Integrating the pasture growthand/or consumption predictions of the multiple DairyMod simula-tions generates a measure of the impacts of irrigation decisions onthe overall efficiency of dairy pasture systems under border-checkirrigation.
The objective of this work was to develop a research tool thatcould be used to support investigation into more efficient watermanagement practices for dairy pasture production. In order touse the tool with confidence for this purpose, it was necessaryto check that the integration process did not introduce additionalerrors in any of the input and output variables. It was also nec-essary to ensure that the predicted input and output values forkey system performance indicators were comparable to observedvalues. Accordingly, we compared the parameter values beingpassed between DairyMod and SRFR with the parameter values inthe stand-alone models to confirm the integrity of the integratedframework. We also evaluated the performance of the integratedmodel by running long-term (10-year) simulations and comparingpredicted changes in the amount of irrigation water applied, pas-ture production and amounts of run-off and deep drainage resultingfrom changes to irrigation duration.
2. Model descriptions
2.1. The dairy farming/production systems model: DairyMod
2.1.1. IntroductionDairyMod is a biophysical simulation model of soil-plant-animal
interactions developed for Australian and New Zealand dairy farm-ing systems primarily as an analytical tool for research. Thefollowing description is based on Johnson et al. (2003, 2008) andJohnson (2008) unless otherwise specified.
2.1.2. Technology/structureDairyMod was developed in the Delphi programming language
as a Windows 32 application using the principles of object ori-

Author's personal copy
P. Douglas et al. / Computers and Electronics in Agriculture 74 (2010) 39–50 41
Fig. 1. Schematic diagram of the files, environments and paths in which data flows between the DairyMod application and the SRFR assemblies in the integrated computerprogram.
ented programming. A distinction is made in the program betweenmodules that are used as a part of the interface or front end andmodules that represent the model or back end (Fig. 1). The interfaceis the means by which the user is able to interact with the modelthrough setting parameters, executing simulations and accessingoutput data.
The model has a hierarchical structure so that values (vari-ables/parameters) within higher level modules apply to the wholefarm (e.g. climate and grazing management modules) whereas val-ues within lower level modules (e.g. irrigation, soil water, fertilizermodules) apply only to a specific paddock. For example grazingmanagement strategies are located at a higher level and have con-trol over the processes within paddocks at the lower level.
2.1.3. Operation/processes: overviewDairyMod has been designed for the simulation of biophysical
processes on a multi-paddock farm. In DairyMod a paddock at itsbasic level represents an area of land in which the soil type/depthand pasture species are defined by the user. It is also possible todefine a schedule for the rate and amount of fertilizer and irrigationapplication. The modules containing all the biophysical processesthat occur within a paddock are collectively referred to as a cell.In a cell the biophysical processes are evaluated on a per unitarea basis and multiplied by the area of the paddock to deter-mine overall paddock values. In this paper a DairyMod paddockhas been referred to as a paddock unless it is referred to in rela-tion to border-check irrigation in which case it has been referredto as an irrigation bay. Each paddock is independent and so canbe given unique parameters/characteristics for soil and pasturesand also different management options (e.g. irrigation strategies).In this mode of operation, whole farm processes involving a seriesof paddocks or a set of selected paddocks can be simulated in asingle model run. Within each paddock all biophysical processesoccur at a point on the two-dimensional surface of the paddockand for this reason the model has been referred to by the authorsas ‘non-spatial’.
Each major process is simulated so that the outputs are avail-able as inputs for the next process. Some processes such aspasture growth are simulated in daily time steps; however soil
water infiltration can be handled in 15 min intervals. The modelconsists of a range of modules representing various biophysical pro-cesses which occur in a dairy farming environment. These includeplant physiological processes, pasture intake by grazing animals,animal physiology, soil water dynamics (soil water infiltration,through drainage, runoff, transpiration and evaporation) and nutri-ent dynamics. The effect of water and nutrient stress on plantgrowth is incorporated using the concept of growth limiting factors(see Johnson, 2008 for a detailed description).
In addition to the mechanistic representation of biophysical pro-cesses, the model also provides a range of options for stock, pasture,irrigation and fertilizer management in a dairy farm, and so can beused to simulate the response of dairy pasture systems to climateand a broad range of management strategies. Climate data can beobtained for a specific region and used as the driver for the dairyproduction system. The farm size, number of paddocks and stockmanagement policies can be set by the user to represent a partic-ular farm and the soil and pasture species can be characterized forthe farm or region.
DairyMod has been used to investigate the dynamics of pas-ture growth in grazing systems in Australia and New Zealand (e.g.Chapman et al., 2008a,b; Cullen et al., 2008; White et al., 2008).These studies have all recorded close agreement between modelpredictions of net pasture growth and observed values for specificlocations and time periods, although White et al. (2008) noted dis-crepancies between predictions of pasture species composition andobserved data for botanical compositions.
2.1.4. Irrigation operations/processesIn DairyMod, water inputs such as rainfall and irrigation applica-
tions are intercepted by the canopy, litter or soil surface. Irrigationwater can be applied directly on to the soil surface as in surface irri-gation methods or on to the canopy surface as in spray irrigationmethods. In this paper all references to irrigation refer to surfaceirrigation. User-defined empirical parameters determine the rain-fall or irrigation fraction that is intercepted by the canopy or litter.If present, rainfall not retained on the canopy or litter surfaces iscombined with irrigation water at the soil surface.

Author's personal copy
42 P. Douglas et al. / Computers and Electronics in Agriculture 74 (2010) 39–50
The main functions of the irrigation management module areto schedule irrigation events, determine irrigation water require-ments and then trigger irrigations. This module has the capabilityto simulate four scheduling strategies. Associated with each strat-egy is an irrigation requirement (depth of applied irrigation) andinitiation threshold (trigger level) which can be selected via the irri-gation module user interface. The optional strategies for schedulingirrigation events are:
1. irrigation in response to plant water deficit;2. irrigation in response to soil water deficit;3. irrigation in response to rainfall deficit (based on evapotranspi-
ration, ET);4. irrigation at regular time intervals.
At each daily time step all four irrigation strategies are testedto determine if an irrigation method has been scheduled. If oneor more strategies have been scheduled then the current date ischecked to determine if it is within the irrigation season. If so thenthe trigger is compared to the initiation threshold. If the initiationthreshold has been exceeded then the irrigation requirement isevaluated and the irrigation water evenly applied in each sub-daytime step within the user specified daily time interval.
2.1.5. Infiltration operation/processesSurface infiltration and the movement of water through the
soil matrix including through drainage are the soil hydraulic pro-cesses of primary importance in this work. The capacitance modelin DairyMod was used to model soil water dynamics in the inte-grated DairyMod/SRFR model.
In the capacitance model, water only moves downwards in thesoil profile and only the fraction of water in excess of the drainagepoint can move. The drainage point is the critical volume fractionof soil water at which point water begins to move downward dueto gravitation pull. This is calculated using the following equation(Johnson, 2008):
�dp = �fc − ��s
1 − �, (1)
where � is the volumetric soil moisture, dp is the drainage point, fcis the field capacity, s is the � at saturation, and � is an empiricalparameter.
Multiple horizons of the soil are available to the user inDairyMod. Each horizon has its own user-defined parameters. Inaddition, each horizon is further subdivided into a fine layer distri-bution. In the model, water moves down the soil profile from eachlayer to the layer below starting from the surface. Only water inexcess of the drainage point in each layer (determined at each sub-hourly time step) can move to the layer below. The equation usedto determine the amount of water that moves to the layer below is(Johnson, 2008):
q = Ks
(� − �dp
�s − �dp
)�
, (2)
where Ks is the saturated hydraulic conductivity and � controls thedecline in the flux as the water content approaches the drainagepoint. After all layers have drained to the layer below the water onthe soil surface is drained into the first layer. In the last step evapo-ration is removed from the canopy and litter, drainage is evaluatedand runoff is calculated and removed from the soil surface.
Fig. 2. A Screenshot from SRFR user interface showing a typical hydrograph in whichthe advancing (upper line) and receding (lower lines) waves are presented. The x-axis represents the distance from the head end of the irrigation bay. The opportunitytime for any given location along the distance down the irrigation bay is representedby the difference between the two lines.
2.2. The surface irrigation flow program: SRFR
2.2.1. IntroductionThe Surface Irrigation Flow Program (SRFR) is a one-dimensional
irrigation hydraulic model for simulating unsteady overland flowin basin, border and furrow irrigation systems (Strelkoff, 1991).SRFR was originally developed by the USDA US Water Conserva-tion Laboratory, Phoenix, AZ, USA as a tool for design, evaluationand management of surface irrigation systems.
2.2.2. Technology/structureSRFR was written in FORTRAN programming language for exe-
cution in a MS-DOS environment (Strelkoff, 1991). The originallegacy code was ported into a set of Microsoft’s .NET Framework 1.1assemblies (library of routines) (similar to Dynamic Link Libraries(dll’s) in the Windows 32 environment) to facilitate the upgrade ofSRFR to a Windows Application. The set of .Net assemblies (backend) were made available for this project.
2.2.3. Overland flow processesWhen sufficient water is released over a porous medium in sur-
face irrigation, part of this water infiltrates into the soil and theremainder moves over the field as overland flow. SRFR was usedto simulate the border-check irrigation method, to determine theinfiltration distribution within an irrigation bay and the associatedirrigation performance parameters for an irrigation event.
Border-check surface irrigation involves overland flow pro-cesses such as the advancing and receding waves and infiltration.The advance phase represents the time interval between the waterfront entering and reaching the end of the irrigation bay. The reces-sion phase represents the time between the cessation of inflow andthe time taken for the surface water to drain from a specified loca-tion. The difference in time between the beginning of the advancephase and the end of the recession phase at a specified location isthe opportunity time during which infiltration is possible (Walkerand Skogerboe, 1987). A typical hydrograph produced by SRFR ispresented in Fig. 2.
In the one-dimensional model, flow variations transverse to themain direction of flow is ignored and so the inflow is assumed to beuniformly distributed across the bay width. Accordingly flow char-acteristics only vary temporally and spatially with distance alongthe main direction of flow from the inlet. Field hydraulic proper-ties such as infiltration characteristics, surface roughness and bedslopes can have a prescribed variation with distance along the maindirection of flow.

Author's personal copy
P. Douglas et al. / Computers and Electronics in Agriculture 74 (2010) 39–50 43
2.2.4. Hydraulic analysisUnsteady overland flow simulation and analysis are required for
the design, evaluation and management of surface irrigation sys-tems. For the purpose of hydraulic analysis the processes of surfaceflow during all the phases of irrigation from advance to recessionare accurately described as a shallow-water wave propagating ona dry, porous surface with negligible inertia. The flow resistance isdescribed using Manning’s equation (Walker and Skogerboe, 1987).
The widely accepted governing equations in one-dimension thatdescribe flow processes are mass conservation and momentumconservation (neglecting inertia components). The equations givenby Strelkoff and Katapodes (1977) are:
∂y
∂t+ ∂q
∂t+ Is = 0 (3)
∂y
∂x− So + n2q |q|
y10/3= 0 (4)
in which y(x,t) is depth of flow; q(x,t) is discharge per unit width;x is distance along the border/basin strip; t is time; So is slope ofborder-strip bed; Is is infiltration rate; and n is Manning’s resistancecoefficient.
2.2.5. Infiltration processesInfiltration is modeled using the modified Kostiakov equation
(Furma et al., 2006) which is an empirical function, that is:
Is = akta−1op + b (5)
In which top is infiltration opportunity time and a,k,b are empir-ical infiltration parameters.
In SRFR the governing Eqs. (3) and (4) are solved numerically tosimulate the flow processes involved in an irrigation event.
2.2.6. EvaluationThe performance of SRFR in modeling border irrigation in south
east Australia was evaluated by Maheshwari and McMahon (1993)who found that, in comparison to other border irrigation models,SRFR was the most satisfactory in modeling advance and reces-sion. SRFR was also generally superior in predicting infiltration andrunoff.
2.3. DairyMod and SRFR integration
2.3.1. Integration frameworkThe integration of DairyMod and SRFR involved the develop-
ment of an interfacing framework that linked the two software toolsat three conceptual levels. It was necessary to develop interfacesbetween:
1. the two computer programs,2. the user and the SRFR assembly, and3. the two models.
The framework enabled: communication between the two com-puter programs; the user to select parameters and execute SRFR(back end) from the DairyMod user interface (front end); inputdata to flow from DairyMod (back end) to SRFR (back end); out-put data to flow from SRFR (back end) to DairyMod (back end); andthe processing and reporting of the output SRFR data (back end) inDairyMod (back and front ends).
2.3.2. Computer program interface: exporting global routines in amixed language and mixed platform environment
In order to integrate the DairyMod application and the SRFRassembly, a mechanism had to be developed so that the routines inthe .Net Fortran assembly could be exposed to the Delphi Windows
Fig. 3. Schematic representation of an irrigation bay layout in the spatial modeof DairyMod (upper diagram) and a hypothetical example of the infiltration depthcorresponding to each cell (lower diagram). A cell represents all the processes thatoccur in one element of an irrigation bay and there are multiple cells per irrigationbay.
32 application. Programs developed in the Win32 environmentare compiled to machine code which is specific to a particularCPU/Hardware architecture and operating system. The compila-tion processes of .Net and Windows 32 source code is different.Windows 32 source code is compiled directly to machine codewhereas .Net source code is compiled initially to an intermedi-ate language. The first time an exported routine is called froma Windows 32 process a .Net session is initiated which involvesloading up the .Net infrastructure, loading the assembly, deter-mining its layout within memory and then compiling the calledroutine to machine code (Cantu, 2005). As a consequence of themixed language and platform environments, routines in the .Netassembly cannot be called directly from the Windows 32 applica-tion.
Despite differences in compilation processes, a Windows32application can access routines in a .Net assembly using a mech-anism included in the .Net platform called unmanaged exportsor Inverse Platform Invoke (Cantu, 2005; Long, 2004). Of all the.Net languages only Delphi supports this mechanism which is lim-ited to exporting Delphi global routines (Long, 2004). Howeverthe routines in the SRFR assembly were not global but existedwithin an object oriented programming structure known as a class.In order to expose (to the Windows 32 application) the routinesin the classes in the .Net SRFR assembly, a .Net interface assem-bly was developed. A set of global routines in the .Net interfaceassembly were used to call the routines in the classes in the .NetSRFR assembly. The global routines in the interface .Net assemblycould then be exposed using the unmanaged exports mecha-nism to the Windows32 application. A schematic representationof the integrated DairyMod/SRFR computer program is depicted inFig. 1.
One important difference between .Net and Win32 programs isthe way in which the floating point control register is set. Manycompilers of Win32 applications disable the error handling withinthe floating point control register and handle the errors at a higherlevel (Smith, 2004). In contrast .Net programs require that the float-ing point control register is set to the default state (Microsoft, 2003).Therefore, in order to facilitate seamless transfer of floating pointdata between the two models, the floating point control registerhad to be enabled by the Windows 32 application before controlwas passed to the .Net dll when floating point operations wereexecuted and then disabled once control was returned.

Author's personal copy
44 P. Douglas et al. / Computers and Electronics in Agriculture 74 (2010) 39–50
Fig. 4. Schematic flow diagram of a six-celled irrigation bay (spatial mode) depicting irrigation related modules and the sequence in which they are processed in a daily timestep in the integrated model. Modules developed as a part of the integrated model and their corresponding flow paths are differentiated from existing modules and flowpaths. The cell in which irrigation is initiated is cell three.
2.3.3. User interface: integration of SRFR parameter and optionselection in the DairyMod user interface
An interface Delphi .Net assembly was developed enabling rou-tines in the SRFR assemblies to be called from the DairyModapplication. The routines in the interface .Net assembly were usedto export input parameters from the DairyMod interface to SRFR,execute SRFR from both DairyMod interface and model and toreturn output data from SRFR for display in the DairyMod inter-face.
A form/unit pair (USRFR) was added to the DairyMod user inter-face (front end) to enable the user to set SRFR input parameters. Asecond unit (SRFR) was added to the DairyMod model (back end)which included header translations for calling the exported rou-tines as well as methods used by the model to determine inputparameters, call SRFR routines and return and use output data todetermine the appropriate values of parameters required by themodel.
2.3.4. Model interface: operational modifications made toDairyMod
Modifications were made to the DairyMod model (back end) sothat:
1. outputs from the DairyMod model could be processed andexported to the SRFR model;
2. outputs from the SRFR model could be processed and exportedto the DairyMod model;
3. DairyMod could also be operated in a spatial mode.
The strategies of irrigation scheduling remain as a functionthat is selected and executed in DairyMod. All existing operationalmechanisms incorporated in the original DairyMod regarding irri-gation are also utilized in the integrated model.
Author's personal copy
P. Douglas et al. / Computers and Electronics in Agriculture 74 (2010) 39–50 45
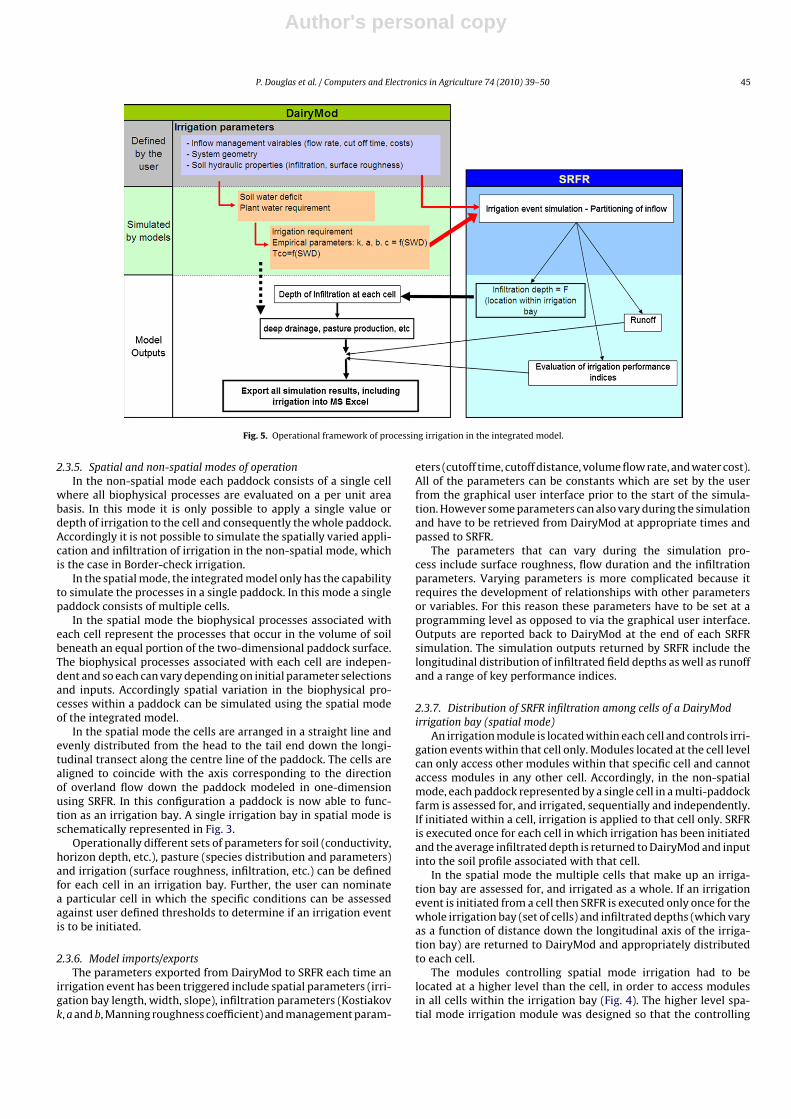
Fig. 5. Operational framework of processing irrigation in the integrated model.
2.3.5. Spatial and non-spatial modes of operationIn the non-spatial mode each paddock consists of a single cell
where all biophysical processes are evaluated on a per unit areabasis. In this mode it is only possible to apply a single value ordepth of irrigation to the cell and consequently the whole paddock.Accordingly it is not possible to simulate the spatially varied appli-cation and infiltration of irrigation in the non-spatial mode, whichis the case in Border-check irrigation.
In the spatial mode, the integrated model only has the capabilityto simulate the processes in a single paddock. In this mode a singlepaddock consists of multiple cells.
In the spatial mode the biophysical processes associated witheach cell represent the processes that occur in the volume of soilbeneath an equal portion of the two-dimensional paddock surface.The biophysical processes associated with each cell are indepen-dent and so each can vary depending on initial parameter selectionsand inputs. Accordingly spatial variation in the biophysical pro-cesses within a paddock can be simulated using the spatial modeof the integrated model.
In the spatial mode the cells are arranged in a straight line andevenly distributed from the head to the tail end down the longi-tudinal transect along the centre line of the paddock. The cells arealigned to coincide with the axis corresponding to the directionof overland flow down the paddock modeled in one-dimensionusing SRFR. In this configuration a paddock is now able to func-tion as an irrigation bay. A single irrigation bay in spatial mode isschematically represented in Fig. 3.
Operationally different sets of parameters for soil (conductivity,horizon depth, etc.), pasture (species distribution and parameters)and irrigation (surface roughness, infiltration, etc.) can be definedfor each cell in an irrigation bay. Further, the user can nominatea particular cell in which the specific conditions can be assessedagainst user defined thresholds to determine if an irrigation eventis to be initiated.
2.3.6. Model imports/exportsThe parameters exported from DairyMod to SRFR each time an
irrigation event has been triggered include spatial parameters (irri-gation bay length, width, slope), infiltration parameters (Kostiakovk, a and b, Manning roughness coefficient) and management param-
eters (cutoff time, cutoff distance, volume flow rate, and water cost).All of the parameters can be constants which are set by the userfrom the graphical user interface prior to the start of the simula-tion. However some parameters can also vary during the simulationand have to be retrieved from DairyMod at appropriate times andpassed to SRFR.
The parameters that can vary during the simulation pro-cess include surface roughness, flow duration and the infiltrationparameters. Varying parameters is more complicated because itrequires the development of relationships with other parametersor variables. For this reason these parameters have to be set at aprogramming level as opposed to via the graphical user interface.Outputs are reported back to DairyMod at the end of each SRFRsimulation. The simulation outputs returned by SRFR include thelongitudinal distribution of infiltrated field depths as well as runoffand a range of key performance indices.
2.3.7. Distribution of SRFR infiltration among cells of a DairyModirrigation bay (spatial mode)
An irrigation module is located within each cell and controls irri-gation events within that cell only. Modules located at the cell levelcan only access other modules within that specific cell and cannotaccess modules in any other cell. Accordingly, in the non-spatialmode, each paddock represented by a single cell in a multi-paddockfarm is assessed for, and irrigated, sequentially and independently.If initiated within a cell, irrigation is applied to that cell only. SRFRis executed once for each cell in which irrigation has been initiatedand the average infiltrated depth is returned to DairyMod and inputinto the soil profile associated with that cell.
In the spatial mode the multiple cells that make up an irriga-tion bay are assessed for, and irrigated as a whole. If an irrigationevent is initiated from a cell then SRFR is executed only once for thewhole irrigation bay (set of cells) and infiltrated depths (which varyas a function of distance down the longitudinal axis of the irriga-tion bay) are returned to DairyMod and appropriately distributedto each cell.
The modules controlling spatial mode irrigation had to belocated at a higher level than the cell, in order to access modulesin all cells within the irrigation bay (Fig. 4). The higher level spa-tial mode irrigation module was designed so that the controlling

Author's personal copy
46 P. Douglas et al. / Computers and Electronics in Agriculture 74 (2010) 39–50
logic could access the tested functionality within the lower levelirrigation modules rather than reproduce it at the higher level. As aconsequence some modifications had to be made to the lower levelmodules in order to facilitate access from the higher level.
At the lower level, methods were added to the irrigation modulein order to accommodate spatial mode and irrigation from SRFR. Inaddition the SRFR module was developed and located within theirrigation module. The functionality of the SRFR module includedpassing input data to SRFR, executing SRFR, retrieving output datafrom SRFR and determining the infiltrated depths corresponding toeach cell from the SRFR data.
Within the SRFR module the amount of infiltrated water from asingle SRFR irrigation event is partitioned into amounts that corre-sponded to both the area represented by each cell (sub-area) andthe position of each cell down the longitudinal axis of the irriga-tion bay. This was accomplished by determining the average depthof infiltrated water associated with each cell. The average depth ofinfiltrated water was determined as the average between the depthof infiltration at the boundaries of the cell or the positions wherethe sub-area associated with a cell started and finished. The depthat the boundaries of each cell was determined by linearly interpo-lating between the SRFR generated infiltrated depths located eitherside of a boundary. The average depth of infiltrated water appliedto a cell is equal to the volume of infiltrated water per unit areawithin each cell (sub-area).
Methods were also added to the soil water module to add infil-trated water to the soil profile and add irrigation quantities (such asrunoff) and the hydraulic performance indices to DairyMod report-ing modules.
The functionality created at the higher level included identifyingthe cell used to initiate irrigation and accessing functionality in theirrigation module to:
1. determine if an irrigation event had been initiated,2. pass SRFR input data from each cell to the SRFR module,3. execute SRFR, and4. retrieve SRFR output data from the SRFR module to each cell.
2.3.8. Input of SRFR infiltration directly into the DairyMod soilprofile
The irrigation logic in DairyMod has been developed so thatirrigation is applied either to the soil surface or the canopy. Thesurface water then infiltrates down through the soil profile. How-ever during an irrigation event in the integrated model quantitiesof infiltrated water are returned from SRFR. As these depths rep-resent water that has already infiltrated into the soil they cannotbe applied to the soil surface in DairyMod. Therefore, these depthshave been treated as volumes (depth multiplied by the user definedarea associated with each cell) occupied by pore spaces in the soilmatrix. The infiltration depths are transferred directly into soil lay-ers (from the top layer down) of the soil profile at the end of eachdaily time step.
2.3.9. Reporting simulation outputsFor the purpose of reporting the total applied water, informa-
tion generated in SRFR is written to the corresponding variable inDairyMod. In the spatial mode, the reported results for each cell rep-resent a fraction of the results for a single irrigation bay. A schematicrepresentation of the flow of variables from the user, through theintegrated model is presented in Fig. 5.
2.4. Verification, preliminary simulation results and validation
Performance evaluations in DairyMod and SRFR have alreadybeen reported in the literature (e.g. DairyMod: Johnson et al., 2008;Cullen et al., 2008; White et al., 2008; and SRFR: Maheshwari and
Table 1Characteristics used to describe the soil in the integrated DairyMod–SRFR model.
Variable Soil horizon
A1 A2 B1 B2
Depth (cm) 2 20 100 200Bulk density (BD, m3/m3) 1.35 1.55 1.65 1.65Saturated hydraulicconductivity (Ksat, mm/h)
2.8 2.8 1.5 1.5
Volumetric moisture content at:Saturation 0.48 0.48 0.50 0.50Field capacity 0.40 0.40 0.46 0.46Wilting Point 0.19 0.19 0.28 0.28
Volumetric moisturecontent of air dry soil
0.13 0.13 0.22 0.22
McMahon, 1993), thus in this paper we only report the performanceof the integrated (DairyMod and SRFR) model.
2.4.1. MethodsIn order to test the integrity of the integrated model, a series of
simulations were run independently on the integrated model andstand-alone DairyMod and SRFR models. Sensitivity of the inte-grated model to irrigation management decisions was tested bysimulating a scenario with three irrigation durations. The scenariowas simulated using a pasture cutting trial (e.g. Johnson et al., 2008)on a border-check irrigated farm run over a period of 10 years usingreal climate data. This virtual farm represented soil and climaticconditions typical of the northern irrigation region, near Sheppar-ton in Northern Victoria, an important dairy production area. Thesoil types within the region are mostly duplex clay loam soils witha shallow A horizon of up to 200 mm and a restricting layer at orbelow the interface with the B1 horizon (Mehta and Wang, 2005).The mean annual rainfall for the 10 years of climate data used in thescenario was 410 mm/year which varied from an annual minimumof 212 mm to an annual maximum 492 mm.
A set of empirical parameters for the modified Kostiakovequation was selected from within the range experimentally deter-mined for a red duplex clay loam as reported by Maheshwari andJayawardarne (1992). A set of physical parameters representing aduplex clay loam was selected from the default soil types avail-able in DairyMod (Table 1). Parameters describing the crop type,irrigation bay, and hydraulic properties associated with overlandflow are presented in Table 2. The simulated perennial ryegrasspasture was assigned a maximum root depth of 40 cm, with 50% ofroot mass occurring within the top 15 cm of the soil, and was man-aged by monthly cutting to estimate net herbage accumulation.This is analogous to the enclosure cage method which has been
Table 2Parameter values used to describe the irrigation bay and the hydraulic properties ofoverland irrigation water flow in the integrated DairyMod–SRFR model.
Variable Value Units
Bay dimensionsLength 300 mWidth 55 mArea 1.65 haAverage slope (S) 0.002 m/m
Cells per bay 6Trigger cell number 4Hydraulic properties
Target depth (Z) 26 mmMannings roughness coefficient (n) 0.2 s/m0.33
Hydraulic conductivity (K) 20 mm/ha
a 0.17b 0 mm
Upstream conditions No drain backDownstream conditions Open endOverflow depth 300 mm

Author's personal copy
P. Douglas et al. / Computers and Electronics in Agriculture 74 (2010) 39–50 47
Table 3Irrigation scheduling and efficiency parameter values used in the integratedDairyMod–SRFR model.
Variable Irrigation duration
Short Medium Long
Time of cutoff (s) 3530 4314 5098Inflow rate (Ml/d) 10 10 10Soil water deficit (mm) 26 26 26Application efficiency (%) 94.0 81.4 70.0Distribution uniformity 0 0.8816 0.887Average irrigation application (Ml/ha) 0.248 0.303 0.358
widely used to determine mean pasture growth rates (Radcliffe,1974; ‘tMannetje, 2000). In the model, plant nutrients removed bycutting were returned as simulated dung and urine with standardvalues for macronutrient concentrations and availability for plantuptake. The simulated irrigation period was from 1st October to30th April each year for 10 years.
Test model runs used a very basic management set up for thesimulations except for the irrigation module. DairyMod default val-ues were used for most of the other variables. The scenarios testedinvolved irrigation scheduling based on the soil water deficit strat-egy. The scenarios were simulated with three irrigation durations,short (tco = 3530 s), medium (tco = 4314 s), and long (tco = 5098 s).Parameter details used in the scenarios are presented in Table 3.
2.4.2. VerificationThe integrated model was subjected to a series of tests to verify
that the framework linking the two models did not introduce anynew sources of error. Input data transfer from DairyMod to SRFRwas tested by comparing the input values in the DairyMod userinterface with the values exported to, and output from the SRFRassembly. It was found that all input data flow variables listed inTables 2 and 3 that were exported from DairyMod to SRFR wereexported without error.
The output data (depth of infiltration and performance indices)were verified by comparing the values generated in the stand-alone SRFR application with the values returned and reportedin DairyMod from the SRFR assembly. Performance indicesreturned by the integrated model and SRFR for the three sce-narios with short, medium and long irrigation durations werecompared. Only minor differences were found in the appli-cation efficiency (less than 2%), the distribution uniformity(0.11), the runoff (less than 3%) and the relative volume error(0.01).
Infiltration distributions returned by the integrated model andSRFR for the three scenarios with short, medium and long irri-gation durations were compared. Some small differences (in theorder of a few percent) were found between the integrated modeland the SRFR outputs and were not investigated further. Despitethese small differences it was considered that the framework usedto import and export data from DairyMod to the SRFR assembly didnot introduce any appreciable source of error.
The procedure used to determine the depth of infiltrated waterapplied to each cell based on the SRFR generated infiltrated water
output was also verified. The potential source of error with theprocedure was in the determination of the average value of the 2linearly interpolated values. The procedure was verified in 2 ways.The first approach was to calculate the error (E) in the differencebetween the average depths of infiltrated water determined usingSRFR and the sum of that applied to the cells using Eq. (4).
E = ISRFR − 1N
N∑j=1
Ij (6)
where I is the average depth of infiltrated water determined inSRFR, I is the depth of infiltrated water applied to a cell in Dairy-Mod, N is the number of cells, j is the cell number. The infiltrationparameters used to verify the framework linking the 2 models werek = 20 mm/ha, a = 0.17 and b = 0. All other parameters are presentedin Tables 1 and 2.
The estimated error was 1.00, 0.17 and 0.06 mm for the short,medium and long duration irrigation scenarios. These errors weresmall relative to the infiltrated depths of 24–27 mm. In the case ofthe short irrigation duration simulation, the error is larger becauseirrigation water did not reach the end of the bay. The interpolateddepth at the final boundary of the last cell is zero. The average valueis then based on the interpolated value at the start boundary of thelast cell and zero. The distinction between the situations in whichinfiltration water almost reaches the end of the cell and infiltrationwater that only just enters the cell is not reflected in the averagevalue.
The second approach was to compare differences between thedistributions of SRFR generated infiltrated water and those appliedto the cells in DairyMod. The distributions were compared for eachirrigation event and are presented in Fig. 6. The infiltration at eachnode in DairyMod was found to coincide with each SRFR nodeexcept for the final point in the short duration simulation. The errorwas a result of the overland flow not reaching the end of the bay. Inthis case the magnitude of the error was small (approximately 4%).Such an error may need to be taken into account in simulations inwhich overland flow does not reach the end of the bay. However, inmost simulations it is expected that the overland flow would reachthe end of the irrigation bay and so the error should be negligible.
It was concluded that the procedure used to determine the depthof infiltrated water applied to each cell did not introduce any appre-ciable source of error.
Finally, the procedure used to add the infiltrated water directlyinto the soil profile was also verified. The actual initial and the actualfinal and the calculated final soil water deficits just prior to and aftera single medium irrigation duration event along with the amountsapplied to each cell are presented in Table 4.The error or differencebetween the calculated and actual final soil water deficit was eithernot detectable (to 2 decimal places) or negligibly small.
2.5. Preliminary simulations
Predicted mean annual outputs (pasture yield, irrigation inputs,deep drainage and runoff) from simulations over a 10-year periodfor the three irrigation durations are presented in Fig. 7. The values
Table 4Actual initial and final soil water deficits (mm), calculated final soil water deficit (mm) and the infiltrated depth applied (mm) for a single medium irrigation duration event.
Cell number
1 2 3 4 5 6
DairyMod initial deficit 77.28 77.28 77.28 77.28 77.28 77.28SRFR applied depth 24.18 25.69 26.55 27.04 27.13 26.86Calculated final deficit 53.1 51.59 50.73 50.23 50.14 50.41DairyMod final deficit 53.09 51.59 50.73 50.24 50.14 50.41Difference 0.01 0 0 −0.01 0 0

Author's personal copy
48 P. Douglas et al. / Computers and Electronics in Agriculture 74 (2010) 39–50
Fig. 6. Comparison of the distribution of SRFR generated infiltration and that appliedto the cells in DairyMod at three irrigation cutoff times (tco). A: short duration(tco = 3530 s), B: medium duration (tco = 4314 s) and C: long duration (tco = 5098 s)All other system parameters are listed in Tables 1 and 2.
are for a single irrigation bay and are presented on a per hectarebasis.
2.5.1. Pasture yieldIncreased irrigation water supply resulted in increased pasture
dry matter. The mean annual irrigation inputs were respectively26% and 48% higher at medium and longer irrigation durationscompared to the shorter irrigation period, resulting in an 11–12%increase in pasture yields (Fig. 7a).
The mean annual pasture yields for the simulations variedfrom 13 to 14.5 t DM/ha/year (Fig. 7a). These are within the rangeof observed annual pasture production for irrigated perennialryegrass/white clover pastures in the Northern Irrigation Regionof Victoria of 10.0–18.3 t DM/ha/year (mean = 14.3 t DM/ha/year)(Doyle et al., 2000). Given that the observed value come from stud-ies of, usually, 2–3 years duration, the 10-year mean predicted byDairyMod appears to align closely with expected pasture produc-tivity.
Fig. 7. Predicted mean annual per bay pasture yield (a), and applied irrigation, deepdrainage and runoff (b) for a simulated cutting trial in which the irrigation durationwas varied and the irrigation scheduling was based on soil water deficit.
2.5.2. Irrigation inputsThe mean annual irrigation inputs were 5.90, 7.46 and
8.71 Ml/ha/year (Ml equals megalitre) respectively for the short,medium and long irrigation duration simulations (Fig. 7b). Longerirrigation durations supplied the bay with higher irrigation vol-umes. Irrigation inputs generated by the model for the mediumand long irrigation duration simulations (7.46 and 8.71 Ml/ha/year)were comparable to the typical irrigation requirement of between8 and 10 Ml/ha/year in Northern Victoria (Linehan et al., 2004).
2.5.3. RunoffThe integrated model predicted mean annual runoff of 0.06, 1.00
and 2.22 Ml/ha/year, respectively for short, medium and long irri-gation simulations (Fig. 7b) confirming the responsiveness of thismodeled parameter to varying irrigation inputs.
Runoff in the integrated model is predicted solely by the parentmodel SRFR which as stated earlier has been found to be generallysuperior in modeling runoff in south east Australia in comparison toother border irrigation models (Maheshwari and McMahon, 1993).Therefore provided that the model was adequately calibrated thenit would be assumed that it would produce a generally superiorprediction of runoff.
In addition the purpose of the preliminary simulations was notto determine optimum management conditions but to demonstrate

Author's personal copy
P. Douglas et al. / Computers and Electronics in Agriculture 74 (2010) 39–50 49
Fig. 8. Mean annual pasture yield cut (a), applied irrigation (b), and deep drainage(c) for each cell for a simulated cutting trial under three irrigation durations, i.e.3530, 4314, and 5098 s. The irrigation scheduling was based on soil water deficit forall simulations.
that pasture production in the integrated model was indeed sensi-tive to changes in the irrigation management parameters. In orderto achieve this end the irrigation duration was varied from whatcould be considered an unrealistically short time interval with norunoff to an excessively long time interval with correspondinglyexcessive levels of runoff.
2.5.4. Deep drainageThe integrated model predicted mean annual deep drainage
of 0.29, 0.39 and 0.39 Ml/ha/year, respectively for short, mediumand long irrigation simulations (Fig. 7b) confirming the respon-siveness of this modeled parameter to varying irrigation inputs.Deep drainage on heavy textured soils comparable to the soil typeused in the simulations reported in this paper has been found to behighly variable and ranged from a few mm/year up to 100 mm/year(equivalent to 1 Ml/ha/year) (Bethune, 2004; Bethune and Wang,2004b). Accordingly the deep drainage predicted using the inte-grated model was within the range of deep drainage reported inthe literature.
As mentioned previously, the two models handle the infiltrationprocess differently with different sets of infiltration parameters.Both sets of infiltration parameters and models are important in thedetermination of the magnitude of deep drainage. If the two setsof infiltration parameters were not sufficiently equivalent then theintegrated model would either over or under predict deep drainage.
The empirical and physical parameters were selected from twodifferent sources, that each represented a duplex clay loam soil.Infiltration parameters within the broad category of a soil type canvary considerably (Bethune and Wang, 2003) and so there was noguarantee that the two sets of parameters were equivalent. Deter-mination of the equivalence of infiltration parameters is further
complicated because it is difficult to relate empirical parameters tosoil properties (Maheshwari and Jayawardarne, 1992).
Accordingly, identification of a sufficiently equivalent set ofinfiltration parameters to use in the integrated model is an areawhere further investigation is required to provide higher levels ofconfidence that the modeling framework can generate more preciseestimates of deep drainage and not just within the range reportedin the literature.
2.5.5. Spatial variation of pasture yield, infiltration and deepdrainage within an irrigation bay
The mean annual pasture yield, infiltration and deep drainagefor each cell are presented in Fig. 8. In each simulation, the maxi-mum infiltration (6.74 Ml/ha/year), pasture yield (15.10 t/ha/year)and deep drainage (0.39 Ml/ha/year) occurred in the fifth cell ofthe irrigation bay. In the short irrigation duration simulation,the advancing water front did not reach the end of the bay andconsequently the applied irrigation (3.29 Ml/ha/year), cut yield(7.00 t/ha/year) and deep drainage (0.09 Ml/ha/year) in cell 6 wereappreciably reduced compared to other cells.
3. Conclusions
The integrated DairyMod–SRFR model generated estimates forirrigation inputs, pasture yields and deep drainage that were withinthe range expected for northern Victorian dairy systems, and wassensitive to irrigation management inputs such as irrigation dura-tion.
The biophysical dairy systems simulation model, DairyMod andthe surface irrigation flow model, SRFR have successfully been inte-grated as a research tool for evaluating the impacts of conditionswithin surface irrigation bays (including spatial variability in sur-face and soil conditions) and irrigation management decisions onirrigation efficiency and pasture production.
The integrated modeling framework produced in this workoffers the opportunity to now explore relationships between irri-gation efficiency at the bay and within-bay level and whole farmeconomic water productivity (defined as the income derived perhectare of pasture or per litre of water applied). Factors at the bayand within-bay spatial level, factors affecting the advance front andinfiltration amounts and depths can be modified by the user. Atthe farm level, management factors influencing water productiv-ity including irrigation practices, grazing management and choiceof plant species, can be manipulated. Opportunities for investigat-ing where, within this continuum, the best improvements in waterproductivity might be found can now be evaluated with reasonableconfidence provided that the two sets of infiltration parametersused in the integrated model are sufficiently equivalent. Furtherdevelopment in the area of relating the two sets of infiltrationparameters is necessary to provide higher levels of confidence thatthe modeling framework can generate more precise estimates ofdeep drainage, a critically important performance indicator of theefficiency of flood irrigation systems.
Acknowledgements
We gratefully acknowledge Dr. Theodore Strelkoff and his teamfor making available the surface irrigation model, SRFR. The projectwas managed by the Melbourne Water Research Centre and fundedby the Victorian Governments Science and Technology InnovationInitiative.
References
ABS, 2006. Water Account of Australia, 2004–05 (ABS Cat. No. 4610.0). AustralianBureau of Statistics, Canberra, Australia.

Author's personal copy
50 P. Douglas et al. / Computers and Electronics in Agriculture 74 (2010) 39–50
Austin, N.R., Prendergast, J.B., 1997. Use of kinematic wave theory to model irrigationon cracking soil. Irrig. Sci. 18, 1–10.
Bethune, M., 2004. Towards effective control of deep drainage under border-checkirrigated pasture in the Murray Darling Basin: a review. Aus. J. Agric. Res. 55 (5),485–494.
Bethune, M.G., Armstrong, D.P., 2004. Overview of the irrigated dairy industry inAustralia. Aust. J. Exp. Agric. 44, 127–129.
Bethune, M.G., Wang, Q.J., 2003. The water balance of sprinkler and border-checkirrigated bays. Department of Primary Industries, Agriculture Victoria – Taturaand Kyabram, Institute of Sustainable Irrigated Agriculture-ISIA.
Bethune, M.G., Wang, Q.J., 2004a. Simulating the water balance of border-checkirrigated pasture on a cracking soil. Aust. J. Exp. Agric. 44, 163–171.
Bethune, M.G., Wang, Q.J., 2004b. A Lysimeter study of the water balance of border-check irrigated perennial pasture. Aust. J. Exp. Agric. 44 (2), 151–162.
Cantu, M., 2005. Mastering Borland Delphi 2005. Sybex, San Francisco/London.Chapman, D.F., Kenny, S.N., Beca, D., Johnson, I.R., 2008a. Pasture and crop options
for non-irrigated dairy farms in southern Australia. 1. Physical production andeconomic performance. Agric. Syst. 97, 108–125.
Chapman, D.F., Kenny, S.N., Beca, D., Johnson, I.R., 2008b. Pasture and crop optionsfor non-irrigated dairy farms in southern Australia. 2. Inter-annual variation inforage supply, and business risk. Agric. Syst. 97, 126–138.
Cullen, B.R., Eckard, R.J., Callow, M.N., Johnson, I.R., Chapman, D.F., Rawnsley, R.P.,Garcia, S.C., White, T., Snow, V.O., 2008. Simulating pasture growth rates inAustralian and New Zealand grazing systems. Aust. J. Exp. Agric. 59, 761–768.
Doyle, P.T., Stockdale, C.R., Lawson, A.R., Cohen, D.C., 2000. Pastures for Dairy Pro-duction in Victoria, 2nd ed. Department of Natural Resources and EnvironmentVictoria.
Furma, N.A., Warrick, A.W., Zerihun, D., Sanchez, C.A., 2006. Modified Kostiakov infil-tration function: accounting for initial and boundary conditions. J. Irrig. Drain.Eng. 132 (6), 587–596.
Johnson, I.R., 2008. Biophysical pasture simulation model documentation;model documentation for DairyMod, EcoMod, and the SGS Pasture Model(http://www.imj.com.au/gmdocs). IMJ Consultants Armidale, Australia.
Johnson, I.R., Chapman, D.F., Snow, V.O., Eckard, R.J., Parsons, A.J., Lambert, M.G.,Cullen, B.R., 2008. DairyMod and EcoMod: biophysical simulation models forAustralia and New Zealand. Aust. J. Exp. Agric. 48, 621–631.
Johnson, I.R., Lodge, G.M., White, R.E., 2003. The sustainable grazing systems pasturemodel: description, philosophy and application to the SGS national experiment.Aust. J. Exp. Agric. 43, 711–728.
Linehan, C.J., Armstrong, D.P., Doyle, P.T., Johnson, F., 2004. A survey of water useefficiency on irrigated dairy farms in northern Victoria. Aust. J. Exp. Agric. 44,131–136.
Long, B., 2004.NET Interoperability: COM Interop. http://www.blong.com/Conferences/BorCon2004/Interop/Win32AndDotNetInterop.html.
Maheshwari, B., Jayawardarne, N., 1992. Infiltration characteristics of some clayeysoils measured during border irrigation. Agric. Water Manage. 21, 265–279.
Maheshwari, B.L., Kelly, D., 1997. Evaluation of time-rated infiltration families forNoncracking soils. J. Irrig. Drain. Eng. 123 (4), 238–245.
Maheshwari, B.L., McMahon, T.A., 1993. Performance evaluation of border irrigationmodels for South-East Australia: part 2. Overall suitability for field applications.J. Agric. Eng. Res. 54, 127–139.
Mehta, B., Wang, Q.J., 2005. Soil Hydraulic Properties of the Shepparton IrrigationRegion. The Department of Primary Industries, Ferguson Road, Tatura, VIC., Aus-tralia.
Meyer, W., Marvaneck, S., Bryan, B., Christen, E., Hornbuckle, J., Shi, K., Tian She,Young, M., 2005. The Irrigation Industry in the Murray and Murrimbidgee Basins.Technical Report 03/05, June 2005.
Microsoft® , 2003. PRB: System.Arithmetic Exception Error When YouChange the Floating Point Control Register in a managed Application(http://support.microsoft.com/default.aspx?acid=KB;EN-US;q326219).
Radcliffe, J.E., 1974. Seasonal distribution of pasture production in New Zealand: 1.Methods of measurement. N. Z. J. Exp. Agric. 2, 337–440.
Robertson, D., Wood, M., Wang, Q.J., 2004. Estimating hydraulic parameters for asurface irrigation model from field conditions. Aust. J. Exp. Agric. 44, 173–179.
Smith, V., 2004. Boosting the VIA C3’s Floating Point Performance.http://www.Vanshardwaare.com/articles/2004/03/040331 C3Fpu/040331 C3-Fpu.htm.
Strelkoff, T., 1991. A model of Surface Irrigation; Version 20. Proc. Natl. Conf. Irrig.Drain. -1991, 676–682.
Strelkoff, T., Katapodes, D., 1977. Border irrigation hydraulics with zero-inertia. ASCEJ. Irrig. Drain. Div. 103 (IR3), 325–342.
‘tMannetje, L., 2000. Measuring biomass of grassland vegetation. In: ‘tMannetje,L., Jones, R.M. (Eds.), Field and Laboratory Methods for Grassland and AnimalProduction Research. CAB International, pp. 151–177.
USDA, 1997. SRFR v3. US Department of Agriculture, Agricultural Research Service,US Water Conservation Laboratory, Phoenix, AZ.
Walker, W.R., Skogerboe, G.V., 1987. Surface Irrigation: Theory and Practice.Prentice-Hall, Englewood Cliffs, NJ, p. c1987.
White, T.A., Johnson, I.R., Snow, V.O., 2008. Comparison of outputs of a biophysi-cal simulation model for pasture growth and composition with measured dataunder dryland and irrigated conditions in New Zealand. Grass Forage Sci. 63,339–349.
Year Book Australia, 2008. Number 90, Australian Bureau of Statistics, Canberra,Australia.