‘Flower’ of Magnolia grandiflora is not flower and what about ‘basal angiosperms’
Upload
khangminh22Category
view
1download
0
Diversity and resource choice of flower-visiting insects in relation to pollen nutritional quality and land use
Diversität und Ressourcennutzung Blüten besuchender Insekten in Abhängigkeit von Pollenqualität und Landnutzung
Vom Fachbereich Biologie der Technischen Universität Darmstadt
zur
Erlangung des akademischen Grades
eines Doctor rerum naturalium
genehmigte
Dissertation von
Dipl. Biologin Christiane Natalie Weiner
aus Köln
Berichterstatter (1. Referent): Prof. Dr. Nico Blüthgen
Mitberichterstatter (2. Referent): Prof. Dr. Andreas Jürgens
Tag der Einreichung: 26.02.2016 Tag der mündlichen Prüfung: 29.04.2016
Darmstadt 2016 D17

2
3
Ehrenwörtliche Erklärung
Ich erkläre hiermit ehrenwörtlich, dass ich die vorliegende Arbeit entsprechend den Regeln
guter wissenschaftlicher Praxis selbständig und ohne unzulässige Hilfe Dritter angefertigt
habe. Sämtliche aus fremden Quellen direkt oder indirekt übernommene Gedanken sowie
sämtliche von Anderen direkt oder indirekt übernommene Daten, Techniken und Materialien
sind als solche kenntlich gemacht. Die Arbeit wurde bisher keiner anderen Hochschule zu
Prüfungszwecken eingereicht.
Osterholz-Scharmbeck, den 24.02.2016

4
5
My doctoral thesis is based on the following manuscripts:
Weiner, C.N., Werner, M., Linsenmair, K.-E., Blüthgen, N. (2011): Land-use intensity in
grasslands: changes in biodiversity, species composition and specialization in
flower-visitor networks. Basic and Applied Ecology 12 (4), 292-299.
Weiner, C.N., Werner, M., Linsenmair, K.-E., Blüthgen, N. (2014): Land-use impacts on
plant-pollinator networks: interaction strength and specialization predict
pollinator declines. Ecology 95, 466–474.
Weiner, C.N., Werner, M , Blüthgen, N. (in prep.): Land-use intensification triggers diversity
loss in pollination networks: Regional distinctions between three different German
bioregions
Weiner, C.N., Hilpert, A., Werner, M., Linsenmair, K.-E., Blüthgen, N. (2010): Pollen amino
acids and flower specialization in solitary bees. Apidologie 41 (4), 476-487.

6
7
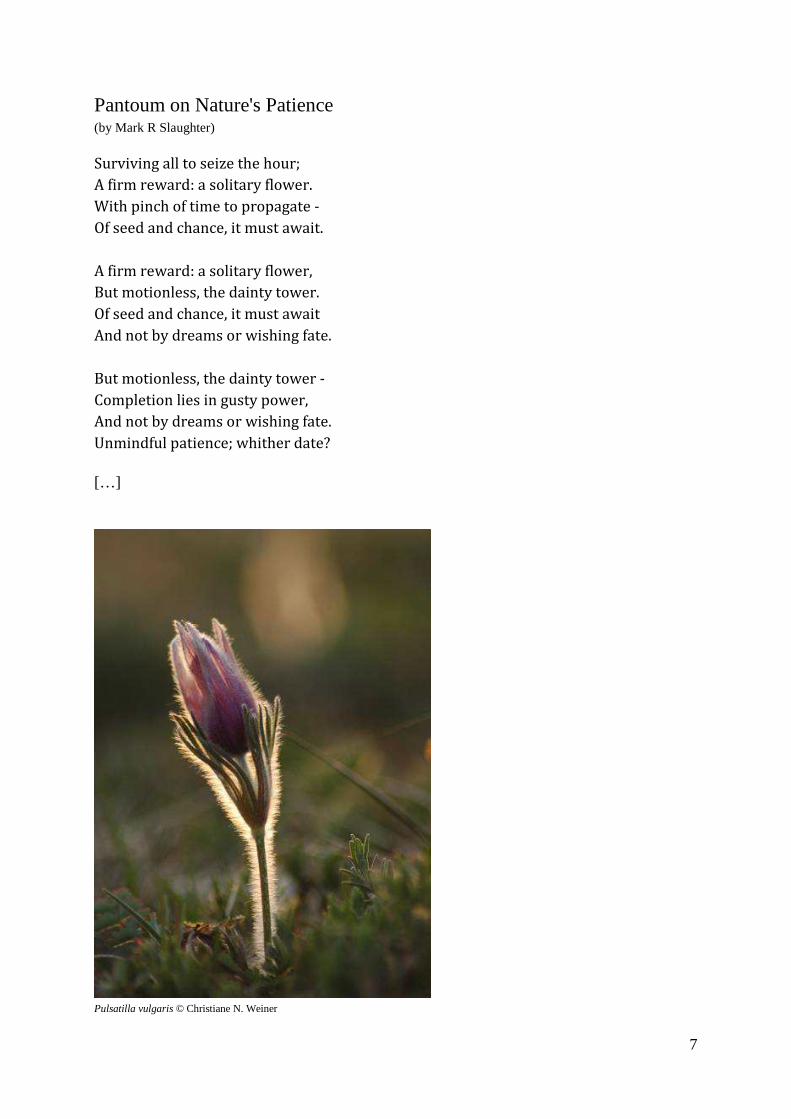
Pantoum on Nature's Patience (by Mark R Slaughter) Surviving all to seize the hour;
A firm reward: a solitary flower.
With pinch of time to propagate -
Of seed and chance, it must await.
A firm reward: a solitary flower,
But motionless, the dainty tower.
Of seed and chance, it must await
And not by dreams or wishing fate.
But motionless, the dainty tower -
Completion lies in gusty power,
And not by dreams or wishing fate.
Unmindful patience; whither date?
[…]
Pulsatilla vulgaris © Christiane N. Weiner

8

9
Inhaltsverzeichnis
Summary _________________________________________________________________ 11
Zusammenfassung __________________________________________________________ 15
1. General introduction _____________________________________________________ 19
1.1 Why study biodiversity and ecosystem functions? __________________________________ 19
1.2 Facts and considerations about mutualistic plant-flower visitor interactions _____________ 21
1.3 The Biodiversity Exploratories _________________________________________________ 30
1.4 Thesis outline ______________________________________________________________ 31
2. Effects of meadow management on diversity, composition and specialization of plant-flower visitor interactions ____________________________________________________ 33
2.1 Introduction _______________________________________________________________ 34
2.2 Methods __________________________________________________________________ 35
2.3 Results ____________________________________________________________________ 39
2.4 Discussion _________________________________________________________________ 43
3. Mutualistic networks and their response to disturbance in relation to diversity and specialization _____________________________________________________________ 47
3.1 Introduction _______________________________________________________________ 47
3.2 Methods __________________________________________________________________ 49
3.3 Results ____________________________________________________________________ 55
3.4 Discussion _________________________________________________________________ 59
4. Differences in land-use effects on plant-pollinator interaction across three different German bioregions _________________________________________________________ 87
4.1 Introduction _______________________________________________________________ 87
4.2 Methods __________________________________________________________________ 89
4.3 Results ____________________________________________________________________ 94
4.4 Discussion ________________________________________________________________ 110
5. Pollen amino acids and flower specialization in solitary bees ____________________ 121
5.1 Introduction ______________________________________________________________ 121
5.2 Methods _________________________________________________________________ 123
5.3 Results ___________________________________________________________________ 126
5.4 Discussion ________________________________________________________________ 134
6. Diversity and resource choice of flower visiting insects in relation to pollen nutritional quality and land use – synopsis and discussion _________________________________ 137
6.1 Land-use effects on plant communities _________________________________________ 137
6.2 Consequences from land use for mutualistic plant-pollinator interactions ______________ 139
6.3 Pollen nutritional quality in relation to specialization in pollinators ___________________ 143
10
6.4 Conclusions _______________________________________________________________ 144
Literature _______________________________________________________________ 145
Acknowlegements _________________________________________________________ 159
Curriculum Vitae _________________________________________________________ 161
Author contributions ______________________________________________________ 163
List of publications ________________________________________________________ 164
11
Summary
Recent declines in honey bee colonies as well as in the diversity and abundance of
native pollinators generated widespread concern about the future of pollination and set
off a discussion about a general “pollination crisis”. Partly, this is due to the functional
importance of this ecosystem service not only for plant reproduction but above all for
crop production and thus human welfare. Consequently, the matter gained particular
attention in current research and a rising number of studies focus on the stability of
plant-pollinator interactions in relation to biodiversity and ecosystem change.
My dissertation focuses on the mutualistic interactions between flowering plants and
flower-visiting insects and their interactive response to land-use intensity as well as
resource choice of flower-visitors in relation to pollen quality. The innovative approach
of my project is to use quantitative interaction networks to provide knowledge on how
species respond to land use and how their responses may influence their interaction
partners. We show that information from ecological networks may help to predict
natural community responses to disturbance and possible secondary extinctions in
systems that undergo agricultural intensification, if the identity of each species’ partners
and relative interaction strengths are considered. This project presents large-scale
investigations on the characteristics and fragility of multi-species networks in real
landscapes. During two seasons we recorded the diversity, species composition and
specialization of plant-pollinator networks along a gradient of increasing land-use
intensity. The study was conducted within the framework of the Biodiversity
Exploratories, which are located in the Schorfheide-Chorin (NE Germany), Hainich-
Dün (Central Germany) and Schwäbische Alb (SW Germany) regions. Each
Exploratory contains 50 experimental grassland plots which comprise near natural,
protected sites as well as intensively fertilized, mown or grazed meadows and pastures.
Comparing meadows of high and low land-use intensities we found that species
richness of plants, bees and butterflies was significantly higher on low intensity
meadows. However, in terms of Shannon diversity and abundance only butterflies
12
responded negatively to land-use intensification (Chapter 2). Nevertheless, the analysis
of plant and flower-visitor composition revealed crucial differences between grassland
types with species overlaps of just 43 % in plants and 42 % in insects. This pointed to
the fact that investigation of biodiversity and abundance alone may not detect biotic
homogenization e.g. a loss in functional diversity. Moreover, resource impoverishment
had stronger effects on the land-use response of highly specialized flower-visitor groups
than on little or unspecialized ones.
We examined if mutual specialization could explain the accelerating parallel declines
observed in plants and pollinators. Focusing on their stability, we analyzed 162 plant-
pollinator networks from 119 meadows and pastures managed at different intensities.
The fate of a flower visitor was predicted by the land-use response of its associated
plant species and vice versa. Furthermore, we detected a disproportional impact of land-
use intensification on the abundance of more specialized pollinator species (Chapter 3).
Land-use intensification seems to set off losses in flower diversity, which leads to
resource-mediated declines in pollinator species. While the mean land-use response of
the pollinators visiting a plant species also influenced its abundance, this effect was
weaker. Network analyses provide a valuable tool for characterizing mutualisms in a
community context and may be used to predict community responses to disturbance and
possible consequences of species loss.
To further illuminate which land-use practices most fundamentally influence plant-
pollinator associations, we analyzed the isolated effects of fertilization, mowing and
grazing intensity on plant – flower-visitor networks (Chapter 4). I found that these three
components of land use strongly differed in their effects on the species richness and
composition of flower-visitor networks. While increases of fertilization and mowing
intensity in two out of three bioregions were accompanied by a decrease in plant species
richness, concerning pollinator species richness, abundance and composition trends
were even more conflictive between taxonomically different pollinator groups and
between regions. Thus, the results showed that it is not possible to readily transfer
results and management recommendations from one region to another. Yet, I found that
across all three regions pollinator fate was determined by the average land-use response
of the plant species they visited and vice versa (Chapter 4). Moreover, in pollinators –

13
but not in plants – specialized species were disproportionately affected by land-use
intensification.
Specialized pollinators such as oligolectic bees (bees that collect pollen only from one
plant family or even just from one single species) are often expected to be more prone to
disturbance and thus more vulnerable to ecosystem change. This is recognized as the
cost of specialization and was reinforced by my results (Chapter 3 and 4). On the other
hand it has frequently been proposed that benefits from resource specialization may
outweigh the costs. In pollinators, benefits of specialization so far were presumed to
result from higher foraging efficiency. Among the various adaptations is assumed
specialization on very nutrient-rich pollen.
We therefore analyzed hand-collected pollen from 142 plant species for its quantitative
and qualitative amino acid composition. The composition of amino acids varied
strongly among plant species, but taxonomically related species had similar
compositions. Surprisingly, the concentration of free- and protein-bound amino acids –
also of the essential ones – was significantly lower in pollen sources used by oligolectic
bees than in other pollen sources (Chapter 5). Moreover, pollen sources of oligoleges
deviated more strongly from the ideal composition of essential amino acids as
determined for honey bees than plants not hosting oligolectic bees. This leads to the
assumption that competitive avoidance or in other words an advantage in terms of the
available pollen quantity might have led to oligolectic bees being specialized on pollen
that is deficient in amino acids. This hypothesis still needs to be tested in detail.
Several of the results presented in this thesis shed new light on patterns and processes
within plant-pollinator interactions. We found that – contrary to the prevailing
contemporary opinion – plant-pollinator networks are highly specialized systems in
which the diversity of plants and pollinators is strongly related to each other.

14
15
Zusammenfassung
Das Bienen-Sterben in den USA und Europa sowie der Rückgang der Diversität und
Abundanz heimischer Blütenbesucher haben weltweit Sorge um die Zukunft der
Pollination geschürt – und eine hitzige Diskussion über eine allgemeine
„Pollinationskrise“ losgetreten. Dies ist zum Teil der funktionellen Bedeutung der
Pollination als Ökosystem-Dienstleistung im Allgemeinen geschuldet. Eine erfolgreiche
Pollination ist nicht nur für die Reproduktion von Blütenpflanzen, sondern auch für die
Nahrungsmittelproduktion – und somit auch für den Wohlstand des Menschen – von
größter Bedeutung. Dementsprechend legt die aktuelle Forschung ein besonderes
Augenmerk auf dieses Thema und eine stetig wachsende Anzahl an Studien beschäftigt
sich in Verbindung mit Biodiversitätsverlust und Ökosystemwandel mit der Stabilität
der Interaktionen zwischen Pflanzen und Bestäubern.
Meine Dissertation konzentriert sich auf die mutualistischen Interaktionen zwischen
Blütenpflanzen und Blüten besuchenden Insekten und ihre interaktive Reaktion auf die
Intensivierung der Landnutzung sowie auf die Ressourcenwahl Blüten besuchender
Insekten in Abhängigkeit von Pollenqualität. Der neuartige Ansatz des hier
präsentierten Projekts ist es, quantitative Interaktionsnetzwerke zu nutzen, um
aufzuzeigen, wie eine Art auf Landnutzung reagiert und wie ihre Reaktion ihre
Interaktionspartner beeinflusst. Betrachtet man die Identität der Partner einer Art sowie
die Interaktionsstärken, lässt sich darauf schließen, wie natürliche
Lebensgemeinschaften auf Störungen reagieren und welche sekundären
Aussterberisiken für Arten in Ökosystemen, die landwirtschaftlicher Intensivierung
unterliegen, möglicherweise resultieren. Mein Projekt ist eine der ersten breit
angelegten Untersuchungen über die Charakteristiken und die Fragilität der
Beziehungen zwischen verschiedenen Spezies in real existierenden Ökosystemen, die
einer sich intensivierenden Flächennutzung unterliegen. Über zwei Vegetationsperioden
hinweg haben wir verschiedene Charakteristika der Beziehungen von Pflanzen und den
sie besuchenden Insekten entlang eines Landnutzungsgradienten im Grünland
untersucht. Die Studie wurde innerhalb des Großprojektes der Biodiversitäts-
Exploratorien durchgeführt, die jeweils 50 experimentelle Grünlandflächen in Nordost-,
16
Zentral- und Südwestdeutschland (Schorfheide-Chorin, Hainich-Dün, Schwäbische
Alb) umfassen. Diese Grünlandflächen repräsentieren Nutzungstypen, die von
naturnahen, geschützten Flächen bis hin zu intensiv gedüngten, häufig gemähten oder
intensiv beweideten Flächen reichen.
Ein Vergleich zwischen intensiv und extensiv genutzten Wiesen ergab, dass die
Abundanz von Pflanzen, Bienen und Schmetterlingen auf extensiv genutzten Wiesen
signifikant höher war als auf intensiv genutzten. Bezüglich der Diversität ließ sich ein
negativer Einfluss höherer Landnutzungsintensität dagegen nur für Schmetterlinge
nachweisen (Kapitel 2). Dennoch zeigte eine Analyse der Artenzusammensetzung von
Pflanzen und Blütenbesuchern erhebliche Unterschiede zwischen den Nutzungstypen
auf. Die Artüberschneidung betrug lediglich 43 % bei Pflanzen und 42 % bei
Blütenbesuchern. Ein klarer Hinweis darauf, dass die Untersuchung von Biodiversität
und Abundanz alleine nicht ausreicht, um eine biotische Homogenisierung und damit
einen Schwund der funktionalen Diversität nachzuweisen. Außerdem hatte die mit der
Landnutzungsintensivierung einhergehende Ressourcen-Verknappung stärkere
Auswirkungen auf die Reaktion spezialisierter Pollinatoren-Gruppen, als auf die
Reaktion solcher, die als nicht oder kaum spezialisiert angesehen werden können.
Daher wollten wir herausfinden, ob sich der zu beobachtende parallele Rückgang von
Pflanzen und Pollinatoren durch eine wechselseitige Spezialisierung erklären lässt. Wir
untersuchten dazu 162 auf 119 Wiesen und Weiden unterschiedlicher
Nutzungsintensität aufgenommene Pflanzen-Pollinatoren-Netzwerke in Hinblick auf
ihre Stabilität. Das durch die Landnutzung bestimmte Schicksal einer Pflanzenart und
des sie besuchenden Bestäubers waren eng miteinander verknüpft. Weiterhin hatte die
Intensivierung der Landnutzung einen überproportionalen Einfluss auf die Abundanz
spezialisierter Bestäuberarten. Die Abundanz spezialisierter Pflanzenarten nahm entlang
des Landnutzungsgradienten nicht überproportional ab (Kapitel 3).
Die Intensivierung der Landnutzung scheint zu einem Rückgang der Pflanzendiversität
zu führen, der wiederum zu einem ressourcenbedingten Rückgang der
Bestäuberdiversität führt. Die durchschnittliche Reaktion der Pollinatoren auf die
Landnutzung hat zwar auch einen Einfluss auf die Abundanz der von Ihnen besuchten
Pflanzen, jedoch ist dieser Effekt weniger stark ausgeprägt. Netzwerkanalysen stellen
somit ein geeignetes Werkzeug zur Charakterisierung mutualistischer Beziehungen
17
innerhalb von Artengemeinschaften dar. Sie können zur Vorhersage der Reaktion einer
Artengemeinschaft auf Störung sowie der durch Artenverlust möglicherweise
resultierenden Konsequenzen herangezogen werden.
Um herauszufinden, welche Aspekte der Landnutzung die Pflanzen-Pollinatoren-
Beziehungen am stärksten beeinträchtigen, haben wir die Auswirkungen der Düngung,
der Mahd und der Beweidung isoliert analysiert (Kapitel 4). Die Ergebnisse zeigten,
dass sich die drei Komponenten in ihrem Einfluss auf den Artenreichtum und die
Abundanz von Pflanzen sowie Pollinatoren zwischen den Exploratorien stark
unterschieden. Während sowohl ein Anstieg der Düngeintensität als auch der
Mahdhäufigkeit in zwei von drei Untersuchungsregionen mit einem Rückgang der
Artenzahl bei den Pflanzen verbunden war, zeigten sich bei Artenreichtum, Abundanz
und Komposition der Pollinatoren sowohl zwischen den Regionen als auch zwischen
taxonomisch verschiedenen Pollinatorengruppen sehr unterschiedliche Trends.
Daher zeigen die Ergebnisse, dass es nicht ohne weiteres möglich ist,
Schlussfolgerungen und Management-Empfehlungen von einer Region auf andere zu
übertragen. Gleichwohl konnten wir auch hier zeigen, dass über alle Exploratorien
hinweg das Schicksal der Pollinatoren durch die Reaktion der von ihnen besuchten
Pflanzen auf die Landnutzungsintensität bestimmt wurde und umgekehrt (Kapitel 4).
Spezialisierte Pollinatoren wie beispielsweise oligolektische Bienen (Bienen, die nur
den Pollen einer einzigen Pflanzenfamilie oder gar einer einzigen Pflanzenart sammeln)
gelten häufig als anfälliger gegenüber äußeren Beeinträchtigungen und somit auch
gegenüber Veränderungen im Ökosystem. Dies wird als Preis für die Spezialisierung
angesehen – eine Hypothese, die durch meine Ergebnisse gestützt wird (Kapitel 3 und
4). Man geht davon aus, dass der Nutzen der Spezialisierung ihre Nachteile überwiegt.
Bezogen auf Pollinatoren galt bislang, dass die Vorteile der Spezialisierung aus einer
effizienteren Nahrungsaufnahme an den besuchten Pflanzen heraus resultieren. Dazu
zählt neben zahlreichen weiteren Aspekten die Spezialisierung auf besonders
nährstoffreichen Pollen.
Wir haben deshalb den Pollen von 142 Pflanzenarten gesammelt und die
Zusammensetzung seiner Aminosäuren qualitativ analysiert. Die Zusammensetzung der
Aminosäuren variierte stark zwischen den verschiedenen Pflanzenarten – nur bei
taxonomisch verwandten Spezies waren große Ähnlichkeiten nachzuweisen.
18
Überraschenderweise erwies sich die Konzentration sowohl freier als auch protein-
gebundener Aminosäuren – auch die der essentiellen – bei den Pollen liefernden
Pflanzen, die von oligolektischen Bienen besucht werden, als deutlich niedriger, als bei
anderen Pflanzen (Kapitel 5).
Des Weiteren wich die Zusammensetzung der Aminosäuren der Pollen bei den von
oligolektischen Bienen besuchten Pflanzen stärker von der für Honigbienen optimalen
Zusammensetzung essentieller Aminosäuren ab, als bei anderen Pflanzen. Das legt die
Annahme nahe, dass Konkurrenzvermeidung oder anders gesagt der kompetitive Vorteil
in Bezug auf die Pollenquantität dazu geführt hat, dass sich oligolektische Bienen auf
Pflanzen spezialisiert haben, die Defizite in der Zusammensetzung ihrer Pollen-
Aminosäuren aufweisen. Dieser Hypothese muss noch genauer nachgegangen werden.
Die Ergebnisse, die ich in dieser Dissertation präsentiere, werfen ein neues Licht auf die
Interaktionsmuster zwischen Pflanzen und Pollinatoren und die daraus resultierenden
Konsequenzen. Konträr zur derzeit vorherrschenden Meinung zeigen wir auf, dass die
Interaktionen zwischen Pflanzen und Pollinatoren ein hoch spezialisiertes System
bilden, in dem die Diversität von Pflanzen und Pollinatoren stark voneinander abhängt.
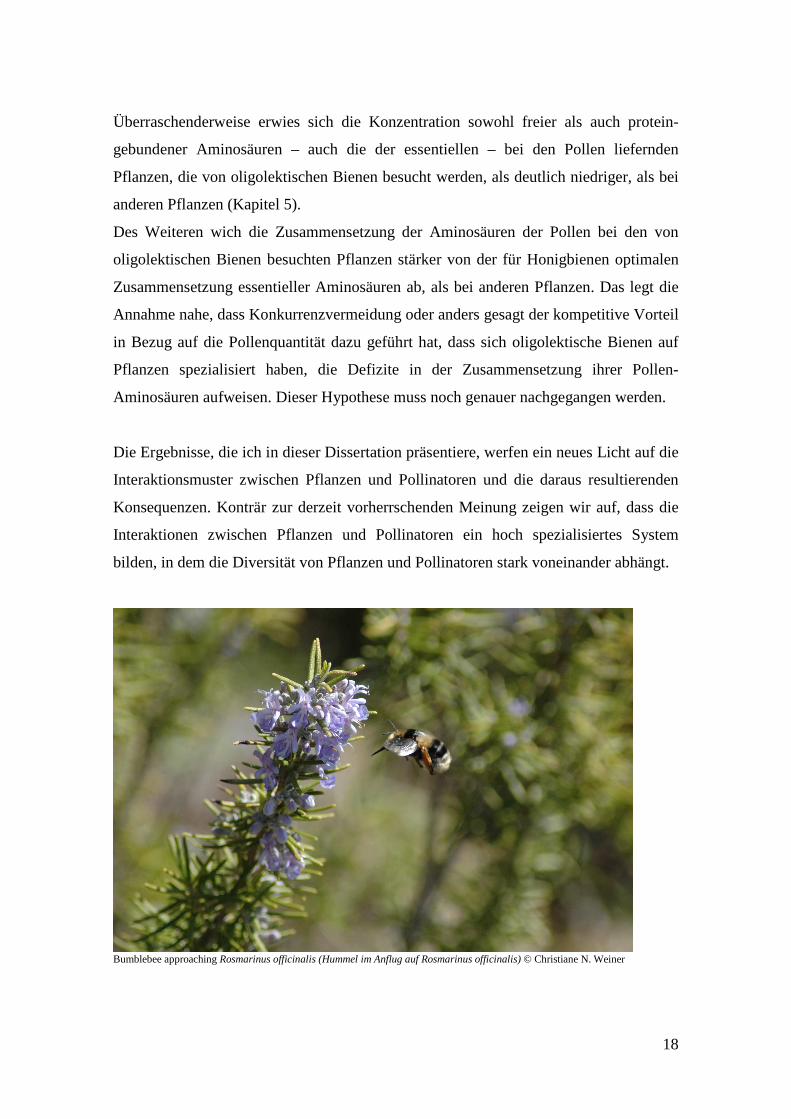
Bumblebee approaching Rosmarinus officinalis (Hummel im Anflug auf Rosmarinus officinalis) © Christiane N. Weiner

19
Figure 1: An overview of ecosystem services (source: www.metrovancouver.org)
1. General introduction
1.1 Why study biodiversity and ecosystem functions?
Biodiversity, a term coined by E. O. Wilson in the late eighties, describes the number
and variety of living organisms, at all levels ranging from genetic diversity within a
species to the variety of ecosystems on Earth. Moreover, biodiversity is a factor
crucially modifying ecosystem function. Numerous studies, mostly for experimental
grassland systems, demonstrated that ecosystem properties such as stability, fertility or
susceptibility to invasion greatly depend on it (Hassan et al. 2005). For example,
species-rich soil communities show
enhanced litter decomposition compared
to species-poor ones and consequently
meliorate soil formation (Bradford et al.
2002). Species-rich plant communities
show higher stability and resilience
towards drought as well as higher
productivity resulting in augmented
carbon storage (Tilman and Downing
1994, Tilman et al. 1997) and high
pollinator richness leads to improved seed
set in some crops and wild flowers (Klein
et al. 2003). Biodiversity thus directly and
indirectly supports the provision with
ecosystem goods and services (Figure 1).
In addition to goods such as fresh water, fiber or fuel (provisioning services), which are
directly obtained from ecosystems, regulating services like pollination as well as
supporting and cultural services gained increasing attention. They are obtained only if
ecosystems include the biodiversity that guarantees the functional processes necessary
to underpin them (Daily 1997, Hassan et al. 2005). However, the mechanism by which
diversity of organisms influences ecosystem functioning is poorly understood (Yachi
and Loreau 1999, Hooper et al. 2005). Biodiversity research is still in its infancy when
20
it comes to the question how sundry components of biodiversity are linked to the
provision of ecosystem services or create resilience to environmental change (Rands et
al. 2010). However, it is uncontroversial that alterations of species composition and loss
of species have far-reaching consequences for each ecosystem and for many aspects of
human welfare, pre-eminent economical ones. Thus, the ongoing and recently
accelerated global declines in biodiversity have given new prominence to questions
concerning the relationship between human activities, biodiversity and the stability of
fundamental ecosystem functions and services (Rands et al. 2010). We thus need to
address the mechanism by which biodiversity influences stability and resilience of
ecosystems to predict the consequences of biodiversity loss and educe suitable nature
conservation strategies.
In terrestrial habitats overexploitation, degradation, habitat disruption, introduction of
alien species, fragmentation, climate change and agricultural intensification are the main
reasons why nowadays human activities are considered the main cause of biodiversity
loss (Butchart et al. 2010, Krauss et al. 2010, Bellard et al. 2012). While for some taxa,
namely vertebrates, vascular plants and some invertebrate groups such as grasshoppers
and butterflies, the existence of a negative correlation between agricultural
intensification and biodiversity is satisfactorily proven, it is unknown for others (Fischer
et al. 2010). In addition, it often remains unclear if land-use intensification affects
biodiversity directly or indirectly and which effect individual elements have within
land-use practices. But undoubtedly it poses a serious risk to biodiversity preservation
and ecosystem services.
As almost two thirds of all hitherto described species are insects and about one sixth are
flowering plants, terrestrial ecosystems are dominated by the interactions of these two
groups (Waser and Ollerton 2006). With regard to ecosystem services they play a major
role in pest control, pollination and above all for our food provision (Kremen and
Chaplin-Kramer 2007).
To achieve the projected global food demand by 2050, particularly grasslands, which
cover more than 36 per cent of the global land surface, are predicted to undergo rapid
intensification (Asner et al. 2004, Tilman et al. 2011). However, replicated large-scale
investigations on the characteristics and fragility of multi-species networks and
21
ecosystem functioning in such real ecosystems facing agricultural intensification are
basically lacking. Studies undertaken on the topic so far focus mostly on few species
and use coarse qualitative categorization of land-use intensities (Fischer et al. 2010).
Theoretic modelling of biodiversity change, stability and resilience of ecosystems has
outcompeted experimental work, especially field research, by far. However, only field
experiments combined with ecosystem monitoring may actually assess temporal
stability and response to as well as recovery from disturbance (Hooper et al. 2005).
My dissertation focuses on the mutualistic interactions between flowering plants and
flower-visiting insects and their interactive response to human activity in relation to the
fundamental aspects of biodiversity that underpin the ecosystem service of pollination.
1.2 Facts and considerations about mutualistic plant-flower visitor
interactions
1.2.1 The beginnings of pollination biology
Nowadays it is a matter of common knowledge that flowers are frequently visited by
insects and that both, flowers and visitors, may benefit from this relationship. While –
concerning ideal mutualistic interactions – insects visit flowers to consume pollen or
nectar, flowers in turn profit by being pollinated. Joseph Gottlieb Kölreuter (1761) was
the first to fully recognize that pollination in many flower species does not result only
from wind as hitherto believed, but from flower-visiting insects. His successor,
Christian Konrad Sprengel (1793), convinced of the intentional design of flowers for
pollination either by insects or wind, described the features of flowers in painstaking
detail. His observations of plant-insect interactions and his hypotheses on the function
of flower structures and colors as signals established the basis for pollination research
(Waser 2006). However, it was not until Darwin (1859) that the study of pollination was
put into its modern evolutionary context. As the interests of plants and pollinators
naturally differ (improvement of reproductive fitness vs. maximum efficiency in
nutrient acquisition), Darwin argued that the complex morphology of some flowers as
well as dichogamy and obligate out-crossing by insect pollination resulted from
22
adaptation by natural selection and co-evolutionary processes in plants and flower-
visitors. Since then, scientists all over the world have tried to shed light on different
aspects of the complex relationships between plants and flower-visitors.
1.2.2 The value and endangerment of pollination as an ecosystem service
As noted above plant-flower visitor relationships involve pollination and thus one of the
most important ecosystem services. This service is not only crucial for the ecological
process of seed set and plant reproduction in the wild, but also for crop production and
thus for human welfare. About 87.5 per cent of angiosperms depend on animal
pollination and roughly 75 per cent of our main food crops show increased fruit or seed
set when animal pollinated (Ollerton et al. 2011). Alike other ecosystem services
pollination is not compensable by technology to any considerable degree. Consequently,
pollination worries rise as honey bees and other pollinators decline. In the USA alone
the annual economic value of pollination services provided by wild and managed
pollinators was estimated to US $ 1.6-5.7 billion for honey bees and US$ 4.1-6.7 billion
for other pollinators (Southwick and Southwick 1992). Simpler calculations which did
not take into account that wild pollinators may replace honey bees in providing
pollination service to several crop species, even estimated the value of honey bee
pollination to $ 8.3 billion (Robinson et al. 1989) and $ 14.6 billion respectively (Morse
and Calderone 2000).
The global decline in honey bee colonies implies that wild pollinators will play an
increasingly important role in crop pollination carried out formally by honey bees.
However, the pollination service provided to cultivated crops by wild and managed
pollinators requires suitable foraging and nesting habitats adjacent to croplands
(Kremen et al. 2002, Klein et al. 2007, Jauker et al. 2009). For example, solitary bees
including oligolectic species only undertake short distance flights of no more than 150-
600 m around their nesting sites for pollen collection (Gathmann and Tscharntke 2002).
Moreover, numerous pollinators, i.e. butterflies and oligolectic bees are known to be
strongly dependent on certain plant species and nesting materials for oviposition and
larval development (Johst et al. 2006, Praz et al. 2008). Thus, not surprisingly, the
response of wild bees to habitat loss strongly depends on their diet breadth and dispersal
ability (Bommarco et al. 2010). On the other hand, one has to take into account that, as
23
many wild pollinators are endangered, with their loss more specialized plant species
may be threatened as well. The goal of yield maximization pursued by modern
agriculture has led to a fundamental increase in land-use intensity followed by a radical
decline in agro-biodiversity. An ample availability of pollinators at the right place and
time, can no longer be taken for granted (Nabhan and Buchmann 1997).
It has been documented that habitat degradation and fragmentation (Jennerston 1988,
Rathcke and Jules 1993, Aizen and Feinsinger 2003, Krauss et al. 2010), the use of
agrochemicals (Johansen 1977, Desneux et al. 2007, Barmaz et al. 2010, Barmaz et al.
2012), introduced pests and competitors (Roubik 1978, Goulson 2003), as well as land
use and climate change may lead to diversity loss, reduced pollinator visitation or
disruption of plant-pollinator interactions resulting in reduced fruit or seed set in plant
populations (Cunningham 2000, Klein et al. 2003, Aguilar et al. 2006, Schweiger et al.
2008, Schweiger et al. 2010).
There is an urgent need to understand how plant-pollinator communities respond to land
use and changes in management in order to be able to elaborate adequate implications
for management and protection. Otherwise, the ecologically and economically valuable
complex interactions between plants and their pollinators, some of which may have
taken ages to evolve, might be lost irretrievably.
1.2.3 Specialization and generalization in plant-flower visitor interactions
Plant-flower visitor interactions are regarded as one of the driving forces having
fostered the adaptive radiation of angiosperms to the present level of plant diversity
(Muchhala et al. 2010). They represent one of the most popular examples of how
enduring reciprocal selective pressure can lead to co-evolutionary races and rapid
evolutionary change (Fenster et al. 2004, Lunau 2004). However, in most cases the
underlying co-evolutionary system is diffuse and co-adaptation cannot be attributed to
specific coevolving species (Lunau 2004). Hence, plant-flower visitor relationships
range from highly specialized interactions between pairs of closely coevolved species to
broadly generalized, loose and randomly appearing associations.
Before analyzing the effect of land-use intensity on diversity and species composition of
plant – flower-visitor interactions, it is therefore necessary to check how much the
different species rely on each other. Depending on how high the degree of specialization
24
is, mutualistic networks are supposed to vary in their susceptibility to disturbance and to
secondary extinctions of species. Thus, the characterization of specialization and
generalization is important for the general understanding of ecosystems and their
endangerment.
1.2.3.1 Niche theory
Characterization of generalization and specialization may be conducted based on the
niche concept. A fundamental niche as defined by Hutchinson (1957) is an n-
dimensional hypervolume, where the dimensions correspond to the range of physical
and biological environmental conditions and the resources that define the requirements
of a species. Typically, a species' realized niche, i.e. the range of environmental
conditions and resources it actually uses, is narrower than the fundamental niche due to
inter-specific interactions like predation and competition (Begon et al. 1990). As long as
a habitat offers conditions and resources matching a species' niche, this species may
persist there, if not forced out by competitive interactions. On the other hand, if
ecosystem change results in conditions and resources not meeting a species’ niche, the
species either needs to adapt to its new environment or will face extinction (Holt 2009,
Colwell et al. 2012).
Specialists, i.e. species inhabiting narrow fundamental niches regarding one or more
dimensions, are usually considered to be more vulnerable to disturbance than
generalists. It is broadly believed that the narrowness of their fundamental niche limits
their ability to cope with sudden or quickly progressing ecosystem changes (e.g.
McKinney 1997, Owens and Bennett 2000). Coherently, species confined to limited
resource diversity, i.e. inhabiting narrow niches concerning resource use, were
hypothesized to be particularly vulnerable to disturbance, too. However, this assumption
requires that species are affected indirectly via their resources and not directly via
increasing mortality (Vázquez and Simberloff 2002).
Considering flower visitors, flowering plants represent important food sources, and
under certain conditions, shelter. Thus, flowers are an important component of a flower
visitor’s niche. Conversely, pollinators represent an important resource for plants in
terms of reproductive fitness and thus a component of their niche (Vázquez and Aizen
2006).
25
As in the context of studying real ecosystems the assessment of specialization and
generalization in most cases will be based on realized niches rather than fundamental
ones, predictions on species vulnerability have to be handled cautiously. While, for
example some highly pollinator-specialized plant species fail to reproduce if introduced
to alien habitats, others may be pollinated effectively by a variety of non-native species
(Armbruster and Baldwin 1998, Richardson et al. 2000). Nevertheless, resource-based
mechanisms may play an important role for ecosystem stability, particularly in highly
specialized interactions (Blüthgen et al. 2007).
1.2.3.2 Specialization metrics
Network analyses provide a valuable tool for characterizing patterns of mutualism,
specialization and generalization in a community context (Montoya et al. 2006,
Blüthgen 2010). Theoretically, they may be employed to predict community responses
to disturbance and possible consequences of species loss. Network metrics enable us to
estimate how dependent co-occurring species are on one another (Blüthgen et al. 2007).
However, for multiple reasons shortly outlined below, the deduction of unbiased
specialization values from species interaction webs refuses to be ordinary. Depending
on the method it is even highly problematic.
Traditionally, one of the most common methods to evaluate specialization was to
simply count of the number of links, i.e. inter-specific interactions a species has, also
called “species degree” (Jordano 1987, Vázquez 2005). One crux of this method is that
it does not allow distinction between species displaying the same number of links, but
differences in quantitative link importance i.e. in interaction strength. The same is
generally true for all other unweighted network metrics (connectance, nestedness,
degree distribution). If one species interacts with three species in equal frequency but
another species interacts with three interaction partners strictly preferring one of them,
this undoubtedly makes a difference in the ecological impact the species may have on
one another (Blüthgen 2010) and should not be ignored. Thus, purely qualitative
network metrics provide only rough information on niche breadth and interdependence
of interacting species.
26
Another crucial point is that most network indices do not account for differences in
sampling effort (Blüthgen et al. 2008, Dormann et al. 2009, Blüthgen 2010). If a species
has been observed frequently and another one just a few times, it is not surprising if the
frequently observed one may display more links. In this case it is logically impossible to
distinguish if differences in species degree derive from sampling limitation or from real
specialization, especially if a species was observed just once (Blüthgen et al. 2008,
Blüthgen 2010). In fact, many ecological networks display a strong correlation between
observation frequency and number of links (Vázquez and Aizen 2003). Thus, the
number of links and metrics based upon it should not be applied without correction for
total observation frequency if trying to analyze dependence and niche breadth in species
networks.
To largely circumvent the problems outlined above, the specialization measures d’ and
H2’ can be used (Blüthgen et al. 2006). H2’ characterizes the network level of
specialization based on the complementarity and exclusiveness of observed interactions
in comparison to a neutral quantitative network i.e. a probability distribution of
interactions based on observed interaction totals. Conversely, H2’ depicts niche
partitioning across species. d’ characterizes niche breadth based on a species’ deviation
e.g. in flower visitation from the neutral distribution of all flower visitors (Blüthgen et
al. 2006).
Both metrics range from 0 to 1, with high values indicating complementary
specialization. Highest specialization is assigned to the most unexpected scenario, e.g.
each pollinator species visiting a plant species not visited by anyone else. Due to the
null-model based correction, the indices are virtually unaffected by variation in
sampling effort and total interaction frequency (Blüthgen et al. 2007, Blüthgen 2010).
However, as they consider interaction probability, these metrics cannot detect
asymmetric specialization, e.g. a rarely observed pollinator specialized on the most
commonly visited plant species, as this corresponds to the expected neutral distribution
(Blüthgen 2010).
27
1.2.3.3 Reasons for and consequences of specialization in plant-flower-visitor networks
Most flower visits from insects do not occur haphazardly, but intended (Cane and Sipes
2006). Indeed, plant-pollinator networks are even very specialized in comparison to
other plant-animal interactions (Blüthgen et al. 2007), although the vast majority of
pollinators visits multiple plant species and most plants are visited by multiple flower-
visitors (Waser et al. 1996, Fenster et al. 2004).
From the plants’ point of view, specialization is easy to understand. Plants need to
maximize their reproductive output at minimal own resource cost, so at minimal loss of
pollen and nectar. The evolution of complex flowers, pollination syndromes and highly
specialized pollination mechanisms can be explained by the fact that flower visitors
vary in their beneficial effects on plants. This variation in effect constitutes one of the
primary conditions required for the specialization of plants on pollinators (Schemske
and Horvitz 1984). While uncompromising specialization on specific pollinator species
is rare, evolutionary selection and diffuse coevolution are supposed however, to favor
morphological or chemical floral traits – also referred to as floral filters – that minimize
reproductive costs by inviting advantageous and excluding undesirable flower-visitors
(Junker and Blüthgen 2010). Extraction of pollen without pollination as well as nectar
robbing, illustrate antagonistic interactions which have to be suppressed. Specialization
thus increases the probability of pollen being transferred among conspecific flowers,
simultaneously reducing the risk of pollen being wasted on alien flowers or alien pollen
blocking conspecific stigmas (Fenster et al. 2004, Muchhala et al. 2010). Yet, in plant
species whose visitation rates are very low, generalization is favored as it reduces the
amount of undispersed pollen in the anthers (Muchhala et al. 2010).
Flower visitors need to maximize their nutrient intake at minimal energy loss. Thus,
from the flower visitor’s point of view specialization is somewhat more difficult to
understand as it may hamper an animal’s ability to cover its nutritional requirements.
While generalized flower visitors spread their risk of extinction on several resources, in
specialists it is concentrated on one or few (Den Boer 1968). Specialization in
pollinators thus was associated with potentially high costs. Conversely, several
hypotheses have been stated which claim that advantages from specialization may
outweigh its costs. These comprise higher foraging efficiency from morphological,
28
physiological or behavioral adaptation, avoidance of competition by specialization on
toxic resources and specialization on very nutrient rich resources (Strickler 1979,
Dobson and Peng 1997, Budde et al. 2004, Müller and Bansac 2004).
On the basis of a comparison of recent and historical data from England and the
Netherlands Biesmeijer and colleagues (2006) showed parallel declines in pollinators
and insect-pollinated plants. The obvious question is, whether a causal relationship
exists. A decrease in floral resources could lead to the disappearance of flower visitors
and vice versa. However, this assumption requires that species are interdependent.
For butterflies it is well documented that the loss of species-specific larval host plants
entails co-extinctions (Thomas et al. 2001, León-Cortés et al. 2003, Koh et al. 2004a, b,
Krauss et al. 2004) and that agricultural land use, e.g. mowing, causes losses in species
diversity via life-cycle disruption (Johst et al. 2006). Likewise, an unconditional
dependence on host plants was shown for some oligolectic bee species that fail to
develop on non-host pollen (Praz et al. 2008). These results underpin the theory that
species inhabiting narrow resource niches are prone to disturbance and that resource
specialization and resource availability play a major role for the diversity and
persistence of plant-flower visitor communities in a given ecosystem. Moreover, it may
be expected that species are affected by land-use related changes in their resources
dependent on their degree of resource specialization (Koh et al. 2004b).
If, due to mutual specialization, flower-visitors are found to be highly dependent on
flower diversity, this would mean that a decrease in resources could lead to a parallel
decline in the biodiversity of consumers (Colwell et al. 2012). Moreover, changes in
resource composition could entail shifts in species composition of consumers,
eventually resulting in the loss of specialists and a functional homogenization at the
community level (Clavel et al. 2010, Filippi-Codaccioni et al. 2010).
Doubtless, the species within a flower-visitor population differ concerning their flower
preferences and diet breadth (e.g. Goulson and Darvill 2004, Tudor et al. 2004).
Imagine a continuum of resource – consumer interactions ranging from broadly
generalized to highly specialized ones. On the one end, consumers do not display any
morphological, physiological or behavioral constraints regarding their resources.
29
Theoretically, such consumers adapt easily to new resources and may even profit from
using multiple resources. Moreover, they do not suffer from resource-mediated declines
in diversity or abundance as long as the overall resource supply serves their nutritional
requirements.
On the other end of the continuum consumers are strictly confined to specific resources
either by morphological, physiological or behavioral constraints, and cannot adapt to
changing environmental conditions as easily as generalists. If a certain pollinator
species is restricted to one floral resource and this resource declines in abundance or
disappears from the ecosystem due to changes in environmental conditions the
pollinator will decline or disappear from the ecosystem accordingly if it is unable to
switch to other resources.
Vice versa, a given plant species, albeit visited by several flower visitors, may suffer
from pollinator loss or pollen limitation if residual flower visitors do not pollinate, e.g.
due to morphological constrains.
In my thesis we employed plant-pollinator interaction networks to explore the diversity
and specialization of flowers and flower visiting insects along a gradient of increasing
land-use intensity in grasslands. We aimed to examine the relationship between niche
properties and species sensitivity to disturbance, i.e. land use and which land-use
components exert the most profound impacts on the diversity of plants and pollinators.
Additionally, we focused on reasons for resource specialization of bees.
30
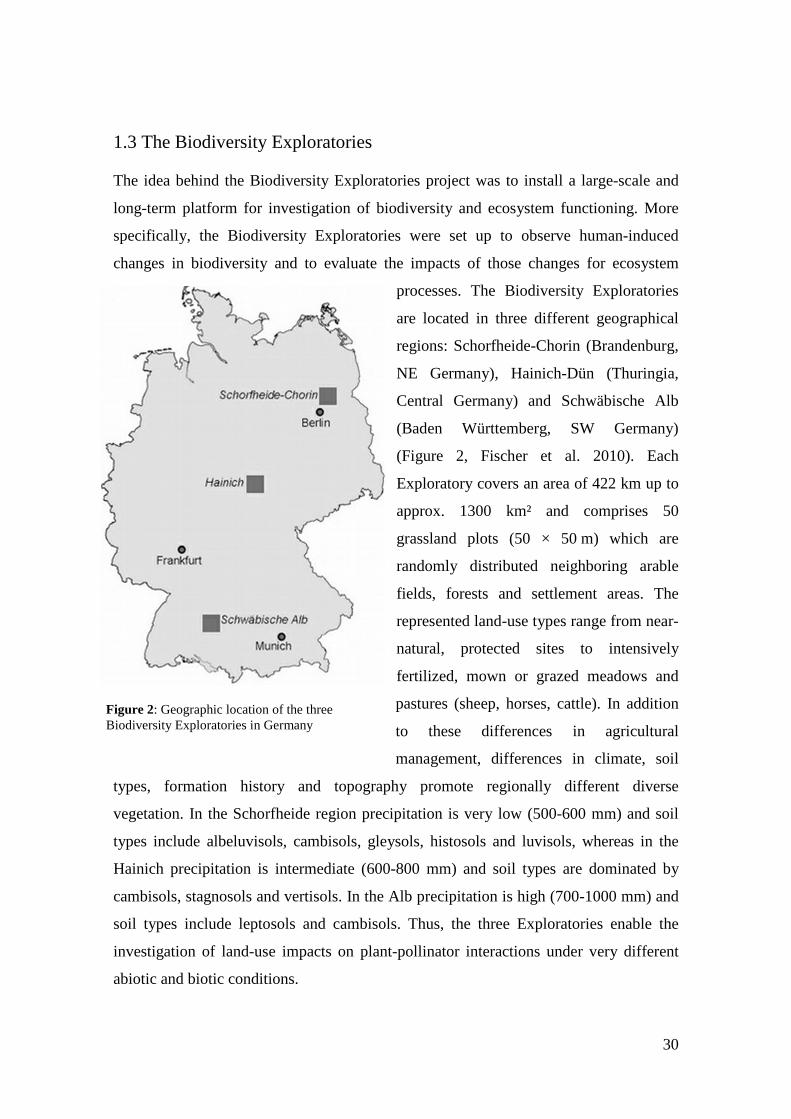
Figure 2: Geographic location of the three Biodiversity Exploratories in Germany
1.3 The Biodiversity Exploratories
The idea behind the Biodiversity Exploratories project was to install a large-scale and
long-term platform for investigation of biodiversity and ecosystem functioning. More
specifically, the Biodiversity Exploratories were set up to observe human-induced
changes in biodiversity and to evaluate the impacts of those changes for ecosystem
processes. The Biodiversity Exploratories
are located in three different geographical
regions: Schorfheide-Chorin (Brandenburg,
NE Germany), Hainich-Dün (Thuringia,
Central Germany) and Schwäbische Alb
(Baden Württemberg, SW Germany)
(Figure 2, Fischer et al. 2010). Each
Exploratory covers an area of 422 km up to
approx. 1300 km² and comprises 50
grassland plots (50 × 50 m) which are
randomly distributed neighboring arable
fields, forests and settlement areas. The
represented land-use types range from near-
natural, protected sites to intensively
fertilized, mown or grazed meadows and
pastures (sheep, horses, cattle). In addition
to these differences in agricultural
management, differences in climate, soil
types, formation history and topography promote regionally different diverse
vegetation. In the Schorfheide region precipitation is very low (500-600 mm) and soil
types include albeluvisols, cambisols, gleysols, histosols and luvisols, whereas in the
Hainich precipitation is intermediate (600-800 mm) and soil types are dominated by
cambisols, stagnosols and vertisols. In the Alb precipitation is high (700-1000 mm) and
soil types include leptosols and cambisols. Thus, the three Exploratories enable the
investigation of land-use impacts on plant-pollinator interactions under very different
abiotic and biotic conditions.
31
1.4 Thesis outline
The major aim of my thesis was to explore the diversity and specialization of flowers
and flower-visiting insects along a gradient of increasing land-use intensity in
grasslands. Moreover, we aimed to explore how the land-use response of a species may
influence its interaction partners. We focused on how niche- and resource-based
mechanisms determine the composition and specialization of plant-pollinator
communities and resource preferences of flower-visitors.
In my thesis I addressed the following subjects:
1. Effects of mowing and fertilization on diversity, composition and specialization
of plant-flower visitor interactions on meadows
To explore how increasing land-use intensity affects diversity and composition of
plant-flower visitor interactions on meadows, we compared meadows managed at
low and high intensities. We employed a network approach to test whether
specialization and complementarity of flower visitors differed between management
types.
2. Effects of quantitative land-use intensity and specialization on mutualistic
interactions
To study if land-use related parallel declines in plants and pollinators may result
from mutual specialization, we analyzed 162 plant-pollinator networks from 119
grassland sites managed at different intensities. We aimed to explore natural
community responses to land-use, i.e. how the land-use response of one species
influences its interaction partners, and to predict possible consequences from
specialization.
3. Response of plant-pollinator networks in relation to management practice
To investigate how plant-pollinator networks respond to differences in management
techniques and intensification within different management types, we conducted
isolated analysis of mowing, grazing and fertilization on plant-pollinator networks.
32
4. Resource choice of flower visiting insects in relation to pollen quality
As I hypothesized that pollinator specialization may increase with the nutritional
quality of pollen offered by a flower, I analyzed 142 plant species for their
qualitative and quantitative amino acid composition and tested whether pollen
protein content and composition plays a role in the host plant selection of
oligolectic bees.
33
2. Effects of meadow management on diversity, composition and specialization of plant-flower visitor interactions This chapter has been published as: Weiner, C.N., Werner, M., Linsenmair, K.-E., Blüthgen, N. (2010): Land-use intensity in grasslands: changes in biodiversity, species composition and specialization in flower-visitor networks. Basic and Applied Ecology 12 (4), 292-299. Summary
The relationship between resource availability and biodiversity of consumers has gained
particular attention with the increasing loss of biodiversity. We evaluated resource
availability on meadows of low intensity (low/unfertilized, mown once or twice per
year) and meadows of high intensity land use (high fertilization, mown twice or trice)
before and after the first mowing in relation to network specialization, species richness
and composition of flower visitors.
We studied 40 meadows, simultaneously sampling one meadow of low intensity and
one meadow of high intensity land use. Each survey yielded a separate interaction
network, comprising all flower-visitors found during 6 h in an area of 1000 m2.
In total we recorded 105 plant species and 586 flower-visitor species. Species
composition of plants and flower visitors differed considerably between the two
management regimes, with species overlaps of 43 % in plants and 42 % in flower
visitors. Complementary specialization of flower visitors differed between taxa:
dipterans were significantly less specialized than beetles and butterflies, and bees had
the highest degree of specialization. Earlier in the season (before mowing), meadows of
low intensity land use were significantly richer in plant, bee and butterfly species. They
also showed more plant-flower visitor interactions, greater flowering areas and higher
individual numbers of butterflies than meadows of high intensity land use. However,
later in the season (after mowing) management types differed only in plant species
richness, being higher on meadows of low intensity land use.
We conclude that variations in plant species composition resulting from differences in
grassland management may alter plant-flower visitor interactions. Moreover, an
impoverishment of flower diversity has stronger effects on the diversity and species
34
composition of specialized flower visitor groups than on little or unspecialized flower
visitors.
2.1 Introduction
The determinants of biodiversity are a key question in ecology which deserves
particular attention in the face of the rising loss of species in recent decades (Ehrlich
and Wilson 1991, Allen-Wardell et al. 1998). Species richness, but especially functional
diversity, may enhance ecosystem stability and resilience (Naeem and Li 1997) and also
determine the performance of ecosystem processes (Tilman et al. 1997). Thus, the
maintenance of ecosystem services such as pollination will require a better
understanding of each species’ role and how species losses may affect them (McCann
2000, Loreau et al. 2001, Memmott et al. 2004, Fontaine et al. 2006).
Despite of the declines in honey bees and wild bees reported from the US and Europe a
general “pollination crisis” is still being controversially discussed (Ghazoul 2005,
Steffan-Dewenter et al. 2005, Biesmeijer et al. 2006, Aizen and Harder 2009). Several
studies have shown that pollinator visitation and diversity may be negatively influenced
by habitat degradation and fragmentation (Rathcke and Jules 1993, Cunningham 2000)
as well as by agrochemicals (Johansen 1977, Crane and Walker 1983, Kevan and
Phillips 2001). Mowing may affect pollinators via changes in resource supply, and its
timing and frequency markedly alter species composition (Fenner and Palmer 1998).
Moreover, mowing causes temporary declines in the diversity and abundance of many
insect species and may limit their reproduction by harming the larvae (Johst et al. 2006).
Losses in pollinator diversity or abundance may lead to a reduced seed set in plants
(Jennerston 1988, Klein et al. 2003). Parallel diversity declines in insect-pollinated
plants and in pollinators were reported from Britain and the Netherlands (Biesmeijer et
al. 2006). Still it is unclear, if one decline causes the other or if both groups are
adversely affected by a third factor. Ebeling et al. (2008) showed that reduced flower
diversity causes reduced pollinator abundance and diversity in small scale experimental
plots. Thus, it is conceivable that declines in plant diversity, as e.g. caused by land-use
intensification may cause declines of flower visitor diversity due to mutual
specialization and vice versa. High soil nitrogen levels due to fertilization are known to
35
affect floral abundance and composition reducing plant diversity and favoring the
biomass of grasses (Suding et al. 2005, Burkle and Irwin 2009). On the contrary, low
nitrogen levels favor forbs and thus flower production and pollinator visitation (Burkle
and Irwin 2010).
We focus on specialization, diversity and composition of plant-pollinator networks on
two meadow types that differ in management intensity. As plant-pollinator networks
show a high seasonality (Olesen et al. 2008) this can override effects of land-use
intensity on a flower-visitor community. We therefore used a standardized pair-wise
sampling design which allowed comparing simultaneously recorded meadows differing
in land-use intensity, but not in season or weather conditions. However, meadows of
high land-use intensity are often mown earlier than ones of low land-use intensity,
which may affect the state of regrowth. We thus expected clearer management effects
before than after mowing.
We hypothesized that (1) flower diversity and abundance decrease with increasing land-
use intensity, and that (2) this trend is associated with a decline in diversity and
abundance of flower visitors. A decline in consumers may be a response to
impoverished resource availability. In particular, (3) stronger effects of flower diversity
on visitor diversity are expected when the latter are more specialized. Hence,
specialization and complementarity of flower visitor interactions were examined using a
network approach and quantitative metrics.
2.2 Methods
2.2.1 Data collection
Between May and August 2007, we investigated a total of 40 grassland plots (20 plots
of high and 20 of low intensity management) in Schwäbische Alb, south-western
Germany. Plots were selected from a pre-selection of 1000 plots for which information
on land-use type was available as part of the Biodiversity Exploratories Project
(www.biodiversity-exploratories.de). Flower visitors were recorded simultaneously on
meadows of low land-use intensity (hereafter called low-IM) and meadows of high
land-use intensity (hereafter called high-IM), thus comprising a pair-wise design. Low-
36
IM were unfertilized or in two cases low fertilized (50/60 kg N/ha), while in high-IM
the fertilization level varied from 80 – 450 kg nitrogen/ha with a median level of 80 kg
N/ha. For the low-IM that were mown only once, the mowing date was in mid-July,
whereas two low-IM were mown in Mid-June and late August. In high-IM, which were
mown 2-3 times a year, the date of the first mowing was in mid-June to mid-July, the
second mowing followed in mid or late August, and in some a third mowing occurred in
late September or October. In our late season sampling (“after mowing”) all types of
meadows were surveyed after their first mowing. Pairs of meadows were chosen to have
soil conditions and plot surroundings as similar as possible. Species composition of
plants and flower visitors was not influenced by the spatial distance between the
meadows (Mantel test, plants: r = 0.08, p = 0.075; insects: r = 0.004, p = 0.468; based
on Bray-Curtis distance and 105 permutations). Each meadow was surveyed for six
hours between morning and afternoon and each survey comprised a meandering transect
walk of 333 m length and 3 m transect width covering an area of approx. 1000 m2 per
plot. Ten pairs of meadows were sampled before their first mowing (May to mid-July)
and ten pairs approximately 3-8 weeks after their first mowing (late July to late August).
We counted the flowering units per plot for all flowering plant species (excl. grasses),
or, in highly abundant species, estimated it by extrapolation from a small area. A
‘flowering unit’ was defined as a unit of one (e.g. Geraniaceae) or more flowers (e.g.
Asteraceae, Apiaceae) demanding insects to fly for getting from one unit to another
(Dicks et al. 2002).
Diversity of flowers was calculated after multiplying the number of flowering units of a
species by its average flowering area in cm² to account for differences in flowering area.
This was done because the size of the flower display relates to pollinator attraction
(Vaughton and Ramsey 1998). Additionally, we found a positive relationship between
flowering area and pollen volume per flower (Pearson, p = 0.00002, r = 0.62, N = 40;
unpublished data). In actinomorphic flowers flowering area was calculated as a circle
based on the flower diameter, whereas the flowering area of zygomorphic flowers was
calculated as a rectangle based on flower length and width. As in umbels the parts of a
flowering unit are standing together rather loose compared with actinomorphic flowers,
their diameter was divided by two before calculating their flowering area.
37
All insects that visited flowers were registered as well as the plant species on which
they were observed, disregarding only those insects which were sitting on the outer
petals and obviously not feeding on pollen or nectar. Specimens that could not be
identified in the field were collected using a sweep net. They were kept in alcohol vials,
sorted and identified to species level where possible. Thysanoptera were not captured as
they are easily overlooked and thus may create a bias for some plants if collected
erratically. For each of the surveyed plots we calculated a separate interaction network.
2.2.2 Statistical analysis
Statistics were conducted in R 2.8 (R Development Core Team 2008). Contrasting most
previous studies each of our recorded plant-flower visitor networks was analyzed
separately. By using only short-term interaction networks we avoid seasonal variation
and non-overlapping phenologies.
Complementary specialization of flower visitors was calculated using the indices di’ and
H2’ (Blüthgen et al. 2006). Unlike previous approaches, the results are not biased by
variation in total interaction frequency and sampling effort (Blüthgen 2010). The index
di’ describes the species’ deviation in flower visitation from the distribution of all
visitors. H2’ characterizes the degree of complementary specialization in the entire
network (compare Blüthgen and Klein 2011). For both measures high values indicate
strong niche partitioning and specialization.
For each of the most abundant flower visitor groups, namely bees, beetles, butterflies,
hoverflies, and other dipterans we calculated a weighted mean di’ per plot. The measure
di’ was weighted by the species total interactions, but excluding species observed only
once. Repeated measures ANOVA (type III, with land use as repeated measure to
account for the pair wise sampling design) followed by a Tukey post-hoc test was
conducted to examine differences in specialization of flower visitor groups. As
homogeneity of variance among the different flower visitor groups could not be
achieved for the full data set, we excluded the groups with the highest variances,
Lepidoptera and Coleoptera, and conducted a second ANOVA on the reduced data set
where variance homogeneity was achieved. Differences between the pollinator groups
stayed highly significant (p < 0.0001), confirming the results for the full data set
presented below.
38
Plant and flower visitor diversity and evenness were calculated based on Simpson’s
diversity
and
where pi is the proportional abundance of each flower visitor i from the total abundance
of N flower visitors. Additionally we compared plant and flower visitor species richness
that was rarefied to the lowest common denominator of all plots (i.e. to 382 flower units
and to 160 individual visitors per plot) using the EcoSim package and 1000 iterations
(Gotelli and Entsminger 2009).
We tested the relationship between floral availability and responses of visitors, first
correlating flowering area and total number of flower visitors per plot. To determine the
relationship between flowering area and interaction frequency at the species level, we
calculated linear correlations between log(number of interactions per plant species) and
log(flowering area) across all plant species per network and then quantified the
combined mean effect size from all 40 networks by using standard meta-analysis tools
(MetaWin 2.0; Fisher’s z-transformation, sample size as richness of plant species, fixed
effect; 95% confidence intervals were based on bootstrapping with 999 iterations, bias-
corrected).
Insect diversity calculations comprised all individuals identified to species level plus all
individuals belonging to groups which generally could be identified only to a cruder
taxonomic level: 512 (3.6 %) visitors, determined to family (283 individuals, 25
families) or genus level (238 individuals, 40 genera). These groups did not contain any
of the identified species, so they added to overall diversity. Removing these cases from
the analysis did not affect the overall results. However, for analyses of specialization
(H2’ , di’), these cases were excluded.
Two-tailed paired t-tests were conducted to examine whether management types
differed in diversity, abundance and rarefied species richness of plants and pollinators,
or network specialization. Where necessary, we used logarithmic transformation to
approach a normal distribution.
To analyze differences in species composition between management types,
permutational multivariate analyses of variance using distance matrices (“Adonis”
∑= 2/1 ipD1
1
−−=
N
DE
39
command, R-package vegan 1.17-1 (Oksanen et al. 2008), based on Bray-Curtis
distances and 105 permutations were conducted. This is a robust technique (Oksanen
2010) that allows partitioning of distance matrices among sources of variation and uses
F-tests based on sequential sums of squares from permutations of the raw data to assess
statistical significance.
We tested species composition of plants, bees, hoverflies, butterflies, beetles and
dipterans as well as all flower-visitors combined. These calculations were based on
relative abundances to eliminate confounding effects of variation in total abundance.
However, calculations based on total abundances and Jaccard’s distances yielded the
same overall results.
2.3 Results
In total we recorded 105 plant species and at least 586 flower-visitor species. Ninety-
four plant species were found on meadows of low land-use intensity (low-IM) and only
56 species on meadows of high land-use intensity (high-IM). Plant species overlap
between land-use types was 45 species (43 %). The number of flower visitor species
amounted to 402 species on low-IM and 433 species on high-IM, with 249 species
occurring in both management types (42 %). Species composition was significantly
different between low-IM and high-IM for plant and bee species, and marginally
significant for butterflies and total flower visitors (Table 1) although land-use type
explained only 3-11 percent of the total variation. Syrphids, other dipterans and
coleopterans did not show significant compositional differences related to management
types. Species composition of all taxa was highly related to season (before vs. after
mowing, Table 1).
40
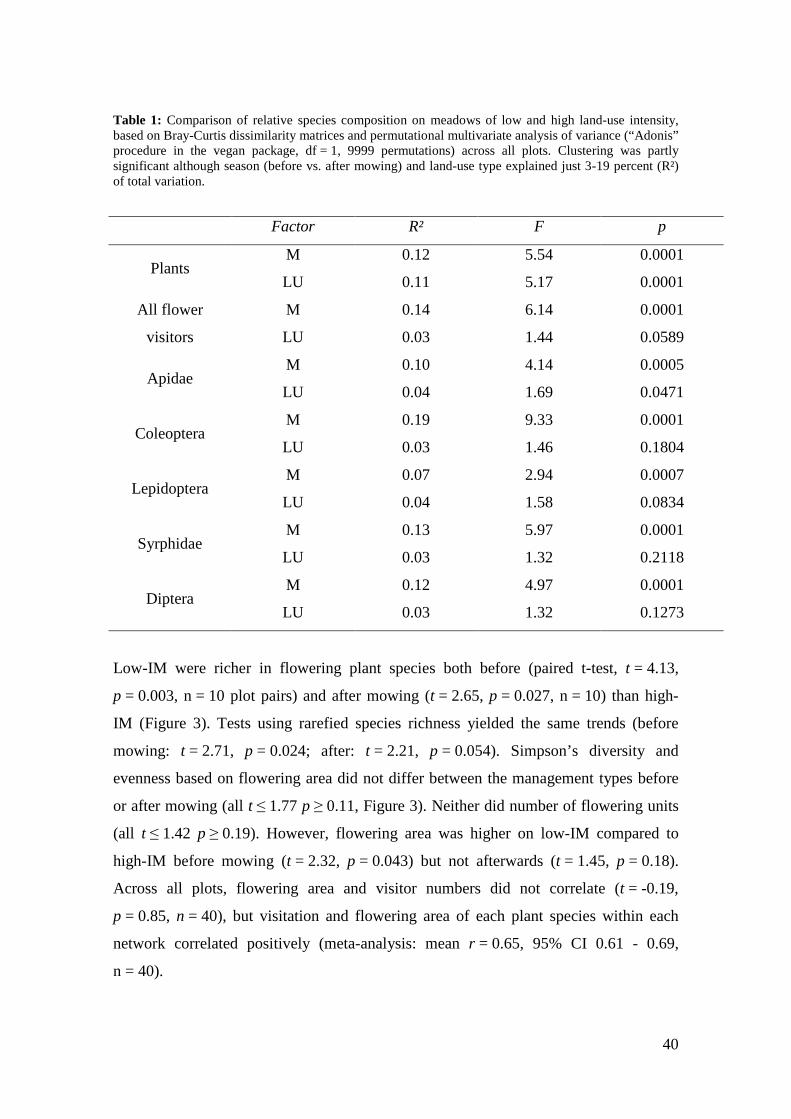
Table 1: Comparison of relative species composition on meadows of low and high land-use intensity, based on Bray-Curtis dissimilarity matrices and permutational multivariate analysis of variance (“Adonis” procedure in the vegan package, df = 1, 9999 permutations) across all plots. Clustering was partly significant although season (before vs. after mowing) and land-use type explained just 3-19 percent (R²) of total variation.
Low-IM were richer in flowering plant species both before (paired t-test, t = 4.13,
p = 0.003, n = 10 plot pairs) and after mowing (t = 2.65, p = 0.027, n = 10) than high-
IM (Figure 3). Tests using rarefied species richness yielded the same trends (before
mowing: t = 2.71, p = 0.024; after: t = 2.21, p = 0.054). Simpson’s diversity and
evenness based on flowering area did not differ between the management types before
or after mowing (all t ≤ 1.77 p ≥ 0.11, Figure 3). Neither did number of flowering units
(all t ≤ 1.42 p ≥ 0.19). However, flowering area was higher on low-IM compared to
high-IM before mowing (t = 2.32, p = 0.043) but not afterwards (t = 1.45, p = 0.18).
Across all plots, flowering area and visitor numbers did not correlate (t = -0.19,
p = 0.85, n = 40), but visitation and flowering area of each plant species within each
network correlated positively (meta-analysis: mean r = 0.65, 95% CI 0.61 - 0.69,
n = 40).
Factor R² F p
Plants M 0.12 5.54 0.0001
LU 0.11 5.17 0.0001
All flower
visitors
M 0.14 6.14 0.0001
LU 0.03 1.44 0.0589
Apidae M 0.10 4.14 0.0005
LU 0.04 1.69 0.0471
Coleoptera M 0.19 9.33 0.0001
LU 0.03 1.46 0.1804
Lepidoptera M 0.07 2.94 0.0007
LU 0.04 1.58 0.0834
Syrphidae M 0.13 5.97 0.0001
LU 0.03 1.32 0.2118
Diptera M 0.12 4.97 0.0001
LU 0.03 1.32 0.1273
41
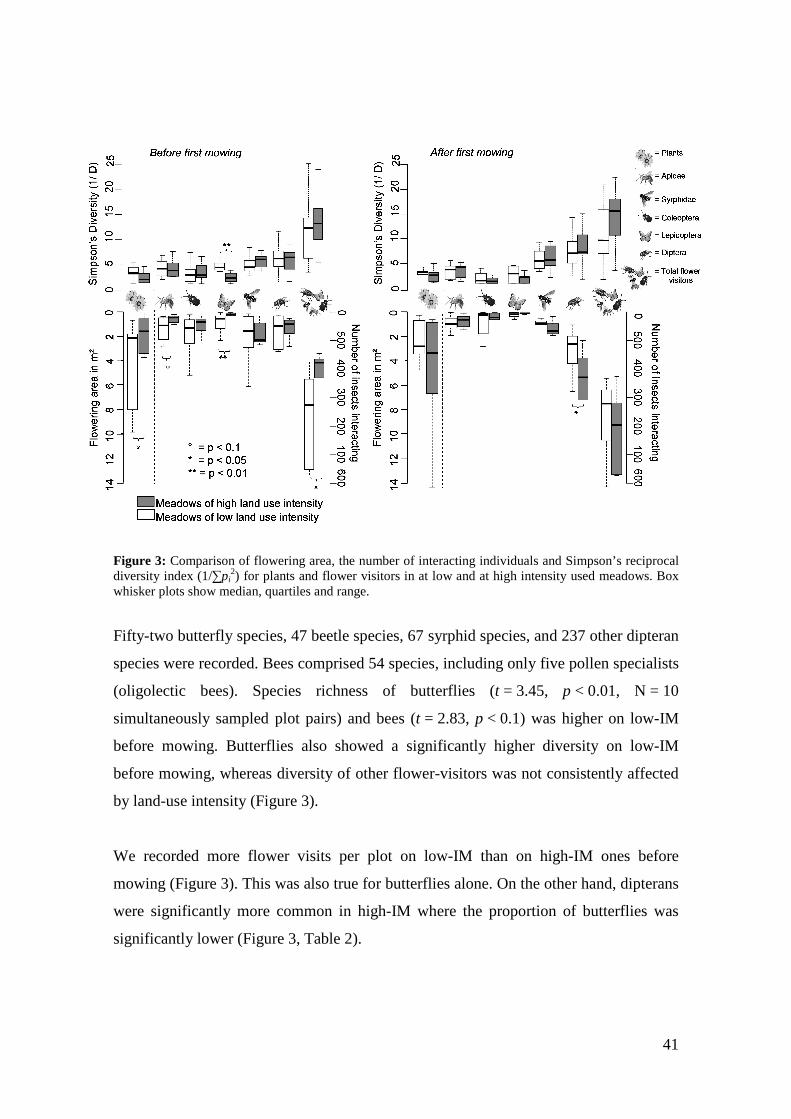
Figure 3: Comparison of flowering area, the number of interacting individuals and Simpson’s reciprocal diversity index (1/∑pi
2) for plants and flower visitors in at low and at high intensity used meadows. Box whisker plots show median, quartiles and range.
Fifty-two butterfly species, 47 beetle species, 67 syrphid species, and 237 other dipteran
species were recorded. Bees comprised 54 species, including only five pollen specialists
(oligolectic bees). Species richness of butterflies (t = 3.45, p < 0.01, N = 10
simultaneously sampled plot pairs) and bees (t = 2.83, p < 0.1) was higher on low-IM
before mowing. Butterflies also showed a significantly higher diversity on low-IM
before mowing, whereas diversity of other flower-visitors was not consistently affected
by land-use intensity (Figure 3).
We recorded more flower visits per plot on low-IM than on high-IM ones before
mowing (Figure 3). This was also true for butterflies alone. On the other hand, dipterans
were significantly more common in high-IM where the proportion of butterflies was
significantly lower (Figure 3, Table 2).
42
Table 2: Comparison of the proportions of several important flower visitor groups between meadows of low (low-IM) and high (high-IM) land-use intensity (paired t-test) Low-IM High-IM t-test
Mean proportion (%) ± SD t p
Apidae 24.0 ± 17.7 15.0 ± 10.9 1.3 0.226
Coleoptera 16.8 ± 19.6 12.4 ± 11.2 0.5 0.599
Lepidoptera 7.9 ± 9.9 1.9 ± 1.9 2.8 0.012
Syrphidae 15.9 ± 11.0 25.4 ± 20.2 -3.4 0.003
Diptera 30.7 ± 24.4 40.5 ± 21.7 -2.2 0.040
Others 4.9 ± 4.0 4.9 ± 2.8 0.6 0.582
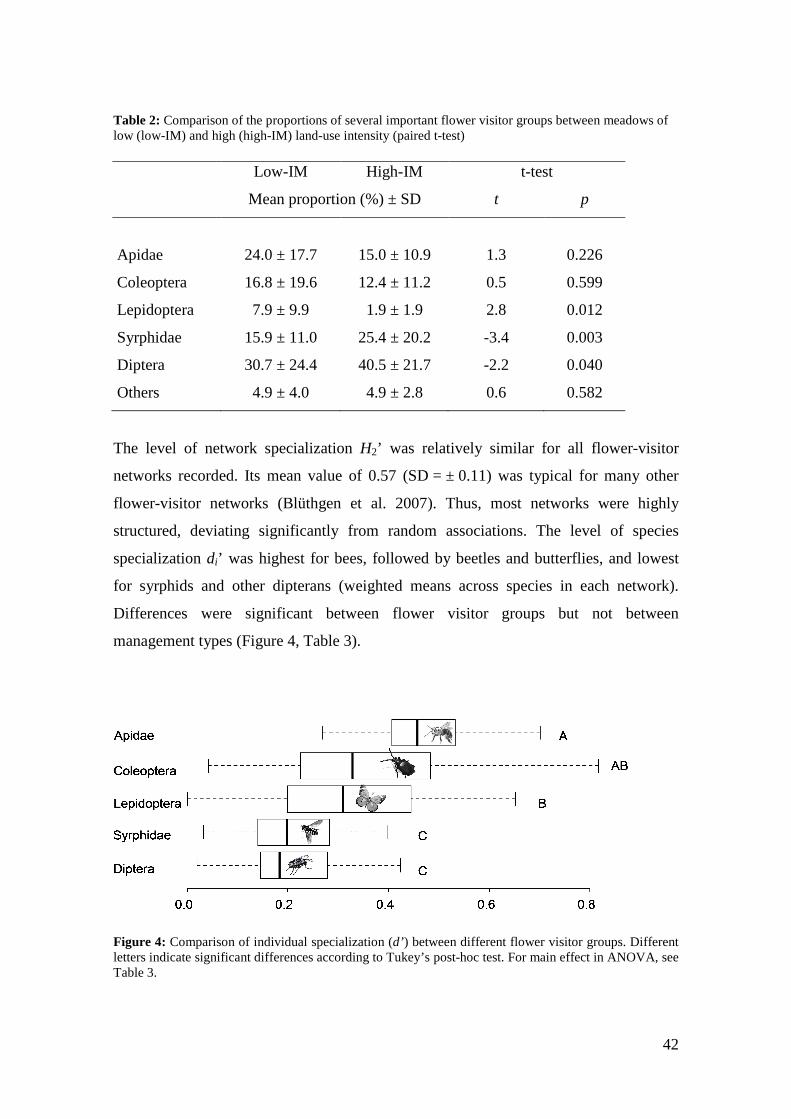
The level of network specialization H2’ was relatively similar for all flower-visitor
networks recorded. Its mean value of 0.57 (SD = ± 0.11) was typical for many other
flower-visitor networks (Blüthgen et al. 2007). Thus, most networks were highly
structured, deviating significantly from random associations. The level of species
specialization di’ was highest for bees, followed by beetles and butterflies, and lowest
for syrphids and other dipterans (weighted means across species in each network).
Differences were significant between flower visitor groups but not between
management types (Figure 4, Table 3).
Figure 4: Comparison of individual specialization (d’) between different flower visitor groups. Different letters indicate significant differences according to Tukey’s post-hoc test. For main effect in ANOVA, see Table 3.
43
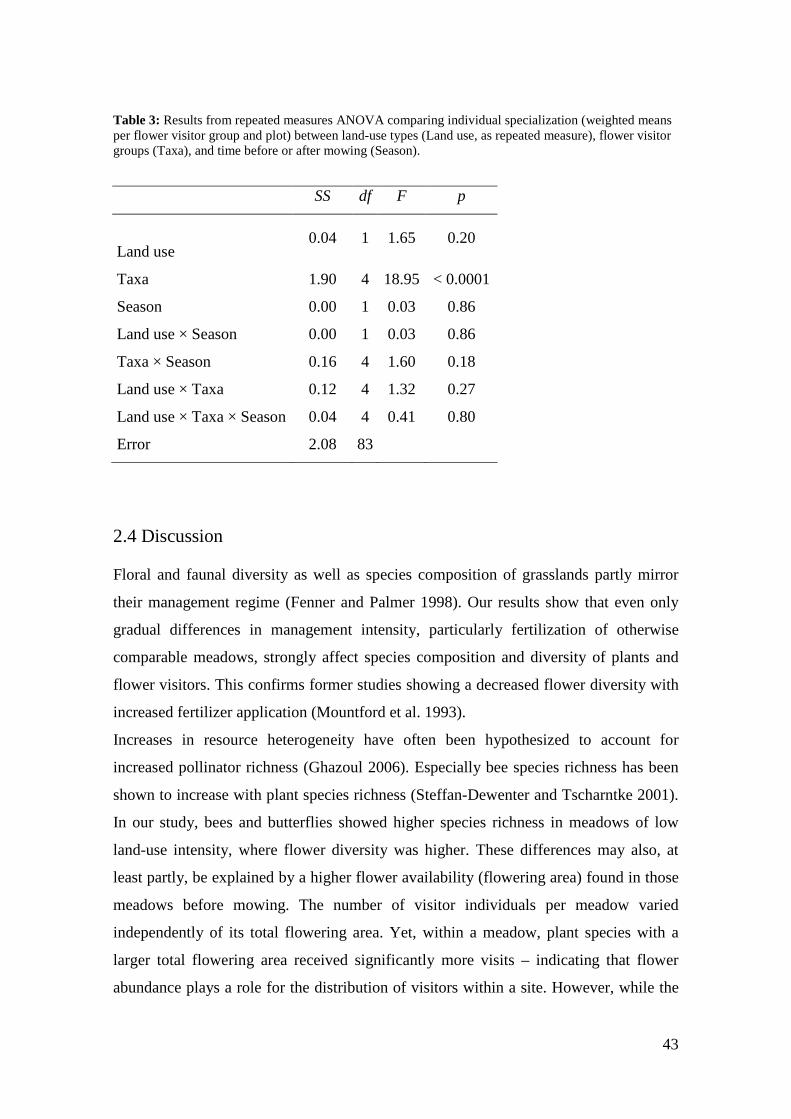
Table 3: Results from repeated measures ANOVA comparing individual specialization (weighted means per flower visitor group and plot) between land-use types (Land use, as repeated measure), flower visitor groups (Taxa), and time before or after mowing (Season).
SS df F p
Land use 0.04 1 1.65 0.20
Taxa 1.90 4 18.95 < 0.0001
Season 0.00 1 0.03 0.86
Land use × Season 0.00 1 0.03 0.86
Taxa × Season 0.16 4 1.60 0.18
Land use × Taxa 0.12 4 1.32 0.27
Land use × Taxa × Season 0.04 4 0.41 0.80
Error 2.08 83
2.4 Discussion
Floral and faunal diversity as well as species composition of grasslands partly mirror
their management regime (Fenner and Palmer 1998). Our results show that even only
gradual differences in management intensity, particularly fertilization of otherwise
comparable meadows, strongly affect species composition and diversity of plants and
flower visitors. This confirms former studies showing a decreased flower diversity with
increased fertilizer application (Mountford et al. 1993).
Increases in resource heterogeneity have often been hypothesized to account for
increased pollinator richness (Ghazoul 2006). Especially bee species richness has been
shown to increase with plant species richness (Steffan-Dewenter and Tscharntke 2001).
In our study, bees and butterflies showed higher species richness in meadows of low
land-use intensity, where flower diversity was higher. These differences may also, at
least partly, be explained by a higher flower availability (flowering area) found in those
meadows before mowing. The number of visitor individuals per meadow varied
independently of its total flowering area. Yet, within a meadow, plant species with a
larger total flowering area received significantly more visits – indicating that flower
abundance plays a role for the distribution of visitors within a site. However, while the
44
trend in plant species diversity was reversed later in the year, there was no concomitant
reversal in species richness and abundance of bees and butterflies in low intensity used
meadows. Hence, negative land-use effects on the composition, diversity and abundance
of flower visitors are not just triggered by flower abundance but by diversity and
species-specific effects like pollinator preferences.
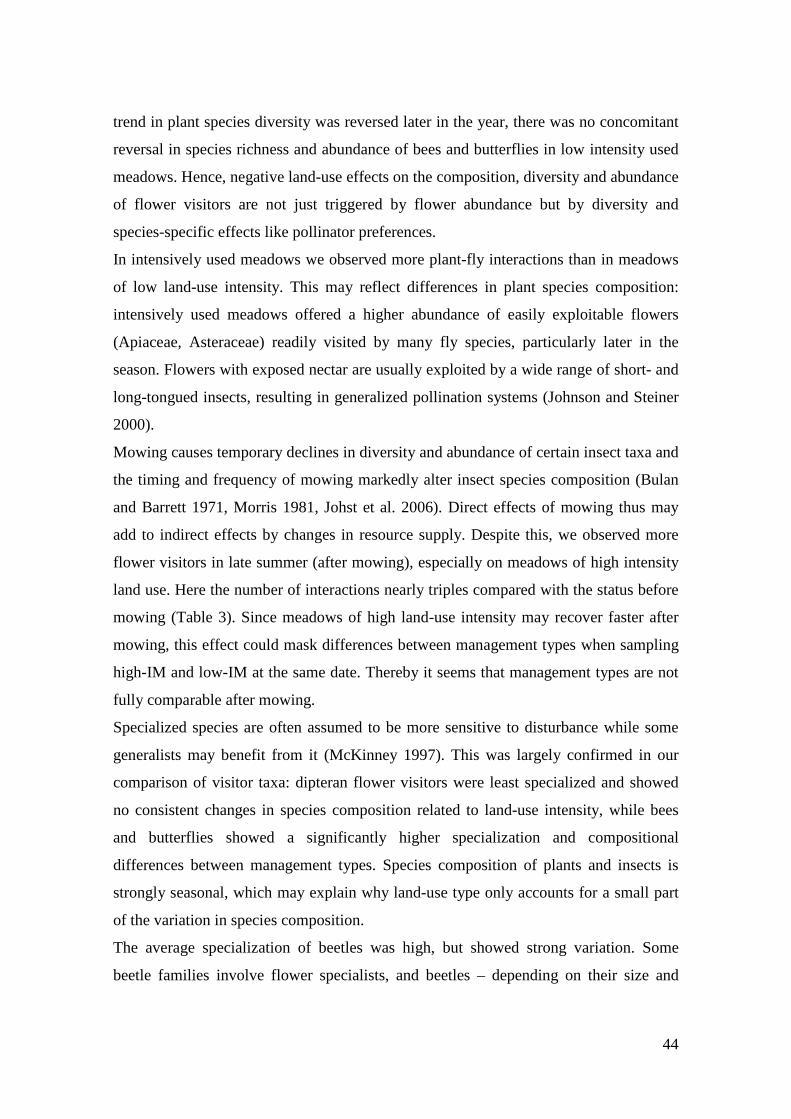
In intensively used meadows we observed more plant-fly interactions than in meadows
of low land-use intensity. This may reflect differences in plant species composition:
intensively used meadows offered a higher abundance of easily exploitable flowers
(Apiaceae, Asteraceae) readily visited by many fly species, particularly later in the
season. Flowers with exposed nectar are usually exploited by a wide range of short- and
long-tongued insects, resulting in generalized pollination systems (Johnson and Steiner
2000).
Mowing causes temporary declines in diversity and abundance of certain insect taxa and
the timing and frequency of mowing markedly alter insect species composition (Bulan
and Barrett 1971, Morris 1981, Johst et al. 2006). Direct effects of mowing thus may
add to indirect effects by changes in resource supply. Despite this, we observed more
flower visitors in late summer (after mowing), especially on meadows of high intensity
land use. Here the number of interactions nearly triples compared with the status before
mowing (Table 3). Since meadows of high land-use intensity may recover faster after
mowing, this effect could mask differences between management types when sampling
high-IM and low-IM at the same date. Thereby it seems that management types are not
fully comparable after mowing.
Specialized species are often assumed to be more sensitive to disturbance while some
generalists may benefit from it (McKinney 1997). This was largely confirmed in our
comparison of visitor taxa: dipteran flower visitors were least specialized and showed
no consistent changes in species composition related to land-use intensity, while bees
and butterflies showed a significantly higher specialization and compositional
differences between management types. Species composition of plants and insects is
strongly seasonal, which may explain why land-use type only accounts for a small part
of the variation in species composition.
The average specialization of beetles was high, but showed strong variation. Some
beetle families involve flower specialists, and beetles – depending on their size and
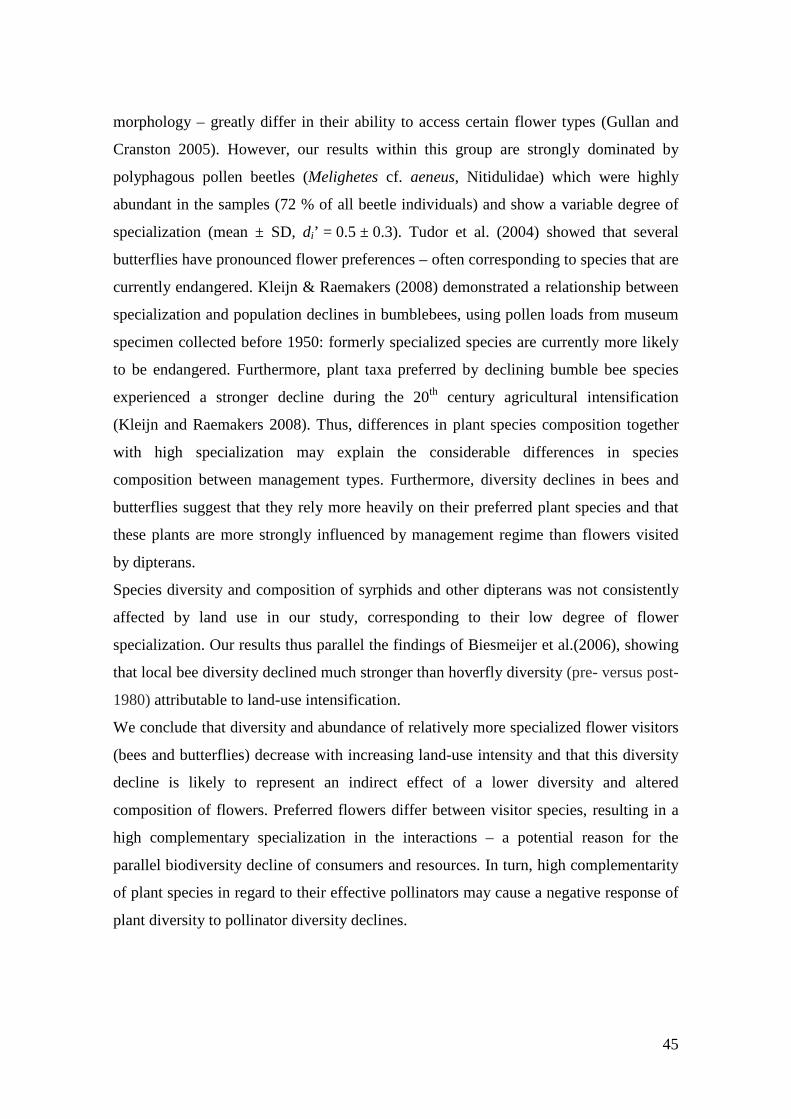
45
morphology – greatly differ in their ability to access certain flower types (Gullan and
Cranston 2005). However, our results within this group are strongly dominated by
polyphagous pollen beetles (Melighetes cf. aeneus, Nitidulidae) which were highly
abundant in the samples (72 % of all beetle individuals) and show a variable degree of
specialization (mean ± SD, di’ = 0.5 ± 0.3). Tudor et al. (2004) showed that several
butterflies have pronounced flower preferences – often corresponding to species that are
currently endangered. Kleijn & Raemakers (2008) demonstrated a relationship between
specialization and population declines in bumblebees, using pollen loads from museum
specimen collected before 1950: formerly specialized species are currently more likely
to be endangered. Furthermore, plant taxa preferred by declining bumble bee species
experienced a stronger decline during the 20th century agricultural intensification
(Kleijn and Raemakers 2008). Thus, differences in plant species composition together
with high specialization may explain the considerable differences in species
composition between management types. Furthermore, diversity declines in bees and
butterflies suggest that they rely more heavily on their preferred plant species and that
these plants are more strongly influenced by management regime than flowers visited
by dipterans.
Species diversity and composition of syrphids and other dipterans was not consistently
affected by land use in our study, corresponding to their low degree of flower
specialization. Our results thus parallel the findings of Biesmeijer et al.(2006), showing
that local bee diversity declined much stronger than hoverfly diversity (pre- versus post-
1980) attributable to land-use intensification.
We conclude that diversity and abundance of relatively more specialized flower visitors
(bees and butterflies) decrease with increasing land-use intensity and that this diversity
decline is likely to represent an indirect effect of a lower diversity and altered
composition of flowers. Preferred flowers differ between visitor species, resulting in a
high complementary specialization in the interactions – a potential reason for the
parallel biodiversity decline of consumers and resources. In turn, high complementarity
of plant species in regard to their effective pollinators may cause a negative response of
plant diversity to pollinator diversity declines.

46
47
3. Mutualistic networks and their response to disturbance in relation to diversity and specialization
This chapter has been published as: Weiner, C.N., Werner, M., Linsenmair, K.-E., Blüthgen, N.: Land-use impacts on plant–pollinator networks: interaction strength and specialization predict pollinator declines. Ecology 95:466–474. Summary
Land use is known to reduce the diversity of species and complexity of biotic
interactions. In theory, interaction networks can be used to predict the sensitivity of
species against co-extinction, but this has rarely been applied to real ecosystems facing
variable land-use impacts. We investigated plant–pollinator networks on 119 grasslands
that varied quantitatively in management regime, yielding 25 401 visits by 741
pollinator species on 166 plant species.
Species-specific plant and pollinator responses to land use were significantly predicted
by the weighted average land-use response of each species' partners. Moreover, more
specialized pollinators were more vulnerable than generalists. Both predictions are
based on the relative interaction strengths provided by the observed interaction network.
Losses in flower and pollinator diversity were linked, and mutual dependence between
plants and pollinators accelerates the observed parallel declines in response to land-use
intensification. Our findings confirm that ecological networks help to predict natural
community responses to disturbance and possible secondary extinctions.
3.1 Introduction
The ongoing large- and small-scale changes in anthropogenic land use are known to
deplete biodiversity (Duraiappah and Naeem 2005). A major goal of biodiversity
research is to understand how complex networks of functional interactions between
species respond to disturbance and how a gradual loss of biodiversity may affect overall
ecosystem function (Loreau et al. 2001, Koh et al. 2004a, Tylianakis et al. 2007).
These questions are of particular concern for the pollination of flowering plants since
about 87.5 % of the angiosperms, among them many agricultural crops, depend on
48
animal pollination (Ollerton et al. 2011). Several studies indicate that agricultural
intensification triggers losses in the diversity of plant and pollinator communities due to
habitat conversion and fragmentation, fertilization and pesticide use (Cunningham 2000,
Burkle and Irwin 2010, Brittain and Potts 2011). Moreover, a high functional diversity
of pollinators may sustain a high plant diversity and lead to higher pollination success
and seed set of individual plants (Klein et al. 2003, Hoehn et al. 2008). Among-plant
competition for limited pollinators may lead to reduction in per capita services to plants
in relatively dense or diverse populations (Vamosi et al. 2006). On the other hand,
visitors to dense populations are expected to be more flower constant, increasing the
chance of pollen transfer between conspecifics (Kunin 1997), and pollination may be
more reliable in dense plant populations (Bernhardt et al. 2008). Outcrossing by
pollinators is important in the long-term where inbreeding negatively affects population
viability and increases local extinction risks (Byers 1995). In turn, high plant diversity is
assumed to promote pollinator richness and functional diversity (Kwaiser and Hendrix
2007). Consequently, experiments with manipulated plant species diversity (Ebeling et
al. 2008) and comparisons across different meadows (Fründ et al. 2010) demonstrated
positive relationships between plant diversity and pollinator diversity and abundance.
Additionally, analyses of historic data from Britain and the Netherlands revealed
parallel diversity declines in bees and insect pollinated plants (Biesmeijer et al. 2006).
These results lead to the hypothesis that losses in plant and flower-visitor diversity
might be causally linked, e.g. a consequence of mutual dependence. Such dependency
on certain partners implies that interaction partners are specialized to a considerable
degree. To understand land-use effects on interacting species, it is thus crucial to
investigate their degree of specialization and the identity of each species’ partners. This
may allow predictions of how land-use induced changes in species composition would
affect natural communities and their functions. Network analysis provides a useful
framework for characterizing specialization and predicting vulnerability of resource-
consumer relationships or mutualisms to species loss (Montoya et al. 2006).
Some studies suggested that specialist species are prone to disturbance, while
generalists benefit from it (McKinney 1997, Aizen et al. 2012, but see Vázquez and
Simberloff 2002, Winfree et al. 2007). While some approaches have predicted the
vulnerability of complex communities based on simulated extinctions or dynamic
49
population modeling (Memmott et al. 2007, Pocock et al. 2012), such changes have
been rarely tested in real world systems. Methods used in modeling approaches are
controversial (Benadi et al. 2012, James et al. 2012), and conflicting conclusions based
on empirical data may be partly explained by the fact that specialization metrics differ
in their sensitivity to sampling effects (Blüthgen 2010). Since the number of links
(observed interaction partners) increases with the number of observations, rarity and
specialization are confounded unless corrected by appropriate network metrics
(Blüthgen et al. 2007).
In the present study, we focus on specialization and changes in plant-pollinator
interactions in grasslands along a gradient of increasing land-use intensity. We
hypothesized that (i) land-use intensification triggers a decline in plant diversity and
consequently, a plant-mediated decline in the diversity of floral resource consumers.
Moreover, we expected (ii) stronger effects of land-use intensification on specialized
plant and pollinator species, which are more dependent on their specific partners than
generalists are. However, we assumed that (iii) pollinator-mediated declines in plant
species are less pronounced than resource-mediated declines of pollinators, since many
plant species are not obligatory insect-pollinated and are capable of vegetative
reproduction.
3.2 Methods
3.2.1 Study area and land-use intensity
The large-scale Biodiversity Exploratories represent three bioregions in Germany
located in the Schorfheide-Chorin (Sch), Hainich-Dün (Hai), and Schwäbische Alb
(Alb) (Fischer et al. 2010). Each of the three Exploratories covers a connected area of
422 to ~1300 km² of land and each comprises 50 grassland plots. These plots are
situated within a matrix of agricultural land in use and measure 50 m × 50 m each. The
minimum distance between the outer edges of two plots is 200 m and each grassland
plot is at least 30 m away from the nearest forest edge. A detailed description of all
selection criteria for experimental plots is given by Fischer et al. (2010). The plots
represent a broad gradient of land-use intensity, ranging from near-natural, protected
50
sites to intensively fertilized, mown or grazed meadows and pastures (sheep, horses,
cattle).
Qualitative categorization of land use such as meadow/pasture or fertilized/unfertilized
obscures the variation of intensities within a category, e.g. differences in grazing
intensity or fertilizer application. We therefore used a continuous land-use intensity
index for grasslands that incorporates the three variables fertilization, mowing and
grazing intensity (Blüthgen et al. 2012). For each plot k, the land-use intensity Lk is
defined as the square root of the sum of these three variables, each of which was
standardized by its regional mean (i.e. the mean of each Exploratory):
Fk is the fertilization level (kg nitrogen ha-1 year-1), Mk the frequency of mowing per
year and Gk the livestock density (livestock units days-1 ha-1 year-1) on the site. Due to
the standardization by ratios, Lk is dimensionless. We used the mean Lk of the three
years 2006 – 2008 for all correlations; although Lk changed only to a small degree
between years, this mean value best captures previous and ongoing management which
may both effect plants and pollinators. Lk has been shown to predict responses in the
vegetation, namely the plants’ nitrogen indicator values, nitrogen and phosphorous
contents in plant and soil as well as plant diversity (Blüthgen et al. 2012).
3.2.2 Data collection
Between May and August 2008, we investigated plant-flower visitor networks on 119
different experimental grassland plots (Alb: 39; Hai: 39; Sch: 41). 29 plots were
investigated repeatedly up to four times (Alb: 15 plots surveyed repeatedly; nine plots
two times, three plots three times and three plots four times; Hainich; eight plots
surveyed repeatedly; four plots two times, four plots three times; Schorfheide: six plots
surveyed repeatedly, five plots two times, one plot three times), resulting in 162 surveys
done in total (Alb: 63; Hai: 51; Sch: 48). Each survey covered a time span of six hours
between morning and afternoon and an area of 200 × 3 m (length × width) along the
edge of the square experimental grassland plot. For this transect, which we walked three
times during one survey (three rounds, two hours each), we documented all plant-flower
mean
k
mean
k
mean
kk
M
M
F
F
G
GL ++=

51
visitor interactions. We recorded each insect that visited a flower as well as the flower
species on which it was observed, but disregarded those insects that were sitting on the
outer petals obviously not feeding on pollen or nectar. Specimens that we could not
identify in the field were collected and later identified to species level with the help of
experts (see Acknowledgements).
To gain independent data on flower abundance, we first counted the number of
flowering units per plant species and transect or, in highly abundant species,
extrapolated it from a smaller area. One ‘flowering unit’ was defined as a unit of one
(e.g. Ranunculaceae) or more flowers (e.g. Asteraceae) demanding an insect to fly in
order to switch to another unit (Dicks et al. 2002). To incorporate differences in
flowering area, we assessed flower diversity by multiplying the number of flowering
units of a species by its average flowering area in cm². In zygomorphic flowers,
flowering area was calculated as a rectangle based on flower length and width, while in
actinomorphic flowers flowering area was calculated as a circle based on the flower
diameter. In umbels we divided the diameter of a flowering unit by two before
calculating the flowering area as flowering units are much less compact here than other
flowers. This is reasonable, since flower display size is related to pollinator attraction
(Grindeland et al. 2005) and also predicted the pollen volume per flower for a subset of
the investigated plants for which we have sampled pollen (Pearson, r = 0.62,
p = 0.00002, N = 40 plant spp., unpublished data). We obtained data on plant species
breeding systems i.e. whether a plant species is potentially self-compatible (autogamous
species and species with mixed mating) or not (xenogamous species) from the BiolFlor
database (Klotz et al. 2002). Forty-seven plant species are self-incompatible, 12 species
show mixed mating, five are autogamous and two species have an apomictic breeding
system.
From each survey a single interaction network was compiled and analyzed separately.
Use of short-term interaction networks allowed us to record a uniquely high number of
network replicates as well as to avoid confounding effects by seasonal variation and
non-overlapping phenology. We analyzed all flower visits from insect flower visitors
belonging to the orders of Diptera, Hymenoptera, Lepidoptera and Coleoptera. All these
visitor taxa are generally known to pollinate and are thus termed “pollinators” in
accordance with previous studies, although they may not pollinate each flower on which
52
they forage. We excluded generally non-pollinating taxa (grasshoppers, spiders), but
also Nitidulidae from analysis, as they occurred in particularly high numbers and are
easily overlooked and under-sampled in structurally complex flowers, which would bias
the analysis.
While in the Hainich and Schorfheide Exploratories we left a minimum interval of 30
days before repeatedly surveying a plot, in the Alb Exploratory regarding 13 repeatedly
sampled plots, we had conducted a total of 27 surveys within 30 days (twelve plots were
sampled two times, one plot three times within 30 days). To avoid phenologically
similar replicates per plot, we calculated mean values from these surveys per plot for
each of the variables below before correlating them to land use. This reduced the
number of independent replicates on the Alb to 49 instead of 63. The dissimilarity of
plant and pollinator assemblages across the remaining repeated surveys from the same
plots was high. Repeated surveys from the same plot showed the same or an even higher
level of species turnover than surveys from different plots (Appendix Table S1). Mantel
tests (Spearman) based on Bray-Curtis distance and 105 permutations showed a strong
correlation between plant/insect species composition (based on relative abundances) and
sampling date (plants: all rM ≥ 0.15, all p ≤ 0.0003, n = 49 Alb, 51 Hai and 48 Sch;
insects: all rM ≥ 0.23, all p ≤ 0.0001, n = 49 Alb, 51 Hai and 48 Sch). In contrast, the
spatial arrangement of the plots did not affect our data (plants: all rM ≤ 0.04, all
p ≥ 0.15, pollinators: all rM ≤ 0.03, p ≥ 0.32). Moreover, land-use intensity neither
correlated with sampling date nor spatial distance in any exploratory (all rM ≤ 0.03, all
p ≥ 0.25). Therefore, despite pronounced temporal variation, we consider our analyses
of land-use effects unbiased by spatial and temporal effects.
3.2.3 Statistical analysis
Hitherto most studies have investigated specialization and predicted possible
consequences for co-extinctions based on qualitative metrics, i.e. the number of links of
each species (“species degree”). Moreover, pooled data over longer temporal or spatial
scales were used (e.g. Memmott et al. 2007). Such metrics are prone to variation in
sampling effort (Vázquez et al. 2009) and disregard differences in the proportional
distribution of species. Species with few observations inevitably have few links, hence
specialization of many rare species is severely overestimated due to several undetected
53
links. This bias has been demonstrated for pollinators when other sources of information
of flower use were employed (Dorado et al. 2009). Pooling data over large areas or over
long time periods also produces many zeros due to “forbidden links” produced by
spatial or temporal non-overlap, which hampers the interpretation of specialization.
Therefore, it is important to carefully define specialization based on quantitative metrics
independent of sampling effort and species abundances (Dormann et al. 2009) in order
to compare the species’ responses to disturbance. We thus calculated complementary
specialization of plants and pollinators employing the information-theoretical indices
H2’ and di’ (Blüthgen et al. 2006) for each of our short term networks. H2’ specifies the
degree of complementary specialization in the entire network, while di’ characterizes the
specialization of each species i as its quantitative non-conformity, e.g. its deviation in
flower visitation from the distribution of all pollinators. Both indices vary between 0 and 1,
with high values corresponding to more pronounced niche complementarity. While H2’ and
di’ are mathematically independent of the total observation frequency per species and per
network, due to the standardization based on marginal totals, other network metrics such as
species degree, dependence, connectance and nestedness directly reflect variation in
species’ total frequencies as well as sampling effort (Blüthgen 2010). This bias is also
evident in our dataset, where species degree and generality strongly increased with number
of observations, whereas di’ was unaffected (Appendix Figure S1). H2’ was tested against
Patefield's null model, running 10000 randomizations (Blüthgen et al. 2006).
We used the weighted mean di’ of each species i across all networks (weighted by the total
interaction records of i per plot k) as well as a weighted mean di’ for taxonomic groups of
flower visitors, namely bees, other hymenopterans, beetles, butterflies, syrphids, and other
dipterans. To provide a weighted mean for such a group in each plot k, each species i was
weighted by its total number of individuals recorded in k. We segregated bees from other
hymenopterans and syrphids from other dipterans, as both are commonly used bioindicator
taxa (Biesmeijer et al. 2006).
Our goal was to distinguish effects of niche properties, e.g. specialization and specific
partner identity, on species' responses to land use from the effects of species abundances.
We thus also tested species abundances (i.e. total number of individuals observed during
flower visits, or total flower area for plants) for land-use effects defined below.
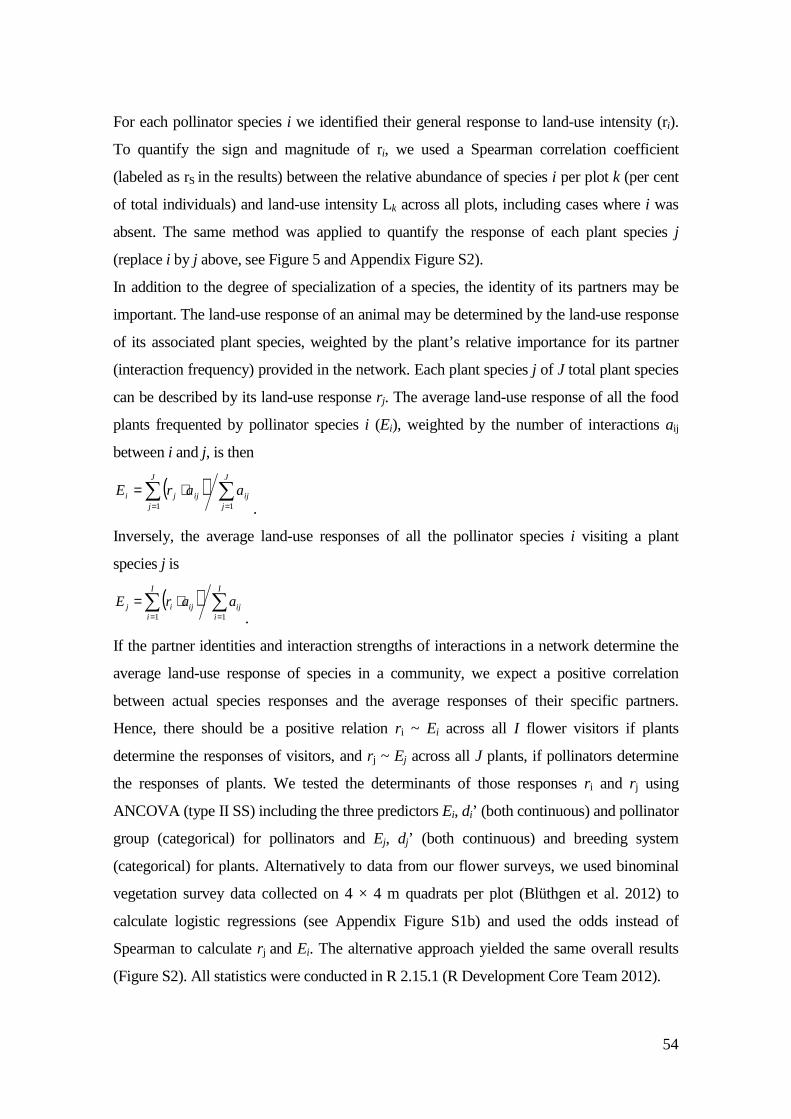
54
For each pollinator species i we identified their general response to land-use intensity (ri).
To quantify the sign and magnitude of ri, we used a Spearman correlation coefficient
(labeled as rS in the results) between the relative abundance of species i per plot k (per cent
of total individuals) and land-use intensity Lk across all plots, including cases where i was
absent. The same method was applied to quantify the response of each plant species j
(replace i by j above, see Figure 5 and Appendix Figure S2).
In addition to the degree of specialization of a species, the identity of its partners may be
important. The land-use response of an animal may be determined by the land-use response
of its associated plant species, weighted by the plant’s relative importance for its partner
(interaction frequency) provided in the network. Each plant species j of J total plant species
can be described by its land-use response rj. The average land-use response of all the food
plants frequented by pollinator species i (Ei), weighted by the number of interactions aij
between i and j, is then
.
Inversely, the average land-use responses of all the pollinator species i visiting a plant
species j is
.
If the partner identities and interaction strengths of interactions in a network determine the
average land-use response of species in a community, we expect a positive correlation
between actual species responses and the average responses of their specific partners.
Hence, there should be a positive relation ri ~ Ei across all I flower visitors if plants
determine the responses of visitors, and rj ~ Ej across all J plants, if pollinators determine
the responses of plants. We tested the determinants of those responses ri and rj using
ANCOVA (type II SS) including the three predictors Ei, di’ (both continuous) and pollinator
group (categorical) for pollinators and Ej, dj’ (both continuous) and breeding system
(categorical) for plants. Alternatively to data from our flower surveys, we used binominal
vegetation survey data collected on 4 × 4 m quadrats per plot (Blüthgen et al. 2012) to
calculate logistic regressions (see Appendix Figure S1b) and used the odds instead of
Spearman to calculate rj and Ei. The alternative approach yielded the same overall results
(Figure S2). All statistics were conducted in R 2.15.1 (R Development Core Team 2012).
( ) ∑∑==
⋅=J
jij
J
jijji aarE
11
( ) ∑∑==
⋅=I
iij
I
iijij aarE
11
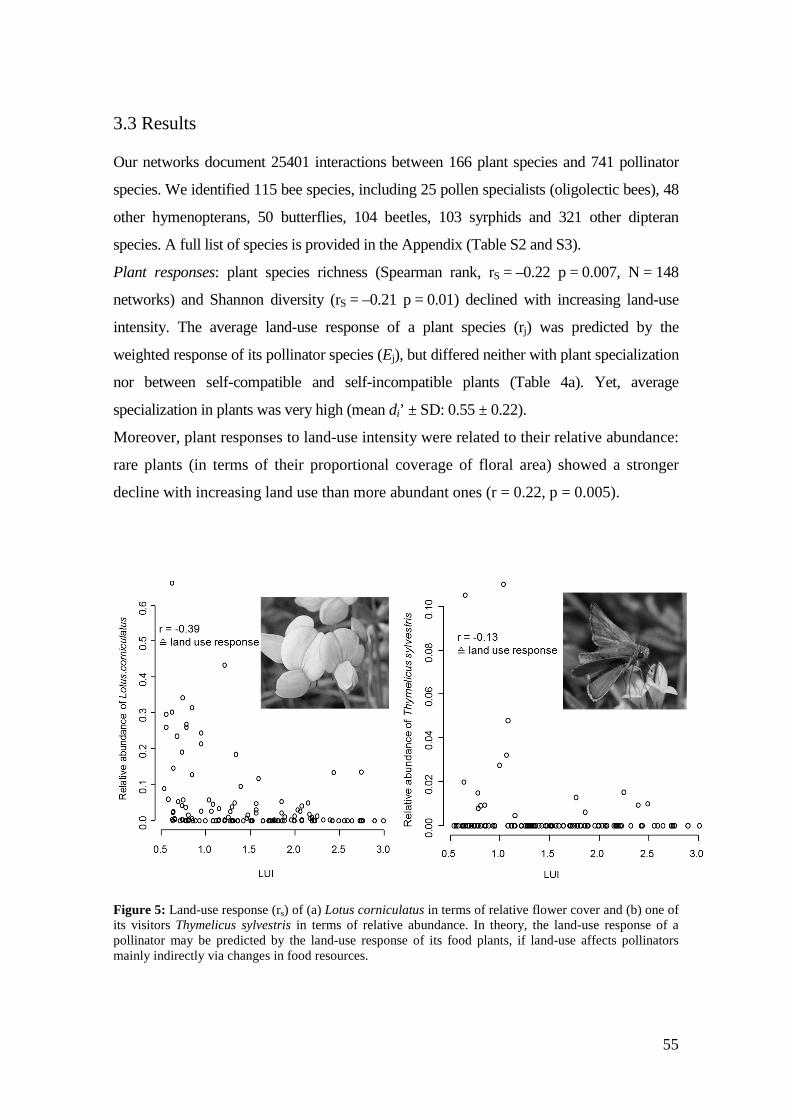
55
3.3 Results
Our networks document 25401 interactions between 166 plant species and 741 pollinator
species. We identified 115 bee species, including 25 pollen specialists (oligolectic bees), 48
other hymenopterans, 50 butterflies, 104 beetles, 103 syrphids and 321 other dipteran
species. A full list of species is provided in the Appendix (Table S2 and S3).
Plant responses: plant species richness (Spearman rank, rS = –0.22 p = 0.007, N = 148
networks) and Shannon diversity (rS = –0.21 p = 0.01) declined with increasing land-use
intensity. The average land-use response of a plant species (rj) was predicted by the
weighted response of its pollinator species (Ej), but differed neither with plant specialization
nor between self-compatible and self-incompatible plants (Table 4a). Yet, average
specialization in plants was very high (mean di’ ± SD: 0.55 ± 0.22).
Moreover, plant responses to land-use intensity were related to their relative abundance:
rare plants (in terms of their proportional coverage of floral area) showed a stronger
decline with increasing land use than more abundant ones (r = 0.22, p = 0.005).
Figure 5: Land-use response (rs) of (a) Lotus corniculatus in terms of relative flower cover and (b) one of its visitors Thymelicus sylvestris in terms of relative abundance. In theory, the land-use response of a pollinator may be predicted by the land-use response of its food plants, if land-use affects pollinators mainly indirectly via changes in food resources.
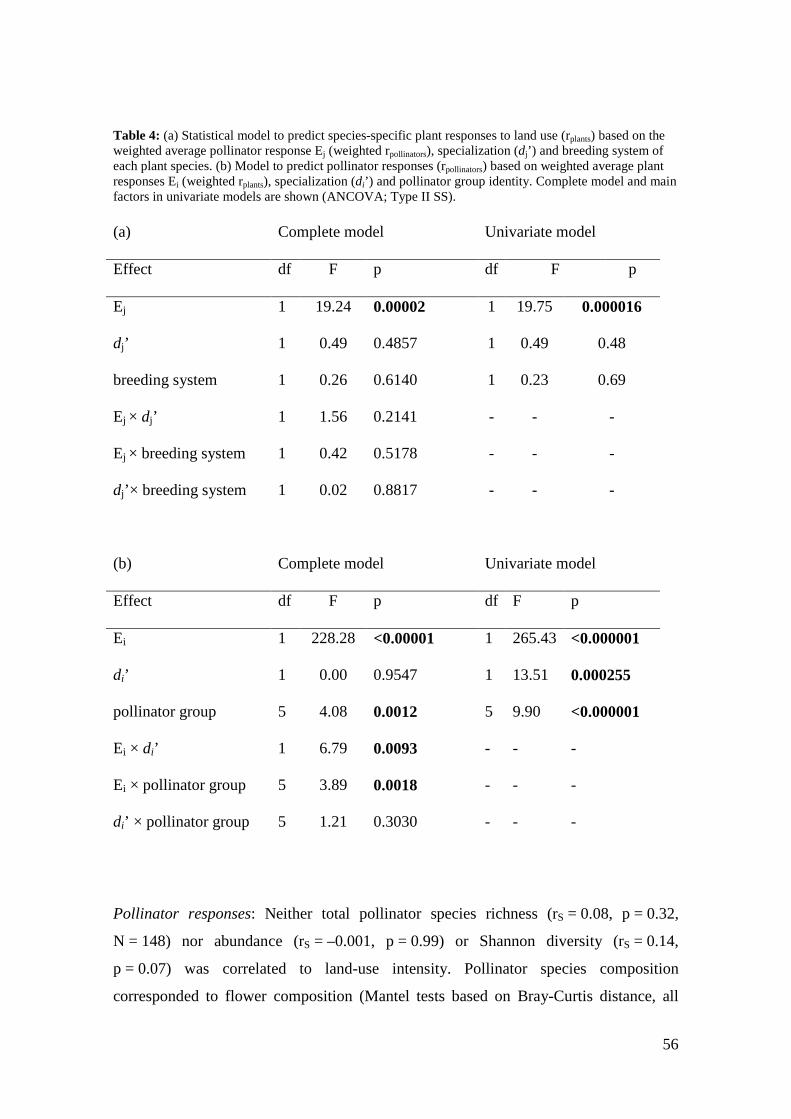
56
Table 4: (a) Statistical model to predict species-specific plant responses to land use (rplants) based on the weighted average pollinator response Ej (weighted rpollinators), specialization (dj’) and breeding system of each plant species. (b) Model to predict pollinator responses (rpollinators) based on weighted average plant responses Ei (weighted rplants), specialization (di’) and pollinator group identity. Complete model and main factors in univariate models are shown (ANCOVA; Type II SS). (a) Complete model Univariate model
Effect df F p df F p
Ej 1 19.24 0.00002 1 19.75 0.000016
dj’ 1 0.49 0.4857 1 0.49 0.48
breeding system 1 0.26 0.6140 1 0.23 0.69
Ej × dj’ 1 1.56 0.2141 - - -
Ej × breeding system 1 0.42 0.5178 - - -
dj’× breeding system 1 0.02 0.8817 - - -
(b) Complete model Univariate model
Effect df F p df F p
Ei 1 228.28 <0.00001 1 265.43 <0.000001
di’ 1 0.00 0.9547 1 13.51 0.000255
pollinator group 5 4.08 0.0012 5 9.90 <0.000001
Ei × di’ 1 6.79 0.0093 - - -
Ei × pollinator group 5 3.89 0.0018 - - -
di’ × pollinator group 5 1.21 0.3030 - - -
Pollinator responses: Neither total pollinator species richness (rS = 0.08, p = 0.32,
N = 148) nor abundance (rS = –0.001, p = 0.99) or Shannon diversity (rS = 0.14,
p = 0.07) was correlated to land-use intensity. Pollinator species composition
corresponded to flower composition (Mantel tests based on Bray-Curtis distance, all
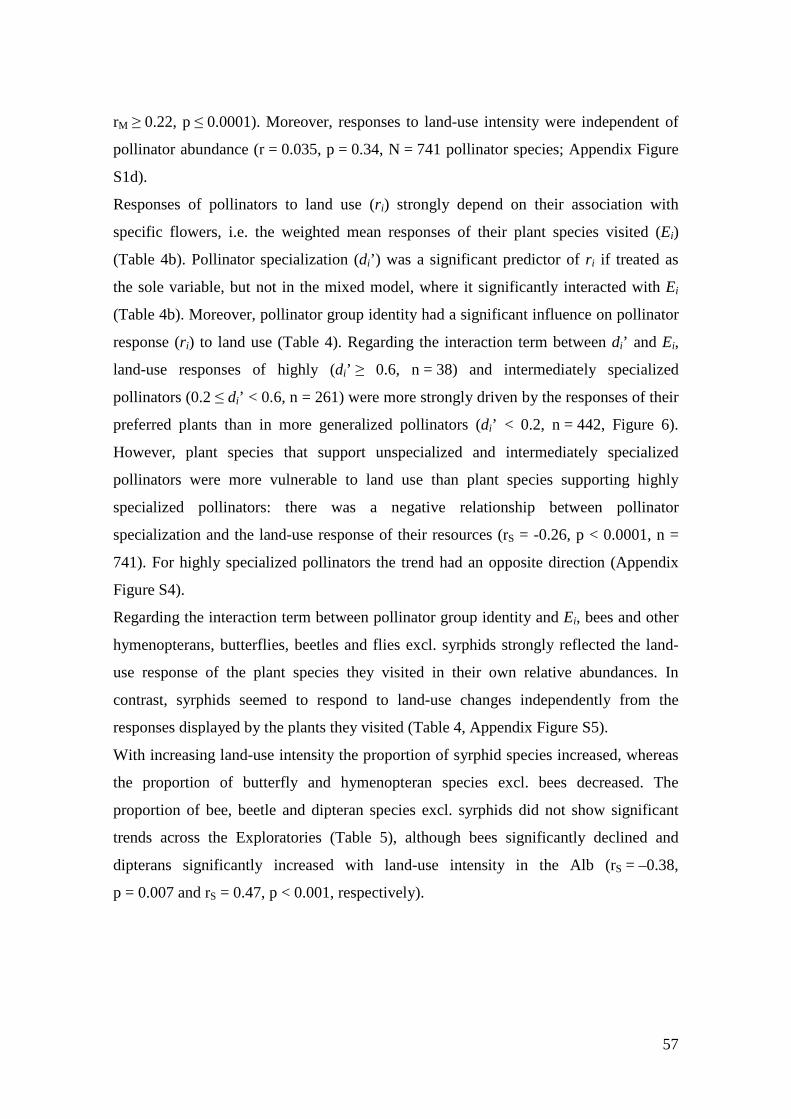
57
rM ≥ 0.22, p ≤ 0.0001). Moreover, responses to land-use intensity were independent of
pollinator abundance (r = 0.035, p = 0.34, N = 741 pollinator species; Appendix Figure
S1d).
Responses of pollinators to land use (r i) strongly depend on their association with
specific flowers, i.e. the weighted mean responses of their plant species visited (Ei)
(Table 4b). Pollinator specialization (di’) was a significant predictor of r i if treated as
the sole variable, but not in the mixed model, where it significantly interacted with Ei
(Table 4b). Moreover, pollinator group identity had a significant influence on pollinator
response (r i) to land use (Table 4). Regarding the interaction term between di’ and Ei,
land-use responses of highly (di’ ≥ 0.6, n = 38) and intermediately specialized
pollinators (0.2 ≤ di’ < 0.6, n = 261) were more strongly driven by the responses of their
preferred plants than in more generalized pollinators (di’ < 0.2, n = 442, Figure 6).
However, plant species that support unspecialized and intermediately specialized
pollinators were more vulnerable to land use than plant species supporting highly
specialized pollinators: there was a negative relationship between pollinator
specialization and the land-use response of their resources (rS = -0.26, p < 0.0001, n =
741). For highly specialized pollinators the trend had an opposite direction (Appendix
Figure S4).
Regarding the interaction term between pollinator group identity and Ei, bees and other
hymenopterans, butterflies, beetles and flies excl. syrphids strongly reflected the land-
use response of the plant species they visited in their own relative abundances. In
contrast, syrphids seemed to respond to land-use changes independently from the
responses displayed by the plants they visited (Table 4, Appendix Figure S5).
With increasing land-use intensity the proportion of syrphid species increased, whereas
the proportion of butterfly and hymenopteran species excl. bees decreased. The
proportion of bee, beetle and dipteran species excl. syrphids did not show significant
trends across the Exploratories (Table 5), although bees significantly declined and
dipterans significantly increased with land-use intensity in the Alb (rS = –0.38,
p = 0.007 and rS = 0.47, p < 0.001, respectively).
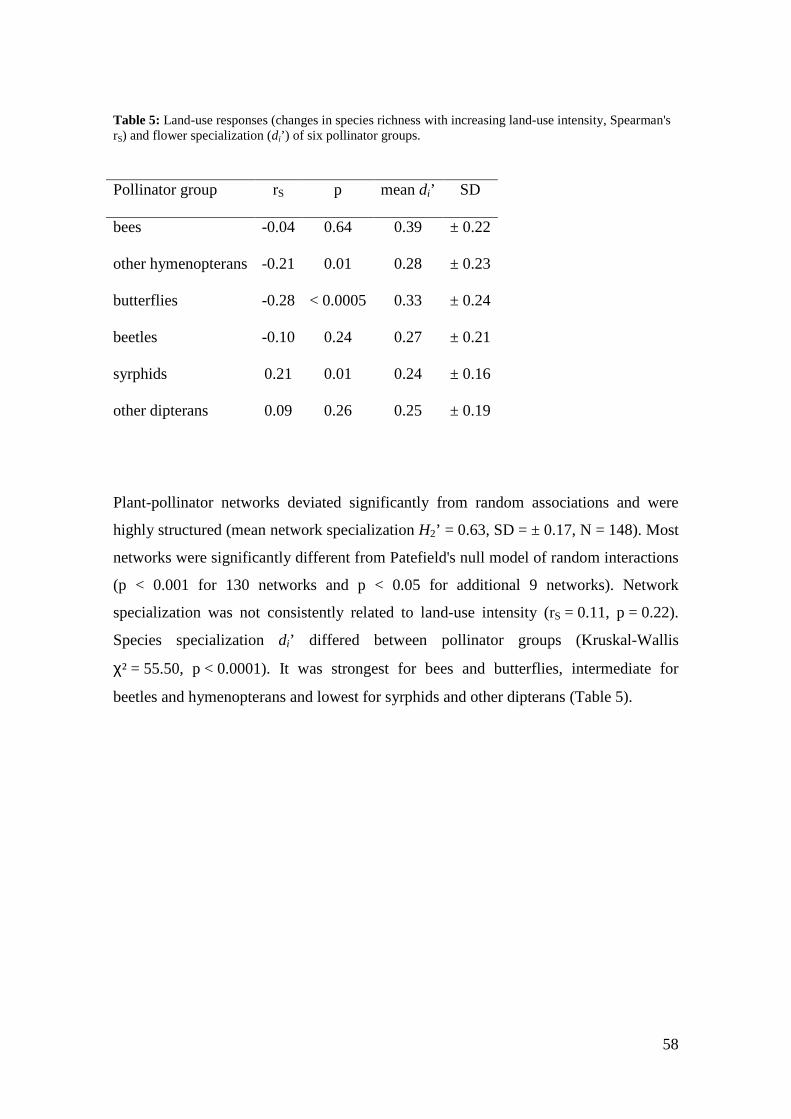
58
Table 5: Land-use responses (changes in species richness with increasing land-use intensity, Spearman's rS) and flower specialization (di’) of six pollinator groups.
Pollinator group rS p mean di’ SD
bees -0.04 0.64 0.39 ± 0.22
other hymenopterans -0.21 0.01 0.28 ± 0.23
butterflies -0.28 < 0.0005 0.33 ± 0.24
beetles -0.10 0.24 0.27 ± 0.21
syrphids 0.21 0.01 0.24 ± 0.16
other dipterans 0.09 0.26 0.25 ± 0.19
Plant-pollinator networks deviated significantly from random associations and were
highly structured (mean network specialization H2’ = 0.63, SD = ± 0.17, N = 148). Most
networks were significantly different from Patefield's null model of random interactions
(p < 0.001 for 130 networks and p < 0.05 for additional 9 networks). Network
specialization was not consistently related to land-use intensity (rS = 0.11, p = 0.22).
Species specialization di’ differed between pollinator groups (Kruskal-Wallis
χ² = 55.50, p < 0.0001). It was strongest for bees and butterflies, intermediate for
beetles and hymenopterans and lowest for syrphids and other dipterans (Table 5).
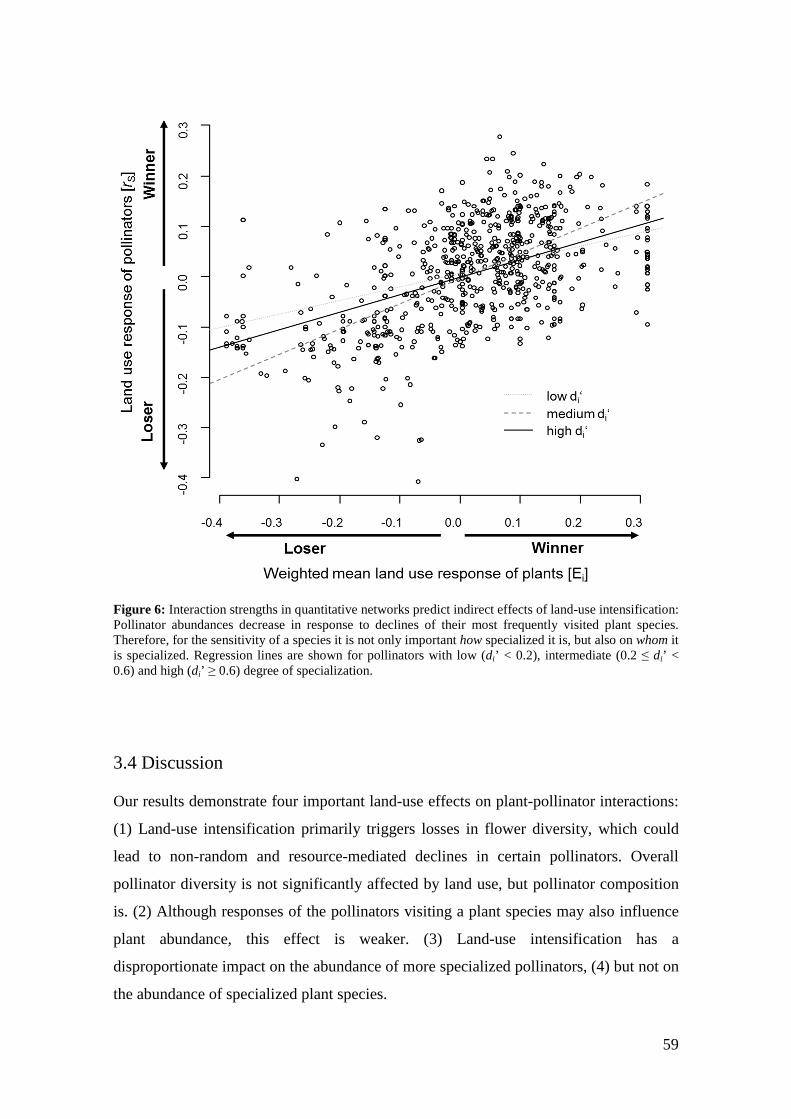
59
Figure 6: Interaction strengths in quantitative networks predict indirect effects of land-use intensification: Pollinator abundances decrease in response to declines of their most frequently visited plant species. Therefore, for the sensitivity of a species it is not only important how specialized it is, but also on whom it is specialized. Regression lines are shown for pollinators with low (di’ < 0.2), intermediate (0.2 ≤ di’ < 0.6) and high (di’ ≥ 0.6) degree of specialization.
3.4 Discussion
Our results demonstrate four important land-use effects on plant-pollinator interactions:
(1) Land-use intensification primarily triggers losses in flower diversity, which could
lead to non-random and resource-mediated declines in certain pollinators. Overall
pollinator diversity is not significantly affected by land use, but pollinator composition
is. (2) Although responses of the pollinators visiting a plant species may also influence
plant abundance, this effect is weaker. (3) Land-use intensification has a
disproportionate impact on the abundance of more specialized pollinators, (4) but not on
the abundance of specialized plant species.
60
The linkage between a pollinator’s response and the response of the plant species it
visits potentiates for specialized pollinators, i.e. specialists on plants that profit from
land use are increasing, while those on negatively affected plant species decrease
accordingly. A strong dependence of pollinators on a narrow set of plant species is
associated with higher co-extinction risk, since these plant species cannot be
functionally replaced by others (Praz et al. 2008). Moreover, in communities
characterized by low response diversity and low functional redundancy, resilience after
disturbance and the ability to buffer environmental changes are reduced (Elmqvist et al.
2003, Laliberte et al. 2013). Negative impacts of specialization may be partly
compensated by a higher efficiency of specialists, e.g. specialist bees are very effective
in finding flowers, pollen collection and digestion (Strickler 1979, Dobson and Peng
1997), but the general extent of such compensation is unknown.
Our findings are consistent with the hypothesis that pollinator declines are driven by the
disappearance of their important host plants, while the reciprocal effects of pollinators
on plants are weaker. In this type of mutualism, the composition of plant communities
may be relatively robust against losses of particular pollinators, at least in the short term
covered by our study (Kalisz et al. 2004). Most grassland plants involved in our study
are self-compatible and/or have vegetative reproduction modes (Klotz et al. 2002) and
thus our surveys may not be suitable to detect effects of reduced genetic diversity in
plant populations that may occur with pollinator losses. While plant reproductive fitness
and outcrossing may be at risk over longer time spans, the immediate effects on the
fitness and/or local distribution of pollinator communities may be more severe when
their important floral resources become unavailable (Biesmeijer et al. 2006, Goulson et
al. 2008). The asymmetry in local extinction risks may be increased by the fact that
pollinators typically provide several times more species per network than plants and
thus a larger buffer (Blüthgen et al. 2007), also mirrored in our data (flowering plants:
8.4 ± 4.4 species, visiting pollinators: 31.9 ± 15.2 species, n = 148 networks). The
mutual specialization and thus dependence between pollinator and plant species may
lead to parallel regional declines in historical comparisons (Biesmeijer et al. 2006,
Fründ et al. 2010). Correspondingly, the more generalized syrphids suffered less from
regional extinctions (and often even gained a higher diversity in some regions) in recent
decades than the more specialized bee species (Biesmeijer et al. 2006, Jauker et al.
61
2009). These trends are also reflected in their responses to land use in our study. Land-
use intensification not only causes a loss in plant diversity, but also translates into
pronounced changes in pollinator communities. The changes in pollinator composition –
the dominance of flies and declines in many other taxa – correspond to a biotic
homogenization (Filippi-Codaccioni et al. 2010) on high intensity grasslands. Species
richness and abundance of syrphids was also positively influenced by land-use
intensification in other studies (Biesmeijer et al. 2006, Ebeling et al. 2008, Jauker et al.
2009), whereas bee diversity and abundance declined (Biesmeijer et al. 2006, Le Féon
et al. 2010). This process is easily overlooked when focusing on total biodiversity only.
Land-use intensification reduces taxonomic breadth and functional diversity, which
could conversely affect plant reproductive success, species richness and functional
diversity (Klein et al. 2003, Hoehn et al. 2008). In a South African ecosystem, Pauw
(2007) showed that among seven species of orchids, those that were more specialized
suffered severely from the loss of the single pollinator species.
Dipteran pollinators showed the lowest specialization for plant species, whereas bees,
other hymenopterans, butterflies and beetles were more specialized (see also Weiner et
al. 2011), confirming that specialization represents a risk that renders species more
vulnerable to co-extinction (McKinney 1997, Vázquez and Simberloff 2002, Winfree et
al. 2007, Aizen et al. 2012, Pocock et al. 2012). Correspondingly, investigations on
butterflies (Tudor et al. 2004), beetles (Kotze and O´Hara 2003) and bumblebees (Kleijn
and Raemakers 2008) demonstrated that many specialized species are of conservation
concern and have undergone a considerable decline in the last decades.
In addition to indirect effects via flower composition and availability, land use may
affect pollinators directly e.g. via disruption of life cycles (Johst et al. 2006) or supply
of appropriate nesting resources (Potts et al. 2005) or larval habitats. Many bees and
beetles show preferences for certain environmental conditions, larval or nesting sites,
and their abundance depends on certain habitats and landscape structures (Gathmann
and Tscharntke 2002). On the other hand, generalized flower visitors like most syrphids
and other dipterans are not restricted to certain landscape structures and may profit from
diverse larval habitats (Jauker et al. 2009). Over longer time spans, such direct land-use
effects on pollinators may transform into pollinator-mediated effects on plant

62
communities. However, in the short term covered by our study land-use effects on
plants and plant-mediated effects on pollinators played a greater role than vice versa.
Our findings emphasize how systems based on mutualism may undergo severe
transformation due to land-use intensification. Agricultural management is a major
factor driving the change of floral and faunal richness in anthropogenic landscapes.
Network analyses, particularly the degree of complementary specialization and the
quantitative interaction strength, may provide important tools to predict how different
species respond to disturbance and biodiversity changes in real communities.

63
Appendix: Specialization metrics, land-use responses and species lists
Alternative specialization metrics
In the main text, we focused on the information-theoretic specialization metrics H2’ and
di’ developed earlier (Blüthgen et al. 2006). These metrics control for the effects of
variable number of observations per species and per network by a standardization based
on fixed marginal totals. The standardization constrains the observed entropy H2 and
Kullback-Leibler distance di into a continuous index between 0 and 1, ranging from
completely random associations (maximum possible H2, minimum di) to the maximum
possible specialization (minimum H2, maximum di). Whereas di characterizes the
specialization for each species, H2’ reflects the overall degree of specialization for the
entire network and is related to the weighted mean di across all species (Blüthgen et al.
2007). Because di’ of a species i depends on the distribution of all other species
(marginal totals), it increases with the exclusiveness of the interaction partners with
which i interacts, hence di’ and H2’ describe the degree of complementary specialization
(Blüthgen 2010). A straightforward alternative to quantify specialization would have
been to use a rarefied diversity index used in many diversity studies or in a recent plant-
pollinator network (Chacoff et al. 2012), but we did not follow this approach due to the
low number of observations for a large proportion of species. Many rare pollinator
species were observed just once (28% singletons) or very few times (52% had fewer
than 5 individuals in total). For a number of rare plant species, only one or few visits
were recorded (14% with only one visit, 27% with <5 visits). Hence, rarefaction to a
meaningful threshold would dramatically reduce the dataset in our study and in many
other studies, leading to an undesirable underrepresentation of rare species and
overrepresentation of common species in the analyses.
Other commonly used specialization metrics are strongly confounded by the total
number of observations per species, i.e. specialization decreases with frequency and is
highest for species with a single observation (Blüthgen 2010). This bias is evident for
the commonly used metrics "species degree" and "generality". Species degree describes
the number of links of a species i (i.e. the richness of its interaction partners), and
generality of species i is the frequency-weighted diversity of its interaction partners.
(Usually, generality is defined as the average across all species rather than for single
species, e.g. Tylianakis et al. 2007). We calculated "weighted generality" for each

64
species as the exponential transformation of the Shannon diversity index, eH. We pooled
all our single-day networks from different regions into a single network to obtain
species degree and eH. As expected, both indices increase strongly with the number of
observations per species (Figure S1a, b). Only the standardized di is largely independent
of the number of observations (Figure S1c); species with few observations show a
stronger variation but no trend in the mean (see also Blüthgen et al. 2006). Hence, we
can test specialization based on di’ separately from abundance unlike the other
specialization metrics (see main text). The effect of pollinator abundance on their land-
use response is shown in Figure S1d. The relationship between pollinator specialization
di’ and response to land use was not confirmed when the uncorrected species degree or
eH were used (p ≥ 0.24). Surprisingly, the level of generalization expressed by species
degree or eH was even positively related to the corrected metric di’ (species degree ~ di’
and eH ~ di’: Spearman rS = 0.36, p < 0.001). For plants, total number of visits also
strongly predicted each species' degree (r2 = 0.96) and eH (r2 = 0.81), whereas di was
again largely independent of the total visitation (r2 = 0.05). Unlike di, species degree
significantly predicted the plant's responses to land use (r = 0.19, p = 0.01), and eH
showed a similar trend (r = 0.14, p = 0.08), but their effect is not independent of the
stronger abundance effect shown in the main text, considering the correlation with total
number of visits. Species degree and eH were again slightly positively related to di’
(species degree ~ di’: Spearman rS = 0.22, p = 0.004; eH ~ di’: rS = 0.17, p = 0.03).
Species turnover within and across plots
Due to a pronounced seasonality of flowers and occasional visits of mobile pollinators,
repeated surveys from the same plots after at least 30 days often yielded highly different
communities, which we consequently used as independent networks in our analyses.
The average dissimilarity between repeated surveys was as high or even higher than the
dissimilarity between plots. Table S1 summarizes the Bray-Curtis distances of the
pollinator and plant communities (based on proportional abundance data) across surveys
within the same plot versus across plots.
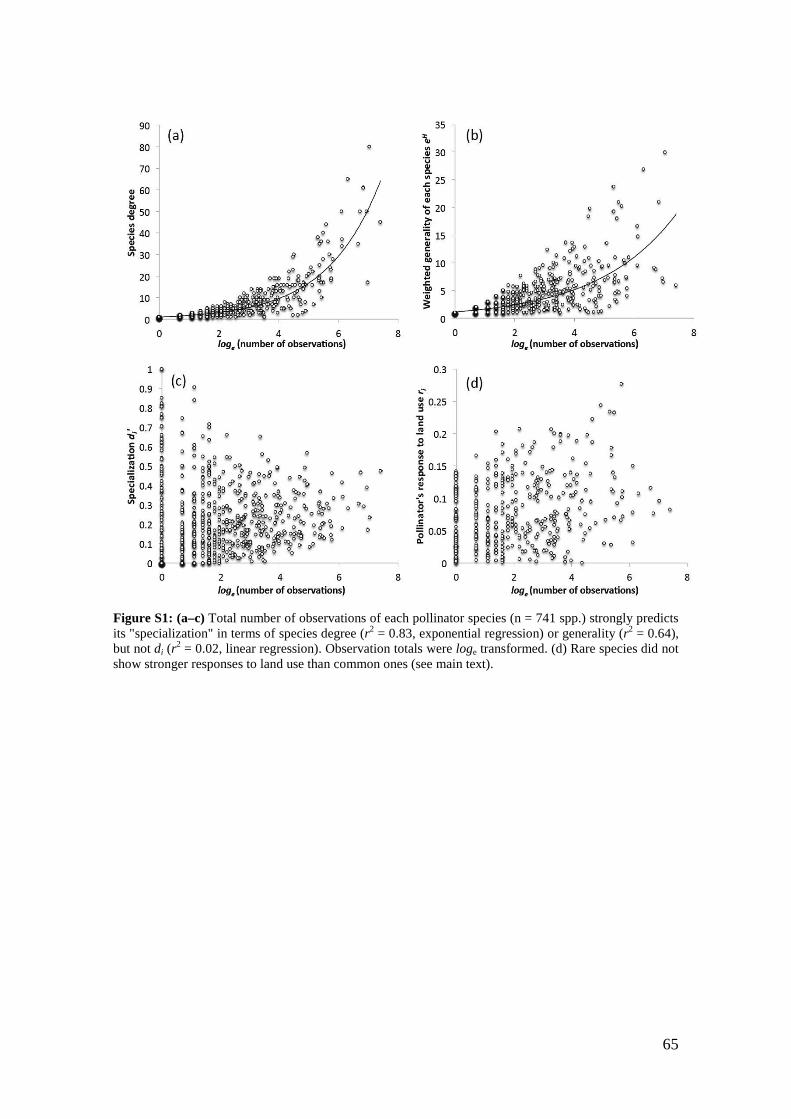
65
Figure S1: (a–c) Total number of observations of each pollinator species (n = 741 spp.) strongly predicts its "specialization" in terms of species degree (r2 = 0.83, exponential regression) or generality (r2 = 0.64), but not di (r
2 = 0.02, linear regression). Observation totals were loge transformed. (d) Rare species did not show stronger responses to land use than common ones (see main text).
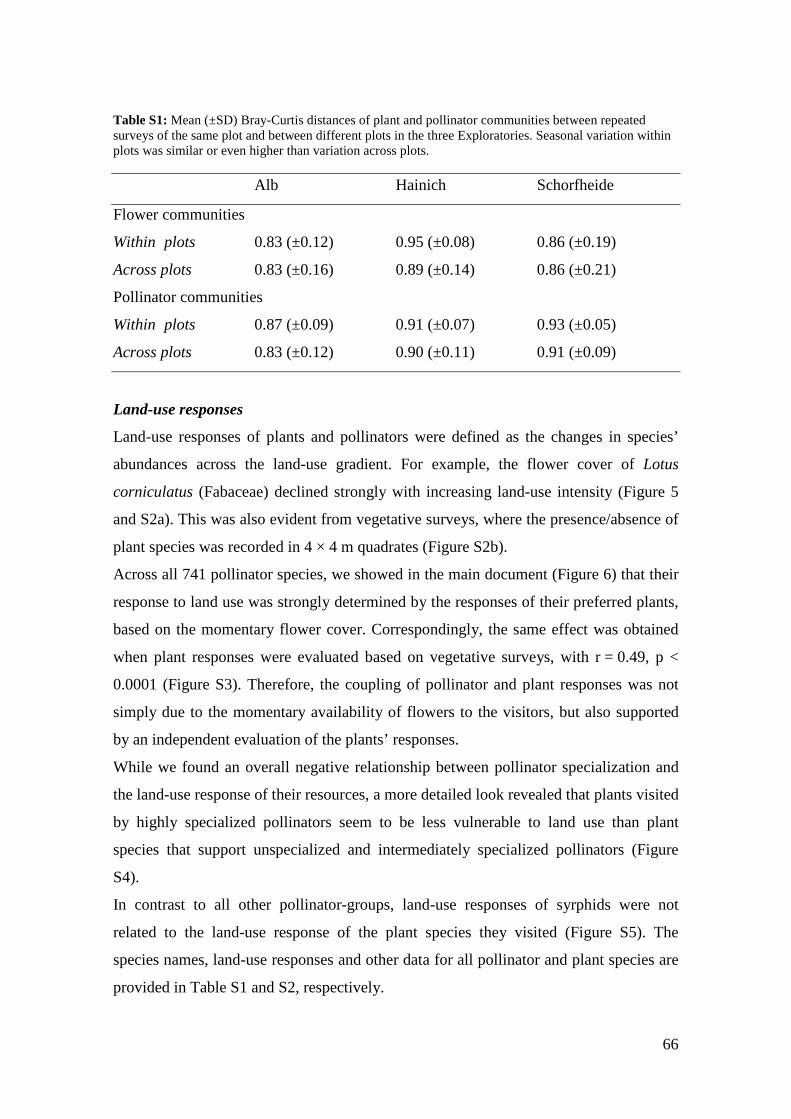
66
Table S1: Mean (±SD) Bray-Curtis distances of plant and pollinator communities between repeated surveys of the same plot and between different plots in the three Exploratories. Seasonal variation within plots was similar or even higher than variation across plots.
Alb Hainich Schorfheide
Flower communities
Within plots 0.83 (±0.12) 0.95 (±0.08) 0.86 (±0.19)
Across plots 0.83 (±0.16) 0.89 (±0.14) 0.86 (±0.21)
Pollinator communities
Within plots 0.87 (±0.09) 0.91 (±0.07) 0.93 (±0.05)
Across plots 0.83 (±0.12) 0.90 (±0.11) 0.91 (±0.09)
Land-use responses
Land-use responses of plants and pollinators were defined as the changes in species’
abundances across the land-use gradient. For example, the flower cover of Lotus
corniculatus (Fabaceae) declined strongly with increasing land-use intensity (Figure 5
and S2a). This was also evident from vegetative surveys, where the presence/absence of
plant species was recorded in 4 × 4 m quadrates (Figure S2b).
Across all 741 pollinator species, we showed in the main document (Figure 6) that their
response to land use was strongly determined by the responses of their preferred plants,
based on the momentary flower cover. Correspondingly, the same effect was obtained
when plant responses were evaluated based on vegetative surveys, with r = 0.49, p <
0.0001 (Figure S3). Therefore, the coupling of pollinator and plant responses was not
simply due to the momentary availability of flowers to the visitors, but also supported
by an independent evaluation of the plants’ responses.
While we found an overall negative relationship between pollinator specialization and
the land-use response of their resources, a more detailed look revealed that plants visited
by highly specialized pollinators seem to be less vulnerable to land use than plant
species that support unspecialized and intermediately specialized pollinators (Figure
S4).
In contrast to all other pollinator-groups, land-use responses of syrphids were not
related to the land-use response of the plant species they visited (Figure S5). The
species names, land-use responses and other data for all pollinator and plant species are
provided in Table S1 and S2, respectively.
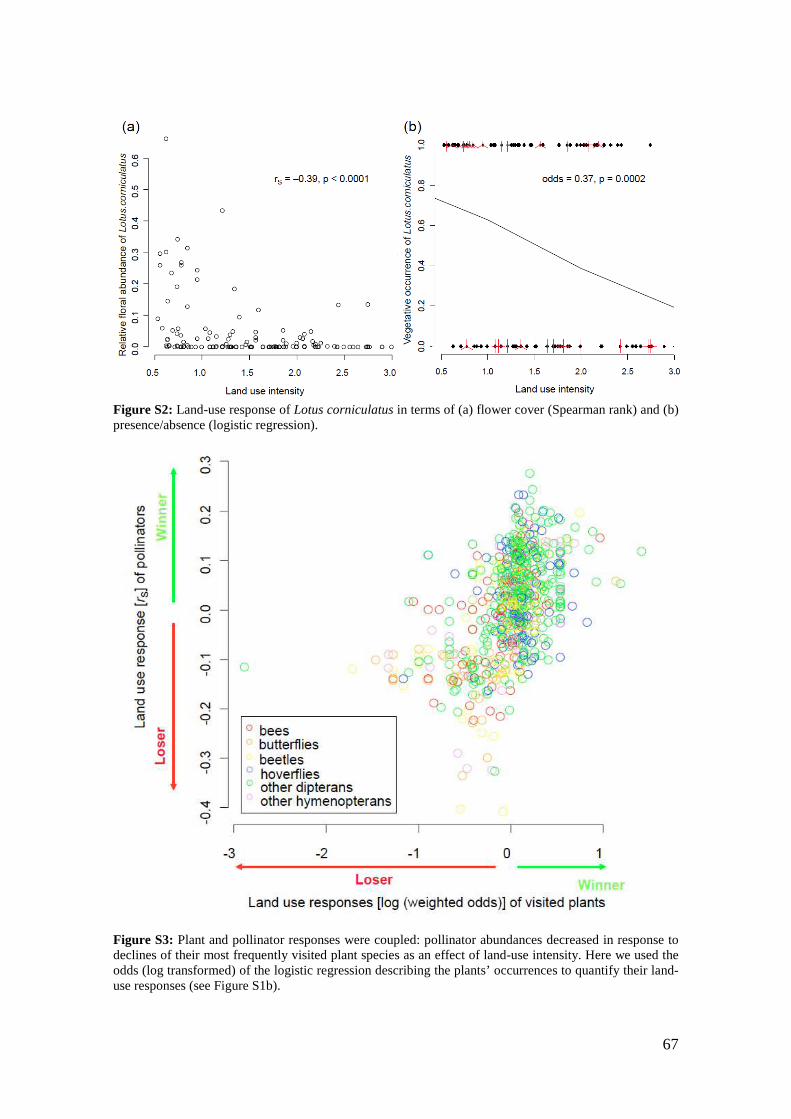
67
Figure S2: Land-use response of Lotus corniculatus in terms of (a) flower cover (Spearman rank) and (b) presence/absence (logistic regression).
Figure S3: Plant and pollinator responses were coupled: pollinator abundances decreased in response to declines of their most frequently visited plant species as an effect of land-use intensity. Here we used the odds (log transformed) of the logistic regression describing the plants’ occurrences to quantify their land-use responses (see Figure S1b).
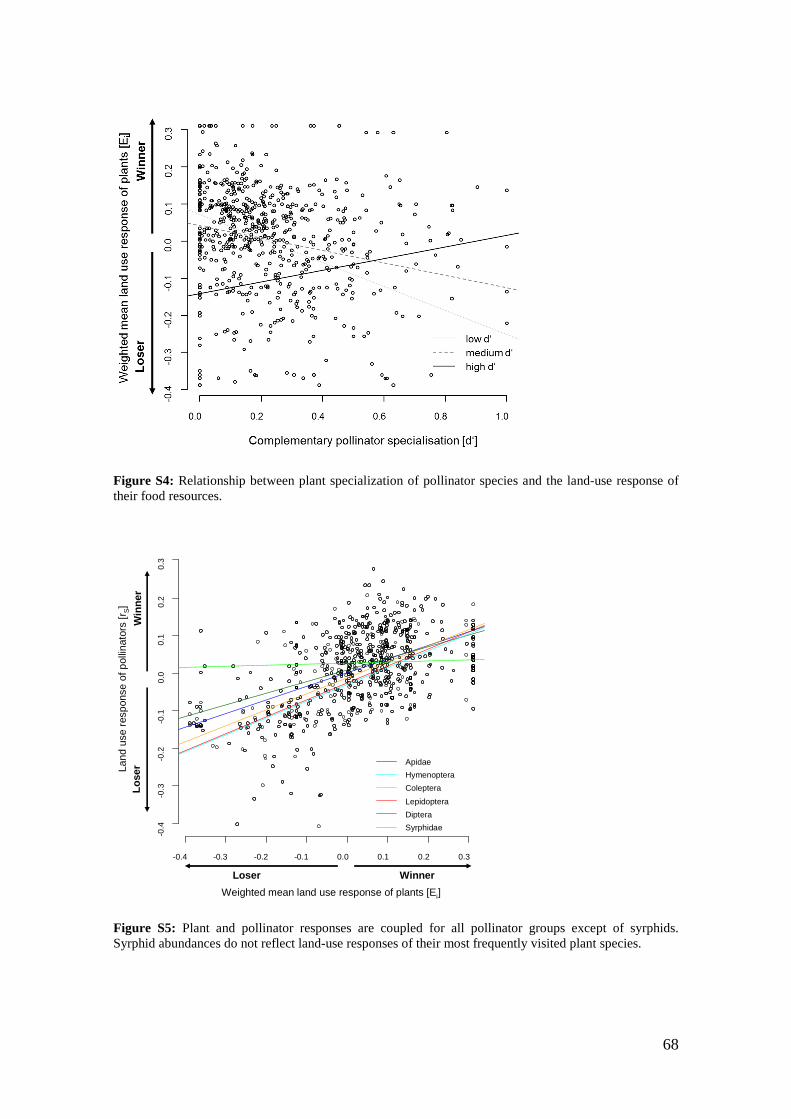
68
Figure S4: Relationship between plant specialization of pollinator species and the land-use response of their food resources.
Figure S5: Plant and pollinator responses are coupled for all pollinator groups except of syrphids. Syrphid abundances do not reflect land-use responses of their most frequently visited plant species.
-0.4 -0.3 -0.2 -0.1 0.0 0.1 0.2 0.3
-0.4
-0.3
-0.2
-0.1
0.0
0.1
0.2
0.3
Apidae
Hymenoptera
Coleptera
Lepidoptera
Diptera
Syrphidae
Land
use
res
pons
e of
pol
linat
ors
[rS]
Lo
ser
Win
ner
Weighted mean land use response of plants [Ei]
Loser Winner
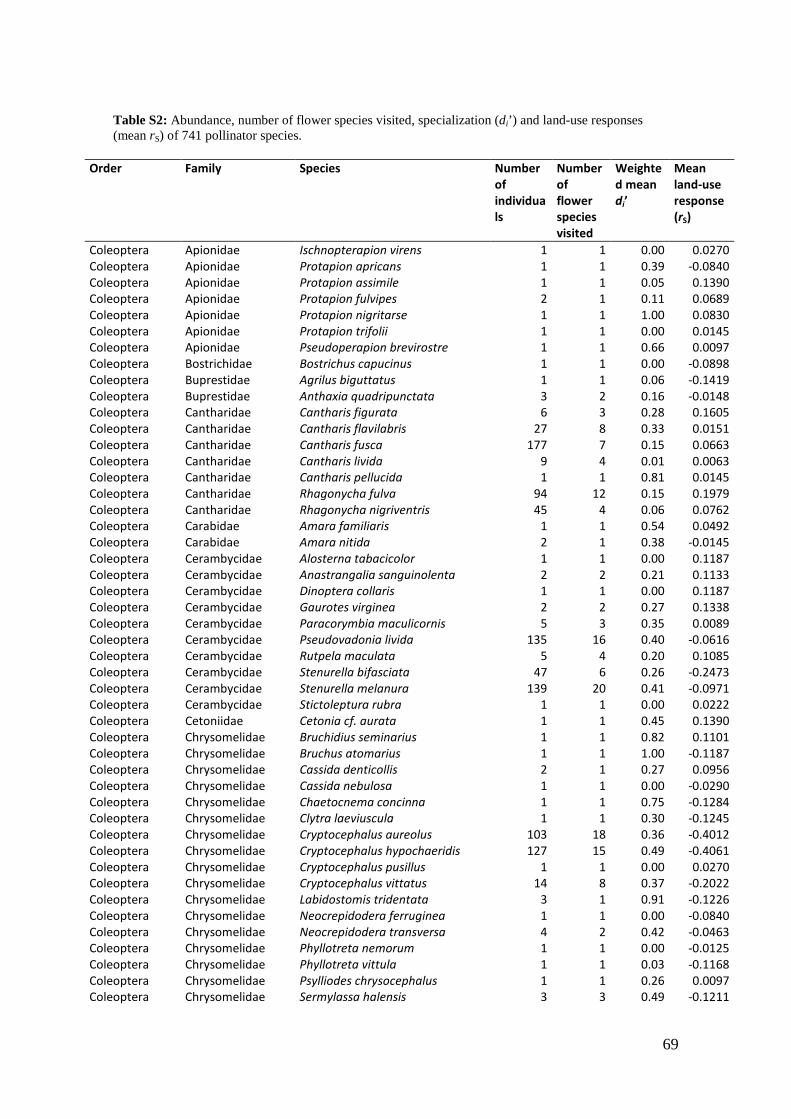
69
Table S2: Abundance, number of flower species visited, specialization (di’) and land-use responses (mean rS) of 741 pollinator species.
Order Family Species Number
of
individua
ls
Number
of
flower
species
visited
Weighte
d mean
di’
Mean
land-use
response
(rS)
Coleoptera Apionidae Ischnopterapion virens 1 1 0.00 0.0270
Coleoptera Apionidae Protapion apricans 1 1 0.39 -0.0840
Coleoptera Apionidae Protapion assimile 1 1 0.05 0.1390
Coleoptera Apionidae Protapion fulvipes 2 1 0.11 0.0689
Coleoptera Apionidae Protapion nigritarse 1 1 1.00 0.0830
Coleoptera Apionidae Protapion trifolii 1 1 0.00 0.0145
Coleoptera Apionidae Pseudoperapion brevirostre 1 1 0.66 0.0097
Coleoptera Bostrichidae Bostrichus capucinus 1 1 0.00 -0.0898
Coleoptera Buprestidae Agrilus biguttatus 1 1 0.06 -0.1419
Coleoptera Buprestidae Anthaxia quadripunctata 3 2 0.16 -0.0148
Coleoptera Cantharidae Cantharis figurata 6 3 0.28 0.1605
Coleoptera Cantharidae Cantharis flavilabris 27 8 0.33 0.0151
Coleoptera Cantharidae Cantharis fusca 177 7 0.15 0.0663
Coleoptera Cantharidae Cantharis livida 9 4 0.01 0.0063
Coleoptera Cantharidae Cantharis pellucida 1 1 0.81 0.0145
Coleoptera Cantharidae Rhagonycha fulva 94 12 0.15 0.1979
Coleoptera Cantharidae Rhagonycha nigriventris 45 4 0.06 0.0762
Coleoptera Carabidae Amara familiaris 1 1 0.54 0.0492
Coleoptera Carabidae Amara nitida 2 1 0.38 -0.0145
Coleoptera Cerambycidae Alosterna tabacicolor 1 1 0.00 0.1187
Coleoptera Cerambycidae Anastrangalia sanguinolenta 2 2 0.21 0.1133
Coleoptera Cerambycidae Dinoptera collaris 1 1 0.00 0.1187
Coleoptera Cerambycidae Gaurotes virginea 2 2 0.27 0.1338
Coleoptera Cerambycidae Paracorymbia maculicornis 5 3 0.35 0.0089
Coleoptera Cerambycidae Pseudovadonia livida 135 16 0.40 -0.0616
Coleoptera Cerambycidae Rutpela maculata 5 4 0.20 0.1085
Coleoptera Cerambycidae Stenurella bifasciata 47 6 0.26 -0.2473
Coleoptera Cerambycidae Stenurella melanura 139 20 0.41 -0.0971
Coleoptera Cerambycidae Stictoleptura rubra 1 1 0.00 0.0222
Coleoptera Cetoniidae Cetonia cf. aurata 1 1 0.45 0.1390
Coleoptera Chrysomelidae Bruchidius seminarius 1 1 0.82 0.1101
Coleoptera Chrysomelidae Bruchus atomarius 1 1 1.00 -0.1187
Coleoptera Chrysomelidae Cassida denticollis 2 1 0.27 0.0956
Coleoptera Chrysomelidae Cassida nebulosa 1 1 0.00 -0.0290
Coleoptera Chrysomelidae Chaetocnema concinna 1 1 0.75 -0.1284
Coleoptera Chrysomelidae Clytra laeviuscula 1 1 0.30 -0.1245
Coleoptera Chrysomelidae Cryptocephalus aureolus 103 18 0.36 -0.4012
Coleoptera Chrysomelidae Cryptocephalus hypochaeridis 127 15 0.49 -0.4061
Coleoptera Chrysomelidae Cryptocephalus pusillus 1 1 0.00 0.0270
Coleoptera Chrysomelidae Cryptocephalus vittatus 14 8 0.37 -0.2022
Coleoptera Chrysomelidae Labidostomis tridentata 3 1 0.91 -0.1226
Coleoptera Chrysomelidae Neocrepidodera ferruginea 1 1 0.00 -0.0840
Coleoptera Chrysomelidae Neocrepidodera transversa 4 2 0.42 -0.0463
Coleoptera Chrysomelidae Phyllotreta nemorum 1 1 0.00 -0.0125
Coleoptera Chrysomelidae Phyllotreta vittula 1 1 0.03 -0.1168
Coleoptera Chrysomelidae Psylliodes chrysocephalus 1 1 0.26 0.0097
Coleoptera Chrysomelidae Sermylassa halensis 3 3 0.49 -0.1211
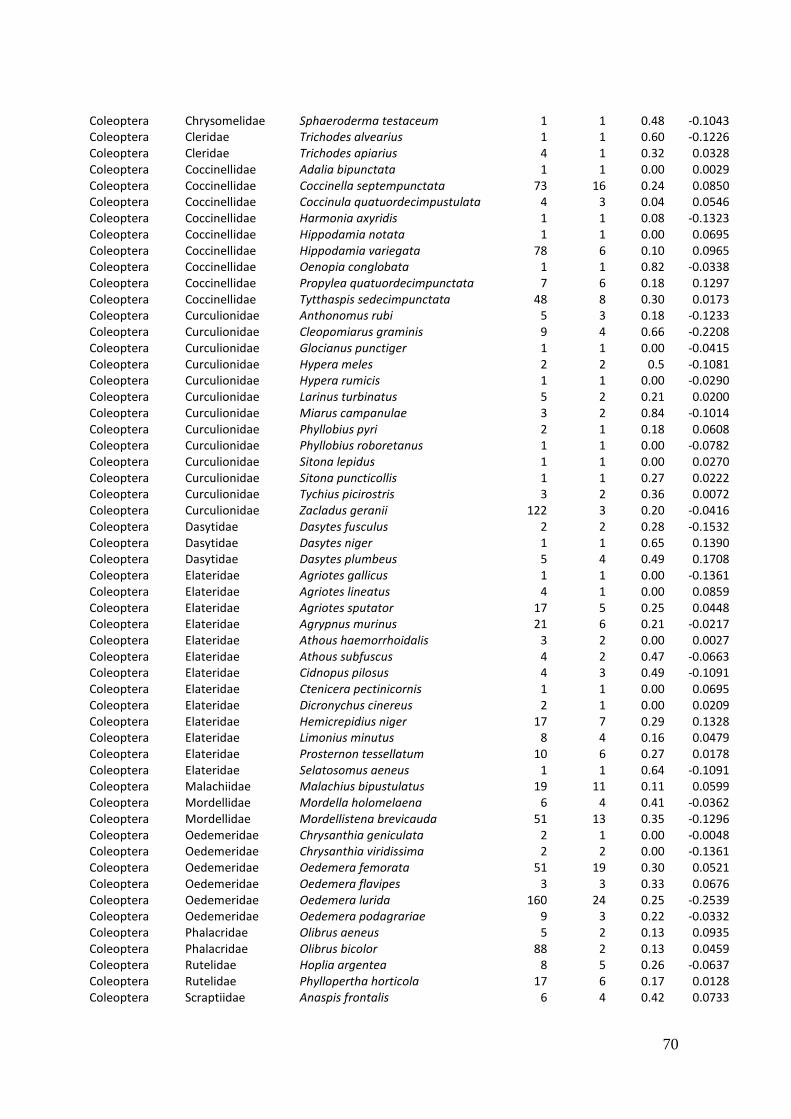
70
Coleoptera Chrysomelidae Sphaeroderma testaceum 1 1 0.48 -0.1043
Coleoptera Cleridae Trichodes alvearius 1 1 0.60 -0.1226
Coleoptera Cleridae Trichodes apiarius 4 1 0.32 0.0328
Coleoptera Coccinellidae Adalia bipunctata 1 1 0.00 0.0029
Coleoptera Coccinellidae Coccinella septempunctata 73 16 0.24 0.0850
Coleoptera Coccinellidae Coccinula quatuordecimpustulata 4 3 0.04 0.0546
Coleoptera Coccinellidae Harmonia axyridis 1 1 0.08 -0.1323
Coleoptera Coccinellidae Hippodamia notata 1 1 0.00 0.0695
Coleoptera Coccinellidae Hippodamia variegata 78 6 0.10 0.0965
Coleoptera Coccinellidae Oenopia conglobata 1 1 0.82 -0.0338
Coleoptera Coccinellidae Propylea quatuordecimpunctata 7 6 0.18 0.1297
Coleoptera Coccinellidae Tytthaspis sedecimpunctata 48 8 0.30 0.0173
Coleoptera Curculionidae Anthonomus rubi 5 3 0.18 -0.1233
Coleoptera Curculionidae Cleopomiarus graminis 9 4 0.66 -0.2208
Coleoptera Curculionidae Glocianus punctiger 1 1 0.00 -0.0415
Coleoptera Curculionidae Hypera meles 2 2 0.5 -0.1081
Coleoptera Curculionidae Hypera rumicis 1 1 0.00 -0.0290
Coleoptera Curculionidae Larinus turbinatus 5 2 0.21 0.0200
Coleoptera Curculionidae Miarus campanulae 3 2 0.84 -0.1014
Coleoptera Curculionidae Phyllobius pyri 2 1 0.18 0.0608
Coleoptera Curculionidae Phyllobius roboretanus 1 1 0.00 -0.0782
Coleoptera Curculionidae Sitona lepidus 1 1 0.00 0.0270
Coleoptera Curculionidae Sitona puncticollis 1 1 0.27 0.0222
Coleoptera Curculionidae Tychius picirostris 3 2 0.36 0.0072
Coleoptera Curculionidae Zacladus geranii 122 3 0.20 -0.0416
Coleoptera Dasytidae Dasytes fusculus 2 2 0.28 -0.1532
Coleoptera Dasytidae Dasytes niger 1 1 0.65 0.1390
Coleoptera Dasytidae Dasytes plumbeus 5 4 0.49 0.1708
Coleoptera Elateridae Agriotes gallicus 1 1 0.00 -0.1361
Coleoptera Elateridae Agriotes lineatus 4 1 0.00 0.0859
Coleoptera Elateridae Agriotes sputator 17 5 0.25 0.0448
Coleoptera Elateridae Agrypnus murinus 21 6 0.21 -0.0217
Coleoptera Elateridae Athous haemorrhoidalis 3 2 0.00 0.0027
Coleoptera Elateridae Athous subfuscus 4 2 0.47 -0.0663
Coleoptera Elateridae Cidnopus pilosus 4 3 0.49 -0.1091
Coleoptera Elateridae Ctenicera pectinicornis 1 1 0.00 0.0695
Coleoptera Elateridae Dicronychus cinereus 2 1 0.00 0.0209
Coleoptera Elateridae Hemicrepidius niger 17 7 0.29 0.1328
Coleoptera Elateridae Limonius minutus 8 4 0.16 0.0479
Coleoptera Elateridae Prosternon tessellatum 10 6 0.27 0.0178
Coleoptera Elateridae Selatosomus aeneus 1 1 0.64 -0.1091
Coleoptera Malachiidae Malachius bipustulatus 19 11 0.11 0.0599
Coleoptera Mordellidae Mordella holomelaena 6 4 0.41 -0.0362
Coleoptera Mordellidae Mordellistena brevicauda 51 13 0.35 -0.1296
Coleoptera Oedemeridae Chrysanthia geniculata 2 1 0.00 -0.0048
Coleoptera Oedemeridae Chrysanthia viridissima 2 2 0.00 -0.1361
Coleoptera Oedemeridae Oedemera femorata 51 19 0.30 0.0521
Coleoptera Oedemeridae Oedemera flavipes 3 3 0.33 0.0676
Coleoptera Oedemeridae Oedemera lurida 160 24 0.25 -0.2539
Coleoptera Oedemeridae Oedemera podagrariae 9 3 0.22 -0.0332
Coleoptera Phalacridae Olibrus aeneus 5 2 0.13 0.0935
Coleoptera Phalacridae Olibrus bicolor 88 2 0.13 0.0459
Coleoptera Rutelidae Hoplia argentea 8 5 0.26 -0.0637
Coleoptera Rutelidae Phyllopertha horticola 17 6 0.17 0.0128
Coleoptera Scraptiidae Anaspis frontalis 6 4 0.42 0.0733
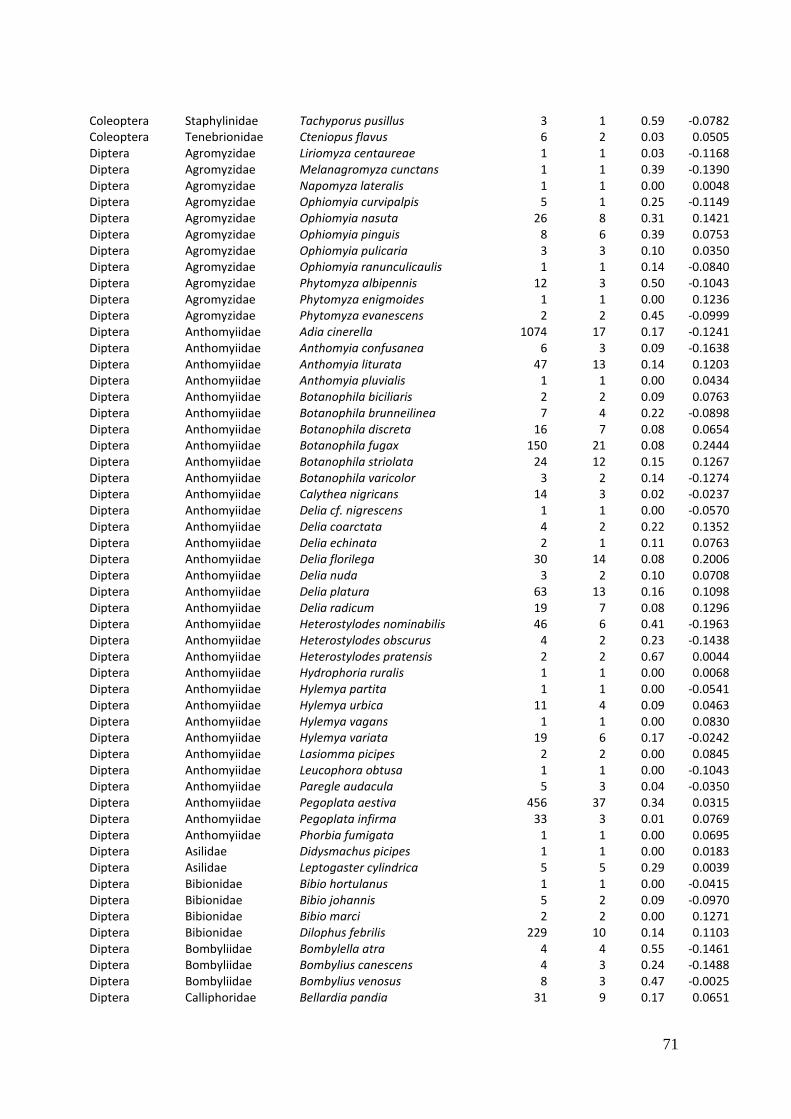
71
Coleoptera Staphylinidae Tachyporus pusillus 3 1 0.59 -0.0782
Coleoptera Tenebrionidae Cteniopus flavus 6 2 0.03 0.0505
Diptera Agromyzidae Liriomyza centaureae 1 1 0.03 -0.1168
Diptera Agromyzidae Melanagromyza cunctans 1 1 0.39 -0.1390
Diptera Agromyzidae Napomyza lateralis 1 1 0.00 0.0048
Diptera Agromyzidae Ophiomyia curvipalpis 5 1 0.25 -0.1149
Diptera Agromyzidae Ophiomyia nasuta 26 8 0.31 0.1421
Diptera Agromyzidae Ophiomyia pinguis 8 6 0.39 0.0753
Diptera Agromyzidae Ophiomyia pulicaria 3 3 0.10 0.0350
Diptera Agromyzidae Ophiomyia ranunculicaulis 1 1 0.14 -0.0840
Diptera Agromyzidae Phytomyza albipennis 12 3 0.50 -0.1043
Diptera Agromyzidae Phytomyza enigmoides 1 1 0.00 0.1236
Diptera Agromyzidae Phytomyza evanescens 2 2 0.45 -0.0999
Diptera Anthomyiidae Adia cinerella 1074 17 0.17 -0.1241
Diptera Anthomyiidae Anthomyia confusanea 6 3 0.09 -0.1638
Diptera Anthomyiidae Anthomyia liturata 47 13 0.14 0.1203
Diptera Anthomyiidae Anthomyia pluvialis 1 1 0.00 0.0434
Diptera Anthomyiidae Botanophila biciliaris 2 2 0.09 0.0763
Diptera Anthomyiidae Botanophila brunneilinea 7 4 0.22 -0.0898
Diptera Anthomyiidae Botanophila discreta 16 7 0.08 0.0654
Diptera Anthomyiidae Botanophila fugax 150 21 0.08 0.2444
Diptera Anthomyiidae Botanophila striolata 24 12 0.15 0.1267
Diptera Anthomyiidae Botanophila varicolor 3 2 0.14 -0.1274
Diptera Anthomyiidae Calythea nigricans 14 3 0.02 -0.0237
Diptera Anthomyiidae Delia cf. nigrescens 1 1 0.00 -0.0570
Diptera Anthomyiidae Delia coarctata 4 2 0.22 0.1352
Diptera Anthomyiidae Delia echinata 2 1 0.11 0.0763
Diptera Anthomyiidae Delia florilega 30 14 0.08 0.2006
Diptera Anthomyiidae Delia nuda 3 2 0.10 0.0708
Diptera Anthomyiidae Delia platura 63 13 0.16 0.1098
Diptera Anthomyiidae Delia radicum 19 7 0.08 0.1296
Diptera Anthomyiidae Heterostylodes nominabilis 46 6 0.41 -0.1963
Diptera Anthomyiidae Heterostylodes obscurus 4 2 0.23 -0.1438
Diptera Anthomyiidae Heterostylodes pratensis 2 2 0.67 0.0044
Diptera Anthomyiidae Hydrophoria ruralis 1 1 0.00 0.0068
Diptera Anthomyiidae Hylemya partita 1 1 0.00 -0.0541
Diptera Anthomyiidae Hylemya urbica 11 4 0.09 0.0463
Diptera Anthomyiidae Hylemya vagans 1 1 0.00 0.0830
Diptera Anthomyiidae Hylemya variata 19 6 0.17 -0.0242
Diptera Anthomyiidae Lasiomma picipes 2 2 0.00 0.0845
Diptera Anthomyiidae Leucophora obtusa 1 1 0.00 -0.1043
Diptera Anthomyiidae Paregle audacula 5 3 0.04 -0.0350
Diptera Anthomyiidae Pegoplata aestiva 456 37 0.34 0.0315
Diptera Anthomyiidae Pegoplata infirma 33 3 0.01 0.0769
Diptera Anthomyiidae Phorbia fumigata 1 1 0.00 0.0695
Diptera Asilidae Didysmachus picipes 1 1 0.00 0.0183
Diptera Asilidae Leptogaster cylindrica 5 5 0.29 0.0039
Diptera Bibionidae Bibio hortulanus 1 1 0.00 -0.0415
Diptera Bibionidae Bibio johannis 5 2 0.09 -0.0970
Diptera Bibionidae Bibio marci 2 2 0.00 0.1271
Diptera Bibionidae Dilophus febrilis 229 10 0.14 0.1103
Diptera Bombyliidae Bombylella atra 4 4 0.55 -0.1461
Diptera Bombyliidae Bombylius canescens 4 3 0.24 -0.1488
Diptera Bombyliidae Bombylius venosus 8 3 0.47 -0.0025
Diptera Calliphoridae Bellardia pandia 31 9 0.17 0.0651
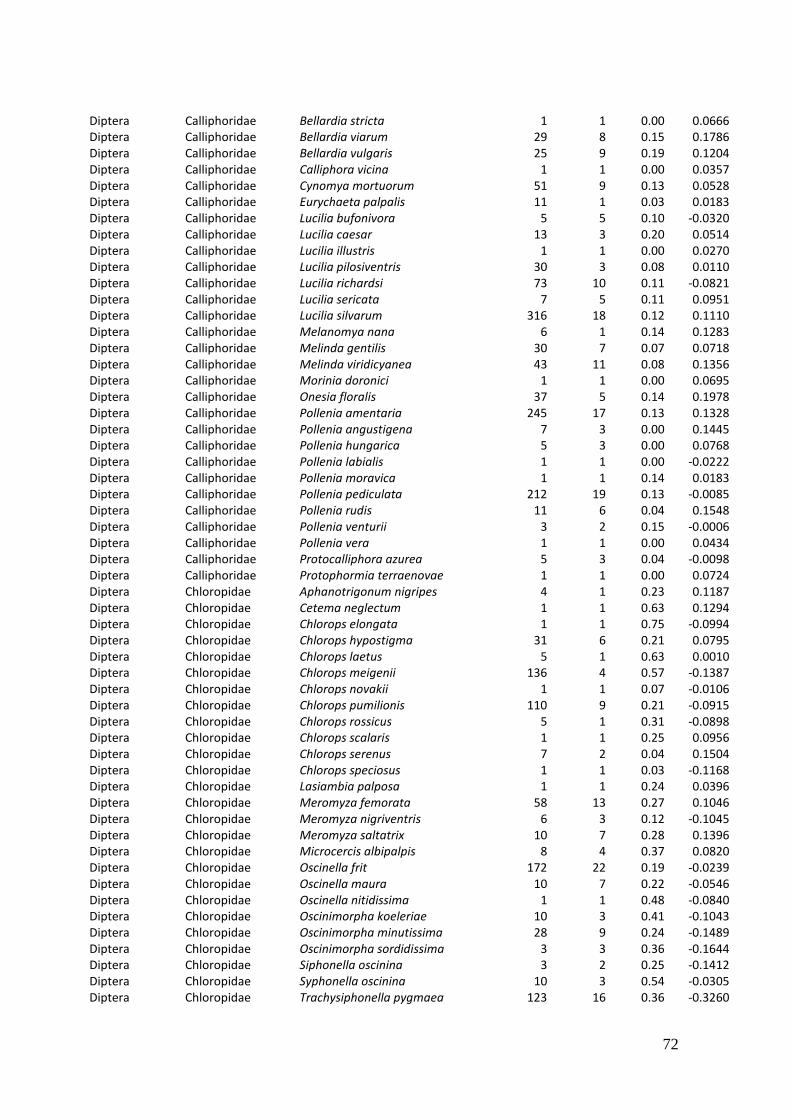
72
Diptera Calliphoridae Bellardia stricta 1 1 0.00 0.0666
Diptera Calliphoridae Bellardia viarum 29 8 0.15 0.1786
Diptera Calliphoridae Bellardia vulgaris 25 9 0.19 0.1204
Diptera Calliphoridae Calliphora vicina 1 1 0.00 0.0357
Diptera Calliphoridae Cynomya mortuorum 51 9 0.13 0.0528
Diptera Calliphoridae Eurychaeta palpalis 11 1 0.03 0.0183
Diptera Calliphoridae Lucilia bufonivora 5 5 0.10 -0.0320
Diptera Calliphoridae Lucilia caesar 13 3 0.20 0.0514
Diptera Calliphoridae Lucilia illustris 1 1 0.00 0.0270
Diptera Calliphoridae Lucilia pilosiventris 30 3 0.08 0.0110
Diptera Calliphoridae Lucilia richardsi 73 10 0.11 -0.0821
Diptera Calliphoridae Lucilia sericata 7 5 0.11 0.0951
Diptera Calliphoridae Lucilia silvarum 316 18 0.12 0.1110
Diptera Calliphoridae Melanomya nana 6 1 0.14 0.1283
Diptera Calliphoridae Melinda gentilis 30 7 0.07 0.0718
Diptera Calliphoridae Melinda viridicyanea 43 11 0.08 0.1356
Diptera Calliphoridae Morinia doronici 1 1 0.00 0.0695
Diptera Calliphoridae Onesia floralis 37 5 0.14 0.1978
Diptera Calliphoridae Pollenia amentaria 245 17 0.13 0.1328
Diptera Calliphoridae Pollenia angustigena 7 3 0.00 0.1445
Diptera Calliphoridae Pollenia hungarica 5 3 0.00 0.0768
Diptera Calliphoridae Pollenia labialis 1 1 0.00 -0.0222
Diptera Calliphoridae Pollenia moravica 1 1 0.14 0.0183
Diptera Calliphoridae Pollenia pediculata 212 19 0.13 -0.0085
Diptera Calliphoridae Pollenia rudis 11 6 0.04 0.1548
Diptera Calliphoridae Pollenia venturii 3 2 0.15 -0.0006
Diptera Calliphoridae Pollenia vera 1 1 0.00 0.0434
Diptera Calliphoridae Protocalliphora azurea 5 3 0.04 -0.0098
Diptera Calliphoridae Protophormia terraenovae 1 1 0.00 0.0724
Diptera Chloropidae Aphanotrigonum nigripes 4 1 0.23 0.1187
Diptera Chloropidae Cetema neglectum 1 1 0.63 0.1294
Diptera Chloropidae Chlorops elongata 1 1 0.75 -0.0994
Diptera Chloropidae Chlorops hypostigma 31 6 0.21 0.0795
Diptera Chloropidae Chlorops laetus 5 1 0.63 0.0010
Diptera Chloropidae Chlorops meigenii 136 4 0.57 -0.1387
Diptera Chloropidae Chlorops novakii 1 1 0.07 -0.0106
Diptera Chloropidae Chlorops pumilionis 110 9 0.21 -0.0915
Diptera Chloropidae Chlorops rossicus 5 1 0.31 -0.0898
Diptera Chloropidae Chlorops scalaris 1 1 0.25 0.0956
Diptera Chloropidae Chlorops serenus 7 2 0.04 0.1504
Diptera Chloropidae Chlorops speciosus 1 1 0.03 -0.1168
Diptera Chloropidae Lasiambia palposa 1 1 0.24 0.0396
Diptera Chloropidae Meromyza femorata 58 13 0.27 0.1046
Diptera Chloropidae Meromyza nigriventris 6 3 0.12 -0.1045
Diptera Chloropidae Meromyza saltatrix 10 7 0.28 0.1396
Diptera Chloropidae Microcercis albipalpis 8 4 0.37 0.0820
Diptera Chloropidae Oscinella frit 172 22 0.19 -0.0239
Diptera Chloropidae Oscinella maura 10 7 0.22 -0.0546
Diptera Chloropidae Oscinella nitidissima 1 1 0.48 -0.0840
Diptera Chloropidae Oscinimorpha koeleriae 10 3 0.41 -0.1043
Diptera Chloropidae Oscinimorpha minutissima 28 9 0.24 -0.1489
Diptera Chloropidae Oscinimorpha sordidissima 3 3 0.36 -0.1644
Diptera Chloropidae Siphonella oscinina 3 2 0.25 -0.1412
Diptera Chloropidae Syphonella oscinina 10 3 0.54 -0.0305
Diptera Chloropidae Trachysiphonella pygmaea 123 16 0.36 -0.3260
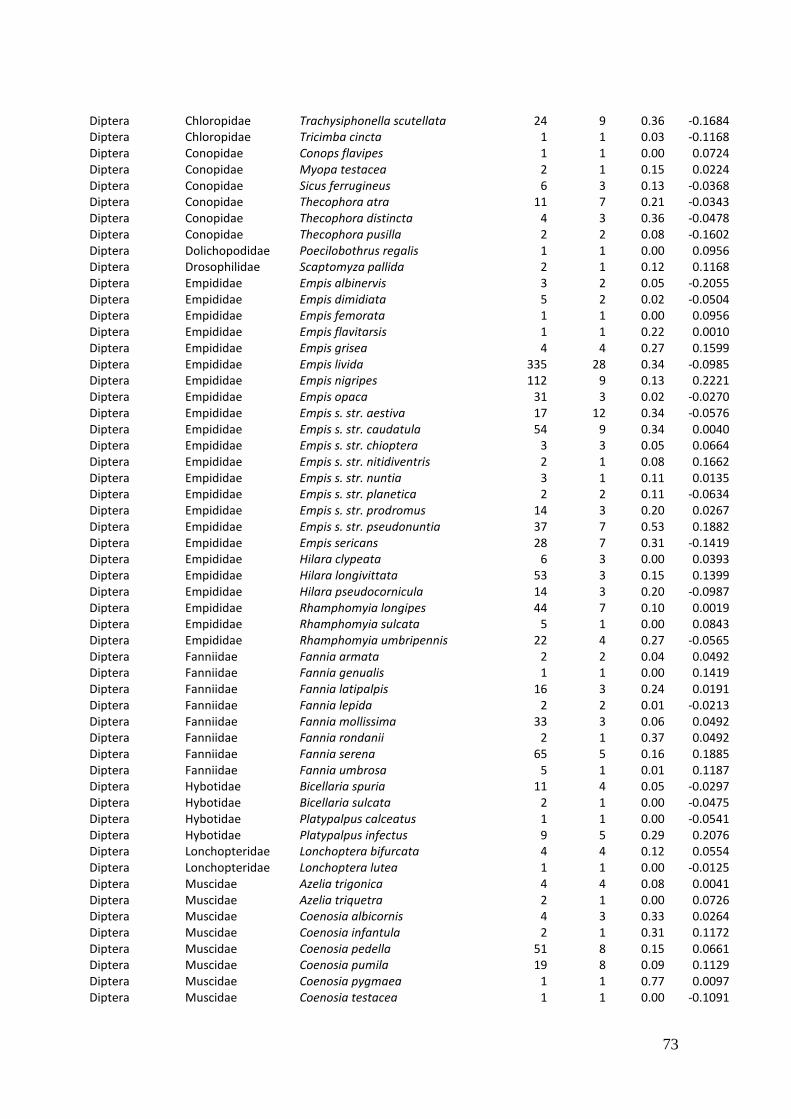
73
Diptera Chloropidae Trachysiphonella scutellata 24 9 0.36 -0.1684
Diptera Chloropidae Tricimba cincta 1 1 0.03 -0.1168
Diptera Conopidae Conops flavipes 1 1 0.00 0.0724
Diptera Conopidae Myopa testacea 2 1 0.15 0.0224
Diptera Conopidae Sicus ferrugineus 6 3 0.13 -0.0368
Diptera Conopidae Thecophora atra 11 7 0.21 -0.0343
Diptera Conopidae Thecophora distincta 4 3 0.36 -0.0478
Diptera Conopidae Thecophora pusilla 2 2 0.08 -0.1602
Diptera Dolichopodidae Poecilobothrus regalis 1 1 0.00 0.0956
Diptera Drosophilidae Scaptomyza pallida 2 1 0.12 0.1168
Diptera Empididae Empis albinervis 3 2 0.05 -0.2055
Diptera Empididae Empis dimidiata 5 2 0.02 -0.0504
Diptera Empididae Empis femorata 1 1 0.00 0.0956
Diptera Empididae Empis flavitarsis 1 1 0.22 0.0010
Diptera Empididae Empis grisea 4 4 0.27 0.1599
Diptera Empididae Empis livida 335 28 0.34 -0.0985
Diptera Empididae Empis nigripes 112 9 0.13 0.2221
Diptera Empididae Empis opaca 31 3 0.02 -0.0270
Diptera Empididae Empis s. str. aestiva 17 12 0.34 -0.0576
Diptera Empididae Empis s. str. caudatula 54 9 0.34 0.0040
Diptera Empididae Empis s. str. chioptera 3 3 0.05 0.0664
Diptera Empididae Empis s. str. nitidiventris 2 1 0.08 0.1662
Diptera Empididae Empis s. str. nuntia 3 1 0.11 0.0135
Diptera Empididae Empis s. str. planetica 2 2 0.11 -0.0634
Diptera Empididae Empis s. str. prodromus 14 3 0.20 0.0267
Diptera Empididae Empis s. str. pseudonuntia 37 7 0.53 0.1882
Diptera Empididae Empis sericans 28 7 0.31 -0.1419
Diptera Empididae Hilara clypeata 6 3 0.00 0.0393
Diptera Empididae Hilara longivittata 53 3 0.15 0.1399
Diptera Empididae Hilara pseudocornicula 14 3 0.20 -0.0987
Diptera Empididae Rhamphomyia longipes 44 7 0.10 0.0019
Diptera Empididae Rhamphomyia sulcata 5 1 0.00 0.0843
Diptera Empididae Rhamphomyia umbripennis 22 4 0.27 -0.0565
Diptera Fanniidae Fannia armata 2 2 0.04 0.0492
Diptera Fanniidae Fannia genualis 1 1 0.00 0.1419
Diptera Fanniidae Fannia latipalpis 16 3 0.24 0.0191
Diptera Fanniidae Fannia lepida 2 2 0.01 -0.0213
Diptera Fanniidae Fannia mollissima 33 3 0.06 0.0492
Diptera Fanniidae Fannia rondanii 2 1 0.37 0.0492
Diptera Fanniidae Fannia serena 65 5 0.16 0.1885
Diptera Fanniidae Fannia umbrosa 5 1 0.01 0.1187
Diptera Hybotidae Bicellaria spuria 11 4 0.05 -0.0297
Diptera Hybotidae Bicellaria sulcata 2 1 0.00 -0.0475
Diptera Hybotidae Platypalpus calceatus 1 1 0.00 -0.0541
Diptera Hybotidae Platypalpus infectus 9 5 0.29 0.2076
Diptera Lonchopteridae Lonchoptera bifurcata 4 4 0.12 0.0554
Diptera Lonchopteridae Lonchoptera lutea 1 1 0.00 -0.0125
Diptera Muscidae Azelia trigonica 4 4 0.08 0.0041
Diptera Muscidae Azelia triquetra 2 1 0.00 0.0726
Diptera Muscidae Coenosia albicornis 4 3 0.33 0.0264
Diptera Muscidae Coenosia infantula 2 1 0.31 0.1172
Diptera Muscidae Coenosia pedella 51 8 0.15 0.0661
Diptera Muscidae Coenosia pumila 19 8 0.09 0.1129
Diptera Muscidae Coenosia pygmaea 1 1 0.77 0.0097
Diptera Muscidae Coenosia testacea 1 1 0.00 -0.1091
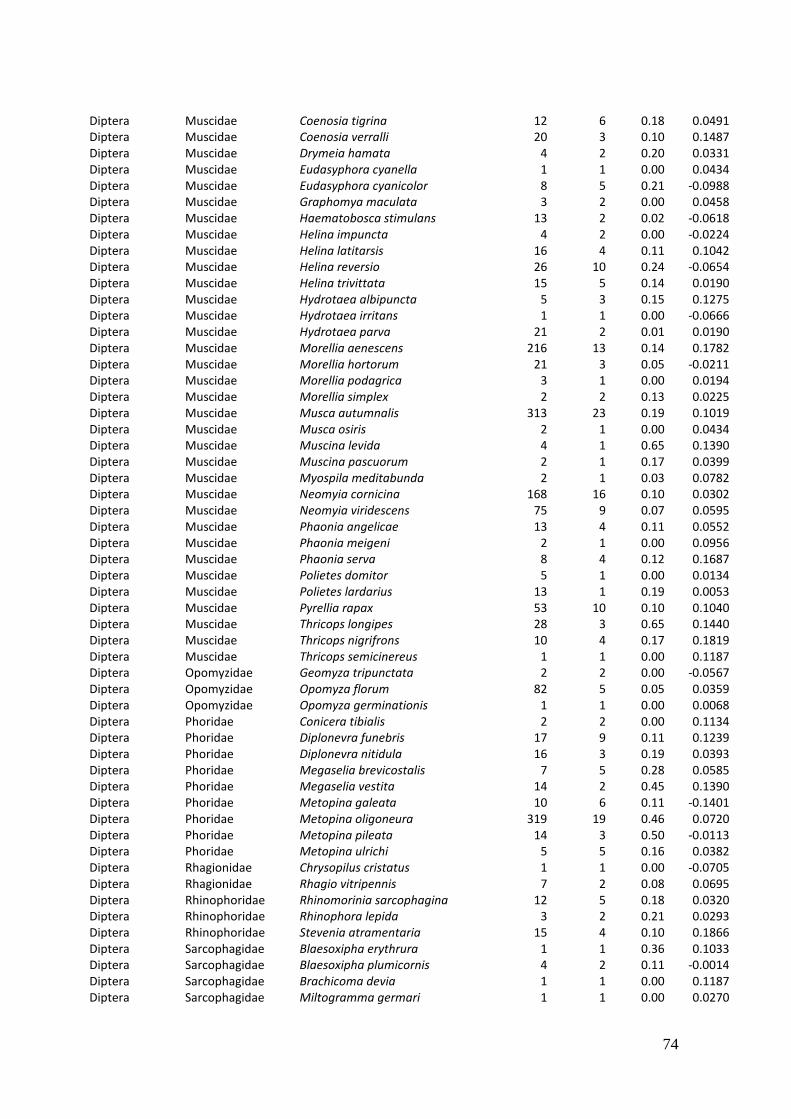
74
Diptera Muscidae Coenosia tigrina 12 6 0.18 0.0491
Diptera Muscidae Coenosia verralli 20 3 0.10 0.1487
Diptera Muscidae Drymeia hamata 4 2 0.20 0.0331
Diptera Muscidae Eudasyphora cyanella 1 1 0.00 0.0434
Diptera Muscidae Eudasyphora cyanicolor 8 5 0.21 -0.0988
Diptera Muscidae Graphomya maculata 3 2 0.00 0.0458
Diptera Muscidae Haematobosca stimulans 13 2 0.02 -0.0618
Diptera Muscidae Helina impuncta 4 2 0.00 -0.0224
Diptera Muscidae Helina latitarsis 16 4 0.11 0.1042
Diptera Muscidae Helina reversio 26 10 0.24 -0.0654
Diptera Muscidae Helina trivittata 15 5 0.14 0.0190
Diptera Muscidae Hydrotaea albipuncta 5 3 0.15 0.1275
Diptera Muscidae Hydrotaea irritans 1 1 0.00 -0.0666
Diptera Muscidae Hydrotaea parva 21 2 0.01 0.0190
Diptera Muscidae Morellia aenescens 216 13 0.14 0.1782
Diptera Muscidae Morellia hortorum 21 3 0.05 -0.0211
Diptera Muscidae Morellia podagrica 3 1 0.00 0.0194
Diptera Muscidae Morellia simplex 2 2 0.13 0.0225
Diptera Muscidae Musca autumnalis 313 23 0.19 0.1019
Diptera Muscidae Musca osiris 2 1 0.00 0.0434
Diptera Muscidae Muscina levida 4 1 0.65 0.1390
Diptera Muscidae Muscina pascuorum 2 1 0.17 0.0399
Diptera Muscidae Myospila meditabunda 2 1 0.03 0.0782
Diptera Muscidae Neomyia cornicina 168 16 0.10 0.0302
Diptera Muscidae Neomyia viridescens 75 9 0.07 0.0595
Diptera Muscidae Phaonia angelicae 13 4 0.11 0.0552
Diptera Muscidae Phaonia meigeni 2 1 0.00 0.0956
Diptera Muscidae Phaonia serva 8 4 0.12 0.1687
Diptera Muscidae Polietes domitor 5 1 0.00 0.0134
Diptera Muscidae Polietes lardarius 13 1 0.19 0.0053
Diptera Muscidae Pyrellia rapax 53 10 0.10 0.1040
Diptera Muscidae Thricops longipes 28 3 0.65 0.1440
Diptera Muscidae Thricops nigrifrons 10 4 0.17 0.1819
Diptera Muscidae Thricops semicinereus 1 1 0.00 0.1187
Diptera Opomyzidae Geomyza tripunctata 2 2 0.00 -0.0567
Diptera Opomyzidae Opomyza florum 82 5 0.05 0.0359
Diptera Opomyzidae Opomyza germinationis 1 1 0.00 0.0068
Diptera Phoridae Conicera tibialis 2 2 0.00 0.1134
Diptera Phoridae Diplonevra funebris 17 9 0.11 0.1239
Diptera Phoridae Diplonevra nitidula 16 3 0.19 0.0393
Diptera Phoridae Megaselia brevicostalis 7 5 0.28 0.0585
Diptera Phoridae Megaselia vestita 14 2 0.45 0.1390
Diptera Phoridae Metopina galeata 10 6 0.11 -0.1401
Diptera Phoridae Metopina oligoneura 319 19 0.46 0.0720
Diptera Phoridae Metopina pileata 14 3 0.50 -0.0113
Diptera Phoridae Metopina ulrichi 5 5 0.16 0.0382
Diptera Rhagionidae Chrysopilus cristatus 1 1 0.00 -0.0705
Diptera Rhagionidae Rhagio vitripennis 7 2 0.08 0.0695
Diptera Rhinophoridae Rhinomorinia sarcophagina 12 5 0.18 0.0320
Diptera Rhinophoridae Rhinophora lepida 3 2 0.21 0.0293
Diptera Rhinophoridae Stevenia atramentaria 15 4 0.10 0.1866
Diptera Sarcophagidae Blaesoxipha erythrura 1 1 0.36 0.1033
Diptera Sarcophagidae Blaesoxipha plumicornis 4 2 0.11 -0.0014
Diptera Sarcophagidae Brachicoma devia 1 1 0.00 0.1187
Diptera Sarcophagidae Miltogramma germari 1 1 0.00 0.0270
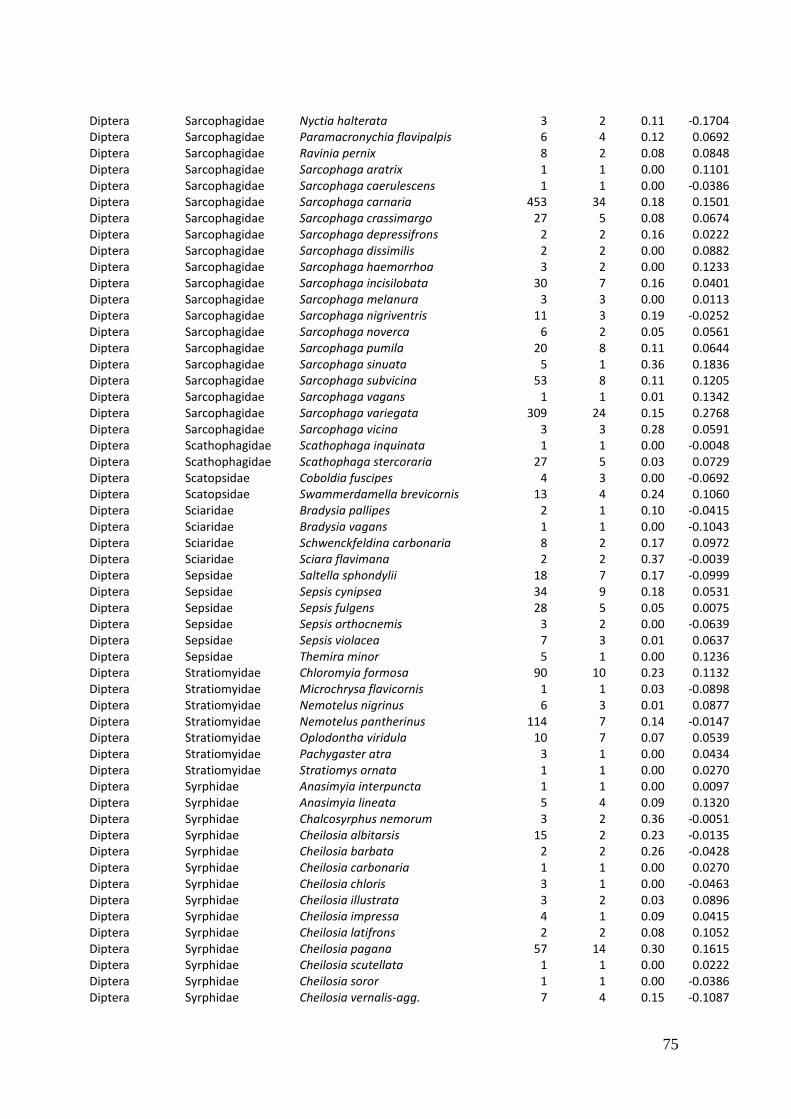
75
Diptera Sarcophagidae Nyctia halterata 3 2 0.11 -0.1704
Diptera Sarcophagidae Paramacronychia flavipalpis 6 4 0.12 0.0692
Diptera Sarcophagidae Ravinia pernix 8 2 0.08 0.0848
Diptera Sarcophagidae Sarcophaga aratrix 1 1 0.00 0.1101
Diptera Sarcophagidae Sarcophaga caerulescens 1 1 0.00 -0.0386
Diptera Sarcophagidae Sarcophaga carnaria 453 34 0.18 0.1501
Diptera Sarcophagidae Sarcophaga crassimargo 27 5 0.08 0.0674
Diptera Sarcophagidae Sarcophaga depressifrons 2 2 0.16 0.0222
Diptera Sarcophagidae Sarcophaga dissimilis 2 2 0.00 0.0882
Diptera Sarcophagidae Sarcophaga haemorrhoa 3 2 0.00 0.1233
Diptera Sarcophagidae Sarcophaga incisilobata 30 7 0.16 0.0401
Diptera Sarcophagidae Sarcophaga melanura 3 3 0.00 0.0113
Diptera Sarcophagidae Sarcophaga nigriventris 11 3 0.19 -0.0252
Diptera Sarcophagidae Sarcophaga noverca 6 2 0.05 0.0561
Diptera Sarcophagidae Sarcophaga pumila 20 8 0.11 0.0644
Diptera Sarcophagidae Sarcophaga sinuata 5 1 0.36 0.1836
Diptera Sarcophagidae Sarcophaga subvicina 53 8 0.11 0.1205
Diptera Sarcophagidae Sarcophaga vagans 1 1 0.01 0.1342
Diptera Sarcophagidae Sarcophaga variegata 309 24 0.15 0.2768
Diptera Sarcophagidae Sarcophaga vicina 3 3 0.28 0.0591
Diptera Scathophagidae Scathophaga inquinata 1 1 0.00 -0.0048
Diptera Scathophagidae Scathophaga stercoraria 27 5 0.03 0.0729
Diptera Scatopsidae Coboldia fuscipes 4 3 0.00 -0.0692
Diptera Scatopsidae Swammerdamella brevicornis 13 4 0.24 0.1060
Diptera Sciaridae Bradysia pallipes 2 1 0.10 -0.0415
Diptera Sciaridae Bradysia vagans 1 1 0.00 -0.1043
Diptera Sciaridae Schwenckfeldina carbonaria 8 2 0.17 0.0972
Diptera Sciaridae Sciara flavimana 2 2 0.37 -0.0039
Diptera Sepsidae Saltella sphondylii 18 7 0.17 -0.0999
Diptera Sepsidae Sepsis cynipsea 34 9 0.18 0.0531
Diptera Sepsidae Sepsis fulgens 28 5 0.05 0.0075
Diptera Sepsidae Sepsis orthocnemis 3 2 0.00 -0.0639
Diptera Sepsidae Sepsis violacea 7 3 0.01 0.0637
Diptera Sepsidae Themira minor 5 1 0.00 0.1236
Diptera Stratiomyidae Chloromyia formosa 90 10 0.23 0.1132
Diptera Stratiomyidae Microchrysa flavicornis 1 1 0.03 -0.0898
Diptera Stratiomyidae Nemotelus nigrinus 6 3 0.01 0.0877
Diptera Stratiomyidae Nemotelus pantherinus 114 7 0.14 -0.0147
Diptera Stratiomyidae Oplodontha viridula 10 7 0.07 0.0539
Diptera Stratiomyidae Pachygaster atra 3 1 0.00 0.0434
Diptera Stratiomyidae Stratiomys ornata 1 1 0.00 0.0270
Diptera Syrphidae Anasimyia interpuncta 1 1 0.00 0.0097
Diptera Syrphidae Anasimyia lineata 5 4 0.09 0.1320
Diptera Syrphidae Chalcosyrphus nemorum 3 2 0.36 -0.0051
Diptera Syrphidae Cheilosia albitarsis 15 2 0.23 -0.0135
Diptera Syrphidae Cheilosia barbata 2 2 0.26 -0.0428
Diptera Syrphidae Cheilosia carbonaria 1 1 0.00 0.0270
Diptera Syrphidae Cheilosia chloris 3 1 0.00 -0.0463
Diptera Syrphidae Cheilosia illustrata 3 2 0.03 0.0896
Diptera Syrphidae Cheilosia impressa 4 1 0.09 0.0415
Diptera Syrphidae Cheilosia latifrons 2 2 0.08 0.1052
Diptera Syrphidae Cheilosia pagana 57 14 0.30 0.1615
Diptera Syrphidae Cheilosia scutellata 1 1 0.00 0.0222
Diptera Syrphidae Cheilosia soror 1 1 0.00 -0.0386
Diptera Syrphidae Cheilosia vernalis-agg. 7 4 0.15 -0.1087

76
Diptera Syrphidae Cheilosia vulpina 9 3 0.06 0.0389
Diptera Syrphidae Chrysogaster coemiteriorum 1 1 0.00 -0.0956
Diptera Syrphidae Chrysogaster solstitialis 7 5 0.34 0.1203
Diptera Syrphidae Chrysogaster virescens 2 2 0.57 0.0528
Diptera Syrphidae Chrysotoxum bicinctum 47 19 0.21 -0.0126
Diptera Syrphidae Chrysotoxum cautum 2 2 0.06 0.0910
Diptera Syrphidae Chrysotoxum elegans 1 1 0.00 0.0068
Diptera Syrphidae Chrysotoxum festivum 27 9 0.21 0.0350
Diptera Syrphidae Chrysotoxum verralli 1 1 0.37 0.1129
Diptera Syrphidae Dasysyrphus hilaris 3 3 0.55 -0.0151
Diptera Syrphidae Dasysyrphus pinastri 1 1 0.00 0.1072
Diptera Syrphidae Epistrophe grossulariae 3 1 0.00 0.1154
Diptera Syrphidae Epistrophe nitidicollis 5 4 0.16 0.0489
Diptera Syrphidae Episyrphus balteatus 929 61 0.29 0.0766
Diptera Syrphidae Eriozona syrphoides 1 1 0.00 0.0357
Diptera Syrphidae Eristalinus aeneus 4 3 0.11 -0.0580
Diptera Syrphidae Eristalinus sepulchralis 79 15 0.15 0.0004
Diptera Syrphidae Eristalis abusiva 44 12 0.10 0.0086
Diptera Syrphidae Eristalis arbustorum 106 18 0.09 0.0948
Diptera Syrphidae Eristalis interrupta 59 16 0.14 0.1299
Diptera Syrphidae Eristalis intricaria 10 5 0.17 -0.0201
Diptera Syrphidae Eristalis lineata 9 5 0.17 0.0249
Diptera Syrphidae Eristalis pertinax 12 4 0.04 0.0611
Diptera Syrphidae Eristalis pseudorupium 8 4 0.07 0.0592
Diptera Syrphidae Eristalis tenax 298 30 0.22 0.0661
Diptera Syrphidae Eumerus strigatus 1 1 0.75 -0.1284
Diptera Syrphidae Eumerus tricolor 2 2 0.15 -0.0266
Diptera Syrphidae Eupeodes bucculatus 4 2 0.18 0.1223
Diptera Syrphidae Eupeodes corollae 88 29 0.18 0.0758
Diptera Syrphidae Eupeodes lapponicus 5 5 0.07 0.1296
Diptera Syrphidae Eupeodes latifasciatus 41 19 0.17 0.1084
Diptera Syrphidae Eupeodes luniger 15 10 0.16 0.1207
Diptera Syrphidae Ferdinandea cuprea 1 1 0.37 0.1129
Diptera Syrphidae Helophilus hybridus 25 8 0.06 0.0295
Diptera Syrphidae Helophilus pendulus 35 12 0.15 0.1014
Diptera Syrphidae Helophilus trivittatus 47 15 0.11 -0.1111
Diptera Syrphidae Heringia latitarsis 1 1 0.00 0.1149
Diptera Syrphidae Lejogaster metallina 5 3 0.47 0.0081
Diptera Syrphidae Lejogaster tarsata 1 1 0.58 -0.0705
Diptera Syrphidae Leucozona glaucia 1 1 0.00 -0.0164
Diptera Syrphidae Leucozona laternaria 1 1 0.00 0.0434
Diptera Syrphidae Melangyna umbellatarum 6 4 0.11 0.1325
Diptera Syrphidae Melanogaster aerosa /
parumplicata
1 1 0.00 -0.0956
Diptera Syrphidae Melanogaster nuda 60 5 0.22 -0.0851
Diptera Syrphidae Melanostoma mellinum-agg. 204 38 0.31 0.2337
Diptera Syrphidae Melanostoma scalare 5 4 0.47 0.0386
Diptera Syrphidae Meliscaeva cinctella 4 2 0.00 -0.0047
Diptera Syrphidae Merodon armipes 23 3 0.24 0.0198
Diptera Syrphidae Merodon rufus 1 1 0.01 -0.1091
Diptera Syrphidae Myathropa florea 37 9 0.09 0.1995
Diptera Syrphidae Neoascia obliqua 3 3 0.21 -0.0512
Diptera Syrphidae Neoascia tenur 3 2 0.16 0.0293
Diptera Syrphidae Neoascia unifasciata 1 1 0.00 -0.0512
Diptera Syrphidae Paragus haemorrhous 1 1 0.00 -0.1361
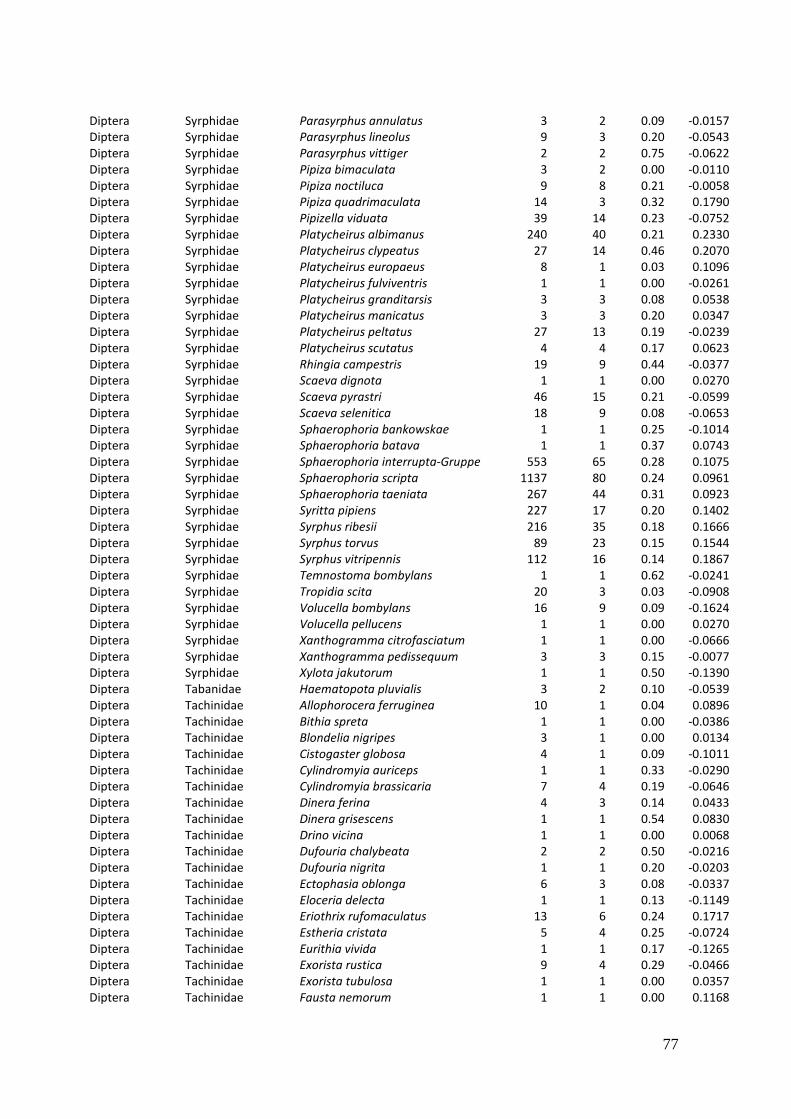
77
Diptera Syrphidae Parasyrphus annulatus 3 2 0.09 -0.0157
Diptera Syrphidae Parasyrphus lineolus 9 3 0.20 -0.0543
Diptera Syrphidae Parasyrphus vittiger 2 2 0.75 -0.0622
Diptera Syrphidae Pipiza bimaculata 3 2 0.00 -0.0110
Diptera Syrphidae Pipiza noctiluca 9 8 0.21 -0.0058
Diptera Syrphidae Pipiza quadrimaculata 14 3 0.32 0.1790
Diptera Syrphidae Pipizella viduata 39 14 0.23 -0.0752
Diptera Syrphidae Platycheirus albimanus 240 40 0.21 0.2330
Diptera Syrphidae Platycheirus clypeatus 27 14 0.46 0.2070
Diptera Syrphidae Platycheirus europaeus 8 1 0.03 0.1096
Diptera Syrphidae Platycheirus fulviventris 1 1 0.00 -0.0261
Diptera Syrphidae Platycheirus granditarsis 3 3 0.08 0.0538
Diptera Syrphidae Platycheirus manicatus 3 3 0.20 0.0347
Diptera Syrphidae Platycheirus peltatus 27 13 0.19 -0.0239
Diptera Syrphidae Platycheirus scutatus 4 4 0.17 0.0623
Diptera Syrphidae Rhingia campestris 19 9 0.44 -0.0377
Diptera Syrphidae Scaeva dignota 1 1 0.00 0.0270
Diptera Syrphidae Scaeva pyrastri 46 15 0.21 -0.0599
Diptera Syrphidae Scaeva selenitica 18 9 0.08 -0.0653
Diptera Syrphidae Sphaerophoria bankowskae 1 1 0.25 -0.1014
Diptera Syrphidae Sphaerophoria batava 1 1 0.37 0.0743
Diptera Syrphidae Sphaerophoria interrupta-Gruppe 553 65 0.28 0.1075
Diptera Syrphidae Sphaerophoria scripta 1137 80 0.24 0.0961
Diptera Syrphidae Sphaerophoria taeniata 267 44 0.31 0.0923
Diptera Syrphidae Syritta pipiens 227 17 0.20 0.1402
Diptera Syrphidae Syrphus ribesii 216 35 0.18 0.1666
Diptera Syrphidae Syrphus torvus 89 23 0.15 0.1544
Diptera Syrphidae Syrphus vitripennis 112 16 0.14 0.1867
Diptera Syrphidae Temnostoma bombylans 1 1 0.62 -0.0241
Diptera Syrphidae Tropidia scita 20 3 0.03 -0.0908
Diptera Syrphidae Volucella bombylans 16 9 0.09 -0.1624
Diptera Syrphidae Volucella pellucens 1 1 0.00 0.0270
Diptera Syrphidae Xanthogramma citrofasciatum 1 1 0.00 -0.0666
Diptera Syrphidae Xanthogramma pedissequum 3 3 0.15 -0.0077
Diptera Syrphidae Xylota jakutorum 1 1 0.50 -0.1390
Diptera Tabanidae Haematopota pluvialis 3 2 0.10 -0.0539
Diptera Tachinidae Allophorocera ferruginea 10 1 0.04 0.0896
Diptera Tachinidae Bithia spreta 1 1 0.00 -0.0386
Diptera Tachinidae Blondelia nigripes 3 1 0.00 0.0134
Diptera Tachinidae Cistogaster globosa 4 1 0.09 -0.1011
Diptera Tachinidae Cylindromyia auriceps 1 1 0.33 -0.0290
Diptera Tachinidae Cylindromyia brassicaria 7 4 0.19 -0.0646
Diptera Tachinidae Dinera ferina 4 3 0.14 0.0433
Diptera Tachinidae Dinera grisescens 1 1 0.54 0.0830
Diptera Tachinidae Drino vicina 1 1 0.00 0.0068
Diptera Tachinidae Dufouria chalybeata 2 2 0.50 -0.0216
Diptera Tachinidae Dufouria nigrita 1 1 0.20 -0.0203
Diptera Tachinidae Ectophasia oblonga 6 3 0.08 -0.0337
Diptera Tachinidae Eloceria delecta 1 1 0.13 -0.1149
Diptera Tachinidae Eriothrix rufomaculatus 13 6 0.24 0.1717
Diptera Tachinidae Estheria cristata 5 4 0.25 -0.0724
Diptera Tachinidae Eurithia vivida 1 1 0.17 -0.1265
Diptera Tachinidae Exorista rustica 9 4 0.29 -0.0466
Diptera Tachinidae Exorista tubulosa 1 1 0.00 0.0357
Diptera Tachinidae Fausta nemorum 1 1 0.00 0.1168

78
Diptera Tachinidae Gonia capitata 13 5 0.22 -0.1342
Diptera Tachinidae Gymnosoma clavatum 3 1 0.11 -0.0580
Diptera Tachinidae Gymnosoma nitens 4 3 0.11 -0.2017
Diptera Tachinidae Gymnosoma nudifrons 1 1 1.00 -0.0048
Diptera Tachinidae Gymnosoma rotundatum 3 1 0.09 -0.0045
Diptera Tachinidae Leucostoma simplex 11 7 0.10 0.0402
Diptera Tachinidae Linnaemya picta 1 1 0.00 -0.0164
Diptera Tachinidae Macquartia dispar 1 1 0.00 -0.0541
Diptera Tachinidae Macquartia praefica 9 2 0.11 -0.0716
Diptera Tachinidae Meigenia mutabilis-Gruppe 2 2 0.08 0.0442
Diptera Tachinidae Ocytata pallipes 1 1 0.17 0.0763
Diptera Tachinidae Opesia cana 1 1 0.00 -0.0125
Diptera Tachinidae Phania curvicauda 1 1 0.00 -0.0203
Diptera Tachinidae Phania funesta 1 1 0.00 -0.0048
Diptera Tachinidae Phasia barbifrons 1 1 0.05 -0.0782
Diptera Tachinidae Phasia hemiptera 17 5 0.11 0.1092
Diptera Tachinidae Phasia obesa 45 6 0.13 -0.1242
Diptera Tachinidae Phasia pusilla 2 2 0.00 0.0262
Diptera Tachinidae Phryxe nemea 1 1 0.10 0.0560
Diptera Tachinidae Phryxe vulgaris 9 5 0.21 0.0420
Diptera Tachinidae Phytomyptera minutissima 1 1 0.00 0.0357
Diptera Tachinidae Prosena siberita 3 2 0.26 0.0805
Diptera Tachinidae Rondania dimidiata 1 1 0.03 -0.1168
Diptera Tachinidae Siphona geniculata 65 16 0.31 0.1237
Diptera Tachinidae Solieria fenestrata 1 1 0.00 0.0724
Diptera Tachinidae Solieria pacifica 15 6 0.23 0.1015
Diptera Tachinidae Tachina fera 30 3 0.05 0.0278
Diptera Tachinidae Voria ruralis 5 4 0.22 0.0415
Diptera Tachinidae Zeuxia cinerea 3 3 0.00 -0.0431
Diptera Tachinidae Zophomyia temula 2 1 0.00 0.0138
Diptera Tephritidae Chaetorellia jaceae 2 2 0.00 -0.0166
Diptera Tephritidae Dioxyna bidentis 1 1 0.00 0.0666
Diptera Tephritidae Ensina sonchi 3 2 0.59 0.1538
Diptera Tephritidae Orellia falcata 6 4 0.51 -0.1101
Diptera Tephritidae Oxyna flavipennis 49 8 0.23 0.0831
Diptera Tephritidae Terellia tussilaginis 1 1 0.00 0.1342
Diptera Tephritidae Urophora cardui 1 1 0.03 -0.1390
Diptera Tephritidae Urophora quadrifasciata 1 1 0.03 -0.1168
Diptera Tipulidae Lunatipula vernalis 104 2 0.14 0.1380
Diptera Tipulidae Nephrotoma appendiculata 34 1 0.24 0.0395
Diptera Tipulidae Nephrotoma flavescens 4 2 0.05 0.2029
Diptera Ulidiidae Physiphora alceae 5 2 0.01 -0.0386
Hymenoptera Apidae Andrena bicolor 20 4 0.46 0.0521
Hymenoptera Apidae Andrena carantonica 2 2 0.17 0.0140
Hymenoptera Apidae Andrena chrysosceles 19 6 0.10 -0.0163
Hymenoptera Apidae Andrena cineraria 4 4 0.00 0.0194
Hymenoptera Apidae Andrena denticulata 1 1 0.82 -0.0338
Hymenoptera Apidae Andrena dorsata 7 1 0.02 0.0270
Hymenoptera Apidae Andrena falsifica 1 1 0.70 0.0183
Hymenoptera Apidae Andrena flavipes 47 8 0.12 0.0704
Hymenoptera Apidae Andrena fucata 3 2 0.32 0.0111
Hymenoptera Apidae Andrena fulvago 3 3 0.33 -0.0169
Hymenoptera Apidae Andrena gelriae 2 2 0.01 -0.0922
Hymenoptera Apidae Andrena gravida 7 4 0.10 0.0573
Hymenoptera Apidae Andrena haemorrhoa 66 5 0.11 0.1370
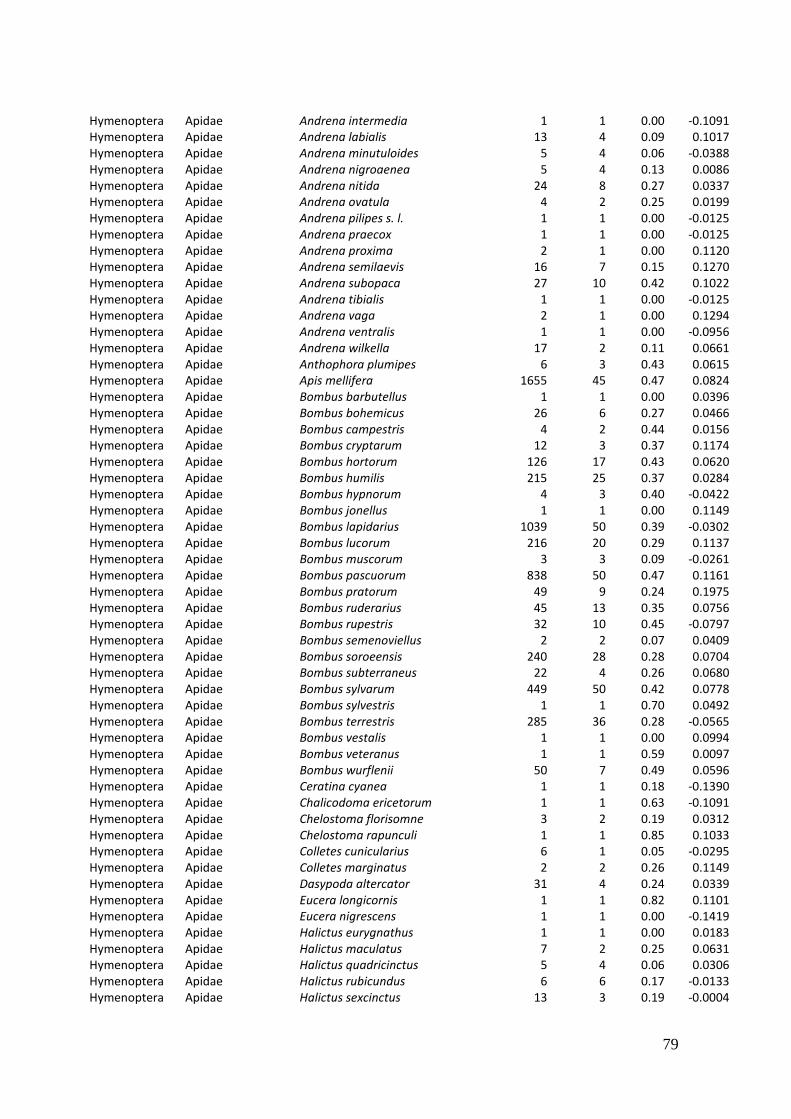
79
Hymenoptera Apidae Andrena intermedia 1 1 0.00 -0.1091
Hymenoptera Apidae Andrena labialis 13 4 0.09 0.1017
Hymenoptera Apidae Andrena minutuloides 5 4 0.06 -0.0388
Hymenoptera Apidae Andrena nigroaenea 5 4 0.13 0.0086
Hymenoptera Apidae Andrena nitida 24 8 0.27 0.0337
Hymenoptera Apidae Andrena ovatula 4 2 0.25 0.0199
Hymenoptera Apidae Andrena pilipes s. l. 1 1 0.00 -0.0125
Hymenoptera Apidae Andrena praecox 1 1 0.00 -0.0125
Hymenoptera Apidae Andrena proxima 2 1 0.00 0.1120
Hymenoptera Apidae Andrena semilaevis 16 7 0.15 0.1270
Hymenoptera Apidae Andrena subopaca 27 10 0.42 0.1022
Hymenoptera Apidae Andrena tibialis 1 1 0.00 -0.0125
Hymenoptera Apidae Andrena vaga 2 1 0.00 0.1294
Hymenoptera Apidae Andrena ventralis 1 1 0.00 -0.0956
Hymenoptera Apidae Andrena wilkella 17 2 0.11 0.0661
Hymenoptera Apidae Anthophora plumipes 6 3 0.43 0.0615
Hymenoptera Apidae Apis mellifera 1655 45 0.47 0.0824
Hymenoptera Apidae Bombus barbutellus 1 1 0.00 0.0396
Hymenoptera Apidae Bombus bohemicus 26 6 0.27 0.0466
Hymenoptera Apidae Bombus campestris 4 2 0.44 0.0156
Hymenoptera Apidae Bombus cryptarum 12 3 0.37 0.1174
Hymenoptera Apidae Bombus hortorum 126 17 0.43 0.0620
Hymenoptera Apidae Bombus humilis 215 25 0.37 0.0284
Hymenoptera Apidae Bombus hypnorum 4 3 0.40 -0.0422
Hymenoptera Apidae Bombus jonellus 1 1 0.00 0.1149
Hymenoptera Apidae Bombus lapidarius 1039 50 0.39 -0.0302
Hymenoptera Apidae Bombus lucorum 216 20 0.29 0.1137
Hymenoptera Apidae Bombus muscorum 3 3 0.09 -0.0261
Hymenoptera Apidae Bombus pascuorum 838 50 0.47 0.1161
Hymenoptera Apidae Bombus pratorum 49 9 0.24 0.1975
Hymenoptera Apidae Bombus ruderarius 45 13 0.35 0.0756
Hymenoptera Apidae Bombus rupestris 32 10 0.45 -0.0797
Hymenoptera Apidae Bombus semenoviellus 2 2 0.07 0.0409
Hymenoptera Apidae Bombus soroeensis 240 28 0.28 0.0704
Hymenoptera Apidae Bombus subterraneus 22 4 0.26 0.0680
Hymenoptera Apidae Bombus sylvarum 449 50 0.42 0.0778
Hymenoptera Apidae Bombus sylvestris 1 1 0.70 0.0492
Hymenoptera Apidae Bombus terrestris 285 36 0.28 -0.0565
Hymenoptera Apidae Bombus vestalis 1 1 0.00 0.0994
Hymenoptera Apidae Bombus veteranus 1 1 0.59 0.0097
Hymenoptera Apidae Bombus wurflenii 50 7 0.49 0.0596
Hymenoptera Apidae Ceratina cyanea 1 1 0.18 -0.1390
Hymenoptera Apidae Chalicodoma ericetorum 1 1 0.63 -0.1091
Hymenoptera Apidae Chelostoma florisomne 3 2 0.19 0.0312
Hymenoptera Apidae Chelostoma rapunculi 1 1 0.85 0.1033
Hymenoptera Apidae Colletes cunicularius 6 1 0.05 -0.0295
Hymenoptera Apidae Colletes marginatus 2 2 0.26 0.1149
Hymenoptera Apidae Dasypoda altercator 31 4 0.24 0.0339
Hymenoptera Apidae Eucera longicornis 1 1 0.82 0.1101
Hymenoptera Apidae Eucera nigrescens 1 1 0.00 -0.1419
Hymenoptera Apidae Halictus eurygnathus 1 1 0.00 0.0183
Hymenoptera Apidae Halictus maculatus 7 2 0.25 0.0631
Hymenoptera Apidae Halictus quadricinctus 5 4 0.06 0.0306
Hymenoptera Apidae Halictus rubicundus 6 6 0.17 -0.0133
Hymenoptera Apidae Halictus sexcinctus 13 3 0.19 -0.0004
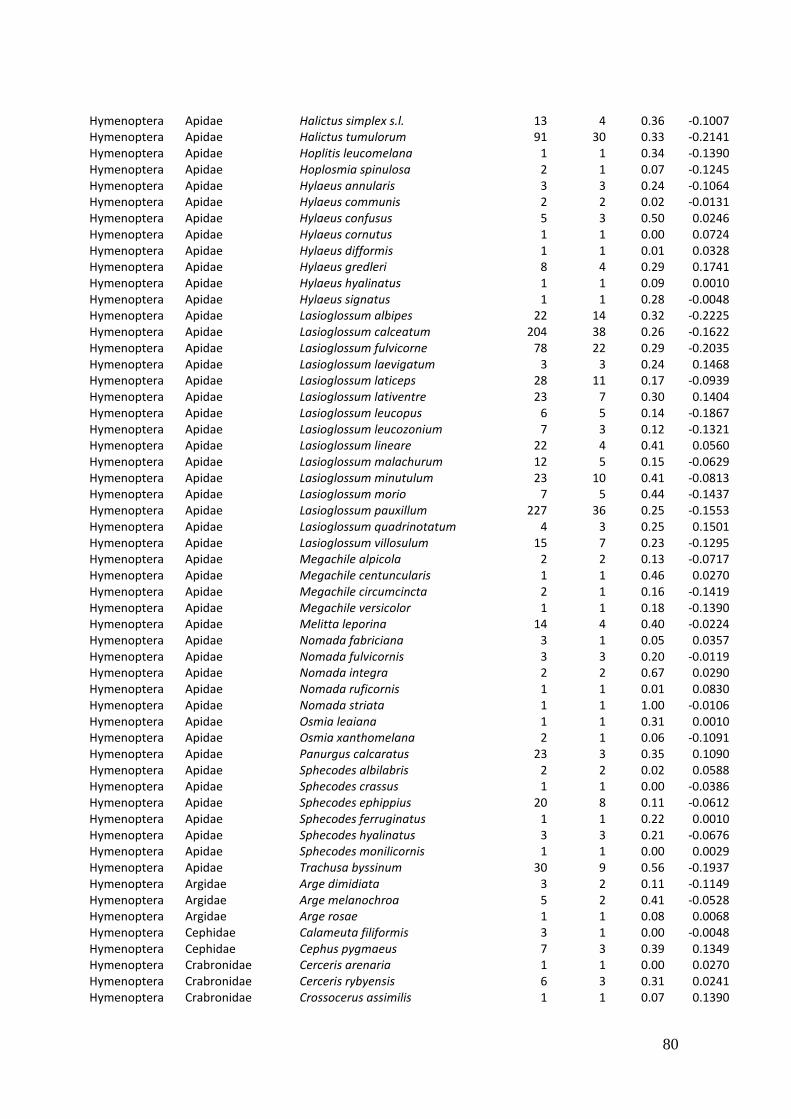
80
Hymenoptera Apidae Halictus simplex s.l. 13 4 0.36 -0.1007
Hymenoptera Apidae Halictus tumulorum 91 30 0.33 -0.2141
Hymenoptera Apidae Hoplitis leucomelana 1 1 0.34 -0.1390
Hymenoptera Apidae Hoplosmia spinulosa 2 1 0.07 -0.1245
Hymenoptera Apidae Hylaeus annularis 3 3 0.24 -0.1064
Hymenoptera Apidae Hylaeus communis 2 2 0.02 -0.0131
Hymenoptera Apidae Hylaeus confusus 5 3 0.50 0.0246
Hymenoptera Apidae Hylaeus cornutus 1 1 0.00 0.0724
Hymenoptera Apidae Hylaeus difformis 1 1 0.01 0.0328
Hymenoptera Apidae Hylaeus gredleri 8 4 0.29 0.1741
Hymenoptera Apidae Hylaeus hyalinatus 1 1 0.09 0.0010
Hymenoptera Apidae Hylaeus signatus 1 1 0.28 -0.0048
Hymenoptera Apidae Lasioglossum albipes 22 14 0.32 -0.2225
Hymenoptera Apidae Lasioglossum calceatum 204 38 0.26 -0.1622
Hymenoptera Apidae Lasioglossum fulvicorne 78 22 0.29 -0.2035
Hymenoptera Apidae Lasioglossum laevigatum 3 3 0.24 0.1468
Hymenoptera Apidae Lasioglossum laticeps 28 11 0.17 -0.0939
Hymenoptera Apidae Lasioglossum lativentre 23 7 0.30 0.1404
Hymenoptera Apidae Lasioglossum leucopus 6 5 0.14 -0.1867
Hymenoptera Apidae Lasioglossum leucozonium 7 3 0.12 -0.1321
Hymenoptera Apidae Lasioglossum lineare 22 4 0.41 0.0560
Hymenoptera Apidae Lasioglossum malachurum 12 5 0.15 -0.0629
Hymenoptera Apidae Lasioglossum minutulum 23 10 0.41 -0.0813
Hymenoptera Apidae Lasioglossum morio 7 5 0.44 -0.1437
Hymenoptera Apidae Lasioglossum pauxillum 227 36 0.25 -0.1553
Hymenoptera Apidae Lasioglossum quadrinotatum 4 3 0.25 0.1501
Hymenoptera Apidae Lasioglossum villosulum 15 7 0.23 -0.1295
Hymenoptera Apidae Megachile alpicola 2 2 0.13 -0.0717
Hymenoptera Apidae Megachile centuncularis 1 1 0.46 0.0270
Hymenoptera Apidae Megachile circumcincta 2 1 0.16 -0.1419
Hymenoptera Apidae Megachile versicolor 1 1 0.18 -0.1390
Hymenoptera Apidae Melitta leporina 14 4 0.40 -0.0224
Hymenoptera Apidae Nomada fabriciana 3 1 0.05 0.0357
Hymenoptera Apidae Nomada fulvicornis 3 3 0.20 -0.0119
Hymenoptera Apidae Nomada integra 2 2 0.67 0.0290
Hymenoptera Apidae Nomada ruficornis 1 1 0.01 0.0830
Hymenoptera Apidae Nomada striata 1 1 1.00 -0.0106
Hymenoptera Apidae Osmia leaiana 1 1 0.31 0.0010
Hymenoptera Apidae Osmia xanthomelana 2 1 0.06 -0.1091
Hymenoptera Apidae Panurgus calcaratus 23 3 0.35 0.1090
Hymenoptera Apidae Sphecodes albilabris 2 2 0.02 0.0588
Hymenoptera Apidae Sphecodes crassus 1 1 0.00 -0.0386
Hymenoptera Apidae Sphecodes ephippius 20 8 0.11 -0.0612
Hymenoptera Apidae Sphecodes ferruginatus 1 1 0.22 0.0010
Hymenoptera Apidae Sphecodes hyalinatus 3 3 0.21 -0.0676
Hymenoptera Apidae Sphecodes monilicornis 1 1 0.00 0.0029
Hymenoptera Apidae Trachusa byssinum 30 9 0.56 -0.1937
Hymenoptera Argidae Arge dimidiata 3 2 0.11 -0.1149
Hymenoptera Argidae Arge melanochroa 5 2 0.41 -0.0528
Hymenoptera Argidae Arge rosae 1 1 0.08 0.0068
Hymenoptera Cephidae Calameuta filiformis 3 1 0.00 -0.0048
Hymenoptera Cephidae Cephus pygmaeus 7 3 0.39 0.1349
Hymenoptera Crabronidae Cerceris arenaria 1 1 0.00 0.0270
Hymenoptera Crabronidae Cerceris rybyensis 6 3 0.31 0.0241
Hymenoptera Crabronidae Crossocerus assimilis 1 1 0.07 0.1390
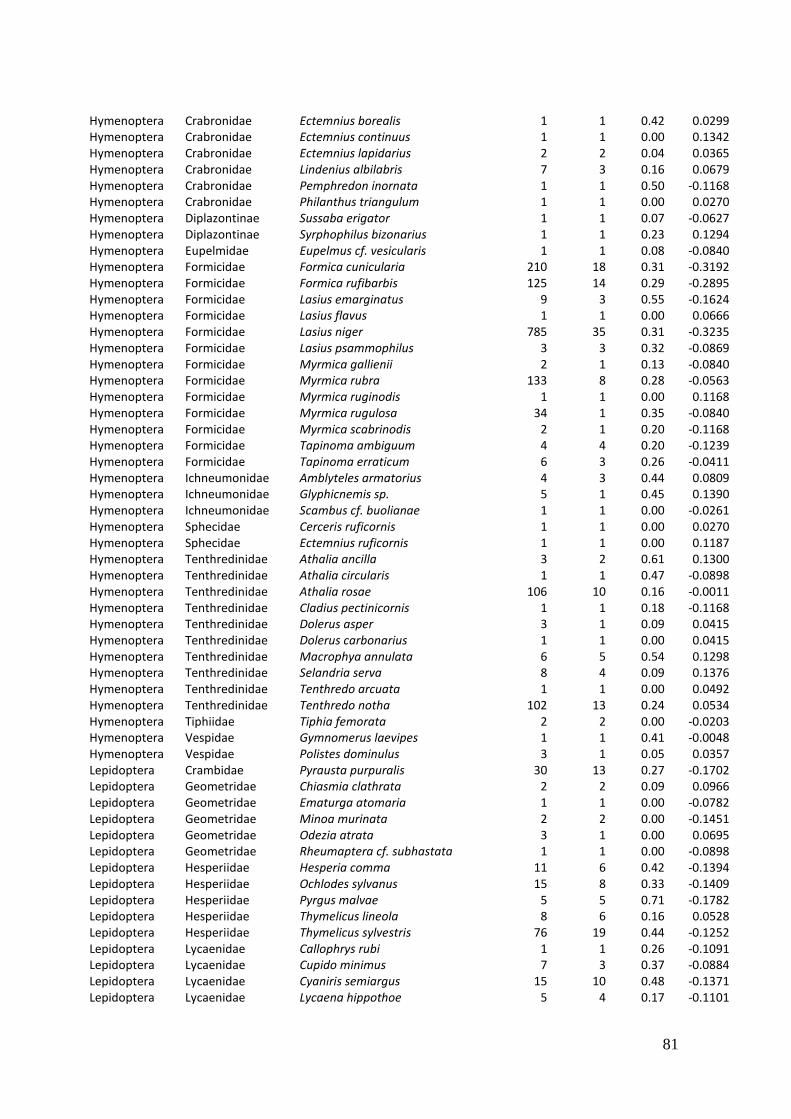
81
Hymenoptera Crabronidae Ectemnius borealis 1 1 0.42 0.0299
Hymenoptera Crabronidae Ectemnius continuus 1 1 0.00 0.1342
Hymenoptera Crabronidae Ectemnius lapidarius 2 2 0.04 0.0365
Hymenoptera Crabronidae Lindenius albilabris 7 3 0.16 0.0679
Hymenoptera Crabronidae Pemphredon inornata 1 1 0.50 -0.1168
Hymenoptera Crabronidae Philanthus triangulum 1 1 0.00 0.0270
Hymenoptera Diplazontinae Sussaba erigator 1 1 0.07 -0.0627
Hymenoptera Diplazontinae Syrphophilus bizonarius 1 1 0.23 0.1294
Hymenoptera Eupelmidae Eupelmus cf. vesicularis 1 1 0.08 -0.0840
Hymenoptera Formicidae Formica cunicularia 210 18 0.31 -0.3192
Hymenoptera Formicidae Formica rufibarbis 125 14 0.29 -0.2895
Hymenoptera Formicidae Lasius emarginatus 9 3 0.55 -0.1624
Hymenoptera Formicidae Lasius flavus 1 1 0.00 0.0666
Hymenoptera Formicidae Lasius niger 785 35 0.31 -0.3235
Hymenoptera Formicidae Lasius psammophilus 3 3 0.32 -0.0869
Hymenoptera Formicidae Myrmica gallienii 2 1 0.13 -0.0840
Hymenoptera Formicidae Myrmica rubra 133 8 0.28 -0.0563
Hymenoptera Formicidae Myrmica ruginodis 1 1 0.00 0.1168
Hymenoptera Formicidae Myrmica rugulosa 34 1 0.35 -0.0840
Hymenoptera Formicidae Myrmica scabrinodis 2 1 0.20 -0.1168
Hymenoptera Formicidae Tapinoma ambiguum 4 4 0.20 -0.1239
Hymenoptera Formicidae Tapinoma erraticum 6 3 0.26 -0.0411
Hymenoptera Ichneumonidae Amblyteles armatorius 4 3 0.44 0.0809
Hymenoptera Ichneumonidae Glyphicnemis sp. 5 1 0.45 0.1390
Hymenoptera Ichneumonidae Scambus cf. buolianae 1 1 0.00 -0.0261
Hymenoptera Sphecidae Cerceris ruficornis 1 1 0.00 0.0270
Hymenoptera Sphecidae Ectemnius ruficornis 1 1 0.00 0.1187
Hymenoptera Tenthredinidae Athalia ancilla 3 2 0.61 0.1300
Hymenoptera Tenthredinidae Athalia circularis 1 1 0.47 -0.0898
Hymenoptera Tenthredinidae Athalia rosae 106 10 0.16 -0.0011
Hymenoptera Tenthredinidae Cladius pectinicornis 1 1 0.18 -0.1168
Hymenoptera Tenthredinidae Dolerus asper 3 1 0.09 0.0415
Hymenoptera Tenthredinidae Dolerus carbonarius 1 1 0.00 0.0415
Hymenoptera Tenthredinidae Macrophya annulata 6 5 0.54 0.1298
Hymenoptera Tenthredinidae Selandria serva 8 4 0.09 0.1376
Hymenoptera Tenthredinidae Tenthredo arcuata 1 1 0.00 0.0492
Hymenoptera Tenthredinidae Tenthredo notha 102 13 0.24 0.0534
Hymenoptera Tiphiidae Tiphia femorata 2 2 0.00 -0.0203
Hymenoptera Vespidae Gymnomerus laevipes 1 1 0.41 -0.0048
Hymenoptera Vespidae Polistes dominulus 3 1 0.05 0.0357
Lepidoptera Crambidae Pyrausta purpuralis 30 13 0.27 -0.1702
Lepidoptera Geometridae Chiasmia clathrata 2 2 0.09 0.0966
Lepidoptera Geometridae Ematurga atomaria 1 1 0.00 -0.0782
Lepidoptera Geometridae Minoa murinata 2 2 0.00 -0.1451
Lepidoptera Geometridae Odezia atrata 3 1 0.00 0.0695
Lepidoptera Geometridae Rheumaptera cf. subhastata 1 1 0.00 -0.0898
Lepidoptera Hesperiidae Hesperia comma 11 6 0.42 -0.1394
Lepidoptera Hesperiidae Ochlodes sylvanus 15 8 0.33 -0.1409
Lepidoptera Hesperiidae Pyrgus malvae 5 5 0.71 -0.1782
Lepidoptera Hesperiidae Thymelicus lineola 8 6 0.16 0.0528
Lepidoptera Hesperiidae Thymelicus sylvestris 76 19 0.44 -0.1252
Lepidoptera Lycaenidae Callophrys rubi 1 1 0.26 -0.1091
Lepidoptera Lycaenidae Cupido minimus 7 3 0.37 -0.0884
Lepidoptera Lycaenidae Cyaniris semiargus 15 10 0.48 -0.1371
Lepidoptera Lycaenidae Lycaena hippothoe 5 4 0.17 -0.1101

82
Lepidoptera Lycaenidae Phengaris arion 3 2 0.18 -0.0897
Lepidoptera Lycaenidae Plebeius
argus/argyrognomon/idas agg.
87 16 0.38 -0.2974
Lepidoptera Lycaenidae Polyommatus amandus 3 2 0.11 -0.1323
Lepidoptera Lycaenidae Polyommatus bellargus 1 1 0.61 -0.1419
Lepidoptera Lycaenidae Polyommatus coridon 39 7 0.47 -0.1176
Lepidoptera Lycaenidae Polyommatus icarus 106 20 0.44 -0.0234
Lepidoptera Lycaenidae Pseudophilotes baton 1 1 0.53 -0.0994
Lepidoptera Noctuidae Autographa gamma 17 4 0.36 0.1154
Lepidoptera Noctuidae Euclidia glyphica 3 3 0.16 -0.0865
Lepidoptera Noctuidae Panemeria tenebrata 1 1 0.81 0.1390
Lepidoptera Noctuidae Polyphaenis sericata 1 1 0.00 -0.0386
Lepidoptera Noctuidae Tyta luctuosa 5 3 0.70 0.0084
Lepidoptera Nymphalidae Aphantopus hyperantus 18 10 0.15 -0.1052
Lepidoptera Nymphalidae Argynnis adippe 1 1 0.48 0.1072
Lepidoptera Nymphalidae Argynnis aglaja 1 1 0.00 0.1101
Lepidoptera Nymphalidae Coenonympha arcania 1 1 0.00 -0.1323
Lepidoptera Nymphalidae Coenonympha glycerion 1 1 0.00 -0.1207
Lepidoptera Nymphalidae Coenonympha pamphilus 52 16 0.37 -0.0477
Lepidoptera Nymphalidae Erebia medusa 5 1 0.00 -0.0666
Lepidoptera Nymphalidae Inachis io 16 6 0.04 0.0023
Lepidoptera Nymphalidae Maniola jurtina 55 19 0.26 -0.0356
Lepidoptera Nymphalidae Melanargia galathea 50 9 0.49 -0.1111
Lepidoptera Nymphalidae Melitaea cf. aurelia 1 1 0.00 -0.1419
Lepidoptera Nymphalidae Melitaea cf. britomartis 16 9 0.23 -0.3347
Lepidoptera Papilionidae Papilio machaon 5 2 0.52 -0.0959
Lepidoptera Pieridae Colias cf. hyale 2 2 0.50 -0.0936
Lepidoptera Pieridae Gonepteryx rhamni 1 1 0.11 0.1072
Lepidoptera Pieridae Pieris brassicae 30 8 0.30 0.0593
Lepidoptera Pieridae Pieris napi 2 2 0.00 0.0408
Lepidoptera Pieridae Pieris rapae 17 5 0.14 0.0965
Lepidoptera Sphingidae Hemaris tityus 1 1 0.00 -0.0666
Lepidoptera Zygaenidae Zygaena cf. viciae 2 2 0.30 -0.1361
Lepidoptera Zygaenidae Zygaena filipendulae 38 9 0.45 -0.2219
Lepidoptera Zygaenidae Zygaena loti 1 1 0.81 0.0183
Lepidoptera Zygaenidae Zygaena purpuralis/minos agg. 95 16 0.36 -0.2268
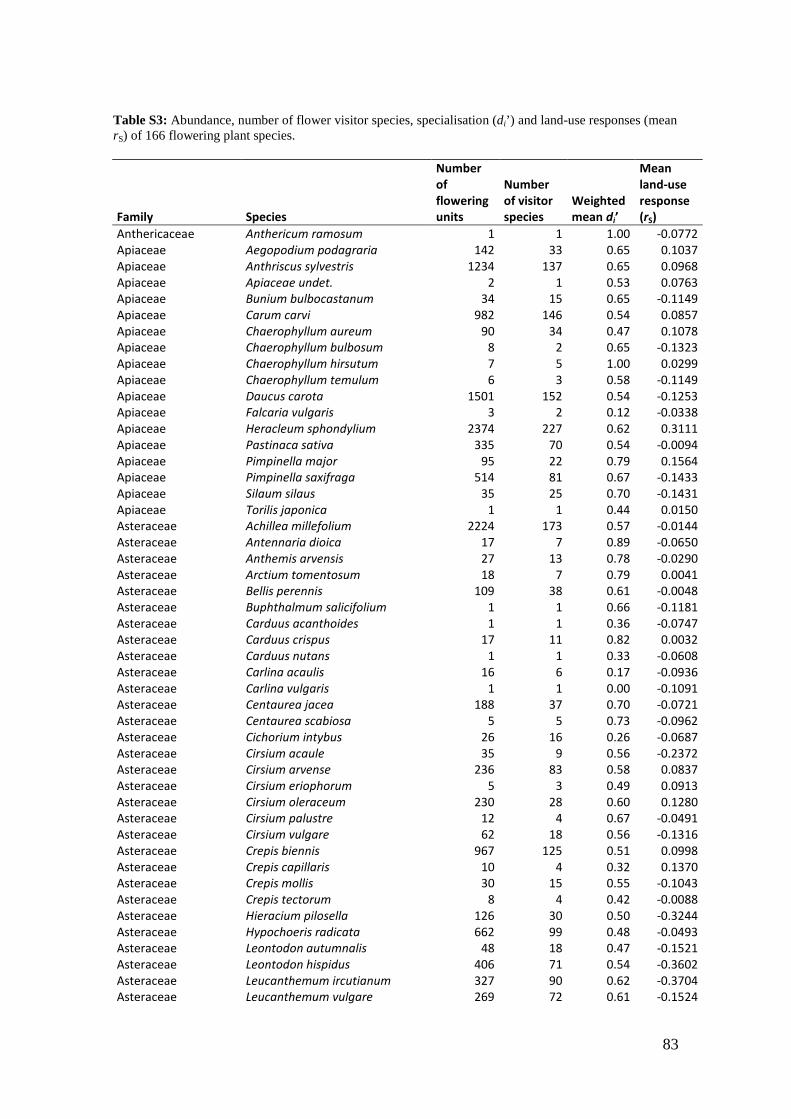
83
Table S3: Abundance, number of flower visitor species, specialisation (di’) and land-use responses (mean rS) of 166 flowering plant species.
Family Species
Number
of
flowering
units
Number
of visitor
species
Weighted
mean di’
Mean
land-use
response
(rS)
Anthericaceae Anthericum ramosum 1 1 1.00 -0.0772
Apiaceae Aegopodium podagraria 142 33 0.65 0.1037
Apiaceae Anthriscus sylvestris 1234 137 0.65 0.0968
Apiaceae Apiaceae undet. 2 1 0.53 0.0763
Apiaceae Bunium bulbocastanum 34 15 0.65 -0.1149
Apiaceae Carum carvi 982 146 0.54 0.0857
Apiaceae Chaerophyllum aureum 90 34 0.47 0.1078
Apiaceae Chaerophyllum bulbosum 8 2 0.65 -0.1323
Apiaceae Chaerophyllum hirsutum 7 5 1.00 0.0299
Apiaceae Chaerophyllum temulum 6 3 0.58 -0.1149
Apiaceae Daucus carota 1501 152 0.54 -0.1253
Apiaceae Falcaria vulgaris 3 2 0.12 -0.0338
Apiaceae Heracleum sphondylium 2374 227 0.62 0.3111
Apiaceae Pastinaca sativa 335 70 0.54 -0.0094
Apiaceae Pimpinella major 95 22 0.79 0.1564
Apiaceae Pimpinella saxifraga 514 81 0.67 -0.1433
Apiaceae Silaum silaus 35 25 0.70 -0.1431
Apiaceae Torilis japonica 1 1 0.44 0.0150
Asteraceae Achillea millefolium 2224 173 0.57 -0.0144
Asteraceae Antennaria dioica 17 7 0.89 -0.0650
Asteraceae Anthemis arvensis 27 13 0.78 -0.0290
Asteraceae Arctium tomentosum 18 7 0.79 0.0041
Asteraceae Bellis perennis 109 38 0.61 -0.0048
Asteraceae Buphthalmum salicifolium 1 1 0.66 -0.1181
Asteraceae Carduus acanthoides 1 1 0.36 -0.0747
Asteraceae Carduus crispus 17 11 0.82 0.0032
Asteraceae Carduus nutans 1 1 0.33 -0.0608
Asteraceae Carlina acaulis 16 6 0.17 -0.0936
Asteraceae Carlina vulgaris 1 1 0.00 -0.1091
Asteraceae Centaurea jacea 188 37 0.70 -0.0721
Asteraceae Centaurea scabiosa 5 5 0.73 -0.0962
Asteraceae Cichorium intybus 26 16 0.26 -0.0687
Asteraceae Cirsium acaule 35 9 0.56 -0.2372
Asteraceae Cirsium arvense 236 83 0.58 0.0837
Asteraceae Cirsium eriophorum 5 3 0.49 0.0913
Asteraceae Cirsium oleraceum 230 28 0.60 0.1280
Asteraceae Cirsium palustre 12 4 0.67 -0.0491
Asteraceae Cirsium vulgare 62 18 0.56 -0.1316
Asteraceae Crepis biennis 967 125 0.51 0.0998
Asteraceae Crepis capillaris 10 4 0.32 0.1370
Asteraceae Crepis mollis 30 15 0.55 -0.1043
Asteraceae Crepis tectorum 8 4 0.42 -0.0088
Asteraceae Hieracium pilosella 126 30 0.50 -0.3244
Asteraceae Hypochoeris radicata 662 99 0.48 -0.0493
Asteraceae Leontodon autumnalis 48 18 0.47 -0.1521
Asteraceae Leontodon hispidus 406 71 0.54 -0.3602
Asteraceae Leucanthemum ircutianum 327 90 0.62 -0.3704
Asteraceae Leucanthemum vulgare 269 72 0.61 -0.1524
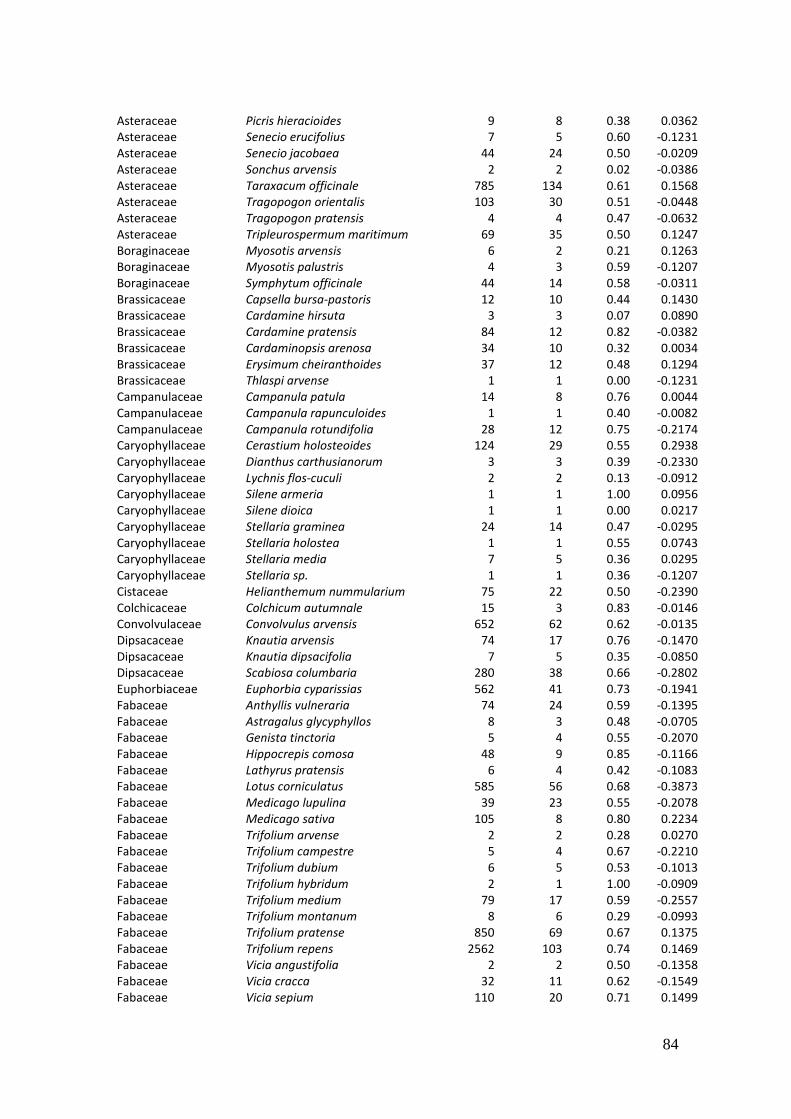
84
Asteraceae Picris hieracioides 9 8 0.38 0.0362
Asteraceae Senecio erucifolius 7 5 0.60 -0.1231
Asteraceae Senecio jacobaea 44 24 0.50 -0.0209
Asteraceae Sonchus arvensis 2 2 0.02 -0.0386
Asteraceae Taraxacum officinale 785 134 0.61 0.1568
Asteraceae Tragopogon orientalis 103 30 0.51 -0.0448
Asteraceae Tragopogon pratensis 4 4 0.47 -0.0632
Asteraceae Tripleurospermum maritimum 69 35 0.50 0.1247
Boraginaceae Myosotis arvensis 6 2 0.21 0.1263
Boraginaceae Myosotis palustris 4 3 0.59 -0.1207
Boraginaceae Symphytum officinale 44 14 0.58 -0.0311
Brassicaceae Capsella bursa-pastoris 12 10 0.44 0.1430
Brassicaceae Cardamine hirsuta 3 3 0.07 0.0890
Brassicaceae Cardamine pratensis 84 12 0.82 -0.0382
Brassicaceae Cardaminopsis arenosa 34 10 0.32 0.0034
Brassicaceae Erysimum cheiranthoides 37 12 0.48 0.1294
Brassicaceae Thlaspi arvense 1 1 0.00 -0.1231
Campanulaceae Campanula patula 14 8 0.76 0.0044
Campanulaceae Campanula rapunculoides 1 1 0.40 -0.0082
Campanulaceae Campanula rotundifolia 28 12 0.75 -0.2174
Caryophyllaceae Cerastium holosteoides 124 29 0.55 0.2938
Caryophyllaceae Dianthus carthusianorum 3 3 0.39 -0.2330
Caryophyllaceae Lychnis flos-cuculi 2 2 0.13 -0.0912
Caryophyllaceae Silene armeria 1 1 1.00 0.0956
Caryophyllaceae Silene dioica 1 1 0.00 0.0217
Caryophyllaceae Stellaria graminea 24 14 0.47 -0.0295
Caryophyllaceae Stellaria holostea 1 1 0.55 0.0743
Caryophyllaceae Stellaria media 7 5 0.36 0.0295
Caryophyllaceae Stellaria sp. 1 1 0.36 -0.1207
Cistaceae Helianthemum nummularium 75 22 0.50 -0.2390
Colchicaceae Colchicum autumnale 15 3 0.83 -0.0146
Convolvulaceae Convolvulus arvensis 652 62 0.62 -0.0135
Dipsacaceae Knautia arvensis 74 17 0.76 -0.1470
Dipsacaceae Knautia dipsacifolia 7 5 0.35 -0.0850
Dipsacaceae Scabiosa columbaria 280 38 0.66 -0.2802
Euphorbiaceae Euphorbia cyparissias 562 41 0.73 -0.1941
Fabaceae Anthyllis vulneraria 74 24 0.59 -0.1395
Fabaceae Astragalus glycyphyllos 8 3 0.48 -0.0705
Fabaceae Genista tinctoria 5 4 0.55 -0.2070
Fabaceae Hippocrepis comosa 48 9 0.85 -0.1166
Fabaceae Lathyrus pratensis 6 4 0.42 -0.1083
Fabaceae Lotus corniculatus 585 56 0.68 -0.3873
Fabaceae Medicago lupulina 39 23 0.55 -0.2078
Fabaceae Medicago sativa 105 8 0.80 0.2234
Fabaceae Trifolium arvense 2 2 0.28 0.0270
Fabaceae Trifolium campestre 5 4 0.67 -0.2210
Fabaceae Trifolium dubium 6 5 0.53 -0.1013
Fabaceae Trifolium hybridum 2 1 1.00 -0.0909
Fabaceae Trifolium medium 79 17 0.59 -0.2557
Fabaceae Trifolium montanum 8 6 0.29 -0.0993
Fabaceae Trifolium pratense 850 69 0.67 0.1375
Fabaceae Trifolium repens 2562 103 0.74 0.1469
Fabaceae Vicia angustifolia 2 2 0.50 -0.1358
Fabaceae Vicia cracca 32 11 0.62 -0.1549
Fabaceae Vicia sepium 110 20 0.71 0.1499
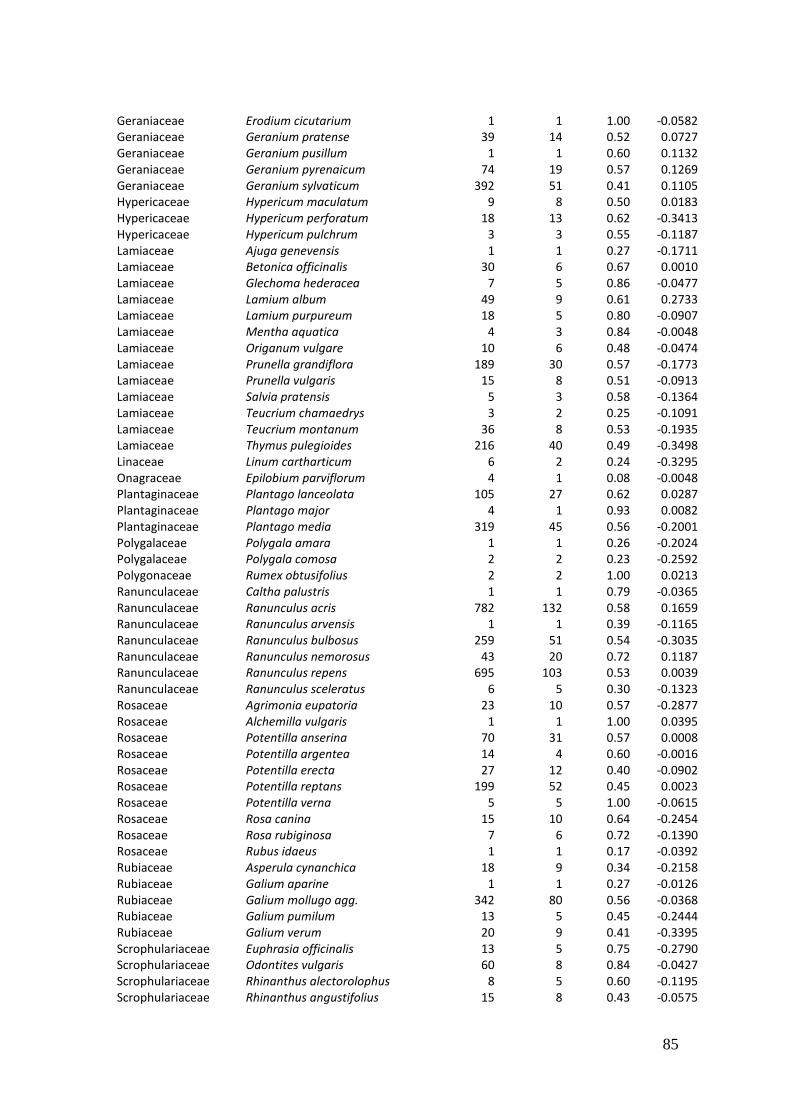
85
Geraniaceae Erodium cicutarium 1 1 1.00 -0.0582
Geraniaceae Geranium pratense 39 14 0.52 0.0727
Geraniaceae Geranium pusillum 1 1 0.60 0.1132
Geraniaceae Geranium pyrenaicum 74 19 0.57 0.1269
Geraniaceae Geranium sylvaticum 392 51 0.41 0.1105
Hypericaceae Hypericum maculatum 9 8 0.50 0.0183
Hypericaceae Hypericum perforatum 18 13 0.62 -0.3413
Hypericaceae Hypericum pulchrum 3 3 0.55 -0.1187
Lamiaceae Ajuga genevensis 1 1 0.27 -0.1711
Lamiaceae Betonica officinalis 30 6 0.67 0.0010
Lamiaceae Glechoma hederacea 7 5 0.86 -0.0477
Lamiaceae Lamium album 49 9 0.61 0.2733
Lamiaceae Lamium purpureum 18 5 0.80 -0.0907
Lamiaceae Mentha aquatica 4 3 0.84 -0.0048
Lamiaceae Origanum vulgare 10 6 0.48 -0.0474
Lamiaceae Prunella grandiflora 189 30 0.57 -0.1773
Lamiaceae Prunella vulgaris 15 8 0.51 -0.0913
Lamiaceae Salvia pratensis 5 3 0.58 -0.1364
Lamiaceae Teucrium chamaedrys 3 2 0.25 -0.1091
Lamiaceae Teucrium montanum 36 8 0.53 -0.1935
Lamiaceae Thymus pulegioides 216 40 0.49 -0.3498
Linaceae Linum cartharticum 6 2 0.24 -0.3295
Onagraceae Epilobium parviflorum 4 1 0.08 -0.0048
Plantaginaceae Plantago lanceolata 105 27 0.62 0.0287
Plantaginaceae Plantago major 4 1 0.93 0.0082
Plantaginaceae Plantago media 319 45 0.56 -0.2001
Polygalaceae Polygala amara 1 1 0.26 -0.2024
Polygalaceae Polygala comosa 2 2 0.23 -0.2592
Polygonaceae Rumex obtusifolius 2 2 1.00 0.0213
Ranunculaceae Caltha palustris 1 1 0.79 -0.0365
Ranunculaceae Ranunculus acris 782 132 0.58 0.1659
Ranunculaceae Ranunculus arvensis 1 1 0.39 -0.1165
Ranunculaceae Ranunculus bulbosus 259 51 0.54 -0.3035
Ranunculaceae Ranunculus nemorosus 43 20 0.72 0.1187
Ranunculaceae Ranunculus repens 695 103 0.53 0.0039
Ranunculaceae Ranunculus sceleratus 6 5 0.30 -0.1323
Rosaceae Agrimonia eupatoria 23 10 0.57 -0.2877
Rosaceae Alchemilla vulgaris 1 1 1.00 0.0395
Rosaceae Potentilla anserina 70 31 0.57 0.0008
Rosaceae Potentilla argentea 14 4 0.60 -0.0016
Rosaceae Potentilla erecta 27 12 0.40 -0.0902
Rosaceae Potentilla reptans 199 52 0.45 0.0023
Rosaceae Potentilla verna 5 5 1.00 -0.0615
Rosaceae Rosa canina 15 10 0.64 -0.2454
Rosaceae Rosa rubiginosa 7 6 0.72 -0.1390
Rosaceae Rubus idaeus 1 1 0.17 -0.0392
Rubiaceae Asperula cynanchica 18 9 0.34 -0.2158
Rubiaceae Galium aparine 1 1 0.27 -0.0126
Rubiaceae Galium mollugo agg. 342 80 0.56 -0.0368
Rubiaceae Galium pumilum 13 5 0.45 -0.2444
Rubiaceae Galium verum 20 9 0.41 -0.3395
Scrophulariaceae Euphrasia officinalis 13 5 0.75 -0.2790
Scrophulariaceae Odontites vulgaris 60 8 0.84 -0.0427
Scrophulariaceae Rhinanthus alectorolophus 8 5 0.60 -0.1195
Scrophulariaceae Rhinanthus angustifolius 15 8 0.43 -0.0575
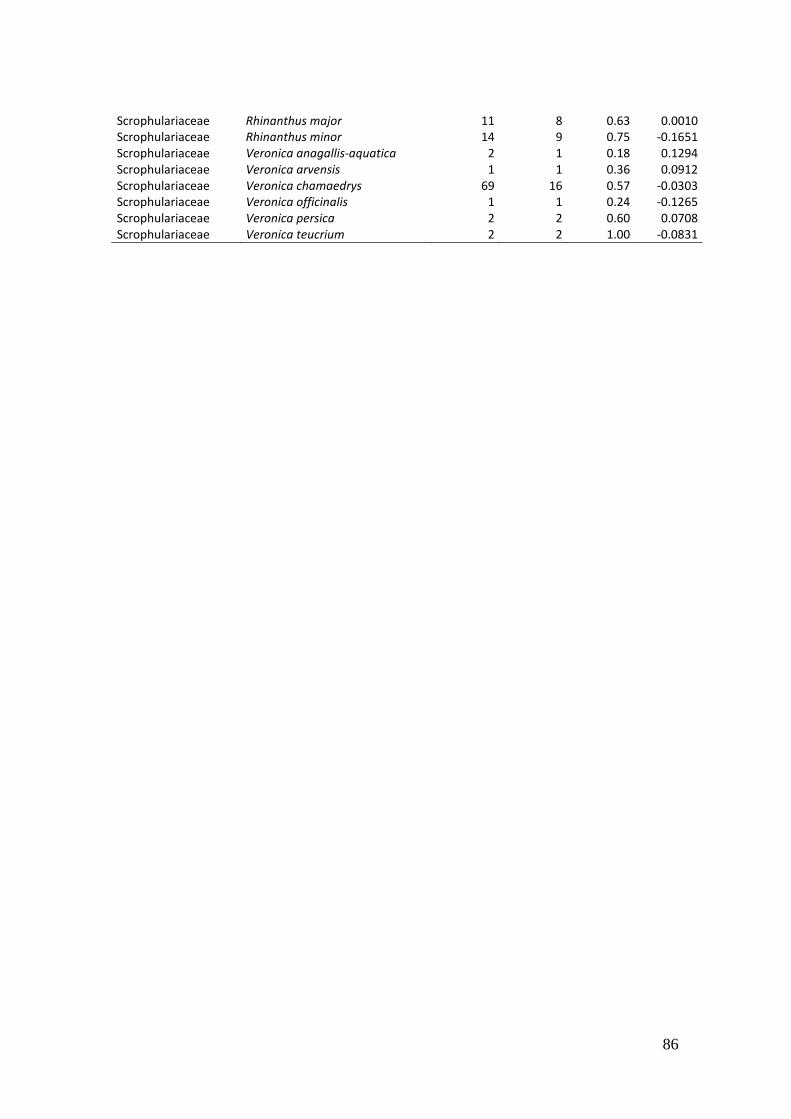
86
Scrophulariaceae Rhinanthus major 11 8 0.63 0.0010
Scrophulariaceae Rhinanthus minor 14 9 0.75 -0.1651
Scrophulariaceae Veronica anagallis-aquatica 2 1 0.18 0.1294
Scrophulariaceae Veronica arvensis 1 1 0.36 0.0912
Scrophulariaceae Veronica chamaedrys 69 16 0.57 -0.0303
Scrophulariaceae Veronica officinalis 1 1 0.24 -0.1265
Scrophulariaceae Veronica persica 2 2 0.60 0.0708
Scrophulariaceae Veronica teucrium 2 2 1.00 -0.0831
87
4. Differences in land-use effects on plant-pollinator interaction across three different German bioregions
This chapter is in preparation as: Weiner, C.N., Werner, M., Linsenmair, K.-E., Blüthgen, N.: Land-use intensification triggers diversity loss in pollination networks: Regional distinctions between three different German bioregions
Summary
Agricultural intensification may pose a serious risk to biodiversity preservation and
ecosystem services such as pollination. On 119 grassland sites in three German
bioregions differing in climate and geology we documented plant-pollinator interactions
along a gradient of increasing land-use intensity. We analyzed abundance, diversity,
composition and specialization focusing on the isolated effects of fertilization, mowing
and grazing intensity.
We found strong regional differences in plant as well as in pollinator response to land-
use intensity and its isolated compounds. Yet, throughout the regions, pollinator fate
was determined by the average land-use response of the plant species they visited and
vice versa. Moreover, in pollinators – but not in plants – land-use intensification
disproportionately affected specialized species.
These results show how closely plants and pollinators rely on each other and that a
decline in plant species might have rigorous consequences for their visitors. We
demonstrate that it is not advisable to transfer results and management
recommendations readily from one region to another. Regional conditions have to be
carefully analyzed before reasoning on how a system will react to land-use changes.
Neither plants nor pollinators react the same way to management conditions under a
different regional context.
4.1 Introduction
Understanding the relationship between ecosystem functioning and human-induced
changes in biodiversity via land-use has become a major challenge for scientists
worldwide. Despite the explosion of research that has taken place on the topic, many
uncertainties remain (Hooper et al. 2005). Thus, further inside to the relationship
88
between land-use and taxonomic as well as functional diversity is essential for
understanding the mechanisms by which biodiversity and gradual losses thereof may
affect ecosystem functions and services (Loreau et al. 2001, Dunne et al. 2002, Kaiser-
Bunbury et al. 2010).
Pollination is an important ecosystem service and it is considered at risk (Daily 1997,
Klein et al. 2007, Aizen and Harder 2009). Agricultural intensification triggers losses in
the diversity of plant and pollinator communities via habitat conversion (Keitt 2009),
fragmentation (Rathcke and Jules 1993), fertilization (Burkle and Irwin 2010), mowing
and grazing (Gibson et al. 1992, Kruess and Tscharntke 2002, Socher et al. 2013) as
well as pesticide use (Desneux et al. 2007). While in line with the intermediate
disturbance hypothesis light grazing or mowing regimes can also augment species
richness and enhance diversity of grasslands (Collins et al. 1998), heavy grazing or
mowing considerably alters species composition and reduces plant diversity (Kruess
and Tscharntke 2002, Zechmeister et al. 2003, Mayer 2004). Also seed set is reduced in
heavily grazed grasslands due to diversity reductions in pollinators (Mayer 2004).
Concerning pollinators, land-use intensification, e.g. increased mowing frequency, may
have direct effects on pollinator diversity and abundance via disruption of life cycles
(Johst et al. 2006) and indirect effects via resource availability. However, different
insect species show differences in their response to agricultural management (Sjödin et
al. 2008). There is evidence that pollinator species response to land-use may be also
determined by pollinator specialization and interaction strength (Weiner et al. 2014).
Especially in specialized species their land-use response and the mean land-use
response of flowers visited are expected to be positively correlated, if plants determine
the response of visitors and vice versa.
Regarding the preservation of ecosystem functions and services, management decisions
have to be made which agricultural practices are appropriate to sustain the ecosystem
service of pollination and which management regimes encourage the species most
important to this service. In such cases species richness or diversity may not always be
the best measures to describe ongoing changes, as another source of biodiversity loss –
biological homogenization – may easily be overlooked (Filippi-Codaccioni et al. 2010).
In the present study, we compare abundance, diversity, composition and specialization
of quantitative pollination networks across three different German bioregions and along
89
a continuous gradient of increasing land-use intensity. We examine which components
of land-use (mowing, grazing, fertilization) most fundamentally influence herbal species
richness and abundance as well as species richness, abundance and composition of
pollinators. Moreover, we take a closer look at specialization of plant-pollinator
interactions and its possible influence in relation to species loss.
We expect that (i) individual land-use components have marked effects on species
richness, abundance and composition of plant-pollinator associations and that (ii) the
direction in which different land-use practices influence diversity and abundance vary
between pollinator groups. Yet, (iii) across regions we expect that responses of plants
and pollinators to land-use are also determined by species specialization and the average
land-use response of their interaction partners.
4.2 Methods
4.2.1 Study area and land-use gradient
We studied a variety of differently used grasslands in three major German research
areas, the so-called Biodiversity Exploratories (Fischer et al. 2010). These Exploratories
are located in the Schorfheide-Chorin (NE Germany), Hainich-Dün (Central Germany)
and Schwäbische Alb (SW Germany) region. Each Exploratory covers an area of 422 -
1300 km² of land and comprises 50 experimental grassland plots measuring 50 × 50 m
each. The plots are situated within a matrix of agricultural land in use and are managed
accordingly by their owners. Fischer et al. (2010) give a detailed description of all plot
selection criteria. Represented land-use types range from near-natural, protected sites to
intensively fertilized, mown or grazed meadows and pastures (sheep, horses, cattle).
As purely qualitative categorization of land-use types disregards quantitative variations
in intensity within a category, we used a quantitative land-use index (L) on a continuous
scale, which incorporates fertilization (kg N × ha-1 × year-1), mowing (mowing
frequency × year-1) and grazing intensity (livestock units × days × ha-1 × year-1).
For each plot k the land-use intensity Lk is defined as the square root of the sum of the
contributing land-use variables, divided by the respective mean of the variable over all
150 sites (“global” standardization):
mean
k
mean
k
mean
kk
M
M
F
F
G
GL ++=
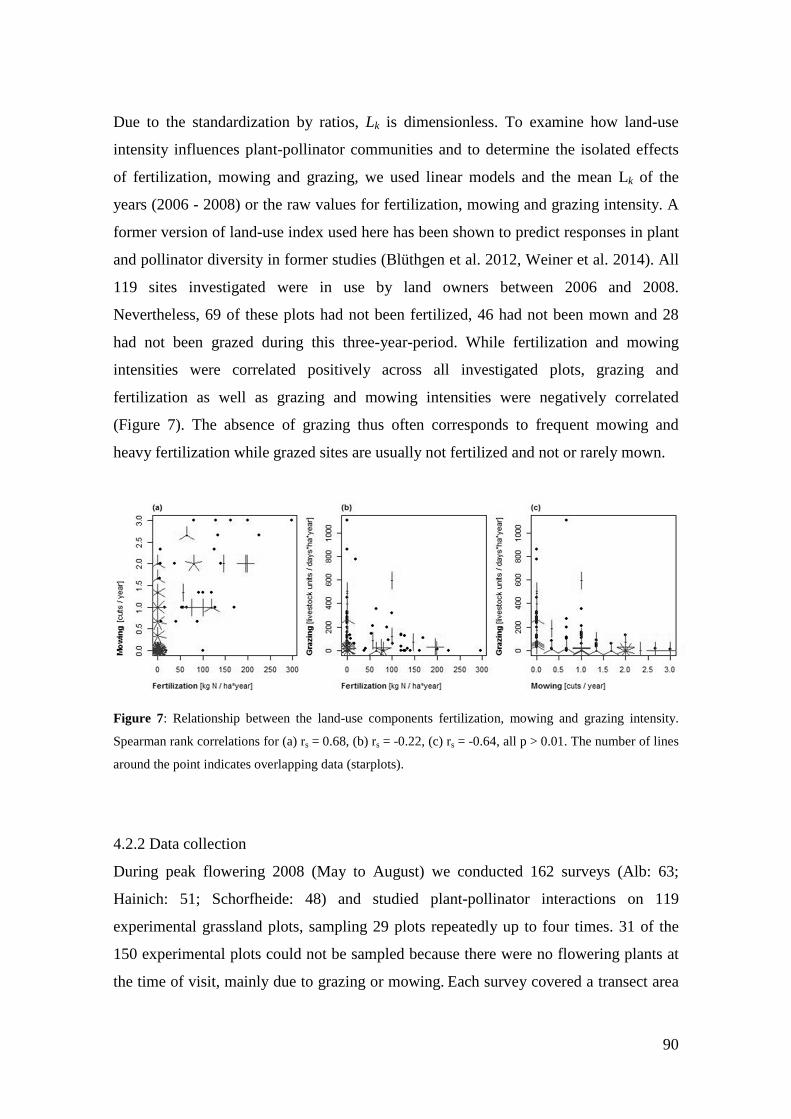
90
Due to the standardization by ratios, Lk is dimensionless. To examine how land-use
intensity influences plant-pollinator communities and to determine the isolated effects
of fertilization, mowing and grazing, we used linear models and the mean Lk of the
years (2006 - 2008) or the raw values for fertilization, mowing and grazing intensity. A
former version of land-use index used here has been shown to predict responses in plant
and pollinator diversity in former studies (Blüthgen et al. 2012, Weiner et al. 2014). All
119 sites investigated were in use by land owners between 2006 and 2008.
Nevertheless, 69 of these plots had not been fertilized, 46 had not been mown and 28
had not been grazed during this three-year-period. While fertilization and mowing
intensities were correlated positively across all investigated plots, grazing and
fertilization as well as grazing and mowing intensities were negatively correlated
(Figure 7). The absence of grazing thus often corresponds to frequent mowing and
heavy fertilization while grazed sites are usually not fertilized and not or rarely mown.
Figure 7: Relationship between the land-use components fertilization, mowing and grazing intensity.
Spearman rank correlations for (a) rs = 0.68, (b) rs = -0.22, (c) rs = -0.64, all p > 0.01. The number of lines
around the point indicates overlapping data (starplots).
4.2.2 Data collection
During peak flowering 2008 (May to August) we conducted 162 surveys (Alb: 63;
Hainich: 51; Schorfheide: 48) and studied plant-pollinator interactions on 119
experimental grassland plots, sampling 29 plots repeatedly up to four times. 31 of the
150 experimental plots could not be sampled because there were no flowering plants at
the time of visit, mainly due to grazing or mowing. Each survey covered a transect area
91
measuring 200 × 3 m (length × width) and six hours of sampling between morning and
afternoon with the 200 m intercept being sampled three times and yielded a single
interaction network, which we analyzed separately. To avoid pseudo-replication we
calculated the mean value per plot and variable for surveys on plots which were
sampled repeatedly two to three times within 30 days. This pertained to 27 surveys on
13 plots in the Alb and resulted in n = 49 surveys in the Alb. We consider our analyses
of land-use effects as unbiased by spatial and temporal effects, as Mantel tests based on
Bray-Curtis distance and 105 permutations showed no correlations between spatial
arrangement of the plots and species composition and land-use intensity was not
correlated with sampling date or spatial distance in any Exploratory (see Chapter 3;
Weiner et al. 2014).
We exclusively recorded visitors that touched the reproductive parts of a flower – thus
likely to be pollinators - , as well as the plant species they visited. Specimens that could
not be identified in the field were collected and later identified to species level by
experts (see acknowledgements). We analyzed flower visits from insect visitors
belonging to the orders of hymenoptera, lepidoptera, diptera and coleoptera. However,
Nitidulidae (sap beetles) were excluded from our analysis as they are easily overlooked
or under-sampled in structurally complex flowers, which may create a bias for some
plants if collected erratically.
To account for flower abundance per plant species and transect we counted the number
of flowering units (a unit refers to one or more flowers demanding an insect to fly in
order to reach the next unit) or, in highly abundant species, extrapolated it from a small
area. Flower diversity was assessed by multiplying the number of flowering units per
species by its average flowering area in cm², to account for differences in flowering
area, which are related to pollinator attraction (Grindeland et al. 2005). A detailed
description of measurement of flowering area is given in Weiner et al. (2011).
4.2.3 Response variables
To test effects land-use intensity and its individual components have on plant-pollinator
associations, we choose three types of response variables: diversity, abundance and
compositional variables. These variables are assumed to be suitable to test land-use
effects because we expect direct or indirect responses to more intensive land-use. For
92
example plant diversity is known to respond negatively to intensive mowing
(Zechmeister et al. 2003), while pollinator diversity and abundance is reduced on
overgrazed pastures (Mayer 2004) and shifts in insect species composition have been
observed in relation to fertilization and subsequent changes in plant species composition
(Haddad et al. 2000).
For each independent survey response variables were calculated separately for plants
and pollinators as well as for six pollinator groups, namely bees, other hymenopterans,
syrphids, other flies, butterflies and beetles. Bees were segregated from other
hymenopterans and syrphids from other flies as because both are commonly used
bioindicator taxa (Jauker et al. 2009).
We used species richness and alternatively the exponential of the Shannon index (eH) to
estimate diversity. Results on the latter are given in the appendix (Table A1).
Abundance was defined as total flower area per plot in plants, while in pollinators it was
defined as total number of pollinator individuals or number of individuals from a
pollinator group per plot, respectively. Pollinator composition was calculated as relative
abundance per pollinator group and experimental plot.
To gain information on the German Red List status of all pollinator species identified,
we surveyed literature (Binot et al. 1998, Binot-Hafke et al. 2011) and assigned a red
list status to each pollinator subsequently, or, in species not listed, the status “data
deficient”. For later analysis, all species assigned as vulnerable, extremely rare,
endangered, critically endangered or near extinction were categorized as threatened, all
species known to be not endangered as not threatened and all other species as data
deficient.
93
4.2.4 Statistical analysis
To assess the relationship between the response variables and the LUI index or its
individual components (fertilization, mowing, grazing) respectively, we used linear
regressions:
� = � ∙ � + �, where a is the slope and b the intercept
These were calculated for each response variable in each of the three Exploratories
separately.
We computed the mean square error (RMSE) for each model and Exploratory and
assessed model significance with an F-test. Moreover, as a rough goodness-of-fit
measure, we computed squared Pearson correlation coefficients between observed and
fitted values (R2-values).
Network and species specialization of plants and flower visitors were calculated using
the information-theoretical specialization metrics H2’ and d’ derived from the Kullback–
Leibler distance (Blüthgen et al. 2006). H2’ discloses the degree of niche
complementarity within a network, whereas d’ in our case describes a species’ deviation
in flower visitation from the distribution of all flower visitors. Both metrics range from
zero to one with high values indicating more pronounced specialization. Due to a null-
model-based correction, the indices are unaffected by variation in sampling effort or
total interaction frequency (Blüthgen et al. 2007).
To identify the general land-use response of a species, for each species i we calculated
Spearman correlation coefficients (rs) of relative species abundance (per cent of total
individuals) per plot and land-use intensity in each Exploratory. Actual species response
to land-use may relate to both, species specialization and the average land-use responses
of the specific partners a species depends on. If so, the identity and interaction strength
of links within a network gives a hint on how species respond to diversity changes. We
calculated the weighted mean di’ (weighted by a species i total interactions per
Exploratory and plot k) of each species to test for a relationship between species
specialization and land-use response. Furthermore, for pollinators we determined the
weighted mean land-use response of all specific partner plants frequented by pollinator
species i (Ei), weighted by the number of interactions aij between a pollinator species i
and its specific partner plants j. For plants we determined the weighted mean land-use
response of all specific flower visitors of a plant j (Ej), also weighted by the number of
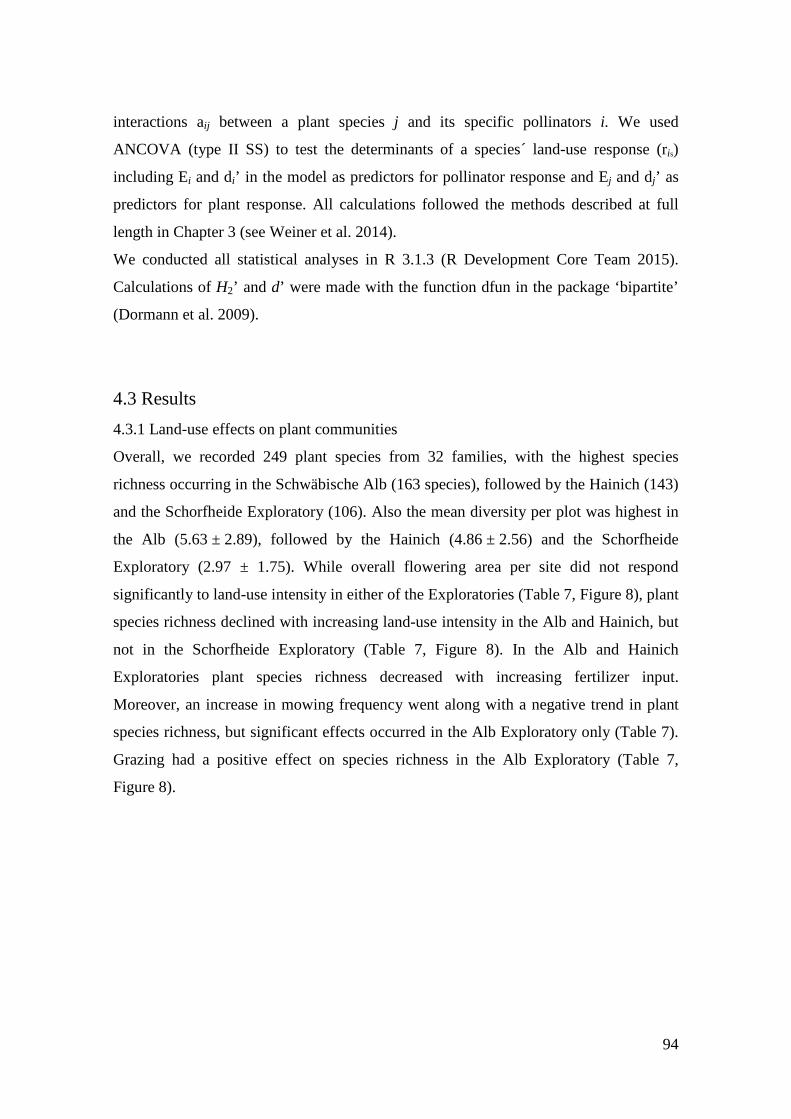
94
interactions aij between a plant species j and its specific pollinators i. We used
ANCOVA (type II SS) to test the determinants of a species´ land-use response (ris)
including Ei and di’ in the model as predictors for pollinator response and Ej and dj’ as
predictors for plant response. All calculations followed the methods described at full
length in Chapter 3 (see Weiner et al. 2014).
We conducted all statistical analyses in R 3.1.3 (R Development Core Team 2015).
Calculations of H2’ and d’ were made with the function dfun in the package ‘bipartite’
(Dormann et al. 2009).
4.3 Results
4.3.1 Land-use effects on plant communities
Overall, we recorded 249 plant species from 32 families, with the highest species
richness occurring in the Schwäbische Alb (163 species), followed by the Hainich (143)
and the Schorfheide Exploratory (106). Also the mean diversity per plot was highest in
the Alb (5.63 ± 2.89), followed by the Hainich (4.86 ± 2.56) and the Schorfheide
Exploratory (2.97 ± 1.75). While overall flowering area per site did not respond
significantly to land-use intensity in either of the Exploratories (Table 7, Figure 8), plant
species richness declined with increasing land-use intensity in the Alb and Hainich, but
not in the Schorfheide Exploratory (Table 7, Figure 8). In the Alb and Hainich
Exploratories plant species richness decreased with increasing fertilizer input.
Moreover, an increase in mowing frequency went along with a negative trend in plant
species richness, but significant effects occurred in the Alb Exploratory only (Table 7).
Grazing had a positive effect on species richness in the Alb Exploratory (Table 7,
Figure 8).
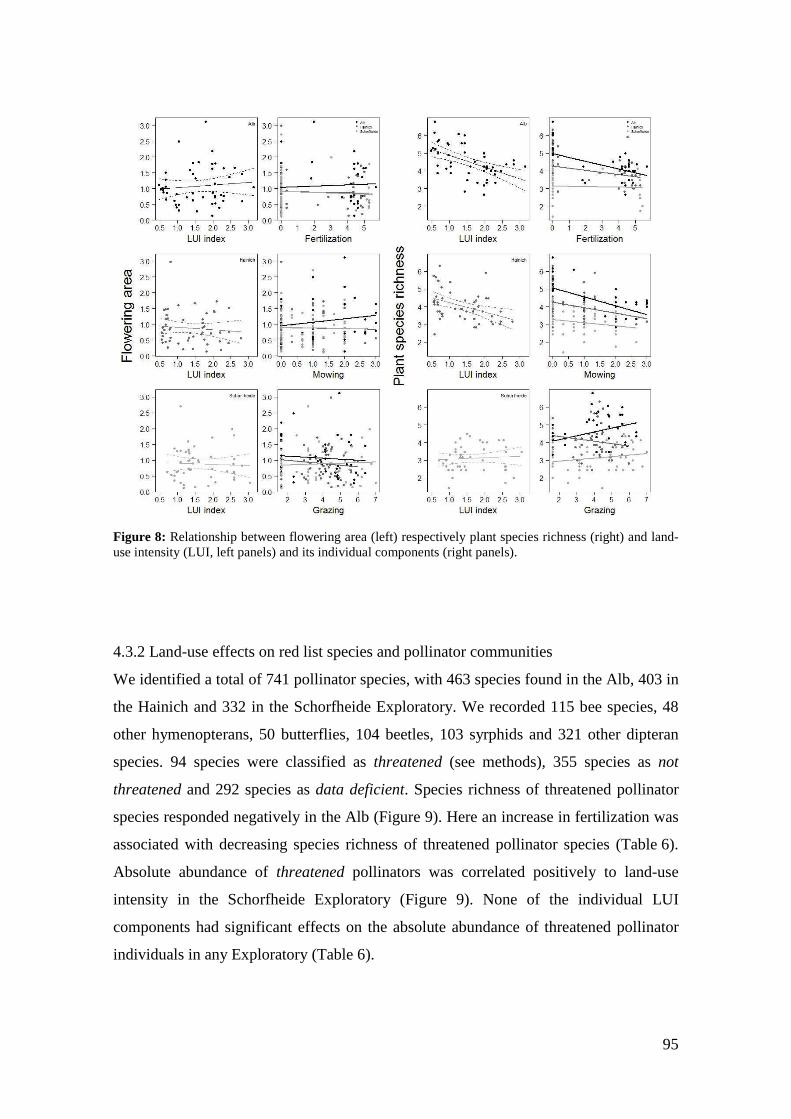
95
Figure 8: Relationship between flowering area (left) respectively plant species richness (right) and land-use intensity (LUI, left panels) and its individual components (right panels).
4.3.2 Land-use effects on red list species and pollinator communities
We identified a total of 741 pollinator species, with 463 species found in the Alb, 403 in
the Hainich and 332 in the Schorfheide Exploratory. We recorded 115 bee species, 48
other hymenopterans, 50 butterflies, 104 beetles, 103 syrphids and 321 other dipteran
species. 94 species were classified as threatened (see methods), 355 species as not
threatened and 292 species as data deficient. Species richness of threatened pollinator
species responded negatively in the Alb (Figure 9). Here an increase in fertilization was
associated with decreasing species richness of threatened pollinator species (Table 6).
Absolute abundance of threatened pollinators was correlated positively to land-use
intensity in the Schorfheide Exploratory (Figure 9). None of the individual LUI
components had significant effects on the absolute abundance of threatened pollinator
individuals in any Exploratory (Table 6).

96
Table 6: Univariate relationships between land-use intensity (LUI), as well as its individual components and response variables. Response Region
LUI index Fertilization intensity Mowing intensity Grazing intensity
variable
N R² RMSE p R² RMSE p R² RMSE p R² RMSE p
Richness of
red list
species
Alb 49 0,11 0,51 0,02692 0,14 0,50 0,01028 0,03 0,53 0,24826 0,00 0,54 0,88931
Hainich 51 0,02 0,73 0,32665 0,00 0,74 0,88530 0,00 0,74 0,76316 0,01 0,73 0,47831
Schorf-
heide 48 0,03 0,60 0,27697 0,01 0,60 0,53445 0,00 0,61 0,76881 0,02 0,60 0,45775
Absolute
abundance
of red list
Individuals
Alb 49 0,02 1,61 0,31934 0,03 1,61 0,26269 0,01 1,62 0,54941 0,00 1,63 0,80379
Hainich 51 0,06 1,87 0,10742 0,01 1,91 0,53382 0,02 1,90 0,36040 0,00 1,92 0,69505
Schorf-
heide 48 0,11 1,74 0,03838 0,05 1,80 0,17257 0,04 1,81 0,22207 0,00 1,85 0,90551
Model fit is expressed as Pearson correlation coefficient (R²) and root mean square error (RMSE), in addition to significance level (p). Significant fit (p < 0.05) was marked boldface. Additionally, positive correlations are highlighted in light grey, negative ones in dark grey. Number of sites (N) is shown for each response.
Figure 9: Relationship between the abundance of threatened pollinator species (left) as well as their species richness (right) and land-use intensity (LUI, left panels) and its individual components (right panels).
More detailed analysis of pollinator responses revealed opposing trends for different
pollinator groups and different trends between the Exploratories (Table 7, Figure
10 - 16), which impedes the deduction of general implications for pollinator protection.
Below results are ordered by Exploratory.
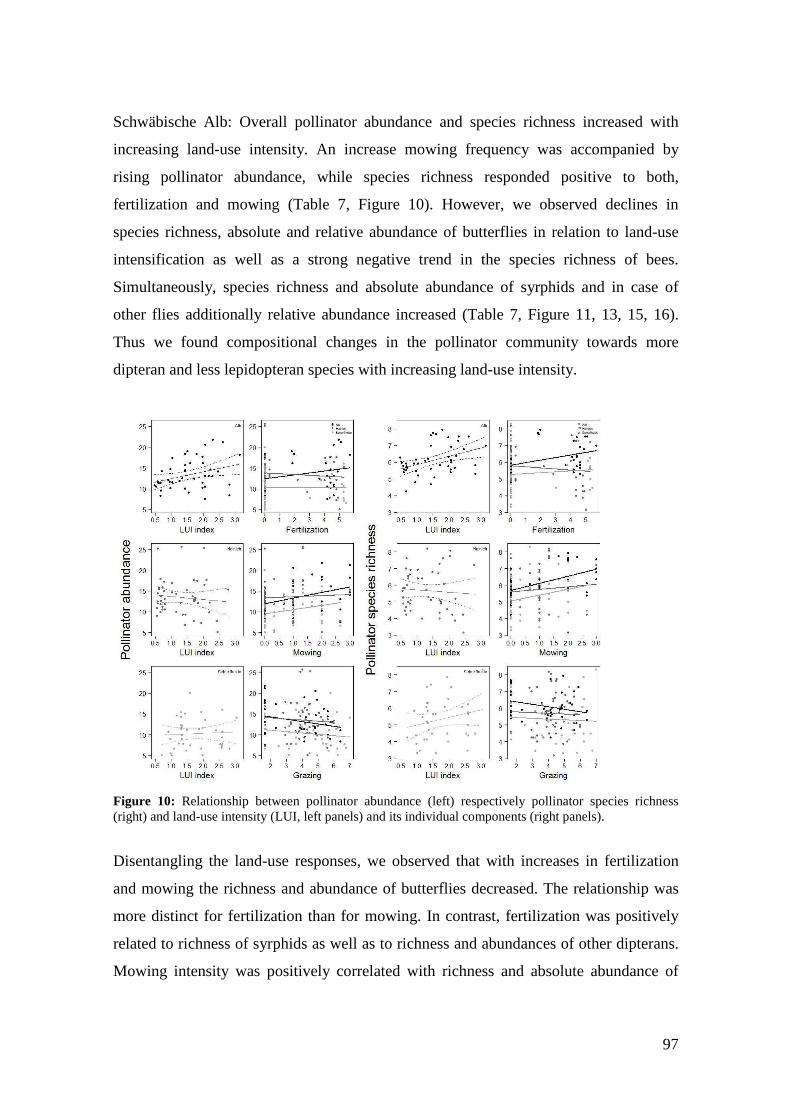
97
Schwäbische Alb: Overall pollinator abundance and species richness increased with
increasing land-use intensity. An increase mowing frequency was accompanied by
rising pollinator abundance, while species richness responded positive to both,
fertilization and mowing (Table 7, Figure 10). However, we observed declines in
species richness, absolute and relative abundance of butterflies in relation to land-use
intensification as well as a strong negative trend in the species richness of bees.
Simultaneously, species richness and absolute abundance of syrphids and in case of
other flies additionally relative abundance increased (Table 7, Figure 11, 13, 15, 16).
Thus we found compositional changes in the pollinator community towards more
dipteran and less lepidopteran species with increasing land-use intensity.
Figure 10: Relationship between pollinator abundance (left) respectively pollinator species richness (right) and land-use intensity (LUI, left panels) and its individual components (right panels).
Disentangling the land-use responses, we observed that with increases in fertilization
and mowing the richness and abundance of butterflies decreased. The relationship was
more distinct for fertilization than for mowing. In contrast, fertilization was positively
related to richness of syrphids as well as to richness and abundances of other dipterans.
Mowing intensity was positively correlated with richness and absolute abundance of
98
syrphids as well as with richness and abundances of other flies. In this case, we
observed stronger positive effects from mowing than from fertilization. None of the
pollinator groups showed a significant response to grazing intensity (Table 7).
Hainich: Neither overall pollinator abundance nor richness responded significantly to
the LUI or one of its components (Table 7, Figure 10). Species richness of beetles,
hymenopterans (excl. bees) and butterflies decreased with increasing land-use intensity.
Hymenopterans and butterflies also decreased in abundance (absolute and relative).
None of the pollinator groups responded positively to land-use intensification (Table 7,
Figure 11 - 16). The LUI was a better predictor for pollinator response to land-use than
the individual LUI components. Nevertheless, increases in fertilization were related to
decreases in species richness of beetles as well as to decreases in the relative abundance
of butterflies and a strong negative trend in their absolute abundance (Figure 13 and 14).
Moreover, the intensification of mowing also went along with decreasing relative
abundance of hymenopterans (excl. bees) and lower species numbers of beetles, though
the effect was less distinct than in fertilization. Increases in grazing were related
positively to species richness of beetles (Table 7, Figure 12 and 14).
Schorfheide: Neither overall pollinator abundance nor richness responded significantly
to changes in land-use intensity (Table 7, Figure 10). Partially opposing the trends in the
other Exploratories we found a positive response to land-use intensification in relative
abundance of bees and butterflies and a strong positive trend in the species richness of
bees, whereas the relative abundance of flies decreased with increasing land-use
intensity (Table 7, Figure 11, 12, 16). Scrutinizing the responses of the individual LUI
components we found that in syrphids higher fertilization went along with increasing
relative abundance, but higher mowing frequency had an even more pronounced
positive effect. An increase in mowing frequency went along with an increase of species
richness, absolute and relative abundance of syrphids (Table 7, Figure 15), while
species richness, and abundances of hymenopterans responded negatively (Figure 12).
Increases in grazing intensity were associated with increases in the relative abundance
of bees and butterflies. In trend the relative abundance of flies decreased (Figure 11, 13,
16).
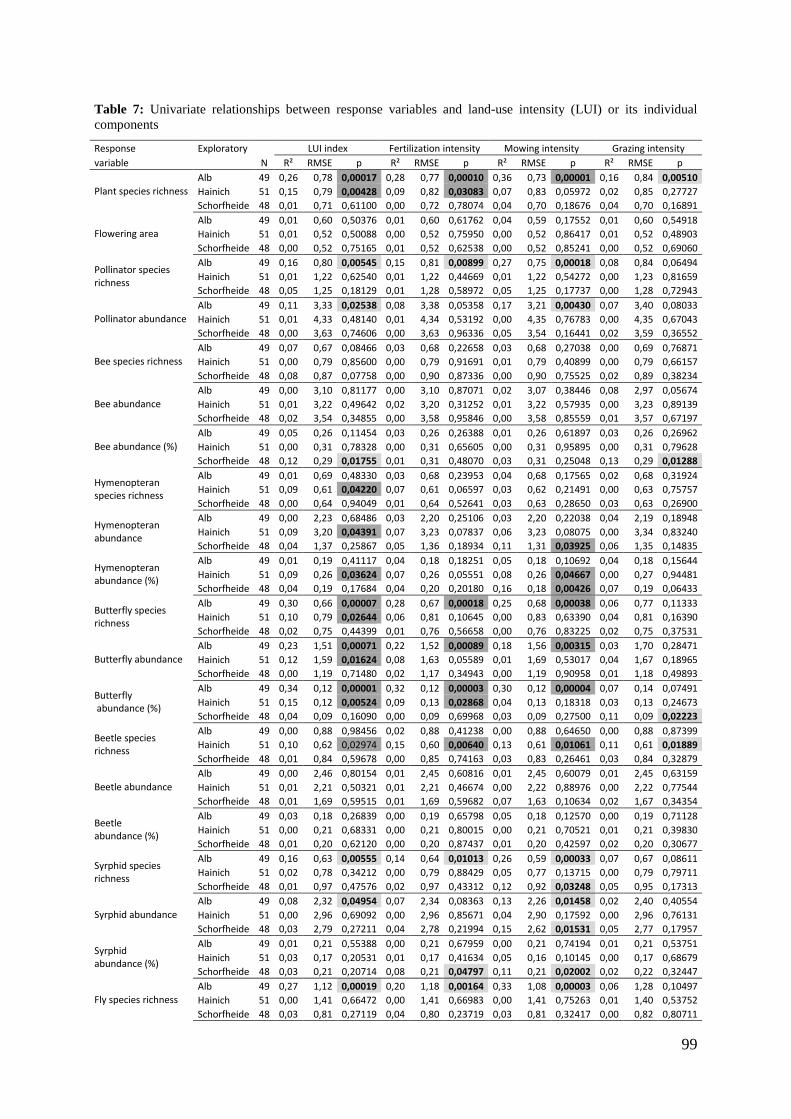
99
Table 7: Univariate relationships between response variables and land-use intensity (LUI) or its individual components
Response Exploratory LUI index Fertilization intensity Mowing intensity Grazing intensity
variable N R² RMSE p R² RMSE p R² RMSE p R² RMSE p
Plant species richness
Alb 49 0,26 0,78 0,00017 0,28 0,77 0,00010 0,36 0,73 0,00001 0,16 0,84 0,00510
Hainich 51 0,15 0,79 0,00428 0,09 0,82 0,03083 0,07 0,83 0,05972 0,02 0,85 0,27727
Schorfheide 48 0,01 0,71 0,61100 0,00 0,72 0,78074 0,04 0,70 0,18676 0,04 0,70 0,16891
Flowering area
Alb 49 0,01 0,60 0,50376 0,01 0,60 0,61762 0,04 0,59 0,17552 0,01 0,60 0,54918
Hainich 51 0,01 0,52 0,50088 0,00 0,52 0,75950 0,00 0,52 0,86417 0,01 0,52 0,48903
Schorfheide 48 0,00 0,52 0,75165 0,01 0,52 0,62538 0,00 0,52 0,85241 0,00 0,52 0,69060
Pollinator species
richness
Alb 49 0,16 0,80 0,00545 0,15 0,81 0,00899 0,27 0,75 0,00018 0,08 0,84 0,06494
Hainich 51 0,01 1,22 0,62540 0,01 1,22 0,44669 0,01 1,22 0,54272 0,00 1,23 0,81659
Schorfheide 48 0,05 1,25 0,18129 0,01 1,28 0,58972 0,05 1,25 0,17737 0,00 1,28 0,72943
Pollinator abundance
Alb 49 0,11 3,33 0,02538 0,08 3,38 0,05358 0,17 3,21 0,00430 0,07 3,40 0,08033
Hainich 51 0,01 4,33 0,48140 0,01 4,34 0,53192 0,00 4,35 0,76783 0,00 4,35 0,67043
Schorfheide 48 0,00 3,63 0,74606 0,00 3,63 0,96336 0,05 3,54 0,16441 0,02 3,59 0,36552
Bee species richness
Alb 49 0,07 0,67 0,08466 0,03 0,68 0,22658 0,03 0,68 0,27038 0,00 0,69 0,76871
Hainich 51 0,00 0,79 0,85600 0,00 0,79 0,91691 0,01 0,79 0,40899 0,00 0,79 0,66157
Schorfheide 48 0,08 0,87 0,07758 0,00 0,90 0,87336 0,00 0,90 0,75525 0,02 0,89 0,38234
Bee abundance
Alb 49 0,00 3,10 0,81177 0,00 3,10 0,87071 0,02 3,07 0,38446 0,08 2,97 0,05674
Hainich 51 0,01 3,22 0,49642 0,02 3,20 0,31252 0,01 3,22 0,57935 0,00 3,23 0,89139
Schorfheide 48 0,02 3,54 0,34855 0,00 3,58 0,95846 0,00 3,58 0,85559 0,01 3,57 0,67197
Bee abundance (%)
Alb 49 0,05 0,26 0,11454 0,03 0,26 0,26388 0,01 0,26 0,61897 0,03 0,26 0,26962
Hainich 51 0,00 0,31 0,78328 0,00 0,31 0,65605 0,00 0,31 0,95895 0,00 0,31 0,79628
Schorfheide 48 0,12 0,29 0,01755 0,01 0,31 0,48070 0,03 0,31 0,25048 0,13 0,29 0,01288
Hymenopteran
species richness
Alb 49 0,01 0,69 0,48330 0,03 0,68 0,23953 0,04 0,68 0,17565 0,02 0,68 0,31924
Hainich 51 0,09 0,61 0,04220 0,07 0,61 0,06597 0,03 0,62 0,21491 0,00 0,63 0,75757
Schorfheide 48 0,00 0,64 0,94049 0,01 0,64 0,52641 0,03 0,63 0,28650 0,03 0,63 0,26900
Hymenopteran
abundance
Alb 49 0,00 2,23 0,68486 0,03 2,20 0,25106 0,03 2,20 0,22038 0,04 2,19 0,18948
Hainich 51 0,09 3,20 0,04391 0,07 3,23 0,07837 0,06 3,23 0,08075 0,00 3,34 0,83240
Schorfheide 48 0,04 1,37 0,25867 0,05 1,36 0,18934 0,11 1,31 0,03925 0,06 1,35 0,14835
Hymenopteran
abundance (%)
Alb 49 0,01 0,19 0,41117 0,04 0,18 0,18251 0,05 0,18 0,10692 0,04 0,18 0,15644
Hainich 51 0,09 0,26 0,03624 0,07 0,26 0,05551 0,08 0,26 0,04667 0,00 0,27 0,94481
Schorfheide 48 0,04 0,19 0,17684 0,04 0,20 0,20180 0,16 0,18 0,00426 0,07 0,19 0,06433
Butterfly species
richness
Alb 49 0,30 0,66 0,00007 0,28 0,67 0,00018 0,25 0,68 0,00038 0,06 0,77 0,11333
Hainich 51 0,10 0,79 0,02644 0,06 0,81 0,10645 0,00 0,83 0,63390 0,04 0,81 0,16390
Schorfheide 48 0,02 0,75 0,44399 0,01 0,76 0,56658 0,00 0,76 0,83225 0,02 0,75 0,37531
Butterfly abundance
Alb 49 0,23 1,51 0,00071 0,22 1,52 0,00089 0,18 1,56 0,00315 0,03 1,70 0,28471
Hainich 51 0,12 1,59 0,01624 0,08 1,63 0,05589 0,01 1,69 0,53017 0,04 1,67 0,18965
Schorfheide 48 0,00 1,19 0,71480 0,02 1,17 0,34943 0,00 1,19 0,90958 0,01 1,18 0,49893
Butterfly
abundance (%)
Alb 49 0,34 0,12 0,00001 0,32 0,12 0,00003 0,30 0,12 0,00004 0,07 0,14 0,07491
Hainich 51 0,15 0,12 0,00524 0,09 0,13 0,02868 0,04 0,13 0,18318 0,03 0,13 0,24673
Schorfheide 48 0,04 0,09 0,16090 0,00 0,09 0,69968 0,03 0,09 0,27500 0,11 0,09 0,02223
Beetle species
richness
Alb 49 0,00 0,88 0,98456 0,02 0,88 0,41238 0,00 0,88 0,64650 0,00 0,88 0,87399
Hainich 51 0,10 0,62 0,02974 0,15 0,60 0,00640 0,13 0,61 0,01061 0,11 0,61 0,01889
Schorfheide 48 0,01 0,84 0,59678 0,00 0,85 0,74163 0,03 0,83 0,26461 0,03 0,84 0,32879
Beetle abundance
Alb 49 0,00 2,46 0,80154 0,01 2,45 0,60816 0,01 2,45 0,60079 0,01 2,45 0,63159
Hainich 51 0,01 2,21 0,50321 0,01 2,21 0,46674 0,00 2,22 0,88976 0,00 2,22 0,77544
Schorfheide 48 0,01 1,69 0,59515 0,01 1,69 0,59682 0,07 1,63 0,10634 0,02 1,67 0,34354
Beetle
abundance (%)
Alb 49 0,03 0,18 0,26839 0,00 0,19 0,65798 0,05 0,18 0,12570 0,00 0,19 0,71128
Hainich 51 0,00 0,21 0,68331 0,00 0,21 0,80015 0,00 0,21 0,70521 0,01 0,21 0,39830
Schorfheide 48 0,01 0,20 0,62120 0,00 0,20 0,87437 0,01 0,20 0,42597 0,02 0,20 0,30677
Syrphid species
richness
Alb 49 0,16 0,63 0,00555 0,14 0,64 0,01013 0,26 0,59 0,00033 0,07 0,67 0,08611
Hainich 51 0,02 0,78 0,34212 0,00 0,79 0,88429 0,05 0,77 0,13715 0,00 0,79 0,79711
Schorfheide 48 0,01 0,97 0,47576 0,02 0,97 0,43312 0,12 0,92 0,03248 0,05 0,95 0,17313
Syrphid abundance
Alb 49 0,08 2,32 0,04954 0,07 2,34 0,08363 0,13 2,26 0,01458 0,02 2,40 0,40554
Hainich 51 0,00 2,96 0,69092 0,00 2,96 0,85671 0,04 2,90 0,17592 0,00 2,96 0,76131
Schorfheide 48 0,03 2,79 0,27211 0,04 2,78 0,21994 0,15 2,62 0,01531 0,05 2,77 0,17957
Syrphid
abundance (%)
Alb 49 0,01 0,21 0,55388 0,00 0,21 0,67959 0,00 0,21 0,74194 0,01 0,21 0,53751
Hainich 51 0,03 0,17 0,20531 0,01 0,17 0,41634 0,05 0,16 0,10145 0,00 0,17 0,68679
Schorfheide 48 0,03 0,21 0,20714 0,08 0,21 0,04797 0,11 0,21 0,02002 0,02 0,22 0,32447
Fly species richness
Alb 49 0,27 1,12 0,00019 0,20 1,18 0,00164 0,33 1,08 0,00003 0,06 1,28 0,10497
Hainich 51 0,00 1,41 0,66472 0,00 1,41 0,66983 0,00 1,41 0,75263 0,01 1,40 0,53752
Schorfheide 48 0,03 0,81 0,27119 0,04 0,80 0,23719 0,03 0,81 0,32417 0,00 0,82 0,80711
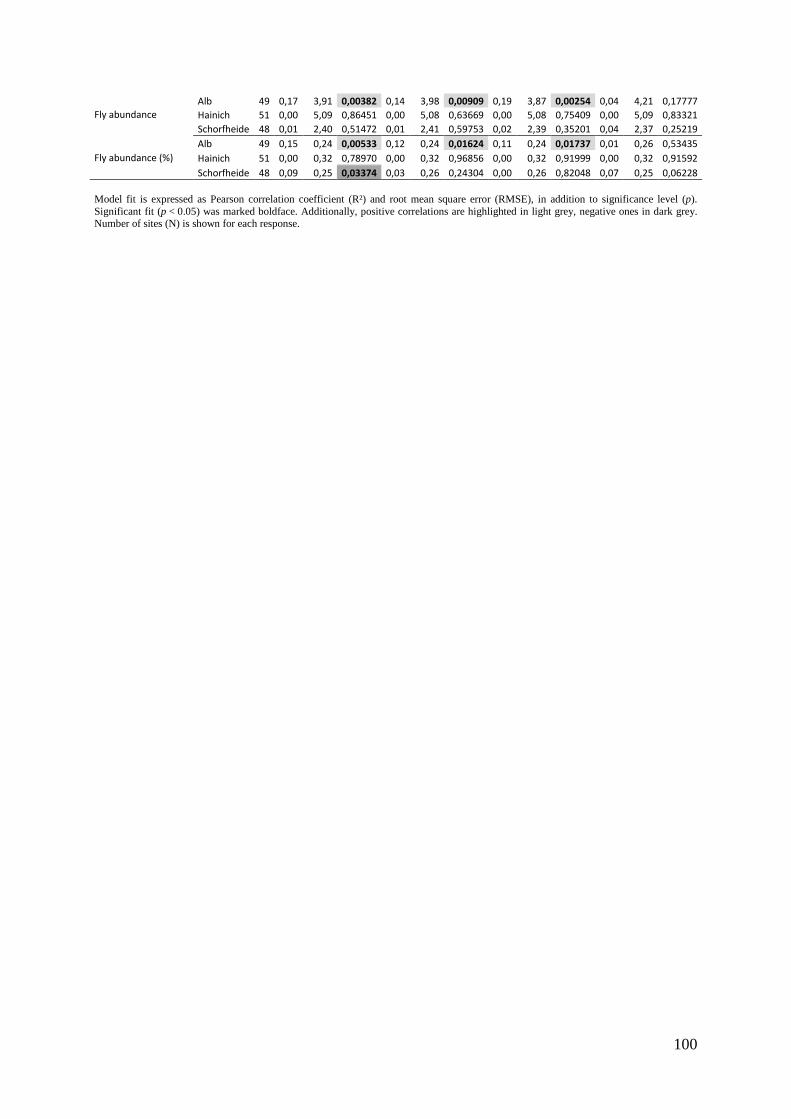
100
Fly abundance
Alb 49 0,17 3,91 0,00382 0,14 3,98 0,00909 0,19 3,87 0,00254 0,04 4,21 0,17777
Hainich 51 0,00 5,09 0,86451 0,00 5,08 0,63669 0,00 5,08 0,75409 0,00 5,09 0,83321
Schorfheide 48 0,01 2,40 0,51472 0,01 2,41 0,59753 0,02 2,39 0,35201 0,04 2,37 0,25219
Fly abundance (%)
Alb 49 0,15 0,24 0,00533 0,12 0,24 0,01624 0,11 0,24 0,01737 0,01 0,26 0,53435
Hainich 51 0,00 0,32 0,78970 0,00 0,32 0,96856 0,00 0,32 0,91999 0,00 0,32 0,91592
Schorfheide 48 0,09 0,25 0,03374 0,03 0,26 0,24304 0,00 0,26 0,82048 0,07 0,25 0,06228
Model fit is expressed as Pearson correlation coefficient (R²) and root mean square error (RMSE), in addition to significance level (p). Significant fit (p < 0.05) was marked boldface. Additionally, positive correlations are highlighted in light grey, negative ones in dark grey. Number of sites (N) is shown for each response.
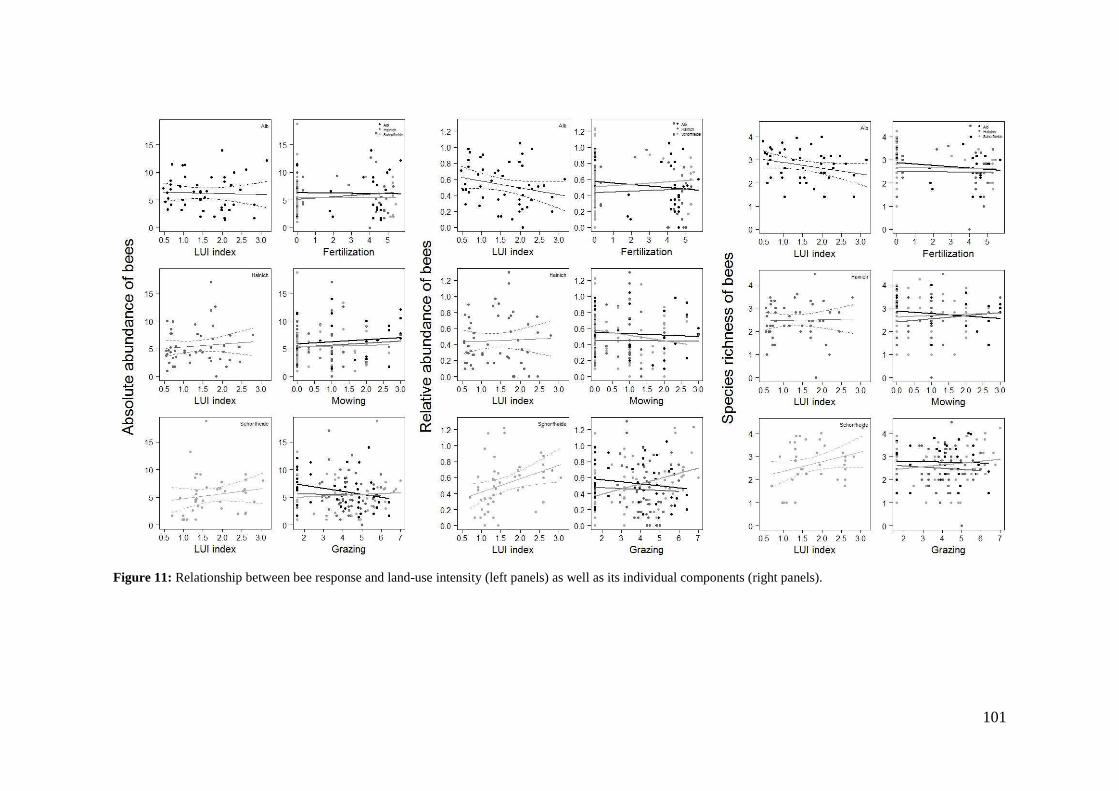
101
Figure 11: Relationship between bee response and land-use intensity (left panels) as well as its individual components (right panels).
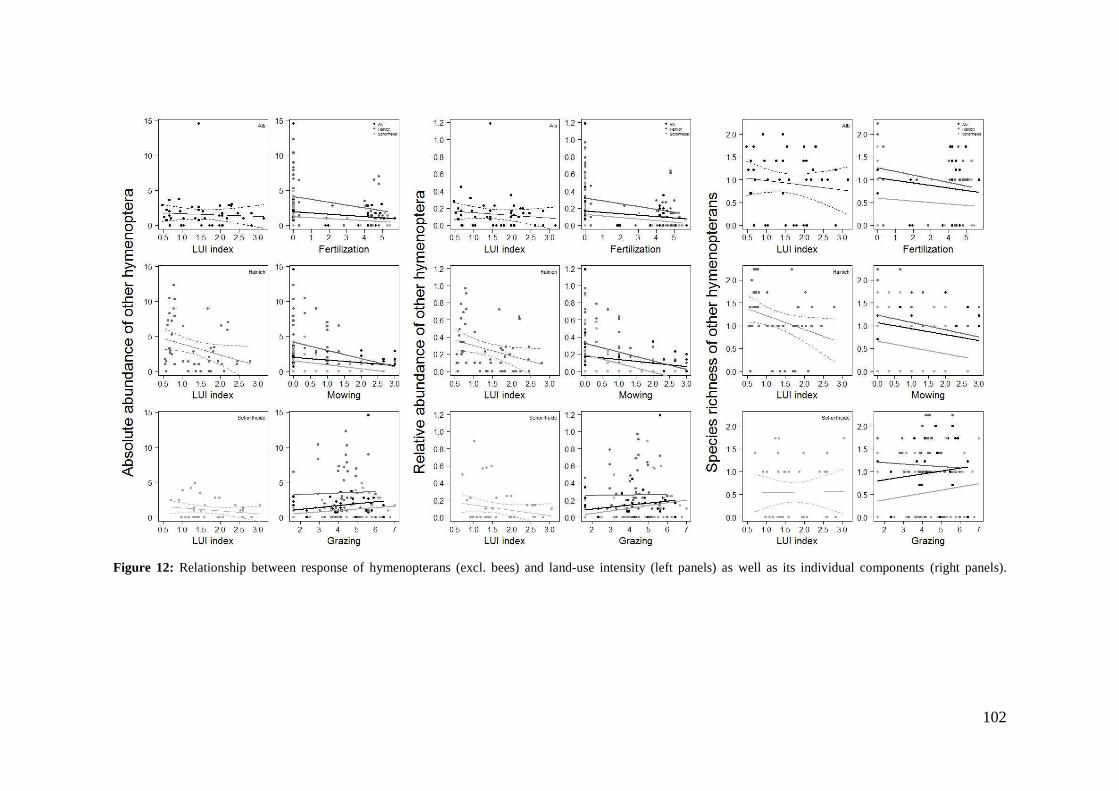
102
Figure 12: Relationship between response of hymenopterans (excl. bees) and land-use intensity (left panels) as well as its individual components (right panels).
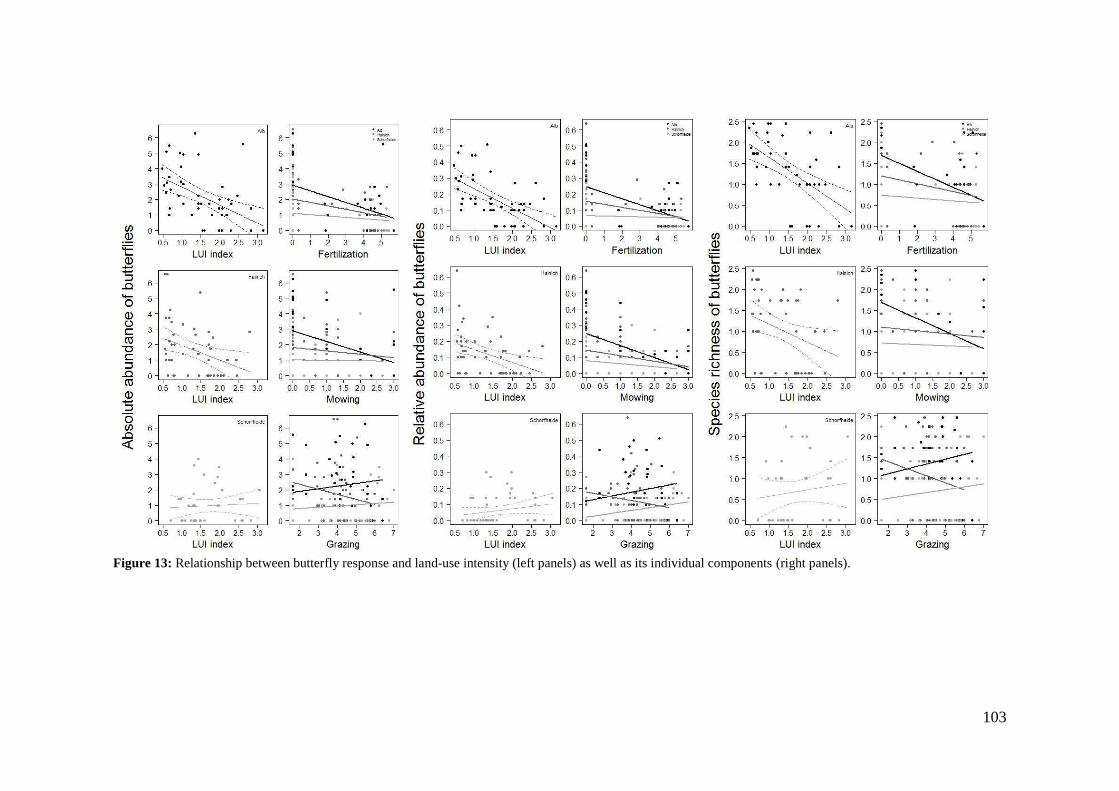
103
Figure 13: Relationship between butterfly response and land-use intensity (left panels) as well as its individual components (right panels).
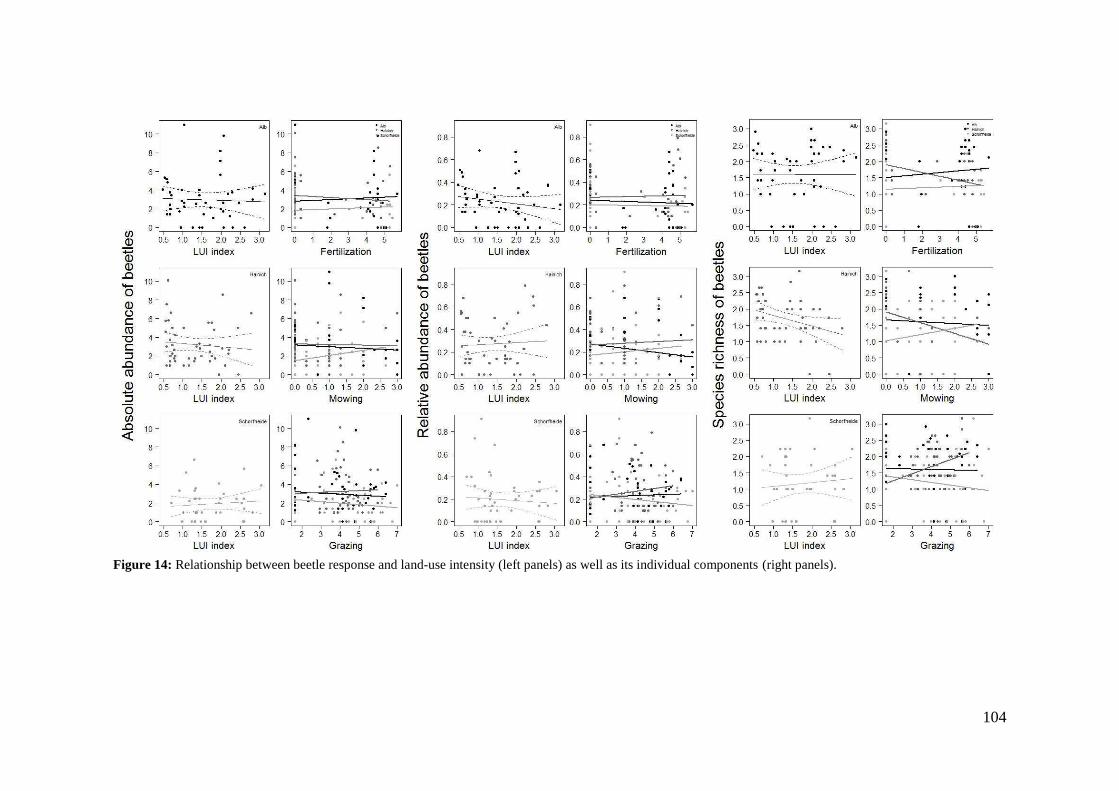
104
Figure 14: Relationship between beetle response and land-use intensity (left panels) as well as its individual components (right panels).
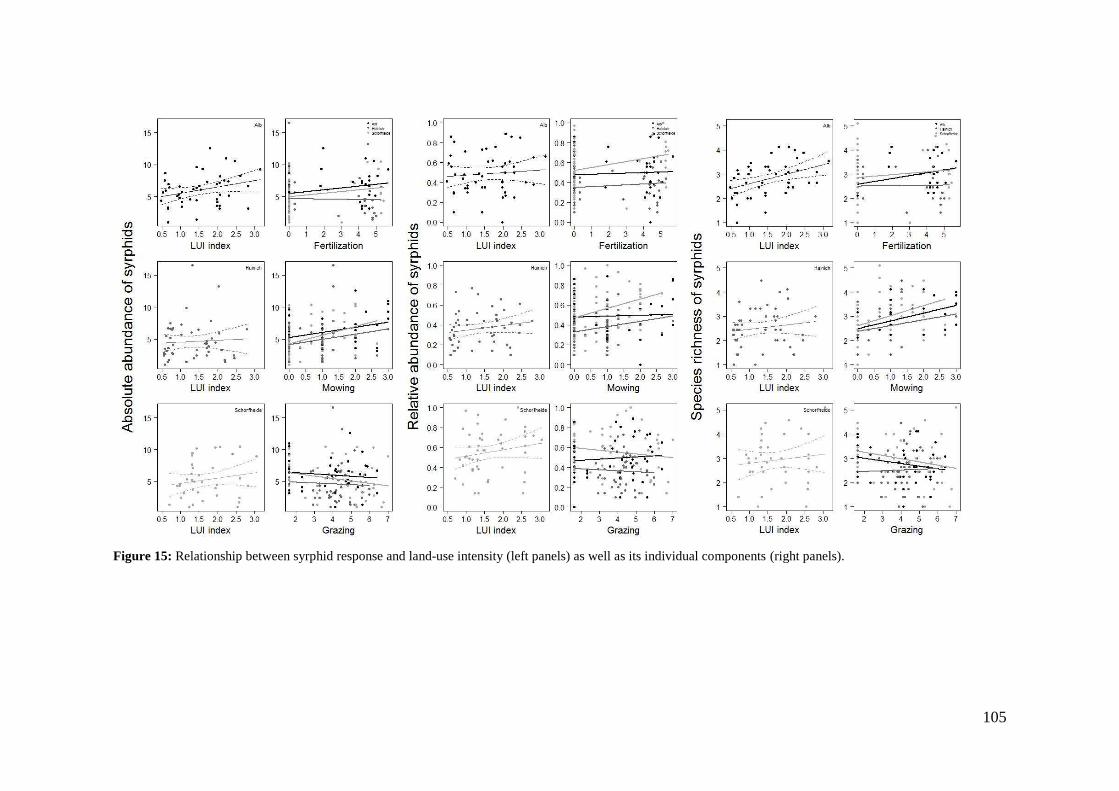
105
Figure 15: Relationship between syrphid response and land-use intensity (left panels) as well as its individual components (right panels).
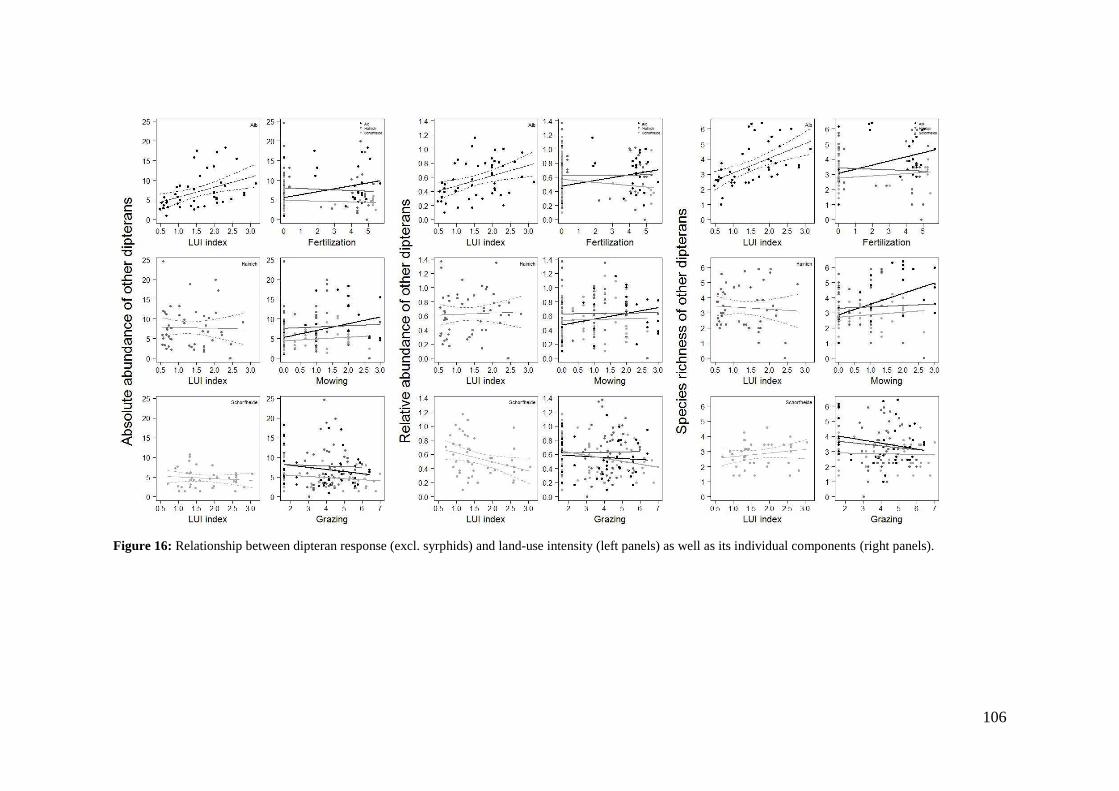
106
Figure 16: Relationship between dipteran response (excl. syrphids) and land-use intensity (left panels) as well as its individual components (right panels).
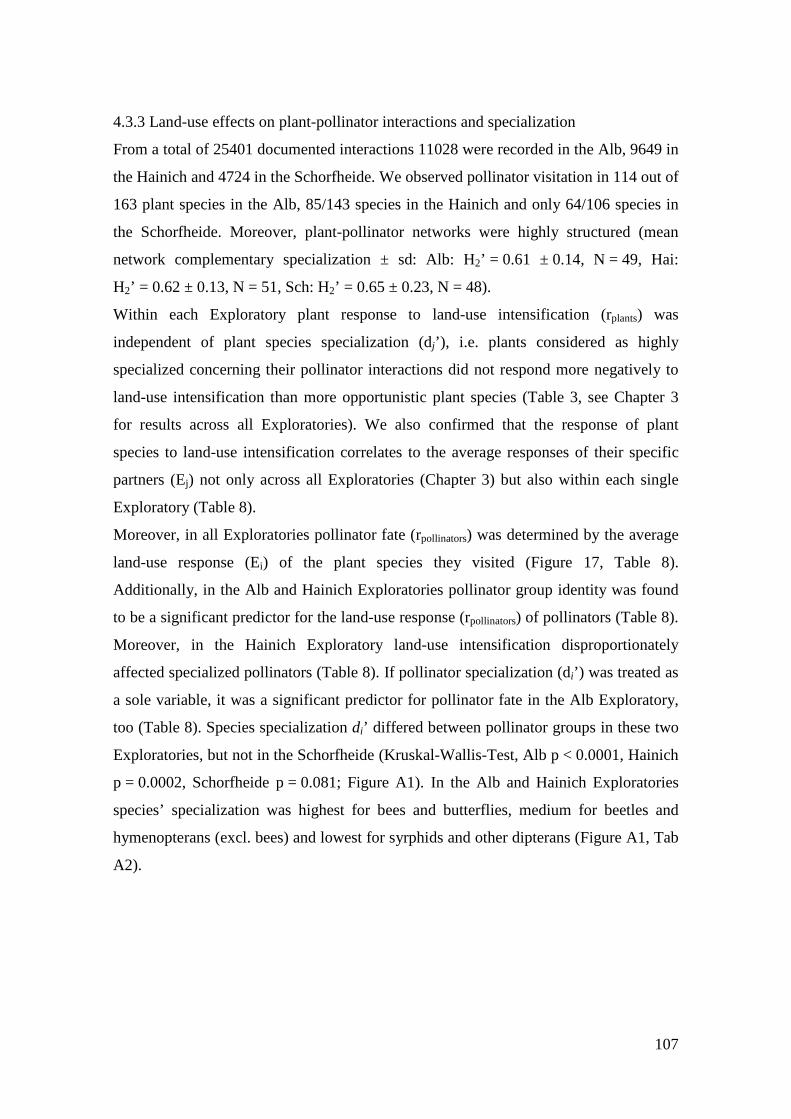
107
4.3.3 Land-use effects on plant-pollinator interactions and specialization
From a total of 25401 documented interactions 11028 were recorded in the Alb, 9649 in
the Hainich and 4724 in the Schorfheide. We observed pollinator visitation in 114 out of
163 plant species in the Alb, 85/143 species in the Hainich and only 64/106 species in
the Schorfheide. Moreover, plant-pollinator networks were highly structured (mean
network complementary specialization ± sd: Alb: H2’ = 0.61 ± 0.14, N = 49, Hai:
H2’ = 0.62 ± 0.13, N = 51, Sch: H2’ = 0.65 ± 0.23, N = 48).
Within each Exploratory plant response to land-use intensification (rplants) was
independent of plant species specialization (dj’), i.e. plants considered as highly
specialized concerning their pollinator interactions did not respond more negatively to
land-use intensification than more opportunistic plant species (Table 3, see Chapter 3
for results across all Exploratories). We also confirmed that the response of plant
species to land-use intensification correlates to the average responses of their specific
partners (Ej) not only across all Exploratories (Chapter 3) but also within each single
Exploratory (Table 8).
Moreover, in all Exploratories pollinator fate (rpollinators) was determined by the average
land-use response (Ei) of the plant species they visited (Figure 17, Table 8).
Additionally, in the Alb and Hainich Exploratories pollinator group identity was found
to be a significant predictor for the land-use response (rpollinators) of pollinators (Table 8).
Moreover, in the Hainich Exploratory land-use intensification disproportionately
affected specialized pollinators (Table 8). If pollinator specialization (di’) was treated as
a sole variable, it was a significant predictor for pollinator fate in the Alb Exploratory,
too (Table 8). Species specialization di’ differed between pollinator groups in these two
Exploratories, but not in the Schorfheide (Kruskal-Wallis-Test, Alb p < 0.0001, Hainich
p = 0.0002, Schorfheide p = 0.081; Figure A1). In the Alb and Hainich Exploratories
species’ specialization was highest for bees and butterflies, medium for beetles and
hymenopterans (excl. bees) and lowest for syrphids and other dipterans (Figure A1, Tab
A2).
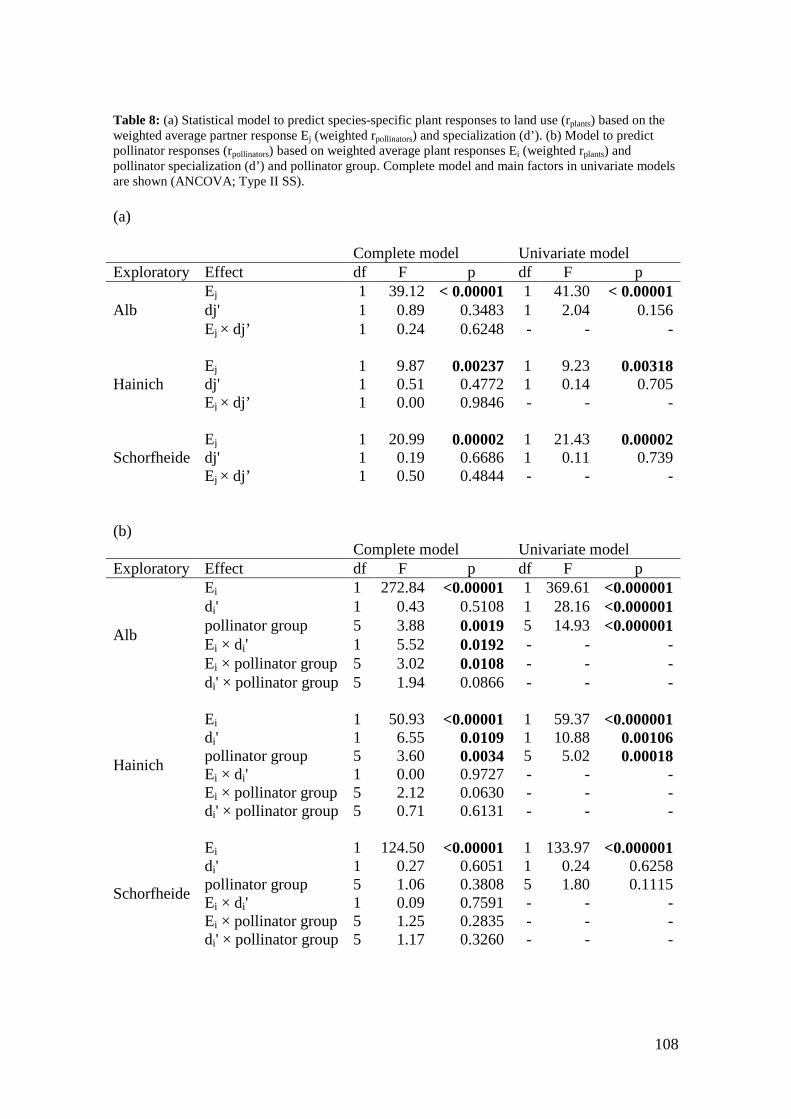
108
Table 8: (a) Statistical model to predict species-specific plant responses to land use (rplants) based on the weighted average partner response Ej (weighted rpollinators) and specialization (d’). (b) Model to predict pollinator responses (rpollinators) based on weighted average plant responses Ei (weighted rplants) and pollinator specialization (d’) and pollinator group. Complete model and main factors in univariate models are shown (ANCOVA; Type II SS). (a)
Complete model Univariate model Exploratory Effect df F p df F p
Alb Ej 1 39.12 < 0.00001 1 41.30 < 0.00001 dj' 1 0.89 0.3483 1 2.04 0.156 Ej × dj’ 1 0.24 0.6248 - - -
Hainich Ej 1 9.87 0.00237 1 9.23 0.00318 dj' 1 0.51 0.4772 1 0.14 0.705 Ej × dj’ 1 0.00 0.9846 - - -
Schorfheide Ej 1 20.99 0.00002 1 21.43 0.00002 dj' 1 0.19 0.6686 1 0.11 0.739 Ej × dj’ 1 0.50 0.4844 - - -
(b)
Complete model Univariate model Exploratory Effect df F p df F p
Alb
Ei 1 272.84 <0.00001 1 369.61 <0.000001 di' 1 0.43 0.5108 1 28.16 <0.000001 pollinator group 5 3.88 0.0019 5 14.93 <0.000001 Ei × di' 1 5.52 0.0192 - - - Ei × pollinator group 5 3.02 0.0108 - - - di' × pollinator group 5 1.94 0.0866 - - -
Hainich
Ei 1 50.93 <0.00001 1 59.37 <0.000001 di' 1 6.55 0.0109 1 10.88 0.00106 pollinator group 5 3.60 0.0034 5 5.02 0.00018 Ei × di' 1 0.00 0.9727 - - - Ei × pollinator group 5 2.12 0.0630 - - - di' × pollinator group 5 0.71 0.6131 - - -
Schorfheide
Ei 1 124.50 <0.00001 1 133.97 <0.000001 di' 1 0.27 0.6051 1 0.24 0.6258 pollinator group 5 1.06 0.3808 5 1.80 0.1115 Ei × di' 1 0.09 0.7591 - - - Ei × pollinator group 5 1.25 0.2835 - - - di' × pollinator group 5 1.17 0.3260 - - -
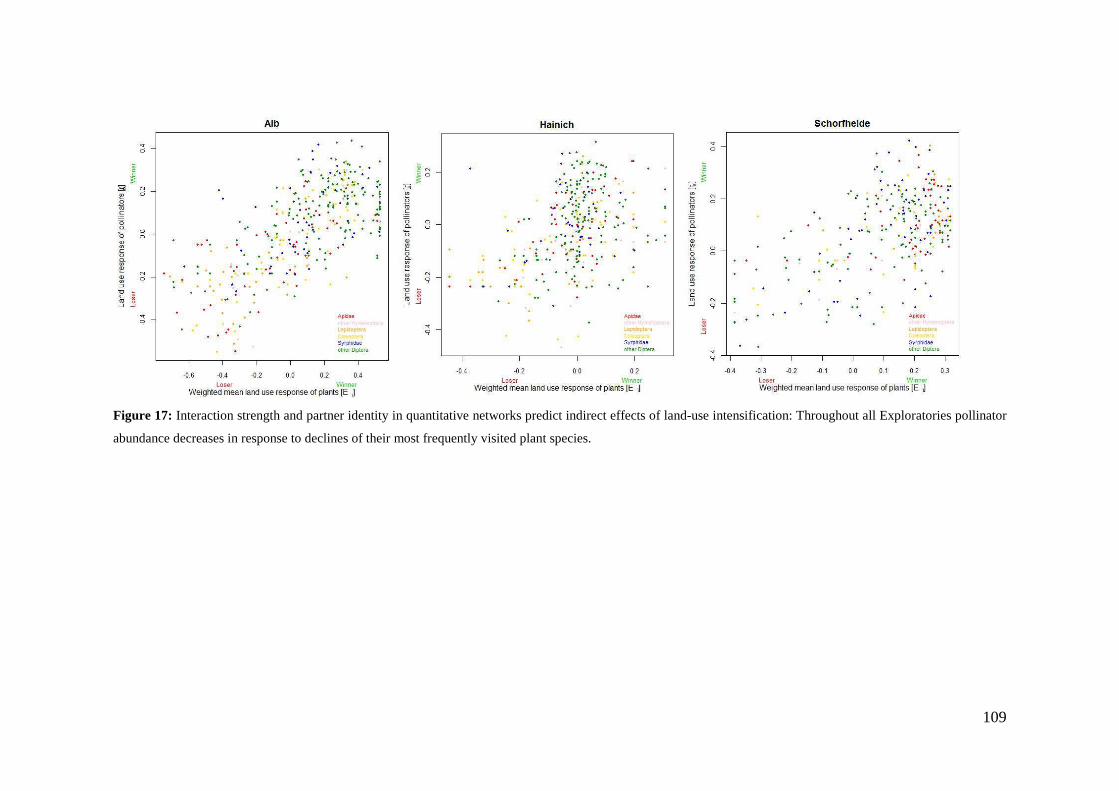
109
Figure 17: Interaction strength and partner identity in quantitative networks predict indirect effects of land-use intensification: Throughout all Exploratories pollinator
abundance decreases in response to declines of their most frequently visited plant species.

110
4.4 Discussion
In grasslands, land-use management mainly consists of three different components,
namely grazing, mowing and fertilization. For plant species richness it has been shown
earlier that its correlations to the intensification of those components may differ in
strength and even direction (Socher et al. 2012). In order to better understand the
mechanisms which may entail the loss of biodiversity in managed grasslands we tried to
disentangle the effects of single land-use components on species composition,
abundance and diversity in plant-pollinator networks. This is a first step towards the
conservation of the ecosystem service pollinators provide. Once the requirements for
maintenance of high pollinator diversity and its significance for plant reproduction are
understood plans for their management can be developed.
4.4.1 Land-use effects on plant communities
For plant communities it is known that increased fertilizer application and augmented
mowing frequency reduce flower diversity and may deteriorate community productivity,
stability and resilience (Mountford et al. 1993, Tilman and Downing 1994, Hector et al.
1999, Cardinale et al. 2007, Hector and Bagchi 2007). Fertilization in our study was
negatively correlated to species richness of flowering plants in the Alb and Hainich
Exploratories while fertilizer input had no significant effect on species richness in the
Schorfheide. This is in line with Socher et al. (2012) who analyzed direct and indirect
effects of fertilization, mowing and grazing intensity on plant species richness in the
same regional context. The difference in effects between Exploratories may be related
to differences in soil types, as the grasslands in the Alb and Hainich Exploratories are
on mineral soils while those of the Schorfheide mainly are on wet, eutrophic organic
soils (Fischer et al. 2010), e.g. conditions which make plants less dependent on
additional nutrient supply. High nitrogen levels or nitrogen addition favors the biomass
and seed production of grasses whereas low nitrogen levels promote herb growth,
flower production and pollinator visitation (Burkle and Irwin 2010). Fertilization affects
plant species richness mainly through indirect effects via increases of productivity
(Crawley et al. 2005). In anthropogenic grasslands species richness declines at high
levels of productivity (Adler et al. 2011) due to increased competition (Grime 1973) and
111
reduced light for subdominant plants (Hautier et al. 2009). These points may also explain
why we found considerable lower species numbers of flowering plants both overall and per
site in the Schorfheide Exploratory in comparison to Schwäbische Alb and Hainich.
Consistent with other studies our analysis showed that an increase in mowing intensity
goes along with a decrease in plant species richness (Hansson and Fogelfors 2000,
Zechmeister et al. 2003, Knop et al. 2006). Although graphically we observed this trend
in all Exploratories, the effect was pronounced significantly in the Alb only and missed
significance just by a narrow margin in the Hainich. Again our results are largely
consistent with Socher et al. (2012). Due to the strong ability of grasses to regrow after
disturbances such as mowing, an increase in the number of cuts goes along with an
increase in the abundance of grasses (Zechmeister et al. 2003). In contrast to grazing,
mowing removes biomass homogeneously and thus generally selects for species with
re-growth ability, favoring shallow-rooted grasses and not deeper rooted herbs and
legumes. A reason for the strong effect of mowing on the species richness of flowering
plants in the Alb Exploratory may be that the diversity of flowering plants per site is
comparatively high in this Exploratory so that shifts in plant species composition
towards grass species induced by mowing carry more weight.
In contrast to mowing grazing was positively correlated to species richness in the Alb
Exploratory. Positive effects from grazing are usually attributed to the higher sward
heterogeneity of grazed grassland plots through trampling and selective grazing, which
increases germination and establishment of otherwise subdominant herbs (Proulx and
Mazumder 1998, Rook et al. 2004). The effect of grazing intensity on plant diversity
varies between different types of livestock, e.g. sheep, horses and cattle (Rook et al.
2004). Pastures grazed by sheep had the highest cover of herbs and a higher species
richness compared to grasslands grazed by cattle or horses (Socher et al. 2012, Socher et
al. 2013).
As in the Alb Exploratory three quarters of the pastures and mown pastures we
surveyed were grazed by sheep, this may explain the overall positive effect of grazing
intensity. In the other two Exploratories pastures and mown pastures surveyed were
mainly grazed by cattle. However, differences in grazing effects can also be attributed
to differences in soil types that influence the degree to which grazing affects sward
heterogeneity and to strongly different initial species composition between the regions.
112
Thus, also factors which we did not consider in our statistical analysis may play a role
and our explanatory variables may be confounded with factors like soil type or initial
species composition and vegetation structure.
4.4.2 Land-use effects on pollinator communities
Baseline information about plant-pollinator interactions, species richness and abundance
of pollinators along gradients of land-use intensity can not only provide us with a better
understanding of pollination but also for maintenance of pollinator diversity and how
pollinators are affected by different land-use regimes. Here it is essential to explore the
land-use responses of distinct pollinator groups in detail as taxonomic and functional
groups as well as rare and abundant species may respond differently to management
regimes (Biesmeijer et al. 2006, Jauker et al. 2009). For example, threatened pollinator
species in our study showed significant decreases in species richness in relation to land-
use intensity (LUI) and fertilization in the Alb Exploratory while abundance of
threatened species was positively related to land-use intensity in the Schorfheide. As
threatened species are usualy rare on the landscape scale but may be very abundant
locally (Kotiaho et al. 2005), our results suggest that in the Alb suitable sites for
threatened species were found rather related to low land-use intensities while in the
Schorfheide threatened species reached high population densities on sites related to
higher land-use intensities. As discussed below in the Schorfheide Exploratory most
sites are on organic soils which proved to be associated with lower species diversities
than sites on mineral soils where land-use intensity is often higher in this Exploratory.
Additionally to differences in land-use responses of rare versus abundant pollinators,
differences between specialist and generalist species may exist (Tudor et al. 2004,
Kleijn and Raemakers 2008) and it has to be kept in mind that an absolute increase of
diversity or abundance can go along with biological homogenization, e.g. that some taxa
disappear while others strongly increase (Clavel et al. 2010, Filippi-Codaccioni et al.
2010). Two pollinator assemblages with equal species numbers can be completely
different in terms of species composition and abundance structure. Thus, numerous
authors cautioned against the use of single indicator taxa for management and
conservation strategies. Our findings support their argument: The intensification of each
land-use component examined in our study showed marked influence on either species
113
richness or abundance or composition of pollinators though the direction in which
different land-use practices were related to species responses varied between pollinator
groups and regions. For example, an increase in compound land-use intensity (LUI) was
positively related to overall pollinator species richness and abundance in the Alb, but a
closer look revealed opposing land-use responses of different pollinators groups.
Increases in overall pollinator abundance and species richness going along with
increases in mowing frequency and fertilization were driven by the enhancement of
abundances and richness of syrphids and other dipterans. We observed simultaneous
declines in bee diversity as well as in absolute and relative abundance and species
richness of butterflies (Table 7 and A1). In relation to intensification species richness of
butterflies as well as absolute and relative abundance also decreased in the Hainich and
dipteran diversities increased in the Schorfheide. Such taxon-specific differences match
the finding of opposing responses to agricultural intensification in bees and syrphids
from Jauker et al. (2009) and Biesmeijer et al. (2006) as well as the results from
Börschig et al. (2013) who observed decreasing abundance and species richness of
butterflies with increasing land-use intensity in the Alb and Hainich, but not in the
Schorfheide Exploratory. The latter assumed that in the Schorfheide region the species
pool of butterflies was too small to detect changes in diversity with increasing land-use
intensity. They further suggest that the regional lack of calcareous grasslands, which are
believed to be an important habitat of high butterfly and overall insect diversity (van
Swaay 2002), might account for the small butterfly species pool in the Schorfheide
study sites. As we detected only eleven butterfly species in the Schorfheide, but 27
species in the Hainich and even 41 species in the Alb, where calcareous grasslands were
most abundant, we subscribe to their explanatory statement. Moreover, butterflies in the
Schorfheide were the taxon less specialized concerning feeding niches in our study
(Table A2) and therefore may be less dependent on certain food resources. Though
diversity trends were inconsistent between regions, Börschig et al. (2013) showed that
with increasing land-use intensity species traits in the butterfly community change from
specialist to generalist characteristics in all regions. Equal results were found by Simons
et al. (2015) in a multi-taxa approach that revealed consistent shifts in arthropod species
traits towards more mobile and less specialized species with increasing land-use
intensity.
114
Generally flower-visitors in intensively managed grasslands have to be able to cope
with frequent habitat disturbance as well as unreliable and low diverse food resources.
In terms of their traits generalist species, e.g. concerning feeding niches or larval
habitats are believed to be less prone to disturbance than specialist species (McKinney
1997). The consistently low species specialization in syrphids and other dipteran species
(Table A2) indicates that they do not depend as heavily on preferred plant species as
bees and butterflies do and is in line with former studies that observed low mean species
specialization in dipterans as well as an increase of plant-fly interactions with increasing
land-use intensity (Weiner et al. 2011).
Concerning individual land-use components fertilization intensity may influence
pollinators rather indirectly via changes in plant diversity and composition. In the Alb
Exploratory we observed parallel declines plant species richness and species richness of
butterflies as well as a decline in bee diversity. For bees and butterflies it is known that
their species richness is positively correlated to plant diversity, although it is not sure if
there is a causal link or if plants and their visitors respond similarly to other
environmental factors (Steffan-Dewenter and Tscharntke 2001, Hawkins and Porter
2003). However, pollinator species responses to land-use proved to be highly correlated
to the weighted mean species responses of their host plants and this effect was even
stronger for specialized species (Weiner et al. 2014). Thus, probably resource-mediated
effects are responsible for the declines of species richness in flower visiting beetles
observed in the Hainich Exploratory as well. Beetles proved to be highly specialized in
flower visitation there.
As in real world landscapes high fertilization intensity is correlated to high mowing
frequency, which also proved to be true for our study sites, pure effects of fertilization
may not always be easily disentangled from mowing effects. Thus, a mélange of true
fertilization effects and effects from mowing (see below) may be responsible for the
effects of fertilization intensity on some pollinator groups. For example in syrphids and
other dipterans correlations to mowing intensity were much stronger pronounced than
correlations to fertilization. Nonetheless, fertilization intensity may have positive effects
on species richness and abundance of dipteran species as it enhances productivity and
thus plant biomass and vegetation height. Vegetation height had a positive effect on
richness and abundance of syrphids in other studies (Sjödin et al. 2008).
115
In relation to mowing temporal declines in diversity and abundance of pollinators were
observed and the timing and frequency of mowing had marked effects on insect species
composition in grasslands (Bulan and Barrett 1971, Morris 1981, Kruess and
Tscharntke 2002, Knop et al. 2006). Mowing may affect pollinators either directly by
disruption of life cycles (Johst et al. 2006) or indirectly by a frequent unselective
removal of food resources and by favoring plant species with a high re-growth ability
after disturbance thus changing plant species composition (Fenner and Palmer 1998,
Knop et al. 2006). Additionally, mowing as well as high grazing intensity may destroy
larval habitats and are detrimental to immobile larvae. Yet, contrarily to grazing which
creates a spatially heterogeneous sward structure by different livestock activities like
trampling and dung deposition, high mowing intensity creates a rather homogeneous
sward structure dominated by few species and a high proportion of grasses. The
observed negative effects of high mowing intensity on butterflies, beetles, bees and
other hymenopterans may be subscribed to such indirect effects via declines in the
number of flowering plant species and compositional changes in plant composition as
well as to direct effects concerning life-cycle disruption. The identified positive relation
between mowing intensity and syrphids as well as other dipterans on the other hand
may be attributed to the observation that intensively used meadows offer a higher
abundance of easily exploitable flowers from the genus Asteraceae and Apidaceae
which are readily visited by dipterans (Weiner et al. 2011). Adult syrphids are mainly
pollen eaters and feed preferably on shallow flowers offering a lot of pollen (Kevan and
Baker 1983). As such flowers usually possess exposed nectar sources they can be
exploited by a wide range of rather short-tonged other dipterans as well.
Similarly to mowing high grazing intensity leads to temporally removal of flowers
which may go along with intermittent declines in pollinator diversity. However, grazing
may also have positive effects on pollinator diversity as it promotes and sustains high
sward heterogeneity, produces nesting sites of bare soil for ground-nesting wild bees
and other insects with endogeic larvae, fosters important pollen and nectar resources for
a high variety of pollinators and prevents the succession of mono-dominant grass
species (Beil and Kratochwil 2004). Additionally, pastures feature a high vegetation
complexity and sward heterogeneity offering a variety of microclimates (Morris 2000).
These characteristics may account for the positive relation of grazing intensity we

116
observed in bees and beetles. Additionally to the high diversity of flowering plants in
pastures, increases of bee diversity and relative abundance may be explained by
breeding strategy. Bees, collect pollen and nectar for their offspring and repeatedly need
to return to the brood cells after foraging (Kleijn and van Langevelde 2006). Bee
diversity and abundance, especially in small and less mobile species (Gathmann and
Tscharntke 2002), may be higher in grasslands offering nesting sites. However, also
general landscape context and other factors which we could not consider as explanatory
variables in our models may play a role for species composition, abundance and
diversity of pollinators in relation to land-use intensification.
4.4.3 Land-use effects on plant-pollinator interactions and specialization
Across all Exploratories our plant-pollinator interaction networks proved to be highly
structured. The mean network specialization level (H2’) found in each Exploratory
corresponds very well to other plant-pollinator networks examined (Blüthgen et al.
2007, Fründ et al. 2010, Weiner et al. 2011). Corresponding to results from earlier
studies (Weiner et al. 2011) in the Alb and Hainich Exploratory mean species
specialization per pollinator group (di’) was highest for bees. Moreover, in the Alb
species specialization of butterflies and beetles was significantly higher than
specialization of other hymenopterans and dipteran species which was echoed in trend
in the Hainich, too. Contrarily, in the Schorfheide pollinator groups did not differ in
mean species specialization per group. This result may explain why pollinator group
identity as well as species specialization played a role for pollinator response to land-
use intensification in the Alb and Hainich, but not in the Schorfheide Exploratory (see
below).
Although land-use responses of plants and pollinators strongly varied between regions
as well as between taxonomic pollinator groups, we found that within each Exploratory
responses of plants and pollinators were determined by species specialization and the
average land-use response of their interaction partners. The response of plant species to
land-use intensification corresponded to the average responses of their specific
pollinators. In return, pollinators responded negatively to land use if the plant species
they frequently visit declined in response to management intensification, so that a
linkage between a pollinator’s response to land-use and the response of the plant species
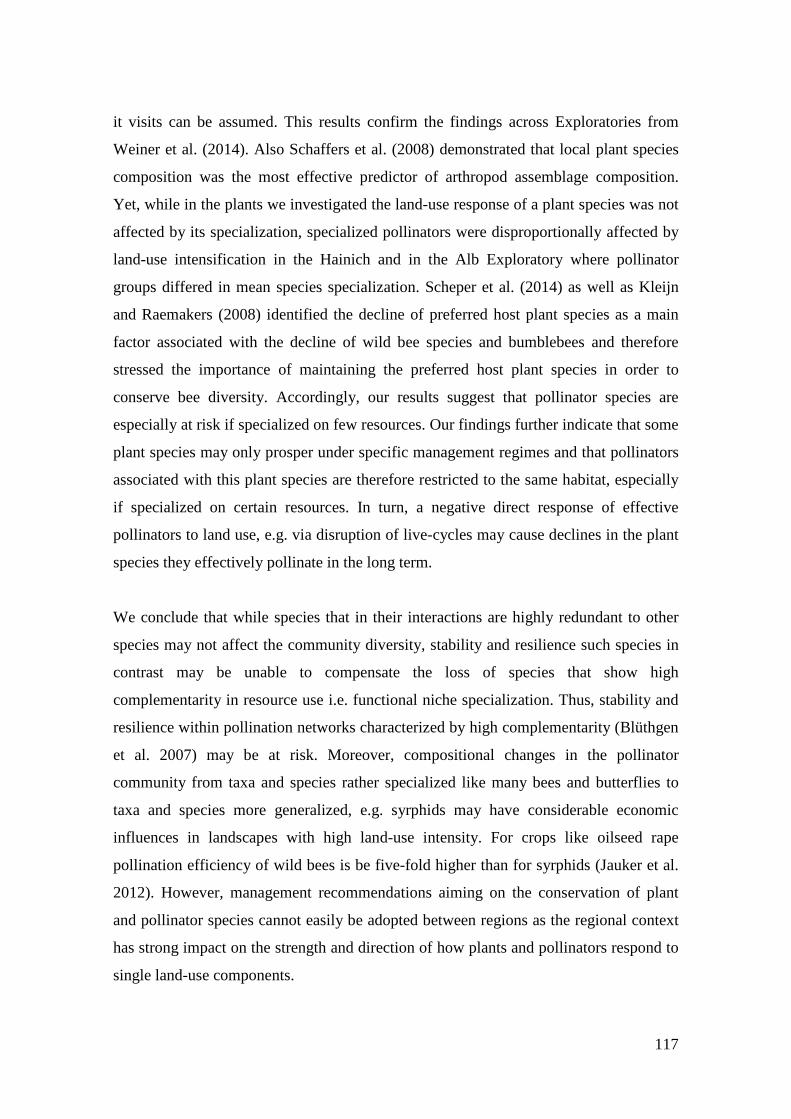
117
it visits can be assumed. This results confirm the findings across Exploratories from
Weiner et al. (2014). Also Schaffers et al. (2008) demonstrated that local plant species
composition was the most effective predictor of arthropod assemblage composition.
Yet, while in the plants we investigated the land-use response of a plant species was not
affected by its specialization, specialized pollinators were disproportionally affected by
land-use intensification in the Hainich and in the Alb Exploratory where pollinator
groups differed in mean species specialization. Scheper et al. (2014) as well as Kleijn
and Raemakers (2008) identified the decline of preferred host plant species as a main
factor associated with the decline of wild bee species and bumblebees and therefore
stressed the importance of maintaining the preferred host plant species in order to
conserve bee diversity. Accordingly, our results suggest that pollinator species are
especially at risk if specialized on few resources. Our findings further indicate that some
plant species may only prosper under specific management regimes and that pollinators
associated with this plant species are therefore restricted to the same habitat, especially
if specialized on certain resources. In turn, a negative direct response of effective
pollinators to land use, e.g. via disruption of live-cycles may cause declines in the plant
species they effectively pollinate in the long term.
We conclude that while species that in their interactions are highly redundant to other
species may not affect the community diversity, stability and resilience such species in
contrast may be unable to compensate the loss of species that show high
complementarity in resource use i.e. functional niche specialization. Thus, stability and
resilience within pollination networks characterized by high complementarity (Blüthgen
et al. 2007) may be at risk. Moreover, compositional changes in the pollinator
community from taxa and species rather specialized like many bees and butterflies to
taxa and species more generalized, e.g. syrphids may have considerable economic
influences in landscapes with high land-use intensity. For crops like oilseed rape
pollination efficiency of wild bees is be five-fold higher than for syrphids (Jauker et al.
2012). However, management recommendations aiming on the conservation of plant
and pollinator species cannot easily be adopted between regions as the regional context
has strong impact on the strength and direction of how plants and pollinators respond to
single land-use components.
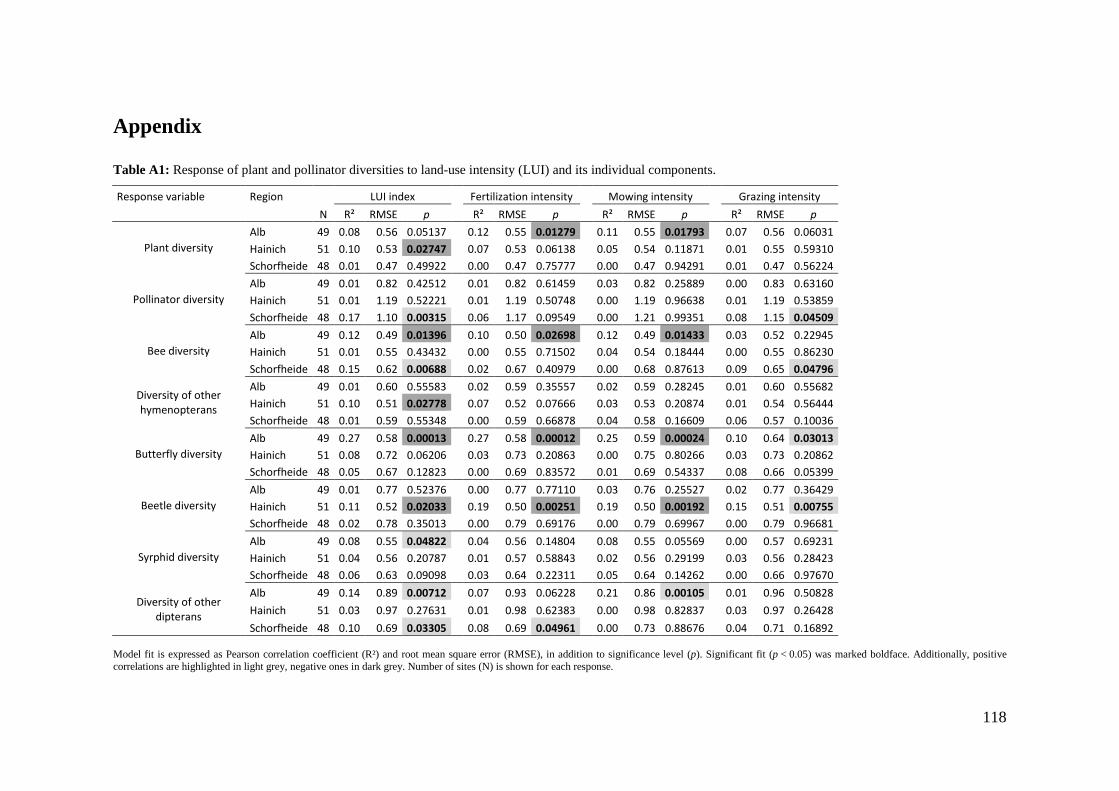
118
Appendix Table A1: Response of plant and pollinator diversities to land-use intensity (LUI) and its individual components.
Response variable Region LUI index Fertilization intensity Mowing intensity Grazing intensity
N R² RMSE p R² RMSE p R² RMSE p R² RMSE p
Plant diversity
Alb 49 0.08 0.56 0.05137 0.12 0.55 0.01279 0.11 0.55 0.01793 0.07 0.56 0.06031
Hainich 51 0.10 0.53 0.02747 0.07 0.53 0.06138 0.05 0.54 0.11871 0.01 0.55 0.59310
Schorfheide 48 0.01 0.47 0.49922 0.00 0.47 0.75777 0.00 0.47 0.94291 0.01 0.47 0.56224
Pollinator diversity
Alb 49 0.01 0.82 0.42512 0.01 0.82 0.61459 0.03 0.82 0.25889 0.00 0.83 0.63160
Hainich 51 0.01 1.19 0.52221 0.01 1.19 0.50748 0.00 1.19 0.96638 0.01 1.19 0.53859
Schorfheide 48 0.17 1.10 0.00315 0.06 1.17 0.09549 0.00 1.21 0.99351 0.08 1.15 0.04509
Bee diversity
Alb 49 0.12 0.49 0.01396 0.10 0.50 0.02698 0.12 0.49 0.01433 0.03 0.52 0.22945
Hainich 51 0.01 0.55 0.43432 0.00 0.55 0.71502 0.04 0.54 0.18444 0.00 0.55 0.86230
Schorfheide 48 0.15 0.62 0.00688 0.02 0.67 0.40979 0.00 0.68 0.87613 0.09 0.65 0.04796
Diversity of other
hymenopterans
Alb 49 0.01 0.60 0.55583 0.02 0.59 0.35557 0.02 0.59 0.28245 0.01 0.60 0.55682
Hainich 51 0.10 0.51 0.02778 0.07 0.52 0.07666 0.03 0.53 0.20874 0.01 0.54 0.56444
Schorfheide 48 0.01 0.59 0.55348 0.00 0.59 0.66878 0.04 0.58 0.16609 0.06 0.57 0.10036
Butterfly diversity
Alb 49 0.27 0.58 0.00013 0.27 0.58 0.00012 0.25 0.59 0.00024 0.10 0.64 0.03013
Hainich 51 0.08 0.72 0.06206 0.03 0.73 0.20863 0.00 0.75 0.80266 0.03 0.73 0.20862
Schorfheide 48 0.05 0.67 0.12823 0.00 0.69 0.83572 0.01 0.69 0.54337 0.08 0.66 0.05399
Beetle diversity
Alb 49 0.01 0.77 0.52376 0.00 0.77 0.77110 0.03 0.76 0.25527 0.02 0.77 0.36429
Hainich 51 0.11 0.52 0.02033 0.19 0.50 0.00251 0.19 0.50 0.00192 0.15 0.51 0.00755
Schorfheide 48 0.02 0.78 0.35013 0.00 0.79 0.69176 0.00 0.79 0.69967 0.00 0.79 0.96681
Syrphid diversity
Alb 49 0.08 0.55 0.04822 0.04 0.56 0.14804 0.08 0.55 0.05569 0.00 0.57 0.69231
Hainich 51 0.04 0.56 0.20787 0.01 0.57 0.58843 0.02 0.56 0.29199 0.03 0.56 0.28423
Schorfheide 48 0.06 0.63 0.09098 0.03 0.64 0.22311 0.05 0.64 0.14262 0.00 0.66 0.97670
Diversity of other
dipterans
Alb 49 0.14 0.89 0.00712 0.07 0.93 0.06228 0.21 0.86 0.00105 0.01 0.96 0.50828
Hainich 51 0.03 0.97 0.27631 0.01 0.98 0.62383 0.00 0.98 0.82837 0.03 0.97 0.26428
Schorfheide 48 0.10 0.69 0.03305 0.08 0.69 0.04961 0.00 0.73 0.88676 0.04 0.71 0.16892 Model fit is expressed as Pearson correlation coefficient (R²) and root mean square error (RMSE), in addition to significance level (p). Significant fit (p < 0.05) was marked boldface. Additionally, positive correlations are highlighted in light grey, negative ones in dark grey. Number of sites (N) is shown for each response.
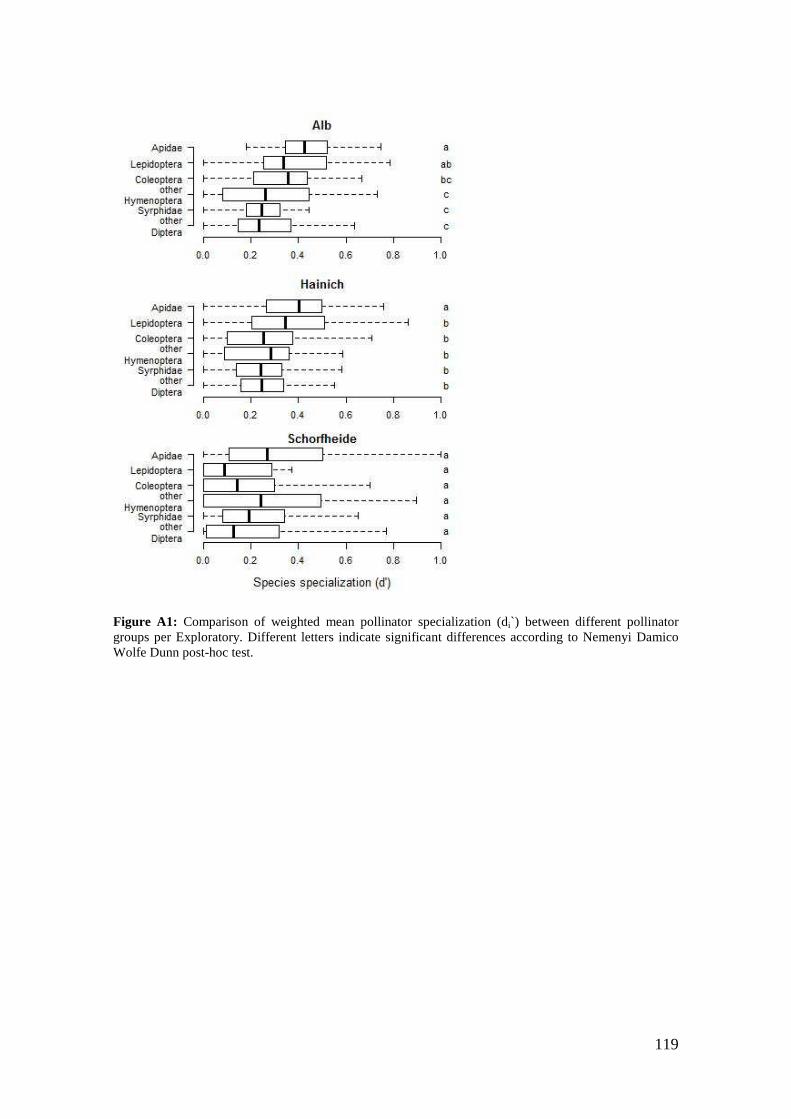
119
Figure A1: Comparison of weighted mean pollinator specialization (di`) between different pollinator groups per Exploratory. Different letters indicate significant differences according to Nemenyi Damico Wolfe Dunn post-hoc test.
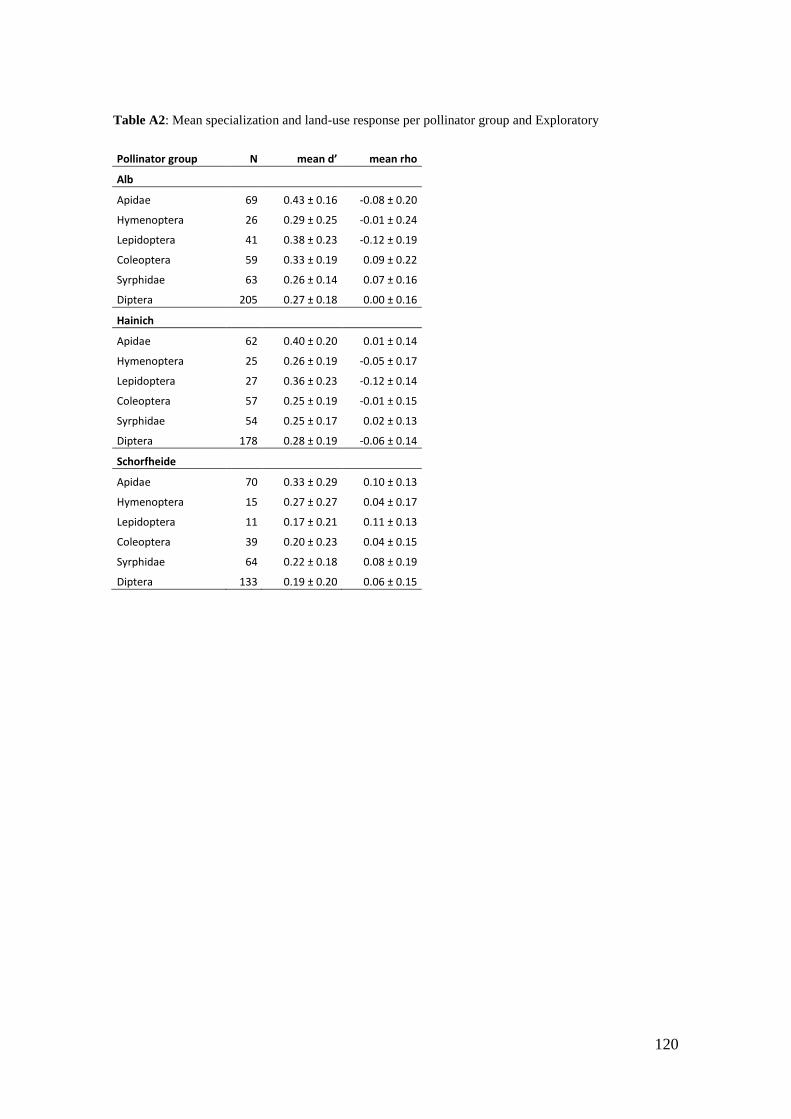
120
Table A2: Mean specialization and land-use response per pollinator group and Exploratory Pollinator group N mean d’ mean rho
Alb
Apidae 69 0.43 ± 0.16 -0.08 ± 0.20
Hymenoptera 26 0.29 ± 0.25 -0.01 ± 0.24
Lepidoptera 41 0.38 ± 0.23 -0.12 ± 0.19
Coleoptera 59 0.33 ± 0.19 0.09 ± 0.22
Syrphidae 63 0.26 ± 0.14 0.07 ± 0.16
Diptera 205 0.27 ± 0.18 0.00 ± 0.16
Hainich
Apidae 62 0.40 ± 0.20 0.01 ± 0.14
Hymenoptera 25 0.26 ± 0.19 -0.05 ± 0.17
Lepidoptera 27 0.36 ± 0.23 -0.12 ± 0.14
Coleoptera 57 0.25 ± 0.19 -0.01 ± 0.15
Syrphidae 54 0.25 ± 0.17 0.02 ± 0.13
Diptera 178 0.28 ± 0.19 -0.06 ± 0.14
Schorfheide
Apidae 70 0.33 ± 0.29 0.10 ± 0.13
Hymenoptera 15 0.27 ± 0.27 0.04 ± 0.17
Lepidoptera 11 0.17 ± 0.21 0.11 ± 0.13
Coleoptera 39 0.20 ± 0.23 0.04 ± 0.15
Syrphidae 64 0.22 ± 0.18 0.08 ± 0.19
Diptera 133 0.19 ± 0.20 0.06 ± 0.15

121
5. Pollen amino acids and flower specialization in solitary bees This chapter has been published as: Weiner, C.N., Hilpert, A., Werner, M., Linsenmair, K.-E., Blüthgen, N. (2010): Pollen amino acids and flower specialization in solitary bees. Apidologie.
Summary
Pollen nutrient composition could be important in host plant selection of oligolectic
bees. In this study, pollen samples from 142 plant species were analysed separately for
water soluble and protein-bound amino acids. The composition of amino acids varied
strongly between plant species, but taxonomically related species had a similar
composition. All plant species contained the entire set of essential amino acids,
although some in small quantities. Total concentration of free and protein-bound amino
acids was significantly lower in pollen sources used by oligoleges than in other pollen
sources. Pollen sources of oligoleges furthermore showed a lower concentration of
essential amino acids, and deviated more strongly from the ideal composition of
essential amino acids as determined for honey bees than plants not hosting oligoleges.
However, this trend was not confirmed on a cruder phylogenetic plant family level,
where pollen chosen by oligolectic bees was similar to other pollen.
5.1 Introduction
Most bees feed exclusively on plant pollen and nectar, representing their primary source
of protein and other nutrients especially during the larval stage (Westrich 1990). While
oligolectic bees depend on pollen from a single plant species, genus or family,
polylectic bees use a broad spectrum of flowering plants (Cane and Sipes 2006).
Traditionally, it has been assumed that polylecty was the ancestral state in bees
(Michener 1954). Indeed this proved to be true for the Hemihalictus series in the genus
Lasioglossum (Danforth et al. 2003), but recently growing evidence suggest that in the
majority of bee lineages generalist species have evolved from oligolectic ancestors
(Larkin et al. 2008, Michez et al. 2008).
The advantages of oligolecty remain largely unknown, though several hypotheses have
been discussed, above all a higher proficiency of specialised bees when visiting their
specific host flowers through evolutionary adaptation (Strickler 1979, Müller 2006). On
the other hand, host-plant specialisation among bees could have been favoured if it
122
reduced interspecific competition (Thorp 1969). As all plant species visited by
oligoleges are visited by polyleges as well, at least a complete escape from competition
seems to be unlikely (Minckley and Roulston 2006). However, some quantitative extent
of competition-avoidance could be achieved by specialising on pollen containing toxic
compounds or being less nutritious and therefore visited less frequently or by fewer
species. On the other hand, it has been suggested that oligolectic bees specialise on
plant pollen with higher nitrogen content but this hypothesis is lacking in
phylogenetically sound evidence so far (Budde et al. 2004). Pollen nutritional value has
been mostly judged by its crude protein content (Day et al. 1990), estimated based on
pollen nitrogen concentration multiplied by 6.25 (e.g. Rabie et al. 1983). This
conversion factor may not be appropriate for pollen (Roulston and Cane 2000).
Moreover, protein content may not adequately reflect the availability and composition
of amino acids. Two diets containing the same protein content may differ in nutritional
value due to a lack or imbalance of essential amino acids (Standifer 1967).
Insects and other animal taxa have relatively similar basic nutritional requirements,
including the spectrum of essential amino acids (De Groot 1952). It has been
demonstrated that dietary protein content is crucial for reproduction, growth and
longevity of bees and other insects (Gilbert 1972, Roulston and Cane 2002). Preferences
for diets with higher amino acid content have been documented in studies on butterflies
(Erhardt and Rusterholz 1998), ants (Blüthgen and Fiedler 2004), parasitoid wasps
(Wäckers 1999) and honey bees (Alm et al. 1990). The ideal composition of essential
pollen amino acids (arginine 11%, histidine 5%, isoleucine 14%, leucine 16 %,
lysine 11%, methionine 5%, phenylalanine 9%, threonine 11%, tryptophan 4%, valine
14%) determined for the honey bee, Apis mellifera, by De Groot (1953) were very
similar to those of other animals (Nation 2002). Thus, it can be assumed that bees do
not vary significantly in their nutritional requirements concerning relative amino acid
composition.
We focussed on qualitative as well as quantitative pollen amino acid composition and
balance of amino acids. Our goal was to find out whether the pollen of plants selected
by oligolectic bee species differs in its chemical composition compared to the pollen of
plants not hosting oligoleges. We tested whether pollen sources of oligoleges contained
either a significantly higher or lower (1) total amino acid content or (2) balanced
123
composition of essential amino acids, (3) and deviation from an ideal composition of
essential amino acids proposed by De Groot (1953) than plants not hosting oligoleges.
5.2 Methods
5.2.1 Pollen collection and analysis
Pollen from 142 plant species was sampled and analysed for its amino acid composition
(Table 9). The nomenclature followed Wisskirchen and Haeupler (1998). Among these
plants only five species may not be regularly visited by bees (namely Caltha palustris
L., Circaea lutetiana L., Erophila verna L., Sambucus nigra L., Silene latifolia Poir.).
However, excluding the plants from the analysis did not affect the overall results.
Ninety-one of the sampled species have been either confirmed to be visited by
oligoleges through pollen analysis from bee pollen scopa and/or observations (Westrich
1990, Müller et al. 1997, Müller 2006) or belong to plant genera known to host
oligolectic bees. We included all species belonging to a plant genus visited by
oligoleges into this group, as most oligoleges are assumed to be specialised on the genus
or family level (Minckley and Roulston 2006), and observations may not cover all
potential pollen host species. This yielded a total of 91 plant species hosting oligoleges
and 51 plant species not hosting oligoleges. Twenty-nine plant species hosting
oligoleges belonged to the family of Asteraceae, 11 species to the family of Lamiaceae.
Such families with high replication may be assumed to be overrepresented in the results
on the species level. We therefore present an additional test where amino acid values
have been pooled for each of the 41 plant families to check whether patterns were
consistent on this crude phylogenetic level (Noligolectic = 22 and Ngeneralised = 26 families,
Table 9). In families containing plants visited and plants not visited by oligoleges, we
pooled plants for each category separately, which resulted in seven plant families
occurring twice.
So far, most studies analysed bee-collected rather than hand-collected pollen and were
based on a few plant taxa only (references in: Roulston and Cane, 2000, but see Wille et
al. 1985). The analysis of bee-collected pollen is problematic as bees add substantial
amounts of nectar to pollen loads (Müller et al. 2006, Leonhardt et al. 2007). This
creates an unknown bias caused by nectar derived sugars accounting for up to 40 % of
the pollen pellet’s dry weight (Roulston and Cane 2000). Any analysis of pollen pellets
124
that disregards the added weight of nectar sugars to the pellets greatly underestimates
the concentration of proteins in the pollen itself. This bias can not be removed by a
standardized multiplier (Roulston and Buchmann 2000).
We therefore attempted to discover differences in the pollen nutritive value using hand-
collected pollen samples only. For each sample, depending on pollen amount per plant
species, pollen from 2-400 flower heads was pooled to yield sufficient amounts for
analysis (0.08 - 9.6 mg). Large samples were subsampled for multiple determinations.
As manual grinding of pollen using a mortar and a pestle prior to extraction did not
change results in terms of total amino acid content (Wilcoxon; Z = 1.54, p = 0.12, N = 8
plant species) samples were not ground. The overall trend even showed higher contents
in untreated pollen (on average 6.15 µg/mg). Each sample was checked for
contaminations under a stereo microscope and then frozen at -20 °C until it was
prepared for analysis by drying over night at 30 °C. Longer drying did not further
decrease pollen dry weight.
Free and protein-bound amino acids were measured separately with an ion exchange
chromatograph (Biotronik, amino acid analyser LC 3000). For analysis of water soluble
amino acids, usually 3-5 mg (dry weight) pollen was extracted with 100 µl water for
30 min in an ultrasonic bath (EMAG, Emmi 20HC) and afterwards for 60 min in the
refrigerator. After centrifugation (15 000 g) and membrane filtration for 10 min, the
sediment was saved for later analysis of the amino acids of the protein fraction. The
supernatant was poured into a new microcentrifuge tube, boiled for 2 min at 100 °C, and
cooled in ice to room temperature before a second centrifugation for 5 min. Afterwards
50 µl of the supernatant was extracted with 10 µl 12.5% 5-Sulfosalicylic acid in the
refrigerator for 30 min for precipitation of proteins. Ten minutes of centrifugation
followed and 50 µl of the supernatant plus 50 µl thinning buffer were poured into a
fresh tube, mixed, and pipetted in a membrane filter (Vecta Spin) before a last
centrifugation for 5 min and adjacent measurement in the amino acid analyser.
For analysis of the amino acids of the protein fraction 200 µl 6 N HCl3 were added to
the sediment, the sample was mixed, boiled for four hours at 100 °C, and cooled to
room temperature. 10 min of centrifugation followed. The supernatant was poured into
a new tube and evaporated at 100 °C. Afterwards the sample was re-dissolved in 200 µl
of water, immediately cooled to room temperature, and centrifuged again (10 min).

125
Subsequently 100 µl of the supernatant were mixed with 20 µl 12.5% sulphosalicylic
acid and extracted 30 minutes in the refrigerator before short mixing and centrifugation
for another 10 minutes followed. 100 µl of the supernatant and 100 µl sample
rarefaction buffer was transferred into a new microcentrifuge tube. Then all was
pipetted through a membrane filter, centrifuged for 5 minutes and transferred into a new
microcentrifuge tube for further rarefaction with sample rarefaction buffer (1:5) before
measurement.
The experimental variability of our technique yields a median coefficient of variation
(CV = standard deviation / mean) of 0.383, with a median standard deviation (SD) of
8.52 µg/mg pollen (n = 91 repeatedly measured pollen samples). It is much smaller than
the variability between samples of the same species varying in date or place of
collection (median CV = 1.084, median SD = 12.16 µg/mg; n = 31 pollen samples of
the same species). If pollen from a plant species was analysed in more than one sample,
for consistency we included only the sample with the highest pollen dry weight into
statistical analyses. However, there was no trend towards higher amino acid
concentration in samples higher in weight (paired t-Test, t = 0.66, p = 0.707, n = 91
pairs). We compared total amino acid content yielded with our method to protein
content of the same samples analysed in Bradford assays. Our results are linear
correlated (y = 0.76x + 44.61, R² = 0.91) and slightly higher for each of the plant
species analysed. Besides, our results are comparable to those of Standifer (1967).
5.2.2 Statistical analysis
The composition of pollen amino acids was examined using non-metric
multidimensional scaling (NMDS), employing a Bray-Curtis similarity matrix, two
dimensions, and 1000 runs. Statistics were conducted in R 2.6 (R Development Core
Team 2006) using the “metaMDS” command and 1000 iterations (R-package vegan
1.8.2). Amino acid composition data were entered as molar proportions (amino acidi
[µMol g-1] / total amino acid concentration [µMol g-1]) based on dry weight. To analyse
differences among plant families and between the groups of plants hosting vs. not
hosting oligoleges analyses of variance using distance matrices (“adonis” command, R-
package vegan) were conducted. The balance of the proportions of amino acids was
measured as standardized evenness derived from Simpson’s diversity index:
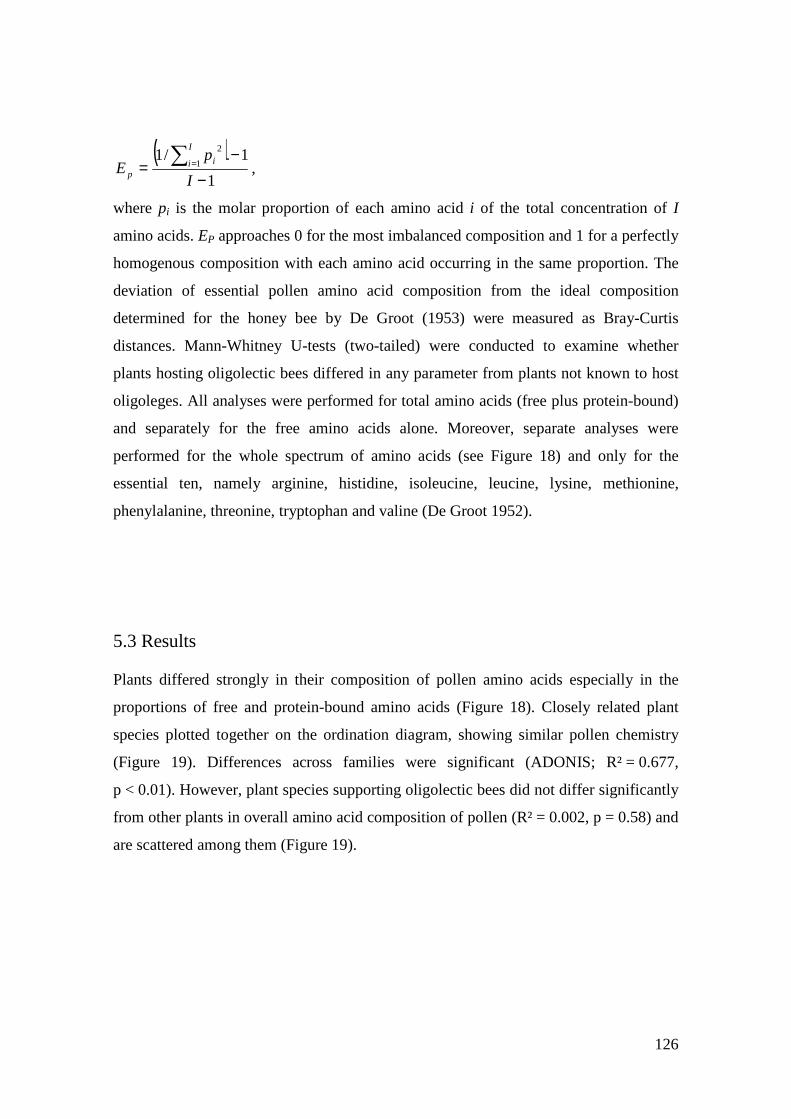
126
( )1
1/11
2
−−
= ∑ =
I
pE
I
i i
p ,
where pi is the molar proportion of each amino acid i of the total concentration of I
amino acids. EP approaches 0 for the most imbalanced composition and 1 for a perfectly
homogenous composition with each amino acid occurring in the same proportion. The
deviation of essential pollen amino acid composition from the ideal composition
determined for the honey bee by De Groot (1953) were measured as Bray-Curtis
distances. Mann-Whitney U-tests (two-tailed) were conducted to examine whether
plants hosting oligolectic bees differed in any parameter from plants not known to host
oligoleges. All analyses were performed for total amino acids (free plus protein-bound)
and separately for the free amino acids alone. Moreover, separate analyses were
performed for the whole spectrum of amino acids (see Figure 18) and only for the
essential ten, namely arginine, histidine, isoleucine, leucine, lysine, methionine,
phenylalanine, threonine, tryptophan and valine (De Groot 1952).
5.3 Results
Plants differed strongly in their composition of pollen amino acids especially in the
proportions of free and protein-bound amino acids (Figure 18). Closely related plant
species plotted together on the ordination diagram, showing similar pollen chemistry
(Figure 19). Differences across families were significant (ADONIS; R² = 0.677,
p < 0.01). However, plant species supporting oligolectic bees did not differ significantly
from other plants in overall amino acid composition of pollen (R² = 0.002, p = 0.58) and
are scattered among them (Figure 19).
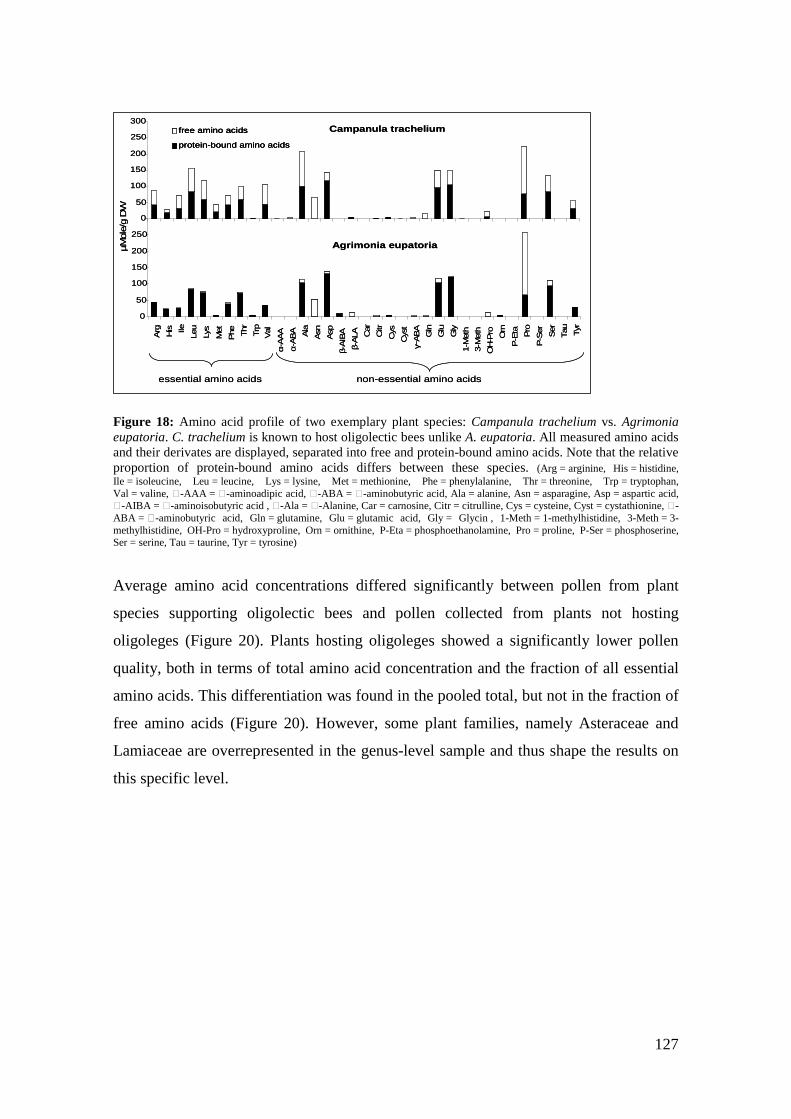
127
Figure 18: Amino acid profile of two exemplary plant species: Campanula trachelium vs. Agrimonia eupatoria. C. trachelium is known to host oligolectic bees unlike A. eupatoria. All measured amino acids and their derivates are displayed, separated into free and protein-bound amino acids. Note that the relative proportion of protein-bound amino acids differs between these species. (Arg = arginine, His = histidine, Ile = isoleucine, Leu = leucine, Lys = lysine, Met = methionine, Phe = phenylalanine, Thr = threonine, Trp = tryptophan, Val = valine, �-AAA = �-aminoadipic acid, �-ABA = �-aminobutyric acid, Ala = alanine, Asn = asparagine, Asp = aspartic acid, �-AIBA = �-aminoisobutyric acid , �-Ala = �-Alanine, Car = carnosine, Citr = citrulline, Cys = cysteine, Cyst = cystathionine, �-ABA = �-aminobutyric acid, Gln = glutamine, Glu = glutamic acid, Gly = Glycin , 1-Meth = 1-methylhistidine, 3-Meth = 3-methylhistidine, OH-Pro = hydroxyproline, Orn = ornithine, P-Eta = phosphoethanolamine, Pro = proline, P-Ser = phosphoserine, Ser = serine, Tau = taurine, Tyr = tyrosine)
Average amino acid concentrations differed significantly between pollen from plant
species supporting oligolectic bees and pollen collected from plants not hosting
oligoleges (Figure 20). Plants hosting oligoleges showed a significantly lower pollen
quality, both in terms of total amino acid concentration and the fraction of all essential
amino acids. This differentiation was found in the pooled total, but not in the fraction of
free amino acids (Figure 20). However, some plant families, namely Asteraceae and
Lamiaceae are overrepresented in the genus-level sample and thus shape the results on
this specific level.
0
50
100
150
200
250
0
Arg
His Ile
Leu
Lys
Met
Phe Thr
Trp
Val
α-A
AA
α-AB
A Ala
Asn
Asp
β-AIB
A
β-ALA C
ar
Citr
Cys
Cys
t
γ−AB
A
Gln
Glu
Gly
1-M
eth
3-M
eth
OH
-Pro Orn
P-E
ta Pro
P-S
er Ser
Tau Tyr
µMol
e/g
DW
free amino acids
protein-bound amino acids
Campanula trachelium
50
100
150
200
250
300
essential amino acids non-essential amino acids
Agrimonia eupatoria
0
50
100
150
200
250
0
Arg
His Ile
Leu
Lys
Met
Phe Thr
Trp
Val
α-A
AA
α-AB
A Ala
Asn
Asp
β-AIB
A
β-ALA C
ar
Citr
Cys
Cys
t
γ−AB
A
Gln
Glu
Gly
1-M
eth
3-M
eth
OH
-Pro Orn
P-E
ta Pro
P-S
er Ser
Tau Tyr
µMol
e/g
DW
free amino acids
protein-bound amino acids
free amino acids
protein-bound amino acids
Campanula trachelium
50
100
150
200
250
300
essential amino acids non-essential amino acids
Agrimonia eupatoria
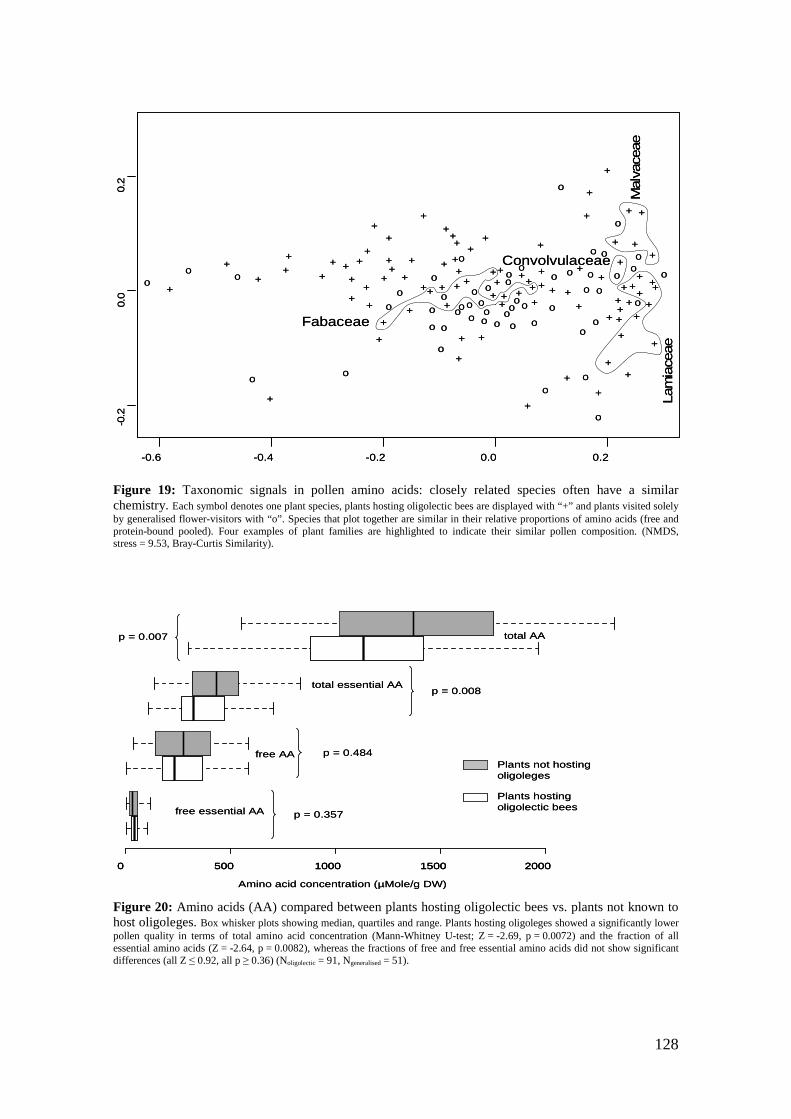
128
Figure 19: Taxonomic signals in pollen amino acids: closely related species often have a similar chemistry. Each symbol denotes one plant species, plants hosting oligolectic bees are displayed with “+” and plants visited solely by generalised flower-visitors with “o”. Species that plot together are similar in their relative proportions of amino acids (free and protein-bound pooled). Four examples of plant families are highlighted to indicate their similar pollen composition. (NMDS, stress = 9.53, Bray-Curtis Similarity).
Figure 20: Amino acids (AA) compared between plants hosting oligolectic bees vs. plants not known to host oligoleges. Box whisker plots showing median, quartiles and range. Plants hosting oligoleges showed a significantly lower pollen quality in terms of total amino acid concentration (Mann-Whitney U-test; Z = -2.69, p = 0.0072) and the fraction of all essential amino acids (Z = -2.64, p = 0.0082), whereas the fractions of free and free essential amino acids did not show significant differences (all Z ≤ 0.92, all p ≥ 0.36) (Noligolectic = 91, Ngeneralised = 51).
-0.6 -0.4 -0.2 0.0 0.2
-0.2
0.0
0.2
o
o
o +
+
oo
o
o +o
o
o
+
+
+
+
o
o++
+
+
++
o
+
++
+
+
+
+
+
+
+
o
o
o
o o+o
+
+
o
+
+++
+
o
o
++
o ++
+
o
+o
+
+
++
+
+o
o
+
o
o o++
+
o
o
oo
o
+
+
o
+o
o
o
+
+ ++
+
o
o
+
+o +
o
o
+
+
+
o
oo
+o
o
+
+
+
+
+
++
+
+
+
+
+
o
o+
o
+
+
+
+
+
+
++
+
++
o
+
+
+
+
+
Lam
iace
ae
Convolvulaceae
Fabaceae
Mal
vace
ae
0 500 1000 1500 2000
Plants hostingoligolectic bees
Plants not hostingoligoleges
total essential AA
free AA
free essential AA
p = 0.008
p = 0.484
p = 0.357
p = 0.007
Amino acid concentration (µMole/g DW)
total AA
0 500 1000 1500 20000 500 1000 1500 2000
Plants hostingoligolectic bees
Plants not hostingoligoleges
total essential AA
free AA
free essential AA
p = 0.008
p = 0.484
p = 0.357
p = 0.007
Amino acid concentration (µMole/g DW)
total AA
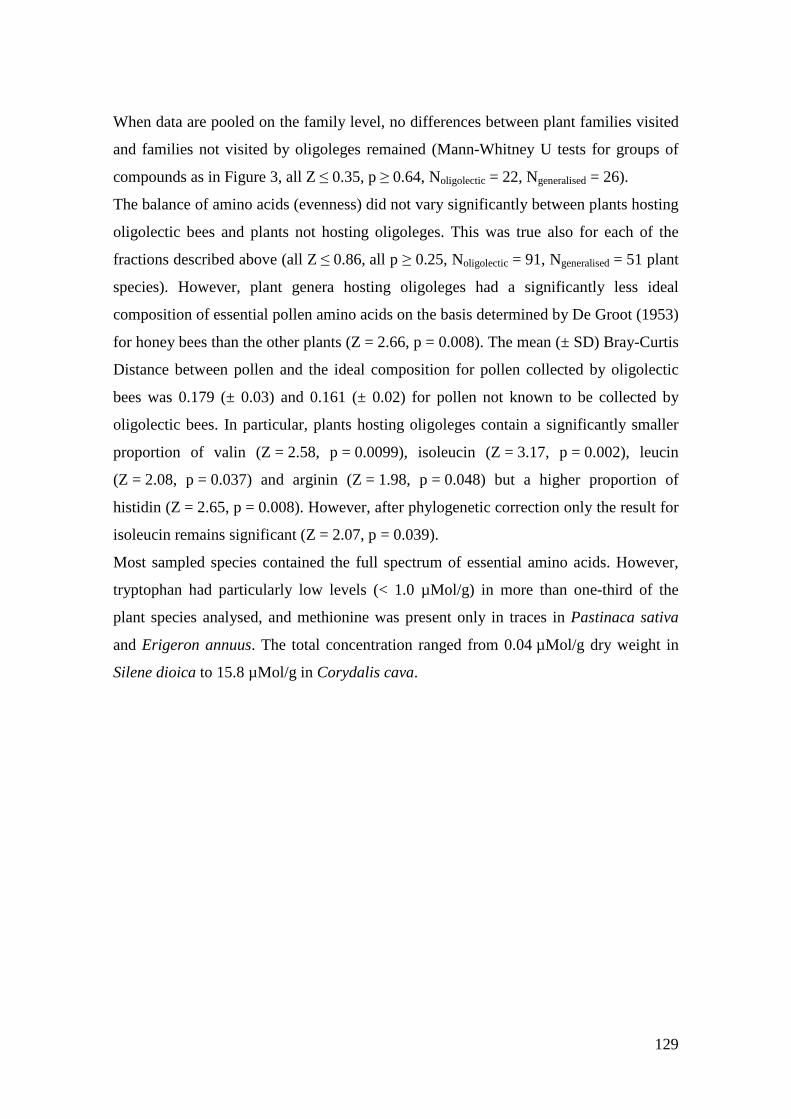
129
When data are pooled on the family level, no differences between plant families visited
and families not visited by oligoleges remained (Mann-Whitney U tests for groups of
compounds as in Figure 3, all Z ≤ 0.35, p ≥ 0.64, Noligolectic = 22, Ngeneralised = 26).
The balance of amino acids (evenness) did not vary significantly between plants hosting
oligolectic bees and plants not hosting oligoleges. This was true also for each of the
fractions described above (all Z ≤ 0.86, all p ≥ 0.25, Noligolectic = 91, Ngeneralised = 51 plant
species). However, plant genera hosting oligoleges had a significantly less ideal
composition of essential pollen amino acids on the basis determined by De Groot (1953)
for honey bees than the other plants (Z = 2.66, p = 0.008). The mean (± SD) Bray-Curtis
Distance between pollen and the ideal composition for pollen collected by oligolectic
bees was 0.179 (± 0.03) and 0.161 (± 0.02) for pollen not known to be collected by
oligolectic bees. In particular, plants hosting oligoleges contain a significantly smaller
proportion of valin (Z = 2.58, p = 0.0099), isoleucin (Z = 3.17, p = 0.002), leucin
(Z = 2.08, p = 0.037) and arginin (Z = 1.98, p = 0.048) but a higher proportion of
histidin (Z = 2.65, p = 0.008). However, after phylogenetic correction only the result for
isoleucin remains significant (Z = 2.07, p = 0.039).
Most sampled species contained the full spectrum of essential amino acids. However,
tryptophan had particularly low levels (< 1.0 µMol/g) in more than one-third of the
plant species analysed, and methionine was present only in traces in Pastinaca sativa
and Erigeron annuus. The total concentration ranged from 0.04 µMol/g dry weight in
Silene dioica to 15.8 µMol/g in Corydalis cava.

130
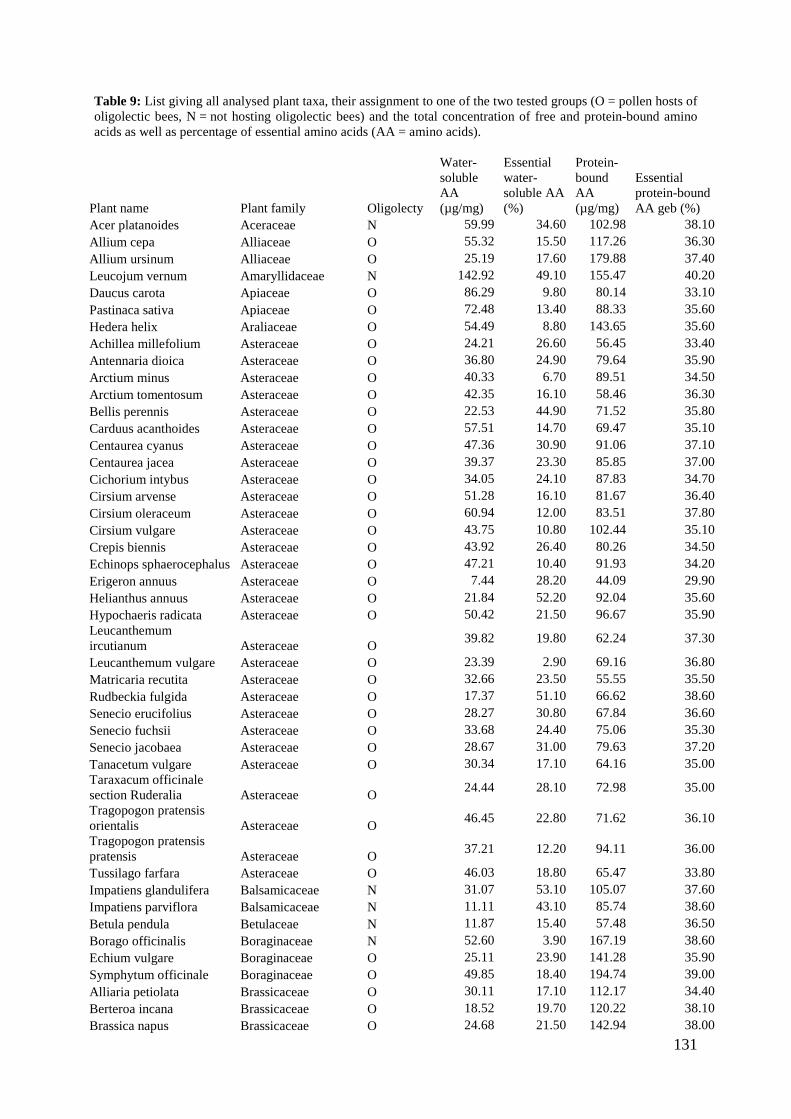
131
Table 9: List giving all analysed plant taxa, their assignment to one of the two tested groups (O = pollen hosts of oligolectic bees, N = not hosting oligolectic bees) and the total concentration of free and protein-bound amino acids as well as percentage of essential amino acids (AA = amino acids).
Plant name Plant family Oligolecty
Water-soluble AA (µg/mg)
Essential water-soluble AA (%)
Protein-bound AA (µg/mg)
Essential protein-bound AA geb (%)
Acer platanoides Aceraceae N 59.99 34.60 102.98 38.10 Allium cepa Alliaceae O 55.32 15.50 117.26 36.30 Allium ursinum Alliaceae O 25.19 17.60 179.88 37.40 Leucojum vernum Amaryllidaceae N 142.92 49.10 155.47 40.20 Daucus carota Apiaceae O 86.29 9.80 80.14 33.10 Pastinaca sativa Apiaceae O 72.48 13.40 88.33 35.60 Hedera helix Araliaceae O 54.49 8.80 143.65 35.60 Achillea millefolium Asteraceae O 24.21 26.60 56.45 33.40 Antennaria dioica Asteraceae O 36.80 24.90 79.64 35.90 Arctium minus Asteraceae O 40.33 6.70 89.51 34.50 Arctium tomentosum Asteraceae O 42.35 16.10 58.46 36.30 Bellis perennis Asteraceae O 22.53 44.90 71.52 35.80 Carduus acanthoides Asteraceae O 57.51 14.70 69.47 35.10 Centaurea cyanus Asteraceae O 47.36 30.90 91.06 37.10 Centaurea jacea Asteraceae O 39.37 23.30 85.85 37.00 Cichorium intybus Asteraceae O 34.05 24.10 87.83 34.70 Cirsium arvense Asteraceae O 51.28 16.10 81.67 36.40 Cirsium oleraceum Asteraceae O 60.94 12.00 83.51 37.80 Cirsium vulgare Asteraceae O 43.75 10.80 102.44 35.10 Crepis biennis Asteraceae O 43.92 26.40 80.26 34.50 Echinops sphaerocephalus Asteraceae O 47.21 10.40 91.93 34.20 Erigeron annuus Asteraceae O 7.44 28.20 44.09 29.90 Helianthus annuus Asteraceae O 21.84 52.20 92.04 35.60 Hypochaeris radicata Asteraceae O 50.42 21.50 96.67 35.90 Leucanthemum ircutianum Asteraceae O
39.82 19.80 62.24 37.30
Leucanthemum vulgare Asteraceae O 23.39 2.90 69.16 36.80 Matricaria recutita Asteraceae O 32.66 23.50 55.55 35.50 Rudbeckia fulgida Asteraceae O 17.37 51.10 66.62 38.60 Senecio erucifolius Asteraceae O 28.27 30.80 67.84 36.60 Senecio fuchsii Asteraceae O 33.68 24.40 75.06 35.30 Senecio jacobaea Asteraceae O 28.67 31.00 79.63 37.20 Tanacetum vulgare Asteraceae O 30.34 17.10 64.16 35.00 Taraxacum officinale section Ruderalia Asteraceae O
24.44 28.10 72.98 35.00
Tragopogon pratensis orientalis Asteraceae O
46.45 22.80 71.62 36.10
Tragopogon pratensis pratensis Asteraceae O
37.21 12.20 94.11 36.00
Tussilago farfara Asteraceae O 46.03 18.80 65.47 33.80 Impatiens glandulifera Balsamicaceae N 31.07 53.10 105.07 37.60 Impatiens parviflora Balsamicaceae N 11.11 43.10 85.74 38.60 Betula pendula Betulaceae N 11.87 15.40 57.48 36.50 Borago officinalis Boraginaceae N 52.60 3.90 167.19 38.60 Echium vulgare Boraginaceae O 25.11 23.90 141.28 35.90 Symphytum officinale Boraginaceae O 49.85 18.40 194.74 39.00 Alliaria petiolata Brassicaceae O 30.11 17.10 112.17 34.40 Berteroa incana Brassicaceae O 18.52 19.70 120.22 38.10 Brassica napus Brassicaceae O 24.68 21.50 142.94 38.00
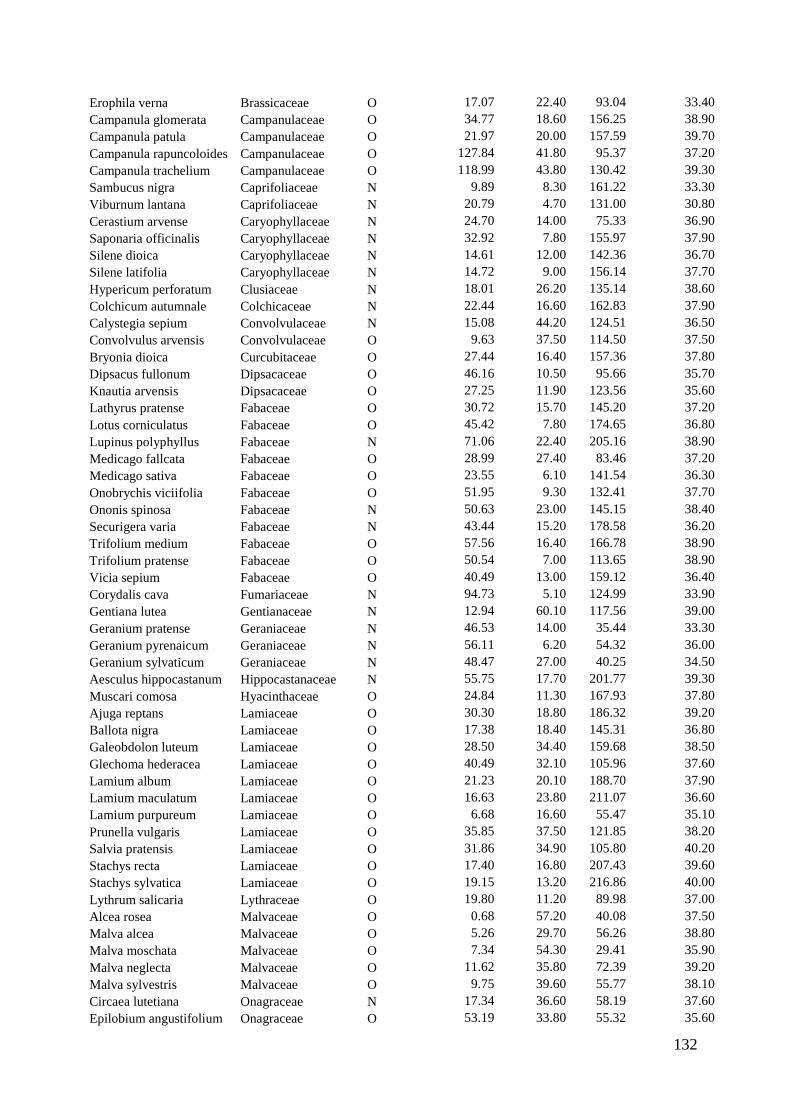
132
Erophila verna Brassicaceae O 17.07 22.40 93.04 33.40 Campanula glomerata Campanulaceae O 34.77 18.60 156.25 38.90 Campanula patula Campanulaceae O 21.97 20.00 157.59 39.70 Campanula rapuncoloides Campanulaceae O 127.84 41.80 95.37 37.20 Campanula trachelium Campanulaceae O 118.99 43.80 130.42 39.30 Sambucus nigra Caprifoliaceae N 9.89 8.30 161.22 33.30 Viburnum lantana Caprifoliaceae N 20.79 4.70 131.00 30.80 Cerastium arvense Caryophyllaceae N 24.70 14.00 75.33 36.90 Saponaria officinalis Caryophyllaceae N 32.92 7.80 155.97 37.90 Silene dioica Caryophyllaceae N 14.61 12.00 142.36 36.70 Silene latifolia Caryophyllaceae N 14.72 9.00 156.14 37.70 Hypericum perforatum Clusiaceae N 18.01 26.20 135.14 38.60 Colchicum autumnale Colchicaceae N 22.44 16.60 162.83 37.90 Calystegia sepium Convolvulaceae N 15.08 44.20 124.51 36.50 Convolvulus arvensis Convolvulaceae O 9.63 37.50 114.50 37.50 Bryonia dioica Curcubitaceae O 27.44 16.40 157.36 37.80 Dipsacus fullonum Dipsacaceae O 46.16 10.50 95.66 35.70 Knautia arvensis Dipsacaceae O 27.25 11.90 123.56 35.60 Lathyrus pratense Fabaceae O 30.72 15.70 145.20 37.20 Lotus corniculatus Fabaceae O 45.42 7.80 174.65 36.80 Lupinus polyphyllus Fabaceae N 71.06 22.40 205.16 38.90 Medicago fallcata Fabaceae O 28.99 27.40 83.46 37.20 Medicago sativa Fabaceae O 23.55 6.10 141.54 36.30 Onobrychis viciifolia Fabaceae O 51.95 9.30 132.41 37.70 Ononis spinosa Fabaceae N 50.63 23.00 145.15 38.40 Securigera varia Fabaceae N 43.44 15.20 178.58 36.20 Trifolium medium Fabaceae O 57.56 16.40 166.78 38.90 Trifolium pratense Fabaceae O 50.54 7.00 113.65 38.90 Vicia sepium Fabaceae O 40.49 13.00 159.12 36.40 Corydalis cava Fumariaceae N 94.73 5.10 124.99 33.90 Gentiana lutea Gentianaceae N 12.94 60.10 117.56 39.00 Geranium pratense Geraniaceae N 46.53 14.00 35.44 33.30 Geranium pyrenaicum Geraniaceae N 56.11 6.20 54.32 36.00 Geranium sylvaticum Geraniaceae N 48.47 27.00 40.25 34.50 Aesculus hippocastanum Hippocastanaceae N 55.75 17.70 201.77 39.30 Muscari comosa Hyacinthaceae O 24.84 11.30 167.93 37.80 Ajuga reptans Lamiaceae O 30.30 18.80 186.32 39.20 Ballota nigra Lamiaceae O 17.38 18.40 145.31 36.80 Galeobdolon luteum Lamiaceae O 28.50 34.40 159.68 38.50 Glechoma hederacea Lamiaceae O 40.49 32.10 105.96 37.60 Lamium album Lamiaceae O 21.23 20.10 188.70 37.90 Lamium maculatum Lamiaceae O 16.63 23.80 211.07 36.60 Lamium purpureum Lamiaceae O 6.68 16.60 55.47 35.10 Prunella vulgaris Lamiaceae O 35.85 37.50 121.85 38.20 Salvia pratensis Lamiaceae O 31.86 34.90 105.80 40.20 Stachys recta Lamiaceae O 17.40 16.80 207.43 39.60 Stachys sylvatica Lamiaceae O 19.15 13.20 216.86 40.00 Lythrum salicaria Lythraceae O 19.80 11.20 89.98 37.00 Alcea rosea Malvaceae O 0.68 57.20 40.08 37.50 Malva alcea Malvaceae O 5.26 29.70 56.26 38.80 Malva moschata Malvaceae O 7.34 54.30 29.41 35.90 Malva neglecta Malvaceae O 11.62 35.80 72.39 39.20 Malva sylvestris Malvaceae O 9.75 39.60 55.77 38.10 Circaea lutetiana Onagraceae N 17.34 36.60 58.19 37.60 Epilobium angustifolium Onagraceae O 53.19 33.80 55.32 35.60
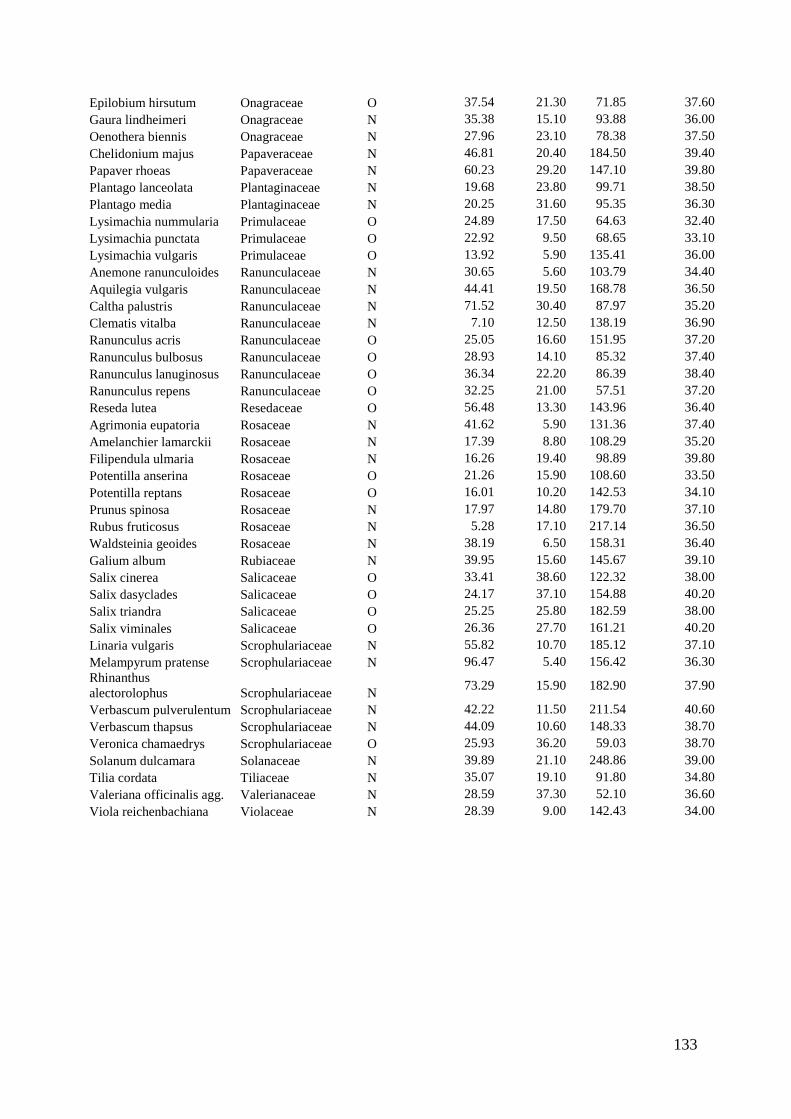
133
Epilobium hirsutum Onagraceae O 37.54 21.30 71.85 37.60 Gaura lindheimeri Onagraceae N 35.38 15.10 93.88 36.00 Oenothera biennis Onagraceae N 27.96 23.10 78.38 37.50 Chelidonium majus Papaveraceae N 46.81 20.40 184.50 39.40 Papaver rhoeas Papaveraceae N 60.23 29.20 147.10 39.80 Plantago lanceolata Plantaginaceae N 19.68 23.80 99.71 38.50 Plantago media Plantaginaceae N 20.25 31.60 95.35 36.30 Lysimachia nummularia Primulaceae O 24.89 17.50 64.63 32.40 Lysimachia punctata Primulaceae O 22.92 9.50 68.65 33.10 Lysimachia vulgaris Primulaceae O 13.92 5.90 135.41 36.00 Anemone ranunculoides Ranunculaceae N 30.65 5.60 103.79 34.40 Aquilegia vulgaris Ranunculaceae N 44.41 19.50 168.78 36.50 Caltha palustris Ranunculaceae N 71.52 30.40 87.97 35.20 Clematis vitalba Ranunculaceae N 7.10 12.50 138.19 36.90 Ranunculus acris Ranunculaceae O 25.05 16.60 151.95 37.20 Ranunculus bulbosus Ranunculaceae O 28.93 14.10 85.32 37.40 Ranunculus lanuginosus Ranunculaceae O 36.34 22.20 86.39 38.40 Ranunculus repens Ranunculaceae O 32.25 21.00 57.51 37.20 Reseda lutea Resedaceae O 56.48 13.30 143.96 36.40 Agrimonia eupatoria Rosaceae N 41.62 5.90 131.36 37.40 Amelanchier lamarckii Rosaceae N 17.39 8.80 108.29 35.20 Filipendula ulmaria Rosaceae N 16.26 19.40 98.89 39.80 Potentilla anserina Rosaceae O 21.26 15.90 108.60 33.50 Potentilla reptans Rosaceae O 16.01 10.20 142.53 34.10 Prunus spinosa Rosaceae N 17.97 14.80 179.70 37.10 Rubus fruticosus Rosaceae N 5.28 17.10 217.14 36.50 Waldsteinia geoides Rosaceae N 38.19 6.50 158.31 36.40 Galium album Rubiaceae N 39.95 15.60 145.67 39.10 Salix cinerea Salicaceae O 33.41 38.60 122.32 38.00 Salix dasyclades Salicaceae O 24.17 37.10 154.88 40.20 Salix triandra Salicaceae O 25.25 25.80 182.59 38.00 Salix viminales Salicaceae O 26.36 27.70 161.21 40.20 Linaria vulgaris Scrophulariaceae N 55.82 10.70 185.12 37.10 Melampyrum pratense Scrophulariaceae N 96.47 5.40 156.42 36.30 Rhinanthus alectorolophus Scrophulariaceae N
73.29 15.90 182.90 37.90
Verbascum pulverulentum Scrophulariaceae N 42.22 11.50 211.54 40.60 Verbascum thapsus Scrophulariaceae N 44.09 10.60 148.33 38.70 Veronica chamaedrys Scrophulariaceae O 25.93 36.20 59.03 38.70 Solanum dulcamara Solanaceae N 39.89 21.10 248.86 39.00 Tilia cordata Tiliaceae N 35.07 19.10 91.80 34.80 Valeriana officinalis agg. Valerianaceae N 28.59 37.30 52.10 36.60 Viola reichenbachiana Violaceae N 28.39 9.00 142.43 34.00
134
5.4 Discussion
Our comparison of pollen amino acid composition showed that closely related species
differ only slightly in their proportions of amino acids, suggesting that the profiles are a
highly conserved trait. Compositional differences were most obvious between families and
orders. Most plant species investigated contained the full spectrum of essential amino acids,
albeit some in extremely small quantities. Earlier studies reported that tryptophan was
lacking in several pollen species (Auclair and Jamieson 1948, Roulston and Cane 2000),
partly for plants where tryptophane was detected only in trace amounts in our analysis.
However, the strong quantitative limitation of tryptophane and occasionally methionine is
evident and this limitation may be crucial for the development of bees or other pollen
feeding insects.
Regarding pollen amino acid concentration on the family level (to compensate
overrepresentation of closely related plants), our results are consistent with earlier findings
of crude protein or nitrogen contents (Roulston et al. 2000): pollen known to be collected
by oligoleges is neither more nor less nutritious than other pollen. On the species level
oligolege pollen hosts contain significantly lower amounts of amino acids. These
conflicting findings on family and species level may result from the latter being strongly
dominated by common plant families, particularly Asteraceae and Lamiacae. Indeed some
plants families are over-proportionally visited by oligoleges, whereas others do not host
oligoleges at all. This suggests that evolutionary constraints may have played a major role
in host-plant choice of oligoleges (Sedivy et al. 2008).
Host plants of oligoleges showed a poorer match to the ideal composition of essential
pollen amino acids determined by De Groot (1953) than other plants. It may thus be
possible that oligolectic bees are better adapted to a poorer nutritional quality of their host
plants, among many other adaptations to their specific pollen sources. Accordingly, it has
been hypothesised that specialist bee species may be more efficient in resource use than
related generalists (Strickler 1979, Dobson and Peng 1997). Higher efficiency in pollen
harvesting can be achieved through behavioural and morphological adaption (Müller and
Bansac 2004). Examples are modification of mouth parts in oligolectic Leioproctus or a
specialised hind leg brush in oligolectic Megachile species (Houston 1989, Müller and
Bansac 2004). The evolution of such specialised pollen removal structures evolved several
times independently in widely separated taxa, but is not restricted to oligolectic bees (Thorp
2000).
135
Nevertheless, Michez et al (2008) found some evidence that host switches occur more
frequently to morphologically similar rather than closely-related plants.
Shorter handling time per flower and the ability of oligoleges to remove more pollen per
flower than generalists was reported by Strickler (1979) and Cane and Payne (1988). These
skills may lead to higher potential reproduction, since more pollen is collected for the brood
cells per unit of handling time. However, bees do not adjust pollen provision based on the
pollen’s protein content. Roulston and Cane (2002) found the amount of pollen provision to
predict larval performance only if, additionally to provision mass, protein content was
considered. Besides, some evidence suggests that oligoleges are physiologically better
adapted to digestion of their host plant pollen and can absorb the nutrients present in the
pollen of their restricted food source more effectively than other bees (Dobson and Peng
1997, Praz et al. 2008). This might explain a choice of pollen species with lower total or
essential amino acids. However, polylectic bees commonly collect monospecific pollen
loads for nest provision (Westrich 1990) and thus also depend on the suitability of their
particular provision. In brood cells containing pollen loads deficient in one or more
essential amino acids, larvae would not be able to develop. Thus, it may not be surprising
that polyleges select similar or even better pollen qualities. Adaptation to a certain pollen
source may be associated with a cost: a decreased capability to digest other pollen types.
Such costs are known to occur in host-specific herbivores (Strauss and Zangerl 2002) and
were recently hypothesised for bees as well (Sedivy et al. 2008). While some studies
demonstrated oligoleges to grow well on some non-host pollen (Bohart and Youssef 1976,
Williams 2003), brood failure has been reported from other investigations (Guirguis and
Brindley 1974, Praz et al. 2008). In some cases toxic compounds may be involved in
specialist bees being able to cope better with some pollen species than others (Praz et al.
2008). To our knowledge no comparative approach of pollen toxins exists so far. If
oligolectic bees specialised on pollen that is either deficient in amino acids or contains toxic
compounds, this might have led to a competitive advantage in terms of the available pollen
quantity and may explain why Asteraceae host large numbers of oligoleges but only few
polyleges (Müller and Kuhlmann 2008). However, effective competitive avoidance has not
been demonstrated so far. Most plant species visited by oligoleges are also regularly visited
by polylectic bees and other insects, but this does not exclude the possibility of quantitative
effects of competitive avoidance. Answering this question would require quantitative
surveys of flower visitation and pollen removal rates.

136
137
6. Diversity and resource choice of flower visiting insects in relation to pollen nutritional quality and land use – synopsis and discussion Biodiversity loss always is a matter of public concern. Yet, losses in pollinating insects
are predestined to raise particular attention due to their potential effects on reproduction
of wild flowers (Biesmeijer et al. 2006) and, above all, crop production and thus human
welfare (Klein et al. 2003, Klein et al. 2007). Thus, albeit controversially discussed, the
pollination crisis became a pervasive topic in ecology (Ghazoul 2005, Steffan-Dewenter
et al. 2005).
Diverse communities of wild pollinators are stated to enhance stability, quality and
quantity of pollination services (Lonsdorf et al. 2009). However, to assure this essential
ecosystem service, wild pollinator assemblages rely on appropriate foraging resources as
well as nesting sites within foraging distance of floral patches.
The goal of my thesis was to examine how and via which pathways land use affects
plant-pollinator communities. We investigated their diversity in relation to different land-
use intensities and management strategies. Contrasting results between different
pollinator groups demanded to illuminate the relationship between species niche
properties and vulnerability to disturbance. We analyzed species response in relation to
specialization and demonstrated that species-specific plant and pollinator responses to
land use may be predicted by the land-use response of each species’ partners when
relative interaction strength is considered. Our findings confirm that ecological networks
suit to predict natural community responses to disturbance and possible secondary
extinctions. As specialization in pollinators potentially is associated with high costs, we
explored if it on the other hand coincides with higher foraging efficiency and investigated
if resource choice in pollinators is influenced by pollen nutritional quality.
6.1 Land-use effects on plant communities
Frequent mowing, grazing and fertilization are known to have profound effects on plant
species richness and functional diversity (Proulx and Mazumder 1998, Maskell et al.
2010). Thus, floral composition and species richness of grasslands partly mirror their
management regime (Fenner and Palmer 1998). Our comparison between meadows used
at high or low land-use intensities revealed crucial differences in plant species
138
composition even between barely varying management types, with species overlaps of
less than 43 per cent (Chapter 2). Plant species richness and diversity declined with
increasing land-use intensity (Chapter 2-3). Our results showed that even gradual
differences in management intensity, particularly increases in mowing frequency and
fertilization, lead to changes in species composition and losses in plant diversity (Chapter
2, 4). Thus, we confirmed former studies detecting decreases in flower diversity with
increasing fertilizer application and mowing frequency (Mountford et al. 1993, Socher et
al. 2012). Nonetheless, a more detailed look at the isolated effects of different land-use
components revealed differing trends between Exploratories, i.e. results cannot be
transferred without further ado between regions (Chapter 4). Considering the importance
of regional contexts, similar findings were reported from other studies conducted within
the framework of the Biodiversity Exploratories project (e.g. Blüthgen et al. 2012,
Socher et al. 2012, Socher et al. 2013).
The average land-use response of a plant species was predicted by the weighted response
of its pollinators, and did not differ with plant specialization (Chapter 3, 4) or between
self-compatible and self-incompatible plants (Chapter 3). This is consistent with a review
by Aizen et al. (2002) who reported that neither breeding system nor specialization
determined plant susceptibility to disturbance. Albeit average specialization in plants was
very high, responses of plants to pollinator fate were less pronounced than responses of
pollinators to plant fate, i.e. resource loss (Chapter 3, 4). This may be due to the fact that
many plant species are capable of vegetative reproduction or do not depend obligatorily
on out-crossing (Klotz et al. 2002). Nevertheless, land-use intensification reduced
taxonomic breadth of some pollinator groups such as bees and butterflies (Chapter 2-4).
This most probably causes a reduction in the functional diversity of pollinators, which
could conversely affect plant species richness and functional diversity (Klein et al. 2003,
Hoehn et al. 2008). While plant reproductive fitness may be at risk over longer time
spans, the immediate effects on the fitness and local distribution of pollinators may be
more severe when their foraging resources become unavailable (Biesmeijer et al. 2006,
Goulson et al. 2008, Bommarco et al. 2010).
Nevertheless, plant responses to land-use intensity were related to relative species
abundance with rare plants showing a stronger decline with increasing land use than
more abundant ones (Chapter 3). Additionally, conversely with other studies (Ebeling et
al. 2008), the total number of visits to a plant species was positively related to overall
139
floral abundance in terms of flowering area (Chapter 2). This implies that rare plants
may suffer disproportionately from a decrease in pollinator diversity and abundance. A
clear plurality of studies showed that pollination and reproductive success decrease in
sparse and sometimes also in small populations, particularly in self-incompatible plant
species (Silander 1978, Jennerston 1988, Kunin 1992, Agren 1996, Knight 2003, Aguilar
and Galetto 2004, Hirayama et al. 2007, Kolb 2008). Still, competition for a limited
number of pollinators may lead to reductions in per capita pollinator visits and pollen
limitation in large or very dense populations (Cambell and Husband 2007, Spigler and
Chang 2009). Reductions in reproductive output in terms of seed set may result from
declines in either pollination quantity or quality of visits. As large plant populations and
high flower densities tend to attract higher numbers of pollinators (Cheptou and
Avendano 2006, Bernhardt et al. 2008) pollen flow within the population is secured even
if per capita visitation might be lower than in some smaller populations. Moreover,
visitors to dense populations are expected to be more flower constant, thus increasing the
chance of intra-specific pollen transfer (Kunin 1997). In contrast, in small populations
beneath negative effects from inter-specific pollen transfer higher rates of inbreeding
may lead to difficulties due to genetic reasons (lowered population viability) and
increase local extinction risk (Ellstrand and Elam 1993, Byers 1995, Waites and Agren
2004). If plant reproductive success decreases with decreasing population size, rareness
rather than specialization may determine plant fate in relation to pollination and land-use
intensification.
6.2 Consequences from land use for mutualistic plant-pollinator interactions
Agricultural management is also a major factor determining diversity and persistence of
faunal richness in anthropogenic landscapes. In contrast to plants, in pollinators,
responses to land-use intensity were independent of pollinator abundance (Chapter 3) and
seem to depend on species-specific pollinator traits (Chapter 2-4). We found that
pollinator composition corresponded to floral composition (Chapter 3) and that overall
species composition of pollinators differed considerably between meadows varying in
mowing frequency and fertilization intensity (Chapter 2). However, neither total
pollinator species richness nor abundance or diversity was correlated negatively to land-
use intensity (Chapter 2-4). When regarded in isolation, composition of bees and
butterflies differed considerably between meadow types, whereas the other pollinator
140
groups did not show significant differences related to management (Chapter 2). In spite
of this, with increasing land-use intensity the proportional abundance and species
richness of dipterans, especially syrphids, mostly increased, whereas it mostly decreased
in bees and other hymenopterans as well as in butterflies and beetles (Chapter 2-4). These
results highlight that different pollinator-groups respond differently to disturbance. They
are in line with earlier studies indicating opposing trends in the responses of wild bees
and syrphids to agricultural change and landscape structure (Biesmeijer et al. 2006,
Jauker et al. 2009). Moreover, they point to the fact that investigation of species
biodiversity alone may not detect biotic homogenization e.g. losses in functional
diversity (Filippi-Codaccioni et al. 2010).
The number of visitor individuals per meadow varied independently of its total flowering
area. Thus, in our study, total flower density was not the vital factor determining overall
pollinator abundance. Nevertheless, visitation and flowering area of each plant species
within each network correlated positively (Chapter 2). Within a grassland plot, a plant
species with a high density, e.g. a large flowering area, received more visits in total. This
indicates that flower density plays a role for the distribution of visitors within a site.
Furthermore, it implies that rare plant species may receive fewer visits than abundant
ones, at least on a per site basis, which beneath effects outlined above may lead to poor
seed set, high selfing rates, and inbreeding depression (Fischer and Matthies 1997, Spira
2001). Considering that rare plants in our study declined disproportionately with
increasing land-use intensity, besides direct effects from land use, pollinator response to
flowering area may explain why these plants are exceptionally prone to disturbance
(Chapter 3).
In addition to floral abundance, pollinator abundance, composition and diversity may be
triggered by floral diversity and species-specific plant preferences (Tudor et al. 2004,
Ebeling et al. 2008, Kleijn and Raemakers 2008, Fründ et al. 2010). This was also
reflected by our results: a decline in plant species frequently visited by a pollinator often
went along with a decline in this pollinator (Chapter 3, 4). Furthermore, pollinator
species composition depended on plant species composition and in some pollinator
guilds on land-use type (Chapter 2).
Although land-use type explained only a small percentage of the total compositional
variation in pollinators (Chapter 2), land use may affect pollinators directly e.g. via
disruption of life cycles (Johst et al. 2006) or supply of appropriate nesting resources
141
(Potts et al. 2005). Such direct effects are known to add on indirect effects via flower
composition and availability, landscape context and availability of larval habitats. For
example, parasitic wasps depend on the local abundance of hosts (Steffan-Dewenter
2003) and in many bees and beetles abundance depends on certain habitats and landscape
structures as well as specific larval or nesting sites (Gathmann and Tscharntke 2002). On
the other hand, generalized flower visitors like most syrphids and other dipterans are not
restricted to certain landscape structures and may profit from diverse larval habitats
within their foraging range (Jauker et al. 2009). In syrphids females can spread into
landscapes progressively, alternating between oviposition and feeding. Contrarily, bees
collect pollen and nectar for their offspring and repeatedly need to return to the brood
cells after foraging, especially small and less mobile species may be restricted to
grasslands offering nesting sites. Such sites may then be characterized by higher bee
diversity and abundance. While high grazing intensity similar to mowing may destroy
larval habitats, in our study such negative aspects were outweighed by positive ones. The
positive effects of grazing intensity we partly observed in bees, butterflies and beetles
(Chapter 4) may be related to the fact that grazing leads to high sward heterogeneity
offering a variety of microclimates, produces nesting sites of bare soil for ground-nesting
insects and fosters important pollen and nectar resources as well as larval food plants for
a high variety of pollinators (Beil and Kratochwil 2004).
Unlike grazing, mowing leads to a frequent unselective removal of food resources and a
rather homogeneus sward structure. Moreover, it goes along with changes in plant
composition, may destroy larval habitats and is detrimental to most immobile larvae.
Therefore negative correlations between mowing intensity and responses in some
pollinator guilds may be stronger than responses to fertilization intensity which in real
world landscapes is highly correlated to mowing frequency and seemed to influence
pollinators rather indirectly via changes in plant diversity and composition (Chapter 4).
In our studies plant-pollinator networks proved to be highly structured. The level of
network specialization H2’ was relatively similar for all flower-visitor networks recorded
and yielded values around H2’ = 0.60, which are also typical of other plant-pollinator
associations (Blüthgen et al. 2007). Thus, most networks were highly structured,
deviating significantly from random associations (Chapter 2-4).
The level of species specialization di’ was highest for bees, intermediate for butterflies,
beetles and hymenopterans excluding bees, and lowest for syrphids and other dipterans.
142
The overall ranking proved to be stable between years and showed mostly similar trends
between different regions (Chapter 2-4).
Specialized pollinators such as oligolectic bees are often expected to be more prone to
disturbance and thus more vulnerable to ecosystem change (Colwell et al. 2012). This is
recognized as the cost of specialization and was reinforced by our results (Chapter 3 and
4). Dipteran flower visitors were least specialized and showed little changes in species
composition and an increase in abundance rather than a decrease related to land-use
intensity. More specialized pollinators e.g. butterflies and bees showed compositional
differences between management types and mostly decreased with increasing land-use
intensity (Chapter 2-4). This corresponds to investigations on bumblebees, butterflies and
beetles which demonstrated that many specialized species are of conservation concern and
have undergone a considerable decline in the last decades (Kotze and O´Hara 2003, Tudor et
al. 2004, Kleijn and Raemakers 2008)
Beneath the response of the plant species associated with a certain pollinator, pollinator
response to land use was significantly influenced by pollinator specialization and
taxonomic identity (Chapter 2-4). In rather specialized species responses to land-use
intensity were more strongly driven by the responses of their preferred plants than in
more generalized pollinators (Chapter 3, 4). Accordingly, on average specialized
pollinator taxa reflected the land-use response of the plant species they visited in their
own relative abundance. In contrast, syrphids and other dipterans seemed to respond to
land-use changes more independently from associated plants (Chapter 3). Nevertheless,
the identified positive effects of mowing intensity on syrphids and other dipterans could
be attributed to the observation that intensively used meadows offer a higher abundance
of easily exploitable flowers like Asteraceae and Apidaceae which are readily visited by
dipterans (Chapter 2, 4) which feed preferably on shallow flowers offering a lot of pollen
(Kevan and Baker 1983). Thus, our results are not only in line with the theory that
specialist species with narrow ecological niches are more susceptible to rapidly changing
environmental conditions, but also confirm that specialization represents a risk that
renders species more vulnerable to co-extinction (McKinney 1997, Vázquez and
Simberloff 2002, Winfree et al. 2007, Aizen et al. 2012, Pocock et al. 2012).
Differences in plant species composition together with high specialization may explain
the considerable differences in pollinator composition and functional diversity between
differently managed grasslands. Furthermore, diversity declines in specialist species
143
suggest that they rely more heavily on their preferred plant species, while diversity and
composition of dipterans was not consistently affected by land use in our study,
corresponding to their low degree of flower specialization.
The results from my thesis suggest that land-use intensification primarily triggers losses
in flower diversity and changes in composition, which then may lead to non-random and
resource-mediated declines in certain pollinators. Although land-use responses of the
pollinators visiting a plant species may also influence plant abundance, this effect is
weaker. While overall pollinator diversity is not significantly affected, pollinator species
composition changes considerably (Chapter 2-4). Land-use intensification has a
disproportionate impact on the abundance of more specialized pollinators, and on the
abundance of rare plant species (Chapter 3). Overall, species responses in plants and
pollinators were most strongly pronounced in relation to the intensification of mowing
which thus seems to be a major factor influencing the composition of plant-pollinator
networks (Chapter 4).
6.3 Pollen nutritional quality in relation to specialization in pollinators
Pollen amino acid profiles suggest that plants differ considerably in the concentration and
composition of pollen proteins and free amino acids (Chapter 5). In butterflies and honey
bees a preference for pollen and nectar that contains high concentrations of amino acids
was found (Alm et al. 1990, Erhardt and Baker 1990, Cook et al. 2003). Furthermore, the
ingestion of pollen or nectar rich in amino acids is known to promote reproductive fitness
in butterflies (Lanza et al. 1997, Mevi-Schutz and Erhardt 2005) and body size in bees
(Roulston and Cane 2002, Tasei and Aupinel 2008, Quezada-Euan et al. 2011). Thus,
visitation rate, visitor diversity and specialization of pollinators may increase with the
quality of pollen plants offer.
We aimed to find out whether amino acid composition affects host plant selection of
oligolectic bees. Thus, we compared amino acid concentration, homogeneity of
composition and deviation from the ideal composition of essential amino acids between
pollen known to be collected by oligoleges and pollen only collected by polylectic bees.
The composition of amino acids varied strongly among plant species, but cognate plant
species displayed similar composition (Chapter 5). This confirmed earlier work by
Roulston et al. (2000) where protein concentrations were found to be highly conserved
144
within plant genera and families. If amino acid content influences flower visitation,
flower visitors, above all pollen specialists, are hypothesized to select for plants rich in
amino acids (Roulston et al. 2000). Surprisingly, the concentration of free- and protein-
bound amino acids – also of the essential ones – is significantly lower in pollen sources
used by oligolectic bees than in other pollen sources (Chapter 5). Moreover, pollen
sources of oligoleges deviated more strongly from the ideal composition of essential
amino acids as determined for honey bees (De Groot 1953) than pollen sources not
hosting oligolectic bees.
This leads to the assumption that competitive avoidance or in other words an advantage
in terms of the available pollen quantity might have led to oligolectic bees being
specialized on pollen that is rather deficient in amino acids (Chapter 5). Though it still
needs to be tested in detail, a recent study considering Asteraceae and their flower
visitors revealed that plants hosting oligoleges are barely visited by generalists (Müller
and Kuhlmann 2008).
However, benefits of specialization may also result from more efficient handling of host
flowers (Strickler 1979), more effective pollen collection due to specific pollen-
harvesting structures (Müller and Bansac 2004), more proficient digestion (Dobson and
Peng 1997) and specialized detoxification abilities (Williams 2003).
6.4 Conclusions
Land-use intensification sets off losses in flower diversity, which leads to resource-
mediated declines in pollinator species. While the mean land-use response of the
pollinators visiting a plant species also influenced its abundance, this effect is weaker.
Network analyses provide a valuable tool for characterizing mutualism in a community
context and may be used to predict community responses to disturbance and possible
consequences of species loss. Our findings emphasize how systems based on mutualism
may undergo severe transformation due to land-use intensification. Mutual specialization
could offer an explanation for the accelerating parallel declines observed in plants and
pollinators.

145
Literature Adler, P. B., E. W. Seabloom, E. T. Borer, H. Hillebrand, Y. Hautier, A. Hector, and W. S.
Harpole. 2011. Productivity is a poor predictor of plant species richness. Science 333:1750-1753.
Agren, J. 1996. Population size, pollinator limitation, and seed set in the self-incompatible herb Lythrum salicaria. Ecology 77:1779-1790.
Aguilar, R., L. Ashworth, L. Galetto, and M. A. Aizen. 2006. Plant reproductive susceptibility to habitat fragmentation: review and synthesis through a meta-analysis. Ecology Letters 9:968-980.
Aguilar, R. and L. Galetto. 2004. Effects of forest fragmentation on male and female reproductive success in Cestrum parqui (Solanaceae). Oecologia 138:513-520.
Aizen, M. A., L. Ashworth, and L. Galetto. 2002. Reproductive success in fragmented habitats: do compatibility systems and pollination specialization matter? Journal of Vegetation Science 13:885-892.
Aizen, M. A. and P. Feinsinger. 2003. Bees not to be? Responses of insect pollinator faunas and flower pollination to habitat fragmentation. Pages 111-129 in G. Bradshaw and P. Marquet, editors. How Landscapes Change. Springer Berlin Heidelberg.
Aizen, M. A. and L. D. Harder. 2009. The global stock of domesticated honey bees is growing slower than agricultural demand for pollination. Current Biology 19:1-4.
Aizen, M. A., M. Sabatiano, and J. M. Tylianakis. 2012. Specialization and rarity predict nonrandom loss of interactions from mutualist networks. Science 335:1486-1489.
Allen-Wardell, G., P. Bernhardt, R. Bitner, A. Burquez, S. Buchmann, J. Cane, P. A. Cox, V. Dalton, P. Feinsinger, M. Ingram, D. Inouye, C. E. Jones, K. Kennedy, P. Kevan, H. Koopowitz, R. Medellin, S. Medellin-Morales, and G. P. Nabhan. 1998. The potential consequences of pollinator declines on the conservation of biodiversity and stability of food crop yields. Conservation Biology 12:8-17.
Alm, J., T. E. Ohnmeiss, J. Lanza, and L. Vriesenga. 1990. Preference of cabbage white butterflies and honey bees for nectar that contains amino acids. Oecologia 84:53-57.
Armbruster, W. S. and B. G. Baldwin. 1998. Switch from specialized to generalized pollination. Nature 394:632.
Asner, G. P., A. J. Elmore, L. P. Olander, R. E. Martin, and A. T. Harris. 2004. Grazing systems, ecosystem responses, and global change. Annual Review of Environment and Resources 29:261-299.
Auclair, J. L. and C. A. Jamieson. 1948. Qualitative analysis of amino acids in pollen collected by bees. Science 108:357-358.
Barmaz, S., S. G. Potts, and M. Vighi. 2010. A novel method for assessing risks to pollinators from plant protection products using honeybees as a model species. Ecotoxicology 19:1347-1359.
Barmaz, S., C. Vaj, A. Ippolito, and M. Vighi. 2012. Exposure of pollinators to plant protection products. Ecotoxicology 21:2177-2185.
Begon, M., J. L. Harper, and C. R. Townsend. 1990. Ecology: individuals, populations and communities. 2 edition. Blackwell Scientific Publications, Boston.
Beil, M. and A. Kratochwil. 2004. Zur Ressourcennutzung von Wildbienen (Hymenoptera, Apoidea) in beweideten und unbeweideten Sand-ökosystemen. Beweidung und Restitution als Chancen für den Naturschutz:179-189.
Bellard, C., C. Bertelsmeier, P. W. Leadley, W. Thuiller, and F. Courchamp. 2012. Impacts of climate change on the future of biodiversity. Ecology Letters 15:365-377.
146
Benadi, G., N. Blüthgen, T. Hovestadt, and H. J. Poethke. 2012. Population dynamics of interacting plant and pollinator communities: stability reconsidered. American Naturalist 179:157-168.
Bernhardt, C. E., R. J. Mitchell, and H. J. Michaels. 2008. Effects of population size and density on pollinator visitation, pollinator behavior, and pollen tube abundance in Lupinus perennis. International Journal of plant science 169:944-953.
Biesmeijer, J. C., S. P. M. Roberts, M. Reemer, R. Ohlemüller, M. Edwards, T. Peeters, A. P. Schaffers, S. G. Potts, R. Kleukers, C. D. Thomas, J. Settele, and W. E. Kunin. 2006. Parallel declines in pollinators and insect pollinated plants in Britain and the Netherlands. Science 313:351-354.
Binot-Hafke, M., S. Balzer, N. Becker, H. Gruttke, H. Haupt, N. Hofbauer, G. Ludwig, G. Matzke-Hajek, and M. Strauch, editors. 2011. Rote Liste gefährdeter Tiere, Pflanzen und Pilze Deutschlands. Band 3: Wirbellose (Teil 1). Bundesamt für Naturschutz, Bonn-Bad Godesberg.
Binot, M., R. Bless, P. Boye, H. Gruttke, and P. Pretscher, editors. 1998. Rote Liste gefährdeter Tiere Deutschlands. Bundesamt für Naturschutz, Bonn-Bad Godesberg.
Blüthgen, N. 2010. Why network analysis is often disconnected from community ecology: A critique and an ecologist´s guide. Basic and Applied Ecology 11:185-195.
Blüthgen, N., C. Dormann, F. Alt, S. Boch, V. Klaus, T. Kleinebecker, S. Gockel, J. Nieschulze, S. Renner, U. Schumacher, K. Birkhofer, F. Buscot, M. Fischer, A. Hemp, N. Hölzel, E. K. V. Kalko, K. E. Linsenmair, Y. Oelmann, D. Prati, C. Rothenwöhrer, C. Scherber, I. Schöning, E.-D. Schulze, T. Tscharntke, C. N. Weiner, K. Wells, and W. W. Weisser. 2012. A quantitative index of land-use intensity in grasslands: Integrating mowing, grazing and fertilization. Basic and Applied Ecology 13:207-220.
Blüthgen, N. and K. Fiedler. 2004. Preferences for sugars and amino acids and their conditionality in a diverse nectar-feeding ant community. Journal of Animal Ecology 73:155-166.
Blüthgen, N., J. Fründ, D. P. Vázquez, and F. Menzel. 2008. What do interaction network metrics tell us about specilization and biological traits? Ecology 89:3387-3399.
Blüthgen, N. and A.-M. Klein. 2011. Functional complementarity and specialisation: The role of biodiversity in plant–pollinator interactions. Basic and Applied Ecology 12:282-291.
Blüthgen, N., F. Menzel, and N. Blüthgen. 2006. Measuring specialization in species interaction networks. BMC Ecology 6:9.
Blüthgen, N., F. Menzel, T. Hovestadt, B. Fiala, and N. Blüthgen. 2007. Specialization, constraints, and conflicting interests in mutualistic networks. Current Biology 17:341-346.
Bohart, G. E. and N. N. Youssef. 1976. The biology and behavior of Evylaeus galpinsiae Cockerell (Hymenoptera: Halictidae). Wasmann Journal of Biology 34:185-234.
Bommarco, R., J. C. Biesmeijer, B. Meyer, S. G. Potts, J. Pöyry, S. P. M. Roberts, I. Steffan-Dewenter, and E. Öckinger. 2010. Dispersal capacity and diet breath modify the response of wild bees to habitat loss. Proceedings of the Royal Society Biological Sciences Series B 277:2075-2082.
Börschig, C., A.-M. Klein, H. von Wehrden, and J. Krauss. 2013. Traits of butterfly communities change from specialist to generalist characteristics with increasing land-use intensity. Basic and Applied Ecology 14:547-554.
Bradford, M. A., T. H. Jones, B. R. D:, H. I. J. Black, B. Boag, M. Bonkowski, R. Cook, T. Eggers, A. C. Gange, S. J. Grayston, E. Kandeler, A. E. McCaig, J. E. Newington, J. I. Prosser, H. Setala, P. L. Staddon, G. M. Tordoff, D. Tscherko, and J. H. Lawton. 2002. Impacts of soil faunal community composition on model grassland ecosystems. Science 298:615-618.
147
Brittain, C. and S. G. Potts. 2011. The potential impacts of insecticides on the life-history traits of bees and the consequences for pollination. Basic and Applied Ecology 12:321-331.
Budde, J., A. Reckert, F. Sporer, M. Wink, T. Eltz, and K. Lunau. 2004. Beiträge zur Evolution der Oligolektie bei solitären Bienen der Gattung Andrena. Entomologie Heute 16:191-200.
Bulan, C. A. and G. W. Barrett. 1971. The effects of two acute stresses on the arthropod component of an experimental grassland ecosystem. Ecology 52:597-605.
Burkle, L. and R. E. Irwin. 2009. The importance of interannual variation and bottom-up nitrogen enrichment for plant-pollinator networks. Oikos 118:1816-1829.
Burkle, L. A. and R. E. Irwin. 2010. Beyond biomass: measuring the effects of community level nitrogen enrichment on floral traits, pollinator vsitation and plant reproduction. Journal of Ecology 98:705-717.
Butchart, S. H. M., M. Walpole, B. Collen, A. van Strien, J. Scharlemann, R. E. A. Almond, J. E. M. Baillie, B. Bomhard, C. Brown, J. Bruno, K. E. Carpenter, G. M. Carr, J. Chanson, A. M. Chenery, J. Csirke, N. C. Davidson, F. Dentener, M. Foster, A. Galli, J. N. Galloway, P. Genovesi, R. D. Gregory, M. Hockings, V. Kapos, J.-F. Lamarque, F. Leverington, J. Loh, M. A. McGeoch, L. McRae, A. Minasyan, M. Hernández Morcillo, T. E. E. Oldfield, D. Pauly, S. Quader, C. Revenga, J. R. Sauer, B. Skolnik, D. Spear, D. Stanwell-Smith, S. N. Stuart, A. Symes, M. Tierney, T. D. Tyrrell, J.-C. Vié, and R. Watson. 2010. Global biodiversity: Indicators of recent declines. Science 328:1164-1168.
Byers, D. L. 1995. Pollen quantity and quality as explanations for low seed set in small populations exemplified by Eupatorium (Asteraceae). American Journal of Botany 82:1000-1006.
Cambell, L. G. and B. C. Husband. 2007. Small populations are mate-poor but pollinator-rich in a rare, self-incompatible plant, Hymenoxys herbaceae (Asteraceae). New Phytologist 174:915-925.
Cane, J. H. and J. A. Payne. 1988. Foraging ecology of the bee Habropoda laboriosa (Hymenoptera: Anthophoridae),an oligolege of blueberries (Ericaceae: Vaccinium) in the southeastern United States. Annals of the Entomological Society of America 81:419-427.
Cane, J. H. and S. D. Sipes. 2006. Characterizing floral specialization by bees: Analytical methods and a revised lexicon for oligolecty. Pages 99-122 in N. M. Waser and J. Ollerton, editors. Specialization and Generalization in Plant-Pollinator Interactions. University of Chicago Press, Chicago.
Cardinale, B. J., J. P. Wright, M. W. Cadotte, I. T. Carroll, A. Hector, D. S. Srivastava, M. Loreau, and J. J. Weis. 2007. Impacts of plant diversity on biomass production increase through time because of species complementarity. Proceedings of the National Academy of Science 104:18123-18128.
Chacoff, N. P., D. P. Vázquez, S. B. Lomáscolo, E. L. Stevani, J. Dorado, and B. Padrón. 2012. Evaluating sampling completeness in a desert plant-pollinator network. Journal of Animal Ecology 81:190-200.
Cheptou, P.-O. and L. G. Avendano. 2006. Pollination processes and the Allee effect in highly fragmented populations: consequences for the mating system in urban environments. New Phytologist 172:774-783.
Clavel, J., R. Julliard, and V. Devictor. 2010. Worldwide decline of specialist species: toward a global functional homogenization? Frontiers in ecology and the environment 9:222-228.
Collins, S. L., A. K. Knapp, J. M. Briggs, J. M. Blair, and E. M. Steinauer. 1998. Modulation of diversity by grazing and mowing in native tallgrass prairie. Science 280:745-747.
148
Colwell, R. K., R. R. Dunn, and N. C. Harris. 2012. Coextinction and persistence of dependent species in a changing world. Annual Review of Ecology, Evolution and Systematics 43:183-203.
Cook, S. M., C. S. Awmack, D. A. Murray, and I. H. Williams. 2003. Are honey bees' foraging preferences affected by pollen amino acid composition? Ecological Entomology 28:622-627.
Crane, E. and P. Walker. 1983. The impact of pest management on bees and pollination. International Bee research Association, London.
Crawley, M. J., A. E. Johnston, J. Silvertown, M. Dodd, C. de Mazancourt, M. S. Heard, D. F. Henman, and G. R. Edwards. 2005. Determinants of species richness in the Park Grass experiment. American Naturalist 165:179-192.
Cunningham, S. A. 2000. Depressed pollination in habitat fragments causes low fruit set. Proceedings of the Royal Society London Series B 267:1149-1152.
Daily, G. C., editor. 1997. Nature's services. Island press, Washington. Danforth, B. N., L. Conway, and S. Ji. 2003. Phylogeny of eusocial Lasioglossum reveals
multiple losses of eusociality within a primitively eusocial clade of bees (Hymenoptera: Halictidae). Systematic Biology 52:23-36.
Day, S., R. Beyer, A. Mercer, and S. Ogden. 1990. The nutrient composition of honeybee-collected pollen in Otago, New Zealand. Journal of Apicultural Research 29:138-146.
De Groot, A. P. 1952. Amino acid requirements for the growth of the honeybee (Apis mellifera L.). Experentia 8:1992-1994.
De Groot, A. P. 1953. Protein and amino acid requirements of the honey bee (Apis mellifera L.). Physiologia Comparata et Oecologia 3:197-285.
Den Boer, P. J. 1968. Spreading of risk and stabilization of animal numbers. Acta Biotheoretica 18:165-194.
Desneux, N., A. Decourtye, and J.-M. Delpuech. 2007. The sublethal effects of pesticides on beneficial arthropods. Annual Review of Entomology 52:81-106.
Dicks, L. V., S. A. Corbet, and R. F. Pywell. 2002. Compartmentalization in plant-insect flower visitor webs. Journal of Animal Ecology 71:32-43.
Dobson, H. E. M. and Y.-S. Peng. 1997. Digestion of pollen components by larvae of the flower-specialist bee Chelostoma florisomne (Hymenoptera: Megachilidae). Journal of Insect Physiology 43:89-100.
Dorado, J., D. P. Vázquez, E. Stevani, and N. Chacoff. 2009. Rareness ans specializaion in plant-pollinator networks. Ecology 92:19-25.
Dormann, C. F., J. Fründ, N. Blüthgen, and B. Gruber. 2009. Indices, graphs and null models: analysing bipartide ecological networks. The Open Ecology Journal 2:7-24.
Dunne, J. A., R. J. Williams, and N. D. Martinez. 2002. Food-web structure and network theory: the role of connectance and size. Proceedings of the National Academy of Sciences of the United States of America 99:12917-12922.
Duraiappah, A. and S. Naeem. 2005. Ecosystems and human well-being: biodiversity ynthesis. World Resources Institute, Washington DC.
Ebeling, A., A.-M. Klein, J. Schumacher, W. W. Weisser, and T. Tscharntke. 2008. How does plant richness affect pollinator richness and temporal stability of flower visits? Oikos 117:1808-1815.
Ehrlich, P. R. and E. O. Wilson. 1991. Biodiversity studies: science and policy. Science 253:758-762.
Ellstrand, N. C. and D. R. Elam. 1993. Population genetic consequences of small population size: implications for plant conservation. Annual Review of Ecology and Systematics 24:217-242.
149
Elmqvist, T., C. Folke, M. Nyström, G. Peterson, J. Bengtsson, B. Walker, and J. Norberg. 2003. Response diversity, ecosystem change, and resilience. Frontiers in ecology and the environment 1:488-494.
Erhardt, A. and I. Baker. 1990. Pollen amino acids an additional diet for a nectar feeding butterfly. Plant Systematics & Evolution 169:111-121.
Erhardt, A. and H. P. Rusterholz. 1998. Do peacock butterflies (Inachis io L.) detect and prefer nectar amino acids and other nitrogenous compounds? Oecologia 117:536-542.
Fenner, M. and L. Palmer. 1998. Grassland management to promote diversity: creation of a patchy sward by mowing and fertiliser regimes. Field studies 9:313-324.
Fenster, C. B., W. S. Armbruster, P. Wilson, M. R. Dudash, and J. D. Thomson. 2004. Pollination syndromes and floral specialization. Annual Review of Ecology, Evolution and Systematics 35:375-403.
Filippi-Codaccioni, O., V. Devictor, Y. Bas, and R. Julliard. 2010. Toward more concern for specialisation and less species diversity in conserving farmland biodiversity. Biological conservation 143:1493-1500.
Fischer, M., O. Bossdorf, S. Gockel, F. Hänsel, A. Hemp, D. Hessenmöller, G. Korte, J. Nieschulze, S. Pfeiffer, D. Prati, S. Renner, I. Schöning, U. Schumacher, K. Wells, F. Buscot, E. Kalko, K. E. Linsenmair, E.-D. Schulze, and W. W. Weisser. 2010. Implementing large-scale and long-term functional biodiversity research: The Biodiversity Exploratories. Basic and Applied Ecology 11:473-485.
Fischer, M. and D. Matthies. 1997. Mating structure and inbreeding and outbreeding depression in the rare plant Gentianella germanica (Gentianaceae). American Journal of Botany 84:1685.
Fontaine, C., I. Dajoz, J. Meriguet, and M. Loreau. 2006. Functional diversity of plant–pollinator interaction webs enhances the persistence of plant communities. PLoS Biology 4:e1.
Fründ, J., K. E. Linsenmair, and N. Blüthgen. 2010. Pollinator diversity and specialization in relation to flower diversity. Oikos 119:1581-1590.
Gathmann, A. and T. Tscharntke. 2002. Foraging ranges of solitary bees. Journal of Animal Ecology 71:757-764.
Ghazoul, J. 2005. Buzziness as usual? Questioning the global pollination crisis. Trends in Ecology and Evolution 20:367-373.
Ghazoul, J. 2006. Floral diversity and the facilitation of pollination. Journal of Ecology 94:295-304.
Gibson, C. W. D., V. K. Brown, L. Losito, and G. C. McGavin. 1992. The response of invertebrate assemblies to grazing. Ecography 15:166–176.
Gilbert, L. E. 1972. Pollen feeding and reproductive biology of Heliconius butterflies. Proceedings of the National Academy of Science 69:1403-1407.
Gotelli, N. J. and G. L. Entsminger. 2009. EcoSim: Null models software for ecology. Version 7.0. Acquired Intelligence Inc. & Kesey-Bear. Jericho, VT 05465. http://garyentsminger.com/ecosim.htm.
Goulson, D. 2003. Effects of introduced bees on native ecosystems. Annual Review of Ecology, Evolution and Systematics 34:1-26.
Goulson, D. and B. Darvill. 2004. Niche overlap and diet breadth in bumblebees: are rare species more specialized in their choice of flowers? Apidologie 35:55-63.
Goulson, D., G. C. Lye, and B. Darvill. 2008. The decline and conservation of bumblebees. Annual Review of Entomology 53:191-208.
Grime, J. 1973. Competitive exclusion in herbaceous vegetation. Nature 242:344-347. Grindeland, J. M., N. Sletvold, and R. A. Ims. 2005. Effects of floral display size and plant
density on pollinator visitation rate in a natural population of Digitalis purpurea. Functional Ecology 19:383-390.
150
Guirguis, G. N. and W. A. Brindley. 1974. Insecticide susceptibility and response to selected pollens of larval alfalfa leafcutting bees, Megachile pacifica (Panzer) (Hymenoptera: Megachilidae). Environmental Entomology 3:691-694.
Gullan, P. J. and P. S. Cranston. 2005. The Insects: An Outline of Entomology. 3 edition. Blackwell Publishing, Oxford, UK.
Haddad, N. M., J. Haarstad, and D. Tilman. 2000. The effects of long-term nitrogen loading on grassland insect communities. Oecologia 124:73-84.
Hansson, M. and H. Fogelfors. 2000. Management of a semi-natural grassland: Results from a 15-year-old experiment in Southern Sweden. Journal of Vegetation Science 11:31-38.
Hassan, R., R. Scholes, and N. Ash, editors. 2005. Ecosystems and human well-being: Current state and trends. Island Press, Washington DC.
Hautier, Y., P. A. Niklaus, and A. Hector. 2009. Competition for light causes plant biodiversity loss after eutrophication. Science 324:636-638.
Hawkins, B. and E. Porter. 2003. Does herbivore diversity depend on plant diversity? The case of California butterflies. The American Naturalist 161:40-49.
Hector, A. and R. Bagchi. 2007. Biodiversity and ecosystem multifunctionality. Nature 448:188-190.
Hector, A., B. Schmid, C. Beierkuhnlein, M. C. Caldeira, M. Diemer, P. G. Dimitrakopoulos, J. A. Finn, H. Freitas, P. S. Giller, J. Good, R. Harris, P. Högberg, K. Huss-Danell, J. Joshi, A. Jumpponen, C. Körner, P. W. Leadley, M. Loreau, A. Minns, C. P. H. Mulder, G. O'Donovan, S. J. Otway, J. S. Pereira, A. Prinz, D. J. Read, M. Scherer-Lorenzen, E.-D. Schulze, A.-S. D. Siamantziouras, E. M. Spehn, A. C. Terry, A. Y. Troumbis, F. I. Woodward, S. Yachi, and J. H. Lawton. 1999. Plant diversity and productivity experiments in European grasslands. Science 286:1123-1127.
Hirayama, K., K. Ishida, S. Setsuko, and N. Tomaru. 2007. Reduced seed production, inbreeding, and pollen shortage in a small population of a threatened tree, Magnolia stellata. Biological conservation 136:315-323.
Hoehn, P., T. Tscharntke, J. M. Tylianakis, and I. Steffan-Dewenter. 2008. Functional group diversity of bee pollinators increases crop yield. Proceedings of the Royal Society Biological Sciences Series B 275:2283-2291.
Holt, R. D. 2009. Bringing the Hutchinsonian niche into the 21st century: Ecological and evolutionary perspectives. Proceedings of the National Academy of Science 106:19659–19665.
Hooper, D. U., F. S. Chapin, A. Ewel, A. Hector, P. Inchausti, J. H. Lavorel, J. H. Lawton, D. M. Lodge, M. Loreau, S. Naeem, B. Schmid, H. Setala, A. J. Symstad, J. Vandermeer, and D. A. Wardle. 2005. Effects of biodiversity on ecosystem functioning: a consensus of current kwoledge. Ecological Monographs 75:3-35.
Houston, T. F. 1989. Leioproctus bees associated with Western Australian smoke bushes (Conospermum spp.) and their adaptations for foraging and concealment (Hymenoptera: Colletidae: Paracolletini). Records of the Western Australian Museum 14:275-292.
James, A., J. W. Pitchford, and M. J. Plank. 2012. Distangeling nestedness from models of ecological complexity. Nature 487:227-230.
Jauker, F., B. Bondarenko, H. C. Becker, and I. Steffan-Dewenter. 2012. Pollination efficiency of wild bees and hoverflies provided to oilseed rape. Agricultural and Forest Entomology 14:81-87.
Jauker, F., T. Diekötter, F. Schwarzbach, and V. Wolters. 2009. Pollinator dispersal in an agricultural matrix: opposing responses of wild bees and hoverflies to landscape structure and distance from main habitat. Landscape Ecology 24:547-555.
Jennerston, O. 1988. Pollination in Dianthus deltoides (Caryophyllaceae): Effects of habitat fragmentation on visitation and seed set. Conservation Biology 2:359-366
151
Johansen, C. A. 1977. Pesticides and pollinators. Annual Review of Entomology 22:177-192. Johnson, S. D. and K. E. Steiner. 2000. Generalization versus specialization in plant
pollination systems. Trends in Ecology and Evolution 15:140-143. Johst, K., M. Drechsler, and J. Settele. 2006. Influence of mowing on the persistence of two
endangered large butterfly species. Journal of Applied Ecology 43:333-342. Jordano, P. 1987. Patterns of mutualistic interactions in pollination and seed dispersal:
connectance, dependence asymmetries, and coevolution. American Naturalist 129:657-677.
Junker, R. and N. Blüthgen. 2010. Floral scents repel facultative flower visitors, but attract obligate ones. Annals of Botany 105:777-782.
Kaiser-Bunbury, C. N., S. Muff, J. Memmott, C. B. Müller, and A. Caflisch. 2010. The robustness of pollination networks to the loss of species and interactions: a quantitative approach incorporating pollinator behaviour. Ecology Letters 13:442-452.
Kalisz, S., D. W. Vogler, and K. Hanley. 2004. Context-dependent autonomous self-fertilization yields reproductive assurance and mixed mating. Nature 430:884-887.
Keitt, T. H. 2009. Habitat conversion, extinction thresholds,and pollination services in agroecosystems. Ecological Applications 19:1561-1573.
Kevan, P. G. and H. G. Baker. 1983. Insects as flower visitors and pollinators. Annual Review of Entomology 28:407-453.
Kevan, P. G. and T. P. Phillips. 2001. The economic impacts of pollinator declines: an approach to assessing the consequences. Conservation Ecology 5:8.
Kleijn, D. and I. Raemakers. 2008. A retrospective analysis of pollen host plant use by stable and declining bumble bee species. Ecology 89:1811-1823.
Kleijn, D. and F. van Langevelde. 2006. Interacting effects of landscape context and habitat quality on flower visiting insects in agricultural landscapes. Basic and Applied Ecology 7:201-214.
Klein, A.-M., I. Steffan-Dewenter, and T. Tscharntke. 2003. Fruit set of highland coffee increases with the diversity of pollinating bees. Proceedings of the Royal Society London Series B 270:955-961.
Klein, A.-M., B. E. Vaissière, J. H. Cane, I. Steffan-Dewenter, S. A. Cunningham, C. Kremen, and T. Tscharntke. 2007. Importance of pollinators in changing landscapes for world crops. Proceedings of the Royal Society Biological Sciences Series B 274:303-313.
Klotz, S., I. Kühn, and W. Durka. 2002. Biolflor: eine Datenbank mit biologisch-ökologischen Merkmalen zur Flora von Deutschland. Bundesamt für Naturschutz, Bonn.
Knight, T. M. 2003. Floral density, pollen limitation, and reproductive success in Trillium grandiflorrum. Oecologia 442:557-563.
Knop, E. V. A., D. Kleijn, F. Herzog, and B. Schmid. 2006. Effectiveness of the Swiss agri-environment scheme in promoting biodiversity. Journal of Applied Ecology 43:120-127.
Koh, L. P., N. S. Sodhi, and B. W. Brook. 2004a. Co-extinctions of tropical butterflies and their hostplants. Biotropica 36:272-274.
Koh, L. P., N. S. Sodhi, and B. W. Brook. 2004b. Ecological correlates of extinction proneness in tropical butterflies. Conservation Biology 18:1571-1578.
Kolb, A. 2008. Habitat fragmentation reduces plant fitness by disturbing pollination and modifying responses to herbivory. Biological conservation 141:2540-2549.
Kotiaho, J. S., V. Kaitala, A. Komonen, and J. Päivinen. 2005. Predicting the risk of extinction from shared ecological characteristics. Proceedings of the National Academy of Sciences of the United States of America 102:1963-1967.
152
Kotze, D. J. and R. B. O´Hara. 2003. Species decline-but why? Explanations of carabid beetle (Coleoptera, Carabidae) declines in Europe. Oecologia 135:138-148.
Krauss, J., R. Bommarco, M. Guardiola, R. K. Heikkinen, A. Helm, M. Kuussaari, R. Lindborg, E. Öckinger, M. Pärtel, J. Pino, J. Pöyry, K. M. Raatikainen, A. Sang, C. Stefanescu, T. Teder, M. Zobel5 and, and I. Steffan-Dewenter. 2010. Habitat fragmentation causes immediate and time-delayed biodiversity loss at different trophic levels. Ecology Letters 13:597-605.
Krauss, J., I. Steffan-Dewenter, and T. Tscharntke. 2004. Landscape occupancy and local population size depends on host plant distribution in the butterfly Cupido minimus. Biological conservation 120:355-361.
Kremen, C. and R. Chaplin-Kramer, editors. 2007. Insects as providers of ecosystem services: crop pollination and pest control. Royal Entomological Society of London, London.
Kremen, C., N. M. Williams, and R. W. Thorp. 2002. Crop pollination from native bees at risk from agricultural intensification. Proceedings of the National Academy of Sciences of the United States of America 99:16812-16816.
Kruess, A. and T. Tscharntke. 2002. Contrasting responses of plant and insect diversity to variation in grazing intensity. Biological conservation 106:293-302.
Kunin, W. E. 1992. Density and reproductive success in wild populations of Diplotaxis ercoides (Brassicaceae). Oecologia 91:129-133.
Kunin, W. E. 1997. Population size and density effects in pollination: pollinator foraging an plant reproductive success in experimental arrays of Brassica kaber. Journal of Ecology 85:225-234.
Kwaiser, K. S. and S. D. Hendrix. 2007. Diversity and abundance of bees (Hymenoptera: Apiformes) in native and ruderal grasslands of agriculturally dominated landscapes. Agriculture, Ecosystems and Environment 124:200-204.
Laliberte, E., J. A. Wells, F. DeClerck, D. J. Metcalfe, C. P. Catterall, C. Queiroz, I. Aubin, S. P. Bonser, Y. Ding, J. M. Fraterrigo, S. McNamara, J. W. Morgan, D. Sanchez Merlos, P. A. Vesk, and M. M. Mayfield. 2013. Land-use intensification reduces functional redundancy and response diversity in plant communities. Ecology Letters 13:76-86.
Lanza, J., M. D. Warriner, and M. McHenry. 1997. Nectar derived amino acids contribute to butterfly reproduction. Bulletin of the Ecological Society of America 78:273.
Larkin, L. L., J. L. Neff, and B. B. Simpson. 2008. The evolution of a pollen diet: host choice and diet breath of Andrena bees (Hymenoptera: Andrenidae). Apidologie 39:133-145.
Le Féon, V., A. Schermann-Lgionnett, Y. Delettre, S. Aviron, R. Billeter, R. Bugter, F. Hendrickx, and F. Burel. 2010. Intensification of agriculture, landscape composition and wild bee communities: A large scale study from European countries. Agriculture, Ecosystems and Environment 137:143-150.
León-Cortés, J. L., J. J. Lennon, and C. D. Thomas. 2003. Ecological dynamics of extinct species in empty habitat networks. 2. The role of host plant dynamics. Oikos 102:465-477.
Leonhardt, S., K. Dworschak, T. Eltz, and N. Blüthgen. 2007. Foraging loads of stingless bees and utilisation of stored nectar for pollen harvesting. Apidologie 38:125-135.
Lonsdorf, E., C. Kremen, T. Ricketts, R. Winfree, N. M. Williams, and S. Greenleaf. 2009. Modelling pollination services across agricultural landscapes. Annals of Botany 103:1589-1600.
Loreau, M., S. Naeem, P. Inchausti, J. Bengtsson, J. P. Grime, A. Hector, D. U. Hooper, M. A. Huston, D. Raffaelli, B. Schmid, D. Tilman, and D. A. Wardle. 2001. Biodiversity and ecosystem functioning: Current knowledge and future challenges. Science 294:804-808.
153
Lunau, K. 2004. Adaptive radiation and coevolution - pollination biology case studies. Organisms, Diversity & Evolution 4:207-224.
Maskell, L. C., S. M. Smart, J. M. Bullock, K. E. N. Thompson, and C. J. Stevens. 2010. Nitrogen deposition causes widespread loss of species richness in British habitats. Global Change Biology 16:671-679.
Mayer, C. 2004. Pollination services under different grazing intensities. International Journal of Tropical Insect Science 24:95-103.
McCann, K. S. 2000. The diversity–stability debate. Nature 405:228-233. McKinney, M. L. 1997. Extinction vulnerability and selectivity: combining ecological and
paleontological views. Annual Review of Ecology and Systematics 28:495-516. Memmott, J., P. G. Craze, N. M. Waser, and M. V. Price. 2007. Global warming and the
disruption of plant-pollinator interactions. Ecology Letters 10:710-717. Memmott, J., N. M. Waser, and M. V. Price. 2004. Tolerance of pollination networks to
species extinctions. Proceedings of the Royal Society London Series B 271:2605-2611.
Mevi-Schutz, J. and A. Erhardt. 2005. Amino acids in nectar enhance butterfly fecundity: a long-awaited link. The American Naturalist 165:411-419.
Michener, C. D. 1954. Records and describtions of North American megachilid bees. Journal of the Kansas Entomological Society 27:65-78.
Michez, D., S. Patiny, P. Rasmont, K. Timmermann, and N. J. Vereecken. 2008. Phylogeny and host-plant evolution in Melittidae s.l.(Hymenoptera: Apoidea). Apidologie 39:146-162.
Minckley, R. L. and T. H. Roulston. 2006. Incidental mutualisms and pollen specialization among bees. Pages 69-98 in N. M. Waser and J. Ollerton, editors. Plant-pollinator interactions from specialization to generalization. University of Chicago Press, Chicago, Illinois, USA.
Montoya, J. M., S. L. Pimm, and R. V. Solé. 2006. Ecological networks and their fragility. Nature 442:259-264.
Morris, M. G. 1981. Responses of grassland invertebrates to management by cutting. III. Adverse effects on Auchenorrhyncha. Journal of Applied Ecology 18:107-123.
Morris, M. G. 2000. The effects of structure and its dynamics on the ecology and conservation of arthropods in British grasslands. Biological conservation 95:129-142.
Morse, R. A. and N. W. Calderone. 2000. The value of honey bees as pollinators of U.S. crops in 2000. Bee Culture 128:1-15.
Mountford, J. O., K. H. Lakhani, and F. W. Kirkham. 1993. Experimental assessment of the effects of nitrogen addition under hay-cutting. Journal of Applied Ecology 30:321-332.
Muchhala, N., Z. Brown, W. S. Armbruster, and M. D. Potts. 2010. Competition drives specialization in pollination systems through costs to male fitness. The American Naturalist 176:732-743.
Müller, A. 2006. Unusual host plant of Hoplitis pici, a bee with hooked bristles on its mouthparts (Hymenoptera: Megachilidae: Osmiini). European Journal of Entomology 103:497-500.
Müller, A. and N. Bansac. 2004. A specialized pollen-harvesting device in western palearctic bees of the genus Megachile (Hymenoptera, Apoidea, Megachilidae). Apidologie 35:329-337.
Müller, A., S. Diener, S. Schnyder, K. Stutz, C. Sedivy, and S. Dorn. 2006. Quantitative pollen requirements of solitary bees: Implications for bee conservation and the evolution of bee-flower relationships. Biological conservation 130:604-615.
Müller, A., A. Krebs, and F. Amiet. 1997. Bienen - Mitteleuropäische Gattungen, Lebensweise, Beobachtung. Naturbuch Verlag, Augsburg.

154
Müller, A. and M. Kuhlmann. 2008. Pollen hosts of western palearctic bees of the genus Colletes (Hymenoptera:Colletidae): the Asteraceae paradox. Biological Journal of the Linnean Society 95:719-733.
Nabhan, G. P. and S. L. Buchmann. 1997. Services provided by pollinators.in G. C. Daily, editor. Nature's Services: Societal dependence on natural ecosystems. Island Press, Washington, D.C.
Naeem, S. and S. Li. 1997. Biodiversity enhances ecosystem reliability. Nature 390:507-509. Nation, J. L. 2002. Insect physiology and biochemistry. CRC Press, Boca Raton, Florida. Oksanen, J. 2010. Multivariate analysis of ecological communities in R: Vegan tutorial. Oksanen, J., R. Kindt, B. Legendre, B. O´Hara, G. L. Simpson, and M. H. Stevens. 2008.
Vegan: Community ecology package. R package version 1.13-2. Olesen, J. M., J. Bascompte, H. Elberling, and P. Jordano. 2008. Temporal dynamics in a
pollination network. Ecology 89:1573-1582. Ollerton, J., R. Winfree, and S. Tarrant. 2011. How many flowering plants are pollinated by
animals? Oikos 120:321-326. Owens, I. P. F. and P. M. Bennett. 2000. Ecological basis of extinction risk in birds: habitat
loss versus human persecution and introduced predators. Proceedings of the National Academy of Science 97:12144-12148.
Pauw, A. 2007. Collapse of a pollination web in small conservation areas. Ecology 88:1759-1769.
Pocock, M. J. O., D. M. Evans, and J. Memmott. 2012. The robustness and restoration of a network of ecological networks. Science 335:973-977.
Potts, S. G., B. Vulliamy, S. Roberts, C. O'Toole, A. Dafni, G. Ne'eman, and P. Willmer. 2005. Role of nesting resources in organising diverse bee communities in a Mediterranean landscape. Ecological Entomology 30:78-85.
Praz, C. J., A. Müller, and S. Dorn. 2008. Specialized bees fail to develop on non-host pollen: Do plants chemically protect their pollen? Ecology 89:795-804.
Proulx, M. and A. Mazumder. 1998. Reversal of grazing impact on plant species richness in nutrient-poor vs. nutrient-rich ecosystems. Ecology 79:2581-2592.
Quezada-Euan, J. J. G., A. Lopez-Velasco, J. Perez-Balam, H. Moo-Valle, A. Velazquez-Madrazo, and R. J. Paxton. 2011. Body size differs in workers produced across time and is associated with variation in the quantity and composition of larval food in Nannotrigona perilampoides (Hymenoptera, Meliponini). Insectes Sociaux 58:31-38.
Rabie, A. L., J. D. Wells, and L. K. Dent. 1983. The nitrogen content of pollen protein. Journal of Apicultural Research 22:119-123.
Rands, M. R. W., W. M. Adams, L. Bennun, S. Butchart, A. Clements, D. Coomes, A. Entwistle, I. Hodge, V. Kapos, J. Scharlemann, W. Sutherland, and B. Vira. 2010. Biodiversity conservation: Challenges beyound 2010. Science 329:1298-1303.
Rathcke, B. J. and E. S. Jules. 1993. Habitat fragmentation and plant pollinator interactions. Current Science (Bangalore) 65:273-277.
Richardson, D. M., N. Allsopp, C. M. D'Antonio, S. J. Milton, and M. Rejmanek. 2000. Plant invasions - the role of mutualism. Biological Review 75:65-93.
Robinson, G., S. Willard, R. Nowogrodski, and R. A. Morse. 1989. The value of honey bees as pollinators of US crops. American Bee Journal 129:477-487.
Rook, A. J., B. Dumont, J. Isselstein, K. Osoro, M. F. WallisDeVries, G. Parente, and J. Mills. 2004. Matching type of livestock to desired biodiversity outcomes in pastures – a review. Biological conservation 119:137-150.
Roubik, D. W. 1978. Competitive interactions between neotropical pollinators and africanized honey bees. Science 201:1030-1032.
Roulston, T. H. and S. L. Buchmann. 2000. A phylogenetic reconsideration of the pollen starch-pollination correlation. Evolutionary Ecology Research 2:627-643.
155
Roulston, T. H. and J. H. Cane. 2000. Pollen nutritional content and digestibility for animals. Plant Systematics and Evolution 222:187-209.
Roulston, T. H. and J. H. Cane. 2002. The effect of pollen protein concentration on body size in the sweat bee Lasioglossum zephyrum (Hymenoptera: Apiformes). Evolutionary Ecology 16:49-65.
Roulston, T. H., J. H. Cane, and S. L. Buchmann. 2000. What governs protein content of pollen: pollinator preferences, pollen-pistil interactions, or phylogeny? Ecological Monographs 70:617-643.
Schaffers, A. P., I. P. Raemakers, K. V. Sýkora, and C. J. F. ter Braak. 2008. Arthropod assemblages are best predictedby plant species composition. Ecology 89:782-794.
Schemske, D. W. and C. C. Horvitz. 1984. Variation among floral visitors in pollination ability: A precondition for mutualism specialization. Science 225:519-521.
Scheper, J., M. Reemer, R. van Kats, W. A. Ozinga, G. T. J. van der Linden, J. H. J. Schaminée, H. Siepel, and D. Kleijn. 2014. Museum specimens reveal loss of pollen host plants as key factor driving wild bee decline in The Netherlands. Proceedings of the National Academy of Sciences 111:17552-17557.
Schweiger, O., J. C. Biesmeijer, R. Bommarco, T. Hickler, P. Hulme, S. Klotz, I. Kühn, M. Moora, A. Nielsen, R. Ohlemüller, T. Petanidou, S. G. Potts, P. Pysek, J. C. Stout, M. Sykes, T. Tscheulin, M. Vila, G.-R. Walther, C. Westphal, M. Winter, M. Zobel, and J. Settele. 2010. Multiple stressors on biotic interactions: how climate change and alien species interact to affect pollination. Biological Reviews 85:777-795.
Schweiger, O., J. Settele, O. Kudrna, S. Klotz, and I. Kühn. 2008. Climate change can cause spatial mismatch of trophically interacting species. Ecology 89:3472-3479.
Sedivy, C., C. J. Praz, A. Müller, A. Widmer, and S. Dorn. 2008. Patterns of host-plant choice in bees of the genus Chelostoma: the constraint hypothesis of host-range evolution in bees. Evolution 62:2487-2507.
Silander, J. A. 1978. Density-dependent control of reproductive success in Cassia biflora. Biotropica 10:292-296.
Simons, N. K., W. W. Weisser, and M. M. Gossner. 2015. Multi-taxa approach shows consistent shifts in arthropod functional traits along grassland land-use intensity gradient. Ecology:DOI: 10.1890/1815-0616.1891.
Sjödin, N. E., J. Bengtsson, and B. Ekbom. 2008. The influence of grazing intensity and landscape composition on the diversity and abundance of flower-visiting insects. . Journal of Applied Ecology 45:763-772.
Socher, S. A., D. Prati, S. Boch, J. Müller, H. Baumbach, S. Gockel, A. Hemp, I. Schöning, K. Wells, F. Buscot, E. K. V. Kalko, K. E. Linsenmair, E.-D. Schulze, W. W. Weisser, and M. Fischer. 2013. Interacting effects of fertilization, mowing and grazing on plant species diversity of 1500 grasslands in Germany differ between regions. Basic and Applied Ecology 14:126-136.
Socher, S. A., D. Prati, S. Boch, J. Müller, V. H. Klaus, N. Hölzel, and M. Fischer. 2012. Direct and productivity-mediated indirect effects of fertilization, mowing and grazing on grassland species richness. Journal of Ecology 100:1391-1399.
Southwick, E. E. and L. Southwick. 1992. Estimating the economic value of honey bees (Hymenoptera: Apidae) as agricultural pollinators in the United States. Economic Entomology 85:621-633.
Spigler, R. B. and S.-M. Chang. 2009. Pollen limitation and reproduction varies with population size in experimental populations of Sabatia angularis (Gentianaceae). Botany 87:330-338.
Spira, T. 2001. Plant-pollinator interactions: A threatened mutualism with implications for the ecology and management of rare plants. Natural Areas Journal 21:78-88.
156
Standifer, L. N. 1967. A comparison of the protein quality of pollens for growth stimulation and hypopharyngeal glands and longevity of honey bees (Apis mellifera, Hymenoptera, Apidae). Insectes Sociaux 14:415-426.
Steffan-Dewenter, I. 2003. Importance of habitat area and landscape context for species richness of bees and wasps in fragmented orchard meadows. Biological conservation 17:1036-1044.
Steffan-Dewenter, I., S. G. Potts, and L. Packer. 2005. Pollinator diversity and crop pollination services are at risk. Trends in Ecology and Evolution 20:652-653.
Steffan-Dewenter, I. and T. Tscharntke. 2001. Succession of bee communities on fallows. Ecology 24:83-93.
Strauss, S. Y. and A. R. Zangerl. 2002. Plant-insect interactions in terrestrial ecosystems. Pages 77-106 in C. M. Herrera and O. Pellmyr, editors. Plant-animal interactions - an evolutionary approach. Blackwell Publishing, Malden.
Strickler, K. 1979. Specialization and foraging efficiency of solitary bees Hoplitis anthocopoides. Ecology 60:998-1009.
Suding, K. N., S. L. Collins, L. Gough, C. Clark, E. E. Cleland, K. L. Gross, D. G. Milchunas, and S. Pennings. 2005. Functional- and abundance-based mechanisms explain diversity loss due to N fertilization. Proceedings of the National Academy of Science 102:4387-4392
Tasei, J.-N. l. and P. Aupinel. 2008. Nutritive value of 15 single pollens and pollen mixes tested on larvae produced by bumblebee workers (Bombus terrestris, Hymenoptera: Apidae). Apidologie 39:397-409.
Thomas, J. A., N. A. D. Bourn, R. T. Clarke, K. E. Stewart, D. J. Simcox, G. S. Pearman, R. Curtis, and B. Goodger. 2001. The quality and isolation of habitat patches both determine where butterflies persist in fragmented landscapes. Proceedings of the Royal Society of London. Series B: Biological Sciences 268:1791-1796.
Thorp, R. W. 1969. Systematics and ecology of bees of the subgenus Diandrena (Hymenoptera: Andrenidae). University of California Publications in Entomology 52:1-146.
Thorp, R. W. 2000. The collection of pollen by bees. Plant Systematics & Evolution 222:211-223.
Tilman, D., C. Balzer, J. Hill, and B. L. Befort. 2011. Global food demand and the sustainable intensification of agriculture. Proceedings of the National Academy of Science 108:20260-20264.
Tilman, D. and J. A. Downing. 1994. Biodiversity and stability in grasslands. Nature 367:363-365.
Tilman, D., J. Knops, D. Wedin, P. Reich, M. Ritchie, and E. Siemann. 1997. The influence of functional diversity and composition on ecosystem processes. Science 277:1300-1302.
Tudor, O., R. L. H. Dennis, J. N. Greatorex-Davies, and T. H. Sparks. 2004. Flower preferences of woodland butterflies in the UK: Nectaring specialists are species of conservation concern. Biological conservation 119:397-403.
Tylianakis, J. M., T. Tscharntke, and O. T. Lewis. 2007. Habitat modification alters the structure of tropical host–parasitoid food webs. Nature 445:202-205.
Vamosi, J., T. M. Knight, J. A. Steets, S. J. Mazer, M. Burd, and T. L. Ashmann. 2006. Pollination decays in biodiversity hotspots. Proceedings of the National Academy of Science 103:956-961.
van Swaay, C. A. M. 2002. The importance of calcareous grasslands for butterflies in Europe. Biological conservation 104:315-318.
157
Vaughton, G. and M. Ramsey. 1998. Floral display, pollinator visitation and reproductive success in the dioecious perennial herb Wurmbea dioica (Liliaceae). Oecologia 115:93-101.
Vázquez, D. P. 2005. Degree distribution in plant-animal mutualistic networks: forbidden links or random interactions? Oikos 108:421-426.
Vázquez, D. P. and M. A. Aizen. 2003. Null model analyzes of specialization in plant-pollinator interactions. Ecology 84:2493-2501.
Vázquez, D. P. and M. A. Aizen. 2006. Community-wide patterns of specialization in plant-pollinator interactions revealed by null modles. Pages 200-219 in N. M. Waser and J. Ollerton, editors. Plant-pollinator interactions: from specialization to generalization. University of Chicago Press, Chicago.
Vázquez, D. P., N. Chacoff, and L. Cagnolo. 2009. Evaluating multiple determinants of the structure of mutualistic networks: comment. Ecology 90:2039-2046.
Vázquez, D. P. and D. Simberloff. 2002. Ecological specialization and susceptibility to disturbance: conjectures and refutations. American Naturalist 159:606-623.
Wäckers, F. L. 1999. Gustatory response by the hymenopteran parasitoid Cotesia glomerata to a range of nectar and honeydew sugars. Journal of Chemical Ecology 25:2863-2877.
Waites, A. R. and J. Agren. 2004. Pollinator visitation, stigmatic pollen loads and among-population variation in seed set in Lythrum salicaria. Journal of Ecology 92:512-526.
Waser, N. M. 2006. Specialization and generalization in plant-pollinator interactions: a historical perspective. Pages 3-17 in N. M. Waser and J. Ollerton, editors. Plant-pollinator interactions: from specialization to generalization. University of Chicago Press, Chicago.
Waser, N. M., L. Chittka, M. V. Price, N. M. Williams, and J. Ollerton. 1996. Generalization in pollination systems, and why it matters. Ecology 77:1043-1060.
Waser, N. M. and J. Ollerton, editors. 2006. Plant-pollinator interactions: from specialization to generalization. University of Chicago Press, Chicago.
Weiner, C., M. Werner, K. E. Linsenmair, and N. Blüthgen. 2011. Land-use intensity in grasslands: changes in biodiversity, species composition and specialization in flower-visitor networks. Basic and Applied Ecology 12:292-299.
Weiner, C. N., M. Werner, K. E. Linsenmair, and N. Blüthgen. 2014. Land-use impacts on plant–pollinator networks: interaction strength and specialization predict pollinator declines. Ecology 95:466-474.
Westrich, P. 1990. Die Wildbienen Baden-Württembergs II. Eugen Ulmer Verlag, Hohenheim.
Wille, H., M. Wille, V. Kilchenmann, A. Imdorf, and G. Bühlmann. 1985. Pollenernte und Massenwechsel von drei Apis mellifera-Völkern auf demselben Bienenstand in zwei aufeinanderfolgenden Jahren. Revue Suisse de Zoologie 92:897-914.
Williams, N. M. 2003. Use of novel pollen species by specialist and generalist solitary bees (Hymenoptera: Megachilidae). Oecologia 134:228-237.
Winfree, R., T. Griswold, and C. Kremen. 2007. Effect of human disturbance on bee communities in a forested ecosystem. Conservation Biology 21:213-223.
Wisskirchen, R. and H. Haeupler. 1998. Standardliste der Farn- und Blütenpflanzen Deutschlands. Verlag Eugen Ulmer, Stuttgart.
Yachi, S. and M. Loreau. 1999. Biodiversity and ecosystem productivity in a fluctuating environment: The insurance hypothesis. Proceedings of the National Academy of Science 96:1463-1468.
Zechmeister, H. G., I. Schmitzberger, B. Steurer, J. Peterseil, and T. Wrbka. 2003. The influence of land-use practices and economics on plant species richness in meadows. Biological conservation 114:165-177.

158

159
Acknowlegements
I want to express my sincere gratitude to Nico Blüthgen. I thank you for your patience with
all my questions, ideas and moods, for always finding the time for discussion, for our walks
around university whenever they where needed and for being such a great advisor and listener
no matter what was going on. Without your constant critic and support throughout the thesis
and your motivation work this PhD project would not have been possible. You were a great
supervisor to learn from.
I furthermore thank Karl-Eduard Linsenmair , my co-supervisor during the first years of my
PhD, for his interest, his encouragement and kindness, constructive criticism and contribution
of many fruitful ideas and Andreas Jürgens for his agreement on taking over the co-
supervision of my PhD thesis when I switched to TU Darmstadt.
Almost countless people helped me to manage working on this challenging project. For
identification of insects, I would like to thank Wolfgang Adaschkiewitz, Rainer Heiß,
Gisela Merkel-Wallner, Bernhard Merz, Verner Michelsen, Sabine Prescher, Hans-
Georg Rudzinski, Andreas Stark, Krzysztof Szpila, Martina Tospann, Michael von
Tschirnhaus, Hans-Peter Tschorsnig (Diptera); Dieter Doczkal (Apidae, Syrphidae);
Martin Fellendorf , Mike Hermann , Volker Mauss, Hans Schwenninger (Apidae); Klaus
Horstmann, Seraina Klopfstein (Ichneumonidae), Lasse Hubweber, Peter Sprick
(Coleoptera); Manfred Krauss, Beate Wende (Symphyta); Roland Schultz (Formicidae)
and Mirko Wölfling (Lepidoptera).
For field work permits my thanks go to the responsible state environmental offices of
Baden-Württemberg, Thüringen, and Brandenburg (according to § 72 BbgNatSchG). The
work has been funded by the DFG Priority Program 1374 "Infrastructure-Biodiversity-
Exploratories" (LI 150/20-1).
Anna Hellwig, Mathias Hoffmeister, Matthias Jäger, Susann Janowski, Linda Jung,
Daniel Schaub, Martina Tospann, Beate Wende and Michael Werner all had their part
gaining data on plant-pollinator interactions during the field season. Their help was
indispensable. Andrea Hilpert spent endless hours with collecting, preparing and analysing
pollen samples and was one of the most important persons behind the scenes as well as
Dorothea Hahne and Verena Seufert who patiently assisted with pollen collection in the
laboratory.
I further like to thank the entire team of the Biodiversity Exploratories for their logistic
support. My special thanks go to Simone Pfeiffer who beneath being a fabulous project
160
coordinator, manages to be a great listener, advisor and motivator for so many people and
does an amazing job for the community. Jens Nieschulze encouraged me to use R (which
proved to be an invaluable facilitation after some challenging time), helped me when I was
frustrated by the program, always managed to give me the feeling I would finally succeed and
together with Carsten Dormann was a marvellous advisor in programming R.
Michael Werner was the one to teach me all the plant species in the beginning, had a never
ending patience with me forgetting their names, was a great field mate and the one to discuss
the details of the project.
Martina Tospann became the one to make me laugh or calm me down whenever things went
wrong. Her tranquillity and encouragement are just indescribable. She is a perfect lab and
field mate and became a really good friend.
Mareike Hillerkus , Yvonne Heyde, Axel and Alicia Kirste, Tim Haarmann and Ingo
Misgeld are the ones who since many years are invaluable companions in the jungle of life,
who have always been the foothold I could count on and whose friendship makes earth a
place worth living.
Rolf Schulte somehow managed to motivate me to continue and finally finish my PhD thesis.
He is the foothold I can count on.
Last but not least I want to thank my parents, Barbara and Rudolf Weiner who always gave
their best to offer me all the opportunities I could have longed for, who patiently waited when
their farsick daughter was exploring the world, who just were there when I once again made
my own experiences and who gave me their unconditional love, friendship and support. There
is no place like home.
161
Curriculum Vitae Dipl. Biol. Christiane Weiner
Siebenkluster 3 27711 Osterholz-Scharmbeck e-mail:[email protected] Education
12/2012 – 04/2016 PhD in biology, Technische Universität Darmstadt, Germany PhD thesis: ’Diversity and resource choice of flower visiting
insects in relation to pollen nutritional quality and land use’. Supervised by Prof. Dr. N. Blüthgen
02/2007 – 06/2010 Julius-Maximilians-University, Würzburg, Department of Animal
Ecology and Tropical Biology. PhD studies. Supervised by Prof. Dr. N. Blüthgen and Prof. Dr. K.-E. Linsenmair
05/2006 Diploma in biology; grade point average: 1.0 (A) 09/2005 – 05/2006 Diploma thesis at the University of Bremen, Germany ’Limiting factors for the short-term recruitment of savanna trees
at woodland islands in the Western Soutpansberg, South Africa’ Field trip to Limpopo Province, Republic of South Africa Scholarship of the German Academic Exchange Service (DAAD) 10/2001 – 08/2005 Study of Biology at the University of Bremen, Germany 08/1992 – 06/2001 College student, St. Joseph Gymnasium, Rheinbach, Germany University entrance exam (Abitur), grade point average: 1.9 Voluntary work
02/2005 - 04/2005 Internship with the Black Vulture Conservation Foundation
(BVCF), Spain 06/2002 – 08/2002 Internship at the Zoological Garden Wroclaw, Poland Teaching and Supervision
02/2007 – 06/2010 University of Würzburg, Germany Co-supervision of two diploma theses Supervision of field work projects and excursions Supervision of a course on insect determination
162
04/2003– 07/2005 University of Bremen, Germany Supervision of several courses on insect determination, plant
physiology, plant determination and animal physiology Work experience
Since 03/2014 Research associate at Avitec Research GbR in Osterholz-
Scharmbeck 09/2013 - 02/2014 Secondary school teacher at the Tomburg Realschule in
Rheinbach Subjects: biology and chemistry 07/2013 - 10/2013 Freelancer for GrünWerk and Eich Landschaftsplanerische
Leistungen 01/2013 - 03/2013 Assistant in a short-term project at Stiftung Rheinische
Kulturlandschaft 08/2010 - 08/2012 Secondary school teacher at the Maria-Sibylla-Merian
Gymnasium in Krefeld Subjects: biology, politics, chemistry and physics 09/2011 – 07/2012 Secondary school teacher at Fichte Gymnasium Krefeld Subject: geography 02/2007 – 06/2010 PhD student at Julius-Maximilians-University, Würzburg,
Department of Animal Ecology and Tropical Biology 09/2006 – 02/2007 Employee at the Black Vulture Conservation Foundation,
(BVCF) Spain 06/2006 – 08/2006 Assistant researcher at the University of Bremen, Department of
Vegetation Ecology Languages
Mother tongue German Second languages English (fluent) Polish (fluent) Spanish (modest) Latin Interests
Hiking Poetry Literature
Travelling Photography Nature conservation
163
Author contributions Chapter 3 has been published as: Weiner, C.N., Werner, M., Linsenmair, K.-E., Blüthgen, N. (2011): Land-use intensity in grasslands: changes in biodiversity, species composition and specialization in flower-visitor networks. Basic and Applied Ecology 12 (4), 292-299. CNW, MW and NB designed the study, NB and KEL conceived the project, CNW and MW performed the fieldwork. CNW performed the statistical analysis and drafted the first version of the manuscript, CNW, KEL and NB contributed to writing. Chapter 4 has been published as: Weiner, C.N., Werner, M., Linsenmair, K.-E., Blüthgen, N.: Land-use impacts on plant–pollinator networks: interaction strength and specialization predict pollinator declines. Ecology 95:466–474. CNW and NB are the principal authors and drafted the manuscript, KEL contributed to writing. KEL and NB conceived the project, CNW performed the statistical analysis, CNW and MW performed the fieldwork. Chapter 5 will be submitted as: Weiner, C., Werner, M., Blüthgen, N. (in prep): Land-use intensification triggers diversity loss in pollination networks: Regional distictions between three different German bioregions CNW and NB designed the study, NB conceived the project, CNW and MW performed the fieldwork. CNW performed the statistical analysis and wrote the manuscript. Chapter 6 has been published as: Weiner, C.N., Hilpert, A., Werner, M., Linsenmair, K.-E., Blüthgen, N. (2010): Pollen amino acids and flower specialization in solitary bees. Apidologie 41 (4), 476-487. CNW, NB and KEL designed the study, CNW and AH collected the pollen samples, AH and CNW performed the pollen analysis, CNW performed the statistical analysis and wrote the first version of the manuscript, MW, NB and KEL commented on the manuscript.
164
List of publications Gamez-Virues S, Perovic D, Gossner MM, Börschig C, Blüthgen N, de Jong H, Simons NK,
Klein AM, Krauss J, Maier G, Scherber C, Steckel J, Rothenwöhrer C, Steffan-Dewenter I, Weiner CN, Weisser W, Werner M, Tscharntke T & Westphal C (2015) Landscape simplification filters species traits and drives biotic homogenization. Nat. Commun. 6:8568.
Allan E , Manning P, Alt F, Binkenstein J, Blaser S, Blüthgen N, Böhm S, Grassein F, Hölzel
N, Klaus VH, Kleinebecker T, Morris EK, Oelmann Y, Prati D, Renner SC, Rillig MC, Schaefer M, Schloter M, Schmitt B, Schöning I, Schrumpf M, Solly E, Sorkau E, Steckel J, Steffen-Dewenter I, Stempfhuber B, Tschapka M, Weiner CN, Weisser WW, Werner M, Westphal C, Wilcke W Fischer M (2015) Land use intensification alters ecosystem multifunctionality via loss of biodiversity and changes to functional composition. Ecology Letters 18: 834–843.
Manning P, Gossner MM., Bossdorf O, Allan E, Zhang YY, Prati D, Blüthgen N, Boch S,
Böhm S, Börschig, C., Hölzel, N., Jung, K., Klaus, V. H., Klein, A. M., Kleinebecker T, Krauss J, Lange M, Müller J, Pašalić E, Socher SA, Tschapka M, Türke M, Weiner, C., Werner M, Gockel S, Hemp A, Renner SC, Wells K, Buscot F, Kalko EKV, Linsenmair KE, Weisser WW and Fischer M (2015) Grassland management intensification weakens the associations among the diversities of multiple plant and animal taxa. Ecology 96: 1492–1501.
Renoult JP, Blüthgen N, Binkenstein J, Weiner CN, Werner M, Schaefer HM (2014) The
relative importance of color signaling for plant generalization in pollination network. Oikos DOI: 10.1111/oik.01361
Weiner CN, Werner M, Linsenmair KE, Blüthgen N (2014) Land-use impacts on plant–
pollinator networks: interaction strength and specialization predict pollinator declines. Ecology 95:466–474.
Allan E , Bossdorf O, Dormann CF, Prati D, Gossner MM, Tscharntke T, Blüthgen N, Bellach
M, Birkhofer K, Boch S, Böhm S, Börschig C, Chatzinotas A, Christ S, Daniel R, Diekötter T, Fischer C, Friedl T, Glaser K, Hallmann C, Hodac L, Hölzel N, Jung K, Klein AM, Klaus VH, Kleinebecker T, Krauss J, Lange M, Morris MK, Müller J, Nacke H, Pašalić E, Rillig MC, Rothenwöhrer C, Schall P, Scherber C, Schulze W, Socher SA, Steckel J, Steffan-Dewenter I, Türke M, Weiner CN, Werner M, Westphal C, Wolters V, Wubet T, Gockel S, Gorke M, Hemp A, Renner SC, Schöning I, Pfeiffer S, König-Ries B, Buscot F, Linsenmair KE, Schulze ED, Weisser WW, Fischer M (2014) Interannual variation in land-use intensity enhances grassland multidiversity. PNAS 111: 308-313.
Chrobock T, Weiner CN, Werner M, Blüthgen N, Fischer M, van Kleunen M (2013) Effects
of native pollinator specialization, self-compatibility and flowering duration of European plant species on their invasiveness elsewhere. Journal of Ecology 101(4): 916–923
165
Schleuning M, Fründ J, Klein AM, Abrahamczyk S, Alarcón R, Albrecht M, Andersson GKS, Bazarian S, Böhning-Gaese K, Bommarco R, Dalsgaard B, Dehling M, Gotlieb A, Hagen M, Hickler T, Holzschuh A, Kaiser-Bunbury C, Kreft H, Morris RJ, Sandel B, Sutherland WJ, Svenning JC, Tscharntke T, Watts S, Weiner CN, Werner M, Williams NM, Winqvist C, Dormann CF, Blüthgen N (2012) Specialization of Mutualistic Interaction Networks Decreases toward Tropical Latitude, Current Biology 22 (20): 1925–1931
Blüthgen N, Dormann C, Alt F, Boch S, Klaus V, Kleinebecker T, Gockel S, Nieschulze J,
Renner S, Schumacher U, Birkhofer K, Buscot F, Fischer M, Hemp A, Hölzel N, Kalko EKV, Linsenmair KE, Oelmann Y, Prati D, Rothenwöhrer C, Scherber C, Schöning I, Schulze E.-D., Tscharntke T, Weiner CN, Wells K, Weisser WW (2012). A quantitative index of land-use intensity in grasslands: Integrating mowing, grazing and fertilization. Basic and Applied Ecology 13 (3), 207-220.
Weiner CN, Werner M, Linsenmair KE, Blüthgen N (2011) Land-use intensity in grasslands:
changes in biodiversity, species composition and specialisation in plant - flower visitor networks. Basic and Applied Ecology 12 (4), 292-299.
Weiner CN, Hilpert A, Werner M, Linsenmair KE, Blüthgen N (2010) Pollen amino acids
and flower specialisation in solitary bees. Apidologie 41 (4), 476-487.
Conference contributions (selection) Weiner CN, Werner M, Linsenmair KE, Blüthgen N (2012) Monitoring von
Blütenbesuchernetzwerken entlang von Landnutzungsgradienten im Grünland. Nationales Biodiversitätsmonitoring 2020, NeFo Workshop 14.-15. Juni, Berlin
Weiner CN, Werner M, Linsenmair KE, Blüthgen N (2010) Intensive land use triggers losses
in flower diversity and specialised pollinators. EcoFlor 2010, La Laguna, Tenerife, Spain
Weiner CN, Werner M, Linsenmair KE, Blüthgen N (2009) Land-use intensity in grasslands:
Changes in biodiversity, species composition and specialisation in flower-visitor networks. 23rd SCAPE meeting [Scandinavian Association for Pollination Ecologists], Seili, Finnland
Weiner CN, Werner M, Linsenmair KE, Blüthgen N (2008) Do bees suffer from land-use
intensification? Jahrestagung der Gesellschaft für Ökologie (GfÖ), Leipzig Weiner CN, Werner M, Hilpert A, Linsenmair KE, Blüthgen N (2007) Pollen amino acids,
plant taxonomy and specialisation in solitary bees. 21st SCAPE meeting [Scandinavian Association for Pollination Ecologists], Århus, Denmark
Copyright © 2022 FDOKUMEN