Diversité des champignons saproxyliques et décomposition ...
160
UNIVERSITÉ DU QUÉBEC EN ABITIBI-TÉMISCAMINGUE DIVERSITE DES CHAl\1PIGNONS SAPROXYLIQUES ET DECOMPOSITION DU BOIS MORTDANSDESPEUPLENOENTSNATURELSETAMOENAGESENFORET BOREALE QUEBECOISE THÈSE PRÉSENTÉE COMNOE EXIGENCE PARTIELLE DU DOCTORAT EN SCIENCES DE L'ENVIRONNENOENT PAR HEDIKEBLI JANVIER 2012
-
Upload
khangminh22 -
Category
Documents
-
view
2 -
download
0
Transcript of Diversité des champignons saproxyliques et décomposition ...

UNIVERSITÉ DU QUÉBEC EN ABITIBI-TÉMISCAMINGUE
DIVERSITE DES CHAl\1PIGNONS SAPROXYLIQUES ET DECOMPOSITION DU BOIS
MORTDANSDESPEUPLENŒNTSNATURELSETAMŒNAGESENFORET
BOREALE QUEBECOISE
THÈSE
PRÉSENTÉE
COMNΠEXIGENCE PARTIELLE
DU DOCTORAT EN SCIENCES DE L'ENVIRONNENŒNT
PAR
HEDIKEBLI
JANVIER 2012

Mise en garde
La bibliothèque du Cégep de l’Abitibi-Témiscamingue et de l’Université du Québec en Abitibi-Témiscamingue a obtenu l’autorisation de l’auteur de ce document afin de diffuser, dans un but non lucratif, une copie de son œuvre dans Depositum, site d’archives numériques, gratuit et accessible à tous.
L’auteur conserve néanmoins ses droits de propriété intellectuelle, dont son droit d’auteur, sur cette œuvre. Il est donc interdit de reproduire ou de publier en totalité ou en partie ce document sans l’autorisation de l’auteur.

ii
REMERCIEMENTS
Je souhaiterais remercier tout d'abord mes directeurs de recherche : Pascal Drouin et
Suzanne Brais pour leur aide tout au long de mon doctorat. Leurs conseils et leur soutien que
ce soit au laboratoire, sur le terrain ou bien encore pendant l'étape décisive de la rédaction
m'ont beaucoup apporté dans mon cheminement d'étudiant à futur chercheur. Je remercie
également mon codirecteur Gavin Kernaghan qui malgré la distance et les problèmes de
langue a toujours fourni d 'excellents et rapides commentaires quand j 'en avais besoin. Je
tiens aussi à remercier Carole Lafrenière pour son aide en spectroscopie infrarouge ainsi que
toute l'équipe de l'URDAAT. Un grand merci à Marc Mazerolle pour son indispensable aide
en statistique.
Je voudrais remercier mes aides de terrain: Josée et Véronique qui m'ont initié à la
forêt boréale et fait découvrir les joies du travail de terrain. Merci également à Manuella qui
m'a accompagné de nombreuses fois sur le terrain et auprès de qui je n'ai probablement pas
été un aussi bon mentor en particulier durant nos premières expéditions!
Merci aux innombrables étudiants que je ne tenterais pas de citer pour leur conseils
informels (mais néanmoins tout aussi important) tant en statistiques qu'au laboratoire ou tout
simplement pour leur bonne humeur, leur amitié ou leur indispensable compagnie. Mon
séjour ici n'aurait pas été aussi agréable sans eux.
Merci également à tous ceux que j'ai connu en dehors du cercle de l'UQAT pour leur
sympathie et pour m'avoir fait décompresser et sortir du milieu universitaire pour découvrir
le Québec, la pêche, la motoneige ou le rodéo du camion ... Et pour m'avoir enduré comme
colocataire pendant ces années!
Je tenais tout spécialement à remercier ma famille que je ne voyais malheureusement
pas assez souvent pour leur colis remplis de bonne nourriture du terroir, leurs valeurs et pour
recharger les batteries quand le besoin s'en faisait sentir; bref pour être tout simplement là
comme toujours.

iii
Merci enfm à mes vieux amis pour ces éreintantes vacances et pour m'avoir fait
visiter une partie de l'Amérique du Nord durant nos périples, pour m'avoir aidé à garder les
pieds sur terre et les idées claires.

TABLE DES MATIERES
TABLE DES I'viATIERES ....................................................................................................... iv
LISTE DES FIGURES .......................................................................................................... viii
LISTE DES TABLE AUX ........................................................................................................ ix
RESU1\1E DE LA TlffiSE ....................................................................................................... xi
INTRODUCTION GENERALE .............................................................................................. 1
Contexte de la thèse ....................... ........................ ......................... ........................ .............. 1
Le bois mort .......................................................................................................................... 2
Rôles écologiques du bois mort ............................................................................................ 3
Les organismes décomposeurs du bois mort : les champignons saproxyliques ...... .............. 4
Interactions fongiques ....................................................................................................... 7
Rôle des décomposeurs pionniers ..................................................................................... 8
Lien entre diversité et fonction ...... ........................ ............................................................... 8
Influence de l'aménagement forestier ................................................................................... 9
Objectifs de la thèse ............................................................................................................ 11
CHAPITRE I SPECIES COMPOSITION OF SAPROXYLIC FUNGAL COMMUNITIES
ON DECA YING LOGS IN Tlffi BOREAL FOREST ........................................................... 15
1.1 Abstract ................................................................................................................... 16
1.2 Introduction ........................ ........................ ......................... ........................ ............ 17
1.3
1.3.1
Materials and methods ............................................................................................ 19
Field sites description ...................................................................................... 19
1.3.2 Field methods ............. ......................... ........................ ........................ ............ 19

1.3.3
1.3.4
1.3.5
1.3.6
1.3.7
1.3.8
1.3.9
1.3.10
v
Log species identification ............................................................................... 21
Wood physical and chemical characteristics .............. ........................ ............. 21
DNA extraction from wood ............................................................................ 22
PCR amplification offungal-specific genes ................................................... 22
Separation offungal ITS amplicons by DGGE .......... ........................ ............. 22
Gel analysis ..................................................................................................... 23
Cloning and sequencing of excised DGGE bands .......................................... 23
Statistical analysis ........................................................................................... 24
1.3.11 Nucleotide sequence accession numbers ........................................................ 26
1.4 Results ..................................................................................................................... 26
1.4.1 Stand characteristics ........................................................................................ 26
1.4.2 Dead wood properties ..................................................................................... 26
1.4.3 Fungal richness and diversity ............ .......................... ........................ ............ 27
1.4.4 Saproxylic fungal community composition .................................................... 33
1.4.5 Indicator species .............................................................................................. 37
1.5 Discussion ............................................................................................................... 37
1.6 Acknowledgements ................................................................................................. 40
CHAPITRE II PATTERNS OF SAPROXYLIC FUNGAL COLONIZATION DURING
WOOD DECOMPOSITION ALONG A GRADIENT OF FOREST DISTURBANCE ....... 41
2.1 Abstract ................................................................................................................... 42
2.2 Introduction ............................................................................................................. 43
2.3 Materials and methods ...... ........................ .......................... ........................ ............ 44
2.3.1 Site description ................................................................................................ 44
2.3.2 Field methods .................................................................................................. 45
2.3.3 Laboratory analyses .... ...................... .......................... ........................ ............ 46

vi
2.3.4 Wood physical and chemical characteristics ................................................... 46
2.3.5 DNA extraction and PCR amplification of fungal-specific genes ...... ............ 47
2.3.6 Separation offungal ITS amplicons by DGGE ............................................... 47
2.3.7 Gel analysis ..................................................................................................... 48
2.3. 8 Cloning and sequencing of excised DGGE bands ...... ........................ ............ 48
2.3.9 Respiration .................. ........................ ......................... ........................ ........... 49
2.3.10 Statistical analysis ........................................................................................... 49
2.4 Results .......... ........................ ........................ ......................... ........................ .......... 51
2.4.1
2.4.2
2.4.3
2.4.4
Stands structure ........... ......................... ........................ ........................ ........... 51
Fungal richness and diversity .......................................................................... 52
Fungal succession ........ ......................... ........................ ........................ .......... 55
Respiration .................. ........................ ......................... ........................ ........... 63
Wood decomposition ......................... ......................... ........................ ............ 64 2.4.5
2.5 Discussion ............................ ........................ ......................... ........................ .......... 65
2.5.1
2.5.2
2.6
Decomposition ............ ......................... ........................ ........................ ........... 67
Relationships between fungal diversity and respiration .................................. 68
Acknowledgements .............. ......................... ........................ ........................ .......... 70
CHAPITRE III IMPACT OF HARVESTING INTENSITY ON WOOD-INHABITING
FUNGI IN AS PEN BOREAL FORESTS OF EASTERN CANADA ........................ ........... 71
3.1 Abstract ........ ........................ ........................ ......................... ........................ .......... 72
3.2 Introduction ......................... ........................ ......................... ........................ ........... 73
3.3
3.3.1
Material and Methods ........ ......................... ........................ ........................ ............ 75
Field sites description ........................... ......................... ........................ .......... 75
3.3.2 Field methods .............. ......................... ........................ ........................ ........... 75
3.3.3 DNA extraction and PCR amplification offungal-specific genes ...... ............ 76

vii
3.3.4 Separation offungal ITS amplicons by DGGE ............................................... 77
3.3.5 Gel analysis ................ ........................ ......................... ........................ ............ 77
3.3.6 Statistical analysis ........................................................................................... 78
3.4 Results ..................................................................................................................... 80
3.4.1 Stand characteristics ........................... ......................... ........................ ............ 80
3.4.1 Fungal richness and diversity .............. ......................... ........................ ........... 81
3.4.2 Indicator species .............................................................................................. 85
3.4.1 Relationships between fungal communities and spatial distribution of snags
and logs ............ ........................ ........................ ......................... ........................ ............ 86
3.4.3 Community composition ...................... ......................... ........................ .......... 86
3.5 Discussion ............................................................................................................... 92
CONCLUSION GENERALE ............ ......................... ........................ ........................ ............ 97
Les communautés fongiques saproxyliques en peuplements naturels ................................ 99
Colonisation initiale ....................... ........................ ......................... ........................ .......... 101
Relation entre diversité fongique et décomposition du bois mort... ......................... ......... 102
Les champignons décomposeurs et l'aménagement forestier 1 perturbation .................... 104
Espèces indicatrices ......................... ........................ ......................... ........................ ........ 107
ANNEXE A .......................................................................................................................... 109
ANNEXE B ............... ........................ ........................ ......................... ........................ .......... 123
ANNEXE C .. 00.00. 00.00. 00 . 00 .... 00.00. 00.00. 00.00 . 00 .... 00.00. 00.00. 00.00 •• 00 .... 00.00. 00.00. 00.00 . 00 .... 00.00. 00.00. 00.00 . 00.00. 00 124
ANNEXE D ............... ........................ ........................ ......................... ........................ .......... 126
ANNEXEE ........................................................................................................................... 128
REFERENCES .......... ........................ ........................ ......................... ........................ .......... 129

viii
LISTE DES FIGURES
Figure 1.1 Histogram of the number of OTUs per log for the five log species o btained from
PCR-DGGE profiles ............................................................................................................... 28
Figure 1.2 OTU number and Shannon diversity index (H') in relation to log species .......... 29
Figure 1.3 Histograms showing the number of occurrences of the 33 OTUs distinguished in
DGGE profiles in relation to log species ................................................................................ 31
Figure 1.4 Canonical correspondence analysis of the saproxylic fungal communities (based
on the DGGE profiling) from 102logs ................................................................................... 35
Figure 1.5 Canonical correspondence analysis of the saproxylic fungal communities (based
on the DGGE profiling) from 102logs ................................................................................... 36
Figure 2.1 (a) Basal area of coniferous and deciduous trees and (b) CWD volume ofnatural
and managed mixedwood stands. ASPEN: stands from 1923 fire; MIXED: stands from 1910
fire and OLD: stands from 1760 frre ....................................................................................... 52
Figure 2.2 Different patterns of blocks colonization over time by 9 different OTUs (upper
row: increasing and high colonization; middle row: peak after summers followed by a
decrease after winter; bottom row: variable pattern of colonization) ..................................... 56
Figure 2.3 Relative frequencies of bals am fir and trembling aspen wood blocks colonization
by individual OTUs ( OTU 1 to 3 5) in relation to the time of incubation .................... ........... 60
Figure 2.4 Relative frequencies of aspen and balsam fir wood blocks colonization by
individual OTUs (OTU 1 to 35) in relation to the type of disturbance following 6 and 30
months of incubation ............................................................................................................... 61
Figure 2.5 (a) Nonmetric Multidimensional Scaling (NMDS) of trembling aspen wood
blocks at 6 months (black points) and 30 months (empty circles) based on fungal community
composition (OTUs) (b) Multivariate homogeneity of group dispersions (i.e. average distance
to centroid) within wood block species ................................................................................... 62
Figure 2.6 Predicted trembling aspen and balsam fir wood blocks respiration in relation to
time, based on multimodel averaging of all candidates models .............................................. 63

ix
Figure 2. 7 Predicted trembling as pen and bals am fir wood blocks respiration in relation to
the Shannon diversity index in eut stands, based on a single model between diversity and
respiration. Dash lines showed confidence intervals at 95%. ................................................. 64
Figure 3.1 Predicted woody debris (WD) volumes (and standard error) according to
harvesting treatments (m3 ha-1). Different letters above the bars indicate a significant
difference between categories (Tukey's test atP :::; 0.05) ....................................................... 81
Figure 3.2 Fungal species richness mean differences and standard errors between large and
smalllogs in five silvicultural treatments (based on predicted data) ...................................... 85
Figure 3.3 Histograms showing the proportion of samples (abundance) colonized by the 35
OTUs distinguished by DGGE profiling in relation to silvicultural treatment for trembling
aspen logs (decomposition classes 3 and 4-5) and snags ........................................................ 91
LISTE DES TABLEAUX
Table 1.1 Mean volume of CWD by decay class and tree species basal area in sampled stands
of different successional status ............................................................................................... 20
Table 1.2 Linear mixed models relating species richness (OTU number) and Shannon
diversity index to stand and log characteristics ....................................................................... 25
Table 1.3 Physical and chemical characteristics (mean and sd values) of decomposing logs
by decay stage found in natural stands·----··-------------------------------------------·---··------------------·---··---- 27
Table 1.4 Sequence analysis of bands excised from DGGE gels ........................................... 30
Table 1.5 Akaike's Information Criterion (AICc) rank and weights (AICcWt) of models
relating species richness (OTU number) and Shannon diversity index to stand and log
characteristics .......................................................................................................................... 32
Table 1.6 Model estimates and standard error obtained from linear mixed model 1 relating
species richness (OTUs number) and Shannon diversity index to log species (n=l02 logs).
Significance values for each linear mixed effect are indicated considering spruce as reference
levet ____ ··--------------------- ···--------------------- ···--------------------- ···---------------------- ···--------------------- ···--------- 33

x
Table 2.1 Generallinear mixed models relating response variables (Shannon diversity index
(H'}, species richness (S), respiration, density and LCI) to explanatory variables during the
first stages of wood decomposition ......................................................................................... 51
Table 2.2 Effects of time of incubation, disturbance and stand basal area on Shannon
diversity index, species richness, respiration, density and LCI of decaying trembling aspen
and balsam fir wood blocks .................................................................................................... 54
Table 2.3 Sequence analysis of bands excised from DGGE gels ........................................... 57
Table 2.4 Effect of time, disturbance and wood block species on assemblage patterns and
variability of saproxylic fungi associated with the colonisation of wood blocks ................... 58
Table 3.1 Generallinear mixed models relating species richness (OTU number) and Shannon
diversity index to stand, log/snag physical characteristics and woody debris (WD) volumes .
................................................................................................................................................ 80
Table 3.2 Akaike's Information Criterion (AICc) rank and weights (wi) of models relating
species richness (OTU number) and Shannon diversity index to stand and logs/snags
characteristics .......................................................................................................................... 83
Table 3.3 Effect of stand and logs characteristics on Shannon diversity index and OTU
number. Model averaged estimates and unconditional standard errors were obtained from
linear mixed multimodel inference (see table 3.1 for models specifications). Only variables
with confidence interval > 95% are presented ........................................................................ 84
Table 3.4 Sequence analysis of bands excised from DGGE gels ........................................... 87
Table 3.5 Effect of harvesting treatment, decomposition class, diameter, snag height, woody
debris volume and type of WD (snag/log) on species assemblage and variability of fungi
associated with dead wood ...................................................................................................... 88

RESUME DE LA THESE
Au sein de l'écosystème forestier, le bois mort est considéré comme un attribut clé pour une cascade de processus écologiques qui affectent à la fois la diversité biologique et la productivité des sols forestiers. Les champignons saproxyliques sont les principaux responsables de la dégradation des débris ligneux. Cependant, la diversité moléculaire de la communauté dans son ensemble, ainsi que son rôle, n'ont été que peu étudiés. La plupart des études sur les communautés boréales de champignons saproxyliques proviennent des forêts fermo-scandinaves qui ont eu un long historique d'aménagement forestier intensif et une faible diversité d'essences forestières. A notre connaissance, peu d'études se sont intéressées à la diversité des champignons décomposeurs en fonction des caractéristiques du bois mort dans la forêt boréale d'Amérique du Nord. Ce projet visait donc à améliorer les connaissances sur les communautés de champignons associées à la dégradation du bois mort tout en évaluant l'effet des pratiques sylvicoles (dont celles issues de l'aménagement écosystémique) sur ces communautés fongiques.
Des billes et des chicots ont été échantillonnés dans différents peuplements que ce soit en conditions naturelles ou aménagées en utilisant une méthode moléculaire afin de détecter l'ADN fongique présent. La diversité moléculaire a été établie notamment selon un gradient de décomposition du bois, de perturbation et de récolte forestière par la technique de PCRDGGE ( denaturing gradient gel electrophoresis ). L'activité métabolique des différentes communautés fongiques a également été étudiée pour les stades précoces de colonisation du bois grâce à des mesures de respiration. La décomposition du bois a été évaluée en s'intéressant à l'évolution des formes de carbone dans le bois par spectroscopie infrarouge.
Lors de l'analyse des communautés fongiques du bois mort au sol et en peuplement naturel, nous avons identifié 33 unités taxonomiques opérationnelles (UT Os) incluant deux espèces indicatrices. Les billes d'épinettes (Picea spp.) supportaient une plus grande diversité ainsi qu'un plus grand nombre d'UTOs. Nos résultats ont confirmé l'hypothèse que l 'essence de la bille influence la richesse et la diversité fongique. La composition du peuplement, le volume et la composition chimique du bois mort structurent la composition des communautés fongiques saproxyliques. La présence de bois mort provenant d'une diversité d'essence forestière permettrait ainsi de maintenir une diversité dans les communautés de décomposeurs du bois. Plus précisément, le bois de sapin (Abies balsamea) et de tremble (Populus tremuloides) étaient rapidement colonisés par des communautés fongiques similaires, qui par la suite se différenciaient après une année de colonisation et ceci dans une grande gamme de peuplements allant des brûlis à des vieilles forêts naturelles. La perturbation dans ces peuplements affectait la composition des communautés de champignons mais seulement pour celles colonisant le sapin. Chaque UTO présentait des patrons de colonisation très variables. Durant les premiers mois de décomposition, le tremble se dégrade plus rapidement que le sapin. Bien que la respiration augmente avec le temps pour le sapin et le tremble, cette augmentation proviendrait de deux processus distincts: une augmentation de la compétition fongique chez le sapin et une augmentation de la décomposition chez le tremble. Dans les peuplements de tremble soumis à la récolte

xii
forestière, les grosses billes bien décomposées avaient une diversité d'environ 10% superieure comparativement aux billes de tremble moyennement décomposées (indépendamment de leur taille). L'effet du diamètre de la bille était dépendant du traitement sylvicole. Les plus grosses billes ont plus d'UTOs et une diversité plus grande mais seulement dans les brulis par rapport aux peuplements non coupés soulignant l'effet de bille refuge dans les traitements fortement aménagés. La relation négative entre la diversité des champignons sur les billes et les chicots et le volume de débris ligneux fins était reliée à l'intensité de la récolte forestière, ce volume augmentant avec l'intensité de récolte. Nos résultats soulignent l'effet des pratiques de récolte intenses qui diminuent la diversité fongique, la richesse spécifique et modifient la composition des communautés. Cependant, 1 'aménagement écosystémique par l'intermédiaire des coupes partielles pourrait contrebalancer ces effets en conservant un volume de bois mort plus important comparativement aux coupes totales.
Il ressort clairement de cette étude que le volume de bois mort occupe une grande importance au niveau des communautés fongiques saproxyliques mais moindrement sur les communautés pionnières, qui sont, quant à elles, très généralistes. Cette thèse apporte des connaissances nouvelles sur l'écologie du bois mort et des espèces fongiques saproxyliques associées. Les relations entre la diversité biologique (spécifique) des champignons et les processus de dégradation du bois ainsi qu'avec les perturbations anthropiques (type d'aménagement forestier) ont été éclaircies. Elle a permis aussi de mieux évaluer l'état des forêts quant à l' importance du bois mort pour la diversité fongique, entre autres, par le biais de nouvelles espèces indicatrices. Les recommandations qui découlent de notre étude faciliteront donc les objectifs de protection et de gestion durable des forêts canadiennes notamment quant à l'utilisation de l'aménagement écosystémique.
Mots-clés : champignons saproxyliques, diversité, décomposition, bois mort, perturbation, forêt boréale, lien diversité-fonction

INTRODUCTION GENERALE
Contexte de la thèse
La foresterie au Québec est un enjeu économique très important puisque cette région
représente 2% des forêts mondiales (Coulombe, 2004) et qu'elle a apporté des retombées
économiques de plus de 10 milliards de dollars en 2001. Elle fournit également des emplois
directs à 1,5% de la population québécoise. Le Canada se classe aussi au deuxième rang
mondial pour deux produits issus de la forêt, soit la pâte à papier et le bois d'œuvre. Cette
activité commerciale est fortement liée aux marchés des États-Unis, puisque plus de 85% de
ces exportations leur sont destinées. Cependant l'industrie forestière a longtemps pratiqué
l'aménagement forestier de façon biaisée vers la récolte de matière ligneuse sans une vision
écologique à plus long terme. C'est pourquoi le Conseil Canadien des Ministres des Forêts a
énoncé six critères d 'aménagement forestier durable qui ont été incorporés dans la loi
québécoise sur les forêts modifiée en 2010. Le respect des critères d'aménagement forestier
durable et des indicateurs correspondants (Kneeshaw et al. , 2000) pose des difficultés dans
leur mise en œuvre par les exploitants forestiers.
L'aménagement forestier écosystémique (Bergeron & Harvey, 1997 ; Harvey et al.,
2002) peut apporter des éléments de solutions au niveau des stratégies d'aménagement et des
pratiques sylvicoles à différentes échelles temporelles et spatiales. D 'après Galindo-Leal et
Bunnel (1995), l'aménagement écosystémique basé sur le fonctionnement des écosystèmes
est durable, s'inspire des perturbations naturelles, permet la viabilité des espèces natives et
s 'applique à une échelle spatiale et temporelle large. Diverses études se sont penchées sur des
pratiques sylvicoles basées sur la dynamique naturelle des forêts (Bergeron & Harvey, 1997).
Les organismes et les écosystèmes sont adaptés à la gamme de perturbations qui affectent les
systèmes naturels ; si les interventions humaines se rapprochent de la gamme d'intensité,
d'étendue et de fréquence des perturbations naturelles, alors on minimise à moyen terme les
impacts négatifs sur les organismes et les écosystèmes. A l'échelle du peuplement, les
travaux sylvicoles réalisés visant à amener la succession des peuplements équiens vers une

2
structure plus complexe caractéristique des forêts naturelles plus anc1ennes favoriseraient
aussi le maintien du fonctionnement de l'écosystème ainsi que la conservation de la
biodiversité. Cette thèse s'inscrit dans cette optique en se focalisant sur la diversité et les
fonctions écologiques des champignons décomposeurs du bois mort.
Le bois mort
Au sein de l'écosystème forestier, le bois mort est considéré comme un facteur clé
dans le maintien de la biodiversité. De nombreux organismes comme les insectes (Simila,
Kouki & Martikainen, 2003), les oiseaux et les petits mammifères (Bowman et al., 2000 ;
Drapeau et al., 2009), ainsi que les champignons et les bactéries (Heilmann-Clausen &
Christensen, 2004 ; Sippola & Renvall, 1999) utilisent ce compartiment que ce soit comme
source d'alimentation ou comme habitat (Harmon et al., 1986). Il se compose de matériel
ligneux que l'on retrouve sur le sol (chablis, branches), dans le sol (racines mortes, bois
enterré, débris fins) et sur pied (chicots, souches). Ces débris sont créés par les perturbations
telles que le feu, les bourrasques de vents, les attaques d'insectes et de maladies mais aussi de
la sécheresse, de la compétition ou tout simplement de la sénescence des individus. Le
volume de bois mort dans un peuplement dépend donc des apports par mortalité des arbres et
des pertes dues à la respiration et aux exportations. Généralement, après une perturbation
sévère, la quantité de débris ligneux suit un modèle en forme de « U » (Brais et al., 2005 ;
Harmon et al. , 1986 ; Ranius et al. , 2003) car au début on retrouve un haut niveau de débris
dû à la perturbation puis comme les seuls apports immédiats proviennent de la végétation qui
est restée debout, il y a une chute dans l'approvisionnement de matériel et enfin le taux
d'apport de bois mort remonte avec le vieillissement des peuplements. Dans un peuplement
forestier, on observe un gradient de décomposition constitué par l'ensemble du bois qui se
retrouve à des états de détérioration plus ou moins avancés. Ainsi on retrouve des chicots
quasiment intacts jusqu'aux débris dans un état très avancé de désagrégation et intégrés à la
matière organique du sol.

3
Rôles écologiques du bois mort
Tout d'abord le bois mort est une ressource importante en ce qui concerne la
biodiversité que ce soit comme habitat, substrat ou source d 'énergie et de nutriments. Par
exemple, dans les forêts finlandaises, il existe entre 4000 et 5000 espèces dites saproxyliques,
c'est-à-dire les espèces qui sont dépendantes durant une partie de leur cycle de vie du bois
mort (debout ou couché) ou qui sont dépendantes d'autres espèces saproxyliques (Davies et
al., 2008; Persiani et al., 2010; Speight, 1989). Les champignons saproxyliques représentent
un groupe très diversifié comptant plus de 1 500 espèces (Siitonen, 2001). Dans de nombreux
cas, les espèces dépendantes du bois mort ont besoin d'une certaine quantité de bois mort
(Lonsdale, Pautasso & Holdenrieder, 2008). Cependant le rôle écologique des débris ligneux
grossiers (DLG), dépend de plusieurs facteurs dont leur état de décomposition (Harmon &
Sexton, 1996). Les débris ligneux interviennent également au niveau de la biodiversité
végétale en servant de substrat pour la régénération de certaines essences forestières
(Lons dale, Pautasso & Holdenrieder, 2008). Le bois mort joue également un rôle essentiel en
ce qui concerne les champignons mycorhyziens (Buée et al., 2007 ; Paul, Chapman &
Chanway, 2006 ; Tedersoo et al., 2008), la ftxation d'azote (Crawford, Li & Floyd, 1997 ;
Feller, 2003 ; Li, Crawford & Chang, 1997 ; Spano et al., 1982), mais aussi le cycle des
nutriments et la séquestration du carbone (Ganjegunte et al., 2004; Harmon et al., 1986).
Durant l'altération du bois, plus la dégradation avance et plus la concentration en
azote et en phosphore augmente car la teneur en carbone diminue à cause de la dégradation
des sucres, de l'amidon et des autres nutriments directement utilisables (Boddy & Watkinson,
1995). Par ce truchement, les débris ligneux influencent la teneur en azote du sol sous-jacent.
En effet, Hafner et Groffman (2005) ont trouvé que les taux d 'azote étaient moins importants
dans le sol sous les débris ligneux que dans le sol sous la litière, ce qui pourrait participer à
l'établissement et au maintien d'une certaine hétérogénéité des conditions environnementales
et donc d'une diversité spécifique des forêts. Frey, Six et Elliott (2003) ont également montré
que, par les champignons décomposeurs, des transferts de carbone et d'azote avaient lieu
entre le sol et la litière. Les filaments mycéliens peuvent ainsi transporter des nutriments
entre ces différents compartiments (Boddy & Watkinson, 1995 ; Lindahl, Finlay & Olsson,
2001).

Les organismes décomposeurs du bois mort: les champignons
saproxyliques
4
Les communautés de champignons saproxyliques sont les principaux décomposeurs
du bois mort en forêt boréale (Moore et al. , 2004) et représentent un groupe très diversifié.
En effet, ces microorganismes sont capables de dégrader les composants récalcitrants du bois
tels que la lignine, la cellulose et les hémicelluloses (Martinez et al., 2005). Selon des critères
macroscopiques et leur capacité à dégrader la lignine, la cellulose et les autres
polysaccharides du bois, on distingue quatre catégories de champignons : les moisissures de
surface et les colorations de l'aubier, les champignons de caries brunes, les champignons de
carie molle et enfin les champignons de carie blanche (Boulet, 2003 ; Martinez et al., 2005).
Ces derniers sont les plus fréquents (90% des espèces fongiques liées au bois mort) et sont
capables de dégrader la lignine, la cellulose et les hémicelluloses. Les moisissures brunes et
blanches sont causées par les Basidiomycota qui sont considérés comme les principaux
agents décomposeurs. Les groupes de plantes vasculaires (Angiospermes et Gymnospermes
ligneux) sont attaqués tous les deux par les champignons, mais la carie brune se développe
presque exclusivement sur les bois tendres (Gymnospermes) (Green III & Highley, 1997 ;
Martinez et al., 2005). Ce type de dégradation n'attaque pas la lignine, seulement la cellulose
et les hémicelluloses. Le bois se fractionne en petits blocs d'où le nom de «carie brune
cubique ». La coloration brune provient de la lignine, composante foncée du bois, qui a
résisté aux champignons. La biodégradation fongique des composés lignocellulosiques a été
revue par Martinez et al. (2005). La pourriture blanche est la plus destructrice car elle
s'attaque en même temps à la lignine, à la cellulose et aux hémicelluloses. Elle touche surtout
les feuillus. Par ce processus de décomposition, les champignons décomposeurs du bois
créent différentes niches écologiques et fournissent les ressources et un habitat pour de
nombreux autres organismes. Lonsdale, Pautasso et Holdenrieder (2008) ont recensé les
études soulignant l'importance du bois mort décomposé par les champignons pour de
nombreux organismes (Tableau A).

5
Tableau A Exemples d'études indiquant le bois mort comme étant la principale ressource pour les organismes vivants mentionnés. Tiré de Lonsdale, Pautasso et Holdenrieder (2008).
Principal organisme Région Références
Gorilla beringei Ouganda Rothman et al. (2006)
Petits mammifères Canada Bowman et al. (2000)
Martes americana Canada Porter, St. Clair et De Vries (2005)
Petite musaraigne (Cryptotis parva) Etats-Unis McCay et Komoroski (2004)
Campagnol à dos roux de Gapper Etats-Unis Ucitel, Christian et Graham (2003) (Clethrionomys gapperi) Souris sylvestre (Peromyscus Etats-Unis Lee (2004) man iculatus) Marsupiaux arboricoles Australie Wormington et a/.(2003)
Chauves-souris Canada Parsons, Lewis et Psyllakis (2003)
Sittelle à poitrine rousse (Sitta Canada Steeger et Hitchcock (1998) canadensis) Grand pic (Dryocopus pileatus) Etats-Unis McClelland et McClelland ( 1999)
Pic tridactyle (Picoides tridactylus) Suisse Bütler et al.(2004)
Pic à face blanche (Picoides Amérique du Jackson et Jackson (2004) borealis) Nord Vertébrés du sol forestier Etats-Unis Butts et McComb (2000)
Salamandre Etats-Unis Alkaslassy (2005)
Macro-arthropodes du sol Allemagne Jabin et al. (2004)
Diptères Norvège 0kland ( 1996)
Insectes en forêt boréale Suède Ehnstrôm (200 1)
Insectes dans les polypores Suède Jonsell et Nordlander (2002)
Insectes dans Fomitopsis pinicola Finlande Komonen (2003)
La décomposition du bois est un processus essentiel pour le cycle des nutriments, la
formation du sol, la régénération de la forêt et le bilan en carbone des écosystèmes forestiers.
En effet, les champignons décomposeurs modulent la disponibilité des ressources pour
plusieurs groupes fonctionnels (Moore et al., 2004). L'importance écologique de la
décomposition du bois mort par les champignons a été soulignée dans de nombreuses études
et revues de littérature (Tableau B).

6
Tableau B Exemple d'articles de synthèse soulignant le rôle écologique fondamental du bois mort en décomposition dans les forêts. Tiré de Lons dale, Pautasso et Holdenrieder (2008).
Objectif principal Région Références Ecosystèmes tempérés Amérique du Nord Harmon et al. (1986) Directives pour la sylviculture Allemagne Ammer (1991)
Canopées Amérique du Nord Parks et Shaw ( 1996)
Directives pour la sylviculture Grande-Bretagne Hoddge et Peterken (1998) Maintien de la biodiversité Amérique du Nord McComb et Lindenmayer (1999) Réserves forestières Allemagne Meyer ( 1999)
Forêts aménagées Suède Fridman et Walheim (2000)
Fonctions des DLG Chine Hou et Pan (200 1)
Statut et écologie du bois en Royaume-Uni Butler (2002) décomposition Insectes saproxyliques Australie Grove (2002)
Dynamique de la décomposition Scandinavie Kruys, Jonsson et Stahl (2002)
Gestion des habitats Grande-Bretagne Bratton (2003) Vieilles forêts Canada Feller (2003)
Billes d'hêtre en décomposition Danemark Heilmann-Clausen et Christensen (2003)
Insectes forestiers Europe Bouget et Duelli (2004)
Coupes de rétention Finlande Hautala et al (2004)
Plantations de conifères Grande-Bretagne Humphrey (2005)
Gestion du bois mort Scandinavie Jonsson: Kruys et Ranius (2005}
Takahashi et Kaagya (2005) ont montré que les patrons de diversité des
communautés fongiques se développant sur les DLG se modifient selon le stade de
dégradation du substrat. D 'autres études se sont intéressées à la diversité des champignons en
relation avec le bois mort. Par exemple, la diversité fongique a été examinée selon le type
d'habitat (Sippola, Monkkonen & Renvall, 2005), l'âge du peuplement (Nordén & Paltto,
2001), l ' essence forestière impliquée (Heilmann-Clausen, Aude & Christensen, 2005 ;
Y amashita, Hattori & Abe, 20 10), la taille des débris ligneux (Heilmann-Clausen &
Christensen, 2004 ; Nordén et al., 2004) et selon l'aménagement forestier (Küffer & Senn
Irlet, 2005 ; Lindhe, Âsenblad & Toresson, 2004 ; Sippola & Renvall, 1999 ; Sippola et al. ,
2004; Vasiliauskas et al., 2004).
7
Cependant la plupart des études sur les communautés boréales de champignons
saproxyliques proviennent des forêts fermo-scandinaves ayant un long historique
d'aménagement forestier intensif et une faible diversité d'essences forestières. A notre
connaissance, peu d'études ont été conduites concernant la diversité des champignons
décomposeurs en fonction des caractéristiques du bois mort dans la forêt boréale d'Amérique
du Nord (Lumley, Gignac & Currah, 2001) ou alors concernant les champignons
mycorhiziens (Kernaghan, Sigler & Khasa, 2003 ; Kernaghan et al., 2003). Dans notre étude,
les peuplements sont naturels et nos expériences sont les seules interventions anthropiques.
Nos résultats reflètent donc ce qu'il se passe en forêt boréale naturelle ou suite à des
interventions sylvicoles directement dans ces peuplements. Nos résultats ne sont donc pas
influencés par un long historique d'aménagement tel qu'effectué dans les forêts scandinaves.
Interactions fongiques
Les interactions entre les champignons colonisant les débris ligneux dans les
écosystèmes forestiers ont lieu lors de la phase de croissance mycélienne (Rayner & Boddy,
1988). La compétition fongique s'observe pour la capture d'une ressource non utilisée en y
accédant le plus rapidement possible ou alors pour la défense (attaque) d'un territoire vis-à
vis d'un autre individu. Les mécanismes responsables de ces relations interspécifiques sont
divers : antagonisme à distance par composés volatiles, interférence des hyphes, parasitisme
et croissance mycélienne par contact (Boddy, 2000). Les différentes espèces fongiques
présentent des capacités compétitrices variables (Woods, Woodward & Redfern, 2005). Ces
relations sont importantes dans la mesure où elles conduisent à une succession des espèces
lors de la dégradation du bois mort (Boulet, 2003). Les colonisateurs primaires puis les
colonisateurs secondaires plus compétiteurs remplacent les champignons de première ligne.
Au fur et à mesure de la dégradation, les propriétés du bois changent et des polypores plus
compétitifs colonisent le substrat. Avec la prolifération des microorganismes, la disponibilité
des ressources énergétiques diminue et les espèces luttent contre leurs concurrents. Ensuite
viennent les champignons de dernière ligne qui interviennent pour attaquer les composés
carbonés récalcitrants dans les états de décomposition du bois très avancés (matériel enfoui et
désagrégé) (Boulet, 2003).

8
Rôle des décomposeurs pimmiers
Parmi les communautés de champignons décomposeurs, les espèces pionnières
jouent un rôle important. En effet, Heilmann-Clausen et Christensen (2003) ont observé que
l'importance du type de DLG pour la richesse des espèces fongiques menacées était reliée à
la présence de certains décomposeurs pionniers. Ces auteurs ont suggéré qu'une grande
diversité de décomposeurs primaires pourrait être un élément clé dans la conservation des
champignons décomposeurs du bois mort. Chez les angiospermes, les décomposeurs
primaires auraient une influence sur l'établissement des champignons arrivant à un stade
subséquent de la succession (Heilmann-Clausen & Boddy, 2005). Fukami et al. (20 10) ont
trouvé de grandes différences dans le fonctionnement de l'écosystème (taux de
décomposition) causés par de petites différences dans la composition de la communauté de
champignons pionniers. De plus les facteurs influençant la diversité fongique dans le bois en
décomposition varient selon le stade successionel des champignons impliqués (colonisateurs
primaires vs. secondaires) (Jonsson, Edman & Jonsson, 2008). On voit donc le rôle non
négligeable de ces décomposeurs primaires à la fois dans le processus de décomposition du
bois mais aussi dans la structure des communautés saproxyliques.
Lien entre diversité et fonction
Le lien entre la diversité biologique et les fonctions associées à cette dernière ont reçu
un intérêt grandissant ces dernières années (Coleman & Whitman, 2005 ; Fitter et al., 2005 ;
Gray et al., 2003 ; Hooper, 2002 ; Naeem, 2002 ; O'Connor & Crowe, 2005). Plus
précisément, il s'agit d'évaluer la perte de biodiversité sur le fonctionnement d'un
écosystème (O'Connor & Crowe, 2005). Cependant peu d'études ont examinées les relations
entre la diversité microbienne et le processus de décomposition (Hattenschwiler, Tiunov &
Scheu, 2005). Une corrélation positive entre la diversité microbienne et la décomposition a
été démontrée pour la cellulose (Wohl, Arora & Gladstone, 2004) et dans les écosystèmes du
sol (Bonkowski & Roy, 2005). Cependant il n'existe pas de consensus permettant de décrire
comment la perte de diversité va affecter la décomposition dans la mesure où il existe des
résultats contradictoires dans la littérature (Mikola & Setala, 1998 ; Müller et al., 2002 ;
Setala & McLean, 2004; Wardle et al., 1999). De plus, la plupart de ces études concerne les

9
microorganismes du sol et les processus impliquant la diversité des champignons
saproxyliques et les processus de décomposition sont rares.
La diversité microbienne pourrait augmenter le processus de décomposition dans la
mesure où certaines réactions biochimiques nécessitent des conditions particulières, et donc,
ne peuvent être assurées par un seul organisme (Van Der Heijden, Bardgett & Van Straalen,
2008). C'est le cas de la dégradation de la lignine (qui est présente en grande quantité dans le
bois). En effet, pour décomposer ce composant, il est nécessaire d'avoir recours à plusieurs
réactions chimiques qui ne peuvent pas être réalisées par un seul organisme (De Boer et al. ,
2005).
Influence de l'aménagement forestier
Les coupes forestières intensives réalisées à l'échelle du paysage entrainent une
augmentation de la proportion des jeunes forêts par rapport aux vieilles forêts et une
réduction importante de la densité des gros arbres vivants (Drapeau et al., 2009). En effet, en
changeant la distribution des classes d'âge des peuplements, la proportion de vieilles forêts
diminue à l'échelle du paysage. En Fenno-Scandinavie, le long historique d'aménagement
forestier intensif (depuis le XIXème siècle, utilisation d'herbicides pendant 30 ans,
plantations, fertilisation en azote) a fait drastiquement chuté la proportion de ces vieilles
forêts et changé la composition forestière (Ostlund, Zackrisson & Axelsson, 1997). En forêt
boréale canadienne, la surreprésentation des coupes totales et des peuplements équiens en
résultant est un des principaux enjeux de l'aménagement forestier (Gauthier et al., 2008).
Pour répondre à cela, la diversification des méthodes de récolte forestière, incluant
l'utilisation des coupes partielles, a été proposée comme une approche d'aménagement des
écosystèmes forestier boréaux (Bergeron et al., 2002 ; Franklin, 1997; Harvey et al., 2002).
Les objectifs de la coupe partielle visent notamment l'augmentation de la diversité des
essences forestières et des classes de taille ainsi que l'établissement et la croissance des
espèces tolérantes à l'ombre tout en maintenant le fonctionnement et la biodiversité des
écosystèmes. Les coupes partielles pourraient mener les peuplements vers des structures de
cohortes plus vieilles ou maintenir la cohorte au même stade. Dans les forêts boréales, une
grande quantité de bois mort est caractéristique des vieux peuplements (Linder, Elfving &

10
Zackrisson, 1997). Cependant l'aménagement forestier entraine une diminution de la quantité
de ces débris ligneux et en particulier concernant la qualité et la quantité des billes en
décomposition (Brais et al., 2004 ; Brassard & Chen, 2008 ; Siitonen et al., 2000). La
sylviculture entraîne en général une augmentation de l'apport de certains types de DLG après
l'éclaircie. Certaines structures clés comme les chicots ou les grands chablis sont remplacées
par les souches (Montes & Cafiellas, 2006) et le bois frais de petite dimension. Les coupes
partielles permettent de conserver certaines structures et de maintenir un recrutement
minimum de bois mort plus proche des forêts non aménagées comparativement aux pratiques
sylvicoles plus intensives (Harvey & Brais, 2007).
L'aménagement forestier par l'intermédiaire des coupes a des effets sur la diversité
biologique et en particulier sur la diversité des communautés de champignons saproxyliques
dans les peuplements aménagés (Bader, Jansson & Jonsson, 1995 ; Penttila, Siitonen &
Kuusinen, 2004). À l'échelle mondiale, la diminution de la disponibilité en matière ligneuse
morte dans les forêts aménagées est considérée comme 1 'une des principales causes de perte
de diversité biologique (Drapeau et al., 2009). En Finlande, 20 à 25% de toutes les espèces
vivantes en forêt sont associées au bois mort (Siitonen, 2001). De plus, en Scandinavie, le
champignon menacé Phellinus nigrolimitatus, est très fortement dépendant des débris ligneux
grossiers bien décomposés, qui sont des caractéristiques rencontrées dans les forêts non
aménagées (Stokland & Kauserud, 2004). En comparant les forêts aménagées et non
aménagées, les auteurs ont observé une diminution de 82% de la fréquence de cette espèce de
champignon sur les sites soumis aux coupes forestières. De même, en Finlande, Sippola et al.
(2004) ont noté une diminution de l'occurrence des champignons polypores, dans les sites
aménagés. Lorsque l'intensité d'exploitation dépassait un certain seuil de tiges coupées, plus
aucun individu des espèces menacées n'était observé. Bien que de nombreuses études se sont
penchées sur l'effet de l'aménagement forestier sur la diversité des champignons
décomposeurs comparativement à des forêts non-aménagées, l'effet des pratiques sylvicoles
alternatives et notamment les coupes partielles sur les communautés fongiques a reçu que très
peu d'intérêt (Lohmus, 2011 ; Nordén et al., 2008), tout particulièrement en Amérique du
Nord.

11
D'autre part, les communautés microbiennes sont caractérisées par une grande
redondance fonctionnelle (décomposition, respiration, nitrification) (Degens, 1998 ; Griffiths
et al., 2000 ; Griffiths et al., 2001 ; Müller et al., 2002) et on ne connait pas dans quelle
mesure une réduction de la diversité spécifique causée par l'aménagement forestier aura des
conséquences sur le fonctionnement de l'écosystème (Baptist et al., 2008 ; Bonkowski &
Roy, 2005 ; Setala & McLean, 2004 ; Wertz et al., 2006). Ceci montre à quel point une
meilleure compréhension des processus associés aux communautés saproxyliques est
nécessaire dans l'élaboration des stratégies d'aménagement forestier fondées sur la
conservation des fonctions de l'écosystème forestier.
Objectifs de la thèse
L'objectif général de cette thèse est d'améliorer les connaissances sur l'écologie du
bois mort et des champignons décomposeurs qui lui sont associés en évaluant les facteurs qui
structurent les communautés fongiques dans les peuplements naturels et sous aménagement.
Il s'agit également de vérifier les relations entre la diversité fongique et l'activité de
décomposition; et enfin de documenter les effets des coupes partielles sur les communautés
de champignons saproxyliques. Dans la plupart des études précédentes, la diversité et la
structure des communautés fongiques se développant sur les DLG ont surtout été étudiées à
partir de 1 'observation de sporocarpes (fructifications) et ont souvent été basées sur une seule
essence de bois mort. Cependant, les sporocarpes ne révèlent pas la richesse entière présente
mais seulement celle des espèces qui ont fructifié au moment de l'échantillonnage et il est
reconnu que les études basées sur l'observation des sporocarpes ont des limitations certaines
(Boddy, 2001). Pour pallier ce problème, d'autres travaux ont été réalisés grâce à des
méthodes d'isolement et de culture du mycélium provenant du bois (Hood et al., 2004).
Cependant certains champignons ne peuvent pas être cultivés sur milieux synthétiques
(Rayner & Boddy, 1988). C'est pourquoi des méthodes de biologie moléculaire ont été
développées pour identifier la présence fongique directement dans le bois mort (Johannesson
& Stenlid, 1999 ; Raberg et al., 2005). Une technique en particulier a été utilisée pour
comparer les fragments d'ADN selon leur séquence : le gel d 'électrophorèse en gradient
dénaturant (Muyzer & Smalla, 1998). Cette technique offre la possibilité d'utiliser l'ADN
pour réaliser du séquençage afin d'identifier les organismes. Cette technique a été utilisée

12
avec succès pour évaluer les changements dans la composition des communautés
microbiennes du sol (Anderson, Campbell & Prosser, 2003) et du bois (Kulhânkova et al.,
2006). Cependant peu d'études ont appliqué ces techniques moléculaires sur les successions
de champignons saproxyliques (Kubartovâ et al., 2007 ; Kubartovâ et al. , 2009). A la
différence des inventaires des fructifications , cette méthode permet de détecter des espèces
fongiques importantes mais discrètes, qui restent sous forme de mycélium et ne fructifient
pas (Rajala et al., 2010 ; Stenlid, Penttila & Dahlberg, 2008). Les inventaires des
fructifications fongiques sont considérés comme «la partie visible de l'iceberg» dans la
mesure où la distribution et l'abondance des sporocarpes ne reflètent pas forcement la
distribution et l'abondance du mycélium. Ainsi, l'absence de sporocarpes dans l'échantillon
ne signifie pas que le champignon est absent (Lindner et al., 2011). Dans cette thèse, nous
avons utilisé la méthode du gel d'électrophorèse en gradient dénaturant afin de caractériser la
composition des communautés fongiques. Les mesures de diversité sur les communautés ont
été mises en relation avec les caractéristiques chimiques du bois (mesurée par spectroscopie
infrarouge) et avec des variables propres aux peuplements comme le stade successionel ou le
volume de bois mort par exemple.
Toute notre étude a été conduite dans le projet SAPE (Sylviculture et Aménagement
Forestier Ecoystémique) (Brais et al., 2004; Haeussler et al., 2007; Harvey & Brais, 2007),
qui consiste en une série d'expériences menées à la Forêt d 'Enseignement et de Recherche du
Lac Duparquet (FERLD) dans la partie sud-est de la forêt boréale canadienne. Le projet
SAPE teste un modèle d'aménagement écosystémique basé sur la dynamique naturelle des
écosystèmes (Bergeron & Harvey, 1997; Harvey et al., 2002).
Dans le premier chapitre « Species composition of saproxylic fungal communities on
decaying logs in the boreal forest », publié en 2011 dans Microbiol Ecology (Kebli et al.,
2011), nous avons analysé la structure et la composition des communautés fongiques dans
des peuplements naturels et leurs relations avec les facteurs environnementaux responsables
des changements de ces communautés le long d'un gradient de décomposition du bois mort
au sol. Il s'agissait d'évaluer 1' état des communautés saproxyliques en s'affranchissant des
problèmes méthodologiques liés à l'identification (tous les champignons de fructifient pas)
ou à la culture des champignons (certains ne sont pas cultivables). D'après les études

13
précédentes, on s 'attendait à ce que la diversité des champignons saproxyliques sur les billes
soit maximale aux stades de dégradations intermédiaires, et que les plus grosses billes
supportent une plus grande diversité. On a également posé 1 'hypothèse que la composition de
la communauté serait influencée par l'âge du peuplement et le volume de bois mort. Pour
répondre à ces suppositions, nous avons donc choisi une chronoséquence de bois mort au sol
(102 billes) pour cinq essences forestières différentes identifiées par microscopie à l'aide de
lames minces (deux feuillus et trois conifères) et dans trois types de peuplements : des vieux
peuplements issus d'un feu de 1760 et des peuplements plus jeunes (des peuplements mixtes
de 1910 et des tremblaies issus d 'un feu de 1923). Nous avons également relié les paramètres
de diversité aux conditions chimiques du bois en plus des variables explicatives à l'échelle du
peuplement et de la bille.
Dans le deuxième chapitre « Patterns of saproxylic fungal colonization during wood
decomposition along a gradient of forest disturbance », on s'est intéressé aux effets des
perturbations du peuplement sur la diversité et l'activité des communautés fongiques lors des
premières étapes de colonisation dans des peuplements de composition différente en utilisant
une approche moléculaire. Dans ce chapitre nous nous sommes également intéressés à la
relation entre la diversité des champignons saproxyliques et la fonction de décomposition.
Nous avions émis l'hypothèse qu'il existait une corrélation positive entre la diversité et
l'activité des champignons due au rôle complémentaire des différentes espèces fongiques. On
s'attendait également à trouver des patrons de décomposition différents selon les trois
intensités de perturbation (traitements sylvicoles) et aussi entre les deux essences de bois hôte
(feuillu et conifère). Enfin, on s'attendait à ce que la diversité et l'activité des champignons
saproxyliques suivent les changements de structure du peuplement (surface terrière résiduelle
et volume de bois mort au sol) causé par le stade successionel du peuplement et par la
perturbation. On a donc choisi les peuplements selon un gradient de perturbation dans une
approche plus expérimentale dans la mesure où l'on a déposé 480 blocs de bois frais (non
plus des billes), c'est-à-dire issus d 'arbres non décomposés, dans les différents traitements
(témoins, partiellement coupés, brûlis) pendant 2 ans et demi.
Le troisième chapitre s'intitule «Impact of harvesting intensity on wood-inhabiting
fungi in aspen boreal forests of Eastern Canada» (soumission prévue à Microbial Ecology en

14
2011). Comme la gestion du bois mort en forêt aménagée est perçue comme un enjeu majeur
de l'aménagement forestier durable, il s'agissait d 'évaluer plus précisément la réponse des
communautés fongiques 10 ans après la réalisation de traitements sylvicoles. Nous avons
donc choisi une essence (le peuplier faux-tremble) et un peuplement homogène (même stade
successionel) dans lequel diverses pratiques sylvicoles ont été effectuées (coupes partielles,
totales et brûlis). Pour ce chapitre nous avons également analysé les communautés fongiques
du bois mort sur pied, à savoir les chicots. Nous nous sommes aussi penchés sur les capacités
de dispersion des champignons en mesurant la distance géographique entre les échantillons
pour savoir si les communautés plus proches géographiquement étaient plus semblables. On
s 'attendait à ce qu'une plus grande connectivité de bois mort dans le peuplement conduise à
une plus grande similarité de la composition des communautés fongiques. Nous avons aussi
émis 1 'hypothèse que la richesse spécifique et la diversité des champignons saproxyliques
était corrélée négativement avec l'intensité des pratiques sylvicoles. Ons 'attendait aussi à ce
que le volume de bois mort résiduel minimise l'impact de la récolte sur les communautés
fongiques. Finalement on s 'attendait que les billes les plus grosses et les plus décomposées
supporteraient une plus grande diversité.
Les trois chapitres s'articulent donc selon un lien logique qui va de l'évaluation des
communautés fongiques en conditions naturelles suivi par l'influence des perturbations sur la
diversité, la composition, la colonisation et l'activité des champignons pionniers et pour se
terminer par l'effet des pratiques sylvicoles sur les communautés fongiques. Toutes les
analyses ont été effectuées en utilisant des méthodes de biologie moléculaire très peu utilisées
dans ce domaine. Le premier chapitre apporte donc des connaissances fondamentales
concernant l'écologie du bois mort et des champignons décomposeurs en peuplements
naturels; le second des informations sur une thématique qui reçoit un intérêt important et
grandissant dans la littérature sur les liens entre diversité et fonction et sur le processus de
colonisation du bois en lien avec la perturbation du peuplement; enfm le troisième chapitre
permet d'évaluer l'effet des pratiques sylvicoles sur les champignons saproxyliques et donc
de guider les exploitants forestiers et d'établir des recommandations de conservation de la
diversité fongique dans le cadre de l'aménagement écosystémique.

CHAPITRE!
SPECIES COMPOSITION OF SAPROXYLIC FUNGAL
COMMUNITIES ON DECA YING LOGS IN THE BOREAL
FOREST
Hedi Kebli, Pascal Drouin, Suzanne Brais et Gavin Kernaghan
Article publié en 2011 dans Microbial Ecology

16
1.1 Abstract
Coarse woody debris support large numbers saproxylic fungal species. However most of the current knowledge cornes from Scandinavia and studies relating the effect of stand or log characteristics on the diversity and composition of decomposer fungi have not been conducted in Northeastem Canada. Logs from five tree species were sampled along a decomposition gradient in nine stands representing three successional stages of the boreal mixed forest of Northwestem Quebec, Canada. Using a molecular fmgerprinting technique, we assessed fungal community Shannon diversity index, richness and composition. We used linear mixed models and multivariate analyses to link changes in fungal communities to log and stand characteristics. We found a total of 33 operational taxonomie units (OTU) including an indicator species for balsam fir (similar to Athelia sp.) and one found only in aspen stands (similar to Calocera cornea). Spruce logs supported the highest fungal Shannon diversity index and OTU number. Our results support the hypothesis that log species influences fungal richness and diversity. However log decay class does not. Stand composition, volume of coarse woody debris and log chemical composition were all involved in structuring fungal communities. Maintaining the diversity of wood decomposing communities in boreal mixedwood forests should then require the presence of dead wood from diverse log host species.

17
1.2 Introduction
Saproxylic (Speight, 1989) fungi are the main agents of wood decomposition and an
essential component of forest ecosystem food webs (Moore et al. , 2004), influencing nutrient
cycling and carbon sequestration (Harmon et al., 1986). They represent a highly diverse
group, for example over 1500 species were identified from Finnish forests alone (Siitonen,
2001). Forest harvesting decreases the amount of deadwood and species diversity of
saproxylic fungi in managed fennoscandian forests (Penttila, Siitonen & Kuusinen, 2004 ;
Sippola & Renvall, 1999) and wood-decaying fungi are considered good indicators of
effective conservation (Lonsdale, Pautasso & Holdenrieder, 2008), as they are sensitive to
changes in forest structure.
Wood structure and transformations in chemical composition over the course of
decomposition can induce changes in fungal species composition, as sorne species utilize
specifie substrates for a limited time according to their biochemical requirements (Boddy,
1992). Succession of saproxylic fungal communities during decomposition has been
described in spruce logs in natural boreal old-growth forests of Sweden (Berglund, Edman &
Ericson, 2005) and in spruce and trembling aspen logs in the boreal mixedwood forest of
Alberta (Canada) (Lumley, Gignac & Currah, 2001). Log host species (Lumley, Gignac &
Currah, 2001) and stand characteristics, such as age (Nordén & Paltto, 2001) and abundance
of deadwood (Junninen et al., 2006), can also influence fungal composition and diversity.
Factors influencing fungal diversity in decomposing logs vary according to fungal
species (Hottola, Ovaskainen & Hanski, 2009), fungal successional status (early vs.
secondary) (Jonsson, Edman & Jonsson, 2008) and the scale of the study (Berglund, Edman
& Ericson, 2005). Also, sorne species, especially heart-rot agents, prefer larger logs (Nordén
et al. , 2004) and species diversity has been shown to increase with log size (Edman, Kruys &
Jonsson, 2004). Large logs may have a buffering effect, which contributes to the stability of
microclimatic conditions. Conversely, the interiors of small logs are subject to greater
variation in sun exposure, temperature, and precipitation, especially in the most open stands
(Bader, Jansson & Jonsson, 1995 ; Sippola & Renvall, 1999). On the other hand, logs at
intermediate decay stages have also been found to harbour more species (Heilmann-Clausen

18
& Christensen, 2003) due to the lack of energy resources when the cellulose is depleted
(Stenlid, Penttila & Dahlberg, 2008) and to the availability of multiple niches caused by
heterogeneous decomposition (Pyle & Brown, 1999).
However, much of the information available on boreal saproxylic fungal
communities cornes from Fennoscandian forests with a long history of forest management
and poor tree diversity. To our knowledge, few studies on saproxylic fungal diversity in
relation to deadwood characteristics have been conducted in the boreal forests of North
America (Lumley, Gignac & Currah, 2001). Moreover, fungal diversity and community
structure of coarse woody debris (CWD) have, so far, mainly been assessed from
observations of sporocarps and based on single log species. For example, investigations of
fungal communities in relation to habitat type (Sippola et al., 2004), stand age (Nordén &
Paltto, 2001), successional status and total volume of dead wood (Junninen et al., 2006), and
host tree species (Yamashita, Hattori & Abe, 2010) were all based on fungal fructifications.
Community fingerprinting techniques have recently been applied to studies of soil fungi and
a few studies have used molecular techniques to study saproxylic fungal diversity on dead
wood (Kubartova et al., 2007 ; Kubartova et al., 2009). Denaturing/Temperature Gradient
Gel Electrophoresis (DGGE/TGGE) has been used successfully for evaluating changes in
community composition in soils (Anderson, Campbell & Prosser, 2003) and in wood
(Kulhankova et al., 2006). Moreover, this technique allows DNA to be recovered and
sequenced for fungal identification.
We used DGGE to separate fungal Internai Transcribed Spacer (ITS) regwns
amplified from total CWD DNA to evaluate saproxylic fungal diversity of five species of
decomposing logs from natural boreal stands of different successional status in relation to
chemical and physical characteristics of CWD. Our objectives were (i) to characterize how
diversity and species composition vary along a decomposition gradient for different wood
species in natural stands, (ii) to link fungal communities to morphological and chemical
features of CWD and other stand features, and (iii) to identify indicator species of log
species, stand features (successional stage) or environmental conditions (decay stage). We
hypothesized that the saproxylic fungal diversity of individual logs would be maximal at
intermediate decay stages, and that higher diversity would occur in larger logs. We also

19
expected fungal composition to be influenced by log species and stand conditions such as age
and CWD volume.
1.3 Materials and methods
1.3.1 Field sites description
The study area was located within the Lake Duparquet Research and Teaching Forest
(Harvey, 1999) in the Abitibi region of northwestem Québec, 45 km northwest of Rouyn
Noranda, Québec (48°86'N--48°32'N, 79°19'W- 79°30'W). The climate is moist continental
with a mean annual temperature of 0.8 oc and annual precipitation is 890 mm (Environment
Canada; Canadian climatic normals 1971-2000). The region was situated in the mixedwood
zone of the boreal shield. Forest succession on rich mesic sites generally begins with the
establishment of pure or mixed stands of paper birch (Betula p apyrifera Marsh.), trembling
aspen (Populus tremuloides Michx.) and jack pine (Pinus banksiana Lamb.) that can
maintain dominance for a period of over 100 years. In the absence of a major disturbance,
these species are gradually replaced by a mixture of shade tolerant species such as white
spruce (Picea glauca (Moench) Voss), black spruce (Picea mariana, (Mill) B.S.P.), and
balsam fir (A bies balsamea (L.) Mill.) (Bergeron & Dubuc, 1989).
1.3.2 Field methods
Sampling took place in the control stands of the SAPE experiment in earl y summer
(Brais et al., 2004). The SAPE study is set in natural stands of fire origin representing a
gradient of composition typical of the natural succession on rich mesic clayey sites. The
oldest stand types (mixed post budworm outbreak stands) dates from a frre in 1760 and was
later effected by the 1970-1987 spruce budworm outbreak (Choristoneura fumiferana)
(Morin, La prise & Bergeron, 1993) resulting in a mixture of white birch, white spruce, and
balsam fir (Table 1.1). The experimental design of the SAPE study includes three, 1-2 ha,
unharvested plots in each stand type, for a total of nine experimental units. In all
experimental units, five permanent circular sampling plots (radius = 11.28 meters) were
established and all tree stems greater than 5.0 cm in diameter at breast height (dbh) were
identified and measured ( dbh) for basal area estimation.

20
Table 1.1 Mean volume of CWD by decay class and tree species basal area in sampled stands of different successional status
Decay class Fresh
Medium Advanced
All categories
Tree species Trembling aspen
Paper birch Spruce
Balsam frr
Post spruce budworm outbreak Mixed trembling
stand 0760) aspen stand (1910)
Stand CWD volume (m3 ha 1)
8.8 (n=6) 55.4 (n=8)
25.5 (n=20) 89.7
0.7 9.6 6.1 2.6
10.3 (n=9) 15.4 (n=6)
85.1 (n=10) 110.8
30.2 0.2 4.0 2.6
Number of logs sampled are given in parenthesis. Fresh wood: decomposition classes I and II. Medium decayed wood: decomposition class III. Advanced decay stage: decomposition classes IV and V.
Trembling aspen stand ( 1923)
7.3 (n=10) 48.9 (n=22) 71.7 (n= ll)
127.9
37.3 0.7 1.4 0.6
The volume of downed wood was estimated using triangular-transects. One triangle
(30 rn side, (Van Wagner, 1982)) was sampled in each experimental plot. Along each transect
line, the frequency of downed wood was recorded by species, diameter class (5-cm: 2.5-7.6
cm, 10-cm: 7.6-12.5 cm, 15-cm: 12.6-17.5 cm, and greater than 17.5 cm) and five
decomposition classes (Daniels et al., 1997).
Logs of spruce, paper birch, jack pine, balsam fir and trembling aspen with diameter
over 10 cm and from five decay classes were located and identified. Log length and diameter
(both ends) were measured. Material for DNA extraction was collected by drilling one hole in
each log in the selected decomposition class with a flat drill bit (12.7 mm). The bark and the
uppermost layer of wood were first removed and precautions taken to prevent cross
contamination of samples; drill bits were cleaned, rinsed with sterile water, soaked in 95%
ethanol and flame sterilised between samples. Additional samples from each log were taken
for physical and chemical laboratory analyses. For well-decomposed logs, where visual
species identification was impossible, an additional wood sample was taken from a less

21
decomposed part of the log for laboratory identification. All samples were kept frozen at
- 20°C un til analyzed.
Of the 102 sampled logs, 43 were sampled in the youngest stands types (1923 fire),
34 in the oldest stands (1760 frre) and 25 in the second youngest stands (1910 frre). Not all
combinations of species and decomposition classes could be found in all stand types. For
example, no trembling aspen logs were found in the 1760 stand or jack pine in the 1910
stand.
1.3.3 Log species identification
Woody species were identified from structural and anatomical features from sub
samples eut using a microtome (Hoadley, 1990). However, this technique did not allow us to
distinguish between white and black spruce.
1.3.4 Wood physical and chemical characte1istics
Log samples were eut into 5 x 5 cm pieces. Wood density was estimated from
volume, determined by water displacement after immersing samples in hot paraffin, and
weight corrected for moisture content estimated from a second sample. The latter sample was
then air-dried and ground with a cutting mill (Rets ch, SI'v12000) for chemical analyses.
Total N and C were measured by dry combustion using a LECO CNS 2000 analyzer
(LECO Corporation, St. Joseph, MI). Lignin and cellulose were determined by near infrared
spectroscopy (Foley et al., 1998) using a FOSS NlRSystems (model 6500). A calibration
equation was first developed following wet chemical measurements from 100 samples to
predict the chemical composition of every sample (Appendix A). The wet chemical analyses
used to calibrate the multivariate spectroscopie method were based on the Acid Detergent
Fiber/Neutral Detergent Fiber method (Goering & Van Soest, 1970). Lignin determination
was based on the method ofBrinkmann (2002).

22
1.3.5 DNA extraction from wood
Wood samples were lyophilized for 48 hours before disruption in a Qiagen
TissueLyser (QIAGEN, Mississauga, Ontario, Canada), then run for 2 min at 26 Hz, or until
the wood was reduce to a fine powder. DNA was extracted with the DNeasy Plant Mini Kit
(QIAGEN) according to the manufacturer's instructions. DNA was eluted in 100 )lL of
elution buffer and stored at -20°C.
1.3.6 PCR amplification of fungal-specific genes
The Internai Transcribed Spacer (ITS) region of the fungal rDNA was polymerase
chain reaction-amplified using the fungal specifie primers ITS1-F (Gardes & Bruns, 1993 ;
Jasalavich, Ostrofsky & Jellison, 2000) and ITS2 (White et al., 1990) to obtain a sequence of
280-bp-length. A GC clamp (CGC CCG CCG CGC CCC GCG CCC GGC CCG CCG CCC
CCG CCC CC) was added to the 5' end of the ITS1-F primer to avoid complete separation of
DNA strands during the subsequent denaturing electrophoresis. Polymerase chain reactions
(50-~) contained 2 ~ oftemplate, 5 ~ ofPCR reaction buffer (ThermoPol, New England
Biolabs), 1 )li (10 mM) of each dNTP, 1 ~ of each primer (50 )lM), 0.2 ~ of Taq
polymerase (5 u.~·1 , New England Biolabs). Cycling parameters were an initial
denaturation cycle of 3 min at 95 oc followed by 35 cycles of denaturation at 94 oc for 45s,
annealing at 55 oc for 45 s, and extension at 72 °C for 1 min 15 s, ending by a final
elongation at 72 oc for 8 min (Kubartova et al., 2007). Negative (no DNA) and positive
controls (fungal DNA from pure culture) were included in each set of reactions. All
amplification products were analysed by electrophoresis with 1% (w/v) agarose gels in T AE
( 40 mM Tris-acetate, 1 mM EDTA), stained with Gelgreen (Biotium) and visualized under
uv light.
1.3.7 Separation offungal ITS amplicons by DGGE
Electrophoresis was performed according to a slight modification from the protocol
of Julien et al. (2008). We used a DCode universal mutation detection system (Bio-Rad
Laboratories, Hercules, CA) and an acrylamide gel (8% [ wt/vol] acrylamide-bis-acrylamide,
37.5:1) with a linear vertical gradient of 20-55% denaturing agents (100% denaturant

23
corresponding to 7 M urea and 40% [v/v] deionized formamide) and increasing in the
direction of the electrophoretic run with a stacking gel ( 4% [w/v] acrylamide-bis-acrylamide,
37.5:1) on top. Approximately 400 ng of each PCR product was loaded and electrophoresis
was performed in tris-acetate-ethylenediaminetetraacetic acid (EDT A) (T AE) buffer ( 40 mM
Tris-acetate, 1 mM EDT A) at 75 V and 60 oc for 16h. Gels were stained for 15 min with
SYBR gold (Invitrogen, Carlsbad, CA), visualized under UV illumination, and digitized
using a ChemiDoc XRS System molecular imager (Bio-Rad Laboratories, Hercules, CA).
1.3.8 Gel analysis
The software package GelCompar II (version 5.0, Applied Maths, Belgium) was used
to analyse ITS DGGE banding patterns. In order to minimize migration differences and to
normalize for distortions between gels, we aligned the gels using an external reference
pattern comprised of mixed ITS amplicons from five different fungi. A band-matching
process was used to obtain a presence-absence matrix for statistical analyses. A 5% band
intensity threshold was set for the band selection process. Individual bands were grouped into
classes based on melting behaviour (positions in the gels). Each band class was then
considered to be an operational taxonomie unit (OTU), allowing calculation of their
frequency among log samples. We also calculated the relative intensity of each band,
applying a value between 0 and 1 by dividing the intensity of the band by the sum of the
intensity of all the bands within the lane, thus eliminating the variation in band intensity due
to difference in amplification and amount ofDNA loaded on the DGGE gel.
1.3.9 Cloning and sequencing of excised DGGE bands
Amplicons which generated prominent DGGE bands were selected for cloning and
sequencing. Bands were excised from DGGE gels and the DNA eluted in 20 11L of sterile
deionized water and subsequently used as a template for PCR using the primers ITS1-F and
ITS2 as described above. Amplicons (280 hp) obtained with the fungal specifie primers were
purified on agarose gels using the Geneclean Turbo kit as recommended by the manufacturer
(Q-bio gene, USA). The purified DNA was cloned by ligation to the pGEM-T Easy vector
system (Promega, Madison, WI) and transformed into competent Escherichia coli cells
(JM109) according to the manufacturer's instructions. Positive clones were selected on

24
appropriate LB agar plates and their plasmids isolated with the Wizard Plus SVMinipreps
system (Promega). Sequencing reactions were petformed with a BigDye Terminator cycle
sequencing kit 3.1 with a genetic analyzer (3130XL; Applied Biosystems, Poster City, CA)
by the Plate-forme d'Analyses Biomoléculaires (Université Laval, Québec, Canada). All
clones were sequenced in both directions using Sp6 and T7 universal primers. Sequences
were aligned using Bioedit software (Hall, 1999) and vector plasmid related sequence were
removed. Sequence identity searches were petformed using BLASTn against the GenBank
database of the National Center for Biotechnology Information (NCBI).
1.3.10 Statistical analysis
A matrix of relative abundance (and presence/absence) was obtained for fungal
species. From this, the number of OTUs (i.e. DGGE band classes per sample) and the
Shannon diversity index (H') were calculated.
Shannon indices were calculated according to Eichner et al. (1999). In order to link
OTU number and H' with explanatory variables , data were analyzed with a linear mixed
effects model using the "nlme" package (R package version 3.1-90; nlme: Linear and
Nonlinear Mixed Effects Models) from R software (R Development Core Team, 2010). Pive
models were tested based upon our hypothesis (Table 1.2).
The global statistical model (model 5) included all possible explanatory factors:
wood density, log volume, species (paper birch, trembling aspen, balsam fir, spruce, jack
pine), decay stage (fresh deadwood (class I and II); medium decay (class III) and well
decomposed wood ( class IV and V)), stand deadwood volume, deciduous and coniferous
basal area, lignocellulose index (LCI = lignin/(lignin + cellulose)) (Preston & Trofymow,
2000) and the carbon:nitrogen ratio. All other models are subsets of the global model each
corresponding to different hypothesis. All explanatory variables were entered as fixed factors
whereas stand, replicates and experimental units were considered random factors - each one
nested in the former. Models were compared on the basis of Akaike's information criteria
(AlC) (Bumham & Anderson, 2004). The "best" model, is the model with the lowest AlC
and the highest Akaike weight. Akaike weights (wi) indicate the level of support in favor of
any given model being the most parsimonious and most probable among candidate models

25
(Mazerolle, 2006). For model selection, we used "AICcmodavg" R package (R package
version 1.01; AICcmodavg: Model selection and multimodel inference based on (Q)AIC(c),
http:/ /CRAN.R-project.org/package= AICcmodavg).
Table 1.2 Linear mixed models relating species richness (OTU number) and Shannon diversity index to stand and log characteristics.
Model Variables included in each model Corresponding hypothesis
1
2
3
4
5
Log species Effect of log species
Decomposition class + log volume + wood log Effect of logs physical density variables
LCI + C:N ratio
CWD Volume+ deciduous basal area + coniferous basal area
Mo del 1 + mo del 2 + model 3 + model 4
Effect of log chemical variables
Effect of stand features
Global model (aU variables)
Multivariate analyses of fungal community composition were computed using the
''vegan" package (R package version 1.15-2; vegan: Community Ecology Package,
http://CRAN.R-project.org/package=vegan). We used CCA (canonical correspondence
analysis) (Fromin et al. , 2002 ; Ramette, 2007) because it positions DGGE profiles (OTU
scores and logs/site scores) in relation to environmental factors and ordinates fungal
communities in such a way that the relationship between samples, species and environmental
variables on the ordination diagram can be assessed from angles between vectors
(quantitative environmental variables) or distances between points (samples and species) and
vectors (Salles, Van Veen & Van Elsas, 2004). The analysis shows the way in which changes
in fungal community composition are associated with changes in environmental variables.
The method assumes a unimodal distribution of species. Quantitative environmental variables
were standardized before performing the analysis by subtracting the mean and dividing by the
standard deviation. CCA was clone on the presence-absence matrix of fungal DGGE bands
because it gave the best separation between different samples (Dilly et al. , 2004).

26
Finally, indicator species analysis was carried out with the duleg function of the
"labdsv" package (R package version 1.3-1; labdsv: Ordination and Multivariate Analysis for
Ecology, http://ecology.msu.montana.edu/labdsv/R). We also applied a Holm correction on
these probabilities. All statistical analyses were called significant when P < 0.05.
1.3.11 Nucleotide sequence accession numbers
The sequences generated during this study have been deposited in GenBank under
accession numbers HM195119 to HM195131.
1.4 Results
1.4.1 Stand characteristics
Stand types were characterized by different amounts of deadwood (Table 1.1), as
well as tree species composition. The 1923 frre trembling aspen stands had the largest amount
of total deadwood while the largest volume of well decomposed wood was found in the
mixed trembling aspen stands (1910 fire stands). The oldest stand types (mixed post
budworm outbreak stands from the 1760 fire) had the lowest volume ofCWD but the largest
volume in the medium decay stage (Table 1.1).
1.4.2 Dead wood properties
Log species differed in their physical and chemical features (Table 1.3). Higher C:N
ratios were found among spruce and jack pine logs, while the lignocellulose index (LCI) was
higher in jack pine. The largest logs were spruce, jack pine and trembling as pen in decreasing
order. C:N ratio and wood density were higher in fresh wood and lower in well-decomposed
wood. Inversely, LCI index and water content was higher for well-decomposed wood (data
not shown).

27
Table 1.3 Physical and chemical characteristics (mean and sd values) of decomposing logs by decay stage found in natural stands.
Wood Decay stage Spruce Balsam fir Paper bir ch Trembling Jack pine characteristics as pen
Log volume Fresh 0.27 ± 0.25 0.16±0.14 0.19 ± 0.26 0.51 ±0.80 0.39± 0.26 Medium 0.36 ± 0.19 0.25 ± 0.19 0.11 ±0.22 0.16±0.14 0.14±0.09 (m3) Advance 0.32 ± 0.31 0.14 ± 0.08 0.16±0.16 0.12 ± 0.07 0.67± 0.58
Density Fresh 0.32 ± 0.10 0.31 ± 0.05 0.31 ±0.15 0.37 ± 0.05 0.32± 0.06 Medium 0.30 ± 0.10 0.25 ± 0.04 0.32 ± 0.11 0.20 ± 0.09 0.28 ± 0.10 (g cm-3) Advance 0.20 ± 0.09 0.20 ± 0.06 0.19±0.10 0.19 ± 0.07 0.29± 0.09
Fresh 0.39 ± 0.03 0.39 ± 0.08 0.23 ± 0.07 0.18±0.03 0.44± 0.03 LCI 1 Medium 0.38 ± 0.02 0.43 ± 0.07 0.27 ± 0.11 0.27 ± 0.09 0.58 ± 0.16
Advance 0.53 ± 0.11 0.46 ± 0.10 0.44 ± 0.15 0.34 ± 0.10 0.54± 0.07
Fresh 1586 ± 709 754 ± 662 615 ± 355 908 ± 799 1805 ± 862 C:N ratio Medium 1812 ± 787 660 ± 260 570 ± 238 597 ± 376 945 ± 230
Advance 273 ± 74 592 ± 283 188 ± 140 321 ± 306 876 ± 772
1Ligno-cellulose index: LCI=lignin/(lignin+cellulose) Fresh correspond to the decay class 1 and 2, medium to the decay class 3 and advance to the decay class 4 and 5.
1.4.3 Fungal richness and diversity
We found a total of 33 different DGGE bands (OTUs) in the 102 logs sampled. The
mean number of OTUs per log was 6.3, with a minimum of one and a maximum of 16 (Fig.
1.1). The maximum number of OTUs in the same log (16 OTUs), was from a non
decomposed (fresh wood) spruce log in the oldest stand (1760 fire) and the second highest
(15 OTUs) was from a trembling aspen log of the medium decay class in the mixed aspen
stands (1910 fire). Seven logs had only one OTU: two trembling aspen, one jack pine and
four bals am frr logs (Fig. 1.1 ). The mean number of OTUs per decomposition class was 6.6
for fresh wood, 7.0 for medium decayed logs and 6.4 for advanced decay stage. With respect
to log species, the mean OTU number was 9.0 for spruce, 6.7 for trembling aspen, 6.0 for
paper birch, 5. 8 for jack pine and 5.5 for bals am frr (Fig. 1.2).

en 0 0> 0
..__ 0 '-Q)
..0 E ::J z
1()
0
1 2 3 4 5 6 7 8 9 10 11 12 13 14 15 16
Operational taxonomie unit per log
Figure 1.1 Histogram of the number of OTUs per log for the five log species obtained from PCR-DGGE profiles. A total of 102 logs have been sampled in all natural stands (three successional stages) and decomposition classes.

0 (")
li")
N
~ N -r- --
J:: ....
~
-'-----.... --0
0 0
'<:1"
-r-N
0 -r-
Qi --..c E ro :::J c
:::> <S:> 1-0 -'-----
'<:1"
-'-----N --
0
Spruce Paper birch TremblinQ as pen Jack pi ne Balsam fir
Figure 1.2 OTU number and Shannon diversity index (H') in relation to log species
We cloned and identified 13 of the 33 OTUs (Table 1.4), corresponding to the
highest band intensity observed on the DGGE gels. Other bands were too weak for cloning
and with less success at the sequencing steps. The distribution of OTUs was highly variable
across log species on the left of figure 1.3 whereas OTUs on the right are more similar
between log species. OTU 22 (98% similar to Bjerkandera adusta), was present in half of the
sampled logs. Sequences similar to Phlebia centrifuga (OTU 21), Athelia sp. (OTU 20),
Ascocoryne sp. (OTU 18) and Phellinus cinereus (OTU 17) were also common. OTUs 28 and
29 were related to ectomycorrhizal fungi, the latter being rare: only 6.9% of alllogs were
colonized by these OTUs.

30
Table 1.4 Sequence analysis of bands excised from DGGE gels
Accession Environment where
OTU Most closely related fungal Similarity no. of
related sequence Occurrence a sequence (%) related
have been isolated sequence
5 Leptodontidium elatius
97 FJ903294.1 Stump of Picea
7.8% isolate A39WD232 abies (Latvia)
7 UnculturedMortierella 99 FJ553782.1 Forest sail (Canada) 11.8%
8 Calocera comea 99 AY789083 Culture collection 7.8%
11 Resinicium bicolor strain
99 DQ826535 Isolated on aspen
17.7% JLL13731b (Canada, Ontario)
15 Ascocoryne cylichnium
99 FJ903373 Stump of Picea
25.5% isolate N31 abies (Latvia)
17 Phellinus cinereus c 99 AY340049 Strain isolated from
36.3% fruiting body
18 Ascocoryne sp. isolate E2 97 FJ903331 Decayed wood of
40.2% Picea abies (Latvia)
20 Athelia neuhoffii 95 U85798.1 Culture collection 39.2%
21 Phlebia centrifuga 99 143380.1 Pinus ponderosa
41.2% (Arizona)
22 Bjerkandera adusta 98 FJ903353 Decayed wood of
51.0% Picea abies (Latvia)
25 Uncultured fun gus clone
86 FJ758813 Phyllosphere of
26.5% Singleton_ 24-2804_ 2353 Quercus macrocarpa
Sporocarp of ectomycorrhiza
28 Uncultured fungus 99 FM999613 isolated from a 18.6% mature beech maple
forest Uncultured fungus clone
Ectomycorrhizosphe 29 Singleton_(159- 83 FJ778188
re of Quercus spp. 6.9%
1104 0519)
Most similar Genbank accessions number and percent sequence similarities for the OTUs used in the multivariate analyses. •: Proportion of logs on which this OTU was found b: same similarity to FJ554463 (Uncultured Agaricomycetes clone LISP_ EUKA _P6P23) •: same similarity to Phellinus nigricans (AF200239)

31
Trembling Aspen
= ~ =D ______ ooo_oooooooOoooDDooOooDoo 2 1 29 27JO J 1 J233J t 6 S 18 9 1012 111J Ut6 1S 19 1118 W21 2223 2:l Z5 26Z3
Jack Pine
= ~ Q) 2 1 29 21 JO J t 32 JJ: s ' 6 s 1 s 9 10 12 11 t J u t6 1s 19 11 1s w 21 22 23 zt Z5 26 za
0 c Q) ...._ :::J 0
= ~ 0 0 -0
Paper Birch
ooooooo=o __ o __ ooooooDDoD0oo00oooo ...._ Q)
.!:> 2 1 29 27 JO J 1 J2 JJ: J t 6 S 7 8 9 1012 111S U16 15 19 1718 W21 2223 2:l 2S2623
E :::J z
Spruce
= ~ _ooo==o __ =_oooooDDD=DoDDooDDDoooo z 1 29 21 JO J t 32 JJ: s ' 6 s 1 s 9 10 12 11 t J u t6 1s 19 11 1s w 21 22 23 zt Z5 26 za
Balsam Fir
= ~ _o_=--=-===-o_o=-=ooOOoooODoDDooo 2 1 29 27 JO J 1 J2 JJ: J t 6 S 7 8 9 1012 111S U16 15 19 1718 W21 2223 2:l 2S2623
Operational taxonomie unit
Figure 1.3 Histograms showing the number of occurrences of the 33 OTUs distinguished in DGGE profiles in relation to log species.

32
For fungal species richness, model 1 had the highest AICc weight (0.99) (Table 1.5),
indicating that the model based solely on log species was the most plausible model (i.e.,
model with lowest AIC) among the set of tested models (Table 1.2). The Akaike weight for
model 1 was strong enough (i.e w, > 0.9) to compute model estimates based solely on this
model (Table 1.6). Spruce logs had the highest OTU number (species richness). We found no
differences among bals am fir, jack pine, trembling as pen and paper birch in terms of richness .
Neither log volume, stand CWD volume, deciduous or coniferous basal area, decomposition
class or wood density were good predictors of the number of OTUs per log.
Table 1.5 Akaike's Information Criterion (AICc) rank and weights (AICcWt) of models relating species richness (OTU number) and Shannon diversity index to stand and log characteristics.
Models Ka AI Cc L'lAI Cc W; b Cum.Wtc
OTUnumber Model 1: log species 9 557.56 0.00 0.99 0.99
Model3: log chemical features 7 568.31 10.75 0.00 1.00
Model 5: global mo del 18 570.40 12.85 0.00 1.00
Model4: stand features 8 570.43 12.87 0.00 1.00
Model2: log physical features 9 572.31 14.75 0.00 1.00
Shannon diversity index (H') Model 1: log species 9 197.30 0.00 0.99 0.99
Model 5: global mo del 18 206.87 9.57 0.01 1.00
Model4: stand features 8 212.47 15.17 0.00 1.00
Model3: log chemical features 7 212.62 15.32 0.00 1.00 Model2: log physical features 9 215.63 18.32 0.00 1.00
Models are listed from best to worst based on AICcWt. • K =estimable number of parameters in the model b Akaike weights, also known as model probabilities. These measures indicate the level of support in favor of any given model being the most parsimonious (i.e the best explanatory model) among the candidate model set (Mazerolle, 2009). c Cumulative Akaike weights
For the Shannon diversity index, model 1 (log species only) was also the most
probable model with an Akaike weight higher than 0.9 (Table 1.5). Model estimates were
computed based solely on this model (Table 1.6). The Shannon diversity index varied
strongly among log species, being lowest in balsam frr and highest in spruce. Jack pine,
trembling aspen and paper birch presented similar diversity indices. Hierarchical

33
classification between log species based on H' is shown in (Fig. 1.2). Other measured
characteristics (included in other models) - CWD volume, decomposition class, log volume,
deciduous or coniferous basal area and wood log density - were poor predictor of logs
Shannon diversity index.
Table 1.6 Model estimates and standard error obtained from linear mixed model 1 relating species richness (OTUs number) and Shannon diversity index to log species (n=102 logs). Significance values for each linear mixed effect are indicated considering spruce as reference level.
Estimated Standard error Df p
value OTUnumber
Balsam fir -4.421 1.131 57 < 0.001 Paper birch -2.904 1.081 57 0.009 Trembling aspen -2.730 1.081 57 0.014 Jackpine -3.392 1.147 57 0.005
Shannon diversity index (H') Balsam fir -0.896 0.194 57 < 0.001 Paper birch -0.442 0.185 57 0.020 Trembling aspen -0.479 0.185 57 0.012 Jack pine -0.518 0.196 57 0.011 1degrees of freedom
1.4.4 Saproxylic frmgal community composition
We assessed the relationship between the composition of saproxylic fungi
assemblages and selected environmental factors using canonical correspondence analysis
(CCA) (Ter Braak & Prentice, 1988). Variables included were deciduous and coniferous
basal area, stand CWD volume and percent lignin and hemicellulose in individuallogs. Log
species and decomposition category were also included as dummy variables ( depicted as
centroids on the CCA diagram). Collinearity between selected environmental variables was
low (VIF< lü). The CCA produced an ordination in which the first axis was significant
(p=0.046) and the test of significance for all canonical axes was also significant (p=0.039)
(assessed by permutation testing). The eigenvalues for the two first axes were 0.11 and 0.08
and the species-environment correlations for the two frrst axes were 0.66 and 0.63

34
respectively. Overall variance explained by environmental variables was 12.44%. The first
three axes of the ordination explain 52.1% of this: 23.0% by the frrst axis and another 15.8%
by the second axis.
The first axis was positively correlated with the deciduous basal area and CWD volume and
negatively correlated with coniferous basal area (Fig. 1.4 and 1.5) (intraset correlation =0.14,
0.25 and -0.24 respectively). The frrst axis was also positively correlated with trembling
aspen and balsam fir logs but negatively correlated with spruce logs (intraset correlation
=0.35, 0.18 and -0.16 respectively).
The second axis was positively correlated with percent lignin and negatively correlated with
percent hemicellulose in individuallogs and deciduous basal area (Fig. 1.4 and 1.5) (intraset
correlations of 0.33 -0.39, -0.38). Hence, axis 2, which accounts for an important part of the
variation, appears to represent the influence of both wood chemical composition and stand
composition.

N <X: 0 0
D
D
D
D Coniferous
D
·································································o··• ····
• Spruce Paper birch
• Trembling aspen Jack pine
• Balsam fi r
-8 -6 -4
D
D
D D •
D 0
D D
Hem1!=ellulose
D
-2 0
CCA1
CWDVolume •
• •
• Deciduous
2 4
Figure 1.4 Canonical correspondence analysis of the saproxylic fungal communities (based on the DGGE profiling) from 102logs. Œl centroids of each log species.

N <! 0 0
•
•
•
• 1923 stand • 1760 stand • 1910 stand
-8 -6
•
Coniferous
c
•• 0
•
• •
•
-4 -2
CCA1
•
c
•
Hem1cellulose
0
CWDVolume c
• •
• •
c Oeciduous
2 4
36
Figure 1.5 Canonical correspondence analysis of the saproxylic fungal communities (based on the DGGE profiling) from 102logs. Sites are displayed according to stand type.

37
1.4.5 Indicator species
We found tluee species characteristic of particular habitats: OTU 14 on trembling
aspen logs (indicator value: 0.32, P < 0.05), OTU 20 (sequence 95% similar to the
Basidiomycete Athelia sp.) on balsam fir logs (indicator value: 0.40, P < 0.05) and OTU 8
(sequence 99% similar to Dacrymycete Calocera cornea), indicative of the stand originating
from the 1923 fire (indicator value: 0.19, P < 0.10) (Table 1.4 and Fig. 1.3). OTU 14 could
not be re-amplified or cloned and therefore was not identified by sequencing.
1.5 Discussion
Although most dominant species (or OTUs) found in this study appeared to be
generalists - being found on a large proportion of the sampled logs - our results indicate that
log species was the main factor affecting the diversity, richness and community composition
of dominant fungal species at the log level. The influence of host tree species on saproxylic
fungal communities is in agreement with other studies based on observations of
fructifications (Küffer & Senn-Irlet, 2005 ; Yamashita, Hattori & Abe, 2010) and on culture
dependant methods (Lumley, Gignac & Currah, 2001). Several authors have also identified
decomposition stage as an important factor influencing saproxylic fungal community
composition or species richness (Heilmann-Clausen & Christensen, 2003 ; Lumley, Gignac &
Currah, 200 1 ). Although we did not find direct evidence for this relationship, we did find that
the composition of the saproxylic fungal community was related to log chemical
composition, which, in tum is related to both log species and decay stage (Table 1.3, Strukelj
Humphery-personal communication, (Moorhead & Sinsabaugh, 2000)). Wood chemical
composition was assessed from wood samples taken as close as possible to the material
extracted for DNA analyses while our assessment of decomposition stage was based on the
entire log. The lignin and hemicelluloses concentrations may be better indicators of
decomposition than decay class estimated at the scale sampled because conditions within a
single log are likely to be quite heterogeneous (Pyle & Brown, 1999). It is possible that
differences detected between log species may have been influenced to sorne degree by
variations in colonization patterns within individuallogs (intra-log variability), which may
have resulted in underestimates offungal diversity for highly variable logs.

38
We also hypothesized that saproxylic fungal diversity would be highest in large logs.
However we found no influence of individual log volume on the fungal community
composition or diversity. Our final hypothesis was that fungal composition would be
influenced by stand conditions such as age and CWD volume. The influence of deadwood
volume on saproxylic communities has been shown previously in Scandinavian boreal forests
(Penttila, Siitonen & Kuusinen, 2004 ; Sippola, Monkk:onen & Renvall, 2005) where
variation in fungal species richness was best explained the number and volume of dead trees
(Penttila, Siitonen & Kuusinen, 2004). In our study, the amount of CWD differed between
the three successional stages (1760, 1910 and 1923 frres) (Table 1.1). Therefore, stands may
support somewhat different fungal communities due to the amount and tree species
composition of CWD. This trend was also reported by Kubartova et al. (2007), who noted
that the dominant tree species had no significant influence on the richness of decomposer
fungi but instead influences community composition. In our study, the proportion of
coniferous trees (basal area) was correlated to the first axis of the CCA (Fig. 1.4 and 1.5) and
was found to be higher in the 1760 stands than for the other successional stages (Table 1.1).
From these results, we can infer that the oldest stand ( 1760) supports a specifie saproxylic
fungal composition due to differences in CWD amount and the proportion of coniferous
trees. However, results may change with the fungal species involved. Jonsson, Edman et
Jonsson (2008) found that different communities were affected differently by environmental
variables. Early colonizers were influenced by the stage of decomposition, whereas
secondary colonizers were influenced by other variables such as log diameter or connectivity.
By analyzing the whole community without this distinction, we may have missed sorne
differences among functional groups. Moreover, saproxylic fungal community patterns may
be influenced by variables acting at a smaller scale. For example, De Bellis, Kernaghan et
Widden (2007) found that most of the variation in a soil saprophytic microfungal
composition was not correlated with overstory tree species, but with the composition of the
understory herb layer. In the same way, microclimatic regime could have also been measured
(Heilmann-Clausen & Christensen, 2003).
OTU 21 was 99% similar to Phlebia centrifuga and found on 41.2% of all logs
(Table 1.4). P. centrifuga prefers unmanaged habitats and is characteristic of old-growth

39
spruce forests (Franzén et al., 2007). All our sampling sites were within natural stands and a
third of our sites were old growth stand originated from a 1760 tire. The closest sequence
match to OTU 28 was that of an ectomycorrhizal fungus. The presence of mycorrhizal roots
is not uncommon in decomposing logs (Tedersoo et al., 2008 ; Vasiliauskas et al., 2007) and
highlights the importance of deadwood for forest nutrition. The closest match for OTU 17
was Phellinus cinereus. This white rot fungus plays a role in CWD cycling and forest
turnover, as it is saprophytic to weakly parasitic fungus, causing trunk rot (Boulet, 2003).
Phellinus cinereus is nearly exclusively found on Betula in the northem hemisphere (Fischer
& Binder, 2004). However, in our study, this species was found relatively frequently (Table
1.4) and seems to be a generalist without specifie preference for log species. OTU 22 had the
broadest distribution in our study, with the closest match being Bjerkandera adusta - a white
rot fungus with high ligninolytic enzymatic activity (Meysami & Baheri, 2003) and a
preference for aspen logs in northeastern America (Boulet, 2003). However, we found it to be
ubiquitous on our sites (Fig. 1.3). OTU 8 (clos est species match Calocera cornea) - an
indicator for the youngest stands (1923 tire origin) - was found preferentially on highly
exposed logs (Lindhe, Âsenblad & Toresson, 2004), a condition typical of our youngest and
open stands (1923). The white rot fungus Resinicum bicolor (closest match for OTU 11) is a
weakly parasitic fungus. Although Resinicum bicolor has preference for Abies and Pinus in
northeastem North America (Boulet, 2003), it was isolated on trembling aspen in Ontario,
Canada (Table 1.4) and we found R. bicolor on all log species. The fact that molecular
techniques allow us to detect fungal hyphae rather than only fructifications may explain
differences between our observations on fungal host preferences and those of based on
fruiting bodies. These studies may underestimate species distribution as sorne fungi may be
non-host specifie, but fruit preferentially on particular log species. Similar asymmetries
between direct molecular studies and fruiting occurrence have been widely reported for
ectomycorrhizal fungi (Gardes & Bruns, 1996).
Sample size may be an issue when using molecular tools (Allmér et al., 2006). A
large log can be up 21 meters long and have a volume ofup to 2.13 m3, while our samples for
DNA analysis consist of only 100 mg (wet weight) of wood. Many more samples per log
would have been needed to obtain a more complete picture of the fungal communities.

40
However that would have been at the cost of a reduction in the total number of logs sampled.
The fungal diversity reported here is consistent with previous studies using PCR-TGGE
method on wood (Kulhânkova et al., 2006) or PCR-Restriction Fragment Length
Polymorphism (Johannesson & Stenlid, 1999). With respect to other identification methods,
species richness found in our study is higher than sorne boreal studies based on fungi
fructification (Berglund, Edman & Ericson, 2005) but lower than others (Kruys & Jonsson,
1999). However, corn paris on is difficult due to differences in the number of logs sampled and
the sampling period. For example, more fungal species (i.e 238) were found in a temperate
Swiss forest (Küffer & Senn-Irlet, 2005) but 3,339 pieces of dead woody debris were
sampled for fruit bodies ofwood-inhabiting basidiomycetes, whereas we sampled 102logs in
our study. However, the focus of our study was on the variation in diversity between logs and
not on total fungal diversity and any sampling biases remains constant between all of our
samples.
The ecological significance of our results is valuable in the context of forest
management. The rate and pattern of decomposition depends on fungal community
composition and functioning of specifie organisms under particular environmental conditions
(Boddy, 2001 ). Because log species harbor different fun gal communities, a change in tree
diversity would lead to a change in the diversity of log species, thereby influencing important
aspects of the decomposition process essential to forest productivity. In the same way,
si lvi cultural practices decrease the quantity of coarse woody debris (Brais et al., 2004 ;
Siitonen et al., 2000). Hence, saproxylic fungal community composition will be modified. To
better understand the consequence of this change, studies are needed which link fungal
community composition and ecological fonction (e.g. decomposition).
1.6 Acknowledgements
This work was supported by Fonds Québécois de recherche sur la nature et les
technologies (FQRNT, grant 121414) and by the Natural Sciences and Engineering Research
Council of Canada (grant 217118-02). We are grateful to Dr Marc Mazerolle for statistical
support, Dr David Paré for chemical analysis, Dr Bernhard Denneler for wood identification
and Josée Frenette for technical assistance.

CHAPITRE II
PATTERNS OF SAPROXYLIC FUNGAL COLONIZATION
DURING WOOD DECOMPOSITION ALONG A GRADIENT
OF FOREST DISTURBANCE
Hedi Kebli, Pascal Drouin, Gavin Kemaghan et Suzanne Brais
Article soumis en 2011 dans FEMS Microbiology Ecology

42
2.1 Abstract
This research aims to understand how commumbes of pioneer saproxylic fungi organize themselves according to disturbance and stand composition. Abies balsamea and Populus tremuloides wood blocks were deposited on the forest floor and harvested every six months. At each sampling time, respiration and wood chemistry were assessed and saproxylic fungal diversity measured using a culture-independent molecular fmgerprinting approach. For balsam fir wood, the fungal community changed over time and was related to disturbance type. For trembling aspen wood however, the fungal community was not affected by disturbance, although the variance in community composition decreased with time becoming significantly lower after 30 months. Trembling aspen and balsam fir were colonized by different assemblages of fungi and the colonization pattern was species specifie. On both wood species, fungal richness and diversity remained fairly stable over time, although there was a decrease on balsam fir wood in eut sites. Decomposition proceeded more efficiently in aspen, as indicated by the strong relationship between time, wood density, lignin 1 (lignin + cellulose) ratio and respiration observed only in aspen. Although respiration increased with time for both wood species, the increase may have resulted from different processes; competition or decomposition, depending on wood species.

43
2.2 Introduction
Saproxylic fungi play a critical role in forest ecosystems, accessing the nutrients
contained in wood and returning them to the soil (Boddy & Watkinson, 1995). Fungi are
unique in their ability to decompose wood, as they possess the enzymatic systems needed to
degrade the recalcitrant lignin component (Baldrian, 2008). Patterns in coarse woody debris
(CWD) colonization, and resulting decomposition, are affected not only by the fungal species
available (Fukami et al., 20 10 ; Rayner & Boddy, 1988), but also by the wood host species
(Vetrovsicy et al., 2011) and a range of abiotic factors, including temperature and moisture
(Harmon et al., 1986 ; Progar et al., 2000). As these factors are in turn related to the structure
of the surrounding forest, wood decomposition is likely indirectly influenced by factors at the
stand level, such as tree species composition, successional stage, and the level of disturbance
by forest harvest practices (Hagemann et al., 2010).
Despite an increasing interest in relationships between biodiversity and ecosystem
functions (Coleman & Whitman, 2005 ; Fitter et al., 2005 ; Gray et al., 2003 ; Hooper, 2002;
Naeem, 2002 ; O'Connor & Crowe, 2005), few studies have examined the relationship
between microbial diversity and decomposition (Hattenschwiler, Tiunov & Scheu, 2005).
However, there is no consensus on how loss of diversity might affect decomposition, as
controversy exists in the literature and results are often context dependent (I\.1ikola & Setala,
1998 ; Müller et al., 2002 ; Setala & McLean, 2004 ; Wardle et al., 1999). The majority of
studies on microbial diversity - ecosystem function relationships have been concerned with
soil bacteria while processes involving fungal diversity and wood decomposition are
relatively unstudied even though saproxylic fungi are the main decomposers of woody
material (Moore et al. , 2004), especially the lignin component (Martînez et al., 2005).
In general, forest harvesting reduces the volume of CWD in managed stands (Brais et
al., 2004 ; Brassard & Chen, 2008 ; Harvey & Brais, 2007; Siitonen et al., 2000) as well as
the diversity of saproxylic fungal communities (Bader, Jansson & Jonsson, 1995 ; Penttila,
Siitonen & Kuusinen, 2004). The present study was conducted in the SAPE ("Sylviculture et
Aménagement Forestier Ecosystémique") project (Brais et al., 2004; Haeussler et al., 2007;
Harvey & Brais, 2007), a series of forest stand level experiments testing an ecosystem-based

44
approach in the boreal forests (Bergeron & Harvey, 1997 ; Harvey et al., 2002). Our main
purpose was to assess the influence of stand successional status, species composition, and
harvesting induced disturbances on the diversity and activity (respiration, decomposition) of
saproxylic fungal communities.
We placed blocks of balsam fir (Abies balsamea) and trembling aspen (Populus
tremuloides) wood on the forest floor in stands of differing composition and disturbance and
tracked the colonization of saproxylic fungi over time, using the culture-independent
approach PCR-denaturing gradient gel electrophoresis (PCR-DGGE) (Anderson, Campbell &
Prosser, 2003 ; Kubartova et al., 2007; Kubartova et al., 2009). We expected to fmd different
patterns of decomposition between three intensities of stand disturbance (silvicultural
treatment) and also between the two wood species (deciduous and coniferous), due to
differences in chemical composition such as flavonoids or terpenoids for example (Harmon et
al., 1986) or lignin complex (Strukelj et al., 2011). We also expected the diversity and
activity (respiration) of saproxylic fungi to parallel changes in stands structure (remaining
basal area and woody debris volume on the ground) brought about by natural succession and
harvesting (Müller, Engel & Blaschke, 2007 ; Sippola et al., 2004). Finally, we expected a
positive correlation between fungal diversity and respiration, due to the complementary roles
of different fungal species (Setala & McLean, 2004; Tiunov & Scheu, 2005) .
2.3 Materials and methods
2.3.1 Site description
The study is located within the Lake Duparquet Research and Teaching Forest
(Harvey, 1999) in the Abitibi region of northwestern Québec ( 48°86'N-48°32'N, 79° 19'W-
79030'W). Climate is humid continental, (Koppen classification) with a mean annual
temperature of 0.8 oc and annual precipitation is 890 mm (Environment Canada; Canadian
climatic normals 1971-2000). The Lake Duparquet Research and Teaching Forest is situated
in the mixedwood zone of the boreal shield.
This study is set in natural stands growing on rich mesic clay sites representing a
gradient of forest composition typical of the natural succession. The studied stands originated

45
from forest fires dating from 1923 (ASPEN stands), 1910 (l\1IXED stands) and 1760 (OLD
stands). Trembling aspen represented 92% of the basal area (40m2 ha-1) of the youngest stand
type (ASPEN) and 81% of the second youngest (l\1IXED). White spruce and balsam fir
accounted for 18% of the total basal area (37m2 ha-1) of the latter stand. The oldest stand type
(OLD) was affected by the 1970-1987 outbreak of spruce budworm (Choristoneura
fumiferana) (Morin, Laprise & Bergeron, 1993), resulting in a mixed composition of white
birch, white spruce, and balsam fir representing respectively 50%, 32% and 13% of the stand
basal area ( 19 m2 ha·1 ). In 1999, three harvesting treatments were applied to the as pen stands
removing 33 to 61% (partial eut) and 100% ( clear-cut) of stand basal area (Brais et al., 2004 ).
The same year, a prescribed hum treatment was conducted in the clear-cut units (Belleau,
Brais & Paré, 2006). In 2001, partial eut treatments were applied in the mixed stands that
removed 42 to 4 7% of basal area, according to two different spatial patterns of tree removal,
a regular dispersed pattern and one removing trees within small gaps. In all, eight different
stand conditions representing a range of tree basal area and composition were utilized. The
oldest undisturbed stands and the controlled hum represented two opposing extremes with
respect to disturbance. All harvesting treatments were replicated three times for a total of 24
experimental units. Treatments were described in terms of disturbance (uncut, eut and
controlled burn), softwood and hardwood residual basal area, and CWD volume.
2.3.2 Field methods
In the 24 experimental units of 1 to 2.5 ha (8 treatments x 3 replications), five 400m2
permanent, circular sampling plots were established between 2006 and 2008 and all trees
greater than 5.0 cm diameter at breast height were identified and measured for basal area
estimation. For each experimental unit, the volume of downed wood was estimated along a
triangular-transect with 30 rn sides (Van Wagner, 1982). Along each transect, the frequency
of downed wood was recorded. In the fall of2005, five 5x5x10 cm blocks ofbalsam fir wood
and five of trembling aspen wood (without bark) were set on the forest floor within two
sampling plots of each experimental unit, for a total of 480 blocks (240 of each wood type).
The blocks were placed such that 50 cm2 (20%) of their surface was in contact with the
ground. Over the following 30 months, blocks were collected twice per year (spring and fall)
for a total of 5 sampling times.

46
2.3.3 Laboratory analyses
Immediately upon collecting, each block was eut in half, and one of the halves eut
again for a total of three pieces. One quarter of each whole block was used for microbial
diversity determination, and was drilled through four of its faces with an electric drill fitted
with a flat bit ( 12.7 mm) to produce wood chips. Between blocks, drill bits were cleaned,
rinsed, soaked in 95% ethanol and flame sterilized to prevent cross-contamination of
samples. All samples were kept frozen at -20°C until analysed.
2.3.4 Wood physical and chemical characte1istics
The other quarter of the who le block was used for measurement of dry weight and for
wood density, determined by water displacement after immersing samples in hot paraffin.
The remaining piece of each wood block was processed for subsequent respiration
measurements (see below) then dried to assess water content and finally ground with a
cutting mill (Retsch, S~OOO) for spectroscopy analyses. Total N was measured by dry
combustion using a Leco CNS 2000 analyzer (LECO Corporation, St. Joseph, MI). Lignin
and cellulose were determined by near infrared spectroscopy (Foley et al., 1998). To
calculate the content of cellulose and lignin, we measured the reflectance of 546 samples
( 480 ground wood blocks + 66 additional wood blocks that had been placed in the field for 6
months) at wavelengths ranging from 400 to 2500 nm at 2 nm intervals using a Foss
NIRSystems 6500 spectrometer (Laurel MD, USA). Calibration was clone by the ADF/NDF
(acid detergent fiber/neutral detergent fiber) method of Goering and Van Soest (1970) and
lignin was measured with the ADF-L (acid detergent fiber-lignin) method according to
Brinkmann et al. (2002) on 100 samples selected by the spectrometer WiniSI software (Foss
NIRSystems, Silver Spring, USA) based on PCA scores of the different spectra. Results from
chemical analyses were regressed against the absorbance spectra using the Standard Normal
Variate and Detrending method (Bames, Dhanoa & Lister, 1989). We calculated the
calibration (number ofblocks=70; 74; 77) and validation (n=25; 20; 20), for ADF-L (ADF
Lignin), ADF and NDF respectively, of the regressions between NIR spectra and wood block
composition using WiniSI software.

47
2.3.5 DNA extraction and PCR amplification of fungal-specific genes
Wood samples were lyophilized for 48 hours before disruption in a Qiagen
TissueLyser (QIAGEN, Mississauga, ON, Canada) for 2 min runs at 26 Hz until the wood
was reduced to a fine powder. Samples were put on ice between runs. DNA was extracted
with the DNeasy Plant Mini Kit (Qiagen) according to the manufacturer's instructions. DNA
was eluted in 100 ~ elution buffer and stored at -20°C.
The Internai Transcribed Spacer region (ITS1) of the fungal rDNA was PCR
amplified using the fungal specifie primers ITS 1-F (CTT GGT CAT TT A GAG GAA GTA
A) (Gardes & Bruns, 1993 ; Jasalavich, Ostrofsky & Jellison, 2000) and ITS2 (GCT GCG
TTC TTC ATC GAT GC) (White et al., 1990) to obtain a sequence of approximately 280-bp.
A GC clamp (CGC CCG CCG CGC CCC GCG CCC GGC CCG CCG CCC CCG CCC CC)
was added to the 5' end of the ITS 1-F primer to avoid complete separation of DNA strands
during the subsequent denaturing electrophoresis. Polymerase chain reactions were
performed using 50-~ of PCR assays containing 2 ~of template, 5 ~of PCR reaction
buffer (ThermoPol, New England Biolabs, Ipswich, MA), 1 ~-tl dNTP ( 10 mM), 1 ~ of each
primer (50 ~' 0.2 ~of Taq polymerase (5 u· ~-1 , New England Biolabs, Ipswich, MA).
Cycling parameters were an initial denaturation cycle of 3 min at 95 oc followed by 35
cycles of denaturation at 94 oc for 45s, annealing at 55 oc for 45 s, and extension at 72 oc for 1 min 15 s, ending with a final elongation at 72 oc for 8 min (Kubartova et al., 2007).
Reactions were performed with negative controls (containing no DNA) and positive controls
(fungal DNA from pure culture) in each PCR run. All amplification products were analysed
by electrophoresis with 1% (w/v) agarose gels in TAE (40 mM Tris-acetate, 1 mM EDTA),
stained with Gelgreen (Biotium, Hayward, CA), and visualized under UV light.
2.3.6 Separation of fungal ITS amplicons by DGGE
Electrophoresis was performed according to the protocol described by Kebli et al.
(2011). We used a DCode universal mutation detection system (Bio-Rad Laboratories,
Hercules, CA) and an acrylamide gel (8% [wt/vol] acrylamide-bis-acrylamide, 37.5:1) with a
linear vertical gradient of 20-55% denaturing agents (lOO% denaturant corresponding to 7 M

48
urea and 40% [v/v] deionized formamide) and a stacking gel (4% [w/v] acrylamide-bis
acrylamide, 37.5: 1) on top. Approximately 400 ng of each PCR product was loaded and
electrophoresis was performed in T AE buffer ( 40 mM Tris-acetate, 1 mM EDT A) at 75 V
and 60 oc for 16h. Gels were stained for 15 min with SYBR gold (Invitrogen, Carlsbad, CA),
visualized under UV illumination, and digitized using a ChemiDoc XRS System molecular
imager (Bio-Rad Laboratories, Hercules, CA). Amplicons that generated prominent DGGE
bands were selected for cloning and sequencing according to Kebli et al. (20 11).
2.3. 7 Gel analysis
The software package GelCompar II (version 5.0, Applied Maths, Belgium) was used
to analyse ITS DGGE banding patterns. In order to minimize migration differences and to
normalize for distortions between gels, we aligned the gels using an external reference
pattern comprised of mixed ITS amplicons from five different fungi. A band-matching
process was used to obtain a presence-absence matrix for statistical analyses. A 5% band
intensity threshold was set for the band selection process. Individual bands were grouped into
classes based on melting behaviour (position in the gels). Each band class was then
considered to be an operational taxonomie unit (OTU), allowing for the calculation of their
frequency among wood block samples. We also calculated the relative intensity of each band,
applying a value between 0 and 1 by dividing the intensity of the band by the sum of the
intensity of all the bands within the lane, thus eliminating the variation in band intensity due
to difference in amplification and amount of DNA loaded on the DGGE gel. A Shannon
diversity index was calculated according to Eichner et al. ( 1999).
2.3.8 Cloning and sequencing of excised DGGE bands
Amplicons which generated prominent DGGE bands were selected for cloning and
sequencing. Bands were excised from DGGE gels and the DNA eluted in 20 ).IL of sterile
deionized water and subsequently used as a template for PCR using the primers ITS1-F and
ITS2 as described above. Ampli cons (280 hp) obtained with the fun gal specifie primers were
purified on agarose gels using the Geneclean Turbo kit as recommended by the manufacturer
(Q-bio gene, USA). The purified DNA was cloned by ligation to the pGEM-T Easy vector
system (Promega, Madison, WI) and transformed into competent Escherichia coli cells

49
(JM109) according to the manufacturer's instructions. Positive clones were selected on
appropriate LB agar plates and their plasmids isolated with the Wizard Plus SVMnipreps
system (Promega). Sequencing reactions were performed with a BigDye Terminator cycle
sequencing kit 3.1 with a genetic analyzer (3130XL; Applied Biosystems, Poster City, CA)
by the Plate-forme d'Analyses Biomoléculaires (Université Laval, Québec, Canada). All
clones were sequenced in both directions using Sp6 and T7 universal primers. Sequences
were aligned using Bioedit software (Hall, 1999) and vector plasmid related sequence were
removed. Sequence identity searches were performed using BLASTn against the GenBank
database of the National Center for Biotechnology Information (NCBI).
2.3.9 Respiration
Activity of wood decay microorganisms was assessed by measuring respiration with
the soda lime method (Edwards, 1982). Respired COz was assessed according to Keith &
Wong (2006) from the following equation:
Wood blocks COz efflux (gC g·1 day"1) = [(sample weight gain (g)-mean blank weight gain
(g)) x 1.69] 1 wood block dry weight (g) x 24 (h) 1 time of exposure (h) x 12/44
COz efflux was calculated as the quantity (g) of carbon produced per gram of wood dry
matter and per day. Briefly, we incubated wood blocks during 24 hours in closed plastic bags
with soda lime. Renee the COz efflux was reflected in weight gain of granules. This weight is
measured on oven-dried granules so that differences in water content of the initial ba teh of
soda lime, and water absorption during exposure do not interfere with measured weight gain
of COz (Keith & Wong, 2006).
2.3.10 Statistical analysis
The data were analyzed with a linear mixed-effects model. We used generallinear
mixed models for the response variables "S'' (species richness calculated as OTU number per
sample), "H"'(Shannon diversity index), "respiration" (naturallog transformed C02 efflux),
"density" (wood density) and the "LCI" (lignocellulose index = lignin/(lignin + cellulose).
The explanatory variables included time of wood block incubation on the forest floor,

50
disturbance intensity (uncut; eut; controlled burn), the basal area of deciduous and coniferous
trees, and coarse woody debris volume. Random factors were stand type, experimental unit
and sampling plot (each one nested in the former). We included a within-group correlation
structure (autocorrelation structure of order 1) to take into account the repeated measures
over time. In models assessing H', S and respiration, we included the binary categorical
variable "season" (spring and faU) to take into account a potential seasonal effect (low winter
temperatures and snow cover vs. high summer temperatures) (Table 2.1). We estimated the
parameters of the linear mixed effect models using the "nlme" package (Linear and Nonlinear
Mixed Effects Models, R package version 3.1-90, (R Development Core Team, 2010)). The
presence of a simple linear relationship between diversity and respiration was also assessed
using a mixed-effects model. Models were compared on the basis of Akaike's information
criteria (AIC) (Burnham & Anderson, 2004). The "best" model is the model with the lowest
AIC score and the highest Akaike weight. Akaike weights (w,) indicate the level of support in
favor of any given model being the most parsimonious and most probable among candidate
models (Mazerolle, 2006). For model selection and multimodel averaging, when no model
had a w, > 0.90, we used "AICcmodavg" (R package version 1.01; AICcmodavg). Model
selection and multimodel inference were based on (Q)AIC(c) (http://CRAN.R
project.org/package=AICcmodavg). Matrices of OTU relative abundance were obtained for
trembling aspen and balsam fir wood separately, as wood species has a strong influence on
fungal community structure (Kebli et al., 2011).
In order to conduct fungal community composition analyses, we tested variation in
OTUs composition among treatments for significance using the adonis function in vegan (R
package vers10n 1.15-2; vegan: Community Ecology Package, http: //CRAN.R
project.org/package=vegan). The adonis function is an analysis of variance using
permutations that partition the species assemblage matrix as the response variable (relative
intensity of DGGE bands) among sources of variation; in this case "disturbance", ''time" or
''wood species". The number of permutations was set at 999. The adonis function is also
analogous to redundancy analysis (Legendre & Andersson, 1999). A subsequent test for
differences in between-sample distances (i.e. dispersion) was conducted. Multivariate
homogeneity of group dispersions (Anderson, 2006) determine if the variance within a group

51
differed from another group within a biological community. This test is a multivariate
analogue of a Levene's test to test for community dispersion (i.e. variability). The analysis
was performed in R with the betadisper function in the vegan package.
Table 2.1 Generallinear mixed models relating response variables (Shannon diversity index (H'), species richness (S), respiration, density and LCI) to explanatory variables during the first stages of wood decomposition.
Mo del Tested hypothesis
1 Effect of disturbance level
2 Effect of time
3 Effect of interaction between time and disturbance
4 Effect of stand composition
5 Effect of total deadwood volume
6 Global model ( all variables)
Exp lana tory variables
Disturbance
Time
Time + disturbance + time:disturbance
Deciduous basal area + coniferous basal area
CWDvolume
Time + Deciduous basal area + coniferous basal area + CWD Volume + disturbance + time: disturbance
The binary categorical variable "season" was included in all models for response variable H', Sand respiration.
Within each model, each response variable was assessed separately.
2.4 Results
2.4.1 Stands structure
Stands represented a gradient of basal area (tree > 5 cm diameter at breast height)
ranging from 39 m2 ha·1 in the uncut ASPEN stand to 0 in the controlled hum treatment (Fig.
2.1a). Both deciduous (mostly trembling aspen) and coniferous basal areas reflected the
intensity of harvesting as well as stand successional status. The OLD stand had equal
proportions of coniferous and deciduous species and the lowest total basal area of all
undisturbed stands. Coarse woody debris volume ranged from 140 m3 ha·1 in the gap
harvested MIXED stands to 57m3 ha·1 in controlled burns (Fig. 2.1b ).

45
40
:;;- 35 l1l
.c 30
"'e 25 l1l
~ 20 l1l
iii 15 Ill
~ 10
5
0
la 0 Coniferous
• Deciduous
~# ~# ~ .$' ..J> ~-v., ~ q~ ~~ ~~ ~..:$ ~..:$ _4<i) '&~~- _4<i) ~-s. 0~-:J _4~~
# ~~ V"" .$' V"" ~ V""
160
::<' 140 iv .c 120 "' !. 1oo QI
E 80 :::J 0 60 > 0 40
~ 20
0
~ ~ ~~
lb
52
Figure 2.1 (a) Basal area of coniferous and deciduous trees and (b) C'WD volume ofnatural and managed mixedwood stands. ASPEN: stands fi-om 1923 :tire; MIXED: stands from 1910 :tire and OLD: stands from 1760 :tire. Treatments that removed 33 and 61% of ASPEN stand basal area are indicated by 113 and 2/3 respectively while 42 to 47% in MIXED stand are indicated by 1/3 and 1/3 gap according to two different spatial patterns of tree removal, a regular disperse pattern and one removing tree within small gaps patterns
2.4.2 Fungal richness and diversity
A total of 325 wood blocks were successfully analyzed for molecular diversity. We
found a total of 35 different OTUs, with the mean number ofOTUs per block being lower for

53
balsam fir (mean of 3.9 and maximum of 12 at 12 months in controlled hum stands) than for
trembling aspen (mean of 5.1 and maximum of 14 at 12 months in eut stands). All
successfully analyzed blocks had at least one OTU.
For both trembling aspen and balsam fir wood blocks, model 2 (time of incubation)
had the highest AICc weight for the response variables H' and S. However, none of the
models had AI Cc Wt > 0.9, meaning that several models could explain the data equally well.
We used model averaging in order to compute confidence intervals for the explanatory
variables of H' and S (Table 2.2). We found no variables affecting the fungal richness (S) or
the Shannon diversity index of trembling aspen wood blocks (Table 2.2). For balsam fir
wood blocks, time of incubation had a negative effect on fungal species diversity and
richness but this effect was seen only in eut sites. Every six months, the Shannon diversity
index of balsam fir wood blocks decreased by 2.4% (Shannon diversity index mean at 6
months = 1.07) and species richness decreased by 0.24 units, i.e. 2% (mean S per balsam fir
wood blocks at 6 months = 4.2). Balsam fir species diversity was also related to season,
being 8% lower in spring than in fall, with a confidence interval of 94% (Table 2.2). We also
found that stand deciduous basal area had clear positive effect on balsam fir S (Table 2.2).
For each increase of 5 m2 ha·1 of the deciduous basal area, the number of fungal OTUs on
balsam fir blocks increased by 1.25% (mean S = 3.9).

54
Table 2.2 Effects of time of incubation, disturbance and stand basal area on Shannon diversity index, species richness, respiration, density and LCI of decaying trembling aspen and balsam fir wood blocks.
Wood spectes
Trembling as pen
Balsam frr
Exp lana tory variables
NA
NA
Time
Time Time*Cut
Time
Time Deciduous basal area Season (spring)
Time Deciduous basal area
Time
Time*Bum Coniferous basal area
Coniferous basal area
Mo del averaged estima te
Unconditional SE
Shannon index NA NA
Species richness NA NA
Respiration 0.014 0.005
Wood density -0.003 0.001 -0.002 0.001
LCI 0.005 0.0004
Shannon index -0.009 0.007 -0.185
0.005 0.005 0.097
Species richness -0.040 0.020 0.032 0.016
Respiration 0.025 0.007
Wood density 0.004 0.001 -0.003 0.002
LCI -0.002 0.001
Unconditional confidence interval
Lower Upper %
NA NA
NA NA
0.005 0.024 95%
-0.005 -0.002 95% -o.oo5 -4x w-6 95%
0.004
-0.018 3xl0-5
-0.367
0.006 95%
-3 xl0-4 94%
0.015 90% -0.002 94%
-0.079 -0.001 95% 0.001 0.063 95%
0.011 0.039 95%
0.001 0.007 93% -0.005 -L8xl0-5 93%
-0.003 -5. 8x 10"5 92%
Levels of significance of unconditional confidence intervals are indicated in parenthesis. "FaU" is the reference level for seasonal effect and ''uncut" is the reference level for disturbance. Model averaged estimates and their unconditional standard error were obtained from multimodel inference (see table 2.1 for models specifications) based on AICc. Only variables with confidence interval > 90% are presented (otherwise NA indicates estimates' confidence interval including 0).
55
2.4.3 Fungal succession
We successfully cloned and identified 22 OTUs observed on the DGGE gels (Table
2.3). OTU 26 was most similar to a Phialophora species (accession number FJ903315.1) and
OTU 5 was closely related to Leptodontidium elatius (FJ903294.1). Both show a seasonal
colonizing pattern, with lower abundance after the winter (Fig. 2.2 row 2). Others (OTU 17,
19 and 22) were similar to Phellinus cinereus (accession number AY340049), an uncultured
species of Dermateaceae (accession number FJ554419) and Bjerkandera adusta (accession
number FJ903353), respectively. OTU 17, 19 and 22 showed variable patterns of
colonization (Fig. 2.2 row 3).

56
60 60 Ascocoryne cylichnium 80 Phlebia centrifuga OTU 15 OTU 21
50 50 70
60 40 40
50
30 30 40
20 20 30
20 10 10
10
0 0 0
60 Leptodontidium elati us 60 Calocem cornea 60 Phialophom sp. :::> OTU5 OTU 8 OTU26 b 50 50 ~ 50 ëii J!i ~ " .,
40 40 ·i -g 40 > 0 ;; :t .: 30 30 ..
ô 30 .. u 20 20 c 20 :!
~ !! 10 10 <l. 10
# 0 0 0
60 Phellinus cinereus 60 Dennateaceae sp. 60 Bjerkandem adusta OTU 17 OTU 19 OTU22
50 50 50
40 40 40
30 30 30
20
~ 20 20
10 10 10
0 0 0 0 6 12 18 24 30 36 0 6 12 18 24 30 36 0 6 12 18 24 30 36
nme (months)
Figure 2.2 Different patterns of blocks colonization over time by 9 different OTUs (upper row: increasing and high colonization; middle row: peak after summers followed by a decrease after winter; bottom row: variable pattern of colonization). All disturbance treatments are pooled. Black points represent balsam fir wood and white points trembling as pen.

Table 2.3 Sequence analysis of bands excised from DGGE gels.
OTU Most closely related fungal Similarity (%) Accession no. of sequence related sequence
4 P ho li ota jlavida 99 JF908576.1 5 Leptodontidium elatius 97 FJ903294.1 6 Uncultured Ascomycota 95 JF960616.1 7 Uncultured Mortier ella 99 FJ553782.1 8 Calocera cornea 99 AY789083 11 Resinicium bicolora 99 DQ826535 15 A scocoryne cylichnium 99 FJ903373 16 Hyalodendriella betulae 93 EU040232.1 17 Phellinus cinereusb 99 AY340049 18 A scocoryne sp. isolate 97 FJ903331 19 Dermateaceae sp. 91 FJ554419.1 20 Athelia neuhoffii 95 U85798.1 21 Phlebia centrifuga 99 L43380.1 22 Bjerkandera adusta 98 FJ903353
23 Uncultured fungus isola te
100 HM015681 DGGE gel band
24 Bisporella citrina 98 AY789386.1
25 Uncultured fun gus clone
86 FJ758813 Singleton_ 24-2804 _ 23 53
26 Phialophora sp. 100 FJ903315.1 27 Phlebiella christiansenii 100 EU118659 28 Uncultured fungus 99 FM999613 29 Uncultured fungus 83 FJ778188 30 Pleurotus ostreatus 98 AY540325.1
Most similar Genbank accessions number and percent sequence similarities for the OTUs
": same similarity to FJ554463 (Uncultured Agaricomycetes clone LTSP _ EUKA _P6P23) b: same similarity to Phellinus nigricans (AF200239)
57
There were significant variations in balsam fir OTU composition among sampling
times (Table 2.4, Figs 2.3 and 2.4). The between-sample distances (dispersion) confirmed
that the significant effects found for balsam fir blocks were caused by differences in
community centroids (i.e. means) rather than community dispersion (i.e. variability). This
was not the case for trembling aspen OTU composition. However, the multivariate
homogeneity of group dispersions indicated that the variance of OTU community

58
composition on trembling aspen decreased with time, becoming significantly lower at the end
of the incubation period after 30 months (Table 2.4, Fig. 2.5a and 2.5b).
Table 2.4 Effect of time, disturbance and wood block species on assemblage patterns and variability of saproxylic fungi associated with the colonisation of wood blocks.
Trembling aspen blocks Balsam fir blocks data All wood blocks data set
data set set
Centroid Variance Centroid Variance Centroid Variance
Time R2 =0.029 F=3.491 R2=0.028 F=0.510 R2=0.023 F=6.206 P=O.OOl P=0.009 P=0.002 ? =0.752 P=O.OOl P=O.OOl
Disturbance R2 =0.026 F=0.437 R2=0.024 F=1.235 R2=0.010 F=1.021 ?=0.385 P=0.725 P=0.003 P=0.313 P=0.269 P=0.602
Wood block NA NA NA NA R2=0.007 F=2. 08 x 1 o·6
spectes P=0.008 ?=0.898
R2 values represent the proportion of variation each factor contributes to the total variation in the dataset. "NA" indicates non-applicable. F corresponds to the F value.
OTU composition for both wood species was similar at six months at the stand level
(Fig. 2.3), but fungal assemblages began to change over time, with different OTUs exhibiting
different dynamics (Fig. 2.2), leading to differences (?=0.008) in species assemblages
between wood block species (Table 2.4). The following OTU/fungal species are ordered
according to their abundance fitness with wood block species. Highest (or lowest) values
explain the highest proportion of the variation in fungal community composition between
trembling aspen and balsam fir wood due to OTU. Negative values indicate that the fungal
species were preferentially found on balsam fir and positive values for trembling aspen. The
OTUs are: OTU 9 (-0.0381), Phlebia centrifuga (-0.0243), OTU 10 (-0.0203), A thelia
neuhoffii (0.0145), OTU 13 (0.0122), Phialophora sp. (0.0097), Calocera cornea (0.0080),
Hyalodendriella betulae (0.0075), OTU 14 (0.0074) and Resinicium bicolor ( -0.0062).
Sorne OTUs were earl y colonizers, present in a large number of blocks and remained
common throughout the course of the experiment (Figs 2.3 and 2.4). Others became less
common after the frrst summer, while still others showed sinusoïdal (seasonal) trends (less
common after winter) (Fig. 2.2). Two main shifts in fungal assemblages were observed: the
first occurred during the first summer (between 6 and 12 months) and the second in the

59
following winter, between 12 and 18 months (Fig. 2.3). After 18 months, assemblages tended
to be more similar between consecutive sampling times. Balsam fir fungal communities
reached a relatively stable composition at 18 months, with OTU 9 and OTU 21 (P.
centrifuga) being clearly dominant (Figs. 2.2 and 2.4). OTUs on balsam fir that were the most
influenced (positively or negatively) by time of incubation are: OTU 9 (0.0087), B. adusta (-
0.0045), P. centrifuga (0.0041), C. cornea ( -0.0028), OTU 10 (0.0025), OTU 12 ( -0.0022), R.
bicolor (-0.0020), uncultured fungus clone (-0.0017), uncultured Mortierella (-0.0016),
Ascocoryne cylichnium (0.0012), OTU 13 (-0.0011). Positive values indicate a positive
correlation with time (see Fig. 2.2 for example with OTU 9 and OTU 22 B. adusta).
Disturbance affected fungal community composition only on balsam fir wood (Table
2.4, Fig. 2.4). The main effect of disturbance was observed in the controlled hum treatments,
with many OTUs absent when compared to uncut and eut treatments. Although sorne
differences in OTU composition are apparent between eut and uncut sites, the assemblages
overlapped and sorne OTUs were common across treatments (e.g. OTU 9 Fig. 2.4).
Comparing uncut stands versus eut stands, the following OTUs explained the highest
proportion of the variation in fungal community composition: OTU 10 (0.0994), B. adusta (-
0.0318), OTU 9 ( -0.0249), R. bicolor ( -0.0237), H. betulae (0.0179), Ascocoryne sp. isolate
(0.0150), C. cornea (-0.0137), P. centrifuga (-0.0124), A. neuhoffii (-0.0111), OTU 12 (-
0.0103), Bisporella citrina ( -0.0 100). Positive values indicate a positive correlation with eut
stands whereas negative values indicate OTU/species related to uncut stands. Comparing
uncut stands versus controlled hum stands the following OTUs explained the highest
proportion of the variation in fun gal community composition: OTU 9 (0.0939), OTU 10 (-
0.0580), R. bicolor (0.0483), P. centrifuga (-0.0381), C. cornea (0.0344), Dermateaceae sp.
(-0.0215), B. adusta (0.0195), Ascocoryne sp. isolate (-0.0194), P. cinereus (-0.0193),
Uncultured Mortierella (0.0 150), OTU 12 ( -0.0130). Positive values indicate a positive
correlation with controlled hum stands whereas negative values indicate OTU/species related
to uncut stands.

60
Trembling aspen 6 months Balsam fir 6 months
1 2 J ' s 6 1 a 9 to ,, 12 1J u ts t6 11 te ,, 20 21 22 23 u 2! ~ 21 u 29 XJ Jt J2 JJ lt ~ 1 2 J '! 6 7 3 9 1011 121.3,. 1!- 161718 191'0 21 22 2.3 2t 2:5 1t 27 28 29 30.31.32 llll .M
Trembling aspen 12 months Balsa rn fir 12 months
Q)
~ 8l (/) 0 ~ .. ~ !<l 0
~ 0
Trembling aspen 18 months
t 2 J ' ~ 6 1 a ' to 11 12 1J u t! t6 11 ta ,, 20 21 n 23 2' 2! ~ 21 ~ 29 JO Jt J2 ll sc M
Balsam fir 18 months
~ l ____ cc_JJOCb_coo~ooj]DDD~----------t 2 J ' s 6 1 a 9 to tt 12 tJ u ts t6 11 ta ,, 20 21 n 23 2' ~ 26 21 '28 '29 JO Jt s2 JJ sc .M
Trembling aspen 24 months Balsa rn fir 24 months
;l --=o~ __ DDDooDdJooOodJDooDCL_o _____ _ 1 2 3 ' s 6 7 3 9 10 11 12 13 u 15 16 17 18 19 20 21 22 23 2t 2:5 2E> 2128 19 Xl 31 32 ~ 34 u
Trembling aspen 30 months Balsa rn fir 30 months
;l -=-oD~odJOooDdJDoDDdJooo~Cb--------t 2 J ' s e. 1 a ' to tt 12 13 u ts t6 11 ta ,, 1<1 21 22 u: u zs 4:6 v za ~ Xl Jt n ~ ~ ~ 1 2 3 ' S 6 1 8 9 10 tt 12 tJ U tS 16 17 18 19 20 21 22 2J 24 2S 1'6 17 2S 'N Xl 31 32 .ll 3' ~
Operational taxonomie unit Operational taxonomie unit
Figure 2.3 Relative frequencies of ba1sam fir and trernbling aspen wood blocks colonization by individua1 OTUs (OTU 1 to 35) in relation to the time of incubation. OTUs' numbers are the same for both wood species.

c ..... ::::J co
6 months As pen
30 months
~
li! n=11
ê 1 ) t 1 t H
0
~ , J 1 '1 ' u
li! n=3
li!
l ~
~
0 1) 1 1 ',
g
iii n=16
,, ,, ~ a ~ ~ ~ a 0 0
:il n=23
" n "' :> " " " ::..; 0
~ , ~ s 7 ., n
:il n=5
"
g
Jl 0 v
Uilll_ 0
" 0
" n "' " "' "' " " 1 ~ s 7 9 11 "
" "'
" "'
61
6 months Balsam fir 30 months
~ 8
li! n=12 al n=18
1 ) 1o 1 t 11 16 H :0
li! n=13 iii n=24
" " " .,
" 8 1 l s 1 , u ' ). ' . "
n=4 n=6
---- _j]_ li __ _ " :t " "' .. 1). 1 . ,,
Figure 2.4 Relative frequencies of aspen and balsam fu wood blocks colonization by individual OTUs (OTU 1 to 35) in relation to the type of disturbance following 6 and 30 months of incubation. OTUs' numbers are the same for both wood species.

0 <D 4a 0
N " (/) ·;;: 0
N
"' (/) • 0 0 • ::;;: z
0 ":'
0 'i
-60 -40
"' <D
-o 0 .ê <D
ë "' "' " "' ~
"' 0
" "' c::
"' "' (ii " '6
"' 0
"' " ~
"' ~ "' "' 0
"'
• 0
• • 0
Oo& • ..... • 0 •• • 0 0 •• • 0 ~so~oo 0 0 % 0 • • 8 ~ 0 ° 0 • • • • 0 ~ ~ 0
• 0 0 0
• 0 •
-20 0 20 40 -60 -40 -20 0 20
NMDS axis 1
4b Trembling aspen Balsam ti r
6 12 18 24 30 6 12 18 24 30
Time of incubation (months)
62
40
Figure 2.5 (a) N orunetri c Multidimensional Scaling (NM DS) of trembling asp en wc o d bio cks at 6 months (bi ack points) and 3 0 m onths ( empty circ! es) b ased on fungal co mm uni ty campo si tien (OTU s) (b) Multivariate homo geneity of group dispersions (i.e. average di stance tc centrai d) wi thin wc o d bio ck sp eci es. Each bar within a wood sp ecies represents the average variance for th at sampling time. Si gni ficant differences between times within a wc o d sp ecies are in di cated by different 1 etters and were on! y ob served in trembling asp en wc cd blacks.

63
2.4.4 Respiration
Respiration of trembling aspen and balsam fir wood blocks was best explained by
model2 (effect oftime ofincubation). Time ofincubationhad a positive effect on respiration
for both species (based on model avet'aging; Table 2.2). Respiration was hlgher on trembling
aspen wood blocks (Fig. 2.6).
.. 0 à>
<D
,...... .. ' >- 0
à> ro li) '0
"ï 0)
0 .. 0) 0 .._.,
à> c .. 0
~ ·o. .. (J} 0 Q)
à> 0:: (')
.. 0 à>
N
..·'
. ...... ········'f~embhng aspen
·•·•····•·•··•·•··•··•··•··•···
········' ······'
············'
··•·····•·
., .. ,···············'
·············
······•····•···•···•··•·•··•·•·•·•·•·••·••·••
···········•·
··········' ···················'
········
··•····•··•····•····•··•····•······•····•···•···•···•···•···•·
10 15 20 25 30
Ti me (months)
Figure 2.6 Predicted trembling aspen and balsam fir wood blocks respiration in relation to time, based on multimodel averaging of all candidates models. Dash tines showed confidence intervals at 9 5%.
There was no relationshlp between respiration and ftmgal richness or diversity for
aspen wood blocks (all sampling times combined). However, there was a negative
relationshlp between diversity (but not 1ichness) and respiration for balsam fir wood blocks
(Fig. 2.7).

64
"<;f 0 .1, ..... . ... -··
"<;f q (])
<D
··············----
Trembling aspen ,...... ' >- "<;f ro 0 u 1
1 (])
Cl) ID
0 Cl)
"<;f '-' c q 0 (]) = "<;f ~ ·a. <n "<;f (])
0 0:: <1> (")
··.. . ..... --·-... __ ... --··
.......... ><.:::::::: ........... , ··-...
···---..
········ · · ·················- ·· ····
·-·--... · ····· ···-· --
· ·· · ·-···--
"<;f q Balsamfir (])
N
0.0 0.5 1.0 1.5 2.0
Shannon Diversiy Index
Figure 2. 7 Predicted trembling aspen and bals am fir wood blocks respiration in relation to the Shannon diversity index in eut stands, based on a single model between diversity and respiration. Dash lines showed confidence intervals at 95%.
2.4.5 Wood decomposition
Model 2 (time of incubation) best explained the changes in wood density of
trembling aspen blocks, with density decreasing at a rate of 4.7% every six months (max
density=0.51). Moreover, trembling aspen wood density decreased fastest in the eut stands,
followed by the hum and then the uncut stands, although only the difference between the eut
and uncut stands was statistically significant Changes in the lignocellulose index (LCI) of
aspen wood blocks were also best explained by model2 (time of incubation).
No strong trends in wood density and LCI with time were observed for balsam fir
wood blocks. Although several models explained wood density equally well, the confidence
intervals of the individual explanatory variables were large (93%) (Table 2.2). Balsam fir
wood block density remained 1.1% higher in controlled hum than in uncut stands (maximum
density=0.47) and decreased with increasing coniferous basal area. Several models could

65
explain LCI for balsam fir wood. However, model averages were computed, as models based
on CWD volume, ''time" and stand composition were also plausible. For balsam fir, LCI
decreased marginally with increasing coniferous basal area (Table 2.2).
2.5 Discussion
Our results underline the similarities and differences between trembling aspen and
balsam fir wood with respect to factors affecting the diversity and activity of early colonizing
fungi. Under a wide range of stand conditions, including late successional stands and
controlled hum, aspen and balsam fir wood blocks were colonized over time by different
assemblages of wood inhabiting fungi with, however, a large overlap in species composition
at the stand level. Fungal colonization proceeded rapidly, with the highest species richness
observed within the first 12 months of the incubation period. Thereafter, a slow decrease in
diversity was observed for balsam fir wood (Table 2.2), while communities became more
homogenous between time periods on aspen wood, without significant changes in diversity.
For both wood species, fungal activity, as measured by respiration, increased with time.
However, while decomposition proceeded rapidly for as pen wood, balsam fir respiration rates
were lower and fir wood underwent few physical or chemical changes within the study
period.
Our results reported new findings about the ecology of several fungal spectes
according to colonization succession, forest disturbances and host species specificity. We
observed three fungal species colonizing balsam fir that decline intime: B. adusta, a white rot
Basidiomycete that prefer deciduous wood and with high ligninolytic enzymatic activity
(Meysami & Baheri, 2003 ; Urcelay & Robledo, 2004); C. cornea a Basidiomycete of the
Heterobasidiomycete classe, generally known as ')elly fungus" and causing brown rot mainly
in deciduous wood (Seifert, 1983); R. bicolor a late successional Basidiomycete white rot
fungus found on both deciduous and coniferous tree and causing "stringy white rot". Usually
white rot fungi (lignin decomposer) are more common at later stage of wood decomposition
compared to brown rot (Stenlid, Penttila & Dahlberg, 2008) although brown rot fungi are also
important decayers on conifers at these late stages of decomposition (Niemela, Renvall &
Penttila, 1995). However, using molecular methods, our results shown that white rot fungi

66
can be present during the first step of colonization on both coniferous and deciduous wood.
During our assay, several OTUs related to white rot tends to decrease over the 30 months
period. Convers ely, presence of the OTU related to P. centrifuga, a white rot Basidiomycete
typically observed on conifers, increased with time. The OTU related to A. cylichnium, a
saprophytic/endophytic Ascomycete, was also more frequent in time (Hallaksela, 1993). In
our study, R. bicolor and P. centrifuga tend to colonize balsam fir compared to trembling
aspen wood. Our results confirm previous observation that R. bicolor is commonly found on
A bies sp. and Pinus sp. and that P. centrifuga was frequently found on gymnospermous and
occasionally angiospermous logs and slash (Boulet, 2003).
Sorne boreal wood-decaying fungi seem to favour bumed areas (Stenlid, Penttila &
Dahlberg, 2008). In our study, we found several OTUs that were strongly associated with
controlled hum treatments compared to uncut stands: R. bicolor, C. cornea, B. adusta and an
uncultured Mortierella. C. cornea has been previously found on highly sun-exposed logs
(Lindhe, Âsenblad & Toresson, 2004) and in open stands (Kebli et al., 2011). Fungi
associated with uncut stands were P. centrifuga, Dermateaceae sp., Ascocoryne sp. and P.
cinereus. P. centrifuga prefers unmanaged habitats and is characteristic of old-growth spruce
forests (Franzén et al., 2007). Hence this fungus could be susceptible to high disturbance
( controlled hum).
We hypothesized that saproxylic fungal richness and diversity would parallel changes
in stand structure brought about by natural succession and harvesting. Fungal community
composition on balsam fir was affected by disturbance and species richness increased as
basal area of deciduous trees increase. The highest values of deciduous basal areas were
observed in unmanaged ASPEN and I\.1IXED stands, whereas the lowest were observed in
controlled hum where species assemblages on bals am fir wood represented a subset of th ose
observed in less disturbed stands. It is possible that harsher environmental conditions in
controlled hum are interacting with balsam fir wood biochemical properties resulting in
fewer species adapted to those conditions and surviving on 30 month-decayed balsam fir
wood blocks. Sippola et al. (2004) also observed that deciduous species (aspen and birch)
contributed significantly to the richness of polypore fungi at the stand level in managed
boreal stands while the number of observed fruiting bodies decreased with harvesting

67
intensity. Contrary to our results, Sippola et al. (2004) also observed a positive relationship
between species richness and CWD volume. However, CWD volumes observed in our study
were much higher than those reported by Sippola et al. (2004) (26 to 34m3 ha.1) and it is
possible that such a relationship may only occur when CWD volumes are more limiting.
While it can be argued that stand successional status may have also affected fungal
species composition, Muller et al. (2007) have shown that harvesting intensity had a much
larger impact on fungal communities than stand age. In natural, unmanaged stands of the
region, balsam fir and trembling aspen are both available for fungal colonization, which may
increase the fungal diversity at the stand level. Convers ely, reducing tree diversity would lead
to a decrease in the diversity of pioneer fungi (Kebli et al., 2011 ; Lumley, Gignac & Currah,
2001).
Contrary to balsam fir, fungal community composition, diversity and richness on
aspen wood were not affected by disturbance type or stand basal area and showed little
changes over time. The high species richness observed at the stand level (Fig. 2.3) and at the
wood block level (n=14) at the end ofthe first year was followed by an increase in similarity
in species composition among wood blocks. Rapid initial colonization by pioneer fungi may
be followed by a more graduai colonization pattern of later successional species with high
competitive abilities. The decrease of the variability in fungal community composition on
aspen wood with time may result from the fact that as wood decays, different generalist
pioneer fungal communities give way to more specialized assemblages (Boulet, 2003 ;
Jonsson, Edman & Jonsson, 2008 ; Rayner & Boddy, 1988).
2.5.1 Decomposition
We expected to find different patterns of decomposition between the different levels
of stand disturbance and also between the two wood host species ( deciduous and coniferous ),
due to differences in chemical composition. Aspen decomposition proceeded efficiently as
indicated by the strong relationships between time and decomposition parameter (wood
density and LCI). This was to be expected, as boreal deciduous species have higher rates of
mineralization than coniferous species (Brais, Pare & Lierman, 2006). Aspen decomposition
was also highest in harvested stands. On the other hand, balsam fir decomposition proceeded

68
very slowly as indicated by the lack of significant changes in wood properties over the 30
month period. The accelerated decomposition of aspen on the eut treatment relative to the
uncut may have been due to abiotic factors such as increased summer temperatures after the
removal of the forest canopy. Renee, decomposer fungi might perform better on trembling
aspen wood in open, disturbed environments similar to those encountered during frrst stages
of natural forest succession.
2.5.2 Relationships between frmgal diversity and respiration
Although respiration increased over time for both wood species (Table 2.2), we did
not find the expected positive correlation between fungal diversity and respiration (Setala &
McLean, 2004). Rowever, for both wood species, respiration and fungal diversity must have
increased concomitantly up to sorne point prior to our first sampling time at six months. The
negative relationship we observed between diversity and respiration in balsam fir wood on
eut sites may have resulted from competitive species interactions (Boddy, 2000 ; Woodward
& Boddy, 2008), which can be metabolically expensive (Wells & Boddy, 2002). The
investment of energy into the production of secondary metabolites during interspecific
competition, instead of into the synthesis of oxidative enzymes necessary for wood
degradation, may result in reduced decomposition rates (Riscox et al., 2010). Increases in
respiration may therefore have resulted from two very different processes; an increase in
decomposition in trembling aspen and an increase in fungal competition in balsam fir wood,
the latter leading to reduced diversity. Woods et al. (2005) found that substrate had a marked
effect on interspecific fungal interactions which might be exacerbated by more severe
nutrient or energy limitations in balsam fir wood. Aromatic compounds that inhibit
decomposition (Ganjegunte et al., 2004), have been found in higher concentrations in balsam
fir wood than in aspen (Struckelj et al. , unpublished data). This may explain the slow
decomposition observed in bals am fir wood ( density and LCI were not related to diversity or
time). Renee the observed changes in fungal community composition on balsam frr over time
(Table 2.3) might reflect species turnover due to competition, as it could be the case for B.
adusta (Fig. 2.2), reported to be easily replace by parasitic fungal infection (Niemela, Renvall
& Penttila, 1995 ; Rayner & Boddy, 1988).

69
The molecular approach used in this study provides a reasonably broad view of
wood-inhabiting fungi community variation according to disturbance gradient. Although it
may have underestimate diversity with respect to next-generation sequencing approaches, the
focus of our study was on the variation in OTUs community structure between wood blocks
not on the total and exhaustive fungal community composition present. Moreover, given the
high number of samples, such methods would have led to significantly costs. Any biases
(DGGE limitation for the detection of rare species, comigration of ampli cons from different
species in DGGE gels or the fact that sorne fungi could have generate more than one ITS
fragment) remain constant between all of our samples and sequence analysis of majors
DGGE bands discarded the possibility of extensive PCR artifacts. Our results are still valid
concerning the dominant population that are detected by DGGE. Moreover our results did not
discriminate between metabolically active or inactive fungal species (Rajala et al., 2011).
Even ifDNA was used instead of eDNA for DGGE, the observed changes in species profiles
indicate that the dominant OTUs are from active organisms at time of sampling. A similar
study would not be possible by fruiting body identification.
As reviewed by Lonsdale et al. (2008), research is needed to elucidate factors that
drive the species richness and species composition of wood decay fungi and to determine
whether early and late successional tree species are colonized by different functional groups
of wood-decay fungi. Although we did not assess functional groups, we have shown that the
fungi colonizing the wood of an early successional tree species differed from that of a late
successional tree (during 30 months). Wood properties also interacted with disturbance in
modulating decomposition efficiency.
The diversity and community composition of primary wood-decaying fungi also have
a marked influence on subsequent establishment of later successional fungi, as well as on the
rate of wood decomposition (Fukami et al. , 2010 ; Heilmann-Clausen & Christensen, 2003 ;
Heilmann-Clausen & Boddy, 2005). Information on pioneer saproxylic fungal communities
is therefore important for an understanding of the general relationship between fungal
diversity and wood decomposition.

70
Little is known about fungal community composition, diversity and succession on
decomposing wood of the Canadian eastern boreal forest and, to our knowledge, no other
study has investigated wood decomposition in relation to initial saproxylic fungal diversity
and disturbance intensity using a culture-independent molecular fingerprinting approach.
Communities of wood decomposing fungi and their activities were modulated by differences
in wood quality, forest disturbance and stand composition. Combining molecular approaches
with sequencing and field identification of fungi would further improve our understanding of
fungal ecology. Moreover, the link between species diversity and community activity and
processes need to be investigated in natural environments.
2.6 Acknowledgements
This work was supported by Fonds Québécois de recherche sur la nature et les
technologies (FQRNT, grant 121414) and by the Natural Sciences and Engineering Research
Council of Canada (grant 217118-02). We are grateful to Dr Marc Mazerolle for statistical
support, Dr David Paré for chemical analysis, Dr Carole Lafrenière for spectroscopy analysis
and Josée Frenette for technical assistance.
CHAPITRE III
IMPACT OF HARVESTING INTENSITY ON WOOD-
INHABITING FUNGI IN ASPEN BOREAL FORESTS OF
EASTERN CANADA
Hedi Kebli, Gavin Kemaghan, Suzanne Brais and Pascal Drouin

72
3.1 Abstract
Environmental changes, including human disturbances, have a striking impact on the biodiversity of ecosystems. Using a molecular fingerprinting technique we have described fungal community Shannon diversity index, richness and composition variations caused by silvicultural practices on trembling aspen logs and snags. Our study was conducted in the SAFE Project, a series of silvicultural experiments that tests an ecosystem management model based on natural dynamics. We wanted to know how saproxylic communities evolve with varying silvicultural treatments that emulate the natural dynamics on trembling aspen deadwood. We found that large and advanced decayed trembling aspen logs had around 9% more OTU number and around 10% higher Shannon diversity index compared to medium decayed logs independently from diameter size. We also found one indicator species of snags, two indicator OTUs (including Phlebiella christiansenii) specifie to advanced decayed logs. Two others (Ascomycota sp. andMortierella sp.) were selectively found on snags of the one third partial eut stands, and one OTU was preferentially found on freshly dead snag. The effect of log diameter was also strongly dependent on the silvicultural treatment where dead wood was situated. Larger logs carry more fungal species and diversity but only in bumed stands compared to uncut stands, hence acting as log refuge. The negative relationship between diversity and fme woody debris volume on logs and snags was related to silvicultural treatment as fine woody debris increased with silvicultural intensity. Our results underline the negative effect of intense silvicultural practice on fungal diversity and species richness by modifying community composition, but they also highlight the benefits of alternative treatments to clear-cut and controlled burn, such as partial cuts which retain coarse woody debris volume.

73
3.2 Introduction
Deadwood is a key factor in forest biodiversity (Drapeau et al., 2002 ; Siitonen,
2001), especially for wood inhabiting fungi (Lonsdale, Pautasso & Holdenrieder, 2008 ;
Sippola & Renvall, 1999). Fungi are the main agents of wood decomposition and are an
essential component of forest ecosystem food webs (Moore et al., 2004), influencing nutrient
cycling and carbon sequestration (Hannon et al., 1986). By decreasing the amount of
deadwood, forestry practices impact the diversity of wood-decay fungi (Bader, Jansson &
Jonsson, 1995 ; Penttila, Siitonen & Kuusinen, 2004). In Scandinavia, intensively managed
forests harbor significantly fewer wood-inhabiting fungi than unmanaged forests (Küffer &
Senn-Irlet, 2005) and threatened species such as Phellinus nigrolimitatus, which are strongly
dependent on large diameter, well decomposed woody debris are less common (Stokland &
Kauserud, 2004). Sorne species have also been shown to disappear locally when management
intensity exceeded a specifie threshold (Sippola et al., 2004).
Post-harvest quantities of coarse wood debris (CWD) are dependent on silvicultural
practices (Ranius et al., 2003). CWD is always less abundant in managed than in natural
forests while forest thinning leads to an increase in sorne CWD types (e.g. stumps). However
large diameter logs and snags, structures of unmanaged forests, are less abundant following
harvesting (Brassard & Chen, 2006 ; Haeussler et al., 2007 ; Montes & Cafiellas, 2006).
Diversifying harvesting practices, including the use of partial harvesting, has been identified
as a key aspect to implementing ecosystemic management in the boreal forest (Bergeron et
al. , 2002 ; Harvey et al., 2002). Objectives of partial harvesting may include increasing
diversity of tree species and size classes, establishment and growth of shade-tolerant species,
and altering rotation lengths while also addressing the maintenance of ecosystem functions
and biodiversity. However, a broader understanding of keystone processes (Bednarz, Ripper
& Radley, 2004) and species associated with the utilization of deadwood is central to the
inception and elaboration offorests conservation strategies.
The SAFE Project, a series of silvicultural experiments in the Lake Duparquet
Research and Teaching Forest (LDRTF) in the southern part of the eastern Canadian boreal
forest, is testing an ecosystem management model (Bergeron et al., 2002 ; Harvey et al.,

74
2002). Briefly, the approach relies on varying silvicultural treatments to more closely reflect
aspects of natural dynamics. Clear-cutting or other even-aged silvicultural systems are
employed as surrogates for stand reinitiation by fire; partial cutting is used to modify stand
composition and structure similar to the process of natural succession from intolerant
hardwoods to mixedwoods or conifer-dominated stands and selection cutting is intended to
mimic gap dynamics. The first phase of the SAFE project involved natural even-aged aspen
(Populus tremuloides Michx.) stands (Brais et al., 2004 ; Haeussler et al., 2007). Following
stand replacing fires, aspen forms pure or mixed stands that can maintain dominance for over
100 years. In Scandinavia, saproxylic organisms associated with aspen are particularly
susceptible to forest management practices and many species are now protected in northern
Europe due to their increasing rarity (Siitonen & Martikainen, 1994 ; Sverdrup-Thygeson &
Ims, 2002).
Our understanding of fungal diversity in the Canadian boreal forest is incomplete and
few studies have addressed the relationship between forest management practices and the
diversity of wood-decaying fungi. Denaturing gradient gel electrophoresis (DGGE), a
culture-independent molecular technique, was used to provide new insights into the impact of
partial harvesting prescriptions on the fungal communities of logs and snags. Our objectives
were (i) to assess how saproxylic fungal species richness, diversity and composition vary
according to five different silvicultural treatments corresponding to four levels of harvesting
intensity and a controlled hum and (ii) to link fungal community structure to physical
features of individuallogs (size and decomposition stage) and snags (diameter and height)
and to the surrounding woody debris volume. We hypothesized that species richness and
diversity of saproxylic fungi are negatively correlated with the intensity of harvesting. We
also hypothesized that residual downed wood would minimize the effect of harvesting on
fungal diversity and richness. We also expected fungal assemblages to show higher similarity
when logs and snags are closer (Edman, Kruys & Jonsson, 2004; Vasiliauskas et al., 2005).
Finally we expected to fmd higher fungal diversity on larger well decomposed logs or snags
(Edman, Kruys & Jonsson, 2004 ; Heilmann-Clausen & Christensen, 2003 ; Nordén et al. ,
2004).

75
3.3 Material and Methods
3.3.1 Field sites description
Our study area is located within the Lake Duparquet Research and Teaching Forest
(LDRTF) (Harvey, 1999) in the Abitibi region of northwestern Québec, 45 km northwest of
Rouyn-Noranda, Québec (48°86'N-48°32'N, 79°19'W- 79°30'W). Climate is humid
continental (Koppen classification), with a mean annual temperature of 0.8°C and
precipitation of 890 mm (Environment Canada; Canadian climatic normals 1971-2000,
available online: www .climate. weatheroffice. ec. ge. ca/ climate _ normals/index _ e.html ). The
region is located in the mixedwood zone of the boreal shield.
The study was conducted in aspen - dominated stands (92% average basal area; 40
m2.ha.1) of fire origin dating from 1923 (Dansereau & Bergeron, 1993). In the winter of
1998-99, four levels of forest harvesting, including uncut sites where no trees were harvested
and one clear-cut treatment, were applied according to a complete block design with three
replications of each treatment (1 to 2.5 ha/experimental unit). In August of the same year,
controlled burns were conducted over clear-cut experimental units (Belleau, Brais & Paré,
2006). The two partial harvesting treatments removed either 33 % (1/3 partial eut) or 61%
(2/3 partial eut) of stand basal area (see Brais et al. (2004) for a complete description of
harvested stands).
3.3.2 Field methods
In each experimental plot, the volume of downed wood was estimated using two
triangular-transects (30 rn per side) (Van Wagner, 1982) per experimental unit. Along each
transect line, the frequency of downed wood was recorded by diameter class (fine woody
debris, 2.5-7.6 cm; medium size woody debris, 7.6-12.5 cm; and large woody debris greater
than 12.5 cm) and two decomposition classes (3 and 4-5) (Daniels et al., 1997) without
distinguishing wood species. In 2007 and in each of 15 experimental units (5 treatments x 3
replications), a total of 191 trembling aspen logs were identified, sampled for fungal DNA
extraction and classified according to their decomposition classes (medium decay ; class 3
and well decayed; classes 4- 5). Forty two logs were sampled in uncut stands, 41 in the 1/3

76
partial cuts, 42 in the 2/3 partial cuts, 39 in the clear cuts and 27 in the controlled hum sites.
Forty-eight trembling aspen snags were also located and sampled; 12 in the 1/3 partial cuts,
21 in 2/3 partial cuts and 15 in uncut stands. Positions of each log and each snag was
recorded by GPS and also manually recorded when logs/snags were too close for GPS
precision. Distances between logs or snags were estimated from the GPS data by geographie
information system techniques using ArcView 3.2 (ESRI Inc., New York, USA).
Wood chips for DNA extraction was collected by drilling one hole in each log (in
the selected decomposition and diameter class) using a flat drill bit (12.7 mm). The bark and
the uppermost layer of wood were first removed and precautions taken to prevent cross
contamination of samples; drill bits were cleaned, rinsed with sterile water, soaked in 95%
ethanol and flame sterilized between samples. Snags were sampled the same way except that
sampling was performed at a height of 137 cm. All samples were transported on ice to the
laboratory and frozen at - 20°C until analyzed.
3.3.3 DNA extraction and PCR amplification of fungal-specific genes
Wood samples were lyophilized for 48 hours before disruption in a Qiagen
TissueLyser (QIAGEN, Canada) and run for 2 min at 26Hz, or until the wood was reduce to
a fine powder. Samples were put on ice between runs. DNA was extracted with the DNeasy
Plant Nlini Kit (QIAGEN) according to the manufacturer's instructions. DNA was eluted in
100 )lL of elution buffer and stored at -20°C. The Internai Transcribed Spacer (ITS) region of
the fungal rDNA was PCR-amplified using the fungal specifie primers ITS1-F (Gardes &
Bruns, 1993 ; Jasalavich, Ostrofsky & Jellison, 2000) and ITS2 (White et al., 1990) to obtain
a 280 hp amplicon. A GC clamp (CGC CCG CCG CGC CCC GCG CCC GGC CCG CCG
CCC CCG CCC CC) was added to the 5' end of the ITS1-F primer to avoid complete
separation of DNA strands during the subsequent denaturing electrophoresis. Polymerase
chain reactions were performed using 50-)!L of PCR assays containing 2 )lL of template, 5
)lL ofPCR reaction buffer (ThermoPoi, New England Biolabs), 1 )11 dNTP (10 mM of each
dATP, dCTP, dGTP and dTTP), 1 )lL of each primer (50 )lM), 0.2 )lL of Taq polymerase
(5 U.)!L"\ New England Biolabs). Cycling parameters used were an initial denaturation cycle
of 3 min at 95 oc followed by 35 cycles of denaturation at 94 oc for 45s, annealing at 55 oc

77
for 45 s, and extension at 72 oc for 1 min 15 s, ending by a final elongation at 72 oc for 8
min (Kubartova et al., 2007). Negative controls ( containing no DNA) and positive controls
(fungal DNA from pure culture) were included with each PCR batch. All amplification
products were analysed by electrophoresis with 1 % (w/v) agarose gels in T AE ( 40 mM Tris
acetate, 1 mM EDT A), stained with Gelgreen (Biotium) and visualized un der UV light.
3.3.4 Separation offungal ITS amplicons by DGGE
Electrophoresis was performed according to a slight modification from the protocol
of Kebli et al. (2011). We used the DCode universal mutation detection system (Bio-Rad
Laboratories, Hercules, CA) and an acrylamide gel (8% [ wt/vol] acrylamide~bis-acrylamide,
37.5:1) with a linear vertical gradient of 20~55% denaturing agents (100% denaturant
corresponding to 7 M urea and 40 % [v/v] deionized formamide ), increasing in the direction
of the electrophoretic run with a stack:ing gel ( 4% [w/v] acrylamide~bis-acrylamide, 37.5: 1)
on top. Approximately 400 ng of each PCR product was loaded and electrophoresis was
performed in TAE buffer (40 mM Tris-acetate, 1 mM EDTA) at 75 V and 60 oc for 16h.
Gels were stained for 15 min with SYBR gold (Invitrogen, Carlsbad, CA), visualized under
UV illumination, and digitized using a ChemiDoc XRS System molecular imager (Bio-Rad
Laboratories, Hercules, CA). Amplicons that generated prominent DGGE bands were
selected for cloning and sequencing according to Kebli et al. (2011).
3.3.5 Gel analysis
The software package GelCompar II (version 5.0, Applied Maths, Belgium) was used
to analyse ITS DGGE banding patterns. In order to minimize migration differences and to
normalize for distortions between gels, we aligned the gels using an external reference
pattern comprised of mixed ITS amplicons from five different fungi. A band-matching
process was used to obtain a presence-absence matrix for statistical analyses. A 5% band
intensity threshold was set for the band selection process. Individual bands were grouped into
classes based on melting behaviour (positions in the gels). Each band class was then
considered to be an operational taxonomie unit (OTU), allowing for the calculation of their
frequency among log samples. We also calculated the relative intensity of each band,
applying a value between 0 and 1 by dividing the intensity of the band by the sum of the

78
intensity of all the bands within the lane, thus eliminating the variation in band intensity due
to difference in amplification and amount ofDNA loaded on the DGGE gel.
3.3.6 Statistical analysis
Matrices of relative abundance and presence/absence were obtained for fungal
species on logs and on snags. Species richness (S) and Shannon diversity indices (H') were
calculated for each log or snag (Eichner et al., 1999). In or der to assess the strength of the
relationship between richness, diversity and salient explanatory variables, data were analyzed
by means of a linear mixed-effects model using the "nlme" package (R package version 3.1-
90; nlme: linear and nonlinear mixed effects models) from R software (R Development Core
Team, 20 10). Pive models for logs and five models for snags were tested based upon our
hypotheses (Table 3.1). Each model corresponded to a different hypothesis. Explanatory
factors for logs were: silvicultural treatments (uncut; 113 partial eut; 2/3 partial eut; clear eut;
controlled hum), woody debris volume of the stands (by decomposition and diameter
classes), and individuallog diameter and decay classes (3 levels: < 10 cm medium decayed
log; > 10 cm medium decayed log and > 10 cm advanced decayed log). In order to assess
whether species richness varies between small and large logs according to silvicultural
treatments, we applied a single model to richness with silviculture treatment, log diameter
and the interaction between the two factors as explanatory variables. This model considered
only fresh logs as no small, well decomposed logs were sampled. Explanatory factors for
snags were: silvicultural treatments (uncut; 113 partial eut; 2/3 partial eut), woody debris
volume (by decomposition and diameter classes), snag diameter (at breast height) and snag
height.
All explanatory variables were entered as fixed factors whereas blocks and
experimental units were considered random factors, with experimental units nested within
blocks. Models were compared on the basis of Akaike's information criteria (AIC) (Burnham
& Anderson, 2004). The "best" model, was the model with the lowest AIC and the highest
Akaike weight (wa. Akaike weights indicate the level of support in favor of any given model
being the most parsimonious and most probable among candidate models (Mazerolle, 2006).
For model selection (and multimodel averaging if no model had a w, > 0.90), we used

79
"AICcmodavg" R package (R package version 1.01; AICcmodavg: Model selection and
multimodel inference based on (Q)AIC(c), http: //CRAN.R
project.org/package=AICcmodavg). Comparison between deadwood volumes among
silvicultural treatment were conducted by means of a simple linear mixed model with blocks
treated as random factors. Multiple comparisons of means used the Tukey contrasts
algorithm.
In order to conduct fungal community composition analyses, we tested variation in
OTUs composition among treatments for significance using the adonis function in vegan
package (R package version 1.15-2; vegan: Community Ecology Package, http: //CRAN.R
project.org/package=vegan). The adonis function is an analysis of variance using
permutations that partition the species assemblage matrix as the response variable (relative
intensity of DGGE bands) among sources of variation. The number of permutations was set
at 999. The adonis function is also analogous to redundancy analysis (Legendre &
Andersson, 1999). A subsequent test for differences in between-sample distances (i.e.
dispersion) was conducted. Multivariate homogeneity of group dispersions (Anderson, 2006)
determine if the variance within a group differed from the other group within a biological
community. This analysis is a multivariate analogue of a Levene's test and was used to
validate community dispersion (i.e. variability). The analysis was performed in R with the
betadisper function in the vegan package (continuo us variables were converted into
categorical class ofvariable before analysis).
We also use Mantel test (Mantel, 1967) to compare a species dissimilarity matrix
(based on DGGE bands and the Jaccard coefficient) with a dissimilarity matrix based on
geographical distances (spatial distance between logs and snags). The Jaccard coefficient was
calculated as following: NAB/(NA+NB-NAB), where NAB = number ofDGGE bands in common
between gel lanes A and B; NA =the total number of bands in the gellane A; and NB =the
total number of bands in gellane B. The relationships between molecular and geographie
distance matrices have previously been used in microbial ecology (reviewed by Ramette
(2007) ). Finally, indicator species analysis was carried out with the duleg function of the
"labdsv" package (R package version 1.3-1; labdsv: Ordination and Multivariate Analysis for

80
Ecology, http://ecology.msu.montana.edu/labdsv/R). A Holm correction (Holm, 1979) was
applied to these probabilities.
Table 3.1 Generallinear mixed models relating species richness (OTU number) and Shannon diversity index to stand, log/snag physical characteristics and woody debris (WD) volumes.
Model Tested hypothesis Exp lana tory variables
Logs richness and diversity
L1
L2
L3
L4
L5
Effect of silvicultural treatment
Effect of physical characteristics of individuallog
Effect of stand WD volumes
Effect of log characteristics and WD volumes
Global model
Silvicultural treatment
Log decomposition and diameter class
WD volume (well decayed) + FWD + Medium size WD + Large WD
Model L2 + Model L3
Model L1 + Model L2
Snags richness and diversity
S1
S2
S3
S4
S5
Effect of silvicultural treatment
Effect of snags physical characteristics
Effect of stand WD volumes
Effect of snag diameter according to silvicultural treatment
Effect of snag characteristics and WD volumes
3.4 Results
3.4.1 Stand characteristics
Silvicultural treatment
Snag diameter class + Snag height
WD volume (well decayed) + FWD + Medium size WD + Large WD
Model S2 + snag diameter class * Silvicultural treatment
Model S2 + Model S3
Total volumes of downed wood ranged from 130m3 ha·1 in uncut stands to 61 and 57
m3 ha·1 in the clear-cut and controlled hum treatments respectively. All inventoried logs were
either from class 3 (medium decay) or classes 4 and 5 (well decomposed). Deadwood volume
decreased with harvesting intensity. However, the highest volume of fine woody debris (2.5-
7.6 cm) was observed in the clear-cuts and the lowest in the uncut stands (Fig. 3.1). Well

81
decayed downed wood volumes were significantly higher in the uncut treatment than in the
1/3 partial harvesting while similar amounts were observed in the 213 partial harvesting, the
clear-cuts and the controlled burn treatments.
a c
Coll u~ uneut 113 partW eut 2l 3 partial eut c•.n ct1t Conuol bum Con~ uncut 113 parMI eut 213 pa.nia.l eut C"-ar eut Control b:um
., ~ > g
c
Control uncut 113 partial eut ZJ3 partial eut Cko:ar eut Conttoi bum Control uncut 113 partiaJ eut 2/3 partial Cllt Cle.ar eut Control bvm
c .... Conttof ufiCVt 1!3 p.utW eut 213 pa.rtal eut Clear eut Controt bum
Figure 3.1 Predicted woody debris (WD) volumes (and standard error) according to harvesting treatments (m3 ha.1
). Different letters above the bars indicate a significant difference between categories (Tukey's test at P :::; 0.05).
3.4.1 Fungal richness and diversity
A total of 191 trembling aspen logs and 48 snags were successfully analyzed for
species richness (S) and species diversity (H') by DGGE. We found a total of 35 different
DGGE bands (or OTUs) on logs and 31 on snags. The mean number ofDGGE bands per log

82
was 5.5 (minimum of 1 and maximum of 20) and 5.4 (minimum of 1 and maximum of 12)
for snags.
For logs, model L2 (log physical variables) had the highest AICc weights for both S
and H' (Table 3.2). For H' the model had an insufficient Akaike weight (i.e AICcWt < 0.9),
meaning that more than one model could explain the data equally well, and model averaging
was used. However, species richness could be explained by model L2 only and model
estimates were computed only for variables included in this model (Table 3.3). Our results
indicate that, independently from harvesting intensity, large well-decayed logs (> 10 cm of
decomposition classes 4 and 5) had higher richness and diversity. These logs had 11.8%
higher diversity than small class 3 logs and 9.3% higher than large class 3 logs (Table 3.3).
Richness was also higher in large decomposed logs with an increase of nearly 2 OTUs
(compared to small, medium decayed wood) and 1.5 OTUs compared to large, medium
decayed wood, corresponding to increases of 10% and 7.5%, respectively.
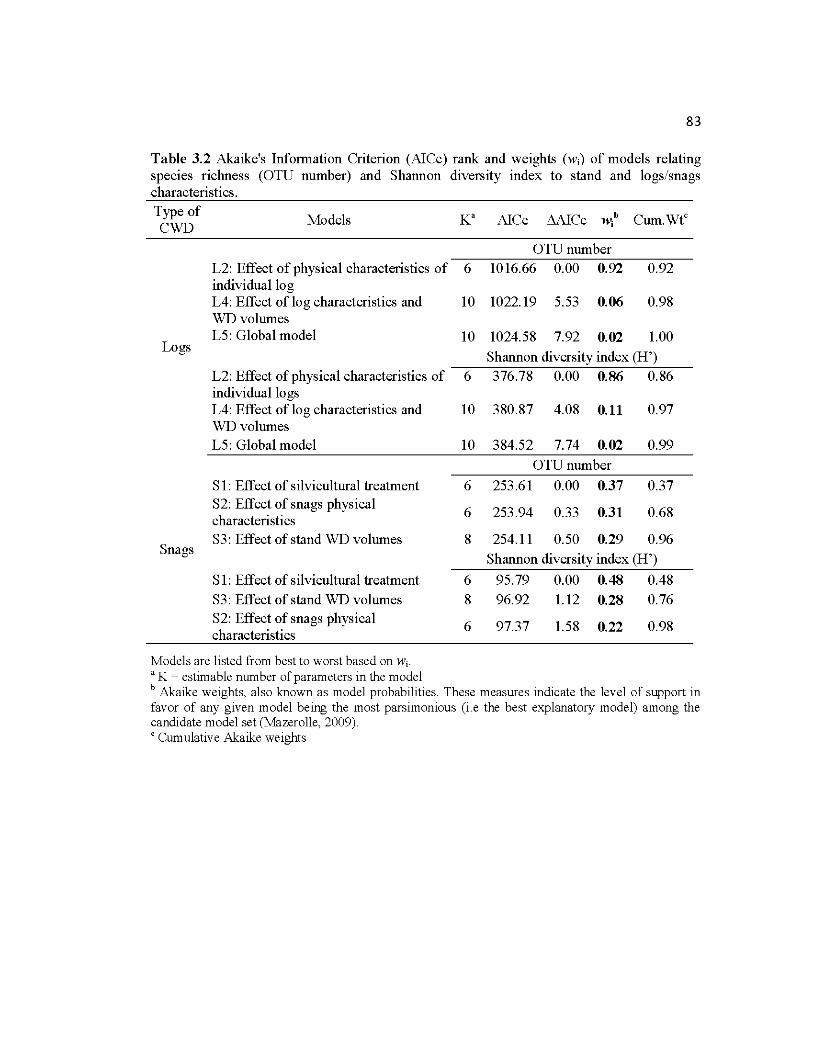
83
Table 3.2 Akaike's Information Criterion (AICc) rank and weights (wi) of models relating species richness (OTU number) and Shannon diversity index to stand and logs/snags characteristics. Type of
Mo dels K" AI Cc ~Cc w,b Cum.Wtc CWD 1
OTUnumber L2: Effect of physical characteristics of 6 1016.66 0.00 0.92 0.92 individuallog L4: Effect oflog characteristics and 10 1022.19 5.53 0.06 0.98 WDvolumes L5: Global model 10 1024.58 7.92 0.02 1.00
Logs Shannon diversity index (H')
L2: Effect of physical characteristics of 6 376.78 0.00 0.86 0.86 individuallogs L4: Effect oflog characteristics and 10 380.87 4.08 0.11 0.97 WDvolumes L5: Global model 10 384.52 7.74 0.02 0.99
OTUnumber
S 1: Effect of silvicultural treatment 6 253.61 0.00 0.37 0.37 S2: Effect of snags physical
6 253.94 0.33 0.31 0.68 characteristics S3: Effect of stand WD volumes 8 254.11 0.50 0.29 0.96
Snags Shannon diversity index (H')
S 1: Effect of silvicultural treatment 6 95.79 0.00 0.48 0.48 S3: Effect of stand WD volumes 8 96.92 1.12 0.28 0.76 S2: Effect of snags physical
6 97.37 1.58 0.22 0.98 characteristics
Models are listed from best to worst based on wi.
• K =estimable number of parameters in the madel b Akaike weights, also known as madel probabilities. These measures indicate the level of support in favor of any given madel being the most parsimonious (i.e the best explanatory madel) among the candidate madel set (Mazerolle, 2009). c Cumulative Akaike weights

84
Table 3.3 Effect of stand and logs characteristics on Shannon diversity index and OTU number. Model averaged estimates and unconditional standard errors were obtained from linear mixed multimodel inference (see table 3.1 for models specifications). Only variables with confidence interval > 95% are presented.
Type of Mo del
Unconditional 95% unconditional
Exp lana tory variable averaged confidence interval CWD SE
estima te Lower Upper
OTU number (S)
Small fresh logs -1.94 0.60 -3.10 -0.77
Large fresh logs -1.46 0.60 -2.64 -0.27 Logs Shannon diversity index (H')
Small fresh logs -0.33 0.11 -0.55 -0.11
Large fresh logs -0.26 0.11 -0.48 -0.04
Fine wood;y debris volume -0.02 0.01 -0.05 -0.001
OTU number (S)
Snags Fine woody debris volume -0.29 0.11 -0.5 -0.08
Shannon diversit;y index (H' )
Fine woody debris volume -0.05 0.02 -0.09 -0.01
' 'Uncut" was the reference level for silvicultural treatment and "large (> 10 cm) decomposed log" is the reference level for diameter and decay class .
Assessing the interaction between treatment and log size by comparing diversity and
richness between large logs and small logs located in the same treatment units, species
diversity increased by 33.7% (estimate = 0.80 ± 0.36; p=0.03) and richness by 27.9% (i.e. 4.2
OTUs; estimate = 4.20 ± 1.73; p=0.02) in large logs but the difference was only significant
between controlled hum and uncut treatments (Fig. 3.2).
Finally, we also found fungal diversity on logs to decrease with increasing fine
woody debris (FWD) volume (i.e. woody debris with diameter < 5 cm). For each increase of
1m3 ha-1 in FWD, fungal diversity decreased by 0.7%.

(/) (/) Q) c .L (.)
~c
(/)
Q)
'ü Q)
o. (/)
c Q) (.)
c Q) L.. Q) t 0
N
0
N 1
• Control uneut • 1/3 partial eut • 213 partial eut
Clear eut Control burn
85
Silvïcuttural treatments
Figure 3.2 Fungal species richness mean differences and standard errors between large and smalllogs in five silvicultural treatments (based on predicted data).
For snags, model3 (snag physical variables) has the highest AICc weight for both H'
and S (Table 3.2). However, the Akaike weight is not sufficient (i.e AICcWt < 0.9) so we
used model averaging to determine which variables influence fungal richness and diversity
on snags (Table 3.3). We found that trembling aspen snags had a slightly lower fungal
diversity when fine woody debris volume increased. Increasing the FWD volume (i.e woody
debris with diameter < Sem) of 1 m3 ha·1 lead to a decrease of 2.4% in fungal species richness
and a decrease of 2.2% in fungal diversity (Table 3.3).
3.4.2 lndicator species
Following the indicator species analysis, we found two OTUs that exhibited
preference for logs at advanced stages of decay (classes 4 and 5): OTU #27 (most similar to
P hlebiella christiansenii, accession number EU118659) and OTU #31 (indicator value: 0.30
and 0.10 respectively, P < 0.05).

86
OTU #13 is found mainly on snags. Two other OTUs, #6 (Ascomycota) and #7 (Mortierella
sp. ), occurred mainly on snags of the one third partial eut stands (indicator value: 0.08, P <
0.05 for both). Also, OTU #25 was preferentially found on snags which had recently died
(indicator value 0.75, P < 0.10).
3.4.1 Relationships between frmgal communities and spatial distribution
of snags and logs
We used the Mantel statistic based on Pearson's product-moment correlation to
compare the fungal community composition with a dissimilarity matrix based on the spatial
distance between dead wood. We did not find any correlation between OTUs fungal
community dissimilarity matrix (based on DGGE bands and the Jaccard coefficient) and
geographie distance matrix of logs and snags. Including both log and snag data in the same
analyses give a Mantel statistic r of -0.0009 and a significance of 0.491. Data with logs only
gave an r value of -0.0168, with significance of0.769. Finally data including only snags gave
an r value of0.0539, with a significance of 0.129.
3.4.3 Community composition
We successfully cloned and identified 22 OTUs (35 OTUs total) observed on the
DGGE gels (Table 3.4).

Table 3.4 Sequence analysis of bands excised from DGGE gels.
OTU Most closely related fungal Similarity (%) Accession no. of sequence related sequence
4 P ho li ota jlavida 99 JF908576.1 5 Leptodontidium elatius 97 FJ903294.1 6 Uncultured Ascomycota 95 JF960616.1 7 Uncultured Mortier ella 99 FJ553782.1 8 Calocera cornea 99 AY789083 11 Resinicium bicolora 99 DQ826535 15 Ascocoryne cylichnium 99 FJ903373 16 Hyalodendriella betulae 93 EU040232.1 17 Phellinus cinereusb 99 AY340049 18 Ascocoryne sp. isolate 97 FJ903331 19 Dermateaceae sp. 91 FJ554419.1 20 Athelia neuhoffii 95 U85798.1 21 Phlebia centrifuga 99 L43380.1 22 Bjerkandera adusta 98 FJ903353
23 Uncultured fungus isola te
100 HM015681 DGGE gel band
24 Bisporella citrina 98 AY789386.1
25 Uncultured fun gus clone
86 FJ758813 Singleton_ 24-2804 _ 23 53
26 Phialophora sp. 100 FJ903315.1 27 Phlebiella christiansenii 100 EU118659 28 Uncultured fungus 99 FM999613 29 Uncultured fungus 83 FJ778188 30 Pleurotus ostreatus 98 AY540325.1
Most similar Genbank accessions number and percent sequence similarities for the OTUs
": sa me similarity to FJ 55 4463 (Uncultured Agaricomycetes clone LTSP _ EUKA _ P6P23) b: same similarity to Phellinus nigricans (AF200239)
87
Logs and snags were colonized by different assemblage of fungal communities
(Table 3.5) with snag communities representing a subset of that found on logs (Fig. 3.3). The
between-sample distances (or dispersion variance) resulting from the community analysis
confirmed that all significant effects in community composition were caused by differences
in community centroids (i.e. means) rather than community dispersion (i.e. variability).

88
Table 3.5 Effect of harvesting treatment, decomposition class, diameter, snag height, woody debris volume and type of WD (snag/log) on species assemblage and variability of fungi associated with dead wood.
Logs dataset Snags dataset All type of wood dataset
Centroid Variance Centroid Variance Centroid Variance
Treatment R2=0.020 F=0.49 R2=0.043 F=1.169 R2 =0.014 F=0.990 ?=0.578 ?=0.745 P= 0.365 ?=0.3194 ?=0.769 ?=0.4137
Log diameter and R2=0.016 F= 0.116 NA NA NA NA
decomposition P=0.05 ?=0.734 class
Snag height NA NA R =0.042 F=0.239 NA NA P=0.025 ?=0.6273
Snag diameter NA NA R =0.007 F=0.0578 NA NA P=0.940 ?=0.811
Medium decayed R2=0.005 F= 0.046 R2= 0.010 F=0.239 R2=0.003 F=0.122 WDvolume P=0.603 P=0.955 ?=0.780 ?=0.789 ?=0.843 ?=0.885
FWDvolume R2=0.003 F= 0.1041 R2= 0.050 F=0.096 R2 =0.007 F=0.164 ? =0.807 ? =0.901 P=0.008 P=0.909 P=0.093 ? =0.849
Medium size R2=0.012 F= 1.880 R2=0.034 F=0.263 R2 =0.005 F=2.275 WDvolume P=0.006 ? =0.155 ? =0.120 P=0.610 ? =0.397 P=0.105 Large WD R2=0.010 F= 0.874 R2= 0.015 F=0.356 R2 =0.003 F=O.ll6
volume P=0.044 ? =0.419 P =0.529 ? =0.702 ? =0.757 ? =0.317
TypeofWD NA NA NA NA R2 =0.012 F=2.801 P=0.004 P=0.096
R2 values represent the proportion of variation each factor contributes to the total variation in the dataset. "NA" indicates non-applicable. F corresponds to the F value. Each variable for the centroid analyses was tested marginally (type III test).
The following OTUs explained the greatest proportion of the variation in fungal
community composition (based on multivariate analyses) and are ordered according to their
fitness with dead wood type (log or snag). Highest (or lowest) values exp lain the highest
proportion of the variation in fungal community composition between logs and snags due to
OTU. Positive values indicated that the fungal species is preferentially found on logs and
negative values for OTUs found on snags. The OTUs are: OTU 13 ( -0.0964 ), Resinicium
bicolor ( -0.0824), OTU 14 ( -0.0688), A th elia neuhoffii (0.0613), OTU 29 ( -0.0542),
Phellinus cinereus (0.0513), OTU 10 (-0.0480), Calocera cornea (0.0471), Phialophora sp.
(-0.0456) and OTU 28 (-0.0428).

89
Fungal communities on snags differed according to overall snag height and variation
in fun gal assemblages was also related to the volume of surrounding fine downed wood. Snag
height and volume of fine woody debris explained the highest proportion of variation in
community composition (Table 3.5). OTUs on snags that were the most influenced
(positively or negatively) by snag height are: P. cinereus (0.0266), Bisporella citrina
(0.0199), Phialophora sp. (-0.0180), Dermateaceae sp. (0.0175), OTU 9 (-0.0167), OTU 10
(-0.0162), Phlebiella christiansenii (-0.0133), OTU 14 (-0.0131), A. neuhoffii (0.0125) and
OTU 12 ( -0.0111 ). The following OTUs on snags were the most strongly influenced
(positively or negatively) by fine woody debris volume: Phlebia centrifuga (0.0651), OTU 14
( -0.0624), Ascocoryne cylichnium ( -0.0615), Dermateaceae sp. ( -0.0606), OTU 23 ( -0.0591),
OTU 25 (-0.0561), OTU 29 (-0.0480), OTU 28 (-0.0464), R. bicolor (-0.0447) and OTU 10 (-
0.0412).
Fungal communities colonizing logs differed according to the diameter and
decomposition class of the sampled log (Table 3.5). Diameter and decay class explained the
highest proportion of the variation in composition (Table 3.5). Harvesting treatments had no
significant direct effects on log communities (Fig. 3.3, Table 3.5). In comparing large well
decomposed logs with small and large fresh logs, the following OTUs explained the highest
proportion of the variation in fungal community composition (positive values indicate that
the fungal species was preferentially found on small and large fresh logs while those with
negative values were found on large and well decomposed logs): OTU 23 (0.0232), P.
christiansenii (-0.0181), P. centrifuga (0.0134), Phialophora sp. (-0.0105), A. neuhoffii
(0.0099), Ascocoryne sp. (-0.0087), OTU 25 (-0.0067), Bjerkandera adusta (0.0051), OTU
32 ( -0.0047) and B. citrina ( -0.0037).
Large and medium size class (7.6-12.5 cm diameter) woody debris volumes affected
fungal community composition on logs. Well-decomposed woody debris volume was not
included in the analysis due to its high correlation with total CWD volume (data not shown).
OTUs on logs that were the most influenced (positively or negatively) by medium size
woody debris volume are: P. centrifuga ( -0.0097), B. citrina (0.0059), Phialophora sp.
(0.0042), A. neuhoffii ( -0.0030), Hyalodendriella betulae (0.0029), B. adusta (-0.0025), P.
christiansenii (0.0024), Dermateaceae sp. (0.0023), P. cinereus (-0.0021) and OTU 23 (-

90
0.00 15). OTUs on logs that were the most influenced (positively or negatively) by large size
woody debris volume are: Phialophora sp. (-0.0018), B. citrina (-0.0014), OTU 23 (0.0013),
B. adusta ( -0.0013), P. centrifuga (0.0012), OTU 25 (0.0009), OTU 29 (0.0007),
Dermateaceae sp. ( -0.0006), P. cinereus (0.0006) and OTU 14 (0.0005).

91
Snags Legs decomposition class 3 Legs decomposition class 4-5
; ~ _____ dlm~:;;~ l Contro l uncut
; =-o=dl:IJorn~=odlbrno[b=---- ;l~~~~ 1 3 5 1 s r 13 15 11 ·s 21 23 25 21 23 J J 33 30 , -3 5 1 9 11 13 ~~ l7 19 21 23 2.5 27 29 31 33 35 1 3 s 1 s n 13 15 11 t3 21 23 25 21 2'3 31 33 35
~1-~~~;~L ~l ~~~~~~~ ~l~~&j~L 1 3 5 7 9 11 lJ 15 17 •9 21 23 25 2j 2.a 31 3:?. 35 1 3 5 1 9 11 13 15 17 19 21 23 25 27 29: 3\ 33 .35 1 3 5 7 9 H l.3 15 17 l9 21 23 25 27 29 31 l3 35
G> g l 213 partial eut Q. o E "'
~ ; __ _lJcriLOJoetibW~rn~Cb_o[L ~l ~~~~~~ ; 1 ŒÜTIL~~~L 1 3 s 1 s n 1J ts 11 ·s 21 23 25 r. 23 2.1 33 35 1 3 5 1 s n t3 t5 l7 19 21 23 25 21 25 3t 33 .35 1 3 5 1 9 n 13 15 11 19 21 23 25 21 29 31 l3 35
; j _ollitiill~~~~~ ; J~-~~~~L 1 -3 5 7 9 11 13 15 17 19 21 23 Z5 27 29: 31 33 J.5 1 3 5 7 9 U '-3 15 17 IS 21 23 25 21 29 31 33 35
Figure 3.3 Histograms showing the proportion of samples (abundance) colonized by the 35 OTUs distinguished by DGGE profiling in relation to silvicultural treatment for trembling aspen logs (decomposition classes 3 and 4-5) and snags.

92
3.5 Discussion
Environmental changes, including human disturbances, have a striking impact on the
biodiversity of ecosystems. Using molecular techniques, we have described variation in
saproxylic fungal communities related to silvicultural practices that mimic canopy
succession, graduai stand break-up and clear-cutting to reinitiate even-aged stands (Harvey et
al., 2002 ; Harvey & Brais, 2007). Our results confmn the negative effects of intense
silvicultural practices on saproxylic fungal communities (Müller, Engel & Blaschke, 2007 ;
Müller, Hothom & Pretzsch, 2007) but they also highlight the benefits of alternative
treatments to clear-cut, such as partial cuts. At the stand level, it is assumed that retaining
forest structures in managed stands through practices such as partial harvesting and green tree
retention should allow for the maintenance of ecosystem functions and biodiversity at the
stand level (Sippola, Lehesvirta & Renvall, 2001). Sippola et al. (2004) and Muller et al.
(2007) found that by maintaining higher substrate availability, partial harvesting mitigated
the negative effects of harvesting on saproxylic fun gal species richness and composition. Our
results represent a further contribution toward constructing a framework for the conservation
of saproxylic fungi in these systems.
We had hypothesized that species richness and diversity of saproxylic fungi would
decrease with the intensity of harvesting in as pen stands. Although we did not fmd evidence
for a direct relationship between treatments and fungal richness or diversity, we did find that
fungal diversity on logs and snags was negatively related to the volume of FWD, which in
tum, increased with stand harvesting intensity and reached maximum values in clear-cuts and
control burns (Fig. 3.1). Sippola et al. (2004) found that increased logging intensity decreased
the number of polypore observations in four forest site types dominated by Pinus sylves tris or
Picea abies, indicating reduced substrate availability and while species richness was not
directly affected by logging intensity, no virgin forest fungal species or threatened species
were found in the most disturbed sites. As clear-cuts contained higher FWD volumes than
controlled hum, partially harvested or unharvested stands, we might expect that clear-cutting
is the most disruptive treatment with respect to the conservation of saproxylic fungal
diversity. We can infer from our results that fungal diversity decreases with harvesting
intensity, despite larger volumes of residual small diameter logs left on the ground indicating

93
that small logs may not be sufficient to mitigate the effect of harvesting on saproxylic
communities diversity. Heilmann-Clausen and Christensen (2004) found that FWD
harboured more species per volume than did larger diameter class of deadwood (based on
sporocarps in unmanaged forest). Molecular techniques allowed us to detect fungal hyphae
without fructifications and that may explain differences between our observations and those
based on fruiting bodies. In Heilmann-Clausen and Christensen (2004) study, fungi might
preferentially produce fruit bodies on fine woody debris but be present on larger logs as well.
Similar asymmetries between direct molecular studies and fruiting occurrence have been
widely reported for ectomycorrhizal fungi (Gardes & Bruns, 1996).
We observed that logs and snags had different community composition (Table 3.5 &
Fig. 3.3). Resinicium bicolor (Basidiomycete) and Phialophora sp. (Ascomycete) tended to
be associated with snags while Athelia neuhojfii, Phellinus cinereus (white rot usually found
on Betula sp. and Populus sp.) and Calocera cornea (brown rot found on deciduous wood)
were preferentially found on logs. Snags and logs fungal communities reacted differently to
the residual volume of deadwood remaining on sites. Snags fungal communities were
affected by the volume of FWD while logs fungal communities were affected by the volume
of medium and large woody debris. Compared to unharvested stands, FWD volume was
highest in clear-cut stands, while medium and large size woody debris volume were lowest in
the clear-cut and controlled hum stands. These two treatments would most greatly change
fungal community composition. Fungal species on snags that were negatively influenced by
high volume of fme woody debris volume were: Ascocoryne cylichnium (Ascomycete
endophyte), Dermateaceae sp. (Ascomycete) and R. bicolor (Basidiomycete). On logs,
reducing the volume of medium size woody debris would decrease the abundance of
Bisporella citrina (Ascomycete), Phialophora sp. (Ascomycete), Hyalodendriella betulae
(Ascomycete), Phlebiella christiansenii (Basidiomycete) and Dermateaceae sp.
(Ascomycete). Similarly, reducing the volume of large size woody debris would decrease the
ahun dance of P. centrifuga and P. cinereus, both of which are white rot Basidiomycetes.
Woody debris volume in the stand was least affected in partial eut treatments,
especially medium size woody debris volume, which remained constant between partial eut
and unharvested stands. For large woody debris, their volumes in 113 partial eut and 2J3

94
partial eut were lower than those found in unharvested stands but higher compared to clear
cut and controlled hum stands. Renee, partial eut treatments, which more closely simulate the
natural forest succession in the absence of stand replacing disturbance, would lead to less
severe changes in fungal community (Lohmus, 2011). Nordén et al. (2008) also found that
species richness of Basidiomycota and Ascomycota declined significantly in partial eut
stands. In their study, total species richness was also significantly reduced on fine woody
debris, but not on coarse woody debris. However they compared fungal richness before and
after the partial eut without reference to more intense silvicultural treatments ( clear-cuts for
example).
The negative relationship between silvicultural intensity and saproxylic fungal
diversity can be seen in larger, well decomposed logs, as these tended to support high fungal
species richness and diversity and are more common in uncut stands (Fig. 3.1). Large well
decomposed logs were more frequently colonized by P. christiansenii (Basidiomycete),
Phialophora sp. (Ascomycete), Ascocoryne sp. (Ascomycete) and B. citrina (Ascomycete).
The most striking difference between small diameter and large diameter logs was observed
when comparing controlled hum stands with uncut stands (Fig. 3.2). In the highly disturbed
control burns, large logs may have a buffering effect with respect to solar exposition,
temperature, and precipitation, which contributes to the stability of these microclimatic
conditions. Conversely, the interiors of smalllogs are subject to greater variation especially
in the most open stands (Bader, Jansson & Jonsson, 1995 ; Sippola & Renvall, 1999). One
recommendation for biodiversity conservation during forest management would require the
retention of large diameter logs in the most disturbed treatments to act as potential refuges for
wood decay fungi. Fungal diversity at the stand level could also be increased by conserving a
variety of log species, such as spruces, which have been shown to support a higher fungal
diversity than other log species (Kebli et al., 20 11).
We expected fungal species assemblages to be more similar between logs or snags
with high connectivity (in close proximity to one another), but this relationship was not
observed in our study. This could be due to the effect of other variables influencing
community composition (humidity, temperature) that were not measured, or their effects may
have been obscured by our poo ling of all variables (decomposition class, silvicultural

95
treatment, etc.) for this analyses. Otherwise, and for reasons similar to those mentioned by
Penttila et al. (2006) with respect to habitat fragmentation, we had a high level of
connectivity (i.e the maximum degree of isolation for forest fragments was < 200 meters and
polypores and corticoid fungi are not dispersal-limited at the scale of 100-200 meters).
Indeed, the distance between our different stand treatments was not sufficiently large to
assess spore dispersion. Stand treatments within the FERLD are surrounded by forest, so a
continuous presence of deadwood may provide sources from a mixed fungal community to
colonize substrate through the soil (mycelium) or by air (spore) (Boddy, 2001). Finally we
could also have a chronological continuity of deadwood in our sites as the stands we sampled
had never been subjected to anthropogenic disturbance prior to harvesting. Further, coarse
woody decomposition dynamics were still under the influence of natural stand dynamics.
Under these conditions, sorne fungi could still be present to colonize freshly fallen wood
rapidly and indiscriminately (Edman, Kruys & Jonsson, 2004).
Our results underscore the negative effects that intense silvicultural practices exert on
the richness, diversity and species composition of saproxylic fungal communities. In
particular, the lack of large woody debris (Jonsson, Kruys & Ranius, 2005) and increases in
fine woody debris in managed stands negatively affect saproxylic fungi diversity. However
partial harvesting counteracts these effects by maintaining larger well decayed logs compared
to clearcut. Our findings agree with those of Lons dale, Pau tasso et Holdenrieder (2008), who
recommended adjustment of forest practices that threaten deadwood-dependent fungi to
achieve sustainable forest ecosystems. Given their predictive value, our results can lead to the
following recommendations with regards to the preservation of fungal biodiversity in the
context of ecosystem forest management:
I) Leaving only fine woody debris following harvesting is not sufficient to maintain
saproxylic communities and large and well-decayed aspen logs significantly increase the
number and diversity of species of saproxylic fungi. Increased abundance of large WD could
be achieved if sorne large fresh logs were left to decompose after harvesting. The refuge
effect of large diameter logs is particularly important in the most extreme treatments ( clear
cutting followed by prescribed buming). Several fungal species would benefit from the

96
deployment of these types of logs: P. christiansenii (Basidiomycete), Phialophora sp.
(Ascomycete) ,Ascocoryne sp. (Ascomycete) andE. citrina (Ascomycete).
II) Partial-cutting appears to be a reasonable approach to ecosystem management with respect
to wood decay fungi compared to even-age silvicultural practices. Our results differ from
those for forest floor microbial communities, in which partial harvesting does not appear to
have any benefit over clearcut harvesting in boreal forest sites (Hannam, Quideau &
Kishchuk, 2006). However, our results indicate that residual woody debris following
harvesting has stronger effects on the diversity and composition of saproxylic fungi than
harvesting intensity.

CONCLUSION GENERALE
L'objectif général de cette thèse était d'améliorer les connaissances sur l'écologie du
bois mort et des champignons décomposeurs qui lui sont associés en évaluant les facteurs qui
structurent les communautés fongiques dans les peuplements naturels et sous aménagement.
Il s'agissait également de vérifier les relations entre la diversité fongique et 1 'activité de
décomposition; et enfin de documenter les effets des coupes partielles sur les communautés
de champignons saproxyliques. Pour cela nous avons utilisés trois approches expérimentales
ou plans d'échantillonnage très différents :une chronoséquence de bois mort, une expérience
de décomposition et une étude expérimentale de sylviculture sur le terrain. Nous avons
nouvellement décrit en forêt boréale mixte canadienne les conditions environnementales et
leurs variations (volume de bois, temps, essence forestière, ... ) auxquelles certaines espèces
fongiques étaient plus sensibles ainsi que l'effet de l'aménagement forestier sur ces espèces.
Nous avons effectué ce travail en nous affranchissant des problèmes
méthodologiques liés à l'identification ou à la culture des champignons grâce aux méthodes
d'écologie moléculaire, encore très peu utilisées dans ce domaine (Rajala et al., 2010). Ces
techniques ont permis d'étudier la diversité des hyphes plutôt que d'identifier les
fructifications, ce qui expliquerait les différences entre nos observations et celles basées sur
les fructifications concernant l'hôte privilégié par une espèce fongique (Boddy, 2001). Ces
études pourraient avoir sous-estimées la distribution de l'espèce dans la mesure où le réseau
d'hyphes de certains champignons serait peu spécifique à une essence de bois, mais ce
champignon pourrait fructifier préférentiellement sur une essence particulière. Les
sporocarpes ne révèlent pas la richesse entière présente mais seulement celle des espèces qui
ont fructifié au moment de l'échantillonnage et il est reconnu que les études basées sur
1 'observation des sporocarpes ont des limitations certaines (Boddy, 200 1 ). A la différence des
inventaires de fructifications, la DGGE ne sous-estime pas la diversité fongique car elle
détecte des espèces fongiques importantes mais discrètes, qui restent sous forme de mycélium
et ne fructifient pas (Rajala et al. , 2010 ; Stenlid, Penttila & Dahlberg, 2008). Les inventaires

98
des fructifications fongiques sont considérés comme «la partie visible de l'iceberg» dans la
mesure où la distribution et l'abondance des sporocarpes ne reflètent pas forcement la
distribution et l'abondance du mycélium. Ainsi, l'absence de sporocarpes dans l'échantillon
ne signifie pas que le champignon est absent. Le chapitre 2 n 'aurait pas pu être réalisé sans
l'aide de méthodes moléculaires car il n'y avait que très peu de fructifications pendant toute
la durée de l'étude. On n'aurait pas pu détecter la succession fongique. De même, pour le
chapitre 3, la différence entre nos résultats et ceux de Heilmann-Clausen et Christensen
(2004) concernant la richesse fongique sur les débris ligneux fins peut aussi s'expliquer par le
fait que nous avons détecté la présence de mycélium. Les différences entre les études basées
sur des méthodes moléculaires et sur la présence de fructifications ont été démontrées pour
les champignons ectomycorhiziens (Gardes & Bruns, 1996). D'ailleurs dans notre étude, la
présence de mycorhizes dans les billes souligne l'importance du bois mort dans le cycle des
nutriments des écosystèmes forestiers.
Bien que toute approche ait ses avantages et ses inconvénients, la technique de
DGGE utilisée dans cette thèse fournie une vue suffisamment précise des variations des
communautés de champignons saproxyliques en fonction des différentes conditions
environnementales. Bien que cette technique puisse sous-estimer la diversité par rapport aux
approches plus récentes telles que le pyroséquencage par exemple (Ovaskainen et al., 2010),
l'objectif de notre étude n'était pas tant de se focaliser sur la composition totale et exhaustive
de la communauté fongique mais plus sur les variations de ces communautés entre les
échantillons. Par ailleurs, étant donné le nombre très élevé d'échantillons dans notre étude, de
telles méthodes auraient conduit à des coûts rédhibitoires et on n'aurait pas pu analyser autant
d'échantillons. Bien que réduit au mieux de nos possibilités, tout biais (limitation pour la
détection d'espèces rares, comigration de différentes espèces dans les gels ou le fait que
certains champignons puissent générer plus d'un seul fragment) reste constant entre
l'ensemble de nos échantillons. L'analyse des séquences des principales bandes a écarté la
possibilité d'artefacts formés lors de la PCR.
Cette thèse se démarque également des études réalisées en Scandinavie où les forêts
ont un long historique d'aménagement intensif. En forêt boréale européenne, Junninen et
Komonen (2011) ont postulé qu'un seuil minimum de volume de bois mort de 20 à 40m3 ha·1

99
était requis pour la présence de polypores rares. Cependant les communautés de champignons
en Fermo-Scandinavie pourraient déjà avoir été modifiées à cause de l'aménagement
forestier. En effet, dans l'étude de Nordén et al. (2008) ayant pour objectifs de caractériser
l'effet des coupes partielles sur les champignons, le volume de bois mort est faible avant le
traitement sylvicole (14m3 ha.1). Dans notre étude en peuplement non aménagé, le volume
inventorié était d'au moins 87 m3 ha·1. Donc les espèces fongiques pourraient être déjà
modifiées par le volume de bois mort moindre. Dans cette thèse, les peuplements sont
naturels et les traitements sylvicoles réalisés sont les premières interventions anthropiques.
Nos résultats expliquent donc les variations des communautés fongiques naturelles et natives.
Nous avons trouvé que ces communautés étaient affectées par des changements dans le
volume de bois mort même si ceux-ci restent à des niveaux élevés (90 à 130 m3 ha.1) par
rapport à ce que l'on retrouve en Europe.
Les communautés fongiques saproxyliques en peuplements naturels
Les principales espèces de champignons décomposeurs que nous avons analysés en
conditions naturelles (chapitre 1) semblent être des espèces généralistes dans la mesure où on
les retrouvait sur une grande proportion des billes échantillonnées. Cependant, le principal
facteur influençant la diversité, la richesse ainsi que la composition des communautés sur les
billes, était l'essence même de la bille. En particulier, les billes d'épinettes supportaient le
plus grand nombre d'espèces et une plus grande diversité fongique. Cet effet de l'essence de
la bille est en accord avec d'autres études basées sur l'observation des fructifications
(Kubartova et al., 2007 ; Y amashita, Hattori & Abe, 20 10) et sur la culture sur milieu
synthétique (Lumley, Gignac & Currah, 2001). Contrairement aux autres études se
concentrant sur moins d'essences (probablement parce que la diversité des essences en
Scandinavie est plus faible), notre étude se démarque également par le prélèvement
d'échantillons à partir de cinq essences différentes, y compris pour des stades très avancés de
décomposition. L'identification à l'aide des structures anatomiques observées sur lames
minces était alors nécessaire.
Bien que différentes études aient identifié le stade de décomposition des billes
comme étant un facteur important influençant la richesse spécifique ou la composition des

100
communautés fongiques saproxyliques (Heilmann-Clausen & Christensen, 2003 ; Lumley,
Gignac & Currah, 2001), nous n 'avons pas trouvé de preuve directe d 'une telle relation.
Cependant, la composition des communautés était reliée à la composition chimique de la bille
qui est elle-même dépendante de l'essence de la bille et du stade de décomposition
(Moorhead & Sinsabaugh, 2000). Nos résultats ont pu être dû au fait que la composition
chimique a été évaluée en prélevant un échantillon de bois aussi près que possible de
l'échantillon servant à l'analyse de diversité moléculaire. Au contraire, le stade de
décomposition est évalué sur la bille entière ou sur une très grande proportion. Ainsi, la
concentration en lignine et en hémicelluloses est un meilleur prédicteur de la décomposition
que la classe de décomposition à cause principalement des conditions hétérogènes régnant à
l'intérieur de la bille (Pyle & Brown, 1999).
Le stade successionel des peuplements influence également la composition des
communautés saproxyliques par le biais des différences entre les volumes de bois mort ainsi
que par une composition forestière différente qui mène à des débris ligneux de différentes
espèces. En particulier, les vieilles forêts (feu de 1760 dans notre étude) supportent un
assemblage de champignons saproxyliques différent à cause du volume de bois mort plus
faible et de la proportion de conifères plus élevée. L'influence du volume de bois mort sur les
communautés fongiques a été montré dans les forêts boréales scandinaves (Penttila, Siitonen
& Kuusinen, 2004; Sippola, Mônkkônen & Renvall, 2005).
Cependant, différentes communautés fongiques ne réagissent pas forcement de la
même façon aux variables environnementales. En effet, Jônsson, Edman et Jonsson (2008)
ont montré que les colonisateurs fongiques primaires étaient influencés par les premiers
stades de décomposition du bois tandis que les utilisateurs secondaires l'étaient plus par le
diamètre de la bille ou la connectivité du bois mort. En analysant les communautés dans leur
ensemble, on peut manquer de telles différences. C'est pourquoi nous nous sommes
concentrés sur les espèces de début de succession dans notre étude sur la relation diversité
fongique-fonction de décomposition du bois (chapitre 2).

101
Colonisation initiale
L'expérience de décomposition sur des blocs de bois frais (chapitre 2) a permis de
montrer que dans une variété de peuplements (des vieilles forêts jusqu'aux brulis ), le bois
mort frais était colonisé par des assemblages d'espèces fongiques pionnières similaires
(seulement pour les premiers mois de colonisation). Après un an, les communautés fongiques
se différencient entre les deux essences (tremble et sapin). De plus cette colonisation se
déroule rapidement car le nombre maximum d'espèces fongiques était retrouvé une année
seulement après la mise en place des blocs de bois.
Pour les espèces pionnières, le temps et la surface terrière en feuillu sont les
principaux facteurs affectant la diversité et la richesse des champignons (pour le bois de
sapin). Dans cette étude, le volume de bois mort n'a que très peu d'impact sur la diversité
fongique du bois de tremble et de sapin (chapitre 2) alors que les volumes de bois mort dans
tous les traitements étaient relativement élevés (minimum de 56.7 m3 ha.1). De plus, les
peuplements n'ont été soumis qu'à très peu de perturbation anthropique avant notre étude.
Ainsi, la dynamique du bois mort serait encore sous l'influence de la dynamique naturelle et
dans ces conditions, l'apport de bois mort provenant d'une diversité d'essences d'arbres
pourrait servir de réservoir d'espèces de champignons capables de coloniser rapidement le
bois mort frais (Edman, Kruys & Jonsson, 2004). Cependant dans l'étude sur la
chronoséquence de bois mort (chapitre 1), le volume de bois mort avait un effet sur la
composition des communautés fongiques retrouvées sur les billes alors que les volumes de
bois mort étaient au minimum de 89.7 m3 ha·1. Cette seconde étude (chapitre 2) semble donc
indiquer que les espèces pionnières sont moins affectées par les variations de volume de bois
mort et qu'elles sont également plus aptes à se maintenir dans les peuplements ayant des
volumes de bois mort plus faibles. Les espèces arrivant plus tardivement dans la succession
fongique seraient ainsi plus fragiles vis-à-vis du volume de bois mort sur le site. Ceci
confirme les résultats de Jonsson, Edman et Jonsson (2008) pour lesquels les colonisateurs
primaires et secondaires étaient influencés par différentes variables. Enfin, les compositions
des communautés pionnières étaient identiques la première année sur le bois de tremble et de
sapin puis se différenciaient. Les communautés retrouvées sur les billes à des stades plus
avancés de décomposition et donc de succession fongique sont quant à elles clairement
102
différentes. Les communautés saproxyliques pionnières seraient plus opportunistes ce qui se
traduit par une moins grande sensibilité à l'essence de bois mort par rapport aux
communautés arrivant plus tardivement dans la succession.
Relation entre diversité fongique et décomposition du bois mort
A notre connaissance, aucune étude ne s'était intéressée à l'activité des
décomposeurs du bois en relation avec leur diversité moléculaire le long d'un gradient de
perturbation. Nous avons clarifié ces phénomènes, en particulier l'activité pour les espèces
pionnières. Les différents taux de décomposition observés entre le tremble et le sapin
pourraient être reliés aux interactions compétitrices sous des conditions variables de
disponibilité en nutriments. Bien que la respiration augmente au cours du temps pour les deux
essences (tremble et sapin) ; cette augmentation proviendrait de deux processus distincts :une
augmentation de la compétition chez le sapin et une augmentation de la minéralisation chez
le tremble. Nos résultats ont montré des différences notables entre le tremble et le sapin en ce
qui concerne les facteurs influençant la diversité et l'activité des colonisateurs primaires dans
les peuplements naturels et aménagés. Même si les communautés semblent initialement
similaires (paragraphe précédent : colonisateurs), elles divergent par la suite et réagissent
différemment aux conditions environnementales (perturbation, temps, composition du
peuplement) selon l'essence de bois qu'elles colonisent. Dans le chapitre 1, nous avons vu
que l'essence du bois jouait un rôle primordial dans la diversité et la composition des
communautés; le chapitre 2 indique que l'essence intervient également dans l'activité
(décomposition) des champignons saproxyliques.
Nous avions émis l'hypothèse qu'il existait une corrélation positive entre la diversité
et l'activité des champignons dû au rôle complémentaire des différentes espèces fongiques.
Cependant, il s'est avéré pour le sapin que la respiration diminuait lorsque la diversité était
plus grande, témoignant d'une activité microbienne moins élevée lorsque la diversité
fongique est importante. Cette relation négative observée entre la diversité et la respiration
sur le sapin pourrait provenir des interactions compétitrices entre les champignons (Boddy,
2000) dans la mesure où elles auraient un coût énergétique notable (Wells & Boddy, 2002).
De plus, il a été démontré que la production de métabolites secondaires durant la compétition

103
interspécifique au lieu d'enzymes responsables de la dégradation du bois peut mener à une
réduction du taux de décomposition (Deacon et al. , 2006 ; Hiscox et al., 2010). Donc au
cours du temps, la diminution de la diversité, l'augmentation de la respiration, la diminution
d'une espèce fongique (Bjerkandera adusta) connue pour décroitre à cause du parasitisme et
le changement de la composition de la communauté alors qu'il n'y a quasiment pas de
décomposition; nous permettent de dire que l'augmentation de la respiration avec le temps
d'incubation observée chez le sapin proviendrait d'une augmentation de la compétition.
Enfin, l'augmentation de la respiration avec le temps d'incubation observée chez le
tremble traduirait une augmentation de la décomposition par une communauté fongique de
plus en plus homogène. Les composés aromatiques seraient moins concentrés chez le tremble
par rapport au sapin, en particulier concernant la proportion de lignines (Struckelj et al.
(données non publiées)). Ces composés aromatiques sont en effets connus pour réduire la
décomposition (Ganjegunte et al., 2004). Les lignines du sapin sont composées uniquement
de phénols vanillyl, tandis que les lignines du tremble sont composées d'unités syringyl et
vanillyl. Comme les phénols syringyl sont plus facilement dégradables que les phénols
vanillyl, alors cela indique que les lignines du tremble sont plus décomposables que celles du
sapin. De plus les espèces feuillues de la forêt boréale (tremble et bouleau blanc) ont un taux
de minéralisation supérieur à celui des essences de conifère telles que le pin ou l'épinette
(Brais, Pare & Lierman, 2006). Ceci est en accord avec nos résultats indiquant que le sapin se
décompose lentement tandis que le tremble présente une tendance à être dégradé rapidement
(Table 2.2). Or dans le chapitre 1, la composition chimique était reliée à 1 'essence de la bille
et au stade de dégradation. On peut donc en déduire que l 'activité des champignons
saproxyliques sera aussi affectée par les différentes essences de bois présentes en forêt
boréale ainsi que par le stade de dégradation. Ces différences d'activités soulignent encore
plus les différences relevées au niveau de la structure des communautés sur des essences
différentes (chapitre 1 ).

104
Les champignons décomposeurs et l'aménagement forestier 1
perturbation
Nous avons évalué l'effet des pratiques sylvicoles et des perturbations sur les
champignons décomposeurs par l'intermédiaire de la composition du peuplement, de la
surface terrière résiduelle, du volume de bois mort au sol ainsi que de la dimension et du
stade de décomposition des billes (ou des chicots). Cela pourrait guider les exploitants
forestiers et établir une aide concernant les recommandations de conservation de la
biodiversité dans un cadre d'aménagement écosystémique.
Dans le chapitre 1 et en peuplements naturels, nous avons vu que la diversité
fongique et la composition des communautés fongiques n'étaient pas influencées par la taille
des billes. Cependant dans le chapitre 3, les grosses billes bien décomposées supportaient
plus d'espèces ainsi qu'une plus grande diversité fongique. La différence de résultats entre
les deux chapitres peut s'expliquer par le fait que dans le chapitre 1, nous avons échantillonné
que des billes de plus de 10 cm de diamètre alors que les débris ligneux de faible diamètre
supportent une richesse et une abondance fongique non négligeables (Juutilainen et al.,
2011). De plus dans le chapitre 3, nous avons échantillonné une seule essence de bille alors
que le chapitre 1 portait sur cinq essences. Les différences de diamètre ont donc pu être
masquées par l'effet de l' essence de la bille. Ce phénomène pourrait aussi expliquer
l'absence d'effet du stade de décomposition dans le chapitre 1 alors que dans le chapitre 3 le
stade de dégradation influençait les communautés fongiques. D'autre part, le diamètre des
billes est particulièrement important dans les peuplements très perturbés comme les brulis. En
effet, l'influence du diamètre de la bille dépend du traitement sylvicole. Donc si on applique
des traitements sévères comme des brûlages, alors il vaudrait mieux conserver des grosses
billes qui agiraient en tant que refuges.
On s'attendait également à trouver des patrons de décomposition différents selon les
trois intensités de perturbation (traitements sylvicoles) et que la diversité et l'activité
(respiration) des champignons saproxyliques suivent les changements de structure du
peuplement (surface terrière résiduelle et volume de bois mort au sol) causé par le stade
successionel du peuplement et par la perturbation. Ni la richesse spécifique, ni la diversité, ni

105
la respiration des communautés fongiques pionnières n'étaient affectées par la perturbation
(chapitre 2). Seule la surface terrière résiduelle en feuillu avait un effet sur la diversité.
Cependant dans le chapitre 3, le traitement sylvicole avait un effet négatif sur la diversité et la
richesse des communautés fongiques saproxyliques par l'intermédiaire du volume de bois
mort résiduel. Ces résultats vont encore dans le sens que les espèces pionnières sont
généralistes et moins sensibles aux variations des conditions environnementales (changement
du volume de bois mort par exemple) que les espèces fongiques arrivant plus tard dans la
succession. Cependant la perturbation (bois de sapin) et le volume de bois mort résiduel
(corrélé significativement au traitement sylvicole) affectent la composition des communautés
fongiques. Par ailleurs, les conditions environnementales générées suites aux différentes
perturbations ont des effets opposés sur les taux de décomposition selon l'essence de bois que
l'on considère (chapitre 2). Plus la perturbation est importante et plus la décomposition est
ralentie chez le sapin. C'est pourquoi la densité du bois reste plus élevée dans les
peuplements les plus perturbés (brulis) (Table 2.2) où l'augmentation de la température du
bois suite à l'exposition au soleil peut limiter l'activité des microorganismes. Pour le tremble,
la densité du bois diminue (donc la décomposition augmente) plus rapidement dans les
traitements moyennement perturbés. Cette différence peut s'expliquer par l'autécologie des
essences d'arbres : le tremble est une espèce pionnière tandis que le sapin arrive plus tard
dans la succession forestière. Ainsi, les champignons décomposeurs pourraient être plus
efficaces sur le tremble dans des conditions de peuplement ouvert et plus perturbé tandis que
la décomposition du sapin serait facilitée par des espèces fongiques spécifiques à des habitats
qui n'ont subi que de petites perturbations comme ceux retrouvés à des stades plus avancés
de la succession forestière.
La signification écologique de nos résultats est remarquable dans un contexte
d'aménagement forestier. En effet, notre hypothèse était que la richesse spécifique et la
diversité des champignons saproxyliques étaient corrélées négativement avec l'intensité des
pratiques sylvicoles (chapitre 3). En fait, la diversité et la richesse diminuaient avec
l'augmentation du volume des débris ligneux fins et ces débris sont plus importants lorsque la
coupe est sévère (chapitre 3). De plus, les taux de décomposition dépendent de l'essence,
mais aussi du fonctionnement des communautés fongiques saproxyliques sous des conditions

106
environnementales particulières (intensité de perturbation) (chapitre 2). Donc, un changement
de la composition forestière dans le peuplement mènerait à un changement des essences de
bois mort et ainsi modifierait les taux de décomposition essentiels à la productivité forestière.
De la même façon, les pratiques sylvicoles font diminuer la quantité de DLG (chapitre 3).
Donc si on enlève certaines essences de billes alors on risque de perdre certaines espèces de
champignons en particulier les espèces fongiques sensibles arrivant tardivement sur le bois.
L'activité de décomposition pourrait être modifiée par ce biais en plus de l'effet direct du
traitement/perturbation. Donc dans le cas de pratiques sylvicoles qui favoriseraient les
peuplements équiens, cela entrainerait:
• une diminution de la diversité des communautés fongiques, en particulier s'il y a
moins de billes d'épinette (chapitre 1);
• un changement dans le processus de décomposition (chapitre 2) : la décomposition
du bois serait ralentie sur le sapin.
• une diminution de la diversité et de la richesse spécifique des communautés
fongiques par 1 'intermédiaire d'une diminution des grosses billes bien décomposées et une
augmentation du volume de petits débris ligneux (chapitre 3);
• une modification de la composition des communautés fongiques (chapitre 1; chapitre
2; chapitre 3).
Réaliser des brulages dirigés dans des peuplements non équiens, et notamment sur
des peuplements ayant du sapin, entrainerait un ralentissement de la décomposition du bois et
donc du cycle des nutriments (Hagemann et al., 2010 ; Palviainen et al., 2010). De plus les
peuplements soumis au brulis sont très différents de ceux issus de feux naturels car les
niveaux de bois mort après btûlage dirigé sont extrêmement faibles (chapitre 3) par rapport à
ce que l'on retrouve après une grande perturbation telle qu'un feu où l'on peut retrouver de
300 à 460 m3 ha·1 7 ans après un feu (Brassard & Chen, 2008 ; Seedre et al., 2011). Les
espèces fongiques arrivant tardivement dans la succession sont plus sensibles aux
perturbations. Donc si le volume de bois mort est réduit suite au brulis, alors il n'y aura pas
de réserve de champignons non-pionniers pour recoloniser le bois mort restant. Que ce soit
pour les communautés se développant en conditions naturelles ou soumises à des pratiques
sylvicoles, les deux chapitres ont montré l'importance de la quantité de bois mort. De plus le

107
volume de bois mort dans les peuplements est dépendant du stade successionel (chapitre 1).
Donc comme les traitements sylvicoles affectent aussi ce volume (chapitre 3), alors là encore,
il faudrait être prudent afin de choisir dans quel type de peuplement sera appliqué tel
traitement au risque sinon, de trop diminuer le volume total de bois mort.
C'est pourquoi l 'aménagement écosystémique par l'intermédiaire des coupes
partielles pourrait contrebalancer ces effets en conservant un volume de bois mort plus
important comparativement aux pratiques sylvicoles plus intensives telles que les coupes
totales ou les brûlages dirigés. Plus précisément, le volume de bois mort au sol de diamètre
moyen reste constant entre les coupes partielles et les peuplements non coupés. Concernant le
bois mort au sol de grand diamètre, les volumes dans les deux coupes partielles sont plus bas
que ceux retrouvés dans les peuplements non coupés mais plus haut que ceux restants après
une coupe totale ou un brulage dirigé. Donc, les coupes partielles, plus proches de la
successwn naturelle de la forêt en absence de perturbation majeure, entrainent des
modifications moindres dans les communautés fongiques saproxyliques. De plus, ces types
de coupe présentent un avantage pour la décomposition du tremble dans la mesure où celle-ci
est accélérée comparativement aux traitements sylvicoles intensifs mais aussi par rapport aux
peuplements non aménagés pouvant accélérer le cycle des nutriments (chapitre 2).
Espèces indicatrices
Malgré le fait que nous n'avons pas été en mesure de séquencer et d'identifier tous
les OTUs, nous avons trouvé plusieurs espèces (ou OTUs) indicatrices comme l'OTU « G »
(plus proche correspondance avec Calocera cornea), indicatrice des peuplements les plus
jeunes (1923) et qui est habituellement retrouvée sur les billes les plus exposées (conditions
typiques des peuplements naturels non aménagés les plus ouverts et les plus jeunes de notre
étude). L'OTU « M » est caractéristique des billes de tremble en peuplements naturels;
l'OTU « S »(plus proche correspondance avec le Basidiomycota Athelia sp.) est retrouvée
préférentiellement sur les billes de sapin et l'OTU « G »(plus proche correspondance avec le
Dacrymycete Calocera cornea) est indicatrice des peuplements de tremble issus du feu de
1923. Grâce au séquençage, il est possible de continuer l'identification des OTUs et donc
d'identifier l'espèce de champignon. D 'autre part, dans cette thèse certaines séquences

108
d'ADN les plus proches accessibles dans les bases de données ne correspondaient que
faiblement à nos séquences. C'est le cas des OTUs 25 et 29 qui avaient un pourcentage de
correspondance avec des séquences connus que de 86% et 83%. Il pourrait s'agir de
nouvelles espèces fongiques inconnues à ce jour (pour lesquelles la séquence n'est pas
disponible). Dans le chapitre 2, nous n 'avons pas retrouvé d'espèces indicatrices, ce qm
souligne encore que les champignons saproxyliques pionniers sont généralistes.
De futures études pourraient évaluer les assemblages des communautés fongiques
saproxyliques en mesurant des variables sur des échelles plus petites. En effet, la composition
de la communauté végétale de sous-bois pourrait influencer les communautés fongiques de
façon plus importante que les variables du peuplement (De Bellis, Kemaghan & Widden,
2007). En effet, dans les brulis la régénération est très faible alors que dans les coupes totales
au contraire la densité est très importante surtout en gaulis de tremble (observation
personnelle).

ANNEXE A
.. File View v. 1.02a Fïle Rroctlons Graphk:s Entry Level Wi1dow He~
., Edit - C:\DOCUME- 1\THIBEAUM\TIBO\HED1.EQA Fie tlameo CIDOQJMEô\ THIBEAUM\ TIBO\HED1.EQA Equation fle FieOa!eo WedJan 20 19:51.462010 Last Update: Fri Jan 22 03:10:46 2010
Ma:ster No: 67370002 lnstn..med Modet: NIRSystems 6500 Seriai No 67370002 c~ 3 NurberoiV«iables: l œü LabBM 01)1htal':tef
S-1 400 - 1098. 2 Segment2 1100 - 2498 2 ~ '""' N .... ,.. SD SEC ASO ECV PJR • Seo ADF 1 71 69.7261 4.2042 1 1154 0.92$ 1.5341 0.87&1 192 D
tiDF 1 73 88.0086 3.6211 1.7154 0.7756 19520 0.72113 188 0 UG 1 74 19.9618 7.6591 2.3003 0.~ 2.8992 0.8682 192 0
Sortie du logiciel (WiniSI software) suite au développement des équations de calibration
d'après les analyses chimiques (ADF;NDF;ADF -L) pour prédire la composition chimique
des échantillons selon la méthode de régression PLS (« partialleast square »).

110
Analyse 1 Analyse 2 Coefficient de variation
Echantillons ADF NDF LIG ADF NDF LIG ADF NDF LIG 1A111S 73,909 87,728 31,252 72,706 87,002 30,182 1,160 0,588 2,464
1A112S 75,866 91 '115 31,405 75,494 90,084 29,833 0,348 0,805 3,630 1A1131S 77,35 92,277 31,881 77,618 90,883 30,565 0,244 1,077 2,980
1A114S 77,68 92,914 31,464 77,516 91,222 30,008 0,150 1,300 3,349
1A121S 74,939 89,563 30,898 75,116 89,164 30,903 0,166 0,316 0,011
1A1231P 65,38 84,527 16,715 65,514 85,615 17,905 0,145 0,904 4,859
1A1231S 74,603 88,917 29,481 74,375 88,840 29,421 0,216 0,062 0,145
1A124P 68,613 88,826 14,129 68,601 88,131 13,398 0,013 0,555 3,758
1A124S 73,757 87,748 30,091 73,669 87,920 30,495 0,085 0,138 0,942
1A131P 65,149 85,666 15,069 65,827 85,679 14,883 0,732 O,ülO 0,879 1A131S 73,669 87,292 28,55 73,285 88,259 29,614 0,369 0,779 2,586
1A132P 67,686 87,738 16,346 67,472 87,114 15,379 0,224 0,505 4,309
1A132S 73,753 87,813 30,352 74,158 88,923 31 ,044 0,387 0,888 1,594
1A1331P 67,97 87,986 16,559 68,026 88,073 16,168 0,058 0,070 1,692
1A1331S 75,754 90,083 31,921 74,772 89,081 30,180 0,922 0,791 3,965
1A134P 67,223 86,952 16,203 67,987 87,558 16,242 0,799 0,491 0, 171
1A134S 76,02 90,602 31,559 74,941 89,466 30,481 1,011 0,892 2,458
1A215P 68,356 88,66 16,111 68,522 88,397 14,961 0,171 0,210 5,235
1A225P 66,281 83,446 16,653 65,949 84,772 17,711 0,355 1,115 4,354
1A225S 73,758 87,012 30,832 73,395 87,837 30,827 0,349 0,667 0,013
1A235P 67,3 87,624 14,915 67,680 87,474 14,695 0,398 0,121 1,051 1A235S 73,014 87,765 28,58 73,321 88,377 29,009 0,296 0,491 1,052
1A3110P 67,153 88,471 14,837 66,830 88,280 13,589 0,341 0,153 6,208
1A3110P 67,025 88,257 14,914 67,379 88,655 14,526 0,372 0,318 1,864
1A3110S 76,424 90,938 30,974 76,233 90,798 30,728 0,177 0,109 0,563
1A317S 77,032 92,596 31,397 77,026 91,409 30,197 0,006 0,913 2,756 1A319S 71,953 81,066 33,727 70,194 83,861 35,191 1,750 2,397 3,005
1A3210P 66,002 85,121 15,773 66,608 85,889 16,326 0,646 0,635 2,434
1A327P 67,313 88,117 13,267 67,163 87,409 13,381 0,158 0,571 0,602
1A327S 75,521 89,989 30,552 74,024 88,551 28,706 1,415 1,139 4,406
1A329S 74,267 84,049 34,169 71,681 85,399 33,200 2,506 1,126 2,034
1A3310P 65,208 81,665 18,535 64,806 82,765 19,948 0,438 0,946 5,194
1A337S 76,35 91,021 31,374 76,395 90,186 30,696 0,042 0,652 1,546
1A339P 65,424 84,439 15,156 64,358 83,660 15,897 1,162 0,655 3,374 1A339S 73,974 88,113 29,313 73,815 88,108 29,528 0,152 0,004 0,516
1D111P 71,266 91,408 12,022 70,552 91,426 11,068 0,713 0,014 5,843
1D111S 75,208 89,358 30,402 75,925 90,219 29,946 0,671 0,678 1,070 1D113-1P 68,592 88,546 13,453 68,762 89,383 13,419 0,175 0,665 0, 180
1D113-1S 74,077 88,248 30,045 74,399 89,117 29,756 0,307 0,693 0,683
1D114P 70,776 91,591 12,605 70,162 91,264 12,038 0,616 0,253 3,254
1D114S 74,063 88,5 29,346 74,310 89,168 28,743 0,235 0,532 1,468
1D121P 71,374 92,05 12,153 70,300 90,896 10,920 1,072 0,892 7,559

111
1D121S 75,636 89,848 30,677 75,810 90,107 30,170 0,162 0,204 1,178 1D122S 74,315 88,261 29,904 75,093 89,627 30,043 0,736 1,086 0,327 1D123-1P 68,542 88,413 13,335 68,333 88,871 13,410 0,216 0,366 0,394 1D123-1S 73,847 87,821 30,103 73,475 88,288 29,532 0,358 0,375 1,355 1D124P 70,956 91,356 12,399 70,435 91,379 11,976 0,521 0,018 2,457
1D124S 74,746 88,872 30,069 74,767 89,704 29,598 0,020 0,659 1,118 1D131S 74,965 88,67 30,677 75,207 88,820 29,391 0,227 0,120 3,028 1D132S 74,485 88,248 30,553 74,319 89,289 30,302 0,158 0,829 0,583 1D133-1S 74,808 88,682 30,626 74,966 89,098 30,406 0,149 0,331 0,510 lD134P 68,777 90,224 12,835 68,674 89,900 12,469 0,106 0,254 2,048
1D134S 74,191 87,938 30,718 74,601 89,366 30,650 0,389 1,139 0,158 1D215P 70,347 90,787 11,669 69,376 91,022 11,112 0,983 0,183 3,458 1D215S 75,455 89,563 30,355 75,550 90,177 30,083 0,089 0,483 0,638
1D225P 67,988 87,896 13,312 68,842 89,351 13,999 0,883 1,161 3,556 1D225S 74,495 88,52 29,242 74,090 89,197 29,047 0,386 0,539 0,473 1D235S 73,126 87,111 30,466 73,369 88,053 30,215 0,234 0,761 0,586
1D3110P 69,278 90,594 12,032 69,579 91,036 12,177 0,306 0,344 0,847 lD3110S 74,411 87,799 30,115 74,354 89,445 30,081 0,055 1,313 0,079
1D317P 70,209 91,721 11,862 69,885 90,833 11,191 0,327 0,688 4,116 1D319P 71,556 91,827 11 ,871 69,765 91,066 10,880 1,793 0,588 6,162 1D319S 74,683 88,882 30,157 75,002 89,703 29,705 0,301 0,650 1,069
1D3210P 69,932 90,648 12,912 68,923 90,124 12,001 1,028 0,410 5,170 1D3210S 74,331 88,242 29,604 74,826 89,246 29,696 0,469 0,800 0,220 1D327P 72,043 92,768 11,606 70,538 91,443 9,988 1,493 1,017 10,595
1D327S 74,249 88,309 28,74 74,107 89,253 29,233 0,136 0,752 1,201 1D329P 70,757 90,935 12,524 69,787 91,284 12,425 0,976 0,271 0,563
1D329S 73,705 87,193 30,68 73,640 88,490 30,642 0,063 1,044 0,088 1D3310S 74,231 88,322 29,962 74,791 89,339 29,828 0,531 0,809 0,318 1D337P 70,528 90,39 13,095 72,697 92,586 14,010 2,141 1,697 4,775
1D337S 74,975 88,887 30,196 75,290 89,818 30,092 0,297 0,737 0,245 1D339P 70,704 91,25 12,005 69,493 90,890 11,157 1,221 0,280 5,181 lD339S 74,769 87,712 31,613 74,816 88,731 30,761 0,044 0,816 1,933
1M111P 68,801 89,523 14,765 70,086 89,933 13,843 1,308 0,323 4,559 1M111S 74,201 88,78 30,044 74,671 89,394 29,881 0,447 0,487 0,386
1M112S 76,91 92,068 31,612 76,302 90,711 30,041 0,561 1,050 3,605 1M114P 64,935 82,692 18,8 65,821 84,131 20,144 0,958 1,220 4,881 1M114S 77,65 93,436 30,926 77,676 91,903 29,656 0,023 1,170 2,965
1M121P 68,804 90,048 14,728 69,783 92,240 15,263 0,999 1,701 2,522 1M121S 74,851 89,917 31,131 74,633 89,249 30,133 0,206 0,527 2,305 1M122P 65,16 85,462 15,004 65,766 85,368 15,075 0,655 0,078 0,334
1M122S 73,312 87,553 28,533 73,685 88,624 28,887 0,359 0,860 0,871 1M1231P 65,844 86,291 15,519 66,693 87,698 15,128 0,906 1,144 1,803 1M1231S 76,166 91,108 29,969 76,583 90,642 29,693 0,386 0,362 0,655
1M124P 68,215 88,872 14,237 68,527 88,476 13,646 0,322 0,316 2,996

112
1M124S 75,263 90,021 30,909 75,333 90,186 30,496 0,066 0,129 0,951 1M131S 74,335 88,575 29,401 74,736 89,648 30,112 0,381 0,851 1,688
1M132P 65,388 84,961 16,504 65,839 84,370 16,512 0,486 0,493 0,032 1M132S 75,799 91,168 31,431 76,218 90,627 30,651 0,390 0,421 1,776 1M1331P 66,842 86,48 15,873 66,210 85,810 14,947 0,671 0,550 4,250
1M1331S 75,308 90,448 30,543 76,117 90,933 30,567 0,755 0,378 0,055 1M134P 67,354 87,276 15,812 68,131 87,527 15,452 0,811 0,203 1,627 1M134S 75,601 90,833 31,171 75,104 89,770 29,801 0,467 0,833 3,179
1M215S 76,123 91,036 30,947 75,926 90,423 29,681 0,183 0,477 2,953 1M235P 68,397 88,785 14,945 69,356 88,803 14,514 0,985 0,014 2,070
1M235S 73,475 88,623 30,332 73,616 88,435 29,559 0,136 0,150 1,825 1M3110P 66,775 88,25 14,528 68,982 89,746 14,189 2,299 1,189 1,671 1M317P 66,646 87,521 13,577 67,176 86,922 13,550 0,560 0,486 0,143
1M317S 77,381 92,591 30,983 77,383 91,811 30,279 0,002 0,598 1,625 1M319S 76,888 92,401 30,551 77,080 91,371 29,499 0,176 0,793 2,478 1M3210P 66,946 87,571 13,954 68,358 88,121 13,889 1,476 0,443 0,333
1M3210S 71,198 78,831 36,324 69,585 83,834 38,909 1,620 4,350 4,858 1M327P 69,207 89,654 12,482 69,031 88,950 12,095 0,180 0,558 2,230
1M327S 77,514 92,517 30,235 77,325 91,820 29,006 0,173 0,535 2,933 1M329P 66,958 88,265 14,413 68,619 89,019 14,013 1,732 0,601 1,991 1M329S 75,297 90,421 29,886 75,836 90,265 29,213 0,504 0,122 1,611
1M3310S 75,583 90,422 29,621 75,630 90,499 28,858 0,044 0,060 1,845 1M337P 68,483 89,515 15,095 69,983 91,580 15,292 1,532 1,613 0,915 1M337S 76,994 92,066 30,592 76,740 91,581 29,719 0,234 0,373 2,048
1M339P 67,557 88,456 13,57 68,033 87,907 13,223 0,496 0,440 1,832 1M339S 74,794 89,294 29,742 74,887 89,860 29,457 0,088 0,447 0,681
1P111P 63,202 80,215 19,333 62,860 81,919 20,760 0,384 1,487 5,034 1P111S 73,888 88,261 29,619 73,476 88,120 29,773 0,396 0,113 0,367 1P112S 70,698 83,676 30,031 70,566 84,649 30,604 0,132 0,817 1,337
1P121S 73,875 87,792 28,375 73,803 87,867 28,724 0,069 0,060 0,865 1P122P 68,121 89,682 15,108 68,118 91,087 16,483 0,003 1,099 6,156 1P123-1 S 73,955 88,113 30,131 73,876 88,023 29,930 0,076 0,072 0,473
1P124S 75,125 89,514 28,429 74,612 89,748 28,214 0,485 0,185 0,538 1P131P 62,943 80,418 20,099 63,735 81,603 21,384 0,884 1,035 4,381
1P131 S 72,853 86,865 28,244 72,906 87,649 29,029 0,051 0,635 1,939 1P132S 76,18 90,514 32,122 76,517 90,428 31,836 0,312 0,067 0,632 1P133-1P 66,271 84,737 18,48 66,346 85,206 18,977 0,080 0,390 1,876 1P133-1S 74,13 88,442 29,503 74,825 88,806 29,798 0,660 0,291 0,703 1P134P 66,352 86,202 16,06 65,999 84,676 14,970 0,377 1,263 4,970 1P134S 74,077 87,122 31,005 73,674 87,895 31 ,239 0,386 0,625 0,531
1P215S 65,467 84,599 16,888 65,919 84,040 17,202 0,486 0,469 1,301 1P225P 76,622 91,915 31,535 75,965 90,465 30,043 0,609 1,124 3,426 1P225S 66,002 85,637 15,458 65,373 84,276 15,174 0,678 1,133 1,313
1P235P 66,152 80,785 18,755 65,703 85,205 20,396 0,482 3,766 5,927

113
1P235S 74,527 88,529 30,111 74,814 88,466 30,545 0,271 0,051 1,011 1P3110S 73,996 88,22 28,782 73,768 88,424 29,242 0,219 0,163 1,120
1P319P 67,592 88,874 15,482 67,902 89,761 15,738 0,323 0,702 1,157 1P319S 74,374 88,585 29,368 74,122 88,812 29,354 0,240 0,181 0,033 1P3210S 74,343 87,825 30,751 73,720 88,605 30,572 0,595 0,625 0,413
1P327S 75,588 90,587 29,385 75,371 90,186 28,972 0,203 0,313 1,002 1P329P 66,517 87,071 15,806 67,227 87,696 16,188 0,751 0,505 1,689 1P3310P 64,962 85,083 16,022 65,448 85,031 16,461 0,526 0,044 1,911
1P3310S 73,754 87,763 28,611 73,875 88,596 29,151 0,115 0,668 1,322 1P337S 73,947 88,068 28,297 74,098 88,223 28,323 0,144 0,124 0,066
3A111 S 74,663 89,469 30,774 73,830 88,471 28,900 0,793 0,793 4,442 3A112S 73,456 87,563 28,893 72,706 87,986 28,830 0,725 0,341 0,156 3A114P 68,424 88,65 15,713 68,280 90,379 18,396 0,149 1,366 11 '124 3A114S 76,559 91,416 31,241 76,998 90,739 30,382 0,404 0,525 1,973 3A121S 74,229 88,597 29,729 73,013 88,007 28,813 1,168 0,472 2,213 3A122S 76,01 90,256 31,996 76,290 90,271 31 ,762 0,260 0,011 0,518
3A1231P 65,527 83,933 17,059 66,676 84,716 18,513 1,229 0,657 5,780 3A1231S 74,084 88,54 30,832 73,073 87,415 29,561 0,972 0,904 2,976
3A124S 67,878 88,998 15,105 68,689 90,329 15,476 0,839 1,050 1,715 3A131P 64,767 83,084 17,977 66,071 84,728 19,049 1,409 1,385 4,094 3A131P 67,269 88,424 14,551 67,618 88,963 14,323 0,366 0,429 1,117
3A131S 73,669 87,71 30,252 73,965 88,502 30,921 0,284 0,636 1,547 3Al32S 76,161 90,52 31,824 76,100 90,394 31,415 0,056 0,099 0,915 3A1331P 67,361 85,274 16,109 66,249 86,203 16,242 1,177 0,766 0,581
3A1331S 74,973 89,11 32,014 74,094 88,360 31,137 0,834 0,597 1,963 3A134P 67,193 85,594 16,131 66,877 86,703 16,559 0,334 0,911 1,851
3A134S 71,239 77,174 37,175 69,558 83,193 40,298 1,689 5,308 5,701 3A215P 66,518 86,615 16,119 67,166 86,226 15,893 0,686 0,318 0,997 3A225P 66,679 85,815 18,261 67,388 86,884 18,713 0,748 0,876 1,728
3A225S 76,921 91,848 30,822 76,606 90,856 30,069 0,290 0,768 1,750 3A235P 66,314 84,732 18,412 65,452 84,305 17,585 0,925 0,357 3,248 3A3110S 73,078 87,272 29,299 73,398 87,966 29,589 0,309 0,560 0,695
3A317S 77,19 92,012 32,66 77,341 91,341 31,406 0,138 0,518 2,769 3A319S 75,69 90,275 30,361 76,159 90,254 30,315 0,436 0,016 0, 108
3A329S 77,385 92,15 32,995 75,034 90,249 30,453 1,245 1,474 5,665 3A3310S 73,971 88,044 29,623 73,458 88,641 29,509 0,492 0,478 0,272 3A337P 66,206 85,931 13,331 65,905 86,033 14,247 0,322 0,084 4,699
3A337S 73,803 87,462 29,327 73,505 87,842 29,808 0,286 0,306 1,150 3A339S 74,371 88,443 30,091 73,720 88,740 29,843 0,621 0,237 0,586 3D111S 74,048 87,845 29,56 73,869 88,858 29,742 0,171 0,811 0,434
3Dl12S 73,978 88 30,463 74,400 89,094 30,352 0,402 0,873 0,258 3D113-1P 69,642 90,202 12,498 69,038 89,783 12,327 0,616 0,329 0,977 3Dl13-1S 74,091 87,538 30,535 74,108 88,193 30,795 0,016 0,527 0,600
3Dl14P 70,401 91,111 13,534 70,450 91,473 12,747 0,049 0,281 4,238

114
3Dl14S 75,006 89,061 30,066 75,168 89,732 29,871 0,152 0,531 0,461 3D121P 69,134 89,7 12,531 69,274 90,228 13,103 0,143 0,415 3,153
3Dl21S 74,46 88,892 29,628 74,349 89,169 29,346 0,106 0,220 0,677 3Dl22P 70,317 90,592 13,379 70,493 90,570 12,914 0,177 0,017 2,500 3D122S 74,295 88,212 30,065 74,660 89,012 30,165 0,346 0,639 0,234 3Dl23-1P 68,785 88,78 13,26 69,295 89,766 13,385 0,523 0,781 0,661 3D124P 71,479 92,158 12,698 70,929 91,126 12,001 0,546 0,796 3,992 3D124S 74,005 88,073 29,307 74,754 89,589 29,510 0,712 1,207 0,489
3Dl31P 69,589 90,659 12,873 69,307 90,351 12,383 0,288 0,240 2,742 3D131S 74,376 88,443 30,413 74,465 89,120 29,882 0,085 0,539 1,245
3Dl32S 75,62 89,541 30,971 76,031 90,245 30,444 0,383 0,554 1,215 3Dl33-1S 73,274 87,389 28,999 73,233 87,952 28,811 0,040 0,454 0,461 3D134P 70,549 91,142 12,749 70,020 90,916 11,753 0,532 0,176 5,752
3Dl34S 75,298 89,701 30,678 75,400 89,978 30,324 0,096 0,218 0,821 3D215P 70,955 91,741 12,055 69,714 90,849 10,772 1,248 0,691 7,950 3D215S 74,492 88,287 30,643 74,680 89,015 30,242 0,178 0,581 0,932
3D225P 71,93 92,48 12,804 70,889 91,939 11,993 1,031 0,415 4,624 3D225S 74,132 88,304 29,833 74,783 89,777 29,884 0,618 1,170 0,121
3D235S 75,976 89,917 30,332 76,129 90,349 30,208 0,142 0,339 0,289 3D3110P 69,811 89,873 12,564 69,809 90,879 13,109 0,002 0,787 3,002 3D3110S 74,313 88,352 29,801 74,316 89,189 29,643 0,002 0,667 0,377
3D317P 70,063 89,912 12,933 70,869 91,510 13,646 0,809 1,245 3,792 3D317S 75,102 89,357 30,551 74,994 89,582 29,624 0,102 0,178 2,180 3D319P 69,705 91,14 11,892 69,063 90,428 11,209 0,655 0,554 4,183
3D319S 73,947 88,014 29,229 74,672 89,709 29,693 0,690 1,349 1,112 3D327P 70,196 90,453 12,279 69,181 90,921 12,091 1,030 0,365 1,094
3D327S 74,002 87,888 30,103 74,128 89,119 30,176 0,121 0,984 0,171 3D329P 69,769 89,921 13,165 68,890 90,223 12,918 0,896 0,237 1,339 3D329S 74,048 87,918 30,436 73,926 88,752 30,678 0,117 0,667 0,559
3D3310P 71,384 91,539 11,592 70,561 91,802 11,038 0,820 0,203 3,464 3D3310S 74,863 88,753 29,8 74,937 89,825 29,466 0,070 0,849 0,796 3D337P 71 ,512 92,569 12,206 70,908 92,237 11,201 0,600 0,254 6,074
3D337S 74,075 88,013 28,658 73,954 89,238 28,739 0,116 0,978 0,200 3D339P 70,136 90,884 12,439 69,715 90,734 12,241 0,426 0,117 1,136
3D339S 74,764 88,608 29,743 74,718 89,491 29,737 0,044 0,701 0,014 3M111P 65,448 84,084 17,945 66,734 86,067 19,644 1,376 1,648 6,391 3M111S 76,657 92,031 30,852 76,271 90,793 29,916 0,357 0,958 2,178
3M112P 65,585 84,659 14,971 65,681 85,652 16,377 0,103 0,824 6,342 3M112S 74,795 89,37 29,583 74,697 89,107 29,639 0,093 0,208 0,133 3M1131P 68,056 88,117 15,777 68,049 88,319 15,402 0,007 0,162 1,701
3M1131S 76,812 91,81 31,291 76,745 91,220 30,870 0,062 0,456 0,957 3M121P 69,561 90,21 14,385 69,669 90,265 13,249 0,109 0,043 5,815 3M121S 73,703 88,678 29,137 74,173 89,220 29,509 0,449 0,431 0,896
3M122P 69,363 89,390 16,018 70,030 89,711 15,188 0,677 0,254 3,761

115
3M1225 76,4 91,234 30,98 75,899 90,297 30,839 0,465 0,730 0,324 3M1231P 67,219 87,232 15,335 66,980 86,710 15,027 0,252 0,424 1,433
3M1231S 75,691 90,178 31,328 76,406 90,103 31,363 0,664 0,059 0,078 3M124P 68,298 89,421 13,503 68,908 89,249 13,050 0,629 0,136 2,411 3M124S 76,818 91 ,826 31,33 76,777 90,841 30,458 0,038 0,762 1,996
3M131P 67,027 86,325 16,48 67,915 87,006 15,605 0,930 0,556 3,857 3M131S 76,546 91,790 31,423 76,636 90,833 30,756 0,083 0,741 1,517 3M132P 67,153 87,051 15,511 67,143 87,271 15,273 0,011 0,179 1,093
3M132S 76,69 91,483 31,613 76,860 91,071 31,338 0,156 0,319 0,618 3M1331S 76,326 91 ,171 31,749 76,556 90,803 31 ,273 0,213 0,286 1,069
3M134P 68,094 86,869 15,187 67,984 87,546 15,380 0,115 0,549 0,891 3M134S 76,827 91,898 31,494 76,309 90,159 30,061 0,479 1,351 3,292 3M215P 67,591 87,372 16,42 67,460 87,206 16,224 0,137 0,134 0,850
3M215S 77,241 92,527 31,11 77,257 91,192 30,009 0,015 1,027 2,547 3M225P 68,747 89,743 13,85 68,647 88,886 12,737 0,103 0,679 5,919 3M225S 75,672 90,654 30,649 75,291 89,858 29,865 0,357 0,624 1,833
3M235P 67,17 86,824 16,284 66,981 86,072 15,813 0,199 0,615 2,076 3M235S 75,003 89,313 30,796 75,302 89,681 30,591 0,281 0,291 0,472
3M3110P 66,431 87,05 13,85 67,793 86,800 14,670 1,435 0,203 4,067 3M3110S 75,517 90,617 29,814 76,000 90,724 29,422 0,450 0,083 0,937 3M317P 68,604 90,283 14,459 70,411 90,848 13,545 1,839 0,441 4,614
3M317S 77,367 92,846 31,279 77,247 91,626 30,237 0,110 0,935 2,397 3M319S 76,125 91,276 31,642 76,246 90,738 30,514 0,112 0,418 2,566 3M3210S 74,499 88,781 28,633 73,818 88,600 28,524 0,649 0,145 0,270
3M327S 77,564 92,704 30,826 76,925 91,704 29,853 0,585 0,767 2,269 3M329P 66,869 87,54 16,088 68,361 89,314 16,850 1,560 1,418 3,272
3M329S 76,826 92,081 31,003 76,910 91,729 29,746 0,077 0,271 2,926 3M3310P 65,135 85,653 15,116 66,691 86,252 15,245 1,669 0,493 0,601 3M3310S 74,847 89,139 29,372 74,896 89,925 29,631 0,047 0,621 0,621
3M337S 74,373 88,687 29,762 74,772 89,495 29,996 0,379 0,641 0,553 3P111S 75,25 90,237 30,318 75,355 89,800 29,816 0,098 0,343 1,182 3Pll3-1S 74,619 88,837 30,171 74,677 89,276 29,941 0,054 0,349 0,542
3Pll4S 77,441 92,174 31,315 77,455 91,337 30,430 0,013 0,645 2,026 3P121S 73,129 88,148 28,321 72,863 87,782 28,299 0,258 0,294 0,056
3P122P 67,516 87,423 15,868 67,352 87,145 15,084 0,172 0,225 3,582 3P122S 75,927 90,35 32,616 75,612 89,096 31,695 0,294 0,989 2,025 3P123-1P 65,438 85,107 15,763 66,125 86,314 17,101 0,738 0,995 5,759 3P123-1S 73,944 88,242 29,482 73,822 88,349 29,856 0,117 0,086 0,892 3P132S 75,113 89,683 31,505 75,180 89,165 30,471 0,063 0,410 2,359 3P133-1P 65,592 80,96 19,172 65,647 85,398 21 ,246 0,059 3,773 7,255
3P134P 74,272 88,956 30,326 73,598 88,685 29,300 0,645 0,216 2,433 3P215P 74,197 88,118 28,649 73,680 88,162 28,639 0,494 0,035 0,026 3P225P 65,634 85,418 16,012 66,259 85,680 16,052 0,670 0,216 0,174
3P225S 70,53 77,86 36,638 68,696 83,055 39,002 1,863 4,566 4,419

116
3P235P 74,719 89,152 29,881 74,362 89,331 29,836 0,339 0,142 0,108 3P235S 74,147 88,675 28,933 73,653 88,142 28,567 0,472 0,426 0,901
3P3110S 73,747 87,969 28,909 73,685 88,440 29,428 0,059 0,378 1,257 3P317P 68,085 90,007 14,032 69,236 90,569 13,036 1,185 0,440 5,205 3P317S 76,73 91,994 31,344 77,855 91,523 30,938 1,029 0,363 0,922
3P319P 77,561 93,013 31,344 76,890 90,975 29,886 0,615 1,566 3,368 3P319S 75,648 90,541 30,857 76,424 90,432 30,523 0,721 0,085 0,770 3P327S 74,439 89,014 29,159 74,856 89,401 29,236 0,395 0,307 0,186
3P329S 74,672 88,817 29,997 74,674 88,799 30,275 0,002 0,014 0,652 3P3310P 63,824 81,879 17,461 62,603 81,713 18,511 1,366 0,144 4,128
3P337P 65,565 84,879 13,798 65,497 84,732 14,909 0,073 0,123 5,472 3P337S 74,277 88,606 28,66 73,740 88,550 28,259 0,513 0,045 0,998 Bl 67,895 88,554 13,871 67,357 87,367 12,955 0,563 0,954 4,829
BIO 67,841 84,106 20,951 65,914 82,863 17,884 2,037 1,053 11 '171 Bl OO 73,488 85,681 30,409 71,673 84,217 29,566 1,769 1,218 1,987 BIOl 66,822 87,604 15,284 67,504 87,071 14,628 0,718 0,431 3,102
Bl02 73,224 85,191 34,254 71,631 84,790 33,149 1,555 0,334 2,319 Bl03 63,85 70,324 35,581 59,703 71,632 36,159 4,747 1,303 1,138
Bl04 69,214 79,156 29,606 67,643 78,760 30,625 1,624 0,355 2,393 Bl05 66,65 79,069 22,462 64,933 84,068 23,247 1,846 4,334 2,429 Bl06 73,945 87,538 28,334 71,858 87,078 27,106 2,024 0,373 3,134
Bl07 65,719 81,764 25,175 65,145 81,434 26,939 0,621 0,286 4,787 Bl08 68,444 70,688 43,008 64,208 78,393 45,259 4,516 7,309 3,606 Bl09 72,733 84,355 34,072 71,031 83,387 33,117 1,675 0,816 2,010
Bll 67,774 78,02 32,227 66,340 77,848 29,994 1,512 0,156 5,077 BllO 75,734 85,477 36,305 73,846 87,016 35,700 1,786 1,262 1,188
Blll 71,471 75,114 38,799 69,066 83,249 41,172 2,421 7,265 4,196 Bll2 74,342 86,511 34,034 73,263 86,149 33,222 1,034 0,297 1,707 Bll3 65,831 85,208 17,518 65,357 84,088 15,664 0,511 0,936 7,901
Bll4 70,06 82,011 32,273 68,251 82,009 32,028 1,850 0,002 0,539 Bll5 73,616 86,519 33,537 72,094 85,347 32,469 1,477 0,965 2,289 Bll6 65,225 80,655 21,531 62,643 78,632 20,054 2,856 1,796 5,025
Bll7 69,685 70,85 42,36 66,260 79,777 45,810 3,563 8,381 5,533 Bll8 69,521 78,699 34,711 66,745 78,234 34,459 2,881 0,419 0,515
Bll9 67,889 69,68 43,666 64,828 78,498 46,570 3,262 8,416 4,552 Bl2 68,728 88,818 13,814 67,661 88,027 12,700 1,106 0,633 5,941 Bl20 69,538 81,468 28,922 67,699 79,527 28,582 1,895 1,705 0,836
Bl21 72,102 82,118 34,314 70,173 82,457 34,150 1,917 0,291 0,338 Bl22 71,776 81,496 33,526 71,357 85,254 33,304 0,414 3,187 0,470 Bl23 66,47 66,547 43,076 63,297 75,911 46,623 3,458 9,296 5,592
Bl24 77,075 90,852 33,723 75,884 89,575 32,429 1,101 1,001 2,766 Bl25 70,541 78,872 34,454 67,401 81,409 34,838 3,220 2,239 0,783 Bl26 74,224 85,618 32,949 71,356 84,923 31 ,853 2,786 0,577 2,393
Bl27 68,232 86,742 11,661 65,572 84,958 10,542 2,811 1,469 7,127

117
Bl28 76,847 92,029 29,178 75,203 90,193 26,275 1,530 1,425 7,405 B129 72,513 86,472 30,194 71,044 86,055 27,553 1,447 0,342 6,467
Bl3 67,948 87,999 14,726 68,566 88,562 14,948 0,640 0,451 1,059 B130 65,878 77,265 21,64 65,447 85,460 24,804 0,464 7,122 9,633 B131 73,184 87,027 28,885 71,357 85,599 28,227 1,788 1,170 1,630
Bl32 74,37 88,75 28,034 73,057 87,106 26,548 1,260 1,322 3,850 B133 76,476 92,194 27,406 75,149 90,677 24,620 1,238 1,173 7,575 B134 64,282 75,359 23,581 61,653 82,563 26,799 2,953 6,451 9,034
Bl35 71,261 91,59 12,952 69,874 91,167 11,298 1,390 0,327 9,646 B136 73,095 87,291 27,545 71,077 85,561 26,324 1,979 1,416 3,207
Bl37 68,411 87,245 14,998 67,289 85,886 13,547 1,170 1,110 7,190 Bl38 74,337 85,617 33,508 73,600 86,254 32,013 0,705 0,524 3,228 B139 61,128 52,251 56,314 55,767 68,050 61,888 6,486 18,572 6,669
Bl4 70,269 90,973 12,183 68,873 89,203 10,507 1,419 1,390 10,448 B140 72,786 85,792 30,827 70,635 84,996 29,205 2,121 0,659 3,821 B141 71 ,159 90,108 11,472 67,518 89,134 8,875 3,713 0,769 18,048
Bl42 73,442 87,976 26,226 71,996 87,847 25,207 1,406 0,104 2,802 B143 74,935 88,453 30,633 73,136 87,776 28,969 1,718 0,543 3,948
Bl44 74,51 85,841 34,025 73,370 86,660 33,246 1,090 0,671 1,637 Bl45 73,355 89,582 17,543 70,640 90,374 15,027 2,666 0,622 10,925 B146 70,155 89,843 16,11 69,981 90,291 14,676 0,176 0,351 6,590
Bl47 75,547 89,236 33,288 73,691 87,648 30,570 1,759 1,269 6,020 Bl48 58,778 70,944 28,736 48,851 62,530 27,513 13,045 8,915 3,076 B149 64,244 60,071 53,309 59,218 70,784 57,358 5,757 11,578 5,175
Bl5 65,589 82,026 21,841 65,417 81,608 22,588 0,186 0,362 2,378 B150 76,855 91,253 30,017 74,657 88,932 27,275 2,052 1,821 6,768
Bl51 74,051 88,644 28,854 72,578 86,876 27,405 1,420 1,425 3,643 Bl52 71,983 83,971 31,587 70,280 82,760 31,120 1,693 1,027 1,053 B153 72,112 83,72 31,612 69,653 81,901 30,820 2,453 1,554 1,793
Bl54 78,581 93,26 30,127 76,605 91,160 26,539 1,801 1,611 8,956 B155 66,623 64,108 47,803 61,154 73,059 50,754 6,053 9,228 4,235 B156 64,663 79,661 23,988 63,419 75,195 23,539 1,374 4,078 1,338
Bl57 75,442 88,823 29,456 72,878 87,186 27,696 2,445 1,315 4,354 B158 66,46 70,394 39,249 63,439 73,803 42,696 3,289 3,343 5,948
Bl59 68,244 87,436 15,15 66,769 87,357 15,333 1,545 0,064 0,849 Bl6 69,392 89,354 13,124 68,673 89,096 11,581 0,736 0,205 8,834 B160 69,869 88,137 13,698 67,371 86,139 11,353 2,574 1,621 13,238
Bl61 66,797 84,857 18,672 64,483 82,160 16,515 2,493 2,283 8,670 B162 73,752 87,161 29,435 71,896 85,316 28,429 1,802 1,513 2,458 B163 68,924 88,318 12,839 67,095 88,176 12,292 1,901 0,114 3,077
Bl64 73,239 86,986 29,534 71,968 86,213 28,378 1,238 0,631 2,822 B165 73,053 86,171 30,931 71,912 85,177 29,616 1,114 0,821 3,071 B166 74,561 87,125 31,43 73,118 86,395 30,610 1,382 0,595 1,870
Bl67 74,379 88,318 31,461 73,655 86,218 29,163 0,692 1,702 5,361
118
Bl68 74,025 87,671 32,219 72,849 85,920 30,842 1,132 1,427 3,089 B169 68,555 86,817 18,14 67,215 86,925 17,539 1,396 0,088 2,384
Bl7 67,301 83,493 20,841 63,613 82,942 22,048 3,985 0,468 3,980 Bl70 71,521 83,421 31,437 69,634 82,634 29,940 1,891 0,670 3,449 B171 68,018 72,439 38,697 64,862 77,543 39,465 3,359 4,812 1,390
Bl72 68,873 75,701 36,558 66,166 77,824 37,306 2,835 1,956 1,432 B173 69,671 80,514 33,688 68,692 81,086 31,563 1,001 0,501 4,605 Bl74 74,089 86,506 32,601 72,270 85,371 30,195 1,758 0,934 5,418
Bl75 73,579 87,013 30,436 72,319 86,092 28,313 1,222 0,752 5,112 B18 71 ,283 78,611 36,204 68,948 82,846 34,689 2,355 3,710 3,023
Bl9 70,158 79,866 32,43 68,157 80,148 32,689 2,046 0,249 0,561 B2 71,444 81,565 34,278 69,280 81,652 32,973 2,175 0,075 2,745 B20 71 ,321 80,05 35,078 70,500 84,204 34,628 0,819 3,577 0,913
B21 73,797 88,602 29,04 73,215 88,451 27,247 0,560 0,121 4,506 B22 67,068 73,311 36,602 61,839 73,670 37,568 5,736 0,345 1,842 B23 68,436 87,721 15,213 67,083 87,288 14,673 1,412 0,350 2,558
B24 66,48 85,438 20,299 65,138 81,926 18,062 1,442 2,968 8,248 B25 67,752 88,781 14,392 67,517 87,978 12,760 0,245 0,642 8,502
B26 73,736 88,606 27,671 72,660 87,102 26,045 1,039 1,211 4,280 B27 72,924 87,08 28,137 70,903 84,057 26,986 1,987 2,498 2,953 B28 68,541 88,115 15,903 68,248 89,256 16,569 0,303 0,910 2,902
B29 71,708 85,41 30,284 69,138 82,264 29,268 2,580 2,654 2,413 B3 60,808 64,082 39,149 56,992 67,130 40,275 4,582 3,286 2,005 B30 67,562 86,158 17,407 66,597 86,217 16,153 1,017 0,048 5,287
B31 64,259 73,896 32,553 64,088 74,841 29,545 0,188 0,899 6,850 B32 61,242 70,112 32,513 60,259 70,975 30,834 1,145 0,865 3,748
B33 69,341 75,835 36,48 64,674 79,537 37,466 4,925 3,370 1,886 B34 69,944 87,902 17,351 68,578 87,957 17,181 1,395 0,044 0,696 B35 62,205 54,165 54,776 56,148 69,549 59,735 7,238 17,586 6,124
B36 67,914 89,409 10,37 67,655 89,457 8,675 0,270 0,038 12,584 B37 62,465 76,626 23,011 59,126 74,288 23,025 3,884 2,191 0,042 B38 70,359 79,685 33,494 69,838 83,851 33,245 0,526 3,603 0,528
B39 69,947 81,129 32,007 68,042 81,300 31,528 1,952 0,149 1,066 B4 72,138 85,782 30,386 71,012 85,245 29,146 1,112 0,444 2,947
B40 68,077 69,347 44,729 65,518 79,555 47,714 2,709 9,695 4,567 B41 67,924 72,641 40,201 66,646 80,781 41,523 1,343 7,503 2,288 B42 67,956 86,755 17,558 67,186 86,064 16,664 0,806 0,566 3,695
B43 68,739 88,199 14,823 68,381 88,765 14,673 0,369 0,453 0,722 B44 70,593 83,304 31,119 69,002 83,743 29,898 1,612 0,372 2,829 B45 71,897 82,31 33,032 69,710 84,440 33,457 2,184 1,807 0,904
B46 70,216 80,129 35,199 68,272 81,005 34,446 1,985 0,769 1,529 B47 69,281 89,887 14,821 70,071 89,830 13,364 0,801 0,045 7,311 B48 63,999 71,292 28,027 62,865 81,558 31,214 1,265 9,498 7,607
B49 69,443 88,458 14,756 69,154 89,560 13,931 0,295 0,875 4,070

119
B5 72,214 85,4 31,179 70,100 84,246 30,243 2,101 0,962 2,155 B50 62,951 79,28 24,627 60,523 75,842 23,803 2,781 3,134 2,406
B51 71,736 81,221 32,374 71,481 85,090 31,862 0,252 3,290 1,128 B52 65,654 81,955 25,326 63,324 80,690 25,416 2,555 1,100 0,251 B53 68,633 76,809 34,104 65,367 76,425 34,548 3,447 0,354 0,914
B54 61,225 66,128 31,403 61,628 80,520 36,880 0,463 13,879 11,343 B55 71,036 91,933 12,632 69,578 90,501 10,861 1,466 1,110 10,664 B56 70,009 90,004 14,193 68,114 87,130 11,937 1,940 2,295 12,213
B57 65,095 81,835 21,000 63,573 78,411 19,258 1,673 3,021 6,121 B58 70,547 77,517 34,512 65,829 79,553 35,617 4,892 1,833 2,227
B59 61,044 70,425 35,28 54,139 62,005 32,025 8,478 8,992 6,839 B6 73,479 87,343 30,23 72,245 86,361 28,924 1,198 0,800 3,122 B60 68,137 86,535 19,697 66,656 83,008 17,487 1,554 2,942 8,404
B61 70,242 84,956 18,493 66,304 85,151 17,106 4,078 0,162 5,510 B62 66,125 85,898 15,401 65,130 85,204 14,212 1,072 0,574 5,677 B63 67,822 86,355 17,74 66,596 84,629 16,992 1,290 1,428 3,045
B64 66, 105 8 1,44 3 26,397 64,395 80,655 26,814 1,306 0,688 1,107 B65 67,6 85,238 20,271 65,436 83,785 19,431 2,247 1,216 2,810
B66 68,301 75,946 34,321 65,322 77,402 35,250 2,614 1,342 1,888 B67 74,606 88,031 30,652 73,039 87,520 29,034 1,501 0,412 3,834 B68 71,137 91,284 13,893 70,015 90,510 11,689 1, 125 0,602 12,134
B69 6S,143 82,074 24, 199 59,482 74,575 24,946 9,597 6,770 2, 149 B7 71,687 91,052 14,703 69,926 90,191 12,406 1,758 0,695 11,983 B70 71 ,938 82,308 31,789 70,680 84,963 31 , 057 1,247 2,249 1,647
B71 73,645 35,197 31,629 71,953 35,120 31,230 1,643 0,064 O,S98 B72 67,194 37,541 15,525 67,647 36,296 13,001 0,475 1,013 12,516
B73 72,356 36,341 28,933 71,191 85,231 27,992 1,148 0,873 2,337 B74 74,550 85,331 35,374 72,693 86,373 34,800 1,784 0,863 1,157 B75 77,983 90,65 35,652 77,200 90,963 34,265 0,714 0,243 2,805
B76 68,593 79,003 33,4b2 66,070 77, 195 33,675 2,650 1,637 0,469 B77 61,329 68,612 34,17 59, 199 69,354 32,832 2,500 0,760 2,825 B78 66,651 77,379 31,721 65,324 77,924 30,502 1,422 0,496 2,772
B79 72,884 36,100 23,517 71,078 85,877 27,73 1 1,774 0,184 1,350 B8 70,827 90,52 2 13,208 69,247 90, 142 12,143 1,595 0,297 5,915
B80 63,400 62,508 45,796 60,505 73,885 43, 185 3,305 11,796 3,595 B81 72,826 36,249 28,939 70,485 34,236 27,898 2,310 1,670 2,590 B82 65,635 74,498 32,519 63,473 74,433 31 '1 11 2,368 0,062 2,994
B83 71,239 79,863 35,255 69, 144 S0,798 36,716 2,110 0,823 2,370 B84 68,262 90,244 10,470 69,131 90,229 8,963 O,S9S 0,012 10,965 B85 75,215 86,31 34,988 73,054 83,809 32,713 2,061 2,079 4,753
B86 61,090 73,770 36,009 54,320 59,299 30,493 3,296 15,380 11,719 B87 64,373 79,62 1 73,400 63,736 79,437 22,532 0,705 0,164 2,680 B83 71,811 82,089 36,250 69,202 82,227 35,740 2,617 0,118 1,001
B89 72,238 3 1,567 34, /9 70,331 83,306 35,508 1,892 1,492 1,445

120
B9 69,589 39,589 13,651 68,151 89,219 12,582 1,476 0,293 5,762 B90 68,000 70,515 40,442 64,222 77,362 42,520 4,041 7,002 3,543
B91 63,329 87,962 14,587 67,9 14 88,011 13,001 0,431 0,040 8,129 B92 73,4 7 3 85,806 30,410 71,135 85,533 29,961 2,286 0,221 1,052 B93 72,150 84,17 32,577 70,534 82,869 31 ,919 1,607 1,101 1,443
B94 63,898 80,322 21,327 63,02 8 79,638 20,969 0,970 0,604 1,197 B95 63,459 75,479 31 ,69 60,901 73,165 33,495 2,909 2,202 3,915 B96 74,320 36,229 33,518 72,878 36,226 33,075 1,385 0,002 0,940
B97 71,850 33,569 30,110 69,442 33,163 29,794 2,411 0,344 0,74 6 B98 75,301 88,307 30,676 73,627 87,732 29,45 1 1,589 0,861 2,881
B99 71,897 82,27 1 33,826 69,741 81,471 33,773 2,153 0,691 0,100 Jl11P 69,914 89,97 13,439 69,179 89,497 13,010 0,748 0,373 2,297 Jl11 s 77,566 92,07 30,954 76,880 91,336 29,970 0,628 0,566 2,284
Jl12S 77,862 92,341 30,587 77,898 93,101 29,545 0,033 0,580 2,451 Jl131P 70,03 90,488 12,651 69,953 90,733 11,755 0,078 0,191 5,193 Jl131S 74,926 89,578 30,855 74,319 89,081 29,383 0,576 0,394 3,456
Jl14P 70,189 90,058 12,033 70,198 91,295 11,728 0,009 0,964 1,818 Jl14S 77,056 91,871 30,798 76,594 91,998 29,063 0,425 0,098 4,098
Jl21P 69,095 88,659 13,11 66,980 87,521 10,894 2,198 0,914 13,056 Jl21S 76,7 90,812 31,413 76,127 91,209 30,968 0,530 0,309 1,010 Jl22P 69,855 89,868 14,077 68,478 89,347 13,404 1,408 0,411 3,462
Jl22S 77,716 92,304 31 ,137 76,722 91,916 29,645 0,911 0,298 3,473 Jl231P 70,311 90,541 12,205 69,558 91,034 11,526 0,761 0,384 4,045 Jl24S 76,248 90,928 31,238 75,861 91,369 30,033 0,360 0,342 2,782
Jl31P 69,615 89,917 14,227 69,093 89,265 14,142 0,532 0,515 0,425 J131S 75,212 90,157 30,441 75,393 91,076 29,700 0,170 0,717 1,744
Jl32P 70,609 91 ,284 12,715 69,743 90,528 10,903 0,873 0,588 10,848 Jl32S 75,464 90,695 31,213 75,683 91,220 30,785 0,205 0,408 0,976 Jl331P 70,32 89,811 13,683 69,278 89,859 12,325 1,055 0,038 7,386
Jl331S 76,403 90,4 32,315 75,320 89,741 31,753 1,010 0,518 1,241 Jl34S 77,375 91,894 31,878 76,383 91,086 30,799 0,912 0,624 2,435 J215P 70,405 90,604 14,012 69,368 89,684 12,160 1,049 0,721 10,007
J215S 77,783 92,63 31,082 77,047 92,264 29,677 0,672 0,280 3,270 J225P 69,998 90,588 12,435 70,041 90,653 11,542 0,043 0,050 5,269
J225S 77,424 92,061 30,758 77,008 92,267 29,309 0,381 0,158 3,411 J235P 70,827 90,578 14,285 68,822 89,297 13,126 2,031 1,007 5,982 J235S 77,063 91,3 31,074 77,200 92,413 30,158 0,125 0,857 2,116
J3110P 69,311 90,056 12,882 68,605 89,778 11,821 0,724 0,218 6,074 J3110S 77,784 92,844 30,716 78,339 93,447 29,955 0,503 0,458 1,774 J317P 69,658 91,644 13,262 70,117 91,363 11,471 0,464 0,217 10,244
J317S 77,987 93,198 30,946 77,649 92,733 29,450 0,307 0,354 3,502 J319P 70,082 91,283 12,902 68,478 89,459 11,383 1,637 1,427 8,847 J3210P 70,083 91,884 13,172 69,964 90,730 11,609 0,120 0,894 8,920
J3210S 77,239 91,64 31,459 77,196 92,195 30,475 0,039 0,427 2,246

121
J327P 70,715 91,606 13,152 69,927 90,226 11,301 0,793 1,073 10,707 J329P 68,952 89,62 12,868 68,165 88,835 12,164 0,812 0,622 3,977
J3310P 69,339 90,867 12,585 69,558 90,239 11,956 0,223 0,490 3,628 J3310S 77,157 91,792 32,561 75,929 90,222 31 ,435 1,135 1,220 2,488 J337S 77,911 92,055 31,199 76,730 91 '183 30,332 1,080 0,673 1,993
J339S 78,75 93,338 32,262 77,842 91,612 30,870 0,820 1,320 3,119 S1BlP1P 68,032 88,46 13,583 68,019 88,451 13,965 0,014 0,007 1,961 S1BlP1S 75,33 89,48 29,754 74,852 90,356 29,602 0,450 0,689 0,362
S1BlP2P 68,57 89,564 15,175 70,917 91,465 14,697 2,380 1,485 2,264 S1BlP2S 77,115 91,585 30,795 76,897 92,145 30,100 0,201 0,431 1,615
S1BlP31S 76,804 91,682 30,79 75,697 90,380 29,514 1,027 1,011 2,992 S1BlP4P 66,245 85,434 15,249 66,535 86,025 16,379 0,309 0,487 5,051 S1BlP4S 77,022 92,446 31,25 76,613 91,261 29,653 0,376 0,912 3,708
S1B2P1P 68,617 89,04 15,658 69,922 90,564 16,305 1,332 1,200 2,864 S1B2P1S 76,715 90,494 31,293 76,124 91,241 30,661 0,547 0,582 1,444 S1B2P2S 75,472 90,05 30,428 75,658 90,883 30,122 0,174 0,651 0,715
S1B2P31P 68,971 90,058 14,237 69,455 90,009 12,998 0,494 0,038 6,434 S1B2P31S 76,182 90,486 31,327 75,987 91,056 31,016 0,181 0,444 0,706
S1B2P4P 68,765 89,82 14,288 69,292 89,904 13,802 0,540 0,066 2,446 S1B2P4S 75,958 90,152 30,867 75,277 90,528 30,485 0,637 0,295 0,882 S1B3P1S 74,805 89,064 30,07 74,573 90,189 30,236 0,220 0,887 0,390
S1B3P2P 67,726 88,942 13,736 68,392 88,628 12,773 0,692 0,250 5,136 S1B3P31P 69,251 89,164 14,335 68,275 88,933 14,044 1,004 0,184 1,453 S1B3P31S 76,447 90,552 31,714 76,062 90,954 31,251 0,357 0,313 1,041
S1B3P4P 69,706 90,164 14,659 69,460 89,929 13,855 0,250 0,184 3,986 S1B3P4S 76,537 90,412 33,011 75,232 89,409 32,744 1,216 0,789 0,575
S2BlP5S 77,862 92,902 30,999 77,342 91,753 30,075 0,474 0,880 2,139 S2B2P5P 66,559 85,579 15,161 66,334 86,812 15,825 0,240 1,012 3,028 S2B2P5S 75,323 89,039 30,851 74,670 89,919 30,452 0,616 0,696 0,922
S2B3P5P 69,49 90,157 13,655 69,182 89,842 13,136 0,3 14 0,247 2,741 S2B3P5S 76,438 90,688 31,74 76,372 91,365 30,936 0,062 0,526 1,814 S3BlP10S 76,646 91,679 30,845 75,666 90,927 29,865 0,91 0 0,582 2,284
S3B1P7P 66,857 86,628 14,311 65,983 86,203 14,496 0,931 0,348 0,909 S3BlP7S 77,683 92,707 31,151 77,101 91,522 30,345 0,532 0,909 1,855
S3BlP9P 66,521 86,626 13,857 65,807 86,299 13,986 0,763 0,267 0,655 S3BlP9S 75,807 88,767 30,218 74,662 90,022 30,513 1,077 0,993 0,686 S3B2P10P 67,029 87,029 15,099 66,414 86,689 14,436 0,652 0,277 3,175
S3B2P10S 74,353 86,128 31,402 73,334 88,131 32,105 0,976 1,626 1,565 S3B2P7P 68,097 88,533 11,837 66,475 87,395 11,029 1,705 0,915 5,001 S3B2P7S 76,584 91,037 30,709 75,824 90,919 29,078 0,706 0,092 3,858
S3B2P9P 67,055 88,186 13,957 67,730 88,709 13,611 0,708 0,418 1,776 S3B2P9S 76,254 90,837 30,798 75,920 90,912 30,145 0,311 0,058 1,516 S3B3P10P 68,039 87,306 15,393 67,966 88,077 15,290 0,076 0,622 0,474
S3B3P10S 76,498 90,99 29,785 75,231 90,944 28,860 1,181 0,035 2,231

S3B3P7P S383P7S
S3B3P9P S3B3P9S
67,946 89,325 15,085 77,323 91,988 31,256 66,847 87,035 13,587 76,59 91,162 30,385
69,719 90,412 14,582 76,631 91,260 30,277
66,535 87' 131 13,960 76,144 91,533 29,555
1,821 0,636 0,331 0,413
122
0,856 2,399 0,562 2,250 0,078 1,915 0,287 1,959
Composition en ADF, NDF et lignine (% de matière sèche) des différents échantillons
(chapitre 1 et 2). Deux analyses (répétitions) ont été effectuées sur chaque échantillon et le
coefficient de variation calculé.

123
ANNEXEB
- -Example of a denaturing gradient gel electrophoresis (DGGE) of rD NA derived fragments
PCR amplified by ITS1F/ITS2 primer pairs in chapter 1.

124
ANNEXEC
Ex ample of two dena turing gradient gel electrophoresis (DGGE) of rD NA derived fragments
PCR ampli fied by ITS1FIITS2 primer pairs in chapter 2.

30 months 24 months 18 months 12 months 6 months
ABBBAA BAA B AA BAA
A = Trembling as pen wood B = Balsam fir wood
125
Dena turing gradient gel electrophoresis of rDNA based ITS 1 regwn profiles of fungal
communities inhabiting trembling aspen (A) and balsam fir (B) wood blocks, classified from
time of incubation (6 to 30 months). Three wood samples from each sampling time are
presented including both wood species (chapter 2).

126
ANNEXED
Example of a denatming gradient gel electrophoresis (DGGE) of rDNA derived fragments
PCR ampli :fied by ITS1FIITS2 primer pairs in chapter 3.

127
Logs Snags
Denaturing gradient gel electrophoresis of rD NA based ITS 1 region profiles of fungal
communities inhabiting trembling aspen logs and snags, classified fromhatvesting treattnent
(B=controlled burn, CC=clear-eut, 2/3=par1ial eut 2/3, 113=partial eut 1/3,
Uneut=unharvested stands). B etween 2 and 4 wood samples from each harvesting treattnents
are presented ( chapter 3).

128
ANNEXEE
La comparaison entre les gels des différents chapitres a été possible grâce à des bandes
communes dans le marqueur de référence. La même méthode que celle indiquée dans le
matériel et méthodes des chapitres a été utilisée. Nous avons utilisé le logiciel GelCompar II
(version 5.0, Applied I'vfaths, Belgique) afin d'analyser les patrons des bandes de DGGE
(région ITS). Afin de minimiser les différences de migration et de normaliser les distorsions
entre les gels d'électrophorèse, nous avons aligné les gels en utilisant une référence externe
constituée d'un mélange d'ADN ITS amplifié à partir de 5 espèces différentes de
champignons. Cependant, les espèces fongiques de référence utilisées dans le premter
chapitre ne sont pas exactement les mêmes que pour les autres chapitres (3 espèces
communes). Donc pour les gels d'un même chapitre, toutes les bandes issues de ces 5 espèces
ont servi à aligner les gels alors que pour aligner les gels du chapitre 1 avec ceux des
chapitres 2 et 3, seulement 5 bandes réparties équitablement sur le gel ont servi de référence.
Références du chapitre 3
Références du chapitre 2
Références du chapitre 1
La figure ci-dessus représente les marqueurs de référence des gels de DGGE entre les trois
chapitres. Les flèches pleines indiquent les bandes communes entre les 3 chapitres, tandis que
toutes les bandes marquées par des flèches indiquent les bandes pour les chapitres 2 et 3.

129
REFERENCES
Alkaslassy, E. 2005. «Abundance of plethodontid salamanders in relation to coarse woody debris in a low elevation mixed forest of the western Cascades». Northwest Science, vol. 79, no 2-3, p. 156-163.
Allmér, J., R. Vasiliauskas, K. Ihrmark, J. Stenlid & A Dahlberg. 2006. «Wood-inhabiting fungal communities in woody debris of Norway spruce (Picea abies (L.) Karst.), as reflected by sporocarps, mycelial isolations and T -RFLP identification». FElvfS Microbiology Ecology, vol. 55, no 1, p. 57-67.
Ammer, U. 1991. «Consequences from the results of research on dead woody material for the forestry practice». Forstwissenschaftliches Centralblatt, vol. 110, no 1, p. 149-157.
Anderson, I. C., C. D. Campbell & J. I. Prosser. 2003. <<Diversity of fungi in organic soils under a moorland - Scots pine (Pinus sylvestris L.) gradient». Environmental Microbiology, vol. 5, no 11, p. 1121-1132.
Anderson, M. J. 2006. <<Distance-based tests for homogeneity of multivariate dispersions». Biometries, vol. 62, no 1, p. 245-253.
Bader, P., S. Jansson & B. G. Jonsson. 1995. «Wood-inhabiting fungi and substratum decline in selectively logged boreal spruce forests». Biological Conservation, vol. 72, no 3, p. 355-362.
Baldrian, P. 2008. «Chapter 2 Enzymes of saprotrophic basidiomycetes». p. 19-41: British Mycological Society Symposia Series.
Baptist, F., L. Zinger, J. C. Clement, C. Gallet, R. Guillemin, J. M. F. Martins, L. Sage, B. Shahnavaz, Ph Choler & R. Geremia. 2008. «Tannin impacts on microbial diversity and the functioning of alpine soils: A multidisciplinary approach». Environmental Microbiology, vol. 10, no 3, p. 799-809.
Bames, R. J., M. S. Dhanoa & Susan J. Lister. 1989. «Standard normal variate transformation and de-trending of near-infrared diffuse reflectance spectra». Applied Spectroscopy, vol. 43, no 5, p. 772-777.
Bednarz, J. C., D. Ripper & P. M. Radley. 2004. <<Emerging concepts and research directions in the study of cavity-nesting birds: Keystone ecological processes». Condor, vol. 106, no 1, p. 1-4.

130
Belleau, A., S. Brais & D. Paré. 2006. «Soil nutrient dynamics after harvesting and slash treatments in boreal aspen stands». Soif Science Society of America Journal, vol. 70, no 4, p. 1189-1199.
Bergeron, Y., A. Leduc, B.D. Harvey & S. Gauthier. 2002. «Natural fire regime: A guide for sustainable management of the Canadian boreal forest». Silva Fennica, vol. 36, no 1, p. 81-95.
Bergeron, Yves, & Michelle Dubuc. 1989. «Succession in the southern part of the Canadian boreal forest». Plant Ecology, vol. 79, no 1, p. 51-63.
Bergeron, Yves, & Brian Harvey. 1997. <<Basing silviculture on natural ecosystem dynamics: an approach applied to the southern boreal mixedwood forest of Quebec». Forest Ecology andManagement, vol. 92, no 1-3, p. 235-242.
Berglund, H., M. Edman & L. Ericson. 2005. «Temporal variation of wood-fungi diversity in boreal old-growth forests: Implications for monitoring». Ecological Applications, vol. 15, no 3, p. 970-982.
Boddy, L. 1992. <<Development and function of fungal communities in decomposing wood». In The Fungal Community. lts Organization and Role in the Ecosystem, D.T. Wicklow & C.G. Carroll, p. 749-782. New York: Marcel Dekker.
2000. «Interspecific combative interactions between wood-decaying basidiomycetes». FEMS Microbiology Ecology, vol. 31, no 3, p. 185-194.
--------. 2001. «Fungal community ecology and wood decomposition processes in angiosperms: From standing tree to complete decay of coarse woody debris». Ecological Bulletins, vol. 49, p. 43-56.
Boddy, L., & S. C. Watkinson. 1995. «Wood decomposition, higher fungi, and their role in nu trient redistribution». Canadian Journal of Botany, vol. 73, no Suppl. 1.
Bonkowski, M., & J. Roy. 2005. «Soil microbial diversity and soil functioning affect competition among grasses in experimental microcosms». Oecologia, vol. 143, no 2, p. 232-240.
Bouget, C., & P. Duelli. 2004. «The effects of windthrow on forest insect communities: A literature review». Biological Conservation, vol. 118, no 3, p. 281-299.
Boulet, B. 2003. Les champignons des arbres de l'est de l'Amerique du Nord.: Les Publications du Québec, Ste-Foy, 356-357 p.
Bowman, J. C., D. Sleep, G. J. Forbes & M. Edwards. 2000. «The association of small mammals with coarse woody debris at log and stand scales». Forest Ecology and Management, vol. 129, no 1-3, p. 119-124.

131
Brais, S., B. D. Harvey, Y. Bergeron, C. Messier, D. Greene, A. Belleau & D. Paré. 2004. «Testing forest ecosystem management in boreal mixedwoods of northwestern Que bec: Initial response of as pen stands to different levels of harvesting». Canadian Journal ofForest Research, vol. 34, no 2, p. 431-446.
Brais, S., D. Pare & C. Lierman. 2006. «Tree bole mineralization rates of four species of the Canadian eastern boreal forest: Implications for nutrient dynamics following standreplacing disturbances». Canadian Journal of Forest Research, vol. 36, no 9, p. 2331-2340.
Brais, S., F. Sadi, Y. Bergeron & Y. Grenier. 2005. «Coarse woody debris dynamics in a post-fire jack pine chronosequence and its relation with site productivity». Forest Ecology and Management, vol. 220, no 1-3, p. 216-226.
Brassard, B. W., & H. Y. H. Chen. 2006. «Stand structural dynamics of North American boreal forests». Critical Reviews in Plant Sciences , vol. 25, no 2, p. ll5-137.
--------. 2008. «Effects of forest type and disturbance on diversity of coarse woody debris in boreal forest». Ecosystems, vol. 11, no 7, p. 1078-1090.
Bratton, J. H. (2003). Habitat management to conserve fungi: A literature review. Natural Science Report. Countryside Council for Wales.
Brinkmann, K., L. Blaschke & A. Polle. 2002. «Comparison of different methods for lignin determination as a basis for calibration of near-infrared reflectance spectroscopy and implications of lignoproteins». Journal of Chemical Ecology, vol. 28, no 12, p. 2483-2501.
Buée, M., P. E. Courty, D. Mignot & J. Garbaye. 2007. «Soil niche effect on species diversity and catabolic activities in an ectomycorrhizal fungal community». Sail Biology and Biochemistry, vol. 39, no 8, p. 1947-1955.
Burnham, K. P., & D. R. Anderson. 2004. <<Multimodel inference: Understanding AIC and BIC in model selection». Sociological Methods and Research, vol. 33, no 2, p. 261-304.
Butler, J., K. Alexander & T. Green. 2002. <<Decaying wood: An overview of its status and ecology in the United Kingdom and continental Europe». Proceedings of the Symposium on the Ecology and Management of Dead Wood in Western Forests , p. ll-19.
Bütler, R., P. Angelstam, P. Ekelund & R. Schlaepfer. 2004. <<Dead wood threshold values for the three-toed woodpecker presence in boreal and sub-Alpine forest». Biological Conservation, vol. 119, no 3, p. 305-318.

132
Butts, S. R., & W. C. McComb. 2000. «Associations of forest-floor vertebrates with coarse woody debris in managed forests of western Oregon». Journal of Wildlife Management, vol. 64, no 1, p. 95-104.
Coleman, D. C., & W. B. Whitman. 2005. «Linking species richness, biodiversity and ecosystem function in soil systems». Pedobiologia, vol. 49, no 6, p. 479-497.
Coulombe, G. (2004 ). Rapport final de la Commission d'étude sur la gestion de la forêt publique québécoise.
Crawford, R. H., C. Y. Li & M. Floyd. 1997. <<Nitrogen ftxation in root-colonized large woody residue of Oregon coastal forests». Forest Ecology and Management, vol. 92, no 1-3, p. 229-234.
Daniels, L. D., J. Do bry, K. Klinka & M. C. Feller. 1997. <<Determining year of death of logs and snags of Thuja plicata in southwestern coastal British Columbia». Canadian Journal ofForest Research, vol. 27, no 7, p. 1132-1141.
Dansereau, P. R., & Y. Bergeron. 1993. <<Pire history in the southern boreal forest of northwestern Quebec». Canadian Journal of Forest Research, vol. 23, no 1, p. 25-32.
Davies, Z. G., C. Tyler, G. B. Stewart & A. S. Pullin. 2008. «Are current management recommendations for saproxylic invertebrates effective? A systematic review». Biodiversity and Conservation, vol. 17, no 1, p. 209-234.
De Bellis, T. , G. Kernaghan & P. Widden. 2007. <<Plant community influences on soil microfungal assemblages in boreal mixed-wood forests». Mycologia, vol. 99, no 3, p. 356-367.
De Boer, W. , L. B. Folman, R. C. Summerbell & L. Boddy. 2005. <<Living in a fungal world: Impact of fungi on soil bacterial niche development». FE!vfS Microbiology Reviews, vol. 29, no 4, p. 795-811.
Deacon, L. J., E. Janie Pryce-Miller, J. C. Frankland, B. W. Bainbridge, P. D. Moore & C. H. Robinson. 2006. <<Diversity and function of decomposer fungi from a grassland soil». Sail Biology and Biochemistry, vol. 38, no 1, p. 7-20.
Degens, B. P. 1998. <<Decreases in microbial functional diversity do not result in corresponding changes in decomposition under different moisture conditions». Sail Biology and Biochemistry, vol. 30, no 14, p. 1989-2000.
Dilly, 0., J. Bloem, A. Vos & J. C. Munch. 2004. <<Bacterial diversity in agricultural soils during litter decomposition». Applied and Environmental Microbiology, vol. 70, no 1, p. 468-474.

133
Drapeau, P., A. Nappi, J.F. Giroux, A. Leduc & J. P. Savard. 2002. <<Distribution patterns of birds associated with snags in natural and managed eastern boreal forests». Proceedings of the Symposium on the Ecology and Management of Dead Wood in Western Forests, p. 193-205.
Drapeau, P., A. Nappi, L. lmbeau & M. Saint-Germain. 2009. «Standing deadwood for keystone bird species in the eastern boreal forest: Managing for snag dynamics». Forestry Chronicle, vol. 85, no 2, p. 227-234.
Edman, M., N. Kruys & B. G. Jonsson. 2004. <<Local dispersal sources strongly affect colonization patterns of wood-decaying fungi on spruce logs». Ecological Applications, vol. 14, no 3, p. 893-901.
Edwards, N. T. 1982. «The use of soda-lime for measuring respiration rates in terrestrial systems». Pedobiologia, vol. 23, p. 321-330.
Ehnstrom, B. 2001. <<Leaving dead wood for insects in boreal forests - Suggestions for the future». Scandinavian Journal of Forest Research, vol. 16, no 1, p. 91-98.
Eichner, C. A., R. W. Erb, K. N. Timmis & 1. Wagner-Dobler. 1999. «Thermal gradient gel electrophoresis analysis of bioprotection from pollutant shocks in the activated sludge microbial community». Applied and Environmental Microbiology, vol. 65, no 1, p. 102-109.
Feller, M. C. 2003. <<Coarse woody debris in the old-growth forests of British Columbia». Environmental Reviews, vol. 11, no 1 SUPPL.
Fischer, Michael, & Manfred Binder. 2004. «Species recognition, geographie distribution and host-pathogen relationships: a case study in a group of lignicolous basidiomycetes, Phellinus s.l.».Mycologia, vol. 96, no 4, p. 799-811.
Fitter, A. H., C. A. Gilligan, K. Hollingworth, A. Kleczkowski, R. M. Twyman & J. W. Pitchford. 2005. <<Biodiversity and ecosystem function in soil». Functional Eco/ogy, vol. 19, no 3, p. 369-377.
Foley, W. J., A. Mcllwee, 1. Lawler, L. Aragones, A. P. Woolnough & N. Berding. 1998. <<Ecological applications of near infrared reflectance spectroscopy - A tool for rapid, cost-effective prediction of the composition of plant and animal tissues and aspects of animal performance». Oecologia, vol. 116, no 3, p. 293-305.
Franklin, J. F. 1997. Alternative silvicultural approaches ta timber harvesting: Variable retention harvest systems. Creating a Forestry for the 2lst Century: Island Press, Washington, D.C., 111-139 p.

134
Franzén, I., R. Vasaitis, R. Penttila & J. Stenlid. 2007. <<Population genetics of the wooddecay fungus Phlebia centrifuga P. Karst. in fragmented and continuous habitats». Molecular Ecology, vol. 16, no 16, p. 3326-3333.
Frey, S. D., J. Six & E. T. Elliott. 2003. <<Reciprocal transfer of carbon and nitrogen by decomposer fungi at the soil-litter interface». Soi! Biology and Biochemistry, vol. 35, no 7, p. 1001-1004.
Fridman, J., & M. Walheim. 2000. «Amount, structure, and dynamics of dead wood on managed forestland in Sweden». Forest Ecology and Management, vol. 131, no 1-3, p. 23-36.
Fromin, N., J. Hamelin, S. Tarnawski, D. Roesti, K. Jourdain-Miserez, N. Forestier, S. Teyssier-Cuvelle, F. Gillet, M. Aragno & P. Rossi. 2002. «Statistical analysis of denaturing gel electrophoresis (DGE) fmgerprinting patterns». Environmental Microbiology, vol. 4, no 11, p. 634-643.
Fukami, T., 1. A. Dickie, J. Paula Wilkie, B. C. Paulus, D. Park, A. Roberts, P. K. Buchanan & R. B. Allen. 2010. <<Assembly history dicta tes ecosystem functioning: Evidence from wood decomposer communities». Ecology Letters, vol. 13, no 6, p. 675-684.
Galindo-Leal, C., & F. L. Bunnell. 1995. <<Ecosystem management: implications and opportunities of a new paradigm». Forestry Chronicle, vol. 71, no 5, p. 601-606.
Ganjegunte, G. K., L. M. Condron, P. W. Clinton, M. R. Davis & N. Mahieu. 2004. <<Decomposition and nutrient release from radiata pine (Pinus radiata) coarse woody debris». Forest Ecology and Management, vol. 187, no 2-3, p. 197-211.
Gardes, M., & T.D. Bruns. 1993. <<lTS primers with enhanced specificity for basidiomycetes -application to the identification of mycorrhizae and rusts». Molecular Ecology, vol. 2, no 2, p. 113-118.
--------. 1996. «Community structure of ectomycorrhizal fungi in a Pinus muricata forest: Above- and below-ground views». Canadian Journal of Botany, vol. 74, no 10, p. 1572-1583.
Gauthier, S., M.-A. Vaillancourt, A. Leduc, L. de Grandpré, D.D. Kneeshaw, H. Morin, P. Drapeau & Y. Bergeron. 2008. Aménagement écosystémique en forêt boréale: Presses de l'Université du Québec, Québec, 568 p.
Goering, H.K, & P.J Van Soest. 1970. «Forage fibre analysis (apparatus, reagents and sorne applications)». In U.S. Department of Agriculture Agricultural Handbook No. 379., p. 1-19: U.S. Department of Agriculture, Washington. D.C.
Gray, N. D. , R. C. Hastings, S. K. Sheppard, P. Loughnane, D. Lloyd, A. J. McCarthy & 1. M. Head. 2003. <<Effects of soil improvement treatments on bacterial community

135
structure and soil processes in an upland grassland soil». FEMS Microbiology Ecology, vol. 46, no 1, p. 11-22.
Green III, F., & T. L. Highley. 1997. <Mechanism of brown-rot decay: Paradigm or paradox». International Biodeterioration and Biodegradation, vol. 39, no 2-3, p. 113-124.
Griffiths, B. S., K. Ritz, R. D. Bardgett, R. Cook, S. Christensen, F. Ekelund, S. J. S0rensen, E. Baath, J. Bloem, P. C. De Ruiter, J. Dolfing & B. Nicolardot. 2000. <<Ecosystem response of pasture soil communities to fumigation-induced microbial diversity reductions: An examination of the biodiversity-ecosystem function relationship». Oikos, vol. 90, no 2, p. 279-294.
Griffiths, B. S., K. Ritz, R. Wheatley, H. L. Kuan, B. Boag, S. Christensen, F. Ekelund, S. J. S0rensen, S. Muller & J. Bloem. 2001. «An examination of the biodiversityecosystem function relationship in arable soil microbial communities». Sail Biology and Biochemistry, vol. 33, no 12-13, p. 1713-1722.
Grove, S. J. 2002. «Saproxylic insect ecolo gy and the sustainable management of forests». Annual Review ofEcology and Systematics, vol. 33, p. 1-23.
Haeussler, S., Y. Bergeron, S. Brais & B. D. Harvey. 2007. «Natural dynamics-based silviculture for maintaining plant biodiversity in Populus tremuloides-dominated boreal forests of eastern Canada». Canadian Journal of Botany, vol. 85, no 12, p. 1158-1170.
Hafner, S. D. , & P. M. Groffman. 2005. «Soil nitrogen cycling under litter and coarse woody debris in a mixed forest in New York State». Sail Biology and Biochemistry, vol. 37, no 11, p. 2159-2162.
Hagemann, U., M. T. Moroni, J. Gleifiner & F. Makeschin. 2010. <<Disturbance history influences downed woody debris and soil respiration». Forest Ecology and Management, vol. 260, no 10, p. 1762-1772.
Hall, T. A. 1999. <<BioEdit: A user-friendly biological sequence alignment editor and analysis». Nucleic Acids Symp. Ser., vol. 41, p. 95-98.
Hallaksela, Anna-Maija. 1993. <<Early interactions of Heterobasidion annosum and Stereum sanguinolentum with non-decay fungi and bacteria following inoculation into stems ofPicea abies». European Journal of Forest Pathology, vol. 23, no 6-7, p. 416-430.
Hannam, K. D., S. A. Quideau & B. E. Kishchuk. 2006. «Forest floor microbial communities in relation to stand composition and timber harvesting in northern Alberta». Sail Biology and Biochemistry, vol. 38, no 9, p. 2565-2575.

136
Hannon, M. E. , J. F. Franklin, F. J. Swanson, P. Sollins, S. V. Gregory, J. D. Lattin, N. H. Anderson, S. P. Cline, N. G. Aumen, J. R. Sedell, G. W. Lienkaemper, K. Cromack Jr, K. W. Cummins, A. MacFadyen & E.D Ford. 1986. «Ecology of coarse woody debris in temperate ecosystems». Advances in Ecological Research, vol. 15, p. 133-302.
Hannon, M. E., & Jay Sexton. 1996. Guide/ines for measurements of woody detritus in forest ecosystems: US. Long-tenn Ecol. Res. Netw. Off. Publ. No. 20 p.
Harvey, B. 1999. «The Lake Duparquet Research and Teaching Forest: Building a foundation for ecosystem management». Forestry Chronicle, vol. 75, no 3, p. 389-393.
Harvey, B. D., & S. Brais. 2007. <<Partial cutting as an analogue to stem exclusion and dieback in trembling as pen (Populus tremuloides) dominated boreal mixedwoods: Implications for deadwood dynamics». Canadian Journal of Forest Research, vol. 37, no 9, p. 1525-1533.
Harvey, B. D., A. Leduc, S. Gauthier & Y. Bergeron. 2002. «Stand-landscape integration in natural disturbance-based management of the southern boreal forest». Forest Ecology and Management, vol. 155, no 1-3, p. 369-385.
Hattenschwiler, S., A. V. Tiunov & S. Scheu. 2005. <<Biodiversity and litter decomposition in terrestrial ecosystems». Annual Review of Ecology, Evolution, and Systematics, vol. 36, p. 191-218.
Hautala, H., J. Jalonen, S. Laaka-Lindberg & I. Vanha-Majamaa. 2004. <<Impacts of retention felling on coarse woody debris (CWD) in mature boreal spruce forests in Finland». Biodiversity and Conservation, vol. 13, no 8, p. 1541-1554.
Heilmann-Clausen, J., E. Aude & M. Christensen. 2005. «Cryptogam commumbes on decaying deciduous wood - Does tree species diversity matter?». Biodiversity and Conservation, vol. 14, no 9, p. 2061-2078.
Heilmann-Clausen, J., & L. Boddy. 2005. <<Inhibition and stimulation effects in communities of wood decay fungi: Exudates from colonized wood influence growth by other species». Microbial Ecology, vol. 49, no 3, p. 399-406.
Heilmann-Clausen, J., & M. Christensen. 2003. <<Fungal diversity on decaying beech logs -Implications for sustainable forestry». Biodiversity and Conservation, vol. 12, no 5, p. 953-973.
--------. 2004. <<Does size matter? On the importance of various dead wood fractions for fungal diversity in Danish beech forests». Forest Ecology and Management, vol. 201, no 1, p. 105-117.

137
Hiscox, J., P. Baldrian, H. J. Rogers & L. Boddy. 2010. «Changes in oxidative enzyme activity during interspecific mycelial interactions involving the white-rot fungus Trametes versicolor». Fungal Genetics and Biology, vol. 47, no 6, p. 562-571.
Hoadley, RB. 1990. Jdentifying wood: accurate results with simple tools: Taunton Press, Newtown, Connecticut, 223 p.
Hodge, S. J., & G.F. Peterken. 1998. <<Deadwood in British forests: Priorities and a strategy». Forestry, vol. 71, no 2, p. 99-112.
Holm, S. 1979. <<A Simple Sequentially Rejective Multiple Test Procedure». Scandinavian Journal ofStatistics, vol. 6, no 2, p. 65-70.
Hood, I. A., P. N. Beets, M. O. Kimberley, J. F. Gardner, G. R. Oliver & S. Pearce. 2004. «Colonisation of podocarp coarse woody debris by decomposer basidiomycete fungi in an indigenous forest in the central North Island of New Zealand». Forest Ecology and Management, vol. 196, no 2-3, p. 311-325.
Hooper, D. U. 2002. Species diversity, functional diversity and ecosystem functioning. Biodiversity and Ecosystem Functioning: Synthesis and Perspectives. New York: Oxford Univ Press, 195-208 p.
Hottola, Jenni, Otso Ovaskainen & Ilkka Hanski. 2009. «A unified measure of the number, volume and diversity of dead trees and the response of fun gal communities». Journal ofEcology, vol. 97, no 6, p. 1320-1328.
Hou, P. , & C. Pan. 2001. <<Coarse woody debris and its function in forest ecosystem». Chinese Journal of Applied Ecology, vol. 12, no 2, p. 309-314.
Humphrey, J. W. 2005. <<Benefits to biodiversity from developing old-growth conditions in British upland spruce plantations: A review and recommendations». Forestry, vol. 78, no 1, p. 33-53.
Jabin, M., D. Mohr, H. Kappes & W. Topp. 2004. <<Influence of deadwood on density of soil macro-arthropods in a managed oak-beech forest». Forest Ecology and Management, vol. 194, no 1-3, p. 61-69.
Jackson, J. A., & B. J. S. Jackson. 2004. <<Ecological relationships between fungi and woodpecker cavity sites». Condor, vol. 106, no 1, p. 37-49.
Jasalavich, C. A., A. Ostrofsky & J. Jellison. 2000. <<Detection and identification of decay fungi in spruce wood by restriction fragment length polymorphism analysis of amplified genes encoding rRNA». Applied and Environmental Microbiology, vol. 66, no 11, p. 4725-4734.

138
Johannesson, H., & J. Stenlid. 1999. <<Molecular identification ofwood-inhabiting fungi in an unmanaged Picea abies forest in Sweden». Forest Ecology and Management, vol. ll5, no 2-3, p. 203-211.
Jonsell, M., & G. Nordlander. 2002. «lnsects in polypore fungi as indicator species: A comparison between forest sites differing in amounts and continuity of dead wood». Forest Ecology and Management, vol. 157, no 1-3, p. 101-118.
Jonsson, B. G., N. Kruys & T. Ranius. 2005. <<Ecology of species living on dead wood -Lessons for dead wood management». Silva Fennica, vol. 39, no 2, p. 289-309.
Jonsson, M. T., M. Edman & B. G. Jonsson. 2008. «Colonization and extinction patterns of wood-decaying fungi in a boreal old-growth Picea abies forest». Journal of Ecology, vol. 96, no 5, p. 1065-1075.
Julien, M. C., P. Dion, C. Lafrenière, H. Antoun & P. Drouin. 2008. «Sources of clostridia in raw milk on farms». Applied and Environmental Microbiology, vol. 74, no 20, p. 6348-6357.
Junninen, K., & A. Komonen. 2011. «Conservation ecology of boreal polypores: A review». Biological Conservation, vol. 144, no 1, p. 11-20.
Junninen, K., M. Simila, J. Kouk:i & H. Kotiranta. 2006. «Assemblages of wood-inhabiting fungi along the gradients of succession and naturalness in boreal pine-dominated forests in Fennoscandia». Ecography, vol. 29, no 1, p. 75-83.
Juutilainen, K., P. Halme, H. Kotiranta & M. Monkkonen. 20ll. «Size matters in studies of dead wood and wood-inhabiting fungi». Fungal Ecology, vol. 4, no 5, p. 342-349.
Kebli, H., P. Drouin, S. Brais & G. Kemaghan. 2011. «Species Composition of Saproxylic Fungal Communities on Decaying Logs in the Boreal Forest». Microbial Ecology, vol. 61, no 4, p. 898-910.
Keith, H., & S. C. Wong. 2006. <<Measurement of soil C02 efl1ux using soda lime absorption: both quantitative and reliable». Soif Biology and Biochemistry, vol. 38, no 5, p. ll21-1131.
Kemaghan, G., L. Sigler & D. Khasa. 2003. <<Mycorrhizal and root endophytic fungi of containerized Picea glauca seedlings assessed by rDNA sequence analysis». Microbial Ecology, vol. 45, no 2, p. 128-136.
Kemaghan, G., P. Widden, Y. Bergeron, S. Légaré & D. Paré. 2003. <<Biotic and abiotic factors affecting ectomycorrhizal diversity in boreal mixed-woods». Oikos, vol. 102, no 3, p. 497-504.

139
Kneeshaw, D. D., A. Leduc, P. Drapeau, S. Gauthier, D. Pare, R. Carignan, R. Doucet, L. Bouthillier & C. Messier. 2000. <<Development of integrated ecological standards of sustainable forest management at an operational scale». Forestry Chronicle, vol. 76, no 3, p. 481-493.
Komonen, A. 2003. <<Distribution and abundance of insect fungivores in the fruiting bodies of Fomitopsis pinicola». A nnales Zoologici Fennici, vol. 40, no 6, p. 495-504.
Kruys, N., & B. G. Jonsson. 1999. <<Fine woody debris is important for species richness on logs in managed boreal spruce forests of northern Sweden». Canadian Journal of Forest Research, vol. 29, no 8, p. 1295-1299.
Kruys, N., B. G. Jonsson & G. Stahl. 2002. <<A stage-based matrix model for decay-class dynamics ofwoody debris». EcologicalApplications, vol. 12, no 3, p. 773-781.
Kubartova, A., J. Moukoumi, T. Béguiristain, J. Ranger & J. Berthelin. 2007. <<Microbial diversity during cellulose decomposition in different forest stands: 1. Microbial communities and environmental conditions». Microbial Ecology, vol. 54, no 3, p. 393-405.
Kubartova, A., J. Ranger, J. Berthelin & T. Beguiristain. 2009. <<Diversity and decomposing ability of saprophytic fungi from tempera te forest litter». Microbial Ecolo gy, vol. 58, no 1, p. 98-107.
Küffer, N., & B. Senn-Irlet. 2005. <<Influence of forest management on the species richness and composition of wood-inhabiting basidiomycetes in Swiss forests». Biodiversity and Conservation, vol. 14, no 10, p. 2419-2435.
Kulhankova, A., T. Béguiristain, J. Moukoumi, J. Berthelin & J. Ranger. 2006. «Spatial and temporal diversity of wood decomposer communities in different forest stands, determined by ITS rDNA targeted TGGE». Annals of Forest Science, vol. 63, no 5, p. 547-556.
Lee, S. D. 2004. <<Population dynamics and demography of deermice (Peromyscus maniculatus) in heterogeneous habitat: Role of coarse woody debris». Polish Journal of Ecology, vol. 52, no 1, p. 55-62.
Legendre, P., & M. J. Andersson. 1999. <<Distance-based redundancy analysis: Testing multispecies responses in multifactorial ecological experiments». Ecological Monographs, vol. 69, no 1, p. 1-24.
Li, C. Y., R. H. Crawford & T. T. Chang. 1997. <<Frankia in decaying fallen trees devoid of actinorhizal hosts and soil». Microbiological Research, vol. 152, no 2, p. 167-169.

140
Lindahl, B. , R. Finlay & S. Olsson. 2001. «Simultaneous, bidirectional translocation of 32P and 33P between wood blocks connected by mycelial cords of Hypholoma fasciculare». New Phytologist, vol. 150, no 1, p. 189-194.
Linder, P., B. Elfving & O. Zackrisson. 1997. «Stand structure and successional trends in virgin boreal forest reserves in Sweden». Forest Ecology and Management, vol. 98, no 1, p. 17-33.
Lindhe, A., N. Âsenblad & H. G. Toresson. 2004. «Cut logs and high stumps of spruce, birch, aspen and oak - Nine years of saproxylic fungi succession». Biological Conservation, vol. 119, no 4, p. 443-454.
Lindner, D. L., R. Vasaitis, A. Kubartova, J. Allmér, H. Johannesson, M. T. Banik & J. Stenlid. 2011. <<Initial fungal colonizer affects mass loss and fungal community development in Picea abies logs 6yr after inoculation». Fungal Ecology, vol. 4, no 6, p. 449-460.
Lôhmus, A. 2011. «Silviculture as a disturbance regime: The effects of clear-cutting, planting and thinning on polypore communities in mixed forests». Journal of Forest Research, vol. 16, no 3, p. 194-202.
Lonsdale, D., M. Pautasso & O. Holdenrieder. 2008. «Wood-decaying fungi in the forest: Conservation needs and management options». European Journal of Forest Research, vol. 127, no 1, p. 1-22.
Lumley, T. C., L. D. Gignac & R. S. Currah. 2001. «Microfungus communities of white spruce and trembling aspen logs at different stages of decay in disturbed and undisturbed sites in the boreal mixedwood region of Alberta». Canadian Journal of Botany, vol. 79, no 1, p. 76-92.
Mantel, N. 1967. «The detection of disease clustering and a generalized regresswn approach». Cancer Research, vol. 27, no 2, p. 209-220.
Martinez, A. T., M. Speranza, F. J. Ruiz-Duefias, P. Ferreira, S. Camarero, F. Guillén, M. J. Martinez, A. Gutiérrez & J. C. Del Rio. 2005. <<Biodegradation of lignocellulosics: Microbial, chemical, and enzymatic aspects of the fungal attack of lignin». lnternationalMicrobiology, vol. 8, no 3, p. 195-204.
Mazerolle, M. J. 2006. <<lmproving data analysis in herpetology: Using Akaike's information criterion (AIC) to assess the strength of biological hypotheses». Amphibia Reptilia, vol. 27, no 2, p. 169-180.
Mazerolle, Marc J. 2009. «AICcmodavg: Model selection and multimodel inference based on (Q)AIC(c). R package vers10n 1.01. http://CRAN.R-project. org/package= AI Ccmodavg».

141
McCay, T. S., & M. J. Komoroski. 2004. <<Demographie responses of shrews to removal of coarse woody debris in a managed pine forest». Forest Ecology and Management, vol. 189, no 1-3, p. 387-395.
McClelland, B. R. , & P. T. McClelland. 1999. <<Pileated woodpecker nest and roost trees in Montana: Links with old-growth and forest 'health'». Wildlife Society Bulletin, vol. 27, no 3, p. 846-857.
McComb, W., & D. Lindenmayer. 1999. <<Dying, dead, and clown trees». In Maintaining Biodiversity in Forest Ecosystems, UK Cambridge, M.L. Hunter, p. 335-372: Cambridge University Press.
Meyer, P. 1999. <<Dead wood research in forest reserves of Northwest-Germany: Methodology and results». Totholzuntersuchungen in nordwestdeutschen Naturwaldern: Methodik und erste ergebnisse, vol. 118, no 3, p. 167-180.
Meysami, P. , & H. Baheri. 2003. <<Pre-screening of fungi and bulking agents for contaminated soil bioremediation». Advances in Environmental Research, vol. 7, no 4, p. 881-887.
Mikola, J., & H. Setala. 1998. <<Relating species diversity to ecosystem functioning: Mechanistic backgrounds and experimental approach with a decomposer food web». Oikos, vol. 83, no 1, p. 180-194.
Montes, F., & 1. Caiiellas. 2006. <<Modelling coarse woody debris dynamics in even-aged Scots pine forests». Forest Ecology and Management, vol. 221, no 1-3, p. 220-232.
Moore, J. C., E. L. Berlow, D. C. Coleman, P. C. De Suiter, Q. Dong, A. Hastings, N. C. Johnson, K. S. McCann, K. Melville, P. J. Morin, K. Nadelhoffer, A. D. Rosemond, D. M. Post, J. L. Sabo, K. M. Scow, M. J. Vanni & D. H. Wall. 2004. <<Detritus, trophic dynamics and biodiversity». Ecology Letters, vol. 7, no 7, p. 584-600.
Moorhead, D. L., & R. L. Sinsabaugh. 2000. «Simulated patterns of litter decay predict patterns of extracellular enzyme activities». Applied Sail Ecology, vol. 14, no 1, p. 71-79.
Morin, H., D. Laprise & Y. Bergeron. 1993. «Chronology of spruce budworm outbreaks near Lake Duparquet, Abitibi region, Quebec». Canadian Journal of Forest Research, vol. 23, no 8, p. 1497-1506.
Müller, A. K., K. Westergaard, S. Christensen & S. J. Sorensen. 2002. «The diversity and function of soil microbial communities exposed to different disturbances». Microbial Ecology, vol. 44, no 1, p. 49-58.

142
Müller, J., H. Engel & M. Blaschke. 2007. «Assemblages ofwood-inhabiting fungi related to silvicultural management intensity in beech forests in southern Germany». European Journal of Forest Research, vol. 126, no 4, p. 513-527.
Müller, J., T. Hothom & H. Pretzsch. 2007. <<Long-term effects of logging intensity on structures, birds, saproxylic beetles and wood-inhabiting fungi in stands of European beech Pagus sylvatica L». Forest Ecology and Management, vol. 242, no 2-3, p. 297-305.
Muyzer, Gerard, & Komelia Smalla. 1998. «Application of denaturing gradient gel electrophoresis (DGGE) and temperature gradient gel electrophoresis (TGGE) m microbial ecology». Antonie van Leeuwenhoek, vol. 73, no 1, p. 127-141.
Naeem, S., Loreau, M., Inchausti, P. 2002. <<Biodiversity and ecosystem functioning: The emergence of a synthetic ecological framework ». In Biodiversity and Ecosystem Functioning. Synthesis and Perspectives, p. 3-11.
Niemela, T., P. Renvall & R. Penttila. 1995. <<Interactions of fungi at late stages of wood decomposition». Annales Botanici Fennici, vol. 32, no 3, p. 141-152.
Nordén, B., F. Gôtmark, M. Ryberg, H. Paltto & J. Allmér. 2008. <<Partial cutting reduces species richness offungi on woody debris in oak-rich forests». Canadian Journal of Forest Research, vol. 38, no 7, p. 1807-1816.
Nordén, B., & H. Paltto. 2001. «Wood-decay fungi in hazel wood: Species richness correlated to stand age and dead wood features». Biological Conservation, vol. 101, no 1, p. 1-8.
Nordén, B., M. Ryberg, F. Gotmark & B. Olausson. 2004. <<Relative importance of coarse and fine woody debris for the diversity of wood-inhabiting fungi in temperate broadleaf forests». Biological Conservation, vol. 117, no 1, p. 1-10.
O'Connor, N. E., & T. P. Crowe. 2005. <<Biodiversity loss and ecosystem functioning: Distinguishing between number and identity of species». Eco/ogy, vol. 86, no 7, p. 1783-1796.
0kland, B. 1996. «Unlogged forests: Important sites for preserving the diversity of mycetophilids (Diptera: Sciaroidea)». Biological Conservation, vol. 76, no 3, p. 297-310.
Ostlund, L., O. Zackrisson & A. L. Axelsson. 1997. «The history and transformation of a Scandinavian boreal forest landscape since the 19th century». Canadian Journal of Forest Research, vol. 27, no 8, p. 1198-1206.
Ovaskainen, 0., J. Nokso-Koivisto, J. Hottola, T. Rajala, T. Pennanen, H. Ali-Kovero, O. Miettinen, P. Oinonen, P. Auvinen, L. Paulin, K. H. Larsson & R. Makipaa. 2010.

143
<<ldentifying wood-inhabiting fungi with 454 sequencing - what is the probability that BLAST gives the correct species?». Fungal Ecology, vol. 3, no 4, p. 274-283.
Palviainen, M., L. Finér, R. Laiho, E. Shorohova, E. Kapitsa & I. Vanha-Majamaa. 2010. «Carbon and nitrogen release from decomposing Scots pine, Norway spruce and silver birch stumps». Forest Ecology and Management, vol. 259, no 3, p. 390-398.
Parles, C. G., & D. C. Shaw. 1996. «Death and decay: A vital part of living canopies». Northwest Science, vol. 70, no SPEC. ISS., p. 46-53.
Parsons, S., K. J. Lewis & J. M. Psyllak:is. 2003. <<Relationships between roosting habitat of bats and decay of aspen in the sub-boreal forests of British Columbia». Forest Ecology andManagement, vol. 177, no 1-3, p. 559-570.
Paul, L. R., B. K. Chapman & C. P. Chanway. 2006. «Suillus tomentosus tuberculate ectomycorrhizal abundance and distribution in Pinus contorta woody debris». CanadianJournal of Forest Research, vol. 36, no 2, p. 460-466.
Penttila, R., M. Lindgren, O. Miettinen, H. Rita & I. Hansk:i. 2006. «Consequences of forest fragmentation for polyporous fungi at two spatial scales». Oikos, vol. 114, no 2, p. 225-240.
Penttila, R., J. Siitonen & M. Kuusinen. 2004. «Polypore diversity in managed and oldgrowth boreal Picea abies forests in southem Finland». Biological Conservation , vol. 117, no 3, p. 271-283.
Persiani, A M., P. Audisio, D. Lunghini, O. Maggi, V. M. Granito, A B. Biscaccianti, U. Chiavetta & M. Marchetti. 20 10. «Link:ing taxonomical and functional biodiversity of saproxylic fungi and beetles in broad-leaved forests in southem Italy with varying management histories». Plant Biosystems, vol. 144, no 1, p. 250-261.
Porter, A D., C. C. St. Clair & A De Vries. 2005. «Fine-scale selection by marten during winter in a young deciduous forest». Canadian Journal of Forest Research, vol. 35, no 4, p. 901-909.
Preston, C. M., & J. A Trofymow. 2000. «Variability in litter quality and its relationship to litter decay in Canadian forests». Canadian Journal of Botany, vol. 78, no 10, p. 1269-1287.
Progar, R. A, T. D. Schowalter, C. M. Freitag & J. J. Morrell. 2000. <<Respiration from coarse woody debris as affected by moisture and saprotroph functional diversity in Western Oregon». Oecologia, vol. 124, no 3, p. 426-431.
Pyle, C., & M. M. Brown. 1999. «Heterogeneity of wood decay classes within hardwood logs». Forest Ecology and Management, vol. 114, no 2-3, p. 253-259.

144
R Development Core Team. 2010. R Development Core Team (2010). R: A language and environment for statistical computing, reference index vers ion 2.1 0.1. R F oundation for Statistical Computing, Vienna, Austria. ISBN 3-900051-07-0, http://www.Rproiect.org/. p.
Riiberg, U., M. L. Edlund, N. Terziev & C. J. Land. 2005. «Testing and evaluation of natural durability of wood in above ground conditions in Europe - An overview». Journal of Wood Science, vol. 51, no 5, p. 429-440.
Rajala, T., M. Peltoniemi, T. Pennanen & R. Makipaa. 2010. <<Relationship between woodinhabiting fungi determined by molecular analysis (denaturing gradient gel electrophoresis) and quality of decaying logs». Canadian Journal of Forest Research, vol. 40, no 12, p. 2384-2397.
Rajala, Tiina, Mikko Peltoniemi, Jarkko Hantula, Raisa Makipaa & Taina Pennanen. 2011. <<RNA reveals a succession of active fungi during the decay of Norway spruce logs». Fungal Eco/ogy, vol. 4, no 6, p. 437-448.
Ramette, A. 2007. <Multivariate analyses in microbial ecology». FEMS Microbiology Eco/ogy, vol. 62, no 2, p. 142-160.
Ranius, T. , O. Kindvall, N. Kruys & B. G. Jonsson. 2003. «Modelling dead wood in Norway spruce stands subject to different management regimes». Forest Eco/ogy and Management, vol. 182, no 1-3, p. 13-29.
Rayner, A. D. M., & L. Boddy. 1988. Fungal Decomposition of Wood: lts Bio/ogy and Eco/ogy. New-York: Wiley.
Rothman, J. M., P. J. Van Soest & A. N. Pell. 2006. «Decaying wood is a sodium source for mountain gorillas». Bio/ogy Letters, vol. 2, no 3, p. 321-324.
Salles, J.F., J. A. Van Veen & J. D. Van Elsas. 2004. «Multivariate analyses of Burkholderia species in soil: Effect of crop and land use history». Applied and Environmental Microbiology, vol. 70, no 7, p. 4012-4020.
Seedre, M., B. M. Shrestha, H. Y. H. Chen, S. Colombo & K. Jogiste. 2011. «Carbon dynamics of North American boreal forest after stand replacing wildfrre and clearcut logging». Journal of Forest Research, vol. 16, no 3, p. 168-183.
Seifert, Keith A. 1983. <<Decay of Wood by the Dacrymycetales». Mycologia, vol. 75, no 6, p. 1011-1018.
Setala, H., & M. A. McLean. 2004. <<Decomposition rate of organic substrates in relation to the species diversity of soil saprophytic fungi». Oecologia, vol. 139, no 1, p. 98-107.

145
Siitonen, J., & P. Martikainen. 1994. «Occurrence of rare and threatened insects living on decaying Populus tremula: A comparison between Finnish and Russian Karelia». ScandinavianJournal ofForest Research, vol. 9, no 2, p. 185-191.
Siitonen, J., P. Martikainen, P. Punttila & J. Rauh. 2000. «Coarse woody debris and stand characteristics in mature managed and old-growth boreal mesic forests in southern Finland». Forest Ecology and M anagement, vol. 128, no 3, p. 211-225.
Siitonen, Juha. 2001. «Forest management, coarse woody debris and saproxylic organisms: Fennoscandian boreal forests as an example». Ecological Bulletins, vol. 49, p. 11-41.
Simila, M., J. Kouk:i & P. Martikainen. 2003. «Saproxylic beetles in managed and seminatural Scots pine forests: Quality of dead wood matters». Forest Ecology and Management, vol. 174, no 1-3, p. 365-381.
Sippola, A L., M. Monkkonen & P. Renvall. 2005. <<Polypore diversity in the herb-rich woodland key habitats of Koli National Park in eastern Finland». Biological Conservation, vol. 126, no 2, p. 260-269.
Sippola, A L., & P. Renvall. 1999. «Wood-decomposing fungi and seed-tree cutting: A 40-year perspective». Forest Ecology and Management, vol. 115, no 2-3 , p. 183-201.
Sippola, A L., M. Simila, M. Monkkonen & J. Jok:imak:i. 2004. <<Diversity of polyporous fungi (Polyporaceae) in northern boreal forests: Effects of forest site type and logging intensity». ScandinavianJournal ofForest Research, vol. 19, no 2, p. 152-163.
Sippola, Anna-Liisa, Timo Lehesvirta & Pertti Renvall. 2001. <<Effects of Selective Logging on Coarse Woody Debris and Diversity of Wood-Decaying Polypores in Eastern Finland». Ecological Bulletins, no 49, p. 243-254.
Spano, S. D., M. F. Jurgensen, M. J. Larsen & A E. Harvey. 1982. «Nitrogen-fixing bacteria in Douglas-fir residue decayed by Fomitopsis pinicola». Plant and Sail, vol. 68, no 1, p. 117-123.
Speight, M. C. D. 1989. Saproxylic invertebrates and the ir conservation. Strasbourg.
Steeger, C., & C. L. Hitchcock. 1998. <<influence of forest structure and diseases on nestsite selection by red-breasted nuthatches». Journal ofWildlife Management, vol. 62, no 4, p. 1349-1358.
Stenlid, J., R. Penttila & A Dahlberg. 2008. «Chapter 13 Wood-decay basidiomycetes in boreal forests: Distribution and community development». p. 239-262: British Mycological Society Symposia Series.

146
Stokland, J., & H. Kauserud. 2004. <<Phellinus nigrolimitatus- A wood-decomposing fongus highly influenced by forestry». Forest Ecology and Management, vol. 187, no 2-3, p. 333-343.
Sverdrup-Thygeson, A., & R. A Ims. 2002. «The effect of forest clearcutting in Norway on the community of saproxylic beetles on aspen». Biological Conservation, vol. 106, no 3, p. 347-357.
Takahashi, K. H., & T. Kagaya. 2005. «Guild structure of wood-rotting fungi based on volume and decay stage of coarse woody debris». Ecological Research, vol. 20, no 2, p. 215-222.
Tedersoo, L., T. Suvi, T. Jairus & U. Kôljalg. 2008. <<Forest microsite effects on community composition of ectomycorrhizal fungi on seedlings of Picea abies and Betula pendula». Environmental Microbiology, vol. 10, no 5, p. 1189-1201.
Ter Braak, Cajo J.F., & 1. Colin Prentice. 1988. «A Theory of Gradient Analysis». Advances in Ecological Research, vol. 18, p. 271-317.
Tiunov, A. V., & S. Scheu. 2005. <<F'acilitative interactions rather than resource partitioning drive diversity-functioning relationships in laboratory fungal communities». Ecology Letters, vol. 8, no 6, p. 618-625.
Ucitel, D., D. P. Christian & J. M. Graham. 2003. «Vole use of coarse woody debris and implications for habitat and fuel management». Journal of Wildlife Management, vol. 67, no 1, p. 65-72.
Urcelay, C., & G. Robledo. 2004. «Community structure of polypores (Basidiomycota) in Andean alder wood in Argentina: Functional groups among wood-decay fungi?». Austral Ecology, vol. 29, no 4, p. 471-476.
Van Der Heijden, M. G. A, R. D. Bardgett & N. M. Van Straalen. 2008. «The unseen majority: Soil microbes as drivers of plant diversity and productivity in terrestrial ecosystems». Ecology Letters, vol. 11, no 3, p. 296-310.
Van Wagner, C. E. ( 1982). Practical aspects of the line intersect method. Chalk River, Petawawa Natl. For. Inst.: 18 p.
Vasiliauskas, R., V. Lygis, K. H. Larsson & J. Stenlid. 2005. «Airbome fungal colonisation of coarse woody debris in North Temperate Picea abies forest: Impact of season and local spatial scale». Mycological Research, vol. 109, no 4, p. 487-496.
Vasiliauskas, R., A. Menkis, R. D. Finlay & J. Stenlid. 2007. «Wood-decay fungi in fme living roots of conifer seedlings». New Phytologist, vol. 174, no 2, p. 441-446.

147
Vasiliauskas, R., A Vasiliauskas, J. Stenlid & A l\1atelis. 2004. <<Dead trees and protected polypores in unmanaged north-temperate forest stands ofLithuania». Forest Ecology and Management, vol. 193, no 3, p. 355-370.
Vetrovsicy, T., J. Vofîskovâ, J. Snajdr, J. Gabriel & P. Baldrian. 2011. <<Ecology of coarse wood decomposition by the saprotrophic fungus Fames fomentarius». Biodegradation, vol. 22, no 4, p. 709-718.
Wardle, D. A, K. I. Bonner, G. M. Barker, G. W. Yeates, K. S. Nicholson, R. D. Bardgett, R. N. Watson & A Ghani. 1999. <<Plant removals in perennial grass land: Vegetation dynamics, decomposers, soil biodiversity, and ecosystem properties». Ecological Monographs, vol. 69, no 4, p. 535-568.
Wells, J. M., & L. Boddy. 2002. <<lnterspecific carbon exchange and cost of interactions between basidiomycete mycelia in soil and wood». Functional Ecology, vol. 16, no 2, p. 153-161.
Wertz, S., V. Degrange, J. I. Prosser, F. Poly, C. Commeaux, T. Freitag, N. Guillaumaud & X. L. Roux. 2006. <<l\1aintenance of soil functioning following erosion of microbial diversity». EnvironmentalMicrobiology, vol. 8, no 12, p. 2162-2169.
White, T. J., T.D. Bruns, S.B. Lee & J. W. Taylor. 1990. «Amplification and direct sequencing of fungal ribosomal RNA genes for phylogenetics». In PCR - Protocols and Applications -A Laboratory Manual, N. Innis, p. 315-322. New York, NY: Academie Press.
Wohl, D. L. , S. Arora & J. R. Gladstone. 2004. «Functional redundancy supports biodiversity and ecosystem function in a closed and constant environment». Ecology, vol. 85, no 6, p. 1534-1540.
Woods, C. M., S. Woodward & D. B. Redfern. 2005. <<ln vitro interactions in artificial and wood-based media between fungi colonizing stumps of Sitka spruce». Forest Pathology, vol. 35, no 3, p. 213-229.
Woodward, S., & L. Boddy. 2008. «Chapter 7 Interactions between saprotrophic fungi». p. 125-141: British Mycological Society Symposia Series.
Wormington, K. R., D. Lamb, H. I. McCallum & D. J. Moloney. 2003. «The characteristics of six species of living hollow-bearing trees and their importance for arboreal marsupials in the dry sclerophyll forests of southeast Queensland, Australia». Forest Ecology and Management, vol. 182, no 1-3, p. 75-92.
Yamashita, S., T. Hattori & H. Abe. 2010. <<Host preference and species richness of woodinhabiting aphyllophoraceous fungi in a cool temperate area of Japan». Mycologia, vol.102,no 1,p.ll-19.