Stereodivergent routes in organic synthesis: Marine natural ...
Upload
khangminh22Category
view
3download
0
Article
Diverse Routes toward Early Somites in the Mouse
EmbryoGraphical Abstract
Highlights
d Multiple transcriptional trajectories underlie somite
emergence
d Outlining the in vivo molecular journey toward the anterior T-
independent somites
d T does not negatively regulate Sox2 to control neural output
at E8.5
Guibentif et al., 2021, Developmental Cell 56, 141–153January 11, 2021 ª 2020 The Authors. Published by Elsevier Inchttps://doi.org/10.1016/j.devcel.2020.11.013
Authors
Carolina Guibentif,
Jonathan A. Griffiths,
Ivan Imaz-Rosshandler, ...,
Valerie Wilson, Berthold Gottgens,
John C. Marioni
[email protected] (V.W.),[email protected] (B.G.),[email protected] (J.C.M.)
In Brief
Guibentif, Griffiths et al. reconstruct three
transcriptional journeys from the
pluripotent mouse epiblast to anterior
somites, posterior somites, and
neuromesodermal progenitors (NMPs)
present at embryonic day 8.5. Single-cell
profiling of T�/�4WT chimeras validates
the molecular journey toward T-
independent anterior somites and
challenges the notion that NMP
differentiation is regulated by T and Sox2
mutual antagonism.
.ll

OPEN ACCESS
llArticle
Diverse Routes toward Early Somitesin the Mouse EmbryoCarolina Guibentif,1,2,3,9 Jonathan A. Griffiths,4,9,10 Ivan Imaz-Rosshandler,1,2 Shila Ghazanfar,4 Jennifer Nichols,2,6
Valerie Wilson,5,* Berthold Gottgens,1,2,* and John C. Marioni4,7,8,11,*1Department of Haematology, University of Cambridge, CB2 0AW Cambridge, UK2Wellcome-Medical Research Council Cambridge Stem Cell Institute, University of Cambridge, CB2 0AW Cambridge, UK3Sahlgrenska Center for Cancer Research, Department of Microbiology and Immunology, University of Gothenburg, 413 90 Gothenburg,Sweden4Cancer Research UK Cambridge Institute, University of Cambridge, CB2 0RE Cambridge, UK5Centre for Regenerative Medicine, Institute for Stem Cell Research, School of the Biological Sciences, University of Edinburgh, EH16 4UU
Edinburgh, UK6Department of Physiology, Development and Neuroscience, University of Cambridge, CB2 3DY Cambridge, UK7Wellcome Sanger Institute, Wellcome Genome Campus, CB10 1SA Cambridge, UK8European Molecular Biology Laboratory, European Bioinformatics Institute, European Molecular Biology Laboratory, EBI), WellcomeGenome Campus, CB10 1SD Cambridge, UK9These authors contributed equally10Present address: Genomics Plc, 50-60 Station Road, Cambridge CB1 2JH, UK11Lead Contact*Correspondence: [email protected] (V.W.), [email protected] (B.G.), [email protected] (J.C.M.)
https://doi.org/10.1016/j.devcel.2020.11.013
SUMMARY
Somite formation is foundational to creating the vertebrate segmental body plan. Here, we describe threetranscriptional trajectories toward somite formation in the early mouse embryo. Precursors of the anterior-most somites ingress through the primitive streak before E7 and migrate anteriorly by E7.5, while a secondwave of more posterior somites develops in the vicinity of the streak. Finally, neuromesodermal progenitors(NMPs) are set aside for subsequent trunk somitogenesis. Single-cell profiling of T�/� chimeric embryosshows that the anterior somites develop in the absence of T and suggests a cell-autonomous function of Tas a gatekeeper between paraxial mesoderm production and the building of the NMP pool. Moreover, weidentify putative regulators of early T-independent somites and challenge the T-Sox2 cross-antagonismmodel in early NMPs. Our study highlights the concept of molecular flexibility during early cell-type specifi-cation, with broad relevance for pluripotent stem cell differentiation and disease modeling.
INTRODUCTION
The recent emergence of high throughput single-cell RNA-
sequencing (scRNA-seq) assays has allowed researchers to sur-
vey entire transcriptional landscapes of development in
numerous species (Cao et al., 2019; Packer et al., 2019; Pi-
juan-Sala et al., 2019; Wagner et al., 2018). Somites are transient
segments of the paraxial mesoderm that give rise to the axial
skeleton and associated musculature. Following formation of
the most anterior somites, subsequent axis elongation is fueled
by a pool of neuromesodermal progenitors (NMPs), which give
rise to neural components of the spinal cord as well as themeso-
dermal tissue of the somites (Pourquie, 2001; Tzouanacou et al.,
2009). NMPs are characterized by co-expression of transcription
factors associated with gastrulation, mesodermal, and neural
development, including Brachyury (T), Sox2, and Nkx1-2 (Henri-
que et al., 2015; Steventon and Martinez Arias, 2017; Wilson
et al., 2009).
Developmental Cell 56, 141–153, JaThis is an open access article und
Starting as uniform blocks of epithelium, somites compart-
mentalize into ventral sclerotome (which gives rise to major ele-
ments of the skeleton, such as the vertebrae and ribs) and dorsal
dermomyotome (precursor of skeletal muscles and of the skin of
the back; Keynes and Stern, 1988). Somitogenesis is often por-
trayed as a relatively uniform process, regulated by an interact-
ing network of signaling pathways and transcription factors
such as Fgf, Wnt, Notch, T, and Tbx6 (Chapman and Papaioan-
nou, 1998; Hubaud and Pourquie, 2014; Martin and Kimelman,
2008). However, multiple lines of evidence indicate that disrup-
tion of these canonical somite regulators has little effect on the
formation of the first, most anterior, somites both in mouse and
in fish (Nowotschin et al., 2012; Pourquie, 2001), and the molec-
ular programs responsible for the formation of these occipital so-
mites remain poorly defined. Occipital somites differentiate early
in development and do not give rise to repetitive skeletal struc-
tures. In chick, gene-expression analysis has demonstrated a
specific molecular make-up of the anterior-most somites
nuary 11, 2021 ª 2020 The Authors. Published by Elsevier Inc. 141er the CC BY license (http://creativecommons.org/licenses/by/4.0/).
caudalrostral rostral
0
1
2
3
0 1 2 3
Mea
n lo
g 2 cou
nts
Sox2 Nkx1−2
T
Tbx6Meox1
neural mesodermNMPs
Lineage ordering
A C
D E
B
0.0
2.5
5.0
7.5
0 1 2 3Transcriptional Ordering
Den
sity
Rostro-caudal ordering
0
1
2
3
0 1 2 3
Mea
n lo
g 2 cou
nts Hoxa1
Hoxa2Hoxb2Hoxa5Cdx1Cdx2Cdx4
UMAP1
UM
AP2 Anterior Somitic Tissues
Caudal Mesoderm
Dermomyotome
Cranial mesoderm
NMP
Posterior Somitic TissuesPresomitic mesoderm
Sclerotome
Spinal cord
Transcriptional Ordering Transcriptional Ordering
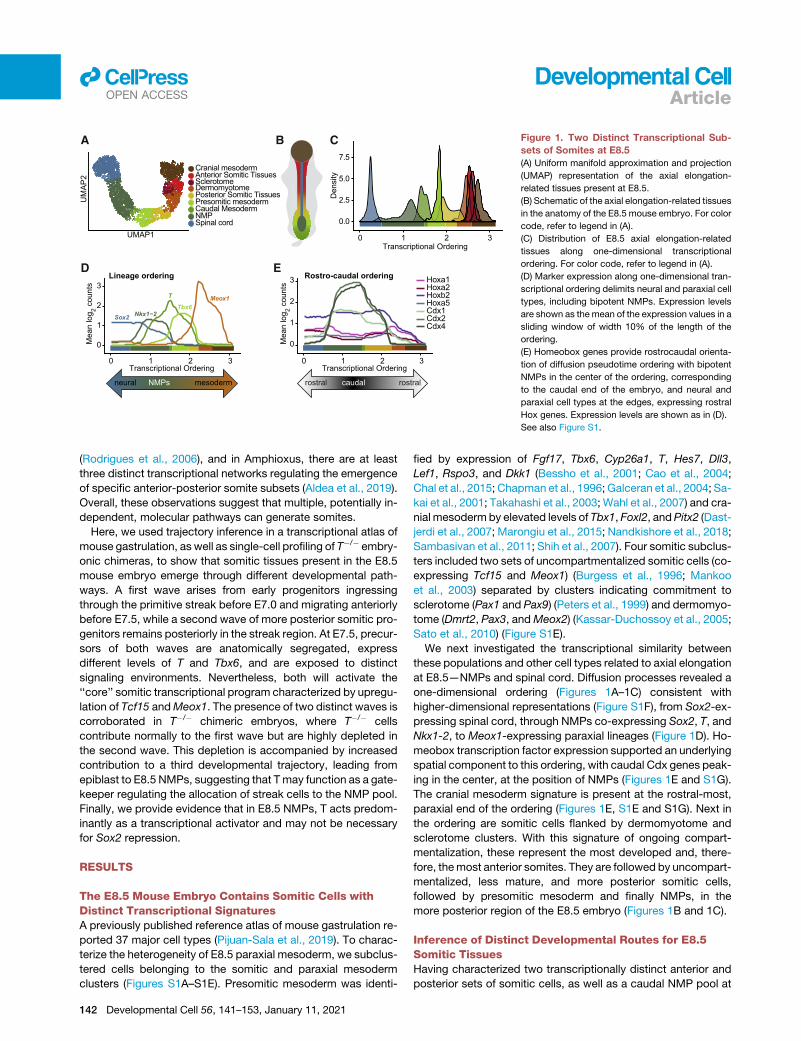
Figure 1. Two Distinct Transcriptional Sub-
sets of Somites at E8.5
(A) Uniform manifold approximation and projection
(UMAP) representation of the axial elongation-
related tissues present at E8.5.
(B) Schematic of the axial elongation-related tissues
in the anatomy of the E8.5 mouse embryo. For color
code, refer to legend in (A).
(C) Distribution of E8.5 axial elongation-related
tissues along one-dimensional transcriptional
ordering. For color code, refer to legend in (A).
(D) Marker expression along one-dimensional tran-
scriptional ordering delimits neural and paraxial cell
types, including bipotent NMPs. Expression levels
are shown as the mean of the expression values in a
sliding window of width 10% of the length of the
ordering.
(E) Homeobox genes provide rostrocaudal orienta-
tion of diffusion pseudotime ordering with bipotent
NMPs in the center of the ordering, corresponding
to the caudal end of the embryo, and neural and
paraxial cell types at the edges, expressing rostral
Hox genes. Expression levels are shown as in (D).
See also Figure S1.
llOPEN ACCESS Article
(Rodrigues et al., 2006), and in Amphioxus, there are at least
three distinct transcriptional networks regulating the emergence
of specific anterior-posterior somite subsets (Aldea et al., 2019).
Overall, these observations suggest that multiple, potentially in-
dependent, molecular pathways can generate somites.
Here, we used trajectory inference in a transcriptional atlas of
mouse gastrulation, as well as single-cell profiling of T�/� embry-
onic chimeras, to show that somitic tissues present in the E8.5
mouse embryo emerge through different developmental path-
ways. A first wave arises from early progenitors ingressing
through the primitive streak before E7.0 and migrating anteriorly
before E7.5, while a second wave of more posterior somitic pro-
genitors remains posteriorly in the streak region. At E7.5, precur-
sors of both waves are anatomically segregated, express
different levels of T and Tbx6, and are exposed to distinct
signaling environments. Nevertheless, both will activate the
‘‘core’’ somitic transcriptional program characterized by upregu-
lation of Tcf15 andMeox1. The presence of two distinct waves is
corroborated in T�/� chimeric embryos, where T�/� cells
contribute normally to the first wave but are highly depleted in
the second wave. This depletion is accompanied by increased
contribution to a third developmental trajectory, leading from
epiblast to E8.5 NMPs, suggesting that T may function as a gate-
keeper regulating the allocation of streak cells to the NMP pool.
Finally, we provide evidence that in E8.5 NMPs, T acts predom-
inantly as a transcriptional activator and may not be necessary
for Sox2 repression.
RESULTS
The E8.5 Mouse Embryo Contains Somitic Cells withDistinct Transcriptional SignaturesA previously published reference atlas of mouse gastrulation re-
ported 37 major cell types (Pijuan-Sala et al., 2019). To charac-
terize the heterogeneity of E8.5 paraxial mesoderm, we subclus-
tered cells belonging to the somitic and paraxial mesoderm
clusters (Figures S1A–S1E). Presomitic mesoderm was identi-
142 Developmental Cell 56, 141–153, January 11, 2021
fied by expression of Fgf17, Tbx6, Cyp26a1, T, Hes7, Dll3,
Lef1, Rspo3, and Dkk1 (Bessho et al., 2001; Cao et al., 2004;
Chal et al., 2015; Chapman et al., 1996; Galceran et al., 2004; Sa-
kai et al., 2001; Takahashi et al., 2003; Wahl et al., 2007) and cra-
nial mesodermby elevated levels of Tbx1, Foxl2, andPitx2 (Dast-
jerdi et al., 2007; Marongiu et al., 2015; Nandkishore et al., 2018;
Sambasivan et al., 2011; Shih et al., 2007). Four somitic subclus-
ters included two sets of uncompartmentalized somitic cells (co-
expressing Tcf15 and Meox1) (Burgess et al., 1996; Mankoo
et al., 2003) separated by clusters indicating commitment to
sclerotome (Pax1 and Pax9) (Peters et al., 1999) and dermomyo-
tome (Dmrt2, Pax3, andMeox2) (Kassar-Duchossoy et al., 2005;
Sato et al., 2010) (Figure S1E).
We next investigated the transcriptional similarity between
these populations and other cell types related to axial elongation
at E8.5—NMPs and spinal cord. Diffusion processes revealed a
one-dimensional ordering (Figures 1A–1C) consistent with
higher-dimensional representations (Figure S1F), from Sox2-ex-
pressing spinal cord, through NMPs co-expressing Sox2, T, and
Nkx1-2, to Meox1-expressing paraxial lineages (Figure 1D). Ho-
meobox transcription factor expression supported an underlying
spatial component to this ordering, with caudal Cdx genes peak-
ing in the center, at the position of NMPs (Figures 1E and S1G).
The cranial mesoderm signature is present at the rostral-most,
paraxial end of the ordering (Figures 1E, S1E and S1G). Next in
the ordering are somitic cells flanked by dermomyotome and
sclerotome clusters. With this signature of ongoing compart-
mentalization, these represent the most developed and, there-
fore, themost anterior somites. They are followed by uncompart-
mentalized, less mature, and more posterior somitic cells,
followed by presomitic mesoderm and finally NMPs, in the
more posterior region of the E8.5 embryo (Figures 1B and 1C).
Inference of Distinct Developmental Routes for E8.5Somitic TissuesHaving characterized two transcriptionally distinct anterior and
posterior sets of somitic cells, as well as a caudal NMP pool at

Tbx6
Eomes
Nanog
Mixl1
Cdh1
Cdh2
E6.5E6.7
5E7.0
E7.25E7.5
E7.75E8.0
E8.25E8.5
Meox1
E6.5E6.7
5E7.0
E7.25E7.5
E7.75E8.0
E8.25E8.5
Tcf15
Gastrulation: Somitic Mesoderm:
Wnt3a
Mesoderm development:
E6.5E6.75E7.0E7.25E7.5
E7.75E8.0E8.25E8.5
Anterior Somitic tissuesPosterior Somitic tissuesShared ancestors Ant/Post somitic tissuesNMP ancestorsShared ancestors NMP/Post somitic tissues
A
0.00.20.40.60.8 Sox2
0.00.51.01.52.0 Nkx1−2
0123 Cdx2
012T
E6.5E6.7
5E7.0
E7.25E7.5
E7.75E8.0
E8.25E8.5
Gene expression dynamics along somitic trajectories:
Anterior Somitic trajectoryPosterior Somitic trajectoryNMP trajectory
NMP signature:
B
C
0.00.51.01.52.0
0.00.51.01.5
012
0123
0.00.20.40.60.8
0.00.51.01.52.0
0.00.20.40.6
0.250.500.75
0.00.20.4
E6.5E6.7
5E7.0
E7.25E7.5
E7.75E8.0
E8.25E8.5
mea
n lo
g 2 cou
nts
Figure 2. Identification of Distinct Developmental Trajectories toward NMPs and Anterior and Posterior Somitic-Cell Subsets
(A) UMAP layout from Pijuan-Sala et al. (2019) highlighting cells belonging to the developmental trajectories for anterior somitic tissues, the newly formed
posterior somitic tissues, and NMPs present at E8.5, predicted using WOT analysis. For visualization purposes, the rare populations of shared ancestors were
plotted on top.
(B) UMAP layout from Pijuan-Sala et al. (2019) highlighting the same cells as in (A) colored by sampling time point.
(C) Gene-expression dynamics along the three developmental trajectories reveals distinct transcriptional programs. y axis: mean log2 (normalised counts).
See also STAR Methods; Figure S2; Table S1.
llOPEN ACCESSArticle
E8.5, we next investigated their putative developmental origins.
We reconstructed developmental trajectories using an optimal
transport approach (WOT) (Schiebinger et al., 2019; STAR
Methods; Figures 2A and 2B), which assigns ‘‘mass’’ to each
cell at the clusters featuring the presumed trajectory endpoints
and then transfers that mass sequentially backward between
cells in adjacent time points that are transcriptionally similar.
For each cell, the ‘‘mass’’ for each of the three endpoints allowed
us to allocate it to a given trajectory based on the highest mass
contribution. As such, WOT enables incorporation of real-time
information of the 9 sequential time points from E6.5 to E8.5
covered in the reference atlas; the classification of cells along
a trajectory is, thus, not only based on their transcriptional simi-
larity but also on time-point progression. NMPs could be traced
back to the epiblast at E6.5, while both somitic trajectories orig-
inate from E6.5 primitive streak cells. Separation between ante-
rior and posterior somitic trajectories occurred within E7.0-E7.5
nascent mesoderm (Figures 2B and S2A), suggesting that the
diversification of these two populations occurs following ingres-
sion through the streak.
Consistent with reported features of gastrulation, both anterior
and posterior somitic trajectories display a sharp early downre-
gulation of Nanog coupled with a shift in cadherin expression
(Cdh1 to Cdh2), which is characteristic of epithelial-to-mesen-
chymal transition (EMT) (Morgani et al., 2018). By contrast, for
the NMP trajectory, these processes occur gradually after E7.0
(Figure 2C). Expression of NMP markers over time confirms the
known NMP signature, with expression of T, Sox2, Nkx1-2, and
Developmental Cell 56, 141–153, January 11, 2021 143
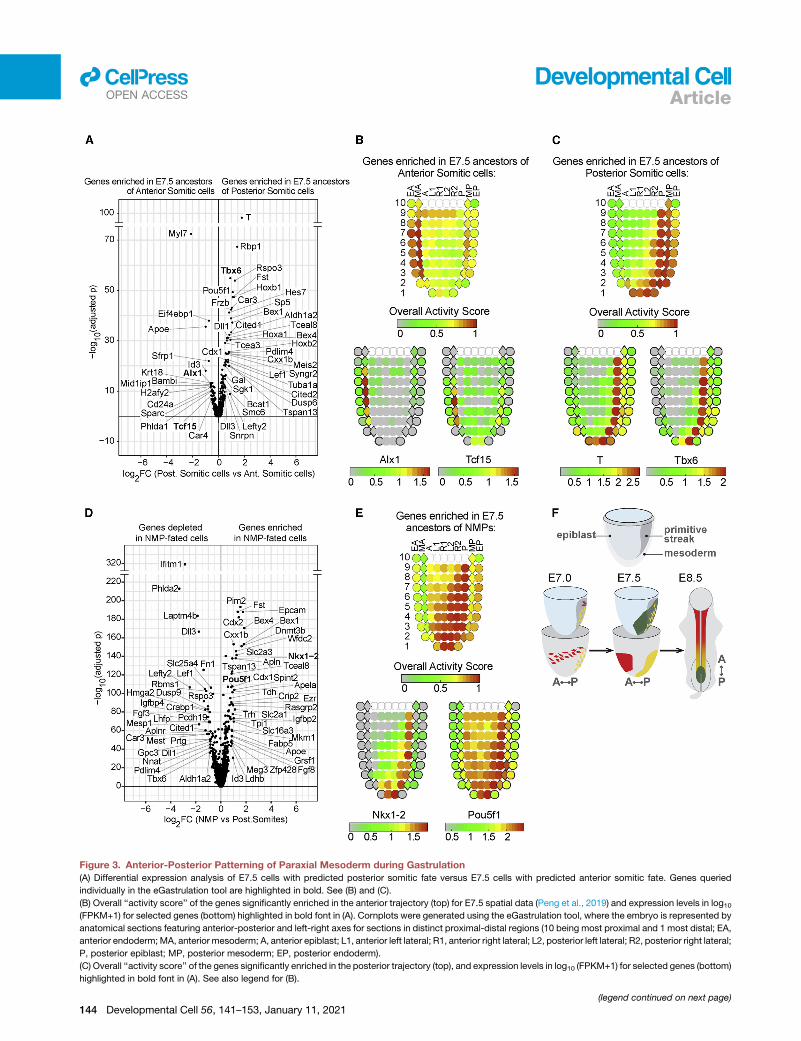
Figure 3. Anterior-Posterior Patterning of Paraxial Mesoderm during Gastrulation
(A) Differential expression analysis of E7.5 cells with predicted posterior somitic fate versus E7.5 cells with predicted anterior somitic fate. Genes queried
individually in the eGastrulation tool are highlighted in bold. See (B) and (C).
(B) Overall ‘‘activity score’’ of the genes significantly enriched in the anterior trajectory (top) for E7.5 spatial data (Peng et al., 2019) and expression levels in log10(FPKM+1) for selected genes (bottom) highlighted in bold font in (A). Cornplots were generated using the eGastrulation tool, where the embryo is represented by
anatomical sections featuring anterior-posterior and left-right axes for sections in distinct proximal-distal regions (10 being most proximal and 1 most distal; EA,
anterior endoderm;MA, anterior mesoderm; A, anterior epiblast; L1, anterior left lateral; R1, anterior right lateral; L2, posterior left lateral; R2, posterior right lateral;
P, posterior epiblast; MP, posterior mesoderm; EP, posterior endoderm).
(C) Overall ‘‘activity score’’ of the genes significantly enriched in the posterior trajectory (top), and expression levels in log10 (FPKM+1) for selected genes (bottom)
highlighted in bold font in (A). See also legend for (B).
(legend continued on next page)
llOPEN ACCESS Article
144 Developmental Cell 56, 141–153, January 11, 2021
llOPEN ACCESSArticle
Cdx2 at E7.5 being maintained up to E8.5. In this trajectory, the
persistence of Cdh1 expression throughout upregulation of
Cdh2 between E7.0 and E8.25 is consistent with an ‘‘incom-
plete’’ EMT in NMPs (Dias et al., 2020). Inspection of additional
EMT genes, including Epcam (epithelial marker) and Vim
(mesenchymal marker), reinforced this notion, with co-expres-
sion detected in half of the predicted NMP ancestors between
E7.5 and E8.0 (Figures S2B–S2D).
Expression of early mesoderm markers, Eomes and Mixl1, in
all three trajectories is followed by upregulation of the somite
markers,Meox1 and Tcf15, specifically in the two somitic trajec-
tories. These two trajectories showed clear molecular diver-
gence at E7.5 (before upregulation ofMeox1 and Tcf15), with up-
regulation of Wnt3a, T, and Tbx6 specific to the posterior
trajectory (Figure 2C).
In addition to examining known regulators, we performed un-
biased pair-wise comparisons of gene expression along the
entire length of the three trajectories. We examined for each
gene whether its expression pattern significantly differed be-
tween each pair-wise combination of trajectories, using as input
data the mean expression level of each trajectory at each time
point (see STAR Methods; Table S1). Gene set enrichment anal-
ysis using the Molecular Signatures Database Hallmark gene set
collection (Liberzon et al., 2015; Subramanian et al., 2005) re-
vealed that genes displaying distinct behaviors between the
three trajectories were enriched for the EMT process (Fig-
ure S2E), consistent with our targeted analysis (Figures S2B–
S2D). The process of myogenesis was enriched in the anterior
versus posterior somitic trajectories comparison, likely due to
the different maturation kinetics of these two sets of somites, re-
flected by the dynamics of the myogenesis regulatorMef2c (Fig-
ures S2E and S2F). The mTORC1 pathway was also enriched,
with distinct expression of the upstream regulator Pdk1 and of
the downstream targets Slc2a1 and Slc2a3 (Figures S2E and
S2F). Differences between anterior and posterior somitogenesis
have been noted previously (Nowotschin et al., 2012; Rashbass
et al., 1991). This inferred transcriptional trajectory leading from
the primitive streak to anterior somitic tissues now provides an
unbiased molecular description of this process.
Canonical Regulators of Somitogenesis Are Depleted inthe Anterior TrajectoryThe anterior and posterior somitic trajectories share early (E6.5–
E7.0) transcriptional changes associated with gastrulation, as
well as upregulation of somitic genes at E8.0–E8.5 (Figure 2C),
but also show divergent expression at intermediate time points
(E7.25–E7.75). Differential gene-expression analysis at E7.5
showed earlier Tcf15 expression in the anterior trajectory,
consistent with a more advanced somitic maturation compared
with the posterior trajectory (Figures 2C and 3A; Table S2).
(D) Differential gene expression of E7.5 cells with predicted NMP fate versus E7.5
gene expression in the cells with predictedNMP fate comparedwith either the ante
somitic mesoderm cells only. Genes queried individually in the eGastrulation too
(E) Overall ‘‘activity score’’ of the genes significantly enriched in the NMP traject
highlighted in bold in (D). See also legend for (B).
(F) Schematic of anterior-posterior patterning of paraxial mesoderm during gastru
E8.5 posterior somites are in yellow, and those biased to the E8.5 NMP pool are
See also Figure S2; Tables S2–S4.
Higher levels of T in the posterior trajectory were matched with
higher expression of canonical regulators of somitogenesis,
including Tbx6 and members of the Wnt, Notch, retinoic acid,
Fgf, and Nodal/Tgfb/BMP signaling pathways. Of note, forma-
tion of the earliest anterior somites has been observed in em-
bryos that lack key somitic regulators such as T, Tbx6, Wnt3a,
and Fgfr1a (Takada et al., 1994; Xu et al., 1999). E7.5 cells on
the anterior somitic trajectory instead showed strong upregula-
tion of the transcriptional regulator Id3 as well as the homeobox
transcription factor Alx1. Oscillating genes of the somitogenesis
clock and wave-front model also had an overall reduced expres-
sion along the trajectory leading to anterior somitic tissues
compared with that of posterior somitic tissues (Figure S3A).
We next interrogated the dynamics of gene expression along
the trajectory toward the anterior paraxial mesoderm (Fig-
ure S3B). The transcription factor Hand1 and adhesion molecule
Pmp22 showed early peaks of expression, the frizzled related
protein Sfrp1 and homeobox transcription factor Alx1 peaked
at a midpoint, and homeobox transcription factors of the Irx
and Prrx family peaked at the end of the trajectory. Many of
the above candidate regulators have not previously been impli-
cated in somite development, yet the anterior trajectory culmi-
nates with induction of the somite master regulators Tcf15
and Meox1.
Parallel Spatial and Transcriptional Divergence ofDistinct Somitic Mesoderm ProgramsComplementary laser-capture microdissection experiments,
profiling contiguous segments of approximately 20 cells, have
been performed at equivalent stages of mouse development
(Peng et al., 2019), thus allowing us to interrogate the spatial
expression of genes differentially expressed between the poste-
rior and anterior trajectories (Figure 3A). The E7.5 anterior somitic
signature shows the strongest positional enrichment in anterior
mesoderm, while the posterior signature is enriched in the pos-
terior mesoderm and in the posterior epiblast sections of the
Peng et al. dataset (Figures 3B and 3C). We also performed a
similar analysis, in the opposite direction, by extracting the
genes enriched, respectively, in anterior and posterior meso-
derm at E7.5 from the Peng et al. dataset (Table S3) and assess-
ing their expression in our single-cell atlas, which highlighted the
expected populations of anterior and posterior somitic trajec-
tories (Figure S3C; STAR Methods). This complementary anal-
ysis also highlighted additional expression sites (such as in
lateral-platemesoderm lineages) for genes on the anterior trajec-
tory. Taken together, this supports the notion that at E7.5, pos-
terior paraxial mesoderm precursor cells are still located close
to the primitive streak, while the precursors of anterior paraxial
mesoderm have already migrated to the anterior end of the
embryo.
cells with predicted somitic fate. Adjusted p value is calculated for differential
rior or the posterior somitic-fated cells. Log2 fold-change is shown for posterior
l are highlighted in bold. See (E).
ory (top), and expression levels in log10 (FPKM+1) for selected genes (bottom)
lation. Tissues biased to the E8.5 anterior somites are in red, those biased to the
in green. A, anterior; P, posterior.
Developmental Cell 56, 141–153, January 11, 2021 145

llOPEN ACCESS Article
The clear separation of the two trajectories at E7.5 suggested
theymay be spatially segregated at earlier stages.We, therefore,
employed a similar strategy to compare the two trajectories at
E7.0 (Figure S3D; Table S2). Genes enriched in the E7.0 posterior
paraxial mesoderm ancestors are most strongly associated with
the primitive streak region, while genes specific to the anterior
paraxial mesoderm ancestors show the highest enrichment in
the mesoderm layer, suggesting that these cells have already in-
gressed through the primitive streak (Figure S3E). Interestingly,
genes enriched in the anterior somitic trajectory are expressed
in more proximal regions of the egg cylinder compared with
those of the posterior trajectory, highlighting an additional spatial
segregation of the two sets of ancestors.
Next, we characterized the trajectory leading to NMPs. Com-
parison with the somitic trajectories not only suggested an early
divergence but also that ancestors of the posterior somitic tis-
sues had a higher likelihood of contributing to the NMP trajectory
than ancestors of anterior somitic tissues (Figures 2A and S3F).
Differential gene-expression analysis between NMP and somitic
trajectory cells at E7.5 showed higher levels of NMP-signature
genes in NMP-fated cells (e.g., Cdx1, Cdx2, Nkx1-2, Fst, and
Grsf1) (Gouti et al., 2017) and a higher expression of the epiblast
markers Dnmt3b, Epcam, and Pou5f1 (Figure 3D; Table S4).
Conversely, NMP-fated cells had lower levels of themesodermal
genes Mesp1, Aldh1a2, Cited1, and Rspo3 relative to the E7.5
ancestors of somitic tissues. This suggests that at E7.5, NMP an-
cestors have amore immature, epiblast-like signature compared
with the early somite precursors. Consistently, spatial visualiza-
tion of this NMP-enriched signature showed the highest scores
in epiblast sections of the E7.5 embryo (Figure 3E).
This spatiotemporal transcriptional analysis supports a model
whereby rostrocaudal patterning of the first somites is concom-
itant with gastrulation. Mesoderm cells biased to an anterior par-
axial fate ingress earlier through the primitive streak and likely
acquire their somitic identity anteriorly (marked by an upregula-
tion of both Tcf15 and Meox1 after spatial segregation at E7.5),
while cells destined for a more posterior paraxial fate undergo
gastrulation later and develop posteriorly in the embryo. Finally,
NMP ancestors remain in the posterior epiblast, where they ac-
quire an NMP signature, sustained up until at least E8.5, the last
time point sampled in the current atlas (Figure 3F).
T–/– Chimera Single-Cell Transcriptional AnalysisReveals Alterations in Common and Rare Cell TypesGiven the role of Brachyury (T) in axial elongation, we were
intrigued to observe that T was the most differentially expressed
gene between the two early somitic trajectories (Figures 3A and
S3D). The homozygous T mutant mouse model is embryonic le-
thal, with a severe arrest of axis elongation, notochord and allan-
tois defects, and a kinked neural tube (Beddington et al., 1992;
Chesley, 1935; Rashbass et al., 1991). To study the cell-autono-
mous effects of T knockout, we performed scRNA-seq on
chimeric mouse embryos. We targeted T in a mouse embryonic
stem cell line constitutively expressing tdTomato (Pijuan-Sala
et al., 2019; see STAR Methods). We confirmed the disruption
of T by sequencing the CRISPR-Cas9-targeted locus, which
showed frameshift mutations and early stop codons precluding
the generation of a functional protein, in two different clones (Fig-
ures S4A and S4B). Chimeric embryos generated with these two
146 Developmental Cell 56, 141–153, January 11, 2021
independent T�/� clones were harvested at E8.5, mutant and
wild-type (WT) cells sorted based on tdTomato fluorescence,
and scRNA-seq performed on four independent pools of em-
bryos, with 14,048 T�/� and 13,724 WT single-cell transcrip-
tomes passing quality control (Figure S4C; STAR Methods).
Cell types were determined by mapping the chimeric embryo
cells onto the reference atlas. As expected, mutant cells still ex-
pressed the T transcript, although at reduced levels (Figure S4D,
in agreement with self-regulation of this transcription factor; Bei-
saw et al., 2018). Importantly and in line withmutation analysis by
sequencing, there is no detectable T protein in T�/� cells of chi-
meras (Figure S4E), likely due to severe effects on the stability
and/or conformation of any residual peptide produced, as only
the first 23% of the amino-acid sequence may be retained
(Figure S4B).
We performed differential abundance testing of cell types with
reference to matched wild-type chimeras (Figure S4F; STAR
Methods). This showed significantly reduced T�/� cell contribu-
tion to intermediate and somiticmesoderm and increased contri-
bution to NMPs (Figures 4A, S4F, and S4G). Other T-expressing
tissues, e.g. notochord and primordial germ cells (PGCs), also
showed changes in differential abundance, but below statistical
significance, likely due to the low numbers of these cells at this
time point. Interestingly, notochord cells showed perturbed
gene-expression patterns in T�/� cells (Figure S4H). Reduced
contribution of T�/� cells to the PGC lineage has been reported,
but no quantitative analysis was performed (Aramaki et al.,
2013). Given a quantitative reduction rather than total absence
seen by scRNA-seq analysis of chimeric embryos, we quantified
the numbers of presumptive PGCs present from the E7.5 (neural
plate) to E8.5 (10 somite) stages in T-expressing embryos and
then compared presumptive PGC numbers at E7.75 (headfold
stage) with T�/� embryos (Figures S4I and S4J). Counting pre-
sumptive PGCs in multiple embryos demonstrated that there is
indeed a statistically significant reduction in the T�/� samples.
Thus, even in rare cell types such as notochord and PGCs,
combining mouse chimeras with scRNA-seq reveals cell-auton-
omous roles for T.
T–/– Chimera Analysis Validates the Two Early SomiticTrajectoriesWe next focused on the subclusters of paraxial mesoderm
defined in Figure 1. In line with previous findings (Beddington
et al., 1992; Rashbass et al., 1991; Wilson et al., 1995), we
observed a marked decrease in contribution to posterior somitic
tissue and presomitic mesoderm, while cranial mesoderm and
anterior somitic tissues showed only small changes in abun-
dance (Figure 4B). This not only supports an essential cell-auton-
omous role for T specifically in the development of the E8.5 pos-
terior somitic tissue but also confirms that the two sets of
somites present at E8.5 emerge in molecularly distinct develop-
mental events, as suggested by the two different trajectories
defined above. To obtain a finer resolution, we assessed the dis-
tribution of chimeric cells mapped onto the transcriptional
ordering from Figure 1C (STAR Methods). In WT chimeras,
tdTomato+ (tdTom+) and tdTomato- (tdTom-) cells were similarly
distributed (p = 0.14, Kolmogorov-Smirnov [KS] test). By
contrast, T�/� cells accumulated in the caudal-most portion of
the ordering in T�/� chimeras (p % 10�15, KS test; Figure 4C).
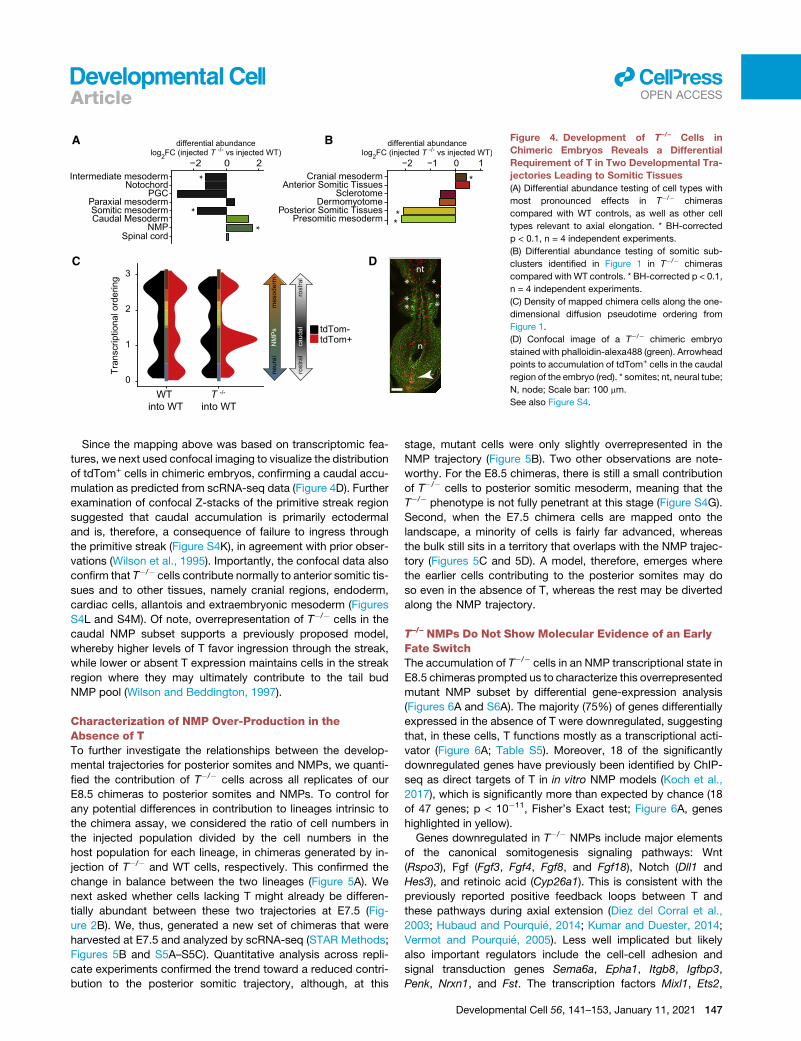
A B
C D
Figure 4. Development of T–/– Cells in
Chimeric Embryos Reveals a Differential
Requirement of T in Two Developmental Tra-
jectories Leading to Somitic Tissues
(A) Differential abundance testing of cell types with
most pronounced effects in T�/� chimeras
compared with WT controls, as well as other cell
types relevant to axial elongation. * BH-corrected
p < 0.1, n = 4 independent experiments.
(B) Differential abundance testing of somitic sub-
clusters identified in Figure 1 in T�/� chimeras
compared with WT controls. * BH-corrected p < 0.1,
n = 4 independent experiments.
(C) Density of mapped chimera cells along the one-
dimensional diffusion pseudotime ordering from
Figure 1.
(D) Confocal image of a T�/� chimeric embryo
stained with phalloidin-alexa488 (green). Arrowhead
points to accumulation of tdTom+ cells in the caudal
region of the embryo (red). * somites; nt, neural tube;
N, node; Scale bar: 100 mm.
See also Figure S4.
llOPEN ACCESSArticle
Since the mapping above was based on transcriptomic fea-
tures, we next used confocal imaging to visualize the distribution
of tdTom+ cells in chimeric embryos, confirming a caudal accu-
mulation as predicted from scRNA-seq data (Figure 4D). Further
examination of confocal Z-stacks of the primitive streak region
suggested that caudal accumulation is primarily ectodermal
and is, therefore, a consequence of failure to ingress through
the primitive streak (Figure S4K), in agreement with prior obser-
vations (Wilson et al., 1995). Importantly, the confocal data also
confirm that T�/� cells contribute normally to anterior somitic tis-
sues and to other tissues, namely cranial regions, endoderm,
cardiac cells, allantois and extraembryonic mesoderm (Figures
S4L and S4M). Of note, overrepresentation of T�/� cells in the
caudal NMP subset supports a previously proposed model,
whereby higher levels of T favor ingression through the streak,
while lower or absent T expression maintains cells in the streak
region where they may ultimately contribute to the tail bud
NMP pool (Wilson and Beddington, 1997).
Characterization of NMP Over-Production in theAbsence of TTo further investigate the relationships between the develop-
mental trajectories for posterior somites and NMPs, we quanti-
fied the contribution of T�/� cells across all replicates of our
E8.5 chimeras to posterior somites and NMPs. To control for
any potential differences in contribution to lineages intrinsic to
the chimera assay, we considered the ratio of cell numbers in
the injected population divided by the cell numbers in the
host population for each lineage, in chimeras generated by in-
jection of T�/� and WT cells, respectively. This confirmed the
change in balance between the two lineages (Figure 5A). We
next asked whether cells lacking T might already be differen-
tially abundant between these two trajectories at E7.5 (Fig-
ure 2B). We, thus, generated a new set of chimeras that were
harvested at E7.5 and analyzed by scRNA-seq (STAR Methods;
Figures 5B and S5A–S5C). Quantitative analysis across repli-
cate experiments confirmed the trend toward a reduced contri-
bution to the posterior somitic trajectory, although, at this
stage, mutant cells were only slightly overrepresented in the
NMP trajectory (Figure 5B). Two other observations are note-
worthy. For the E8.5 chimeras, there is still a small contribution
of T�/� cells to posterior somitic mesoderm, meaning that the
T�/� phenotype is not fully penetrant at this stage (Figure S4G).
Second, when the E7.5 chimera cells are mapped onto the
landscape, a minority of cells is fairly far advanced, whereas
the bulk still sits in a territory that overlaps with the NMP trajec-
tory (Figures 5C and 5D). A model, therefore, emerges where
the earlier cells contributing to the posterior somites may do
so even in the absence of T, whereas the rest may be diverted
along the NMP trajectory.
T–/– NMPs Do Not Show Molecular Evidence of an EarlyFate SwitchThe accumulation of T�/� cells in an NMP transcriptional state in
E8.5 chimeras prompted us to characterize this overrepresented
mutant NMP subset by differential gene-expression analysis
(Figures 6A and S6A). The majority (75%) of genes differentially
expressed in the absence of T were downregulated, suggesting
that, in these cells, T functions mostly as a transcriptional acti-
vator (Figure 6A; Table S5). Moreover, 18 of the significantly
downregulated genes have previously been identified by ChIP-
seq as direct targets of T in in vitro NMP models (Koch et al.,
2017), which is significantly more than expected by chance (18
of 47 genes; p < 10�11, Fisher’s Exact test; Figure 6A, genes
highlighted in yellow).
Genes downregulated in T�/� NMPs include major elements
of the canonical somitogenesis signaling pathways: Wnt
(Rspo3), Fgf (Fgf3, Fgf4, Fgf8, and Fgf18), Notch (Dll1 and
Hes3), and retinoic acid (Cyp26a1). This is consistent with the
previously reported positive feedback loops between T and
these pathways during axial extension (Diez del Corral et al.,
2003; Hubaud and Pourquie, 2014; Kumar and Duester, 2014;
Vermot and Pourquie, 2005). Less well implicated but likely
also important regulators include the cell-cell adhesion and
signal transduction genes Sema6a, Epha1, Itgb8, Igfbp3,
Penk, Nrxn1, and Fst. The transcription factors Mixl1, Ets2,
Developmental Cell 56, 141–153, January 11, 2021 147

A
1
5
10
20
T-/-chimera: WT
Rel
ativ
e r a
tio
(NM
P ra
tio/P
ost.
Som
ratio
)
E8.5
0.9
1.0
1.1
1.2
1.3
E7.5B
C
T-/-chimera: WT
Rel
ativ
e an
cest
or ra
tio
(NM
P ra
tio/ P
ost.
Som
ratio
)
p = 0.0125 p = 0.015
Posterior Somite trajectory
NMPstrajectory
E7.5 tdTom-
E7.5 tdTom+
E8.5 tdTom-
E8.5 tdTom+T -/-chimeras:
WT chimeras:
15
D
log2mass(NMP)
mass(Posterior Somites)( )5.0-5.0 -2.5 2.50
Figure 5. Assessing Allocation of T–/– Cells to the NMP Pool
(A) Relative contribution of injected cells to NMPs versus posterior
somites in E8.5 chimeras (p values calculated by permutation). Each
point is an independent experiment (pool of chimeric embryos) and
calculated as: relative ratio = (number of tdTom+ NMPs / number of
tdTom� NMPs) / (number of tdTom+ posterior somite cells / number
of tdTom� posterior somite cells). Hollow circles, values for WT
chimera assays; filled circles, values for T�/� chimeras.
(B) Relative contribution of injected cells to trajectories toward NMPs
versus posterior somites in E7.5 chimeras, showing significant bias
toward the NMP fate in T�/� chimeras compared with WT (p values
estimated by permutation; values plotted as in (A).
(C) UMAP layout from Pijuan-Sala et al. (2019), highlighting mapped
nearest neighbors of injected (tdTom+) and host cells (tdTom�) inE7.5 and E8.5 chimeras.
(D) UMAP layout from Pijuan-Sala et al. (2019) with cells colored by
their relative mass from NMP versus posterior trajectories. Values
are capped at �5 and +5 for better legibility. Arrowhead highlights
the nascent mesoderm cell subset with balanced mass (i.e., equal
likelihood) for both trajectories, according to WOT.
llOPEN ACCESS Article
Mycl, and Dlx5 were also downregulated and may, therefore,
play previously unsuspected roles in NMP regulation and somi-
togenesis downstream of T.
148 Developmental Cell 56, 141–153, January 11, 2021
It was proposed that the multipotent nature of NMPs
relies on cross-antagonism between T and the neural-
determining factor, Sox2, where each serves as a line-
age-determining factor (Gouti et al., 2017; Koch et al.,
2017). Furthermore, in our analysis of gene-expression
dynamics along the NMP trajectory, we observed a
decline in T transcript concurrent with the increase in
Sox2 between E7.5 and E8.5 (Figure 2C), which would
support this model. Accordingly, T�/� NMPs would be
expected to express higher levels of Sox2 than WT
NMPs, which would, in turn, increase the production of
spinal cord progenitors (Takemoto et al., 2011). Howev-
er, neither Sox2, nor a broader neural signature, were
upregulated in T�/� NMPs (Figures 6A, S6B, and S6C).
Moreover, spinal cord cells were not overproduced in
the T�/� chimeras (Figure 4A). Our analysis of primary
cells, therefore, argues against a cell-autonomous
mutually repressive model of T and Sox2 as early NMP
fate determinants.
To investigate earlier molecular consequences of T
knockout, we next performed differential gene-expres-
sion analysis within E7.5 chimeras, focusing on the
tdTom+ and tdTom� cells mapping to each trajectory
(Figures 6B and S6D–S6F; Table S6). There was little
overlap between the sets of deregulated genes across
the different trajectories, consistent with trajectory-spe-
cific effects at this early time point. Among the genes up-
regulated in cells biased to anterior somitic tissues was
the T-box family transcription factor Tbx3. Cells biased
to posterior somitic tissues showed downregulation of
genes involved in cell migration including Vim, Pdlim4,
and Htra1 (Fu et al., 2019; Singh et al., 2014; Ye and
Weinberg, 2015). These cells also displayed downregu-
lation of Cited1, previously shown to label specifically
cells that have ingressed through the primitive streak
(Garriock et al., 2015). Of note, genes related to an incomplete
EMT state (Figures S2B–S2D) were not affected in T�/�NMP an-
cestors at any of the analyzed time points (Figures 6A and 6B).

A E7.5 Downregulated Genes:
12
12 2
40
0
4
E7.5 Upregulated Genes:
12
4 3
13
02
anterior somite-fated cells
posterior somite-fated cells
NMP-fated cells
Krt18Colec12Dynlt1fCar4Slc9a3r1Igfbp2Pusl1Tmem242Mt2Gsto1CpoxMt1
Rbm26Commd6
Crabp1Aldh1a2FstCited1Rspo3Pdlim4Htra1VimMeis2Ccnd2Chst7Car3
TIpo5Uchl3Grb10
Gtf2h5LhfpCkbMrps6
Tbx3Phlda3Med4Naa16Sult5a1Mettl3Sucla2Psme1EsdMphosph8Tox4Pinx1
Psme2Mrpl57Nedd8
Lefty2Tdgf1Grrp1Nufip1
Peg3Sugt1
H2afjSap18Oxa1l
Ebpl
B
Nascent Mesoderm
NMPsAnterior Somitic tissues
Posterior Somitic tissues
CranialMesoderm
Primitive Streak
E6.75-E7 E7-E8.5T-independent EMT
and somitic inductionT-dependent EMT
C
0
2
4
6
8
10
12
30
32
−6 −3 0 3 6Log2 FC (T -/- vs T+/+ cells)
- Log
10 (a
dj.P
)
Slco5a1
AcadlPid1
Cdk18
Mixl1
Uap1l1
Adamtsl2
H13
Amot
S100a10
Penk
Plpp3
Mfsd2a
Mycl
Hes3
Rell1
0Dlx5
BpgmEpha1
Ttyh1
Selenov
Aqp11Fgf3
Fgf4
Arg1
CenpwRab20
Nefm
AW551984
Rab8b
Tpm1
Igfbp3 Fam161a
Fgf18
Arl4d
Amph
Fst
Itgb8
Zcrb1
Ets2
T
Dll1
Nrxn1
Sema6a
Cyp26a1Fgf8
Hoxd9
Necab1
Arpc1b
Hoxa5
pWipf3Arl6ip5
Emp3
H19
Socs2Nrp1 Tirap
3110004A20Rik
Ngfr
Igfbp4
Slc38a4
Hoxc10
Rspo3
T -/- into WT0
1
2
3
Tran
scrip
tiona
l ord
erin
g
Bound by T (Koch et al. 2017)
Figure 6. Role of T in the Formation of the First Posterior Somites and Establishment of the NMP Pool
(A) Differential gene expression between E8.5 mutant cells accumulated in an NMP state and their WT counterparts within chimeras (see inset and Figure 4C).
Genes previously found to be bound by T (Koch et al., 2017) are highlighted in yellow.
(B) Differentially expressed genes in tdTom+ T�/� cells in E7.5 chimeric embryos compared with their tdTom� WT counterparts (adjusted p < 0.1), within the
transcriptomes mapping to each of the developmental trajectories highlighted in Figures 2A and 2B. Genes also identified as differentially expressed in control
chimeras (injected with WT tdTom+ cells) or significantly correlated with the tdTomato transcript were considered as results of a chimera assay-related technical
bias and excluded from the analysis (see Figures S6D–S6F).
(C) Working model for cell-autonomous role of T in the formation of the first somites during gastrulation.
See also Figure S6; Tables S5 and S6.
llOPEN ACCESSArticle
Taken together, these results suggest that the precursors of
anterior mesoderm are capable of undergoing gastrulation in
the absence of T. Precursors of more posterior somites reach
the streak later in development and require T to activate genes
involved in EMT. In the absence of T, they remain in the streak
region, where they may contribute to the developing pool of
NMPs (Figure 6C).
DISCUSSION
By integrating computational methods with scRNA-seq of em-
bryonic chimeras, we inferred three distinct trajectories from
pluripotent epiblast cells toward somite development. We re-
vealed previously unknown dynamic gene expression during
the emergence of the anterior-most somites, accompanied by
a clear spatial separation at E7.5. Analysis of T�/� chimeras vali-
dated these trajectories, suggested reallocation of early poste-
rior somite progenitors to the NMP pool in the absence of T,
and supported a model whereby T does not inhibit expression
of Sox2 in NMPs.
To infer developmental trajectories, we applied WOT (Schie-
binger et al., 2019), which has the key advantage, compared
with many trajectory inference methods, of incorporating real-
time information when analysing time-course datasets. Methods
that do not take real-time information into account can produce
erroneous assignments when similar cell types emerge over an
extended period of time or in ‘‘waves’’. WOT allowed us to disen-
tangle transcriptional trajectories with relatively similar signa-
tures (in relation to the whole embryonic landscape), but with
different times of developmental emergence. Importantly, addi-
tional independent analyses using spatial transcriptomic data,
as well as the distinct effects of the T knockout in the -chimera
Developmental Cell 56, 141–153, January 11, 2021 149
llOPEN ACCESS Article
assays were consistent with the trajectories inferred from the
scRNA-seq data.
Our results support a model whereby the first somites develop
from precursors that ingress early through the primitive streak
and migrate anteriorly, concurrently with the precursors of other
anterior mesoderm tissues. This agrees with previous fate-map-
ping experiments where precursors of the first pairs of somites
are found in the same regions of the primitive streak as cardiac
and cranial mesoderm, ingressing at around E7.0 (Kinder et al.,
1999). The anterior somitic trajectory was characterized by
higher levels of previously identifiedmarker genes of lateral-plate
mesoderm (e.g., Hand1, Prrx1, and Prrx2), also suggesting this
shared ontogeny. Different timing of ingression is further sup-
ported by higher expression levels of caudal Cdx/Hox transcrip-
tion factors in the E8.5 posterior paraxial tissues compared with
anterior paraxial tissues, reflecting a later timing of ingression of
precursors of posterior paraxial mesoderm (Forlani et al., 2003).
One of the most noteworthy observations here is molecular
convergence, where both the early anterior and posterior trajec-
tories ultimately acquire a paraxial transcriptional identity, yet
through journeys that are temporally, spatially, and molecularly
distinct.
Analysis of T�/� embryos indicated that the anterior somitic
tissues identified here correspond to the first somite subsets,
previously shown to form in the absence of T (Chesley, 1935).
In E7.5 chimeric embryos, genes involved in cell migration
were specifically downregulated in posterior somite-fated T�/�
cells, providing a molecular explanation for previous reports
where impaired cell migration was suggested to cause the
observed accumulation of mutant cells in the remnants of the
primitive streak of chimeric embryos (Wilson and Beddington,
1997; Wilson et al., 1995). Our data further show that E8.5 caudal
accumulation of T�/� cells is coupled with the acquisition of an
aberrant NMP signature, consistent with the model proposed
by Wilson and Beddington (1997), where primitive streak cells
harboring lower levels of T protein remain in the streak
throughout gastrulation and contribute to the NMP pool of the
developing tail bud to fuel subsequent axial elongation. Further
studies will be required to functionally validate whether different
levels of T regulate the allocation of individual streak cells to par-
axial mesoderm or NMPs in the wild-type setting.
The ability of anterior paraxial mesodermprecursors to ingress
through the streak andmigrate anteriorly in the absence of T sug-
gests they rely on other factors. Other members of the T-box
protein family may play this role: the anterior somite-fated cells
ingress through the streak before E7.0, within the window of
Eomes expression during gastrulation (Figure 2C) and with
considerable overlap with T in gene targets (Tosic et al., 2019).
Our analysis revealed Tbx3 as another possible candidate, with
specific upregulation at the start of the developmental trajectory
toward anterior somitic tissues, and in the E7.5 T�/� cells fated to
the anterior somitic tissues (Figures 6B and S3B).
As in prior mouse and zebrafish studies, we observed a resid-
ual contribution of T�/� cells to the posterior somitic tissues
(Martin and Kimelman, 2010; Wilson and Beddington, 1997).
While expression of somiticmarkers had not been tested in these
studies, our results suggest that some of these residual cells
are indeed correctly transcriptionally patterned as somitic
mesoderm.
150 Developmental Cell 56, 141–153, January 11, 2021
Characterization of T�/� NMP-like cells suggested a model
where T is required for NMPs to move down a somitic differentia-
tion path, but where T has little bearing onNMPsmoving along the
neural lineage. The observation that many T�/� NMPs become
trapped in the primitive streak, rather than produce excess neural
tissue, suggests that at the single-cell level in the intact embryo,
many NMPs may not have both somitic and neural differentiation
options available to them, possibly due to spatial constraints.
Indeed, although in vivo lineage tracing suggest widespread bipo-
tency for largerNMPclones (Tzouanacouet al., 2009), heterotopic
transplantation and live-cell imaging studies suggest that many
cells with NMP potential will only differentiate into one lineage in
the embryo (Wood et al., 2019; Wymeersch et al., 2016).
In the present report, we show that single-cell transcriptional
analysis of entire embryos provides a complementary approach
toward a better understanding of long-standing questions in
developmental biology. Moving forward, the ability to couple
such unbiased transcriptional profiling with information about a
cell’s location within the organism will further enable new biolog-
ical discovery. Together with appropriate functional experi-
ments, this promises to open an exciting new chapter in devel-
opmental biology, where hypotheses can be investigated
in vivo, at single-cell resolution, genome-wide scale, and at the
level of the whole organism.
STAR+METHODS
Detailed methods are provided in the online version of this paper
and include the following:
d KEY RESOURCES TABLE
d RESOURCE AVAILABILITY
B Lead Contact
B Materials Availability
B Data and Code Availability
d EXPERIMENTAL MODELS AND SUBJECT DETAILS
B Cell Lines
B Mouse Models
d METHOD DETAILS
B Somitic Trajectory Analysis from Atlas Data
B Chimera Generation and Sequencing
B Quantification of Primordial Germ Cells
B Single-Cell RNA Sequencing Analysis
B Visualisation of Single-cell RNA Sequencing Data
B Chimera Cell Type Annotation
B Mapping Chimera Cells onto the Atlas Backbone
d QUANTIFICATION AND STATISTICAL ANALYSIS
B Analysis of Single-Cell Datasets
B Overlap Computation (GSEA)
B Analysis of Embryonic Chimeras
B Differential Expression Analyses
B Relative Ratio Comparisons
B Quantification of Primordial Germ Cells
d ADDITIONAL RESOURCES
SUPPLEMENTAL INFORMATION
Supplemental Information can be found online at https://doi.org/10.1016/j.
devcel.2020.11.013.

llOPEN ACCESSArticle
ACKNOWLEDGMENTS
We thank William Mansfield and the Gurdon Institute animal facility for blasto-
cyst injections, the Flow Cytometry Core Facility at CIMR for cell sorting, Ka-
tarzyna Kania at the CRUK-CI genomics core for preparing the 103 libraries,
the Wellcome Sanger Institute DNA Pipelines Operations for sequencing,
and Rebecca Hannah for reanalysis of the GSM2454138 dataset. Initial anal-
ysis of T knockout embryos was inspired by Rosa Beddington and performed
in her laboratory. Research in the authors’ laboratories is supported by the
Wellcome Trust, MRC, CRUK, Blood Cancer UK, NIH-NIDDK, the Sanger-
EBI Single Cell Centre; by core support grants by the Wellcome Trust to the
Cambridge Institute for Medical Research and Wellcome Trust-MRC Cam-
bridge Stem Cell Institute; and by core funding from Cancer Research UK
and the European Molecular Biology Laboratory. J.A.G. was funded by Well-
come Trust award (109081/Z/15/A). C.G. was funded by the Swedish
Research Council (2017-06278). This work was funded as part of a Wellcome
Strategic award (105031/D/14/Z) awarded toWolf Reik, B.G., J.C.M., J.N., Lu-
dovic Vallier, Shankar Srinivas, Benjamin Simons, Sarah Teichmann, and
Thierry Voet.
AUTHOR CONTRIBUTIONS
C.G. designed and performed the chimera single-cell-analysis experiments,
C.G., J.A.G., I.I.-R., and S.G. analyzed the data. J.C.M., B.G., J.N., and V.W.
supervised the study. C.G., J.A.G., J.C.M., B.G., and V.W. wrote the manu-
script. All authors read and approved the final manuscript.
DECLARATION OF INTERESTS
The authors declare no competing interests.
Received: April 18, 2020
Revised: September 8, 2020
Accepted: November 11, 2020
Published: December 11, 2020
REFERENCES
Aldea, D., Subirana, L., Keime, C.,Meister, L., Maeso, I., Marcellini, S., Gomez-
Skarmeta, J.L., Bertrand, S., and Escriva, H. (2019). Genetic regulation of
amphioxus somitogenesis informs the evolution of the vertebrate head meso-
derm. Nat. Ecol. Evol. 3, 1233–1240.
Angerer, P., Haghverdi, L., B€uttner, M., Theis, F.J., Marr, C., and Buettner, F.
(2016). Destiny: diffusion maps for large-scale single-cell data in R.
Bioinformatics 32, 1241–1243.
Aramaki, S., Hayashi, K., Kurimoto, K., Ohta, H., Yabuta, Y., Iwanari, H.,
Mochizuki, Y., Hamakubo, T., Kato, Y., Shirahige, K., and Saitou, M. (2013).
A mesodermal factor, T, specifies mouse germ cell fate by directly activating
germline determinants. Dev. Cell 27, 516–529.
Beddington, R.S., Rashbass, P., and Wilson, V. (1992). Brachyury–a gene
affecting mouse gastrulation and early organogenesis. Dev. Suppl. 157–165.
Beisaw, A., Tsaytler, P., Koch, F., Schmitz, S.U., Melissari, M.T., Senft, A.D.,
Wittler, L., Pennimpede, T., Macura, K., Herrmann, B.G., and Grote, P.
(2018). Brachyury directs histone acetylation to target loci during mesoderm
development. EMBO Rep. 19, 118–134.
Bessho, Y., Miyoshi, G., Sakata, R., and Kageyama, R. (2001). Hes7: a bHLH-
type repressor gene regulated by Notch and expressed in the presomitic
mesoderm. Genes Cells 6, 175–185.
Burgess, R., Rawls, A., Brown, D., Bradley, A., and Olson, E.N. (1996).
Requirement of the paraxis gene for somite formation and musculoskeletal
patterning. Nature 384, 570–573.
Cao, J., Spielmann, M., Qiu, X., Huang, X., Ibrahim, D.M., Hill, A.J., Zhang, F.,
Mundlos, S., Christiansen, L., Steemers, F.J., et al. (2019). The single-cell tran-
scriptional landscape of mammalian organogenesis. Nature 566, 496–502.
Cao, Y., Zhao, J., Sun, Z., Zhao, Z., Postlethwait, J., and Meng, A. (2004).
fgf17b, a novel member of Fgf family, helps patterning zebrafish embryos.
Dev. Biol. 271, 130–143.
Chal, J., Oginuma, M., Al Tanoury, Z., Gobert, B., Sumara, O., Hick, A.,
Bousson, F., Zidouni, Y., Mursch, C., Moncuquet, P., et al. (2015).
Differentiation of pluripotent stem cells to muscle fiber to model Duchenne
muscular dystrophy. Nat. Biotechnol. 33, 962–969.
Chapman, D.L., Agulnik, I., Hancock, S., Silver, L.M., and Papaioannou, V.E.
(1996). Tbx6, a mouse T-Box gene implicated in paraxial mesoderm formation
at gastrulation. Dev. Biol. 180, 534–542.
Chapman, D.L., and Papaioannou, V.E. (1998). Three neural tubes in mouse
embryos with mutations in the T-box gene Tbx6. Nature 391, 695–697.
Chesley, P. (1935). Development of the short-tailed mutant in the house
mouse. J. Exp. Zool. 70, 429–459.
Dastjerdi, A., Robson, L., Walker, R., Hadley, J., Zhang, Z., Rodriguez-
Niedenf€uhr, M., Ataliotis, P., Baldini, A., Scambler, P., and Francis-West, P.
(2007). Tbx1 regulation of myogenic differentiation in the limb and cranial
mesoderm. Dev. Dyn. 236, 353–363.
Dias, A., Lozovska, A., Wymeersch, F.J., Novoa, A., Binagui-Casas, A., Sobral,
D., Martins, G.G., Wilson, V., and Mallo, M. (2020). A Tgfbr1/Snai1-dependent
developmental module at the core of vertebrate axial elongation. eLife 9,
e56615.
Diez del Corral, R., Olivera-Martinez, I., Goriely, A., Gale, E., Maden, M., and
Storey, K. (2003). Opposing FGF and retinoid pathways control ventral neural
pattern, neuronal differentiation, and segmentation during body axis exten-
sion. Neuron 40, 65–79.
Forlani, S., Lawson, K.A., and Deschamps, J. (2003). Acquisition of Hox codes
during gastrulation and axial elongation in the mouse embryo. Development
130, 3807–3819.
Fu, C., Li, Q., Zou, J., Xing, C., Luo, M., Yin, B., Chu, J., Yu, J., Liu, X., Wang,
H.Y., andWang, R.-F. (2019). JMJD3 regulates CD4 T cell trafficking by target-
ing actin cytoskeleton regulatory gene Pdlim4. J. Clin. Invest. 129, 4745–4757.
Galceran, J., Sustmann, C., Hsu, S.C., Folberth, S., and Grosschedl, R. (2004).
LEF1-mediated regulation of delta-like1 linksWnt and Notch signaling in somi-
togenesis. Genes Dev. 18, 2718–2723.
Garriock, R.J., Chalamalasetty, R.B., Kennedy, M.W., Canizales, L.C.,
Lewandoski, M., and Yamaguchi, T.P. (2015). Lineage tracing of neuromeso-
dermal progenitors reveals novel Wnt-dependent roles in trunk progenitor cell
maintenance and differentiation. Development 142, 1628–1638.
Ginsburg,M., Snow,M.H., andMcLaren, A. (1990). Primordial germ cells in the
mouse embryo during gastrulation. Development 110, 521–528.
Gouti, M., Delile, J., Stamataki, D., Wymeersch, F.J., Huang, Y., Kleinjung, J.,
Wilson, V., and Briscoe, J. (2017). A gene regulatory network balances neural
and mesoderm specification during vertebrate trunk development. Dev. Cell
41, 243–261.e7.
Griffiths, J.A., Richard, A.C., Bach, K., Lun, A.T.L., and Marioni, J.C. (2018).
Detection and removal of barcode swapping in single-cell RNA-seq data.
Nat. Commun. 9, 2667.
Haghverdi, L., B€uttner, M., Wolf, F.A., Buettner, F., and Theis, F.J. (2016).
Diffusion pseudotime robustly reconstructs lineage branching. Nat. Methods
13, 845–848.
Henrique, D., Abranches, E., Verrier, L., and Storey, K.G. (2015).
Neuromesodermal progenitors and the making of the spinal cord.
Development 142, 2864–2875.
Hubaud, A., and Pourquie, O. (2014). Signalling dynamics in vertebrate seg-
mentation. Nat. Rev. Mol. Cell Biol. 15, 709–721.
Kassar-Duchossoy, L., Giacone, E., Gayraud-Morel, B., Jory, A., Gomes, D.,
and Tajbakhsh, S. (2005). Pax3/Pax7 mark a novel population of primitive
myogenic cells during development. Genes Dev. 19, 1426–1431.
Keynes, R.J., and Stern, C.D. (1988). Mechanisms of vertebrate segmentation.
Development 103, 413–429.
Kinder, S.J., Tsang, T.E., Quinlan, G.A., Hadjantonakis, A.K., Nagy, A., and
Tam, P.P. (1999). The orderly allocation of mesodermal cells to the extraem-
bryonic structures and the anteroposterior axis during gastrulation of the
mouse embryo. Development 126, 4691–4701.
Koch, F., Scholze, M., Wittler, L., Schifferl, D., Sudheer, S., Grote, P.,
Timmermann, B., Macura, K., and Herrmann, B.G. (2017). Antagonistic
Developmental Cell 56, 141–153, January 11, 2021 151

llOPEN ACCESS Article
activities of Sox2 and brachyury control the fate choice of neuro-mesodermal
progenitors. Dev. Cell 42, 514–526.e7.
Kumar, S., and Duester, G. (2014). Retinoic acid controls body axis extension
by directly repressing FGF8 transcription. Development 141, 2972–2977.
Liberzon, A., Birger, C., Thorvaldsdottir, H., Ghandi, M., Mesirov, J.P., and
Tamayo, P. (2015). The molecular signatures database (MSigDB) hallmark
gene set collection. Cell Syst. 1, 417–425.
Lun, A.T., McCarthy, D.J., and Marioni, J.C. (2016). A step-by-step workflow
for low-level analysis of single-cell RNA-seq data with Bioconductor.
F1000Res. 5, 2122.
Lun, A.T.L., Riesenfeld, S., Andrews, T., Dao, T.P., Gomes, T.; participants in
the 1st Human Cell Atlas Jamboree, and Marioni, J.C. (2019). EmptyDrops:
distinguishing cells from empty droplets in droplet-based single-cell RNA
sequencing data. Genome Biol. 20, 63.
Mankoo, B.S., Skuntz, S., Harrigan, I., Grigorieva, E., Candia, A., Wright, C.V.,
Arnheiter, H., and Pachnis, V. (2003). The concerted action of Meox homeobox
genes is required upstream of genetic pathways essential for the formation,
patterning and differentiation of somites. Development 130, 4655–4664.
Marongiu, M., Marcia, L., Pelosi, E., Lovicu, M., Deiana, M., Zhang, Y., Puddu,
A., Loi, A., Uda, M., Forabosco, A., et al. (2015). FOXL2 modulates cartilage,
skeletal development and IGF1-dependent growth in mice. BMC Dev. Biol.
15, 27.
Martin, B.L., and Kimelman, D. (2008). Regulation of canonical Wnt signaling
by brachyury is essential for posterior mesoderm formation. Dev. Cell 15,
121–133.
Martin, B.L., and Kimelman, D. (2010). Brachyury establishes the embryonic
mesodermal progenitor niche. Genes Dev. 24, 2778–2783.
McCarthy, D.J., Chen, Y., and Smyth, G.K. (2012). Differential expression anal-
ysis of multifactor RNA-seq experiments with respect to biological variation.
Nucleic Acids Res. 40, 4288–4297.
McInnes, L., Healy, J., andMelville, J. (2020). UMAP: uniformmanifold approx-
imation and projection for dimension reduction. arXiv https://arxiv.org/abs/
1802.03426.
Morgani, S.M., Metzger, J.J., Nichols, J., Siggia, E.D., and Hadjantonakis, A.K.
(2018). Micropattern differentiation of mouse pluripotent stem cells recapitu-
lates embryo regionalized cell fate patterning. eLife 7, e32839.
Nandkishore, N., Vyas, B., Javali, A., Ghosh, S., and Sambasivan, R. (2018).
Divergent early mesoderm specification underlies distinct head and trunk
muscle programmes in vertebrates. Development 145, dev160945.
Nowotschin, S., Ferrer-Vaquer, A., Concepcion, D., Papaioannou, V.E., and
Hadjantonakis, A.K. (2012). Interaction of Wnt3a, Msgn1 and Tbx6 in neural
versus paraxial mesoderm lineage commitment and paraxial mesoderm differ-
entiation in the mouse embryo. Dev. Biol. 367, 1–14.
Packer, J.S., Zhu, Q., Huynh, C., Sivaramakrishnan, P., Preston, E., Dueck, H.,
Stefanik, D., Tan, K., Trapnell, C., Kim, J., et al. (2019). A lineage-resolved mo-
lecular atlas of C. elegans embryogenesis at single-cell resolution. Science
365, eaax1971.
Peng, G., Suo, S., Cui, G., Yu, F., Wang, R., Chen, J., Chen, S., Liu, Z., Chen,
G., Qian, Y., et al. (2019). Molecular architecture of lineage allocation and tis-
sue organization in early mouse embryo. Nature 572, 528–532.
Peters, H., Wilm, B., Sakai, N., Imai, K., Maas, R., and Balling, R. (1999). Pax1
and Pax9 synergistically regulate vertebral column development.
Development 126, 5399–5408.
Pijuan-Sala, B., Griffiths, J.A., Guibentif, C., Hiscock, T.W., Jawaid, W.,
Calero-Nieto, F.J., Mulas, C., Ibarra-Soria, X., Tyser, R.C.V., Ho, D.L.L.,
et al. (2019). A single-cell molecular map of mouse gastrulation and early
organogenesis. Nature 566, 490–495.
Pourquie, O. (2001). Vertebrate somitogenesis. Annu. Rev. Cell Dev. Biol. 17,
311–350.
Ran, F.A., Hsu, P.D.,Wright, J., Agarwala, V., Scott, D.A., and Zhang, F. (2013).
Genome engineering using the CRISPR-Cas9 system. Nat. Protoc. 8,
2281–2308.
152 Developmental Cell 56, 141–153, January 11, 2021
Rashbass, P., Cooke, L.A., Herrmann, B.G., and Beddington, R.S. (1991). A
cell autonomous function of brachyury in T/T embryonic stem cell chimeras.
Nature 353, 348–351.
Rashbass, P., Wilson, V., Rosen, B., and Beddington, R.S. (1994). Alterations
in gene expression during mesoderm formation and axial patterning in bra-
chyury (T) embryos. Int. J. Dev. Biol. 38, 35–44.
Rodrigues, S., Santos, J., and Palmeirim, I. (2006). Molecular characterization
of the rostral-most somites in early somitic stages of the chick embryo. Gene
Expr. Patterns 6, 673–677.
Sakai, Y., Meno, C., Fujii, H., Nishino, J., Shiratori, H., Saijoh, Y., Rossant, J.,
andHamada, H. (2001). The retinoic acid-inactivating enzymeCYP26 is essen-
tial for establishing an uneven distribution of retinoic acid along the anterio-
posterior axis within the mouse embryo. Genes Dev. 15, 213–225.
Sambasivan, R., Kuratani, S., and Tajbakhsh, S. (2011). An eye on the head:
the development and evolution of craniofacial muscles. Development 138,
2401–2415.
Sato, T., Rocancourt, D., Marques, L., Thorsteinsdottir, S., and Buckingham,
M. (2010). A Pax3/Dmrt2/Myf5 regulatory cascade functions at the onset of
myogenesis. PLoS Genet. 6, e1000897.
Schiebinger, G., Shu, J., Tabaka, M., Cleary, B., Subramanian, V., Solomon,
A., Gould, J., Liu, S., Lin, S., Berube, P., et al. (2019). Optimal-transport anal-
ysis of single-cell gene expression identifies developmental trajectories in re-
programming. Cell 176, 1517.
Schindelin, J., Arganda-Carreras, I., Frise, E., Kaynig, V., Longair, M., Pietzsch,
T., Preibisch, S., Rueden, C., Saalfeld, S., Schmid, B., et al. (2012). Fiji: an
open-source platform for biological-image analysis. Nat. Methods 9, 676–682.
Shih, H.P., Gross, M.K., and Kioussi, C. (2007). Expression pattern of the ho-
meodomain transcription factor Pitx2 during muscle development. Gene Expr.
Patterns 7, 441–451.
Singh, H., Nero, T.L., Wang, Y., Parker, M.W., and Nie, G. (2014). Activity-
modulating monoclonal antibodies to the human serine protease HtrA3 pro-
vide novel insights into regulating HtrA proteolytic activities. PLoS One 9,
e108235.
Steventon, B., and Martinez Arias, A. (2017). Evo-engineering and the cellular
and molecular origins of the vertebrate spinal cord. Dev. Biol. 432, 3–13.
Subramanian, A., Tamayo, P., Mootha, V.K., Mukherjee, S., Ebert, B.L.,
Gillette, M.A., Paulovich, A., Pomeroy, S.L., Golub, T.R., Lander, E.S., and
Mesirov, J.P. (2005). Gene set enrichment analysis: a knowledge-based
approach for interpreting genome-wide expression profiles. Proc. Natl.
Acad. Sci. USA 102, 15545–15550.
Takada, S., Stark, K.L., Shea, M.J., Vassileva, G., McMahon, J.A., and
McMahon, A.P. (1994). Wnt-3a regulates somite and tailbud formation in the
mouse embryo. Genes Dev. 8, 174–189.
Takahashi, Y., Inoue, T., Gossler, A., and Saga, Y. (2003). Feedback loops
comprising Dll1, Dll3 and Mesp2, and differential involvement of Psen1 are
essential for rostrocaudal patterning of somites. Development 130,
4259–4268.
Takemoto, T., Uchikawa, M., Yoshida, M., Bell, D.M., Lovell-Badge, R.,
Papaioannou, V.E., and Kondoh, H. (2011). Tbx6-dependent Sox2 regulation
determines neural ormesodermal fate in axial stem cells. Nature 470, 394–398.
Tosic, J., Kim, G.J., Pavlovic, M., Schroder, C.M., Mersiowsky, S.L., Barg, M.,
Hofherr, A., Probst, S., Kottgen, M., Hein, L., and Arnold, S.J. (2019). Eomes
and brachyury control pluripotency exit and germ-layer segregation by chang-
ing the chromatin state. Nat. Cell Biol. 21, 1518–1531.
Tzouanacou, E., Wegener, A., Wymeersch, F.J., Wilson, V., and Nicolas, J.F.
(2009). Redefining the progression of lineage segregations during mammalian
embryogenesis by clonal analysis. Dev. Cell 17, 365–376.
Vermot, J., and Pourquie, O. (2005). Retinoic acid coordinates somitogenesis
and left-right patterning in vertebrate embryos. Nature 435, 215–220.
Wagner, D.E., Weinreb, C., Collins, Z.M., Briggs, J.A., Megason, S.G., and
Klein, A.M. (2018). Single-cell mapping of gene expression landscapes and
lineage in the zebrafish embryo. Science 360, 981–987.
Wahl, M.B., Deng, C., Lewandoski, M., and Pourquie, O. (2007). FGF signaling
acts upstream of the NOTCH and WNT signaling pathways to control

llOPEN ACCESSArticle
segmentation clock oscillations in mouse somitogenesis. Development 134,
4033–4041.
Wilson, V., and Beddington, R. (1997). Expression of T protein in the primitive
streak is necessary and sufficient for posterior mesoderm movement and so-
mite differentiation. Dev. Biol. 192, 45–58.
Wilson, V., Manson, L., Skarnes, W.C., and Beddington, R.S. (1995). The T
gene is necessary for normal mesodermal morphogenetic cell movements
during gastrulation. Development 121, 877–886.
Wilson, V., Olivera-Martinez, I., and Storey, K.G. (2009). Stem cells, signals and
vertebrate body axis extension. Development 136, 1591–1604.
Wood, T.R., Kyrsting, A., Stegmaier, J., Kucinski, I., Kaminski, C.F., Mikut, R.,
and Voiculescu, O. (2019). Neuromesodermal progenitors separate the axial
stem zones while producing few single- and dual-fated descendants.
bioRxiv. https://doi.org/10.1101/622571.
Wray, J., Kalkan, T., Gomez-Lopez, S., Eckardt, D., Cook, A., Kemler, R., and
Smith, A. (2011). Inhibition of glycogen synthase kinase-3 alleviates Tcf3
repression of the pluripotency network and increases embryonic stem cell
resistance to differentiation. Nat. Cell Biol. 13, 838–845.
Wymeersch, F.J., Huang, Y., Blin, G., Cambray, N., Wilkie, R., Wong, F.C., and
Wilson, V. (2016). Position-dependent plasticity of distinct progenitor types in
the primitive streak. eLife 5, e10042.
Xu, X., Li, C., Takahashi, K., Slavkin, H.C., Shum, L., and Deng, C.X. (1999).
Murine fibroblast growth factor receptor 1alpha isoforms mediate node
regression and are essential for posterior mesoderm development. Dev.
Biol. 208, 293–306.
Ye, X., and Weinberg, R.A. (2015). Epithelial-mesenchymal plasticity: a central
regulator of cancer progression. Trends Cell Biol. 25, 675–686.
Ying, Q.L., Wray, J., Nichols, J., Batlle-Morera, L., Doble, B., Woodgett, J.,
Cohen, P., and Smith, A. (2008). The ground state of embryonic stem cell
self-renewal. Nature 453, 519–523.
Zheng, G.X.Y., Terry, J.M., Belgrader, P., Ryvkin, P., Bent, Z.W., Wilson, R.,
Ziraldo, S.B., Wheeler, T.D., McDermott, G.P., Zhu, J., et al. (2017).
Massively parallel digital transcriptional profiling of single cells. Nat.
Commun. 8, 14049.
Developmental Cell 56, 141–153, January 11, 2021 153

llOPEN ACCESS Article
STAR+METHODS
KEY RESOURCES TABLE
REAGENT or RESOURCE SOURCE IDENTIFIER
Antibodies
Human/Mouse Brachyury Affinity Purified
Polyclonal Ab antibody
R and D Systems Cat# AF2085; RRID: AB_2200235
Donkey anti-Goat IgG (H+L) Cross-
Adsorbed Secondary Antibody, Alexa
Fluor 647
Thermo Fisher Scientific Cat# A-21447; RRID: AB_2535864
Chemicals, Peptides, and Recombinant Proteins
VECTASHIELD Mounting Medium Vector Laboratories Cat# H-1000; RRID: AB_2336789
Alexa Fluor 488 Phalloidin Thermo Fisher Scientific Cat# A12379
Critical Commercial Assays
Chromium Single Cell 30 Library & Gel Bead
Kit v2
10X Genomics PN-120237
Chromium Single Cell 30 Chip Kit v2 10X Genomics PN-120236
Deposited Data
T chimera single-cell RNA-seq This paper ArrayExpress: E-MTAB-8811
New wild-type chimera single-cell RNA-seq This paper ArrayExpress: E-MTAB-8812
Existing wild-type chimera single-cell
RNA-seq
Pijuan-Sala et al., 2019 ArrayExpress: E-MTAB-7324
Mouse gastrulation single-cell RNA-
seq atlas
Pijuan-Sala et al., 2019 ArrayExpress: E-MTAB-6967
Experimental Models: Cell Lines
tdTomato+ mESC line (male, karyotypically
normal)
Pijuan-Sala et al. 2019 B6xtdTom+ cl12-F10
T-/- tdTomato+ mESC Clone 1 This paper B6xtdTom+ cl12-F10-B6
T-/- tdTomato+ mESC Clone 2 This paper B6xtdTom+ cl12-F10-C6
Experimental Models: Organisms/Strains
Heterozygous T/+ BTBR/Pas mice Rashbass et al., 1994 Heterozygous T/+ BTBR/Pas mice
C57BL/6 wild type mice Charles River C57BL/6J (JAX� Mice Strain)
Oligonucleotides
F-primer for embryo genotyping (Figures
S4I and S4J)
CCAGTTGACACCGGTTGTTACA
Sigma Aldrich N/A
R-primer for embryo genotyping (Figures
S4I and S4J)
TATCCCAGTCTCTGGTCTGT
Sigma Aldrich N/A
F-primer for embryo genotyping (Figures
S4I and S4J; positive control)
GCGCCAGTGCAGGGAAGATTGGAA
Sigma Aldrich N/A
R-primer for embryo genotyping (Figures
S4I and S4J; positive control)
GATATGACTGGGCCAGACGGAAA
Sigma Aldrich N/A
T locus targeting gRNA1:
TGACGGCTGACAACCACCGC
Sigma Aldrich N/A
T locus targeting gRNA2:
GCCCCAAAATTGGGCGAGTC
Sigma Aldrich N/A
F-primer for NGS of T-targeted mESC
clones
TCGTCGGCAGCGTCAGATGTGTATAA
GAGACAGTCCCGGTGCTGAAGGTAAAT
Sigma Aldrich N/A
(Continued on next page)
e1 Developmental Cell 56, 141–153.e1–e6, January 11, 2021

Continued
REAGENT or RESOURCE SOURCE IDENTIFIER
R-primer for NGS of T-targeted mESC
clones
GTCTCGTGGGCTCGGAGATGTGTA
TAAGAGACAGCCTGCTTAACCC
TCATCAGC
Sigma Aldrich N/A
Recombinant DNA
pX458 plasmid Addgene #48138
Software and Algorithms
Cellranger Zheng et al., 2017 https://support.10xgenomics.com/single-
cell-gene-expression/software/downloads/
latest?
Scran Lun et al., 2016 http://bioconductor.org/packages/release/
bioc/html/scran.html
DropletUtils Griffiths et al., 2018 http://bioconductor.org/packages/release/
bioc/html/DropletUtils.html
Uwot McInnes et al. 2020, https://arxiv.org/abs/
1802.03426
https://cran.r-project.org/web/packages/
uwot/index.html
Destiny Angerer et al. 2016 http://bioconductor.org/packages/release/
bioc/html/destiny.html
FIJI Schindelin et al. 2012 https://imagej.net/Fiji
llOPEN ACCESSArticle
RESOURCE AVAILABILITY
Lead ContactFurther information and requests for resources and reagents should be directed to and will be fulfilled by the Lead Contact, John C.
Marioni ([email protected]).
Materials AvailabilityMouse embryonic stem cell lines generated in this study are available upon request.
Data and Code AvailabilityRaw sequencing data is available on Arrayexpress: T chimeras – E-MTAB-8811; WT chimeras – E-MTAB-7324 (as used in Pijuan-
Sala et al., 2019) and E-MTAB-8812 (newly generated). Original data have been deposited with accession numbers: Arrayexpress:
E-MTAB-8811, E-MTAB-8812. Processed data is available from the Bioconductor package MouseGastrulationData (https://
bioconductor.org/packages/release/data/experiment/html/MouseGastrulationData.html). This includes the single-cell RNA-seq
data directly, as well as the NMP orderings, and somitogenesis trajectory labels used in this manuscript. An online visualisation
tool is available at https://marionilab.cruk.cam.ac.uk/EarlySomites2020/.
EXPERIMENTAL MODELS AND SUBJECT DETAILS
Cell LinesAll mouse embryonic stem cell lines were expanded under the 2i+LIF conditions (Ying et al., 2008), in a humidified incubator at 37�Cand 7% CO2, and routinely tested negative for mycoplasma infection. A male, karyotypically normal, tdTomato-expressing mouse
embryonic stem cell line was derived from E3.5 blastocysts obtained by crossing a male ROSA26tdTomato (Jax Labs – 007905)
with a wildtype C57BL/6 female. Competence for chimera generation was assessed using morula aggregation assay. Targeting
of the T locuswas performed using the CRISPR/Cas9 system (seeMethod Details), mutant clones were assessed by next-generation
sequencing (see Figure S4). Two mutant clones were used to generate T-/- embryonic chimeras.
Mouse ModelsAll procedures were performed in strict accordance to the UK Home Office regulations for animal research. Chimaeric mouse em-
bryos were generated under the project licence number PPL 70/8406. Animals used in this study were 6-10 week-old females,
maintained on a lighting regime of 14 hours light and 10 hours darkness with food and water supplied ad libitum. For chimera
generation, E3.5 blastocysts were derived from wildtype C57BL/6 matings, and after injection of the mutant cells, the resulting
chimaeric embryos were transferred to C57BL/6 recipient females at 0.5 days of pseudopregnancy following mating with
vasectomised males.
Developmental Cell 56, 141–153.e1–e6, January 11, 2021 e2

llOPEN ACCESS Article
METHOD DETAILS
Somitic Trajectory Analysis from Atlas DataSubclustering the Atlas Paraxial Cell Types
To dissect the Paraxial Mesoderm sub-populations present in the E8.5 embryo, cells from the reference Atlas (Pijuan-Sala et al.,
2019) belonging to E8.5 time-point and to the cell types ‘‘Paraxial Mesoderm’’ and ‘‘Somitic Mesoderm’’ were extracted and re-clus-
tered using igraph’s Louvain algorithm. Clustering was performed on Mutual Nearest Neighbours (MNN) batch corrected principal
components (top 50), and the resulting subclusters were annotated using differentially expressed genes.
Transcriptional Ordering of Axial Elongation Cell Types
The Atlas data were subset to E8.5 cells of spinal cord, NMP, caudal epiblast, caudal mesoderm, somitic mesoderm, and paraxial
mesoderm cell types. A 50-dimensional principal component (PC) space was generated from these cells from log-transformed nor-
malised gene counts (with an added pseudocount of 1), considering only highly-variable genes (HVGs, see Selection of HVGs in the
‘‘quantification and statistical analysis’’ section, below). Expression levels for each gene were centred, but not scaled, prior to PC
computation. PCs were calculated using the irlba package. To ensure that the atlas manifold was continuous in the PC subspace,
and so that batch-effects could not affect mapping of chimera data, it was batch-corrected as described below (see ‘Batch correc-
tion’). As themanifold is largely a one-dimensional structure (see Figure 1A), it was summarised into a one-dimensional ordering using
diffusion pseudotime (DPT; Haghverdi et al., 2016). DPT was computed from a diffusion map, itself computed from the atlas cells in
the PC subspace, with DPT ordering from the spinal cord cell with most extreme value of the first diffusion component.
Identifying Somitic Developmental Trajectories
To reconstruct the lineages of cells in the reference atlas, we used the W-OT package 1.0.7 (Schiebinger et al., 2019) to estimate the
sequence of ancestor distributions at earlier time points. Cells were allocated to the trajectory of their largest endpoint mass contri-
bution, or to multiple trajectories if their mass contribution was at least 90% as large as their largest endpoint mass contribution (to
capture apparently uncommitted cells).
Spatial Domains of Trajectory-Specific Expression Signatures
Genes that defined the posterior and anterior somitic trajectories at E7.0 and E7.5 (determined by differential expression, with
adjusted P value < 0.1; differential expression testing was performed using the scran function findMarkers using default parameters)
were introduced into the Gene Activity Score tool provided by the eGastrulation database (http://egastrulation.sibcb.ac.cn/; Peng
et al., 2019) to generate 2-dimensional ‘‘corn plots’’. For the reverse analysis (Figure S3C), signature genes enriched in anterior
and posterior mesoderm domains in the Peng et al. dataset were retrieved using the ‘‘Gene Search by Pattern’’ tool provided by
the eGastrulation database. The following patterns were used as input: anterior – value of 80 for rows 3 to 7 of MA column (remaining
slots were given 0); posterior – value 80 for rows 3 to 7 of MP column and value 60 for rows 3 to 7 of P column. Cutoff for correlation
analysis: RCC > 0.4. We transformed the atlas expression levels onto a common scale (as a Z-score for each gene), and plotted the
average Z-score of the Peng et al. signature genes on our transcriptional Atlas layout, which highlighted the expected populations of
anterior and posterior somitic trajectories (Figure S3C). For details on gene expression comparisons along trajectories, see ‘‘quan-
tification and statistical analysis’’ section below.
Chimera Generation and SequencingEmbryo Collection
All procedures were performed in strict accordance to the UK Home Office regulations for animal research under the project license
number PPL 70/8406.
Chimera Generation
TdTomato-expressing mouse embryonic stem cells (ESC) were derived as previously described (Pijuan-Sala et al., 2019). Briefly,
ESC lines were derived from E3.5 blastocysts obtained by crossing a male ROSA26tdTomato (Jax Labs – 007905) with a wildtype
C57BL/6 female, expanded under the 2i+LIF conditions (Ying et al., 2008) and transiently transfected with a Cre-IRES-GFP plasmid
(Wray et al., 2011) using Lipofectamine 3000 Transfection Reagent (ThermoFisher Scientific, #L3000008) according to manufac-
turer’s instructions. A tdTomato-positive, male, karyotypically normal line, competent for chimera generation as assessed using
morula aggregation assay, was selected for targeting T. Two guides were designed using the http://crispr.mit.edu tool (guide 1:
TGACGGCTGACAACCACCGC; guide 2: GCCCCAAAATTGGGCGAGTC) and were cloned into the pX458 plasmid (Addgene,
#48138) as previously described (Ran et al., 2013). The obtained plasmids were then used to transfect the cells and single transfected
clones were expanded and assessed for Cas9-inducedmutations. Genomic DNAwas isolated by incubating cell pellets in 0.1 mg/ml
of Proteinase K (Sigma, #03115828001) in TE buffer at 50�C for 2 hours, followed by 5 min at 99�C. The sequence flanking the guide-
targeted sites was amplified from the genomic DNA by polymerase chain reaction (PCR) in a Biometra T3000 Thermocycler (30 sec at
98�C; 30 cycles of 10 sec at 98�C, 20 sec at 58�C, 20 sec at 72�C; and elongation for 7 min at 72�C) using the Phusion High-Fidelity
DNA Polymerase (NEB, #M0530S) according to the manufacturer’s instructions. Primers including Nextera overhangs were used (F-
TCGTCGGCAGCGTCAGATGTGTATAAGAGACAGTCCCGGTGCTGAAGGTAAAT; R- GTCTCGTGGGCTCGGAGATGTGTATAAGA
GACAGCCTGCTTAACCCTCATCAGC), allowing library preparation with the Nextera XT Kit (Illumina, #15052163), and sequencing
was performed using the Illumina MiSeq system according to manufacturer’s instructions. Two ESC clones showing frameshift mu-
tations in exon 2 resulting in the functional inactivation of T were selected for injection into C57BL/6 E3.5 blastocysts. A total of 17
chimaeric embryos were harvested at E8.5, dissected, and single-cell suspensions were generated from three independent pools of
e3 Developmental Cell 56, 141–153.e1–e6, January 11, 2021

llOPEN ACCESSArticle
embryos by TrypLE Express dissociation reagent (Thermo Fisher Scientific) incubation for 7-10 minutes at 37�C under agitation. Sin-
gle-cell suspensions were sorted into tdTom+ and tdTom- samples using a BD Influx sorter with DAPI at 1mg/ml (Sigma) as a viability
stain for subsequent 10X scRNA-seq library preparation (version 2 chemistry), and sequencing using the Illumina HiSeq 4000 plat-
form, which resulted in 13,724 tdTom- and 14,048 tdTom+ cells that passed quality control (see ‘‘Single-cell RNA sequencing anal-
ysis’’ below). To exclude transcriptional effects intrinsic to the chimera assay, chimaeric embryos were generated by injecting the
parental tdTom+ T+/+ (WT) line into C57BL/6 E3.5 blastocysts and processed as for the T�/- samples. Three independent embryo
pools with a total of 13 embryos were used for scRNA-seq, and 1,077 tdTom- and 2,454 tdTom+ cells passed quality control.
Embryo Staining and Imaging
Following dissection, embryoswerewashed in PBS and fixed in 4%paraformaldehyde (PFA, ThermoScientific) for 1 hour at room tem-
perature. They were thenwashed three times for 15minutes in wash buffer (0.1% fraction 5 bovine serum albumin, 0.1%Tween20, 5%
DMSO, 0.1% Triton-X in PBS), permeabilized overnight at 4�C in permeabilization buffer (0.1% fraction 5 bovine serum albumin, 0.1%
Tween20, 5% DMSO, 0.25% Triton-X in PBS) and washed three times for 15 minutes in wash buffer. Embryos were then incubated
overnight in blocking solution (5% donkey serum and 1%BSA in wash buffer) at 4�C, washed three times for 15minutes in wash buffer
and incubated overnight at 4�C in blocking solution containing the goat anti mouse Brachyury primary antibody (1:200, R&D Systems,
cat# AF2085). After three 15minute washes, Phalloidin-AlexaFluor488 (Thermofisher Scientific) was added 1:1000 and 40,6-Diamidino-
2-phenylindole dihydrochloride (DAPI, Sigma) was added at 200ng/ml with the donkey anti-goat Alexa647 antibody (1:500, Invitrogen,
cat#A21447) in blocking solution for another overnight incubation at 4�C.Embryoswere thenwashed three times for 15minutes inwash
buffer and mounted in Vectashield mountingmedia (Vector laboratories, cat# H-1000) and imaged in a Confocal Leica TCS SP5micro-
scope. Images were captures with the Leica Application Suite software and processed for publication using Fiji.
Quantification of Primordial Germ CellsFollowing dissection, embryos were stained for Alkaline phosphatase activity as described previously (Ginsburg et al., 1990). Briefly,
embryos were fixed in absolute ethanol with 12.5% glacial acetic acid at 4�C for 1 hour, followed by two 24h incubations in absolute
ethanol at 4�C and two 1h washes in chloroform. They were mounted in wax, sectioned and incubated in freshly made staining so-
lution (0.1mg/ml 1-Naphthyl phosphate, 0.5%borax solution, 0.5mg/ml Fast Red TR salt and 0.6%MgCl2, pH 9.2) for 15-30minutes.
For genotyping, extra-embryonic tissues of each embryo were digested with Proteinase K and tested by polymerase chain reaction
for the presence of a 310bp region including the 3’ coding region of the T gene, missing in T-/- embryos (primers: CCAGTTGA
CACCGGTTGTTACA and TATCCCAGTCTCTGGTCTGT). A 350bp fragment spanning the homeodomain of Hox 2.1 was used as
a positive control (primers: GCGCCAGTGCAGGGAAGATTGGAA and GATATGACTGGGCCAGACGGAAA) (Rashbass et al., 1994).
Single-Cell RNA Sequencing Analysis10X Data Pre-processing
Raw files were processed with CellRanger 2.1.1 using default mapping arguments, with reads mapped to the mm10 genome and
counted with GRCm38.92 annotation, including tdTomato sequence. This older annotation was used to ensure consistency with
the reference atlas (Pijuan-Sala et al., 2019). Processed data and raw count matrices are available in the Bioconductor package
MouseGastrulationData.
Swapped Molecule Removal
Molecule counts that derived from barcode swapping were removed from all 10X samples by applying the DropletUtils function
swappedDrops (default parameters) to groups of samples (where a sample is a single lane of a 10X Chromium chip) that were multi-
plexed for sequencing.
Cell Calling
Cell barcodes that were associated with real cell transcriptomes were identified using emptyDrops (Lun et al., 2019), which assesses
whether the RNA content associated with a cell barcode is statistically significantly distinct from the ambient background RNA pre-
sent within each sample. A minimum UMI threshold was set at 5,000, and cells with an adjusted p-value < 0.01 (BH-corrected) were
considered for further analysis.
Quality Control
Cells with mitochondrial gene expression fractions greater than 2.52% and 2.90%, for the T-/- chimeras and WT chimeras respec-
tively, were excluded. These thresholds were determined by the data – we considered a median-centred MAD-variance normal dis-
tribution; cells with mitochondrial read fraction ‘‘outside’’ of the upper end of this distribution were excluded (adjusted p-value < 0.05;
BH-corrected).
Normalisation
Transcriptome size factors were calculated for each dataset separately (T-/- chimeras, WT chimeras), using computeSumFactors
from the R scran package (Lun et al., 2019), using default parameters. Raw counts for each cell were divided by their size factors,
and the resulting normalised counts were used for further processing.
Visualisation of Single-cell RNA Sequencing DataBatch Correction
Batch-effects were removed using the fastMNN function in scran on the first 50 PCs, computed from the HVG-subset logcount
matrix. Default parameters were used. When correcting the reference atlas (Pijuan-Sala et al., 2019), correction was performed first
Developmental Cell 56, 141–153.e1–e6, January 11, 2021 e4

llOPEN ACCESS Article
between the samples within each time-point, merging sequentially from the samples containing the most cells to the samples con-
taining the least. Time-points were then merged from oldest to youngest. When correcting the chimeras, correction was performed
on all samples within a genotype first, from largest sample to smallest, then across the two genotypes.UMAPswere calculated using
the uwot R package with default parameters except for min_dist = 0.7.Diffusionmapswere calculated using the R package destiny,
with function DiffusionMap, using default settings. Batch-corrected principal components were used.
Chimera Cell Type AnnotationTo annotate the cell types in the chimaeric embryos, we performed a transcriptional mapping to a large reference atlas of mouse em-
bryonic development (Pijuan-Sala et al., 2019). Each stage of the atlaswas sub-sampled at random to 10,000 cell libraries (i.e., including
the technical artefacts of doublets and stripped nuclei) at each time-point. Cells from the mixed time-point were excluded. This sub-
sampling reduces potential bias due to the different number of cells captured at each stage. Stages E6.5 and E6.75 contained fewer
cells than other stages (3,697 and 2,169 respectively) and were not downsampled; however we do not expect cells from E8.5 or
E7.5 chimeras to map to these time-points. A shared 50-dimensional PC subspace was constructed from the subsampled cells
from the atlas, and all chimera cells that were to be mapped. Batch-correction was then performed on the atlas cells in the PC space,
as described above (Batch correction), to construct a single contiguous referencemanifold. Samples to bemappedwere then indepen-
dently mapped onto the newly-corrected atlas data (scran function fastMNN), and the 10 nearest cells (by Euclidean distance) in the
atlas to each chimera cell were recorded. Mapped time-point and cell type of chimera cells were defined as the most frequent of those
of its 10 nearest-neighbours. Ties were broken by choosing the stage or cell type of the cell that had the lowest distance to the chimera
cell. Cells thatmapped to doublet- or stripped nucleus-labelled cells were excluded fromdownstreamanalyses. For cell type differential
abundance testing in chimaeric embryos, see ‘‘quantification and statistical analysis’’ section below.
Mapping Chimera Cells onto the Atlas BackboneTo map chimera cells onto their appropriate positions on the atlas manifold, they were mapped onto it using a strategy similar to that
used in Batch correction (above). Individual samples (i.e. one 10X channel) of the E8.5 chimera datasets were mapped onto the cor-
rected atlas using fastMNN, using coordinates from the PC subspace. This operation was repeated for each chimera sample, retain-
ing the mapped coordinate values for each cell. Performing this operation in parallel across samples prevents any mapped chimera
cells affecting the future mapping of other samples. For the spinal cord to head mesoderm ordering, mapping was performed only
using cells from the relevant cell types. DPT values (i.e., ordering positions) were inferred for chimera cells by considering the mean
DPT value for the 5 nearest atlas cells in the PC space, after performing the per-sample mapping. This value of DPT is, effectively, the
position of a chimera cell along the atlas backbone. For mapping chimera cells to somite trajectories through the atlas, chimera cells
were mapped to the whole atlas (excluding cells from the ‘‘mixed gastrulation’’ atlas time-point, and with the subsampling described
above), as above for cell type labelling. As for the previous approach, chimera cells were considered a part of a trajectory if the most
common trajectory state of their 10 nearest neighbours was one of the somite trajectories. For differential gene expression analyses,
see ‘‘quantification and statistical analysis’’ section below.
QUANTIFICATION AND STATISTICAL ANALYSIS
Analysis of Single-Cell DatasetsSelection of HVGs
HVGs were calculated using trendVar and decomposeVar from the scran R package, with loess span 0.05. Genes that had signifi-
cantly higher variance than the fitted trend (BH-corrected p < 0.05) were retained. Genes with mean log2(normalised count) < 10-3,
genes on the Y chromosome, Xist, and tdTomato were excluded.
Gene Expression Comparisons along Trajectories
First, we selected genes that were variable along any of the three trajectories.We took the union of the genes calculated in each of the
three trajectories, calculated according to the following procedure, considering only the cells from that trajectory: HVGs were first
identified (see Selection of HVGs, below), and their mean expression level at each time-point was calculated; an order three poly-
nomial linearmodel fit was compared to an intercept-onlymodel by F-test (i.e., R function anova). We considered genes to be variable
along a trajectory if the polynomial fit was significantly better than the intercept-only model (BH-corrected p < 0.1). In a pairwise
manner across the three trajectories, we then tested these genes for differences in expression along them. As above, we calculated
the mean expression level in each trajectory for the genes at each time-point. We then fitted a null model of an order three polynomial
(i.e., the same model as for selecting genes above, except with the model using data from two, rather than one, trajectories at each
time point). The alternative model allowed for trajectory-specific coefficients for each coefficient of the order three polynomial. We
then compared the fit of the two models (by F-test) and considered genes to show different patterns of expression along the trajec-
tories if they were fit better by the alternative model (BH-corrected FDR < 0.01). If the latter model fits better than the null, this sug-
gests that the data are better described by different polynomials for each trajectory.
Overlap Computation (GSEA)Following pair-wise comparisons of expression dynamics along the entire length of transcriptional trajectories (Table S1), resulting
gene lists were used as input for computing overlap with the Molecular Signatures Database Hallmark gene set collection using the
e5 Developmental Cell 56, 141–153.e1–e6, January 11, 2021
llOPEN ACCESSArticle
Gene Set Enrichment Analysis tool (Liberzon et al., 2015; Subramanian et al., 2005). Results were plotted in Figure S2E using the
calculated FDR q-values, analog of hypergeometric p-value after correction for multiple hypothesis testing according to Benjamini
and Hochberg (Subramanian et al., 2005).
Analysis of Embryonic ChimerasDifferential abundance testing was performed using edgeR (McCarthy et al., 2012). Each 103 sample was considered as a repli-
cate, andmapped cell type counts were used in place of gene counts. A separate linear model was fitted for E7.5 and E8.5 chimeras.
Each linear model contained an intercept value specific to each biological replicate (i.e., pools of chimaeric embryos – one sample
tdTom+ and the other tdTom-). A factor term was included for the injected samples from theWT chimeras, and another was included
for the injected samples from the T-/- chimeras. Differential abundancewas tested using the contrast between these two factor terms,
effectively asking whether the injected cell type frequency differed between the WT and T-/- chimeras. This approach is preferable to
testing entirely within the T-/- chimeras, where the tdTom- fraction of cells may be influenced by aberrant behaviour of the T-/- cells.
The intra-chimera approach is also vulnerable to confounding injected status (whichmay subtly affect cell behaviours) with genotype;
the inter-chimera approach is not confounded. The use of wild-type chimeras also allows incorporation of the intrinsic variability of a
mutation-free chimera system into the model. Finally, the use of edgeR allows sharing of uncertainty estimates across cell types
with similar frequency in this sample-limited experiment. edgeR models were fitted and contrasts tested using the functions
calcNormFactors, glmQLFit, and glmQLFTest.
Differential Expression AnalysesDifferential expression testing was performed using the scran function findMarkers using default parameters. There was one excep-
tion. For the across-background NMP differential expression (Figure 6A), cells were selected with DPT values between 1.25 and 1.6.
However, different distributions of cells along this section could induce apparent differential expression due to positions along
ordering, rather than due to differences in genetic background. Here, we used the more sophisticated edgeR model, where we
also fit the centred DPT values as a model coefficient to control for different distributions along the cell ordering. For this model,
we tested against an absolute log2 fold-change of 0.5 as the edgeR model proved extremely sensitive to very small differences in
expression level.
Relative Ratio ComparisonsIn Figures 5A and 5B, relative contribution of injected cells to NMPs vs Posterior somites trajectories are calculated in E8.5 and E7.5
embryonic chimeras, respectively. Each point corresponds to an independent experiment (pool of chimaeric embryos), and calcu-
lated as: relative ratio = (number of tdTom+ on NMPs trajectory / number of tdTom- on NMPs trajectory) / (number of tdTom+ on pos-
terior somites trajectory / number of tdTom- on posterior somites trajectory). This approach is robust to chimera-wide composition
effects, as cell numbers are normalised using the host cells from each sample. To assess the difference in ratios between chimera
types (i.e. WT into WT vs T-/- into WT chimeras). p-values were estimated from 1000 permutations of the cells’ trajectory labels.
Quantification of Primordial Germ CellsDifferences in Alkaline Phosphatase-positive PGC counts in T-expressing vs T-/- mouse embryos at the headfold stage were as-
sessed using an unpaired two-sample t-test (Figure S4J).
ADDITIONAL RESOURCES
The code used to perform these analyses is available at https://github.com/MarioniLab/TChimeras2020. A singularity image that
contains the exact versions of software used can be downloaded from the Github repository. An online visualisation tool is available
at https://marionilab.cruk.cam.ac.uk/EarlySomites2020/.
Developmental Cell 56, 141–153.e1–e6, January 11, 2021 e6
Developmental Cell, Volume 56
Supplemental Information
Diverse Routes toward Early Somites
in the Mouse Embryo
Carolina Guibentif, Jonathan A. Griffiths, Ivan Imaz-Rosshandler, ShilaGhazanfar, Jennifer Nichols, Valerie Wilson, Berthold Göttgens, and John C. Marioni
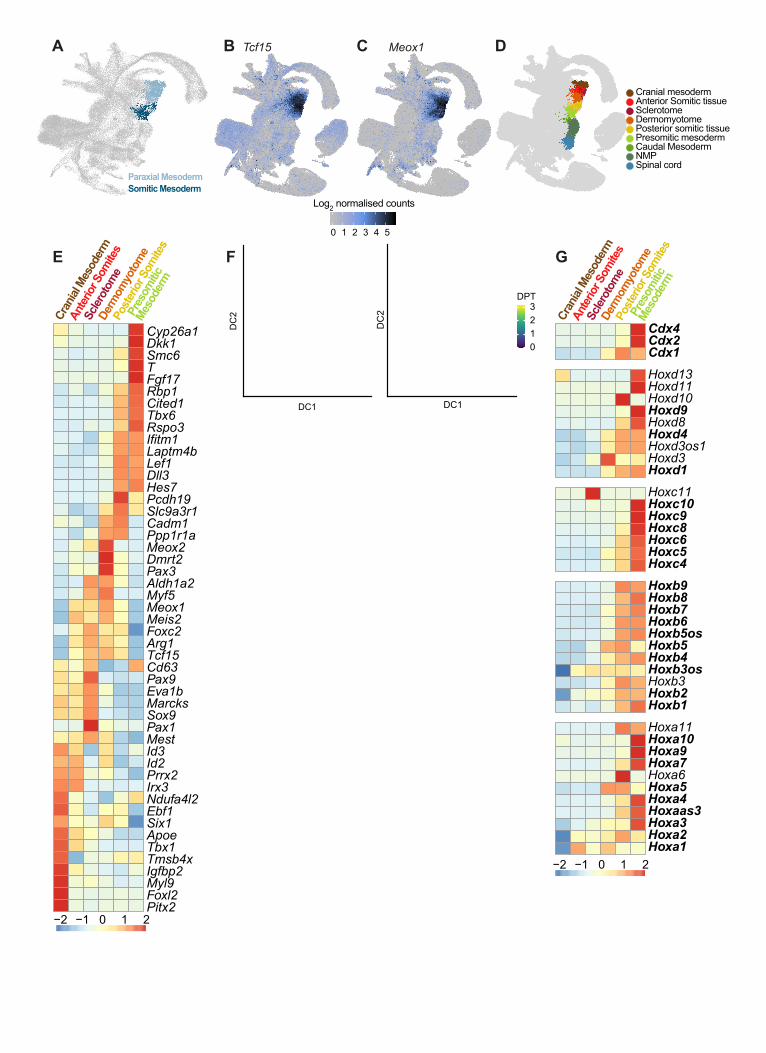
DC1
DC
2
Tcf15 Meox1
Paraxial MesodermSomitic Mesoderm
A B C D
E F
−2 −1 0 1 2
DC1
DC
2
0123
DPT
Anterior Somitic tissue
Caudal Mesoderm
Dermomyotome
Cranial mesoderm
NMP
Posterior somitic tissuePresomitic mesoderm
Sclerotome
Spinal cord
0 1 2 3 4 5
Log2 normalised counts
Dmrt2Pax3Aldh1a2
Meox2
Myf5Meox1Meis2Foxc2Arg1Tcf15
Slc9a3r1Cadm1Ppp1r1a
Pcdh19
Ifitm1Laptm4bLef1Dll3Hes7
Rbp1Cited1Tbx6Rspo3
Ndufa4l2
Cd63
Cyp26a1Dkk1Smc6TFgf17
Pax9Eva1bMarcksSox9Pax1Mest
Ebf1Six1
Id3Id2
ApoeTbx1
Prrx2Irx3
Tmsb4xIgfbp2Myl9Foxl2Pitx2
Cran
ial M
esod
erm
Scler
otome
Derm
omyo
tome
Anter
ior S
omite
sPo
sterio
r Som
ites
Pres
omitic
Me
sode
rm
Hoxc4
Hoxd8
Hoxc6Hoxc5
Cdx1
Hoxd1
Hoxd3os1Hoxd4
Hoxd13Hoxd11
Hoxc10
Hoxc8
Cdx2
Hoxc9
Hoxd9
Cdx4
Hoxc11
Hoxd10
Hoxd3
Hoxa4
Hoxa7
Hoxaas3
Hoxb1
Hoxb8Hoxb7Hoxb6Hoxb5os
Hoxa11
Hoxb9
Hoxb3
Hoxb4
Hoxa3
Hoxa10Hoxa9
Hoxa6
Hoxa1
Hoxb3os
Hoxa2
Hoxb2
Hoxa5
Hoxb5
Cran
ial M
esod
erm
Scler
otome
Derm
omyo
tome
Anter
ior S
omite
sPo
sterio
r Som
ites
Pres
omitic
Me
sode
rm
G
−2 −1 0 1 2

(A) UMAP layout from Pijuan-Sala et al. (2019), highlighting clusters containing paraxial cell types used for further subclustering.(B) Expression levels of Tcf15 in the Atlas layout.(C) Expression levels of Meox1 in the Atlas layout.(D) Atlas layout highlighting the newly defined axial elongation-related tissues present at E8.5(E) Centred and scaled average expression levels of signature genes characterizing the newly identified elongation-related tissues present at E8.5.(F) Left: diffusion map of elongation-related tissues present at E8.5 coloured by newly-identified subcluster (see corresponding legend in (D)); right: diffusion map of elongation-related tissues present at E8.5 colored by Diffusion Pseudotime value (i.e. position in the one-dimensional ordering).(G) Centred and scaled average expression levels of Cdx and Hox transcription factors in the newly identified elongation-related tissues present at E8.5. Genes differentially expressed with FDR < 0.05 in at least one comparison are highlighted in bold font.
Figure S1. Transcriptional characterization of axis elongation-related tissues (related to Figure 1):

A
EpiblastPrimitive Streak
Caudal epiblast
Anterior Primitive StreakNascent mesodermMixed mesoderm
Intermediate mesodermPharyngeal mesoderm
Somitic mesoderm
B
E8.0 (46.0%) E8.25 (18.8%) E8.5 ( 5.4%)
E7.25 (31.3%) E7.5 (49.2%) E7.75 (49.9%)
E6.5 (18.4%) E6.75 (10.8%) E7.0 (26.1%)
0 1 2 3 4 0 1 2 3 4 0 1 2 3 4
0
1
2
3
4
0
1
2
3
4
0
1
2
3
4
Epcam log2 counts
Vim
log 2 c
ount
s E6.5E6.75E7.0E7.25E7.5E7.75E8.0E8.25E8.5
C
0
1
2Epcam
0.5
1.0Krt18
0.00.10.20.30.4 Col4a1
0.000.050.100.150.20 Tjp1
0.250.300.350.40
Krt10
0.00.10.20.30.4 Crb3
0.100.150.200.250.300.35 Tjp2
0.1
0.2
Lamb1
0.00.51.01.5
Fn1
0.40.81.2
Vim
0.51.01.52.0 Lef1
0.0
0.2
0.4
0.6 Zeb2
0.000.050.100.15 Zeb1
0.000.030.060.090.12 Snai2
0.00.40.81.21.6 Snai1
E6.5E6.7
5E7.0
E7.25E7.5
E7.75E8.0
E8.25E8.5 E6.5
E6.75E7.0
E7.25E7.5
E7.75E8.0
E8.25E8.5 E6.5
E6.75E7.0
E7.25E7.5
E7.75E8.0
E8.25E8.5
E6.5E6.7
5E7.0
E7.25E7.5
E7.75E8.0
E8.25E8.5
Gene expression dynamics along trajectories:
Anterior Somitic trajectoryPosterior Somitic trajectoryNMP trajectory
0.0
0.1
0.2
0.3
0.4
0.5
E6.5E6.75
E7.0E7.25
E7.5E7.75
E8.0E8.25
E8.5
Frac
tion
of V
im+ E
pcam
+ cel
ls
D
Anterior Somitic trajectoryPosterior Somitic trajectoryNMP trajectory
Paraxial mesodermHaematoendothelial progenitorsRostral neurectodermCaudal neurectodermSurface ectodermPGC
0 2 4 6 8 10 12 14 16 18
HALLMARK_HYPOXIA
HALLMARK_MTORC1_SIGNALING
HALLMARK_MYOGENESIS
HALLMARK_KRAS_SIGNALING_UP
HALLMARK_EPITHELIAL_MESENCHYMAL_TRANSITIONAnterior vs Posterior Somitic trajectories:
-log10(FDR)0 1 2 3 4 5 6 7 8 9 10
HALLMARK_P53_PATHWAY
HALLMARK_CHOLESTEROL_HOMEOSTASIS
HALLMARK_APICAL_JUNCTION
HALLMARK_MTORC1_SIGNALING
HALLMARK_EPITHELIAL_MESENCHYMAL_TRANSITION
-log10(FDR)
NMP vs Somitic trajectories:E
F
0.0
0.1
0.2
0.3 Mef2c
123 Slc2a1
0
1
2Slc2a3
0.2
0.4
0.6 Pdk1
E6.5E6.7
5E7.0
E7.25E7.5
E7.75E8.0
E8.25E8.5 E6.5
E6.75E7.0
E7.25E7.5
E7.75E8.0
E8.25E8.5 E6.5
E6.75E7.0
E7.25E7.5
E7.75E8.0
E8.25E8.5 E6.5
E6.75E7.0
E7.25E7.5
E7.75E8.0
E8.25E8.5
mea
n lo
g 2 cou
nts
mea
n lo
g 2 cou
nts
Gene expression dynamics along trajectories:
Anterior Somitic trajectoryPosterior Somitic trajectoryNMP trajectory

(A) Pijuan-Sala et al. (2019) annotation of cells belonging to the developmental trajectories for NMPs as well as for anterior vs posterior somites present at E8.5, predicted using Waddington Optimal Transport analysis (See Figure 2A, B).(B) Expression dynamics of epithelial and mesenchymal signature genes along the three developmental trajec-tories. y-axis: mean log2(normalised counts).(C) Scatterplots of log2(normalised counts) for Epcam (epithelial marker) vs Vim (mesenchymal marker) in NMP-fated cells along developmental time-points suggest a state of incomplete EMT. Titles indicate percentage of cells in which both genes were detected.(D) Quantification of Epcam/Vim double-positive cells in transcriptional trajectories towards NMP, Anterior Somitic tissues and Posterior somitic tissues throughout development suggest a high incidence of cells in a incomplete EMT state on the NMP trajectory.(E) Top 5 Hallmark signatures resulting from Gene Set Enrichment Analysis with (left) the genes displaying different behaviours over time in the anterior and posterior somitic trajectories, and (right) the genes with expres-sion dynamics specific to the NMP trajectory (these are genes overlapping between comparisons: NMP vs anterior somitic trajectories and NMP vs posterior somitic trajectories). See also Supplemental Table 1 and Methods.(F) Expression dynamics along the three developmental trajectories for genes featured in the “Myogenesis” and “mTorC1 signaling” Hallmark signatures in (E).
Figure S2. Multiple transcriptional trajectories towards somites (related to Figure 2):

10987654321
EA M A L R P M EP
11
10.50
Overall Activity Score Hmga2
1.40.6 1
Etv2
1.50 0.5 21 0.5 2.51.5
Myl7
10.50
Overall Activity Score
10987654321
EA M A L R P M EP
11
1.510.50
Sp5 Mesp2
1.510.50 1.510.50
Dusp6
D
Genes enriched in E7.0 ancestors of Anterior Somitic tissues:
Genes enriched in E7.0 ancestors of Posterior Somitic tissues:
C
0
40
80
120
−2 −1 0 1log2FC(posterior vs anterior)
Phlda2
Myl7Ppic
Hand1 Id3Etv2
Mpc2
Dusp9Phlda1
ApoeS100a10 Mest
T
Sp5Fst
Bex4Frzb Bex1
Pou5f1Mesp2 Igfbp2
Pim2 Fgf8Mixl1Dusp6
EpcamDnmt3b
Mesp1Pmaip1 Lefty2Tuba1a
SnrpnRbp1Pycr2
Cyp26a1
E7.0
Car4Pmp22
Hmga2
−log
10(a
djus
ted
p)
Genes enriched in E7.0 ancestors of Anterior Somitic tissues:
Genes enriched in E7.0 ancestors of Posterior Somitic tissues:
E
Frac
tion
NM
P m
ass
Trajectory:Anterior Somitic tissues Posterior Somitic tissues �
�
A B
Genes enriched in Peng et al. E7.5 Anterior Mesoderm
Genes enriched in Peng et al. E7.5 Posterior Mesoderm
Average Z-scoreAverage Z-score
1.51.00 0.5320 1
F
0.00.40.81.21.6 Snai1
E6.5E6.7
5E7.0
E7.25E7.5
E7.75E8.0
E8.25E8.5
0.00.20.40.60.8 Lfng
0.00.51.01.52.0 Hes7
0.0
0.5
1.0
1.5 Nrarp
0.250.500.751.001.25 Nkd1
0.000.050.100.150.200.25 Dact1
0.10.20.30.40.5 Axin2
0.00.10.20.30.40.5
Dusp4
0.30.60.91.2 Dusp6
0.000.010.020.030.040.05 Spry2
0.000.050.100.150.20 Spry4
0.00.20.40.6 Alx1
0.0
0.5
1.0Irx3
0.0
0.5
1.0
1.5 Sfrp1
0.00.51.01.52.0 Hand1
0.000.250.500.75
Pmp22
0.00.51.01.52.0 Lmo1
0.00.20.40.6 Tbx3
E6.5E6.7
5E7.0
E7.25E7.5
E7.75E8.0
E8.25E8.5
E6.5E6.7
5E7.0
E7.25E7.5
E7.75E8.0
E8.25E8.5
E6.5E6.7
5E7.0
E7.25E7.5
E7.75E8.0
E8.25E8.5
0.00.51.01.52.02.5 Prrx2
0.0
0.2
0.4
0.6 Prrx1
E6.5E6.7
5E7.0
E7.25E7.5
E7.75E8.0
E8.25E8.5
E6.5E6.7
5E7.0
E7.25E7.5
E7.75E8.0
E8.25E8.5
Gene expression dynamics along trajectories:
Anterior Somitic trajectoryPosterior Somitic trajectoryNMP trajectory
0.00.20.40.6
Irx1
mea
n lo
g 2 cou
nts
mea
n lo
g 2 cou
nts
E6.5E6.7
5E7.0
E7.25E7.5
E7.75E8.0
E8.25
0.00
0.02
0.04
0.06

(A) Expression dynamics of markers of the clock and wave-front somitogenesis model along the three developmental trajectories. y-axis: mean log2(normalised counts).(B) Gene expression dynamics of candidate regulators specific to the anterior somite development along the three developmental trajectories. y-axis: mean log2(normalised counts).(C) Levels of average Z-scores for the genesets retrieved from Peng et al. (2019), as enriched in E7.5 anterior mesoderm (left) and in E7.5 posterior mesoderm (right), in the Pijuan-Sala et al. (2019) dataset. To compare with Figure 2A. See also Supplemental Table 3 and Methods.(D) Differential expression analysis between E7.0 cells present on the posterior somitic tissues trajectory vs E7.0 cells on the anterior somitic tissue trajectory.(E) Schematics of the overall “activity score” for the genes significantly differentially expressed in each trajectory (from analysis in D), calculated using the eGastrulation tool for E7.0 spatial data (Peng et al., 2019) and expression levels in log10(FPKM+1) for selected genes highlighted in bold font in (D). See also legend for Figure 3B. M: whole Mesoderm; L: Left lateral; R: Right lateral.(F) Average fraction of optimal transport mass for the NMP lineage, in cells allocated to the anterior or posterior somite trajectories. In all comparisons, cells on the posterior somitic tissue trajectory have significantly higher NMP mass (adjusted p < 10-10, Student’s t-test; error bars: standard deviation).
Figure S3. Spatial segregation of somitic developmental trajectories(related to Figure 3):

Glog2FC (injected T -/- vs injected WT)
*
**
−2 0 2Allantois
Blood progenitors 1Blood progenitors 2
CardiomyocytesCaudal Mesoderm
Caudal epiblastCaudal neurectoderm
Def. endodermEndothelium
Erythroid1Erythroid2Erythroid3
ExE ectodermExE endodermExE mesoderm
Forebrain/Midbrain/HindbrainGut
Haematoendothelial progenitorsIntermediate mesoderm
MesenchymeNMP
Neural crestNotochord
PGCParaxial mesodermParietal endoderm
Pharyngeal mesodermRostral neurectoderm
Somitic mesodermSpinal cord
Surface ectodermVisceral endoderm
WT
T -/-
ED
012345
Def. e
ndod
erm
Caud
al M
esod
erm
Som
itic m
esod
erm
NMP
Caud
al ep
iblas
t
Int. m
esod
erm
01234
Mea
n T
log 2(c
ount
)
T -/- into WT
WT into WT
tdTom+tdTom-
TtdTom
F H
K L
*
a necm
M
Shh
Nog
Noto
WT T -/-
4
2
0
4
2
0
4
2
0
1 42675 150 225 300 375
1 75 163
1 104
1 75 162
T-box sequence
dimerization domain
DNA-binding domain
CTGGACTTCGTGACGGCTGACAACCACCGCTGGAAATATGTGAACGGGGAGTGGGTACCTGGGGGCAAA L D F V T A D N H R W K Y V N G E W V P G G K
CTGGACTTCGTGACGGCTGACAACCACC--TGGAAATATGTGAACGGGGAGTGGGTACCTGGGGGCAA L D F V T A D N H L E I C E R G V G T W G Q
CTGGACTTCGTGACGGCTGACAACCAC-GCTGGAAATATGTGAACGGGGAGTGGGTACCTGGGGGCAAA L D F V T A D N H A G N M stop
CTGGACTTCGTGACGGCTGACAACC-----TGGAAATATGTGAACGGGGAGTGGGTACCTGGGGGCAA L D F V T A D N L E I C E R G V G T W G Q
WT
Clone 1 het (allele 1)
Clone 1 het (allele 2)
Clone 2 hom
T locusWT
Clone 1 het (allele 1)
Clone 1 het (allele 2)
Clone 2 hom
A B
WT protein
predicted mutant protein
I
J
C
0
50
100
150
200
NP HF2−
5s6−
8s 10s
StageAl
kalin
e Ph
osph
atas
e+ c
ell c
ount
s
0
20
40
60
HFT +/-
HFT -/-Genotype:
p = 0.0018Al
kalin
e Ph
osph
atas
e+ c
ell c
ount
s
CRISPR targeting of theT locus in tdTom+ mESCs
Injection of tdTom+ T -/- mESCsinto tdTom- WT blastocysts
E8.5 chimera harvestand dissociation
Single-cell RNAseq
tdTom- tdTom+
FACS sorting oftdTom fractions
Analysis
(A) Schematic of sequencing results of the CRISPR-targeting of T locus showing frameshift mutations in both analyzed clones. Het: heterozygous; hom: homozygous.(B) Schematics of the predicted protein sequences resulting from mutations depicted in (A). All detected mutations result in an early stop codon and prevent the formation of DNA-binding and dimerization domains, precluding the existence of a functional T protein.(C) Schematic of experimental strategy for generation of E8.5 T-/- chimeras.(D) Average detected levels of T transcript in T-expressing cell types in T-/- (top) and WT control (bottom) chimeras.(E) Confocal image of a T-/- chimeric embryo with high chimerism levels showing negative correlation between tdTomato and T protein. Scale bar: 50μm.(F) Differential abundance testing of embryonic cell types in T-/- chimeras compared to the WT chimera controls. Only cell types comprising more than 10 chimeric cells are displayed (excluded cell types: Mixed Mesoderm and Epiblast containing 3 and 1 cells respectively). *: BH-corrected p < 0.1, n = 4 independent experiments.(G) UMAP representation of the scRNAseq data of chimeric embryos, split by genotype. See (F) for colour code of the different cell types. Arrowheads highlight the cell types with observed significant increased or decreased representation in the T-/- cell fraction as depicted in Figure 4A, corresponding to NMPs, somitic mesoderm, Intermediate mesoderm. Notochord and PGCs (depleted but below statistical significance) are also highlighted.(H) Close-up of the definitive endoderm and notochord lineages in the UMAP in (G), displaying expression levels for key notochord genes dysregulated in the T-/- fraction. Colour scale represents Log2(normalized counts) for each transcript.(I) Counts of Alkaline Phosphatase-positive PGCs in T-expressing mouse embryos increase exponentially throughout development. NP: Neural Plate (E7.5); HF: Headfold (E7.75); s: somite stage. (J) Counts of Alkaline Phosphatase-positive PGCs in T-expressing and T-/- mouse embryos at the headfold stage showing a significant decrease in numbers in homozygous mutant embryos (p-value = 0.0018, Student’s t-test).(K) Confocal image of the caudal region of an E8.5 chimeric embryo with low chimerism showing accumulation of tdTom+ cells within the remnant primitive streak region (arrowhead). a: allantois, containing tdTom+ cells. Scale bar: 50μm.(L) Confocal image of the heart region of an E8.5 chimeric embryo showing contribution of tdTom+ cells to cardiac tissue (white arrowheads), foregut diverticulum (asterisk) and extra-embryonic mesoderm (blue arrowhead). Scale bar: 100μm.(M) Confocal image of the cranial region of an E8.5 chimeric embryo with high chimerism, showing contribution of tdTom+ cells to cranial tissues, including cranial mesenchyme (cm) and neurectoderm (ne). Scale bar: 100μm.
Figure S4. Dissecting the cell-autonomous role of T (related to Figure 4):

(A) Representative images of E7.5 T-/- chimeric embryos, bright field (top) and tdTomato fluorescence (bottom). Scale bar: 500μm.(B) Differential abundance testing of embryonic cell types in E7.5 T-/- chimeras compared to the WT chimera controls. No statistically significant deviations in relative abundance were observed (n = 3 independent experiments).(C) UMAP representation of the scRNAseq data of chimeric embryos, split by genotype. See (B) for colour code of the different cell types.
Figure S5. Lineage contribution of T-/- cells in E7.5 chimaeras (related to Figure 5):
−10
−5
0
5
10
15
20
25
30
35
40
45
50
55
60
−10
0
10
20
30
40
50
60
70
80
90
100
110
120
130
WT
T -/-
−8 −4 0Allantois
Anterior Primitive StreakBlood progenitors 1Blood progenitors 2
CardiomyocytesCaudal Mesoderm
Caudal epiblastCaudal neurectoderm
Def. endodermEndothelium
EpiblastErythroid1
ExE ectodermExE endodermExE mesoderm
GutHaematoendothelial progenitors
Intermediate mesodermMesenchyme
Mixed mesodermNMP
Nascent mesodermNotochord
PGCParaxial mesodermParietal endoderm
Pharyngeal mesodermPrimitive Streak
Rostral neurectodermSomitic mesoderm
Spinal cordSurface ectoderm
Visceral endoderm
log2FC (injected T -/- vs injected WT)BA C

A B C
T
Sox2
Nkx1-2
T -/-WT543210
43210
43210
WT chimera T -/- chimera
tdTom-
tdTom+
0 1 2 3 4 0 1 2 3 4
012345
012345
Sox2 log2 counts
T lo
g 2 cou
nts
WTT -/-
Log 2 c
ount
s
Sox1Sox
3Sox
21Sp8Zic1Zic2Zic3 Irx1Irx
3Irx
5
Nkx6−1Olig
2Olig
3Pax
3Pax
601234
Akr1e1
Apoa1
Apoe
Cdkn1c
Erdr1Fabp3
H13
Kcnq1ot1Lamtor3
Mcts2
Mt1
Nnat
Phlda2
Rhox5
Slc38a4
Spink1
Ttr Xist
Aldh1a2
Car3
Ccnd2
Chst7Cited1
CkbCrabp1
Ebpl
Fst
Grb10
Grrp1
Gtf2h5
Htra1
Ipo5
Lefty2
LhfpMeis2
Mrps6Nufip1
Pdlim4
Peg3
Rspo3Sugt1
T
Tdgf1
Uchl3Vim
−10
0
10
20
30
40
50
60
70
80
90
100
110
120
130
−10 0 10 20 30 40 50 70 80 90 100 110 120
Akr1e1
Apoa1
Apoe
Cdkn1c
Erdr1Fabp3
H13
Kcnq1ot1Lamtor3
Mcts2
Mt1
Nnat
Phlda2
Rhox5
Slc38a4
Spink1
Ttr Xist
Aldh1a2
Car3
Ccnd2
Chst7Cited1
CkbCrabp1
Ebpl
Fst
Grb10
Grrp1
Gtf2h5
Htra1
Ipo5
Lefty2
LhfpMeis2
Mrps6Nufip1
Pdlim4
Peg3
Rspo3Sugt1
T
Tdgf1
Uchl3Vim
−10
0
10
20
30
40
50
60
70
80
90
100
110
120
130
−10 0 10 20 30 40 50 60 70 80 90 110 120 130
E7.5 Posterior Somitic tissues trajectory
Apoa1
Cdkn1c
Fabp3
H13
Impact
Kcnq1ot1
Lamtor3
Mcts2
Nnat
Phlda2
Rhox5
Slc38a4
Spink1Ttr
Xist
Car4
Ckb
Colec12
Cpox
Dynlt1f
Ebpl
Esd
Grb10
Gsto1Gtf2h5
H2afj
Igfbp2
Ipo5
Krt18
Lhfp
Med4
Mettl3
Mphosph8
Mrps6
Mt1
Mt2Naa16
Oxa1l
Peg3
Pinx1
Pusl1
Sap18
Slc9a3r1
Sucla2
Sugt1T
Tbx3Tmem242
Tox4
Uchl3
−10
−5
0
5
10
15
20
25
30
35
40
45
50
55
60
−10 −5 0 5 10 15 20 25 30 35 40 45 50 55 60
Psme1Phlda3
Sult5a1
Apoa1
Cdkn1c
Fabp3
H13
Impact
Kcnq1ot1
Lamtor3
Mcts2
Nnat
Phlda2
Rhox5
Slc38a4
Spink1Ttr
Xist
Car4
Ckb
Colec12
Cpox
Dynlt1f
Ebpl
Esd
Grb10
Gsto1Gtf2h5
H2afj
Igfbp2
Ipo5
Krt18
Lhfp
Med4
Mettl3
Mphosph8
Mrps6
Mt1
Mt2Naa16
Oxa1l
Peg3
Pinx1
Pusl1
Sap18
Slc9a3r1
Sucla2
Sugt1T
Tbx3Tmem242
Tox4
Uchl3
−10 −5 0 5 10 15 20 25 30 35 40 45 50 55 60
Psme1Phlda3
Sult5a1
Apoa1
Cdkn1c
Ckb
Erdr1Fabp3
Gcsh
H13
H19
Kcnq1ot1
Mcts2
Nnat
Phlda2
Rhox5 Spink1
Ttr
Wfdc2
Xist
Commd6
Ezr
Grb10
H2afj
Ipo5
Krt18
Mrpl57
Nedd8
Oxa1l
Peg3
Psme2
Rbm26
Sap18Sugt1
T
Uchl3
−10
0
10
20
30
40
50
60
70
80
90
100
110
120
130
−10 0 10 20 30 40 50 70 80 90 100 110 120 130
Apoa1
Cdkn1c
Ckb
Erdr1Fabp3
Gcsh
H13
H19
Kcnq1ot1
Mcts2
Nnat
Phlda2
Rhox5 Spink1
Ttr
Wfdc2
Xist
Commd6
Ezr
Grb10
H2afj
Ipo5
Krt18
Mrpl57
Nedd8
Oxa1l
Peg3
Psme2
Rbm26
Sap18Sugt1
T
Uchl3
−10 0 10 20 30 40 50 60 70 80 90 110 120 130
Genes correlated with tdTomatoGenes differentially expressed in the WT chimeras
WT chimeras Log10 (adjusted p value)
T-/- c
him
eras
Log
10 (a
djus
ted
p va
lue)
WT chimeras Log10 (adjusted p value)
T-/- c
him
eras
Log
10 (a
djus
ted
p va
lue)
WT chimeras Log10 (adjusted p value)
T-/- c
him
eras
Log
10 (a
djus
ted
p va
lue)
E7.5 Anterior Somitic tissues trajectory
E7.5 NMP trajectory
D E
F
(A) UMAPs of E8.5 T-/- chimera cells, split by genotype with expression levels of NMP marker genes. Arrowhead: NMP cells. See also Figure S4G.(B) Scatterplots of log2(normalised counts) for T and Sox2 in single E8.5 NMP-mapped cells in WT into WT chimeras (left) and T-/- chimeras (right). Although T and Sox2 appear generally anti-correlated, Sox2 is not up-regulated in the absence of T (lower-right), arguing against cross-antagonism of these two regulators in NMPs.(C) Violin plots of genes featuring a neural signature in T-/- chimera NMP-mapped cells, showing no up-regulation in the T-/- fraction.(D-F) Genes significantly deregulated in E7.5 T-/- chimera cells mapping to anterior somitic tissues (D), posterior somitic tissues (E), NMP (F) trajectories plotted by adjusted p values corresponding to expression levels comparison of tdTom+ injected cells and tdTom- host cells in WT (x-axis) and T-/- chimeras (y-axis). Highlighted are genes excluded from Figure 6b analysis due to significant deregulation in WT chimeras (plotted in grey) or high correlation with the tdTomato transcript (plotted in brown) over whole WT chimeras. These highlighted genes are likely technical artefacts of the chimera generation procedure (e.g. imprinted genes).
Figure S6. Molecular analysis of T-/- chimaeras (related to Figure 6):
Copyright © 2022 FDOKUMEN