SAFE ROUTES TO SCHOOL ACTION PLAN
143
HINSDALE MIDDLE/HIGH SCHOOL SAFE ROUTES TO SCHOOL ACTION PLAN SEPTEMBER 2016
-
Upload
khangminh22 -
Category
Documents
-
view
2 -
download
0
Transcript of SAFE ROUTES TO SCHOOL ACTION PLAN

HINSDALE MIDDLE/HIGH SAFE ROUTES TO SCHOOL ACTION PLAN
H I N S D A L E M I D D L E / H I G H S C H O O L
SAFE ROUTES TO SCHOOL ACTION PLAN
SEPTEMBER 2016

HINSDALE MIDDLE/HIGH SCHOOL – SAFE ROUTES TO SCHOOL ACTION PLAN
ii
H I N S D A L E M I D D L E / H I G H S C H O O L
SAFE ROUTES TO SCHOOL ACTION PLAN
Acknowledgements
During the 2015/2016 school year, the Hinsdale School District (HSD) worked with Southwest Region Planning Commission (SWRPC) to develop
Safe Routes to School Action Plans for the Hinsdale Middle/High School (HM/HS). The school principal, Joseph Boggio, helped to provide SWRPC
staff with locally relevant guidance and input for this Action Plan. In addition, a team of students from the Keene State College Geography
Department provided assistance with data collection and analysis and developed a report of their findings, which is included in Appendix A of
this document. The Hinsdale School District and SWRPC are grateful for the contributions provided by members of this student team, who are
listed below.
Funding for this document was made possible, in part, by the Centers for Disease Control and Prevention through the Partnership to Improve
Community Health initiative. This is done in conjunction with Healthy Monadnock 2020, a community engagement initiative designed to foster
and sustain a positive culture of health throughout Cheshire County and the Monadnock region. The action plans of Healthy Monadnock 2020
are focused on improving quality of life and preventing the leading causes of illness and death. The goal of Healthy Monadnock 2020 is to make
the Monadnock region the healthiest community in the nation where all individuals reach their highest potential for health.
The views expressed in this document do not necessarily reflect the official policies of the Department of Health and Human Services, nor does
the mention of trade names, commercial practices, or organizations imply endorsement by the United States Government.
KSC Geography Student Team members
Michelle Kelley, student Kate Mann, student Jake Morel, student Jack Rogers, student Lara Bryant, Professor/student team advisor

HINSDALE MIDDLE/HIGH SCHOOL – SAFE ROUTES TO SCHOOL ACTION PLAN
iii
Table of Contents INTRODUCTION .......................................................................................................................................................................................................... 1
Project Overview .................................................................................................................................................................................................... 1
Benefits of Safe Routes to School ........................................................................................................................................................................... 3
Planning Process ..................................................................................................................................................................................................... 3
Study Area .............................................................................................................................................................................................................. 4
EVALUATION OF EXISTING TRAVEL CONDITIONS ....................................................................................................................................................... 8
School Arrivals and Departures .............................................................................................................................................................................. 8
Parent and In-Classroom Surveys ........................................................................................................................................................................... 9
Pedestrian Infrastructure Conditions ................................................................................................................................................................... 11
Traffic Volume and Speeds ................................................................................................................................................................................... 14
SAFE ROUTES TO SCHOOL STRATEGIES .................................................................................................................................................................... 16
Education ............................................................................................................................................................................................................. 16
Encouragement .................................................................................................................................................................................................... 18
Enforcement ......................................................................................................................................................................................................... 21
Engineering........................................................................................................................................................................................................... 22
Evaluation ............................................................................................................................................................................................................. 24
IMPLEMENTATION ................................................................................................................................................................................................... 25
APPENDICES ............................................................................................................................................................................................................. 31

HINSDALE MIDDLE/HIGH SCHOOL – SAFE ROUTES TO SCHOOL ACTION PLAN
1
INTRODUCTION
The Hinsdale Safe Routes to School Action Plan was created to identify measures that will improve conditions for walking and biking to school for
Hinsdale Middle/High School (HM/HS). It includes an evaluation of existing travel conditions, strategies to improve education, encouragement, and
enforcement activities, and recommendations for physical improvements, educational programs and community efforts that will encourage walking
and biking within a two-mile radius of HM/HS.
There are far-reaching implications of an SRTS program. SRTS programs can improve
safety for children and a community of pedestrians and bicyclists. They provide
opportunities for children to become more physically active and to rely less on their
cars. SRTS programs also benefit the environment and a community’s quality of life
by reducing traffic congestion and motor vehicle emissions. The goal of this Action
Plan is to identify potential physical improvements and operational measures and
programs for HM/HS and the surrounding area. This action plan will be available for
use by the school and community leaders as a framework to guide actionable next
steps, both in the short‐term and long‐term.
Project Overview
Safe Routes to School (SRTS) is a national program established in 20051 by the Federal
Highway Administration (FHWA) that is focused on improving the health and
wellbeing of children by creating safe opportunities to walk and bike to school. SRTS
programs examine the conditions around schools and conduct activities to improve
safety, accessibility, traffic, and air pollution near schools. Communities conducting
these programs are encouraged to employ a combination of evaluation, education,
encouragement, enforcement and engineering strategies to address the specific
needs of their school(s).
1 "Safe Routes to School.” Federal Highway Administration. Accessed April 21, 2016. http://www.fhwa.dot.gov/environment/safe_routes_to_school/.
Figure 1 - The Six E's of Safe Routes to Schools.

HINSDALE MIDDLE/HIGH SCHOOL – SAFE ROUTES TO SCHOOL ACTION PLAN
2
This comprehensive approach, called the five (5) E’s, is centered on an understanding that the barriers to safe walking and bicycling are both
behavioral and physical. In 2015, the Safe Routes to School National Partnership introduced a sixth (6) E, Equity. Although the focus of this Action
Plan is evaluation, each of the six (6) E’s (described below) is addressed.

HINSDALE MIDDLE/HIGH SCHOOL – SAFE ROUTES TO SCHOOL ACTION PLAN
3
Benefits of Safe Routes to School
Safe Routes to School (SRTS) programs create a safer travel environment near
schools and serve to reduce motor vehicle congestion at school drop-off and pick-
up areas. One of the main goals of the SRTS program—along with increasing
safety—is to increase the numbers of children who walk and bicycle to school.
Students that choose to walk or bike to school are rewarded with the benefits of
a more active lifestyle, as well as the responsibility and independence that comes
from being in charge of the way they travel.
SRTS can improve communities by making walking- and bicycling-safe ways to get
to school and by encouraging more children to do so. SRTS programs offer
additional benefits to neighborhoods by helping to reduce school-related traffic
and provide infrastructure improvements that facilitate walking and bicycling for
everyone. Identifying and improving routes for students to safely walk and bicycle
to school can also help reduce traffic speeds in neighborhoods, reduce traffic
congestion on weekday mornings and afternoons at schools, and decrease auto-
related pollution around school environments.
Planning Process
Data Collection
In the fall of 2015, staff from Southwest Region Planning Commission (SWRPC)
met with the principals of the Hinsdale schools, SAU staff, and the Hinsdale School
Board to discuss the development of SRTS Action Plans for the Hinsdale schools.
Following these meetings, SWRPC staff began working with a team of students
from the Keene State College geography department (KSC Team) to assess walking
and bicycling conditions around the schools and collect baseline data about
current walking bicycling trends among students.
Figure 2 - The benefits to SRTS for Hinsdale.

HINSDALE MIDDLE/HIGH SCHOOL – SAFE ROUTES TO SCHOOL ACTION PLAN
4
In order to better understand the walking, bicycling and travel conditions of each study area, SWRPC and the KSC Team:
Conducted field studies to review the behaviors and travel patterns of students, buses, and motorists at the Hinsdale schools during
student arrival and departure times;
Conducted an infrastructure assessment of sidewalks in the Town of Hinsdale;
Distributed and analyzed parent surveys related to walking and biking behaviors;
Distributed and analyzed student in-classroom travel tallies related to student arrival and departure travel modes;
Conducted traffic volume and speed studies at four locations: Plain Road, Brattleboro Road, School Street, and Prospect Street; and,
Gathered and analyzed accident data in 2-mile radius of HM/HS.
Community Input
During the spring of 2016 SWRPC staff attended several school events to gather community input about Safe Routes to School activities. This
included attending a HM/HS PTSA meeting on April 5, 2016.
Study Area
HM/HS is located on School Street near the SAU 92 offices and across from
Hinsdale Elementary School. It is approximately one mile west of Town Hall on
Main Street (NH 119) and can be accessed from Brattleboro Road (NH 119) to
the north and Prospect Street to the south. Figure 3 on the next page shows the
relationship of the school with the surrounding area. The school includes grades
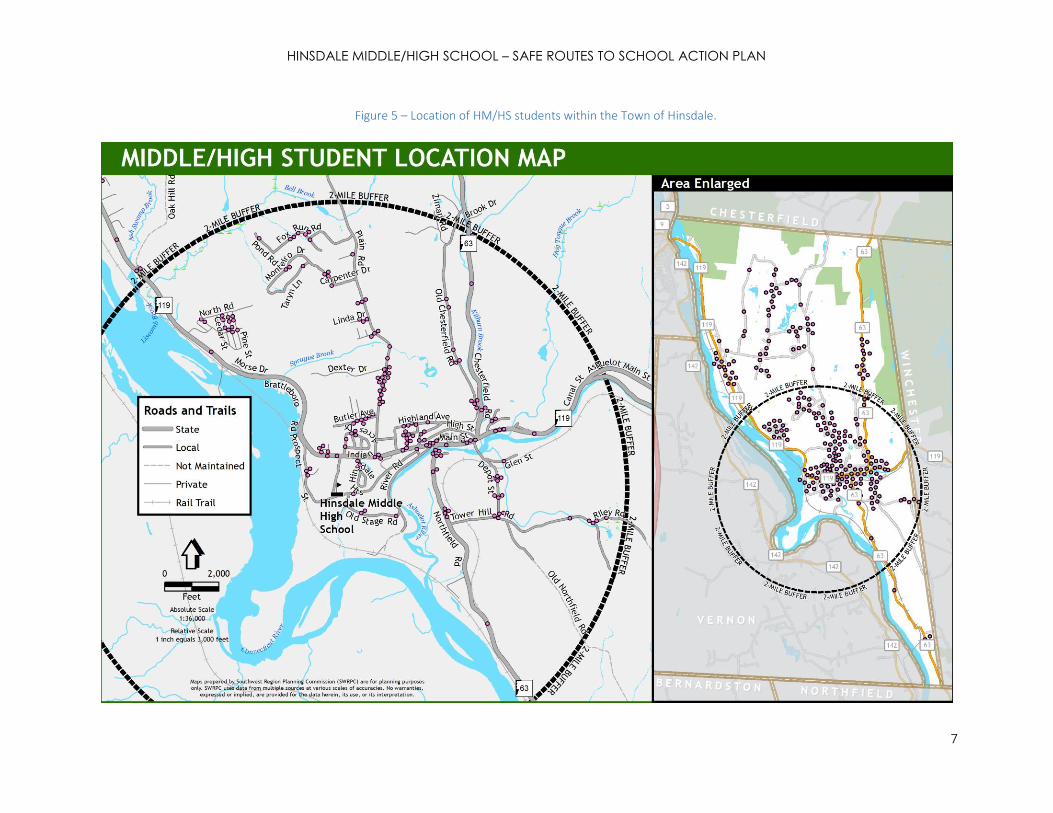
sixth to twelfth and had 256 students enrolled as of October 1, 2015.
Approximately 52.7% of the student population, or 135 out of 256 students, lived
within one mile of the school in 2015. Figure 4 on the following page shows the
walking distance from HM/HS to most students’ homes. Lastly, Figure 5 on page
7 shows the location of K-12 students within the Town of Hinsdale.
Table 1 - October 1, 2015 enrollment at HM/HS.

HINSDALE MIDDLE/HIGH SCHOOL – SAFE ROUTES TO SCHOOL ACTION PLAN
5
Figure 3 - HM/HS within the Town of Hinsdale.

HINSDALE MIDDLE/HIGH SCHOOL – SAFE ROUTES TO SCHOOL ACTION PLAN
6
Figure 4 - Hinsdale Middle/High School walking distance.
HINSDALE MIDDLE/HIGH SCHOOL – SAFE ROUTES TO SCHOOL ACTION PLAN
7
Figure 5 – Location of HM/HS students within the Town of Hinsdale.

HINSDALE MIDDLE/HIGH SCHOOL – SAFE ROUTES TO SCHOOL ACTION PLAN
8
EVALUATION OF EXISTING TRAVEL
CONDITIONS
To better understand existing travel conditions within the study area, SWRPC
staff worked with a team of students from the Keene State College Geography
Department to conduct field studies to review the behaviors and travel patterns
of students, buses, and motorists at HES during drop-off and pick-up hours. In
addition, SWRPC staff collected and analyzed traffic speed and volume data at
four locations within Hinsdale and distributed and analyzed data from a take-
home parent survey and an in-class student tally related to student travel modes.
A review of these observations and analysis is summarized in the sections below.
School Arrivals and Departures
Bus Drop-Off and Pick-Up
During the 2015 - 2016 school year, school started at 7:55 a.m. and ended at 2:36
p.m. The bus drop-off and pick-up location is in front of the school across from
the parent pick-up and drop-off location, shown in Figure 7. There are no signs
marking the bus drop-off and pick-up area, and this area was used by parents for
drop-off before the buses arrived. There was one staff person present to help
students exit the school bus. Likewise, there was a staff member present in the
afternoon in the loading area.
Parent Drop-Off and Pick-Up
The student drop-off and pick-up area is shown in yellow in Figure 7. It was
observed that there are no signs or designated areas for picking-up or dropping-
off students. The average wait time for pick up and drop off was around 1 minute;
however, there were parents who arrived at the school 30 minutes before it
Figure 7 - Field review areas of safety concern.
Figure 6 - The bus loading and unloading area in front of HM/HS.

HINSDALE MIDDLE/HIGH SCHOOL – SAFE ROUTES TO SCHOOL ACTION PLAN
9
ended. A staff person was present to direct students from the drop-off location to the school entrance. A safety concern was that parents seemed
to be in a rush once they had dropped off or picked up the students.
Other Observations
Speeding seems to be an issue on School Street in front of the school on nearby roads, including Prospect Street and Brattleboro Road.
Additional speed limit signs and “One-Way” signs could help improve safety and traffic flow on School Street.
In general, wayfaring could be improved. Though entering and exiting signs to the school are clearly defined, there are no signs for walking
and bike routes, nor are there signs to indicate where children will be crossing the roads.
There is a lack of bicycle infrastructure, such as bike lanes, wide shoulders, “Share the Road” signs, etc.
Parent and In-Classroom Surveys
SWRPC staff worked with HM/HS faculty and administration to conduct the National SRTS Parent and In-Classroom Surveys during the 2015-2016
school year. These surveys helped generate a baseline of the number of students currently biking and walking to school and identified some of
the barriers that prevent parents from allowing their children to walk or bike to school.
Parent Survey
The parent survey collects information from parents about how their children arrive and depart from school and what concerns, issues, and barriers parents have about their child walking or biking to school. Survey results will help determine how to improve safety conditions and make walking and biking easier and more convenient for children and parents.
Among the HM/HS population, 11 households responded to the Parent Survey, seven (64%) of which have children in middle school and four (36%) of which have children in high school. Roughly half, or 5 out of 11 respondents, indicated that they were not comfortable with their child walking and biking to/from school at any age. The other six respondents recorded grades five, six, nine, ten, and eleven.
Respondents identified numerous factors that influence their decision to allow their child to walk or bike to school. The top factor that influences parents is the condition of surrounding sidewalks and pathways. The second top factor was a four-way tie between distance to/from school, the speed/amount of traffic along the travel route, weather conditions, and safety of intersections and crossings.

HINSDALE MIDDLE/HIGH SCHOOL – SAFE ROUTES TO SCHOOL ACTION PLAN
10
The top two choices for primary travel mode to and from school were family vehicle and school bus. Six respondents indicated that their primary arrival mode to school and primary departure mode from school is family vehicle. Four respondents answered school bus as their primary arrival mode and three respondents answered school bus as their primary departure mode. One respondent indicated that their child currently walks home from school.
In-Classroom Survey
An In-Classroom survey was administered by all classrooms at
HM/HS in late October 2015. Teachers surveyed students each
morning and afternoon for three consecutive days (Tuesday –
Thursday) on their mode of travel to and from school. On average,
386 students shared their arrival modes and 375 shared their
departure modes. An average of 12 students arrive to school via
walking and 34 students depart school on foot, a jump of 6% of
respondents.
Table 2 - Mode of travel to and from school based on in-classroom survey.
Comments from the Parent Survey
“The fact is you never know who's out there (safety); my daughter also has physical incapability’s
which makes it so she can't [walk]!”
“I lived in Hinsdale Heights right next to school. I walked to and from with siblings and friends all
grades. Times are different now. Not as safe?”
“Would love to see a crosswalk at the top of Sand Hill on Rt. 119 from Taylor Heights to the sidewalk on
the other side.”

HINSDALE MIDDLE/HIGH SCHOOL – SAFE ROUTES TO SCHOOL ACTION PLAN
11
Students that biked to school also experienced a small jump, from 18 on average to 23. Approximately 154 students (40%) rode the bus to school
and 131 students (35%) rode the bus home in the afternoon. The average of number of students taking a family vehicle to work dropped by 15,
from 161 average respondents to 146 respondents. Around 7-8% of students carpooled, with 31 average respondents stating they carpooled to
school and about 26 respondents stating they carpooled home. Fewer students took public transit or other forms of transportation, with
approximately 10 students taking those forms of transportation in the morning and 15 taking these in the afternoon.
Pedestrian Infrastructure Conditions
Pedestrian infrastructure includes sidewalks, crosswalks, paved shoulders, off-road trails or paths, and amenities such as lighting and street furniture.
The presence or lack of pedestrian infrastructure has a large impact on safety, both real and perceived. Studies have shown that for students living
within 1 mile of school, implementation of effective pedestrian interventions can reduce the traffic dangers (real or perceived) that prevent children
from walking to school.2,3
Statewide Asset Data Exchange System (SADES) Data
In order to better understand pedestrian infrastructure conditions near the school, SWRPC staff assessed the conditions of sidewalks and crosswalks
in Hinsdale using the NH Statewide Asset Data Exchange System, or SADES. SADES provides a common set of collection and training standards,
ensuring that data collected throughout the state is comparable and assessed uniformly. The sidewalk assessment includes data such as the width
of the sidewalk, sidewalk condition (good, fair, or poor), curb condition (good, fair, or poor), and the presence of buffer strips, curb ramps and
crosswalks.
Figure 9 on the next page shows the extent of the sidewalk network in Hinsdale and sidewalk structural conditions. “Good condition” indicates little
or no distress or vertical displacements on the sidewalk, “fair condition” indicates the presence of narrow cracks and/or sidewalk displacements less
than ½ inch, and “poor condition” indicates sidewalk cracks and/or large vertical displacements greater than ½ inch.
2 Beck, Laurie F. and Greenspan, Arlene I. “Why Don’t More Children Walk to School?” Journal of Safety Research. 39.5 (2008): 449-52. 3 Nasar, J.L. (2015). Creating places that promote physical activity: Perceiving is believing. [Research brief.] Active Living Research.

HINSDALE MIDDLE/HIGH SCHOOL – SAFE ROUTES TO SCHOOL ACTION PLAN
12
As Figure 9 indicates, there are several locations where sidewalks are in fair or poor condition. In particular, the section of sidewalk along Brattleboro
Road between High Street and Hinsdale Heights is problematic for students walking and bicycling to school. While this sidewalk is in fair structural
condition, there are other factors that make this sidewalk unsafe for pedestrians. In some locations, there is no buffer between the sidewalk and
traffic. Due to the high speeds and traffic volumes along this road, a buffer strip of at least 5 feet in width and a six inch curb would help improve
safety by physically and visually separating walkers from traffic.
Figure 8 - A section of sidewalk in poor structural condition on School Street (left) and in good structural condition on River Road (right).

HINSDALE MIDDLE/HIGH SCHOOL – SAFE ROUTES TO SCHOOL ACTION PLAN
13
Figure 9 - Sidewalk conditions near HES.

HINSDALE MIDDLE/HIGH SCHOOL – SAFE ROUTES TO SCHOOL ACTION PLAN
14
Traffic Volume and Speeds
To better understand traffic conditions on routes near the school, SWRPC
staff conducted traffic volume and speed counts at four locations in
Hinsdale, including Brattleboro Road west of School Street (site 1), School
Street in front of HM/HS (Site 2), Prospect Street west of School Street
(site 3), and Plain Road south of Cottage Street (Site 4). Figure 10 shows
the locations of the traffic counters. Table 3, below, shows the minimum,
maximum, average, and 85th percentile speed (the speed which no more
than 15% of traffic is exceeding) detected at each location in miles per
hour (mph) during school arrival and departure times. Figure 11, on the
next page, shows the 85th percentile speed for the morning and afternoon
at each traffic counter site.
There was significant speeding detected at Site 4 on Plain Road. The
posted speed limit at this location is 35 mph, however about 41% of
drivers exceeded this speed limit. The maximum speed detected at this
location during school arrival and departure times was 62.2 mph, or about
27 mph over the posted speed limit. Due to the lack of sidewalks and
paved shoulders on this road, speeding may deter parents from allowing
Figure 10 - Traffic counter locations in Hinsdale.
Table 3 - Speed data for Hinsdale traffic study locations.

HINSDALE MIDDLE/HIGH SCHOOL – SAFE ROUTES TO SCHOOL ACTION PLAN
15
their children to walk or bike on this road. Speeding was detected at Site 1 (Brattleboro Road) as well. During school arrival and departure times,
the speed limit is 20 mph due to the proximity of the school. However, the average speed at this location during these times was 31.8 mph in the
morning and 30.5 mph in the afternoon. About 15% of drivers in this location were going over 37.2 mph and 35.8 mph in the morning and afternoon,
respectively.
On School Street (Site 2), the posted speed limit is 15 mph.
The average observed speeds at this location were 19 mph
and 17 mph during morning and afternoon arrival and
departure times, respectively. Fifteen percent of drivers
exceeded 22.7 mph in the morning and 21 mph in the
afternoon.
At Site 3 (Prospect Street), the posted speed limit is 25 mph.
Average speeds at this location are within the posted speed
limit during school arrival and departure times. The 85th
percentile speeds at this location are 27.9 mph in the morning
and 27.7 mph in the afternoon. This data suggests that,
during school hours, there is not a significant amount of
speeding on this road. Overall, the average speed on this
road is 25.1 mph, and the 85th percentile speed is 29.55 mph.
Figure 11 – 85th percentile speeds at traffic counter locations during morning (8-9 AM) and afternoon (3-4 PM) hours.

HINSDALE MIDDLE/HIGH SCHOOL – SAFE ROUTES TO SCHOOL ACTION PLAN
16
SAFE ROUTES TO SCHOOL STRATEGIES
The Hinsdale Middle/High School Safe Routes to School program works to create safe, active, and healthy opportunities for all children and seeks to
engage families from all incomes, abilities, and walks of life. The Safe Routes to School program works to create safe, active, and healthy
opportunities for all children and seeks to engage families from all incomes and abilities. To achieve this, all of the strategies developed under the
5 “E’s” incorporate the sixth E- equity. The following strategies help HM/HS work towards their goal of increasing the number of students who walk
and bike to school and improve safety conditions.
Education
Education is essential for improving safe walking and biking conditions. Hinsdale Middle/High School should consider using this Action Plan as an
opportunity to educate the school community about the benefits of walking and biking to school and on safe travel behavior for students and
parents. Recommendations for enhancing education and awareness of the importance of and need for safe walking and bicycling routes to school
are described below.
1. Incorporate Safe Routes to Schools into Extended Learning Opportunities (ELO) Program and/or School Curriculum.
There are many opportunities for students who wish to earn school credits through the ELO
program to engage in Safe Routes to Schools. The exact nature of an ELO project will depend on
the interests of the student and the specific competencies the student would like to learn. ELO
project ideas include:
Organize an HM/HS bicycle club. Example activities could include creating a bicycle
safety training, putting on a bicycle workshop for new riders, identifying and mapping
potential routes for bicycle rides, teaching bicycle maintenance skills, creating a “how-
to” guide for starting a bicycle club, researching the health benefits of bicycling, and/or
organizing special bicycle events or fundraisers (i.e. “bike to ice cream” or “bike to the
movies”). Potential community partners include the School Resource Officer and local
bike shops.
Collect and analyze walking and/or bicycling data. Example activities could include administering the National Safe Routes to School
Student Travel Tally and creating a report based on the findings, doing pedestrian and bicycle counts at intersections near the school,
Figure 12 - Alexandria, Virginia’s Junior Bicycle Ambassadors demonstrate a turn signal during
a bike rodeo at an elementary school.

HINSDALE MIDDLE/HIGH SCHOOL – SAFE ROUTES TO SCHOOL ACTION PLAN
17
mapping student locations and determining the average commute time by mode of
travel, developing and implementing a survey that asks questions about student
attitudes and behaviors around walking and bicycling to school, and/or calculating the
amount of carbon dioxide avoided by walking or bicycling instead of driving or riding
the bus. Potential community partners include Southwest Region Planning Commission
(SWRPC) and local colleges/universities that have GIS labs, such as Keene State College.
Create an educational video about safe walking and bicycling practices. Example
activities include researching state and local laws pertaining to pedestrians and
bicyclists, researching safe walking and bicycling practices, interviewing local “experts”
such as the School Resource Officer, collecting data on current walking and bicycling
trends, and/or demonstrating safe walking and bicycling practices. Potential
community partners include the School Resource Officer, the Town of Hinsdale, the
Monadnock Alliance for Sustainable Transportation, the Monadnock Cycling Club, and
local bike shops.
Teach younger students and children about safe walking and bicycling practices.
Example activities include organizing a bicycle rodeo for the elementary school, helping
out at Bike/Walk to School Days, helping to organize and lead a local “walking school
bus” for younger students, helping to create and lead a bike club at the elementary
school, and/or putting on an interactive presentation about safe walking and bicycling
practices for younger students. Potential community partners include the School
Resource Officer, the Hinsdale Elementary School (HES), and the HES Parent Teacher
Association.
2. Start a “Hinsdale Bike Club” to teach students bicycling skills in a safe and supervised
environment.
After School Bike Clubs teach students the skills necessary to become responsible cyclists and allow students to practice these skills in a safe
and structured setting. Generally, bike clubs are led by at least one staff member or trained coach with help from parent volunteers. HM/HS
Designate an event organizer. This could be a parent, PE teacher, school principal, or local non-profit organization.
Try to include all students, including those who live too far to walk, by designating a remote drop-off location . To ensure students of all abilities can be involved, seek input from your Special Education staff and confirm that Walk to School Day routes are accessible.
Recruit partners and volunteers, such as the police department, parent volunteers, teachers, and school administrators.
Promote the event ahead of time with flyers, newsletters, PA announcements, and letters to parents.
Contact local media and invite community leaders/local celebrities, such as the mayor or a team mascot, to your event. Take pictures of the event, and celebrate!
Figure 13 - Tips for organizing a walk/bike to school day event.

HINSDALE MIDDLE/HIGH SCHOOL – SAFE ROUTES TO SCHOOL ACTION PLAN
18
may want to require students to complete a bicycle safety training course (for example, a “bike rodeo”) before they are allowed to go out on
rides. Family members can benefit from learning proper helmet fitting techniques, easy bicycle checks, tips for riding safely with children to
school, and specific state and local laws about where and/or how to ride (e.g. Sidewalk riding is allowed for children under age 10 in residential
areas, etc.).
3. Share information on student bicycle and pedestrian safety via the school website, newsletter, and/or other information outlets.
HM/HS should periodically remind parents and students about school rules for walking and bicycling and provide safety tips. For example, when
the weather starts to get cold, the school could post information about when bicycling to school is allowed, as well as the proper clothing to
wear while walking or bicycling in cool weather.
4. Include information about how families can walk, bike, take the bus, or carpool to school in the HM/HS Parent Handbook
The HM/HS Parent Handbook should include information such as who is eligible to ride the bus, where parents can find information about bus
routes and schedules, recommended walking/bicycling routes to school, etc. In addition, the school may want to consider providing resources
to help parents arrange carpools.
5. Give presentations about Safe Routes to School at School Board meetings, PTSA meetings, and other meetings as appropriate.
The Hinsdale Safe Routes to School task force should consider giving at least one presentation to the School Board and PTSA each year about
the HM/HS Safe Routes to School program. These presentations could include information such as an overview of the SRTS Action Plan, an
overview of the benefits of Safe Routes to School, and/or an update on the Safe Routes to School activities that HM/HS has undertaken or will
undertake during the year. The SRTS task force may also want to consider giving presentations to other groups that may have an interest in
Safe Routes to Schools.
Encouragement
Encouragement activities help generate excitement and interest in walking and bicycling to school. Coordinating special events, contests, mileage
clubs, and ongoing activities all provide ways for students to discover, or re-discover, the benefits of walking and bicycling to school. Encouragement
activities can be done with little funding and can remind students that walking or bicycling can be fun. Encouraging middle and high school students
to walk and bike to school will require creative strategies that provide opportunities for self-expression and independence. By offering them
leadership roles, students can learn valuable skills in community service. Several recommended encouragement activities are listed below:

HINSDALE MIDDLE/HIGH SCHOOL – SAFE ROUTES TO SCHOOL ACTION PLAN
19
1. Organize Walk/Bike to School Day events to promote walking and bicycling to school.
Walk and Bike to School Day events create opportunities for children to interact and socialize with their peers and encourage families and
children to try walking or bicycling to school. National Walk to School Day occurs the first week of October, and National Bike to School day
occurs the first week of May, but many schools choose to hold walk/bike to school day events throughout the year. For example, some
schools designate the first Wednesday of every month as “Walking Wednesday”. For more information, guidance, and resources on how
to plan a Walk to School Day event, see the Walk to School Day Guide, available at www.walkbiketoschool.org
2. Enlist Older Students to Help Plan SRTS-Related Activities.
There are many opportunities to coordinate events that support and promote walking
and bicycling to school such as safe routes to school fundraisers, publicity campaigns,
and special events. Enlisting middle and high school students to help plan these events
can teach them independence, give them a chance to become a role model to younger
students, and give them freedom to make an event their “own”. Hinsdale Middle/High
School staff could mobilize a group of motivated students to develop a student “walk to
school committee” or “youth SRTS task force” that could work directly with staff and
parents to coordinate education and encouragement activities for both younger
students and for their fellow peers. One example of how high school/middle school
students can vamp up a walk/bike to school day event is to incorporate a “Bicycle
Blender”.
A “Bicycle Blender” lets students use their own pedal power to make a smoothie and is
a great tool to reward participation in Safe Routes to School activities and teach about
health and wellness.
3. Engage Students in Creating Tools that will Help Make Walking and Biking to School More
Convenient and Fun for their Peers.
Middle and High School students can support walking and bicycling to school by creating
walking or biking maps that provide fun information including safety facts, distances,
and calories burned walking or biking that particular route. These maps can be used by
Figure 14 - San Mateo, CA schools bring in a Bicycle Blender to encourage students to participate in
Walk/Bike to School.

HINSDALE MIDDLE/HIGH SCHOOL – SAFE ROUTES TO SCHOOL ACTION PLAN
20
their peers, by parents, or as a resource for Walk/Bike to School Day events. Hinsdale Middle/High School can also encourage students to
design SRTS-related promotional materials including logos, posters, and websites to further educate the community about the benefits of
walking and bicycling to school.
4. Create a School-Wide Mileage Club or Contest to Offer Incentives to Students who Bike or Walk to School.
Mileage Clubs can provide quick reinforcement to students for walking and bicycling to school. Students track the number of times they walk or bike to school and are rewarded with recognition, prizes, or awards. Prizes can include stickers, wrist bands, healthy treats, etc. Contests can be between individuals, classrooms, or between schools. Mileage Clubs are generally year-round programs, but schools can also choose to coordinate a “Mileage Contest” as an event. Tips for organizing a Mileage Club or Contest include:
Bring in a local expert, such as Beth Corwin from Symond’s Elementary School, to
share lessons learned from developing a successful “Walk, Roll, & Ride” program.
Identify a program coordinator, such as a PE teacher or another staff member that
is enthusiastic about the program.
Decide where students can accrue mileage (on the way to school, at home, on the
school campus).
Create system for logging and tracking mileage or number of times
walked/bicycled. Utilize free physical activity tracking tools provided by Safe
Route’s to School’s “Fire up Your Feet” initiative to log and track mileage or number
of times students walked/bicycled.
Decide on incentives (pizza party, recognition at assembly, etc.).
Seek funding to support the program—materials, awards, prizes, etc.
Recognize and reward participation.
Track participation.
Make changes as needed—the program will change over time to fit the unique
needs of your school community.
Figure 15 - Symonds Elementary School students get their cards punched for the Symonds "Walk,
Roll, and Ride" program.

HINSDALE MIDDLE/HIGH SCHOOL – SAFE ROUTES TO SCHOOL ACTION PLAN
21
Enforcement
Enforcement strategies help reduce unsafe behaviors by drivers, pedestrians, and
bicyclists and encourage all road users to obey traffic laws and share the road safely.
Law enforcement, school personnel, and community members can work together to
create and sustain a safe environment for walking and biking to school. Enforcement
strategies should be implemented in combination with education, encouragement,
and engineering strategies to have a maximum impact. Used on its own, enforcement
does not usually result in long-term, lasting changes in driver behavior.
Recommended enforcement strategies are listed below.
1. Organize a Student Safety Patrol to Increase Safety for Younger Students and
Improve Traffic Flow Efficiency.
School safety patrols are trained student volunteers responsible for enhancing
safety around the school and includes tasks such as directing and assisting
students in crossing the street. A safety patrol program allows students to take a
participatory role in promoting traffic safety. It is important for the school and a
committed teacher or staff person to grant permission for such a program and
coordinate trainings to ensure students are following safety protocols.
Hinsdale Middle/High School could also look into developing partnerships with
local law enforcement and the American Automobile Association (an entity known
for supporting student safety patrol programs) to assist the school in creating a
safety patrol curriculum and training materials.
2. Engage Students to help chaperone a “Walking School Bus” for younger students.
A walking school bus is a group of children walking to school with one or more
adults, and it can be informal (usually organized by parents) or a formal school
program. Hinsdale Middle/High School students could get involved by assisting
adult volunteers or school staff with chaperoning the walking school bus. During
Figure 16 - Wheelock School Student Safety Patrol Program.

HINSDALE MIDDLE/HIGH SCHOOL – SAFE ROUTES TO SCHOOL ACTION PLAN
22
a PTSA meeting in the spring of 2016, several Middle/High School students expressed interest in this activity. Becoming a “walking school bus
chaperone” could civically engage the Middle/High School student community in Safe Routes to School by providing them a leadership role.
Students would be offering a valuable service to their school community and could help bridge the safe routes to school initiatives between the
two schools.
3. Clarify Bus Pick Up and Drop Off Zones.
During the field review, students noticed that there were no signs or arrows
signifying traffic flow or bus pick up and drop off locations on the
middle/high school campus. This poses safety concerns because parent
vehicles picking up or dropping off their children may not be aware of which
way buses are entering and exiting which could cause traffic congestion or
an auto accident. To enforce proper pick up and drop off procedures,
HMS/HES could paint directional arrows indicating desired traffic flow for
buses or create a bus-loading lane indicated by signage or pavement
markings.
Engineering
Engineering is a broad concept used to describe the design, implementation, operation and maintenance of traffic control devices or physical
measures, including low-cost as well as high-cost capital measures. Infrastructure such as sidewalks, wide paved shoulders or bike lanes, visible
crosswalks, trails/paths, and connectivity between sidewalks and trails/paths creates conditions that improve safety for walking and bicycling in the
area surrounding the school. Recommended engineering strategies for HM/HS are listed below.
1. Work with the Town of Hinsdale and N.H. Department of Transportation (NHDOT) to improve sidewalks on N.H. Route 119/Brattleboro Road.
The sidewalks along Brattleboro Road are the only pedestrian infrastructure available for students walking to school from the east side of town.
The section of sidewalk on Brattleboro Road between Hinsdale Heights to the west and High Street to the east is in fair condition, as shown in
the Pedestrian Infrastructure map (Figure 9 on page 13). The sidewalk is asphalt with a granite curb, and it contains cracks, heaves, and other
surface defects, and in several locations, it is not separated from the road with a buffer strip. The school should consider working with the Town
of Swanzey and NHDOT to come up with a plan to upgrade this section of sidewalk so it is in good condition. Where possible, the sidewalk
should be separated from the road with a buffer strip of grass or concrete.
Figure 17 - Deer Valley School District in Phoenix, Arizona uses pavement markings and clear signage to designate parent drop off
circulation for school parking lots.

HINSDALE MIDDLE/HIGH SCHOOL – SAFE ROUTES TO SCHOOL ACTION PLAN
23
2. Work with the Town of Hinsdale and NHDOT to implement traffic calming measures on
roads near the school.
High traffic speeds are a major safety concern for students walking and bicycling to
school, especially on roads without sidewalks or wide paved shoulders. The school
should consider working with the Town of Hinsdale to implement traffic calming
measures on Plain Road between Butler Avenue and Brattleboro Road, Prospect Street
near the school, and Brattleboro Road near the school. Traffic calming ideas include
narrowing travel lanes when restriping the road to no more than 11 feet, posting speed
feedback signs that show driver’s speeds in real time, installing School Zone signs with
flashing lights to make them more visible, and/or painting pavement markings to help
visually narrow travel lanes (i.e. transverse pavement markings, painted shoulders,
etc.).
3. Work with Town of Hinsdale to increase pedestrian and bicyclist safety on Plain Road.
Plain Road is a significant barrier for students who must walk or bike along that road to get to school. Several parents have commented that
they think the road is unsafe even for adults walking or bicycling. According the traffic study that was conducted on Plain Road, 15% of drivers
exceeded the speed limit by more than 10 mph during school arrival and departure times, and the highest speed detected during these times
was 27 mph over the speed limit. The school should consider working with the Town of Hinsdale to install pedestrian and bicycle infrastructure
along the section of Plain Road between Brattleboro Road and Butler Avenue. The presence of a wide paved shoulder, or ideally a paved
sidewalk, would greatly increase the comfort and safety for people walking and bicycling along this section of road. In combination with traffic
calming measures, a widened shoulder or sidewalk could make it possible for more students to safely walk and bike to school.
4. Implement traffic calming measures on School Street in front of the Middle/High School.
According to the traffic study that was conducted on School Street, there is some speeding in front of the Middle/High School during school
hours. About 15% of drivers go faster than 22.7 mph despite the 15 mph speed limit. The school may want to consider implementing traffic
calming measures such as installing speed tables to help slow traffic in front of the school.
Figure 18 - Shoulder markings were used to visually narrow travel lanes on a two-way road in Roland, IA.

HINSDALE MIDDLE/HIGH SCHOOL – SAFE ROUTES TO SCHOOL ACTION PLAN
24
Evaluation
Evaluation involves monitoring and documenting outcomes, attitudes and trends through the collection of data before and after program activities
or projects. These activities help track which strategies would be most or least successful and which should be modified for better results. HM/HS
has already collected baseline data on student travel modes to and from school and parent concerns about walking and bicycling to school. Moving
forward, the school should consider the evaluation recommendations listed below.
1. Administer the “Safe Routes to School Arrival and Departure Tally Sheet” on an annual basis to track trends over time.
The Student arrival and departure tally sheet is simple to administer, and it provides useful data on student travel modes to and from school.
In addition, students can be involved with data collection and analysis, turning it into an educational opportunity. By collecting this data on an
annual basis, the school will be able to track trends in travel modes over time and adjust education, encouragement, enforcement, and
engineering strategies accordingly. The data from the tally sheets can also be used to enhance applications for grant funds to help support Safe
Routes to School programs and/or infrastructure projects. The National Center for Safe Routes to Schools will tabulate survey responses free
of charge; for more information please visit www.saferoutesinfo.org. A copy of this survey can be found in Appendix D.
2. Administer the “Parent Survey about Walking and Biking to School” on a bi-annual basis (every two years).
The parent take-home survey provides useful information about parents’ safety concerns related to their children walking and biking to school,
and it helps to uncover the reasons behind travel behaviors. In addition, students can be involved with data collection and analysis, turning it
into an educational opportunity. In order to stay current with the school population, this survey should be administered once every two years.
Since participation in the parent survey in 2015 was low, the survey should be re-administered as soon as possible. The National Center for Safe
Routes to Schools will tabulate survey responses for free; for more information please visit www.saferoutesinfo.org. A copy of this survey can
be found in Appendix C.
3. Update the Safe Routes to School Action Plan every five years.
The data and recommendations outlined in this Action Plan are intended to be used as a starting point for launching a comprehensive Safe
Routes to School program. As the program progresses, the Action Plan will need to be updated to include current data and recommendations
that fit the needs of the school and community at that time. The Hinsdale Middle/High School staff should consider taking this task on.

HINSDALE MIDDLE/HIGH SCHOOL – SAFE ROUTES TO SCHOOL ACTION PLAN
25
IMPLEMENTATION
Following the adoption of this Action Plan, the HM/HS Safe Routes to School Task Force should work on implementing priority strategies within this
Plan. The task force may want to consider going through a strategy prioritization process to determine which strategies would be most effective in
the short term. Factors to consider in this prioritization process could include the expected level of impact for each strategy, the funding and/or
resources available to help implement each strategy, and the ease of implementation for each strategy. Figure 19 gives an example chart that can
be used to help with the prioritization process. Table 4 provides information about each strategy, including potential partners for each strategy, a
suggested timeframe for implementation, implementer, and potential funding source.
IMPLEMENTATION STEPS:
1) Designate an existing committee or form a SRTS Task Force
to implement this Action Plan that (ideally) includes the
following:
a. Parents
b. School administrators and teachers
c. Community members
d. Town staff and/or officials
e. Students
2) Prioritize Strategies for implementation. Factors to consider
may include:
a. Expected impact of strategy
b. Ease of implementation
c. Availability of resources such as funding, volunteers,
etc.
3) Begin putting high priority strategies into action
4) Evaluate success and share results!
Figure 19 - Prioritization chart for SRTS strategies

HINSDALE MIDDLE/HIGH SCHOOL – SAFE ROUTES TO SCHOOL ACTION PLAN
26
Table 4 - Hinsdale Middle/High School Safe Routes to School strategies matrix. Strategy Partners Timeframe Implementer Potential Funding Source
EDU
CA
TIO
N
1. Incorporate Safe Routes to Schools into Extended Learning Opportunities (ELO) Program and/or School Curriculum.
Southwest Region Planning Commission (SWRPC), local police dept., School Resource Officer, Town of Hinsdale, local bike shops, etc.
Immediate/ongoing Hinsdale Middle/High School (HM/HS)
N/A
2. Start a “Hinsdale Bike Club” to teach students bicycling skills in a safe and supervised environment.
School Resource Officer, Hinsdale PTSA
Immediate/ongoing HM/HS
Advocates for Healthy Youth (AFHY) Mini Grant Program; Hinsdale School District (HSD)
3. Share information on student bicycle and pedestrian safety via the school website, newsletter, and/or other information outlets.
Hinsdale School District Immediate/ongoing HM/HS N/A
4. Include information about how families can walk, bike, take the bus, or carpool to school in the HM/HS Parent Handbook.
Hinsdale School District Immediate/ongoing HM/HS N/A

HINSDALE MIDDLE/HIGH SCHOOL – SAFE ROUTES TO SCHOOL ACTION PLAN
27
Strategy Partners Timeframe Implementer Potential Funding Source ED
UC
ATI
ON
5. Give presentations about Safe Routes to School at School Board meetings, PTSA meetings, and other meetings as appropriate.
Hinsdale PTSA; Hinsdale School Board
Ongoing, ~1-2 times per year
Hinsdale SRTS task force or other committee charged with implementation of this plan
N/A
ENC
OU
RA
GM
ENT
1. Organize Walk/Bike to School Day Events to Promote Walking and Bicycling to School.
Hinsdale PTSA, Town of Hinsdale, Local Businesses, Community Service Groups
Start September 2016, then ongoing
HM/HS
AFHY Mini Grant; Hinsdale School District; Hinsdale PTSA (fundraising)
2. Enlist Older Students to Help Plan SRTS-Related Activities.
Hinsdale School District Start September 2016, then ongoing
Staff, Teachers, SRTS Task Force
AFHY Mini Grant; Hinsdale School District; Hinsdale PTSA (fundraising)
3. Engage Students in Creating Tools that will Help Make Walking and Biking to School More Convenient and Fun for their Peers.
HM/HS, Student groups Start September 2016, then ongoing
Teachers, SRTS Task Force
N/A

HINSDALE MIDDLE/HIGH SCHOOL – SAFE ROUTES TO SCHOOL ACTION PLAN
28
Strategy Partners Timeframe Implementer Potential Funding Source EN
CO
UR
AG
MEN
T
4. Create a School-Wide Mileage Club or Contest to Offer Incentives to Students who Bike or Walk to School.
Hinsdale PTSA, Local Businesses, Community Service Groups
3-6 months to implement, then ongoing
Teachers at HM/HS, SRTS Task Force
AFHY Mini Grant; Hinsdale School District; Hinsdale PTSA (fundraising)
ENFO
RC
EMEN
T
1. Organize a Student Safety Patrol to Increase Safety for Younger Students and Improve Traffic Flow Efficiency.
Local Police Department, AAA
6-12 months to implement, then ongoing
Hinsdale School District
Hinsdale School District; AFHY Mini Grant
2. Organize a Group of “Walking School Bus Chaperones”.
Local Police Department, PTA
3-6 months to implement, then ongoing
Hinsdale School District
Hinsdale School District; AFHY Mini Grant
3. Clarify Bus Pick Up and Drop Off Zones.
Hinsdale School District 3-6 months to implement
Hinsdale School District
Hinsdale School District

HINSDALE MIDDLE/HIGH SCHOOL – SAFE ROUTES TO SCHOOL ACTION PLAN
29
Strategy Partners Timeframe Implementer Potential Funding Source EN
GIN
EER
ING
1. Work with the Town of Hinsdale and N.H. Department of Transportation (NHDOT) to improve sidewalks on N.H. Route 119/Brattleboro Road.
Town of Hinsdale, SWRPC, NHDOT
~1-5 years NHDOT
Transportation Alternatives Program (TAP)*, Highway Safety Improvement Program (HSIP)*
2. Work with the Town of Hinsdale and NHDOT to implement traffic calming measures on roads near the school.
Town of Hinsdale, SWRPC, NHDOT
1-5 years
NHDOT (Brattleboro Road); Town of Hinsdale (Plain Road and Prospect Street)
TAP*, Town of Hinsdale
3. Work with Town of Hinsdale to increase pedestrian and bicyclist safety on Plain Road.
Town of Hinsdale, SWRPC
1-5 years Town of Hinsdale TAP*, Town of Hinsdale
4. Implement traffic calming measures on School Street in front of the Middle/High School.
Town of Hinsdale 6 months - 1 year Hinsdale School District/Town of Hinsdale
Hinsdale School District, Town of Hinsdale

HINSDALE MIDDLE/HIGH SCHOOL – SAFE ROUTES TO SCHOOL ACTION PLAN
30
Strategy Partners Timeframe Implementer Potential Funding Source EV
ALU
ATI
ON
1. Administer the “Safe Routes to School Arrival and Departure Tally Sheet” on an annual basis to track trends over time.
SWRPC (to enter data); National Center for Safe Routes to School Data Center
Ongoing/yearly HM/HS; SRTS task force
N/A
2. Administer the “Parent Survey about Walking and Biking to School” on a bi-annual basis (every two years).
SWRPC (to enter data), National Center for Safe Routes to School Data Center
Ongoing/every two years
HM/HS; SRTS task force
N/A
3. Update the Hinsdale Middle/High School Safe Routes to School Action Plan every five years.
SWRPC (to help update plan)
Every 5 years HM/HS; SRTS task force
N/A
* Note: Projects may or may not be eligible for funds through TAP and HSIP. Please contact SWRPC for assistance with applying for funds via these programs.

HINSDALE MIDDLE/HIGH SCHOOL – SAFE ROUTES TO SCHOOL ACTION PLAN
31
APPENDICES
Appendix A: Keene State College Student Report about Hinsdale Safe Routes to School program
Appendix B: Hinsdale Middle/High School Field Review Summary
Appendix C: National Safe Routes to Schools Parent Survey
Appendix D: National Safe Routes to Schools In-Classroom Student Tally
Appendix E: Safe Routes to Schools Resource List


1
TABLE OF CONTENTS
ACKNOWLEDGEMENTS 2
ABSTRACT 3
LIST OF FIGURES 4
LIST OF TABLES 5
CHAPTER 1: INTRODUCTION 6
HISTORY OF SAFE ROUTES TO SCHOOL PROGRAMS 8
HEALTHY MONADNOCK 2020 10
REPORT OUTLINE 11
CHAPTER 2: LITERATURE REVIEW 14
IMPACTS OF WALKING AND BIKING TO SCHOOL 15
HISTORY OF CHANGE 19
INFLUENTIAL FACTORS 21
RELEVANT CASE STUDIES 23
CHAPTER 3: METHODOLOGY 26
HINSDALE, NEW HAMPSHIRE 27
HINSDALE SCHOOL DISTRICT 30
METHOD 1: GPS AND GIS DATA COLLECTION 32
METHOD 2: SURVEYS 36
METHOD 3: INTERVIEWS 39
CHAPTER 4: RESULTS AND DISCUSSION 41
METHOD 1: GPS AND GIS DATA COLLECTION 42 METHOD 2: SURVEYS 55 METHOD 3: INTERVIEWS 66
CHAPTER 5: CONCLUSION 70
RECOMMENDATIONS 74
REFERENCES 76
APPENDICES 81
2
Acknowledgements
The authors would like to express their appreciation towards the people who made this final project
possible. We would like to thank Dr. Lara Bryant and Dr. Christopher Brehme of the Keene State College
Geography Department for being our advisors throughout the whole project. We would also like to
thank Mari Brunner and J.B. Mack of the South West Regional Planning Commission for their generous
support and guidance throughout the course of this study. Additionally we like to thank the parents of
Hinsdale Elementary School for taking time to fill out our survey along with other seminar groups who
provided feedback along the way. We would also like to recognize the following people:
Henry Underwood, GIS Technician, South West Regional Commission
Joseph Boggio, Principal, Hinsdale Elementary School
Beth Corwin, Physical Education Teacher, Founder of Rock, Ride & Roll at Symonds Elementary
School

3
Abstract
With adolescent obesity rates skyrocketing over the past decade, the need for children
to get active is stronger than ever. By implementing Safe Routes to School programs in
Hinsdale, New Hampshire, we can help keep kids active and reduce childhood obesity in the
community. We collected data through field observations, GIS mapping, and parent and
classroom surveys. Over the course of the fall 2015 semester our group worked with both the
Southwest Region Planning Commission and the Monadnock Region Transportation
Management Association to produce a Safe Routes to School program plan for the Hinsdale
School District in Hinsdale, New Hampshire. We evaluated the safety conditions of routes in
proximity to the schools for students that choose to walk or bike to school. In addition, we
surveyed the school communities on their current travel behaviors and concerns for their
children’s safety. Our study focused on implications as to why children aren’t walking and biking
to school in regards to infrastructure and safety. Our study informed Southwest Region
Planning Commission and Hinsdale Public Schools about ways to implement safer routes for
children and promote walking and biking to school and create a healthier community among
children.

4
List of Figures
Four major impacts of walking and biking to school on students……………………………………………..18
The downward trend of driving children to school…………………………………………………………………..19
Hinsdale, New Hampshire………………………………………………………………………………………………………..27
Hillshade map of Hinsdale, New Hampshire…………………………………………………………………………….29
Population of each age group in Hinsdale, New Hampshire……………………………………………………..30
Roads around the Hinsdale campus and Main Street……………………………………………………………….32
Locations of all Hinsdale School District students…………………………………………….………………………43
Elementary school student locations within one mile of the school………………………………..……….44
Middle school student locations within two miles of the school………………………………………..…….45
High school student locations within two miles of the school…………………………………………….……46
Hinsdale school campus infrastructure and amenities……………………………………………………………..49
SADES results of Hinsdale infrastructure…………………..……………………………………………………………..53
Major transportation routes near downtown Hinsdale……………………………………………………………54
Distribution of parent surveys received……………………………………………………………………………………55
Student travel distance to school…………………………………………………………………………………………….56
Students most common mode of transportation to and from school…………………………………….…57
Parent survey responses on most influential factors preventing active commuting…………………57
Responses to questions 15 and 18 on the parent survey……………………………………………………….…64

5
List of Tables
Group statistics showing the numbers of active commuting between Hinsdale High School/Middle School and Elementary…………………………………………………………………………………….60
Independent samples test of the difference in active commuting numbers between Hinsdale High School/Middle School and Elementary…………………………………………………………………………….61
Case processing summary………………………………………………………………………………………………………..62
Perform better/Parent walk/bike as child crosstabulaion……………………………………………………..…62
Chi-Square test…………………………………………………………………………………………………………………………62
Group statistics of the number of active commuters between the morning and afternoon……..66
Independent samples test of the number of active commuters between the morning and afternoon…………………………………………………………………………………………………………………………………66

6
Chapter 1: Introduction

7
Physical Activity Guidelines for Americans recommend that youth participate in
“vigorous to moderate-intensity physical activity” for at least sixty minutes every day, and yet
studies show that only about half of youth meet these standards (Del Valle Cook 2013). For
some youth, participating in sixty minutes of physical activity could be as easy as walking or
bicycling to and from school rather than taking a bus or being driven by a parent.
Unfortunately, not all children have access to safe traveling routes in their neighborhoods due
to high traffic volume, pot-hole ridden sidewalks or the simple factor of distance. Other families
may be willing to allow their children to walk to school, but they simply do not have the time
required in their busy schedules to walk with their children and driving is more convenient.
The factors that prevent children from walking to school have caused significant
declines in walking rates over the years. Data suggests that 41 percent of all trips to schools in
1969 were made by walking or bicycling. This rate dropped to a staggering 13 percent by 2001,
a time when motorized vehicles were more convenient and available (McDonald and Aalborg
2009). With more families choosing to drive rather than walk, there is increased traffic in
neighborhoods surrounding schools. The increased traffic poses a threat to the safety of
children who do choose to actively commute to school and can also lead to environmental
hazards with increased CO2 emissions.
The decrease in active transportation to school closely coincides with the trend of
increasing childhood obesity. As of 1980, 7 percent of children between the ages of six and
eleven and 5 percent of adolescents between the ages of twelve and nineteen were considered
obese (CDC 2015). In 2012, these rates increased drastically to 18 percent and 21 percent
respectively (CDC 2015). This issue is especially prevalent in rural settings where there is a

8
higher rate of overweight individuals than in urban areas (Joens-Matre et al. 2008). To counter
this epidemic, many schools have implemented Safe Routes to School programs that are
designed to encourage local families to walk or bike, rather than drive to school by
orchestrating groups of volunteers to lead group walks. Schools who do not have the
appropriate funding or resources such as volunteers, established routes, infrastructure, and
amenities to appropriately implement this program are able to apply for Safe Routes to School
funding.
If more schools had the ability to successfully execute a Safe Routes to School program
there would be benefits for nearly everyone. Even those who are not involved with local
schools enjoy reduced traffic, less pollution from vehicles, and a greater sense of community
(UNCHSRC). Parents who are actively involved in Safe Routes to School get the opportunity to
meet other families, save money on gas required to drive to and from school, enjoy physical
activity, and provide services to the school and the community (UNCHSRC). Most importantly,
the children learn pedestrian safety with adult guidance, experience increased physical activity,
socialize with friends, and above all, have fun (UNCHSRC). Because of the variety of benefits
that come with Safe Routes to School programs, this study is important to anyone from a family
with children enrolled in the public school systems to an individual with no direct ties to their
school community whatsoever.
History of Safe Routes to School Programs
The Safe Routes to School program was initially created under the Safe, Accountable,
Flexible, and Efficient Transportation Equity Act. The program is designed to encourage children

9
to walk or bicycle to school in order to promote healthy lifestyle choices from an early
age. During the Fiscal Years of 2004-2009, Safe Routes to School programs were to be funded
$612 million in total based on the “ratio of total student enrollment in primary and middle
schools in each state relative to the total student enrollment in primary and middle schools in
all the states” (Fisher 2005). With the apportionment each state received, programs such as
improving sidewalks, traffic diversion improvements, and all around increased pedestrian safety
within two miles of primary and middle schools were created to help encourage walking and
bicycling to school.
Students in low-income households need programs such as Safe Routes to School to
improve and implement safer routes to school in their communities. Children from low-income
families are twice as likely to walk to school as children from higher-income families even
though they have a greater risk of danger. The Safe Routes to School program has the intent to
“inspire nonprofit organizations, schools, and community residents to come together to
implement and sustain successful, culturally sensitive, and inclusive Safe Routes to School
initiatives” (SRSNP 2010). Having members of the community come together regardless of their
income or the area of town they live in to organize and implement a safe walking or biking
route to school for students. This would help alleviate areas of concern parents have with
regards to their children walking or biking to school. The major issues that prevent walking and
bicycling to school include fears of crime and violence, lack of awareness about health benefits
gained through walking and bicycling, lack of planners and engineers that help in obtaining
programming funds, long distances to school due to rural settings and high traffic volume with
a lack of sidewalks, crosswalks, and other safety measures.
10
Safe Routes to School programs have been found to have success across the United
States. In 1999 in Marin County, California, two residents initially worked with the community
to reduce the amount of motor vehicles commuting to school. A year later, a $50,000 grant was
given to the Marin County Safe Routes to School program. The program served 4,665 students
throughout fifteen schools. After being implemented, the program reported a 64 percent
increase of students walking to school, an increase of 114 percent bicycling to school and a 91
percent increase of carpooling to school. There was also a 39 percent decrease of private
vehicles being a means of transportation to school (Staunton, Hubsmith, and Kallins 2003). If
more programs can be created in more school districts, there will be a higher rate of children
walking and bicycling to school.
Healthy Monadnock 2020
The implementation of Safe Routes to School programs is closely related to the Healthy
Monadnock 2020 community engagement initiative. Healthy Monadnock 2020 was founded
and developed by the Cheshire Medical Center and Dartmouth-Hitchcock in Keene, New
Hampshire in 2007. The program is focused on making the Monadnock Region, which is
comprised of Cheshire County and the western towns of Hillsboro County, the healthiest
community in the United States by the year 2020. Like the Safe Routes to School program,
Healthy Monadnock 2020 aims to increase active living, educational attainment, mental well-
being, and social connections (HM 2020 2014).
By partnering with local towns, businesses, school districts, and even other initiatives,
Healthy Monadnock 2020 focuses on “improving quality of life and preventing the leading
11
causes of illness and death” (HM 2020 2014). Healthy Monadnock 2020 has grouped the many
indicators that lead to overall quality of life and cause illnesses into five major themes: health
behaviors, health care access and quality, health status, social capital, socio-economic, and
environmental. Health behaviors include rates of smoking, binge drinking, or physical activity
levels. Health care access and the quality of health care refers to whether or not a person is
covered by health care and whether or not a person is visiting a doctor. Health statuses include
cases of cardiovascular disease, rates of diabetes, and rates of overweight or obese individuals.
Social capital, one of the more positive target areas, focuses on rates of volunteerism or simply
having social gatherings. Lastly, the socio-economic and environmental target area observes
poverty rates, unemployment rates, education rates, and day-to-day air quality.
In an effort to increase active living, especially for youth, Healthy Monadnock 2020 has
supported the implementation of Safe Routes to School at all levels (HM 2020 2014). Areas
within the Monadnock Region, such as the city of Keene, have begun to develop the Safe
Routes to School program within their public schools system. However, there is still more work
to be done and more schools within the region need to develop Safe Routes to School
programs. One of those school districts, and the focus of this report, is the Hinsdale School
District in Hinsdale, New Hampshire.
Report Outline
Over the course of the Fall 2015 semester we worked with both the Southwest Region
Planning Commission (SWRPC) and the Monadnock Alliance for Sustainable Transportation
(MAST) to produce a Safe Routes to School program plan for the Hinsdale School District in

12
Hinsdale, New Hampshire. We will be working to examine and evaluate the safety conditions of
routes in proximity to the schools for students that choose to walk or bike to school. In
addition, we will be surveying the school communities on their current travel behaviors and
concerns for their children’s safety. With adolescent obesity rates skyrocketing over the past
decade the need for children to get active is stronger than ever. By implementing Safe Routes
to School programs in Hinsdale, we can help keep kids active and reduce childhood obesity in
the community.
While preventing childhood obesity is the overreaching goal, we will focused on
completing three main objectives to better the community during the course of this project.
First, we developed baseline data through field observations, GIS mapping, walking route
infrastructure assessments and parent and classroom surveys. This data will enable the school
community to adequately assess the conditions of the travel routes within a one mile radius of
the school. Field observations include counts of how many children walk and bike to school, as
well as how many children are dropped off by parents in cars. Field observations held away
from the school campus will focus on areas of safety concern such as high traffic areas or
streets without sidewalks. A survey was sent to elementary school parents in order to fully and
effectively assess their concerns with Safe Routes to School programs being implemented into
their school community. Teachers recorded tallies on multiple days regarding how their
students arrived to school. Second, we develop a deeper understanding of the needs and
interests of the school with regard to students walking and biking activity. This was done
through extensive data analysis of both the field observations and survey answers received.
Lastly, with all the necessary data collected, we ascertained a feasible plan of action for the

13
school to address existing and potential safety concerns in order to encourage increased
physical activity within the school community.

14
Chapter 2: Literature Review
15
There are three major themes related to Safe Routes to School: the impacts of actively
commuting to school on students, changes throughout history that have led to the decline of
actively commuting to school, and Safe Routes to School case studies relevant to Cheshire
County, New Hampshire. Reviewing these three major themes will illustrate the challenge
related to the decline in walking to biking to school and why Safe Routes to School programs
are so important. The discussed case studies also begin to build the groundwork for the
research methods and strategies used in this project.
The Impacts of Walking and Biking to School
There are four main benefits that walking and biking to school have on students. The
first is the positive relationship between actively commuting to school and physical health
among students. Before discussing the benefits, however, it is important to review the problem
itself. Unfortunately, the multitude of health benefits that come from something as simple as
walking still do not seem to encourage people to be more physically active. The alarming truth
is that one third of Americans are overweight (Binns et al. 2009). Obesity and overweight issues
are global and affect everyone regardless of gender, ethnicity, age or financial well-being.
According to a study conducted in 2008, children who live in a rural area such as Hinsdale, New
Hampshire are often found to have higher average Body Mass Indexes (BMI) than those in small
city or urban environments (Joens-Matre et al. 2008).
However, there are many different organizations and initiatives like the Safe Routes to
School program that are actively combatting the obesity epidemic. There are multiple studies
that suggest a positive correlation between walking or biking to school and increasing physical

16
health and fitness (ALR 2009; ALR 2015; Binns et al. 2009). According to Active Living Research,
walking and biking to school fulfills sixteen of the recommended sixty minutes of physical
activity on average (ALR 2009). Although it does not seem like a significant amount of time,
sixteen minutes of physical activity may be more than a child would be exposed to if they were
not encouraged to walk to school. What matters most about a child’s physical activity is not
necessarily the time they spend, but the types of activity and the intensity at which they
participate (Edmunds, Biggs, and Goldie 2013).
Increased rates of physical activity have also been shown to reduce stress levels which is
especially important for students who are faced with the challenges of standardized tests and
academic grades (Edmunds, Biggs, and Goldie 2013). By simply participating in short bursts of
physical activity such as a brisk ten minute walk, students experience an increase in mental
alertness, increased energy, and improved mood states (Edmunds, Biggs, and Goldie 2013).
Studies have suggested that increased physical activity leads to improved cardiovascular fitness
and reduced risk of adulthood cardiovascular disease (ALR 2009; Barry, Lambaise, and
Roemmich 2010). The Centers for Disease Control and Prevention suggests physical activity
leads to other health benefits including healthy bones and muscles and reduced risk of obesity
and diabetes (CDC 2015).
The physical health benefits experienced by students also may lead to mental health
benefits and academic improvements. Studies suggest that there is evidence of physical activity
being associated with better overall mental health and academic ability (ALR 2015; Edmunds,
Biggs, and Goldie 2013; Murnaghan 2009). According to the Department of Health and Human
Services, mental health includes a person’s emotional, psychological and social well-being

17
(DHHS 2015). According to Edmunds, Biggs, and Goldie, mental health affects a person’s ability
to develop, improve and build positive relationships and contribute to society (2013).
The issue with mental health is that it is not always easy to know when somebody is in
need of help. Mental health can have numerous negative effects on a person’s optimism, self-
esteem, sense of purpose, ability to handle stress and even simply relate with others (DHHS
2015; Edmunds, Biggs, and Goldie 2013). Much like the physical health issue of obesity, mental
health problems can affect anybody and may develop at any point throughout the course of a
person’s life. Major factors that contribute to mental health problems, according to the
Department of Health and Human Services, include biological factors, traumatic life
experiences, and family history of mental health problems (DHHS 2015).
Physical activity has also been shown to have positive effects on academic and in-class
performances. According to Trudeau and Shephard, increased rates of physical activity may
lead to small gains in grade point averages among students (2008). A goal of the Safe Routes to
School program is to get students to class after having been physically stimulated in hopes that
it will give students an opportunity to release extra energy before having to sit and be tentative
in the classroom (UNCHSRC).
The fourth key benefit student’s get from walking or biking to school is increased social
opportunities. Social skills are heavily impacted by an individual’s physical and mental health.
Students who are mentally fit are often more connected to their schools, tend to have more
pro-social behaviors and have less oppositional behaviors (Murnaghan 2009). This means that
students who are mentally fit are often more outgoing and tend to not be bullies. These skills
are important for children who participate in Safe Routes to School programs because walking

18
to school can provide an important time for students to socialize and make personal
connections that are important for cognitive development. This concept is similar to the way
students develop friendships and grow through being a part of a sports team.
Overall these four benefits as a whole are very dependent on one another (Figure 1).
When students participate in Safe Routes to School programs, they are engaged in physical
activities that cause stress relief and increased mood states which then lead to higher cognition
and less oppositional behavior in the classroom. Meanwhile, the children are spending time
outdoors with their friends during the walk and creating more positive community bonds within
their classrooms due to positive mood states. Of course, these benefits do not work for all
people and this is not a quick fix solution. Rather, this is a helpful tool that can be used to have
positive impacts on the development of the whole child.
Figure 1 Four major impacts of walking and biking to school on students

19
History of Change
Although most students in the United States walked or biked to school prior to the
1980s, since then, the number of students walking or bicycling to school has sharply declined.
Statistics show that 42 percent of all students between five and eighteen years of age walked or
bicycled to school in 1969, including 87 percent of students who lived within one mile of the
school they attended. In 2001 fewer than 13 percent of students walked or bicycled any
distance to get to school (McDonald and Aalborg 2009). This decline is due to a number of
factors, including urban development patterns, school-siting requirements that encourage
school development in unpopulated areas, increased traffic, and parental concerns about
safety. The situation is self-perpetuating: as more parents drive their children to school, there is
increased traffic at the school site, resulting in more parents becoming concerned about traffic
who therefore drive their children to school. As seen in Figure 2, this trend is deterring more
and more students from walking and biking to school.
Figure 2 The downward trend of driving children to school
20
During a research study published by the Journal of the American Planning Association
in 2009, researchers were able to collect data from parents by administering surveys asking
questions about what they enjoyed or did not enjoy about the walking program already
implemented in their school district. Questions asked about various other parental concerns
and whether they felt comfortable or not allowing their child to walk to school. Analysis of
these survey questions showed that 75 percent of parents driving their children less than two
miles to school said they did it for convenience purposes and to ultimately save themselves
time (Aalborg and McDonald 2009). Most parents also replied that they did not want their child
walking even the shortest distance to school without an adult because of dangerous people
living nearby. These results led the researchers of this study to implement a program that filled
everyone’s needs. The teachers decided to meet the students at a designated location and walk
with the students to their classroom. The new program made it so it was still convenient for
parents to have their kids walk but they could also feel comfortable knowing that there is adult
supervision for the child walking to school.
In comparison to other first-world countries, the United States has much higher obesity
rates. Approximately 17 percent or 12.5 million children and adolescents are obese in the
United States (Joens-Matre et al. 2008). Supporters of pedestrian and bike friendly
neighborhoods partly blame the rise in obesity rates on the drop in the number of children who
walk or transport themselves to school each day. A study that was done by the Journal of Rural
Health provides great information about children in rural and urban communities and the
relationship with obesity rates in these areas. Within this study, 3,500 fourth, fifth, and sixth
grade students were recruited from a variety of rural areas, small cities, and urban areas. These

21
children were compared using BMI and a physical activity self-assessment. According to the
results of the multilevel modeling analysis, there was a higher percentage of overweight
children in rural environments than urban environments, while children from small cities
reported higher levels of physical activity (Joens-Matre et al. 2008). Information such as this is
crucial when building support for walking and biking to school especially in rural areas such as
the Hinsdale, New Hampshire school district. Information gathered in the study can also be
used in comparing the rates of children’s physical activity levels currently to the goals in the
Healthy Monadnock 2020 plan, which is a community engagement initiative designed to foster
and sustain a positive culture of health throughout Cheshire County and the Monadnock region
by the year 2020. Getting children active by walking and biking to school could assist in
decreasing the high childhood obesity rates in Cheshire County where 25 percent of the
children are considered obese (Nilsen 2014).
Influential Factors
There are many factors that influenced a shift from walking and biking being the
predominant mode of travel for students to school to becoming the least common. Some
factors that helped increase walking and biking among all students include a shorter distance to
school, clean sidewalks, active school encouragement about walking and biking, higher grade
level, and economic status. Also students who live within a half-mile of school were the most
likely to walk and bike if there are good sidewalks or if the school encourages students to walk
and bike regularly. Major road crossings, scattered sex offender locations in the neighborhood,

22
and severe weather were some of the deterrents (Kapell and Dill 2009). The Transportation
Research Board Business Office investigated the relationship between the built environment
and parent’s perception of the barriers of walking or biking to school. Parents were surveyed
about travel habits and perceptions of hindrances to biking and walking with the greatest
impact on their children's travel. These were compared to infrastructure conditions that include
distance, sidewalks, bike facilities, major street crossings, slope, and crime rate, to demographic
characteristics such as grade, gender, income, and ethnicity (Kapell and Dill 2009). The analysis
indicated that parental perceptions of traffic-related barriers are not consistent with objective
measures of the street environment, but perceptions of crime rates and lack of sidewalks are
both supported by ground trusted on verified conditions. The results of this study concluded
that policies promoting neighborhood schools, improvement to sidewalk walkability, and
encouraging student involvement all help increase the number of children walking and biking to
school on a regular basis.
Another factor that influences parent’s decisions about whether or not to allow their
children to walk to school is what they will be exposed to on their walk. For schools in urban
settings, such as Wheelock School in Keene, New Hampshire, students may be subject to
substances like alcohol, tobacco, or other drugs on these routes. Researchers at Prevention
Science performed a study in 2013 to determine the risk of children being exposed to such
dangers on their way to school. In the study, 394 urban elementary school students’ addresses,
school location, alcohol outlet data were geocoded and walking routes to school were mapped.
Then the route was compared to the locations of the alcohol outlet. The association was
estimated by logistic regression models and inferred that children with an alcohol outlet on the

23
route to school were more likely to be offered alcohol, tobacco, or other drugs as well as being
exposed to drug trafficking (Milam et al. 2013). The results of this study caused parents to
realize the huge risk they were taking by letting their child walk to school if they were located
near an alcohol outlet.
In recent years there have been many studies that have addressed the fact that children
do not walk or bike to school anymore, and many plans have been implemented in an effort to
reverse this trend. For example, a study done in Putney, Vermont by the national center for the
Safe Routes to School program, helped to assist Putney schools to put together their own way
of getting children active within the community. In the town of Putney, children do not live
close enough to the schools to safely travel to their destination. The Putney central school
health committee rallied and implemented several fun activities to get families of the
community, especially elementary aged children, more active. They planned many unique
activities, including forest walks, a healthy snack program and an organic gardening activity
(Corbett 2007). Activities such as these helped children stay active to combat obesity rates in
the area and helped children and families have more fun together within their community.
Relevant Case Studies
Safe Routes to School programs are being created across the United States and for the
most part, literature shows that many of the factors and barriers that discourage children
walking and bicycling to school are related to one another. In New Hampshire, Safe Routes to
School programs are largely funded by the New Hampshire Department of Transportation

24
(NHDOT). For schools to be eligible for funding they must demonstrate that their programs are
specifically geared toward encouraging students from kindergarten through eighth grade to
walk and bike to school. These programs must also demonstrate the “five e’s” which include
evaluation, education, encouragement, enforcement and engineering. “New Hampshire has
been allocated $1 million per year since 2005, most of which will be used to reimburse 100
percent of local expenses for infrastructure and non-infrastructure projects” (NHDOT). If
schools don't have the funding, improvements to sidewalks, paths, and signs won't be made
possible.
In the area of Cheshire County, Safe Routes to School programs want to promote safer,
healthier and sustainable education for children. According to Simonds Elementary School Safe
Routes to School Travel Plan, the Central New Hampshire Regional Planning Commission first
began to collect transportation data such as traffic count, speed and volume. Next they sent out
a survey to parents to make it possible to identify why parents didn't want their kids walking or
biking to school. These steps were followed while observing Hinsdale Elementary School and
Hinsdale Middle/High School. It was important to collect both quantitative and qualitative data
for this research in order to create an effective plan of action.
When comparing Safe Routes to School evaluation to Simonds Elementary School in
Warner, NH to Jonathan Daniels School in Keene, New Hampshire, it can be seen that both
schools faced the same barriers and factors that discouraged children from active commuting
to school. Once the parents were surveyed, it was found that speed, volume of cars, and the
infrastructure of sidewalks were the main barriers preventing parents from allowing their
children to walk and bike to school. According to Simonds School Journey survey, more than 50
25
percent of parents would allow their children to actively commute to school if the
improvements were made.
In Keene and Portsmouth, New Hampshire, bicycle lanes are the main focus for the Safe
Routes to School programs according to the NHDOT. Once bike lanes are introduced, more
signs are going to be put up to make the citizens more aware of the bike lanes and hopefully
reduce traffic on those roads. Bike lanes are being introduced in these communities because of
their geography. The schools are close to downtowns and around residential neighborhoods
where children could be walking and biking if the infrastructure was improved. This is related to
Hinsdale Schools because of their location near residential areas.
After creating and implementing Safe Routes School programs, it is important to provide
incentive and motivation for students to keep walking and biking to school. At Symonds School
in Keene, NH, they implemented a program called Walk, Roll, and Ride. Their goals included
creating a sustainable program, evolve the school program to a neighborhood parent effort,
and making active commuting a daily habit in the community. The program has volunteers
along the walk handing out apples and water, which was an effort to give incentive to students
for participating in the walk or bike to school. After creating a Safe Routes to School plan of
action, it will be important to create an event that will encourage the importance of walking
and biking after educating the students and parents

26
Chapter 3: Methodology
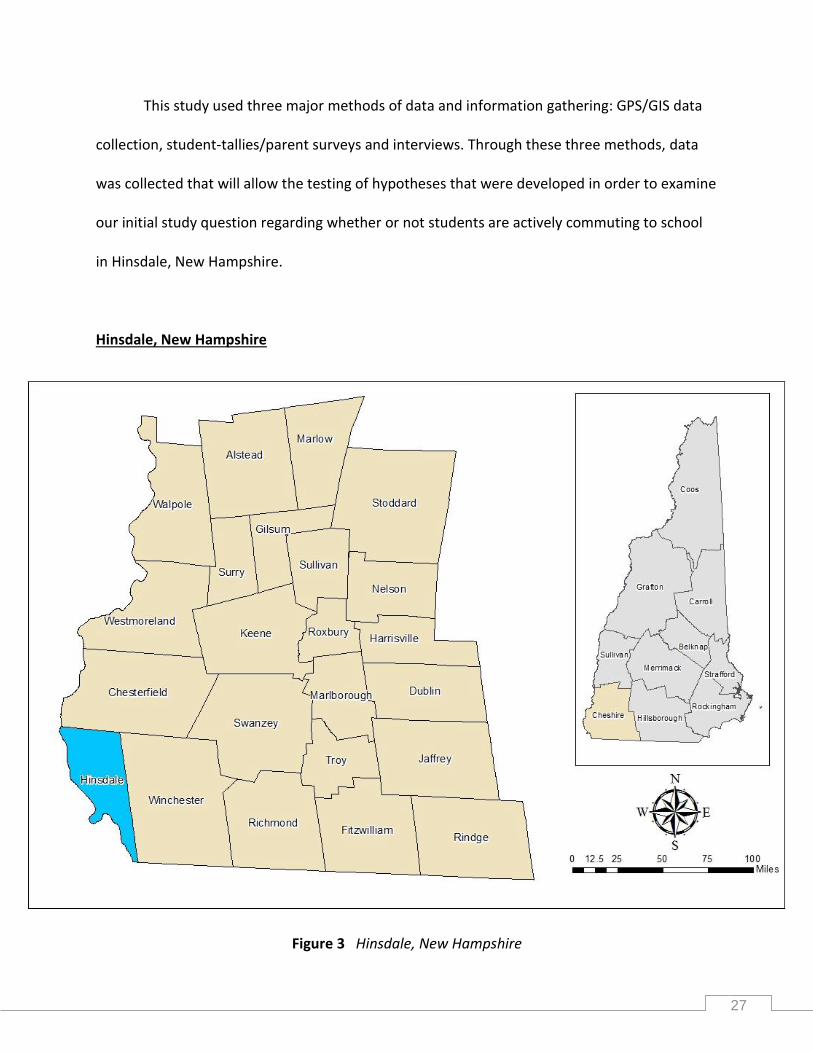
27
This study used three major methods of data and information gathering: GPS/GIS data
collection, student-tallies/parent surveys and interviews. Through these three methods, data
was collected that will allow the testing of hypotheses that were developed in order to examine
our initial study question regarding whether or not students are actively commuting to school
in Hinsdale, New Hampshire.
Hinsdale, New Hampshire
Figure 3 Hinsdale, New Hampshire

28
Hinsdale is a small, rural town in southwest Cheshire County, New Hampshire that was
chartered in 1753. It is located on the borders of Vermont to the west and Massachusetts to
the south. The western border of Hinsdale historically included territory west of the
Connecticut River, but the borders were redrawn in the late 1700s with the establishment of
the state of Vermont. Today, Hinsdale has a total land area of nearly 15,000 acres (HCIDC 2015)
which is approximately 23.5 square miles and is represented in Figure 3.
The topography of Hinsdale is defined by the confluence of two major rivers: the
Ashuelot and the Connecticut. Historically, these rivers provided important benefits including
travel, transportation of goods, and power for the manufacturing of paper. The floodplains of
the Ashuelot and Connecticut Rivers provide excellent arable lands due to the deposition of
nutrient rich soils after periods of flooding. Compared to the lower river valleys to the west and
southwest, the terrain of Hinsdale becomes much steeper to the north and northeast at the
boundaries of Wantastiquet Mountain Natural Area and Pisgah State Park (ELMI 2015). The
varying steepness throughout Hinsdale may deter some families from choosing to walk or bike
to school. These features can be seen in the hillshade map found in figure 4.
Hinsdale has a similar overall climate of New England. The town experiences warm
summer months between May and September with temperatures in July averaging about 71°
Fahrenheit and cold winter months between December and March with temperatures in
January averaging 19° Fahrenheit (Town of Hinsdale 2015; UNH 2013). On average, this area
receives an annual average precipitation of nearly 44.5 inches (Town of Hinsdale 2015). Due to
the cold winter months, a portion of this precipitation falls as snow which may be a deterrence
for some families who choose to have their children walk to school.

29
Figure 4 Hillshade map of Hinsdale, New Hampshire
Since the first census survey in 1790 Hinsdale’s population has increased from 522 to
4,018 in 2013 (ELMI 2015). According to the New Hampshire Office of Energy and Planning,

30
Hinsdale is currently the sixth largest town in Cheshire County (NHOEP 2014). The average age
in Hinsdale is about forty six years old and the largest age cohort is between the ages of thirty
five and fifty four (Figure 2). The next largest cohort, however, are those under the age of
twenty years old. Out of the total population, there are 807 youth between the ages of zero
and nineteen years old which make up about 20 percent of Hinsdale’s total population (Figure
2).
Figure 5 Population of each age group in Hinsdale, New Hampshire (ELMI 2015)
Hinsdale School District
With nearly one-fifth of Hinsdale’s total population being between the ages of 0 and 19,
there is a need for a few key amenities including a strong public school system. The Hinsdale
School District, located west of the intersection of State Routes 63 and 119, provides valuable
educational experience for nearly 550 students (ELMI 2015). The Hinsdale School District, with a

31
budget of nearly $11 million (HSD 2014), is divided into two main buildings, one acting as the
elementary school for students in Kindergarten through 5th Grade and the other acting as a
middle/high school for students in 6th Grade through 12th Grade. There are 542 students that
attend the Hinsdale Schools, 360 of whom live within two miles of the school campus which is
about 66 percent of the student population. There are a total of 192 students that live within
one mile of the school campus which means that active commuting to and from school could be
plausible with proper infrastructure. Both Hinsdale Elementary School and Hinsdale
Middle/High School are found on the same campus and share many of the same amenities and
infrastructure including sports fields, parking lots and sidewalks. The town of Hinsdale does not
have any private or parochial schools which makes the Hinsdale School District even more
important, especially for those families who may not be able to afford to travel further
distances to get their children to school or pay for enrollment. (ELMI 2015).
The school campus is located near downtown Hinsdale on School Street where there is a
denser population. The area around Main Street is where most active commuting can be
observed before and after school. The road map in figure 6 was created as a reference tool
when we discuss major problem roads.
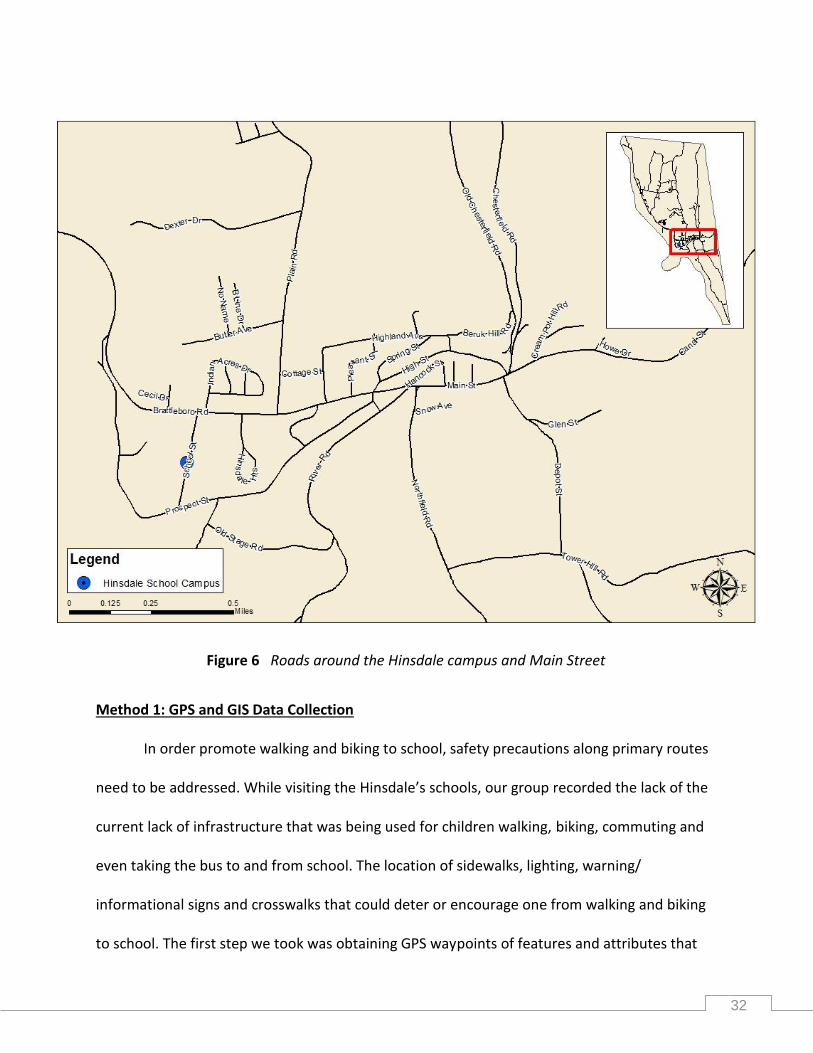
32
Method 1: GPS and GIS Data Collection
In order promote walking and biking to school, safety precautions along primary routes
need to be addressed. While visiting the Hinsdale’s schools, our group recorded the lack of the
current lack of infrastructure that was being used for children walking, biking, commuting and
even taking the bus to and from school. The location of sidewalks, lighting, warning/
informational signs and crosswalks that could deter or encourage one from walking and biking
to school. The first step we took was obtaining GPS waypoints of features and attributes that
Figure 6 Roads around the Hinsdale campus and Main Street

33
were already existing or acknowledging potential sites of where one could exist. We first began
collecting data at the intersection of Prospect Street and School Street then made our way
down to the intersection of Brattleboro Road and School Street. We observed and collected
waypoints and pictures of already existing stop signs, light posts, crosswalks, no parking signs,
speed-limit signs, sidewalks, bike racks, and speed bumps as well as noting potential areas that
could use work.
GPS waypoints were downloaded to the computer using DNRGPS software to manage
and manipulate the in ArcMap. With the collected waypoints we created a point shapefile that
was added to a base map of the area around Hinsdale Elementary and Hinsdale Middle/High
School. Each attribute was assigned a symbol and put on the GPS point. A legend was created
to show the meaning of each symbol. The map created shows potential needs of a sidewalk,
sign and lighting improvement compared to where they already exist (figure 6). Potential
sidewalks, lights and crosswalks were decided by observing the arrival and pickups to and from
school and where the heaviest of volume of students were crossing the streets. For more
qualitative data, Safe Routes to School Field Review packets were completed on two separate
days. These field observations took place on two separate days, once in the morning and once
in the afternoon. An example of the Safe Routes to School Field Review packets is provided in
Appendix A. Individual field reports were developed for each of the two schools on campus.
These more detailed reports have been provided in Appendices B and Appendices C.
The next step we had to take was measuring data on pedestrian infrastructure including
sidewalks, curb-ramps and crosswalks which is shown in figure 7. Data collection was collected
following the Statewide Asset Data Exchange System (SADES) provided by the Southwest
34
Regional Planning Committee as well as a tape measure, digital level and ESRI Collector
Application on the Apple iPad. As we collected attributes of the data, the application also
allowed us to take pictures of the features conditions. For streets with no infrastructure, a
separate assessment was completed using the Pedestrian and Bicycle Infrastructure
Assessment form in Appendix D.
First our group started taking network attributes of the sidewalk infrastructure around a
one-mile radius of the Hinsdale schools. When the application is first opened, we opened a
base map and zoomed into the area of Hinsdale. Then our group noted the direction the side of
the street faced whether it was north, south, east, or west based on guidelines provided by
SADES. The surface material and condition of the sidewalk were then determined. He following
rating scale was use: good meant no distress was found and there were no vertical
displacements; fair meant narrow sidewalks cracks and sidewalk displacements less than ½” are
present; and, poor meant the sidewalk had multiple crack and vertical displacements greater
than ½” present. We also recorded if the surface had defects and took notes on their location.
After assessing the sidewalk, the curb type was determined, and the condition. It
received a good if there was no distress, fair if there were a low number of faults, minimal
heaves and cracks on the curb, poor if there were a high number of faults, large heaves or
cracks or curb face loss due to asphalt overlay and none meant there was nothing wrong. We
then determined the curb depth by measuring from the ground to the top of the curb in inches
then calculated the maximum grade percent by measure the slope of the sidewalk. It was noted
whether a buffer existed such as a grass strip, bicycle lane, parking spaces, street furniture,
none or a different type of buffer.

35
After evaluating the sidewalk, we then went onto measuring curb ramps. To begin our
group had to decide the ramp type based on whether it was perpendicular, parallel, diagonal,
combined or other and the material it was made of. The condition had to be determined
whether it was good, fair, poor based on guidelines of what was used to measure the sidewalk
conditions. As we walked along we noted where crosswalks existed already and if the
conditions of the on/off ramp were flush and free from abrupt level changes with detectable
warnings like pavers or tiles. We then noted if the ramp had flared sides and if there were none,
decided whether other conditions along the ramp discouraged use of it and if the ramp was
outside the path of the cars. We then measured the curb ramp to see if it was at least 36” wide
and the ramp running slope by measuring the rise over run, the ramp cross slope and the gutter
slope.
Third, our group had to assess the crosswalks within a one-mile radius of the Hinsdale
schools. We began examining the material the crosswalk was on, and deciding if the type of
paint was retroreflective, raised, flat and if the paint was faded. We then observed if speed
bumps were present and raised and if there was lighting around the crosswalks as well as
crossing signs or pedestrian actuated utilities present such as cross walk signs, or a light. We
then measured the width and slope of the crosswalk (if raised) as well as the cross slope which
is perpendicular to the direction of the travel and running slope which is parallel to the
direction of travel.

36
Method 2: Surveys
When it comes to data collection, conducting surveys to reveal answers to specific and
important questions is one of the best methods to use. The purpose of our surveys were to gain
a better understanding of the ideas and concerns of parents as well as students in regards to
safe walking and biking routes to school. The questions in the survey are diverse and cover a
wide range of topics in order to fully encapsulate the attitude towards a Safe Routes to School
program. The questions in the survey were strategically ordered and planned in order to
achieve the best possible results from our survey takers.
The goal of this study regarding the ease of walking and biking in Hinsdale is to
encourage children to start walking and biking more frequently. However, it is unfortunate that
not all children have equal access to safe traveling routes in their neighborhoods. This is due to
a number of reasons including high traffic volume, lack of sidewalks, pothole ridden roads, and
sheer distance from school. Some families are choosing to drive their child to school just for the
simple reason that they do not have the time to walk due to their busy schedules. It could also
be that it is far more convenient to drop of their child on the way to their daily activities instead
of walking or biking. Our Safe Routes to School project group collected field data from
observing the pickup and drop off hours of students at both Hinsdale High School/Middle
School and Elementary School in order to derive the major areas of concerns from their own
experience and not just the experience and concerns from parents of students at the two
schools. The Safe Routes to School program took these factors and concerns that they found
into consideration and created two surveys which asked various questions to try and reveal
what some of the major reasons were that parents had for not allowing their child to walk or

37
bike to school, as well as some of the reasons they would allow their child to walk or bike to
school.
The first of our surveys, which can be found in Appendix E, was administered to the
elementary school parents by way of parent teacher conferences. We feel our rate of turn back
was so high because of how they were administrated. The parents were asked to fill out the
surveys for only one child per household by their parent or guardian which would take ten to
fifteen minutes then to be given back once it was completed for analysis by both the Southwest
Regional Planning Commission (SWRPC) and the Keene State Geography Department. This
survey was a modified version of the National Center for Safe Routes to School Parent Survey
about Walking and Biking to School. Five questions were added that were not originated by the
National Center for Safe Routes to School, but were approved to be added to the survey by
SWRPC staff. For example, “Does your child appear to perform better on mental tasks when
they are physically active?” and “Does your child participate in the recommended 60 minutes of
play every day?” Asking questions about mental alertness and how prepared children are at
school assisted us in understanding whether or not parents and students think that walking or
biking to school helps to stimulate their thinking process during or after school hours, or if there
is no relationship between the two variables at all. We also asked questions about how parents
perceive the sidewalks, roads, and other infrastructure factors that their children are using to
and from school to see if there is a relationship.
Some of the other questions had to do with concerns parents might have about
infrastructure or other problems their child might encounter on their route to school grounds.
The main factors regarding these concerns were put into one large chart where parents were

38
allowed to check off all that apply while making their decision to let their child walk or bike to
school. Influential factors such as the amount of traffic, sidewalk and path conditions, weather,
violence or crime and weather conditions. Being able to determine which factors parents are
thinking about first when they decide whether or not they will allow their child to walk or bike
to school will help the Safe Routes to School program prioritize changes needed to increase
walkability in town. By analyzing this data, we will be able to determine if there is a relationship
between the number of children walking to school and the parent’s perception of infrastructure
conditions.
The second survey that we used for data collection, which can be found in Appendix F,
came in the form of an in-classroom tally that was completed by teachers in all grades in
Hinsdale Elementary, Middle, and High School. Tallies were taken three times throughout the
course of one week between Tuesday and Thursday in order to record the number of students
who walked, biked, took a school bus, or drove with their family. This was completed twice a
day, once in the morning and once in the afternoon to assess temporal patterns in active
commuting.
The parent surveys and in-classroom tallies were used to test hypotheses that had been
developed not to answer our overarching question, but to answer a series of subquestions
which will be used to help support our final conclusion. The alternative hypotheses are as
follows:
Hypothesis 1: There is a difference between the number of middle and high school
students actively commuting to school and the number of elementary school students
that are actively commuting to school.
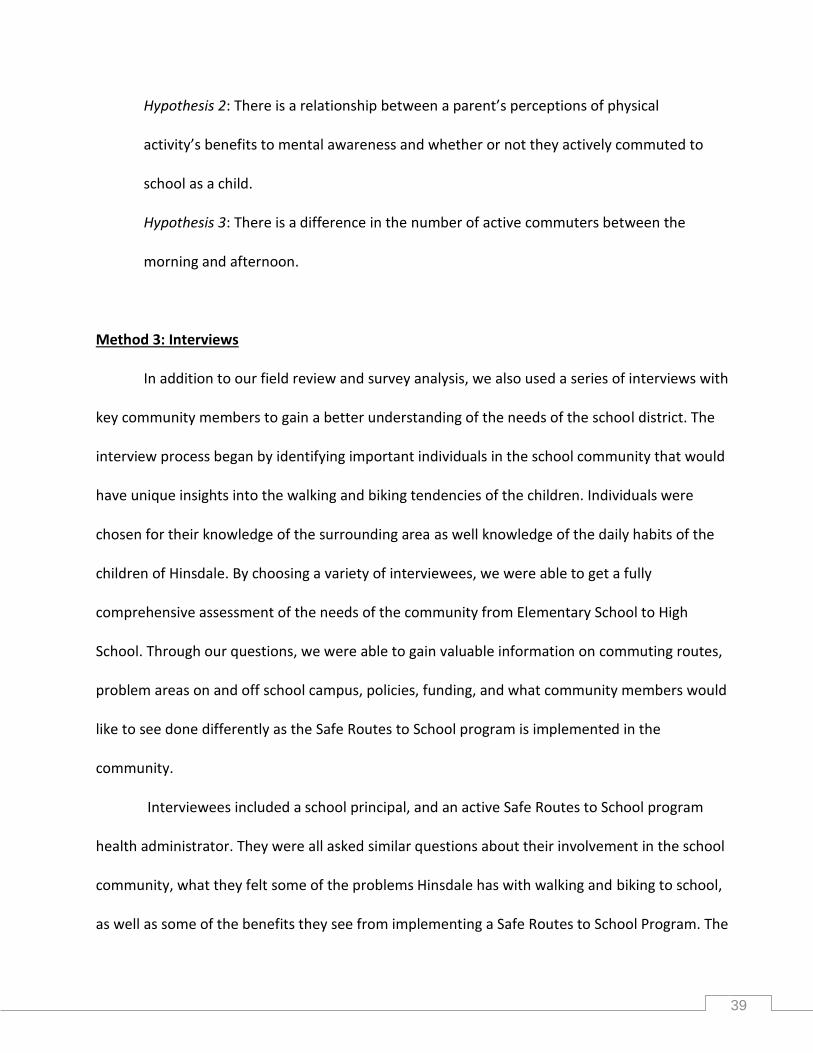
39
Hypothesis 2: There is a relationship between a parent’s perceptions of physical
activity’s benefits to mental awareness and whether or not they actively commuted to
school as a child.
Hypothesis 3: There is a difference in the number of active commuters between the
morning and afternoon.
Method 3: Interviews
In addition to our field review and survey analysis, we also used a series of interviews with
key community members to gain a better understanding of the needs of the school district. The
interview process began by identifying important individuals in the school community that would
have unique insights into the walking and biking tendencies of the children. Individuals were
chosen for their knowledge of the surrounding area as well knowledge of the daily habits of the
children of Hinsdale. By choosing a variety of interviewees, we were able to get a fully
comprehensive assessment of the needs of the community from Elementary School to High
School. Through our questions, we were able to gain valuable information on commuting routes,
problem areas on and off school campus, policies, funding, and what community members would
like to see done differently as the Safe Routes to School program is implemented in the
community.
Interviewees included a school principal, and an active Safe Routes to School program
health administrator. They were all asked similar questions about their involvement in the school
community, what they felt some of the problems Hinsdale has with walking and biking to school,
as well as some of the benefits they see from implementing a Safe Routes to School Program. The

40
questions were purposefully in a structured format to efficiently get the most data out of our
interviewee’s time.
The first individual we talked to was Joseph Boggio, Principal of the Hinsdale Elementary
School. Principal Boggio has lived in the Hinsdale community for over twenty years, and has
been principal of the elementary school since 2012. His extensive background with the area, as
well as his ability to address daily issues with safety on campus made him the ideal candidate
for an interview. After we gained an administrative perspective to the problem at hand, we
wanted to get the perspective of an active Safe Routes to School program. The final interview
that was set up was with the Symonds Elementary School in Keene, a school that already has a
Safe Routes to School program implemented into it. This provided us with great inside
information as to how the program was actually being utilized and the success the program was
having. By learning about an undergoing project it helped show us how useful the Safe Routes
to Program can be when executed correctly.
Field data collection, surveys and interviews were vital pieces to accurately assess
Hinsdale’s walk and bike ability. By utilizing GPS/GIS technology, analyzing surveys, and
interviewing key community members we were able to completely and accurately gain the
results necessary to assess the validity of our hypotheses. These results will be discussed in
more complete detail in the following section.

41
Chapter 4: Results and Discussion

42
In this chapter we will be discussing the results of our three major strategies of data
collection as well as some of the implications of those results. Once again, our three methods of
data collection were GIS/GPS mapping, parent and in-classroom surveys, and interviews. The
following information will be used in order to formulate conclusions and suggestions in the
following chapter.
Method 1: GPS/GIS Data Collection
In order to analyze the walk and bike ability of Hinsdale, New Hampshire we utilized
Garmin eTrex H handheld GPS units and major mapping software including ArcGIS and
ArcCollector. Before making any maps, we first had to collect data. Road and political
boundaries of towns and states were downloaded from the GRANIT website which is New
Hampshire’s statewide GIS clearinghouse. All other point and lines were gathered with GPS
units and through the ArcCollector application on an iPad in the field.
Student Locations
Before analyzing any infrastructure around the Hinsdale schools, we first had to
examine where the students live. After obtaining this data from the Hinsdale School District, it
was possible to upload it into ArcGIS. These maps do not show the exact location of students,
but it does show which streets they live on, which helped us to develop major walking routes
throughout the town. Four maps were produced using this information: one that shows the
locations of all students in the entire town of Hinsdale (Figure 7), one showing the locations of
elementary students within one mile of the school (Figure 8), one showing the locations of

43
middle school students within two miles of the school (Figure 9), and one showing the locations
of high school students within two miles of the school (Figure 10).
Figure 7 Locations of all Hinsdale School District students

44
Figure 8 Elementary school student locations within one mile of the school

45
Figure 9 Middle school student locations within two miles of school

46
Figure 10 High school student locations within two miles of school

47
Students have been assigned different point icons in order to determine whether or not
students in different schools take different routes to school. Buffers were created for 1 and 2-
mile radiuses around the Hinsdale School District campus. We set these buffers because
Hinsdale does not allow students to take the school bus if they live within one mile of the
school. We included a two mile radius because high school students may be more likely to
actively commute further distances than those in elementary or middle school. Although we did
not include a three mile radius, it is generally assumed that three miles is an acceptable biking
distance, but most students will likely not walk or bike to school if they live further than two
miles away which is something that was taken into account during this study.
Campus Infrastructure/Amenities
GPS points for all infrastructure and amenities on the Hinsdale School District campus
were collected using a Garmin eTrex H GPS unit. Points were collected for infrastructure and
amenities including sidewalks, crosswalks, lighting, signage, bike racks, speed bumps and bus
and parents drop off/pick up locations. This field study of both schools campus infrastructure
revealed that there needs to be additional Bus Pickup/Drop Off Areas because there is only one
located on the curb of the elementary school. This area is defined as a Bus Pickup/Drop Off
Area by one sign in this area. In order for there to be well organized drop off and pick up area,
painted lines and arrows should be panted on the pavement to signify the direction that traffic
should be flowing in at these times. On the high school campus there are no signs that signify
where the Bus Pickup/Drop Off Areas are for this end of School Street. There are also no arrows
that signify the flow of traffic. This is a huge safety hazard for students entering and leaving the
school because they are not aware of where the busses will be picking them up as well as

48
where they are dropping them off. This is also poses a safety concern for parents who are
picking their children up from school or dropping them off because they will not be aware of
whether they are in the way of busses exiting or entering the campus which could potentially
cause a car accident fatality. The information of the locations of both schools infrastructure can
be found in Figure 11.
The campus infrastructure and amenities being shown on this map were gathered by a
series on GPS points. The types of infrastructure that were recorded into the GPS as points
were things such as crosswalks, light posts, bus zones, speed limit signs, bus direction signs and
more that were related to promoting safe driving on School Street. Collecting these points of
data were important to our study for further analysis as to where the major areas of concerns
are located on school grounds.
The High School/Middle School posed the most areas of potential pedestrian and
student concerns for walking and biking on the school campus area. The High School/Middle
School was the area where the majority of crosswalks were located for students to use when
crossing from one side of School Street to the other side of School Street where the athletic
field and parking lot were located. However, there was one location nearest to the High
School/Middle School where a crosswalk could have been used. This update for a new
crosswalk could be placed at the end of School Street closest to Prospect Street where students
were crossing from the end of the sidewalk walk on the side the school was on, to the corner of
School Street and Prospect Street. There is however, a sign that signals pedestrians crossing at
the corner of School Street and Prospect Street, but there is no crosswalk to reinforce that the
pedestrians crossing the street have the right of way.

49
Figure 11 Hinsdale School campus infrastructure and amenities

50
The High School/Middle School did have one speed limit sign that clearly stated the
allowed speed during school hours which was 15 miles per hour. This speed limit sign was
located at the end of School Street right before the sign that signaled pedestrian crossing in this
area. At the end of School Street where Prospect Street began, there was a speed limit sign that
showed a 25 miles per hour speed limit on this street. Prospect Street is still in what is
considered to be the school zone area, so the speed here should match the speed limit on
School Street. Where these two streets meet is a serious area of concern when it comes to
traffic leaving and entering the school zone. Cars that are going 25 miles per hour are not going
to be able to stop for a pedestrian at a crosswalk as quickly as a car that is moving 15 miles per
hour. Between the High School/Middle School and Elementary School there was also a sign that
stated that School Street was to be used as a one-way street during school hours. Indication of
School Street being a one-way street during school hours should be shown at the beginning of
School Street rather than closer to the end. Painting arrows on the ground to signal the
direction of the one-way street during school hours would be a useful correction to this area of
campus as well. Seeing these signs was a good indicator that the school was concerned with
people’s speed limit on school grounds and were enforcing it so that no one gets hurt. Although
there are signs that indicate these rules, there is certainly potential areas for many more signs
that enforce these rules, as well as painting lines and arrows on the ground to show the
direction of traffic.
Having a campus that is well lit at night is a major concern for some people and to have
it be light around there at night or at dusk makes people feel much safer on school grounds.
There are also the locations of the bike racks at both schools. The locations of both bike racks
51
were outside of the school buildings on grassy patches. There was no overgrown shrubbery in
this areas which made it easily accessible for students to get to their bikes. Spot lights at both
schools were placed in the corners of the buildings so that students could find their bike after
dusk if they were across the street participating in a sporting event. The bike rack at both the
Elementary School and High School/Middle School were able to hold sixty bikes.
Sidewalk infrastructure at the High School/Middle School was in much better shape
than the sidewalks that lined the elementary school. The Elementary School sidewalks should
be considered for an upgrade. The elementary school also had three speed bumps evenly
spaced between one another in front of the school. There were no speed bumps in front of the
High School/Middle School. Having another speed bump or two outside the High School/Middle
School would not be a bad idea considering that would help reduce the speed traveled in the
school zone.
Much like the High School/Middle School, the Elementary School could use some more
crosswalks. There is an area of the school zone where students are crossing the road that leads
to the parking lot in the back to get to the side parking lot where their parents are parked for
pick up. There is a stop sign at the end of the road where children are crossing but this might be
a great place for a new pedestrian crossing sign as well as a crosswalk.
Overall, both schools did not properly show the direction of traffic that was to flow
through the school zone. People said they were dropping their child off where they were
because they were informed by the school in person or by a newsletter that went home with
their student. Although this seems to work for Hinsdale, there are many areas for updates that
would make the school zone a much safer area for students to walk or bike to and from school.
52
The two major updates that should be made to this campus are more crosswalks at the
locations where students are actually crossing the street. On School Street near both the
Elementary School and High School/Middle School there are a number of crosswalks that were
drawn in areas where students are not crossing. These crosswalks need to be removed and put
in places where they are more crucial for students’ safety. There should also be more signs that
show where drop off and pickup bus zones are, as well as where car pick up and drop off zones
are located on both campuses as well as more signs to signify that School Street is to be
considered as a one way street during school hours. The lack signs that show the direction of
traffic as well as the speed limit are a major concern and should be updated in order to keep
drivers as well as students safe while driving and walking down School Street. Additional field
reports have been written for both the Hinsdale Elementary School and the Hinsdale
Middle/High School which can be found in Appendices D and E respectively.
Statewide Asset Data Exchange System (SADES)
The Statewide Asset Data Exchange System (SADES) is a data exchange system used as a
geospatial transportation asset inventory of transportation related infrastructure including
sidewalks and crosswalks. This data was collected through ArcCollector, an application
downloaded on tablets which allows the user to directly draw line and point files onto a base
map file and used to create Figure 11. Through SADES, it was concluded that the vast majority
of sidewalks and crosswalks are within 1 mile of the school campus which can be seen in Figure
12.
Using SADES, we traveled around the area of Hinsdale collecting data on crosswalks and
sidewalks. We created a map of Hinsdale with one and two mile radius buffers around the

53
schools so we knew which areas needed to be examined and which areas had more children in
the area. We determined if roads were safe by looking at the sidewalks and locations of
crosswalks. If roads were wide, in good condition and had a buffer in-between the road and
Figure 12 SADES results of Hinsdale infrastructure
sidewalk we determined they were safe enough for children to commute on those roads to
school. If roads didn’t have convenient and useful sidewalks coming out onto Brattleboro Road,
no crosswalks and the speed limit was high we determined they were unsafe. Only a few roads
within the one mile radius had sidewalks including High Street and Hancock Road. Plain Road
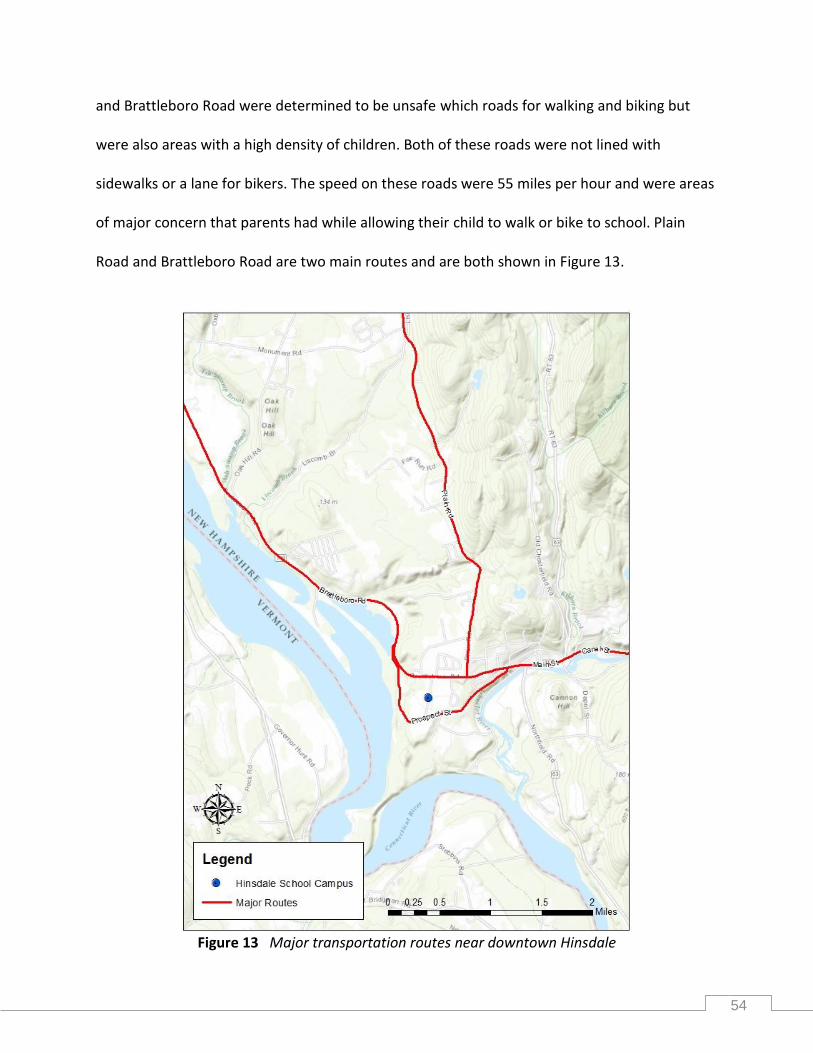
54
and Brattleboro Road were determined to be unsafe which roads for walking and biking but
were also areas with a high density of children. Both of these roads were not lined with
sidewalks or a lane for bikers. The speed on these roads were 55 miles per hour and were areas
of major concern that parents had while allowing their child to walk or bike to school. Plain
Road and Brattleboro Road are two main routes and are both shown in Figure 13.
Figure 13 Major transportation routes near downtown Hinsdale

55
Method 2: Surveys
This method of surveying proved successful and yielded us with one hundred completed
surveys. These one hundred parent surveys were completed as the second collective data
method and was entered into a spreadsheet where the results could be further analyzed. As
seen in Figure 14, 7 percent of survey responses were of student in grades 7-12, while 20
percent of responses came just from the third grade classrooms alone.
Parents were asked a wide variety of questions to get at most of the basic details of
why/why not they do/do not let their child walk or bike to school. The survey sample is skewed
due to a majority of High School parents not attending parent/teacher conferences and
therefore did not have a chance to fill out the survey. The distribution of male and female
responses was favored to the males with fifty-seven male responses and forty-three female
responses for an even total of one hundred responses. Specifically speaking about the
distribution of surveys between both schools, the majority of the surveys that were completed
were from the Elementary School. We analyzed seventy-four surveys from the Elementary
Figure 14 Distribution of Parent Surveys received

56
School and a mere twenty-five from the High School/Middle School. From Figure 14 on the
previous page, it is obvious that the majority of the surveys that were completed by parents
were from Elementary School aged children. On the other hand, parents of the High
School/Middle School students did not fill out anywhere close to the younger student’s parents
did.
One of the first questions that parents were asked on the survey was about how far they
live from the school. It was found that thirty-four percent of students live within one mile of the
schools, while thirty-nine
percent of students live more
than two miles from the school
making it increasingly difficult for
those students to actively
commute to school. The
breakdown of these distances
can be seen in the pie chart,
Figure 15, on the right. While these distances influence, the way students are actually getting
to school shows us if these distances have any influence on the number of students who are
actively commuting to and from school. Figure 16 displays the ways that students are most
often commuting to and from school. The data shows that an overwhelming majority of
students in Hinsdale are either driven to school or take the bus, with a staggering fifty-five
percent taking a form of car and forty percent taking the bus to school that leaves a lacking five
percent of students who choose to actively commute to school most days. Of the thirty four
Figure 15 Student travel distance to school

57
percent of respondents that live within one mile of the school, only 5 percent actively commute
leaving 29 percent of students living within one mile of the schools that could be potential
active commuters if the problem areas of the town were dealt with to incorporate a Safe
Routes to School program.
The next set of questions asked about the influential factors that parents thought played
a role in their decision to either let their child walk or bike to school using in Question 11 on the
Parent Survey. The parents were asked to pick from a list of fifteen influential factors and
choose as many or as few of them as they deemed necessary. To quantify these responses we
counted each tally on every category and found several interesting results. The results to this
Figure 16 Students most common mode of transportation to and from school
Figure 17 Parent survey responses on most influential factors preventing active commuting

58
question can be seen in the bar chart in Figure 17, organized with the top concerns at the top
and the least influential factors at the bottom.
As seen in Figure 17 parents were most concerned about the speed and amount of
traffic that is present on the major roads in Hinsdale. Brattleboro Road as well as Plain Road
were of the utmost concern for parents, with speed limits of over 30 miles per hour and very
little to no room on the shoulder of the roads to safely walk. Infrastructure conditions were also
a very large concern for parents due to the lack of sidewalk and crosswalks on the major
commuting routes. The lack of infrastructure leads to drastic safety risks that parents are just
not willing to take with their child leading to less and less active commuting to school. This was
somewhat surprising considering crossing guards could provide a safer traffic environment for
students as they make their way to or from school. When the Hinsdale Schools on campus pick
up/drop off routines were observed, one crossing guard was seen at the intersection of
Brattleboro Road and School Street for only a total of fifteen minutes helping children cross the
busy street. If more crossing guards were implemented and for a longer period of time, maybe
parents would begin to feel more comfortable with the busy intersections near the school.
The last set of questions that were asked of parents were a set of Yes, No, and I do not
know responses. Question number twelve asked parents if their child had access to a bike, and
an outstanding 90 percent of respondents said that their child did have access to a bicycle they
could use. Next parents were asked if their child participates in at least sixty minutes of physical
activity every day in question number fifteen. Sixty minutes is the recommended amount of
activity every child should have every day in order to live a healthier lifestyle. It was positive to
see that 88 percent of respondents said that their child did receive the recommended 60

59
minutes of physical activity every day. Another result that was determined from the survey data
was that 59 percent of respondents participate in some form of after school activities including
sports, dance, various clubs, or after school help. This could be why we see a decrease in the
number of children riding the school bus home from school and an increase in the number
going home in a family vehicle.
The data collected in the parent survey was vital to the analysis of the walking and
biking conditions of the Hinsdale area. The responses helped solidify the major themes in our
report by providing quantifiable data that could be used to either prove or disprove our
hypotheses through more in depth statistical analysis. By first looking at the descriptive
statistics of our data it provided us with a strong base to then apply our hypotheses directly to
the focus areas.
Hypothesis 1
Generally, people might assume that high schoolers and middle schoolers would be
more likely to walk to school than elementary school age students given the fact that they are
older and have a better understanding of safety. This assumption was formed early on in this
study from collecting data through field observations, parent surveys, and in-classroom tally
sheets that were completed by teachers in the classrooms of all elementary, middle and high
school classrooms that kept track of how their students commuted to and from school in both
the morning and afternoon on specified days during a one week period. In order to test if
whether high school and middle school students are walking more or less than students in the
elementary school, two hypotheses were formed:

60
Null Hypothesis: There is no difference between the number of middle and high school
students actively commuting to school and the number of elementary school students
that are actively commuting to school.
Alternative Hypothesis: There is a difference between the number of middle and high
school students actively commuting to school and the number of elementary school
students that are actively commuting to school.
An independent samples t-test was used in order to examine the difference in the
number of walkers between the high school, middle school, and elementary school. Running an
independent samples t-test provided the information that is required in order to accept one of
the previously stated hypotheses. The in-classroom tally sheets used by teachers in all three
schools provided the data required for running this test by counting the number of active
commuters and non-active commuters each day. The data was categorized by the number of
active commuters in the Hinsdale Elementary School and the number of active commuters in
both Hinsdale Middle School and Hinsdale High School and then entered into an Excel sheet
that was used in SPSS, statistics software. The results from the statistical analysis are shown in
the Tables 1 and 2 below.
Table 1 Group Statistics showing the numbers of active commuting between Hinsdale High School/Middle School and Elementary School
V4 N Mean Std. Deviation Std. Error Mean
Walkers 1 96 .948 .8750 .0893
2 90 1.167 1.3678 .1442
An independent samples t-test test for differences between two different groups. The
value that is important to determining whether there is a statistical significance between both

61
variables is the Sig. (2-tailed) number in these results. Which can be found in Table 2. In the
table that was created when the test was ran in SPSS, a value of .193 was our level of
significance. This value shows that both variables are not significant because the results of the
data are greater than the .05 value which is considered to be significant. In this case, our study
chose to accept the null hypothesis that was formed from gathering this data which stated that:
There is no difference between the number of middle and high school students actively
commuting to school and the number of elementary school students that are actively
commuting to school.
Table 2 Independent Samples Test of the Difference in active commuting numbers between Hinsdale High School/Middle School and Elementary School
Levene's
Test for
Equality of
Variances t-test for Equality of Means
F Sig. t df
Sig. (2-
tailed)
Mean
Differe
nce
Std. Error
Difference
95%
Confidence
Interval of
the
Difference
Low
er Upper
Walkers Equal
variances
assumed
30.033 .000 -
1.307 184 .193 -.2188 .1673
-
.548
8
.1113
Equal
variances
not
assumed
-
1.290
149.
748 .199 -.2188 .1696
-
.553
9
.1164

62
In conclusion to these results, we are able to say with confidence that there is no
significant difference between the number of students walking and biking in the Hinsdale high
school/middle school and the elementary school. Students at both schools are walking around
the same amount as the other. The statistical results from the test support the decision to
accept the null hypothesis in this study.
Hypothesis 2
One main topic of interest for this study was the relationship between physical activity
levels and mental awareness. Generally this relationship is examined through the use of brain
scans, which was not a technology available for use in this study. Instead, this relationship was
examined by asking the question “Do parents who actively commuted to school as children
think that physical activity improves their child’s mental awareness more than parents who did
not actively commute as children?” The data used for this test were derived from questions 15
and 18 of the parent survey. Question 15 asked “Does your child participate in after school
activities?” and question 18 asked “Did you walk and/or bike to school as a child?” The
hypothesis for this test are as follows:
Null Hypothesis: There is no relationship between a parent’s perceptions of physical
activity’s benefits to mental awareness and whether or not they actively commuted to
school as a child. Alternative Hypothesis: There is a relationship between a parent’s
perceptions of physical activity’s benefits to mental awareness and whether or not they
actively commuted to school as a child.
With the responses to the parent survey questions it was possible to run a Pearson’s
Cross-Tabulation test in SPSS. Pearson’s Cross-Tabulation is a Chi-square one-sample

63
nonparametric test that determines if the number of occurrences across multiple categories is
random. The independent variable in this test is whether or not the parent answering the
survey actively commuted to school. The dependent variable in this test is whether or not the
parent has noticed improvements in their child’s mental awareness after any amount of
physical activity. The results of this test can be seen in Tables 3-5.
Table 3 Case Processing Summary
Cases
Valid Missing Total
N Percent N Percent N Percent
Perform Better * Parent Walk/Bike as Child 88 100.0% 0 0.0% 88 100.0%
Table 4 Perform Better * Parent Walk/Bike as Child Crosstabulation
Parent Walk/Bike as Child
Total No Yes
Perform Better No 2 6 8
Not Sure 11 16 27
Yes 16 37 53
Total 29 59 88
Table 5 Chi-Square Tests
Value df Asymptotic Significance (2-sided)
Pearson Chi-Square 1.153a 2 .562
Likelihood Ratio 1.143 2 .565
N of Valid Cases 88
Table 3 is simply a summary of the number of responses which is represented by N,
which in this case is eighty-eight. Table 4 shows the number of parents who answered “Yes”,
“No”, or “I do not know” on question 15 in the parent survey based on whether or not the
parent answered “Yes” or “No” on question 18. In this instance, there were twenty-nine
parents who did not actively commute as a child and fifty-nine parents who did walk as a child.

64
There were 8 respondents who answered “No”, 27 who answered “I do not know” and fifty-
three who answered “Yes”. Parents, regardless of whether or not they personally actively
commuted to school, most commonly answered “Yes” to question 15 and least commonly
answered “No” to question 15. This information is also presented in the bar graph in Figure 18.
Table 5 provides the information that supports one of the previously stated hypotheses.
The asymptotic significance for the Pearson’s Chi-Square is .562 which is not significant because
it is significantly larger than the critical value which was set at .05. Because this number is not
significant, we accept the null hypothesis which assumes that there is no relationship between
a parent’s perceptions of physical activity’s benefits to mental awareness and whether or not
they actively commuted to school as a child.
Figure 18 Responses to question 15 and 18 on the parent survey

65
Hypothesis 3
Our group wanted to determine if the time of day affected when students were more
likely to be active commuting to school. Convenience of time, distance to school, and after
school programs could play a role in determining if a student would rather ride a bike or walk
compared to a school bus or being pick up or dropped off by a parent. In order to determine
whether or not the time of day affected if children were actively commuting, we developed two
hypotheses:
Null Hypothesis: There is no difference in the number of active commuters between the
morning and afternoon.
Alternative Hypothesis: There is a difference in the number of active commuters
between the morning and afternoon.
Across the course of three days, teachers from the elementary school, middle school
and high school collected tallies during the morning and afternoon in order to determine how
students arrived at school and how they planned to get home. With these tallies, a spreadsheet
was created with two independent groups: the number of students actively commuting during
the morning and the number of students actively commuting in afternoon. With this
spreadsheet created, it was then possible to run an independent t-test in SPSS to determine if
there is a statistical difference.
An equal variance of 95 percent was assumed with a threshold of .05. The t-test showed
that the Sig. (two tailed) value was .095, higher than .05. Since .095 is higher than .05, we
accept the null hypothesis which assumes that there is not a significant difference in the
amount of active commuters during the day compared to the afternoon. An error not

66
accounted for was the weather on the days the tallies were taken because this could have
prevented students from actively commuting. The results of this test can be found in Tables 6
and 7.
Table 6 Group Statistics of the number of active commuters between the morning and
afternoon
V5 N Mean Std. Deviation Std. Error Mean
Walkers 1 93 .914 1.0285 .1066
2 93 1.194 1.2359 .1282
Table 7 Independent Samples Test of the number of active commuters between the morning
and afternoon
Levene's Test
for Equality of
Variances t-test for Equality of Means
F Sig. t df
Sig.
(2-
tailed
)
Mean
Differen
ce
Std. Error
Differenc
e
95% Confidence
Interval of the
Difference
Lower Upper
Walk
ers
Equal
variances
assumed
5.090 .025
-
1.6
77
184 .095 -.2796 .1667 -.6085 .0494
Equal
variances
not
assumed
-
1.6
77
178.
122 .095 -.2796 .1667 -.6086 .0494
Method 3: Interviews
After compiling the information from our two interviews, we analyzed the responses
from each subject. Since we interviewed one subject from a school that is attempting to start a
Safe Routes to School program in Principal Boggio, and another from a school that has an

67
already existing program in place, in Beth Corwin, it gave us a great contrast of answers in order
to see where the Hinsdale School system could make the most improvements.
We found very similar ideas, problems, and concerns while talking with our
interviewees. The first interviewee, Principal Boggio, has been an active member the of
Hinsdale community for twent-three years since 1991. He has worked for the town
department, as well as a Math teacher at several different grade levels. This gives him a very
comprehensive knowledge of the town's major issues as well as tendencies of the children over
an extended period of time. Principal Boggio was hired as the Hinsdale Elementary School
principal in November of 2012, making this his fourth year as principal. Over the past years
Principal Boggio has showed a strong interest in achieving a healthier school environment. He
has attempted to implement a “Healthy Habits” program into the daily lives of the students,
encouraging healthy snacks, more physical activity, and more constructive socialization of the
children to promote stronger psychological habits as well.
When Principal Boggio was asked about his opinion of the pickup/drop off areas
surrounding the Elementary school he had some great ideas for improvement. At both the Pre-
School pick up location on School Street and the Elementary School pick up around the back
side of the school, traffic is a huge problem. This was observed during our Field Report where
several cars lined up, sometimes thirty to forty-five minutes early, blocking the access roads to
other cars that want to come through. When asked what could be done Principal Boggio stated,
“Some more signs directing parents into designated locations would be very helpful”. During
the Field Report we had observed an obvious lack of signage on campus, with a few signs even
facing the wrong direction due to years of weathering and erosion without being replaced.

68
During the next part of the interview, Principal Boggio began talking about some of the problem
streets and amenities of the surrounding area. One area he mentioned as needing
improvement was Route 119, which runs directly through the middle of Hinsdale connecting
most of the town to each other. He suggested a bike lane be added on the road in order to give
riders a safer commute than on the narrow shoulder of the road. He thought this could be of
great use with several students living on or very close to Route 119. The last section of the
interview are insight to some of the overarching policies the school has on children walking and
biking to school. During this we found out that the Elementary School does not have a written
rule on who can and cannot walk or bike to school but teachers and parents are constantly on
the lookout for children who seem to be on their own or in unsafe situations. This illustrates
just how a close knit a rural town like Hinsdale truly is.
Our second interview was with Beth Corwin of the Symonds Elementary School in
Keene, New Hampshire. Mrs. Corwin is the comprehensive physical education teacher at the
elementary school and has been for the past twenty one years. This interview was quite
different than the first since Symonds already has a very active walking program they call the
Symond’s Walk, Roll, and Ride program. This program has been extremely successful in getting
students to actively commute to or from school in some way or another. Mrs. Corwin was the
founder of this program for the Symonds school but it was not an easy journey. She first
created a “district wide and School Administrative Unit (SAU) wide wellness committee to start
working to stem the tide, and change our culture, so that we could reduce childhood obesity,
improve the practices in our schools that support our health curriculum, and healthy living.”
Since Symonds has had this program implemented, they have a multitude of ways of getting

69
children more active during the school day. From activity breaks during class time, mandatory
recess, and running and walking programs to level the playing field to get all children involved
not just a select group. One of the most interesting programs she has implemented is the
“5,2,1, 0, +10 wellness message” which breaks down to ; five servings of fruit/vegetables a day,
two or less hours of screen time, one hour or more of physical activity, zero sugar added
beverages, and ten or more hours of sleep. Mrs. Corwin strongly believes in this message and
promotes it vigorously to all her students. The amount of time and effort that Mrs. Corwin has
put into the program shows tremendously throughout the school community. From kids being
excited about walking or biking to school, to tackling childhood obesity issues Mrs. Corwin has
changed the entire culture of a community over her time at Symonds Elementary. In order for
the Hinsdale program to flourish quite like the Symonds program has, someone from inside the
school must step up like Mrs. Corwin has in order to lead the effort. We hope the Hinsdale
program can learn from Symonds on how to successfully run a Safe Routes to School program.

70
Chapter 5: Conclusion

71
Through the use of surveys, interviews, and field data collection we were able to
thoroughly examine the active commuting trends of the Hinsdale School District. This analysis
was conducted in order to develop suggestions for implementing a Safe Routes to School
Program to encourage walking and biking to school. This kind of program can provide students
with the opportunity to be more physically active and also leads to safer school zones due to
less traffic during pickup and drop-off times. We were also able to highlight some major
problem areas including areas with high traffic speed or areas that lack important
transportation related infrastructure. Acknowledging these problems may be important in the
future when implementing a Safe Routes to School Program.
We found that the school campus is well equipped with transportation infrastructure
including signage, sidewalks, speed bumps, and lighting. Transportation infrastructure is also
present throughout downtown Hinsdale on Brattleboro Road, as well as the residential areas
within High Street and Hancock Street. The sidewalk on Brattleboro Road travels east over one
mile away from the school making it a major route for nearly all students.
Outside of the downtown area, however, we found that there were hardly any
sidewalks. Roads such as Plain Road and Brattleboro Road on the west side of the school, which
could be major walking and biking routes for children, simply do not have any transportation
infrastructure necessary for a safe commute. The lack of sidewalks coupled with increased
speed will make these two roads exceptionally large challenges when encouraging families that
live north of the school to actively commute. This was also a major theme that was discussed
during our interview with Principal Boggio. We had hoped to find any possible trails that would

72
allow students who live further from the school to bypass some of the high traffic roads but we
were unable to locate any major trails.
Through our parent surveys we were able to determine some of the determining factors
that influence a parent’s decision to have their child actively commute to school or not.
Infrastructure conditions, safety of intersections and crosswalks, and amount and speed of
traffic made up three of the five most common influences. This shows that the lack of
transportation infrastructure on key routes such as Plain Road or Brattleboro Road may actually
be directly affecting whether or not a family allows their child to walk to school.
The other two major influences that influence whether or not parents allow their
children to walk or bike to school included weather and distance, two factors that would be
very difficult to overcome with the use of a Safe Routes to School program. These were two
major variables that we had assumed would be highly influential factors from the beginning of
our research due to the climate and geography of Hinsdale.
Perhaps the biggest surprise of this study was the lack of statistical significance in all
three of our hypotheses. We discovered that within our sample there was no statistically
significant differences in the number of active commuters between the two schools, that there
is no difference in the number of active commuters between the morning and afternoon and
that there is no significant relationship between whether or not a parent walked to school and
whether or not they think that physical activity benefits their child’s mental awareness. We
were not surprised that there was no difference between active commuters in the morning and
afternoon because we assumed that if a child were to bike to school in the morning then they
would have to bike back for example. The other two conclusions were rather surprising though

73
because we assumed that the older middle and high school aged students would walk or bike at
a higher rate because their parents might trust them to be safe during their commute to and
from school. We were also surprised that there was no significant difference in perceptions
about physical activity’s effects on mental awareness because our prior research had suggested
that there were strong ties between the two variables.
While these hypotheses conclusions were not ideal, they do give us some insight as to
planning for the future. Because there is no difference in the number of morning and afternoon
active commuters, then it will be important to have monitors outside of the school to ensure
child safety which is a major concern for parents. The fact that there is no difference in active
commuters between schools means that it will be important to encourage active commuting at
all age levels and there does not need to be a special focus on just one school.
Different conclusions may have been drawn if there were more classes to increase the
sample sizes for student tallies and more parent survey responses. We had also developed a
high school student survey that was not used for this study. Had we been able to collect data
directly from students we may have been able to draw different conclusions. We also may have
benefitted from an earlier field data collection date so that we could have made observations
during warmer days when children may have been more inclined to actively commute.
Collecting data in October meant that we were making field observations during cold mornings
and we faced time constraints due to earlier sunsets. Most of our information was also highly
based on perception rather than real fact which means that most of our information comes
from the opinions of survey takers not hard data.

74
Recommendations
After examining the issues and possibilities that revolve around developing a Safe
Routes to School program, we believe that it is still beneficial to further pursue this subject.
Comments from parent surveys suggest that there is interest in a program like Safe Routes to
School. Not all major influential factors can be fixed by a Safe Routes to School program, but we
have developed a few recommendations that may make a big difference in providing students
the means necessary to actively commute to school.
These recommendations include widening shoulders and installing sidewalks on major
transportation routes such as Plain Road and Brattleboro Road west of the Hinsdale schools.
Improving transportation related infrastructure on these two major roads will provide students
who live further distances north of the campus with more safe means of transportation. Along
with the installation of transportation related infrastructure, we believe that speed limits
should be reevaluated near the school campus. For example, Brattleboro Road to the west of
the Hinsdale campus does not have any sidewalks, shallow shoulders and a speed limit of 50
miles per hour. It simply is not safe for the students who live further north on Brattleboro Road
to actively commute to school with these factors present.
We have also developed a few recommendations for Hinsdale to consider when
implementing a Safe Routes to School program. Because there is interest for a Safe Routes to
School program in the community, it may be appropriate to encourage parents to volunteer to
assist in the day-to-day operations. Other schools that have implemented this kind of program
have found success in designating meeting locations where parents can drop their children off
to walk to school under adult supervision. This allows for parents to allow their children to

75
enjoy the benefits of active commuting while knowing that their child is safe with a responsible
adult. Similarly, because the safety of crosswalks and intersections are such a large concern
among surveyed parents, we believe parents would be more comfortable with allowing their
children to actively commute to or from school if teachers or volunteer parents were assigned
to monitor major intersections and crosswalks. Many parents also claimed that other
individuals were a major concern when letting their children commute to school. We believe
that involving local police departments may help ensure that students are safe in every way
possible. Having a higher police presence during times when students are most commonly
walking to or from school may help parents feel that their child is less susceptible to dangerous
situations.

76
References

77
Aalborg, A., and N. McDonald. 2009. Why parents drive children to school: implications for safe routes to school programs. Journal of the American Planning Association 75(3): 331-342.
Active Living Research. 2009. Walking and biking to school, physical activity and health
outcome: building evidence to prevent childhood obesity and support active
communities. San Diego State University.
http://www.rwjf.org/content/dam/farm/reports/issue_briefs/2009/rwjf40524.pdf (last
accessed 29 August 2015).
---. 2015. Impact of safe routes to school programs on walking and biking. San Diego, CA: Active
Living Research.
http://activelivingresearch.org/sites/default/files/ALR_Review_SRTS_May2015.pdf (last
accessed 1 August 2015).
Barry, H., M. Lambaise, and J. Roemmich. 2010. Effect of a simulated active commute to school
on cardiovascular stress reactivity. Medicine & Science in Sports & Exercise 42(8): 1609-
1616.
Binns, H., J. Foreman, C. Karr, K. Osterhoudt, J. Paulson, J. Roberts, M. Sandel, J. Seltzer, and R.
Wright. 2009. The built environment: Designing communities to promote physical
activity in children. Journal of Pediatrics 123(6): 1591-1598.
Boggio, J. Principal. Hinsdale Elementary School
Bohner, C., M. Friedrichs, and M. Nanney. 2008. Poverty-related factors associated with obesity
prevention policies in Utah secondary schools. Journal of the American Dietetic
Association 108(7): 1210-1215.
Center for Disease Control and Prevention. 2015. Childhood obesity facts.
Washington DC: Center for Disease Control and Prevention.
http://www.cdc.gov/healthyschools/obesity/facts.htm (last accessed 23 September
2015).
Centers for Disease Control and Prevention. 2015. Physical activity facts. Atlanta, GA: Centers
for Disease Control and Prevention.
http://www.cdc.gov/healthyschools/physicalactivity/facts.htm (last accessed 13
September 2015).
Corbett, P. 2007. Putney, Vermont: Encouraging healthy living. National Center for Safe Routes
to School. http://www.saferoutesinfo.org/program-tools/success-stories/putney-
vermont-encouraging-healthy-living (Last Accessed 29 August 2015).

78
Corwin, B. Physical Education Department. Symonds Elementary School
Del Valle Cook, H. 2013. Educating the student body: Taking physical activity and physical
education to school. Washington DC: Institute of Medicine of the National Academies.
http://iom.nationalacademies.org/~/media/Files/Report%20Files/2013/Educating-the-
Student-Body/EducatingTheStudentBody_rb.pdf (last accessed 4 September 2015).
Department of Health and Human Services. 2015. What is mental health? Washington D.C.:
Department of Health and Human Services. http://www.mentalhealth.gov/basics/what-
is-mental-health/ (last accessed 14 September 2015).
Economic and Labor Market Information Bureau. 2015. Community profiles: Hinsdale, NH.
Concord, NH: New Hampshire Employment Security.
http://www.nhes.nh.gov/elmi/products/cp/profiles-htm/hinsdale.htm (last accessed 27
October 2015).
Edmunds, S., H. Biggs, and I. Goldie. 2013. Let’s get physical: The impact of physical activity on
wellbeing. London, England: Mental Health Foundation.
http://www.mentalhealth.org.uk/content/assets/pdf/publications/lets-get-physical-
report.pdf (last accessed 1 August 2015).
Fischer, J. 2005. Safe, accountable, flexible, efficient transportation equity act – A legacy for
users. Washington D.C.: Congressional Research Service.
http://wadot.wa.gov/NR/rdonlyres/D3DF664F-7456-4877-9788-
7E62EFC8F51E/0/CongressionalResearchServiceOverviewTLU.pdf (last accessed 29
August 2015).
Healthy Monadnock 2020. 2014. About Healthy Monadnock 2020. Keene, NH: Healthy
Monadnock 2020. http://www.healthymonadnock.org (last accessed 11 September
2014)
---- 2015. Healthy Monadnock 2020 magazine. Keene, NH: Cheshire Medical Center/Dartmouth-
Hitchcock.
http://www.heathymonadnock.org/wp-content/uploads/2014/20/HM2020-update-
booklet-Nov-20141.pdf(last accessed 11 September 2015).
Hinsdale Commercial and Industrial Development Corporation. 2015. Welcome to Hinsdale,
New Hampshire. Hinsdale, NH: Hinsdale Commercial and Industrial Development
Corporation. http://www.hinsdaledevelopment.net/abouthinsdale.html (last accessed
27 October 2015).

79
Hinsdale School District. 2014. 2014 annual meeting budget information. Hinsdale, NH: Hinsdale
School District. http://www.hnhsd.org/HSDOld/info/FinInfo/BudgetInfo14.pdf (last
accessed 27 October 2015).
Joens-Matre, R., G. Welk, M. Calabro, D. Russell, E. Nicklay, and L. Hensley. 2008. Rural-urban
differences in physical activity, physical fitness, and overweight prevalence of children.
The Journal of Rural Health 24(1): 49-54.
McDonald, N., and A. Aalborg. 2009. Why parents drive children to school: Implications for safe
routes to school programs. Journal of the American Planning Association
75(3): 331-342.
Milam, A., Furr-Holden, C., Cooley-Strickland, M., Bradshaw, C., and Leaf, P. 2013. Risk for
exposure to alcohol, tobacco, and other drugs on the route to and from school: the role
of alcohol outlets. Prevention Science 15(1) 12-21.
Murnaghan, D. 2009. Prince Edward Island provincial results: Mental fitness, physical activity
and healthy eating. Prince Edward Island, Canada: University of Prince Edward Island.
http://www.gov.pe.ca/photos/original/eecd_shape08_09.pdf (last accessed 15 August
2015).
New Hampshire Office of Energy and Planning. 2014. 2013 population estimates of New
Hampshire cities and towns. Concord, NH: New Hampshire Office of Energy and
Planning. http://www.nh.gov/oep/data-center/documents/population-estimates-
2013.pdf (last accessed 27 October 2015).
Nilsen, E. 2014. Childhood obesity on the decline in the Monadnock Region. The Keene Sentinel.
8 December.
Rodriguez, A., and C. Vogt. 2009. Demographic, environmental, access, and attitude factors that
influence walking to school by elementary school-aged children. Journal of School
Health 79(6): 255-261.
Safe Routes to School National Partnership. 2010. Implementing safe routes to school in low-
income schools and communities: A resource guide for volunteers and professionals.
Oakland, CA: Safe Routes to School National Partnership.
http://www.saferoutespartnership.org/sites/default/files/pdf/LowIncomeGuide.pdf
(last accessed 1 August 2015).
Staunton, C., D. Hubsmith, and W. Kallins. 2003. Promoting safe walking and biking to school:
The Marin County success story. The Journal of Public Health
93(9): 1431-1434.

80
Town of Hinsdale. 2015. Welcome to our website. Hinsdale, NH: http://hinsdale.govoffice.com/
(last accessed 27 October 2015).
Trudeau, F., R. Shephard. 2008. Physical education, school physical activity, school sports and
academic performance. International Journal of Behavioral Nutrition and Physical
Activity 5(10): 1-12
United States Census Bureau. 2015. U.S.
Census Bureau: State and county quick facts. Washington D.C.: United States Census
Bureau. http://quickfacts.census.gov/qfd/states/00000.html (last accessed 7 September
2015).
University of New Hampshire. 2013. Climatic averages for selected New Hampshire cities and
towns. Durham, NH: http://www.unh.edu/stateclimatologist/nh_data_summary.htm
(last accessed 27 October 2015).
University of North Carolina Highway Safety Research Center. 2006. The walking school bus:
Combining safety, fun and the walk to school. Chapel Hill, NC: University of North
Carolina Highway Safety Research Center.
http://guide.saferoutesinfo.org/walking_school_bus/pdf/wsb_guide.pdf (last accessed 1
August 2015).

81
Appendices

82
Appendix A: Safe Routes to School Field Review Packet
SAFE ROUTES TO SCHOOL FIELD REVIEW
DATE:__________ TIME: _______________ LOCATION:_____________ REVIEWER:____________
BUSES (please identify/label location and flow of Bus Loading Areas on map)
1. Are bus loading and drop off zones clearly defined?
Yes No Other: Map ID:
2. Is school staff assigned to bus loading areas?
Yes No Other: Map ID:
3. Is access to bus loading areas restricted to other vehicles during loading/unloading?
Yes No Other: Map ID:
4. Are non-authorized vehicles present in bus loading area?
Yes No Other: Map ID:
5. Is there traffic/congestion in the bus loading area?
Yes No Other: Map ID:
6. Other conditions to note:
PARENT DROP OFF / PICK UP (please identify/label location and flow of Parent Pick Up/Drop Off Areas on
map)
7. Are parent pick up and drop off locations clearly defined?
Yes No Other: Map ID:
8. What is the average wait time for parents to drop off student?
Yes No Other: Map ID:
9. Is staff assigned to parent drop off/pick up areas?
Yes No Other: Map ID:
10. Do drivers appear distracted? Yes No Other: Map ID:
11. Is there traffic/congestion in the parent pick up and drop off area?
Yes No Other: Map ID:
12. Is there a smooth flow of traffic in and out of drop off/pick up area?
Yes No Other: Map ID:
13. Are there any potential safety concerns or pedestrian/vehicle conflict areas (if so, mark location on map)?
Yes No Other: Map ID:
14. Are vehicles lined up in the street during parent pick up and drop off?
Yes No Other: Map ID:
15. Other conditions to note:
SPEED
16. Are there are traffic calming devices present such as speed bumps, speed tables, pedestrian signals to restrict vehicle speed?
Yes No Other: Map ID:
17. Mark where these devices are located on the map and what type of device they are.
Yes No Other: Map ID:
18. Is there noticeable speeding in school zone?
Yes No Other: Map ID:
19. If so, on which routes is speeding occurring?
Yes No Other: Map ID:

83
20. Are speed limits clearly marked? Yes No Other: Map ID:
21. What is the speed limit of routes leading into and on school property (mark speed limits on map)?
Yes No Other: Map ID:
22. Other conditions to note: LIGHTING
23. Is there adequate lighting around the school building?
Yes No Other: Map ID:
24. Is there lighting along the sidewalks and pedestrians routes leading into and on the school?
Yes No Other: Map ID:
25. Are there areas where lighting is needed (mark location of these areas on map)?
Yes No Other: Map ID:
26. Other conditions to note:
WAYFARING
27. Are entrances and exits to the school clearly marked?
Yes No Other: Map ID:
28. Are walking and biking routes clearly defined (if so, mark sign locations on map)?
Yes No Other: Map ID:
29. Are there signs indicating vehicle speed limits (if so mark location on map)?
Yes No Other: Map ID:
30. Are there signs indicating pedestrians crossing (if so mark location on map)?
Yes No Other: Map ID:
31. Other conditions to note:
BIKE FACILITIES
32. Are bicycle racks are present (if yes, mark on the map)?
Yes No Other: Map ID:
33. If yes, how many bicycles could be parked at each rack?
Yes No Other: Map ID:
34. Are racks in a secure location? Yes No Other: Map ID:
35. Are there any bicycles parked at rack(s)? Yes No Other: Map ID:
36. How many bicycles are locked to the rack?
Yes No Other: Map ID:
37. Are there bike lanes present (if so, mark where on the map)?
Yes No Other: Map ID:
38. Are there any students biking to school (if yes, how many?)?
Yes No Other: Map ID:
39. Are parents biking with students to school (if yes, how many?)?
Yes No Other: Map ID:
40. Are there shoulders present along routes leading into and on school property?
Yes No Other: Map ID:
41. What is the width and material (e.g. pavement, gravel, sand, grass) of the shoulders?
Yes No Other: Map ID:
42. Is it safe for students biking to school to enter and exit school property?
Yes No Other: Map ID:
43. Are there any signs present about sharing the road or watch out for bicyclists (mark location on map)?
Yes No Other: Map ID:

84
44. Other conditions to note:
SIDEWALKS
45. Are sidewalks present (if so, mark the location on the map)?
Yes No Other: Map ID:
46. If so, what condition are the sidewalks in?
Yes No Other: Map ID:
47. What material are sidewalks made of? Yes No Other: Map ID:
48. Are sidewalks maintained in the winter? Yes No Other: Map ID:
49. Do sidewalks and paths stop in inconvenient locations?
Yes No Other: Map ID:
50. Are sidewalks blocked by any obstructions such as dumpsters, poles, shrubs, etc (if so, ID obstruction and mark location on map)?
Yes No Other: Map ID:
51. Are students using the sidewalks or pedestrian paths available?
Yes No Other: Map ID:
52. Are sidewalks and pedestrian paths lighted?
Yes No Other: Map ID:
53. Do parked vehicles block shoulder of bike path or walking route (if so, mark location on map)?
Yes No Other: Map ID:
54. Other conditions to note:
TRAILS
55. Are there walking paths/trails present (if yes, mark location on map)?
Yes No Other: Map ID:
56. What condition are walking paths/trails in?
Yes No Other: Map ID:
57. Are students walking on paths/trail present (is so, how many)?
Yes No Other: Map ID:
58. Do paths and trails lead directly to the school or sidewalk (mark where trails/paths end on map)?
Yes No Other: Map ID:
59. Other conditions to note:
CROSSINGS
60. Are there crosswalks present (if yes, mark location on map)?
Yes No Other: Map ID:
61. Is there a crossing guard present (if yes, mark location on the map)?
Yes No Other: Map ID:
62. What are the hours of the crossing guard?
Yes No Other: Map ID:
63. Are there areas where crosswalks should be present (mark location on map)? If yes, why?
Yes No Other: Map ID:
64. Do vehicles stop for pedestrians trying to cross (if no, mark where on the map)?
Yes No Other: Map ID:
65. Are there any sight obstructions making it difficult to see vehicles before/during crossing (parked cars, shrubbery, trees, etc) (if so, ID obstruction and mark on the map)?
Yes No Other: Map ID:

85
66. How long does it take students to cross roadways at marked crossings (is there enough time for students to cross?)?
Yes No Other: Map ID:
67. Are curb ramps present at crosswalks (if so, mark the locations)?
Yes No Other: Map ID:
68. Other conditions to note:
DRIVER BEHAVIOR
69. Did drivers back out of driveways or turn onto roads without looking?
Yes No Other: Map ID:
70. Did drivers yield to pedestrians crossing the road (if no, mark where on map)?
Yes No Other: Map ID:
71. Did drivers make U-turns in middle of road or turn into private driveway (if yes, mark where on map)?
Yes No Other: Map ID:
72. Other driver behavior to note, please describe:
ENVIRONMENTAL CONDITIONS:
73. Is noise an issue (if yes, mark where on map)?
Yes No Other: Map ID:
74. If automobile exhaust an issue (if yes, mark where on the map)?
Yes No Other: Map ID:
75. Are the walking routes clear of litter? Yes No Other: Map ID:
76. Are the walking routes pleasant to walk? Yes No Other: Map ID:
77. Other conditions to note:
POLICIES
78. Are friends, relatives or non-custodial parents required to have written permission to pick up a student from school?
Yes No Other: Map ID:
79. Are bike locks available for students at the school?
Yes No Other: Map ID:
80. Are helmets required for students biking to school?
Yes No Other: Map ID:
81. Are helmets available for students to use at the school?
Yes No Other: Map ID:
82. Other policies to note:

86
Appendix B: Elementary School Field Review
Hinsdale Elementary School Field Review Fall 2015 During the month of October, students from the Keene State College Geography Department visited
Hinsdale New Hampshire several times to examine and evaluate the safety conditions of routes in
proximity to the school for students who choose to walk and/or bike to school. The students were also
looking to grasp a better understanding of the needs and interests of the school community to increase
biking and walking ability. These observations took place for both morning drop off and afternoon pick
up at the elementary school. The most important findings in these observations are addressed in this
document.
Parent drop off/Pick up of children
In the morning parent drop off wait time was anywhere between 1 minute to 7 minutes.
Drop off zones were not clearly marked but parents knew where to go from “word of
mouth”.
Some parents dropped their child off at the front entrance of the school which where
the loading zone and bus zones were located, not drop off zone (signs are facing the
school).
There was slight traffic congestion after slowing down from the
speed bumps before cars turned the corner to go around the back of the school for drop
off.
Flow of traffic was smooth because School Street is a one-way street during school
hours (7:00am-4:00pm).
In the afternoon parent pick up took anywhere from 1 minute to 15 minutes.
Parents drove their cars around the back of the school where they formed a line around
the parking lot.
Right: “Bus
Zone” sign
facing the
wrong
direction of
traffic.
Left:
“Loading
Zone” in
front of
school
clearly
marked.

87
There is a potential safety concern at the right turn to go behind the school to wait in
the pickup line because students are crossing the road there to get into cars waiting in
the parking lot along the field.
Bus drop off/Pick up of children
Bus loading and drop off zones are not clearly marked with paint, there is one sign that
says “Bus Drop/Pickup”.
In the morning the drop off/pickup zone is marked with orange traffic cones to show
where the buses will pull up to the sidewalk curb.
In the morning it took 4 minutes to unload all students off of the bus and into the
school.
The afternoon took 6 minutes to load all students on to the bus that were not being
picked up by their parent.
The school principal and three teachers stood at the entrance of the school as students
got onto the bus in the afternoon.
Four teachers, school principal, and one Hinsdale Police officer stood at the entrance of
the school as students got off of the buses in the morning.
The bus drop off/pickup zone are restricted to other vehicles by the “School Bus Only”
sign.
One crossing guard stood to assist students in crossing the road at the intersection of
School Street and Brattleboro Road at 3:10pm when school was let out and stayed for
approximately 10 minutes.
Right: Right turn off of School Street to enter back of the school where students
are crossing to cars waiting in the parking lot by the field where parents are
waiting for pickup.
Left: Parents starting pickup line in the back of school (no specific direction).

88
Speed
Three speed bumps are present at entrance of School Street, in the middle, and one at
the end of the street.
Traffic is slow because of speed bumps out front of the elementary school but cars are
driving faster by the high school because speed bumps are mostly located in front of the
elementary school.
Speed signs are located near the beginning of School Street on Brattleboro Road (15
mph) and there is also a speed sign located at the end of School Street when taking a
right on to Proctor Street (25 mph).
Wayfaring
Neither the entrance to School Street nor the exit are clearly marked. People seem to be
making their own routine from the sign that indicated a one-way street during school
hours.
Walking and biking routes in the school zone are defined by sidewalks. There are no
signs.
There are no crosswalks in the elementary school area, sidewalks are only located by
the high school.
Right: The only “Bus Drop/Pick up” sign on the sidewalk in front of the school
Middle: Orange traffic cones during morning drop off to dictate bus drop off area
Left: “School Bus Only” sign to show restriction of other vehicles at the sidewalk
in front

89
No indication of speed limit signs on school grounds. The only speed limit signs are
located on the streets off of School Street (Prospect Street and Brattleboro Street).
Lighting
Lights are on the sides of the buildings but no street light posts are present.
There are street lights on both main roads leading to School Street (Brattleboro Street
and Prospect Street).
Bike use/Facilities
Bike rack is located in between the main school building and the gymnasium.
There are 60 spots available for bikes and is located in a secure area where they can be
monitored by anyone on school grounds.
There were no bicycles parked at the bike rack when the school ground was surveyed.
No bike lanes are present for bikers, they just ride along School Street in any direction.
Both the entrance from Brattleboro Street and Prospect Street are sharp turns and since
there are no signs indicating bikers this could be dangerous to bikers entering or exiting
the school grounds.
Bikers are required to wear helmets if they are biking to the elementary school.
Right: Only
sign posted
about direction
of school zone
traffic.
Left: Speed
limit sign
posted on
Proctor Street
at the end of
School Street

90
Sidewalks
Sidewalks located on school grounds but are in fair condition and made of concrete.
Grassy shoulder is on one side of the sidewalk that interferes with walking path only
slightly, but it is still very walkable
Sidewalks in this area have curb ramp transitions and are handicap friendly.
Sidewalk stops right in front of the high school where a new sidewalk begins that is in
much better condition than the elementary school sidewalks.
Sidewalk is interrupted by the entrance to the school playground in the back.
Sidewalks are also only located on one side of School Street (East).
On the day that was observed, students and parents and teachers at the elementary
school made very good use of the sidewalks that were present.
Right:
Sidewalk in
fair condition
out front of
elementary
school.
Left: Poor
sidewalk that
strops at
playground
entrance
Elementary school bike rack showing no bikes present on
this day.

91
Crossings
There is one crosswalk past the elementary school gym and just before the high school
that connects both parking lots together.
There is no sign that indicates pedestrian crossing.
There was no crossing guard present of the first day that we observed but on our
second trip there was a crossing guard that was located on the corner of School Street
and Brattleboro Road at 3:10pm when school was let out and stayed for approximately
10 minutes.
Vehicles on school grounds seemed to always be stopping for pedestrians crossing that
were no in a crosswalk.
Driver Behavior
On the day that was observed, many cars were parking in front of the school at the
“Loading Zone” signs and would quickly back out without looking.
Drivers followed a single line of traffic to exit and enter School Street.
Environmental Conditions
Noise of cars and traffic was not an issue.
Buses were turned off instead of idling while they waited for students.
Most parents kept their cars on while they were waiting to drop off or pick their child
up, less parents shut their engines off while they waited in line.
Policies
Non-custodial parents are allowed to pick students up as long as the school is notified of
this change.
Bike locks are not available for student at the school but they are allowed to bring their
own to lock their bike to the bike rack.
Helmets are required for students to wear while riding their bike to school but are not
supplied by the school.
Extensive afterschool program is offered that contains 80-100 children and varies each
week.

92
Appendix C: Hinsdale High School Field Review
Hinsdale Middle/High School Field Review Fall 2015
During the month of October, students from the Keene State
College Geography Department visited Hinsdale New Hampshire
several times to examine an devalue the safety conditions of
routes in the proximity to the students who choose to walk
and/or bike to school. The students were also looking to grasp a
better understanding of the needs and interest of the school
community to increase biking and walking ability. These
observations took place for both morning drop off and afternoon
pick up at the middle/high school. The most important findings in
these observations are addressed in this document.
PARENT DROP OFF / PICK UP OF CHILDREN
Parent drop off and pick up route and location is
not clearly defined, however parents loop to front
of the building.
The average wait time for pick up and drop off was around 1 minute. There were parents who
arrived at the school 30 minutes before it ended.
One staff was present during pick up and drop off. There could have been more supervision for
the amount of children present.
After students were dropped off or picked up, parents seemed to be more in a rush when
leaving the school.
Safety concerns included no signs or designated area for pick up and drop off and lack of
crosswalks presents where children were leaving the school
BUSES
Bus drop off and pick up was located right in front of
the school across from parent pick up and drop off.
This area was used by cars before buses arrived.
This area was not clearly marked by signs.
One staff member was present during drop off and
loading.
Three buses were present during pick up and drop
off.
Safety concerns include the only pedestrian
crosswalk leading commuting children through the
loading and unloading area
Left photo: Bus drop off lane.
Right photo: Parent drop off location.

93
SPEED
Speed limit signs were located on Prospect Street and Brattleboro Road
that both have an entrance to School Street which the elementary and
middle/high schools are located on.
There are two speed bumps entering the school zone by the elementary
school and few stop signs.
The speed limit on Brattleboro Road and Prospect Street are 25 mph,
however cars seemed to be going 30-40 mph on those roads.
Turning onto School Street from Brattleboro Road there was one speed
limit sign of 15 MPH. After the speed limit sign, there was another sign
that said that the street was one way during the hours of 7 AM and 4
PM. This sign however was very small and had a lot of wording.
Buses seem to follow the speed limit signs compared to cars.
In front of the school there were no traffic calming devices other than a
crosswalk from the parking lot and one right before the school coming
from the side of Brattleboro Road. The school could benefit from speed
bumps in front of the school to slow parents down after their child gets
out of the car.
WAYFARING
Entering and exit signs to the school are clearly defined.
There are no signs for walking and biking routes.
There are no signs to indicate where children will be crossing the road.
There are no signs that indicate where the busses drop children off and
that cars aren’t allowed in that area.
LIGHTING
In the parking lot across from the school, there are six lights.
School Street had lights.
Prospect Street lacked lighting.
Lighting on Brattleboro road was apparent
BIKE USE/FACILTIES
There is one bike rack located which could hold a total of 15
bikes.
On the date ta the site was surveyed there were 8 bikes at
the bike rack, however the number of people who bike will
vary depending on the weather and the day.
Out of the 8 bikes only one was locked.
It was only safe for children coming from Brattleboro Road
to cross the street with the crossing guard at the crosswalk.
There wasn’t a crosswalk or sidewalk located on Prospect
Street.
Top photo: Speed limit sign
posted on Prospect Street.
Top photo: Do not enter sign to
the bus loop.
Below photo: Bike rack located by
the gym.

94
There were no signs on Brattleboro Road or Prospect Street alerting
drivers to the presence of bicyclists.
Student will most likely ride on the sidewalks because of the heavy
flow of traffic on the road and the speed limit outside of the school
zone.
SIDEWALKS
Students were using sidewalks along School Street in front of the
school however they were a little bit faded.
There is not sidewalk present along Prospect Street.
Along Brattleboro Road the sidewalk was in decent condition.
CROSSINGS
There was a crosswalk from Brattleboro road to School Street and a crossing guard present for
about 10 minutes before and after school.
No crosswalk was present on Prospect Street.
Car stop for children crossing from student parking lot to go
into the school.
One cross walk could be present leaving the gym where many
students exit from to go to the athletic fields.
There are curb ramps at the end of all cross walks.
More students may walk if crossing guard is present longer.
ENVIRONMENTAL CONDITIONS
Noise was not an issue in the area.
Parking areas were clean but not clearly marked.
School grounds were kept very clean.
Idling did seem to be an issue when parents were waiting to pick up
their children. A “No Idling” sign in the pickup and drop off area
could help to prevent this problem.
DRIVER BEHAVIOR
Parents seemed to be paying attention to children crossing roads.
Once the child was dropped off, parents seemed to drive faster.
Once pulling out onto Prospect Street, parents seemed to follow the
speed limit.
No U-Turns or driving the wrong way in the one way section was
apparent.
POLICIES
Bike locks were not provided by the school. One bike had a lock.
Officer enforces wearing helmets but only one was at the bike rack.
The student must provide own helmet and must wear one.
All students outside of a 1 mile radius of the school have an option for bus pickup.
Top photo: Crosswalk from the front of the
school building to the parent drop off and
student parking.
Below photo: Caution sign that children
will be crossing but no crosswalk present.

95
Appendix D: Non-Sidewalk Infrastructure Assessment Sheet

96
Appendix E: Parent Survey
Dear Parent or Caregiver,
Your child’s school wants to learn your thoughts about children walking and biking to school. This survey will take about 10 minutes to complete. We ask that each family complete only one survey per school your children attend. If more than one child from a school brings a survey home, please fill out the survey for the child with the next birthday from today’s date.
After you have completed this survey, please send it back to the school with your child or give it to his/her teacher. Your responses will be kept confidential and neither your name nor your child’s name will be associated with any results. Results will be analyzed by students in the Keene State College Geography Department as part of their senior capstone project.
Thank you for participating in this survey!
1. What is the grade of the child who brought home this survey? _________ Grade (K,1,2,3,…)
2. How many children do you have in Kindergarten through 8th grade? _________
3. Is the child who brought home this survey male or female?
Male Female Prefer not to answer
4. How far does your child live from school?
Less than ¼ mile ½ mile up to 1 mile More than 2 miles
¼ mile up to ½ mile 1 mile up to 2 miles Don't know
5. On most days, how does your child travel to and from school? (Select one choice per column)
Arrive to school Leave from school
Walk Walk
Bike Bike
School Bus School Bus
Family vehicle (only children in your family) Family vehicle (only children in your family)
Carpool (with other families) Carpool (with other families)
Other (skateboard, scooter, etc.) Other (skateboard, scooter, etc.)
6. How long does it normally take your child to get to/from school? (Select one choice per column)
Travel time to school Travel time from school
Less than 10 minutes Less than 10 minutes
11-20 minutes 11-20 minutes
More than 20 minutes More than 20 minutes
I don't know I don't know
PARENT SURVEY ABOUT WALKING AND BIKING TO SCHOOL
PLEASE WRITE CLEARLY ON THE LINES PROVIDED OR PLACE AN “X” IN THE CHECK BOX.

97
7. Has your child asked you for permission to walk or bike to/from school in the last year?
8. At what grade would you allow your child to walk or bike to/from school without an adult?
_________ Grade (K, 1, 2, 3, …) OR I would not feel comfortable at any grade
9. Which of the following issues affect your decision to allow, or not allow, your child to walk or bike to/from
school? (Check ALL that apply)
10. Would you probably let your child walk or bike to/from school if this problem were changed or
improved?
My child already walks or bikes to/from school
Distance Yes No Not sure
Convenience of driving Yes No Not sure
Time Yes No Not sure
Child's before or after-school activities Yes No Not sure
Speed/Amount of traffic along route Yes No Not sure
Adults to walk or bike with Yes No Not sure
Sidewalk/pathway/trail conditions Yes No Not sure
Lighting along walkways Yes No Not sure
Safety of intersections and crossings Yes No Not sure
Route difficulty (steepness, flatness, etc.) Yes No Not sure
Crossing guards Yes No Not sure
Violence or crime Yes No Not sure
Weather Conditions Yes No Not sure
Time of year (fall, winter, etc.) Yes No Not sure
Other (please write): Yes No Not sure
11. Which of the factors from question 9 is the most influential in your decision to allow or not allow your child to
walk to school?
(Please choose only one factor):
______________________________________________________________________________
12. Does your child have access to a bicycle?
13. Does your child participate in 60 minutes of physical activity every day?
14. Does your child participate in after school activities?
Yes No
Yes No
Yes No
Yes No

98
15. Does your child appear to perform better on mental tasks after he/she is physically active?
Yes No I do not know
16. In your opinion, how much does your child's school encourage or discourage walking and biking to/from school?
Strongly Encourages
Encourages Neither Discourages Strongly Discourages
17. In your opinion, how much fun is walking or biking to/from school for your child?
Very Fun Fun Neutral Boring Very Boring
18. Did you walk and/or bike to school as a child?
19. Please provide any additional comments below.
__________________________________________________________________________________________
__________________________________________________________________________________________
__________________________________________________________________________________________
__________________________________________
Yes No

99
Appendix F: Teacher Tally sheet

100
Thank you for reading. Stay Safe.

Hinsdale Middle/High School - Summary of Field Review Fall 2015
During the month of October, students from the Keene State College Geography Department visited Hinsdale New Hampshire several times to
examine and evaluate the safety conditions of routes in the proximity to the students who choose to walk and/or bike to school. The students were
also looking to grasp a better understanding of the needs and interest of the school community to increase biking and walking ability. These
observations took place for both morning drop off and afternoon pick up at the middle/high school. The most important findings in these
observations are addressed in this document.
PARENT DROP OFF / PICK UP OF CHILDREN
Parent drop off and pick up route and location is not clearly defined, however parents loop to front of the building.
The average wait time for pick up and drop off was around 1 minute. There were parents who arrived at the school 30 minutes before it
ended.
One staff was present during pick up and drop off. There could have been more supervision for the amount of children present.
After students were dropped off or picked up, parents seemed to be more in a rush when leaving the school.
Safety concerns included no signs or designated
area for pick up and drop off and lack of crosswalks
presents where children were leaving the school
BUSES
Bus drop off and pick up was located right in front of
the school across from parent pick up and drop off.
This area was used by cars before buses arrived.
This area was not clearly marked by signs.
One staff member was present during drop off and
loading.
Three buses were present during pick up and drop
off.
Safety concerns include the only pedestrian
crosswalk leading commuting children through the
loading and unloading area. Left photo: Parent drop off location. Right photo: Bus drop off lane.

SPEED
Speed limit signs were located on Prospect Street and Brattleboro Road near the entrances to School
Street.
There are speed bumps entering the school zone by the elementary school and few stop signs.
The speed limit on Brattleboro Road and Prospect Street are 25 mph, however cars seemed to be
going 30-40 mph on those roads.
Turning onto School Street from Brattleboro Road there was one speed limit sign of 15 MPH. After
the speed limit sign, there was another sign that said that the street was one way during the hours of
7 AM and 4 PM. This sign however was very small and had a lot of wording.
Buses seem to follow the speed limit signs compared to cars.
In front of the school there were no traffic calming devices other than a crosswalk from the parking
lot and one right before the school coming from the side of Brattleboro Road. The school could benefit
from speed bumps in front of the school to slow parents down after their child gets out of the car.
WAYFARING
Entering and exit signs to the school are clearly defined.
There are no signs for walking and biking routes.
There are no signs to indicate where children will be crossing the road.
There are no signs that indicate where the busses drop children off and that cars aren’t allowed in that area.
LIGHTING
In the parking lot across from the school, there are six lights.
School Street had lights.
Prospect Street lacked lighting.
Lighting on Brattleboro road was apparent
This picture shows the speed
limit sign posted on Prospect
Street.

BIKE USE/FACILTIES
There is one bike rack located which could hold a total of 15 bikes.
On the date ta the site was surveyed there were 8 bikes at the bike rack, however the number
of people who bike will vary depending on the weather and the day.
Out of the 8 bikes only one was locked.
It was only safe for children coming from Brattleboro Road to cross the street with the
crossing guard at the crosswalk. There wasn’t a crosswalk or sidewalk located on Prospect
Street.
There were no signs on Brattleboro Road or Prospect Street alerting drivers to the presence
of bicyclists.
Student will most likely ride on the sidewalks because of the heavy flow of traffic on the road
and the speed limit outside of the school zone.
SIDEWALKS
Students were using sidewalks along School Street in front of the school however they were
a little bit faded.
There is not sidewalk present along Prospect Street.
Along Brattleboro Road the sidewalk was in decent condition.
CROSSINGS
There was a crosswalk from Brattleboro road to School Street and a crossing guard present
for about 10 minutes before and after school.
No crosswalk was present on Prospect Street.
Car stop for children crossing from student parking lot to go into the school.
One cross walk could be present leaving the gym where many students exit from to go to the
athletic fields.
There are curb ramps at the end of all cross walks.
More students may walk if crossing guard is present longer.
The picture above is a do not enter sign to the
bus loop. The picture below is the bike rack
located by the gym.

ENVIRONMENTAL CONDITIONS
Noise was not an issue in the area.
Parking areas were clean but not clearly marked.
School grounds were kept very clean.
Idling did seem to be an issue when parents were waiting to pick up their children. A “No Idling”
sign in the pickup and drop off area could help to prevent this problem.
DRIVER BEHAVIOR
Parents seemed to be paying attention to children crossing roads.
Once the child was dropped off, parents seemed to drive faster.
Once pulling out onto Prospect Street, parents seemed to follow the speed limit.
No U-Turns or driving the wrong way in the one way section was apparent.
POLICIES
Bike locks were not provided by the school. One bike had a lock.
Officer inforces wearing helmets but only one was left with the bike at the bike rack.
The student must provide own helmet and must wear one.
All students outside of a 1 mile radius of the school have an option for bus pickup.
The top picture shows the crosswalk
from the front of the school building to
the parent drop off and student parking.
The picture below is a caution sign that
children will be crossing but no
crosswalk present.


Appendix D: Safe Routes to School Resources
National Safe Routes to School Guide: http://guide.saferoutesinfo.org/pdf/SRTS-Guide_full.pdf This guide is a comprehensive online reference manual designed to support the development of Safe Routes to School (SRTS) programs. Available online or in a downloadable PDF version, the guide covers engineering, education, enforcement, encouragement, evaluation and more. Safe Routes to School’s Bicycle and Pedestrian Curricula Guide: Making the Case for Bicycle and Pedestrian Youth Education http://www.in.gov/indot/files/BicyclePedestrianCurriculaGuide2011.pdf The Safe Routes to School National Partnership created this guide to provides background and tips for systematic implementation of bicycle and pedestrian safety education and a variety of curriculum programs and materials are provided. How to Plan a Walk to School Day Event Guide: http://www.walkbiketoschool.org/sites/default/files/WBTS_HowToPlan_ForWeb.pdf This guide provides steps, tips, and ideas for planning a fun and safe walk to school day event. Get Out and Get Moving: Opportunities to Walk to School through Remote Drop off Programs: http://www.changelabsolutions.org/sites/default/files/SRTS-Remote-Drop-Off-Rural_School_Districts-FINAL_20140611.pdf This resource provides information on organizing a remote drop off location and offers examples of how different schools have structured their own remote drop off programs to ensure safety.
Safe Routes to School Encouragement Guide http://guide.saferoutesinfo.org/pdf/SRTS-Guide_Encouragement.pdf The Safe Routes to School Encouragement Guide provides tips for organizing a variety of encouragement activities including walk to school day events and mileage clubs and contests. Student Drop off and Pick up Guide: http://guide.saferoutesinfo.org/pdf/SRTS-Guide_Dropoff-Pickup.pdf The Student Drop off and Pick up Guide provides information on how to improve drop off and pick up procedures using engineering, enforcement, and education, and encouragement solutions. School Walk and Bike Routes: A Guide for Planning and Improving Walk and Bike to School Options for Students http://www.wsdot.wa.gov/NR/rdonlyres/5463FD69-F7B9-477D-B9AA-D21CEEFCF722/0/SchoolAdminGuide.pdf This guide provides resources for school administrators and educators to help develop, maintain, and improve school walk routes and address bicycle and pedestrian safety. Walkability Checklist http://www.saferoutesinfo.org/sites/default/files/walkabilitychecklist.pdf The walkability checklist allows users to evaluate a neighborhood’s walkability to plan safe walking routes to and from school. Bikability Checklist http://www.saferoutesinfo.org/sites/default/files/resources/Bikeability_Checklist.pdf The bikability checklist allows users to evaluate a neighborhood’s bikability.