divai 2018
531
-
Upload
khangminh22 -
Category
Documents
-
view
1 -
download
0
Transcript of divai 2018

Constantine the Philosopher University in Nitra
Faculty of Natural Sciences
Department of Computer Science
and
University of Hradec Králové
Faculty of Informatics and Management
DIVAI 2018
12th International Scientific Conference on Distance Learning in Applied Informatics
Conference Proceedings
Štúrovo, Slovakia
May 2 – 4, 2018

DIVAI 2018
12th International Scientific Conference on Distance Learning in Applied Informatics
Publisher: Wolters Kluwer ČR, a. s., U nákladového nádraží 10, 130 00 Praha
Edition: 3274
Organized by:
Constantine the Philosopher University in Nitra
University of Hradec Králové
OZ DIVAI (Dištančné vzdelávanie v aplikovanej informatike) Nitra
Partners:
EUNIS Slovakia
EUNIS‐CZ
Sponzors:
Dimension Data Slovakia, s r.o.
IBM Slovensko
MICROCOMP – Computersystém s r.o.
Mühlbauer Technologies s.r.o.
Česká asociace distančního univerzitního vzdělávání
Editors: Milan Turčáni, Zoltán Balogh, Michal Munk, Jozef Kapusta, Ľubomír Benko
© The authors listed in the Table of Contents
ISBN 978-80-7598-059-5
ISSN 2464-7470 (Print)
ISSN 2464-7489 (On-line)
Papers are printed as delivered by authors without substantial modifications. All accepted papers have been double‐blind reviewed.
Preface
Dear readers!
Sixteen years ago the Department of Informatics, Faculty of Natural Sciences, Constantine the Philosophy University in Nitra decided to organize a conference focusing on the application of ICT into the instruction of informatics subjects. The very first years of the conference we were very careful about the number of participants. Participants came mostly from departments of informatics from the universities in the Czech and Slovak Republic, which was mainly connected with the considerable resentment of other fields to use modern information technologies for the support of instruction at their workplaces. In the first few years of the conference, which was called DIVAI (Distant Education in Applied Informatics) the powerful community of experts on informatics succeeded in proving that supporting education using the tools of Internet has its substantiation and a permanent place mainly in the distant form of educating the students. Departments of informatics in Slovakia and Czech Republic started to use these tools and created educational environs for their activity. Later, we extended the participation of experts from the surrounding states, mainly from the Czech Republic, Poland, Slovenia, Lithuania, Latvia, Hungary and in 12th year we are going to welcome participants from Serbia, Ukraine, Azerbaijan, Russia and other countries. The conference within the university education has one thing in common and that is utilization of services and tools of Internet, thus eliminating barriers for permanent cooperation in this sphere. After finishing 9th conference and based on the reviews and the feedback from the participants of the conference we sent our outcomes of the event in the form of proceedings from the conference into the database WoS Thomson Reuters for indexing process. After a certain period we were surprised by a message on positive evaluation and the subsequent indexing of the proceedings in the WoS database. At the jubilee conference we are ready to publish the accepted and reviewed contributions in the printed form of serious quality. We have asked the renowned publishing house Volters Kluver, which has its representation in Prague for its realization. We believe that after serious reviews and selection of those best contributions you will receive professional material from the sphere of university instruction using modern information means of a very good quality.
In conclusion I wish all the readers of the outcomes of the conference coming from professional practice, as well as all those interested in these issues on all levels of education a quality experience and acquiring new knowledge in the given area.
I want to express my best thanks in this form to all members of the programme committee, as well as members of the organizing committee for their willingness and helpfulness at preparation and during the course of the conference DIVAI 2018 and editing of the final publication, which will be sent for indexing to WoS database of Thomson Reuters. We believe that the publication will be positively accepted not only by the readers, but also by the evaluators from the Thomson Reuters publishing house.
Milan Turčáni
Conference chair

Conference Organization
INTERNATIONAL PROGRAM COMMITTEE
Boris Aberšek University of Maribor, Maribor, Slovenia
Agnaldo Arroio University of São Paulo, São Paulo, Brazil
Abzetdin Adamov Kafkaz University, Baku, Azerbaijan
Zoltán Balogh Constantine the Philosopher University in Nitra, Nitra, Slovakia
Štefan Beňuš Constantine the Philosopher University in Nitra, Nitra, Slovakia
Martin Bílek University of Hradec Králové, Hradec Králové, Czech Republic
Andris Broks University of Latvia, Riga, Latvia
Jana Burgerová University of Prešov in Prešov, Prešov, Slovakia
Douglas Butler iCT Training Centre, Oundle, United Kingdom
Klára Císařová Technical University of Liberec, Liberec, Czech Republic
Soňa Čeretková Constantine the Philosopher University in Nitra, Nitra, Slovakia
Martin Drlík Constantine the Philosopher University in Nitra, Nitra, Slovakia
Ludvík Eger University of West Bohemia, Plzeň, Czech Republic
Mikuláš Gangur University of West Bohemia, Plzeň, Czech Republic
Sue Greener Brighton Business School, Brighton, United Kingdom
Claudio Guarnaccia University of Salerno, Salerno, Italy
Milan Houška Czech University of Live Sciences Prague, Prague, Czech Republic
Mikuláš Huba Slovak University of Technology, Bratislava, Slovakia
Štěpán Hubálovský University of Hradec Králové, Hradec Králové, Czech Republic
Josef Hynek University of Hradec Králové, Hradec Králové, Czech Republic
František Jakab The Technical University of Košice, Košice, Slovakia
Stanislaw Jusczyk University of Silesia, Katowice, Poland
Jozef Kapusta Constantine the Philosopher University in Nitra, Nitra, Slovakia
Alexander Khoroshilov Institute for Information Technologies in Education, Moskva, Russia
Daniel Kluvanec European Commision, Brussels, Belgium
Kateřina Kostolányová University of Ostrava, Ostrava, Czech Republic
Vincentas Lamanauskas Šiauliai University, Šiauliai, Lithuania
Jan Lojda ČADUV Praha, Czech Republic
Arno Louw University of Johannesburg, Johannesburg, South Africa
Gabriela Lovászová Constantine the Philosopher University in Nitra, Nitra, Slovakia

Conference Organization
Jaroslava Mikulecká University of Hradec Králové, Hradec Králové, Czech Republic
Peter Mikulecký University of Hradec Králové, Hradec Králové, Czech Republic
Gyorgy Molnár Budapest University of Technology and Economics, Budapest, Hungary
Renate Motschnig University of Vienna, Vienna, Austria
Arnošt Motyčka Mendel University in Brno, Brno, Czech republic
Nicholas Mousoulides University of Nicosia, Nicosia, Cyprus
Michal Munk Constantine the Philosopher University in Nitra, Nitra, Slovakia
Daša Munková Constantine the Philosopher University in Nitra, Nitra, Slovakia
Michal Musílek University of Hradec Králové, Hradec Králové, Czech Republic
Tomáš Pitner Masaryk University, Brno, Czech Republic
Miroslav Plevný University of West Bohemia, Plzeň, Czech Republic
Petra Poulová University of Hradec Králové, Hradec Králové, Czech Republic
Ivana Rábová Mendel University in Brno, Brno, Czech Republic
Lucie Rohlíková University of West Bohemia, Pilsen, Czech Republic
Ivana Šimonová University of Hradec Králové, Hradec Králové, Czech Republic
Jiří Šťastný Mendel university in Brno, Brno, Czech Republic
Marta Takács University of Novi Sad, Novi Sad, Serbia
Darina Tóthová EUNIS Slovakia, Slovakia
Pavel Trojovský University of Hradec Králové, Hradec Králové, Czech Republic
Eugenia Smyrnova Trybulska University of Silesia, Katowice, Poland
Milan Turčáni Constantine the Philosopher University in Nitra, Nitra, Slovakia
Andreas Ulovec University of Vienna, Vienna, Austria
Ivan Vrana EUNIS---CZ, Czech Republic
Mateja Ploj Virtič University Maribor, Maribor, Slovenia
Wei-Chi Yang Radford University, Radford, Virginia, United States of America
Ľubomír Zelenický Constantine the Philosopher University in Nitra, Nitra, Slovakia
ORGANIZING COMMITTEE
Department of Computer Science, Constantine the Philosopher University in Nitra, Nitra, Slovakia
Milan Turčáni
Zoltán Balogh
Michal Munk
Jozef Kapusta
Martin Drlík

Conference Organization
Mária Burianová
Katarína Kurajdová
Ľubomír Benko
Tibor Tóth
Jan Francisti
LIST OF REVIEWERS
Boris Aberšek University of Maribor, Maribor, Slovenia
Agnaldo Arroio University of São Paulo, São Paulo, Brazil
Zoltán Balogh Constantine the Philosopher University in Nitra, Nitra, Slovakia
Ľubomír Benko University of Pardubice, Pardubice, Czech Republic
Martin Bílek University of Hradec Králové, Hradec Králové, Czech Republic
Martin Boltižiar Constantine the Philosopher University in Nitra, Nitra, Slovakia
Jana Burgerová University of Prešov in Prešov, Prešov, Slovakia
Martin Cápay Constantine the Philosopher University in Nitra, Nitra, Slovakia
Soňa Čeretková Constantine the Philosopher University in Nitra, Nitra, Slovakia
Martin Drlík Constantine the Philosopher University in Nitra, Nitra, Slovakia
Martin Drozda Slovak University of Technology, Bratislava, Slovakia
Ludvík Eger University of West Bohemia, Plzeň, Czech Republic
Vladimír Falťan Comenius University in Bratislava, Bratislava, Slovakia
Rostislav Fojtík University of Ostrava, Ostrava, Czech republic
Mikuláš Gangur University of West Bohemia, Plzeň, Czech Republic
Milan Houška Czech University of Live Sciences Prague, Prague, Czech Republic
Mikuláš Huba Slovak University of Technology, Bratislava, Slovakia
Štěpán Hubálovský University of Hradec Králové, Hradec Králové, Czech Republic
Imrich Jakab Constantine the Philosopher University in Nitra, Nitra, Slovakia
Jozef Kapusta Constantine the Philosopher University in Nitra, Nitra, Slovakia
Štefan Koprda Constantine the Philosopher University in Nitra, Nitra, Slovakia
Kateřina Kostolányová University of Ostrava, Ostrava, Czech Republic
Peter Kuna Constantine the Philosopher University in Nitra, Nitra, Slovakia
Gabriela Lovászová Constantine the Philosopher University in Nitra, Nitra, Slovakia
Martin Magdin Constantine the Philosopher University in Nitra, Nitra, Slovakia
Peter Mikulecký University of Hradec Králové, Hradec Králové, Czech Republic
Gyorgy Molnár Budapest University of Technology and Economics, Budapest, Hungary
Michal Munk Constantine the Philosopher University in Nitra, Nitra, Slovakia
Tatiana Pavlova Herzen State Pedagogical University of Russia, Sankt Petersburg, Russia
Tomáš Pitner Masaryk University, Brno, Czech Republic

Conference Organization
Petra Poulová University of Hradec Králové, Hradec Králové, Czech Republic
Ivana Rábová Mendel University in Brno, Brno, Czech Republic
Jaroslav Reichel Constantine the Philosopher University in Nitra, Nitra, Slovakia
Lucie Rohlíková University of West Bohemia, Pilsen, Czech Republic
Antonín Slabý University of Hradec Králové, Hradec Králové, Czech Republic
Eugenia Smyrnova Trybulska University of Silesia, Katowice, Poland
Jiří Šťastný Mendel university in Brno, Brno, Czech Republic
Peter Švec Constantine the Philosopher University in Nitra, Nitra, Slovakia
Júlia Tomanová Constantine the Philosopher University in Nitra, Nitra, Slovakia
Darina Tóthová EUNIS Slovakia, Slovakia
Pavel Trojovský University of Hradec Králové, Hradec Králové, Czech Republic
Milan Turčáni Constantine the Philosopher University in Nitra, Nitra, Slovakia
Mateja Ploj Virtič University Maribor, Maribor, Slovenia
Martin Vozár Constantine the Philosopher University in Nitra, Nitra, Slovakia
Olga Yakovleva Herzen State Pedagogical University of Russia, Sankt Petersburg, Russia

Table of Contents
Preface ............................................................................................................................... 4
Conference Organization ..................................................................................................... 5
Table of Contents ................................................................................................................ 9
Keynote Lectures
Flexible Forms of Learning as a Challenge for Higher Education
Lucie Rohlíková ............................................................................................................................ 13
Conference Papers
SECTION: INFORMATION TECHNOLOGIES SUPPORTING LEARNING
Application of Geographical Information System (GIS) in Geography (Digital Data Pre-processing for Land-use Changes Analysis)
Martin Boltižiar, Peter Chrastina ................................................................................................ 29
Comparison of IT Skills Testing of Preschool and Elementary Education Students by the IT Fitness Test
Jana Burgerová, Martina Adamkovičová, Vladimír Piskura ........................................................ 37
Automated Generation of Statistical Tasks
Mikuláš Gangur ........................................................................................................................... 47
Virtualisation Tools In Science Education
Ján Gunčaga, Robert Janiga ........................................................................................................ 59
E-learning Courses Structural Evaluation
Dominik Halvoník, Jozef Kapusta ................................................................................................ 71
New Directions in Nationwide Technology Integration into Mathematics Teaching: The Geomatech Project
Lilla Korenova, Marta Kis, Zsolt Lavicza, Peter Ostradicky, Theodosia Prodromou .................... 81
Perception of the Educational Potential of Online Social Networks in Romania and Lithuania
Vincentas Lamanauskas, Gabriel Gorghiu, Dragos Daniel Iordache, Costin Pribeanu................ 91
The Role of Mobile Devices Supported Education and Open Content Development in the Learning Process
György Molnár .......................................................................................................................... 103
Creation of Personalized Learning Courses in Adaptive LMS
Marián Mudrák, Milan Turčáni, Mária Burianová .................................................................... 117

Users’ Characteristics for Analyzing the Educational Texts with an Eye-Tracking Technology
Kristýna Mudrychová, Tereza Horáková, Martina Houšková Beránková ................................ 129
Information Behaviour and Attitude to Lifelong Learning: A Comparative Study for Students of Person-Oriented Specialties
Tatyana Noskova, Olga Yakovleva, Tatyana Pavlova, Barbara Kołodziejczak, Magdalena Roszak ................................................................................................................................................... 139
Microlearning in the Instruction of Technical and Humanities Courses
Radim Polasek, Tomas Javorcik ................................................................................................. 151
The Importance of Mobile Access to Information Systems for Pre-service Teachers
Lucie Rohlíková, Jiří Kohout, Václav Vrbík, Ondřej Rohlík ......................................................... 161
Specific Mistakes Made by Students in Teaching of Parametric Modelling
Antonin Slaby, Josef Matejus, Pavel Cyrus ................................................................................ 175
The use of Monte Carlo Computer Simulation in Teaching Statistics
Milan Svoboda, Mikuláš Gangur ............................................................................................... 185
E-learning at Slovak University of Agriculture in Nitra
Darina Tothova.......................................................................................................................... 195
Innovative Model of Environmental Education in Lower Secondary Education
Martina Zigová, Zuzana Pucherová, Imrich Jakab .................................................................... 205
SECTION: LEARNING/TEACHING METHODOLOGIES, ASSESSMENT
AND LEARNING ENVIRONMENTS
Experience-Based Learning – an Analogy for Self-Healing Porous Materials
Boris Aberšek, Metka Kordigel Aberšek, Andrej Flogie ............................................................. 219
Typing or Longhand Writing – IWM Test, a Methodology for Making a Smart Decision
Metka Kordigel Aberšek, Boris Aberšek .................................................................................... 229
How to Combine Inquiry Based Science Education and ICT: A Case of Science Methodology
Martin Bílek, Jarmila Kmeťová .................................................................................................. 241
Method of Analysis and Optimal Fingerprints Database Cleaning
Jan Budina, Martin Zmitko ........................................................................................................ 251
Digital Marketing Course: A Study on the Effectiveness of Blended Learning
Ludvík Eger, Michal Mičík .......................................................................................................... 263
Teaching of Object-Oriented Programming
Rostislav Fojtík .......................................................................................................................... 273
Importance of Feedback in Testing by use of Universal Testing System
Dana Horváthová, Patrik Voštinár ............................................................................................ 283

Learning Critical Thinking Without Teacher’s Presence
Jozef Hvorecky, Lilla Korenova .................................................................................................. 293
Petri Net Model of Student Choices in a LMS Moodle E-Course
Michal Kuchárik, Zoltán Balogh, Martin Drozda ....................................................................... 303
Trends and Strategies in ICT Application in Higher Education versus Evaluation of Teaching and Learning
Josef Malach, Kateřina Malachová ........................................................................................... 313
Standards and Frameworks of Digital Competence of Teachers as a Tools for Professional Training and Assessement
Josef Malach, Veronika Švrčinová ............................................................................................. 325
Data Science Study Program
Petra Poulova, Jaroslava Mikulecka, Tomas Kozel, Blanka Klimova ......................................... 337
Academic Information Transparency: From Teachers’ E-Portfolio to Upgrading the Rankings of Universities
Eugenia Smyrnova-Trybulska, Nataliia Morze, Olena Kuzminska ............................................ 347
Applying Cloud Computing for Automated Generation of Parameterized Tasks and Test
Václav Sova Martinovský, Miroslav Plevný ............................................................................... 357
Adaptive Aproach to the Gamification in Education
Petr Škuta, Kateřina Kostolányová ............................................................................................ 367
On Difficulties with Knowledge Transfer from Visual to Textual Programming
Tomáš Tóth, Gabriela Lovászová .............................................................................................. 379
SECTION: INTELLIGENT COMPUTING
Large-scale data modeling in Hive and distributed query processing using Mapreduce and Tez
Abzetdin Adamov ...................................................................................................................... 389
Identification of necessary tasks for effective Adoption of Learning Analytics at the University
Martin Drlík ............................................................................................................................... 405
Wireless Sensor Network as a part of Internet of Things
Jan Francisti, Zoltán Balogh ...................................................................................................... 419
Three stage object boundary intersection solver
Petr Jindra, Jiri Stastny .............................................................................................................. 431
Analysis of MOOC course: Experiment processing
Miroslav Kadlečík, Michal Munk ............................................................................................... 451
Mobile phone as an interactive device in augmented reality system
Milan Košťák, Bruno Ježek ........................................................................................................ 461

Clouds for Smart Learning Environments
Peter Mikulecky, Lubos Mercl ................................................................................................... 473
Identification of Important Activities for Teaching Programming Languages by Decision Trees
Juraj Obonya, Jozef Kapusta ..................................................................................................... 481
Fuzzy knowledge unit
Michal Peták, Milan Houška ..................................................................................................... 491
Data processing methods in the development of the microlearning-based framework for teaching programming languages
Jan Skalka .................................................................................................................................. 503
Web Log Data Preprocessing using Raspberry Pi Cluster and hadoop cluster
Peter Svec, Lukas Chylo, Jakub Filipik ........................................................................................ 513
List of Authors ................................................................................................................. 522
Partners........................................................................................................................... 528
Sponsors .......................................................................................................................... 528

Keynote Lectures

Lucie Rohlíková Flexible Forms of Learning as a Challenge for Higher Education
DIVAI 2018 – The 12th international scientific conference on Distance Learning in Applied Informatics. 13 ISBN 978-80-7598-059-5 (Print) ISSN 2464-7470 (Print) ISSN 2464-7489 (On-line)
Flexible Forms of Learning as a Challenge for
Higher Education
Lucie Rohlíková
Faculty of Education, University of West Bohemia, Pilsen, Czech Republic [email protected]
Abstract
This paper will discuss current trends in the development of lifelong and online education through the eyes of universities. Given the demographic situation and progressive automation, significant changes in demand for education can be expected in the near future in individual and flexible forms using digital technologies. Flexible forms of education are becoming an increasingly more important part of the portfolio of successful world universities. It turns out that flexible education not only allows study for students who are limited by university distances, but also has the potential to contribute to reducing students’ low learning success rates. From the point of view of academic staff, flexible education can reduce the number of lessons taught, thereby freeing up research time. From the point of view of university management, quality flexible education opens up opportunities for study to new target groups, and assures the university a stable position. In the paper, we will try to answer the question of what universities can do in order to prepare for new challenges in the field of education.
Keywords
Flexibility. Flexible Learning. Online Learning. Individualised Learning. Higher Education. Industry 4.0.
INTRODUCTION
“If institutions do not already have robust strategies for integrating new pervasive approaches, then they simply will not survive.”
(NMC Horizon Report: 2017 Higher Education Edition)
The internationally recognized NMC Horizon Report series presents trends, significant challenges, and developments in educational technology each year. The document in 2017 was created in collaboration with 78 experts, and features the following highlights (Adams Becker, Cummins, Davis, Freeman, Hall Giesinger & Ananthanarayanan, 2017):
� Advancing progressive learning approaches requires cultural transformation. Institutions must be structured in ways that promote the exchange of fresh ideas, identify successful models within and outside of the campus and reward teaching innovation — with student success at the center.
� Real-world skills are needed to bolster employability and workplace development. Students expect to graduate into gainful employment. Institutions

Lucie Rohlíková Flexible Forms of Learning as a Challenge for Higher Education
DIVAI 2018 – The 12th international scientific conference on Distance Learning in Applied Informatics. 14 ISBN 978-80-7598-059-5 (Print) ISSN 2464-7470 (Print) ISSN 2464-7489 (On-line)
have a responsibility to deliver deeper, active learning experiences and skills-based training that integrate technology in meaningful ways.
� Collaboration is key for scaling effective solutions. Communities of practice, multidisciplinary leadership groups and open social networks can help spread evidence-based approaches. Institutions and educators can make more progress learning from each other.
� Despite the proliferation of technology and online learning materials, access is still unequal. Gaps persist across the world that hamper college completion for student groups by socioeconomic status, race, ethnicity, and gender. Further, sufficient internet access remains uneven.
� Processes for assessing nuanced skills at a personal level are needed. Adaptive technologies and a focus on measuring learning are driving institutional decision-making while personalizing student learning experiences; leaders must now consider how to evaluate the acquisition of vocational skills, competencies, creativity, and critical thinking.
� Fluency in the digital realm is more than just understanding how to use technology. Training must go beyond gaining isolated technology skills toward generating a deep understanding of digital environments, enabling intuitive adaptation to new contexts and co-creation of content with others.
� Online, mobile, and blended learning are foregone conclusions. An important step is tracking how these models are actively enriching learning outcomes.
� Learning ecosystems must be agile enough to support the practices of the future. In using tools and platforms like LMS, educators have a desire to unbundle all of the components of a learning experience to remix open content and educational apps in unique and compelling ways.
� Higher education is an incubator for developing more intuitive computers. As artificial intelligence and natural user interfaces tip into mainstream use, universities are designing machine learning algorithms and haptic devices that more authentically respond to human interaction.
� Lifelong learning is the lifeblood of higher education. Institutions must prioritize and recognize ongoing learning — both formal and informal — for their faculty, staff, and students.
If we were looking for a common denominator for these ten previous points, it is certainly flexible learning - a choice of time, place, and method of learning (Gordon, 2014), based on giving the responsibility to learners, identifying opportunities by instructors, and building flexible systems that help institutions ensure a quality learning experience (Ryan & Tilbury, 2013).
The digital revolution has penetrated many aspects of society and economy and profoundly transformed our lives (Lifelong Learning Platform, 2017). Learning is becoming increasingly ubiquitous in time and place, and the lines between traditionally divided tools such as audio, videos, textbooks, games, and others are blurred (Livingstone, Haddon, Görzig & Ólafsson, 2011). To achieve enhanced learning experiences and outcomes of learning, the system needs to conform to the needs of learners, and not the other way around. The place of the learner is at the centre (Green, Pearson & Stockton, 2006).

Lucie Rohlíková Flexible Forms of Learning as a Challenge for Higher Education
DIVAI 2018 – The 12th international scientific conference on Distance Learning in Applied Informatics. 15 ISBN 978-80-7598-059-5 (Print) ISSN 2464-7470 (Print) ISSN 2464-7489 (On-line)
Providing high quality, relevant, and widely accessible higher education is a fundamental goal of the European Higher Education Area. Within the frameworks of the Bologna Process, higher education systems and institutions have been engaged in a constant drive, both individually and collaboratively, to achieve this. New and emerging approaches to learning and teaching, made possible by new technologies, can complement, consolidate, support, and further advance these efforts (European Commission, 2014).
In this paper, we will first describe flexible forms of learning in more detail, along with their specifics and potential. Next, we will present the current context of tertiary education, which in the near future will mainly affect demographic development and automation.
HIGHER EDUCATION AND THE POTENTIAL OF THE FLEXIBILITY
The terms “flexible learning” and “flexible delivery” have become an integral part of every university’s lexicon in order to attract students, by conveying the impression that modes of study can be adapted to suit individuals needs, interests, and learning styles (Diezmann & Yelland, 2000). Flexible learning is about empowering students by offering them choices in how, what, when, and where they learn: the pace, place, and mode of delivery. This requires a balance of power between institutions and students, and seeks to find ways in which choice can be provided that is economically viable and appropriately manageable, for institutions and students alike (Higher Education Academy, 2018).
Some others definitions describes flexible learning as:
� a generic term that covers all those situations where learners have some say in how, where, and when learning takes place – whether within the context of traditional institution centred courses or in non-traditional contexts, such as open learning, distance learning, CAT schemes, wider-access courses, or continuing professional development (Ellington, 1997).
� a movement away from a situation in which key decisions about learning dimensions are made in advance by the instructor or institution, towards a situation where the learner has a range of options from which to choose, with respect to these key dimensions (Collis & Moonen, 2001).
� a set of educational philosophies and systems, concerned with providing learners with increased choice, convenience, and personalisation to suit the learner. In particular, flexible learning provides learners with choices about where, when, and how learning occurs. Sometimes also referred to as personalized learning (Shurville, O'Grady & Mayall, 2008).
Nunan (1996) describes that there are progressive interpretations of flexible learning which are structured around competing social and humanist values, which have educational expression through concepts such as constructivism, open education, student centred learning, life-long learning, deep learning, and accessible learning structures. Nunan (1996) also argues that flexible delivery is a new commodity to be marketed and sold, and as such, creates a market niche for universities and educational designers and suppliers. In this way flexibility means different things to different people and thus any

Lucie Rohlíková Flexible Forms of Learning as a Challenge for Higher Education
DIVAI 2018 – The 12th international scientific conference on Distance Learning in Applied Informatics. 16 ISBN 978-80-7598-059-5 (Print) ISSN 2464-7470 (Print) ISSN 2464-7489 (On-line)
conceptualisation of what constitutes flexible, has to be viewed from the context of the particular stakeholder.
Hart (2000) separate “flexible delivery” (technology or economically driven strategies) from true “flexible learning” (an educational goal). He has defined eight principles important in the implementation of a flexible learning policy – see Table 1.
Table 1. Eight principles of flexible learning (according to Hart, 2000)
Flexible access There are no barriers to student admission, and students can choose whether to work independently, attend classes, or a combination of the two.
Recognition of prior learning Giving credit for formal or non-formal learning, including work experience and training, using of individual competence in the course development
Flexible content Breaking the course into modules, problem based tasks, recognition of units from other universities, extensions of offered units, supervised practical work, or learning contracts
Flexible participation Availability of staff at all times that are convenient to students, multiple ways of communication
Flexible teaching and learning methods
Independent learning based on deep approach and learner responsibility, collaboration is encouraged, metacognitive goals
Flexible resources Modular self-instruction materials, access to all university resources are available both on and off campus
Flexible assessment Assessment is based on competency rather than time. Assessment matches the goal of the course and encourages students to be responsible for their own level of achievement.
Ongoing evaluation Ongoing formative and summative evaluations of flexible learning curricula and materials is crucial
In a multinational study, Collis and van der Wende (2002) identified 19 dimensions of flexibility, and listed them under five key categories as follows Table 2:
Table 2. Dimensions of flexibility
Flexibility related to time Times (for starting and finishing a course)
Times (for submitting assignments and interacting with the course)
Tempo/pace of study
Moments of assessment
Flexibility related to content Topics of the course
Sequence of different parts of a course
Orientation of the course (theoretical, practical)
Key learning materials of the course
Assessment standards and completion requirements
Flexibility related to entry requirements
Conditions for participation
Flexibility related to instructional approach and resources
Social organisation of learning (face-to-face, group, individual)
Language to be used during the course
Learning resources: modality, origin (instructor, learners, library, WWW)
Instructional organisation of learning (assignments, monitoring)
Flexibility related to delivery and logistics
Time and place where contact with instructor and other students occur

Lucie Rohlíková Flexible Forms of Learning as a Challenge for Higher Education
DIVAI 2018 – The 12th international scientific conference on Distance Learning in Applied Informatics. 17 ISBN 978-80-7598-059-5 (Print) ISSN 2464-7470 (Print) ISSN 2464-7489 (On-line)
Methods, technology for obtaining support and making contact
Types of help, communication available, and technology required
Location, technology for participating in various aspects of the course
Delivery channels for course information, content communication
The key idea here is choice, though not everything can be made flexible at all times, and for all students. This approach fosters equal opportunities for learners with wide-ranging goals. Flexible and personalised learning initiatives may include the use of learning analytics or the use of adaptive learning technologies to cater for the needs of individual students. Managing such course provision requires complex logistics, and there is currently an unsatisfied demand for this type of learning (Hermans, Janssen, Vogten & Koper, 2015, Johnson, Adams Becker, Estrada & Freeman, 2015)
What is the potential of flexible learning for higher education? It shows that flexible delivery is therefore a pedagogy and a marketing strategy, as well as a form of work organisation (Sappey, 2005). Peters (2003) it emphasises that the urge to make our universities more flexible has increased so considerably that one can speak of a campaign towards more flexibility at many universities.
The proof of the perception of flexibility as a very important variable in the context of higher education is the renowned Bradley Review (Bradley, Noonan, Nugent & Scales, 2008), which influenced Australian higher education policy discourse in 2008 (Palmer, 2011). This wide-ranging report recapitulates all former policy conceptions of flexibility including:
� flexible provision of higher education, particularly as a means for reaching otherwise uneconomic student markets;
� a flexible system that responds rapidly to stakeholder wants;
� flexibility derived from ICTs;
� flexibility in institutional staff working arrangements (this is noted as desirable, but also as having negative impacts on certain staff);
� development of graduates who think and operate flexibly;
� more flexible, less bureaucratic higher-education legislation;
� institutional strategic plans with in-built flexibility to respond to opportunities;
� flexible articulation of study pathways between the technical and further education and university sectors; and
� more flexibility in the qualifications framework that defines generic qualification types and learning outcomes.
The current development of micro credentials, including nanodegrees (offered by MOOC platform Udacity), MicroMasters (offered by edX), and Educator Micro credentials (offered by Digital Promise) are extremely important. One example is also ‘Kies op Maat’, a partnership of universities of applied sciences that allows students to complete their minors with all participating partner institutions without any financial implications. The 4-TU federation (Delft, Eindhoven, Twente and Wageningen) and the partnership of the universities of Leiden, Delft and Rotterdam (CLE) also offer opportunities for micro credentials. In both cases, education completed elsewhere can be recognised within a bachelor or master study programme at the home institution. This indicates that

Lucie Rohlíková Flexible Forms of Learning as a Challenge for Higher Education
DIVAI 2018 – The 12th international scientific conference on Distance Learning in Applied Informatics. 18 ISBN 978-80-7598-059-5 (Print) ISSN 2464-7470 (Print) ISSN 2464-7489 (On-line)
consistent organisation of flexible education at several institutions and the allocation of credentials in this respect is becoming more important (Kerver & Riksen, 2016).
EADTU-EU Summit 2017 “Innovations in teaching and learning; new directions for higher education” Conclusions supports the creation of Short learning programmes (SLPs). SLPs respond to the demand of large numbers of students for a shorter study period in order to obtain an academic award, a certificate or a diploma at diverse qualification levels (EFQ 4 to 8: foundation, bachelor, master and doctoral level). SLPs fit in the formal qualification systems. Integrating academic SLPs in higher education systems is important, because they make higher education more attainable for adult learners, who combine work and study or learn for personal development. Many of these learners have already a degree, others don’t, but all will have longer careers or switch careers and are in need for updating knowledge and skills (EADTU, 2017).
HIGHER EDUCATION AT THE CROSSROADS
In the current communiqué from the European Commission “on a renewed EU agenda for higher education” (European Commission, 2017a), it shows that flexible study options (part-time or online) and more widespread recognition of prior learning are also required to make higher education more accessible, particularly for adult learners.
The European Commission estimates that by 2020, the proportion of the population aged 30-34 with tertiary educational attainment should be at least 40% (European Commission, 2015). Actual attainment indicated Figure 1 (OECD, 2018).
Figure 1. Population with tertiary education (25 – 34 year-olds, % in same age group, 2016)
Source: OECD
The tertiary education attainment of the Czech Republic rate continued its rapid rise, reaching 32.8 % in 2016 and surpassing the 32 % national target for 2020 (European

Lucie Rohlíková Flexible Forms of Learning as a Challenge for Higher Education
DIVAI 2018 – The 12th international scientific conference on Distance Learning in Applied Informatics. 19 ISBN 978-80-7598-059-5 (Print) ISSN 2464-7470 (Print) ISSN 2464-7489 (On-line)
Commission, 2017c). In Slovakia, the tertiary attainment rate in 2016 was 31.5 %. While below the EU average of 39.1 %, it has progressed strongly with an increase of 7.8 pp. since 2012 (European Commission, 2017d).
Tertiary educational achievement is very closely related to overall demographic development. According to Eurostat (2018), the size of a population changes in a dynamic fashion over time, as a function of three demographic factors: births, deaths and migratory flows, each of which shapes the population’s structure over time. The main outcome of the current low levels of fertility and mortality in the EU-28 is a progressive ageing of the population.
Eurostat’s projections indicate that the EU-28’s population will grow overall by 1.7 % between 1 January 2016 and 1 January 2080, with the number of inhabitants increasing by 8.5 million persons. The EU-28’s population is projected to peak around 2045, reaching 529 million persons, an increase of 18.8 million (or 3.7 %) compared with the situation as of 1 January 2016. The size of the EU-28’s population is then projected to progressively fall with a population of 519 million persons by the start of 2080 (see Figure 2).
Figure 2. Projected population, EU-28, 1 January 2016-2080
Note: 2016 and 2017, estimates. 2017: break in series. 2018-2080: projections.
Source: Eurostat (online data codes: demo_gind and proj_15npms)
Interestingly, the prediction considers very different developments in different European countries. An increase in the number of inhabitants foreseen for 13 EU member states (Luxembourg, Sweden, Ireland, United Kingdom, Belgium, Denmark, Malta, Cyprus, France, Netherlands, Austria, Spain, Finland), as well as for Norway. By contrast, the number of inhabitants is projected to fall between 2016 and 2080 in 15 of the EU Member States. Among these, there will be a relatively modest decline in the total number of inhabitants living in Germany, Slovenia and the Czech Republic (where the population is expected to contract by 5-7 %). The decline in the number of inhabitants is projected to be

Lucie Rohlíková Flexible Forms of Learning as a Challenge for Higher Education
DIVAI 2018 – The 12th international scientific conference on Distance Learning in Applied Informatics. 20 ISBN 978-80-7598-059-5 (Print) ISSN 2464-7470 (Print) ISSN 2464-7489 (On-line)
within the range of 11-13 % in Italy, Hungary, Slovakia and Estonia, while reductions of 22-27 % are projected for Croatia, Poland, Romania and Portugal. Larger contractions — with the total number of inhabitants falling by approximately one third — are projected for Greece, Latvia and Bulgaria, while the largest reduction of all is projected in Lithuania, as its population is predicted to fall by 42.6 % between 2016 and 2080.
It can therefore be assumed that the reduction and aging of the population will, in the future, be characteristic of all post-communist countries of Central and Eastern Europe. Of course, this trend will also affect tertiary education enrolment. It is already evident in both the overall drop in the number of students and the increased interest in study by persons over the age of 25 (see data from the Czech Republic - Figure 3).
Figure 3. Development of the total number of university students – Czech Republic
Source: Česko v datech (2017) (The Czech Republic in data)
Figure 3. shows that although there has been a drop in absolute numbers for university graduates in the last few years, this does not mean that interest in this type of study is diminishing. The decline is mainly due to demographic developments, i.e. the drop in the population of 19 year olds. The proportion of university graduates of this age is, on the contrary, growing, and is currently more than 70%. As far as graduates of universities are concerned, in 2001, a total of 30,103 students in the Czech Republic received higher education degrees. Then 13 years later, the number of graduates was 88,152 - almost three times as many. It’s important to bear in mind the fact that the number of students older than 24 years of age is growing. The Czech Republic in data (2017) shows an increase from 43,082 students in 2000 to 106,306 students in 2016.
This trend is also evident in non-European countries. The U.S. National Center for Education Statistics (2018) demonstrates a marked increase in student interest in the 25-year-olds an older. It also states that, with the advent of this group of students into a classical academic environment, strategies are needed to support these students both academically and financially. At the same time, it should be noted that without the participation of this group of students, it will not be possible to achieve the planned attainment goals.

Lucie Rohlíková Flexible Forms of Learning as a Challenge for Higher Education
DIVAI 2018 – The 12th international scientific conference on Distance Learning in Applied Informatics. 21 ISBN 978-80-7598-059-5 (Print) ISSN 2464-7470 (Print) ISSN 2464-7489 (On-line)
According to research by Ruffalo Noel Levitz (2016) of U.S. adult students from the 2015-16 academic year, adult learners have different needs than “traditional-aged” students. These results come from the Adult Learner Inventory ™ (ALI), an assessment tool completed by students while they are currently enrolled at an institution. One group represents 23,185 students from 65 four-year private and public institutions that completed the ALI between the autumn of 2012 and the spring of 2015. The second group reflects 9,131 students from 35 community colleges, who completed the ALI during the same time frame. Research results have shown that flexibility is one of the main needs of adult learners in these respects:
� Course offering flexibility
� More course offering in their major
� Multiple options for financial aid and billing
Table 3. Enrolment factors for adult learners (at four-year private and public institutions and at community colleges)
Factor 4-year institutions
Community colleges
Availability of programme I wanted 93% 89%
Convenient time and place for classes 92% 88%
Flexible pacing for completing a programme 88% 81%
Time required to complete programme 88% 81%
Availability of financial assistance 86% 82%
Ability to transfer credits 85% 79%
Requirement for current or future job 85% 85%
Cost 84% 86%
Reputation of institution 83% 74%
Availability of online courses 80% 73%
High rate of job placement 79% 75%
Program accreditation 78% 72%
Credit for learning gained from life and work 76% 68%
Distance from campus 74% 78%
Tuition reimbursement from employer 72% 63%
Ability to design my own programme 68% 66%
Employer endorsement 52% 49%
Courses held at employment site 37% 44%
Labour union support/endorsement 36% 40%
Availability of child care 34% 43%
In order to meet this growing demand of flexible learning, higher education institutions are increasingly turning to e-learning as they view it as a convenient way to provide flexible access to learning (Buleen & Janes, 2007). Among the key findings of the US 2016 Survey of Online Babson Survey Research (Allen & Seaman, 2016) are, for example:
� A year-to-year 3.9% increase in the number of distance education students, up from the 3.7% rate recorded last year.

Lucie Rohlíková Flexible Forms of Learning as a Challenge for Higher Education
DIVAI 2018 – The 12th international scientific conference on Distance Learning in Applied Informatics. 22 ISBN 978-80-7598-059-5 (Print) ISSN 2464-7470 (Print) ISSN 2464-7489 (On-line)
� More than one in four students (28%) now takes at least one distance education course (a total of 5,828,826 students, a year-to-year increase of 217,275).
� Public institutions command the largest portion of distance education students, with 72.7% of all undergraduate and 38.7% of all graduate-level distance students.
� The percentage of academic leaders rating the learning outcomes in online education as the same or superior to those in face-to-face instruction is now at 71.4%.
Flexible learning needs are also one of the major reasons for leading higher education institutions to create and implement MOOC courses. Figure 4. presents the primary objectives of the MOOC offers of higher education institutions, presented by the European Association of Distance Teaching Universities (Jansen, Goes-Daniels, 2016). A total of 20% of the 150 research respondents (representatives of higher education institutions) who were mostly European, but a few were non-European, listed flexible learning opportunities as their primary objective.
Figure 4. Primary objective of offered MOOC courses
In this context, it is a pity that in the Czech Republic, according to the Czech Statistical Office, only 18,659 students were studying in a distance or combined form, out of a total of 77,318 graduates (2018a) in 2016. The huge potential for distance and combined forms of study by foreign students which Czech universities are able to provide was only taken advantage of by 1034 students in 2016, and 7018 foreign students attending full-time form. On the other hand, it is possible to follow the gradual increase in the number of students in distance and combined forms. Ten years ago, in 2006, only 12,753 students and only 860 foreign students graduated from these types of studies in the Czech Republic at universities (Czech Statistical Office (2018b).
In addition to demographic developments, future enrolment in higher education will influence changes, especially those related to changes in the labour market. Shifts in the structure of European economies and the nature of specific job profiles and occupations
0% 20% 40% 60% 80% 100%
Primary objectives
Increase Institution Visibility
Drive Student Recruitment
Innovative Pedagogy
Flexible Learning Opportunities
Reach New Students
Supplement On-campus

Lucie Rohlíková Flexible Forms of Learning as a Challenge for Higher Education
DIVAI 2018 – The 12th international scientific conference on Distance Learning in Applied Informatics. 23 ISBN 978-80-7598-059-5 (Print) ISSN 2464-7470 (Print) ISSN 2464-7489 (On-line)
go hand in hand with an increase in part-time work, temporary work, and self-employment – at the expense of 'traditional' permanent, full-time employment (OECD, 2016, European Commission, 2017b). This trend also has implications for the skills needs. As jobs become more flexible in form, as well as complex in terms of content, a higher proportion of the population needs a broader set of high-level skills to allow them to adapt to, and operate effectively in, the new reality of work. Open and flexible learning is one of the various ways in which higher education institutions can support the workforce to upskill and reskill, in a cost-effective and flexible way, in order to meet the requirements of an ever-changing job market (Joint Research Centre, 2015, European Commission, 2017b).
Higher education institutions are aware of the above trends when developing strategic goals. Inspiration could come, for example, from the Dutch Strategic Agenda for Higher Education 2015-25 (Ministerie van Onderwijs, Cultuur en Wetenschap, 2015, European Commission, 2016):
� Small scale learning communities (student-teacher interaction, individualised support and feedback)
� Rich learning environments intertwined with research, professional practice, internationalised classrooms, online education, and new learning environments
� Flexible lifelong learning (demand-driven education experiments, piloting learning pathways and a ‘lifelong learning credit’)
� Sustainable regional and sector-based collaboration (engagement with the society and labour market);
� Stronger labour market links (entrepreneurship education, alumni policies and stronger orientation of the Universities of Applied Sciences centres of expertise to societal challenges).
CONCLUSION
Both the labour and education markets will increasingly influence technology and the aging population in the near future, both of which will result in greater differentiation of education offerings to provide students with more flexibility. Adult learners place on course flexibility a high priority. They want courses to fit with their life and work schedules and options when it comes to course delivery. The university of the future will be more practical and based on experience and with greater social interaction between students. Training must be personalized and solving specific needs immediately. It will require flexibility and agility with a more open, modular and recognized courses and specific range of services according to needs (modules, contents, tutoring, assessment, certification, and personalization). The university should offer a new range of services such as micro-credentials, e-assessment (data observation and collection to assess activities, not only in exams), and lifelong learning (personalized, discontinuous and at different paces).
REFERENCES
Adams Becker, S., Cummins, M., Davis, A., Freeman, A., Hall Giesinger, C. & Ananthanarayanan, V., 2017. NMC Horizon Report: 2017 Higher Education Edition. Austin, Texas: The New

Lucie Rohlíková Flexible Forms of Learning as a Challenge for Higher Education
DIVAI 2018 – The 12th international scientific conference on Distance Learning in Applied Informatics. 24 ISBN 978-80-7598-059-5 (Print) ISSN 2464-7470 (Print) ISSN 2464-7489 (On-line)
Media Consortium. [online] Available at <http://cdn.nmc.org/media/2017-nmc-horizon-report-he-EN.pdf> [Accessed 14 March 2018].
Allen, I., E., & Seaman, J., 2016. Online report card: Tracking online education in the United States. Babson Survey Research Group and Quahog Research Group. [online] Available at <http://onlinelearningsurvey.com/reports/onlinereportcard.pdf> [Accessed on 14 April 2018].
Bradley, D., Noonan, P., Nugent, H., & Scales, B., 2008. Review of Australian Higher Education – Final Report, Commonwealth of Australia, Canberra.
Buleen, M., & Janes, D., 2007. Preface. In: M. Buleen, & D. Janes, (Eds.). Making the transition to elearning: Strategies and issues (pp. vii–xvi). Hershey, PA.: Information Science Publishing.
Collis, B., & Moonen, J., 2001. Flexible learning in a digital world: Experiences and expectations. London: Kogan Page.
Collis, B., & van der Wende, M., 2002. Models of technology and change in higher education: An international comparative survey on the current and future use of ICT in higher education Netherlands: Centre for Higher Education Policy Studies, Universiteit Twente. [online] Available at <http://doc.utwente.nl/44770/1/Collis02models.pdf> [Accessed on 14 April 2018].
Czech Statistical Office, 2018b. Universities: students by form of study and type of study programme: by citizenship; academic year 2006/07. Source: Institute for Information on Education. [online]. Available at <https://www.czso.cz/documents/11292/32508276/0607_c04t42.pdf/603e5afd-c245-497d-9501-2158e316d675?version=1.0> [Accessed on 14 April 2018].
Czech Statistical Office, 2018a. University students, first enrolled, and graduates by study and type of study programme by citizenship in 2016. Source: Ministry of Education, Youth, and Sports. [online] Available at <https://www.czso.cz/documents/11292/32508276/1617_c04t42.pdf/f71e70cd-a264-440c-b36c-c4588f3efb43?version=1.0> [Accessed on 14 April 2018].
Česko v datech, 2017. Studenti nové generace. Kdo navštěvuje české vysoké školy a co chce od svého budoucího zaměstnání. [online] Available at <http://www.ceskovdatech.cz/clanek/60-studenti-nove-generace-br-kdo-navstevuje-ceske-vysoke-skoly-a-co-chce-od-sveho-budouciho-zamestnani/> [Accessed on 14 April 2018].
Diezmann, C., M., & Yelland, N., J., 2000. Being flexible about flexible learning and flexible delivery. In Richardson, L and Lidstone, J, Eds. Proceedings ASET-HERDSA 2000 Conference, Toowoomba. [online] Available at https://eprints.qut.edu.au/1854/1/1854.pdf [Accessed on 14 April 2018].
EADTU, 2017. EADTU-EU Summit 2017. Innovations in teaching and learning; new directions for higher education. Brussels, 25 April 2017 SUMMIT Conclusions. [online] Available at <https://eadtu.eu/documents/Summit_/2017_-_EADTU-EU_SUMMIT_Conclusions.pdf> [Accessed on 14 April 2018].
Ellington, H., 1997. Flexible learning – Your flexible friend. In: C. Bell, M. Bowden, & A. Trott, (Eds.). Implementing flexible learning: Aspects of educational and training technology (pp. 3–14). London: Kogan Page.

Lucie Rohlíková Flexible Forms of Learning as a Challenge for Higher Education
DIVAI 2018 – The 12th international scientific conference on Distance Learning in Applied Informatics. 25 ISBN 978-80-7598-059-5 (Print) ISSN 2464-7470 (Print) ISSN 2464-7489 (On-line)
European Commission, 2014. Report to the European Commission on New modes of learning and teaching in higher education. In: Luxembourg: Publications Office of the European Union. October 2014. [online] Available at <http://ec.europa.eu/dgs/education_culture/repository/education/library/reports/modernisation-universities_en.pdf> [Accessed 14 March 2018].
European Commission, 2015. Education and Training Monitor 2015. [online] Available at <http://ec.europa.eu/education/tools/et-monitor_en.htm> [Accessed 14 March 2018].
European Commission, 2016. Developing future skills in higher education. KEY FINDINGS. ET2020 – Peer Learning Activity. (PLA)1 Brussels, 25–26 February. [online] Available at <http://ec.europa.eu/education/sites/education/files/2016-future-skills-report_en.pdf> [Accessed 14 March 2018].
European Commission, 2017a. Communication from the Commission to the European Parliament, the Council, the European Economic and Social Committee and the Committee of the Regions. A renewed EU agenda for higher education. {COM(2017) 247 final}. [online] Available at <https://ec.europa.eu/education/sites/education/files/he-com-2017-247_en.pdf> [Accessed 14 March 2018].
European Commission, 2017b. COMMISSION STAFF WORKING DOCUMENT Accompanying the document Communication from the Commission to the European Parliament, the Council, the European Economic and Social Committee and the Committee of the Regions A renewed EU agenda for higher education. SWD/2017/0164 final. [online] Available at <https://eur-lex.europa.eu/legal-content/en/TXT/?uri=CELEX%3A52017SC0164> [Accessed 14 March 2018].
European Commission, 2017c. Czech Republic. Education and Training Monitor 2017. Country report. Publications Office of the European Union, Luxembourg, 2017. [online] Available at <https://ec.europa.eu/education/sites/education/files/monitor2017-cz_en.pdf> [Accessed 14 March 2018].
European Commission, 2017d. Slovakia. Education and Training Monitor 2017. Country report. Publications Office of the European Union, Luxembourg, 2017. [online] Available at <https://ec.europa.eu/education/sites/education/files/monitor2017-sk_en.pdf> [Accessed 14 March 2018].
Eurostat, 2018. People in the EU - population projections. Statistic explained. [online] Available at <http://ec.europa.eu/eurostat/statistics-explained/index.php/People_in_the_EU_%E2%80%93_population_projections> [Accessed on 14 April 2018].
Gordon, N., 2014. Flexible Pedagogies: technology-enhanced learning. Higher Education Academy. [online] Available at <https://www.heacademy.ac.uk/sites/default/files/resources/tel_report_0.pdf> [Accessed 14 March 2018].
Green, S., Pearson, E. & Stockton, C., 2006. Personal Learning Environments: Accessibility and Adaptability in the Design of an Inclusive Learning Management System. In E. Pearson & P. Bohman (Eds.), Proceedings of ED-MEDIA 2006--World Conference on Educational Multimedia, Hypermedia & Telecommunications (pp. 2934–2941). Orlando, FL USA: Association for the Advancement of Computing in Education (AACE). [online] Available at <https://www.learntechlib.org/p/23425/> [Accessed 14 March 2018].

Lucie Rohlíková Flexible Forms of Learning as a Challenge for Higher Education
DIVAI 2018 – The 12th international scientific conference on Distance Learning in Applied Informatics. 26 ISBN 978-80-7598-059-5 (Print) ISSN 2464-7470 (Print) ISSN 2464-7489 (On-line)
Hart, I., 2000. Learning and the ‘F’ word. Educational Media International, 37 (2), 98–101. doi:10.1080/095239800410388.
Hermans, H., Janssen, J., Vogten, H. & Koper, R., 2015. Flexible Provisioning Adult Learners. Journal of Universal Computer Science, 21 (2), 206–222.
Higher Education Academy, 2018. Flexible Learning. Higher Education Academy. [online] Available at <https://www.heacademy.ac.uk/workstreams-research/themes/flexible-learning> [Accessed on 14 April 2018].
Jansen, D., Goes-Daniels, M., 2016. Comparing Institutional MOOC strategies. Status report based on a mapping survey conducted in October–December 2015. EADTU – HOME project. [online] Available at <http://eadtu.eu/images/publicaties/Comparing_Institutional_MOOC_strategies.pdf> [Accessed on 14 April 2018].
Johnson, L., Adams Becker, S., Estrada, V. & Freeman, A., 2015. NMC Horizon Report: 2015 Higher Education Edition. Austin, Texas: The New Media Consortium.
Joint Research Centre, 2015. OpenCases: case studies on openness in higher education. [online] Available at <http://is.jrc.ec.europa.eu/pages/EAP/opencases.html> [Accessed 14 March 2018].
Kerver, B., & Riksen, D., 2016. White Paper on Open Badges and Micro-Credentials. SURFnet. [online] Available at <https://www.surf.nl/binaries/content/assets/surf/en/knowledgebase/2016/whitepaper-on-open-badges-en-micro-credentials.pdf> [Accessed on 14 April 2018].
Lifelong Learning Platform, 2017. Reimagining education for the digital age. Position Paper. [online] Available at <http://lllplatform.eu/lll/wp-content/uploads/2015/09/DigitalPaper_final.pdf> [Accessed 14 March 2018].
Livingstone, S., Haddon, L., Görzig, A. & Ólafsson, K., 2011. Risks and safety on the internet: The perspective of European children. Full Findings. LSE, London: EU Kids Online.
Ministerie van Onderwijs, Cultuur en Wetenschap, 2015. De waarde(n) van weten. Strategische Agenda Hoger Onderwijs en Onderzoek 2015–2025. Den Haag: Ministerie van OC&W. [online] Available at <file:///C:/Users/lrohlik/Downloads/strategische-agenda-hoger-onderwijs.pdf> [Accessed on 14 April 2018].
National Center for Education Statistic, 2018. Total fall enrollment in degree-granting postsecondary institutions, by attendance status, sex, and age: Selected years, 1970 through 2024. [online] Available at <https://nces.ed.gov/programs/digest/d14/tables/dt14_303.40.asp?referrer=report> [Accessed on 14 April 2018].
Nunan, T., 1996. Flexible delivery: What it is and why is it a part of current educational debate? Paper presented at HERDSA Perth, WA.
OECD, 2016. OECD Employment Outlook 2016. [online] Available at <http://www.oecd.org/els/oecd-employmentoutlook-19991266.htm> [Accessed 14 March 2018].
OECD, 2018. Population with tertiary education (indicator). doi: 10.1787/0b8f90e9-en. [online]. Available at <https://data.oecd.org/eduatt/population-with-tertiary-education.htm> [Accessed on 14 April 2018].

Lucie Rohlíková Flexible Forms of Learning as a Challenge for Higher Education
DIVAI 2018 – The 12th international scientific conference on Distance Learning in Applied Informatics. 27 ISBN 978-80-7598-059-5 (Print) ISSN 2464-7470 (Print) ISSN 2464-7489 (On-line)
Palmer, S., 2011. The lived experience of flexible education: Theory, policy and practice. Journal of University Teaching & Learning Practice, 8 (3), 1–16. [online]. Available at <http://dro.deakin.edu.au/view/DU:30041161>
Peters, O., 2003. Models of open and flexible learning in distance education. In: S. Panda, ed.. Planning and Management in Distance Education, Kogan Page, London.
Ruffalo, N., L., 2016. 2015–16 adult learners report. Cedar Rapids: Ruffalo Noel Levitz. [online] Available at <http://cdn2.hubspot.net/hubfs/617695/2015-16_RNL_AdultLearners_Report_Final.pdf?submissionGuid=4f688ed0-d5f6-42d5-845d-9d343aba27c4> [Accessed on 14 April 2018].
Ryan, A. & Tilbury, D. 2013. Flexible Pedagogies: new pedagogical ideas. Higher Education Academy. [online] Available at <https://www.heacademy.ac.uk/sites/default/files/resources/npi_report.pdf> [Accessed 14 March 2018].
Sappey, J., 2005. The commodification of higher education: Flexible delivery and its implications for the academic labour process. In: M. Baird, R. Cooper, & M. Westcott, (eds). Reworking Work – AIRAANZ 19th Conference, 9–11 February 2005, Sydney. The Association of Industrial Relations Academics of Australia and New Zealand, pp. 495–502.
Shurville, S., O'Grady, T. & Mayall, P., 2008. Educational and institutional flexibility of Australian educational software. Campus-Wide Information Systems. 25 (2), 74–84.

Conference Papers
Section:
Information Technologies Supporting Learning

Martin Boltižiar, Peter Chrastina Application of Geographical Information System (GIS) in Geography (Digital Data Pre-processing for Land-use Changes Analysis)
DIVAI 2018 – The 12th international scientific conference on Distance Learning in Applied Informatics. 29 ISBN 978-80-7598-059-5 (Print) ISSN 2464-7470 (Print) ISSN 2464-7489 (On-line)
Application of Geographical Information System
(GIS) in Geography (Digital Data Pre-processing for
Land-use Changes Analysis)
Martin Boltižiar
Department of Geography and Regional Development, Faculty of Natural Sciences, The Constantine the Philosopher University in Nitra, Nitra, Slovakia
e-mail: [email protected]
Peter Chrastina
Department of Historical Sciences and Central European Studies, Faculty of Philosophy, University of Ss. Cyril and Methodius in Trnava, Trnava, Slovakia
e-mail: [email protected]
Abstract
Middle and large-scale maps do not only represent part of the plethora of historical sources, but also provide an invaluable source of information on the character of cultural landscape of a given territory over a selected time horizon. Cartographic documentation, besides its use in geography, has been increasingly employed also within the historical research. One of the basic conditions undermining the effective use of these many times unique map documents involves their digitalisation and implementation into the environment of geographical information system (GIS) and their subsequent interpretation .The aim of this paper is to familiarise the reader with the potential GIS has for geography. In fact, this phenomenon supports preservation of the old map originals or their accessibility in digital form (i.e. map server) for the lay and professional public who thus have the opportunity to make use of information contained in specific sources.
Keywords
Geographical information system. Geography. Historical military maps. Aerial photographs.
INTRODUCTION
Middle and large-scale maps do not only represent part of the plethora of historical sources, but also provide an invaluable source of information on the character of cultural landscape of a given territory over a selected time horizon. Cartographic documentation , besides its use in geography, has been increasingly employed also within historical research. One of the basic conditions undermining the effective use of these many times unique map documents involves their digitalisation and implementation into the environment of geographical information system (GIS) and their subsequent interpretation (Brůna, Křováková, 2006).

Martin Boltižiar, Peter Chrastina Application of Geographical Information System (GIS) in Geography (Digital Data Pre-processing for Land-use Changes Analysis)
DIVAI 2018 – The 12th international scientific conference on Distance Learning in Applied Informatics. 30 ISBN 978-80-7598-059-5 (Print) ISSN 2464-7470 (Print) ISSN 2464-7489 (On-line)
The aim of this paper is to familiarise the reader with the potential GIS has for geography. In fact, this phenomenon supports preservation of the old map originals or their accessibility in digital form (i.e. on the map server) for the lay and professional public who thus have the opportunity to make use of the information contained in specific sources.
Geographical information system in geography
In the area of landscape research, the concept of environment, culture, and geography within geography draws on the variety of interdisciplinary methodologies. (Chrastina, 2009) Study of the material-dialectic relations within the landscape (as seen in historical land use, multi temporal analysis, etc.) builds on the old maps' information database. The :"traditional" way of archiving cartographic documents and their accessibility for the needs of specific research negatively impacts physical condition of maps. Digitalisation of maps thus represents a certain "safeguard" against their becoming damaged, stolen, or destroyed, and at the same time allows to create a cartographical database. Making these sources accessible through modern and effective methods (e.g. on the map server or a multimedia CD, DVD) adds to a better public awareness of map collections. As Tomas (2006) points out, it helps in the development of basic and applied research of a specific institution.
METHODS
Processing of maps, aerial photographs within the geographical information
system and their interpretation
First step in the preparation of map or historical aerial photographs for the GIS involves its digitalisation, or translation from the analogue (paper) form to digital form. According to Olah et al. (2006) maps in their digital form may be obtained by scanning color or black and white originals or high-quality copies of at least 300 DPI) and saving them in the format (TIFF, JPG) compatible with the used type of the GIS software (most often ArcView GIS 3.2/3.3. currently ArcGIS 10.x Desktop, ERDAS Imagine, etc.) Important is the right size of the scanner in relation to the size of the scanned map, to prevent subsequent gluing of scanned areas in a graphic editor (less precision)
Another step is to assign graphical reference coordinates to digital maps - georeferencing or digital aerial photographs - orthorectification. To do this, special GIS modules are employed (such as TRIM, ImageWarp, Orthobase, etc.). Georeferencing uses the system in which the map was created, or the one closest to its design characteristics. In Slovakia, military maps have used the S-42 or S-JTSK platform for basic and topical maps (Olah et al. 2006) and orthorectification needs also digital terrain model (Figure1, 2).
In georeferencing, we assign known coordinates to different points on the map through two ways. First of the approaches is used when the coordinates of the map corners are known. (from folds of the map sheets) Often; however, the corner coordinates are not known, in which case it is necessary to find on the map the so-called ground control points with known latitude/longitude, or we obtain the coordinates through a direct, GIS in-field measurement, or by deducting from the already georeferenced maps. This means that the ground control points can be identified on the georeferenced (historical) map as well as on the reference map. Figure 1 shows that these include mainly

Martin Boltižiar, Peter Chrastina Application of Geographical Information System (GIS) in Geography (Digital Data Pre-processing for Land-use Changes Analysis)
DIVAI 2018 – The 12th international scientific conference on Distance Learning in Applied Informatics. 31 ISBN 978-80-7598-059-5 (Print) ISSN 2464-7470 (Print) ISSN 2464-7489 (On-line)
the sites that have not changed their localization (churches, road intersections, coordinates, etc.)
Boltižiar, Olah (2009) suggest more transformation methods; the more simple ones locate the map within the grid and rotate it by certain angle, the more complex ones can also deform the map in space. Precision of performed transformation is determined by calculating the RMS (Root Mean Square) error that defines the average deviation in reference points and thus also determines precision of the transformed map. RMS error at georeferencing of the maps of the I. military mapping usually reaches values within the interval of 0-100 m (lowlands, basins).; however, in higher altitudes, distance between the ground control (identical) points grows to approx. 500 to 800 m. Precision of the maps of the II. and III. military mapping grows to tens of m.
Figure 1: Georeferencing of map I of the military mapping from 1782 within the ArcView GIS 3.1 sowtware, with the help of military topographical map from 1953 within the S-42 reference coordinate system. With the use of the ImageWarp module, a number of identical ground control points was found
on each map, here representing road intersections.

Martin Boltižiar, Peter Chrastina Application of Geographical Information System (GIS) in Geography (Digital Data Pre-processing for Land-use Changes Analysis)
DIVAI 2018 – The 12th international scientific conference on Distance Learning in Applied Informatics. 32 ISBN 978-80-7598-059-5 (Print) ISSN 2464-7470 (Print) ISSN 2464-7489 (On-line)
Figure 2: Orthorectification of the panchromatic aerial photograph from 1949 within the ERDAS Imagine software with the help of orthophotomap from 2007 within the S-JTSK reference coordinate system.
With the use of the Orthobase module a number of identical ground control points was found on each aerial photographs.
GIS is an instrument that, after a thorough preparation of map documentation, allows for rapid and reliable spatial analyses in form of a topical map/maps. The current geographical research often employs maps with historical land use/landscape use topics. Before they are created, an interpretation key and a legend are developed, but most importantly, vectorising of the polygons that represent a specific landscape use category (LUC) is carried out (Figure 3). Vectorisation or also digitalization of spatial data on the map is carried out within the ArcGIS equipment by manual clicking with the mouse around the individual areas of non-forest trees and sparsely vegetation (NBFTV), arable land, vineyards, roads etc. displayed on the computer's screen. Result of the analogue (visual) interpretation of maps is a cartographic output – topical LUC map (Figure 3, 4) related to a specific time horizon (as defined by the date of the original map's creation).
1949
2007
Martin Boltižiar, Peter Chrastina Application of Geographical Information System (GIS) in Geography (Digital Data Pre-processing for Land-use Changes Analysis)
DIVAI 2018 – The 12th international scientific conference on Distance Learning in Applied Informatics. 33 ISBN 978-80-7598-059-5 (Print) ISSN 2464-7470 (Print) ISSN 2464-7489 (On-line)
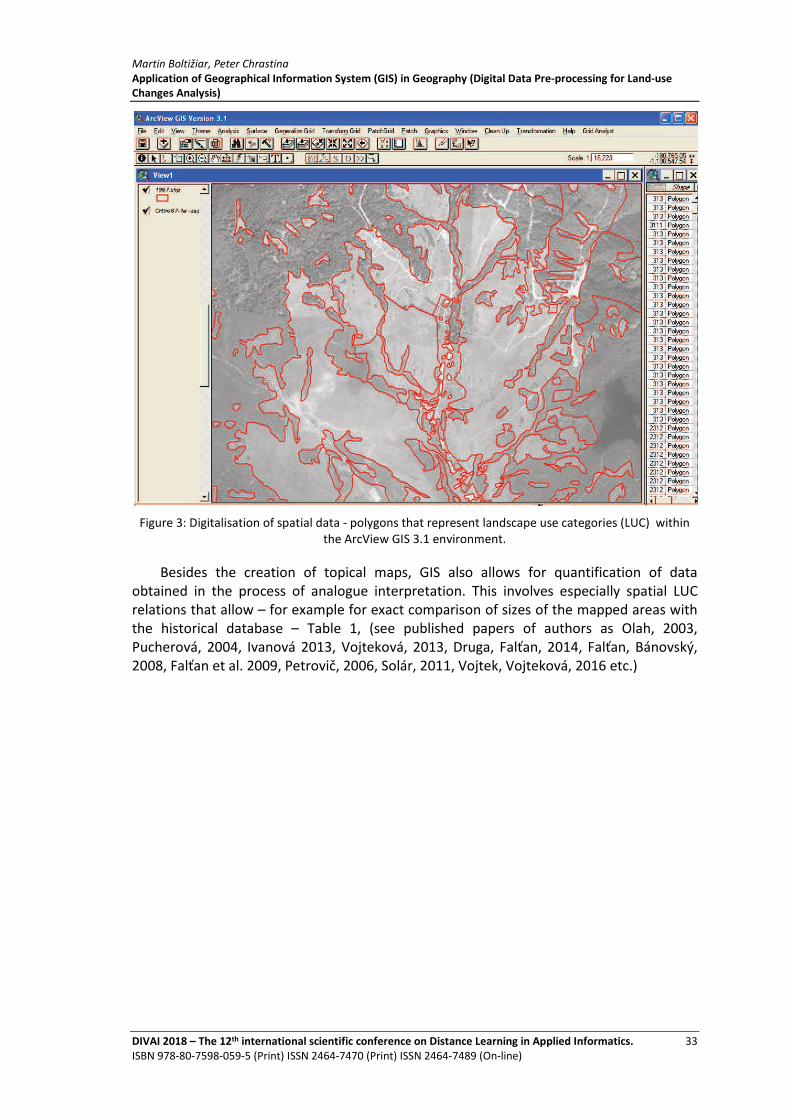
Figure 3: Digitalisation of spatial data - polygons that represent landscape use categories (LUC) within the ArcView GIS 3.1 environment.
Besides the creation of topical maps, GIS also allows for quantification of data obtained in the process of analogue interpretation. This involves especially spatial LUC relations that allow – for example for exact comparison of sizes of the mapped areas with the historical database – Table 1, (see published papers of authors as Olah, 2003, Pucherová, 2004, Ivanová 2013, Vojteková, 2013, Druga, Falťan, 2014, Falťan, Bánovský, 2008, Falťan et al. 2009, Petrovič, 2006, Solár, 2011, Vojtek, Vojteková, 2016 etc.)

Martin Boltižiar, Peter Chrastina Application of Geographical Information System (GIS) in Geography (Digital Data Pre-processing for Land-use Changes Analysis)
DIVAI 2018 – The 12th international scientific conference on Distance Learning in Applied Informatics. 34 ISBN 978-80-7598-059-5 (Print) ISSN 2464-7470 (Print) ISSN 2464-7489 (On-line)
Figure 4: Land use category (LUC) in 1951 (model territory of Cáfár - Čerňa and Jášč in the Hungarian Trans-Danube region). Source: Chrastina, Boltižiar (2006).
Table 1: Trend in the LUC of Nové Sady in 1782 – 2002. Source: Chrastina, Boltižiar (2006).
1782 1839 1987 2002
ha % ha % ha % ha % Forests and NBFTV 510,4 20,3 471,6 18,8 114,6 4,6 156,6 6,2
Permanent grasslands 491,4 19,6 355,9 14,2 0,0 0,0 0,0 0,0 Arable land 1 445,0 57,5 1 607,0 64,0 2 191,6 87,2 2 115,0 84,2
Permanent arable crops
Vineyards 24,7 1,0 40,6 1,6 0,0 0,0 0,0 0,0 House
gardens 12,6 0,5 28,7 1,1 75,2 3,0 104,4 4,2
Settlements units 18,5 0,7 8,8 0,4 131,2 5,2 136,6 5,4 Aggregate 2 512,6 100,0 2 512,6 100,0 2 512,6 100,0 2 512,6 100,0
Use of digital maps in geography (selected aspects)
Digital maps prepared with high precision serve as the basis for correct geographic analyses and syntheses of various scales and topics. Multi-temporal analysis allows for the otherwise static character of map documentation; it provides a complete view on the trend in the historic land use/landscape use at specific time horizons. (Feranec, 1996). In reality, this involves the study of CLU dynamics within the computerised environment of the ArcGIS platform through the method of superposition (overlay) of topical digital maps in the identical system of coordinates. Its assessment builds on monitoring spatial LUC relations within a given time frame and a subsequent processing through numerical and graphical analysis (Table 1).

Martin Boltižiar, Peter Chrastina Application of Geographical Information System (GIS) in Geography (Digital Data Pre-processing for Land-use Changes Analysis)
DIVAI 2018 – The 12th international scientific conference on Distance Learning in Applied Informatics. 35 ISBN 978-80-7598-059-5 (Print) ISSN 2464-7470 (Print) ISSN 2464-7489 (On-line)
CONCLUSION
Aim of this paper was to point to the importance of processing the old maps within the GIS and outline its potential for the geographical research. The "traditional" way of archiving cartographic documents and their accessibility for the public negatively impacts physical condition of maps. Digitalisation of maps thus represents a certain "safeguard" against their becoming damaged, stolen, or destroyed, and at the same time allows to create cartographical database for the needs of basic and applied research at a given institution.
ACKNOWLEDGEMENT
The paper was supported by project of grant agency VEGA 1/093417 “Land-use changes of Slovak cultural landscape over the past 250 years and prediction of its further development” and grant of agency GAČR GAP410/12/G113 “Research centre of historical geography”.
REFERENCES
Boltižiar, M. Olah, B. 2009. Krajina a jej štruktúra (Mapovanie, zmeny a hodnotenie). Nitra : Faculty of Natural Sciences UKF, 2009. 150 p.
Brůna, V., Křováková, K. 2006. Staré mapy v prosředí GIS a Internetu. In: Sborník z konference GEOS 2006. [online] Available at <http://www.igeos.cz/stranky/konference.htm> [Accessed 1.March 2018].
Druga, M., Falťan, V., 2014. Influence of environmental drivers on the land cover structure and its long-term changes - case study of Malachov and Podkonice villages in Slovakia. In: Moravian Geographical Reports, Vol. 22, No. 3, 2014. pp 29-41.
Falťan, V., Bánovský, M. 2008. Changes in land cover in the area of Vyšné Hágy - Starý Smokovec, impacted by the wind calamity in November 2004 (Slovakia). In: Moravian Geographical Reports, Vol. 16, No. 3, 2008. pp. 16-26.
Falťan, V., Katina, S., Bánovský, M., Pazúrová, Z. 2009. The influence of site conditions on the impact of windstorms on forests: The case of the High Tatras foothills (Slovakia) in 2004, In: Moravian Geographical Reports, Vol. 17, No. 3, 2009. pp. 10-18.
Feranec, J. 1996. Prístupy k analýze viac časových údajov diaľkového prieskumu zeme. In: Geografický časopis, Vol. 48, No. 1, 1996. pp. 3-11.
Chrastina, P. 2009. Historical Geography in the 21st century. In: Annales Univ. Apulensis Series Historica 13, 2009, pp. 183-195.
Chrastina, P., Boltižiar, M. 2006. Nové Sady: Historický Land use rurálneho sídla v nížinnej poľnohospodárskej krajine západného Slovenska. In: Studia Historica Nitriensia 13. 2006, pp. 187-202.
Ivanová, M. 2013. Zmeny krajinnej pokrývky zázemia Zemplínskej šíravy v rokoch 1956 - 2009. Prešov: PUv Prešove, 2013. 233 p.

Martin Boltižiar, Peter Chrastina Application of Geographical Information System (GIS) in Geography (Digital Data Pre-processing for Land-use Changes Analysis)
DIVAI 2018 – The 12th international scientific conference on Distance Learning in Applied Informatics. 36 ISBN 978-80-7598-059-5 (Print) ISSN 2464-7470 (Print) ISSN 2464-7489 (On-line)
Olah, B., 2003. Vývoj využitia krajiny Podpoľania – Starostlivosť o kultúrnu krajinu prechodnej zóny BR Poľana, Zvolen : TU, 2003. 111 p.
Olah, B., Boltižiar, M., Petrovič, F., Gallay, I. 2006. Vývoj využitia krajiny slovenských biosférických rezervácií UNESCO. Zvolen : TU, 2006. 140 p.
Petrovič, F. 2006. The changes of the landscape with dispersed settlement. In: Ekológia (Bratislava), Vol. 25, No. 1, 2006. pp 65-9.
Pucherová, Z. 2004. Land use development on the border of Zobor Mts. and Žitavská pahorkatina (on the example of selected villages). Nitra : Faculty of Natural Sciences UKF, 2004. 142 p.
Solár, V. 2011. Faktory a podmienky determinujúce zmeny krajinnej štruktúry Popradskej kotliny za ostatných 250 rokov. In: Geographia Cassoviensis, Vol. 5, No. 1, 2011. pp 89-92.
Šolcová, L. 2012. Vývoj krajiny s disperzným typom osídlenia v Novobanskej štálovej oblasti. Nitra : Faculty of Natural Sciences UKF, 2004. 208 p.
Tomas, R. 2006. Digitální mapový archiv České geologické služby. In: Historická geografie – Supplementum I. Šimůnek, R. ed. Praha : HiÚ AV ČR, 2006, pp. 26-38.
Vojtek, M., Vojteková, J. 2016. Flood hazard and flood risk assessment at the local spatial scale: a case study. In: Geomatics, Natural Hazards and Risk. Vol. 7, No. 6, 2016. pp 1973-1992.
Vojteková, J. 2013. Trendy vývoja banskej krajiny na hornom Ponitrí. Nitra : Faculty of Natural Sciences UKF, 2004. 208 p.

Jana Burgerová, Martina Adamkovičová, Vladimír Piskura Comparison of IT Skills Testing of Preschool and Elementary Education Students by the IT Fitness Test
DIVAI 2018 – The 12th international scientific conference on Distance Learning in Applied Informatics. 37 ISBN 978-80-7598-059-5 (Print) ISSN 2464-7470 (Print) ISSN 2464-7489 (On-line)
Comparison of IT Skills Testing of Preschool and
Elementary Education Students by the IT Fitness
Test
Jana Burgerová, Martina Adamkovičová
Faculty of Education, University of Presov in Presov, Presov, Slovakia [email protected], [email protected]
Vladimír Piskura
Faculty of Education, University of Presov in Presov, Presov, Slovakia [email protected]
Abstract
The presented paper brings a comparison of digital skills test results of students of the Faculty of Education, University of Presov within their undergraduate training with the aim to estimate the level of their digital skills in five defined domains. The IT Fitness Test 2015 consisting of 25 items was used as the measure of the target skills. The sample included 532 students in 2016 and 212 students in 2017 in bachelor and master study programs. The paper provides an interpretation of the selected research findings (total mean scores and mean scores for the given domains). The results of digital skills testing point out the tendency of the overall overestimation of Digital Natives Skills. The demands of pedagogues as well as teaching practice itself give rise of new challenges for students. Within the preparation process of the new study programs accreditations it is therefore necessary to modify the curricula of math- and IT-oriented subjects and include further activities allowing for the development of the lacking “Digital Skills”, since these are needed not only for students’ own study but also due to the increasing demands related to the use of digital technologies in primary and pre-primary education.
Keywords
Students. Preschool and elementary education. Digital skills. IT Fitness test.
INTRODUCTION
Young people studying at universities have been termed by several names, Millenial Generation- coined by Howe and Strauss (1991), Net Generation –Tapscot (1997) or Digital Natives – the „native speakers‟ of the digital language of computers and the Internet (Prensky, 2001), Y Generation – first appearing in the AdAge magazine in 1993 (Zhao and Liu, 2008), as a term to identify the generational cohort following Generation X.
Regardless the given name, young people are generally considered to be adept at working with digital technologies. The digital skills testing carried out throughout Slovakia
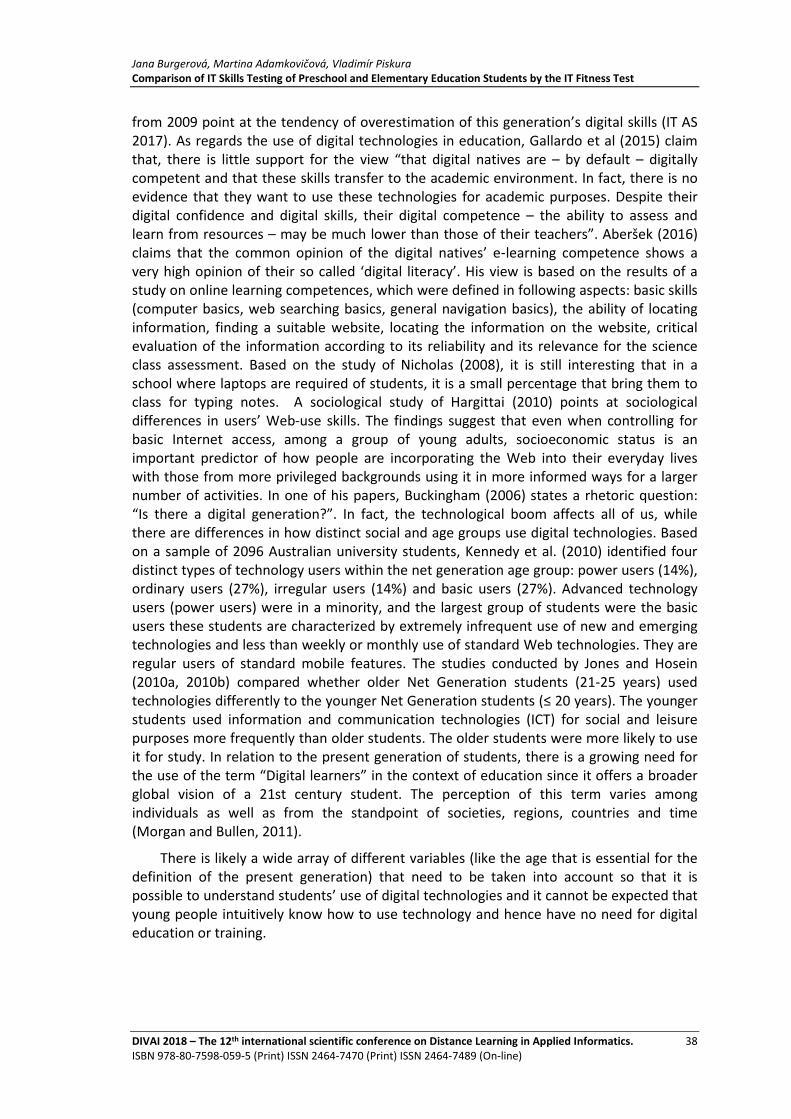
Jana Burgerová, Martina Adamkovičová, Vladimír Piskura Comparison of IT Skills Testing of Preschool and Elementary Education Students by the IT Fitness Test
DIVAI 2018 – The 12th international scientific conference on Distance Learning in Applied Informatics. 38 ISBN 978-80-7598-059-5 (Print) ISSN 2464-7470 (Print) ISSN 2464-7489 (On-line)
from 2009 point at the tendency of overestimation of this generation’s digital skills (IT AS 2017). As regards the use of digital technologies in education, Gallardo et al (2015) claim that, there is little support for the view “that digital natives are – by default – digitally competent and that these skills transfer to the academic environment. In fact, there is no evidence that they want to use these technologies for academic purposes. Despite their digital confidence and digital skills, their digital competence – the ability to assess and learn from resources – may be much lower than those of their teachers”. Aberšek (2016) claims that the common opinion of the digital natives’ e‐learning competence shows a very high opinion of their so called ‘digital literacy’. His view is based on the results of a study on online learning competences, which were defined in following aspects: basic skills (computer basics, web searching basics, general navigation basics), the ability of locating information, finding a suitable website, locating the information on the website, critical evaluation of the information according to its reliability and its relevance for the science class assessment. Based on the study of Nicholas (2008), it is still interesting that in a school where laptops are required of students, it is a small percentage that bring them to class for typing notes. A sociological study of Hargittai (2010) points at sociological differences in users’ Web-use skills. The findings suggest that even when controlling for basic Internet access, among a group of young adults, socioeconomic status is an important predictor of how people are incorporating the Web into their everyday lives with those from more privileged backgrounds using it in more informed ways for a larger number of activities. In one of his papers, Buckingham (2006) states a rhetoric question: “Is there a digital generation?”. In fact, the technological boom affects all of us, while there are differences in how distinct social and age groups use digital technologies. Based on a sample of 2096 Australian university students, Kennedy et al. (2010) identified four distinct types of technology users within the net generation age group: power users (14%), ordinary users (27%), irregular users (14%) and basic users (27%). Advanced technology users (power users) were in a minority, and the largest group of students were the basic users these students are characterized by extremely infrequent use of new and emerging technologies and less than weekly or monthly use of standard Web technologies. They are regular users of standard mobile features. The studies conducted by Jones and Hosein (2010a, 2010b) compared whether older Net Generation students (21-25 years) used technologies differently to the younger Net Generation students (≤ 20 years). The younger students used information and communication technologies (ICT) for social and leisure purposes more frequently than older students. The older students were more likely to use it for study. In relation to the present generation of students, there is a growing need for the use of the term “Digital learners” in the context of education since it offers a broader global vision of a 21st century student. The perception of this term varies among individuals as well as from the standpoint of societies, regions, countries and time (Morgan and Bullen, 2011).
There is likely a wide array of different variables (like the age that is essential for the definition of the present generation) that need to be taken into account so that it is possible to understand students’ use of digital technologies and it cannot be expected that young people intuitively know how to use technology and hence have no need for digital education or training.

Jana Burgerová, Martina Adamkovičová, Vladimír Piskura Comparison of IT Skills Testing of Preschool and Elementary Education Students by the IT Fitness Test
DIVAI 2018 – The 12th international scientific conference on Distance Learning in Applied Informatics. 39 ISBN 978-80-7598-059-5 (Print) ISSN 2464-7470 (Print) ISSN 2464-7489 (On-line)
PRESENT STUDY
Our extensive practice with the undergraduate training of future teachers in primary and pre-primary education at the Faculty of Education, University of Presov indicates that the digital skills of the Digital Natives are usually rather overestimated. The latest interim results of pretesting the students within the course “ICT in preschool and leisure time education” in February and September 2017 (students were required to modify a document in a word processing software using basic tools) point at students’ lack of skills. In 2016 study, the aim was to examine the use of mobile devices by the students of the faculty. For study purposes, student mostly used notebooks and mobile phones, while accessing freely available study materials on the Internet most of the time. These devices were used to find study-related information on Google+, LinkedIn, scholarly-oriented discussion groups far less frequently (Adamkovičová and Burgerová, 2016). The research comparing the distribution of study materials using LMS Moodle and Google Apps among the faculty students in 2016 and 2017 showed that students considered Google Apps, which we assumed would be more user friendly for them, actually just as difficult a technology as LMS Moodle. (Adamkovičová, Burgerová, Piskura 2017).
METHOD
Participants
Testing was carried out on a total sample of 744 students with a modal age range of 19-22 years. The participants were sampled from the all the students studying at the Faculty of Education, University of Presov, by means of including all the study groups that had their math and IT courses.
Procedure
Prior to testing, students were instructed in person about the testing procedure. Place and time of testing was up to the students as the expected testing time took approximately 60-120 minutes. Students solved all the test items via LMS MOODLE for which they had a unique enrolment key. They could log in also on external devices. After completion, MOODLE immediately generated a report of the result for the student as well as all the data needed for subsequent analyses. Time to complete under 30 minutes was regarded impossible; the given subjects were removed from the analyses (n = 28).
Measurement
The IT Fitness test 2015 was used to test the students’ digital skills in 2016 and 2017 The test was made accessible for a public national testing following the registration on the official site eSkills. The test contained 25 multiple choice items (4 to 16 possible answers) with only one answer being correct. The items of the IT Fitness test 2015 could be summed up to obtain a score of the following domains: Internet, Security and computer systems, Collaborative tools and social networks, Office tools, and Complex tasks. Each of the mentioned domains was reflected by five items. Following a consent from the IT Association Slovakia (IT AS, 2015a), we used the identical test for our testing, however, (1) it has been implemented in LMS MOODLE and (2) we used a fixed set of items so that

Jana Burgerová, Martina Adamkovičová, Vladimír Piskura Comparison of IT Skills Testing of Preschool and Elementary Education Students by the IT Fitness Test
DIVAI 2018 – The 12th international scientific conference on Distance Learning in Applied Informatics. 40 ISBN 978-80-7598-059-5 (Print) ISSN 2464-7470 (Print) ISSN 2464-7489 (On-line)
every participant got the same questions instead of randomly sampling 25 question from a larger pool of items used for the national testing.
Results
The results of the 2017 IT Fitness Test are displayed in Table 1. From the Faculty of Education, 212 students participated on the testing, with the average success rate of 50%.
Table 1: Descriptive statistics test 2017
Domain n Mean SD SE
Internet 212 63.4 21.06 1.45
Security and computer systems 212 38.87 27.38 1.88
Collaborative tools and social networks 212 46.51 25.18 1.73
Office tools 212 54.62 28.74 1.97
Complex tasks 212 45.09 28.49 1.96
The mean success rate achieved in the IT Fitness Test consisting of 25 items was 58% (SD 21.06) in 2016, compared to only 50% (SD 18.38) in 2017. The total distribution of scores for 2016 and 2017 is shown in Figure 1. It is evident from the histograms that the students tested in 2017 were more similar to each other. Thus, their performance was poorer compared to 2016 and the data variability was smaller, i.e., their performance was more consistent.
Figure 1: The distribution of scores in the IT Fitness test 2016 and 2017. Vertical line represents the mean.
Welch´s t-test was used to test the statistical significance of the differences between 2016 and 2017. The total mean success rate of the observed sample in 2017 (M = 49.70; SD = 18.38) was statistically significantly lower than in 2016, (M = 58.24; SD = 21.06), t(448) = 5,45; p = 8e10-8, while Cohen´s d = 0,44 points at small-to-medium effect size. It is therefore evident that the students achieved worse results than in the previous year, which subsequently points at the decreasing trend in the area of complex IT skills.

Jana Burgerová, Martina Adamkovičová, Vladimír Piskura Comparison of IT Skills Testing of Preschool and Elementary Education Students by the IT Fitness Test
DIVAI 2018 – The 12th international scientific conference on Distance Learning in Applied Informatics. 41 ISBN 978-80-7598-059-5 (Print) ISSN 2464-7470 (Print) ISSN 2464-7489 (On-line)
Table 2: Mean difference in overall success rates - Welch Two Sample t-test
Domain M 2016
M 2017
t df p ∆ d 95% CI LB-UB
Summary 58.2 49.7 5.45 447.8 < .001 8.54 0.44 0.054 0.116
Internet 80.6 63.4 10.14 375.01 < .001 17.6 0.82 16.841 20.49
Security and computer systems
45.9 38.9 3.03 434.53 0.002 6.98 0.25 2.445 11.517
Collaborative tools and social networks
53.5 46.5 3.31 419.58 0.001 6.95 0.27 2.826 11.073
Office tools 61.9 54.6 3.13 373 0.001 7.28 0.26 2.748 11.816
Complex tasks 48.9 45.1 1.60 407.54 0.109 3.78 0.13 -0.850 8.394
Note. ∆ = raw mean difference. d = effect size in Cohen’s d units. CI = confidence interval.
The tested items were divided into 5 thematic domains. Figure 2 shows medium success rate in the given domain for 2016 and 2017. From Figure 2 it is clearly evident that in 2016, the students were more successful in all domains. The one year difference in the results of the respective domains can be observed in the Table 2. With the exception of the category Complex tasks, all differences between the two years are statisticaly significant and are associated with small, medium but also large effect sizes. The difference in the Complex tasks category could have been caused by random fluctuation.
Figure 2: Success rate percentage for the respective categories in 2016 and 2017
In 2016 the domain "Internet" turned out as relatively most simple, "Security and computer systems " and "Complex tasks" as the most difficult. The same result were confirmed in 2017 where the domain "Internet" also proved to be the easiest and among the most difficult were again the domains "Security and computer systems" and "Complex tasks". According to the results of testing searching for study-related information via search engines is one of the favourite activities among university students (IT AS, 2015b). In the study of Nicholas (2008), students identified Google as their starting point of information search, as well as the most popular electronic source. One of the reasons could also be the fact that the activities related to IT that we devote more time to, are then expected to be mastered more easily.
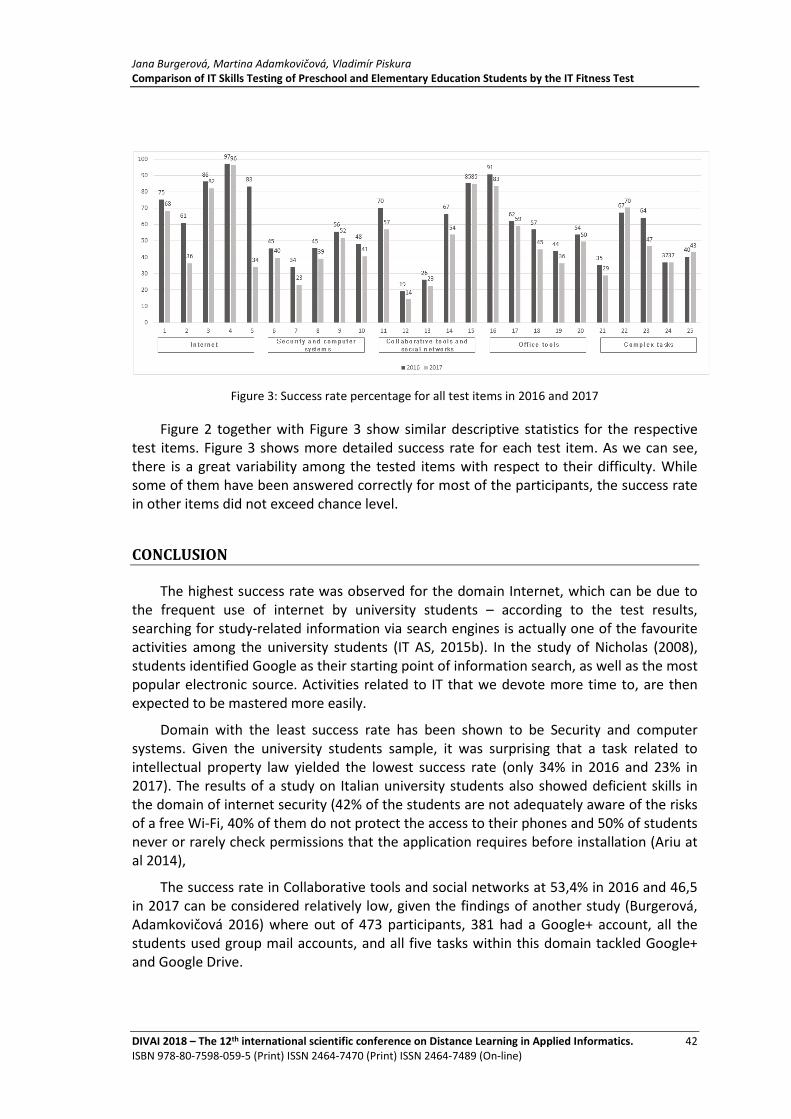
Jana Burgerová, Martina Adamkovičová, Vladimír Piskura Comparison of IT Skills Testing of Preschool and Elementary Education Students by the IT Fitness Test
DIVAI 2018 – The 12th international scientific conference on Distance Learning in Applied Informatics. 42 ISBN 978-80-7598-059-5 (Print) ISSN 2464-7470 (Print) ISSN 2464-7489 (On-line)
Figure 3: Success rate percentage for all test items in 2016 and 2017
Figure 2 together with Figure 3 show similar descriptive statistics for the respective test items. Figure 3 shows more detailed success rate for each test item. As we can see, there is a great variability among the tested items with respect to their difficulty. While some of them have been answered correctly for most of the participants, the success rate in other items did not exceed chance level.
CONCLUSION
The highest success rate was observed for the domain Internet, which can be due to the frequent use of internet by university students – according to the test results, searching for study-related information via search engines is actually one of the favourite activities among the university students (IT AS, 2015b). In the study of Nicholas (2008), students identified Google as their starting point of information search, as well as the most popular electronic source. Activities related to IT that we devote more time to, are then expected to be mastered more easily.
Domain with the least success rate has been shown to be Security and computer systems. Given the university students sample, it was surprising that a task related to intellectual property law yielded the lowest success rate (only 34% in 2016 and 23% in 2017). The results of a study on Italian university students also showed deficient skills in the domain of internet security (42% of the students are not adequately aware of the risks of a free Wi-Fi, 40% of them do not protect the access to their phones and 50% of students never or rarely check permissions that the application requires before installation (Ariu at al 2014),
The success rate in Collaborative tools and social networks at 53,4% in 2016 and 46,5 in 2017 can be considered relatively low, given the findings of another study (Burgerová, Adamkovičová 2016) where out of 473 participants, 381 had a Google+ account, all the students used group mail accounts, and all five tasks within this domain tackled Google+ and Google Drive.

Jana Burgerová, Martina Adamkovičová, Vladimír Piskura Comparison of IT Skills Testing of Preschool and Elementary Education Students by the IT Fitness Test
DIVAI 2018 – The 12th international scientific conference on Distance Learning in Applied Informatics. 43 ISBN 978-80-7598-059-5 (Print) ISSN 2464-7470 (Print) ISSN 2464-7489 (On-line)
Office tools represented by spreadsheet software showed the second highest overall success rate. However, the fact that in 2017 were students less successful in all office tools than in 2016, is rather alarming. This decreasing tendency was evidenced also by the interim results of the digital skills testing in Slovakia in 2017, where Office package landed the lowest score – only 38%. Based on testing as well as in-class experience which provides for direct observation of students’ work with word processing, spreadsheet and presentation software, we lean towards the conclusion that the students are more or less capable of using these tools but fail when faced with more elaborate demands. Similarly, a study carried out on a sample of 1000 participants who had left school in the past three years, 85 percent of university graduates learned to use PowerPoint software while in school but only 39 percent reported using it at work, 88 percent learned to use spreadsheet software, but only 65 percent use it as part of their job. According to the study, “many young adults are confident in their digital skills, survey finds, but businesses are not making the most of their tech savvy” (Lomas, 2008). The Chartered Institute for IT (2017) points out that the employers regard email, word processing and spreadsheet skills necessary for most roles in the work place.
The domain Complex tasks was a combination of search tasks and other knowledge where the participants were required to carry out a series of steps to resolve the tasks. This domain was marked with the second lowest success rate indicating a long-term issue which we face in education: tasks requiring higher-order cognitive functions are usually those in which the students fail.
All in all, we can conclude that in 2017 were students less successful compared to the 2016 testing – in all tested domains. Based on our research finding so far, we concur that the digital skills of the digital generation tend to be generally overestimated as shown by numerous other studies. What follows is the conclusion that favourite digital lifestyle skills of digital natives such text messaging, playing games, watching videos, listening to music are arguably not sufficient for study and work purposes of the future. Digital skills needed for study and preferred by employers can be quite specific and it is necessary to systematically and understand learn them. At the same time, it is important that the students develop skills needed for complex tasks where it is necessary to link pieces of knowledge within a broader context while making use of higher-order cognitive operations (analysis, assessment, creativity) (IT AS, 2015b). The combination of the development of digital skills and higher-order cognitive functions is offered by numerous applications. One of the most helpful tools is, e.g. iPedagogy Wheel (Padagogy.cz, 2017), which – based on Bloom’s taxonomy – categorizes mobile applications according to the following criteria: remembering criteria, understanding criteria, applying criteria, analyzing criteria, evaluating criteria, creating criteria.
With respect to the studied sample of participants, it is important to mention that the educational practice continuously provides for new challenges by implementing digital technologies into pre-primary and primary education. That is why it is important to implement into courses with math and IT leaning activities allowing for the development of lacking study-related Digital Skills as well as activities leading to the improvement of teachers’ competences to use digital technologies in primary and pre-primary education. Of importance is also the fact that much of the acquired competences to work with digital technologies is a subject to self-study. The role of institutional education is to complement the acquired skills with systematic approach and professional development.

Jana Burgerová, Martina Adamkovičová, Vladimír Piskura Comparison of IT Skills Testing of Preschool and Elementary Education Students by the IT Fitness Test
DIVAI 2018 – The 12th international scientific conference on Distance Learning in Applied Informatics. 44 ISBN 978-80-7598-059-5 (Print) ISSN 2464-7470 (Print) ISSN 2464-7489 (On-line)
ACKNOWLEDGEMENT
The paper was written with the support of the VEGA 1/0844/17 project called „Identification of the key aspects of math education in the pre-primary education within the international and historical context. “
REFERENCES
Aberšek, M., K.., 2016. The Digital Natives Generation and their Prerequisites for Learning Online. In: DIVAI 2016, The 11th International Conference on Distance Learning in Applied Informatics, Constantine The Philosopher University, Nitra, Slovakia and University of Hradec Králové Faculty of Science Department of Informatics pp. 55-67, ISBN 978-80-7552-249-8.
Adamkovičová, M., Burgerová, J., Piskura, V., 2017. E-learning ako podpora vzdelávania a možnosti jeho využitia na peagogických fakultách. Prešov: Pedagogická fakulta Prešovskej university, ISBN 978-80-555-1873-2.
Adamkovičová, M., Burgerová, J., 2016. Mobile Devices and Social Networks within Pre-Service Teacher Preparation. In: International Journal of Information and Communication Technologies in Education, 5(2). [online] Avaliable at <http://doi.org/10.1515/ijicte-2016-0005> [Accessed 15 January 2018].
Ariu, D., Bosco, F., Ferraris, V., Perri, P., Spolti, G., Stirparo, P., … Zanero, S., 2014. Security of the Digital Natives. Tech And Law Center. [online] Avaliable at <https://ssrn.com/abstract=2442037> [Accessed 10 January 2018].
Buckingham, D., Willett, R., 2006. Digital generations : children, young people, and new media (1st ed.). Mahwah, N.J. : Lawrence Erlbaum Associates, Publishers. ISBN 10: 0805859802.
Bullen, M.., Morgan, T.. 2011. Digital learners not digital natives. In: La Cuestión Universitaria, 7, 60–68. ISSN 1988-236x.
Ebel, R.., Frisbie, D., 1986. Essentials of Educational Measurement. Journal of Educational Measurement, 24(2), 182–184. [online] Avaliable at <http://www.jstor.org/stable/1434697> [Accessed 28 January 2018].
Erdong, Z., Liwei, L., 2008. China’s Generation Y: Understanding the workforce. [online] In: 2008 4th IEEE International Conference on Management of Innovation and Technology (pp. 612–616). IEEE. Avaliable at < http://doi.org/10.1109/ICMIT.2008.4654435 > [Accessed 28 January 2018].
Gallardo-Echenique, E. E., Marqués-Molías, L., Bullen, M., Strijbos, J.-W., 2015. Let’s talk about digital learners in the digital era. [online] In: The International Review of Research in Open and Distributed Learning, 16(3). Avaliable at http://www.irrodl.org/index.php/irrodl/article/view/2196/3337 [Accessed 28 January 2018].
Hargittai, E., 2010. Digital Na(t)ives? Variation in Internet Skills and Uses among Members of the ‘Net Generation’. [online] In: Sociological Inquiry, 80(1), 92–113. Avaliable at http://doi.org/10.1111/j.1475-682x.2009.00317.x [Accessed 28 January 2018].
Hosein, A., Ramanau, R., Jones, C., 2010. Are all net generation students the same? The frequency of technology use at university. [online] In IADIS E-Learning Conference, 26-29 Jul

Jana Burgerová, Martina Adamkovičová, Vladimír Piskura Comparison of IT Skills Testing of Preschool and Elementary Education Students by the IT Fitness Test
DIVAI 2018 – The 12th international scientific conference on Distance Learning in Applied Informatics. 45 ISBN 978-80-7598-059-5 (Print) ISSN 2464-7470 (Print) ISSN 2464-7489 (On-line)
2010. Freiberg, Germany. Avaliable at http://oro.open.ac.uk/id/eprint/24114 [Accessed 28 January 2018].
Hosein, A., Ramanau, R., Jones, C., 2010. Learning and living technologies: a longitudinal study of first-year students’ frequency and competence in the use of ICT. [online] In: Learning, Media and Technology, 35(4), 403–418. Avaliable at http://doi.org/10.1080/17439884.2010.529913 [Accessed 28 January 2018].
Howe, N., Strauss, W., 1991. Generations: The History of America’s Future, 1584 to 2069. New York : Morrow, ISBN 0688119123 9780688119126.
IT Asociácia Slovenska. 2017. [online] Avaliable at <http://itas.sk/> [Accessed 28 January 2018].
IT Asociácia Slovenska. 2015a. Fitness Test 2015. [online] Avaliable at http://www.eskills.sk/sk/statistiky/grafy/prieskum/16eac8bc406aac0f4e2a45c07af8ba0eea128574/ [Accessed 18 January 2018].
IT Asociácia Slovenska. 2015b. Správa o výsledkoch IT FITNESS Testovania 2015. [online] Avaliable at <http://www.eskills.sk/media/redactor/ITAS_2016-fitnes_test_FINAL.pdf> [Accessed 18 January 2018].
Kennedy, G., Judd, T., Dalgarno, B., Waycott, J., 2010. Beyond natives and immigrants: exploring types of net generation students. [online] In: Journal of Computer Assisted Learning, 26(5), 332–343. Avaliable at http://doi.org/10.1111/j.1365-2729.2010.00371.x [Accessed 18 January 2018].
Lomas, N., 2008. Survey: Generation Facebook’s skills wasted at work - CNET. [online] Avaliable at https://www.cnet.com/news/survey-generation-facebooks-skills-wasted-at-work / [Accessed 18 January 2018].
Nicholas, A., 2008. Preferred Learning Methods of the Millennial Generation. In: [online] The International Journal of Learning, 15(6), 27-34. Avaliable at <http :// escholar . salve . edu / fac _ staff _ pub /18/ > [Accessed 8 January 2018].
Padagogy.cz., 2017. Kolo iPadagogiky. [online] Avaliable at < http://www.padagogy.cz/?page_id=15> [Accessed 28 January 2018].
Prensky, M., 2001. Digital Natives, Digital Immigrants Part 1. [online] On the Horizon, 9(5), 1–6. Available at <http://doi.org/10.1108/10748120110424816 > [Accessed 15 February 2018].
R Development Core Team. 2011. R: A Language and Environment for Statistical Computing. [online] Vienna, Austria: R Foundation for Statistical Computing. Avaliable at <http://www.r-project.org/ > [Accessed 28 January 2018].
Tapscott, D., 1998. Growing Up Digital: The Rise of the Net Generation. New York: McGraw-Hill Book, ISSN 0-07-063361-4.
The Chartered Institute for IT. 2014. Digital skills are key to employment according to BCS. [online] Avaliable at http://www.bcs.org/content/conWebDoc/52627 [Accessed 10 January 2018].
Zhao, E., Liu, L., 2008. China´s Generation Y: Understanding the Workforce. In: 2008 4th IEEE International Conference on Management of Innovation and Technology [online], IEEE, 612-616. ISBN 978-1-4244-2329-3. Available at <DOI: 10.1109/ICMIT.2008.4654435 > [Accessed 10 January 2018].


Mikuláš Gangur Automated Generation of Statistical Tasks
DIVAI 2018 – The 12th international scientific conference on Distance Learning in Applied Informatics. 47 ISBN 978-80-7598-059-5 (Print) ISSN 2464-7470 (Print) ISSN 2464-7489 (On-line)
Automated Generation of Statistical Tasks
Mikuláš Gangur
Faculty of Economics, University of West Bohemia, Pilsen, Czech Republic [email protected]
Abstract
The contribution presents the use of automated generation of tasks in the field of statistics and statistical data analysis. The use of statistical data of a larger extent is the key problem when solving tasks from this field. These data collections enable practicing the problems of statistical analysis and application of corresponding tests of statistical interference. A proposal and implementation of the generation of random data of required qualities is shown in the contribution as these factors correspond to the instructions of the generated problem. Further in the contribution namely the integration of these data is shown in the form of a data file as part of the generated description of the task. The proposed solution shows two approaches: In the first one the created data file is stored as an integral part of the task definition in the repository of the applied LMS system. The second approach solves the problems of the attachment of the data file in cases when the output of the generating process is in PDF file. The data are stored in cloud in a chosen repository and the approach to them is implemented by means of a dynamic link generated in the text of the instruction of the generated task. The conclusion presents a proposal of a possible solution of storing the generated data in cloud in the repository and at the same time the solution of downloading the stored data to the output PDF file by means of dynamic links.
Keywords
Generation of random data collection. Statistical data. Automatic generator of questions. XML. XSLT. Cloud solution.
INTRODUCTION
Automatic generation of parameterized task can generate a unique problem for each student. Students can practise one task with different input parameters. It helps them to understand the problem from different points of view.
In the article (Gangur M. , 2011) an automatic generator of questions and answers is described. The universal principle of the automatic parameterized questions generation was explained. The generator of algorithms generates random input parameters of a question according to particular problem constraints. At the same time, the generator solver calculates and generates responding answers based on the input parameters according to the problem solution. The outputs of the procedure consist in creating questions meant to be imported to a question bank and/or in creating a set of randomly selected and automatically created questions for the whole test. Both outputs can be

Mikuláš Gangur Automated Generation of Statistical Tasks
DIVAI 2018 – The 12th international scientific conference on Distance Learning in Applied Informatics. 48 ISBN 978-80-7598-059-5 (Print) ISSN 2464-7470 (Print) ISSN 2464-7489 (On-line)
generated within the demanded structure suitable for the applied system. One of the generator output formats is Moodle XML which is used to import data into LMS Moodle Question bank. On the basis of this principle it is possible to create a unique task for each student and to practise problem solving on different input data. This way students can grasp the principle of problem solving and then, because of that, the mere memorizing of the solution process is no longer necessary.
A specific approach is applied when generating tasks from the field of statistics and statistical processing as well as an analysis of the data. In this case just the statistical data are the key object. Creating the data according to the required parameters, storing the data in the file and inserting the information about the file must be an integrated part of the generation process, as well as the information about the data themselves and then storing them in the output description of the generated task.
This contribution introduces a feature of the question that can be processed by the generator, i.e. automatically generated parameterized data, i.e. data file. This new feature of such a question follows the previously developed generator feature, i.e. automatic generation of parameterized images, see (Gangur M. , 2016), (Plevný & Gangur, 2016). The process of data generating and including uses similar principles as the image generating and inserting to the question text.
In the following parts, the principles of generating data are presented on an example of Matlab functions (MathWorks, 2013).
RELATED WORKS
Within the educational process we can use a number of modern technologies in schools that are meant to be used both in the classical teaching and distant education (Kapusta, Munk, & Turčáni, 2009). Automated generation of questions into the tests by means of a question bank is one of the most widely spread technologies of testing, for example in mathematics. Just in this exact discipline, as opposed to the tests created by questions with open answers, the above method is a frequently used way of testing by means of questions with a choice of one or more correct answers out of more options (multichoice questions, MCQ). (Snajder, Cupic, Basic, & Petrovic, 2008). Generally, the task bank can be created for generating tests by means of different ways. In literature we can find approaches using both declarative programming (Prologue) and approaches using non-declarative programme languages to create mathematical tasks.
The declarative approach is applied, for example, in (Pinto, et al., 2007), (Snajder, Cupic, Basic, & Petrovic, 2008), (Xiao, 2001), (LeActiveMath, 2004) and (PmatE, 1980), where systems are proposed which create tests by means of MCQ from the field of mathematical problems. (Tomas & Leal, 2013) present an application using principles of constraint logic programming, CLP, to create MCQ for mathematics tests.. The described system called AGILMAT consists of two parts, a generator of expressions and a generator of instructions plus the solver. The grammar for the generator of expressions was proposed by (Tomas & Leal, 2002). The solver includes “error” algebraic rules which generate generally known mistakes for constructing incorrect varieties of answers. The given rules are also used by other e-learning tools for generation of more incorrect answers in the generated task. For example, a system for symbolic derivation SLOPERT,

Mikuláš Gangur Automated Generation of Statistical Tasks
DIVAI 2018 – The 12th international scientific conference on Distance Learning in Applied Informatics. 49 ISBN 978-80-7598-059-5 (Print) ISSN 2464-7470 (Print) ISSN 2464-7489 (On-line)
designed in Prologue, is used in LeActiveMath a MathBridge (Goguadze, 2011), (Zinn, 2013).
Some authors do not use declarative programming. (Fikar, 2007), in a technical report, presents automatic generation of questions by means of MATLAB system and XML with the subsequent generation of tests. MATLAB system is also used for automated generation of tasks in courses of financial mathematics and statistics (Gangur M. , 2011) and operational research (Plevný & Gladavská, 2014).
The problem of automated generation of tasks has been solved in different specific fields. (Cristea & Tuduce, 2011) generate questions in the field of analysis of electric circuits; other works aim at generating tasks in the field of object oriented programming (Hsiao, Brusilovsky, & Sosnovsky, 2008). The problem of generating mathematical or scientific problems has also been solved by (Ugurdag, Argali, Eker, Basaran, Gören, & Özcan, 2009). The authors generate questions with the choice of the right answer out of multiple choices by means of image modifications based on a designed graphic tool. However, the new input values of parameterized tasks are not generated automatically.
Automatically generated test questions directly from the chosen text can be found in the publication (Zeng, Sakai, Yin, & al., 2013). The contributions from this field aim namely at generating questions from English texts (Sung, Lin, & Chen, 2007).
As has already been mentioned, in the available literature there are a number of articles dealing with the problem of automated generating test tasks. However, the majority of the described generators generate the instruction of a particular question, while the individual varieties on offer contain only text or mathematical expressions.
There are a number of publications dealing with automated generation of collections of statistical data for the purposes of analysis by means of various tools of statistical analysis. However, the author of this contribution has no knowledge about the existence of other publications dealing with the issue of automated generation of statistical data in connection with an automatically generated instruction of a problem of the required statistical analysis. One of the possible solutions of this problem is proposed in the subsequent parts of the article.
DATA FILES
The work with data files in the process of generation is based on the principles applied in the generation of images and their integration into the generated task (Gangur M. , 2016). In the solution of some partial problems both the approaches are different, and therefore the problems of data files and their inclusion into the instruction of the task are dealt with this self-contained chapter.
The data file and its application
Data with files, most often in text format, or in some other proprietary formats, for example MS Excel, are understood as data file in the context of solving tasks from various fields.
A number of tasks, for example in statistics and in statistical data processing require a larger number of numeric or categorical data. These data represent values of statistical
Mikuláš Gangur Automated Generation of Statistical Tasks
DIVAI 2018 – The 12th international scientific conference on Distance Learning in Applied Informatics. 50 ISBN 978-80-7598-059-5 (Print) ISSN 2464-7470 (Print) ISSN 2464-7489 (On-line)
attributes from more observations. With a smaller number of observations and a smaller number of statistical attributes it is possible to show the generated data in a table (Gangur M. , 2011) and this table can be inserted as a part of the task. With a larger number of recordings and statistical attributes such a table may become unclear and with regard to the necessary subsequent computer processing such a table may also become unusable. For this reasons it is suitable to store the generated data and to distribute them in electronic form as the described data file.
The considered solution is not suitable for any target format. If we required a given task with a larger number of data as an attachment to the instruction in PDF format or AcroTeX, it would be necessary to resolve the problem of distributing the data together with the text instructions in the PDF format. If we do not consider the discussed solution in the form of an unclear and unsuitable text format, the only solution is delivering the data in an independent file as a complement to the PDF file with the generated instruction. Such a file, as well as a possible archive created from those two files can only be read by a software application and the given solution requires the use of a corresponding facility. For that reason we are going to aim only at a format applicable in a chosen SW application, particularly at a solution for the target Moodle XML format.
Principles of generating tasks with data files
If we choose Moodle XML as a target format that can be later displayed on a website, we have two options of solving the problem of the attached data file:
1. The generated data will be displayed on a website in the form of a table (Gangur M. , 2011) without any constraints at the end of the task instruction. When displaying the task it is possible to mark the data and copy them into a required application to be processed later.
2. The generated data will be stored into an independently created file in the required format (for example txt, csv, xls) and this file will be stored in the repository of the given application; we will then generate a hypertext link to this file in the task text.
ad 1) This solution can be used in case that the application in which the instruction of the generated tasks has no possibility of storing other files in the repository. The disadvantage is the necessity of copying the data from a website and the following insertion into the application in the required format. This process may not always be successful.
ad 2) This solution requires a storage area for the attached data files. In a universal case cloud can be used as a repository. In such a case the generating application must have secured access to cloud and it must also have access to data reading from cloud. In the subsequent text we will show an example of the integration of a data file into a question in Moodle XML in such a way that the data in the attached file are always part of a complex description of the task.
The applied principle is based on the solution of the image insertion. As well as in case of inserting the image into a bank of tasks together with the task instruction, even here we need the information about the content of the file and the name of the file in the structure of LMS Moodle repository. After that, as well as with inserting the image, the HTML link to the given file and the content of the file is generated at the end of the task instruction and

Mikuláš Gangur Automated Generation of Statistical Tasks
DIVAI 2018 – The 12th international scientific conference on Distance Learning in Applied Informatics. 51 ISBN 978-80-7598-059-5 (Print) ISSN 2464-7470 (Print) ISSN 2464-7489 (On-line)
all that is completely inserted into the text of the XML file. All other issues of the construction of a transformation XSL template, namely the location of the information about the file in the source XML file and the location of the individual parts in the output Moodle XML file, are solved in the same way as in case of the inserted image (Gangur M. , 2011).
The tag <data> is the key tag and it has the same function as the tag <image> Its content including the name of the tag is identical with the <image> tag. The tag <data> is generated and inserted into the XML file of the question description in the same way as the tag of the image. This is implemented by means of the Matlab function Create_data_file_tag (see Listing 1).
Listing 1: Matlab function generating XML tag of data file (Source: own)
function [tag_data_file] = Create_data_file_tag(data)
if exist(data,'file')
[pathstr,data_name,ext] = fileparts(data);
base64FileContent = base64file(data);
tag_data_file = sprintf('<data
name="%s.xlsx">\n<Base64File>%s ...
</Base64File>\n<tmpname>%s</tmpname>\n</data>',
data_name,base64FileContent,data);
else
tag_data_file = '';
end
end
Unlike the image the processing of the <data> tag is simpler. In this case we locate the link to the data file only into the instruction of the question, not into the individual options of the answers in case of questions with the choice of one or more correct answers (MCQ), which is the same situation as in case of processing the image. In the same way as with the image we will generate two XSL rules for generating a HTML code of the link to the data file (see Listing 2) which is inserted at the end of the text of the instruction after finishing the tag <questiontext>. This is implemented when processing the content of the <questiontext> tag, when the generating code of the template DataHTMLCode is called at the end, after the processing of the task instruction text and after closing the tag (see Listing 3).
Listing 2: XSL template for the generation of the HTML code of the link to the data file (Source: own)
<xsl:template name="DataHTMLCode">
<xsl:param name = "data" />
<xsl:if test="$data">
<p> The data file can be found <a
href="@@PLUGINFILE@@/
<xsl:value-of select="$data/@name" />" /> zde
</a>.</p>
</xsl:if >
</xsl:template>
Listing 3: XSL template for calling the generating code in tag questiontext processing (Source: own)
<xsl:template match="questiontext">
...
<xsl:call-template name="DataFileCode">
<xsl:with-param name="data" select="./text/data" />

Mikuláš Gangur Automated Generation of Statistical Tasks
DIVAI 2018 – The 12th international scientific conference on Distance Learning in Applied Informatics. 52 ISBN 978-80-7598-059-5 (Print) ISSN 2464-7470 (Print) ISSN 2464-7489 (On-line)
</xsl:call-template>
...
</xsl:template>
Similarly, the information about the file including its content is generated and then inserted into the resulting file in the Moodle XML format by means of the XSL template DataFileCode (see Listing 4). The generating code of this template is called when processing the <text> tag which contains the text of the task instruction itself whose part is information about the data file in the <data> tag (see Listing 5).
Listing 4: the XSL template for generating the code for saving the content file in the repository (Source: own)
<xsl:template name="DataFileCode">
<xsl:param name = "data" />
<xsl:if test="$data">
<file>
<xsl:attribute name="name">
<xsl:value-of select="$data/@name"/>
</xsl:attribute>
<xsl:attribute name="encoding">
<xsl:text>base64</xsl:text>
</xsl:attribute>
<xsl:apply-templates select="$data/Base64File" />
</file>
</xsl:if >
</xsl:template>
Listing 5 XSL template for calling the generating code in processing of the tag text (Source: own)
<xsl:template match="text">
...
<xsl:call-template name="DataHTMLCode">
<xsl:with-param name="data" select="./data" />
</xsl:call-template>
...
</xsl:template>
Similarly as in case of the image, an empty XSL template data will be created (See Listing 6) which will eliminate the processing of the data tag, that would be different from the processing of the tags <question_text> and <text> (see Listing 3 and Listing 5)
Listing 6: An empty XSL template for elimination of undesirable listing of the data tag (Source: own)
<xsl:template match="data">
</xsl:template>
An example of a task with a data file
The following statistical problem of the description of data choice and the determination of the basic characteristics of the population may serve as an example of a task using and processing data from the attached file. The entry template may be defined in the following way:
The sample of values is saved in attached file. With help of
##test_type## test find out, whether mean value of sample is
##more_less## ##value##.

Mikuláš Gangur Automated Generation of Statistical Tasks
DIVAI 2018 – The 12th international scientific conference on Distance Learning in Applied Informatics. 53 ISBN 978-80-7598-059-5 (Print) ISSN 2464-7470 (Print) ISSN 2464-7489 (On-line)
<br />
<subquestion type="multichoice" id="1" file=""><text>What
test you employ~?</text></subquestion>
<subquestion type="multichoice" id="2" file=""><text>What
test of normality you employ~?</text></subquestion>
<subquestion type="numerical" id="3"><text>Determine the
value of test statistics</text></subquestion>
<subquestion type="numerical" id="4"><text>Determine p-value
of test</text></subquestion>
<subquestion type="multichoice" id="5" file=""><text>What is
the distribution of sample~?</text></subquestion>
<subquestion type="multichoice" id="6" file=""><text>What
test of means equivalence you employ~?</text></subquestion>
<subquestion type="numerical" id="7"><text> Determine the
value of test statistics</text></subquestion>
<subquestion type="numerical" id="8"><text> Determine p-value
of test </text></subquestion>
<subquestion type="multichoice" id="9" file=""><text>What of
following states are correct~?</text></subquestion>
<br />
All tests make on the level of significance ##alpha##.
The way of generating random numerical data of the entry data file is the key part of the process of generating the entry data of a task. The following Listing 7 shows the appropriate part of the Matlab code which generates the field of numerical data NumData with regard to the parameters n and value which determine the number of observations and the position (median value) around which the data will be generated in case of normal division, or the maximum value in case of even division. By means of the rand function which generates random values corresponding to the even division, we will set the proportion in which the data corresponding to normal or even division are generated. In case stated in Listing 8 the proportion is set as 70% of tasks with normally divided data and 30% of tasks with evenly divided data. The field of random values of size n which correspond to normal division is generated by random function which is furbished with the median value of normal division value and a standard deviation value/3 together with the dimensions of the output field l x n. The generated values of both the divisions are rounded to 2 decimal numbers. Next the numerical data are inserted into the field TaskData in which the name of the attribute is on the first position. By the last command xlswrite the data are stored into the file in MS Excel format. The name of the file is stored in the global data variable which, similarly as in case of the image variable, contains the generated name of the temporary file.
Listing 7: Matlab code for random sample generation (Source: own)
maximum = 100; n = 10+round(rand*100/10)*10;
value = 10 + round(rand*(maximum-10)*100)/100;
if rand<0.7
NumData = round(random('Normal',value,value/3,1,n)*100)
/100;
else
NumData = round(2*value*rand(1,n)*100)/100;
end

Mikuláš Gangur Automated Generation of Statistical Tasks
DIVAI 2018 – The 12th international scientific conference on Distance Learning in Applied Informatics. 54 ISBN 978-80-7598-059-5 (Print) ISSN 2464-7470 (Print) ISSN 2464-7489 (On-line)
TaskData = {'Random variable'};
TaskData(2:n+1) = NumData;
xlswrite(data,TaskData');
The result of the generation and transformation process in the form of the task in the task bank LMS Moodle is shown in Figure 1. In the instruction of the task there is an important hypertext link at the end of the instruction of the task and all the sub questions. It refers to the data file in the repository of LMS Moodle. By clicking on this link it is possible to download the file to a local disk.
TASKS WITH DATA FILES IN CLOUD
When working with files and with regard to the lifetime period of the data file these are divided into two groups. In the first group there are data files that are closely linked with the given generated task. In case of generating a task into the task bank in Moodle these files are part of a file with the description of the entire task. For example, in statistical tasks these are relatively smaller selective files with the data selections which are unique for each task.
Figure 1: Instruction of the task in the LMS Moodle task bank (Source: own)
In the second group there are data files that are joint for more tasks. Such files often contain a vast volume of data and it is not desirable to store them in repository together with the definition of each task. Basic files with a vast volume of the whole population may be an example of that.
The given division influences even the administration of these files when storing them in cloud in case of generating tasks into the output formats based on TexLaTex, AcroTex), whose result is instructing tasks in PDF format. The temporary files can be cancelled in cloud after a certain period of time. These are generated only for the purposes of one time written tests generated in PDF format. If it is necessary to preserve a data file for a longer period of time, it is possible to mark such a file by a tag for permanent data file (for example, practice test in an interactive PDF format may be inserted into an e-course in LMS for a longer period of time).

Mikuláš Gangur Automated Generation of Statistical Tasks
DIVAI 2018 – The 12th international scientific conference on Distance Learning in Applied Informatics. 55 ISBN 978-80-7598-059-5 (Print) ISSN 2464-7470 (Print) ISSN 2464-7489 (On-line)
In the subsequent listings templates for generating links to data files in PDF are defined. The templates generate a LaTex (AcroTex) code for creating a link to the file in the temporary data repository (Listing 8) and a link to the file in the repository with permanent data files (Listing 9).
Listing 8: XSL template for generating the LaTeX code of the link to the temporary data file. (Source: own)
<xsl:template match="data">
Data can be found on URL
\\ \vspace{5mm}
\href{https://temp_storage/<xsl:value-of select="./@name"/>}
{\url{https://temp_storage/<xsl:value-of select="./@name"/>}
}
</xsl:template>
Listing 9: XSL template for generating the LaTeX code of the link to the permanent data file (Source: own)
<xsl:template match="url">
\href{https://storage/<xsl:applytemplates/>}
{\url{https://storage/<xsl:apply-templates/>}}
</xsl:template>
By means of the described method it is possible to generate a link to the data in the instruction of a task in a PDF file which can be rewritten (in the instruction) in the web browser and it is also possible to download the data to a local disk or, in case of opening a PDF file (for example in Acrobat Reader), it is possible to use the generated dynamic link to the data file and to download it to a local disk in one click.
CONCLUSION
The proposed and implemented solution solves a long term problem when working with tasks from the field of statistical data analysis. Tasks of a basic course of statistics can be solved with data of a smaller extent represented by table data. When solving tasks of statistical data analysis, statistical inference, application of various types of tests of characteristic assessment of population or of comparison characteristics of more populations it is desirable to work with the data of a larger extent, whose representation in the task instruction by means of a table or simple text is complicated or impossible.
For the given reasons the possibility of generating data collections of the assigned qualities with regard to the solved problem and namely the integration of these data into the task instruction in the form of the attached data file is very useful. When the generator is used practically for the generation of tasks for the field of statistical data analysis, the described functionality of the generator appears to be indispensable.
For the individual implementations of the generator it is necessary to solve namely the administration of the files in the cloud solution in case of the generated PDF documents with inserted URL links to data files. These are namely the methods of storing the generated data files in cloud and then their identification, but it is also the generation of a corresponding URL of the link to this source and a possibility of subsequent downloading. Storing the data in a repository under a given name which is mapped as a

Mikuláš Gangur Automated Generation of Statistical Tasks
DIVAI 2018 – The 12th international scientific conference on Distance Learning in Applied Informatics. 56 ISBN 978-80-7598-059-5 (Print) ISSN 2464-7470 (Print) ISSN 2464-7489 (On-line)
shared resource appears to be a functional solution. The solution of the subsequent identification and the downloading of the file are possible by means of an application which is called from a generated URL link with one parameter in the form of the name of the data file. This application (for example php script) uses the web service of the repository and on the basis of the name of the data file it gains the entire path to the data file in the repository. This complex link enables the application to find the file and download the data.
The described generation of unique tasks related to statistical data allows students to process the input data in a different structure in the task of the same type. According to the characteristics of these data they have to select the most suitable method of data analysis. This approach to practicing statistical tasks supports better understanding of the principles of statistical data analysis.
ACKNOWLEDGEMENT
This paper is published thanks to the support of the internal projects SGS-2018-042 of the University of West Bohemia in Pilsen.
REFERENCES
Cristea, P., & Tuduce, R. (2011). Automatic generation of exercises for self-testing in adaptive e-learning environments: Exercises on ac circuits. Inter. Workshop on Authoring of Adaptive and Adaptable Educational Hypermedia (Part of WBE) (pp. 1126–1136). Inter. Workshop on Authoring of Adaptive and Adaptable Educational Hypermedia (Part of WBE): WSEAS Publishing.
Fikar, M. (2007). On Automatic Generation of Quizzes using MATLAB and XML in Control Engineering Education. Retrieved October 2014, from http://www.kirp.chtf.stuba.sk/publication_info.php?id_pub=348
Gangur, M. (2011). Automatic generation of cloze questions. CSEDU 2011 - Proceedings of the 3rd International Conference on Computer Supported Education. 1, pp. 264-269. CSEDU 2011 - Proceedings of the 3rd International Conference on Computer Supported Education, Portugalsko: SciTePress - Science and Technology Publications.
Gangur, M. (2016). The Quiz Questions with Automatically Generated Images. DIVAI 2016 - 11th International Scientific Conference on Distance Learning in Applied Informatics (stránky 87-97). Praha: Wolters Kluwer.
Goguadze, G. (2011). ActiveMath – Generation and Reuse of Interactive Exercises using Domain Reasoners and Automated Tutorial Strategies. Saarland: Saarland University.
Hsiao, I., Brusilovsky, P., & Sosnovsky, S. (2008). Web-based parameterized questions for object-oriented programming. World Conf. on ELearning in Corporate, Government, Healthcare, and Higher Education. World Conf. on ELearning in Corporate, Government, Healthcare, and Higher Education.
Kapusta, J., Munk, M., & Turčáni, M. (2009). Experimental Comparison of Adaptive Links Annotation Technique with Adaptive Direct Guidance Technique. V J. Filipe, & J. Cordeiro (Editor), WEBIST 2009: Proceedings of the Fifth International Conference on Web

Mikuláš Gangur Automated Generation of Statistical Tasks
DIVAI 2018 – The 12th international scientific conference on Distance Learning in Applied Informatics. 57 ISBN 978-80-7598-059-5 (Print) ISSN 2464-7470 (Print) ISSN 2464-7489 (On-line)
Information Systems and Technologie (stránky 250-255). WEBIST 2009: Proceedings of the Fifth International Conference on Web Information Systems and Technologie, Lisbon, Portugal: INSTICC.
LeActiveMath. (2004). LeActiveMath: Language-Enhanced, User Adaptive, Interactive eLearning for Mathematics, EU project (2004–2006). Retrieved December 2015, from http://www.leactivemath.org/
MathWorks. (2013). Matlab. Retrieved October 15, 2013, from MathWorks: http://www.mathworks.com/
Pinto, J. S., Oliveira, M. P., Anjo, A. B., Vieira Pais, S. J., Isidro, R. O., & Silva, M. H. (2007). TDmat-Mathematics Diagnosis Evaluation Test for Engineering Sciences Students. Int. J. Mathematical Education in Science and Technology, 38, pp. 283–299.
Plevný, M., & Gangur, M. (2016). On the Possibility of Solving the Problem of Automatic Generation of Images in Quiz Questions. DIVAI 2016 - 11th International Scientific Conference on Distance Learning in Applied Informatics (stránky 385-395). Praha: Wolters Kluwer.
Plevný, M., & Gladavská, L. (2014). Problems of automatic generation of questions for the purpose of testing the knowledge in a management science course. (stránky 325-335). Praha: Wolters Kluwer.
PmatE. (1980, December). PmatE – Mathematics Education Project. Retrieved December 2015, from http://pmate4.ua.pt/pmate/
Snajder, J., Cupic, M., Basic, B. D., & Petrovic, S. (2008). Enthusiast: An Authoring Tool for Automatic Generation of Paper-and-Pencil Multiple-Choice Tests. IC. IC, Kassel, Germany: Kassel University Press.
Sung, L.-C., Lin, Y.-C., & Chen, M. C. (2007). An Automatic Quiz Generation System for English Text. 7th IEEE International Conference on Advanced Learning Technologies, Proceedings, (pp. 196-197.). 7th IEEE International Conference on Advanced Learning Technologies, Proceedings.
Tomas, A. P., & Leal, J. P. (2002). A CLP-Based Tool for Computer Aided Generation and Solving of Maths Exercises. PADL 2003. LNCS, 2562, pp. 223–240.
Tomas, A. P., & Leal, J. P. (2013). Automatic generation and delivery of multiple-choice math quizzes. 19th International Conference on Principles and Practice of Constraint Programming (pp. 848-863). 19th International Conference on Principles and Practice of Constraint Programming: Springer-Verlag.
Ugurdag, H., Argali, E., Eker, D., Basaran, A., Gören, S., & Özcan, H. (2009). Smart question (sq): Tool for generating multiple-choice test questions. Proceedings of the 8th WSEAS International Conference on Education and Educational Technology (pp. 173–177). Proceedings of the 8th WSEAS International Conference on Education and Educational Technology, Athens, Greece: WORLD SCIENTIFIC AND ENGINEERING ACAD AND SOC.
Xiao, G. (2001). WIMS – An Interactive Mathematics Server. Journal of Online Mathematics and its Applications, 1(1).
Zeng, J., Sakai, T., Yin, C., & al. (2013). Automatic generation of tourism quiz using blogs. Artificial Life and Robotics, vol. 17, pp. 412-416.

Mikuláš Gangur Automated Generation of Statistical Tasks
DIVAI 2018 – The 12th international scientific conference on Distance Learning in Applied Informatics. 58 ISBN 978-80-7598-059-5 (Print) ISSN 2464-7470 (Print) ISSN 2464-7489 (On-line)
Zinn, C. (2013). Program Analysis and Manipulation to Reproduce Learners’ Erroneous Reasoning. In E. Albert (Ed.), LOPSTR 2012. LNCS. 7844, pp. 228–243. LOPSTR 2012. LNCS, Heidelberg: Springer.

Ján Gunčaga, Robert Janiga Virtualisation Tools In Science Education
DIVAI 2018 – The 12th international scientific conference on Distance Learning in Applied Informatics. 59 ISBN 978-80-7598-059-5 (Print) ISSN 2464-7470 (Print) ISSN 2464-7489 (On-line)
Virtualisation Tools In Science Education
Ján Gunčaga
Department of Science Education, Faculty of Education, Comenius University in Bratislava, Bratislava,Slovakia
Robert Janiga
Department of Informatics, Faculty of Education, Catholic University in Ružomberok, Ružomberok, Slovakia [email protected]
Abstract
The ways of teaching and learning nowadays, in the age of information technology, are changing significantly in schools and especially in universities. There exists a big change in education of each school subject, fort his reason this change exists also n teacher training in university. Lecturers cannot teach as they used to several years ago. New training tools based on information technologies emerge. New teaching techniques and tools with use of information technologies are implemented in teacher training courses for pre-service teachers at universities. Teachers need to introduce some new approaches, for example virtual laboratories, which are able to replace real ones in many cases. In this paper authors deal with the creation and application of electronic teaching materials for natural science subjects teaching. The authors present the virtual laboratory work on informatics “Fiberoptics laboratory”. The physical principle of the experiment is described. The ways of interaction between a user and the virtual lab are shown. The authors present a part of research results, which they obtained in a major research focused on optical signal processing. This topic is goo application for using interdisciplinary approach in science education. In our research study, we deal with the digital alternatives and presentation of the topic “signal processing” in science education subjects. We also focus on students´ and teachers´ attitude toward these applications and the effectiveness of such applications in education process. The research study results indicate that virtual presentation of the “signal processing” is suitable tool for students in the field of understanding of the principles by signal processing and effective for problem solving tasks.
Keywords
Virtual laboratory. Teacher Training in Science Education. Simulation. Problem solving.

Ján Gunčaga, Robert Janiga Virtualisation Tools In Science Education
DIVAI 2018 – The 12th international scientific conference on Distance Learning in Applied Informatics. 60 ISBN 978-80-7598-059-5 (Print) ISSN 2464-7470 (Print) ISSN 2464-7489 (On-line)
INTRODUCTION
The large development of information and communication technologies brings to the learning process the possibility of using virtual laboratories, especially in STEM (Science, Technology, Engineering, Mathematics) subjects (Černák et al., 2015). For their efficient use by pupils and students, they need a certain level of computer and information literacy (CIL). This problem has already been dealt by Fraillon et al. (2014) with in many countries around the world on various continents in the International Computing and Information Literacy Study (ICILS).
This study compares the level of computer and information literacy of students from different countries. Computer and Information Literacy (CIL) is the ability to use a computer to explore, create and communicate in order to effectively work at home, at school, at work, in society and specific teaching process (Záhorec et al., 2016). CIL combines technical capability and intellectual ability. The CIL construction consists of two components - collecting and working with information and creating and exchanging information. Each of them has some aspects or elements:
1. Collecting and Working with Information:
• ability to use the computer and general knowledge of it,
• collecting and evaluating of information,
• work with information.
2. Creating and exchanging information:
• transformation of information
• creating information
• information exchange
18 countries were involved in the international study ICILS 2013. The survey was conducted at the eighth grade of the primary school, which showed that Slovakia gained 517 points, averaging 500 points across the ICILS studies. For Slovakia, there are some interesting findings, i.e. in which subject students use computers for almost every lesson, 82% of students answered. It was in mathematics 11 percent and in science subjects (physics, chemistry and biology) it was 17 percent. These items belong to STEM and it is indicative that these results are worse for those items, such as the country average in the ICILS study. Therefore, it is important to carry out research and support activities to increase the use of computers in STEM subjects (Majherová et al., 2014). For this purpose, we think virtual laboratories and educational programs are appropriate.
VIRTUAL LABORATORIES AND SIMULATIONS IN TEACHING INFORMATICS
The ICILS results point to the need to increase the use of ICT in the learning process for visualization and simulation purposes. In addition, practical experience is an important part of the learning process. However, the time and economic resources often needed for the establishment and construction of scientific laboratories are out of the budget for many institutions. The solution of this problem can be found in the use of virtual reality

Ján Gunčaga, Robert Janiga Virtualisation Tools In Science Education
DIVAI 2018 – The 12th international scientific conference on Distance Learning in Applied Informatics. 61 ISBN 978-80-7598-059-5 (Print) ISSN 2464-7470 (Print) ISSN 2464-7489 (On-line)
technology that could allow the creation of a virtual lab to simulate processes and activities similar to those in real laboratories (Fischer, 2007).
One of the unique capabilities of virtual lab technology is the successful translation of abstract concepts into visualized events with the ability to interact with the user. Laboratories, in facts, can extend the capability of a conventional laboratory by increasing the number of times and places in which a student can perform experiments (Canfora et al., 2004) while also extending the availability of the laboratory to several students (Krbeček et al., 2013).
One of the trends evolving in this direction is experimental learning or "learning experience" where users are not just passive recipients of information. Experimental learning requires a high degree of interactivity (Harms, 2000):
1. Sharing resources becomes a reality, improving the use of expensive equipment,
2. Access to educational and research material is easier for students and teachers,
3. Scientific research standards are set in areas where practical experimentation is an obligatory part of research,
4. Reducing travel costs and increasing productivity.
Virtual Laboratories (VLs) have as their primary objective the creation of a virtual learning environment to provide further practical teaching materials and teaching experience in fields such as computer science. The VL also provide communication and collaboration tools such as chat, app sharing. Users access the system using a web browser. Well designed lab activities can provide learning opportunities that help students develop concepts. They also provide significant opportunities to help students learn to explore, build up scientific arguments, and substantiate these arguments in the community. In order to achieve important but demanding goals, the education system must provide time and opportunity for teachers to communicate with their students, as well as enough time for students to perform complex investigative tasks.
WHAT IS VIRTUAL REALITY?
For many decades, the term "Virtual Reality" has been dealt with a large number of authors in literature, many of which have slightly different meanings of the term. A few years ago, a common definition was that the VR should be considered as a situation where a person was immersed in a computer-generated environment that has strong similarities to reality (Burianova and Turčáni, 2016). Other authors tend to define the Virtual Reality (VR) in terms of what technology tools are used; i. e. the VR takes place when visual imaging units and motion gauntlets are present. One could define a VR from a psychological point of view, where nothing becomes of technology but rather a state created in the minds of users that can occupy their awareness in a similar way as in a real environment (Koreňová, 2015). We describe strong and weak aspects of VR in the following table (Sampson, 2010):

Ján Gunčaga, Robert Janiga Virtualisation Tools In Science Education
DIVAI 2018 – The 12th international scientific conference on Distance Learning in Applied Informatics. 62 ISBN 978-80-7598-059-5 (Print) ISSN 2464-7470 (Print) ISSN 2464-7489 (On-line)
Table 1: SWOT analysis of the Virtual Reality
Strengths: Weaknesses:
Quick verification of simulation without the need for real time. Detection of limitations. A lot of reports to verify the simulation goal. Simplicity of simulation without programming.
Need to know the explored subject and relationships between entities. Simplicity of the model. Unexpected behavior of the worker. Is it based on historical data, extreme shocks? Higher initial costs. Methodological difficulty.
Simulation allows: Simulation does not allow:
Solution of analytically non-solvable tasks. Explore system dynamics. Time and space comparison Revealing new facts Support decision-making at different decision-making levels System enhancement Cost savings in different business areas
Replacement of man in the decision making process Complete production control Correct data for incorrect parameters Automatically optimize your system Result when the goal is not defined
Basic functions of virtual laboratories
The main objective of the VL is to provide all the simulation tools, applications and conditions that give an effective space where they can experiment, communicate and collaborate on the creation and exchange of knowledge. This means that the virtual environment to be used for laboratories tries to simulate the process of learning from the very beginning to its end. Users should simulate the real process as realistically as possible (Rocard, 2007).
Virtual reality offers a nice display of information, interaction with a system that does not require advanced computing skills and lower costs compared to other technologies.
The use of virtual laboratories may be the following (Majherová, 2014):
a) Support the teaching of theory
� illustration / demonstration of events
� applying theory to real situations
� demonstration of limitation theory
� interaction with phenomena in authentic life situations
b) Creating a set of knowledge
� materials, equipment and technology
� safety rules and procedures
� special equipment and technologies
c) Creating a set of skills, including
� manual skills
� critical observation, interpretation and evaluation

Ján Gunčaga, Robert Janiga Virtualisation Tools In Science Education
DIVAI 2018 – The 12th international scientific conference on Distance Learning in Applied Informatics. 63 ISBN 978-80-7598-059-5 (Print) ISSN 2464-7470 (Print) ISSN 2464-7489 (On-line)
� diagnostic skills
� planning and organization
� solutions to practical problems
d) Develop attitudes which
� stimulate interest in science
� create confidence in all areas
VL is defined as a software simulation experiment, whose data output is unrecognizable from the data of real experiments.
Types of virtual environments
Virtual lab environment can be divided into the following categories (Niedererr, 2003):
� Network applets - are experimental devices in small virtual laboratories and are very popular in science subjects. They are small in size and are easy to carry and can be used regardless of the type of operating system.
� Virtual Reality Laboratories - use workshops created on the computer and highly interactive. The user becomes a participant in a "practically real" world, in an artificial three dimensional environment. These workshops are basically high-level interfaces, including real-time three-dimensional simulations using different sensing channels.
� Remote laboratories - are remote controlled laboratories, otherwise known as on-line laboratories. They include real-time remote telecom experiments, while the user uses the technology from a different location. A large part of the remote laboratory program consists of computing applications running on a local user's computer (Dikke and Faltin, 2015).
EDUCATIONAL EXPERIMENT WITH VIRTUAL LABORATORIES
At the Department of Computer Science of the Catholic University of Ruzomberok, virtual laboratories have been tested on the subject of Fiberoptics Communication Systems for 3 years.
At the beginning of our research, we have built the hypothesis:
H1 - Learners who do not use any form of simulation at lessons achieve worse learning outcomes than students using a virtual lab.
We performed educational experiment with students – future teachers of informatics for lower and upper secondary level. The experiment duration was 8 weeks, 2 hours per week and last two weeks were aimed to the testing and collecting data. Control group was not taught with using virtual laboratories and experimental group used virtual experiments installed on local computers. They are in the second year of the bachelor study. Students were divided at the beginning of the semester, into two groups using the pretest. Pretest examined the level of gained knowledge from the field of fib

Ján Gunčaga, Robert Janiga Virtualisation Tools In Science Education
DIVAI 2018 – The 12th international scientific conference on Distance Learning in Applied Informatics. 64 ISBN 978-80-7598-059-5 (Print) ISSN 2464-7470 (Print) ISSN 2464-7489 (On-line)
Figure 1: Groups formation process
Fiberoptics communication system is a subject, that prerequisite our testing subject. The results of pretest from the previous semester and subject was used for the distribution. We prepared contro and experimental groups with similar abilities and knowledge. The experimental and control group had a total of 44 students each.
In the control group, we followed the common lesson process, using a whiteboard, dataprojector and teaching aids.
In the experimental group, the classroom was supplemented with a set of 5 virtual laboratories where students measured optical fiber characteristics, attenuation, bending effects, light detector characteristics, optical spectrum analysis.
At the end of the semester, students were tested with the same test on both groups. We have learned the level of gained knowledge. The test questions were focused on understanding the physical phenomena in the communication systems and fiber optics. For example, students had to describe the possibilities of lowering optical fiber damping, describing the impact of fiber bending on attenuation. They counted the numerical aperture and selected the correct optical transmitters and photodetectors for the specified optical path. They solved the possibilities of compensation in chromatic and polarization mode dispersion.
•Number of students 88 (of
which 35 female)
Division to 2 groups using pretest
•44 with result over 75%
•44 with result under 75%
Classification of students according the results and
gender •Experimental group of 44 students, of which 17 females
•Control group of 44 students, of which 18 females
Approximately equivalent groups of
students
88 % experimental group
74 % control group
0 10 20 30 40 50 60 70 80 90 100
Success of students in the final test of the subject Fiber optics communication systems

Ján Gunčaga, Robert Janiga Virtualisation Tools In Science Education
DIVAI 2018 – The 12th international scientific conference on Distance Learning in Applied Informatics. 65 ISBN 978-80-7598-059-5 (Print) ISSN 2464-7470 (Print) ISSN 2464-7489 (On-line)
Figure 2: Final test results
The experimental group received an average 88 percent success rate in the final test, the control group had a 74 percent success rate. Interestingly, there was no student in the experimental group who would have mastered the test below 50 percent. This can be seen in the boxplot below.
Figure 3: Results of control and experimental group
Table 2: Statistical calculations of control and experimental group results
Control group Difference Experimental group Difference
Minimum 48 48 Minimum 68 68
Quartile 1 68 20 Quartile 1 84 16
Median 74 6 Median 88 4
Quartile 3 82 8 Quartile 3 94 6
Maximum 95 13 Maximum 99 5
Table 3: Paired Two Sample t-Test for Means of the control and experimental group
t-Test: Paired Two Sample for Means
Control group Final Test
Experimental group Final Test
Mean 73,95454545 88,04545455
Variance 127,7188161 53,02114165
Observations 44 44
Pearson Correlation
0,100067798
Hypothesized Mean Difference
0
df 43
t Stat -7,292650697
P(T<=t) one-tail 2,43109E-09
t Critical one-tail 1,681070703
0 10 20 30 40 50 60 70 80 90 100
1
2
Experimental group
…

Ján Gunčaga, Robert Janiga Virtualisation Tools In Science Education
DIVAI 2018 – The 12th international scientific conference on Distance Learning in Applied Informatics. 66 ISBN 978-80-7598-059-5 (Print) ISSN 2464-7470 (Print) ISSN 2464-7489 (On-line)
P(T<=t) two-tail 4,86218E-09
t Critical two-tail 2,016692199
We compared the results of the experimental and control group by means of a double-sample pair t-test of the mean sample values of the students. We proceeded from the following hypotheses:
H0: The mean values of the experimental and control group of students do not show a statistically significant difference.
H1: The mean values of the experimental and control group of students are statistically significantly different, assuming that the mean values of the experimental group are larger than the control sample of the students
According to the table 9, the absolute value of the statistical variable | t-stat | = 7.292650697 is greater than the critical value of the one-sided Critical One-tail test 1.681070703. This means that the mean values are statistically significantly different. The mean value of the experimental group 88.04545455 is greater than the control group 73.95454545.
Therefore, we reject the H0 hypothesis and accept the hypothesis H1. This means that the experimental group achieved better results in the exit test than the control group. This confirms the positive impact of teaching through virtual laboratories
In the experimental group, we also tried find out the experience and opinions of using virtual laboratories in the form of VL questionnaires providing reliable feedback on students' abilities. Feedback from students and experts provides a number of constructive comments and suggestions. The questions in the questionnaires will be shown in the following charts. Column abbreviations mean: TD - Totally disagree, D - Disagree, A - Agree, CA - Completely agree. The numbers indicate the percentage of respondents' answers.
From the questionnaire survey, we found that 15% of the students did not understand the function of the transfering information using LASER, so it would be advisable to complete the theoretical lesson with further simulations or educational videos. In some virtual laboratories, it has been difficult for some students to adjust the wavelengths as shown in Figure 4. This helps us to adjust the VL to look and to make them more readible and legible. Nearly all students understood the occurrence and measurement of optical fiber loss. Up to 80% of students said the virtual environment of the lab is very similar to real lab and has no problems in its use.

Ján Gunčaga, Robert Janiga Virtualisation Tools In Science Education
DIVAI 2018 – The 12th international scientific conference on Distance Learning in Applied Informatics. 67 ISBN 978-80-7598-059-5 (Print) ISSN 2464-7470 (Print) ISSN 2464-7489 (On-line)
Figure 4: Questionaire at the end of the term – with using VL – understanding of measurement principles
CONCLUSION
Different methods of visualization and simulation can be used in different STEM subjects. The concept of a virtual lab was defined as a "laboratory experiment without a real laboratory with its walls and doors." It allows the student to combine the theoretical aspects and practical without paper and pen. There are many simulations in mathematics teaching, for example. GeoGebra. The research community of GeoGebra already has an international character, which offers an opportunity to exchange experience in the field of motivation of pupils and students in mathematics and STEM education (Hohenwarter and Lavicza, 2010).
As part of the experiment, we have been using virtual lab to teach Subject Fiber optics communication systems at the Department of Informatics at Catholic University in Ruzomberok. We tested the students in the experiment using Virtual Laboratories, and we found out that they are very good teaching aid. VL can be used for not only informatics physics but also for informatics, our next aim will be to compare virtual laboratories vs real
0
10
20
30
40
50
60
70
80
90
100
absolutely disagree disagree agree completely agree

Ján Gunčaga, Robert Janiga Virtualisation Tools In Science Education
DIVAI 2018 – The 12th international scientific conference on Distance Learning in Applied Informatics. 68 ISBN 978-80-7598-059-5 (Print) ISSN 2464-7470 (Print) ISSN 2464-7489 (On-line)
laboratories in some respects and to spread VL to other subjects such as computer networks.
The mean values of the experimental and control group of the students at the exit test were statistically significantly different, with the mean value of the experimental group being greater than the control sample of the students. The experimental group achieved better results in the exit test than the control group. An experiment within a given sample of students has shown that simulation visualization in STEM education helps students understand new concepts, relationships between them and incorporate these new findings into existing structures. This is important for the development of different levels of thinking in the teaching of natural sciences. Simulations can be used in many e-learning courses. The real experiment can be presented through a virtual experiment in the learning process.
The added value of the educational experiment was, that students of the experimental group can better understand principles of the given problems in the final test, their answers were more accurate and they need less time to perform the final test. We would like to extend the experiment through preparing Learning Management System with virtual experiments. We have interest in future research with more students from other universities and schools.
The role of a virtual experiment is a supportive tool for better understanding the principles of proven phenomena. When a teacher has the opportunity to implement a virtual experiment using computer simulation, important student skills necessary for their professional lives can be developed not only in the STEM area, but also in other areas (Kopáčová and Žilková, 2015).
ACKNOWLEDGEMENT
The paper was made with the support of the grant KEGA 012UK-4/2018 “The Concept of Construcionism and Augmented Reality in the Field of the Natural and Technical Sciences of the Primary Education (CEPENSAR)” and grant KEGA 009KU-4/2017 “Inovative methodology in informatics education at the secondary level”.
REFERENCES
Burianova, M., Turčáni, M., 2016. Non-traditional Education Using Smart Devices. Turčáni, M., Balogh, Z., Munk, M., Benko, L. (ed.) DIVAI 2016: 11th International Scientific Conference On Distance Learning in Applied Informatics. Wolters Kluwer, pp. 77-86.
Canfora, G., Daponte, P., Rapuano, S. 2004. Remotely Accessible Laboratory for Electronic Measurement Teaching. Computer Standards & Interfaces, 26 (6), pp. 489–499. ISSN 0920-5489.
Černák, I., Petrušková, H., Majherová, J., 2015. Didaktické aspekty výcviku leteckých špecialistov, PERNER´S CONTACS. Elektronický odborný časopis o technológii, technice a logistice v dopravě. Pardubice: Dopravní fakulta Jana Pernera, Univerzita Pardubice, pp. 22-31. ISSN 1801-674X.

Ján Gunčaga, Robert Janiga Virtualisation Tools In Science Education
DIVAI 2018 – The 12th international scientific conference on Distance Learning in Applied Informatics. 69 ISBN 978-80-7598-059-5 (Print) ISSN 2464-7470 (Print) ISSN 2464-7489 (On-line)
Dikke, D., Faltin N., 2015. Go-Lab MOOC – An online course for teacher professional development in the field of Inquiry-Based Science Education. 7th International Conference on Education and New Learning Technologies, Barcelona Available online: https://telearn.archives-ouvertes.fr/hal-01206503 [Accessed 16 February 2018].
Fischer, J., Mitchell, R. & del Alamo, J., 2007. Inquiry learning with WebLab: Undergraduate Attitudes and Experiences. Journal of Science Education and Technology,16 (4), pp. 337-348.
Harms, U., 2000. Virtual and remote labs in physics education. Proceedings of the Second European Conference on Physics Teaching in Engineering Education, Budapest, pp. 1-6.
Hohenwarter, M., Lavicza, Z., 2010. Gaining momentum: GeoGebra inspires educators and students around the world. GeoGebra The New Language for the Third Millennium. Zigotto Printing & Publishing House Galati-Romania, 1 (1), p. 1-6.
Kopáčová, J., Žilková, K. Developing Children's Language and Reasoning about Geometrical Shapes - a Case Study. International Symposium on Elementary Mathematics Teaching
(SEMT). Prague: Charles University, pp. 184-192. ISBN:978-80-7290-833-2.
Koreňová, L., 2015. What to use for mathematics in high school: PC, tablet or graphing calculator? International Journal for Technology in Mathematics Education, 22(2), pp. 59-64. ISSN: 1744-2710.
Krbeček, M., Schauer, F., Lustig, F., 2013. Easy Remote ISES – Development Environment Remote Experiments. Easy Remote ISESDevelopment Environment for Remote Experiments.
INNOVATIONS 2013 – World Innovations in Engineering Education and Research, Potomac, Maryland: iNEER, pp. 81 -100. ISSN 1553-9911, ISBN 978-0-9818868-4-8.
Majherová, J., Palásthy, H., Janigová, E., 2014. Pupils in the Virtual World and Education. Lecture Notes in Computer Science, Vol. 8730, pp. 112-123. ISSN 0302-9743.
Niederrer et al., 2003. Research about the use of information technology in Science Education. Education research in knowledge based Society. Kluwer Academic Publishers.
Rocard, M., 2007. Science education NOW: a renewed pedagogy for the future of Europe. Luxembourg: Office for Official Publications for the European Commission. Available at: http://ec.europa.eu/research/science-society/document_library/pdf_06/report-rocard-on-science-education_en.pdf.
Sampson, D., 2010. Instructional Design. Course Lectures. University Piraeus.
Záhorec, J., Hašková, A., Munk, M., 2016. Teaching Database Systems and Technologies in Economy and Managerial Study Fields. Turčáni, M., Balogh, Z., Munk, M., Benko, L. (ed.) DIVAI 2016: 11th International Scientific Conference On Distance Learning in Applied Informatics. Wolters Kluwer, p. 457-468.


Dominik Halvoník, Jozef Kapusta E-learning Courses Structural Evaluation
DIVAI 2018 – The 12th international scientific conference on Distance Learning in Applied Informatics. 71 ISBN 978-80-7598-059-5 (Print) ISSN 2464-7470 (Print) ISSN 2464-7489 (On-line)
E-learning Courses Structural Evaluation
Dominik Halvoník, Jozef Kapusta
Department of Informatics, Constantine the Philosopher University in Nitra, Slovakia [email protected], [email protected]
Abstract
The evaluation of the structural form is an essential part of the creation and subsequent evaluation of any educational material. There are a large number of methodologies that define clear quantitative evaluation criteria. In our research, we focus on designing methods and developing extensions in LMS Moodle for evaluating students and educational materials. The aim of this article is to analyze the available methods for the automated evaluation of the electronic courses. In this paper we focus on the methodology used in Slovakia for textbooks in paper form as well as the criteria for evaluating e-learning courses as a whole in the world. Based on these, we will propose a set of structural criteria specifically for e-learning educational content.
Keywords
E-learning. E-learning courses evaluation. Textbook evaluation.
INTRODUCTION
Nowadays, the use of e-learning in the education process is a common reality at all levels of education in Slovakia. Although so much money has been invested so far in this form of education, the benefits often did not match the expected premise and therefore it was necessary to look for cost-effective solutions to contribute making the learning process more efficient and better (Pomffyová, 2009). The reason for such an unclear outcome in the initial applications of e-learning to the education process in Slovakia was a number of shortcomings. However, studies clearly demonstrate that the integration of e-learning into the education process has a clear positive impact and increases the effectiveness of education (Mihailov, 2009). An important element in the successful completion of the learning process by the e-learning method is the continuous interest of the student in the presented topic. This interest is directly proportional to the level of attention paid by the student to his / her study. The student's attention is influenced by several factors. One of these factors is the graphical and structural form of educational materials produced. This is the main aim of this article.
The main emphasis in our research is the proposal of a methodology that identifies potentially problematic parts of the course based on student's behavior and the structural nature of educational materials. In our article we will focus on the second part of our research, a proposal of a methodology for evaluating the structural design of educational materials.

Dominik Halvoník, Jozef Kapusta E-learning Courses Structural Evaluation
DIVAI 2018 – The 12th international scientific conference on Distance Learning in Applied Informatics. 72 ISBN 978-80-7598-059-5 (Print) ISSN 2464-7470 (Print) ISSN 2464-7489 (On-line)
We realize that e-learning is a demanding process, and the structure and content of the course is often not critical to the success of the course (Munk et al., 2016; Benko and Munkova, 2016). Often a course that contains only references to appropriate resources (i.e. practically without own content) but with great emphasis on discussion and activity is often perceived by students as very successful. This is confirmed by the increasing trend of interest in microlearning courses, gamming, etc., i.e. content structures that are different from the "ordinary" concept of e-learning courses.
Unfortunately, the automatic assessment of these "unorthodox" courses is very problematic. It is not our goal to rate the courses and classify them on good and bad. The aim is to help the course developer, using existing applications as well as designing his / her own metrics, and point out the potentially problematic parts of the course. These will be automatically evaluated using LMS Moodle extensions.
RELATED WORK
The student's attention is also influenced by the graphic and content processing of the educational material, with the help of which it acquires the required knowledge. We can also indirectly observe this fact on the basis of conducted student behavior studies in VLE (Munk, 2014). Therefore, in the field of evaluation and assessment of educational materials, there is practically in every developed country a guideline or a complete methodology examining the quality of textbooks and teaching aids. Nor is it otherwise in Slovakia. In our country this issue is dealt with by the State Educational Institute, which is part of the Ministry of Education, Science, Research and Sport. The specific formulation of this institutes competence in this area is defined as guiding the creation of textbooks and teaching aids for all types and levels of schools and school facilities, monitoring the publication of teaching texts and teaching aids (ŠPU, 2009). This institution uses a methodology called "Methodological Issues of Textbook Assessment". The author (Hrehovčík, 2009) divides the evaluation of educational materials into two parts:
1. Criteria for evaluating the quality of textbooks for general education subjects,
2. Evaluation of the quality for textbook processing - foreign languages.
These criteria are set in the form of a point scale so that each textbook is quantitatively ranked by a certain number of points, and the result of the evaluation in word form is then assigned based on the number of points achieved and the placement on the preprogrammed scale. The way of assigning points is as follows:
� 5 points - requirements are met - the assessor has assigned the full number of points,
� 4 points - the requirements of the criteria are met, but there are controversial elements, meaning that the assessor would also suggest improving,
� 3 points - the rated phenomenon still meets the requirements of the criterion, but has several minor deficiencies,
� 2 points - the requirements of the criterion are only partially met, the shortcomings prevail,
� 1 point - the processing of a given phenomenon only meets at least the criterion, has too many drawbacks,

Dominik Halvoník, Jozef Kapusta E-learning Courses Structural Evaluation
DIVAI 2018 – The 12th international scientific conference on Distance Learning in Applied Informatics. 73 ISBN 978-80-7598-059-5 (Print) ISSN 2464-7470 (Print) ISSN 2464-7489 (On-line)
� 0 points - the rated phenomenon does not meet the criterion requirements.
Despite the fact that several reading comprehension studies have confirmed that there is no significant difference between the learner's ability to understand and memorize the presented information when presented in paper or online form (d'Haenens, 2004), e-learning courses contain certain specifics.
Klement (2011) states that the classical concept of distance learning education, sometimes referred to as "training programs", was based on Kirkpatrick's 4th grade model. The four grades of the "learning evaluation" model were later revised and updated in a 1993 book called Evaluating Training Programs: The Four Levels:
1. student's reaction - what they think and feel,
2. student learning - resulting increase in knowledge and skills,
3. student behavior - scope of behavior and improvement of skills and implementation or application,
4. student results - impact on business or the environment resulting from performance.
Fourth grade was added to the fifth, one with e-learning consultants Jack Phillips: return on investment - did the results of the training outweigh its cost?
This e-learning rate evaluation system, based on the e-learning efficacy assessment system, was based on the basic postulate of distance learning that this education is mainly focused on adult education and can therefore be applied not only in the corporate sphere but also in tertiary and lifelong learning.
How we can see these e-learning course concepts and systems focusing on the additional value of that education with a strong emphasis on its economic benefits. As such, they assess the quality of the course or of the e-learning itself, as well as its passing through methods that in no way point to specific shortcomings in the educational materials. Therefore, we consider this area of evaluation of e-learning courses to be unusable from our point of view.
A much more usable and more suitable from our point of view is the E-learning methodology compiled by Rohlíková (2012). It provides some sort of guidance on how to design an e-learning course so that it meets all didactic rules and thus fulfills the prerequisites for an effective and correctly designed course. It is important to say that, in addition to the structural criteria described in this methodology, the author relies on a wide set of criteria. Several of these predicted features are relatively difficult, and practically impossible to apply to machine control. These include, for example, the up-to-date facts in the training materials. That is why we limit our methodology only to the structural criteria of electronic learning materials.
In addition to the basic characteristics of educational content, such as its size or character, from the didactic point of view, the structuring form of learning content also significantly influences the efficiency of the educational process. It goes without saying that when a student studies material that is conceived as a single paragraph consisting strictly of the text without any styling, his attention and interest in learning through such educational content is far less than when the information was received from much more user friendly conceived material. As Klement (2011) states, there are several types of e-

Dominik Halvoník, Jozef Kapusta E-learning Courses Structural Evaluation
DIVAI 2018 – The 12th international scientific conference on Distance Learning in Applied Informatics. 74 ISBN 978-80-7598-059-5 (Print) ISSN 2464-7470 (Print) ISSN 2464-7489 (On-line)
learning assessments. One of these types is the area of evaluation in the technological understanding of e-learning.
In this concept, aspects focusing primarily on the form, layout and content of e-learning learning, and thus technology-driven, come to the forefront of interest. Teacher (author) has to create a learning material rich in a range of formal and content elements that will fully replace present interpretation and allow understanding and memorization of study content. The basic requirements for the study text for distance learning in the form of e-learning are:
� clarity of the text,
� dividing the text into shorter study units,
� a large number of activating and motivating elements (multimedia elements in static or dynamic form),
� provide a large number of specific examples and practical examples of content application,
� applying a large number of feedback elements,
� study guides,
� orientation and explanation apparatus (navigation icons, margins, color classification, font type, etc.).
Fulfillment of the above requirements must be made possible by the technology used. Some activation and motivation elements are in modern, exclusively electronic educational materials, implemented in a multimedia format that is not portable to the printed version of "classical" study support. In addition, these elements, in this form, can solve some shortcomings in distance learning - classical learning support is often not able to meet the psychomotor goals of education because it does not contain the appropriate tools to train and consolidate. Multimedia elements with an interactive nature can eliminate these shortcomings only if the form of such learning material is exclusively electronic.
It is a sad experience that there is much talk about multimedia in e-learning, but only a few educational institutions support and implement multimedia. Specific research even confirms that a significant number of educational institutions do not even make a difference in evaluating classical teaching and e-learning (Skalka, 2012). For example, some educational institutions understand video sequences, that really act on more senses but are by no means interactive (interactivity is one of the basic requirements for effective multimedia). The multimedia application model in a distance learning environment (cognitive) is driven by the basic principles:
� it is always better to explain the curriculum by spoken word and picture, just as a picture,
� it is always better to present students with multimedia support at the time of interpretation - that is, during the interpretation rather than as a supplementary material (e.g. in the case of a combustion engine it is better to have a multimedia model than a written information),
� individual principles are more important for "weaker students" than for gifted and active students,

Dominik Halvoník, Jozef Kapusta E-learning Courses Structural Evaluation
DIVAI 2018 – The 12th international scientific conference on Distance Learning in Applied Informatics. 75 ISBN 978-80-7598-059-5 (Print) ISSN 2464-7470 (Print) ISSN 2464-7489 (On-line)
� we use less words in multimedia interpretation than more. Students are better taught from a clearly structured, indelible text.
This issue was also dealt with by Rohlíková (2012), who described the graphic processing of the educational content as follows:
� text layout on a page,
� font (size, font type, style, line spacing, line length, text colors, etc.),
� "white spots" - vacancies reserved for students' own notes,
� text supplements (illustrations, photographs, tables, charts, diagrams, diagrams, maps, etc.).
The image forms an inherent part of the text. Everything that is possible is expressed by image (illustration, scheme, graph, etc.). We choose more functional than decorative illustrations. We recommend the use of symbol icons for easy and fast text orientation. The page should act "lightly", not too empty or too inflamed. Different styles and font sizes are selected in a straight line. We prefer to highlight the main ideas rather than underlining. We also use frames. Frames and highlighting have a lot of power - we often concentrate on repeating and rewinding the text.
CRITERIA DESIGN FOR THE EVALUATION OF THE STRUCTURAL FORM OF E-
ELARNING EDUCATIONAL MATERIALS
Based on the above information, we have decided to define a pre-existing set of rules for educational content that will determine the correctness of the formal structure of educational content. These rules are focused on the structural form of educational content, and therefore constitute a complementary decision-making mechanism for determining suitably designed educational content. These policies, as well as the established methodology, are generally applicable to all e-learning educational materials, even though they are based on testing and analysis of data extracted from LMS Moodle. We will outline these rules in a spreadsheet format, and then describe the content of each rule so that it is clearly explained for implementation.
Table 1: Design of structural rules.
Points Rule 4 The maximum number of words without multimedia content per
page is 150 - 250 2 The minimum number of words without multimedia content per
page is 20-30 3 One multimedia unit for 150 - 250 words per page 3 The maximum number of words per page is 1000 1 Multimedia content type image 2 Multimedia content type video 3 Interactive multimedia content (flash etc.) 1 Using text highlighting: „bold“ 1 Do not use underline for highlighting 2 The maximum number of consecutive words highlighted in italics is
30 3 The maximum number of different font types on the page is 2 3 The maximum number of different font sizes on the page is 3 2 Are paragraphs on the page?(if yes)

Dominik Halvoník, Jozef Kapusta E-learning Courses Structural Evaluation
DIVAI 2018 – The 12th international scientific conference on Distance Learning in Applied Informatics. 76 ISBN 978-80-7598-059-5 (Print) ISSN 2464-7470 (Print) ISSN 2464-7489 (On-line)
Such summarized rules can be implemented relatively easily either in the form of a control program or by compiling a questionnaire containing similarly formulated questions. In the formal conception of these rules, we were inspired by tools for evaluating pedagogical software such as EPASoft, but also a questionnaire for evaluating pedagogical software created by Bílek and Voltrom. These rules are based on the assumption that the core unit of educational content is the site itself (e.g. a page in an electronic book or PDF document page) The detailed evaluation mechanism for using these rules is as follows:
The maximum number of words without multimedia content per page is 150 – 250 – each page within the e-learning content should contain text. However, it may not exceed a certain maximum limit. This boundary ensures the text clarity and clarity of the learned topic, as well as keeping the student's attention by requiring his / her interaction when going to the next page of educational content after studying the current page. This count is only taken into consideration if there is no multimedia content on the page. If the page contains a number of words in the range of 150 to 250 words, it is rated 4 points. When you exceed 250 words, 1 point for every 20 words on the page is decreased. In the event that the lower limit of the interval is not reached, a 1 point break occurs for every 30 words that are missing on the page. The reason for this rule is to try to achieve the optimal number of words on the page so that the student is not exposed to an absurdly long text without the support of multimedia content, and on the other hand that the educational material is rich enough on the content page to allow the student to focus and concentrate to the presented content.
The minimum number of words without multimedia content per page is 20-30 – as well as the previous rule, this is also intended to achieve the optimal number of words on the educational content page. If a page has a number of words in a given interval, the page is rated by 2 points. If the page does not contain a minimum number of words, say 20, we will give 0 points. If the page exceeds the specified interval, the number of points decreases by every 20 words on the page. This rule should eliminate pages of educational content that are navigational rather than content in nature. This kind of site should be minimal within the educational content.
One multimedia unit for 150 - 250 words per page – by this rule we would like to guide the creators of individual e-learning materials to make greater use of multimedia elements in the creation of educational materials. There are a number of words on the page, which should be supported by multimedia content. If there is 1 multimedia element on the page and the number of words on the page is within the specified interval, the page gets 3 points. If the page contains more words than the upper bound of the interval, it starts as if it were from the beginning. This rule would be exempt from the context of other rules and could produce an unlimited number of points. Therefore, it is important to use the rules as a whole, not separately. Once there is at least 1 multimedia element on the page, but the number of words did not reach the bottom of the interval, the score is reduced by 1 point for every 50 words. We would like to prevent the creation of educational content in such a way that the authors would only put videos or other multimedia elements on individual pages without additional written explanation. Of course, the exception is SCORM modules, which are temporarily excluded from this methodology.

Dominik Halvoník, Jozef Kapusta E-learning Courses Structural Evaluation
DIVAI 2018 – The 12th international scientific conference on Distance Learning in Applied Informatics. 77 ISBN 978-80-7598-059-5 (Print) ISSN 2464-7470 (Print) ISSN 2464-7489 (On-line)
The maximum number of words per page is 1000 – the rule is only applicable when combining rules, The maximum number of words without multimedia content per page is 150 – 250 and One multimedia unit for 150 - 250 words per page. Also, it is inappropriate to include too much written content on the one hand when supporting multimedia content. Therefore, a certain limitation must be given in terms of content. This rule has more Boolean character than the previous rules. Once the above rules are met and the page exceeds the number of words 1000, this rule assigns 0 points, if the maximum number is adhered to 3 points.
Multimedia content type image – if a multimedia content that is represented by an image is on the page, the rule assigns 1 point.
Multimedia content type video – if the site contains multimedia content that is represented by a video, the rule will assign 2 points.
Interactive multimedia content – if the site contains multimedia content that is represented by an application interface that allows the student to interact with the element (e.g., a flash application animating the operation of the RISC microprocessor), the rule assigns 3 points. This type of multimedia content is the highest quality viewing element for multimedia content in educational content.
Using text highlighting: „bold“ – it has been already mentioned that this form of keyword highlighting or supportive ideas is more recommended in the e-learning content that the other types of highlighting. The rule then assigns 1 point to this highlighting method.
Do not use underline for highlighting – a recommendation that encourages us to eliminate this form of text highlighting comes from the same source as the previous rule. The rule assigns 1 point if there is no underline in the text.
The maximum number of consecutive words highlighted in italics is 30 – this graphically oriented rule is intended to prevent one of the most common mistakes in creating e-learning content which is creation of whole paragraphs using the formatting element - italic. When using it, be cautious as it is commonly used to address direct speech in this form of communication. In case a student needs to know a quote that goes beyond a given number of words, it is more appropriate to include an external link. The rule will assign page 2 points if it is matched. This rule is only considered if there is at least one incidence of italics on the page. A prerequisite for this rule is a more intense reference to the general principles of creating e-learning content.
The maximum number of different font types on the page is 2 – this rule applies not only to educational materials but to any written content. Formatting the text should ideally contain 1 type of font but no more than 2. The page gets 3 points if it complies with this rule and 0 if not.
The maximum number of different font sizes on the page is 3 – as well as the previous rule, this principle applies to all kinds of written content. In our evaluation system, however, we have tightened the number of sizes, given the main objective of this methodology and the clarity and understanding of the assessed educational content for the student. The rule ensures the use of normal size, title and subtitle text. There should not be more header levels on the page than three. Therefore, adhering to this rule, the page gets 3 points if it does not get 0.

Dominik Halvoník, Jozef Kapusta E-learning Courses Structural Evaluation
DIVAI 2018 – The 12th international scientific conference on Distance Learning in Applied Informatics. 78 ISBN 978-80-7598-059-5 (Print) ISSN 2464-7470 (Print) ISSN 2464-7489 (On-line)
Are paragraphs on the page? – learning material should be subdivided into paragraphs. If such a breakdown of the text is absent, the readability, and hence the ability to quickly understand the substance, is significantly reduced on the page. The rule assigns the 2-point page if its content is broken down into paragraphs.
The described rules are a system for the allocation of points to individual sites. In conclusion, all points are added together and then divided by the number of pages to obtain the resulting value, which represents the total number of points earned for the assessed learning material. We have drawn up the evaluation scale on which we can present the structural correctness or the inadequacy of the given educational material, taking into account aspects of pedagogical research dealing with the creation and evaluation of evaluation scales. For our needs, we chose to choose the interval scale (Gavora, 2010), using the overall rating. The scale listed above has the following scale:
Table 2: Evaluative scale of structural content.
Points Rating Description 40 and more A Educational material reaches the highest possible level
32 - 39 B There are minor shortcomings in the educational material
25 - 31 C Educational material contains certain shortcomings requiring the author's attention
19 - 24 D Educational material has several drawbacks. The author is recommended to modify the content
11 - 18 E Educational content contains major shortcomings and is recommended complex rebuilding
0 - 10 FX Educational material is structurally deficient in design, which may lead to a decrease its educational value
DISCUSSION AND CONCLUSION
Based on our established methodology, we are able to clearly and comprehensively evaluate individual e-learning educational materials, such as the electronic book in LMS Moodle or static textbooks in PDF format. The methodology proposed by us is relatively simple to apply because the relevant criteria can be easily implemented in the form of a program that will evaluate the relevant educational materials in electronic form.
The interpretation of the evaluation obtained on the basis of these criteria can also be positively evaluated, given its clarity as well as the combination of the individual criteria. This part of the evaluation is quite important given that there is only a very small number of methodologies which follow the individual criteria. As we have seen in the evaluation criteria used by SEIs, the individual criteria are not interrelated, which may lead to the situation that some educational material will appear correct in order of structure, but a certain structural part will be absolutely inadequate. The rules proposed by us will detract from this deficiency.
In the following research, we would like to focus on the experimental verification of the proposed method of evaluation e-learning educational materials in terms of their structural form. Our experiment will be designed to confirm whether students who attended a course that met the criteria proposed by us have achieved better results than students who have used the unadjusted course. We are aware of many data analysis approaches (Balog, 2014) on this occasion, we will use the classic analytical tools of

Dominik Halvoník, Jozef Kapusta E-learning Courses Structural Evaluation
DIVAI 2018 – The 12th international scientific conference on Distance Learning in Applied Informatics. 79 ISBN 978-80-7598-059-5 (Print) ISSN 2464-7470 (Print) ISSN 2464-7489 (On-line)
Educational Data Mining (Drlík, 2014). This ensures that we obtain and formulate relevant results with a high degree of accuracy.
ACKNOWLEDGEMENT
This work was supported by the Slovak Research and Development Agency under the contract No. APVV-14-0336 and Scientific Grant Agency of the Ministry of Education of the Slovak Republic (ME SR) and of Slovak Academy of Sciences (SAS) under the contracts No. VEGA 1/0809/18.
REFERENCES
BALOG, Z., KOPRDA, Š., 2014, Application of Petri Net for Evaluation Modeling of Student in the LMS. In DIVAI, Štúrovo, Slovakia, 2014, ISBN 978-80-7478-497-2, p. 229-239.
BENKO, Ľ., MUNKOVA, D., 2016, Application of POS Tagging in Machine Translation Evaluation. In DIVAI 2016: 11th International Scientific Conference On Distance Learning In Applied Informatics, Štúrovo, Slovakia, 2016, p. 471-479.
D´HENENS, L., JANKOWSKI, N., HEUVELMAN, A., 2004, News in Online and Print Newspapers: Differences in Reader Consumption and Recall. In New Media & Society 6/3, 2004, p. 363 - 382.
DRLÍK, M., ŠVEC, P., SKALKA, J., 2014, Comparison of Approaches to the Data Analysis in the Virtual Learning Environments. In DIVAI, Štúrovo, Slovakia, 2014, ISBN 978-80-7478-497-2, p. 561–572.
GAVORA, P., 2010, Elektronická učebnica pedagogického výskumu. [cit: 2018-01-02] Dostupné na internete: <http://www.e-metodologia.fedu.uniba.sk>, Bratislava, ISBN 978–80–223–2951–4.
HREHOVČÍK, T., Kritériá na hodnotenie kvality učebníc pre všeobecno-vzdelávacie predmety, [cit: 2017-12-07] Dostupné na internete: <http://www.statpedu.sk/files/articles/dokumenty/ucebnice-metodiky-publikacie/kriteria_vseobecno_vzdelavacie_predmety.pdf>
KLEMENT, M., Přístupy k hodnocení elektronických studijních opor určených pro realizaci výuky formou elearningu. [cit: 2017-12-29] Dostupné na internete: <https://www.researchgate.net/profile/Milan_Klement/publication/280313726_Pristupy_k_hodnoceni_elektronickych_studijnich_opor_urcenych_pro_realizaci_vyuky_formou_e-learningu/links/55b1f5a708aed621ddfd72be/Pristupy-k-hodnoceni-elektronickych-studijnich-opor-urcenych-pro-realizaci-vyuky-formou-e-learningu.pdf>.
MIHAILOV, P., 2009, E-learning effectiveness. In ICL, Villach, Austria, 2009, ISBN 978-3-89958-481-3, p. 551–557.
MUNK, M., DRLÍK, M., 2014, Analysis of stakeholders' behaviour depending on time in virtual learning environment. In Applied Mathematics and Information Sciences, Vol. 8, Issue 2, 2014, ISSN 19350090, p. 773 - 785.
MUNK, M., MUNKOVA, D., BENKO, Ľ., 2016, Identification of Relevant and Redundant Automatic Metrics for MT Evaluation. In Multi-disciplinary trends in artificial intelligence, (MIWAI 2016), Lecture Notes in Computer Science, Vol. 10053, 2016, p. 141 - 152.

Dominik Halvoník, Jozef Kapusta E-learning Courses Structural Evaluation
DIVAI 2018 – The 12th international scientific conference on Distance Learning in Applied Informatics. 80 ISBN 978-80-7598-059-5 (Print) ISSN 2464-7470 (Print) ISSN 2464-7489 (On-line)
POMFFYOVÁ, M., E-LEARNING súčasný stav a perspektívy využívania technológií. [cit: 2017-10-22] Dostupné na internete: <http://www.efocus.sk/images/uploads/e_learning.pdf>.
ROHLÍKOVÁ, L., 2012, Kompetentní učitel - Metodika e-learningu., Plzeň, 2012.
SKALKA, J., ŠVEC, P., DRLÍK, M., 2012, E-learning and Quality: The Quality Evaluation Model for E-learning Courses. In DIVAI, Štúrovo, Slovakia, 2012, ISBN 978-80-558-0092-9, p. 279-287.
ŠPU., Štatút Štátneho pedagogického ústavu v Bratislave, [cit: 2017-11-27] Dostupné na internete: <http://www.statpedu.sk/files/articles/dokumenty/organizacia-spu/statut-spu.pdf>

Lilla Korenova, Marta Kis, Zsolt Lavicza, Peter Ostradicky, Theodosia Prodromou New Directions in Nationwide Technology Integration into Mathematics Teaching: The Geomatech Project
DIVAI 2018 – The 12th international scientific conference on Distance Learning in Applied Informatics. 81 ISBN 978-80-7598-059-5 (Print) ISSN 2464-7470 (Print) ISSN 2464-7489 (On-line)
New Directions in Nationwide Technology
Integration into Mathematics Teaching: The
Geomatech Project
Lilla Korenova
Comenius University in Bratislava, Faculty of Education, Slovakia
Marta Kis
Metropolitan University Budapest, Hungary
Zsolt Lavicza
Johannes Kepler University Linz, Austria
Peter Ostradicky
Comenius University in Bratislava, Faculty of Education, Slovakia
Theodosia Prodromou
University of New England, Australia
Abstract
Based on the competencies, involving creativity, innovativeness, enhanced communication and cooperation as well as critical and scientific thinking defined by the International Society for Technology in Education, the practice of teaching of mathematics needs to be updated. Technology rich teaching and learning environments demand new approaches to pedagogies, content and tool uses. This paper offers an overview of new approaches for teaching mathematics with the uses of digital technologies and offers some insights on how technology can be integrated in large-scale and at a national level. The Geomatech project in Hungary attempted to integrate technology into mathematics and science teaching by developing resources for the entire mathematics and science curriculum and offer training for one third of teachers and schools in the country (2500 teachers, 950 schools).. The paper aims introduce the goals and, methodologies for curriculum development and teacher training in the Geomatech project and highlights some technology examples utilised in the project.
Keywords
Teaching and learning mathematics. Information and communication technology. Collaborative learning. GeoGebra.

Lilla Korenova, Marta Kis, Zsolt Lavicza, Peter Ostradicky, Theodosia Prodromou New Directions in Nationwide Technology Integration into Mathematics Teaching: The Geomatech Project
DIVAI 2018 – The 12th international scientific conference on Distance Learning in Applied Informatics. 82 ISBN 978-80-7598-059-5 (Print) ISSN 2464-7470 (Print) ISSN 2464-7489 (On-line)
INTRODUCTION
In the past decades, technology has been becoming an integral part of everyday life and slowly shaping mathematics and science teaching and learning (e.g., Heid & Blume, 2008). Although there has been massive investment in educational technologies in numerous countries, technology has yet to make a sizable impact on education (e.g., Drijvers et al., 2010). On the one hand, students are becoming increasingly proficient users of technology while, on the other hand, opportunities offered by technologies have still little been utilized. Nevertheless, technologies are becoming more integrated into education providing new opportunities for pedagogical approaches and classroom organization. Results of several international assessments (TIMSS study, PIRLS-studies, PISA-assessments) have shown that the performance of Hungarian students in the past decades has decreased. These studies had revealed that students finishing elementary school today are less knowledgeable in the field of mathematics and sciences than students who had finished 10-15 years ago, based on the measures of the surveys. The deterioration in scores is evident on both ends of the performance scale. Society at large is in an enormous need of students skilled in the fields of mathematics and sciences. The PISA assessments, however, indicate that the rate of poor performers in mathematics is increasing, which can lead to severe problems later in relation to employability and trainability. The number of students with high-level of mathematical skill is also declining and possibly lead to a narrowed base of students pursuing higher education and that can hurt innovation as well as the development of academia. PISA also points out that Hungary has a large divide between schools in terms of performance showing that the effect of family background highly determine students performances and schools can’t mitigate this effect. Additionally, findings of international studies point out to problems arising in students’ learning strategies caused largely by the flaws in the system making students focus memorization instead of critical thinking and comprehension of complex issues. PISA assessment has favoured applied knowledge from the onset, students from a system of education preferring memorization showed significantly inferior performances than their peers in more up-to-date systems. Their scores on computer-based and creative problem solving related tests were even worse than poor achievements in paper-based tests. These results indicate that students will have difficulties adapting to a modern, technology rich learning and working environment (Csapo et al. 2014). There are a number of projects developed in Hungary with the aim of improving mathematical aptitude as well as providing a more practical and experience-based education for students to cultivate 21st Century skills. According to new government policies, digital skills in the teaching and learning of mathematics will be a priority, thus, research and development have started into this direction. Studies show that even mathematicians use technology for teaching as they can be more easily treat students as young mathematicians and can develop their discovery and experimental skills (Lavicza, 2010). Focusing on these new developments we will highlight new approaches for digital mathematical skills based on the work of the Geomatech project.
THE GEOMATECH PROJECT
Numerous Hungarian mathematicians, scientist and mathematics educators have a world-wide respect. In addition, mathematics education theorists and practitioners;

Lilla Korenova, Marta Kis, Zsolt Lavicza, Peter Ostradicky, Theodosia Prodromou New Directions in Nationwide Technology Integration into Mathematics Teaching: The Geomatech Project
DIVAI 2018 – The 12th international scientific conference on Distance Learning in Applied Informatics. 83 ISBN 978-80-7598-059-5 (Print) ISSN 2464-7470 (Print) ISSN 2464-7489 (On-line)
among others George Pólya, Zoltán Dienes, Imre Lakatos, Tamás Varga; are often quoted as great innovators and founders of modern theories and practices in mathematics education. In order to utilize the opportunities technologies offer a large-scale project Geomatech (http://geomatech.hu), has been developed in Hungary, which integrates teaching traditions of the country as well as good practices from around the world. In the Geomatech project, new approaches have been developed for technology integration into Hungarian schools utilizing Hungarian teaching traditions, successful international examples, and experiences of Hungarian teachers. The Geomatech project (owing to the generous 8million Euro EU Funding, TÁMOP-3.1.12) is developing high-quality teaching and learning materials for all grades in primary and secondary schools in Hungary (http://tananyag.geomatech.hu/). These materials (1200+ Mathematics, 600+ Science) are embedded into an on-line communication and collaboration environment that can be used as an electronic textbook, a homework system, and a virtual classroom environment. In addition to material development, the project offers 60-hour professional development courses for more than 2500 teachers in 9500 schools in Hungary. Furthermore, it is organizing a wide-range of teacher and student activities including competitions, maths and science fairs, and developing a network of schools for the long-term sustainability of the Geomatech project. The technology background of the project is offered by GeoGebra (http://geogebra.org ), which is an open-source, dynamic mathematics software widely used around the world. The accredited Geomatech courses include both mathematical and natural scientific modules and are intended for primary and secondary school teachers, covering all K-12 levels. The trainings took place in small, 10-12 person groups. The most important goals of the course are that the participants familiarize themselves with the Geomatech education materials in order to implement them successfully in their own teaching practice, and also to learn the advantages that new technologies can offer to their teaching. The training focuses to three main areas:
� Geogebra in education: to become able to design own Geogebra applications.
� Becoming familiar with the Geomatech materials and preparing to use them in everyday teaching practices
� Learning and practicing new pedagogical approaches (http://komplexinstrukcio.hu), developing IT competences, studying methods for experience-centered mathematics education (www.experienceworkshop.hu). The mathematical training is based on problem-based approaches and the natural scientific modules are supporting inquiry-based learning.
Geomatech’s response to the PISA assessment
The usefulness of students’ knowledge is not only determined by the quantity of knowledge, but more by the quality of knowledge (Csapó 1999). Studies outlined earlier have shown that students had achieved better scores when the task at hand was similar to the curriculum they had learned and were less successful when they had to use their newly acquired knowledge. Even when students managed to replicate new knowledge exactly as they had learned, they were seldom able to apply it in a new environment. The problems associated with students’ quality of knowledge had increased, which was largely attributable to archaic teaching methods and outdated tools being employed.
The Geomatech project offers possible new ways to tackle these by placing emphasis on:

Lilla Korenova, Marta Kis, Zsolt Lavicza, Peter Ostradicky, Theodosia Prodromou New Directions in Nationwide Technology Integration into Mathematics Teaching: The Geomatech Project
DIVAI 2018 – The 12th international scientific conference on Distance Learning in Applied Informatics. 84 ISBN 978-80-7598-059-5 (Print) ISSN 2464-7470 (Print) ISSN 2464-7489 (On-line)
� experience based learning;
� solution focused thinking;
� visualization of abstract mathematical concepts and relationships;
� application of information-communications technology;
� group work;
� application of open ended, creativity driven tasks.
The Geomatech project was developed considering these focus areas.
CARRYING OUT THE PROJECT GEOMATECH
The Geomatech project was carried out with the sole purpose of rejuvenating the tools and methodologies of mathematics and science education in Hungary; to improve teaching competencies and motivation of teachers; to change the attitude and competency of students in a positive manner in the affected areas, and to enable parents to support the advancement of their children with this system (Figure 1).
Figure 1: GEOMATECH goals
Geomatech curriculum
In order to reach the outlined goals, we have developed a digital toolkit comprised of 1800 complex learning units and aligned it to regular classes and made it available on the project website as task repository. The Geomatech tasks aimed to provide direct experiences and motivation to teachers and students for experimentation with the help of teacher and student guidelines contained in the learning units. Teacher guides contained examples and recommendations as to which age group (lower/upper elementary school,

Lilla Korenova, Marta Kis, Zsolt Lavicza, Peter Ostradicky, Theodosia Prodromou New Directions in Nationwide Technology Integration into Mathematics Teaching: The Geomatech Project
DIVAI 2018 – The 12th international scientific conference on Distance Learning in Applied Informatics. 85 ISBN 978-80-7598-059-5 (Print) ISSN 2464-7470 (Print) ISSN 2464-7489 (On-line)
secondary school) and skill level (normal, advanced and prodigy) the learning units are most suitable for. In terms of mathematical teaching, pedagogy was developed to emphasize on learning by discovery and experimentation. With the right teacher attitude and approach these learning units allow an exciting learning process through discovery. Student guides, on the other hand, enable students to practice, strengthen their knowledge, make independent discoveries, and uncover new aspects and relationships between previously acquired knowledge and concepts in a playful manner either individually or with parental help (depending on age).
Geomatech methodology
Geomatech, however, is much more than a collection of educational materials on the project website. Geomatech also encompasses the methodology that enables introducing of this knowledge and in a broader sense, all of the information technology and communications support that can be applied in the field of mathematics and science education and related methodologies. It is essential that teachers get to know and develop experience in preparing for classes where digital materials are utilized; to understand the instances when these should be used; and the added benefits in terms of motivation, demonstration, playfulness, and its practical use compared to traditional ways of teaching. It is vital to consider the learning process a constructive one, which means that learning either individually or in a group is a method of construction that should be both an active and personal process. The most important elements of this teaching concept are:
� Learning is encouraged through a series of problems for initiating understanding, processing, problem solving and cognitive processes.
� Prior knowledge was a critical element in the learning process, where prior experiences (which also play a significant role) are constructed through a process of interpretation.
� In the course of learning it is essentially the prior knowledge that is transformed. This transformation can be an enrichment process, but can also result in a transformation of concepts if the learning and prior knowledge are conflicting in nature. Students’ commitment and motivation are the key factors that influence this process.
� The process of learning is greatly influenced by the study environment, which consequently determines the manner, the extent, the structure and the complexity of prior knowledge that a student will mobilize to tackle the task at hand.
� During the learning process, (hopefully complex) activities that can be performed individually or in the company of friends are especially important, as they enable prior knowledge to be used, thereby allow students to understand situations and materials.
The efficiency in which new knowledge is constructed is greatly increased by online learning environments, and digital learning tools.
Geomatech training
In order to allow the learning materials developed in line with the educational concepts mentioned above to take root and become a part of daily routine and thus bear

Lilla Korenova, Marta Kis, Zsolt Lavicza, Peter Ostradicky, Theodosia Prodromou New Directions in Nationwide Technology Integration into Mathematics Teaching: The Geomatech Project
DIVAI 2018 – The 12th international scientific conference on Distance Learning in Applied Informatics. 86 ISBN 978-80-7598-059-5 (Print) ISSN 2464-7470 (Print) ISSN 2464-7489 (On-line)
fruit, it is important for educators to receive proper training. It is important, according to (Cox and Graham, 2009), to implement TPACK (technological pedagogical content knowledge) on teacher training programs. If we support transformation from transmissive teaching to constructivist and constructionist teaching in schools without supporting transformation on teacher training programs at universities, it will be impossible. That is, TPACK is the basis of effective teaching with technology, requiring an understanding of the representation of concepts using technologies. It involves pedagogical techniques that use technologies in constructive ways to teach content; knowledge of what makes concepts difficult or easy to learn and how technology can help redress some of the problems that students face; and knowledge of students’ prior knowledge and theories of epistemology. It helps to understand how knowledge and technologies can be used to build on existing knowledge to develop new epistemologies or strengthen old ones (Mishra, P., Koehler, M. J., Kereluik, K., 2009).
The Geomatech project offered a 60-hour training delivered to over 2500 teachers coming from different schools from all parts of the Hungary. During the course of the trainings, teachers were introduced to technologies, and communication tools, new methodologies all in a constructive environment led by experienced colleagues. They could test run all new tools, share their experiences, have meaningful discourse about the opportunities and risks of these new applications thereby fully prepare themselves and others for future use in their own classes. The success of these trainings is most evident if we consider that teachers partaking in the training, irrespective of their prior experiences had all effectively mastered these methods, got to know the GeoGebra software used to develop these teaching methodologies, had used it to create their own learning materials, which through their accounts from later on proved to be effective in their own classes to both their, and their students’ pleasure.
MATERIAL SAMPLES ON THE GEOMATECH PORTAL
Materials were organised by different categories such as age and grade levels (from year 1 at primary school) to senior year. Some materials were also suitable for university students. Each interactive material was created by the GeoGebra software of a team of experts and included a methodical guide for use in teaching maths and science subjects. Emphasis was placed on emerging discovery teaching and learning, constructionist teaching and learning. Teachers had the opportunity to use these materials on computers, on an interactive whiteboard, and on smartphones and tablets. The Geometech Portal contains 1336 materials for mathematics and 781 interactive materials for natural sciences. The portal can be searched by subject, grade, and keywords.

Lilla Korenova, Marta Kis, Zsolt Lavicza, Peter Ostradicky, Theodosia Prodromou New Directions in Nationwide Technology Integration into Mathematics Teaching: The Geomatech Project
DIVAI 2018 – The 12th international scientific conference on Distance Learning in Applied Informatics. 87 ISBN 978-80-7598-059-5 (Print) ISSN 2464-7470 (Print) ISSN 2464-7489 (On-line)
Sample for Primary School: What Does a Machine Do?
Figure 2: Sample for Primary School, https://geomatech-beta.geogebra.org/
Students should discover the operations of the machine (Figure 2). They can try to move the rings and by using the tick button they can check the correctness of the result. Pressing "refresh" will generate another random task. Feedback is also important for the pupil: after several unsuccessful attempts, it will show the right solution.
Sample for Primary School: A guess game
Figure 3: Sample for Primary School, https://geomatech-beta.geogebra.org /
Students should guess: find the location of the triangle’s height (Figure 3). Clicking on the check button the figure will show the correct solution and the percentage deviation from the exact placement. The game consists of 24 randomly generated triangles.

Lilla Korenova, Marta Kis, Zsolt Lavicza, Peter Ostradicky, Theodosia Prodromou New Directions in Nationwide Technology Integration into Mathematics Teaching: The Geomatech Project
DIVAI 2018 – The 12th international scientific conference on Distance Learning in Applied Informatics. 88 ISBN 978-80-7598-059-5 (Print) ISSN 2464-7470 (Print) ISSN 2464-7489 (On-line)
Sample for Secondary School: Viewing a particular integral
Figure 4: Sample for Secondary School, https://geomatech-beta.geogebra.org/
Students change the width and number of rectangles, visualizing the upper and lower integral sum (Figure 4).
Sample for Secondary school: Transformation of the cosine function graph
Figure 5: Sample for Secondary school, https://geomatech-beta.geogebra.org/
Students can change the value of u and thus track the function shift in the x-axis direction (Figure 5).

Lilla Korenova, Marta Kis, Zsolt Lavicza, Peter Ostradicky, Theodosia Prodromou New Directions in Nationwide Technology Integration into Mathematics Teaching: The Geomatech Project
DIVAI 2018 – The 12th international scientific conference on Distance Learning in Applied Informatics. 89 ISBN 978-80-7598-059-5 (Print) ISSN 2464-7470 (Print) ISSN 2464-7489 (On-line)
Questionnaire results
After the teacher training in Hungary, teachers were surveyed on their views on electronic materials on the Geomatech website. The questionnaire was completed by 786 teachers from all over Hungary, 473 elementary school teachers and 313 secondary school teachers. Distribution in the region: 116 teachers from Budapest, 282 from cities and 169 from villages. As far as digital technology is concerned, the teachers stated that it is used regularly used by 339 teachers, sometimes by 233 teachers and never (because they have no option) by 43 teachers. The question as to what teachers would need to help in with the use of digital teaching materials was answered by 296 teachers. 291 teachers stated that more interactive materials at Geomatech portal and more training on methodological use of portal materials is needed. 262 teachers, stated they needed more methodical materials. The questionnaire shows that teachers appreciated the electronic materials and used them in their lessons, as long as the technical conditions were met, but more importantly teachers must be supported by training and methodical materials to change the teaching methods and to integrate these electronic materials in their teaching.
CONCLUSION
There are a number of important studies published recently about the importance of renewing mathematics education and integrate technology into teaching. It is important that technology integration needs to be rethought and a wide-ranging resources coupled with pedagogy needs to be developed considering national teaching traditions. The Geomatech project aimed to offer such availability of technology, coupled with teacher training, and generate a critical mass of teachers who can sustain such approach in the education system. Our goal was to provide students, regardless of his or her ability and prior knowledge experimental mathematics learning that can increase their motivation and knowledge. Through this we believe that we can contribute to students knowledge and raising the level of mathematics and science learning in Hungary.
ACKNOWLEDGMENT
The paper was written with the support of the grant KEGA 012UK-4/2018 “The Concept of Construcionism and Augmented Reality in the Field of the Natural and Technical Sciences of the Primary Education (CEPENSAR)”.
REFERENCES
Csapó B. 1999: A tudás minősége. Educatio. 1999/3. sz., 473–487. p.
Cox, S.; Graham, C. R., “Diagramming TPACK in practice: using and elaborated model of the TPACK framework to analyze and depict teacher knowledge,” TechTrends, no. 53, pp. 60-69, 2009.
Drijvers, P., Kieran, C., Mariotti, M.-A., Ainley, J., Andresen, M., Chan, Y. C., … Meagher, M. (2010). Integrating Technology into Mathematics Education: Theoretical Perspectives. In C.

Lilla Korenova, Marta Kis, Zsolt Lavicza, Peter Ostradicky, Theodosia Prodromou New Directions in Nationwide Technology Integration into Mathematics Teaching: The Geomatech Project
DIVAI 2018 – The 12th international scientific conference on Distance Learning in Applied Informatics. 90 ISBN 978-80-7598-059-5 (Print) ISSN 2464-7470 (Print) ISSN 2464-7489 (On-line)
Hoyles & J.-B. Lagrange (Eds.), Mathematics Education and Technology-Rethinking the Terrain (pp. 89–132). Springer US.
Heid, M. K., & Blume, G. W. 2008. Algebra and function development. In M. K. Heid & G. W. Blume (Eds.), Research on technology and the teaching and learning of mathematics: Research Syntheses (Vol. 1, pp. 55-108). Charlotte, NC: Information Age Publishing.
Hohenwarter, M., Hedes, C., 2016. “Using quality factors to find "good" resources on the geogebra materials sharing platform”.Proceedings of the 15th International Conference WWW/Internet 2016, Mannheim; Germany, p. 229-232,
Herendiné-Kónya, E., 2013. “A matematika tanítása alsó tagozaton”. Nemzedékek Tudása Tankönyvkiadó, Budapest.
Korenova, L. 2015. “What to use for mathematics in high school: PC, tablet or graphing calculator?”. The International Journal for Technology in Mathematics Education, 22(2), 59-65.
Krawczyk-Stamdo, D., Guncaga, J., & Stamdo, J. 2013. Some examples from historical mathematical textbook with using GeoGebra. In 2013 2nd International Conference on E-Learning and E-Technologies in Education, ICEEE 2013, pp. 207–211.
Lavicza, Z. 2010. Integrating technology into mathematics teaching: A review. ZDM: The International Journal of Mathematics Education. 42(1), 105-119.
Mishra, P., Koehler, M. J., Kereluik, K., “The song remains the same: Looking back to the future of educational technology,” TechTrends, vol. 53, no. 5, pp. 48-53, 2009.
Prodromou, T., Lavicza, Z., & Koren, B., 2015. “Increasing students' involvement in technology-supported mathematics lesson sequences”. The International Journal for Technology in Mathematics Education, 22(4), 169-178.
Stoffová, V., Štrbo, M., 2016. “Educational technologies to support language teaching”. Proceedings of XXIX. DidMatTech 2016, Eötvös Loránd Tudományegyetem, Budapest, 2016.
Wintsche, G., 2014. “Egy kísérlet nem kísérlet. A játéktól a kutatásig”. Budapest, Varga Tamás Tanítványainak Emlékalapítványa, 2014, s. 90-93.
Weigand, H.-G., 2014. “Looking back and ahead-didactical implications for the use of digital technologies in the next decade”. Teaching Mathematics and its Applications Volume 33, Issue 1, March 2014, Article number hru006, Pages 3-15

Vincentas Lamanauskas, Gabriel Gorghiu, Dragos Daniel Iordache, Costin Pribeanu Perception of the Educational Potential of Online Social Networks in Romania and Lithuania
DIVAI 2018 – The 12th international scientific conference on Distance Learning in Applied Informatics. 91 ISBN 978-80-7598-059-5 (Print) ISSN 2464-7470 (Print) ISSN 2464-7489 (On-line)
Perception of the Educational Potential of Online
Social Networks in Romania and Lithuania
Vincentas Lamanauskas
Siauliai University, Siauliai, Lithuania [email protected]
Gabriel Gorghiu
Valahia University, Targoviste, Romania [email protected]
Dragos Daniel Iordache, Costin Pribeanu
National Institute for Research and Development in Informatics - ICI Bucharest, Romania University of Bucharest, Romania
Academy of Romanian Scientists, Romania {dragos.iordache, costin.pribeanu}.ici.ro
Abstract
The social media technologies are blurring the boundaries between formal and informal/non-formal learning and provide new educational opportunities. Recent work shows that online social networks provide various kinds of educational support, such as social learning, informal/non-formal education, information, interaction, and collaboration. This research aims at analyzing the perception of university students from two countries as regards the educational opportunities provided by Facebook. In order to do this, a multidimensional model has been developed and tested, oriented on four kinds of opportunities: information, collaboration, personal development and professional development. Then an invariance analysis has been carried on and shows that the model has metric invariance across the samples from two countries. The results illustrate that the university students from Lithuania and Romania have different perceptions regarding the opportunities provided by Facebook.
Keywords
Educational opportunities. Invariance analysis. Multidimensional model. Social learning.
INTRODUCTION
The social media technologies are blurring the boundaries between formal and informal/non-formal learning and provide new educational opportunities as regards learning in cooperation, learner’s creativity, independence, and motivation (Manca & Ranieri, 2013; Donlan, 2014, Greenhow & Lewin, 2016). On the one hand, the social networks are “moving” into the educational space, but on the other hand, the context of
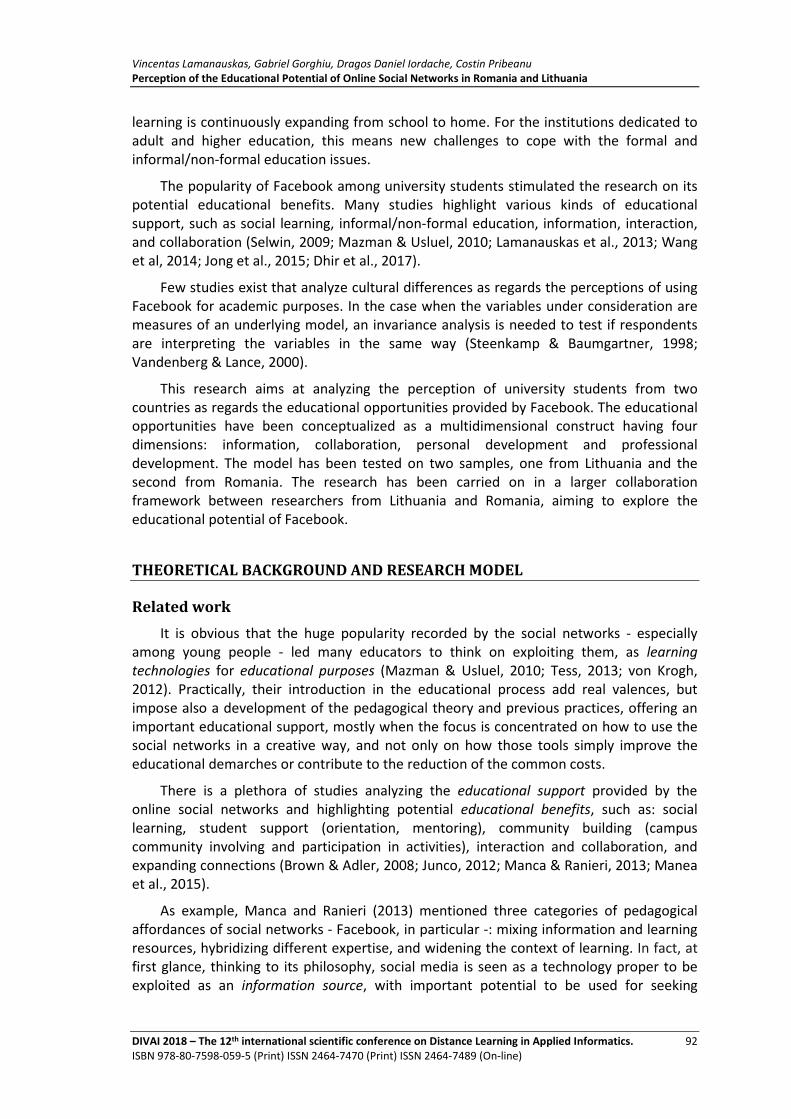
Vincentas Lamanauskas, Gabriel Gorghiu, Dragos Daniel Iordache, Costin Pribeanu Perception of the Educational Potential of Online Social Networks in Romania and Lithuania
DIVAI 2018 – The 12th international scientific conference on Distance Learning in Applied Informatics. 92 ISBN 978-80-7598-059-5 (Print) ISSN 2464-7470 (Print) ISSN 2464-7489 (On-line)
learning is continuously expanding from school to home. For the institutions dedicated to adult and higher education, this means new challenges to cope with the formal and informal/non-formal education issues.
The popularity of Facebook among university students stimulated the research on its potential educational benefits. Many studies highlight various kinds of educational support, such as social learning, informal/non-formal education, information, interaction, and collaboration (Selwin, 2009; Mazman & Usluel, 2010; Lamanauskas et al., 2013; Wang et al, 2014; Jong et al., 2015; Dhir et al., 2017).
Few studies exist that analyze cultural differences as regards the perceptions of using Facebook for academic purposes. In the case when the variables under consideration are measures of an underlying model, an invariance analysis is needed to test if respondents are interpreting the variables in the same way (Steenkamp & Baumgartner, 1998; Vandenberg & Lance, 2000).
This research aims at analyzing the perception of university students from two countries as regards the educational opportunities provided by Facebook. The educational opportunities have been conceptualized as a multidimensional construct having four dimensions: information, collaboration, personal development and professional development. The model has been tested on two samples, one from Lithuania and the second from Romania. The research has been carried on in a larger collaboration framework between researchers from Lithuania and Romania, aiming to explore the educational potential of Facebook.
THEORETICAL BACKGROUND AND RESEARCH MODEL
Related work
It is obvious that the huge popularity recorded by the social networks - especially among young people - led many educators to think on exploiting them, as learning technologies for educational purposes (Mazman & Usluel, 2010; Tess, 2013; von Krogh, 2012). Practically, their introduction in the educational process add real valences, but impose also a development of the pedagogical theory and previous practices, offering an important educational support, mostly when the focus is concentrated on how to use the social networks in a creative way, and not only on how those tools simply improve the educational demarches or contribute to the reduction of the common costs.
There is a plethora of studies analyzing the educational support provided by the online social networks and highlighting potential educational benefits, such as: social learning, student support (orientation, mentoring), community building (campus community involving and participation in activities), interaction and collaboration, and expanding connections (Brown & Adler, 2008; Junco, 2012; Manca & Ranieri, 2013; Manea et al., 2015).
As example, Manca and Ranieri (2013) mentioned three categories of pedagogical affordances of social networks - Facebook, in particular -: mixing information and learning resources, hybridizing different expertise, and widening the context of learning. In fact, at first glance, thinking to its philosophy, social media is seen as a technology proper to be exploited as an information source, with important potential to be used for seeking

Vincentas Lamanauskas, Gabriel Gorghiu, Dragos Daniel Iordache, Costin Pribeanu Perception of the Educational Potential of Online Social Networks in Romania and Lithuania
DIVAI 2018 – The 12th international scientific conference on Distance Learning in Applied Informatics. 93 ISBN 978-80-7598-059-5 (Print) ISSN 2464-7470 (Print) ISSN 2464-7489 (On-line)
information related to serious or delicate topics, but with doubts or circumspections concerning how people discern and assess the source credibility of the information (Westerman, Spence & Van Der Heide, 2012).
Social networks are considered to record a massive potential for enhancing students’ collaboration, being defined as asynchronous tools with benefits detached from educational forums, with flexible access and communication records. More, the online socialization and virtual relationships lead in several circumstances to real meetings and face-to-face ties. But it is obvious that this type of relationship has become a default practice in such environments, offering opportunities for joining the online communities and enhancing participation and collaboration, facilitating students’ collaborative learning and creating understanding among students, by group-discussing, knowledge sharing and even developing students’ research skills (Redecker, Ala-Mutka & Punie, 2010).
Not in the end, the motivation recorded behind the exploiting of the social networks in education is strongly related to the teacher’s responsibility on providing the students with the necessary skills needed to understand the virtual relationships in the new social and cultural format defined by the social networks. For students, the use of social networks represents a good opportunity to express their creativity starting with their personal characterization by defining the own avatar (profile), posted photos and personal interests - a digital frame for each personality. The personal development is achieved embracing various formats: building friendship networks, exchanging ideas and experiences related to different subjects, sharing information about preferred habits, places or interests or communicating particular aspects of the self (Ellison, Steinfield & Lampe, 2007).
Social networks represent a proper environment for enhancing networking opportunities, but at the same time, they have an important contribution to career progression (Donelan, 2016). Providing the necessary resources for students with the aim to retrieve information and plan their future careers became a common task for the university career’ centers. In addition, students may join public or private professional groups, or even they can define a particular social network group in order to increase the preparation for their career development (Wong, Kwan, Leung & Wang, 2014).
Research model
The research model is featuring a global factor - educational opportunities - conceptualized as a second-order construct and four dimensions conceptualized as first-order constructs: information, collaboration, personal development, and professional development (see Figure 1). The second-order factor model makes possible to distinguish between the contribution of each dimension, to analyze on two levels, and to compare the relative importance of each dimension. The operationalization of the constructs is presented in Table 1.

Vincentas Lamanauskas, Gabriel Gorghiu, Dragos Daniel Iordache, Costin Pribeanu Perception of the Educational Potential of Online Social Networks in Romania and Lithuania
DIVAI 2018 – The 12th international scientific conference on Distance Learning in Applied Informatics. 94 ISBN 978-80-7598-059-5 (Print) ISSN 2464-7470 (Print) ISSN 2464-7489 (On-line)
Figure 1. Research model
The empirical study is testing the dimensionality of the global factor: ED→EDI,
ED→EDC, ED→EDD, and ED→EDP. There are two related research questions: (1) Is the model is invariant across the two country samples? and (2) If so, are there significant differences between the perceptions of the students from Lithuania and Romania?
Table 1: Constructs and items.
Construct Item Statement
EDI EDI1 Using Facebook, I can find useful information for my work
EDI2 Using Facebook, I can find useful resources for my work
EDC EDC1 The use of Facebook improves the participation in collective activities
EDC2 The use of Facebook improves the communication between colleagues
EDC3 The use of Facebook improves the student group work
EDD EDD1 The use of Facebook stimulates the critical thinking
EDD2 The use of Facebook stimulates the debate
EDD3 The use of Facebook stimulates the initiative
EDP EDP1 Using Facebook, I can find relevant information about my future profession
EDP2 Using Facebook, I have a broader view on my future profession
The opportunities for information (EDI) refer to the potential to find useful information as regards the learning resources, university-related events, life in university, and issues of interest. This educational potential has been frequently mentioned in the literature (Mazman & Usluel, 2010; Lamanauskas et al, 2013; Manca & Ranieri, 2013). The opportunities for collaboration (EDC) refer to the facilities for the creation and management of interest groups, and collaboration between colleagues. These opportunities have been mentioned in several studies (Mazman & Usluel, 2010; Hamid et al, 2015; Dhir et al, 2017).
The opportunities for personal development (EDD) refer to the development of critical thinking, stimulation of debate, and initiative. This educational potential of the online social networks has been frequently discussed in the context of social learning (Selwin, 2009; Manca & Ranieri, 2013). The opportunities for professional development (EDP) refer to the possibilities to find useful information related to the future profession. This kind of opportunities have been mainly mentioned in the context of informal education (Manca & Ranieri, 2013).

Vincentas Lamanauskas, Gabriel Gorghiu, Dragos Daniel Iordache, Costin Pribeanu Perception of the Educational Potential of Online Social Networks in Romania and Lithuania
DIVAI 2018 – The 12th international scientific conference on Distance Learning in Applied Informatics. 95 ISBN 978-80-7598-059-5 (Print) ISSN 2464-7470 (Print) ISSN 2464-7489 (On-line)
EMPIRICAL RESEARCH
Method and samples
The empirical validation of the models has been done in a two-step approach (Anderson & Gerbing, 1988): testing the measurement model (four inter-correlated first-order factors) and the structural model (one second-order factor and four first-order factors). Testing the multidimensional model followed according to the recommendations from literature (Marsh & Hocevar, 1985; Edwards, 2001; Koufteros et al, 2009). The two models are presented in Figure 2.
Figure 2. Measurement model (left) and structural model (right)
Data analysis was carried out using the SPSS for Windows. Structural Equation Modelling (SEM) with AMOS for Windows software was applied to test the model. Each model has been analyzed for dimensionality, the internal consistency of the scale, and convergent validity (Anderson & Gerbing, 1988; Fornell & Larcker, 1981, Hair et al., 2010). Since the dimensions are supposed to be highly correlated (Koufteros et al, 2009), discriminant validity is not so relevant for multidimensional models. The model fit was assessed through commonly used goodness-of-fit indices (Hair et al., 2010): the χ2 statistic, χ2 / df ratio, Tucker-Lewis Index (TLI), Comparative Fit Index (CFI), Root Mean Square Error of Approximation (RMSEA), and Standardized Root Mean Square Residual (SRMR).
A multi-group CFA (MGCFA) using AMOS for Windows has been conducted, that is, based on testing a hierarchical series of nested models, starting with a baseline model that fits all the samples together. The parameters are freely estimated, and a baseline chi-square value is derived. Metric invariance tests if the factor loadings are equivalent across groups (equality of scaling units). Metric invariance enables the comparison of the observed scores. The scalar invariance tests the equality of the intercepts (origin of the scale) across groups. Scalar invariance enables the comparison of latent mean scores.
Prior to carrying on the multi-group CFA, the model has been tested and validated on each group, in order to check the configural invariance. Configural invariance means that

Vincentas Lamanauskas, Gabriel Gorghiu, Dragos Daniel Iordache, Costin Pribeanu Perception of the Educational Potential of Online Social Networks in Romania and Lithuania
DIVAI 2018 – The 12th international scientific conference on Distance Learning in Applied Informatics. 96 ISBN 978-80-7598-059-5 (Print) ISSN 2464-7470 (Print) ISSN 2464-7489 (On-line)
in each group the dimensions are perceived in a similar way (same pattern of free and fixed factor loadings on the items).
The first sample includes 211 university students (22 male and 190 female) from two Lithuanian universities. The age is varying between 15 and 46 years with a mean of 23.5 years (SD=6.03). The mean number of Facebook friends is 473.23 (SD=446.19) out of which 87.95 (SD=11.81) are university students. The time spent daily on Facebook is on average 114.48 min. (SD=148.43). The second sample includes 567 university students (264 male and 303 female) from two Romanian universities. The age is varying between 18 and 59 years with a mean of 22.7 years (SD=6.53). The mean number of Facebook friends is 913.26 (SD=948.18), out of which 74.69 (SD=137.95) are university students, and the time spent daily on Facebook is on average 67.99 min. (SD=67.65).
The participants have been asked to answer some general questions, and then to evaluate several statements, using a 7-point Likert scale.
Model testing results - Lithuanian sample
The descriptive and model validation results (measurement model) are presented in Table 2.
Table 2: Descriptive statistics and model validation results (N=212).
Construct CR AVE α Item M SD Loading
EDI .901 .819 .900 EDI1 3.48 1.72 0.89
EDI2 3.36 1.69 0.92
EDC .801 .573 .799
EDC1 4.47 1.58 0.73
EDC2 4.41 1.58 0.79
EDC3 4.91 1.52 0.75
EDD .817 .599 .817
EDD1 3.63 1.54 0.73
EDD2 4.08 1.55 0.77
EDD3 3.95 1.56 0.82
EDP .806 .677 .804 EDP1 3.63 1.62 0.89
EDP2 3.40 1.70 0.75
All dimensions are unidimensional (loadings over 0.6) and have convergent validity (composite reliability CR is over 0.7 and average variance extracted AVE is over 0.5). The scale reliability is very good since Cronbach’s alpha is over 0.8.
The results indicated a very good fit of the measurement model with the data:
χ2=56.199, df=29, p=.002, χ2/df=1.938, TLI=0.958, CFI=0.973, SRMR = 0.0412, RMSEA=0.067. The level of perceptions is higher for the opportunities for collaboration (EDC) and personal development (EDD).
The structural model testing results also showed unidimensionality, scale reliability, and convergent validity. The second order factor exhibits unidimensionality, since the loadings on the four dimensions are varying between 0.59 and 0.80. The testing results
indicated a good fit of the model with the data: χ2=80.496, df=31, p=0.0001, χ2/df=2.597, TLI=0.928, CFI=0.950, SRMR = 0.0655, RMSEA=0.087.

Vincentas Lamanauskas, Gabriel Gorghiu, Dragos Daniel Iordache, Costin Pribeanu Perception of the Educational Potential of Online Social Networks in Romania and Lithuania
DIVAI 2018 – The 12th international scientific conference on Distance Learning in Applied Informatics. 97 ISBN 978-80-7598-059-5 (Print) ISSN 2464-7470 (Print) ISSN 2464-7489 (On-line)
The structural model explains 34% variance in EDI, 45% in EDC, 64% in EDD, and 59% of the variance in the EDP. The global factor manifests mainly in the personal development and professional development dimensions.
Model testing results - Romanian sample
The descriptive and model validation results are presented in Table 3. The level of perceptions is higher for the opportunities for information (EDI) and collaboration (EDC). All dimensions are unidimensional (loadings over 0.6) and have convergent validity (composite reliability CR is over 0.7 and average variance extracted AVE is over 0.5). The scale reliability is very good since Cronbach’s alpha is over 0.8.
The testing results indicated an acceptable fit of the model with the data: χ2=151.774,
df=29, p=.0001, χ2/df=5.234, TLI=0.938, CFI=0.9650, SRMR = 0.0523, RMSEA = 0.086.
Table 3: Descriptive statistics and model validation results (N=567).
Construct CR AVE α Item M SD Loading
EDI .890 .802 .884 EDI1 4.12 1.68 0.86
EDI2 4.03 1.66 0.93
EDC .867 .686 .863
EDC1 4.30 1.63 0.76
EDC2 4.72 1.67 0.86
EDC3 4.87 1.63 0.86
EDD .815 .597 .810
EDD1 3.63 1.76 0.69
EDD2 3.94 1.75 0.85
EDD3 3.70 1.71 0.77
EDP .851 .740 .853 EDP1 3.59 1.79 0.88
EDP2 3.08 1.76 0.84
The structural model testing results also showed unidimensionality, scale reliability, and convergent validity. The second order factor exhibits unidimensionality, since the loadings on the four dimensions are varying between 0.63 and 0.75. The testing results
indicated an acceptable fit of the model with the data: χ2=185.284, df=31, p=.0001,
χ2/df=5.977, TLI=0.927, CFI=0.950, SRMR = 0.0627, RMSEA=0.094.
The structural model explains 56% variance in EDI, 54% in EDC, 51% in EDD, and 40% of the variance in the EDP. The global factor manifests in a balanced way in the first three dimensions and less in the professional development dimension.
Analysis of country differences
The model testing results on the two samples demonstrated the configural invariance across countries. Then the model has been tested on a sample fitting the two samples together (N=779). The results showed an acceptable fit of the unconstraint model with the
data: χ2=209.973, df=58, p=.0001, χ2/df=3.588, TLI=0.9437, CFI=0.963, SRMR = 0.0412, RMSEA=0.058.
Then the analysis of invariance tested the series of nested models for metric and scalar invariance. The results are presented in Table 4.
The next step constrained the factor loadings (measurement weight) to be equivalent
across groups. The model comparison shows a nonsignificant chi-square difference (Δχ2 =

Vincentas Lamanauskas, Gabriel Gorghiu, Dragos Daniel Iordache, Costin Pribeanu Perception of the Educational Potential of Online Social Networks in Romania and Lithuania
DIVAI 2018 – The 12th international scientific conference on Distance Learning in Applied Informatics. 98 ISBN 978-80-7598-059-5 (Print) ISSN 2464-7470 (Print) ISSN 2464-7489 (On-line)
4.54, Δdf = 6, p = .6), therefore the model exhibits metric invariance. This means that the model has been perceived in the same way in each group and enables the comparison of observed scores.
Table 4: Analysis of invariance results (N=779).
Model DF CMIN CFI d DF d CMIN d CFI p
Unconstraint 58 207.973 0.963
Meas. weights 64 212.522 0.964 6 4.549 0.001 .6
Meas. intercepts 74 288.155 0.948 10 75.633 -0.016 .007
The next comparison showed a significant chi-square difference (Δχ2 = 75.63, Δdf = 10, p = .007) and CFI depreciation larger than .01 which means a lack of scalar invariance (measurement intercepts are not equivalent).
The comparison of observed scores is presented in Table 5, together with the results of the ANOVA test for significance (1, 777, 778).
Table 5: Differences between countries.
Country EDI1 EDI2 EDC1 EDC2 EDC3 EDD1 EDD2 EDD3 EDP1 EDP2
LT 3.48 3.36 4.47 4.41 4.91 3.63 4.08 3.95 3.63 3.40
RO 4.12 4.03 4.30 4.72 4.87 3.63 3.94 3.70 3.59 3.08
F 21.862 24.832 1.646 5.757 0.119 0.000 1.181 3.620 0.072 4.918
p .0001 .0001 .200 .017 .731 .996 .278 .057 .788 .027
The Romanian students scored higher the items related to the opportunities for information dimension. The differences are statistically significant. They also scored higher (the difference is statistically significant) the item EDC2 (communication between colleagues) and lower the items EDC1 and EDC3.
Lithuanian students scored higher all the items related to the personal development and professional development dimensions. The differences are statistically significant for EDP2 and marginally significant for EDD3.
DISCUSSION
Previous work showed that university students from Romania are more interested than Lithuanian students to use Facebook for getting access to shared resources and participating in group discussions (Iordache et al., 2015). Those findings are still present, the current research strengthening this situation clearly. In Romania, the students use Facebook mainly for communication and information, and exploiting less its valences for personal and career development. In the last years, Facebook became the most important source of knowledge and communication among individuals and in principle, due to the fact that it has the ability to make people interact and discover each other. Unfortunately, many students perceive it in a simplistic way, without significant benefits concerning personal and professional development, being considered as designed just to

Vincentas Lamanauskas, Gabriel Gorghiu, Dragos Daniel Iordache, Costin Pribeanu Perception of the Educational Potential of Online Social Networks in Romania and Lithuania
DIVAI 2018 – The 12th international scientific conference on Distance Learning in Applied Informatics. 99 ISBN 978-80-7598-059-5 (Print) ISSN 2464-7470 (Print) ISSN 2464-7489 (On-line)
communicate with others and eventually to propose a new format on presenting the personal image. More, even Facebook apparently encourages people to be social, in fact, many users spend too much time among the latest friends’ notifications, and do not acknowledge the huge potential offered by Facebook for personal and career development. In fact, there are not so many Facebook pages (in Romanian language) which are dedicated to personal and professional development. Anyway, the students have to be aware that social networks offer advantages for personal and professional purposes, in the actual context, many employers considering not only the professional skill set, but also prospective employees hobbies and passions outside of work (Squires, 2016).
Lithuanian university students give quite a lot of attention to Facebook. It is very widely used. As the carried-out research shows, Lithuanian university students use Facebook for personal and professional improvement purposes much more than Romanian university students. For example, willing to be occupied in voluntary activity can use a special program on social networking site Facebook “e-volunteer”, the creation of which was initiated by European Commission representation in Lithuania, implementing youth volunteer encouragement program on the internet. Student representations operating in Lithuanian universities widely use Facebook possibilities not only for communication, but solving various questions related to studies. Owing to Lithuanian career specialist association, there is a special page on the social network Facebook on career consultation questions (https://www.facebook.com/Karj%C3%A8ras-Karjerai-1492708847699108/?fref=ts).
In the earlier carried out research in Lithuania it was stated, that most of the students express a positive attitude regarding the statements about the possibilities to get interesting information about university on FB, to find useful resources for studies, about academic group collaboration. This shows, that they are important in students’ life, FB diversifies study methods, helps to get useful information for university studies, at a certain level guarantees students’ personal and professional development (Lamanauskas, Šlekienė, Ragulienė, 2016). The other research carried out in Lithuania showed, that such Facebook functions as discussion in a group, file and link exchange in a social network, common blog writing, group wiki page creation, setting of different privacy rights for resources and so on, ensure a successful study process (Gudonienė, Rutkauskienė, Lauraitis, 2013). A wider use of the educational potential of Facebook for studies is actively discussed in Lithuania. A big part of Lithuanian university students are working people, therefore, in this respect, one of the main advantages of Facebook (and other social network) involvement in a learning process is, that learning in social networking sites can save their time, because they can learn just from home or other suitable place. Learning in this way, they can easier match personal and professional responsibilities with the possibility to improve. This allows finding new learning styles, performing group tasks, regardless geographic limits or other factors (Mandravickaitė, 2010).
In general, social network (especially Facebook) usage in student as adult education opens a field for the researchers, seeking to find out more, how social networks influence adult learning (Trepulė, Daukšienė, 2016), how they contribute to their professional as future specialist development. It is obvious, that Facebook provides new educational possibilities and encourages study process changes. Enhanced independent learning skills give students the possibility to take responsibility for their study process.

Vincentas Lamanauskas, Gabriel Gorghiu, Dragos Daniel Iordache, Costin Pribeanu Perception of the Educational Potential of Online Social Networks in Romania and Lithuania
DIVAI 2018 – The 12th international scientific conference on Distance Learning in Applied Informatics. 100 ISBN 978-80-7598-059-5 (Print) ISSN 2464-7470 (Print) ISSN 2464-7489 (On-line)
There are some inherent limitations of this work since two dimensions are measured with only two items and the Lithuanian sample is relatively small.
CONCLUSIONS
This research contributes to a better understanding of the perceived educational opportunities provided by Facebook in Romanian and Lithuanian universities. The results provide evidence for the reliability and validity of the scale that exhibits configural and metric invariance across countries.
In essence, the obtained results strengthen the fact that university students exploit Facebook as an environment used mainly for sharing resources and promoting cooperation. In a real sense, the interaction and participation in related groups is easy to be understood - students exchange text or multimedia objects, in asynchronous and synchronous ways, with their virtual friends, making full use of the benefits related to the collaboration between them - as individuals and/or groups of people -, and subsequently, being interested on exploiting the virtual environment as a learning one. Their common interests should be more visible on the last two dimensions proposed by the current research - personal development and professional development. It is obvious that students enjoy the time spent on Facebook, considering this social networking site as the main communication platform. But it is important for them to be more immersed in communications concerning academic topics. In this respect, the teachers have the possibility to open discussion groups with the view to facilitate the students’ involvement in academic discussions, moderating the communication and enhancing the students’ reflective / critical thinking, in order to promote peer-learning. Furthermore, with a minimum implication of teachers, the students can use Facebook to be informed concerning the skills sought on the labor market. In this sense, they can fully exploit its benefits related to personal and career development. In future research, it may be useful to further explore the perceived educational opportunities provided by Facebook in universities in different countries.
ACKNOWLEDGEMENT
This work was supported in part by a national grant financed by ANCS (Romania) under COGNOTIC 1609 0602 / 2016.
REFERENCES
Anderson, J. C. Gerbing, D. W. (1988). Structural equation modeling in practice: A review and recommended two-step approach. Psychological Bulletin, 103 (3), 411-423.
Arbuckle, J. L. (2007). AMOS 16.0 user’s guide. Amos Development Corporation.
Brown, J. S., Adler, R. P. (2008). Open education, the long tail, and learning 2.0. Educause review, 43 (1), 16-20.
Dhir, A., Khalil, A., Lonka, K., Tsai, C.-C. (2017). Do educational affordances and gratifications drive intensive Facebook use among adolescents? Computers in Human Behavior, 68, 40-50.

Vincentas Lamanauskas, Gabriel Gorghiu, Dragos Daniel Iordache, Costin Pribeanu Perception of the Educational Potential of Online Social Networks in Romania and Lithuania
DIVAI 2018 – The 12th international scientific conference on Distance Learning in Applied Informatics. 101 ISBN 978-80-7598-059-5 (Print) ISSN 2464-7470 (Print) ISSN 2464-7489 (On-line)
Donelan, H. (2016). Social media for professional development and networking opportunities in academia. Journal of Further and Higher Education, 40 (5), 706-729.
Donlan L. (2014). Exploring the views of students on the use of Facebook in university teaching and learning. Journal of Further and Higher Education, 38 (4), 572-588.
Edwards, J. R. (2001). Multidimensional constructs in organizational behavior research: An integrative analytical framework. Organizational Research Methods, 4 (2), 144-192.
Ellison, N. B., Steinfield, C., Lampe, C. (2007) The benefits of Facebook “Friends”: Social capital and college students’ use of online social network sites. Journal of Computer-Mediated Communication, 12, 1143-1168.
Fornell, C., Larcker, D.F. (1981). Evaluating structural equations models with unobservable variables and measurement error. Journal of Marketing Research, 18(1), 39-50
Greenhow, C., Lewin, C. (2016). Social media and education: Reconceptualizing the boundaries of formal and informal learning. Learning, Media and Technology, 41 (1), 6-30.
Gudonienė, D., Rutkauskienė, D., Lauraitis, A. (2013). Pažangių mokymosi technologijų naudojimas ugdymo procese [Advanced learning technologies in education]. Informacijos mokslai, 66, 96–107.
Hair, J. F., Black, W. C., Babin, B. J., Anderson, R. E., Tatham, R. L. (2006). Multivariate data analysis. 6th ed., Prentice Hall, 2006.
Hamid, S., Waycott, J., Kurnia, S., Chang, S. (2015). Understanding students' perceptions of the benefits of online social networking use for teaching and learning, Internet and Higher Education, 26, 1-9.
Iordache, D. D., Pribeanu, C., Lamanauskas, V., Raguliene, L. (2015). Usage of Facebook by university students in Romania and Lithuania: A comparative study. Informatica Economică, 19 (1), 46-54.
Jong, B. S., Lai, C. H., Hsia, Y. T., Lin, T. W., Liao, Y. S. (2014). An exploration of the potential educational value of Facebook. Computers in Human Behavior, 32, 201-211.
Junco, R. (2012). The relationship between frequency of Facebook use, participation in Facebook activities, and student engagement. Computers & Education, 58 (1), 162-171.
Koufteros, X. A., Babbar, S., Kaighobadi, M. (2009). A paradigm for examining second-order factor models employing structural equation modeling. International Journal of Production Economics, 120 (2), 633-652.
Lamanauskas, V., Šlekiene, V., Raguliene, L., Iordache, D. D., Pribeanu, C., Bilek, M., Cavas, B., Mazurok, T. (2013). Social networking websites from the point of view of university students: A comparative analysis. Problems of Education in the 21st Century, 57, 61-78.
Lamanauskas, V., Šlekienė, V., Ragulienė, L. (2016). Facebook vaidmuo studentų socialinėje ir edukacinėje aplinkoje [Facebook‘s role in students` social and educational environment]. Gamtamokslinis ugdymas / Natural Science Education, 13 (3), 96-113.
Manca, S., Ranieri, M. (2013). Is it a tool suitable for learning? A critical review of the literature on Facebook as a technology-enhanced learning environment. Journal of Computer Assisted Learning, 29 (6), 487-504.
Mandravickaitė, J. (2010). Privačios informacijos sklaida socialiniame tinklalapyje Facebook [Private information dissemination on the social website Facebook]. (Magistro darbas / Master work). Kaunas: VDU.

Vincentas Lamanauskas, Gabriel Gorghiu, Dragos Daniel Iordache, Costin Pribeanu Perception of the Educational Potential of Online Social Networks in Romania and Lithuania
DIVAI 2018 – The 12th international scientific conference on Distance Learning in Applied Informatics. 102 ISBN 978-80-7598-059-5 (Print) ISSN 2464-7470 (Print) ISSN 2464-7489 (On-line)
Manea, I. V., Gorghiu, G., Iordache, D. D. (2015). The educational potential of Facebook use by students in Romanian universities. Revista Română de Interacțiune Om-Calculator, 8 (3), 195-208.
Marsh, H. W., Hocevar, D. (1985). Application of confirmatory factor analysis to the study of self-concept: first- and higher order factor models and their invariance across groups. Psychological Bulletin, 97 (3), 562-582.
Mazman, S. G., Usluel, Y. K. (2010). Modeling educational usage of Facebook. Computers & Education, 55 (2), 444-453.
Redecker, C., Ala-Mutka, K., Punie, Y. (2010). Learning 2.0 - The impact of social media on learning in Europe. Policy brief. JRC Scientific and Technical Report. EUR JRC56958 EN. Retrieved from: http://ipts.jrc.ec.europa.eu/publications/pub.cfm?id=3099.
Selwyn, N. (2009). Faceworking: Exploring students’ education-related use of Facebook. Learning, Media and Technology, 34 (2), 157-174.
Squires, D. (2016). Managing personal vs. professional identity on social media. The social Construction of Media. Retrieved from http://scalar.usc.edu/works/cultures-of-social-media/managing-personal-vs-professional-identity-on-social-media.
Steenkamp, J. B. E., Baumgartner, H. (1998). Assessing measurement invariance in cross-national consumer research. Journal of Consumer Research, 25 (1), 78-107.
Tess, P. A. (2013). The role of social media in higher education classes (real and virtual) - A literature review. Computers in Human Behavior, 29, A60-A68.
Trepulė, E., Daukšienė, E. (2016). Socialinių tinklų naudojimas suaugusiųjų švietime [Use of social networks in adult education]. Kaunas: VDU, p. 1-8. Retrieved from https://ec.europa.eu/epale/sites/epale/files/2016-epale-lt-00097.pdf.
Vandenberg, R. J., Lance, C. E. (2000). A review and synthesis of the measurement invariance literature: Suggestions, practices, and recommendations for organizational research. Organizational Research Methods, 3 (1), 4-70.
von Krogh, G. (2012). How does social software change knowledge management? Toward a strategic research agenda. The Journal of Strategic Information Systems, 21, 154-164.
Wang, R., Scow, P., Urquhart, C., Hardman, J. (2014). Tapping the educational potential of Facebook: Guidelines for use in higher education. Education and Information Tehnologies, 19, 21-39.
Westerman, D., Spence, P. R., Van Der Heide, B. (2012). A social network as information: The effect of system generated reports of connectedness on credibility on Twitter. Computers in Human Behavior, 28, 199-206.
Wong, K., Kwan, R., Leung, K., Wang, F. L. (2014). Facebook’s potential for personal, social, academic and career development for higher education students. International Journal of Innovation and Learning, 16 (2), 203-220.

György Molnár The Role of Mobile Devices Supported Education and Open Content Development in the Learning Process
DIVAI 2018 – The 12th international scientific conference on Distance Learning in Applied Informatics. 103 ISBN 978-80-7598-059-5 (Print) ISSN 2464-7470 (Print) ISSN 2464-7489 (On-line)
The Role of Mobile Devices Supported Education
and Open Content Development in the Learning
Process
György Molnár
Department of Technical Education, Budapest University of Technology and Economics, Budapest, Hungary
Abstract
In the world of constant changes, due to the constraint of continuous learning and the transformation of the economic and social environment, the changes in pedagogy are clearly outlined. In digital age are students are faced with many changes within the framework of socialization, institutional education and formal, informal and informal learning. For example, with changing technologies and its widespread and constant implications. Starting from this fact, the author can describe the importance of digitalisation at all levels and forms of schooling. The rapid expansion of mobile devices has almost forced it to be widely used in education. Cloud-based learning is another way of teaching. The new methodological solution has a lot of potential to support the learning process. One important point here is the altered way of content development and the changed habits of mobile devices use. In this article, the author presents the results of an empirical qualitative survey, which was completed in the autumn of 2017 in higher education in Hungary. The focus of the study was the mapping of content consumption and content creation habits developed by their own digital devices.
Keywords
Mobil learning. E-material. ICT. BYOD. Network-based learning. Web 2.0.
INTRODUCTION
In today’s information society, in which the increased value of not only information but information technology has become significant, the concept of the digital divide has gradually been given a new meaning: it has become a qualitative indicator of the use of devices, information flow and transfer. That is to say that while earlier access to devices was the indicator of digital literacy for nations and nation states, today it has become the indicator of support for information flow and communication processes. This process is illustrated by the fact that the penetration of mobile communications devices and internet access has today reached a point whereby every second person owns a device and its inherent services. Further, at a global level there are 2-3 mobile telephones and subscriptions for every person. The age of mobile devices has brought unprecedented interaction. Reception of the concept of Web 2.0 has often referred to the emergence of a participatory web culture. According to this understanding the user is not merely a
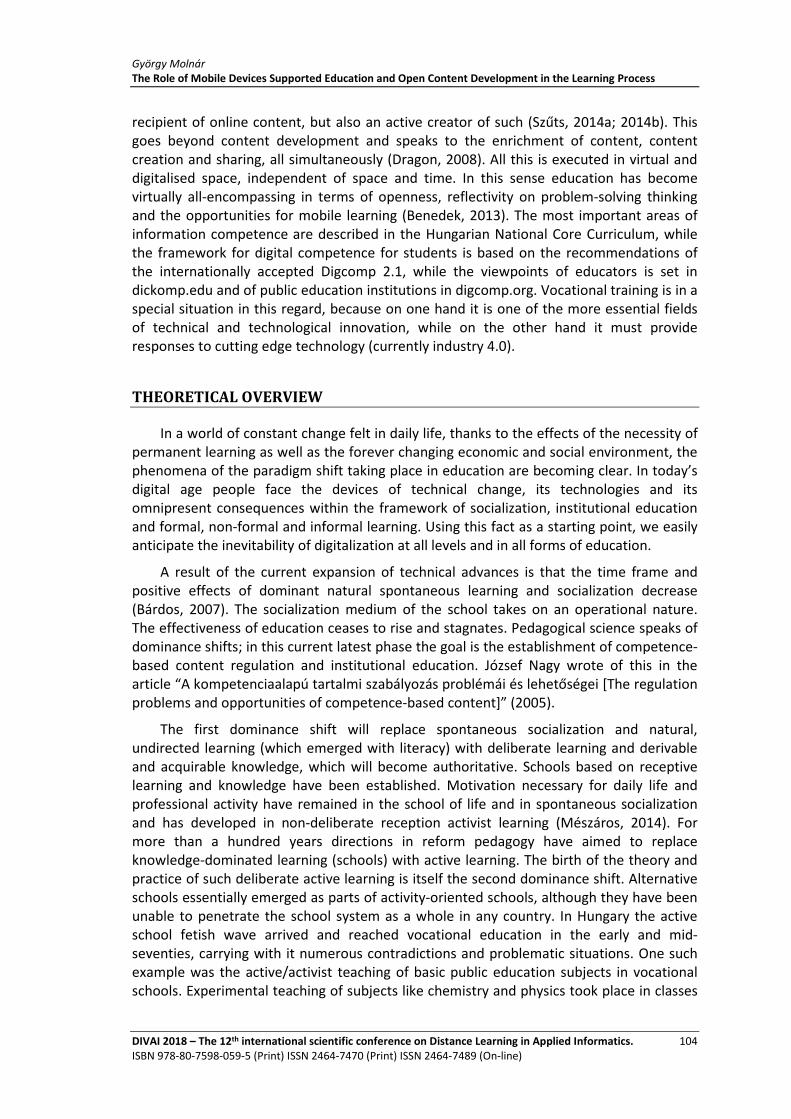
György Molnár The Role of Mobile Devices Supported Education and Open Content Development in the Learning Process
DIVAI 2018 – The 12th international scientific conference on Distance Learning in Applied Informatics. 104 ISBN 978-80-7598-059-5 (Print) ISSN 2464-7470 (Print) ISSN 2464-7489 (On-line)
recipient of online content, but also an active creator of such (Szűts, 2014a; 2014b). This goes beyond content development and speaks to the enrichment of content, content creation and sharing, all simultaneously (Dragon, 2008). All this is executed in virtual and digitalised space, independent of space and time. In this sense education has become virtually all-encompassing in terms of openness, reflectivity on problem-solving thinking and the opportunities for mobile learning (Benedek, 2013). The most important areas of information competence are described in the Hungarian National Core Curriculum, while the framework for digital competence for students is based on the recommendations of the internationally accepted Digcomp 2.1, while the viewpoints of educators is set in dickomp.edu and of public education institutions in digcomp.org. Vocational training is in a special situation in this regard, because on one hand it is one of the more essential fields of technical and technological innovation, while on the other hand it must provide responses to cutting edge technology (currently industry 4.0).
THEORETICAL OVERVIEW
In a world of constant change felt in daily life, thanks to the effects of the necessity of permanent learning as well as the forever changing economic and social environment, the phenomena of the paradigm shift taking place in education are becoming clear. In today’s digital age people face the devices of technical change, its technologies and its omnipresent consequences within the framework of socialization, institutional education and formal, non-formal and informal learning. Using this fact as a starting point, we easily anticipate the inevitability of digitalization at all levels and in all forms of education.
A result of the current expansion of technical advances is that the time frame and positive effects of dominant natural spontaneous learning and socialization decrease (Bárdos, 2007). The socialization medium of the school takes on an operational nature. The effectiveness of education ceases to rise and stagnates. Pedagogical science speaks of dominance shifts; in this current latest phase the goal is the establishment of competence-based content regulation and institutional education. József Nagy wrote of this in the article “A kompetenciaalapú tartalmi szabályozás problémái és lehetőségei [The regulation problems and opportunities of competence-based content]” (2005).
The first dominance shift will replace spontaneous socialization and natural, undirected learning (which emerged with literacy) with deliberate learning and derivable and acquirable knowledge, which will become authoritative. Schools based on receptive learning and knowledge have been established. Motivation necessary for daily life and professional activity have remained in the school of life and in spontaneous socialization and has developed in non-deliberate reception activist learning (Mészáros, 2014). For more than a hundred years directions in reform pedagogy have aimed to replace knowledge-dominated learning (schools) with active learning. The birth of the theory and practice of such deliberate active learning is itself the second dominance shift. Alternative schools essentially emerged as parts of activity-oriented schools, although they have been unable to penetrate the school system as a whole in any country. In Hungary the active school fetish wave arrived and reached vocational education in the early and mid-seventies, carrying with it numerous contradictions and problematic situations. One such example was the active/activist teaching of basic public education subjects in vocational schools. Experimental teaching of subjects like chemistry and physics took place in classes

György Molnár The Role of Mobile Devices Supported Education and Open Content Development in the Learning Process
DIVAI 2018 – The 12th international scientific conference on Distance Learning in Applied Informatics. 105 ISBN 978-80-7598-059-5 (Print) ISSN 2464-7470 (Print) ISSN 2464-7489 (On-line)
that were not broken down into smaller groups, causing numerous organizational issues. Consider, for example, a class of 36 freshman who are expected not only to become familiar with the education institution type and its expectations, but were also faced with active learning demands that “burdened students and of course teachers as well” (Lükő, 2015).
The third dominance shift has become possible in the situation that has emerged today, namely that in the regulatory framework of competence-oriented and -based institutional education personality development becomes possible through components of established competencies and personality.
In my view what we see today is the beginning of a fourth dominance shift which can be called mobile learning or the dominance of digital pedagogy. We are witness to the effects of the changing learning environment (Balogh et al, 2011) , which are pushing at the walls of the school. An ICT-based, very pluralistic and changing, spatial and temporal course learning system is unfolding, and today’s concepts are hardly capable of describing or grasping the new reality. This has been discussed in the book “Digitális pedagógia [Digital Pedagogy]” edited by András Benedek.
In the societies of the modern age the motors of globalization and technical development have resulted in a paradigm shift, innovation and technological-methodological change in teaching and learning (Holik, 2015; Simonics, 2017). A new sub-section of science and practice has embarked on its victory march under the name digital pedagogy. The term digital refers to the ideas that the construction and operation of modern electronic devices is based on unique signal creation and transfer, formally the “two logical values” of signals (yes, no). The sociological aspects, schooling, education policy crises, solutions and connectivities of this digital world are discussed by István Bessenyei and others in the study “Tanulás és tanítás az információs társadalomban - Az e-learning 2.0 és a konnektivizmus [Learning and Teaching in the Information Society - E-learning 2.0 and Connectivity]” (Bessenyei , 2007).
Bessenyei considers reform pedagogy, the phenomena of the worldwide crisis in education, the historical context and scientific analysis through the work of Freinet, Philip H. Combs and Illich. Modern ICT devices first spread traditional knowledge-sharing forms in Web 1.0, then Web 2.0 and finally e-learning 2.0. Digital natives not only seek information on the web, but also become content providers (Bessenyei, 2007:203). Web 1.0 was not yet fully interactive, but it made possible learning organization based on the internet, i.e., Learning Management Systems (LMS). These organized various databases, communications devices, divisions of tasks and administration into units (Balogh et al., 2012).
In his study Bessenyei refers to Castells and to Kristóf Nyíri, Barabási and Csermely to describe the relationship between network elements and e-Learning 2.0. The learning element of the information age is connectivity. Its founder was Georg Siemens, who went beyond behaviorism, cognitivism and constructivism to shed light on how learning took place in organizations and networks (Siemens, 2005; Balogh et al., 2011).
Digital pedagogy focuses on the following contents and activities, as well as communications devices: the development of communication-management in learning, collaborative and cooperative learning, the use of blogs and the relations of virtual institutions.

György Molnár The Role of Mobile Devices Supported Education and Open Content Development in the Learning Process
DIVAI 2018 – The 12th international scientific conference on Distance Learning in Applied Informatics. 106 ISBN 978-80-7598-059-5 (Print) ISSN 2464-7470 (Print) ISSN 2464-7489 (On-line)
Through the background support of web 2.0 and e-learning 2.0 new education information methods came to be (Ollé, Papp, Lévai, Tóth-Mózer, Virányi; 2013), which often significantly reformed the learning environment with the methodological system of new media (Forgó, 2017). As such we reached the newest accomplishments of entirely digital pedagogy 2.0 (Benedek, Molnár; 2014). The continuation of this direction, Web 3.0, is unfolding and points beyond current technologies. Besides earlier services it assist intelligent orientation in large collections of data, places distributed mobile technologies in the forefront and further provides spaces for, among other things, the first steps of new technologies like artificial intelligence.
Relying on my previous research it has become increasingly clear that classrooms—the centuries-old environment for learning—have become completely spread and opened through the tools, methods and educator roles of digital pedagogy.
The rapid spread of mobile devices has for all intents and purposes forced their widespread use in learning, and cloud-based learning is again a learning-teaching method of a different dynamic. The new methodological solution contains vast potential in the support of the learning process, one of the essential points of which is the development of content consumption and content creation habits through own mobile devices.
The concept of m-learning usually means access to content related to learning anywhere at any time through mobile devices, along with learning activities related to such. More precisely, it refers to that kind of learning through which an existing online CMS or LMS system can be accessed through a mobile networked device capable of executing communication (Balogh - Koprda, 2014.). These conditions are met foremost by the category of smartphones, tablet PC-s and i-Pads. An example of such a smartphone is the Samsung GalaxyTab touchscreen device, with which web content and a full range of multimedia is accessible at will. The intelligence of mobile devices is limited by the character of the accessible content (web 2.0, flash, audio, video). Smartphones available today run on various operating systems, which makes compatibility somewhat problematic (Balogh et al., 2015). The key examples of such systems are the long-familiar Symbian, the Windows phone, the new Android, Apple iOS, Bada and the Blackberry platform. The other key challenge for these devices is that web presence should be optimized for mobile screens (unique CSS, optimized contents) in the interest of seamless content use. Despite these aspects, a large number of people make use of the possibilities of m-learning, and a majority of developers are headed in this direction, e.g., the official Moodle Mobile client has been completed for the now well-known Moodle LMS system (Molnár & Benedek, 2014). Though these systems are predominantly used in higher education they are increasingly employed in public and vocational education areas. The following screenshot is of the Moodle learning environment developed and distributed by our department in 2006. In its appearance it fully executes the responsive content presentation criteria expected today.

György Molnár The Role of Mobile Devices Supported Education and Open Content Development in the Learning Process
DIVAI 2018 – The 12th international scientific conference on Distance Learning in Applied Informatics. 107 ISBN 978-80-7598-059-5 (Print) ISSN 2464-7470 (Print) ISSN 2464-7489 (On-line)
Figure 1: The Moodle system of our Department, own photo
The appearance of electronic learning environments has undergone generational development, through which the aesthetic of new content-management Wordpress websites was followed by a built-in LearnPress LMS extension. The following Budapest University of Technology and Economics Electrical Engineering Faculty’s “VIK Open” online course system is an example of such.
Figure 2: The Moodle Environment of VIK open, own photo
The connection of the work of students, teachers and prospective teachers in open curriculum development is a unique interaction chain, of which one of the cores is the Hungarian Academy of Sciences methodological research project unfolding in the department. A part of this is a curriculum development effort supported by a micro-content based and scaleable cloud service, which we are designing to build on the experiences of our practicing expert lecturers as well as the needs of our students in professional training. We are basing the executed professional methodology open curriculum on student use via mobile devices, which is attainable by developing mobile applications from the content consumption side. To support content development we aim to develop and test a cloud-based dynamic databank-management platform. The following

György Molnár The Role of Mobile Devices Supported Education and Open Content Development in the Learning Process
DIVAI 2018 – The 12th international scientific conference on Distance Learning in Applied Informatics. 108 ISBN 978-80-7598-059-5 (Print) ISSN 2464-7470 (Print) ISSN 2464-7489 (On-line)
figure presents a micro-content based m-learning framework from an earlier R+D project, which illustrates the LMS structure, with main menu functions accessible on the left side. The figure’s right side shows the micro-content-based curriculum elements and the related self-checking test questions as presented on a mobile telephone.
Figure 3: Mobile learnig framework, own photo
EMPIRICAL ASSESSMENT RESEARCH OF MOBILE DEVICES SUPPORTED
EDUCATION
Thanks to the nature of the information age students in higher education wish to study through an ever-expanding horizon of quick and comfortable access to information. As such, they are already accessing basic texts via the internet. A portion of students would rather approach education materials instinctively, in accordance with daily user practice, using their smart devices. To assist their efforts it is necessary to offer information in an institutionally operated manner. Students have a range of expectations, and the generation socialized through the internet is now entering higher education. Recently hired faculty members are much more ICT-oriented that earlier generations. In the framework of our research we have studied the digital competence skill levels of various generations, ICT device use habits and the effects of utilized ICT and experiential-pedagogy methods. An open question we faced consistently concerned how the use of modern ICT-based mobile devices would affect the process of teaching-learning. Are there successful ICT application strategies, and if yes, what are they? To explore answers we conducted a quantitative questionnaire survey in the fall of 2017, using a simple stratified sample of N=150, with the target group being full-time students within the higher education base. The size of the useable sample was N=94. Our exploratory method employed an interactive, experiential (kahoot) measurement tool. Our survey employed methodological support on own devices, i.e., the BYOD method. The target group was composed mainly of engineering students from the Y and Z generations who were continuing their studies in a higher education institution. Our survey used largely closed questions, the answers to which we analysed using simple descriptive statistical methods which we presented through diagrams. Among the multivariate statistical procedures

György Molnár The Role of Mobile Devices Supported Education and Open Content Development in the Learning Process
DIVAI 2018 – The 12th international scientific conference on Distance Learning in Applied Informatics. 109 ISBN 978-80-7598-059-5 (Print) ISSN 2464-7470 (Print) ISSN 2464-7489 (On-line)
available, we used the Kruskal-Wallis analysis method. Below we present some more significant and characteristic results, acknowledging the limitations of the survey.
Figure 4: The distribution of age of the respondents, own chart
The age distribution of the respondents is shown in Figure 4, in which we easily see that all of the student cohort is part of the digital (Howe & Strauss, 2000) or Z generation, just as theory would predict. The age distribution also shows that the majority of our respondents were freshmen. The largest group of subjects had begun their studies immediately after secondary school, which is apparent given that a majority of 53, i.e., almost half the respondents, was 19 years of age, with 20% being 20, and 17 of them being 18. Answering another question, many marked themselves as members of the Y and alfa generation, despite the fact we had clarified generation theory previously.
Figure 5: The distribution of students' openness in modern, new generation teaching methods, own chart
Figure 5 answers the question of the degree of openness the respondents had to modern, new style open teaching and learning methods. The results show that 50% of the
17
53
19
5
0
10
20
30
40
50
60
18 years old 19 years old 20 years old 21 years olds
Please, state your age!
10%
12%
28%
50%
Please, evaluate from 1 to 4 the how open are for the new teaching-learning methods. "4" indicates the "most open state".
1
2
3
4
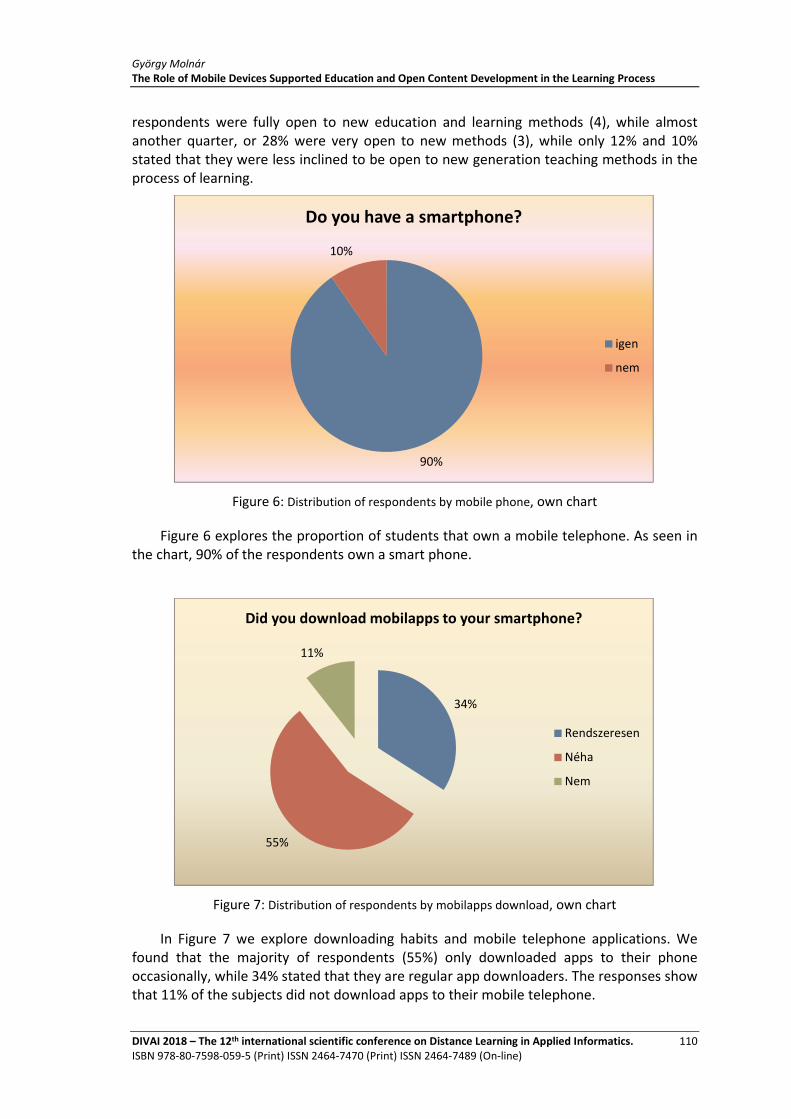
György Molnár The Role of Mobile Devices Supported Education and Open Content Development in the Learning Process
DIVAI 2018 – The 12th international scientific conference on Distance Learning in Applied Informatics. 110 ISBN 978-80-7598-059-5 (Print) ISSN 2464-7470 (Print) ISSN 2464-7489 (On-line)
respondents were fully open to new education and learning methods (4), while almost another quarter, or 28% were very open to new methods (3), while only 12% and 10% stated that they were less inclined to be open to new generation teaching methods in the process of learning.
Figure 6: Distribution of respondents by mobile phone, own chart
Figure 6 explores the proportion of students that own a mobile telephone. As seen in the chart, 90% of the respondents own a smart phone.
Figure 7: Distribution of respondents by mobilapps download, own chart
In Figure 7 we explore downloading habits and mobile telephone applications. We found that the majority of respondents (55%) only downloaded apps to their phone occasionally, while 34% stated that they are regular app downloaders. The responses show that 11% of the subjects did not download apps to their mobile telephone.
90%
10%
Do you have a smartphone?
igen
nem
34%
55%
11%
Did you download mobilapps to your smartphone?
Rendszeresen
Néha
Nem

György Molnár The Role of Mobile Devices Supported Education and Open Content Development in the Learning Process
DIVAI 2018 – The 12th international scientific conference on Distance Learning in Applied Informatics. 111 ISBN 978-80-7598-059-5 (Print) ISSN 2464-7470 (Print) ISSN 2464-7489 (On-line)
In the following paragraphs we will examine a few relations through multivariate statistical analysis, for which we utilized the SPSS 23 program. Due to a technical problem our sample size was N=93 or 92. Our analysis resulted in two unique results. The first was reached by using the Kruskal-Wallis test.

György Molnár The Role of Mobile Devices Supported Education and Open Content Development in the Learning Process
DIVAI 2018 – The 12th international scientific conference on Distance Learning in Applied Informatics. 112 ISBN 978-80-7598-059-5 (Print) ISSN 2464-7470 (Print) ISSN 2464-7489 (On-line)
Figure 8: The relationship between mobile Internet use for different generations, own chart
There is overall no difference in smart phone ownership between generations and age cohorts. However, it is clear that those claiming they are members of the alpha generation are “exceptions” as there are more students among them who do not have a smart phone than students who do.
In the next analysis we employ the Mann-Whitney test, because in our case we had binary variables as independent variables.

György Molnár The Role of Mobile Devices Supported Education and Open Content Development in the Learning Process
DIVAI 2018 – The 12th international scientific conference on Distance Learning in Applied Informatics. 113 ISBN 978-80-7598-059-5 (Print) ISSN 2464-7470 (Print) ISSN 2464-7489 (On-line)
Figure 9: Openness to mobile and learning methods, own chart
Comparison was more difficult in the analysis shown above (Figure 9), because there were hardly any students who did not have a mobile phone (8 of 91). As such we could not have produced a significant deviation, but it can be said of those who have a smart phone that openness to new generation methods increased to the maximum, while those who did not own such a device were either completely open or were full rejectors (the two subgroups having almost the same numbers). The average for smart phone owners was 2,94 while for non-owners it was 2,87. As such there is no significant difference, but the distribution of openness was different in this field.
CONCLUSION
New competences in higher education are constantly changing and developing, with innovation, creativity and the new learning environment gaining an increasingly significant role. Based on the analysed sample we can establish that ownership of modern digital and ICT devises and access to the internet have been secured and that the desire for up-to-date teaching methods is an unequivocal expectation of current students in the school institutional system. Regarding the use of the new methods and digital content as well as the framework systems, students are generally partners and offer support for educator initiatives and efforts at renewal. There is not yet a clear recipe for the use of new ICT-based effective methods, but at the level of micro-activities we increasingly frequently experience changes in methodological culture.
Regardless of when, the historical message of knowledge able to respond to challenges of the given age is of importance to all higher education institutions.

György Molnár The Role of Mobile Devices Supported Education and Open Content Development in the Learning Process
DIVAI 2018 – The 12th international scientific conference on Distance Learning in Applied Informatics. 114 ISBN 978-80-7598-059-5 (Print) ISSN 2464-7470 (Print) ISSN 2464-7489 (On-line)
In this study the size of our analysed sample (which was rather small, at 94 respondents), the large number of generations and the small age differences among respondents did not make it possible to uncover significant differences among generations. At the same time we can state that the characteristics of the students pointed in one direction in a basically homogeneous manner. For this reason the Kruskal-Wallis test did not find differences among them. Ownership of a smart phone is characteristic of all the age groups, with those of the age of 18 (i.e., the youngest) having the lowest access to smart phones.
Overall the effects of the variables analysed as a whole allow us to state that having these attributes and being of this age influences acceptance of new-style learning methods. Based on this it is my position that we can establish that student openness must by all means adapt to the integration of up-to-date pedagogical methods and tools of the pedagogical profession in the teaching process.
ACKNOWLEDGEMENT
This study was written with the support of a János Bólyai Research Scholarship.
REFERENCES
Balogh, Zoltan; Turcani, Milan; Magdin, Martin; et al., 2012. Creating model educational processes using petri nets implemented in the LMS, 9th International Conference on Efficiency and Responsibility in Education, EFFICIENCY AND RESPONSIBILITY IN EDUCATION pp. 7-16.
Balogh, Zoltan; Klimes, Cyril; Turcani, Milan, 2011. Instruction adaptation modelling using fuzzy petri nets, International Conference on Distance Learning, Simulation and Communication (DLSC), DISTANCE LEARNING, SIMULATION AND COMMUNICATION (DLSC 2011) pp. 22-29.
Balogh, Zoltan; Koprda, Stefan, 2014. Application of Petri Net for Evaluation Modeling of Student in the LMS, 10th International Scientific Conference on Distance Learning in Applied Informatics (DIVAI), Sturovo, Slovakia, pp. 229-239.
Balogh, Zoltan; Koprda, Stefan; Hruby, Dusan; et al., 2015. Proposal of the irrigation system using low-cost Arduino system as part of a smart home, IEEE Conference: 13th IEEE International Symposium on Intelligent Systems and Informatics (SISY), Subotica, Serbia, pp. 229-233.
Bárdos Jenő, 2007. A nyelvpedagógiai tudás jellege, In: Sárdi Csilla (ed.) Kommunikáció az információs technológia korszakában: MANYE XVII. : XVII. Magyar Alkalmazott Nyelvészeti Kongresszus. Székesfehérvár; Kodolányi János Főiskola (KJF), 2007. pp. 14-32.
Benedek, A., 2013. New educational paradigm: 2.0: items of digital learning, In: Benedek A. (ed.) Digital Pedagogy 2.0. Budapest, Typotex, pp. 312
Benedek, A.; Molnár, Gy., 2014. ICT in Education: A New paradigm and old obstacle. In: The Ninth International Multi-Conference on Computing in the Global Information Technology. Arno Leist, Tadeusz Pankowski (ed.) Sevilla: IARIA, pp. 54-60.
Bessenyei István, 2007. In: Szerk. Pintér Róbert: Az információs társadalom Tankönyv, Gondolat - Új Mandátum Kiadó Budapest

György Molnár The Role of Mobile Devices Supported Education and Open Content Development in the Learning Process
DIVAI 2018 – The 12th international scientific conference on Distance Learning in Applied Informatics. 115 ISBN 978-80-7598-059-5 (Print) ISSN 2464-7470 (Print) ISSN 2464-7489 (On-line)
Dragon, Zoltán 2008. „Mi vagy te, web kettes interaktivitás?” http://www.dragonweb.hu/blog/mi-vagy-te-web-kettes-interaktivitas/ [Accessed 30.12.2017.]
Forgó Sándor, 2017. Új médiakörnyezet, újmédia-kompetenciák, In: Forgó Sándor (szerk.) Az információközvetítő szakmák újmédia-kompetenciái, az újmédia lehetőségei. 152 p. Eger: Líceum Kiadó, 2017. pp. 9-24. (ISBN:978-615-5621-35-2)
Holik Ildikó, 2015. Szakmai tanárok módszertani repertoárja, In: Tóth Péter, Maior Enikő, Pogátsnik Monika (szerk.) Tanári és tanulói kompetenciák az empirikus kutatások fókuszában. Nagyvárad, Románia, Budapest, Óbudai Egyetem Trefort Ágoston Mérnökpedagógiai Központ, pp. 35-54.
Howe Neil − Strauss, William, 2000. Millennials Rising: The Next Great Genera�on. Knopf Doubleday Publishing Group.
Lükő István, 2015. Szakmai nevelés és szakmai szocializáció, Opus et Educatio, Vol 2, No 2, pp. 17-25.
Mészáros Attila, 2014. A felsőoktatás humánerőforrás kutatásához alkalmazható HS mérőrendszer bemutatása, In: Mészáros Attila (szerk.) A felsőoktatás tudományos, módszertani és munkaerőpiaci kihívásai a XXI. században. Győr: Széchenyi István Egyetem, pp. 20-30. (ISBN:978-615-5391-32-3)
Ollé János, Papp-Danka Adrienn, Lévai Dóra , Tóth-Mózer Szilvia, Virányi Anita, 2013. Oktatásinformatikai módszerek ELTE Eötvös, Budapest, pp.150, ISBN: 97896331215734, http://www.eltereader.hu/kiadvanyok/vi-oktatas-informatikai-konferencia-tanulmanykotet/, [Accessed 30.01.2018.]
Siemens, George, 2006. Knowing Knowledge. Letöltés: http://www.elearnspace.org/KnowingKnowledge_LowRes.pdf [Accessed 26.06.2015.]
Siemens, George: Connectivism, 2005.”A learning theory for the digital age.” International Journal of Instructional Technology and Distance Learning (ISSN 1550-6908),Vol 2. No. 1. http://www.itdl.org/journal/jan_05/article01.htm [Accessed 20.04.2014.]
Simonics István, 2017. Mérnöktanárok és mentortanárok IKT eszköz felhasználása, In: Mrázik Julianna (szerk.) HERA Évkönyv 2016: A tanulás új útjai. Budapest: Magyar Nevelés- és Oktatáskutatók Egyesülete (HERA), 2017. pp. 298-315.
Szűts Zoltán, 2014a, Egyetem 2.0: Az internetes publikációs paradigma, az interaktív tanulási környezet és a felhasználók által létrehozott tartalom kihívásai a felsőoktatásban, Kodolányi János Főiskola (KJF), Székesfehérvár, pp.114
Szűts Zoltán, 2014b. Bevezetés az internetpedagógiába, http://e-nyelvmagazin.hu/2014/12/03/bevezetes-az-internetpedagogiaba-halozati-tanulas-halozati-tudomany-halozati-tudas/ [Accessed 20.11.2017.]


Marián Mudrák, Milan Turčáni, Mária Burianová Creation of Personalized Learning Courses in Adaptive LMS
DIVAI 2018 – The 12th international scientific conference on Distance Learning in Applied Informatics. 117 ISBN 978-80-7598-059-5 (Print) ISSN 2464-7470 (Print) ISSN 2464-7489 (On-line)
Creation of Personalized Learning Courses in
Adaptive LMS
Marián Mudrák, Milan Turčáni, Mária Burianová
Department of Informatics, Constantine the Philosopher University, Nitra, Slovakia [email protected], [email protected], [email protected]
Abstract
The paper deals with the principles of e-learning course creation, the design of a specific methodology and personalized e-course model. To fulfil the conditions of such an e-course, it is important to choose an appropriate LMS on which the authors used the method of SWOT analysis. For the purpose of the research, the LMS with adaptive qualities has been used that fulfils the conditions to achieve the objective of the research problem. An important part of the paper is a methodology design of personalized e-course creation that fulfils the requirements for personalized learning in the given field. The authors of the paper introduce the achieved results and findings from the realized research to date. The conclusion of the paper deals with the summary of the results and findings such as further tendency of the field.
Keywords
E-learning. LMS Moodle. Adaptive hypermedia systems. Personalization. Educational process. Petri nets.
INTRODUCTION
Since the integration of Information and Communication Technologies (ICT) into the educational process, new ways of use of these technologies in education have been sought. One of them was the e-learning that represented new era in education. With the increasing trend of lifelong learning supported by ICT, some roles and competences of the teacher are changing. According to Burianová and Turčáni (2016), the digital competences of the teachers represent a bridge between the traditional learning and e-learning. Progressively, the educational process is starting to focus on the personality of the learner and the teacher is getting into the role of a tutor. E-learning has become the part of education in today's times thanks to its diverse use, from its presentation of digital content till the so-called Learning Management Systems (LMS) (Kostolányová, 2012).
At the beginning of creating a computer support in the form of e-courses created in virtual environment, they brought some disadvantages among the advantages. One of them was disrespecting the individual attributes of the learners. This disadvantage has already been pointed out by multiple authors. The most famous one is P. Brusilovsky who has already written a few scientific publications. He called the approach “one size fits all”. An example of the concept is publishing the same study materials for the e-course participants. In 2007, Peter Brusilovsky was one of the editors of the book The Adaptive

Marián Mudrák, Milan Turčáni, Mária Burianová Creation of Personalized Learning Courses in Adaptive LMS
DIVAI 2018 – The 12th international scientific conference on Distance Learning in Applied Informatics. 118 ISBN 978-80-7598-059-5 (Print) ISSN 2464-7470 (Print) ISSN 2464-7489 (On-line)
Web, Methods and Strategies of Web Personalization which sets the objective of mapping the current situation in adaptive systems. In the book, each author describes their own approach to the issue of adaptation (Brusilovsky and Millan, 2007).
The mass education in the class with the help of standard e-learning is not capable of fulfilling the individual needs of students. Some of them are kept hold and start to get bored and then there are those for who the speed is too high and cannot understand everything. Some students might like the study topic, but they might not be satisfied with the teacher's teaching style. By time, these students might show dislike for the teacher and the subject. As a consequence, this results in impaired learning results (Brusilovsky, 2003; Magdin, Turčáni, 2015).
The reasons mentioned above led to efforts to personalize the content of e-learning courses according to individual attributes of particular classes of users. To some extent, every student is determined by a set of his individual attributes. These attributes can be expectations, motivation, learning habits and styles, needs, etc. according to which students can be categorized into particular groups (Despotović-Zrakić et al., 2012).
Education personalization is a way by which students learn with regard to their previous knowledge, skills and learning styles (Jeong, Choi and Song, 2012; Magdin, Turčáni, 2015).
Nowadays, efforts are being given to design more efficient concepts that could possibly be used in applied adaptive learning systems. The goal is to use system tools that help to identify automatically the mentioned individual attributes of students. The more aspects would be taken into account the more precise personalization could be created. Before the implementation of the personalized course itself, the first was to analyse the given LMS Moodle and to create an e-course model with the help of simulation tool Petri nets (PN).
EDUCATION PERSONALIZATION SUPPORTED BY LMS
In scientific publications about personalized systems with adaptive potentials, there is a certain difference in opinions in the meaning of terms adaptability and personalization. It can also be caused by understanding them from various points of view. They are not used only in informatics which can be another reason for misunderstanding or various definitions by authors.
Multiple authors indicate that system personalization represents supplying and providing personalized content to a particular user. In our opinion, the terms personalization and adaptability are closely related. Personalization is viewed as a “problem solution how to provide the user with as much comfort as possible while working with the system.” Bieliková and Návrat (2006) claim that besides providing individualized information to the user, the objective of the personalization is to define which information is the most relevant for him and to present it to him in the most convenient way. Kostolányová and Šarmanová (2016) understand the term personalization as a solution adaptation for various problems, situations, environments, etc. to specific conditions and requirements of individuals.

Marián Mudrák, Milan Turčáni, Mária Burianová Creation of Personalized Learning Courses in Adaptive LMS
DIVAI 2018 – The 12th international scientific conference on Distance Learning in Applied Informatics. 119 ISBN 978-80-7598-059-5 (Print) ISSN 2464-7470 (Print) ISSN 2464-7489 (On-line)
According to Karagiannis and Satratzemi (2016), there are two approaches in personalized e-learning – static and dynamic. An example of a static approach is a specialized questionnaire at the beginning of the course where the student has to fill in order to find out his entry attributes (learning style, previous knowledge, motivation, etc.). According to this information, the course adapts in advance to the student, so it suits his needs. On the other hand, the dynamic approach is based on observation of user's activities in virtual learning environments (VLE) in real time. The system saves the data about the user into the database. Immediately after evaluation it adapts its content, user interface, etc. to the given user. Karagiannis and Satratzemi (2016) claim that better results are achieved with the second approach, because in the first one is dealing with the initial state of learners while the second deals with a specific state.
In the paper, the combination of the approaches has been proposed. In our opinion, with the static approach it could be possible to find out information via diagnostic methods where this information would be hard to obtain. For new students it would enable to adapt the course right at the beginning. After receiving a sufficient amount of data about each user, there would be another adaptation with the dynamic approach.
The knowledge mentioned above would be summarized and an interrelationship would be described between personalization and adaptability. Adaptability of e-learning courses could be understood as means provided by the system that allows to collect and to save data about the user. Based on the information, it could enable a change of system elements leading to personalization.
THE IMPLEMENTATION OF LMS WITH ADAPTIVE QUALITIES IN EDUCATION
LMS are commonly used in e-learning but provide a low level of adaptability. With the combination of adaptability and personalization in LMS, such a learning environment could be created that adapts to students and motivates them appropriately.
Grafová (2007) tried to use the advantages of the LMS and proposed a use of adaptive methods in Moodle. In her work she used the Felder-Silverman learning style model (FSLSM) but the visual/verbal dimension has been ignored when creating the learning sources mostly because it was time consuming. This could end up in wrong results and the learning process might not be fully personalized.
Baylari and Montazer (2009) presented a personalized “multi-agent” e-learning system based on “item response theory” that uses adaptive tests as a prerequisite to the students' acquired knowledge and enables changing them according to the student's needs and results.
Zhuge and Li (2004) designed KGTutor, which is and intelligent personalized e-learning system that examines the requirements, the previous knowledge and study objectives of every student and then provides personalized content. The system can also provide the student with messages about his progress, evaluation and suggestions based on his performance.
Yarandi et al. (2011) proposed an approach to develop the personalized e-learning system using the ontology to create the user model based on his behaviour. Besides, they

Marián Mudrák, Milan Turčáni, Mária Burianová Creation of Personalized Learning Courses in Adaptive LMS
DIVAI 2018 – The 12th international scientific conference on Distance Learning in Applied Informatics. 120 ISBN 978-80-7598-059-5 (Print) ISSN 2464-7470 (Print) ISSN 2464-7489 (On-line)
used the ontology to create hierarchical and navigational relations among parts of study materials.
Despotović-Zrakić et al. (2012) developed a method to create adaptive learning courses for distance education in Moodle. The courses are organized and adapted to three groups of students according to their learning styles. The authors used the model FSLSM leaving the sensing/intuitive dimension out. It is interesting that for this purpose only default functions of LMS Moodle were used.
Magdin and Turčáni (2015) modified the module book in LMS Moodle that provides advanced adaptive behaviour of the original module and called it AdaptiveBook. The authors used the questionnaire ILS (Index of Learning Styles) to assign the appropriate learning style to every student.
STATING THE OBJECTIVE OF THE RESEARCH PROBLEM
When stating the objectives, it is necessary to know the research topic and to define the research problem. From the topic it is possible to determine several problems. In our case, there are the following research problems:
1. Choice of LMS and its impact on activation of learners in a given learning field.
2. The impact of personalized e-courses created in adaptive LMS on the level of the students' knowledge.
It follows a few questions:
� What aspects affect the choice of LMS?
� What principles have to be applied when creating a personalized e-course?
� How does the e-course created in adaptive LMS affect the level of students' knowledge?
� Which of the student's attributes has to be taken into account when proposing the methodology of the e-course?
� How to approach the student with a given set of attributes?
The main goal of the research work was to create a personalized e-course in a chosen LMS that could increase the level of students' knowledge efficiently. The following partial objectives emerged:
� to propose and to verify a methodology of learning personalization in the chosen LMS,
� to carry out a pedagogical research to verify the validity and suitability of this form of education,
� to determine the evaluation of outputs for pedagogical practice,
� to apply the outputs in the current education supported by ICT and using a chosen LMS.
The procedure of research problem was segmented according to defined objectives. First, the significant aspects of teaching process supported by e-learning have been analysed. The next step was to choose an LMS that would be the most appropriate to create an e-course to support education in the study of informatics. To create an e-course

Marián Mudrák, Milan Turčáni, Mária Burianová Creation of Personalized Learning Courses in Adaptive LMS
DIVAI 2018 – The 12th international scientific conference on Distance Learning in Applied Informatics. 121 ISBN 978-80-7598-059-5 (Print) ISSN 2464-7470 (Print) ISSN 2464-7489 (On-line)
structure model and its transition simulation, a visualization modelling program called TransPlaceSim was used that has been developed at the Department of Informatics at UKF in Nitra (Balogh, Kuchárik, 2016). After the model design verification, a systematic progression took place to create the e-course with adaptive qualities and its implementation into the educational process. Last but not least, the impact of the created e-course on acquiring the student's knowledge with the use of known methods of pedagogical research and statistics was observed and evaluated.
The issue of personalization of adaptive LMS included:
� the resolution of its implementation into education,
� the design of adaptability and the suitability of the LMS structure for the given purpose,
� the creation of materials to support learning that would take into consideration pedagogical and psychological aspects,
� the creation of an appropriate curriculum,
� the efficiency of problem interpretation, etc.
The implementation of LMS into education supported by adaptive possibilities might represent an opportunity to improve the quality and to increase the efficiency of the teaching of subjects related to informatics (Turčáni, 2008).
THE DESIGN OF CREATION METHODOLOGY OF A PERSONALIZED E-COURSE
The next step was to create an e-course structure and content based on adaptive possibilities and needs. For this purpose, modelling methods have been chosen that enabled to formalize the given problem. A visualization modelling system with the possibility of a simulation has been selected. For the indicated purposes, a modelling system with PN has emerged as the most appropriate. To create a didactically effective e-course, it was essential to know the principles of its creation. When designing and creating a teaching with the support of e-learning, it was important to choose tools that would have actual didactic effect. The basic requirement was that the students would become active and creative working beings instead of receiving information in a passive way (Čapek, 2015). For the creator of the e-course, the educational objective should be determinative.
The design, the creation or the construction of teaching is called instructional design (ID).
According to Zounek et al. (2016) ID includes:
� tools (ID process, theories and models, digital technology, etc.)
� participants (of teaching, management, ID team, etc.),
� environment (school, LMS, etc.).
ID model represents a systematic arrangement of teaching that had an objective to support the processes of teaching. ID should be based on theories and principles of learning and it should describe each phase of teaching operations.

Marián Mudrák, Milan Turčáni, Mária Burianová Creation of Personalized Learning Courses in Adaptive LMS
DIVAI 2018 – The 12th international scientific conference on Distance Learning in Applied Informatics. 122 ISBN 978-80-7598-059-5 (Print) ISSN 2464-7470 (Print) ISSN 2464-7489 (On-line)
When creating an e-course with the use of any model, it was necessary to take into account the didactic principles that were laid down for the teaching process in accordance to educational objectives and the content. A precise formulation of educational objectives of the e-course simplified the choice of study content, didactic methods and improves the organization of teaching. When creating an e-course, two approaches arose regarding the course's organization, e.g. teacher-directed learning or learner-oriented learning. Zounek et al. (2016) introduced a suggestion of particular phases of e-course creation from both views while they gave specific examples of system and tool use. In their publication, they dealt with:
� defining objectives,
� e-course schedulling,
� teaching and learning processes,
� evaluation of achieved results.
An appropriately created course has set the objectives in advance even before the creative process. The objectives and the tasks should cover the content of the course and should be relevant to the study program. The objectives were formulated briefly and clearly pointing out the process of evaluation. It was important that the students knew about the objectives, and they have been provided. LMS Moodle provided a wide range of tools for the purpose, such as Wiki, Forum, the option of mass information via e-mail, or a separate tool to define the goals of the e-course that can be find in Administration – Grade administration – Outcomes.
The time management of the course was convenient to design on the bases of the stated objectives. Among other things, entry knowledge, the size of the group, the difficulty, the character of the subject or content, methods would have been projected and implied into the timetable. The content would have given a precise picture about the course arrangement. The organization of the course, its graphic arrangement and structure would have been invariable during the whole course. For the purpose of the time management of the course, LMS Moodle provided pre-set functions Calendar, Upcoming events, Completion tracking, and also Access restriction.
To allow the users of the course to proceed efficiently, an appropriate strategy of teaching had to be chosen. This represented to observe some rules:
� briefly expressed instruction,
� setting rules of performing activities in the e-course,
� determining a sequential or global acquisition of knowledge in the course,
� informing about the responsibility in on-line education, deadlines, assignments, punishments for non-compliance, plagiarism, etc.
� defining the expectations for collaborative learning or group activities,
� using audio-visual and multimedia content to support teaching,
� enabling students to step in the course with time and content so they can choose their own speed, the activities they incline to, to repeat some of the parts, etc.
� applying activities that develop critical thinking, creativity, problem-solving skills, etc.

Marián Mudrák, Milan Turčáni, Mária Burianová Creation of Personalized Learning Courses in Adaptive LMS
DIVAI 2018 – The 12th international scientific conference on Distance Learning in Applied Informatics. 123 ISBN 978-80-7598-059-5 (Print) ISSN 2464-7470 (Print) ISSN 2464-7489 (On-line)
� enabling access to source content and to references to other study materials negotiating about the given issue, to external database, etc.
Knowledge evaluation of learners that were an active part of the e-course was one of the important parts of each educational process. The evaluating activities had to be feasible, relevant, precise and in accordance with the practical applications of e-course content. To achieve this goal, it was essential to fill the following requirements:
� students needed to receive clear expectations and criteria to get an evaluation,
� the number of tasks and deadlines had to be real and achievable,
� the evaluation had to be explicitly expressed,
� students had to be informed about the criteria used for their evaluation (expected achieved objectives, performing activities, etc.),
� providing feedback during the course,
� if a mutual evaluation was expected in the course, the criteria had to be set in advance,
� information about the consequences of plagiarism, copyright law, etc.
LMS systems offered multiple options of student evaluation whether in a formative or summative way. LMS Moodle itself provided ways of evaluating students via activities such as Quiz, Assignment, Workshop, etc.
The e-course evaluation required knowing each participant’s opinion about the way the teaching course worked. That is the reason why the e-course needed the option of teacher assessment or more precisely the teaching process and the e-course itself by students. Tools such as Feedback, Survey and Forum could be used in LMS Moodle for this purpose. Feedback could serve as a self-reflection of the teacher, it could lead to correction of the e-course or the teaching process itself.
EDUCATION PERSONALIZATION USING DIAGNOSTIC TOOLS
The decision was made for a survey that was used as the education personalization tool. It has been applied in subjects Logic Systems (LS) and Computer Architecture (CA). When creating the tool, the following procedure took place:
� setting the objectives,
� the choice of research file,
� the specification of variables,
� the construction of the content part of the survey,
� data collection,
� computer data processing,
� data reading,
� results and conclusion of the survey.
The goal of the designed survey was to gain specific information about each student. The research sample included students of the first and second year studying at the Department of Informatics at CPU in Nitra taking the subjects Applied Informatics (AI) and

Marián Mudrák, Milan Turčáni, Mária Burianová Creation of Personalized Learning Courses in Adaptive LMS
DIVAI 2018 – The 12th international scientific conference on Distance Learning in Applied Informatics. 124 ISBN 978-80-7598-059-5 (Print) ISSN 2464-7470 (Print) ISSN 2464-7489 (On-line)
Teacher Training of Academic Subjects (TTAS) with a combination of informatics. To create a survey, tools provided by LMS Moodle were used.
The subjects LS and AP took place every week in a form of a lecture and seminars. One experimental group and one control group have been created. The students in the control group had unlimited access to all materials during the whole semester, and they also studied in the original e-course. The students in experimental group studied in the proposed methodology and modification of the original e-course.
On the introduction lesson, the students were given a survey and a pre-test. The objective of the second one was to find out the students learning styles. For this purpose, the survey ILS has been used. According to the results from ILS, students were divided into three groups and recommendation of study materials and activities were presented to them that match their learning styles. The goal of the pre-test was to find out information about new students highlighting their entry knowledge. For this, Quiz activity has been used the LMS Moodle environment. According to the results from the pre-test, the assumption of knowledge level equivalent of students has been verified in both experimental and control groups. From the point of view of didactic efficiency evaluation of the proposed e-course methodology, it was more convenient that the assumption would approve. It continued with verification of the next assumption that the results of the post-test would depend on the type of the used course.
That would mean that in the case of better results in the experimental groups in the post-test verifying the acquired knowledge of students at the end of the e-course, compared to the control group, were the results of the application of the proposed e-course. This way it might have had confirmed that the proposed personalized e-course had a more prominent impact on the efficiency of students’ knowledge acquisition than the standard (non-personalized) e-course.
In order to be able to create an as efficient e-course as possible, it was needed to identify the flaws of the hitherto used e-course in the subject LS. A sample of 88 students was provided. The students of the control group (19 students) studied the standard way, e.g. that they had the unlimited and voluntary access to all materials and activities. In the experimental group of students (69 students), few options were used such as conditional access, activity performance, feedback via Lesson and Quizzes to control the teaching with LMS Moodle. Both groups studied in a form of a blended learning. Students of the experimental group were provided with a survey created in LMS Moodle. The goal of the survey was to obtain an overview and basic information about the students that participated in the e-course. The results were exported into a spreadsheet of Microsoft Excel where the results were processed.
As the second survey, the students filled in the Felder-Soloman ILS survey. The results were interpreted in the course and were processed in a form of chart and diagram as well. There were efforts to find other standardized survey that would suit the need of the research, however it was unsuccessful.
The next subject of interest was to observe the study results of students in the e-course and to find out the differences between the control and the experimental group. The survey has been divided into three phases. In the first one, surveys have been used as diagnostic tools. In the second phase, a pre-test in a paper form has been applied in the control and the experimental group where the content included some key questions

Marián Mudrák, Milan Turčáni, Mária Burianová Creation of Personalized Learning Courses in Adaptive LMS
DIVAI 2018 – The 12th international scientific conference on Distance Learning in Applied Informatics. 125 ISBN 978-80-7598-059-5 (Print) ISSN 2464-7470 (Print) ISSN 2464-7489 (On-line)
regarding the subject LS. The observation of student activity in the e-course was a part of the second phase, and system tools of LMS Moodle were used. The third phase represented the end of the subject with an exam which was considered to be the post-test.
The total activity of the students was also observed during the whole semester. It is presented in Figure 1. The observation of the activities and conditional activities were used in the first month of teaching in the semester. During this period, at least a double of activities were observed compared to the period after the credit week where the conditional activities have not been used. Another finding was that the majority of students started to show more activities in the e-course immediately before the important events such as credits and exams.
Figure 1 The total activity of students in the course during the Winter Semester
Furthermore, the hypothesis saying “the previous secondary education has an impact on the entry knowledge extent of students of Applied Informatics (AI)” has been also confirmed. Students graduating from secondary schools of electrical engineering had better results from the pre-test compared to students from other secondary schools. Surprisingly, they showed worse results at post-tests.
Finally, the overall success of students in the post-test from both experimental and control group has been compared to a group of students studying the subject until 2015. The results of these students were obtained from the Academic Information System (AIS). Content and methodology of the subject haven’t changed during last years. The sample of students from AIS included the study results of 919 students and we considered it equivalent to the control sample. Specifically, the grade percentage of each group has been compared. The experimental group alone had a decreasing trend towards worse evaluation. The control group and the sample data from AIS had a slight correlation among the results. The results are shown in Figure 2 for better clearness.

Marián Mudrák, Milan Turčáni, Mária Burianová Creation of Personalized Learning Courses in Adaptive LMS
DIVAI 2018 – The 12th international scientific conference on Distance Learning in Applied Informatics. 126 ISBN 978-80-7598-059-5 (Print) ISSN 2464-7470 (Print) ISSN 2464-7489 (On-line)
Figure 2 Result comparison of exams from each group
The findings might represent that the quality of the achieved results students from the subject LS studying in this type of e-course might be on a right track.
DISCUSSION AND CONCLUSION
Despite the fact that the issue has already been dealt with for a longer time, there are still some students with specific characteristics. On the basis of the above, it is still needed to analyse consistently the learner's state and his level of knowledge in the given subject and to adapt his study to the requirements for fulfilling the requirements made on his study. The described issue deals with each activity accompanying the learner in the given subjects, and also it is a part of a research project at the university grant agency UGA. The results of the project will be published in the next period in a form of scientific articles at international conferences and in magazines registered in the database SCOPUS and WoS.
From our research, it follows that, through the methodology used so far, most students were able to achieve predominantly average results (mark C), or on the edge of successful completion of the subject (mark E). We are already tracking improvement by using proposed methodology. The goal is to achieve above average results (B and better) as many students as possible, by using the proposed methodology in the future. The above statements have been formulated on the basis of the data presented in Figure 2.
The proposed e-course will be implemented into the teaching process and the data obtained from surveys, pre-tests and post-tests will be processed and evaluated for the purpose of increasing the quality of teaching the given fields of study.
The publication of results emerging from the stated partial goals mentioned above will be the expected benefit of the research problem solving. Particularly, it deals with:
� aspect analysis influencing the educational process in the current e-learning, evaluation and interpretation of obtained data,
� stating the criteria according to which the students would be divided into characteristic groups,
0,00%
5,00%
10,00%
15,00%
20,00%
25,00%
30,00%
35,00%
40,00%
45,00%
A B C D E FX
Comparing the test results of each group
AIS experimental control

Marián Mudrák, Milan Turčáni, Mária Burianová Creation of Personalized Learning Courses in Adaptive LMS
DIVAI 2018 – The 12th international scientific conference on Distance Learning in Applied Informatics. 127 ISBN 978-80-7598-059-5 (Print) ISSN 2464-7470 (Print) ISSN 2464-7489 (On-line)
� a proposition of a model e-course in a given LMS,
� a complete procedure when creating and implementing the adaptive e-course,
� the results and analysis of student behaviour in the created e-course,
� the presentation of results, findings and conclusions from the pedagogical research in a given field, etc.
The use of adaptive possibilities of LMS Moodle and an appropriate e-course structure using the ways of personalization will be determinative. By applying the designed concept in future, it is expected that the efficiency of study and the quality of results will increase thanks to knowledge acquired in the proposed e-course.
REFERENCES
Balogh, Z., Kuchárik, M., 2016. Petri Nets Tool Creation for Process Visualisation and Formalization. In: DIVAI 2016. 11th International Scientific Conference on Distance Learning in Applied Informatics, Štúrovo, Slovakia, Publisher: Wolters Kluwer, Prague, CZ. pp. 67. ISBN 978-80-7552-249-8.
Baylari, A., Montazer, G., 2009. Design a personalized e-learning system based on item response theory and artificial neural network approach. Expert Syst. Appl., vol.36(4), pp. 8013–8021.
Bieliková, M., Návrat, P., 2006. Modelovanie adaptívnych webových systémov. Štúdie vybraných tém softvérového inžinierstva, STU, Bratislava, pp. 207-232.
Brusilovsky, P., 2003. From Adaptive Hypermedia to the Adaptive Web. Mensch & Computer. Interaktion in Bewegung. Stuttgart: B. G. Teubner, pp. 21-24.
Brusilovsky, P., Millan, E., 2007. User Models for Adaptive Hypermedia and Adaptive Educational Systems. In: The adaptive web. Springer, Berlin, Heidelberg, 2007. pp. 3-53.
Burianová, M., Turčáni, M., 2016. Non-traditional Education Using Smart Devices. In: DIVAI 2016. 11th International Scientific Conference on Distance Learning in Applied Informatics, Štúrovo, Slovakia, Publisher: Wolters Kluwer, Prague, CZ. pp. 67. ISBN 978-80-7552-249-8.
Capterra, 2017. LMS Software. [online]. Available at: <http://www.capterra.com/learning-management-system-software/#infographic> [Accessed 29 December 2017].
Carvalho, A., Areal, N., Silva, J., 2011. Student's perceptions of Blackboard and Moodle in a Portuguese university. British Journal of Educational Technology, Volume: 42, Issue: 5, pp. 824-841.
Čapek, R., 2015. Moderní didaktika. Grada Publishing. Praha. pp. 608 ISBN 978-80-247-3450-7
Despotović-Zrakić, M., Marković, A., Bogdanović, Z., Barać, D., Krčo, S., 2012. Providing Adaptivity in Moodle LMS, Courses. Educational Technology & Society, 15 (1), pp. 326–338.
Graf, S., 2007. Adaptivity in Learning Management Systems Focusing on Learning Styles. Ph.D. dissertation, Faculty of Informatics, Vienna Univ. of Technology, Vienna, Austria
Jeong, H.Y., Choi, C.R., Song, Z.J., 2012. Personalized Learning Course Planner with E-learning DSS Using User Profile. Expert Systems with Applications, vol. 39, pp. 2567-2577.

Marián Mudrák, Milan Turčáni, Mária Burianová Creation of Personalized Learning Courses in Adaptive LMS
DIVAI 2018 – The 12th international scientific conference on Distance Learning in Applied Informatics. 128 ISBN 978-80-7598-059-5 (Print) ISSN 2464-7470 (Print) ISSN 2464-7489 (On-line)
Karagiannis, I., Satratzemi M., 2016. A Framework to Enhance Adaptivity in Moodle. In: Verbert K., Sharples M., Klobučar T. (eds) Adaptive and Adaptable Learning. EC-TEL, Lecture Notes in Computer Science, vol. 9891. Springer, Switzerland, Cham
Kostolányová, K., 2012. Teorie adaptivního e-learningu. Ostrava: Ostravská univerzita v Ostravě, 118 pp. ISBN 978-80-7464-014-8.
Kostolányová, K., Šarmanová, J., 2016. Individualisation and personalisation of education - modern trend of eLearning. In: Int. J. Continuing Engineering Education and Life-Long Learning, 26(1), pp. 90–104. doi: 10.1504/IJCEELL.2016.075035.
Magdin, M., Turčáni, M., 2015. Personalization of student in course management systems on the basis using method of data mining. TOJET: The Turkish Online Journal of Educational Technology, Sakarya, Turkey, volume 14, issue 1, pp. 58.
Turčáni, M., 2008. Adaptívne systémy a multimediálne e-learningové prostredie v Aplikovanej informatike. ISKI 2008, pp. 108.
Yarandi, M., Tawil, A., Jahankhani, H., 2011 Adaptive e-learning system using ontology. In: 22nd International Workshop on Database and Expert Systems Applications, Toulouse, France, 2011, pp. 511–516.
Zhuge, H., Li, Y., 2004. KGTutor - A knowledge grid based intelligent tutoring system. In: Yu, J.X., Lin, X., Lu, H., Zhang, Y. (eds.) APWeb, LNCS, vol. 3007, pp. 473–478. Springer, Heidelberg, Berlin, GER
Zounek, J., Juhaňák, L., Staudková, H., Poláček, J., 2016 E-learning: učení (se) s digitálními technologiemi: kniha s online podporou. Praha: Wolters Kluwer, ISBN 978-80-7552-217-7.
Kristýna Mudrychová, Tereza Horáková, Martina Houšková Beránková Users’ Characteristics for Analyzing the Educational Texts with an Eye-Tracking Technology
DIVAI 2018 – The 12th international scientific conference on Distance Learning in Applied Informatics. 129 ISBN 978-80-7598-059-5 (Print) ISSN 2464-7470 (Print) ISSN 2464-7489 (On-line)
Users’ Characteristics for Analyzing the
Educational Texts with an Eye-Tracking
Technology
Kristýna Mudrychová, Tereza Horáková, Martina Houšková Beránková
Department of Systems Engineering, Faculty of Economics and Management, Czech University of Life Sciences Prague, Czech Republic
[email protected], [email protected], [email protected]
Abstract
This paper aims to disclose how to use eye-tracking technology in educational process and learning process; mainly in comparison of text styles, which are used in those processes. There are two types of text styles - knowledge text and common text. We investigated what eye-movement measures have been used for the investigation and how was employed the eye-tracking approach. This experiment was realized in a laboratory HUBRU (Human Behavior Research Unit) at Czech University of Life Sciences Prague (CULS). In this laboratory were used two computers with integrated Tobii Pro Eye trackers X2-60. In the experiment were involved 33 university students from CULS. They were from bachelor and master degrees study programs. The educational texts and their styles are described, and eye tracking measures Total Fixation Duration to analyze data, which came from tracking eye movements of students. Based on the results we discovered that there is no difference in the measure of Total Fixation Duration between the knowledge and the common text.
Keywords
Educational text. Eye tracking. Fixation. Areas of Interest. Knowledge text.
INTRODUCTION
The essential part of learning in the education process is to understand and remember information from educational texts. It is a famous fact that many students have a problem with that and struggling. Also, so many researchers have problems to recognize that students might have difficulties perceiving and remembering texts and it is more difficult for them to find exactly where differences exist to target specific areas for improvement. Especially the last decade of the last years is difficult for many teachers and students from the basic school. Every year are more and more adults and children diagnosed with neurodevelopmental disorders. Between frequent neurodevelopmental disorders belong dyslexia, dysgraphia, dysorthography, dyscalculia, dyspraxia, and others.
In the eye-tracking technology is a great potential for application in a wide variety of fields of study and disciplines in the commercial sphere. The highest usage which has some evidence if until nowadays in medicine and higher education, usability studies or in

Kristýna Mudrychová, Tereza Horáková, Martina Houšková Beránková Users’ Characteristics for Analyzing the Educational Texts with an Eye-Tracking Technology
DIVAI 2018 – The 12th international scientific conference on Distance Learning in Applied Informatics. 130 ISBN 978-80-7598-059-5 (Print) ISSN 2464-7470 (Print) ISSN 2464-7489 (On-line)
psycholinguistics. Also, there are few studies, which relate to the education, and it seems to be a growing tendency to focus on new technologies and integrate them with education, teaching and learning process. The last few year are more often existing researchers on the stages of basic schools and primary education and new-borns (Mayer, 2010; Sim, Cassidy, & Read, 2013; Mason, Tornatora, & Pluchino, 2013).
Nowadays, it is possible to say that there are many learning strategies, such as active learning strategies, construct learning strategies and others and they´re still under discussion between authors, such as Oxford and Randall (2017) or Griffits (2013). First two authors, Oxford and Randall (2017) had a different point of view on learning strategies than other authors and defines them as “... goal-oriented attempts to manage and control effort to learn the L2 (the second or foreign language)” (p. 12). Griffits (2013), describes those strategies as “activities consciously chosen by learners to regulate their own learning” (p. 87). However, most of the other authors agree on their view on learning strategies that are goal-oriented, there is always involvement of learner responsibility for a chosen learning strategy and have a metacognitive component (Ben et al. 2017). Based on this idea those strategies should be updated related to the topic of educational learning and educational texts. Most of the materials which students have at schools are based in textual form (no matter if it is in a school online learning program, books, presentations and others), and they always need to extract relevant information from those texts. And when, as has been realized in this study, educational texts are properly prepared and transformed to the knowledge form, teachers and professors would be able to transfer knowledge more easily because students don't have a problem to extract a piece of specific information from the knowledge text. At least, it is not more complicated for them than from common text, as was mentioned above in the results of the didactic test and the results of some of the specified hypotheses.
The study is focused on using eye-tracking technology in the educational process, namely on the comparison chosen metric (Total Fixation Duration) for students´ reading and processing of text. There are used texts in different text styles, knowledge text, and common text.
METHODS
Classification of the educational text styles
In this study is always a piece of the knowledge text based on one knowledge unit. This piece of a knowledge text represents the knowledge transferred to the reader. It is very difficult to read a text that is made only from the knowledge units. For this purpose, knowledge unit can be accompanied with a subordinated auxiliary text containing additional information and this auxiliary text improves the readability of the text to the specific reader. On the other hand in this study, we have another kind of text which is called common text. Common text is represented as a sequence of individual information and in this piece of text is no intentional orientation to transfer knowledge (Horáková and Houška, 2016).
Kristýna Mudrychová, Tereza Horáková, Martina Houšková Beránková Users’ Characteristics for Analyzing the Educational Texts with an Eye-Tracking Technology
DIVAI 2018 – The 12th international scientific conference on Distance Learning in Applied Informatics. 131 ISBN 978-80-7598-059-5 (Print) ISSN 2464-7470 (Print) ISSN 2464-7489 (On-line)
Knowledge text
We call a basic unit of knowledge elementary knowledge. We can describe this knowledge by one predictive hypothesis, which has the following the form: we have a situation X and a problem Y. Concerning objective(s) Z we can expect consequences Q. Formally, EK = {X, Y, Z, Q}. As we can see from the formula, a problem Y is a part of a problem situation X. Due to the predicate hypothesis in the form “IF condition THEN results” the knowledge is given and that consequence influencing the problem situation X is determined. There is also another important part, which is let's say “point of view Z” and comes from the problem situation X, and the Q is let us say the “way how we can see the point of view Z.” (Houška and Beránková, 2006).
Common text
In our research, the common text represents as normal educational text that gives us the similar information as a knowledge text. Each piece of the knowledge text contains all 4 parts (as it is described in the previous paragraph), but common text contains just some of them, but never all of them (Houška and Beránková, 2006).
Areas of Interest
Areas of Interest (AOI) are described as part of the text or image on the screen. Those parts of text or image are the most relevant for the researcher and attend there to examine eye movements’ patterns such as words, sentences, and images (Holmquist et al. 2011). Those AOIs can be static or dynamic. All AOIs, which are drawn by the researcher and collect data throughout the entire display time of the media, are called static. On the other side are dynamic AOIs which Keyframes define their shapes and behaviors. Every single Keyframe is a user defines shape and position of the AOI that corresponds to a certain point on the timeline of the media. Of course, dynamic media containing dynamic AOIs typically have numerous Keyframes for each AOI (Mudrychová, Houšková Beránková, Houška, and Dömeová, 2017). In general, all AOIs are constructed separately for each study by the researcher who determines the most relevant areas of the stimuli. Every study is a unique piece of research, and every research rarely has identical AOIs. Special types of AOIs are used e. g. in Hessels et al., 2016; Garcia-Burgos et al. 2017; Papinutto et al. 2017.
One part of our research problem is to choose areas of interest in general. For this experiment and our purpose, it was from the theoretical point of view quite logical. It was necessary to preselect educational texts to smaller pieces of text to compare knowledge and common text. So in this experiment are AOIs equal to knowledge unit parts (Y – an elementary problem, X – a problem situation, Z – the objectives of the elementary problem to solve and Q – a solution of the elementary problem). The creation of those knowledge units’ primary on knowledge educational texts and after copied and checked with common educational texts was done and described in Grüter et al. 2012.

Kristýna Mudrychová, Tereza Horáková, Martina Houšková Beránková Users’ Characteristics for Analyzing the Educational Texts with an Eye-Tracking Technology
DIVAI 2018 – The 12th international scientific conference on Distance Learning in Applied Informatics. 132 ISBN 978-80-7598-059-5 (Print) ISSN 2464-7470 (Print) ISSN 2464-7489 (On-line)
Figure 1: Example of knowledge text with AOIs created in the Czech language.
Total Fixation Duration
Total Fixation Duration (seconds, mean values): measures the duration of each fixation within an AOI.
What does it mean fixation of the eye (respectively eye movements on the screen):
� The fixation can be the length from about 100 to 600 milliseconds, and at that moment, the brain starts to process the visual information, which was received from the eyes.
� During fixations is acquired information of the information from the scene.
� Typical fixation frequency is < 3 Hz.
� The fixation length indicates information processing or cognitive activities.
� It is obvious and statistically proved that common words get shorter fixations than less common words (Matos, 2010).
The most important related to Total Fixation Duration measure is that readers read a text, they move their eyes from word to word through an alternating pattern of fixations (points at which the eyes are stationary and focused on a word) and saccades (points at which the eye are moving between words). If we calculate each fixation for a piece of text, slide and time within the AOI, we will get our Total Fixation Duration measure. Fixations following saccades that move the reader forward through the text are called forward fixations and fixations following saccades that move the reader to prior points in a text are called regressive fixations (Matos, 2010).
The basic assumption of eye-tracking methods is that increased processing demands are associated with increased processing time or changes in the pattern of fixations. Longer duration fixations or a larger number of fixations (forward and regressive) may reflect increased processing time (Matos, 2010).
Respondents of the Research
The representative sample in this experiment included bachelor and master degree students from the Czech University of Life Sciences Prague. They were 20 to 29 years old. The group consisted of 13 men and 20 women. Most of the involved students are right-handed, only two students are left-handed, and one is both handed. All participants reported researchers normal or corrected to normal vision (only contact lenses or glasses) and reported a known history of neurological or psychiatric and pain-related diseases.

Kristýna Mudrychová, Tereza Horáková, Martina Houšková Beránková Users’ Characteristics for Analyzing the Educational Texts with an Eye-Tracking Technology
DIVAI 2018 – The 12th international scientific conference on Distance Learning in Applied Informatics. 133 ISBN 978-80-7598-059-5 (Print) ISSN 2464-7470 (Print) ISSN 2464-7489 (On-line)
Those participants usually had normal injuries. 15 students have one of common eye disease (e. g. myopia), 18 students don’t have any of them or don’t know about it. Students were also asked about relevant injuries (of eyes or head), 12 students had some, and 21 students did not have any of them. All participants gave written informed consent to participate the experiment.
RESULTS
Statistical hypothesis
H0.1: There is no difference in the mean values of total fixation duration of all participants between the knowledge text and the common text.
Statistical analysis
The success rate of all students from the experiment was more than 62.3% right answers, even if the subject of the study was not familiar to anyone of them. Most of them they were studying bachelor studies and different programmes, which are not related too close to the environmental studies and its issues that were described in presented texts. They reached this rate in the didactic test, which was used as a control mechanism for processing the educational texts in both styles. There was a difference between right answers on knowledge text and common text followed by a question that was for knowledge and common text the same as those educational texts contained the same piece of information. Student reached from knowledge texts´ questions 50.7% and common texts´ questions 49.3%.
Data from the eye-tracking experiment were processed, and statistical analysis was performed using statistical software Statistica, the version 12. Elementary statistics were count. It was necessary to investigate if selected data were normally distributed. For this purpose, we used Shapiro-Wilk W test. The null hypothesis says that data are normally distributed (Schmidt et al. 2017). Moreover, the visualization of the distribution of data was done by histograms. Then we used suitable non-parametric test for testing the mean values of indicators measured for comparing knowledge texts and common texts. In the study was used a level of significance α = 0.05.
A non-parametric test for two independent measures (for results of the mean values of Total Fixation Duration) was applied. In software Statistica, we had a choice to apply Wald-Wolfowitz test and also Mann-Whitney U (M-W U test) test and Kolmogorov-Smirnov test. We applied those tests because those are the most used. In this study we primary used to apply the Wald-Wolfowitz test, so the other two tests were only for comparison of p-values.
Indicators and metrics used in the Research - Difference between the
knowledge and the common text

Kristýna Mudrychová, Tereza Horáková, Martina Houšková Beránková Users’ Characteristics for Analyzing the Educational Texts with an Eye-Tracking Technology
DIVAI 2018 – The 12th international scientific conference on Distance Learning in Applied Informatics. 134 ISBN 978-80-7598-059-5 (Print) ISSN 2464-7470 (Print) ISSN 2464-7489 (On-line)
Figure 2: Histogram of Total Fixation Duration for knowledge text; not normally distributed.
Figure 3: Histogram of Total Fixation Duration for common text; not normally distributed.
It is transparent from Figure 1 that the p-values of Shapiro-Wilk W test were less than α = 0.05; the null hypothesis about the normality of the distribution of the selection was rejected. The result was visualized by constructing histograms for both text styles (knowledge and common text) of the indicator Total Fixation Duration. It has been summarized as that data were not from a normally distributed population and there was the only option how to proceed further; the non-parametric tests were used. As a primary

Kristýna Mudrychová, Tereza Horáková, Martina Houšková Beránková Users’ Characteristics for Analyzing the Educational Texts with an Eye-Tracking Technology
DIVAI 2018 – The 12th international scientific conference on Distance Learning in Applied Informatics. 135 ISBN 978-80-7598-059-5 (Print) ISSN 2464-7470 (Print) ISSN 2464-7489 (On-line)
non-parametric test was used Wald-Wolfowitz test and as a control were used other two tests, Mann-Whitney U test and Kolmogorov-Smirnov test.
Table 1. Non-parametric test of knowledge and common text (Total Fixation Duration) – Wald-Wolfowitz test.
Variable
Valid N Know. text
Valid N Com. text
Mean Know. text
Mean Com. text
Z p-value
Z adj.
p-value of Z adj.
No. of runs
No. of ties
Results 363 363 6.330 5.941 0,000 1.000 -0.037 0.970 364 89
Source: own work, processed in the STATISTICA 12 (StatSoft) program
In Wald-Wolfowitz test was grouping variable “Type of text”; grouping variable was meant as a knowledge text or common text. Also, the significance level was set up at α = 0.05. The null hypothesis H0.1 was not rejected at a given significance level (p > α). The p-value of Z adjusted for those tested mean values of all participants of the indicator Total Fixation Duration was p = 0.970. There were other two tests for control, Mann-Whitney U (M-W U test) test and Kolmogorov-Smirnov test.
The p-value of M-W U test was p = 0.490, and the p-value for Kolmogorov-Smirnov test was p > 0.10, so those p-values were higher than the significance level α. It means that H0.1 was not rejected. P-value of Wald-Wolfowitz test was significantly higher than given significance level. That means in the mean values of Total Fixation Duration of all participants does not exist a difference between the knowledge text and the common text. Those mean values describe time (in seconds) as the duration of each fixation within an AOI spent by those participants.
DISCUSSION AND CONCLUSION
By this study has been proven no difference of eye-tracking indicators Total Fixation Duration between knowledge and common text. This difference was tested by a non-parametric test for independent measures (by groups) because data were not normally distributed. P-values were higher than α = 0.05, so the null hypothesis H0.1 was not rejected at a given significance level.
In related educational research studies, which are connected to learning strategies and learning processes, many of them have been devoted to the processes and outcomes of learning. The most used method has been the interview procedure based on the think-aloud protocol to describe and explains cognitive activities during learning (D´Melloa et al. 2012; Cervera et al. 2010). Researchers interested in educational research seek for various research methods developed in different academic domains in the hope to present the process of learning from different ways (Castelhano, M. S., Heaven, C. (2011). But what should be observed if researchers want to know more about learning and teaching processes and especially about learners´ and teachers´ interactions and how they feel at that time when the interaction on-going. From this point of view could be quite interesting

Kristýna Mudrychová, Tereza Horáková, Martina Houšková Beránková Users’ Characteristics for Analyzing the Educational Texts with an Eye-Tracking Technology
DIVAI 2018 – The 12th international scientific conference on Distance Learning in Applied Informatics. 136 ISBN 978-80-7598-059-5 (Print) ISSN 2464-7470 (Print) ISSN 2464-7489 (On-line)
to design an experiment to investigate differences of those processes between levels of education and the effectiveness between those levels in the educational system, meant primary, secondary and tertiary education. There are already studies from few authors related to higher education or secondary education (Zhang et al. 2016).
Future research is needed to deal with other characteristics and measurements, which are related to eye tracking, e. g. Total Visit Duration, heat maps, etc. Essential parts are visualizations and motivation, and the effectiveness of those visualizations on student's effectiveness rate (such as good marks and passing of exams) based on redesigning of few studying materials. For further research studies and experiments should be implemented more eye trackers, try more environments where to investigate subject (not only in a specialized laboratory) and as was mentioned above more sensors which can cooperate with eye trackers. It is closer to artificial intelligence, and it can help to improve it by watching child-parent interactions while reading books before going to sleep or students´- teachers ‘interactions in the realistic classroom in real time, etc. The most important is to understand educational and psychological issues and cooperation between other interesting fields before developing any useful framework, procedure, the process or tool to improve educational processes, learning and teaching in general (Meng-Lung et al., 2013; Ben, Sherry, Yu-Cheng and Meng-Lung, 2017).
ACKNOWLEDGEMENT
The paper is supported by the grant project of the Internal Grant Agency of the FEM CULS Prague "Knowledge engineering methods in the process of evaluating employee knowledge," No. 20161026.
REFERENCES
Ben, Ch., Sherry, Y. Ch., Yu-Cheng, T. & Meng-Lung, L. (2017). The effects of task activities and gaming scales on eye reading and visual search performance. Computers in Behavior, 66, 16-25. doi:10.1016/j.chb.2016.09.013.
Castelhano, M. S., Heaven, C. (2011). Scene context influences without scene gist: Eye movements guided by spatial associations in visual search. Psychonomic Bulletin & Review, 18, 890-896. doi:10.3758/s13423-011-0107-8.
Cervera, G. M., Ranilla, C. J. M. & Isus, S. (2010). Las simulaciones en entornos TIC como herramienta para la formación en competencias transversales de los estudiantes universitarios. Revista Electrónica Teoría de la Educación: Educación y Cultura en la Sociedad de la Información, 11 (1). 352-370. doi: 10.14201/eks.
D´Melloa, S., Olney, A., Williams, C. & Hays, P. (2012). Gaze tutor: A gaze-reactive intelligent tutoring system. International Journal of Human-Computer Studies, 70, 377-398.
Domeová, L., Houška, M. & Houšková Beranková, M. (2008) Systems Approach to Knowledge Modelling, Hradec Kralove: GSOC.
Griffiths, D., Hingsburger, D., Hoath, J. & Ioannou S. (2013). Counterfeit Deviance Revisited. Journal of Applied Research in Intellectual Disabilities, 25 (5), 471-480. doi: 10.1111/jar.12034.

Kristýna Mudrychová, Tereza Horáková, Martina Houšková Beránková Users’ Characteristics for Analyzing the Educational Texts with an Eye-Tracking Technology
DIVAI 2018 – The 12th international scientific conference on Distance Learning in Applied Informatics. 137 ISBN 978-80-7598-059-5 (Print) ISSN 2464-7470 (Print) ISSN 2464-7489 (On-line)
Grüter, T., Lew-Williams, C. & Fernald, A. (2012). Grammatical gender in L2: A production or a real-time processing problem?, Second Language Research, 28 (2), 191-215. doi: 10.1177/0267658312437990.
Herwig, A. & Horstmann, G. (2011). Action-effect associations revealed by eye movements. Psychonomic Bulletin & Review, 18, 531-537. doi: 10.3758/s13423-011-0063-3.
Hessels, R. S., Kemner, C., van den Boomen, C. & Hooge, I. T. C. (2016). The area-of-interest problem in eye-tracking research: A noise-robust solution for face and sparse stimuli. Behavior Research Methods, 48 (4), 1694-1712. doi: 10.3758/s13428-015-0676-y.
Holmquist, K., Nystrom, M., Anderson, R., Dewhurst, R., Jarodzka, H. & van de Weijer, J. (2011). Eye Tracking: A Comprehensive Guide to Methods and Measures. Oxford: Oxford University Press.
Horáková, T. & Houška, M. (2016). Differences among knowledge and normal educational texts: a fMRI Study. In 11th International Scientific Conference on Distance Learning in Applied Informatics, Štúrovo, Slovakia: Wolters Kluwer, 523-532.
Houška, M. & Houšková Beránková, M. (2006). Mathematical models for elementary knowledge representation. Scientia Agriculturae Bohemica, 37 (5), 32-37. ISSN: 1211-3174.
Mayer, R. E. (2010). Unique contributions of eye-tracking research to the study of learning with graphics. Journal of Learning and Instruction, 20, 167-171.
Mason, L., Pluchino, P., Tornatora, M. C. & Ariasi, N. (2013). An Eye-Tracking Study of Learning from Science Text with Concrete and Abstract Illustrations. Journal of Experimental Education, 81 (3), 356-284.
Matos, R., 2010. Designing eye tracking experiments to measure human behavior. [online] Available at <http://www.measuringbehavior.org/files/tutorials/Tobii_MB2010_tutorial_handouts.pdf> [Accessed 19 Februar 2017]. Meng-Lung, L., Meng-Jung, T., Fang-Ying, Y., Chung-Yuan, H., Tzu-Chien, L., Wen-Yu, L. S., Min-Hsien, L. Guo-Li, Ch., Jyh-Chong, L. & Chin-Chung, T. (2013). A review of using eye-tracking technology in exploring learning from 2000 to 2012. Educational Research Review, 10, 90-115. doi: 10.1016/j.edurev.2013.10.001.
Oxford, R. G. & Randall, M. Ch. (2017). Neurosurgical Considerations in Craniofacial Trauma. Facial Plastic Surgery Clinics of North America, 24 (4), 479-491. doi: 10.1016/j.fsc.2017.06.002.
Papinutto, M., Lao, J., Ramon, M., Caldara, R. & Miellet, S. (2017). The Facespan – the perceptual span for face recognition. Journal of Vision, 17 (5), 1-12.
Sim, G., Cassidy, B. & Read J. C. (2013). Understanding the fidelity effect when evaluating games with children. 12th International Conference on Interaction Design and Children, New York, 193-200.
Schmidt, K., Gamer, M., Forkmann, K. & Bingel, U. (2017). Pain Affects Visual Orientation: an Eye-Tracking Study. Journal of Pain, An Article in Press. doi: 10.1016/j.jpain.2017.09.005.
Zhang, X., Laubie, B., Houzelot, V., Plasari, E., Echevarria, G. & Simonnot, M.-O. (2016). Increasing purity of ammonium nickel sulfate hexahydrate and production sustainability in a nickel phytomining process. Chemical Engineering Research and Design, 106, 26-32. doi: 10.1016/j.cherd.2015.12.009.


Tatyana Noskova, Olga Yakovleva, Tatyana Pavlova, Barbara Kołodziejczak, Magdalena Roszak Information Behaviour and Attitude to Lifelong Learning: A Comparative Study for Students of Person-Oriented Specialties
DIVAI 2018 – The 12th international scientific conference on Distance Learning in Applied Informatics. 139 ISBN 978-80-7598-059-5 (Print) ISSN 2464-7470 (Print) ISSN 2464-7489 (On-line)
Information Behaviour and Attitude to Lifelong
Learning: A Comparative Study for Students of
Person-Oriented Specialties
Tatyana Noskova, Olga Yakovleva, Tatyana Pavlova
Herzen State Pedagogical University of Russia, Saint-Petersburg, Russia
[email protected], [email protected], [email protected]
Barbara Kołodziejczak, Magdalena Roszak
Poznan University of Medical Sciences, Poznan, Poland
[email protected], [email protected]
Abstract
The paper describes a study of students’ information behaviour and their perception of lifelong learning values in the context of future professional activity. According to authors’ approach, the following structure of information behaviour was suggested: the motivational aspect; strategies for new information obtainment; self-management strategies within learning; ICT tools use efficiency for learning. The research proved that students generally understand the importance of lifelong learning and perceive it as a value and requirement of the 21st century. Nevertheless, their information behaviour not always meets the goals and values of lifelong learning which is mainly manifested in the lack of initiative in building own educational route and insufficient orientation in the opportunities of e-learning. Students’ information behaviour is connected with their future professional activities, especially when we refer to person-oriented specialties that demands communicational openness, empathy, and interaction management skills. In addition, it has a sociocultural background related to mentality and peculiarities of the education system in a particular country.
Keywords
Information behaviour. ICT tools. Lifelong learning. E-environment. Person-oriented specialties. Academic education. Medical science students. Pedagogical science students.
INTRODUCTION
Digital technologies intensively influence social activities, transferring them into virtual formats. This process is facilitated by the development of the Internet and mobile technologies, simplifying access to electronic resources. Interactions of users in the network environment arise not only in web 2.0 formats (Mokwa-Tarnowska, 2017; Patarakin, 2017), but also in web 3.0 (Lafuente, 2017; Noskova et al., 2015). The changing
Tatyana Noskova, Olga Yakovleva, Tatyana Pavlova, Barbara Kołodziejczak, Magdalena Roszak Information Behaviour and Attitude to Lifelong Learning: A Comparative Study for Students of Person-Oriented Specialties
DIVAI 2018 – The 12th international scientific conference on Distance Learning in Applied Informatics. 140 ISBN 978-80-7598-059-5 (Print) ISSN 2464-7470 (Print) ISSN 2464-7489 (On-line)
social environment of a person includes social media, access to electronic services, e-learning resources of science and education, etc. Consequently, we can say that human interaction with the e-environment induces a new type of behaviour – information behaviour. Generally, behavior is defined as “the way in which a person behaves in response to a particular situation or stimulus” (English Oxford living dictionaries). Consequently, we can define an information behaviour as a system of actions that a person undertakes to implement the processes of interaction with information. New generations actively interact with the e-environment. The development of modern youth occurs in the context of the intensifying influences of the e-environment and technologies (Lopez-Rosenfeld, M., 2017).
The education system responds to the increasing role and importance of digital technologies with the implementation of new forms and methods (e-learning, b-learning, distance technologies, etc.). However, lifelong learning paradigm is one of the core concepts that can advance this process. Lifelong learning strategies help adopting to the changing labour market of the open knowledge economy (Roszak et al., 2016; Morze, et al., 2017).
Students and young people are the main consumers of educational services. They have to learn and acquire professional competencies, being ready for future life and career in the new dynamically changing information conditions. Youth is the object of transdisciplinary research and study. Terminology analysis allows us to distinguish the following characteristics of contemporary youth: homo virtualis (Jarmon, 2010), the Net generation (Nau, 2017), the Millennials (Howe and Strauss, 2000). In the academic literature, we can find suggestions about teaching the Millennials in the classroom (Mastrolia and Willits, 2013) and online (Ruppel et al., 2007), for example, emphasising the benefits of students’ engagement into social media, collaboration and online interactions activation (Barry et al., 2016; Polevoy and Pavlova, 2017). Generational factors are proved to influence learning styles (Hill et al., 2017).
Sociological research sponsored by large companies can help adding a few touches to the portrait of a young person everyday life (Sberbank, 2017). Young people often prefer alternative employment schemes (freelance), they want to get experience in different areas. Self-development, self-improvement is in many respects a tribute to fashion. When reporting new information, they prefer seeing, but not listening. Young people are constantly on the Net, mostly with mobile devices. Video bloggers are important agents of influence. In addition, involvement in the Internet leads to a number of problems. For example, a study of young American adults proved that they have “developed a level of trust in technology that may leave them vulnerable to online threats and attacks” (Zogbyanalytics, 2013, p.1). Although a portrait of a young man remains somewhat incomplete and blurred, it is clear that the information behaviour is changing. Moreover, the main goal of the education is to overcome the risks of the e-environment and create conditions for a constructive and socially positive self-development.
RESEARCH PROBLEM
What are the characteristics of information behaviour? The basis of behaviour is the satisfaction of human needs: firstly, an awareness of the need is formed, secondly,

Tatyana Noskova, Olga Yakovleva, Tatyana Pavlova, Barbara Kołodziejczak, Magdalena Roszak Information Behaviour and Attitude to Lifelong Learning: A Comparative Study for Students of Person-Oriented Specialties
DIVAI 2018 – The 12th international scientific conference on Distance Learning in Applied Informatics. 141 ISBN 978-80-7598-059-5 (Print) ISSN 2464-7470 (Print) ISSN 2464-7489 (On-line)
motivation develops, and then a person works out an action plan and implements it. If we refer to Maslow's hierarchy of needs (Maslow, 1970), we will see that the information need as the basis of information behaviour can take place at the upper levels of the pyramid. In this study, we explore information behaviour within learning, so we propose the corresponding structure of information behaviour: the motivational aspect (attitude to learning); motives for educational activities (attitudes, interests and orientations within learning); strategies for new information obtainment; self-management strategies within learning; ICT tools use efficiency for learning, because this meets the challenges of the information society.
Not by chance, the Coursera 2016 statistics shows that “Learning: How to Learn” was among the most demanded courses (Coursera, 2016). This reflects the advanced trends in education and the demand of young people as the consumers of educational services. When developing electronic courses and electronic resources, we need to be aware of students’ attitude and readiness towards continuing education, to see the balance between a successful learning and a large degree of students’ autonomy demanded by modern educational standards throughout the world.
In this paper, we draw out the general trends in students’ information behaviour in terms of realizing and taking the benefits of lifelong learning within digital society. The hypothesis we are putting forth here is that students generally realize the importance of lifelong learning and perceive it as a value and requirement of the 21st century. However, their information behaviour does not entirely meet the goals and values of lifelong learning. To concretize the hypothesis, we formulated several additional questions that focus mostly on the aspects of ICT tools application to facilitate information interactions and learning:
1. What is the relation of educational activity and the use of ICT tools for solving educational problems?
2. Do students use ICT-tools for self-management in learning? 3. Do students realise the opportunities of professional communities and
cooperation for their development and professionalization? 4. Is there any relation between the information behaviour and future profession? 5. Is there any relation between the information behaviour, age and academic
progress?
RESEARCH METHODOLOGY
In the initial stage of the research, we focused on students of person-oriented specialties (future teachers and medical workers). The sample of research comprised 137 respondents: 58 (42%) students of pedagogical sciences from the Herzen State Pedagogical University of Russia, Saint Petersburg (future teachers of arts, natural science, informatics and languages), and 79 (58%) students of medical sciences from the Poznan University of Medical Sciences, Poland (future Doctors of Dental Surgery and Doctors of Medicine).
The research included several stages. Firstly, a questionnaire was elaborated for students. The questionnaire included several blocks of questions, corresponding to the information behaviour structure proposed by the authors:

Tatyana Noskova, Olga Yakovleva, Tatyana Pavlova, Barbara Kołodziejczak, Magdalena Roszak Information Behaviour and Attitude to Lifelong Learning: A Comparative Study for Students of Person-Oriented Specialties
DIVAI 2018 – The 12th international scientific conference on Distance Learning in Applied Informatics. 142 ISBN 978-80-7598-059-5 (Print) ISSN 2464-7470 (Print) ISSN 2464-7489 (On-line)
I) General attitude to learning and lifelong learning paradigm,
II) Motives for educational activities and behaviour,
III) Attitudes, interests, orientations within current learning stage,
IV) General strategies for learning (approaches to acquire new information),
V) Self-management strategies for educational activities,
VI) ICT tools use efficiency for learning,
VII) Additional information: academic performance, age, and faculty.
In each of the questions, respondents were asked to assess the degree of compliance or preference on a 5-point scale (1 point – never or almost never, 2 points – very rarely, 3 – rarely, 4 – quite often, 5 – very often or constantly).
Secondly, the answers underwent statistical analysis: descriptive statistics for all questions, including distribution of answers to questions for all respondents, comparative statistics for Polish and Russian respondents and correlation analysis. Due to the nature of survey data, non-parametric tests were used in the analysis. Differences in questionnaire answers between Polish and Russian group of students were detected by Mann-Whitney U-test. Differences in nominal data among groups were tested Chi-square test or Fisher’s exact test. The relationship between survey questions were analyzed with the Spearman’s rank correlation coefficient. All results were considered significant at p<0.05. The analyses were performed with the statistical package STATISTICA v. 12.0 (StatSoft. Inc., Tulsa, Oklahoma, USA).
RESEARCH RESULTS
General attitude to learning and lifelong learning
Table 1 shows the descriptive statistics for the first group of questions with the comparison of the results between Polish (Group 1) and Russian (Group 2) students (answers that have statistical significant difference with p<0.05 are marked in red).
Table 1: General attitude to learning and lifelong learning.
Questions Descriptive statistics Me (IQR)*
p-value Group 1
N=79 Group 2
N=58
Q1. Are you ready for lifelong learning? Me=3.5 (3 – 5)
Me=5 (4 – 5) 0.009
Q2. Are you sure, you know what is your
occupation (job) will be in the future? Me=5 (4 – 5)
Me=4 (3 – 5)
< 0.001
Q3. Is your current education related to your plans?
Me=5 (5 – 5)
Me=4 (4 – 5)
< 0.001
*Me – median, IQR – interquartile range.
All students consider themselves ready for lifelong learning. From the whole sample, only one person considered him/herself to be not ready. We can presume that most of
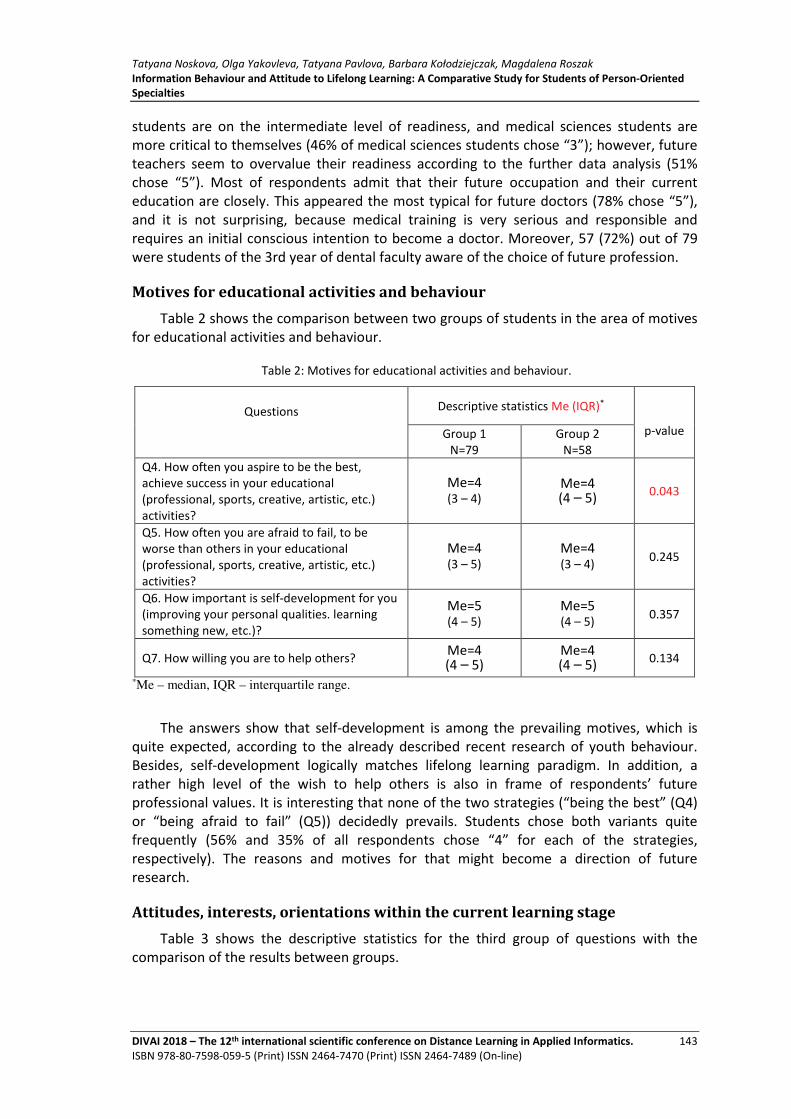
Tatyana Noskova, Olga Yakovleva, Tatyana Pavlova, Barbara Kołodziejczak, Magdalena Roszak Information Behaviour and Attitude to Lifelong Learning: A Comparative Study for Students of Person-Oriented Specialties
DIVAI 2018 – The 12th international scientific conference on Distance Learning in Applied Informatics. 143 ISBN 978-80-7598-059-5 (Print) ISSN 2464-7470 (Print) ISSN 2464-7489 (On-line)
students are on the intermediate level of readiness, and medical sciences students are more critical to themselves (46% of medical sciences students chose “3”); however, future teachers seem to overvalue their readiness according to the further data analysis (51% chose “5”). Most of respondents admit that their future occupation and their current education are closely. This appeared the most typical for future doctors (78% chose “5”), and it is not surprising, because medical training is very serious and responsible and requires an initial conscious intention to become a doctor. Moreover, 57 (72%) out of 79 were students of the 3rd year of dental faculty aware of the choice of future profession.
Motives for educational activities and behaviour
Table 2 shows the comparison between two groups of students in the area of motives for educational activities and behaviour.
Table 2: Motives for educational activities and behaviour.
Questions Descriptive statistics Me (IQR)*
p-value Group 1
N=79 Group 2
N=58
Q4. How often you aspire to be the best, achieve success in your educational (professional, sports, creative, artistic, etc.) activities?
Me=4 (3 – 4)
Me=4 (4 – 5) 0.043
Q5. How often you are afraid to fail, to be worse than others in your educational (professional, sports, creative, artistic, etc.) activities?
Me=4 (3 – 5)
Me=4 (3 – 4)
0.245
Q6. How important is self-development for you (improving your personal qualities. learning something new, etc.)?
Me=5 (4 – 5)
Me=5 (4 – 5)
0.357
Q7. How willing you are to help others? Me=4 (4 – 5)
Me=4 (4 – 5) 0.134
*Me – median, IQR – interquartile range.
The answers show that self-development is among the prevailing motives, which is quite expected, according to the already described recent research of youth behaviour. Besides, self-development logically matches lifelong learning paradigm. In addition, a rather high level of the wish to help others is also in frame of respondents’ future professional values. It is interesting that none of the two strategies (“being the best” (Q4) or “being afraid to fail” (Q5)) decidedly prevails. Students chose both variants quite frequently (56% and 35% of all respondents chose “4” for each of the strategies, respectively). The reasons and motives for that might become a direction of future research.
Attitudes, interests, orientations within the current learning stage
Table 3 shows the descriptive statistics for the third group of questions with the comparison of the results between groups.

Tatyana Noskova, Olga Yakovleva, Tatyana Pavlova, Barbara Kołodziejczak, Magdalena Roszak Information Behaviour and Attitude to Lifelong Learning: A Comparative Study for Students of Person-Oriented Specialties
DIVAI 2018 – The 12th international scientific conference on Distance Learning in Applied Informatics. 144 ISBN 978-80-7598-059-5 (Print) ISSN 2464-7470 (Print) ISSN 2464-7489 (On-line)
Table 3: Attitudes, interests, orientations within the current learning stage.
Questions Descriptive statistics Me (IQR)*
p-value Group 1
N=79 Group 2
N=58
Q8. Is it interesting for you to do research (study literature, write research papers, prepare reports, etc.)?
Me=3 (2 – 4)
Me=3 (3 – 4) 0.013
Q9. Do you participate in extracurricular activities (students’ self-government, social and volunteer projects, etc.)?
Me=3 (2 – 4)
Me=2 (1 – 3)
0.236
Q10. Evaluate your current professional experience (practice, part-time/full-time employment, etc.)
Me=3 (2 – 3)
Me=3.5 (2 – 4)
0.003
*Me – median, IQR – interquartile range.
Defining students’ attitudes, interests, orientations within the current learning stage we can admit that for the pedagogical sciences group research seems to be more interesting (17% of Russian students marked their interest as “5-very often or constantly”, while for the medical sciences group this was typical only for 6%). Contrariwise, extracurricular activities seem to be more appealing for future doctors (35% chose “4” and “5” while for future teachers this value is 21%).
The differences in the level of professional experience can be explained by the structure of the curriculum in each of the universities. At the Herzen University students have their first practice during the second year; however, it is more observational. During the next years of training, they have a more in-depth practice of conducting lessons and other activities in schools. Students have about 980 hours of practice during all four years of bachelor programme, including practice in summer camps. However, a number of hours may vary, depending on a particular educational programme. After two years of study, it is typical for students to have a part-time job, often as private tutors or as teacher assistants. At the Poznan University of Medical Sciences, students of the Faculty of Medicine and Dentistry do their holiday internship after completion of the first four years of studies and the internship lasts 480 hours in total. Moreover, practical clinical teaching conducted during 5th academic year includes activities in clinics and departments of medical schools in total number of 900 hours. Students of the Faculty of Medicine begin their holiday internship also following the first academic year and the total number of hours equals 600. Practical clinical teaching is conducted during 4th academic year. It consists of activities in clinics or hospital wards and lasts 30 weeks (900 hours). First years’ students are mainly observers, and their direct contact with patients takes place usually after 3rd year of studies. Furthermore, because of large number of classes at the university, students of the Faculty of Medicine do not have time for professional development as full-time or part-time employees. This may be the reason of such low estimation of their professional qualifications quoted in question Q10.

Tatyana Noskova, Olga Yakovleva, Tatyana Pavlova, Barbara Kołodziejczak, Magdalena Roszak Information Behaviour and Attitude to Lifelong Learning: A Comparative Study for Students of Person-Oriented Specialties
DIVAI 2018 – The 12th international scientific conference on Distance Learning in Applied Informatics. 145 ISBN 978-80-7598-059-5 (Print) ISSN 2464-7470 (Print) ISSN 2464-7489 (On-line)
General strategies for learning and self-management strategies
Table 4: General strategies for learning and self-management strategies.
Questions
Descriptive statistics Me (IQR)*
p-value Group 1
N=79 Group 2
N=58
Q11a. I do only those tasks that teachers offer Me=3 (3 – 4)
Me=4
(3 – 5) 0.001
Q11b. I try to study deeper, to find additional information myself
Me=4 (3 – 4)
Me=3 (3 – 4)
0.184
Q11c. I use the help and hint of others (including social networks and Internet communities)
Me=4 (4 – 5)
Me=4 (3 – 4)
0.009
Q11d. I try to be creative and initiative (I carry out additional tasks; participate in projects, competitions, scientific research, etc.)
Me=3 (2 – 3)
Me=3 (2 – 4)
0.877
Q12a. I do everything at the last moment, immediately before handing over the job
Me=3 (2 – 4)
Me=3 (2 – 4)
0.733
Q12b. I plan and distribute my work systematically
Me=3 (2 – 4)
Me=3 (2 – 4)
0.348
Q12c. I am finishing the job late, often after the deadline
Me=2 (1 – 3)
Me=2 (1 – 3)
0.681
*Me – median, IQR – interquartile range.
In the knowledge society with the active use of ICT for learning, collaboration and networking, the approaches to study deeper and ask for help in social networks and Internet communities seems the most efficient and natural for young people. In these aspects, students of medical sciences demonstrate a higher level of activity (44 % of Polish students chose “5” in question 11C, while only 24% of Russian students did so). Likewise, students of pedagogical sciences more often prefer not to go beyond teachers’ tasks (38% of Russian students chose “5”, while only 15% of Polish students did so). However, for both groups of students being creative and initiative is moderately popular. This can be one of the important areas of academic teachers’ work - motivation of students to participate in projects, competitions and scientific research.
ICT tools use efficiency for learning
Table 5: General strategies for learning and self-management strategies.
Questions
Descriptive statistics Me (IQR)*
p-value Group 1 N=79
Group 2 N=58
Q13. Do you think it is necessary for you to undertake electronic distance courses in your professional field?
Me=3 (2 – 4)
Me=3 (3 – 4)
0.065
Q14. Do you think it is necessary for you to share experience in professional communities (in social networks, etc.)?
Me=4 (3 – 5)
Me=4 (3 – 5)
0.621
Q15. Do you think peer assessment of outcomes is necessary for you?
Me=4 (3 – 5)
Me=4 (4 – 5)
0.296

Tatyana Noskova, Olga Yakovleva, Tatyana Pavlova, Barbara Kołodziejczak, Magdalena Roszak Information Behaviour and Attitude to Lifelong Learning: A Comparative Study for Students of Person-Oriented Specialties
DIVAI 2018 – The 12th international scientific conference on Distance Learning in Applied Informatics. 146 ISBN 978-80-7598-059-5 (Print) ISSN 2464-7470 (Print) ISSN 2464-7489 (On-line)
Q16. Is it important for you to share information about your successes and achievements (e.g., in social networks and other communities)?
Me=3 (1 – 4)
Me=3 (2 – 4)
0.013
Q17. Are you searching for possible partners, colleagues in your future professional field (e.g. in social networks and other communities)?
Me=3 (2 – 4)
Me=3.5 (3 – 4)
0.009
Q18. Do you actively use additional materials found by yourself when doing assignments?
Me=4 (3 – 5)
Me=4 (3 – 4)
0.825
Q19. Do you actively use electronic tools (ICTs) when planning your activities (electronic calendars, plans, reminders, etc.)?
Me=4 (3 – 5)
Me=3 (2 – 3)
< 0.001
Q20. Do you search for grants (competitions, etc.) that you can undertake?
Me=3 (2 – 4)
Me=3 (2 – 3)
0.911
*Me – median, IQR – interquartile range.
These questions show the differences between the two groups of students. Future teachers seem to be more focused on social interaction in the Internet environment. Only 7% of the Russian group chose “1” for the question about sharing successes and achievements, while students of the Polish group chose the lowest grade in 29% of answers. In terms of searching for possible partners and colleagues in the future professional field, 24% of the Russian group chose “5”, while 15% of the Polish did so. However, the Polish respondents appeared to have more experience in the use of electronic tools (ICTs) for planning own activities (30% of the Polish group chose “5”, while for the Russian group this value is only 7%). On the whole, we see that a list of objectives, pursued by the ICT tools use, includes, firstly, peer assessment and sharing knowledge and experience in network communities, and secondly, finding additional educational materials. Students underestimate electronic distance courses (students chose “quite often” and “very often” within 30-40% in both groups) as well as they are not active in application for grants and various competitions that indeed contribute to the acquisition of professional experience (about 20% in both groups marked that they “never or almost never” undertook such kind of activities). A possible reason is the low age of the respondents (average equal 20 years; range: 17-25 years) and little work experience.
Correlation analysis
Correlation analysis helped to see students’ information behaviour characteristics in more detailed.
Firstly, the data obtained may indicate that lifelong learning precedency determines the advanced diversity of learning strategies. Particularly, a relationship between Q1 and Q11d (the Spearman correlation coefficient R=0.22, p=0.012) means that the more students consider themselves ready for lifelong learning, the more they try to be creative and initiative (e.g., additional assignments, projects, competitions, scientific research. etc.). Furthermore, a relationship between Q1 and Q12c (R=-0.17, p=0.048) gives reason to believe that the more students consider themselves ready for lifelong learning, the better managing and planning your activities and more rare they irresponsibly violate the deadlines. In addition, for the future teachers group of respondents we found the positive correlations between the readiness for lifelong learning and increasing activity in projects, competitions and scientific research (R=0.34, p=0.009), accompanied by planning and

Tatyana Noskova, Olga Yakovleva, Tatyana Pavlova, Barbara Kołodziejczak, Magdalena Roszak Information Behaviour and Attitude to Lifelong Learning: A Comparative Study for Students of Person-Oriented Specialties
DIVAI 2018 – The 12th international scientific conference on Distance Learning in Applied Informatics. 147 ISBN 978-80-7598-059-5 (Print) ISSN 2464-7470 (Print) ISSN 2464-7489 (On-line)
distributing work systematically (R=0.49, p < 0.001). This trend is proved by the negative correlations for the alternative questions: the higher is the readiness for lifelong learning, the lower is the tendency for “doing everything at the last moment” (R=-0.35, p=0.007) and violating the deadlines (R=-0.29, p=0.032).
Secondly, we found some examples of the connection between students’ readiness for lifelong learning and the ICT tools use efficiency. For instance, the readiness for lifelong learning correlates with the need to undertake electronic distance courses in the professional field (R=0.19, p=0.029) and with the importance of peer assessment (R=0.25, p=0.003). We should note that peer assessment is more relevant for medical sciences students (R=0.23, p=0.046).
Thirdly, the research showed that there is no obvious connections between the attitude and readiness for lifelong learning and professional experience, age and academic progress. However, we can assume a connection between future professional activity and information behaviour. For example, we discovered a higher social openness and activity in the Internet for future of teachers, and the tendency to regulate and streamline work with the help of electronic tools for future doctors. Nevertheless, this issue still needs a more detailed study.
CONCLUSION
The described experimental research gives the ground to outline some characteristics of students’ information behaviour and attitude to lifelong learning. Along with that, we can draw out some features in terms of future professional activities. The hypothesis of the study was proved: students indeed generally understand the importance of lifelong learning and perceive it as a value and requirement of the 21st century. Nevertheless, their information behaviour not always meets the goals and values of lifelong learning. Mainly they lack initiative in building own educational route, insufficiently oriented in the opportunities of e-learning in general and knowledge sharing professional community in particular. Therefore, these are the main directions of academic teachers’ work with students. Mastery of advanced strategies of information behaviour is very important for both teachers and doctors, since all the time it is necessary to be at the forefront of knowledge.
The study of the motivational aspect of students’ information behaviour including attitudes and motives to learning and interests within future profession showed that self-development lies among the prevailing motives. In addition, a tendency to help others is evident that meets the values of person-oriented specialties. Students might be interested either in research or in extracurricular activities and academic teachers need to reveal and support these interests. In addition, students of the first years of study admit that they lack practice in the future professional field. Therefore, they can be more motivated to do practice-oriented assignments (Capay et al., 2011).
In terms of strategies for new information obtainment, students often refer to social networks and Internet communities. They prefer to receive precise and concise tasks and do not necessarily go beyond them. Consequently, being creative and initiative is moderately popular and it means that academic teachers face the necessity to motivate students to participate in projects, competitions and scientific research.

Tatyana Noskova, Olga Yakovleva, Tatyana Pavlova, Barbara Kołodziejczak, Magdalena Roszak Information Behaviour and Attitude to Lifelong Learning: A Comparative Study for Students of Person-Oriented Specialties
DIVAI 2018 – The 12th international scientific conference on Distance Learning in Applied Informatics. 148 ISBN 978-80-7598-059-5 (Print) ISSN 2464-7470 (Print) ISSN 2464-7489 (On-line)
From the ICT tools use standpoint, searching for additional educational materials, peer assessment and sharing knowledge in virtual communities form the basis of students’ preferred aspects of information behaviour. Unfortunately, some students still underestimate electronic distance courses and do not show a high activity in grants and various competitions, and this is, again, the direction of academic teachers’ activities in motivating students. However, we found out that the understanding of various and learning routes (e.g., e-courses) increases with the acquisition of lifelong learning strategies. Overall, the readiness for lifelong learning is closely connected with learning and self-management strategies. We found out the direct correlations between the readiness for lifelong learning and the increase of such qualities as initiative, responsibility, and self-management, with the active use of special electronic tools (electronic calendars, plans, reminders, etc.).
We presume that students’ information behaviour in some aspects might be connected with their future professional activities, especially when we refer to person-oriented specialties that demands communicational openness, empathy, and interaction management skills. Some traits of information behaviour might be related to mentality, peculiarities of the education system in a particular country. In this context, comparative sociocultural aspects are promising. In addition, the absence of obvious connections between the attitude and readiness for lifelong learning and professional experience, age and academic progress once again emphasises the essence of lifelong learning when people have an ongoing motivation to the pursuit of knowledge in accordance with the individual goals (UNESCO, 2002).
ACKNOWLEDGEMENT
The results were obtained in the framework of the State Task of the Ministry of Education and Science of the Russian Federation No. 2.2939.2017/4.6
REFERENCES
Barry, D. S., Marzouk, F., Chulak-Oglu, K., Bennett, D., Tierney, P. and O'Keeffe, G. W., 2016. Anatomy education for the YouTube generation. American Association of Anatomists, 9, pp. 90-96. doi:10.1002/ase.1550.
Cápay, M., Kapusta, J., Magdin, M., Mesárošová, M., Švec, P. and Valovičová, L., 2011 Popularizing natural sciences by means of scientific fair. International Journal of Emerging Technologies in Learning, 6 (4), pp. 12-17.
English Oxford living dictionaries [online] Available at <https://en.oxforddictionaries.com/definition/behaviour> [Accessed 18 January 2018].
Hill, R. L., Swanson A. and Kirwan J., 2017. EI and Learning Styles: The Effect on Learning of Generationals. In: Auer M., Guralnick D., Uhomoibhi J. (eds) Interactive Collaborative Learning. ICL 2016. Advances in Intelligent Systems and Computing, Vol. 545, pp. 101-115 Springer, Cham.
Howe, N., Strauss, W., 2000. Millennials Rising: The Next Great Generation. New York, NY: Vintage Books, A Division of Random House, Inc.
Tatyana Noskova, Olga Yakovleva, Tatyana Pavlova, Barbara Kołodziejczak, Magdalena Roszak Information Behaviour and Attitude to Lifelong Learning: A Comparative Study for Students of Person-Oriented Specialties
DIVAI 2018 – The 12th international scientific conference on Distance Learning in Applied Informatics. 149 ISBN 978-80-7598-059-5 (Print) ISSN 2464-7470 (Print) ISSN 2464-7489 (On-line)
Institutionalising lifelong learning, 2002. Ed. Singh M. UNESCO Institute for Education Hamburg, Germany [online] Available at <http://www.unesco.org/education/uie/pdf/ILLBOOK.pdf> [Accessed 18 January 2018].
Jarmon, L., 2010. Homo virtualis: Virtual worlds, learning, and an ecology of embodied interaction, International Journal of Virtual and Personal Learning Environments, 1 (1), pp. 38-56.
Lafuente, M., 2017. Getting looped in to the web: Characterizing learning processes and educational responses. Interactive Learning Environments, 25 (1), pp. 72-84. DOI:10.1080/10494820.2015.1116014.
Mokwa-Tarnowska, I., 2017. Higher interest, deeper concentration, more satisfaction – Web 2.0 tools to enhance technical English classes. In: Innovations in languages for specific purposes, Innovations en langues sur objectifs spécifiques: Present challenges and future promises, défies actuels et engagements à venir, Ed. by Sowa, M., Krajka, J. Frankfurt am Mein: Peter Lang Edition, pp. 156-167.
Noskova, T., Pavlova, T., and Iakovleva, O., 2015. Web.3 technologies and transformation of pedagogical activities. In Artificial Intelligence Technologies and the Evolution of Web 3.0 ed. T. Issa, P. Isaías, pp. 16-36 DOI: 10.4018/978-1-4666-8147-7.ch002.
Lopez-Rosenfeld, M., 2017. Tell me and I forget, teach me and I may remember, involve me and I learn: Changing the approach of teaching computer organization. In Proceedings - 2017 IEEE/ACM 1st International Workshop on Software Engineering Curricula for Millennials, SECM 2017, pp. 68-71.
Maslow, A. H., 1970. Motivation and personality. New York: Harper & Row.
Mastrolia, S. A., Willits, S. D., 2013. Millennials: What do we really know about them? [online] Available at <http://www.emeraldinsight.com/doi/abs/10.1108/S1085-4622%282013%290000014009> [Accessed 18 January 2018] doi:10.1108/S1085-4622(2013)0000014009.
Morze, N., Smyrnova-Trybulska, E., and Glazunova, O., 2017. Design of a University Learning Environment for SMART Education. In Smart Technology Applications in Business Environments. Hershey, PA: IGI Global, pp.221-248. doi: 10.4018/978-1-5225-2492-2.ch011.
Nau, S. Z., 2017. From Understanding Net Generation Expectation to Sustainable Student Engagement. In: Issa T., Isaias P., Issa T. (eds) Sustainability, Green IT and Education Strategies in the Twenty-first Century. Green Energy and Technology. Pp. 63-76 Springer, Cham.
Patarakin, E. D., 2017. Macroscopic approach to the analysis of collaborative network activity. Education technology, 2, pp. 309-329.
Polevoy, S. A., Pavlova V. V., 2017. Peculiarities of teaching students with mosaic thinking. Open education, 21 (2), pp. 56-67.
Preparing Millennials to Lead in Cyberspace 2013. [online] Available at <https://www.zogbyanalytics.com/images/PDF/Raytheon%20Zogby%20Cyber%20Millennial%20survey%20report.pdf> [Accessed 20 January 2018].
Roszak, M., Kołodziejczak, B., Kowalewski, W. and Ren-Kurc, A., 2016. Implementation of e-learning portal for academic education and lifelong learning. Int. J. Continuing Engineering Education and Life-Long Learning, Vol. 26, No.2, pp. 135-152.

Tatyana Noskova, Olga Yakovleva, Tatyana Pavlova, Barbara Kołodziejczak, Magdalena Roszak Information Behaviour and Attitude to Lifelong Learning: A Comparative Study for Students of Person-Oriented Specialties
DIVAI 2018 – The 12th international scientific conference on Distance Learning in Applied Informatics. 150 ISBN 978-80-7598-059-5 (Print) ISSN 2464-7470 (Print) ISSN 2464-7489 (On-line)
Ruppel, C.P., Griffin, T.E. and Fleming, C.T., 2007. Millennials and online learning: Identifying barriers and facilitators for research. In IADIS International Conference on Cognition and Exploratory Learning in Digital Age, CELDA, pp. 303-308.
Sberbank study: 30 facts about modern youth, 2017. [online] Available at <https://adindex.ru/news/researches/2017/03/10/158487.phtml> [Accessed 20 January 2018].

Radim Polasek, Tomas Javorcik Microlearning in the Instruction of Technical and Humanities Courses
DIVAI 2018 – The 12th international scientific conference on Distance Learning in Applied Informatics. 151 ISBN 978-80-7598-059-5 (Print) ISSN 2464-7470 (Print) ISSN 2464-7489 (On-line)
Microlearning in the Instruction of Technical and
Humanities Courses
Radim Polasek, Tomas Javorcik
Pedagogical faculty, University of Ostrava, Ostrava, Czech Republic [email protected], [email protected]
Abstract
Today, different areas of human life are rapidly developing. Education is no exception. It can almost be said that the ability to adapt to changes have become a new skill. Technological development and technological equipment of schools leads to the following question: How should this trend be reflected in the education/learning area? Integration of microLearning into instruction should help us answer this question. This computer-based instruction can be perceived as the eLearning evolution. The transformation of appropriate courses into microLearning units may be beneficial for both agents of education – the teacher and the student. This paper presents a research project aimed at implementation of microLearning units into technical and humanities courses taught at the Department of Information and Communication Technologies of the Pedagogical Faculty of the University of Ostrava. The authors introduce research objectives, questions and design and basic theoretical outcomes. The results may help determine not only the differences in the creation of microLearning units and their inclusion in the instruction of various courses, but also both teachers’ and students’ attitude toward them.
Keywords:
MicroLearning. ELearning, course. Information and communication technologies. Technical course. Humanities course.
INTRODUCTION
Information and communication technology is so widespread that it has become a part of everyday life. Based on our own experience, the number of conferences (both academic and professional) and journal articles, it can be said that information and communication technology is being successfully integrated into the education process at all educational levels – from kindergartens to universities. However, this process does not end here as the development of technology, software and infrastructure brings new possibilities for integrating information and communication technology into instruction and learning. This integration should go hand in hand with the development, reflecting current trends and public demand. Moreover, the degree and manner of integration of technology into the education process may be a good business strategy for any educational institution.

Radim Polasek, Tomas Javorcik Microlearning in the Instruction of Technical and Humanities Courses
DIVAI 2018 – The 12th international scientific conference on Distance Learning in Applied Informatics. 152 ISBN 978-80-7598-059-5 (Print) ISSN 2464-7470 (Print) ISSN 2464-7489 (On-line)
Today’s hurried age influences all areas of human activity, including education. The massive popularity of mobile technology has put even more pressure on people to learn as fast as possible. Mobile technology made it possible to take various courses while traveling to work, sitting in a dentist waiting room, standing on a train platform or sitting on a bench in a park. Today we no longer need to rely only on text study materials, but we can also use multimedia elements which make the curriculum easier to understand.
It can be assumed that the manner in which the facts and information are presented to the student will be entirely different to full-time study. It is hard to imagine that a student would listen to a 1.5-hour long recording of their teacher’s lecture on their cellular phone while sitting on a bench in a park. The session should be shorter, concise and should include interactive and multimedia elements. Regular eLearning is too comprehensive and ponderous, often resulting in the students’ ignoring the majority of its content.
Reflecting current trends, microLearning appears to be an interesting way of using information and communication technology for educational purposes. Although microLearning is nothing new (it dates back to 2003 – Salas, 2017), it has yet to become widely used. That is why we decided to focus on this phenomenon, using existing research results to transform eLearning into microLearning in the selected courses taught at the Pedagogical Faculty of the University of Ostrava.
The aforementioned pilot use of microLearning in instruction will be thoroughly examined in order to determine its impact on students’ knowledge and skills. The following are some of the questions which need to be answered:
� How will microLearning change students’ way through the course? Will it speed it up?
� What study materials will be used more often?
� On what type of course (humanities or technological) will microLearning have a larger impact?
� Will there be gender differences in the research results?
� Will students’ activity be evenly distributed throughout the entire semester?
The following paragraphs present the research objective, which we intend to realize in the next two years.
MOTIVATION
Their personal experience with students’ attendance and activity in eLearning courses prompted the authors to conduct this research. Even though the courses include text study materials, video tutorials, examples, animations, control questions, tests and discussions, and are regularly updated and well managed, not all of the mentioned parts are used equally by students. Students tend to skip those elements which contain new information that is essential for completing the course. Therefore, using the trial and error method, students try to complete correspondence tasks without reading the instructions, etc. These findings are based on the LMS Moodle statistics.
The course ‘Educational Technology’ was selected for demonstration purposes. Since the course is intended for the majority of study programs, it can be assumed that the

Radim Polasek, Tomas Javorcik Microlearning in the Instruction of Technical and Humanities Courses
DIVAI 2018 – The 12th international scientific conference on Distance Learning in Applied Informatics. 153 ISBN 978-80-7598-059-5 (Print) ISSN 2464-7470 (Print) ISSN 2464-7489 (On-line)
knowledge and skills regarding information and communication technology of the majority of students in the course are not good enough for them to be able to complete the course without having to consult the included study materials. 79 students participated in the course in the winter semester of the 2017/2018 academic year. The following chart illustrates the activity of all students during the semester.
Figure 1: Complete activity (browsing and posting) of students in the course
The chart shows that the student activity line fluctuates. There are three fluctuations – the beginning of the semester (1), the end of the semester (2) and the exam period (3). These three stages indicate when students access the course most often, which means that they do not study continuously, but fitfully. The analysis of the parts of the course which students access most often is presented below (see Figure 2).
Figure 2 present a detailed view of the individual parts of the course and the number of clicks on them. The data show that students most often work with the Task element. As far as the remaining parts of the course are concerned, students use video tutorials (or animations) and study texts the most. If we took a detailed look at each individual element of the course separately (the course consists of 151 elements), we would find out that the number of clicks on some elements was in single digits. Moreover, there were also elements that were never viewed. There are two solutions:
1. Limiting the number of times an assignment can be submitted
2. Creating more attractive content which reflects current trends, i.e. to include more animations, interactive elements, infographics, schemes and short videos instead of long texts and video tutorials.
0
500
1000
1500
2000
2500
3000
Student browsing Student posting
1
2
3

Radim Polasek, Tomas Javorcik Microlearning in the Instruction of Technical and Humanities Courses
DIVAI 2018 – The 12th international scientific conference on Distance Learning in Applied Informatics. 154 ISBN 978-80-7598-059-5 (Print) ISSN 2464-7470 (Print) ISSN 2464-7489 (On-line)
Figure 2: Total number of students’ accesses to the individual course elements
Based on above mentioned findings of how students work with e-Learning courses we are motivated to modify these electronic materials in a way that would reflect present-day situation and needs of students. The aim is to directly look for a solution of students' approach towards learning using current e-Learning courses and motivate them to increase their course related activities even during semester. After analysing the possible solutions we came to choice of MicroLearning concept which we consider as suitable for several reasons:
� Less time consuming for students (smaller pieces).
� Learning objects can be viewed on various devices (ie. mobile).
� More interactivity is employed.
� division into smaller units ease updating
At last MicroLearning is quite new approach that move forward e-Learning, some authors say that it is evolution of e-Learning (Giurgiu, 2017).
MICROLEARNING AND ITS USE
Created in the digital age, microLearning offers new possibilities for the organization of instruction (particularly small steps in the form of small curriculum units). MicroLearning means a complex approach to education based on using web content to connect activities that are short in duration (Kamilali and Sofianopoulou, 2015). Such activities are called a MicroLearning Unit (Hug and Friesen, 2009). Singh (2014) defines microLearning in more detail: “The way of learning with short size of learning content that
34
575
28
521
590
11
118
1211
15286
1363
0 2000 4000 6000 8000 10000 12000 14000 16000 18000
Discussion
Questionnaire
Control Questions
Pokyny
List of assigments
Glossary of terms
Software
Text
Task
Video

Radim Polasek, Tomas Javorcik Microlearning in the Instruction of Technical and Humanities Courses
DIVAI 2018 – The 12th international scientific conference on Distance Learning in Applied Informatics. 155 ISBN 978-80-7598-059-5 (Print) ISSN 2464-7470 (Print) ISSN 2464-7489 (On-line)
is made up of fine-grained, interconnected and loosely-coupled short learning activities, determines the focus on the individual learning needs”.
The majority of authors (e.g. Buchem and Hamelmann, 2010) agree that microLearning is either partly or entirely based on the following concepts:
� Microcontent – this concept is used to define the method of presenting a certain amount of knowledge and information structured into several short chapters. Microcontent is an integral part of microLearning.
� Web 2.0
� Social software
� E-Learning 2.0
� Personal Learning Environment
� Informal learning – Lorenc (2017) argues that microLearning may also be designed for formal learning.
� Work-based learning
Since microLearning uses a large number of concepts, there are many different versions of microLearning. Drawing on the results of his own analysis, Hug (2005) introduces the following versions of microLearning (see Figure 3).
Figure 3: microLearning versions according to Hug (2005)
As has already been mentioned, microLearning is nothing new. Therefore, various researches have been conducted in different areas of education. Their results prove that we are moving in the right direction. Results of research aimed at perception of microLearning by students between the ages of 23 and 65 (Peterson, 2017) can serve as an example. The sample consisted of participants, the majority of whom had no previous experience with microLearning. According to this research, a microLearning course should include:
� Navigational instructions which the participant could follow.
� Definition of terms which students may encounter in a particular microLearning course, i.e. a glossary of terms.
� Course progression indicator.
� Estimated time needed for completing every part of the course.

Radim Polasek, Tomas Javorcik Microlearning in the Instruction of Technical and Humanities Courses
DIVAI 2018 – The 12th international scientific conference on Distance Learning in Applied Informatics. 156 ISBN 978-80-7598-059-5 (Print) ISSN 2464-7470 (Print) ISSN 2464-7489 (On-line)
� The option to skip the parts of the course which the participant has already mastered. 47% of the course participants proceeded gradually without skipping any parts.
� Interactive elements.
The following specific principles can be added to the general ones:
� An educational/instructional video should be more than 90 seconds long.
� An educational text should not be longer than 150 words.
� Practical examples should be a part of the course.
� Following every class, students’ knowledge should be tested using a control test, quiz or other analytical tools.
The course creators were supposed to take into account that the course participants should have at least elemental information and communication technology skills. Aside from the aforementioned research, we would also like to mention Buch and Hamelmann’s study (2010). Their research was aimed at the instruction of technical English. At the end of the course, the participants not only had better results, but were also more satisfied with the current level of their knowledge.
MicroLearning can also be seen in a non-traditional area, marketing – microcontent elements were used in a number of marketing campaigns. The following are two examples of general knowledge commonly used in marketing:
� Up to 1,800,000 words can be replaced by a 1-minute video.
� More than 58% of viewers stop watching a video during the first 90 seconds.
RESEARCH OBJECTIVE
There are various circumstances that lead us to use microLearning to deal with the evolution of eLearning. Even though it may not seem to be the ideal solution, it is based on adapting study materials to the learner’s needs, i.e. social influences that change learners’ approach to study materials. We are aware of the current trend of fragmented attention, choice overload (‘overchoice’ of activities and interests evident mainly in the sales area – Gourville and Soman, 2005), information overload (“Information overload,” 2010; Khalid et al., 2016) and academic procrastination (Kouroshnia, 2016). A combination of those circumstances creates a competitive environment, in which study materials should be easily accessible and should not distract the learner’s attention. Since eLearning contains materials in electronic form, it has to compete with everything that the Internet, which is an integral part of eLearning, has to offer.
One of the reasons why we decided to implement eLearning with microLearning elements into instruction was the students’ insufficient involvement in eLearning courses during the semester. As stated in the motivational part of the paper, the students only paid attention to study materials and assigned tasks at the beginning and end of the semester. Granulation of the content and its division into smaller units should lead to more personified electronic courses. In this case, personification is one of the challenges that eLearning did not meet (Neuhold and Lindner, 2006), as well as one of its future directions (Yang, 2013). Our goal is to find an appropriate method of implementation of

Radim Polasek, Tomas Javorcik Microlearning in the Instruction of Technical and Humanities Courses
DIVAI 2018 – The 12th international scientific conference on Distance Learning in Applied Informatics. 157 ISBN 978-80-7598-059-5 (Print) ISSN 2464-7470 (Print) ISSN 2464-7489 (On-line)
microLearning, determine how this method influences students’ knowledge and what students think about it, especially with respect to the already realized instruction. We intend to use the findings to create other microLearning courses which would be beneficial for students and could be used in further research.
MicroLearning courses will be realized in two different subjects – one technical subject and one humanities subject. The following courses were preselected: “Computer Architecture and the Basics of Operating Systems” and “Marketing in Education”. Used at the University of Ostrava, the LMS Moodle is an eLearning environment in which the courses will be created. Students’ knowledge before and after the course will be tested, including their evaluation of the microLearning course.
MicroLearning-based courses will include illustration images, animations, schemes, charts and other concise objects that will be aggregated (Buchem and Hamelmann, 2010; Hug and Friesen, 2009). Interactive HTML5 elements suitable for enhancement of the created course will be used to improve its interactivity and encourage greater involvement of students.
We expect the modified microLearning courses to spark students’ interest in the discussed curriculum, i.e. to make the information more accessible and easier to understand.
RESEARCH METHODOLOGY
Our research is a pedagogical experiment consisting of one group of students for each course (depending on students’ interest, there may be parallel groups).
During the first year, microLearning units (MLU) will be created. Before the start of instruction, we will use a didactic test (designed by the authors) to determine students’ knowledge (in the technical and humanities course, respectively). Moreover, a pretest will be used to determine students’ evaluation of the proposed changes to eLearning courses. We will be interested in learning their subjective evaluation, opinions and affective attitude toward microLearning.
During the winter semester, the microLearning courses will be pilot tested in instruction (then a didactic test will be used once again to determine students’ knowledge). At the end of the first year, we will evaluate all the acquired data. We intend to compare the “before and after” results (independently for each course), focusing on the possible differences in knowledge of technical and humanities topics (i.e. whether the students in one course were more successful than the students in the other course). Considering the different nature of those two areas, it can be expected that there will be differences in knowledge. A technical course contains much more facts, data and values, requiring understanding basic principles of how a complex machine (a computer) works. A humanities course, on the other hand, requires understanding the individual parts of the whole, context and the suitable approach to problem solving.
Based on the findings, results and experience with microLearning courses acquired during the first year, these courses will then be updated (and students’ knowledge before and after the updated course will once again be tested, including their evaluation of eLearning instruction). At the end of the second year, besides the evaluation of the results,

Radim Polasek, Tomas Javorcik Microlearning in the Instruction of Technical and Humanities Courses
DIVAI 2018 – The 12th international scientific conference on Distance Learning in Applied Informatics. 158 ISBN 978-80-7598-059-5 (Print) ISSN 2464-7470 (Print) ISSN 2464-7489 (On-line)
we will compare students’ knowledge (whether or not it is better than the previous year), whether they used electronic aids more often and how their attitude toward microLearning changed from year to year.
Figure 4: Research timetable

Radim Polasek, Tomas Javorcik Microlearning in the Instruction of Technical and Humanities Courses
DIVAI 2018 – The 12th international scientific conference on Distance Learning in Applied Informatics. 159 ISBN 978-80-7598-059-5 (Print) ISSN 2464-7470 (Print) ISSN 2464-7489 (On-line)
CONCLUSION
The different forms of instruction and their support can be adapted to changes in society. Since microLearning is already being discussed abroad, we think it is high time that we presented concrete results that would help us determine the future direction of eLearning courses and instruction support. We intend to learn students’ attitude toward microLearning, determine whether it has a positive impact on their knowledge and also whether there are differences in the results of the two groups (technical and humanities courses). So far there is no research (experiment) that would look at this issue in the context of schooling of higher education. Results of our study then may help to realize effectiveness of microLearning in previously defined subject areas of our interest. Already there are some positive outcomes of experiments from medical practice (Orwoll et al., 2018) which shows positive results, despite the fact that they are not supported by further researches from other fields and settings. MicroLearning applied so far (Orwoll et al., 2018) in employee training has in contrast to pregradual education its specifics. Moreover, we intend to take results our or research into account when creating new courses and study materials and share them with the professional public.
ACKNOWLEDGMENT
This paper is part of the Student Grant Competition: MicroLearning in the Instruction of Technical and Humanities Courses.
REFERENCES
Buchem, I., & Hamelmann, H. (2010). Microlearning: a strategy for ongoing professional development [Online]. Elearning Papers, 2010 (21), 1-13. Retrieved from https://www.openeducationeuropa.eu/sites/default/files/old/media23707.pdf
Giurgiu, L. (2017). Microlearning an Evolving Elearning Trend. Buletin Scientific 22, 18–23.
Gourville, J.T., Soman, D. (2005). Overchoice and Assortment Type: When and Why Variety Backfires. Marketing Science 24, 382–395.
Hug, T. (2006). Microlearning: A New Pedagogical Challenge (Introductory Note). In T. Hug, M. Lindner, & P. A. Bruck, (Eds.), Microlearning: Emerging Concepts, Practices and Technologies After E-Learning: Proceedings of Microlearning Conference 2005: Learning & Working in New Media (pp. 8-11). Innsbruck, áustria: Innsbruck University Press.
Hug, T., & Friessen, N. (2009). Outline of a Microlearning Agenda [Online]. Elearning Papers, 2009 (16), 1-13. Retrieved from https://www.openeducationeuropa.eu/sites/default/files/old/media20252.pdf
Hug, T., Friesen, N. (2009). Outline of a Microlearning Agenda. eLearning Papers.
Information overload [WWW Document] (2010). McMillan Dictionary. Retrieved from https://www.macmillandictionary.com/dictionary/british/information-overload
Kamilali, D., & Sofianopoulou, C. (Eds.). (2015). MICROLEARNING AS INNOVATIVE PEDAGOGY FOR MOBILE LEARNING IN MOOCS. In D. Kamilali & C. Sofianopoulou (Eds.), IADIS

Radim Polasek, Tomas Javorcik Microlearning in the Instruction of Technical and Humanities Courses
DIVAI 2018 – The 12th international scientific conference on Distance Learning in Applied Informatics. 160 ISBN 978-80-7598-059-5 (Print) ISSN 2464-7470 (Print) ISSN 2464-7489 (On-line)
International Conference Mobile Learning 2015 (pp. 127-131). Madeira, Portugal: International Association for Development of the Information Society.
Khalid, S., Saeed, M., Syed, S. (2016). Impact of Information Overload on Students’ Learning: An Empirical Approach. FWU Journal of Social Sciences 10, 58–66.
Kouroshnia, N. (2016). ACADEMIC PROCRASTINATION. Journal of Fundamentals of Mental Health 18, 514–522.
Lorenc, Pavel. Microlearning a jeho využití ve vzdělávání. Pavel Lorenc: web and eLearning designer [online]. 2017 [cit. 2018-02-09]. Retrieved from https://pavellorenc.cz/microlearning-vyuziti-ve-vzdelavani/
Neuhold, E., Lindner, M. (2006). Quo Vadis, eLearning?, in: Microlearning: Emerging Concepts, Practices and Technologies ; Proceedings of Microlearning 2005 ; Learning & Working in New Media Environments. Univ. Press, Innsbruck, p. 223.
Orwoll, B., Diane, S., Henry, D., Tsang, L., Chu, K., Meer, C., … Roy-Burman, A. (2018). Gamification and Microlearning for Engagement With Quality Improvement (GAMEQI): A Bundled Digital Intervention for the Prevention of Central Line–Associated Bloodstream Infection. American Journal of Medical Quality, 33(1), 21–29. Retrieved from https://doi.org/10.1177/1062860617706542
Peterson, W. (2017). Learners’ Perceptions of the Microlearning Format for the Delivery of Technical Training (Dissertation theses). University of Southern California, USA.
Salas, A. (2017). Microlearning: What It Is Not and What It Should Be [WWW Document]. URL https://www.learningsolutionsmag.com/articles/2255/microlearning-what-it-is-not-and-what-it-should-be (accessed 2.12.18).
Yang, H.H. (2013). New World, New Learning: Trends and Issues of E-Learning. Procedia - Social and Behavioral Sciences 77, 429–442. Retrieved from https://doi.org/10.1016/j.sbspro.2013.03.098

Lucie Rohlíková, Jiří Kohout, Václav Vrbík, Ondřej Rohlík The Importance of Mobile Access to Information Systems for Pre-service Teachers
DIVAI 2018 – The 12th international scientific conference on Distance Learning in Applied Informatics. 161 ISBN 978-80-7598-059-5 (Print) ISSN 2464-7470 (Print) ISSN 2464-7489 (On-line)
The Importance of Mobile Access to Information
Systems for Pre-service Teachers
Lucie Rohlíková, Jiří Kohout, Václav Vrbík
Faculty of Education, University of West Bohemia, Pilsen, Czech Republic [email protected], [email protected], [email protected]
Ondřej Rohlík
Faculty of Applied Sciences, University of West Bohemia, Pilsen, Czech Republic [email protected]
Abstract
The goal of this study was to explore the disposition to, attitudes towards, and usage of ICT, the ownership and importance of individual devices for academic success, and the importance of using a handheld mobile device for various student-related activities of pre-service teachers. The survey involved 365 pre-service teachers of primary and secondary schools -- students of the University of West Bohemia in Pilsen, Czech Republic. In order to gather data from the respondents, an electronic questionnaire, inspired by ECAR study 2014, was developed. The wording of selected questions was identical to the original (the metrics were verified). The disposition to, attitudes towards, and self-reported usage of ICT surprisingly decreased between the studies conducted in 2014/2015 and 2016/2017. On the other hand, the results show a significant increase for smartphone importance for academic success. There are increased numbers of pre-service teachers who owned a smartphone and reported it as being important for their academic success. There was an observed increase of importance of mobile devices in the case of recording lectures and/or class activities, participation in interactive class activities, and accessing organisational information. The results of the study provide us with current information about the relationship of future teachers to ICT, and how equipped they are with mobile technologies, as well as confirming the possibility of utilising BYOD (“Bring Your Own Device”) in the preparation of future teachers, and improving interfaces for access to university information systems, including library information systems, from students’ mobile equipment.
Keywords:
Mobile technology. Acceptance. Access. Pre-service teacher. Higher Education. Information Systems.
INTRODUCTION
Mobile technology has the potential to change the very nature and processes of pedagogy (McCombs et al, 2006). There are currently much discussed, investigated, and also well documented areas, but in spite of this, a host of teachers are still apprehensive

Lucie Rohlíková, Jiří Kohout, Václav Vrbík, Ondřej Rohlík The Importance of Mobile Access to Information Systems for Pre-service Teachers
DIVAI 2018 – The 12th international scientific conference on Distance Learning in Applied Informatics. 162 ISBN 978-80-7598-059-5 (Print) ISSN 2464-7470 (Print) ISSN 2464-7489 (On-line)
about their use in teaching (Alrasheedi and Capretz, 2015). Baran (2014) states that there is an increasing trend in integrating mobile learning into teacher education contexts, and engagement with mobile learning and devices is reported as being beneficial. Burton (2011) showed the ability of the pre-service teachers to not only adopt this technology for the classroom, but also illustrated their ability to create new learning experiences for their students beyond the demonstrated activities. Mobile tools could help build closer relationships, as well as more personalized learning experiences for teacher candidates, as needs change over time (Herro et al., 2013).
Mobile technologies can fundamentally change the way classrooms are organized within teacher education programs by increasing mobility (Price et al., 2014). The increasing number of pre-service teachers were accessing resources on mobile devices (Hossain and Quinn, 2013), and a whole range of studies have been realised, which confirmed the possibility of using mobile technologies in teaching pre-service teachers (Baran, 2014). Foulger (2013) argued that the innovators use a variety of methods as they explore the possibilities, but, as a whole, we have not yet reached the tipping point necessary for this innovation to take hold.
Gado (2006) points out five factors that can affect the integration of handheld technology for instruction and learning: (a) classroom and school environment, (b) teachers’ technological background and predisposition, (c) students’ prior knowledge and experience, (d) an open and engaging curriculum, and (e) access to handheld computers as learning tools. The use of handheld-based science activities also enhanced pre-service teachers’ inquiry abilities, organizational skills, engagement in science content learning, attitudes, and even self-efficacy.
Järvelä et al. (2007) showed that there is a need to place students in various situations in which they can engage in effortful interactions in order to build a shared understanding, and that wireless networks and mobile tools provide multiple opportunities for bridging different contents and contexts, as well as virtual and face-to-face learning interactions in higher education. Effective professional learning requires reflection and collaboration, and mobile learning is ideally suited to allow reflection in action, as well as to capture the spontaneity of learning moments (Aubusson et al., 2009). Husbye and Elsener (2013) try to engage pre-service teachers, as they collaboratively constructed meanings around content, and found that after being exposed to mobile device integration, pre-service teachers began to utilise such tools in their own practices. Minner et al. (2010) state that teaching strategies which actively engage students in the learning process through scientific research are more likely to increase conceptual understanding than are strategies that rely purely on more passive techniques, which are often necessary in the current standardised-assessment laden educational environment.
Cushing (2011) reports that mobile technology connects pre-service teachers to their colleagues, enhances professional learning through collaboration, and facilitates mentoring processes. Research by Parsons and Ryu (2006) indicates that the quality of a learning experience is not solely based on the quality of the software, but also on the conceptual basis upon which the learning experience is constructed. Kearney and Maher (2013) examined the use of iPads in the teaching of pre-service Maths teachers and pre-service primary teachers, and found that the iPad has the potential to mediate professional learning, exploiting features of authenticity and personalisation, conveniently and spontaneously take notes, observe lessons, and make multi-modal reflections.

Lucie Rohlíková, Jiří Kohout, Václav Vrbík, Ondřej Rohlík The Importance of Mobile Access to Information Systems for Pre-service Teachers
DIVAI 2018 – The 12th international scientific conference on Distance Learning in Applied Informatics. 163 ISBN 978-80-7598-059-5 (Print) ISSN 2464-7470 (Print) ISSN 2464-7489 (On-line)
Baran (2014), after careful studies of relevant research papers about mobile learning, summarises motivating factors for the integration of mobile learning into pre-service teacher education settings: a) modelling mobile pedagogies, b) deeper explorations of content areas, c) enhancing pre-service teachers’ mobility, d) connecting pre-service teachers with a larger community, e) providing pre-service teachers with personalised learning experiences, f) enhancing social interaction, g) presenting alternative assessment techniques, and h) promoting collaborative knowledge construction.
The company EDUCAUSE, the Center for Analysis and Research, published at the end of 2014 their results from robust research devoted to the use of information and communication technologies in education ECAR Study 2014 (Dahlstrom and Bichsel, 2014). Technology does not now just play a minor, supporting role, and does not mean its occasional use during studies, but it is evident that technologies are currently ever present in students’ lives (Dahlstrom and Bichsel, 2014). Results of ECAR Study 2014 inspired us, and lead us to the question as to whether similar trends can be observed in the Czech Republic, and the realisation of the research. The aim of our research was to obtain data to adjust teaching methods for subjects focused on information and communication technologies. We tried to discover how well students are equipped with information and communication technologies (with a special focus on mobile technologies), how they use said technologies, and their attitudes towards usage. At the same time, we also discovered how much students use mobile equipment to access university information systems, including systems provided by the university library, and the importance that students place on access to these systems.
At the University of West Bohemia in Pilsen, research has been carried out in recent years concerning how equipped students are (including pre-service teachers) in the techniques and skills necessary for using ICT in education, as well as monitoring students’ attitudes to ICT use in teaching (Rohlíková et al., 2012, Rohlíková et al., 2013). The results showed that, among other things, the vast majority of university students are convinced that using ICT in education leads to good results in learning, however the time that students spend on the internet or on social networks very rarely has a professional content. Most often, technology helps students on the organisational side. Students can, through the technology, confirm deadlines, exchange study materials, support each other when preparing for exams, and so on. On the contrary, the rather negative attitudes of students of the Faculty of Education of the University of West Bohemia in Pilsen towards teaching via e-learning was described by Přibáň (2013), who monitored in detail the process of e-learning courses for 152 pre-service teachers for the subject Introduction to processing textual information (KVD/ÚZTI), and met with insufficient motivation of students, and minimal contact between the students and the teachers.
Other previous studies carried out at the University of West Bohemia focused on information literacy of pre-service teachers (Filipi and Simbartl, 2015 Simbartl and Michalik, 2014). In both of these investigations, we examined students’ ability associated with text editing and processing of qualifying work on the computer, and it was verified that the students manage to work with the technology at a high level, regardless of their field of study.
All of the existing research to date dealt with specific issues that occurred in our research, especially the issues of students’ attitudes towards information and communication technologies, the technology skills of students, information literacy, and

Lucie Rohlíková, Jiří Kohout, Václav Vrbík, Ondřej Rohlík The Importance of Mobile Access to Information Systems for Pre-service Teachers
DIVAI 2018 – The 12th international scientific conference on Distance Learning in Applied Informatics. 164 ISBN 978-80-7598-059-5 (Print) ISSN 2464-7470 (Print) ISSN 2464-7489 (On-line)
the ability to utilise technology in their studies. One benefit of the current study can be seen in the complex concept research, which is based on a variant of the questionnaire from EDUCAUSE (Dahlstrom and Bichsel, 2014) for the opportunity to compare the underlying trends at the University of West Bohemia in Pilsen, and at foreign institutions. Its aim was to explore the disposition that attitudes towards, and usage of, ICT, ownership, and the importance of the individual devices for academic success, as well as the importance of using a handheld mobile device for various student-related activities of pre-service teachers. With this research, we now have detailed current information on the relationship of future teachers for ICT, their equipment level of mobile technologies, and the possibility of using BYOD (Afreen, 2014). This research can also be the basis for editing the interface for access to university information systems towards facilitating user access from mobile equipment.
METHODS
To obtain the data from respondents, an electronic questionnaire was drawn up in the form a Google form, for whose completion we invited students of the Faculty of Education University of West Bohemia in Pilsen by e-mail. In the academic year 2014/2015, we addressed 608 students, and in the period from December 2014 to March 2015 we received 87 responses. To obtain the answers, we did not use any special motivation; students were only asked to contribute their answers to improve teaching at the Faculty of Education. In the academic year 2016/2017, we addressed 333 students by e-mail, and we motivated them to participate in the survey with the possibility of acquiring points in addition to the credit for KVD/ITV Information technology in education. Thus, in the period December 2016 to January 2017, we received 287 responses. The rate of return was thus in the academic year 2014/2015 a total of 14.3%, and in the academic year 2016/2017 as much as 86.2%.
In the first part of the questionnaire, there were 5 questions relating to the general characteristics of the respondents (length of study, field of study, form of study, age, sex). Furthermore, the questionnaire contained a total of 27 selected questions from the ECAR Study 2014. The questions were used in the exact same wording as in the ECAR Study 2014, and the English version of the question was supplemented by a translation into the Czech language, so as to ensure understanding by all students, including those who do not have optimal language skills. From the original questionnaire, Student Study 2014 (EDUCAUSE 2014), we primarily included in our study issues relating to mobile technology, students’ relationships to technology, and the issues that were addressed directly to the use of technology in the study. We considered shortening the questionnaire crucial, because the original ECAR Study 2014 questionnaire was very large, and had a relatively low rate of return (only about 7%). The overall response rate in our study was 38.8%.
In the first part of the expert questions, the students, on a scale of 0-100, rated from 17 different perspectives their own experience and their relationship and attitude towards information and communication technologies. In the next part of the questionnaire, there were two questions related to the skills of students with specific technologies. The last 8 questions concerned the use of different types of technology in teaching by university teachers, the use of technology by students to gather information about the organization

Lucie Rohlíková, Jiří Kohout, Václav Vrbík, Ondřej Rohlík The Importance of Mobile Access to Information Systems for Pre-service Teachers
DIVAI 2018 – The 12th international scientific conference on Distance Learning in Applied Informatics. 165 ISBN 978-80-7598-059-5 (Print) ISSN 2464-7470 (Print) ISSN 2464-7489 (On-line)
of studies in the actual teaching, and the importance of using technology for study success.
In the introduction of the data evaluation, we investigated whether the metric for determining the inclination towards information and communication technologies in the Czech version of the questionnaire had adequate psychometric properties in terms of internal consistency and factor structure, and whether it was possible to compare the data from our survey with the results of the original ECAR Study 2014 (Dahlstrom and Bichsel, 2014). Data from the academic year 2014/2015 on pre-service teachers is part of the broader set of data, which also included the data obtained from informatics students of the Faculty of Applied Sciences. These results have been published in the Czech magazine for university and science policy, Aula (Rohlíková et al., 2015), and the conference DIVA 2016 - Distance Learning in Applied Informatics, Štúrovo, Slovakia (Rohlíková et al., 2016). In the academic year 2016/2017, we narrowed the research down to students of the Faculty of Education, and in this paper we concentrated mainly on comparing the answers of respondents from both of the investigations, and on identifying changes and trends over the last two years.
From the statistical point of view, a two-sample t-test was used for a comparison of inclination towards ICT, measured on a scale ranging from 0 to 100 points, and the z-test was used for the comparison of population proportions. Moreover, we used Pearson’s correlation coefficient with the corresponding test of independence in order to identify possible links between various characteristics of respondents and the stated importance of using a mobile device in given situations. The results of all of the tests were given with P-values, and a test P-value of less than 0.05 was considered statistically significant.
RESULTS AND DISCUSSION
The basic characteristics of the samples of respondents from 2014/2015 and 2016/2017 studies are given in Table 1. In most of the presented characteristics, the samples are representative for the Faculty of Education in Pilsen.
Table 1: Basic characteristics of the samples of pre-service teachers from the years 2014/2015 and 2016/2017
Characteristic Pre-service teachers in Pilsen in 2014/2015
(n1 = 78)
Pre-service teachers in Pilsen in 2016/2017
(n2 = 287)
Gender
Male 24 (30.8 %) 70 (24.4 %)
Female 54 (69.2 %) 217 (75.6 %)
Age 26.0±7.6a years (range: 20-53 years)
22.6±5.2a years (range: 19-53 years)
Field of study
Science 25 (32.0 %) 81 (28.2 %)

Lucie Rohlíková, Jiří Kohout, Václav Vrbík, Ondřej Rohlík The Importance of Mobile Access to Information Systems for Pre-service Teachers
DIVAI 2018 – The 12th international scientific conference on Distance Learning in Applied Informatics. 166 ISBN 978-80-7598-059-5 (Print) ISSN 2464-7470 (Print) ISSN 2464-7489 (On-line)
Humanities 37 (47.4 %) 144 (50.2 %)
Other (e.g. Sport studies, Teaching for elementary schools…)
16 (20.6 %)
62 (21.6 %)
Form of study
Regular study 63 (80.8 %) 277 (96.5 %)
Combined study 15 (19.2 %) 10 (3.5 %)
Year of study at university
First or second 58 (74.4 %) 246 (85.4 %)
Third or fourth 11 (14.1 %) 32 (11.1 %)
Fifth or higher 9 (11.5 %) 11 (3.8 %) a average ± standard deviation
Regarding the year of study, the proportion of students in the first two years is significantly higher in both samples than in the whole population (mainly due to the fact that it is easier to recruit freshmen than seniors), but the year of study does not seem to be a key factor influencing the results. The minor and typically statistically non-significant differences between the both groups in terms of gender, age, as well as the form, field, and year of study cannot have a significant effect on the comparisons presented in the results part of the paper.
Table 2: Disposition and attitudes towards, and usage of ICT
Pre-service teachers in
Pilsen in 2014/2015
(n1 = 78)
Pre-service teachers in
Pilsen in 2016/2017 (n2 = 287)
P-value of the two-sample t-
test with equality of variances
USA normative
sample (ECAR study 2014)
Scale 1 – Disposition to ICT (8 items)
61.51±20.90a 51.97±18.96a <0.001 63b
Scale 2 – Attitudes towards ICT (5 items)
71.74±17.66 63.01±17.00 <0.001 71
Scale 3 – Usage of ICT (4 items) 70.98±18.75 61.95±17.33 <0.001 72
Overall inclination to ICT (all 17 items)
66.83±17.23 57.56±16.09 <0.001 68±15a
a average±standard deviation b average
Note. Values in bold represent cases in which the hypothesis of the mean in both groups studied was rejected at a significance level of 0.05.
As can be seen from Table 2, the disposition to, attitudes towards, and self-reported usage of ICT significantly decreased between the studies conducted in 2014/2015 and

Lucie Rohlíková, Jiří Kohout, Václav Vrbík, Ondřej Rohlík The Importance of Mobile Access to Information Systems for Pre-service Teachers
DIVAI 2018 – The 12th international scientific conference on Distance Learning in Applied Informatics. 167 ISBN 978-80-7598-059-5 (Print) ISSN 2464-7470 (Print) ISSN 2464-7489 (On-line)
2016/2017. The same is true for the overall inclination to ICT, which was evaluated as a weighted average of the individual scale scores. Although in 2014/2015 the results of Czech pre-service teachers were comparable with the normative data from the USA ECAR Study 2014, significantly lower values were observed two years later. We have also studied the correlation between overall inclination to ICT and the basic characteristics of the students, and found that the main predictor of the inclination is gender, with women achieving significantly lower values than men (Pearson’s correlation of 0.416 with the P-value of the corresponding independence test of lower than 0.001). On the other hand, the correlations between inclination to ICT and age, year of study, and field of study were close to zero, and statistically non-significant, suggesting a negligible effect of these variables.
Table 3: Ownership and importance of individual devices for academic success.
Pre-service teachers in
Pilsen in 2014/2015
(n1 = 78)
Pre-service teachers in
Pilsen in 2016/2017 (n2 = 287)
P-value of the z-test for 2
population proportions
USA normative sample (ECAR study 2014)
Laptop 93.6a/79.5b 93.7 a /85.6 b 0.995/0.183 90 a /83 b
Tablet or iPad 47.4/11.5 43.7/10.4 0.555/0.787 47/20
Smartphone 82.1/25.6 91.3/42.8 0.020/0.006 87/29
Dedicated e-reader
20.5/2.6 16.2/4.5 0.358/0.787 23/4
Desktop computer 62.8/41.0 38.8/26.0 <0.001/0.009 N/A a Percentage of respondents in the given group who reported the use of the technology in
at least one course during the previous year. b Percentage of respondents in the given group who agreed or strongly agreed with the
statement that they could be more effective if they were better at using the technology.
Note. Values in bold represent cases in which the hypothesis of the same proportion in both groups studied was rejected for a significance level of 0.05.
Table 3 shows only very little changes in the percentage of pre-service teachers owning laptops, tablets, and e-readers, and reporting these devices as being important for their academic success between the studies conducted in 2014/2015 and 2016/2017. On the other hand, a significant increase was observed for smartphones in terms of both ownership and the stated importance for academic success. Desktop computers became significantly less popular among pre-service teachers, and also their importance for academic success from the point of the target group was declined.
Table 4: Importance of using a handheld mobile device for various student-related activities.
How important is it that you are able to perform the following activities from a handheld mobile
Pre-service teachers in 2014/2015 in Pilsen,
Pre-service teachers in 2016/2017 in Pilsen,
P-value of the z-test
for 2 population
USA normative sample (ECAR
study)

Lucie Rohlíková, Jiří Kohout, Václav Vrbík, Ondřej Rohlík The Importance of Mobile Access to Information Systems for Pre-service Teachers
DIVAI 2018 – The 12th international scientific conference on Distance Learning in Applied Informatics. 168 ISBN 978-80-7598-059-5 (Print) ISSN 2464-7470 (Print) ISSN 2464-7489 (On-line)
device (e.g. smartphone or tablet)?
Czech Republic (n1 = 78)
Czech Republic (n2 =
287)
proportions
Record lectures or in-class activities
17.9a 32.2a 0.015 52 a
Use the mobile device as a digital passport for access or identification
30.8 33.3 0.818 57
Participate in interactive class activities
30.8 49.0 0.004 63
Register for courses 82.1 79.9 0.697 64
Access library resources 64.1 67.7 0.535 64
Capture static images of in-class activities or resources
46.2 51.2 0.412 66
Read e-texts 46.2 44.6 0.826 68
Access information about events, student activities, and clubs/organizations
56.4 69.9 0.021 74
Use the course or learning management system
65.4 65.5 0.998 77
Look up information while in class
80.8 78.1 0.447 79
Check grades 82.1 83.5 0.757 83
Communicate with other students about class-related matters outside classes
93.6 92.0 0.380 85
a Percentages of respondents in the given group who reported the possibility to use a mobile device for the activity as at least of moderate importance.
Note. Values in bold represent cases in which the hypothesis of the same proportion in both groups studied was rejected for a significance level of 0.05.
As can be seen from Table 4, despite the abovementioned decrease of overall inclination towards ICT (see Table 2), the stated importance of mobile devices for various student-related activities remained either virtually unchanged or even increased significantly. An increase was observed in the cases of recording lectures or class activities, participation in interactive class activities, and accessing information about events and student activities and organizations. Note that the values observed in our 2016/2017 study are, despite the increase in the last two years, lower than the USA normative data obtained in the 2014 ECAR Study.

Lucie Rohlíková, Jiří Kohout, Václav Vrbík, Ondřej Rohlík The Importance of Mobile Access to Information Systems for Pre-service Teachers
DIVAI 2018 – The 12th international scientific conference on Distance Learning in Applied Informatics. 169 ISBN 978-80-7598-059-5 (Print) ISSN 2464-7470 (Print) ISSN 2464-7489 (On-line)
Table 5: Correlation between the stated importance of using a handheld mobile device for various student related activities, and characteristics of respondents (2016/2017 study only, n= 287)
Importance of using a device for the given activity
Overall inclination to ICT
Gender Age Year of study
Field of study
Access library resources
0.246
-0.052
0.071
-0.013
0.105
Check grades 0.174
0.065
0.015
-0.071
0.028
Register for courses 0.117
0.113
0.025
-0.064
0.110
Use the course or learning management system
0.175
0.048
0.041
-0.050
0.018
Access information about events, student activities, and clubs/organizations
0.249
-0.007
-0.033
-0.113
0.098
Read e-books 0.231 -0.018 -0.023 -0.011 0.058
Communicate with other students about class-related matters outside classes
0.148
0.076
-0.056
-0.082
0.033
Look up information while in class
0.325
-0.034
-0.052
0.010
-0.082
Capture static images of in-class activities or resources
0.208
-0.021
-0.028
-0.067
-0.302
Note. Values in bold represent cases in which the hypothesis of the same proportion in both groups studied was rejected for a significance level of 0.05.
Table 5 shows that there are no significant correlations between the stated importance of mobile devices and age, year of study, and even gender of pre-service teachers in our 2016 study (note that significant differences in overall inclination to ICT were observed here). The same is true in most cases also for the field of study. The exception is capturing of static images of in-class activities, which seems to be significantly important for pre-service teachers studying science than for their peers studying humanities and/or other disciplines. In accordance with expectations, a positive correlation between the overall inclination to ICT and the stated importance of using a device was observed for all the evaluated activities. On the other hand, the values of these

Lucie Rohlíková, Jiří Kohout, Václav Vrbík, Ondřej Rohlík The Importance of Mobile Access to Information Systems for Pre-service Teachers
DIVAI 2018 – The 12th international scientific conference on Distance Learning in Applied Informatics. 170 ISBN 978-80-7598-059-5 (Print) ISSN 2464-7470 (Print) ISSN 2464-7489 (On-line)
correlations are in the range of 0.12-0.33 suggesting weak or maximum moderate link between the variables.
Table 6: Extent of technology use during courses in the past year, and expectations that the better use of technology can increase student effectiveness.
In the past year, I used…/ I could be more effective if I were better in using of…
Pre-service teachers in Pilsen
in 2014/2015 (n1 = 78)
Pre-service teachers in Pilsen
in 2016/2017 (n2 = 287)
P-value of the z-test for 2 population proportions
USA normative
sample (ECAR study 2014)
…the course or learning management system
83.3a/28.2b
91.9 a/31.2b
0.024/0.610
83a/51 b
…online collaboration tools 42.3/35.9 46.3/31.6 0.168/0.472 74/51
...my laptop during class 59.0/41.0 71.0 /36.2 0.038/0.430 67/47
...my tablet during class 32.1/25.6 33.0 /20.4 0.873/0.313 29/23
...my smartphone during class
39.7/21.8 73.7 /25.7 <0.001/0.453 57/33
...social media as a learning tool
50.0/17.9 56.9 /22.7 0.280/0.358 46/29
...e-books or e-textbooks 65.4/32.1 61.3 /35.5 0.342/0.522 56/42
...simulations or educational games
38.5/26.9
25.7 /31.8
0.026/0.395 38/38
...recorded lectures or “lecture capture”
41.0/43.6 44.4 /51.4 0.576/0.211 35/48
...e-portfolios 47.4/21.8 46.0 /21.6 0.818/0.981 23/24 a Percentages of respondents in the given group who reported the use of the technology in
at least one course during the past year. b Percentages of respondents in the given group who strongly agreed or agreed with the
statement that they could be more effective if they were better at using the technology.
Note. Values in bold represent cases in which the hypothesis of the same proportion in both groups studied was rejected for a significance level of 0.05.
Table 6 shows that for use of technologies during classes, a statistically significant increase occurred between the studies from 2014/2015 and 2016/2017 for learning management systems, laptops, and smartphones. The biggest change (from 40 to 73 %) was observed here for smartphones, being in accordance with the increasing percentage of pre-service teachers owning this device and reporting it as important for their academic success (see Table 3). Regarding the expectations that the better use of technology can increase student effectiveness, no significant evolution was observed in the group of pre-service teachers over the last two years. Note that their expectations are in most cases still much lower in comparison with the results of 2014 USA ECAR Study.

Lucie Rohlíková, Jiří Kohout, Václav Vrbík, Ondřej Rohlík The Importance of Mobile Access to Information Systems for Pre-service Teachers
DIVAI 2018 – The 12th international scientific conference on Distance Learning in Applied Informatics. 171 ISBN 978-80-7598-059-5 (Print) ISSN 2464-7470 (Print) ISSN 2464-7489 (On-line)
Very often, one of the main reasons for the non-inclusion of technology into the classroom is cited as a lack of funds (Crompton, 2013), while basic equipment for technology enhanced learning is increasingly available, and also increases in the general skills of individuals and households. With the continuous improvement of technology, it is becoming increasingly more accessible, along with increases in the usefulness of technology in everyday life (Ewans-Cowley, 2010). Universities are slow to adapt to new technologies, and are only gradually discovering their potential for education (Alrasheedi and Capretz, 2015).
According to data from the Czech Statistical Office in the Czech Republic, computers are in 75. 6 % of households (72.5 % own laptops), in households of persons younger than 40 years, it is as much as 91.5 % (83.7 % own laptops). Mobile phones for internet are used by 53.9 % of people, and in the group 16-24 years it is 84.2 % of the population. Our study shows that 93.7 % pre-service teachers are equipped with laptops, and a significant increase was recorded in smartphone ownership, where when comparing data from 2014/2015 and 2016/2017, it increased by 8.2 % to a value of 91,3 %, which shows excellent conditions for teaching methods based on the BYOD (Afreen, 2014). For students, the importance of smartphones for academic success increased by 17.2 % (25.6 % to 42.8 %), and using a telephone during lessons in the last year was reported by as many as 41.2 % more respondents in 2016/2017 than in 2014/2015 (an increase from 39.7 % to 73.7 %).
CONCLUSION AND FUTURE WORK
From our research, it was evident that pre-service teachers at the University of West Bohemia are very well equipped with technology, and thus it can be incorporated into a variety of technology enhanced teaching activities, including methods based on BYOD (Afreen, 2014). The results show a significant increase for smartphone importance for academic success, and an increase of importance of mobile devices in the case of recording lectures or class activities, participation in interactive class activities, and accessing organisational information.
When comparing data from research conducted in the academic year 2014/2015 and 2016/2017, we observed a distinct decrease in overall general inclination towards ICT. It is surprising that, according to our results in the first part of the questionnaire (see Table 2), there was a decrease in the disposition to, attitudes towards, and self-reported usage of ICT, on issues dealing with equipped technology, or the perception of the importance of each technology for success in the study results are the same or higher in 2016/2017 than in 2014/2015. It is possible that pre-service teachers a priori to technology are more reserved, because the Czech media are also becoming more space sceptical, and dismissive attitudes affected e.g. by the publications by M. Spitzer (Spitzer, 2012). Specific questions about students’ equipped technologies and the importance of their use reveal in detail how students actually perceive technology. Our study is thus consistent with McCaughtry and Dillon (2008), which also reported a shift in pre-service teachers’ perceptions following initial scepticism towards the integration of mobile devices in teacher education, and Gado et al. (2006) reported a positive change in pre-service teachers’ self-efficacy and attitudes towards classroom technologies after exposure to handheld computers.

Lucie Rohlíková, Jiří Kohout, Václav Vrbík, Ondřej Rohlík The Importance of Mobile Access to Information Systems for Pre-service Teachers
DIVAI 2018 – The 12th international scientific conference on Distance Learning in Applied Informatics. 172 ISBN 978-80-7598-059-5 (Print) ISSN 2464-7470 (Print) ISSN 2464-7489 (On-line)
We believe that the results of our study may be influenced by the fact that the collection of data in 2014/2015 was purely voluntarily, and also had a much lower rate of return. It is therefore possible that the questionnaire focused on the use of technology in the study was completed rather by pre-service teachers with a greater focus on technology than pre-service teachers who are averse to technology. In 2016/2017, the high return rate for the questionnaire, therefore, probably gave a more accurate picture of the attitudes of pre-service teachers. For further research, we chose the suitable form of mixed research (Creswell and Clark, 2007), for quantitative data obtained from the questionnaire, to interpret deeper with the support of the results obtained by qualitative methods.
ACKNOWLEDGEMENTS
We would like to thank the authors of the ECAR STUDY 2014, Eden Dahlstrom and Jacqueline Bichsel, for their consent to use selected questions from the ECAR STUDY 2014 within the framework of our research.
REFERENCES
Afreen, R. (2014). Bring your own device (BYOD) in higher education: Opportunities and challenges. International Journal of Emerging Trends & Technology in Computer Science (IJETTCS), 3(1), 233-236.
Alrasheedi, M. and Capretz, L. F. (2015), “Determination of Critical Success Factors Affecting Mobile Learning: A Meta-Analysis Approach”, TOJET: The Turkish Online Journal of Educational Technology, 14(2), pp. 41-51.
Aubusson, P., Schuck, S., and Burden, K. (2009), “Mobile learning for teacher professional learning: Benefits, obstacles, and issues”, Research in Learning Technology, 17(3), pp. 233-247.
Baran, E. (2014), “A Review of Research on Mobile Learning in Teacher Education”, Educational Technology & Society, 17 (4), pp. 17-32.
Bates, C. C. and Martin, A. (2013), “Using mobile technology to support literacy coaching practices”, Journal of Digital Learning in Teacher Education, 30(2), pp. 60-66.
Burton, E. P., Frazier, W., Annetta, L., Lamb, R., Cheng, R. and Chmiel, M. (2011), “Modeling augmented reality games with presser vice elementary and secondary science teachers”, Journal of Technology and Teacher Education, 19(3), pp. 303-329.
Creswell, J. W., Plano Clark, V.L. (2007), Designing and conducting mixed methods research, SAGE Publications, Thousand Oaks.
Crompton, H. (2013), “The Benefits and Challenges of Mobile Learning”, Learning & Leading with Technology, September/October 2013, pp. 38-39.
Cushing, A. (2011), “A Case Study of Mobile Learning in Teacher Training – MENTOR ME (Mobile Enhanced Mentoring)”, Medien Pädagogik, 19, pp. 1-14.

Lucie Rohlíková, Jiří Kohout, Václav Vrbík, Ondřej Rohlík The Importance of Mobile Access to Information Systems for Pre-service Teachers
DIVAI 2018 – The 12th international scientific conference on Distance Learning in Applied Informatics. 173 ISBN 978-80-7598-059-5 (Print) ISSN 2464-7470 (Print) ISSN 2464-7489 (On-line)
Český statistický úřad (2016), “Domácnosti v České republice vybavené počítačem podle typu zařízení”, available at: https://www.czso.cz/documents/10180/33117171/062004-161.pdf/c0d531ae-74fa-4bcf-b2dd-82edac39045e?version=1.0 (accessed 15 January 2018).
Český statistický úřad (2016), “Jednotlivci v České republice používající k přístupu na internet různá zařízení”, available at:
https://www.czso.cz/documents/10180/33117171/0620041619.pdf/366ace91-712a-47d3-83ac-68bf048b47d9?version=1.0 (accessed 15 January 2018).
Dahlstrom, E. and Bichsel, J. (2014) ECAR Study of Undergraduate Students and Information Technology (Research report), ECAR, Louisville, CO, available at: https://net.educause.edu/ir/library/pdf/ss14/ERS1406.pdf (accessed 15 January 2018).
EDUCAUSE (2014). Student Study, 2014 (survey), available at: http://net.educause.edu/ir/library/pdf/SI/ESI1406.pdf (accessed 15 January 2018).
Evans-Cowley, J. (2010). “Planning in the Real-Time City: The Future of Mobile Technology”, Journal of Planning Literature, 25(2), pp. 136–149
Filipi, Z. and Simbartl, P. (2015), “Vliv studijního oboru na dovednost úpravy textů na počítači”, Media4u Magazine, 12(2), pp. 31-34.
Foulger, T. S., Burke, D., Williams, M. K., Waker, M. L., Hansen, R. and Slykhuis, D. A. (2013), “Innovators in teacher education: Diffusing mobile technologies in teacher preparation curriculum”, Journal of Digital Learning in Teacher Education, 30(1), pp. 21-29.
Gado, I., Ferguson, R. and van't Hooft, M. (2006), “Using hand held-computers and probeware in a science methods course: Preservice teachers’ attitudes and self-efficacy”, Journal of Technology & Teacher Education, 14(3), pp. 501-529.
Herro, D., Kiger, D. and Owens, C. (2013), “Mobile technology: Case-based suggestions for classroom integration and teacher educators”, Journal of Digital Learning in Teacher Education, 30(1), pp. 30-40.
Hossain, M. M. and Quinn, R. J. (2013), “Prospective U.S. mathematics teachers’ engagement in hand-held cellular devices and Web 2.0 activities, and their perception of using these technologies for teaching-learning purposes”, Scientific Journal of Education Technology, 3(7), pp. 95-103.
Husbye, N. E., Elsener, A. E. (2013) To move forward, we must be mobile: Practical uses of mobile technology in literacy education courses. Journal of Digital Learning in Teacher Education 30(2): 46–51.
Järvelä, S., Näykki, P., Laru, J. and Luokkanen, T. (2007). “Structuring and regulative collaborative learning in higher education with wireless networks and mobile tools”, Educational Technology & Society, 10(4), pp. 71-79.
Kearney, M. and Maher, D. (2013). “Mobile learning in math teacher education: Using iPads to support pre-service teachers’ professional development”, Australian Educational Computing, 27(3), pp. 76-84.
McCaughtry, N. and Dillon, S. R. (2008). “Learning to use PDAs to enhance teaching: The perspectives of pre-service physical educators”, Journal of Technology and Teacher Education, 16(4), pp. 483-503.
McCombs, S., Houk, K., Higginbotham, D., Johnson, G. and Liu, Y. (2006), “Turning the iPod into an Effective Portable Learning Tool”, in Crawford, C., Carlsen, R., McFerrin, K., Price, J.,

Lucie Rohlíková, Jiří Kohout, Václav Vrbík, Ondřej Rohlík The Importance of Mobile Access to Information Systems for Pre-service Teachers
DIVAI 2018 – The 12th international scientific conference on Distance Learning in Applied Informatics. 174 ISBN 978-80-7598-059-5 (Print) ISSN 2464-7470 (Print) ISSN 2464-7489 (On-line)
Weber, R. and Willis, D. (Eds.), Proceedings of Society for Information Technology & Teacher Education International Conference 2006, Association for the Advancement of Computing in Education (AACE), Chesapeake, VA, pp. 438-443.
Minner, D. D., Levy, A. J. and Century, J. (2010), “Inquiry-based science instruction - what is it, and does it matter? Results from research synthesis, years 1984 to 2002”, Journal of Research in Science Teaching, 47(4), pp. 474-496.
Parsons, D. and Ryu, H. (2006), “A framework for assessing the quality of mobile learning”, in Dawson, R., Georgiadou, E., Lincar, P., Ross, M. and Staples, G, (Eds.), Learning and Teaching Issues in Software Quality, Proceedings of the 11th International Conference for Process Improvement, Research and Education, Southampton, UK, pp. 17-27.
Price, S., Davies, P., Farr, W., Jewitt, C., Roussos, G. and Sin, G. (2014), “Fostering geospatial thinking in science education through a customizable smartphone application”, British Journal of Educational Technology, 45(1), pp. 160-170.
Rohlíková, L., Kohout, J., Rohlík, O. and Vrbík, V. (2015). “Informační a komunikační technologie a vysokoškolský student v éře mobilních technologií”, Aula, 23(2), pp. 3-28.
Rohlíková, L., Kohout, J., Rohlík, O. and Vrbík, V. (2016), “The Importance of Information and Communication Technology for Academic Success from a Student’s Perspective” in 11th International Scientific Conference on Distance Learning in Applied Informatics Conference Proceedings (DIVAI 2016), Štúrovo, Slovakia.
Rohlíková, L., Vejvodová, J., Zounek, J. and Bárta, O. (2012), “Informační a komunikační technologie a jejich využití při studiu na vysoké škole”, in Kvalita ve vzdělávání: XX. výroční konference České asociace pedagogického výzkumu, Praha, 10.-12. září 2012.
Rohlíková, L., Vejvodová, J., Zounek, P. (2013). “Modern technology and university students”, in Proceedings of the 8th international conference DisCo 2013: New technologies and media literacy education. Center for Higher Education Studies, Praha, pp. 181-187. ISBN 978-80-86302-45-4.
Simbartl, P. and Michalík, P. (2014), Schopnosti studentů při zpracování kvalifikační práce na počítači. In Mezinárodní Masarykova konference pro doktorandy a mladé vědecké pracovníky. vol. 5. Hradec Králové: Magnanimitas. s 2555-2560.
Spitzer, M. (2012), Digitale Demenz. Wie wir uns und unsere Kinder um den Verstand bringen., Droemer, München.

Antonin Slaby, Josef Matejus, Pavel Cyrus Specific Mistakes Made by Students in Teaching of Parametric Modelling
DIVAI 2018 – The 12th international scientific conference on Distance Learning in Applied Informatics. 175 ISBN 978-80-7598-059-5 (Print) ISSN 2464-7470 (Print) ISSN 2464-7489 (On-line)
Specific Mistakes Made by Students in
Teaching of Parametric Modelling
Antonin Slaby, Josef Matejus, Pavel Cyrus
University of Hradec Kralové, Hradec Kralove, Czech republic [email protected],[email protected],[email protected]
Abstract
The current trend in the design of objects, and not only objects of technical nature, is applying parametric modelling. Parametric programming places high demands to students in the area of logical thinking and spatial imagination and mastering software. Learning to solve problems is based on the fact that students acquire ability to search independently for solutions and strategies and decisions in alternative situations. The aim of this article is to produce (mainly for appropriately targeted educational community) the most frequently occurring specific mistakes arising in the learning process of parametric modelling and suggest methods to eliminate some of them. Authors introduce and characterize briefly 23 main kinds of mistakes found through observation of working students. Mistakes are evaluated by their frequency and other characteristics, divided into categories. Results are based on authors own research and experiences. The problem is accentuated in distance or combined form of education. Results give some ideas for the creation of modern teaching aids and tools.
Keywords
Parametric modellin. Specific mistakes. CAD. Spatial imagination.
INTRODUCTION. THE NATURE OF PARAMETRIC MODELING AND APPLYING
OF PARAMETRIC MODELING IN EDUCATION
Current trend in the design of objects is applying parametric modelling. The core of CAD (computer aided design) system is a parametric modeller. According to its purpose, it is used to create 3D (volumetric) or 2D (planar) objects. There are also hybrid modellers. Parametric modeller is usually based on the representation of objects by means of NURBS - non-uniform rational B-spline curves and flats. Parametric modelling is sometimes also according to their purpose, aptly called technical modelling or precise modelling. The effectiveness of parametric modelling results from its philosophy. Description of the model of some object/body through changes of the parameters and mathematical expressions permits according to [Fort] the immediate modifying, then automatic transfer of a modification to the assembly of components, drawings or related instruments of control and production. Some assembly components - mechanisms enable animation and dynamism. Their correct function can verified dynamically. Typical custom CAD system also has a number of tools and functions, for example a database of standard parts, essentials

Antonin Slaby, Josef Matejus, Pavel Cyrus Specific Mistakes Made by Students in Teaching of Parametric Modelling
DIVAI 2018 – The 12th international scientific conference on Distance Learning in Applied Informatics. 176 ISBN 978-80-7598-059-5 (Print) ISSN 2464-7470 (Print) ISSN 2464-7489 (On-line)
of stress analysis etc. On that basis there is possible to reduce production costs at the analysis and design stage of the future product.
Computer aided design influences substantially teaching of technical subjects. Parametric modeler performs in particular the function of creative tool. It can be applied in teaching disciplines of applied arts such as industrial design. The models are formed by means of sketches and use volumetric or planar components. Their definitions must be clear and without conflicts or redundant information. Usually there are more possible solutions of one problem. Parametric programming places high demands to students in the area of logical thinking and spatial imagination. Learning to solve problems, then according [Linhart] lies in the fact that a student acquires the ability to search independently for solutions and strategies and decisions in alternative situations. Technology based on parametric modeling are also sometimes called "from 3D to 2D." The work environment for creating drawings can easily generate various projections of pre-created three-dimensional model. The reverse process, when students on the basis of the submitted drawings form a three-dimensional model is more difficult. Success in realization of tasks depends on the level of visual spatial component of intelligence of students and their spatial thinking. These components of intelligence are sometimes called the cognitive abilities. Cognitive abilities are necessary for handling various spatial relationships.
METHODS. LIST OF MAIN DETECTED GROUPS OF MISTAKES
Some students commit in the process of parametric modeling repeatedly the same petty mistakes even after months of proper training. We will call them specific mistakes. The causes of these mistakes often involve the improper operation with the user interface of parametric modeler. Some specific errors are independent of software used, the emergence of others is typical for working with a particular software application. Available literature and other supportive learning tools contains theoretical information and practical design examples. They lack but from the didactic point of view description of the specific errors and possible prevention eliminating their occurrence.
Some methods for improving the teaching process of parametric modeling are described in the literature [Fort]. Education of parametric modeling was investigated on technical school equipped particularly with Autodesk Inventor Professional (hereinafter Inventor). We will demonstrate formation of specific errors during students work in his environment. Inventor is very suitable software for teaching purposes with regard to its user-friendly working environment enabling students relatively rapidly and easily master and operate the software. The aim of this work is to produce educational community the most frequently occurring specific errors arising in the learning process of parametric modeling, or suggest methods to eliminate the cause of some of them. As the Inventor user interface can be extensively modified, all information will suppose its standard settings. Mentioned groups of mistakes are accented in distance (combined) form of education where they prevent in various combinations achieve effectively required results and solve given tasks. Classes of mistakes were founds by observing students activity during their solution of specific tasks.

Antonin Slaby, Josef Matejus, Pavel Cyrus Specific Mistakes Made by Students in Teaching of Parametric Modelling
DIVAI 2018 – The 12th international scientific conference on Distance Learning in Applied Informatics. 177 ISBN 978-80-7598-059-5 (Print) ISSN 2464-7470 (Print) ISSN 2464-7489 (On-line)
We will now list main groups of mistakes without their deeper description due to possible scope of this article. Some details will be given in presentation. Here are 23 main groups of mistakes.
1 A common mistake for beginners is to ignore the importance of the navigation software panel, or even deactivation of it.
2 Students often activate visibility axes, but do not create their projections in a sketch, then try to create unsuccessfully apply the geometric bindings of axes.
3 Attempt to create a volumetric (3D) model of the structural element by the profile, which is not a closed curve.
4 Attempt to apply geometric binding to the wrong choice of sketch entities.
5 The pursuit of immediate selection sketch entities without providing a time delay for activating selective tool and then a random selection of some of sketch entities.
6 Attempt to create contradictions between sketch entities.
7 Creation of ambiguous (resp. incomplete) definition of the sketch.
8 Incorrect interpretation of information derived from drawing documentation of the model.
9 Dimensioning the length of the line through the dimensions of its projection to the horizontal and vertical plane. Given that most of the acts during the creation of parametric dimensions is performed by pressing of the left mouse button, improper use of the mouse can be a cause of specific errors.
10 Attempt to label parametric dimension mode dimensioning for subsequent removal.
11 Specific mistake based on two clicking by the left mouse button with too long time delay on the name of the sketch leading to editing only his name.
12 The specific mistake: Creation a new sketch instead of the original plan to edit an existing sketch.
13 Creation of the other kind of sketch, than that is required.
14 Creating of un-correct profiles and subsequent attempts to create a structural element through them.
15 Repeated application of the "undo" and the removal of parts of the model created leading subsequently to the defect and defect itself.
16 Attempts to modify already existing structural elements in the sketch mode, which is impossible.
17 Specific mistakes based on the formation of a structural member by rotation of the whole cross section of the desired body.
18 Creating a sketch containing multiple profiles and subsequent unsuccessful attempts to eject limiting their different methods of "determining" or the parameter "distance".
19 Unsuccessful attempt to modify directly design geometry entities, which is impossible

Antonin Slaby, Josef Matejus, Pavel Cyrus Specific Mistakes Made by Students in Teaching of Parametric Modelling
DIVAI 2018 – The 12th international scientific conference on Distance Learning in Applied Informatics. 178 ISBN 978-80-7598-059-5 (Print) ISSN 2464-7470 (Print) ISSN 2464-7489 (On-line)
20 Distributing structural elements should be preferred over distributing sketch entities, if the two methods can achieve the same result. Specific mistake is a violation of this rule.
21 Common specific mistakes is applying the wrong mirroring plane.
22 The specific mistake is distortion - violence of model integrity.
23 Special mistake raising in the process of editing the assembly componentis unsuccessful attempts to apply the design element to the layout that is not part of the currently edited component.
We will discuss in more details only specific mistakes 3 and 4 Due to possible scope of contribution.
The Location and size of sketch entities are expressed through geometric bindings (constraints) and parametric dimensions. They belong to a group of dimensional parameters. Geometric constraints and parametric dimensions are equivalent, they can be complementary or substitute mutually. Information, which they represent together, must be unambiguous, must not contain contradictions and they should not be redundant. Geometric bindings contained in the sketch, for reasons of clarity are not visible by default, but can be arbitrarily made visible or invisible. Simultaneously with the stages of the process of creation and formation of sketch entities the working environment of Inventor offers intuitively possibility to create geometric binding and it depends on users, whether or not they take it. The second way is manual creation i.e. to mark an existing sketch entity and select the appropriate binding. User can accept or refuse this possibility. Automatic generating of dimensional parameters but in particular for complex drawings often lead to confusing structures and structures difficult to modify. Entities of the sketch consist of one or more profiles.
After completion of the formation of a sketch it is possible to apply so called construction element (extension, rotation, etc.). The sketch becomes part of the definition of the construction element. If the profile is represented by a closed curve, it is possible to create by structural element a solid object, otherwise only creation of surface is possible. Individual entities forming profile (lines, arcs, etc.) share some of their end points, they have "identical binding, binding of identity". Even if the starting point and ending related entities profile have identical coordinates, without applying the binding of identity sum of parts is not considered a closed curve and has not to be used to create a solid body. Coordinates of the end point of one entity can then be modified independently of the starting point of the second entity, which in this case is undesirable and may cause instability of the profile. This specific error is the attempt to create a volumetric (3D) model of the structural element by the profile, which is not a closed curve ( mistake 3). It is correct to warn students that sketch entities possessing some degree of freedom are distinguished by the green colour (fully fixed entities possess dark purple colour). If in the sketch mode is currently inactive some tool then grasping single sketch entities (for example lines, arcs) by their initial, middle, or end points) and attempt to change their position or size is an effective visual inspection technique.

Antonin Slaby, Josef Matejus, Pavel Cyrus Specific Mistakes Made by Students in Teaching of Parametric Modelling
DIVAI 2018 – The 12th international scientific conference on Distance Learning in Applied Informatics. 179 ISBN 978-80-7598-059-5 (Print) ISSN 2464-7470 (Print) ISSN 2464-7489 (On-line)
Figure 1: Creating bindings between sketch entities and selective tool Inventor
When creating a geometric bindings between sketch entities, it is necessary to distinguish these properly. For example, "identity" binding applied to the selection end point of the line segment m and the starting point of the line segment n ensure that both of these points are always the same. The same binding applied to the selection of the line m and the start point of line segment n states, that the starting point of the line segment n will always belong to a line collinear with the line m. In the selection of the entity is therefore necessary to distinguish between a straight line (resp. a set of points) itself, and its initial, end point and centre point. Profile of course need not be formed only by lines. Circles, arcs and splines and others can be applied too. The specific error is to apply geometric binding to the wrong choice of sketch entities - specific mistake 4.
RESULTS. DIVISION AND FREQUENCY OF OCCURRENCE OF SPECIFIC
MISTAKES
Specific mistakes can be divided into categories I and II based on their connection with using specific parametric modeler:
I Mistakes typical for work with specific parametric modeler and its environment ( for example Inventor). Category I covers the following kinds of mistakes: 2,3,5,9,10,11,13,16,18,23.
II Mistakes independent of the specific parametric modeler. These mistakes may be of interest to any teacher of parametric modeling Category II includes these kinds of mistakes: 1,4,6,7,8,12,14,15,17,19,20,21,22.

Antonin Slaby, Josef Matejus, Pavel Cyrus Specific Mistakes Made by Students in Teaching of Parametric Modelling
DIVAI 2018 – The 12th international scientific conference on Distance Learning in Applied Informatics. 180 ISBN 978-80-7598-059-5 (Print) ISSN 2464-7470 (Print) ISSN 2464-7489 (On-line)
Table 1. Division specific mistakes into categories I and II
Division of specific mistakes of parametric modeling
into categories I and II
List of Mistakes of category I 2,3,5,9,10,11,13,16,18,23
List of Mistakes of category II
1,4,6,7,8,12,14,15,17,19,20,21,22
Another possible division is based on the necessity to detect them by observation of students work:
A Specific mistakes, that can be easily and unambiguously identified when checking completed work. Category A includes the following groups of mistakes: 2,7,8,9,12,13,17,20.
B Specific mistakes, that can only be recorded through observation during student's own work. Category B covers mistakes 1,3,4,5,6,10,11,14,15,16,18,19,21,22,23.
Table 2. Division of specific mistakes into categories A and B
Division of specific mistakes of parametric modeling
into categories A and B
List of Mistakes of category A
2,7,8,9,12,13,17,20
List of Mistakes of category B
1,3,4,5,6,10,11,14,15,16,18,19,21,22,23
DISCUSSION. ANALYSIS OF SPECIFIC MISTAKES
In order to find out which specific errors were the most influential in the teaching, the frequency of their occurrence was examined through observations during the work of the students on the exercises of the respective subject and the control of their completed work. The tested sample was 50 students divided into two separate groups for the purpose of objective observation. It was necessary to anticipate the fact that a certain number of students did not attend the exercise due to various reasons. Therefore, substitutes were also included in each group whose work was not normally investigated. They represented members of the test group in the event of absence. To make the observation results statistically significant, the implementation time was 10 units (i.e. 450 minutes). During each pair of units, one task was assigned to each student (five jobs in total).
Some modelling techniques may prevail over others depending on particular assignment and its nature, Applying multiple different test tasks was therefore necessary.

Antonin Slaby, Josef Matejus, Pavel Cyrus Specific Mistakes Made by Students in Teaching of Parametric Modelling
DIVAI 2018 – The 12th international scientific conference on Distance Learning in Applied Informatics. 181 ISBN 978-80-7598-059-5 (Print) ISSN 2464-7470 (Print) ISSN 2464-7489 (On-line)
The subject of parametric modelling was the tasks in which it was necessary to apply the tools, working procedures and techniques potentially related to all the specific mistakes described in the previous chapters.
It is beyond the possibilities of observers to register all appearances of category B mistakes. If a student does not correct a wrong procedure classified in category B, he/she is not usually capable to finish the job. We can formulate the following zero hypothesis: the frequency of specific mistakes belonging to categories A and B are the same and their distribution can be explained by chance. The hypothesis was tested with significance (resp. probability to be improperly rejected), α = 0.01. When calculating the expected frequency we have the assumption that ( if the null hypothesis holds) number of specific mistakes of category A will be 8/23 of the sum of errors of category B will form 15/23 of the total registered amount, as mentioned in Table 1. When comparing the test chi –square with so-called. critical value for the chosen significance level and 22 degrees of freedom (results from the literature [Chrastka])
��,��� �22 = 40,289
�� = ∑ ������ = 112,866 (1)
Table 3: The goodness of fit chi-square (expected frequency of different sizes).
categ. observed frequency
estimated frequency P - O (P – O)2 ��
P O A 191 103,652 87,348 7629,643 73,608
B 107 194,348 87,348 7629,643 39,258
Σ 298 298 0 15259,286 112,866
The null hypothesis was rejected. We can therefore accept the alternative hypothesis: The frequency of mistakes category A outweighs i.e. is greater then the frequency of mistakes of category B. For that reason, it is not reasonable to compare the mistakes of these two categories, their frequency is expressed in isolation. The following table shows frequency of examined specific mistakes.
Table 4. Frequency of registered specific mistakes
Frequency of registered specific mistakes
Mistake No.
1
2
2
4
5
6
7
8
9
10
11
12
Frequency
0
10
4
23
5
8
59
39
7
5
10
24
Mistake No.
13
14 15 16 17 18 19 20 21 22 13
Frequency
2
9
9
4
18
20
5
32
3
2
2

Antonin Slaby, Josef Matejus, Pavel Cyrus Specific Mistakes Made by Students in Teaching of Parametric Modelling
DIVAI 2018 – The 12th international scientific conference on Distance Learning in Applied Informatics. 182 ISBN 978-80-7598-059-5 (Print) ISSN 2464-7470 (Print) ISSN 2464-7489 (On-line)
Figure 2 shows a histogram of the frequency of specific mistakes category A, the mode is equal to the value 59.
Figure 2: Frequency of specific mistakes of category A
Figure 3 is a histogram of the frequency of specific mistakes category B, the mode is equal to the value 23.
Figure 3: Frequency of specific mistakes of category B

Antonin Slaby, Josef Matejus, Pavel Cyrus Specific Mistakes Made by Students in Teaching of Parametric Modelling
DIVAI 2018 – The 12th international scientific conference on Distance Learning in Applied Informatics. 183 ISBN 978-80-7598-059-5 (Print) ISSN 2464-7470 (Print) ISSN 2464-7489 (On-line)
Reliability and accuracy of measurement is expressed by the coefficient of reliability. High reliability is a prerequisite for a good measurement validity, although it does not guarantee it. Determining its value was realized using the half-split method, through the Pearson correlation coefficient rp and Spearman-Brown formula
���∙∑���∑�∙∑����∙∑����∑���∙��∙∑����∑��� =
� ∙�������!∙�"���� ∙�#$%���!��∙�� ∙�%����"��� = 0,911094 (2)
&'( = �∙���)�� =
�∙�,%���%$�)�,%���%$ = 0,953479 (3)
Tested students were divided into two groups. Based on the calculated values of the correlation coefficient rp can, according [Chrastka] between the results of the test groups of students find a very high dependence. Due to the high reliability of calculated value of coefficient RSB can be claimed that the observation of the work of students and assessing their work were quite accurate.
CONCLUSION
The article highlighted some problems associated with the use of information technology to solve challenging and modern problems, especially the management of a particular complex software tool and its graphical user interface. Selected application areas showed typical mistakes regularly occurring with the students being taught, which should be a challenge for the creation of modern teaching aids and tools. The aim of this article is to produce (mainly for appropriately targeted educational community) the most frequently occurring specific errors arising in the teaching process of parametric modeling, and suggest ways to eliminate some of them. We were able to present only very briefly our results achieved in this area during research provided with students due to the possible scope of the article. Our results concern cognition problems raised in the process of creation projects using parametric modeling, errors connected with specific features of used software and selected cognitive problems connected with special imagination. We outlined main groups of errors being made and their frequency and other problems with mastering CAD software and its GUI including some technical problems for improving teaching process of parametric modeling. Mainly Errors of Category II having their substance in the philosophy and elements of spatial imagination in parametric modeling may be of interest to teachers of parametric modeling and other specialists. The results may enrich current knowledge in the area of common mistakes in parametric modeling and avoiding them. Other research is in progress.
ACKNOWLEDGEMENT
Support of the Specific research project of the University of Hradec Kralove is kindly acknowledged.
Antonin Slaby, Josef Matejus, Pavel Cyrus Specific Mistakes Made by Students in Teaching of Parametric Modelling
DIVAI 2018 – The 12th international scientific conference on Distance Learning in Applied Informatics. 184 ISBN 978-80-7598-059-5 (Print) ISSN 2464-7470 (Print) ISSN 2464-7489 (On-line)
REFERENCES
Chrastka M. Metody pedagogického výzkumu - Základy kvantitativního výzkumu. Praha: Grada Publishing, 2007. 272 p. ISBN 978-80-247-1369-4.
Fořt P, Kletecka J. Autodesk Inventor - Funkční navrhování v průmyslové praxi. Brno: Computer Press, 2007. 318 p. ISBN 978-80-251-1773-6.
Linhart J. Psychologie učení: Příručka pro studium na pedagogických fakultách. Praha: Státní pedagogické nakladatelství, 1967. 392 p.
Matejus J. Parametrické modelování a tvorba multimediálních opor jeho výuky. In Sborník příspěvků a anotací mezinárodní vědecké konference Modernizace vysokoškolské výuky technických předmětů, Hradec Králové, 1. 4. 2010. Hradec Králové: Gaudeamus, 2010, 23p, ISBN 978-80-7435-014-6, ISSN 1214-0554.
Valny M. Autodesk Inventor efektivně. Brno: CCB s.r.o., 2003. 279 p. ISBN 80-85825-53-8.
González-Lluch C., Company P., Contero M., Camba J.D., & Plumed, R. (2016). A Survey on 3D CAD model quality assurance and testing tools. Computer-Aided Design. available at: http://dx.doi.org/10.1016/j.cad.2016.10.003
Stroud,I. Boundary Representation Modelling Techniques London: Springer, doi: 10.1007/978-1-84628-616-2_1,2006
Yang J, Han S, Kang H, Kim J. Product data quality assurance for e-manufacturing in the automotive industry. Int. J. Comput. Integr. Manuf. 2006; 19(2): 136–47
Danjou S, Koehler P. Challenges for design management. Comput.-Aided Des. Applic. 2007; 4 (1-6): 109-16.
Gu H, Chase TR, Cheney DC, Bailey T, Johnson D. Identifying, correcting, and avoiding errors in computer-aided design models which affect interoperability. J. Comput. Inf. Sci. Eng. 2001; 1(2): 156-66
Son S, Na S, Kim K. Product data quality validation system for product development processes in high-tech industry. Int. J. Prod. Res. 2011; 49(12)
Lion R. Excitech's CAD Checker: Simplifying the burden of CAD Standards. Excitech Computers Limited, Design Productivity Journal 1999;
McKenney D. Model quality: the key to CAD/CAM/CAE interoperability. In: Proceedings of the 1998 MSC software Americas users conference. Universal City, CA. 1998

Milan Svoboda, Mikuláš Gangur The use of Monte Carlo Computer Simulation in Teaching Statistics
DIVAI 2018 – The 12th international scientific conference on Distance Learning in Applied Informatics. 185 ISBN 978-80-7598-059-5 (Print) ISSN 2464-7470 (Print) ISSN 2464-7489 (On-line)
The use of Monte Carlo Computer
Simulation in Teaching Statistics
Milan Svoboda, Mikuláš Gangur
University of West Bohemia, Univerzitní 22, 306 14 Pilsen, Czech Republic [email protected], [email protected]
Abstract
The contribution shows a simple use of Monte Carlo method in teaching the basics of statistics and probability by means of the available programme equipment MS Excel or a built-in tool VBA for Excel. Two applications constructed by means of the basic functions of MS Excel are shown as well as one interactive application constructed by means of VBA for Excel. The construction of this simple application may also familiarize students with this tool. In two practical experiments with one or two dice the experimental method Monte Carlo can make students familiar with the core of Law of large numbers. The given experiments are practically almost unfeasible with regard to the requested or changeable large numbers of attempts. The Monte Carlo method is also useful to verify the calculation of conditional probability of fairness of a coin based on Bayes’ rule. Most students are not able to identify themselves intuitively with the calculated probability. A practical simulation of possible phenomena by means of spreadsheet enables us, according to the statistical definition, to determine this probability and persuade students about the correctness of the calculations carried out on the basis of Bayes’ rule. The described principles are suitable for a number of simple experiments with probability calculus.
Keywords
Monte Carlo method. Empirical Probability. Bayes’ rule. Law of large numbers. Microsoft Excel.
INTRODUCTION
A basic course of statistics is one of the compulsory subjects of bachelor study programmes in most schools of economics. Many students, especially those with less talent for mathematics, often experience a lack of connection between the presented theory of randomness and probability and the existence of randomness and probability in the real world. Students are able to learn and use the presented procedures related to the theory of randomness but in discussions with them we find out that they are not inwardly convinced about the correctness of the procedures. Mathematical derivation of the procedures or proofs of theorems cannot be applied here due to the insufficient mathematical knowledge of students. These issues can be explained to the students through the application of illustrative diagrams as described, for example, in (Erickson, 2017) when demonstrating conditional probabilities. It was just this contribution that inspired us to write this article and to show other possibilities to explain this subject

Milan Svoboda, Mikuláš Gangur The use of Monte Carlo Computer Simulation in Teaching Statistics
DIVAI 2018 – The 12th international scientific conference on Distance Learning in Applied Informatics. 186 ISBN 978-80-7598-059-5 (Print) ISSN 2464-7470 (Print) ISSN 2464-7489 (On-line)
matter in an illustrative way. In this context Monte Carlo simulation method proved extremely successful in demonstrating the subject matter.
The aim of this contribution is the description and application of Monte Carlo method implemented by means of basic computer equipment MS Excel in teaching the basics of statistics and probability (MS Excel, 2018). The construction of a MS Excel table makes students without deeper knowledge of statistics and probability understand the core of the Law of large numbers as well as the core of conditional probability and application of Bayes’ rule in a real experiment. At the same time, this article can be a manual for lecturers of the basics of statistical methods.
THEORY
Replacement of theoretical calculations by an experiment is enabled by the Law of large numbers when a real experiment is replaced by Monte Carlo computer simulation method.
Law of Large Numbers
The Law of large numbers refers to the statement about convergence of average in random variables sequence. For our needs this law can be formulated in the following way: Let X2, . . . , Xn be independent random variables with the same distribution and a mean μ.
If is defined as , then the sequence converges according to the
probability on μ, i.e. with probability 1.
The Law of large numbers has two important practical consequences:
• We can estimate the expected value by the average if we have a sufficient number of observations available.
• We can experimentally estimate the unknown probability of a phenomenon
according to the observed relative frequency. states the relative
frequency of the phenomenon A occurrences, i.e. xi=1 when the phenomenon came about in the i-th attempt or xi=0 when it did not come about.
, i.e. the statistical definition of probability.
To gain sufficiently accurate results we must carry out as many attempts as possible. These issues have been dealt, for example, by (Ross, 2009). In other words this means that depending on the number of possible results of the performed experiment we must carry out hundreds or rather thousands of observations. This is practically almost unfeasible. The results of the real experiment can be estimated by means of Monte Carlo computer simulation method.
nS ∑=
=n
i
in Xn
S1
1}{ nS
µ → ∞→n
nS }{
}{ nS
( )nnS
P An
µ→∞→ =

Milan Svoboda, Mikuláš Gangur The use of Monte Carlo Computer Simulation in Teaching Statistics
DIVAI 2018 – The 12th international scientific conference on Distance Learning in Applied Informatics. 187 ISBN 978-80-7598-059-5 (Print) ISSN 2464-7470 (Print) ISSN 2464-7489 (On-line)
MONTE CARLO METHOD
Monte Carlo method has a wide use, from simulations of experiments, through calculating particular types of integrals, to, for example, solving differential equations. To those who are interested in more specific information on the subject the publication (Rubinstein and Kroese, 2007), for example, may be recommended.
Today, the numerical solution of probability and determinist tasks by means of a statistic experiment is understood as Monte Carlo method. When using this method a probability task is constructed for experimenting and it has a solution which is identical with the original task. The solution gained by the Monte Carlo method has a probability character; it is a statistical estimate whose accuracy grows with the number of implemented attempts.
The basic idea of this method is very simple. A computer model of a random action is created and after carrying out a sufficient number of simulations data can be processed by means of classic statistical methods, such as determining the mean or standard deviation.
EXPERIMENTS
Below we will show a solution of three tasks of probability calculus which we use in teaching by means of Monte Carlo method. The first task, the simulation of a throw with one dice, is used to illustrate the Law of large numbers and to explain the principle of Monte Carlo method. The second task, a flip with four coins, is used to introduce students to VBA for Excel (MS Excel VBA, 2018). The third task is used to explain Bayes’ rule.
A throw with one dice
As has already been stated, Monte Carlo method is used to an empiric estimate of an unknown theoretical probability. However, during the first explanation of that method it is advisable to assess such probability that is easy for students to estimate. Some of the simplest and basic random experiments for beginners in statistics are dice games (Foster & Martin, 2016). A throw with one dice is used as an introductory experiment on which we can verify the validity of the Law of large numbers. The initial question asks about the level of probability that in the case we throw a dice, a certain number of dots, for instance 5, will come up. This question is answered by students correctly and with no hesitation and the answer is 1/6.
The experimental verification of the correctness of this result can be carried out in the MS Excel environment as follows:
The following functions are used in simulations: RAND, IF, COUNTIF and ROUND (MS Excel, 2018). Mathematical function RAND returns an evenly distributed random real number greater than or equal to 0 and less than 1. If we need evenly distributed numbers in the interval (a, b) we must multiply the generated number by the difference (b-a) and add the number a. A new random real number is returned every time the worksheet is calculated. The logical function IF returns one of two values. One value if a condition is evaluated to true or another if that condition is evaluated to false. The COUNTIF function counts the number of cells within a range that meet a single criterion that you specify. The

Milan Svoboda, Mikuláš Gangur The use of Monte Carlo Computer Simulation in Teaching Statistics
DIVAI 2018 – The 12th international scientific conference on Distance Learning in Applied Informatics. 188 ISBN 978-80-7598-059-5 (Print) ISSN 2464-7470 (Print) ISSN 2464-7489 (On-line)
mathematical function ROUND rounds a number to a specified number of digits. The particular application of the above functions is stated below.
Four columns will be sufficient to carry out the simulation. In column A we register the number of throws carried out. In column B we simulate a dice throw by means of functions RAND and ROUND. The number generated by RAND function is multiplied by number 6 and number 0.5 is added, by which we gain numbers between values 0.5 and 6.5 and then, after rounding off to the whole numbers we gain numbers between 1 and 6. Alternatively, for generating whole positive numbers in MS Excel the function RANDBETWEEN can be used. In column C, by means of COUNTIF function, we record how many times the number 5 came up in the realized throws. In column D a relative frequency (empiric probability) of the occurrence of number 5 is counted. The result of the simulation can be seen in Fig. 1.
Figure 1: Simulation of a dice throw.
One line represents one implementation of an attempt. The simulation begins in the second line. There are the following formulas in the second line:
• B2 =ROUND(0,5+RAND()*6;0)
• C2 =COUNTIF($B$2:B2;5)
• D2 =D2/A2
The given formulas are in the European notation. After that we will have to decide about the number of repetitions of the random attempt. The more repetitions there are, the more the statistical (empiric) probability is closer to the mathematical probability. These issues have been dealt, for example, by (Ross, 2009). We opt for the number of attempt implementations to be 10000, therefore the formulas in the second line will be copied up to line 10001 (lines 9 to 9993 are hidden in the figure). In the cell D10001 there is the empiric probability found by the experiment. In the implementation shown in the figure this probability is equal to 0.1675, which differs from the theoretical probability 0.1666 only negligibly.
The RAND function returns a new random number every time the worksheet is calculated. This quality can be used to show students that the given probability really oscillates round value 0.1666. The simplest implementation of a new simulation is to place the cursor in an empty cell and push the Delete button. It is also possible to carry out a few simulations and to determine the average probability and standard deviation.

Milan Svoboda, Mikuláš Gangur The use of Monte Carlo Computer Simulation in Teaching Statistics
DIVAI 2018 – The 12th international scientific conference on Distance Learning in Applied Informatics. 189 ISBN 978-80-7598-059-5 (Print) ISSN 2464-7470 (Print) ISSN 2464-7489 (On-line)
The convergence of the empiric probability on the theoretical probability with the growing number of attempts can be seen well in the figure below (values from column D).
Figure 2: Convergence of empiric probability.
A throw with four dice
A throw with one dice is very simple and to gain a sufficiently accurate result thousands of attempts are enough. But in tasks where the number of possible results is higher, it is necessary to carry out many more attempts to obtain sufficiently accurate empiric results. For example, if we are interested in the probability of getting the total of 16 in a throw of 4 dice, then Monte Carlo method implemented by copying formulas is not comfortable enough. A throw with 4 dice offers a much larger number of possible results than the previous instruction. To gain sufficiently accurate results, it is not enough to repeat the attempt 10000 times as in the previous case but there must be many more attempts. If we have basic knowledge of programming, MS Excel offers a built-in programming language Visual Basic for Application (VBA) (MS Excel VBA, 2018) to solve this more complicated task. The programme simulating a throw with four dice can be written in VBA as follows:
Figure 3: Algorithm of simulation of throw with 4 dice

Milan Svoboda, Mikuláš Gangur The use of Monte Carlo Computer Simulation in Teaching Statistics
DIVAI 2018 – The 12th international scientific conference on Distance Learning in Applied Informatics. 190 ISBN 978-80-7598-059-5 (Print) ISSN 2464-7470 (Print) ISSN 2464-7489 (On-line)
The general advantage of the programmed Monte Carlo method is that we can change parameters of simulation easily. It is, for example, easy to adjust the program for a different number of dice. Or, just as in this case, it is possible to set certain parameters of simulation directly in the spreadsheet, such as total of dots (to be entered in cell A1) and the desired number of attempts (to be entered in cell B1). After closing the programme the empiric probability is stored in cell C1. The empiric probability that when throwing 4 dice the total of dots will be equal to 16 is, after carrying out 200,000 attempts, equal to 0.09654. For the sake of completeness let us also state that the theoretical probability equals 0.0964506 (125/1296).
Using this introductory and very simple experiment we make students familiar with Monte Carlo method and experimentally also with the validity of the Law of large numbers. Students usually understand the Law of large numbers well and it is not necessary to persuade them about the validity of this law by Monte Carlo method. The situation is different when explaining Bayes’ rule, as students are often not convinced that the obtained results are correct and Monte Carlo method is illustrative and useful when explaining Bayes’ conditional probability.
Bayes’ rule
The explanation of this subject matter starts by assigning this generally known task, for example (Erickson, 2017), called Two head coin. Suppose we have two coins: a regular coin (the fair coin) and one with two heads (the unfair coin). We choose one at random.
1. What is the chance that we have chosen the fair coin?
2. What is the chance that we have chosen the fair coin, if it comes up heads in one flip?
The first question, what is the probability that we will choose the fair coin, is answered correctly, i.e. 0.5. The second question, what is the probability that the coin is fair if it comes up heads in one flip, is, however, mostly not answered correctly. Most students’ answer is 0.5 or they do not know. When we ask our students why they think the probability did not change and the result is 0.5, we get roughly the following answer: “The probability of choosing the coin is always the same, the fact that the coin came up heads does not change the original probability.” Students usually cannot determine the correct result even in the case when we say that to solve this task they have to use Bayes’ rule which can be mathematically, with regard to the instructions of our task, expressed by the following equation:
(1)
This formula is rather abstract for students and they are not able to substitute in the right way. In the case we show them the right substitution and solution they are not convinced of the correctness of our method. It turned out that if we want to show the way to come to the correct result, it is best to use the simulation of this task by Monte Carlo method first and only then to use Bayes’ rule.
In implementing the experiment we will use, apart from the above described functions, functions IF and SUM. The logical function IF returns one value if a condition you
( ) ( ) ( )( ) ( ) ( ) ( )
||
| |
P A P B AP A B
P A P B A P A P B A
⋅=
⋅ + ¬ ⋅ ¬

Milan Svoboda, Mikuláš Gangur The use of Monte Carlo Computer Simulation in Teaching Statistics
DIVAI 2018 – The 12th international scientific conference on Distance Learning in Applied Informatics. 191 ISBN 978-80-7598-059-5 (Print) ISSN 2464-7470 (Print) ISSN 2464-7489 (On-line)
specify evaluates to true, and another value if that condition evaluates to false. The logical function AND returns true if all its arguments evaluate to true; it returns false if one or more arguments evaluate to false. By using the AND function as the logical test argument of the IF function, you can test many different conditions instead of just one. The mathematical function SUM adds all the numbers that you specify as arguments.
Four columns will be enough for carrying out the simulation. In column A we simulate random choice (drawing) of a coin by means of RAND and IF functions. The values smaller than 0.5 generated by function RAND represent the choice of the fair (marked F) coin, the values equal or bigger than 0.5 represent the choice of the unfair (marked U) coin. In column B we implement the flip of the coin by means of functions RAND and IF. In case we flip the unfair coin (the value in column A is U), the result is always head (marked H). In case we flip the fair coin, the result depends on the value that is returned by function RAND. The values smaller than 0.5 represent the result H, and the values equal or bigger than 0.5 represent the result tail (marked T). In column C we calculate the number of occurrences of H by means of function IF. The value in column C will be 1 if in column B the value is H, otherwise we will leave it blank (or we can assign value 0). Just for the sake of completeness let us state that column C may be left out and the number of occurrences H in column B can be gained by means of function COUNTIF. However, we do not do it because of didactical reasons. In column D the number of cases when the fair coin came up heads is calculated. Functions IF and AND are applied here. In column D the value is 1 if in column A the value is F and, at the same time, in column B the value is H, otherwise it is left blank. The result of the simulation can be seen in Figure 4.
Figure 4: Simulation of coin flip
The simulation begins in the second line and in the cells in the second line there are the following formulas:
• A2 =IF(RAND()<0,5;"F";"U")
• B2 =IF(A2="U";"H";IF(RAND()<0,5;"H";"T"))
• C2 =IF(B2="H";1;"")
• D2 =IF(AND(A2="F";B2="H");1;"")
Again, the number of attempts is 10000 and therefore the formulas in line 2 are to be copied all the way up to line 10001 (lines 9 up to 9994 are hidden in the figure). Then, by means of function COUNTIF, we will find out how many times the fair coin (cell A10002) was drawn. By means of function SUM we will find out the number of occurrences of

Milan Svoboda, Mikuláš Gangur The use of Monte Carlo Computer Simulation in Teaching Statistics
DIVAI 2018 – The 12th international scientific conference on Distance Learning in Applied Informatics. 192 ISBN 978-80-7598-059-5 (Print) ISSN 2464-7470 (Print) ISSN 2464-7489 (On-line)
heads (cell C10002) and the number of occurrences of heads in case the coin was fair (cell D10002). Cell B 10004 contains the statistical probability that the chosen coin will be fair (the answer to the first question) and cell D10004 contains the statistical probability that the chosen coin will be fair in case that it came up heads in one flip (the answer to the second question). The formulas in these cells are as follows:
• A10002 =COUNTIF(A2:A10001;"F")
• C10002 =SUM(C2:C10001)
• D10002 =SUM(D2:D10001)
• B10004 =A10002/10000
• D10004 =D10002/C10002
By repeating the simulation (push the Delete button) we will find out that the empiric probability oscillates around the value 0.33. By substituting into formula 1 we gain the accurate solution of this task.
After carrying out the simulation students usually discover the mistake in their judgement. They realize that we focus only on the attempts in which heads came up. The attempts in which tails came down are not considered. The simulation helps students understand a priori and a posteriori probabilities. A priori probability, i.e. that the chosen coin will be fair, is 0.5. After we gain supplementary information, i.e. the result of the flip, the a posteriori probability is 1/3 in case head came up or 1 in case tails came down.
CONCLUSION
The use of computer simulation of Monte Carlo method in MS Excel in teaching the subject matter of theory of probability enables students to understand the covered subject matter much better. This method is applied not only when explaining the Law of large numbers and Bayes’ rule but also when explaining other subject matters, for example, Estimation and Test of Hypotheses. Monte Carlo method enables clear understanding and “hands-on” experience of the core of randomness and probability and their unpredictability. The interactive environment enables to change entry parameters and to increase the number of attempts, to follow the convergence of probability on the values determined according to the classic definition of probability and to verify the reliability of the methods.
ACKNOWLEDGEMENT
The research project was supported by Grant SGS-2018-042 of the Faculty of Economics, University of West Bohemia in Pilsen.
REFERENCES
Erickson, T. (2017). Beginning Bayes. Teaching Statistics, 39, pp. 30-35.
( ) ( ) ( )( ) ( ) ( ) ( )
| 1/ 2 1/ 2 1|
| | 1/ 2 1/ 2 1/ 2 1 3
P F P H FP F H
P F P H F P U P H U
⋅ ⋅= = =⋅ + ⋅ ⋅ + ⋅

Milan Svoboda, Mikuláš Gangur The use of Monte Carlo Computer Simulation in Teaching Statistics
DIVAI 2018 – The 12th international scientific conference on Distance Learning in Applied Informatics. 193 ISBN 978-80-7598-059-5 (Print) ISSN 2464-7470 (Print) ISSN 2464-7489 (On-line)
MS Excel (2018) MS Office Support, [online] Avalaible at < https://support.office.com> [Accessed 10 January 2018].
MS Excel VBA (2018) Excel VBA reference, [online] Avalaible at < https://msdn.microsoft.com/ vba/vba-excel> [Accessed 15 January 2018].
Ross, S. (2009). A first course in probability. Prentice Hall press.
Rubinstein, R. Y.; Kroese, D. P. (2007). Simulation and the Monte Carlo Method (2nd ed.). New York: John Wiley & Sons. ISBN 978-0-470-17793-8.


Darina Tothova E-learning at Slovak University of Agriculture in Nitra
DIVAI 2018 – The 12th international scientific conference on Distance Learning in Applied Informatics. 195 ISBN 978-80-7598-059-5 (Print) ISSN 2464-7470 (Print) ISSN 2464-7489 (On-line)
E-learning at Slovak University of Agriculture in
Nitra
Darina Tothova
Slovak University of Agriculture in Nitra, Center of Information Technology, Tr. A. Hlinku 2, 949 76 Nitra, Slovakia
Abstract
E-learning provides more opportunities for teachers to provide up-to-date information, to manage teaching, to stimulate activity, to motivate to discover and to communicate more with students. Some of the universities use the adopted concept. The Slovak University of Agriculture in Nitra (SUA in Nitra) uses e-learning more or less “unrestrainedly”, mostly in the framework of various projects, or using the results of projects in the teaching process. As an example, of the 134 registered electronic courses and electronic objects in the electronic support database of SUA in Nitra, 129 were created within the projects, most of them KEGA and Leonardo da Vinci. Therefore, a group of employees of the Slovak University of Agriculture in Nitra, together with co-researchers of the University of Economics in Bratislava and the University of Žilina, who are convinced that e-learning plays an important role in the education process, decided to submit the KEGA project entitled "Creating an University E-learning Portal of SUA in Nitra that was adopted, funded and solved by the Cultural and Educational Grant Agency (Tothova, 2014).
Keywords
E-learning. LMS Moodle.
INTRODUCTION
The project's goal was to innovate the proposed concept of wider e-learning implementation in the teaching process of recent years and to propose a modern education system at the Slovak University of Agriculture with an emphasis on ensuring its quality. Precondition for the success of this strategic goal was to build the university e-learning portal based on LMS Moodle (Moodle's Highest Stable Version), editing the graphical environment and ensuring the greatest possible compatibility during the transfer of courses from old versions of faculties´ installations of Moodle to the new portal. The analyzes show that the use of e-leaming systems is already a common part of the education and the top rated universities prefer commercial e-leaming systems and are willing to pay fees for licenses. But the trend is changing and we can assume that there will continue the grow of Open Source software against commercial e-leaming systems (Fabus Juraj, Kolarovska and Fabus Jozef, 2013). This is confirmed by Burian and Turcani (2016), when they wrote: “Their production just for one platform is financially demanding and

Darina Tothova E-learning at Slovak University of Agriculture in Nitra
DIVAI 2018 – The 12th international scientific conference on Distance Learning in Applied Informatics. 196 ISBN 978-80-7598-059-5 (Print) ISSN 2464-7470 (Print) ISSN 2464-7489 (On-line)
time consuming. That is the reason why there are freely available tools and applications by the use of which it is possible to create educational apps for all platforms.” It is inevitable to think of Management of IT environment end users and the impact of new technological solutions (Olahova, 2016).
FROM HISTORY
The implementation of LMS MOODLE took place at the Faculty of Economics and Management at the Slovak University of Agriculture in Nitra by its employees from Center of Information Technologies in 2005. In 2007, a common MOODLE SUA environment (available at http://moodle.uniag.sk) was created, with separate MOODLE installations for all faculties at SUA in Nitra. During this time, the following tasks were performed (all points also apply to other SUA faculties, administration and user support was provided by CIT FEM):
� providing a technical platform for full-value use of LMS in teaching process and for running the server www.moodle.sk,
� providing translation of modules and documentation of the MOODLE environment into the Slovak language,
� implementation of LMS in the university environment of SUA in Nitra, presentation of possibilities of using OpenSource LMS MOODLE in contact education (Semelakova, 2012),
� creation of online e-learning on the use of the system in the university environment,
� creating a virtual environment at www.moodle.sk, which has been used to improve the awareness of users of this learning management system and for more effective translation coordination not only within our university, it was created the possibility to use the platform by other universities and other institutions in the education sector (after the departure of the server administrator, the CIT FEM worker, the domain was taken into the administration of UKF in Nitra),
� the first e-course methodology (Methodology for creating learning materials in the Web application environment) was created within the project Distance learning at FEM SUA in Nitra in 2005, in 2006 it was innovated and publicly defended within the project Leonardo “Online Distance Learning Module in European Agrarian Law” it has not been officially innovated ever since, renegotiated in the management of the university, although certain adjustments have been carried out.
� the concept of wider implementation of e-learning in the learning process was developed, but the approval process did not proceed.
By the end of 2007, several courses of different levels were created in the LMS MOODLE environment, which were primarily used to make learning materials available to students, where the content of the courses was very often static documents that mediated the content of the subject to students, sometimes combined with online and offline communication. Although many pedagogues already use different e-learning supports,

Darina Tothova E-learning at Slovak University of Agriculture in Nitra
DIVAI 2018 – The 12th international scientific conference on Distance Learning in Applied Informatics. 197 ISBN 978-80-7598-059-5 (Print) ISSN 2464-7470 (Print) ISSN 2464-7489 (On-line)
they do so mostly for their own interest, as they understand the benefits of e-learning, especially for students, but they also see the benefits for their work. The use of other activities that MOODLE provides and systematic use of LMS for study management have been and are still inadequate.
In January 2008, a move forward was the recommendation of the FEM Management for FEM Departments to move part of the full-time study to combined form with the use of LMS MOODLE, which encouraged the emergence of new e-learning courses. The support of LMS users by CIT FEM continued through an agreed uniform template and methodology for generation of new e-courses used in MOODLE FEM.
However, both FEM and the SUA in Nitra continue to lack:
� anchoring the interest in the development of e-learning in the strategic documents of the SUA in Nitra,
� conception of e-learning application,
� inclusion of e-learning activities into the criteria for qualitative growth of pedagogical staff,
� ensuring the systematic training of workers and students in this field,
� an internal quality monitoring system for e-learning courses,
� the storage of educational objects and the provision of related marketing services and the protection of copyright,
� smooth financing of the development and implementation of e-learning.
From the pedagogues - course builders still persist:
� inadequate teacher training for managing teaching process with help of e-courses in combined and distance learning,
� using the LMS capabilities only to make the learning materials available to students,
� courses content often consists of static documents that mediate the content of the subject or links to other resources on the Internet,
� insufficient use of other activities and the systematic use of LMS for study management.
After the first years, when LMS MOODLE served mainly as a repository of electronic materials for students, e-courses began to develop, some of which are today at very good level. However, their amount at the Faculty of Economics and Management is far from sufficient; in other faculties at SUA in Nitra the situation is even more critical.
With the departure of the CIT FEM employee responsible for the administration of LMS MOODLE, the system upgrade was gradually abandoned at the individual faculties of the SUA in Nitra, the system was only maintained in an acceptable form at the Faculty of Economics and Management. Earlier versions of the 2.0-based system lost the technical support of Moodle's LMS developers and this brought the necessity to solve the situation by moving to the current version and to the unified and nationwide solution at the SUA in Nitra. As a result, it is necessary to address the objectives of the project and implement them in the practice.

Darina Tothova E-learning at Slovak University of Agriculture in Nitra
DIVAI 2018 – The 12th international scientific conference on Distance Learning in Applied Informatics. 198 ISBN 978-80-7598-059-5 (Print) ISSN 2464-7470 (Print) ISSN 2464-7489 (On-line)
CREATING AN UNIVERSITY E-LEARNING PORTAL AT THE SUA IN NITRA
The years 2010 - 2013 were the preparatory phase for the creation of the university e-learning portal at the SUA in Nitra. A new wave of interest in e-learning has come to grips with the KEGA project, not only by the team of solvers, but also by the eager course designers. Several training sessions were organized, electronic instructions were developed.
Currently, the E-learning Portal (one of the KEGA project results) has the following interface, see. Fig. no. 1.
The LMS Moodle was installed to the university server in the next version 3.1.1+. The following third-party modules have been installed: book module, questionnaires, attendance, Quickmail, filter for glossary and mathematical formulas.
Figure 1 E-learning portal of SUA in Nitra. Source: own
THE SURVEY ON ELECTRONIC LEARNING AT SUA IN NITRA
Replies of students
The e-learning survey at the SUA in Nitra was conducted based on polling that have been published on the faculty web site, in LMS Moodle, by the employees requesting the head and secretaries to distribute questionnaires both in printed and on-line form, by asking students to distribute questionnaires in the form of URL notification. Anonymous questionnaires created in Google Forms were used for the survey.
Number of completed questionnaires: 351 students
96% of respondents were full-time students, only 4% were students of external study (14 students). 54.5% use e-learning courses in the learning process.

Darina Tothova E-learning at Slovak University of Agriculture in Nitra
DIVAI 2018 – The 12th international scientific conference on Distance Learning in Applied Informatics. 199 ISBN 978-80-7598-059-5 (Print) ISSN 2464-7470 (Print) ISSN 2464-7489 (On-line)
87.8% use LMS Moodle. Surprising answer is 10.8% students who use the LMS system, but do not know how. 69.5% use LMS during the time outside the classroom as a support for education directly related to the university studies. At school, LMS Moodle is used by 39.3% students to support contact education. Most of the study materials are created in MS Word, followed by PowerPoint, then MS Excel, 6.1% of respondents do not know or they are not interested in what format was the studying material created.
Figure 2 Responses based on faculties. Source: own
In order to distinguish an electronic course from a location that is only a file repository rather than an electronic course, a storage space for learning materials accumulation was created in the LMS Moodle at the SUA in Nitra - File Repository for FEM Departments, see Fig. no. 3. This space was also rated by the students as being the most used for teaching materials. On the second place was the space reserved for an electronic course, where teachers store supporting materials such as presentations, exercises, and so on. The document server (within the university IS) was placed on the third place and the space designated by the faculty, workplace (shared disk on PC, server, e.g. EXRCISES at FEM) on the fourth place. Far behind this space, Google Drive lags behind - 8.3%. 4% of respondents said they did not use any file repositories.
Up to 80.1% of respondents indicated that the e-courses used at university are their own, 23.2% external (created by external supplier), 13.3% hosted (operated on the infrastructure of another organization).
Part of the University Portal (https://www.portalvs.sk/sk/) is the e-learning module created for the purpose of recording university e-courses and e-objects. The module enables the e-course creator to access the information about the course to public in order to establish co-operation and share courses with other authors, allowing students of all levels of study to find additional resources for their studies. To a question, "Do you know this module?” 25.9% of respondents answered positively. This means that students are looking for additional resources for education also at Portal of Universities.
0,30%
15,70%
27,30%
1,50%
11,30%
43,90%
Faculty of Agrobiology and FoodResources
Faculty of Biotechnology and FoodSciences
Faculty of Economics and Management
Faculty of European Studies andRegional Development
Faculty of Horticultural and LandscapeEngineering
Faculty of Engineering
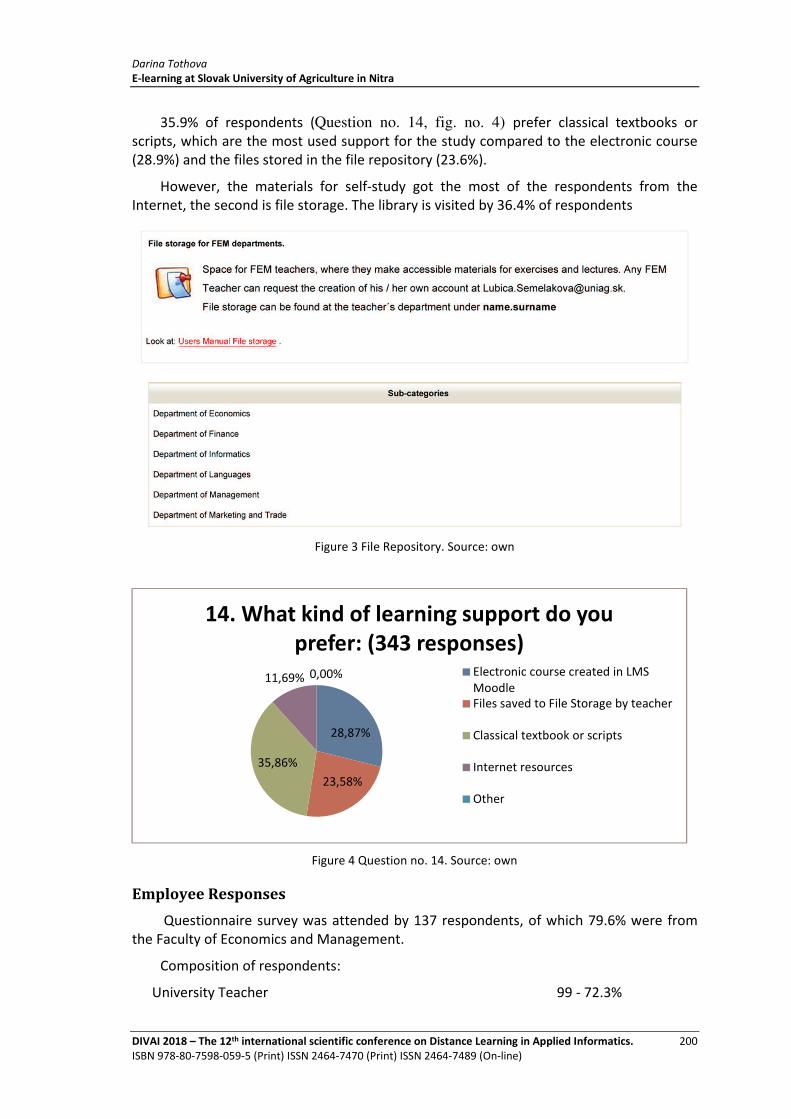
Darina Tothova E-learning at Slovak University of Agriculture in Nitra
DIVAI 2018 – The 12th international scientific conference on Distance Learning in Applied Informatics. 200 ISBN 978-80-7598-059-5 (Print) ISSN 2464-7470 (Print) ISSN 2464-7489 (On-line)
35.9% of respondents (Question no. 14, fig. no. 4) prefer classical textbooks or scripts, which are the most used support for the study compared to the electronic course (28.9%) and the files stored in the file repository (23.6%).
However, the materials for self-study got the most of the respondents from the Internet, the second is file storage. The library is visited by 36.4% of respondents
Figure 3 File Repository. Source: own
Figure 4 Question no. 14. Source: own
Employee Responses
Questionnaire survey was attended by 137 respondents, of which 79.6% were from the Faculty of Economics and Management.
Composition of respondents:
University Teacher 99 - 72.3%
28,87%
23,58%
35,86%
11,69% 0,00%
14. What kind of learning support do you prefer: (343 responses)
Electronic course created in LMSMoodleFiles saved to File Storage by teacher
Classical textbook or scripts
Internet resources
Other

Darina Tothova E-learning at Slovak University of Agriculture in Nitra
DIVAI 2018 – The 12th international scientific conference on Distance Learning in Applied Informatics. 201 ISBN 978-80-7598-059-5 (Print) ISSN 2464-7470 (Print) ISSN 2464-7489 (On-line)
PhD student 11 - 8% Other employee participating in the teaching process 2 - 1.5% Other 25 - 18.2%
Only 27% of respondents use the e-learning in the teaching process. Of these, 79.4% is also the creator of e-learning course content. 94.9% of respondents use LMS Moodle.
In the number 1-5 a complete electronic textbook was created by 9 respondents, an e-course of 28 respondents, and an e-object of 5 respondents. Only 1 respondent created more than 5 courses and 3 respondents created more than 5 e-objects.
The use of the e-materials repository is shown in Fig. no. 6. However, only 4 respondents identified more than 10 materials in the repository, which did not correspond to the answers of the students. However, it is possible that the questionnaire was not filled by teachers who use some of the repositories.
The use of the e-courses methodology developed at the SUA in Nitra is as follows (Fig. No. 5), 20.5% of respondents do not use any repository.
Figure 5 Using the e-course methodology. Source: own
Electronic courses are used more than support for a daily form of study, not an external one, and only 6 respondents have indicated they are creating courses for the public.
The use of study resources is illustrated in Figure. no. 7, the use of activities in LMS Moodle can be seen in Figure no. 8.
Figure 6 Using the File Repository. Source: own

Darina Tothova E-learning at Slovak University of Agriculture in Nitra
DIVAI 2018 – The 12th international scientific conference on Distance Learning in Applied Informatics. 202 ISBN 978-80-7598-059-5 (Print) ISSN 2464-7470 (Print) ISSN 2464-7489 (On-line)
Figure 7 Study resources. Source: own
The evidence of the e-courses at Portal of Universities is known only by 14 respondents, out of which 8 said they have information about their courses in the e-learning module at the Portal of Universities. From individual responses, it is clear that many do not know this module of the Portal of Universities and think that there are whole courses. This also implies from the answers to the question: "Would you support the extension of the current e-learning module to the University Portal with further functionality - DEK's proposed module?" - 67.5% answered: I do not know yet.
The concept of MOOC (massive open online courses) is recognized by only 7 respondents.
The methodology of the creation of electronic courses was also implemented in the syllabi of the subject Technology of Education in the additional pedagogical study in both daily and external form. The application of the methodology was used for the creation of seminar papers in LMS Moodle by students (98 student papers) – based on methodology prepared electronic course (processed at least one lesson). For this purpose, “Sandpit” was prepared, but also a new system of presenting projects with a temporary role of teacher for students of the subject of Technology of Education.
Figure 8 Activities in LMS Moodle. Source: own

Darina Tothova E-learning at Slovak University of Agriculture in Nitra
DIVAI 2018 – The 12th international scientific conference on Distance Learning in Applied Informatics. 203 ISBN 978-80-7598-059-5 (Print) ISSN 2464-7470 (Print) ISSN 2464-7489 (On-line)
CONCLUSION
In the last academic year, at the Congress Center of the Slovak University of Agriculture in Nitra, a seminar on E-learning at the SUA in Nitra took place, which included the competition for the best electronic course at the SUA in Nitra. Nine courses were registered in two categories (7 courses were attended), which were first assessed anonymously by three independent reviewers. At the seminar, the contestants presented their courses to a 9-member evaluation committee, composed of representatives of faculties at SUA in Nitra, doc. P. Poulová from the University of Hradec Králové and Ing. A. Ondrejková from the University of Economics in Bratislava.
The competition and the seminar confirmed the importance of creating a full-university e-learning portal at the SUA in Nitra.
The e-learning surveys that took place at the SUA in Nitra showed that students and employees have positive attitude towards e-learning, but there are relatively few electronic courses, some of which are presented as courses, but in fact they are still just file repositories. This is despite the fact that the file repositories are quite available to the teacher, one of them being a repository site directly in LMS Moodle. But as it is written in an article Reflections on the Exploitation of a Virtual Study Environment (Semrádová, 2010): "It is assumed that the perception of ICT as an instrument is a major motive for the use of ICT in the learning process, but its use does not guarantee a positive educational effect", the same applies to the electronic course. Similar opinions can be found also with other authors, such as Hallova, Polakovic and Slovakova (2017), Hostovecky, Stubna and Stankovsky (2012).
REFERENCES
Mária Burianová, Milan Turčáni. 2016. Non traditional Education Using Smart Devices. DIVAI 2016 – The 11th international scientific conference on Distance Learning in Applied Informatics. p. 77-86. ISBN 978-80-7552-249-8 ISSN 2464-7470 (Print) ISSN 2464-7489 (On-line)
Fabus, Juraj, Kolarovszka, Z. and Fabus, Jozef. 2013. EDULEARN13: 5TH International Conference On Education And New Learning Technologies. Edulearn Proceedings Pages: 6242-6249 Published: 2013. ISSN: 2340-1117 ISBN: 978-84-616-3822-2
Hallová, M., Polakovič, P. and Slováková, I. (2017) “Current Trends in Training of Managers in the Field of Information And Communication Technologies And Identifying the Barriers to Education of Managers", AGRIS on-line Papers in Economics and Informatics, Vol. 9, No. 4, pp. 45-52. ISSN 1804-1930.DOI 10.7160/aol.2017.090405.
Hosťovecký, M., Štubňa, J., Stankovský, J. (2012). The Potential Implementation of 3D Technology in Science Education. In: Proceedings of 10th IEEE International Conference on Emerging eLearning Technologies an Application, Stará Lesná, The High Tatras, Slovakia,
pp.135-138. http://ieeexplore.ieee.org/abstract/document/6418607/
Olahova, E. 2016. Management of IT environment end users and the impact of new technological solutions. In The agri-food value chain: challenges for natural resources management and society: international scientific days 2016, May 19-20, 2016, Nitra, Slovak

Darina Tothova E-learning at Slovak University of Agriculture in Nitra
DIVAI 2018 – The 12th international scientific conference on Distance Learning in Applied Informatics. 204 ISBN 978-80-7598-059-5 (Print) ISSN 2464-7470 (Print) ISSN 2464-7489 (On-line)
Republic, conference proceedings. Nitra : Slovak University of Agriculture. (2016), s. 746--
751. URL: http://dx.doi.org/10.15414/isd2016.s9.03.
SEMRÁDOVÁ Ilona a kolektív, 2010. Reflections on the Exploitation of a Virtual Study Environment. Hradec Králové: Miloš VOGNAR Publishing House-M&V, 2010. 121 s. [cit. 2016-11-18]. ISBN 978-80-86771-43-4
ŠEMELÁKOVÁ, Ľ. a kolektív (2012): Integrácia e-vzdelávania do výučbového procesu: metodická príručka. Nitra: Slovenská poľnohospodárska univerzita, 2012. 101 s.[cit. 2016-11-18] ISBN 978-80-552-0849-7.
TÓTHOVÁ, D. a kolektív: Vytvorenie celouniverzitného e-vzdelávacieho portálu na SPU v Nitre. Projekt KEGA 005SPU-4/2014. [cit. 2016-11-18]. Dostupné na
internete:<https://projekty.portalvs.sk/projekty/projekt/pdf/8176>

Martina Zigová, Zuzana Pucherová, Imrich Jakab Innovative Model of Environmental Education in Lower Secondary Education
DIVAI 2018 – The 12th international scientific conference on Distance Learning in Applied Informatics. 205 ISBN 978-80-7598-059-5 (Print) ISSN 2464-7470 (Print) ISSN 2464-7489 (On-line)
Innovative Model of Environmental Education in
Lower Secondary Education
Martina Zigová, Zuzana Pucherová
Department of Ecology and Environmental Sciences, Faculty of Natural Sciences, Constantine the Philosopher University in Nitra, Slovak Republic
[email protected], [email protected]
Imrich Jakab
Department of Ecology and Environmental Sciences, Faculty of Natural Sciences, Constantine the Philosopher University in Nitra, Slovak Republic
Abstract
Is there a possibility for schools to be actively involved in solving global issues? Do pupils have the opportunity to engage personally in solving environmental problems? How can a teacher use it to modernize the learning process and increase its efficiency? Answers to these questions are part of the content of our contribution aimed at introduction of an innovative model for the implementation of environmental education based on the practical mapping of illegal dumping by pupils of lower secondary education. The model uses the principles of outdoor education, project-based learning and mobile learning together with information and communication technologies (ICT). Model built in this way brings several benefits to the teacher - school participation in solving environmental problem, effective combination of various pedagogical approaches using ICT to increase pupil motivation to learn, interdisciplinary approach to pupil projects, and developing a wide range of knowledge, skills and attitudes.
Keywords
Environmental education. Outdoor education. Mobile learning. Project-based learning. Information and communication technologies. Illegal dumping.
INTRODUCTION
Waste production occurs in every human society, manufacturing or in consumer activities. Waste is any substance which is discarded after primary use, or it is worthless, defective and of no use. The most common way of waste disposal in the Slovak Republic is landfilling (year 2016 – 66%) (Lieskovská, Némethová et al., 2017). Waste is currently not only a global but also a local problem. Increasingly and repeatedly, we encounter with an illegal way of storing waste in our environment - illegal waste dumps, which must be eliminated by municipalities at their own expense.

Martina Zigová, Zuzana Pucherová, Imrich Jakab Innovative Model of Environmental Education in Lower Secondary Education
DIVAI 2018 – The 12th international scientific conference on Distance Learning in Applied Informatics. 206 ISBN 978-80-7598-059-5 (Print) ISSN 2464-7470 (Print) ISSN 2464-7489 (On-line)
The model proposed presents an innovative approach in mapping of the presence of illegal dumping. Schools can involve it into practical activity which takes place during the teaching process with a direct connection to the content of education of individual subjects. Main actors of the mapping are pupils. They are getting acquainted with the issue, searching, mapping, recording, analysing, evaluating, creating and sharing, and are involved personally in solving the global problem. In addition to the acquired knowledge and skills of individual subjects, pupils also develop attitudes that are the content of environmental education (EE). According to the State Education Program of Slovakia (http://www.statpedu.sk, 2015), EE is a compulsory part of education as a cross sectional subject. Role of teachers is to implement its objectives in the content of the subjects they teach. EE directly allows to interconnect the issue of illegal dumping mapping to the educational content of selected subjects. In regular pedagogical practice, the issue of illegal dumping is addressed within EE on a theoretical basis via frontal teaching. Our model activates the pupil through work on a practical and useful project, modernizes the teaching process through information and communication technologies (ICT) and moves teaching into external environment.
Learning outdoors provides an exciting and memorable experience for pupils. It offers them the opportunity to experience, explore and investigate and helps to transfer what they learn at school into everyday life (Brown, 2010). In this process teachers and pupils can use several available applications and ICT which according to Hamelink (1997) also include GIS, GNSS/GPS and smartphones, and which are also part of our education model. ICT have become part of a modern way of teaching at our schools in recent years and it has a potential to be used in development of student’s skills for cooperation, communication, problem solving and lifelong learning (Plomp et al., 1996; Voogt, 2003 cited in Afshari, 2009).
In addition to outdoor education and mobile learning, pedagogical approaches of project-based learning are also integrated into the model proposed to increase the efficiency of work with the ICT. Within this approach pupils work on their own projects.
Projects have the potential to enhance deep understanding of curriculum. Pupils pursue solutions to nontrivial problems by asking refining questions, debating ideas, making predictions, designing plans or experiments, collecting and analysing data, drawing conclusions, communicating their ideas and findings to others, asking new questions, and creating artefacts. Students have to acquire and apply information, concepts and principles, and they have the potential to improve competence in thinking (Blumendfeld et al., 1991). Learning occurs the most efficient when it is situated in an authentic, real-world context (Krajcik and Blumenfeld, 2006).
Our education model suggests the use of project-based learning – pupils work on a project based on illegal dumping mapping with use of GNSS for localization of dumps and GIS for their visualization on a map. Not only does the model give the possibility of the direct connection of the pupil with the surrounding external environment, but it also allows his own, active, experience and personal engagement for solving this environmental problem.

Martina Zigová, Zuzana Pucherová, Imrich Jakab Innovative Model of Environmental Education in Lower Secondary Education
DIVAI 2018 – The 12th international scientific conference on Distance Learning in Applied Informatics. 207 ISBN 978-80-7598-059-5 (Print) ISSN 2464-7470 (Print) ISSN 2464-7489 (On-line)
METHODS
The aim of the contribution is to introduce an innovative model for the implementation of environmental education based on the practical mapping of illegal dumping by pupils of lower secondary education. Model uses the principles of outdoor education, project-based learning and mobile learning together with ICT (Figure 1).
The education model proposed links three pedagogical principles:
1. Project-based learning (PBL) - is a student-driven, teacher-facilitated education approach where pupils are learning through facilitated problem solving (Bell, 2010; Hmelo-Silver, 2004). According to Savery and Duffy (1995), in case of PBL, learning is aimed at a real problem which is possible to connect with education content.
In our case, pupils deal with the waste issue connected with the practical mapping of illegal dumping. Issue creates a sufficient scope for building subject interrelations. The topic is connected directly to the objectives of environmental education as well as the educational content of several teaching subjects in lower secondary education (e.g. Geography - searching for specific locations in the field and on maps using geographical coordinates; Biology - the mutual relationship of man and his environment, ecological conditions of life; Ethics, Religious education and Social Studies – the personal responsibility for the environment, the importance of ecological thinking in a society-wide context).
2. Outdoor education (OE) - is a mean of curriculum enrichment (Lappin, 1984). According to Priest (1986), definition of outdoor education is based upon six major points: (1) is a method for learning; (2) is experiential; (3) takes place primarily in the outdoors; (4) requires use of all senses and domains; (5) is based upon interdisciplinary curriculum matter; and (6) is a matter of relationships involving people and natural resources. The outdoor environment has massive potential for learning. As a part of our model, we use outdoor education to allow pupils direct contact with the waste issue through their involvement in the mapping of illegal dumping that are located near their school or their residence.
3. Mobile learning (ML) - use of mobile and handheld IT devices, such as mobile phones, laptops and tablet technologies in teaching and learning. Advantages of mobile learning are that with the mobility of general portable devices learner is not fixed at predetermined location and it is accessible virtually from any place, which provides access to all the different learning materials available (Alsaadat, 2017). Mobile learning offers new ways to extend education outside the classroom, into the conversations and interactions of everyday life (Sharples et al. 2009). In our model mobile learning is implemented through use of mobile phones (smartphones) nowadays owned by more and more pupils. Using smartphones, pupils can accurately locate illegal dumping, create necessary photo documentation, communicate with teachers and classmates, and search for additional information on the Internet.
Important part of our model are the information and communication technologies ICT. They can enhance teaching and learning through its dynamic, interactive, and engaging content and provide real opportunities for individualized instruction. ICT can make school more efficient and productive (Kirschner and Woperies, 2003). Our model integrates several ICT, which are used at different phases of teaching and in relation to the

Martina Zigová, Zuzana Pucherová, Imrich Jakab Innovative Model of Environmental Education in Lower Secondary Education
DIVAI 2018 – The 12th international scientific conference on Distance Learning in Applied Informatics. 208 ISBN 978-80-7598-059-5 (Print) ISSN 2464-7470 (Print) ISSN 2464-7489 (On-line)
different pedagogical approaches included in the model (Figure 1). The most important ICT used in our educational models are:
- Trash Out - one of the fundamental ICT included in our model directly used for mapping of illegal dumping. Trash Out is an environmental project aimed at location of illegal dumping all around the world. According to the application website (https://www.trashout.ngo, 2018) it is a simple app that can be downloaded to mobile phone, it boasts a civic initiative, educates towards environmental sensitivity and helps ordinary people to have impact on their environment. This project can also help local institutions and governments to improve the status of the environment.
- Global navigation satellite system (GNSS) - satellite-based system that is used to pinpoint the geographic location of a user's receiver anywhere in the world (Bhatta, 2010). Examples of GNSS are e.g. the USA’s NAVSTAR Global Positioning System (GPS) or Russia’s Global'naya Navigatsionnaya Sputnikovaya Sistema (GLONASS). The exact localization of illegal dumping via GNSS is available directly in TrashOut application. Besides TrashOut, there is also possibility to use a variety of other GPS mobile applications. They are available for every smartphone operating system. Many of them are available for free (e.g. for Android - GPS Coordinates, Map Coordinates, UTM Geo Map; for iOS - My GPS Coordinates, GPS & Maps, GPS Data).
- Geographic Information System (GIS) - the term Geographic Information System represents an integration of many subject areas. GIS is a system of hardware, software, data, people, organizations, and institutional arrangements for collecting, storing, analysing, and disseminating information about areas of the earth (Dueker and Kjerne, 1989). Using the GIS, pupils can further process the located illegal dumping, i.e. to compute their area, to examine their relations with the surrounding landscape and to visualize results through map outputs.

Martina Zigová, Zuzana Pucherová, Imrich Jakab Innovative Model of Environmental Education in Lower Secondary Education
DIVAI 2018 – The 12th international scientific conference on Distance Learning in Applied Informatics. 209 ISBN 978-80-7598-059-5 (Print) ISSN 2464-7470 (Print) ISSN 2464-7489 (On-line)
Figure 1: Scheme of educational model phases
RESULTS
The model proposed links deliberately various pedagogical approaches with ICT to the efficient addressing of environmental education in lower secondary education. Realization of the model has 5 successive steps (Figure 1):
1. Introduction to the issue and definition of the problem - first step is an introduction to the waste and illegal dumping issue. In this phase pupils get familiar with the issue and learn about the causes of waste production, its impact on the environment and possible solutions. Teacher explains why it is inappropriate to create illegal dumps in several aspects e.g. ecological and environmental aspect, health and hygiene, aesthetics, ethics, cultural aspect, etc. Subsequently, teacher presents an assignment with the character of the problem that the pupils will solve. The role of pupils is the mapping of illegal dumping for the purpose of the quality of the environment assessment with the possibility to provide data to municipalities in order to eliminate the problem.
Important is that pupils have all necessary information about the problem, a well-defined assignment as well as a proper methodology that will lead them to the results

Martina Zigová, Zuzana Pucherová, Imrich Jakab Innovative Model of Environmental Education in Lower Secondary Education
DIVAI 2018 – The 12th international scientific conference on Distance Learning in Applied Informatics. 210 ISBN 978-80-7598-059-5 (Print) ISSN 2464-7470 (Print) ISSN 2464-7489 (On-line)
desired. The teacher can use a variety of ICT to assist him in activation of pupils and visualization of teaching lessons (presentation software, Internet, e-learning, etc.). As a part of this step, it is important that pupils realize the importance of solving the waste problem, particularly illegal dumping, as well as the fact that they can actively help in removal of illegal dumps near their school or residence.
2. Analysis of the state of the initial problem - in the second step teacher use TrashOut app to introduce pupils the status of illegal dumping mapping in the area of interest (settlement, region). Advantage of this application is the final map (TrashMap) with illegal dumps categorized by date of their registration in the app. Pupils can use this map to search for the new illegal dumps, search in list of already registered dumps, update the current status of dumps and monitor their dynamics. Based on a quick analysis of reachable illegal dumps, pupils can choose a way of illegal dumps mapping. There are two possible options:
- Update of the existing geodatabase – in the case there already are illegal dumps present in TrashOut application in the area of interest, it is possible to check up their status or extend the geodatabase with new, yet unrecorded dumps.
- Creation of new geodatabase – if there is no reporting of illegal dumping in the area of interest, pupils can be successful and useful in mapping of uncharted sites.
3. Mapping of illegal dumps - process of illegal dump mapping is associated with movement in an external environment. For this reason, it is necessary to pay sufficient amount of attention to the safety instructions before the mapping itself. Not less important is the precise delimitation of the area of interest which should be closely related with the residence or school location. Mapping can be realized with the teacher, but also without him e.g. on the way to school or during the walk with parents. The assignment can be solved by whole class together or teacher can create groups of pupils and divide the area of interest among them.
The mapping process itself consists of the localization of dumps and recording their basic characteristics. This should be done by direct use of TrashOut application or using GPS/GNSS applications that are available for free in pupils’ smartphones. The advantage of TrashOut is that it is a complex application with options to locate the illegal dumping (measure its exact position defined by longitude and latitude), describe it and update information to TrashOut geodatabase. However, TrashOut has a disadvantage – reported dumps data cannot be downloaded from the database for further processing e.g. using spatial analyses or map visualization by GIS. Another way of mapping is the use of smartphone as a GPS/GNSS receiver to acquire the coordinates of illegal dump. Pupils can also use the smartphone to create photographic documentation, audio or text notes, etc. In this case, pupils are not limited by the possibilities of TrashOut app and the upload of illegal dumps to TrashOut can be carried out within the next steps of our model.
Basic attributes that can be defined for every dump are size (there are 3 categories in TrashOut application – a bag, a wheelbarrow and a van) and a type of trash (household, plastic, construction, automotive, glass, metal, liquid, electronic and dangerous). At the same time, it is possible to estimate the representation of individual materials (e.g. 80% construction, 20% plastic) and describe the place where the waste is stored and create the photo documentation.

Martina Zigová, Zuzana Pucherová, Imrich Jakab Innovative Model of Environmental Education in Lower Secondary Education
DIVAI 2018 – The 12th international scientific conference on Distance Learning in Applied Informatics. 211 ISBN 978-80-7598-059-5 (Print) ISSN 2464-7470 (Print) ISSN 2464-7489 (On-line)
4. Processing of spatial data acquired - spatial data processing can be carried out directly during Geography lessons (orientation on maps, working with thematic maps) and Informatics (processing tables in spreadsheet software, creation of a presentation, work in a text editor and with the Internet). For visualization of spatial data obtained, pupil can use desktop (Figure 2) or web-based GIS software. Both options are distinguished by advantages and disadvantages.
Desktop GIS software programs, e.g. open source QGIS, have the ability to perform many advanced spatial related operations. It is possible to analyse data to reveal patterns, relationships and trends and create maps of a high quality. However, desktop GIS is installed and operates mainly on a personal computer, so it can be used only locally. Also, software and data are not accessible on a server or externally (Hyndman, 2016). Nowadays there is also option to use several GIS applications for smartphones.
Web-based GIS (e.g. Google Maps) is an easy way of dissemination of spatial data. Users do not have to purchase and install commercial GIS software. Data can be easily and quickly imported and presented on a map. Data are accessible anytime and anywhere via the World Wide Web or an Intranet. Disadvantage of web GIS is only basic functionality and need of Internet connection (Verma et al., 2012).
As a next step, pupils should create the basic statistic of recorded dumps. They can process data to express average size of illegal dumps, type of waste prevailing, distance of dumps from a nearest settlement, etc.
5. Utilization of the results - final step of the project is demonstration of the results. Completing the investigation, pupils have to present their project results. A form should be chosen properly depending on the audience. Good way to present results in class among classmates is an oral presentation. Pupils can use any available presentation software (PowerPoint, Prezi, etc.) to create a presentation or make a project poster. Since the illegal dumping is a serious problem to our environment, wide range of people should be informed. In this case, pupils may present results using media available for the public e.g. school journal, school web, or create posters and brochures. This all may lead to solution of the illegal dumping problem in cooperation with the school, the municipality and the third sector.
Successful realisation of pupil projects can present a positive feedback for teachers, efficient and interesting way to spend time for pupils and appropriate advertising for a school that is personally engaged in activities aimed at protection and development of the environment.

Martina Zigová, Zuzana Pucherová, Imrich Jakab Innovative Model of Environmental Education in Lower Secondary Education
DIVAI 2018 – The 12th international scientific conference on Distance Learning in Applied Informatics. 212 ISBN 978-80-7598-059-5 (Print) ISSN 2464-7470 (Print) ISSN 2464-7489 (On-line)
Figure 2: Visualisation via Desktop GIS software (QGIS) (Zigová, 2018)
DISCUSSION
Knowledge of the content and process aspects of the model design, as well as previous experience and realisation of environmental education using PBL and ICT allows us to suggest some ideas and recommendations for teaching using this method. Teaching with use of our model is based on the following principles:
1. School participation in solving the environmental problem - main idea of the model is the participation of pupils in the process of solving the problems that are not only local, but also have a global character. Schools can be helpful especially in process of searching for illegal dumping. Mapping can be included directly into the teaching process. Model can be supportive by creating direct link between secondary education and practice, what can motivate pupils as they solve real problems with real methods, data and tools (applications, software).
The negative aspect of solving this problem may be the absence of available dumps in surrounding of the school or residence. In this case, pupils can focus on searching for loose waste, a.k.a. littering. Heeb et al. (2005) defines littering as an inconsiderate disposal of waste in the place of its origin without use of bins specified for this purpose. Littering can be the most frequently observed in the urbanized landscape along routes, watercourses but also freely in the nature and its removal is an equal financial burden for local governments and organizations.
2. Efficient combination of various pedagogical approaches using ICT to increase motivation of pupil to learn - according to Marsh (2012), the most efficient teaching and learning involves different teaching methods, approaches, and strategies to maximize knowledge acquisition and skills development. Good teachers always use more than one method or approach and good learners will always combine different strategies of learning. The model proposed combines selected pedagogical approaches (PBL, OE and

Martina Zigová, Zuzana Pucherová, Imrich Jakab Innovative Model of Environmental Education in Lower Secondary Education
DIVAI 2018 – The 12th international scientific conference on Distance Learning in Applied Informatics. 213 ISBN 978-80-7598-059-5 (Print) ISSN 2464-7470 (Print) ISSN 2464-7489 (On-line)
ML) with use of ICT toward a common unified goal - to make teaching of environmental education more efficient and modern.
In our model PBL predestines education to solve real problems through pupil projects, creates conditions for realization of each phase of education, OE moves a part of learning process to the external environment, ML provides an option to use pupils’ smartphones efficiently and ICT contributes to change the overall education structure (Moran et al., 1999 cited in Anderson, 2005). We agree with Rose (2009) and Livingstone (2012) that ICT skills are becoming accepted as a third life skill alongside literacy and numeracy. According to Gaible et al. (2011) pupils are frequently ready to benefit from instructional methods, therefore use of ICT in the educational process does not present any problem for them. ICT becomes an efficient medium for dissemination of educational content and a convenient way to increase motivation to learn.
3. Interdisciplinary Approach to Pupil Projects - realizing individual phases, model gradually provides many opportunities of cross-curricular relationships in lower secondary education in conditions of Slovakia. The education content itself has a strong interdimensional character. Model is thematically focused on the global problem – waste that is the content of the cross sectional subject of Environmental Education. The waste, as a content of education, is directly related to the curriculum of Biology (human and environmental relations, environmental conditions of life) and Chemistry (water and soil pollution). In Ethics, Religious Education and Social Studies should be an effort of the teacher to direct the pupil to the personal responsibility for the environment. The role of Geography is to teach pupils to search for specific terrain and map locations using geographic coordinates. Within the subject of Physical and Sports Education, the pupil can undergo a continuous long-distance march of the length of 4-8 km what is a sufficient distance for the mapping of illegal dumps. Through the subject of Informatics, the pupil has the opportunity to use various ICT, mainly application software (where we can include TrashOut and GIS applications) and mobile devices (e.g. photo documentation and localization of dump using GPS/GNSS apps). He is supposed to learn how to search for different types of information on web and create a presentation that can be used for mapping of illegal dumps in the surroundings of the school or residence. The acquired data can be further processed within the Mathematics, where the topic of illegal dumping can be applied in all classes (5-9th class) according to the difficulty of the curriculum (the calculation of the area and volume of the dump in the form of various geometric formations, the calculations of the percentage of waste type composition, resolving the application tasks and the tasks developing specific mathematical thinking, the realization of an adequate statistical survey) (http://www.statpedu.sk, 2015).
4. Development of a wide range of knowledge, skills and attitudes - we agree with So and Kim (2009) that design and implementation of PBL lessons is time consuming and requires IT skills from both students and teachers. However, the model proposed has a strong potential to develop a wide range of skills and attitudes, which is predetermined by its interdisciplinary character, as well as a wide range of pedagogical approaches and the use of ICT. The goals of PBL include helping students to develop 1) flexible knowledge, 2) efficient problem-solving skills, 3) self-directed learning (SDL) skills, 4) efficient collaboration skills, and 5) intrinsic motivation (Hmelo-Silver, 2004). Mobile learning, outdoor learning experiences and ICT offer different opportunities for personal and learning skills development in areas such as communication, problem solving, working

Martina Zigová, Zuzana Pucherová, Imrich Jakab Innovative Model of Environmental Education in Lower Secondary Education
DIVAI 2018 – The 12th international scientific conference on Distance Learning in Applied Informatics. 214 ISBN 978-80-7598-059-5 (Print) ISSN 2464-7470 (Print) ISSN 2464-7489 (On-line)
with others, critical thinking, and technological skills. It also helps to develop the skills of enquiry and reflection (Brown, 2010; Plomp et al., 1996, Voogt, 2003 cited in Afshari, 2009).
CONCLUSION
Our contribution points out the innovative approach to the teaching of environmental education using project-based learning, outdoor education, mobile learning and information and communication technologies. Pupils in lower secondary education are in the role of illegal dumps surveyors who are involved and help resolving illegal dumps problem. Our educational model proposed has the potential to overlap efficiently the contents of individual teaching subjects and thereby share the creation and strengthening of subject cross-curricular relationships.
Model is intended for formal teaching of pupils of lower secondary education, but we think that it can be used also in higher secondary education as well as in the non-formal (extracurricular) environmental education.
ACKNOWLEDGEMENT
The work was supported by the projects VEGA 1/0608/16 and KEGA 032UKF-4/2018.
REFERENCES
Afshari, M., Bakar, K.A., Luan, W.S., Samah, B.A. and Fooi, F.S., 2009. Factors affecting teachers' use of information and communication technology. Online Submission, 2(1), 77-104.
Alsaadat, K., 2017. Mobile learning technologies. International Journal of Electrical and Computer Engineering (IJECE), 7(5), pp.2833-2837.
Anderson, J. (2005). IT, E-Learning and Teacher Development. International Education Journal, 5(5), 1-14.
Bell, S., 2010. Project-based learning for the 21st century: Skills for the future. The Clearing House, 83(2), pp.39-43.
Bhatta, B., 2010. Global navigation satellite systems: insights into GPS, GLONASS, Galileo, Compass, and others. BS Publications.
Blumenfeld, P.C., Soloway, E., Marx, R.W., Krajcik, J.S., Guzdial, M. and Palincsar, A., 1991. Motivating project-based learning: Sustaining the doing, supporting the learning. Educational psychologist, 26(3-4), pp.369-398.
Brown, K., 2010. Curriculum for excellence through outdoor learning. Learning and Teaching Scotland.
Dueker, K.J. and Kjerne, D., 1989, December. Multipurpose cadastre: Terms and definitions. American Society for Photogrammetry and Remote Sensing.
Martina Zigová, Zuzana Pucherová, Imrich Jakab Innovative Model of Environmental Education in Lower Secondary Education
DIVAI 2018 – The 12th international scientific conference on Distance Learning in Applied Informatics. 215 ISBN 978-80-7598-059-5 (Print) ISSN 2464-7470 (Print) ISSN 2464-7489 (On-line)
Gaible, E., Bloome, T., Schwartz, A., Hoopes, J. and Wayan, P., 2011. First Principles: Designing Effective Education Programs Using Information and Communication Technology (ICT). [pdf] Available at: < http://www.equip123.net/docs/E1-FP_ICT_Compendium.pdf > [Accessed 02 January 2018].
Hamelink, C.J., 1997. New information and communication technologies, social development and cultural change (Vol. 86). Geneva: United Nations Research Institute for Social Development
Heeb, J., Ableidinger, M., Berger, T. and Hoffelner, W., 2005. Littering-ein Schweizer Problem. Eine Vergleichsstudie Schweiz-Europa.
Hmelo-Silver, C.E., 2004. Problem-based learning: What and how do students learn? Educational psychology review, 16(3), pp.235-266
Hyndman, N., 2016. Advantages of a web mapping GIS. [Online] Available at: < https://www.azimap.com/news/view/18/advantages-of-a-webmapping-gis > [Accessed 16 January 2018].
Kirschner, P. and Wopereis, I.G., 2003. Mindtools for teacher communities: A European perspective. Technology, Pedagogy and Education, 12(1), pp.105-124.
Krajcik, J.S. and Blumenfeld, P.C., 2006. Project-based learning (pp. 317-34). na.
Lappin, E., 1984. Outdoor Education for Behavior Disordered Students.
Lieskovská, Z., Némethová, M. et al., 2017. Report on the state of the environment of the Slovak Republic in 2016. Bratislava: Ministry of environment of the Slovak Republic and Banská Bystrica: Slovak Environment Agency, 206 p.
Livingstone, S., 2012. Critical reflections on the benefits of ICT in education. Oxford review of education, 38(1), pp.9-24.
Marsh, D., 2012. Blended learning creating learning opportunities for language learners. Retrieved April, 20, p.2015.
National Institute for Education in Slovak Republic, 2015. State Education Program. [pdf] Available at: < http://www.statpedu.sk/files/articles/dokumenty/inovovany-statny-vzdelavaci-program/svp_nsv_6_2_2015.pdf > [Accessed 08 December 2017].
Priest, S., 1986. Redefining outdoor education: A matter of many relationships. The Journal of Environmental Education, 17(3), pp.13-15.
Rose, J., 2009. Identifying and teaching children and young people with dyslexia and literacy difficulties: An independent report.
Savery, J.R. and Duffy, T.M., 1995. Problem based learning: An instructional model and its constructivist framework. Educational technology, 35(5), pp.31-38.
Sharples, M., Arnedillo-Sánchez, I., Milrad, M. and Vavoula, G., 2009. Mobile learning. In Technology-enhanced learning (pp. 233-249). Springer, Dordrecht.
So, H.J. and Kim, B., 2009. Learning about problem based learning: Student teachers integrating technology, pedagogy and content knowledge. Australasian Journal of educational technology, 25(1), pp.101-116.
TrashOut, 2018. Locate illegal dumps all around the world. [Online] Available at: < https://www.trashout.ngo > [Accessed 15 January 2018].

Martina Zigová, Zuzana Pucherová, Imrich Jakab Innovative Model of Environmental Education in Lower Secondary Education
DIVAI 2018 – The 12th international scientific conference on Distance Learning in Applied Informatics. 216 ISBN 978-80-7598-059-5 (Print) ISSN 2464-7470 (Print) ISSN 2464-7489 (On-line)
Verma, S., Verma, R.K., Singh, A. and Naik, N.S., 2012. Web-based GIS and desktop open source GIS software: An emerging innovative approach for water resources management. In Advances in Computer Science, Engineering & Applications (pp. 1061-1074). Springer, Berlin, Heidelberg.

Section:
Learning/Teaching Methodologies, Assessment
and Learning Environments

Boris Aberšek, Metka Kordigel Aberšek, Andrej Flogie Experience-Based Learning – an Analogy for Self-Healing Porous Materials
DIVAI 2018 – The 12th international scientific conference on Distance Learning in Applied Informatics. 219 ISBN 978-80-7598-059-5 (Print) ISSN 2464-7470 (Print) ISSN 2464-7489 (On-line)
Experience-Based Learning – an Analogy for Self-
Healing Porous Materials
Boris Aberšek, Metka Kordigel Aberšek
University of Maribor, Maribor, Slovenia [email protected], [email protected]
Andrej Flogie
Institute Anton Martin Slomšek, Vrbanska 30, Maribor, Slovenia ([email protected])
Abstract
In ancient Greece, knowledge was not neatly contained in distinct disciplines, and leading scholars moved freely among different fields. The influence of reductionism, which began with Aristotle and has continued ever since, created disciplines with precise boundaries. With such a disciplinary approach, each field evolves independently as a specialized set of analysis tools. The question arises: are these boundaries still necessary today, or should we consider the teaching/learning process in a more transdisciplinary manner? The human skeleton presents an unusual opportunity to teach science, technology, engineering and mathematics (STEM) skills and concepts. The present research will show how the science of anatomy interacts with methods of teaching science and engineering through mathematics, based on an experience-based learning (EBL) model and analogies. Through an already known concept (basic skeletal anatomy), students are able to learn new concepts in mathematics, science and engineering. The skeletal system can serve as the basis for teaching interactions between natural porous materials and artificial ones, as well as for teaching concepts such as scale, growth charting, remodelling, ratios, proportions, geometric designs, strength, problem solving, and measuring using the body parts as a standard. In the following article, we will demonstrate and evaluate one of the possible ways of applying a transdisciplinary model of teaching STEM as an appropriate solution for the study of modern engineering materials such as self-healing porous materials. A research-based and experience-based model for teaching with analogies will be described, which provides guidelines for the use of analogies in science and engineering classrooms, textbooks, and web-based science instruction.
Keywords:
Analogies. Cognitive education. Holistic approach. Self-healing material. Transdisciplinary model.

Boris Aberšek, Metka Kordigel Aberšek, Andrej Flogie Experience-Based Learning – an Analogy for Self-Healing Porous Materials
DIVAI 2018 – The 12th international scientific conference on Distance Learning in Applied Informatics. 220 ISBN 978-80-7598-059-5 (Print) ISSN 2464-7470 (Print) ISSN 2464-7489 (On-line)
INTRODUCTION
As disciplines reach maturity, a dynamic meta-structure is needed which facilitates merging and new divisions of disciplines. Under such a meta-structure, the disciplines propel the evolution of knowledge, but adapt themselves when driving forces emerge sufficient to provoke their adaptation (Aberšek, 2016). Science-education research studies and STEM teachers’ classroom experience have shown that analogies, when used properly, can help make science concepts meaningful to students. This article explains what analogies are, how analogies foster learning and interest, and what form analogies should take to be effective.
Effective analogy use fosters understanding and avoids misconceptions (Duit and Glynn, 1992, 1995). In order to use analogies effectively, it is important to understand exactly what an analogy is, how it can help learning, and what kind of analogy is best. What we need, therefore, is an explanation. Logical explanations are summarized in the following schema (Hempel, 1965):
Logical
deduction
C1, C2, …….Ck Statements of antecedent conditions L1, L2, …….Lk General law
Explanans (bone
remodelling) E Description of the empirical phenomenon to be explained Explanandum
(self-healing artificial materials)
We must divide a logical explanation into two major constituents, the explanandum and the explanans. These two expressions, derived from the Latin explanare, were adopted in preference to the perhaps more customary terms »explicandum« and »explicans« in order to reserve the latter for use in the context of explication of meaning, or analysis (Hempel, 1965: 247). By the explanandum, we understand the sentence describing the phenomenon to be explained (not that phenomenon itself); by the explanans, the class of those sentences which are adduced to account for the phenomenon. The explanans falls into two subclasses; one of these contains sentences (Ck) which state specific antecedent conditions; the other is a set of sentences (Lx) which represent general laws. For a proposed explanation to be sound, its constituents have to satisfy certain conditions of adequacy, which may be divided into three logical conditions:
� the explanandum must be a logical consequence of the explanans;
� the explanans must contain general laws and these must actually be required for the derivation of the explanandum, and
� the explanans must have empirical content;
and one empirical condition: the sentences constituting the explanans must be true.
Let us note here that the same formal analysis, including the four necessary conditions, applies to scientific prediction as well as to explanation. The difference between the two is of a pragmatic character (Hempel, 1965). This theoretical background serves as the basis for our analogy method.

Boris Aberšek, Metka Kordigel Aberšek, Andrej Flogie Experience-Based Learning – an Analogy for Self-Healing Porous Materials
DIVAI 2018 – The 12th international scientific conference on Distance Learning in Applied Informatics. 221 ISBN 978-80-7598-059-5 (Print) ISSN 2464-7470 (Print) ISSN 2464-7489 (On-line)
ANALOGIES, SCIENCE AND SCIENCE TEACHING
Throughout history, analogies have played an important role in scientific discoveries, not as proof, but as inspiration. Analogies have also played an important role in explaining those discoveries (Kaiser, 1989). For example, Johannes Kepler, the famous seventeenth-century astronomer, wrote: “I especially love analogies, my most faithful masters, acquainted with all the secrets of nature” (Vickers, 1984: 149). Kepler, who discovered laws of planetary motion, used analogies to help explain his discoveries: “I am much occupied with the investigation of the physical causes. My aim in this is to show that the celestial machine is to be likened not to a divine organism but rather to a clockwork” (Holton, 1973: 72).
Science teachers, like scientists, frequently use analogies to explain concepts to students (James and Scharmann, 2007). The analogies serve as initial models, or simple representations, of science concepts. The teachers frequently preface their explanations with expressions, such as, “It’s just like,” “Just as,” “Similarly,” and “Likewise.” These expressions are all ways of saying to students, “Let me give you an analogy.”
Analogies are double-edged swords: They can foster understanding, but they can also lead to misconceptions. As Duit, Roth, Komorek, and Wilbers (2001: 283) explain:
“A growing body of research shows that analogies may be powerful tools for guiding students from their pre-instructional conceptions towards science concepts. But it has also become apparent that analogies may deeply mislead students’ learning processes. Conceptual change, to put it into other words, may be both supported and hampered by the same analogy”.
What is an analogy?
An analogy is a comparison of the similarities between two concepts (Hempel, 1965). The familiar concept is called the analogue (explanans) and the unfamiliar one the target (explanandum). Both the analogue and the target have features (also called attributes). If the analogue and the target share similar features, an analogy can be drawn between them. A systematic comparison, verbally or visually, between the features of the analogue and target is called a mapping. A conceptual representation of an analogy, with its constituent parts, appears in Figure 1. An example of an analogy drawn between a bio-porous material (bones) and an artificial porous material, is shown in Figure 2.
Analogy
Analogy Concept Target Concept
Feature 1 Feature 2 Feature 3
.
.
.
Feature n
Feature 1 Feature 2 Feature 3
.
.
.
Feature n
Figure 1: A conceptual representation of an analogy, with its constituent parts

Boris Aberšek, Metka Kordigel Aberšek, Andrej Flogie Experience-Based Learning – an Analogy for Self-Healing Porous Materials
DIVAI 2018 – The 12th international scientific conference on Distance Learning in Applied Informatics. 222 ISBN 978-80-7598-059-5 (Print) ISSN 2464-7470 (Print) ISSN 2464-7489 (On-line)
Analogical reasoning can occur between conceptual domains and within a particular conceptual domain. Between the domains of biology and engineering, for example, an analogy can be drawn between the human skeleton and an engineering construction (see Figure 2). Within the domain of physics, for example, an analogy can be drawn between the flow of water and the flow of electricity (Gačnik, Ren, Ihan Hren, 2014).
Analogy
Analogy concept Target concept
Feature 1: Osteoblast Feature 2: Osteocycle
Feature 3: Mass etc.
Feature 1: Healing substance Feature 2: Piezoelectric layer Feature 3: Conductive layer
etc.
Figure 2: A conceptual representation of an analogy, between natural and artificial self-healing materials
How do analogies help learning?
The analogies used in classrooms, textbooks, and web-based instruction should be designed to promote elaboration, the cognitive process of constructing relations between what is already known and what is new (Duit and Glynn, 1995). Elaboration can be defined more precisely as “any enhancement of information which clarifies or specifies the relationship between information to-be-learned and related information, i.e., a learner’s prior knowledge and experience or contiguously presented information” (Hamilton, 1997: 299). Elaboration can be activated by questions, objectives, personal examples, and other strategies, but analogies seem to be particularly appropriate because they can provide the rich, familiar contexts that successful elaboration requires.
Elaboration plays a critical role in a constructivist framework for learning science. In this framework, students learn progressively more sophisticated mental models of science concepts. Often, these concepts represent complex, hard-to-visualize systems. Such concepts are often introduced to students when they are about ten years of age, and then elaborated in subsequent grades, technical schools, and college. Familiar analogues (e.g., a factory) often serve as early mental models that students can use to form limited, but meaningful, understandings of complex target concepts (e.g., a cell). The analogy paves the way for the expansion of the target concept.
STEM TEACHERS’ USE OF EBL AND ANALOGY
The teaching-with-analogies model (Glynn, 2004, 2007) is based on cognitive task analyses of lessons, textbooks, and websites. In both formal experiments and classroom settings, the use of the model has been found to increase students’ learning and interest in science concepts. The six steps of the model are to be followed:
1. Introduce the target concept to students.
2. Remind students of what they know of the analogue concept.

Boris Aberšek, Metka Kordigel Aberšek, Andrej Flogie Experience-Based Learning – an Analogy for Self-Healing Porous Materials
DIVAI 2018 – The 12th international scientific conference on Distance Learning in Applied Informatics. 223 ISBN 978-80-7598-059-5 (Print) ISSN 2464-7470 (Print) ISSN 2464-7489 (On-line)
3. Identify relevant features of relevant concepts.
4. Connect (map) the similar features of the concepts.
5. Indicate where the analogy between the concepts breaks down.
6. Draw conclusions about the concepts.
To help students think about the analogy, a graphic or an algorithm can be designed (cf. Figure 2). It should also be pointed out that analogies break down in a lot of places, and how they break down. One implication of the teaching-with-analogies model is that teachers should try to select analogues that share many similar features with the target concept. In general, the more features shared, the better the analogy. Another implication is that teachers should verify that students have not formed misconceptions. One way to do this is to ask focused questions about features that are not shared between the analogue and the target concept.
Analogies and contemporary technologies
Analogies play an important role in science instruction in all forms of media and information-communication technologies (ICT). Elaborate analogies are often used on science education websites to explain concepts, using various combinations of text, audio, video, etc.
Guidelines for designing analogies in web-based science instruction
Six guidelines should be kept in mind when designing elaborate science analogies. These guidelines are discussed here with a focus on web-based science instruction, but they also apply to other forms of media.
(1) Designers should take into account the characteristics of the target concept. If the concept is relatively simple and straightforward, an elaborate analogy might be unnecessary. Elaborate analogies have been found to enhance learning when the target concepts are complex and represent hard-to-visualize systems with interacting parts (Glynn and Takahashi, 1998). In combination with web-based animation, interactivity, and hyperlinks – features that have also been found to enhance learning – elaborate analogies have the potential to strongly enhance learning, provided that the features interact without increasing cognitive load (Bodemer, Ploetzner, Feuerlein and Spada, 2004; Ploetzner and Loweb, 2004).
(2) Designers should take into account the characteristics of the analogue concept. A good analogue is one with which the students are already familiar, so it does not have to be taught from scratch, it just needs to be reviewed by means of hyperlinked websites. Another characteristic of a good analogue is that it shares many features with a target concept, rather than just a few features.
(3) Designers should follow the steps in the teaching-with-analogies model to introduce a target concept, suggest a good analogue, identify similar features of the analogue and target, visually map these features, indicate where the similarities break down, and draw conclusions about the target. Following these steps will help students to

Boris Aberšek, Metka Kordigel Aberšek, Andrej Flogie Experience-Based Learning – an Analogy for Self-Healing Porous Materials
DIVAI 2018 – The 12th international scientific conference on Distance Learning in Applied Informatics. 224 ISBN 978-80-7598-059-5 (Print) ISSN 2464-7470 (Print) ISSN 2464-7489 (On-line)
transfer relevant knowledge from the analogue to the target and to draw valid conclusions about the target.
(4) Designers should hyperlink features of elaborate analogies to related bodies of knowledge. Creating hyperlinks, within the website and to other websites, simulates the exemplary science teacher’s use of supplementary resources to enrich students’ learning. Because students vary in their relevant background knowledge, designers should link to a variety of resources that are relevant, accurate, and authentic.
(5) Designers should animate elaborate analogies to ensure that they engage students’ interest and promote understanding. Animation can help students to visualize the dynamics of processes by depicting temporal or causal sequences and the transitions that occur between stages and states.
(6) Designers should make elaborate analogies interactive to simulate the actions that exemplary teachers perform when using analogies. Students should be able to interact with components of the analogies by selecting embedded links. Actions such as questions, prompts, suggestions, and feedback should be incorporated into a hyperlinked, database-driven website that gathers information from students, displays it, and provides them with evaluations of their understanding.
STEM transdisciplinary teaching
Transdisciplinary learning and teaching is the exploration of a relevant issue or problem that integrates the perspectives of multiple disciplines (e.g., science, technology, engineering, and mathematics) in order to connect new knowledge and deeper understanding to real life experiences. There is a great variation in the onset and rate of physical development that students are curious about and need to know about during their school years. The area of research chosen in this article, i.e. bones, offers a non-sensitive but essential part of the body that is easily shown and readily available to the students. A major objective is for teachers to explore the skeleton as a basis to teach problem solving, graphing, ratios, proportions, percents, strength, etc. The objectives of this unit include activities such as:
1. list the ratio between bone mass, density and strength,
2. describe how bones grow using the femur as an illustration,
3. describe how bones are reformed in a process known as bone remodelling,
4. understand the process of self-healing,
5. connect and compare the functions and structures of bones and artificial porous self-healing materials,
6. list the type of bone porosity, etc.
The objectives described above have been accomplished using scientific information, names and explanations, through transdisciplinary integration (fusion) of biology, mathematics, science and engineering.

Boris Aberšek, Metka Kordigel Aberšek, Andrej Flogie Experience-Based Learning – an Analogy for Self-Healing Porous Materials
DIVAI 2018 – The 12th international scientific conference on Distance Learning in Applied Informatics. 225 ISBN 978-80-7598-059-5 (Print) ISSN 2464-7470 (Print) ISSN 2464-7489 (On-line)
Analogy through a mathematical model
In order to determine what to include in equations that mathematically describe the process of bone formation, we simply require some logical thinking. We can ask ourselves: “What changes the population of a species over time?” It is clear that the populations of cells over time are governed by a birth/source term minus a death/sink term. The amount of bone over time is influenced by the populations of osteoblasts and osteoclasts, the speed at which they act and, more subtly, where they exist (in the holes or pores of the bone!). Some biological and mathematical intuition allows us to derive differential equations.
When a mathematical model is constructed, it can be adapted and used for a variety of materials, including artificial ones. In this way, through the use of mathematics and the analogy method, we can connect basic sciences (biology, physics, chemistry, etc. – which are usually well known) to their applied versions (technology and engineering, which are usually less known, or even unknown). Thus, the understanding of natural process can help students to understand how man is able to recreate these natural processes, and produce artificial materials. We can transform the remodelling rule shown in Figure 3 to a remodelling algorithm shown in Figure 4. The remodelling algorithm can be used for different classes of materials.
Remodelling rule
Figure 3: Remodelling rule
An iterative algorithm for simulating bone adaptation around the screw was coupled with different numerical methods, such as for example the finite element method. The same algorithm can also be used for artificial porous materials.
CONCLUSION
As Duit et al. (2001: 285) noted, “Analogical reasoning is a key feature of learning processes within a constructivist perspective: every learning process includes a search for similarities between what is already known and the new, the familiar and the unfamiliar.” STEM teachers should support students’ learning by using analogies effectively. The steps in the teaching-with-analogies model and logical explanation describe how to do this. Carefully crafted elaborate analogies can help students understand science concepts that represent complex, hard-to-visualize, hard-to-understand systems with interacting parts. Analogies can also increase students’ interest in these concepts. Carefully crafted,
*+,*-
ψref
Dead zone
ψref - ω
ψref + ω
loss gain

Boris Aberšek, Metka Kordigel Aberšek, Andrej Flogie Experience-Based Learning – an Analogy for Self-Healing Porous Materials
DIVAI 2018 – The 12th international scientific conference on Distance Learning in Applied Informatics. 226 ISBN 978-80-7598-059-5 (Print) ISSN 2464-7470 (Print) ISSN 2464-7489 (On-line)
elaborate science analogies can help students build conceptual bridges between what they already know and what they are setting out to learn. Just like scientists such as Johannes Kepler and Steven Chu, STEM teachers should use analogies as pedagogical tools when explaining important concepts in science.
Bone-screw FEM
Solve von Misses
stresses for
transient stresses
state ψ
Compute local
bone density
change using
remodelling rule
Steady
state
reached?
actual mechanical
stimulus for
modelling/remodelling
Calculate
loading
history
Construct
bones/screw
geometries
Element stress
within dead
zone?
Control FEM
Solve von Misses
stresses for
reference signal
ψref
Stop
Figure 4: Remodelling algorithm
During the last few decades, more and more insights have been gained into the processes involved in bone adaptation, but also more and more questions have arisen regarding the underlying biochemical and mechanobiological pathways. With the availability of different imaging techniques to visualize and quantify different aspects of bone remodelling, we can create and validate simulation tools to reflect the behaviour of the human body at organ level, micro-level and single-cell level. The models presented here, which simulate the mechanical behaviour of bone at the organ level, represent bone by using its apparent material properties and apparent mechanical strength. This plays a significant role in the understanding of the stability of our bones within the body, but it also provides a significant opportunity to understand other, similar phenomena, which are not yet well known, such as artificial bones, and bone-like materials.
Further research will then, in turn, provide invaluable feedback for the development of more sophisticated and more reliable hierarchical models, forming an iterative process that will progressively further our understanding of bone adaptation. This process could eventually lead to the development of novel strategies for bone disease treatment, and improve our understanding of the basic phenomena related to artificial intelligent porous materials.
REFERENCES
Aberšek, B. (2016). Teaching with analogies: examples of a self-healing porous material. Problems of education in the 21st century, vol. 70, 4-7.
Bodemer, D., Ploetzner, R., Feuerlein, I., & Spada, H. (2004). The active integration of information during learning with dynamic and interactive visualisations. Learning and Instruction, 14, 325-341.
no
no
yes
Boris Aberšek, Metka Kordigel Aberšek, Andrej Flogie Experience-Based Learning – an Analogy for Self-Healing Porous Materials
DIVAI 2018 – The 12th international scientific conference on Distance Learning in Applied Informatics. 227 ISBN 978-80-7598-059-5 (Print) ISSN 2464-7470 (Print) ISSN 2464-7489 (On-line)
Duit, R., Roth, W.-M., Komorek M., & Wilbers J. (2001). Fostering conceptual change by analogies – between Scylla and Carybdis. Learning and Instruction, 11(4), 283-303.
Duit, R., & Glynn, S. M. (1992). Analogien und Metaphern, Brücken zum Verständnis im schülergerechten Physikunterricht. (Analogies and metaphors, bridges to understanding in student-oriented physics instruction.) In P. Häußler (Ed.), Physikunterricht und Menschenbildung (pp. 223-250). Kiel, Germany: Institute for Science Education.
Duit, R., & Glynn, S. M. (1995). Analogien – Brücken zum Verständnis. (Analogies – Bridges to understanding). Naturwissenschaften im Unterricht – Physik, 27(6), 4-10.
Gačnik, F., Ren, Z., Ihan Hren, N. (2014). Modified bone density-dependent orthotropic material model of human mandibular bone. Medical engineering & physics, 36, (12), 1684-1692.
Glynn, S. M. (2004). Connect concepts with questions and analogies. In T. R. Koballa, Jr., & D. J. Tippins, (Eds.). Cases in middle and secondary science education (2nd ed.) (pp. 136-142). Upper Saddle River, NJ: Pearson Education.
Glynn, S. M. (2007). Methods and strategies: Teaching with analogies. Science and Children,44(8), 52-55.
Glynn, S. M., & Takahashi, T. (1998). Learning from analogy-enhanced science text. Journal of Research in Science Teaching, 35, 1129-1149.
Hamilton, R. J. (1997). Effects of three types of elaboration on learning concepts from text. Contemporary Educational Psychology, 22, 299-318.
Hempel, C. G. (1965). Aspects of scientific explanation and other essays in the philosophy of science. New York: Free Press.
Holton, G. (1973). Thematic origins of scientific thought. Cambridge, MA: Harvard University Press.
James, M. C., & Scharmann, L. C. (2007). Using analogies to improve the teaching performance of preservice teachers. Journal of Research in Science Teaching, 44(4), 565-585.
Kaiser, W. (1989). Analogien in Physik und Technik im 19. und 20. Jahrhundert. (Analogies in physics and technology in the 19th and 20th centuries.) Berichte zur Wissenschaftsgeschichte, 12(1), 19-34.
Ploetzner, R., & Loweb, R. (2004). Dynamic visualisations and learning. Learning and Instruction, 14(3), 235-240.
Vickers, B. (1984). Analogy versus identity: The rejection of occult symbolism, 1580-1680. In B. Vickers (Ed.), Occult and scientific mentalities in the Renaissance (pp. 95-163). Cambridge, England: Cambridge University Press.


Metka Kordigel Aberšek, Boris Aberšek Typing or Longhand Writing – IWM Test, a Methodology for Making a Smart Decision
DIVAI 2018 – The 12th international scientific conference on Distance Learning in Applied Informatics. 229 ISBN 978-80-7598-059-5 (Print) ISSN 2464-7470 (Print) ISSN 2464-7489 (On-line)
Typing or Longhand Writing – IWM Test, a
Methodology for Making a Smart Decision
Metka Kordigel Aberšek, Boris Aberšek
University of Maribor, Maribor, Slovenia [email protected], [email protected]
Abstract
Keyboards are quickly replacing the pen and paper and children in school are increasingly encouraged to type instead to write by hand – also in the frame of science education. In this paper, we introduce a methodology to evaluate the result of such changing writing modality in the science class - the Impact of Writing Modality test, which is focused on the quantity and the quality of the text written in the science class and which is focused on the lexical, syntax and semantic level of the written text. The results of two case studies, in which IWM test was implemented confirm the expectations of the theoretical background (embodied cognition) and the expectations of the previous research of interconnection between writing modality and cognitive achievement. All that despite the fact that students are able to type a greater number of words in the same period as they are able to write them with the pencil. A closer look to their text-product shows a different picture: in the typing modality, they seem to be cognitively overloaded. In addition, the consequence of that is a lower level of academic achievements in their typed text. They show less knowledge, less terminological accuracy - and above all - less understanding of the interconnection between the listed information. We can conclude the IWM test confirmed itself as a useful methodology to make a decision whether to replace handwriting with typing in a science class or not.
Keywords:
Cognitive evaluation. Longhand writing. Typing. Science education.
INTRODUCTION
We cannot oversee that more and more of the current writing is the writing with digital devices, weather a laptop, tablet or smart phone. According to the study, performed in Great Britain on a sample of 2000 adult participants, one third of them had not written anything by hand in previous six month. On average, they did not write anything in last 41 days (Chemin, 2014) Computers and keyboards are quickly replacing the pen and paper and children in school are increasingly encouraged to type instead to write by hand. Even more, in the process of literacy acquisition at the beginning of primary school authorities tend to replace handwriting with keyboard typing.

Metka Kordigel Aberšek, Boris Aberšek Typing or Longhand Writing – IWM Test, a Methodology for Making a Smart Decision
DIVAI 2018 – The 12th international scientific conference on Distance Learning in Applied Informatics. 230 ISBN 978-80-7598-059-5 (Print) ISSN 2464-7470 (Print) ISSN 2464-7489 (On-line)
Scientific background
Such a development seen not to be in accordance with scientific background on which the decisions for changing literacy curricula and for changing a didactic paradigm should be grounded. As already pointed out in Kordigel Aberšek, Aberšek, Flogie (2018) the act of writing is a complex cognitive process, relying on perceptual sensorimotor combinations (Mangen et. all, 2015). Writing is the process of externalizing the content of our thinking, what we know what we think, what we feel … Writing always involves the skilful handling of mechanical/technical devices, and necessarily results in a visuographic representation: some kind of readable text in a form of letters or symbols (Mangen, Velay, 2010). The neuroscientific research points out writing is a process that requires the integration of visual, proprioceptive (haptics/kinaesthetic) and tactile information in order to be accomplished (Fogassi, Gallese, 2004). Replacing handwriting with typing is, according to the contemporary cognitive science, not only an act of adjusting writing curriculum to new, predominant technical devices. It will have, with high probability, implications to high-level cognitive processes of the Generation Z (Kiefer&Trumpp, 2012). The cognition namely does not take place only in our brain, but also in the perceptual and motor systems (Calvo&Gomila, 2008). According to the Embodied Cognition Theory the processes of perception (visual, audio, tactile), motor action and cognition are strongly connected (Gibbs, 2005; Shapiro, 2010). Embodied cognition is an active sensory, probing of humans' surrounding lifeworld. Learning and cognitive development are the processes, in which we develop representations by – hapticly – the interacting with the environment, by exploring our surrounding with all our sensory modalities. In other words: theoretical and empirical knowledge about the cognition and the brain point out the necessity of the acknowledgement that »the hands have a role to play in teaching and learning« (Goldin – Meadow, 2003). Not only in gestures and non-verbal communication, but also, and more specifically, in the haptics interaction with different technologies (Mangen, Velay, 2010).
Research of interdependence of writing modality and cognitive achievement
The majority of research in the field of the interdependence of writing modality and cognitive achievement has been performed with the focus on the morphological and lexical level. Longcamp, Anton, Roth and Velay (2005) performed the most influential study, focused on the morphological level. In this study, the impact of writing modality on the memorization of letters was observed. Children, which used a keyboard for learning of letters, recognized later a smaller number of letters than those, who used a pencil and paper and whose learning strategy was a synchronal reading and writing learning process. Longhamp et. all results, which were later (2008) confirmed by fMRI data, seem to have influence on literacy curriculum in those language communities with a very complicated relationship between phonemes and graphemes (like for instance in French language). France school authorities, differently than American ones, remain using handwriting in the literacy acquisition process.
Among the studies of impact of writing modality on the cognitive achievement on the morphological level, a study performed by Mangen, Anda, Oxenborough and Bronnick (2015) should be pointed out. Researchers checked, in which condition college students can remember lists of words more successfully. The experiment was performed in three writing modalities: students used a keyboard, they touched the fields on iPad and they wrote words with pencil on the paper. The results showed no statistical difference in

Metka Kordigel Aberšek, Boris Aberšek Typing or Longhand Writing – IWM Test, a Methodology for Making a Smart Decision
DIVAI 2018 – The 12th international scientific conference on Distance Learning in Applied Informatics. 231 ISBN 978-80-7598-059-5 (Print) ISSN 2464-7470 (Print) ISSN 2464-7489 (On-line)
achievement of word recall between typing on the keyboard and “typing” on the iPad, but they showed a statistical significant difference between word recall after typing and handwriting with the pencil.
The research of impact of replacing of taking notes in school or at the university with the pen (pencil) on the paper with typing them in to the computer is quite rare. One of most influential studies was performed by Mueller and Oppeheimer (2014) at the Princeton university. They gave the students a free choice to take notes in the writing modality, they prefer or they are more used to. Students of both groups, those, who chose a pencil, and those, who used a computer, listened to a 15 minutes-long lecture and afterwards answered 40 questions about the presented topic. After a week, a group of students had the opportunity to study their notes again – before answering the same set of 40 questions. Comparing the results of academic achievement showed the significant better results of those students, who took notes in handwriting modality. Mueller and Oppenheimer decided to explore the quality of notes, written in different modalities to clarify the cause of the different level of academic achievement. They compered, what was written, by focusing on the number of verbatim notes. They found out that the laptop notes contained 14,6% of verbatim overlap with the lecture in comparison with the notes, written with the hand, which contained 8.8% of verbatim overlap with the original oral text. Writing on the keyboard is obviously faster than writing with the hand. Consequently, a writer can take more notes, write more words, and store more information in his external memory (the computer file). On the other hand, the slowness of handwriting modality is pushing the student to modify the presented information in to the shorter form, before writing it down – which means the information stays in mind for longer time and in there manipulated. A decision-making processes, whether it is important enough to be written down, or it is not and can be neglected, do not allowed a shallow processing of new information in the school lecture.
Mueller and Oppenheimer’s study confirms the assumption that the quality notes in function of the external memory (the quality of the written text) correlates with the cognitive achievement. If that is so, we can continue developing the hypothesis: if there is a connection between the quality of the text and the cognitive achievement and if there is the interdependence between the typing modality and the quality of the written text, there must be a interdependence between the writing modality and the cognitive achievement. This new hypothesis is not connected, as on the first hand we could think, only with the question of writing narratives, it is far more important in the context of science literacy. Science literacy has to be understood in the broader sense of the word, as in the framework of the PISA. A modern science teaching approach knows that science literacy is not only a set of information about the nature, a modern science didactics is aware that in order to answer or solve scientific questions, several competences are needed. In this framework PISA distinguishes three competences: understanding scientific questions (distinction of scientific and non-scientific questions), explaining scientific phenomena (description, explanation and prediction of phenomena) as well as using scientific evidence (handling empiric evidence and scientific reasoning) (OECD Programme for International Student Assessment PISA, 2018).
In the context of our study, a second competence is of our particular interest: the competence of explaining scientific phenomena, which contains (according to PISA) also the competence to describe and to explain the scientific phenomena. This competence

Metka Kordigel Aberšek, Boris Aberšek Typing or Longhand Writing – IWM Test, a Methodology for Making a Smart Decision
DIVAI 2018 – The 12th international scientific conference on Distance Learning in Applied Informatics. 232 ISBN 978-80-7598-059-5 (Print) ISSN 2464-7470 (Print) ISSN 2464-7489 (On-line)
seem to be strongly connected with a language competence. And this connection of the science literacy (competence) and the competence to express knowledge and understanding of knowledge with linguistic means (in words and sentences) brings us closer to the solutions, how to observe and measure the text, written by students, to evaluate its’ usefulness in the progress of students’ academic achievement. Only counting the number of verbatim overlaps, as Mueller and Oppenheimer did, is in the context of science literacy not enough. A more sophisticated tool for measuring the quality of the written scientific text and for comparing the influence of writing modality on the quality of the written scientific text should be developed.
The impact of writing modality test (IWM test)
In the frame of present paper the Impact of Writing Modality (IWM) test is introduced and explained. It was developed for the purpose of a case study in Slovenia. Results of this study are presented in Kordigel Aberšek, Aberšek, Flogie, (2018). IWM test is focusing on the linguistic and thematic achievement level of student texts in the frame of science literacy. In this context, IWM test is serving, as a tool for making a decision weather handwriting should be abandoned from contemporary school for digital natives, or whether it serves for encouraging deeper taught and cognitive processes needed for gaining science literacy competence. IWM was developed to precisely observe which type of knowledge students demonstrate in the text, and how they understand that knowledge, by observing the language they use for expressing it, since texts (and language used in the text) are always a means of externalizing human thought (Mangen&Velay, 2010).
IWM test consists five sets of criteria and evaluates the text on the lexical, syntactical, and semantic level.
Criterion Nr. 1 - the lexical level
On the lexical level, the number of used words and the number of different words are counted. On the level of number of written or typed words, used in the scientific text, we could form two kinds of suppositions. According to the first one, the supposition that typing is the more demanding writing modality, a scientific text typed on the computer will contain less words than a scientific text written with the hand. According to the second supposition, according to which handwriting is more tiresome and far more slowly than typing, we could expect higher number of words, used in the typing modality.
Counting the words is not the only criterion observed on the lexical level. Focusing on the cognitive achievement, the IWM test is counting the number of different words in the text. A speed of typing words (a speed of the process of text production in typing modality) gives less time and opportunity for planning and choosing appropriate word selection. This will probably cause more lexical repetitions (i.e. less different words) in the text, written typing modality, in comparison with the handwritten text.
On the lexical level IWM is also collecting data about terminological accuracy. The number of used terms and the number of correct terms are counted and compared. Using the correct terminology is equally important from the linguistically as from the science literacy point of view: it is hardly possible to describe and explain scientific phenomena without learning and using the correct terminology. And above all it is impossible to develop the competence of distinction between science and non-science text, since the

Metka Kordigel Aberšek, Boris Aberšek Typing or Longhand Writing – IWM Test, a Methodology for Making a Smart Decision
DIVAI 2018 – The 12th international scientific conference on Distance Learning in Applied Informatics. 233 ISBN 978-80-7598-059-5 (Print) ISSN 2464-7470 (Print) ISSN 2464-7489 (On-line)
use of correct terminology and the use of figurative language is one of the main differences between them.
Criterion Nr. 2 – the syntax level.
For evaluating the syntax level, sentences and the syntactic structure of sentences is observed. These criteria gives us an insight into the students’ quantitative, but also their cognitive achievement. Compound sentences in IWM test were assumed as a cognitively more demanding text feature than simple sentences. In English grammar, a coordinate clause is a clause belonging to a series of two or more clauses, which are not syntactically dependent and are introduced by one of the coordinate conjunctions – most commonly ‘and’, ‘but’ or ‘or’. A subordinate clause or a dependent clause is a clause that cannot stand alone as a complete sentence. It is always used with the so called main clause and is introduced by subordinating conjunction, such as ‘because’, ‘when’,’ unless’… A subordinating conjunction is a grammatical means, which links constructions by making one of them a constituent of another. Most common subordinating conjunctions are adverbializers, which indicates, that subordinate clause they introduce has an adverbial relation to the main clause, indicating purpose, condition, time or location (Kordigel Aberšek, Aberšek, Flogie, 2018)
By counting the number of coordinate clauses in students’ typed and written texts and comparing them with the number of subordinate clauses IWM test gives a deeper insight into the students’ cognitive achievement in scientific writing. The subordinate clauses used to construct complex sentences points to a cognitively more advanced level of scientific narrative. The use of subordinate clauses indicates that the student understood the cause-effect interdependence between the data, that he understood the conditioning interdependence of the presented data and that he understood the time/location interdependence. Focusing on the number of subordinate clauses in the typed text could be an important indicator for students’ cognitive achievement or for his shallow processing of new information in the school lecture.
Criterion Nr. 3 - coherence of the text.
The coherence of a text refers to the meaningful connections that readers perceive in a written (or oral) text. Kamiloff and Kamiloff Smith (2001), developed for their research the criteria for evaluating the level of child’s language acquisition. They claim that coherence (and cohesion) is a significant indicator of speaker’s language competence. Even more, according to their research, coherence and cohesion are the key criteria for evaluating child’s language (Marjanovič et all., 2010). There must be pointed out that mentioned authors evaluated the level of language acquisition on the narrative texts - storytelling, but it seems logically that the coherence and cohesion are equally or even more important in the science explicatory text. It is typical for the science text that it is more rigorously structured than the fictional or everyday narrative text. In the fictional text the author has to take care about his originality, the text structure in fiction has to be innovative; the text structure is an important stylistic device. In a scientific text, on the contrary, a text structure is in most cases prescribed. A manuscript preparation for a scientific conference is in most cases prescribing the IMRAD structure for the paper. In a frame of science literacy and its’ aim: learning how to ‘explain scientific phenomena’, a student must learn a text structure for explaining geographic phenomena, chemic elements, the description of the plant, or a description of the animal… All this typical text

Metka Kordigel Aberšek, Boris Aberšek Typing or Longhand Writing – IWM Test, a Methodology for Making a Smart Decision
DIVAI 2018 – The 12th international scientific conference on Distance Learning in Applied Informatics. 234 ISBN 978-80-7598-059-5 (Print) ISSN 2464-7470 (Print) ISSN 2464-7489 (On-line)
samples have a strictly defined structure. For instance in the texts sample ‘description of a plant’, children are acquainted with very early in their curriculum, following structure is prescribed: description, taxonomy, distribution, ecology, uses, cultivation. Focusing on the cohesion of students typed or written text about the plant gives us the information about cognitive process behind it. The coherence of the text shows, how organized the new knowledge in students brain is. If the students’ text consequently follows the text structure, these shows, he has the whole picture. If the student writes the information just when it falls in his mind (and it does not belong in the particular paragraph), this means that the picture is fragmental and there is a very small possibility that such fragmental data will remain in his memory for a longer time. And of course there is a very little possibility that the student understands the interconnection between such fragmented particles of knowledge.
Criterion Nr.4 – cohesion of the text
Cohesion is a fundamental element of discourse analysis and cognitive stylistics. According to A. Naciscione (2001), cohesion is considered as one of the basic theoretical concepts of semantic relationships.
In the simplest terms, cohesion is the process of linking and connecting sentences together through a variety of linguistic and semantic ties, which can be broken into three types of semantic relationships: immediate, mediated and remote ties. In each case, cohesion is considered as the relationship between two elements in written or oral text where the two elements may be clauses, words, or phrases (Nordquist, 2018).
In immediate ties, the two elements that are linked occur in adjacent sentences, such as in the sentence "Common nettle is a flowering plant. It is native in Europe, Asia and northern America.” The plant stinging nettle is conveyed in the following sentence by the immediate tie of the word "it".
In mediated ties cohesion occurs through a link in an intervening sentence such as "Common nettle is a flowering plant. It belongs to the family Urticacea. It is native in Europa, Asia, Nothern America.” Here, the word “it” is used as a cohesion device to tie the name and subject stinging nettle through all three sentences. On a lower cognitive level, the writer would use a simple repetition. Instead of using the pronoun “it”, he could simple repeat the word common nettle. If he would continue with this cohesion strategy, we would talk about so called “chaining”. On the other hand, on the cognitive more demanding level the writer could use in such case synonyms or hypernyms as a cohesion tie. In this case, he would say as in Wikipedia: “Urtica dioica, often called common nettle, stinging nettle … or nettle leaf, is a herbaceous perennial flowering plant in the family Urticaceae. It is native to Europe, Asia, northern Africa, and western North America,[1] and introduced elsewhere. The species is divided into six subspecies, five of which have many hollow stinging hairs called trichomes on the leaves and stems, which act like hypodermic needles, injecting histamine and other chemicals that produce a stinging sensation when contacted by humans and other animals.[2] The plant has a long history of use as a source of medicine, food, and fiber. (https://en.wikipedia.org/wiki/Urtica_dioica)
Finally the cohesion can be created as a remote tie. If two cohesive elements occur in nonadjacent sentences, they create a remote tie wherein the middle sentence of a paragraph or group of sentences might have nothing to do with the subject of the first or

Metka Kordigel Aberšek, Boris Aberšek Typing or Longhand Writing – IWM Test, a Methodology for Making a Smart Decision
DIVAI 2018 – The 12th international scientific conference on Distance Learning in Applied Informatics. 235 ISBN 978-80-7598-059-5 (Print) ISSN 2464-7470 (Print) ISSN 2464-7489 (On-line)
third, but cohesive elements inform or remind the reader of the third sentence of the first's subject (Nordquist, 2018).
To sum up: cohesion is the process of linking and connecting sentences together through a variety of linguistic and semantic ties. In writing, the author can choose among several devices for creating cohesion, called cohesive clues. In the IWM survey, we focus on three groups of cohesive clues: repetition, pronouns and synonyms, hypernyms and homonyms in the function of transitional expressions.
Criterion Nr. 5 – knowledge
It was focused on to semantic level of students written and typed text. The so called knowledge was observed on the level of learned data, in the IWM called thematic items and on the level of understanding the connection between thematic items. The number of correct thematic items and the number of incorrect thematic items were observed, counted and compared. Finally, the survey focused on the students’ understanding of the interconnectedness of thematic items. Understanding the interconnectedness of thematic items and including this understanding into the text in such a way that the reader can understand the logical relationship between the information, demands from the student a high level of cognitive involvement. So this criterion seem to be vital for the decision whether to use the pencil and paper or to use computer and keyboard for taking notes in a science class.
IWM test was tested fort its’ suitability in two case studies in Slovenia. The aim of these studies was to find out whether the replacing paper and pencil with a key board would have an impact on cognitive achievement of young children in science class. Studying the scientific literature did not clarify this question, since the majority of research was focused on achievements of college and university students.
METHODOLOGY OF RESEARCH
A qualitative research approach was adopted since the main objective of the research was rather exploratory. A text analysis on the base of IWM test was undertaken according to categories defined in the focus of the research question.
Participants and context
In the first study (Kordigel Aberšek, Aberšek, Flogie, 2018) 26 children, aged between 10 years and 9 months and 11 years and 9 months participated in our research. This study took place in an urban area. In the second study, 23 5th grade students aged between 10 years and 9 months and 11 years and 9 month participated. This study was performed in a rural area. All children in both studies were students of the same class unit. This was important to guarantee the same educational context of the research: all children had the same computer education, all students had the same number of hours spent on the school computer devices and had the opportunity to construct the same amount of knowledge in their biology classes.

Metka Kordigel Aberšek, Boris Aberšek Typing or Longhand Writing – IWM Test, a Methodology for Making a Smart Decision
DIVAI 2018 – The 12th international scientific conference on Distance Learning in Applied Informatics. 236 ISBN 978-80-7598-059-5 (Print) ISSN 2464-7470 (Print) ISSN 2464-7489 (On-line)
Data Collection
After a week, spent in a scientific project, students were asked to write a textbook chapter about the plant, they had explored and studied in their scientific project. With the textbook chapter, a text sample was defined: informational correctness, terminological accuracy and the structure of the text - description of the plant. On the next day students went to their computer classrooms and again studied their graphic organizers, they turned on their computers and wrote the textbook chapter again – in the changed writing modality.
Data Analysis
Both texts were evaluated according to their lexical, syntactic, and semantic elements according to IWM test. Data from a written text of each student were compared with the data of his typed text. For the lexical level, syntax level and semantic level of the text mean values were calculated, for the coherence the percentage of texts which are written according to the feature of the text structure and which are only partly written according to the text structures calculated.
RESULTS OF RESEARCH
The results of research in both case studies, that, which was performed on a city school, and that, which was performed on the school in the rural area, are presented in the same table. Such form of presenting results had been chosen with the aim to give the quick insight into the differences among results, gained on the city population and on the rural population.
Table 1: Lexical level, syntax level and semantic level of writing performance according to writing modality
Social background city city rural rural Writing MODALITY WRITING TYPING WRITING TYPING mean mean mean mean
LEXICAL LEVEL Number of used words 129.5 139.8 123.4 142.7 Number of different words 122.4 130.4 112.6 127.8 Number of used terms 12.7 11.0 11.3 9.8 Number of correct terms 11.3 10.1 10.6 9.1
SYNTAX LEVEL Number of clauses 28.9 20.9 27.4 19.6 Number of clauses per sentence
1.90 1.50 1.9 1.4
Number of coordinate clauses 1.88 3.01 1.78 3.3 Number of subordinate clauses 3.78 2.59 3.56 2.01
Cohesive clues Repetition 4.9 7.03 4.5 8.4 Pronouns 13.3 11.2 12.7 9.3 Synonyms, hypernyms … 0.95 0.15 1.2 0.6
SEMANTIC LEVEL (KNOWLEDGE)

Metka Kordigel Aberšek, Boris Aberšek Typing or Longhand Writing – IWM Test, a Methodology for Making a Smart Decision
DIVAI 2018 – The 12th international scientific conference on Distance Learning in Applied Informatics. 237 ISBN 978-80-7598-059-5 (Print) ISSN 2464-7470 (Print) ISSN 2464-7489 (On-line)
Number of correct thematic items
29.5 26.4 27.4 25.3
Number of incorrect thematic items
1.75 3.1 2.3 4.2
Understanding interconnectedness of thematic items
2.0 0.7 1.9 0.5
The IWM test results show different picture on the lexical level than on the syntax level and on the semantic level. The lexical level confirms the supposition that typing is a less tiresome writing modality and the students write more words on the keyboard than on the paper. Since typing seem to be more automatically than writing, one would expect that the vocabulary would repeat itself in the typing modality. But the results show a different picture. Students from city area equally than students from rural area use more different words in the keyboard writing modality.
The syntax level of IWM test shows a different picture: the number of clauses is in both groups bigger in typing modality (which can still be explained with the fact that students type faster than they write on the paper) but observing the structure of clauses shows a much more simple structure of texts in typing modality. Number of clauses per sentence is in both group smaller in typed texts than in handwritten texts. Comparing the number of coordinate and subordinate clauses shows a bigger presence of subordinate clauses in handwritten texts. Comparing the difference of coordinate and subordinate clauses in city environment and in rural environment shows a bigger gap between writing and typing performance – which gives us a deeper insight in the students’ cognitive engagement in the process of writing a scientific text. This result is additionally confirmed with the result of observing the use of coherence devices: Students use more simple cohesive devices in typing modality than in writing modality. In typing modality, the most common cohesive device is a repetition (in grammar defined as the simplest possibility for connecting sentences). On the other hand, synonyms and hypernyms as cohesion devices, which are used in the longhand written text, in the keyboard written text hardy occur.
The semantic level of IWM test shows the knowledge, students had acquired in the science class. On this level the number of correct thematic structure are counted and the number of incorrect thematic items. Actually also the number of used terms and the number of correctly used terms could be considered in the frame of knowledge, which are in the IWM test listed in the lexical part of the table, because terms in linguistically logic belong on the lexical level. What is most interesting on the semantic level of IWM results is the possibility to highlight students’ understanding of interconnectedness of thematic items. We can observe weather students understand what they had learned or the data/information is a content of their memory only for a short time, because it is not connected to previous knowledge or to any previously existing mental scheme.
Table 2: Text coherence according to writing modality
Social background
city city city city rural rural rural rural
Writing modality
writing writing typing typing typing writing writing typing
f f% f f% f f% f f% Narration without structure
0 0 0 0 0 0 0 0
Narration partly

Metka Kordigel Aberšek, Boris Aberšek Typing or Longhand Writing – IWM Test, a Methodology for Making a Smart Decision
DIVAI 2018 – The 12th international scientific conference on Distance Learning in Applied Informatics. 238 ISBN 978-80-7598-059-5 (Print) ISSN 2464-7470 (Print) ISSN 2464-7489 (On-line)
uses features of the text structure
4 14.8
8 25.9
6 18.9
8 34.8
Narration consequently uses features
of the text structure
22
85.2
18
74.1%
17
81.1
15
65.2
The IWM test results on the level of text coherence show even a greater gap between results in the keyboard writing modality and longhand writing modality. In the 5th grade in Slovenia of course we do not expect a text without any text structure, because different types of the explicatory text and its’ texts structures are an important part of integrated language-science curriculum. So all results on the level of text coherence are between ‘narration partly uses features of the text structure’ and ‘narration consequently uses the features of the text structure’. The number of students, which forget to think about the text structure while typing the scientific text on the keyboard is bigger than when they are writing on the paper. And that despite the fact that text structure mistakes are very easy to correct on the computer screen, where a writer can scroll the button of the mouse, return to the place in the text, where the information belongs, and then returnes to the end of the text. IWM test shows on the text coherence level a bigger discrepancy between the city students and in the students in the rural area.
DISCUSSION AND CONCLUSIONS
The gained results confirm the suitability of IWM test for observing the interdependence of writing modality and cognitive achievement in science class. The writing modality according to IWM test has no influence on the number of used words, the number of different used words. Even more. Children write more slowly when they use the pencil or pen. Differently the typing modality according to IWM test has an influence on the cognitive achievement. Syntactic structure of the written text shows in comparison with the typed text more an advanced structure. In addition, on the semantic level with the IWM test more knowledge and deeper understanding of the knowledge were detected in the written text than in the typed text. Finally, IWM test detected a stronger influence of writing modality on the quantity and quality of the text among the students in a rural area.
The results we had gained with the help of IWM test confirm the expectations of the theoretical background (embodied cognition) and the expectations of the previous research of interconnection between writing modality and cognitive achievement. All that despite the fact that the Generation Z evidently uses the keyboard with a greater ease than the pencil and despite the fact that they are able to type a greater number of words in the same time frame as they are able to write them with the pencil. A closer look to their text-product shows a different picture: in the typing modality, they seem to be cognitively overloaded. In addition, the consequence of that is a lower level of academic achievements in their typed text. They show les knowledge, less terminological accuracy - and above all - less understanding of the interconnection between the listed information. We can conclude the IWM test confirmed itself as a useful methodology to make a decision whether to replace handwriting with typing in a science class or not.

Metka Kordigel Aberšek, Boris Aberšek Typing or Longhand Writing – IWM Test, a Methodology for Making a Smart Decision
DIVAI 2018 – The 12th international scientific conference on Distance Learning in Applied Informatics. 239 ISBN 978-80-7598-059-5 (Print) ISSN 2464-7470 (Print) ISSN 2464-7489 (On-line)
REFERENCES
Calvo, P., Gomila, A. (Eds.) (2008) Handbook of Cognitive science: An Embodied Approach. Amsterdam: Elsevier.
Chemin, A. (2014). Handwriting vs typing: is the pen still mightier than the keyboard? https://www.theguardian/science/2014/dec/16/. Retrieved 12. 2. 2018.
Fogassi, L., & Gallese, V. (2004). Action as a Binding Key to Multisensory Integration. In G. A. Calvert, C. Spence & B. E. Stein (Eds.), The handbook of multisensory processes (pp. 425-441). Cambridge, Mass: MIT Press..
Gibbs, R. W. (2005). Embodiement and cognitive science. Cambridge: Cambridge University Press.
Goldin_Meadow, S. (2003). Hearing Gesture: how our hands help us think. Cambridge, MA: Belknap Press of Harward University Press.
Kordigel Aberšek, M., B. Aberšek, A. Flogie (2018). Writing versus typing during science teaching: case study in Slovenia Journal of Baltic Science Education, Vol. 17. No. 1, 2018, (pp. 84 – 96).
Kiefer, M., & Trumpp, N. M. (2012). Embodiment theory in education.: The foundations of cognition and perception and action. Trends in Neuroscience and Education, 1(1), 15-20.
Mangen, A., Velay, J.-L. (2010). Digitalizing literacy: Reflections on the haptics of writing. In M. H. Zadeh (Ed.), Advances in Haptics (pp. 385 – 402). Vienna: IN-TECH web.
Mangen, A., Anda, L.G., Oxborough, G. & Brønnick, K. (2015) Handwriting versus typewriting: Effect on word recall. Journal of writing research. October 2015. https://www.researchgate.net/publication/275018584_Mangen_A_Anda_LG_Oxborough_G_Bronnick_K_2015_Handwriting_versus_typewriting_Effect_on_word_recall. Retrived 20.3.2017
Marjanovič – Umek, L., U. Fekonja – Peklaj, S. Kranjc (2010). Childrens’ Storrytelling: The Effect of the Preschool Family Environment. European Early Childhood Education Journal 18(1) pp. 55 -73.
Naciscione, A. (2001). Phraseological Units in Discourse: Towards Applied Stylistics . Riga: Latvian Academy of culture.
Nordquist, R. (2018): Languages. English Grammar. Parts of Speech. Adverbs. https://www.thoughtco.com/what-is-cohesion-composition-1689863 Updated February 03, 2018
OECD Programme for International Student Assessment PISA, 2018. http:www. pisa.dum.de, retrieved: 12. 2. 2018.
Shapiro, L. A. (2010). Embodied cognition. New York: Routledge.


Martin Bílek, Jarmila Kmeťová How to Combine Inquiry Based Science Education and ICT: A Case of Science Methodology
DIVAI 2018 – The 12th international scientific conference on Distance Learning in Applied Informatics. 241 ISBN 978-80-7598-059-5 (Print) ISSN 2464-7470 (Print) ISSN 2464-7489 (On-line)
How to Combine Inquiry Based Science Education
and ICT: A Case of Science Methodology
Martin Bílek
Faculty of Science,University of Hradec Králové, Hradec Králové, Czech Republic [email protected]
Faculty of Education, Charles University, Prague, Czech Republic [email protected]
Jarmila Kmeťová
Faculty of Natural Sciences, Matej Bel University, Banská Bystrica, Slovakia [email protected]
Abstract
The inquiry based science education (IBSE) differs from the instruction which insists on remembering facts only; it is a transformation into such a process which emphasizes understanding the concept and process of acquiring new knowledge itself. The centre of the problem is in the fact learners become involved into inquiring science relations and principles, they connect information into a meaningful context, develop their critical thinking and support to the positive approach to natural sciences. The term of “inquiry“ is synonymous with research, exploration, investigation, survey, examination, testing, i.e. with procedures which are typical for natural sciences as such; and which should be reflected and implemented in their process of teaching and learning. Sometimes the “inquiry-based“ instruction is defined as the transition from the deductive to inductive instruction. Despite this really is a method of considerable strengthening the inductive approach to the cognitive process, it cannot displace deductive ways of cognition from the science education. It should work in co-operation of both sides of one process, i.e. it provides mutual complementarity of cognitive tools of empirical-inductive and theoretical-deductive type. The IBSE is characterized by four levels which relate to the share of management within pupil´s activities from the teacher´s side – the confirmed, structured, guided and open inquiry. Each type requires specific application of the ICT depending on the support of basic methodological tools of the natural science cognition. Theoretical background and practical examples are described and discussed in the article.
Keywords
Inquiry-based Science Education. Computer Supported School Chemical Experiment. Early Chemistry Education. Sensors. Class Experimental Activities. Science Methodology.
INTRODUCTION
Lately, the constructivist paradigm has been penetrating the approaches to the science education, which is reflected in increased frequency of publication activities,

Martin Bílek, Jarmila Kmeťová How to Combine Inquiry Based Science Education and ICT: A Case of Science Methodology
DIVAI 2018 – The 12th international scientific conference on Distance Learning in Applied Informatics. 242 ISBN 978-80-7598-059-5 (Print) ISSN 2464-7470 (Print) ISSN 2464-7489 (On-line)
mainly in English and German literature (Nezvalová et al., 2005). The Czech scientists have been publishing some works but the occurrence in the field of science education is relatively rare (e.g. Doulík, 2005). The cognition as a construction activity relates both to the pupil´s cognitive activities and supportive role of the science teacher or science didactic researcher. The starting point is to accept the science concepts and pupils´ pre-concepts to be equal sources for content structure re-construction. In time of running curricular re-formation in the Czech Republic a new opportunity is provided, i.e. to increase pupils´ interest in science education, further science studies, job positions in science and technologies and last but not least to improve the general science literacy within the whole population. These ideas are reflected in several lines of innovations in the science instruction listed below:
� pupils´ interest in natural sciences and science instruction (What am I interested in?; What would I like to learn?; What will I need to know?) – responses to these questions were dealt e.g. in analyses of the international comparative study ROSE (Relevance of Science Education) (e.g. Bílek, 2005, Gedrovics, Bílek, Janiuk, Mojsa, Mozheika, Řádková, 2008),
� context of instruction (the ideal – “school science”, application context, social context, personality context) (e.g. Lavonen, Juuti, Byman, Meisalo, 2006, Balogh, Kuchárik, 2016),
� learning content (standards; framework and school education programmes; tradition; new topics (e.g. Čtrnáctová, Zajíček, 2010, Balogh Turčáni, Magdin, 2015),
� competences (key competences; “scientific literacy“; science activities, inquiry-based instruction (Held et al., 2011, Profiles Project, 2012, Primas Project, 2012).
The criticized constructivist (trans-missive) approach to instruction at schools is characterized by the dominant position of teacher and receptive passivity of pupils. Scientific information is received in such a form, which hardly includes its later application and use. Pupils are not able to use the knowledge in concrete situations because they do not recognize its relation to the reality; they are not able to apply the knowledge in real situations. Teachers should focus on creating content-rich communicative environment which will address the subjective field of experience and at the same time it will contain new “riddles and mysteries” which invite pupils to creative self-orientation. The teacher´s art is in predicting the chain of consequences between the pupil´s original construction of reality and scientific information, which the pupil understands as the state of expected contradiction, and solves and overcomes it using various approaches, including the trial-error way (e. g. Bílek, Klečková, 2006, Burianová, Turčáni, 2016).
INQUIRY-BASED INSTRUCTION IN EARLY CHEMISTRY EDUCATION
The inquiry-based science education or science instruction is called IBSE in English. The Czech equivalent is still under discussions, so currently other terms describing the same concept can be also used, e.g. “inquiry-based science instruction“, “inquiry-oriented conception of science instruction“ following the Slovak terminology (Held et al., 2011), or “discovery-based science instruction“ which is close to the concept of complex teaching methods of problem solving and the project method. In any case, the IBSE is based on

Martin Bílek, Jarmila Kmeťová How to Combine Inquiry Based Science Education and ICT: A Case of Science Methodology
DIVAI 2018 – The 12th international scientific conference on Distance Learning in Applied Informatics. 243 ISBN 978-80-7598-059-5 (Print) ISSN 2464-7470 (Print) ISSN 2464-7489 (On-line)
turning away from the only acquiring the presented facts to the transformation in such a process of instruction that emphasizes the conceptual understanding and entire process of acquiring knowledge. This process arises from learner´s engagement in inquiring (discovering) science principles, connecting information to the meaningful context, developing critical thinking and supporting the positive approach to natural sciences (Kyle, 1985, Rakow in Stuchlíková, 2010). The emphasis is paid on the process of instruction based on learners´ activity, i.e. on inquiring, not memorizing facts (Profiles Project, 2012). The term of “to inquire“ has other meanings in the educational context, e.g. to survey, investigate, research, question, and it is also used in the substantive form – a question. That is why we agree with the Czech approach defined by Stuchlíková (2010) or Papáček (2010) saying that “to inquire is a purposive process of formulating problems, critical experimenting, considering alternatives, planning and running research, deducing conclusions, searching for information, creating models of the studied phenomena, having discussions and defining coherent arguments.“ Some authors understand the “inquiry-based orientation” (mainly in the science education) to be the transition from the deductive to inductive instruction (Held et al., 2011). Although it includes the strengthening of inductive aspects of the cognitive process, we do not consider desirable to leave deductive ways to cognition in science education. As shown in the complex schema of science cognition (Bílek et al., 2011, p. 16) both approaches to the process of cognition work in co-action, i.e. in mutual complementarity of tools of cognition of both the empirical-inductive and theoretical-deductive types. Within the practical IBSE applications it is obvious that school inquiry will not be always identical with work of scientists. Age consequences, content consequences and material-technical consequences must be considered. Banchi and Bell (2008) characterized four IBSE levels regarding to the teacher´s involvement in managing pupils´ activities – the confirmed, structured, guided and open inquiry.
COMPUTER-SUPPORTED SCHOOL CHEMICAL EXPERIMENT AND INQUIRY-
BASED APPROACH
The IBSE is characterized by four levels of pupil´s activities – confirmed, structured, guided and open inquiry. They relate to the share of management within pupil´s activities from the teacher´s side. Each type requires specific application of the ICT depending on the support of basic methodological tools of the natural science cognition.
The computer measurement systems are an example of direct connection of the real experiment and computer, which means that the computer is used for recording, storing and processing the changing values of physical and physical-chemical quantities and as a managing medium for the automation of experimental activities. The reasons for using computers for these purposes are listed below (Bílek et al., 2011):
� direct support to experimental activities, i.e. recording values of measured quantities within an experiment, it means in real time,
� immediate evaluation and storing of experimental data,
� a more detailed insight in the role of computers in automation management systems of technological production processes,

Martin Bílek, Jarmila Kmeťová How to Combine Inquiry Based Science Education and ICT: A Case of Science Methodology
DIVAI 2018 – The 12th international scientific conference on Distance Learning in Applied Informatics. 244 ISBN 978-80-7598-059-5 (Print) ISSN 2464-7470 (Print) ISSN 2464-7489 (On-line)
� acquiring computer-supported methods of searching for information and processing,
� compensation of expensive laboratory equipment.
The connection of real experiments and computers, i.e. the technical devices and control and recording devices, is made either by sending the digital data directly to the input port of the computer, or in case of analogue data by using basic components of control automation systems – special computer peripherals - A/D - analogue-digital and D/A - digital-analogue converters which digitalize the given signal. The A/D a D/A converters thus work for registration of data (i.e. changing physical quantities) within the experiment and for influencing reactive conditions via control action elements. The quantities are measured by the computer and A/D converter and can be changed to proportional electric signal. That is why not only electric quantities can be measured but also the temperature, pressure, weight, tangential tension, pH-values, conductivity, light intensity etc. During these measurements the A/D converter is connected to the sensor (electrode, detector, etc.) or to the output from the measuring device. The D/A converter enables to transform the digital information from computer (i.e. the result of programmed instruction) to the analogue signal controlling the action elements. New computer measurement systems are being developed for school application to replace expensive professional complex hardware and software systems used in current production practice.
Basically, there exist two ways how measurement devices are connected to the computer:
� The device is located outside the computer and connected by the standard interface.
� A card is inserted in the computer motherboard (with A/D and D/A converters, digital inputs and outputs) the measured signals and control action elements are connected to.
The above described use of computers within the process of instruction evokes the problem of suitable software. Several software packages from production practice are provided which are applied in the process of creating managerial complexes in technological processes but their complexity and connection to special peripherals makes them less suitable for school experiments. That is why several attributes have been defined for school computer measurement systems following the principles of simplicity and clearness, which mainly include:
� digital presentation of quantities (data) in adequate font size and the graphical presentation on the monitor (either in present or switch on/off mode),
� possibility to compare similar measurements, i.e. comparison of several similar data files stored on the disc, or comparison to data from the real experiment,
� work with the graphical record, i.e. to focus on part of the records, cut or increase it, run a simple data processing,
� make measurements in two ways – in time intervals or step-by-step.
Each such a measurement programme consists of three parts:
� measuring of a selected quantity - MEASUREMENTS,
� working with data files - DATA,

Martin Bílek, Jarmila Kmeťová How to Combine Inquiry Based Science Education and ICT: A Case of Science Methodology
DIVAI 2018 – The 12th international scientific conference on Distance Learning in Applied Informatics. 245 ISBN 978-80-7598-059-5 (Print) ISSN 2464-7470 (Print) ISSN 2464-7489 (On-line)
� data processing - PROCESSING.
The MEASUREMENTS mode serves for setting or checking the parameters of the running experiment. Single parameters are set either step-by-step or at a time, in the form of dialogue window. The DATA mode enables to work with the received data stored in files, i.e. to zoom, store, load, print or write them down. The data can be adjusted within the PROCESSING mode. Programmes provide various possibilities how users can work with the data, from presenting them, lining single quantities, drawing approximate curves of demanding statistic operations etc.
Proceeding from the hardware and software advantages of computer measurement systems, following features of computer-supported chemical experiments can be used emphasizing all of four above mentioned IBSE levels.
I. Kinetic Aspect of Chemical Experiments
School experiments are often made in such a way, when pupils only determine the quantity in the reaction beaker before and after the reaction. They can measure e.g. the temperature by laboratory thermometer, the pH value by universal indicator paper, to set changes in the colour of solution, to watch the sediment etc. Computer measurement systems enable simple and operative implementation of the kinetic aspect in the course of experiments, i.e. pupils can determine and record the values of changing quantities within the experiment. These can be recorded in short intervals, e.g. less than 1 second, while if the thermometer is used, the interval of approximately 30 seconds is required for determining and recording the quantity. And, long observations (more than 1 hour) can be made supported by graphs designed at the same time and storing and evaluating the experimental data later on. Systems used in chemical experimenting mostly work in three modes of experimental data registration: first, the registration of the measured quantity in pre-defined intervals, second, the registration of the measured quantity in pre-defined intervals of another quantity (undependable variable on x axis, semi-automatic measurements, change of interval indication on the x axis e.g. after pressing any key, clicking the mouse etc.) and third, registration of the measured quantity in relation to another one (automatic measurements, two-channel ones as minimum). If this approach is applied, the most important for IBSE is fast and accurate data registration so that the verification of replies to questions (verification of hypotheses) could be provided, the data processed and presented.
II. Speed of Measurements and Frequency of Experiments
One of advantages of computer measurement systems is a wide variability of the measuring device (in addition to fast registration of experimental data) - an easy change of sensors (or sensors and modules) makes the digital pH-meter from the digital thermometer during several seconds etc. Thus numerous measurements can be made which are (often) not limited by the measured quantity, which means that wider or complex experimental units can be analysed. And, several approaches are available for IBSE, e.g. methodological set of experiments (i.e. the consequence of measurements which follow one after the other, or experiments with graduating complexity, parallel (comparative) experiments (comparison of various parameters of the phenomenon), partial experiments (co-operative approach to verification of defined problems), sets of experiments focusing on the same topics (complex concept of problems, e.g. monitoring of

Martin Bílek, Jarmila Kmeťová How to Combine Inquiry Based Science Education and ICT: A Case of Science Methodology
DIVAI 2018 – The 12th international scientific conference on Distance Learning in Applied Informatics. 246 ISBN 978-80-7598-059-5 (Print) ISSN 2464-7470 (Print) ISSN 2464-7489 (On-line)
the environment), strengthening of activating elements in the process of instruction (technical devices for collecting relevant data from experiments in progress which will result in trustful verification of hypotheses etc.).
III. Quantitative Aspect of Experiments
Computer measurement systems provide tools for quantitative description of phenomena, which have been characterized in the qualitative manner. They enable to make experiments, let us call them real ones, as their motivation elements relate to pupil´s (i.e. experimentation’s) own experience and thus are able to discover even small differences in measured quantities. These methods applying the verification of hypotheses, efforts to reaching the concrete product or output substantially contribute to developing intellectual and sensual-motoric skills.
Several applications of computer measurement systems in science (chemistry) instruction can be highlighted within the four IBSE levels (Bílek, Hrubý, 2012), e.g. the confirmed inquiry on example of neutralising reaction within the experimental confirmation of stoichiometry coefficients (temperature sensor for monitoring changes of temperature during the neutralising reaction with different molar relation of reactants) (Čipera, Bílek, 1997), the structured inquiry for verification of pH scale of samples available in households in the mini-project “Chemistry in the Kitchen“ (pH-sensor to measure pH of the set of “chemicals“ from pupils´ homes) (Bílek, 1999), the guided inquiry to discover causes of different thermal effects during the vaporization of liquids from the surface of the temperature sensor (Bílek, Toboříková, 2010), or the open inquiry in evaluation of natural science principles in suggestive TV advertisements (e.g. measuring of neutralisation with pH-sensor in mouth after eating by using of chewing gum or in stomach after hyperacidity) (Bílek et al., 1995).

Martin Bílek, Jarmila Kmeťová How to Combine Inquiry Based Science Education and ICT: A Case of Science Methodology
DIVAI 2018 – The 12th international scientific conference on Distance Learning in Applied Informatics. 247 ISBN 978-80-7598-059-5 (Print) ISSN 2464-7470 (Print) ISSN 2464-7489 (On-line)
Fig. 1 Temperature sensor for setting the changes in temperature during the neutralising reaction with different molar relation of reactants as an example of the confirmed inquiry for experimental checking
of stoichiometry coefficients of the neutralising reaction
Fig. 2 The use of pH-sensor for measurements of set of chemicals from households as an example of the structured inquiry for verification of the pH scale of household samples within the mini-project
“Chemistry in the Kitchen“
Fig. 3 Measurement of changes in temperature during the vaporization of liquids from the surface of the temperature sensor as an example of the guided inquiry for discovering causes of different thermal
effects of changes in chemicals state

Martin Bílek, Jarmila Kmeťová How to Combine Inquiry Based Science Education and ICT: A Case of Science Methodology
DIVAI 2018 – The 12th international scientific conference on Distance Learning in Applied Informatics. 248 ISBN 978-80-7598-059-5 (Print) ISSN 2464-7470 (Print) ISSN 2464-7489 (On-line)
Fig. 4 Measuring pH in the model experiment of neutralising the acid environment in stomach via antacids as an example of the open inquiry for evaluating science principles in TV advertisements
CONCLUSION
The computer-supported measurements both in or out of school laboratories provide new opportunities for school experimental activities by making the pupils´ laboratory activities more efficient applying the “inductive approach“, i.e. supporting the inquiry-based science (i.e. including chemistry) education. Creating diagrams and graphs as means of verification of hypotheses or expected results with direct participation of pupils is an important contribution to developing the science literacy. The problematic availability of demanding and expensive technical devices (automatic burettes, titration instruments, action elements) is thus replaced by quite a simple and flexible computer-based apparatus which is affordable under the school conditions and is used in common life as well. That is why the school paradigm should be oriented to forming partial competences which dominate the science instruction (i.e. Bílek, Toboříková, 2010, Bílek, Kmeťová, 2010, Machková, Bílek, 2013, Chroustová, Bílek, Šorgo, 2017), i.e. observation and measurements, comparison and ordering, research and experiments, predicting and verifying, discussion and interpretation, modelling and mathematisation, recherching and communication. The strengthening trends of increasing simplicity, robustness and universality of school computer measurement systems on one side, and their economic affordability on the other side are the strong promise towards necessary required changes.
Martin Bílek, Jarmila Kmeťová How to Combine Inquiry Based Science Education and ICT: A Case of Science Methodology
DIVAI 2018 – The 12th international scientific conference on Distance Learning in Applied Informatics. 249 ISBN 978-80-7598-059-5 (Print) ISSN 2464-7470 (Print) ISSN 2464-7489 (On-line)
ACKNOWLEDGEMENT
The research is supported by the OP VVV project “Didactics: Man and Nature A“, No. MS2014 CZ.02.3.68/0.0/0.0/16_011/0000665 at Faculty of Science University of Hradec Králové and program PROGRES Q17, part 5 “Teachers Education and Teacher’s Profession in Science and Research Context” at Faculty of Education Charles University.
REFERENCES
Aberšek, B., Kordigel-Aberšek, M., Dolenc, K. 2016. Modernization, Optimization and Development of STEM Education. In Turčáni, M., Balogh, Z, Munk, M. & Benko. L. (eds.) DIVAI 2016 – Proceedings of 11th International Scientific Conference on Distance learning in Applied Informatics, Prague: Wolters Kluwer, pp. 45-54.
Balogh, Z. Kuchárik, M. 2016. Petri Nets Tool Creation for Process Visualisation and Formalization. In Turčáni, M., Balogh, Z, Munk, M. & Benko. L. (eds.) DIVAI 2016 – Proceedings of 11th International Scientific Conference on Distance learning in Applied Informatics, Prague: Wolters Kluwer, pp. 67-76.
Balogh, Z., Turčáni, M., Magdin, M. 2015. Use of Petri Nets for Evaluation Modelling of the Student Transition through the Web Environment. International Journal of Education and Information Technologies, Volume 9, p. 29-35.
Banchi, H., Bell, R. 2008. The Many Levels of Inquiry. Science and Children, 46(2), 26-29.
Bílek, M. et al. 1995. IP-Coach a chemický experiment. Liberec, Praha: CMA Foundation, PEPEKO a MFF UK.
Bílek, M. 1999. Počítačem podporovaný chemický experiment i na základní škole. Biologie-Chemie-Zeměpis, 8(3), 140 – 145.
Bílek, M. 2005. Why to Learn Science and Technology? Selected Results of the International ROSE Project. In Mechlová, E. (ed.) Information and Communication Technology in Education – Proceedings, Ostrava: University of Ostrava, pp. 11 – 14.
Bílek, M., Klečková, M. 2006. K možnostem inovace výuky chemie na základní škole v době kurikulární reformy. In Kričfaluši, D. (ed.) Aktuální aspekty pregraduální přípravy a postgraduálního vzdělávání učitelů chemie – sborník přednášek z mezinárodní konference. Ostrava: PřF OU, s. 13 – 16.
Bílek, M., Kmeťová, J. 2010. Current Challenges for Computer Supported School Chemical Experiments. Problems of Education in the 21st Century, Vol. 24, pp. 58 – 65.
Bílek, M, Toboříková, P. 2010. Aktuální výzvy pro počítačem podporované školní chemické experimenty. In Chupáč, A., Veřmiřovský, J. (eds.) Aktuální aspekty pregraduální přípravy a postgraduálního vzdělávání učitelů chemie – Sborník přednášek z mezinárodní konference, Ostrava: PřF OU, s. 32 – 35.
Bílek, M., Hrubý, J. 2012. Počítačem podporovaný školní chemický experiment jako prostředek badatelsky orientované výuky. In Aktuálne trendy vo vyučovaní prírodných vied. Trnava: Trnavská univerzita. Pedagogická fakulta, s. 1-7.
Burianová, M., Turčáni, M. 2016. Non-traditional Education Using of Smart Devices. In Turčáni, M., Balogh, Z, Munk, M. & Benko. L. (eds.) DIVAI 2016 – Proceedings of 11th International

Martin Bílek, Jarmila Kmeťová How to Combine Inquiry Based Science Education and ICT: A Case of Science Methodology
DIVAI 2018 – The 12th international scientific conference on Distance Learning in Applied Informatics. 250 ISBN 978-80-7598-059-5 (Print) ISSN 2464-7470 (Print) ISSN 2464-7489 (On-line)
Scientific Conference on Distance learning in Applied Informatics, Prague: Wolters Kluwer, pp. 77-86.
Čipera, J., Bílek, M. 1997. Komplexní použití počítačů ve výuce chemie (Určování koeficientů reaktantů). Technológia vzdelávania, 7/97, 12 - 15.
Čtrnáctová, H., Zajíček, J. 2010. Současné školství a výuka chemie v České republice a v EU. Chemické listy, 100, 811-818.
Doulík, P. 2005. Geneze dětských pojetí vybraných fenoménů. Acta Universitatis Purkynianae 107 – Studia Pedagogica, Ústí nad Labem: UJEP.
Gedrovics, J., Bílek, M., Janiuk, R. M., Mojsa, R., Mozheika, D., Řádková O. 2008. Trendy změn v zájmech a postojích patnáctiletých žáků k přírodním vědám. In Acta Facultatis Paedagogicae Universitatis Tyrnaviensis, Séria D – Vedy o výchove a vzdelávání, Ročník 12, 2008; Supplementum 2 – Aktuálne vývojové trendy vo vyučovaní chémie. Trnava: PF TU, s. 13 – 17.
Held, Ľ. a kol. 2011. Výskumne ladená koncepcia prírodovedného vzdelávania. IBSE v slovenskom kontexte. Bratislava: Vydavateľstvo TYPI Universitatis Tyrnaviensis.
Chroustová, K. Bílek, M, Šorgo, A. 2017. Validation of Theoretical Constructs toward Suitability of Educational Software for Chemistry Education: Differences between Users and Nonusers. Journal of Baltic Science Education, 16(6), 873-897.
Kyle, W. C. 1985. What research says: Science through discovery: Students love it. Science and Children, 23(2), 39 – 41.
Lavonen, J., Juuti, K., Byman, R., Meisalo, V. 2006. Contexts and Teaching Methods in School Science. In Marnauza, M. (ed.) Theory for Practice in the Education of Contemporary Society – Scientific articles and Conference proceedings. Riga: RPIVA, pp. 277 – 281.
Machková, V., Bílek, M. 2013. Didactic Analysis of the Web Acid-Base Titration Simulations Applied in Pre-Graduate Chemistry Teachers Education. Journal of Baltic Science Education, 12(6), 829-839.
Nezvalová, D. a kol. 2005. Konstruktivismus v integrovaném pojetí přírodovědného vzdělávání – Bibliografie publikací k projektu GAČR 406/05/0188. Olomouc: PřF UP.
Papáček, M. 2010. Badatelsky orientované přírodovědné vyučování – cesta pro biologické vzdělávání generací Y, Z a alfa? SCIED, 1(1), 33 – 49.
PRIMAS Project. 2012. PRIMAS to promote inquiry-based learning in mathematics and science at both primary and secondary levels across Europe. [online]. Available at: <http://www.primas-project.eu>[Accessed 29 August 2012]
PROFILES Project. 2012. Profesní reflexně-orientované zaměření na badatelsky orientované přírodovědné vzdělávání (IBSE). [online]. Available at: <http://profiles.ped.muni.cz/ibse.ph> [Accessed 29 November 2012]
Stuchlíková, I. 2010. O badatelsky orientovaném vyučování. In Papáček, M. (ed.) Didaktika biologie v České republice 2010 a badatelsky orientované vyučování – DiBi 2010, s. 129 – 135. [on/line]. Available at: http://www.pf.jcu.cz/stru/katedry/bi/DiBi2010.pdf [Accessed 29 November 2012]

Jan Budina, Martin Zmitko Method of Analysis and Optimal Fingerprints Database Cleaning
DIVAI 2018 – The 12th international scientific conference on Distance Learning in Applied Informatics. 251 ISBN 978-80-7598-059-5 (Print) ISSN 2464-7470 (Print) ISSN 2464-7489 (On-line)
Method of Analysis and Optimal Fingerprints
Database Cleaning
Jan Budina, Martin Zmitko
Faculty of Informatics and Management, University of Hradec Kralove, Hradec Kralove, Czech Republic
[email protected], [email protected]
Abstract
Nowadays, we are surrounded with difference sensors and technologies. Modern technology improves our life and helps us with getting better experience with education in schools. Our school is developing new system for better e-learning, which is connected to the positioning system. All sensors collecting huge amount of data, which we need to analyse and process. The goal of following text is to design system, which can be able to automatically analyse data, proceed optimization of fingerprint database and provide results. The following text describes set of algorithms, which helps with this issue.
Keywords
iBeacon. Localization. Database. Bluetooth 4.0 Low Energy. Algorithm. Optimisation. E-learning. School.
INTRODUCTION
At the time of great boom in mobile technologies and related applications, we are opening a whole new perspective on communication technologies and e-learning. E-learning is widely used to provide access to study materials, whether from school or from home. To enable the students to share the content at the right time, the technology is needed, that is able to locate students inside the building and determine where the school located is. For these purposes, devices called Bluetooth Beacons were developed, in our case, iBeacon. They are usually used in large shopping centres, for example, to focus on discounts or to obtain more detailed information about the goods. iBeacon (Budina et al., 2015) is a very small device powered by a small battery, so it can work for several years without the need for any intervention. iBeacon works as a beacon that transmits via Bluetooth 4.0 LE (low power). In this time, the University of Hradec Kralove has one of the buildings fitted with iBeacons. Due to the correct placement of iBeacon, it is possible to determine precisely the location of the student if he / she is inside or outside a classroom. Based on this information, it is possible to provide students with materials suitable for teaching in specific classrooms. In order to reliably determine the location, the database should have its fingerprints and their bases and their similarity to determine the location. The problem occurs in a database that is filled with fingerprints of various devices that can send bad data that does not match actual information. The aim of this work is to create an

Jan Budina, Martin Zmitko Method of Analysis and Optimal Fingerprints Database Cleaning
DIVAI 2018 – The 12th international scientific conference on Distance Learning in Applied Informatics. 252 ISBN 978-80-7598-059-5 (Print) ISSN 2464-7470 (Print) ISSN 2464-7489 (On-line)
algorithm that will be able to analyse this database and identify those fingerprints that do not correspond to reality and isolate them.
PROBLEM DEFINITION
The aim of this paper is to optimize the fingerprint database in the system under preparation . The database is created as a source of fingerprints for comparing with incoming data and using appropriate methods to determine the user's position within buildings. The aim is to create the system that will analyse and optimize the mentioned fingerprint database in several phases. This analysis and optimization will be done in the form of an experiment within a real environment. Hypothetically, it can be assumed that the resulting database over which a system for optimization works for some time will be more efficient, accurate, and potentially more usable than a database over which a similar system didn´t work. Self-optimization can be viewed from several perspectives. The first criterion for the parameters of the upcoming system is the speed which we can obtain the relevant data from the database with. Just the speed plays here a critical role in the upcoming application. From the point of view of speed, we get into a situation where you need to search in big data within seconds. Within this approach, we will try to use a variety of principles and technologies to meet this assumption, such as elastic search or partitioning over databases. The second glance within the overall optimization is to define the algorithm where, with its start-up and simulation, we will be able to locate and isolate fingerprints that in any way interfere with the overall condition of the database. The work will therefore concentrate on defining procedures and rules for cleaning this database and re-validating this theory in practice.
RELATED WORK
As part of the solution, we have encountered a number of similar projects that solve this problem and system and algorithm design to some extent. Let us take a closer look at each of them. Based on research, there are no similar systems or concepts. In the following are described basic technologies and concepts.
Elastic search
In the first steps of our experiment at the University of Hradec Kralove, we dealt with the overall approach to optimizing the search speed in large data. More research has led us to ElasticSearch. This is a fulltext search principle based on Apache Lucene. Key features include: Providing large amounts of data in real time, Distributed system, High availability and RESTful API. (Gormley and Tong, 2015)
Above all, the possibility of using RESTful api and providing real-time data was the reason why we are going to plan to use this technology as part of our experiment. At the same time, the scalability of the system allows us to expand easily and optimize searches with future data growth. This technology uses its own database system based on the NoSQL principle to store data. It uses its main benefits, including distribution and horizontal scalability. Thus, there are no classical transactional relationships in the database that would make unnecessary delays in this system. Compared to traditional

Jan Budina, Martin Zmitko Method of Analysis and Optimal Fingerprints Database Cleaning
DIVAI 2018 – The 12th international scientific conference on Distance Learning in Applied Informatics. 253 ISBN 978-80-7598-059-5 (Print) ISSN 2464-7470 (Print) ISSN 2464-7489 (On-line)
database concepts, for example, Postgres and Full-Text Search does not just look for the exact match between the search phrase and the search text, it searches for the entire context of the information from the search phrase (Baldominos et al., 2014). For data collection, PostgreSQL and ZooKeeper are used as the first store before the data are reloaded into the Elastic Search database.
Bigdata
In conjunction with Elastic Search, the Bigdata concept goes hand in hand and with it, Hadoop framework, which facilitates the physical storage of data on servers into specific documents. This is basically a distributed file system. All major portals use this system (Google, Amazon, Facebook) (Nandimath et al., 2013). This highly scalable and distributed system can be used when we need to access a large amount of data. The system itself consists of two main components. The first one is the Hadoop Distributed File System, which is a proprietary file system. The second part is MapReduce - here is a programming paradigm using redundancy, which means that individual information is stored in different ways (Thusoo et al., 2010). Thanks to this redundancy, it is possible to distribute features through clusters. This is the master / slave type where the master manages the file tree and its metadata, and the slave provides the writes and updates of data and informs master about all the changes. This system is used by many companies from Facebook through Amazon, Apple and Google itself. For example, JPMorganChase, which uses Hadoop, thanks to this technology, manages 150 petabytes of data through 30,000 databases and 3.5 billion user accounts (Tang et al., 2015).
Partitioning
Partitioning in the context of BigData offers direct Handoop using the so-called map reducer. Looking at the partitioning itself in our system will then be a bit less common than in common systems. Here are the main partitions divided mainly by the time stamp. This allows easy manipulation of data - for example, deleting data (data clusters that are tied to a specific date) (Sacca et al., 1982). We do not, however, need to throw away quickly the entire partitions from a date. Our goal is to search more effective. However, our fingerprint database may look geographically rather than timer. This database is basically a cluster of information that potentially is connected to a place in the building. If we can divide this building into predefined sectors, we can look at information in database indexed through these sectors. This assumption will allow us to work with the data more efficiently (Ceri et al., 1982). First, determine the approximate location of the user - the sector in which it is located, and then look for the similarity of fingerprints obtained from this sector. If we find a similar imprint in another sector, it may be a fingerprint that we do not want in this database, and we will then try to isolate it and then test it - which will be, among other things, the work of a being prepared analyser, which we describe in the next part (Ross and Cieslewicz, 2009).
METHODS
In this part, the paper focuses on the system design itself and the description of the key features and functionality. Our goal is to create a general procedure - an algorithm or mechanism that can be applied to a fingerprint database. Although in the chapter on
Jan Budina, Martin Zmitko Method of Analysis and Optimal Fingerprints Database Cleaning
DIVAI 2018 – The 12th international scientific conference on Distance Learning in Applied Informatics. 254 ISBN 978-80-7598-059-5 (Print) ISSN 2464-7470 (Print) ISSN 2464-7489 (On-line)
testing we show some of the real implementation, which serves as a validation of the proposed solution, we leave the remainder of the design description on a general theoretical level, primarily because of the easy demonstrability and portability of any task in relation to fingerprint databases. The reasons behind the description mechanism below are as follows:
� many fingerprints in the database
� dynamic development of stored fingerprints and total database fingerprint status
� Inability to monitor the quality of the database from a data viewpoint
� Inability to estimate database development and respond to emerging situations
The reasons mentioned above were used as a basis for the creation of this work. If we focus on filling the database in one of the parallel research, we come to the following conclusions. The measurement factor of the application itself is its usability in practice. The aim is to measure the real fulfilment of the database from the theoretical one. First the upper boundary of the database was defined. This value was determined based on the following formula:
measure/minute * minutes * hours * days * people * size of record = size of database in period (1)
After we add real numbers to the calculation:
6 * 60 * 5 * 30 * 2250 * 0,015 = 1,822 GB per month (2)
This means 121 500 000 records every month.
The above points to the fact that the databases that will work with the prints will not be insignificant. Considering the assumption that such a database will contain inappropriate prints, it can be assumed that in large databases this number will not be insignificant. In the case of database fingerprints, it cannot be viewed as a common repository, it is necessary to realize the underlying fact, that each subsequent measurement affects the overall state of the database and the ability of the database to provide data to obtain accurate positioning results. Therefore, it is necessary to look at the fingerprint database as a function that evolves over time. The course of this feature needs to be monitored to analyse and optimize. Otherwise, the database may run into a state where it does not provide the required accuracy, and may partially or completely clean the database with the need to re-feed the database. The following part describes the division of the mechanism into two basic components - Analyzer and Optimizer.
Analyzer
Because it will be a large database with many millions of records, it is not advisable to work with the whole database. That is why the so-called analyser was decomposed. It is a mechanism that runs at regular intervals over the fingerprint parts of the database and will try to analyse and test their status. The acquired knowledge passes on the output as input for the second part of the optimizer, which will provide the optimization of the database itself or its part. By separating the analyser we ensure that the overall mechanism has minimal impact on the overall database load. The analyser can be described by the following procedure:
Start
Set partition as processing
Load data from partition

Jan Budina, Martin Zmitko Method of Analysis and Optimal Fingerprints Database Cleaning
DIVAI 2018 – The 12th international scientific conference on Distance Learning in Applied Informatics. 255 ISBN 978-80-7598-059-5 (Print) ISSN 2464-7470 (Print) ISSN 2464-7489 (On-line)
Proceed Random Test of N elements (core of analyser)
Analyse results
Store information about partition into analyser_results table
Set partition as processed
Finish
The analyser will therefore be such a test micro unit that runs throughout the day and will test the parts of the database according to the partition, according to the geographical breakdown. The way the database is divided is shown below.
Figure 1: Environment analysis
It is visible from the Figure 1 Environment analysis that the individual sections of the building floor are geographically divided into parts. These sections also reflect the individual partitions in the database in which the prints are stored. The granularity is determined from the distance to which the given beacon type can transmit the signal. From this data, the mean value was taken, with no signal loss, in our case 10m. Partitioning in the proposed system also works with the building floor. Overall, the partition is determined by the floor of the building - the geographic column and the space line. The mechanism also knows about neighbouring partitions within one floor due to so-called cross-partition impressions. It can be assumed that the database will contain fingerprints that come from the same or neighbouring partitions (cases where it is not, it deals with and solves the next part of the work), it is therefore appropriate to take into consideration the neighbouring neighbours (marked yellow). All others are invisible for the analyser in this moment, and these partitions and their fingerprints are not taken into account for that part of the calculation and are marked as "forbidden" (marked in red).
Random Test of N Elements
Random Test of N Elements (RToN elements) is the pivotal part of the analyser that is in the phase when testing a particular partition and its surrounding elements by entering this part is a coefficient N that determines the number of prints that will be checked in that partition. Coefficient N is determined as a number equal to max. 10% of fingerprints from a partition. If there are 100,000 fingerprints in the partition, 10,000 entries will be tested per iteration. This iteration checks the measured fingerprints and beacons from which the fingerprint was compiled with respect to the partition in which the beacon is located. If the analyser evaluates that two or more unique fingerprints come from the so-called forbidden partition, the analysed partition is marked as potentially problematic along with the fingerprints that served as a source for that designation. This information is used as an input for the optimizer, which is described in the next subchapter.

Jan Budina, Martin Zmitko Method of Analysis and Optimal Fingerprints Database Cleaning
DIVAI 2018 – The 12th international scientific conference on Distance Learning in Applied Informatics. 256 ISBN 978-80-7598-059-5 (Print) ISSN 2464-7470 (Print) ISSN 2464-7489 (On-line)
Optimizer
Optimizer is the second component of the mechanism described in this work. The input was provided by the Analyzer, which uses and processes further. The Optimizer also works over the fingerprint database. In this case, there is no repeated running during the day. This component was scheduled to run only once a day and aims to improve database status. The various parts of the algorithm described below.
Separation of extremes
Every fingerprint contains all of the scanned transmitters seen at the time of scanning. From this set of scanned transmitters, we want to remove values that are out of range. Extreme separation was carried out using a so-called knowledge matrix. It contains information about whether individual iBeacon can be seen between them. This information is very important for the algorithm that goes through the database and performs basic cleaning from measured crosstalk. In the event that we measure extreme data that is not physically possible, the algorithm can be found and deleted by comparison with the knowledge matrix.
Figure 2: Extreme separation
The matrix must be manually filled when adding individual iBeacon devices to the infrastructure. It is clear that the transmitters that are located at the other end of the building will not see them, so it is necessary to mark them as invisible. If someone simultaneously measures both transmitters, the record will be deleted from the database.
To identify fast and efficiently which transmitters do not see each other, it is necessary to create and maintain a knowledge matrix. This matrix lists all transmitters that are physically distributed around the building and distinguishes whether the transmitters see each other. At this stage, we are dealing only with extremes where each transmitter is at another end of the building or on another floor. These extremes can significantly affect the resultant fingerprint and its position. Depending on the removed extremes, it will be necessary to recalculate the fingerprint positions.
start
load knowledgeMatrix
repeat for all fingerprints from partition
load all beacons from fingerprint
delete duplicates beacons
compare beacons each other
remove extreme beacons

Jan Budina, Martin Zmitko Method of Analysis and Optimal Fingerprints Database Cleaning
DIVAI 2018 – The 12th international scientific conference on Distance Learning in Applied Informatics. 257 ISBN 978-80-7598-059-5 (Print) ISSN 2464-7470 (Print) ISSN 2464-7489 (On-line)
count new position for fingerprints
finish
Clustering
Clustering works with data cleared from extremes from the previous algorithm. Each fingerprint was scanned several times during fingerprint scanning. When scanning a single fingerprint, at least five Bluetooth devices were scanned. Remote fingerprints were not scanned as often, as they usually have a higher signal attenuation and do not get so many times in a scanned set of transmitters.
Figure 3: Clustering diagram
As described in Figure 3 Clustering diagram, the light orange lines and transmitters correspond to the first scan, the darker second and the brown third scan. Transmitters that are closer to the scanning device will be in all of the scans during the fingerprint acquisition interval. This method is more reliable than simply subtracting signal attenuation, which often fluctuates, may be affected by reflections between walls or attenuation between walls. Even by its averaging, we do not get the correct values that would be better used to refine the position. After applying this method, the three most frequent occurrences of the given transmitters in the given location were identified. Other transmitters are of lower frequency and will be erased from that measurement. After this hit, the resulting position from the given fingerprint is recalculated.
start
repeat for all fingerprints from partition
load all beacons from fingerprints
do frequency analyse for beacons
find three highest values
remove rest of values
count new position for fingerprints
finish
Post-processing
This is the last part of the overall mechanism. This is a set of tests and measurements that serve to analyse and establish the reliability of a new recalculated database. These are the following.
Measurement of changes
This is where the optimizer performs the analysis and formulation of the changes. This design provides the possibility of refurbishment performed by optimizations and opens up the possibility of analysing individual changes.

Jan Budina, Martin Zmitko Method of Analysis and Optimal Fingerprints Database Cleaning
DIVAI 2018 – The 12th international scientific conference on Distance Learning in Applied Informatics. 258 ISBN 978-80-7598-059-5 (Print) ISSN 2464-7470 (Print) ISSN 2464-7489 (On-line)
Correlation analysis of subjects in partition
This module attempts to find a correlation between the individual prints that were removed from the previous partitions within the partition being watched. These fingerprints were compared with the manufacturer's and device model parameters, as well as the time of fingerprint measurement. The aim is to verify whether the problematic impressions found in one partition were correlated with other fingerprints created under the same conditions or from the same device. In this case, it is advisable to have the statistics of these devices and eventually exclude them from the database.
Finding of weak partitions
The aim of this part of the post-processing is to estimate the potentially poor partition in terms of the location of the transmitting equipment. This module works with the assumption that if there is a number of measurements in the problematic partition whose sources (iBeacons) originate from neighbouring partitions or partitions that are forbidden, it can be assumed that there is probably not enough broadcast coverage in this area. This section allows us to identify easily the so-called "white spots" in our design of deploying individual iBeacons.
Testing of database reliability
Testing of database reliability serves to verify that the given Optimizer (or Analyzer) course was beneficial in the context of an overall database view. This is essentially a module for automatically testing the functionality of the proposed mechanism and reporting this information. All testing works based on comparing an already modified and refined database with database status before these actions using a set of authenticated fingerprints that are known to be sent to both databases.
RESULTS
The testing of the above algorithms are based on the post processing, which reports on the modifications to the database and changed fingerprints. To be able to determine whether the algorithms have contributed to improving the database, you need to test the original version of the database and over the repaired version. The first part finds out if all the extremes have been removed from the database and the second part is whether the position has been refined.
In the framework of testing, the implementation of theoretical knowledge within the real environment of the faculty was verified.
Test of extreme values
The test sequence deals with searching for possible extreme values that the first algorithm could not remove.
Testing is based on a knowledge matrix that brings together visibility information between partitions. The algorithm passes all data in the database and verifies them against a knowledge matrix. As a result, we will get information on whether an analyser is working properly to identify the wrong partition and pass it on to the optimizer to remove the extremes of the fingerprints.

Jan Budina, Martin Zmitko Method of Analysis and Optimal Fingerprints Database Cleaning
DIVAI 2018 – The 12th international scientific conference on Distance Learning in Applied Informatics. 259 ISBN 978-80-7598-059-5 (Print) ISSN 2464-7470 (Print) ISSN 2464-7489 (On-line)
Test of accuracy
For accuracy testing, a test agent is used to simulate mapping and builds test fingerprints based on their position. Based on these fingerprints, it is then possible to test the quality of the repaired database.
Based on this fingerprint, we expect a certain output from the database. The output is the scanned transmitters that should be located in the given location. We send these data to both the old and the cleaned databases and we investigate in which of them the resulting location more accurate is. Because it is a test fingerprint, where we know the exact location, we can determine which database is more accurate.
Result of testing
The purpose of testing was to verify the functionality of the proposed and described access to the fingerprint database. Experiments conducted under local conditions at the University of Hradec Kralove suggested that the proposed principle could be realized. As part of testing, the initial version of the algorithm, which was run over the database for some time, was tested. From the results presented below, it is clear that after a certain period of time, in our case 7 days, the accuracy of the database from the point of view of the provided position increased by 12%. It can be assumed that additional modulations will be improved when the mechanism is replenished. An important factor is also the length of time the mechanism was deployed. The graph shows that the database was progressively optimized during testing. These receipts are likely to stabilize at a certain level after a certain time.
Figure 4: Optimisation progress
DISCUSSION
This article explores the possibility of optimizing the fingerprint database to improve its quality and provide better results when comparing fingerprints. Certain difficulties are empty places where there are few fingerprints, and it is not so good to provide relevant
1,747
3,316
5,049
6,725
8,416
10,063
11,851
0,000
2,000
4,000
6,000
8,000
10,000
12,000
14,000
1 2 3 4 5 6 7
AC
CU
RA
NC
Y [%
]
DURATION [DAYS]
Optimisation progress

Jan Budina, Martin Zmitko Method of Analysis and Optimal Fingerprints Database Cleaning
DIVAI 2018 – The 12th international scientific conference on Distance Learning in Applied Informatics. 260 ISBN 978-80-7598-059-5 (Print) ISSN 2464-7470 (Print) ISSN 2464-7489 (On-line)
results from the database. Certain options for filling the database in these empty places can be the use of an autonomous robot that would ride along a precisely defined route and scan fingerprints. This would fill the database with relevant data to provide more accurate user location information. Secondary information resulting from this problem is the blanks warning and the possibility of extending the algorithm to propose the location of additional beacons to the surrounding area so that space is sufficiently filled with fingerprints.
Building partitioning has proven to be a great way to distinguish where the beacon is, whether it is visible to you and whether it is relevant to the fingerprint. It helps to remove the beacons, which represent an extreme value and disturbed positioning from the remaining beacons.To compare the resulting values when testing and reporting, it is always good to keep old and new.
REFERENCES
BALDOMINOS, Alejandro, Esperanza ALBACETE, Yago SAEZ a Pedro ISASI. A scalable machine learning online service for big data real-time analysis. In: 2014 IEEE Symposium on Computational Intelligence in Big Data (CIBD) [online]. IEEE, 2014, s. 1-8 [cit. 2017-12-06]. DOI: 10.1109/CIBD.2014.7011537. ISBN 978-1-4799-4540-5. Online: http://ieeexplore.ieee.org/document/7011537/
Budina J., Klapka O., Kozel T., Zmitko M.: Method of iBeacon optimal distribution for indoor localization. In George Angelos Papadopoulos. Proceedings of the Ninth International and Interdisciplinary Conference on Modeling and Using Context, Larnaca, Cyprus, November 2-6, 2015. Springer
BUDINA, Jan, Martin ZMÍTKO a Pavel KŘÍŽ. Optimization of algorithms in relation to ibeacon. Journal of Telecommunication, Electronic and Computer Engineering. 2017, 2017, 47-51. ISSN 21801843.
CERI, S., M. NEGRI, G. PELAGATTI, et al. Horizontal data partitioning in database design. Proceedings of the 1982 ACM SIGMOD international conference on Management of data - SIGMOD '82. New York, New York, USA: ACM Press, 1982, 15(3), 128-. DOI: 10.1145/582353.582376. ISBN 0897910737. ISSN 1424-8220. Online: http://portal.acm.org/citation.cfm?doid=582353.582376
GORMLEY, Clinton a Zachary TONG. Elasticsearch: the definitive guide. Sebastopol, CA: O'Reilly, 2015. ISBN 978-1-449-35854-9.
NANDIMATH, Jyoti, Ekata BANERJEE, Ankur PATIL, Pratima KAKADE, Saumitra VAIDYA a Divyansh CHATURVEDI. Big data analysis using Apache Hadoop. IEEE, 2013, , 700-703. DOI: 10.1109/IRI.2013.6642536. ISBN 978-1-4799-1050-2. Online: http://ieeexplore.ieee.org/document/6642536/
ROSS, Keneth A., CIESLEWICZ, J. Optimal splitters for database partitioning with size bounds Proceedings of the 12th International Conference on Database Theory - ICDT '09. New York, New York, USA: ACM Press, 2009, 10(1). ISBN 9781605584232. ISSN 03625915. Online: http://portal.acm.org/citation.cfm?doid=1514894.1514907
SACCA, Domenico, Gio WIEDERHOLD, G. PELAGATTI, et al. Database partitioning in a cluster of processors. ACM Transactions on Database Systems. New York, New York, USA: ACM Press,

Jan Budina, Martin Zmitko Method of Analysis and Optimal Fingerprints Database Cleaning
DIVAI 2018 – The 12th international scientific conference on Distance Learning in Applied Informatics. 261 ISBN 978-80-7598-059-5 (Print) ISSN 2464-7470 (Print) ISSN 2464-7489 (On-line)
1982, 10(1), 29-56. DOI: 10.1145/3148.3161. ISBN 0897910737. ISSN 03625915. Online: http://portal.acm.org/citation.cfm?doid=3148.3161
TANG, Jian, Yuwei CHEN, Liang CHEN, et al. Fast Fingerprint Database Maintenance for Indoor Positioning Based on UGV SLAM. Sensors. IEEE, 2015, 15(3), 5311-5330. DOI: 10.3390/s150305311. ISBN 978-1-4799-1050-2. ISSN 1424-8220. Online: http://www.mdpi.com/1424-8220/15/3/5311/
THUSOO, Ashish, Joydeep Sen SARMA, Namit JAIN, et al. Hive - a petabyte scale data warehouse using Hadoop. 2010 IEEE 26th International Conference on Data Engineering (ICDE 2010). IEEE, 2010, 15(3), 996-1005. DOI: 10.1109/ICDE.2010.5447738. ISBN 978-1-4244-5445-7. ISSN 1424-8220. Online: http://ieeexplore.ieee.org/document/5447738/

Ludvík Eger, Michal Mičík Digital Marketing Course: A Study on the Effectiveness of Blended Learning
DIVAI 2018 – The 12th international scientific conference on Distance Learning in Applied Informatics. 263 ISBN 978-80-7598-059-5 (Print) ISSN 2464-7470 (Print) ISSN 2464-7489 (On-line)
Digital Marketing Course: A Study on the
Effectiveness of Blended Learning
Ludvík Eger, Michal Mičík
Faculty of Economics, University of West Bohemia, Pilsen, Czech Republic [email protected], [email protected]
Abstract
The article is focused on blended learning approach in higher education. The main goal of the first part was to identify and discuss advantages of blended learning for the innovation purpose of teaching and learning at universities. Blended learning offers many advantages to students, teachers and faculty. Faculties that traditionally teach their courses should imagine how they could teach these courses in the blended mode. A case study was used to gather data about students’ learning activity and their performance in the subject Digital marketing. As the findings of the learning process show, students who paid more attention to the learning process in both face-to-face and e-learning components, achieved the best learning performance. Our case study has shown a positive link between student activity in both blended learning components and the resulting subject assessment. Students, who participated in the final evaluation of the course, expressed medium level of satisfaction with this form of teaching and learning. The study contributes to our understanding of blended learning application in an education process at a university.
Keywords
Blended learning. University. E-learning. Face-to-face teaching. Evaluation. Case study. Digital marketing.
INTRODUCTION
Universities are now broadly using information and communications technologies (ICT) in their education processes. E-learning and blended learning continue to develop rapidly, supported by increasing sophistication of ICT and by better understanding of how to make course content and delivery more effective (Balogh et al. 2012; Bentley, Selassie, Parking, 2012; Bersin, 2004; Eger & Egerová, 2013; Hartman, Dziuban & Moskal, 2007; Horton, 2006; Khan, 2007). Blended learning, also known as hybrid learning, has become popular over the past two decades because it integrates face-to-face teaching with different types of e-learning. In higher education blended learning has been implemented in a variety of contexts ranging from individual instructor-designed courses, to blended academic and professional programs, through to large institutional and system-wide initiatives (Owston & York, 2018).
Currently, new forms of e-learning and blended learning support systems are being introduced to higher education institutions. Many faculties in many study programmes

Ludvík Eger, Michal Mičík Digital Marketing Course: A Study on the Effectiveness of Blended Learning
DIVAI 2018 – The 12th international scientific conference on Distance Learning in Applied Informatics. 264 ISBN 978-80-7598-059-5 (Print) ISSN 2464-7470 (Print) ISSN 2464-7489 (On-line)
have adopted a blended learning approach to deliver course content. It is important to determine whether the increased use and availability of online courses and the use of a blended learning approach have made a positive impact on students’ academic performance.
WHAT IS BLENDED LEARNING?
The recent trend in e-learning has been moving increasingly towards blended learning and face-to-face activities in which students participate in collaborative learning and interaction with their instructors and classmates (Alshehri, 2017). Original e-learning had its advantages and disadvantages, both pedagogical and technological. Blended learning as a combination of F2F and online learning brings possibilities how to avoid some disadvantages of pure online courses. Blended learning emerged as one of the most popular pedagogical concepts at the beginning of 2000 (Eger, 2004b; Egerová & Mužík, 2010; Güzer & Caner, 2014; Šimonová, Poulová, Šabatová et al. 2009). Blended learning refers to a mix of instructor-led and technology-based learning.
Hartman et al. (2007) defined it as courses that combine F2F classroom instruction with online learning and reduced classroom contact hours (reduced seat time). Bersin (2004, 56) defines blended learning as “the combination of different training ‘media’ (technologies, activities, and types of events) to create an optimum training program for a specific audience.” Then he formulates two main approaches and calls them program flow model and core-and-spoke model. The first one represents step by step curriculum approach that integrates several media into chronological program or syllabus and second one represents fundamental training approach using additional optional or mandatory learning materials.
Apparent simplicity of its implementation in today’s education environments at our universities is perhaps the most common meaning of blended learning used in a higher education context (c.f. Porter et al., 2016; Rogojanu, Badeja and Frâncu, 2015; Wong, Tatnall & Burgess, 2014). Typically, blended learning at universities includes F2F classroom teaching, online e-learning, self-paced e-learning, and structured off-line study including set readings and doing (team) assignments.
A very important tool that helps execute blended learning is a learning management system. Petrovic & Kennedy (2005) defined a Learning management systems (LMSs) as a collection of online software applications, packaged together to deliver teaching and learning in either a distance education or an on-campus mode. And it should be noted that these systems have also undergone significant changes over the past ten years.
Moreover, LMSs offer a number of administrative tools to facilitate the management of courses and student accounts, grade books, usage statistics, content authoring, timed release of materials, assessment tools, calendars, personal information and integration with other administrative systems and are available to users 24 hours per day (Ajide & Tik, 2009; Petrovic & Kennedy, 2005).
In recent years, blended learning, the mixture of F2F learning and e-learning, has been presented as a promising alternative learning approach to relieve the aforementioned problems, since it is characterized as maximizing the advantages of traditional learning and e-learning (Bersin, 2004; Güzer & Caner, 2014; Wu, Tennyson & Hsia, 2010). Blended

Ludvík Eger, Michal Mičík Digital Marketing Course: A Study on the Effectiveness of Blended Learning
DIVAI 2018 – The 12th international scientific conference on Distance Learning in Applied Informatics. 265 ISBN 978-80-7598-059-5 (Print) ISSN 2464-7470 (Print) ISSN 2464-7489 (On-line)
learning offers many advantages to students, faculty, and other institutions. A persistent question asked by faculties and lecturers when they embark on the redesign process is how much time should be devoted to F2F teaching and learning and how much time to online activities (Owston & York, 2018).
Also students’ self-control and self-regulated learning play an important role in blended learning approach and as pointed by Zhu, Au & Yates (2016) the impact of self-control on the participants' learning outcomes is mediated through their self-regulated learning and course participation. Broadbent (2017) compared students’ self-regulated learning strategies and highlighted the relative importance of using time management and elaboration strategies, while avoiding rehearsal strategies. Similarly, Owston & York (2018) investigated the relationship between the proportion of time spent online in a blended course and student perceptions and performance. Studies focusing on good practice are usually focused on taking full advantage of blended learning (e.g. Alshehri, 201; Broadbent, 2017; Hubackova, Semradova, 2016)
To identify the degree of blending which may occur in teaching and learning process we can use classification based on the level of online resources by Jones et al. (2009). The continuum of blended learning begins with no ICT use, then progresses through the most basic level of ICT used to support F2F teaching, to intensive use, whereby the construct continues to teaching and learning process which is delivered online with minimal or no F2F interaction (Wong, Tatnall & Burgess, 2014). Lecturers who are looking for an appropriate mix for a blended learning package, can select from different options across the mentioned continuum (c.f. types of e-learning, Eger, 2004a; Wright, 2003).
The effect of blended learning on student performance has been researched in different contexts, e.g. higher education, adult education, and workplace training. The results have shown a positive impact of blended learning (Vo, Zhu & Diep, 2017). Dang et al. (2016) investigated influencing factors on students’ learning in the blended learning environment from three different perspectives, students themselves, instructors, and institutional support. The actual and important research topic is the effect of blended learning across disciplines and of the concrete design of blended learning (Boelens, Wever & Voet, 2017). Other important research question is whether students’ perceptions and performance are related to the amount of effort and time spent in blended courses. And next question is focused on students’ learning results and their engagement (collaboration) in the selected course: Why some students are more successful than others in blended learning courses?
MEASURING LEARNING OUTCOMES
Generally, learning outcomes can be measured in two domains - cognitive and affective. Learning outcomes in the cognitive domain refer to academic performance measuring learners’ ability to remember and apply knowledge, the affective domain involves learners’ attitudes, appreciations, values, and emotions. Satisfaction is an important measure of learning in the affective domain, while students’ performance is typically assessed at course or subject matter levels by final course grade (Schilling, Applegate, 2012; Sundberg, 2002).

Ludvík Eger, Michal Mičík Digital Marketing Course: A Study on the Effectiveness of Blended Learning
DIVAI 2018 – The 12th international scientific conference on Distance Learning in Applied Informatics. 266 ISBN 978-80-7598-059-5 (Print) ISSN 2464-7470 (Print) ISSN 2464-7489 (On-line)
Methodology
These case study explores the topic of blended learning, its implementation in a selected subject at university context and it is focused on evaluation of teaching and learning process and students’ performance. The purpose is to extend our experience with application of blended learning at a university settings and to increase conviction of advantages of this teaching and learning approach at a university. A quantitative approach is used in the conducted case study (Gray, 2009).
Different methods were used to address different stages of the application of blended learning to the one selected blended learning course. The research is focused on the evaluation of the effectiveness of blended learning in the education process at the Faculty of economics in the West Bohemia University in Pilsen, Czech Republic. The described case study is based on the analysis of selected student learning activities, results of the learning process and on the final assessment in one selected subject.
The data capture lectures of F2F teaching, learning process and students’ activities in e-learning part of study process and final evaluation. It is important to note that in our case is lecturer and tutor are one person which is typical for an education process at a university.
Research questions:
To achieve the above mentioned objective, the following research questions will be addressed:
� How effective is blended learning in making students active learners in the study of a business subject?
� Is there a significant association between students’ activities in both F2F and e-learning components and final evaluation?
� What is the students’ satisfaction with the impact of blended learning course?
� Does the satisfaction of students with a blended learning course influence the expression of their customer loyalty?
Respondents
University students, 44 males and 71 females, third year undergraduate study programme - business administration. Full-time study programme students had previously experience in e-learning and with using LMS. Students were divided into 5 sub-groups for seminar F2F teaching and learning.
Subject: Digital marketing
The course is a thirteen - weeks course (one semester long course in final year of the bachelor study programme) with important F2F component and online component in LMS. The F2F component was structured as one-hour long lecture per week and one-hour long seminar focused on training (knowledge application, skills development, web pages’ evaluation, SEO planning, copywriting, PPC campaign planning, etc.) each week. Seminar was organised for 20-25 students to support collaborative activities and skills development in small groups. The online component of the course required students to use study materials for further readings and for sending the final task also in the electronic version.

Ludvík Eger, Michal Mičík Digital Marketing Course: A Study on the Effectiveness of Blended Learning
DIVAI 2018 – The 12th international scientific conference on Distance Learning in Applied Informatics. 267 ISBN 978-80-7598-059-5 (Print) ISSN 2464-7470 (Print) ISSN 2464-7489 (On-line)
The online component also provides tutors’ news, two self-tests and essential information for complementing course assignments. LMS also offers tools for internal e-mails and chat but interactive electronic communication was not supported by tutor because the course used blended learning approach and students could meet lecturer – tutor each week at the faculty.
Course materials
Chapters as www pages were structured according to the methodology of distance learning text with aims, icons, headlines etc. (Eger, 2012; Horton, 2006). As mentioned above, 2 self-tests and links to external study resources for further reading were included in the e-learning component in LMS. Use of the e-learning was not compulsory. Students were able to choose how and when they will collaborate online.
Course arrangement
Mixed and congruent approach in sequence of the F2F teaching and learning and online parts of activities was used, the online component played mostly a supportive role. According to the subject aims and purpose, the F2F seminar played a key role in teaching and learning process. The seminar learning activities required students to collaborate with their peers and to prepare their business presentation as the final practical output of their seminar work. The e-learning component offered basic study materials and resources for further reading to students and the self-tests prepared students for the final written test that took place in a classroom in examination period.
We can describe the selected mix of F2F and e-learning components as a low blend (30% e-learning in LMS) or a supplemental blend. This means that online activities were added above and beyond the normal class time.
Course evaluation
Student must actively participate in half of the seminars in minimum. To receive the final assessment students in pairs have to successfully pass business presentation of their evaluation results of selected company web pages and successfully complete the final written test. Final written test takes place at the faculty (not online).
Data analysis
F2F component
Attendance at lectures is not mandatory and for this reason not recorded. The content of the lectures is also replaced by chapters in e-learning. However, the lecture at the faculty is supplemented by lecturer’s comments and it is connected with discussion with students, and classical e-learning will never replace it.
Seminars that were focused on skills development were recorded as number of seminars attendance. They represent the active participation in teaching and learning process at the faculty. In the second half of the semester students in pairs work on their seminar task during the seminars, continuously present it and discuss with peers and a lecturer. Attendance (compulsory) in the two final seminars that are focused on evaluation of students’ business presentation of their seminar work is not included, which means that maximum of 10 points is available (Table 1, Seminars, active F2F).

Ludvík Eger, Michal Mičík Digital Marketing Course: A Study on the Effectiveness of Blended Learning
DIVAI 2018 – The 12th international scientific conference on Distance Learning in Applied Informatics. 268 ISBN 978-80-7598-059-5 (Print) ISSN 2464-7470 (Print) ISSN 2464-7489 (On-line)
E-learning component
Students’ behaviour descriptive data are derived from the LMS, administrative part. It is an indirect observation connected with technology (LMS). The behaviour of the students was not affected by the presence of an observer. If a student entered all chapters in each part, they received 10 points (Table 1).
Evaluation component
RESULTS
Table 1: Results of the teaching and learning process
Number of students
Grade
Average e-learning points
Average self-test points
Average seminars active F2F points
Average sum of learning process points
9 1 6 1.55 9.55 17.11
34 2 4.18 1.18 9.65 15
44 3 3.43 1.06 9.07 13.57
31 4 4.54 1.32 8.8 14.68
Figure 3: Respondents, sum of their learning activities and levels of evaluation
The following text provides a commentary on the selected results in table 1 and figure 1:
� The findings provide information on how active students were in both components of blended learning, items: E-learning, Self-tests and Seminars - active F2F.
� There are differences in the individual learning process. Tables 1 shows that average time spent with learning process is higher for group with the best evaluation and the lowest for group with the lowest evaluation.
� Figure 1 clearly demonstrates the association between students’ activity in learning process and final evaluation in the selected subject. Individual differences exist but the tendency from the picture is evident.
5
8
11
14
17
20
1 3 5 7 9 11 13 15 17 19 21 23 25 27 29 31 33 35 37
Lear
nin
g p
roce
ss t
ota
l po
ints
Number of respodents (students)
SUM of the learning process
Grade 1
Grade 2
Grade 3
Grade 4

Ludvík Eger, Michal Mičík Digital Marketing Course: A Study on the Effectiveness of Blended Learning
DIVAI 2018 – The 12th international scientific conference on Distance Learning in Applied Informatics. 269 ISBN 978-80-7598-059-5 (Print) ISSN 2464-7470 (Print) ISSN 2464-7489 (On-line)
� Opposite extreme is represented by students who failed in the first term. Then some of them took advantage of e-learning and actively learned in e-learning component to prepare for a second term.
� Students who spent less time to participate in both components of blended learning course had usually problems to successfully complete the final test.
An important course outcome that cannot be measured through attendance and assessment of the data is learner’s satisfaction. Before the final written test, students were asked to fill out a feedback questionnaire that was focused on their experience with the learning process in this subject. In order to depict the connections between selected indicators, a statistical analysis was conducted and is presented below. In order to calculate the dependencies, a number of hypotheses were formed. In the data analysis, due to the character of the data, Kendall Tau indicator was used on the basis of which the occurrence of the statistical significance was tested.
Table 2: Dependencies between variables
Dependencies Results
There is a dependence between students’ evaluation of their progress in marketing and their satisfaction with this subject.
τ=0.54, p=0.0000001
There is a dependence between the teaching and learning form in which this subject is offered and student’s satisfaction with the subject.
τ=0.44, p=0.0000001
There is a dependence between the evaluation of interaction (with peers and teachers) and student’s satisfaction with the subject.
τ=0.29, p=0.0000001
There is a dependence between the evaluation of learning in the e-learning part and student’s satisfaction with the subject.
τ=0.23, p=0.0000001
There is a dependence between student’s satisfaction with the subject and the students’ loyalty (measured by the NPS).
τ=0.53, p=0.0000001
The following text provides a commentary on table 2:
� Selected mix of F2F and e-learning components represents the low blend (30% e-learning in LMS) or a supplemental blend (Wong, Tatnall & Burgess, 2014). It is evident that the association between e-learning part and student’s satisfaction is weak.
� Similarly, the association between the evaluation of interaction (with peers and teachers) and student’s satisfaction is weak.
� On the other hand, conducted study identified a moderate association between students’ evaluation of their progress in marketing and their satisfaction with this subject and student’s satisfaction with the subject and the students’ loyalty (measured by the NPS).
CONCLUSION AND DISCUSSION
There is no simple answer to our research questions because many other factors must be also taken into account. The implications of the above presented case study are

Ludvík Eger, Michal Mičík Digital Marketing Course: A Study on the Effectiveness of Blended Learning
DIVAI 2018 – The 12th international scientific conference on Distance Learning in Applied Informatics. 270 ISBN 978-80-7598-059-5 (Print) ISSN 2464-7470 (Print) ISSN 2464-7489 (On-line)
significant for the design of blended courses. Our case study has shown a positive link between student activity in both blended learning components and the resulting subject assessment. In addition, students who participated in the final evaluation expressed their medium level of satisfaction with this form of teaching and learning.
The research results (Dowling et al., 2003; Potter & Johnston, 2006) showed that students’ use of the new system was positively associated with both their examination performance and the internal assessment result. For example, Naaj et al. (2012) considered student satisfaction an important factor in measuring the quality of blended learning. Their study proposed that students’ satisfaction is influenced by a combination of factors which include the instructor, the technology, class management, interaction and instruction. Also, Owston & York (2018) report that students tend to prefer blended learning over traditional classroom instruction.
Many factors have influence on blended learning effectiveness, e.g Owston & York (2018) emphasize: student characteristics, learning engagement, access to technology, teaching quality, instructor attitudes and openness to new pedagogical approaches, institutional support, learning resources, and nature of the subject matter (e.g., Alammary et al., 2015; Brown, 2016; Ellis, Pardo & Han, 2016). Findings by Boelens, De Wever & Voet (2017) emphasize: when designing blended learning more attention should be paid to increasing learner control, stimulating social interaction and fostering an affective learning climate.
The study has several limitations. First, this study is namely focused only on students’ activity in F2F and e-learning components and on their performance which is measured by grades. It is required to give more attention to other factors that have an influence on blended learning effectiveness. Second, the sample of the students in the case study is small, only 115 students. Therefore, to be able to generalize the results, the study should have involved more participants and different blended learning courses. Finally, the scope and depth of the discussion in the paper is compromised by being confined to the selected resources.
For future research it is important to consider other kinds of variables that can help us to improve our understanding of a learners' behaviour when studying blended learning course.
REFERENCES
Ajide, O. E. and Tik, Ch. Ch., 2009. A study on the effectiveness of blended learning. Proceedings of the 2nd International Conference of Teaching and Learning (ICTL 2009), INTI University College.
Alshehri, A. F., 2017. Student satisfaction and commitment towards a blended learning finance course: A new evidence from using the investment model. Research in International Business and Finance. 41, 423-433.
Balogh, Z, Turcani, M., Magdin, M. et al. 2012. Creating model educational processes using petri nets implemented in the LMS. l9th International Conference on Efficiency and Responsibility in Education Location: Prague, Jun 07-08, 2012 Efficiency and Responsibility in Education, pp. 7-16

Ludvík Eger, Michal Mičík Digital Marketing Course: A Study on the Effectiveness of Blended Learning
DIVAI 2018 – The 12th international scientific conference on Distance Learning in Applied Informatics. 271 ISBN 978-80-7598-059-5 (Print) ISSN 2464-7470 (Print) ISSN 2464-7489 (On-line)
Bentley, Y. Selassie, H. and Parking, E., 2012. Evaluation of a global blended learning MBA programme. The International Journal of Management Education. 10, 75-87.
Bersin, J., 2004. The Blended Learning Book. San Francisco: Pfeiffer.
Boelens, R. De Wever, B. and Voet, M., 2017. Four key challenges to design of blended learning: A systematic literature review. Educational Research Review. 22, 1-18.
Broadbent, J., 2017. Comparing online and blended leaner’s self-regulated learning strategies and academic performance. Internet and Higher Education. 33, 24-32.
Dang, Y., Zhang, Y., Ravindran, S. and Osmoubekov, T., 2016. Examining Student Satisfaction and Gender Differences in Technology-Supported, Blended Learning. Journal of Information Systems Education. 2(2), 119-130.
Eger, L. et al., 2004a. E-learning, evaluace e-learningu + případová studie z projektu Comenius. Plzeň: ZČU v Plzni.
Eger, L., 2004b. Blended learning. Aula, 3, 21-24.
Eger, L., 2012. ICT ve vzdělávání dospělých. Plzeň: Nava.
Eger, L. and Egerová, D., 2013. e-Learning trends in Central Europe: The case of the Czech Republic. Knowledge Management & E-Learning, 5(3), 375-387.
Egerová, D. and Mužík, J., 2010. Aplikace metody Delphi při expertním stanovení faktorů ovlivňujících efektivnost e-learningu ve vzdělávání pracovníků v malých a středních podnicích. E+M. Ekonomie a Management, 13(2), 137-151.
Ellis, R. A., Pardo, A. and Han, F., 2016. Quality in blended learning environments – Significant differences in how students approach learning collaborations. Computers & Education, 102, 90-102.
Graham, C. R., 2006. Blended learning systems. Definition, current trends, and future directions. In: Curtis J. Bonk, Charles R. Graham (eds) Handbook of blended learning: Global perspectives, local designs, Pfeiffer Publishing, 3-21.
Gray, D.E., 2009. Doing Research in the Real World. London: SAGE.
Güzer, B. and Caner, H., 2014. The past, present and future of blended learning: an in depth analysis of literature. Procedia. Social and Behavioral Sciences, 116, 4596-4603.
Hartman, J., Dziuban, C. and Moskal, P., 2007. Strategic initiatives in the online environment: opportunities and challenges, Horizon, 15(3) 157-168,
Horton, W., 2006. E-Learning by Design. San Francisco: Pfeiffer.
Hubackova, Š., 2015. Evolution and evaluation of e-Learning. Procedia. Social and Behavioral Sciences, 171, 231-235.
Hubackova, S. and Semradova, I., 2016. Evaluation of Blended Learning. Procedia, Socila and Behavioral Sciences. 217, 551-557.
Jones, N., Chew, E., Jones, C. and Lau, A., 2009. Over the worst or at the eye of the storm? Education + Training, 51(1), 6-22.
Khan, B. H. et al., 2007. Flexible Learning in an Information Society. London: Information Science Publishing.

Ludvík Eger, Michal Mičík Digital Marketing Course: A Study on the Effectiveness of Blended Learning
DIVAI 2018 – The 12th international scientific conference on Distance Learning in Applied Informatics. 272 ISBN 978-80-7598-059-5 (Print) ISSN 2464-7470 (Print) ISSN 2464-7489 (On-line)
Owston, R. and York, D. N., 2018. The nagging question when designing blended courses: Does the proportion of time devoted to online activities matter? The Internet and Higher Education. 36, 22-32.
Petrovic, T., Kennedy, G. (2005), How often do students use a learning management system in an on-campus, problem-based learning curriculum? Available at
<http://www.ascilite.org.au/conferences/brisbane05/blogs/proceedings/61_Petrovic.pdf> [Accessed 18th January, 2018]
Porter, W. W., Graham, Ch., R., Bodily, R. G. and Sandberg, D. S., 2016. A qualitative analysis of institutional drivers and barriers to blended learning adoption in higher education. Internet in Higher Education, 28, 17-27.
Reichheld, F. F., 2003. The One Number You Need to Grow. Harward Business Review. 81(12), 46-54.
Rogojanu, A., Badeja, L. and Frâncu, L. G., 2015. Blended Learning – A Path towards Modernizing Higher Economic Education? Theoretical and Applied Economics. 22(4), 237-246.
Schilling, K. and Applegate, R., 2012. Best methods for evaluating educational impact: a comparison of the efficacy of commonly used measures of library instruction. Journal of the Library Association, 100(4), 258-269.
Sundberg, M. D., 2002. Assessing Student Learning. Cell Biol Educ. 1, 11-15.
Šimonová, I., Poulová, P. and Šabatová, M. et al., 2009. On contribution of modern technologies towards developing key competencies. Hradec Králové: University of Hradec Králové.
Vo, H. M., Zhu, Ch. and Diep, N. A., 2017. The effect of blended learning on student performance at course-level in higher education: A meta-analysis. Studies in Educational Evaluation. 53, 17-28.
Wong, L., Tatnall, A. and Burgess, S., 2014. A framework for investigating blended learning effectiveness. Education + Training, 56, (1/2), 233-251.
Wright, C. R. (2003). Criteria for Evaluating the Quality of Online Courses. [online] Available at <from: http://www.imd.macewan.ca/imd/content.php?contentid=36> [Accessed 18th January 2009]
Wu, J-H., Tennyson, R. D. and Hsia, T. L., 2010. A Study Of Student Satisfaction In A Blended E-Learning System Environment. Computers & Education, 55, 155-164.
Zhu, Y., Au, W. and Yates, G., 2016. University students' self-control and self-regulated learning in a blended course. Internet and Higher Education. 30, 54-62.

Rostislav Fojtík Teaching of Object-Oriented Programming
DIVAI 2018 – The 12th international scientific conference on Distance Learning in Applied Informatics. 273 ISBN 978-80-7598-059-5 (Print) ISSN 2464-7470 (Print) ISSN 2464-7489 (On-line)
Teaching of Object-Oriented Programming
Rostislav Fojtík
Department of Informatics and Computers, University of Ostrava, Ostrava, Czech republic [email protected]
Abstract
This article deals with the subject of object-oriented programming. The programming area has been very dynamic in recent years. On the other hand, there is often a discrepancy between the methodology and the focus of programming instruction on the one hand, and the development of programming languages, development tools and development methodologies on the other. The existing teaching methodology of programming usually starts with algorithmization, followed by the teaching of a particular programming language and the conversion of algorithms into code. Object-oriented programming is often taught as an add-on and other property of the programming language. Students are not usually preparing for a completely different paradigm and another style of designing programs. Moving to object-oriented programming then makes students usually problems. There are also teaching methods that introduce an object-oriented paradigm right from the beginning of the lesson. Teachers of this methodology usually have reservations that are challenging for students. The paper tries to show simple comparisons of student results that this concern is not justified and can be taught by object-first. This article describes an experiment at a grammar school and compares the results of bachelor students who have been learning algorithm-first and object-first. The results of experiments and observations show that the students of object-first methodology manage and do not have worse learning outcomes, knowledge and skills than students who have learned traditionally.
Keywords
Education. Java. LMS. Object-First Methodology. Object-Oriented Programming. T-test. UML.
INTRODUCTION
Programming has undergone major changes over the past decades. It changes not only programming languages but also programming paradigms. New programming languages, libraries and frameworks are created to make it easier for programmers to work. However, in the field of programming teaching, we often use procedures that usually do not accept the modern knowledge of modern programming. At present, programmers most use an object-oriented approach. However, programming instruction is still focused mainly on a structured and imperative approach. Students usually learn a particular programming language and basic programming structures. For a very long time, students devote themselves to the syntax of the programming language, data types, variables, operators, and function creation. In the best case, the pupils learn to work with the field and program some simple algorithms. Object-oriented programming is often
Rostislav Fojtík Teaching of Object-Oriented Programming
DIVAI 2018 – The 12th international scientific conference on Distance Learning in Applied Informatics. 274 ISBN 978-80-7598-059-5 (Print) ISSN 2464-7470 (Print) ISSN 2464-7489 (On-line)
understood only as an add-on and other chapters (Janke, Brune, Wagner, 2015). After completing this course, students have problems to correctly design a program that responds to an object-oriented way of solving problems (Fergany, El-Raouf, 2011).
TEACHING OBJECT-ORIENTED PROGRAMMING USING OBJECT-FIRST
METHODOLOGY
In addition to the traditional approach to programming teaching, which focuses mainly on creating algorithms and transcribing them into a particular programming language, there are also newer methodologies. These include, for example, object-first or architecture-first. These methodologies try to present students with the object and architectural model of the project from the beginning (Pecinovsky, 2013) (Pecinovsky, 2014). In discussions with teachers, most of them consider it necessary to begin teaching programming using the algorithm-first methodology. Programming instruction then focuses only on the procedural paradigm. Other paradigms of programming are often neglected. Paradigms such as object-oriented, functional, logical, parallel are almost not taught in secondary schools.
The methodology
To verify the hypotheses, we used a simple experiment in which we studied the learning outcomes of two different groups in programming at the grammar school and in the first year of the bachelor study. At the same time, we have been observing student activities in the monitored groups. For analysis of the results in each item was measured as having detected data variability. We used a coefficient of variation. To interpret the results of the second stage classification was done a t-test. For evaluating the results were used MS Excel and statistical software Wizard for the operating system Mac OS X and statistical software Statistics Visualizer for iPad (Řehák, Brom, 2015).
The experiments
A common argument against objectively-oriented object-first programming is the notion that learning object-oriented programming teaching is challenging for students. We found out in interviews with computer science teachers that most of them tend to think that it is best, to begin algorithmization first and traditional procedural programming. When students can write algorithms in the designated programming language that they start to look at the object-oriented paradigm. This teaching method assumes that the object-oriented paradigm is merely an extension of a procedural approach (Zhu, 2012). Our experiments aimed to find out whether it is possible to begin the education of programming other than methodology algorithm-first.
The experiments aimed to find out whether it is possible to begin the education of programming other than algorithm-first.
At our university, we have organised courses for high school students on which we have taught object-first programming. The course participants did not have problems with this way, even in a situation where they had no programming experience.
To verify our observations, we did a simple pedagogical experiment at grammar school. During the lessons, we tried to prove whether students who were first in classical

Rostislav Fojtík Teaching of Object-Oriented Programming
DIVAI 2018 – The 12th international scientific conference on Distance Learning in Applied Informatics. 275 ISBN 978-80-7598-059-5 (Print) ISSN 2464-7470 (Print) ISSN 2464-7489 (On-line)
programming lessons would be more successful than students studying the object-first methodology (Liu, Sun, Chan, 2016).
We selected two groups of students for the experiment. The first group consisted of fifteen students who had not yet learned the programming lessons. The second group consisted of thirteen students of the final year. These students have been taught programming in the previous year. They used traditional programming teaching methodology and C# language. These students first became familiar with simple data types and variable variables. The course was focused on conditions, cycles and function creation (class methods). The primary emphasis was put on the developing of algorithms and their writing into the programming language. The lesson ended with a description of the fieldwork. The concepts of class and object are mentioned only marginally in their teaching.
We have set the following zero and alternative hypotheses:
Zero hypothesis: The study results of the two groups studied will not differ.
Alternative hypothesis: The study results of the two groups studied will differ.
The experiment lasted for five months. Every week they had two hours. Both groups used the same teaching methodology in the new school year. The aim was to teach students to create functional programs based on an object-oriented paradigm. Teaching was done using the Java programming language using the object-first method (Bennedsen, Caspersen, 2004). The programming language was just a means and not a learning goal. Instead, the teacher does not describe all the simple data types, the creation of variables, and the management procedures, but he immediately takes an object-oriented approach to program creation. Students created classes and their instances in the first hours. Particular syntactic rules of language, data types, and Java program constructs were referenced as needed and following the example. The teacher put great emphasis on the analysis of the problem solved and its graphical representation using the UML class diagram (Moisan, Rigault, 2009) (Torchianoa, Scanniellob, Riccac, Reggioc, Leottac, 2017). All students had teaching materials and solved examples at an electronic course in LMS Moodle. Tests and tasks were also solved using LMS. The first practical program devoted to creating a Rectangle class and its instance. Pupils subsequently tried to create other classes such as Circle.
There followed a program to simulate a simple game in which two players threw two dice. The one who has the higher sum wins. Pupils together with the teacher at the input base first compiled a simple UML class diagram. The pupils then created individual classes according to the diagram. Similarly, based on practical examples, students learned about other object-oriented programming options such as composition, inheritance, interface, etc.
Figure 1 shows the UML class diagram, by which pupils created a simple game. Game creation was also a good motivation for pupils.

Rostislav Fojtík Teaching of Object-Oriented Programming
DIVAI 2018 – The 12th international scientific conference on Distance Learning in Applied Informatics. 276 ISBN 978-80-7598-059-5 (Print) ISSN 2464-7470 (Print) ISSN 2464-7489 (On-line)
Figure 1: UML class diagram - simple game.
Figure 2 shows an inappropriately designed class, and Figure 3 explains the principle of inheritance. Similarly, other fundamental principles of object-oriented programming have been dealt.
Figure 2: The inappropriately designed class.
Figure 3: An example of using composition.

Rostislav Fojtík Teaching of Object-Oriented Programming
DIVAI 2018 – The 12th international scientific conference on Distance Learning in Applied Informatics. 277 ISBN 978-80-7598-059-5 (Print) ISSN 2464-7470 (Print) ISSN 2464-7489 (On-line)
Course content:
1. Information on basic programming principles.
2. Lower and higher programming languages.
3. Basic programming paradigms.
4. Object-Oriented Programming Principles.
5. Basic Java programming language information.
6. Creating classes and their instances.
7. Class methods. Constructors.
8. Folding objects.
9. Simple inheritance.
10. Manipulation of Objects. Array.
11. Interface.
12. Design patterns.
The results
Students completed three tests during the course, in which was verified the theoretical knowledge. Practical skills have been validated through five projects. Students program these tasks separately. All student work was scored. The results of the students are processed by the F-test and then by the T-test. We also conducted the simple observation of the students of both groups. In the early hours, it turned out that the students of the first group had fewer problems with code generation than the students of the second group. There was a similarity between C# and Java programming languages. Pupils could benefit from a knowledge of C# syntactic rules. These pupils had fewer problems writing code and finding bugs. Many of the language constructions they knew from the past year did not need to be described and explained more thoroughly. However, these differences between the two groups were minimised after several hours.
Table 1: The results of experiment at grammar school.
t-Test: Two-Sample Assuming Unequal Variances Group 1 Group 2
Mean 89,656 83,9992308
Variance 21,0911686 91,8369577
Observations 15 13
Hypothesized Mean Difference 0
df 17
t Stat 1,94363622
P(T<=t) one-tail 0,03434161
t Critical one-tail 1,73960673
P(T<=t) two-tail 0,06868322
t Critical two-tail 2,10981558
Statistical results show that a zero hypothesis cannot be rejected (table 1). Therefore, it is not possible to verify in the experiment that students who first undergo traditional programming instruction based on an imperative paradigm will be more successful in the subsequent teaching of object-oriented programming. Figure 4 shows a graph of study results for pupils in both groups.

Rostislav Fojtík Teaching of Object-Oriented Programming
DIVAI 2018 – The 12th international scientific conference on Distance Learning in Applied Informatics. 278 ISBN 978-80-7598-059-5 (Print) ISSN 2464-7470 (Print) ISSN 2464-7489 (On-line)
Figure 4: A graph of the comparison of the results achieved.
CHANGING THE CONCEPT OF PROGRAMMING TEACHING
During teaching programming at our university, we are still struggling with students who have problems understanding the object-oriented programming approach. Many students have difficulty correctly defining classes, objects, and relationships between them. Very often they create classes with a large number of competencies, poorly define relationships between classes, and are unable to identify specific objects and their roles correctly. Therefore, we decided to present the concept of object-oriented programming in the introductory course and use the object-first methodology. When changing the concept of learning, some teachers have been afraid to begin the lesson of object-first programming for students more demanding.
We have set the following zero and alternative hypotheses:
Zero hypothesis: Students in the group before the introduction of the new learning concept will not have different outcomes for students who learn the object-first methodology.
Alternative hypothesis: Students in the group before the introduction of the new learning concept will have different outcomes for students who learn the object-first methodology.
The study results were used in the winter semesters of 2016 and 2017 to validate hypotheses. Specifically, in the course "Programming Basics", which is a compulsory course for students of Applied Informatics and Informatics. The course is recommended for the first semester of the bachelor's degree program. Students can earn up to 100 points during the semester. The student must earn a minimum of 51 points to complete the course successfully. The results were examined by attendance and distance students separately. Groups of students who attended the course in 2016 were traditional taught lessons. A group of students who completed the course in 2017 was taught using the object-first method, with an emphasis on the object-oriented paradigm. All students had teaching materials and solved examples at an electronic course in LMS Moodle. Tests and tasks were also solved using LMS.

Rostislav Fojtík Teaching of Object-Oriented Programming
DIVAI 2018 – The 12th international scientific conference on Distance Learning in Applied Informatics. 279 ISBN 978-80-7598-059-5 (Print) ISSN 2464-7470 (Print) ISSN 2464-7489 (On-line)
The comparison results
The student's results were processed by the F-test and subsequently by the T-test. In particular, the results of distant and full-time students were monitored. A lot of distance students do not complete the course and study. The group of unsuccessful distance students is more significant than for students of full-time attendance. Many students did not even try to finish the course. These students earned 0 points.
Figure 5 is a graph of the comparison of the results achieved by all distance students. Table 2 compares groups of distance students. The results show that we can confirm the zero hypothesis.
Figure 5: A graph of the comparison of the results achieved by all distance students.
Table 2: The comparison of the results achieved by all distance students.
t-Test: Two-Sample Assuming Equal Variances 2016 2017
Mean 36,6440678 26,0615385
Variance 1620,95733 1163,2149
Observations 59 65
Pooled Variance 1380,83016
Hypothesized Mean Difference 0
df 122
t Stat 1,58376664
P(T<=t) one-tail 0,05791785
t Critical one-tail 1,6574395
P(T<=t) two-tail 0,1158357
t Critical two-tail 1,97959988
Figure 6 is a comparison graph of the learning outcomes achieved by only distance students who have tried to finish the course successfully. So without the students who earned 0 points.

Rostislav Fojtík Teaching of Object-Oriented Programming
DIVAI 2018 – The 12th international scientific conference on Distance Learning in Applied Informatics. 280 ISBN 978-80-7598-059-5 (Print) ISSN 2464-7470 (Print) ISSN 2464-7489 (On-line)
Figure 6: A graph of the comparison of the results achieved without the distance students who earned
0 points.
In Table 3 the groups of full-time students are compared. The results show that we can confirm the zero hypothesis.
Table 3: The comparison of the results achieved by all full-time students
t-Test: Two-Sample Assuming Equal Variances 2016 2017
Mean 49,0545455 44,125
Variance 1051,71919 944,947727
Observations 55 56
Pooled Variance 997,843682
Hypothesized Mean Difference 0
df 109
t Stat 0,82203345
P(T<=t) one-tail 0,2064262
t Critical one-tail 1,65895346
P(T<=t) two-tail 0,41285241
t Critical two-tail 1,98196749
Figure 7 is a graph of the comparison of the results of all full-time students.
Figure 7: A graph of the comparison of the results achieved by all full-time students.
Figure 8 is a comparison graph of the learning outcomes achieved by full-time students who attempted to complete the course successfully. So without the students who earned 0 points.

Rostislav Fojtík Teaching of Object-Oriented Programming
DIVAI 2018 – The 12th international scientific conference on Distance Learning in Applied Informatics. 281 ISBN 978-80-7598-059-5 (Print) ISSN 2464-7470 (Print) ISSN 2464-7489 (On-line)
Figure 8: A graph of the comparison of the results achieved without the full-time students who earned
0 points.
CONCLUSION
Experiments and the comparison of study results show that it is possible to initiate programming instruction directly by the object-oriented approach. It was not confirmed that students beginning with an object-oriented approach would have more significant problems in mastering lessons than students who were first instructed by traditional methodology. From student observations, on the contrary, they seem to understand better the formation of classes, objects and their mutual communication. More accurate results in this field will be reflected in the higher years of the bachelor's degree program where the object-oriented programming is used more intensively. The objective-first methodology can also be successfully applied to high school education. Experiments show that it is possible to begin programming lessons than methodology algorithm-first.
REFERENCES
Bennedsen, J., Caspersen, M.: Teaching Object-Oriented Programming – Towards Teaching a Systematic Programming Process. [online] Available at <http://cs.au.dk/~mec/publications/workshop/11--ecoop2004.pdf> [Accessed 2004].
Fergany, T., El-Raouf, A.: An active learning environment for teaching object-oriented concepts, design and implementation. Proceeding of the 2011 ASEE Northeast Section Annual Conference University of Hartford. [online] Available at <https://www.asee.org/documents/sections/northeast/2011/AN-ACTIVE-LEARNING-ENVIRONMENT-FOR-TEACHING.pdf> [Accessed 2011].
Janke, E., Brune, P., Wagner, S.: Does outside-in teaching improve the learning of object-oriented programming? Proceedings of the 37th International Conference on Software Engineering. Volume 2. Pages 408-417. 2015.
Liu, Y., Sun, M. Chan, Y.: Teaching Guidance in Programming Courses from Procedure-oriented to Object-oriented. Proceedings of the 2016 2nd International Conference on Social Science and Higher Education. 2016. Volume 53. ISSN 2352-5398.
Moisan, S., Rigault, J-P.: Teaching Object-Oriented Modeling and UML to Various Audiences. Models in Software Engineering. MODELS 2009. Lecture Notes in Computer Science, vol 6002. Springer, Berlin 2009. ISBN 978-3-642-12260-6.

Rostislav Fojtík Teaching of Object-Oriented Programming
DIVAI 2018 – The 12th international scientific conference on Distance Learning in Applied Informatics. 282 ISBN 978-80-7598-059-5 (Print) ISSN 2464-7470 (Print) ISSN 2464-7489 (On-line)
Pecinovský, R.: Java 8. Úvod do objektové architektury pro mírně pokročilé. Grada. Praha 2014. ISBN 978-80-247-4638-8.
Pecinovský, R.: Methodology Architectur First. Journal of Technology and Information Education. Olomouc 2013. Volume 5. Issue 1. ISSN 1803-537X.
Řehák, J., Brom, O.: SPSS, Praktická analýza dat. Computer Press. Brno 2015. ISBN 978-80-251-4609-5.
Torchianoa, M., Scanniellob, G., Riccac, F., Reggioc, G., Leottac, M.: Do UML object diagrams affect design comprehensibility? Results from a family of four controlled experiments. Journal of Visual Languages and Computing. 2017. Volume 41. ISSN: 1045-926X.
Zhu, X.: Teaching Adaptability of Object-oriented Programming Language Curriculum. International Education Studies. Volume 5, No. 4. 2012. ISSN 1913-9020.

Dana Horváthová, Patrik Voštinár Importance of Feedback in Testing by use of Universal Testing System
DIVAI 2018 – The 12th international scientific conference on Distance Learning in Applied Informatics. 283 ISBN 978-80-7598-059-5 (Print) ISSN 2464-7470 (Print) ISSN 2464-7489 (On-line)
Importance of Feedback in Testing by use of
Universal Testing System
Dana Horváthová, Patrik Voštinár
Department of Computer Science, Faculty of Natural Sciences, Matej Bel University, Banska Bystrica, Slovakia
[email protected], [email protected]
Abstract
The aim of our article is to describe the issue of verifying knowledge using our created Universal testing system and to compare existing testing systems with our UTS. Testing is important part of teaching process. Before the year 2009 the LMS Moodle didn’t have good testing possibilities, so we decided to create our own testing system UTS. In our UTS over the period of 8 years were tested more than 400 students of informatics in the Department of Computer Science FPV UMB in Banská Bystrica during their Multimedia course. Original version of UTS had several weaknesses that we were able to remove in the latest version. In addition to that, the system was complemented by some useful features and was tested in real life practice. The most useful module of UTS is the feedback system, because it allows students to gain valuable lessons from the mistakes they have made while answering questions in the test. The universality of our testing system is based on its expandability and the possibility of its implementation into other courses with similar focus. In the article we will also briefly describe the database security of our testing questions, the time limit and mainly the feedback module and its importance for the improvement of education. Our article builds on the years of experience in the use of Universal testing system UTS, which we presented at DIVAI 2014 conference. More than 400 students of informatics in the Department of Computer Science FPV UMB in Banská Bystrica were tested over the period of 8 years during their Multimedia course. Original version of UTS had several weaknesses that we were able to remove in the latest version. In addition to that, the system was complemented by some useful features and was tested in real life practice. In comparison with some commercial testing systems, our system has still some drawbacks that will be removed in the future. Despite these weaknesses, the most useful module of UTS is the feedback system, because it allows students to gain valuable lessons from the mistakes they have made while answering questions in the test. The universality of our testing system is based on its expandability and the possibility of its implementation into other courses with similar focus. The aim of our article is to describe the issue of verifying knowledge using a computer network and to compare existing testing systems with our UTS. We will also briefly describe the database security of our testing questions, the time limit and mainly the feedback module and its importance for the improvement of education.
Keywords
Verification of knowledge. E-testing system. Feedback. Question database. Security.

Dana Horváthová, Patrik Voštinár Importance of Feedback in Testing by use of Universal Testing System
DIVAI 2018 – The 12th international scientific conference on Distance Learning in Applied Informatics. 284 ISBN 978-80-7598-059-5 (Print) ISSN 2464-7470 (Print) ISSN 2464-7489 (On-line)
INTRODUCTION
An important part of the learning process is verification of knowledge or testing. The main aim of testing is to measure performance, potential, diagnose weak and strong suits, evaluate performance and capabilities and possibly comparing groups and multifaceted diagnostics. (Chráska, 2007)
The development of digital technologies affects the educational process in all its phases. Their support is not only in preparation, presentation and the use of IT in laboratories. They have their undisputable role also in verification of teaching process. (Horváthová et. al., 2014)
Computer-aided learning (CAL) is a viable alternative to traditional teaching methods. While CAL is used for teaching only, computer-aided testing (CAT) can be applied as a computer-based examination method. CAT systems may be an alternative for conventional multiple-choice tests. The reduction in teaching time required to administer and score examinations is a major advantage of CAT compared with written tests. This is consistent with previous studies. (Karl et. al., 2011)
KNOWLEDGE EVALUATION BY HELP OF COMPUTERS
Testing with computers is nowadays one of the widely used ways of getting feedback. It is a type of automatized testing in which intervention of the examiner is not necessary. When teacher creates questions for testing the whole executional role is passed to the testing system which creates test from the set of test questions, processes the test and evaluates it. In comparison to classical testing, much time and energy is saved this way. Indisputable advantage is also that it protects against errors caused by inattention or tiredness of the evaluator. (Varga, 2011).
Developing and automatically generation of questions are important functions of modern e-Learning, which includes the existence of intelligent tutoring systems (Ristov, et. al., 2015) and e-Assessment systems.
Motivation to build tools for automated question asking has raised a lot of attention, in order to create a relevant question database. Teachers have a huge problem to build a knowledge base that can be used to assess the students’ learning outcomes properly. This is a very difficult and time-consuming task, which requests a huge amount of resources (Pain, et. al., 2003).
In order to better understand the problem of our universal testing system, other similar work in this area can be found in articles listed below. They describe and solve the problematics of testing in education from various points of view. E.g. architecture of testing systems (Kultan, 2006), validity and reliability of tests (Jacková, 2006), formative testing (Deutsch et al., 2012; Ćukušić et al., 2014), measurement of learning outcomes (Butaš, 2009), feedback influence (Škrinárová et al., 2013), collaborative learning (Wilson, 2003; Denny, 2008), quality of education (Kultan, 2007) and analysis and evaluation of questions bank in the electronic testing of knowledge and skills (Hanclová, et. Al., 2013). All these articles combine an effort of increasing efficiency and effectiveness of the education process.

Dana Horváthová, Patrik Voštinár Importance of Feedback in Testing by use of Universal Testing System
DIVAI 2018 – The 12th international scientific conference on Distance Learning in Applied Informatics. 285 ISBN 978-80-7598-059-5 (Print) ISSN 2464-7470 (Print) ISSN 2464-7489 (On-line)
EXISTING TESTING SYSTEMS
There are many products which can be used in e-testing on the market. We focused on five most popular systems, based on the recommendations from various web forums and articles. These systems were also the most popular when using the internet search engines. The systems we mentioned are very similar, therefore we focused on some important differences and created a list of some functions, shown in the table below. Into the table we also added our created UTS system mostly to pinpoint some weaknesses that will be removed in the future. In comparison with other five popular systems, our UTS system has the most similar features with Moodle system. Since 2009 a number of modules that support the score of testing results (e.g. Pupin - FlashQuestion, etc.) and allow to put multimedia into the test have been created. In many cases, however, modules have not been further developed for a new version of Moodle. Our UTS has met requirements to create a final test with different point questions from different themes with a predefined number of points, randomly generated for each student.
Table 1: Comparing of testing systems.
Types of Questions
Moodle Testmoz ProProfs
Quiz MyGradeBook ClassMarker
Our UTS
Multiple Choice
Question yes yes yes yes yes yes
short answer yes yes yes no yes yes
answer yes / no
yes yes yes yes no yes
other answers
yes no yes no no yes
paid system no no yes yes yes no
support multimedia
no no yes no yes no
scoring questions
yes yes no no no yes
scoring the test
no yes yes yes no yes

Dana Horváthová, Patrik Voštinár Importance of Feedback in Testing by use of Universal Testing System
DIVAI 2018 – The 12th international scientific conference on Distance Learning in Applied Informatics. 286 ISBN 978-80-7598-059-5 (Print) ISSN 2464-7470 (Print) ISSN 2464-7489 (On-line)
automatic evaluation
yes yes yes yes yes yes
self-test yes no yes no no yes
time limit yes no yes yes no yes
ARCHITECTURE OF UTS
All of these requirements are incorporated into the following architecture. Our system contains several modules that record certain data sets. Module User records teachers, students and assigns them roles and rights. The module Theme records the division of the subject into the chosen topics and the module Questions allows the teacher to enter different types of questions. Questions can be included in the relevant theme, they can be assigned the number of points and they can be ranked among the self-testing questions. The module Test allows to set the test number, the number of points and the time limit of the test. The most recent module is the Feedback module, which will be discussed in the next chapter Feedback in the UTS.
THE DATABASE SECURITY FOR TESTING QUESTIONS
The Universal testing system UTS were created with the markup language HTML, cascading style sheets CSS, programming languages JavaScript and PHP, database system PostgreSQL and Apache server.
All the information about the users, test results and testing questions is stored in the database and it consists of eight tables and twenty-eight columns with various date types. Diagram of the database is graphically shown in the Table 2.

Dana Horváthová, Patrik Voštinár Importance of Feedback in Testing by use of Universal Testing System
DIVAI 2018 – The 12th international scientific conference on Distance Learning in Applied Informatics. 287 ISBN 978-80-7598-059-5 (Print) ISSN 2464-7470 (Print) ISSN 2464-7489 (On-line)
Table 2: Diagram of database from our UTS system.
Security of stored passwords in the database is one of the most important parts of our security system. Therefore, we encrypt password with hash algorithm offered by PHP developers (from the PHP version 5.5 it is available with simple set of functions):
Table 3: Set of functions.
1 $encrypted = password_hash("tajneheslo", PASSWORD_DEFAULT);
2 // $2y$10$0c.UyV1FqPecM0DO6uS0/D/0NtxBGtEMUjM6.Mn6bmZmvDMOu
The variable $encrypted is unique hash for the password. Exactly this value is stored in the user database for verifying the password for the next sign in. For this step the following function is used:
Table 4: Verifying the password.
1 if(password_verify("tajneheslo", $encrypted)) {
2 // spravne heslo, prihlasim pouzivatela
3 } else {
4 // nespravne heslo
5 }
The constant PASSWORD_DEFAULT always uses the latest algorithm. Currently it is linked to CRYPT_BLOWFISH, but if it is necessary, PHP developers can update this constant.
FEEDBACK IN EDUCATION
The educational process can be understood (when simplifying) as a controlled process, in which it is possible to differentiate two basics functions:
� Sharing of new knowledge
� Control of the quantity and quality of acquired knowledge and skills.
These two phases create one part, which cannot be divided. We can understand feedback as information that highlights whether the system’s behavior is correct or not.

Dana Horváthová, Patrik Voštinár Importance of Feedback in Testing by use of Universal Testing System
DIVAI 2018 – The 12th international scientific conference on Distance Learning in Applied Informatics. 288 ISBN 978-80-7598-059-5 (Print) ISSN 2464-7470 (Print) ISSN 2464-7489 (On-line)
So, it is the information that show us the view on external and internal signs of the system. There are different types of feedback: (Rusnák, 2017):
� Evaluative Feedback
� Non-Evaluative Feedback
Evaluative feedback explains informative relationship in which the information about the consequences of ones’ activities is provided to its performer. Based on this feedback the administrator can correct or modify activity in given aim. The student was not given only the information about evaluation in the form of marks but also information on which questions in test are correct and or incorrect and also what should be the best answer to that question.
Non-evaluative feedback is a situation when the information about the correctness of the result is not available to students. In this case, feedback can be represented by the knowledge, whether the student is satisfied with his own result or he needs to improve his knowledge.
Research shows that when student makes a mistake in the test but does not get the feedback with expected answer, he tends to do the same mistake again in other tests. This incorrect information can disrupt student`s knowledge. It is one of the reasons why feedback is important. Student’s reaction to this type of test made by the computer is very positive. However, testing on computers has also disadvantages, but it saves time and also human and natural resources. Another advantage is that this system avoids mistakes from inattention or exhaustion that can appear when the paper test is corrected.
FEEDBACK IN UTS
The feedback module in UTS is created (Rusnák, 2017) the way that it has to register all the students’ answers from the test. These answers are clearly written in the module "Feedback". With this module the teacher can show students, where they made mistakes and which answers were expected. The teacher has in his administration menu the list of all registered students. The results of all the students are stored in this module. Teacher can print or download (.pdf) the test with correct answers. The predefined name of this file is the name of each student (firstname_familyname.pdf).
The feedback module is available only in teacher’s interface because of the security reasons. This face-to-face contact with student is important and safe because we can discuss these questions and focus more on student’s wrong answers. Also in this phase the feedback has the educational function, because student can learn from his mistakes.
When students solve and send the test, the answers are saved into our first table of the database where they are compared with correct answers from our second table. On teacher’s administration panel a "Feedback" button is created for each registered student, who sent the test. When the button is pressed, it shows the evaluated test with correct (marked with green color) and incorrect (marked with red color) answers of the student. Correct and wrong answers have different deepness in black and white version, so used colors are suitable for both black and white and color printers.

Dana Horváthová, Patrik Voštinár Importance of Feedback in Testing by use of Universal Testing System
DIVAI 2018 – The 12th international scientific conference on Distance Learning in Applied Informatics. 289 ISBN 978-80-7598-059-5 (Print) ISSN 2464-7470 (Print) ISSN 2464-7489 (On-line)
Figure 1: Example of feedback.
Another new feature of the UTS is the time limit module. This module allows the teacher to set the time limit for the selected test in his administration interface. After the deadline, the test is automatically sent onto the server, therefore students cannot continue with the test.

Dana Horváthová, Patrik Voštinár Importance of Feedback in Testing by use of Universal Testing System
DIVAI 2018 – The 12th international scientific conference on Distance Learning in Applied Informatics. 290 ISBN 978-80-7598-059-5 (Print) ISSN 2464-7470 (Print) ISSN 2464-7489 (On-line)
Figure 2: Setting time limit for test (by the teacher).
Figure 3: Displaying time limit for students.
The UTS is available at https://devel.umb.sk/phpapps/testsys/ in self-test mode. We do not publish here a registration code because of the security reasons, this is why it is not possible to log into a system without it.
CONCLUSION
Our UTS system is being used at our faculty without any problems for 8 years. In the last year, the second version of UTS was tested. This version contains some small design changes, changes in security policy, in extension of time limit module and mainly in feedback module. This module enables teachers to add the last phase of education process - learning from mistakes. Student’s reactions were very positive because of the possibility to see their mistakes. Mainly students in second (repair) exam appreciated this feature of feedback (due to results of statistics).

Dana Horváthová, Patrik Voštinár Importance of Feedback in Testing by use of Universal Testing System
DIVAI 2018 – The 12th international scientific conference on Distance Learning in Applied Informatics. 291 ISBN 978-80-7598-059-5 (Print) ISSN 2464-7470 (Print) ISSN 2464-7489 (On-line)
Our system is unique because of the opportunity to set the exact number of points from the test to all students and randomly generate a unique test for each student. The questions can be created from different type of thematic topics, with different number of points for each question according to the level of difficulty, respectively according to the number of correct answers. This variability of self-testing supplement opportunities are offered without registration. Other free versions of testing systems do not have all of these features in one testing system. In the future we will add multimedia elements like pictures, sounds, animation, videos and interactivity (drag-and-drop objects) to the system. We will also create a module for supporting more teaching courses and more teachers into one course.
ACKNOWLEDGEMENT
This contribution has been processed as part of the grant project Implementation of Blended Learning into Preparation of Future Mathematics Teachers, Project no. 003UMB-4 / 2017th.
REFERENCES
Butaš, J., 2009. Meranie výsledkov vzdelávania pomocou testov = Measurement of learning outcomes by testing. Ružomberok : Katolícka univerzita.
Ćukušić, M., Garača, E., Jadrić, M., 2014. Online self-assessment and students' success in higher education institutions. In Computers & Education, vol. 72, 3 (March 2014), 100-109. http://dx.doi.org/10.1016/j.compedu.2013.10.018
Denny, P. et al., 2008. PeerWise. In Proceedings of the 8th International Conference on Computing Education Research (Koli '08). ACM, New York, NY, USA, 109-112. http://doi.acm.org/10.1145/1595356.1595378
Deutsch, T., Herrmann, K., Frese, T., Sandholzer, H., 2012. Implementing computer-based assessment - A web-based mock examination changes attitudes. In Computers & Education, vol. 58, 4 (May 2012), 1068-1075. http://dx.doi.org/10.1016/j.compedu.2011.11.013
Chráska, M., 2007: Metody pedagogického výzkumu: Základy kvantitativního výzkumu = Methods of Pedagogical Research: Basics of Quantitative Research, 1. aktualizované vydání. Praha: Grada, 2007. 272 s. ISBN 9788024713694.
Hanclová, J., Banarová, J. Nemec, R.: The increase of efficiency and effectiveness of student e-testing and knowledge assessment. 10th International Conference on Efficiency and Responsibility in Education 2013 Location: Prague, Czech Republic, 2013
Horváthová, D., Brodenec, I., Jacková, J., 2014: The use of own e-testing system in the multimedia course, In DIVAI 2014 : 10th international scientific conference on distance learning in applied informatics, Štúrovo, Slovakia, May 5 - 7, 2014. ISBN 978-80-7478-497-2. - S. 75-84.
Jacková, J., 2006. Validity and Reliability of Tests in Web-PSI Courses. In 7TH International conference Virtual university, 2006. Bratislava: STU, 2006, s.229–232.
Karl, M., Graef, F., Eitner, S., Wichmann, M., Holst, S. and Beck, N., 2011, Student attitudes towards computer-aided testing. European Journal of Dental Education, 15: 69–72.

Dana Horváthová, Patrik Voštinár Importance of Feedback in Testing by use of Universal Testing System
DIVAI 2018 – The 12th international scientific conference on Distance Learning in Applied Informatics. 292 ISBN 978-80-7598-059-5 (Print) ISSN 2464-7470 (Print) ISSN 2464-7489 (On-line)
Kultan, J., 2006. Využívanie IKT pri testovaní - jedna z foriem zvýšenia kvality vzdelávania = The Use of ICT in Testing – one of the way to improve the quality of education. In Mezinárodní Baťova doktorandská konference : recenzovaný sborník příspěvků [elektronický zdroj]. Zlín : Univerzita Tomáše Bati, 2006.
Kultan, J., 2007. Testovací systém - jedna z možností zvýšenia kvality vzdelávania = Test system – one of the possibilities to improve the quality of education. In DIVAI 2007 - Dištančné vzdelávanie v aplikovanej informatike [elektronický zdroj] : zborník príspevkov z medzinárodnej konferencie : Nitra, 2007. Nitra : Katedra informatiky FPV UKF, 2007, s. 146-154.
Pain, D.,Heron, J. L., 2003: Webct and online assessment: The best thing since soap? Educational Technology & Society, vol. 6, no. 2, pp. 62–71, April 2003. [Online]. Available: https://www.jstor.org/stable/jeductechsoci.6.2.62?seq=1#page_scan_tab_contents
Ristov, S., Gusev, M., Armenski, G., 2015: Massive Development of E-Testing Questions. International Journal of Emerging Technologies in Learning. Volume: 10 Issue: 4 Pages: 46-53 Published: 2015
Rusnák, R., 2017: Spätná väzba vo webovom univerzálnom testovacom systéme = Feedback of web universal test system. Banská Bystrica, 68s. Diplomová práca na Fakulte prírodných vied v Banskej Bystrici. Vedúci DP: one of the authors
Škrinárová, J., 2011. Metodika dištančného vzdelávania a e-learningu = Methodology of distance learning and e-learning. Banská Bystrica : Univerzita Mateja Bela,
Varga, P., 2011. Webový univerzálny testovací system = Web universal test system. Banská Bystrica, 58s. Diplomová práca na Fakulte prírodných vied v Banskej Bystrici. Vedúci DP: one of the authors
Wilson, E. V., 2003. ExamNet asynchronous learning network: augmenting face-to-face courses with student-developed exam questions. In: Computers & Education, vol. 42, 1 (January 2004), 87–107. http://dx.doi.org/10.1016/S0360-1315(03)00066-6
Jozef Hvorecky, Lilla Korenova Learning Critical Thinking Without Teacher’s Presence
DIVAI 2018 – The 12th international scientific conference on Distance Learning in Applied Informatics. 293 ISBN 978-80-7598-059-5 (Print) ISSN 2464-7470 (Print) ISSN 2464-7489 (On-line)
Learning Critical Thinking Without Teacher’s
Presence
Jozef Hvorecky
Vysoká škola manažmentu, Trenčín, Slovakia [email protected]
Lilla Korenova
Faculty of Education, Comenius University, Bratislava, Slovakia [email protected]
Abstract
The recent spread of hoaxes and trolling rises the importance of critical thinking. The process consists of four key components: clarification of the problem, assessing evidence (judging the credibility of information), making and proving inferences, and applying appropriate strategy leading to conclusions. Their absence affects the entire population of Slovakia. Solving this massive problem would require huge numbers of qualified instructors. The authors study opportunities for training the skills at distance: Developing and making them durable among our young generation; Increasing and strengthening them among adults. Below we demonstrate three strategies developed for these groups using Socrates dialogue. The first approach addresses pupils of secondary school using a book. The second one is based on discussions about video lectures made by Master students of Education. The third one exploits video lectures built-in to a virtual classroom for postgraduate students of Business Administration. In all cases, the educator’s presence is welcome but not necessary. If he/she is available, he/she rather acts as a facilitator not as the “only relevant source of information”. We have completed simple pilot tests addressed the relevant groups. The learning materials have been positively appreciated. However, due to small numbers of participants, the results must be considered with caution and deeper investigated. In our contribution, we describe all learning materials and explain why the results of our pilot tests allow us be optimistic prior to their wider application.
Keywords
Teaching Critical Thinking. Cognitive Skills Development. Social Learning Techniques. Dialogue Enhancing Techniques.
INTRODUCTION
In this paper, selected problems of teaching critical thinking are discussed. In the field of education, the topic has become intensively discussed due to the recent spread of hoaxes and trolling. The development of critical thinking didactic techniques is considered

Jozef Hvorecky, Lilla Korenova Learning Critical Thinking Without Teacher’s Presence
DIVAI 2018 – The 12th international scientific conference on Distance Learning in Applied Informatics. 294 ISBN 978-80-7598-059-5 (Print) ISSN 2464-7470 (Print) ISSN 2464-7489 (On-line)
as a right tool for fighting their recipients’ mind confusion. At the same time, the topic is not new one. The oldest references to the ability of evolving the adequate responses to intentional and unintentional mind confusions go as far as to Plato and Socrates dialogues in 4th century BC.
According to (Bullen, 1998), the components of critical thinking are:
� Clarification: The attempt to appraise and understand the exact nature of the problem, issue, or dilemma. This includes attempting to understand different points of view on an issue.
� Assessing evidence: In order to establish a sound basis for inferences, the evidence used to support those inferences must be assessed. It involves judging the credibility of the sources of information and making and judging the credibility of observations.
� Making and judging inferences: Inductive and deductive inferences and value judgements are involved in making a decision about what to believe or to do. Critical thinking involves the ability to judge the soundness of inferences and to make good inferences. Using evidence to support arguments is included in this category.
� Using appropriate strategies and tactics: Critical thinking is not a matter of following steps or procedures but some strategies and heuristics can be useful in guiding thinking.
Notice that this characteristic was written on the dawn of the Internet Era. As such, it does not address social media with their freedom of publishing “anything”. It simply describes a systematic and watchful method of thinking independent on its actor and circumstances.
Each of its four concepts reduces the probability of making unwanted mistakes in reasoning. As a result, critical thinking is a popular method of solving not-well-structured problems. For example, (Snyder & Snyder, 2008) underline its importance in training of students of humanities: “Simply put, students who are able to think critically are able to solve problems effectively.” The same authors state that the principles of critical thinking are a part of the U.S. educational system for more than 300 years. This represents a big difference compared to the Slovak education, in which critical thinking is rarely a part of school education. (Čavojová, 2016) points to the fact that critical thinking in all post-Communist countries is not widespread due to repression of any criticism of establishment and its policies during the former regime. The reader can find examples of pilot studies of Slovak educators in (Kalaš & Winczer, 2008; Gunčaga & Janiga, 2016; Štoffová & Štrbo, 2016; Kostrub & Severini, 2017; Tóthová et al, 2017).
TEACHING CRITICAL THINKING: THE STATE-OF-ART
Teaching Critical Thinking is a long and never-ending process. Despite many years of experience, the state-of-the art in the U.S.A. is not brilliant yet. (Lochhead & Clement, 1979) commented it: “We should teach student how to think. Instead we are teaching them what to think.” These words propose an educational method: Do not talk to learners what is Critical Thinking. Rather give them topics to think about, watch their progress, and

Jozef Hvorecky, Lilla Korenova Learning Critical Thinking Without Teacher’s Presence
DIVAI 2018 – The 12th international scientific conference on Distance Learning in Applied Informatics. 295 ISBN 978-80-7598-059-5 (Print) ISSN 2464-7470 (Print) ISSN 2464-7489 (On-line)
– if necessary – point to their blunders. Again, not tell them the solution; give them an advice leading from their dead end.
In our below-described educational approaches, we exploit similar relationships between critical thinking and problem solving. They demonstrate three possible delivery methods which divert from the instructionism – the most spread delivery method in Slovakia (and probably in Central Europe). Instructionism “in terms of teaching, typically involves the teacher giving instructions to children, such that they have limited opportunity for their own activity and personal way of thinking” (Gunčaga et al., 2018). In opposite, our presented approaches incline to constructivism. It assumes that each end every learner creates – “constructs” – his/her own knowledge of the world in which s/he lives (Gunčaga et al., 2018). The constructivism tries to overcome the mechanical transmission of traditional teaching – the transfer of “teacher’s knowledge” to the student’s heads via routine repetitions of known facts. In our examples, the learners have to learn by solving problems which are new to them. They not only learn something explicit but hopefully expand their tacit knowledge and enhance their capability to transfer and exploit it in their future problem solving.
Below we demonstrate three approaches to training our students to think critically. All allow learning without a presence of an educator. To avoid misunderstanding, we have to explain our proposed interpretation of “educator’s absence”.
� First, the instructor intensively prepares learning materials, plans students’ activities and thinks over possible directions of their positive and negative development. He/she must be prepared for several scenarios and be capable of recognizing their symptoms. The students must not be familiar with the problem’s solution. The solution must contain elements of “mystery” i.e. cannot be found without their additional efforts, knowledge and/or skills that go slightly beyond their existing level(s). The amount of absent knowledge and skills should be limited in order to keep it solvable.
� The problem is presented to the learners. They should solve the problem on their own. The educator’s “absence” can have two forms. He/she can be physically present in the role of an observer. If a symptom of deviation appears, he/she may gently point to it – not to start solving the problem on his/her students’ behalf. In other cases, the students are supposed to solve the problem by themselves. The educator may/may not be accessible during their work.
� Regardless which approach is applied, the students should in the end learn the correct/alternative solutions and learn from their mistakes. The explanation should be followed by a discussion about their potential improvements, alterations, blunder removals, etc.
When speaking about interactions between educators and learners during the constructivist methods, (Rábeková & Hvorecký, 2015) provide an analogy to the bean plant and its stick: The bean stick itself does not bring fruit. It is here to give a support to the plant and to lead it towards the sun. Similarly, the teacher’s main function is to provide a support for the students’ activity and his/her guidance towards their new knowledge. Every bean plant needs its stick. Otherwise, it remains underdeveloped. Such an approach is in a strong opposition to instructionism in which the stick dominates to the plant and does not allow it moving into any other way.

Jozef Hvorecky, Lilla Korenova Learning Critical Thinking Without Teacher’s Presence
DIVAI 2018 – The 12th international scientific conference on Distance Learning in Applied Informatics. 296 ISBN 978-80-7598-059-5 (Print) ISSN 2464-7470 (Print) ISSN 2464-7489 (On-line)
There are not enough national specialists in the field of Critical Thinking in Slovakia. The gap of these skills is evident in the entire population. For this reason, the authors address two non-separable methodology problems:
� How to develop the critical thinking skills among our young generation and to make the gained skills sustainable and durable.
� How to expand and facilitate the skills among adults.
Our presented learning approaches might partially fill in the gap. They can be considered as recommendations for the volunteers until a needed number of qualified specialists will be reached. The examples address three different age groups: pupils, university students at Master level and university students at PhD. level. In no meaning, the presence of an instructor is prohibited. Inversely, whenever possible his/her presence is welcome. He/she can expose the student’s failures and blunders faster, point to them and explain their sources. The presented approaches should therefore be considered as parallel and supportive way filling the gap in our educational system. Notice that none of the examples addresses Critical Thinking as an isolated subject. Its content is present here indirectly – through proposed problems. Due to their novelty, their solutions open to our students a window to innovative forms of education. They allow them to comprehend that Critical Thinking can be incorporated into any course.
TEACHING CRITICAL THINKING
(Mayfield, 2007) define critical thinking as an application of “conscious awareness, skills, and standards to the process of observing, analysing, reasoning, evaluating, reading, and communicating”. This definition also suggests considering critical thinking as “thinking on thinking”. If one accepts this position, the above sets of activities can be trained and practiced i.e. become a subject of education. Such aim expresses (Facione, 2015) using the words: “We understand critical thinking to be purposeful, self-regulatory judgment which results in interpretation, analysis, evaluation, and inference, as well as explanation of the evidential, conceptual, methodological, criteriological, or contextual considerations upon which that judgment is based.” The subtitle of Mayfield’ book – Developing Critical Thinking Skills Through Reading and Writing – inspired our intention to design and develop methods not requiring a direct presence of instructor.
Every subject of education is built upon two basic components: Its content and its educational methodology. We believe that critical thinking should be applied to every activity in every field. To demonstrate it, below we show its application in rather distant fields: Physics and Slovak Language, Technology Principles, and Research Methods.
The traditional educational method of critical thinking is Socratic dialogue. First, such an approach is self-propagating as it refers to fundaments of the Western culture. Secondly, any content of education can be presented as a series of discussions, questions and answers. (MacKnight, 2000) presents sets of questions typical for Socratic dialogue:
� Questions for Clarification: What do you mean by X? What is your main point? How does X relate to Y? Could you explain that further?
� Questions about the initial question or issue: What does the issue assume? Can we break this question down at all? Does the question lead to other questions?

Jozef Hvorecky, Lilla Korenova Learning Critical Thinking Without Teacher’s Presence
DIVAI 2018 – The 12th international scientific conference on Distance Learning in Applied Informatics. 297 ISBN 978-80-7598-059-5 (Print) ISSN 2464-7470 (Print) ISSN 2464-7489 (On-line)
� Questions about probe assumptions: What are we assuming? How would you justify taking this for granted? Is this always the case?
� Questions that probe reasons and evidence: What would be an example? Are those reasons adequate? Do you have any evidence for that? How could we find out if that is true?
� Questions that probe origin or source questions: Where did you get this idea? How have you been influenced by media?
� Questions that probe implications and consequences: What are you implying by that? What effect would that have? What is an alternative? If this is the case, then what else must be true?
� Questions about viewpoints or perspectives: Can anyone see this another way? What would someone who disagrees say?
Notice that the questions can be considered as meta-questions. They can be adopted by any course and adapted to its content in order to allow students to comprehend the subject in depth and become capable of thinking about it critically. The Learning Slovakia program (Burjan et al, 2017) is the most recent attempt to change the widespread instructionism in our country. Due to the change of the Minister of Education, it seems that this progressive proposal is endangered and might be cancelled.
ENHANCING STUDENTS’ CRITICAL THINKING
The Ministry of Education’s lack of interest should not lead to our resignation on introducing critical thinking training in our schools. It only means that the presumed frontal approach must be replaced by initiatives of individuals and small groups. Everyone considering it as a key part of education should work on its implementation. To make their own contribution, the authors designed, developed and implemented learning materials targeting dissimilar groups of learners.
The first target group are pupils of age approximately between ten and twelve years. They are attending regular schools. Due to the existence of educational standards, one can rather easily identify their (presumed) knowledge. In our case, Physics and Slovak Language certainly belong among their courses. Nevertheless, the learning material does not direct the full content of these subjects, only their selected parts. On the other hand, it occasionally goes beyond their prescribed compulsory content. It is not a textbook. It is rather a complementary material for spare hours or pupil’s free time. The book’s design and layout do not resemble typical formats of Slovak “serious” textbooks. Its reading as well as the execution of its specified activities only depends on the decision of its readers. To attract them to solve the problems, the most promise having fun and joy. The teachers are invited to use it as a supplementary material, to suggest its reading to their pupils and to be ready for their consultations.
The second target group are pre-service teachers of elementary schools. The Technology Fundamentals is a part of their compulsory study program. Its aim is making them to learn appropriate application of technology in classrooms. High quality applications require a lot of critical thinking of the (future) teachers in order to recognize what technology fits to which learning material and why. For this reasons the students

Jozef Hvorecky, Lilla Korenova Learning Critical Thinking Without Teacher’s Presence
DIVAI 2018 – The 12th international scientific conference on Distance Learning in Applied Informatics. 298 ISBN 978-80-7598-059-5 (Print) ISSN 2464-7470 (Print) ISSN 2464-7489 (On-line)
were asked to select a section of learning material from the syllabus, to elaborate it into a video, to present it to their classmates and to face and respond to their criticism.
The third target group consists of external postgraduate students of Business Administration. The official title of the discussed course is Quantitative Methods in Business Management Research. As the university offers three courses related to quantitative methods, the author discussed its content with the lecturers teaching two other courses. Upon their mutual agreement, his content has been moved closer towards general Critical Thinking. The course is compulsory. To facilitate the absent student’s learning, the key sections of the lectures were recorded. The videos have been posted on the internet in a Moodle virtual classroom. Each video contains a set of Socratic questions that are then discussed using a standard format of discussion forum (Lipovská et al, 2014).
The Children’s Book
The book (Hvorecký, 2018) deals with Physics and Slovak Language but is not written using the standard “scientific” style. Instead of it, it has got the form of a dialogue between the author and a not-well specified amoeba-like being named Ameb. Ameb exists since the Big Bang and have witnessed the evolution of the Universe but do not understand properly what was really happening and why. In a way, he is a version of Dr. Watson – an individual curious and eager for knowledge but unable to make all relevant inferences. The storyteller discloses to him the hidden processes behind his observations. As a result, each of the partners explains the evolution of the Universe from a different perspective. The pair presents two principles of critical thinking:
� Seeing more does not necessarily means knowing more.
� To make a conclusion, we have to have data to be our subject of discussions. Every story player is sometimes in a position of an observer, sometimes in the position of thinker.
The book primarily exploits a dialogue format. There is no straightforward storyline; Physics is intertwined with specific features of the Slovak language. There are examples:
� In the Slovak language, there are a few hundred words without vowels. Examples are krt (a mole), spln (full Moon), hlt (a draught). The book starts with the author composing a crossword puzzle having no vowels. The main subject of the book remains still hidden. The reader is not “being taught” from very beginning. A more serious content comes when this barrier is broken.
� The letter q is not used much in our language. In the majority of cases, its transcripted to “kv”. For example, the particle quark adopts the form “kvark”. In order to “compensate the q’s mental damage”, the figures write a story in which the group “kv” (as “mrkva” i.e. carrot or “lekvár” - jam) are typed with q. The purpose of similar stories is making a break. The reader can relax, to process his/her gained information and only then to proceed further.
� One of the short stories has a specific purpose. It builds a bridge between the Slovak language and Physics. It starts with a question: “Why are there so many laws in physics?” The response is: “Because any discipline including the Slovak language contains many laws.” (It is much easier to explain a necessity of having laws in the pupils’ mother tongue.) Despite the common opinion, the spoken and written form of Slovak words not always correspond linearly. The

Jozef Hvorecky, Lilla Korenova Learning Critical Thinking Without Teacher’s Presence
DIVAI 2018 – The 12th international scientific conference on Distance Learning in Applied Informatics. 299 ISBN 978-80-7598-059-5 (Print) ISSN 2464-7470 (Print) ISSN 2464-7489 (On-line)
key rule is “píš, ako počuješ”. The chapter is intentionally headed by its grammatically wrong version “Pýš ako počuieš” (something like “Right wot u r listening to”). The children may start understanding that some discrepancies must be resolved by introducing additional regulations.
Socrates dialogue is present in several forms: (a) the dialogue between the narrator and Ameb, (b) the introspection of the reader evoked by problems after every chapter, (c) solving group task proposed to be taken with friends or family members, (d) potential dialog with a teacher or a facilitator and the reader. Every chapter ends with a series of assignments and questions. In order to develop children’s lateral thinking (de Bono, 2010), the most of them are open – without a well-defined, unique solution. Some of them are even not connected to Physics or Slovak Language. On the other hand, the solutions are provided at least in the form of hints. The questions ask for clarifications of concepts, require their improved formulations, probe evidence, assumptions or conclusions, etc. In total, they cover all principles of critical thinking and test their application on problems the children understand and often have fun during their solution.
The Instructional Videos
The course Principles of Technology for future teachers of elementary schools is (at the Faculty of Pedagogy of the Comenius University) located in a semester crowded by other activities like international mobility and practical training in schools. They take away at least 4 out of 13 weeks. Its instructor faced a risk of not covering all presumed learning objectives. Using a non-standard educational format has been a solution of this dilemma.
In the beginning of the term, the study material was divided to sections. Small groups (consisting of two or three students) were asked to select a topic and to prepare a 10-15 minute long video. The students undergoing their Erasmus mobility ware asked to prepare a video on teaching technology-oriented courses in their host country. The students were also welcome to shoot their own presentations in the classrooms and then explain why they proceed in their preferred way and what their pupils’ reactions were.
The completed videos were then posted in Moodle to become accessible by the rest of the class. The classmates can express their opinion and discuss with its authors their potential improvements over the Internet. In this way, Socrates dialogue become an integral part of the course. The dialogue often went beyond the originally planned learning objectives because the students reflected their teaching and learning experience from their visited schools in Slovakia and abroad.
In this way, the educator primarily functioned as a course facilitator. Her main role was to control the educational processes: keeping time schedule, evoke discussion among students and help them to make general conclusions from their observations. At the same time, the students participated at preparation of the substantial portion of course material, evaluate its quality and discussed its future development i.e. they experienced constructivist learning and could see its advantages. Many of them expressed their satisfaction. In our plans, the course will be a subject of further research and will be evaluated using formal methods.

Jozef Hvorecky, Lilla Korenova Learning Critical Thinking Without Teacher’s Presence
DIVAI 2018 – The 12th international scientific conference on Distance Learning in Applied Informatics. 300 ISBN 978-80-7598-059-5 (Print) ISSN 2464-7470 (Print) ISSN 2464-7489 (On-line)
Virtual Classroom for Postgraduate Students
The PhD. students already have certain own experience in critical thinking and problem solving. What they need is a support in selecting their “right” research topic, relevant research methods and capability to make solid conclusions. They have to be trained in forming their assumptions, probing them, verifying evidence, applying an appropriate method(s) for its processing, and forming compact implications and conclusions and present them in legible and consistent manner. It also means that their dissertation advisor must introduce them to a theoretical basis of his/her research and to typical skills required in the particular field.
The research methodologies are often presented as a specific course. Such an approach allows collaborating with larger groups of students e.g. a cohort starting their PhD. study in the same year. The School of Management offers three interrelated courses. Each of them is oriented to various aspects of research methods. The one delivered by the author is oriented to general aspects edging with Knowledge Management. From historical reasons, its title is a bit confusing Quantitative Methods in Business Management Research. It consists of four main blocks with the following content:
� Innovativeness and originality: The potential direction of research in Business Administration; Selecting a research topic; Relations between research and knowledge management; Tacit and explicit knowledge and their role in decision making; SECI model.
� Project development: Mental models of a researcher – a specialist and a generalist; Stages of a dissertation project; Positivism and Constructivism; Data, information, knowledge as stages of project development.
� Doing research: Examples of earlier successful projects.
� Errors and blunders in research: Falsification (in Popper’s meaning) as a research method; Retardations in research development; Interdisciplinarity as a researcher’s obligation.
The course is proposed in a blended mode i.e. as a combination of online and on-site lectures. For each of the four blocks, a PowerPoint slide presentations is prepared and posted on Moodle. The blocks are cut to seventeen shorter themes; for each of them the author prepared a video lecture lasting from five to ten minutes. The videos are in a private sector of Youtube but all of them are accessible from the course. An example of such Youtube video from the second block is on (Hvorecký, 2017).
The Moodle course also contains a discussion forum with a separate thread for each block. The students are requested to express their opinion of some the block theme. Each of them has to comment at least two statements of his/her classmates. In this way (and with their instructor’s support), they expand their knowledge and orientation in the area. They also learn that research in humanities is based on different principles compared to research in science or technology.
CONCLUSION
The still persisting spirit of obedience of authorities in the Slovak educational system (Hvorecký & Višňovský, 2017) means that the innovative educational methods will hardly

Jozef Hvorecky, Lilla Korenova Learning Critical Thinking Without Teacher’s Presence
DIVAI 2018 – The 12th international scientific conference on Distance Learning in Applied Informatics. 301 ISBN 978-80-7598-059-5 (Print) ISSN 2464-7470 (Print) ISSN 2464-7489 (On-line)
be implemented in their needed extent and intensity. The traditional methods based on memorization will continue to dominate. Critical-thinking-based approaches will run as a parallel but subdued method executed by teachers - volunteers out of the mainstream. According to (Snyder & Snyder, 2008), the lack of training, time constrains and preconceptions belong among main barriers impeding erudition in critical thinking. Insufficiently trained individuals lack the routine necessary for the capability to disclose them and free their mind during assumption, reason and evidence probes. Their deficiency results in bad evaluation of data quality – even when data are available. This is a case of hoax and trolling.
In the Internet era, data are available (sometimes even abundant) but their quality is often questionable. Without relevant training, the students are unable to uncover their low quality and misleading character. As a result, there is a danger that the critical thinking skills of school and university graduates will remain underdeveloped. In our paper, we have presented three approaches that allow introducing Socrates dialogue to pupils and students. Our experience shows that they welcome it because it enhances their curiosity and opens new horizons of their creativity.
In the future, we will verify our first informal and positive experiences using methods that are more formal. We will have to because the verification is a core of critical thinking.
ACKNOWLEDGEMENT
The paper was written with the support of the grant KEGA 012UK-04/2018 “The Concept of Constructionism and Augmented Reality in the Field of the Natural and Technical Sciences of the Primary Education (CEPENSAR)”.
REFERENCES
Bullen, M., 1998. Participation and Critical Thinking in Online University Distance Education. International journal of E-Learning and Distance education, Vol. 13, No. 2, 1-32. [online] Available at http://ijede.ca/index.php/jde/article/view/140/394 [Acessed on 2 February 2018]
Burjan, V., Ftáčnik, M., Juráš, I., Vantuch, J., Višňovský, E., and Vozár, L., 2017: Učiace sa Slovensko, Národný program rozvoja výchovy a vzdelávania, Ministerstvo školstva, vedy, výskumu a športu SR, Bratislava. [online] Available at https://www.minedu.sk/data/files/6987_uciace_sa_slovensko.pdf [Acessed on 8 February 2018]
Čavojová, V. et al, 2016. Rozum: Návod na použitie (Brain: User Manual). IRIS, Bratislava.
De Bono, E., 2010. Lateral thinking: a textbook of creativity. Penguin UK.
Facione, P.A., 2015. Critical Thinking: What It Is and Why It Counts. Measured Reasons LLC, Hermosa Beach, CA. [online] Available at http://go.roguecc.edu/sites/go.roguecc.edu/files/dept/nursing/PDF/Nursing/Critical%20Thinking-What%20it%20is%20and%20Why%20it%20Counts--to%20be%20linked%20to%20HSRT%20info.pdf [Acessed on 7 February 2018].

Jozef Hvorecky, Lilla Korenova Learning Critical Thinking Without Teacher’s Presence
DIVAI 2018 – The 12th international scientific conference on Distance Learning in Applied Informatics. 302 ISBN 978-80-7598-059-5 (Print) ISSN 2464-7470 (Print) ISSN 2464-7489 (On-line)
Gunčaga, J., Koreňová, L., and Kostrub, D., 2018. The Educational Research Focused on the Development of Mobile Technologies in Education. In: Artois, M.: Teaching with Technology: Perspectives, Challenges and Future Directions. Nova Science Publishers.
Hvorecký, J., 2017. A sample video lecture. [online] Available at https://youtu.be/p1Zpb8NiFC0 [Accessed on 17 February 2018].
Hvorecký, J., 2018, Životopis oranžovej myši. (CV of an Orange Mouse). Raabe, Bratislava (in print).
Hvorecký, J. and Višňovský, E. 2017. Universities Should Also Learn. In Interactive Collaborative Learning (ICL), 2017 International Conference on. (pp. 1481 – 1491). IEEE.
Gunčaga, J., and Janiga, R., 2016. Virtual Labs and Educational Software as a Tool for more Effective Teaching STEM Subjects. In: The Third International Conference on Computer Science, Computer Engineering, and Education Technologies. Łodz: Łodz University of Technology, 1-12.
Kalaš, I., and Winczer, M., 2008. Informatics as a Contribution to the Modern Constructivist Education Informatics Education. In: Mittermeir R.T., Sysło M.M. (eds) Informatics Education - Supporting Computational Thinking. Lecture Notes in Computer Science, 5090.
Kostrub, D., and Severini, E., 2017. Critical research of teaching mathematics – action research in teaching – you don`t measure and don`t cut, leave it all to students; you "are still on your way". DIDMATTECH 2017: New methods and technologies in education and practice, 1, Trnava: Trnavská univerzita, 141-152.
Lipovská, A., Hvorecký, J. and Šimúth, J., 2014. Virtuálna trieda: Sprievodca adaptívnym online vzdelávaním. Equilibria.
Lochhead, J. and Clement, J., 1979. Cognitive Process Instruction. Research on Teaching Thinking Skills. Franklin Institute Press, 20th & Race Sts., Box 2266, Philadelphia, PA.
MacKnight, C. B., 2000. Teaching Critical Thinking Through Online Discussions. Educause Quaterly, No. 4/2000.
Mayfield, M., 2007. Thinking for yourself: Developing Critical Thinking Skills Through Reading and Writing. Thomson, Boston.
Rábeková, L. and Hvorecký, J., 2015, September. Learning strategies for small groups of professionals. In Interactive Collaborative Learning (ICL), 2015 International Conference on (pp. 764-770). IEEE.
Snyder, L.G. and Snyder, M.J., 2008. Teaching critical thinking and problem solving skills. The Journal of Research in Business Education, 50(2), p.90.
Štoffová, V., and Štrbo, M., 2016. Educational Technologies to support language teaching Proceedings of XXIX. DidMatTech 2016, Eötvös Loránd Tudományegyetem, Budapest, http://didmattech.inf.elte.hu/proceedings/.
Tóthová, R., Kostrub, D., and Ferková, Š., 2017. Žiak, učiteľ a výučba (všeobecná didaktika pre študentov učiteľstva). Prešov: Rokus.

Michal Kuchárik, Zoltán Balogh, Martin Drozda Petri Net Model of Student Choices in a LMS Moodle E-Course
DIVAI 2018 – The 12th international scientific conference on Distance Learning in Applied Informatics. 303 ISBN 978-80-7598-059-5 (Print) ISSN 2464-7470 (Print) ISSN 2464-7489 (On-line)
Petri Net Model of Student Choices in a LMS Moodle
E-Course
Michal Kuchárik, Zoltán Balogh
Department of Informatics, Constantine the Philosopher University, Nitra, Slovakia [email protected], [email protected]
Martin Drozda
Slovak University of Technology in Bratislava, Bratislava, Slovakia [email protected]
Abstract
The paper describes the creation of a Petri net model of student behaviour in a LMS e-course. The model was based on Moodle’s log files that allow seeing what parts of the e-course the student has visited at what time. This way it was needed to know whether there is a relation between the time spent on study materials and the acquired knowledge necessary in order to complete the final exam. It is more important to determine whether the LMS course is a suitable source of learning materials for this course. A model was created according to the course Operating systems. Petri nets were used to create a model of a student's visit in the course. With this model, it should be easier to explain the student’s behaviour in an e-course. Later, the study materials can be modified together with the course to be more comprehensible and better accessible for the students within the e-course. This course is quite old and has been updated over the years and there might be time to renovate it.
Keywords
Petri net. Moodle. LMS. Web log mining. E-course.
INTRODUCTION
E-learning is the unifying term to describe the fields of online learning, web-based training, and technology-delivered instruction. Moodle is a highly flexible open-source learning platform with complete, customizable and secure learning management features to create a private website filled with dynamic courses that extend e-learning education anytime and anywhere. Most educational institutions today use e-learning platforms and a great majority of them uses Moodle for their online campus. In their paper, authors (Dias, Diniz et al. 2014) deal with blended learning which is a learning type that combines traditional learning with online learning that is supposed to balance and optimize time, development and also cost. They also work with LMS Moodle. They tried to measure the quality of interaction using fuzzy logic. The paper from authors (Giuffra Palomino, Azambuja Silveira et al. 2014) deals with the idea of making LMS Moodle better suited for

Michal Kuchárik, Zoltán Balogh, Martin Drozda Petri Net Model of Student Choices in a LMS Moodle E-Course
DIVAI 2018 – The 12th international scientific conference on Distance Learning in Applied Informatics. 304 ISBN 978-80-7598-059-5 (Print) ISSN 2464-7470 (Print) ISSN 2464-7489 (On-line)
individual students. They proposed an intelligent LMS based on a tutoring system which could help the teacher to provide customized activities and learning materials for students based on the student’s performance and his behaviour. The paper from (Joo, Kim et al. 2016) made a similar attempt to obtain statistics from a mobile LMS use. They wanted to observe mainly the simplicity of use, perceived usefulness, satisfaction, and the intention to continue. The paper from (Balogh and Turčáni 2011) is directly describing a Petri net model of students personality traits that affect his final grade. It explains the use of a fuzzy logic combined with Petri nets to model and to simulate students' final grade. However, it is hypothetical and does not provide any case study. The model used in this paper was later evaluated in the paper from (Kuchárik and Balogh 2016) with Petri net modelling application TransPlaceSim. Authors (Moldt, Offermann et al. 2004) wanted to use coloured Petri nets to develop a web service based on Petri nets. This type of Petri nets can be used for complex web applications as shown later on.
Models of mobile web user behaviour have broad applicability in fields such as mobile network optimization, mobile web content recommendation, collective behaviour analysis, and human dynamics. Paper (Yuan, Xu et al. 2014) proposed and evaluated URI model, a novel approach to analyze user mobile Web usage behaviour, which combines user interest modelling with location analysis.
In paper (Labaj and Bieliková 2015), authors describe a study based on an experiment on logging the parallel browsing behaviour, both in an adaptive web-based educational system and on the open Web, while using the educational system as a tool for recruiting and motivating the participants.
The models offer several advantages to help to analyze and to test the software. They allow testers to do most of their design work at an abstract level where they do not get lost in the details of the source code. They also allow testers to understand and to focus on functional key behaviour of the software. Authors (Offutt and Thummala 2018) analyzed four candidate types of models for modelling presentation layer components to study current behaviour and to analyze the properties of a system. While several models could possibly be used, Petri nets have some advantages. They provide a graphical display that can help visualize the process and therefore can be easy to understand.
Designing a model that fully depicts user interactions is a significant activity in system development processes. Paper (Brant-Ribeiro, Araújo et al. 2017) is focused on creating a modelling style for representing interaction flows that happen between users and Web interfaces, a detail not fully comprised by traditional usage of CPNs in generic circumstances.
The aim of the paper was to make a Petri net model based on the student's movement through the e-learning course in LMS Moodle. Moodle’s log files were used that can be exported directly from Moodle and contain the information on what action the student has made in the LMS and when he did them. With these logs, sessions could be created and from them, the order of visited course parts could be extracted. This could help to re-order the course sections into better order and bring learning materials that are visited more often. Parts of the e-course that students ignore could be removed as well (Škoda, Doulík et al. 2015).

Michal Kuchárik, Zoltán Balogh, Martin Drozda Petri Net Model of Student Choices in a LMS Moodle E-Course
DIVAI 2018 – The 12th international scientific conference on Distance Learning in Applied Informatics. 305 ISBN 978-80-7598-059-5 (Print) ISSN 2464-7470 (Print) ISSN 2464-7489 (On-line)
MATERIALS AND METHODS
Petri net
Models of discrete event systems (DESs) may be grouped into two main classes. Untimed models are those models in which the order of states or events was relevant in the control specification and the design. The specific periods of time when state transitions and events occur were not considered. Timed models were assigned for the study of properties explicitly dependent on inter-event timing. Petri nets were effective for modelling both untimed and timed DESs, particularly when there was a high degree of concurrence and synchronization (Holloway, Krogh et al. 1997).
In most cases, Petri nets are composed of four components: Place (location or condition or situation), Transition (or event), Directed Arc (or flow relation) and Token. A classical Petri net is described as a six-tuple, PN = (P, T, A, W, K, M) where, P is place set, T is transition set, A is a finite set of directed arc, P ∩ T = ∅, P ∪ T = ∅, F ⊆ (PxT) ∪ (TxP). W is a weight function of directed arc, K is a capacity function of places, M is marking that assigns a non negative number of tokens to places (Zhang, Li et al. 2011).
To create the model, particular students were needed, their sessions in this course and the map of links these students visited during each session. For the purpose, course parts would be places and transitions would connect these places based on the link the students created with their movement through the course.
Petri net model from the subject Operating systems
When modelling the learning process, it was necessary to base it on its interactional understanding and on the mutual social interactions of participants in the learning process. The resulting generic model of the learning process then included a wider environment, input factors, the process itself as well as its products (immediate outcomes and long-term effects). The ambition was that the created model reflected the needs of both the students and the teacher that it was sufficiently modular and was not too complicated but understandable and compendious (Eger and Micik 2017).
Petri nets were used to create the universal model of the student passing the LMS. Process models could be also created using UML diagrams (Rabova 2012). The structure diagram of the universal model is shown in Figure 1. To better understand the concept of modelling and simulation, it is essential to acquire the basic notions.(Peringer 2008, Hubalovsky and Sedivy 2011).

Michal Kuchárik, Zoltán Balogh, Martin Drozda Petri Net Model of Student Choices in a LMS Moodle E-Course
DIVAI 2018 – The 12th international scientific conference on Distance Learning in Applied Informatics. 306 ISBN 978-80-7598-059-5 (Print) ISSN 2464-7470 (Print) ISSN 2464-7489 (On-line)
Figure 1 The structure diagram of the universal model a.) exam, b.) ongoing evaluation
When creating the e-course model itself, all aspects of creation of e-courses were reflected. A proper e-learning course should contain the following fundamental parts for the creation of the explanatory part of e-materials (Balogh and Turčáni, 2009):
� introduction,
� aims of study,
� time schedule and guide to study material,
� explanatory text complemented with resolved exercises, multimedia elements, partial questions, tests, etc.,
� correspondence tasks,
� summary,
� final tests,
� vocabulary of terms,
� literature, important references, annexes, etc.

Michal Kuchárik, Zoltán Balogh, Martin Drozda Petri Net Model of Student Choices in a LMS Moodle E-Course
DIVAI 2018 – The 12th international scientific conference on Distance Learning in Applied Informatics. 307 ISBN 978-80-7598-059-5 (Print) ISSN 2464-7470 (Print) ISSN 2464-7489 (On-line)
Figure 2 A part of the universal model created in Petri nets: Student´s passing through the lecture
The design of the universal model (Figure 2) has been described in the article of Balogh and Koprda (2014). Based on the proposed universal model, e-courses from subjects such as Operating Systems 1 and 2 and the subject of Selected Chapters in Hardware and Software were created.
Evaluation of e-courses based on standard statistical methods was also important in order to be able to find out correctness and validity of the designed model.
Obtaining times from LMS Moodle Logs
Moodle provided an easy way to obtain the student's visit logs. These logs contain the following information:
� Time
� User name
� Influenced user
� Event context
� Component
� Event name
� Description
� Source
� IP
For the paper's purpose, at time, user name, event name and event context were important. The logs were sorted as following: Main unit was the student. The student contained a number of sessions. Each session contained a link to the Moodle’s log that will show what parts of the e-course the student has visited during the session. Sessions were obtained from the Moodle’s logs. To obtain the session, the data from the logs by name

Michal Kuchárik, Zoltán Balogh, Martin Drozda Petri Net Model of Student Choices in a LMS Moodle E-Course
DIVAI 2018 – The 12th international scientific conference on Distance Learning in Applied Informatics. 308 ISBN 978-80-7598-059-5 (Print) ISSN 2464-7470 (Print) ISSN 2464-7489 (On-line)
and time were sorted first. Based on (Fang and Huang 2010) the user’s access time to the whole website was given an upper limit-θ. If it has had exceeded, it would be considered as a new session. Supposing the timestamp of the beginning page in a session was t0 and the same user’s URL requirement time was t, it would be in the present session under the condition of the inequality - − -� ≤ 4. While the first page which was in line with the inequality of -� + 4 < -.
This was the beginning page of the following session. Usually θ was 30min. Times of each next entry were important. If the entry was made in less than 45 minutes from the previous one, it would be within session 1. If the time interval was larger than 45 minutes, it would be a new session. The right interval was 45 minutes as one lesson since usually takes one and a half hour. In that case, if students did not access the course at least 2 times during one lesson, it could be assumed that they did not use the e-course at that time (Fang and Huang 2010, Rao, Kumari et al. 2011, Munk, Drlík et al. 2017). Based on the time sessions that contained only one entry were removed, in fact they were not sessions but just a 1-time login during a lesson.
CREATION OF THE PETRI NET MODEL FROM THE REAL DATA OF OPERATING
SYSTEMS
The first issue was how to create one model from so many different students. Students have chosen a different route through the course and creating one model for every single one of them would be useless. First, a map of the whole course has been created. This was done by dividing the course into individual parts and observing the sessions of all students. The parts separately and the parts the students visited next with what frequency have been observed. Then it was possible to create a complete model of the course and thanks to measured transition even to simulate how high the probability was to visit the next part of the course from current one (Křupka, Jirava et al. 2010). However, when the approach for all the logs has been applied, there was an enormous model from the past 4 years with too many nodes that was completely unreadable. See Figure 3.
Figure 3 Entire model of our e-course.
The same model has been created for one semester only but it was still too robust. Later, a simplified version has been created where the places would represent the component part of the Moodle log. It described what component of the e-course has been visited by the student, e.g. Source, book, kernel, link, etc. The approach has been chosen for academic year 2017/2018. It turned out to be comprehensible, Figure 2.

Michal Kuchárik, Zoltán Balogh, Martin Drozda Petri Net Model of Student Choices in a LMS Moodle E-Course
DIVAI 2018 – The 12th international scientific conference on Distance Learning in Applied Informatics. 309 ISBN 978-80-7598-059-5 (Print) ISSN 2464-7470 (Print) ISSN 2464-7489 (On-line)
Figure 4 Model of student's movement in e-course based on components.
From the model, it was possible to see what parts of the e-course has been visited by particular students. It also showed how high the probability of the student's moves was from one specific part to a different one. To make to make it possible it was needed to:
� Put students into alphabetic order. We use the category User name from Moodles log file.
� Arrange their entries chronologically. The time is obtained from Time category from Moodles log file. Time in Moodle log file is in format “day-month-year hour:minute”. This time is converted to minutes, as the precision of seconds is not necessary, so that we are able to compare time of each log entry. 789: =98;<-: + ℎ><& ∗ 60 + *@A ∗ 24 ∗ 60 +9>;-ℎ ∗ B@ACD:&E>;-ℎ ∗ 24 ∗ 60 +A:@& ∗ 12 ∗ B@ACD:&E>;-ℎ ∗ 24 ∗ 60.
� Remove entries that were older than the year 2017. In order to do this we create time in minutes for the day 1. 9. 2016 as this is the first day of the academic year 2016/2017. We are going to look at only this one academic year in this case. Time for the day 1. 9. 2016 is created the same way as the time for all log entries. At last we compare this time with every log entry time and remove those entries whose time is less that the day 1. 9. 2016.
� Divide entries into sessions. To do this we compare the time difference between consecutive log entries based on the time that we calculated in second step. As stated in the chapter Obtaining times from LMS Moodle Logs, we decided that time difference between consecutive log entries can not be longer that 45 minutes in order to be within one session. When they are longer that 45 minutes, we are dealing with a new session.
� Observe what parts of the e-course follow each other in these sessions based on component. When one course part leads to course part of different component type, this course part with different component is remembered and when this same succession is found again, number of this succession is increased.

Michal Kuchárik, Zoltán Balogh, Martin Drozda Petri Net Model of Student Choices in a LMS Moodle E-Course
DIVAI 2018 – The 12th international scientific conference on Distance Learning in Applied Informatics. 310 ISBN 978-80-7598-059-5 (Print) ISSN 2464-7470 (Print) ISSN 2464-7489 (On-line)
� From this observation we can create a Petri net model where:
o Places represent course parts based on component
o Transitions represent the oriented connection between different course parts
o Weight of transition represents the number of times students chose this path
Kernel and book have been visited most. Kernel was the e-course basis; it was the hub from where students accessed all other parts of the e-course. Books were the e-courses learning materials; students had to study from them to complete the final test.
DISCUSSION
The paper describes how to create a Petri net model from log files exported from LMS Moodle. The decision fell on Petri nets as it is a modelling tool that has been previously used many times in cases where education modelling and simulation had to be done (Balogh and Turčáni 2011, Campos-Rebelo, Costa et al. 2012, Balogh, Turcani et al. 2013, Dias, Diniz et al. 2014). It is common practice to create a model first and then use it to create an e-course. It is an issue found in the paper provided by Balogh and Koprda (2014) and at this point, an evaluation of the course was needed. There was the desire to know what learning path the student chose in the course. Then it has been compared to the predicted learning paths that were used during the design. The problem was that the model from Balogh and Koprda (2014) in Figure 2 was too robust to be properly evaluated. It included tests that students did not take. Then the result of the model was the final grade. On the other hand, the model from Figure 4 created from the log files displayed only the student's movement through the course. Using it to evaluate the correctness of the first model may not be possible.
The usefulness was based on the observation of student’s movement through the e-course. It was possible to see what parts of the e-course students visited the most, what parts followed each other and what parts were ignored or visited only once. By removing parts that were unnecessary and make more accessible those parts that follow each other, it was possible to modify the e-course.
CONCLUSION
Creating a model of an entire e-course may not be very effective but it depended on what was needed to be observed. The last figure showed that after some data filtering and specification about what exactly was needed to be observed, we ended up with a model that represented the student’s movement through the e-course, it was comprehensible and did not contain unnecessary data. With such a model, it was obvious what parts of the e-course were visited more often, what probability the students visited the following part of the e-course and what parts of the course served simply as hubs, what parts of the e-course were ignored or not used at all. These models helped to visualize, simulate and to better understand how students had moved through the e-course. Parts of the e-course could be made more accessible and unnecessary parts simply removed.

Michal Kuchárik, Zoltán Balogh, Martin Drozda Petri Net Model of Student Choices in a LMS Moodle E-Course
DIVAI 2018 – The 12th international scientific conference on Distance Learning in Applied Informatics. 311 ISBN 978-80-7598-059-5 (Print) ISSN 2464-7470 (Print) ISSN 2464-7489 (On-line)
ACKNOWLEDGEMENTS
This research has been supported by University Grant Agency UGA 2018.
REFERENCES
Balogh, Z., & Koprda, S. (2014). Application of Petri Net for Evaluation Modeling of Student in the LMS. Divai 2014: 10th International Scientific Conference on Distance Learning in Applied Informatics, 229-239
Balogh, Z. and M. Turčáni (2011). Possibilities of Modelling Web-Based Education Using IF-THEN Rules and Fuzzy Petri Nets in LMS, Berlin, Heidelberg, Springer Berlin Heidelberg. 93-106
Balogh, Z. and M. Turčáni (2011). Possibilities of Modelling Web-Based Education Using IF-THEN Rules and Fuzzy Petri Nets in LMS. Informatics Engineering and Information Science: International Conference, ICIEIS 2011, Kuala Lumpur, Malaysia, November 12-14, 2011. Proceedings, Part I. A. Abd Manaf, A. Zeki, M. Zamani, S. Chuprat and E. El-Qawasmeh. Berlin, Heidelberg, Springer Berlin Heidelberg: 93-106.
Balogh, Z., M. Turcani and M. Magdin (2013). The possibilities of using Petri Nets for realization of a universal model of educational process. Information Reuse and Integration (IRI), 2013 IEEE 14th International Conference on. 162-169
Brant-Ribeiro, T., R. D. Araújo, I. E. Mendonça, M. S. Soares and R. G. Cattelan (2017). "Interactive web interfaces modeling, simulation and analysis using Colored Petri Nets." Software & Systems Modeling. 1-17
Campos-Rebelo, R., A. Costa and L. Gomes (2012). Finding Learning Paths Using Petri Nets Modeling Applicable to E-Learning Platforms. Technological Innovation for Value Creation: Third IFIP WG 5.5/SOCOLNET Doctoral Conference on Computing, Electrical and Industrial Systems, DoCEIS 2012, Costa de Caparica, Portugal, February 27-29, 2012. Proceedings. L. M. Camarinha-Matos, E. Shahamatnia and G. Nunes. Berlin, Heidelberg, Springer Berlin Heidelberg: 151-160.
Dias, S. B., J. A. Diniz and L. J. Hadjileontiadis (2014). Exploring B-Learning Scenarios Using Fuzzy Logic-Based Modeling of Users’ LMS Quality of Interaction in Ergonomics and Psychomotor Rehabilitation Academic Courses, Cham, Springer International Publishing. 233-243
Eger, L. and M. Micik (2017). Customer-oriented communication in retail and Net Promoter Score. 142-149
Fang, Y. and Z. Huang (2010). An Improved Algorithm for Session Identification on Web Log, Berlin, Heidelberg, Springer Berlin Heidelberg. 53-60
Giuffra Palomino, C. E., R. Azambuja Silveira and M. K. Nakayama (2014). An Intelligent LMS Model Based on Intelligent Tutoring Systems, Cham, Springer International Publishing. 567-574
Holloway, L. E., B. H. Krogh and A. Giua (1997). "A Survey of Petri Net Methods for Controlled Discrete Event Systems." Discrete Event Dynamic Systems 7(2): 151-190.

Michal Kuchárik, Zoltán Balogh, Martin Drozda Petri Net Model of Student Choices in a LMS Moodle E-Course
DIVAI 2018 – The 12th international scientific conference on Distance Learning in Applied Informatics. 312 ISBN 978-80-7598-059-5 (Print) ISSN 2464-7470 (Print) ISSN 2464-7489 (On-line)
Hubalovsky, S. and J. Sedivy (2011). Education of student's project team cooperation using virtual communication supported by LMS system. 2011 14th International Conference on Interactive Collaborative Learning (Icl). 456-459
Joo, Y. J., N. Kim and N. H. Kim (2016). "Factors predicting online university students’ use of a mobile learning management system (m-LMS)." Educational Technology Research and Development 64(4): 611-630.
Křupka, J., P. Jirava and M. Kašparová (2010). Quality of life modelling based on decision trees. 130-146
Kuchárik, M. and Z. Balogh (2016). Evaluation of fuzzy Petri nets with the tool TransPlaceSim. 2016 IEEE 10th International Conference on Application of Information and Communication Technologies (AICT). 1-5
Labaj, M. and M. Bieliková (2015). Conducting a Web Browsing Behaviour Study – An Educational Scenario. SOFSEM 2015: Theory and Practice of Computer Science, Berlin, Heidelberg, Springer Berlin Heidelberg. 531-542
Moldt, D., S. Offermann and J. Ortmann (2004). A Proposal for Petri Net Based Web Service Application Modeling, Berlin, Heidelberg, Springer Berlin Heidelberg. 93-97
Munk, M., M. Drlík, L. Benko and J. Reichel (2017). "Quantitative and Qualitative Evaluation of Sequence Patterns Found by Application of Different Educational Data Preprocessing Techniques." IEEE Access 5: 8989-9004.
Offutt, J. and S. Thummala (2018). "Testing concurrent user behavior of synchronous web applications with Petri nets." Software & Systems Modeling. 1-24
Peringer, P. (2008). Modelování a simulace: skripta. Brno, Fakulta informačních technologií VUT.
Rabova, I. (2012). Methods of Business Rules Harvesting in University Environment. Divai 2012: 9th International Scientific Conference on Distance Learning in Applied Informatics: Conference Proceedings, Nitra, Constantine Philosopher Univ Nitra. 261-267
Rao, V. V. R. M., V. V. Kumari and K. V. S. V. N. Raju (2011). An Intelligent System for Web Usage Data Preprocessing, Berlin, Heidelberg, Springer Berlin Heidelberg. 481-490
Škoda, J., P. Doulík, M. Bílek and I. Šimonová (2015). "THE EFFECTIVENESS OF INQUIRY BASED SCIENCE EDUCATION IN RELATION TO THE LEARNERS'MOTIVATION TYPES." Journal of Baltic Science Education 14(6). 791-803
Yuan, B., B. Xu, C. Wu and Y. Ma (2014). Mobile Web User Behavior Modeling. Web Information Systems Engineering – WISE 2014, Cham, Springer International Publishing. 388-397
Zhang, N., Y. Li and E. Zhang (2011). Petri Net Based on Behavior of Token and Its Applications, Berlin, Heidelberg, Springer Berlin Heidelberg. 656-663
Josef Malach, Kateřina Malachová Trends and Strategies in ICT Application in Higher Education versus Evaluation of Teaching and Learning
DIVAI 2018 – The 12th international scientific conference on Distance Learning in Applied Informatics. 313 ISBN 978-80-7598-059-5 (Print) ISSN 2464-7470 (Print) ISSN 2464-7489 (On-line)
Trends and Strategies in ICT Application in Higher
Education versus Evaluation of Teaching and
Learning
Josef Malach
Department of Education and Adult Education, University of Ostrava, Ostrava, Czech Republic [email protected]
Kateřina Malachová
Department of Biology and Ecology, University of Ostrava, Ostrava, Czech Republic [email protected]
Abstract
In higher education and learning, we can identify trends in the application of information and communication technology (ICT), which result from technical innovations, educational knowledge and requirements for the effectiveness of the process and quality of its output. Educational systems or individual higher educational institutions (HEI) respond to the recognised trends by formulating digital strategies, aiming to adapt to these trends. At the same time, processes for the quality assurance of teaching and learning are implemented through student evaluation of teaching (SET) or more recently student rating of teaching (SRT) in higher education institutions. The evaluation tool is usually the result of teachers and students’ beliefs of teaching, which change with time and with particular circumstances in education institutions. The article works on the assumption that trends in the application of ICT in higher education, or more precisely individual strategic goals are not transformed into currently used tools for student rating of teaching. The analysis of evaluation tools in selected universities confirmed the given assumption. Therefore, it is not possible to reliably verify whether and to what extent or with what reaction from students the innovative pedagogies that use ICT and respect identified trends are applied in the higher education teaching. To eliminate this discrepancy between potential possibilities of ICT in higher education and the absence of examination of this phenomenon, other tools for SET/SRT are suggested.
Keywords
Trends accelerating HE technology adoption. Development in educational technology in HE. Digital strategy. ICT in higher education. Student evaluation of teaching (SET). Student rating of teaching (SRT).
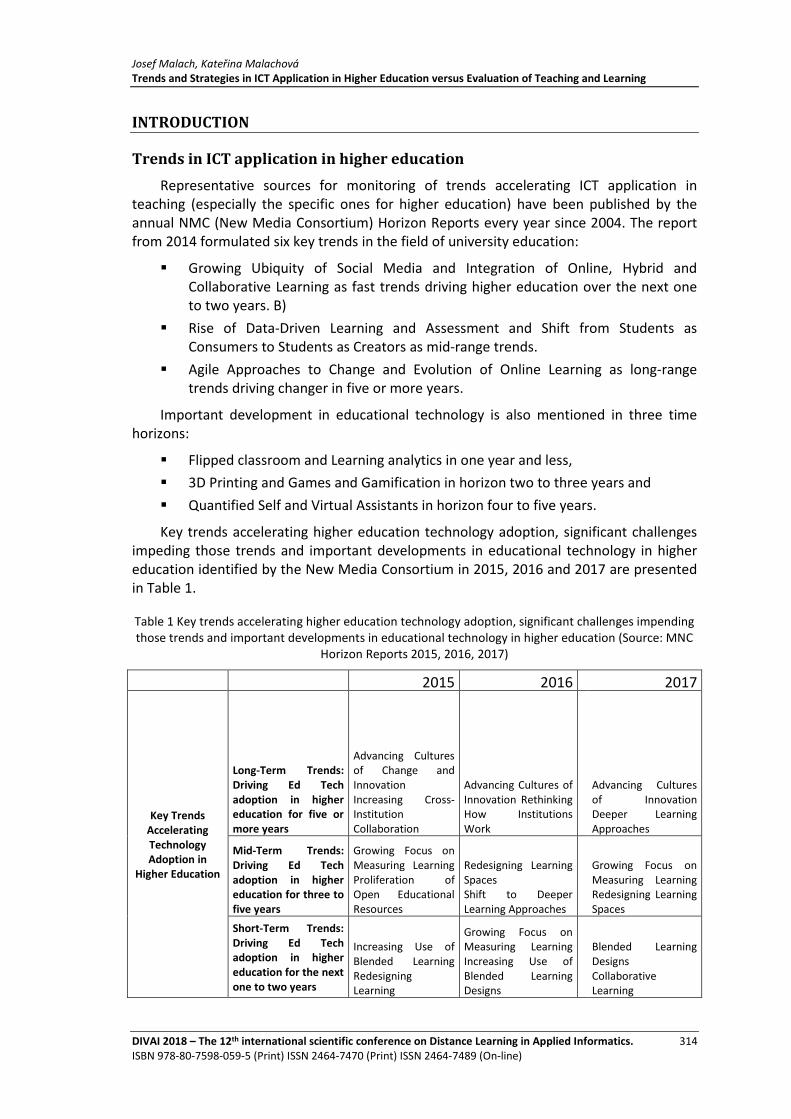
Josef Malach, Kateřina Malachová Trends and Strategies in ICT Application in Higher Education versus Evaluation of Teaching and Learning
DIVAI 2018 – The 12th international scientific conference on Distance Learning in Applied Informatics. 314 ISBN 978-80-7598-059-5 (Print) ISSN 2464-7470 (Print) ISSN 2464-7489 (On-line)
INTRODUCTION
Trends in ICT application in higher education
Representative sources for monitoring of trends accelerating ICT application in teaching (especially the specific ones for higher education) have been published by the annual NMC (New Media Consortium) Horizon Reports every year since 2004. The report from 2014 formulated six key trends in the field of university education:
� Growing Ubiquity of Social Media and Integration of Online, Hybrid and Collaborative Learning as fast trends driving higher education over the next one to two years. B)
� Rise of Data-Driven Learning and Assessment and Shift from Students as Consumers to Students as Creators as mid-range trends.
� Agile Approaches to Change and Evolution of Online Learning as long-range trends driving changer in five or more years.
Important development in educational technology is also mentioned in three time horizons:
� Flipped classroom and Learning analytics in one year and less,
� 3D Printing and Games and Gamification in horizon two to three years and
� Quantified Self and Virtual Assistants in horizon four to five years.
Key trends accelerating higher education technology adoption, significant challenges impeding those trends and important developments in educational technology in higher education identified by the New Media Consortium in 2015, 2016 and 2017 are presented in Table 1.
Table 1 Key trends accelerating higher education technology adoption, significant challenges impending those trends and important developments in educational technology in higher education (Source: MNC
Horizon Reports 2015, 2016, 2017)
2015 2016 2017
Key Trends Accelerating Technology Adoption in
Higher Education
Long-Term Trends: Driving Ed Tech adoption in higher education for five or more years
Advancing Cultures of Change and Innovation Increasing Cross-Institution Collaboration
Advancing Cultures of Innovation Rethinking How Institutions Work
Advancing Cultures of Innovation Deeper Learning Approaches
Mid-Term Trends: Driving Ed Tech adoption in higher education for three to five years
Growing Focus on Measuring Learning Proliferation of Open Educational Resources
Redesigning Learning Spaces Shift to Deeper Learning Approaches
Growing Focus on Measuring Learning Redesigning Learning Spaces
Short-Term Trends: Driving Ed Tech adoption in higher education for the next one to two years
Increasing Use of Blended Learning Redesigning Learning
Growing Focus on Measuring Learning Increasing Use of Blended Learning Designs
Blended Learning Designs Collaborative Learning

Josef Malach, Kateřina Malachová Trends and Strategies in ICT Application in Higher Education versus Evaluation of Teaching and Learning
DIVAI 2018 – The 12th international scientific conference on Distance Learning in Applied Informatics. 315 ISBN 978-80-7598-059-5 (Print) ISSN 2464-7470 (Print) ISSN 2464-7489 (On-line)
Significant Challenges Impeding Technology Adoption
Solvable Challenges: Those that we understand and know how to solve
Blending Formal and Informal Learning Improving Digital Literacy
Blending Formal and Informal Learning Improving Digital Literacy
Improving Digital Literacy Integrating Formal and Informal Learning
Difficult Challenges: Those we understand but for which solutions are elusive
Personalizing Learning Teaching Complex Thinking
Competing Models of Education Personalizing Learning
Achievement Gap Advancing Digital Equity
Wicked Challenges: Those that are complex to even define, much less address
Competing Models of Education Rewarding Teaching
Balancing Our Connected and Unconnected Lives Keeping Education Relevant
Managing Knowledge Obsolescence Rethinking the Roles of Educators
Important Developments in Educational Technology
Time-to-Adoption Horizon: One Year or Less
Bring Your Own Device (BYOD) Flipped Classroom
Bring Your Own Device (BYOD) Learning Analytics and Adaptive Learning
Adaptive Learning Technologies Mobile Learning
Time-to-Adoption Horizon: Two to Three Years
Makerspaces Wearable Technology
Augmented and Virtual Reality Makerspaces
The Internet of Things Next-Generation LMS
Time-to-Adoption Horizon: Four to Five Years
Adaptive Learning Technologies The Internet of Things
Affective Computing Robotics
Artificial Intelligence Natural User Interfaces
As for the long-term trends, the tendency of HEIs towards innovative cultures is repeated, the profiling medium-term trend is the growing focus on measuring learning and the near term requires an increasing use of blended learning.
Developments in educational technology are mainly seen in the early use of adaptive learning technology and mobile learning, in the medium term horizon, it is the use of the Internet of things and the new generation of LMS. According to experts, ‘bring your own device’ (BYOD), ‘flipped classroom’, ‘gamification’ and ‘3D printing’, for example, can be considered as the ones already well-established.
Kaushik (2016) regards the trends as follows: Blended Learning, MOOCs and Badges to Accredit Learning, Flipped Classrooms, Flexible and Personalised Pedagogies Through Bring Your Own Devices (BYOD), Learning Through Storytelling or Narrative-Based Pedagogies.
Other trends mentioned by Kaushik are briefly commented on:
Web 2.0 Supported Pedagogies
“Web 2.0” is an umbrella term for a host of recent Internet applications such as social networking, wikis, folksonomies, virtual societies, blogging, multiplayer online gaming and “mash-ups”. It is also referred to as Edu 2.0. Web 2.0 applications are built around the appropriation and sharing of content amongst communities of users, resulting in various forms of user-driven communication, collaboration, content creation and recreation.
Gamification of Learning
Gamification, or the application of gaming techniques, can be a powerful tool for delivering education and training in subjects that require strategic planning, scenario

Josef Malach, Kateřina Malachová Trends and Strategies in ICT Application in Higher Education versus Evaluation of Teaching and Learning
DIVAI 2018 – The 12th international scientific conference on Distance Learning in Applied Informatics. 316 ISBN 978-80-7598-059-5 (Print) ISSN 2464-7470 (Print) ISSN 2464-7489 (On-line)
building, stimulating and evaluating alternatives, as well as developing imaginative and creative solutions under defined constraints. As a pedagogy application, games allow the freedom “to think outside of normal parameters, to add a little bit of fantasy or surrealism, and to force people to think in different ways” (Kapp 2012, in Kaushik, 2016) ).
Learning Design Informed by Analytics
Learning analytics involve the collection, analysis and reporting of large datasets relating to learners, their context and of the learning behaviour across a course. Analytics enable visualisations and recommendations designed to influence student behaviour while a course is in progress.
Current developments are focused on three areas: understanding the scope and uses of learning analytics; integrating analytics into existing courses; and expansion of learning analytics to inform decisions on pedagogic approaches to be applied. Learners can apply the information supplied through analytics to monitor their own progress, achievements and learning progress.
Maker Culture
Educators, concerned about the disinterest of learners in the STEM subjects in formal educational settings, have become attracted to the maker culture, which represents a “learning through making” approach, much like the apprenticeship. This approach applies a more participative approach to learning by involving learners in creating objects and artefacts relevant to their own learning or life, and in the process becoming familiar with the concepts used in creation, engineering, and innovative solutions. As a process, the approach emphasises experimentation, innovation and the testing of theoretical principles applicable to the given problem. Collaboration and participation are encouraged, and creativity in the use of different materials or different techniques is encouraged.
Crowd Learning
Crowd learning approaches represent the informal learning practices supported by the power of ICT and the prevailing culture of 24/7 quest for knowledge. It involves harnessing the support of many to satisfy the knowledge needs of many. As opportunities for anytime and anywhere learning multiply, and digital scholarship makes independent learning the norm rather than the exception, it also makes sense to multiply the sources of learning to involve large number of people who may be willing and able to share the knowledge that they possess. One good example of crowd learning is the Stack Exchange website, where the seekers of knowledge are invited to ask questions, indicating the type of answers they expect and also relating what they have already tried to gauge and know.
Augmentation Pedagogy
Good education has always focused beyond transmission of knowledge and assessment procedures towards making students active and independent learners. Augmentation pedagogy, being applied to modern science and technology education invites learners to make claims and propositions and then substantiate those claims by presenting evidence and arguments.
Dynamic Assessment
With the evolution of pedagogies that support flexible, adaptive, open, anytime anywhere learning, either through digital scholarship or by instructor-supported learning,

Josef Malach, Kateřina Malachová Trends and Strategies in ICT Application in Higher Education versus Evaluation of Teaching and Learning
DIVAI 2018 – The 12th international scientific conference on Distance Learning in Applied Informatics. 317 ISBN 978-80-7598-059-5 (Print) ISSN 2464-7470 (Print) ISSN 2464-7489 (On-line)
learner assessment practices have also evolved to reflect both outcome-based measurement and measurement across the learning cycle rather than at certain fixed points in the cycle. ePortfolios, forum-based assessments, peer evaluation and 360 degree assessments are some of the assessment practices that are fairly prevalent based on enabling technologies. Dynamic assessment consists of measurement of learner progress as well as his/her potential to learn throughout his/her journey through a given course or programme.
In July 2017, Navitas Ventures conducted an exploratory study to gather a range of perspectives on digital transformation in higher education. The study’s participants represent groups who are central to digital transformation in higher education, as leaders and facilitators of change and as those who will be affected by digital transformation. They were drawn from a diverse group of stakeholders. The purpose of this initial study was to better understand the perspectives of these diverse groups, to gather their digital transformation views and experiences, and to identify any emerging common themes as well as key differences. “There is no doubt that higher education transformation is already underway, with every university leader indicating they are at least part way through their digital journey.” An expert survey among 168 university leaders, students and recent graduates and founders and leaders of education start-ups from across the edtech ecosystem brought interesting answers to the following question: What key outcomes is your digital transformation focused on delivering? Improving attractiveness of the University 50%, Remaining relevant 56%, Growth & sustainability 61%, Meeting needs of the future workforce 67%, Efficiency 78%, Meeting changing student needs 83%, Improving student experience 94%. Many new educational technologies have been driven by technology – such as smart devices, cloud computing, broadband Internet, and the increasing ease of creating websites and software. Survey respondents considered Artificial intelligence and machine learning the most significant from the range of emerging technologies. This was followed by the Internet of Things and virtual/augmented reality – perhaps reflecting an interest in connecting the physical and digital worlds as applied to higher learning. Respondents considered chatbots, robotics, and blockchain as being relatively less important, which also reflects the novelty of these technologies.
Chatbots – software programs that simulate conversing with a human – have the potential to automatically handle routine queries, freeing up human staff to deal with more complicated problems.
Augmented and virtual reality are two technologies whose use in education is just emerging. Already, they are being used to bring science to life, transport classes on virtual trips, and market universities to potential future students.
Isaias (2017) observes that “higher education is progressively being displaced from the traditional classroom and, as it progresses towards online settings, it requires the support of technology to facilitate that transference. Within the context of higher education, there are numerous technologies that will have a revolutionary impact on teaching and learning. In exploring a prospective scenario for 2020, 2025 and 2030, it is possible to envision a higher education sector that has widely adopted innovative Learning Management Systems, adaptive learning technologies, Massive Open Online Courses, mobile learning, Artificial Intelligence, activity-based technology, Internet of Things and Social Technology. These technologies are expected to have profound implications in the traditional learning environments and require thorough preparation. Predictions as they

Josef Malach, Kateřina Malachová Trends and Strategies in ICT Application in Higher Education versus Evaluation of Teaching and Learning
DIVAI 2018 – The 12th international scientific conference on Distance Learning in Applied Informatics. 318 ISBN 978-80-7598-059-5 (Print) ISSN 2464-7470 (Print) ISSN 2464-7489 (On-line)
may be, the exercise of forecasting provides the present with the opportunity to prepare for the future.”
Digital strategy for education in HEI
An example of a goal-directed reaction to trends of ICT adoption in educational activities in higher education institutions is the Digital Strategy for Education (University of Cambridge, 2016). The Strategy is pedagogically-led and was developed collaboratively by many higher education institutions.
“The University has launched its new Digital Strategy for Education, which aims to provide a framework for the introduction of technology that supports teaching and learning. Although face-to-face teaching such as lectures, supervisions and small-group teaching will remain at the heart of a Cambridge education, the University strongly believes that there is a key role for technology that enhances or supports these core activities.”
“Digital” in the context of the Digital Strategy for Education primarily indicates interaction (accessing and providing information) through the medium of computerised devices, such as a personal computer, a smartphone, or tablet with computerised networks, and related developments, such as 3D printing or virtual reality. This description is not exhaustive, and the University intends a broad and fluid definition of digital technology.
“Teaching” in the context of the Digital Strategy for Education is intended to encompass all elements of the learning experience, rather than taking a narrow definition of lecture or supervision delivery. This should include approaches to instil or encourage the qualities of successful learners, such as engagement, attentiveness, thoughtfulness, exploration and critical thinking. In all cases, the introduction of new technology should demonstratively support or enhance pedagogical aspects of teaching practice, rather than be introduced for its own sake.
Through the Strategy, the University will seek to achieve five strategic goals:
� to build and maintain a shared understanding of the needs and priorities of the collegiate University;
� to support students throughout the learning cycle;
� to ensure quality and equity of the student experience;
� to provide maximum effectiveness and efficiency of resource for students, staff, and collegiate University administration;
� to enable and propagate innovation.
Australian Griffith University has the Digital Vision 2020. In placing our students first, their experience is enhanced by using rich data analytics to personalise their learning journey and their access to digitally enhanced services. Learning, research, collaboration and knowledge transfer will be facilitated through technology-enriched formal and informal spaces—merging both the virtual and physical. Technology will be a cornerstone for innovative academic program delivery. Griffith’s strategy is to be at the leading edge of digital innovation to enhance the student experience and Griffith’s reputation as a university of influence. Key priorities of this strategy are to, through digital innovation: • Create scalable, authentic, flexible and personalised learning experiences for our students

Josef Malach, Kateřina Malachová Trends and Strategies in ICT Application in Higher Education versus Evaluation of Teaching and Learning
DIVAI 2018 – The 12th international scientific conference on Distance Learning in Applied Informatics. 319 ISBN 978-80-7598-059-5 (Print) ISSN 2464-7470 (Print) ISSN 2464-7489 (On-line)
so that all students, regardless of physical or virtual location, are effectively prepared for employment. • Exploit emergent technologies to drive research excellence. • Provide scalable, personalised, mobile, anywhere anytime digitally-enabled services to students and staff. • Deliver systems and infrastructure that are secure, scalable and sustainable, whilst maximising the innovative use of technology for academic and business excellence, and the student experience. • Treat information as a strategic asset in support of the University. The Strategy is underpinned by four key strategic digital enablers of transformation: The first is student digital experience. Students will be able to maximise learning opportunities and work across a merging virtual and physical campus – a digital campus – using a personalised digital workspace. A mobile first philosophy will support learning and engagement anywhere and at anytime, bringing the classroom to the student. Immersive technologies and virtual computer laboratories in conjunction with digitally enabled teaching spaces will enhance the learning experience and program delivery. The second is cognitive computing. The ability for self-learning systems to ingest and analyse unstructured information, in association with structured data, is a powerful tool that will be used to enhance and personalise our interaction and advice to the student, and to support new forms of research. As this capability matures, its use will be expanded into areas of advanced interactive and personalised learning as well as supporting operational areas of facilities and technology delivery.
STUDENT EVALUATION OF TEACHING (SET)
At universities, the evaluation of teaching is carried out using several basic methods or procedures: student evaluation of teaching face-to-face, classic questionnaires or online, peer evaluation, self-evaluation, evaluation of the curriculum and student documentation analysis.
Even though the student evaluation/rating of teaching has been carried out for quite some time at universities in the Czech Republic and abroad, it is necessary to take a range of reservations about their execution and use seriously (The Ontario Universities´ Teaching Evaluation Toolkit, 2015): evaluation processes and tools were not validated, a lack of evidence of the relation between the student evaluation of teaching and students’ results, a lack of evidence that the student evaluation changes with time and is effectively used by faculties to improve their teaching. It was evident that the result of the student evaluation of teaching is influenced by other factors, for instance, the number of people in the study group, teachers’ likeability, subject difficulty, subject level, manner of teaching provided by the faculty, and teachers’ age.
Hornstein (2017) analysed a range of critical reservations about the student evaluation of teaching. Among other things, it turns out that male teachers are given fewer points than female teachers for the same performance. Another problem is that “the lower the evaluations, the better that student performance tends to be because the instructor has required students to expend significant effort in order to achieve better grades, and students dislike expending effort”. It is recommended to use, for instance, more teaching portfolios, classroom observations and avoid comparing teaching in courses of different types, levels, sizes, functions, or disciplines.

Josef Malach, Kateřina Malachová Trends and Strategies in ICT Application in Higher Education versus Evaluation of Teaching and Learning
DIVAI 2018 – The 12th international scientific conference on Distance Learning in Applied Informatics. 320 ISBN 978-80-7598-059-5 (Print) ISSN 2464-7470 (Print) ISSN 2464-7489 (On-line)
METHODS
The aim of this survey was to find out whether the use of ICT in teaching and learning is investigated within the student evaluation of teaching in higher educational institutions (HEI). Individual research questions were as follows:
1. In evaluation questionnaires, are there questions investigating whether teachers use ICT in teaching?
2. Is student satisfaction with the quality of ICT application, with following recent trends and possibilities of ICT investigated?
3. Is the ICT equipment in HEIs investigated?
The method of the research was a comparative analysis of tools for the student evaluation of teaching. In questionnaires for students, we looked for questions identifying the use of technology in teaching and learning, or student satisfaction with their availability and efficiency.
Data collection
Data collection was carried out in January 2018. Tools for the SET were searched for in two ways: a) by searching for pages focusing on the quality assurance of teaching or student evaluation of teaching in websites of randomly selected universities, or b) by searching for tools for the student evaluation of teaching using keywords such as SET, SRT, student evaluation of teaching, course evaluation questionnaire and others. The second way was more effective.
The entry line for one university consisted of the university name, number of questions in the evaluation questionnaire, number of questions focusing on the ICT application, formulation of this item and year of creation of the questionnaire.
RESULTS
The results of the survey are gathered in Table 2. We analysed 20 tools from the USA, Australia and Europe (mainly Poland). It was not possible to acquire questionnaires from Czech universities.
Out of 20 universities, 9 of them have at least one item (exceptionally two items) focusing on the ICT application in teaching and the use of information or didactic materials and sources in their questionnaires, which accounts for 45% of analysed tools. In ten Polish universities, the ICT application is reflected in two of them (20%), in the remaining ten universities it is reflected in 7 cases (70%). Therefore, it can be concluded that postulated trends in the development of the ICT application can be applied to Central European universities; however, the SET cannot monitor or evaluate the current state (see Table 2).
In terms of the quantity of items in evaluation questionnaires, there are interesting data about the maximum and the minimum number of items, which are 49 items and 10 items respectively. The average number of items is 20.2 per questionnaire, where questionnaires from Polish universities usually have a smaller number of items, oscillating around 12 items (the average is 13.9).

Josef Malach, Kateřina Malachová Trends and Strategies in ICT Application in Higher Education versus Evaluation of Teaching and Learning
DIVAI 2018 – The 12th international scientific conference on Distance Learning in Applied Informatics. 321 ISBN 978-80-7598-059-5 (Print) ISSN 2464-7470 (Print) ISSN 2464-7489 (On-line)
Table 2 Analysis of tools for student evaluation of teaching (own source)
Higher educational institution
Number of question on
SET/SRT
Questions
identifying
ICT
applications
in teaching
and
learning
Formulation of questions about ICT
applications in teaching
Year of
creation of
SET / SRT
questionnaire,
if stated
11 University of Cambridge
22, 7 in section Instructional
practice Yes, 1
The teacher uses materials and media
when appropriate 2015
22 Iowa State University
31, 10 in section Teaching
methods/strategies/practices Yes 1
The instructors uses technology
effectively to advance my learning 2007
33
Course Evaluation Questionnaire,
Australia
49, Parts Learning Resources,
Student support Yes 2
Where it was used, the information
technology in teaching and learning
was effective. I was able to access
information technology resources
when I needed them 2009
44 University of South Alabama
General student Survey, part
Academic facilities and
technology Yes 10
Quality of technology in classrooms,
labs, computer labs, availability of
computer labs, hours of operation of
computer labs, the use of technology
by our professor/instructor, design
software, technical software 2016
55 Western Carolina University 20 No 2008
66 Uniwersytet Zielonogórski 12 No 2016
77 Uniwersytet Marii Curie-Skłodowskiej 10 No 2016
88 Uniwersytet Ekonomiczny w Poznaniu 23 Yes, 1
Materialy i informacje przekazywane
w systemie elektronicznym np
Moodle ulatwialy przyswajanie wiedzy 2011
99
Państwowa szkola Wyzsza im Papieza
Jana Pavla II. w Bialej Podlaskiej 13 No 2017
110
Wyzsza szkola Ekonomii a Informatyki
w Krakowie 12 No 2012
111 Uniwersytet Śląski w Katowicach 11 No 2015
112 Politechnika Wroclawska 22 Yes 1
Materialy dydaktyczne wspomagajace
zajecia byly dostepne 2015
113
AGH University of Science and
Technology Krakow 14 No 2017
114 Uniwersystet Opolski 12 No 2014
115 Uniwersytet Kaz. Wielkiego Bydgość 10 No 2017
116 Utrecht School of Economics 11 Yes 1
The study materials (slides, online
learning environment… ) helped me
study the course material 2014
117 Curtin University Perth, WA 23 NO 2014
118 University of California Berkeley
31 Instructor specific question themes (Departments can choose any items) NO 2009
119 University of Wisconsin, Madison 43 Yes, 1
The provision of learning resources on
the Web was adequate qnd
appropriate (if relevant) 2017
220 Université de Lausanne 20 Yes, 1
The use of didactic materials (slides,
blackboard, film, etc.) helps you
understand the concept that were
taught 2017

Josef Malach, Kateřina Malachová Trends and Strategies in ICT Application in Higher Education versus Evaluation of Teaching and Learning
DIVAI 2018 – The 12th international scientific conference on Distance Learning in Applied Informatics. 322 ISBN 978-80-7598-059-5 (Print) ISSN 2464-7470 (Print) ISSN 2464-7489 (On-line)
The items found are usually a question for a student to generally assess whether the ICT (often in the form of provided materials and sources) helped them understand the learning content, or in fewer cases, how the teacher was able to use them. We have not found any items which explicitly investigate whether or to what extent some of the new technical applications or didactic methods related to the use of ICT are used at universities. Therefore, it is not possible to assess whether these innovations (mentioned in Table 1 or in the text) are used, what their effects and drawbacks are in teaching and learning in higher education institutions.
Questions investigating the equipment in HEIs are not usually part of the student evaluation of the course or of the teacher. Out of 20 questionnaires, only one of them (HEI n. 12 in Table 1) included a question asking whether materials conducive to learning were available. However, it was not possible to clearly determine whether inquirers also meant digital materials and sources. In American universities, questions investigating the equipment can be found in the so-called General Student Survey, in section Academic facilities and technology (HEI n. 4), where students can express their attitudes and opinions regarding the quality of technology in classrooms, labs, computer labs, availability of computer labs, hours of operation of computer labs, the use of technology by their professor/instructor, design software, technical software.
DISCUSSION
The discussion of survey results is problematic because authors are not aware of any other surveys which would examine the mutual connection between the two constructs, i.e. trends in the development of the application of digital technology in higher education institutions and the content of student evaluation questionnaires. Nonetheless, students themselves express their need for such a feedback, which was testified by a student from North America: “Make sure to test new technologies with student focus groups and continually ask students for feedback as new technology is adopted” (Navitas Venture, 2017, p. 89).
CONCLUSION
The focus of the survey on the analysis of publicly available data can be a factor limiting its conclusion for a wide range of HEIs. Nevertheless, the fact that HEIs make student evaluation tools available shows that they consider the SET to be an important component of the quality assurance in teaching and learning and they strive to get effective feedback which is multi-purposeful. On the other hand, in terms of general trends of the development of higher education and in terms of the development of the ICT application or digital technology in HEIs, the reflection on these trends and applications using the SET appears to be inadequate, limited, outdated and too generic. Studies prove that students have certain specific beliefs of teaching and they include informative, accessible, communicative and professional among ten indicators of effective teaching (Delaney et al., 2010), to which digital technologies can functionally contribute. The current generation of university students considers digital technologies in their life and learning to be common and inseparable means and it is not possible to ignore this fact in evaluation tools in the future. Students want to have an opportunity to express their

Josef Malach, Kateřina Malachová Trends and Strategies in ICT Application in Higher Education versus Evaluation of Teaching and Learning
DIVAI 2018 – The 12th international scientific conference on Distance Learning in Applied Informatics. 323 ISBN 978-80-7598-059-5 (Print) ISSN 2464-7470 (Print) ISSN 2464-7489 (On-line)
opinion regarding the equipment and use of digital technology in teaching and universities can decide whether it will be included in course questionnaires, teacher questionnaires or questionnaires focusing on how the HEIs are equipped with technology and its educational applications.
ACKNOWLEDGEMENT
The research leading to these results has received, within the framework of the IRNet project, funding from the People Programme (Marie Curie Actions) of the European Union's Seventh Framework Programme FP7/2007-2013/ under REA grant agreement No: PIRSES-GA-2013-612536.
REFERENCES
Adams Becker, S., Cummins, M., Davis, A., Freeman, A., Hall Giesinger, C., and Ananthanarayanan, V., 2017. NMC Horizon Report: 2017 Higher Education Edition. Austin, Texas: The New Media Consortium.
Darwin, S., 2016. Student Evaluation in Higher Education. Reconceptualising the Student Voice. Springer. ISBN 978-3-319-41893-3.
Delaney, J., Johnson, A., Johnson, T. and Treslan, D., 2010. Students perceptions of effective teaching in higher education. St. Johnś, NL: Distance education and Learning technologies.
Digital Strategy for Education 2016-2020, 2016. University of Cambridge. [online] Available at < https://www.cctl.cam.ac.uk/news/digital-strategy-education> [Accessed 12 February 2018].
Hanan A. et al, 2017. Internet of Things in Higher Education: A Study on Future Learning. Journal of Physics: Conf. Series 892 (2017) 012017 doi:10.1088/1742-6596/892/1/012017.
Hativa, N.,2013. Student Rating of Instruction. A practical Approach to Designing, Operating and Reporting. Oron Publ. ISBN 13:9789-1481054331.
Hornstein, H.A., 2017. Student evaluations of teaching are an inadequate assessment tool for evaluating faculty performance. Cogent Education, (4), 1304016.
Isaias, P., 2017. The future of learning technologies in higher education. Proceedings of the 6th International conference on Sustainability, Technology and Education (STE 2017). Sydney, Australia 11 – 13 December. IADIS Press. ISBN 978-989-8533-73-9.
Johnson, L., Adams Becker, S., Estrada, V., and Freeman, A., 2014. NMC Horizon Report: 2014 Higher Education Edition. Austin, Texas: The New Media Consortium.
Johnson, L., Adams Becker, S., Estrada, V., and Freeman, A., 2015. NMC Horizon Report: 2015 Higher Education Edition. Austin, Texas: The New Media Consortium.
Johnson, L., Adams Becker, S., Cummins, M., Estrada, V., Freeman, A., and Hall, C., 2016. NMC Horizon Report: 2016 Higher Education Edition. Austin, Texas: The New Media Consortium.
Kapp, K, M., 2012. The Gamification of Learning and Instruction: Game-Based Methods and Strategies for Training and Education, San Francisco: Pfeiffer.

Josef Malach, Kateřina Malachová Trends and Strategies in ICT Application in Higher Education versus Evaluation of Teaching and Learning
DIVAI 2018 – The 12th international scientific conference on Distance Learning in Applied Informatics. 324 ISBN 978-80-7598-059-5 (Print) ISSN 2464-7470 (Print) ISSN 2464-7489 (On-line)
Kaushik, M., 2016. Technology Supported Pedagogy in Higher Education: Approaches and Trends. In Raman, S. (ed.) Emerging Trends in Higher Education Pedagogy. Pepnang: Wawasan Open University. ISBN 978-983-3910-03-8.
Navitas Venture, 2017. Digital transformation in higher education. [online] Available at <https://www.navitasventures.com/wp-content/uploads/2017/08/HE-Digital-Transformation-_Navitas_Ventures_-EN.pdf> [Accessed 2 February 2018].
Griffith Digital Strategy 2020, 2016. Griffith University Available at <https://www.griffith.edu.au/__data/assets/pdf_file/0006/935070/griffithuniversity-digital-strategy.pdf> [Accessed 7 February 2018].

Josef Malach, Veronika Švrčinová Standards and Frameworks of Digital Competence of Teachers as a Tools for Professional Training and Assessement
DIVAI 2018 – The 12th international scientific conference on Distance Learning in Applied Informatics. 325 ISBN 978-80-7598-059-5 (Print) ISSN 2464-7470 (Print) ISSN 2464-7489 (On-line)
Standards and Frameworks of Digital Competence
of Teachers as a Tools for Professional Training
and Assessement
Josef Malach
Department of Education and Adult Education, University of Ostrava, Ostrava, Czech Republic [email protected]
Veronika Švrčinová
Department of Technical and Vocational Education, University of Ostrava, Ostrava Czech Republic
Abstract
This study deals with the issue of integration and codification of teachers‘ digital competences into the teacher's professional standards, with deeper development of teachers' digital competences into specific frameworks, with the transfer of standards and frameworks to teacher education programs and further education systems, and with ways of self-assessment of the level of digital competence of teachers. The authors draw on analytical studies, international and national documents as well as professional reports that highlight the need for system linking of standards, frameworks, curricula and courses and self-assessment tools that can provide effective use of the ever-expanding range of ICT resources in digital teaching and learning in all components of lifelong learning.
Keywords
Assessment of digital competences. Digital competence. Qualification framework for digital competences. Teachers professional qualification.
INTRODUCTION
Digital competence of teachers is a factor underlying the use of ICT in teaching and learning at all formal learning levels as well as in non-formal learning. The purpose of ICT applications is not only to achieve higher efficiency, attractiveness to education and greater involvement of pupils in the educational process, but also to create a digital competence for pupils which has been included in key competencies (European Parliament and the Council, 2006) or in the basic curriculum as Information, Media and Technology Skills (P21's Framework for 21st Century Learning, 2007). Digital literacy, knowledge and skills necessary to participate in basic ICT-related activities are now considered prerequisites for acquiring basic skills both in specific subjects and in cross-

Josef Malach, Veronika Švrčinová Standards and Frameworks of Digital Competence of Teachers as a Tools for Professional Training and Assessement
DIVAI 2018 – The 12th international scientific conference on Distance Learning in Applied Informatics. 326 ISBN 978-80-7598-059-5 (Print) ISSN 2464-7470 (Print) ISSN 2464-7489 (On-line)
cutting themes (Klíčové údaje, 2011). In May 2015 UNESCO was entrusted to coordinate the Education 2030 agenda with its partners. The targets for education are essentialy captured in Sustainable Goal 4 (SDG4) and aim to „ensure inclusive and equitable quality education and promote lifelong learning opportunities for all“. By 2030, member states have to substantially increase the supply of qualified teachers and ensure that teachers and educators are adequately recruited, well-trained, professionally qualified, motivated and supported within well-resourced and effectively governed systems (Incheon Declaration, 2016). According to Par. 10 of Incheon Declaration and Framework for Action „ICTs must be harnessed to strengthen education systems, knowledge dissemination, information access, quality and effective learning, and more effective service provision.” The role of ICT have to be considered in realising education for all by to 2030. Fengchun and Nanaieva (2015) consider this an argument for need to ensure citizens with the knowledge, skills, and competences as well as the lifelong learning opportunities required for living in an inceasingly technology rich environment.
Study Innovative Learning Environments (ILE) (OECD, 2017) clearly and unambiguously shows that digital technology is and will be integrated into education and learning at present and in the future, and that it is necessary to redefine the professional competencies of school pedagogical staff and to ensure their upbringing and innovation. Du Toit (2015) proposes to monitor this training in pre-service and in-service and on-going training, and this training should include teachers of all subjects, at all levels and administrators, online facilitators and principals too.
DIGITAL COMPETENCE OF TEACHERS
Digital competence of teachers/teachers´ digital competence is an up-to-date version of the recently used ICT Competency for Teachers (used by UNESCO in 2011) or Teachers‘ ICT Competency. Krumsvick (2011, p. 45) defined teacher's digital competence as a "teacher's competence in using ICT in a professional context with a good pedagogical-didactic judgment and his/her awareness of its implications for learning strategies and the digital building of pupils and students ". More recently, From (2017), following the analysis of terminology development, proposed using the Pedagogical Digital Competence (PDC), which he defined as follows: "The concept of pedagogical digital competence refers to the ability to consistently apply the attitudes, knowledge and skills required to plan and conduct, and to evaluate and review on a continuous basis, ICT-based teaching, based on theory, current research and proven experience with a view to supporting student learning in the best possible way (p. 48).“
Digital Competence in Models of Professional Competences of Teachers
Broader framework for establishing models or frameworks of digital competence of teachers are models or standards of teaching profession. For example, the Australian Professional Standards for Teachers (2011) in the introductory preambles first decently declares the main purpose of the teaching profession: 1) teachers share a significant responsibility in preparing young people to lead successful and productive lives, 2) teacher’s effectiveness has a powerful impact on students, with broad consensus that

Josef Malach, Veronika Švrčinová Standards and Frameworks of Digital Competence of Teachers as a Tools for Professional Training and Assessement
DIVAI 2018 – The 12th international scientific conference on Distance Learning in Applied Informatics. 327 ISBN 978-80-7598-059-5 (Print) ISSN 2464-7470 (Print) ISSN 2464-7489 (On-line)
teacher quality is the single most important in-school factor influencing student achievement, 3) effective teachers can become a source of inspiration and, equally importantly, provide a dependable and consistent influence on young people as they make choices about further education, work and life.
The standard is built hierarchically (defines teachers' requirements for graduate, proficient, highly accomplished, lead), and formulates the requirements for the performance of teachers in three domains of teaching (professional knowledge, professional practice and professional engagement). Then each standard may have a more focus area.
ISTE Standards for Educators
ISTE Standards for Educators (2017) is one of the five related norms of the International Society for Technology in Education (hereafter standards for students, computer science educators, coaches, administrators). The ISTE Standards work together to support educators, students and leaders with clear guidelines for the skills and knowledge necessary to move away from the factory model. They provide a framework for rethinking education, adapting to a constantly changing technological landscape and preparing students to enter a growing global economy. Educator is an empowered professional who plays the role of Learner, Leader, Citizen, and Learning Catalyst, with roles: Collaborator, Designer, Facilitator and Analyst.
SELECTED MODELS AND FRAMEWORKS OF TEACHERS’ DIGITAL
COMPETENCES
ICT Competency Framework for Teachers
UNESCO’s Framework (UNESCO, 2011) emphasizes that it is not enough for teachers to have ICT competences and be able to teach them to their students. Teachers need to be able to help the students become collaborative, problem solving and creative learners through using ICT so they will be effective citizens and members of the workforce. UNESCO framework includes six aspects of teacher´s work: 1) understanding ICT in education, 2) curriculum and assessment, 3) pedagogy, 4) ICT, 5) organization and administration and 6) teachers professional learning.
European Digital Competence Framework for Teachers (DigCompTeach)
The teaching professions face rapidly changing demands, which require a new broader and more sophisticated set of competences than before. A digital competence framework for teachers at European level could reinforce national and/or regional initiatives by providing a common understanding of the digital competence needs for teachers at all levels. The objective of DigCompTeach is to identify and describe the key components of teachers' digital competence and to provide an instrument for (self -) assessment, based on research and stakeholder's consultations. As a result of the project solved in 2012-2014 under the patronage of Spain, the model consists of five areas: 1) information and data literacy, 2) communication and collaboration, 3) digital content creation, 4) safety and 5) problem solving. Each area is saturated with a set of competences, as shown in Table 1.

Josef Malach, Veronika Švrčinová Standards and Frameworks of Digital Competence of Teachers as a Tools for Professional Training and Assessement
DIVAI 2018 – The 12th international scientific conference on Distance Learning in Applied Informatics. 328 ISBN 978-80-7598-059-5 (Print) ISSN 2464-7470 (Print) ISSN 2464-7489 (On-line)
Table 1: Areas and competences in European Digital Competence Framework for Teachers (2017)
Area Competences
1. Information and data literacy 1.1. Browsing, searching, filtering data, information and digital content
1.2. Evaluating data, information and digital content
1.3. managing data, information and digital content
2. Communication and collaboration 2.1. Interacting through digital technology
2.2. Sharing information and content
2.3. Online civic engagement
2.4. Collaborating through digital technologies
2.5. Netiquette
2.6. Managing digital identity
3. Digital content creation 3.1. Developing digital content
3.2. Integrating and re-elaborating digital content
3.3. Copyright and licenses
3.4. Programming
4. Safety 4.1. Protecting devices
4.2. Protecting personal data and privacy
4.3. Protecting health and well-being
4.4. Protecting the environment
5. Problem solving 5.1 Solving technical problems
5.2. Identifying needs and technological responses
5.3. Creatively using digital technologies
5.4. Identifying digital competence gaps.
The framework is streamlined and its visual model in the form of close to the "Olympic circles" indicates the interdependence of the different areas.
European Framework for the Digital Competence of Educators
In the area of educators' digital competence there are several national and international competence frameworks, each with their own underlying logic, specificity and level of development. A digital competence framework for educators at European level could reinforce national and/or regional initiatives by providing a common understanding of the digital competence needs for educators. The objective of DigCompEdu is to identify and describe the key components of educators' digital competence and to provide an instrument for (self-)assessment, based on research and

Josef Malach, Veronika Švrčinová Standards and Frameworks of Digital Competence of Teachers as a Tools for Professional Training and Assessement
DIVAI 2018 – The 12th international scientific conference on Distance Learning in Applied Informatics. 329 ISBN 978-80-7598-059-5 (Print) ISSN 2464-7470 (Print) ISSN 2464-7489 (On-line)
stakeholder consultations. The framework works with six different areas of competence, with a total of 23 competences (Table 2 and Figure 1).
Table 2: Areas and competencies in European Framework for the Digital Competence of Educators (2017)
Area Competence
1. Professional Engagement 1.1 Data management
1.2 Communication
1.3 Professional collaboration
1.4 Reflective practice
1.5 Digital CPD
2. Digital Resources 2.1 Selecting
2.2 Organizing & sharing
2.3. Creating
3. Digital Pedagogy (Using digital tools to enhance &innovate)
3.1 Instruction
3.2 Teacher-learner interaction
3.3 Learner collaboration
3.4 Self-directed learning
4. Digital Assessment (Using digital tools to enhance & innovate)
4.1 Assessment formats
4.2 Analyzing evidence
4.3 Feedback & planning
5. Empowering Learners (Using digital tools to empower learners through:
5.1 Accessibility & inclusion
5.2 Differentiation & personalization
5.3 Actively engaging learners
6. Facilitating Learners Digital Competence 6.1 Information and media literacy
6.2 Communication
6.3 Content creation
6.4 Wellbeing
6.5 Problem solving
Also, the authors of this framework have used proficiency levels to describe their digital competences in individual areas considered as motivational. They also used the Common European Framework of Reference for Languages (CEFR) as the previous framework and named and characterized each level. Newcomers (A1) have had very little

Josef Malach, Veronika Švrčinová Standards and Frameworks of Digital Competence of Teachers as a Tools for Professional Training and Assessement
DIVAI 2018 – The 12th international scientific conference on Distance Learning in Applied Informatics. 330 ISBN 978-80-7598-059-5 (Print) ISSN 2464-7470 (Print) ISSN 2464-7489 (On-line)
contact with digital tools and need guidance to expand their repertoire. Explorers (A2) have started using digital tools without, however, following a comprehensive or consistent approach. Explorers need insight and inspiration to expand their competences. Enthusiasts (B1) experiment with digital tools for a range of purposes, trying to understand which digital strategies work best in which contexts. Professionals (B2) use range of digital tools confidently, creatively and critically to enhance their professional activities. They continuously expand repertoire of practices. Experts (C1) rely on a broad repertoire of flexible, comprehensive and effective digital strategies. Pioneers (C2) question the adequacy of contemporary digital and pedagogical practices, of which themselves are experts. They lead innovations and are a role model for younger teachers (DigCompEdu, 2017).
Figure 1: The dominant areas and essential ICT competencies in European Framework for the Digital Competence of Educators 2017 (DigCompEdu, 2017)
According to DigCompEdu we can set out initiatives which should be implemented. The preparation of student teachers at university level should aim at 1) confidence with general technology and use of computers for administrative purposes and documentation, 2) empowering using digital tools, 3) preparation of appropriate lesson plans including digital resources, 4) creating conductive learning environment – motivate active learning, maintain a collaborative learning environment, 5) promotion students´participation and collaboration, applying questioning and reacting skills, 6) developing higher order thinking skills, 7) acquiring skills on testing, assessment and evaluation, developing formative and summative assessment tools, 8) engaging in professional development – sharing and applying new knowledge and skills gained from professional development activities, study visits and exchange programs.
NC Digital Learning Competencies for Classroom Teachers
Using the North Carolina Professional Teaching Standards, the ISTE Standard (International Society for Technology in Education) and other sources, a set of 20 skills has been developed in four focus areas, more closely characterized by their respective competencies: 1) Leadership in Digital Learning - teacher will demonstrate leadership in accelerating their intergation of digital teaching and learning pedagogies, 2) Digital

Josef Malach, Veronika Švrčinová Standards and Frameworks of Digital Competence of Teachers as a Tools for Professional Training and Assessement
DIVAI 2018 – The 12th international scientific conference on Distance Learning in Applied Informatics. 331 ISBN 978-80-7598-059-5 (Print) ISSN 2464-7470 (Print) ISSN 2464-7489 (On-line)
Citizenship - teachers will model and teach digital citizenship by ethical, respectful, and safe use of digital tools and resources that support the creation of a positive digital school culture, 3) Digital Content and Instruction - teachers will know and use appropriate digital tools for instruction, 4) Data and Assessment - teacher will use technology to make data accessible, adjust instruction to better meet the needs of a diverse learner population and reflect upon their practice through the consistent, effective use of assessment.
ECDL module ICT in education
This module enables candidates to start engaging in the pedagogically effective use of ICT to support and enhance teaching, learning and assessment in the classroom. The benefits of this module are: 1) certifies the key concepts relating to the use of ICT in the classroom, 2) supports educators who wish to start effectively using ICT in their professional practice and 3) develops the areas of teaching practice and IT user skills. The candidate will be able to: understand the key concepts and benefits of using ICT to support and enhance teaching, learning and assessment in the classroom, outline considerations for planning an ICT enhanced lesson, understand safety, security and well-being considerations when using ICT in education, outline ICT resources that can be used to support and enhance teaching, learning and assessment, understand how to source and evaluate ICT resources to support and enhance teaching, learning and assessment, outline key features of classroom technologies and use key features of a learning platform (ECDL Foundation, 2018).
The above-mentioned digital competency models of teachers were created in a different geographic area, by more or less specialized organizations for the use of ICT in education and in different formal (textual or visual) structures. The study aimed to identify and present models and study their content from the point of view of subsequent use in both undergraduate teachers study and in in-service teacher training.
ACQUSITION OF PDC IN TEACHER TRAINING PROGRAMMES
In teacher education and in-service-training teachers have to become familiarized with a broad variety of teaching methods and especially learning processes which gain from embedding digital media. Learning becomes more open ended in contrast to today’s trend to be more standard oriented (Learning, innovation and ICT, 2010).
Røkenes and Krumsvik (2014) analyzed documents from 2000 to 2013 regarding the development of digital competence of student teachers in teacher education qualified to teach in the secondary school grade level. They found out that it is possible to identify a few approaches on how teacher education develop student teachers’ digital competence: collaboration approaches and co-operative learning refer to technology training situations where two or more student teachers “work together to maximize their own and each other’s learning”, metacognition approaches or reflective practice usually refers to as reflection-on-action, where student teachers analyze and document their thoughts, reactions, and/or consequences of their actions surrounding a situation involving ICT, blended learning or a multimedia instruction approach regards ICT-training of student teachers through the use and combination of both face-to-face and online teaching, authentic learning approach refers to a “pedagogical approach that situates learning tasks

Josef Malach, Veronika Švrčinová Standards and Frameworks of Digital Competence of Teachers as a Tools for Professional Training and Assessement
DIVAI 2018 – The 12th international scientific conference on Distance Learning in Applied Informatics. 332 ISBN 978-80-7598-059-5 (Print) ISSN 2464-7470 (Print) ISSN 2464-7489 (On-line)
in the context of real-world situations” or “the context of future use”, modeling approach is base on promoting particular practices, which could play an important role in shaping “student teachers’ professional learning”.
According to Mandinach and Cline (Youssef, 2015), there are four developmental phases of teacher development and they can be divided into their use of technology. In the Survival phase, a teacher uses technology but inefficiently and needs support. The teacher who survives this stage will learn new strategies for their teaching and can plan basic and varied ways of using them (Mastery phase). At the Impact stage the teacher continually improves the use of technology and prepares tools for more efficient achievement of the intended outputs. In the final stage called Innovation stage, the teacher uses the technology in way, which have clearly improved the state of the learning process. In this phase teacher analyzes and evaluates learning process and is able to create more effective approaches using current and anticipated technology.
The Conclusion of the ICILS Report (Basl et al., 2013) recommends that the Czech Ministry of Education, in the preparation of the teacher and career standards, should ensure the minimum (standard) level of ICT abilities and responsibilities that a graduate is able to master and which can be used in teaching and learning. It should also ensure that this requirement is embedded in teacher training curricula. The Digital Education Strategy for 2020 (2014) sets out in one of the seven priorities "Ensuring the conditions for the development of digital literacy and teacher-oriented thinking" but its implementation has certain problems and delays. However, by the end of 2019, samples of syllables will be developed for subjects of higher education of teachers focused on didactics of digital literacy development for children and pupils and didactics of informatics.
The TALIS 2013 survey (Kašparová et al.) showed that the largest share of teachers in the Czech Republic (15%) felt a great need for education in ICT skills necessary for teaching.
ASSESSING THE DEVELOPMENT OF TEACHERS’ DIGITAL COMPETENCES
The starting point for solving the question of assesment or self-assessment is the approach to evaluating of teacher competences as a whole. Measures to assess the development of teachers' competences are important because they: can raise teacher's awareness of the need to develop her or his competences; can support a transformation in teaching culture and practice; permit the recognition of the (new) competences acquired or developed; play a part in the quality assurance and control of training and development, thereby leading to its improvement and helping to achieve excellence; can help to develop trust in the teaching workforce; and can facilitate timely intervention to improve teaching (Supporting teacher competence development for better learning outcomes, 2013). This output also defines the three basic functions of this rating that can serve for supporting teachers’ development (formative assesment), monitoring their progress (summative assessment) or for establishing their level (competence level), for decisions on salaries/new roles.
For purpose of the formative assessment these tools and techniques are available (low stakes for the teacher): regular meetings with principal or other staff – reviews of competences, self-assessment, critical friends groups, peer review, individual

Josef Malach, Veronika Švrčinová Standards and Frameworks of Digital Competence of Teachers as a Tools for Professional Training and Assessement
DIVAI 2018 – The 12th international scientific conference on Distance Learning in Applied Informatics. 333 ISBN 978-80-7598-059-5 (Print) ISSN 2464-7470 (Print) ISSN 2464-7489 (On-line)
development plans, classroom observations by peers, video analysis, written reflections/narratives, reports, portfolio (inputs/outputs), action research, student/parent feedback. Summative assessment tools and techniques (high stakes for the teacher) include: examinations, classroom observations, micro teaching, video, essays, testing.
Instruments for (self) evaluation of teacher's digital competence have recently become the focus of educators of in-service teachers and teachers, as well as all other stakeholders, to provide feedback and background material for updating relevant learning needs.
Evaluating the level of PDC of (future) teachers, similarly to other research of learning outcomes, should prefer methods of solving authentic tasks (didactic or performance test, scring rubrics) and combine internal and external evaluations. This would give a more objective picture of the level of teachers PDC than just using a questionnaire with items subjectively evaluated by the teacher himself.
CONCLUSION
The acquisition of pedagogical digital competence and its use by the teacher for an increase in the quality and importance of the process of teaching and learning can be considered a significant subject of common interest in educational policy, theory and practice itself. An analysis of the educational policy segment has shown that conclusions and recommendations have been adopted at many levels to support the development of teacher PDC as a part of their professional qualifications and are incorporated in some countries into Professional standards for teachers. There are also several examples of decomposing PDCs into sub-tasks and activities that require specific knowledge and skills to master. They represent a content of specific frameworks for the digital competence of teachers. These two groups of documents can be considered sources of current and valid educational needs. Technological development requires a sustained updating of needs so that it can become one of the bases of initial teacher education and is thus included in higher education programs and further education. The education theory segment should provide scientific evidence of the effects and effectiveness of digitally-supported teaching and learning for both types of education. Finally, the segment of the educational practice should monitor, analyze and evaluate innovative teaching and learning, while using several methods and pedagogical digital competence of teachers. Advances in the use of digital technologies in teaching and learning will become increasingly dependent on interconnection of all three segments of education systems in the future.
REFERENCES
Australian Professional Standards for Teachers, 2011. Australian Institute for Teaching and School Leadership. [online] Available at <https://www.aitsl.edu.au/teach/standards> [Accessed 1 February 2018].
Basl, J., Boudová, S., Řezáčová, L, 2014. Národní zpráva šetření ICILS 2013. Počítačová a informační gramotnost českých žáků. Praha: Česká školní inspekce, ISBN 978-80-905632-6-1.

Josef Malach, Veronika Švrčinová Standards and Frameworks of Digital Competence of Teachers as a Tools for Professional Training and Assessement
DIVAI 2018 – The 12th international scientific conference on Distance Learning in Applied Informatics. 334 ISBN 978-80-7598-059-5 (Print) ISSN 2464-7470 (Print) ISSN 2464-7489 (On-line)
Du Toit, J., 2015. Teacher training and usage of ICT in education. New directions for the UIS global data collection in the post-2015 context. UNESCO Institute for Statistic. [online] Available at: <http://www.unesco.org/education/lwf/dl/edict.pdf> [Accessed 12 February 2018].
ECDL Foundation, 2018. ECDL MODULE ICT IN EDUCATION Syllabus Version 1.0. 2018. [online] Available at: <http://ecdl.org/media/ecdlictineducation_syllabus1.01.pdf> [Accessed 1 February 2018].
European Digital Competence Framework for Teachers, 2017. INTEF. [online] Available at: <https://www.slideshare.net/educacionlab/common-digital-competence-framework-for-teachers. > [Accessed 1 February 2018].
European Framework for the Digital Competence of Educators (DigCompEdu), 2017. [online] Available at: <https://ec.europa.eu/jrc/sites/jrcsh/files/digcompedu_overview_-_english.pdf> [Accessed 1 February 2018].
European Parliament and the Council, 2006. Recommendation of the European Parliament and of the Council of 18 December 2006 on key competences for lifelong learning. In: Official Journal of the European Union, L394/310.
Fengchun, M., Nanaieva, T., 2015. Ensuring effective use of ICT in teaching and learning. In: Open Educational E-environment of modern university. Volume 1, pp. 179 – 188.
From, J., 2017. Pedagogical Digital Competence–Between Values, Knowledge and Skills. In: Higher Education Studies.Vol. 7, no. 2, pp. 43-50.
Incheon Declaration, 2016. [online] Available at <http://uis.unesco.org. > [Accessed 1 February 2018].
ISTE, 2017. ISTE Standards for educators. [online] Available at: <https://www.iste.org. > [Accessed 1 February 2018].
Kašparová, V., Boudová, S., Ševců, M., and Soukup, P., 2014. Národní zpráva šetření TALIS 2013. Praha: MŠMT.
Klíčové údaje o učení a inovacích prostřednictvím IKT ve školách v Evropě 2011, 2011. Education, Audiovisual and Culture Executive Agency: Brusssels, ISBN 978-92-9201-209-0.
Krumsvik, R. A., 2011. Digital competence in Norwegian teacher education and schools. In: Högre Utbildning, 1(1), pp. 39-51.
Learning, innovation an ICT, 2010. Lessons learned by the ICT cluster Education & Training 2010 programme. [online] Available at <https://www.erte.dge.mec.pt > [Accessed 1 February 2018].
OECD, 2017. The OECD Handbook for Innovative Learning Environments. [online] Available at: <http://www.oecd.org > [Accessed 14 February 2018].
P21's Framework for 21st Century Learning, 2007. [online] Available at: <http://www.p21.org/our-work/p21-framework> [Accessed 12 February 2018].
Røkenes, F.M. and Krumsvik, R.J., 2014. Development of Student Teachers’ Digital Competence in Teacher Education A Literature Review. In: Nordic Journal of Digital Literacy, vol. 9, Nr. 4-2014, pp. 250–280.
Strategie digitálního vzdělávání do roku 2020, 2014. Praha: MŠMT.

Josef Malach, Veronika Švrčinová Standards and Frameworks of Digital Competence of Teachers as a Tools for Professional Training and Assessement
DIVAI 2018 – The 12th international scientific conference on Distance Learning in Applied Informatics. 335 ISBN 978-80-7598-059-5 (Print) ISSN 2464-7470 (Print) ISSN 2464-7489 (On-line)
Supporting teacher competence development for better learning outcomes. European Commission, 2013. [online] Availabe at: <http://ec.europa.eu/ > [Accessed 1 February 2018].
UNESCO, 2011. ICT competency framework for teacher. [online] Availabe at: <http://unesdoc.unesco.org/images/0021/002134/213475e.pdf> [Accessed 1 February 2018].
Youseff, Y., 2015. Capacity building for school leaders to support ICT integration in teaching and learning. [online] Available at: <https://www.academia.edu > [Accessed 10 February 2018].


Petra Poulova, Jaroslava Mikulecka, Tomas Kozel, Blanka Klimova Data Science Study Program
DIVAI 2018 – The 12th international scientific conference on Distance Learning in Applied Informatics. 337 ISBN 978-80-7598-059-5 (Print) ISSN 2464-7470 (Print) ISSN 2464-7489 (On-line)
Data Science Study Program
Petra Poulova, Jaroslava Mikulecka, Tomas Kozel, Blanka Klimova
University of Hradec Kralove, Faculty of Informatics and Management, Hradec Kralove, Czech Republic
{petra.poulova, jaroslava.mikulecka, tomas.kozel, blanka.klimova}@uhk.cz
Abstract
Society producing data at an incredible rate, fuelled by the increasing ubiquity of the Web, and stoked by social media, sensors, and mobile devices. The current rapid development in the field of Big Data brings a new approach to education. The amount of produced data continues to increase, so does the demand for practitioners who have the necessary skills to manage and manipulate this data. Reflecting the call for new knowledge and skills required from Graduates of the Faculty of Informatics and Management, University of Hradec Kralove, the study program Data Science is being prepared. The first step is to ensure the quality of highly professional training program; the faculty started the co-operation with IBM in 2015. The aim of the joint training program BigData EduCloud was to provide students with practical professional skills and prepare them for new positions that have recently been created on the labour market. The program consisted of lectures, workshops and intensive consultations. On the basis of experience with the BigData EduCloud program, the new study program Data Science is being prepared.
Keywords
Big Data. Data Science. eLearning. NoSQL. Hadoop. LMS.
INTRODUCTION
Declared by Harvard Business Review as the “sexiest job of the 21st century” (Davenport and Patil, 2012), data science skills are becoming a key asset in any organisation confronted with the daunting challenge of making sense of information that comes in varieties and volumes never encountered before.
METHODOLOGICAL FRAME
The structure of the paper follows the standard pattern. 'Methodological frame' as the first chapter covers literature review and setting objectives. The following main chapters are 'Data science study program' - definition of the key concepts and 'Conclusion' with practical implications.
The theoretical background to this article is based on the method of a literature re-view of available relevant sources on the research topic.
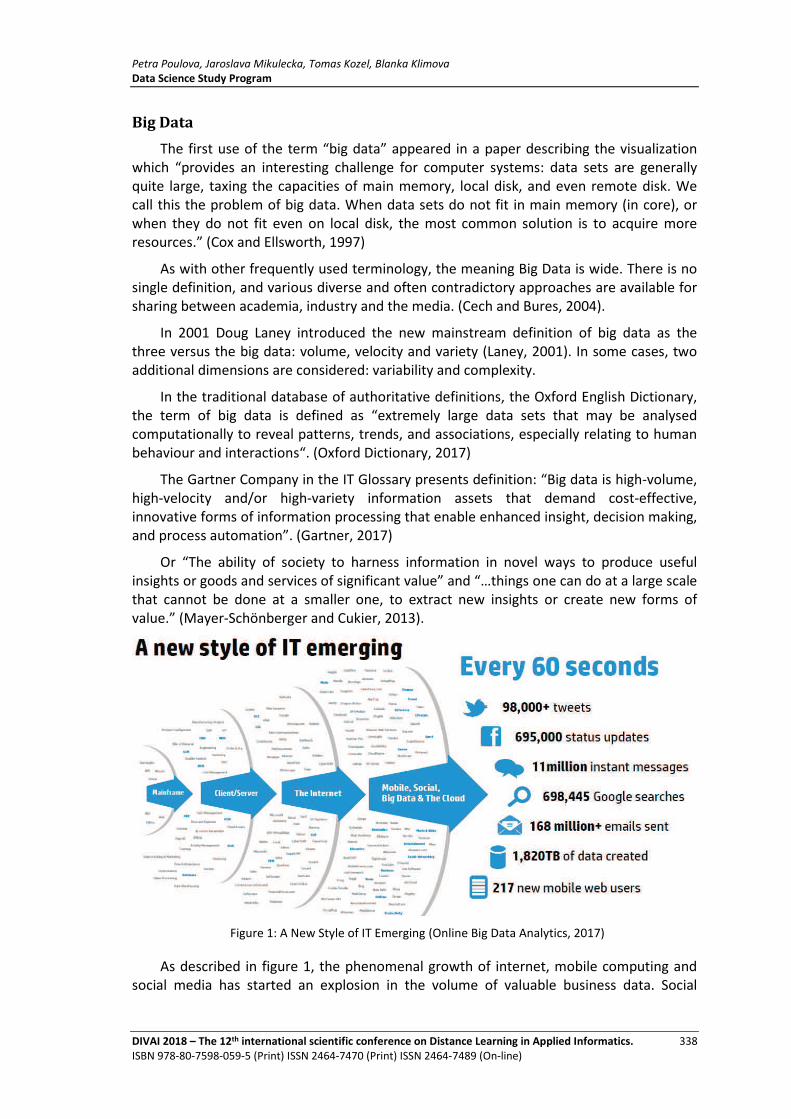
Petra Poulova, Jaroslava Mikulecka, Tomas Kozel, Blanka Klimova Data Science Study Program
DIVAI 2018 – The 12th international scientific conference on Distance Learning in Applied Informatics. 338 ISBN 978-80-7598-059-5 (Print) ISSN 2464-7470 (Print) ISSN 2464-7489 (On-line)
Big Data
The first use of the term “big data” appeared in a paper describing the visualization which “provides an interesting challenge for computer systems: data sets are generally quite large, taxing the capacities of main memory, local disk, and even remote disk. We call this the problem of big data. When data sets do not fit in main memory (in core), or when they do not fit even on local disk, the most common solution is to acquire more resources.” (Cox and Ellsworth, 1997)
As with other frequently used terminology, the meaning Big Data is wide. There is no single definition, and various diverse and often contradictory approaches are available for sharing between academia, industry and the media. (Cech and Bures, 2004).
In 2001 Doug Laney introduced the new mainstream definition of big data as the three versus the big data: volume, velocity and variety (Laney, 2001). In some cases, two additional dimensions are considered: variability and complexity.
In the traditional database of authoritative definitions, the Oxford English Dictionary, the term of big data is defined as “extremely large data sets that may be analysed computationally to reveal patterns, trends, and associations, especially relating to human behaviour and interactions“. (Oxford Dictionary, 2017)
The Gartner Company in the IT Glossary presents definition: “Big data is high-volume, high-velocity and/or high-variety information assets that demand cost-effective, innovative forms of information processing that enable enhanced insight, decision making, and process automation”. (Gartner, 2017)
Or “The ability of society to harness information in novel ways to produce useful insights or goods and services of significant value” and “…things one can do at a large scale that cannot be done at a smaller one, to extract new insights or create new forms of value.” (Mayer-Schönberger and Cukier, 2013).
Figure 1: A New Style of IT Emerging (Online Big Data Analytics, 2017)
As described in figure 1, the phenomenal growth of internet, mobile computing and social media has started an explosion in the volume of valuable business data. Social

Petra Poulova, Jaroslava Mikulecka, Tomas Kozel, Blanka Klimova Data Science Study Program
DIVAI 2018 – The 12th international scientific conference on Distance Learning in Applied Informatics. 339 ISBN 978-80-7598-059-5 (Print) ISSN 2464-7470 (Print) ISSN 2464-7489 (On-line)
networks and many other cloud-based applications are not only increasing the amount of data, but also the types and sources of that data – both inside and outside the enterprise.
The world produces every day 2.5 trillion bytes of data and the volumes have constantly been increasing. They can be outputs of sensors measuring the climate, pictures, videos, data from social networks, business transactions, unstructured text, and other formats (see Fig.2)
Figure 2: Big Data Applications (DataFlair, 2017)
Processing of large amounts of data in the traditional way means making huge investments in software and hardware implementations. Applying the Big Data technologies, data can be stored and analysed more efficiently and without large upfront investments. The companies understand the great potential in data analysis and their proper usage, on the other hand, the lack of qualified professionals who would be able to handle this data is a limitation to this process.
Data Science
The Data Science is typically linked to a number of core areas of expertise, from the ability to operate high-performance computing clusters and cloud-based infrastructures, to the know-how that is required to devise and apply sophisticated Big Data analytics techniques, and the creativity involved in designing powerful visualizations (Magoulas and King, 2014). (See Fig. 3)

Petra Poulova, Jaroslava Mikulecka, Tomas Kozel, Blanka Klimova Data Science Study Program
DIVAI 2018 – The 12th international scientific conference on Distance Learning in Applied Informatics. 340 ISBN 978-80-7598-059-5 (Print) ISSN 2464-7470 (Print) ISSN 2464-7489 (On-line)
Figure 3: Data Science (Data Science Institute, 2017)
Moving further away from the purely technical, organizations are more and more looking into novel ways to capitalize on the data they own (Benjamins and Jariego, 2013), and to generate added value from an increasing number of data sources openly available on the Web, a trend which has been coined as “open data”. To do so they need their employees to understand the legal and economic aspects of data-driven business development, as a prerequisite for the creation of product and services that turn open and corporate data assets into decision making insight and commercial value (Mikroyannidis, et al, 2017). (See Fig.4)
Figure 4: Data Scientist (Kégl, 2017)
Data scientists are, however, still a rare breed. Beyond the occasional data-centric start-up and the data analytics department of large corporations, the skills scarcity is already becoming a threat for many European companies and public sector organizations

Petra Poulova, Jaroslava Mikulecka, Tomas Kozel, Blanka Klimova Data Science Study Program
DIVAI 2018 – The 12th international scientific conference on Distance Learning in Applied Informatics. 341 ISBN 978-80-7598-059-5 (Print) ISSN 2464-7470 (Print) ISSN 2464-7489 (On-line)
as they struggle to seize Big Data opportunities in a globalized world (Domingue, et al, 2014). A McKinsey study estimated already in 2011 that the United States would soon require 60 percent more graduates able to handle large amounts of data as part of their daily jobs (James, et al,2011).
An increasing demand in higher-education programs and professional training confirm this trend (Glick, 2013), with some EU countries forecasting an increase of almost 100 percent in the demand for data science positions in less than a decade (McKenna, 2012).
Objectives of Data Science Program
The Data Science Program is establishing a powerful learning production cycle for data science, in order to meet the following objectives:
� Analyse the sector specific skillsets for data analysts;
� Develop modular and adaptable curricula to meet these data science needs;
� Develop learning resources based on these curricula.
DATA SCIENCE STUDY PROGRAM
One of the main objectives of the Faculty of Informatics and Management (FIM), University of Hradec Kralove (UHK) is to facilitate the integration of students in national and international labour markets by equipping them with the latest theoretical and applied investigation tools for the information technology (IT) area.
The development of the study program Data Science was done into two main steps; firstly, in cooperation with IBM, study program of Applied Informatics BigData EduCloud was developed, and secondly, the independent program Data Science is being prepared.
The Big Data EduCloud Program
In this respect, close co-operation with IBM Company appears to be a logical step using the IBM EduCloud program. Its main objective is to create a transparent set of multidisciplinary courses, seminars and online practical exercises, which give students the opportunity to gain both theoretical knowledge and practical skills as well as to develop their key competences. Students participating in this program will get practical experience in a very specific field of great potential. The added value and one of the strong advantages of the program is the opportunity to receive globally recognized certifications credited by IBM for free.
IBM actively cooperated with the FIM on creating appropriate joint curriculum topics for the course of bachelor and master IT studies.
The program consists of single modules, faculty regular courses, additional seminars and on-line practical exercises. In order to meet the program requirements and get a final certificate of Big Data Analyst, a student should successfully pass all regular faculty courses listed in the curriculum as well as all IBM modules. They may also be certified in DB2 Fundamentals focusing on the position of administrator or developer. Both certifications brings them obvious advantages. First, they can get the IBM certificates as part of their CV

Petra Poulova, Jaroslava Mikulecka, Tomas Kozel, Blanka Klimova Data Science Study Program
DIVAI 2018 – The 12th international scientific conference on Distance Learning in Applied Informatics. 342 ISBN 978-80-7598-059-5 (Print) ISSN 2464-7470 (Print) ISSN 2464-7489 (On-line)
documents, and second, the certificates entitle them to a better starting position in IBM, be it an internship or full-time positions in the company.
Table 1: Curriculum of the EduCloud modules
Module Abbreviation
Subject Type of Module Timing Credits
A.DBS1 Database University accredited WS 6
A.DBS2 Database University accredited SS 5
L.HAD Hadoop Lectured by the IBM expert SS 1
L.NoSQLDB NoSQL Lectured by the IBM expert SS 1
A.DORDB DOR database University accredited WS +1 6
L.BigIn Lecture Big Technological lecture WS +1 2
E.BigIn PoT BigSheets EduCloud online exercises WS +1
A.APSTA Applied University accredited WS +1 6
L.SPSS SPSS Modeler Lectured by the IBM expert WS +1 2
E.SPSS PoT SPSS EduCloud online exercises WS +1
E.BigIn/SPSS PoT SPSS EduCloud online exercises WS +1 2
Note: WS=Winter semester, SS=Summer semester Source: own
Table 2 indicates an overview which shows high interest of FIM students in the program.
Table 2: Basic program overview in numbers (2014-2016)
Total number of students participating in the program: 54 Total number of successful students (students who have successfully completed modules: A.DBS1, A.DBS2, L.HAD, L.NoSQLDB):
23
Total number of failed students: 31 Total number of students applying for the certification DB2: 21 Successful students: 13 Failed students: 8
Source: own
In total, 54 % of students from primary focus group participated in the BigData EduCloud program. Total number of successful students in percentage is 42.60 %, whereas 57.4 % of the participating students failed. Totally 61.90 % of participating students was successfully certified (38.1 % did not succeed). The failure rate is rather high. However, this activity does not belong to compulsory subjects and the topic (subject) is demanding (from the time and knowledge), the 2/5 success rate is not low.
Data Science Program
Designing a curriculum that covers data science is an inherently difficult task that faces a number of challenges, most notably the speed at which this field is changing (Hirsh, 2008). Increasing amounts of data lead to challenges around data storage and pro-cessing, not to mention increasing complexity in finding the useful story from that data. New computing technologies rapidly lead to others becoming obsolete. New tools are developed which change the data science landscape (Mikroyannidis, et al, 2017).

Petra Poulova, Jaroslava Mikulecka, Tomas Kozel, Blanka Klimova Data Science Study Program
DIVAI 2018 – The 12th international scientific conference on Distance Learning in Applied Informatics. 343 ISBN 978-80-7598-059-5 (Print) ISSN 2464-7470 (Print) ISSN 2464-7489 (On-line)
The new study program Data Science must cover a number of the key areas (See Fig.5). Big data scientists need to have a wide range of skills.
They need to have statistical, mathematical, predictive modelling as well as business strategy skills to build the algorithms necessary to ask the right questions and find the right answers. They also need to be able to communicate their findings, orally and visually. They need to understand how the products are developed and even more important, as big data touches the privacy of consumers, they need to have a set of ethical responsibilities. (Rijmenam, 2017a)
A big data scientist understands how to integrate multiple systems and data sets. They need to be able to link and mash up distinctive data sets to discover new insights. This often requires connecting different types of data sets in different forms as well as being able to work with potentially incomplete data sources and cleaning data sets to be able to use them.
Of course, the big data scientist needs to be able to program, preferably in different programming languages such as Python, R, Java, Ruby, Clojure, Matlab, Pig or SQL. They need to have an understanding of Hadoop, Hive and/or MapReduce. In addition, the need to be familiar with disciplines such as:
� Natural Language Processing: the interactions between computers and humans;
� Machine learning: using computers to improve as well as develop algorithms;
� Conceptual modelling: to be able to share and articulate modelling;
� Statistical analysis: to understand and work around possible limitations in models;
� Predictive modelling: most of the big data problems are towards being able to predict future outcomes;
� Hypothesis testing: being able to develop hypothesis and test them with careful experiments.
� However, to be successful big data scientists should have at least some of the following capabilities:
and skills such as:
� Strong written and verbal communication skills;
� Being able to work in a fast-paced multidisciplinary environment as in a competitive landscape new data keeps flowing in rapidly and the world is constantly changing;
� Having the ability to query databases and perform statistical analysis;
� Being able to develop or program databases;
� Being able to advice senior management in clear language about the implications of their work for the organisation;
� Having an, at least basic, understanding of how a business and strategy works;
� Being able to create examples, prototypes, demonstrations to help management better understand the work;
� Having a good understanding of design and architecture principles;
� Being able to work autonomously.

Petra Poulova, Jaroslava Mikulecka, Tomas Kozel, Blanka Klimova Data Science Study Program
DIVAI 2018 – The 12th international scientific conference on Distance Learning in Applied Informatics. 344 ISBN 978-80-7598-059-5 (Print) ISSN 2464-7470 (Print) ISSN 2464-7489 (On-line)
Figure 5: Long Road to Data Scientist (Rijmenam, 2017b)
These all occur at such a rapid pace that teaching data science requires an agile and adaptive approach that can respond to these changes. By carrying out rigorous Learning Analytics and sourcing input from the learners and the wider data science community, we aim to continuously monitor the changes.
CONCLUSION
Fast development of the latest technologies is reflected in new requirements for graduates´ knowledge and skills. In the data analysis and their proper usage, the IT companies see a great potential. What they are concerned about, however, is the lack of qualified professionals who would be able to handle this data. Recently the positions of Big Data architects, Big Data analytics, and lead engineer for Big Data have been requested and offered by plenty of IT companies on the labour market. This university program prepares students for key and demanded positions. Consequently, this was the main reason why the FIM curricula were adjusted to the latest requirements.

Petra Poulova, Jaroslava Mikulecka, Tomas Kozel, Blanka Klimova Data Science Study Program
DIVAI 2018 – The 12th international scientific conference on Distance Learning in Applied Informatics. 345 ISBN 978-80-7598-059-5 (Print) ISSN 2464-7470 (Print) ISSN 2464-7489 (On-line)
ACKNOWLEDGEMENT
The paper is supported by the SPEV project (2018) at the Faculty of Informatics and Management of the University of Hradec Kralove, Czech Republic. The author also thanks Jana Hamtilová for her help with data collection.
REFERENCES
Benjamins, R., Jariego, F., 2013. Open Data: A ‘No-Brainer’ for all. [online] Available at http://blog.digital.telefonica.com/2013/12/05/open-data-intelligence/ [Accessed 8 October 2017].
Cech, P., Bures, V., 2004. E-learning Implementation at University, Proceedings of 3rd European Conference on e-Learning, Paris, pp. 25-34.
Davenport, T. H., Patil, D., 2012. Data scientist: The sexiest job of the 21st century. Harvard Business Review.
Cox, M., Ellsworth, D., 1997. Application-controlled demand paging for out-of-core visualization. VIS '97 Proceedings of the 8th conference on Visualization '97, pp. 235.
Data Science Institute, 2017. What is Data Science? [online] Available at http://www.fox.temple.edu/institutes-and-centers/data-science/ [Accessed 15 January 2018].
DataFlair, 2017. Top Real Time Big Data Applications in Various Domains [online] Available at https://data-flair.training/blogs/big-data-applications-various-domains/ [Accessed 12 January 2018].
Domingue, J., d'Aquin, M., Simperl, E., Mikroyannidis, A., 2014. The Web of Data: Bridging the Skills Gap. IEEE Intelligent Systems, 29(1), 70-74
Gartner. 2017. Big Data. [online] Available at http://www.gartner.com/it-glossary/big-data [Accessed 18 December 2017].
Glick, B., 2013. Government calls for more data scientists in the UK. [online] Available at http://www.computerweekly.com/news/2240208220/Government-calls-for-more-datascientists-in-the-UK [Accessed 8 October 2017].
Hirsh, H., 2008. Data mining research: Current status and future opportunities. Statistical Analysis and Data Mining, 1(2), 104-107.
James, M., Michael, C., Brad, B., Jacques, B., Richard, D., Charles, R., Angela, H., 2011. Big data: The next frontier for innovation, competition, and productivity. The McKinsey Global Institute.
Kégl, B. 2017, Teaching the Data Science Process. KDnuggets [online] Available at https://www.kdnuggets.com/2017/05/teaching-data-science-process.html [Accessed 8 Octo-ber 2017].
Laney, D., 2001. 3D Data Management: Controlling Data Volume, Velocity, and Variety. Application Delivery Strategies, META Group, file 949
Mayer-Schönberger, V., Cukier, 2013. Big Data: A Revolution That Will Transform How We Live, Work and Think. John Murray

Petra Poulova, Jaroslava Mikulecka, Tomas Kozel, Blanka Klimova Data Science Study Program
DIVAI 2018 – The 12th international scientific conference on Distance Learning in Applied Informatics. 346 ISBN 978-80-7598-059-5 (Print) ISSN 2464-7470 (Print) ISSN 2464-7489 (On-line)
Magoulas, R., King, J., 2014. 2013 Data Science Salary Survey: Tools, Trends, What Pays (and What Doesn't) for Data Professionals: O'Reilly.
McKenna, B., 2012. Demand for big data IT workers to double by 2017, says eSkills. [online] Available at http://www.computerweekly.com/news/2240174273/Demand-for-bigdata-IT-workers-to-double-by-2017-says-eSkills [Accessed 8 October 2017].
Mikroyannidis, A., Domingue, J., Phethean, C., Beeston, G., Simperl, E., 2017. The European Data Science Academy: Bridging the Data Science Skills Gap with Open Courseware. Open Education Global Conference 2017, Cape Town.
Online Big Data Analytics MBA Degree. 2017. [online] Available at http://OnlineMBAPage.com [Accessed 8 October 2017]
Oxford Dictionary, 2017. Big Data. [online] Available at http://www.oxforddictionaries.com/definition/english/big-data [Accessed 8 February 2018].
Rijmenam, M., 2017a, Big Data Scientist Profile. Datafloq [online] Available at https://datafloq.com/read/job-description-big-data-scientist/197 [Accessed 8 October 2017].
Rijmenam, M. 2017b.The Long Road To Become a Big Data Scientist – Infographic. Datafloq [online] Available at https://datafloq.com/read/long-road-big-data-scientist-infographic/423 [Accessed 8 October 2017].

Eugenia Smyrnova-Trybulska, Nataliia Morze, Olena Kuzminska Academic Information Transparency: From Teachers’ E-Portfolio to Upgrading the Rankings of Universities
DIVAI 2018 – The 12th international scientific conference on Distance Learning in Applied Informatics. 347 ISBN 978-80-7598-059-5 (Print) ISSN 2464-7470 (Print) ISSN 2464-7489 (On-line)
Academic Information Transparency: From
Teachers’ E-Portfolio to Upgrading the Rankings of
Universities
Eugenia Smyrnova-Trybulska
University of Silesia in Katowice, Faculty of Ethnology and Sciences of Education, Cieszyn, Poland, [email protected]
Nataliia Morze
Borys Grinchenko Kyiv University, Kyiv, Ukraine [email protected]
Olena Kuzminska
National University of Life and Environmental Sciences of Ukraine, Faculty of Information Technologies, Kyiv, Ukraine [email protected]
Abstract
In the world of the globalization of higher education, international university rankings are becoming more important every year, because universities play dominant role in spreading scientific and cultural achievements, at the academic level. The most effective indicators of the quality of higher education are the openness and transparency of all the results of the university's activities, including the results of the educational and scientific work of each teacher and student. This article presents the experience of creating e-portfolio for the academic community. The correspondence of the portfolio sections to the indicators of the Webometric Ranking of World University is shown. The results show a positive dynamics in the growth of the ranking indicators for teachers, participants of international projects and as a result – an increase in quality, openness and globalization of the educational process. It is suggested that international cooperation promotes the development of both - scientific direction and increase in the rating indicators of higher education institutions.
Keywords
Higher education. University ranking. Webometrics. E-portfolio. Project.
INTRODUCTION
The philosophy of the Internet, built on the ideas of openness and transboundary nature, has become popular in the period of globalization. The Internet is becoming a way of uniting disparate scientific and educational centers of the world. Now sites of socially

Eugenia Smyrnova-Trybulska, Nataliia Morze, Olena Kuzminska Academic Information Transparency: From Teachers’ E-Portfolio to Upgrading the Rankings of Universities
DIVAI 2018 – The 12th international scientific conference on Distance Learning in Applied Informatics. 348 ISBN 978-80-7598-059-5 (Print) ISSN 2464-7470 (Print) ISSN 2464-7489 (On-line)
significant institutions are not representative, but information resources, complex structures, consisting of content subsystems are.
The new requirements that society places on university websites are most easily identified from the ratings that rate the quality of portals according to a limited set of criteria. It is important for entrants to choose a university for their studies, for universities - to be able to attract high student numbers, grants and investments, best teachers and researchers.
Among the most popular rankings are Shanghai Academic Ranking of World Universities, QS World University Rankings (Quacquarelli Symonds), The Times Higher Education World University Ranking and National Taiwan University Ranking - aimed at the selection of leading universities, thus stimulating elite education in the world (Bershadskaya, Voznesenskaya and Karpenko, 2016). One of the most respected ratings is Webometrics (Ranking Web of Universities, 2018), which analyzes the presence of a given university as a research center in the Internet space. Universities give high priority to the international ranking of Webometrics because the analysis of open resources of the university in the Internet space indirectly allows us to assess the educational and research achievements of universities by comparing the same indicators (Bershadskaya, Voznesenskaya and Karpenko, 2016).
Analyzing Key Indicators of the Webometrics Rating (Aguillo, Ortega and Fernandez, 2008), we can make the conclusion that the display of data of the results of teachers and researchers’ activities in open space will have a positive impact on the university's indicators in Webometrics. Therefore, the teacher's e-portfolio is one of the indicators of education quality in universities (Morze, Varchenko-Trotsenko, 2016). Indicators of a portfolio should include those of a priority for university development in a given time and be taken into account in different ratings, including international ones.
Expanding the experience of teachers and as a result, strengthening the positions of universities today is impossible under the conditions of closed systems of education and individual institutions. One of the solutions is academic mobility and the implementation of international projects and cooperation in scientific research.
The purpose of this article is to present the experience of scientific cooperation of researchers and mobility of 5 European universities (in Poland, the Czech Republic, Slovakia, Portugal, the Netherlands, Spain) and 4 non-European universities (in Australia, Ukraine, Russia), as part of the European IRNet project (www.irnet.us.edu.pl), and to analyze the impact of such cooperation on the publishing activity of each participant-scientist and, as a result, the impact on the webometrics rating of the participating universities. Identification of differences in university e-environments between selected EU and non-EU countries using knowledge mining methods was studied in (Drlík et al., 2017).
One of the more important impacts was: relevance of the exchange between the partner countries for ERA. In accordance with the principle of the new ERA (European Research Area) initiatives (launched in 2008), the IRNet research project aims at establishing long lasting partnerships within EU and Third Countries (Figure 1).

Eugenia Smyrnova-Trybulska, Nataliia Morze, Olena Kuzminska Academic Information Transparency: From Teachers’ E-Portfolio to Upgrading the Rankings of Universities
DIVAI 2018 – The 12th international scientific conference on Distance Learning in Applied Informatics. 349 ISBN 978-80-7598-059-5 (Print) ISSN 2464-7470 (Print) ISSN 2464-7489 (On-line)
Figure 1. The principle of the new ERA (European Research Area) initiatives (launched in 2008) in context IRNet project impact
Source: Council Conclusions on The Launch of the “Ljubljana Process" - towards full realisation of ERA
FINDINGS
Indicators of webometrics and recommendations for improving university
performance
Webometrics (Methodology, 2018) is rated by the research group Cybermetrics, which is part of the National Research Council (CSIC) of Spain. The initial goal of the Webometrics project was not so much to create a ranking of educational institutions but to stimulate the web publishing activity of universities. The main task of Webometrics is to motivate scientific and educational institutions to make their scientific and educational materials available to the public. When such information is made public through the Internet, it attests to a high academic level of the University. The Internet provides an exhaustive way to describe a range of events where scientific publications are just one of the components that can be found on the website (Table 1). In addition, providing access and promoting web publishing among teachers means that other colleagues will be aware of the results of the research, more future students can learn about the scientific and international activities of the university, companies can find suitable partners for the implementation of research projects, and organizations can easily access data for expert search. These and other reasons should be taken into account with the support of the Universities of open access initiatives (Budapest Open Access Initiative, 2012).
Таble 1: Some personal activities reflected on personal webpages.
Research Teaching Professional development Project Reports Workshops or seminars
slides Personal info (CV)
Monographies, thesis, dissertations
Textbooks Professional certification
Book chapters, papers in local journals
Websites for e-learning Organising events
Patent Book reviews Certificate of Registration of Copyright

Eugenia Smyrnova-Trybulska, Nataliia Morze, Olena Kuzminska Academic Information Transparency: From Teachers’ E-Portfolio to Upgrading the Rankings of Universities
DIVAI 2018 – The 12th international scientific conference on Distance Learning in Applied Informatics. 350 ISBN 978-80-7598-059-5 (Print) ISSN 2464-7470 (Print) ISSN 2464-7489 (On-line)
Peer-review Bibliographies Achievement
The criteria for evaluating Webometrics (Aguillo, Ortega and Fernandez, 2008) change every six months (Figure 2).
Figure 2: Webometrics rankings as of 01.2018: weight, characteristics, evaluation tools, support.
Source: (Aguillo, Ortega and Fernandez, 2008)
Compared to previous periods, the weight of the Excellence increased by 5% (from 30% to 35%) and the Presence Index decreased by 5% (Ranking Web of Universities, 2018).
Based on Webometrics rankings, it is necessary to do further work on the site to improve the indicators and, as a result, to move up the ranking:
1. To improve site visibility (Visibility 50%).
1.1. Enable public access to scientific publications of staff, teaching materials of teachers, and materials of journals published at the university, materials of conferences held at the university, which will allow the scientific community to put links in their publications on the electronic resource - the sites of conferences or magazines of the university. It will also be useful to open the results of scientific projects in the form of reports.
1.2. To increase the presence of the university in social networks. It is required not only to synchronize news, but also to manage blogs by university researchers, and it is necessary that the web pages contain useful high-quality content, which leads to the increase in the number of such links on other sites.
1.3. Provide links to partner sites: Universities participating in international projects, to post information on information partners on the university's website and vice versa (by mutual agreement).
2. Improvement of the excellence criteria by the number of publications (35%).

Eugenia Smyrnova-Trybulska, Nataliia Morze, Olena Kuzminska Academic Information Transparency: From Teachers’ E-Portfolio to Upgrading the Rankings of Universities
DIVAI 2018 – The 12th international scientific conference on Distance Learning in Applied Informatics. 351 ISBN 978-80-7598-059-5 (Print) ISSN 2464-7470 (Print) ISSN 2464-7489 (On-line)
2.1. Granting public access to scientific publications of the university staff is the main resource allowing to increase this criterion. Here we are talking about high-rating publications and abstracts of conference reports. At the same time, it is important to stimulate the publishing activity of scientific and pedagogical employees of the university in the magazines of international databases, primarily Scopus.
2.2. To open for public access the pages of scientific projects, where analytical materials of the project are published, including scientific reports, analytics and other materials accompanying the project.
2.3. To open for public access scientific journals (full-text access), pages of scientific conferences held at the university, as well as dissertation materials defended at the university, materials of scientific conferences.
2.4. To form personal pages of teachers, which contain the section "Publications", where publicly available scientific publications of the staff of the university are presented.
3. To increase the indexes by the number of indexed pages Presence (5%):
3.1. Increasing the site pages of the university (including sites of institutes, faculties, departments, projects, activities) containing unique content. Here important materials will be not only informational but also analytical.
4. To increase the number of indexed attached files Openness (10%):
4.1. To provide public (open) access to educational and methodological materials of the university. Such materials may include not only study materials, curricula that are published in university publications, but also e-courses, presentations and handouts of masterclasses, case-study that the teacher frequently updates. This means that teachers should have tools that ensure the publication of materials on the university's website.
4.2. Provide public access to the scientific materials of the staff. Such materials, above all, include scientific publications (articles, monographs, reports, dissertations). Publications should contain not only the description (name, journal, year, etc.), but also attached files with a full-text publication, preferably in .pdf, .doc, .dox format.
4.3. Ensure the maintenance of pages of e-conferences, seminars held at the university, e-support of the university's magazines and repositories, open access to the results of scientific projects in the form of reports, analytical materials.
4.4. To provide the openness of the staff pages. The teacher's pages may contain sections that will reflect his publishing and non-publishing scientific activity: participation in scientific projects (and scientific reports), management of research projects of masters - post-graduate students - doctoral students (and texts of dissertations), pedagogical (links to e-courses, announcements and recordings of webinars, etc.), professional achievements.
Teacher's e-portfolio as an indicator of the teacher's rating and improving
university performance
Organizational actions to provide open access to the results of the university's activities are without a doubt important. However, the qualitative educational and scientific work of each teacher and its information support are necessary conditions for the quality of teaching in a particular university. In our opinion E-portfolio can be an

Eugenia Smyrnova-Trybulska, Nataliia Morze, Olena Kuzminska Academic Information Transparency: From Teachers’ E-Portfolio to Upgrading the Rankings of Universities
DIVAI 2018 – The 12th international scientific conference on Distance Learning in Applied Informatics. 352 ISBN 978-80-7598-059-5 (Print) ISSN 2464-7470 (Print) ISSN 2464-7489 (On-line)
instrument for measuring the quality of the teaching staff by assessing the quantity and quality of academics’ performance. Quantitative indicators of activity quality can be print and electronic publications, participation in projects, conferences, grants, etc. Qualitative indicators are professional internships, training with the purpose of qualification improvement, scientific schools, peers reviews, certification and so on.
E-portfolio - a portfolio of a scientific and pedagogical employee based on electronic resources. An e-portfolio can be placed in the LMS Moodle environment or as a separate page on the university department's website; to create a personal website or blog; to use the Mahara tool or to post on the Viki-portal of the high school (Morze, Varchenko-Trotsenko, 2016).
The goal of a portfolio depends on its structure, if a portfolio is a tool for measuring the performance of the scientific and pedagogical employee, it should reflect all the scientific and pedagogical staff's aspects affecting the overall presentation of the university (Figure 3).
Figure 3: Structure of an e-portfolio of a scientific-pedagogical staff member.

Eugenia Smyrnova-Trybulska, Nataliia Morze, Olena Kuzminska Academic Information Transparency: From Teachers’ E-Portfolio to Upgrading the Rankings of Universities
DIVAI 2018 – The 12th international scientific conference on Distance Learning in Applied Informatics. 353 ISBN 978-80-7598-059-5 (Print) ISSN 2464-7470 (Print) ISSN 2464-7489 (On-line)
For example, at the Borys Grinchenko Kyiv University a professor can enter her/his own data on the site: http://e-portfolio.kubg.edu.ua. A part of the data is transferred automatically from the institutional repository of the University (http://elibrary.kubg.edu.ua), Google Scholar, ResearcherID, ORCID profile (Figure 4). Other data, for example, participation in projects, data on patents or links to personal pages, the sites of departments or scientific schools, are included in the portfolio after an audit is carried out by the administrator.
Figure 4: Algorithm of filling an e-portfolio.
Thus, the creation and filling of a portfolio by each teacher allows not only for ranking the teachers, but also for promoting the e-presentation of the university's activities by combining the efforts of teachers, administration and technical personnel.
Analysis of the impact of the project on the development of project
researchers, universities as well as Webometrics
The most significant component of Webometrics (50%) is the number of hyperlinks to the site from other resources. The growth of this indicator can be achieved by the participation of teachers in various socio-cultural and scientific projects, including international ones.
Let us consider the experience of the participation of teachers from different countries in the IRNET project from the standpoint of the influence of international cooperation on increasing the rating of teachers and relevant institutions.
Consider that one of the tasks of the project was the publication of the results, participation in the project creates conditions for increasing the publishing performance of the participants and, accordingly, an increase in the Webometrics of the Excellence indicator, taking into account the number of publications in the science-computer databases.

Eugenia Smyrnova-Trybulska, Nataliia Morze, Olena Kuzminska Academic Information Transparency: From Teachers’ E-Portfolio to Upgrading the Rankings of Universities
DIVAI 2018 – The 12th international scientific conference on Distance Learning in Applied Informatics. 354 ISBN 978-80-7598-059-5 (Print) ISSN 2464-7470 (Print) ISSN 2464-7489 (On-line)
Table 2. Webometrics indexes of IRNet consortium universities
University Country Country Rank
World Rank
Presence Rank
Impact Rank
Openness Rank
Excellen-ce Rank
The University of Silesia in Katowice
Poland 8 933 652 1013 1312 1159
University of Twente The Netherlands
9 207 467 175 357 281
University of Extremadura
Spain 30 778 711 1007 723 900
Constantine the Philosopher University in Nitra
Slovak Republic
7 2574 1375 5495 3756 2395
The Lisbon Lusíada University
Portugal
33 3703 3862 6364 4712 3839
University of Ostrava Czech Republic
15 1876 1651 3369 2003 1913
Curtin University in Perth CU
Australia 9 235 1069 227 245 276
Borys Grinchenko Kyiv University
Ukraine 92 9043 2019 72979 9593 5777
Dniprodzerzhinsk State Technical University
Ukraine 143 12395 13734 15221 6602 5777
Herzen State Pedagogical University of Russia, St.Petersburg
Russian Federation
91 4666 2052 1394 4535 5777
Source: Own research
Within the framework of the IRNet project (www.irnet.us.edu.pl) research is being conducted in several WPs which are separate, yet simultaneously connected through interrelated stages, which roughly address our several research questions. We created a bibliographic database containing all the published articles, books from 2014 to date by all IRNet researchers (178 publications). The result is a visualization of the graph structure of co-authorship with a graphics editing program Pajek (http://mrvar.fdv.unilj.si/pajek//) we obtain the layout, Kamada-Kawai (2008) (Figure 4).

Eugenia Smyrnova-Trybulska, Nataliia Morze, Olena Kuzminska Academic Information Transparency: From Teachers’ E-Portfolio to Upgrading the Rankings of Universities
DIVAI 2018 – The 12th international scientific conference on Distance Learning in Applied Informatics. 355 ISBN 978-80-7598-059-5 (Print) ISSN 2464-7470 (Print) ISSN 2464-7489 (On-line)
Figure 4: Example of visualization of the graph structure of co-authorship - Kamada-Kawai Layout.
Source: Own research
Grouping within each cluster was used for building the visualizations. This made it possible to analyze the contribution (number of publications) of the project participants and their collaborators within each country. For example, the largest representation of scientists are from Ukraine, representatives from Russia (3 participants) did not attract other sponsors from their country, but their activity was high, and there are countries, represented by one party such as Turkey (Sekret I.) and the Netherlands (Kommers P.), but the representative from the Netherlands actively cooperated with other project participants (Smyrnova-Trybulska et al., 2017).
One of the final evaluation methods that were used as an experiment, the influence of participation in the project on professional development (and as a result the increase in the university's ranking) was the self-assessment method. According to the results of an online survey of project participants (available https://docs.google.com/forms/d/e /1FAIpQLSdaZgUHhQ57LrYkP7idmD1vaY0noNLFYfoW8VcUkgs8zuSJ5g/viewform), 82.4% of respondents believe that the project network will contribute to the project development and dissemination of its results. More detail survey results will analyze and published in next publications.
CONCLUSIONS
One of the most common indicators for assessing the performance of universities is the rating of the Webometric Ranking of World University. The activity of each university scientific-pedagogical staff member, presented in digital form and open access mode has an effect not only on the formation of the teacher's rating, but also the university's rating.
The e-portfolio of a teacher, which presents various aspects of the teacher's work (including publication activity and recognition, participation in international research projects, professional achievements) can be used to stimulate and measure the quality of the scientific and pedagogical staff of the institution, and, accordingly, can serve as a tool to enhance the Webometric Ranking of the university.
International cooperation and participation in joint international projects promotes both the development of science and contributes to an increase in the rating indicators of higher education institutions. The research analysis and international cooperation will continue and new results will available in further publications.
ACKNOWLEDGEMENT
The research leading to these results has received, within the framework of the IRNet project, funding from the People Program (Marie Curie Actions) of the European Union's Seventh Framework Program FP7/2007-2013/ under REA grant agreement No: PIRSES-GA-2013-612536
Eugenia Smyrnova-Trybulska, Nataliia Morze, Olena Kuzminska Academic Information Transparency: From Teachers’ E-Portfolio to Upgrading the Rankings of Universities
DIVAI 2018 – The 12th international scientific conference on Distance Learning in Applied Informatics. 356 ISBN 978-80-7598-059-5 (Print) ISSN 2464-7470 (Print) ISSN 2464-7489 (On-line)
REFERENCES
Aguillo, I., Ortega, J., Fernandez, M., 2008. Webometric Ranking of World Universities: Introduction, Methodology, and Future Developments. Higher Education in Europe, 33(2/3), 233-244. doi:10.1080/03797720802254031.
Bershadskaya, M., Voznesenskaya, Y., Karpenko, O., 2016. Research Webometrics. Ranking in the Context of Accessibility of Higher Education. Universal Journal of Educational 4 (7), 1506-1514. DOI: 10.13189/ujer.2016.040702.
Budapest Open Access Initiative, 2012. Ten years on from the Budapest Open Access Initiative: setting the default to open. [online] Available at <http://www.budapestopenaccessinitiative.org/boai-10-recommendations> [Accessed 16 March 2018].
Competitiveness Council Conclusions of 3 June 2008 on “The Launch of the ‘Ljubljana Process’ - towards full realisation of ERA” http://register.consilium.europa.eu/doc/srv?l=EN&f=ST%2010231%202008%20INIT [Accessed 20 March 2018].
Drlík, M., Švec, P., Kapusta, J., Munk, M., Noskova, T., Pavlova, T., Yakovleva, O., Morze, N., Smyrnova-Trybulska, E., 2017. Identification of Differences in University E-environment
between Selected EU and Non-EU Countries Using Knowledge Mining Methods: Project
IRNet Case Study, International Journal of Web Based Communities 13(2): 1 · January 2017 DOI: 10.1504/IJWBC.2017.10004116 ISSN online: 1741-8216. ISSN print: 1477-8394 p. 236-261
European Research Area (Era) Roadmap 2015-2020 https://era.gv.at/object/document/1845 [Accessed 20 March 2018].
Kamada T. & Kawai S., 1988. An Algorithm for Drawing General Undirected Graphs. Information Processing Letters, 31:7-15, 1988.
Morze, N., Varchenko-Trotsenko, L., 2016. Educator's e-Portfolio in the Modern University. In ICTERI (pp. 231-240).
Ranking Web of Uneversities, 2018. Ranking Web of Universities. January New Edition [online] Available at <http://www.webometrics.info/en/node/200> [Accessed 16 March 2018].
Ranking Web of Universities, 2018. Methodology. [online] Available at <http://www.webometrics.info/en/Methodology> [Accessed 16 March 2018].
Smyrnova-Trybulska, E., Morze, N., Kuzminska, O., & Kommers, P., 2017. Bibliometric Science Mapping as a Popular Trend: Chosen Examples of Visualisation of International Research Network Results. In: Proceedings of the International Conferences on Educational Technologies 2017 (ICEduTech 2017) Western Sydney University, Sydney, Australia 11 - 13 December, 2017. Edited by Piet Kommers, Tomayess Issa, Pedro Isaías, Ana Hol. IADIS 2017 pp.3-10 ISBN: 978-989-8533-71-5.

Václav Sova Martinovský, Miroslav Plevný Applying Cloud Computing for Automated Generation of Parameterized Tasks and Test
DIVAI 2018 – The 12th international scientific conference on Distance Learning in Applied Informatics. 357 ISBN 978-80-7598-059-5 (Print) ISSN 2464-7470 (Print) ISSN 2464-7489 (On-line)
Applying Cloud Computing for Automated
Generation of Parameterized Tasks and Test
Václav Sova Martinovský, Miroslav Plevný
Faculty of Economics, University of West Bohemia in Pilsen, Czech Republic [email protected], [email protected]
Abstract
Testing students´ knowledge is an indispensable part of the educational process by means of e-learning. A sufficient amount of suitable questions is necessary for creating a necessary number of test variants whose creation is demanding. For that purpose it is possible to use a generator of parameterized text tasks. However, application of this generator depends on a particular computer in which a system is installed with an embedded generator and where the source codes of the generator are stored. The possibility of a wider use of the generator by more users is thus significantly limited. This contribution presents basic characteristics of the created cloud application which enables the use of a generator of parameterized questions comfortably from a web browser from whatever place in the world. The CloudMat system is presented including a brief technical description of this application and it is complemented by samples of the application interface on a desktop and a mobile device. The presented solution provides outputs in PDF and Moodle XML formats. The created web interface in cloud makes the technology of the test generation accessible to a wide range of users without the necessity of special knowledge, expensive hardware or specific licensed software. A common web browser is sufficient to enable a fully-fledged use.
Keywords
Cloud computing. Software as a service (SaaS). E-learning. Test generator.
INTRODUCTION
Over the past few years e-learning has become a common part of the educational process. According to the report of Beige Market Intelligence company the average annual growth of the e-learning market is expected to be 6% in the period between the years 2016 and 2022 (Beige Market Intelligence, 2017). Therefore it can be concluded that even in the future this field will still be an interesting and promising area.
Practical tests are an important part of the educational process based on the use of e-learning. They can serve both as a tool for self-evaluation thanks to which a student can get an instant feedback about his/her knowledge or as a part of a final course assessment. A sufficient number of quality tasks is a precondition for creating a test suitable for the given purposes. Creating a large number of unique tasks including suitable answers representing individual variants for solving these tasks is, however, rather demanding. Therefore proposals of various generators of parameterized test tasks including the

Václav Sova Martinovský, Miroslav Plevný Applying Cloud Computing for Automated Generation of Parameterized Tasks and Test
DIVAI 2018 – The 12th international scientific conference on Distance Learning in Applied Informatics. 358 ISBN 978-80-7598-059-5 (Print) ISSN 2464-7470 (Print) ISSN 2464-7489 (On-line)
description of their implementations can be found in professional literature. Random Test Generator (RTG-PRO, 2011), Test Maestro II (TMII, 2016), a system of managing database of questions (Yang et al., 2008) or a system created in the workplace of the authors of this contribution (Gangur, 2014) can be quoted as examples.
The aim of this contribution is to present basic characteristics of the created cloud application which enables us to use a generator of parameterized questions comfortably from a web browser from whatever place in the world at very low cost. The application is available at https://cloudmat.zcu.cz (please contact the authors of this paper to obtain the access).
CLOUD COMPUTING
Cloud computing (hereinafter only cloud) has been, especially over the last decade, a dynamically developing area in the field of information technologies. By means of the Internet it enables us to use remote computing sources, platforms or complete applications. The advantage is an easy and fast use and flexible scaling. Its popularity is also given by its undisputable economic advantages, both for cloud users thanks to payments for the sources really used, and for cloud providers thanks to the optimization of sources and aggregation of load (Armbrust et al., 2009; Etro, 2011; Vaquero, Rodero-Merino, Caceres, & Lindner, 2008).
As indicated above, three basic types of services may be provided by cloud:
� IaaS (Infrastructure as a Service) – access to virtualised infrastructure (i.e. the equivalent of common servers and network elements);
� PaaS (Platform as a Service) – access to a developmental environment meant to support the development and operation of cloud applications;
� SaaS (Software as a Service) – access to a particular application in cloud (Google Does, Office 365, Google Mail, ...).
The most popular model of practical application is SaaS which represents a market share of 59% (MarketLine, 2016). It makes sense because the cloud services SaaS are meant for masses of users and they are usually constructed in such a way that no deep knowledge or special equipment is necessary to use them; usually a simple computer with an Internet browser is enough.
EDUCATION AND CLOUD
Not only thanks to the support of large companies, such as Microsoft, Google or Amazon, the cloud spreads into ever more fields across various companies (Marston et al., 2011). State institutions and other organizations are not left behind either - NASA, for example, has been developing and using a cloud solution since the year 2008 (Phillips, 2015).
In the field of Technology-Enhanced Learning (TEL) the use of cloud has been identified as a key trend (Johnson, Adams, & Cummins, 2012), thanks to which it is possible to access sources from whatever location and whenever you want. Cloud also

Václav Sova Martinovský, Miroslav Plevný Applying Cloud Computing for Automated Generation of Parameterized Tasks and Test
DIVAI 2018 – The 12th international scientific conference on Distance Learning in Applied Informatics. 359 ISBN 978-80-7598-059-5 (Print) ISSN 2464-7470 (Print) ISSN 2464-7489 (On-line)
enables easy scalability, increased reliability and cost saving (Dong et al., 2009; McDonald, Breslin, & MacDonald, 2010).
Sultan (2010) states two main reasons why cloud begins to be used more and more among educational institutions. One of them is a possibility of using technologies and sources which would otherwise not be available at all. The second reason is higher effectiveness and related financial savings.
An extensive systematic literary research study into the field of use of cloud in education was carried out by González-Martínez et al. (2015). They focused on identification of all the key stakeholders in the field of education (teachers, students, IT administrators and educational institutions themselves) and carried out an analysis of advantages and risks with regard to the specifics of these stakeholders. Apart from the advantages mentioned above and applicable to practically any field, also advantages specific to the field of education were highlighted. For the individual stakeholders the advantages are as follows:
� Teachers are, thanks to advanced technologies, given a possibility of creating brand new teaching scenarios. They can develop collaborative methods of teaching or carrying out demanding calculations without the necessity of buying expensive equipment (mathematical simulations, CAD systems, ...).
� Students are given a possibility of significantly simplified communication, knowledge sharing, work with teaching materials practically from any location, usually by means of mobile devices (from home, the halls, means of transport, and such like).
� IT administrators are enabled to reduce the cost of installing and administering the equipment.
� Educational institutions are given a possibility of carrying out cost demanding operations without the necessity of investing in an amply dimensioned infrastructure which may be unused for most of the time, entry cost are reduced, and payments for only the really used sources are enabled.
Safety and protection of personal data (namely in cases where sensitive students´ data are stored), the risk of providers´ lock-in and often insufficient licensing models have been identified as the most frequent risks of the use of cloud.
PARAMETERIZED TASKS
There is a number of tools for automated generation of tests from an available bank of tasks and also a number of Learning Management Systems (LMS) supporting automated generation of tests (for example LMS Moodle).
However, the preparation of the question bank itself is a very demanding activity. To avoid the repetition of questions is necessary if students are to be prevented from just memorizing correct answers instead of real understanding a problem. This means that it is necessary to create a large number of variants of diverse tasks. However, this problem is not solved by the above mentioned LMS environment.
Václav Sova Martinovský, Miroslav Plevný Applying Cloud Computing for Automated Generation of Parameterized Tasks and Test
DIVAI 2018 – The 12th international scientific conference on Distance Learning in Applied Informatics. 360 ISBN 978-80-7598-059-5 (Print) ISSN 2464-7470 (Print) ISSN 2464-7489 (On-line)
For easy generation of a wide bank of tasks based on a formulated template of task entry by means of parameterized and randomly generated values a generator of tasks has been created in the workplace of the authors of this contribution (Gangur, 2014). This generator of parameterized tasks has been created in Matlab environment and it is suitable for generating questions from the fields such as statistics, mathematics, operational research, and such like (Plevný & Gladavská, 2016). Currently, this generator is able to generate particular questions on the basis of randomly set values of parameters and it functions with a number of input and output data formats. It supports generating numerical and text values (Gangur, 2011), but also more complex structures, such as charts, matrixes, functions, or multimedia objects, such as images (Plevny & Gangur, 2016).
CLOUD SOLUTION OF THE TASK GENERATOR
The existing solution of the created generator has had a number of disadvantages up to now. The biggest one can be the dependency on a particular computer where Matlab is installed and where the source codes of the generator are stored. Without Matlab it is not possible to switch on the generator and the requirement of a valid licence for the given computer is another drawback. The possibility of using the generator by more users is thus significantly limited.
The use of the cloud solution can eliminate the above mentioned disadvantages of the generator. We have proposed a cloud solution which functions on the principle of software as a service (Saas), when a user accesses a particular application through a web browser. To control the application no specific software or hardware equipment is necessary – a simple computer or smartphone is enough.
Our solution thus satisfies the main features of cloud computing, i.e. comfortable network access through a web browser from whatever location in the world, easy sharing with more users, and reducing the cost of the service thanks to the payment for the really used sources. For the service to be in operation it is not necessary to have an amply dimensioned capacity, and, at the same time, by means of using a suitable cloud environment with flexible scaling it is easily possible to increase the capacity, for example, in the time of the examination period when a bigger wave of users can be expected.
Technical description of the CloudMat application
The backend of all the application is based on the already proposed generator in Matlab. To achieve independence on a particular computer or licence the existing solution was extended by a set of functions for communication with external programmes and the whole project was translated into an autonomously executable programme by means of Matlab Compiler. The programme created in such a way can be spread further without any licence limitations and the only thing to execute the programme is to have the freely accessible Matlab Runtime application installed. It is necessary to have a licence for only one computer on which the translation of the source files is underway (not necessarily in cloud).
The frontend is formed by an application created in the script language PHP by means of Slim framework. The interface is based on a fully responsive template using Bootstrap

Václav Sova Martinovský, Miroslav Plevný Applying Cloud Computing for Automated Generation of Parameterized Tasks and Test
DIVAI 2018 – The 12th international scientific conference on Distance Learning in Applied Informatics. 361 ISBN 978-80-7598-059-5 (Print) ISSN 2464-7470 (Print) ISSN 2464-7489 (On-line)
framework and jQuery library. Thanks to these components it was possible to create a user friendly interface which can be operated comfortably without any further adjustments both on a desktop (Fig. 1) and on mobile devices (Fig. 2).
Figure 1: Application interface on a desktop
Figure 2: A sample of an application interface on a mobile device
The web interface of CloudMat application is designed for work of more users. The user interface is protected by HTTP authentication and the operation is implemented through a secured HTTPS protocol. The system supports a multilanguage environment; currently it is available in English and Czech. Upon the first login the detection of the language is carried out based on the setting of the browser but the user can always change the language of the application by clicking on the flag in the top right corner.

Václav Sova Martinovský, Miroslav Plevný Applying Cloud Computing for Automated Generation of Parameterized Tasks and Test
DIVAI 2018 – The 12th international scientific conference on Distance Learning in Applied Informatics. 362 ISBN 978-80-7598-059-5 (Print) ISSN 2464-7470 (Print) ISSN 2464-7489 (On-line)
In the first step a list of available objects is shown, including the description of the given object and the number of tasks available (Fig. 1). If even the English version of the tasks is available, the number of tasks in English is shown also. By clicking on the chosen language version (English or Czech) the user selects what question base he/she is going to work with.
After the selection of the subject and the language version a list of all the questions available is shown (Fig. 3). The right part contains questions which will form the future test. The control arrows between the right and left part have the function of shifting the questions from one part to the other one. In both the parts of the list the filter for shortlisting is available.
Figure 3: The selection of tasks relating to a particular object
For each selected task a window with a preview and a possibility of adjusting the default number of points and number of repetitions of the task within one test is formed. The preview of the task is pre-generated by running the bulk function in Matlab which will generate a PDF file for each individual question with particular values. This PDF file is then

Václav Sova Martinovský, Miroslav Plevný Applying Cloud Computing for Automated Generation of Parameterized Tasks and Test
DIVAI 2018 – The 12th international scientific conference on Distance Learning in Applied Informatics. 363 ISBN 978-80-7598-059-5 (Print) ISSN 2464-7470 (Print) ISSN 2464-7489 (On-line)
automatically cropped and transferred to the PNG format with transparent background. Thanks to this conversion it is possible to simply upload the sample to the Web. Framework Bootstrap provides support for setting resolution even in case of images, i.e. in case when the web window is diminished (or if the client has lower than recommended resolution) the size of the sample is adjusted accordingly.
Our solution currently supports the following output formats:
� PDF: Two versions of output are generated: a file for students (without results) and a file for teachers (with results). The number of variants which are generated for each test can be set as an optional parameter.
� Moodle XML: It is a list of tasks ready for comfortable inserting into LMS Moodle. The name of the category under which the tasks are imported into the task bank can be set as an optional parameter.
A compiled version of Matlab programme is started after pressing the button Generate (see Fig. 3). The web interface then waits for an output file which it takes over, stores it in a personal file of each user and offers it for immediate download. In case a mistake occurs, an error message is shown.
As has already been indicated above each user has his/her own directory available into which all outputs generated by him/her are stored. He/she can get back to them at any time in the future. These files can also be deleted directly from the interface.
LIMITATION AND CONCLUSION
From the user´s point of view the work with the proposed application is relatively simple. In spite of that it is necessary to respect certain procedures and limitations when using the application. Let us mention them now.
With regard to the nature of the application (autonomously executable package) it is first necessary to compile the entire application. All the tasks that will be processed later will have to be included into this process. It is thus necessary that after each change (both in the programme and in tasks) the entire application is to be recompiled again. The time consumption of this process grows proportionately to the number of the tasks included. However, the advantage is that neither a graphic interface, nor a manual action of the user (e.g. mouse clicking) is necessary and so this activity can be automated. On the other hand, the fact that it is necessary to have the complete Matlab installed together with an active licence for the process of translation can be seen as a disadvantage. However, this is a backend application that does not concern the end-user. He/she is not limited by the need to own licensed Matlab.
As has already been mentioned, the previews of the individual tasks are generated collectively by a transformation process all the way up to the output PNG file. After each change of the task it is therefore necessary, apart from recompiling of the entire application, to carry out new generation of these previews.
As for the future, we plan to extend the application by, for example, the following functions:

Václav Sova Martinovský, Miroslav Plevný Applying Cloud Computing for Automated Generation of Parameterized Tasks and Test
DIVAI 2018 – The 12th international scientific conference on Distance Learning in Applied Informatics. 364 ISBN 978-80-7598-059-5 (Print) ISSN 2464-7470 (Print) ISSN 2464-7489 (On-line)
� Import and export of a structure. In the current form the application, after the test compilation (order of questions, number of repetitions, and number of points), generates an output in a chosen format. However, the structure of the test is not stored anywhere. The aim is to enable the export of this structure and also the following import in such a way that at any time in future it will be possible to adjust the structure without the necessity of starting it all over again.
� Sharing. We will enable sharing of selected tests both within the group of the application users and also outside the group (for external and not registered visitors).
� Editor of questions. The aim is to create and make accessible such an editor by which it will be possible to adjust the existing questions and create new questions within the Matlab notation. And, what´s more, after any adjustment the recompilation of the entire application will be initiated automatically.
The created web interface in cloud makes the technology of the test generation accessible to a wide range of users. These users do not have to have any specific knowledge, expensive hardware equipment or licences. For fully fledged use it is sufficient to have a simple web browser – all the rest is taken care of by the cloud application. Thanks to the proposed model and the applied script language it is easily possible to extend this application and to further supplement it by, for example, the useful above mentioned functions.
ACKNOWLEDGEMENT
This work was supported by the University of West Bohemia in Pilsen under the internal project No. SGS-2018-042.
REFERENCES
Armbrust, M., Fox, A., Griffith, R., Joseph, A. D., Katz, R. H., Konwinski, A., … Zaharia, M. (2009). Above the Clouds: A Berkeley View of Cloud Computing. Retrieved from http://www2.eecs.berkeley.edu/Pubs/TechRpts/2009/EECS-2009-28.html.
Beige Market Intelligence. (2017). Global E-learning Market - Strategic Assessment and Forecast 2017-2022. Retrieved from https://www.researchandmarkets.com/research/ 8qhtvm/global_elearning
Dong, B., Zheng, Q., Yang, J., Li, H., & Qiao, M. (2009). An E-learning Ecosystem Based on Cloud Computing Infrastructure. In 2009 Ninth IEEE International Conference on Advanced Learning Technologies (pp. 125–127). doi: 10.1109/ICALT.2009.21
Etro, F. (2011). The Economics of Cloud Computing. The IUP Journal of Managerial Economics, IX(2), 7–22. Retrieved from http://econpapers.repec.org/RePEc:icf:icfjme: v:09:y:2011:i:2:p:7-22
Gangur, M. (2011). Automatic generation of mathematic tasks. In 7th WSEAS/IASME International Conference on Educational Technologies (pp. 129–134). Retrieved from http://www.wseas.us/e-library/conferences/2011/Iasi/EDUTE/EDUTE-22.pdf

Václav Sova Martinovský, Miroslav Plevný Applying Cloud Computing for Automated Generation of Parameterized Tasks and Test
DIVAI 2018 – The 12th international scientific conference on Distance Learning in Applied Informatics. 365 ISBN 978-80-7598-059-5 (Print) ISSN 2464-7470 (Print) ISSN 2464-7489 (On-line)
Gangur, M. (2014). Automatic Parameterized Generation of Test. In DIVAI 2014 - 10th
International Scientific Conference on Distance Learning in Applied Informatics.
Conference proceedings, pp. 55–64. Prague: Wolters Kluwer.
Gladavská, L. & Plevný, M. (2014). Problems of automatic generation of questions for the purpose of testing the knowledge in a management science course. In DIVAI 2014 - 10th
International Scientific Conference on Distance Learning in Applied Informatics.
Conference proceedings, pp. 325-335. Prague: Wolters Kluwer.
González-Martínez, J. A., Bote-Lorenzo, M. L., Gómez-Sánchez, E., & Cano-Parra, R. (2015). Cloud computing and education: A state-of-the-art survey. Computers & Education, 80, 132–151. doi: 10.1016/J.COMPEDU.2014.08.017
Johnson, L., Adams, S., & Cummins, M. (2012). NMC Horizon Report: 2012 Higher Education Edition. Austin, Texas. Retrieved from https://www.learntechlib.org/p/48964
MarketLine. (2016). Cloud Computing Industry Profile: Global. Cloud Computing Industry Profile: Global, 1–36. Retrieved from http://search.ebscohost.com/login.aspx?direct= true&db=bth&AN=121615891&lang=cs&site=ehost-live
Marston, S., Li, Z., Bandyopadhyay, S., Zhang, J., & Ghalsasi, A. (2011). Cloud Computing - The Business Perspective. Decis. Support Syst., 51(1), 176–189. doi: 10.1016/j.dss.2010.12.006
McDonald, D., Breslin, C., & MacDonald, A. (2010). Review of the environmental and organisational implications of cloud computing: final report. University of Strathclyde. Retrieved from https://strathprints.strath.ac.uk/32900/
Phillips, V. (2015). Nebula Cloud Computing Platform. Retrieved January 26, 2018, from https://www.nasa.gov/open/nebula.html
Plevny, M., & Gangur, M. (2016). On the Possibility of Solving the Problem of Automatic Generation of Images in Quiz Questions. In DIVAI 2016: 11th International Scientific Conference on Distance Learning in Applied Informatics, pp. 385–395. Prague: Wolters Kluwer.
RTG-PRO (2011). RTG-PRO, Random Test Generator-PRO. [cit. 18. 1. 2011] Retrieved from http://www.hirtlesoftware.com/p\_rtgpro.htm.
Sultan, N. (2010). Cloud computing for education: A new dawn? International Journal of Information Management, 30(2), 109–116. doi: 10.1016/J.IJINFOMGT.2009.09.004
TM-II (2016). TM-II, 2011 Test Maestro II details. [cit. 26. 1. 2017] Retrieved from https://en.freedownloadmanager.org/Windows-PC/Test-Maestro-II.html.
Vaquero, L. M., Rodero-Merino, L., Caceres, J., & Lindner, M. (2008). A Break in the Clouds: Towards a Cloud Definition. SIGCOMM Comput. Commun. Rev., 39(1), 50–55. doi: 10.1145/1496091.1496100
Yang, A., Wu, J., & Wang, L. (2008). Research and design of test question database management system based on the three-tier structure. In WSEAS Transactions on Systems 7(12), 1473–1483.


Petr Škuta, Kateřina Kostolányová Adaptive Aproach to the Gamification in Education
DIVAI 2018 – The 12th international scientific conference on Distance Learning in Applied Informatics. 367 ISBN 978-80-7598-059-5 (Print) ISSN 2464-7470 (Print) ISSN 2464-7489 (On-line)
Adaptive Aproach to the Gamification in Education
Petr Škuta, Kateřina Kostolányová
University of Ostrava, Ostrava, Czech Republic [email protected], [email protected]
Abstract
The gamification popularity is raising with each published paper (Dicheva et al. 2015). It has crossed from other areas into the education (Warmelink et al. 2018). There are already various ways of implementation of the game elements and principles (Bíró 2014). However, it seems that nobody has thought about adaptive approach yet. Meanwhile common custom is to implement all available elements and principles (Kapp, 2012) – result of this can be seen in very popular applications like Duolingo or Khan Academy. A rather rare approach is to offer player, or better student in our case, only the elements and principles that match with his characteristics. Before implementation itself it is necessary to analyze the possible ways of distribution and create a mechanism that would be able to decide based on student’s characteristic which game elements and principles are the most suitable for her or him. Due to popular Richard Bartle’s Player Typology (2004) these characteristics can be categorized according to the player types. With its implementation either an entry questionnaire or a demo lecture can help. These all aspects can help create a gamified layer, which can be included into education.
Keywords
Adaptivity. Gamification. Education. E-Learning. Adaptive Mechanism. Game Elements.
INTRODUCTION
The twenty-first century is facing many challenges. The young people born in the 1990s to the present are coming into the education process. They are naturally using the latest advances in technology such as electronics, the internet, social networks. On the other hand, they tend to have difficulty concentrating on one thing, to keep their attention (Bruder, 2015). However, with their positive attitude to games a solution can be find (Barata, 2014).
Several theories of pedagogy and psychology have been written to find an approach to their difficulties. Recently, there has also been talk of a new way called gamification. It itself is not a completely new phenomenon but has been repeatedly and successfully used in various fields such as marketing and business (Hofacker et al, 2016) and even healthcare (Warmelink et al. 2018). The theory of gamification is known for a long time, but its application to the world of pedagogy is booming right now and many researchers are trying to prove that gamification might be the good approach (Hamari, 2017).

Petr Škuta, Kateřina Kostolányová Adaptive Aproach to the Gamification in Education
DIVAI 2018 – The 12th international scientific conference on Distance Learning in Applied Informatics. 368 ISBN 978-80-7598-059-5 (Print) ISSN 2464-7470 (Print) ISSN 2464-7489 (On-line)
GAMIFICATION OR GAME BASED LEARNING
Currently, a large number of studies focusing on gaming in the field of education can be found. However, studies up to 2008 mostly focus on other areas. Especially in business and marketing, a number of researchers have tested it out before the boom in 2008. Authors were looking for a way to encourage customers to buy more and more. In other words, wanted them to be motivated to spend (Bíró, 2013). Simply because the motivated customer is happy to return and voluntarily spends more than a regular customer (Hofacker et al, 2016).
Based on these studies, certain theories have emerged, now called by the term of gamification. The gamification comes out of games, not just today's widespread computer games, and takes from them the so-called game principles and elements. It is therefore appropriate to provide a popularized definition (although different authors use different definitions, but they are not that different):
"Gamification is adding game principles and elements into non-gaming environments and situations." (Kapp, 2012)
In other words, it is about removing common game elements and principles that are part of most games and applying them to an environment that is not normally a game. In the case of business and marketing, for example, you are collecting loyalty points (game element) in order to get a discount (game element) and buy more (game principle).
If we read the application of game elements and principles in this area, it is also our use of education in the field of pedagogy. Many scientists have come to the same conclusion, and they have recently published their research on this subject. Almost everyone usually comes from the pioneering works in this area, namely Karl M. Kappa (2012) and Gábor István Bíró (2013, 2014). Their studies have formed the basis for further research and are one of the most cherished in the field of gamified education applications.
Before embarking on deeper into gamification and discussing the appropriate terminology, it is necessary to distinguish it from other approaches. The long-known practice and theory often referred to as Game-Based Learning, which was already promoted by Jan Amos Komensky, a teacher of the peoples, differs from the Gamification. One of the definitions of Game-Based Learning is as it follows:
"Game-based learning refers to using games to enrich the learning experience." (Burrus, 2012)
When we want to use the theory of Game-Based Learning, we take the game and use it for educational purposes. This game (and does not necessarily need software) then serves as an educational aid. Many of these games are custom-made and cover a wide range of educational areas (Khaleel et al, 2017).

Petr Škuta, Kateřina Kostolányová Adaptive Aproach to the Gamification in Education
DIVAI 2018 – The 12th international scientific conference on Distance Learning in Applied Informatics. 369 ISBN 978-80-7598-059-5 (Print) ISSN 2464-7470 (Print) ISSN 2464-7489 (On-line)
As we mentioned above, gamification inherits and abstracts part of the mechanics of Game-Based Learning and transmits it away from the game itself. The result of this process is illustrated in Chyba! Nenašiel sa žiaden zdroj odkazov..
Analyzing the sources published so far, researchers have identified the most common division of gamification into two categories: game principles and game elements (Kapp, 2012). Game principles and elements were created by extracting methods and procedures that are used to design and create real (not only computer) games. Let us now give you an approximate definition of both categories:
"The game principle is the way we get to the set goal."
"The game element is a representation of progress, which may be partial or final." (Deterding, 2011)
Game principles (9):
Goals / Challenges, Personalization, Visible Status, Unlocking Content, Freedom to Fail, Storyline / New Identities, Onboarding, Time Restriction, Social Engagement
Game elements (6):
Points, Badges, Levels, Leaderboards, Virtual Goods, Avatars
Applying both gaming principles and elements to a common non-gaming environment creates a gamified environment. It can be an electronic environment as well as a non-electronic environment. Due to the focus of the work, we will continue to deal with electronic environments.
With popular gaming applications of the principles and elements commonly found as online e-learning platforms such as Khan Academy-but also Duolingo, which play a primary
GAME PRINCIPLE
NON-GAME ENVIRONMENT
GAME ELEMENT GAME
Figure 4 - Gamification

Petr Škuta, Kateřina Kostolányová Adaptive Aproach to the Gamification in Education
DIVAI 2018 – The 12th international scientific conference on Distance Learning in Applied Informatics. 370 ISBN 978-80-7598-059-5 (Print) ISSN 2464-7470 (Print) ISSN 2464-7489 (On-line)
role in most of all principles and elements thanks to the breadth of the courses. Their involvement increases the inner (student is entertained) and external motivation (the student is motivated).
At the time of writing the research for this paper there are not many sources dealing with the design of the gamified environment we can again quote especially the works of Karl M. Kappa and Gábor István Bíró. So far, it seems like no one has thought of adapting gaming principles and features to player needs, although some proposed to create more versatile tools or frameworks (Khaleel et al, 2017).
ADAPTIVITY
Any educational and learning environments can be considered adaptive if they are able to monitor and interpret all activities of their users (students), derive user preferences and preferences based on interpreted activities. Then, thanks to this information, he manages to dynamically change and modify the learning process (Takács, 2014).
The adaptation of teaching itself can take many forms. However, they can be divided into the following categories:
Adaptation of the user interface
It customizes the user, for example, the theme of the learning environment, the font and font size used, the structure and the order of the actions being performed by the user.
Adaptation of teaching content
It adapts and presents the content of the lesson to match as much as possible with the given characteristics of the user, thus adapting learning from a qualitative and time perspective. This method of adaptation includes, for example, a dynamic change in the structure of teaching content, adaptation of navigational elements in the teaching material, and dynamic selection of learning materials.
Adaptation of search and compilation of teaching content
On the basis of the identified characteristics and goals of the user from distributed sources, such materials that are currently most beneficial to the user.
Adaptive support for cooperation
It focuses on communication between people and various types of group activities. The subject of the adaptation here is to facilitate the process of communication between people and cooperation and ensure a good combination of users within the group.
From the point of view of applying gamification to the educational environment, it is primarily about adapting the user environment. As a result of individual game principles, it will result in game elements implemented in the given environment. In the following chapters we consider this option.

Petr Škuta, Kateřina Kostolányová Adaptive Aproach to the Gamification in Education
DIVAI 2018 – The 12th international scientific conference on Distance Learning in Applied Informatics. 371 ISBN 978-80-7598-059-5 (Print) ISSN 2464-7470 (Print) ISSN 2464-7489 (On-line)
ADAPTIVE GAMIFICATION
As outlined in the first chapter, on the date of writing, no one has ever attempted to adapt the game elements and principles. We build on the analysis of many scientific studies that have been the subject of this paper. We also build on our own analysis of the gamified environments we tested, namely Duolingo (a gamified language learning environment) and Khan-Academy (a gamified environment for natural sciences). Of course, by the enumeration of these two environments it does not end at all, and we can find a lot of representatives.
However, it combines the same approach. All game principles and elements are fully covered, and it is relied on that the user will choose the most appropriate one for them. But what if the learning environment responds to stimuli come from the user? Could the distribution of game principles and the elements of an abstract adaptive layer help guide the gamified environment, based on user needs?
Player’s Typology
In order to design an abstract adaptive layer, we need to support it by analyzing the user's properties. It will be a procedure similar to that used by doc. Kostolányová when designing an adaptive model of teaching based on learning styles (Kostolányová, 2012). Here she leans on a model of sensory variants - auditory, verbal, visual and kinestetic. On the basis of these variants, the rules are then formulated according to the characteristics of the individual sense variants, which serve to categorize the users - students of the adapted learning environment. A learning environment with this adaptive layer is able to offer users content that is suited to their dominant learning style, thus increasing learning efficiency. Other styles are not removed from the environment and the user can access these styles according to their preferences.
In the same way, it would be advisable to create an adaptive layer for the gamified model of the learning environment. The system would first test the user and then offer him a customized set of game principles and elements. However, the other gamified elements would not be suppressed, but they would be rebutted over those dominant for that user. For this model to work, you'll need to find the ideal set of categories to describe, including user-specific features. Because we rely on gaming itself, it would be useful to find categories or better player typologies.
This problem was dealt with by Richard Bartle (Bartle, 2004). Based on psychological features, he proposed four basic categories and assigned common features and characteristics to them.
Bartle's Player Typology:
a) Achiever – A player focused on success and achievement.
b) Explorer – A discoverer, examining information and environment under the surface.
c) Socializer – A player focused on interacting with other players, prefers team play and co-operation.
d) Killer – aimed at winning and killing other players.

Petr Škuta, Kateřina Kostolányová Adaptive Aproach to the Gamification in Education
DIVAI 2018 – The 12th international scientific conference on Distance Learning in Applied Informatics. 372 ISBN 978-80-7598-059-5 (Print) ISSN 2464-7470 (Print) ISSN 2464-7489 (On-line)
Along with these characteristics, he later added the possibilities of interacting with the game environment. We get the inclusion in the form of bonds and interactions and the model becomes more complex. The links between typology and environment are clearly illustrated in Figure 5 - Bartle's Player Typology.
Figure 5 - Bartle's Player Typology
Although Bartle's typology captures very many aspects, it does not cover all players. Based on this, he decided to enrich Bartley's topology, psychologist David Kiersey, about blending with a well-known model of personality from Myers-Briggs (Taylor, 2006). This extended model adds other aspects such as Internal and External Motives, as well as the principles of Freedom and Order.
Concept of Adaptive Layer for Gamification
Adaptive layer design will use the basic Bartle’s model. The reason is its simplicity and easy testability. If the adaptive layer is proven, it can easily expand on the more sophisticated Marczewski model.
First, it will be necessary to divide the game principles and elements into the Bartle’s Typology categories. It should be noted that due to the general description of the principles and elements, they are likely to fall into more typology categories. It is possible, therefore, that a partial overlap occurs similar to that found in the adaptive layer with learning styles of so-called multimodality (multi-intelligence) due to individuals with more dominant senses (Takács et al., 2016).
When reading and analyzing the characteristics of each topology described on the previous page, the game principles were assigned to match the characteristics of the players within them.

Petr Škuta, Kateřina Kostolányová Adaptive Aproach to the Gamification in Education
DIVAI 2018 – The 12th international scientific conference on Distance Learning in Applied Informatics. 373 ISBN 978-80-7598-059-5 (Print) ISSN 2464-7470 (Print) ISSN 2464-7489 (On-line)
Game Principles (9):
Goals / Challenges, Personalization, Visible Status, Unlocking Content, Freedom to Fail, Storyline / New Identities (Story), Onboarding, Time Restriction, Social Engagement
Assigned Principles to Bartle's Typology:
Achiever
Goals / Challenges, Visible Status, Unlocking Content, Freedom to Fail, Time Restriction
Explorer
Visible Status, Unlocking Content, Storyline, Freedom to Fail, Onboarding
Socializer
Personalization, Visible Status, Freedom to Fail, Onboarding, Social Engagement
Killer
Goals / Challenges, Visible Status, Unlocking Content, Onboarding, Social Engagement
By assigning principles, we managed to achieve a balanced ratio of five major characteristics for each type, with three out of nine principles unique to one type of topology player. Others will, as expected, overlap with the topologies of other players.
When searching for a suitable typology, the green-marked characteristics will form the feature with the greatest weight for assigning the topology, since it is unambiguous for a given category. The features with the second largest decision weight are marked in blue. These occur only in two categories at a time. Orange features are three categories and have a lower decision weight. And black are the characteristics commonly found in all four topologies.
Such distributed game principles serve as a basic adaptation and the first part of the adaptive layer. Now we will focus on the distribution of game elements. Game elements are targets that are governed by game principles and represent their specific interpretations in the system. One game element can help implement multiple principles.
Game elements (6):
Points, Badges, Levels, Leaderboards, Virtual Goods (Add-ons), Avatars
Game principles with associated game elements:
Goals / Challenges: Points, Badges, Levels
Personalization: Virtual Goods, Avatars
Visible Status: Levels, Badges, Leaderboards
Unlocking Content: Levels, Badges
Freedom to Fail: Points, Levels
Storyline / New Identities (Story): Virtual Goods, Avatars
Onboarding: Leaderboards, Virtual Goods, Avatars
Time Restriction: Points, Levels, Badges

Petr Škuta, Kateřina Kostolányová Adaptive Aproach to the Gamification in Education
DIVAI 2018 – The 12th international scientific conference on Distance Learning in Applied Informatics. 374 ISBN 978-80-7598-059-5 (Print) ISSN 2464-7470 (Print) ISSN 2464-7489 (On-line)
Social Engagement: Leaderboards, Avatars
These linked elements can fit into Bartle's typology with game principles. This creates a matrix illustrating the probable specific elements of the gameplay on which the player-user-student will respond positively and who, upon proper assignment, would have to offer the adaptive layer in a gamified environment.
The matrix displays Table 1 - Decision Matrix. Numbers represent the meaning of the game element for each player's typology. They came about by setting the game principles and counting the number of occurrences after including all game principles.
Table 1 - Decision Matrix
Achiever Explorer Socializer Killer Points 3 1 1 1 Badges 4 2 1 3 Levels 5 3 2 3 Leaderboards 1 2 3 3 Virtual Goods 0 2 2 1 Avatars 0 2 3 2
This defines the basic decision matrix for the design of the abstract layer and the subsequent assignment of the game elements in the learning environment.
IMPLEMENTATION POSSIBILITIES
Thanks to the created matrix it will be possible to implement the game elements into the educational environment and adapt them. The admission questionnaire is used to adapt the learning styles (Kostolányová, 2012). Similarly, adaptive layer in gamification could be implemented.
Option A - Input questionnaire
Using a questionnaire input questionnaire, the player-user characteristics can be verified. These would then be matched to the score matrix with the decision matrix and the learning environment would be adapted according to the result of this comparison.
The disadvantage of this variant, however, is that the gamified is totally visual - it stimulates, in particular, visual perceptions. However, the questionnaire often operates with words and illustrations may not be sufficient.
Option B - Input lessons
Introductory tutorials are often known from games where players are offered an introduction to game principles and features. This way, the user has the chance to try out all the procedures before he actually starts playing. For the adaptive layer, it would mean creating a tutorial - a truncated demonstration in which all the game elements would be displayed by default and all the principles used. Then, based on the user's reactions in the environment, the individual activities would be compared to the decision matrix and the user transferred to a full learning lesson that would be fully adapted to the data found in the demonstration.
The obvious disadvantage of this approach is the great difficulty in preparing dual content - especially for demonstration and especially for sharp lessons. According to

Petr Škuta, Kateřina Kostolányová Adaptive Aproach to the Gamification in Education
DIVAI 2018 – The 12th international scientific conference on Distance Learning in Applied Informatics. 375 ISBN 978-80-7598-059-5 (Print) ISSN 2464-7470 (Print) ISSN 2464-7489 (On-line)
detailed data, however, it should provide a better environment adaptation than the input questionnaire.
Specific implementation will be the subject of further exploration in the direction of gamification as a form of adaptive teaching. It is intended to implement into an e-learning environment in the form of one of the selected LMS and deployment to the teaching.
CONCLUSION
In the paper the theory of gamification was introduced. It is offered as a solution associated with the challenges brought to the education by the emerging generation of Z. Technology, which is a matter of course for them, also means problems with concentration and loss of motivation for education. Gaming based on games can help solve these problems. It is based on the premise that gameplay increases motivation and helps with concentration.
Although gaming itself is not a new phenomenon, its application to education is now experiencing a great start. However, the procedures are not unified, and the sources are different approaches to implementation into the learning environment. The result is often the implementation of all game principles and elements.
The paper presents a new approach to gamification, using an adaptive approach. Primary resources were already functional, such as the adaptability of learning environments through learning styles. By analysing these procedures, a similar procedure has been proposed for the application of adaptability to a gamified educational environment.
Individual game principles and elements have been linked to the game topology of players that represent certain categories of players. Thus, a decision matrix has emerged as a basis for the decision-making processes of the adaptive layer, which can be integrated into the gamified environment.
It was a building block for using gamification as a form of adaptive teaching. The following steps will need to verify this theory in practice by designing and implementing specific elements for a particular environment.
As part of further progress in the research, the e-learning environment is expected to be used. The implementation of game elements into LMS and then implementation of decision adaptive matrix will verify the theory. The data obtained will serve to further adjustments and eventual expansion to more advanced players topology. Adaptive layer application is expected to increase the efficiency of a gamified environment.
ACKNOWLEDGEMENT
This project has received funding from the University of Ostrava – Study Grant Program 2018 and is part of the dissertation thesis.

Petr Škuta, Kateřina Kostolányová Adaptive Aproach to the Gamification in Education
DIVAI 2018 – The 12th international scientific conference on Distance Learning in Applied Informatics. 376 ISBN 978-80-7598-059-5 (Print) ISSN 2464-7470 (Print) ISSN 2464-7489 (On-line)
REFERENCES
Barata, G. et al., 2014. Identifying Student Types in a Gamified Learning Experience. In International Journal of Game-Based Learning. pp. 19-36. Available at: http://services.igi-global.com/resolvedoi/resolve.aspx?doi=10.4018/ijgbl.2014100102.
Bartle, R.A., c2004. Designing virtual worlds, Indianapolis, Ind.: New Riders Pub.
Bíró, G.I., 2014. Didactics 2.0: A Pedagogical Analysis of Gamification Theory from a Comparative Perspective with a Special View to the Components of Learning. In Procedia - Social and Behavioral Sciences. Hungary: Elsevier, pp. 148-151.
Bruder, P., 2015. GAME ON: Gamification in the Classroom. Education Digest, 80(7), pp.56-60. Available at: http://search.ebscohost.com/login.aspx?direct=true&db=a9h&an=101100101&scope=site [Accessed October 05, 2015].
Burrus, D., 2012. Gamification: A trend to accelerate learning. In Toledo Business Journal. Toledo: Toledo, p. 16. Available at: http://connection.ebscohost.com/c/articles/83777953/gamification-trend-accelerate-learning [Accessed February 13, 2018].
Dicheva, D. et al., 2015. Gamification in Education: A Systematic Mapping Study. Journal of Educational Technology, 18(3), pp.75-88. Available at: http://www.ifets.info/journals/18_3/6.pdf [Accessed October 05, 2015].
Hamari, J., 2017. Do badges increase user activity? A field experiment on the effects of gamification. In Computers in Human Behavior. pp. 469-478. Available at: http://linkinghub.elsevier.com/retrieve/pii/S0747563215002265.
Hofacker, C.F. et al., 2016. Gamification and Mobile Marketing Effectiveness. In Journal of Interactive Marketing. pp. 25-36. Available at: http://linkinghub.elsevier.com/retrieve/pii/S1094996816300019.
Kapp, K.M., 2012. The gamification of learning and instruction: game-based methods and strategies for training and education, San Francisco, CA: Pfeiffer.
Khaleel, F.L. et al., 2017. Methodology for developing gamification-based learning programming language framework. In 2017 6th International Conference on Electrical Engineering and Informatics (ICEEI). IEEE, pp. 1-6. Available at: http://ieeexplore.ieee.org/document/8312378/.
Kostolányová, K., 2012. Teorie adaptivního e-learningu, Ostrava: Ostravská univerzita v Ostravě.
Martens, M., 2014. Reading and "Gamification". Children, 12(4), pp.19-25. Available at: http://search.ebscohost.com/login.aspx?direct=true&db=a9h&an=100188621&scope=site [Accessed October 05, 2015].
Škuta, P. & Kostolányová, K., 2016. A PRELIMINARY RESEARCH OF LEARNING LANGUAGES THROUGH THE GAMIFIED APPLICATION. In ICTE 2016: Information and Communication Technology in Education. Ostrava: University of Ostrava, Pedagogical Faculty, pp. 159 - 168.
Škuta, P. & Kostolányová, K., 2016. The Inclusion of Gamification Elements in the Educational Process. In DIVAI 2016: The 11thinternational scientific conference on Distance Learning in Applied Informatics. Štúrovo: Wolters Kluwer, pp. 421 - 429.

Petr Škuta, Kateřina Kostolányová Adaptive Aproach to the Gamification in Education
DIVAI 2018 – The 12th international scientific conference on Distance Learning in Applied Informatics. 377 ISBN 978-80-7598-059-5 (Print) ISSN 2464-7470 (Print) ISSN 2464-7489 (On-line)
Takács, O., 2014. Automatizované řízení adaptivní výuky v e-learningu podle stylů učení studenta. Dizertační práce. Ostrava.
Taylor, T.L., c2006. Play between worlds: exploring online game culture, Cambridge, Mass.: MIT Press.
Warmelink, H. et al., 2018. Gamification of the work floor: Aliterature reviewof gamifying production and logistics operationsHarald. In Hawaii International Conference on System Sciences. Hawaii: University of Hawai'i at Manoa, pp. 1108-1117.

Tomáš Tóth, Gabriela Lovászová On Difficulties with Knowledge Transfer from Visual to Textual Programming
DIVAI 2018 – The 12th international scientific conference on Distance Learning in Applied Informatics. 379 ISBN 978-80-7598-059-5 (Print) ISSN 2464-7470 (Print) ISSN 2464-7489 (On-line)
On Difficulties with Knowledge Transfer from
Visual to Textual Programming
Tomáš Tóth, Gabriela Lovászová
Department of Informatics, Faculty of Natural Sciences, Constantine the Philosopher University in Nitra, Slovakia
[email protected], [email protected]
Abstract
Visual programming environments are often used in introductory programming courses. Despite their many advantages, there are several difficulties in developing complex applications in visual programming environments, such as less readability of the code, and clumsy code editing by drag-and-drop technique in contrast to typing text in textual programming. The transition from visual to textual programming is a natural step from learning basics of programming towards obtaining advanced programming skills. An exploratory research on teaching programming of mobile applications was realized. First, MIT App Inventor 2 visual programming environment was used for developing applications. Then, the direct transition to programming in Android Studio professional textual programming environment was done. The research was conducted during a voluntary course with students of upper secondary education. We mainly focused on factors which influence students’ motivation for learning programming and also on the influence of visual and textual programming environments on students’ performance, as well as on influence of their performance on their motivation to learn. The research and its results are presented in a case study. The results of our research point to the problem of the gap between introductory programming in visual programming environments and advanced programming in textual programming environments. Java Bridge appears to be a useful assistance tool to overcome students’ difficulties while bridging the gap between development of applications in MIT App Inventor 2 and Android Studio.
Keywords
Teaching programming. Programming for mobile devices. MIT App Inventor. Java Bridge.
INTRODUCTION
Informatics as a school subject differs in extent, form and content according to educational aims in several countries. Hromkovič and Steffen (2011) present arguments for the teaching of Informatics as a separate school subject, which has the potential to enrich education in ways other subjects cannot or do not sufficiently. They assert teaching proper informatics (and not only ICT skills) focused on fundamentals. They consider the concepts of algorithms and computational complexity as the fundamental and sustainable knowledge that reveal us the existence of some natural laws of information processing
Tomáš Tóth, Gabriela Lovászová On Difficulties with Knowledge Transfer from Visual to Textual Programming
DIVAI 2018 – The 12th international scientific conference on Distance Learning in Applied Informatics. 380 ISBN 978-80-7598-059-5 (Print) ISSN 2464-7470 (Print) ISSN 2464-7489 (On-line)
and that are also crucial for many of today’s applications. Students can gain this knowledge actively through their own experience of programming.
However, as evidenced by many scientific studies and empirical experience, learning programming is difficult and it is a serious challenge for students (Koorsse, Cilliers, Calitz, 2015; Saeli et al., 2011; Papadakis et al., 2014; Garneli, Giannakos, Chorianopoulos, 2015). Students consider the lack of experience of problem solving, difficulties with introducing abstract concepts, problems with syntax and semantics of programming language, insufficient planning and designing of algorithm as main difficulties in the beginning of learning programming. Ouahbi et al. (2015) indicate the causes on the side of teacher: inappropriate teaching methodology; weak interaction with students in the classroom; insufficient motivation or frustration of students. Choosing the right teaching approach and attractive content combined with an appropriate programming environment should prevent the above-mentioned learning difficulties and to increase students’ motivation (Garneli, Giannakos, Chorianopoulos, 2015; Saeli et al., 2011).
For educational purposes, special programming environments are often used, because professional programming environments can burden students with their extensive functionality and interface. Depending on how the algorithm is coded, educational programming environments can be named as textual or visual. Programming environments based on text editing can be challenging for students as they have to make a lot of effort to learn the programming language and its syntax. However, this extra effort can be overcome by the students' feeling that they are working with a professional tool. Visual programming environments do not require active knowledge of the programming language. The program is usually composed from ready-made visual blocks in the way that prevents from being connected syntactically incorrectly. They are more suitable for beginners and make programming more accessible to broader audience (Garneli, Giannakos, Chorianopoulos, 2015; Kurihara et al., 2015).
Engagement of students is usually effective when learning is linked to an object of their interest. In our research, we work with the assumption that an attractive and motivating teaching of programming can be carried out through the programming of applications for mobile devices. In the following case study, an experimental teaching of programming for mobile devices and our findings regarding the motivation and ability of students to program mobile applications in visual and textual programming environments are described.
COURSE OF PROGRAMMING FOR MOBILE DEVICES: A CASE STUDY
Research problem
Based on our past teaching experience and on derivative experience from published research studies (mentioned in the introductory section), we assume that programming for mobile platforms can increase students’ motivation to learn, and that visual programming environments are the appropriate learning tools for beginners. The aim of the exploratory research described in this case study is to gain authentic experience of teaching programming of mobile applications and to confront it by these assumptions. We are looking for answers to the following research questions:
Q1: What factors influence students’ motivation for learning programming?

Tomáš Tóth, Gabriela Lovászová On Difficulties with Knowledge Transfer from Visual to Textual Programming
DIVAI 2018 – The 12th international scientific conference on Distance Learning in Applied Informatics. 381 ISBN 978-80-7598-059-5 (Print) ISSN 2464-7470 (Print) ISSN 2464-7489 (On-line)
Q2: What is the difference between the performance of students while using visual and textual programming environment?
Q3: What is the impact of student's performance on his/her motivation to learn?
Findings of this pilot research will form the basis for our future research aimed at designing a conception of teaching programming of mobile applications.
Method
The research was executed within the scope of a voluntary programming course meant for students at upper secondary level of education and focused on programming of mobile applications.
Target group: The course was attended by 6 grammar school students aged 14-17 years. The students had some programming experience: they had already programmed in Imagine Logo, Delphi, or Lazarus programming environments. They had a positive attitude towards computer science and programming; they planned to take a school-leaving exam in computer science and to continue their study at university; they attended the course in their free time. All these facts make evident their positive motivation and a good foundation for learning programming.
Context: The course was carried out during 2016/2017 school year. One lesson took about 1 hour 30 minutes once a week. The course was led by one lecturer who was also in the role of researcher. The content of the course is shown in Table 1. Two programming environments were used within the course: the visual MIT App Inventor 2 at the beginning, and the professional textual IDE Android Studio at the end of the course. Table 1 shows the sequence of projects programmed during the course, which were carefully chosen to achieve the stated learning objectives. Project ideas were inspired by Wolber et al. (2014) and Michaličková (2016) as well as based on our original ideas and on creative ideas of students.
Research methods: Methods of qualitative research have been used. The researcher actively participated in lectures as a lecturer. Data collection was performed through:
� participatory observation
� informal interviews with students as well as with their teachers
� collective discussions
� analysis of students’ projects
Collected data was recorded as field notes and processed by reflection into detailed pedagogical journal.
Table 1: Content of the mobile application programming course
Programming environment
Created application Objectives
MIT App
Inventor 2
Hello World! (greets user by showing text
and by speech)
- Introduction of MIT App Inventor 2 - Show text on a display – statically and
dynamically entered text - Read text by TextToSpeach function - Respond to events (button click, device
shaking – accelerometer) - Use live testing on physical device

Tomáš Tóth, Gabriela Lovászová On Difficulties with Knowledge Transfer from Visual to Textual Programming
DIVAI 2018 – The 12th international scientific conference on Distance Learning in Applied Informatics. 382 ISBN 978-80-7598-059-5 (Print) ISSN 2464-7470 (Print) ISSN 2464-7489 (On-line)
MIT
App
Inventor
2
Hello Tomcat (Tomcat meows and purrs
(vibrates) as a response to an event)
- Set GUI layout - Use media (playing sounds, showing images)
How Are You? (conducts dialogue with the
user)
- Show message using Notifier - Use control structure If-Then-Else - Hide keyboard
PaintPot (allows to draw on a white
canvas or on a photo)
- Use Canvas – drawing various objects (line, rectangle, circle) with various colours and of various sizes; clearing canvas
- Generate random values (for setting the size of drawing objects)
- Use arguments and variables - Take photography - Save drawn picture and its load from gallery
MoleMash (the player tries to hit a
randomly showing mole)
- Use ImageSprite – due to the player’s character that represents mole
- Create procedure – due to the principle: write code once, use anywhere
- Add comment to own procedure - Use Clock – showing mole in regular intervals - Use File – writing and loading data (count of
hits and misses) to/from a file - Add new Screen – for main menu
Have a Look! (allows to take a photo, add
information into it (GPS coordinates, date, time) and
share it with friends)
- Use Checkbox – to mark which information should be added
- Use LocationSensor – get current location - Use Sharing – to share photo with friends
News Headlines Generator (several users enter some words from which random
funny sentences are created)
- Use Lists – words entered by users are added into them
- Save history of generated sentences to a file and display it on a new screen
Cath Egg (player controls the mouse
which catches the falling eggs)
- Control movement of player’s character by recognizing which part of the screen was touched by user/player
- Check whether game objects were collided or whether they reached edge of the screen
Android
Studio
Hello World! (displays a text on the screen)
- Install and configure IDE Android Studio - Introduction of IDE Android Studio - Understand the structure of project/app, life
cycle of app and basic code needed for app Hello World!
- Test app on physical device
Roll the dice (imitates rolling the dice – displays a random number
from 1 to 6)
- Set GUI layout - Response to button click event - Generate random numbers from 1 to 6 - Count number of dice rolls and reset the
number
Results
Students became familiar with MIT App Inventor programming environment quickly and easily. They learned intuitively, mostly independently without (or with little) help of

Tomáš Tóth, Gabriela Lovászová On Difficulties with Knowledge Transfer from Visual to Textual Programming
DIVAI 2018 – The 12th international scientific conference on Distance Learning in Applied Informatics. 383 ISBN 978-80-7598-059-5 (Print) ISSN 2464-7470 (Print) ISSN 2464-7489 (On-line)
lecturer. They appreciated the simplicity of creating programs by composing code from command blocks in contrast with writing code in other programming languages and environments:
“It suits me to compose blocks in App Inventor in comparison with other programming languages. It is simpler and faster.”
They liked programming of mobile applications because “you can take it wherever with you” and “use it whenever you want”.
"Thanks to the simplicity of creating apps in App Inventor, we can also build more complex apps that use various sensors, not just the geometry formulas we've solved in another programming language."
Students enjoyed creating mobile applications doing it simultaneously with the lecturer and trying to overcome him. They had creative ideas of various custom enhancements of their applications. The role of the lecturer was to present the problem; to familiarize students with new components and command blocks; to moderate discussions; and to guide students in solving more demanding programming problems (e. g. writing data to a file, calculating coordinates on the screen etc.). Live testing and debugging on mobile devices was a very useful feature of App Inventor for students. It supports incremental development, which enables to isolate bugs in program more quickly and fix them more easily.
In the course of time, students began to lose interest in creating applications through visual programming. They considered it to be too easy for them. They started to demand "more professional" application development:
"It's a shame that some things cannot be set up more precisely while designing and programming an application."
"Writing code in English is closer to real programming as it is in Android Studio."
Responding to repeated requests of students, an intervention in teaching strategy was realized. App Inventor programming environment was changed for Android Studio. Changes of content and teaching methods were also needed because several problems had arisen during transition from visual to textual programming:
� missing knowledge of Java and XML
� demanding design of GUI and its connection to program logic
� technical problems with hardware performance
Consequently, the pace of work was slowed down and students’ self-reliance was reduced. Therefore, the solved problems had to be more simple, students started to program plain applications again. The role of teacher was changed; the importance of teacher’s help in students’ learning was increased.
Findings
In consequence of our observations, the following answers to the research questions can be formulated:
Q1: What factors influence students’ motivation for learning programming?
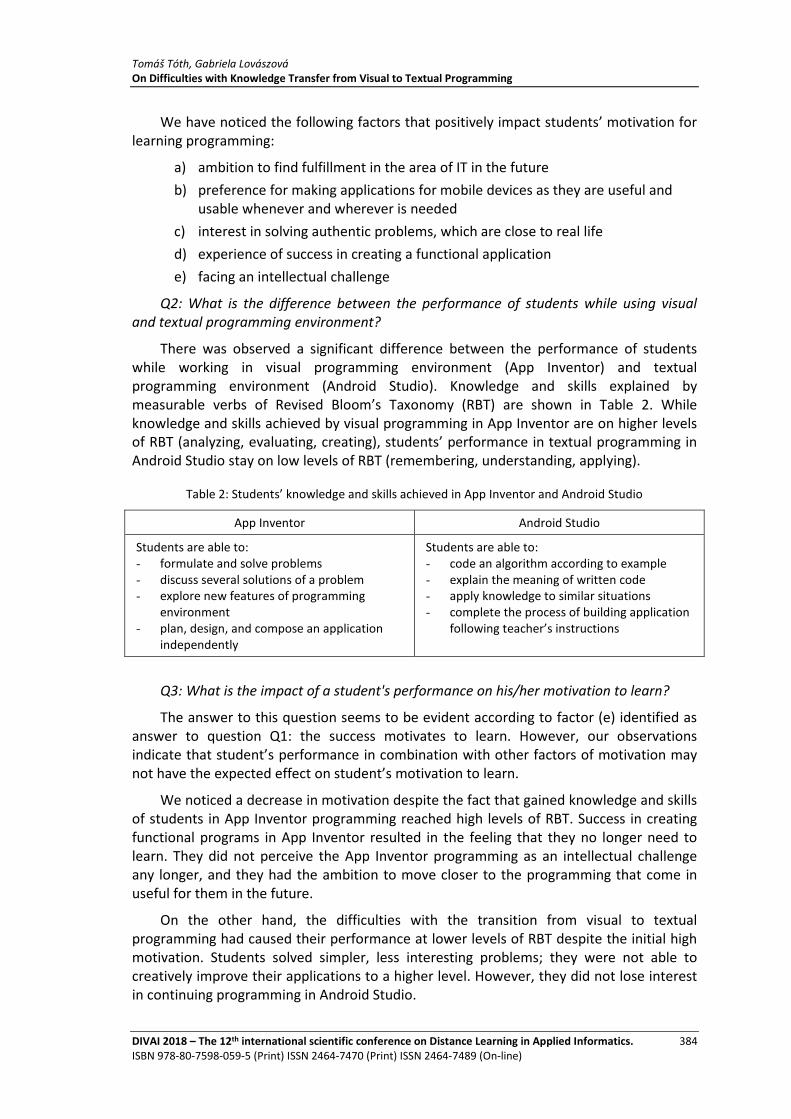
Tomáš Tóth, Gabriela Lovászová On Difficulties with Knowledge Transfer from Visual to Textual Programming
DIVAI 2018 – The 12th international scientific conference on Distance Learning in Applied Informatics. 384 ISBN 978-80-7598-059-5 (Print) ISSN 2464-7470 (Print) ISSN 2464-7489 (On-line)
We have noticed the following factors that positively impact students’ motivation for learning programming:
a) ambition to find fulfillment in the area of IT in the future
b) preference for making applications for mobile devices as they are useful and usable whenever and wherever is needed
c) interest in solving authentic problems, which are close to real life
d) experience of success in creating a functional application
e) facing an intellectual challenge
Q2: What is the difference between the performance of students while using visual and textual programming environment?
There was observed a significant difference between the performance of students while working in visual programming environment (App Inventor) and textual programming environment (Android Studio). Knowledge and skills explained by measurable verbs of Revised Bloom’s Taxonomy (RBT) are shown in Table 2. While knowledge and skills achieved by visual programming in App Inventor are on higher levels of RBT (analyzing, evaluating, creating), students’ performance in textual programming in Android Studio stay on low levels of RBT (remembering, understanding, applying).
Table 2: Students’ knowledge and skills achieved in App Inventor and Android Studio
App Inventor Android Studio
Students are able to: - formulate and solve problems - discuss several solutions of a problem - explore new features of programming
environment - plan, design, and compose an application
independently
Students are able to: - code an algorithm according to example - explain the meaning of written code - apply knowledge to similar situations - complete the process of building application
following teacher’s instructions
Q3: What is the impact of a student's performance on his/her motivation to learn?
The answer to this question seems to be evident according to factor (e) identified as answer to question Q1: the success motivates to learn. However, our observations indicate that student’s performance in combination with other factors of motivation may not have the expected effect on student’s motivation to learn.
We noticed a decrease in motivation despite the fact that gained knowledge and skills of students in App Inventor programming reached high levels of RBT. Success in creating functional programs in App Inventor resulted in the feeling that they no longer need to learn. They did not perceive the App Inventor programming as an intellectual challenge any longer, and they had the ambition to move closer to the programming that come in useful for them in the future.
On the other hand, the difficulties with the transition from visual to textual programming had caused their performance at lower levels of RBT despite the initial high motivation. Students solved simpler, less interesting problems; they were not able to creatively improve their applications to a higher level. However, they did not lose interest in continuing programming in Android Studio.
Tomáš Tóth, Gabriela Lovászová On Difficulties with Knowledge Transfer from Visual to Textual Programming
DIVAI 2018 – The 12th international scientific conference on Distance Learning in Applied Informatics. 385 ISBN 978-80-7598-059-5 (Print) ISSN 2464-7470 (Print) ISSN 2464-7489 (On-line)
IMPLICATIONS FOR THE FUTURE WORK
The assumptions we entered into this research were that the programming of mobile applications will be motivating for students and that the visual programming environment will be an appropriate learning tool. Results of the research confirmed our assumptions. Moreover, other interesting facts have been explored:
� The ambition to program in a professional programming environment is an extremely strong motivation for 14-17 year old students, even stronger than experience of success.
� There is a gap between programming in a visual programming environment designed for learners and textual programming environment designed for professional programmers. Bridging the gap without proper assistance may be very difficult, even impossible for students.
For these reasons, it is important to look for ways that would help students with transition from a visual programming environment to a textual programming environment. Presenting an equivalent algorithm in text form at the same time as the algorithm is created by graphics blocks is one option how to teach transition-oriented programming. In this way students can create their mental connections between the visual representation of created algorithm (graphic blocks) and the algorithm in text form.
In the case of teaching programming using MIT App Inventor 2, Java Bridge can be used for this purpose. It allows transition specifically from MIT App Inventor 2 to Java programming language. Transition from visual programming to textual programming in professional IDE Android Studio can be done thanks to Java Bridge. Java Bridge allows hybrid development whereby the visual blocks language is used to create the initial version of an app using App Inventor, and Java is used to add functionality that is difficult to develop in MIT App Inventor 2. The code can be edited in IDE Android Studio (AppInventor.org).
CONCLUSION
Visual programming environments do not divert the student's attention from the algorithmic solution of the problem towards solving technical problems with coding the algorithm into programming language. For that reason, they are considered as suitable tools for teaching the basics of programming. Students can concentrate on conceptual issues of programming instead of learning commands and syntax of the programming language. However, composing the code from pre-rendered visual blocks is less flexible than editing text directly. For larger projects, the visual program can be less readable and code editing by drag-and-drop technique can be more difficult than typing text on the keyboard. The transition from visual to textual programming is a natural step from learning basics of programming towards obtaining advanced programming skills.
The results of our pilot research described in the case study as well as studies by other authors point to the problem of the gap between introductory programming in visual programming environments and advanced programming in textual programming environments. Bridging the gap is a challenge for both the student and the teacher.

Tomáš Tóth, Gabriela Lovászová On Difficulties with Knowledge Transfer from Visual to Textual Programming
DIVAI 2018 – The 12th international scientific conference on Distance Learning in Applied Informatics. 386 ISBN 978-80-7598-059-5 (Print) ISSN 2464-7470 (Print) ISSN 2464-7489 (On-line)
Our future research is focused on creating teaching methodology for bridging the gap between visual programming of mobile applications in MIT App Inventor and textual programming in Java as native programming language for Android platform. We consider Java Bridge as an appropriate link between programming in App Inventor and Java, as well as a useful tool for a fluent transfer of knowledge from one context to application in another.
REFERENCES
AppInventor.org. App Inventor Java Bridge. [online] Available at <http://www. appinventor.org/jbridge> [Accessed 13 February 2018].
Garneli, V., Giannakos, M. N., Chorianopoulos, K., 2015. Computing education in K-12 schools: A review of the literature. Global Engineering Education Conference (EDUCON), 2015 IEEE, Tallinn, Estonia. p.543-551.
Hromkovič, J., Steffen, B., 2011. Why Teaching Informatics in Schools Is as Important as Teaching Mathematics and Natural Sciences. ISSEP 2011, Informatics in Schools. Contributing to 21st Century Education, Vol. 7013, Berlin, Heidelberg. p.21-30.
Koorsse, M., Cilliers, C., Calitz, A., 2014. Programming assistance tools to support the learning of IT programming in South African secondary schools. Computers & Education 82, p.162-178.
Kurihara A., et al., 2015. A Programming Environment for Visual Block-Based Domain-Specific Languages. The 2015 International Conference on Soft Computing and Software Engineering (SCSE 2015), California, USA. p.287-296.
Michaličková, V., 2016. Programovanie mobilných aplikácií v prostredí MIT App Inventor 2. Univerzita Konštantína Filozofa v Nitre. ISBN 978-80-558-1101-7. 93 p.
Ouahbi, I., et al., 2015. Learning Basic Programming Concepts By Creating Games With Scratch Programming Environment. WCES 2014, Procedia - Social and Behavioral Sciences 191, Malta. p.1479-1482.
Papadakis S., et al., 2014. Novice Programming Environments. Scratch & App Inventor: a first comparison. IDEE '14 Proceedings of the 2014 Workshop on Interaction Design in Educational Environments, Albacete, Spain.
Saeli, M., et al., 2011. Teaching Programming in Secondary School: A Pedagogical Content Knowledge Perspective. Informatics in Education Vol. 10, No. 1. p.73-88.
Wolber, D., et al., 2014. App Inventor 2: Create Your Own Android Apps. O'Reilly Media, Inc. ISBN 9781491906842. 360 p.


Section:
Intelligent Computing
Abzetdin Adamov Large-scale data modeling in Hive and distributed query processing using Mapreduce and Tez
DIVAI 2018 – The 12th international scientific conference on Distance Learning in Applied Informatics. 389 ISBN 978-80-7598-059-5 (Print) ISSN 2464-7470 (Print) ISSN 2464-7489 (On-line)
Large-scale data modeling in Hive and distributed
query processing using Mapreduce and Tez
Abzetdin Adamov
Center for Data Analytics Research (CeDAR) ADA University, Baku, Azerbaijan [email protected]
Abstract
Huge amounts of data being generated continuously by digitally interconnected systems of humans, organizations and machines. Data comes in variety of formats including structured, unstructured and semi-structured, what makes it impossible to apply the same standard approaches, techniques and algorithms to manage and process this data. Fortunately, the enterprise level distributed platform named Hadoop Ecosystem exists.
This paper explores Apache Hive component that provides full stack data managements functionality in terms of Data Definition, Data Manipulation and Data Processing. Hive is a data warehouse system, which works with structured data stored in tables. Since, Hive works on top the Hadoop HDSFS, it benefits from extraordinary feature of HDFS including Fault Tolerance, Reliability, High Availability, Scalability, etc. In addition, Hive can take advantage of distributed computing power of the cluster through assigning jobs to MapReduce, Tez and Spark engines to run complex queries. The paper is focused on studying of Hive Data Model and analysis of processing performance done by MapReduce and Tez.
Keywords
Data Model Apache Hive. HDFS. MapReduce and Tez Distributed Computing.
INTRODUCTION
Hadoop is open source common platform that combines two main tasks of any operating system: storing and processing data. Unlike to traditional systems, Hadoop accomplishes that tasks towards Big Data. The popularity of Hadoop increases day by day, because of simplicity, scalability and affordability that it enables thanks to its distributed architecture. Although, the Hadoop Core consists of two main components (HDFS and MapReduce) and has limited functionality, but thanks to many other components available in the Hadoop Ecosystem under Apache Licence, this platform can cover any requirements to manage and process data regardless to its size and format.
Data Analytics in scale that is enabled by Hadoop Ecosystem opens new horizons in turning operational data of businesses into actionable knowledge and consequently into value. In most cases, operational data is generated in structured format and stored in RDBMS. These databases and warehouses are still important, but now in era of Big Data businesses deal with amounts of data that can't feet into traditional RDBMS. Another

Abzetdin Adamov Large-scale data modeling in Hive and distributed query processing using Mapreduce and Tez
DIVAI 2018 – The 12th international scientific conference on Distance Learning in Applied Informatics. 390 ISBN 978-80-7598-059-5 (Print) ISSN 2464-7470 (Print) ISSN 2464-7489 (On-line)
challenge here is that in order to keep competitive advantage, businesses want to use for analytics all available data including website clickstream data, text from call centers, emails, instant messaging repositories, open data initiatives from public and private entities. Its clear that this goal can't be achieved based on traditional RDBMS systems. In contrast, Hadoop is a platform which consists of many components designed to accomplish specific tasks using particular data format. Hadoop Ecosystem components are classified into several categories to make it easier for user to choose appropriate components in accordance to the functions they designed for. There are following categories of the Hadoop components:
� Core Hadoop
� Governance, Integration
� Data Access and Storage
� Operations, Monitoring, Orchestration
� Security
� Data Intelligence
This paper explores Apache Hive component that provides full stack data managements functionality in terms of Data Definition, Data Manipulation and Data Processing. Hive is a data warehouse system, which works with structured data stored in tables. Since, Hive works on top the Hadoop HDSFS, it benefits from extraordinary feature of HDFS including Fault Tolerance, Reliability, High Availability, Scalability, etc. (Zhou, W., Feng, D., Tan, Z., & Zheng, Y., 2017). In addition, Hive can take advantage of distributed computing power of the cluster through assigning jobs to MapReduce, Tez and Spark engines to run complex queries. The study is focussed on studying of Hive Data Model and analysis of processing performance done by MapReduce and Tez (Hortonworks Inc., 2017).
Hive is open-source software that is components of Hadoop Ecosystem. It designed to query and analysis of huge amounts of data stored in HDFS using SQL-like language HiveQL (Hive Query Language). Hive also can be considered as ETL and Data warehousing tool for the large-scale data.
Hive can be also considered as alternative of the MapReduce with higher level of abstraction. Since MapReduce applications are developed in Java or Python, its more flexible, efficient and faster. It is designed to process structured data, so it suppose creation of table with certain structure before loading data. To work with Hive there are at least two options: Web GUI or more popular command line interface (CLI) using HQL (for DDL, less for DML). Hive supports four file formats those are TEXTFILE, SEQUENCEFILE, ORC and RCFILE (Record Columnar File).
Significant difference between DBMS and Hive is that: DBMS generally works on "Schema on READ and Schema on Write", but Hive on "Schema on READ only" (latest version on "WRITE Once READ Many Times").
LITERATURE REVIEW
As the most popular platform for large-scale data management and analytics, Hadoop ecosystem has attracted substantial interest from researchers. Hadoop and its multiple

Abzetdin Adamov Large-scale data modeling in Hive and distributed query processing using Mapreduce and Tez
DIVAI 2018 – The 12th international scientific conference on Distance Learning in Applied Informatics. 391 ISBN 978-80-7598-059-5 (Print) ISSN 2464-7470 (Print) ISSN 2464-7489 (On-line)
components build unique system that allow to hide most of complexities staying focused on real data analysis. This advantages inspires many researchers and us to to understand key components of the ecosystem in depth. The following studies from authors are devoted to different use-cases of the Hadoop Ecosystem.
Lee, Shao and Kang solved the problem of handling big graph that doesn't fit into memory of traditional system. Authors offered to use distributed platform Hadoop HDFS to store data physically and HBase for low latency data access (Lee H., Shao B., & Kang U., 2015). HBase is considered as an open source implementation of Google's Bigtable technology.
Authors of following paper explain relation between cloud computing platforms widely used by enterprises and Hadoop. Paper comprises the ways how enterprises can benefit from Hadoop platform along with existing cloud computing systems. Author observe and discuss primary sub-components of core Hadoop and how they related to each other enabling execution and monitoring of jobs that process data stored on top of HDFS (Ghazi M. R., & Gangodkar D., 2015).
Gadiraju, Verma, Davis and Talaga performed benchmark research comparing performance of Apache Hive with traditional database management system MySQL. Hive is a data warehouse platform that is member of Hadoop ecosystem and works on top of distributed file system HDFS. Hive queries written in HiveQL (SQL-like language) are executed as a MapReduse jobs using cumulative power of distributed Hadoop cluster (Laboshin, L. U., Lukashin, A. A., & Zaborovsky, V. S., 2017). The authors also provide evidence based on experiments that Hive loads the large datasets much faster than MySQL, while it loses its advantage over MySQL when loading the smaller datasets (Gadiraju K.K., Verma M., Davis K.C., & Talaga P.G., 2016). Same is true for query execution as well: Hive is much faster when it comes to processing large amounts of data. Using similar arguments, our paper paper states that the architecture of Hadoop and most of its components is tuned to manage huge amounts of data, but not for random low- latency data access to small chunks of data.
HIVE AS A DISTRIBUTED ETL PLATFORM
Hive Arcitectire
Even Hive provides same DDL and DML services and acts like DBMS, but in reality it is not a DBMS. Traditional DBMS is a software that encapsulates two main subcomponents implemented internally: storage and query engine. Unlike DBMS, Hive is just SQL Query Engine. Hive doesn't care about data storage, instead it relies on the scalable and redundant HDFS. Furthermore, Hive doesn't process computation-intensive queries itself, instead it consumes the MapReduce (or Tez and Spark) framework to use the distributed power of the Hadoop cluster. General architecture and interaction between it’s sub-components is demonstrated on Figure 1.

Abzetdin Adamov Large-scale data modeling in Hive and distributed query processing using Mapreduce and Tez
DIVAI 2018 – The 12th international scientific conference on Distance Learning in Applied Informatics. 392 ISBN 978-80-7598-059-5 (Print) ISSN 2464-7470 (Print) ISSN 2464-7489 (On-line)
Figure 1: General Architecture of Hive.
Hive Data Model – Schema on Read
Unlike Database Systems, Hive enforces the Read schema rather than the Write schema. Any DBMS is strictly checking the model of any data that pretended to be inserted into database whether it follows to the predefined structure, and declines insertion if does not. Opposite to this Hive does not check the model of new data, but instead just copies it into HDFS without any control in order to improve writing speed. Hive checks the relevance of the data and the structure just on read.
Look at the following example that demonstrate what can happen if the data uploaded into table does not follow to the structure defined during the table creation (HiveQL script on Figure 2.).
Figure 2: Source code of HiveQL to create a table.

Abzetdin Adamov Large-scale data modeling in Hive and distributed query processing using Mapreduce and Tez
DIVAI 2018 – The 12th international scientific conference on Distance Learning in Applied Informatics. 393 ISBN 978-80-7598-059-5 (Print) ISSN 2464-7470 (Print) ISSN 2464-7489 (On-line)
Figure 3: Source code of HiveQL to create a table.
As it has been clearly seen in Figure 3. the column “id” was declared as an integer. In this particular example, even data associated with mentioned column was loaded into Hive, but still the values are missing in output of the “select” query. The problem becomes clear after screening the content of data source file. The values of column associated with attribute “id” is surrounded by quotes, what means the type is character. The data type conflict has not been revealed during data load, but comes clear on read.
Hive Metadata
The first implementation of Metadata in Hadoop Ecosystem has started with Hive that used Metastore to store description of data model of Hive tables. Later it became clear that other components of Hadoop need this technique as well. As a result, new components, particularly HCatalog and WebHCat (REST API) appeared those enable Hive metastore to other components of the Hadoop Ecosystem.
Hive storage consists of two categories: metadata and real data. Metadata of tables is stored in "Meta storage database" (generally MySQL), while real data stored in HDFS.
Data Model Components
The Hive data models contain the following components:
� Databases
� Tables

Abzetdin Adamov Large-scale data modeling in Hive and distributed query processing using Mapreduce and Tez
DIVAI 2018 – The 12th international scientific conference on Distance Learning in Applied Informatics. 394 ISBN 978-80-7598-059-5 (Print) ISSN 2464-7470 (Print) ISSN 2464-7489 (On-line)
� Partitions
� Denormalizing
� Buckets or clusters
Data partitioning is about splitting datasets into smaller peaces in order to avoid reading huge volumes of data at once. The reason of doing this is to reduce the speed of read and manipulation of any particular data. Unlike traditional DBMS systems, HDFS does not support low latency transactions, instead it was designed to support the ingestion of huge amounts of data at high speed. In terms of Hive, Data Partitioning enables breaking the data into smaller subsets that allow to retrieve particular data enclosed into subset instead of retrieving all data from the table. (Gwen Shapira, Jonathan Seidman, Ted Malaska, Mark Grover, 2015).
To create a partitioned table in Hive, the certain instruction of HiveQL “PARTITIONED BY” should be used while creating the table (as shown in Figure 4.).
Figure 4: HiveQL code to Create and Manage Partitioned Table.
After loading the data into partitioned table, the content of folder on HDFS associated with the table may look similar to the structure demonstrated on Figure 5.
Figure 5: The Structure of Partitioned Table’s Folder.
HiveQL provides special command (SHOW PARTITIONS table;) to list all partitions generated for the table.
Another technique that can increase data access and processing speed on expense of storage usage effectiveness is Data Denormalization. Usually, tables in relational databases follow to the requirements of the 3rd Normal Form (3NF), as well as 1st and 2nd. The 3NF states that if two tables are related between each other based on Primary Key (example on Figure 6.), not any attribute of the master table can be included into the second table except Primary Key itself. This approach helps to keep records smaller saving a memory at the same time providing high consistency of data.

Abzetdin Adamov Large-scale data modeling in Hive and distributed query processing using Mapreduce and Tez
DIVAI 2018 – The 12th international scientific conference on Distance Learning in Applied Informatics. 395 ISBN 978-80-7598-059-5 (Print) ISSN 2464-7470 (Print) ISSN 2464-7489 (On-line)
Figure 6: Two Related Table those follow to 3rd Normal Form.
When it comes to Hadoop, in reality each join-included query is accomplished by the MapReduce operation that takes too much resources of cluster, especially if the query is called frequently. The idea is to change the structure of table in advance that will eliminate the need to join tables on run as it is shown in Figure 7.
Figure 7: Same two table are Denormalized by joining in advance.
DISTRIBUTED QUERY PROCESSING
HiveServer2 (HS2) is essential component of Hive 2.x that in contrast with HiveServer1, supports multiclient concurrency and authentication. Another important advantage of the HiveServer2 is the fact that it provides JDBC and ODBC interface to interact with Hive.
Queries submitted to Hive are processed in the following way (look at Figure 8.):
1. Client send query to one of HiveServer2 instances connecting over JDBC/ODBC interface;
2. Query is compiled and divided into sub-tasks by HS2; 3. Compiled query is submitted to Tez or MapReduce (depending on which execution engine was set); 4. Coordinator (Tez/ApplicationMaster) asks YARN for allocation of the computing resources (containers) across the cluster; 5. Tez/ApplicationMaster transfers tasks into containers; 6. Data that resides within HDFS in variety formats (text, ORC, AVRO, Parquet) is read using HDFS interface; 7. Data is processed and result are returned over JDBC/ODBC interface.
Tez is new high-performance batch processing framework for execution of complex Hive queries that significantly outperforms traditional MapReduce framework (which is used by Hive as a default execution engine).

Abzetdin Adamov Large-scale data modeling in Hive and distributed query processing using Mapreduce and Tez
DIVAI 2018 – The 12th international scientific conference on Distance Learning in Applied Informatics. 396 ISBN 978-80-7598-059-5 (Print) ISSN 2464-7470 (Print) ISSN 2464-7489 (On-line)
Figure 8: Query Execution Architecture of Hive.
Hive queries are submitted to HiveServer2 server that generates Tez graph that in its turn is transfered to YARN for processing. Each Hive query is monitored by their individual Tez ApplicatiuonMaster. Number of simultaneous queries are limited with number of allowed ApplicationMasters.
MapReduce and Tez have significant differences in computation models that effects their performance. Looking to the architecture of computation model of MapReduce shown in Figure 10., (while executing the query shown on Figure 9.) it obvious that following elements increase cost and time of the MapReduce execution:
� To execute this query using MapReduce execution engine, Hive should launch 4 MR jobs
� Generally, each MR job has its own start-up time and after processing writes result to HDFS providing data to subsequent job for read.
Figure 9: HiveQL code to retrieve data from three tables.

Abzetdin Adamov Large-scale data modeling in Hive and distributed query processing using Mapreduce and Tez
DIVAI 2018 – The 12th international scientific conference on Distance Learning in Applied Informatics. 397 ISBN 978-80-7598-059-5 (Print) ISSN 2464-7470 (Print) ISSN 2464-7489 (On-line)
Figure 10: Computation Model of MapReduce.
At the same the following features of Tez make it’s computation model (look at Figure 11.) more efficient and consequently fast:
� In contrary to MapReduce, Tez performs complex query as a single execution graph
� Tez doesn’t implement wasting intermediate IO operations with HDFS
� Vertexes in graph are processing jobs and edges are data streams
� Tez supports “hot containers” to start jobs immediately without wasting time for
start-up
Figure 11: Computation Model of Tez.

Abzetdin Adamov Large-scale data modeling in Hive and distributed query processing using Mapreduce and Tez
DIVAI 2018 – The 12th international scientific conference on Distance Learning in Applied Informatics. 398 ISBN 978-80-7598-059-5 (Print) ISSN 2464-7470 (Print) ISSN 2464-7489 (On-line)
LLAP is a new computation paradigm recently implemented in Hive. It consists of the set of persistent daemons that execute fragments of Hive queries. This persistency allows to start jobs much faster, since containers do not need warm-up. Query execution on LLAP is very similar to Hive without LLAP, except that jobs run inside LLAP daemons, and not within YARN containers. Both the Hive on Tez engine for batch queries and the enhanced Hive on Tez LLAP-enhanced engine run on YARN nodes. The Hive LLAP layer over Tez execution engine requires particular Hadoop YARN settings to consume full potential of this new advancement in Hive (Hortonworks Community Connection, 2017).
Computing Resources for Experiments
In the framework of the Center for Data Analytics Research (CeDAR) the mid power computing cluster has been launched (Figure 12.).
Computing Cluster Hardware – the primary component of the CeDAR. This is powerful, scalable and fault-tolerant computing cluster based on distributed architecture, which operates totally on open-source software. Each computing node is equipped with Intel Xeon E-5 processor, 96 GB memory, 8 LFF Hard Drives of 2 TB storage each and 1Gb Ethernet support.
Characteristics of the cluster:
� Processing Cores: 102
� RAM: 1,568 TB
� Storage: 136 TB
Specifications of the cluster's components:
� NameNode (1 unit): HP DL360 Gen9 4LFF CTO Server: 2 x Intel® Xeon® E5-2603v4 (1.7GHz/6- core/15MB/85W), 128GB RAM, 4 x HP 2TB 12G SAS 7.2K rpm LFF HDD, HP 1U LFF Gen9 Mod Easy Install Rail Kit;
� DataNode (15 units): HP DL380 Gen9 12LFF CTO Server: Intel® Xeon® E5- 2603v4 (1.7GHz/6- core/15MB/85W), 96GB RAM, 8 x HP 2TB 12G SAS 7.2K rpm LFF HDD, HP 2U LFF Easy Install Rail Kit;

Abzetdin Adamov Large-scale data modeling in Hive and distributed query processing using Mapreduce and Tez
DIVAI 2018 – The 12th international scientific conference on Distance Learning in Applied Informatics. 399 ISBN 978-80-7598-059-5 (Print) ISSN 2464-7470 (Print) ISSN 2464-7489 (On-line)
Figure 12: Distributed cluster at the CeDAR research center.
Computing Cluster Software – the cluster is running on Apache Hadoop ecosystem. It is deployed using Hortonworks HDP 2.6 distribution, which is 100% open source.
EXPERIMENTAL RESULTS
Many experiments have been accomplished on the CeDAR cluster to identify most important parameters and criteria those have highest impact on the performance of the query processing on Hive.
The following datasets listed in Table 1. publicly available at the Kaggle Datasets repository (Kaggle Inc., 2018) were used to implement experiments. The table “houses_part” with relatively large number of records was used to reveal the effect of the file format on the performance. Other three tables “occup”, “occupdata” and “jobs” were used in the complex HQL queries where 2-4 tables are merged using multiple join instructions.
Table 1: Parameters of tables used in experiments.
Query Performance depending on Execution Engine
As it was stated above Tez outperforms MapReduce as a execution engine while processing HiveQL queries. Computation architectures of both engines depicted on Figures 10. and 11. displays key differences those affect the performance. As the Table 2.

Abzetdin Adamov Large-scale data modeling in Hive and distributed query processing using Mapreduce and Tez
DIVAI 2018 – The 12th international scientific conference on Distance Learning in Applied Informatics. 400 ISBN 978-80-7598-059-5 (Print) ISSN 2464-7470 (Print) ISSN 2464-7489 (On-line)
demonstrates, based on experimental query execution initiated with three different queries it is clearly seen that Tez is faster.
Table 2: Query performance dependence on Execution Engine.
* - with following settings
sethive.input.format=org.apache.hadoop.hive.ql.io.CombineHiveInputFormat;
set hive.merge.mapfiles=true;
** - if execution engine is tuned using following settings, the execution time increases to about 5 times (154 sec):
set hive.input.format=org.apache.hadoop.hive.ql.io.HiveInputFormat;
set hive.merge.mapfiles=false;
Partitioning Effect on Query Performance
As it was indicated above, Hive supports the partitioning of the data file by value of specific column or several columns. This technique can significantly effect the query performance. This impact can be explained by the fact that in the partitioned table the query executor does not forced to read whole file from the HDFS, instead it reads just particular partition(s) where the data of interest is located.
To create the partitioned table, the instruction PARTITIONED BY “columnName TYPE” should be included into the table creation script (look at Figure 13.). To ingest the data into the partitioned table, we need to load data firstly into non-partitioned intermediate table, and after that insert into the partitioned table.
Figure 13: Storage Efficiency by Hive File Formats.

Abzetdin Adamov Large-scale data modeling in Hive and distributed query processing using Mapreduce and Tez
DIVAI 2018 – The 12th international scientific conference on Distance Learning in Applied Informatics. 401 ISBN 978-80-7598-059-5 (Print) ISSN 2464-7470 (Print) ISSN 2464-7489 (On-line)
After ingesting the data into table, the exact number of data-files equal to the number of unique values of column. These files (partitions) will appear in the folder associated with partitioned table. In presented example (Figure 13.) there are five distinct values (“D”, ”F”, “O”, “S”, “T”) of the column and accordingly there are five files (the size of each partition is on the left) in the directory.
Figure 13: Computation Model of Tez.
The experimental results obtained after execution the same queries on the data that this time stored in partitioned table reveals significant performance improvement, as shown on Table 3., in comparison with results of unpartitioned table shown in Table 2.
Table 3: Folder associated with partitioned table.
File Format Effect on Query Performance
Hive as a many other components of the Hadoop Ecosystem is designed following to the write-once concept, but not for low latency data access. By default, Hive that is functioning on top of HDFS supports neither ACID nor OLTP transactions. Even so, low latency data access can be enabled using particular file format to store the data and LLAP (Low Latency Analytical Processing) daemons based on persistent query executors.
Hive supports four file formats those are TEXTFILE, SEQUENCEFILE, ORC and RCFILE (Record Columnar File). Optimized Row Columnar (ORC) is a file format that specially designed for storing the Hive data. ORC outperforms all other file formats supported by Hive. The following chart in Figure 14. demonstrates the advantage of the ORC file format in terms of storage efficiency.

Abzetdin Adamov Large-scale data modeling in Hive and distributed query processing using Mapreduce and Tez
DIVAI 2018 – The 12th international scientific conference on Distance Learning in Applied Informatics. 402 ISBN 978-80-7598-059-5 (Print) ISSN 2464-7470 (Print) ISSN 2464-7489 (On-line)
Figure 14: Storage Efficiency by Hive File Formats.
Besides, ORC file format supports internal indexing that enables skipping large intervals of rows those are out of interest. Default size of the ORC blocks is 256 MB what makes sequential read highly effective and decrease the load on the NameNode (Blog by Christian Prokopp, 2014).
In order to create the table that stores data in ORC format, it is enough to replace the instruction “STORED AS TEXTFILE” to “STORED AS ORC” in HiveQL code shown in Figure 13.
After loading the data into ORC-table, the following files will be created in the folder associated with partitioned table. Simple comparison of total size of the folders associated with two tables stored as TextFile and ORC, demonstrates that ORC file format is about 4 times more space-effective even without compression (look at Figure 15.).
Figure 15: Folder associated with partitioned table stored as ORC file.
By being space-effective ORC file format has quite significant impact on overall performance of the HiveQL execution. If same data occupies less space on the file system, it means less time will be spent for HDFS read operations speeding up split and map jobs. The Table 4. shows the time spent for query execution applied to the table stored as ORC file. It is important to notice that the execution performance will increase in parallel with growth of data size.

Abzetdin Adamov Large-scale data modeling in Hive and distributed query processing using Mapreduce and Tez
DIVAI 2018 – The 12th international scientific conference on Distance Learning in Applied Informatics. 403 ISBN 978-80-7598-059-5 (Print) ISSN 2464-7470 (Print) ISSN 2464-7489 (On-line)
Table 4: Query Performance on the ORC file format.
CONCLUSION AND FUTURE WORK
The Hadoop Ecosystem becomes the de facto standard platform of choice for enterprises that provides critical features like scalability, fault-tolerance, low TCO and high ROI those are hardly available in traditional IT platforms. One of the most important components of Hadoop Ecosystem Apaches Hive has been thoroughly observed, key features those have highest impact on performance revealed and extensive experiments conducted to demonstrate the truth of findings.
While observing the results it is important to keep in mind that Hive, as a many other components of Hadoop Ecosystem running on top of HDFS, is not designed for low latency random access to data. Real power of Hive can be seen while processing huge chunks of structured data stored on HDFS.
Further research is needed to investigate the computation model of LLAP and its advantage in terms of the query processing performance as compared to Tez without LLAP. Even both Tez and Tez with LLAP are working on top on the YARN nodes, there are some peculiarities implemented in the architecture of LLAP engine those make the query processing about 25 times faster than performance offered by Hive without LLAP (Nita Dembla, 2016).
ACKNOWLEDGEMENT
This research was supported by a grant from “Strengthening Teaching and Research Capacity at ADA University” project funded by the European Union. For the research experiments the distributed computing cluster of the Center for Data Analytics Research (CeDAR) has been used.
REFERENCES
Blog by Christian Prokopp, 2014, ORC: An Intelligent Big Data file format for Hadoop and Hive. [online] Available at <http://www.semantikoz.com/blog/orc-intelligent-big-data-file- format-hadoop-hive/> [Accessed January 2018].
Gadiraju, K. K., Verma, M., Davis, K. C., & Talaga, P. G. (2016). Benchmarking performance for migrating a relational application to a parallel implementation. Future Generation Computer Systems, 63, 148–156. https://doi.org/10.1016/j.future.2015.12.015

Abzetdin Adamov Large-scale data modeling in Hive and distributed query processing using Mapreduce and Tez
DIVAI 2018 – The 12th international scientific conference on Distance Learning in Applied Informatics. 404 ISBN 978-80-7598-059-5 (Print) ISSN 2464-7470 (Print) ISSN 2464-7489 (On-line)
Ghazi, M. R., & Gangodkar, D. (2015). Hadoop, MapReduce and HDFS: A Developers Perspective. Procedia Computer Science, 48, 45–50. https://doi.org/10.1016/j.procs.2015.04.108
Gwen Shapira, Jonathan Seidman, Ted Malaska, Mark Grover, 2015, Hadoop Application Architectures, O'Reilly Media, Inc.
Hortonworks Community Connection, 2017, Introduction: how does LLAP fit into Hive, [online] Available at <https://community.hortonworks.com/articles/149894/llap-a-one-page- architecture-overview.html> [Accessed Fevruary 2018].
Hortonworks Inc., 2017. Apache Tez. [online] Available at <https://hortonworks.com/apache/tez/> [Accessed January-March 2018].
Kaggle Inc., 2017, Publicly open datasets, [online] Available at <https://www.kaggle.com/datasets> [Accessed December 2017 - March 2018].
Laboshin, L. U., Lukashin, A. A., & Zaborovsky, V. S. (2017). The Big Data Approach to Collecting and Analyzing Traffic Data in Large Scale Networks. Procedia Computer Science, 103, 536–542. https://doi.org/10.1016/j.procs.2017.01.048
Lee, H., Shao, B., & Kang, U. (2015). Fast graph mining with HBase. Information Sciences, 315, 56–66. https://doi.org/10.1016/j.ins.2015.04.016
Nita Dembla, 2016, Announcing Apache Hive 2.1: 25X Faster Queries and Much More, [online] Available at <https://hortonworks.com/blog/announcing-apache-hive-2-1-25x-faster-queries- much/> [Accessed March 2018]
Zhou, W., Feng, D., Tan, Z., & Zheng, Y. (2017). Improving big data storage performance in hybrid environment. Journal of Computational Science. https://doi.org/10.1016/j.jocs.2017.01.003.

Martin Drlík Identification of necessary tasks for effective Adoption of Learning Analytics at the University
DIVAI 2018 – The 12th international scientific conference on Distance Learning in Applied Informatics. 405 ISBN 978-80-7598-059-5 (Print) ISSN 2464-7470 (Print) ISSN 2464-7489 (On-line)
Identification of necessary tasks for effective
Adoption of Learning Analytics at the University
Martin Drlík
Constantine the Philosopher University in Nitra, Slovakia [email protected]
Abstract
Learning analytics represents a research discipline, which deals with a gathering, measuring, and analysis of available educational data about stakeholders for understanding and optimizing of the learning process as well as the whole environment, where the learning process takes place. Although several approaches and frameworks for learning analytics successful adoption and implementation at the higher educational institutions are proposed in the literature, meaningful implementation of the learning analytics still faces several challenges and encounters many obstacles. The paper summarizes the main challenges and issues, which modern universities should take into account in case they plan to adopt some useful features of the learning analytics at different levels of the university management. Consequently, it analyses a current state of readiness of the university for learning analytics implementation. As a result, a strategy for the learning analytics adoption and implementation is proposed.
Keywords
Learning analytics. Decision making support. Higher educational institutions.
INTRODUCTION
Learning Analytics (LAK) is a rapidly growing area of interest in higher educational institutions (HEI) worldwide. LAK represents a new research discipline, which applies modern statistical techniques and methods on the system level of the learning process, targets the institutional level, and tries to support the decision-making processes of the educational institutions (Ferguson et al., 2016). LAK research is primarily driven by the need to improve student success, retention, and the learning experience. The book by Larusson & White (2014) summarised that the LAK methods and techniques could:
� enhance student and faculty performance,
� improve student understanding of course material,
� assess and attend to the needs of struggling learners,
� provide feedback in real-time,
� develop self-regulated learning skills,
� improve accuracy in grading,

Martin Drlík Identification of necessary tasks for effective Adoption of Learning Analytics at the University
DIVAI 2018 – The 12th international scientific conference on Distance Learning in Applied Informatics. 406 ISBN 978-80-7598-059-5 (Print) ISSN 2464-7470 (Print) ISSN 2464-7489 (On-line)
� allow instructors to assess and develop their own strengths,
� encourage the more efficient use of resources at the institutional level.
As can be seen, the LAK focuses on the interpretation of the wide range of available educational data with the aim of evaluation of the learning progress, future student’s performance, or potential study problems identification (Macfadyen et al., 2014). Moreover, the LAK outcomes can be applied not only to the evaluation of the student’s performance, but they can help to review the study programs, syllabus, even the educational institutions (Johnson et al., 2011).
Several HEIs see the LAK as a way of enhancing teaching, in particular by encouraging more timely assessing of students’ activities and helping to build better relationships between students and teaching staff. For these institutions, the focus is on putting the LAK outcomes in the hands of teaching staff who work directly with students and providing them with actionable insights into student performance (Sclater, 2014).
On the other hand, other HEIs see the educational data, which arose from the students and faculty activity, as a source, which analysis should be useful for the stakeholders at every level of the organisation, from individual students and their tutors to educational researchers, to the HEI’s management (Sclater, 2014).
If the results of several solid review papers are taken into account (Ferguson et al., 2016, Larruson and White, 2016), it is clear, that most institutions are still in a preparatory or early stage of LAK adoption (Figure 1). In other words, HEIs are aware of LAK opportunities, but surprisingly, they use only some basic reports. These findings are in line with the next survey results that 70 percent of surveyed institutions agreed that LAK is a major priority for them, but the majority of HEIs have not yet moved beyond basic reporting (Bichsel, 2012; Norris & Baer, 2013). They are predominantly in the stages marked as Aware or Experimentation according to the general sophistication model of LAK (Figure 1).
Figure 1: Learning analytics sophistication model (Siemens et al., 2014).
It is not surprising that many higher institutions have not defined clear strategies for LAK adoption yet and moving towards the next stages like Organizational Transformation

Martin Drlík Identification of necessary tasks for effective Adoption of Learning Analytics at the University
DIVAI 2018 – The 12th international scientific conference on Distance Learning in Applied Informatics. 407 ISBN 978-80-7598-059-5 (Print) ISSN 2464-7470 (Print) ISSN 2464-7489 (On-line)
require the procedural concerns and practical applications, as well as establishing strategic leadership and monitoring (Tsai and Gasevic, 2016).
Considering the above-mentioned contradiction between the current and desired stage of LAK adoption, the main objective of the paper is to summarise known challenges, which HEIs should solve if they can adopt LAK. Subsequently, the paper tries to suggest a strategy based on the review of valuable resources, which should be used at the authors’ university for achieving success in LAK adoption and implementation.
The paper has the following structure. The next section provides several widely accepted LAK definitions with focus on its relation to the HEIs. The third section summarises challenges, which should HEIs take into account if they would adopt perspective contributions of LAK at different levels and for different stakeholders. A request to manage LAK adoption using some verified guidelines, frameworks, as well as case studies, is emphasized in the fourth section. Considering them, the consequent section analyses the current state at the Constantine the Philosopher University and provides some recommendations to follow in the. Finally, a short discussion and conclusion provide several open questions and tasks for the future research.
LEARNING ANALYTICS DEFINITIONS
Learning analytics belongs to the contemporary most emerging research disciplines in the field of educational technology. Although Cooper (2012) noted, that it is hard to provide any definition of LAK as there are different perspectives or commercial motivations to emphasise a particular focus area or nuance, there are several concise definitions, which specify the LAK and topics, which it researches, and which explain the reason for contemporary rising popularity of the LAK.
The most widely used and accepted definition defines LAK as a research discipline, which deals with a gathering, measuring, and analysis of available data about stakeholders for understanding and optimizing of the learning process and the whole environment, where the learning process is realized (Baker and Siemens, 2014).
Bichsel (2012) subsequently defines LAK as usage of data, statistical analysis, and explanatory and predictive models to gain insights and act on complex issues relating to learners and other stakeholders of the educational environment.
There are also published some less formal definitions of LAK. For example, Duval (2012) states, that LAK is about collecting traces that learners leave behind and using those traces to improve learning or learning analytics is the process of developing actionable insights through problem definition and the application of statistical models and analysis against existing and/or simulated future data. Barneveld et al. (2012) propose that analytics should be viewed as an overarching concept and defined LAK as the use of analytic techniques to help target instructional, curricular and support resources to support the achievement of specific learning goals. Finally, JISC views analytics as something people do. It descripts LAK as the process of developing actionable insights through problem definition and the application of statistical models and analysis against existing and/or simulated future data (JISC, 2014; Jordaan and Merwe, 2015).

Martin Drlík Identification of necessary tasks for effective Adoption of Learning Analytics at the University
DIVAI 2018 – The 12th international scientific conference on Distance Learning in Applied Informatics. 408 ISBN 978-80-7598-059-5 (Print) ISSN 2464-7470 (Print) ISSN 2464-7489 (On-line)
These definitions define the LAK in general. A closer look at the definition of the LAK regarding the focus of this paper, e.g., assuming suitable approach to the effective LAK features adoption and implementation at the HEI, provide the following definitions. Adejo and Connolly (2017) narrowed the LAK definition to its use in the context of HEI and virtual learning environment. They understand the LAK as a collection, storage, and analysis of data from learning management systems in order to gain useful and intelligent insights for decision making that will have a lasting impact on learners and the HEI. In other words, the main intention of LAK is for gathering learners’ data for the development of models, algorithms, and processes that can be further used and generalised to improve stakeholders’ performance.
Similarly, Siemens and Baker (2012) define LAK as a discipline, which deals with measuring, collecting, analysing and reporting of the data, which was created during the HEI stakeholders’ activity, for the purpose of the understanding, optimization or improvement of the learning process. At the same time, LAK utilizes the same activities in order to optimization of the learning environment.
This exhaustive list of definitions indicates that considering the critical mass of researchers, who deal with the LAK related topics, as well as continual progress in data science and technologies the meaning of the LAK is changing from a buzzword to the set of process frameworks, methodologies, and recommendations. They will allow the HEIs easier start the process of LAK features implementation. The following section summarizes several challenges, which stand before the management of HEI.
CHALLENGES FOR LAK ADOPTION AT HEI
LAK is designed to be of immense benefit to the organisation, teachers and learners in the areas of learning personalization, performance enhancement and feedback, student empowerment, learning methods design and consequently improved educational decision making (Adejo and Connoly, 2017). While the vision of improving student learning and assessment through the implementation of effective LAK tools and approaches holds promise, further challenges of implementation are significant. Therefore, HEIs face many technical and leadership challenges in the adoption of LAK (Head and Alford, 2013). These challenges should HEI solve before they can state, that LAK positively influenced several aspects of the educational process, as well as decision support of the HEI’s management (Adejo and Connoly, 2017). At the most basic level, they need to understand what learning analytics is, how they could benefit the institution and what drawbacks they have (Tsai and Gasevic, 2017).
Larruson and White (2014) noticed that these challenges naturally come out of the fact, that the LAK researchers have primarily focused on issues such as the development and testing of algorithms and visualizations. When they develop analytics that can support learning and teaching, few LAK projects will have the capacity to undertake an ethnographic study of institutional culture or a review of recent thinking on change management. Moreover, according to Norris and Baer (2013) a critical deficit, once a vision and strategy have been established, is the limited capacity of universities in implementing analytics strategies. Adejo and Connoly (2017) noted that a shift from small-

Martin Drlík Identification of necessary tasks for effective Adoption of Learning Analytics at the University
DIVAI 2018 – The 12th international scientific conference on Distance Learning in Applied Informatics. 409 ISBN 978-80-7598-059-5 (Print) ISSN 2464-7470 (Print) ISSN 2464-7489 (On-line)
scale research towards broader institutional implementation introduces a new set of challenges because institutions are stable systems, resistant to change.
Several authors tried to summarise challenges related to the LAK implementation at the HEIs, with the aim to point out the complexity of the whole process and create a basis for LAK frameworks and models proposals. As a result, some authors provide a list of general challenges, which need to be taken into account, further analysed and researched before they are applicable at the institutional level. For example, Jordaan and Merwe (2017) assume, its necessary to
� begin with a clear strategic vision,
� create a culture within institutions to adapt processes and accept the importance of data,
� identify potential barriers to adoption,
� adopt new processes and change management,
� allocate additional costs on already constrained budgets within higher education,
� consider the fact that data are seldom interoperable and successful implementation of LAK relies not only on data integration but also on the quality of data,
� put in place appropriate forms of support, training, and community building,
� cooperate with the aim to minimise a lack of dedicated data management experts to produce needed datasets in a timely manner.
In this context, Tsai and Gasevic (2017) summarised the following six challenges regarding the adoption of learning analytics:
� Challenge 1 - There is a shortage of leadership capabilities to ensure that implementation of learning analytics is strategically planned and monitored.
� Challenge 2 - There are infrequent institutional examples of equal engagement with different stakeholders at various levels.
� Challenge 3 - There is a shortage of pedagogy-based approaches to removing learning barriers that have been identified by analytics.
� Challenge 4 - There are insufficient training opportunities to equip end users with the ability to employ learning analytics.
� Challenge 5 - There are a limited number of studies empirically validating the impact of analytics-triggered interventions.
� Challenge 6 - There is limited availability of policies that are tailored for learning analytics-specific practice to address issues of privacy and ethics as well as challenges identified above.
These challenges create borders of an environment, context, in which HEIs live. They can not be ignored, while the strategy of LAK adoption is developed. On the other hand, these challenges are to general, and more tangible rules or recommendations should be considered during this process.
Pineda (2016) provides an example of the approach, which takes into account the uniqueness of a particular HEI. This approach identifies organizational and technical trends, which relate to the successful adoption and implementation of LAK at the HEI. Pineda proposed a Readiness Assessment process, which was conducted as part of JISC’s

Martin Drlík Identification of necessary tasks for effective Adoption of Learning Analytics at the University
DIVAI 2018 – The 12th international scientific conference on Distance Learning in Applied Informatics. 410 ISBN 978-80-7598-059-5 (Print) ISSN 2464-7470 (Print) ISSN 2464-7489 (On-line)
learning analytics project (JISC, 2016). The Readiness Assessment process is designed to be collaborative and conducted onsite with a variety of key stakeholders across the institution. As Pineda noted, from an organizational perspective, there is required a high level of support for learning analytics. While there are concerns, as expressed before, the learning and teaching, academic staff, and student groups all feel strongly that LAK would be of benefit to the institutions. However, only if it will be implemented correctly and with the full participation of all required groups of stakeholders (Pineda, 2016).
The main ideas of the Readiness Assessment approach will be used in the section, which deals with the strategy for implementing LAK at the author’s university. However, even before a short description of the LAK adoption frameworks will be introduced, which provide a more systemic approach to the effective and meaningful adoption.
LAK ADOPTION AND IMPLEMENTATION FRAMEWORKS
The challenges of implementing institution-wide LAK include both procedural concerns and practical applications. They require many procedural changes at different levels of education. These challenges highlight the need to develop a comprehensive policy that meets the requirements of LAK and considers multiple dimensions including an institution’s context, stakeholders, pedagogical applications, institutional capacities, success evaluation, legal and ethical considerations, and a long-term strategy of the HEI (Tsai and Gasevic, 2016).
Firstly, it is of great importance that institutions adopt learning analytics under clear guidelines that are based on known best practices for learning analytics in HEI environment. Moreover, they should take into account cultural, social, economic and political specifications of the individual HEI (Macfadyen et al., 2014).
Several initiatives and project have focused on the institutional adoption of LAK. They provide models, which try to prepare or improve conditions of whole education environment to adopt the features of LAK, as well as individual HEI. Tsai and Gasevic (2017) realized a detailed review of eight existing LAK policies. The review confirms that one of the biggest challenges in the adoption of learning analytics is the lack of institutional policies. The review also shows that the eight policies have not considered enough the establishment of two-way communication channels and pedagogical approaches. Most of the policies also lack guidance for the development of data literacy among end-users and for evaluation of the impact and effectiveness of LAK.
Based on these conclusions, the EU project SHEILA was initialized. This project introduced a systemic approach to LAK, which has been developed to assist European universities to become more mature users and custodians of digital data about their students as they learn online (Gashevic et al. 2014). The main deliverable of the SHEILA project is a policy development framework that supports HEIs in LAK adoption and implementation. This project introduced a modified framework RAPID (Research and Policy in Development) Outcome Mapping Approach (ROMA), which offers a systematic approach to the institutional implementation of learning analytics. As a result, ROMA serves as a policy and planning heuristic for learning analytics implementation (Ferguson et al., 2014).
This framework consists of seven iterative steps (Figure 2):

Martin Drlík Identification of necessary tasks for effective Adoption of Learning Analytics at the University
DIVAI 2018 – The 12th international scientific conference on Distance Learning in Applied Informatics. 411 ISBN 978-80-7598-059-5 (Print) ISSN 2464-7470 (Print) ISSN 2464-7489 (On-line)
� Define a clear set of overarching policy objectives.
� Map the context.
� Identify the key stakeholders.
� Identify learning analytics purposes.
� Develop a strategy.
� Analyse capacity; develop human resources.
� Develop a monitoring and learning system (evaluation).
Figure 2: The RAPID Outcome Mapping Approach (ROMA) (Ferguson et al., 2014).
The ROMA framework is focused on evidence–based policy change. It is designed to be used iteratively and to allow refinement and adaptation of policy goals and the resulting strategic plans over time and as contexts change, emphasizing the provisional nature of any solutions. The ROMA process begins with a systematic effort at mapping institutional context, the people, political structures, policies, institutions and processes that may help or hinder change (Tynan and Buckingham Shum, 2013). This critical activity allows institutions to identify the key factors specific to their own context that may influence (positively or negatively) the implementation process (Macfadyen et al., 2014).
Besides these surely evitable external steps defined by SHEILA and similar initiatives (SOLAR, EDUCASE, ECAR), HEI should adjust own strategy and identify the most relevant key players for successful implementation of LAK at the HEI. According to Tsai and Gasevic (2017), the following six key themes should be included in an institutional policy:
� Privacy and transparency
� Roles and responsibilities
� Objectives of learning analytics
� Risks and challenges
� Data management
� Research and data analysis
These themes relate closely to the dimensions postulated by Drachsler and Greller (2012). They developed a framework that includes six critical dimensions related to the

Martin Drlík Identification of necessary tasks for effective Adoption of Learning Analytics at the University
DIVAI 2018 – The 12th international scientific conference on Distance Learning in Applied Informatics. 412 ISBN 978-80-7598-059-5 (Print) ISSN 2464-7470 (Print) ISSN 2464-7489 (On-line)
LAK initiative. Each of the dimensions mentioned in Figure 3 should be addressed in order to institutionalise the LAK initiative successfully. The model assumes that the modification of the individual parameter or representative, which characterize given dimension, influences other dimensions. This modification can cause changes in the observed outcomes. It means that only the balance between the various dimensions leads to the optimal utilization of the LAK methods in HEI (Drachsler and Greller, 2012).
Figure 3: Dimensions of LAK in the context of the learning process (Greller and Drachsler, 2012).
The LAK adoption is an iterative process, which does not fit to all (Gašević et al., 2016). Considering the previously mentioned frameworks, it is, therefore, necessary to estimate the fulfilment of each key area from the perspective of resources, processes, people, responsibilities and their impact on the expected results. The adjustment of the proposed frameworks to the conditions of the Constantine the Philosopher University in Nitra (UKF) will be discussed in more detail in the next section.
PROPOSAL OF LAK ADOPTION AT THE UKF STRATEGY
The UKF belongs to the universities, which are in the preliminary stage of maturity of LAK deployment according to the schema in Figure 1. The university management has not yet fully uncovered the possibilities of the data-driven era. Educational data analysis is realized in the form of reports, pivotal tables, and simple charts. Considering the individual dimensions of LAK from the previous section (Greller and Drachsler, 2012), the current state can be summarized as follows.
Educational data are systematically collected in the academic IS and LMS for more than ten years. It has the structured (relational databases) and unstructured form (e-learning courses and scholarly publications content. While the structured data are evaluated, transformed and loaded to the form of data warehouse, the unstructured data is in raw form.
Instruments in the meaning of tools, which can be applied in the preliminary phase of LAK adoption have been already implemented. LMS Moodle maintained at the university level provides up-to-date LAK tools and interface. However, its effective use depends on the systematic use of other instruments, like guidelines, following the rules of using LMS and the knowledge of the trained stakeholders. Objectives of LAK adoption exist only in the conceptual form described in several papers. Their materialization requires the support of all HEI management levels. Moreover, the stakeholders at all levels do not have any knowledge, as well as any expectations related to the possibilities of LAK. Consequently, it is obvious, that these weaknesses constrain the further discussion about
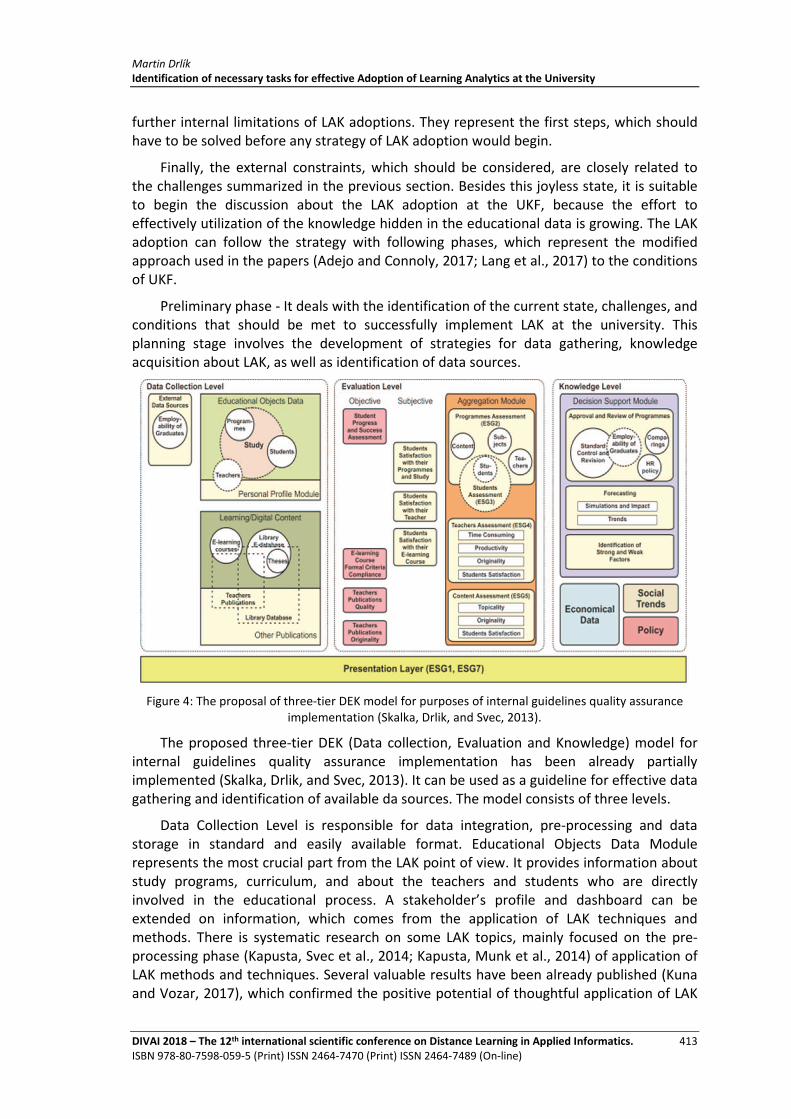
Martin Drlík Identification of necessary tasks for effective Adoption of Learning Analytics at the University
DIVAI 2018 – The 12th international scientific conference on Distance Learning in Applied Informatics. 413 ISBN 978-80-7598-059-5 (Print) ISSN 2464-7470 (Print) ISSN 2464-7489 (On-line)
further internal limitations of LAK adoptions. They represent the first steps, which should have to be solved before any strategy of LAK adoption would begin.
Finally, the external constraints, which should be considered, are closely related to the challenges summarized in the previous section. Besides this joyless state, it is suitable to begin the discussion about the LAK adoption at the UKF, because the effort to effectively utilization of the knowledge hidden in the educational data is growing. The LAK adoption can follow the strategy with following phases, which represent the modified approach used in the papers (Adejo and Connoly, 2017; Lang et al., 2017) to the conditions of UKF.
Preliminary phase - It deals with the identification of the current state, challenges, and conditions that should be met to successfully implement LAK at the university. This planning stage involves the development of strategies for data gathering, knowledge acquisition about LAK, as well as identification of data sources.
Figure 4: The proposal of three-tier DEK model for purposes of internal guidelines quality assurance implementation (Skalka, Drlik, and Svec, 2013).
The proposed three-tier DEK (Data collection, Evaluation and Knowledge) model for internal guidelines quality assurance implementation has been already partially implemented (Skalka, Drlik, and Svec, 2013). It can be used as a guideline for effective data gathering and identification of available da sources. The model consists of three levels.
Data Collection Level is responsible for data integration, pre-processing and data storage in standard and easily available format. Educational Objects Data Module represents the most crucial part from the LAK point of view. It provides information about study programs, curriculum, and about the teachers and students who are directly involved in the educational process. A stakeholder’s profile and dashboard can be extended on information, which comes from the application of LAK techniques and methods. There is systematic research on some LAK topics, mainly focused on the pre-processing phase (Kapusta, Svec et al., 2014; Kapusta, Munk et al., 2014) of application of LAK methods and techniques. Several valuable results have been already published (Kuna and Vozar, 2017), which confirmed the positive potential of thoughtful application of LAK

Martin Drlík Identification of necessary tasks for effective Adoption of Learning Analytics at the University
DIVAI 2018 – The 12th international scientific conference on Distance Learning in Applied Informatics. 414 ISBN 978-80-7598-059-5 (Print) ISSN 2464-7470 (Print) ISSN 2464-7489 (On-line)
to the educational process. Learning Digital Content Module collects information about the study materials, recommended publications, e-learning courses, e-books, and interactive multimedia applications and could be further analysed by LAK tools.
Evaluation Level contains the Objective evaluation module, which allows quantified measurement. This module quantifies several criteria from obtained data and converts them to the numerical representation.
Knowledge Level Knowledge provides tools and modules suitable for uncovering of hidden causalities among data and decision support of the university management. Planned forecasting module identifies trends and opportunities in the fields closely associated with the activities of the university on the basis statistical data and simulations. Finally, this level provides anonymized data used as an input to the LAK tools for the description of learning engagement and progress, diagnosis of learning engagement and progress, prediction of learning progress as well as prescription (recommendations) for improvement of learning progress. Simultaneously, it involves the identification of major stakeholders and necessary technologies and tools to address the gap. Special attention is put on the identification and assessment of the impact of the behaviour of each stakeholder on the development of LAK.
Security, privacy and compliance phase – An adequate identification and understanding of security, privacy and legal issues relating to the accessibility, use, and storage of educational data is necessary. Current development in EU should be taken into account. General Data Protection Regulation (GDPR) and other regulations must be implemented and monitored during the whole period of LAK adoption. As a result, a set of guidelines, policies, and standards for privacy, data protection, security, and mainly highly sensitive ethical aspects of educational data are prepared (Ferguson et al., 2016; Lang, 2017).
Strategy development phase - This phase involves designing and development of the key strategy to meet the specific requirement of LAK development. The technological, organizational and human-related factors should be analysed in this phase (Adejo and Connoly, 2017).
Considering the results of the best practices and LAK adoption frameworks, as well as personal capacities, it is necessary to define the technological requirements of the university regarding LAK, evaluate available technologies and tools, choose and design appropriate one.
From the organisational point of view, this phase requires to start a process of changes implementation, assess compatibility with any other university technologies currently used for learning like LMS, academic IS, social networks. At the same time, organizational support of the stakeholders should be designed and developed to engage stakeholders in the process of LAK adoption from the early stages of the strategy. The activities like establishing institution training program in LAK, creating a conductive environment for the implementation of LAK tools, ensuring adequate support from the university management and information systems administrator, establishing a standardised control and monitoring of effective utilization of LAK technologies should be prepared (Adejo and Connoly, 2017).

Martin Drlík Identification of necessary tasks for effective Adoption of Learning Analytics at the University
DIVAI 2018 – The 12th international scientific conference on Distance Learning in Applied Informatics. 415 ISBN 978-80-7598-059-5 (Print) ISSN 2464-7470 (Print) ISSN 2464-7489 (On-line)
The previous organizational requirements closely relate to the human and environmental factors. An effective utilisation, implementation, and interpretation of LAK tools and technologies, which simplify and visualize the results of more sophisticated LAK methods and techniques require highly trained stakeholders if the HEI want to profit from the LAK adoption. This is possible only by involving the higher university management, which will apply a top-down approach to the successful implementation of LAK principles.
Adoption and evaluation phase starts after the selected LAK strategy has been fully implemented at the HEI. It needs to be continually evaluated to assess the strengths and weaknesses of the tools as well as the impact on the legacy technology, organisation, and learners (Larruson and White, 2014).
Monitoring and control phase ensure the overall progress of the LAK strategy adoption is continually monitored and performance assessed by measuring the performance of the tools against organisational performance benchmark, students’ performance, as well as security strategies.
CONCLUSION
Education needs new ways of thinking, new ways of doing and new ways to evaluate and demonstrate impact. The connection of LAK and new models of pedagogy promise benefits to the contemporary education sector. However, as was mentioned several times before, although there is a growing interest in LAK among HEIs, the maturity level of HEIs in terms of LAK is still at an early stage (Wong, 2017). It is evident that adoption of LAK is a long-lasting and iterative process.
An important barrier to the implementation of LAK is the lack of knowledge, both theoretical and practical, as well as examples of good practices. LAK application in educational environments still comes up against some important barriers, such as the lack of a data-driven culture and of fast, comprehensive and easy-to-use tools (Calvet Liñán and Juan Pérez, 2015).
On the other hand, as many researchers noted, it can not be assumed, that there will be the one-size-fills-all solution for LAK adoption at the HEI in the future. Therefore, this paper provides a background for further analysis of current findings, best practices, implementation frameworks and recommendations, which will surely stir the calm environment of the contemporary HEIs in this data-driven era.
ACKNOWLEDGEMENT
This work was supported by the project VEGA 1/0776/18 Optimizing the content and structure of the disclosures under Pillar 3 by modelling their use by stakeholders of commercial bank.
REFERENCES
Adejo O, Connolly, T., 2017. Learning Analytics in Higher Education Development: A Roadmap. Journal of Education and Practice. ISSN 2222-1735. Vol.8, No.15.

Martin Drlík Identification of necessary tasks for effective Adoption of Learning Analytics at the University
DIVAI 2018 – The 12th international scientific conference on Distance Learning in Applied Informatics. 416 ISBN 978-80-7598-059-5 (Print) ISSN 2464-7470 (Print) ISSN 2464-7489 (On-line)
Arroway, P., Morgan, G., O’Keefe, M., Yanosky, R., 2016. Learning Analytics in Higher Education. Research report. Louisville, CO: ECAR, March 2016.
Baker, R. S. J. D., and Yacef, K., 2009. The State of Educational Data Mining in 2009: A Review and Future Visions. Journal of Educational Data Mining 1 (1), pp. 3–17.
Barneveld, A., Arnold, K., Campbell, J., 2012. Analytics in Higher Education: Establishing a Common Language. EDUCASE, [online] Available at <https://library.educause.edu/resources/2012/1/analytics-in-higher-education-establishing-a-common-language>, [Accessed January 2018].
Bichsel, J., 2012. Analytics in higher education: benefits, barriers, progress and recommendations. ECAR, 1–30. [online] Available at <www.Educause.edu/library/resources/2012-ecar-study-analytics-higher-education> [Accessed October 2017].
Buckingham Shum, S., 2013. Designing Systemic Learning Analytics at the Open University., [online] Available at <https://www.slideshare.net/sbs/designing-systemic-learning-analytics-at-the-open-university> [Accessed August 2017].
Calvet Liñán, L., Juan Pérez, Á. A., 2015. Educational Data Mining and Learning Analytics: differences, similarities, and time evolution. RUSC. Universities and Knowledge Society Journal, 12(3). pp. 98-112. doi: http://dx.doi.org/10.7238/rusc.v12i3.2515)
Cooper A., 2012. CETIS Analytics Series: What is Analytics? Definition and Essential Characteristics. 1(5). CETIS LLP publications. [online] Available at <http://publications.cetis.org.uk/2012/521>, [Accessed February 2018].
Drlik, M., Skalka, J., 2011. Virtual Faculty Development Using Top-down Implementation Strategy and Adapted EES Model. World Conference on Educational Technology Researches-2011, 28, 6. doi: 10.1016/j.sbspro.2011.11.117
Drachsler, H. and Greller, W., 2012. The Pulse of Learning Analytics Understandings and Expectations from the Stakeholders. In: Proceedings of LAK12: 2nd International Conference on Learning Analytics & Knowledge, New York, NY: Association for Computing Machinery, pp. 252–254.
Duval, E., 2012. Learning Analytics and Educational Data Mining, Erik Duval’s Weblog, 30 January 2012, [online] Available at <https://erikduval.wordpress.com/2012/01/30/learning-analytics-and-educational-data-mining/> , [Accessed July 2017]
Ferguson, R., 2012. Learning analytics: drivers, developments and challenges. International Journal of Technology Enhanced Learning, 4(5/6) pp. 304–317.
Ferguson, R., Macfadyen, L. P., Clow, D., Tynan, B., Dawson, S., 2015. Setting learning analytics in context: overcoming the barriers to large-scale adoption. Journal of Learning Analytics, 1(3) pp. 120–144.
Ferguson, R., Brasher, A., Clow, D., Cooper, A., Hillaire, G., Mittelmeier, J., Rienties, B., Ullmann, T., Vuorikari, R., 2016. Research Evidence on the Use of Learning Analytics - Implications for Education Policy. R. Vuorikari, J. Castaño Muñoz (Eds.). Joint Research Centre Science for Policy Report; EUR 28294 EN; doi:10.2791/955210.
Gašević, D., Dawson, S., Rogers, T., Gašević, D., 2016. Learning analytics should not promote one size fits all: The effects of course-specific technology use in predicting academic success. The Internet and Higher Education, 28, 68–84.

Martin Drlík Identification of necessary tasks for effective Adoption of Learning Analytics at the University
DIVAI 2018 – The 12th international scientific conference on Distance Learning in Applied Informatics. 417 ISBN 978-80-7598-059-5 (Print) ISSN 2464-7470 (Print) ISSN 2464-7489 (On-line)
Greller, W., Drachsler, H., 2012. Translating Learning into Numbers: Toward a Generic Framework for Learning Analytic. The Educational Technology and Society (JETS). Special Issue on Learning Analytics. 15(3).
Head, B. W., Alford, J., 2013. Wicked problems: Implications for public policy and management. Administration & Society. doi:10.1177/0095399713481601
Johnson, L., Smith, R., Willis, H., Levine, A. and Haywood, K., 2011. The 2011 Horizon Report. Austin, The New Media Consortium, [online] Available at <http://net.educause.edu/ir/library/pdf/HR2011.pdf>.
Jordaan, A.J.J., Van der Merwe, A., 2015. Best practices for learning analytics initiatives in higher education. In: Education Innovation. [online] Available at <http://hdl.handle.net/2263/50576> [Accessed January 2018].
Kapusta, J., Munk, M., Svec, P., Pilkova, A., 2014. Determining the time window threshold to identify user sessions of stakeholders of a commercial bank portal. In: 2014 International Conference On Computational Science, 2014, Procedia Computer Science, vol. 29, pp. 1779-1790.
Kapusta, J., Svec, P., Munk, M., Skalka, J., 2014. User Session Identification Using Extended Href Method. In: DIVAI 2014: 10th International Scientific Conference On Distance Learning In Applied Informatics, 2014, pp. 581-588.
Kuna, P., Vozar, M., 2017. Student’s behavior in virtual environment. Advances in Intelligent Systems and Computing, 544, pp. 177-184.
Lang, Ch., Siemens. G., Wise, A., Gasevic, D. 2017. The Handbook of Learning Analytics. SOLAR. ISBN: 978-0-9952408-0-3. DOI: 10.18608/hla17
Larruson, J. A., White, B., 2014. Learning Analytics. From Research to Practice. Springer-Verlag New York. DOI:10.1007/978-1-4614-3305-7
Macfadyen, L., Dawson, S., Pardo, A., Gašević, D., 2014. The learning analytics imperative and the sociotechnical challenge: Policy for complex systems. Research & Practice in Assessment, 9(Winter 2014), pp.17-28.
Norris, D.M., Baer, L.L., 2013. Building Organizational Capacity for Analytics. EDUCASE. [online] Available at <https://library.educause.edu/resources/2013/2/building-organizational-capacity-for-analytics> [Accessed December 2017].
Pineda, L., 2016. Learning Analytics Adoption and Implementation Trends Identifying Organizational and Technical Patterns. Unicon.
Sclater, N., 2014. Learning analytics. The current state of play in the UK higher and further education. JISC. Effective Learning Analytics. Using data and analytics to support students. [online] Available at <https://repository.jisc.ac.uk/5657/1/Learning_analytics_report.pdf>, [Accessed November 2017].
Siemens, G., and R. S. J. d. Baker., 2012. Learning Analytics and Educational Data Mining: Towards Communication and Collaboration. In: Proceedings of LAK12: 2nd International Conference on Learning Analytics & Knowledge, New York, NY: Association for Computing Machinery, pp. 252–254.
Siemens, G., Dawson, S., Lynch, G., 2014. Improving the Quality and Productivity of the Higher Education Sector -Policy and Strategy for Systems-Level Deployment of Learning Analytics.

Martin Drlík Identification of necessary tasks for effective Adoption of Learning Analytics at the University
DIVAI 2018 – The 12th international scientific conference on Distance Learning in Applied Informatics. 418 ISBN 978-80-7598-059-5 (Print) ISSN 2464-7470 (Print) ISSN 2464-7489 (On-line)
Canberra, Australia: Office of Learning and Teaching, Australian Government. [online] Available at <http://solaresearch.org/Policy_Strategy_Analytics.pdf>,[Accessed June 2017]
Skalka, J., Drlik, M. and Svec, P. 2013. Knowledge Discovery from University Information Systems for Purposes of Quality Assurance Implementation. In: IEEE Global Engineering Education Conference (EDUCON), Berlin, GERMANY. DOI: 10.1109/EduCon.2013.6530165
Tsai, Y.S., Grasevic, D., 2016. Adoption of Learning Analytics in Higher Education: State, Challenges, and Policies.
Tsai Y.S, Gasevic, D., 2017. Learning analytics in higher education --- challenges and policies: a review of eight learning analytics policies. In Proceedings of the Seventh International Learning Analytics & Knowledge Conference (LAK '17). ACM, New York, NY, USA, 233-242. DOI: https://doi.org/10.1145/3027385.3027400
Tynan, B., Buckingham Shum, S., 2013. Designing Systemic Learning Analytics at the Open University. Webinar in the SoLAR online open course Strategy & Policy for Systemic Learning Analytics.
Wong, A., Lavrencic, M., Khosravi, H., 2017. An Overview of Learning Analytics in Higher Education. University of Queensland. [online] Available at <http://www.cs.ubc.ca/~hkhosrav/pub/learninganalytics.pdf> , [Accessed July 2017]

Jan Francisti, Zoltán Balogh Wireless Sensor Network as a part of Internet of Things
DIVAI 2018 – The 12th international scientific conference on Distance Learning in Applied Informatics. 419 ISBN 978-80-7598-059-5 (Print) ISSN 2464-7470 (Print) ISSN 2464-7489 (On-line)
Wireless Sensor Network as a part of Internet
of Things
Jan Francisti, Zoltán Balogh
Departmant of Informatics, Faculty of Natural Sciences, Constantine The Philospher University, Nitra, Slovakia
[email protected], [email protected]
Abstract
The concept of the Internet of Things is becoming more and more present today. Every day there will be more devices that could be included in the Internet of Things, whether it is a smart home device or workstation. It is a platform that connects different types of objects and provides them mutual communication. This means that different objects are interconnected with the ability to communicate, allowing users to manage and control them more effectively. Our aim is to conceive and approach IoT in terms of sensor networks and intelligent devices. Intelligent devices in the form of wristbands or watches contain different sensors that can be used to obtain data such as heart rate, blood pressure or body temperature. In this article, wireless sensor networks will be discussed which measure pulse and body temperature. Focus will be on hardware solutions for devices that allow the collection of selected data, specifically devices that could be included in future research. Similar researches will be included and tests that have been carried out in the past. The result of the article will be a summary of available tests with comparing them to each other, to design own solution in the future.
Keywords
Wireless sensor Network. Internet of Things. Smart devices. Physiological functions.
INTRODUCTION
The Internet of Things can be understood as a large number of interconnected devices that communicate and send information to each other. The Internet of Things can include common devices that we use daily for the automation processes, devices that are built into cars, medical devices and other (Kummerfeld and Kay, 2017). According to (Niu et al., 2016) the number of IoT devices should rise to 50 billion by 2020, which suggests that it will be possible to identify every facility on the planet for a short while.
The IoT concept involves a large number of interconnected technologies with the main aim of enabling access to the Internet and the real world. The concept is presented as a new generation of large-scale data aggregation. The very purpose of the IoT is to connect objects into a one complex platform (Sánchez López et al., 2012).
In the case of IoT devices, there is no a prerequisite for being actively connected to the Internet. Bluetooth technology is used for transferring information to control a device,

Jan Francisti, Zoltán Balogh Wireless Sensor Network as a part of Internet of Things
DIVAI 2018 – The 12th international scientific conference on Distance Learning in Applied Informatics. 420 ISBN 978-80-7598-059-5 (Print) ISSN 2464-7470 (Print) ISSN 2464-7489 (On-line)
a computer or a smartphone that can move data further, whether on a local storage or in the Cloud. The IoT object can be accessed from the inside of the local network, but also from the outside. Object control is implemented through the installed applications or the web interface, depending on which objects are used. Also, the applications can be used for object tracking, for configuring and controlling. For example, various household appliances such as lighting, heating or electrical appliances (Wirtz et al., 2014). In order to ensure the proper functioning of the application and the communication between the application and the object, a stable connection and a well-distributed network topology must be ensured. Also, safety precautions should not be missed. In order to send data, which cannot be caught or misused, it is important that the application provides encryption of the transmitted data. (Kim, 2015).
The aim of the article is to describe the use of the Internet of Things in the form of Wireless Sensor Networks, to compare and design architecture, how to use wireless sensor networks using intelligent devices for collecting data. The aim of the research is to design a system that can automate the collection of data from various sensors (motion and user activity sensors), skin temperature, electrodermal activity (what happens to the skin when a person is sweating) and pulse rate.
RELATED WORK
The Internet of Things is now an integral part of everyday life. It can be identified at every step, whether in home or industry. Using IoT capabilities provides open doors to a new world where many things can be addressed much more efficiently and easily, such as automating the processes that take place when a defined event occurs (Coates, Hammoudeh and Holmes, 2017). Even though many devices have the ability to connect to the network, they cannot be interconnected or managed remotely. Because of this, trying to link all objects into one system which can manage objects and retrieve real-time information from anywhere and anytime (Gómez et al., 2013). The Internet of Things can be divided into two subgroups, shown in Figure 1, where consumer and industrial IoT is distinguished.
Figure 1: Distribution of IoT (https://www.i-scoop.eu/internet-of-things-guide/).
In the article, discussion will continue about wireless sensor networks and their use both in the home and in the industry. Also, sensory networks can be used in education and

Jan Francisti, Zoltán Balogh Wireless Sensor Network as a part of Internet of Things
DIVAI 2018 – The 12th international scientific conference on Distance Learning in Applied Informatics. 421 ISBN 978-80-7598-059-5 (Print) ISSN 2464-7470 (Print) ISSN 2464-7489 (On-line)
teaching, as well as in healthcare (Yick, Mukherjee and Ghosal, 2008). In recent years, different technologies have been added to home including sensory networks. These embedded technologies should ensure increased security, streamline and automation of certain house features (Gram-Hanssen and Darby, 2018). As a first aspect, security is considered. Sensors located on windows, doors, motion sensors, smoke sensors, indoor and outdoor security cameras as well as an alarm system (Döbelt et al., 2015). Another aspect is the control and management of the house. With an intelligent device such as a smartphone, we can basically set up all home appliances. Through application control, we are able to set the "behaviour" of the house by choice or time. For example, set up lighting, jalousie movements, the activity of household appliances in the kitchen can be checked. Through the Internet of Things and applications a full view of the whole house will be possible (Alaa et al., 2017). Artificial Intelligence is also part of an intelligent house. Since there are various sensors installed in the house, there must be a central computer that will manage the devices and data flow from the sensors that will be processed. Devices and sensors can also be controlled by various assistants such as Google, Amazon Alexa, etc. These assistants are built-in to the devices which contain a specific listener (Tirado Herrero, Nicholls and Strengers, 2018). Intelligent houses also include solar panels that are capable of generating electricity and store it in high-capacity batteries.
Besides household, the IoT and sensory networks are used in industry and transport. The current factories are equipped with technologies which can automate activities and accelerate the entire production process. Robotic hands that are used in the car manufacturing contain many sensors that affect their operation. For example, remote sensors for individual components, cameras, and code readers, sensors that evaluate and visualize robotic hands work. Robots are able to communicate with each other using M2M technology, and during the manufacturing process the robot knows what the robot did in front of him and what will be his job (Gronau, Ullrich and Teichmann, 2017). Sensory networks are also used in cars. The system of several cameras that are designed to assist the driver in parking by creating a simulation on the screen or parking the vehicle automatically. In addition to built-in cameras, there are also sensors intend for sensing the surroundings to create a virtual assistant to enhance safety. All sensors build up a complex system that is capable of driving the vehicle automatically (Krasniqi and Hajrizi, 2016).
Schools and universities are also places where sensory networks are applied. The use of new technologies increases the possibility of changing the way of teaching and learning (Kiryakova, Yordanova and Angelova, 2017). In primary schools, sensory networks are used to secure student safety. Each student owns an RFID tag that indicates his location. For example, when a student comes to school, the parent gets the information about his child’s entrance (Violino, 2016). In high-schools are IoT and sensory applications used to modernize teaching using intelligent devices, for example, smartphones or tablets (Burianová and Turčáni, 2016). With a similar issue of modern teaching was also dealt with by authors (Molnar, 2015; Bílek, 2016). Intelligent devices convert passive learning to active. They offer simple and almost unlimited access to information and knowledge that can be provided in real time. They also provide information about students' successes in exams. The effectiveness of the use of ICT components in teaching at universities has been studied by the authors (Drlík et al., 2017), where analysed data from several universities joined in the 7RP project IRNet. Within the smart campus project (Sari, Ciptadi and Hardyanto, 2017) the lessons were taught through an e-learning course where students could connect from everywhere in school using the wireless network. In this way, students could take the curriculum and communicate with the teacher outside the classroom as well.

Jan Francisti, Zoltán Balogh Wireless Sensor Network as a part of Internet of Things
DIVAI 2018 – The 12th international scientific conference on Distance Learning in Applied Informatics. 422 ISBN 978-80-7598-059-5 (Print) ISSN 2464-7470 (Print) ISSN 2464-7489 (On-line)
Sensory networks are used in healthcare where nowadays they play an important role. The technologies can be divided into two units: those used in hospitals or clinics and those that can be used in households. In the first group, there is equipment used by doctors to determine the health of patients. Based on the fact that healthcare systems are connected, the advantage is that the doctor will have all information about each patient, regardless of his or her place of residence (Farahani et al., 2018). The second group consists of devices that people use every day at home. They are various devices that collect and store data such as body temperature, blood pressure, heart rate, etc. Measuring and collecting data is important if the patient has health problems and it is necessary to obtain the data from a certain time interval. The advantage of these technologies is that each device is connected to the central device using Bluetooth and after a certain period the data are sent to a storage where the doctor has access(Qi et al., 2017).
Furthermore, devices that allow obtaining the physiological functions data will be discussed. There are many types of devices that have similar features that we have already encountered. These devices have a form of wristbands or other wearable objects that we can have on ourselves for a longer period, with the possibility of working while the device will measure the functions of the body. These devices are characterized by interoperability, ensuring that they are able to collaborate and communicate with devices of a different kind, and are interconnected by one central computer. For example, one device measures heartbeat and a second body temperature, and the central computer is able to process different data and establish correlations.
Author (Farahani et al., 2018) describes special glasses which have a built-in sensor for measuring heartbeat from the nose. There is also a microchip, which converts the data and sends it to the central computer, in this case Arduino, which contains the tool that processes the data sent to the cloud.
(Lee and Chung, 2009) used a T-shirt with a built-in sensor designed to monitor the heart work. The sensor has small dimensions, so basically it is not even possible to feel it. It has also a built-in memory that retains data unless it is synchronized over a Wi-Fi connection.
Authors (Cvetković et al., 2017; de Zambotti et al., 2016; Kwak et al., 2017; Yong et al., 2017) use wristbands to measure heartbeat during sports. The athletes had attached wristband and performed the assigned workout. As the first sensor began measuring heart activity and moving data further. The chip processed the data and kept it in memory. After the wristband was attached to the central computer, the data was sent for processing. The system server received the data from the wristband and processed them into a predefined form. If there are more connected devices, the cluster was used for data processing. Processed data can be displayed on a web or mobile app in the form of tables or charts.
Other authors used similar principles and wristbands for monitoring emotions, precisely stress (Gjoreski et al., 2017) based on the context. The measurements were divided into two parts where the first was a laboratory measurement and the second was a real one. In the laboratory, the respondents had wristbands with the volume of blood measuring functions. Stress was evaluated by solving stressful situations. Then authors compared the results from the wristband and from solving the situations. Segmentation and filtering were performed as first. If some part of data was inadequate, testing was

Jan Francisti, Zoltán Balogh Wireless Sensor Network as a part of Internet of Things
DIVAI 2018 – The 12th international scientific conference on Distance Learning in Applied Informatics. 423 ISBN 978-80-7598-059-5 (Print) ISSN 2464-7470 (Print) ISSN 2464-7489 (On-line)
repeated. Grouped data was processed using WEKA machine learning. Subsequently, data were evaluated and a stress detector was created for each respondent. In the second part of the test, the respondents were given questions of stress feeling level during the day. Because they had a wristband with built-in stress detector, the respondents’ true level of stress was easy to follow. Final results were compared based on the respondents' and the detector’s responses.
(Jha, Prakash and Sagar, 2017) used sensory network and wristband for measuring anger. Respondents were given the wristbands which they had during the day. The wristbands captured the heart rate and skin temperature. Before testing, the thresholds for temperature and heart rate were defined to determine the scale of anger. The results from the sensors were compared with the created physiological table. As the result of the test, the author created charts showing anger based on increased heart rate as well as skin temperature. The structure of the overall measurement process was similar to the previous tests of mentioned authors.
MATERIALS AND METHODS
A comprehensive design solution for a sensory system has been created using a microcomputer or a microcontroller for the need to monitor and evaluate the emotional state. The collection and evaluation of the obtained data has been processed with the help of an application that was able to monitor and record every single change and the obtained outputs were be subsequently processed and evaluated in the indication form of the student's current emotion. It has been assumed that a system designed and built this way would be cheaper than other available monitoring systems. Also, it would be modular and would have wider usage. Then, it would be possible to share the measured data over the network for further processing and also it could be validated for the given research area. A prerequisite for the autonomous functioning of emotional monitoring was a system optimization based on different statistical methods. On the basis of the system, there was an opportunity to expand the research role in the field of IoT but also in other fields, such as ambient intelligence.
Figure 2: Conceptual model of a complex system (own model).

Jan Francisti, Zoltán Balogh Wireless Sensor Network as a part of Internet of Things
DIVAI 2018 – The 12th international scientific conference on Distance Learning in Applied Informatics. 424 ISBN 978-80-7598-059-5 (Print) ISSN 2464-7470 (Print) ISSN 2464-7489 (On-line)
Methodology of research
The issue of evaluating human emotions is a very interesting topic which has gained more and more attention in recent years. It is worth noticing the unusual overlapping multiple unrelated areas, for example automotive industry and fields such as informatics and psychology. Research of human emotions began in the 17th century and became the basis for further development in this area.
Over time, methods and techniques have been developed to make it possible to classify the emotional state of individuals with great precision. Authors (Ekman and Friesen, 1978) point to the ability to identify up to 7 types of emotion:
1. happiness, 2. sadness, 3. surprise, 4. fear, 5. anger, 6. disgust, 7. neutral expression.
At this time is being paid too much attention to this issue. However, the aim of current research is to use the data that can be obtained from individual sensory attribute (sight, smell, touch, hearing, taste) to determine the overall emotional state of the student while understanding his activity and thinking. A typical example is real-time emotional evaluation based on skin resistance, measurement of the difference between eye movement or neuro-impulses measurement, etc.
Sensory system design
Realizing data collection has been done through wristbands. In order to be able to measure physiological functions by devices, the system needed to be divided into several parts, which are shown in Figure 3. For our research, the wristbands that were able to measure heart rate and body temperature were used. They had a form of fitness wristbands with features similar to those used by the previously mentioned authors. For laboratory testing, a comparison of the physiological functions of heartbeat and body temperature have been chosen, since the results of the author's research (Jha, Prakash and Sagar, 2017) pointed out that the two measured physiological functions correlated with each other.
Figure 3: Block diagram of the overall system for the measurement of physiological functions (own diagram).

Jan Francisti, Zoltán Balogh Wireless Sensor Network as a part of Internet of Things
DIVAI 2018 – The 12th international scientific conference on Distance Learning in Applied Informatics. 425 ISBN 978-80-7598-059-5 (Print) ISSN 2464-7470 (Print) ISSN 2464-7489 (On-line)
The type of chosen wristbands included a battery to allow the respondents to wear it freely and also a memory for temporary storage of data. The heart rate sensor was a classic LED diode and thermistor for temperature measurement. Measured data has been converted to the digital signal and sent to the processor. In laboratory heart rate measurement, the boundary heart rate bpm had to be marked. According to (American Heart Association, 2018) the boundary value at the age of 30 is up to 100 bpm. With these values, it was needed to optimize the measurement of the sensor and to determine the magnitude of the variance. Also for body temperature, the standard range was from 36,1 to 37,2 °C.
The wristband also had a built-in wireless transmitter that communicated with the central computer where it sent data via Bluetooth technology. In the test, more devices at once have been used so the data was sent after the selected time interval.
After sending data to the central computer, the testing and data processing part continued. Some wristbands used a mobile device as the central computer. The grouped data could be exported and edited later. In laboratory testing, more wristbands were used to create a sensor network, therefore as a central computer, other devices than smartphones were used that offered more efficient and convenient way to connect all wristbands. For those purposes, the perfect solution was a microcomputer such as Raspberry PI, Arduino, or Intel Edison which has also been used by Farahani et al. (2018) and combined Raspberry PI and Intel Edison together.
Based on the laboratory measurement of selected physiological functions, the data obtained must have been evaluated and sorted. Based on obtained data, it was possible to evaluate them according to various methods as stated by the authors (Stencl and Stastny, 2010; Skorpil and Stastny, 2006).
The wristbands were given to the students throughout the testing which took 30 minutes. First, it was necessary to determine the correct time interval for the measured functions. Measuring the functions every second was set as a default setting. If the results had been repeated, the time interval would have been changed. It might have been possible to define boundary values based on the results and compare them with those proposed by the association, also to refute and filter out the deviations. The time interval would have been also observed on the basis of the wristbands, i.e. how battery life had changed during testing. If the wristband had had a low battery capacity, the timeframe would have had to be adjusted. By evaluating the data, the quality of the individual wristbands sensors would have been tested. In the case of large deviations, the wristbands would be compared with other manufacturers. Wristbands with best results would be put on the next test. There was also the possibility of composing a custom wristband that would consist of the same parts as the commercial one.
Previously mentioned authors used Debian Jessie as a software platform for data processing and visualization that is shown in Figure 4. In the laboratory testing, a similar solution has been used that offered export of data to the tables for further filtering. For statistical evaluation and visualization of data, Statistica was a suitable tool, which enabled data analysis, the correlations, etc (Munk and Kadlecik, 2016).
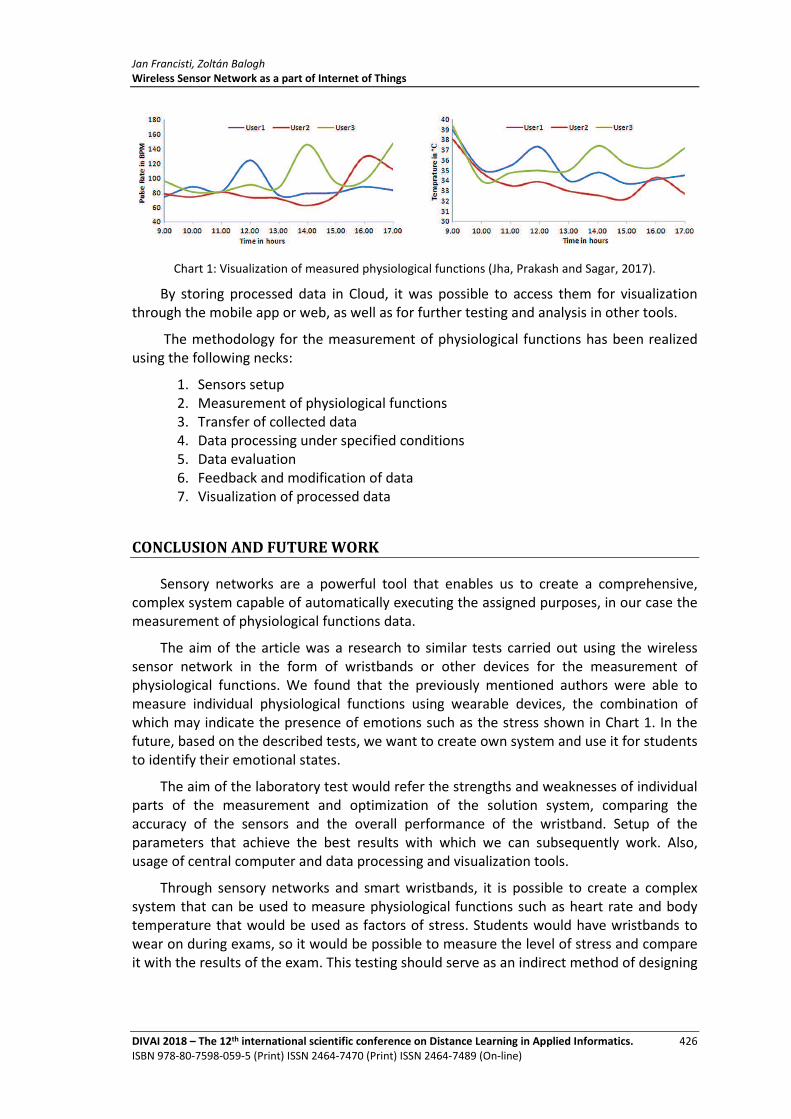
Jan Francisti, Zoltán Balogh Wireless Sensor Network as a part of Internet of Things
DIVAI 2018 – The 12th international scientific conference on Distance Learning in Applied Informatics. 426 ISBN 978-80-7598-059-5 (Print) ISSN 2464-7470 (Print) ISSN 2464-7489 (On-line)
Chart 1: Visualization of measured physiological functions (Jha, Prakash and Sagar, 2017).
By storing processed data in Cloud, it was possible to access them for visualization through the mobile app or web, as well as for further testing and analysis in other tools.
The methodology for the measurement of physiological functions has been realized using the following necks:
1. Sensors setup 2. Measurement of physiological functions 3. Transfer of collected data 4. Data processing under specified conditions 5. Data evaluation 6. Feedback and modification of data 7. Visualization of processed data
CONCLUSION AND FUTURE WORK
Sensory networks are a powerful tool that enables us to create a comprehensive, complex system capable of automatically executing the assigned purposes, in our case the measurement of physiological functions data.
The aim of the article was a research to similar tests carried out using the wireless sensor network in the form of wristbands or other devices for the measurement of physiological functions. We found that the previously mentioned authors were able to measure individual physiological functions using wearable devices, the combination of which may indicate the presence of emotions such as the stress shown in Chart 1. In the future, based on the described tests, we want to create own system and use it for students to identify their emotional states.
The aim of the laboratory test would refer the strengths and weaknesses of individual parts of the measurement and optimization of the solution system, comparing the accuracy of the sensors and the overall performance of the wristband. Setup of the parameters that achieve the best results with which we can subsequently work. Also, usage of central computer and data processing and visualization tools.
Through sensory networks and smart wristbands, it is possible to create a complex system that can be used to measure physiological functions such as heart rate and body temperature that would be used as factors of stress. Students would have wristbands to wear on during exams, so it would be possible to measure the level of stress and compare it with the results of the exam. This testing should serve as an indirect method of designing

Jan Francisti, Zoltán Balogh Wireless Sensor Network as a part of Internet of Things
DIVAI 2018 – The 12th international scientific conference on Distance Learning in Applied Informatics. 427 ISBN 978-80-7598-059-5 (Print) ISSN 2464-7470 (Print) ISSN 2464-7489 (On-line)
an e-learning course and student testing in order to achieve the highest degree of education and knowledge.
ACKNOWLEDGEMENT
This research has been supported by University Grant Agency under the contract No. VII/6/2018.
REFERENCES
Alaa, M. et al. (2017) ‘A review of smart home applications based on Internet of Things’. doi: 10.1016/j.jnca.2017.08.017.
American Heart Association (2018) Know Your Target Heart Rates for Exercise, Losing Weight and Health. Available at: https://healthyforgood.heart.org/move-more/articles/target-heart-rates (Accessed: 6 February 2018).
Bílek, M. (2016) ‘Question for Current sCienCe eduCAtion: virtuAl or reAl?’, Journal of Baltic Science Education, 15(2). Available at: http://www.scientiasocialis.lt/jbse/files/pdf/vol15/136-139.Bilek_JBSE_Vol.15_No.2.pdf (Accessed: 17 April 2018).
Burianova, M. and Turcani, M. (2016) ‘Non-traditional Education Using Smart Devices’, in Turcani, M. et al. (eds) DIVAI 2016: 11TH INTERNATIONAL SCIENTIFIC CONFERENCE ON DISTANCE LEARNING IN APPLIED INFORMATICS . Sturovo, SLOVAKIA: WOLTERS KLUWER CR A S, U NAKLADOVEHO NADRAZI 6, PRAHA 3, PRAGUE 130 00, CZECH REPUBLIC , pp. 77–86. doi: 978-80-7552-249-8.
Coates, A., Hammoudeh, M. and Holmes, K. G. (2017) ‘Internet of Things for Buildings Monitoring’, in Proceedings of the International Conference on Future Networks and Distributed Systems - ICFNDS ’17. doi: 10.1145/3102304.3102342.
Cvetković, B. et al. (2017) ‘ARTICLE IN PRESS Real-time activity monitoring with a wristband and a smartphone’, Information Fusion. doi: 10.1016/j.inffus.2017.05.004.
Döbelt, S. et al. (2015) ‘Consumers’ privacy concerns and implications for a privacy preserving Smart Grid architecture—Results of an Austrian study’, Energy Research & Social Science. Elsevier, 9, pp. 137–145. doi: 10.1016/J.ERSS.2015.08.022.
Drlík, M. et al. (2017) ‘Identification of differences in university e-environment between selected EU and non-EU countries using knowledge mining methods: project IRNet case study’, International Journal of Web Based Communities, 13(2), p. 236. doi: 10.1504/IJWBC.2017.084416.
Ekman, P. and Friesen, W. (1978) Facial Action Coding System: Investigator’s Guide. Palo Alto, CA: Consulting Psychologists Press.
Farahani, B. et al. (2018) ‘Towards fog-driven IoT eHealth: Promises and challenges of IoT in medicine and healthcare’, Future Generation Computer Systems. doi: 10.1016/j.future.2017.04.036.
Gjoreski, M. et al. (2017) ‘Monitoring stress with a wrist device using context’, Journal of Biomedical Informatics. doi: 10.1016/j.jbi.2017.08.006.

Jan Francisti, Zoltán Balogh Wireless Sensor Network as a part of Internet of Things
DIVAI 2018 – The 12th international scientific conference on Distance Learning in Applied Informatics. 428 ISBN 978-80-7598-059-5 (Print) ISSN 2464-7470 (Print) ISSN 2464-7489 (On-line)
Gómez, J. et al. (2013) ‘Interaction system based on Internet of things as support for education’, in Procedia Computer Science. doi: 10.1016/j.procs.2013.09.019.
Gram-Hanssen, K. and Darby, S. J. (2018) ‘“Home is where the smart is”? Evaluating smart home research and approaches against the concept of home’, Energy Research and Social Science. Elsevier, 37(September), pp. 94–101. doi: 10.1016/j.erss.2017.09.037.
Gronau, N., Ullrich, A. and Teichmann, M. (2017) ‘Development of the Industrial IoT Competences in the Areas of Organization, Process, and Interaction Based on the Learning Factory Concept’, Procedia Manufacturing. Elsevier, 9, pp. 254–261. doi: 10.1016/J.PROMFG.2017.04.029.
Jha, V., Prakash, N. and Sagar, S. (2017) ‘Wearable anger-monitoring system’, ICT Express. doi: 10.1016/j.icte.2017.07.002.
Kim, J. young (2015) ‘Secure and Efficient Management Architecture for the Internet of Things’, in Proceedings of the 13th ACM Conference on Embedded Networked Sensor Systems - SenSys ’15. doi: 10.1145/2809695.2822522.
Kiryakova, G., Yordanova, L. and Angelova, N. (1842) ‘Can we make Schools and Universities smarter with the Internet of Things?’, TEM Journal Journal, 6(1), pp. 80–84. doi: 10.18421/TEM61-11.
Krasniqi, X. and Hajrizi, E. (2016) ‘Use of IoT Technology to Drive the Automotive Industry from Connected to Full Autonomous Vehicles’, IFAC-PapersOnLine. Elsevier, 49(29), pp. 269–274. doi: 10.1016/J.IFACOL.2016.11.078.
Kummerfeld, B. and Kay, J. (2017) ‘User Modeling for the Internet of Things’, in Proceedings of the 25th Conference on User Modeling, Adaptation and Personalization - UMAP ’17. doi: 10.1145/3079628.3079658.
Kwak, Y. H. et al. (2017) ‘Flexible heartbeat sensor for wearable device’, Biosensors and Bioelectronics. doi: 10.1016/j.bios.2017.03.016.
Lee, Y. D. and Chung, W. Y. (2009) ‘Wireless sensor network based wearable smart shirt for ubiquitous health and activity monitoring’, Sensors and Actuators, B: Chemical. doi: 10.1016/j.snb.2009.04.040.
Molnar, G. (2015) ‘Teaching and learning in modern digital environment’, in 2015 IEEE 13th International Symposium on Applied Machine Intelligence and Informatics (SAMI). IEEE, pp. 213–217. doi: 10.1109/SAMI.2015.7061878.
Munk, M. and Kadlecik, M. (2016) ‘Experimental Data Analysis: Verification of a Didactical Efficiency of a Course’, in Turcani, M. et al. (eds) DIVAI 2016: 11TH INTERNATIONAL SCIENTIFIC CONFERENCE ON DISTANCE LEARNING IN APPLIED INFORMATICS. Sturovo, SLOVAKIA: WOLTERS KLUWER CR A S, U NAKLADOVEHO NADRAZI 6, PRAHA 3, PRAGUE 130 00, CZECH REPUBLIC, pp. 561–570.
Niu, J. et al. (2016) ‘Panel Security and Privacy in the Age of Internet of Things’, in Proceedings of the 21st ACM on Symposium on Access Control Models and Technologies - SACMAT ’16. doi: 10.1145/2914642.2927920.
Qi, J. et al. (2017) ‘Advanced internet of things for personalised healthcare systems: A survey’, Pervasive and Mobile Computing. doi: 10.1016/j.pmcj.2017.06.018.

Jan Francisti, Zoltán Balogh Wireless Sensor Network as a part of Internet of Things
DIVAI 2018 – The 12th international scientific conference on Distance Learning in Applied Informatics. 429 ISBN 978-80-7598-059-5 (Print) ISSN 2464-7470 (Print) ISSN 2464-7489 (On-line)
Sánchez López, T. et al. (2012) ‘Adding sense to the Internet of Things: An architecture framework for Smart Object systems’, Personal and Ubiquitous Computing. doi: 10.1007/s00779-011-0399-8.
Sari, M. W., Ciptadi, P. W. and Hardyanto, R. H. (2017) ‘Study of Smart Campus Development Using Internet of Things Technology’, IOP Conference Series: Materials Science and Engineering. IOP Publishing, 190(1), p. 12032. doi: 10.1088/1757-899X/190/1/012032.
Skorpil, V. and Stastny, J. (2006) ‘Back-Propagation and K-Means Algorithms Comparison’, in 2006 8th international Conference on Signal Processing. IEEE. doi: 10.1109/ICOSP.2006.345838.
Stencl, M. and Stastny, J. (2010) Neural network learning algorithms comparison on numerical prediction of real data, 16TH INTERNATIONAL CONFERENCE ON SOFT COMPUTING MENDEL 2010. Brno.
Tirado Herrero, S., Nicholls, L. and Strengers, Y. (2018) ‘Smart home technologies in everyday life: do they address key energy challenges in households?’, Current Opinion in Environmental Sustainability. Elsevier, 31, pp. 65–70. doi: 10.1016/J.COSUST.2017.12.001.
Violino, B. (2016) Finding a fit for wearable tech in education. Available at: https://www.districtadministration.com/article/finding-fit-wearable-tech (Accessed: 2 February 2018).
Wirtz, H. et al. (2014) ‘Opportunistic interaction in the challenged internet of things’, in Proceedings of the 9th ACM MobiCom workshop on Challenged networks - CHANTS ’14. doi: 10.1145/2645672.2645679.
Yick, J., Mukherjee, B. and Ghosal, D. (2008) ‘Wireless sensor network survey’, Computer Networks, 52(12), pp. 2292–2330. doi: 10.1016/j.comnet.2008.04.002.
Yong, B. et al. (2017) ‘IoT-based intelligent fitness system’, Comput. J. Parallel Distrib. Comput. doi: 10.1016/j.jpdc.2017.05.006.
de Zambotti, M. et al. (2016) ‘Measures of sleep and cardiac functioning during sleep using a multi-sensory commercially-available wristband in adolescents’, Physiology and Behavior. doi: 10.1016/j.physbeh.2016.03.006.


Petr Jindra, Jiri Stastny Three stage object boundary intersection solver
DIVAI 2018 – The 12th international scientific conference on Distance Learning in Applied Informatics. 431 ISBN 978-80-7598-059-5 (Print) ISSN 2464-7470 (Print) ISSN 2464-7489 (On-line)
Three stage object boundary intersection solver
Petr Jindra
Institute of Automation and Computer Science, Brno University of Technology, Brno, Czech republic
Jiri Stastny
Institute of Automation and Computer Science, Brno University of Technology, Brno, Czech republic
Department of Informatics, Mendel University in Brno, Brno, Czech Republic [email protected]
Abstract
Detection of collisions is an important part of many applications which work with three-dimensional graphics. When intersections of objects can be determined, significant computation time is saved because many computations do not have to be done. The algorithm described in this article cannot determine the intersection of real objects, but it can help to save CPU time by determining the intersection of object boundaries. The algorithm can be used in many engineering or graphical applications, such as improvement of semi-transparent object rendering or auxiliary collision detection in applications solving interactions of objects.
Keywords
Graphics. multi thread programming. mesh objects. Computation. Algorithm. boundary intersection.
INTRODUCTION
In applications dealing with interactions of objects displayed in space (two dimensional (Tan, et al., 2009) and/or three dimensional), it is very often necessary to determine whether two objects touch (intersect) or not. One option is to perform calculations over objects with all spatial data. Spatial data means vertices, edges and faces (mesh objects) or surfaces (objects defined by e.g. NURBS surfaces (Zhao & Lan, 2012). This approach has a considerable disadvantage in a computational cost.
The second option is to replace the real (complex) objects by delegating objects with size of the largest dimensions of real ones. The evaluation of intersections on these objects is much easier and consumes much less time compared to the original complex shapes.
This method is discussed by Subhash (Suri & Hughes, 1999), describing a heuristic evaluation function for the probability of the intersection. First in the two-dimensional space, and subsequently developed into a general form for the N-dimensional space.

Petr Jindra, Jiri Stastny Three stage object boundary intersection solver
DIVAI 2018 – The 12th international scientific conference on Distance Learning in Applied Informatics. 432 ISBN 978-80-7598-059-5 (Print) ISSN 2464-7470 (Print) ISSN 2464-7489 (On-line)
There are many approaches to determine the collision. For example, there are methods based on the Monte Carlo approach (Guy & Debunne, 2004), methods using the graphic card's A-buffer (Jang & Han, 2008) or more complex approaches using the expert systems (Castro, et al., 2011) or systems that support deformable objects (Govindaraju, et al., 2007) or the other methods (Capay, M., et al., 2011; Beranek, L. & Nydl, V., 2013; Munk et al., 2015).
The following chapter explains why the algorithm was developed and clarifies its background. The third chapter deals with the algorithm itself, and individual steps are explained in detail. The fourth part of the article describes a parallelization scheme to exploit the full potential of the CPU. The fourth chapter is followed by a further increase of performance and a combinatorial explosion caused by many objects. The following chapter describes an implementation of the algorithm in C++. The penultimate part describes an experiment. In the experiment, the program was run with different settings (number of objects, number of threads, etc.) and the last part contains the experiment evaluation, the whole algorithm evaluation and it includes proposals for further development, resulting from findings identified during the implementation and key performance indicators measured during the experiment.
MOTIVATION
The algorithm described in this article was developed for rendering of semi-transparent objects by OpenGL. Semi-transparent objects need to be rendered in a correct order. When they are not, colour blending causes an unreal final colour (Shreiner, 2006). The consequence is shown on Figure 1.
Figure 1: Blending semi-transparent colours.
If objects are not intersected, it is possible to sort them by their distance from a chosen referential point (usually a camera position) and render them from the furthest to the closest. However, when they are in intersection, it is necessary to render in the correct order individual polygons. It is very expensive (in computation time) to order polygons of all objects in scene.
Petr Jindra, Jiri Stastny Three stage object boundary intersection solver
DIVAI 2018 – The 12th international scientific conference on Distance Learning in Applied Informatics. 433 ISBN 978-80-7598-059-5 (Print) ISSN 2464-7470 (Print) ISSN 2464-7489 (On-line)
The sorting of all polygons of all objects would be a too time-consuming operation and it would be impossible to carry out in real time. This algorithm has been developed to optimize this task and it is described below.
ALGORITHM
The algorithm is based on a replacement of the real objects by their delegates (placeholders). Dimensions of the delegate objects must cover whole original object. Delegate objects contain all information required to evaluation whether the collision may occur or not.
The delegate object is composed of a boundary box and a wrapping sphere. The boundary box contains information about its vertex positions and the wrapping sphere is constructed around this box. The whole delegate object is positioned in space by its transformations. Each transformation is described by a matrix 7F, which is of dimension 4.
The vertex positions are calculated from the biggest dimensions of the original object (mentioned above). Vertex group of the object’s boundary box 8 is marked as VH. The centre of the wrapping sphere of the object 8 is marked as sH and the mutual position of the VH and the sH is defined by (1) and (2).
JFK ∈ MF; &F = OCFJFKO �1In equation (2), we can see that the distance of the sphere's centre is equal from each
bounding box's vertex.
The sphere radius of the object 8 is marked as &F and it is equal to distance between sH and an arbitrary vertex of object 8 (1).
JFK , JFP ∈ MF; j ≠ k; OCFJFKO = |CFJFP| �2
The algorithm itself can be divided into the three following steps. The first step uses the wrapping spheres, the following step operates with the vertices and faces of the boundary boxes, and the last one evaluates the mutual positions of the boundary boxes' edges and faces.
The first step has the least computation cost. The distance between the centres of two objects is calculated and the sum of the radii of their wrapping spheres subtracted. If the value after subtraction is greater than zero, a terminal condition is satisfied, and the algorithm stops with return value False, the objects cannot be in intersection (3). Otherwise, the next step must be done.
CF, CK ∈ U;&F, &K ∈ V; 8 ≠ W;OCFCKO − X&F + &KY > 0 �3

Petr Jindra, Jiri Stastny Three stage object boundary intersection solver
DIVAI 2018 – The 12th international scientific conference on Distance Learning in Applied Informatics. 434 ISBN 978-80-7598-059-5 (Print) ISSN 2464-7470 (Print) ISSN 2464-7489 (On-line)
Before the second and the third stage can be done, the inversion matrix of transformations must be calculated. This inversion matrix moves the whole delegate object to the origin of the coordinate system.
Figure 2: Common object position.
In the second stage, the evaluation of the absolute position of each delegate's vertex to the faces of the second block is done. The faces are described as planes defined by the general equation with normal direction “outwards” from the box. If one vertex “under” of all faces is found, the boundaries are in intersection and the algorithm is terminated with return value True. This step can find an intersection of the type shown on Figure 2.
The steps of this part of the algorithm are following:
1. Let \� be the width, ℎ� be the height and *� be the depth of the first box and M� be the vertex group of the second replacing box.
2. Set parameter 8 to 1 3. If 8 is greater than 8, end calculation with return value False 4. If (4) is true, return value True 5. Increase the value of 8 by 1 and go to 1
�]^� ≤ J�F� ≤ ]^
� ∧ �`^� ≤ J�F� ≤ `^
� ∧ �a^� ≤ J�Fb ≤ a^
� �4
When all vertices of the first object are traversed and no intersection was found, the step has to be done once again but with swapped roles of the objects. The first box provides its vertices and the second one provides its bounding box. This swapping must be done for the case shown on Figure 3. When the solid-line object is in the first role and the dotted one in the second role, neither traversing over all vertexes can find the intersection although they are intersected.

Petr Jindra, Jiri Stastny Three stage object boundary intersection solver
DIVAI 2018 – The 12th international scientific conference on Distance Learning in Applied Informatics. 435 ISBN 978-80-7598-059-5 (Print) ISSN 2464-7470 (Print) ISSN 2464-7489 (On-line)
Figure 3: Corner object position.
There is one more case undetectable by the second step. When the faces are in intersection, but all vertices are outside of the other object, the second stage has failed. This case is shown on Figure 4.
Figure 4: No vertex is inside the second object.
In this situation, the objects are in intersection, but the points of both objects are not inside the bodies of each other. A test of intersection of planes and edges must be done.
The last stage calculates the mutual position of the faces of the first object and the edges of the second object. The first step is a transform of the first object to the origin of the coordinate system by the inversion transformation matrix and then a transform of the second object by same matrix too. This preserve identical mutual position of both delegates like before transformation by inverse matrix.
When this transformation is done, each face of the first object is parallel with one basis plane (planes XY, XZ and ZY going through coordinate system origin, see Figure 5).

Petr Jindra, Jiri Stastny Three stage object boundary intersection solver
DIVAI 2018 – The 12th international scientific conference on Distance Learning in Applied Informatics. 436 ISBN 978-80-7598-059-5 (Print) ISSN 2464-7470 (Print) ISSN 2464-7489 (On-line)
Figure 5: Object after transformation with vertex indexes.
Now, the comparison of planes and edges can be done. The edges and planes are compared until all of them are traversed or an intersection is found. The planes are described by the general equation defined by three vertexes of the first boxD�, D�and D� (Figure 6 and (8)) and the edges are described only by their end points Dc� andDc�.
Figure 6: Points defining plane (face).
ne = P�P�ggggggggh �5 ;� = D�D�gggggggggh �6 ;� = ;�ggggh j ;�ggggh �7 l ∙ ;�� + A ∙ ;�� + m ∙ ;�b + *�� = 0 �8
In the first part of the third stage, the distance of the edge's end points from the side plane (*� and *�) is calculated by substituting points' coordinates into plane equation (Burda, et al., 2005). If the sign of both (signed) distances is the same, the points lie on same side of the plane and the edge has no intersection with the face. Otherwise, the position of the intersection must be tested.
The position of the intersection point can be simply calculated from the ratio of the end point to plane distance as is shown in (11).
egh = Po�Po�ggggggggggggh �9 k = p^
p^)p� �10 PH = Po� + egh ⋅ k �11

Petr Jindra, Jiri Stastny Three stage object boundary intersection solver
DIVAI 2018 – The 12th international scientific conference on Distance Learning in Applied Informatics. 437 ISBN 978-80-7598-059-5 (Print) ISSN 2464-7470 (Print) ISSN 2464-7489 (On-line)
When the intersection point DF is known, a test must be performed, whether DF belongs to the actual side, because the bounding box's side occupies only a small portion of the plane. For this purpose, two perpendicular planes are constructed with normals. The distances of the point from these planes are calculated and tested, whether their signs are positive or equal to zero. If at least one sign is negative, DF is not belongs to the side and return False.
Otherwise, the intersection point is moved by negative vectors ;� and ;� and the
distance is measured again. This time both values must be negative or equal to zero to return True (edge and face is in intersect). For an explanation of this step, see Figure 6.
Figure 6: Intersection point is moved by ;� and ;� vectors.
This was the last step of the third stage of the algorithm. Now, it is known whether a pair of real objects delegated by a bounding box and a sphere is not in intersection, or whether it can be. If the algorithm returns True (real objects can be in intersection), some other algorithm must be applied, which is able to solve collisions of the original complex objects.
PARALLELIZATION
When there is many objects in space, a sequential computation will be very slow. The way to accelerate the runtime is parallelization. The algorithm itself cannot be parallelized because its steps must be done in correct order. Therefore, the parallelization consists of multiple threads that perform the calculation of different pairs of the objects (Hanák, 2009).
There will be a main thread in the role of manager and a several other threads in the role of workers, performing the calculations. No algorithm calculations are done in the main thread. The main thread is responsible for support operations: it provides interface for thread-to-thread communication, generates experimental environment and output experiment results.
The distribution of jobs to the workers is performed by assigning of object sets. Because each object must be compared with all others, the distribution can be implemented by the following algorithm:
1. Set the list of objects as >rWs8C- and the number of objects as >rWt><;-.

Petr Jindra, Jiri Stastny Three stage object boundary intersection solver
DIVAI 2018 – The 12th international scientific conference on Distance Learning in Applied Informatics. 438 ISBN 978-80-7598-059-5 (Print) ISSN 2464-7470 (Print) ISSN 2464-7489 (On-line)
2. Calculate the total number of combinations to be compared, divide it by the number of threads and round up. Put the result into the u@&-t><;- variable.
3. Set the value of the C-@&-+;*:l variable to zero. 4. Calculate the size of the >rWs8C- subset, which will be passed to a worker thread
for comparison. This section is the smallest possible section where the number of combinations is greater than the value of u@&-t><;-. Put the calculated size into the variable C:v9:;-U8m:.
5. Pass the size information (C:v9:;-U8m: variable) and the value of the C-@&-+;*:l variable to the thread.
6. Add the C:v9:;-U8m: value to the value of C-@&-+;*:l. 7. If C-@&-+;*:l is lesser than >rWt><;-, go to (4). 8. Run the worker threads. 9. End.
The jobs are almost uniformly distributed between the threads by this algorithm. This distribution is not completely uniform for several reasons. The first (least serious) reason is the rounding in the segment size calculation. The second reason is a consequence of the different size of selected object sequences. The first selected sequences are relatively large and therefore there may occur relatively big overhead. This problem could be solved, by passing object index list instead of index ranges. These indexes should be selected with an emphasis on the minimal number of overhead comparisons. Due to the ratio of the number of objects and the number of threads, the difference in the experiment will be insignificant.
INCREASING OF SPEED
An increase of speed was mentioned several times. When an object group is evaluated, the objects are compared using the "round robin" strategy. The number of comparisons ; is defined by (12). The w is total number of the objects.
n = x�x��
� �12
For this purpose, a combination reduction method has to be used. The method used in the experiment divides the space into sectors (subspaces). The simplest implementation of cuts uses planes (this method is used in the experiment), or any other spatial surface, which divides the space in two parts and each point can be assigned to the subspace above or under the surface. An experiment space with the objects is divided into several sectors. These sectors are evaluated individually. When the sectors are created, each object belongs to one or more sectors. If an object belongs to more than one sector (sector boundary passes through the object), the object is tested for intersection in each sector to which it belongs.
The choice of the shape, number and distribution in space of the cutting surfaces assumes of the spatial distribution of the objects. If a uniform distribution of the objects in space is assumed, the simplest distribution is to cut the space into a specified number of equally sized sectors using planes.

Petr Jindra, Jiri Stastny Three stage object boundary intersection solver
DIVAI 2018 – The 12th international scientific conference on Distance Learning in Applied Informatics. 439 ISBN 978-80-7598-059-5 (Print) ISSN 2464-7470 (Print) ISSN 2464-7489 (On-line)
When another than uniform distribution is assumed, the optimal positions and shapes of the space cuts need to be designed by a suitable heuristic. For example, when one half of the objects is found near the origin and the second half is dispersed to the periphery of space, the first group can be separated by a sphere, dividing the space into the sector inside the ball, and the sector outside the ball.
However, this algorithm has a major disadvantage. No delegate object can be larger than the smallest sector. If some object is larger, a situation can occur, when a sector is completely contained within the volume of the object, but the object is not added into this sector, because none of its vertexes is inside of it. The problem can be solved by a virtual vertex grid inside the bounding box. The grid must be dense enough to cover all possible sectors, which are located inside the box. This grid is used only for the inclusion of the box into sectors and it can be deleted after this process to release the assigned memory. This improvement is not implemented in the implementation described in the next chapter. The problem is solved by reducing the object size to value small enough to prevent this situation.
IMPLEMENTATION
The algorithm and the experimental program is implemented in C++ and is compiled for Linux using the thread module of C++11 Standard Template Libary (STL) to thread manipulation (Gove, 2011).
The libraries and the experimental program contain auxiliary mathematical functions and classes, auxiliary objects used in the algorithm, and module containing an implementation of the algorithm itself.
The auxiliary mathematical objects contain data container classes (vectors, matrices) and a special object for transformation matrix.
Another group of the first part of the program is formed by auxiliary objects specially designed for the algorithm. There is a class assigning jobs to the worker threads (called Director), a class representing boundary boxes, and a worker class with logic implemented for the processing of pairs of objects. This approach makes future extensions much easier.
Also, there is a specialized class containing a list of placeholder boxes and a class for the placeholder box itself. The class of placeholder box can be clearly classified as a class designed directly for the algorithm. On the other hand, the object container class (called World) is rather an auxiliary object than an algorithm one. It contains the object generation methods and it can split objects into sectors, but it does not do anything else.
The filling of the container object is done at the beginning of the experiment. For object generation, there are used three random number generators (part of STL). The first one generates the objects themselves (size generator), the second one generates coordinates of object's origin (the position generator) and the last one generates radnom rotation of objects in space (angle generator). All generators use the uniform probability distribution defined in STL. These implementations of generators have a unified ancestor. The ancestor is an abstract generator allowing to implement a new type of generator with a different distribution function compatible with other generators implementing this

Petr Jindra, Jiri Stastny Three stage object boundary intersection solver
DIVAI 2018 – The 12th international scientific conference on Distance Learning in Applied Informatics. 440 ISBN 978-80-7598-059-5 (Print) ISSN 2464-7470 (Print) ISSN 2464-7489 (On-line)
interface. These potential generators will be employed in the future in the next phases of the algorithm development.
The measuring of time is realized by the chrono module of STL. When the measurement is done, the current timestamp is stored and finaly delta times are calculated. This time measuring function is called two times. For the first time at the beginning of the experiment to obtain a reference time (before the director's thread starts) and the second time when the at the end of the measurement when all calculations are finished, and the director's thread stops.
The backend of experimental program consists of two functions. The main() function, which is the entry point of all programs in C/C++ and the function doExperiment(). The first function is designed to iterate through the various settings of the experiment, and it passes these settings to the function doExperiment().
The doExperiment() function takes care of the setup up and creation of the test scenarios (it creates random generators, sets the number of threads, etc.) and runs the experiment. When the experiment is finished, it stores the values in an output file.
EXPERIMENT
The experiment was carried out on a desktop computer with an AMD FX-8350 (eight cores) processor, 16 GB RAM DDR3 and Linux operating system (openSUSE Leap 42.1 kernel version 4.1.12). The experiment was run several times with different size and number of objects, number of worker threads and number of the planes cutting the space into sectors. To minimize the noise of the experiment due to other running programs, the measurement was done twenty times for each setting.
The size of the space where the experiment was done was set to +/- 1000 units in direction of each axis. This size represents a limit only for the centres of the boundary boxes, not for the vertices (some object points may be located outside of the test space).
The number of the objects in the test space is set to 1000, 3000, 5000, 7000, 9000, 11000 and 13000 objects and the range of the objects sizes was set in interval from 10 to 350 units (a big object experiment) and 10 to 50 units (a small object experiment). The first range of of the object size was chosen with regard to the size of the sector to avoid the problem of too small sectors (described above). The reason for two different ranges of sizes is to test the algorithm on an overfilled space (the first range) and on a space where objects have more space around them (the second range).
Various number of the cuts to cut the space and a different number of worker threads are set too. The cutting planes were chosen perpendicular to the one selected axis. On each axis, there is an identical number of planes. The number of cuts was chosen from 0 to 3.
For example, when a single cut is used, the space is divided by three planes passing through the origin and each plane is perpendicular to one of the axes: one plane to the X axis, the second to the Y axis and the third to the Z axis.

Petr Jindra, Jiri Stastny Three stage object boundary intersection solver
DIVAI 2018 – The 12th international scientific conference on Distance Learning in Applied Informatics. 441 ISBN 978-80-7598-059-5 (Print) ISSN 2464-7470 (Print) ISSN 2464-7489 (On-line)
The number of the worker threads is one for the scenario with no cut and four threads for the others. This provides a referential result, when the calculations are performed on only one core and a case when data is processed in more threads.
Due to the number of sectors created by the higher number of cuts and the number of data-processing threads, the overhead time used to start and stop threads and distributing the objects into the small sectors is measured, too.
Table 2: Number of object to number of intersection dependency.
Obj count Intersects
1000 3221
3000 28543
5000 81065
7000 157658
9000 259133
11000 386447
13000 545509
Figure 7: Intersections number dependency on number of objects.
Graph Figure 7 shows the number of intersection found due to the objects count. Data are taken from Table 2 which is part of Table 3 introduced below. It does not grow linearly but approximately to a polynomial of the second degree (Munk, Drlik and Vrabelova, 2011; Munk, Vrabelova and Kapusta, 2011). The graph also shows polynomial regression of the second-degree fitting to points.

Petr Jindra, Jiri Stastny Three stage object boundary intersection solver
DIVAI 2018 – The 12th international scientific conference on Distance Learning in Applied Informatics. 442 ISBN 978-80-7598-059-5 (Print) ISSN 2464-7470 (Print) ISSN 2464-7489 (On-line)
Table 3. One thread and no cut.
Objects Intersects Time Time per Intersect
[1] [1] [s] [s]
1000 3221 0,262 8,1313E-05
3000 28543 2,326 8,1489E-05
5000 81065 6,515 8,0371E-05
7000 157658 12,703 8,0573E-05
9000 259133 20,948 8,0837E-05
11000 386447 31,286 8,0958E-05
13000 545509 44,063 8,0774E-05
Table 4: Four threads and one cut.
Objects Intersects Time Time per Intersect
[1] [1] [s] [s]
1000 3889 0,084 2,1702E-05
3000 34450 0,716 2,0782E-05
5000 97973 1,912 1,9511E-05
7000 190935 3,664 1,9189E-05
9000 314397 5,956 1,8943E-05
11000 468082 8,796 1,8791E-05
13000 659842 12,351 1,8719E-05
Table 5: Four threads and two cuts.
Objects Intersects Time Time per Intersect
[1] [1] [s] [s]
1000 4549 0,088 1,9402E-05
3000 40895 0,742 1,8150E-05
5000 115443 2,048 1,7743E-05
7000 222288 3,942 1,7732E-05
9000 362052 6,477 1,7889E-05
11000 538346 9,776 1,8159E-05
13000 760239 13,570 1,7850E-05

Petr Jindra, Jiri Stastny Three stage object boundary intersection solver
DIVAI 2018 – The 12th international scientific conference on Distance Learning in Applied Informatics. 443 ISBN 978-80-7598-059-5 (Print) ISSN 2464-7470 (Print) ISSN 2464-7489 (On-line)
Table 6: Four threads and three cuts.
Objects Intersects Time Time per Intersect
[1] [1] [s] [s]
1000 4751 0,098 2,0593E-05
3000 42313 0,831 1,9645E-05
5000 124507 2,095 1,6830E-05
7000 242606 4,045 1,6672E-05
9000 397434 6,594 1,6592E-05
11000 590918 9,897 1,6749E-05
13000 834508 14,247 1,7073E-05
Figure 8: Number of thread and cuts to time dependency.
Figure 9: Number of thread and cuts to time dependency.
The figures from Figure 7 to Figure 9 show data about the experiment on the large size objects. Data sources are tables from Table 2 to Table 6. Results of the experiment on

Petr Jindra, Jiri Stastny Three stage object boundary intersection solver
DIVAI 2018 – The 12th international scientific conference on Distance Learning in Applied Informatics. 444 ISBN 978-80-7598-059-5 (Print) ISSN 2464-7470 (Print) ISSN 2464-7489 (On-line)
small size objects are shown in tables from Table 7 to Table 11 and charts form Figure 10 to Figure 12. These tables and charts have same meaning as in the big objects experiment, so it is not necessary to explain them again.
Table 7: Number of object to number of intersection dependency.
Objects Intersects
[1] [1]
1000 28
3000 242
5000 659
7000 1297
9000 2136
11000 3240
13000 4527
Figure 10: Intersections number dependency on number of objects.
Table 8: One thread and no cut.
Objects Intersects Time Time per Intersect
[1] [1] [s] [s]
1000 28 0,044 1,5543E-03
3000 242 0,366 1,5129E-03
5000 659 0,997 1,5122E-03
7000 1297 1,964 1,5140E-03
9000 2136 3,248 1,5208E-03
11000 3240 4,873 1,5039E-03
13000 4527 6,855 1,5142E-03

Petr Jindra, Jiri Stastny Three stage object boundary intersection solver
DIVAI 2018 – The 12th international scientific conference on Distance Learning in Applied Informatics. 445 ISBN 978-80-7598-059-5 (Print) ISSN 2464-7470 (Print) ISSN 2464-7489 (On-line)
Table 9: Four threads and one cut.
Objects Intersects Time Time per Intersect
[1] [1] [s] [s]
1000 28 0,004 1,5765E-04
3000 255 0,025 9,9922E-05
5000 683 0,057 8,3043E-05
7000 1342 0,101 7,5627E-05
9000 2210 0,164 7,4429E-05
11000 3350 0,240 7,1586E-05
13000 4699 0,333 7,0880E-05
Table 10: Four threads and two cuts.
Objects Intersects Time Time per Intersect
[1] [1] [s] [s]
1000 29 0,003 1,0317E-04
3000 251 0,013 5,2853E-05
5000 720 0,032 4,3954E-05
7000 1406 0,057 4,0216E-05
9000 2305 0,085 3,6718E-05
11000 3498 0,128 3,6507E-05
13000 4884 0,169 3,4591E-05
Table 11: Four threads and three cuts.
Objects Intersects Time Time per Intersect
[1] [1] [s] [s]
1000 27 0,004 1,3964E-04
3000 277 0,016 5,8576E-05
5000 738 0,025 3,4210E-05
7000 1426 0,044 3,0514E-05
9000 2376 0,071 2,9953E-05
11000 3546 0,101 2,8463E-05
13000 5049 0,136 2,6891E-05

Petr Jindra, Jiri Stastny Three stage object boundary intersection solver
DIVAI 2018 – The 12th international scientific conference on Distance Learning in Applied Informatics. 446 ISBN 978-80-7598-059-5 (Print) ISSN 2464-7470 (Print) ISSN 2464-7489 (On-line)
Figure 11: Number of thread and cuts to time dependency.
Figure 12: Number of thread and cuts to time dependency.
An assumption mentioned above says that dividing the space into sectors leads to a notable increase of the calculation speed. Large acceleration of calculation has been observed only when one slice was done compared to the scenario with no cut. The calculation time with one cut and one thread is almost halved. This is caused by using only one thread in scenario without cuts (only one thread per sector can be used) and four threads for the other ones. Contrary to the expectation, a higher number of cuts does not mean a noticeable increase of the calculation speed. The most probable reason is an excessive space fragmentation and most of the objects are located in more than one sector. This behaviour is common for both object size ranges.
When the number of cuts is higher than one, the behaviour of the situation with small objects and with big objects is different. The time has an ascending trend in the big-object scenario and a descending trend in the small-object scenario. The ascending time can be
Petr Jindra, Jiri Stastny Three stage object boundary intersection solver
DIVAI 2018 – The 12th international scientific conference on Distance Learning in Applied Informatics. 447 ISBN 978-80-7598-059-5 (Print) ISSN 2464-7470 (Print) ISSN 2464-7489 (On-line)
explained by objects belonging to more sectors at once. In this case, an object belonging to more than one sector is tested in each sector individually.
The overlapping of objects also explains the number of intersections ascending with number of cuts. This difference is more significant in the big size range scenario. The larger difference is caused by the higher probability of existence of multi-sector objects (a bigger object has a higher probability to belong to more than one sector).
There is also a difference in the time per intersect. The time per intersection of big size range is in tens of microseconds but the time per intersect of one-thread calculation of small object size is in milliseconds. Of course, the algorithm in the small object case is faster because 3221 intersects were found in the big-object case (Table 2) and only 28 intersects were found in the small object case (Table 7). This time (and all times per intersect) was obtained by (13).
tzH = {|}~ �13
Where -�F is time per intersect, -� is total calculation time and ;F is the total number
of intersects. The bad average time per intersect for one thread and small object is caused by overhead time costs of algorithm's support code. If we pair scenarios from small object group and big object group by the number of objects, both scenarios in every pair have a similar overhead time. However, in the big object case, this overhead is less significant because more intersects are found and due to (13) this overhead is split into more pieces, so it seems lower than in the small objects scenario, where there are only few intersects, and each intersect takes up a bigger part of this overhead time.
CONCLUSION
The algorithm was tested on two sets of a large number of objects placed in a small space. The first set contains big objects and the second set contains small objects. These situations were chosen deliberately to get significant differences in measured times and could be used for evaluation in the previous chapter. When the measurement was done, the raw values were processed to get relevant data and suppress noise caused by other programmes that were running on computer while experiment was in progress.
The measured results show that the algorithm can be used for real time calculations in applications where there are hundreds of big objects or thousands of small objects. The algorithm can be used in many applications where collision detection is required e.g. kinematic system simulations, simulations of robots moving in virtual environment or computer games. Of course, this is only a heuristic algorithm and its return value can be False when two objects cannot be in collision or True when two objects could be in collision (but it is not sure if they really are in collision). The purpose of this algorithm is to reduce the search space, so for a more precise collision result, some other algorithm is necessary, which is designed for an exact collision detection.
There should be some additional development because the current version of the algorithm has some notable disadvantages. Probably the biggest disadvantage of the current version is the delegation of real objects only by box shapes. There should be a support for more complex delegating shapes in the future. Maybe the most important
Petr Jindra, Jiri Stastny Three stage object boundary intersection solver
DIVAI 2018 – The 12th international scientific conference on Distance Learning in Applied Informatics. 448 ISBN 978-80-7598-059-5 (Print) ISSN 2464-7470 (Print) ISSN 2464-7489 (On-line)
shapes to implement are simple planes (to delegate walls and boundaries), standalone spheres, cylinders and n-sided pyramids. With more delegating shapes, we can choose the one which is the best fitting to the real object.
Another option to improve the performance is to modify the algorithm to a “dynamic version”. The dynamic version evaluates only objects which changed their positions in space. This leads to the intersection calculation only once on the whole set, and after that only objects that have been identified as changed are evaluated.
There are some ways to improve the performance of the algorithm, but even in this state it is usable for some simple application. The core of the algorithm (the collision detection functions and methods) works well and the multi thread worker was implemented too, so it is ready to be used in real applications.
ACKNOWLEDGEMENT
This work has been supported by the grant of Brno University of Technology [FSI-S-17-4785].
REFERENCES
Beránek, L. & Nýdl, V., 2013. The Use of Belief Functions for the Detection of Internet Auction Fraud. Proceedings of the International Conference Mathematical Methods in Economics, pp. 31-36, Jihlava, Czech republic.
Burda, P., Havelek, R. & Hradecká, R., 2005. Algebra A Analytická Geometrie. VŠB Technická univerzita Ostrava, Czech republic.
Capay, M., Balogh, Z. et al., 2011. Interpretation of Questionnaire Survey Results in Comparison with Usage Analysis in E-Learning System for Healthcare. Proceedings of the International Conference on Digital Information and Communication Technology and Its Applications, Dijon, France.
Castro, J. L., Delgado, M., Medina, J. & Ruiz-Lozano, M., 2011. An expert fuzzy system for predicting object collisions. Its application for avoiding pedestrian accidents. Expert Systems with Applications, 1(38), pp. 486-494.
Gove, D., 2011. Programování Aplikací Pro Vícejádrové Procesory. Editor Brno: Computer Press.
Govindaraju, K. N., Kabul, I., Lin, M. C. & Manocha, D., 2007. Fast continuous collision detection among deformable models using graphics processors. Computers & Graphics, 1(31), pp. 5-14.
Guy, S. & Debunne, G., 2004. Monte-Carlo collision detection, Paris: INRA.
Hanák, J., 2009. Praktické Paralelné Programovanie V Jazykoch C# 4.0 A C++. 1 editor Brno: Artax.
Jang, H. & Han, J., 2008. Fast collision detection using the A-buffer. Visual Computer, Issue 24, pp. 659-667.

Petr Jindra, Jiri Stastny Three stage object boundary intersection solver
DIVAI 2018 – The 12th international scientific conference on Distance Learning in Applied Informatics. 449 ISBN 978-80-7598-059-5 (Print) ISSN 2464-7470 (Print) ISSN 2464-7489 (On-line)
Munk, M., Benko, Ľ., Gangur, M., Turcani, M., 2015. Influence Of Ratio Of Auxiliary Pages On The Pre-Processing Phase Of Web Usage Mining. E & M EKONOMIE A MANAGEMENT, 18(3), pp. 144-159.
Munk, M., Drlik, M., Vrabelova, M., 2011. Probability Modelling of Accesses to the Course Activities in the Web-Based Educational System. Computational Science And Its Applications - ICCSA 2011, PT V, Lecture Notes in Computer Science, 6789, pp. 485-499.
Munk, M., Vrabelova, M., Kapusta, J., 2011. Probability modeling of accesses to the web parts of portal. World Conference On Information Technology (WCIT-2010), Procedia Computer Science, 3.
Shreiner, D., 2006. Opengl: Průvodce Programátora. Editor Brno: Computer Press.
Suri, S. H. P. M. & Hughes, J., 1999. Analyzing bounding boxes for object intersection. ACM Transactions on Graphics, 3(18), pp. 257-277.
Tan, Y., Liu, C. & Yu, Y., 2009. The Design of Collision Detection Algorithm in 2D Grapple Games. Information Engineering and Computer Science.
Zhao, W. & Lan, Y., 2012. A Fast Collision Detection Algorithm Based on Distance Calculations between NURBS Surfaces. Hangzhou, Computer Science and Electronics Engineering, pp. 534-537.

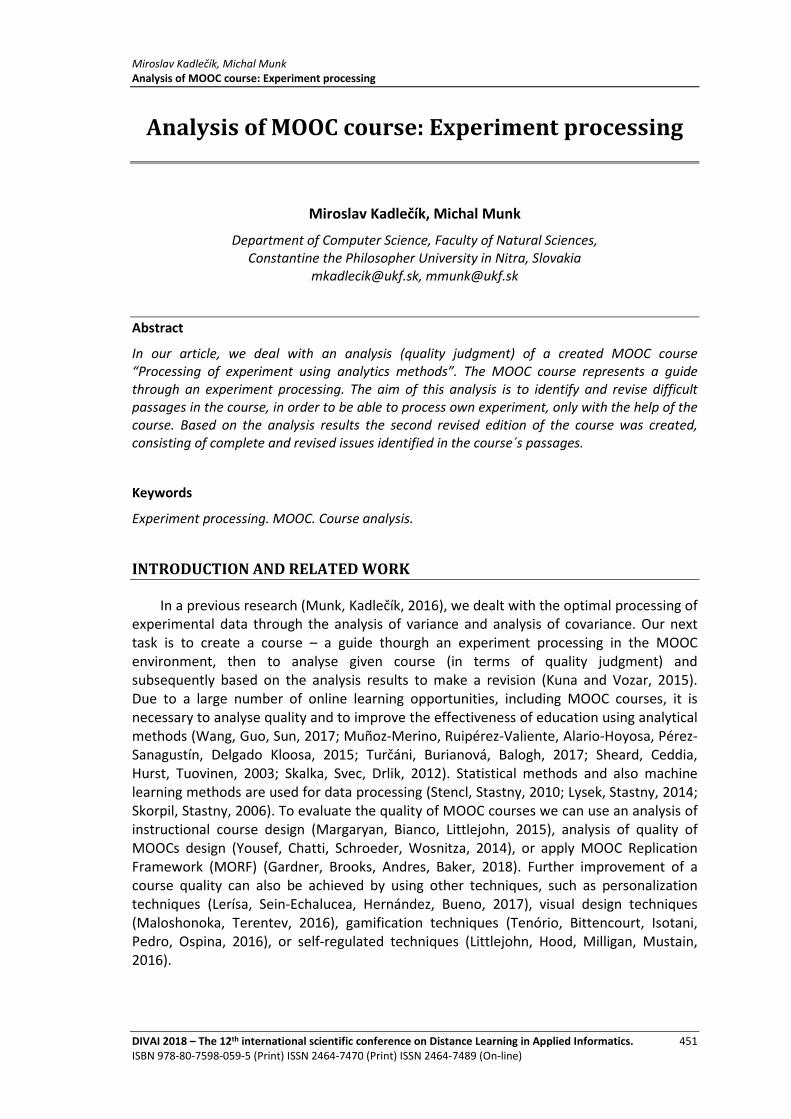
Miroslav Kadlečík, Michal Munk Analysis of MOOC course: Experiment processing
DIVAI 2018 – The 12th international scientific conference on Distance Learning in Applied Informatics. 451 ISBN 978-80-7598-059-5 (Print) ISSN 2464-7470 (Print) ISSN 2464-7489 (On-line)
Analysis of MOOC course: Experiment processing
Miroslav Kadlečík, Michal Munk
Department of Computer Science, Faculty of Natural Sciences, Constantine the Philosopher University in Nitra, Slovakia
[email protected], [email protected]
Abstract
In our article, we deal with an analysis (quality judgment) of a created MOOC course “Processing of experiment using analytics methods”. The MOOC course represents a guide through an experiment processing. The aim of this analysis is to identify and revise difficult passages in the course, in order to be able to process own experiment, only with the help of the course. Based on the analysis results the second revised edition of the course was created, consisting of complete and revised issues identified in the course´s passages.
Keywords
Experiment processing. MOOC. Course analysis.
INTRODUCTION AND RELATED WORK
In a previous research (Munk, Kadlečík, 2016), we dealt with the optimal processing of experimental data through the analysis of variance and analysis of covariance. Our next task is to create a course – a guide thourgh an experiment processing in the MOOC environment, then to analyse given course (in terms of quality judgment) and subsequently based on the analysis results to make a revision (Kuna and Vozar, 2015). Due to a large number of online learning opportunities, including MOOC courses, it is necessary to analyse quality and to improve the effectiveness of education using analytical methods (Wang, Guo, Sun, 2017; Muñoz-Merino, Ruipérez-Valiente, Alario-Hoyosa, Pérez-Sanagustín, Delgado Kloosa, 2015; Turčáni, Burianová, Balogh, 2017; Sheard, Ceddia, Hurst, Tuovinen, 2003; Skalka, Svec, Drlik, 2012). Statistical methods and also machine learning methods are used for data processing (Stencl, Stastny, 2010; Lysek, Stastny, 2014; Skorpil, Stastny, 2006). To evaluate the quality of MOOC courses we can use an analysis of instructional course design (Margaryan, Bianco, Littlejohn, 2015), analysis of quality of MOOCs design (Yousef, Chatti, Schroeder, Wosnitza, 2014), or apply MOOC Replication Framework (MORF) (Gardner, Brooks, Andres, Baker, 2018). Further improvement of a course quality can also be achieved by using other techniques, such as personalization techniques (Lerísa, Sein-Echalucea, Hernández, Bueno, 2017), visual design techniques (Maloshonoka, Terentev, 2016), gamification techniques (Tenório, Bittencourt, Isotani, Pedro, Ospina, 2016), or self-regulated techniques (Littlejohn, Hood, Milligan, Mustain, 2016).

Miroslav Kadlečík, Michal Munk Analysis of MOOC course: Experiment processing
DIVAI 2018 – The 12th international scientific conference on Distance Learning in Applied Informatics. 452 ISBN 978-80-7598-059-5 (Print) ISSN 2464-7470 (Print) ISSN 2464-7489 (On-line)
The aim of this research is to identify and subsequently to revise difficult passages of the MOOC course (phases of experiment processing); to be a user able to process own experiment only with the use of the given course.
To achieve the above-mentioned aim, the following research question is addressed: Is a created course sufficient for a student to process own experiment? Experiment procedure: 1. To allow an access to the guide. 2. Based on the created guide to process an experiment (students´ works). 3. To evaluate students’ works. 4. To identify difficult phases. 5. To revise and enlarge difficult phases.
OPEN THE MOOC COURSE – A GUIDE THROUGH EXPERIMENT PROCESSING
MOOCs can be seen as a term or word related to the scalability of open and online education. MOOC courses are specially designed for a large number of subscribers, they can be accessed from anywhere and anyone who has an internet connection. They are open to everyone without the need to verify the previous qualification and they are completely free (OpenUpEd, 2015). Openness to students and digital openness, student-centred learning and anonymous learning, media supported interactions, eligibility, focus on quality and variability are basic criteria (quality label) for this type of courses (Rohlíková, 2016).
The created MOOC course provides an informal, open, and community environment (edX, 2015; Baker, 2015). Therefore, it is expected that students will work independently with this material. The course is an electronic learning aid to process an experiment. The user does not need to learn/memorize the course contents, just to know how to work with this material and to use it as a tool for the experiment processing. The main course chapters represent individual phases of the experiment. Each phase is illustrated by an example.
The course informs the user how to process the experiment from the beginning, a creation of an experimental and control group, to the end- interpretation of the results. It emphasizes the need to create quality measurement procedures - in our case didactic tests. It provides a number of methods how to verify reliability and validity of the didactical tests. It offers to a user a number of experimental plans. It pays attention to data understanding, i.e. to calculate descriptive characteristics and confidence intervals. Based on these results to build a zero statistical hypothesis. The course offers two methods to test the given hypothesis - analysis of variance and analysis of covariance. Besides the description of these methods and the procedure how to verify the assumptions of their use, they also provide solutions for possible violence of the validity of assumptions.
The student was introduced to the course and was informed about how to use this learning aid. Each student had own user´s account and the course “Processing of experiment” was available after an authentication to the virtual learning environment.

Miroslav Kadlečík, Michal Munk Analysis of MOOC course: Experiment processing
DIVAI 2018 – The 12th international scientific conference on Distance Learning in Applied Informatics. 453 ISBN 978-80-7598-059-5 (Print) ISSN 2464-7470 (Print) ISSN 2464-7489 (On-line)
EXPERIMENT PROCESSING BASED ON A CREATED WIZARD
Selected students of the master study program (2nd year) of the general-educational subjects (teacher training) prepared a project on the experiment topic.
Their task was to process a fictional experiment based on the created course.
They should precisely proceed based on the experiment phases comprising the main course chapters. The average page range of projects was eight pages, the minimum range was six and maximum eleven, the most frequent projects, in terms of page range (eleven times), were projects of seven pages. Further descriptive characteristics of the page range are depicted in the following tables (table 1, table 2).
Table 1: Descriptive Statistics: Descriptive characteristics of the page range of work.
N Mean -95% +95% Variance Std.Dev Std. Err.
Skewness Kurtosis
Range
40
8.1
25
7.6
54
59
3
8.5
95
40
7
2.1
63
46
2
1.4
70
87
1
0.2
32
57
0.4
34
95
7
-0.5
39
63
2
Table 2: Ordinal Descriptive Statistics: Descriptive characteristics of the page range of work.
N Median Mode Frequency of Mode
Min. Max. 25% 75% Range Q.Range
Range 40 8 7 11 6 11 7 9 5 2
EVALUATION OF STUDENTS’ PROJECTS
We did not evaluate the project as a whole piece, but each phase separately. Firstly, we defined the criteria for an assessment (separately for each phase):
1) Experimental and control group
� random selection, random grouping, if required by an experimental plan,
� establishing a research hypothesis,
� a correct formulation of the research hypothesis.
2) Quality measuring procedures
� estimation of objectivity,
� estimation of reliability,
� estimation of concurrent validity,
� a correct interpretation of calculated estimates.
3) Implementation of an experimental plan
� a description of the implementation of the selected experimental plan,
� an intervention.
4) Data understanding
� calculation of descriptive characteristics and confidence intervals for all groups and for each group separately,
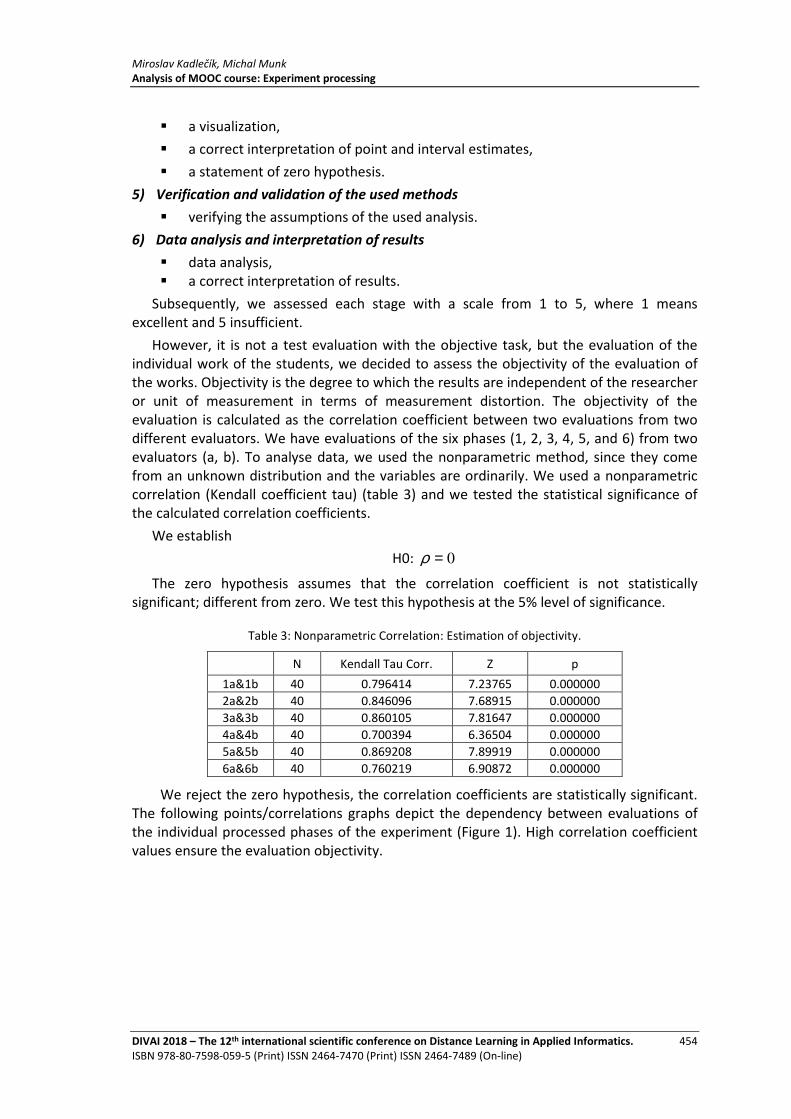
Miroslav Kadlečík, Michal Munk Analysis of MOOC course: Experiment processing
DIVAI 2018 – The 12th international scientific conference on Distance Learning in Applied Informatics. 454 ISBN 978-80-7598-059-5 (Print) ISSN 2464-7470 (Print) ISSN 2464-7489 (On-line)
� a visualization,
� a correct interpretation of point and interval estimates,
� a statement of zero hypothesis.
5) Verification and validation of the used methods
� verifying the assumptions of the used analysis.
6) Data analysis and interpretation of results
� data analysis, � a correct interpretation of results.
Subsequently, we assessed each stage with a scale from 1 to 5, where 1 means excellent and 5 insufficient.
However, it is not a test evaluation with the objective task, but the evaluation of the individual work of the students, we decided to assess the objectivity of the evaluation of the works. Objectivity is the degree to which the results are independent of the researcher or unit of measurement in terms of measurement distortion. The objectivity of the evaluation is calculated as the correlation coefficient between two evaluations from two different evaluators. We have evaluations of the six phases (1, 2, 3, 4, 5, and 6) from two evaluators (a, b). To analyse data, we used the nonparametric method, since they come from an unknown distribution and the variables are ordinarily. We used a nonparametric correlation (Kendall coefficient tau) (table 3) and we tested the statistical significance of the calculated correlation coefficients.
We establish
H0: 0=ρ
The zero hypothesis assumes that the correlation coefficient is not statistically significant; different from zero. We test this hypothesis at the 5% level of significance.
Table 3: Nonparametric Correlation: Estimation of objectivity.
N Kendall Tau Corr. Z p
1a&1b 40 0.796414 7.23765 0.000000
2a&2b 40 0.846096 7.68915 0.000000
3a&3b 40 0.860105 7.81647 0.000000
4a&4b 40 0.700394 6.36504 0.000000
5a&5b 40 0.869208 7.89919 0.000000
6a&6b 40 0.760219 6.90872 0.000000
We reject the zero hypothesis, the correlation coefficients are statistically significant. The following points/correlations graphs depict the dependency between evaluations of the individual processed phases of the experiment (Figure 1). High correlation coefficient values ensure the evaluation objectivity.

Miroslav Kadlečík, Michal Munk Analysis of MOOC course: Experiment processing
DIVAI 2018 – The 12th international scientific conference on Distance Learning in Applied Informatics. 455 ISBN 978-80-7598-059-5 (Print) ISSN 2464-7470 (Print) ISSN 2464-7489 (On-line)
Figure 1: Scatterplot: visualization of objectivity estimates.
Qualitative evaluation of projects:
1. Control and experimental group In some projects, research hypothesis was missing and a small fraction of students did not create groups randomly when implementing the experimental plan, which requires it.
2. Quality measuring procedures The estimation of objectivity was not calculated in either case. On the other hand, all students calculated an estimate of reliability and an estimate of concurrent validity. With an estimate of concurrent validity, they almost had no problem, unlike the estimate of reliability that the most students calculated incorrectly. The calculated estimates were correctly interpreted.
3. Implementation of an experimental plan Most students implemented an experimental plan using a pre-test and post-test, however, the entities in groups were selected randomly. However, we did not consider it as a mistake, but rather an unnecessary effort on their side. The most students, who chose an experimental plan using a post-test created groups randomly.
4. Data understanding Students did not know when to use the suitable statistics. They had problems with the correct interpretation of point and interval estimation. They did not visualize the results of descriptive statistics. Some students did not state a zero hypothesis.
5. Verification of validity of used methods
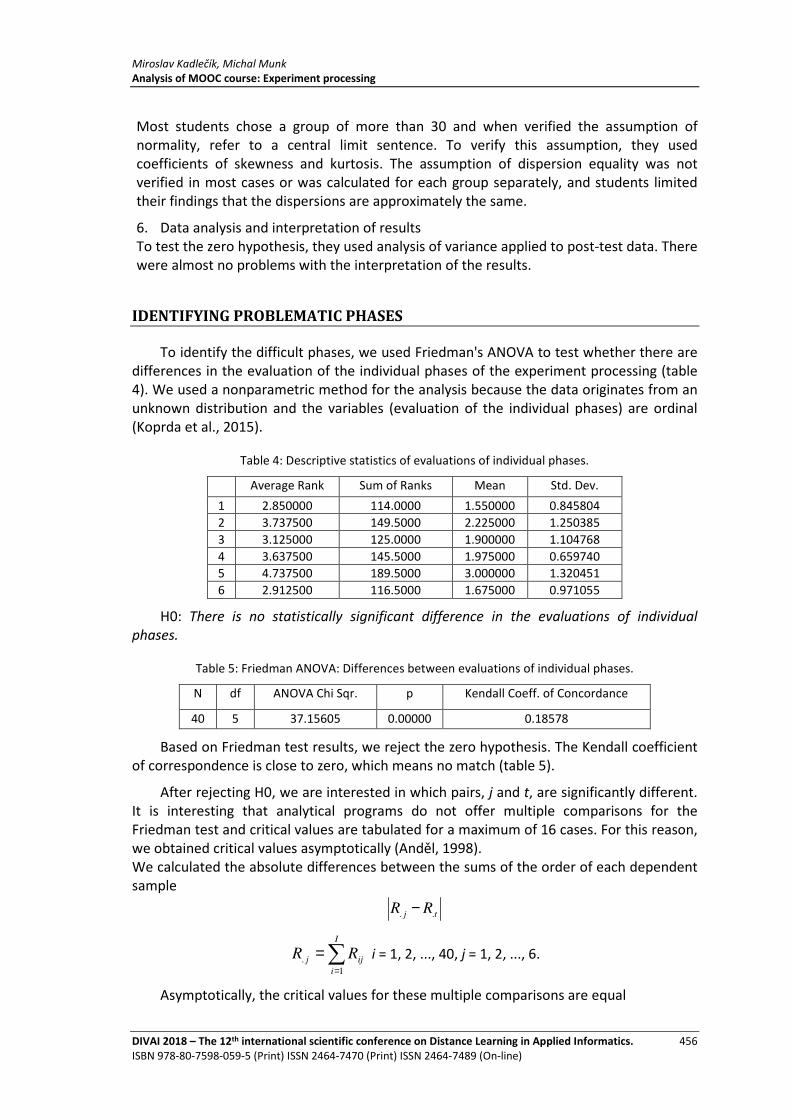
Miroslav Kadlečík, Michal Munk Analysis of MOOC course: Experiment processing
DIVAI 2018 – The 12th international scientific conference on Distance Learning in Applied Informatics. 456 ISBN 978-80-7598-059-5 (Print) ISSN 2464-7470 (Print) ISSN 2464-7489 (On-line)
Most students chose a group of more than 30 and when verified the assumption of normality, refer to a central limit sentence. To verify this assumption, they used coefficients of skewness and kurtosis. The assumption of dispersion equality was not verified in most cases or was calculated for each group separately, and students limited their findings that the dispersions are approximately the same.
6. Data analysis and interpretation of results To test the zero hypothesis, they used analysis of variance applied to post-test data. There were almost no problems with the interpretation of the results.
IDENTIFYING PROBLEMATIC PHASES
To identify the difficult phases, we used Friedman's ANOVA to test whether there are differences in the evaluation of the individual phases of the experiment processing (table 4). We used a nonparametric method for the analysis because the data originates from an unknown distribution and the variables (evaluation of the individual phases) are ordinal (Koprda et al., 2015).
Table 4: Descriptive statistics of evaluations of individual phases.
Average Rank Sum of Ranks Mean Std. Dev.
1 2.850000 114.0000 1.550000 0.845804
2 3.737500 149.5000 2.225000 1.250385
3 3.125000 125.0000 1.900000 1.104768
4 3.637500 145.5000 1.975000 0.659740
5 4.737500 189.5000 3.000000 1.320451
6 2.912500 116.5000 1.675000 0.971055
H0: There is no statistically significant difference in the evaluations of individual phases.
Table 5: Friedman ANOVA: Differences between evaluations of individual phases.
N df ANOVA Chi Sqr. p Kendall Coeff. of Concordance
40 5 37.15605 0.00000 0.18578
Based on Friedman test results, we reject the zero hypothesis. The Kendall coefficient of correspondence is close to zero, which means no match (table 5).
After rejecting H0, we are interested in which pairs, j and t, are significantly different. It is interesting that analytical programs do not offer multiple comparisons for the Friedman test and critical values are tabulated for a maximum of 16 cases. For this reason, we obtained critical values asymptotically (Anděl, 1998). We calculated the absolute differences between the sums of the order of each dependent sample
tj RR .. −
∑=
=I
i
ijj RR1
. i = 1, 2, ..., 40, j = 1, 2, ..., 6.
Asymptotically, the critical values for these multiple comparisons are equal

Miroslav Kadlečík, Michal Munk Analysis of MOOC course: Experiment processing
DIVAI 2018 – The 12th international scientific conference on Distance Learning in Applied Informatics. 457 ISBN 978-80-7598-059-5 (Print) ISSN 2464-7470 (Print) ISSN 2464-7489 (On-line)
)1(121
)(, +∞ JIJq j α
where I is number of cases (40) and J is the number of dependent samples (6). The formula is used for I > 5.
If absolute differences are greater than or equal to the critical value, we reject the H0 for equality. These comparisons are done for all pairs j < t,
)1(121
)(,.. +≥− ∞ JIJqRR jtj α
)1(121
)(, +∞ JIJq j α = 4.03*11.83 = 47.6836030517829.
Table 6: Multiple comparisons: The absolute differences between the sums in rank the evaluations of the individual phases.
Critical Value 47.6836
1 2 3 4 5 6
114 149.5 125 145.5 189.5 116.5
1 114 35.5 11 31.5 75.5 2.5
2 149.5 35.5 24.5 4 40 33
3 125 11 24.5 20.5 64.5 8.5
4 145.5 31.5 4 20.5 44 29
5 189.5 75.5 40 64.5 44 73
6 116.5 2.5 33 8.5 29 73
Statistically significant difference is in the evaluations between 5. – 1., 5. – 3., and 5. – 6. phases (table 6). The differences are also visible on the box plot depicting median, quartile, and variation ranges (figure 2).
Figure 2: Box Plot: visualization of differences.
The smallest issues have students to design a control and experimental group, to implement an experimental plan, to analyse data, and interpret the results. The biggest problem was to verify the validity of the used methods.

Miroslav Kadlečík, Michal Munk Analysis of MOOC course: Experiment processing
DIVAI 2018 – The 12th international scientific conference on Distance Learning in Applied Informatics. 458 ISBN 978-80-7598-059-5 (Print) ISSN 2464-7470 (Print) ISSN 2464-7489 (On-line)
CONCLUSION
Based on the results, the second revised edition of the MOOC course titled “Processing of experiment” was created (thoroughly revised and enlarged). The 2nd revised edition consists of completing the second, fourth phase and partially in reworking of the fifth experimental phase.
2 Quality measuring procedures 2.1 Correlation analysis
2.2 Estimation of objectivity
2.3 Estimation of reliability 2.4 Estimation of validity 2.5 Example
In this section, subchapters 2.1 and 2.2 were added. Compared to the first edition, we deal with the correlation analysis given that, some students had a problem to calculate the estimates. We discuss the estimation of objectivity separately in one subchapter, although we briefly mentioned it before in the main chapter (only). We want to make sure, to give the student the same space for the quality measurement such as reliability and validity because these estimates were not even calculated in any project.
4 Data understanding 4.1 Position characteristics
4.2 Variability characteristics
4.3 Shape characteristics
4.4 Quantities, percentiles and quartiles
4.5 Confidence interval 4.6 Visualization
4.7 Example
In this section, subchapters 4.1, 4.2, 4.3, 4.4, and 4.6 were added. Compared to the first edition, we especially pay attention to the characteristics of position, variability, shape and quantity. In the first edition, we limited ourselves to a brief description of the individual characteristics in the chapter of descriptive characteristics. In the revised second edition, we also deal with the use of individual characteristics, when it is advisable to use the average as the characteristic of a position (the median and modus). We also visualize descriptive characteristics, since, in any students´ projects, they did not try to visualize computed characteristics.
5 Verification of validity of the used methods 5.1 Assumptions for the use of analysis of variance 5.2 Assumptions for the use of analysis of covariance 5.3 Example
In this section, subchapter 5.3 has been revised. Verification of individual assumptions is not only roughly described, but also is illustrated by animations (interactive images). The course was supplemented by the use of non-linear transformations in the case of breach of the assumption of normality.
The MOOC course is mostly used by students as a tool for solving projects or research problems related to the final theses (diploma thesis, rigorous thesis, dissertation, etc.). The

Miroslav Kadlečík, Michal Munk Analysis of MOOC course: Experiment processing
DIVAI 2018 – The 12th international scientific conference on Distance Learning in Applied Informatics. 459 ISBN 978-80-7598-059-5 (Print) ISSN 2464-7470 (Print) ISSN 2464-7489 (On-line)
course accompanies the student during a research realization and replaces many consultations with their supervisors, which finally saves the time on both sides. Based on the analysis results of the Processing of experiment course, the second revised edition was created, consisting of the second and fourth phase completion, and partially of the fifth re-worked phase of experiment processing.
ACKNOWLEDGEMENT
This work was supported by the project VEGA 1/0776/18 Optimizing the content and structure of the disclosures under Pillar 3 by modelling their use by stakeholders of commercial bank.
REFERENCES
Anděl, J., 1998. Statistické metody. Praha: Matfyzpress, 1998. ISBN 80-85863-87-8.
Baker, R., Big Data and Education. [online] Available at: <http://www.columbia.edu/~rsb2162/bigdataeducation.html> [Accessed 22 Jun 2015].
edX, 2015. [online] Available at: <https://www.edx.org/> [Accessed 22 Jun 2015].
Gardner, J., Brooks, Ch., Andres, J., Baker, R., 2018. MORF: A Framework for MOOC Predictive Modeling and Replication At Scale, [online] Available at: <https://arxiv.org/abs/1801.05236v2> [Accessed 17 January 2018].
Koprda, S., Balogh, Z., Hruby, D. et al., 2015. Proposal of the irrigation system using low-cost Arduino system as part of a smart home. In: IEEE 13th International Symposium On Intelligent Systems And Informatics (SISY), International Symposium on Intelligent Systems and Informatics, 2015, pp. 229-233.
Kuna, P., Vozar, M., 2015. Web application as a support for teaching methodology in educating informatics curricula. In: Proceedings Of 2015 International Conference On Interactive Collaborative Learning (ICL), 2015, pp. 904-910.
Lerísa, D., Sein-Echalucea, M., Hernández, M., Bueno, C., 2017. Validation of indicators for implementing an adaptive platform for MOOCs. In: Computers in Human Behavior, Volume 72, July 2017, ISSN: 0747-5632, pp. 783-795.
Littlejohn, A., Hood, N., Milligan, C., Mustain, P., 2016. Learning in MOOCs: Motivations and self-regulated learning in MOOCs. In: Internet and Higher Education, Volume 29, April 2016, ISSN: 1096-7516, pp. 40-48.
Lysek, J., Stastny, J., 2014. Automatic discovery of the regression model by means of grammatical and differential evolution. Agricultural Economics, 2014, Volume 60, Issue 12, ISSN 0139-570X, pp. 546-552.
Maloshonoka, N., Terentev, E., 2016. The impact of visual design and response formats on data quality in a web survey of MOOC students. In: Computers in Human Behavior, Volume 62, September 2016, ISSN: 0747-5632, pp. 506-515.
Margaryan, A., Bianco, M., Littlejohn, A., 2015. Instructional quality of Massive Open Online Courses (MOOCs). In: Computers & Education, Vol. 80, 2015, ISSN: 0360-1315, pp. 77-83.

Miroslav Kadlečík, Michal Munk Analysis of MOOC course: Experiment processing
DIVAI 2018 – The 12th international scientific conference on Distance Learning in Applied Informatics. 460 ISBN 978-80-7598-059-5 (Print) ISSN 2464-7470 (Print) ISSN 2464-7489 (On-line)
Munk, M., Kadlečík, M., 2016. Experimental Data Analysis : Verification of a Didactical Efficiency of a Course. In: DIVAI 2016: 11th International Scientific Conference on Distance Learning in Applied Informatics, ISBN 978-80-7552-249-8, pp.561-570.
Muñoz-Merino, P., Ruipérez-Valiente, J., Alario-Hoyosa, C., Pérez-Sanagustín, M., Delgado Kloosa, C., 2015. Precise Effectiveness Strategy for analyzing the effectiveness of students with educational resources and activities in MOOCs. In: Computers in Human Behavior, Volume 47, June 2015, ISSN: 0747-5632, pp. 108-118.
OpenUpEd, 2015. Definition Massive Open Online Courses (MOOCs). [online] Available at: <http://home.eadtu.eu/images/Results/Definition_Massive_Open_Online_Courses.pdf> [Accessed 6 April 2018].
Rohlíková, L., 2016. MOOC – definice a rámec kvality. Prezentace ZČU. [online] Available at: <http://www.caduv.cz/mooc> [Accessed 6 April 2018].
Sheard, J., Ceddia, J., Hurst, J., Tuovinen, J., 2003. Inferring student learning behaviour from website interactions: A usage analysis. In: Journal of Education and Information Technologies, Volume 8, Issue 3, September 2003, ISSN: 1360-2357, pp.245–266.
Skalka, J., Svec, P., Drlik, M., 2012. E-learning and Quality: The Quality Evaluation Model for E-learning Courses. In: DIVAI 2012: 9TH INTERNATIONAL SCIENTIFIC CONFERENCE ON DISTANCE LEARNING IN APPLIED INFORMATICS, pp. 279–287.
Skorpil, V., Stastny, J., 2006. Back-Propagation and K-Means Algorithms Comparison. In: 8TH INTERNATIONAL CONFERENCE ON SIGNAL PROCESSING, Guilin, China, IEEE Press, 2006, ISSN 2164-5221, WOS:000244650602064, pp. 1871-1874.
Stencl, M., Stastny, J., 2010. Neural network learning algorithms comparison on numerical prediction of real data. In: 16TH INTERNATIONAL CONFERENCE ON SOFT COMPUTING MENDEL 2010. Brno, 2010, ISSN 1803-3814, pp. 280-285.
Tenório, T., Bittencourt, I., Isotani, S., Pedro, A., Ospina, P., 2016. A gamified peer assessment model for on-line learning environments in a competitive context. In: Computers in Human Behavior, Volume 64, November 2016, ISSN: 0747-5632, pp. 247-263.
Turčáni, M., Burianová, M., Balogh, Z., 2017. STUDY EFFICIENCY IMPROVEMENT USING PERSONALIZED TEACHING AND ADAPTIVE POSSIBILITIES OF LMS MOODLE. In: Proceedings of the 14th International Conference on Efficiency and Responsibility in Education 2017 (ERIE), ISSN: 2336-744X, ISBN:978-80-213-2762-7, WOS:000409038600056, pp: 460-468.
Wang, W., Guo, L., Sun, R., 2017. Rational herd behavior in online learning: Insights from MOOC. In: Computers in Human Behavior, Huaqiao University, Quanzhou, Fujian, China. [online] Available at <https://doi.org/10.1016/j.chb.2017.10.009> [Accessed 9 October 2017]
Yousef, A., Chatti, M., Schroeder, U., Wosnitza, M., 2014. What Drives a Successful MOOC? An Empirical Examination of Criteria to Assure Design Quality of MOOCs. In: Advanced Learning Technologies (ICALT), 2014 IEEE 14th International Conference, 7-10 July 2014, ISBN: 978-1-4799-4038-7

Milan Košťák, Bruno Ježek Mobile phone as an interactive device in augmented reality system
DIVAI 2018 – The 12th international scientific conference on Distance Learning in Applied Informatics. 461 ISBN 978-80-7598-059-5 (Print) ISSN 2464-7470 (Print) ISSN 2464-7489 (On-line)
Mobile phone as an interactive device in
augmented reality system
Milan Košťák, Bruno Ježek
Faculty of Informatics and Management, University of Hradec Králové, Hradec Králové, Czech Republic
[email protected], [email protected]
Abstract
The paper explores the possibilities of applying augmented reality in combination with mobile devices inside web browsers environment. Mobile phones are ubiquitous devices, which makes them good for deploying applications. In addition, combined with sensors and cameras they can be used as interactive devices to control remote graphical scene. The paper is trying to find ways of obtaining data from sensors and image from camera and techniques for best transmission of acquired data. Accelerometer and gyroscope are used to determine orientation and image from camera is used to get the device movement information by marker detection. These information are sent over the network using web sockets and are applied using WebGL to render graphical output. Measured results showed satisfactory response speed of web sockets and speed of marker detection for detecting device movement. Paper proves that all proposed principles are capable of providing sufficient performance, precision and flexibility to be used in full-featured web applications.
Keywords
Augmented Reality. Mobile Devices. Interactive Systems. Sensors. Web browsers. WebGL. Web Sockets. Marker Detection.
INTRODUCTION
In today's modern world, only a few people can imagine life without ubiquitous electronics. Almost everyone has more or less “smart” phone, which makes it a good device for targeting applications. Nowadays mobile phones contain many different kinds of sensors, which allow using mobiles on completely different level than it was possible just a few years back.
The concept of augmented reality does not represent anything new or revolutionary. The first prototypes were created in the 1950s and 1960s. One of the first was a project by Morton Heilig who created prototype called “Sensorama” in 1962. It was capable of displaying stereoscopic images, playing stereo sound, simulating wind and blow into the air different aromas (Carmigniani et al., 2011).
In 1965, Ivan Sutherland created device called “The Sword of Damocles” which was the forerunner of virtual and augmented reality. It was a head mounted display and eye

Milan Košťák, Bruno Ježek Mobile phone as an interactive device in augmented reality system
DIVAI 2018 – The 12th international scientific conference on Distance Learning in Applied Informatics. 462 ISBN 978-80-7598-059-5 (Print) ISSN 2464-7470 (Print) ISSN 2464-7489 (On-line)
movement was used to interact with the scene. Sutherland himself described the project as “The Ultimate Display” (Sutherland, 1965).
For a long time, however, these systems were too cumbersome to be applied in a wider scope. It was not until in the 1990s, when more researchers got interested in the augmented reality because devices finally had enough power and big enough displays which made it easier for augmented reality to expand.
The division of realities into augmented and virtual was defined in 1994 in the article "A taxonomy of mixed reality visual displays" (Milgram and Kishino, 1994). In 1997, Ronald Azuma defined the area of augmented reality (Azuma, 1997), described problems that need to be addressed, and summarized the current development. The article also attempted to outline the possible use of augmented reality in medicine, general visualization, industrial production, robotics and military, and problems associated with each of the sectors.
By the end of the 1990s, the first conferences focused on augmented reality began and the first companies started developing applications and games that included augmented reality. ARQuake was one of the first outdoor mobile games. It was he created in 2000 by Bruce Thomas and his team (Thomas et al., 2002).
In 2015, Lv et al. came up with a concept of touch-less interaction with augmented reality games. Its goal was to suggest a way of controlling games that is more intuitive and sensitive, and which could replace currently used classic approaches and technologies. These include both classic hardware devices (e.g. gamepads) and touch screens that are usually facing problem called “the fat finger problem” (Lv et al., 2015).
The fact that mobile phones are ubiquitous devices having a lot of computational power and many different sensors can make a good combined use. The idea behind using mobile phone as an interactive device is simple. It gathers all the movement data and sends it over the network to the second client that appropriately reacts to it and changes the rendered scene. Moreover, all of this makes a good use of a fact that mobile phone has nearly everyone now. Mobile phone is usually quite light so it can easily be used as a controlling interactive device for directing remote graphical scenes or augmented reality systems. As suggested by (Lv et al., 2015) touch-less approach is usually preferable in such situations.
METHODS
Using web browser
There are a number of different mobile operating systems available so the development of a specific application for each platform would be more time-consuming and in the longer term also more demanding to maintain it and keep it up to date. That is the main reason why the web browser environment was chosen as the platform for the application development. Other reason was an easy access to the power of the graphic card with WebGL that is necessary for implementing principles of augmented reality.
WebGL (Web Graphics Library) is a web standard for rendering a dynamic three-dimensional scene in JavaScript using a graphic card. It is based on OpenGL ES, which

Milan Košťák, Bruno Ježek Mobile phone as an interactive device in augmented reality system
DIVAI 2018 – The 12th international scientific conference on Distance Learning in Applied Informatics. 463 ISBN 978-80-7598-059-5 (Print) ISSN 2464-7470 (Print) ISSN 2464-7489 (On-line)
brings the advantage of easy implementation in browsers, and in the future WebGL can easily follow new features of OpenGL ES. Important facts are that any support is dependent only on a web browser without the need to install another plug-ins and that it supports features of programmable graphics pipeline.
JavaScript is the main programming language when developing applications for web browsers. In the last few years, it has gone through a lot of development thanks to which it is nowadays possible to develop full-featured applications running with it.
Sensor data
As it was explained, mobile phones contain many kids of sensors, which provide a lot of useful information about the state of a device. Methods of obtaining current orientation and movement of a device are explained further.
The device orientation is detected using the “deviceorientation” event. It returns an object that contains the value of alpha, beta and gamma. Each of the value represents movement around one axis.
Device relative movement is also detected using the “devicemotion” event. It works just like an event for getting the orientation, but it varies with an object that the function returns as a parameter. The parameter contains four different information:
� Device acceleration in 9/C�
� Device acceleration including the influence of gravity in 9/C�
� Speed of device rotation in degrees per second
� Interval in milliseconds telling how often are data being obtained directly from hardware
Both objects with acceleration contain values of acceleration for each of the three axes. An object with acceleration including the effect of gravity usually does not offer as much use, but it can be used in a situation when the device is unable to eliminate the effect of gravity from the resulting data, which can usually occur on devices that do not have a gyroscope.
Image from camera
Access to the camera is obtained with the function “MediaDevices.getUserMedia()”. It accepts an object as a parameter with a specification of the required resources. Typically, this is a request for audio and video with possible further refinements. In the case of a video, it may be a preference for access to the front or rear cameras if both are available - which usually happens in mobile phones. In addition, it is possible to specify the preferred image resolution from the camera, but it is also possible to request exact values or to use the minimal and maximum attributes and thus to request the range that is necessary for proper functioning of the application.
DESIGN AND IMPLEMENTATION
The main goal is to demonstrate the use of data from sensors and other inputs provided by mobile devices to control remote rendered scene. The concept of an

Milan Košťák, Bruno Ježek Mobile phone as an interactive device in augmented reality system
DIVAI 2018 – The 12th international scientific conference on Distance Learning in Applied Informatics. 464 ISBN 978-80-7598-059-5 (Print) ISSN 2464-7470 (Print) ISSN 2464-7489 (On-line)
augmented reality is consisting of a system of communicating mobile and desktop devices. Key elements of the system are scene visualization and interaction with the user. A camera on a mobile phone captures the image generated on a computer, detection is performed, and the detected data is transmitted over the network. Data is delivered to a computer that applies it and generates a new image. The important thing is that the new image on the desktop computer is generated in dependence on how the user interacts with the mobile phone.
The following text describes in detail the proposed ways to detect motion and orientation changes that are the key to control applications. It also explains how to communicate between mobile and desktop devices. It is also possible to use multiple mobile phones to communicate with one computer, which can be, for example, useful in multiplayer games.
Movement detection
Movement detection with accelerometer has proven to be problematic since the sensor serves relative change of data and acquiring absolute units has proven to be difficult and very inaccurate despite the fact that the object directly returns the interval to which the acceleration applies. It was possible to calculate the absolute distance of the movement from delivered data, but the accuracy even in the best situation ranged only in centimetres, more often even in tens of centimetres.
In addition, the device on which the sensor was tested may have contained a bug in the hardware. This could have been caused by the previous fall of the device that could cause the sensor to deviate. The situation has only shown that the sensor cannot be relied on because other devices can show a significantly higher error rate that cannot be predicted in advance.
Because of all these facts, it was necessary to lean towards more complex and computationally more demanding movement detection using computer vision approach based on identification a colour marker in an image. This raster texture is obtained from a camera using WebGL, for which, however, can rely on unambiguous behaviour across devices. It is necessary for the marker colour to be unique in the image of the camera. For this reason, green colour was chosen. The program is not just testing the intensity of green colour but also red and blue components, which have to be low to avoid the detection of white colour.
The whole process of movement detection is divided into the following steps:
1. Update texture according to the image from a camera 2. The first pass through rendering pipeline for detection of the marker 3. The second pass for detection of the marker and texture dimension reduction 4. Read data from texture 5. Find marker and get its coordinates in the image
Updating texture is simple. Image source from a camera can be used directly in graphical call. During the first rendering pass of graphics pipeline, all pixels of the original image are checked for the presence of green pixels. It also inspects both red and blue components. The following figure (Figure 1) illustrates the behaviour of the first pass. The pixels are checked in groups of 16 (4 × 4) pixels to reduce the size of output image. In each
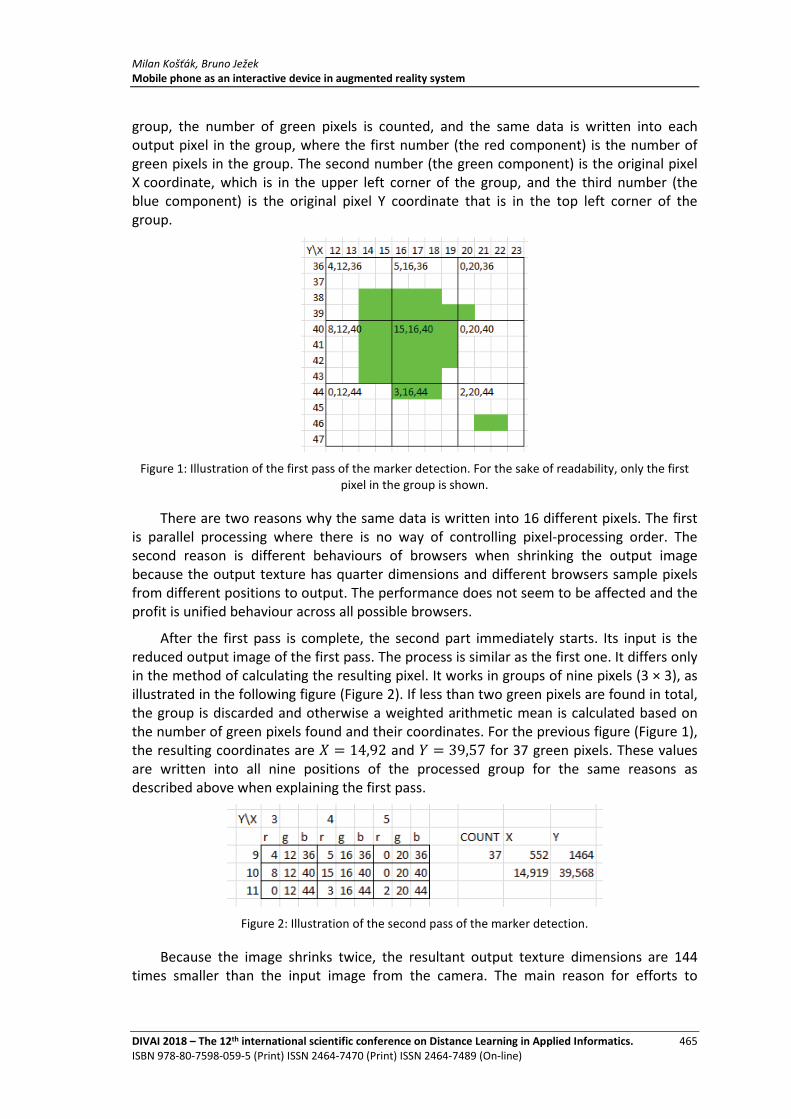
Milan Košťák, Bruno Ježek Mobile phone as an interactive device in augmented reality system
DIVAI 2018 – The 12th international scientific conference on Distance Learning in Applied Informatics. 465 ISBN 978-80-7598-059-5 (Print) ISSN 2464-7470 (Print) ISSN 2464-7489 (On-line)
group, the number of green pixels is counted, and the same data is written into each output pixel in the group, where the first number (the red component) is the number of green pixels in the group. The second number (the green component) is the original pixel X coordinate, which is in the upper left corner of the group, and the third number (the blue component) is the original pixel Y coordinate that is in the top left corner of the group.
Figure 1: Illustration of the first pass of the marker detection. For the sake of readability, only the first pixel in the group is shown.
There are two reasons why the same data is written into 16 different pixels. The first is parallel processing where there is no way of controlling pixel-processing order. The second reason is different behaviours of browsers when shrinking the output image because the output texture has quarter dimensions and different browsers sample pixels from different positions to output. The performance does not seem to be affected and the profit is unified behaviour across all possible browsers.
After the first pass is complete, the second part immediately starts. Its input is the reduced output image of the first pass. The process is similar as the first one. It differs only in the method of calculating the resulting pixel. It works in groups of nine pixels (3 × 3), as illustrated in the following figure (Figure 2). If less than two green pixels are found in total, the group is discarded and otherwise a weighted arithmetic mean is calculated based on the number of green pixels found and their coordinates. For the previous figure (Figure 1), the resulting coordinates are � = 14,92 and � = 39,57 for 37 green pixels. These values are written into all nine positions of the processed group for the same reasons as described above when explaining the first pass.
Figure 2: Illustration of the second pass of the marker detection.
Because the image shrinks twice, the resultant output texture dimensions are 144 times smaller than the input image from the camera. The main reason for efforts to
Milan Košťák, Bruno Ježek Mobile phone as an interactive device in augmented reality system
DIVAI 2018 – The 12th international scientific conference on Distance Learning in Applied Informatics. 466 ISBN 978-80-7598-059-5 (Print) ISSN 2464-7470 (Print) ISSN 2464-7489 (On-line)
maximize the reduction is that the data read operation takes approximately 90 % of the time of the entire algorithm and the time increases with the amount of resulting pixels.
The final step is reading the pixels into the JavaScript and searching for the area with the largest count of green pixels. The calculated average coordinates from the second step are presented as the result. This result means � = 14,92 and � = 39,57 coordinates are the position of the detected marker. The position is top right corner of the marker but it does not matter because only relative changes are used.
Orientation detection
For obtaining orientation of the device, the “DeviceOrientationEvent” event is used, which was described previously. Sensor values must be processed before use. It returns data very often, so the average of two consecutive data is always processed. Additionally, the data is adjusted so that it is possible to detect rotation of the device both in the vertical and in the horizontal positions. First, the value of beta is adjusted according to the gamma value - if the gamma is a positive number, the beta value is deducted from 180. If the value is negative after this operation, 360 degrees is added. After given sequence of calculations, the obtained value is in the interval �0;360 degrees, with zero in the situation where the top of the device faces to the left and adding degrees with clockwise rotation.
Communication
Due to the nature of the application, communication needs to be made in real time. For this purpose, the technology of web sockets is used. With its help, it is possible to send data from the server to the client without the client having to periodically query the server for any new data. Instead, the client only opens a permanent connection with the server and listens to given event. All activity depends on the server that automatically transmits everything to the registered clients whenever it receives any data.
In order to use web sockets, it is also necessary to support them on the server so that the client program can register for their reception. In particular, due to the resulting simplification, where there is no splitting between multiple programming languages, the server code was also written in JavaScript using Node.js and “ws” module that provides support for web sockets.
Application structure
The basic principle is the division into two cooperating parts, which unidirectionally communicate through the server. In general, the first part can be called a controller because it is used for controlling. Mobile phones or tablets are typical devices for this role. The second part is a receiver, which receives data from the controller and modifies the scene accordingly. The receiver may be any device, but it should normally be a laptop or a desktop computer. In theory, however, it is possible to use any device that meets the basic requirements - an Internet connection and a web browser that supports WebGL.
Figure 3 illustrates how communications between parts of the application is being performed. Within the controller, the marker detection and detection of required sensor data are performed. All data in JSON format is sent to a server that is forwarding it to the receiver via a permanent connection.

Milan Košťák, Bruno Ježek Mobile phone as an interactive device in augmented reality system
DIVAI 2018 – The 12th international scientific conference on Distance Learning in Applied Informatics. 467 ISBN 978-80-7598-059-5 (Print) ISSN 2464-7470 (Print) ISSN 2464-7489 (On-line)
Communication does not necessarily consist of one controller and one receiver. It is possible to use more controllers if the receiver is ready to handle the received data. The data of each controller is always identifiable by the attached identifier. With one controller, it is also possible to control multiple different receivers. Server data does not distinguish data in any way and forwards everything to all registered receivers.
Figure 3: Illustration of communication between individual parts.
RESULTS
This chapter contains results for implemented solution. For testing purposes, simple applications were designed and implemented. They are meant to prove the concept of using mobile devices as interactive device in augmented reality system. These applications were tested for the response speed of the communication and for the speed of marker detection. One of the testing receivers was capable of handling data from multiple controllers.
Figure 4: A mobile phone screenshot of the implemented controller with turned on rotation detection. The black bordered background represents an image of real video grabbed from a camera. The green
box in the centre represents the colour marker for position detection. The outlined square shows current aim of the mobile phone (small letter “l” on the picture).

Milan Košťák, Bruno Ježek Mobile phone as an interactive device in augmented reality system
DIVAI 2018 – The 12th international scientific conference on Distance Learning in Applied Informatics. 468 ISBN 978-80-7598-059-5 (Print) ISSN 2464-7470 (Print) ISSN 2464-7489 (On-line)
The response speed
The response speed of communication depends on several factors. Firstly, it is important that all devices have a good internet connection. If a device is connected to, for example, a wireless network with a poor signal because of a long distance from the source, the response speed may become unusable. The amount of data sent from the controller varies between 30-60 kB per second. The exact amount depends on how many different data is sent from the controller. In the case of multiple players (controllers), the receiver can become a bottleneck if its connection is not reliable.
Second important factor is the physical location of the machine on which the server is running because all data have to go through it. If it is located inside a local network, the response speed is usually so fast that users do not have any chance to notice any delay in response. According to the tests, the average time required for data transfer from the controller to the receiver is 18.2 milliseconds (average for 100 measurements). Each row in the following table (Table 1) represents one program part. The first row shows the time for transmission from the controller to the server using AJAX technology. The second row provides the time it takes to transfer data from the server to the receiver, which is where web sockets are used. The third row shows total time required to transfer the data from the controller to the receiver when using local server.
Table 1: The time required to transfer data from the controller to the receiver.
Mean Median Minimum Maximum
From controller to server 8.5 ms 8 ms 5 ms 35 ms
From server to receiver 9.7 ms 9 ms 2 ms 22 ms
Total time from controller to receiver 18.2 ms 17 ms 8 ms 50 ms
Total time through remote server 52.0 ms 51 ms 46 ms 99 ms
Hosting “Heroku” was used for more realistic testing, because it provides free space for JavaScript applications. However, it can be seen in the previous table (Table 1) that the communication with a server that is several thousand kilometres away is still good. The average time for 100 measurements was 52.0 milliseconds, which are still values that are imperceptible to most users. Since the minimum was only six milliseconds below the average time, it can be concluded that the times between the measurements were very stable. Only five measured values exceeded 60 milliseconds.
The marker detection speed
As it was explained, movement detection is done using a colour marker detection in an image from a camera. The proposed algorithm is rather complicated, and therefore continuous tests of the speed of its execution have been performed to detect any problematic sections. Final testing was performed on three different devices representing the controller. The first one is a 2-core Intel Core i5 processor laptop from Arrandale generation with ATI Radeon HD 6300M graphics card and Windows 8.1 operating system. The second is the Honor 9 mobile phone with the HiSilicon Kirin 960 chip with eight cores CPU Cortex A-73, Mali-G71 MP8 GPU and Android 7. The third device is the Lumia 640 mobile phone, representing the older generation of phones. A Snapdragon 400 chip with four cores CPU Cortex-A7 and Adreno 305 GPU powers it. The installed operating system is Windows 10 Mobile in the “Creators Update” version.

Milan Košťák, Bruno Ježek Mobile phone as an interactive device in augmented reality system
DIVAI 2018 – The 12th international scientific conference on Distance Learning in Applied Informatics. 469 ISBN 978-80-7598-059-5 (Print) ISSN 2464-7470 (Print) ISSN 2464-7489 (On-line)
Measurements are made for five different parts of the detection process. The first is filling buffers. The second and the third parts are the individual passes in the rendering pipeline. The fourth part is reading the data from the graphic card. This is the most critical part as it takes the most of the time of the detection. The last part is searching data and finding the area where the marker is located. All measurements are the average for 1000 measurements.
Table 2: Required time of particular parts of the marker detection in the image, Part 1: Filling buffers, Part 2 and 3: Two passes of the rendering pipeline, Part 4: Reading data from the graphic card, 5th part:
Searching through the read data.
1st part 2nd part 3rd part 4th part 5th part Total Percentage of 4th part
Laptop 0.04 ms 0.11 ms 0.05 ms 8.96 ms 0.07 ms 9.23 ms 97.1 %
Honor 9 phone
0.06 ms 0.46 ms 0.39 ms 3.36 ms 0.13 ms 4.40 ms 76.4 %
Lumia 640 phone
0.16 ms 1.16 ms 1.28 ms 27.14 ms 0.54 ms 30.28 ms 89.6 %
As it can be seen, the fourth part takes majority of the time. The only way of making it faster is by reducing the amount of data that are copied from graphic card. At the same time, however, decreasing the amount of data reduces the overall resolution of the algorithm to find the marker. It was therefore necessary to find a compromise between the two opposing requirements.
The table above (Table 2) contains measurements for the state that was chosen as ideal when marker detection is still very reliable and detection speed is still acceptable. The input image resolution of the camera was set at 1280 × 720 pixels, and the algorithm first reduces the image four times and then three times in one dimension. The result is an image of 107 × 60 dimension containing 6,420 pixels.
Table 3: Summary of testing with different levels of reduction in marker detection.
Pixel count Time for reading from graphic card
Percentage difference from “4 and 3”
“3 and 3” 11,360 9.81 ms + 9.5 %
“3 and 4” 6,420 9.22 ms + 2.9 %
“4 and 3” 6,420 8.96 ms –
“4 and 4” 3,600 8.88 ms - 0.9 %
“5 and 3” 4,128 9.32 ms + 4.0 %
“5 and 4” 2,340 9.19 ms + 2.6 %
Before selecting the ideal state, testing with different levels of shrinking was performed - "3 and 3" (11,360 resulting pixels), "4 and 4" (3,600 resulting pixels), both combinations "3 and 4" and "4 and 3" (6,420 resulting pixels), "5 and 3" (4,128 pixels) and "5 and 4" (2,340 pixels). The measurement in the first three parts did not differ in the situations described, only in the second part there was a deviation of 0.02 milliseconds in some cases. Differences were measured only in the fourth and fifth parts. Attention is mainly focused on the fourth part because the differences in the fifth part were also only less than 0.1 millisecond. From the table (Table 3) it can be seen that the “4 and 3” method is having almost the best performance and with the given final pixel count it was chosen as the best solution.

Milan Košťák, Bruno Ježek Mobile phone as an interactive device in augmented reality system
DIVAI 2018 – The 12th international scientific conference on Distance Learning in Applied Informatics. 470 ISBN 978-80-7598-059-5 (Print) ISSN 2464-7470 (Print) ISSN 2464-7489 (On-line)
CONCLUSION
It was proven that web technologies with JavaScript provide enough options for implementing an augmented reality system. The possibilities of augmented reality in a web browser have been extensively tested in the context of the proposed applications. Emphasis was placed on the use of data from sensors and a camera accessible on mobile devices. Data and images obtained from sensors were processed using the WebGL standard, which allows using hardware-accelerated graphics directly in a web browser. The designed concept of augmented reality was tested using desktop and mobile devices interacting in a scene. The implemented applications demonstrated the use of available data in different situations.
Response measurement and communication with the server have proven to be sufficient for the smooth flow of information using web sockets and AJAX technologies. From the user's point of view, there is usually no noticeable delay.
Tested scenarios demonstrated that the proposed concept of using mobile devices as interactive device in augmented reality system is possible. Marker detection and orientation detection are precise enough for anticipated use case. Interactions within individual parts took place without noticeable latency and were intuitive only by the movements of the mobile phone.
Another direction of research could focus on improving the proposed marker detection algorithm. A potential problem is the use of applications on the network with poor Internet connectivity. In this situation, jamming and other unwanted behaviour may occur. The solution would for example be to implement the prediction of the further incoming data in a situation where data suddenly ceases to be received.
ACKNOWLEDGEMENT
This work and the contribution were supported by a project of Students Grant Agency – FIM, University of Hradec Kralove, Czech Republic. Milan Košťák is a student member of the research team.
REFERENCES
Azuma, R.T., 1997. A Survey of Augmented Reality. Presence: Teleoperators and Virtual Environments 6, 355–385. https://doi.org/10.1162/pres.1997.6.4.355
Carmigniani, J. et al., 2011. Augmented reality technologies, systems and applications. Multimedia Tools and Applications 51, 341–377. https://doi.org/10.1007/s11042-010-0660-6
Lv, Z., Halawani, A., Feng, S., Réhman, S. ur, Li, H., 2015. Touch-less interactive augmented reality game on vision-based wearable device. Personal and Ubiquitous Computing 19, 551–567.https://doi.org/10.1007/s00779-015-0844-1

Milan Košťák, Bruno Ježek Mobile phone as an interactive device in augmented reality system
DIVAI 2018 – The 12th international scientific conference on Distance Learning in Applied Informatics. 471 ISBN 978-80-7598-059-5 (Print) ISSN 2464-7470 (Print) ISSN 2464-7489 (On-line)
Milgram, P., Kishino, F., 1994. A taxonomy of mixed reality visual displays. IEICE TRANSACTIONS on Information and Systems 77, 1321–1329.
Sutherland, I.E., 1965. The Ultimate Display 506–508. https://doi.org/10.1.1.97.5951
Thomas, B. et al., 2002. First Person Indoor/Outdoor Augmented Reality Application: ARQuake. Personal and Ubiquitous Computing 6, 75–86. https://doi.org/10.1007/s007790200007


Peter Mikulecky, Lubos Mercl Clouds for Smart Learning Environments
DIVAI 2018 – The 12th international scientific conference on Distance Learning in Applied Informatics. 473 ISBN 978-80-7598-059-5 (Print) ISSN 2464-7470 (Print) ISSN 2464-7489 (On-line)
Clouds for Smart Learning Environments
Peter Mikulecky, Lubos Mercl
Department of Information Technologies, Faculty of Informatics and Management, University of Hradec Kralove, Hradec Kralove, Czech Republic
[email protected];[email protected]
Abstract
Smart learning environments, based on approaches and technologies developed in areas of Ambient Intelligence and Smart Environments, certainly are in focus of the large community of specialists oriented on technology-enhanced learning. A number of new technologies and approaches influenced recent research, where the most attractive as well as the most useful seem to be solutions based on cloud services. Cloud computing technology has rapidly evolved through several phases over the couple of last years, and includes, among other grid and utility computing, application service provision, software as a service, and infrastructure as a service.
This contribution tries to summarize recent state of the art in the area, stressing the main features of successfully implemented projects, based on cloud computing technology and big data analytics. We present several interesting and challenging examples of solutions aiming to support smart learning in smart learning environments. In the conclusion, a couple of challenging directions for further research are sketched.
Keywords
Computers and education. Smart environments. Smart learning. Cloud computing technology. Big data analytics.
INTRODUCTION
Undoubtedly, for a couple of years we are witnessing the increasing importance of new learning paradigm – smart learning. This concept, that is intensively developed and exploited today, naturally plays an important role in design and even constructing of smart learning environments, that is proper environments for effective smart learning. These smart learning environments are considered to be able to support learners’ activities as well as teachers’ possibilities of controlling and regulating selected learning activities.
It seems that the original ISTAG Scenario 4 (Ducatel et al., 2001) Annette and Solomon in the Ambient for Social Learning (ASL) represents actually the origin of various further efforts leading to design and utilization of real smart learning environments. This scenario was a vision of a learning environment, based on a position that learning is a social process. However, later on the initiatives based on the “anywhere and anytime learning” approach started to be considered as impractically broad (Alsaif, 2014) and were merely substituted by the approach that can be characterized as “saying

Peter Mikulecky, Lubos Mercl Clouds for Smart Learning Environments
DIVAI 2018 – The 12th international scientific conference on Distance Learning in Applied Informatics. 474 ISBN 978-80-7598-059-5 (Print) ISSN 2464-7470 (Print) ISSN 2464-7489 (On-line)
the right thing at the right time in the right way to the right person”, see (Hwang, 2014), or (Bures et al, 2016).
There are various approaches trying to define learning environments that deserve the name “smart learning environments”. Let us recall some of them.
(Kinshuk, 2014) wrote, that “a learning environment can be considered smart when the learner is supported through the use of adaptive and innovative technologies from childhood all the way through formal education, and continued during work and adult life where non-formal and informal learning approaches become primary means for learning”. This approach seems to be relatively broad, as it covers in a sense the lifelong learning as the main point, without any closer look on how such an environment should look like.
Another description of smart learning environments has been presented in (Koper, 2014). The smart learning environments are defined here as physical environments that are enriched with digital, context-aware and adaptive devices, to promote better and faster learning. Particularly, according to Koper, “a smart learning environment is such a learning environment, in which:
� One or more digital devices are added to the physical locations of the learner;
� The digital devices are aware of the learners location, context and culture;
� The digital devices add learning functions to the locations, context and culture, such as the provision of (augmented) information, assessments, remote collaboration, feedforward, feedback, etc.;
� The digital devices are monitoring the progress of learners and provides appropriate information to relevant stakeholders.”
It means that a smart learning environment should be context-aware and adaptive to the individual learner’s behaviour. Nevertheless, Koper stressed, that concentrating on the technical aspects mentioned above, does not automatically promote better and faster learning.
In the scope of our research in this direction, some related ideas can be found in (Bures et al, 2016), (Mikulecky, 2011, 2012b, 2013, or 2014), and in (Mikulecky, Olsevicova, Cimler, 2012). The state of the art in the area of ubiquitous and context aware learning until 2012 was mapped in our paper (Mikulecky, 2012a), and later on for the period until 2016 in our paper (Mikulecky, 2016). However, as the area of smart learning environments is very dynamically evolving and modern field, it is necessary to take into account new approaches based on rather new technologies and their applications. Therefore, in this paper we try to focus our attention mainly on the role of cloud computing technologies, services, and applications in further evolution of smart learning environments.
NEW METHODS AND APPROACHES
Let us quote the opinion of (Libbrecht, Müller, Rebholz, 2015) as an incentive for introducing new technologies into Smart Learning Environments research and development. According to them, Smart Learning Environments can be understood “as systems that apply novel approaches and methods on the levels of learning design

Peter Mikulecky, Lubos Mercl Clouds for Smart Learning Environments
DIVAI 2018 – The 12th international scientific conference on Distance Learning in Applied Informatics. 475 ISBN 978-80-7598-059-5 (Print) ISSN 2464-7470 (Print) ISSN 2464-7489 (On-line)
and instruction, learning management and organization, and technology to create a context for learning…”. However, they pointed out that these novel approaches cannot be restricted only on the technological level. In spite of that, let us concentrate first mostly on the technological aspect of smart learning environments and their recent evolution.
According to (Zhu, Yu, and Riezebos, 2016), smart learning, as a new educational paradigm, bases its foundations quite naturally on smart devices and intelligent technologies. The major technology-enhanced learning paradigm today seems to be mobile learning as the result of a real explosion of mobile and wireless technologies. These mobile and wireless technologies enables also the rise of other most important intelligent technologies that are more and more exploited in the area of smart education. These intelligent technologies are cloud computing, learning analytics, big data, Internet of things (IoT), and wearable technology. The smart learning environments could decrease learners’ cognitive load, and thus enable learners to focus on sense making and facilitate ontology construction as well.
Recently, one of the most important and applied approaches in various areas is undoubtedly cloud computing and its applications. Cloud computing technologies are currently rising and many companies are working to deploy and operate their infrastructure using a private cloud that is run on their own resources and where they want to get the most out of their operation and usage (Mercl, 2017).
According to (Mercl, Sec, and Sobeslav, 2017), cloud computing is a model, which is based on the Internet principle and providing services and computer technology over the Internet. Customers access their services via the Internet and pay regular fees to cloud service provider, on either a subscription basis or a consumed computing environment basis (typically processor time, operation memory, data storage, software licenses, etc.). Between basic IT and cloud services belong:
� Infrastructure as a Service, when the infrastructure is provided as a service and the customer rents this infrastructure to build its own IT infrastructure;
� Platform as a Service, when a customer rents ready runtime environment (a typical example is the Microsoft Azure Services, where customers can rent, e.g. a database instance);
� Software as a Service, when entire software is provided as a service for an user (a typical example is Microsoft Office 365).
Cloud computing, that has been recently emerging as a key paradigm of the present century, can be considered to be a new model for hosting resources and provisioning of services to e-learning systems. It provides a convenient, on-demand access to a centralized shared pool of computing resources that can be deployed by a minimal management overhead and with a great efficiency (see (El-Mhouti et al., 2017) or (González – Martínez et al., 2015)). The cloud computing paradigm offers a pool of virtual resources (hardware, development platforms or services) available over the network. According to (Kim, Song, Yoon, 2011), the cloud computing environment provides the necessary foundation for the integration of platform and technology because it integrates teaching and research resources distributed over various locations. Cloud computing offers new ideas and solutions in achieving interoperability among heterogeneous resources and systems, enabling thus new possibilities for Internet being used as huge workspace, repository, platform, and infrastructure. (Kim, Song, Yoon, 2011) stressed that proactive cloud

Peter Mikulecky, Lubos Mercl Clouds for Smart Learning Environments
DIVAI 2018 – The 12th international scientific conference on Distance Learning in Applied Informatics. 476 ISBN 978-80-7598-059-5 (Print) ISSN 2464-7470 (Print) ISSN 2464-7489 (On-line)
services can be effectively used for learners, offering them vast learning materials through mobile devices in the anytime anywhere regime.
RECENT DIRECTIONS AND SOLUTIONS
There are three important directions in further evolution of smart learning environments. These three directions are full context awareness, big data and learning analytics, as well as autonomous decision-making (Kinshuk et al, 2016).
Full context awareness enables smart learning environments to provide learners with authentic learning contexts and seamless learning experiences to fuse a variety of features in the e-learning environments. This includes learning management systems, mobile and ubiquitous learning systems, various artificial intelligence based adaptive tutoring or learning systems. These systems would assist teachers and instructors in direct monitoring of the learning environment, understand learners’ conditions and give learners real-time adaptive assistance, as well as facilitating independent learning for the learners, see (Kinshuk et al., 2016) or (Hwang, 2014).
Smart learning environments need to consider advanced data manipulation techniques such as employing big data and learning analytics to collect, combine and analyse individual learning profiles (from past to present) in order to generalize and infer each individual learning need in real time and in ubiquitous settings. The availability of large sets of data and increased needs for better understanding of various relations as well as knowledge hidden inside of these huge datasets have led to establishing recently very popular research field – Data Science. As (Liu and Huang, 2017) stressed, data science can be characterized as “extracting useful knowledge from data by employing techniques and theories drawn from many fields within the broad areas of mathematics, statistics, and information technology. The field of statistics is the core building block of data science theory and practice, and many of the techniques for extracting knowledge from data have their roots in this. Traditional statistical analytics mainly have mathematical foundations, while data science analytics emphasize the computational aspects of pragmatically carrying out data analysis, including acquisition, management, and analysis of a wide variety of data”. Learning analytics over big data can monitor individual learners‘ progress and behaviour continuously in order to explore factors that may influence learning efficiency and effectiveness (Kinshuk et al, 2016). Kinshuk also stressed that through big data and learning analytics, smart learning environments could derive new and more effective learning models.
Another important feature of smart learning environments is their autonomous knowledge management capability that enables them automatic collection of individual learners’ life learning profiles. For smart learning environments is very important to possess an autonomous decision-making capability that could utilize learning analytics features to provide individual adaptive learning support. As Spector (Spector, 2014) points out, it is necessary for a smart learning environment to autonomously provide “different learning situations and circumstances, as... a human teacher or tutor…to help learners become more organized and aware of their own learning goals, processes and outcomes” (Spector, 2014).
Peter Mikulecky, Lubos Mercl Clouds for Smart Learning Environments
DIVAI 2018 – The 12th international scientific conference on Distance Learning in Applied Informatics. 477 ISBN 978-80-7598-059-5 (Print) ISSN 2464-7470 (Print) ISSN 2464-7489 (On-line)
It is well known that the big data technology is recently closely related to a broad utilization of cloud computing technology. In the context with recent research directions, it is more than clear that cloud computing technology as the most important technical basis and enabler for big data analytics can be efficiently used for learning analytics as well. Let us present several interesting examples of cloud-based solutions applied in the area of smart learning.
An interesting and relatively early developed example of cloud computing technology utilization for smart learning presented (Akaichi, Saidi, 2012). The authors proposed an assistance system, based on pervasive cloud solution, for lifelong mobile learners, namely for mobile professionals motivated to improve their skills through a lifelong learning process. Their solution was based on using a number of Software as a Service approaches. These were oriented on such activities as learning centres localization, learning centres courses matching with mobile professional curriculum and level, learning centres courses schedules matching with mobile professional free time, and mobile professional subscription according to learning centres vacancies. All of these activities generate data, which are then integrated into a data warehouse, and analysed for further needs. In the light of recently used approaches, the data generated by above mentioned activities could be concentrated in a cloud from where they could be easily accessible for further learning analytics.
As (El Mhouti, Erradi, and Nasseh, 2017) pointed out, the cloud computing technology has evolved through several phases over the years, which include grid and utility computing, application service provision, and software as a service. They brought a number of arguments supporting the idea, that the cloud computing technologies are very convenient for being used in the area of technology-enhanced learning (e-learning). Educational institutions, which are using e-learning systems with an intensive use of computers, are seeking free or at least low-cost alternatives to expensive and exclusive tools. As a result, cloud computing paradigm has promoted the growth of e-learning systems with its pay as you go model, that is, users can use computer resources anywhere, anytime, simply on demand and only pay for the usage thereof. This model is adapted to all scales of budgets and requirements. By further development of Internet and computer networking technologies, cloud computing was introduced as one of the best and economical option to the needs of educational institutions. Instead of adopting expensive and complex hardware and software resources, cloud-based smart learning can be used with less expensive costs, using mainly Software as a Service and Infrastructure as a Service approaches. Further on, cloud computing technology has been adopted in e-learning to increase the efficiency and availability of e-learning systems. Due to the scalability and cost reduction, cloud services allow implementing easier, faster and less expensive e-learning solutions, concluded El Mhouti, Erradi, and Nasseh (El Mhouti, Erradi, and Nasseh, 2017).
Also (Sánchez et al., 2016) brought the arguments in favour of the idea that the cloud computing technology could be very much suitable for the area of smart learning, and could be utilized as supporting technology for smart learning environments. Sánchez et al. introduced the notion of cloud learning that allows a reuse of learning resources in a distributed manner. Cloud learning provides available educational services in the cloud, using the mechanisms and tools that provides cloud computing. In particular, the Smart Environment for education based on the cloud could be used as a space, where the
Peter Mikulecky, Lubos Mercl Clouds for Smart Learning Environments
DIVAI 2018 – The 12th international scientific conference on Distance Learning in Applied Informatics. 478 ISBN 978-80-7598-059-5 (Print) ISSN 2464-7470 (Print) ISSN 2464-7489 (On-line)
technologies of the cloud and ubiquitous, help the learning processes in an unobtrusive manner, to improve their scalability and integration capabilities (Sánchez et al., 2016).
In their paper, Sánchez et al. proposed a middleware for intelligent cloud learning environments called AmICL and specified a cloud management subsystem for AmICL. They also have shown the functionality of the cloud component of AmICL, to guarantee a cloud learning. AmICL mixes the reflectiveness, autonomy and context awareness of Smart Environments, with capabilities that provides a learning environment in the cloud with academic services, which can be accessed from anywhere. This result provides improving resources and academic services in a learning environment. Moreover, it allows adapting the environment to the academic needs of users.
CONCLUSION
Cloud computing aims to deliver a network of virtual services so that users can access them from anywhere in the world on subscription at competitive costs depending on their Quality of Service (QoS) requirements. It is a model, which is based on the Internet principle and providing services and computer technology over the Internet.
According to (El Mhouti, Erradi, and Nasseh, 2017), “cloud computing brings for educational institutions a new type of business model where the services that are provided become computer resources. By choosing cloud computing, educational institutions can develop their services and use resources in a flexible manner in the cloud. When users need more resources to their smart learning system, it is no need to install software or purchase hardware, but these resources are automatically transferred to user, which constitutes a cost-effective platform to respond the educational needs.”
Cloud computing technology promises a lot for the area of smart learning, as can be clear from the examples of its usage presented above. It could be used very conveniently as a technical platform for collecting data about learners, their profiles, and their progress, and offer these data efficiently for further analysis, enabling thus thorough learning analytics, with a strong feedback to both learners and teachers. We are convinced, that further research should be focused on looking for new and efficient connection of smart learning environments with new kinds of cloud services, based not only on the Software as a Service paradigm, but also on broader use of the Infrastructure as a Service paradigm. Some broader applications of the Data Science approaches and methods in the area of smart learning can be expected as well. Further, a significant part of research activities in this area must be devoted also on solving problems connected with cloud privacy, security and confidence. This all represent a couple of new and challenging research goals that deserves to be in researchers’ focus for the next period of smart learning environments evolution.
ACKNOWLEDGEMENT
The research has been partially supported by the Faculty of Informatics and Management UHK specific research project “Computer Networks for Cloud, Distributed Computing, and Internet of Things”.

Peter Mikulecky, Lubos Mercl Clouds for Smart Learning Environments
DIVAI 2018 – The 12th international scientific conference on Distance Learning in Applied Informatics. 479 ISBN 978-80-7598-059-5 (Print) ISSN 2464-7470 (Print) ISSN 2464-7489 (On-line)
REFERENCES
Akaichi, J., Saidi, F., 2012. Mobile LifeLong Learners on the Cloud. In: DIVAI 2012, The 9th International Conference on Distance Learning in Applied Informatics, Constantine The Philosopher University, Nitra, Slovakia, pp. 35-42.
Alsaif, F., 2014. Determination of Smart System Model Characteristics for Learning Process. In: International Conference on Convergence Technology, Vol. 4, No. 1, pp. 881-885.
Bures, V., Tucnik, P., Mikulecky, P., Mls, K., Blecha, P., 2016. Application of Ambient Intelligence in Educational Institutions: Visions and Architectures. International Journal of Ambient Computing and Intelligence 7 (1), pp. 94-120.
Ducatel, K., et al., 2001. Scenarios for Ambient Intelligence in 2010: Final Report. Seville, Spain, Information Society Technologies Advisory Group, [online] Available at <ftp://ftp.cordis.lu/pub/ist/docs/istagscenarios2010.pdf>, [Accessed 7 June 2011].
El Mhouti, A., Erradi, M., Nasseh, A., 2017. Using cloud computing services in e-learning process: Benefits and challenges. Education and Information Technologies, DOI 10.1007/s10639-017-9642-x (published on-line).
González – Martínez, J.A., Bote-Lorenzo, M.L., Gómez – Sánchez, E., Cano – Parra, R., 2015. Cloud computing and education: A state-of-the-art survey. Computers & Education 80, pp. 132 – 151.
Hwang, G. J., 2014. Definition, framework and research issues of smart learning environments-a context-aware ubiquitous learning perspective. In: Smart Learning Environments, 1(1), pp. 1-14.
Kim, S., Song, S.M., Yoon, Y.I., 2011. Smart learning services based on smart cloud computing. Sensors 11(8), 7835–7850.
Kinshuk, 2014. Roadmap for adaptive and personalized learning in ubiquitous environments. In: Ubiquitous Learning Environments and Technologies. Springer, 1-13.
Kinshuk, Chen, N.-S., Cheng, I.-L., Chew, S.-W., 2016. Evolution is not Enough: Revolutionizing Current Learning Environments to Smart Learning Environments. Int. J. Artif. Intell. Educ., Springer, DOI 10.1007/s40593-016-0108-x (published on-line).
Koper, R., 2014. Conditions for effective smart learning environments. Smart Learning Environments 1, 5.
Libbrecht, P., Müller, W., Rebholz, S., 2015. Smart Learner Support Through Semi-automatic Feedback. In: Smart Learning Environments. Lecture Notes in Educational Technology, Springer, Heidelberg, pp. 129-157.
Liu, M.-C., Huang, Y.-M., 2017. The use of data science for education: The case of social-emotional learning. Smart Learning Environments 4, 1.
Mercl L., 2017. An Algorithm for Migration and Resource Planning in Cloud Technologies. In: Advances on P2P, Parallel, Grid, Cloud and Internet Computing. 3PGCIC 2017. Lecture Notes on Data Engineering and Communications Technologies, Vol 13. Springer, pp 347-356.
Mercl L., Sec D., Sobeslav V., 2017. Analysis of Frameworks for Building IaaS Cloud Using by Cloud Computing Providers. In: Advances on P2P, Parallel, Grid, Cloud and Internet Computing. 3PGCIC 2017. Lecture Notes on Data Engineering and Communications Technologies, Vol 13. Springer, pp 655-663.

Peter Mikulecky, Lubos Mercl Clouds for Smart Learning Environments
DIVAI 2018 – The 12th international scientific conference on Distance Learning in Applied Informatics. 480 ISBN 978-80-7598-059-5 (Print) ISSN 2464-7470 (Print) ISSN 2464-7489 (On-line)
Mikulecky, P., 2011. Learning in Smart Environments – From Here to There. In: Proc. of the 10th European Conference on e-Learning ECEL 2011 (A. Rospigliosi, ed.), Academic Publishing Ltd., Reading, pp. 479-484.
Mikulecky, P., 2012a. Smart Environments for Smart Learning. In: DIVAI 2012, The 9th International Conference on Distance Learning in Applied Informatics, Constantine The Philosopher University, Nitra, Slovakia, pp. 213-222.
Mikulecky, P., 2012b. User Adaptivity in Smart Workplaces In: ACIIDS 2012 (J.-S. Pan, S.-M. Chen, N.T. Nguyen, eds.), Part II, LNAI 7197, Springer, Heidelberg, pp. 401--410.
Mikulecky, P., 2013. Smart Environments for Learning - Multi-Agent Systems Approach. In: European Conference on e-Learning. Academic Conferences International Limited. p. 304.
Mikulecky, P., 2014. Smart Learning Environments - A Multi-agent Architecture Proposal. In: DIVAI 2014, 10th International Scientific Conference on Distance Learning in Applied Informatics. Wolters Kluwer, pp. 611 – 620.
Mikulecky, P., 2016. Smart Learning Environments Revisited. In: DIVAI 2016: 11th International Scientific Conference on Distance Learning in Applied Informatics, Wolters Kluwer, pp. 33-42.
Mikulecky, P., Olsevicova, K., Cimler, R., 2012. Outdoor Large-scale Ambient Intelligence. In: Innovation Vision 2020: Sustainable Growth, Entrepreneurship, and Economic Development, Vols 1-4, IBIMA, Norristown, PA., pp. 1840 – 1842.
Sánchez, M., Aguilar, J., Cordero, J., Valdiviezo-Díaz, P., Barba-Guamán, L., Chamba-Eras, L., 2016. Cloud Computing in Smart Educational Environments: Application in Learning Analytics as Service. In: New Advances in Information Systems and Technologies. Springer International Publishing. pp. 993-1002.
Spector, J. M., 2014. Conceptualizing the emerging field of smart learning environments. Smart Learning Environments, 1(1), 2.
Zhu, Z.-T., Yu, M.-H., Riezebos, P., 2016. A research framework of smart education. Smart Learning Environments 3, 4.

Juraj Obonya, Jozef Kapusta Identification of Important Activities for Teaching Programming Languages by Decision Trees
DIVAI 2018 – The 12th international scientific conference on Distance Learning in Applied Informatics. 481 ISBN 978-80-7598-059-5 (Print) ISSN 2464-7470 (Print) ISSN 2464-7489 (On-line)
Identification of Important Activities for Teaching
Programming Languages by Decision Trees
Juraj Obonya, Jozef Kapusta
Department of Informatics, Constantine the Philosopher University in Nitra, Slovakia [email protected], [email protected]
Abstract
The aim of this paper is to classify students by their successfully completed activities in a concrete course. Data analysis of the outputs from information systems is the base of making the right managerial decisions. Nowadays e-learning is supported by information systems like LMS (Learning Management System), therefore we have to decide with which context to fill the concrete courses to improve the whole education process. These systems are intended for students monitoring, because with them we can track the partial perform of activities over an explicit time period. These systems are intended for tracking of students, as we can monitor the rate of the fulfillment of the partially set activities during the education process. In our article we are focusing on data analysis and classification from a specific LMS system, through decision trees, where we created a programming course for students, which was filled with submissions and testing activities, within which we extracted the dataset about the attainment and evaluation of each particular activity. These specific activities are part of the content of the programming course. By the decision trees we extracted a set of rules, with which we can classify specific activities, which have strong effort on the student’s final assessment. The output of the data evaluation helps us to decide how to rate the students in the future.
Keywords
Data analysis. Decision trees. E-learning. Teaching Programming Languages.
INTRODUCTION
The development of e-learning represents a rapid growth of technology. The basis of the LMS system is the content, with which it is filled and systematically divided by subjects into the individual courses. According to (Balogh et al., 2012) LMS course can be divided into more sections. It contains various activities study materials and tests. A great feature and a great added value of the LMS system is the ability to facilitate the information sharing and the communication between the course users (Romero, Ventura and García, 2008). (Ninoriya, 2011) specifies the versatility of the LMS system. One of the goals of LMS system is the activity monitoring of registered users. The evaluation of each student, rate of fulfilment of the entered submissions. LMS helps to lead the whole organization of educational process (Bentley, Selassie and Shegunshi, 2012). To perform the contextual filling of these kind of educational courses is a very complicated task,
Juraj Obonya, Jozef Kapusta Identification of Important Activities for Teaching Programming Languages by Decision Trees
DIVAI 2018 – The 12th international scientific conference on Distance Learning in Applied Informatics. 482 ISBN 978-80-7598-059-5 (Print) ISSN 2464-7470 (Print) ISSN 2464-7489 (On-line)
because the aforementioned materials provide the quality of education and the knowledge.
In this paper we will rely on the received data received from LMS Moodle. After finishing the course we divided the students into groups according to their final course grades and we assigned them the success rate of partially activities and the final evaluation during the whole semester. The grading of students were measured also by (Balogh and Koprda, 2014), because the evaluation was focused on to the semestral performance. From the mentioned data we tried to extract the knowledge, which determined the important partially activities, which had a significant impact on the performance at the final exam. For the knowledge extraction we used one of the basic methods from educational data mining (Drlík et al., 2014) – decision trees. The aim of our article is to describe how to use decision trees to determine the important partial activities of an e-learning course.
RELATED WORK
User behaviour, access to information in LMS and all kind of activities create a lot of data, which needs to be processed and evaluated in a specific way. LMS system records a lot of information about the performed actions and activities. (Muehlenbrock, 2005) describes some of the concrete activities, when and how they were processed, which materials were mostly accessed and submitted in time by students, or else were not solved at all. Recieved data can be evaluated through data mining methods. This area is difficult to define, due to its versatility in a dynamically changing set of newly acquired information (Mugica, 2007). Through data mining we can identify relationships from LMS system datasets, which later help to choose the best possible decision form system for education support, as we are dealing with the important knowledge extraction from recorded data (Kumar, 2011). During the investigation of users behaviour in our case there are users of LMS system, we start from data, which were recorded and stored in the database of LMS (Munk and Drlik, 2014). Data mining is an adjustable term, which includes some statistical disciplines and calculations, for example decision trees, Bayes classifier and statistical algorithms.
The evaluation and analysis of courses, which are based on web technologies first of all represents students interaction with the environment. The analysis consists of the character and interaction of users in a course over a particular activity in it. The analysis further comprises of students interactions with the course. Thanks to these factors we can identify specific cases, when the course does not meet certain expectations of the students (Ortigosa and Carro, 2003). Data mining sets analytical models, which can identify interesting models about the usage of course from the students perspective. These patterns help us to identify the whole learning process of student and help to improve and maintain the course for education.
According to (Romero, Ventura and García, 2008) data mining is an area which consists of the following parts:
� Data collection. Data related to the interactions between system and the user are stored into the database.
� Data preprocessing represents data transformation into the required form.

Juraj Obonya, Jozef Kapusta Identification of Important Activities for Teaching Programming Languages by Decision Trees
DIVAI 2018 – The 12th international scientific conference on Distance Learning in Applied Informatics. 483 ISBN 978-80-7598-059-5 (Print) ISSN 2464-7470 (Print) ISSN 2464-7489 (On-line)
� Application of methods from data mining.
� Interpretation and evaluation of results.
For the teacher the key information is the final assessment from the evaluation. There are many algorithms for preprocessing and evaluation of a particular dataset, for example: classification, regression, clustering, association rules and visualization.
In classification the predicted i.e. the expected variable can be a binary or categorical. Frequently are used general classification methods are for example decision trees, decision rules, step regression, logistic regression. Classificators in Educational Data Mining are mainly evaluated through cross validation, where a particular dataset is used to test the accuracy of the model (Shaun, Baker and Inventado, 2014).
DECISION TREES AS CLASSIFICATORS FOR E-LEARNING COURSE CONTENT
In our article we want to reveal the options for educational data analysis through decision trees. These methods make up the basic principles for knowledge discovering from data. Generally, the purpose of the decision trees is to classify some objects into different classes. The basic approach to generate a decision tree consists of selecting attributes for sub-tree nodes and subsequent separation of data into subsets according to this attribute. If not all data in one subset belongs to one class, we choose another attribute for splitting the subset.
In our case decision trees will be used to identify the most important e-learning course activities from Programming. According to data about the success of each partial activity finished by students a decision tree will be created, which will in pursuance of managed activities create a prediction of the final mark from the subject. The final evaluation was obtained after finishing the course and it was based on two final tests and a final exam from subject Programming and data structures. The final grade from the subject was created from these three final activities. The final grade will represent each classification group for which the whole decision tree will be created.
Research methodology
The main goal of our research is to identify, which concrete activities of educational course are important for the final appreciation of students from subject Programming and data structures. Through decision trees we want to identify the main activities, which succeeded in the particular course and were successfully solved by students with excellent results on the final exam. The general research methodology consists of the following steps:
1. creation of a source file, which consists of:
� results from on-going tests and autotests
� results from VPL activities
� the final grades from the subject Programming (students will be divided into decision tree classification groups based on this criterion)
2. pre-processing the results for statistical analysis 3. creation of decision tree to identify decision rules

Juraj Obonya, Jozef Kapusta Identification of Important Activities for Teaching Programming Languages by Decision Trees
DIVAI 2018 – The 12th international scientific conference on Distance Learning in Applied Informatics. 484 ISBN 978-80-7598-059-5 (Print) ISSN 2464-7470 (Print) ISSN 2464-7489 (On-line)
4. identification of the most important rules 5. evaluations of the obtained results.
Virtual programming lab (VPL) is an activity module in LMS Moodle for management of the programming assignments. Big advantages of this solution are editing, modification and running the program through the web browser. It is a handy activity during the education of programming. This tool can automatically evaluate the output of a concrete program, which must to be identical to the output of a student. In addition, this tool can identify the plagiarism between the submitted assignments and files.
Source data
Source data are from course Programming and data structures, which was implemented on the educational portal. We obtained the particular dataset by exporting the records from course activities, on which students practiced their programming knowledge and skills (Skalka, Svec and Drlik, 2012; Hvorecky, Drlik and Munk, 2010). LMS Moodle is a system, which allows that specific kind of data importing into .xls format. From the obtained dataset we extracted information about the success of students from specific activities. In our case were activities such as virtual programming lab, final exam tests and autotests.
The testing activities with students were provided before the start of lessons. It was a feedback for the teacher about the acquired knowledge from previous lessons. The test activities were set to 15 minutes before the start of each lessons. The results from the evaluation of the tests informed the teacher about that how effectively did the students deal with programming issues. All of the scored points during the whole teaching period were added to the final evaluation of the students. The course allowed us to practice programming on similar assignments, which were connected to the concrete topic.
Within our analysis we exported data from the course of programming. They included all kind of the activities of testing and VPL. Testing consists mostly of 10 to 15 questions, which were referred to the specific topics.
Used methods for knowledge discovery
There are many algorithms to create decision trees. They vary in a way that they choose the attribute for the sub-node. One of the possibilities is to select a node using the entropy, employing the J48 algorithm. The entropy value is calculated for each node and represents the level of subset disorder.
According to (Grosan and Ajith, 2011), putting together a decision tree is all a matter of choosing which attributes to test at each node in the tree. If this attribute is not clear, we shall define a measure called information gain, which will be used to decide which attribute to test at each node. The information gain itself is calculated by using a measure called entropy (Munk and Benko, 2018), which we first define for the case of a binary decision problem and then define for a general case.
Given a binary categorization, t, and a set of examples, U, for which the proportion of examples categorized as positive by t is u� and the proportion of examples categorized as negative by t is ux, then the entropy of U is:
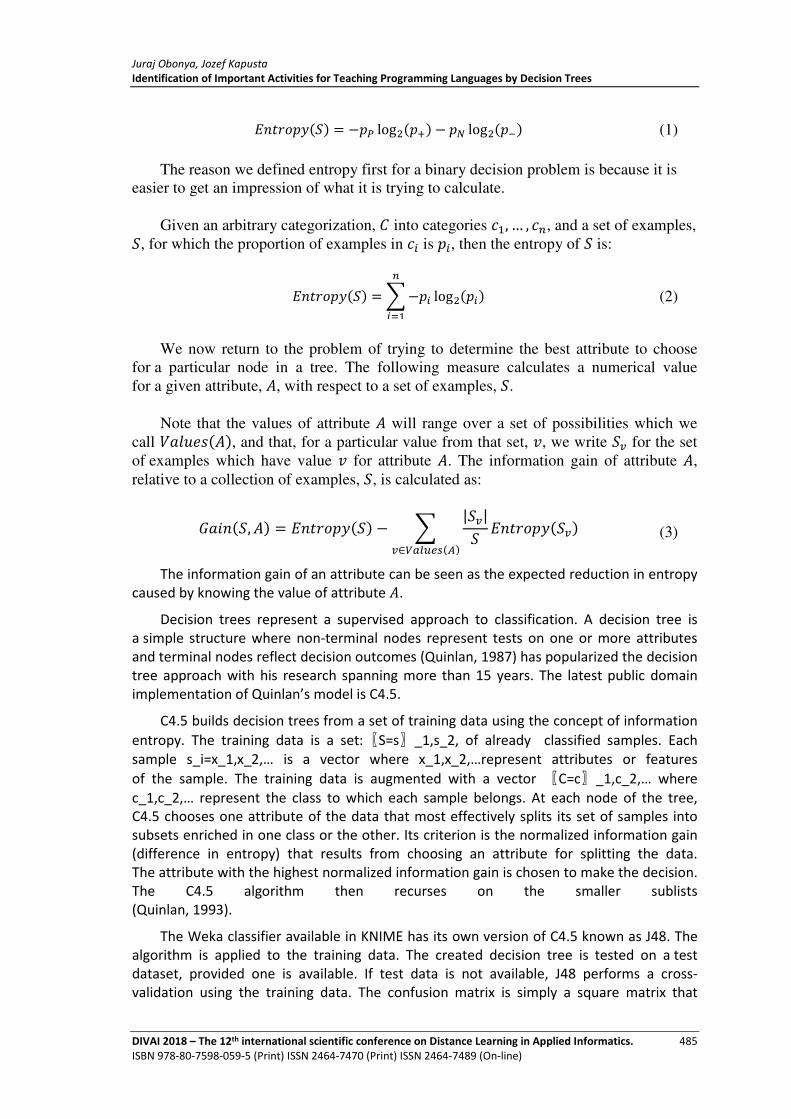
Juraj Obonya, Jozef Kapusta Identification of Important Activities for Teaching Programming Languages by Decision Trees
DIVAI 2018 – The 12th international scientific conference on Distance Learning in Applied Informatics. 485 ISBN 978-80-7598-059-5 (Print) ISSN 2464-7470 (Print) ISSN 2464-7489 (On-line)
�;-&>uA�U = −u� log��u) − ux log��u� (1)
The reason we defined entropy first for a binary decision problem is because it is easier to get an impression of what it is trying to calculate.
Given an arbitrary categorization, t into categories ��, … , ��, and a set of examples, U, for which the proportion of examples in �F is uF, then the entropy of U is:
�;-&>uA�U =�−uF log��uF�
F�� (2)
We now return to the problem of trying to determine the best attribute to choose for a particular node in a tree. The following measure calculates a numerical value for a given attribute, ,, with respect to a set of examples, U.
Note that the values of attribute , will range over a set of possibilities which we call M@�<:C�,, and that, for a particular value from that set, J, we write U� for the set of examples which have value J for attribute ,. The information gain of attribute ,, relative to a collection of examples, U, is calculated as:
�@8;�U, , = �;-&>uA�U − � |U�|U�∈����c'��
�;-&>uA�U� (3)
The information gain of an attribute can be seen as the expected reduction in entropy caused by knowing the value of attribute ,.
Decision trees represent a supervised approach to classification. A decision tree is a simple structure where non-terminal nodes represent tests on one or more attributes and terminal nodes reflect decision outcomes (Quinlan, 1987) has popularized the decision tree approach with his research spanning more than 15 years. The latest public domain implementation of Quinlan’s model is C4.5.
C4.5 builds decision trees from a set of training data using the concept of information
entropy. The training data is a set:〖S=s〗_1,s_2, of already classified samples. Each sample s_i=x_1,x_2,… is a vector where x_1,x_2,…represent attributes or features
of the sample. The training data is augmented with a vector 〖C=c〗_1,c_2,… where c_1,c_2,… represent the class to which each sample belongs. At each node of the tree, C4.5 chooses one attribute of the data that most effectively splits its set of samples into subsets enriched in one class or the other. Its criterion is the normalized information gain (difference in entropy) that results from choosing an attribute for splitting the data. The attribute with the highest normalized information gain is chosen to make the decision. The C4.5 algorithm then recurses on the smaller sublists (Quinlan, 1993).
The Weka classifier available in KNIME has its own version of C4.5 known as J48. The algorithm is applied to the training data. The created decision tree is tested on a test dataset, provided one is available. If test data is not available, J48 performs a cross-validation using the training data. The confusion matrix is simply a square matrix that

Juraj Obonya, Jozef Kapusta Identification of Important Activities for Teaching Programming Languages by Decision Trees
DIVAI 2018 – The 12th international scientific conference on Distance Learning in Applied Informatics. 486 ISBN 978-80-7598-059-5 (Print) ISSN 2464-7470 (Print) ISSN 2464-7489 (On-line)
shows the various classifications and misclassifications of the model in a compact area. The columns of the matrix correspond to the number of instances classified as a particular value and the rows correspond to the number of instances with that actual classification (Mohanty, Ravi and Patra, 2010).
Results
The input into this method with decision trees were data about 74 students from a programming course. At the end of the course students were evaluated by 2 final tests and an oral examination. Based on these results we divided students into three groups:
� excellent,
� good,
� insufficient.
From e-learning course all the results were analyzed and prepared for the input data file format. Input data consisted of 10 tests and 29 VPL activities. In the following table we introduce id of a concrete activity, their description, mean, minimal and maximal values. We did not mentioned the VPL values, because we have only the specific information if it is met or it is not. In this case these activities were optional to solve, therefore in the Figure 1 and Table 3 zero and one numbers are displayed.
Table 1: List of evaluated activities in programming course.
Activity ID
Activity description mean min max
test1 Test :Repeat yourself (01x02) 4.878378 0 10
test2 Test : Repeat yourself (01x01) 4.289459 0 9
test3 Test : Repeat yourself (01x03) 4.878378 0 10
test4 Test : Repeat yourself (01x04) 4.289459 0 9
test5 Test : Repeat yourself (01x06) 3.972973 0 9
test6 Test : Repeat yourself (01x07) 2.351351 0 9
test7 Test : Repeat yourself (01x08) 5.000000 0 9
test8 Test : Repeat yourself (01x05) 3.503649 0 10
test9 Test :String (Quick-test) 5.675676 0 10
test10 Test :Input(Quick-test) 5.591622 0 10
The first step was the creation of the specific decision tree through the J48 algorithm with classification into classes, which represented the final evaluation of students. We created the decision tree from all of the recorded data. It means that we did not used the testing data for the evaluation of correctness of the decision tree. Each attribute of the tree is recorded into the Table 2.

Juraj Obonya, Jozef Kapusta Identification of Important Activities for Teaching Programming Languages by Decision Trees
DIVAI 2018 – The 12th international scientific conference on Distance Learning in Applied Informatics. 487 ISBN 978-80-7598-059-5 (Print) ISSN 2464-7470 (Print) ISSN 2464-7489 (On-line)
Table 2: Classified instances by the created decision tree.
classes number of leaves size of the tree
correctly classified instances
incorrectly classified instances
excellent, good insufficient
9 17 63 (85.14 %) 11 (14.86 %)
The created tree is in Figure 1:
Figure 1: Created decision tree from the dataset.
After the overwriting the rules into table form we received following standards:
Table 3: Extracted rules from the decision tree.
s.n. Extracted rules Counf of correct classifications
Counf of incorrect classifications
1 (VPL18 <= 0) and (test2 <= 4.5) and (VPL13 <= 0) and (test1 <= 7)
=> insufficient 27 6
2 (VPL18 <= 0) and (test2 <= 4.5) and ( VPL13 <= 0) and ( test1 > 7) and ( test4 <= 4)
=> good 2
3 (VPL18 <= 0) and (test2 <= 4.5) and ( VPL13 <= 0) and ( test1 > 7) and ( test4 > 4)
=> excellent 2
4 (VPL18 <= 0) and (4.5 < test2 <= 6.42) and ( VPL13 <= 0) and ( test5 <= 4)
=> insufficient 7 1
5 (VPL18 <= 0) and (4.5 < test2 <= 6.42) and ( VPL13 <= 0) and (test5 > 4)
=> good 15 4
6 (VPL18 <= 0) and (test2 <= 6.42) and (VPL13 > 0)
=> good 3
7 (VPL18 <= 0) and (test2 > 6.42) and (test8 <= 6.33)
=> good 5
8 (VPL18 <= 0) and (test2 > 6.42) and (test8 > 6.33)
=> excellent 9
9 (VPL18 > 0) => excellent 4

Juraj Obonya, Jozef Kapusta Identification of Important Activities for Teaching Programming Languages by Decision Trees
DIVAI 2018 – The 12th international scientific conference on Distance Learning in Applied Informatics. 488 ISBN 978-80-7598-059-5 (Print) ISSN 2464-7470 (Print) ISSN 2464-7489 (On-line)
With the rules we can identify the users of our programming course. The implementation of were firstly implemented in our curriculum for students. Through the overwriting we got 9 rules, which can be interpreted in the following way. The difference between the successful and unsuccessful students is stated in the rule number 1, which describes 27 students, who did not master VPL18, test2, VPL13 and test1, they also did not make the final exam either. Subsequently, here we can take a look at this specific rule, which also displays also wrong classification of 6 students, it accounts for 18%, of students who were not able to solve these activities, however they passed through the final exam. For example, the last rule with number 9 represents the students who did manage the activity VPL18, so their final evaluation from course was excellent. In this case it is obvious, that students in the next iteration of the course need to be motivated to solve the VPL18 activity, which appears as a key exercise. The most numerous rule for the “excellent” category is the rule with number 8, which describes the most of students who finished the whole subject excellently, although they did not succeed with the VPL18 activity, but they handled the test2 and test8 perfectly.
Similarly, we can analyze the rest of the generated rules from the Table 2. For completeness we introduced the confusion matrix in the Table 4, which is a closer description of the wrong classified cases. This particular data analysis finds a better result and a point of view over a specific dataset as was mentioned by (Lýsek and Stastny, 2014) to obtain a better and a simpler result.
Table 4: The final evaluation matrix of course users.
excellent good insufficient classified as
15 2 6 excellent
0 21 1 good
0 2 27 insufficient
In the Table 4 we described the matrix multiplicity of users thought our decision tree classification and the normal evaluation by the teacher.
CONCLUSION
The aim of this article was the referring of an identification of the key activities in a specific e-learning course. We attempted to identify the important activities that affect the readiness and the final mark of students. We identified these important activities, which have an impact on the preparedness and on the final grade of students. These were identified by the concrete aforementioned decision tree. In our research it means, that in the next iteration of the course we can predict the students final evaluation according to our decision tree, which classified 85% percent of the students. Based on this knowledge we are able to predict the students final evaluation without the need of the final test. This approach cannot be applied in real life education conditions for now. Even our decision tree confirmed the existence of a group of students, whose successes of partially activities is low, nevertheless they acquire a good final evaluation.

Juraj Obonya, Jozef Kapusta Identification of Important Activities for Teaching Programming Languages by Decision Trees
DIVAI 2018 – The 12th international scientific conference on Distance Learning in Applied Informatics. 489 ISBN 978-80-7598-059-5 (Print) ISSN 2464-7470 (Print) ISSN 2464-7489 (On-line)
In our case we did not use the tree for the prediction of the future evaluation, but according to the entropy of the decision tree, we pointed out to the important activities in the course. Their successful fulfillment gives students a higher probability of mastering the final test for their final mark.
ACKNOWLEDGEMENT
This work was supported by the Slovak Research and Development Agency under the contract No. APVV-14-0336 and Scientific Grant Agency of the Ministry of Education of the Slovak Republic (ME SR) and of Slovak Academy of Sciences (SAS) under the contracts No. VEGA 1/0809/18.
REFERENCES
Balogh, Z. et al. (2012) ‘Creating model educational processes using Petri Nets implemented in the LMS’, in EFFICIENCY AND RESPONSIBILITY IN EDUCATION 2012, pp. 7–16.
Balogh, Z. and Koprda, S. (2014) ‘Application of Petri Net for Evaluation Modeling of Student in the LMS’, Divai 2014: 10Th International Scientific Conference on Distance Learning in Applied Informatics, pp. 229–239.
Bentley, Y., Selassie, H. and Shegunshi, A. (2012) ‘Design and Evaluation of Student-Focused eLearning’, Electronic Journal of e-Learning, 10(1), pp. 1–12.
Drlík, M. et al. (2014) ‘Comparisson of Approaches to the Data Analysis in the Virtual Learning Environments.’, in DIVAI 2014 – The 10th International Scientific Conference on Distance Learning in Applied Informatics., pp. 561–572.
Grosan, C. and Ajith, A. (2011) ‘Decision Trees’, in Intelligent Systems. Springer-Verlag Berlin Heidelberg, pp. 269–280. doi: 10.1007/978-3-642-21004-4.
Hvorecky, J., Drlik, M. and Munk, M. (2010) ‘The effect of visual query languages on the improvement of information retrieval skills‘, Innovation And Creativity In Education, Procedia Social and Behavioral Sciences, 2(2), pp. 717-723.
Kumar, V. (2011) ‘An Empirical Study of the Applications of Data Mining Techniques in Higher Education’, International Journal of Advanced Computer Science and Applications, 2(3), pp. 80–84. doi: 10.14569/IJACSA.2011.020314.
Lýsek, J. and Stastny, J. (2014) ‘Automatic discovery of the regression model by the means of grammatical and differential evolution’, Agricultural Economics (Czech Republic), 60(12), pp. 546–552. doi: 10.17221/160/2014-AGRICECON.
Mohanty, R., Ravi, V. and Patra, M. R. (2010) ‘Web-services classification using intelligent techniques’, Expert Systems with Applications. Elsevier Ltd, 37(7), pp. 5484–5490. doi: 10.1016/j.eswa.2010.02.063.
Muehlenbrock, M. (2005) ‘Automatic Action Analysis in an Interactive Learning Environment’, Proceeding of the 12th international conference on artificial intelligence in education (AIED), pp. 73–80.
Mugica, F. C. V. N. (2007) ‘Applying Data Mining Techniques to e-Learning Problems’, Evolution of Teaching and Learning Paradigms in Intelligent Environment, NA(2007), pp. 183–221.

Juraj Obonya, Jozef Kapusta Identification of Important Activities for Teaching Programming Languages by Decision Trees
DIVAI 2018 – The 12th international scientific conference on Distance Learning in Applied Informatics. 490 ISBN 978-80-7598-059-5 (Print) ISSN 2464-7470 (Print) ISSN 2464-7489 (On-line)
Munk, M. and Benko, Ľ. (2018) ‘Using Entropy in Web Usage Data Preprocessing ‘, Entropy, 20(1), 67.
Munk, M. and Drlik, M. (2014) ‘Analysis of Stakeholders ’ Behaviour Depending on Time in Virtual Learning Environment’, APPLIED MATHEMATICS & INFORMATION SCIENCES, 8(2), pp. 773–785.
Ninoriya, S. (2011) ‘CMS, LMS and LCMS For eLearning.’, International Journal of Computer Science Issues, 8(March 2011), pp. 644–647. doi: 10.1007/978-1-4020-5612-3_20.
Ortigosa, A. and Carro, R. (2003) ‘The Continuous Empirical Evaluation Approach: Evaluating Adaptive Web-Based Courses’, User Modeling 2003, pp. 146–146. doi: 10.1007/3-540-44963-9_22.
Quinlan, J. (1993) C4. 5: programs for machine learning. 1st edn, Machine Learning. 1st edn. Morgan Kaufmann Publishers (The Morgan Kaufmann series in machine learning). doi: 10.1016/S0019-9958(62)90649-6.
Quinlan, J. R. (1987) ‘Simplifying decision trees’, International Journal of Man-Machine Studies, 27(3), pp. 221–234. doi: https://doi.org/10.1016/S0020-7373(87)80053-6.
Romero, C., Ventura, S. and García, E. (2008) ‘Data Mining in Course Management Systems: Moodle Case Study and T utorial’, Computers {&} Education, 51(1), pp. 368–384. doi: 10.1016/j.compedu.2007.05.016.
Shaun, R., Baker, J. De and Inventado, P. S. (2014) ‘Chapter 4: Educational Data Mining and Learning Analytics’, Springer, Chapter 4, pp. 61–75. doi: doi-org.ezproxy.lib.uts.edu.au/10.1007/978-1-4614-3305-7_4.
Skalka, J., Svec, P. and Drlik, M. (2012) ‘E ‐ learning and Quality : The Quality Evaluation Model for E ‐ learning Courses’, in Capay, M; Mesarosova, M; Palmarova, V. (ed.) 9th International Scientific Conference on Distance Learning in Applied Informatics, pp. 279–287.

Michal Peták, Milan Houška Fuzzy knowledge unit
DIVAI 2018 – The 12th international scientific conference on Distance Learning in Applied Informatics. 491 ISBN 978-80-7598-059-5 (Print) ISSN 2464-7470 (Print) ISSN 2464-7489 (On-line)
Fuzzy knowledge unit
Michal Peták, Milan Houška
Department of Systems Engineering, Faculty of Economics and Management, Czech University of Life Sciences Prague, Czech Republic
[email protected], [email protected]
Abstract
Current state, trends and applications in the field of knowledge representation and their inference mechanisms offer potential for the use of knowledge units. Fuzzy knowledge units are based on knowledge units and use all their features.
This article aims to define a fuzzy knowledge unit as a specific form of a production rule. The starting point are the fuzzy linguistic production rules in conjunction with knowledge units. The defined knowledge unit as a production rule is extended, or "changed", by the fuzzy function of membership in the elementary member "Q". This fuzzyfied member "FQ" extends the problem-solution with the use of an individual fuzzy membership function.
The defined fuzzy knowledge unit is subsequently used in a case study. The case study describes the construction of a fuzzy expert system based on fuzzy knowledge units employing the fuzzy mamdani principle of inference. The results are demonstrated in a case study focused on an expert system designed to decide on upgrading an ERP (Enterprise Resource Planning) system and propose further steps. This or similar case of the expert system can be used for distance learning for student of Informatics or System integration. The MatLab software with the Fuzzy Logic Toolbox add-in is used to this end. The conclusion and discussion summarizes the benefits of this article derived from the definition of fuzzy knowledge units and their potential for use in the construction of expert systems. The concluding part includes possible themes for further research with the focus on distance learning.
Keywords
Expert system. Inference mechanisms. Fuzzy knowledge units. Fuzzy mamdani inference. Production rules.
INTRODUCTION
In practice, expert systems can perform a variety of roles. In particular, they help people find, organize and interpret information. Help users to collect to gather expert knowledge to solve complex problems. The development in expert systems leads to a better simulation of human decision-making. In order to achieve the best possible simulation, the systems have to deal with uncertainty. The orientation towards fuzzy expert systems seems to be a promising possibility. For example, Moreno and Espejo (2015) present a fuzzy expert system for Failure mode identification in shafts. This expert system determines the manner of breaking according to the description of the tested

Michal Peták, Milan Houška Fuzzy knowledge unit
DIVAI 2018 – The 12th international scientific conference on Distance Learning in Applied Informatics. 492 ISBN 978-80-7598-059-5 (Print) ISSN 2464-7470 (Print) ISSN 2464-7489 (On-line)
material. The expert system by Venturelli et al. (2017) focuses on assessing a firm from the viewpoint of CSR “Social Responsibility” indices. Ghanei et al (2015) offer another demonstration of an expert system, evaluating the state of materials by means of non-destructive checks employing ANFIS, an approach combining neural networks and fuzzy logic.
In terms of fuzzy principles of inference and fuzzy rule definition, this article follows and uses the system approach of representation of procedural knowledge offered by knowledge units (Dömeová et al. 2008, Brožová et al. 2011, Rauchová and Houška 2013, Houška and Beránková 2013). This article aims at defining fuzzy knowledge units as specific forms of production rules. The work also aims at proposing a method to carry out fuzzy inference with a knowledge unit. The definition of a fuzzy knowledge unit follows (Zadeh 1973, Mamdani a Assilian 1975), stating that fuzzy logic provides tools for the expression of a linguistic rule, fuzzy mamdani inference. The fuzzy knowledge unit is going to be defined by the connection of a linguistic rule and the knowledge unit. The next part includes a case study of inference with a fuzzy knowledge unit – for a potential use of a fuzzy knowledge unit in fuzzy expert systems. Pre-defined inference with knowledge units as stated in Peták and Houška (2017) represents the foundation for this part. The work comprises the initial point for forming an expert system. Results are going to be demonstrated on a case study focused on an expert system for deciding on performing an upgrade (a version update) of the ERP system (Enterprise Resource Planning) and proposing other necessary steps. This case of the expert system can be used in the distance learning like a simulator for upgrade process of an information system. The MatLab software with the Fuzzy Logic Toolbox add-in is used for this purpose. The conclusion proposes potential areas for future research.
MATERIAL AND METHODS
Knowledge units
Knowledge units may be expressed in an analytic or textual form. The analytic form of a knowledge unit is represented as follows (Brožová et al, 2011):
KU = {X, Y, Z, Q} , where
X = „problem situation“,
Y = „elementary problem“,
Z = „aim of elementary problem solution“,
Q = „elementary problem solution“.
Although Kendal and Creen (2007) see problems in forming self-contained texts in natural language from production rules, knowledge units may be represented textually (Brožová et al. 2011).
“ If problem situation X requires solving elementary problem Y in order to achieve aim Z, it is necessary to apply solution Q.”

Michal Peták, Milan Houška Fuzzy knowledge unit
DIVAI 2018 – The 12th international scientific conference on Distance Learning in Applied Informatics. 493 ISBN 978-80-7598-059-5 (Print) ISSN 2464-7470 (Print) ISSN 2464-7489 (On-line)
Even a text consisting of only knowledge units would be hardly readable. However Rauchová and Houška (2013) proposed a method to supplement knowledge units with information and data so that they are usable for example as a basis for educational texts.
Inference with knowledge units
Knowledge units may be defined as production rules in which individual elementary members are interrelated. Such relations are defined as follows
IF (X and Y and Z) THEN Q.
The above described relation represents a production rule expressing a knowledge unit. Standard production rules (IF – THEN rules) consist of two parts, i.e. an antecedent (evidence, situation, problem) and a consequent (a hypothesis, action, solution). A formalized production rule takes the following form (Mařík et al, 2004), where
E – is evidence
H – is hypothesis
E → H.
Gass and Harris (2001) introduce “modus ponens”, forward chaining, and “modus tollens”, backward chaining, as possibilities for the inference of a general production rule.
The mentioned strategies may also be applied to knowledge units (Peták and Houška, 2017).
Let
KU1 = {X1,Y1,Z1,Q1},
KU2 = {X2,Y2,Z2,Q2}.
Be two knowledge units. Then inference with knowledge units proceeds by means of members Q1 and Y2 as follows (Peták and Houška, 2017):
KUINF = {Q1} → {Y2} for backward chaining,
KUINF = {Y1} → {Q2} for forward chaining.
Textual form:
Backward chaining
“If we fail to apply solution Q1, Y2 becomes an elementary problem that solves a problem situation X2 to achieve goal Z2, then we shall apply solution Q2.”
Forward chaining
“If we need to find solution Q2, Y1 becomes an elementary problem that solves a problem situation X1 to achieve goal Z1, then we shall apply solution Q1.“
The following figures figure 1 show an analytic diagram of backward and forward chaining respectively.

Michal Peták, Milan Houška Fuzzy knowledge unit
DIVAI 2018 – The 12th international scientific conference on Distance Learning in Applied Informatics. 494 ISBN 978-80-7598-059-5 (Print) ISSN 2464-7470 (Print) ISSN 2464-7489 (On-line)
Figure 1: Backward / Forward chaining (Peták and Houška, 2017).
Fuzzy mamdani
Mamdani and Assilian (1975) use fuzzy logic for transferring inaccurate intuitive control rules in order to replace a human operator by means of an automatic control strategy. In the mentioned experiment, they study the possibilities of replacing a regulator controlled by an expert with an automatic regulator. One of the bases for the work is Zadeh (1973) who states that fuzzy logic offers tools for expressing a linguistic rule in a form that might be synthesized into a specific control strategy. This represented the foundation for Mamdani and Assilian (1975) and their definition of a “Controller” as follows:
A Fuzzy subset A of a universe of discourse U is characterised by a membership function µ: U → (0,1) which associates with eachelement u of U a number µ (u) in the interval (0,1) which represents the grade of membership of u in A. The fuzzy set A of U = u1, u2, …, un is will be denoted:
(1)
Where ui is an element in universum U
µ(ui) is crisp value, degree of membership of element ui to fuzzy subset A
Mamdani a Assilian (1975) further defined three fundamental operations for their work - unification „A+B“, Maximum „OR“ and Minimum „AND“ where the complement is negation „NOT“. The MatLab software also offers the fuzzy Mamdani method of forming a control strategy. Lilly (2010) describes the fundamental structure of a fuzzy system, where Input “x” represents crisp values of inputs and “y” represents crisp values of outputs.
The following diagram describes the fuzzy mamdani type of inference in the Matlab sotware, i.e. the input fuzzification and output defuzzification procedures for two rules.

Michal Peták, Milan Houška Fuzzy knowledge unit
DIVAI 2018 – The 12th international scientific conference on Distance Learning in Applied Informatics. 495 ISBN 978-80-7598-059-5 (Print) ISSN 2464-7470 (Print) ISSN 2464-7489 (On-line)
Figure 2: Fuzzy mamdani diagram (MatLab online Documentation, 2017).
The MatLab software with Fuzzy Logic Toolbox add-in allows to form an expert system based on fuzzy mamdani or sugeno type of inference mechanism. For example Olesiak (2017) and Akgun et al (2012) employ the mamdani inference principle. The input crisp values are fuzzified by means of a large amount of available functions. The tool has a rule editor available that allows entering rules for the course of inference, see figure 3. There are a lot of defuzzification methods and the MatLab software offers a variety of them.
Figure 3: Example of fuzzification and inference (MatLab online Documentation, 2017).
According to Sivandam et al (2007), defuzzification transforms fuzzified values of inputs via membership functions and rules to crisp values of outputs. This example uses the Centroid Method. The Centroid Method arises from the area-based principle (Deepak et al, 2008). As the name suggests, the output membership function is divided into area halves and the centre marks the defuzzified crisp value from axis X.

Michal Peták, Milan Houška Fuzzy knowledge unit
DIVAI 2018 – The 12th international scientific conference on Distance Learning in Applied Informatics. 496 ISBN 978-80-7598-059-5 (Print) ISSN 2464-7470 (Print) ISSN 2464-7489 (On-line)
RESULTS
Fuzzy knowledge units
Fuzzy knowledge units = FKU are derived from knowledge units, as described in Brožová et al (2011). The result is an enhancement of the knowledge unit with a fuzzy element in the position of elementary member Q – the solution of the elementary problem. Member Q was chosen for fuzzification for the following reasons:
� Q represents a consequent and expresses what was done or what should be done in order to achieve the solution of the elementary problem from the viewpoint of the specified goal.
� The given elementary problem Z may have more solutions. Hence, solution suggestions may complement each other, intertwine or compete.
First, knowledge unit fuzzification must take place, specifically the fuzzification of elementary member Q. The analytic form prepared for fuzzyfication to a fuzzy knowledge unit takes the form demonstrated in Table 1.
Table 1: Analytic form of FKU.
Member state Part of rule Member Member description
Crisp X, Y, Z Evidence
X Problem situation
X ≠ ∅ is a standard set
Y Elementary problem
Y ≠ ∅ is a standard set
Z The goal of the elementary problem solution Z ≠ ∅ is a standard set
Fuzzy Q Hypothesis Fuzzy Q Fuzzy solution of the elementary problem
µQi , i = 1, 2, … i.
Where,
µQi = The unique membership function which represent a fuzzy set Q.
The textual form of FKU:
“If problem situation X requires a solution for problem Y in order to achieve goal Z,
one may consider solutions Q1, Q2, … Qi, that represent solutions of the problem with
membership functions µQ1 , µQ2 ... µQi.”
Setting hypotheses, for elementary member fuzzy Q (solution of the elementary problem), is possible by means of analyses, assessment by an expert or experts or good practice with the elementary problem solution. Venturelli et al (2017) uses a group of experts in the definition of a block of rules. The knowledge of this expert group must bear a significant impact on the solution of the problem. In the case of expert systems, this expert group forms blocks of rules. In the context of fuzzy knowledge units, this means that they form blocks of fuzzy knowledge units. The definition of the membership function progress for elementary member Q arises from the knowledge unit as a whole (an enhanced production rule) and the knowledge unit elementary member Y (the elementary

Michal Peták, Milan Houška Fuzzy knowledge unit
DIVAI 2018 – The 12th international scientific conference on Distance Learning in Applied Informatics. 497 ISBN 978-80-7598-059-5 (Print) ISSN 2464-7470 (Print) ISSN 2464-7489 (On-line)
problem). The shape of the membership function for individual fuzzy Q is determined by the domain expert in cooperation with the knowledge engineer. This definition can be use also for presenting how experts can react for described situation, in this case for the upgrade.
CASE STUDY
The example comprises an expert system for decisions on performing an upgrade (system version update) of the ERP system (Enterprise Resource Planning) and proposing further steps. The system is designed to take into consideration the defined blocks of rules = fuzzy knowledge units and to form ground for further activities. These final activities, designed by the system, should be implemented in order to refine the assessment of the upgrade demands. The basic structure of the expert system consists of three blocks – fuzzy knowledge units. Figure 4 shows the overall scheme. The whole example was proposed and designed in the MatLab programme by means of the mamdani type of fuzzy inference.
Figure 4: The scheme of the expert system.
The scheme depicts input in the form of three fuzzified knowledge units to the left, a block of rules, and the output fuzzy knowledge unit to the right. The block scheme is described further on.
The first block comprises a knowledge unit FKU, Preparation for upgrade. The purpose of the FKU is to assess the time necessary for the preparation of the upgrade. Table 2 shows its analytic and textual forms.

Michal Peták, Milan Houška Fuzzy knowledge unit
DIVAI 2018 – The 12th international scientific conference on Distance Learning in Applied Informatics. 498 ISBN 978-80-7598-059-5 (Print) ISSN 2464-7470 (Print) ISSN 2464-7489 (On-line)
Table 2: Analytic form of FKU with fuzzy member µQi.
State of member Part of rule Member
Member description
Crisp X, Y, Z E – Evidence
X Preparation for upgrade Y Assessment of the preparation demands
Z Assessment of the time for the preparation of the upgrade
Fuzzy Q H – Hypothesis
Fuzzy
Q=µQ1, µQ2, µQ3 Perform internal analysis, Instruct external analysts, Both variants
A general textual form:
„If we need Preparation for upgrade and Assessment of the preparation demands, we Perform internal analysis, Instruct external analysts, Both variants, to Assess the time for the preparation of the upgrade.”
Such assigning implies that a membership function µQi is determined for each solution
option of problem situation Q. In relation to members of the knowledge units, µQ1..3 –
Membership function (Characteristic function), for elementary member Q,
X ≠ ∅ standard set,
Y ≠ ∅ standard set,
Z ≠ ∅ standard set,
Q = µQi(k) represents the degree of membership of member k to the fuzzy set Q.
Fuzzy set Q in universum X is defined as a couple:
Q = (X, µQ1..3)
depicts the fuzzification of member Q and membership function in figure 5.
Figure 5: The fuzzification of member Q.

Michal Peták, Milan Houška Fuzzy knowledge unit
DIVAI 2018 – The 12th international scientific conference on Distance Learning in Applied Informatics. 499 ISBN 978-80-7598-059-5 (Print) ISSN 2464-7470 (Print) ISSN 2464-7489 (On-line)
For the system newly formed in the MatLab – Fuzzy Logic Toolbox system, a testing scenario is proposed. The following situation is going to be modelled.
In the interface for adjustments, crisp values of the degree of membership of member
Y = µQi(k) to individual fuzzy sets Q for individual knowledge units FKU are defined.
� The entered crisp values, from fuzzy set Q. FKUn, µQi(k) = xn, where FKUn is a konkret fuzzy knowledge unit n=1, 2 … n. xn = Crisp value for konkret FKU n=1, 2, … n.
� x1= 0,407; x2 = 0,508; x3= 0,17.
� The entered values are recalculated parallelly, using linguistic rules of fuzzy mamdani inference.
� Rules defined above 1, 2, 3
� Results arising from the rules are combined and defuzzified
� See figure 6.
� The result is a crisp - number.
� x4 = 0,592, Graphic form see figure 6
Figure 6: Representation of the settings and result.
The lines in the graphic representation of the settings and output depict three rules in the lines and three knowledge units in the columns. The output part presents the crisp result by means of the „Centroid“ x4 = 0.592 Method. The graphic form and crisp result give rise to the description of output knowledge unit FKU. The textual representation of the output transformed into a fuzzy knowledge unit from the given example takes the following form:
„If we need to Upgrade the ERP and Assess its Demands, we must especially Perform Information Adding and partly Perform internal analyses and decide on performing the upgrade.”
The textual form arises from the defined output knowledge unit with the settings specified in the testing scenario.
X3

Michal Peták, Milan Houška Fuzzy knowledge unit
DIVAI 2018 – The 12th international scientific conference on Distance Learning in Applied Informatics. 500 ISBN 978-80-7598-059-5 (Print) ISSN 2464-7470 (Print) ISSN 2464-7489 (On-line)
DISCUSSION
Knowledge units represent a suitable tool for modelling which respects the system approach. System approach and possibilities of knowledge units to perform other operations, such as drill down, roll up, adding and subtracting, give rise to forming a system diagram of knowledge defined in knowledge units. The value added of the results of this paper lies in the definition of fuzzy knowledge units. Fuzzy logic comprises a suitable system attribute in the development of knowledge units, as supported by many authors (Venturelli et al. 2017, Moreno and Espejo 2015 and Nilashi et al. 2015) and in constructing simulations for expert systems. It combines the ability of an expert system to simulate the decision-making process with uncertainty typical for human thinking. The use of fuzzy logic and fuzzy sets employs Linguistic Production Rules (Zadeh 1973, Mamdani and Assilian 1975). The authors present a so-called fuzzy mamdani inference principle. They justify it with an assertion that fuzzy logic provides tools for expressing a linguistic rule in such a form that it might be synthesized into a specific control strategy. These fundaments give ground to the definition of fuzzy knowledge units with fuzzified elementary member of the knowledge unit “Q”, which is – in the concept of knowledge unit as a production rule – a consequent. The potential of other members of the knowledge unit to get fuzzified is apparently possible but exceeds the scope of this paper. Defined inference that allows forward “modus ponens” and backward “modus Tollens” of knowledge units represents a substantial precondition as well. Further development in this work arises from attributes of system approach and extends inference even to fuzzy knowledge units.
The factors above establish possibilities to form a fuzzy expert system with fuzzy knowledge, similar to those from works by (Venturelli et al. 2017, Ghanei et al. 2015, Moreno and Espejo 2015, Nilashi et al. 2015). Likewise, when forming production rules among knowledge units, standard logic operations defined for inference may be used. The fact that the transcript of the knowledge unit has a textual form as well is fundamental. Although Kendal and Creen (2007) state that it is problematic to form complex texts from production rules in natural language, knowledge units can be represented textually (Brožová et al. 2011). The construction of a fuzzy expert system takes the standard form (Lilly 2010), i.e. by means of the fuzzification of crisp input values, passage through an inference mechanism and subsequent defuzzification. Knowledge units may be represented textually within the process, as demonstrated in the case study.
CONCLUSION
The use of fuzzy knowledge units in an inference mechanism enables a better possibility of dealing with uncertainty in designing expert systems based on knowledge units. The paper defined fuzzy knowledge units as a specific form of a production rule. Fuzzy knowledge units complement the system view of the representation of procedural knowledge in the concept of knowledge unit. The shift of knowledge units with fuzzy logic into fuzzy knowledge units complements the concept of knowledge units with a solution of uncertainty by means of fuzzy approaches, specifically fuzzy linguistic rules. The procedure opens a possibility of simulations in expert systems based on knowledge units, as demonstrated in the case study in this paper.

Michal Peták, Milan Houška Fuzzy knowledge unit
DIVAI 2018 – The 12th international scientific conference on Distance Learning in Applied Informatics. 501 ISBN 978-80-7598-059-5 (Print) ISSN 2464-7470 (Print) ISSN 2464-7489 (On-line)
Defined fuzzy knowledge units give ground to the formation of expert systems. Systems with such base in fuzzy knowledge units may draw on all attributes defined for knowledge units and carry out the function of an expert system at the same time. The possibility to take a textual form represents a general property and advantage of knowledge units. A further research opportunity in terms of knowledge units opens in terms of extending the fuzzy principle to other parts of knowledge units and operations defined for knowledge units.
ACKNOWLEDGEMENT
The research is supported by the grant project of the Internal Grant Agency of the FEM CULS Prague “Data, information and knowledge in expert systems”, No. 20171026.
REFERENCES
Akgun, A., Sezer E.A., Nefeslioglu H.A., Gokceoglu C., Pradhan B.(2011) ‘An easy-to-use MATLAB program (MamLand) for the assessment of landslide susceptibility using a Mamdani fuzzy algorithm’, Computers & Geosciences, no. 38, pp. 23-34. https://doi.org/10.1016/j.cageo.2011.04.012
Brožová, H., Houška, M. at al. (2011) Modelování znalostí, Prague: Professional Publishing.
Chen, S.H. and Pollino, C.A. (2012) ‘Good practice in Bayesian network modelling’, Environmental Modelling and Software, vol. 37, pp. 134-145. https://doi.org/10.1016/j.envsoft.2012.03.012
Dömeová, L., Houška, M. and Houšková Beránková, M. (2008) Systems Approach to Knowledge Modelling. Hradec Králové: GSOC.
Gass, S.I. and Harris, C.M. (2001) Encyclopedia of Operations Research and Management Science, Springer US.
Ghanei, S., Vafaeenezhad H., Kashefia M., Eivani A.R. and M. Mazinani M. (2015) ‘Design of an expert system based on neuro-fuzzy inference analyzer for on-line microstructural characterization using magnetic NDT method‘, Journal of Magnetism and Magnetic Materials. Vol. 379, pp. 131-136. https://doi.org/10.1016/j.jmmm.2014.12.028
Houška, M. and Beránková, M. (2013) ‘Binary Operations with Knowledge Units’, AWERProcedia Information Technology & Computer Science, vol. 3, no. 3, pp. 1716–1726.
Kendal, S.L. and Creen, M. (2007) An Introduction to Knowledge Engineering. London: Springer.
Lilly, J.H. (2010) Basic Concepts of Fuzzy Sets, John Wiley & Sons, Inc, http://dx.doi.org/10.1002/9780470874240.ch2
Mamdani, E.H. a Assilian S. (1975) ‘An experiment in linguistic synthesis with a fuzzy logic controller’, International Journal of Man-Machine Studies, no. 7, pp. 1-13, https://doi.org/10.1016/S0020-7373(75)80002-2.
Mařík, V., Štěpánková, O., Lažanský, J. et al. (2004) Artificial Intelligence I – IV. Prague: Academia Praha.

Michal Peták, Milan Houška Fuzzy knowledge unit
DIVAI 2018 – The 12th international scientific conference on Distance Learning in Applied Informatics. 502 ISBN 978-80-7598-059-5 (Print) ISSN 2464-7470 (Print) ISSN 2464-7489 (On-line)
MatLab online Documentation, (2017). Fuzzy Inference Process. Available from: https://www.mathworks.com/help/fuzzy/fuzzy-inference-process.html. [04 Januar 2018]
Moreno, C.J. and Espejo, E. (2015) ‘A performance evaluation of three inference engines as expert systems for failure mode identification in shafts’, Engineering failure analysis, vol. 53, pp. 24–35. https://doi.org/10.1016/j.engfailanal.2015.03.020
Nilashi, M. a kol. (2015) ‘A knowledge-based expert system for assessing the performance level of green buildings’, Knowledge-Based Systems. no. 86, pp. 194-209, https://doi.org/10.1016/j.knosys.2015.06.009.
Olesiak K. (2017) ‘Application of fuzzy logic toolbox for modeling fuzzy logic controllers’, Proceedings of the International Scientific Conference. Society. Integration. Education. no. 3, pp. 539-546.
Peták M., Houška M. (2017). ‘An Inference Strategy for Knowledge Units’, HAICTA 2017 : 8th International Conference on Information & Communication Technologies in Agriculture, Food and Environment, September 21-24, Chania, Crete, Greece. no. 2030, pp. 304-313. http://ceur-ws.org/Vol-2030/
Rauchová, T., a Houška, M. (2013). ‘Efficiency of knowledge transfer through knowledge texts: statistical analysis’, Journal on Efficiency and Responsibility in Education and Science, vol. 6, pp. 46-60. https://doi.org/10.1016/j.sbspro.2013.12.003.
Sivanandam S.N., Sumathi S., Deepa S. N., Introduction to Fuzzy Logic using MATLAB Springer-Verlag Berlin Heidelberg, 2007. ISBN 978-3-540-35780-3.
Venturelli, A. et al. (2017) ‘How can CSR identity be evaluated? A pilot study using a Fuzzy Expert System’, Journal of Cleaner Production, vol. 141, pp. 1000-1010. https://doi.org/10.1016/j.jclepro.2016.09.172
Zadeh, L.A. (1973) ‘Outline of a new approach to the analysis of complex systems and decision processes’, IEEE Transactions on Systems, Man, and Cybernetics, vol. 3, pp. 28-44. 10.1109/TSMC.1973.5408575.

Jan Skalka Data processing methods in the development of the microlearning-based framework for teaching programming languages
DIVAI 2018 – The 12th international scientific conference on Distance Learning in Applied Informatics. 503 ISBN 978-80-7598-059-5 (Print) ISSN 2464-7470 (Print) ISSN 2464-7489 (On-line)
Data processing methods in the development of the
microlearning-based framework for teaching
programming languages
Jan Skalka
Department of Computer Science, Constantine the Philosopher University, Nitra, Slovakia [email protected]
Abstract
Application of microlearning-based training in higher education raises several new questions about the didactical design of learning activities, effective methodologies as well as technical implementation issues. Microlearning is an action-oriented educational approach offering bite-sized learning that gets learners to learn, act, and practice. Teaching programming languages provides a wide range of educational resources, strategies, and methods suitable for the development of critical and innovative thinking. Some of these activities are possible to design as microlearning units, but many involved problems are out of microlearning time interval. It is crucial to complement microlearning activities with program writing tasks, for improving the successful result. The result of this requirement in the conceptual framework designed for programming languages teaching via the combination of microlearning, automatic code validation, competitions, and community learning. Building presented framework is a very complicated challenge. The modules in the structure are defined to allow dividing system into independent tasks with key elements like automated code validation and automated content development. This article describes main parts of the defined framework, approaches to assessing the correctness of source codes and brings new ideas for content building via data processing methods.
Keywords
Microlearning. Automated assessment. Automated code validation. Summarization. Automated content development. Programming languages.
INTRODUCTION
Demand for employees capable of working in the IT sector immediately or after brief training has lasted for several years. Sufficient staff is essential for the development of the IT sector, but the educational systems are not able to satisfy its requirements in a sufficient rate (Eurostat, 2017), (Hüsing, W.B., & Dashja, 2015). An established computer science educational concept at the universities, yet still often based on the combination of lectures and labs, is outdated and inefficient. The effectivity of knowledge and skills acquisition is insufficient, and graduates are very often out of real requirements of the labor market (Guzman, Dormido, & M., 2013).

Jan Skalka Data processing methods in the development of the microlearning-based framework for teaching programming languages
DIVAI 2018 – The 12th international scientific conference on Distance Learning in Applied Informatics. 504 ISBN 978-80-7598-059-5 (Print) ISSN 2464-7470 (Print) ISSN 2464-7489 (On-line)
The problem is based on the discrepancy of learning styles of nowadays students with learning scenarios and materials, which were valid at the time without permanent connection to the Internet. The way of learning has changed over the years, too. Young people are not interested in spending time by reading or listening to the lectures. They prefer immediate use or application of the obtained knowledge and skills. They require the options to learn anytime and anywhere, not only in the schools (Alamri, Meccawy, Khoja, & Bakhribah, 2017).
The paper describes microlearning and its role in modern teaching, especially in teaching programming languages. The main part of the article is devoted to the conceptual framework based on a combination of microlearning, mobile learning, automated assessment, and gamification. Second part presents new ideas of automated or semi-automated content building via data processing methods.
MICROLEARNING
Microlearning represents approach based on the piecemeal development of skills and knowledge by small or very small content units. Microlearning is an action-oriented educational approach offering bite-sized learning that gets learners to learn, act, and practice (Hug, 2005), (Kamilali & Sofianopoulou, 2013). By Dash in (Lindner, 2006), microlearning consists of micro-content and micro-activities. Micro-content is information published in a short form and micro-activities are forms of interactivity with user – short test, question, simple task, etc. It can provide better educational results in comparison with the classical approaches if it is suitably combined and sufficiently interactive (Kovachev, Cao, Klamma, & M., 2011).
Current view of the microlearning presents pedagogical approaches, technological models and wide experience gained over the past years in the e-learning. It can be seen as a simple version of e-learning with all its positives and negatives contained in pedagogical models. Teachers in many universities use microlearning in their classes because it engages students with the subject matter and results in deeper learning, encouraging them to connect the subject matter with their everyday lives and the world around them (Pandey, 2016). Microlearning is suitable for building soft skills, compliance, obtaining professional skills, learning languages, etc.
By (Kerres, 2007) microlearning encourages learners to become active co-producers of content through active social participation.
There are three groups of tools used in microlearning. The first group of tools and platforms were not prepared for microlearning, but they are used very often: YouTube, Twitter, Instagram, SlideShare. The second group is represented by LMSs, which were developed for building e-learning content in general, but contains useful tools for microlearning lesson creation. The special tools for micro-content creation represent the last group, e.g., Coursmos, Grovo, Yammer (Giurgiu, 2017), (Mykhalevych, 2017).
Microlearning is an innovative way of transfer of skills and knowledge, but there are some disadvantages too:

Jan Skalka Data processing methods in the development of the microlearning-based framework for teaching programming languages
DIVAI 2018 – The 12th international scientific conference on Distance Learning in Applied Informatics. 505 ISBN 978-80-7598-059-5 (Print) ISSN 2464-7470 (Print) ISSN 2464-7489 (On-line)
� Each piece of microlearning content must create a separate online training unit. The course creators need to define and set only a single teaching goal for one lesson. It is necessary to come up with a well-thought concept, and eliminate the extra content (Zufic & Jurcan, 2015).
� Brief modules and online training activities are not typically the best choice for more complicated tasks, skills, or processes (Pappas, 2016).
� Microlearning should be part of a larger online training strategy, but it should not be primary online training method (Pappas, 2016).
Ubiquitous communication and computing technologies enable smartphones to be widely used to acquire instant knowledge anywhere and anytime (Kovachev, Cao, Klamma, & M., 2011). Despite the general belief that students primarily work with online content, sometimes is possible to find the opposite attitude (Munk & Drlik, 2014). Students are also willing to study in places where no permanent connection is available and require application customized to these situations. By nowadays trends, smartphones provide a one-to-one relationship with its owner, what is the basic assumption of education content personalization (Wong, 2012).
Teaching programming languages
Teaching programming languages has several specific features (Capay, Skalka, & Drlik, Computer Science Learning Activities Based on Experience, 2017), (Capay, Algorithmic thinking observation: How students of applied informatics break the mystery of black box applications, 2014). It offers a wide range of educational resources, approaches, and methods suitable for the development of critical and innovative thinking. The typical training activities are analyzing a problem, design data structure, programming code, and searching logical mistakes in code. Some of these activities are possible to design as microlearning units, but a lot of complex problems are out of microlearning time interval (Robins, Rountree, & Rountree, 2003), (Kalelioğlu, 2015).
Nowadays, there are available several well-known solutions for teaching programming. They can be divided into following basic groups:
� Web portals based on collections of programming tasks with and automated assessment (e.g., Hackerrank, CodeWars, CodeHunt, CodingBat, etc.). The content is usually divided into lessons, but they are often created by the software experts or engineers without adequate knowledge of the didactical approaches and principles. These portals are very useful, the automated evaluation of the programming code is a common feature, but they are not appropriate for beginners. One of the most grown portals at present is Datacamp focused on Python, R and data science.
� Universal LMS with programming content (lessons, quizzes, discussions) provided via the web or mobile apps (usually not in microlearning form). The most popular MOOCs portals with programming languages content are Udemy, EdX, Coursera, OpenClassRooms, etc.
� Mobile applications with content organized into lessons and quizzes with or without code evaluation ability via the online compiler. The most popular applications are Programming Hub, Sololearn, DCoder, etc. The code evaluation

Jan Skalka Data processing methods in the development of the microlearning-based framework for teaching programming languages
DIVAI 2018 – The 12th international scientific conference on Distance Learning in Applied Informatics. 506 ISBN 978-80-7598-059-5 (Print) ISSN 2464-7470 (Print) ISSN 2464-7489 (On-line)
ability is often limited. Sololearn is the typical and successful example of microlearning in learning programming languages. It utilizes the elements of microlearning approach enhanced by the concept of gamification, development of learning community, the uncomplicated creation of the educational content, but it provides only simple interactive elements without the possibility to write programs with automated testing and code evaluation.
� Web or mobile applications designed for introduction to programming or computational thinking. They are usually focused on children and the content is adapted to younger students. The code.org is the typical portal with rich content dedicated to K-12 student. There are a lot of applications with a narrow focus or language restriction (e.g., CodeCombat, GalaxyCodr., etc.).
Each of these groups brings a different approach to programming teaching and according to (Skalka & Drlik, 2018) can be assumed that their sophisticated combination is the optimal way for a balanced skill building. From a student's point of view, education can be divided into several layers, and besides the first layer, the student also creates new educational content. The layers allow:
� Learning based on the didactically ordered content and interactive units – obtaining basic knowledge and skills.
� Involving students in the discussions, problem-solving, peer-to-peer programming code evaluating, discussion about the effectiveness and programming code correctness.
� Creating new questions and assignments, which extend provided educational content.
� Developing lessons for other programming languages and frameworks.
� Developing of new types of interactive activities, an alternative design of mobile and web applications. This action has great potential in the case of university study programs. The students obtain knowledge and practical skills because they develop real applications with immediate feedback from the users.
CONCEPTUAL FRAMEWORK
In (Skalka & Drlik, 2018) was presented conceptual framework designed for programming languages teaching via the combination of microlearning, automated code validation, competitions, and community learning.

Jan Skalka Data processing methods in the development of the microlearning-based framework for teaching programming languages
DIVAI 2018 – The 12th international scientific conference on Distance Learning in Applied Informatics. 507 ISBN 978-80-7598-059-5 (Print) ISSN 2464-7470 (Print) ISSN 2464-7489 (On-line)
Figure 1: Structure of conceptual framework (Skalka & Drlik, 2018).
To build presented framework is a very complex challenge. The modules in framework structure are therefore defined to allow dividing system into independent tasks. The key elements of the framework are:
� automated code validation,
� automated content development.
Automated code validation
Code validation is a complicated task, but this topic has a few good and validated solutions. According to (Staubitz, Klement, Renz, Teusner, & Meinel, 2015), the approaches are categorized to perform the automated assessment into dynamic approaches, which require execution of the program under test, and static approaches, which do not:
� The main static approach is represented by I/O-based assessment that refers to assessing a program solely by using a standard I/O interface. The tested program reads predefined values, performs an algorithm and compare produced output values with expected values. The advantage of this approach is its versatility because I/O-based assessment can be applied to any programming language, which can read/write data (Ihantola, Ahoniemi, Karavirta, & O., 2010). The useful feature of this approach is that it is possible to use the same pairs (input-output) for validation programs written in different program languages. According to

Jan Skalka Data processing methods in the development of the microlearning-based framework for teaching programming languages
DIVAI 2018 – The 12th international scientific conference on Distance Learning in Applied Informatics. 508 ISBN 978-80-7598-059-5 (Print) ISSN 2464-7470 (Print) ISSN 2464-7489 (On-line)
(Staubitz, Klement, Renz, Teusner, & Meinel, 2015) due to lacking insights into the inner mechanics of a code submission, I/O based assessment is limited to testing side effects that are exposed in the form of program output. This approach is not qualified for providing the learner with feedback regarding why the submission deviates from the specification.
� Acceptance testing is typical dynamical approach allowed building and running customers scenarios for validating programs. It is based on industrial testing technique like JUnit, CUnit or generally xUnit. Scenarios building allows automated code validation not only through input-output pairs, but they can check behavior, used classes, attributes, methods, and speed or memory demands.
We have verified and tried several tools over the past two years. The most appropriate solution is Virtual Programming Lab (VPL) (Rodriguez-del-Pino, 2011). The architecture includes three modules: a plugin for Moodle, which allows the integration with the submission and grades modules in Moodle; a code editor based on browser, which allows coding without the necessity of an installed compiler; and a jail server, which hosts the environment where the assignment will be evaluated (Caiza & Del Alamo, 2013).
VPL (and especially its jail server) is an appropriate part of framework module for validation code, because of:
� support a lot of common programming languages,
� support both: I/O based testing, and acceptance testing,
� jail server is independent of the client, and consists of many compilers and interpreters supported update,
� Moodle implementation can be used for content preparation and parallel offer of educational content.
Automated content development
Content development for the presented framework is the most time-consuming activity in several phases, e.g.:
� creation of educational material divided into micro-activities,
� preparation of interactive activities based on micro-activities content,
� definition of correct answers to a prepared question,
� preparation of final interactive tests and answers.
The most common activity of content development is an appropriate formulation of knowledge close to the learner language. Content building is often based on existing educational materials collected in books or e-learning courses, identification of main or essential information and text reduction focused on this information. This process can be automated, completely or at least partially, via summarization.
The summarization is one of text mining approach that allows getting the most important content in a condensed form in a manner sensitive to the user or task needs (Steinberger & Ježek, 2012). According to (Allahyari, a iní, 2017) automatic text summarization is very challenging, because when we as humans summarize a piece of text,
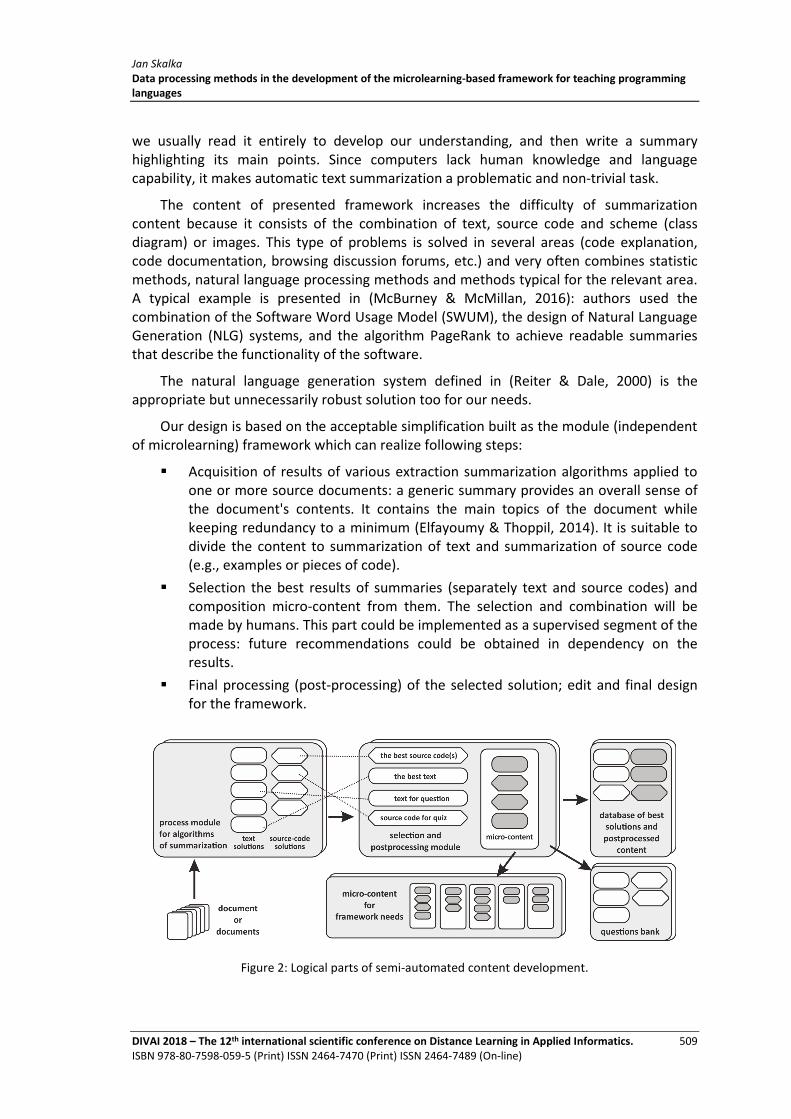
Jan Skalka Data processing methods in the development of the microlearning-based framework for teaching programming languages
DIVAI 2018 – The 12th international scientific conference on Distance Learning in Applied Informatics. 509 ISBN 978-80-7598-059-5 (Print) ISSN 2464-7470 (Print) ISSN 2464-7489 (On-line)
we usually read it entirely to develop our understanding, and then write a summary highlighting its main points. Since computers lack human knowledge and language capability, it makes automatic text summarization a problematic and non-trivial task.
The content of presented framework increases the difficulty of summarization content because it consists of the combination of text, source code and scheme (class diagram) or images. This type of problems is solved in several areas (code explanation, code documentation, browsing discussion forums, etc.) and very often combines statistic methods, natural language processing methods and methods typical for the relevant area. A typical example is presented in (McBurney & McMillan, 2016): authors used the combination of the Software Word Usage Model (SWUM), the design of Natural Language Generation (NLG) systems, and the algorithm PageRank to achieve readable summaries that describe the functionality of the software.
The natural language generation system defined in (Reiter & Dale, 2000) is the appropriate but unnecessarily robust solution too for our needs.
Our design is based on the acceptable simplification built as the module (independent of microlearning) framework which can realize following steps:
� Acquisition of results of various extraction summarization algorithms applied to one or more source documents: a generic summary provides an overall sense of the document's contents. It contains the main topics of the document while keeping redundancy to a minimum (Elfayoumy & Thoppil, 2014). It is suitable to divide the content to summarization of text and summarization of source code (e.g., examples or pieces of code).
� Selection the best results of summaries (separately text and source codes) and composition micro-content from them. The selection and combination will be made by humans. This part could be implemented as a supervised segment of the process: future recommendations could be obtained in dependency on the results.
� Final processing (post-processing) of the selected solution; edit and final design for the framework.
Figure 2: Logical parts of semi-automated content development.

Jan Skalka Data processing methods in the development of the microlearning-based framework for teaching programming languages
DIVAI 2018 – The 12th international scientific conference on Distance Learning in Applied Informatics. 510 ISBN 978-80-7598-059-5 (Print) ISSN 2464-7470 (Print) ISSN 2464-7489 (On-line)
Various algorithms (or its options) can bring different summaries with various length. Some results can be used for questions bank building (short answers, supplementation of missing source code, ordering of shuffled lines in a source code, selection right answers of a list, etc.).
Application of summarization module into framework will bring speeding up content creation and advanced level of automation not only in the presented framework but also generally in content development.
DISCUSSION, CONCLUSION AND FUTURE WORK
In the article was described microlearning as the modern approach to current education. This approach was used for definition framework oriented to programming languages teaching. The education consists of two types of activities – interactive activities based on pair content/activity where micro-content represents explanation part, and micro-activities represents fixation part of educational process. A various number of pairs is followed by programming task, which is determined as the first evaluation of knowledge obtain from micro-content.
Two main features of the framework: automated code validation and automated content development were presented as its most important benefits.
Automated code validation simplifies the education and provides learning comfort for students. Every student obtains the evaluation of source code immediately after posting solution into the framework. The form, structure and information value of feedback are the most important features of communication with the student, and they defined attractiveness and usability of learning in the virtual environment. Source code validation approaches related to feedback building will be developed in future work.
Automated content development is based on the premise that creation of micro-content uses existing educational material, and new content is a summarization of existing content. The article presents opportunities for summarization, opportunities of building various content based on one or more documents in micro-content development. The module dedicated to manipulation with summarization is capable of preparing not only content for an explanation but also content for various question types. These questions represent starting content for interactive activities. Automated content development can accelerate content building meaningfully and represents a significant part of the presented framework. Future work will be focused to build software environment uses summarization techniques not only for English but also for Middle European languages, which are our target destination.
ACKNOWLEDGEMENT
The research for this paper was financially supported by grant KEGA - 029UKF-4/2018 Innovative Methods in Programming Education in the University Education of Teachers and IT Professionals.

Jan Skalka Data processing methods in the development of the microlearning-based framework for teaching programming languages
DIVAI 2018 – The 12th international scientific conference on Distance Learning in Applied Informatics. 511 ISBN 978-80-7598-059-5 (Print) ISSN 2464-7470 (Print) ISSN 2464-7489 (On-line)
REFERENCES
Alamri, S., Meccawy, M., Khoja, B. & Bakhribah, H., 2017. Learning Anytime, Anywhere: Benefits and Challenges of M-Learning through the Cloud. International Advanced Research Journal of Science, Engineering and Technology, 4(5), pp. 37-41.
Allahyari, M. et al., 2017. Text Summarization Techniques: A Brief Survey, USA: arXiv:1707.02268 (https://arxiv.org/abs/1707.02268).
Caiza, J. & Del Alamo, J., 2013. Programming assignments automatic grading: review of tools and implementations. Valencia, Spain, 7th International Technology, Education and Development Conference INTED2013 Proceedings, pp. 5691-5700.
Capay, M., 2014. Algorithmic thinking observation: How students of applied informatics break the mystery of black box applications. Dubai, World Engineering Education Forum (WEEF 2014) : Interactive Collaborative Learning (ICL 2014).
Capay, M., Skalka, J. & Drlik, M., 2017. Computer Science Learning Activities Based on Experience. Athens, The IEEE Global Engineering Education Conference (EDUCON) 2017.
Elfayoumy, S. & Thoppil, J., 2014. A Survey of Unstructured Text Summarization Techniques. International Journal of Advanced Computer Science and Applications, 5(4), pp. 149-154.
Eurostat, 2017. Europe 2020 indicators – employment. [Online] Available at: http://ec.europa.eu/eurostat/statistics-explained/index.php/Europe_2020_ indicators_ _employment [Accessed 1 2 2018].
Giurgiu, L., 2017. Microlearning an Evolving Elearning Trend. Scientific Bulletin, 22(1), pp. 18-23.
Guzman, J. L., Dormido, S. & M., B., 2013. Interactivity in Education: an Experience in the Automatic Control Field. Computer Applications in Engineering Education, 21(2), pp. 360-371.
Hug, T., 2005. Micro learning and narration: exploring possibilities of utilization of narrations and storytelling for the design of" micro units" and didactical micro-learning arrangements. Media in Transition, MIT, Cambridge (MA), USA.
Hüsing, T., W.B., K. & Dashja, E., 2015. e-Skills in Europe Trends and Forecasts for the European ICT Professional and Digital Leadership Labour Markets (2015-2020). [Online] Available at: http://eskills-lead.eu/fileadmin/lead/working_paper_-_supply_demand_forecast_2015_ a.pdf [Accessed 1 2 2018].
Ihantola, P., Ahoniemi, T., Karavirta, V. & O., S., 2010. Review of Recent Systems for Automatic Assessment of Programming Assignments. Proceedings of the 10th Koli Calling International Conference on Computing Education Research, ACM, p. 86–93.
Kalelioğlu, F., 2015. A new way of teaching programming skills to K-12 students: code.org. Computers in Human Behavior, 52(1), pp. 200-210.
Kamilali, D. & Sofianopoulou, C., 2013. Lifelong Learning and Web 2.0: Microlearning and Self Directed Learning. Barcelona, Proceedings of EDULEARN13.
Kerres, M., 2007. Microlearning as a Challenge for Instructional Design. In: Didactics of Microlearning: Concepts, Discourses and Examples. Münster: Waxmann, pp. 98-109.

Jan Skalka Data processing methods in the development of the microlearning-based framework for teaching programming languages
DIVAI 2018 – The 12th international scientific conference on Distance Learning in Applied Informatics. 512 ISBN 978-80-7598-059-5 (Print) ISSN 2464-7470 (Print) ISSN 2464-7489 (On-line)
Kovachev, D., Cao, Y., Klamma, R. & M., J., 2011. Learn-as-you-go: New Ways of Cloud-Based Micro-learning for the Mobile Web. ICWL 2011: Advances in Web-Based Learning - ICWL 2011, Springer, pp. 51-61.
Lindner, M., 2006. Use these tools, your mind will follow. Learning in immersive micromedia and microknowledge environments. , The next generation: Research proceedings of the 13th ALT-C conference.
McBurney, P. & McMillan, C., 2016. Automatic Source Code Summarization of Context for Java Methods. IEEE Transactions on Software Engineering, 42(2), pp. 103-119.
Munk, M. & Drlik, M., 2014. Analysis of Stakeholders' Behaviour Depending on Time in Virtual Learning Environment. Applied mathematics & information sciences, 8(2), pp. 773-785.
Mykhalevych, N., 2017. Microlearning In The Workplace: 7 Learning Tools And 4 Tips To Make Microlearning Exciting. [Online] Available at: https://elearningindustry.com/microlearning-in-the-workplace-7-learning-tools-4-tips-make-microlearning-exciting[Accessed 20 2 2018].
Pandey, A., 2016. 5 Killer Examples: How To Use Microlearning-Based Training Effectively.. [Online] Available at: https://elearningindustry.com/5-killer-examples-use-microlearning-based-training-effectively [Accessed 20 2 2018].
Pappas, C., 2016. Microlearning In Online Training: 5 Advantages And 3 Disadvantages. [Online] Available at: https://elearningindustry.com/microlearning-in-online-training-5-advantages-and-3-disadvantages [Accessed 2018 2 20].
Reiter, E. & Dale, R., 2000. Building natural language generation systems. New York: Cambridge University Press.
Robins, A., Rountree, J. & Rountree, N., 2003. Learning and teaching programming: A review and discussion. Computer science education, 13(2), pp. 137-172 Rodriguez-del-Pino, J. C., 2011. VPL — Virtual Programming. [Online] Available at: http://vpl.dis.ulpgc.es/ [Accessed 20 2 2018].
Skalka, J. & Drlik, M., 2018. Conceptual Framework of Microlearning-Based Training Mobile Application for Improving Programming Skills. Cham, Auer M., Tsiatsos T. (eds) Interactive Mobile Communication Technologies and Learning. IMCL 2017. Advances in Intelligent Systems and Computing, vol 725. Springer.
Staubitz, T. et al., 2015. Towards practical programming exercises and automated assessment in Massive Open Online Courses. Zhuhai, IEEE International Conference on Teaching, Assessment and Learning for Engineering, TALE 2015, pp. 23-30.
Steinberger, J. & Ježek, K., 2012. Evaluation measures for text summarization. Computing and Informatics, Issue 25, p. 1001–1025.
Wong, L., 2012. A learner-centric view of mobile seamless learning. British Journal of Educational Technology, 43(1).
Zufic, J. & Jurcan, B., 2015. Micro Learning and EduPsy LMS. Varazdin, Central European Conference on Information and Intelligent Systems.

Peter Svec, Lukas Chylo, Jakub Filipik Web Log Data Preprocessing using Raspberry Pi Cluster and hadoop cluster
DIVAI 2018 – The 12th international scientific conference on Distance Learning in Applied Informatics. 513 ISBN 978-80-7598-059-5 (Print) ISSN 2464-7470 (Print) ISSN 2464-7489 (On-line)
Web Log Data Preprocessing using Raspberry Pi
Cluster and hadoop cluster
Peter Svec
Department of Computer Science, Constantine the Philosopher University in Nitra, Nitra, Slovakia
Lukas Chylo, Jakub Filipik
Department of Computer Science, Constantine the Philosopher University in Nitra, Nitra, Slovakia
Abstract
We describe the process of the data preprocessing in Web Log Mining. The preprocessing is the essential part of the mining process, and there are many approaches to accomplish this task. We are dealing with the problem that the original log file from the server contains many records which are not required for the mining process. These lines represent data used for the browser to generate the web page for the client, e.g., style sheets, graphics, etc. As the log file is relatively small in its size, we can use classic approach for parsing the log file. As the amount of data grows rapidly, we are dealing with the Big Data problem. We have to employ cluster technologies in this process. In this paper, we show the concept of the Raspberry Pi cluster for parallel analysis of the web server log file by parallel access to the file from many nodes of the cluster. We also show the way, how to clean data using the Apache Hadoop environment using the MapReduce framework. We were able to build the cluster and successfully distribute the preprocessing of the log file using both of the methods.
Keywords
Web Log Mining. Data Pre-processing. Raspberry Pi. Apache Hadoop. MapReduce.
INTRODUCTION
The essential part of Web Log Mining (VLM) process it the analysis of webserver log file. Webserver log files keep information about visitors, which can be used for the analysis of visitor behaviour (Munk, Drlik, & Vrabelova, 2011). A web server log is in its default form known as Common Log File and keeps information about IP address; date and time of visit; accessed and referenced resource. If we use the extended version of the log file, we can collect more information, e.g. type of browser (User-Agent Field). Webserver logs every information generated by the user’s browser including requests for cascading style-sheets, images, fonts etc. Usually we do not need these data for analysis of user behavior and we have to cut them from the log file. There are many approaches how to purge this

Peter Svec, Lukas Chylo, Jakub Filipik Web Log Data Preprocessing using Raspberry Pi Cluster and hadoop cluster
DIVAI 2018 – The 12th international scientific conference on Distance Learning in Applied Informatics. 514 ISBN 978-80-7598-059-5 (Print) ISSN 2464-7470 (Print) ISSN 2464-7489 (On-line)
data from the log file. We describe the parallel approach using Raspberry Pi (RPi) minicomputer to create a cluster used for data preparation of the webserver log file for further analysis employing some database. Then we extend this approach to Hadoop ecosystem which is essential for BigData analysis. We show the cleaning process using MapReduce framework. We describe the possibilities to construct RPi cluster and use it for parallel analysis of log file and its extension to Hadoop cluster in following sections.
RELATED WORK
Based on the methodology described in our previous research (Kapusta, Pilková, Munk, & Švec, 2013; Kapusta, Svec, Munk, & Skalka, n.d.; Pilkova, Munk, Svec, & Medo, 2015) the webserver log file analysis consist of following steps: data preprocessing, data cleaning, identification of sessions and reconstruction of activities of a web visitor. The first step in the log file preprocessing is the removal of unnecessary data (Munk, Drlik, Benko, & Reichel, 2017) as mentioned in the introduction section of this paper. Despite this fact, there are also data from web robots. Web robots may be defined as autonomous systems that send requests to web servers across the Internet. A canonical example of a web robot is a search engine indexer while a less common example is an RSS feed crawler, or a robot designed to collect web sites for an Internet archive (Stevanovic, An, & Vlajic, 2011). Web robots also carry out helpful tasks like web content archiving, link and code validation, the change of the content monitoring, or website mirroring.
The difference between the robot and the human can be determined based on basic and common features like click rate, HTML-to-Image ratio, percentage of file requests, percentage of 4xx error responses, percentage of HEAD requests, or access to robot.txt file, and we can use new methods like standard deviation of requested page’s depth or percentage of consecutive sequential HTTP requests (Stevanovic et al., 2011). There are many robots or crawlers that cannot be identified based on general crawler attributes. In this case, we can use the method navigational patters analysis (Tan & Kumar, 2004), we can use cluster analysis (Suchacka & Sobków, 2015), classification techniques (Stevanovic, An, & Vlajic, 2012).
After the cleaning of the log file and removing web crawlers’ accesses and unnecessary data, the log file with just the 10% of the original file (Munk, Kapusta, & Švec, 2010). The main tool we used in our previous research for removal of unnecessary data is the Unix grep call. The speed of the grep tools depends on the amount of lines in the log file as the grep process the log file line by line. We can speedup this process using the GNU Parallel or using the cluster computing. The cluster computing offers the environment to assess the log file as the Big Data source. We deal with the Beowulf cluster based on the RPi computers in this paper.
Beowulf cluster is simply a collection of identical, (typically) commodity computer hardware-based systems, networked together and running some kind of parallel processing software that allows each node in the cluster to share data and computation as seen on Figure 1. Typically, the parallel programming software is MPI (Message Passing Interface), which utilizes TCP/IP along with some libraries to allow programmers to create parallel programs that can split a task into parts suitable to run on multiple machines
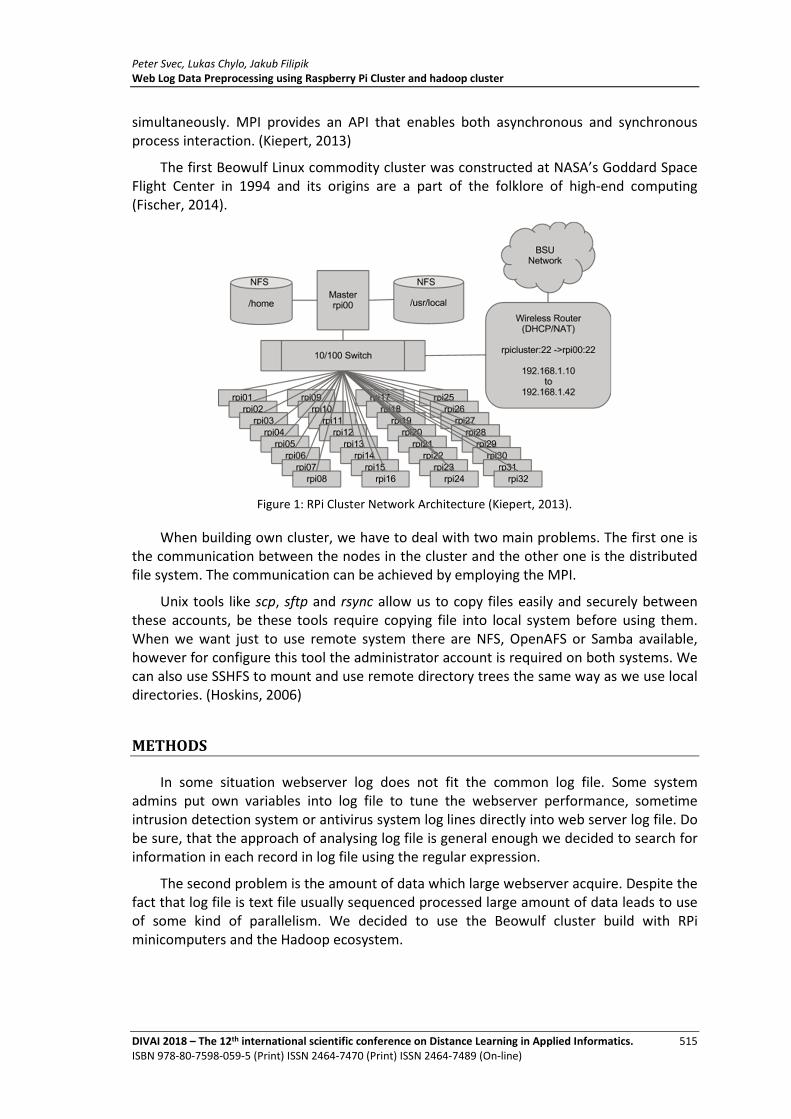
Peter Svec, Lukas Chylo, Jakub Filipik Web Log Data Preprocessing using Raspberry Pi Cluster and hadoop cluster
DIVAI 2018 – The 12th international scientific conference on Distance Learning in Applied Informatics. 515 ISBN 978-80-7598-059-5 (Print) ISSN 2464-7470 (Print) ISSN 2464-7489 (On-line)
simultaneously. MPI provides an API that enables both asynchronous and synchronous process interaction. (Kiepert, 2013)
The first Beowulf Linux commodity cluster was constructed at NASA’s Goddard Space Flight Center in 1994 and its origins are a part of the folklore of high-end computing (Fischer, 2014).
Figure 1: RPi Cluster Network Architecture (Kiepert, 2013).
When building own cluster, we have to deal with two main problems. The first one is the communication between the nodes in the cluster and the other one is the distributed file system. The communication can be achieved by employing the MPI.
Unix tools like scp, sftp and rsync allow us to copy files easily and securely between these accounts, be these tools require copying file into local system before using them. When we want just to use remote system there are NFS, OpenAFS or Samba available, however for configure this tool the administrator account is required on both systems. We can also use SSHFS to mount and use remote directory trees the same way as we use local directories. (Hoskins, 2006)
METHODS
In some situation webserver log does not fit the common log file. Some system admins put own variables into log file to tune the webserver performance, sometime intrusion detection system or antivirus system log lines directly into web server log file. Do be sure, that the approach of analysing log file is general enough we decided to search for information in each record in log file using the regular expression.
The second problem is the amount of data which large webserver acquire. Despite the fact that log file is text file usually sequenced processed large amount of data leads to use of some kind of parallelism. We decided to use the Beowulf cluster build with RPi minicomputers and the Hadoop ecosystem.

Peter Svec, Lukas Chylo, Jakub Filipik Web Log Data Preprocessing using Raspberry Pi Cluster and hadoop cluster
DIVAI 2018 – The 12th international scientific conference on Distance Learning in Applied Informatics. 516 ISBN 978-80-7598-059-5 (Print) ISSN 2464-7470 (Print) ISSN 2464-7489 (On-line)
Beowulf cluster
The Beowulf cluster was described in the introduction section. We are using Python script for the data analysis and the bash script to invoke parallel processing. The methodology consists of following steps:
� Build and setup a cluster.
� Get number of lines in the log file.
� Analyse portion of log file at the node of cluster.
� Find information based on regular expression.
� Collect information into insert them into database.
The main issue is to search for information in record of the log file. We are using the python “re” library to manipulate with regular expressions. We have to find the IP address, the time and date, the URL, the Referrer and if exist also User-Agent field. All other information can be omitted.
We suppose the web server is using only IPv4. The common format of IP address is four octets separated with the dot. To find IP address the regular expression will be as following:
Figure 2: Regular expression to find the IP address.
The date in log file consist from the date, time, and time zone that the request was received in strftime format. An example of date is [10/Oct/2010:13:55:36 -0700]. The regular expression which math this format is on Figure 3 together with code do format the date into appropriate format for processing.
Figure 3: Regular expression to find the Date and Time.
As the next step we have to find the URL of accessed a resource. The http protocol offers few ways how to access the resource. The most common are „POST“, „GET“ and „HEAD“. For the WLM, we only need the GET method. Based on recommendation from (Goyvaerts & Levithan, 2012) we will use expression on Figure 4 to find the URL, and similar expression also for the Referrer.
Figure 4: Regular expression to find URL and Referrer.

Peter Svec, Lukas Chylo, Jakub Filipik Web Log Data Preprocessing using Raspberry Pi Cluster and hadoop cluster
DIVAI 2018 – The 12th international scientific conference on Distance Learning in Applied Informatics. 517 ISBN 978-80-7598-059-5 (Print) ISSN 2464-7470 (Print) ISSN 2464-7489 (On-line)
We can also extend the regex_URL to skip lines which contain list of unnecessary data as we mentioned in the Introduction section.
The last field we are looking for it the Agent field. Usually, the agent is the name and version of user’s browser, but also many search engine’s bots are using this field to identify them as robots (Figure 5).
Figure 5: Regular expression to find the Agent.
After the analysis of each line of the log file, we insert data into database. In our test environment we used the MongoDB as the NoSQL database, but we can use any database engine we are familiar with. The structure of the database consists of IP, TimeFrame, URL, Referrer and Agent. The database can be used for another, more comprehensive processing. To achieve the parallel run of this code, some requirements should be met. First, the analysed log file has to be on shared file system, so all the nodes will have access to it. Based on the number of stations, a bash script will invoke the parallel processing of the log file. The processing script require the range of lines to be analysed. We can run the processing script using rsh. The starting script is displayed on Figure 6.
Figure 6: Starting script to invoke parallel processing of log file.
Hadoop ecosystem
Hadoop is an open-source implementation of MapReduce, which become the most popular framework (Figure 7) for large-scale processing and analysis of vast data sets in clusters of machines, mainly because of its simplicity. With MapReduce, the developer gets various cumbersome tasks of distributed programming for free without the need to write any code; indicative examples include machine to machine communication, task scheduling to machines, scalability with cluster size, ensuring availability, handling failures, and partitioning of input data. (Doulkeridis & Norvaag, 2014).

Peter Svec, Lukas Chylo, Jakub Filipik Web Log Data Preprocessing using Raspberry Pi Cluster and hadoop cluster
DIVAI 2018 – The 12th international scientific conference on Distance Learning in Applied Informatics. 518 ISBN 978-80-7598-059-5 (Print) ISSN 2464-7470 (Print) ISSN 2464-7489 (On-line)
Figure 7: MapReduce framework (Doulkeridis & Norvaag, 2014).
We suppose that we have the Hadoop cluster running based on the setup we describe in (Svec, 2017). We are using Java for writing the MapReduce code. We will use Hadoop for data cleaning – removing unnecessary data.
The methodology consists of following steps:
� Read the log file
� Create Mapper Job to distribute the process to nodes
� Create Combiner and Reducer Job to clean data
� Get number of lines in the log file.
� Analyse portion of log file at the node of cluster.
� Find information based on regular expression.
� Collect information into insert them into database.
The mission of the Mapper class (Figure 8) is to transform key / value input values into advanced key / value couples that are processed in the Reducer class. We are using blank string as the variable because we want the whole row to be processed in the Reducer class, not just its part. The implemented types are LongWritable and Text. Longwritable stores the so-called offset. This value is generated automatically. The offset value is allocated based on the value of the previous offset plus the value of the number of characters of the current row in the file.
Figure 8: Mapper class in Java.

Peter Svec, Lukas Chylo, Jakub Filipik Web Log Data Preprocessing using Raspberry Pi Cluster and hadoop cluster
DIVAI 2018 – The 12th international scientific conference on Distance Learning in Applied Informatics. 519 ISBN 978-80-7598-059-5 (Print) ISSN 2464-7470 (Print) ISSN 2464-7489 (On-line)
The next step is the cleaning process which is divided into four tasks:
� removing of unnecessary data,
� removing robots and their IP addresses,
� resolving inconsistencies,
� write cleaned records and check empty rows.
We are using simple robots cleaning just based on the access to robots.txt file and based on the Agent field. The removing of unnecessary data is based on the content of the uselessdatalist.txt file. This file is made by an expert and the content of the file is set of keywords which can be omitted from the original log file. Whenever we found the match we mark the IP address and all other record within the same IP are deleted. We are also omitting lines which do not fit the apache web server log file structure. The cleaning process is the task of the Reduced job (Figure 9).
Figure 9: Reduced class in Java.
CONCLUSION
We described two ways how to speed up the process of web server log file analysis. The solution with the RPi computers in an example that we do not need big cluster to run the parallel log file processing but just few commodity computers. Our approach with RPis is to connect the research in this field to the teaching process, so everyone can easily build the small cluster and take a look into the Big Data analysis. The Hadoop ecosystem is the environment with big potential for the research we are dealing with. We described the way how to employ parallel tasks using the MapReduce framework for the most necessary step in the WLM. We understand that the cleaning process should be more comprehensive. We are working on the algorithm to detect non-human access to the web site employing the machine learning algorithms and the Hadoop Apache Spark. There is lot of work done in this field like employing unsupervised neural network models, like the

Peter Svec, Lukas Chylo, Jakub Filipik Web Log Data Preprocessing using Raspberry Pi Cluster and hadoop cluster
DIVAI 2018 – The 12th international scientific conference on Distance Learning in Applied Informatics. 520 ISBN 978-80-7598-059-5 (Print) ISSN 2464-7470 (Print) ISSN 2464-7489 (On-line)
Self-Organizing Map with Adaptive Resonance Theory, to cluster visitors into four groups of humans, well-behaved crawlers, malicious crawlers, and unknown visitors (Stevanovic, Vlajic, & An, 2013) or Density-Based Spatial Clustering of Applications with Noises to identify web robots (Zabihi, Jahan, & Hamidzadeh, 2014).
ACKNOWLEDGEMENT
This work was supported by the project VEGA 1/0776/18 Optimizing the content and structure of the disclosures under Pillar 3 by modelling their use by stakeholders of commercial bank.
REFERENCES
Doulkeridis, C., & Norvaag, K. (2014). A Survey of Large-scale Analytical Query Processing in MapReduce. The VLDB Journal, 23(3), 355–380. http://doi.org/10.1007/s00778-013-0319-9
Fischer, R. J. (2014). The Roots of Beowulf. Proceedings of the 20 Years of Beowulf Workshop on Honor of Thomas Sterling’s 65th Birthday, 1–6. http://doi.org/10.1145/2737909.2770195
Goyvaerts, J., & Levithan, S. (2012). Regular expressions cookbook. O’reilly.
Hoskins, E. M. (2006). SSHFS: super easy file access over SSH. Linux Journal, 2006(146), 4. Retrieved from https://ezproxy.cvtisr.sk:2362/citation.cfm?id=1134786
Kapusta, J., Pilková, A., Munk, M., & Švec, P. (2013). Data pre-processing for web log mining: Case study of commercial bank website usage analysis. Acta Universitatis Agriculturae et Silviculturae Mendelianae Brunensis, 61(4), 973–979. http://doi.org/10.11118/actaun201361040973
Kapusta, J., Svec, P., Munk, M., & Skalka, J. (n.d.). User Session Identification Using Extended Href Method. DIVAI 2014: 10TH INTERNATIONAL SCIENTIFIC CONFERENCE ON DISTANCE LEARNING IN APPLIED INFORMATICS, 581–588. Retrieved from http://apps.webofknowledge.com/full_record.do?product=UA&search_mode=GeneralSearch&qid=1&SID=P2LHOY1PuFok2vuTFiF&page=1&doc=3
Kiepert, J. (2013). Creating a raspberry pi-based beowulf cluster. Boise State.
Munk, M., Drlik, M., & Vrabelova, M. (2011). Probability Modelling of Accesses to the Course Activities in the Web-Based Educational System. Computational Science And Its Applications - ICCSA 2011, PT V, Lecture Notes in Computer Science, 6786, 485-499.
Munk, M., Drlik, M., Benko, Ľ., & Reichel, J. (2017). Quantitative and Qualitative Evaluation of Sequence Patterns Found by Application of Different Educational Data Preprocessing Techniques. IEEE Access, 5, 8989-9004
Munk, M., Kapusta, J., & Švec, P. (2010). Data preprocessing evaluation for web log mining: reconstruction of activities of a web visitor. Procedia Computer Science, 1(1), 2273–2280. http://doi.org/10.1016/j.procs.2010.04.255
Pilkova, A., Munk, M., Svec, P., & Medo, M. (2015). Assessment of the Pillar 3 Financial and Risk Information Disclosures Usefulness to the Commercial Banks Users. In Advanced

Peter Svec, Lukas Chylo, Jakub Filipik Web Log Data Preprocessing using Raspberry Pi Cluster and hadoop cluster
DIVAI 2018 – The 12th international scientific conference on Distance Learning in Applied Informatics. 521 ISBN 978-80-7598-059-5 (Print) ISSN 2464-7470 (Print) ISSN 2464-7489 (On-line)
Intelligent Computing Theories and Applications (pp. 429–440). Springer International Publishing.
Stevanovic, D., An, A., & Vlajic, N. (2011). Detecting Web Crawlers from Web Server Access Logs with Data Mining Classifiers. In M. Kryszkiewicz, H. Rybinski, A. Skowron, & Z. W. Raś (Eds.), Foundations of Intelligent Systems (pp. 483–489). Berlin, Heidelberg: Springer Berlin Heidelberg.
Stevanovic, D., An, A., & Vlajic, N. (2012). Feature evaluation for web crawler detection with data mining techniques. Expert Systems with Applications, 39(10), 8707–8717. http://doi.org/https://doi.org/10.1016/j.eswa.2012.01.210
Stevanovic, D., Vlajic, N., & An, A. (2013). Detection of malicious and non-malicious website visitors using unsupervised neural network learning. Applied Soft Computing, 13(1), 698–708. http://doi.org/https://doi.org/10.1016/j.asoc.2012.08.028
Suchacka, G., & Sobków, M. (2015). Detection of Internet robots using a Bayesian approach. In 2015 IEEE 2nd International Conference on Cybernetics (CYBCONF) (pp. 365–370). http://doi.org/10.1109/CYBConf.2015.7175961
Svec, P. (2017). Possibilities of Distributed Systems in GRID and Cloud. In EDULEARN17 Proceedings (pp. 5573–5578). IATED. http://doi.org/10.21125/edulearn.2017.2265
Tan, P.-N., & Kumar, V. (2004). Discovery of Web Robot Sessions Based on Their Navigational Patterns. In Intelligent Technologies for Information Analysis (pp. 193–222). Berlin, Heidelberg: Springer Berlin Heidelberg. http://doi.org/10.1007/978-3-662-07952-2_9
Zabihi, M., Jahan, M. V, & Hamidzadeh, J. (2014). A density based clustering approach for web robot detection. In 2014 4th International Conference on Computer and Knowledge Engineering (ICCKE) (pp. 23–28). http://doi.org/10.1109/ICCKE.2014.6993362

List of Authors
List of Authors
Boris Aberšek
University of Maribor, Maribor, Slovenia [email protected]
Metka Kordigel Aberšek
University of Maribor, Maribor, Slovenia [email protected]
Martina Adamkovičová Faculty of Education, University of Presov in Presov, Presov, Slovakia [email protected]
Abzetdin Adamov Center for Data Analytics Research (CeDAR) ADA University, Baku, Azerbaijan [email protected]
Zoltán Balogh Department of Informatics, Constantine the Philosopher University, Nitra, Slovakia [email protected]
Martin Bílek Faculty of Science,University of Hradec Králové, Hradec Králové, Czech Republic [email protected] Faculty of Education, Charles University, Prague, Czech Republic [email protected]
Martin Boltižiar Department of Geography and Regional Development, Faculty of Natural Sciences, The Constantine the Philosopher University in Nitra, Nitra, Slovakia e-mail: [email protected]
Martina Houšková Beránková Department of Systems Engineering, Faculty of Economics and Management, Czech University of Life Sciences Prague, Czech Republic [email protected]
Jan Budina Faculty of Informatics and Management, University of Hradec Kralove, Hradec Kralove, Czech Republic [email protected]
Mária Burianová Department of Informatics, Constantine the Philosopher University, Nitra, Slovakia [email protected]
Jana Burgerová Faculty of Education, University of Presov in Presov, Presov, Slovakia [email protected], [email protected]
Pavel Cyrus University of Hradec Kralové, Hradec Kralove, Czech republic [email protected]
Martin Drlík Constantine the Philosopher University in Nitra, Slovakia [email protected]
Martin Drozda Slovak University of Technology in Bratislava, Bratislava, Slovakia [email protected]

List of Authors
Ludvík Eger Faculty of Economics, University of West Bohemia, Pilsen, Czech Republic [email protected]
Jakub Filipik Department of Computer Science, Constantine the Philosopher University in Nitra, Nitra, Slovakia
Andrej Flogie Institute Anton Martin Slomšek, Vrbanska 30, Maribor, Slovenia [email protected]
Rostislav Fojtík Department of Informatics and Computers, University of Ostrava, Ostrava, Czech republic [email protected]
Jan Francisti Departmant of Informatics, Faculty of Natural Sciences, Constantine The Philospher University, Nitra, Slovakia [email protected]
Mikuláš Gangur Faculty of Economics, University of West Bohemia, Pilsen, Czech Republic [email protected]
Gabriel Gorghiu Valahia University, Targoviste, Romania [email protected]
Ján Gunčaga Department of Science Education, Faculty of Education, Comenius University in Bratislava, Bratislava,Slovakia [email protected]
Dominik Halvoník Department of Informatics, Constantine the Philosopher University in Nitra, Slovakia [email protected]
Tereza Horáková Department of Systems Engineering, Faculty of Economics and Management, Czech University of Life Sciences Prague, Czech Republic [email protected]
Dana Horváthová Department of Computer Science, Faculty of Natural Sciences, Matej Bel University, Banska Bystrica, Slovakia [email protected]
Milan Houška Department of Systems Engineering, Faculty of Economics and Management, Czech University of Life Sciences Prague, Czech Republic [email protected]
Jozef Hvorecky Vysoká škola manažmentu, Trenčín, Slovakia [email protected]
Peter Chrastina Department of Historical Sciences and Central European Studies, Faculty of Philosophy, University of Ss. Cyril and Methodius in Trnava, Trnava, Slovakia [email protected] Lukas Chylo Department of Computer Science, Constantine the Philosopher University in Nitra, Nitra, Slovakia
Dragos Daniel Iordache National Institute for Research and Development in Informatics - ICI Bucharest, Romania University of Bucharest, Romania Academy of Romanian Scientists, Romania [email protected]

List of Authors
Imrich Jakab Department of Ecology and Environmental Sciences, Faculty of Natural Sciences, Constantine the Philosopher University in Nitra, Slovak Republic [email protected]
Robert Janiga Department of Informatics, Faculty of Education, Catholic University in Ružomberok, Ružomberok, Slovakia [email protected]
Tomas Javorcik Pedagogical faculty, University of Ostrava, Ostrava, Czech Republic [email protected]
Bruno Ježek Faculty of Informatics and Management, University of Hradec Králové, Hradec Králové, Czech Republic [email protected]
Petr Jindra Institute of Automation and Computer Science, Brno University of Technology, Brno, Czech republic [email protected]
Miroslav Kadlečík Department of Computer Science, Faculty of Natural Sciences, Constantine the Philosopher University in Nitra, Slovakia [email protected]
Jozef Kapusta Department of Informatics, Constantine the Philosopher University in Nitra, Slovakia [email protected]
Marta Kis Metropolitan University Budapest, Hungary
Blanka Klimova University of Hradec Kralove, Faculty of Management, Hradec Kralove, Czech Republic [email protected]
Jarmila Kmeťová Faculty of Natural Sciences, Matej Bel University, Banská Bystrica, Slovakia [email protected]
Jiří Kohout Faculty of Education, University of West Bohemia, Pilsen, Czech Republic [email protected]
Lilla Korenova Faculty of Education, Comenius University, Bratislava, Slovakia [email protected]
Kateřina Kostolányová University of Ostrava, Ostrava, Czech Republic [email protected]
Milan Košťák Faculty of Informatics and Management, University of Hradec Králové, Hradec Králové, Czech Republic [email protected]
Tomas Kozel University of Hradec Kralove, Faculty of Informatics and Management, Hradec Kralove, Czech Republic [email protected]
Michal Kuchárik Department of Informatics, Constantine the Philosopher University, Nitra, Slovakia [email protected]
Olena Kuzminska National University of Life and Environmental Sciences of Ukraine, Faculty of Information Technologies, Kyiv, Ukraine [email protected]
List of Authors
Vincentas Lamanauskas Siauliai University, Siauliai, Lithuania [email protected]
Zsolt Lavicza Johannes Kepler University Linz, Austria
Gabriela Lovászová Department of Informatics, Faculty of Natural Sciences, Constantine the Philosopher University in Nitra, Slovakia [email protected]
Josef Malach Department of Education and Adult Education, University of Ostrava, Ostrava, Czech Republic [email protected]
Kateřina Malachová Department of Biology and Ecology, University of Ostrava, Ostrava, Czech Republic [email protected]
Václav Sova Martinovský Faculty of Economics, University of West Bohemia in Pilsen, Czech Republic [email protected]
Josef Matejus University of Hradec Kralové, Hradec Kralove, Czech republic [email protected]
Lubos Mercl Department of Information Technologies, Faculty of Informatics and Management, University of Hradec Kralove, Hradec Kralove, Czech Republic [email protected]
Michal Mičík Faculty of Economics, University of West Bohemia, Pilsen, Czech Republic [email protected]
Jaroslava Mikulecka University of Hradec Kralove, Faculty of Informatics and Management, Hradec Kralove, Czech Republic [email protected]
Peter Mikulecky Department of Information Technologies, Faculty of Informatics and Management, University of Hradec Kralove, Hradec Kralove, Czech Republic [email protected]
György Molnár Department of Technical Education, Budapest University of Technology and Economics, Budapest, Hungary [email protected]
Nataliia Morze Borys Grinchenko Kyiv University, Kyiv, Ukraine [email protected]
Marián Mudrák Department of Informatics, Constantine the Philosopher University, Nitra, Slovakia [email protected]
Kristýna Mudrychová Department of Systems Engineering, Faculty of Economics and Management, Czech University of Life Sciences Prague, Czech Republic [email protected]
Michal Munk Department of Computer Science, Faculty of Natural Sciences, Constantine the Philosopher University in Nitra, Slovakia [email protected]
Tatyana Noskova Herzen State Pedagogical University of Russia, Saint-Petersburg, Russia [email protected]

List of Authors
Juraj Obonya Department of Informatics, Constantine the Philosopher University in Nitra, Slovakia [email protected]
Peter Ostradicky Comenius University in Bratislava, Faculty of Education, Slovakia
Tatyana Pavlova Herzen State Pedagogical University of Russia, Saint-Petersburg, Russia [email protected]
Michal Peták Department of Systems Engineering, Faculty of Economics and Management, Czech University of Life Sciences Prague, Czech Republic [email protected]
Vladimír Piskura Faculty of Education, University of Presov in Presov, Presov, Slovakia [email protected]
Miroslav Plevný Faculty of Economics, University of West Bohemia in Pilsen, Czech Republic [email protected]
Radim Polasek Pedagogical faculty, University of Ostrava, Ostrava, Czech Republic [email protected]
Petra Poulova University of Hradec Kralove, Faculty of Informatics and Management, Hradec Kralove, Czech Republic [email protected]
Costin Pribeanu National Institute for Research and Development in Informatics - ICI Bucharest, Romania University of Bucharest, Romania Academy of Romanian Scientists, Romania [email protected]
Theodosia Prodromou
University of New England, Australia
Zuzana Pucherová Department of Ecology and Environmental Sciences, Faculty of Natural Sciences, Constantine the Philosopher University in Nitra, Slovak Republic [email protected]
Ondřej Rohlík Faculty of Applied Sciences, University of West Bohemia, Pilsen, Czech Republic [email protected]
Lucie Rohlíková Faculty of Education, University of West Bohemia, Pilsen, Czech Republic [email protected]
Antonin Slaby University of Hradec Kralové, Hradec Kralove, Czech republic [email protected]
Jan Skalka Department of Computer Science, Constantine the Philosopher University, Nitra, Slovakia [email protected]
Eugenia Smyrnova-Trybulska University of Silesia in Katowice, Faculty of Ethnology and Sciences of Education, Cieszyn, Poland, [email protected]
Jiri Stastny Department of Informatics, Mendel University in Brno, Brno, Czech Republic [email protected]
Peter Svec Department of Computer Science, Constantine the Philosopher University in Nitra, Nitra, Slovakia [email protected]

List of Authors
Milan Svoboda University of West Bohemia, Univerzitní 22, 306 14 Pilsen, Czech Republic [email protected]
Petr Škuta University of Ostrava, Ostrava, Czech Republic [email protected]
Veronika Švrčinová Department of Technical and Vocational Education, University of Ostrava, Ostrava Czech Republic [email protected]
Tomáš Tóth Department of Informatics, Faculty of Natural Sciences, Constantine the Philosopher University in Nitra, Slovakia [email protected]
Darina Tothova Slovak University of Agriculture in Nitra, Center of Information Technology, Tr. A. Hlinku 2, 949 76 Nitra, Slovakia [email protected]
Milan Turčáni Department of Informatics, Constantine the Philosopher University, Nitra, Slovakia [email protected]
Patrik Voštinár Department of Computer Science, Faculty of Natural Sciences, Matej Bel University, Banska Bystrica, Slovakia [email protected]
Václav Vrbík Faculty of Education, University of West Bohemia, Pilsen, Czech Republic [email protected]
Olga Yakovleva Herzen State Pedagogical University of Russia, Saint-Petersburg, Russia [email protected]
Martina Zigová Department of Ecology and Environmental Sciences, Faculty of Natural Sciences, Constantine the Philosopher University in Nitra, Slovak Republic [email protected]
Martin Zmitko Faculty of Informatics and Management, University of Hradec Kralove, Hradec Kralove, Czech Republic [email protected]

Partners
Sponsors

Title: DIVAI 2018 - 12th International Scientific Conference on Distance Learning in Applied Informatics
Subtitle: Conference Proceedings
Publisher: Wolters Kluwer ČR, a. s., U nákladového nádraží 10, 130 00 Prague
Edition: 3274
Editors: Milan Turčáni, Zoltán Balogh, Michal Munk, Jozef Kapusta, Ľubomír Benko
Cover Design: Peter Švec
Format: B5
Year: 2018
Place: Prague
Pages: 529
Copies: 60
ISBN: 978-80-7598-059-5
ISSN: 2464-7470 (Print)
ISSN: 2464-7489 (On-line)