2018 Final Report (City of Brainerd SAUD 2018 [12/31/2018 ...
191
CITY OF BRAINERD, MINNESOTA COMPREHENSIVE ANNUAL FINANCIAL REPORT YEAR ENDED DECEMBER 31, 2018 PREPARED BY: Administrator's Office Administrator Cassandra Torstenson
-
Upload
khangminh22 -
Category
Documents
-
view
0 -
download
0
Transcript of 2018 Final Report (City of Brainerd SAUD 2018 [12/31/2018 ...

CITY OF BRAINERD, MINNESOTA
COMPREHENSIVE ANNUAL
FINANCIAL REPORT
YEAR ENDED DECEMBER 31, 2018
PREPARED BY: Administrator's Office
Administrator
Cassandra Torstenson


CITY OF BRAINERD, MINNESOTA TABLE OF CONTENTS DECEMBER 31, 2018
PAGE INTRODUCTORY SECTION Letter of Transmittal 1-5 GFOA Certificate of Achievement 6 Organizational Chart 7 Principal City Officials 8 FINANCIAL SECTION Independent Auditors’ Report 9-11 Management’s Discussion and Analysis 12-21
Basic Financial Statements Statement of Net Position 22-23 Statement of Activities 24-25 Balance Sheet – Governmental Funds 26-27 Reconciliation of the Governmental Funds Balance Sheet to the Statement of Net
Position – Governmental Activities 28 Statement of Revenues, Expenditures, and Changes in Fund Balances –
Governmental Funds 29-30 Reconciliation of the Governmental Funds Statement of Revenues, Expenditures,
and Changes in Fund Balance to the Statement of Activities – Governmental Activities 31
Statement of Fund Net Position – Proprietary Funds 32 Statement of Revenues, Expenses, and Changes in Fund Net Position –
Proprietary Funds 33 Statement of Cash Flows – Proprietary Funds 34 Statement of Fiduciary Net Position – Agency Fund 35 Notes to Basic Financial Statements 36-95
Required Supplementary Information Brainerd Fireman’s Relief Association – Schedule of Changes in the Net Pension Asset and Related Ratios 96 Schedule of Changes in the City’s OPEB Liability and Related Ratios 97 Schedule of the City’s Proportionate Share of the Net Pension Liability 98 Schedule of City PERA Contributions 99 Budgetary Comparison Schedule – General Fund 100 Budgetary Comparison Schedule – Public Safety Fund 101
Budgetary Comparison Schedule – Park and Recreation Fund 102 Budgetary Comparison Schedule – Street Fund 103 Budgetary Comparison Schedule – Economic Development Authority Fund 104
Notes to Required Supplementary Information 105-106
Combining and Individual Nonmajor Fund Statements and Schedules Combining Balance Sheet – Nonmajor Governmental Funds 107-108 Combining Statement of Revenues, Expenditures, and Changes in Fund
Balances – Nonmajor Governmental Funds 109-110 Schedule of Revenues, Expenditures, and Changes in Fund Balance –
Budget and Actual – Recycling Fund 111 Schedule of Revenues, Expenditures, and Changes in Fund Balance –
Budget and Actual – City Parking Lots Fund 112

CITY OF BRAINERD, MINNESOTA TABLE OF CONTENTS (CONTINUED)
DECEMBER 31, 2018
PAGE
FINANCIAL SECTION (CONTINUED) Combining and Individual Nonmajor Fund Statements and Schedules (Continued) Schedule of Revenues, Expenditures, and Changes in Fund Balance –
Budget and Actual – Transit Fund 113 Schedule of Revenues, Expenditures, and Changes in Fund Balance – Budget and Actual – Permanent Improvement Fund 114 Schedule of Revenues, Expenditures, and Changes in Fund Balance –
Budget and Actual – Mayor’s Contingency Fund 115 Schedule of Revenues, Expenditures, and Changes in Fund Balance –
Budget and Actual – Hydrant Rental and Electric Current Fund 116 Component Unit Financial Statements Brainerd Lakes Regional Airport Reconciliation of the Balance Sheet to the Statement of Net Position 117 Reconciliation of the Statement of Revenues, Expenditures, and
Changes in Fund Balance to the Statement of Activities 118 Statement of Revenues, Expenditures and Changes in Fund Balance –
Budget and Actual 119 Brainerd Public Library Reconciliation of the Balance Sheet to the Statement of Net Position 120 Reconciliation of the Statement of Revenues, Expenditures, and
Changes in Fund Balance to the Statement of Activities 121 Statement of Revenues, Expenditures and Changes in Fund Balance –
Budget and Actual 122 STATISTICAL INFORMATION SECTION (UNAUDITED) Net Position by Component – Last Ten Fiscal Years 123-124 Changes in Net Position – Last Ten Fiscal Years 125-128 Fund Balances – Governmental Funds – Last Ten Fiscal Years 129-130
Changes in Fund Balances – Governmental Funds – Last Ten Fiscal Years 131-132 Net Tax Capacity and Estimated Market Value of Property – Last Ten Fiscal Years 133-134 Direct and Overlapping Property Tax Rates – Last Ten Fiscal Years 135-136 Property Tax Levies and Collections – Last Ten Fiscal Years 137-138
Principal Taxpayers – Current Year and Ten Years Ago 139 Ratio of Outstanding Debt by Type – Last Ten Fiscal Years 140-141
Ratio of Net General Obligation Bonded Debt to Assessed Value and Net General Obligation Debt Per Capita – Last Ten Fiscal Years 142
Direct and Overlapping Governmental Activities Debt – December 31, 2018 143 Computation of Legal Debt Margin – Last Ten Fiscal Years 144-145 Pledged-Revenue Coverage – Last Ten Fiscal Years 146-147 Demographic and Economic Statistics – Last Ten Calendar Years 148 Principal Employers – Current Year and Ten Years Ago 149 Full-Time Equivalent Employees – City Government Employees by Function/Program – Last Ten Years 150-151 Operating Indicators by Function/Program – Last Ten Years 152-153 General Asset Statistics by Function/Program – Last Ten Years 154-155

CITY OF BRAINERD, MINNESOTA TABLE OF CONTENTS (CONTINUED)
DECEMBER 31, 2018
PAGE OTHER REPORTS SECTION
Independent Auditors’ Report on Internal Control Over Financial Reporting and on Compliance and Other Matters Based on an Audit of Financial Statements Performed in Accordance with Government Auditing Standards 156-157
Independent Auditors’ Report on Compliance for Each Major Federal Program and Report on Internal Control Over Compliance Required by the Uniform Guidance 158-159
Schedule of Expenditures of Federal Awards 160
Independent Auditors’ Report on Minnesota Legal Compliance 161
Schedule of Findings and Questioned Costs 162-163


INTRODUCTORY SECTION


(2)
PROFILE OF THE GOVERNMENT The City of Brainerd was incorporated in 1881 and is governed by a Home Rule Charter. Brainerd is the County seat of Crow Wing County and is located in central Minnesota approximately 125 miles north of the Minneapolis/St. Paul metropolitan area. The City is considered a regional center in the state and serves an estimated population of 13,679. The City is empowered to levy a property tax on both real and personal properties located within its boundaries. The City is also empowered by state statute to extend its corporate limits by annexation which has been used to accommodate continued growth of the community. Policy-making and legislative authority are vested in a City Council consisting of the Mayor and seven Council members. According to the Charter, the Mayor is the Chief Executive Officer of the City and the City Administrator is the Chief Administrative Officer of the City. The City Council is responsible, among other things, for passing ordinances, adopting the budget, appointing committees, and hiring staff including the City Administrator. The City Administrator is responsible for carrying out the policies of the City Council and for overseeing the day-to-day operations of the City government excluding the Public Utilities Department. The Council is elected on a non-partisan basis. The Mayor and Council members serve four-year staggered terms, with four Council members elected during an election and the Mayor and three Council members elected during the next election. Four Council members are elected by Wards and the Mayor and three Council members are elected at large. The City of Brainerd provides a full range of municipal services. These include: public safety (police and fire), streets, economic development services, culture/parks/recreation, engineering, public improvements, animal control, civil defense, planning and zoning and general administrative services. The City also operates public electric, water, sanitary and storm sewer collection and treatment utilities and is co-owner of a municipal airport. The annual budget serves as the foundation for the City of Brainerd financial planning and control. All departments and agencies of the City submit requests for appropriation to the City Administrator in July/August of each year. The City Administrator and Finance Director use these requests as the starting point for developing a proposed budget for the upcoming calendar/fiscal year. The City Administrator and Finance Director then present this proposed budget to the President of the Council and the Chair of the Personnel and Finance Committee for initial review. The Council President and Personnel and Finance Committee Chair then present their recommendation to the Council. The Council is required to hold public hearings on the proposed budget and to adopt a final budget by no later than December 31, the close of the City of Brainerd’s fiscal year. The appropriated budget is prepared by fund (e.g., General Fund), function (e.g., public safety), and department (e.g., police). Department Heads utilize the approved budget to make appropriations within their department. Transfers of appropriations between funds require the special approval of the City Council. Departmental appropriations are approved for payment by Council action at each regular City Council meeting. To provide the elected officials a further understanding of budgetary activity, a monthly financial report is provided to the City Council by the Finance Director. Budget-to-actual comparisons are provided in this report for each individual governmental working fund. For the General Fund, Public Safety Fund, Park and Recreation Fund, Street Fund, and Economic Development Fund this comparison is presented starting on page 101 as part of the required supplementary information. For budgeted nonmajor special revenue funds this comparison is presented in the combining and individual nonmajor statements and schedules of this report, which starts on page 107.

(3)
FACTORS AFFECTING FINANCIAL CONDITION The information presented in the financial statements is perhaps best understood when it is considered from the broader perspective of the specific environment within which the City of Brainerd operates. Local Economy The City of Brainerd is situated in the heart of one of the prime resort and recreational areas in the state which includes Gull Lake, the Whitefish Chain of Lakes, the northwest shore of Mille Lacs Lake, as well as over 450 additional lakes located within 25 miles of the City. The greatest economic impact from tourism and recreation in the area is derived during the summer season due to the lake oriented amenities available in the region as well as the numerous championship golf courses located within 15-30 minutes of the City. Winter activities such as ice fishing, skiing, and snowmobiling attract vacationers during the winter season. The Cities of Brainerd and neighboring Baxter are the major commercial, service, and industrial centers in the region. The trade area encompasses a year-round population in excess of 60,000 and includes major resort facilities on Gull Lake and the Whitefish Chain of Lakes. It is estimated that area population nearly doubles during the summer months due to the high number of second homes/seasonal residents and tourists. In recent years, a great deal of new commercial development and redevelopment has taken place along local state highways including the construction of numerous national chain stores, auto dealerships, motels, banks, gas, and highway convenience stores and restaurants. In addition to commercial and industrial development, the Minnesota Department of Transportation, Minnesota Pollution Control Agency, and Minnesota Department of Natural Resources have their regional operations located in the Brainerd area, further diversifying the local job market. The City’s economic environment has improved since the Great Recession. The local economy seems to have stabilized. The City is experiencing a slow recovery similar to the national economy. The City is a regional center in the state which brings a great deal of commerce to the area which assists the local economy. Past annexation of property located adjacent to the City and the development of industrial sites by the City will allow the community to continue to grow to accommodate commercial/industrial and residential opportunities. Relevant Financial Policies and Long-term Financial Planning The City Council has adopted financial management policies in order to allow for the planning of adequate funding of services desired by the public, to manage City finances wisely, and to carefully account for public funds. The financial management policies include: fund balance policies; annual budgeting policies; debt management policies; investment policies; credit card policies; capitalization policies; and internal control policies. The City’s fund balance policy is the City will maintain spendable-unassigned portion of the fund balance in a range equal to 35 – 50% of the working funds current year operating expenditures. The percentage of unassigned fund balance at December 31, 2018 is 154%. However, the combined “working funds” which include the General, Public Safety, Park and Recreation, and Street Funds are only at 40% of expenditures at December 31, 2018. The City typically issues debt for significant infrastructure projects, using revenue from identified beneficiaries as the source of repayment. The City has achieved a bond rating of AA- from Standard & Poor’s. This rating reflects the status of the City with very strong budget flexibility, liquidity, strong management conditions, adequate budgetary performance, and debt and contingent liability profile, with an improving economy, and strong institutional framework.

(4)
Major Initiatives The Brainerd Council is directing staff on numerous projects that will affect the growth of the City. A partial list of the major projects includes:
Industrial Park. The Brainerd Economic Development Authority (EDA) and the City Council continue to market the Brainerd Industrial Park (the Park). In 2009, the Park was expanded and through the use of a grant, the infrastructure was constructed. The Park was one of the first regions in the State to receive a “Shovel Ready” certification. The certification means that the building sites have all the appropriate preliminary work done to expedite the construction process. The lots are graded and “pad ready,” offering transportation, electric, water, gas and fiber optic infrastructure already in place.
Sidewalk/Trail Expansion. The 2014 State Legislature appropriated bonding funds for
constructing the Cuyuna Lakes State Trail through Brainerd. Also, a Minnesota Department of Transportation Alternatives Program grant was awarded to the City to extend sidewalks in 2022 on S. 6th Street (B371) from Joseph Drive to Industrial Park Boulevard. In 2019, the City will be utilizing a Safe Routes to School grant to expand sidewalks in Northeast Brainerd.
Riverfront Project. The Mississippi River runs through the City of Brainerd. The City Council appointed a steering committee to develop riverfront improvement concepts. The City committed funds to support part of a trail feasibility study and the committee is seeking the remaining funds.
Other. Several street, storm and sanitary sewer reconstruction and resurfacing projects were started and/or completed in 2018 with a value of approximately $1.3 million. The City continues to upgrade its existing streets and infrastructure as well as developing, improving, and officially adopting a capital improvement infrastructure plan. The City is also implementing a new software package in late 2019 early 2020 affecting all departments across the City.
AWARDS AND ACKNOWLEDGEMENTS The Government Finance Officers Association (GFOA) awarded a Certificate of Achievement for Excellence in Financial Reporting to the City of Brainerd for its CAFR for the fiscal year ended December 31, 2017. This was the 25th consecutive year that the City has received this prestigious award. In order to be awarded a Certificate of Achievement, the government published an easily readable and efficiently organized CAFR. This report satisfied both GAAP and applicable legal requirements. A Certificate of Achievement is valid for a period of one year only. We believe that our current CAFR continues to meet the Certificate of Achievement Program’s requirements and we are submitting it to the GFOA to determine its eligibility for another certificate.

(5)
AWARDS AND ACKNOWLEDGEMENTS (CONTINUED)
The preparation of this report would not have been possible without the dedicated services of the Administration Department staff. We would like to express our appreciation to all members of the Department who assisted and contributed to the preparation of this report. Credit also must be given to the Mayor and City Council for their support for maintaining the high standards of professionalism in the management of the City of Brainerd finances.
Respectfully submitted,
Cassandra Torstenson Connie L. Hillman City Administrator Finance Director

(6)

(7)

CITY OF BRAINERD, MINNESOTA PRINCIPAL CITY OFFICIALS
DECEMBER 31, 2018
(8)
Position Term Expires Name
ELECTED OFFICIALS
Mayor Council Member, President, Ward 1
12/31/18 12/31/20
Edwin L. Menk David Pritschet
Council Member, Vice President, At Large 12/31/18 Sue Hilgart Council Member, At Large Council Member, At Large
12/31/20 12/31/20
Janice Lambert Kevin Stunek
Council Member, Ward 3 12/31/20 Dave Badeaux Council Member, Ward 2 12/31/18 Kelly Bevans Council Member, Ward 4 12/31/18 Gabe Johnson
APPOINTED
OFFICIALS
City Administrator
Cassandra Torstenson
Finance Director/Deputy Clerk Connie Hillman Engineer Paul Sandy Planner Mark Ostgarden Fire Chief Timothy Holmes Police Chief Corky McQuiston HRA Executive Director Jennifer Bergman Airport Manager Steven Wright Public Utilities Superintendent Scott Magnuson Public Utilities Secretary
Todd Wicklund
CONTRACTUAL OFFICIALS
City Civil Attorney
Joseph J. Langel
Auditor
CliftonLarsonAllen LLP

FINANCIAL SECTION


(9)
INDEPENDENT AUDITORS’ REPORT Honorable Mayor and Members of the City Council City of Brainerd Brainerd, Minnesota Report on the Financial Statements
We have audited the accompanying financial statements of the governmental activities, the business-type activities, the aggregate discretely presented component units, each major fund, and the aggregate remaining fund information of the City of Brainerd (the City), Minnesota, as of and for the year ended December 31, 2018, and the related notes to the financial statements, which collectively comprise the City’s basic financial statements as listed in the table of contents. Management’s Responsibility for the Financial Statements
Management is responsible for the preparation and fair presentation of these financial statements in accordance with accounting principles generally accepted in the United States of America; this includes the design, implementation, and maintenance of internal control relevant to the preparation and fair presentation of financial statements that are free from material misstatement, whether due to fraud or error. Auditors’ Responsibility
Our responsibility is to express opinions on these financial statements based on our audit. We conducted our audit in accordance with auditing standards generally accepted in the United States of America and the standards applicable to financial audits contained in Government Auditing Standards, issued by the Comptroller General of the United States. Those standards require that we plan and perform the audit to obtain reasonable assurance about whether the financial statements are free from material misstatement. An audit involves performing procedures to obtain audit evidence about the amounts and disclosures in the financial statements. The procedures selected depend on the auditors’ judgment, including the assessment of the risks of material misstatement of the financial statements, whether due to fraud or error. In making those risk assessments, the auditor considers internal control relevant to the City’s preparation and fair presentation of the financial statements in order to design audit procedures that are appropriate in the circumstances, but not for the purpose of expressing an opinion on the effectiveness of the City’s internal control. Accordingly, we express no such opinion. An audit also includes evaluating the appropriateness of accounting policies used and the reasonableness of significant accounting estimates made by management, as well as evaluating the overall presentation of the financial statements. We believe that the audit evidence we have obtained is sufficient and appropriate to provide a basis for our audit opinions.

Honorable Mayor and Members of the City Council City of Brainerd
(10)
Opinions
In our opinion, the financial statements referred to above present fairly, in all material respects, the respective financial position of the governmental activities, the business-type activities, the aggregate discretely presented component units, each major fund, and the aggregate remaining fund information of the City of Brainerd, Minnesota, as of December 31, 2018, the respective changes in financial position and, where applicable, cash flows thereof for the year then ended in accordance with accounting principles generally accepted in the United States of America. Emphasis of a Matter
During the year ended December 31, 2018, the City adopted the provisions of Governmental Accounting Standards Board Statement (GASB) No. 75, Accounting and Financial Reporting for Postemployment Benefits Other than Pensions. As a result of the implementation of this standard, the City reported a restatement for a change in accounting principle (see Note 13). Our auditors’ opinion was not modified with respect to the restatement. Other Matters
Required Supplementary Information
Accounting principles generally accepted in the United States of America require that the management’s discussion and analysis, Schedule of Changes in Net Pension Asset and Related Ratios, Schedule of Changes in the City’s OPEB Liability and Related Ratios, Schedule of the City’s Proportionate Share of the Net Pension Liability, Schedule of City PERA Contributions, and budgetary comparison information as listed in the table of contents, be presented to supplement the basic financial statements. Such information, although not a part of the basic financial statements, is required by the Governmental Accounting Standards Board who considers it to be an essential part of financial reporting for placing the basic financial statements in an appropriate operational, economic, or historical context. We have applied certain limited procedures to the required supplementary information in accordance with auditing standards generally accepted in the United States of America, which consisted of inquiries of management about the methods of preparing the information and comparing the information for consistency with management’s responses to our inquiries, the basic financial statements, and other knowledge we obtained during our audit of the basic financial statements. We do not express an opinion or provide any assurance on the information because the limited procedures do not provide us with sufficient evidence to express an opinion or provide any assurance. Supplementary and Other Information
Our audit was conducted for the purpose of forming opinions on the financial statements that collectively comprise the City’s basic financial statements. The combining and individual nonmajor fund financial statements and schedules, introductory section, statistical information and component unit financial statements are presented for purposes of additional analysis and are not a required part of the basic financial statements. The Schedule of Expenditures of Federal Awards, as required by Title 2 U.S. Code of Federal Regulations Part 200, Uniform Administrative Requirements, Cost Principles, and Audit Requirements for Federal Awards, is also presented for purposes of additional analysis and is not a required part of the basic financial statements.

Honorable Mayor and Members of the City Council City of Brainerd
(11)
The combining and individual nonmajor fund financial statements and schedules, component unit financial statements and the Schedule of Expenditures of Federal Awards are the responsibility of management and were derived from and relate directly to the underlying accounting and other records used to prepare the basic financial statements. Such information has been subjected to the auditing procedures applied in the audit of the basic financial statements and certain additional procedures, including comparing and reconciling such information directly to the underlying accounting and other records used to prepare the basic financial statements or to the basic financial statements themselves, and other additional procedures in accordance with auditing standards generally accepted in the United States of America. In our opinion, the combining and individual nonmajor fund financial statements and schedules, component unit financial statements and the Schedule of Expenditures of Federal Awards are fairly stated, in all material respects, in relation to the basic financial statements as a whole.
The introductory section and statistical information have not been subjected to the auditing procedures applied in the audit of the basic financial statements and, accordingly, we do not express an opinion or provide any assurance on them.
Other Reporting Required by Government Auditing Standards
In accordance with Government Auditing Standards, we have also issued our report dated June 12, 2019, on our consideration of the City’s internal control over financial reporting and on our tests of its compliance with certain provisions of laws, regulations, contracts, and grant agreements and other matters. The purpose of that report is solely to describe the scope of our testing of internal control over financial reporting and compliance and the result of that testing, and not to provide an opinion on the effectiveness of the City’s internal control over financial reporting or on compliance. That report is an integral part of an audit performed in accordance with Government Auditing Standards in considering the City’s internal control over financial reporting and compliance.
CliftonLarsonAllen LLP
Brainerd, Minnesota June 12, 2019

This Page Has Been Intentionally Left Blank.

CITY OF BRAINERD, MINNESOTA MANAGEMENT’S DISCUSSION AND ANALYSIS
DECEMBER 31, 2018
(12)
As management of the City of Brainerd (the City), Minnesota, we offer readers of the City’s financial statements this narrative overview and analysis of the financial activities of the City for the fiscal year ended December 31, 2018. We encourage readers to consider the information presented here in conjunction with additional information that we have furnished in our letter of transmittal, which can be found on pages 1-5 of this report. Financial Highlights
The assets and deferred outflows of resources of the City of Brainerd exceeded its liabilities and deferred inflows of resources at the close of the most recent financial year by $53,669,419 (net position). Restricted net position is $6,548,341, which will be used for debt service, economic development, and pension and unrestricted net position is $2,811,640.
The City’s total net position increased by $2,015,653 from operations. As of the close of the current fiscal year, the City’s governmental funds reported combined
ending fund balances of $11,504,712. At the end of the current fiscal year, unassigned fund balance for the General Fund was
$3,861,936, or 154% of total General Fund expenditures; however, it should be noted that unassigned fund balance for the combined “primary operating funds” including General, Public Safety, Park and Recreation, and Street Funds was only 40% of 2018 expenditures.
The City’s total bonded debt decreased by $431,202 during the current fiscal year as a result of payments on existing debt.
The Sanitary Sewer Collection System Fund’s net position increased $218,656 from the prior year due to capital contributions from the Airport. The Storm Sewer Fund’s net position increased $66,081 from the prior year due to an increase in charges for services.
Overview of the Financial Statements Management’s discussion and analysis is intended to serve as an introduction to the City’s basic financial statements for the year ended December 31, 2018. The information presented should be read in conjunction with the financial statements and the accompanying notes for the basic financial statements. The City’s basic financial statements are comprised of three components: 1) government-wide financial statements, 2) fund financial statements, and 3) notes to the financial statements. The financial statements are prepared on the accrual basis (government-wide) and modified accrual basis (fund level) of accounting in accordance with accounting principles generally accepted in the United States of America. This report also contains the independent auditors’ report, notes that explain in more detail information in the financial statements, and statistical information on a multi-year basis. Government-Wide Financial Statements The government-wide financial statements are designed to provide readers with a broad overview of the City’s finances, in a manner similar to a private-sector business. The Statement of Net Position presents information on all of the City’s assets, deferred outflows of resources, deferred inflows of resources and liabilities, with the difference between them reported as net position. Over time, increases or decreases in net position may serve as a useful indicator of whether the financial position of the City is improving or deteriorating.

CITY OF BRAINERD, MINNESOTA MANAGEMENT’S DISCUSSION AND ANALYSIS
DECEMBER 31, 2018
(13)
Overview of the Financial Statements (Continued) Government-Wide Financial Statements (Continued) The Statement of Activities presents information showing how the City’s net position changed during the most recent fiscal year. All changes in net position are reported as soon as the underlying event giving rise to the change occurs, regardless of the timing of related cash flows. Thus, revenues and expenses are reported in this statement for some items that will only result in cash flows in future fiscal periods (e.g., uncollected taxes and earned but unused vacation/sick leave). The government-wide financial statements report functions of the City that are principally supported by taxes and intergovernmental revenues (governmental activities) including general government, public safety, public works, economic development, and culture and recreation. The government-wide financial statements can be found on pages 22-25 of this report. Fund Financial Statements A fund is a grouping of related accounts that is used to maintain control over resources that have been segregated for specific activities or objectives. The City, like other state and local governments, uses fund accounting to ensure and demonstrate compliance with finance-related legal requirements. All of the funds of the City can be divided into two categories: governmental funds or proprietary funds. Governmental Funds Governmental funds are used to account for essentially the same functions reported as governmental activities in the government-wide financial statements. However, unlike the government-wide financial statements, governmental fund financial statements focus on near-term inflows and outflows of spendable resources, as well as on balances of spendable resources available at the end of the fiscal year. Such information may be useful in evaluating a government’s near-term financial requirements. Because the focus of governmental funds is narrower than that of the government-wide financial statements, it is useful to compare the information presented for governmental funds with similar information presented for governmental activities in the government-wide financial statement. By doing so, readers may better understand the long-term impact of the City’s near term financial decisions. Both the governmental fund balance sheet and governmental fund Statement of Revenues, Expenditures, and Change in Fund Balances provide a reconciliation to facilitate this comparison between governmental funds and governmental activities. The City maintains eight individual major governmental funds. Information is presented separately in the governmental fund balance sheet and in the governmental fund Statement of Revenues, Expenditures, and Changes in Fund Balances for the General Fund, Public Safety Fund, Park and Recreation Fund, Street Fund, Revolving Loans Fund, Economic Development Authority Fund, Debt Service Fund, and Capital Projects Fund, all of which are considered to be major funds. Data from the other governmental funds are combined into a single aggregated presentation. Individual fund data for the other nonmajor governmental funds is provided in the form of combining statements elsewhere in this report. The City adopts an annual appropriated budget for its general and special revenue funds. A budgetary comparison statement has been provided for those funds to demonstrate compliance with this budget. The basic governmental fund financial statements can be found on pages 26-31 of this report.

CITY OF BRAINERD, MINNESOTA MANAGEMENT’S DISCUSSION AND ANALYSIS
DECEMBER 31, 2018
(14)
Overview of the Financial Statements (Continued) Proprietary Funds The City reports three proprietary funds. Enterprise funds are used to report the same functions presented as business-type activities in the government-wide financial statements. The City uses enterprise funds to account for its sanitary sewer and storm sewer utilities. Proprietary fund financial statements provide the same type of information as the government-wide statements, only in more detail. The City also maintains an internal service fund which is an accounting device used to accumulate and allocate costs internally among the City’s various functions. The City uses an internal service fund to account for its health insurance and general risk management. These services have been included within governmental activities in the government-wide financial statements. The basic proprietary fund financial statements can be found on pages 32-34 of this report. Fiduciary Funds The City is the trustee, or fiduciary, over assets which can be used only for the trust beneficiaries based on the trust arrangement. All of the City’s fiduciary activities are reported in a statement of fiduciary net position that can be found on page 35 of this report. Notes to Financial Statements The notes provide additional information that is essential to the full understanding of the data provided in the government-wide and fund financial statements. The notes to the financial statements can be found on pages 36-96 of this report. Other Information The combining statements referred to earlier in connection with nonmajor governmental funds are presented immediately following the required supplementary information. Combining and individual fund statements and schedules can be found on pages 107-122 of this report. Government-Wide Financial Analysis As noted earlier, net position may serve over time as a useful indicator of the City’s financial position. In the case of the City, assets and deferred outflows of resources exceeded liabilities and deferred inflows of resources by $53,669,419 at the close of the most recent fiscal year. By far, the largest portion of the City’s net position (83%) reflects its investment in capital assets (e.g., land, building, equipment, infrastructure) less any related debt used to acquire those assets that is still outstanding. The City uses these capital assets to provide services to citizens; consequently, these assets are not available for future spending. Although the City’s investment in its capital assets is reported net of related debt, it should be noted that the resources needed to repay this debt must be provided from other sources, since the capital assets themselves cannot be used to liquidate these liabilities.

CITY OF BRAINERD, MINNESOTA MANAGEMENT’S DISCUSSION AND ANALYSIS
DECEMBER 31, 2018
(15)
Government-Wide Financial Analysis (Continued) City’s net position:
2018 2017 2018 2017 2018 2017
Current and Other Assets 18,263,937$ 17,081,278$ 1,382,673$ 1,194,524$ 19,646,610$ 18,275,802$ Capital Assets 37,393,742 37,645,958 18,265,344 17,585,999 55,659,086 55,231,957
Total Assets 55,657,679 54,727,236 19,648,017 18,780,523 75,305,696 73,507,759 Deferred Outflows of Resources 3,271,720 4,252,147 8,780 14,962 3,280,500 4,267,109 Long-Term Liabilities
Outstanding 12,675,768 13,195,331 5,334,493 4,747,126 18,010,261 17,942,457 Other Liabilities 738,740 946,907 1,015,784 1,003,773 1,754,524 1,950,680
Total Liabilities 13,414,508 14,142,238 6,350,277 5,750,899 19,764,785 19,893,137 Deferred Inflows of Resources 5,142,090 5,685,555 9,902 14,302 5,151,992 5,699,857 Net PositionNet Investment in Capital Assets 31,371,030 31,299,024 12,938,408 12,867,762 44,309,438 44,166,786 Restricted 6,548,341 6,894,413 - - 6,548,341 6,894,413 Unrestricted 2,453,430 958,153 358,210 162,522 2,811,640 1,120,675
Total Net Position 40,372,801$ 39,151,590$ 13,296,618$ 13,030,284$ 53,669,419$ 52,181,874$
Governmental Activities Business-Type Activities Total
A portion of the City’s net position represents resources that are subject to external restrictions on how they may be used. The remaining unrestricted net position is $2,811,640 and may be used to meet the City’s ongoing obligations to citizens and creditors.

CITY OF BRAINERD, MINNESOTA MANAGEMENT’S DISCUSSION AND ANALYSIS
DECEMBER 31, 2018
(16)
Government-Wide Financial Analysis (Continued) City’s changes in net position:
2018 2017 2018 2017 2018 2017
Revenue Program Revenues:
Charges for Services 3,266,732$ 3,697,514$ 1,032,572$ 924,091$ 4,299,304$ 4,621,605$ Operating Grants and Contributions 1,755,202 1,626,126 - - 1,755,202 1,626,126 Capital Grants and Contributions 1,073,531 1,960,551 - 584,488 1,073,531 2,545,039
General Revenues:Property Taxes 5,532,714 5,297,185 - - 5,532,714 5,297,185 Sales Taxes 1,011,506 1,004,910 - - 1,011,506 1,004,910 Franchise Fees - 6,557 - - - 6,557 Grants and Contributions not Restricted to Specific Programs 4,223,899 4,130,660 - - 4,223,899 4,130,660 Unrestricted Investment Earnings 96,643 52,827 601 161 97,244 52,988 Other 201,696 120,144 249,138 255,263 450,834 375,407
Total Revenues 17,161,923 17,896,474 1,282,311 1,764,003 18,444,234 19,660,477
ExpensesGeneral Government 2,510,055 2,402,941 - - 2,510,055 2,402,941 Public Safety 4,873,597 5,092,682 - - 4,873,597 5,092,682 Public Works 4,844,864 4,013,059 - - 4,844,864 4,013,059 Culture and Recreation 1,211,222 1,171,905 - - 1,211,222 1,171,905 Economic Development 1,842,447 2,292,834 - - 1,842,447 2,292,834 Debt Service 98,351 135,042 - - 98,351 135,042 Sanitary Sewer - - 736,458 641,506 736,458 641,506 Storm Sewer - - 311,587 391,349 311,587 391,349
Total Expenses 15,380,536 15,108,463 1,048,045 1,032,855 16,428,581 16,141,318
Change in Net Position Before Transfers 1,781,387 2,788,011 234,266 731,148 2,015,653 3,519,159 Transfers (50,471) - 50,471 - - -
Increase (Decrease) in Net Position 1,730,916 2,788,011 284,737 731,148 2,015,653 3,519,159 Net Position, Beginning 39,151,590 36,363,579 13,030,284 12,299,136 52,181,874 48,662,715 Change in Accounting Principle, See Note 13 (509,705) - (18,403) - (528,108) - Net Position, Beginning, Restated 38,641,885 36,363,579 13,011,881 12,299,136 51,653,766 48,662,715 Net Position, Ending 40,372,801$ 39,151,590$ 13,296,618$ 13,030,284$ 53,669,419$ 52,181,874$
Business-Type Activities TotalGovernmental Activities
Governmental Activities Governmental activities increased the City’s net position by $1,730,916 compared to an increase of $2,788,011 in the prior year. Governmental activities expenses were up by $272,000 and revenues were down by $735,000. Revenues were down due to a decrease in intergovernmental revenue which was caused by a decrease in capital projects that were funded by the state in the prior year. Expenses increased due to an increase in pension related expenses.

CITY OF BRAINERD, MINNESOTA MANAGEMENT’S DISCUSSION AND ANALYSIS
DECEMBER 31, 2018
(17)
Government-Wide Financial Analysis (Continued)
Governmental Activities (Continued)
$-
$1,000,000
$2,000,000
$3,000,000
$4,000,000
$5,000,000
$6,000,000
GeneralGovernment
Public Safety Public Works Culture andRecreation
EconomicDevelopment
Debt Service
2018 Expenses and Program Revenues Governmental Activities
Expenses Program Revenues
Charges for Services19%
Operating Grants and Contributions
10%
Capital Grants and Contributions
6%Property Taxes
32%
Other Taxes6%
Grants and Contributions not
Restricted25%
Unrestricted Investment Earnings
1%Other1%
2018 Revenues by Source - Governmental Activities

CITY OF BRAINERD, MINNESOTA MANAGEMENT’S DISCUSSION AND ANALYSIS
DECEMBER 31, 2018
(18)
Government-Wide Financial Analysis (Continued)
Business-Type Activities Business-Type Activities increased the City’s net position by $284,737 compared to an increase of $731,148 in the prior year. Overall City expenses were relatively the same and revenues were down by approximately $482,000. Revenues overall decreased due to a decrease in capital contributions from the component unit.
$-
$100,000
$200,000
$300,000
$400,000
$500,000
$600,000
$700,000
$800,000
Sanitary Sewer Storm Sewer
2018 Expenses and Program Revenues -Business-Type Activities
EXPENSES PROGRAM REVENUES
Charges for Services81%
Miscellaneous19%
Unrestricted Investment Earnings
0%
2018 Revenues by Source -Business-Type Activities

CITY OF BRAINERD, MINNESOTA MANAGEMENT’S DISCUSSION AND ANALYSIS
DECEMBER 31, 2018
(19)
Financial Analysis of Governmental Funds
Governmental Funds The focus of the City’s governmental funds is to provide information on near-term inflows, outflows, and balances of spendable resources. Such information is useful in assessing the City’s financing requirements. In particular, unassigned fund balance may serve as useful measure of a government’s net resources available for spending at the end of the fiscal year.
At the end of the current fiscal year, the City’s governmental funds reported combined ending fund balances of $11,504,712. Approximately 34% of this total amount ($3,861,936) constitutes of unassigned fund balance. Approximately 24% of the fund balance is restricted to indicate that it is not available for new spending because it must be used only for debt retirement or other restricted purposes ($2,725,436).
General Fund increased its fund balance by $566,516. Revenues increased due to an increase in licenses and permits due to an increase in construction during the year.
The Public Safety Fund increased its fund balance by $96,412. The City received funding for TZD equipment that was not fully expended as of the end of the year.
The Park and Recreation Fund slightly increased its fund balance in 2018. The Park and Recreation Fund increase was due to an increase in charges for services and contributions and donations which were higher than the related expenditures.
The Street Fund slightly decreased its fund balance in 2018. The Street Fund was over budget due to higher snow removal costs during the year.
The Revolving Loans Fund decreased its fund balance by $333,211 in 2018, primarily as a result of transferring money to a unified fund outside of City operations and didn’t have any significant new loans.
The Economic Development Authority Fund increased its fund balance by $7,021 in 2018. Tax levy was increased to the maximum allowed by state statute and expenditures came in under budget.
The Debt Service Fund increased its fund balance by $80,759 in 2018. Tax and special assessment collections were more than the annual principal and interest payments.
The Capital Projects Fund increased its fund balance by $1,248,321 in 2018. The increase is due to the City putting away money for a facility study, the City did not spend money budgeted for the water tower project, and the City received additional revenue that related to closing of capital related grants.

CITY OF BRAINERD, MINNESOTA MANAGEMENT’S DISCUSSION AND ANALYSIS
DECEMBER 31, 2018
(20)
Capital Assets and Debt Administration Capital Assets The City’s investment in capital assets for its governmental and business-type activities as of December 31, 2018, amounts to $55,659,086 (net of accumulated depreciation). This investment in capital assets includes land, buildings, infrastructure, machinery and equipment. The City’s capital assets (net of depreciation):
Governmental Business-TypeActivities Activities Total
Land 3,650,925$ 140,865$ 3,791,790$ Construction-in-Progress 95,850 14,962 110,812 Land Improvements 1,685,108 - 1,685,108 Buildings 3,837,389 - 3,837,389 Improvements Other Than Buildings 1,244,409 1,458 1,245,867 Machinery and Equipment 1,530,611 415,679 1,946,290 Infrastructure 24,278,720 17,692,380 41,971,100 Motor Vehicles 986,376 - 986,376 Office Equipment 84,354 - 84,354
Total 37,393,742$ 18,265,344$ 55,659,086$
Additional information on the City’s capital assets can be found in Note 4.A.5 starting on page 59 of this report. Long-Term Debt At the end of the current fiscal year, the City had total indebtedness of $10,967,225. Of this amount, $287,495 is capital lease related, $4,050,000 is special assessment debt for which the City is liable in the event of default by the property owners subject to the assessment. The remainder ($6,629,730) of the City’s debt is secured by specified revenue sources (i.e., revenue bonds); however, $4,500,200 represents revenue bonds backed by the full faith and credit of the City in the event that the revenue source was inadequate to fund debt payments. The City’s outstanding bonded indebtedness at December 31, 2018:
Governmental Business-TypeActivities Activities Total
General Obligation Bonds 352,500$ -$ 352,500$ General Obligation Revenue Bonds - 4,500,200 4,500,200 General Obligation Capital Improvement Bonds 415,000 - 415,000 Equipment Certificates 1,037,330 324,700 1,362,030 Special Assessment Improvement Bonds 4,050,000 - 4,050,000 Capital Lease Payable 287,495 - 287,495 Subtotal 6,142,325 4,824,900 10,967,225 Plus: Issuance Premiums 169,963 407,556 577,519 Net Outstanding Indebtedness 6,312,288$ 5,232,456$ 11,544,744$

CITY OF BRAINERD, MINNESOTA MANAGEMENT’S DISCUSSION AND ANALYSIS
DECEMBER 31, 2018
(21)
Capital Assets and Debt Administration (Continued) Long-Term Debt (Continued) The City’s total long term liabilities increased approximately $345,000 due to the issuance of new debt during 2018. The City of Brainerd is rated AA- from Standard & Poor’s Rating Services on all of its general obligation debt. State statutes limit the amount of general obligation debt a Minnesota city may issue to 3% of total Estimated Market Value. The current debt limitation for the City of Brainerd is $20,576,493. Only $1,452,330 of the City’s outstanding debt is counted against the statutory limitation as the debt is wholly financed by general tax levy, leaving the City with additional legal borrowing capacity of $19,124,163. Additional information on the City’s long-term debt can be found in Note 4.B.1 beginning on page 63 of this report. Economic Factors and Next Year’s Budgets and Rates At the end of 2018, the consulting firm had the facility assessment completed for the inclusion of projects in the 2019 budget. The assessment includes all buildings owned by the City, with the exception of those buildings operated by the Brainerd Public Utilities, and will identify any deficiencies, as well as recommendations for possible improved operating efficiencies for the City. All labor union contracts were not settled for 2019 at the end of 2018. The 2019 budget reflects an estimate amount of the wages for settlement. In 2018, the City Council also authorized a new compensation method to be used in 2019. The school district passed a referendum which the City is expected to receive additional permit revenue in 2019. The adopted 2019 levy resulted in additional tax revenue of $333,712 for 2019. The City Council continues to monitor the City’s performance and to work toward obtaining the City’s strategic financial goals. Requests for Information This financial report is designed to provide a general overview of the City of Brainerd’s finances for all those with an interest in the City’s finances. Questions concerning any of the information provided in this report or requests for additional information should be addressed to the office of the City Finance Director, 501 Laurel Street, Brainerd, Minnesota 56401.

BASIC FINANCIAL STATEMENTS

CITY OF BRAINERD, MINNESOTA STATEMENT OF NET POSITION
DECEMBER 31, 2018
See accompanying Notes to Basic Financial Statements.
(22)
Governmental Activities
Business-Type Activities Total
ASSETS
Cash and Investments 12,641,971$ -$ 12,641,971$ Cash Held with Escrow Agent - - - Receivables Taxes - Delinquent 293,504 - 293,504 Accounts 152,430 - 152,430 Special Assessments 2,906,785 - 2,906,785 Accrued Interest 31,928 - 31,928 Loans 1,289,093 - 1,289,093 Due from Other Governments 560,853 - 560,853 Due from Component Unit 196,865 179,372 376,237 Due from Primary Government - - - Internal Balances (1,203,272) 1,203,272 - Inventory - - - Prepayments 70,143 29 70,172 Net Pension Asset 835,385 - 835,385 Restricted Assets Cash and Investments - - - Bonds and Notes Receivable - - - Notes Receivable - Interest - - - Land Held for Resale 488,252 - 488,252 Service Territory Acquisitions, Net of Amortization - - - Other Assets - - - Capital Assets Land and Construction In Progress 3,746,775 155,827 3,902,602 Other Capital Assets, Net of Depreciation 33,646,967 18,109,517 51,756,484
Total Assets 55,657,679 19,648,017 75,305,696
DEFERRED OUTFLOWS OF RESOURCESPension Related 3,176,072 6,489 3,182,561 OPEB Related 95,648 2,291 97,939
Total Deferred Outflows of Resources 3,271,720 8,780 3,280,500
LIABILITIES
Current LiabilitiesAccounts Payable 148,778 4,614 153,392 Contracts Payable 62,923 94,480 157,403 Accrued Liabilities 172,246 1,599 173,845 Deposits Payable 18,900 - 18,900 Accrued Interest Payable 60,677 52,427 113,104 Unearned Revenue - - - Prepaid Rent - - - FSS Escrow - - - Due to Other Governments 44,081 - 44,081 Due to Primary Government - - - Due to Component Unit 135,487 860,373 995,860 Other Postemployment Benefits 95,648 2,291 97,939
Long-Term LiabilitiesDue within One Year 1,847,377 430,748 2,278,125 Due in More than One Year 5,842,653 4,848,008 10,690,661 FSS Escrow - - - Other Postemployment Benefits, Net of Current Portion 863,461 20,690 884,151 Net Pension Liability 4,122,277 35,047 4,157,324
Total Liabilities 13,414,508 6,350,277 19,764,785
DEFERRED INFLOWS OF RESOURCESPension Related 5,142,090 9,902 5,151,992
NET POSITIONNet Investment in Capital Assets 31,371,030 12,938,408 44,309,438 Restricted for Net Pension Asset 835,385 - 835,385 Restricted for Debt Service 3,740,487 - 3,740,487 Restricted for Economic Development 1,972,469 - 1,972,469 Restricted for HAP or FSS Escrow Liabilities - - - Restricted for Security Deposit Refunds - - - Restricted for Reserve Requirements - - - Unrestricted 2,453,430 358,210 2,811,640
Total Net Position 40,372,801$ 13,296,618$ 53,669,419$
Primary Government

(23)
Brainerd Public Library
Brainerd Lakes Regional Airport
Brainerd Public Utilities
Housing and Redevelopment
Authority of Brainerd
230,527$ 1,767,061$ 11,206,415$ 1,196,518$ - - - 549
7,991 - - - 354 36,347 3,383,214 20,721
- - - - - - 48,089 - - - - - - 865,177 - - - - - - - - 995,640 220 - - - - - - 937,711 - - 50 133,559 69,071 - - - -
- - 5,338,512 230,681 - - 5,222,667 - - - 66,600 - - - - -
- - 229,638 - - - - 2,174
9,041 2,072,136 666,591 452,386 298,303 26,989,334 63,276,486 3,902,169 546,216 31,730,105 91,505,122 5,874,489
- 22,856 560,117 - - 1,022 31,901 1,682 - 23,878 592,018 1,682
2,272 83,226 1,417,329 12,101 - 651,085 - - - 25,386 462,042 53,871 - - 326,030 66,266 - - 348,900 105,259 - - - 24,068 - - - 2,865 - - - 11,597 8 - - 25,312 - - 376,077 160 - - - - - - - 1,682
- 55,394 3,087,787 90,358 - 101,973 34,554,340 795,000 - - - 16,856 - 1,677 346,040 81,126 - 128,997 2,956,866 -
2,280 1,047,738 43,875,411 1,286,521
- 36,046 790,431 -
307,344 28,371,560 28,104,575 3,810,055 - - - - - - 8,033,299 - - - - 99,077 - - - 11,239 - - - 4,205 - - - 88,071
236,592 2,298,639 11,293,424 577,003 543,936$ 30,670,199$ 47,431,298$ 4,589,650$
Component Units

CITY OF BRAINERD, MINNESOTA STATEMENT OF ACTIVITIES
YEAR ENDED DECEMBER 31, 2018
See accompanying Notes to Basic Financial Statements.
(24)
Functions/Programs ExpensesCharges for
ServicesOperating Grants and Contributions
Capital Grants and Contributions
Governmental Activities:Primary Government
Governmental ActivitiesGeneral Government 2,510,055$ 1,108,869$ 68,042$ 41,904$ Public Safety 4,873,597 967,443 588,913 82,582 Public Works 4,844,864 728,788 875,047 937,869 Culture and Recreation 1,211,222 275,788 8,652 10,000 Economic Development 1,842,447 185,844 214,548 1,176 Interest on Long-Term Debt 98,351 - - -
Total Governmental Activities 15,380,536 3,266,732 1,755,202 1,073,531
Business-Type ActivitiesSanitary Sewer 736,458 655,505 - - Storm Sewer 311,587 377,067 - -
Total Business-Type Activities 1,048,045 1,032,572 - - Total Primary Government 16,428,581$ 4,299,304$ 1,755,202$ 1,073,531$
Component UnitsBrainerd Public Library 220,636 - 24,219 - Brainerd Lakes Regional Airport 3,850,766 702,300 421,495 1,681,205 Brainerd Public Utilities 26,345,614 26,952,226 1,333,922 - Housing and Redevelopment
Authority of Brainerd 3,845,957 1,280,463 1,761,265 368,130 Total Component Units 34,262,973$ 28,934,989$ 3,540,901$ 2,049,335$
General RevenuesTaxes
Property Taxes and Franchise Fees, Levied for General PurposeSales Taxes
Grants and Contributions not Restricted to Specific ProgramsUnrestricted Investment Earnings (Interest)Gain on Sale of Capital AssetsMiscellaneous
TransfersTotal General Revenues Change in Net Position
Net Position - Beginning of YearChange in Accounting Principle, See Note 13Net Position - Beginning of Year, as RestatedNet Position - End of Year
Program Revenues

(25)
Governmental Activities
Business-Type Activities Total
Brainerd Public Library
Brainerd Lakes Regional Airport
Brainerd Public Utilities
Housing and Redevelopment
Authority of Brainerd
(1,291,240)$ -$ (1,291,240)$ -$ -$ -$ -$ (3,234,659) - (3,234,659) - - - - (2,303,160) - (2,303,160) - - - -
(916,782) - (916,782) - - - - (1,440,879) - (1,440,879) - - - -
(98,351) - (98,351) - - - - (9,285,071) - (9,285,071) - - - -
- (80,953) (80,953) - - - - - 65,480 65,480 - - - -
- (15,473) (15,473) - - - - (9,285,071) (15,473) (9,300,544) - - - -
- - - (196,417) - - - - - - - (1,045,766) - - - - - - - 1,940,534 -
- - - - - - (436,099) - - - (196,417) (1,045,766) 1,940,534 (436,099)
5,532,714 - 5,532,714 147,716 - - 170,415 1,011,506 - 1,011,506 - - - - 4,223,899 - 4,223,899 - - 118,803 4
96,643 601 97,244 2,373 18,867 341,971 (4,659) 101,553 50,800 152,353 - 9,000 52,945 - 100,143 198,338 298,481 4,593 - 87,115 393,446 (50,471) 50,471 - - - - -
11,015,987 300,210 11,316,197 154,682 27,867 600,834 559,206 1,730,916 284,737 2,015,653 (41,735) (1,017,899) 2,541,368 123,107
39,151,590 13,030,284 52,181,874 585,671 31,686,000 45,200,265 4,463,655 (509,705) (18,403) (528,108) - 2,098 (310,335) 2,888
38,641,885 13,011,881 51,653,766 585,671 31,688,098 44,889,930 4,466,543 40,372,801$ 13,296,618$ 53,669,419$ 543,936$ 30,670,199$ 47,431,298$ 4,589,650$
Component UnitsNet (Expense) Revenue and Changes in Net Position
Primary Government

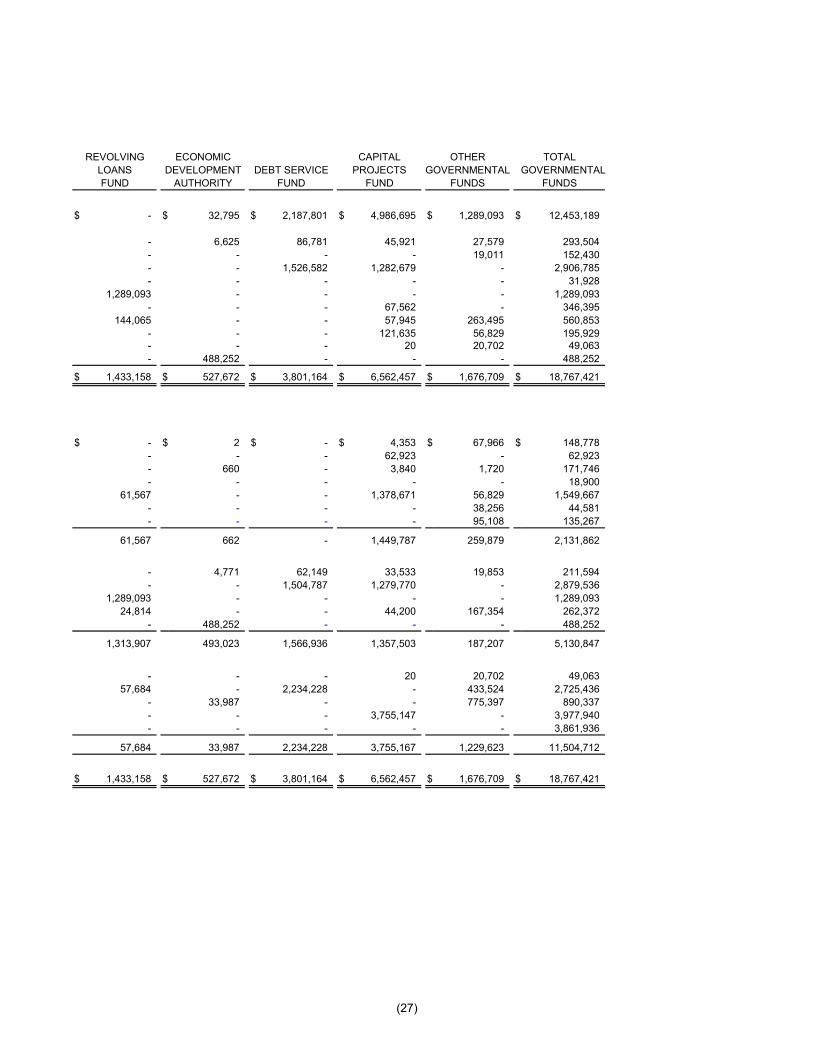
CITY OF BRAINERD, MINNESOTA BALANCE SHEET
GOVERNMENTAL FUNDS DECEMBER 31, 2018
(26)
PUBLIC PARK AND
GENERAL SAFETY RECREATION STREETFUND FUND FUND FUND
ASSETS
Cash and Investments $ 3,681,722 $ 218,899 $ 10,430 $ 45,754 Receivables
Taxes - Delinquent 120,039 2,494 1,897 2,168 Accounts 132,635 784 - - Special Assessments 88,723 - - 8,801 Accrued Interest 31,928 - - - Loans and Notes - - - -
Due from Other Funds 242,492 7,875 4,132 24,334 Due from Other Governments 29,904 59,490 5,763 191 Due from Component Unit 17,465 - - - Prepayments 9,236 18,002 1,074 29 Land Held for Resale - - - -
Total Assets $ 4,354,144 $ 307,544 $ 23,296 $ 81,277
LIABILITIES, DEFERRED INFLOWS OF RESOURCES, AND FUND BALANCES
LiabilitiesAccounts Payable $ 25,872 $ 16,221 $ 1,694 $ 32,670 Contracts Payable - - - - Accrued Liabilities 38,841 99,257 13,966 13,462 Deposit Payable 18,900 - - - Due to Other Funds - 52,600 - - Due to Other Governments - 5,804 521 - Due to Component Unit 3,818 7,875 4,132 24,334
Total Liabilities 87,431 181,757 20,313 70,466
Deferred Inflows of ResourcesUnavailable Revenue - Property Taxes 86,570 1,793 1,365 1,560 Unavailable Revenue - Special Assessments 86,178 - - 8,801 Unavailable Revenue - Notes - - - - Unavailable Revenue - Grants - 26,004 - - Unavailable Revenue - Land Held For Resale - - - -
Total Deferred Inflows of Resources 172,748 27,797 1,365 10,361
Fund BalancesNonspendable 9,236 18,002 1,074 29 Restricted - - - - Committed - 79,988 544 421 Assigned 222,793 - - - Unassigned 3,861,936 - - -
Total Fund Balances 4,093,965 97,990 1,618 450
Total Liabilities, Deferred Inflows of Resources, and Fund Balances $ 4,354,144 $ 307,544 $ 23,296 $ 81,277
(27)
REVOLVING ECONOMIC CAPITAL OTHER
LOANS DEVELOPMENT DEBT SERVICE PROJECTS GOVERNMENTAL GOVERNMENTALFUND AUTHORITY FUND FUND FUNDS FUNDS
$ - $ 32,795 $ 2,187,801 $ 4,986,695 $ 1,289,093 $ 12,453,189
- 6,625 86,781 45,921 27,579 293,504 - - - - 19,011 152,430 - - 1,526,582 1,282,679 - 2,906,785 - - - - - 31,928
1,289,093 - - - - 1,289,093 - - - 67,562 - 346,395
144,065 - - 57,945 263,495 560,853 - - - 121,635 56,829 195,929 - - - 20 20,702 49,063 - 488,252 - - - 488,252
$ 1,433,158 $ 527,672 $ 3,801,164 $ 6,562,457 $ 1,676,709 $ 18,767,421
$ - $ 2 $ - $ 4,353 $ 67,966 $ 148,778 - - - 62,923 - 62,923 - 660 - 3,840 1,720 171,746 - - - - - 18,900
61,567 - - 1,378,671 56,829 1,549,667 - - - - 38,256 44,581 - - - - 95,108 135,267
61,567 662 - 1,449,787 259,879 2,131,862
- 4,771 62,149 33,533 19,853 211,594 - - 1,504,787 1,279,770 - 2,879,536
1,289,093 - - - - 1,289,093 24,814 - - 44,200 167,354 262,372
- 488,252 - - - 488,252
1,313,907 493,023 1,566,936 1,357,503 187,207 5,130,847
- - - 20 20,702 49,063 57,684 - 2,234,228 - 433,524 2,725,436
- 33,987 - - 775,397 890,337 - - - 3,755,147 - 3,977,940 - - - - - 3,861,936
57,684 33,987 2,234,228 3,755,167 1,229,623 11,504,712
$ 1,433,158 $ 527,672 $ 3,801,164 $ 6,562,457 $ 1,676,709 $ 18,767,421
TOTAL

This Page Has Been Intentionally Left Blank.

CITY OF BRAINERD, MINNESOTA RECONCILIATION OF THE GOVERNMENTAL FUNDS BALANCE SHEET TO
THE STATEMENT OF NET POSITION GOVERNMENTAL ACTIVITIES
DECEMBER 31, 2018
See accompanying Notes to Basic Financial Statements.
(28)
Total Fund Balances for Governmental Funds 11,504,712$
66,999,592$ (29,605,850) 37,393,742
5,130,847
Net Pension Asset 835,385Net Pension Liability (4,122,277) Deferred Outflows of Resources - Pension Related 3,176,072 Deferred Inflows of Resources - Pension Related (5,142,090) (5,252,910)
Other Postemployment Benefits Payable (959,109) Deferred Outflows of Resources - OPEB Related 95,648 (863,461)
Net position held in Internal Service funds are included in the statement of net position. 210,578
(60,677)
Bonds Payable (5,854,830) Unamortized Discounts and Premiums (169,963) Obligations Under Capital Leases (287,495) Compensated Absences Payable (1,377,742) (7,690,030)
Total Net Position of Governmental Activities 40,372,801$
Long-term liabilities that pertain to governmental funds, including bonds payable, arenot due and payable in the current period and, therefore, are not reported as fundliabilities. All liabilities (both current and long-term) are reported in the statement ofnet position.
Capital assets used in governmental funds are not financial resources and, therefore,are not reported in the funds. Those assets consist of:
Some of the City's property taxes, special assessments, notes, sales of land held forresale and revenues will be collected after year-end, but are not available soonenough to pay for the current-period's expenditures and, therefore, are reported asdeferred inflows of resources in the governmental funds.
Interest on long-term debt is not accrued in governmental funds, but rather isrecognized as an expenditure when due. Accrued interest for general obligationbonds is included in the statement of net position.
Net Pension Asset, Liability and related deferred inflows and outflows of resources arerecorded only on the statement of net position. Balances at year-end are:
Other Postemployment Benefits Payable and related deferred inflows and outflows ofresources are recorded only on the statement of net position. Balances at year-endare:
Total net position reported for governmental activities in the statement of net position different because:
Capital AssetsAccumulated Depreciation

CITY OF BRAINERD, MINNESOTA STATEMENT OF REVENUES, EXPENDITURES, AND CHANGES IN FUND BALANCES
GOVERNMENTAL FUNDS YEAR ENDED DECEMBER 31, 2018
See accompanying Notes to Basic Financial Statements.
(29)
PUBLIC PARK AND
GENERAL SAFETY RECREATION STREETFUND FUND FUND FUND
REVENUESTaxes $ 1,568,587 $ 960,351 $ 35,216 $ 39,883 Sales Tax - - - - Tax Increments - - - - Licenses and Permits 538,283 - - - Intergovernmental 369,548 3,044,042 787,337 625,466 Charges for Services 36,345 641,751 203,026 - Fines and Forfeits - 211,354 - - Special Assessments 41,904 - - 21,447 Interest 12,304 - - - Contributions and Donations - 113,456 8,652 - Miscellaneous 440,801 100,300 76,371 309,398
Total Revenues 3,007,772 5,071,254 1,110,602 996,194
EXPENDITURESCurrentGeneral Government 2,428,360 - - - Public Safety - 4,715,100 - - Public Works - - - 1,118,666 Culture and Recreation - - 1,086,229 - Economic Development - - - -
Capital Outlay 57,869 116,129 8,188 - Debt ServicePrincipal Retirement 20,838 37,076 17,889 7,612 Interest and Fiscal Charges 1,939 2,965 1,380 324 Total Expenditures 2,509,006 4,871,270 1,113,686 1,126,602
EXCESS (DEFICIENCY) OF REVENUES OVER EXPENDITURES 498,766 199,984 (3,084) (130,408)
OTHER FINANCING SOURCES (USES)Issuance of Capital Leases 57,869 116,129 8,188 - Issuance of Debt - - - - Premiums on Bonds Issued - - - - Sale of Capital Assets - - - - Transfers In 173,572 36,128 200 130,292 Transfers Out (163,691) (255,829) (4,346) - Total Other Financing Sources (Uses) 67,750 (103,572) 4,042 130,292
NET CHANGE IN FUND BALANCES 566,516 96,412 958 (116)
Fund Balances - Beginning of Year 3,527,449 1,578 660 566
FUND BALANCES - END OF YEAR $ 4,093,965 $ 97,990 $ 1,618 $ 450

(30)
REVOLVING ECONOMIC CAPITAL OTHER
LOANS DEVELOPMENT DEBT SERVICE PROJECTS GOVERNMENTALFUND AUTHORITY FUND FUND FUNDS FUNDS
$ - $ 122,209 $ 1,605,095 $ 840,868 $ 508,707 $ 5,680,916 - - - - 1,011,506 1,011,506 - - - - 224,211 224,211
- - - - - 538,283 214,548 - - 575,914 1,072,319 6,689,174
- - - - 362,396 1,243,518 - - - - 29,313 240,667 - - 389,356 94,410 - 547,117
2,027 247 17,816 49,281 13,033 94,708 - - - 8,540 12,485 143,133
225,077 - - 15,547 8,792 1,176,286 441,652 122,456 2,012,267 1,584,560 3,242,762 17,589,519
- - - - 11,439 2,439,799 - - - - 13,095 4,728,195 - - - - 1,276,442 2,395,108 - - - - - 1,086,229
601,291 115,435 - - 1,230,473 1,947,199 - - - 2,504,452 82,005 2,768,643
- - 1,816,502 - - 1,899,917 - - 166,952 - - 173,560
601,291 115,435 1,983,454 2,504,452 2,613,454 17,438,650
(159,639) 7,021 28,813 (919,892) 629,308 150,869
- - - - - 182,186 - - - 1,385,300 - 1,385,300 - - - 114,234 - 114,234 - - - 99,449 2,104 101,553 - - 51,946 569,430 - 961,568
(173,572) - - (200) (414,401) (1,012,039) (173,572) - 51,946 2,168,213 (412,297) 1,732,802
(333,211) 7,021 80,759 1,248,321 217,011 1,883,671
390,895 26,966 2,153,469 2,506,846 1,012,612 9,621,041
$ 57,684 $ 33,987 $ 2,234,228 $ 3,755,167 $ 1,229,623 $ 11,504,712
TOTALGOVERNMENTAL

CITY OF BRAINERD, MINNESOTA RECONCILIATION OF THE GOVERNMENTAL FUNDS STATEMENT OF REVENUES,
EXPENDITURES, AND CHANGES IN FUND BALANCE TO THE STATEMENT OF ACTIVITIES GOVERNMENTAL ACTIVITIES
YEAR ENDED DECEMBER 31, 2018
See accompanying Notes to Basic Financial Statements.
(31)
Net Change in Fund Balances - Total Governmental Funds 1,883,671$
Capital Outlay 1,805,334$ Loss on Disposal of Capital Assets (9,029) Depreciation Expense (2,048,521) (252,216)
Issuance of Capital Leases (182,186) Principal Payments of Capital Leases 83,415
Issuance of Debt (1,385,300) Repayment of Debt Principal 1,816,502 Change in Accrued Interest 6,367 Premium on Bond Issuance (114,234) Amortization of Bond Discount/Premium 45,900 369,235
Change in Compensated Absences (29,584)
(418,085)
251,803
9,159
15,704
Change in Net Position of Governmental Activities 1,730,916$
Delinquent property taxes, special assessments, notes receivable, accounts receivable andsales of land held for resale will be collected subsequent to year-end, but are not availablesoon enough to pay for the current-period’s expenditures and, therefore, are deferredinflows of resources in the governmental funds.
The governmental funds report bond proceeds as financing sources, while repayment ofbond principal is reported as an expenditure. In the statement of net position, however,issuing debt increases long-term liabilities and does not affect the statement of activities.Also, governmental funds report the effect of premiums and discounts when debt is firstissued, whereas these amounts are amortized in the statement of activities. Interest isrecognized as an expenditure in the governmental funds when it is due. In the statement ofactivities, however, interest expense is recognized as it accrues. The effect of these itemsis as follows:
In the statement of activities, compensated absences are measured by the amounts earnedduring the year. In the governmental funds, however, expenditures for these items aremeasured by the amount of financial resources used (essentially, the amounts actuallypaid).
Pension expenditures on the governmental funds are measured by current year employercontributions. Pension expenses on the statement of activities are measure by the changein Net Pension Liability and the related deferred inflows and outflows of resources.
Amounts reported for governmental activities in the statement of activities are differentbecause:
Governmental funds report capital outlays as expenditures. However, in the statement ofactivities, assets are capitalized and the cost is allocated over their estimated useful livesand reported as depreciation expense. This is the amount by which capital outlay exceededdepreciation expense in the current period.
Internal service funds are used by management to charge the costs of health insurancecosts to individual funds. The net revenue of certain activities of internal service funds isreported in governmental activities.
Some capital asset additions are financed through capital leases. In governmental funds, acapital lease arrangement is considered a source of financing, but in the statement of netposition, the lease obligation is reported as a liability. Principal payments of capital leasesare reported as expenditures in the governmental funds. In the statement of net position,however, the repayment of principal reduces the liability.
Other Postemployment Benefits (OPEB) expenditures on the governmental funds aremeasured by current year employer contributions. OPEB expenses on the statement ofactivities are measure by the change in the OPEB Liability and the related deferred inflowsand outflows of resources.

CITY OF BRAINERD, MINNESOTA STATEMENT OF NET POSITION
PROPRIETARY FUNDS DECEMBER 31, 2018
See accompanying Notes to Basic Financial Statements.
(32)
SANITARY GOVERNMENTALSEWER STORM ACTIVITIES -
COLLECTION SEWER INTERNAL SERVICESYSTEM FUND TOTALS FUND
ASSETSCURRENT ASSETS
Cash and Investments -$ -$ -$ 188,782$ Due from Other Funds 1,378,671 - 1,378,671 - Due from Component Unit 115,970 63,402 179,372 936 Prepayments 20 9 29 21,080
Total Current Assets 1,494,661 63,411 1,558,072 210,798
NONCURRENT ASSETSCapital Assets
Land (Non-Depreciable) 61,742 79,123 140,865 - Construction in Progress (Non-Depreciable) 14,962 - 14,962 - Improvements Other Than Buildings 24,966 - 24,966 - Machinery and Equipment 502,997 - 502,997 - Infrastructure 16,908,952 11,182,924 28,091,876 - Motor Vehicles 63,050 - 63,050 - Accumulated Depreciation (5,661,161) (4,912,211) (10,573,372) -
Net Capital Assets 11,915,508 6,349,836 18,265,344 -
Total Assets 13,410,169 6,413,247 19,823,416 210,798
DEFERRED OUTFLOWS OF RESOURCESPension Related 4,440 2,049 6,489 - OPEB Related 1,792 499 2,291 -
6,232 2,548 8,780 -
LIABILITIESCURRENT LIABILITIES
Accounts Payable 4,563 51 4,614 - Contracts Payable 94,480 - 94,480 - Due to Other Funds 30,805 144,594 175,399 - Due to Component Unit 860,373 - 860,373 220 Accrued Liabilities 1,099 500 1,599 - Accrued Interest Payable 47,489 4,938 52,427 - Other Postemployment Benefits Liability - Due Within One Year 1,792 499 2,291 - Bonds Payable - Due Within One Year 347,100 75,000 422,100 - Compensated Absences Payable - Due Within One Year 6,963 1,685 8,648 -
Total Current Liabilities 1,394,664 227,267 1,621,931 220
NONCURRENT LIABILITIESBonds Payable - Due in More Than One Year 4,472,636 337,720 4,810,356 - Other Postemployment Benefits Liability - Due in More Than One Year 16,180 4,510 20,690 - Compensated Absences Payable - Due in More Than One Year 30,316 7,336 37,652 - Net Pension Liability 25,001 10,046 35,047 -
Total Noncurrent Liabilities 4,544,133 359,612 4,903,745 -
Total Liabilities 5,938,797 586,879 6,525,676 220
DEFERRED INFLOWS OF RESOURCESPension Related 7,063 2,839 9,902 -
NET POSITIONNet Investment in Capital Assets 7,001,292 5,937,116 12,938,408 - Unrestricted 469,249 (111,039) 358,210 210,578
Total Net Position 7,470,541$ 5,826,077$ 13,296,618$ 210,578$
ENTERPRISE FUNDS

CITY OF BRAINERD, MINNESOTA STATEMENT OF REVENUES, EXPENSES, AND CHANGES IN FUND NET POSITION
PROPRIETARY FUNDS YEAR ENDED DECEMBER 31, 2018
See accompanying Notes to Basic Financial Statements.
(33)
SANITARY GOVERNMENTALSEWER STORM ACTIVITIES -
COLLECTION SEWER INTERNAL SERVICESYSTEM FUND TOTALS FUND
OPERATING REVENUESCharges for Services 655,505$ 377,067$ 1,032,572$ 1,038,657$
OPERATING EXPENSESSalaries and Benefits 100,606 28,809 129,415 - Professional Services 24,109 1,498 25,607 - Repairs and Maintenance - 71 71 - Insurance 4,223 2,112 6,335 - Depreciation 401,248 249,013 650,261 - Materials and Supplies 45,876 20,669 66,545 - Other Services and Supplies - - - 1,024,888 Miscellaneous 1,608 1,831 3,439 -
Total Operating Expenses 577,670 304,003 881,673 1,024,888
OPERATING INCOME (LOSS) 77,835 73,064 150,899 13,769
NONOPERATING REVENUES (EXPENSES)Intergovernmental 198,338 - 198,338 - Gain on Disposal of Capital Assets 50,800 - 50,800 - Interest Income - 601 601 1,935 Interest Expense and Fiscal Charges (121,900) (7,584) (129,484) - Contribution to Component Unit (36,888) - (36,888) -
Total Nonoperating Revenues (Expenses) 90,350 (6,983) 83,367 1,935
CHANGE IN NET POSITION BEFORE TRANSFERS 168,185 66,081 234,266 15,704
Transfers In 50,471 - 50,471 -
CHANGE IN NET POSITION 218,656 66,081 284,737 15,704
Net Position - Beginning of Year 7,265,874 5,764,410 13,030,284 194,874 Change in Accounting Principle, See Note 13 (13,989) (4,414) (18,403) - Net Position - Beginning of Year, as Restated 7,251,885 5,759,996 13,011,881 194,874
NET POSITION - END OF YEAR 7,470,541$ 5,826,077$ 13,296,618$ 210,578$
ENTERPRISE FUNDS
.

CITY OF BRAINERD, MINNESOTA STATEMENT OF CASH FLOWS
PROPRIETARY FUNDS YEAR ENDED DECEMBER 31, 2018
See accompanying Notes to Basic Financial Statements.
(34)
SANITARY GOVERNMENTALSEWER STORM ACTIVITIES -
COLLECTION SEWER INTERNAL SERVICESYSTEM FUND TOTALS FUND
CASH FLOWS FROM OPERATING ACTIVITIES Receipts from Customers 655,505$ 377,067$ 1,032,572$ 1,038,657$ Receipts from Other Sources - - - 220 Payments to Suppliers (166,772) (26,139) (192,911) (1,027,033) Payments to Employees (121,290) (44,068) (165,358) - Net Cash Provided by Operating Activities 367,443 306,860 674,303 11,844
CASH FLOWS FROM NONCAPITAL FINANCING ACTIVITIES Intergovernmental 198,338 - 198,338 - Transfers 50,471 - 50,471 - Interfund Borrowing (295,946) 107,275 (188,671) 580 Net Cash Provided (Used) by Noncapital Financing Activities (47,137) 107,275 60,138 580
CASH FLOWS FROM CAPITAL AND RELATED FINANCING ACTIVITIES Acquisition and Construction of Capital Assets (894,453) (326,761) (1,221,214) - Interfund Borrowing (5,668) - (5,668) - Proceeds from the Sale of Bonds 884,700 - 884,700 - Principal Paid on Bonds (226,200) (75,000) (301,200) - Interest and Fiscal Charges Paid on Bonds (78,685) (12,975) (91,660) - Net Cash Provided (Used) by Capital and Related Financing Activities (320,306) (414,736) (735,042) -
CASH FLOWS FROM INVESTING ACTIVITIES Interest Income - 601 601 1,935
NET INCREASE (DECREASE) IN CASH AND CASH EQUIVALENTS - - - 14,359
Cash and Cash Equivalents - Beginning of Year - - - 174,423
CASH AND CASH EQUIVALENTS - END OF YEAR -$ -$ -$ 188,782$
RECONCILIATION OF OPERATING INCOME (LOSS) TO CASH FLOWS FROM OPERATING ACTIVITIES Operating Income 77,835$ 73,064$ 150,899$ 13,769$ Adjustments to Reconcile Operating Loss to Net Cash Provided by Operating Activities
Depreciation Expense 401,248 249,013 650,261 - (Increase) Decrease in Assets and Deferred Outflows of Resources Prepaid Items (20) (9) (29) (1,190) Deferred Outflows of Resources - Pension Related 6,675 1,798 8,473 - Deferred Outflows of Resources - OPEB Related (1,792) (499) (2,291) - Increase (Decrease) in Liabilities and Deferred Inflows of Resources Accounts Payable (90,936) 51 (90,885) (955) Accrued Liabilities (232) (49) (281) - Due to Component Unit - - - 220 Compensated Absences 3,566 (7,284) (3,718) - Other Postemployment Benefits Liability (4,768) (2,662) (7,430) - Net Pension Liability (20,571) (5,725) (26,296) - Deferred Inflows of Resources (3,562) (838) (4,400) -
Total Adjustments 289,608 233,796 523,404 (1,925)
Net Cash Provided by Operating Activities 367,443$ 306,860$ 674,303$ 11,844$
NONCASH INVESTING, CAPITAL AND FINANCING ACTIVITIESAssets Purchased on Account 94,480$ -$ 94,480$ -$
ENTERPRISE FUNDS

CITY OF BRAINERD, MINNESOTA STATEMENT OF FIDUCIARY NET POSITION
AGENCY FUND DECEMBER 31, 2018
See accompanying Notes to Basic Financial Statements.
(35)
ASSETS
Cash and Pooled Investments 6,901$
LIABILITIES
Due to Other Governments 6,901$

CITY OF BRAINERD, MINNESOTA NOTES TO FINANCIAL STATEMENTS
DECEMBER 31, 2018
(36)
NOTE 1 SUMMARY OF SIGNIFICANT ACCOUNTING POLICIES
The accounting methods and procedures adopted by the City of Brainerd (the City), Minnesota, conform to generally accepted accounting principles (GAAP) as applied to governmental entities. The following notes to the financial statements are an integral part of the City’s Comprehensive Annual Financial Report.
A. Financial Reporting Entity
The City was incorporated under the laws of the State of Minnesota and operates underan elected Mayor-Council form of government. As required by generally acceptedaccounting principles, the financial statements of the reporting entity include those of theCity (the Primary Government) and its component units. The component units discussedbelow are included in the City’s reporting entity because of the significance of theiroperational or financial relationship with the City.
Component Units
Component units are legally separate entities for which the City (Primary Government) isfinancially accountable, or for which the exclusion of the component unit would renderthe financial statements of the Primary Government misleading. The criteria used todetermine if the Primary Government is financially accountable for a component unitinclude whether or not the Primary Government appoints the voting majority of thepotential component unit’s governing body, is able to impose its will on the potentialcomponent unit, is in a relationship of financial benefits or burden with the potentialcomponent unit, or is fiscally depended upon by the potential component unit.
In conformity with generally accepted accounting principles, the financial statements ofcomponent units have been included in the financial reporting entity either as blendedcomponent units or as discretely presented component units.
Blended Component UnitsThe Economic Development Authority (EDA) was organized to promote development,improve housing and reduce blighted areas in the City. It has been blended in thesefinancial statements because members of this board are appointed by the mayor andapproved by the City Council. The members of the EDA board act as an advisory boardto the Council, which is the governing board of the EDA. The City Council has the finalapproval for the EDA’s actions. Additionally, the City provides a material portion of theEDA's annual operating budget and the EDA provides services entirely to the City. Citystaff handles the EDA activity including the funds and the City approves the tax leviesand bonding activity. The EDA is reported as a major special revenue fund. No separatefinancial statements for the EDA are issued.
Discretely Presented Component UnitsThe component unit columns in the combined financial statements include the financialdata of the City’s discretely presented component units. These component units arereported in a separate column to emphasize that they are legally separate from the City.

CITY OF BRAINERD, MINNESOTA NOTES TO FINANCIAL STATEMENTS
DECEMBER 31, 2018
(37)
NOTE 1 SUMMARY OF SIGNIFICANT ACCOUNTING POLICIES (CONTINUED)
A. Financial Reporting Entity (Continued)
Component Units (Continued)
Discretely Presented Component Units (Continued)
1. Brainerd Public Library The members of the governing board of the Library are appointed by the Mayor and approved by the City Council. The Library requests tax levy revenue from the City each year because the Library does not have the authority to levy its own tax. The tax levy request and any bonded debt must be approved by the City Council. Separate financial statements have not been issued.
2. Brainerd Lakes Regional Airport The Airport is a joint venture between the City and Crow Wing County. The City Council and the Crow Wing County Board of Commissioners each appoint three members of the Airport Commission. Any bonded debt must be approved by the City Council. The City pledges its full faith and credit for its share for the airport’s bonded indebtedness and provides a material portion of its annual operating budget. Separate financial statements have not been issued. See Note 8 for additional information on the Airport.
3. Brainerd Public Utilities (BPU) BPU includes the operations of the electric, water, and wastewater departments and is governed by a five-member Board of Commissioners, appointed by the Mayor and approved by the City Council to serve five-year terms. The City has the authority to approve or modify BPU’s operational and capital budgets and any bonded debt must be approved by the City Council.
Complete financial statements of the Utilities can be obtained from the Brainerd Public Utilities, P.O. Box 373, Brainerd, Minnesota 56401.
4. Housing and Redevelopment Authority of Brainerd (HRA) The members of the governing board of the HRA are appointed by the Mayor and approved by the City Council. The HRA requests tax levy revenue from the City each year since the HRA does not have the authority to levy its own tax. The tax levy request and any bonded debt must be approved by the City Council.
Complete financial statements of the HRA can be obtained from the Housing and Redevelopment Authority of Brainerd, 324 East River Road, Brainerd, Minnesota 56401.

CITY OF BRAINERD, MINNESOTA NOTES TO FINANCIAL STATEMENTS
DECEMBER 31, 2018
(38)
NOTE 1 SUMMARY OF SIGNIFICANT ACCOUNTING POLICIES (CONTINUED)
A. Financial Reporting Entity (Continued)
Other Organizations The Brainerd Fire Department Relief Association (the Association) is organized as a nonprofit organization, legally separate from the City, by its members to provide pension and other benefits to its members in accordance with Minnesota Statutes. The membership appoints the board of this Association, and separate financial statements are issued for this Association. All funding is conducted in accordance with Minnesota Statutes. The City’s portion of the costs of the Association’s pension benefits is included in the Public Safety Fund. The Association does not have any significant operational or financial relationship with the City.
B. Government-Wide and Fund Financial Statements
The government-wide financial statements (i.e., the Statement of Net Position and the Statement of Activities) report information about the Primary Government and its component units. These statements include the financial activities of the overall City government. Eliminations have been made to minimize the double-counting of internal activities. Governmental activities, which normally are supported by taxes and intergovernmental revenues, are reported separately from business-type activities, which rely to a significant extent on fees and charges to external parties for support. Likewise, the Primary Government is reported separately from certain legally separate component units for which the Primary Government is financially accountable.
The Statement of Activities demonstrates the degree to which the direct expenses of each function of the City’s governmental activities and different business-type activity are offset by program revenues. Direct expenses are those that are clearly identifiable with a specific function or activity. Program revenues include: (1) fees, fines, and charges paid by the recipients of goods, services, or privileges provided by a given function or activity; and (2) grants and contributions that are restricted to meeting the operational or capital requirements of a particular function or activity. Revenues that are not classified as program revenues, including all taxes, are presented as general revenues. Franchise fees are also shown as general revenues as they are based on the gross receipts of the related services.
Separate financial statements are provided for governmental funds and proprietary funds. The City has no fiduciary funds. Major individual governmental funds and major individual proprietary funds are reported as separate columns in the fund financial statements.

CITY OF BRAINERD, MINNESOTA NOTES TO FINANCIAL STATEMENTS
DECEMBER 31, 2018
(39)
NOTE 1 SUMMARY OF SIGNIFICANT ACCOUNTING POLICIES (CONTINUED)
C. Measurement Focus and Basis of Accounting
The government-wide and proprietary fund financial statements are reported using the economic resources measurement focus and the accrual basis of accounting. Revenues are recorded when earned, and expenses are recorded when a liability is incurred, regardless of the timing of related cash flows. Property taxes are recognized as revenues in the year for which they are levied. Grants and similar items are recognized as revenue as soon as all eligibility requirements imposed by the provider have been met.
Governmental fund financial statements are reported using the current financial resources measurement focus and the modified accrual basis of accounting. Revenues are recognized as soon as they are both measurable and available. The City considers revenues to be available if they are collected within 60 days after the end of the current period. Expenditures are recorded when the related fund liability is incurred, except for principal and interest on general long-term debt, compensated absences, and claims and judgments, which are recognized as expenditures to the extent that they have matured. Proceeds of general long-term debt are reported as other financing sources.
Property taxes, franchise taxes, licenses, and interest associated with the current fiscal period are all considered to be susceptible to accrual and so have been recognized as revenues in the current fiscal period. Only the portion of special assessments receivable due within the current fiscal period is considered to be susceptible to accrual as revenue of the current period. All other revenue items are considered to be measurable and available only when cash is received by the government.
The City reports the following major governmental funds:
General Fund – The General Fund is the general operating fund of the City. It accounts for all the financial resources of the general government, except those required to be accounted for in another fund.
Public Safety Fund – The Public Safety Fund, a special revenue fund, accounts for property tax levy, fines and forfeitures, and charges for services that are committed for the operations and maintenance of the fire, police, and other public safety functions of the City.
Park and Recreation Fund – The Park and Recreation Fund, a special revenue fund, accounts for local government aid and charges for services which are committed for the acquisition and maintenance of public parks and public recreation activities.
Street Fund – The Street Fund, a special revenue fund, accounts for local government aid and reimbursement for utility expenses that are committed to be used for all expenses of cleaning and repairing of streets and alleys.

CITY OF BRAINERD, MINNESOTA NOTES TO FINANCIAL STATEMENTS
DECEMBER 31, 2018
(40)
NOTE 1 SUMMARY OF SIGNIFICANT ACCOUNTING POLICIES (CONTINUED)
C. Measurement Focus and Basis of Accounting (Continued)
Revolving Loans Fund – The Revolving Loans Fund, a special revenue fund, accounts for grant proceeds and has current loan repayment proceeds, which are restricted in that they are to be used in funding various revolving loans maintained by the City, including residential and commercial loans.
Economic Development Authority Fund – The Economic Development Authority Fund, a special revenue fund, was established by the bylaws of the Economic Development Authority and accounts for property tax levy revenues which are committed for the activities of the Economic Development Authority.
Debt Service Fund – The Debt Service Fund is used to account for the accumulation of resources and payment of general obligation bond principal, interest and related costs of governmental funds.
Capital Projects Fund – The Capital Projects Fund is used to account for financial resources to be used for the acquisition or construction of major capital facilities.
The City reports the following proprietary funds:
Sanitary Sewer Collection System – The Sanitary Sewer Collection System Fund provides for the operation and maintenance of the wastewater collections. The fund charges user fees to those served by the system.
Storm Sewer Fund – The Storm Sewer Fund provides for the maintenance to the City’s storm sewer system. The fund charges user fees to those served by the system.
Internal Service Fund – The City reports an internal service fund to account for the health insurance provided to other departments of the City on a cost reimbursement basis and general risk management.
Additionally, the City reports the following fiduciary fund type:
Agency Fund – The Agency Fund is custodial in nature and do not present results of operations or have a measurement focus. These funds account for assets that the City holds in an agency capacity.
The City’s financial statements are prepared in accordance with GAAP. The Governmental Accounting Standards Board is responsible for establishing GAAP for state and local governments through to pronouncements (statements and interpretations).

CITY OF BRAINERD, MINNESOTA NOTES TO FINANCIAL STATEMENTS
DECEMBER 31, 2018
(41)
NOTE 1 SUMMARY OF SIGNIFICANT ACCOUNTING POLICIES (CONTINUED)
C. Measurement Focus and Basis of Accounting (Continued)
The proprietary funds distinguish operating revenues and expenses from nonoperating items. Operating revenues and expenses generally result from providing services and producing and delivering goods in connection with the proprietary funds’ principal ongoing operations. The principal operating revenue of the City’s proprietary funds are charges to customers for sales of goods and services and charges to the City’s governmental funds related to employee insurance benefits. Operating expenses for the proprietary funds include the cost of sales and services, administrative expenses, depreciation on capital assets and the cost of services and supplies. All revenues and expenses not meeting this definition are reported as nonoperating revenues and expenses.
When both restricted and unrestricted resources are available for use, it is the City’s policy to use restricted resources first, and then unrestricted resources as they are needed. When committed or assigned resources are available for use, it is the City’s policy that the resources are considered to be spent in this order; committed, assigned and then unassigned.
D. Assets, Deferred Outflows of Resources, Liabilities, Deferred Inflows of Resources, and Net Position or Equity
1. Cash and Investments (Including Cash Equivalents) Cash balances from all funds (including cash equivalents) are pooled and invested to the extent available in various securities as authorized by Minnesota Statutes. Investment earnings are allocated to all funds on the basis of average cash balance.
For the purpose of reporting cash flows in the proprietary funds, the City considers all highly liquid debt instruments with an initial maturity of less than three months to be cash equivalents.
Cash and cash equivalents consist of checking accounts, savings certificate accounts, and cash on hand.
2. Taxes Receivable Taxes which remain unpaid are classified as delinquent taxes receivable. Delinquent taxes represent the past seven years of uncollected tax years. Revenue from these delinquent property taxes that is not collected within 60 days of year-end is reported as a deferred inflow of resources because it is not known to be available to finance the operations of the City in the current year. No allowance for uncollectible taxes has been provided as such amounts are not expected to be material.
Property Tax Collection Calendar The City levies its property tax for the subsequent year during the month of December. In Minnesota, the lien date and assessment date is January 2. The property tax is recorded as revenue when it becomes available. Crow Wing County is the collecting agency for the levy and then remits the collections to the City. All taxes not collected as of December 31 each year are shown as delinquent taxes receivable.

CITY OF BRAINERD, MINNESOTA NOTES TO FINANCIAL STATEMENTS
DECEMBER 31, 2018
(42)
NOTE 1 SUMMARY OF SIGNIFICANT ACCOUNTING POLICIES (CONTINUED)
D. Assets, Deferred Outflows of Resources, Liabilities, Deferred Inflows of Resources, and Net Position or Equity (Continued)
2. Taxes Receivable (Continued)
Property Tax Collection Calendar (Continued) The county auditor makes up the tax list for all taxable property in the City, applying the applicable tax capacity rate to the tax capacity value of individual properties, to arrive at the actual tax for each property. The county auditor also collects all special assessments, except for certain prepayments paid directly to the City.
The county auditor turns over a list of taxes and special assessments to be collected on each parcel of property to the county treasurer in January of each year.
Property owners are required to pay one-half of their real estate taxes by May 15 and the balance by October 15.
Within 30 days after the May settlement, the county treasurer is required to pay 70% of the estimated collections of taxes to the City treasurer. The county treasurer must pay the balance to the city treasurer within 60 days after settlement, provided that after 45 days interest begins to accrue.
Within ten business days after November 15, the county treasurer shall pay to each taxing district, except any school district, 100% of the estimated collections arising from taxes levied by and belonging to each taxing district from May 20 to November 20.
3. Accounts Receivable No substantial losses are anticipated from present receivable balances, therefore, no allowances for uncollectible accounts are deemed necessary.
4. Special Assessments Receivable Special assessments receivable are levied against the benefited properties for the assessable costs of improvement projects in accordance with Minnesota Statutes. Assessments are collectible over a term of years at an interest rate established by the City Council upon adoption of each assessment roll. Any annual installments remaining unpaid as of November 30 of each year are certified to the county for collection with property taxes during the following year. Property owners are allowed to prepay future installments without interest or prepayment penalties.
In the governmental fund financial statements, special assessment levies are recorded as a receivable and as unavailable revenue at the time of the levy. Unavailable revenue is recognized as current revenue as the annual assessment installments become measurable and available. Interest on special assessments is also recognized when it becomes measurable and available.

CITY OF BRAINERD, MINNESOTA NOTES TO FINANCIAL STATEMENTS
DECEMBER 31, 2018
(43)
NOTE 1 SUMMARY OF SIGNIFICANT ACCOUNTING POLICIES (CONTINUED)
D. Assets, Deferred Outflows of Resources, Liabilities, Deferred Inflows of Resources, and Net Position or Equity (Continued)
4. Special Assessments Receivable (Continued) Delinquent special assessments represent the uncollected special assessments that have not been collected within 60 days of year-end. Significant portions of special assessments receivable are not expected to be collected within one year.
5. Due from Other Governments Amounts due from other governments is composed primarily of state and federal grants and aids for which the City has spent or will be incurring costs for the various grant purposes.
6. Short-Term Interfund Receivables/Payables During the course of operations, numerous transactions occur between individual funds for goods provided or services rendered. These receivables and payables are classified as “due from other funds” or “due to other funds” on the fund financial statements. Any residual balances outstanding between the governmental activities and business-type activities are reported in the government-wide financial statements as internal balances.
7. Inventories and Prepayments Inventory for BPU consists of supplies and replacement parts for the water and electrical distribution system. Inventory is valued using a moving average cost method.
Certain payments to vendors reflect costs applicable to future accounting periods and are recorded as prepayments in both government-wide and fund financial statements.
8. Restricted Assets BPU, based on certain grant agreements, is required to establish and maintain prescribed amounts of resources (consisting of cash, temporary investments, and certain notes receivable) that can be used for plant replacement and debt service retirement. Also, amounts have been set aside for customer deposits.
9. Land Held for Resale Land held for resale represents land acquired by the Primary Government for subsequent resale for redevelopment purposes. Land held for resale is reported at the lower of cost or estimated realizable value. Realizable value estimates have been based on estimated realizable sales proceeds net of expected selling expenses.

CITY OF BRAINERD, MINNESOTA NOTES TO FINANCIAL STATEMENTS
DECEMBER 31, 2018
(44)
NOTE 1 SUMMARY OF SIGNIFICANT ACCOUNTING POLICIES (CONTINUED)
D. Assets, Deferred Outflows of Resources, Liabilities, Deferred Inflows of Resources, and Net Position or Equity (Continued)
10. Capital and Intangible Assets Capital and intangible assets, which include property, plant, equipment, infrastructure assets (e.g., roads, bridges, sidewalks, and similar items), easements and computer software are reported in the governmental activities column in the government-wide financial statements. Capital and intangible assets are defined by the government as assets with an initial, individual cost greater than a range of $1,000 to $5,000 (depending on the type of capital asset) and an estimated useful life in excess of one year. Such assets are recorded at historical cost or estimated historical cost if purchased or constructed. Donated capital assets are recorded at acquisition value at the date of donation.
In the case of the initial capitalization of general infrastructure assets (i.e., those reported by governmental activities), the City chose to include all such items regardless of their acquisition date or amount. The City was able to estimate the historical cost for the initial reporting of these assets through backtrending (i.e., estimating the current replacement cost of the infrastructure to be capitalized and using an appropriate price-level index to deflate the cost to the acquisition year or estimated acquisition year). The costs of normal maintenance and repairs that do not add to the value of the asset or materially extend assets lives are not capitalized. Major outlays for capital assets and improvements are capitalized as projects are constructed.
Capital and intangible assets of the Primary Government are depreciated or amortized using the straight-line method over the following estimated useful lives:
Assets YearsLand Improvements 20Buildings and Improvements 5-20Machinery and Equipment 3-20Furniture and Fixtures 5-15Vehicles 3-20Infrastructure 20-40Permanent Easements N/A
Software 5
Length of Term or 5 years
Temporary Easements
11. Deferred Outflows of Resources In addition to assets, the Statement of Net Position reports a separate section for deferred outflows of resources. This separate section represents a consumption of net position that applies to a future period. The City will not recognize the related outflow until a future event occurs.

CITY OF BRAINERD, MINNESOTA NOTES TO FINANCIAL STATEMENTS
DECEMBER 31, 2018
(45)
NOTE 1 SUMMARY OF SIGNIFICANT ACCOUNTING POLICIES (CONTINUED)
D. Assets, Deferred Outflows of Resources, Liabilities, Deferred Inflows of Resources, and Net Position or Equity (Continued)
12. Compensated Absences It is the City’s policy to permit employees to accumulate earned but unused vacation and sick pay benefits. All vacation and sick pay allowable is accrued when incurred in the government-wide and proprietary statements. A liability for these amounts is reported in governmental funds only if they have matured, for example, as a result of employee resignations and retirements. The current portion for vacation pay is calculated based on historical trends. For governmental activities, compensated absences are generally liquidated by the General, Public Safety, Park and Recreation, and Street Funds.
13. Long-Term Obligations In the government-wide financial statements and proprietary funds in the fund financial statements, long-term debt and other long-term obligations are reported as liabilities in the applicable governmental activities, business-type activities, or proprietary fund type Statement of Net Position. Bond premiums and discounts, are amortized over the life of the bonds using the effective interest method. Bonds payable are reported net of the applicable bond premium or discount. In the fund financial statements, governmental fund types recognize bond premiums and discounts, during the current period. The face amount of debt issued is reported as other financing sources. Premiums received on debt issuances are reported as other financing sources while discounts on debt issuances are reported as other financing uses.
14. Fund Balance In the fund financial statements, governmental funds report components of fund balance to provide information about fund balance availability for appropriation. Nonspendable fund balance represents amounts not in spendable form or legally or contractually required to be maintained intact. Restricted fund balance represents amounts available for appropriation but intended for a specific use and is legally restricted by outside parties. Committed fund balance represents constraints on spending that the government imposes upon itself by a City Council resolution at a meeting prior to the close of the period. Committed fund balance may be un-committed by a City Council resolution only. Assigned fund balance reflects funds intended to be used by the government for specific purposes assigned by more informal operational plans. The City Council policy authorizes the City Administrator or the Finance Director to assign fund balance as necessary. Unassigned fund balance is the residual classification for the government’s general fund and includes all spendable amounts not contained in the other classifications. Other funds would report a negative unassigned fund balance should the total of nonspendable, restricted, and committed fund balances exceed the total net resources of that fund. It is the City’s policy that at the end of each fiscal year, the City will maintain unassigned portion of the fund balance for cash flow in a range equal to 35 – 50% of the working funds’ current year operating expenditures.

CITY OF BRAINERD, MINNESOTA NOTES TO FINANCIAL STATEMENTS
DECEMBER 31, 2018
(46)
NOTE 1 SUMMARY OF SIGNIFICANT ACCOUNTING POLICIES (CONTINUED)
D. Assets, Deferred Outflows of Resources, Liabilities, Deferred Inflows of Resources, and Net Position or Equity (Continued)
15. Deferred Inflows of Resources The City’s governmental fund financial statements report a separate section for deferred inflows of resources. This separate financial statement element reflects an increase in fund balance that applies to a future period. The City will not recognize the related revenue until a future event occurs.
16. Pension For purposes of measuring the net pension liability (asset), deferred outflows/inflows of resources, and pension expense, information about the fiduciary net position of the Public Employees Retirement Association (PERA) and Brainerd Firefighters Relief Association plans (FRA), and additions to/deductions from PERA’s and the FRA’s fiduciary net position have been determined on the same basis as they are reported by PERA and the FRA. For this purpose, plan contributions and benefit payments (including refunds of contributions) are recognized as of employer payroll paid dates and benefit payments and refunds are recognized when due and payable in accordance with the benefit terms. Investments are reported at fair value.
17. Use of Estimates The preparation of financial statements in conformity with accounting principles generally accepted in the United States of America requires management to make estimates and assumptions that affect the reported amounts of assets and liabilities and disclosure of contingent assets and liabilities at the date of the financial statements and the reported amounts of revenues and expenses during the reporting period. Actual results could differ from those estimates.
NOTE 2 STEWARDSHIP, COMPLIANCE, AND ACCOUNTABILITY
A. Budgetary Information
The City follows these procedures in establishing the budgetary data reflected in the financial statements:
1. Budget requests are submitted by all department heads to the City Administrator. The Administrator’s office compiles the budget requests into an overall preliminary City budget, balancing budget requests with available revenue.

CITY OF BRAINERD, MINNESOTA NOTES TO FINANCIAL STATEMENTS
DECEMBER 31, 2018
(47)
NOTE 2 STEWARDSHIP, COMPLIANCE, AND ACCOUNTABILITY (CONTINUED)
A. Budgetary Information (Continued)
2. The preliminary budget is submitted to the Personnel and Finance Committee of the City Council for their review and/or modification.
3. The City administration presents the proposed budget to the City Council which in turn holds a truth-in-taxation public hearing on the proposed budget. The budget resolution adopted by the City Council sets forth the budget at the fund level for the General Fund and certain special revenue funds.
4. Management is authorized to transfer budgeted amounts between departments within any fund; however, any revisions that alter the total expenditures of any fund must be approved by the City Council. Reported budget amounts are as originally adopted or amended by the City Council. Budget amendments for the year are deemed immaterial.
5. The City has legally adopted budgets for the General Fund and these special revenue funds: Transit Fund, Public Safety Fund, Recycling Fund, Park and Recreation Fund, Street Fund, City Parking Lots Fund, Permanent Improvement Fund, Mayor’s Contingency Fund, Hydrant Rental Fund, and Economic Development Authority Fund. Expenditures may not legally exceed budgeted appropriations at the total fund level. All amounts over budget have been approved by the City Council through the disbursement process. The City is not required to legally adopt an annual budget for the Debt Service Fund and formal budgetary integration is not employed for Debt Service Fund because effective budgetary control is alternatively achieved through general obligation bond indenture provisions.
6. Budgets for the General Fund and certain special revenue funds are adopted on a basis consistent with GAAP.
7. The City does not utilize encumbrances. Budget appropriations for all funds lapse at year end.
The following funds had expenditures in excess of budget at the fund level for the year ended December 31, 2018:
Expenditures Appropriations Appropriations
General Fund $ 2,509,006 $ 2,497,156 $ 11,850
Public Safety Fund 4,871,270 4,842,246 29,024 Park and Recreation Fund 1,113,686 1,095,774 17,912 Street and Sewer Fund 1,126,602 966,266 160,336 Recycling Fund 47,971 46,610 1,361 Hydrant Rental and Electric Fund 170,769 170,419 350

CITY OF BRAINERD, MINNESOTA NOTES TO FINANCIAL STATEMENTS
DECEMBER 31, 2018
(48)
NOTE 3 COMPONENTS OF FUND BALANCE
At December 31, 2018, portions of the City’s fund balance are not available for appropriation due to legal restrictions (Restricted), City Council action (Committed), policy and/or intent (Assigned), any residual balance in the General Fund or negative balance in any other fund is classified as (Unassigned). The following is a summary of the components of fund balance:
Public Park and Street and Revolving Economic Capital OtherGeneral Safety Recreation Sewer Loans Development Debt Service Projects Governmental
Fund Fund Fund Fund Fund Authority Fund Fund FundsFund Balances:
Nonspendable: 9,236$ 18,002$ 1,074$ 29$ -$ -$ -$ 20$ 20,702$ Restricted:
Debt Service - - - - - - 2,234,228 - - Revolving Loans - - - - 57,684 - - - - School Patrol Operations - - - - - - - - 30,443 Recycling Operations - - - - - - - - 106 Transit Operations - - - - - - - - 142,604 Economic Development - - - - - - - - 164,246 Police Forfeiture Purchases - - - - - - - - 62,620 Employee Wellness - - - - - - - - 33,505
Committed to:Economic Development - - 544 - - 33,987 - - - City Parking Lot Improvements - - - - - - - - 479 Public Safety - 79,988 - - - - - - - Street Maintenance - - - 421 - - - - - Water and Sewer Availability Operations - - - - - - - - 767,192 Capital Projects - - - - - - - - 5,151 Other Purposes - - - - - - - - 2,575
Assigned:Severance 50,000 - - - - - - - - Economic Development 172,793 - - - - - - - - Other Capital Projects - - - - - - - 3,755,147 -
Unassigned: 3,861,936 - - - - - - - - Total Fund Balances 4,093,965$ 97,990$ 1,618$ 450$ 57,684$ 33,987$ 2,234,228$ 3,755,167$ 1,229,623$
NOTE 4 DETAILED NOTES ON ALL FUNDS
A. Assets
1. Deposits - Primary Government and Library/Airport Component Units (Pooled with Primary Government) The City maintains a cash and investment pool that is available for use by all funds. Each fund type’s portion of this pool is displayed on the combined balance sheet as “Cash and Investments.” In accordance with Minnesota Statutes, the City maintains deposits at financial institutions which are authorized by the City Council. Custodial Credit Risk – Custodial credit risk is the risk that in the event of a bank failure, the City’s deposits may not be returned to it. The City follows Minnesota Statutes for deposits.

CITY OF BRAINERD, MINNESOTA NOTES TO FINANCIAL STATEMENTS
DECEMBER 31, 2018
(49)
NOTE 4 DETAILED NOTES ON ALL FUNDS (CONTINUED)
A. Assets (Continued)
1. Deposits – Primary Government and Library/Airport Component Units (Pooled with Primary Government) (Continued) Minnesota Statutes require that all deposits be protected by insurance, surety bond, or collateral. The market value of collateral pledged must equal 110% of the deposits not covered by insurance or corporate surety bonds. Authorized collateral include: U.S. government treasury bills, notes, or bonds; issues of a U.S. government agency; general obligations of a state or local government rated “A” or better; revenue obligations of a state or local government rated “AA” or better; irrevocable standby letter of credit issued by a Federal Home Loan Bank; and time deposits insured by a federal agency. Minnesota Statutes require securities pledged as collateral be held in safekeeping in a restricted account at the Federal Reserve Bank or at an account at a trust departments of a commercial bank or other financial institution not owned or controlled by the depository.
The bank balance of City deposits at December 31, 2018 were fully covered by federal depository insurance, irrevocable standby letters of credit, or pledged collateral in accordance with Minnesota Statutes.
2. Investments – Primary Government and Library/Airport Component Units (Pooled with Primary Government) The City has an investment policy and is permitted to invest its idle funds as authorized by Minnesota Statutes as follows: Direct obligations or obligations guaranteed by the United States or its agencies. Shares of investment companies registered under the Federal Investment
Company Act of 1940 and received the highest credit rating is rated in one of the two highest rating categories by a statistical rating agency, and all of the investments have a final maturity of thirteen months or less.
General obligations rated “A” or better; revenue obligations rated “AA” or better. General obligations of the Minnesota Housing Finance Agency rate “A” or better. Bankers’ acceptances of United States banks eligible for purchase by the
Federal Reserve System. Commercial paper issued by United States banks corporations or their Canadian
subsidiaries, of highest quality category by a least two nationally recognized rating agencies, and maturing in 270 days or less.
Guaranteed investment contracts guaranteed by United States commercial banks or domestic branches of foreign banks or United States insurance companies if similar debt obligations of the issuer or the collateral pledged by the issuer is in the top two rating categories.

CITY OF BRAINERD, MINNESOTA NOTES TO FINANCIAL STATEMENTS
DECEMBER 31, 2018
(50)
NOTE 4 DETAILED NOTES ON ALL FUNDS (CONTINUED)
A. Assets (Continued)
2. Investments – Primary Government and Library/Airport Component Units (Pooled with Primary Government) (Continued) Repurchase or reverse purchase agreement and securities lending agreements
financial institutions qualified as a “depository” by the government entity, with banks that are members of the Federal Reserve System with capitalization exceeding $10,000,000, a primary reporting dealer in U.S. government securities to the Federal Reserve Bank of New York, or certain Minnesota securities broker-dealers.
Credit Risk – Credit risk is the risk that an issuer of an investment will not fulfill its obligation to the holder of the investment. This is measured by the assignment of a rating by a nationally recognized statistical rating organization.
Credit Quality Rating Amount
CityMoney Market Not Rated 6,836,270$ Negotiable CDs Not Rated 4,746,361 MN Municipal Money Market Fund Plus Trust Not Rated 60
Total Investments 11,582,691$
AirportMoney Market Not Rated 954,671$ Negotiable CDs Not Rated 662,820
Total Investments 1,617,491$
Library
Money Market Not Rated 125,073$ Negotiable CDs Not Rated 86,837
Total Investments 211,910$

CITY OF BRAINERD, MINNESOTA NOTES TO FINANCIAL STATEMENTS
DECEMBER 31, 2018
(51)
NOTE 4 DETAILED NOTES ON ALL FUNDS (CONTINUED)
A. Assets (Continued)
2. Investments – Primary Government and Library/Airport Component Units (Pooled with Primary Government) (Continued) Interest Rate Risk – Interest rate risk is the risk that changes in market interest rates will adversely affect the fair value of an investment. Generally, the longer the maturity of an investment, the greater the sensitivity of its fair value to changes in market interest rates.
12 Months 13 to 24 25 to 60Type Total or Less Months MonthsCityMoney Market 6,836,270$ 6,836,270$ -$ -$ Negotiable CDs 4,746,361 1,228,437 1,079,713 2,438,211 MN Municipal Money Market Fund Plus Trust 60 60 - -
Total 11,582,691$ 8,064,767$ 1,079,713$ 2,438,211$
AirportNegotiable CDs 662,820$ 171,549$ 150,780$ 340,491$ Money Market 954,671 954,671 - -
Total 1,617,491$ 1,126,220$ 150,780$ 340,491$
Library
Negotiable CDs 86,837$ 22,475$ 19,754$ 44,608$ Money Market 125,073 125,073 - -
Total 211,910$ 147,548$ 19,754$ 44,608$
The deposits and investments are presented in these financial statements:
Primary GovernmentDeposits 1,059,280$ Investments 11,582,691
Total Cash and Investments 12,641,971$
AirportDeposits 149,570$ Investments 1,617,491
Total Cash and Investments 1,767,061$
LibraryDeposits 18,617$ Investments 211,910
Total Cash and Investments 230,527$
Cash and Investments - Primary Government 12,641,971$ Cash and Investments - Airport 1,767,061 Cash and Investments - Library 230,527
Total Cash and Investments 14,639,559$

CITY OF BRAINERD, MINNESOTA NOTES TO FINANCIAL STATEMENTS
DECEMBER 31, 2018
(52)
NOTE 4 DETAILED NOTES ON ALL FUNDS (CONTINUED)
A. Assets (Continued)
2. Investments – Primary Government and Library/Airport Component Units (Pooled with Primary Government) (Continued) The City uses fair value measurements to record fair value adjustments to certain assets and liabilities and to determine fair value disclosures.
The City follows an accounting standard that defines fair value, establishes a framework for measuring fair value, establishes a fair value hierarchy based on the quality of inputs used to measure fair value, and requires expanded disclosures about fair value measurements. In accordance with this standard, the City has categorized its investments, based on the priority of the inputs to the valuation technique, into a three-level fair value hierarchy. The fair value hierarchy gives the highest priority to quoted prices in active markets for identical assets or liabilities (Level 1) and the lowest priority to unobservable inputs (Level 3). If the inputs used to measure the financial instruments fall within different levels of the hierarchy, the categorization is based on the lowest level input that is significant to the fair value measurement of the instrument. Financial assets and liabilities recorded on the combined statements of financial position are categorized based on the inputs to the valuation techniques as follows: Level 1 – Financial assets and liabilities are valued using inputs that are
unadjusted quoted prices in active markets accessible at the measurement date of identical financial assets and liabilities. The inputs include those traded on an active exchange, such as the New York Stock Exchange, as well as U.S. Treasury and other U.S. government and agency mortgage-backed securities that are traded by dealers or brokers in active over-the-counter markets.
Level 2 – Financial assets and liabilities are valued based on quoted prices for similar assets, or inputs that are observable, either directly or indirectly for substantially the full term through corroboration with observable market data. These inputs include bonds valued by a pricing service that uses matrix pricing and valuation multiples.
Level 3 – Financial assets and liabilities are valued using pricing inputs which are unobservable for the asset, inputs that reflect the reporting entity’s own assumptions about the assumptions market participants and would use in pricing the asset.
Assets measured at fair value on a recurring basis:
Type Level 1 Level 2 Level 3 TotalNegotiable CD's -$ 5,496,017$ -$ 5,496,017$
Negotiable certificates of deposit are valued using a matrix pricing based on the securities’ relationship to benchmark quoted prices.

CITY OF BRAINERD, MINNESOTA NOTES TO FINANCIAL STATEMENTS
DECEMBER 31, 2018
(53)
NOTE 4 DETAILED NOTES ON ALL FUNDS (CONTINUED)
A. Assets (Continued)
2. Investments – Primary Government and Library/Airport Component Units (Pooled with Primary Government) (Continued)
Brainerd Public Utilities (BPU) – Component Unit
Interest Rate Risk - Interest rate risk is the risk that changes in market interest rates will adversely affect the fair value of an investment. Generally, the longer the maturity of an investment, the greater the sensitivity of its fair value to changes in market interest rates. BPU does not have a specific policy regarding interest rate risk.
Information about the sensitivity of the fair values of BPU’s investments to market interest rate fluctuations is provided by the following table that shows the distribution of BPU’s investments at December 31, 2018 by maturity:
Investment Total 12 Months 13 to 60 More thanType Amount or Less Months 60 Months
Negotiable CD's 6,324,834$ 1,825,975$ 4,049,135$ 449,724$ FNMA 1,779,292 - 287,960 1,491,332 FHLMC 964,108 - - 964,108 FFCB 796,968 - - 796,968
Commercial Paper 1,065,000 1,065,000 - - Total 10,930,202$ 2,890,975$ 4,337,095$ 3,702,132$
Remaining Maturity (in Months)
Credit Risk - Credit risk is the risk that an issuer of an investment will not fulfill its obligation to the holder of the investment. The BPU does not have a specific policy for credit risk, but follows Minnesota Statutes for allowable investments. This is measured by the assignment of a rating by a nationally recognized statistical rating organization. Presented below is the minimum rating required by (where applicable) Minnesota Statutes, the BPU’s investment policy, and the S&P credit ratings for BPU’s investments as of December 31, 2018 are as follows:
Investment S & PType Rating
Negotiable CDs Not RatedFNMA AA+FHLMC AA+FCCB AA+
Commercial Paper A1

CITY OF BRAINERD, MINNESOTA NOTES TO FINANCIAL STATEMENTS
DECEMBER 31, 2018
(54)
NOTE 4 DETAILED NOTES ON ALL FUNDS (CONTINUED)
A. Assets (Continued)
2. Investments – Primary Government and Library/Airport Component Units (Pooled with Primary Government) (Continued)
Brainerd Public Utilities (BPU) – Component Unit (Continued)
Concentration of Credit Risk – The investment policy of the BPU contains no limitations on the amount that can be invested in any one issuer beyond that stipulated by Minnesota Statutes. Investment in any one issuer, as a percentage of total BPU investments as of December 31, 2018, are disclosed above. All negotiable CD’s by issuer are less than 5% of total investments. Investments The custodial credit risk for investments is the risk that, in the event of the failure of the counterparty (e.g., broker-dealer) to a transaction, a government will not be able to recover the value of its investment or collateral securities that are in the possession of another party. BPU does not have a policy for custodial credit risk over investments. Fair Value Measurements BPU uses fair value measurements to record fair value adjustments to certain assets and liabilities and to determine fair value disclosures.
Assets measured at fair value on a recurring basis:
Type 12/31/2017 Level 1 Level 2 Level 3Negotiable CD's 6,324,834$ -$ 6,324,834$ -$ FNMA Securities 1,779,292 - 1,779,292 - FHLMC Securities 964,108 - 964,108 - FFCB Securities 796,968 - 796,968 - Commercial Paper 1,065,000 1,065,000 - - Total Investments by Fair Value Level 10,930,202$ 1,065,000$ 9,865,202$ -$
Housing and Redevelopment Authority of Brainerd (HRA) – Component Unit
The Authority held no investments as of December 31, 2018.

CITY OF BRAINERD, MINNESOTA NOTES TO FINANCIAL STATEMENTS
DECEMBER 31, 2018
(55)
NOTE 4 DETAILED NOTES ON ALL FUNDS (CONTINUED)
A. Assets (Continued)
3. Interfund Receivables, Payables, and Transfers At December 31, 2018, due from/to other funds were as follows:
Due To
Other Governmental
FundsPublic
Safety Fund
Sanitary Sewer
Collection System
Storm Sewer Fund
Revolving Loan Fund
Capital Projects Fund Total
General Fund 20,488$ -$ 15,843$ 144,594$ 61,567$ -$ 242,492$
Public Safety Fund 7,875 - - - - - 7,875
Park and Recreation Fund 4,132 - - - - - 4,132
Street Fund 24,334 - - - - - 24,334
Sanitary Sewer Collection System - - - - - 1,378,671 1,378,671
Capital Projects Fund - 52,600 14,962 - - 67,562
Total 56,829$ 52,600$ 30,805$ 144,594$ 61,567$ 1,378,671$ 1,725,066$
Due From
Some balances are to record utility payments that will be paid next year. Other balances from Sanitary and Storm Sewer are to help pay for projects that are being paid for in the capital projects fund and will be repaid next year. The last balances noted are from negative cash and will be repaid next year.

CITY OF BRAINERD, MINNESOTA NOTES TO FINANCIAL STATEMENTS
DECEMBER 31, 2018
(56)
NOTE 4 DETAILED NOTES ON ALL FUNDS (CONTINUED)
A. Assets (Continued)
3. Interfund Receivables, Payables, and Transfers (Continued) Interfund transfers for the year ended December 31, 2018 were as follows:
Public Park and Debt Capital Sanitary Sewer
General Safety Street Recreation Service Projects Collection
Transfer Out Fund Fund Fund Fund Fund Fund System Total
General Fund -$ 36,128$ 107,563$ -$ -$ 20,000$ -$ 163,691$
Public Safety Fund - - - - 51,946 203,883 - 255,829
Park & Rec Fund - - - - - 4,346 - 4,346
Revolving Loan Fund 173,572 - - - - - - 173,572
Capital Projects Fund - - - 200 - - - 200
Other Governmental Funds - - 22,729 - - 341,201 50,471 414,401
Total 173,572$ 36,128$ 130,292$ 200$ 51,946$ 569,430$ 50,471$ 1,012,039$
Transfer In:
Transfers are used to 1) move revenues to cover various expenditures in other funds which were approved by the council, 2) to close out funds, or 3) transfer excess funds back to the general fund due to budget cuts.
4. Bonds and Notes Receivable
The City had the following notes receivable as of December 31, 2018:
Special Revenue Funds Amount
Revolving Loans Fund
Housing Revolving LoansDeveloped in order to financially assist homeowners in the City with home repairs;Twenty-three loans ranging from $700 to $13,000 are outstanding for owneroccupied, rental dwellings and revolving loan funds; due upon transfer or sale ofproperty; no interest; secured by subordinate mortgages. $ 65,475
Commercial Revolving Loans Brainerd Mobile, Inc.; 120 monthly payments of $402, including interest at 6%,commencing March 1999, and ending April 2019; secured by property, equipment,and inventory. 2,372
Stern Companies, Inc.; 28 monthly payments of $701, including interest at 4%,commencing October 2012; secured by existing equipment. 6,684
Total Commercial Revolving Loans 9,056

CITY OF BRAINERD, MINNESOTA NOTES TO FINANCIAL STATEMENTS
DECEMBER 31, 2018
(57)
NOTE 4 DETAILED NOTES ON ALL FUNDS (CONTINUED)
A. Assets (Continued)
4. Bonds and Notes Receivable (Continued)
Special Revenue Funds (Continued) Amount
Revolving Loans Fund (Continued)
Small Cities Development Program (SCDP)
Developed in order to financially assist commercial and residential rehabilitation ofthe downtown area of the City. Loans are provided for commercial projects in threeparts, (1) 1/3 loan at 3% to be repaid in up to 15 years, (2) 1/3 deferred loan at 10%(forgiven in 10 years if property remains under current ownership), (3) 1/3 privatefinancing. Loans are provided for residential projects in two parts, (1) 1/2 loan at 3%to be repaid in up to 15 years, (2) 1/2 deferred loan (forgiven in 10 years if propertyremains under current ownership). $ 102,834
Notes ranged from $17,000-$30,000; no interest loans were issued; the notes areonly repaid from 0-9 years at 100%, 10-19 years at 50% and 20 plus years the noteis forgiven; repayment proceeds will be due upon sale or change in ownership.
87,150
Developed in order to financially assist commercial and rental rehabilitation in thedowntown area of the City. The loans are provided for commercial and rentalprojects. They are due upon transfer or sale of property and are forgiven in 10 yearsif property remains under current ownership. 584,726
Developed in order to financially assist commercial and residential rehabilitation ofthe southeast area of the City. The loans are provided for commercial and residentialprojects. They are due upon transfer or sale of property and are forgiven in 10 yearsif property remains under current ownership. 439,852
Total Small Cities Development Program (SCDP) 1,214,562
Total Revolving Loan Funds 1,289,093$
Component Unit
On February 17, 2009, the City of Brainerd, on behalf of BPU, entered into a financing agreement in a principal amount not to exceed $11,667,000 with the City of Baxter related to the financing of the expansion of the wastewater treatment facility (WWTF). Baxter will own one-third share of the expanded WWTF’s capacity and Brainerd will own two-thirds of the expanded WWTF’s capacity. The financing of the expanded WWTF is being funded by two loans from the Minnesota Public Finance Authority (PFA) to Brainerd.

CITY OF BRAINERD, MINNESOTA NOTES TO FINANCIAL STATEMENTS
DECEMBER 31, 2018
(58)
NOTE 4 DETAILED NOTES ON ALL FUNDS (CONTINUED)
A. Assets (Continued)
4. Bonds and Notes Receivable (Continued)
Component Unit (Continued)
Baxter agrees to finance its one-third share of the capital costs of the expanded WWTF and its obligation to do so have been evidenced by the issuance and sale of two Taxable General Obligation Utility Revenue Notes to Brainerd. The Baxter Notes are secured by the net revenues of the Baxter sewer utility and the revenues of a local option sales tax imposed by Baxter, and by Baxter’s full-faith and credit and taxing powers. The Baxter Notes contain a schedule of maturities and specified interest rate that corresponds to the maturity schedules and interest rates of the BPU loan agreements with PFA. The obligation of Baxter to make scheduled payments to BPU pursuant to the Baxter Notes is absolute and unqualified. Note receivable activity for the year ended December 31, 2018, is as follows:
Note No. 1 Note No. 2 TotalBeginning Balance -$ 5,659,334$ 5,659,334$ Payments Received - (436,667) (436,667) Ending Balance -$ 5,222,667$ 5,222,667$
Additions to notes receivable are recorded as Capital Contributions on the Statements of Revenues, Expenses, and Changes in Net Position. Interest accrued on the notes receivables as of December 31, 2018, of $66,600, is recorded as a restricted asset. Interest received from Baxter which is recorded as Interest Income for the year ended December 31, 2018, was $183,686.

CITY OF BRAINERD, MINNESOTA NOTES TO FINANCIAL STATEMENTS
DECEMBER 31, 2018
(59)
NOTE 4 DETAILED NOTES ON ALL FUNDS (CONTINUED)
A. Assets (Continued)
5. Capital Assets Capital asset activity for the Primary Government for the year ended December 31, 2018 is as follows:
Beginning Ending
Balance Increases Decreases Balance
Governmental Activities
Capital Assets, Not Being Depreciated
Land and Permanent Easements 3,620,325$ 30,600$ -$ 3,650,925$
Construction-in-Progress 47,116 57,763 (9,029) 95,850
Total Capital Assets, Not Being Depreciated 3,667,441 88,363 (9,029) 3,746,775
Capital Assets, Being Depreciated
Land Improvements 2,227,741 - - 2,227,741
Buildings 7,287,452 281,636 - 7,569,088
Improvements Other Than Buildings 5,022,903 145,203 - 5,168,106
Machinery and Equipment 5,009,203 745,038 (308,948) 5,445,293
Infrastructure 38,918,735 334,956 - 39,253,691
Motor Vehicles 3,073,697 210,138 (156,752) 3,127,083
Office Equipment 534,181 - (72,366) 461,815
Total Capital Assets, Being Depreciated 62,073,912 1,716,971 (538,066) 63,252,817
Less Accumulated Depreciation for
Land Improvements (480,265) (62,368) - (542,633)
Buildings (3,528,913) (202,786) - (3,731,699)
Improvements Other Than Buildings (3,849,660) (74,037) - (3,923,697)
Machinery and Equipment (3,952,642) (270,988) 308,948 (3,914,682)
Infrastructure (13,866,833) (1,108,138) - (14,974,971)
Motor Vehicles (2,020,886) (276,573) 156,752 (2,140,707)
Office Equipment (396,196) (53,631) 72,366 (377,461)
Total Accumulated Depreciation (28,095,395) (2,048,521) 538,066 (29,605,850)
Total Capital Assets, Being Depreciated, Net 33,978,517 (331,550) - 33,646,967
Governmental Activities Capital Assets, Net 37,645,958$ (243,187)$ (9,029)$ 37,393,742$
Business-Type Activities:
Capital Assets, Not Being Depreciated:
Land 140,865$ -$ -$ 140,865$
Construction in Progress 92,103 4,702 (81,843) 14,962
Total Capital Assets not depreciated 232,968 4,702 (81,843) 155,827
Capital Assets, Being Depreciated:
Improvements Other Than Buildings 24,966 - - 24,966
Machinery and Equipment 322,342 400,405 (219,750) 502,997
Infrastructure 27,085,534 1,006,342 - 28,091,876
Motor Vehicles 63,050 - - 63,050
Total Capital Assets being Depreciated 27,495,892 1,406,747 (219,750) 28,682,889
Less Accumulated Depreciation For:
Improvements Other Than Buildings (22,260) (1,248) - (23,508)
Machinery and Equipment (304,947) (2,121) 219,750 (87,318)
Infrastructure (9,752,604) (646,892) - (10,399,496)
Motor Vehicles (63,050) - - (63,050)
Total Accumulated Depreciation (10,142,861) (650,261) 219,750 (10,573,372)
Total Capital Assets, Being Depreciated, Net 17,353,031 756,486 - 18,109,517
Business-Type Activities Capital Assets, Net 17,585,999$ 761,188$ (81,843)$ 18,265,344$

CITY OF BRAINERD, MINNESOTA NOTES TO FINANCIAL STATEMENTS
DECEMBER 31, 2018
(60)
NOTE 4 DETAILED NOTES ON ALL FUNDS (CONTINUED)
A. Assets (Continued)
5. Capital Assets (Continued) Depreciation Expense was charged to functions/programs of the Primary Government as follows:
Governmental Activities
General Government 107,279$
Public Safety 347,496
Public Works 1,478,424
Culture and Recreation 115,322
Total Depreciation Expense - Governmental Activities 2,048,521$
Business-Type Activities
Sanitary Sewer System 401,248$
Storm Fund 249,013
Total Depreciation Expense - Business-Type Activities 650,261$
Capital asset activity for the Brainerd Public Library for the year ended December 31, 2018 is as follows:
Beginning Ending
Balance Increases Decreases Balance
Capital Assets, Not Being Depreciated
Land 9,041$ -$ -$ 9,041$
Capital Assets, Being Depreciated
Buildings 1,730,490 - - 1,730,490
Improvements Other Than Buildings 119,924 1,045 (5,144) 115,825
Total Capital Assets, Being Depreciated 1,850,414 1,045 (5,144) 1,846,315
Less Accumulated Depreciation for
Buildings (1,461,348) (47,149) - (1,508,497)
Improvements Other Than Buildings (41,492) (466) 2,443 (39,515)
Total Accumulated Depreciation (1,502,840) (47,615) 2,443 (1,548,012)
Total Capital Assets, Being Depreciated, Net 347,574 (46,570) (2,701) 298,303
Component Unit - Library Capital Assets, Net 356,615$ (46,570)$ (2,701)$ 307,344$

CITY OF BRAINERD, MINNESOTA NOTES TO FINANCIAL STATEMENTS
DECEMBER 31, 2018
(61)
NOTE 4 DETAILED NOTES ON ALL FUNDS (CONTINUED)
A. Assets (Continued)
5. Capital Assets (Continued) Capital asset activity for the Brainerd Lakes Regional Airport for the year ended December 31, 2018 is as follows:
Beginning Ending
Balance Increases Decreases Balance
Capital Assets, Not Being Depreciated
Land 971,423$ -$ -$ 971,423$
Construction in Progress 1,434,948 1,082,083 (1,416,318) 1,100,713
Total Capital Assets, Not Being Depreciated 2,406,371 1,082,083 (1,416,318) 2,072,136
Capital Assets, Being Depreciated
Buildings 15,504,534 - - 15,504,534
Improvements Other Than Buildings 2,054,457 712,606 - 2,767,063
Machinery and Equipment 4,357,611 32,033 (123,504) 4,266,140
Infrastructure 33,362,828 1,215,020 - 34,577,848
Motor Vehicles 56,330 - - 56,330
Office Equipment 18,479 - - 18,479
Total Capital Assets, Being Depreciated 55,354,239 1,959,659 (123,504) 57,190,394
Less Accumulated Depreciation for
Buildings (6,248,359) (680,261) - (6,928,620)
Improvements Other Than Buildings (1,565,396) (72,170) - (1,637,566)
Machinery and Equipment (3,361,505) (258,093) 123,504 (3,496,094)
Infrastructure (16,416,666) (1,655,967) - (18,072,633)
Motor Vehicles (44,060) (6,403) - (50,463)
Office Equipment (13,890) (1,794) - (15,684)
Total Accumulated Depreciation (27,649,876) (2,674,688) 123,504 (30,201,060)
Total Capital Assets, Being Depreciated, Net 27,704,363 (715,029) - 26,989,334
Component Unit - Airport Capital Assets, Net 30,110,734$ 367,054$ (1,416,318)$ 29,061,470$

CITY OF BRAINERD, MINNESOTA NOTES TO FINANCIAL STATEMENTS
DECEMBER 31, 2018
(62)
NOTE 4 DETAILED NOTES ON ALL FUNDS (CONTINUED)
A. Assets (Continued)
5. Capital Assets (Continued) Capital asset activity for the BPU for the year ended December 31, 2018 is as follows:
Beginning Ending
Balance Increases Decreases Balance
Capital Assets, Not Being Depreciated
Construction in Progress 93,886$ 2,503,898$ (1,931,193)$ 666,591$
Capital Assets, Being Depreciated
Electric 40,107,463 1,353,210 (33,019) 41,427,654
Water 23,162,192 1,222,501 (25,446) 24,359,247
Wastewater Treatment 36,123,583 324,726 (129,153) 36,319,156
General Plant 5,799,896 431,851 (273,962) 5,957,785
Total Capital Assets, Being Depreciated 105,193,134 3,332,288 (461,580) 108,063,842
Less Accumulated Depreciation For
Land and Land Improvements (383,475) (17,091) 172,057 (228,509)
Water Plant (8,141,962) (889,919) - (9,031,881)
Electric Plant (15,344,361) (1,598,297) - (16,942,658)
Wastewater Collection System (2,950,908) (156,089) 62,110 (3,044,887)
Vehicles and Equipment (2,614,577) (314,398) 148,939 (2,780,036)
Warehouse (65,800) - - (65,800)
Wastewater Treatment Plant (8,759,576) (1,277,025) 19,640 (10,016,961)
Service Center (2,571,937) (163,521) 58,834 (2,676,624)
Total Accumulated Depreciation (40,832,596) (4,416,340) 461,580 (44,787,356)
Total Capital Assets, Being Depreciated, Net 64,360,538 (1,084,052) - 63,276,486
Component Unit - BPU Capital Assets, Net 64,454,424$ 1,419,846$ (1,931,193)$ 63,943,077$

CITY OF BRAINERD, MINNESOTA NOTES TO FINANCIAL STATEMENTS
DECEMBER 31, 2018
(63)
NOTE 4 DETAILED NOTES ON ALL FUNDS (CONTINUED)
A. Assets (Continued)
5. Capital Assets (Continued) Capital asset activity for the HRA of Brainerd for the year ended December 31, 2018 is as follows:
Beginning Ending
Balance Increases Decreases Balance
Governmental Activities
Capital Assets, Not Being Depreciated
Land 77,400$ -$ -$ 77,400$
Business-Type Activities
Capital Assets, Not Being Depreciated
Land 374,262 - - 374,262
Construction in Progress 11,713 269,904 (280,893) 724
Total Capital Assets, Not Being Depreciated 385,975 269,904 (280,893) 374,986
Capital Assets, Being Depreciated
Buildings and Improvements 13,470,154 313,893 (123,909) 13,660,138
Furniture, Fixtures and Equipment 359,142 - (33,690) 325,452
Total Capital Assets, Being Depreciated 13,829,296 313,893 (157,599) 13,985,590
Less Accumulated Depreciation for
Buildings and Improvements (9,615,614) (297,085) 95,951 (9,816,748)
Furniture, Fixtures and Equipment (288,317) (12,046) 33,690 (266,673)
Total Accumulated Depreciation (9,903,931) (309,131) 129,641 (10,083,421)
Total Capital Assets, Being Depreciated, Net 3,925,365 4,762 (27,958) 3,902,169
Component Unit - Brainerd HRA Capital Assets, Net 4,388,740$ 274,666$ (308,851)$ 4,354,555$

CITY OF BRAINERD, MINNESOTA NOTES TO FINANCIAL STATEMENTS
DECEMBER 31, 2018
(64)
NOTE 4 DETAILED NOTES ON ALL FUNDS (CONTINUED)
B. Liabilities
1. Long-Term Debt
Primary Government
General Obligation Bonds The City issues general obligation bonds to provide funds for economic development and for the acquisition and construction of major capital facilities including infrastructure. General obligation bonds have been issued for general government activities. In addition, general obligation bonds have been issued to refund general obligation bonds. General obligation bonds are direct obligations and pledge the full-faith and credit of the City. Special assessment improvement bonds will be repaid from amounts levied against the property owners benefited by this construction. In the event that a deficiency exists because of unpaid or delinquent special assessments at the time a debt service payment is due, the government must provide resources to cover the deficiency until other resources (e.g., foreclosure proceeds), are received. The airport improvement bonds represent the City’s 50% share of the total bonds outstanding.
On March 22, 2018, the City issued $3,280,000 in G.O. Utility Revenue Bonds, $755,000 in G.O. Bonds, and $1,260,000 in G.O. Equipment Certificates of Indebtedness for a total of $5,295,000. Of this total amount, $3,025,000 is the responsibility of BPU. The bonds have a term of 5-10 years with interest rates from 3 to 5%.

CITY OF BRAINERD, MINNESOTA NOTES TO FINANCIAL STATEMENTS
DECEMBER 31, 2018
(65)
NOTE 4 DETAILED NOTES ON ALL FUNDS (CONTINUED)
B. Liabilities (Continued)
1. Long-Term Debt (Continued)
Primary Government (Continued)
General Obligation Bonds (Continued) General obligation bonds currently outstanding for the Primary Government are as follows:
Range of Original Amount
Interest Rates Issue Outstanding BONDED INDEBTEDNESS PRIMARY GOVERNMENT GENERAL OBLIGATION BONDS
Airport Improvement Refunding Bonds, Series 2010A 1.00-3.35% 1,770,000$ 352,500$
GENERAL OBLIGATION SPECIAL ASSESSMENTIMPROVEMENT BONDS
Series 2009A 2.50-4.00% 2,715,000 585,000 Series 2010A 0.50-2.75% 1,670,000 505,000 Series 2011A 2.00-2.30% 980,000 385,000 Series 2011B 0.50-1.80% 2,085,000 210,000 Series 2012A 0.50-1.60% 845,000 405,000 Series 2013A 2.00-3.00% 795,000 490,000 Series 2015A 2.25-4.00% 725,000 525,000 Series 2015B 1.75-2.75% 245,000 190,000 Series 2018A 3.00-5.00% 755,000 755,000
GENERAL OBLIGATION CAPITAL IMPROVEMENT BONDS
Series 2015B 1.75-2.05% 635,000 415,000
GENERAL OBLIGATION REVENUE BONDS (SANITARY SEWER & STORM SEWER)Series 2015C 3.00% 540,000 395,000 Series 2015C 3.00% 280,000 205,000 Series 2016A 2.00 - 5.00% 3,682,200 3,340,200 Series 2018A 3.00-5.00% 560,000 560,000
EQUIPMENT CERTIFICATESSeries 2016B 2.00% 673,165 407,030 Series 2018A 3.00-5.00% 955,000 955,000
Total Primary Government General Obligation Bonds 19,910,365$ 10,679,730$

CITY OF BRAINERD, MINNESOTA NOTES TO FINANCIAL STATEMENTS
DECEMBER 31, 2018
(66)
NOTE 4 DETAILED NOTES ON ALL FUNDS (CONTINUED)
B. Liabilities (Continued)
1. Long-Term Debt (Continued)
Component Unit – BPU
General Obligation Revenue Notes On May 4, 2009, the City, on behalf of BPU, entered into a project loan agreement in the amount of $25,966,788 between the State of Minnesota, by and through the PFA and the BPU, for eligible costs related to the wastewater treatment facility expansion. The City, on behalf of BPU, issued a General Obligation Build America Bonds to the PFA, evidencing its obligation to repay the loan. The interest rate on the loan is 3.23% and the loan matures August 20, 2028. The Minnesota Legislature, effective April 1, 2007, authorized the City to impose a one-half percent sales and use tax to assist in funding the debt service costs for the expansion. Local option sales tax proceeds received by the City are remitted to BPU on a monthly basis to pay for the general obligation revenue notes. General Obligation Build America Bonds The resolutions authorizing the issuance of General Obligation Build America Bonds contain various covenants, reserve fund requirements, and obligations which BPU must comply. To comply with coverage test, local option sales tax proceeds received equaling 105% of the following year’s principal and interest payment is reported as restricted cash and investment. The amount shown as restricted cash and investments as of December 31, 2018 was $1,858,899. The Interest payments are made semi-annually on February 20 and August 20, and principal payments on August 20. General Obligation Utility Revenue Bonds, Series 2018A The resolutions authorizing the issuance of utility revenue bonds contain various covenants, reserve fund requirements, and obligations which BPU must comply. The amount shown as restricted cash and investments as of December 31, 2018 was $363,090. The interest payments are made semi-annually on February 1 and August 1, and principal payments on August 1.

CITY OF BRAINERD, MINNESOTA NOTES TO FINANCIAL STATEMENTS
DECEMBER 31, 2018
(67)
NOTE 4 DETAILED NOTES ON ALL FUNDS (CONTINUED)
B. Liabilities (Continued)
1. Long-Term Debt (Continued)
Component Unit – BPU (Continued)
General Obligation Equipment Certificates of Indebtedness, Series 2018A The resolutions authorizing the issuance of equipment certificates of indebtedness contain various covenants, reserve fund requirements, and obligations which BPU must comply. The amount shown as restricted cash and investments as of December 31, 2018 was $23,856 (Electric portion), $19,383 (Water portion), and $31,311 (Wastewater Treatment portion). The interest payments are made semi-annually on February 1 and August 1, and principal payments on February 1. Electric Utilities Revenue bonds, General Obligation Sewer Revenue Note and General Obligation Build America Bond currently outstanding for the component units (BPU) are as follows:
Range of Original Amount Interest Rates Issue Outstanding
Electric Utility Revenue Bonds, Series 2014A 2.00-4.00% 6,070,000$ 4,660,000$ Electric Utility Revenue and Refunding Bonds, Series 2017 2.00-4.00% 6,035,000 5,605,000 Water Utility Revenue Bonds, Series 2015A 2.00-4.00% 1,700,000 1,215,000 General Obligation Build America Bond, Series 2009 3.23% 25,966,788 15,668,000 General Obligation Utility Revenue Note, Series 2016A 1.625-5.0% 6,007,800 5,449,800 General Obligation Equipment Certificates, Series 2016B 2.00% 401,835 242,970 General Obligation Utility Revenue Bonds, Series 2018A 3.00-5.00% 2,720,000 2,720,000 General Obligation Equipment Certificates, Series 2018A 5.00% 305,000 305,000
Total Component Units 49,206,423$ 35,865,770$
Component Unit – HRA
Taxable Tax Increment Note The HRA issued a taxable tax increment note in 2005 to finance the redevelopment of a downtown commercial site. Future tax increment revenues will be used to retire the bonds, in addition to a conditional pledge of a portion of the HRA’s special benefits taxes collected.

CITY OF BRAINERD, MINNESOTA NOTES TO FINANCIAL STATEMENTS
DECEMBER 31, 2018
(68)
NOTE 4 DETAILED NOTES ON ALL FUNDS (CONTINUED)
B. Liabilities (Continued)
1. Long-Term Debt (Continued)
Component Unit – HRA (Continued)
Second Mortgage Payable Trail Ridge II entered into their second mortgage (MHFA Affordable Rental Investment fund Loan) payable to Minnesota Housing Finance Agency (MHFA) in the original amount of $450,000 dated January 12, 1998, with interest at 1%. Principal and interest are due January 28, 2028. The mortgage is secured by the Project. Revenue bonds currently outstanding for the component units (HRA) are as follows:
Original Amount Interest Rate Issue Outstanding
Taxable Tax Increment Note, Series 2005 6.96 753,000$ 371,000$ MHFA - ARIF 1.00 450,000 450,000
Total Component Units 1,203,000$ 821,000$
Other Long-Term Liabilities
Primary Government The City has ten outstanding capital leases for equipment. In 2014, the City entered into a lease agreement for a copy machine for the parks department. In 2015, the City entered into a lease agreement for four department copy machines. In 2016, the City entered into a lease agreement as lessee for financing the acquisition of a postage machine, and four vehicles for various departments. In 2017, the City entered into lease agreements for four additional vehicles for various departments. In 2018, the City entered into lease agreements for six vehicles for various departments and two copiers for various departments. These lease agreements qualify as capital leases for accounting purposes and, therefore, have been recorded at the present value of their future minimum lease payments as of the inception date.

CITY OF BRAINERD, MINNESOTA NOTES TO FINANCIAL STATEMENTS
DECEMBER 31, 2018
(69)
NOTE 4 DETAILED NOTES ON ALL FUNDS (CONTINUED)
B. Liabilities (Continued)
1. Long-Term Debt (Continued)
Other Long-Term Liabilities (Continued)
The assets acquired through capital leases, are as follows:
Equipment 479,836$ Less: Accumulated Depreciation (188,749) Total 291,087$
The future minimum lease obligations and the net present value of these minimum lease payments as of December 31, 2018, were as follows:
2019 103,610$ 2020 90,530 2021 60,668 2022 35,726 2023 9,718
Total Minimum Lease Payments 300,252 Less: Amount Representing Interest (12,757)
Present Value of Minimum Lease Payments 287,495$
Component Units The Airport entered into a hangar financing contract of $332,552 with the Minnesota Department of Aeronautics for the construction of a five unit ‘T’ hangar in 2010. The contract is interest free and requires 120 monthly installment payments of $2,771 commencing in March 2010. A summary of other long-term liabilities payable as of December 31, 2018 is as follows:
Range of Original Amount Interest Rates Issue Outstanding
PRIMARY GOVERNMENT Capital Lease Payable 11 - 12% 450,566$ 287,495$
COMPONENT UNITS Airport Contract Payable - State of Minnesota N/A 332,552 38,825
Total Reporting Entity 783,118$ 326,320$

CITY OF BRAINERD, MINNESOTA NOTES TO FINANCIAL STATEMENTS
DECEMBER 31, 2018
(70)
NOTE 4 DETAILED NOTES ON ALL FUNDS (CONTINUED)
B. Liabilities (Continued)
1. Long-Term Debt (Continued) A summary of long-term debt transactions for the year ended December 31, 2018 is as follows:
Beginning Balance Additions Reductions Ending Balance
Due Within One Year
Primary Government
Governmental Activities
General Obligation Bonds Payable
General Obligation Bonds 432,500$ -$ (80,000)$ 352,500$ 82,500$
General Obligation Capital Improvement Bonds 490,000 - (75,000) 415,000 80,000
Equipment Certificates 538,532 630,300 (131,502) 1,037,330 250,133
Special Assessment Improvement Bonds 4,825,000 755,000 (1,530,000) 4,050,000 1,080,000
Issuance Premium (Discount) 101,629 114,234 (45,900) 169,963 -
Total Bonds Payable 6,387,661 1,499,534 (1,862,402) 6,024,793 1,492,633
Capital Leases 188,724 182,186 (83,415) 287,495 97,407
Compensated Absences 1,348,158 588,030 (558,446) 1,377,742 257,337
Governmental Activity Long-Term
Liabilities 7,924,543$ 2,269,750$ (2,504,263)$ 7,690,030$ 1,847,377$
Business-Type Activities
General Obligation Utility Revenue Bonds 4,241,400$ 560,000$ (301,200)$ 4,500,200$ 362,600$
Equipment Certificates - 324,700 - 324,700 59,500
Compensated Absences 50,018 10,251 (13,969) 46,300 8,648
Issuance Premium (Discount) 382,357 65,617 (40,418) 407,556 -
Business-Type Activity Long-Term
Liabilities 4,673,775$ 960,568$ (355,587)$ 5,278,756$ 430,748$

CITY OF BRAINERD, MINNESOTA NOTES TO FINANCIAL STATEMENTS
DECEMBER 31, 2018
(71)
NOTE 4 DETAILED NOTES ON ALL FUNDS (CONTINUED)
B. Liabilities (Continued)
1. Long-Term Debt (Continued) A summary of long-term debt transactions for the year ended December 31, 2018 is as follows:
Beginning Balance Additions Reductions Ending Balance
Due Within One Year
Component Units
Brainerd Lakes Regional Airport
Contracts Payable 72,077$ -$ (33,252)$ 38,825$ 33,252$
Compensated Absences 122,848 57,589 (61,895) 118,542 22,142
Brainerd Crow Wing County
Regional Airport Long-Term Liabilities 194,925$ 57,589$ (95,147)$ 157,367$ 55,394$
Brainerd Public Utilities
Electric Utility Revenue Bonds 11,060,000$ -$ (795,000)$ 10,265,000$ 850,000$
Water Utility Revenue Bonds 7,133,600 2,720,000 (468,800) 9,384,800 727,400
Revenue Bond Premium 813,235 221,026 (87,032) 947,229 -
General Obligation Build America Bond 16,978,000 - (1,310,000) 15,668,000 1,352,000
General Obligation Certificates 321,468 305,000 (78,498) 547,970 135,367
Capital Lease Payable 79,918 - (27,915) 52,003 23,020
Compensated Absences 713,739 469,791 (406,405) 777,125 -
Brainerd Public Utilities
Long-Term Liabilities 37,099,960$ 3,715,817$ (3,173,650)$ 37,642,127$ 3,087,787$
Housing and Redevelopment
Authority of Brainerd
Tax Increment Note Payable 394,000$ -$ (23,000)$ 371,000$ 26,000$
Mortgage Note Payable 450,000 - - 450,000 -
Notes Payable 97,377 - (97,377) - -
Compensated Absences 62,706 49,631 (47,979) 64,358 64,358
Housing and Redevelopment
Authority of Brainerd Long-Term Liabilities 1,004,083$ 49,631$ (168,356)$ 885,358$ 90,358$

CITY OF BRAINERD, MINNESOTA NOTES TO FINANCIAL STATEMENTS
DECEMBER 31, 2018
(72)
NOTE 4 DETAILED NOTES ON ALL FUNDS (CONTINUED)
B. Liabilities (Continued)
1. Long-Term Debt (Continued) Annual debt service requirements to maturity for general obligation bonds, contracts payable, and capital lease obligations of the Primary Government are as follows:
General Obligation Bonds
Governmental Activities
Principal Interest Principal Interest
2019 82,500$ 9,714$ 2019 362,600$ 152,272$
2020 87,500 7,246 2020 370,200 136,492
2021 90,000 4,516 2021 391,600 120,182
2022 92,500 1,549 2022 398,000 103,127
Total 352,500$ 23,025$ 2023 424,400 85,252
2024-2028 1,660,400 218,840
2029-2031 893,000 38,513
Total 4,500,200$ 854,678$
General Obligation Special Assessment General Obligation Capital
Improvement Bonds Improvement Bonds
Governmental Activities Governmental Activities
Principal Interest Principal Interest
2019 1,080,000$ 104,234$ 2019 80,000$ 7,073$
2020 880,000 98,967 2020 80,000 5,673
2021 600,000 50,484 2021 85,000 4,229
2022 425,000 35,694 2022 85,000 2,614
2023 340,000 23,459 2023 85,000 871
2024-2026 725,000 27,644 Total 415,000$ 20,460$
Total 4,050,000$ 340,482$
Capital Leases
Governmental Activities Governmental Activities
Principal Interest Principal Interest
2019 250,133$ 35,422$ 2019 97,407$ 6,203$
2020 253,433 26,872 2020 86,644 3,886
2021 263,164 18,043 2021 58,656 2,012
2022 132,000 10,230 2022 35,135 591
2023 138,600 3,465 2023 9,653 63
Total 1,037,330$ 94,032$ Total 287,495$ 12,755$
Principal Interest
2019 59,500$ 14,748$
2020 61,200 11,730
2021 64,600 8,585
2022 68,000 5,270
2023 71,400 1,785
Total 324,700$ 42,118$
General Obligation Utility Revenue Bonds
Business-Type Activities
Equipment Certificates
Equipment Certificates
Business-Type Activities

CITY OF BRAINERD, MINNESOTA NOTES TO FINANCIAL STATEMENTS
DECEMBER 31, 2018
(73)
NOTE 4 DETAILED NOTES ON ALL FUNDS (CONTINUED)
B. Liabilities (Continued)
1. Long-Term Debt (Continued)
Annual debt service requirements to maturity for revenue bonds, contracts payable, and capital lease obligations of the component units are as follows:
Principal Interest Principal Interest Principal Interest
2019 1,577,400$ 607,537$ 1,352,000$ 506,546$ 135,367$ 17,932$
2020 1,619,800 552,778 1,396,000 462,836 140,367 13,448
2021 1,718,400 496,263 1,441,000 417,704 142,236 8,822
2022 1,792,000 435,907 1,488,000 371,116 65,000 4,876
2023 1,870,600 370,107 1,536,000 323,009 65,000 1,625
2024-2028 9,119,600 936,665 8,455,000 837,412 - -
2029-2031 1,952,000 82,637 - - - -
Total 19,649,800$ 3,481,894$ 15,668,000$ 2,918,623$ 547,970$ 46,703$
Principal Interest Principal Interest Principal Interest
2019 33,252$ -$ 2019 -$ 4,500$ 26,000$ 25,369$
2020 5,573 - 2020 - 4,500 29,000 23,525
Total 38,825$ -$ 2021 - 4,500 32,000 21,437
2022 - 4,500 36,000 19,140
2023 - 4,500 40,000 16,564
2024-2028 450,000 22,500 208,000 34,312
Total 450,000$ 45,000$ 371,000$ 140,347$
Revenue Bonds Build America Bonds Equipment Certificates
BPU
Mortgage Notes PayableContracts Payable
Airport
Tax Increment Note
HRA

CITY OF BRAINERD, MINNESOTA NOTES TO FINANCIAL STATEMENTS
DECEMBER 31, 2018
(74)
NOTE 4 DETAILED NOTES ON ALL FUNDS (CONTINUED)
B. Liabilities (Continued)
6. Conduit Debt Obligations
Component Units The HRA issued conduit debt to provide financial assistance for the development and modernization of low-rent housing units and for the acquisition and construction of facilities deemed to be in the public interest. The bonds for the development and modernization of low-rent public housing units are payable by HUD and secured by annual contributions. The facilities bonds are payable solely from payments received on the underlying lease and do not constitute a general obligation of the HRA. Upon repayment of the facilities bonds, ownership of the facilities transfers to the entity served by the bond issuance. None of these bonds constitutes a debt of the HRA; accordingly, they have not been reported as liabilities in the accompanying financial statements. At December 31, 2018, the following conduit debt existed: Lease Revenue Bonds 1,080,000$

CITY OF BRAINERD, MINNESOTA NOTES TO FINANCIAL STATEMENTS
DECEMBER 31, 2018
(75)
NOTE 4 DETAILED NOTES ON ALL FUNDS (CONTINUED)
B. Liabilities (Continued)
7. Risk Management The City is exposed to various risks of loss related to torts; theft of, damage to, or destruction of assets; errors or omissions; injuries to employees; or natural disasters. The City has entered into a joint powers agreement with the League of Minnesota Cities Insurance Trust (LMCIT). The LMCIT is a public entity risk pool currently operating as a common risk management and insurance program for Minnesota Cities. The agreement for formation of the LMCIT provides that the pool will be self-sustaining through member premiums and will reinsure through commercial companies for claims in excess of insured events. The pool can make additional assessments to make the pool self-sustaining. The City has determined that it is not possible to estimate the amount of such additional assessments; however, they are not expected to be material to the financial statements. There were no significant reductions in insurance coverage from the previous year or settlements in excess of insurance coverage for any of the past three fiscal years.
NOTE 5 PENSION PLANS
A. Public Employees Retirement Association
The City participates in the following cost-sharing multiple-employer defined benefit pension plans administered by the Public Employees Retirement Association of Minnesota (PERA). PERA’s defined benefit pension plans are established and administered in accordance with Minnesota Statutes, Chapters 353 and 356. PERA’s defined benefit pension plans are tax qualified plans under Section 401(a) of the Internal Revenue Code. 1. General Employees Retirement Fund (General Employees Plan)
All full-time and certain part-time employees of the City are covered by the General Employees Plan. General Employees Plan members belong to the Coordinated Plan. Coordinated Plan members are covered by Social Security.
2. Public Employees Police and Fire Plan (Police and Fire Plan) The Police and Fire Plan, originally established for police officers and firefighters not covered by a local relief association, now covers all police officers and firefighters hired since 1980. Effective July 1, 1999, the Police and Fire Plan also covers police officers and firefighters belonging to a local relief association that elected to merge with and transfer assets and administration to PERA.

CITY OF BRAINERD, MINNESOTA NOTES TO FINANCIAL STATEMENTS
DECEMBER 31, 2018
(76)
NOTE 5 PENSION PLANS (CONTINUED)
B. Benefits Provided
PERA provides retirement, disability, and death benefits. Benefit provisions are established by state statute and can only be modified by the state legislature. Vested, terminated employees who are entitled to benefits but are not receiving them yet are bound by the provisions in effect at the time they last terminated their public service. 1. General Employees Plan Benefits
General Employees Plan benefits are based on a member’s highest average salary for any five successive years of allowable service, age, and years of credit at termination of service. Two methods are used to compute benefits for PERA’s Coordinated Plan members. Members hired prior to July 1, 1989, receive the higher of Method 1 or Method 2 formulas. Only Method 2 is used for members hired after June 30, 1989. Under Method 1, the accrual rate for Coordinated members is 1.2% of average salary for each of the first 10 years of service and 1.7% of average salary for each additional year. Under Method 2, the accrual rate for Coordinated members is 1.7% of average salary for all years of service. For members hired prior to July 1, 1989, a full annuity is available when age plus years of service equal 90 and normal retirement age is 65. For members hired on or after July 1, 1989, normal retirement age is the age for unreduced Social Security benefits capped at 66. Benefit increases are provided to benefit recipients each January. Increases are related to the funding ratio of the plan. If the General Employees Plan is at least 90% funded for two consecutive years, benefit recipients are given a 2.5% increase. If the plan has not exceeded 90% funded, or have fallen below 80%, benefit recipients are given a 1% increase. A benefit recipient who has been receiving a benefit for at least 12 full months as of June 30, will receive a full increase. Members receiving benefits for at least one month but less than 12 full months as of June 30 will receive a pro rata increase.
2. Police and Fire Plan Benefits Benefits for Police and Fire Plan members first hired after June 30, 2010, but before July 1, 2014, vest on a prorated basis from 50% after five years up to 100% after ten years of credited service. Benefits for Police and Fire Plan members first hired after June 30, 2014, vest on a prorated basis from 50% after ten years up to 100% after 20 years of credited service. The annuity accrual rate is 3% of average salary for each year of service. A full, unreduced pension is earned when members are age 55 and vested, or for members who were first hired prior to July 1, 1989, when age plus years of service equal at least 90.

CITY OF BRAINERD, MINNESOTA NOTES TO FINANCIAL STATEMENTS
DECEMBER 31, 2018
(77)
NOTE 5 PENSION PLANS (CONTINUED)
B. Benefits Provided
2. Police and Fire Plan Benefits (Continued) Benefit increases are provided to benefit recipients each January. Police and Fire Plan benefit recipients receive a future annual 1.0% increase. An annual adjustment will equal 2.5% any time the plan exceeds a 90% funded ratio for two consecutive years. If the adjustment is increased to 2.5% and the funded ratio falls below 80% for one year or 85% for two consecutive years, the postretirement benefit increase will be lowered to one percent. A benefit recipient who has been receiving a benefit for at least 12 full months as of June 30 will receive a full increase. Members receiving benefits for at least one month but less than 12 full months as of June 30 will receive a pro rata increase. For retirements after May 31, 2014, the first increase will be delayed two years.
C. Contributions
Minnesota Statutes Chapter 353 sets the rates for employer and employee contributions. Contribution rates can only be modified by the state legislature. 1. General Employees Plan Contributions
Coordinated Plan members were required to contribute 6.50% of their annual covered salary in calendar year 2018. The City and BPU were required to contribute 7.50% for Coordinated Plan members in calendar year 2018. The City contributions to the General Employees Plan for the year ended December 31, 2018, were $218,258. BPU contributions to the General Employees Plan for the year ended December 31, 2018, were $276,672. The City and BPU contributions were equal to the required contributions as set by state statute.
2. Police and Fire Plan Contributions Plan members were required to contribute 10.8% of their annual covered salary in calendar year 2018. The City was required to contribute 16.20% of pay for Police and Fire Plan members in calendar year 2018. The City contributions to the Police and Fire Plan for the year ended December 31, 2018, were $319,608. The City contributions were equal to the required contributions as set by state statute.

CITY OF BRAINERD, MINNESOTA NOTES TO FINANCIAL STATEMENTS
DECEMBER 31, 2018
(78)
NOTE 5 PENSION PLANS (CONTINUED)
D. Pension Costs
1. General Employees Fund Pension Costs At December 31, 2018, the City reported a liability of $2,313,346 for its proportionate share of the General Employees Fund’s net pension liability and BPU reported a liability of $2,956,866 for its proportionate share of the General Employees Fund’s net pension liability. The City and BPU’s net pension liability reflected a reduction due to the State of Minnesota’s contribution of $16 million to the fund in 2018. The State of Minnesota is considered a non-employer contributing entity and the State’s contribution meets the definition of a special funding situation. The State of Minnesota’s proportionate share of the net pension liability associated with the City totaled $75,939 and the State of Minnesota’s proportionate share of the net pension liability associated with BPU totaled $97,081. The net pension liability was measured as of June 30, 2018, and the total pension liability used to calculate the net pension liability was determined by an actuarial valuation as of that date. The City and BPU proportion of the net pension liability was based on the City and BPU contributions received by PERA during the measurement period for employer payroll paid dates from July 1, 2017, through June 30, 2018, relative to the total employer contributions received from all of PERA’s participating employers. At June 30, 2018, the City proportionate share was 0.0417%, which was an increase of 0.004% from its proportion as measured at June 30, 2017. At June 30, 2018, BPU’s proportionate share was 0.0533% which was a decrease of 0.0009% from its proportion measured as of June 30, 2017. For the year ended December 31, 2018, the City recognized pension expense of $160,138 for its proportionate share of the General Employees Fund’s pension expense and BPU recognized pension expense of $346,250 for its proportionate share of the General Employees Fund’s pension expense. In addition, the City recognized an additional $17,709 as pension expense (and grant revenue) and BPU recognized an additional $22,639 as pension expense (and grant revenue) for its proportionate share of the State of Minnesota’s contribution of $16 million to the General Employees Fund.

CITY OF BRAINERD, MINNESOTA NOTES TO FINANCIAL STATEMENTS
DECEMBER 31, 2018
(79)
NOTE 5 PENSION PLANS (CONTINUED)
D. Pension Costs (Continued)
1. General Employees Fund Pension Costs (Continued) At December 31, 2018, the City and BPU reported their proportionate share of the General Employees Fund’s deferred outflows of resources and deferred inflows of resources related to pensions from the following sources:
DescriptionDeferred Outflows of
ResourcesDeferred Inflows of
ResourcesDeferred Outflows of
ResourcesDeferred Inflows of
ResourcesDifferences Between Expected and Actual Economic Experience 61,231$ 67,470$ 78,263$ 86,239$ Changes in Actuarial Assumptions 221,262 260,038 282,456 332,235 Net Difference Between Projected and Actual Earnings on Pension Plan Investments - 236,387 - 302,145 Changes in Proportion 18,370 82,638 62,130 69,812 City/BPU Contributions Subsequent to the Measurement Date 109,296 - 137,268 -
Total 410,159$ 646,533$ 560,117$ 790,431$
City BPU
$109,296 and $137,268 reported as deferred outflows of resources related to pensions resulting from City and BPU contributions subsequent to the measurement date will be recognized as a reduction of the net pension liability in the year ended December 31, 2019. Other amounts reported as deferred outflows and inflows of resources related to pensions will be recognized in pension expense as follows:
City Pension BPU PensionYear Ending December 31, Expense Amount Expense Amount
2019 36,913$ 90,472$ 2020 (152,885) (142,637) 2021 (181,306) (253,702) 2022 (48,392) (61,715)

CITY OF BRAINERD, MINNESOTA NOTES TO FINANCIAL STATEMENTS
DECEMBER 31, 2018
(80)
NOTE 5 PENSION PLANS (CONTINUED)
D. Pension Costs (Continued)
2. Police and Fire Fund Pension Costs At December 31, 2018, the City reported a liability of $1,972,975 for its proportionate share of the Police and Fire Plan’s net pension liability. The net pension liability was measured as of June 30, 2018, and the total pension liability used to calculate the net pension liability was determined by an actuarial valuation as of that date. The City proportion of the net pension liability was based on the City contributions received by PERA during the measurement period for employer payroll paid dates from July 1, 2017, through June 30, 2018, relative to the total employer contributions received from all of PERA’s participating employers. At June 30, 2018, the City proportionate share was 0.19%, which was an increase of 0.002% from its proportion as measured at June 30, 2017. For the year ended December 31, 2018, the City recognized pension expense of $116,607 for its proportionate share of the Police and Fire Plan’s pension expense. The City also recognized $16,659 for the year ended December 31, 2018, as pension expense (and an offsetting reduction of net pension liability) for its proportionate share of the State of Minnesota’s on-behalf contributions to the Police and Fire Plan. Legislation passed in 2013 required the State of Minnesota to begin contributing $9 million to the Police and Fire Plan each year, starting in fiscal year 2014. At December 31, 2018, the City reported its proportionate share of the Police and Fire Plan’s deferred outflows of resources and deferred inflows of resources related to pensions from the following sources:
DescriptionDeferred Outflows of
ResourcesDeferred Inflows of
ResourcesDifferences Between Expected and Actual Economic Experience 79,521$ 484,021$ Changes in Actuarial Assumptions 2,452,900 2,904,478 Net Difference Between Projected and Actual Earnings on Pension Plan Investments - 413,245 Changes in Proportion 35,299 410,119 City Contributions Subsequent to the Measurement Date 161,553 -
Total 2,729,273$ 4,211,863$

CITY OF BRAINERD, MINNESOTA NOTES TO FINANCIAL STATEMENTS
DECEMBER 31, 2018
(81)
NOTE 5 PENSION PLANS (CONTINUED)
D. Pension Costs (Continued)
2. Police and Fire Fund Pension Costs (Continued) $161,553 reported as deferred outflows of resources related to pensions resulting from City contributions subsequent to the measurement date will be recognized as a reduction of the net pension liability in the year ended December 31, 2019. Other amounts reported as deferred outflows and inflows of resources related to pensions will be recognized in pension expense as follows:
Year Ending December 31,Pension Expenses
Amount2019 (153,490)$ 2020 (245,100) 2021 (393,385) 2022 (852,003) 2023 (165)
E. Total Pension Expense
The total pension expense for all plans recognized by the City and BPU for the year ended December 31, 2018 was $338,938.
F. Actuarial Assumptions
The total pension liability in the June 30, 2018, actuarial valuation was determined using the following actuarial assumptions:
AssumptionsInflation 2.50% per YearActive Member Payroll Growth 3.50% per YearInvestment Rate of Return 7.50%
Salary increases were based on a service-related table. Mortality rates for active members, retirees, survivors, and disabilitants for all plans were based on RP 2014 tables for males or females, as appropriate, with slight adjustments to fit PERA’s experience. Cost of living benefit increases after retirement for retirees are assumed to be 1.25% per year for the General Employees Plan and 1.0% per year for the Police and Fire Plan. Actuarial assumptions used in the June 30, 2018 valuation were based on the results of actuarial experience studies. The most recent six-year experience study in the General Employees Plan was completed in 2015. The most recent four-year experience study for Police and Fire Plan was completed in 2016. Economic assumptions were updated in 2017 based on a review of inflation and investment return assumptions.

CITY OF BRAINERD, MINNESOTA NOTES TO FINANCIAL STATEMENTS
DECEMBER 31, 2018
(82)
NOTE 5 PENSION PLANS (CONTINUED)
F. Actuarial Assumptions (Continued)
The following changes in actuarial assumptions occurred in 2018: General Employees Fund The mortality projection scale was changed from MP-2015 to MP-2017. The assumed post-retirement benefit increase was changed from 1.0% per year
through 2044 and 2.5% per year thereafter to 1.25% per year.
Police and Fire Fund The mortality projection scale was changed from MP-2016 to MP-2017. As set by statute, the assumed post-retirement benefit increase was changed from
1.0% per year through 2044 and 2.5% per year thereafter to 1.0% for all years with no trigger.
The State Board of Investment, which manages the investments of PERA, prepares an analysis of the reasonableness of the long-term expected rate of return on a regular basis using a building-block method in which best-estimate ranges of expected future rates of return are developed for each major asset class. These ranges are combined to produce an expected long-term rate of return by weighting the expected future rates of return by the target asset allocation percentages. The target allocation and best estimates of arithmetic real rates of return for each major asset class are summarized in the following table:
Asset Class Target Allocation
Long-Term Expected Real Rate
of Return Domestic Stocks 36 % 5.10 %International Stocks 17 5.30Private Markets 25 5.90Fixed Income 20 0.75Cash 2 0.00
Totals 100 %
G. Discount Rate
The discount rate used to measure the total pension liability in 2018 was 7.5%. The projection of cash flows used to determine the discount rate assumed that contributions from plan members and employers will be made at rates set in Minnesota Statutes. Based on these assumptions, the fiduciary net positions of the General Employees Fund and the Police and Fire Fund was projected to be available to make all projected future benefit payments of current plan members. Therefore, the long-term expected rate of return on pension plan investments was applied to all periods of projected benefit payments to determine the total pension liability.

CITY OF BRAINERD, MINNESOTA NOTES TO FINANCIAL STATEMENTS
DECEMBER 31, 2018
(83)
NOTE 5 PENSION PLANS (CONTINUED)
H. Pension Liability Sensitivity
The following presents the City and BPU proportionate share of the net pension liability for all plans it participates in, calculated using the discount rate disclosed in the preceding paragraph, as well as what the City and BPU proportionate share of the net pension liability would be if it were calculated using a discount rate one percentage point lower or one percentage point higher than the current discount rate:
Description
1% Decrease in Discount Rate
(6.50%)
Current Discount Rate
(7.50%)
1% Increase in Discount Rate
(8.50%)City's Proportionate Share of the General Employees Fund Net Pension Liability: 3,759,482$ 2,313,346$ 1,119,600$ BPU's Proportionate Share of the General Employees Fund Net Pension Liability: 4,805,285 2,956,866 1,431,048 City's Proportionate Share of the Police and Fire Fund Net Pension Liability: 4,230,183 1,972,975 106,358
I. Pension Plan Fiduciary Net Position
Detailed information about each pension plan’s fiduciary net position is available in a separately-issued PERA financial report that includes financial statements and required supplementary information. That report may be obtained on the Internet at www.mnpera.org.
J. Allocation
Below is the allocation of Deferred Outflows of Resources, Deferred Inflows of Resources, Net Pension Liability, and Pension Expense by opinion unit within the City:
Deferred Outflows of Resources
Deferred Inflows of Resources Net Pension Liability Pension Expense
Governmental Activities 3,176,072$ 5,142,090$ 4,122,277$ 281,842$ Sanitary Sewer Fund 4,440 7,063 25,001 1,922 Storm Sewer Fund 2,049 2,839 10,046 772 Discretely Presented Component Unit - Airport 22,856 36,046 128,997 9,917
Total 3,205,417$ 5,188,038$ 4,286,321$ 294,453$

CITY OF BRAINERD, MINNESOTA NOTES TO FINANCIAL STATEMENTS
DECEMBER 31, 2018
(84)
NOTE 5 PENSION PLANS (CONTINUED)
K. Defined Contribution Plan
The elected officials of the City of Brainerd are covered by the Public Employees Defined Contribution Plan (PEDCP), a multiple-employer deferred compensation plan administered by PERA. The PEDCP is a tax qualified plan under Section 401(a) of the Internal Revenue Code and all contributions by or on behalf of employees are tax deferred until time of withdrawal. Plan benefits depend solely on amounts contributed to the plan plus investment earnings, less administrative expenses. Minnesota Statutes, Chapter 353D.03, specifies plan provisions, including the employee and employer contribution rates for those qualified personnel who elect to participate. An eligible elected official who decides to participate contributes 5% of salary which is matched by the elected official’s employer. For ambulance service personnel, employer contributions are determined by the employer, and for salaried employees must be a fixed percentage of salary. Employer contributions for volunteer personnel may be a unit value for each call or period of alert duty. Employees who are paid for their services may elect to make member contributions in an amount not to exceed the employer share. Employer and employee contributions are combined and used to purchase shares in one or more of the seven accounts of the Minnesota Supplemental Investment Fund. For administering the plan, PERA receives 2% of employer contributions and twenty-five hundredths of 1% (.0025) of the assets in each member’s account annually. Total contributions made by the City during fiscal year 2018 were:
PercentageAmount of Covered Payroll
RequiredEmployees Employer Employees Employer Rates
2,790$ 2,790$ 5.00% 5.00% 5.00%
Component Unit – HRA – Defined Contribution Plan
Qualified employees of the HRA belong to the Housing Renewal and Local Agency Retirement Plan, which is a defined contribution retirement plan. The retirement plan is a national plan with local or regional housing authorities and commissions, urban renewal agencies and other organizations eligible to participate. The Plan and Trust are qualified under Section 401(a) of the Internal Revenue Code and their income is exempt from taxation under Section 501(a) of the Code. Plan provisions and contribution requirements are established and amended by the Board of Trustees.

CITY OF BRAINERD, MINNESOTA NOTES TO FINANCIAL STATEMENTS
DECEMBER 31, 2018
(85)
NOTE 5 PENSION PLANS (CONTINUED)
K. Defined Contribution Plan (Continued)
Component Unit – HRA – Defined Contribution Plan (Continued)
Terminated or retiring participants are entitled to certain benefits including the full amount of their contributions to the Plan as well as earnings on their contributions. In addition to the amount of their contribution, each participant is entitled to the portion of the employer’s contributions in which he or she has a vested interest. Detailed information concerning the HRA’s pension plan is presented in its publicly available annual report for the year ended December 31, 2018. That report may be obtained by contacting the HRA. Plan Funding The Plan is funded by employer and employee contributions (7.5% and 5.5% of gross wages, respectively). The HRA's contributions for the year ended December 31, 2018, 2017, and 2016 were $59,406, $57,480, and $50,822, respectively.
NOTE 6 FIREFIGHTERS RELIEF ASSOCIATION DEFINED BENEFIT PENSION PLAN
A. Plan Description
Firefighters of the City of Brainerd are members of the Brainerd Firefighters Relief Association (the Association). The Association is the administrator of the single-employer defined benefit pension plan available to firefighters. The Plan is administered pursuant to Minnesota Statutes, Chapter 69, Chapter 424A, and the Association’s by-laws. As of January 1, 2017, membership includes 33 active participants and 6 inactive participants entitled to benefit but not yet receiving them. The Plan issues a stand-alone financial statement.
B. Benefits Provided
Authority for payment of pension benefits is established in Minnesota Statutes §69.77 and may be amended only by the Minnesota State Legislature. Each member who is at least 50 years of age, has retired from the Fire Department, has served at least 20 years of active service with such department before retirement shall be entitled to a lump sum service pension in the amount of $9,500 for each year of active Fire Department service but not exceeding the maximum amount per year of service allowed by law for the minimum average amount of available financing per firefighter as prescribed by law. Pursuant to Minnesota Statutes §424A.02, Subds. 2 and 4, members who retire with five years of service and have reached the age of 50 years are eligible for a retirement benefit. Members who retire before full retirement age and years of service requirements are eligible for a reduced benefit, based on the vesting schedule as set forth in Minnesota Statutes §424A.02, Subd. 2(c). During the time a member is on early vested pension, they will not be eligible for disability benefits.
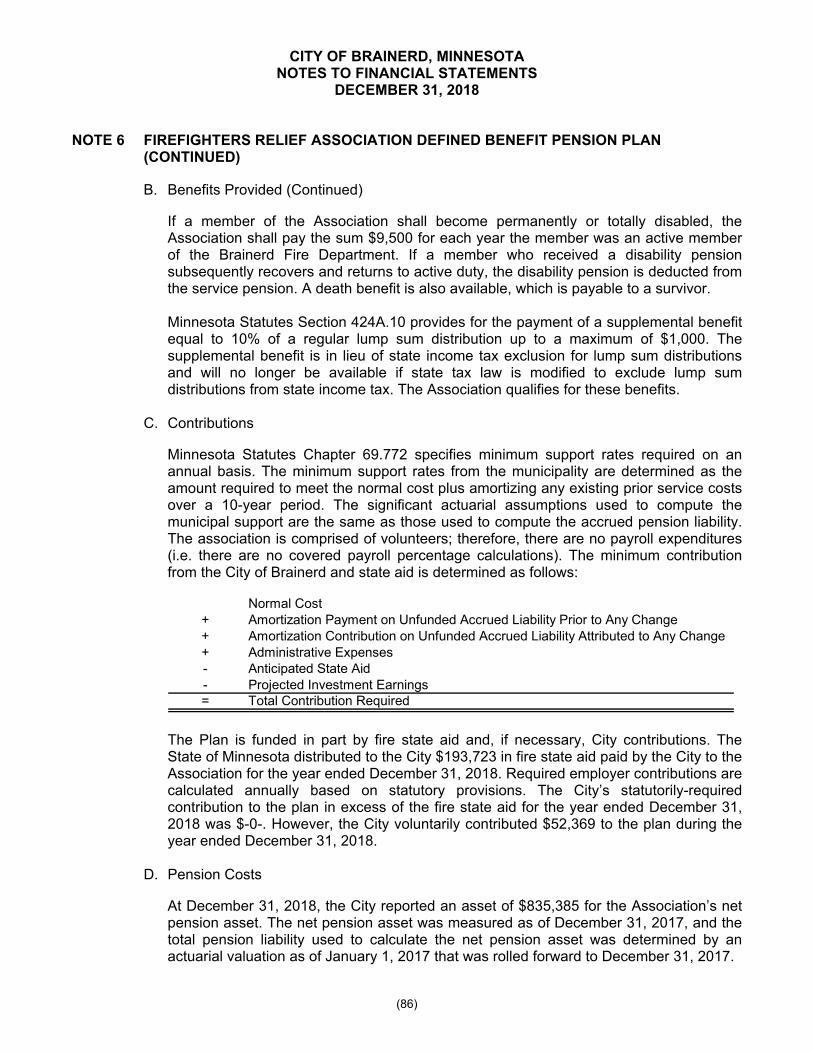
CITY OF BRAINERD, MINNESOTA NOTES TO FINANCIAL STATEMENTS
DECEMBER 31, 2018
(86)
NOTE 6 FIREFIGHTERS RELIEF ASSOCIATION DEFINED BENEFIT PENSION PLAN (CONTINUED)
B. Benefits Provided (Continued)
If a member of the Association shall become permanently or totally disabled, the Association shall pay the sum $9,500 for each year the member was an active member of the Brainerd Fire Department. If a member who received a disability pension subsequently recovers and returns to active duty, the disability pension is deducted from the service pension. A death benefit is also available, which is payable to a survivor. Minnesota Statutes Section 424A.10 provides for the payment of a supplemental benefit equal to 10% of a regular lump sum distribution up to a maximum of $1,000. The supplemental benefit is in lieu of state income tax exclusion for lump sum distributions and will no longer be available if state tax law is modified to exclude lump sum distributions from state income tax. The Association qualifies for these benefits.
C. Contributions
Minnesota Statutes Chapter 69.772 specifies minimum support rates required on an annual basis. The minimum support rates from the municipality are determined as the amount required to meet the normal cost plus amortizing any existing prior service costs over a 10-year period. The significant actuarial assumptions used to compute the municipal support are the same as those used to compute the accrued pension liability. The association is comprised of volunteers; therefore, there are no payroll expenditures (i.e. there are no covered payroll percentage calculations). The minimum contribution from the City of Brainerd and state aid is determined as follows:
Normal Cost+ Amortization Payment on Unfunded Accrued Liability Prior to Any Change+ Amortization Contribution on Unfunded Accrued Liability Attributed to Any Change+ Administrative Expenses- Anticipated State Aid- Projected Investment Earnings= Total Contribution Required
The Plan is funded in part by fire state aid and, if necessary, City contributions. The State of Minnesota distributed to the City $193,723 in fire state aid paid by the City to the Association for the year ended December 31, 2018. Required employer contributions are calculated annually based on statutory provisions. The City’s statutorily-required contribution to the plan in excess of the fire state aid for the year ended December 31, 2018 was $-0-. However, the City voluntarily contributed $52,369 to the plan during the year ended December 31, 2018.
D. Pension Costs
At December 31, 2018, the City reported an asset of $835,385 for the Association’s net pension asset. The net pension asset was measured as of December 31, 2017, and the total pension liability used to calculate the net pension asset was determined by an actuarial valuation as of January 1, 2017 that was rolled forward to December 31, 2017.

CITY OF BRAINERD, MINNESOTA NOTES TO FINANCIAL STATEMENTS
DECEMBER 31, 2018
(87)
NOTE 6 FIREFIGHTERS RELIEF ASSOCIATION DEFINED BENEFIT PENSION PLAN (CONTINUED)
D. Pension Costs (Continued)
As a result of its requirement to contribute to the Relief Association, the City recognized pension expense of $62,193 for the year ended December 31, 2018. At December 31, 2018, the City reported deferred outflows of resources and deferred inflows of resources from the following sources:
DescriptionDeferred Outflows of
ResourcesDeferred Inflows of
Resources
Differences Between Expected and Actual Economic Experience -$ 164,473$ Changes in Actuarial Assumptions 13,616 -
Net Difference Between Projected and Actual Earnings on Pension Plan Investments - 165,169 City Contributions Subsequent to the Measurement Date 52,369 - Total 65,985$ 329,642$
The City contributions to the Association subsequent to the measurement date, $52,369 reported as deferred outflows of resources will be recognized as a reduction of the net pension liability in the year ended December 31, 2019. Other amounts reported as deferred outflows and inflows of resources related to the Association’s pension will be recognized in pension expense as follows:
Year Ending December 31,Pension Expense
Amount2019 (43,057)$ 2020 (47,793) 2021 (93,890) 2022 (81,000) 2023 (25,143)
Thereafter (25,143)

CITY OF BRAINERD, MINNESOTA NOTES TO FINANCIAL STATEMENTS
DECEMBER 31, 2018
(88)
NOTE 6 FIREFIGHTERS RELIEF ASSOCIATION DEFINED BENEFIT PENSION PLAN (CONTINUED)
E. Actuarial Assumptions
The actuarial total pension liability was determined as of January 1, 2017, using the following actuarial assumptions, applied to all periods included in the measurement: Valuation Date 1/1/2017Actuarial Cost Method Entry Age NormalAmortization Method Level Dollar
ClosedActuarial Assumptions:Discount Rate 5.25%Investment Rate of Return 5.25%20-Year Municipal Bond Yield 3.50%Age of Service Retirement 50 The best-estimate of expected future real rates of return were developed by aggregating data from several published capital market assumption surveys and deriving a single best-estimate based on the average survey values. These capital market assumptions reflect both historical market experience as well as diverse views regarding anticipated future returns. The expected inflation assumption was developed based on an analysis of historical experience blended with forward-looking expectations available in market data. Best estimates of geometric real and nominal rates of return for each major asset class included in the pension plan's asset allocation as of December 31, 2017 are summarized in the following table:
Asset Class Portfolio WeightExpected Class
Return
Cash 15.00 % 2.00 %Fixed Income 28.00 3.50Equities 56.00 7.00Other 1.00 6.00
Total Portfolio 100.00 % 5.25

CITY OF BRAINERD, MINNESOTA NOTES TO FINANCIAL STATEMENTS
DECEMBER 31, 2018
(89)
NOTE 6 FIREFIGHTERS RELIEF ASSOCIATION DEFINED BENEFIT PENSION PLAN (CONTINUED)
F. Discount Rate
The discount rate used to measure the total pension asset was 5.25%. Assets were projected using expected benefit payments and expected asset returns. Expected benefit payments were discounted by year using expected assets return assumption for years in which the assets were sufficient to pay all benefit payments. Any remaining benefit payments after the trust fund is exhausted are discounted at the municipal bond rate of return. The equivalent single rate is the discount rate. Based on those assumptions, the pension plan’s fiduciary net position was projected to be available to make all projected future benefit payments of current plan members.
G. Pension Asset Sensitivity
The following presents the City of Brainerd’s proportionate share of the net pension asset of the Association, calculated using the discount rate of 5.25%, as well as what the Association’s net pension liability would be if it were calculated using a discount rate that is one percentage point lower (4.25%) or one percentage point higher (6.25%) than the current rate:
1% Decrease in Discount Rate
(4.25%)Current Discount
Rate (5.25%)
1% Increase in Discount Rate
(6.25%)Net Pension Liability (Asset) (761,337)$ (835,385)$ (907,116)$

CITY OF BRAINERD, MINNESOTA NOTES TO FINANCIAL STATEMENTS
DECEMBER 31, 2018
(90)
NOTE 6 FIREFIGHTERS RELIEF ASSOCIATION DEFINED BENEFIT PENSION PLAN (CONTINUED)
H. Plan’s Fiduciary Net Position
Information about the changes in the Plan’s net pension asset is as follows: Total Pension LiabilityService Cost 138,165$ Interest 124,317 Differences Between Expected and Actual Experience 177,823 Benefit Payments, Including Member Refunds (192,583) Net Change in Total Pension Liability 247,722
Total Pension Liability - Beginning of Year 2,326,072 Total Pension Liability - End of Year (a) 2,573,794
Plan Fiduciary Net PositionMunicipal Contributions 255,293 Net Investment Income 434,272 Benefit Payments (192,583) Administrative Expenses (17,129) Net Change in Fiduciary Net Position 479,853
Fiduciary Net Position - Beginning of Year 2,929,326 Fiduciary Net Position - End of Year (b) 3,409,179
(835,385)$ Association's Net Pension Liability/(Asset) - Ending (a) - (b)
Detailed information about the pension plan’s fiduciary net position is available in the audit report. That report may be obtained by calling Brainerd City Hall at 218-828-2307, or on-line at www.ci.brainerd.mn.us.

CITY OF BRAINERD, MINNESOTA NOTES TO FINANCIAL STATEMENTS
DECEMBER 31, 2018
(91)
NOTE 7 OTHER POSTEMPLOYMENT BENEFITS OTHER THAN PENSIONS
The City operates a single-employer retiree benefit plan (the Plan) that provides health insurance to eligible employees and their spouses through the City’s health insurance plan. Benefit and eligibility provisions are established through negotiations and are renegotiated every two years. The Plan does not issue a publicly available financial report. Below are the total employees on the plan:
City BPU AirportActive Employees 49 47 2Inactive Employees 4 1 -
- - - Inactive Employees Entitled but not Receiving Benefits
Funding Policy The City has no assets accumulated in a trust that meets the criteria in GASB 75. Contribution requirements are negotiated. The eligibility for, amount of, duration of, and the City’s contribution to the cost of the benefits provided varies by contract and date of retirement. The City is funding this liability on a pay-as-you-go basis.
Actuarial Methods and Assumptions The City’s OPEB liability was measured as of January 1, 2018, and the total OPEB liability was determined by an actuarial valuation as of January 1, 2018. The total OPEB liability was determined by an actuarial valuation of as January 1, 2018, using the following actuarial assumptions, applied to all periods included in the measurement, unless otherwise specified: Inflation 2.50%Salary Increases 3.00%Health Care Trend Rates 6.50% Decreasing to
5.00% Over 6Years
Mortality rates were based on the RP-2014 with projected mortality improvements based on scale MP- 2017, and other adjustments. The actuarial assumptions used in the January 1, 2018 valuation were based on the results of an actuarial experience study for the period January 1, 2017 to December 31, 2017. The discount rate used to measure the total OPEB liability was 3.30%. The discount rate is based on the estimated yield of 20-yield AA-rated municipal bonds.

CITY OF BRAINERD, MINNESOTA NOTES TO FINANCIAL STATEMENTS
DECEMBER 31, 2018
(92)
NOTE 7 OTHER POSTEMPLOYMENT BENEFITS OTHER THAN PENSIONS (CONTINUED)
Actuarial Methods and Assumptions (Continued) Since the most recent GASB 45 valuation, the following changes have been made: The mortality tables were updated from the RP-2014 White Collar Mortality Tables with
MP-2014 Generational Improvement Scale to the RP-2017 White Collar Mortality Tables with MP-2017 Generational Improvement Scale.
The retirement and withdrawal tables for all employees were updated. The retiree plan participation assumptions for participants not eligible for a pre-65
subsidy was changed from 50% to 40%. The percent of married retirees electing spouse coverage was changed from 25% to 50%.
The discount rate was changed from 4.00% to 3.30%. Changes in the OPEB Liability
BrainerdPublic Brainerd Brainerd
City Utilities HRA Airport TotalBalance December 31, 2017, as Restated 993,471$ 370,966$ 74,718$ 2,898$ 1,442,053$ Changes for the Year:
Service Cost 46,846 23,674 8,901 1,023 80,444 Interest Cost 32,840 12,031 2,702 91 47,664 Benefit Payments (91,067) (60,631) (3,513) (2,335) (157,546)
Net change in Total OPEB Liability (11,381) (24,926) 8,090 (1,221) (29,438) Balance as December 31, 2018 982,090$ 346,040$ 82,808$ 1,677$ 1,412,615$
Discretely Presented Component Units
The following presents the OPEB liability of the City, BPU, the HRA, and the Airport, as well as what the OPEB liability would be it if were calculated using a discount rate one percentage lower or one percentage higher than the current discount rate:
1% Decrease Discount Rate 1% IncreaseOPEB Liability (2.30%) (3.30%) (4.30%)City 1,044,666$ 982,090$ 923,958$ Brainerd Public Utilities 367,282 346,040 325,738 Brainerd HRA 88,302 82,808 77,534 Brainerd Airport 1,764 1,677 1,597 Total 1,502,014$ 1,412,615$ 1,328,827$

CITY OF BRAINERD, MINNESOTA NOTES TO FINANCIAL STATEMENTS
DECEMBER 31, 2018
(93)
NOTE 7 OTHER POSTEMPLOYMENT BENEFITS OTHER THAN PENSIONS (CONTINUED)
Actuarial Methods and Assumptions (Continued) The following presents the OPEB liability of the City, BPU, the HRA, and the Airport, as well as what the OPEB liability would be if it were calculated using healthcare cost trend rates that are 1% lower (5.5% decreasing to 4.0% over 6 years) or 1% higher (7.5% decreasing to 6.0% over 6 years) than the current healthcare cost trend rates:
Current Trend1% Decrease Rates (6.5% 1% Increase
(5.5% Decreasing Decreasing to (7.5% DecreasingOPEB Liability to 4.0%) 5.0%) to 6.0%)City 908,885$ 982,090$ 1,067,209$ Brainerd Public Utilities 315,039 346,040 382,250 Brainerd HRA 74,580 82,808 92,159 Brainerd Airport 1,489 1,677 1,904 Total 1,299,993$ 1,412,615$ 1,543,522$
For the year ended December 31, 2018, the City recognized OPEB expense of $79,686. At December 31, 2018, the City reported no deferred inflow of resources, and $97,939 in deferred outflows of resources resulting from amounts paid by the City for benefits due subsequent to the measurement date and will be recognized as a reduction of the OPEB liability in the year ended December 31, 2019. For the year ended December 31, 2018, BPU recognized OPEB expense of $35,705. At December 31, 2018, BPU reported no deferred inflow of resources, and $31,901 in deferred outflows of resources resulting from amounts paid by BPU for benefits due subsequent to the measurement date and will be recognized as a reduction of the OPEB liability in the year ended December 31, 2019. For the year ended December 31, 2018, the HRA recognized OPEB expense of $11,603. At December 31, 2018, the HRA reported no deferred inflow of resources, and $1,682 in deferred outflows of resources resulting from amounts paid by the HRA for benefits due subsequent to the measurement date and will be recognized as a reduction of the OPEB liability in the year ended December 31, 2019. For the year ended December 31, 2018, the Airport recognized OPEB expense of $1,114. At December 31, 2018, the Airport reported no deferred inflow of resources, and $1,022 in deferred outflows of resources resulting from amounts paid by the Airport for benefits due subsequent to the measurement date and will be recognized as a reduction of the OPEB liability in the year ended December 31, 2019.

CITY OF BRAINERD, MINNESOTA NOTES TO FINANCIAL STATEMENTS
DECEMBER 31, 2018
(94)
NOTE 8 JOINT VENTURES
Shown on the combined financial statement as a discrete component unit, is the City's interest in the Brainerd Lakes Regional Airport. The City and Crow Wing County have an agreement whereby each contribute equally to all locally financed costs of the operation of the airport. An airport commission is responsible for operations and the City provides accounting services. The City accounts for all transactions of the airport. Any appropriation by the City for the airport commission is recorded as expenditure in the year it is approved by the City Council. The City also has a 50% undivided interest in the property, improvements and buildings of the airport.
NOTE 9 SUMMARY OF OTHER ITEMS
A. Claims and Litigation
The City, in connection with the normal conduct of its affairs, is involved in various claims, judgments, and litigations. The City estimates that the potential claims resulting from such litigation and not covered by insurance would not materially affect the financial statements of the City. No liability or provision for loss has been recorded in the December 31, 2018 financial statements in relation to any of these matters.
B. Grants
Amounts received or receivable from federal and state agencies are subject to agency audit and adjustment. Any disallowed claims, including amounts already collected, may constitute a liability of the applicable funds. The amount, if any, of funds which may be disallowed by the agencies cannot be determined at this time although the City expects such amounts, if any, to be immaterial. The financial assistance received is subject to an audit pursuant to Uniform Guidance or audits by the grantor agency. The City received Small Cities Development Program money during 2008. This money was then passed through to Art Space with the intention that in 30 years, it will be repaid to the City. If the City receives the money in 30 years, the City will develop a new plan to properly spend the grant money. This receivable is not recorded due to the likelihood of the City not receiving the money.
C. Commitments
BPU is obligated to purchase all of its wholesale power requirements from Minnesota Power and Light Company through June 30, 2019. On January 4, 2016, BPU signed a market based rate full requirements power sales agreement with AEP Energy Partners, Inc. for the period July 1, 2019 through May 31, 2030.
NOTE 10 TRANSACTIONS BETWEEN THE CITY AND BPU
BPU makes monthly contributions to the City based on retail sales of the electric department. The contributions for the year ended December 31, 2018, totaled $691,284. BPU bills the City for all utility services at regular utility rates as set by the BPU Commission.

CITY OF BRAINERD, MINNESOTA NOTES TO FINANCIAL STATEMENTS
DECEMBER 31, 2018
(95)
NOTE 11 RELATED-PARTY TRANSACTIONS
At December 31, 2018, a business owned by one of the City’s council members owed the City’s Revolving Loan Fund a balance of approximately $2,371 under the City’s local business revolving loan program.
NOTE 12 TAX ABATEMENTS
The City has a pay-as-you-go tax increment financing district with a local business to promote housing development within the City as authorized under Minnesota Statutes §469.174. The City is currently collecting tax increments that are paid through the property tax collection process. The district will stop collections in 2028. The requirement for the business to receive the excess tax increments from the City is to provide affordable housing to moderate and low income individuals. The agreement calls for 95% of the property tax increments collected to be returned to the developer. For the year ended December 31, 2018, the City paid excess tax increment in the amount of $11,092. No other commitments were made by the City as a part of this agreement. The City has pay-as-you-go tax increment financing districts with local businesses to promote redevelopment within the City as authorized under Minnesota Statutes §§469.124 through 469.134. The redevelopment TIF districts permits the City to assist with virtually any type of development or redevelopment project within the boundaries of the TIF districts. The City is currently collecting tax increments that are paid through the property tax collection process. The districts will stop collections from 2029 through 2042. The increment taxes are based on the increase of the property value after the improvements are made. The agreements call for 90% to 98.50% of the property tax increments collected to be returned to the developers. For the year ended December 31, 2018, the City paid excess tax increment in the amount of $207,216. No other commitments were made by the City as a part of these agreements.
NOTE 13 RESTATEMENT FOR A CHANGE IN ACCOUNTING PRINCIPLE
During the year ended December 31, 2018, the City adopted the provisions of Governmental Accounting Standards Board Statement (GASB) No. 75, Accounting and Financial Reporting for Postemployment Benefits Other than Pensions. This pronouncement requires the restatement of the December 31, 2017 net position of the governmental activities and proprietary funds as follows:
Brainerd Santiary Sewer StormGovernmental Business-Type Public Brainerd Brainerd Collection Sewer
Activities Activities Utilities HRA Airport System FundNet Position, December 31, 2017, as Previously Reported 39,151,590$ 13,030,284$ 45,200,265$ 4,463,655$ 31,686,000$ 7,265,874$ 5,764,410$ Affect of Application of GASB 75 (509,705) (18,403) (310,335) 2,888 2,098 (13,989) (4,414) Net Position, December 31, 2017, as Restated 38,641,885$ 13,011,881$ 44,889,930$ 4,466,543$ 31,688,098$ 7,251,885$ 5,759,996$
Discretely Presented Component Units Enterprise Funds

REQUIRED SUPPLEMENTARY INFORMATION


CITY OF BRAINERD, MINNESOTA BRAINERD FIREMAN’S RELIEF ASSOCIATION
SCHEDULE OF CHANGES IN THE NET PENSION ASSET AND RELATED RATIOS LAST TEN YEARS
(96)
Measurement DateDecember 31, 2017
Measurement DateDecember 31, 2016
Measurement DateDecember 31, 2015
Measurement DateDecember 31, 2014
Total Pension LiabilityService Cost 138,165$ 155,063$ 155,042$ 151,260$ Interest 124,317 141,169 133,392 135,543 Differences Between Expected and Actual Experience 177,823 - - - Changes in Assumptions - 18,154 - - Changes in Benefit Terms - - 64,528 - Gain or Loss - (219,298) - - Benefit Payments, Including Member Refunds (192,583) (361,338) (371,914) (201) Net Change in Total Pension Liability 247,722 (266,250) (18,952) 286,602
Total Pension Liability - Beginning of Year 2,326,072 2,592,322 2,611,274 2,324,672 Total Pension Liability - End of Year (a) 2,573,794 2,326,072 2,592,322 2,611,274
Plan Fiduciary Net PositionMunicipal Contributions 255,293 257,414 266,542 249,938 Net Investment Income 434,272 216,918 (67,607) 152,718 Benefit Payments (192,583) (361,338) (371,917) (201) Administrative Expenses (17,129) (15,586) (18,356) (14,697) Other Changes - - - (23,681) Net Change in Fiduciary Net Position 479,853 97,408 (191,338) 364,077
Fiduciary Net Position - Beginning of Year 2,929,326 2,831,918 3,023,253 2,659,173 Fiduciary Net Position - End of Year (b) 3,409,179 2,929,326 2,831,915 3,023,250
(835,385)$ (603,254)$ (239,593)$ (411,976)$
132.46% 125.93% 109.24% 115.78%
Covered Payroll N/A N/A N/A N/A
N/A N/A N/A N/A
Association's Net Pension Liability/(Asset) - End of Year (a) - (b)
Fiduciary Net Position as a Percentage of the Total Pension Liability
Net Pension Liability/(Asset) as a Percentage of Covered Payroll
Note: Information is presented prospectively and an accumulation of 10 years will be provided when available.

CITY OF BRAINERD, MINNESOTA SCHEDULE OF CHANGES IN THE CITY’S OPEB LIABILITY AND RELATED RATIOS
YEAR ENDED DECEMBER 31, 2018
(97)
Measurement
DateJanuary 1, 2018
Total OPEB LiabilityService Cost 80,444$ Interest Cost 47,664 Assumption Changes - Benefit Payments (157,546) Net Change in Total OPEB Liability (29,438) Total OPEB Liability - Beginning 1,442,053 Total OPEB Liability - Ending 1,412,615$
Covered-Employee Payroll 7,465,484$
19%City's OPEB Liability as a Percentage of Covered-Employee Payroll
Note 1: Information is presented prospectively and an accumulation of 10 years will be provided when available. Note 2: No assets are accumulated in a trust for payment of OPEB benefits.

CITY OF BRAINERD, MINNESOTA SCHEDULE OF THE CITY’S PROPORTIONATE SHARE
OF THE NET PENSION LIABILITY LAST TEN MEASUREMENT PERIODS
(98)
Measurement Date
June 30, 2018Measurement Date
June 30, 2017Measurement Date
June 30, 2016Measurement Date
June 30, 2015General Employee Fund - CityCity's Proportion of the Net Pension Liability 0.0417% 0.0413% 0.0437% 0.0449%City's Proportionate Share of the Net Pension Liability 2,313,345$ 2,636,565$ 3,548,223$ 2,326,952$ State's Proportionate Share of the Net Pension Liability Associated with the City 75,939 33,145 46,267 -
2,389,284$ 2,669,710$ 3,594,490$ 2,326,952$
City's Covered Payroll 2,805,045$ 2,659,329$ 2,710,025$ 2,639,880$ 82.47% 99.14% 130.93% 88.15%79.53% 75.90% 68.91% 78.20%
General Employee Fund - BPUBPU's Proportion of the Net Pension Liability 0.0533% 0.0542% 0.0520% 0.0543%BPU's Proportionate Share of the Net Pension Liability 2,956,866$ 3,460,092$ 4,222,142$ 2,814,108$ State's Proportionate Share of the Net Pension Liability Associated with BPU 97,081 43,509 55,060 -
3,053,947$ 3,503,601$ 4,277,202$ 2,814,108$
BPU's Covered Payroll 3,584,388$ 3,491,769$ 3,224,539$ 3,189,264$ 82.49% 99.09% 130.94% 88.24%79.53% 75.90% 68.91% 78.20%
Police and Fire FundCity's Proportion of the Net Pension Liability 0.1900% 0.1830% 0.2080% 0.2320%City's Proportionate Share of the Net Pension Liability 1,972,975$ 2,470,718$ 8,347,402$ 2,636,063$ City's Covered Payroll 1,950,374$ 1,777,822$ 2,000,021$ 2,123,949$
101.16% 138.97% 417.37% 124.11%88.84% 85.40% 63.90% 78.20%Plan Fiduciary Net Position as a Percentage of the Total Pension Liability
BPU's Proportionate Share of the Net Pension Liability as a Percentage of Its Covered PayrollPlan Fiduciary Net Position as a Percentage of the Total Pension Liability
Total City's Proportionate Share of the Net Pension Liability and State's Proportionate Share of the Net Pension Liability
Total BPU's Proportionate Share of the Net Pension Liability and State's Proportionate Share of the Net Pension Liability
City's Proportionate Share of the Net Pension Liability as a Percentage of Its Covered PayrollPlan Fiduciary Net Position as a Percentage of the Total Pension Liability
City's Proportionate Share of the Net Pension Liability as a Percentage of Its Covered Payroll
Note: Information is presented prospectively and an accumulation of 10 years will be provided when available.

CITY OF BRAINERD, MINNESOTA SCHEDULE OF CITY PERA CONTRIBUTIONS
LAST TEN YEARS
(99)
2018 2017 2016 2015 2014
General Employee Fund - CityContractually Required Contribution 218,258$ 202,498$ 196,628$ 205,880$ 188,278$ Contributions in Relation to the Contractually Required Contribution (218,258) (202,498) (196,628) (205,880) (188,278) Contribution Deficiency (Excess) -$ -$ -$ -$ -$
City's Covered Payroll 2,910,111$ 2,699,973$ 2,621,712$ 2,745,076$ 2,596,929$
Contributions as a Percentage of Covered Payroll 7.50% 7.50% 7.50% 7.50% 7.25%
General Employee Fund - BPUContractually Required Contribution 276,672$ 258,176$ 244,836$ 251,138$ 213,149$ Contributions in Relation to the Contractually Required Contribution (276,672) (258,176) (244,836) (251,138) (213,149) Contribution Deficiency (Excess) -$ -$ -$ -$ -$
BPUs Covered Payroll 3,688,960$ 3,442,336$ 3,264,478$ 3,354,434$ 2,939,984$
Contributions as a Percentage of Covered Payroll 7.50% 7.50% 7.50% 7.49% 7.25%
Police and Fire Fund - CityContractually Required Contribution 319,608$ 309,929$ 299,349$ 353,057$ 312,432$ Contributions in Relation to the Contractually Required Contribution (319,608) (309,929) (299,349) (353,057) (312,432) Contribution Deficiency (Excess) -$ -$ -$ -$ -$
City's Covered Payroll 1,972,885$ 1,913,143$ 1,847,833$ 2,179,363$ 2,042,040$
Contributions as a Percentage of Covered Payroll 16.20% 16.20% 16.20% 16.20% 15.30%
Fire Relief Association PlanStatutorily Required Contribution 193,723$ 196,198$ 194,646$ 206,218$ 203,105$ Contributions in Relation to the Statutorily Required Contribution (246,092) (254,293) (255,414) (263,542) (249,938) Contribution Deficiency/(Excess) (52,369)$ (58,095)$ (60,768)$ (57,324)$ (46,833)$
Association's Covered Payroll N/A N/A N/A N/A N/A
Contributions as a Percentage of Covered Payroll N/A N/A N/A N/A N/A
Note: Information is presented prospectively and an accumulation of 10 years will be provided when available.

CITY OF BRAINERD, MINNESOTA BUDGETARY COMPARISON SCHEDULE
GENERAL FUND YEAR ENDED DECEMBER 31, 2018
See accompanying Notes to Required Supplementary Information.
(100)
ACTUAL FINAL BUDGET
REVENUES Taxes $ 1,426,450 $ 1,426,450 $ 1,568,587 $ 142,137 Licenses and Permits 330,320 330,320 538,283 207,963 Intergovernmental 259,303 259,303 369,548 110,245 Charges for Services 30,640 30,640 36,345 5,705 Special Assessments 20,000 20,000 41,904 21,904 Interest 8,000 8,000 12,304 4,304 Miscellaneous 427,443 427,443 440,801 13,358
Total Revenues 2,502,156 2,502,156 3,007,772 505,616
EXPENDITURESCurrentGeneral GovernmentMayor and Council 131,389 131,389 129,653 (1,736) City Administration 532,554 532,554 507,454 (25,100) Legal 70,000 70,000 72,658 2,658 Engineering 111,009 111,009 116,939 5,930 Information Technology 254,261 254,261 253,104 (1,157) Planning and Zoning 181,632 181,632 174,175 (7,457) Buildings and Plant 79,984 79,984 85,155 5,171 Inspections 395,089 395,089 388,991 (6,098) Other 709,043 709,043 700,231 (8,812)
Capital Outlay - - 57,869 57,869 Debt ServicePrincipal Retirement 22,195 22,195 20,838 (1,357) Interest and Fiscal Charges 10,000 10,000 1,939 (8,061)
Total Expenditures 2,497,156 2,497,156 2,509,006 11,850
EXCESS OF REVENUES OVER EXPENDITURES 5,000 5,000 498,766 493,766 OTHER FINANCING SOURCES (USES)Issuance of Capital Leases - - 57,869 57,869 Transfers In - - 173,572 173,572 Transfers Out (20,000) (20,000) (163,691) (143,691)
Total Other Financing Sources (Uses) (20,000) (20,000) 67,750 87,750
NET CHANGE IN FUND BALANCE $ (15,000) $ (15,000) 566,516 $ 581,516
Fund Balance - Beginning of Year 3,527,449
FUND BALANCE - END OF YEAR $ 4,093,965
VARIANCE WITHORIGINAL FINAL
BUDGET

CITY OF BRAINERD, MINNESOTA BUDGETARY COMPARISON SCHEDULE
PUBLIC SAFETY FUND YEAR ENDED DECEMBER 31, 2018
See accompanying Notes to Required Supplementary Information.
(101)
ACTUAL FINAL BUDGETREVENUES
Taxes $ 1,089,994 $ 1,089,994 $ 960,351 $ (129,643) Intergovernmental 3,082,194 3,082,194 3,044,042 (38,152) Charges for Services 639,787 639,787 641,751 1,964 Fines and Forfeits 155,000 155,000 211,354 56,354 Contributions and Donations - - 113,456 113,456 Miscellaneous 78,500 78,500 100,300 21,800
Total Revenues 5,045,475 5,045,475 5,071,254 25,779 EXPENDITURES
CurrentPublic Safety
Police 3,686,847 3,686,847 3,667,633 (19,214) Fire 769,819 769,819 750,467 (19,352) Fire Retirement Association 259,133 259,133 246,092 (13,041) Civil Defense 6,000 6,000 4,030 (1,970) Animal Control 71,860 71,860 46,878 (24,982)
Capital Outlay - - 116,129 116,129 Debt Service
Principal Retirement 43,587 43,587 37,076 (6,511) Interest and Fiscal Charges 5,000 5,000 2,965 (2,035)
Total Expenditures 4,842,246 4,842,246 4,871,270 29,024 EXCESS (DEFICIENCY) OF REVENUES OVER EXPENDITURES 203,229 203,229 199,984 (3,245)
OTHER FINANCING SOURCES (USES)Issuance of Capital Leases - - 116,129 116,129 Transfers In - - 36,128 36,128 Transfers Out (203,229) (203,229) (255,829) (52,600)
Total Other Financing Sources (Uses) (203,229) (203,229) (103,572) 99,657 NET CHANGE IN FUND BALANCE $ - $ - 96,412 $ 96,412 Fund Balance - Beginning of Year 1,578
FUND BALANCE - END OF YEAR $ 97,990
ORIGINAL FINALVARIANCE WITHBUDGET

CITY OF BRAINERD, MINNESOTA BUDGETARY COMPARISON SCHEDULE
PARK AND RECREATION FUND YEAR ENDED DECEMBER 31, 2018
See accompanying Notes to Required Supplementary Information.
(102)
ORIGINAL FINAL ACTUALREVENUES
Taxes $ 35,000 $ 35,000 $ 35,216 $ 216 Intergovernmental 787,174 787,174 787,337 163 Charges for Services 206,600 206,600 203,026 (3,574) Contributions and Donations - - 8,652 8,652 Miscellaneous 67,000 67,000 76,371 9,371
Total Revenues 1,095,774 1,095,774 1,110,602 14,828 EXPENDITURES
CurrentCulture and Recreation 1,076,654 1,076,654 1,086,229 9,575
Capital Outlay - - 8,188 8,188 Debt Service
Principal Retirement 15,120 15,120 17,889 2,769 Interest and Fiscal Charges 4,000 4,000 1,380 (2,620)
Total Expenditures 1,095,774 1,095,774 1,113,686 17,912
EXCESS (DEFICIENCY) OF REVENUES OVER EXPENDITURES - - (3,084) (3,084)
OTHER FINANCING SOURCES (USES)Issuance of Capital Leases - - 8,188 8,188 Transfers In - - 200 200 Transfers Out - - (4,346) (4,346)
Total Other Financing Sources (Uses) - - 4,042 4,042
NET CHANGE IN FUND BALANCE $ - $ - 958 $ 958 Fund Balance - Beginning of Year 660
FUND BALANCE - END OF YEAR $ 1,618
VARIANCE WITHFINAL BUDGET
BUDGET

CITY OF BRAINERD, MINNESOTA BUDGETARY COMPARISON SCHEDULE
STREET FUND YEAR ENDED DECEMBER 31, 2018
See accompanying Notes to Required Supplementary Information.
(103)
VARIANCE WITH
ACTUAL FINAL BUDGETREVENUES
Taxes $ 40,000 $ 40,000 $ 39,883 $ (117) Intergovernmental 625,466 625,466 625,466 - Special Assessments 10,800 10,800 21,447 10,647 Miscellaneous 280,000 280,000 309,398 29,398
Total Revenues 956,266 956,266 996,194 39,928 EXPENDITURES
CurrentPublic Works
Streets and Alleys 807,777 807,777 933,911 126,134 Ice and Snow Removal 85,050 85,050 152,317 67,267 Traffic Control 64,639 64,639 32,438 (32,201)
Debt ServicePrincipal Retirement 7,500 7,500 7,612 112 Interest and Fiscal Charges 1,300 1,300 324 (976)
Total Expenditures 966,266 966,266 1,126,602 160,336
EXCESS (DEFICIENCY) OF REVENUES OVER EXPENDITURES (10,000) (10,000) (130,408) (120,408)
OTHER FINANCING SOURCES (USES)Transfers In 10,000 10,000 130,292 120,292
NET CHANGE IN FUND BALANCE $ - $ - (116) $ (116) Fund Balance - Beginning of Year 566
FUND BALANCE - END OF YEAR $ 450
ORIGINAL FINALBUDGET

CITY OF BRAINERD, MINNESOTA BUDGETARY COMPARISON SCHEDULE
ECONOMIC DEVELOPMENT AUTHORITY FUND YEAR ENDED DECEMBER 31, 2018
See accompanying Notes to Required Supplementary Information.
(104)
REVENUES
Taxes $ 122,223 $ 122,223 $ 122,209 $ (14) Interest 100 100 247 147
Total Revenues 122,323 122,323 122,456 133
EXPENDITURES Current
Economic Development 116,322 116,322 115,435 (887)
NET CHANGE IN FUND BALANCE $ 6,001 $ 6,001 7,021 $ 1,020
Fund Balance - Beginning of Year 26,966
FUND BALANCE - END OF YEAR $ 33,987
VARIANCE WITHFINAL BUDGETFINAL ACTUALORIGINAL
BUDGET

CITY OF BRAINERD, MINNESOTA NOTES TO REQUIRED SUPPLEMENTARY INFORMATION
YEAR ENDED DECEMBER 31, 2018
(105)
NOTE 1 LEGAL COMPLIANCE – BUDGETS
The General, Public Safety, Park and Recreation, Street, and Economic Development Authority Fund budgets are legally adopted on a basis consistent with accounting principles generally accepted in the United States of America. Any budgetary overages were considered by the City’s management to be the result of necessary expenditures critical to operations and were approved by the Council.
NOTE 2 UNBUDGETED MAJOR SPECIAL REVENUE FUND
The City has not adopted a budget for the Revolving Loans Fund. Thus, there is no budgetary comparison schedule included in the required supplementary information.
NOTE 3 CHANGES IN SIGNIFICANT PENSION PLAN PROVISIONS, ACTUARIAL METHODS, AND ASSUMPTIONS
The following changes were reflected in the valuation performed on behalf of the Public Employees Retirement Association for the year ended June 30: A. General Employees Fund
2018 The mortality projection scale was changed from MP-2015 to MP-2017. The assumed post-retirement benefit increase was changed from 1.0% per year
through 2044 and 2.5% per year thereafter to 1.25% per year. 2017 The Combined Service Annuity (CSA) loads were changed from 0.8% for active
members and 60% for vested and non-vested deferred members. The revised CSA loads are now 0.0% for active member liability, 15.0% for vested deferred member liability and 3.0% for non-vested deferred member liability.
The assumed post-retirement benefit increase rate was changed from 1.0% per year for all years to 1.0% per year through 2044 and 2.5 % per year thereafter.
2016 The assumed post-retirement benefit increase rate was changed from 1.0% per year
through 2035 and 2.5% per year thereafter to 1.0% per year for all future years. The assumed investment return was changed from 7.9% to 7.5%. The single
discount rate was changed from 7.9% to 7.5%. Other assumptions were changed pursuant to the experience study dated June 30,
2015. The assumed future salary increases, payroll growth, and inflation were decreased by 0.25% to 3.25% for payroll growth and 2.50% for inflation.

CITY OF BRAINERD, MINNESOTA NOTES TO REQUIRED SUPPLEMENTARY INFORMATION (CONTINUED)
YEAR ENDED DECEMBER 31, 2018
(106)
NOTE 3 CHANGES IN SIGNIFICANT PENSION PLAN PROVISIONS, ACTUARIAL METHODS,
AND ASSUMPTIONS (CONTINUED)
B. Police and Fire Fund 2018 The mortality projection scale was changed from MP-2016 to MP-2017. As set by statute, the assumed post-retirement benefit increase was changed from
1.0% per year through 2064 and 2.5% per year thereafter to 1.0% per year for all years with no trigger.
2017 Assumed salary increases were changed as recommended in the June 30, 2016
experience study. The net effect is proposed rates that average 0.34% lower than the previous rates.
Assumed rates of retirement were changed, resulting in fewer retirements. The Combined Service Annuity (CSA) load was 30% for vested and non-vested
deferred members. The CSA has been changed to 33% for vested members and 2% for non-vested members.
The base mortality table for healthy annuitants was changed from the RP-2000 fully generational table to the RP-2014 fully generational table (with a base year of 2006), with male rates adjusted by a factor of 0.96. The mortality improvement scale was changed from Scale AA to Scale MP-2016. The base mortality table for disabled annuitants was changed from the RP-2000 disabled mortality table to the mortality tables assumed for healthy retirees.
Assumed termination rates were decreased to 3.0% for the first three years of
service. Rates beyond the select period of three years were adjusted, resulting in more expected terminations overall.
Assumed percentage of married female members was decreased from 65% to 60%. Assumed age difference was changed from separate assumptions for male members
(wives assumed to be three years younger) and female members (husbands assumed to be four years older) to the assumption that males are two years older than females.
The assumed percentage of female members electing Joint and Survivor annuities was increased.
The assumed post-retirement benefit increase rate was changed from 1.00% for all years to 1.00% per year through 2064 and 2.50% thereafter.
2016 The assumed post-retirement benefit increase rate was changed from 1.0% per year
through 2037 and 2.5% thereafter to 1.0% per year for all future years. The assumed investment return was changed from 7.9% to 7.5%. The single
discount rate changed from 7.9% to 5.6%. The assumed future salary increases, payroll growth, and inflation were decreased
by 0.25% to 3.25% for payroll growth and 2.50% for inflation.

This Page Has Been Intentionally Left Blank.

COMBINING AND INDIVIDUAL NONMAJOR FUND STATEMENTS AND SCHEDULES

NONMAJOR GOVERNMENTAL FUNDS
SPECIAL REVENUE FUNDS
Special Revenue Funds are used to account for revenues derived from specific taxes or other earmarked revenue sources. They are usually required by statute, charter provision, or local ordinance to finance particular functions or activities of government. The Nonmajor Special Revenue Funds maintained by the City are described as follows: SCHOOL PATROL FUND The School Patrol Fund was established to account for donations from individuals and service organizations that are restricted for the purpose of sending students to school patrol training at Legionville, Minnesota. RECYCLING FUND The Recycling Fund accounts for revenue from Crow Wing County’s SCORE funds, funds provided to the City from the County to develop waste reduction, recycling, and solid waste management programs, that are restricted for the City’s recycling program. CITY PARKING LOTS FUND The City Parking Lots Fund accounts for all charges for services from parking lot rentals which are committed to maintaining the City parking lots. TRANSIT FUND The Transit Fund accounts for government grant revenues which are restricted for the expenditures of the City’s dial-a-ride transportation system operation. WATER AND SEWER AVAILABILITY CHARGES FUND The Water and Sewer Availability Charges Fund was created by Ordinance 1147, which accounts for charges for services which are committed for the purpose of providing funds for the City’s wells, water treatment, water storage, water distribution systems, waste water treatment, force mains, lift stations and sewage collection systems, and the plant and facilities connected therewith, and the payment of capital charges represented by bonds, certificates of indebtedness or otherwise, which may be used to finance the costs. EMPLOYEE WELLNESS PROGRAM The Employee Wellness Program Fund was established to account for restricted grant money received for an employee wellness program. The program is designed to create, promote, develop, and maintain healthy lifestyles that will encourage habits that can be incorporated into employee’s daily lives.

NONMAJOR GOVERNMENTAL FUNDS
SPECIAL REVENUE FUNDS (CONTINUED)
PERMANENT IMPROVEMENT FUND The Permanent Improvement Fund was established by authority of the City Charter to account for property tax levy which is committed for paying the portion of the cost of improving streets and alleys assessed upon the City. MAYOR’S CONTINGENCY FUND The Mayor’s Contingency Fund was established by authority of the City Charter to account for local government aid which is committed for the use of the Mayor in paying expenditures incurred by the Mayor in promoting the best interest of the City. HYDRANT RENTAL AND ELECTRIC CURRENT FUND The Hydrant Rental and Electric Current Fund was established by authority of the City Charter to account for the property tax levy which is committed to provide payment for rent for water drawn from hydrants for the needs and use of the City and for rates for the lighting of the streets and electric power for City use to the Brainerd Public Utilities. DRUG AND DRIVING UNDER THE INFLUENCE (DUI) FORFEITURE FUND The Drug and DUI Forfeiture Fund is maintained according to federal forfeited property regulations and is used to account for restricted monies allocated to the City and spent according to their specific guidelines. It is also maintained to account for the collection of funds from the sale of recovered property and the sale of DUI forfeiture property. DUI forfeiture proceeds are restricted to DUI enforcement and education per Minnesota Statutes. TAX INCREMENT FINANCING DISTRICT FUND The Tax Increment Financing District Fund was established to account for tax increment revenues which are restricted for expenditures related to the following tax increment projects:
Taco Johns Jimmy Johns
Art Space Royal Tire
East Brainerd Mall Timberland Townhome
LOCAL OPTION SALES TAX The Local Option Sales Tax Fund accounts for the collection of the 0.5% local sales tax authorized by the State of Minnesota and voters of the City of Brainerd which are restricted for the construction costs of water and wastewater treatment plants, infrastructure, and improvements, as well as for trail improvements for the cities of Brainerd and Baxter, Minnesota.
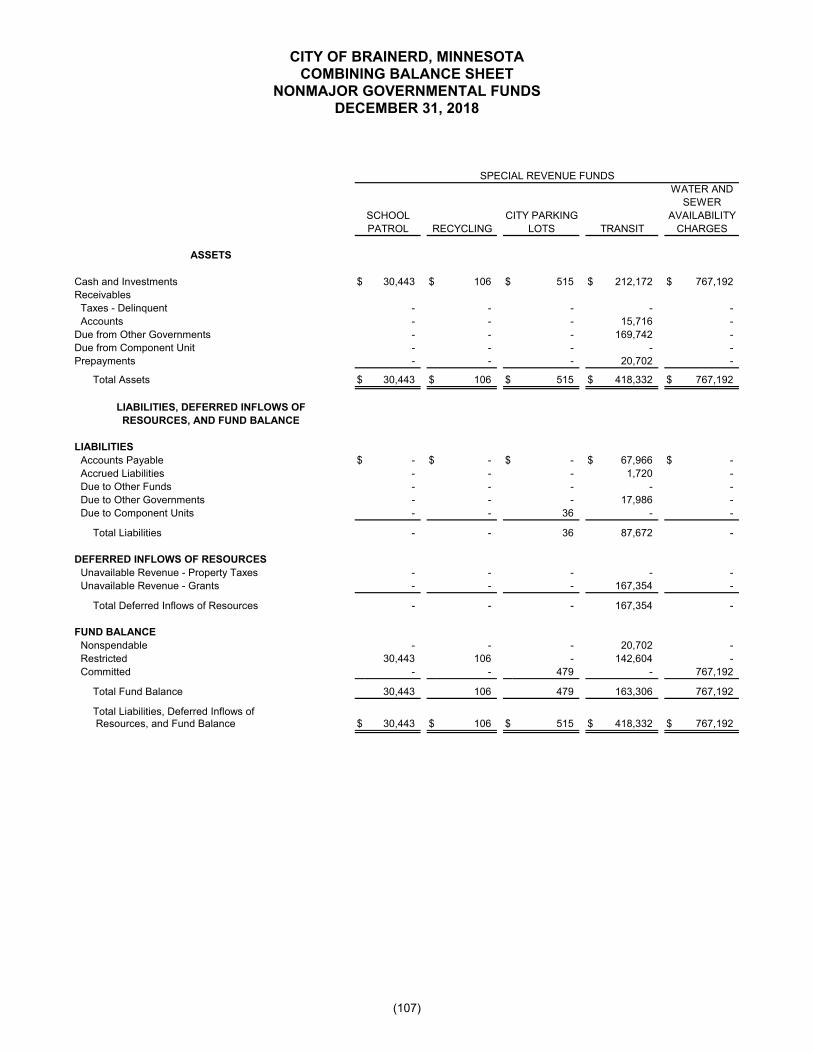
CITY OF BRAINERD, MINNESOTA COMBINING BALANCE SHEET
NONMAJOR GOVERNMENTAL FUNDS DECEMBER 31, 2018
(107)
SCHOOL CITY PARKING AVAILABILITYPATROL RECYCLING LOTS TRANSIT CHARGES
Cash and Investments $ 30,443 $ 106 $ 515 $ 212,172 $ 767,192 Receivables
Taxes - Delinquent - - - - - Accounts - - - 15,716 -
Due from Other Governments - - - 169,742 - Due from Component Unit - - - - - Prepayments - - - 20,702 -
Total Assets $ 30,443 $ 106 $ 515 $ 418,332 $ 767,192
LIABILITIESAccounts Payable $ - $ - $ - $ 67,966 $ - Accrued Liabilities - - - 1,720 - Due to Other Funds - - - - - Due to Other Governments - - - 17,986 - Due to Component Units - - 36 - -
Total Liabilities - - 36 87,672 -
DEFERRED INFLOWS OF RESOURCESUnavailable Revenue - Property Taxes - - - - - Unavailable Revenue - Grants - - - 167,354 -
Total Deferred Inflows of Resources - - - 167,354 -
FUND BALANCENonspendable - - - 20,702 - Restricted 30,443 106 - 142,604 - Committed - - 479 - 767,192
Total Fund Balance 30,443 106 479 163,306 767,192
Total Liabilities, Deferred Inflows of Resources, and Fund Balance $ 30,443 $ 106 $ 515 $ 418,332 $ 767,192
ASSETS
LIABILITIES, DEFERRED INFLOWS OFRESOURCES, AND FUND BALANCE
SEWER
SPECIAL REVENUE FUNDSWATER AND

(108)
HYDRANT LOCAL MAYOR'S RENTAL AND OPTION
WELLNESS PERMANENT CONTIN- ELECTRIC DRUG & DUI SALESPROGRAM IMPROVEMENT GENCY CURRENT FORFEITURE TAX
$ 31,529 $ - $ - $ - $ 82,890 $ 164,246 $ - $ 1,289,093
- 18,386 - 9,193 - - - 27,579 - - - - - - 3,295 19,011
1,976 - - - - - 91,777 263,495 - - - 56,829 - - - 56,829 - - - - - - - 20,702
$ 33,505 $ 18,386 $ - $ 66,022 $ 82,890 $ 164,246 $ 95,072 $ 1,676,709
$ - $ - $ - $ - $ - $ - $ - $ 67,966 - - - - - - - 1,720 - - - 56,829 - - - 56,829 - - - - 20,270 - - 38,256 - - - - - - 95,072 95,108
- - - 56,829 20,270 - 95,072 259,879
- 13,235 - 6,618 - - - 19,853 - - - - - - - 167,354
- 13,235 - 6,618 - - - 187,207
- - - - - - - 20,702 33,505 - - - 62,620 164,246 - 433,524
- 5,151 - 2,575 - - - 775,397
33,505 5,151 - 2,575 62,620 164,246 - 1,229,623
$ 33,505 $ 18,386 $ - $ 66,022 $ 82,890 $ 164,246 $ 95,072 $ 1,676,709
TAXINCREMENTFINANCINGDISTRICTS TOTALS
EMPLOYEE
SPECIAL REVENUE FUNDS

CITY OF BRAINERD, MINNESOTA COMBINING STATEMENT OF REVENUES, EXPENDITURES, AND
CHANGES IN FUND BALANCES NONMAJOR GOVERNMENTAL FUNDS
YEAR ENDED DECEMBER 31, 2018
(109)
SEWERSCHOOLPATROL RECYCLING
REVENUESTaxes $ - $ - $ - $ - $ - Sales Tax - - - - - Tax Increments - - - - - Intergovernmental - 44,150 - 1,012,816 - Charges for Services - 542 25,602 143,656 192,596 Fines and Forfeits - - - - - Interest 308 149 117 2,699 7,454 Contributions and Donations 12,485 - - - - Miscellaneous - - - 6,511 -
Total Revenues 12,793 44,841 25,719 1,165,682 200,050
EXPENDITURESCurrent
General Government - - - - - Public Safety 255 - - - - Public Works - 47,971 14,559 1,043,143 - Economic Development - - - - -
Capital Outlay - - - 82,005 - Total Expenditures 255 47,971 14,559 1,125,148 -
EXCESS (DEFICIENCY) OF REVENUES OVER EXPENDITURES 12,538 (3,130) 11,160 40,534 200,050
OTHER FINANCING SOURCES (USES)Sale of Capital Assets - - - 2,104 - Transfers Out - - (24,634) - (50,471)
Total Other Financing Sources (Uses) - - (24,634) 2,104 (50,471)
NET CHANGE IN FUND BALANCE 12,538 (3,130) (13,474) 42,638 149,579
Fund Balance (Deficit) - Beginning of Year 17,905 3,236 13,953 120,668 617,613
FUND BALANCE (DEFICIT) - END OF YEAR $ 30,443 $ 106 $ 479 $ 163,306 $ 767,192
TRANSIT CHARGESPARKING AVAILABILITY
LOTS
SPECIAL REVENUE FUNDSWATER &
CITY

(110)
HYDRANT LOCALRENTAL & SALES
IMPROVE- ELECTRIC DUI & DRUG TAXMENT CURRENT FORFEITURE OPTION
$ - $ 338,391 $ - $ 170,316 $ - $ - $ - $ 508,707 - - - - - - 1,011,506 1,011,506 - - - - - 224,211 - 224,211
12,853 - 2,500 - - - - 1,072,319 - - - - - - - 362,396 - - - - 29,313 - - 29,313
302 - - - 809 1,195 - 13,033 - - - - - - - 12,485 - - - - 2,281 - - 8,792
13,155 338,391 2,500 170,316 32,403 225,406 1,011,506 3,242,762
8,939 - 2,500 - - - - 11,439
- - - - 12,840 - - 13,095 - - - 170,769 - - - 1,276,442 - - - - - 218,967 1,011,506 1,230,473 - - - - - - - 82,005
8,939 - 2,500 170,769 12,840 218,967 1,011,506 2,613,454
4,216 338,391 - (453) 19,563 6,439 - 629,308
- - - - - - - 2,104 - (339,296) - - - - - (414,401) - (339,296) - - - - - (412,297)
4,216 (905) - (453) 19,563 6,439 - 217,011
29,289 6,056 - 3,028 43,057 157,807 - 1,012,612
$ 33,505 $ 5,151 $ - $ 2,575 $ 62,620 $ 164,246 $ - $ 1,229,623
WELLNESSPROGRAM GENCY
SPECIAL REVENUE FUNDS
DISTRICTSCONTIN-
PERMANENT MAYOR'SEMPLOYEEFINANCING
TAX
TOTALS
INCREMENT

CITY OF BRAINERD, MINNESOTA SCHEDULE OF REVENUES, EXPENDITURES, AND CHANGES IN FUND BALANCE
BUDGET AND ACTUAL RECYCLING FUND
YEAR ENDED DECEMBER 31, 2018
(111)
REVENUES
Intergovernmental $ 44,150 $ 44,150 $ - Charges for Services 600 542 (58) Interest - 149 149
Total Revenues 44,750 44,841 91 EXPENDITURES
CurrentPublic Works 46,610 47,971 1,361
Total Expenditures 46,610 47,971 1,361
NET CHANGE IN FUND BALANCE $ (1,860) (3,130) $ (1,270)
Fund Balance - Beginning of Year 3,236
FUND BALANCE - END OF YEAR $ 106
FINAL BUDGETVARIANCE WITHORIGINAL AND
FINAL BUDGET ACTUAL

CITY OF BRAINERD, MINNESOTA SCHEDULE OF REVENUES, EXPENDITURES, AND CHANGES IN FUND BALANCE
BUDGET AND ACTUAL CITY PARKING LOTS FUND
YEAR ENDED DECEMBER 31, 2018
(112)
REVENUES
Charges for Services $ 25,000 $ 25,602 $ 602 Interest - 117 117
Total Revenues 25,000 25,719 719 EXPENDITURES
CurrentPublic Works 20,653 14,559 (6,094)
EXCESS (DEFICIENCY) OF REVENUES OVER EXPENDITURES 4,347 11,160 6,813
OTHER FINANCING USESTransfers Out (10,000) (24,634) (14,634)
NET CHANGE IN FUND BALANCE $ (5,653) (13,474) $ (7,821) Fund Balance - Beginning of Year 13,953
FUND BALANCE - END OF YEAR $ 479
FINAL BUDGETVARIANCE WITHORIGINAL AND
FINAL BUDGET ACTUAL

CITY OF BRAINERD, MINNESOTA SCHEDULE OF REVENUES, EXPENDITURES, AND CHANGES IN FUND BALANCE
BUDGET AND ACTUAL TRANSIT FUND
YEAR ENDED DECEMBER 31, 2018
(113)
REVENUESIntergovernmental $ 981,248 $ 981,248 $ 1,012,816 $ 31,568 Charges for Services 150,084 150,084 143,656 (6,428) Interest - - 2,699 2,699 Miscellaneous 7,680 7,680 6,511 (1,169)
Total Revenues 1,139,012 1,139,012 1,165,682 26,670 EXPENDITURES
CurrentPublic Works 1,058,012 1,058,012 1,043,143 (14,869)
Capital Outlay 81,000 81,000 82,005 1,005 Total Expenditures 1,139,012 1,139,012 1,125,148 (13,864)
EXCESS OF REVENUES OVER (UNDER) EXPENDITURES - - 40,534 40,534
OTHER FINANCING SOURCES- - 2,104 2,104
NET CHANGE IN FUND BALANCE $ - $ - 42,638 $ 42,638
Fund Balance - Beginning of Year 120,668
FUND BALANCE - END OF YEAR $ 163,306
VARIANCE WITHFINAL BUDGET
Sale of Capital Assets
FINALORIGINAL ACTUALBUDGET

CITY OF BRAINERD, MINNESOTA SCHEDULE OF REVENUES, EXPENDITURES, AND CHANGES IN FUND BALANCE
BUDGET AND ACTUAL PERMANENT IMPROVEMENT FUND YEAR ENDED DECEMBER 31, 2018
(114)
REVENUES
Taxes $ 340,838 $ 338,391 $ (2,447)
EXCESS OF REVENUES OVER (UNDER) EXPENDITURES 340,838 338,391 (2,447)
OTHER FINANCING USES Transfers Out (340,838) (339,296) 1,542
NET CHANGE IN FUND BALANCE $ - (905) $ (905) Fund Balance - Beginning of Year 6,056
FUND BALANCE - END OF YEAR $ 5,151
ORIGINAL AND VARIANCE WITHFINAL BUDGETFINAL BUDGET ACTUAL

CITY OF BRAINERD, MINNESOTA SCHEDULE OF REVENUES, EXPENDITURES, AND CHANGES IN FUND BALANCE
BUDGET AND ACTUAL MAYOR’S CONTINGENCY FUND
YEAR ENDED DECEMBER 31, 2018
(115)
ACTUALREVENUES
Intergovernmental $ 2,500 $ 2,500 $ -
EXPENDITURES Current
General GovernmentMayor and Council 2,500 2,500 -
NET CHANGE IN FUND BALANCE $ - - $ - Fund Balance - Beginning of Year -
FUND BALANCE - END OF YEAR $ -
ORIGINAL AND VARIANCE WITHFINAL BUDGETFINAL BUDGET

CITY OF BRAINERD, MINNESOTA SCHEDULE OF REVENUES, EXPENDITURES, AND CHANGES IN FUND BALANCE
BUDGET AND ACTUAL HYDRANT RENTAL AND ELECTRIC CURRENT FUND
YEAR ENDED DECEMBER 31, 2018
(116)
FINAL BUDGETREVENUES
Taxes $ 170,419 $ 170,316 $ (103)
EXPENDITURESCurrent
Public Works 170,419 170,769 350
NET CHANGE IN FUND BALANCE $ - (453) $ (453) Fund Balance - Beginning of Year 3,028
FUND BALANCE - END OF YEAR $ 2,575
ORIGINAL AND VARIANCE WITHFINAL BUDGETACTUAL

This Page Has Been Intentionally Left Blank.

COMPONENT UNIT FINANCIAL STATEMENTS


CITY OF BRAINERD, MINNESOTA BRAINERD LAKES REGIONAL AIRPORT
RECONCILIATION OF THE BALANCE SHEET TO THE STATEMENT OF NET POSITION DECEMBER 31, 2018
(117)
Balance Conversion to Statement of Sheet Full Accrual Net Position
ASSETSCash and Investments 1,767,061$ -$ 1,767,061$ Receivables Accounts 36,347 - 36,347 Due from Other Governments 865,177 - 865,177 Prepaid Expense 50 - 50 Capital Assets Land and Construction In Progress - 2,072,136 2,072,136 Other Capital Assets, Net of Depreciation - 26,989,334 26,989,334
Total Assets 2,668,635$ 29,061,470 31,730,105
DEFERRED INFLOWS OF RESOURCESPension Related 22,856 22,856 OPEB Related 1,022 1,022
Total Deferred Inflows of Resources 23,878 23,878
LIABILITIESCurrent Liabilities
Accounts Payable 83,226$ - 83,226 Accrued Liabilities 25,386 - 25,386 Contracts Payable 651,085 - 651,085
Long-Term LiabilitiesNet Pension Liability - 128,997 128,997 Other Postemployment Benefits Liability - 1,677 1,677 Due within One Year - 55,394 55,394 Due in More Than One Year - 101,973 101,973
Total Liabilities 759,697 288,041 1,047,738
DEFERRED INFLOWS OF RESOURCESUnavailable Revenue - Grants 851,104 (851,104) - Pension Related - 36,046 36,046
Total Deferred Inflows of Resources 851,104 (815,058) 36,046
FUND BALANCE/NET POSITIONFund Balance
Assigned 1,057,834 (1,057,834) - Total Fund Balances 1,057,834 (1,057,834)
Total Liabilities, Deferred Inflows of Resources, and Fund Balance 2,668,635$
Net PositionNet Investment in Capital Assets 28,371,560 28,371,560 Unrestricted 2,298,639 2,298,639
Total Net Position 30,670,199$ 30,670,199$

CITY OF BRAINERD, MINNESOTA BRAINERD LAKES REGIONAL AIRPORT
RECONCILIATION OF THE STATEMENT OF REVENUES, EXPENDITURES, AND CHANGES IN FUND BALANCE TO THE STATEMENT OF ACTIVITIES
YEAR ENDED DECEMBER 31, 2018
(118)
Statement of Revenues,
Expenditures and Changes Conversion to Statement of
in Fund Balance Full Accrual Activities
Expenditures/Expenses 2,833,833$ 1,016,933$ 3,850,766$
Program RevenuesCharges for Services 702,300 - 702,300 Operating Grants 421,495 - 421,495 Capital Grants 1,021,160 660,045 1,681,205
Total Program Revenues 2,144,955 660,045 2,805,000
Net Program Revenue (688,878) (356,888) (1,045,766)
General RevenuesInterest 18,867 - 18,867 Sale of Capital Assets 9,000 - 9,000
Total General Revenues 27,867 - 27,867
Change in Net Position (661,011) (356,888) (1,017,899)
Fund Balance/Net PositionBeginning of Year 1,718,845 29,967,155 31,686,000 Change in Accounting Principle, See Note 13 - 2,098 2,098 Beginning of Year, as Restated 1,718,845 29,969,253 31,688,098End of Year 1,057,834$ 29,612,365$ 30,670,199$

CITY OF BRAINERD, MINNESOTA BRAINERD LAKES REGIONAL AIRPORT
STATEMENT OF REVENUES, EXPENDITURES, AND CHANGES IN FUND BALANCE BUDGET AND ACTUAL
YEAR ENDED DECEMBER 31, 2018
(119)
VARIANCE WITHORIGINAL FINAL ACTUAL FINAL BUDGET
REVENUESIntergovernmental 481,230$ 481,230$ 1,442,655$ 961,425$ Charges for Services 600,372 600,372 693,954 93,582 Interest 2,609 2,609 18,867 16,258 Miscellaneous 12,854 12,854 8,346 (4,508)
Total Revenues 1,097,065 1,097,065 2,163,822 1,066,757
EXPENDITURESCurrent
Personal Services 596,052 596,052 596,701 649 Supplies 127,800 127,800 142,493 14,693 Other Services and Charges 257,540 257,540 253,798 (3,742)
Capital Outlay 115,673 115,673 1,840,841 1,725,168 Total Expenditures 1,097,065 1,097,065 2,833,833 1,736,768
EXCESS (DEFICIENCY) OF REVENUES OVER EXPENDITURES - - (670,011) (670,011)
GENERAL REVENUESSale of Capital Assets - - 9,000 9,000
NET INCREASE (DECREASE) IN FUND BALANCE -$ -$ (661,011) (661,011)$
FUND BALANCEBeginning of Year 1,718,845End of Year 1,057,834$
BUDGET

CITY OF BRAINERD, MINNESOTA BRAINERD PUBLIC LIBRARY
RECONCILIATION OF THE BALANCE SHEET TO THE STATEMENT OF NET POSITION DECEMBER 31, 2018
(120)
Balance Conversion to Statement of Sheet Full Accrual Net Position
ASSETSCash and Investments 230,527$ -$ 230,527$ Receivables
Taxes - Delinquent 7,991 - 7,991 Accounts 354 - 354
Capital AssetsLand and Construction In Progress - 9,041 9,041 Other Capital Assets, Net of Depreciation - 298,303 298,303
Total Assets 238,872$ 307,344 546,216
LIABILITIESCurrent Liabilities
Accounts Payable 2,272$ - 2,272 Due to Other Governments 8 - 8
Total Liabilities 2,280 - 2,280
DEFERRED INFLOWS OF RESOURCESUnavailable Revenue - Taxes 5,754 (5,754) -
FUND BALANCE/NET POSITIONFund Balances
Assigned 230,838 (230,838) -
Total Liabilities, Deferred Inflows ofResources, and Fund Balance 238,872$
Net PositionNet Investment in Capital Assets 307,344 307,344 Unrestricted 236,592 236,592
Total Net Position 543,936$ 543,936$

CITY OF BRAINERD, MINNESOTA BRAINERD PUBLIC LIBRARY
RECONCILIATION OF THE STATEMENT OF REVENUES, EXPENDITURES, AND CHANGES IN FUND BALANCE TO THE STATEMENT OF ACTIVITIES
YEAR ENDED DECEMBER 31, 2018
(121)
Statement of Revenues,
Expenditures,and Changes Conversion to Statement of
in Fund Balance Full Accrual Activities
Expenditures/Expenses 171,365$ 49,271$ 220,636$
Program RevenuesOperating Grants 24,219 - 24,219
Net Program Expense (147,146) (49,271) (196,417)
General RevenuesProperty Taxes Levied for General Purposes 147,435 281 147,716 Interest 2,373 - 2,373 Miscellaneous 4,593 - 4,593
Total General Revenues 154,401 281 154,682
Change in Net Position 7,255 (48,990) (41,735) Fund Balance/Net Position
Beginning of Year 223,583 362,088 585,671End of Year 230,838$ 313,098$ 543,936$

CITY OF BRAINERD, MINNESOTA BRAINERD PUBLIC LIBRARY
STATEMENT OF REVENUES, EXPENDITURES, AND CHANGES IN FUND BALANCE BUDGET AND ACTUAL
YEAR ENDED DECEMBER 31, 2018
(122)
ORIGINAL AND VARIANCE WITHFINAL BUDGET ACTUAL FINAL BUDGET
REVENUESTaxes 150,416$ 147,435$ (2,981)$ Interest - 2,373 2,373 Miscellaneous 75 28,812 28,737
Total Revenues 150,491 178,620 28,129
EXPENDITURESSupplies 13,657 10,835 (2,822) Other Services and Charges 130,834 160,482 29,648 Capital Outlay 6,000 48 (5,952)
Total Expenditures 150,491 171,365 20,874
NET INCREASE (DECREASE) IN FUND BALANCE -$ 7,255 7,255$
FUND BALANCEBeginning of Year 223,583End of Year 230,838$

STATISTICAL INFORMATION SECTION (UNAUDITED)


STATISTICAL INFORMATION SECTION (UNAUDITED) This part of the City of Brainerd’s comprehensive annual financial report presents detailed information as a context for understanding what the information in the financial statements, note disclosures, and required supplementary information says about the City’s overall financial health. CONTENTS Financial Trends The financial trends schedules contain trend information to help the reader understand how the City’s financial performance and well-being have changed over time. Revenue Capacity The revenue capacity schedules contain information to help the reader assess the City’s most significant local revenue source, the property tax. Debt Capacity The debt capacity schedules present information to help the reader assess the affordability of the City’s current levels of outstanding debt and the City’s ability to issue additional debt in the future. Demographic and Economic Information The demographic and economic information schedules offer demographic and economic indicators to help the reader understand the environment within which the City’s financial activities take place. Operating Information The operating information schedules contain service and infrastructure data to help the reader understand how the information in the City’s financial report relates to the services the City provides and the activities it performs. Source: Unless otherwise noted, the information in these schedules is derived from the comprehensive financial reports for the relevant year.

CITY OF BRAINERD, MINNESOTA NET POSITION BY COMPONENT
LAST TEN FISCAL YEARS (ACCRUAL BASIS OF ACCOUNTING)
(123)
2009 2010 2011Governmental Activities
Net Investment in Capital Assets 28,593,652$ 31,154,173$ 32,803,075$ Restricted for Net Pension Asset - - - Restricted for Debt Service 5,608,739 5,607,975 8,067,819 Restricted for Economic Development - - 2,017,875 Unrestricted 5,858,504 5,053,510 830,121
Total Governmental Activities Net Position 40,060,895 41,815,658 43,718,890
Business-Type ActivitiesNet Investment in Capital Assets - - - Unrestricted - - -
Total Business-Type Activities Net Position - - -
Primary GovernmentNet Investment in Capital Assets 28,593,652 31,154,173 32,803,075 Restricted for Net Pension Asset - - - Restricted for Debt Service 5,608,739 5,607,975 8,067,819 Restricted for Economic Development - - 2,017,875 Unrestricted 5,858,504 5,053,510 830,121
Total Primary Government Net Position 40,060,895$ 41,815,658$ 43,718,890$

(124)
2012 2013 2014 2015 2016 2017 2018
38,840,279$ 39,957,398$ 40,601,443$ 29,274,442$ 29,077,014$ 31,299,024$ 31,371,030$ - - - - - 603,254 835,385
5,772,916 5,316,231 5,197,989 5,186,164 4,694,841 3,837,524 3,740,487 1,744,361 2,529,669 2,374,348 2,497,112 2,442,127 2,453,635 1,972,469 4,528,929 2,636,006 3,772,372 276,847 149,597 958,153 2,453,430
50,886,485 50,439,304 51,946,152 37,234,565 36,363,579 39,151,590 40,372,801
- - - 12,943,309 12,691,158 12,867,762 12,938,408 - - - (759,538) (392,022) 162,523 358,210
- - - 12,183,771 12,299,136 13,030,285 13,296,618
38,840,279 39,957,398 40,601,443 42,217,751 41,768,172 44,166,786 44,309,438 - - - - - 603,254 835,385
5,772,916 5,316,231 5,197,989 5,186,164 4,694,841 3,837,524 3,740,487 1,744,361 2,529,669 2,374,348 2,497,112 2,442,127 2,453,635 1,972,469 4,528,929 2,636,006 3,772,372 (482,691) (242,425) 1,120,676 2,811,640
50,886,485$ 50,439,304$ 51,946,152$ 49,418,336$ 48,662,715$ 52,181,875$ 53,669,419$

CITY OF BRAINERD, MINNESOTA CHANGES IN NET POSITION LAST TEN FISCAL YEARS
(ACCRUAL BASIS OF ACCOUNTING)
(125)
2009 2010 2011Expenses
Governmental Activities:General Government 2,615,361$ 2,379,213$ 2,231,366$
Public Safety 4,854,810 4,580,987 4,507,891
Public Works 4,634,327 3,904,216 4,429,406
Culture and Recreation 1,121,263 1,037,305 911,159
Economic Development 1,824,784 1,701,076 2,245,635
Interest on Long-Term Debt 598,163 618,993 540,817
Total Governmental Activities Expenses 15,648,708 14,221,790 14,866,274 Business-Type Activities:
Arena 332,995 - - Sanitary Sewer - - - Storm Sewer - - -
Total Business-Type Activities 332,995 - - Total Primary Government Expenses 15,981,703$ 14,221,790$ 14,866,274$
Program RevenuesGovernmental Activities
Charges for ServicesGeneral Government 688,459$ 887,143$ 874,597$
Public Safety 1,133,519 1,078,047 993,349
Public Works 1,286,307 1,139,507 1,102,729
Culture and Recreation 242,391 256,659 262,772
Economic Development 379,826 521,537 444,809
Operating Grants and Contributions 1,134,667 1,102,604 1,124,436
Capital Grants and Contributions 2,222,836 2,433,687 3,092,349
Total Governmental Activities Program Revenues 7,088,005 7,419,184 7,895,041 Business-Type Activities
Charges for ServicesArena 283,190 - -
Sanitary Sewer - - -
Storm Sewer - - -
Operating Grants and Contributions 27,146 - -
Capital Grants and Contributions - - - Total Business-Type Activities Program Revenues 310,336 - -
Total Primary Government Program Revenues 7,398,341$ 7,419,184$ 7,895,041$
Net (Expense)/RevenueGovernmental Activities (8,560,703)$ (6,802,606)$ (6,971,233)$
Business-Type Activities (22,659) - -
Total Primary Government Net Expense (8,583,362)$ (6,802,606)$ (6,971,233)$

(126)
2012 2013 2014 2015 2016 2017 2018
2,156,504$ 3,046,396$ 2,450,864$ 2,264,850$ 2,294,344$ 2,402,941$ 2,510,055$
4,787,874 5,054,814 4,911,805 5,094,506 5,988,001 5,092,682 4,873,597
4,997,160 4,843,435 4,983,553 3,654,249 4,817,410 4,013,059 4,844,864
907,168 1,015,966 961,494 1,069,824 1,163,323 1,171,905 1,211,222
1,816,490 1,491,673 1,675,233 1,715,635 1,343,868 2,292,834 1,842,447
468,208 528,521 365,052 340,895 221,979 135,042 98,351
15,133,404 15,980,805 15,348,001 14,139,959 15,828,925 15,108,463 15,380,536
- - - - - - - - - - 523,043 902,801 641,506 736,458 - - - 381,269 327,621 391,349 311,587
- - - 904,312 1,230,422 1,032,855 1,048,045 15,133,404$ 15,980,805$ 15,348,001$ 15,044,271$ 17,059,347$ 16,141,318$ 16,428,581$
1,005,716$ 844,051$ 1,014,998$ 941,998$ 998,828$ 998,024$ 1,108,869$
880,882 1,008,956 978,321 947,757 969,118 923,876 967,443
1,128,528 1,069,177 1,063,614 595,306 498,889 706,796 728,788
237,939 237,278 237,308 262,425 268,084 254,272 275,788
419,810 430,499 732,859 534,502 222,191 814,546 185,844
1,160,026 1,269,439 1,887,902 1,633,211 1,359,201 1,626,126 1,755,202
8,673,123 1,817,863 1,056,045 790,375 698,891 1,960,551 1,073,531
13,506,024 6,677,263 6,971,047 5,705,574 5,015,202 7,284,191 6,095,465
- - - - - - -
- - - 392,175 458,681 567,740 655,505
- - - 310,030 322,489 356,351 377,067
- - - - - - -
- - - 377,067 - 584,488 - - - - 1,079,272 781,170 1,508,579 1,032,572
13,506,024$ 6,677,263$ 6,971,047$ 6,784,846$ 5,796,372$ 8,792,770$ 7,128,037$
(1,627,380)$ (9,303,542)$ (8,076,954)$ (8,434,385)$ (10,813,723)$ (7,824,272)$ (9,285,071)$
- - - 174,960 (449,252) 475,724 (15,473)
(1,627,380)$ (9,303,542)$ (8,076,954)$ (8,259,425)$ (11,262,975)$ (7,348,548)$ (9,300,544)$

CITY OF BRAINERD, MINNESOTA CHANGES IN NET POSITION (CONTINUED)
LAST TEN FISCAL YEARS (ACCRUAL BASIS OF ACCOUNTING)
(127)
2009 2010 2011General Revenues and Other Changes in Net Position
Governmental ActivitiesProperty Taxes 4,093,299$ 3,638,501$ 3,873,508$
Sales Taxes 854,392 815,628 835,200
Franchise Fees 118,212 121,645 119,899
Unrestricted Grants and Contributions 4,298,468 3,739,617 3,842,796
Unrestricted Investment Earnings 53,644 34,699 20,814
Gain (Loss) on Sale of Capital Assets 244,345 - -
Miscellaneous 207,345 207,279 182,248
Transfers 989,074 - -
Total Governmental Activities 10,858,779 8,557,369 8,874,465 Business-Type Activities
Unrestricted Grants and Contributions - - - Unrestricted Investment Earnings 14 - - Gain on Sale of Capital Assets - - -
Miscellaneous - - -
Transfers (989,074) - -
Total Business-Type Activities (989,060) - - Total Primary Government 9,869,719$ 8,557,369$ 8,874,465$
Change In Net Position 1,286,357$ 1,754,763$ 1,903,232$ Net Position – Beginning of Year 38,774,538 40,060,895 41,815,658
Prior Period Restatement/ Change in Accounting Principle - - - Net Position – End of Year 40,060,895$ 41,815,658$ 43,718,890$

(128)
2012 2013 2014 2015 2016 2017 2018
3,858,484$ 3,770,803$ 4,216,202$ 4,755,199$ 5,157,448$ 5,297,185$ 5,532,714$
881,057 875,111 882,484 905,665 977,696 1,004,910 1,011,506
118,798 124,125 125,917 128,650 63,935 6,557 -
3,654,874 3,749,085 4,036,949 4,089,134 4,128,905 4,130,660 4,223,899
10,698 7,013 9,098 22,142 30,229 52,827 96,643
- - 33,539 - 20,056 - 101,553
271,064 330,224 279,613 263,995 125,195 120,144 100,143
- - - - (61,000) - (50,471)
8,794,975 8,856,361 9,583,802 10,164,785 10,442,464 10,612,283 11,015,987
- - - - 359 - - - - - 438 1,513 162 601 - - - - - - 50,800
- - - 1,546 1,745 255,263 198,338
- - - - 61,000 - 50,471
- - - 1,984 64,617 255,425 300,210 8,794,975$ 8,856,361$ 9,583,802$ 10,166,769$ 10,507,081$ 10,867,708$ 11,316,197$
7,167,595$ (447,181)$ 1,506,848$ 1,530,277$ (755,621)$ 3,519,160$ 2,015,653$ 43,718,890 50,886,485 50,439,304 51,946,152 49,418,336 48,662,715 52,181,874
- - - (4,058,093) - - (528,108) 50,886,485$ 50,439,304$ 51,946,152$ 49,418,336$ 48,662,715$ 52,181,875$ 53,669,419$

CITY OF BRAINERD, MINNESOTA FUND BALANCES – GOVERNMENTAL FUNDS
LAST TEN FISCAL YEARS (MODIFIED ACCRUAL BASIS OF ACCOUNTING)
(129)
2009 2010 2011General Fund
Nonspendable -$ -$ 1,776$ Assigned - - - Unassigned 2,687,647 3,056,299 3,052,607
Total General Fund 2,687,647$ 3,056,299$ 3,054,383$
All Other Governmental Funds
Nonspendable:
Special Revenue Funds -$ -$ 1,181$
Debt Service Fund - - 82,198
Capital Projects Fund - - 33 Restricted:
Special Revenue Funds 1,448,433 1,512,909 1,395,205 Debt Service Fund 1,313,658 1,201,601 3,670,026
Committed to:Special Revenue Funds 656,798 455,596 527,587
Assigned:Capital Projects Fund 1,617,069 790,629 171,598
Unassigned (104,871) (191,288) (292,748) Total All Other Governmental Funds 4,931,087$ 3,769,447$ 5,555,080$
Total All Funds 7,618,734$ 6,825,746$ 8,609,463$
December 31,

(130)
2012 2013 2014 2015 2016 2017 2018
1,597$ 1,982$ 6,111$ 1,536$ 1,330$ 1,604$ 9,236$ - - - 50,000 50,000 50,000 222,793
2,668,991 2,463,854 2,985,777 3,360,516 3,445,653 3,475,845 3,861,936
2,670,588$ 2,465,836$ 2,991,888$ 3,412,052$ 3,496,983$ 3,527,449$ 4,093,965$
251$ 2,774$ 1,782$ 1,114$ 1,129$ 1,175$ 39,807$
84,336 45,490 - - - - -
- 33 33 12 23 - 20
1,158,103 1,081,416 1,199,193 1,269,601 1,309,064 762,857 491,208 1,378,469 1,063,038 1,250,181 2,764,323 1,969,210 2,153,469 2,234,228
863,690 747,295 517,443 537,355 453,933 669,245 890,337
206,022 1,608,077 1,149,566 1,991,175 2,300,354 2,506,846 3,755,147 - - (83,442) - - - -
3,690,871$ 4,548,123$ 4,034,756$ 6,563,580$ 6,033,713$ 6,093,592$ 7,410,747$
6,361,459$ 7,013,959$ 7,026,644$ 9,975,632$ 9,530,696$ 9,621,041$ 11,504,712$
December 31,

CITY OF BRAINERD, MINNESOTA CHANGES IN FUND BALANCES – GOVERNMENTAL FUNDS
LAST TEN FISCAL YEARS (MODIFIED ACCRUAL BASIS OF ACCOUNTING)
(131)
2009 2010 2011REVENUES
Property Taxes 3,674,598$ 3,860,723$ 3,964,397$ Sales Tax 854,392 815,628 835,200 Tax Increments 474,311 482,935 456,531 Licenses and Permits 308,872 294,569 283,062 Intergovernmental 6,683,126 6,543,103 6,839,202 Charges for Services 1,854,763 1,772,443 1,692,398 Interest 53,214 34,306 20,709 Fines and Forfeits 250,737 212,913 211,232 Special Assessments 608,686 774,829 626,682 Miscellaneous 1,246,908 1,292,126 1,293,617
Total Revenues 16,009,607 16,083,575 16,223,030
EXPENDITURESCurrent:
General Government 2,198,122 2,277,650 2,132,815 Public Safety 4,323,401 4,312,696 4,153,421 Public Works 2,330,005 2,231,927 2,324,158 Culture and Recreation 1,022,135 981,865 822,990 Community Development 1,735,849 1,559,884 1,569,492
Capital Outlay 4,463,948 4,821,280 4,417,424 Debt Service
Principal 1,766,128 1,772,206 1,591,303 Interest and Fiscal Charges 639,996 634,913 582,122
Total Expenditures 18,479,584 18,592,421 17,593,725 EXCESS (DEFICIENCY) OF REVENUES OVER EXPENDITURES (2,469,977) (2,508,846) (1,370,695)
OTHER FINANCING SOURCES (USES)Sale of Capital Assets 306,980 8,130 59,967 Issuance of Debt 2,715,000 1,670,000 3,065,000 Issuance of Capital Leases - 47,331 15,496 Payment on Refunded Bonds - - - Discount on Bonds Issued - (9,603) (9,383) Premium on Bonds Issued 54,149 - 23,330 Transfer In 500,369 1,254,747 1,517,215 Transfer Out (639,035) (1,254,747) (1,517,215)
Total Other Financing Sources (Uses) 2,937,463 1,715,858 3,154,410
NET CHANGE IN FUND BALANCES 467,486$ (792,988)$ 1,783,715$
Debt Service as a Percentage ofNoncapital Expenditures 16.2% 17.4% 16.2%
Year Ended December 31,

(132)
2012 2013 2014 2015 2016 2017 2018
4,107,782$ 4,049,317$ 4,623,956$ 5,005,880$ 5,363,034$ 5,488,754$ 5,680,916$ 881,057 875,111 882,484 905,665 977,969 1,004,910 1,011,506 316,407 284,377 286,265 287,200 226,732 216,989 224,211 275,222 255,160 330,372 400,253 360,537 391,487 538,283
12,108,798 7,246,211 6,216,202 6,728,827 5,700,546 7,137,282 6,689,174 1,590,595 1,606,900 1,681,143 1,220,305 1,181,962 1,271,003 1,243,518
10,661 6,968 9,004 21,865 29,578 51,909 94,708 197,846 181,578 180,746 195,222 191,361 188,421 240,667 971,858 596,754 682,789 944,571 434,847 596,802 547,117
1,320,889 1,252,939 1,318,159 1,198,165 1,082,678 1,314,426 1,319,419 21,781,115 16,355,315 16,211,120 16,907,953 15,549,244 17,661,983 17,589,519
2,112,439 2,081,271 2,264,729 2,357,566 2,173,160 2,318,939 2,439,799 4,345,830 4,538,998 4,509,942 4,843,001 4,515,089 4,534,685 4,728,195 2,111,718 2,268,579 2,348,643 1,970,102 2,067,492 2,150,345 2,395,108
825,647 918,401 882,124 959,597 1,003,043 1,022,261 1,086,229 1,681,619 1,439,868 1,289,423 1,428,954 1,340,976 2,451,092 1,947,199 9,178,164 3,206,036 3,273,015 1,370,770 1,890,500 2,839,133 2,768,643
1,654,302 2,107,741 2,065,940 2,032,576 1,989,012 2,193,132 1,899,917 495,779 422,203 377,931 360,851 258,170 213,911 173,560
22,405,498 16,983,097 17,011,747 15,323,417 15,237,442 17,723,498 17,438,650
(624,383) (627,782) (800,627) 1,584,536 311,802 (61,515) 150,869
26,379 10,374 31,039 89,424 36,118 46,378 101,553 845,000 1,240,000 725,000 1,915,000 673,165 - 1,385,300
- - 8,979 54,059 113,660 91,682 182,186 (2,495,000) - - (670,000) (1,035,000) - -
- - - - - - - - 29,908 48,294 45,257 16,319 - 114,234
1,198,109 1,264,400 1,128,481 658,062 1,354,075 980,246 961,568 (1,198,109) (1,264,400) (1,128,481) (598,062) (1,415,075) (980,246) (1,012,039) (1,623,621) 1,280,282 813,312 1,493,740 (256,738) 138,060 1,732,802
(2,248,004)$ 652,500$ 12,685$ 3,078,276$ 55,064$ 76,545$ 1,883,671$
14.9% 17.6% 16.7% 16.7% 16.4% 15.8% 13.3%
Year Ended December 31,

CITY OF BRAINERD, MINNESOTA NET TAX CAPACITY AND ESTIMATED MARKET VALUE OF PROPERTY
LAST TEN FISCAL YEARS
(133)
Commercial/ Less:
Payable Residential Industrial Other Personal Captured
Year Property (2) Property Property Property Tax Increment
2009 5,486,734$ 4,125,297$ 85,247$ 46,730$ 574,912$ 2010 5,562,890 4,104,885 98,656 47,971 586,453 2011 5,206,895 3,894,721 85,844 49,998 559,470 2012 4,044,050 3,662,615 71,880 51,392 366,921 2013 3,568,818 3,546,418 61,886 58,658 322,007 2014 3,640,038 3,532,321 43,709 47,306 335,230
2015 3,709,854 3,447,983 43,632 48,910 343,010
2016 4,115,162 3,142,104 46,383 49,053 283,032 2017 4,356,548 3,015,428 49,273 46,927 269,765 2018 4,580,804 2,819,936 51,864 54,801 276,240
Source: Official Statements for Bond Issues and Crow Wing County, Minnesota Auditor's Office.
Notes: (1) The taxable capacity of the property is calculated by applying a statutory formula to the taxable estimated market value of the property.
(2) Residential property includes both residential homestead and non-homestead property.

(134)
Percentage of
Net Assessor's Assessor's Net Tax Capacity
Tax Total Direct Estimated Estimated Taxable as a Percentage of
Capacity (1) Tax Rate Market Value Market Value Est. Taxable Market Value
9,169,096$ 44.5 % 776,407,800$ 766,211,800$ 1.20 %9,227,949 45.8 779,115,100 773,527,200 1.198,677,988 48.0 731,773,000 727,117,400 1.197,463,016 54.5 676,712,100 598,149,800 1.256,913,773 58.4 622,641,700 545,139,400 1.276,928,144 64.9 629,997,700 550,809,900 1.26
6,907,369 71.7 632,116,200 550,978,400 1.25
7,069,670 74.6 656,258,500 577,935,000 1.227,198,411 75.1 674,149,600 594,903,199 1.217,231,165 77.4 685,883,100 606,984,452 1.19

CITY OF BRAINERD, MINNESOTA DIRECT AND OVERLAPPING PROPERTY TAX RATES
LAST TEN FISCAL YEARS
(135)
Fiscal Year Basic RateGeneral Obligation
Debt Service Total Direct
2009 33.1 % 11.418 44.5 %2010 33.0 12.806 45.82011 32.5 15.552 48.02012 34.4 20.128 54.52013 37.2 21.727 58.92014 37.5 27.410 64.92015 43.9 27.797 71.72016 45.2 29.364 74.62017 46.2 28.839 75.12018 55.3 22.137 77.4
Source: Crow Wing County, Minnesota Auditor's Office
City Direct Rate

(136)
School District 181
Crow Wing County Other
Total Overlapping
Total Direct and Overlapping Tax
Rate
17.5 % 27.8 % 1.6 % 46.9 % 91.4 %20.8 27.3 1.6 49.7 95.521.7 29.8 1.8 53.3 101.323.5 31.6 2.0 57.1 111.624.2 33.5 1.8 59.5 118.424.8 34.5 1.8 61.1 126.025.3 33.8 1.8 60.9 132.625.4 32.8 1.8 60.0 134.624.6 31.6 1.8 58.0 133.124.6 31.0 1.9 57.5 135.0
Overlapping Rates

CITY OF BRAINERD, MINNESOTA PROPERTY TAX LEVIES AND COLLECTIONS
LAST TEN FISCAL YEARS
(137)
Taxes Levied for the Fiscal YearPercentage
Fiscal Operating Debt Total Tax Additions/ Adjusted Tax of Year Tax Levy Tax Levy Levy (1) (Abatements) Levy Amount Levy
2009 2,915,349$ 1,046,959$ 3,962,308$ (13,767)$ 3,948,541$ 3,799,438$ 96.2 %
2010 2,930,591 1,181,717 4,112,308 (274,068) (2) 3,838,240 3,687,724 96.1
2011 2,706,175 1,349,661 4,055,836 (288,593) (2) 3,767,243 3,537,182 93.9
2012 2,453,825 1,499,661 3,953,486 (41,766) 3,911,720 3,807,696 97.3
2013 2,453,486 1,500,000 3,953,486 (32,287) 3,921,199 3,826,847 97.6
2014 2,553,486 1,900,000 4,453,486 (32,371) 4,421,115 4,354,288 98.5
2015 2,978,835 1,920,000 4,898,835 (14,783) 4,884,052 4,786,294 98.0
2016 3,141,344 2,075,916 5,217,260 (5,429) 5,211,831 5,063,749 97.2
2017 3,297,862 2,075,916 5,373,778 (7,257) 5,366,521 5,210,252 97.1
2018 3,960,974 1,600,886 5,561,860 (192) 5,561,668 5,398,449 97.1
Notes:(1) Total tax levy and current tax collections include property tax apportionments from Crow Wing Country and homestead, disparity reduction credits and equalization aid from the State of Minnesota.
(2) Included in Additions/(Abatements) is the cut of Market Value Homestead Credit by the State of Minnesota.
Collected within the
Fiscal Year of Levy

(138)
Total Collections to DateCollections Percentage Outstanding Percentage
in Subsequent of Delinquent of LevyYears Amount Levy Forfeitures Taxes Outstanding
130,487$ 3,929,925$ 99.5 % 3,243$ -$ %
121,397 3,809,121 99.2 3,179 - -
222,017 3,759,199 99.8 8,043 - -
91,508 3,899,204 99.7 8,131 4,386 0.1
86,970 3,913,817 99.8 3,521 3,861 0.1
59,482 4,413,770 99.8 4,077 3,268 0.1
36,894 4,823,188 98.8 3,720 57,144 1.2
126,353 5,190,102 99.6 3,221 18,508 0.4
127,215 5,337,467 99.5 1,963 27,091 0.5
- 5,398,449 97.1 1,629 161,590 2.9

This Page Has Been Intentionally Left Blank.

CITY OF BRAINERD, MINNESOTA PRINCIPAL TAXPAYERS
CURRENT YEAR AND TEN YEARS AGO
(139)
2018 2009
Percentage Percentageof Total of Total
Net City Net CityTax Net Tax Tax Net Tax
Taxpayer Capacity (1) Rank Capacity Capacity (1) Rank Capacity
KTJ Limited Partnership 251,266$ 1 3.47 % 278,086$ 1 3.03 %
Brainerd Lakes Integrated
Health Systems 167,149 2 2.31 244,844 2 2.67
BNSF Railway Co. 160,377 3 2.22 75,394 8 0.82
Individuals 117,297 4 1.62 - -
Edgewood Brainerd Senior Living 93,702 5 1.30 114,071 5 1.24
Liberty Group 72,284 6 1.00 70,476 10 0.77
GJR Investments, LLP 66,292 7 0.92 140,350 4 1.53
Individuals 55,180 8 0.76 - -
Westgate Mall Realty Group LLC 48,926 9 0.68 - -
Brainerd Land LLC 48,696 10 0.67 - -
Wausau Paper Plant - - 188,960 3 2.06
Developers Diversified Realty - - 92,316 7 1.01
Individual - - 107,682 6 1.17
Oak Ridge Professional Building - - 71,616 9 0.78
Total 1,081,169$ 14.95 % 1,383,795$ 15.08 %
Total Tax Capacity 7,231,165$ 9,169,096$
Source: Crow Wing County Auditor's Office.
Notes:(1) The tax capacity of the property is calculated by applying a statutory formula to the estimated market value of the property.

CITY OF BRAINERD, MINNESOTA RATIOS OF OUTSTANDING DEBT BY TYPE
LAST TEN FISCAL YEARS
(140)
Governmental ActivitiesGeneral GO Special GO Capital
Fiscal Obligation Assessment Lease Equipment Improvement CapitalYear Bonds Bonds Bonds Certificates Bonds Lease2009 1,147,500$ 12,690,000$ 1,030,000$ 225,000$ -$ 9,963$ 2010 865,000 13,180,000 975,000 - - 44,238 2011 885,000 14,925,000 920,000 - - 50,914 2012 812,500 11,850,000 860,000 - - 39,212 2013 737,500 10,780,000 800,000 445,000 - 21,371 2014 662,500 9,685,000 735,000 445,000 - 19,410 2015 587,500 9,230,000 - 300,000 635,000 60,893 2016 512,500 6,525,000 - 823,165 570,000 145,541 2017 432,500 4,825,000 - 538,532 490,000 188,724 2018 352,500 4,050,000 - 1,037,330 415,000 287,495
* Revenue Bonds were classified as governmental bonds in previous years. 2015 is the first year they are classified as business-type.
Notes:
population data.
Details regarding the City's outstanding debt can be found in the notes to the financial statements.See the Demographic and Economic Statistics schedule on page 148 for personal income and

(141)
Business-Type ActivitiesOther Total GO Utility * Total Total Percentage
Long-Term Premium/ Revenue Equipment Premium/ Primary of Personal PerDebt (Discount) Bonds Certificates (Discount) Government Income Capita
279,133$ 36,492$ 1,490,000$ -$ -$ 16,908,088$ 3.9 % 1,212$ 122,483 26,679 1,405,000 - - 16,618,400 3.8 1,223
- 38,717 1,320,000 - - 18,139,631 3.9 1,333 - 35,860 1,235,000 - - 14,832,572 3.1 1,089 - 62,911 1,145,000 - - 13,991,782 2.9 1,024 - 105,629 1,050,000 - - 12,702,539 2.5 930 - 140,182 1,765,000 - 51,966 12,770,541 2.3 934 - 131,471 4,502,200 - 414,441 13,624,318 2.5 997 - 101,629 4,241,400 - 382,357 11,200,142 2.0 819 - 169,963 4,500,200 324,700 407,556 11,544,744 2.0 842

CITY OF BRAINERD, MINNESOTA RATIO OF NET GENERAL OBLIGATION BONDED DEBT
TO ASSESSED VALUE AND NET GENERAL OBLIGATION DEBT PER CAPITA LAST TEN FISCAL YEARS
(142)
Gross Less Debt Net Percentage ofFiscal Bonded Service Bonded Estimated Taxable PerYear Debt Fund (1) Debt Market Value (2) Capita (3)
2009 15,363,992$ 1,196,606$ 14,167,386$ 1.85 1,015$ 2010 15,476,679 206,665 15,270,014 1.97 1,124 2011 17,168,717 1,844,373 15,324,344 2.11 1,126 2012 13,933,360 498,556 13,434,804 2.25 986 2013 12,725,411 931,045 11,794,366 2.16 863 2014 11,503,129 919,286 10,583,843 1.92 775 2015 12,409,948 2,490,517 9,919,431 1.80 726 2016 12,655,612 1,610,081 11,045,531 1.91 807 2017 10,472,888 1,934,874 8,538,014 1.44 622 2018 9,895,219 1,859,991 8,035,228 1.32 586
Notes:(1) Amount available for repayment of general obligation bonds.(2) See Estimated Assessed Value on pages 133 & 134 for property value data.(3) See the Demographic and Economic Statistics schedule on page 148 for population data.
Net General Bonded Debt Outstanding

CITY OF BRAINERD, MINNESOTA DIRECT AND OVERLAPPING GOVERNMENTAL ACTIVITIES DEBT
DECEMBER 31, 2018
(143)
Estimated
Estimated Share ofDebt Percentage Overlapping
Outstanding Applicable Debt
Overlapping:Crow Wing County General Obligation Bonds 9,725,698$ 6.7 % 651,622$ ISD No. 181 General Obligation Bonds 185,160,000 14.9 27,588,840
Total Overlapping 28,240,462
City of Brainerd Direct Debt 6,312,290 100.0 6,312,290
Total Direct and Overlapping Debt: 34,552,752$
Sources: Taxable value data used to estimate applicable percentages provided by the County Property Appraiser. Debt outstanding data provided by each governmental unit.
Notes: Overlapping governments are those that coincide, at least in part, with the geographic boundaries of the City. This schedule estimates the portion of the outstanding debt of those overlapping governments that is borne by the residents and businesses of the City. This process recognizes that, when considering the City's ability to issue and repay long-term debt, the entire debt burden borne by the residents and businesses should be taken into account. However, this does not imply that every taxpayer is a resident and, therefore, responsible for repaying the debt of each overlapping government.

CITY OF BRAINERD, MINNESOTA COMPUTATION OF LEGAL DEBT MARGIN
LAST TEN FISCAL YEARS
(144)
2009 2010 2011 2012
Debt Limit 23,292,234$ 23,373,453$ 21,953,190$ 19,858,386$
Total Net Debt Applicable to Limit 1,255,000 975,000 920,000 860,000
Legal Debt Margin ** 22,037,234$ 22,398,453$ 21,033,190$ 18,998,386$
Total Net Debt Applicable to Limit as a Percentage of Debt Limit 5.39% 4.17% 4.19% 4.33%
**
Fiscal Year
The legal debt margin is referred to statutorily as the "Net Debt Limit" and permits debt to be offset by debt service funds and current revenues which are applicable to the payment of debt in the current fiscal year. No such offset has been used to increase the margin as shown above.

(145)
Legal Debt Margin Calculation for Fiscal Year 2018Estimated Market Value 685,883,100$ Debt Limit (3% of Estimated Market Value) 20,576,493 Debt Applicable to Limit 1,452,330 Legal Debt Margin 19,124,163$
2013 2014 2015 2016 2017 2018
18,679,251$ 18,899,931$ 18,963,486$ 19,687,755$ 20,224,488$ 20,576,493$
1,245,000 1,180,000 945,000 1,393,165 1,028,532 1,452,330
17,434,251$ 17,719,931$ 18,018,486$ 18,294,590$ 19,195,956$ 19,124,163$
6.67% 6.24% 4.98% 7.08% 5.09% 7.06%
Fiscal Year

CITY OF BRAINERD, MINNESOTA PLEDGED-REVENUE COVERAGE
LAST TEN FISCAL YEARS
(146)
Less: NetFiscal Operating AvailableYear Revenue Principal Interest Coverage Revenue Expense Revenue
2009 1,286,416$ 1,215,000$ 410,010$ 0.79 145,436$ (431)$ 145,005$ 2010 1,375,495 1,180,000 466,044 0.84 142,062 (431) 141,631 2011 3,737,658 1,320,000 469,013 2.09 138,174 (216) 137,958 2012 2,044,629 3,920,000 367,008 0.48 18 - 18 2013 1,847,461 1,865,000 307,790 0.85 140,676 - 140,676 2014 2,001,376 1,820,000 264,734 0.96 146,676 (431) 146,245 2015 3,557,280 1,735,000 240,163 1.80 703,751 (349,095) 354,656 2016 3,541,087 2,705,000 216,841 1.21 783,274 (364,741) 418,533 2017 2,177,955 1,700,000 150,908 1.18 924,091 (369,787) 554,304 2018 1,560,587 1,530,000 119,153 0.95 1,032,572 (231,412) 801,160
Note: Details regarding the City's outstanding debt can be found in Note 4 of the notes to the financial statements.
Special Assessment / Improvement Bonds
Debt Service
Revenue Bonds

(147)
Principal Interest Coverage Revenue Principal Interest Coverage
55,000$ 62,478$ 1 100,929$ 55,000$ 49,883$ 0.96 85,000 59,678 0.98 100,853 55,000 48,650 0.97 85,000 56,278 0.98 104,344 55,000 46,665 1.03 85,000 52,878 - 66,154 60,000 44,445 0.63 90,000 49,378 1.01 103,536 60,000 45,145 0.98 95,000 45,678 1.04 102,221 65,000 37,183 1.00
105,000 49,870 2.29 - - - - 105,000 32,715 3.04 - - - - 260,800 180,157 1.26 - - - - 301,200 157,274 1.75 - - - -
Lease Obligations Bonds
Debt ServiceDebt Service
Revenue Bonds

CITY OF BRAINERD, MINNESOTA DEMOGRAPHIC AND ECONOMIC STATISTICS
LAST TEN CALENDAR YEARS
(148)
Personal PerIncome Capita
Fiscal (thousands Personal School UnemploymentYear Population (1) of dollars)(2) Income (3) Enrollment (4) Rate (5)2009 13,954 454,607$ 32,579$ 6,819 16.5 %2010 13,590 456,339 33,579 6,707 15.02011 13,606 475,421 34,942 6,625 13.82012 13,621 489,770 35,957 6,550 12.12013 13,662 503,322 36,841 6,612 11.62014 13,659 534,108 39,103 6,600 9.92015 13,671 553,676 40,500 6,648 6.02016 13,679 572,972 41,887 6,745 5.72017 13,719 586,762 42,770 6,744 5.22018 13,719 * 586,762 * 42,770 * 6,812 4.4
Notes:(1) Population is shown as the latest federal census data/state demographer's estimate.(2) Calculated as (1) x (3) / $1,000(3) Office of State Demographer; which uses U.S. Department of Commerce, Bureau of
Economic Analysis, Washington D.C., Per Capita Income for Crow Wing County, Minnesotain which the City of Brainerd resides.
(4) Brainerd Public School District # 181, Preschool - Grade 12.(5) Unemployment rate is for the City of Brainerd
* Most Recent Information not Available

CITY OF BRAINERD, MINNESOTA PRINCIPAL EMPLOYERS
CURRENT YEAR AND TEN YEARS AGO
(149)
2018 2009Percentage Percentage
of Total of Total Taxpayer Employees Rank Population Employees Rank Population
Essentia Health - Central Region (2) 1,496 1 10.9 % 903 2 6.5 %Independent School District No. 181 (1) 900 2 6.6 1,700 1 12.2Ascenus (3) 480 3 3.5 500 3 3.6Crow Wing County 471 4 3.4 471 4 3.4Cub Foods/Super Valu (3 locations) 335 5 2.4 - -Central Lakes College 300 6 2.2 304 6 2.2Mills Companies 200 7 1.5 223 8 1.6Bang Printing 200 8 1.5 185 10 -Good Samaritan Center - Bethany 195 9 1.4 330 5 2.4Good Samaritan Center - Woodland 178 9 1.3 - -Minnesota Care 165 10 1.2 - -Brainerd Medical Center - - 300 7 2.1Wausau Paper Corporation - - 188 9 1.3
Total 4,920 36.1 % 5,104 35.1 %
as well as the surrounding areas.
Notes:(1) Includes 1,000 permanent and 700 temporary/casual employees for 2009(2) Known as St. Joseph Medical Center in 2009(3) Known as Bisys Retirement Services in 2009
Source: Brainerd Lakes Area Economic Development Corporation. The employers represent major employers in the City of Brainerd

CITY OF BRAINERD, MINNESOTA FULL-TIME EQUIVALENT EMPLOYEES
CITY GOVERNMENT EMPLOYEES BY FUNCTION/PROGRAM LAST TEN YEARS
(150)
2009 2010 2011 2012 2013General Government
Management Services 2.00 2.00 2.00 2.00 2.00 Finance 4.00 4.00 4.00 4.00 4.00 Planning 2.00 1.00 1.00 1.00 1.00 Building 4.00 4.00 2.00 3.00 3.00
Total General Government 12.00 11.00 9.00 10.00 10.00
Public SafetyPolice
Officers 25.00 23.00 23.00 22.00 23.00 Civilians (1) 9.10 7.21 7.22 7.26 7.32
Total Police 34.10 30.21 30.22 29.26 30.32 Fire
Officers 7.00 6.00 8.00 8.00 8.00
Civilians 1.00 1.00 1.00 1.00 1.00
Paid On-Call Volunteers (1) 4.02 4.88 3.81 3.72 3.45 Total Fire 12.02 11.88 12.81 12.72 12.45
Total Public Safety 46.12 42.09 43.03 41.98 42.77 Public Works
Engineering (1) 7.36 6.24 6.18 7.10 7.23 Other 1.00 1.00 1.00 1.00 1.00
Total Public Works 8.36 7.24 7.18 8.10 8.23
Culture and Recreation (1) 14.88 12.47 12.72 12.64 12.77 Street, Sanitary, and Storm Sewer 9.00 7.00 7.00 6.00 7.00 Transit 1.00 1.00 1.00 1.00 1.00 Arena - - - - -
Total 91.36 80.80 79.93 79.72 81.77
Source: City Finance Office.
Notes:(1) Full-time equivalents for part time and temporary positions, is calculated by taking the total
temporary hours paid divided by 2,080 hours.
Full-time-Equivalent Employees as of December 31,

(151)
2014 2015 2016 2017 2018
2.00 2.00 2.00 2.38 2.00 4.00 4.00 4.00 4.00 4.00 1.00 1.00 1.00 1.26 1.54 3.00 2.00 3.00 3.25 3.40
10.00 9.00 10.00 10.89 10.94
22.00 23.00 23.00 24.00 24.00 7.24 7.21 7.25 7.36 7.27
29.24 30.21 30.25 31.36 31.27
7.00 1.00 2.00 2.00 2.00
1.00 1.00 1.00 1.00 1.00
3.87 4.25 4.80 4.48 4.15 11.87 6.25 7.80 7.48 7.15
41.11 36.46 38.05 38.84 38.42
7.71 7.14 7.03 5.73 5.71 1.00 1.50 1.50 2.24 2.25
8.71 8.64 8.53 7.97 7.96
12.36 12.36 12.07 12.17 12.68 7.00 7.00 7.00 7.00 7.00 1.00 1.00 1.00 1.00 1.00
- - - - -
80.18 74.46 76.65 77.87 78.00
Full-time-Equivalent Employees as of December 31,

CITY OF BRAINERD OPERATING INDICATORS BY FUNCTION/PROGRAM
LAST TEN FISCAL YEARS
(152)
Function/Program 2009 2010 2011 2012 2013
General GovernmentElections
Primary - 1 - 1 - General - 1 - 1 -
Registered VotersPrimary - 6,736 - 6,451 - General - 7,269 - 7,966 -
Number of Votes CastPrimary - 1,492 - 890 - General - 3,974 - 5,868 -
Voter Participation (Registered)Primary - 22.1% - 13.8% - General - 54.7% - 73.7% -
Public SafetyPolice
Part I Crimes (1) 665 691 836 844 917 Part II Crimes (2) 1,603 1,647 1,726 1,554 1,663 Total Incidents 14,639 14,670 15,949 16,542 17,131
FireFire/Other 411 422 421 821 1,126 Rescue 34 72 75 70 127
InspectionsBuilding Permits Issued 536 625 652 534 495Value of Building Permits 13,034,987$ 5,537,981$ 6,223,486$ 4,732,499$ 4,316,448$
Public WorksGeneral Maintenance (hours) 6,192 6,490 7,015 5,349 5,863 Traffic Control (hours) 881 653 675 957 1,201 Snow Removal (hours) 4,194 2,880 3,108 1,879 4,179
Culture and RecreationProgram Participants 2,617 2,454 2,437 2,321 2,058
Sanitary SewerSanitary Sewer Accounts 4,561 4,570 4,569 4,593 4,602
Storm SewerResidential Accounts 4,041 4,046 4,053 4,062 4,044 Commercial Accounts 692 696 695 705 698
ParkingParking Leases 185 185 185 185 185
TransitTotal Number of Route Miles (3) 266,576 281,067 283,363 275,339 262,966 Number of Passengers 64,768 65,938 67,436 61,176 62,183
Source: Various City Departments
Notes:(1) Part I crimes includes murder, rape, robbery, burglary, felony theft, serious assault, and arson.(2) Part II crimes includes fraud, vandalism, weapons, drugs, simple assault, DWI, juvenile delinquency, disorderly conduct, etc.(3) Includes mileage for both City and County rides.(4) Information not available is labeled N/A.
Fiscal Year

(153)
2014 2015 2016 2017 2018
1 - 1 - 11 - 1 - 1
6,568 - 6,422 - 7,029 7,031 - 7,819 - 7,484
879 - 452 - 1,851 4,078 - 5,923 - 4,805
13.4% - 7.0% - 26.3%58.0% - 75.8% - 64.2%
881 863 857 727 540 1,784 1,758 1,962 2,522 2,195
17,774 18,104 17,961 16,899 18,094
422 435 397 424 467 86 60 62 45 39
538 503 558 509 5377,837,040$ 17,034,773$ 9,564,814$ 13,540,726$ 32,769,401$
7,123 7,629 8,239 9,386 11,293 1,184 1,361 1,367 1,233 442 3,827 1,523 2,129 1,303 1,706
2,145 2,248 2,159 2,134 2,249
4,596 4,600 4,625 4,674 4,710
4,097 3,977 3,868 4,027 4,061 709 695 757 716 717
185 185 185 185 185
282,197 280,560 274,091 276,471 285,149 80,867 81,870 80,658 77,824 73,012
Fiscal Year

CITY OF BRAINERD, MINNESOTA GENERAL ASSET STATISTICS BY FUNCTION/PROGRAM
LAST TEN YEARS
(154)
Function/Program 2009 2010 2011 2012 2013
Public SafetyPolice
Stations 1 1 1 1 1Patrol Units 11 11 11 11 11Other Specialty Units 6 6 5 5 5
FireStations 2 2 2 2 2Fire Trucks 10 10 10 10 10Other Rescue Units 13 13 13 13 13Fire Rating 4 4 4 4 4
Public WorksVehicles 40 40 39 39 39Streets (Miles) (1) 85.25 85.25 85.25 85.25 85.25Sidewalks (Miles) 34.8 34.8 34.8 35.8 35.8Trails (Miles) 6.23 6.9 6.9 8.1 10.2
Culture and RecreationParks
Parks 16 16 17 17 18Park Acres 319 340 374 374 392Park Shelters 11 11 11 11 11Basketball Courts 1 1 1 1 1Boat Launches 3 3 3 3 3Fishing Pier 3 3 3 3 3Skating Rinks 6 6 6 6 6Soccer Fields 1 1 1 1 1Softball Fields 7 7 7 7 7Swimming Beach 1 1 1 1 1Tennis Courts 5 5 5 5 5Volleyball Courts 2 2 2 2 2Baseball Fields 6 6 6 6 6
Sanitary SewerCollection System (Miles) 77.19 77.19 77.19 77.19 77.19
Storm SewerPipe (Miles) 17.33 17.33 17.33 17.33 17.33
ParkingPaylots / Permit Parking 5 5 5 5 5
TransitBuses 4 4 4.5 4.5 4.5
Source: Various City Departments
Note:(1) Includes both paved and unpaved roads.
Fiscal Year

(155)
2014 2015 2016 2017 2018
1 1 1 1 19 9 9 9 96 7 7 7 7
2 2 2 2 210 10 8 8 813 13 12 12 114 4 4 4 4
39 39 38 38 3885.25 82.25 82.25 82.25 82.2536.41 36.41 36.41 36.41 36.4110.2 10.68 10.68 10.68 10.68
18 18 14 14 14392 392 392 392 39211 11 11 11 111 1 1 1 13 3 3 3 33 3 3 3 36 6 6 6 61 1 1 1 17 7 7 7 71 1 1 1 15 5 5 5 52 2 2 2 27 7 7 7 7
77.19 77.19 77.19 79.42 79.42
17.33 17.52 17.52 17.62 17.62
5 5 5 5 5
7 7 7 7 7
Fiscal Year

This Page Has Been Intentionally Left Blank.

OTHER REPORTS SECTION

(156)
INDEPENDENT AUDITORS’ REPORT ON INTERNAL CONTROL OVER FINANCIAL REPORTING AND ON COMPLIANCE AND OTHER MATTERS
BASED ON AN AUDIT OF FINANCIAL STATEMENTS PERFORMED IN ACCORDANCE WITH GOVERNMENT AUDITING STANDARDS
Honorable Mayor and Members of the City Council City of Brainerd Brainerd, Minnesota We have audited, in accordance with the auditing standards generally accepted in the United States of America and the standards applicable to financial audits contained in Government Auditing Standards issued by the Comptroller General of the United States, the financial statements of the governmental activities, the business-type activities, the aggregate discretely presented component units, each major fund, and the aggregate remaining fund information of City of Brainerd (the City), as of and for the year ended December 31, 2018, and the related notes to the financial statements, which collectively comprise the City’s basic financial statements, and have issued our report thereon dated June 12, 2019. The City’s basic financial statements include the operations of the Housing and Redevelopment Authority of Brainerd (HRA) and Brainerd Public Utilities (BPU) (component units) for the year ended December 31, 2018. This report does not include the operations of the HRA and BPU because the component units engaged for their own separate audits in accordance with Government Auditing Standards. Internal Control Over Financial Reporting
In planning and performing our audit of the financial statements, we considered the City’s internal control over financial reporting (internal control) to determine the audit procedures that are appropriate in the circumstances for the purpose of expressing our opinions on the financial statements, but not for the purpose of expressing an opinion on the effectiveness of the City’s internal control. Accordingly, we do not express an opinion on the effectiveness of the City’s internal control. A deficiency in internal control exists when the design or operation of a control does not allow management or employees, in the normal course of performing their assigned functions, to prevent, or detect and correct, misstatements on a timely basis. A material weakness is a deficiency, or a combination of deficiencies, in internal control, such that there is a reasonable possibility that a material misstatement of the City’s financial statements will not be prevented, or detected and corrected on a timely basis. A significant deficiency is a deficiency, or a combination of deficiencies, in internal control that is less severe than a material weakness, yet important enough to merit attention by those charged with governance.

Honorable Mayor and Members of the City Council City of Brainerd
(157)
Our consideration of internal control was for the limited purpose described in the first paragraph of this section and was not designed to identify all deficiencies in internal control that might be material weaknesses or significant deficiencies and therefore, material weaknesses or significant deficiencies may exist that have not been identified. Given these limitations, during our audit we did not identify any deficiencies in internal control that we consider to be material weaknesses. We did identify a certain deficiency in internal control, described in the accompanying schedule of findings and questioned costs as item 2018-001 that we consider to be a significant deficiency.
Compliance and Other Matters
As part of obtaining reasonable assurance about whether the City’s financial statements are free from material misstatement, we performed tests of its compliance with certain provisions of laws, regulations, contracts, and grant agreements, noncompliance with which could have a direct and material effect on the determination of financial statement amounts. However, providing an opinion on compliance with those provisions was not an objective of our audit, and accordingly, we do not express such an opinion. The results of our tests disclosed no instances of noncompliance or other matters that are required to be reported under Government Auditing Standards.
City’s Response to the Finding
The City’s response to the finding identified in our audit is described in the accompanying schedule of findings and questioned costs. The City’s response was not subjected to the auditing procedures applied in the audit of the financial statements and, accordingly, we express no opinion on it.
Purpose of this Report
The purpose of this report is solely to describe the scope of our testing of internal control and compliance and the result of that testing, and not to provide an opinion on the effectiveness of the entity’s internal control or on compliance. This report is an integral part of an audit performed in accordance with Government Auditing Standards in considering the City’s internal control and compliance. Accordingly, this communication is not suitable for any other purpose.
CliftonLarsonAllen LLP
Brainerd, Minnesota June 12, 2019

(158)
INDEPENDENT AUDITORS’ REPORT ON COMPLIANCE FOR EACH MAJOR FEDERAL PROGRAM AND REPORT ON INTERNAL CONTROL OVER
COMPLIANCE REQUIRED BY THE UNIFORM GUIDANCE Honorable Mayor and Members of the City Council City of Brainerd Brainerd, Minnesota Report on Compliance for Each Major Federal Program
We have audited the City of Brainerd’s (the City) compliance with the types of compliance requirements described in the OMB Compliance Supplement that could have a direct and material effect on each of the City’s major federal programs for the year ended December 31, 2018. The City’s major federal programs are identified in the summary of auditors’ results section of the accompanying Schedule of Findings and Questioned Costs. The City's basic financial statements include the operations of the Housing and Redevelopment Authority of Brainerd (HRA), which expended $2,317,868 in federal awards which are not included in the accompanying Schedule of Expenditures of Federal Awards for the year ended December 31, 2018. Our audit, described below did not include the operations of the HRA because the component unit engaged for its own separate audit in accordance with the Uniform Guidance. Management’s Responsibility
Management is responsible for compliance with federal statutes, regulations, and the terms and conditions of its federal awards applicable to its federal programs. Auditors’ Responsibility
Our responsibility is to express an opinion on compliance for each of the City’s major federal programs based on our audit of the types of compliance requirements referred to above. We conducted our audit of compliance in accordance with auditing standards generally accepted in the United States of America; the standards applicable to financial audits contained in Government Auditing Standards, issued by the Comptroller General of the United States; and the audit requirements of Title 2 U.S. Code of Federal Regulations Part 200, Uniform Administrative Requirements, Cost Principles, and Audit Requirements for Federal Awards (Uniform Guidance). Those standards and the Uniform Guidance require that we plan and perform the audit to obtain reasonable assurance about whether noncompliance with the types of compliance requirements referred to above that could have a direct and material effect on a major federal program occurred. An audit includes examining, on a test basis, evidence about the City’s compliance with those requirements and performing such other procedures as we considered necessary in the circumstances. We believe that our audit provides a reasonable basis for our opinion on compliance for each major federal program. However, our audit does not provide a legal determination of the City’s compliance.

Honorable Mayor and Members of the City Council City of Brainerd
(159)
Opinion on Each Major Federal Program
In our opinion, the City complied, in all material respects, with the types of compliance requirements referred to above that could have a direct and material effect on each of its major federal programs for the year ended December 31, 2018.
Report on Internal Control Over Compliance
Management of the City is responsible for establishing and maintaining effective internal control over compliance with the types of compliance requirements referred to above. In planning and performing our audit of compliance, we considered the City’s internal control over compliance with the types of requirements that could have a direct and material effect on each major federal program to determine the auditing procedures that are appropriate in the circumstances for the purpose of expressing an opinion on compliance for each major federal program and to test and report on internal control over compliance in accordance with the Uniform Guidance, but not for the purpose of expressing an opinion on the effectiveness of internal control over compliance. Accordingly, we do not express an opinion on the effectiveness of the City’s internal control over compliance.
A deficiency in internal control over compliance exists when the design or operation of a control over compliance does not allow management or employees, in the normal course of performing their assigned functions, to prevent, or detect and correct, noncompliance with a type of compliance requirement of a federal program on a timely basis. A material weakness in internal control over compliance is a deficiency, or combination of deficiencies, in internal control over compliance, such that there is a reasonable possibility that material noncompliance with a type of compliance requirement of a federal program will not be prevented, or detected and corrected, on a timely basis. A significant deficiency in internal control over compliance is a deficiency, or a combination of deficiencies, in internal control over compliance with a type of compliance requirement of a federal program that is less severe than a material weakness in internal control over compliance, yet important enough to merit attention by those charged with governance.
Our consideration of internal control over compliance was for the limited purpose described in the first paragraph of this section and was not designed to identify all deficiencies in internal control over compliance that might be material weaknesses or significant deficiencies. We did not identify any deficiencies in internal control over compliance that we consider to be material weaknesses. However, material weaknesses may exist that have not been identified.
The purpose of this report on internal control over compliance is solely to describe the scope of our testing of internal control over compliance and the result of that testing based on the requirements of the Uniform Guidance. Accordingly, this report is not suitable for any other purpose.
CliftonLarsonAllen LLP
Brainerd, Minnesota June 12, 2019

CITY OF BRAINERD, MINNESOTA SCHEDULE OF EXPENDITURES OF FEDERAL AWARDS
YEAR ENDED DECEMBER 31, 2018
(160)
PASS-THROUGH PASSEDFEDERAL AGENCY/PASS-THROUGH ENTITY INDENTIFYING THROUGH TO
GRANTOR/PROGRAM TITLE NUMBER SUBRECIPIENTS
U.S. DEPARTMENT OF HOUSING AND URBAN DEVELOPMENTPassed Through Minnesota Department of Employment and Economic Development
Community Development Block Grants/State's Programs and Non-Entitlement Grants in Hawaii - #CDAP-12-0020-O-FY13 14.228 CDAP-15-0038-O-FY16 223,107$ 45,419$
U.S. DEPARTMENT OF EDUCATION Passed Through Minnesota Department of Education
Rehabilitation Services - Vocational Rehabilitation Grants to States 84.126 Unknown 478 -
U.S. DEPARTMENT OF JUSTICEPassed Through Minnesota Department of Justice
Bulletproof Vest Partnership Program 16.607 Unknown 3,525 - Special Data Collections & Statistical Studies 16.734 Unknown 27,500 -
Total U.S. Department of Justice 31,025 -
U.S. DEPARTMENT OF TRANSPORTATIONPassed Through State Department of Public Safety
Formula Grants for Other than Nonurbanized Areas 20.509 MN-2017-001-00 347,681 - State and Community Highway Safety (Highway Safety Cluster) 20.600 F-ENFRC18-2018-BRAINDPD 3,367$ State and Community Highway Safety (Highway Safety Cluster) 20.600 F-ENFRC19-2019-BRAINDPD 949 Total State and Community Highway Safety 4,316 3,800
National Priority Safety Programs(Highway Safety Cluster) 20.616 F-ENFRC18-2018-BRAINDPD 8,907 Total National Priority Safety Programs 8,907 7,663 Total Highway Safety Cluster 13,223
Minimum Penalties for Repeat Offenders for Driving While Intoxicated 20.608 F-ENFRC18-2018-BRAINDPD 17,962 Minimum Penalties for Repeat Offenders for Driving While Intoxicated 20.608 F-ENFRC19-2019-BRAINDPD 5,793 Total Minimum Penalties for Repeat Offenders for Driving While Intoxicated 23,755 20,085 Total U.S. Department of Transportation 384,659 31,548
U.S. DEPARTMENT OF HOMELAND SECURITYPassed Through Minnesota Department of Homeland Security
Grants to States to Support Oral Health Workforce Activities 93.236 Unkonwn 1,989 -
Total Primary Government Federal Awards 641,258 76,967
DISCRETELY PRESENTED COMPONENT UNITS (NOT INCLUDING BRAINERD HRA OR BPU)
U.S. DEPARTMENT OF TRANSPORTATIONPassed Through Minnesota Department of Transportation
Airport Improvement Program 20.106 AIP-3-27-0014-040-2015 36,450 Airport Improvement Program 20.106 AIP-3-27-0014-041-2016 25,462 Airport Improvement Program 20.106 AIP-3-27-0014-042-2017 552,390 Airport Improvement Program 20.106 AIP-3-27-0014-043-2018 630,951 Total Airport Improvement Program 1,245,253 -
Total Discretely Presented Component Units 1,245,253 -
Total Federal Awards 1,886,511$ 76,967$
Notes to Schedule of Expenditures of Federal Awards:
1. The Schedule of Expenditures of Federal Awards presents the activity of federal award programs expendedby the City of Brainerd and its discretely presented component unit the Brainerd Lakes Regional Airport.This schedule does not include the federal expenditures of the Housing and Redevelopment Authority of Brainerdor Brainerd Public Utilities. The City's reporting entity is defined in Note 1 to the basic financial statements.
2. The expenditures on this schedule are on the modified accrual basis of accounting, which is described
in Note 1 to the basic financial statements of the City. The City has not elected to use the 10% de minimis
indirect cost rate as allowed under Uniform Guidance.
PRIMARY GOVERNMENT
FEDERAL
EXPENDITURES

(161)
INDEPENDENT AUDITORS’ REPORT ON MINNESOTA LEGAL COMPLIANCE
Honorable Mayor and Members of the City Council City of Brainerd Brainerd, Minnesota
We have audited, in accordance with auditing standards generally accepted in the United States of America and the standards applicable to financial audits contained in Government Auditing Standards issued by the Comptroller General of the United States, the financial statements of the governmental activities, the business-type activities, the aggregate discretely presented component units, each major fund, and the aggregate remaining fund information of the City of Brainerd (the City), Minnesota, as of and for the year ended December 31, 2018, and the related notes to the financial statements, which collectively comprise the City’s basic financial statements and have issued our report thereon dated June 12, 2019.
The City’s basic financial statements include the operations of Brainerd Public Utilities and the Housing and Redevelopment Authority of Brainerd (HRA). This report does not include the operations of Brainerd Public Utilities or the HRA because each of the component units engaged for its own separate audit that included the provisions of the Minnesota Legal Compliance Audit Guide for Other Political Subdivisions.
The Minnesota Legal Compliance Audit Guide for Cities, promulgated by the State Auditor pursuant to Minn. Stat. §6.65, contains seven categories of compliance to be tested: contracting and bidding, deposits and investments, conflicts of interest, public indebtedness, claims and disbursements, miscellaneous provisions and tax increment financing.
In connection with our audit, nothing came to our attention that caused us to believe that the City of Brainerd, Minnesota failed to comply with the provisions of the Minnesota Legal Compliance Audit Guide for Cities. However, our audit was not directed primarily toward obtaining knowledge of such noncompliance. Accordingly, had we performed additional procedures, other matters may have come to our attention regarding the City’s noncompliance with the above-referenced provisions, insofar as they relate to accounting matters.
The purpose of this report is solely to describe the scope of our testing of compliance relating to the provisions of the Minnesota Legal Compliance Audit Guide for Cities and the results of that testing, and not to provide an opinion on compliance. Accordingly, this report is not suitable for any other purpose.
CliftonLarsonAllen LLP
Brainerd, Minnesota June 12, 2019

CITY OF BRAINERD, MINNESOTA SCHEDULE OF FINDINGS AND QUESTIONED COSTS
YEAR ENDED DECEMBER 31, 2018
(162)
Section I – Summary of Auditors’ Results
Financial Statements
Type of auditor’s report issued: Unmodified Internal control over financial reporting:
Material weakness(es) identified? yes X no Significant deficiency(ies) identified? X yes none reported Noncompliance material to financial statements noted? yes X no
Federal Awards
Internal control over major programs:
Material weakness(es) identified? yes X no Significant deficiency(ies) identified? yes X none reported Type of auditor's report issued on compliance for major programs: Unmodified Any audit findings disclosed that are required to be reported in accordance with 2 CFR 200.516(a)? yes X no Identification of major programs:
CFDA Numbers Name of Federal Program or Cluster
20.106
Airport Improvement Project
Dollar threshold used to distinguish between Type A and Type B programs: $750,000 Auditee qualified as low-risk auditee? yes X no

CITY OF BRAINERD, MINNESOTA SCHEDULE OF FINDINGS AND QUESTIONED COSTS (CONTINUED)
YEAR ENDED DECEMBER 31, 2018
(163)
Section II – Financial Statement Findings
2018-001 Significant Deficiency in Internal Control Over Financial Reporting Petty Cash and Change Fund Accounts Condition: As part of the audit, we noted that several department petty cash funds did not match the Council approved amount. It was also noted that these departments did not follow the controls and procedures in place over those funds. Criteria/Context: Departments within the City that are allocated petty cash funds should receive City Council approval for a specific amount to be kept on hand. Departments should have controls and procedures in place over those funds and keep those funds at the Council approved amount. Cause: Change over in staff. Possible Effect: Departmental petty cash funds are at an increased risk of being misused or misappropriated without formal documentation of the amount and intent for their purpose. Repeat Finding: No. Recommendation: We recommend City management create a listing of all petty cash funds in use by each department and ensure proper Council approval for each of those funds and its purpose. We also recommend City management ensure all departments are following the controls and procedures in place over those funds. View of Responsible Official and Planned Corrective Action: Contact Person: Connie Hillman, Finance Director Corrective Action Planned: A corrective action is in place. Anticipated Completion Date: December 31, 2019.
Section III – Findings and Questioned Costs – Major Federal Programs
None noted.


![arXiv:1706.09811v3 [math.ST] 12 Jul 2018](https://static.fdokumen.com/doc/165x107/6326677ecedd78c2b50d1110/arxiv170609811v3-mathst-12-jul-2018.jpg)