District Census Handbook, Rangareddi, Part XII-A & B, Series-2
444
CENSUS OF INDIA 1991 SERIES 2 ANDHRA PRADESH DISTRICT CENSUS HANDBOOK RANGAREDDt PART XII -A & B VILLAGE & TOWN DIRECTORY VILLAGE & TOWNWISE PRIMARY CENSUS ABSTRACT DIRECTORATE OF CENSUS OPERATIONS ANDHRA PRADESH PUBLISHED BY THE GOVERNMENT OF ANDHRA PRADESH 1997
-
Upload
khangminh22 -
Category
Documents
-
view
3 -
download
0
Transcript of District Census Handbook, Rangareddi, Part XII-A & B, Series-2
CENSUS OF INDIA 1991
SERIES 2
ANDHRA PRADESH
DISTRICT CENSUS HANDBOOK
RANGAREDDt
PART XII - A & B
VILLAGE & TOWN DIRECTORY
VILLAGE & TOWNWISE PRIMARY CENSUS ABSTRACT
DIRECTORATE OF CENSUS OPERATIONS
ANDHRA PRADESH
PUBLISHED BY THE GOVERNMENT OF ANDHRA PRADESH
1997


FOREWORD
Publication of the District Census Handbooks (DCHs) was initiated after the 1951 Census and is continuing since then with some innovations/modifications after each decennial Census. This is the most valuable district level publication brought out by the Census Organisation on behalf of each State Govt.j Union Territory administration. It InicTalia Provides data/information on some of the basic demographic and socio-economic characteristics and on the availability of certain important civic amenities/facilities in each village and town of the respective districts. This publication has trrus proved to be of immense utility to the planners., administrators, academicians and researchers.
The scope of the DCH was initially confined to certain important census tables on population, economic and socio-cultural aspects as also the Primary Census Abstract (PCA) of each village and town (ward wise) of the district. The DCHs published after the 1961 Census contained a descriptive account of the district, administrative statistics, census tables and Village and Town Directories including PCA. After the 1971 Census, two parts of the District Census Handbooks (Part-A comprising Village and Town Directories and Part-9 comprising Village and Town PC A) were released in all the States and Union Territories. The third Part (C) of the District Census Handbooks comprising administrative statistics and district census tables, which was also to be brought out, could not be published in many States/UTs due to considerable delay in compilation of relevant material. In 1981, some new features alongwith the restructuring of the formats of Village and TO'IVn Directory were introduced in the DCHs. These were published in two parts for each dislrict after the 1981 Census. While Part-A comprised Village and Town Directories, the PCA of Villages and Towns (ward-wise) including Scheduled Caste and Scheduled Tribe PCA upto tellsil/town level were provided in Part-B. To illustrate, all the amenities except electricity, were brought together in the Village Directory and if an amenity was not available in the referrent village, the distance in broad ranges from the nearest place having such amenity was given. Information on some new items such as adult literacy centres, primary health sub-centres and community health workers in the village were provided so as to meet some of the requirements ot the Revised Minimum Needs Programme. Similarly, information on approach to the village was also provided for the first time in the Village Directory so as to give an idea about the number of inaccessible villages in each distriCt. In case of Town Directories also, keeping in view the requirements of the Minimum Needs Programme, a Statement IV-A on slum2 was provided so as to enable the planners to chalk out the programmes for providing better civic and other amenities in the slums. I n this statement details on civic Ctr ,d other amenities were reported for the slums of class I and cla~s II towns. Apart from this, one column on the scheduled castes and scheduled tribes population ancl ;::mother on adult literacy classes/centres were added in statements IV and V respectively.
The manner of presentation of the DCHs for the 1991 Census is by and large the same as followed in 1981. However, the format of PCA has been restructured slightly in the 1991 Census for the benefit of data users. Nine-fold industrial classification of main workers has been given as against four-fold industrial classification presented in the 1981 Census. In addition to this, the sex-wise population in the 0-6 age-group has also been included in PCA for the first time with a view to enabling data users to compute more realistic literacv rate as all children below 7 years of age have been treated as illiterate at the time of th(} 1991 Census. It is expected that the above mentioned modifications will help the planner8 in chalking out more effective developmental programme.
One of the most important innovations in the 1991 Census is the Community Development Block-level presentation of data in the Village Directory and PCA instead of the traditional Tahsil/Taluk/PS level presentation. It is expected that the presentation of Village Directory and PCA data at C.D. Block level will help the planners in formulation of micro-level developmental plans, as the C.D. Block is the lowest administrative unit for developmenral planning.

In order to facilitate the task of administrators, planners and researchers intending to US'€ Village Directory /PCA data, either from the magnetic tapes/ floppies or from the published records, both the computer and manual codes for each village have been provided for the 1991 Census alongwith the corresponding codes of 1981.
This publication is a jOint venture of the State Govt. and the Census Organisation. The data have been collected and compiled under the direction of Shri R.P. Singh, lAS, Director of Census Operations, Andhra Pradesh, Hyderabad on behalf of the State Government which has borne the cost of printing. The task of planning, designing and co-ordination of the publication was initiated by Dr. K.P.lttaman, former Deputy Registrar General, (Social Studies) and Shri M.M. Dua. Joint Director. For the sake of uniformity in presentation of information/data and for preparation of analytical note depicting the salient features emerging from a micro-level analysis of census/non-census data, a model District Census Handbook from each state and union territory was thoroughly scrutinised in the Social studies Division under the guidance of Shri M.K.Jain, the present Deputy Registrar General (S.S). This task was carried by Shri A.K.Singh, Deputy Director who was assisted by Shri N.S. Soam, Assistant Director and his staff. Technical guidance in the preparation of the maps was initially provided by Dr. B.K.Roy former Deputy Registrar General (Map) and later by ,Mrs. Minati Ghosh, the present Deputy Registrar General (Map).
I am thankful to all those who have contributed to this project.
New Delhi the 11th June, 1992.
A.A. Nanda Registrar General, India

PREFACE
The District Census Hand Book (DCHB) brought out by the Census Organisation on behalf of the State Government is one of the most valuable and important publications of the Census. It is the sole publication depicting authentic information in the form of Primary Census Abstract upto village level for the rural areas and ward level in urban areas. Simultaneously, it also presents statistics on infrastructure amenities available in the villages and towns of the respective districts.
It was in 1951 Census when DCHB was published first time. The History, scope and significance of the DCHB as well as the changes effected since 1951 has been discussed in detail in the foreward by Registrar General, India. As per the 1991 Census publication programme this volume was supposed to be published in two parts i.e., Part "A' comprising of analytical note supported by number of tables on Census and non-census data for village and town directories, while Part 'B' contains detailed Census data for village and town in the form of Primary Census Abstract. However, Part "A' and 'B' are compiled in single volume for the convenience of data users. Analytical note presented in DCHB is brief, concise but quite informative. The Hand Book is further enriched with maps at the level of Distrtict and Revenue Divisions. One of the major changes brought in 1991 publications is the presentation of the Primary Census Abstract with nine fold industrial classification of workers as against the four fold divisions of 1981.
A complete reorganisation of the administrative units below the district level in Andhra Pradesh has taken place in 1985 when 1,110 Mandals replaced 316 Taluks. Upto 1981 Census, the data were presented in respect of village in each taluk in the DCHB. In the present series the village-wise data have been present(;u at the level of Mandai Praja Parishads instead of Revenue MandaI. The data in respect of statutory towns are presented separately.
Village-wise and town-wise data received from the various sources such as Mandai Revenue Officers, Mandai Praja Parishads and Municipal Officers have been examined exhaustively for consistency in reporting and comparability with the data published in 1981 DCHBs. This process of reconciliation contributed to considerable delay in bringing out these volumes. The processing of such massive data pertaining to village and town directories are an arduous task requiring minute care in checking at various stages. Various officers have to do assiduous efforts to erc_:re high quality of data.
The major work relating to DCHBs was successfully carried out under the able guidance and direction 01 Sri R.P. Singh, lAS., Director of Census Operations, Andhra Pradesh. I gratefully acknowledge his valuable contribution made for this publication. The work was later continued by Sri Y.G. Krishna Murthy, Joint Director. I express

my thanks to him. I also thank all officers and officials of this Directorarte who have been actively involved in the compilation of this volume. A list of I\Gknowledgement is appended in the book. The Andhra Pradesh Technology Services Ltd., Government of Andhra Pradesh helped us by providing the final print-outs which have been used as camera ready copies by Commissioner of Printing. I am thankful to the officials of General Administration Department and Commissioner of Printing, Government of Andhra Pradesh for their involvement and help in bringing out the publication. I would like to express deep gratitude to Sri A.R. Nanda, lAS., Registrar General, India and Census Commissioner of India for his valuable guidance and encouragement. I express my thanks to Dr. M.K. Jain, Deputy Registrar General, India (Social Studies Division) and as well as Smt. Minati Ghosh, Deputy Registrar General, India (Map) for their guidance and help in finalising this volume.
Hopefully, the publication will serve as a useful source of reference for the data users.
Hyderabad
RAM SINGH
Joint Director of Census Operations
Andhra Pradesh

Officials who worked on this book
Overall Supervision Smt. P .Lalitha, Assistant Director
Supervision of Mapping work Sri Shyam Deo, Research Officer.
i) Preliminary Drafting, Scrutiny and Supervision of Printing P.A.M. Tayaru. Investigator
Smt. N.Suseela, Investigator
Sri T.Lokanadham, Investigator
ii) Collection, Compilation & Scrutiny Sri D. Prakash, Statistical Assistant
Sri M.A.Elah, Statistical Assistant
Sri M.Narsing Rao, Statistical Assistant
Sri NVSastry. Statistical Assistant
Kum.K.Anasuya, Statistical Assistant
Sri M.Sathaiah, Statistical Assistant
Sri L.Sudarshan Rao, Statistical Assistant
Sri M.Makhatlal, Statistical Assistant
Sri V. Anantasayana Rao, Statistical Assistant
Sri V.Chandrasekhar, Junior Supervisor
Sri K.Surapu Naidu, Computer
Sri C.V.Nataraj, Operator Grade-B
Sri P.Kulasekhar,Operator Grade-B
Sri T.Sri Ram, Operator Grade-8
iii) Computerisation of data and Graphs Sri N.Shivaramakrishna, D.E. Operator
Sri D.Venkata Ramana, D.E. Operator
iv) Scrutiny and Supervision of Mapping work Dr.(Kum.)Aqueela Begum, Senior Geographer
v) Preparation of Maps, Cover design & Ammonia printing Sri M.J.Sadiq, Sr. Artist
Sri Gulam Hassan Mohinuddin, Draughtsman
Sri P .Babji, Draughtsman
Sri K. Koteswara Rao, Ferro Operator

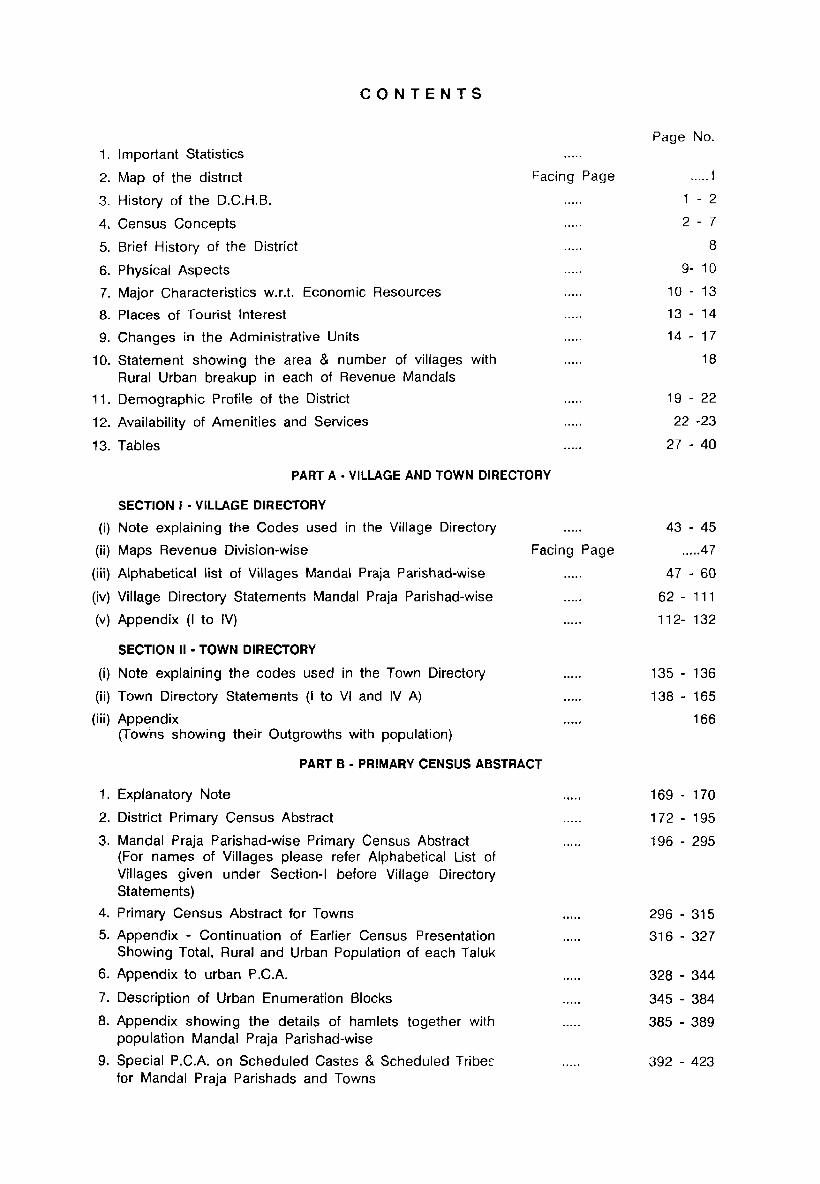
CONTENTS
1. Important Statistics
2. Map of the distnct Facing Page
3. History of the D.C.H.B.
4. Census Concepts
5. Brief History of the District
6. Physical Aspects
7. Major Characteristics w.r.t. Economic Resources
8. Places of Tourist Interest
9. Changes in the Administrative Units
10. Statement showing the area & number of villages with Rural Urban breakup in each of Revenue Mandals
11. Demographic Profile of the District
12. Availability of Amenities and Services
13. Tables
PART A - VILLAGE AND TOWN DIRECTORY
SECTION I • VILLAGE DIRECTORY
(i) Note explaining the Codes used in the Village Directory
(ii) Maps Revenue Division-wise
(iii) Alphabetical list of Villages Mandai Praja Parishad-wise
(iv) Village Directory Statements Mandai Praja Parishad-wise
(v) Appendix (I to IV)
SECTION II • TOWN DIRECTORY
(i) Note explaining the codes used in the Town Directory
(ii) Town Directory Statements (I to VI and IV A)
(iii) Appendix (Towhs showing their Outgrowths with population)
Facing Page
PART B • PRIMARY CENSUS ABSTRACT
1. Explanatory Note
2. District Primary Census Abstract
3. Mandai Praja Parishad-wise Primary Census Abstract (For names of Villages please refer Alphabetical List of Villages given under Section-I before Village Directory Statements)
4. Primary Census Abstract for Towns
5. Appendix - Continuation of Earlier Census Presentation Showing Total, Rural and Urban Population of each Taluk
6. Appendix to urban P .C.A.
7. Description of Urban Enumeration Blocks
8. Appendix showing the details of hamlets together with population Mandai Praja Parish ad-wise
9. Special P.C.A. on Scheduled Castes & Scheduled Tribes for Mandai Praja Parishads and Towns
Page No.
..... 1
1 - 2
2 - 7
8
9- 10
10 - 13
13 - 14
14 - 17
18
19 - 22
22 -23
27 - 40
43 - 45
.... .47
47 - 60
62 - 111
112- 132
135 - 136
138 - 165
166
169 - 170
172 - 195
196 - 295
296 - 315
316 - 327
328 - 344
345 - 384
385 - 389
392 - 423

IMPORTANT STATISTICS
STATE RANGA REDDY DISTRICT
POPULATION TOTAL '" Persons 66,508,008 2,551,966
... Males 33,724,581 1,314,560
... Females 32,783,427 1,237,406
RURAL ... Persons 48,620,882 1,346,789 ... Males 24,591,875 688,394 ... Females 24,029,007 658,395
URBAN ... Persons 17,887,126 1,205,177 ... Males 9,132,706 626,166 ... Females 8,754,420 579,011
DECENNIAL POPULATION GROWTH RATE 1981-91 24.20 61.31
AREA (Sq. km.) 275,045 7,493
DENSITY OF POPULATION (Per Sq. km.) 242 341
SEX RATIO (Number of Females per 1000 males) 972 941
LITERACY RATE ... Persons 44.08 49.07 (excluding children in ... Males 55.12 60.43
the age-group 0~6) ... Females 32.72 36.91
PERCENTAGE OF URBAN 26.89 47.23 POPULATION TO TOTAL POPULATION
PERCENTAGE TO TOTAL·POPULATION i) Main workers ... Persons 42.77 39.69
... Males 55.13 52.12
... Females 30.05 26.48
ii) Marginal workers ... Persons 2.28 1.06 ... Males 0.35 0.23 ... Females 4.27 1.95
iii) Non-workers ... Persons 54.95 59.25 ... Males 44.52 47.65 ... Females 65.68 71.57
BREAK UP OF MAIN WORKERS PERCENTAGE AMONG MAIN WORKERS
i. CULTIVATORS ... Persons 27.74 25.32 ... Males 30.59 24.92 ... Females 22.37 26.18
ii. AGRICULTURAL LABOURERS ... Persons 40.87 28.53 ... Males 30.55 17.93 ... Females 60.33 50.68

STATE DISTRICT
iii. LIVESTOCK, FORESTRY, ... Persons 1.77 1.92 FISHING, HUNTING, ... Males 2.35 2.34
PLANTATIONS, ORCHARDS AND ... Females 0.67 1.05 ALLIED ACTIVITIES
iv. MINING AND QUARRYING ... Persons 0.87 1.55 ... Males 1.10 1.55 ... Females 0.43 1.56
v. a) MANUFACTURING, PROCESSING, ... Persons 3.36 1.00 SERVICING &REPAIRS ... Males 2.71 1.02
IN HOUSEHOLD INDUSTRY ... Females 4.59 0.97
b) MANUFACTURING, PROCESSING, ... Persons 5.47 13.84 SERVICING & REPAIRS ... Males 7.05 18.21
IN OTHER THAN ... Females 2.50 4.70 HOUSEHOLD INDUSTRY
vi. CONSTRUCTION ... Persons 1.65 4.47 ... Males 2.22 5.46 '" Females 0.59 2.41
vii. TRADE AND COMMERCE ... Persons 6.69 7.94 ... Males 8.90 10.21 ... Females 2.50 3.20
viii. TRANSPORT, STORAGE AND ... Persons 2.79 4.33 COMMUNICATION ... Males 4.18 6.08
... Females 0.17 0.66
ix. OTHER SERVICES ... Persons 8.79 11.09 ... Males 10.35 12.28 ... Females 5.85 8.60
PERCENTAGE OF SCHEDULED ... Persons 15.93 17.22 CASTES POPULATION TO ... Males 15.95 17.06
TOTAL POPULATION ... Females 15.90 17.38
PERCENTAGE OF SCHEDULED ... Persons 6.31 4.29 TRIBES POPULATION TO ... Males 6.35 4.29
TOTAL POPULATION ... Females 6.27 4.28
NUMBER OF OCCUPIED 13,474,576 486,410 RESIDENTIAL HOUSES
NUMBER OF VILLAGES ... TOTAL 28,000 927 ... INHABITED 26,586 865 ... UNINHABITED 1,414 62
NUMBER OF TOWNS 264 14


RANGAREDOI DISTRICT

0. ..J I< 0
0 d
G ~ " \. 'a f>.
" \'I
,/
t-O -
0 a: ~ t-
:Ie en .., Q 0 III
~-C
~ e II: It. Q ~IO
X I- e C II: :Ie W
" c a: z ,.. 0
~ e c(
~~ CJ z c( ~
<II 0
" a:
<Xl
'" '" w 0
"r )..
o
tr
5 T R
c
_!!,1 o ' . ,,-\ (
~ o ___
.I I-
~G-A In " ...
,,~ ~ ~ ,,<:>
Q.~
~ .§
0
fJ
FROM KODANGAL
0 ..:z:
. .J 0, <r
III
L"'>-f • ,.. J
./.t. I ,.J
.. ....., -?;
.. b iii
~ ] 0
CD
u
~
•••• r
- "': ~ . .. .
~ u !i! u " 0
i ~ ; l-
i . 0 ..
.. , " 5 'g 0
'" ::l
0' .. ~
s. · e · · t 0
0
~ '" ~ ~ c ~ I-
:r Il:
~ g ;r:
il a:
•

1
3. HISTORY OF THE DISTRICT CENSUS HANDBOOK
3.1 The district census handbook in its present form was first introduced at the 1951 census to meet the ever increasing demand for micro level data by administrators and planners. Prior to this, after every census, the data used to be brought out in the shape of village statements which presented mainly the number of occupied houses and population by religion for each village and town. At each successive census the scope of the district handbook was enlarged. The present volumes of the district handbooks being brought out after 1991 census are more or less similar to the volumes brought out after 1981 census.
3.2 Scope of the 1991 census handbook: As in the case of 1981 handbooks, the book starts with descriptive notes giving brief history, physical aspects, major characteristics of the district relating to the economic resources and jurisdictional changes during the past decade. Apart from this, various census concepts have been briefly explained for proper appreciation of the data presented, followed by a brief demographic profile of the district. The tables are pres'ented as Part A and Part B. Part A again has two sections. Section I contains the village directory and Section II contains the town directory. In Part B the Primary census abstract has been presented.
3.3 The Village and Town Directory : The village directory mainly gives the list of villages with area, population, amenities such as educational, medical, communications, drinking water facilities, etc., and also the land use of each village. For this purpose the villages have been arranged Mandai Praja Parishad-wise in order of their location code.* Unlike the 1981 handbooks, instead of giving a list of villages in each Mandai before the village directory of that particular Mandai, a list of all the villages in the District, Mandalwise has been incorporated in the beginning itself. This has been done to facilitate the reader in locating the Mandai in which a particular village lies. The village directory now contains only 18 columns as against 20 in the 1981 handbook. The information relating to the staple food was removed as it was found to be repetitive in nature since the diet habits do not change from village to village in rural areas. The column relating to places of religious and historical interest was felt redundant as the same information was being provided in the write up and it does not change with every census. The information regarding the day of the market was found to be of doubtful value and misleading in the absence of a clear standardised definition of 'market'. Therefore, the column relating to the
* See Census Concepts
day of the market was also removed. Noncensus data presented in the village and town directories relate to the year 1989. Howeve~, wherever the field agencies have indicated the later position, the data has been updated.
As regards the town directory, there is hardly any chang. cOII,pared to the 1981 book. Seven statements have been provided presenting growth history, physical aspects, various amenities and facilities, the financial position of the local bodies etc. A separate Statement IV-A has been provided to bring out civic conditions of the notified slums.
3.4 The Primary Census Abstract: As at the previous censuses the primary census abstract is presented village-wise in the case of rural areas. In case of urban areas the data is presented up to the Municipal ward or Block level. The primary censuli abstract format of 1981 census has undergon~ a change with a view to present the ninefold industrial classification of the workers as followed prior to 1981. Two more columns have been added to present the sex~wise population of 0-6 age-group separately with a view to work out literacy rates in the light of the modified definition. In all the previous handbooks, the data has been presented taluk/tehsil-wise. After the reorganisation 01 taluks into Mandals, in the normal course, il the earlier pattern had been followed, the dats would have been presented revenue Mandai· wise. In fact the location code structure before the start of census was evolvec taking into consideration the jurisdiction 0 the revenue Mandals. However, a decisio~ was subsequently taken at the all India lev(~ to present the data Community Developmen Block-wise which will be more useful t< the planners and development agencies a various levels. The corresponding entity il the Andhra Pradesh administrative set ul is the Mandai Praja Parishad. The dat within a district has, therefore, been presentel
Mandai Praja Parishad-wise. For each Mand( Praja Parishad, after furnishing the data c the Mandai Praja Parishad level with run urban break up, the village-wise data ar furnished covering all the villages in th Mandai Praja Parishad in the serial ordE of their location code. After presenting th village data MPP-wise tor all the Mandai Praj Parishads, the data relating to towns al furnished in the ascending order of the location code separately. While in case I
a P anchayat town, the name of the Mand Praja Parishad in which it falls is indicated brackets, such mention is not made in case Municipalities/Notified Area Committees. ell as they are statutory towns.
Fortunately for the state of Andhra Pradesh, the Mandai Praja Parish ads barring a few exceptions are coterminus with the revenue mandals. The same code structure is therefore valid. As regards the statutory urban areas Le. municipalities and NAGs., though these are covered by the revenue Mandals, they are not covered by the corresponding Mandai Praja Parishad. The data in respect of these areas is presented in the town directory
2
and also in the urban primary census abstract. There are few cases where the revenue Mandai mainly consists of an urban area and for the remaining rural area, no Mandai Praja Parishad was notified. Such cases exist ir Rangareddy district.ln such a situation the left over villages have been presenteu at the end after covering all the mandai praja parish ads before covering in urban areas.
4. CENSUS CONCEPTS
4.1 The 1991 census was the 13th deceflnial census of India and the 5th after Independence. The main enumeration was conducted from 9th February to 28th February 1991. This was followed by a revisional round from 1 st March, 1991 to 5th March, 1991 to update the data with reference to sunrise of 1 st of March, 1991. The main enumeration was preceded by an operation called 'Houselisting' which was conducted in Andhra pradesh State from 15th June to 14th July, 1990. The houselisting operation which provided a base for the main enumeration was also made use of to collect data on housing stock, civic amenities, etc. It also provided a frame for canvassing the 'Enterprise list' on behalf of the Central Stastistical Organisation.
4.2 Schedules canvassed: During the main enumeration, two schedules namely, the 'Household Schedule' and the 'Individual slip' were canvassed. There were significant changes in these two schedules compared to the schedules canvassed in 1981. The questions on number of married couples residing in the household, cultivation particulars and type of tenancy for households engaged in cultivation were not canvassed in the household schedule. Information on number of living rooms available to the household and access to civic amenities was shifted to the 'Houselist schedule'. A new question on the type of fuel used for cooking in the household was added to the houselist schedule. It was possible to accommodate these extra items in the houselist as three columns concerning physically handicapped persons in the household were dropped.
In the individual slip, there were important changes in the economic questions. Questions 16, viz., 'seeking/available for work?' was confined only to non~workers unlike in 1981 when it was canvassed for the marginal workers also. An additional query was added for those seeking work to find out whether they had ever worked before. Two extra questions were added to find out whether an ex-servicemen is a pensioner or not. For studying the reasons for migration, two extra codes were added to classify separately the
cases where people migrated for reasons of business or due to natural calamities like floods, drought, etc. Certain details like mother tongue, religion, etc. were repeated in the household schedule with a view to facilitate tabulation directly from the household schedules.
During 1981 census, the questions 0 "I migration and fertility in the individual slip were canvassed only in 20% sample of enumeration blocks. In the present census, the earlier practice of canvassing all the questions in the individual slip for the whole population was revived. The other significant departure from the preceding census was to treat the children of the age of six years and below as illiterate, unlike in the previous census where only children of 4 years and below were so treated. The net effect of this change which is in consonance with the International practice is that children upto the age of 6 will be ignored for the purpose of determining literacy rate. The instructions regarding identification of shceduled castes were modified to cope up with the constitutional amendment whereby scheduled castes converted to Buddhism continued to be treated as scheduled castes. However the houselisting operations had already been completed before this change was effected.
4.3 Criteria for enumeration of a person in a particular household: a) All those who normally stay and are present in that household during the entire period of enumeration i.e., from February 9th to February 28th, 1991 (both days inclusive).
b) Also, those who are known to be normally residing and have actually stayed during a part of the enumeration period (Febraury 9th to 28th, 1991) but are not present at the time of enumerator's visit.
c) Also those who are known to be normally residing and are not present at the time of the enumerator's visit but are expected to return before February 28th, 1991, and

d) Visitors who are present in the household censused and are away from the place(s) of their usual residence during the entire enumeration period. For the purpose of enumeration, such visitors will be treated as normal residents of the household in which they are actually found during the enumeration period provided they have not been enumerated elsewhere.
4.4 Rural-urban classification: 1991 census is no exception to the tradition of presenting the demographic data collected in census separately for rural and urban areas. Such a classification is very meaningful to assess the variables in social, economic and cultural characteristics of the two segments of population over a period of time. The task of identifying the urban areas for 1991 census was completed well before the commencement of the census count. In the scheme of delineating rural and urban areas, all places where civic affairs are managed by an Urban Local Body like a Municipality, Corporation, a Cantonment or a notified area committee are automatically treated as urban areas and referred to as statutory towns. The villages or panchayats satisfying the following criteria are also treated as urban areas:
i. a minimum expected population of 5,000
ii. a minimum population density of 400 persons per square kilometre
iii. at least 75% of the male working population should be engaged in nonagricultural pursuits
Such urban areas are referred to as census towns or non-statutory towns.
4.5 Urban agglomeration: Even after identifying 264 statutory and non-statutory towns in the state, the delineation of urban frame was not complete without considering the pockets of urban sprawl beyond the limits of statutory and non-statutory towns. A village or a part thereof which is immediately adjacent to a town and has pronounced urban characteristics but does not qualify to be an independent town is treated as an outgrowth. Data in respect of such outgrowths is presented along with the core town. Towards this end, the concept of 'urban agglomeration' has emerged from 1971 Census onwards. An urban agglomeration is a continuous urban spread constituting a town and the adjoining urban out-growths or two or more physically contiguous towns together with the contiguous well recognised urban out-growths if any, of such towns.
4.6 Standard Urban Areas: It has been the practice of the Census Organisation to tabulate
3
and present Census statistics on certain well defined areas delineated on the basis of a number of physical and demographic characteristics, in re~l .. h .. Ise to the ever growing demand of pl::ml.ers, administrators, scholars and others. The presentation of data on town-group in 1961 was one such attempt in this direction to provide suitable data on urbanisation trends. The data so generated under 'town-group' could not be put to use as envisaged earlier as it was realised that it lost 'comparability from one Census to another owing to the boundaries of the town getting changed and intermediate areas being left out of reckoning. The Census Organisation ha~, therefore, contemplated replacing the concept of 'town-group' by a more suitable conce~t which could form the basis of a constant statistical spatial reporting unit and serve the needs of the master plans for cities and towns and for helping in urban development planning. Thus, for the 1971 Census, the concept of 'town-group' was given up and in its place, two concepts were evolved, viz., the concept of 'Urban Agglomeration' (U.A.) and the concept of 'Standard Urban Area' (SUA).
The 'Standard Urban Area' was defined as the projected growth area of a city or town, having 50,000 or more popUlation in 1971, as it would be in 1991, taking into account, not only the towns and villages which will get merged into it, but asia intervening rural areas which are potentially urban. The standard urba'J area is a larger areal unit which includes n(:t merely urban areas lying in close proximity but also surrounding and intervening rural pockets which are likely to be urbanised by 1991. Thus it was to remain a constant statistical reporting unit during the three successive Censuses 1971, 1981 and 1991.
In brief, the characteristic feature of a standard urban area is that (i) it should have a core town of a minimum pupulation of 50,000 (ii) the contiguous areas made up of other urban as well as rural administrative units should have close mutual socio-economic linkages with the core town and (iii) in all probability this entire area will get urbanised in a period of two to three decades. The standard urban area is normally identified with respect to the administrative units such as cities, towns or villages encompassed by it. The boundary of a standard urban area remains co-terminus with the administrative boundaries of the peripheral units.
In 1971 Census, 29 S.U.A.s were delineated in the State on the basis of 1961 Ce~sus population of towns and by projecting their population for 1971. In 1981 Census 2 more S.U.A.s were delineated bringing the total S.U.A.s in the State to 31. The number of S.U.A.s remain same in 1991 Census also.

4.7 Classification of towns: For the purpose of classification of different towns into various categories on the basis of the size of the population, the urban aggolomeration as a whole is considered as one unit. Therefore for the sake of this discussion, a town includes an agglomeration as a whole wherever such agglomeration has been constituted. Traditionaly, the towns have been classified into the following size classes based on the population.
Population
1 lakh and above 50,000 - 99,999 20,000 - 49,999 10,000 - 19,999
5,000 - 9,999 Below 5,000
Size Class
I II
III IV V
VI
The class I towns or agglomerations are referred to as cities. The million plus cities/urban agglomerations are referred to as metropolitan cities/urban agglomerations.
4.8 Census houses and households : Columns 4 and 5 of the primary census abstract give the number of occupied residential census houses and the number of households. According to Indian census, 'Census House' is a building or a part thereof having a main entrance from the road or common courtyard or staircase, etc. It may be occupied or vacant, residential, non-residential or both. A 'household' is a group of persons who commonly live together and would take their meals from a common kitchen, unless the exigencies of work prevented them from doing so. A household may be of persons related by blood or unrelated persons or having a mix of both. There may be single member or more than one member households. Households of unrelated persons termed as institutional households' include boarding houses, messes, hostels, residential hostels, rescue homes, jails, ashrams etc.
Houseless population or houseless households include persons who do not have any fixed place of residence but go on moving from place to place, camp at night or just live on the streets, in gardens or in open places.
4.9 Scheduled Caste/Scheduled Tribes: Every State or UT has a list of SCs/STs notified under the relevant provision of the constitution. After the latest amendment the SCs can now belong to Buddhism also apart from Hinduism and Sikhism. Therefore a person will be treated as SC only if he belongs to anyone of the above mentioned three religions. An ST can however belong to any religion. A person will be considered belonging to SC or ST Community only if the.
4
name of his caste or tribe finds place in the notified list (given below). The enumerator has to therefore pursuade the respondent to come out with the actual caste or tribe name to decide whether the person enumerated is a SC/ST or not. Any person who belongs to a community which is nLlified as SC or ST in some other state, even though it may be the state of his origin, w:!I not be reckoned as SC or ST unless his caste or tribe has been notified as such in this state list. This limitation may be kept in view while using the data on SCs/STs.
4.10 List of Scheduled Castes in Andhra Pradesh: 1 Adi Andhra, 2 Adi Dravida, 3 Anamuk 4 Aray Mala, 5 Arundhatiya, 6 Arwa Mala, 7 Bariki, 8 Bavuri, 9 Beda Jangam, Budga Jangam, 10 Bindla, 1! Byagara, 12 Chachati, 13 Chalavadi, 14 Chamar, Mochi, Muchi, 15 Chambhar, 1t. Chandala, 17 Dakkal, Dokkalwar, 18 Dandasi, 19 Ohor, 20 Dom, Dombara, Paidi,., Pano, 21 Eliamalawar,Yeliamma!wandlu, 22 Ghasi, Haddi, Relli Chachandi, 23 Godagali, 24 Godari, 25 Gosangi, 26 Holeya, 27 Holeya Dasari, 28 Jaggali, 29 Jambuvulu, 30 Kolupulvandlu, 31 Madasi Kuruva, Madari Kuruva, 32 Madiga, 33 Madiga Dasu, Mashteen, 34 Mahar, 35 Mala, 36 Mala Oasari, 37 Mala Dasu, 38 Mala Hannai, 39 Malajangam, 40 Mala Masti, 41 Mala Sale, Netkani, 42 Mala Sanyasi, 43 Mang, 44 Mang Garodi, 45 Manne, 46 Mashti, 47 Matangi, 48 Mehtor, 49 Mitha Ayyalvar, 50 Mundala, 51 Paky, Moti, Thoti, 52 Pambada, Pambanda, 53 Pamidi, 54 Pancham, Pariah, 55 ReIF, 56 Samagara, 57 Sam ban, 58 Sapru, 59 Sindhollu, Chindollu.
4.11 List of Scheduled Tribes in Andhra Pradesh: 1 Andh, 2 Bagata, 3 Bhil, 4 Chenchu, Chenchwar, 5 Gadabas, 6 Gond, Naikpod, Rajgond, 7 Goudu (in the Agency tracts), 8 Hill Reddis, 9 Jatapus, 10 Kammara, 11 Kattunayakan, 12 Kolam, Mannervarlu, 13 Kanda Dhoras, 14 Konda Kapus, 15 Kondareddis, 16 Kondhs, Kodi, Kodhu, Oesaya Kondhs, Oongria Kondhs, Kuttiya Kondhs, Tikiria Kondhs, Yenity Kondhs, H Kotia, Bentho Oriya, Bartika, Dhulia, Oulia, Holva, Paiko, Puttya, Sanrona, Sindhopaiko, 18 Koya, Goud, Rajah, Rasha Koya, Lingadhari Koya, (ordinary), Kottu Koya, Bhine Koya, Rajkoya, 19 Kulia, 20 Malis (Excluding Adilabad, Hyderabad, Rangareddi, Karimnagar, Khammam, Mahbubnagar, Nizamabad, Medak, Nalgonda and Warangal districts), 21 Manna Ohora, 22 Mukha Ohara, Nooka Ohora, 23 Nayakas (in the Agency tracts), 24 Pardhan, 25 Porja, Parangiperja, 26 Reddi Ohoras, 27 Rona, Rena, 28 Savaras, Kapu Savaras, Maliaya Savaras, Khutto Savaras, 29 Sugalis, Lambadis, 30 Thoti (in Adilabad , Hyderabad, Rangareddi, Karimnagar, khammam, Mahbubnagar, Medak,
Nalgonda, Nizamabad and Warangal districts), 31 Valmiki (in the agency tracts), 32 Yenadis, 33 Yerukulas.
4.12 Location Code: The location code is a simple device by which every area in an administrative unit in the country can be identified by assigning specific code numbers for different levels of administrative units. Every state in the country has been assigned a particular code number. The code for Andhra Pradesh is 2. Every district in Andhra Pradesh is assigned a particular code number. The 23 districts of the State are numbered serially in a serpentine order starting from Srikakulam district in the north-east corner, ending at Nalgonda as done in 1981. In a similar way, all Mandals within a district are numbered serially and all villages in a Mandai are again numbered serially. Any particular village can therefore be identified by a combination of state, district, mandai and village code numbers. In the case of an urban area, instead of the mandai code, town code number is adopted. The towns are serialised according to alphabetical order in the district and the town code is indicated in Roman numerals. Below the town code for the urban area, the ward or locality is assigned a code. When these codes, starting with the state code are written side by side separated by oblique lines, identity of the smallest administrative unit is quite easily known. To give an example, location code 2/7/24/1 refers to village no.1, in Mandai no. 24 of district no.7 i.e. village Takkellapadu of Phirangipuram Mandai in Guntur district.
4.13 Computer Code for Rural: The P.C.A. of all the Villages are made available on the N.I.C. Computer network, and access to the same can be had at any of the district Headquarters in the country. For this purpose each village was assigned a code which had relationship with the location code described above. For each State and District two digit codes are adopted while for each Mandai and Village four digits code is adopted. For making up the requisite numbers in the code structure, auxilliary zeros are added in the begining to the corresponding State, District, Mandai and Village Location Codes. For instance in the example given above in the previous paragraph, the Rural L.C.2/7/24/1, when transferred into Computer code would be like 02/07/0240/0001.
4.14 Computer Code for Urban: Similarly for towns (Urban areas), the codes for State/District are same as adopted in case of rural areas while for each town/ward four digit code is adopted. For making up the requisite numbers in the code structure auxilliary zeros
5
are prefixed to the ward number for ward code.
The computer codes for urban areas are assigned according to the size/class of town. Unlike the rural areas, the town code starts from 1000 and ranges upto 1990 for separate towns which are not components of any City/agglomeration. Urban Agglomerations of less than one lakh population (having a continuous outgrowths within a district) have been treated as one individual town. Unit position is always zero in the code field while O.G. of the city is given main town code. Special treatment is given to the towns cuttin~ across the boundaries of the district anI I spread over two districts while assigning the codes. The code for Urban Agglomeration of less than 1 lakh population having two or more adjoining towns with their' out growths within a district, starts from 2000 and ranges upto 2990 i.e. in the thousand and hundred position of the code field. In such Urban Agglomerations constituent towns are assigned codes, in tenth position of the code field like 2000, 2010, 2020 - 2090 or 2100,2110,2120 - 2190 etc. For Urban Agglomerations which cut across the boundary of districts, the code assigned for constituent towns is 2900, 2910 - 2990.
For cities and Urban Agglomerations having a population of One Lakh and above, which is not the component of any Urban Agglomeration the code begins from 3000 and ranges upto 4900 (i.e. in the thousand and hundred position of the code field). Outgrowth of a city is given the main city code. For Cities/Towns which are components of Urban Agglomeration, the codes are assigned in the unit and tenth positions of the code field i.e. 3001, 3002 - 3099 etc.
For instance in the example given above in the previous paragraph, the urban L.C.2/7/IV/5, when tra lsterred into computer code would be like 02/07/3000/0005.
4.15 Literates: A person is considered literate if he is able to read and write with understanding in anyone language. One who can merely read but cannot write is nm considered literate. However, to qualify as ,'A
literate it is not necessary that a person should have received any formal education. During 1991 census, all children below 7 years of age have been treated as illiterate eventhough some school going children might actually have picked up reading and writing. This is a departure from the pre'iious practice when children b€;l;__ (J th8 ~.ge of ) only were treated as illiterate.
--~-----.---- ~---.----

4.16 Working Population - Workers, Nonworkers, Main and Marginal Workers: Work is defined as physical or mental participation in any economically productive activity and includes effective supervision and direction of work. To appreciate the definition of worker,
I Q. 14A Did you work any time at all last year?
6
(including unpaid work on farm or in family enterprise)
it is worthwhile to look at the economic
questions canvassed during the 1991 census
to ericit information on work participation of
the population.
Y' e. No(HI STID/ RIB! I /0)
Q. 14B If 'Yes' in 14A. did you work for major part of last year? Yes(1)jNo(2)
II Q. 15A Main activity last year? 'Yes'in14B(C/ ALI H HI/OW) 'N o'in HB( H/ ST / D / R/ D/ I/O)
Q 158 'Yes' in HB-Any other work u.ny time lu.st, year: Yes(C/AL/HHljOW)/No . 'No' in 14B-Work done any time last year', (CIAL/HHI/OW)
[C", Cultivators. AL '" Agricultural Labourers. HHI co Workers in Househcld Industry. OW == Other Workers, H '" Household duties, ST == Students, D = Dependents, R == Retired persons or Rentiers, 1:3 ~ Beggars, etc., I = Inmates of institutions, 0 == Other non-workers] -
Question 14A is designed to classify the total population into workers and non- workers. Q.14B is intended to categorise the workers into main and marginal workers. O.15A&8 are designed to capture the details of the work doge by the main and marginal workers. Main workers are those who have worked for a major part of the year preceding the enumeration. Marginal workers are those who have worked any time at all during the year preceding enumeration, but have not worked for a major part of the year. Major part, of course, means 183 days or more in an year. These categories of main workers, marginal workers and non-workers are exclusive with no overlap and together exhaust the total population. In otherwords every person counted at the census gets classified as a main worker, marginal worker or a non worker. The question 15A further divides the workers into different categories of cultivators, agricultural labourers, workers in household industry and other workers.
The definition of work in the census context is extremely liberal and the questions are designed to net all possible economic activities of the people. Still there has been a feeling in the past that the economic activity of the women and children was not being properly reflected in the census schedules. An attempt was therefore made to bring about certain qualitative changes in the instruction booklet clarifying the concepts of work, marginal worker and main worker. Ouestion 14A was elucidated by introducing within parentheses the clause 'including unpaid work on farm or family enterprise'with a view to capture 'invisible' work of women and children. The only rider to this is that the economic activity in family enterprise should at least
partly result in production of goods/services for other than self consumption alone. A cultivator however is treated as worker even if he consumes the whole production. The rationale behind this distinction has been questioned by many experts. The women's organisations have been particularlv concerned about not considering the unpai:J work on family enterprise as work unless .:t part of the goods/services are marketed. On the other hand it is argued that if all the household work qualifies as work, perhaps all the women will be part of the work force and no meaningful analysi~ will be possible. It cannot however be denied that there has to be an element of arbitruriness in defining the boundaries of human eC'Jnomic activity and one has to keep in view the concepts while comparing/evaluating data on work force made available from different sources.
The concept of work, main worker and marginal worker as adopted during 1991 census is same as one adopted during 1981 census. The 1961 census did not gather any information regarding the secondary work. It the 1971 census a specific enquiry was mad:3 regarding secondary work. However, it wa.s a' the 1981 census that a clear distinction was drawn between main workers and marginal workers. For the purpose of comparability of data, marginal workers of 1981 and 1991 censuses will correspollu to non-workers with secondary activity of work during 1971 census. Again the workels at 1961 census shOuld roughly correspond to both main and marginal workers put together at 1981 and 1991 census.
4.17 Industrial Category Classification : For both categories of workers i.e., main and Marginal, further details on the sector of economy in which they have worked are

ascertained based on which they are classified into 9 industrial categories. These categories which have been retained as such since 1971 census are:(I) Cultivators, (II) Agricultural labourers, (III) Workers in livestock, forestry, fishing, hunting and plantations, orchards and allied activities, (IV) Workers in mining and quarrying, (V) Workers in manufacturing, processing, servicing and repairs which are - (a) run as household industry, (b) not run as household industry; (VI) Workers in constructions, (VII) Workers in trade and Commerce, (VIII) Workers in transport, storage and communications, (IX) Workers in other services.
In the Primary Census Abstract the data for different categories is presented only in respect of main workers. In 1981 census PCA, instead of presenting separate data for all 9 categories the data under categories III, IV, V(b), VI, VII,VIII and IX were pooled together and shown under heading 'other workers' thereby presenting only four broad classifications i.e., Cultivators, Agricultural labourers, workers in Household industry i.e., Category V(a) and Other Workers. At the 1991 census PCA, however the nine-fold classification is being adopted again. Therefore, while the data in respect of Cultivators, Agriculturai Labourers and Household Industry Workers is comparable to corresponding data of 1981. the data in respect of categories III. IV. V((b) and VI to IX pooled together will correspond to the other workers data presented in 1981 PCA.
4.1 B Cultivators and Agricultural Labourers: For the purpose of the census, cultivator is one, who is engaged as employer or worker in cultivation of certain crops on land owned by him or held by him for payment in money, kind or share. Cultivation includes supervision or direction of cultivation. A tenant or a share cropper qualifies to be a cultivator whereas a person who has given his land for cultivation to another person for money or share in the crop and who does not supervise the cultivation is not a cultivator. A person working in another person's land for wages in cash or kind is an agricultural labourer. He has no risk in cultivation as he merely works in another person's land for wages. Cultivation involves ploughing, sowing and harvesting and production of cereals and millet crops such as wheat, paddy, jowar, bajra, ragi, etc., and other crops such as sugar-cane, groundnut, tapioca, etc., and pulses, raw jute and
7
kindered fibre crop, cotton, etc., and does not include fruitgrowing, vegetable growing or keeping orchards or groves or working on plantations like tea, coffee, rubber, cinchona and other medicinal plantatiolls.
As may be seen from the above description, census defines growing of only certain specified crops as cultivation. Those who are engaged in raising or working on other crops or orchards or vegetable growing etc., will qualify to be included in industrial category III.
4.19 Household Industry: Household Industry (HHI) is defined as an industr I conducted by the head of the household himself or herself and/or by the members of the household at home or within the village in rural areas and only within the precincts of the house where the household lives in urban areas. The larger proportion of workers in household industry consists of members of the household including the head. The industry is not run on the scale of registered factory which would qualify or has to be registered under the Indian Factories Act.
Trle mHin criterion of a household industry is the participation of one or more members of a household. This criterion will apply in urban areas also. Even jf the industry is not actually located at home in rural areas, ther~ is greater possibility of the members of the household participating even it it is located anywhere within the village limits. In the urban areas where organised industry takes greater prominence, the household industry should be confined to the precincts of the house where the participants live. In urban areas even if the members of the household by themselves run an industry but at a place away from the precincts of their home, it is not considered as a household industrv. It should be located within the precincts at' the house where the members live in the case of urban areas.
Household industry relates to production, processing, servicing, repairing or making and selling (but not merely selling) of goods. It does not include professions such as a pleader, doctor, barber, musician, dancer. waterman, dhobi, astrologer, etc., or merely trade or business, even if such professions, trade or services are run at home by members of the households.
8
5. BRIEF HISTORY OF THE DISTRICT
Rangareddi district comprises erstwhile Hyderabad(rural) district which was formed on 15th August, 1978 by carving out some portion of Hyderabad (urban) taluk and the merger of the rural and urban areas of the remaining taluks of Hyderabad district. Therefore., the history of Rangareddi is no other than the history of Hyderabad which is detailed hereunder.
The history of Hyderabad district was described elaborately in the District Census Handbook of i 961 Census. In the 1971 and 1981 Handbooks also historical background was presented in detail. The present Handbook of 1991 therefore gives a brief account of the history of Hyderabad district.
Hindu Period: It was the Dravidian race [n pre-historic times which ruled the major por1ions of South India and the Deccan Plateau. Inscriptions of Asoka, the Great, reveal that Andhras ruled the Kingdom till the end of third century. Before the invasion of Mohammad-bin·Tuglak, tile Kakatiyas of Warangal were the first important rulers who occupied this part of the country between 1150 A.D. and 1323 A.D. After sometime, the royal court of Bahamani Sultan ruled the Deccan for about two centuries. The later d~lnasties worth mentioning are Pallavas, Chalukyas, Pulakesin-II and Rashtra Kutas. The rule of Chalukyas was thrown out around 1189 A.D. by Hoyasalas and Yadavas. Yadavas of Deogiri were the last Hindu rulers of Deccan.
Mohammadan Period: The first Mohammedan expedition in Deccan was carried out by Allaud-din Khilji in 1294. The next prominent kings in the Deccan were Outub Shahis of Golkonda who ruled from 1512 to 1687 A.D. During the reign of this dynasty, particularly of the fifth ruler Mohammad Ouli, the glory of Hyderabad city, famous for its magnificent mansions, was cherished.
The first great king in this period was Mohammad Ouli Outub Shah of Qutub Shahi Dynasty who ascended the throne in 1580. He is remembered as a great planner who founded the city of Hyderabad in 1591. As the legend goes, he was enamoured of a woman named Bhagmati. To perpetuate his love for her the city of Bhagnagar was founded. later when the title 'Hyder Mahal' was bestowed on her, the city came to be called Hyderabad, Ouli Qutub Shah was succeeded by Abdul Hasan who is also known as Tana Shah. After the fall of Bijapur in 1686 AD. Aurangzeb took OVEn Golkonda in the following year and made it a part of Mughal Empire. With this the
Outub Shahi dynasty came to an end. Chin Kalich Khan, popularly known as Asaf Jall-', a renowned general of Aurangzeb captured power and established Asaf Jahi dynasty ant' the autonomous Deccan under his control. He was appointed as Subedar of the Deccan in 1713 A.D. He introduced the hereditary and dynastic title 'NizClIll' for the successive rulers. After Ule battle at Shakarkhelrda in 1724 in Serar, I\SLit JJ.h emerged as the master of the Deccan. It is believed that this marks the end of the medieval period and beginning of modern period in the history of Deccan. Then he annexed Berar and fixed his residence at Hyderabad. Following the death of Asat·Jah, 11is sons and grandsons were struggling for succession. At this delicate juncture, France also appeared in the scene striving for supremacy in the East by maldng Duplex, the French Governor as the control!(·~ of Nizam's Authority. Then England slow,y emerged contesting for power in the Deccan. In 1761, Nizam Ali Khan was proclaimed ruler with the support of England on the promise of dismissing ail the French people from his service. Nizarn Ali Khan, popularly known as Asaf Jah-II, moved the capital from Aurangabad to I-Iyder::lbad. The present Hyderabad district along with the rest of Telangana came under the control of Asaf-Jahi dynasty and remained a part of the Nizam's dominions for about two hundred years,
As a result of a treaty in 1800 Nizam ceded the districts of Cuddapah, Kurnool, Anantapur and Bellary of Madras province to the British. From then on these districts came to be called the 'Ceded Districts'. M·r Osman Ali Khan rose to power in 1911 and ruled till 1950. In 1947 India becamE; independent. After the Police Action in 1948, Nizam's Dominions became part of Indian Union as a Part-B State. A popular Government in Hvderabad State came into being in 1952 ullder Chief Ministership of Booroula Ramakrishna Rao.
Following the death of Amarajeevi Patti Sreeramuiu, Andhra State was formed in 1953 wit~ Andhra Kesari T.Prakasarn as Chief Minister. Kurnool was the capital. When Independent Republic of 1ndia implemented State's ReorganisRtion Act, Hyderabad State was tritwcmed ar·d the Telallgana Region was merged 'f/iih Andhra State to become th~ present Andhra Pradesh all 1 st NovembE I, 1956 with Hyderabad as capital. Later Rangareddi district was carved out of Hyderabad district on 15th August, 1978 when Dr.M.Chenna Reddy was the Chief Minister.

9
6. PHYSICAL ASPECTS
6.1 General: Rangareddi district was formed on 15th August, 1978 by carving out all rural areas and certain urban areas of the erst- while Hyderabad district. The district was named after late Shri K.V.Ranga Reddy, who was the Deputy Chief Minister of Andhra Pradesh. Presently, the district comprises 37 MPPs and 14 Towns which form part of Telangana plateau. The district spreads approximately between 16030' and 18020' North latitudes and 77030' and 79030' Ea&t longitudes. It is bounded on the north by Medak district, on the east by Nalgonda district, on the south by Mahbubnagar district and on the west by Gulbarga district of Karnataka State.
The district occupies an area of 7493.00 Sq.Kms. with a density of population of 341 per Sq.Km. as per 1991 Census. The total population of the district is 25.51 lakhs comprising 13.46 lakhs rural and 12.05 lakhs urban as per 1991 Census. The percentage of rural population in the district is 52.77 while that of urban population is 47.23. The scheduled caste population in the district forms 17.22% of the total population while scheduled tribe accounts for 4.29%. Of the 264 towns in the state 14 are situated in the district.
6.2 Hills: The district is mostly hilly with some woods. The general slope of the land is from west to east and south east. The Rajkonda hill runs in a south-eastern direction upto Devarakonda Mandai in Nalgonda district. The Ananthagiri hills traverse the district from the south in Mahbubnagar district to the north upto Dharur. A large portion of this range is composed of high grade laterite. Isolated granite hills are also found here and there.
6.3 Rivers: Rangareddi district comprises plains but is mostly criscrossed with some rivers, several rivulets and small streams. The chief river of the district is Musi which rises in the /\nanthagiri hills near Sivareddipet village (Vicarabad Revenue Mandai). It flows from west to almost due east passing through middle of Hyderabad city and joins river Krishna near Vadepalle of Nalgonda district. The two water reservoirs namely Osman Sagar and Himayat Sagar across Musi and its tributary are situated at a distance of 19.31 Kms. and 9.66 Krns. from Hyderabad city respectively, to supply drinking water exclusively for the twin cities. However, the use of water for irrigation purposes has been banned because of the rights created for Hyderabad city water supply. The next largest tributary of River Shima called Kanga, rises in the former Vicarabad taluk(mandal) and it
drains a number of villages in the erstwhile Vicarabad and Tandur taluks. The third water source for the district is Manjira a tributary of River Godavari but the area under irrigation is very limited.
1.4 Climate and Rainfall: The climate in the district is characterised by hot summers and is generally dry except during the south-west monsoon season. The summer season starts in the district by about the middle of March and continues till the first week of June. The heat in April and May is very severe. The south-west monsoon season begins in the firs~ week of June and extends upto the end cf September. North-east monsoon season form:; from October to December while January tv February is the winter season in the district. The average annual rainfall in the district is 812.5 mm, the bulk of which is received through the south-west monsoon during June to September.
6.5 Soils: Red spils predominate in the district followed by black cotton soils. More than 50% of the villages of 1 7 mandals have redchelka soils. Dubba soils are largely found in 5 mandals while the soils of 13 mandals of the district are predominantly black.
6.6 Flora: The flora of the district exhibits xerophytic adaptations because of it~, moderately hot and dry climate. About 42.5<J I of the land in the district is under cultivatior.. The uncultivated patches, the hills and the slopes are generally covered by some sort ci greenery. The inland flora that are commonly seen are Acacia arabica (Nallathumma) Acacia sundra (Sandra), Borassus flabellifer (Pedda Ita) and Phoenix sylrestris (Ita). Groves of mango, tamarind and guava are commonly found in and around the villages. Ficus bengaleusis (Marri) is a very common roadside tree. Other common indigeneous flora with their botanical nam8~ are Azadirachta indica (Vepa), Bombax malabaricum (Burugu), Moringa oleifera (Munaga), Melia axadirachta (Vepa), Feronia elephantum (Velaga), Aegle marmelos (Maredu) and Anona squamose' (Seethaphalam).
6.7 Fauna: It is on record that in 1900:: the district with its low shrub forests was the home off Carnivore like leopards, bears, hyenas and occasionally tigers. Before the merger of the Nizam's dominions with the Indian Union, these forests were preserved for the members of the royal famify for their exclusive enjoyment.
They were the abode of every species of big and small game. But all this was of the past. The forests receded into narrow and small pockets in the midst of habitations and traversed by cart traeks and roads. The unfavourable natural factors, advent of modern weapons and other means of hunting have made wild life very scarce and almost put an end to the growth of wild life. Members of the deer family like black-duck, chita or spotted
10
dear and sam bar can still be seen in the interior forests of Rangampalli. Tirumalapur, Rasam. Anantagiri and Gokafasalwad. Wild bear, jackal and fox are found in small numbers. Birds like pGacL·ck and jungle fowl are seen in Anantagiri blu.;k. In cold season the aquatic birds such as wild duck, geese, teal and spine occur along with partridges and wild pigeons in the district.
7.MAJOR CHARACTERISTICS WITH REFERENCE TO ECONOMIC RESOURCES
7.1 Forestry: The district cannot boast of any important timber yielding forest. This may be because of the low rainfall and inhospitable soil conditions. The inferior type of forests (from economic point of view) yield only thorn, fuel and small timber which the soil can sustain. In the eastern portion of the district the forests are mostly restricted to isolated hills while in the western portion, they are confined to the slopes of the hillocks and plateau. The forest area of the district forms about 10% of the total geographical area. The situation of the state capital in the midst of the district and the highest density of population have a great bearing on the development of these forests in the district. The species that occur in these forests include teak, nallamaddi, chirumanu, eppa, bijasal, chenangi, sali, satin and sandal. The important forest products obtained from the forest of this district include firewood, small timber, beedi leaves, fodder grass, mohwar flavor, mohwar seed, karanj seed, amla, marking nut, chironji nirmoli, sitaphal, honey, wax and rosa grass, In a predominantly agricultural district like Rangareddi, the average ryot and agricultural labourer depends on great deal on the forests for agricultural implements, grazing of cattle and other livestock and green leaves for manuring. The forests of this district are unable to meet the local requirements. The people of this district purchase wood from the cities of Hyderabad and Secunderabad. The forests and the scattered trees abutting the twin cities are being destroyed due to industrialisation, development of housing colonies, grazing and breeding of cattle, sheep and goats, indiscriminate felling of trees and shrubs to meet the demand for fuel and timber and frequent burning of forest by the grazers to induce fresh grass to grow in summer.
The forest provides employment to the working class during slack agricultural seasons in forest operations, like raising nurseries, plantations and forest based cottage industries like basket making, rope making, making of platters, mat-weaving and collecting beedi leaves.
7.2 Minerals: In this district quartz and feldspar are the principal minerals. The extenSively exploited quartz veins are ill the mandals of Medchal, Maheshwaram, Rajendranagar, Malkajgiri and Pargi. Feldspar, the second principal mineral is also available in the mandals of Medchal, Hayathnagar, Maheshwaram, Rajendranagar and Malkajgiri around the district headquarters. Puller earth is also available in Chevella, Vicarabad and Tandur mandals.
Umestone is available mostly in Tandur and Marpally mandals. In Tandur quarries of limestone are extensively developed and lime is sold locally. Lime kankar is availab!e in the villages of Ibrahimpatnam and this is used as lime mortar for building purposes. Clays of different types are also available ::1 Tandur area and these are presently being used in ceramic industry.
7.3 Electricity: There was a great demand for power for domestic and upcoming industries in and around Rangareddi district. After the formation of Andhra Pradesh in 1956, the capacity of the existing substations were raised and distribution lines extellded. Tl.a establishment of large scale industries like Indian Drugs and Pharmaceuticals Ltd., Hindustan Machine Tools, Hindustan Aeronautics Ltd., Hindustan Cables Ltd., Electronics Corporation of India Ltd., Indian Detonators Ltd., Hyderabad Allwyn Metal Works, Usha Works and others necessitated the setting up of another 13? KV ring main and sub-stations of 33 KV with capacities varyi n g from 12 to 15 MV P, near Allwyn Metal Works, Indian Drugs and Pharmaceuticals Ltd., Hindustan Machine Tools at Ibrahimbagh, Moula Ali and Uppal respectively. These industries use the H.T./S.T. The total number of services account for 2,71,469. There are two divisions of the Electricity Board to look after the area covered by Rangareddi district amJ a part of the urban area.

There are 865 inhabited villages in Rangareddi district out of which 860 villages are electrified as per the information furnished in village directory achieving 99.42% electrification.
The length of different transmission lines as on 31.3.90 is as follows.
220 KV 365.80 Kms. 132 KV 285.00 Kms. 33 KV 507.99 Kms. 11 KV 4,099.38 Kms.
L.T. 12,322.98 Kms.
The details regarding the number of services available as on 31.3.90 and the power sold during the year 1989-90 are as follows.
Category
1
1) Domestic 2) Non-domestic 3) Industries 4) Cottage Industries 5) Agriculture 6) Street lights 7) Others
Number of Power Sold services (in Kwhts)
2,11,504 19,062 11,109
91 49,985
1,820 1,968
2 3 14,12,04,271 2,32,39,521
10,19,09,594 2,53,245
3,36,32,702 23,57,539 17,15,795
7.4 Agricultural Activity: The total geographical area of the district is 7.49 lakh hectares of which the current fallows constitute 19.4% whife the area not available for cultivation is about 13.4%. Forest area accounts for 9.5%. The variation· in the fertility of the soils is the main cause for the difference in the cropping pattern of the eastern and western regions in the district. While white sandy loams occur in the eastern region (Hayathnagar and Ibrahimpatnam), black cotton soils predominate the western region (Chevella, Pargi, Vicarabad, Marpally and Tandur). The principal crops of the district are jowar, paddy, ragi, castor and pulses. Food crops account for 39.3% and the remaining nonfood crops accounts for 18.4%. Grape cultivation makes the district occupy a distinct place in the State.
7.5 land Utilisation: The land utilisation pattern of the district during 1989-90 is as follows.
SI. Item No.
1 2
1 Forest
land utilisation Particulars 1989-90
Area in Percentage lakh over total
hectares geographical area
3 4 0.71 9.5
11
1 2 2 Barren and uncul-
turable land 3 Land put to non-
agricultural use 4 Permanent pastures
and other grazing lands
5 Miscellaneous tree crops and grooves not included in net area sown
6 Culturable waste 7 Other fallow lands 8 Current fallows 9 Net area 10 Total geographical
area
3
0.33
0.65
0.44
0.08 0.28 0.59 1.46 2.95
7.49
4.4
9.0
5.8
1.0 3.7 7.9
19.4 39.~:
100.0
The total geographical area of the district is 18.69 lakh acres of which the current fallows contribute 16.4% while the area not available for cultivation is about 35.2% and forest area accounts for 9.4% of the total area.
7.6 Animal Husbandry; Rangareddi district occupies a prominent position in livestock and poultry wealth. Factors like marketing facilities, high demand for milk and milk products and eggs and chicken in the twin cities gave greater impetus for the development of livestock and poultry. Apart from the products of milk and meat, the cattle ill the district are used as the draught power in agriculture and it is an allied activity to agriculture. As per the Livestock Census 1987, the district has a livestock population of 10.47 lakhs and poultry population of 60.97 lakhs. The following statement shows the particulars of livestock population in Rangareddi district.
Cattle 4,33,690 Buffaloes 1,95,166 Goats 1,89,609 Sheep 1,80,376 Others 48,017 Total Livestock 10,46,858 Poultry 60,97,180
The poultry population is mostly con·· centrated in Hayathnagar and Rajendranaga( mandals due to their proximity to the twill cities.
7.7 Fisherie§: Rangareddi district has no sea coast or major river for E.I\.hing activities. There are 207 water bodies 1f!'"1 the district of which 201 were transferred to Zilla Praja Parishad. There are 90 Fishermen CoOperative Societies in the district. The water spread area in the district is 19.84 acres. There ;s only one fish seed farm in the district. There are about 17,360 fishermen in the district.

7.8 Industries: Rangareddi district has the largest number of agrobased industries. Further, the district ranks first in respect of chemical and allied industries in the State. The largest number of engineering units in the State are found only in Rangareddi district. A brief account of the workIng of the various large and medium scale industries in the district is presented below ..
The Andhra Pradesh Industrial Infrastructure Corporation has established industrial estates and industrial development areas at the following centres.
1. Vicarabad
2. Balanagar
3. Kushaiguda
4. Nacharam
5. Medchal
6. Uppal
7. Katedan
8. Kukatpally
There are about 1900 registered smallscale industry units working in the district employing about 14,700 persons. But most of the industrial development has occurred in the areas around the twin-cities as these areas form part of Rangareddi district.
PUBLIC SECTOR:
7.9 Hindustan Machine Tools: It is a Government of India undertaking with a machine tools division started in 1965 with a capital of As. 1 0.65 Crores and is located on the Narsapur road. The product of this unit includes special purpose machines, milling machines and automatic plates and electric bulbs. A separate press division was set up in 1971 for manufacturing hydrantio area process machines, press balls, joint pressers, handlers and mining machinery at a cost of Rs.5 crores. It also established a lamp factory, glass factory and component factory at a cost Rs.10 Crores.
7.10 The Indo Nippon Precision Bearings Limited: It was established in Moulali in 1965 with a capital outlay of Rs.9.35 crores and went into production in 1970 as a subsidiary of Andhra Pradesh State Industrial Development Corporation, manufacturing ballbearings and cylindrical beaiings under the brand KoyoIndia and thF\ name has been changed to Indo-Nippon ,frecision Bearing Limited in 1979. In 1981 it was changed into Hyderabad Bearings Limited. More than 1000 persons are employed in this company.
7.11 Republican Forge Company: It was established in 1957 with a capital of Rs.3.35
12
crores at Moulali. It has technical collaboratio'1 with MIs. Sari Renait Engineering of Paris, a. French government undertaking. About more than 1,000 persons are employed in it and it manufactures 9,000 tonl18S of steel forgings, springs, steel crips and clamps per annum. The products have a wide marketing in Hyderabad, Maharastra, Talnilnadu, Karnataka, Kerala and Uttar Pradesh ':::>tat8s.
7.12 Vergain Hydrain Limited: This was established at Balanagar in 1965 and it went into production during 1967. Pneumatic and Hydrau)jc equipment are manufactured. It has a capital investment of RS.259 lakhs. More than 400 persons are employed in this organisation.
7.13 The Hyderabad Ailwyn Metal Work:; Limited: Allwyn Metal Works Limite.:i was established in 1942 at Sanathnagar. Its main products are refrigerators, water coolers, washing machines, L.P.G.cylinders, domestic and office furniture, industrial serving machines, bus bodies and trailers, watches and scooters. The electrical and electronic industry take the place next to engineering industry in this district.
7.14 Hindustan Aeronautics Limited: It is a government venture established in 1965 with a capital investment of Rs.19.95 crores. It manufactures Aeronautic equipment, ground radar, naval equipment, etc.. These products are supplied to Indian Air Force, Army, Navy, Police and Railway Departments. About 3,000 employees are working in this concern.
7.15 Electronic Corporation of India Limited: It was set-up by the Department of Atomic Energy, Government of India in 1967 with authorised capital of Rs.33.95 crores at Cherlapally. The products cover the technology groups of control systems and electronic instruments, and electronic equipment like television sets and computers. The company manufactures 250 variety of products. About more than 3,000 skilled and semi-skilled workers and 1,000 unskilled workers are employed in this organisation.
7.16 The Hindustan Cables Limited: It was established as Government of India undertaking in 1972 at Cherlapally. It started production in 1974. A wide variety of cables are manufactured on modern technology with a capital investment of Rs.5.23 crores and it provides employment to over 1,200 persons. The annual production capacity of the product, i.e. telephone cables is 7,89,000 C.K.M. and switch board wires of 66,000 C.K.M.
Apart from the above, Andhra Pradesh Government Undertaking viz., A.P.Electrical Equipment Corporation was started in Sanathnagar in 1963 for manufacture of various types of metres with a capital investment
of Rs.3.39 crores. Many prominent medium scale industries, spinning, weaving and textile mills were established in the district. They are Penguin Textiles Limited. at Tarnaka, Telangana Spinning & Weaving Mills at Balanagar and Sanghi Textiles Pressers Private Limited at Omarkhan Daera, Koheda village. Cotton yarn of different varieties is manufactured in these mills. The total capital investment of these units is Rs.434.00 lakhs. Around 2,000 persons are employed.
7.17 Leather Industry: The Hyderabad Tanneries Limited, is the only leather industry unit worth the name in the district, situated at Dargah Hussein Shahwali was transferred to Leather Industries Corporation of Andhra Pradesh (LiDCAP) during 1973, with a capital investment of Rs.55.00 lakhs with 192 persons. The product, finished leather used in the manufacture of footwear and leather goods is sold to individual artisans in the field. The annual capacity and production are about 1,00,000 Hydes and 3,00,000 tanning skins.
7.18 Food & Agro ProceSSing Industry: The Andhra Pradesh Child Nutrition Council, now called R.E.P.T.R.O.N. was set up at Nacharam with the help of C.A.R.E.(Cooperative for America Relief Every where) during 1977 to provide mid~day meals in the form of protein save to nearly 3 lakh school going children, pregnant women and lactating mothers in Rangareddi district besides three other districts. The capital investment of this project is Rs.220.00 lakhs while the working capital is met by the Government of Andhra Pradesh. It produces about Rs.3 crores worth nutrition food in the form of sev, muruku, snacks etc .. The Modern Food Industry (India) Limited, a Government of India enterprise opened a unit in Uppal in 1969 with a capital investment of Rs.53.40 lakhs. It manufactures bread popularly known as Modern Bread. The Ampro Food Products Pvt. Ltd. was established in 1961 at Uppal with a capital investment of 106.00 Lakhs, manufactures biscuits with a capacity of 12 thousand tonnes of biscuits every year.
13
7.19 Glass Industry: The Associated Glass Industries Limited, established its unit at Kukatpally as a joint venture with APIDC in 1972 has a capital investment of Rs.65? Lakhs. It manufactures glass, shells, glass tubes, crystal glass and glassware. The products enjoy market all over India. Crystalware is in great demand abroad.
7.20 Cement Industry: The Cement Corporation of India Limited, established during 1982 at Karankote near Tandur with capital investment of Rs.90.00 crores, producf.l one million tonnes of cement per annum. Some important research and development institutions are also located in Rangareddi district. The names are furnished below.
1. Defence Metallurgical Research Laboratories (D.M.R.L.)
2. Defence Rese'arcfr 'Development Laboratory (D.R.D.L.)
3. Defence Electronics and Research Laboratory (D.E.R.L.)
4. Regional Research Laboratories
5. A.P .Engg. Research Laboratory a~ Rajendranagar.
There are 15 civil hospitals in the district besides T.B.Sanitorium at Anantagiri in Vicarabad mandai, 12 Ayurvedic, 14 Unani and 7 Homoeopathi dispensaries functioning in the district. The following educational institutions are functioning in the district. Primary and Upper Primary Schools, Junior Colleges, Degree Colleges, Agricultural Colleges and Veterinary College. Apart from the above, the district has the privilege of having the following universities. Central University of Hyderabad at Gachibowli, AP.Agricultural University at Rajendranagar and Jawaharlal Nehru Technological University at Kukatpalle.
8. PLACES OF TOURIST INTEREST
8.1 Keesaragutta: Sri Ramalingeswaraswamy temple at r(eesara is a famous pilgrim centre with a glorious past. On a 400 feet high hillock with a Sivalingam is the place of worship in this village and therefore is known as Keesaragutta. It is believed that Sri Rama visited this place after slaying demon king Ravana. This being a sacred place Lord Sri Rama desired to install 101 Sivalingas to absolve himself of the sin committed by
slaying the great Siva Bhakta Ravana and ordered Hanuman to bring 101 Lingas from Varanasi. The idol of Goddess Bhavani was installed specially in this place. The carvings on the stone pillar depicting the first three incarnations of Lord Vishnu, viz., Mathsya, Kurma and Varaha and Vighneswhwara and Anjaneya are a special attraction.

In Sri Ramalingeswara Swamy temple 6 days uthsavam takes place on Mahasivaratri day. Fasting and jagarana are observed. Large number of devotees attend this uthsavam irrespective of caste or creed.
Ghatkesar Ranganayaka Swamy temple is situated in Edulabad village.
8.2 Karmanghat: The famous Veeranjaneya temple is located at Saroornagar mandai of Rangareddi district.
8.3 Ibrahimpatnam: In this place a big tank was constructed by Ibrahim Qutb Shah. It irrigate over 480 hectares of cultivable land. The well known Astronomical Observatory in India is situated in Rangapur village of Ibrahimpatnam mandai. It is reported as the largest telescope in South East Asia.
14
8.4 Rajendranagar: All important picnic resort centres are situated in this mandai, viz., Kidwai Garden, Gandipet, Himayatsagar and Osmansagar. The falillJUS Husseni Alam Darga and Agricultural Uiliversity are located in Rajendranagar mandaI.
8.5 Vicarabad: Vicarabad mandai is situated at a distance of 83 Kms. from Hyderabad and is a railway station on the SecunderabadBombay broad-guage line. This p1ace serves as a tourist centre in summer season. Then.! is a T.B.Sanitorium Center at this place.
8.6 Valal: It is believed that Yalal place have been a Budhist centre in the past. It is J
place of confluence of the rivers Kagna and Kakaraveni.
9. CHANGES IN THE ADMINISTRATIVE UNITS
In 1985 the then existing 11 taluks were reorganised into 37 mandals corresponding to the Revenue Mandals, Mandai Praja Parishads were also formed which are coterminus with the Revenue Mandals, in all cases except Uppal MandaI. The statutory towns are not included in the jurisdiction of the MPPs. The 11 mandals have been formed by taking villages from two erstwhile taluks. Each of the remaining 26 mandals has been formed by taking villages exclusively from each of the erstwhile 11 taluks (i.e. without including villages from a second taluk). The chart on the adjacent page gives a clear picture of the distribution of the villages of the erstwhile taluks into present mandals. The figure in the block at the intersection of the taluk and the mandai gives a number of villages taken out of the particular taluk for inclusion into that particular mandaI. In the alphabetical list of villages in the succeeding pages, the erstwhile taluk to which the village belonged at the time of 1981 Census has been indicated.
While comparing the list of villages at 1991 Census with that of 1981 Census, it may kindly be kept in view that the difference in the total number of villages is due to merger of one village with another revenue village, four villages are newly sprungup and one village transfered from erstwhile Chari mar taluk of Hyderabad district. 128 villages have been deleted from the list of villages as they are now parts of the Municipalities/Panchayat
towns. Details of these villages with L.C.Nos. included fully in urban areas are given in the annexure to the alphabetical list of villages.
Seven towns i.e. Balanagar, Bowenpalle, Fathenagar and Moosapet in Kukatpalle; Budvel in Rajendranagar and Machabolaram and Yapral in Alwal,were merged with othef towns and six towns treated as such for the I first time at 1991 Census. Thus there am at present in all, eleven statutory towns, one Municipal Corporation and three census towns in the district.
The 37 mandals have been organised into three revenue divisions in the district as follows:-
9.1 Hyderabad East Division: Quthbullapur, Medchal, Shamierpet, Keesara, Ghatkesar, Uppal, Hayathnagar, Saroornagar (L.B.Nagar), Maheswaram, Jbrahimpatnam, Manchal, Yacharam and Kandukur.
9.2 Chevella Division: Shankarpalle, Ser ilingampalle, Balanagar, Malkajgiri, Rajen· dranagar, Moinabad, Chevella, Shabad ami Shamshabad.
9.3 Vicarabad Division: Marpalle, Mominpet, Nawabpet, Vicarabad, Dharur, Bantaram, Peddemul, Tandur, Basheerabad, Yalal, Doma, Gandeed, Kulkacherla, Pargi and Pudur.
CHART FOLLOWS

16
DISTRIBUTION OF VILLAGES OF THE ERSTWHILE TALUKS
NAME UF T ALUK PRIOR
LC Name of Medchal Marpalle Hayath- Ibrahim- Mahes- Rajendra-No Mandai nagar patnarn waram nagar
2 3 4 5 6 7 8
1 MARPALLE 28
2 MOMINPET 23
3 NAWABPET 6 4 SHANKARPALLE 1 5 SERILINGAMPALLE 26 6 BALANAGAR 8 7 QUTHBULLAPUR 18
8 MEDCHAL 29 9 SHAMIRPET 30 10 MALKAJGIRI 11 KEESARA 15 12 GHATKESAR 21 13 UPPAL 20 14 HAYATHNAGAR 41 15 SAROORNAGAR** 28 16 RAJEN DRANAGAR 40 17 MOINABAD 7 1:3 CHEVELLA 19 VICARABAD 20 DHARUR 21 BANTARAM 26 22 PEDDAMUL 5 23 TANDUR 24 BASHEERABAD 25 YELAL 26 DOMA 27 GANDEED 28 KULKACHARLA
29 PARGI 30 PUDUR 31 SHABAD 32 SHAMSHABAD 35 33 MAHESWARAM 33 34 IBRAHIMPATNAM 28 35 MANCHAL 25 36 YACHARAM 18 2 37 KANDUKUR 30
GRAND TOTAL 92 89 110 71 65 117
* Column 14 includes the villages fully included in Urban Areas
( **)One village from Charminar taluk of Hyderabad district was transferred to Saroornagar Mandai of Rangareddy district.

17
INTO PRESENT MANDALS IN RANGAREDDY DISTRICT
TO 1991 CENSUS
Cheve- Vicara- Tandur Pargi Vallabha- Total* LC lIa bad nagar NO
9 10 11 12 13 14
28 1
23 2 16 22 3
25 26 4
26 5 6 14 6
18 7
29 8 30 9
12 12 10 16 11 21 12 20 13 41 14 29 15** 40 16
19 26 17 36 36 18 ..
34 35 19 38 38 20
26 21 29 34 22 38 38 23 31 31 24 34 34 25
28 28 26 29 29 27 30 30 28 37 37 29
21 13 34 30 25 25 31
8 43 32 33 33 28 34 25 35 20 36 30 37
113 109 132 137 19 1055

18
10. STATEMENT SHOWING THE AREA AND NUMBER OF VILLAGES WITH RURAL/ URBAN BREAKUP IN EACH REVENUE MANDAL
Total No. of Villages No.of Villages included in Towns
L.C. Name of the Total Area No.of Total No. Mandai in Sq.Kms. Towns Villages Inhabited Uninhabited Fully Partly
2 3 4 5 6 7 8 9
1 MARPALLE 234.40 28 28 2 MOMINPET 178.30 23 23 3 NAWABPET 161.80 22 22 4 SHANKARPALLE 142.70 26 25 5 SERILINGAMPALLE 108.15 26 6 BALANAGAR NA 14 7 QUTHBULLAPUR 145.27 12 12 6 8 MEDCHAL 188.10 29 26 3 9 SHAMIRPET 200.42 29 29 1
10 MALKAJGIRI 53.38 2 12 11 KEESARA 157.80 1 15 15 1 12 GHATKESAR 133.13 1 19 17 2 2 13 UPPAL 60.66 1 5 4 1 15 14 HAYATHNAGAR 286.30 36 31 5 5 15 SAROORNAGAR 114.12 2 13 11 2 16 16 RAJENDRANAGAR 186.67 1 25 16 9 15 17 MOINABAD 198.30 26 26 18 CHEVELLA 286.30 36 36 19 VICARABAD 215.09 26 24 2 9 20 DHARUR 220.40 38 37 1 21 BANTARAM 187.80 26 24 2 22 PEDDAMUL 270.90 34 29 5 23 TANDUR 229.12 35 34 1 3 24 BASHEERABAD 209.60 31 29 2 25 YELAL 189.40 34 33 1 26 DOMA 172.00 28 28 27 GANDEED 239.50 29 28 28 KULKACHARLA 229.60 30 30 29 PARGI 190.10 37 35 2 30 PUDUR 209.50 34 32 2 31 SHABAD 207.50 25 25 32 SHAMSHABAD 189.34 40 37 3 3 33 MAHESWARAM 302.50 33 30 3 34 IBRAHIMPATNAM 235.00 28 22 6 35 MANCHAL 244.20 25 21 4 36 'YACHARAM 354.20 20 19 1 37 KANDUKUR 347.20 30 27 3
TOTAL 7,493.00 14 927 865 62 128
Note: 1. The District "Geographical Area" figures are as supplied by Surveyor General, India
t The total of the area figures of Mandals will not tally with the District Area figures because the former represents land use area and are derived from the figures supplied by the State Survey Department.
3. Villages shown under Col.5 do not include the villages under Column 8.
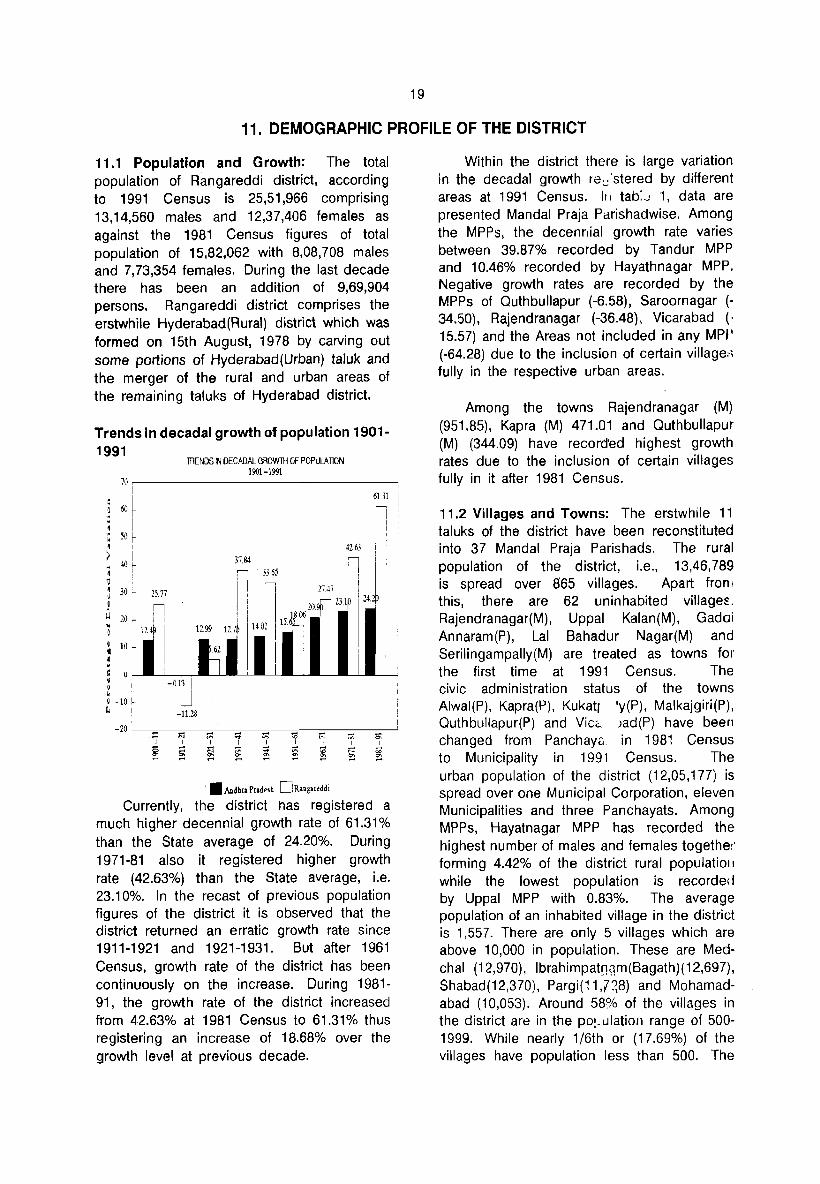
19
11. DEMOGRAPHIC PROFILE OF THE DISTRICT
11.1 Population and Growth: The total population of Rangareddi district, according to 1991 Census is 25,51,966 comprising 13,14,560 males and 12,37,406 females as against the 1981 Census figures of total population of 15,82,062 with 8,08,708 males and 7,73,354 females. During the last decade there has been an addition of 9,69,904 persons. Rangareddi district comprises the erstwhile Hyderabad(Rural) district which was formed on 15th August, 1978 by carving out some portions of Hyderabad(Urban) taJuk and the merger of the rural and urban areas of the remaining taluks of Hyderabad district.
Trends in decadal growth of population 1901-1991
TRENDS IN DECADAL GROWTH OF POPULA TlON 1901-1991
70 ~--------------
6O~ I
50 ~ I I
'i 4U~
~ ! 30 25.77 , i . ~ 20
; 10 ~ I
C ; Q I , I i -10 ~ ~ I -1128
I -20 -i 1'1
I
~ § ;;:: I
~
6UI
n I I j
42.63 i I
37.84 nil II H6~ I I II lin 27471:
: I I ,~23!r '24.' ! i h II,Je"'1 II '
127b 14 Of I '. , I I I
I I .
:;; - :;; r:: - s: '" ,~
I I I I I I
§ ::;! § ~ ~ Q¢ ::: :::
•• I\ndhra Prade,h 0 Rangmddi
Currently, the district has registered a much higher decennial growth rate of 61.31% than the State average of 24.20%. During 1971-81 also it registered higher growth rate (42.63%) than the State average, Le. 23.10%. In the recast of previous population figures of the district it is observed that the district returned an erratic growth rate since 1911-1921 and 1921-1931. But after 1961 Census, growth rate of the district has been continuously on the increase. During 1981-91, the growth rate of the district increased from 42.63% at 1981 Census to 61.31% thus registering an increase of 18.68% over the growth level at previous decade.
Within the district there is large variation in the decadal growth re~ 'stered by different areas at 1991 Census. It I tab: . .: 1, data are presented Mandai Praja Parishadwise. Among the MPPs, the decennial growth rate varies between 39.87% recorded by Tandur MPP and 10.46% recorded by Hayathnagar MPP. Negative growth rates are recorded by the MPPs of Quthbullapur (-6.58), Saroornagar (-34.50), Rajendranagar (-36.48), Vicarabad (. 15.57) and the Areas not included in any MPf' (-64.28) due to the inclusion of certain village~; fully in the respective urban areas.
Among the towns Rajendranagar (M) (951.85), Kapra (M) 471.01 and Quthbullapur (M) (344.09) have recorded highest growth rates due to the inclusion of certain villages fully in it after 1981 Census.
11.2 Villages and Towns: The erstwhile 11 taluks of the district have been reconstituted into 37 Mandai Praja Parishads. The rural population of the district, Le., 13,46,789 is spread over 865 villages. Apart fronl this, there are 62 uninhabited village~.
Rajendranagar(M), Uppal Kalan(M), GadCli Annaram(P), Lal Bahadur Nagar(M) and Serilingampally(M) are treated as towns for the first time at 1991 Census. The civic administration status of the towns Alwal(P), Kapra(P), Kukatr 'y(P), Malkajgiri(P), Quthbuliapur(P) and Vice.. >ad(P) have been changed from Panchaya in 1981 Census to Municipality in 1991 Census. The urban population of the district (12,05,177) is spread over one Municipal Corporation, eleven Municipalities and three Panchayats. Among MPPs, Hayatnagar MPP has recorded the highest number of males and females togethe~' forming 4.42% of the district rural populatioll while the lowest population is recorded by Uppal MPP with 0.83%. The average population of an inhabited village in the district is 1,557. There are only 5 villages which are above 10,000 in population. These are Medchal (12,970), Ibrahimpatn.~m(Bagath)(12,697),
Shabad(12,370), Pargi(11.1?8) and Mohamadabad (10,053). Around 589/0 of the villages in the district are in the po!_ulation range of 500-1999. While nearly 1/6th or (17.69%) of the villages have population less than 500. The

average area of an inhabited village is 786 hectares.
11.3 Urbani~ation Trends: The degree of urbanisation can be measured in terms of percentage of urban population to total population. In 1991 the district has shown an increasing trend in urbanisation by growing to the level of 47.23% over the level of 23.83% at the previous Census. Rangareddi district registered urban growth rate of 130.73% as against 27.09% in rural population during the decade. The rank of the district in urban population increased from 6th position at 1981 to 2nd pOSition and next to Hyderabad(100%)
at 1991 Pace of urbanisation 1qn1-1991 PACE OF URBANISA flON (1 W1 -1il:91) _/l "
(Perc.;ntlge oiUrban Population to Total Population') (J~ 50~--------------------~------~
~l.Jl ' III C I
o ' • !
~ ~(Il ~ ,~
"pO
I r
~ !
9,65
17.42
13.43
1009 10,21 1113
79
1931 17.43
.7S
.46
t.:~"'l iJ'~
.15
16.
i I
Ii ! I I I
, l , I 27 I 75 52 96 I-- II J i I h h h , i
1901 1911 1921 1931 1941 1951 1961 1971 1981 1991
_ .. __ • Andhn Pradesh U R.n1;aredd, In Rangaredd i distr:':ic"';"t'7th2eo::.r:::::e::""a-re-"'fo-u-r""'t-ow-nS"-
namely Kukatpally(M), Lal Bahadur Nagar(M), Malkajgiri(M) and Qutbuliapur(M) in class I category. There are six towns in the category of class II towns. In the category of class III three towns are there in the district while only two towns namely Shamshabad(P) ,and Ghatkesar(P) fall in class IV. There are no towns in the categories of class V and VI in the district. Among the towns Kukatpally(M) has registered highest population of 1,86,963. Out of the 15 towns in the district 13 towns have more than 20,000 population and only 2 towns, namely Ghatkesar(P) and Shamshabad(P) have less than 20,000 population.
11.4 Density of Population: Due to the increasing trend of urbanisation in the district the density has been continuously on th~ increase since 1931. The density of population ,
20
has increased from 211 in 1981 to 341 in 1991. Rangareddi is the seventh highest district which returned higher density of population than Adilabad district (129) and is much higher than the State average of 242 persons per sq.km. in 1991. Industrialisation is the main reason for the tremendous increase ir population.
DAnsitv of population 1901-1991
DENSITY DF POPULA liON (1 001 -1991) 41)0 " -----------------------
I N __ I
: 31)) ~ ,
~ I 24~
i
: )Oil I 19~ ~ 111
• ~
! I
113 99
15S
131 t4J ~ l(l(i Il 78 78
88
~ ~
I i I I
69 I
ts71 74
'451 ~ n I '1 I I I
! I
1901 1911 1921 .1931 1941 1951 1961 1911 1981 1991
• Andbr. Prad_db _D Rangareddi
I
The density figures of the rural and urban areas of the district are 194 persons an'j 2,115 respectively as against 180 and 3,45S respectively for the State. Around onefifth of the villages (or 19.77% of villages) in the district have a density higher than 300 persons per sq.km. Only about 3.46% villages have a density lower than 50 persons per sq.km.
11.5 Sex-ratio: Rangareddi is one of the districts in Andhra Pradesh where sex-ratio has been generally favourable to males. The district has registered slight decrease in sexratio from 956 in 1981 to 941 in 1991 which is lower than the State average of 972.
Interestingly both in urban and rural population of Rangareddi, sex-ratio of 924 and 956 respectively is favourable to males. At 1981 Census there were only 8 MPPs that have recorded a sex-ratio favourable to females while at 1991 4 MPPs have recorded similar situation. Yelal MPP has recorded highest female sex-ratio of 1023
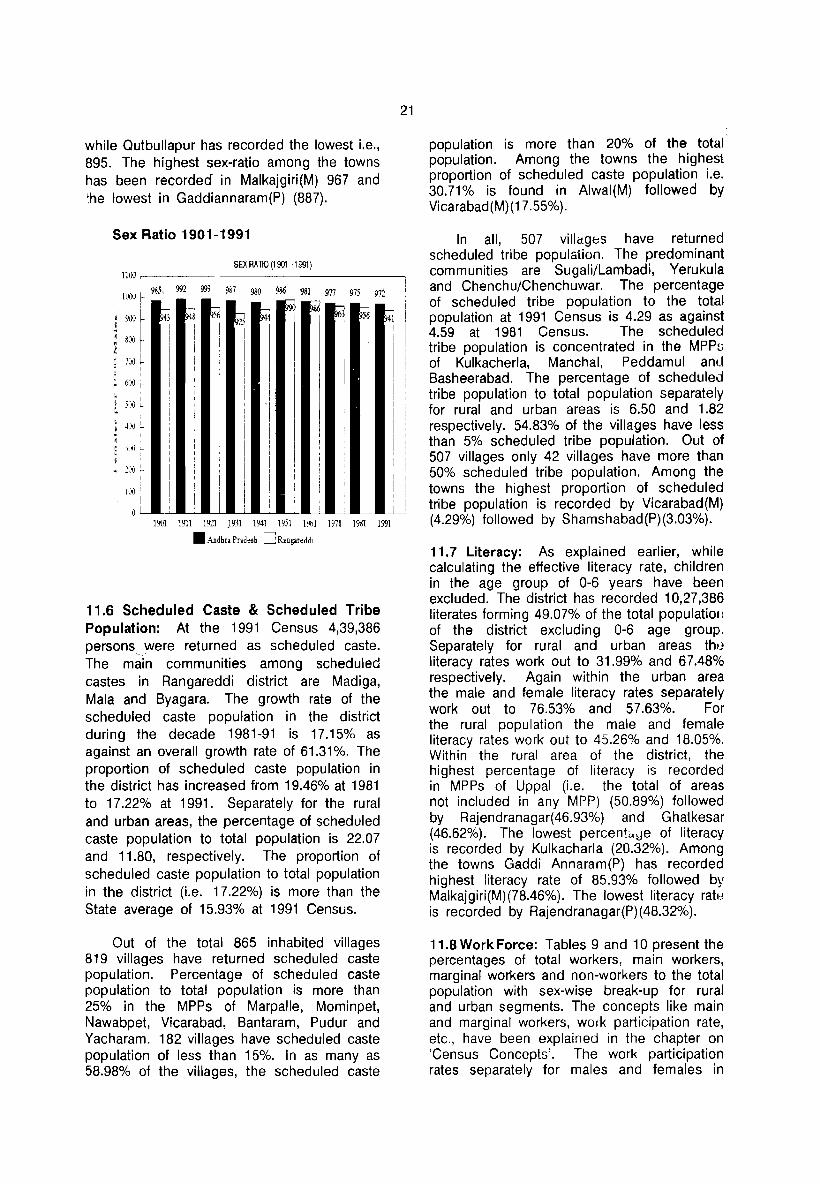
while Qutbullapur has recorded the lowest i.e., 895. The highest sex-ratio among the towns has been recorded in Malkajgiri(M} 967 and :he lowest in Gaddiannaram(P} (887).
Sex Ratio 1901-1991
SEX RAOO (1 001-1(91)
21
1100 ,....----------------
I 000 ~ 9~5, 992 993 987 980 986 981 977 975 972
I
~ ~ ~ ~ ~ fs6 ~ ~ ~ ~ ~ I
I I I i
L I i I i I I
70,) I ~ I I I
I , : 61~) I i
~ I
i I
~ I : ~(I) I I
I
L I I I I , i , I , I
~ I I I I I
,
i ,
: ,
I I i i
I I , i
1<,0(11 1911 1921 1931 1941 1951 1961 1971 1981 1991
• Andh" Pradesh n Rangareddi
11.6 Scheduled Caste & Scheduled Tribe Population: At the 1991 Census 4,39,386 persons were returned as scheduled caste. The main communities among scheduled castes in Rangareddi district are Madiga, Mala and Byagara. The growth rate of the scheduled caste population in the district during the decade 1981-91 is 17.15% as against an overall growth rate of 61.31%. The proportion of scheduled caste population in the district has increased from 19.46% at 1981 to 17.22% at 1991. Separately for the rural and urban areas, the percentage of scheduled caste population to total population is 22.07 and 11.80, respectively. The proportion of scheduled caste population to total population in the district (i.e. 17.22%) is more than the State average of 15.93% at 1991 Census.
Out of the total 865 inhabited villages 819 villages have returned scheduled caste population. Percentage of scheduled caste population to total population is more than 25% in the MPPs of Marpalle, Mominpet, Nawabpet, Vicarabad, Bantaram, Pudur and Yacharam. 182 villages have scheduled caste population of less than 15%. In as many as 58.98% of the villages, the scheduled caste
, i
, I I
population is more than 20% of the total population. Among the towns the highest proportion of scheduled caste population i.e. 30.71% is found in Alwal(M) followed by Vicarabad(M)(17.55%).
In all, 507 villtigt:s have returned scheduled tribe popUlation. The predominant communities are Sugali/Lambadi, Yerukula and Chenchu/Chenchuwar. The percentage of scheduled tribe population to the total population at 1991 Census is 4.29 as against 4.59 at 1981 Census. The scheduled tribe population is concentrated in the MPPu of Kulkacherla, Manchal, Peddamul and Basheerabad. The percentage of scheduled tribe population to total population separately for rural and urban areas is 6.50 and 1.82 respectively. 54.83% of the villages have less than 5% scheduled tribe population. Out of 507 villages only 42 villages have more than 50% scheduled tribe population. Among the towns the highest proportion of scheduled tribe population is recorded by Vicarabad(M) (4.29%) followed by Shamshabad(P)(3.03%).
11.7 Literacy: As explained earlier, while calculating the effective literacy rate, children in the age group of 0-6 years have been excluded. The district has recorded 10,27,386 literates forming 49.07% of the total populatioll of the district excluding 0-6 age group. Separately for rural and urban areas thlJ literacy rates work out to 31.99% and 67.48% respectively. Again within the urban area the male and female literacy rates separately work out to 76.53% and 57.63%. For the rural population the male and female literacy rates work out to 45.26% and 18.05%. Within the rural area of the district, the highest percentage of literacy is recorded in MPPs of Uppal (Le. the total of areas not included in any MPP) (50.89%) followed by Rajendranagar(46.93%) and Ghatkesar (46.62%). The lowest percentu\:Je of literacy is recorded by Kulkacharla (20.32%). Among the towns Gaddi Annaram(P) has recorded highest literacy rate of 85.93% followed by Malkajgiri(M)(78.46%). The lowest literacy ratu is recorded by Rajendranagar(P)(48.32%).
11.8 Work Force: Tables 9 and 10 present the percentages of total workers, main workers, marginal workers and non-workers to the total population with sex-wise break-up for rural and urban segments. The concepts like main and marginal workers, work participation rate, etc., have been explained in the chapter on 'Census Concepts'. The work participation rates separately for males and females in

the rural areas are 55.21% and 43.58% respectively against the corresponding figures of 49.19% and 11.08% in urban areas. The work participation tate in Rangareddi district is 40.75% which is lower than the State average of 45.05%. Again if we consider main workers alone, the proportion stands at 39.69% as against 42.77% for the State. Within the rural area the work participation rate varies between the minimum of 36.81% recorded in Uppal MPP (i.e. total of Areas not included in any MPP) to a maximum of 54.39% in Doma.
Among the main workers the percentage of cultivators has come down substantially from 33.34% at 1981 Census to 25.32% at 1991 Census. There is a slight decrease in the percentage of agricultural labourers from 29.37 at 1981 Census to 28.53% at 1991 Census. There is decrease nearly 75%
22
in the percentage of workers in householu industry from 4.24% at 1981 Census to 1.00% at 1991 Census. The district has registered considerable increase in the percentage of workers in 'Other Services' from 33.05% at 1981 Census to 45.14% in 1991 Census. There is an apprecial.J:e decrease during the decade in the pro;Joltion of workers in agriculture sector from 62.71 % at 1981 Census to 53.85% at 1991 Census. Overall female participation rate in the district (when main workers and marginal workers are considered), has also decreased from 35.28% at 1981 Census to 28.43% at 1991 Census.
When looked into the rural and urball sectors, the female partiCipation rate has shown siight lncreasp. at 1991 over the level at 1981.
12. AVAILABILITY OF AMENITIES AND SERVICES
12.1 Education: Minimum educational facilities are available in 93.76% of the villages covering 98.89% of the population. In the Mandai Praja Parishads of Mominpet, Nawabpeta, Quthbullapur, Ghatkesar, Rajendranagar, Vicarabad, Peddamul, Basheerabad, Pudur, Ibrahimpatnam and Yacharam all the villages are covered by educational facility. There is no village with a population of more than 2000 without a school. Out of 54 villages without a school in the district, 52 villages have the facility within a distance of 5 Kms. while 2 villages avail this facility from a distance of 5-10 Kms.
12.2 Medical: Medial facilities exist only in 277 villages forming 32.02% of the total number of villages. The percentage of rural population served by medical facility of some kind or the other is 53.08%. Among the different MPPs in the district, the situation is poor in respect of Vicarabad, Bantaram, Kulkacherla, and Yacharam where less than 20% of population hf:lve access to medical facility in their native village. The happiest position is in Peddamul MPP where 95.65% of population is covered by medical facility. Of the 588 villages which do not have medical facility, 261 villages avail this facility within a distance of 5 Kms. There are 57 villages where people have to travel more than 10 Kms. to avail medical facility.
12.3 Drinking Water: A" the villages in the district have drinking water facility. The
main source of drinking water are open wells (84.85%), hand pumps (61.85%) and taps (16.64%). About 62.89% of the villages have more than one source of drinking water facility.
12.4 Post and Telegraph: Nearly half of the inhabited villages in the district covering a population of 74.12% have some kind ci post and telegraph facility or the other. Thf) happiest position is in respect of Moinabau and Yacharam MPPs where 99.88% and 96.42% of population respectively are covered by this facility. The poor case is Shamshabad MPP where only 50.69% of the population enjoys this facility. Of the 445 villages which do not have the post and telegraph facility, 356 villages have the facility within a distance of 5 Kms.
12.5 Communication and Approach: Rangareddi district has the railway line connecting Bombay, Bangalore and Manmad centres. Apart from this there are state highways linkinr, Vicarabad, Rajendranagar and Ghatkesa r
covering a length of 194.00 Kms. of doubb line. About 77.01% of the population has gOl
access by pucca road with public transport facility (bus stop) as also railway station. Of the remaining villages, 211 villages have the facility within a distance of 5 Kms, 84 villages within a distance of 5 to 10 Kms. and the remaining 4 villages have the facility at a distance beyond 10 Kms.

12.6 Power Supply: During the last decade there has been slight improvement in the position of power supply in the rural areas of the district. As against 83.03% of villages at the 1981 Census, 99.42% of the villages are now electrified. In 32 MPPs all the villages are electrified.
12.7 Land use and Irrigation facilities: About 56% of the total area of the district is cultivable of which 17.40% of the land is irrigated.
There is some improvement in irrigation facility during the last 10 years. Least percentage of area under cultivation is returned in Ghatkesar MPP (22.44%) followed by Rajendranagar MPP (35.46%), and Hayathnagar MPP (36.34%). More than 70% of area is cultivable in Shankarpalle, Keesara, Moinabad, Chevella, Vicarabad, Dharur, Doma and Pargi MPPs. In Ghatkesar MPP more than 76% of the cultivable area is irrigated.


TABLES


27
Table - 1
POPULATION, SEX RATIO, LITERACY RATES AND DECADAL VARiATION OF VILLAGES-M.P.P-WISE
No.of Villages Population % age Decadal
1981 1991 Sex Ratio Literacy Rates Growth Name of Mandai Inha-Praja Parishad Total bited Persons Males Femals Persons Males Females 19811991 Persons Males Females 1981-91
2 3 4 5 6 7 8 9 10 11 12 13 14 15
1 MARPALLE 28 28 33,443 16,926 16,517 41,231 21,159 20,Q72 976 949 23.57 35.41 11.13 23.29 2 MOMINPET 23 23 30,211 15,266 14,945 36,960 16,779 16,181 979 968 25.6439.82 11.46 22.34 3 NAWABPET 22 22 29,686 14,996 14,690 35,684 18,317 17,367 980 948 29.32 46.06 11.58 20.20 4 SHANKARPALLE 26 25 39,094 19,847 19,247 50,082 25,791 24,291 970 942 35.2049.69 19.77 28.11 5 SERILINGAMPALLE - 32,867 17,305 15,562 - 899 6 BALANAGAR 10,263 5,341 4,922 - 922 7 QUTHBULLAPUR 12 12 30,152 15,488 14,664 28,169 14,863 13,306 947 895 39.90 53.95 23,87 -6.58 8 MEDCHAL 29 26 36,000 18,41 B 17,582 46,647 23,975 22,672 955 946 45.11 57.96 31.36 29,58 9 SHAMIRPET 29 29 40,375 20,663 19,712 54,534 28,095 26,439 954 941 38.3551.13 24.60 35,07
10 MALKAJGIRI 3,730 1,947 1,783 - 916 11 KEESARA 15 15 21,048 10,839 10,209 27,217 14,066 13,151 942 935 39.86 53.57 25,04 29.31 12 GHATKESAR 19 17 26,955 13,755 13,200 32,333 16,803 15,530 960 924 46,62 61,03 31,06 19,95 14 HAYATHNAGAR 36 31 53,869 27,765 26,104 59,505 31,317 28,188 940 900 38.05 52.47 21.81 10.46 15 SAROORNAGAR 13 11 40,326 20,824 19,502 26,413 13,711 12,702 937 926 39.54 50.81 27.09 -34,50 16 RAJENDRANAGAR 25 16 47,170 24.809 22,361 29,964 15,660 14,304 901 913 46.93 58,33 34,21 -36.48 17 MOINABAD 26 26 36,034 18,354 17,680 45,811 23,666 22,145 963 936 32.91 46,48 18.20 27.13 18 CHEVELLA 36 36 38,925 19,671 19.254 49,946 25,516 24,430 979 957 31,14 47.91 13,51 28.31 19 VICARABAD 26 24 30,631 15,566 15,065 25,861 13,131 12,730 968 969 24.78 38,89 10.28 -15.57 20 DHARUR 38 37 28,620 14,321 14,299 35,774 18,045 17,729 998 982 27.66 41.03 14.05 25.00 21 B~NTARAM 26 24 24,087 12,012 12,075 29,574 14,915 14,6591005 983 24.71 37.22 11,99 22.78 22 PEDDEMUL 34 29 32,799 16,369 16,430 41,667 20,870 20,7971004 997 24.74 36.51 12.91 27.04 23 T.L\NDUR 35 34 27,055 13,491 13,564 37,841 19,016 18,8251005 990 27.79 40.40 15,13 39.87 24 BASHEERABAD 31 29 28,132 13,881 14,251 34,888 17,287 17,60110271018 27.01 40,23 14,15 24.02 25 YELAL 34 33 27,616 13,527 14,089 33,879 16,748 17,13110421023 23,06 34.27 12.17 22.603 26 DOMA 28 28 27,936 13,780 14,156 35,413 17,684 17,72910271003 21.9434,11 9.76 26.76 27 GANDEED 29 28 39,453 19,470 19,983 48.771 24,324 24,4471026 1005 25.43 37.41 13.47 23,6? 28 KULKACHARLA 30 30 37,259 18,556 18,703 46,550 23,369 23,1 Bl1 OOB 992 20.32 30.59 10,0"; 24.94 29 PARGI 37 35 35,587 17,B83 17,704 46,172 23,313 22,859 990 981 33.50 47,22 19.35 29.74 30 PUDUR 34 32 29,932 15,083 14,849 37,900 19,244 18,656 984 969 28.12 41.34 14.39 26.62 31 SHABAD 25 25 35,296 17,696 17,600 43,360 22,059 21,301 995 966 30.30 43,51 16.66 22,85 32 SHAMSHABAD 40 37 33,798 17,419 16,379 44,235 22,935 21,300 940 929 29.81 42.06 16,37 30.88 33 MAHESWARAM 33 30 36,248 18,373 17,875 46,863 24,025 22,838 973 951 31.15 43.40 18,02 29,28 34 IBRAHIMPATNAM 28 22 46,027 23,493 22,534 57,896 29,800 28,096 959 943 39.20 52.97 24.51 25.79 35 MANCHAL 25 22 31,423 15,996 15,427 37,106 19,071 18,035 964 946 32.00 46.02 17.11 18.09 36 YACHARAM 20 19 36,416 18,283 18,133 42,911 22,069 20,842 992 944 33.90 47,91 19.03 17.84 37 KANDUKUR 30 27 35,196 17,B77 17,319 44,413 22,903 21,510 969 939 28.22 39.80 15.74 26,19
AREAS NOT INCLUDED IN ANY MPP 5 4 31,406 16,384 15,022 11,219 5,868 5,351 917 912 50.89 61.48 39.18 -64.28
TOTAL 927 86512,05,0656,11,6745,93,39113,46,7896,88,394 6,58,395 970 956 31.99 45.26 1B.05 11.76
Note 1. Deacadal growth rate for MPPs having SI.No,5, 6 & 10 are not given since all these MPPs have trated as fully urban during 1991 Census,
2. Negative growth rate for MPPs having SI.No.15, 16, 19 and for the "Areas not included in any MPP" is due to the merger/ inclusion of certain villages of 1981 Census in nearby towns after 1981 Census,

28
Table·2
POPULATION, SEX RATIO, LITERACY RATES AND DECADAL VARIATION OF TOWNS
Population % age
Decadal
Class, Name and Civic 1981 1991 Sex Ratio Literacy Rates Growth
status of the Town
Persons Males Females Persons Males Females 1981 1991 Persons Males Female, 1981-91 ---
2 3 4 5 6 7 8 9 10 11 12 13
II ALWAL [M]* 39,249 20,018 19,231 67,271 34,274 32,997 961 963 72.69 81.77 63,26 71.40
IV GHATKESAR (P) 9,773 5,222 4,551 12,645 6,631 6,014 872 907 65,07 77.81 51.44 29.39
II HYDERABAD (MC) PORTIOW 93,774 49,377 44,377 93,455 48.499 44.956 898 927 66.48 75.31 56,86 -0.34
II KAPRA (M) 15,367 8,020 7,347 87,747 45,626 42,121 916 923 73.71 81,53 65.16 471,01
I KUKATPALL Y (M) 56,659 30,153 26,506 1,86.963 98,342 88,621 879 901 6806 77.52 57.42 229,98
I LALBAHADUR NAGAR (M) 1,55,514 80,553 74,961 931 72039 80.98 63,1',
I MALKAJGIRI (M) 65,776 34,094 31,682 1,27,178 64.647 62,531 929 967 78.46 86,14 7052 93.35
I QUTUBULLAPUR (M) 24.002 12,684 11,318 1,06,591 56,207 50,384 892 896 61,30 71.81 49.41 344.09
II RAJENDRA NAGAR (M)" 8,038 4,160 3.878 84.548 44.253 40,295 932 911 48.32 58,68 3675 951,85
II SERI LlNGAMPALL Y (M) 72,320 37,896 34.424 908 60.84 70.41 50,13
IV SHAMSHABAD (P) 11,172 5,786 5,386 15,366 7,870 7,496 931 952 54,33 67,78 4026 37,54
III TANDUR (11.1) 32.450 16,676 15.774 45,517 23,233 22,284 946 959 56,04 68.70 42,90 40,27
II UPPAL KALAN [M)* 75,660 39,531 36,129 914 70,17 79,15 6021
III VICARABAD [MJ 20,737 10,824 9,913 39,215 19,959 19,256 916 965 52.20 58,08 46,07 89,11
III GADDIANNARAM [P) 9,693 5,143 4,550 35,187 18.645 16.542 885 887 85.93 91,88 80.65 263.01
All Towns 3,86,6902,02,177 1,84,513 12,05,177 6,26,166 5,79,011 913 925 67.49 76,53 57,63 211.66
• Inclusive of outgrowths
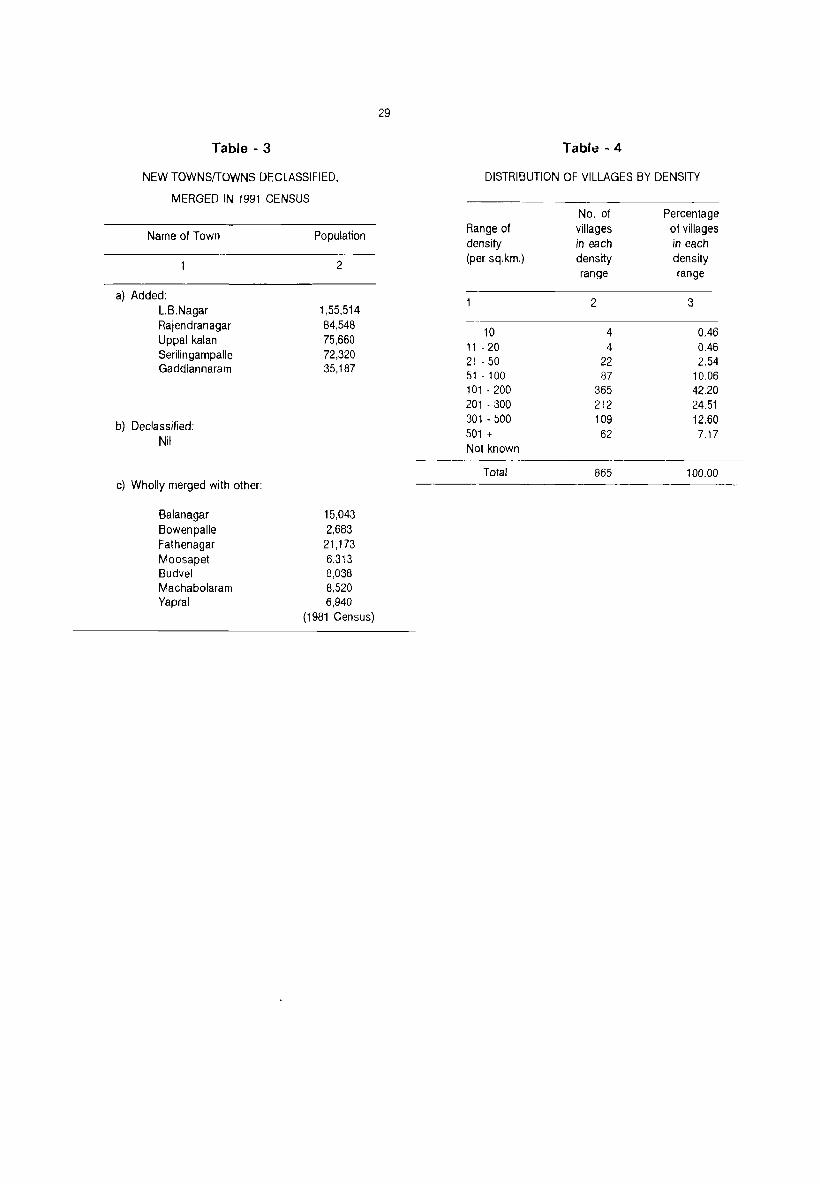
Table - 3
NEW TOWNSfTOWNS DECLASSIFIED,
MERGED IN 1991 CENSUS
Name of Town
a) Added: L.B.Nagar Rajendranagar Uppal kalan Serilingampalle Gaddiannaram
b) Declassified: Nil
c) Wholly merged with other:
Balanagar Bowenpalle Fathenagar Moosapet Budvel Machabolaram Yapral
Population
2
1,55,514 84,548 75,660 72,320 35,187
15,043 2,683
21,173 6,313 8,038 8,520 6,940
(1981 Census)
29
Table·4
DISTRIBUTION OF VILLAGES BY DENSITY
Range of density (per sq.km.)
- 10 11 - 20 21 - 50 51 - 100 101 - 200 201 - 300 301 - 500 501 +
Not known
Total
No. of villages in each density range
2
4 4
22 87
365 212 109 62
865
Percentage of villages in each density range
3
0.46 0.46 2.54
10.06 42.20 24.51 12.60 7.17
100.00
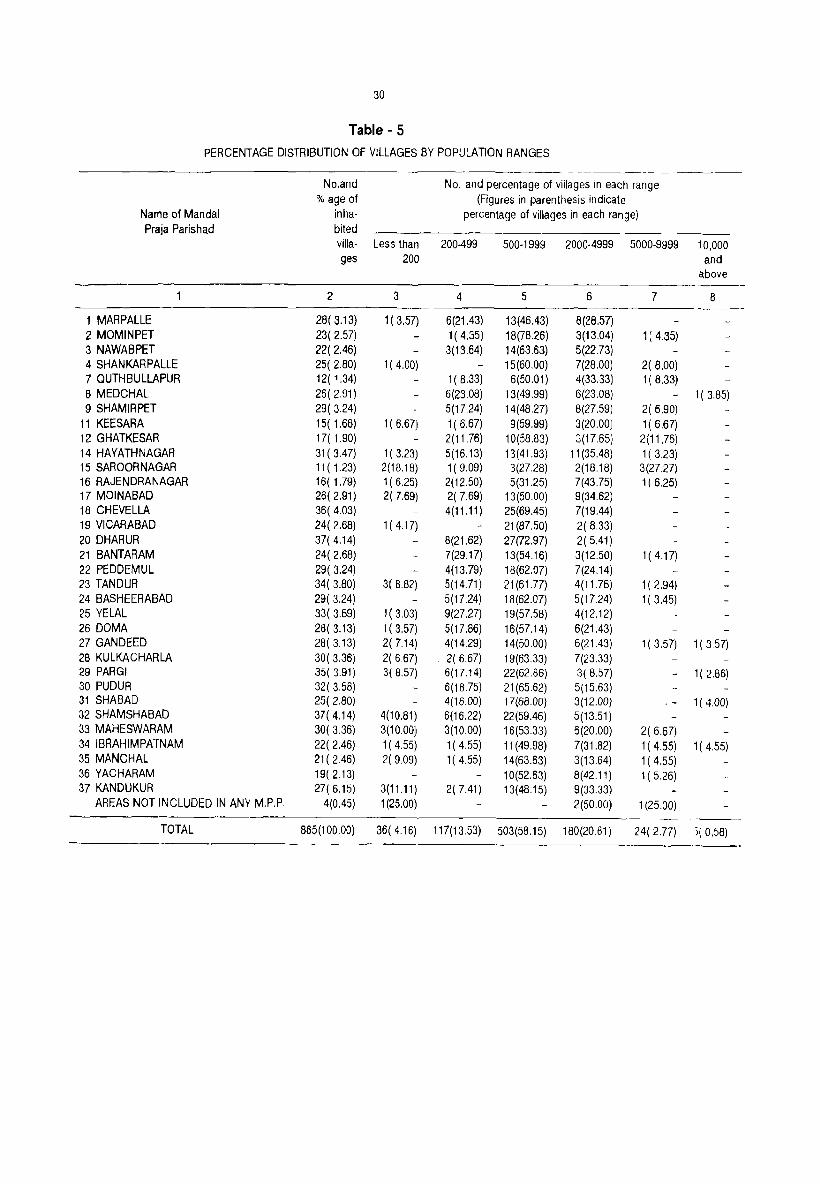
30
Table - 5
PERCENTAGE DISTRIBUTION OF VILLAGES BY POPULATION RANGES
--------~----
No,and No, and percentage of villages in each range % age of (Figures in parenthesis indicate
Name of Mandai inha- percentage of villages in each range) Praja Parish ad bited
villa- Less than 200-499 500-1999 2000-4999 5000-9999 10,000 ges 200 and
above ---
2 3 4 5 6 7 8 ---
1 MARPALLE 28( 3,13) 1( 3,57) 6(21.43) 13(46.43) 8(28,57) 2 MOMINPET 23( 2,57) 1 (4,35) 18(78,26) 3(13,04) 1 (4,35) 3 NAWABPET 22( 2.46) 3(13,64) 14(63,63) 5(22.73) 4 SHANKARPALLE 25( 2,80) 1( 4,00) 15(60,00) 7(28,00) 2( 8,00) 7 QUTHBULLAPUR 12(i,34) 1 ( 8,33) 6(50,01 ) 4(33,33) 1 (8,33) 8 MEDCHAL 26( 2.91) 6(23,08) 13(49.99) 6(23.08) 1( 3,85) 9 SHAMIRPET 29( 3.24) 5(17.24) 14(48.27) 8(27.59) 2( 6,90)
11 KEESARA 15( 1,68) 1( 6,67) 1( 6,67) 9(59,99) 3(20.00) 1( 6,67) 12 GHATKESAR 17( 1,90) 2(11.76) 10(58.83) 3(17.65) 2(11,76) 14 HAYATHNAGAR 31 ( 3.47) 1 ( 3,23) 5(16.13) 13(41,93) 11 (35.48) 1 ( 3,23) 15 SAROORNAGAR 11 ( 1.23) 2(18.18) 1( 9.09) 3(27.28) 2(18.18) 3(27,27) 16 RAJENDRANAGAR 16( 1,79) 1( 6.25) 2(12,50) 5(31,25) 7(43,75) 1 (6,25) 17 MOINABAD 26( 2,91) 2( 7,69) 2( 7.69) 13(50,00) 9(34.62) 18 CHEVELLA 36( 4,03) 4(11.11 ) 25(69.45) 7(19.44) 19 VICARABAD 24( 2,68) 1 ( 4.17) 21 (87.50) 2( 8.33) 20 DHARUR 37( 4.14) 8(21,62) 27(72,97) 2( 5.41) 21 BANTARAM 24( 2.68) 7(29.17) 13(54.16) 3(12.50) 1 ( 4,17) 22 PEDDEMUL 29( 3,24) 4(13,79) 18(62,07) 7(24,14) 23 TANDUR 34( 3.80) 3( 8.82) 5(14.71) 21 (61.77) 4(11.76) 1 (2.94) 24 BASHEERABAD 29( 3,24) 5(17,24) 18(62,07) 5(17,24) 1 ( 3,45) 25 YELAL 33( 3.69) 1( 3.03) 9(27.27) 19(57.58) 4(12.12) 26 DOMA 28( 3,13) 1( 3,57) 5(17,86) 16(57.14) 6(21,43) 27 GANDEED 28( 3.13) 2( 7.14) 4(14.29) 14(50.00) 6(21.43) 1 (3,57) 1 ( 3.57) 28 KULKACHARLA 30( 3.36) 2( 6.67) 2( 6.67) 19(63.33) 7(23.33) 29 PARGI 3S( 3.91) 3( 8.57) 6(17.14) 22(62.86) 3( 8.57) - 1( 2,86) 30 PUDUR 32( 3,58) 6(18,75) 21 (65.62) 5(15,63) 31 SHABAD 25( 2.80) 4(16.00) 17(68.00) 3(12.00) - 1( 4.00) 32 SHAMSHABAD 37(4,14) 4(10,81) 6(16,22) 22(59.46) 5(13,51 ) 33 MAHESWARAM 30( 3.36) 3(10.00) 3(10.00) 16(53.33) 6(20.00) 2( 6.67) 34 IBRAHIMPATNAM 22( 2.46) 1( 4,55) 1 (4,55) 11 (49,98) 7(31,82) 1 ( 4.55) 1 ( 4.55) 35 MANCHAL 21 ( 2.46) 2( 9.09) 1( 4.55) 14(63.63) 3(13.64) 1 (4,55) 36 YACHARAM 19( 2,13) 10(52,63) 8(42.11) 1 (5.26) 37 KANDUKUR 27( 6.15) 3(11.11) 2( 7.41) 13(48.15) 9(33.33)
AREAS NOT INCLUDED IN ANY M,P,P, 4(0.45) 1 (25,00) 2(50.00) 1 (25.00)
TOTAL 865(100,00) 36(4.16) 117(13.53) 503(58.15) 180(20.81 ) 24( 2.77) i( 0.58) ._---
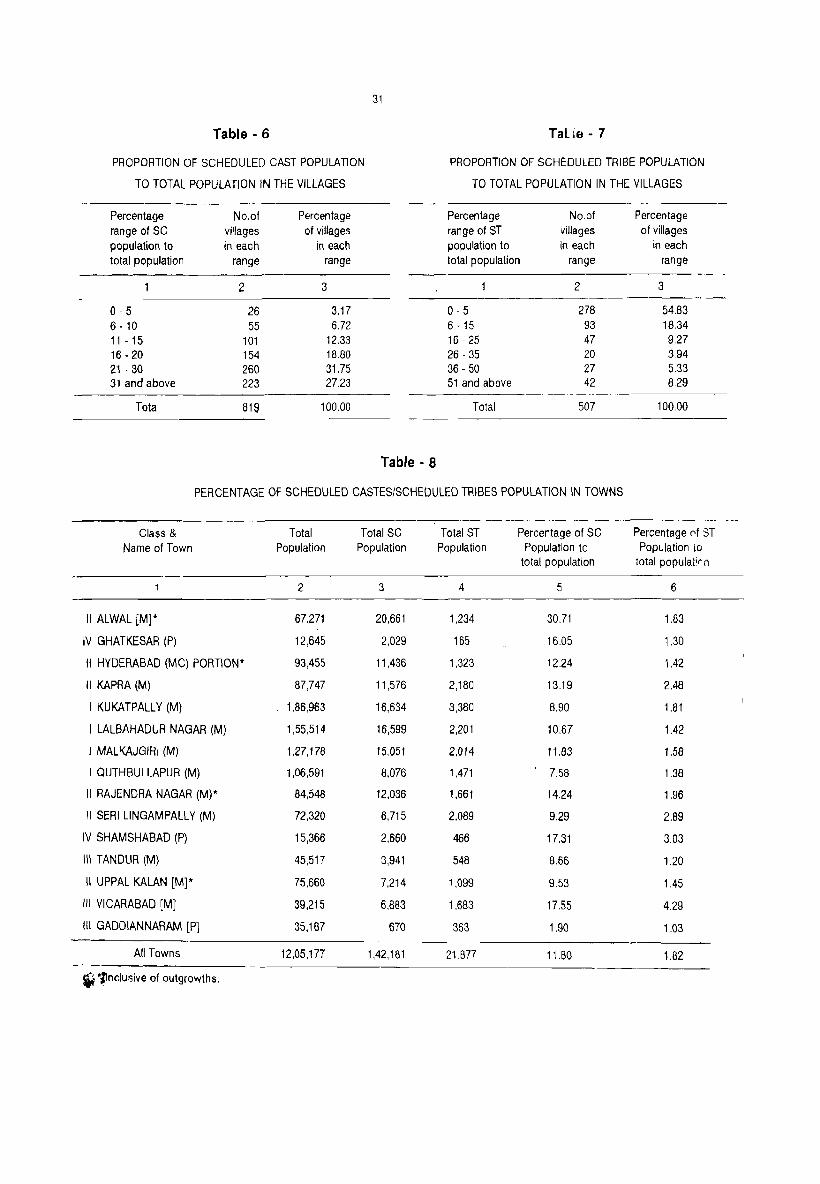
Table - 6
PROPORTION OF SCHEDULED CAST POPULATION
TO TOTAL POPULATION IN THE VILLAGES
Percentage No.of Percentage range of SC villages of villages population to in each in each total population range range
2 3
0-5 26 3.17 6 - 10 55 6.72 11 - 15 101 12.33 16 - 20 154 18.80 21 - 30 260 31.75 31 and above 223 27.23
Total 819 100.00
31
Table· 8
TaUe - 7
PROPORTION OF SCHEDULED TRIBE POPULATION
TO TOTAL POPULATION IN THE VILLAGES
Percentage No.of Percentage range of ST villages of villages population to in each in each lotal population range range
2 3
0-5 278 54.83 6 - 15 93 18.34 16 - 25 47 9.27 26 - 35 20 3.94 36 - 50 27 5.33 51 and above 42 8.29
Total 507 100.00
PERCENTAGE OF SCHEDULED CASTES/SCHEDULED TRIBES POPULATION IN TOWNS
Class & Total Total SC Total ST Percentage of SC Percentage rf ST Name of Town Population Population Population Population to Population to
total population total populatir 11
2 3 4 5 6
II ALWAL [MJ* 67,271 20,661 1,234 30.71 1.83
IV GHATKESAR (P) 12,645 2,029 165 16.05 1.30
II HYDERABAD (MC) PORTIOW 93,455 11,436 1.323 12.24 1.42
II KAPRA (M) 87,747 11,576 2,180 13.19 2.48
I KUKATPALLY (M) 1.86,963 16,634 3,380 8.90 1.81
I LALBAHADUR NAGAR (M) 1,55,514 16,599 2,201 10.67 1.42
I MALKAJGIRI (M) 1,27,178 15,051 2,014 11.83 1.58
I QUTHBULLAPUR (M) 1,06,591 8,076 1,471 7.58 1.38
II RAJENDRA NAGAR (M)* 84,548 12,036 1,661 14.24 1.96
II SERI LlNGAMPALLY (M) 72,320 6,715 2,089 9.29 2.89
IV SHAMSHABAD (p) 15,366 2,660 466 17.31 3.03
III TANDUR (M) 45,517 3,941 548 8.66 1.20
II UPPAL KALAN [M)* 75,660 7,214 1,099 9.53 1.45
III VICARABAD [MJ 39,215 6,883 1.683 17.55 4.29
III GADDIANNARAM [P1 35,187 670 363 1.90 1.03
All Towns 12,05,177 1,42,181 21,877 11.60 1.82
~ ~l1nclusive of outgrowths.
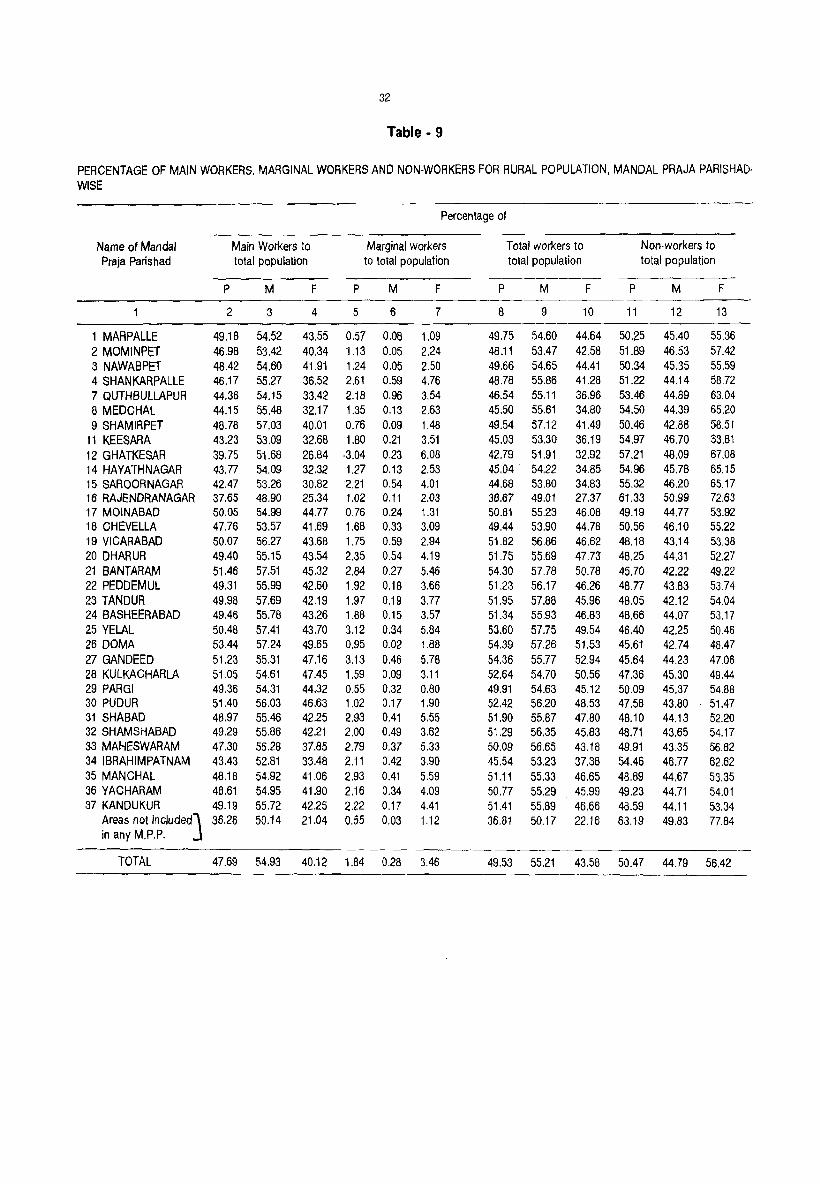
32
Table - 9
PERCENTAGE OF MAIN WORKERS, MARGINAL WORKERS AND NONWORKERS FOR RURAL POPULATION, MANDAL PRAJA PARISHAD· WISE
---Percentage of
Name of Mandai Main Workers to Marginal workers Total workers to Non·workers to Praja Parishad total population to total population total population total population
P M F P M F P M F P M F
2 3 4 5 6 7 8 9 10 11 12 13
1 MAAPALLE 49,18 54.52 43.55 0.57 0.08 1.09 49.75 54.60 44.64 50.25 45.40 55.36 2 MOMINPET 46.98 53.42 40.34 "1.13 0.05 2.24 48.11 53.47 42.58 51.89 46.53 57.42 3 NAWABPET 48.42 54.60 41.91 1.24 0.05 2.50 49.66 54.65 44.41 50.34 45.35 55.59 4 SHANKARPALLE 46.17 55.27 36.52 2.61 0.59 4.76 48.78 55.86 41.28 51.22 44.14 58.72 7 QUTHBULLAPUR 44.36 54.15 33.42 2.18 0.96 3.54 46.54 55.11 36.96 53.46 44.89 63.04 8 MEDCHAL 44.15 55.48 32,17 1.35 0.13 2,63 45.50 55.61 34.80 54.50 44.39 65,20 9 SHAMIRPET 48.78 57.03 40.01 0.76 0.09 1.48 49.54 57.12 41.49 50.46 42.88 58.51
11 KEESARA 43.23 53.09 32.68 1.80 0.21 3.51 45.03 53.30 36.19 54,97 46.70 83.81 12 GHATKESAR 39.75 51.68 26.84 ·3.04 0.23 6.08 42.79 51.91 32.92 57.21 48.09 67.08 14 HAYATHNAGAR 43.77 54.09 32.32 1.27 0.13 2.53 45.04 . 54.22 34.85 54.96 45.78 65.15 15 SAROORNAGAR 42.47 53.26 30.82 2.21 0.54 4.01 44.68 53.80 34.83 55.32 46.20 65.17 16 RAJENDRANAGAR 37.65 48.90 25.34 1.02 O.H 2.03 38.67 49.01 27.37 61.33 50.99 72.63 17 MOINABAD 50.05 54.99 44.77 0.76 0.24 1.31 50.81 55.23 46.08 49.19 44.77 53.92 18 CHEVELLA 47.76 53.57 41.69 1.68 0,33 3.09 49.44 53,90 44.78 50.56 46,10 55.22 19 VICARABAD 50.07 56.27 43.68 1.75 0.59 2.94 51.82 56.86 46.62 48,18 43.14 53.38 20 DHARUR 49.40 55.15 43.54 2.35 0.54 4.19 51.75 55.69 47.73 4B.25 44.31 52.27 21 BANTARAM 51.46 57,51 45.32 2.84 0.27 5.46 54.30 57.78 50.78 45,70 42.22 49.22 22 PEDDEMUL 49.31 55.99 42.60 1.92 0.1B 3.66 51.23 56.17 46.26 4B.77 43.83 53.74 23 TANDUR 49.98 57.69 42.19 1.97 0.19 3.77 51.95 57.88 45.96 48.05 42.12 54.04 24 BASHEERABAD 49.46 55.78 43.26 1.8B 0.15 3.57 51.34 55.93 46.83 48.66 44.07 53.17 25 YELAL 50.48 57.41 43.70 3,12 0.34 5.84 53.60 57.75 49.54 46.40 42.25 50.46 26 DOMA 53.44 57.24 49.65 0.95 0.02 1.88 54.39 57.26 51.53 45.61 42.74 48.47 27 GANDEED 51.23 55.31 47.16 3.13 0.46 5.78 54.36 55.77 52.94 45.64 44.23 47.06 28 KULKACHARLA 51.05 54.61 47.45 1.59 0,09 3.11 52.64 54.70 50.56 47.36 45,30 49.44 29 PARGI 49.36 54.31 44.32 0.55 0.32 0.80 49.91 54.63 45.12 50.09 45.37 54.88 30 PUDUR 51.40 56.03 46.63 1.02 0.17 1.90 52.42 56.20 48.53 47,58 43.80 51.47 31 SHABAD 48.97 55.46 42.25 2.93 0.41 5.55 51.90 55.B7 47.80 4B.10 44.13 52.20 32 SHAMSHABAD 49.29 55.86 42,21 2.00 0.49 3.62 51.29 56.35 45.83 48.71 43.65 54.17 33 MAHESWARAM 47.30 56.28 37.85 2.79 0.37 5.33 50.09 56.65 43.18 49.91 43.35 56.82 34 IBRAHIMPATNAM 43.43 52.81 33.48 2.11 0.42 3.90 45.54 53.23 37,38 54.46 46.77 62.62 35 MANCHAL 48.18 54.92 41.06 2.93 0.41 5.59 51.11 55,33 46.65 4B.89 44.67 53.35 36 YACHARAM 48.61 54.95 41.90 2.16 0.34 4.09 50.77 55.29 45.99 49.23 44.71 54.01 37 KANDUKUR 49.19 55.72 42.25 2.22 0.17 4.41 51.41 55.B9 46.66 4B.59 44.11 53.34
Areas not inClUded) 36.26 50.14 21.04 0.55 0.03 1.12 36.B1 50.17 22.16 63.19 49.83 77.84 in any M.P.P.
TOTAL 47.69 54.93 40.12 1.84 0.2B 3.46 49.53 55.21 43.58 50.47 44.79 56.42

33
Table - 10
PERCENTAGE OF MAIN WORKERS, MARGINAL WORKERS
AND NON-WORKERS FOR TOWNS
Percentage of Name and civic Administration Main Workers to Marginal Workers Total Workers to Non-work~r$
Status of total population to total population total population to total poplilation towns
P M F P M F P M F P M F
1. 2. 3. 4. 5. 6. 7. 8. 9. 10. 11. 12. 13.
II ALWAL [M]* 30.30 47.59 12.33 0.13 0.13 0.12 30.43 47.72 12.45 69.57 52.28 87.55
IV GHATKESAR (P) 28.39 45.11 9.96 0.46 0.29 0.65 28.85 45.40 10.61 71.15 54.60 89.39
II HYDERABAD (MC) PORTION 28.90 46.96 9.42 0.29 0.48 0.09 29.19 47.44 9.51 70.81 52.56 90.49
II KAPRA (M) 31.55 50.28 11.27 0.07 0.05 0.09 31.62 50.33 11.36 68.38 49.67 88.64
I KUKATPALLY (M) 32.03 51.98 9.88 0.14 0.23 0.04 32.17 52.21 9.92 67.83 47.79 90.08
I LALBAHADUR NAGAR (M) 29.77 47.93 10.25 0.10 0.14 0.05 29.87 48.07 10.30 70.13 51.93 89.70
I MALKAJGIRI (M) 28.69 47.28 9.48 0.06 0.05 0.06 28.75 47.33 9.54 71.25 52.67 90.46
I QUTHBULLAPUR (M) 32.40 53.15 9.25 0.06 0.04 0.08 32.46 53.19 9.33 67.54 46.81 90.67
II RAJENDRA NAGAR (M)* '33.29 49.09 15.94 0.10 0.10 0.10 33.39 49.19 16.04 66.61 50.81 '13.96
II SERI LI NGAM PALL Y (M) 30.77 48.34 11.42 0.11 0.10 0.11 30.88 48.44 11.53 69.12 51.56 88.47
IV SHAMSHABAD (P) 31.34 45.73 16.22 0.26 0.01 0.52 31.60 45.74 16.74 68.40 54.26 83.26
III TANDUR (M) 29.13 45.96 11.58 0.09 0.02 0.18 29.22 45.98 11.76 70.78 54.02 88.24
II UPPAL KALAN [M]* 31.00 49.94 10.27 0.10 0.10 0.11 31.10 50.04 10.38 68.90 49.96 89.62
III VICARABAD [M] 32.56 45.13 19.52 0.16 0.12 0.20 32.72 45.25 19.72 67.28 54.75 80.28
III GADDIANNARAM [P] 28.51 47.09 7.57 0.49 0.72 0.24 29.00 47.81 7.81 71.00 52.19 92.19
All Towns 30.75 49.03 10.98 0.13 0.16 0.10 30.88 49.19 11.08 69.12 50.81 88.92
* Inclusive of outgrowths.

34
Table - 11
DISTRIBUTION OF VILLAGES ACCORDING TO LAND USE
No.of Total Percentage of Percentage Name of Villages area Cultivable of Irrigated Mandai (in hec,) area to area to total
Praja Parishad total area cultivable area
2 3 4 5
1. MARPALLE 28 23440,00 59,99 6,18 2. MOMINPET 23 17830,00 40,81 13.57 3, NAWABPET 22 16180,00 43,27 8,90 4. SHANKARPALLE 26 19272,00 76,26 30,83 7. QUTHBULLAPUR 12 9840,00 47,86 21,96 8, MEDCHAL 29 18810,00 41,01 23,17 9. SHAMIRPET 29 19860,00 68,53 12.48
11. KEESARA 15 11390,00 79,49 14.18 12, GHATKESAR 19 11930,00 20,18 76.97 14, HAYATHNAGAR 36 28630,00 30,84 18,98 15. SAROORNAGAR 13 9690.00 35.48 30,10 16, RAJENDRANAGAR 25 13320,00 38,01 5,95 17, MOINABAD 26 19830,00 71,86 18. CHEVElLA 36 28630,00 77.23 19, VICARABAD 26 15460.00 72,86 13,65 20, DHARUR 38 22040,00 80,79 7,91 21. BANTARAM 26 18780,00 43.44 1,23 22. PEDDAMUL 34 27090.00 59.83 14.72 23. TANDUR 35 21090.00 66,05 6,99 24. BASHEERABAD 31 20960,00 65,13 7,35 25. YALAL 34 18940,00 60,67 52.72 26. DOMA 28 17200.00 70.35 55,29 27, GANDEED 29 23950.00 50.00 49.39 28, KULKACHARLA 30 22960.00 62,24 29. PARGI 37 19010,00 72,32 11.71 30, PUDUR 34 20950.00 49.77 24.14 31, SHABAD 25 20750.00 45.72 0,04 32. SHAMSHABAD 40 17060,00 58,99 47.18 33. MAHESWARAM 33 30250,00 61,99 12.63 34, IBRAHIMPATNAM 28 23500.00 55,60 19.57 35, MANCHAL 25 24420.00 68,12 23,07 36. YACHARAM 20 35420,00 57,18 1.27 37, KANDUKUR 30 34720,00 47,68
AREAS NOT INCLUDED IN ANY M,P,P. 5 4150.00 22.02 23.03
TOTAL 927 692316.00 52.72 15.66
N.B.:- The data presented includes the area figures of uninhabited villages 2. For total area figures see note given at page no312
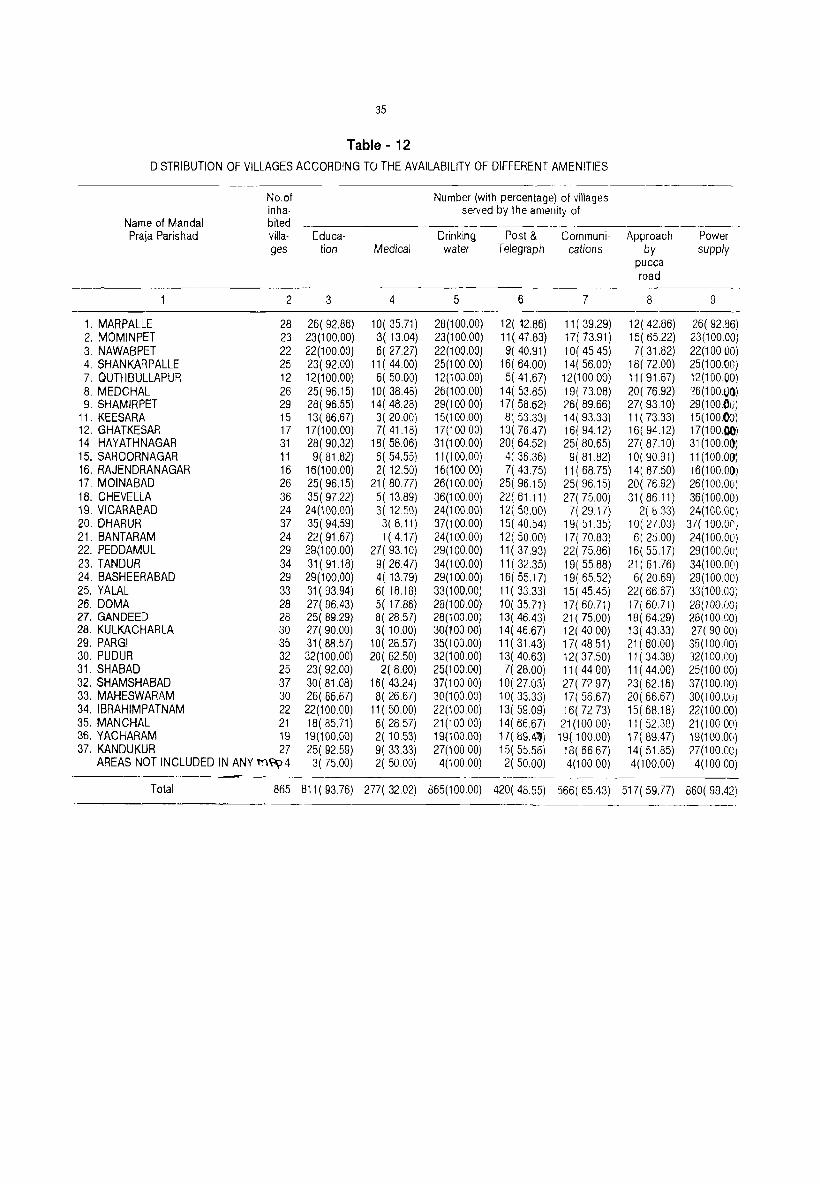
35
Table - 12
DISTRIBUTION OF VILLAGES ACCORDING TO THE AVAILABILITY OF DIFFERENT AMENITIES --------~~
No.of Number (with percentage) of villages inha- selyed by the amenity of
Name of Mandai bited Praja Parishad villa- Educa- Drinking Post & Communi- Approach Power
ges lion Medical water Telegraph catiol1s by supply pucca road
2 3 4 5 6 7 8 9
1. MARPALLE 28 26( 92,86) 10( 35,71) 28(100,00) 12( ~2.86) 11 ( 39,29) 12( 42,86) 26( 92.86) 2. \'10MINPET 23 23(100.00) 3( 13.04) 23(100.00) 11 ( 47.83) l7( 73.91) 15( 65.22) 23(100.00) 3. NAWABPET 22 22(100,00) 6( 27.27) 22(100,00) 9( 40,91) 1 O( 45.45) 7( 31.82) 22(100.00) 4. SHANKARPALLE 25 23( 92.00) 11 ( 44.00) 25(100.00) 16( 64.00) 14( 56,00) 18( 72.00) 25(100.00) 7. QUTHBULLAPUR 12 12(100,00) 6( 50.00) 12(100.00) 5( 41,67) 12(100,00) 11 ( 91.67) 12(100.00) 8. MEDCHAL 26 25( 96.15) 10( 38.48) 26(100,00) 14( 53 85) 19( 73.08) 20( 76.92) '26(100.1)0) 9. SHAMIRPET 29 28( 96.55) 14( 48.28) 29(100.00) 17( 58.62) 26( 89.66) 27( 93.10) 29(100.eO)
11. KEESARA 15 13( 86.67) 3( 20.00) 15(100.00) 8( 53.33) 14( 93.33) 11 ( 73.33) 15(100.()0) 12. GHATKESAR 17 17(100.00) 7(41.18) 17(100,00) 13( 76.47) 16( 94.12) 16( 94.12) 17(100,00) 14. HAYATHNAGAR 31 28( 90.32) lS( 58.06) 31 (1 00.00) 20( 64.52) 25( 80.65) 27( 87.10) 31 (1 OO.O!)) 15. SAROORNAGAR 11 9( 81.82) 6( 54.55) 11 (1 00.00) 4( 36,36) 9( 81,82) 10( 90.91) 11 (100.QCJ) 16. RAJENDRANAGAR 16 16(100.00) 2( 12,50) 16(100.00) 7( 4375) 11( 68.75) 14( 87.50) 16(100.0(}) 17. MOINABAD 26 25( 96.15) 21( 80.77) 26(100.00) 25( 96.15) 25( 96.15) 20( 76.92) 26(100.0CI) 18. CHEVELLA 36 35( 97.22) 5( 13.89) 36(100.00) 22( 6111) 27( 75.00) 31 ( 86.11) 36(100.00) 19. VICARABAD 24 24(100.00) 3( 1250) 24(100.00) 12( 50.00) 7( 29.17) 2( 833) 24(10C.OC) 20. DHARUR 37 35( 94.59) 3( 8.11) 37(100.00) 15( 40.54) 19( 51.35) 1 O( 27.03) 37( 100.0C) 21, BANT ARAM 24 22( 91.67) 1( 4.17) 24(100,00) 12( 50.00) 17( lO.83) 6( 2:i.00) 24(100.00) 22. PEDDAMUL 29 29(100.00) 27( 93.10) 29(100.00) 11( 37,93) 22( 75.86) 16( 55,ll) 29(100.0(1) 23. TANDUR 34 31( 91.18) 9( 26.47) 34(100.00) 11( 32.35) 19( 55.88) 21 (61.76) 34(100.0CI) 24. BASHEERABAD 29 29(100.00) 4( 13.79) 29(100.00) 16( 55.17) 19( 65.52) 6( 20.69) 29(100.00) 25. YALAL 33 31 ( 93.94) 6( 18.18) 33(100.00) 11 ( 33.33) 15( 45.45) 22( 66.67) 33(100.00) 26. DOMA 28 27( 96.43) 5( 17.86) 28(100.00) 10( 35.71) 17( 60.l1) 17( 60.71) 28(100.00) 27. GANDEED 28 25( 89.29) 8( 28.51) 28(100.00) 13( 46.43) 21 (75,00) 18( 64.29) 28(100.00) 28. KULKACHARLA 30 27( 90.00) 3( 10.00) 30(100.00) 14( 46.67) 12( 40.00) 13( 43.33) 27( 90.00) 29. PARGI 35 31 (88.57) 10( 28.57) 35(100.00) 11( 31.43) 17( 48.51) 21 ( 60.00) 35(100.1)0) 30. PUDUR 32 32(100.00) 20( 62.50) 32(100.00) 13( 40.63) 12( 37.50) 11( 34.38) 32(100.1)0) 31. SHABAD 25 23( 92.00) 2( 8.00) 25(100.00) 7( 28.00) 11 ( 44.00) 11( 44.00) 25(100,00) 32. SHAMSHABAD 37 30( 81.08) 16( 43.24) 37(100.00) 10( 27.03) 2l( 72.97) 23( 62.16) 37(100.00) 33. MAHESWARAM 30 26( 86.67) 8( 26.67) 30(100.00) 10( 33.33) 17( 56.6l) 20( 66.67) 30(100.0U) 34. IBRAHIMPATNAM 22 22(100.00) 11 ( 50,00) 22(100.00) 13( 59.09) l6( 72.'13) 15( 68.18) 22(100.00) 35. MANCHAL 21 18( 85.71) 6( 28 57) 21 (1 00.00) 14( 66.67) 21 (100.00) 11 (52.38) 21 (100.00) 36. YACHARAM 19 19(100,00) 2( 10,53) 19(100.00) 17( 89.41) 19( 100.00) 17( 89.4l) 19(100.0(,) 37. KANDUKUR 27 25( 92.59) 9( 33.33) 27(100.00) 15( 55.56) 18( 66.67) 14( 5185) 27(100.GC)
AREAS NOT INCLUDED IN ANY m~4 3( 75.00) 2( 50.00) 4(100.00) 2( 50.00) 4(100.00) 4(100,00) 4(100.00)
Total 865 8l1( 93.76) 277( 32.02) 865(100.00) 420( 48.55) 566( 65.43) 517( 59.77) 860( 99.42)

36
Table - 13
PROPORTION OF RURAL POPULATION SERVED BY DIFFERENT AMENITIES
Total Proportion of Rural population Name of Mandai Popula- served by the amenity of Praja Parishad tion of
inhabited Educa- Medical Drink- Post & Commu- Appro- Power villages in tion ing Telegraph nica- ach by supply
the mandai water tions pucca road
2 3 4 5 6 7 8 9
1, MARPALLE 41231 99,28 63,26 100,00 73,50 64,53 65.31 98,65 2, MOMINPET 36960 100.00 27,78 100,00 71.80 85.51 81.17 100.00 3. NAWABPET 35684 100,00 44,84 100.00 65.94 57,37 39,23 100.00 4. SHANKARPALLE 50082 96,10 63.47 100.00 79.20 72,27 88.48 100,00 7. QUTHBULLAPUR 28169 100,00 73,32 100,00 66,16 100,00 98.71 100,00 B, MEDCHAL 46647 97,85 69,29 100,00 83,70 90,38 93,54 100,00 9, SHAMIRPET 54534 99,10 68,65 100,00 80,66 97,16 97,47 100,00
11. KEESARA 27217 97.48 35,91 100.00 82.57 99.74 93,86 100,00 12, GHATKESAR 32333 100,00 69.26 100.00 86.80 97.75 97.75 100.00 14, HAYATHNAGAR 59505 98.45 77.25 100.00 85.84 93.85 94.60 100.00 15. SAROORNAGAR 26413 9B.13 88.55 100.00 64.34 98.13 98.25 100.00 16. RAJENDRANAGAR 29964 100.00 32.61 100.00 53.86 93.32 97.38 100.00 17. MOINABAD 45811 99.88 89.13 100.00 99.88 98,74 83.96 100.00 18. CHEVELLA 49946 99.58 24,07 100,00 76.66 76.65 82.61 100.00 19. VICARABAD 25861 100.00 16.43 100.00 68.04 39.15 9,26 100.00 20, DHARUR 35774 97,83 22.78 100,00 60.44 68.30 43.84 100,00 21, BANTARAM 29574 97,77 18,78 100.00 75.44 84.33 51,76 100.00 22, PEDDAMUL 41667 100.00 95.65 100.00 71.49 88.17 71.69 100.00 23, TANDUR 37841 99.43 51.12 100.00 64.56 75.89 80.00 100.00 24, BASHEERABAD 34888 100.00 32.61 100.00 79.57 78.99 32.23 100.00 25. YALAL 33879 98.78 39.51 100.00 63.11 57,75 80.72 100.00 26. DOMA 35413 98.94 42.28 100,00 62.32 77.53 77.53 100.00 27. GANDEED 48771 98.02 41.87 100,00 75.07 89,81 83.38 100.00 2B. KULKACHARLA 46550 98.81 19.48 100,00 72.0B 63.49 67.18 96.89 29. PARGI 46172 98.66 56,96 100.00 63.74 66,91 79,67 100.00 30. PUDUR 37900 100.00 78,89 100.00 64.92 56,71 47,54 100,00 31, SHABAD 43360 95,98 31.90 100.00 63,21 61.47 65,93 100,00 32. SHAMSHABAD 44235 97,35 66.61 100.00 50.69 88.35 74.97 100.00 33, MAHESWARAM 46863 98,97 56.15 100.00 64.87 79.99 82.07 100,00 34, IBRAHIMPATNAM 57896 100.00 79.84 100.00 87.71 91.21 90.43 100.00 35. MANCHAL :37106 98.33 51.98 100.00 82.14 100.00 74.70 100.00 36. YACHARAM 42911 100.00 15.66 100.00 96.42 100,00 89.35 100.00 37. KANDUKUR 44413 99.46 58.02 100.00 77.84 86,29 74.04 100.00
AREAS NOT INCLUDED IN ANY i\,\·f:·p 11219 99,52 53.28 100.00 81.62 100.00 100,00 100.00
Total 1346789 98.75 52.68 100.00 73.81 80.56 77.01 99.77

37
Table - 14
DISTRIBUTION OF VILLAGES ACCORDING TO THE DISTANCE FROM THE NEAREST TOWN AND AVAILABILITY OF DIFFER EN ~ AMENITIES
----Distance No.of Number (with percentage) of villages
range inha- having the amenity of from the bited nearest villages Educa- Medical Drink- Post & Commu- Approach Power town in each tion ing water Telegraph nications by pucca supply
(in Kms.) range road
2 3 4 5 6 7 8 9
o -5 35 33 11 35 16 23 27 35 (4.04) (94.29) (31.43) (100.0) (45.71) (65.71) (77.14) (100.00)
6 - 15 217 203 72 217 87 142 129 217 (25.09) (93.55) (33.18) (100.00) (40.09) (65.44) (59.45) (100.00)
16 - 50 594 556 192 594 30B 389 34B 589 (68.67) (93.60) (32.32) (100.0) (51.85) (63.49) (58.59) (99.16)
51 + 19 19 2 19 9 12 13 19 (2.20) (100.00) (10.53) (100.00) (47.37) (63.16) (68.42) (100.00)
TOTAL 865 Bl1 277 865 420 566 517 860 (93.76) .(32.02) (100.00) (48.55) (65.43) (59.77) (99.42)
Table - 15
DISTRIBUTION OF VILLAGES ACCORDING TO POPULATION RANGE AND AMENITIES AVAILABLE
No.of Number (with percentage) of villages inha- having the amenity of
Population bited range vill- Educa- Medical Drink- Post & Commu- Appro- Power
ages in tion ing water Telegraph nica- ach by supply each tions pucca
range road ---
2 3 4 5 6 7 8 9
499 153 104 11 153 15 57 60 151 (17.69) (67.97) (7.19) (100.00) (9.BO) (37.25) (39.22) (98.69)
500 - 1999 503 497 122 503 207 307 272 499 (58.15) (99.01) (24.25) (100.00) (41.15) (62.82) (54.08) (99.40)
2000 - 4999 180 180 117 180 170 164 156 180 (20.81) (100.00) (65.00) (100.00) (94.44) (91.11) (86.67) (100.00)
5000 + 29 29 26 29 28 29 29 29 (3.35) (100.00) (89.66) (100.00) (96.55) (100.00) (100.00) (100.00)
TOTAL 865 811 277 865 420 566 517 860 (93.76) (32.02) (100.00) (48.55) (65.43) (59.77) (99.42)

38
Table - 16
DISTRIBUTION OF VILLAGES NOT HAVING CERTAIN AMENITIES, ARRANGED BY DISTANCE RANGES FROM THE PLACES WHERE THESE ARE AVAILABLE
Number of villages where the amenity is Villages not having the amenity of not available and available at a distance of
-5 Kms 5-10 Kms 10 + Kms Total (cols. 2-4)
2 3 4 5
1. Education 53 2 55
2. Medical 262 270 58 590
3. Drinking water
4. Post and Telegraph 357 87 2 446
5. Communications 218 86 5 309 --~--

39
Table - 17
PER CAPITA RECEIPT AND EXPENDITURE IN TOWNS
Per Capita
Receipt Expenditure
Class, Name & Civic Receipt Gen- Expenditure Expenditure status of the Town Receipt from Total eral on public Pub· on Other
Total through all expen- admi- health lic public as;)e receipts taxes other diture nistra- & conve- works insti- CIS
sources tion niences tutions ----_
2 3 4 5 6 7 8 9 10 ----
II ALWAL (M) 119,87 29,03 90,84 101.35 32.09 6.00 13.46 49,80 IV GHATKESAR (P) 66,95 16.39 50.56 66.94 10.47 20.41 9.41 26,65 II HYDERABAO (M.C.PORTION) -NA--II KAPRA (M) 80.04 66.10 13.94 61.50 7.12 11,60 28.61 14.17 I KUKATPALLY (M) 79.75 55.36 24.39 72,57 8,85 26.78 32,93 4,01 I L,B,NAGAR(M) 85,81 16.50 69,31 43,00 4,31 7,69 1,52 29.48 I MALKAJGIRI (M) 122,62 40,56 82,06 86,35 19,59 37.40 27,58 1.78 I QUTHBULLAPUR (M) 60,53 39,69 20.84 52.B4 4.85 15.31 11.30 0.14 21.24 II RAJENDRANAGAR (M) 53.47 18.22 35.25 24.08 14.54 4.52 5.01 0.01 II SERILINGAMPALL Y (M) 114.59 95.92 18,67 96,87 22,lQ 7.78 14,88 52,11 IV SHAMSHABAD (P) 50,35 26.2ti 24,10 57,66 11,67 35.40 8,64 1,23 0,92 III TANDUR (M) 57,82 40,25 17,57 64,83 8.44 26,87 5,38 24,14 II UPPAL KALAN (M) 106,23 51,69 54,54 65,60 28,99 25,10 " ,51 III VICARABAD (M) 92.62 46.72 45.90 75,25 9.79 31.19 6.25 28,02 III GADDIANNARAM (P) 189.60 175.D4 14.56 138.08 19,03 26.90 86.42 5,73
_.---ALL TOWNS 83,63 43.88 39.75 62.72 12,35 17.47 17.15 1.06 14.69
Table - 18 MOST IMPORTANT COMMODITY MANUFACTURED,
IMPORTED AND EXPORTED IN TOWNS
Class, Name & civic Most important commodity status of the Town
Manufactured Exported Imported
2 3 4
II ALWAL (M) VEGETABLES VEGETABLES RICE IV GHATKESAR (P) TEA TEA POWDER PULSES III HYDERABAD M,C. (PORTION) NA NA NA II KAPRA (M) T.V, SETS ELEC.GOODS TV. SETS TV. SPARE PARTS I KUKATPALLY (M) MEDICINES MEDICINES ALUMINUM I loB,NAGAR (M) DRUGS DRUGS FRUITS I MALKAJGIRI (M) BATIERY CELLS BATIERY CELLS COAL I QUTHBULLAPUR (M) DRUGS DRUGS CHEMICALS II RAJENDRANAGAR (M) OIL PLASTIC MATERIAL FERTIlIZERS II SERILINGAMPALL Y (M) ALUMINIUM CABLES ALUMINIUM CABLES VEGETABLES IV SHAMSHABAD (P) VEGETABLES VEGETABLES FERTILIZERS III TANDUR (M) CEMENT PULSES RICE II UPPAL KALAN (M) CIGARETIES CIGARETIES III VICARABAD (M) PAPER PULP PAPER PULP JOWAR III GADDIANNARAM(P) STEEL ITEMS FRUITS FRUITS

Class, Name & civic status of the town
II ALWAL (M) II HYDERABAD (M.C.) PORTION "KAPAA (M) I KUKATPALL Y (M) I L.B.NAGAR (M) I MALKAJGIRI (M) I QUTHBULLAPUR (M) (I RAJENDRANAGAR (M) II SERILINGAMPAL (M) II UPPAL KALAN (M)
ALL TOWNS
40
Table - 19
PROPORTION OF SLUMS POPULATION IN TOWN
Proportion of the slums population
to total population
of the town
2
46.35 N.A.
31.96 16.29 19.09 26.84 63.32 28.03 28.33 25.13
29.49
Density in slums
(per sq.km)
3
N.A. N.A. N.A. N.A.
17230 N.A. NA N.A. NA
14513
*16056
• Pertains to l.B.Nagar and Uppal Kalan towns only.
Table - 20
EDUCATIONAL AJ\jD MEDICAL AMENITIES IN TOWNS
Class, name &Civic No.of Schools per status of towns 10,000 population
*HS/I/ *SecJ *JS/ PUC/JC Matric Middle
2 3 4
II ALWAL (M) 0.30 2.23 4.16 IV GHATKESAR (P) 0.79 2.37 3.95 III HYDERABAD (M.C.) PORTION NA NA NA II KAPRA (M) 0.46 0.11 0.80 I KUKATPALLY (M) 0.11 0.64 0.96 I L.B.NAGAR (M) 0.26 0.26 0.71 I MALKAJGIRI (M) 0.31 1.34 0.63 I QUTHBULLAPUR (M) 0.09 0.19 II RAJENDRANAGAR (M) 0.12 0.35 0.47 II SERILINGAMPALLY (M) 0.14 0.28 0.41 IV SHAMSHABAD (P)· 0.65 1.95 1.95 III TANDUR (M) 0.22 2.20 0.66 II UPPAL KALAN (M) 0.40 0.40 1.06 III VICARABAD (M) 0.26 1.53 2.55 III GADDIANNARAM (M) 1.42 2.56 0.57
TOTAL 0.27 0.80 1.01
No. of Beds in medical in stitution
Pri· per 1000 mary Population
5 6
1.49 0.74 6.33 5.30 NA
2.62 2.05 0.80 0.32 2.06 1.11 3.77 0.24 1.50 0.38 1.18 1.44 3.46 0.69 5.86 1.04 3.08 0.66 2.64 0.75 1.53 22.54 4.26 2.56
2.26 1.66
* HS-Higher Secondary, I-Intermediate, PUC-Pre University Course, JC-Junior College, Sec-Secondary, JS-Junior Secondary.
PART - A
VILLAGE AND TOWN DIRECTORY
SECTION I • VILLAGE DIRECTORY
SECTION II· • TOWN DIRECTORY


43
SECTION - 1 VILLAGE DIRECTORY
A village is the smallest statutorily recognised administrative unit having a definite boundary and separate land records. The village directory gives the list of villages, their area, population, amenities such as educational, medical, communications, drinking water facilities etc, as also the land use. In case a village is treated as an out growth of an urban agglomeration, data on amenities and land use for that village have not been given in the village directory but shown along with the urban component. In case, part of a village is an out growth, data pertaining to the remaining part alone will be shown in the village directory. However the names and the area particulars in respect of such out growths are being mentioned in the village directory without any further data for the purpose of cross reference. Similarly in the case of uninhabited villages also, only the location code, the name of the village and the land use particulars are being given without any information on amenities, etc.
Various abbreviations used for describing the amenities in different columns are as tallows:
Educational (Column No.6)
P : Primary or Elementary School (upto Class IV)
M : Middle Schaal or Junior Secondary (Class V to VIII)
H : Matriculation or Secondary School (Class IX and X)
JC : Higher Secondary/PUC
C : College (graduate level and above whether arts, science or commerce etc.)
J : Industrial School
Tr : Training School
AC : Adult Literacy Class/Centre
o : Other educational institutions which include Sanskrit Pathasala, Senior Basic School, etc. Which do not fall in any of the above mentioned categories.
A composite school which has got both secondary and middle classes has been reckoned as two different institutions i.e., secondary school as well as middle school. A middle school with primary classes has also been treated similarly.
When there is more than one institution of a type in the village, the number is indicated
against the relevant abbreviation, e.g. if a vilage has got two ptimary schools, one middle school and one matriculation school, the entry under this column will be: P;4, M;2, H. Where no educational facility is available, the distance -5, 5-10, 10+ kms., at which the nearest, primary school located is indicated in broad ranges.
Medical (Column No.7)
H : Hospital (A=Ayurvedic, U=Unani, Hom=Homeopathic)
MCW : Maternity and Child Welfare Centre or Maternity and Child Health Centre.
MH : Maternity Home
CWC : Child Welfare Centre
HC : Health Centre
PHC : Primary Health Centre
PHS :. Primary Health Sub-centre
D : Dispensary (A=Ayurvedic, U=Unani, Hom=Homeopathic)
FPC : Family Planning Centre
T8 : T.B. Clinic
NH Nursing Home
RP : Registered Private practitioner
SMP : Subsidised Medical Practitioner
CHW : Community Health Worker
o : Others
If there is more than one medical institution of a type in the village, the number is indicated against the relevant abbreviation e.g. H;3, 0;2.
All types of medical institutions irrespective of the system of medicine practised therein are covered under this column without any attempt to provide a further break up.
If the village does not have any medical facility whatsoever, the minimum distance one has to travel to secure the minimum level of medical facility is indicated in ranges of -5., 5-10, 10+ kms.
Drinking Water (Column No.8)
Following abbreviations have been used to describe the availability of different types of potable drinking water in the village.
T : Tap
W : Well
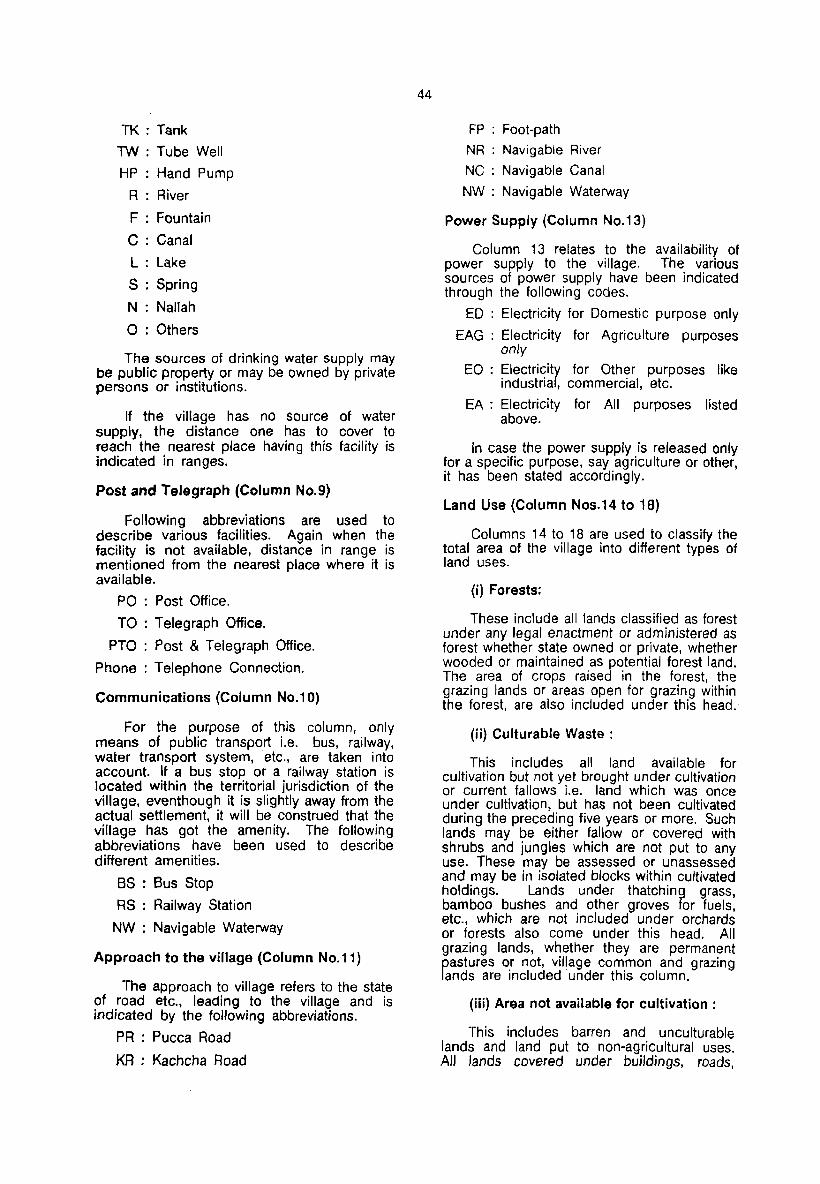
TK : Tank
TW : Tube Well
HP : Hand Pump
R : River
F : Fountain
C : Canal
L : Lake
S : Spring
N : Nallah
o : Others
The sources of drinking water supply may be public property or may be owned by private persons or institutions.
If the village has no source of water supply, the distance one has to cover to reach the nearest place having this facility is indicated in ranges.
Post and Telegraph (Column No.9)
Following abbreviations are used to describe various facilities. Again when the facility is not available, distance in range is mentioned from the nearest place where it is available.
PO : Post Office.
TO : Telegraph Office.
PTO : Post & Telegraph Office.
Phone : Telephone Connection.
Communications (Column No.10)
For the purpose at this column, only means of public transport i.e. bus, railway, water transport system, etc., are taken into account. If a bus stop or a railway station is located within the territorial jurisdiction of the village, eventhough it is slightly away from the actual settlement, it will be construed that the village has got the amenity. The following abbreviations have been used to describe different amenities.
BS : Bus Stop
RS : Railway Station
NW : Navigable Waterway
Approach to the village (Column No.11)
The approach to village refers to the state of road etc., leading to the village and is indicated by the following abbreviations.
PR : Pucca Road
KR ; Kachcha Road
44
FP : Foot-path NR : Navigable River
NC : Navigable Canal
NW : Navigable Waterway
Power Supply (Column No.13)
Column 13 relates to the availability of power supply to the village. The various sources of power supply have been indicated through the following codes.
ED : Electricity for Domestic purpose only
EAG : Electricity for Agriculture purposes only
EO : Electricity for Other purposes like industrial, commercial, etc.
EA : Electricity for All purposes listed above.
In case the power supply is released only for a specific purpose, say agriculture or other, it has been stated accordingly.
Land Use (Column Nos.14 to 18)
Columns 14 to 18 are used to classify the total area of the village into different types of land uses.
(i) Forests:
These include all lands classified as forest under any legal enactment or administered as forest whether state owned or private, whether wooded or maintained as potential forest land. The area of crops raised in the forest, the grazing lands or areas open for grazing within the forest, are also included under this head.
(ii) Culturable Waste:
This includes all land available for cultivation but not yet brought under cultivation or current fallows i.e. land which was once under cultivation, but has not been cultivated during the preceding five years or more. Such lands may be either fallow or covered with shrubs and jungles which are not put to any use. These may be assessed or unassessed and may be in isolated blocks within cultivated holdings. Lands under thatching grass, bamboo bushes and other groves for fuels, etc., which are not included under orchards or forests also come under this head. All grazing lands, whether they are permanent pastures or not, village common and grazing lands are included under this column.
(iii) Area not available for cUltivation:
This includes barren and unculturable lands and land put to non-agricultural uses. All lands covered under buildings, roads,

railways, rivers, canals, etc., are considered as lands under non-agricultural uses. Barren and unculturable lands include mountains, rocks, deserts. etc .• which cannot be brought under cultivation except at very high cost.
(iv) Irrigated and un irrigated:
Columns 15 and 16 cover all agricultural lands put together should correspond to the net area sown plus the current fallows. Area sown more than once. in the same year is counted only once. Column 15 gives source wise break up of the irrigated area using the following abbreviations ..
GC : Government Canal
Source: MRO & District Officials Concerned
45
PC : Private Canal
W : Well (without electricity)
WE : Well (with electricity)
rvv ; Tube Well (without electricity)
rvvE : Tube Well (with electricity)
TK : Tank
R : River
L : Lake
WF : Water Fall
o : Others


HYDERABAD EAST REVENUE DIVISION

... ~-,-
1/1
...
!'"
... \ HYDERAUD
""\
j " L..
'-._
i m
m
L,
...
... It
....
o
.;
\ D
Based \4)on SlI'vcy of ntiO may wlttl tl'l. perrNSSlOI'I 01 Inc !)UI'Ylyor Gtnval of Indio.
S T
c
l \
@"" I eB \
Gl ,/\
rI
c
o
it
Q
ANDHRA 'RADEIH
HYDERABAD EAST REVENUE DIVISION
RAHGAREDDI DISTRICT
NA~ Q£ T!:! MA1()"~} NAME Of THE TOWNS I)JTHBu..LAP~
MEOCHAL QHjTMUAR "I
5I<AIiRPET KHAPA. ill ~
L,NJWU
" K[EURA QUne.uAP\MM ..
12 lWoMSAR ........ "" 13 IAtPAL MAN)Al ~"AMI'1 '" "
HA.,An..AG .. " II SAROOMrtAGAR
Jl MAHUWARA ..
3. I8RAHirrATNA"4
31 MANCHAL
36 'tACHA"AM
37 KANllI<I.Il
lW()lR", OI5fltIeT
III(V["U 0IV1SI0f0I
MAJrC)I.l WITH lOCATION (OO( MJMII£II
Yl.ljGl: WITH lot.TI()ff ( 00( ""....a[~
H£lDQUAltT(RS N(VOl.(. '''!Illl
vt.l.t.G{ ,"rH ~A f'I:)N SlIE )000 AI«) AIIOV( •
~OOO _ • . '"
)00 __ '"
ffIO _ ."
l(SS J~N 100
\.Nt4".TED VLLj(j(s WITH lOCUIOtt toor M.,t.I8(A
~.N ARU WITH lOCAl.",. tOO( Irf..MM:R
N.TIQM .. lt«iHWnWITH ........ "
SlAT[ HIGHW"Y
"O'ITANT Iot(T.u.lED 111010
IIIl1..wu lit( *ITH STlTIC* : 1II0lO ".t.ut£
WEUt( Gll,Q
IftVtR U() ,TM, ..
.&lEIt r(l1\lttS : TAN( , LAKE
!lOST orrc£ , Tn(GfI!"," Ofr lC[
1tGt4(. "CON)"It., stHOOl, ~ COll(G(
ItCla SU'OON
MOMTAL, ~"ICAl.Tt1C(NTIt[
...... , IMTUIIITY AI() Ct«.D w(VAI( CCNTfIf
NoI"HfCldqwOl'l"tf~iItf.H[.tlllllvf!lut l)l, ... ts
L.c,I" In H,o.'olIod Olltrlel
.... " . lC"ItI1 "t2t. t'oIICI tll.IOII~IIIoWM,"","'"
I'--"iif " ~
~ ......a.. --"'--
" --~ ~GS)
~ '0 10 I J(;
'S e • + •
lC llitl?)" S,,_ttl lAonfcti flrl flAl, rw:1ooCIt'1I'I ~IIIII"""" twl
L eNa 12 .'lIllItt,"O'\fGI,l C NI 2.t CofIlIIIlUIJI,IQtIftI
ond l C!+al t It J ., UpOtI Mill".' hi, ~ .... JIIIC!Itf'.1WI
l C .... I II ""'UIO' ~ It ,_.., "" ..... M ~i ... 'If'I. l CHGl71.IO'tI.lIlOGI ..... aI •• I..,Iftc: .... fll'l~1oI!
l C""" It ,7 .t ""' ... tr.iOlliW, l,e NIl l,t",lItU ., Ht,lf~
tr.I-*" IIId lC""" ! t. , , "' ... " It 14., s. ... fOttII' li&MMI ... IIIIyN"" .. ltIll ......... 1
lC ••• fS. ............ r..,lIInItMlI'I~.,.."
It Gover,,","! of Inilo Copyrl~t, 1991.

CHEVELLA REVE,NUE DIVISION

PDqolUDl1N '1
o
z 0 ;;; ... -> (,) - i. :t Q
II) W ... w CI) Q :::;) is 4( Z a: W Q Do. > Q 4( W W a: a: ex: :z: < 0( i " 4( .J Z .J 0( W It > W ::c (J
Ci)
~
12
~
! • E .. .lI i
0
a
• I"
• Q
o
" ~
~ ~ Vi " 0 0
~ >
"
u
~ '\'6 i5 \~
~ \\ " § ?\ 0
\ ~o '" '" ..
o
j (j o
l ... 0
" \ ~
~ ~
l ""
. " , <! .. a
Q 0
t '" '"' :
~ '0 . .. 1 0
~
" • ~ II
" · 0 < "
~ 3 · " . 'ii " <II U 0 ~ ~ ~ 0 .. 3 ~ 0 .. 1: Q. f-
I'lr, , I II\ I :~: © • IL,J L J
· , ~ ~
0
'" '" '" < ~ E "D
Z ,
C Z 0 . . a " " 0 0 a U U o. .~ c on
0
~ 3 · c .;; 0 0 0 ] ..J ..J 0 >
£ 0 i5 £ ~ J i 0
~ , .. ~ " f " ~ 0
~ c .!l & " 0 > " " II: ::! 0 'i .
I .. ; " <> 0 0 0 ~ l
~ c . u . ~
· 'i J c ;g · u " .0 u
" 0 'Ii 0 ,2 · 0 '0 1: ... Vi ~ ?: '8 ..
~ ~ 0 0 ~ • S It '0 'ii 0
Q. I 0: Ci ::!
r;,;l~ht 1:11 ~J • · .. rJ~~PI v, "1
'" '" '" a a '" '" '" N "'. '" 0: 0 0: 0
" I I f-
0 0 a · 0 0 a on N • a ..J
... 0 l i I g 0
:; z
'0 £! 0 z
~ . '" 0 ;;
i5 >
... 0 J .0 <> 'I . "0 iii
ci " 5 ::!
1 ~ c . .. II:
B I l
... 0
I ','
z
,; ;; .5
o
~ .~ ~ '" . =
'Ii .. • ; '"

VICARABAD REVENUE DIVISION

\ I
·z 0 ;;; ;: i5i
i w ll! ::;,
f ,. ILl > .. w
I II:
0 .. C UI C II: C (,) ;:
I-U i l-It
! is is X~ c d III II: C
" z .. II:
,
...
• f I
,
, ! II
..
, t
.. o .. ~ a
'" ::0 .. '" .. ... ..
.. .... .... III .. III :II: U
...
.. '" !!!
;
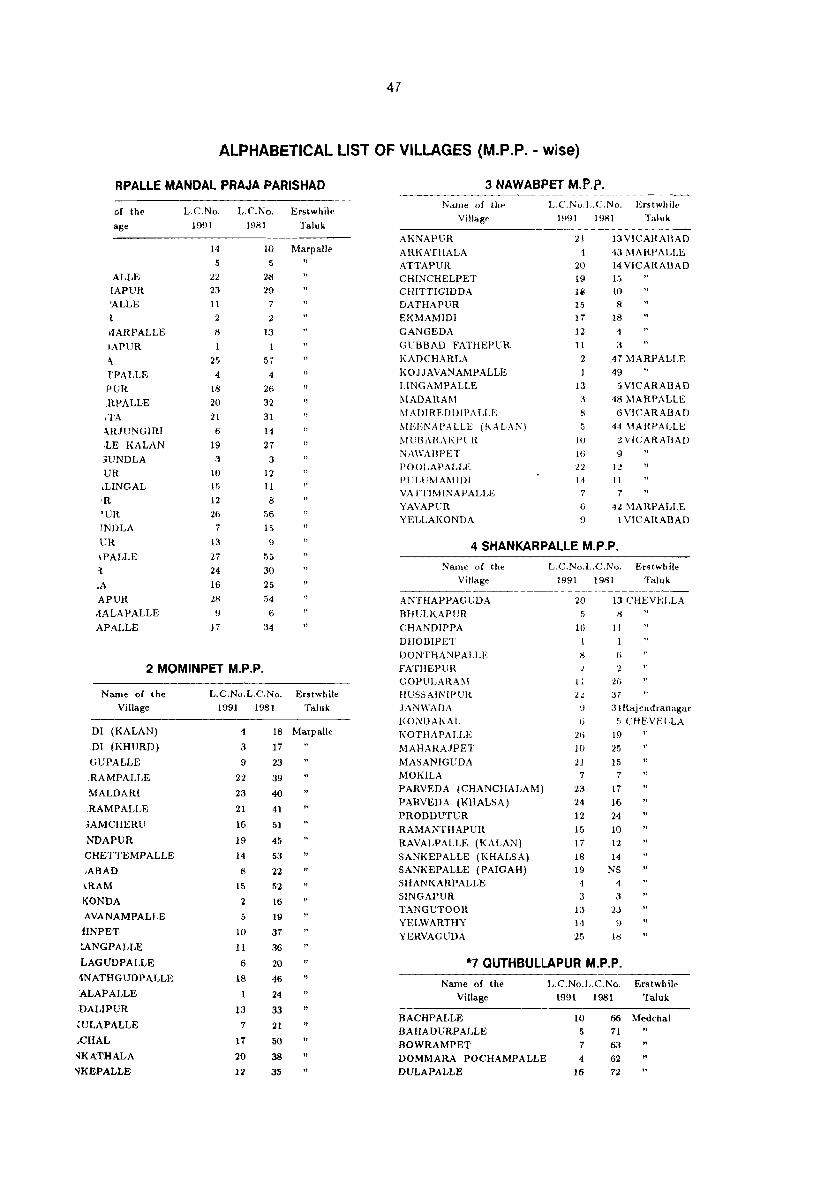
47
ALPHABETICAL LIST OF VILLAGES (M.P.P.· wise)
RPALLE MANDAL PRAJA PARISHAD
of the
age
ALLE IAPVR 'ALLE
l
I1ARPALLE
fAPUR ,\
fPALLE
PVR
.RPALLE
ITA
~RJUNGIRI
,LE KALAN }VNDLA
UR ,LINGAL
'R 'UR JNDLA
OR
tPALLE
1
.A APUR
IIALAPALLE
APALLE
L.e.No.
1991
14
5
22
23 11
2
8
1
2.5 4
18
20 21 6
19
3
10
15
12
26 7
13
27
24
16
28
9
17
L.C.No.
1981
Erstwhile
Taluk
10 Marpalle
5
28 29
7
2
13
1
57
4
26 32 31
14
27
3
12
11
8
56
15
9
55
30
25 54
6
34
"
2 MOMINPET M.P.P.
Name of the Village
or (KALAN)
.01 (KHORD)
GVPALLE
RAMPALLE
MALDARI
.RAMPALLE
iAMCHERU
NDAPUR
CHETTEMPALLE
,ABAD
~RAM
KONDA
AVANAMPALLE
lINPET
~ANGPALLE
LAGVDPALLE
iNATHGUDPALLE
'ALAPALLE
.DALIPVR
WLAPALLE
,CHAL
IIKATHALA
~KEPALLE
L.C.No.L.C.No. Erstwhile
1991 1981 TaJuk
4 18 Marpalle
3 17
9
22
23
21
16
19
14
8
15
2
5
10
11
6
18
1
13
7
17
20
l:il
23
39
40
41
51
45
53
22
52
16
19
37
36
20
46
24
33
21
50
38
35
"
3 NAWABPET M.P.P. Nalue of tht'"
Villag~
AKNAPUR ARKATHALA ATTAPUR CHINCHELPET CHlTTIGIDDA DATHAPUR EI<MAMIDI GANGEDA GtJBBAD FATHEPUR KADCHARLA I(OJJAVANAMPALLE LINGAMPALLE l\!ADARMl MADIREDUIPALLE MEEl\:APALLE (l\ALA1\:) l\IllBARAKPl'j{
NAWABPET POOLAPALLE PULUMAMIDI VATTIMINAPALLE YAVAPUR YELLAKONDA
L.C.No.L.c'No. Erstwhile
1991 1981 Taluk
21 1
20 19 lil
15 17
12 11
2
1 13
3
8 5
IV
IG
22 l.J
7
6
9
13VICARABAD 13 MARPALLE 14 VICARABAD 15
10
8
18
4
3
47 MARPALLE 49
5VICARABAD
48 MARPALLE 6VICARABAD
41 ~IARPALLE
'l. \'ICARABAD
9
12
II
4'l. MARPALLE 1 VICARADAD
4 SHANKARPALLE M.P.P.
Name of the Village
ANTHAPPAGUDA BHULKAPUR
CHANDIPPA DHOBIPET DONTHANPALLE FATIlBPUR GOPULARAl\! l!USSAINIPUf{ JANWADA J(O;'l1DAKAL
KOTHAPALLE MAHARAJPET
MASANIGUDA MOKILA PARVEDA (CHANCHALAM) PARVEDA (KHALSA)
PRODDUTUR RAMANTHAPUR RAVALPALLE (KALAN) SANKEPALLE (KHALSA) SANKEPALLE (PAIGAH) SHANKARPALLE SINGAPUR TANGUTOOR YELWARTHY YERVAGUDA
L.C.No,L.C.Na, Erstwhile Taluk 1991 1981
20
5
16
II
Ij
2G 10
:.!1 7
23 24 12 15 17
18
19
1
3
13 1,1
25
13 CHEVELLA 8
11
G
2 'lG
J7
31 Raj ell d ranagar
5 CHEVELLA 19
25 15
7
17
16
24 10
12 14
NS 4
3
1J
9
Hs
"
*7 QUTHBUlLAPUR M.P.P.
Name of the
Village
BACHPALLE BAHADURPALLE BOWRAMPET DOMMARA POCHAMPALLE DVLAPALLE
L.C.No.L.C.No. Erstwhile
Taluk 1991 1981
10
5
7
4 16
66 Medchal 71
63 " 62
72

48
ALPHABETICAL LIST OF VILLAGES (M.P.P .• wise)
.. 7 QUTHBULLAPUR M.P.P. (Concld .. )
Name of the
Village
DUNDIGAL
GAGILAPUR
KOMPALLE
MALLAMPET
NAGLUR
NIZAMPET
SAMBHUPVR
L.C.No.L.C.No.
1991 1981
Erstwhile
Taluk
3
17
9
2 11
8
60 Medchal
61
73
65
36
67
64
8 MEDCHAL M.P.P.
Name of the Village
AKBARJAPET
ATEVELLE BANDA MADHARAM
BANDAKUNTA
DABIRPUR
GHANPUR
GIRMAPUR
GOSAIGUDA
GOUDAVELLE
KANDLAKOI
KAZIGUDA KONAIPALLE MAISIREDDIPALLE
MEDCHAL
MUNIRABAD
MURAHARIP ALLE
NUTHANKAL
POCHAMPALLE
PUDOOR
RAILAPUR
RAJ BOLLARAM
RAVALKOLA
SEETHARIGUDA
SHAl{AZADIGUDA
SOMARAM SRIRANGAVARAM
VELGALKUNTA
YADARAM YELLAMPET
L.C.No.L.C.No. 1991 1981
Erstwhile
Taluk
11
12 14 16
13
23
18
24
19
27 29
25 Medchal
29
4
3
20
25
10
2
28 21 17 22
7
26 8 6
15
9
5
32
35
31
23
38
28
39
59
75 3
30
41 9
2
58
27
37
24
6
40 26
5 34
33 7
4
"
"
"
"
* 9 SHAMIRPET M.P.P.
Name of the
Village
ADRASPALLE
ALIABAD
ANANTHARAM
ANTAIPALLE
BOMRASPET
DEVAR YAMJAL HOSHYARPALLE JAGGAMGUDA
JAWAHARNAGAR
KESAVAPUR
KESAVARAM
KOTHUR
LAKSHMAPUR
LALGADIMALAKPET
LINGAPUR
L.C.No.L.C.No. Erstwhile
1991 1981 Taluk
15 13
4
29
22
24
18 14
30 19
9
2
6
11 16
45 Medchal
21 " 12 53
43
57 47 44
80
49 18
10
14 20
16
"
.. 9 SHAMIRPET M.P.P, (Concld .. )
Name of the Village
MAJIDPUR MANDAIPALLE MOODUCHINTALAPALLE NAGISETTIPALLE
NARAYANPUR PONNAL
POTHAIPALLE POTHARAM SAMPANBOLE SHAMIRPET THUMKUNTA TURKAPALLE UDDEMARRI
YAKHATPURA
L.C.No.L.C.No. 1991 1981
Erstwhile
Taluk
12 27
7
8
5
21 26
3
10 23 28
17
20
22 Medchal 55
15 17
13
50
56
11 19 42 54
8 46
48
"
* 11 KEESARA M.P.P. Name of the
Village
AHMADGUDA
BOGARAM CHEERIYAL
DHARMAVARAM GODMAKUNTA HARIDASP ALLE KEESARA KEESARA DAIRA KUNDANPALLE NAGARAM
NARSAMPALLE RAMPALLE
THIMMAJPALLE YADGARPALLE (EAST)
YADGARPALLE (WEST)
L.C.No.L.C.No. 1991 1981
Erstwhile Taluk
13 90 Medchal
16 93
8 86
2 52
14 7
5
9
10
11
3
15
b
4
91
85 84 87
88 89 51
92 81
82
83
* 12 GHATKESAR M.P.P. Name of the
Village
ANKUSHAPUR ANNOJIGUDA AUSHAPUR BADESAHEBGUDA CHANGICHERLA
EDULABAD
ISMAILKHANGUDA
KACHWANISINGARAM KONDAPUR
KORREMUL MADHARAM
MAJARGUDA MUTHAWALLIGUDA
NAREPALLE
PADAMATISAIGUDA PARVATHAPUR POCHARAM PRATHAPSINGARAM YAMNAMPET
L.C.No.L.C.No. Erstwhile
Taluk 1991 1981
10
12 9
19
3
20
6 15 8
18
21 13 16
14 7
4
17
5
3 Hayathnagar 18
2
25 16
19
7
41
1
26
20 27
42
28
5
39 17
43 6
* 14 HAVATHNAGAR M.P.P. Name of the
Village
ABDULLAPUR AKBARJA
L.C.No.L.C.No. Erstwhile . 1991 1981 Taluk
34
13
69 Hayathnagar
21 "

49
ALPHABETICAL LIST OF VILLAGES (M.P.P. - wisE:)
* 14 HAYATHNAGAR M.P.P. (Concld .. )
Name of the
Village
ANAJPUR
BACHARAM
BALJAGUDA
BANDARAVIRYAL
BATASINGARAM
DAIRA GOWRELLI
GUNTAPALLE HATHIGUDA
INAMGUDA
INJAPUR
KALVANCHA KAWADIPALLE KOHEDA
KUNTLOOR LASKERGUDA MANNEGUDA MARRIPALLE
MAZIDPUR
MUNGANOOR OMERKHANDAIRA
PASMAMLA PEDDA AMBERPET (KALAN)
PIGILIPUR
POCHAMPALLE WADA
QUTHBULLAPUR
SAGARPUMP SURMAIGUDA TATTI ANNARAM TATTI KHANA THARAMATHIPET
THIMMAIGUDA
TOROOR (FAROOR) TURKAYAMJAL
L.C.No.L.C.No. Erstwhile
1991 1981 Taluk
41
10
15
12
36 11
9 40
3
33
23
20
35 29
18
32
25 6
38
27 30
17 28
37
16
7
39 31
4
5
14
8
26
24
78 Hayathnagar
24 47
22
70
23 44 74
65
75
98
85
46 80
66
76 100
38
72
81
79
48 68
71
67
50
73
77 52
51 45 49
99 101
* 15 SAROORNAGAR M.P.P.
Name of the
Village
ALMASGUDA
BADANGPET
CHINTALAK UNTA DAWOODKHANGUDA JALPALLE JILLALGUDA
KURMALGUDA
MAMIDIPALLE
MEDBOWLI MEERPET
NADARGUL PAPAYAKUMANDAN
RENUKAPUR
L.C.No.L.C.No. Erstwhile
1991 1981 Taluk
15
17
18
16 25
12
28
27
13
14
29 26
23
96 Hayathnagar
95 92 97
107
89
103
109
90
91
102 108
105
* 16 RAJENDRANAGAR M.P.P.
Name of the Village
ALIZAPUR BAIRAGIGUDA BANDLAGUDA(JAGIR)
GANDAMGUDA
L.C.No.L.C.No. Erstwhile
1991 1981 Taluk
13
16 24
17
49 Rajendra-
54 nagar 60
53
* 16 RAJENDRANAGAR M.P.P.(Concld .. )
Name of the Village
GANDIPET GUNGURTHY HIMAYATHSAGAR
JANIBEGUM KHANAPUR KISMATPUR KOKAPET MANCHIREVULA MANIKONDA (KHALSA)
MANIKONDA (JAGIR) MAQTHA KOUSARALI
NARSINGI NEKNAMPUR PALLECHERU PANJASHAJAMALBOWLI PEERAMCHERU POKKALWADA PREMAVATHIPET PUPPALGUDA
SIKANDERGUDA SOGBOWLI VATTINAGULAPALLE
L.c.No.L.C.No. 1991 1981
Erstwhile Taluk
5
26
23
2
27 4
15
9
10
8
6
1-1
37
12 25
11
33
7
39
22 3
38 Rajendra-35 nagar 57
61
36 69 37
55
41
44 40
39
48 77
46 59
45 73 47
78
64 33
17 MOINABAD M.P.P.
Name of the Village
AMDAPUR AZIZNAGAR BAKARAM (JAGIR) BANGALIGUDA CHANDANAGAR CHILKOOR
CHlNNA MANGALARAI\I CHINNASHAPUR HIMAYATHNAGAR KANAKAMAMIDI KETHIRED DIP ALLE MEDIPALLE MOTHUKUPALLE
MURTHUZAGUDA NAGIREDDIGUDA NAKKALAPALLE NAZEEBNAGAR PEDDAMANGALARAM REDDIPALLE SAJJANPALLE SRIRAMNAGAR
SURANGAL TOLKATTA VENKATAPUR YENKEPALLE YETHBARPALLE
L.C.No.L.C.No. 1991 1981
Erstwhile Taluk
24 73 Chevella 8 70 Rajendra-
23 82 nagar 21 72
5
6
2
12 7
18 17
3
10 22 16 20
11 4
13
25 19
11
26
9
15
30 Chevclla 56Rajendranagar
28 Che\'ella 51
58Rajendranagar 55 Chevella 71 27 29
52 81Rajendranagar 77 Chevella 53
32
31
56 72
54
57
76 71Rajendranagar 70 Chevella
18 CHEVELLA M.P.P.
l\alllc of the Village
ALLAWADA ALOOR II ALOOR III ALOOR
L.C.i':o.L.<'.No. Erstwhile Taluk J 991 1981
.11
6
4
68 Chevella NS NS 44
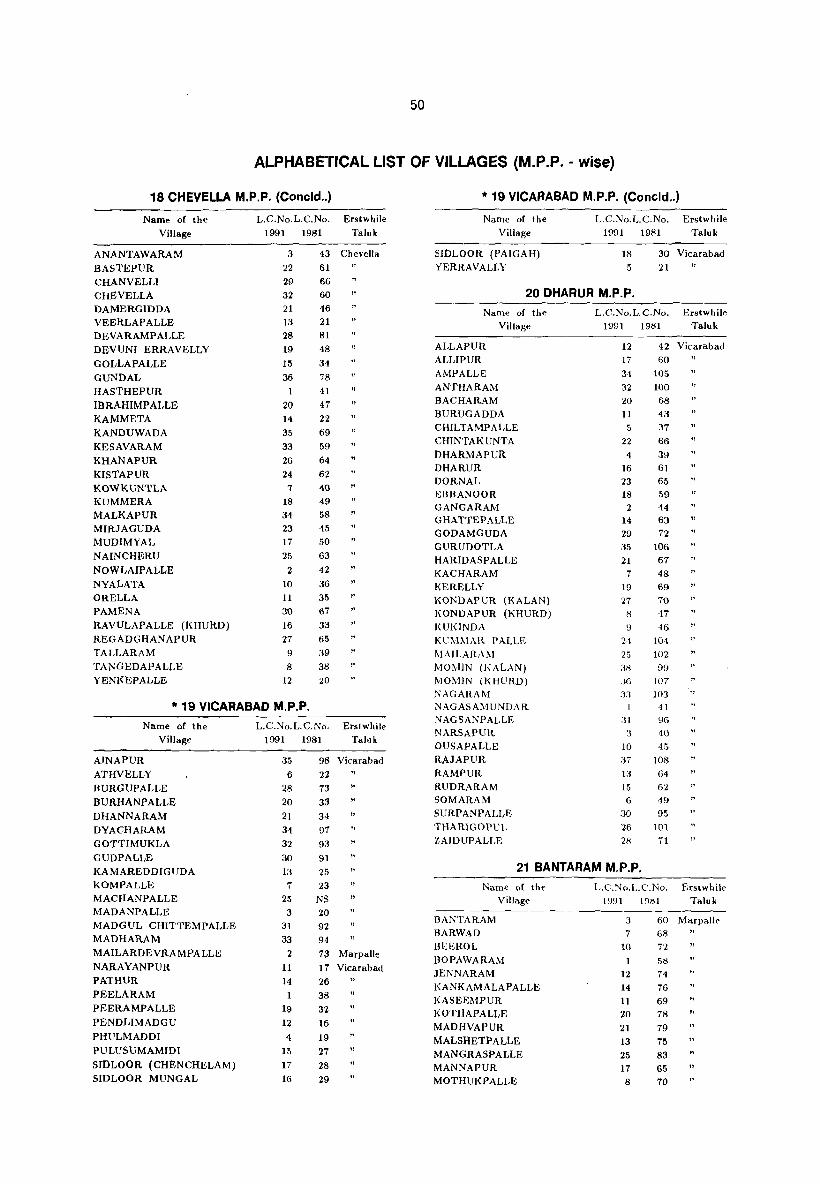
50
ALPHABETICAL LIST OF VILLAGES (M.P.P. - wise)
18 CHEVELLA M.P.P. (Concld .. )
Name of the
Village
ANANTAWARAM BASTEPUR CHANVELLI CHBVELLA DAMERGIDDA VEERLAPALLE DEVARAMPALLE DEVUN! ERRAVELLY GOLLAPALLE GUNDAL HASTHEPUR IBRAHIMPALLE KAMMETA KANDUWADA KESAVARAM KHANAPUR KISTAPUR KOWKUNTLA KUMMERA MALKAPUR MIRJAGUDA MUDlMYAL NAINCHERU NoWLAIPALLE NYALATA ORELLA PAMENA RAVULAPALLE (KHURD) REGADGHANAPUR TALLARAM TANGEDAPALLE YENKEPALLE
L.C.No.L.C.No. 1991 1981
Erstwhile Taluk
3
22
29 32 21 13
28
19
15 36
43 Chevella 61
1
20
14
35
33
26
24
7
18
34
23 17
25
2 10
11
30
16
27
9
8
12
66 60 46 21 81
48 34
78
41 47 22
69
59
64
62
40 49 58
45
50
63 42 36 35
67
33
65
39
38
20
"
"
"
"
"
" "
* 19 VICARABAD M.P.P.
Name of the
Village
AINAPUR ATHVELLY BURGUPALLE BURHANPALLE DHANNARAM DYACHARAM GOTTIMUKLA GUDPALLE KAMAREDDIGUDA KOMPALLE MACHANPALLE MADANPALLE MADGUL CHITTEMPALLE MADHARAM MAILARDEVRAMPALLE NARAYANPUR PATHUR PEELARAM PEERAMPALLE PENDLIMADGU PHULMADDI PULUSUMAMIDI SIDLOOR (CHENCHELAM) SIDLOOR MUNGAL
L.C.No.L.C.No. Erstwhile 1991 1981 Taluk
35 6
28
20 21 34
32 30
13
7 25 3
31
33
2
11
14 1
19
12
4
15
17
16
98 Vicarabad
22 73
33
34
91 93
91
25 23
NS 20
92 94
., " "
"
"
73 Marpalle 17 Vicarabad
26
38
32 16
19
27 28 29
* 19 VICARABAD M.P.P. (Concld .. )
Name of the
Village
SIDLOOR (PAIGAH) YERRAVALLY
L.C.No.L.C.No. Erstwhile Taluk 1991 1981
18
5
30 Vicarabad
21
20 DHARUR M.P.P.
Name of the
Village
ALLAPUR ALLlPUR AMPALLE ANTHARAM BACHARAM BURUGADDA CHILTAMPALLE CHINTAKUNTA DHARMAPUR DHARUR DORNAL EBBANOOR GANGARAM GHATTEPALLE GODAMGUDA GURUDOTLA HARIDASP ALLE KACHARAM KERELLY KONDAPUR (KALAN) KONDAPUR (KHURD) KUKINDA KUMl\lAR PALLE MAILARAl\J MOl'vIlN (KALAN) MOMIN (KHURD) NAGARAM NAGASAMUNDAR NAGSANPALLE NARSAPUR OUSAPALLE RAJAPUR RAMPUR RUDRARAM SOMARAM 5URPANPALLE THARIGOPUL ZAIDUPALLE
L.e.No.L.C.No. Erstwhile
Taluk 1991 1981
12 17
34
32 20
11
5
22 4
16 23 18
2 14 29
.35
21 7
19
27
8
!.J
24 25
:18
:JG
:J:I
:1[
3
10 37 l:i
15
6
.30
26 28
42 Vicarabad
60
105
100
68 43
37 66
39 61 65 59
44 63 72
106
67 48 69
10 47 46
104
102
99
107 103
41 96 40
45 108
64 62 49 95
101
71
"
21 BANTARAM M.P.P.
Name of th.,.
BANTARAM BARWAD
Village
BEEROL BOPAWARAM JENNARAM KANKAMALAPALLE KASEEMPUR KOTHAPALLE MADHVAPUR MALSHETPALLE MANGRASPALLE MANNAPUR MOTHUKPALLE
L.C.No.L.C.No. E~slwhile
I!.J91 19tH 'faluk
3 60 Marpalle
7 68 "
10 72
12
14
11 20 21
58
74
76 69 78
79 13 i5
25 17
8
83 65 70
"
" "
"
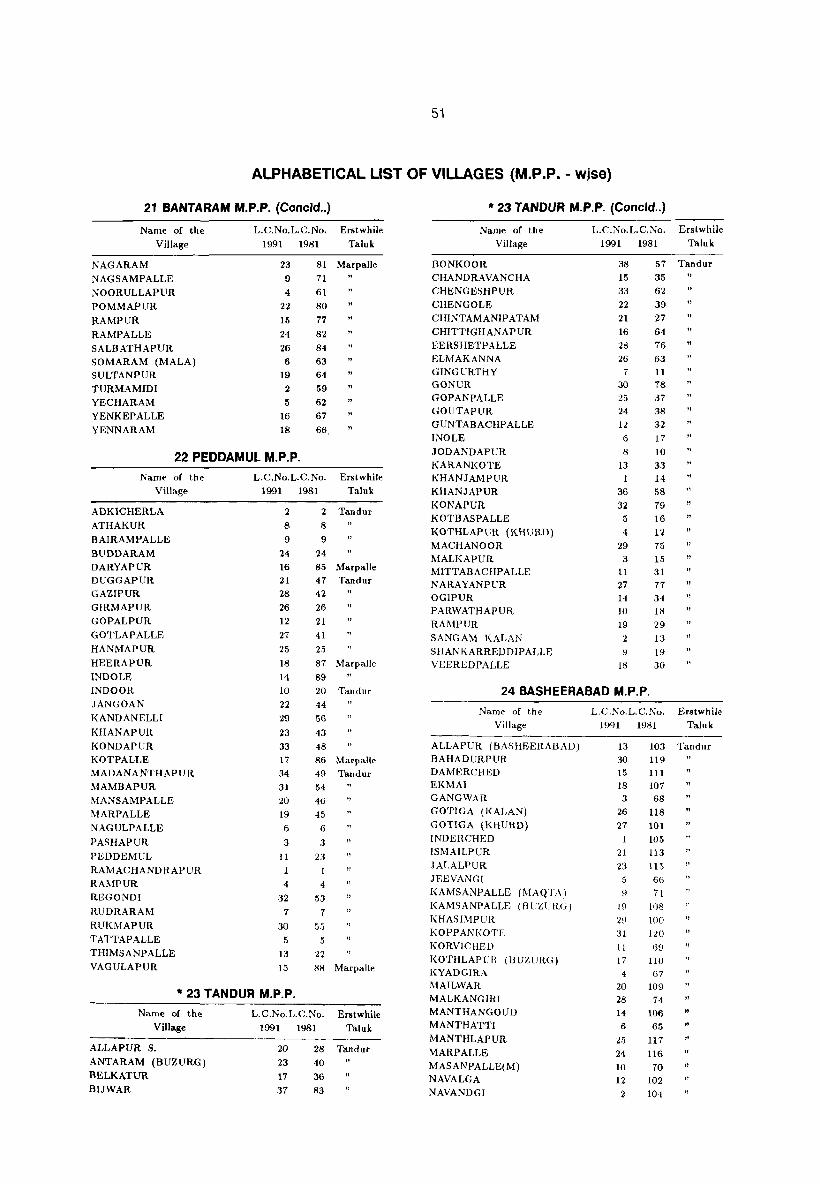
51
ALPHABETICAL LIST OF VILLAGES (M.P.P. - wjse)
21 BANTARAM M.P.P. (Conoid .. )
Name of the
Village
NAGARAM
NAGSAMPALLE
NOORULLAPUR
POMMAPUR
RAMPUR
RAMPALLE
SALBATHAPUR SOMARAM (MALA)
SULTANPUR
TURMAMIDI
YECHARAM
YENKEPALLE
YENNARAM
L.C.No.L.C.No.
1991 1981
Erstwhile
Taluk
23 9
4
22
15
24
26
81 Marpalle
71
6
19
2 5
16
18
61
80 77 82
84
63
64
59
62
67 66
"
"
"
22 PEDDAMUL M.P.P.
Name of the
Village
ADKICHERLA
ATHAKUR
BAIRAMPALLE
BUDDARAM
DARYAPUR
DUGGAPUR
GAZIPUR
GIRMAPUR
GOPALPUR
GOTLAPALLE
HANMAPUR
HEERAPUR
INDOLE
INDOOR
JANGOAN
KANDANELLI
KHANAPUR
KONDAPUR
KOTPALLE
MADANANTHAPUR
MAMBAPUR
MANSAMPALLE
MARPALLE
NAGULPALLE
PASHAPUR
PEDDEMUL
RAMACHANDRAPUR
RAMPUR
REGONDI
RUDRARAM
RUKMAPUR
TATTAPALLE
THIMSANPALLE
VAGULAPUR
L.C.No.L.C.No.
1991 1981
Erstwhile
Taluk
2
8
9
24
16
21 28
26 12
27
25 18
14
10
22
29 23 33 17
34
31 20
19
6
3
11
1
4
32 7
30
5
13
15
2 Tandur
8
9
24
85 Marpalle
47 Tandur
42
26
Zl 41
25 87 Marpalle
89
20 Tandur
44
56
43
48
86 Marpalle
49 Thndur
54
46
45
6
3 23
1 4
53
7
5.5
5
22
88 Marpalle
fr 23 TANDUR M.P.P.
Name of the
Village
ALLAPUR S.
ANTARAM (BUZURG)
BELKATUR
BIJWAR
L.C.No.L.C.No. Erstwhile
1991 1981 Taluk
20 23 17
37
28 Tandur
40
36
83
'II 23 TANDUR M.P.P. (Concld .. )
Name of the
Village
BONKOOR
CHANDRAVANCHA
CHENGESHPUR
CHENGOLE
CHINTAMANIPATAM
CHITTIGHANAPUR
EERSHETPALLE ELMAKANNA GINGURTHY GONUR
GOPANPALLE GOUTAPUR GUNTABACHPALLE
INOLE
JODANDAPUR
KARANKOTE KHANJAMPUR
KHANJAPUR
KONAPUR
KOTBASPALLE
KOTHLAPUR (KHURD)
MACHANOOR MALKAPUR MITTABACHPALLE NARAYANPUR OGIPUR PARWATHAPUR
RAMPUR
SANG AM KALAN
SHANKARRED DIP ALLE VEEREDPALLE
L.C.No.L.C.No.
1991 1981
Erstwhile
Taluk
38
15
33
22
21 16
28 26
7 30
25 24
l:.!
6
8
13
36
32 5
4
29 3
11 27 14
10
19
'2
9
18
57 Tandur
35
62 39
27 64
76 63
11 78 37 38
32
17
10
33
14 58 79 16
12 75 15
31 77
34 18
29
13
19 30
"
"
"
"
24 BASHEERABAD M.P.P.
Name of the
Village
ALLAPUR (BASHEERABAD) BAHADURPUR DAMERCHED EKMAI GANGWAR
GOTIGA (KALAN)
GOTICA (KHURD)
INDERCHED
ISl\IAILPUR
JALALPUR
JEEVANGI
KAMSANPALLE (MAQTA)
KAMSANPALLE (BUZURG)
KHASIMPUR
KOPPANKOTE
KORVICHED
KOTHLAPl'R (BUZURG) KYADGIRA MAILWAR
MALKANGIRI
MANTHANGOUD MANTHATTI
MANTHLAPUR
MARPALLE
MASANPALLE(M) NAVALGA
NAVANDGI
L.C.No.L.C.No.
1991 1981
13
30
15 18 3
26 27
21 23
5 9
19
2~l
31
Ii
17
4
20
28
14 6
25 24
10
12 2
103
119
111
107 68
118
101
105
113
115
66 71
108
100
120
69 110 67
109
74 106
65 117
116 70
102
104
Erstwhile
Taluk
Tandllr
" "
" " "
" "

52
ALPHABETICAL LIST OF VILLAGES (M.P.P. - wise)
24 BASHEERABAD M.P.P. (Concld .. )
Name of the Village
NEELAPALLE PARWATHPALLE REDDIGHAN APUR SHAPUR (MAQTA)
L.C.No.L.C.No. 1991 1981
Erstwhile Taluk
22 16
7
8
114 Tandur
112 73 72
" "
25 YELAL M.P.P.
Name of the Village
ACHUTHAPUR ADHALIPUR AGNOOR AMBERPET ANNASAGAR BANAPUR BENNUR
BHAGAIPALLE CHENNARAM DEVANOOR DOULAPUR
GANGASAGAR GIRIJAPUR GOREPALLE HAJIPUR JAKKEPALLE JUNTPALLE KAMALAPUR KISHTAPUR KOKAT LAKSHMINARAYANAPUR MAZRASANGAM MUDDAIPET MUKUNDAPUR NAGASAMUNDAR PAGDIAL PAYARKAMPALLE RAGHAPUR RASNAM RASOOLPUR THIMMAIPALLE VISWANATHPUR
YELAL YENKAPALLE
L.C.No.L.C.No. 1991 1981
11 88
7 52 1 98
20 94 13 86
8 51 21
14 23 33 27
9
28
32 18
19
26 6
31
3
22 4
34 30
15 12 25
5
10
2
29
16
17 24
95
90 97
131
124 50
125 130
129
126
122 85
128
59
96 82
132 127
91
89 121 84
87
81
123 92
93
99
Erstwhile Taluk
Tandur
" "
" "
"
26 DOMA M.P.P.
Name or the Village
AINAPUR ANANTHAREDDIPALLE BACHPALLE BADAMPALLE BATLA CHANDRARAM BOMPALLE BRAHMANPALLE BUDLAPUR DADAPUR DIRSAMPALLE
DOMA DONGAYANKEPALLE DORNALPALLE
L.C.No.L.C.No. 1991 1981
Erstwhile Taluk
21 24 10
16 25
70 Pargi
5
14
27
22 11 8 9
74
67 72
75
55
50
49 82
71
68
65
66
" "
" "
" "
26 DOMA M.P.P. (Concld .. )
Name of the Village
GANJIPALLE GUDUR GUMDAL KHAMMAM NACHARAM KISHTAPUR KONDAIPALLE LINGANPALLE MALLEPALLE MOTHKUR OOTPALLE PALEPALLE POTHREDOYPALLE RAKONDA SIVAREDDIPALLE TIMMAIPALLE
L.C.No.L.C.No. 1991 1981
Erstwhile Taluk
15 7
28
19
51 Pargi
2
23 13 26
20
4
18
3 17 6
12
57
83
78
48 73 53 76 77
46 69 47 52 56
54
27 GANDEED M.P.P.
Name of the Village
ANNAREDDIPALLE BAISPALLE BALSULGONDA CHELMILLA CHINNAVARVAL CHOWDERPALLE GADRIAL GANDEED GOVINDPALLE JINNARAM JULAPALLE KAPLAPUR KOMREDDIPALLE KONDAPUR LINGAIPALLE M~GAMPET
MANSOORPALLE MOHAMADABAD MUKARLABAD NANCHERLA PAGDIYAL PEDDAVARVAL REDDIPALLE RUSUMPALLE SALARNAGAR SALKERPET SANGAIPALLE VARAHAGIRIPALLE VENN ACHED
L.C.No.L.C.No. Erstwhile 1991 1981 Taluk
26 125 Pargi 10 106
16 4 7
22
21
9 14
3
25
19 17
27 2:J
18 28 24 20
15 6
11
8
5
12 29
LJ
2
136 85
98 128 109
132 103
84 130 102 131 135 124
127 134 122
126 129
137 99
133 107
100
105
123 104
101
28 KULKACHARLA M.P.P.
Name of the Village
ADAVIVENKATAPUR ALLAPUR ALMASKHANPET ANANTHASAGAR ANTHARAM BANDAYELKACHERLA BOMREDDIPALLE CHAKALPALLE CHELLAPUR
L.C.No.L.C.No. 1991 1981
Erstwhile Taluk
11
9
15 17 14
6
5 30
92 Pargi 64 97
111
96 81
89 121 86

ALPHABETICAL LIST OF VILLAGES (M.P.P. - wise)
28 KULKACHARLA M.P.P. Concld ..
Name of the
Village
L.C.No.L.C.No. Erstwhile 1991 1981 Taluk
CHOWDAPUR
GHANAPUR
IPPAIPALLE
KANMANKALVA
KOTHAPALLE
KULKACHARLA
KUSUMASAMUDRAM
LINGAMPALLE
MAGULLAPALLE
MALKAPUR
MANDIPAL
20 94 Pargi
MARKAL
3
13
28 24
4
18
10
29
26
21 '1.7
MUJAHIDPUR 8
PEERAMPALLE 7
PURSAMPALLE 25
PUTTAPAHAD 16
SALVEED 2
TIRUMALAPUR 12
VEERAPUR n VENKATAPUR 23
VITTALAPUR 19
29 PARGI M.P.P.
88
95
119
118
90
110
79
120
115
113
116
63
80
117
108
87
91
114
112 93
Name of the
Village
L.C.No.L.C.No.
ANNARAM
BABAPUR
BARKATPALLE
BASIREDDIPALLE
CHIGRALPALLE
CHITYAL
GADSINGAPUR
GOVINDAPUR
HEERAPUR
IBRAHIMPUR
JAFFERPALLE
KADLAPUR
KHUDAVANPUR
LAKHANAPUR
MADHARAM
MALKAIPET MITTAKODUR
NAG ULAP ALLE
NARAYANPUR
NASKAL
NAZEERABAD
PARGI
ROOPKHANPET
RAGHAVAPUR
RAMREDDIPALLE
RANGAMPALLE
RANGAPUR
RAPOLE
RAVALPALLE
RUKUMPALLE SHAKAPUR
SONDEPUR
SULTHANPUR
SYEDMALKAPUR
SYEDPALLE
1991 1981
4 4 20
5
8
13
32
16
14
37
1
34
26
33
3
28
15 2
27
23 6
9
11
21 24
18
17
7
29
35
12
10
19
22
25 36
27
5
17
21 39
24 22 62
58
41
42 3
15
23 2
31
44
7
18
20
28
43
45
25
16
40
59
6
19
26
29
30 60
Erstwhile
Taluk
Parg;
29 PARGI M.P.P. (Concld .. )
Name of the Village
TONDAPALLE YABAJIGUDA
L.C.Nu.L.C.No. Erstwhile 19D1 1981 Talll k
31 61 Pargi JO 38
30 PUDUR M.P.P. Name of the
Village
ANGADICHITTAMPALLE
BAKAPUR
ClI.-.>.!GOMUL
CHEELAPUR
CHINTALAPALLE
GANGUPALLE GHATPALLE
KAl'I'DLAPALLE KANKAL
KERVELLI
KODMOOR
KOTHAPALLE
MANCHANPALLE
MANNEGUDA (PAIGAII)
MANNEGUDA (SARFECAS)
MEDIKONDA
MEDIPALLE (KALAN)
MIRZAPUR
MITTAKANKAL
NIZAMPET MEDIPALLE PEDDAUMANTIIAL POTHIREDDIG UDA
PUDGURTHY PUDUR
QUTHBULLAPUR
RAKAMCHERLA
REGADIMAMIDIPALLE
SIRGAIPALLE
SOMANGURTHY
THIMMAPUR
THIPPAPUR
THIRMALAPUR
L.C.No.L.C.No. Erstwhile
Taluk 1991 1981
6 76 Vicarabad
8
15
10
33
11
30 5
28
23 '/.7
\)
29
4
19
26
3
17
32
25 7
34 12
18
20
16
24
22 14 13
21
31
86 78
89
35 Parsi
74 Vicarabad
33 Parsi 75 Vicarabad 12 Pargi
1-1 81 Vicarabad
87
32 Parsi
56 Vicarabad
55
84 83
31
80
36 Pargi 11
77 Vicarabad
34 Pargi 90 Vicarabad
82
10 Pargi
79 Vicarabad
13 Pargi
9
85 Vicarabad
88 8 Parsi
37 TURKAYENKEPALLE
YENKEPALLE 2
31 SHABAD M.P.P. 54 Vicarabad
Name of the Village
ANANTHAWARAM
BHONGIRPALLE
BOBBlLGAM
CHANDENVALLE
DAMERLAPALLE
ETLAERRAVALY
HAYATHABAD
KAKLOOR
KESAVAIL\M
KOMERAllANDA
MACHANPALLE
MADDUR MANMARRI
NAGARKUNTA OBAGUNTA
PEDDAVED POLARAM
L.e.No.L.C.No. 1991 1981
23 107
13 100
104
6 86
11
:1
7
n H
l~
11
9
21
12
ID )0
97 80 95
110
1O~
103
91'
Dol
lOG
99 105
96
101
Erstwhile Taluk
Chevella

ALPHABETICAL LIST OF VILLAGES (M.P.P. - wise)
31 SHABAD M.P.P. (Concld .. )
Name of the
Village
POTHUGAL
RANGAPUR REGADIDOSWADA
RUDRARAM
SHABAD
SOLIPET
TADLAPALLE TIRUMALAPUR
L.C.No.L.C.No.
1991 1981
16 25
17
5
20
8
4
2
84
109 83 85
102 87
79 82
Erstwhile Taluk
Chevella
* 32 SHAMSHABAD M.P.Po Name of the
Village
AMMAPALLE
BAHADURGUDA
CHERLAGUDA
CHOWDERGUDA DEVATABOWLI
GANDIGUDA
GHANSIMIAGUDA
GOLKONDA (KALAN)
GOLKONDA (KHURD) GOLLAPALLE (KALAN) GOLLAPALLE (KHURD) HAMIDULLANAGAR HARIGUDA JUKAL
KACHARAM KAVELIGUDA
KISHANGUDA i<aLBOWIDODDI
KOTHWALGUDA
LANGERGUDA
MADANPALLE
MALKARAM
MUCHINTAL NANAJPUR NARKHUDA OOTPALLE PALMAKOLE PASHAMBANDA
PEDDASHAPUR
PEDDATOPRA POSETTYGUDA RAMANUJAPUR
RASHEEDGUDA
RAYANNAGUDA SANGHIGUDA
SATAMRAI
SAYYED GUDA SHANKARAPUR
SULTANPALLE TONDPALLE
L.C.No.L.C.No. Erstwhile Taluk 1991 1981
12 39
32
10
24 25
31
43 40 a8 35
33
13
9
6
2
21
4
14
16 27
3
30
8
11
22 28
18
26
29 :14
1
36
7
42
15 37 41
5
23
93 Rajendra-
111 nagar
107
95 97
102
106
112
108 110
99 101 83
104
92 Chevella
89
91 Rajendranagar
75 Chevella
80 Rajendrao
85 nagar
105
90 Chevella
115 Rajendranagar 93 Chevella 94
92 116 88
103
117
98
88 Chevella
100Rajendranagar
91 Chevella 113 Rajendra-
84 nagar
109 114
74 Chevella 96 Rajendranagar
33 MAHESWARAM MoPoPo
Name of the
Village
AKANPALLE
ALMASGUDA
AMEERPET
------LoC.NooL.C.No. Erstwhile
1991 1981 Taluk
32
15 6
37 Maheswaram
8
14
33 MAHESWARAM MoP.P. (Concld .. )
Name of the Village
BAGHMANKHAL DABILGUDA DILWARGUDA DUBBACHERLA GANGARAM GHATPALLE GOLLOR IMAMGUDA KALWAKOLE KOLLAPADKAL KONGAR (KHURD) (Al KONGAR (KI!URD) (B) MAHESWARAM MALIKDANGUDA
MANKHAL MANSANPALLE MOHABATNAGAR NAGARAM NAGIREDDIPALLE
NANDIPALLE PENDYAL
PORANDLA RAVIRYAL SARDAR NAGAR SIRIGIRIPUR SREENAGAR SUBHANPUR THUMMALOOR TOOPRA (KHURD) VENKANNAGUDA
L.C.No.L.C.No. 1991 1981
Erstwhile Taluk
14 10 30 28
12 27
20 Maheswaram 16
2
21 8
3[
19 20
26
23
16
11 24
4
5
3 9
:1:3 18 17 13 "l.2
29 25
7
1
35 36
18 31 11
5
33
38 :.I
4
]0
21
7
17 22
10 15
11 32 39
2
1
19 6
34 29
13
12
" " " " ,.
"
34 IBRAHIMPATNAM MoP.Po
Name of the Village
ADIBATLA
ALIMIYAKUNTA BONGLOOR CHINTAPALLEGUDA DANDUMAILARAM FEROZGUDA IBRAHIMPATNAM (BAGATH) IBRAHIMPATNAM (KHALSA) ISMAILSHAPAMPU
KAPPAPAHAD KONGARA KALAN MANGALPALLE MUKNOOR NAGANPALLE
NARREPALLE POCHARAM POLKAMPALLE RAINGUDA RAIPOLE RAMDASPALLE RAMREDDIGUDA TADLAKALVA TATTIKHANA
TOOLEKALAN TURKAGUDA YELIMINEDU YENGALAGUDA YERRAKUNTA
L.C.No,L.C,No. Erstwhile Taluk 1991 1981
2 17
3
'I 11 20 18
7
6
27
19 12
8 10
22
9 13 15
5
21
24 16
28 26 23
11 2:;
lIbrahimpatnam
20 "
4 " 6
14 3
21
8 " 8
39 2
5
15
10
13
23 12 16 17
7
22
25 19
41 10 24
11
26
"
" II
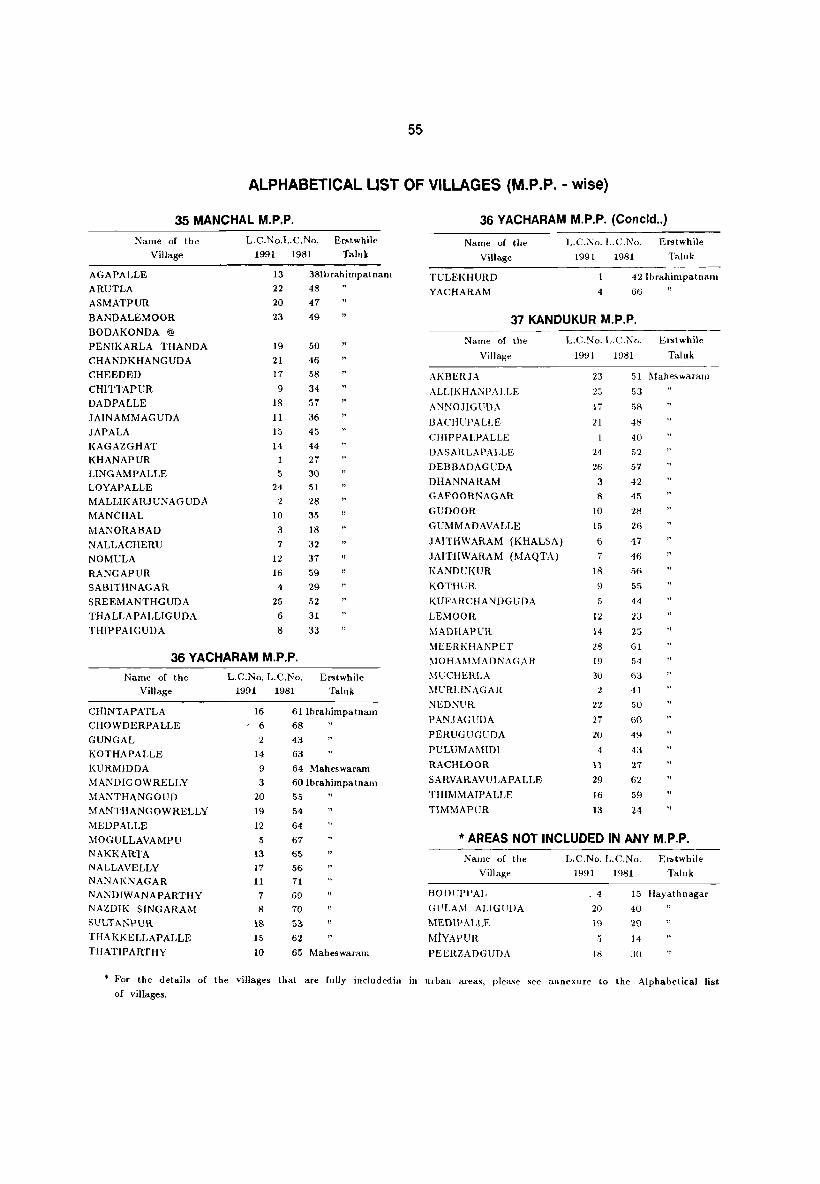
55
ALPHABETICAL LIST OF VILLAGES (M.P.P. - wise)
35 MANCHAL M.P.P.
Name of the L.C.No.L.C.No. Erstwhile
Village 1991 1981 Taluk
AGAPALLE 13 38lbrahimpatnam
ARUTLA 22 48
ASMATPUR 20 47
BANDALEMOOR 23 49
BODAKONDA @
PENIKARLA THANDA 19 50
CHANDKHANGUDA 21 46
CHEEDED 17 58
CHITTAPUR 9 34
DADPALLE 18 57
JAINAMMAGUDA 11 36
JAPALA 15 45
KAGAZGHAT 14 44 KHANAPUR 27 LlNGAMPALLE 5 30 LOYAPALLE 24 51
MALLIKARJUNAGUDA 2 28
MANCHAL 10 35
MANORABAD 3 18
NALLACHERU 7 32
NO MULA 12 37
RANGAPUR 16 59
SABITHNAGAR 4 29
SREEMANTHGUDA 25 52
THALLAPALLIGUDA 6 31
THIPPAIGUDA 8 33
36 YACHARAM M.P.P.
Name of the L.C.No. L.C.No. Erstwhile Village 1991 1981 Taluk
CHINTAPATLA 16 61 Ibrahimpatnam CHOWDERPALLE , 6 68
GUNGAL 2 43 KOTHAPALLE 14 63
KURMlDDA 9 64 Maheswaram MANDlGOWRELLY 3 60Ibrahimpatnam
MANTHANGOUD 20 55
MANTHANGOWRELLY 19 54
MEDPALLE 12 64
MOGULLAVAMPU 5 67 NAKKARTA 13 65 NALLAVELLY 17 56 NANAKNAGAR 11 71 NANDIWANAPARTHY 7 69
NAZDIK SJNGARAM 8 70 SULTANPUR 18 53 THAKKELLAPALLE 15 62 THATIPARTHY 10 65 Maheswaram
36 YACHARAM M.P.P. (Concld .. )
Name of the
Village
TULEKHURD
YACHARAM
L.C.No. L.C.No. Erstwhile
Taluk 1991 1981
4
42Ibrahimpatnalll
66
37 KANDUKUR M.P.P.
Name of the
Village
AKBERJA
ALLII<HANPALLE
ANNOJIGllDA
I3ACHUPALLE
CHIPPALPALLE
DASARLAPALLE
DEBBADAGUDA
DHANNARAM
GAFOORNAGAR
GUDOOR
G UMMAD AVALLE
JAITHWARAM (KHALSA)
JAITHWARAM (MAQTA)
KANDUKUR
KOTBUR
KUFARCHANDGUDA
LEMOOR
MADHAPUR
MEERKHANPET
I\IOHAI\IMADNAGAR
I\1UCHERLA
I\1URLlNAGAR
NEDNUR
PANJAGUDA
PERUGUGUDA
PULUMAMIDI
RACHLOOR
SARVARAVULAPALLE
THIMMAIPALLE
TIMMAPUR
L.C.No.L.C.No. Erstwhile
1991
23
25
17
21
'24
26
3
8
10
15
6
7
18
9
5
12
14
28
19 30
2
22
27 :.10
4
11
29
16
13
1981 Taluk
51 1\1aheswaram
53
58
48
40
52
57
42
45
28
26
47
46
56
55
44
2.3
25 61
54
6]
41
50
60 49 4,J
27
62
59
24
* AREAS NOT INCLUDED IN ANY M.P.P.
Name of the L.C.No. L.C.No. Erstwhile
Village 1991 1981 Taluk
BODUPPAL _ 4 15 Hay at h nagar
Gl'LAM ALIGUDA 20 40
MEDlPALLE 19 29
MtYAPUR 5 14
PEERZADGUDA 18 30
• For the details of the villages that are fully includedin In urban areas, please see annexure to the Alphabetical list of villages.

56
ANNEXURE TO THE ALPHABETICAL LIST OF VILLAGES
Particulars of Revenue villages that have been deleted in Alphabetical list and that are fully included in
Municipality /Panchayat Towns.
Name of the
Mandai
1.
5. Serilingampalle
6. Balanagar
Name of the
Village
2.
Chandan agar
Darga Hussainshabowli
Gopanpalle
Gafoornagar
Gachibowli
Guttalabegumpet
Hafeezpet
Izzathnagar
Kondapur
Kothaguda
Khanammet
Khajaguda
Madinaguda
Miyapur
Maktha Mahbubpet
Madhapur
Nalagandla
Nanakramguda
Ramannaguda
Raidurg Panmaktha
Raidurg Khalsa
Raidurg Nowkhalsa
Raidurg Paigah
Serinalagandla
Serilingampalle
Taranagar
AUapur
Bobbuguda
Bhagmeeri
Kukatpalle (M)
Shamshiguda
L.C.No. t.C.No. N arne of the Municipality /
of of Panchayat in which the
1991 1981 village is included.
3. 4. 5.
6 8' 22 43
3 23
16 25
17 24
20 26
11 14
12 15
13 22
14 21
15 20
25 31
7 13
9 6
10 4 Serilingampalle(M)
19 27
2 11
26 32
8 7
18 29
21 28
23 42
24 30
1 10
4 12
I) 9
5 19 Kukatpalle(M)
6 18
3 2
2 3·

57
Name of the Name of the L.C.No. L.C.No. N arne of the Municipality /
MandaI Village of of Panchayat in which the
1991 1981 village is included.
1- 2. 3. 4. 5.
6. Balanagar (Coneld .. )
Ferozguda 12 16
Hasmathpet 14 14
Hydernagar 1 5
Bowenpalle 13 15
Jinkalwada 8 1
Kukatpalle 4 16 Kukatpalle (M)
Moosapet 7 17·
Balanagar 9 17
Begumpet Paigah 11 19
Fateh Nagar 10 18 ;
7. Quthbullapur Gajularamaram 12 68
Jeedimetla 15 76
N amdarnagar @ Silarguda 13 78
Petbashirabad 18 74 Quthbullapur (M)
Quthubullapur 14 77
Suraram 6 7~j
9. Shamirpet Singaipalle 25 79 O.G. to Alwal (M)
10.Malkajgiri Dammaiguda 2 13
Farzandguda 5 2
Lothkunta 1 6
Alwal 3 7
Akbarjha 6 I)
Ammuguda 11 12 Alwal (M)
Kowkur 8 3
Mahadevpur 9 9
Machabolaram 4 4
Turkapalle 7 1
Yapral 10 8
Malkajgiri 12 11 Malkajigiri(M)
11.Keesara Kapra 12 10 Kapra (M)
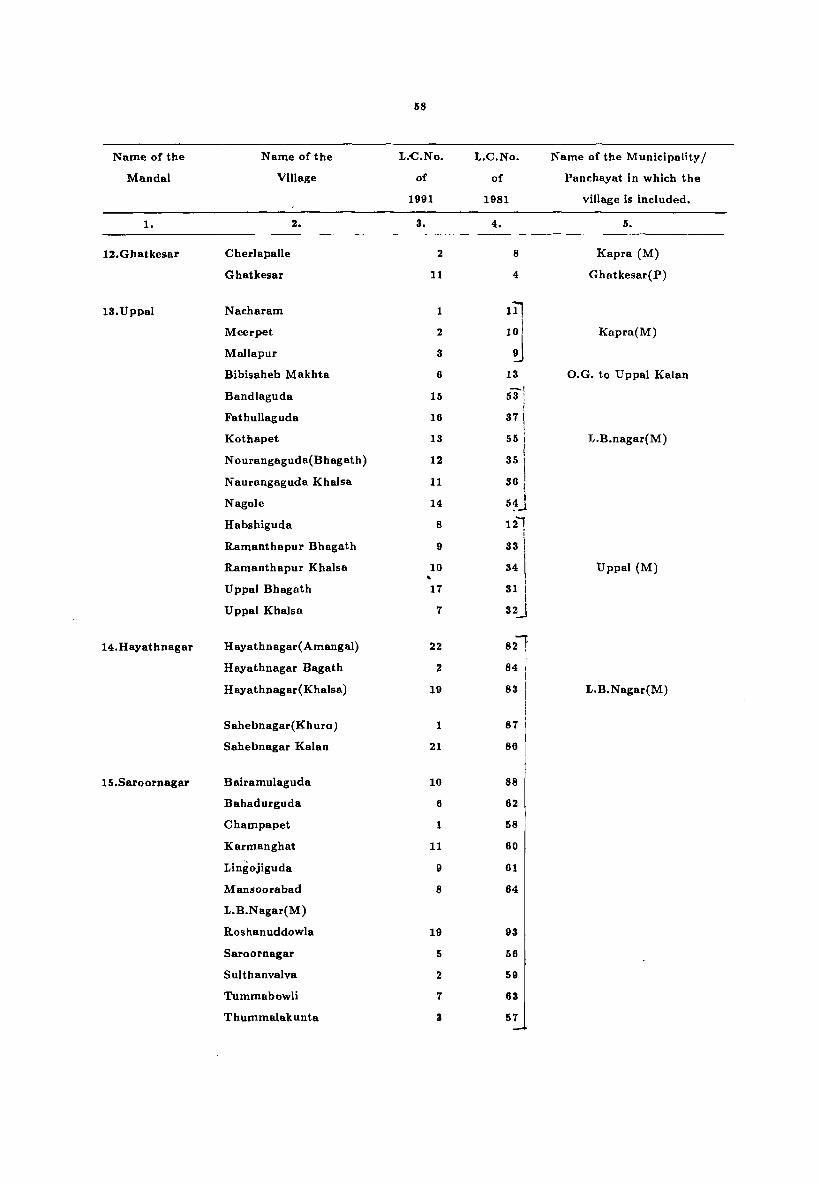
58
Name of the Name of the L.e.No. L.C.No. Name of the Municipality /
Mandai Village of of Panchayat in which the
1991 1981 village is included.
1. 2. 3. 4. 5.
12.Ghatkesar Cherlapalle 2 8 Kapra (M)
Ghatkesar 11 4 Ghatkesar(P)
13.Uppal Nacharam 1 lil Meerpet 2 10l Kapra(M)
Mallapur 3 J Bibisaheb Makhta 6 13 D.G. to Uppal Kalan
Bandlaguda 15 -I
53 ~ , , Fathullaguda 16 37[ Kothapet 13 55 I JJ.B.nagar(M)
N ourangaguda(Bhagath) 12 35 ! Naurangaguda Khalsa 11 36 1
I Nagole 14 54 I .J Habshiguda 8 u"l
i Ramanthapur Bhagath 9 33
Ramanthapur Khalsa 10 34 Uppal (M) .. Uppal Bhagath 17 31J Uppal Khalsa 7 32
14.Hayathnagar Hayathnagar(Amangal) 22 8t~ Hayathnagar Bagath 2 84
! Hayathnagar(Khalsa) 19 83 L.B. N agar(M) ! I
Sahebnagar(Kh ura) 1 87 I Sahebnagar Kalan 21 86
1
15.Saroornagar Bairamulaguda 10 88[
Bahadurguda 6 62 ,
Champapet 1 58
Karmanghat 11 60
Lingojiguda 9 61
Mansoorabad 8 64
L.B.Nagar(M)
Roshanuddowla 19 93
Saroornagar 5 56
Sulthanvalva 2 59
Tummabowli 7 63
ThummaIakunta 3 57

59
Name of the Name of the L.C.No. L.C.No. Name of the Municipality /
Mandai Village of of Panchayat in which the
1991 1981 village is included.
1. 2. 3. 4. 5.
15.Saroornagar (Coneld .. )
Balapur (D.G.) 20
"1 r Kothapeta (D.G.) 21 94 Hyderabad MC (Portion)
Mallapur (D.G.) 22 104
Venkatapur (D.G.) 24 10J
Gaddianaram 4 3 Gaddianaram (P)
16.Rajendranagar Attapur 21 ~ Budvel 28 68
Bumrukuddowla 30
::J Rajend ranagar(M)
Gaganpahad 34
Hyderguda 19 50
Hydershakot (O.G.) 18 52 Hyderabad MC (Portion)
Katedan 35 m I
Lakshmiguda 38 781
Madannaguda 40 861
Mailardevpalle 36 75! Rajendranagar{M) i
Premavathipet 33 731 !
Sagbowli 29 62! \
Sivrampalle(Jagir) 31 661
Sivrampalle(Paigah) 32 67! ! I
Upperpalle 20 511 -i
19.Viearabad Ananthagiripalle 26 5~1 Alampalle 9 35 \
Girgetpalle 8 36/ I
Gangaram 27 58 \
Kotrepalle 29 57 I ViCarabad(M) I
Kothagadi 10 24 ! , I
Sivareddipet 22 53 ! f
Viearabad 24 51 : I
Yennepalle 23 52J
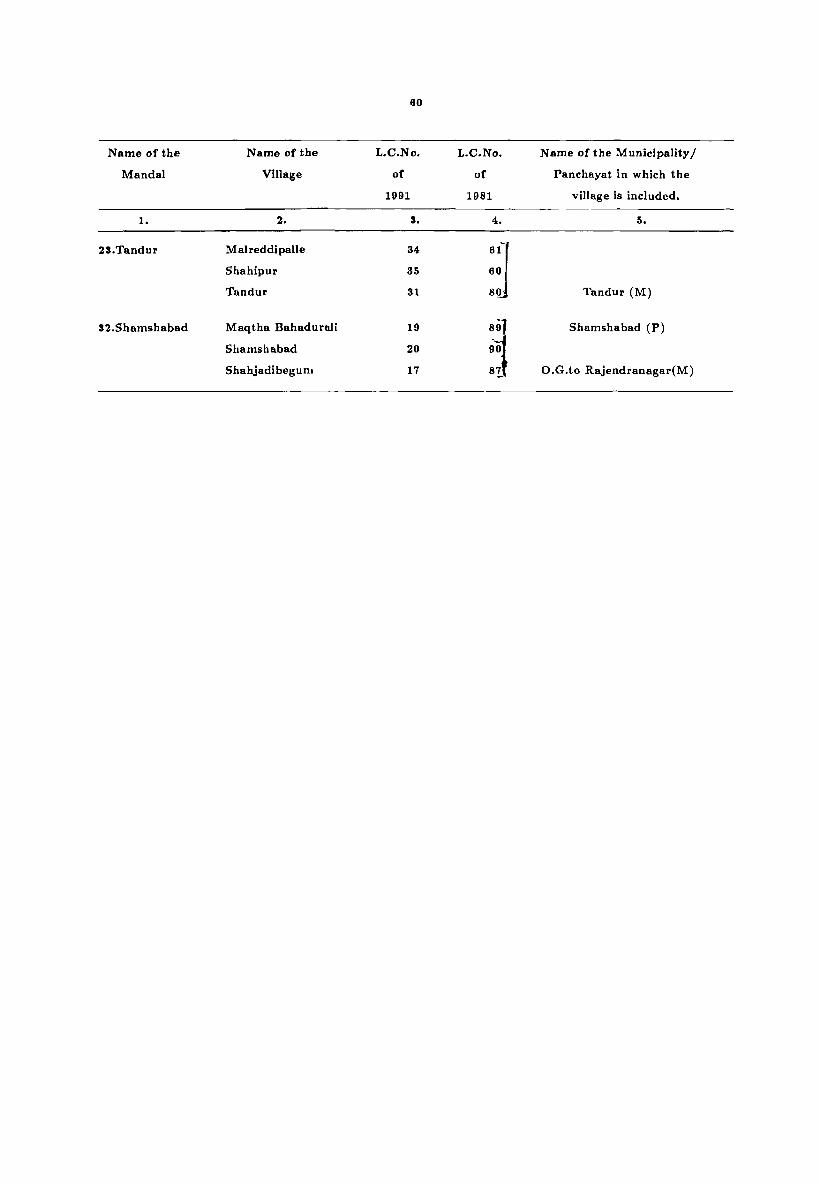
60
Name of the Name of the L.C.No. L.C.No. Name of the Municipality/
Mandai Village of of Panchayat in which the
1991 1981 village is included.
1. 2. 3. 4. 5.
23.Tandur Malreddipalle 34 61] Shahipur 35 60
Tandur 31 80 Tandur (M)
32.Shamshabad Maqtha Bahadurali 19 891 Shamshabad (P)
Shamshabad 20 .~ Shahjadibegum 17 87 O.G.to Rajendranagar(M)

VILLAGE DIRECTORY FOLLOWS

RANGA REDDY DISTRICT
Loca-tion Name of village Code No.
2
Total area of the village (In hectares)
3
Total Number of households
and population
Household.
4
Population
5
l.MARPALLE MANDAL PRAJA PARISHAD 1.
2.
3.
4.
5.
6.
7.
8.
9.
10.
11.
12.
13.
14.
15.
16.
17.
18.
19.
20.
21.
22.
23.
24.
25.
26.
n 28.
JAMSHEDAPUR
GHANPUR
MOGILIGUNDLA
KOMSHETPALLE
BILKAL
MALLlI{ARJUNGIRI
PILLIGUDLA
GUNDLAMARPALLE
THUMMALAPALLE
NARSAPUR
DARGULI'ALLE
PATLOOR
RAMAPUR
ALLAPUR
PANCHALINGAL
SIRPURA
VEERLAPALLE
KOTHLAPUR
MARPALLE-KALAN
KOTAMARPALLE
KUDGUNTA
BHUCHANPALLE
OAMASTHAPUR
SHAPUR
KOLKODA
PEDDAPUR
RAVALAPALLE
THIMMAPUR
2.MOMINPET M.P.P.
1.
2.
3.
4.
5.
6.
7.
RAVALAPALLE
I<OLKONDA
AMARADHI (KHURD)
AMARADHI (KALAN)
MEKAVANAMPALLE
RALLAGUDPALLE
TEKULAPALLE
214.08
1066.75
484.81
603.38
532.97
254.55
252.93
390.93
872.90
418.04
364.62
2178.42
246.05
165.92
611.48
1759.57
663.28
1137.97
2185.70
1364.19
474.29
1730.84
1402.64
469.84
2048.57
409.95
670.56
466.60
269.52
666.52
580.32
740.57
603.38
429.37
140.26
125 652
210 1224
156 763
381 2193
184 944
69 303
126 688
101 504
284 1495
188 1126
65 321
819 4987
36 245
12 53
344 1865
584 3265
245 1466
387 2231
868 4909
407 2279
59 315
515 2605
255 1292
78 384
460 2657
121 648
245 13.32
75 485
72 340
247 1537
184 1193
195 1032
294 1674
152 732
576 3093
62
Amenities available
VILLAGE Amenities and
(If not available within the villag~, the distance in broad ranges viz., -5 Kms., 5-10 Kills. and 10+ Kills. of the
nearest place where the facility available is given)
Educa.- Medical Drinking tional water
P
P
P
P,M
p
P
P
P
P
P
p
6 7
5-10
5-10
CHW
CHW
-5
5-10
5-10
5-10
5-10
5-10
-5
P;2,M,H D;4
-5 -5
-5 -5
P -5
P,M,H CHW
P CHW
P D
P;2,Mj2,H HC,O'
P CHW
P 5-10
P
P
P,M
P,M
P
P,M
P
p
-.5
5-10
-5
RP
-5
D
5-10
-5
(potable)
8
W
W
ill
W
W
W
W
W
W
W
W,HP
T,W
w W
W
W,R
W
W
W,TK
W
W
W
W
W
W
W
W
W
W,HP
Post and Telegraph
9
5-10
5-10
-5
PO
-5
-5
-5
5-10
PO
-5
-r,
PO,PHONE
-5
-5
PO,PHONE
PO,PHONE
5-10
PO,PHONE
PO,PHONE
PO,PHONE
5-10
PO,PHONE
.5-10
-5
PO,PHONE
PO,PHONE
PO
-5
P 5-10 W PO,PHONE
P
P
P
P
P,M
5-10 W,TW,HP -5
-5 T,W,TW,HP 5-10
CHW T,W,HP PO
-5 W,HP -5
5-10 T,W,HP PO
Commu
nications
10
5-10
5-10
BS
BS
-5
-5
-5
5-10
5-10
-5
-5
BS
-5
-5
BS
BS
5-10
BS
BS,RS
5-10
5-10
BS
5-10
-5
BS BS
5-10
fiS
-5
BS
BS
BS
BS
BS
BS

DIRECTORY Land use
Approach
to village
11
KR KR PR
PR
KR
KR
KR
KR
KR
KR
PR
PR
KR KR PR
PR
KR
PR
PR
KR
KR
PR
KR
KR PR
PR
KR PR
KR PR
PR
PR
PR
KR PR
Nearest town and distance
(in kms.)
12
SADASIVPET25
SADASIVPET23
SADASIVPET16
SADASIVPET 16
SADASIVPET14
SADASIVPET13
SADASIVPET27
SADASIVPET21
SADASIVPETll
SADASIVPET19
SADASIVPET22
SADASIVPET29
SADASIVPETZ5
SADASIVPETi1
SADASIVET 27
SADASIVPET20
SADASIVPET24
SADASIVPET25
SADASIVPET28
VICARABAD 28
SADASIVPET31
SADASIVPET30
SADASIVPET35
SADASIVPET33
SADASIVPET33
SADASIVPET25
VICARABAD 30
VICARABAD 30
SADASIVPET16
SADASIVPET16
SADASIVPETI0
SADASIVPETI0
SADASIVPET17
SADASIVPET 9
SADASIVPET17
Power supply
13
ED
ED
ED
EA
ED,EAG
ED
ED
ED,EAG
ED
EA
ED,EAG
ED,EAG
ED,EAG
ED,EAG
ED,EAG
ED,EAG
EA
ED
EO
ED,EAG
ED
ED
ED
ED
ED
ED
ED,EAG
EA
EA
EA
EA
ED,EAG
ED,EAG
Forest
14
63
Land use (i.e. area under different type, of land use ill heclares
rounded uplo 2 decimal places)
Location Code No. Irrigated by Source
15
W;I1.74
W;124.28
W;lD.52
TK;2l.4·1, W;16.19
GC;20.24, W; 12.95
W;2.43
W;11.22
W;I.62
W;17.80
W;4.05
W;2.03
W;32.78,TK;22.66
W;38.85
W;8.92
W;26.30
W;122.06
GC;23.87
W;16.19
W;202.3-1
W;lO.22
W;4.01
W;50.58
GC;7.28,W;2.43
W;20.2·1
W;8.09
W;6.07
W;8.09
W;Z.03
W;8.10
W;16.19
W;40.00
Wi57.00
W;2.84
WjI6.11
WEj3.01,TK;1.02
Un-Irrigated
16
Culturable
Area not aval-
Waste lable for
cultivation
17 18
1. MARPALLE MANDAL PRAJA PARISHAD
164.71
853.48
420.87
422.09
426.13
212.86
216.62
:153.70
507.89
325.37
205.84
1594.46
115.74
82.00
190.88
251.69
447.58
8i8.57
1640.24
103.3.56
167.94
908.02
1619
172.80
863.19
273.57
341.06
104.85
226.62
583.96
300.00
300.39
472.22
200.00
57.00
51.40
48.56
25.03
14.57
232.78
43.30
216.10
89.34
157.47
692.91
201. 53
293.40
41.87
100.00
485.62
510.61
25·1..54
500.23
119.79
200.00
80.00
31.62
37.23
200.00
300.00
114.00
ll3.26
4.3.00
37.63
37.59
53.42
95.10
48.62
39.26
25.09
21.04
114.43
88.62
113.45
312.42
2.12
75.00
236.83
692.91
191.83
41.68
49.72
278.54
202.31
286.62
857.13
22.26
677.06
10.52
121.41
279.72
2
3
4
5
6
7
8
9
10
11
12
13
14
15
Ie 1/
18
19
20
21
22
23
24
25
26
27
28
2. MOMINPET M.P.P,
3.18
29.14
40.32
83.18
14.32
100.00
36.2:1
2
3
4
5
G
7
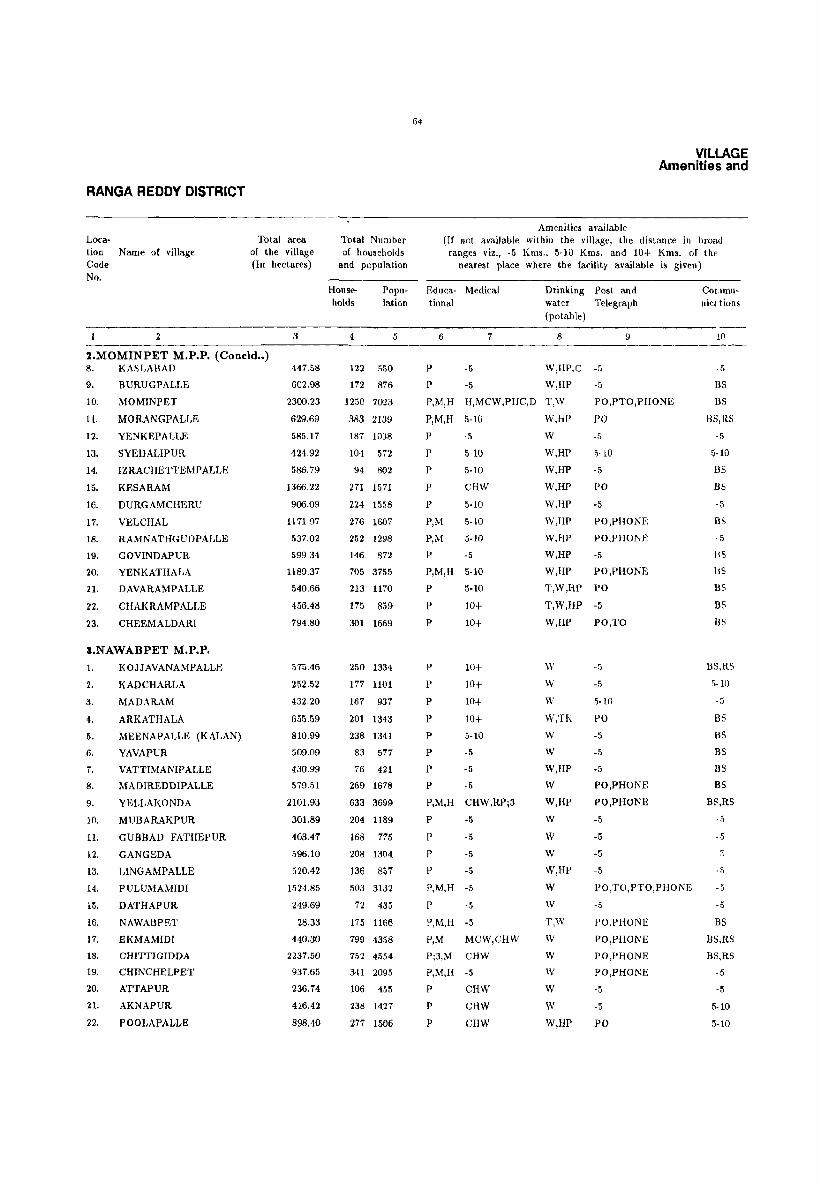
RANGA REDDY DISTRICT
Loca· tion Name of villa.ge Code No.
2
Total area of the village (In hectares)
3
2.MOMINPET M.P.P. (Concld .. ) 8. KASLABAD
9. BURUGPALLE
10.
11.
12.
13.
14.
15.
16.
17.
18.
19.
20.
21.
22.
23.
MOMINPET
MORANGPALLE
YENKEPALLE
SYEDALIPUR
IZRACHETTEMPALLE
KESARAM
DURGAMCHERU
VELCHAL
RAMNATHGUDPALLE
GOVINDAPUR
YENKATHALA
D AVARAMP ALLE
CHAKRAMPALLE
CHEEMALDARI
3.NAWABPET M.P.P.
1.
2.
3.
4.
5.
6.
r. 8.
9.
10.
11.
12.
13.
14.
15.
16.
17.
18.
19.
20.
21.
22.
KOJJAVANAMPALLE
KADCHARLA
MADARAM
ARKATHALA
MEENAPALLE (KALAN)
YAVAPUR
VATTIMANIPALLE
MADIREDDIPALLE
YELLAKONDA
MUBARAKPUR
GUBBAD FATHEPUR
GANGEDA
LINGAMPALLE
PULUMAMIDI
DATHAPUR
NAWABPET
EKMAMIDI
CHITTIGlDDA
CHINCHELPET
ATTAPUR
AKNAPUR
POOLAPALLE
447.58
602.98
2300.23
629.69
585.17
424.92
586.79
1366.22
906.09
1171.97
537.02
599.34
1189.37
540.66
456.48
794.80
575.46
252.52
432.20
655.59
810.99
509.09
430.99
579.51
2101.93
301.89
403.47
596.10
520.42
1524.85
249.69
28.33
440.30
2237.50
937.65
236.74
416.42
898.40
Total Number of households
and population
64
Amenities available
VILLAGE Amenities and
(If not available within the village, the distance in broad ranges viz., ·5 Kms., 5·10 Kms. and 10+ Kills. of the
nearest place where the facility available is given)
Households
Popu· Educa- Medical Drinking Post and water Telegraph (potable)
COI.nun· nicl tions lation tional
4
122 550
172 876
1250 7023
383 2139
187 1038
104 572
94 802
271 1571
224 1558
276 1607
252 1298
146 872
705 3755
213 1170
175 859
301 1669
250 1334
177 1101
167 937
201 1343
238 1341
83 577
76 421
269 1678
633 3699
204 1189
168 775
208 1304
136 857
503 3132
72 435
175 1166
799 4358
752 4554
341 2095
106 455
238 1427
277 1506
5
P
P
6
-5
-5
7 8
W,HP,C -5
W,HP -5
9
P,M,H
P,M,H
P
H,MCW,PHC,D T,W PO,PTO,PHONE
PO 5-10 W,HP
·5 W -5
P 5-10 W,HP 5-10
P
P
P
P,M
P,M
P
5·10
CHW
5·10
5-10
5-10
-5
P,M,H 5-10
p
p
p
p
P
P
5·10
10+
10+
10+
10+
10+
P 10+
P 5·10
P -5
P -5
P -5
P,M,H CHW,RP;3
P -5
P -5
P -5
P -5
P,M,H -5
P -5
P,M,H -5
P,M MCW,CHW
P;3,M CHW
P,M,H -5
P CHW
P
P
CHW
CHW
W,HP
W,IIP
W.HP
W,ll?
W,HP
W,HP
W,HP
-5
PO
-5
PO,PHONE
PO,PHONE
-5
PO,PHONE
T,W,HP PO
T,W,HP -5
W,HP PO,TO
\\'
W
W
W,TK
W
W
W,HP
W
W,HP
W
W
W
W,HP
W
W
T,W
W
W
W
W
W
W,HP
-5
-5
5-10
PO
-5
-5
-5
PO,PHONE
PO,PHONE
-5
-5
-5
-5
PO,TO,PTO,PHONE
-5
PO,PHONE
PO,PHONE
PO,PHONE
PO,PHONE
-5
-5
PO
10
-5
BS
BS
BS,RS
-5
5-10
BS
BS
·5
BS
5
ISS
liS
BS
B5
IlS
BS,RS
5-10
·5
BS
BS
BS
BS
BS
B~,RS
5
-5
-~
-5
-5
BS
BS,RS
BS,RS
-5
-5
5-10
5-10

DIRECTORY Land use
Approach
to "iJlage
11
KR PR
I'll.
PR
KR
KR
PR
PR
KR PR
KR
KH.
PR
PR
PH.
PR
PH KR
KR
PR hR
hIt
PR
PR
I'll
KR KR KR
KR
I<R
I\R
PR
PR KR I(R
KR KR KR
Nearest town and distance
(ill kms.)
12
SADASIVPETll
SADASIVPETlO
SADASIVPET [3
VICARABAD 19
VICARABAD 32
VICARABAD 31
VICARABAD 27
VICARABAD 25
VICARABAD 19
VICARABAD 16
VICARABAD 14
VICARABAD 22
SADASIVPET19
VICARABAD 32
SADASIVPET26
SADASIVPET26
VICARABAD 12
VICARABAD 16
VICARABAD 19
VICARABAD 26
VICARABAD 26
VICARABAD 28
VICARAB.-\O 22
VICARABAD 25
VICARABAD 28
VICARABAD 30
VICARABAD 28
VICARABAD 24
VICARABAD 25
VICARABAD 19
VICARABAD 20
VICARABAD 20
VICARABAD 12
VICARABAD 16
VICARABAD 10
VICARABAD 14
VICARABAD 18
VICARABAD 2Z
Power supply
13
ED,EAG
ED,EAG
EA
ED.EAG
ED,EAG
ED
ED,EAG
ED.EAG
ED,EAG
ED,EAG
ED,EAG
ED,EAG
EA
ED,EAG
ED,EAG
EA
EA
EA
ED,EAG
ED,BAG
EA
EA
EA
EA
EA
EA
ED,EAG
ED,EAG
ED,EAG
ED,EAG
ED,EAG
EA
ED,EAG
ED,EAG
ED,EAG
ED,EAG
ED,EAG
ED,EAG
Forest
14
141.64
193.00
65
Land use (i.e. area under different types of land use in hectares
rounded uplo 2 decimal places) Location CodL No. Irrigated by Source
1.5
W;J.03
W;1O.13
TK;19.20
W;87.12
W;1.01
W;93.25
W;19.36
W;83.00
TI<;1l0.12
\V;48.00
W;93.00
\\,;,,5.43
W;152.07
W:28.00
\V ;22.30
W;48.20
WE;36.00
WE;16.00
WE;HOO
WE;lO.OO
WEj48.00
WE;20.00
WE;12.00
WE;12.00
WE;16.00
WE;20.00
WE:16.00
WEjI2.00
WE;12.00
WE;57.00
WE;40.00
WE;8.00
W;80.00
W;132.00
W;22.00
W;4.00
W;8.00
W;18.00
tIn-Irrigated
16
244.72
730.00
200.17
222.75
150.20
251.43
237.18
392.67
430.90
132.88
HO.51
315.07
284.27
77.41
345.30
296.00
125.00
217.00
249.59
224.00
196.00
180.00
194.00
1229.00
143.00
308.00
384.00
130.00
016.00
120.00
12.33
74.66
687.00
170.00
94.00
179.00
249.00
Culturable
Waste
17
300.00
200.00
794.03
292.10
36.21
120.30
300.00
986.04
400.00
499.:37
298.41
100.40
199.96
100.00
300.·lD
300.30
205.46
95.52
179.20
354.00
280.99
190.00
200.00
260.51
755.93
111.89
56.47
160.00
256.42
479.85
39.69
4.00
100.00
636.00
456.65
124.74
169.00
392.00
Area not avai
lable for cultivatiQn
18
2. MOMINPET M.P.P. (Coneld .. ) 101.0J
148.13
757.00
50.30
32.5.20
61.17
16.00
60.00
33.30
193.70
12.73
353.00
522.27
128.39
5h37
101.00
8
9
10
11
12
13
14
15
16
Ii
Ib
19
20
21
22
23
3. NAWABPET M.P.P.
38.00
16.00
12.00
12.00
258.00
103.09
38.99
113.00
101.00
2i.OO
noo 40.10
122.00
72.00
50.00
4.00
14.00
589.50
289.00
14.00
60.42
239.40
3
4
6
7
8
9
10
11
12
13
14
15
16
17
18
19
20
2)

RANGA REDDY DISTRICT
Loca-tion Name of village Code No.
1 2
4.SHANKARPALLE M.P.P.
1.
2.
3.
-1.
5.
6.
7.
8.
9.
10.
11.
12.
13.
14.
15.
16.
17.
18.
19.
20.
21.
DHOBIPET
FATHEPUR
SINGAPUR
SHANKARPALLE
BHULKAPUR
KONDAKAL
MOKILA
DONTHANPALLE
JANWADA
MAHARAJPET
GOPULARAM
PRODDUTUR
TANGUTUR
ELWARTHY
RAMANTHAPUR
CHANDIBBA
RAVALPALLE (KALAN)
SANKEPALLE (KHALSA)
SANKERPALLE(PAIGHA)
ANTHAPPAGUDA
MASANIGUDA
22. HUSSAINIPUR
23. PARVEDA (CHINCHALAM)
24. PARVEDA (KHALSA)
25. YERVAGUDA
26. KOTHAPALLE
7.QUTHBULLAPUR M.P.P.
1.
2.
3.
4.
5.
7.
8.
9.
10.
GAGILAPUR
NAGLUR
DUNDIGAL
DOMMARA POCHAMP ALLE
BAHADURPALLE
BHOWRAMPET
SHAMBHUPUR
MALLAMPET
BACHPALLE
66
Amenities available
VILLAGE Amenities and
Total area Total Number (If not available within the village, the distance in broad ranges viz., -5 Kms., 5-10 Kms. and lOt Kms. of the
nearest place where the facility available is given) of the village of households (In hectares) and population
House- Popu· holds lation
3 4 5
Educational
6
6011 Pj2,M,H
1379 P
2426 P
Medical
7
FPC,O
CHW
-5
Drinking Post and water Telegraph (potable)
8
T,W
T,W
PO
-5
T,W,TW -5
9
3219.27
694.03
787.11
788.33
893.54
1090
226
454
1176
428
566
441
6649 P,M,H,C,AC,O H,PHC,O,RP,O T,W,TW,N PO,TO,PTO
1483.98
844.17
560.49
1904.04
235.53
314.44
1064.32
1226.19
1072.41
261.43
603.38
301.09
218.53
1.00
410.35
163.09
152.97
784.68
632.52
163.09
493.72
797.63
509.09
2027.87
722.36
578.29
1446.58
62.32
236.74
1214.86
95
780
224
214
395
405
315
128
202
294
214
175
192
20
98
341
135
257
268
111
1178
334
406
676
71
280
269
2421 P,M PHS,CHW W,TW PO
3205 P,M
2430 P
594 P
4918 P;2,M
1064 P,M
1040 P
2141 P,M,H,AC
2335 P
1937 P
663 P
1153 P
1640 P
1038 P
PHS,CH\V
5-10
-5
H,HC,D
O,CHW
-5
CHW,RP
PHS
-5
-5
CHW
5-10
5-10
-------- Un-Inhabited
1208 P
1052 P
145 -5
511 P;2,M;2
1808 -5
821 P
1493 P
2017 P
566 P
6482 P,M,H
1650 P
1908 P
3721 P,M,H
363 P
1347 P
1240 P
10+
5-10
-5
PHS
5-10
-5
10+
-5
5-10
H,PHC,O
-5
° H
-5
PHC
5-10
T,W,TW PO
W,TW
TW
T,W,TW
T,W
T,W
W,TW
W,TW
W,TW
W,TW
W,TW
W,TW
T
PO
-5
PO,PHONE
PO,PTO
-5
PO,PHONE
PO
PO
-5
-5
PO
PO
T,W -5
T,W PO
T,W
W,TW
W
W,TW
T,W
W,TJ{
W,TI(
W,TK
W,TK
W
W,TK
W,HP
T
T
-5
PO
-5
PO
PO
-5
5-10
PO
-5
-5
PO
Commu· nications
10
BS
BS
BS
BS,RS
-5
BS BS
BS
BS
RS
~S
HS BS
-5
-5
-5
5-10
-5
-5
5-10
-5
BS
-5
-5
'IS
BS
BS
BS
BS
BS
BS
BS
BS
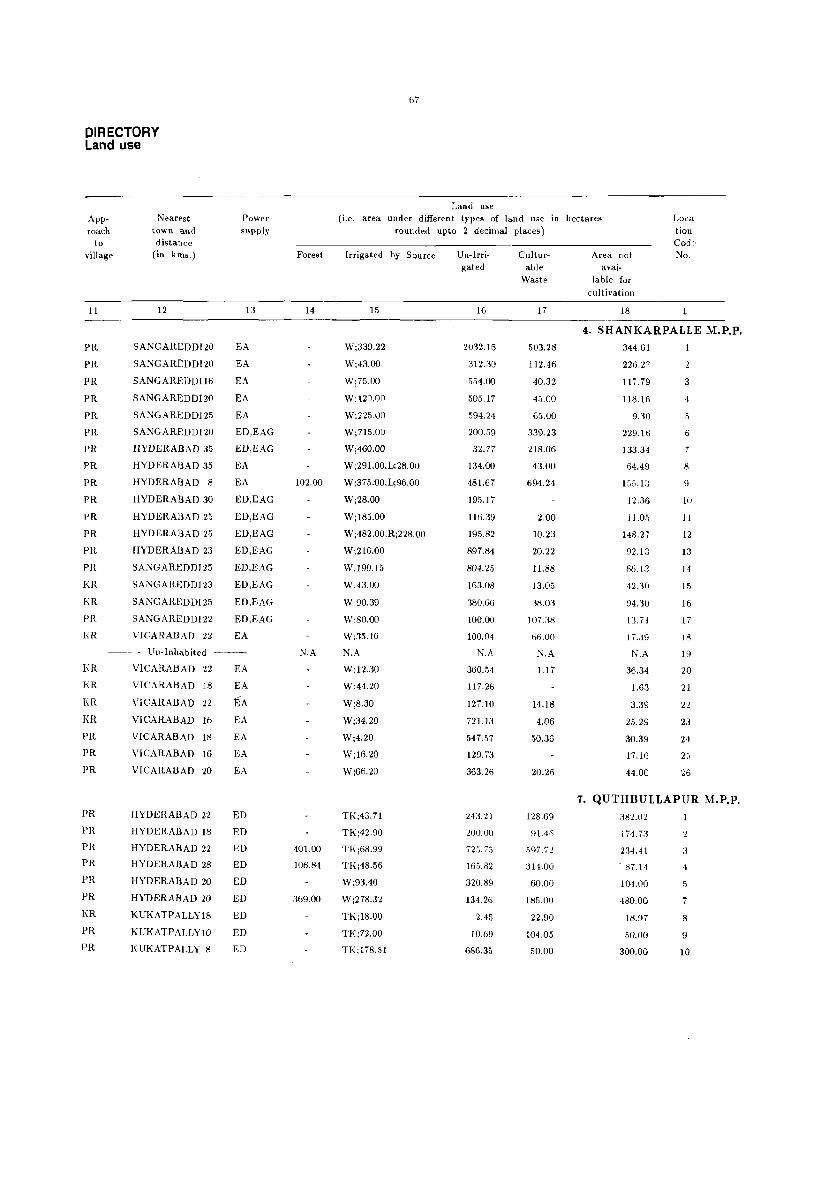
DIRECTORY Land use
Approach
to village
11
PR
PR
PR
PR
PR
PR
PR
PR
PR
PR
PR
PR
PR
PR
KR
KR PR
KR
Nearest town and
distance (in kms.)
12
SANGAREDDI20
SANGAREDDI20
SANGAREDDI16
SANGAREDDI20
SANGAREDDI25
SANGAREDDI20
HYDERABAD 35
HYDERABAD 35
HYDERABAD 8
HYDERABAD 30
HYDERABAD 25
HYDERABAD 25
HYDERABAD 23
SANGAREDDI25
SANGAREDDI23
SANGAREDDI25
SANGAREDDI22
VICARABAD 22
Power supply
13
EA
EA
EA
EA
EA
ED,EAG
ED,EAG
EA
EA
ED,EAG
ED,EAG
ED,EAG
ED,EAG
ED,EAG
ED,EAG
ED,EAG
ED,EAG
EA
---- Un-Inhabited ----
KR KR
KR KR
PR
PR
PR
PR
PR
PR
PR
PR
PR
KR
PR
PR
VICARABAD 22
VICARABAD 18
VICARABAD 22
VICARABAD 16
VICARABAD 18
VICARABAD 16
VICARABAD 20
HYDERABAD 22
HYDERABAD 18
HYDERABAD 22
HYDERABAD 28
HYDERABAD 20
HYDERABAD 20
KUKATPALLY18
KUKATPALLYlO
KUKATPALLY 8
EA
EA
EA EA
EA
EA
EA
ED
ED
ED
ED
ED
ED
ED
ED ED
Forest
14
102.00
N.A
401.00
106.84
369.00
67
Land use (Le. area under different types of land use in hectares
rounded up to 2 decimal places) Loca
tion Coo,,
No. Irrigated by Source
15
W;339.22
W;43.00
Wj75.00
W;t20.00
Wj22G.OO
Wj715.00
W;460.00
W ;291.00,Lj 28.00
W;375.00,Lj96.00
Wj28.00
W;185.00
W j482.00,Rj228.00
Wj216.00
W;190.15
W;43.00
W;90.39
W;80.00
W;.15.1O
N.A
W;12.30
Wj44.20
W;8.30
W;34.20
Wj4.20
Wj16.20
W;66.20
TKj43.71
TK;42.90
TKj68.99
TKj48.56
Wj93.40
Wj278.32
TK;18.00
TK;72.00
TKj178.51
Un-Irrigated
16
2032.16
312.30
554.00
50.5.17
594.24
200.59
32.77
134.00
481.67
195.17
116.39
195.82
897.84
804.2.5
163.08
380.66
100.00
100.Q4.
N.A
.360.54
117.26
127.10
721.13
547 .. 57
129.73
363.26
243.21
200.00
72G.75
165.82
320.89
134.26
2.45
10.69
686.35
Cultur
able Waste
17
503.28
112.46
40.32
45.00
65.00
339.23
218.06
13.00
694.24
2.00
10.23
20.22
11.88
13.05
38.m
107.38
66.00
N.A
1.17
14.18
4.06
50.36
20.26
128.69
91.46
597.i2
:114.00
60.00
185.00
22.90
104.05
50.00
Area not
available for
cultivation
18
4. SHANKARPALLE M.P.P.
:H4.61
226.27
117.79
118.16
9.30
229.16
133.34
64.49
155.1:l
12.36
11.05
148.27
92.13
66.13
42.:30
94.:50
13.71
N.A
36.34
1.63
3.39
25.29
30.39
17.16
44.00
3
4
5
6
7
8
9
11
12
13
14
15
16
17
18
19
20
21
22
23
24
26
7. QUTHBULLAPUR M.P.P.
31l2.02
174.73
234.41
. 87.14
104.00
480.00
18.97
50.00
300.00
2
:3
4
5
7
8
9
10

RANGA REDDY DISTRICT
Loca-tion Name of village Code NQ.
2
Total area of the village (In hectares)
3
7.QUTHBULLAPUR M.P.P. (Concld .. ) 11. NIZAMPET 389.71
16. DULAPALLE 970.84
17. KOMPALLE
8.MEDCHAL M.P.P. 1-
2.
3.
4.
5.
6.
7.
8.
9.
10.
11.
12.
13.
14.
15.
16.
17.
18.
19.
20.
21.
22.
23.
24.
25.
26.
27.
28.
29.
VELGALKUNTA
NUTANKAL
MAISIREDDIPALLE
KONAIPALLE
YELLAMPET
SOMARAM
RAVALKOLA
SHAHZADIGUDA
YADARAM
MURAHARIP ALLE
AKBARJAPET
ATIVELLE
DABIRPUR
BANDA MADHARAM
SRIRANGAVARAM
BANDAKUNTA
RAILAPUR
GJRMAPUR
GOUDAVELLE
MEDCHAL
pUDOOR
RAJ BOLLARAM
GHANPOOR
GOSAIGUDA
MUNIRABAD
SEETHARIGUDA
KANDLAKOI
POCHAMPALLE
KAZIGUDA
1077.68
73.25
852.67
251.31
175.23
556.44
140.02
2130.66
198.30
978.53
249.69
66.77
829.60
1134.33
424.92
1590.41
134.76
461.34
728.84
1261.40
1598.10
1353.67
165.52
487.24
99.55
324.56
37.23
663.68
1333.84
32.78
68
Amenities available
VILLAGE Amenities al1d
Total Number of households
and population
(If not available within the village, the distance in broad ranges viz., -5 Kms., 5-10 Kms. and 10+ Kms. of the
nearest place where the facility available is given)
Households
4
356
402
1166
305
74
36
214
120
517
182
114
110
55
304
639
130
410
155
302
568
2503
528
236
118
59
327
109
217
749
Population
Educa- Medical tional
5
1680 P
2231 P,M
4964 P,M
6
-5
o D,O
7
Drinking Post and water Telegraph (potable)
T
T
T
8
-5
PO
PO
9
--~------ Un-Inhabited ----------~
1519 P,M,AC
353 P
292 P,AC
940 P
5-10
5-10
-5
-5
488 P 5-10
2619 P,M,H,AC CHW
1005 -5
636 P
471 P
253 P
-5
-5
-5
-5
1591 P;2,M,H -5
3502 P,M,AC,O D
736 P,AC CHW
2152 P,M,H,AC PHC,CHW,RP,O
587 P RP
RP
-5
U n- Inhabited
W,TW
TW
TW
TW
W,TK
PO,TO,PHONE
-5
-.5
PHONE
PHONE
W,TK,HP PO,TO
W,HP
W,HP
HP
-5
PO
-5
W,TK,HP -5
T,W
TW
T,TW
T,TW
T,HP
W,HP
TW,HP
PO,PHONE
PO,PHONE
-5
PO
-5
17<15 P,O
2869 P;2
12970 P,M,H, C,AC,O
H,MCW,MH,PHC, T,W HC,O,CHW,RP
PO
PO,PHONE
PO,TO,PTO
2935 P,M,H
1297 P
586 P
291 P
1471 P
526 P
1031 P
3779 P
Mew CHW
-5
-5
-5
5-10
5-10
B,O,O
W,HP
W,HP
W,HP
W,HP
W,HP
W
HP
TW
PO
PO
-5
·5
-5
5-10
-5
PO,PHONIU
--------- Un-Inhabited ----------~
Communications
10
BS
BS
BS
BS
-5
-5
BS
-5
BS
-5
B" BS
BS
BS
BS,RS
BS
BS
BS
BS
BS,RS
BS RS
BS
BS
-5
-5
BS
BS
RS
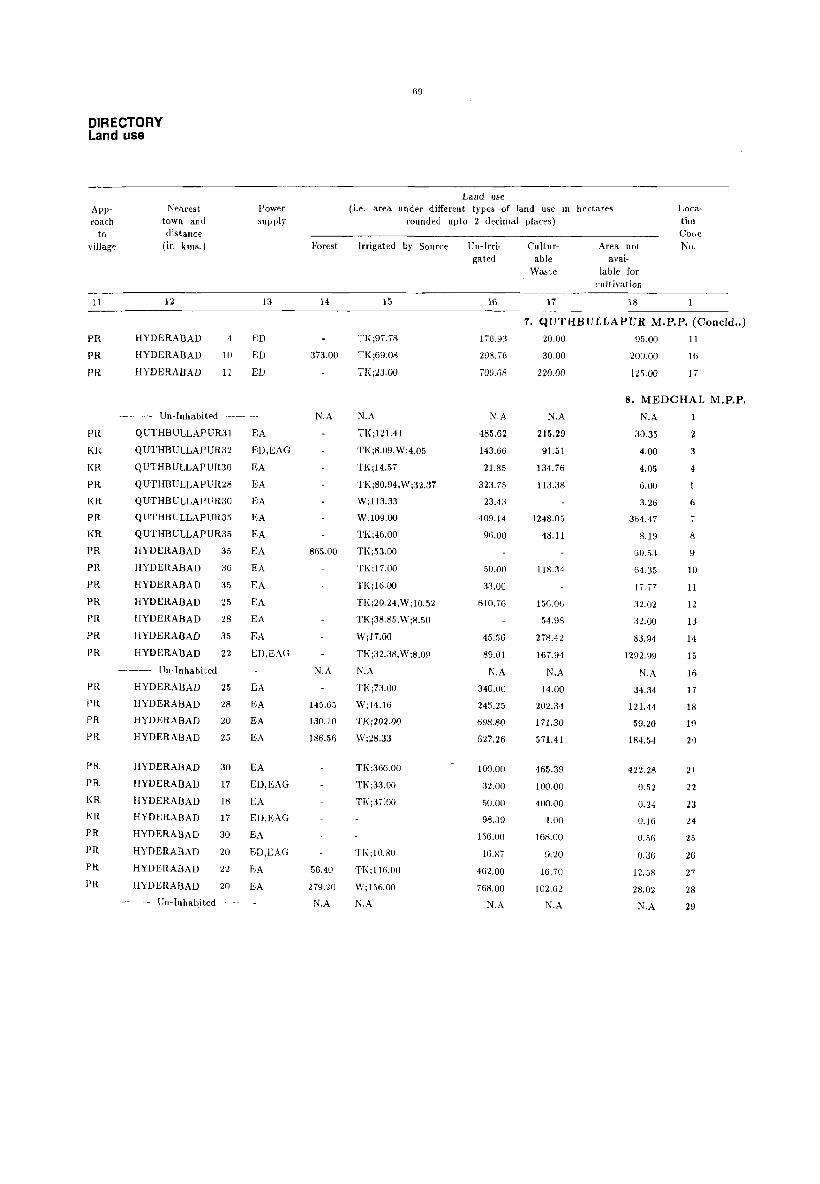
DIRECTORY Land use
Approach
to village
11
PR
PR
PR
PR
KR
KR
PR
KR
PR
KR
PR
PR
PR
PR
PR
PR
PR
PR
PR
PR
PR
PR
PR
KR KR
PR
PR
PR
PR
Nearest town and distance
(in kms.)
12
HYDERABAD
HYDERABAD
HYDERABAD
4
10
11
Power supply
13
ED
ED
ED
---- Un-Illhabited -----
QUTHBULLAPUR31
QUTHBULLAPUR32
Q UTHB ULLAPUR30
QUTHBULLAPUR28
Q UTHB ULLAPUR30
QUTHBULLAPUR35
QUTHBULLAPUR35
HYDERABAD
HYDERABAD
HYDERA8AD
HYDERABAD
HYDERABAD
HYDERA8AD
HYDERABAD
35
36
35
25
28
35
22
EA
ED,EAG
EA
EA
EA
EA
EA
EA
EA
EA
EA
EA
EA ED,EAC;
---- LTn-Inhabited ----
HYDERABAD
HYDERABAD
HYDERABAD
HYDERA8AD
HYDERABAD
HYDERA8AD
HYDERABAD
HYDERABAD
HYDERABAD
HYDERABAD
HYDERABAD
HYDERABAD
25
28
20
25
30
17
18
17
30
20
22
20
EA
EA
EA
EA
EA
ED,EAG
EA
ED,EAG
EA
ED,EAG
EA
EA
---- Un-Inhabited ----
Forest
14
373.00
N.A
855.00
N.A
145.65
130.10
186.56
56.40
279.20
N.A
69
Lalld use (i.e. area under different types of land use in hectares
rounded upto 2 decimal places)
LocatiO! CO(le
No. Irrigated by Source
15
TKj97.78
TKj69.08
TKj23.00
N.A
TK;121.41
TKj8.09,W;4.05
TKj14.57
TKj80.94,Wj32.37
Wi 113.33
Wj109.00
TK;46.00
TK;53.00
TK;17.00
TK;16.00
TK;20.24, W j10.52
TK j38.85, W j8.50
W;17.00
TK j32.38, W ;8.09
N.A
TK;73.00
W;14.16
TKj202.00
W;28.33
TK;36G.00
TKj33.00
TKj:n:OO
Tl\i 10.80
TKj1l6.00
W;156.00
N.A
Un-Irrigated
16
176.93
298.76
i09.68
N.A
485.62
143.65
21.85
323.75
23.43
409.14
96.00
50.00
33.00
610.76
45.56
89.01
N.A
340.00
245.25
598.80
627.26
100.00
:32.00
SO.OO
98.39
156.00
16.8i
462.00
768.00
N.A
Culturable
Waste
17
Area not avai
lable for cultivatioll
18
7. QUTHBULLAPUR M.P.P. (Coneld .. )
20.00
30.00
220.00
N.A
215.29
91.51
134.76
113.38
1248.05
48.11
118 .. 34
156.0(j
54.98
278.42
167.94
N.A
14.00
202.34
171.30
571.41
465.39
100.00
400.00
1.00
168.00
9.20
16.70
102.62
N.A
95.00
200.00
125.00
11
16
17
8. MEDCHAL M.P.P.
N.A
30.35
4.00
4.05
6.00
3.26
364.47
8.19
60.53
64.35
IT.77
32.02
32.00
83.94
1292.99
N.A
34.34
121.44
59.20
184.54
422.28
0.02
0.24
O. [(j
0.56
0.36
12.58
28.02
N.A
3
4
6
7
8
9
10
11
12
13
14
15
16
17
18
lil
2')
21
22
23
24
25
26
27
28
29

RANGA REDDY DISTRICT
Loca· tion Name of village Code
No.
2
9.SHAMIRPET M.P.P.
1.
2.
3.
4.
5.
6.
7.
8. 9.
TURKAPALLE
KOTHUR
POTHARAM
ANANTHARAM
NARAYANPUR
LAKSHMAPUR
MOODtJCHINTALAPALLE
NAGISETTIPALLE
KESHAVARAM
10. SAMPANBOLE
II. LALGADIMALAKPET
12. MAJIDPUR
13. ALIABAD
14. JAGGAMGUDA
15. ADRASPALLE
16. LINGAPUR
17. UDDEMARRI
18. HOSHYARPALLE
19. KESAVAPUR
20. YAKHATPURA
21. PONNAL
22. BOMRASPET
23. SHAMIRPET
24. DEVAR YAMJAL
26. POTHAIPALLE
27. MANDAIPALLE
28. THUMKUNTA
29. ANTAIPALLE
30. JAWAHAR NAGAR
1l.KEESARA M.P.P.
1.
2.
3.
4.
5.
6.
7.
THIMMAIPALLE
DHARMAVARAM
NARSAMPALLE
YADGARPALLE(WEST)
KEESARA
YADG ARP ALLE(EAS T)
HARIDASPALLE
Total area of the village (In hectares)
3
1305.11
1398.59
288.14
424.92
109.51
543.90
282.47
157.83
652.76
446.77
1864.79
186.56
1050.56
562.11
.525.(;9
188.18
962.34
5099
2564.26
496. \4
1187.75
1423.68
1458.08
1883.00
218.9:1
117.36
1534.56
-143.5:1
2418.80
610.67
441.51
210.03
414.40
2918.18
212.46
314.44
Total Number of households
and population
Households
4
Population
521 2725
511 2740
88 .J.14
245 1190
106 575
387 2043
283 HelO
128 684
333 1847
143 SHI
697 3081
178 882
824 427·1
386 1870
300 1656
68 3~)7
294 1591
199 887
J09 572
95 491
331 179:1
428 2101
1005 5678
1145 5832
2U 11.30
67 376
536 2701
77 372
975 :J738
)50 756
135 617
78 369
177 776
1201 6470
299 1701
14 70
70
Amenities available
VILLAGE Amenities and
(If not available within tile village, the distance in broad ranges viz., -5 KillS., 5·10 Kms. and 10+ Kms. of thE
nearest place where the facility availahle is given)
Educa- Medical tional
6
P,M
P
I'
I'
P,M
P
p
7
RP;2.0
RP
D
-5
5·10
5-10
MH,RP
-5
P(2), M,H HC, 0.0.
P,M
P
P,M.H
r.M I'
I'
P,M
P
I'
-5
RP
RP
-5
PHC,RP,O
RP
-5
-5
RP
-5
-5
-5
D
-5
Drinking Post and water Telegraph (potable)
8
W,HP
\\'.HP
W,HP
W,IIP
W
W,HP
W,HP
W,HP
9
PO
PO,TO
-5
PO,PHONE
-5
PO
PO, PHONE
-5
T,W,HP PO,TO,PHONE
W,HP
W,HP
W,I!P
W,lfP
W.llP
W,HP
W,!!P
W,HP
W
\V
W
W,IIP
W,!!P
PO,TO
PO,PHONE
-5
PO,PHONE
PO,PTO
PO, PHONE
-5
PO,PHONE
·5
" -.)
-5
:\!CW,PHC,FPC,O W,HP
PO,PHONE
PO
PO,PHONE
PO J',M,H
P
P
P.M
P
P
P,M
-5
P
P
I'HC,O
-0
·5
D
-5
5· 10
o -:J
5-10
P,M,H,O I!.PHC,D
P,M 5-10
-5 5-10
W,HP
W,HP
W,HP
W
W,HP
W,HP
TK,l!!'
\\'
\V
-5
·5
PO
·5
-;;
PO
5-10
5-10
W,TK.IIP PO
W,BP PO,l'1I0NE
W,TK,!!P PO,TO
W,HP 5-10
Conllnunict.1.t;ons
10
BS
BS
BS
BS
BS
BS
BS
-5
BS
BS
BS
BS
BS
BS
BS
BS
BS
BS
BS
-5
BS
BS
liS
tlS
BS
-5
HS
BS
US
US
BS
BS
BS
BS
BS
-.5

DIRECTORY Land use
Approach
to village
II
PR
PR
PR
PR
PR
PR
PR
PR
PR
PR
PR
PR
PR
PR
PR
PR
PR
KR
PR
KR
PR
PR
PR
PR
PR
PR
PR
PR
PR
PR KR
KR
PR
PR
PR
KR
Nearest town and distance
(in kms.)
12
HYDERABAD25
HYDERABAD28
HYDERABAD45
HYDERABAD42
HYDERABAD45
HYDERABAD45
HYDERABAD40
HYDERABAD43
HYDERABAD40
HYDERABAD22
HYDERABAD35
HYDERABAD35
HYDERABAD36
HYDERABAD39
HYDERABAD33
HYDERABAD18
HYDERABAD38
HYDERABAD40
HYDERABAD30
HYDERABAD20
HYDERABAD32
HYDERABADI8
HYDERABAD20
HYDERABADn
HYDERABAD15
HYDERABADI8
HYDERABAD17
HYDERABAD20
HYDERABAD22
HYDERABAD29
HYDERABAD36
HYDERABAD28
HYDERABAD20
HYDERABAD14
HYDERABAD2~
HYDERABADI0
Power supply
13
EA
EA
EA
EA ED,EAG
EA
EA
ED,EO
EA
EA
EA
ED,EAG
EA
EA
ED,EO
ED,EO
ED
EA
EA
EA
EA
EA
EA E1\
EA
EA
EA
EA
ED, EO
EAG
ED,EAG
EA
EA
EA
EA
Forest
14
213.22
200.00
10.00
160.00
185.90
25.00
146.06
1453.11
79.72
·10.16
326.00
175.26
444.10
38.46
104.13
101. 22
22.05
71
Land use (i.e. area under different types of land use in hectare,
rounded up to 2 decimal places)
Irrigated by Source
15
TK:171.16
W;20.25
TK;96.38
W;H.38
TI<;192.00
W;93.13
O;16.26,TK:8.15
TK;95.16,0; 13.19
0;4.00,TK;3.00
TI\;tl8.22,R;77 .70,W E;25.3 \
TK;287.24,O;35.00
0;208.03
TK;41.28
0;6.37
TI<;32.27
0;139.02
TK;55.20
W;12.00
W;12.00
W;140.00
TK;148.33
TK;18.00
W;20.00
Un-Irrigated
16
GI1.56
763.39
2:.17.83
7:1.40
1.38.81
53.05
111.24
335.28
.3,32.56
11..';5
GO·I.0~
411. 5·j
369.63
178.1U
794.26
36.94
135.00
467.84
746 .. 14
1254.43
123.43
852.17
99.92
869.16
376.19
1910.43
436.49
295.28
180.13
233.60
2366.87
132.39
180.00
CultUl'able Wast~
j ..
K'>. \t)
n".I)()
20.10
22.00
43.:;0
).Ju
2300.00
6.05
173.00
.50.00
20.00
411.50
H04
(;'62
20.00
140.00
(J.84
Area not avai
lalAc for
·cultivation
18
Locatior Co(le No.
9. SHAMIRPET M.P.P. 22 \.0,
160.20
20.06
9.5.1-1
16.32
166.00
101.2\)
22.18
63.07
94.11
370.13
63 .. 34
'20'1.24
1·15.27
156.06
10.08
168.08
14.05
89.10
28.30
109.36
169.25
364.15
772.80
177.65
11.07
201.30
35.07
369 .. 15
3
4
5
6
7
8
jv
11
12
13
14
15
16
17
18
19
20
21
22
23
2·'
26
27
28
29
30
11. KEESARA M.P.P. 32.02
6.06
11.28
20.80
161.76
-lO.(ll
113.60
2
3
4
5
6
7

RANGA REDDY DISTRICT
Loca-tion Name of village Code No.
2
Total area of the village (In hectares)
3
l1.KEESARA M.P.P. (Concld .. ) 8. CHIRYAL
9. KEESARA DAIRA
10.
11.
13.
14.
15.
16.
KUNDANPALLE
NAGARAM
AHMEDGUDA
GODMAKUNTA
RAMf'ALLB
BHOGARAM
12.GHATKESAR M.P.P. t.
3.
4.
5.
6.
7.
8.
9.
10.
12.
13.
14.
15.
16.
17.
18.
19.
20.
21.
PARVATHAPOOR
CHANGICHERLA
POCHARAM
YAMNAMPET
ISMAILKHANGUDA
PADAMATISAIGUDA
KONDAPUR
AUSHAPUR
ANKUSHAPUR
ANNOJIGUDA
MAJARGUDA
NAREPALLE
KACHWANI SINGARAM
MUTHAWALLIGUDA
PRATHAP SINGARAM
KORREMUL
BADESAHEBGUDA
EDULADAD
MADHARAM
14.HAYATHNAGAR M.P.P. 3.
4.
5.
6.
7.
8.
HATHIGUDA
TATTIANNARAM
TATTIKHANA
MARRIPALLE
QUTHBHULLAPUR
THIMMAIGUDA
1134,33
163.09
663.68
1419.26
158.64
358.96
2176.39
813.82
74.06
1055.01
700.10
388.09
152.57
135.57
862.62
919.04
814.58
300.28
33.18
507.07
401.85
111.69
487.24
1327.32
N.A.
1580.29
869.26
39.25
601.36
238.36
581.13
702.94
153.38
Total Number of households
and population
Households
Population
4
4M 2548
104 614
159 792
781 3902
198 975
215 1306
865 4411
363 1880
315 1619
255 1364
198 1022
403 1870
139 729
83 305
355 2155
599 2831
367 2090
278 1360
188 1017
220 1145
107 617
331 1605
986 5167
5
Amenitie~ '" .Lilable
VILLAGE Amenities and
(If not \\\ adaille within lh€ \ ilLo0, tlae distilHce in broad ranges ,·iz., -5 K,"s., ~-10 KillS. and 10+ KillS. of the
nearest place where the raeili') available is given)
Educa- Medical tiona!
6 7
P,M,H H
P 5-10
P 5-10
P,M,H -5
P
P
5-10
5-10
P,M,II 5-10
P 10+
P
P
P
P
P
P
P,M
P,M
5-10
RP
-5
-5
-5
-5
D
o P,M,H RP
P,M 5·10
Drinkiug Post and water Telegraph (potable)
W
HP
8
PO
-5
9
W,HP 5-10
W,TK,HP PO
W,HP
W,HP
5-10
-5
W,TK,HP PO
W,TK 1'0
W,HP PHONE
W,TK,HP 5-10
W,TK PO,PHONE
W -5
W
W
W,TK
W,TJ\
W
W,TK
-5
-5
PHONE
PHONE
PO,PHONE
pO,PHONE
Un· Inhabited
P
P,M
P
P,M
5-10
5-10
-5
RP
W
W
W
W,TK
P;2,M,H PHC,D,RP W,TI\
PHONE
PO,PHONE
PHONE
PO
PO,PHONE
COIllnlU
nications
10
as BS
BS
as BS
BS
tlS
BS
as as BS
BS
-5
BS
BS
BS
BS
as
BS
as BS
BS
BS
-------- Un-Inhabited -------~--
1360 7181
52 256
217 1091
4 31
121 753
334 1828
72 424
P;2,M.H PHC,D,RP TK,TW
P 5-10 HP
------- Un-Inhabited
P
-5
P
P
-5
5-10
5-10
-5
o -5
W
W
HP
W
W
PO,PHONE
PO,PHONE
5-10
-5
-5
PO
-5
BS
BS
BS
-5
10+ BS
BS

DIRECTOR'f Land use
Approach
to village
11
PR
KR
PR
PR
PR
PR
PR
PR
Nearest town and distance
(in kms.)
12
HYDERAIIAD 10
HYDERABAD 8
HYDERABAD 15
HYDERABAD 15
HYDERABAD 8
HYDERABAD 8
HYDERABAD 10
HYDERABAD 10
UPPALKALAN 6
tTPPALKALAN 8
UPPALKALANIO
UPPALKALAN 6
UPPALKALAN16
HYDERABAD 10
HYDERABAD 16
HYDERABAD 21
Power supply
13
EA
ED,EAG
EA
EA
EA
EA
EA
ED
EA
EA
EA
EA
EA
EA
EA
EA
PR
PR
PR
PR
KR
PR
PR
PR
PR
PR
UPPALKALAN26 EA
UPPALKALAN16 EA
---- Un-Inhabited ----
PR
PR
PR
PR
PR
PR
PR
PR
PR
PR
PR
PR
UPPALKALAN 10
UPPALI<ALANll
UPPALKALANll
UPPALKALANI0
UPPALKALAN13
EA
EA
EA
EA
EA
---- Un-Inhabited ----
UPPALKALAN34
UPPALKALAN24
EA
ED,EAG
--- Un-Inhabited ----
HYDERABAD 10
HYDERABAD 10
HYDERABAD 13
HYDERABAD 13
HYDERABAD 10
ED.EAG
EAG
ED,EAG
ED,EAG
ED,EAG
73
Land use (i.e. area under different types of land use in hectares
rounded upto 2 decimal places)
Loce.tiOH
Code No. Forest
14
206.12
275.71
N.A
329.47
N.A
N.A
Irrigated by Source
15
1'1\;136.00
1'1\;14.00
W;28.28
W;70.00
W;55.00
W;92.00
Wj300.00
W;182.80
W;34.06
Wi80.15,OilO·92
WE;33.59,O;6.88
WEi51.40,0;1.62
W;2L85
W;26.:10
Wi52.21 ,0;1.62
Wil80.00
WE;171.00,0;4.00
Oj28.33,WE;23.47
N.A 0;2.42
0;33.59,WF;20.25,WEj3.8!;
Oi31.04,WF;21.04,W i4.46
WF;121.42,0;38.68, W;3.42
WF;392.14,0;88.93,WE;57.8S
N.A
1'1(;2,51.35, W ;37. 24,0; 12.52
W;4.05,0;1.61
N.A
440.00 W;19.00
W;lD.OO
458.00 0;85.00
351.00 0;135.00,W;3.00
O;27.00,W;2.oo
Un-Irrigated
16
330.10
30.82
510.00
640.00
20.20
200.20
1684.00
530.48
17.00
noo 38.·1:'
19.1{1
41.69
53.02
85.00
50.19
44.52
N.A
13.76
7.43
7.11
8.00
N.A
62.35
52.18
N.A
8.00
4.00
13.00
Culturable
Wasle
Ii
Area not avaI
lable [or cultivation
18
11. KEESARA M.P.P. (Concld .. )
I 7..t I
5.40
175.14
9.79
28.36
172.39
69.74
39.00
:.!95.GO
2:17.22
75.35
51.44
547.88
;;07,49
-tH.03
73.16
N.A 77.71
1-12.07
18.47
200.44
421.64
N.A
1107.92
699.98
6.50.82
56.52
120.00
328.00
73.65
38.40
20.00
30.80
8
9
10
11
13
14
15
16
12. GHATKESA R M.P.P.
1.00
37!),63
369.41
112.71
35,54
16.14
207,89
146.55
192.36
130.80
N.A 97.47
188.33
29.25
116.17
357.83
N.A
408.91
111.44
3
6
7
8
9
10
12
13
14
15
11,
Ii
18
19
20
21
14. HAYATHNAGAR M.P.P. N.A
78.36
170.00
30.00
75.00
85.00
N.A
56.00
54.36
8.13
138.94
26.38
3
4
6
i
8
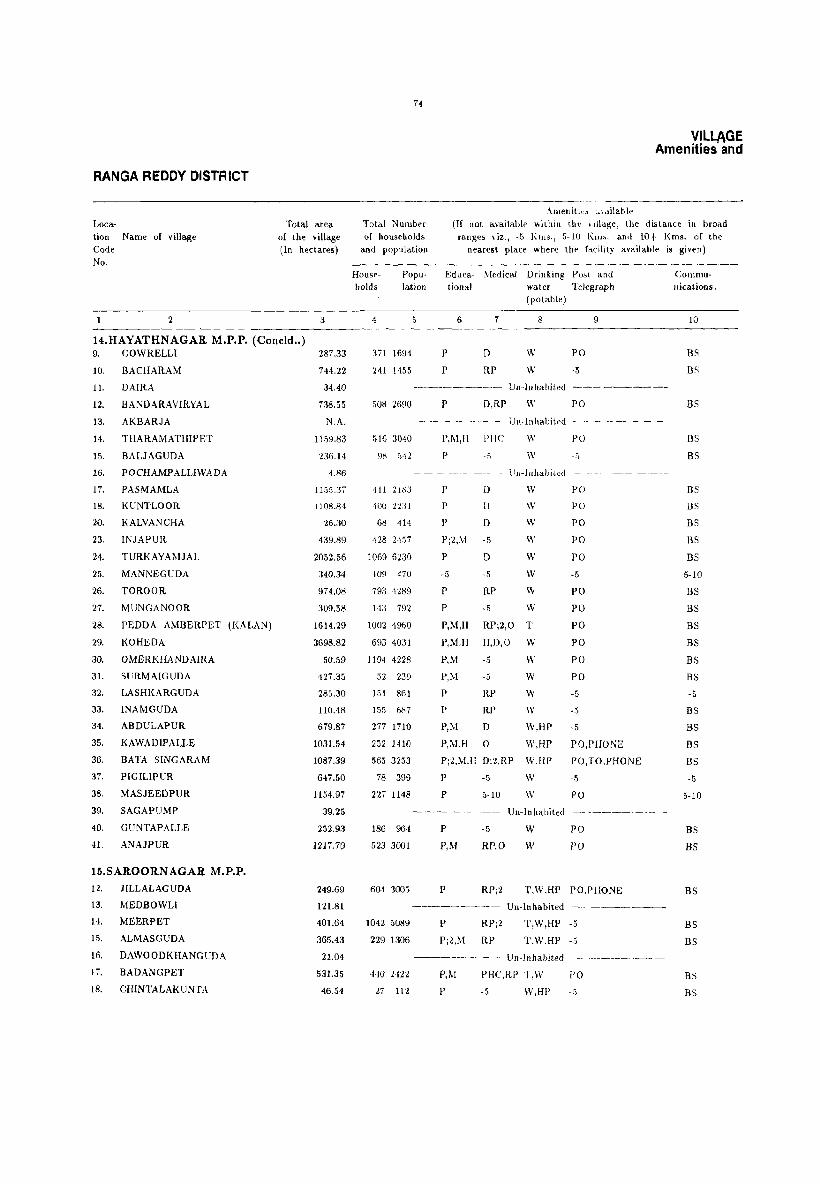
RANGA REDDY DISTRICT
Loca· tion Name of village Code No.
2
Total area of the village (In hectares)
3
14.HAYATHNAGAR M.P.P. (Coneld .. ) 9. GOWRELLI 287.33
10. BACHARAM 744.22
11.
12.
13.
14.
DAIRA
BANDARAVIRYAL
AKBARJA
THARAMATHIPET
15. BALJAGUDA
16. POCHAMPALLIWADA
17. PASMAMLA
18. KUNTLOOR
20. KALVANCHA
23. INJAPUR
24. TURKAYAMJAL
25. MANNEGUDA
26. TOROOR
27.
28.
MUNGANOOR
PEDDA AMBERPET (KALAN)
29. KOHEDA
30. OMERKHANDAIRA
31. SURMAIGUDA
32. LASHKARGUDA
33. INAMGUDA
34. ABDULAPUR
35. KAWADIPALLE
36.
37.
38.
39.
BATA SINGARAM
PIGILIPUR
MASJEEDPUR
SAGAPUMP
40. GUNTAPALLE
41. ANAJPUR
15.SAROORNAGAR M.P.P. 12.
13.
JILLALAGUDA
MEDBOWLI
14. MEERPET
15. ALMASGUDA
16. DAWOODKHANGUDA
17. BADANGPET
18. CHINTALAKUNTA
34.40
738.55
N.A.
1159.83
236.14
4.86
1155.37
1108.84
26.30
439.89
2052.56
340.34
974.08
309.58
1614.29
3698.82
50.59
427.35
285.30
110.48
679.87
1031.54
1087.39
647.50
1154.97
39.25
252.93
1217.70
249.69
121.81
401.64
365.43
21.04
531.35
46.54
74
Total Number of housebolds
and population
Allleniti._:;, :"'hiilable
VILLAGE Amenities and
(If not available "ilhin tbt I illage, the distance in broad ranges viz., -5 1,,,,,., 5-l() Kill', and 10+ Kills. of the
nearest place where the facility available is given)
Households
Popu· Educa· Medical Drinking Post and Comlllunications, lation tional water Telegraph
4
371 1694
241 1455
508 2690
516 3040
98 '>42
411 2iKJ
400 22:11
68 414
428 2457
1069 6230
109 470
793 4289
143 792
1002 4960
693 4031
1194 4228
52 239
151 861
155 687
277 1710
252 1410
565 3253
78 399
227 1148
186 964
523 3001
60-1 3005
1042 5089
229 1306
440 2421
27 112
5
P
P
6 7
D
RP
P D,RP
(potable)
W
W
w
8
P,JI.!,H PHC W
p ·5 \\'
PO
-5
PO
Pll
Un-Inhabited -
P D P H
P D
Pj2,M ·5
P D -5 ·5
P RP
w W
W
w W
W
W
p
P,M,H
-5 W
RPj2,O T
PO
PO
PO
PO
PO
-5
PO
PO
PO
P,M,H H,D,O W PO
P,M -5 W PO
P,M ·5 W PO
P RP W -5
P RP W ·5
P,M D W,HP-5
9
P,M,H 0 W,HP PO,PHONE
Pj:t,M,1I D;2,RP
P ·5
P 5-10
W.ffP
W
\\'
PO,TO,PHONE
·5
PO
Un-Inhabited -- -----.----
P
P,M
P
-5
RP,O
RP;Z
W
W
PO
PO
T,W,HP PO,PHONE
--------- Un· Inhabited ---------.--
P RPjZ
Pj2,M RP
T,W,HI' -5
T.W.HP -5
Un.Inhabited --. ------- 00-----
P,M PHC,RP T,W FO
·5 P ·5 W,HI'
10
BS
IlS
BS
BS
BS
BS
BS
BS
BS
BS
5·10
BS BS
BS
BS
BS BS
·5
BS
BS
BS BS
·5
5·10
BS
BS
BS
BS
BS
BS
BS

DIRECTORY Land use
App
roach
to
village
11
PR
PR
Nearest
town and distance
(in kills.)
12
HYDERABAD 20
UPPALKALAN22
Power
supply
1.1
EA
EA
._-- lin-Inhabited ----
PR
PR PR
PR
PR
PR PR
PR
PIt
PIt
PIt
PR
PR
PIl
Kit
Kit
PH.
PI{
PH.
PIt
PH.
KH
KR
PR
PR
PH PH.
PR
PH
HYDERABAD 35
---- Un-Inhabited -
HYDERABAD 10
HYDERAllAD 10
EA
EA
EA
------ Un-Inhabited ----
H't'DERAllAD 10
HYDERABAD 16
IIYDERABAD 10
IlYDERAI:lAD 13
IIYDERAI:lAD 24
HYDERABAD 26
HYDERAAAD 16
HYDERAAAD 16
HYDERABAD 1(;
lIYDERABAD 10
HYDERAAAD 20
HYDERABAD 29
HYDERABAD 29
HYDERAAAD 29
HYDERABAD 10
HYDERABAD 20
lIYDERABAD 30
HYDERABAD 30
IIYDERABAD 32
-- Un-Inhabited
HYDERABAD 29
HYDERABA D 29
HYDERA13AIJ S
HYDEIL\13.-\U 10
HYDER,\IHIl 'l
00- [In-Inhabited
HYDER,\BAD IG
HYDERA13AD 10
EA
EA
EA
EA
EA ED,E.\C
EA
ED,EAG
EA
£A
EA
EA
EA
EA
EA
EA
EA
ED,EAG
EA
EA
EA
ED
L\
£A
EA
Forest
71.00
N.A
N.A
N.A
·112.00
\99.00
32.00
·170.00
24.()O
52.00
N./\.
20.76
Land lise
(i.~. area under different types of land use in hectares
rounded uplo 2 decimal places)
Irrigated by Source
15
Un-Irri
gated
16
Cultur
abl" Wa",le
17
Area not avai
lable for
cultivatioll
18
Loc .• -
tio t
Cod,
No.
14. HAYAl'HNAGAR M.P.P. (Concld .. )
0;12'1.00,W;li.OO
0;57.aO,W; 15.00
N.A
0;14.00.\\';4.00
N.A
W;I1.00,0;4.00
W;15.00.0;4.00
N.A
T](:6~.OO, W; 15.00
W;26.00,TI(;26.00
W;3.00
W:2:J.OO,0: 12.00
'1'1<: 1.1-1.00.0: 101.00
0; I :'.00,\\'; 10.00
0:40.00. \\': 2:;.00
0;9.00. \\' :7.00
TI\;21.00,W; 14.(1)
W:1·1.00
1'](;140.00
W:8.00
0:2.00.\\';1.00
0;G.00,W;2.00
W:16.00,0:2.00
0:11.00,W:9.00
\\' E;·1.00, Ti( ;·1.00
1,:25.00,'1'1(; 17.00, IV :8.00
N.A
0; 12.00, \\. ;3.00
TI(; 120.00. IV E;80.00. W:oO.OO
T](;I%.OO
N.A
TK;81.00
0;107.00
:--I.A
\\·E;98.00
W;7Ar;
21.00
116.00
N.A
46B.OO
N.A
122.50
33.00
N.A
noo 22.00
8.00
I07.UO
:5Sfi.OO
JWI.34
11)2.00
blJ.OO
Inoo 311·1.00
12.00
27:1.00
11".00
2'l.48
51.1l7
11'\.00
.53(j.00
.13. GO
162.97
'\:.A
lIVIO
·loG.OO
noo N.A
105.(lU
iLOO
N.A 167.00
3.00
72.00
2M.OO
N.A
B7.00
N.A
451.50
36.70
N.A
100.00
700.00
,~.Ol)
l·17.IIO
1i82.011
20.00
204.(18
IGO.:'x
141.00
471.il2
10.00
7.16
HS.H
66.00
20·1.0U
145.00
:176.00
IG7.00
2!IHIO
5:1.33
4S7.22
N.A
165.55
N.A
570.R:1
147.44
;0.;. A
BDM.37
3J·1.84
7.:lO
SO.89
367 . .06
lOG.OO
:lo:J.DO
1116.29
S7.00
28.FJ9
G.il!l
H.W
12.00
:l8LOO
131.:11)
25·1.00
775.00
:\' .. \ 9G.00
207.70
9
10
11
12
13
14
15
17
18
20
2J
24
25
26
86
:17
3R
39
40
41
15. SAROORNAGAR M.P.P.
I ~).6!1
N.A
'>(I.G4
N.A 6·l.35
5,00
7.00
N.A
IG5.00
100.20
N.A
202.00
10.32
12
13
14
15
16
17
1,~

RANGA REDDY'pISTRICT
L()ca-
tion N arne of village
Code
No.
2
Total area
of the "Village (In hectares)
3
15.SAROORNAGAR M.P.P. (Concld .. ) 23. RENUKAPUR 97.12
25.
26.
27.
28.
29.
JALPALLE
PAPAYAKUMANDAl\
MAMIDIPALLE
KURMALGUDA
NADARGUL
16.RAJENDRANAGAR M.P.P.
1.
2.
3.
4.
5.
6_
7.
8.
9.
10.
11.
12.
13.
14.
15.
16.
17.
22-
23.
24.
25.
26.
27.
37.
39.
GUNGURTHY
KHANAPUR
VATTINAGULAPALLE
KOKAPET
GANDlPET
NARSINGI
PUPPALGUDA
MAQTAKOWSARAALI
MAN!l(ONDA (KHALSA)
MANIKONDA (JACm)
POKKALWADA
PANJASHAJMAL BOWL!
ALIJAPUR
NEKNAMPUR
MANCHIREVULA
BAIRAGIGUDA
GANDAMGUDA
SOGBOWLI
JANIBEGUM
BANDLAGUDA (JAGrR)
PEERAMCHERU
HIMAYATHSAGAR
KISMATPUR
PALLECHERUV~
SIKENDERGUDA
1070.80
1740.00
897.92
369.07
193'1.39
2G.:J0
816.65
1447.56
706.58
2167.49
690.33
972.05
2.83
9.31
808.56
792.05
4.86
157.83
2.51.i1
914.59
102.39
203.56
40.06
4.05
577.18
153.78
278.40
417.23
51.26
76.08
Total Number
of households and population
76
Amenities <"dHable
VILLAGE Amenities and
(If not available within the ,illage, the distance in broad
ranges ,-iz., ·5 Kms., 5-10 KillS. and lOt KillS. of the nearest place where the facility available is given)
House
holds
Popu- Educa- Medical Drinking Post and Commu
nications lation tional water Telegraph
4
9 31
321 1710
79 462
870 5478
144 709
1101 6089
236 1716
384 2204
385 2080
208 1083
944 5576
327 1851
435 2254
33 202
132 758
489 2892
38 196
38
296 2048
107 589
348 2062
681 4196
5
(potable)
6 7 8 9
-5 -5 W -5
P -5 \V,TW,HP 5-10
-5
P,M
P,M
5-10
MH,PHC
-5
W
T,W
1',III,H l'HC.RP,O
T.liP
T,W,HP
P
P,M
P
5-10
5-10
-5
hl-Illhabited _c_
T,W
W,TW
W,TW
P -5 T,W
P,M,H MCW.PHC,FPC T,W,HP
P -5 T,W
Un-llll)abited
Un-Inhabited
5-10
PO,PHONE
-5
1'0
-5
PO
PO
PO
PO,PHONE
-5
P,M -5 T,W -5
P
P
P
p
-5
-.5
-5
-5
P;2 -5
P
P
P
P,M
-5
-5
-5
RP
Un-Inhabited
Un-Inhabited
T,W
W,HP
W,HP
W,HP
-5
-5
PO
W,HP PO
Un-Inhabited
Un-Inhabited
T,W
W,HP
TI<
W,TK
Un-Inhabited
Un-Inhabited
PO
-5
-5
-5
10
-5
BS -5
BS
BS
BS
BS
BS
BS
BS
BS
BS
BS
-5
-5
US
-5
BS
-5
BS
BS

DIRECTORY Land use
Approach
to village
11
PR
PR
KR
PR
PR
PR
Nearest town and distance
(in kms.)
12
HYDERABAD13
HYDERABAD16
HYDERABAD20
HYDERABAD 8
HYDERABADlO
HYDERABAD20
Power supply
13
EA
EA
ED,EAG
EA
EA
EA
---- Un-Inhabited ---.
PR
PR
PR
PR
PR
PR
PR
PR PR
PR
KR
PR
PR
KR
PR
PR
HYDERABAD10
HYDERABAD 7
HYDERABAD 5
HYDERABAD 4
HYDERABAD 7
HYDERABAD 3
Un- Inhabited
Un-Inhabited
HYDERABAD 7
U 11- Inhabited
Un- Inhabited
HYDERABAD 3
HYDERABAD 6
HYDERABAD 4
HYDERABAD 4
HYDERABAD 3
Un- Inhabited
Un-Inhabited
HYDERABAD 5
HYDERABAD 4
HYDERABAD 5
HYDERABAD ·1
Un-Inhabited
Un-Inhabited
EA
EA
ED,EAG
EA
EA
EA
EA
EA
EA
EA
ED,EAG
EA
EA
EA
EA
EA
Forest
14
162.00
N.A
N.A
N.A
N.A
N.A
N.A
N.A
N.A
N.A
77
Land use (i.e. area under different types of land use III hectares
rounded upto 2 decimal places) Loc •• -tior,
Code No. Irrigated by Source
15
W;3.00
WE;80.94,GCj60.00
W;8.09
GCjlO.12
Oj42.00,TKj2.00
Wj.340.00
N.A
N.A
N.A
N.A
N.A
N.A
N.A
Wj5G.65
TKj28.33
TKj20.23
TKj196.27
N.A
N.A
Un-Irri· gated
16
61.13
496.00
6.09
859.50
134.00
4F3.39
N.A
182.00
956.00
389.00
262.00
518.00
606.00
N.A
N.A
207.00
N.A
N.A
144.00
161.00
572.00
71.00
151.20
N.A
N.A
233.27
30.00
173.21
106.00
N.A
N.A
Culturable
Waste
17
Area not avaI
lable for
cultivation
18
15. SAR.OORNAGAR M.P.P. (Concld.~)
10.16
231.39
1724.60
61.07
402.75
N.A
118.65
371.56
125.18
121.02
125.00
lfi3.05
N.A N.A
20.00
N.A
N.A
4.00
3.24
27.09
19.39
29.13
N.A
N.A
169.21
83.45
GO. 70
N.A
N.A
19.83
40.47
1723.82
28.30
130.00
726.25
23
25
26
27
28
29
16. RAJENDRANAGAR M.P.P.
N.A
516.00
120.00
192.40
1784.4 7
47.33
203.00
N.A
N.A
581.56
N.A
N.A
9.83
87.47
315.50
12.00
23.23
N.A
N.A
118.35
12.00
84.96
54.26
N.A
N.A
.3
4
6
T
8
9
10
11
12
13
14
15
lti
17
22
23
21
25
26
27
37
39
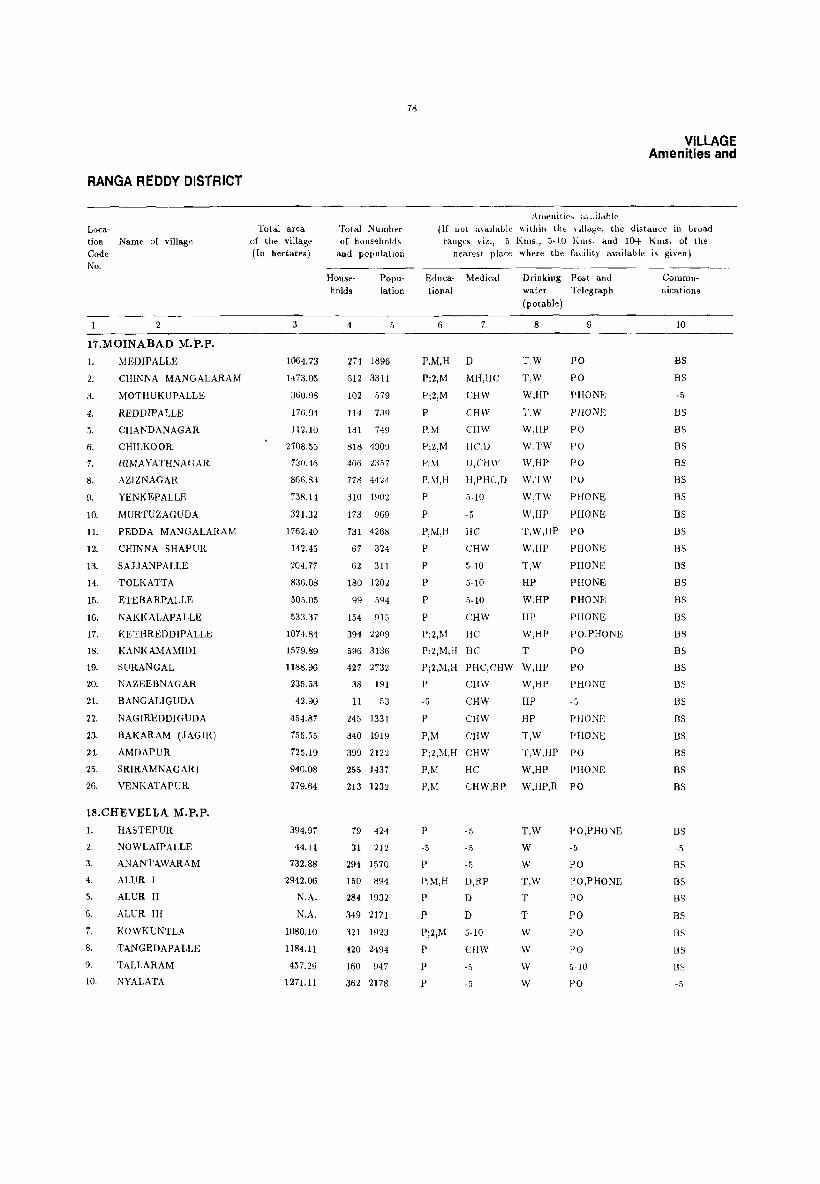
RANGA REDDY DISTRICT
Loca-tion Name of village Code No.
2
17.MOINABAD M.P.P.
1.
2.
3.
4.
5.
6.
7.
8.
9.
10.
11.
12.
13.
14.
15.
16.
17.
18.
19.
20.
21.
22.
23.
24.
25.
26.
MEDIPALLE
CHINNA MANGALARAM
MOTHUKUPALLE
REDDIPALLE
CHANDANAGAR
CHILKOOR
HIMAYATHNAGAR
AZIZNAGAR
YENKEPALLE
MURTUZAGUDA
PEDDA MANGALARAM
CHINNA SHAPUR
SAJJANPALLE
TOLKATTA
ETEBARPALLE
NAKKALAPALLE
KETHREDDIP ALLE
KANKAMAMIDI
SURANGAL
NAZEEBNAGAR
BANGALIGUDA
NAGIREDDIGUDA
BAKARAM (JAGIR)
AMDAPUR
SRIRAMNAGAR)
VENKATAPUR
18.CHEVELLA M.P.P.
1.
2.
3.
4.
5.
6.
7.
8.
9.
10.
HASTEPUR
NOWLAIPALLE
ANANTAWARAM
ALUR I
ALUR II
ALUR III
KOWKUNTLA
TANGEDAPALLE
TALLARAM
NYALATA
Total area of the village (In hectares)
3
1064.73
1473.05
360.98
176.04
112.10
2708.55
730.46
866.83
738.14
321.32
1762.40
142.45
204.77
836.08
505.05
533.37
1074.84
1579.89
1188.96
235.53
42.90
454.87
755.55
725.19
940.08
279.64
394.97
44.11
732.88
2942.06
N.A.
N.A.
1080.10
1184.11
457.29
1271.11
Total Number of households
and population
Households
4
Population
274 1896
612 3311
102 579
114 739
131 749
818 4909
406 2357
778 4424
310 1902
173 969
731 4268
67 324
62 311
180 1202
99 594
154 915
394 2209
596 3136
427 2732
38 191
11 53
245 1331
340 1919
399 2122
255 1437
213 1232
79 424
31 212
294 1570
150 894
284 1932
349 2171
321 1923
420 2494
160 947
362 21711
78
Ameni tie, ,,, .. iJdble
VILLAGE Amenities and
(If not ,,,ailablr within the \ ill,,;;o, the distance in broad ranges viz., -5 KillS., 5-10 KillS. and 10+ Kms. of the
nearest place where the facility available is given)
Edllca· Medical tional
6 7
P,M,H D
Pi2,M MH,HC
Pi2,M CHW
P eHW
Drinking Post and water Telegraph
(potable)
8
T,W
T,W
W,HP
T,W
9
PO
PO
PHONE
PHONE
P,M CH\\' W,HP PO
PiZ,M IlC,lJ W,TW PO
P,M D,CHW W,HP PO
P,M,H 1I,PHC,D W,TW 1'0
P 5-10 W,TW PHONE
P -5 W,HP PHONE
P,M,H HC
P
P
P
P
P
CHW
5,10
5-10
5·10
eHW
Pi2,M He
P;2,M,H HC
T,W,HP PO
W,HP
T,W
HP
W,HP
HP
W,HP
T
PHONE
PHONE
PHONE
PHONE
PHONE
PO,PHONE
PO
Pi2,M,H PHC,CHVV W,HP PO
P
-5
P
P,M
emv CHW
eHW
CHW
Pi2,M,H CHW
W,HP
HI'
HP
T,W
PHONE
-5
PHONE
PHONE
T.W.HP PO
P,M
P,M
HC W,HP PHONE
CHW,RP W,HP,R PO
P
-5
-5
-5
P -0
P,M,H D,RP
P D
P D
Pi2,M 5-10
P CllW
P -5
P -5
T,W
W
W
T,W
T
T
'II'
W
w
w
PO,PHONE
-5
PO
PO,PHONE
PO
PO
PO
PO
;)-10
PO
Communications
10
BS
BS
-5
BS
BS
BS
BS
BS
BS
BS
BS
BS
BS
BS
BS
BS
BS
BS
BS [)S
I3S
[)S
BS BS
BS
BS
BS
-5
BS
BS BS
BS
BS
BS
BS
-5

79
Land use Power (i.e. area under different types of land use ill hectares Loc .. -supply rounded upto 2 decimal places) tion
Code Forest Irrigated by Source Un-Irri- Cultur- Area not No.
gated able aval-Waste lable [or
culti vation
13 14 15 16 17 18
17. MOINABAD M.P.P.
D30 EA 95.00 820.90 24.44 124.39
D18 EA 1255.00 49.42 168.63 2
D17 EA 320.00 10.60 30.38 3
D18 EA 137.00 12.03 27.01 4
D16 EA 80.00 15.84 16.26 5
D 8 EA 484.00 1220.01 779.98 224.56 6
D 6 EA 522.85 47.35 160.26 7
D 5 EA 540.35 187.98 138.50 8
D 7 EA 702.00 23.64 12.50 9
D24 EA 214.00 42.30 65.02 10
D19 EA 1120.15 375.17 267.08 11
D36 EA 105.50 15.93 21.02 12
D30 EA 147.00 6.00 51.77 13
D36 EA 755.(;9 58.15 22.24 14
D28 EA 366.00 38.38 100.67 15
D25 EA 342.81 100.76 89.80 16
D39 EA 825.26 65.00 184.58 17
D28 EA 1180.19 251.87 147.83 18
D25 EA 1038.54 76.00 74.42 19
D28 EA 175.00 24.64 35.89 20
D29 EA 31.28 2.03 9.59 21
D18 EA 320.00 60.05 74.82 22
D 8 EA 531.00 70.94 153.61 2c.
D36 EA 570.93 67.00 87.26 2'1
D36 EA 760.95 54.05 125.08 25
D12 EA 168.00 21.05 90.59 26
18. CHEVELLA M.P.P. ) 30 EA 204.93 190.U4
) 21 EA 34.51 9.60 2
) 18 ED,EAG 495.28 237.60 3
) 20 EA' 1104.80 1594.06 243.20 4
) 20 EA 629.00 150.00 5
) 20 EA 664.60 96.40 6
) 20 ED,EAG 733.30 346.80 7
) 24 EA 802.51 381.60 8 ) 22 EA 348.89 108.40 9
) 24 ED,EAG 941.11 330.00 10
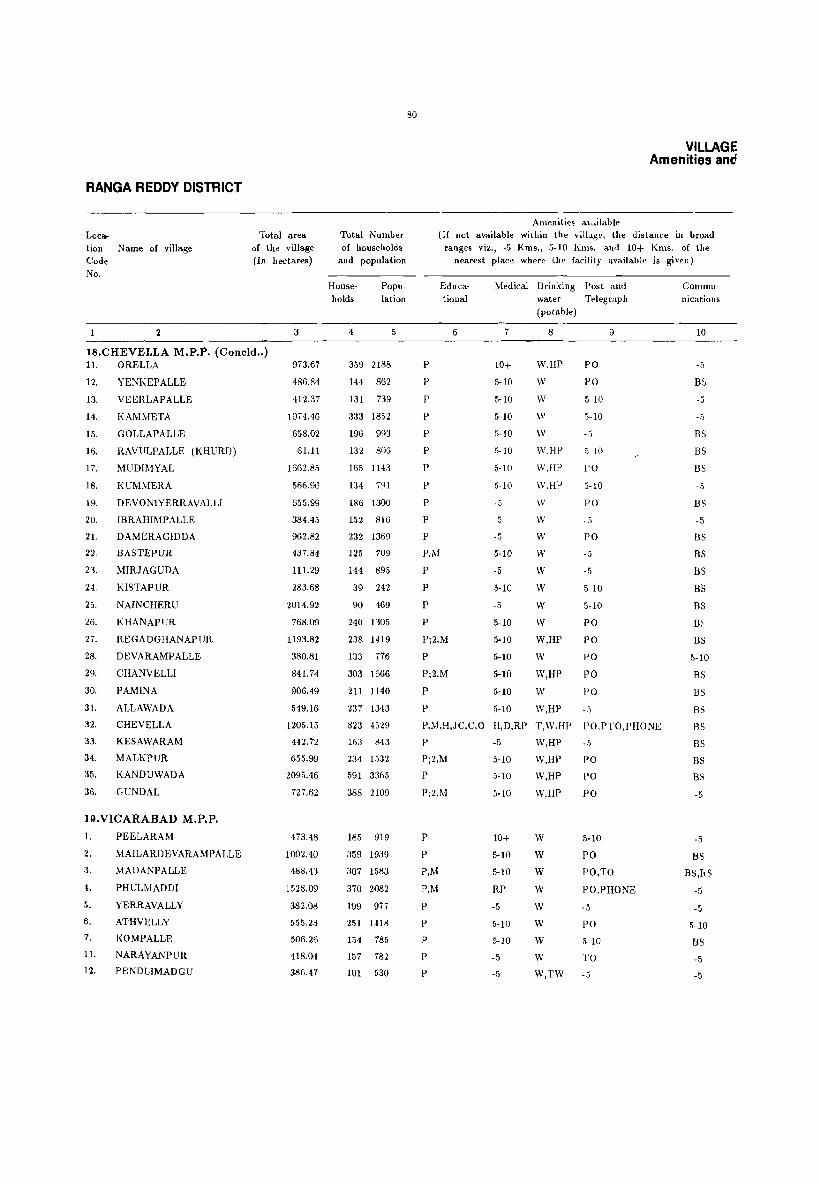
RANGA REDDY DISTRICT
Loca-tion N arne of village Code No.
2
Total area of the village (In hectares)
3
18.CHEVELLA M.P.P. (Concld .. ) 11. ORELLA
12. YENKEPALLE
13.
14.
15.
16.
17.
18.
19.
20.
21.
22.
23.
24.
25.
26.
27.
28.
29.
30.
31.
32.
33.
34.
35.
36.
VEERLAPALLE
KAMMETA
GOLLAPALLE
RAVULPALLE (KHURD)
MUDIMYAL
KUMMERA
DEVONIYERRAVALLI
IBRAHIMPALLE
DAMERAGIDDA
BASTEPUR
MIRJAGUDA
KISTAPUR
NAINCHERU
KHANAPUR
REGADGHANAPUR
DEVARAMPALLE
CHANVELLI
PAMINA
ALLAWADA
CHEVELLA
KESAWARAM
MALKPUR
KANDUWADA
GUNDAL
19.VICARABAD M.P.P.
1.
2.
3.
4.
5.
6.
7.
11.
12.
PEELARAM
MAILARDEVARAMPALLE
MADANPALLE
PHULMADDI
YERRAVALLY
ATHVELLY
KOMPALLE
NARAYANPUR
PENDLIMADGU
973.67
486.84
412.37
1074.46
658.02
61.11
1662.85
566.96
655.99
384.45
962.82
437.84
111.29
283.68
2014.92
768.09
1193.82
380.81
841.74
906.49
549.16
1205.15
442.72
655.99
2095.46
727.62
473.48
1002.40
488.43
1528.09
382.08
555.23
506.26
418.04
386.47
Total Number of households
and population
Households
Population
4
359 2188
144 862
131 739
333 1852
196 993
132 80G
165 1143
134 791
186 1300
152 816
232 1369
125 709
144 895
39 242
90 469
240 1305
238 1419
133 776
303 1666
211 1140
237 13·13
823 4529
163 843
234 1532
591 3365
388 2109
185 919
359 1939
307 1583
370 2082
199 977
251 1418
154 785
157 782
101 530
5
80
Amenities a'uilable
VILLAGE Amenities and
(If not available within the ,;I1""c, the distance in broad ranges viz., -5 KillS., 5-10 KillS. and 10+ I<m8. of the
nearest place where the facility available is given)
Educational
P
P
P
P
P
P
P
P
P
P
P
P,M
P
P
P
P
Pj2,M
P
P;2,M
P
P
6
Medical Drinking Post and
7
10+
5-10
.5-10
5·10
5-10
5-10
5-10
5·10
-5
-5
5-10
-5
5-10
-5
5-10
5-10
5-10
5-10
5-10
5-10
water Telegraph (potable)
8
W,HP
W
W
w W
W,HP
WJW W,HP
W
W
W
W
W
W
W W
W,HP
W
W,HP
W
W,HP
PO
PO
5-10
5-10
-3
510
PO
5-10
PO
-5
PO
-5
-5
5·10
5-10
PO
PO
PO
PO
PO
-!\
9
P,M,H,JC,C,O H,D,RP T,W,HP PO,PTO,PHONE
P
Pj2,M
I'
P;2,M
P
P
P,M
P,M
P
P
P
P
P
-5
5-10
5-10
5-10
10+
5-10
5-10
RP -5
5-10
5-10
-5
-5
W,HP
W,HP
W,HP
W,HP
W
W
W
W
W
W
W
-5
PO
PO
PO
5·10
PO
PO,TO
PO,PHONE
-5
PO
5·LO
W TO
W,TW -5
Communications
10
-5
BS
·5
-5
BS
BS
BS
·5
BS
-5
BS
BS
BS
BS
BS
BS
5-10
BS
BS
BS
BS
BS
BS BS
-5
-5
BS
BS,hS
-5
-5
5-10
BS -5
-5

DIRECTORY Land use
Approach
to village
11
KR
PR
PR
PR
PR
PR
PR
KR
PR
PR PR
PR
PR
PR
PR
PR
KR
PR PR
PR
PR
PR PR PR PR KR
KR
KR KR
KR KR I<R
KR KR
KR
Nearest town and distance
(in kms.)
12
VICARABAD 30
VICARABAD 20
HYDERABAD 49
HYDERABAD 30
HYDERABAD 30
HYDERABAD 35
HYDERABAD 30
HYDERABAD 36
HYDERABAD 32
HYDERABAD 30
HYDERABAD 28
VICARABAD 28
HYDERABAD 48
VICARABAD 20
VICARABAD 20
VICARABAD 20
VICARABAD 22
HYDERABAD 36
HYDERABAD 39
HYDERABAD 30
HYDERABAD 40
VICARABAD 30
HYDERABAD 38
HYDERABAD 38
HYDERABAD 60
VICARABAD 60
VICARABAD 15
VICARABAD 16
VICARABAD 13
VICARABAD 18
VICARABAD 14
VICARABAD 10
VICARABAD 10
VICARABAD 10
VICARABAD 12
Power supply
13
ED,EAG
ED,EAG
EA
ED,EAG
EA
ED
EA
ED
EA
EA
ED,EAG
EA
ED,EAG
EA
ED,EAG
EA
EA
EA
EA
ED,EAG
ED,EAG
EA
EA
EA
EA
EA
EA
EA
ED,EAG
EA
EA
ED,EAG
ED,EAG
ED, BAG
ED,EAG
Forest
14
NA
668.00
42.00
438.43
566.00
81
Land use (i.e. area under different types of land use in hectares
rounded upto 2 decimal places) Loc.,
tion Code No. Irrigated by Source
15
NA
W;12.oo
Wj34.00
W;40.oo
Wj32.00
W;60.oo
Wjl08.00
W j24.oo, TKj20.00
W;28.00
W;25.oo
lIn-Irrigated
16
828.87
439.34
274.77
970.06
493.62
NA
645.65
355.36
575.99
323.65
725.62
.307.44
69.69
170.82
1928.52
671.69
888.62
340.01
735.34
698.89
461.16
1055.95
383.92
506.79
1763.06
538.42
414.48
694.00
486.00
296.02
423.23
404.26
313.04
330.47
Culturable
Area not avai-
Waste lable for cultivation
17 18
18. CHEVELLA M.P.P. (Concld .. )
2.00
NA
270.40
4-10.09
47.00
57.00
22.00
144.80
45.50
1.'.17.60
104.40
164.40
NA
349.20
211.60
80.00
60.80
237.20
130.10
41.GO
112.86
86.40
96.40
305.20
40.80
106.40
207.60
88.00
149.20
58.80
149.20
332.40
189.20
1J
12
13
14
15
16
17
1t:
19
20
21
22
23
24
25
26
27
28
29
30
31
37
3;1
34
35
36
19. VICARABAD M.P.P.
5.00
4.00
10.00
4.00
26.06
24.00
11.00
20.00
9.00
2
3
4
5
6
7
11
12

RANGA REDDY DISTRICT
Loca-tion N arne of village Code No.
2
Total area of the village (In hectares)
3
19.VICARABAD M.P.P. (Concld .. ) 13. KAMAREDDYGUDA
14. PATHUR
15. PULUSUMAMIDI
16. SIDLOOR MUNGAL
17. SIDLOOR (CHENCHELAM)
18. SIDLOOR (PAIGA)
19. PEERAMPALLE
20. BURHANPALLE
21. DHANNARAM
25. MACHAN PALLE
28. BURUGPALLE
30. GUDPALLE
31. CHITTEMPALLE(MODUGULA)
32.
33.
GOTTIMUKLA
MADHARAM
34. DYACHARAM
35. AINAPUR
20.DHARUR M.P.P. 1.
2,
3,
4,
5,
6,
7.
8.
g,
10.
11.
NAGASAMUNDER
GANGARAM
NARSAPUR
DHARMAPUR
CHITTAMPALLE
SOMARAM(MALA)
KACHARAM
KONDAPUR (KHURD)
KUKINDA
OUSAPALLE
BURUGADDA
12, ALLAPUR
13, lUMPUR
14, GHATTEPALLE-
15,
16.
RUDRARAM
DHARUR
17. ALLIPUR
18, EBBANOOR
19. KERELLY
20, BACHARAM
21. HARIDASPALLE
22. CHINTAKUN'fA
U. DORNAL
280.04
344.79
667.73
671.37
734.50
788.33
401.45
309.58
787.11
884.24
903.66
642.23
1067.15
612.36
314.04
307.56
203.15
1507.45
565.34
530.95
424.37
969.34
441.51
308.77
287.50
542.28
151.76
345.60
244.02
483.60
718.32
533.37
2339.08
585.98
604.60
419.66
277,61
244.64
528.92
79l.[)7
82
Total Number DC households
and p<lpulation
Amenities available
VILLAGE Amenities and
(If not available within the village, the distance in broad ranges viz., -5 Kms., 5-10 Kms. and 10+ Kms. of tlte
nearest place where the facility available is given)
Households
Popu- Educa- Medical Drinking Post and Communications lation tional water Telegraph
4
103 590
118 583
252 1481
160 1152
121 821
224 1345
180 861
88 528
6 7
P 5-10
P 5-10
P 5-10
P -5
P,M PHS
P RP
P 10+
P 5-10
(potable)
8 9
W 5-10
W -5
W PO
\V,TW -5
W,TW PO,Ta
W,HP PO
W,TW PO
W -5
266 1574 P,M -5 W,TW PO
166 866
85 641
376 2271
245 1439
84 558
29 136
508 2973
139 782
89 479
80 429
163 959
157 998
29 200
107 620
11$9 1152
96 564
76 413
93 648
140 688
158 693
762 4482
168 947
163 923
328 1980
48 270
175 898
142 775
267 1400
------- Un-Inhabited ------~--
P 5-10
P 5-10
P,M 5-10
P 10+
P
P
10+
10+
P,M 0
P 5-10
P 5-10
P 10+
P 5-10
P 5-10
P 10+
P 5-10
Pj2,M 5-10
P -5
P 5-10
P;2,M 5-10
P 5-10
P 0
P,M,H Hj2,D
P
P
P
P
P
P
P
-5
5-10
5-10
-5
5-10
-5
5-10
W -0
W,TW 5-10
W PO
W PO,TO
Un-Inhabited ----------
W
W
W
W
W
W
W
W
W
W
W
-5
-5
PO,PHONE
PO
-5
5-10
PO
PO
-5
·5
PO
W -5
Un-Inhabited ---- -------
W
W
W
W
T,W
-5
-5
PO
-5
PO,TO,PTO,PHONE
W -5
W -5
T,W PO,TO,PTO,PHONE
W -5
W ·5
W -5
W,HP -5
10
5-10
5·10
5·10
BS
BS
5-10
5-10
-5
BS
-5
5-10
BS
5-10
5-10
5-10
BS
5-10
5-10
-5
5-10
BS
5-10
5-10
BS
BS
-5
-5
BS
BS
BS,RS
BS
BS
BS
BS
-5
-5
8S

DIRECTORY Land use
Approach
to village
11
KR KR
KR
KR PR
KR
KR
KR
PR
Nearest town and distance
(in kms.)
12
VICARABADlO
VICARABAOI0
VICARABA013
VICARABAD18
VICARABAD18
VlCARABA018
VICARABA012
VICARABAO 8
VlCARABAD 5
Power supply
13
EA EA EA
EA EA
EA
EA ED,EAG
EA --.--- Un-Inhabited --_
KR
KR
KR
KR
lCR
KR
PR
KR
KR
KR
KR
PR
KR
KR 1m KR
I<R
ER
KR
PR
PR KR
KR
PR PR
KR
KR PR
VICARABA015
VICARABAO 6
VICARABAD 8
VICARABA012
---- Un-Inhabited
VICARABAD15
VICARABA019
VICARABA028
VICARABAD22
VICARABA024
VICARABAD21
VICARABADlO
VICARABAD13
VICARABAD14
VICARABA020
VrCARABAD20
VICARABAD21
---- Un-Inhabited
VICARABA020
VICARABAD20
VICARABAD26
VICARAIJAD24
VICARABAD19
VICARABAD15
VICARABAD18
VICARABAD12
VICARABAD14
VICARABADlli
VICARABA018
VICARABAD25
EA
ED.EAG
ED,BAG EA
EO,EAG
ED.EAG
EA
ED
EA
EA
EA
EA
EA EA
EA
ED
ED ED
ED
ED
EA ED,EAG
EA
EA ED,EAG ED.EA(;
EA
EA
Forest
14
N.A
N.A
308.00
284.00
62.00
24.00
20.00
:-.r.A
,1.00
:14.00
2:32.00
2·10.00
6·'l9.00
172.00
2()0.OO
83
Land use (i.e. area under different types of land use in hectares
rounded upto 2 decimal places I Loca
tion Code No. Irrigated by Source
15
W;16.00
Wi280.00
Wi 48.OO
Wi48.00
W;60.00
W;64.00
W;215.00
W;10.00
W;50.00
N.A W;44.00
Wi64.oo W;16.00
1'1\;64.00. W;50.00
N.A
W;100.00
1'1<;16.00. W;lD.OO
GC;120.00
GC;S.OO
GCi6.00
W:15.00
GC;28.00
W;41.00
GC;liS.OO
w::noo W;.30.00
li( ';12.00
0/.A
\v;2.00
1'1(:2.00
TK;4H10
Tl(;J7.00
GC;101.00
W;4,5,00
W;GS.OO
W;72.00
1'K;54.00
T)(;·1O.00. W;20.00
CCi 11.00,\\'; 10.00
1'1\;47.00
Un-Irrigated
16
254.04
36.79
470.00
~37.00
420.50
610.33
104.4.5
289.58
63:1.11
N.!\.
gJ.j.66
·11G.2.3
1028.15
:39'1.00
N .. -\
187.56
170.15
879.4:;
215.:14
m:05 40:3,.3,
006.34
212.05
·JJG.2il
12(j.,r;
'\.,\
1:1<1.02
·117.60
:178.32
264.:17
1441.08
530.98
·181.60
.122.66
21l.61
176.64
Culturable
Area not Hvai-
Wasll' lable for culthatioll
17 18
19. VICARABAD M.P.P. (Concld .. )
140.00
80.37
134.00
1.00
57.00
N.A
120.00
104.:j6
N.A
82.00
7.00
lZ.()()
10.00
41.45
:u.oo (i.OO
20.00
20,.00
2x.00
25.00
noo
10.00
28.00
9.73
6.00
120.00
114.00
82.00
9.00
47.00
N.A
·15.00
·1'1.00
2.1.00
2.00
N.A
20.00
7.00
13
14
15
16
17
18
H'
2(
21
25
28
30
31
32
33
34
35
20.DHARUR M.P.P. 118.00
58.00
136,00
6,00
28.00
1.J.OO
3.00
2.00
14.00
7.00
N.A 5.0lJ
5.00
63.00
12.00
I~O.OO
10.00
30.00
2.';.00
12.00
8.00
26.00
2.(1)
2
3
4
5
6
7
8
9
to
11
12
13
14
15
16
17
18
Ib
20
21
2'1
23

RANGA REDDY DISTRICT
Loca-tion Name of village Code No.
2
Total area
of the village (In hectares)
3
20.DHARUR M.P.P. (Concld .. ) 24. KUMMARPALLE
25. MAILARAM
26.
21.
28.
29.
30.
3i.
32.
33.
34.
35.
36.
31.
38.
THARIGOPUL
KONDAPUR (KALAN)
ZAIDUPALLE
GODAMGUDA
SURPANPALLE
NAGSANPALLE
ANTHARAM
NAGARAM
AMPALLE
GURUDOTLA
MOMIN (KHURD)
RAJAPUR
MOMIN (KALAN)
21.BANTARAM M.P.P.
1-
2.
3.
4.
5.
6.
7.
8.
9.
10.
11.
12.
13.
14.
15.
16.
17.
18.
19,
20,
21.
22.
23.
24.
25.
26.
BOPAWARAM
TURMAMIDI
BANTAR.AM
NOORULLAPUR
YECHARAM
SOMARAM (MALA)
BARWAD
MOTHUKPALLE
NAGSAMPALLE
BEEROL
KASEEMPUR
JENNARAM
MALSHETP ALLE
KANKAMALAPALLE
RAMPUR
YENKEPALLE
MANNAPUR
YENNARAM
SULTANPUR
KOTHAPALLE
MADHVAPUR
POMMAPUR
NAGARAM
RAMPALLE
MANGHASPALLE
SALBOTHAPllR
381.21
468.22
1247.64
246.05
420.47
432.61
252.48
1073.22
667.32
998.76
437.46
382.02
323.75
582.34
670.97
1066.34
2993.86
1729.22
165.11
426.94
4-11. 70
1534.56
1141.62
1072.82
665.30
263.45
589.63
239.98
341.96
481.57
361. 79
273.97
80:3.70
;195.78
483.60
297.8~
l:iR.OO
543.09
1197,82
:152,411
412.27
Total Number
of households and population
Households
Population
4
62 330
130 822
299 1673
54 336
167 917
161 775
104 701
92 448
131 803
307 1651
110 655
181 1036
100 564
101 596
215 1194
330 1622
907 5555
509 2857
47 303
II 42:'1
160 691
393 2434
374 2051
175 911
135 ~29
85 540
149 887
37 258
77 440
253
132
1420
698
325 1600
76 445
232 1286
84
Amenities available
VILLAGE Amenities and
(If not available within the village, the distance in broad
ranges viz., -5 Kms., 5-10 Ems. and 10+ Kms. of the nearest place where the facility available IS given)
Educa- Medical Drinking Post and tional water Telegraph
(potable)
-5
P
6
P,M
P
P
P
P
-5
P
P,M
P
P
P
P
P
7
10+
10+ 10+
-5
10+
5-10
10+ 10+
10+
10+
10+ 10+
10+
10+ 10+
P -5
P,M,I! H
P;2,I\I,H 5-10
P
P
P
-5
-5
-5
P,M 5-10
P;2,I\I,H 5-10
P -5
P
P
P
·5
I'
-5
-5
5-10
5-10
5-10
P,M 5-10
I' 5-10
I'
P
p
5-10
5-10
-1)
W
W
W
w W
W
W
W
W
W
W
W
W
W
W
8
W,HP,O
T
T,W,HI'
W,IIP
W,IIP
HP,O
-5
-5
PO
-5
PO
PO
-5
-5
PO
PO
-5
-5
-5
PO
PO
9
PO
I'O,PHONE
PO,PHONE
PO
-5
PHO!\E
T,W PO
W,TW,HP PO
W,HP,O -5
W,IIP,O
W,HP
W,HP,O
W,HP,O
W.HP.O
W,HP,O
W,O
Un-Illhabited
W,I1I'.O
W,HP,O
W,lW
-5
-5
5-10
5-10
5-10
PO,TO,PHONE
PO,PHONE
PO.PHONE
-!)
Communications
10
BS
RS
RS
-5
BS
BS,RS
-5
-5
-5
BS
5-10
-5
-5
5-10 .
BS
BS
BS
BS
BS
BS
BS
BS
BS
BS
-5
BS
5-10
5-10
5-10
BS
BS
BS
tiS
-5
73 402 -5 lOt W,TW -5 -5
87 531
299 IG·l0
61 3lO
255 1441
~ ----.~ Un-Inhabited
p
P,III
P;Z,M
[',M
-5
5-10
-~
-5
W,HP.O
W,HP,O
W,HP
W,f{P,O
.. 'i
PO,PHONE
-5
PO,PIIONE
5-10
BS
BS
BS

DIRECTORY Land use
Approach
to
village
11
KR KR
KR
KR
PR FR
KR
KR
KR
KR
KR
KR
KR
KR
PR
KR
PR PR
KR
KR
KR
PR KR
KR
KR
KR
KR
KR
KR
PR
KR
Nearest town and distance
(in kms.)
12
VICARABAD20
VICARABAD18
VICARABADlO
VICARABAD12
VICARABAD 9
VICARABAD18
VICARABAD14
VICARABAD14
VICARABAD18
VICARABAD22
VICARABAD27
VICARABAD28
VICARABAD23
VICARABAD24
VICARABAD22
TANDUR 35
TANDUR 37
VICARABAD35
VICARABAD39
VICARABAD32
VICARABAD32
VICARABADz9
VICARABAD32
VICARABAD38
VICARABAD16
VICARABAD40
VICARABAD38
VICARABAD40
VICARABAD39
VICARABAD28
VICARABAD24
Power 'supply
13
ED
ED
EA
ED
ED
EA EA
EA
EA
EA
EA
EA
EA
EA
ED
ED,EAG
ED,EAG
EA
ED
ED
ED,EAG
ED,EAG
EA
ED
ED,EAG
ED
ED,EAG
ED
ED,EAG
ED,EAG
ED,EAG
-_ Un-Inhabited ---
PR KR
KR
KR
KR
KR KR PR
VICARABAD35
VICARABAD38
TANDUR 32
ED,EAG
ED,EAG
ED,EAG
TANDUR 29 EO
-~ Un-Inhabited ----
TANDUR 38
TANDUR 35
TANDUR 30
TANDUR 29
ED,EAG
ED,BAG
ED
ED,EAG
Forest
14
37.00
255.00
274.32
1126.27
219.20
138.11
103.40
N.A
N.A
32.32
254.23
85
Land use (i.e. area under different types of land use in hectares
rounded upto 2 decimal places) Location Code
No. Irrigated by Source
15
TK;10.oo,W,2.00
GC;14.oo,W;10.oo
GC;60.00, W;20.00
W;36.00
W;4.00
W;14.00
Wi I4 .OO
GC;20.oo
GC;28.00
GC,26.00
TK;14.00,W;10.00
W;42.00
GC;24.00
GC,8.00
GC;49.00
TK,I00.00
N.A
N.A
Un-Irri
gated
16
294.21
418.22
1110.64
163.05
280.47
334.61
226.48
1035.22
597.32
940.76
132.46
296.02
295.75
554.34
600.97
1000.00
420.51
353.95
100.00
359.63
140.70
416.25
821.00
400.00
101.27
151.07
291.00
190.76
330.90
200.00
182.36
N.A
569.00
138.90
300.00
200.00
N.A
100.00
900.00
90.00
300.00
Cultur
able Area not
avai-Waste lable for
cultivation
17
16.00
2.00
16.00
10.00
2.00
37.00
66.34
1083.73
129.00
63.11
60.31
200.94
500.00
182.41
57i. 79
460.00
12.19
200.39
42.22
5.06
280.57
132.09
N.A
229.70
105.09
179.15
88.08
N.A
94.80
289.82
73.03
18
20.DHARUR M.P.P.(Concld •• )
22.00
24.00
57.00
31.00
136.00
74.00
10.00
18.00
42.00
32.00
26.00
7.00
4.00
20.00
21.00
24
25
26
27
28
29
30
3]
32
33
34
35
36
37
38
21.BANTARAM M.P.P.
0.34
1215.30
20.00
2.00
7.00
100.05
399.11
0.10
95.03
0.63
100.19
98.24
7.00
6.00
1.00
47.34
N.A
5.00
151. 79
4.45
9.77
N.A
315.97
8.00
8.25
99.24
2
3
4
5
6
7
8
9
10
11
12
13
14
15
16
17
18
19
20
21
22
23
24
25
26

,',
RANGA REDDY DISTRICT
Loca-tion Name of village
Code No.
2
22_ PEDDAMUL M.P.P.
1,
2,
3.
4.
5.
6.
1.
8.
9.
10.
11.
12,
13.
14.
15,
16.
17.
18.
19.
20.
21.
22.
23.
24.
25.
26.
27.
28.
29.
30.
31.
32,
33.
34.
RAMACHANDRAPUR
ADKICHERLA
PASHAPUR
RAMPUR
TATTAPALLE
NAGULPALLE
RUDRARAM
ATHAKUR
BAIRAMPALLE
INDOOR
PEDDAMUL
GOPALPUR
THlMSANPALLE
INDOLE
VAGULAPUR
DARYAPUR
KOTPALLE
HEERAPUR
MARPALLE
MANSAMPALLE
DUGGAPUR
JANGOAN
KHANAPUR
BUDDARAM
HANMAPUR
GIRMAPUR
GOTLAPALLE
GAZIPUR
KONDANELLE
RlIKMAPUR
MAMBAPUR
REGONDI
KONDAPUR
MADANANTHAPUR
23.TANDUR M.P.P.
1.
2.
3,
4,
5.
KHANJAMPUR
SANGAMKALAN
MALI<APUR
KOTHLAPUR (KHURDj
KOTBASPALLE
Total area of the village
(Ill hectares)
3
N.A
841. 74
254.93
616.33
228.5i
838.89
526.90
673,80
676.63
2462.51
1362,5i
441.80
433.01
1007.66
276.40
128.69
484.00
296.63
613.50
320.51
373.93
998.36
373.52
761.85
390.93
229.05
746.64
664.09
1118.14
296.63
604.60
.503.43
799.23
134.76
138.00
1235.91
581.13
406.30
·171.86
Total Number of households
alld population
Households
4
Population
86
Amen ities available
VILLAGE Amenities and
(If not available within the village. the distance in broad
ranges viz., -5 Kms .• 5-10 Kills. and lOt Kms. of the nearest place wllere the [acil;!, al'ailable is given)
Educa- Medical tional
6 7
Drinkil.g Post and watt< Telegraph (potable)
9
ComnJUnications
10
------------- Un-Inhabited ----------
384 2279
140 902
796 4895
293 1636
134 649
143 844
413 2J!l3
806 4729
146 808
57 324
120 716
118 (j:l9
784 4655
226 1140
151 752
76 361
337 1820
66 279
121 6,,5
110 572
67 386
139 787
217 1363
461 2678
172 911
409 2301
227 1080
111 637
96 516
296 15H
533 2771
160 87:1
254 13G9
P
P
P,O
P
P
P
PHC,RP
5-10
Un-Inhabited
RP;4
PHC,RP;2
RP
RP Un-Iuhabited
PHC,Rp;1
W PO,PHONE
W,TW -5
1,W,TW PO
T,W
W,TW
W,TW
W:l II'
PO
-5
-5
P;2,!-.I,H I!,~ICW,J>HC.FP(, T,W
PO,PTO
I'O,TO
-5 P RP W,IW
P
P
ItP
RP
P RP
Un-Inhabited
P.\I,H PHC,CHW,RP
W,TW
W,TW
-5
5-10
W,TW -5
W,TW PO,TO
--- ----- Un-Inhabited ~,----~----
P
P
P
P
P
P
?
p
p
P
P.!\!
P
p
p
p
p
RP
RP
Itp
ItP
Itp
CHW,RP
Rp
Rp
R?
PHe,RI'
MH,PHC,RP
-1
H,PIIC,RP
CHW
RP
ItP
--- --- _-- - Uu-Inh"bjted
P
[',M
p
p
Itp
MeW,RP
RP
RP:2
T,W,TW ·5
W,TW -5
W,TW
W,TW
W,TW
W,] II'
-5
PO
-5
W,"!W -5
W,TW -5
W,TW -5
W,TW PO
W,TW PO,TO,PHONE
W,TW -5
W,TW
W,TW
W,TW
W,TW
T,R
W,PI'
PO,TO,PHONE
PO,PTO
-5
5-10
PO
PO,PHONE
W,ll1' -5
T,W.HP TO
BS
hS
-5
-5
BS
liS
liS
-5
-5
5-10
as
LS
113
b~
BS
BS
-5
BS
BS
as BS
as BS
BS
PS
rs I;S
5· [(
BS
BS
BS
BS

DIRECTORY Land use
Approach
to village
11
Nearest town and distance
(in kms.)
12
Power supply
13
-_ Un-Inhabited ----
KR
KR
PR
KR
KR
PR
PR
PR
PR
KR
KR
PR
PR
PR PR PR
KR
KR
PR
KR
KR
PR
PR
PR
PR PR
KR
KR
KR
PR PR
PR
PR
TANDUR20 EA
TANDURZO
-~- Un-Inhabited
TANDURZO
TANDUR16
TANDUR12
TANDUR14
EA
EA
EA
EA
EA
-~ Un-Inhabited -_
TANDUR12
TANDUR13
TANDUR15
TANDUR14
TANDUR30
TANDUR28
-- Un-Inhabited
TANDUR32
EA EA EA
EA
EA
EA
EA
-~ Un-Inhabited --_
TANDUR16
TANDUR18
TANDUR14
TANDUR15
TANDUR13
TANDURI0
TANDURI0
TANDURI0
TANDUR 6
TANDUR 9
TANDUR 8
TANDUR 9
TANDURI0
TANDURll
TANDUR13
TANDUR18
--~ Un-Inhabited
TANDUR20
TANDUR16
TANDUR16
TANDUR14
EA
EA
EA
EA
EA
EA EA EA
EA EA
EA EA
EA
EA
EA
EA
EA
EA ED,EAG,EO
EA
Forest
14
N.A
N.A
N.A
N.A
N.A
185.00
489.23
N.A
87
Land use (i.e. area under different types of land use in hectares
rounded upto 2 decimal places) Location Code No. Irrigated by Source
15
N.A
Wi34.00
N.A
W;70.00
Wi4.00
Wi10.00
Wi3.OO
N.A
W;5.00
Oi360.00, Wi 40.OO
Wi18.00
Wi24.00
W;12.00
N.A
W;120.00
N.A
W;200.00
W;18O.00
W;140.00
W;320.00
W;48.00
Wi40.oo Wi5•OO
W;20.00
Wi20.00
W;32.00
W;60.00
Wi40.OO
W;Z80.00
W;140.00
Wi1Z0.00
W;40.00
N.A
WE;8.00
WEi3.OO
WEi18.00
Un-Irrigated
16
N.A
505.74
250.00
N.A
128.57
779.89
500.00
657.00
N.A
2429.5i
920.57
417.80
373.01
'981.66
2-14.40
N.A
159.00
N.A
353.50
96.51
23.93
553.36
305.02
644.85
353.93
185.05
606.61
590.09
838.14
236.63
281.60
241.43
110.00
54.76
1129.11
417.13
374.10
288.2G
Culturable
Area not avai ...
Waste lable for
17
N.A
N.A
N.A
2.00
N.A
5.00
N.A
4.00
'1.00
2 .. )(j
3.00
2.00
N.A
5.60
25.60
78,80
cultivation
18
22.PEDDAMUL M.P.P.
N.A
302.00
4.93
N.A
30.00
;;5.00
16.90
13.80
N.A
Z8.00
40.00
[i.00
60.00
2.00
20.00
N.A 2£1\..00
N.A 60.00
40.00
25.00
120.00
20.50
80.00
32.00
24.00
120.00
40.00
220.00
20.00
40.00
120.00
80.00
40.00
1
2
3
4
5
6
7
8
9
10
11
12
13
14
15
16
17
18
19
20
21
22
23
24
25
26
27
28
29
30
31
32
33
34
23.TANDUR M.P.P. N.A
101.20
130.40
29.20
2
3
4
5
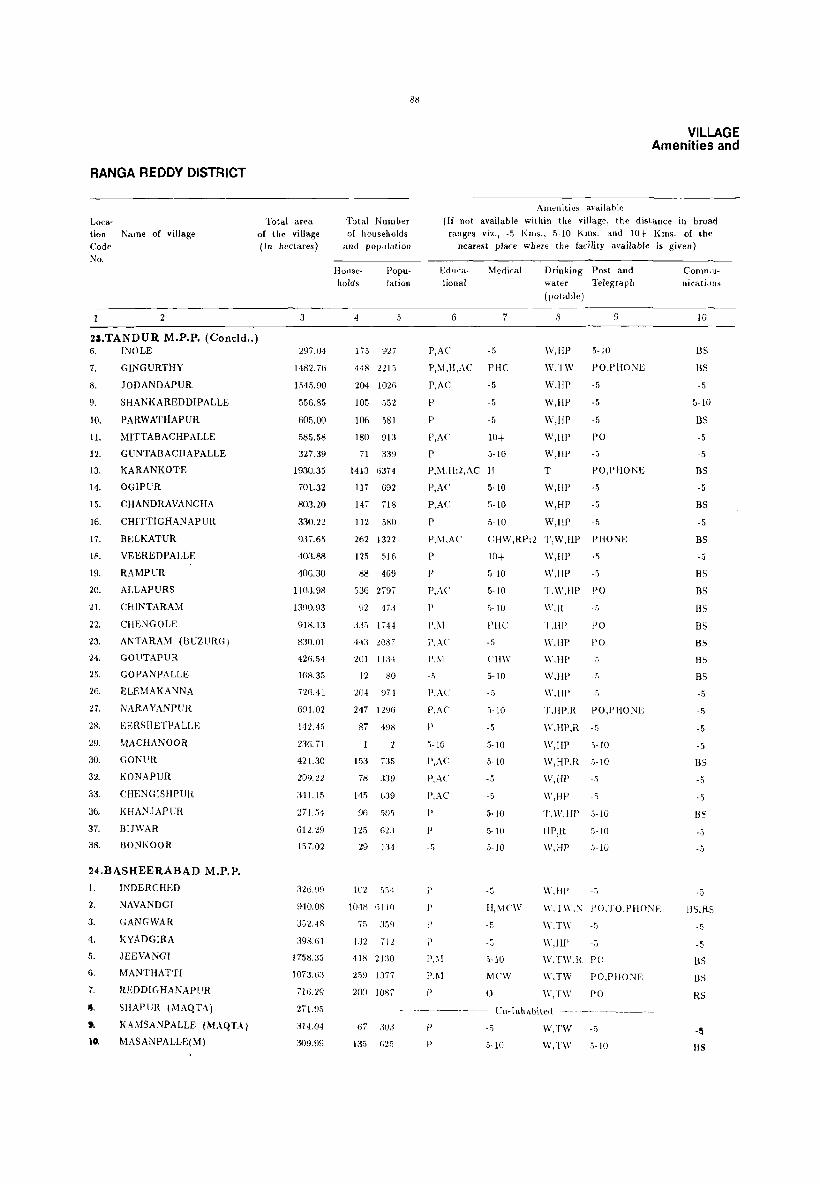
RANGA REDDY DISTRICT
Loca-tion Name of village
Code No.
2
Total ar~a
of the village (In hectares)
J
23.TANDUR M.P.P. (Coneld .. ) 6. INOLE
7. GINGURTHY
8.
9.
10.
II.
12.
13.
14.
15.
16.
17.
lB.
19.
20.
21.
22.
23.
24.
25.
26.
27.
28.
29.
30.
32.
33.
36.
37.
38.
JODANDAPUR
SHANKAREDDIPALLE
PARWATHAPUR
MITTABACHPALLE
GUNTABACHAPALLE
KARANKOTE
OGIPUR
CHANDRAVANCHA
CHITTIGHANAPLIR
BELKATUR
VEEREDPALLE
RAMPUR
ALLAPURS
CHINTARAM
CHENG OLE
ANTARAM (BUZllRG)
GOUTAPUR
GOPANPALLE
ELEMAKANNA
NARAYANpUR
EERSHETPALLE
MACHANOOR
GONl'R.
KONAPLIR
CHENGISHPUR
KHANJAplJR
I3IJWAR
BONI<OOR
24.BASHEERABAD M.P.P.
1.
2.
3.
4.
5.
G.
7.
8.
t
.0.
INDERCHED
NAVANDGI
GANGWAR
KYADGIRA
JEEVANGI
MANTHATTI
REDDIGHANAPliR
SHAPL:R (MAQTA)
KA.MSANPALLE (MAQTAI
MASANpALLE(M)
297.0·1
1·182. iG
1545.90
556.8fi
605.00
585.58
327.39
1930.35
701.32
803.20
330.22
937.65
4(l:J.B8
40G.30
IIO:J.98
1:I')().93
918.13
8:10.0]
42G.54
IG8.35
nG . .j[
691.02
142.45
23G.71
421.30
209.22
341. 15
2i1.!H
61U9
157.02
326.99
~)40.08
J:i2.48
398.61
I 75/U5
1073.6:1
71G.29
271.%
:J14'()4
309.99
Total Number of hOllseholds
and population
Households
Population
4
175 927
448 221"
204 102()
105 552
106 581
180 91:1
71 339
1413 6314
11 i G92
147 718
112 580
262 1322
125 516
88 469
536 2797
'12 473
·Hl lOSi
201 ILl!
12 80
204 9i4
2·17 1296
117 498
I:'] 735
78 .139
115 039
125 62:1
29 J:I.j
102 oJ.!
10·Hl (ill0
132 711
418 21:10
25~) 1377
200 lOKi
67 ,10:1
l:J5 filS
Amenities available
VILLAGE Amenities and
(If not available within the village, the dist"nce ill broad ranges viz., -5 KillS., 5-10 Kms. and 10+ KIllS. of the
nearest place where the facility available is given)
Educational
Medi('al
6 i
P,AC -5
P,M,H,AC PHC
P,i\C
P
P
-5
-5
-5
P,AC 10+ P 5-10
P,M,H;2,AC H
P,AC
P.AC
P
5-10
5-10
5-10
Drinking Post and waler Telegraph
(potable)
8
\V,lIP
\V.lW
W,HI'
W,IlP
\\' ,III'
W,!!P
W,III'
T
W,HP
\\',HI'
\V ,Ill'
9
5-10
pO,PHONE
-5
·5
·5
PO
-.j
PO,PHONE
-5
-5
P,M,AC
P
CHW,RP;2 T,W,IIP
-5
PHONE
-5
p
P.AC
p
1\)\[
1',.'1.('
1'.\1
-!)
1' . .'\.('
I',AC
I'
:'·10
P,AC
fl,AC
I'.AC
I'
I'
10+ \\',111'
;'-10 W,IlI'
5-10
:'-10
PIlC
-;:,
(,lIW
5-10
-5
5-10
-5
5-10
5-10
-5
-5
.5- J()
5-10
5-10
-5
II,MC\\'
-5
5-10
MeW
o
T.W,HP 1'0
\V,I{ -'j
T.lil' 1'0
W,III' 1'0
\\'.111' -'I
W.1l1' -s \\'.111' -5
T.III',R I'O,PHONE
\\',HP,1t .:,
W,HP 5-10
W,HI',R 5-10
W,HP -!i
\\',HP -!\
T,W,IIP 5-10
IIP,R 5-10
W,HP :'-10
\\', HI' -:)
W,T\\'.:\ I'O,TO.PHONE
\\'. T\\' -:,
\\', Ii!' -0)
W,TW.lt PO
W.TW
W,n\'
PO,PHONE
PO
------- Un-InhabIted .. ---.--.. ---------
f) -5 W:rW-5
p 5-10 \\',T\\' .5-10
Comn"UnicaticJJ1S
10
llS
US
-5
5-10
I3S
-5
-5
BS
-5
BS
-5
BS
-5
BS
BS
BS
BS
BS
BS
BS
-5
-5
-5
-5
BS -5
-5
BS
·5
-5
BS,RS
-5
-5
liS
liS
RS
-~
BS

DIRECTORY Land use
ApI" roach
to
village
11
PR PR KR
KR
PR
1m
KR
PR KR
KR
J\R
I'R
KR
I'R
I'R
I'R
I'R
PR Pit
pR
KR
I'R
1\R
Pit
PI{
I'll.
Pit
Pit
I\R
KH
Ell
Pit
Kit
KH
PIt
1m KIt
Nearest
town and
distance
(in kms.)
12
Power
supply
13
TANDUR12 ED,EAG.EO
TANDUR14 EA
TANDUR16 ED,EAG
TANDUR24 ED,EAG
TANDURIO ED,EAG
TANDUR13 ~;A
TANDUR12 EA
TANDUR12 EA
TANDl1R17 lOA
TANDUR13 EA
TANDUR 8 EA
TANDUR 9 EA
TANDUR12 EA
TANDURIO EA
TANDUR 7 EA
TANDUR 7 EA
TANDUR.5 EA
T,\NDUR:l EA
TANDUR 4 EA
TANDUR 7 lOA
TANDUR.5 ED
TANDUR [) EA
TANDl'R [) EA
TANDURIO ED. EM;
TANDl7R 2 EA
TANDFR 4 EA
T,\NDllR 4 EA
TANDUR 6 EA
TANDUR G EA
TANDUR 9 ED.EAG
TA,"Wl'R24 ED.EAC;
TANDUR20 EA
TANDUIU8 ED,EAG
TANDURI8 ED.LAG
TANDURI4 ED,EAG
TANDlIR 9 EA
TANDUR 9 ED,EAG
----. Un-Inhabited ----
KIt
Kit
TANDURI2 ED,EAG
TANDURI4 EA
89
Land lise
(i.e. area under different types of land usc in hectares
rounded upto 2 decimal places)
Loca·
tion
Code
No. Forest
14
Irrigated by Source
15
WE;IG.OO
TK;8O.00, WE;8.00
WE;1.00
WE;6.00
WE;5.00
WE;12.00
\\,1':;4.00,TWE;2.00
WE;22.00,0;5.00
WE;5.00
TWE; 18.00, W E;4 .00
TK;8.oo,WE;3.00
WE;40.00,TI\;12.00,TWE;8.00
WI':.; 14.00
TK; 12.00, WE;.5.00
GC;75.oo,WE;14.oo,TWE;1O.00
TWE;12.00,WE;10.oo
TI\;45.00,WB;25.oo,TWE;16.00
TI\;63.00, \\,E;55.00.TWE;25.00
WE; 15.00, T1< ;8.00.TW E;5.00
TI(;6.00,WE;;'.00
TI( ;40.00, WE; 12.00. TWE:8.00
W [.;; 2:' .00, !l;20.00, 1'W£; 5.00,T K;5. 00
TW £;8.00, WE; 2.00
W£;1O.00.TWE;4.00
WE; 5.00, 0; 5.00,TW£;3.00
TI\;4.oo,W£;:1.00
W£:20.00,TI(:20.00,TW; 10.00
W£;12.00,TWE;2.00
174.00 TJ( ;30.00, WE;K.OO
WE::'.OO
47.00
N.A
o ;6·LOD. \V E; 1.00
R; t:lK.00,TWE;34.00,TI(; 13.00
WE: 16.00,TK;11.00
WE;2.00
TWE;65.oo. W E:(;.OO
TK;21.00,WE;6.00
W£:0.00,TI(;5.00
N.A
T](; 19.00, WE; 14.00
\\' E; 10.00."1 K ;G.OO
Un-Irri
gated
16
229.""
914.36
577.30
440.8:'
374.50
370.38
259.3()
814.55
54.:'2
61LiO
301.82
761.65,
352.28
293.70
605.38
227.73
378.23
37<1.45
198.94
108.15
622.01
32H2
.j').G5
20n I
:J5G.'10
180.00
231l.iS
201.94
199.·10
12H2
180.00
432.00
182.00
195.00
1420.00
760.00
490.00
N.;\
240.00
206.<)9
( 'ult"r
"bl<\\·a .... t"
17
An'a not avai
lable for
cultivatioll
18
23.TANDUR M.P.P.(Concld .. )
37.20
195.20
637.20
32.00
199.50
188.00
33.20
576..10
!i 17.00
lOG. 10
4..10
3.:W
12.00
40.80
229.60
1091.20
238.80
243.76
1]0.00
·10.00
14.80
2:,·1.S0
:IK.OO
(jAO
1.00
21.5~)
16.00
D.20
2H.OO
14.40
285.20
330.40
78.00
26.00
15.20
28.80
512.40
124.80
G3.IO
10.00
112.80
'15.60
54.80
170.00
50.00
215.10
68.80
69.60
9.20
29.60
G8.80
H.80
H.OO
;j0.40
0.03
3().37
42.40
172.80
29.60
6
7
8
9
lO
1I
12
13
14
15
16
17
18
19
20
21
22
23
24
17
28
29
:50
:12
:1:1
36
37
:18
24. BASHEERABAD M.P.P. 72.99
1R4.00
1:17.-18
nS.(j1
160.35
224.(;.3
192.29
6G.OO
900
92.08
5.00
2(;.00
JOV)O
02.00
24.00
N.t\
R.OO
27.00
I
(j
i
8
9
10

RANGA REDDY DISTRICT
Loca-tion Name of village Code No.
Total ar~a
of the village (In hectares)
2 3
24.BASHEERABAD M.P.P. (Concld .. ) 11. KORVICHED 346.01
12. NAVALGA 1466.98
13. ALLAPUR (BASHEERABAD) 523.66
14. MANTHAN GOUD 701.92
15. DAMERCHED
16. PARWATHPALLE
17. KOTHLAPUR (BUZURG)
18. EKMAI
19. KAMSANPALLE (BUZURG)
20. MAILWAR
21. ISMAILPUR
22. NEELAPALLE
23. JALALPUR
24.
25.
26.
21.
MARPALLE
MANTHLAPUR
GOTIGA (KALAN)
GOTIGA (KHURD)
28. MALKANGIRI
29. KHASIMPUR
30. BAHADURPUR
31. KOPPANKOTI
25.YELAL M.P.P. 1.
2.
AGNOOR
RASOOLPUR
3. KOKAT
4. MAZRASANGAM
5. RAGHAPUR
6. KAMALAPUR
7. ADHALlPUR
8. BANAPUR
9. GANGASAGAR
10. RASNAM
11. ACHUTHAPUR
12. PAGDIAL
13. ANNASAGAR
14. BHAGAIPALLE
15. NAGASAMUNDAR
16. VISWANATHPUR
17.
18.
19.
YELAL
HAJIPUR
JAKKEPALLE
20. AMBERPET
1230.65
543.90
536.21
1862.36
536.61
1406.68
380.81
282.47
459.70
919.44
301.09
828.15
547.94
179.68
532.56
591.24
265.07
1401. 73
236.34
1800.44
378.38
235.53
908.52
326.58
731.27
1527.28
977.31
402.66
535.40
581.53
356.12
460.13
223.39
1062.70
492.91
511.12
4.45
90
Total Number of households
and population
Amenities available
VILLAGE Amenities and
(If not available within the village, the distance in broad ranges viz., -5 Kms., 5-10 Kms. and LOt Kms. of tre
neatest place where the facility available is given)
House· holds
Popu- Educa- Medical Drinking Post and Commu· nications lation tional water Telegraph
4
315 1755
470 2896
92 503
191 1060
416 2131
197 931
107 641
476 2636
116 654
500 2803
60 270
104 617
102 562
107 524
114 608
173 841
69 321
195 962
95 560
65 356
367 2042
399 2281
172 873
105 555
161 832
71 376
71 445
77 461
315 1727
97 531
306 1675
III 485
67 250
173 932
144 775
612 3023
168 895
174 795
35 171
6 7
P 5·10
P 5·10
P ·5
P -5
P,M 5-10
P 5-10
P -5
P,M 5·10
P ·5
P,M,H H
P 5-10
P
P
5-10
5-10
P 5-10
P 10+
P,M 10+
P
P
P
P
5-10
5-10
5-10
5·10
(potable)
8 9
W PO
W,TW PO
W -5
W,HP PO,PHONE
W
W
W
T,W
PO
5-10
-5
PO,PHONE
W -5
W,TW PO,PHONE
W,TW PO
W,TW PO
W,TW PO
W PO
Un·Inhabited ---------~
W ·5
T,W PO
T,W
W
W
W
-5
PO
-5
5-10
P,M PHC,O T,TW PO
10
BS
BS
BS
-5
-5
BS
-5
BS
-5
BS
BS
BS
BS
BS
BS
IlS
IlS
IlS
-5
5-10
BS
------~- Un·Inhabited ~-~-----
P,M -5
P 5-10
P 5-10
P 5-10
P 5-10
P 5-10
P 5-10
PlOt
P 10+
P,M RP
P 5-10
P 5-10
P -5
P 5·10
T,R PO,PTO
W,TW -5
W 5-10
W,TW 5-10
W -5
T,W -5
W 5·10
W,TW PO
W -5
T,W PO
W,TW -5
W,TW -5
W -5
P,M,H PHC,D T,W,R PO,PHONE
5-10 P 5·10 W,TW
P 5-10 W,TW -5
-5 5-10 W -5
·5
BS
5-10
5-10
5-10
10+ 5·10
5·10
-5
5-10
BS
-5
-5
BS,RS
5·10
-5
BS
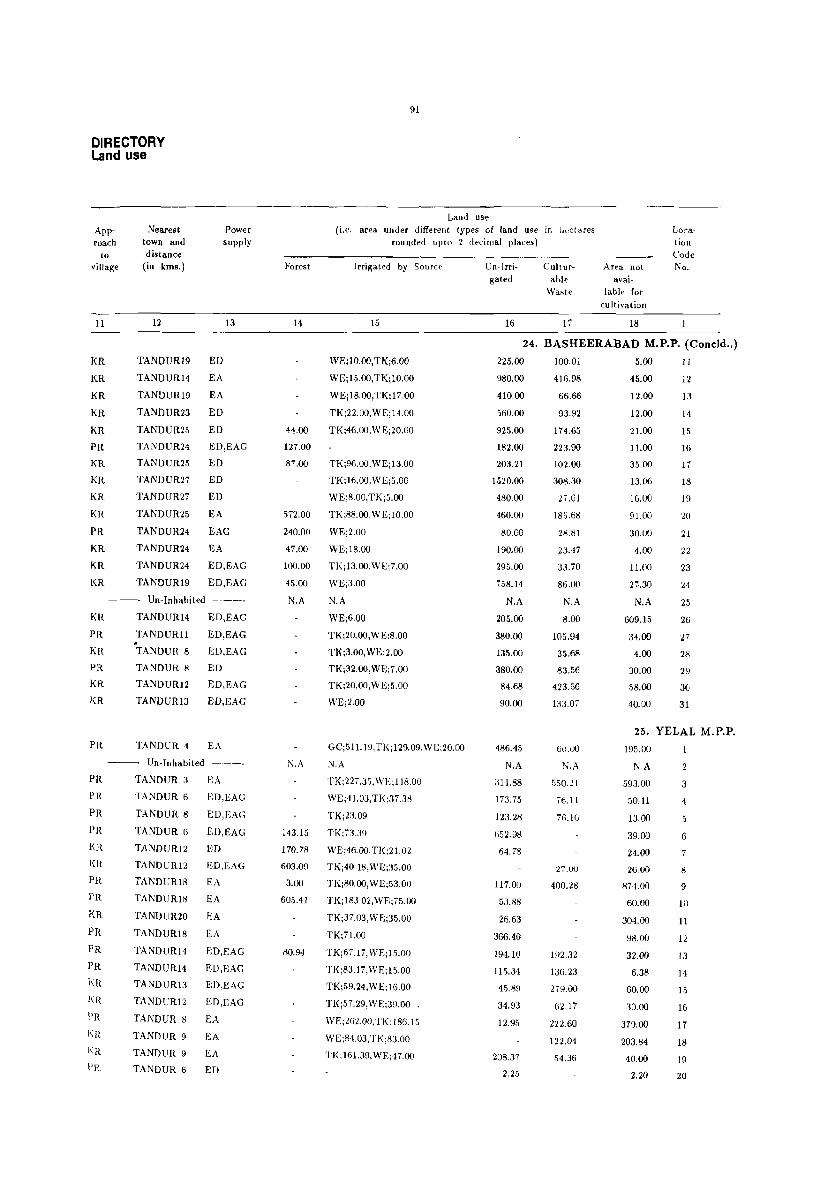
DIRECTORY Land use
Approach
to village
11
KR
KR
KR
KR
KR
PR
KR
KR
KR
KR
PR
KR
KR
KR
Nearest town and distance
(in kms.)
12
TANDUR19 ED
TANDUR14 EA
TANDUR19 EA
TANDUR23 ED
TANDUR25 ED
Power supply
13
TANDUR24 ED,EAG
TANDUR25 ED
TANDUR27 ED
TANDUR27 ED
TANDUR25 EA
TANDUR24 EAG
TANDUR24 EA
TANDUR24 ED,EAG
TANDUR19 ED,EAG
--- Un-Inhabited - .---
KR
PR
KR
PR
KR
KR
PR
PR
PR
PR
PR
KR
KR PR
PR
KR PR
PR
PR
KR I(R
I'R
I\ll
I\ll
PIt
TANDUR14
TANDURll . TANDUR 8
TANDUR 8
TANDUR12
TANDUR13
ED,EAG
ED,EAG
ED,EAG
ED
ED,EAG
ED,EAG
TANDUR 4 EA
--_ Un· Inhabited ---.
TANDUR 3 EA
TANDUR 6 ED,EAG
TANDUR 8 ED,EAG
TANDUR 6 ED,EAG
TANDUR12 ED
TANDUR12 ED,BAG
TANDUR18 EA
TANDUR18 EA
TANDUR20 EA
TANDUR18 SA
TANDUR14 ED,EAG
TANDUR14 ED,EAG
TANDUR13 ED,EAG
TANDUR12 ED,BAG
TANDUR 8 EA
TANDUR 9 EA
TANDUR 9 EA
TANDUR 6 ED
Forest
14
91
Land use (i.e. area under different types of land use in I.cci ares
rounded upto 2 decimal places)
Irrigated by Source
15
Un·lrri· gated
16
Cult ur· al>!e
Ar~a not avai-
Waste lable for
cultivation
17 18
Loca· tion Code No.
24. BASHEERABAD M.P.P. (Coneld .. )
44.00
127.00
WE: 10.00, TK:6.00
WEiI5.00,TKil0.00
WEiI8.00,TKiI7.00
TK:22.00,WE:14.00
TK:46.00,WE:20.00
87.00 TK;96.00,WE;13.00
TK:16.00, WE:5.00
WE;8.00,TK :5.00
5i2.00 TK;88.00,WE;10.00
240.00 WE:2.00
47.00 WE:18.00
100.00 TK;13.00,WE:7.00
45.00 WE:3.00
N.A
N.A
N.A WE:6.00
TKj20.00,WE;8.00
TK:3.00, WE;2.00
TKj32.00,WE:7.00
TK;20.00, WE:5.00
WE:2.00
GC:511.19,TK:129.09,WE:20.00
N.A
TK:227.35, W£:118.00
WE:41.03,TK:37.38
TK;23.09
143.15 TK;73,39
170.78 WE:46,OO, TK;21.02
603.09 TK;40, 18, WE;:15.00
3.00 TK;80,OO,WE,53.00
605.41 TK:183,02,WE:75.00
TK;37,03, WE:35.00
TK,71.00
80.94 TK,67,17,WE,15.00
TK:83,17,WE:15,00
TK;59.24,WE;16,00
TK,57.29, W E,39,00
WE:2G2,OO,TK: 186,15
WE:84,03,TK:83,OO
TK:161.39, WE:47,00
225.00
980,00
410,00
560,00
925,00
182,00
203,21
1520,00
480,00
460.00
80,00
190.00
295,00
758.14
N.A
205.00
380.00
135.00
380,00
84.68
90.00
486.45
N.A
311.88
173.75
123,28
G52.98
64.78
117.00
53.88
26,63
366,40
194.10
115.34
45.89
34.93
12.95
208,37
2,25
100,01
416,98
66,66
93,92
174,65
223,90
102,00
308,30
27.61
185.68
28.81
23.47
33.70
86.00
N.A
8.00
105.94
35.68
83.56
423.G6
133,07
6<),<)0
N,A
550.lL
76,11
76.IG
27,00
400.28
192,32
136,23
279.00
62.17
222,60
122.04
54,36
5.00
45.00
12,00
12,00
21.00
11.00
35.00
13.06
16.00
91.00
30.00
4.00
11.00
21.30
N.A
609.15
34.00
4.00
30.00
58.00
40.00
11
n 13
14
15
16
17
18
19
20
21
22
23
24
25
26
27
28
29
30
31
25. YELAL M.P.P.
195.00
N,A
593.00
50.11
13.00
39.00
24.00
26.00
874.00
60.00
30'1.00
98,00
32,00
6,38
60.00
30,00
379,00
203,84
40,00
2,20
3
4
5
6
7
8
9
11)
11
1~
13
14
15
16
17
18
19
20

RANGA REDDY DISTRICT
L()~a-
tion Name of village Code No.
1 2
25.YELAL M.P.P. (Concld .. ) 21. BENNUR
22. LAKSHMINARAYANAPUR
23. CHENNARAM
24. YANKAPALLE
25. PAYARKAMPALLE
26. JUNTPALLE
27. DOULAPUR
28. GIRIJAPUR
29. THIMMAIPALLE
30. MUKUNDAPUR
31. KISHTAPUR
32. GOREPALLE
33. DEVANOOR
31. MUDDAIPET
26.DOMA M.P.P.
1.
2.
3.
4.
5.
6.
7.
8.
9.
10.
1l.
12.
13.
14.
15.
16.
17.
18.
19.
20.
21-
22.
2~.
24.
25.
26.
27.
28.
BUDLAPUR
KISHTAPUR
POTHREDDYPALLE
OOTPALLE
BOMPALLE
SIVAREDDYPALLE
GUDUR
DONGAYANKEPALLE
DORNALPALLE
BACHPALLE
DOMA
THIMMAIP ALLE
LINGAMPALLE
BRAHMANPALLE
GANJIPALLE
BADAMPALLE
RAKONDA
PALEPALLE
KHAMMAM NACHARAM
MOTHKUR
AINAPUR
DIRSAMPALLE
KONDAIPALLE
ANANTHAREDDIP ALLE
BATLACHANDRAM
MALLEPALLE
DADAPUR
GUMDAL
Total area of the village (In hectares)
3
735.31
284.19
370.69
228.00
693.10
2856.26
263.85
213.67
928.35
320.91
274.38
516.38
737.34
283.68
306.35
991.88
252.93
958.70
300.47
458.51
696.63
303.51
373.52
414.49
768.50
233.91
1122.19
714.67
416.42
397.40
436.65
399.G2
239.57
1405.07
1169.13
937.65
561.30
339.94
220.15
466.20
1124.62
811.39
Total Number of households
and population
Households
Population
4
245 1290
93 537
198 970
116 636
110 642
764 4174
52 295
43 241
257 1472
87 494
68 407
157 870
291 1726
169 1001
148 933
425 2480
69 374
172 1017
324 1752
256 1348
168 937
184 943
166 1044
164 941
724 3972
90 435
41 251
212 919
120 608
177 796
141 701
238 1159
57 316
660 3577
378 2185
400 2187
175 725
33 166
50 327
185 1010
478 2757
273 1553
5
92
Amenities available
VILLAGE Amenities and
(If not available within the village, the distance in broad ranges viz., -5 Kms., 5-10 Kms. and 10+ Kms. of the
nearest place where the facility available is given)
Educa- Medical tional
P
P
P
P
P
P,M
P
-5
P
P
P
P
P
P,M
6 7
5-10
5-10
5-10
-5
10+
CHW
5-10
5-10
CHW
5-10
-5
-5
5-10
PHC,O
P 10+
P,AC CHW
-5 5-10
P 5-10
P,M,AC 5-10
P,M,AC 5-10
P,AC 5-10
P,AC 5-10
P 5-10
P -5
Drinking Post and water Telegraph (potable)
8 9
W PO
W -5
W,TW PO,PHONE
W -5
T,W,R -5
W,TW PO
W,TW -5
W -5
T,W P0
W,TW 5-J"
W,TW
W,TW
W PU
T,TW PO,PHONE
W,HP -5
W,TW PO
W,HP -5
W,HP PO
W,TW PO
W,HP,N PO
W,HP -5
W,HP
\\' ,HP
W,HP,N -0
P,M,H,AC PHC,CHW T,W,HP Pu, rO,PHONE
-5 P -5 W,HP
P
P
P
P,AC
P,AC
P,AC
P
5-10
5-10
-5
-5
-5
5-10
5-10
P,M,H,AC CHW,RP
P,AC 5-10
P,AC CHW
P -5
P,AC -5
P -5
P -5
P,M,H,AC CHW,RP
P,AC -5
W,TW
W,HP
W,HP
W,HP
W,HP
W,HP
W,HP
5-10
-5
-5
PO
-5
-5
-5
W,HP,N PO,PHONE
W,HP,N PO,TO
W,HP PO
W,HP -5
W,HP -I)
W,HP -5
W,HP -5
W,HP,N PO
W,HP -5
Communications
10
BS BS
BS
BS
5-10
BS
BS -5
BS -5
-5
as BS
BS
BS
BS
5-10
BS
BS
BS
BS
-5
BS
BS
BS
5-10
-5
BS
-5
-5
BS
-5
-5
BS
-5
BS
-5
-5
BS
DS
BS
DS
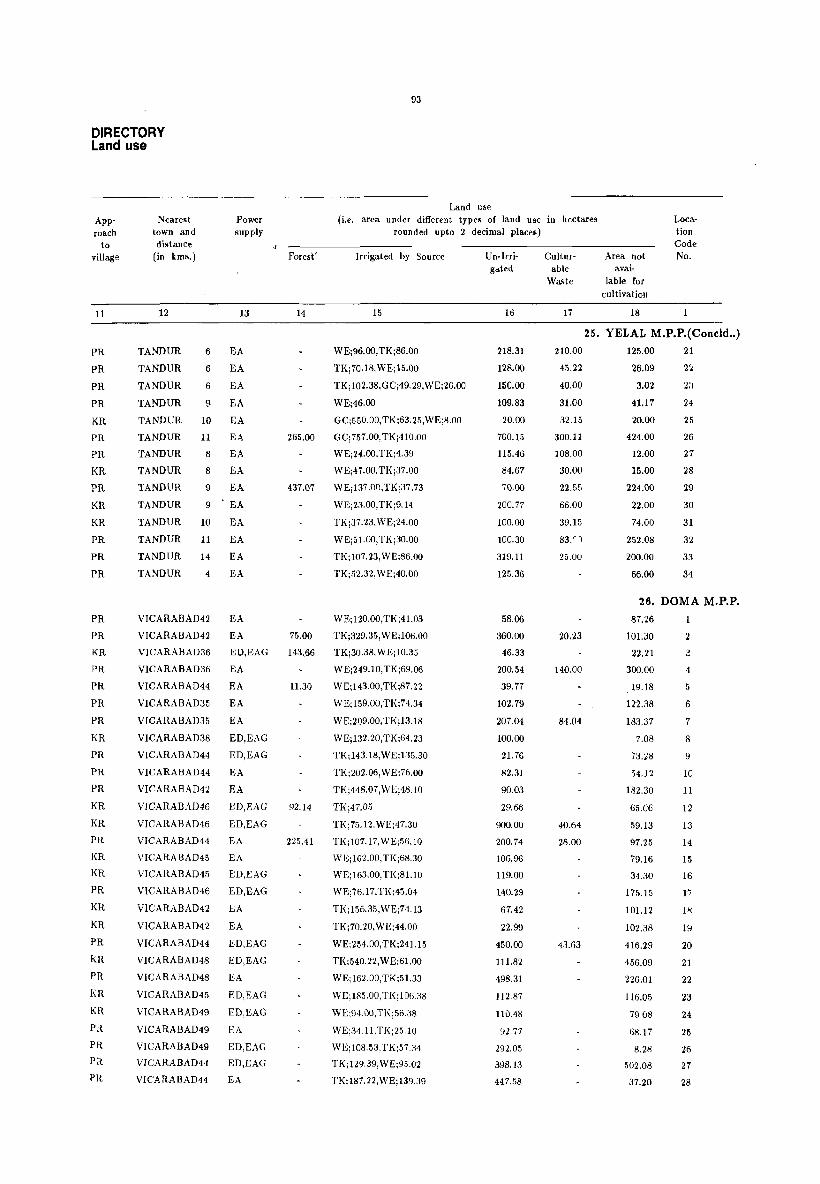
DIRECTORY Land use
Approach
to village
11
PR PR
PR PR KR
PR
PR
KR
PR KR
KR
PR
PR
PR
Nearest town and distance
(in kms.)
12
TANDUR
TANDUR
TANDUR
TANDUR
TANDUR
TANDUR
TANDUR
TANDUR
TANDUR
TANDUR
TANDUR
TANDUR
TANDUR
TANDUR
Power supply
13
6 EA
6 EA
6 EA
9 EA
10 EA
11 EA
8 EA
8 EA
9 EA
9 EA
10 EA
11 EA
14 EA
4 EA
VICARABAD42 EA
VICARABAD42 EA
VICARABAD36 EO,EAG
VICARABAD36 EA
VICARABAD44 EA
VICARABAD35 EA
VICARABAD35 EA
VICARABAD38 ED,EAG
VICARABAD44 ED,EAG
VICARABAD44 EA
VICARABAD42 EA
VICARABAD46 ED,EAG
VICARABAD46 ED,EAG
93
Land use (i.e. area under different types of land use ill hectares
rounded upto 2 decimal places) Location Code No. Forest '
14
265.00
437.07
Irrigated by Source
15
WE;96.00, TK;86.00
TK; 70.18, WE; 15.00
TK; 102.38,GC;49. 29, WE;26.oo
WE;46.oo
GC;550.00, TK j63. 25, WEj8.00
GCj757.00,TK;410.00
WE;24.oo,TK;4.39
WE;47.00,TK;37.00
WE;137.00,TKj37.73
WEj23.00,TKj9.14
TKj37.23, WE;24.00
WE;51.oo,TK;30.00
TK;107.23, WE;86.00
TK;52.32, WE;40.00
WE;120.00,TK;41.03
75.00 TK;329.35, WE;106.00
143.66 TK;30.38,WE;10.35
WE;249.10,TK;69.06
11.30 WEj143.00,TK;87.22
92.14
WE;159.00,TKj74.34
WE;209.00. TK;13.18
WEjI32.20,TKj64.23
TKj 143.18, WE;135.30
TK;202.06,WEj76.00
TK;448.07,WE;48.10
TI(j47.05
Un-Irrigated
16
218.31
128.00
150.00
109.83
20.00
700.15
115.46
84.67
70.00
200.77
100.00
100.30
319.11
125.36
58.06
360.00
46.33
200.54
39.77
102.79
207.04
100.00
21. 76
82.31
90.03
29.66
CuIturable
Area not avai-
Waste lable for
17
210.00
45.22
40.00
31.00
32.15
300.11
108.00
30.00
22.55
66.00
39.15
83. r 1
25.00
20.23
140.00
84.04
cultivation
18
25. YELAL M.P.P.(Concld .. ) 125.00
26.09
3.02
41.17
20.00
424.00
12.00
15.00
224.00
22.00
74.00
252.08
200.00
66.00
21
2~
2:\
24
25
26
27
28
29
30
31
32
33
34
26. nOMA M.P.P.
87.26
101.30
22.21
300.00
19.18
122.38
183.37
7.08
73.~8
54.12
182.30
2
PR PR KR
PR PR PR PR
KR
PR PR PR KR
KR
PR
KR
KR
PR
KR
KR
PR KR
PR
KR
KR
PR
PR PR
PR
VICARABAD44 EA 225.41
TK;75.12, WE;47.30
TK;107.17,WE;56.10
WE;162.00,TKj68.30
WE;163.00, TK;81.10
WE;76.17,TKj45.04
TK;156.35,WE;74.13
TK;70.20, WE;44.00
WE;254.00,TK;241.15
TK;540.22,WE;61.00
WEj 162.00,TKj51.33
WEj185.00,TKj106.38
WEj94.00,TK;56.38
WE;34.11,TK;25.10
WE; 108.53,TK;57.34
TK;129.39, WE;95.02
TK; 187. 22, WE;139.39
900.00
200.74
106.96
119.00
140.29
40.64
28.00
65.06
59.13
97.25
79.16
34.30
4
5
6
7
8
9
10
11
12
13
14
15
16
VICARABAD45 EA
VICARABAD45 ED,EAG
VICARABAD46 ED,EAG
VICARABAD42 EA
VICARABAD42 EA
VICARABAD44 ED,EAG
VICARABAD48 ED,EAG
VICARABAD48 EA
VICARABAD45 ED,EAG
VICARABAD49 ED,EAG
VICARABAD49 EA
VICARABAD49 ED,EAG
VICARABAD44 ED,EAG
VICARABAD44 EA
67.42
22.99
450.00
111.82
498.31
Il2.87
110.48
~)2. 77
292.05
398.13
447.58
43.63
175.15
101.12
102.38
416.29
456.09
226.01
116.05
79.08
68.17
8.28
502.08
37.20
I?
1>:
19
20
21
22
23
24
25
26
27
28
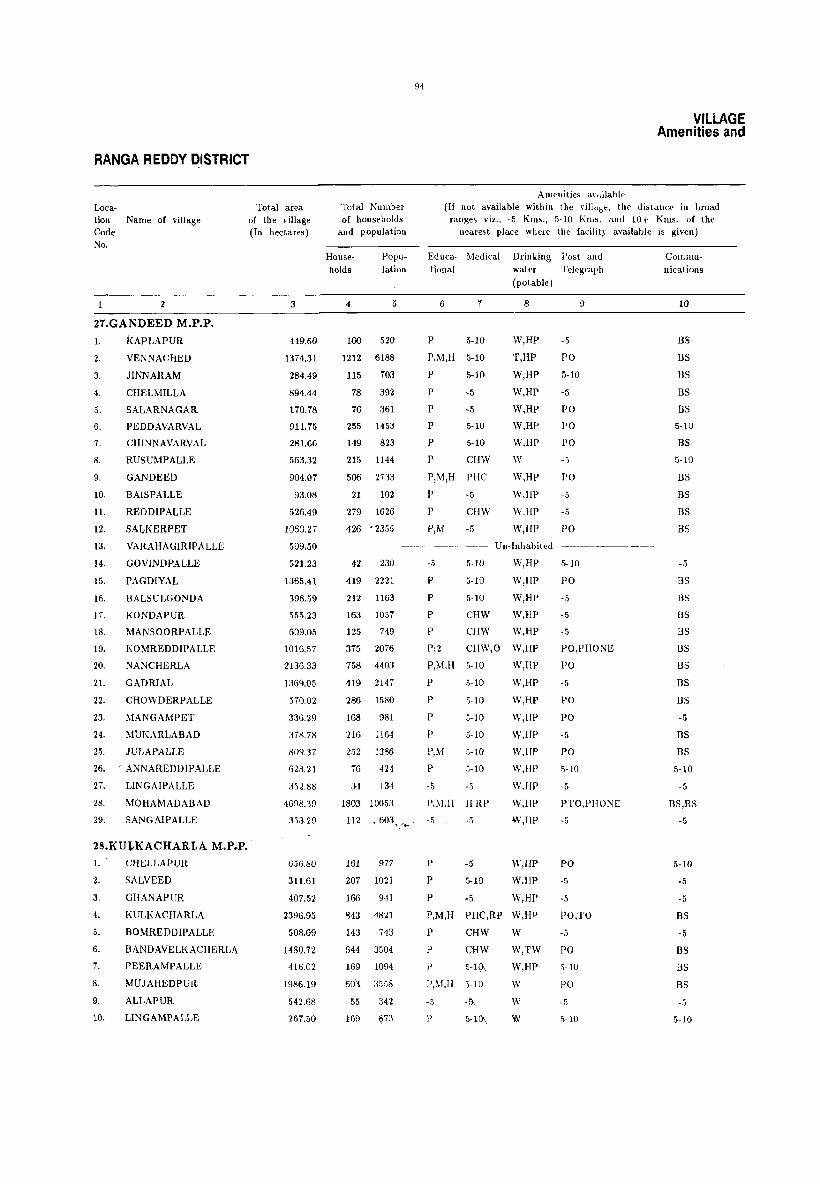
RANGA REDDY DISTRICT
Loca-tion Name of village Code No.
2
27.GANDEED M.P.P.
1.
2.
3.
4.
5.
6.
7.
8.
9.
10.
11.
12.
13.
14.
I(APLAPUR
VENNACHED
JINNARAM
CHELMILLA
SALARNAGAR
PEDDAVARVAL
CHINN AVARVAL
RUSUMPALLE
GANDEED
BAISPALLE
REDDIPALLE
SALKERPET
VAltAHAGIRIPALLE
GOVINDPALLE
15. PAGDIYAL
16. BALSULGONDA
17. KONDAPUR
18. MANSOORPALLE
19. KOMREDDlPALLE
20. NANCHERLA
21. GADRIAL
22. CHOWDERPALLE
23. MANGAMPET
24. MUKARLABAD
25. JULAPALLE
26. 'ANNAREDDIPALLE
27. LlNGAIPALLE
28.
29.
MOHAMADABAD
SANGAIPALLE
28.KU1KACHARLA M.P.P. 1.
2.
3.
4.
5.
6.
,. 8.
9.
10.
CHELLAPUR
SALVEED
GHANAPUR
KULKACHARLA
BOMREDDIPALLE
BANDAVELKACHERLA
PEERAMPALLE
MUJAHEDPUlt
ALLAPUR
LINGAMPALLE
Total area of the village (In hectares)
3
449.60
1374.31
284.49
894.44
170.78
911.75
281.66
563.32
904.07
93.08
526.49
1060.27
509.50
521.23
1365.41
396.59
555.23
609.05
1016.57
2136.33
1369.05
570.02
336.29
378.78
809.37
623.21
352.88
1698.39
353.29
6.56.80
311.61
407.52
2396.95
508.69
1480.72
416.02
1986.19
542.68
267.50
Total Number of households
and population
Households
Population
4 5
100 520
1212 6188
115 703
78 392
76 361
255 1453
149 823
215 1144
506 2733
21 102
279 1626
426 • 2355
42 230
419 2221
212 1163
163 1057
125 749
375 2076
758 4403
419 2147
286 1580
168 981
216 1164
252 1386
76 424
34 134
1803 10053
94
Amenities a\ d;lable
VILLAGE Amenities and
(If not available within the rill"be. the distallce in broad ranges viz., -5 KillS., 5-10 KIllS. and 10+ KillS. of the
nearest place where the facility available is given)
Educa- Medical Drinking Post alld tional water Telegraph
(potable)
6 7
P 5-10
P,M,H 5-10
P 5-10
P -5
P -5
P 5-10
P 5-10
P CHW
P,M,H PHC
P -5
P CHW
r,M -5
-5 5-10
8
W,HP
T,HP
W,HP
W,HP
W,HP
W,HP
W,lIP
W
W,HP
W,HP
W.HP
W,HP
Un-Inhabited
W,HP
P 5-10 W,HP
P 5-10 W,HP
P CHW W,BP
P CHW W,HP
P;2 CHW,O W,HP
P,M,H 5-10 W,HP
P 5-10 W,HP
P 5-10 W,HP
P 5-10 W,HP
P 5-10 W,HP
P,M 5-10 W,HP
P 5-10 W,IlP
-5 -5 W,HP
P,l\I,H II,ltP
-5
PO
5-10
-5
PO
PO
PO
-5
PO
-5
-5
PO
5-10
PO
-5
-5
-5
9
PO,PHONE
PO
-5
PO
PO
·5
PO
5-10
Communications
10
BS
BS
BS
BS
BS
5-10
BS
5-10
I3S
BS
BS
BS
-5
BS
BS
I3S
BS
BS
BS
BS
BS
-5
BS
BS
5-10
112 .603,/~._ -5 -5
W,HP
W,HP
PTO,PHONE
-5
-5
BS,RS
-5
161 977
207 1021
166 941
843 4821
143 743
64·1 3504
169 1094
60l 3558
55 342
169 ~73
P -5 W,HP PO
P 5-10 W.HP -5
P -5 W,HP·5
P,M,H PHC,RP W,HP PO,TO
P CHW W -5
P CHW W,TW PO
p 5-1~ W,HP 5-10
P,M,H 5-10 W PO
-5 or>, W -5
P 5-1~ W .5-10
5-10
-5
-5
BS
-5
BS
BS
BS
-5
5-10

DIRECTORY Land use
Approach
to village
11
PR PR
KR
KR
PR KR
KR
PR
PR
PR
Nearest town and distance
(in kms.)
12
MAHBUBNAGAR 34
MAHBUBNAGAR 34
MAHBUBNAGAR 44
MAHBUBNAGAR 45
MAHBUBNAGAR 44
MAHBUBNAGAR 45
MAHBUBNAGAR 33
MAHBUBNAGAR 33
MAHBUBNAGAR 28
MAHBUBNAGAR 30
Power supply
13
EA
EA
ED,EAG
ED,EAG
ED,EAG
ED,EAG
ED,EAG
ED,EAG
ED,EAG
ED,EAG
PR MAHBUBNAGAR 23 ED,EAG
PR MAHBUBNAGAR 30 ED,EAG
KR
PR
PR
PR
PR PR
PR
PR
KR
KR
PR KR
KR
KR PR
PR
KR KR
KR
PR KR
PR PR
PR
KR
KR
~-- Un-Inhabited ---.
MAHBUBNAGAR 33
MAHBUBNAGAR 35
MAHBUBNAGAR 34
MAHBUBNAGAR 34
MAHBUBNAGAR 34
MAHBUBNAGAR 26
MAHBUBNAGAR 24
MAHBUBNAGAR 32
MAHBUBNAGAR 32
ED,EAG
ED,EAG
ED,EAG
ED,EAG
ED,EAG
ED,EAG
ED,EAG
ED,EAG
ED,EAG
MAHBUBNAGAR 32 ED,EAG
MAHBUBNAGAR W ED
MAHBUBNAGAR 28 ED
MAHBUBNAGAR 29 ED,EAG
MAHBUBNAGAR 27 ED,EAG
MAHBUBNAGAR 18 EA
MAHBUBNAGAR 16 ED,EAG
MAHBUBNAGAR 41
MAHBUBNAGAR 39
VICARABAD 39
VICARABAD 38
VICARABAD 39
MAHBUBNAGAR 35
VICARABAD 50
VICARABAD 51
VICARABAD 38
VICARABAD 51
ED
EA
EA
ED
EA
EA
ED
EAG
EA
EA
Forest
14
12.00
156.14
N.A
88.00
602.37
466.37
268.23
648.33
104.41
256.63
264.93
1018.47
95
Land use (i.e. area uudel' different types of land use lU I., dares
rounded upto 2 decimal places) Location Code No. Irrigated by Source
15
TKj67 .00, WEj25.00
TKj900.00,WEjl00.00
WEjIOO.00,TlCj76.00
TKj 176.00, WEj40.00
TKjl10.00
TKj98.00, WEj45.00
WEj40.00,TKjZ8.00
GCj50.00,TKj35.00
TKj267.00, WEj60.00
G Cj35.00, WEi 10.00
TKj230.00,WEj80.oo
WEj5oo.00,TKj230.00
N.A
TKj99.00,WE;42.00
TKj180.00,WEj60.00
WEj60.00, TKj43.34
TKj58.00, WEj20.00
WEj55.00,TKi47.02
TKj50.00
WE;100.00, TK,BO.OO
TK, 220.00, WE,60.oo
TKj86.00, WE;40.00
TK;137.40
TKj50.00, WEi37,00
WEjGO.OO, TK;38.00
TK;50.00
TKj800.00,WE;100.00
WEj20.00,TK;19.34
Un·Irri· gated
16
129.87
129.00
70.00
300.00
20.00
50.00
101.66
200.10
15.00
W.OO
LOO.OO
L70.00
N.A
242.83
408.81
100.00
367.00
204.00
364.47
357.50
241.26
136.02
38.89
1.58.78
109.37
47.19
283.20
1563.24
134.00
505.84
229.21
267.60
1107.44
924.46
6.63
439.04
72.36
236.00
Cultur· able
Waste
17
82.73
10.31
8.49
280.44
27.28
650.00
50.00
11.00
333.00
14.17
5G.·19
100.00
N.A
114.10
149.60
93.23
10.23
103.03
300.10
430.46
300.37
208.50
90.00
6:.1.00
250.00
247.00
57.68
986.82
53.54
119.83
36.55
43.23
190.D3
55.IB
100.36
44.00
144.91
98.70
4.00
Area not avai~
lable for cultivation
18
21. GANDEED M.P.P.
145.00
235.00
30.00
98.00
1.3.50
68.75
50.00
81.08
229.07
14.91
60.00
60.27
N.A
23.30
567.00
100.02
100.00
200.00
214.00
566.00
81.05
100.00
70.00
70.00
352.00
10.79
12.00
600.00
22.00
2
6
1
8
9
10
11
12
13
14
15
16
17
1,
D
20
21
22
23
24
25
26
27
28
29
28. KULKACHARLA M.P.P.
31.13
45.85
96.69
842.85
453.51
455.90
100.46
383.77
371.62
27.50
2
4
6
7
8
9
10
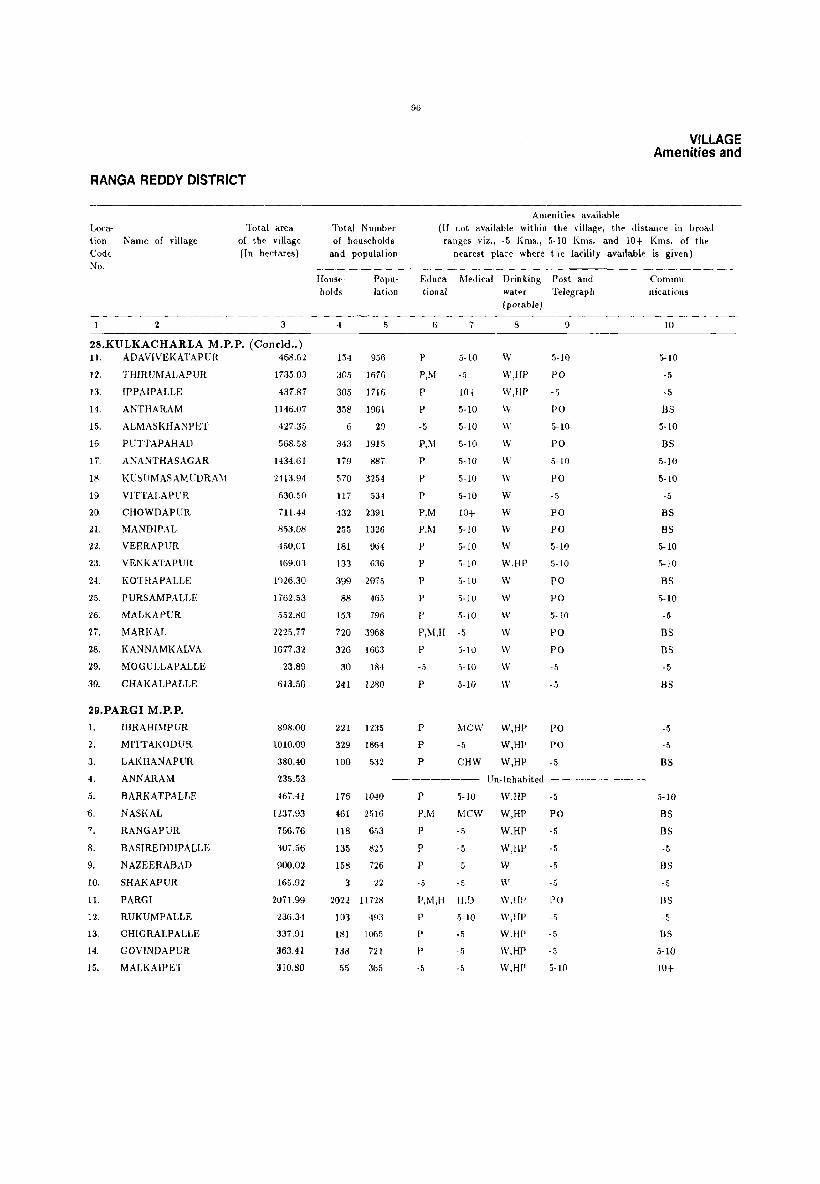
RANGA REDDY DISTRICT
Loca-tion Name of village Code No.
2
Total area of the village (In hectares)
3
28.KULKACHARLA M.P.P. (Concld .. ) 11. ADAVIVEKATAPUR 468.62
12.
13.
14.
15.
16,
17.
18.
19.
20.
21.
22,
23.
24.
25.
26.
27.
28.
29.
30.
THIRUMALAPUR
IPPAIPALLE
ANTHARAM
ALMASKHANPET
PUTTAPAHAD
ANANTHASAGAR
KUSUMASAMUDRAl\!
VITTALAPUR
CHOWDAPUR
MANDl PAL
VEERAPUR
VENKATAPUR
KOTHAPALLE
PURSAMPALLE
MALKAPUR
MARKAL
KANNAMKALVA
MOGULLAPALLE
CHAKALPALLE
29.PARGl M.P.P.
I.
2.
3.
4.
5.
~.
7.
8.
9.
10.
11.
12.
13.
14.
15.
IBRAHlMPUR
MITTAKODUR
LAKHANAPUR
ANNARAM
BARKATPALLE
NASKAL
RANGAPUR
BASIREDDIPALLE
NAZEERABAD
SHAKAPUR
PARGI
RUKUMPALLE
CHIGRALPALLE
GOVINDAPUR
MALKAIPET
1735.0.1
437,87
1146.07
427,35
568 .. 58
1434.61
2413.94
630.50
711.44
853.08
450.01
·169.03
Ig26.30
1762.53
552.80
2225.77
1677.32
23.89
613.50
898.00
1010.09
380.40
235.53
46iAl
1237.93
756.76
:}07.56
900.02
165.92
2071.99
236.34
337.91
363.41
310.80
Total Number of households
and population
Households
4
Popubtion
154 956
305 1676
305 1716
358 1961
6 29
343 1915
179 887
570 3254
117 534
432 2391
255 1326
181 964
133 636
399 2075
88 46.5
153 796
720 3968
326 1663
30 181
241 1280
221 1235
329 1864
100 532
Amenities available
VILLAGE Amenities and
(If not available within the village, the distance in broad ranges viz., -5 Kms., 5-10 Kms. and 10+ Kms. of the
nearest place where the facility available is given)
Educa- Medical Drinking Post and tional water Telegraph
(potable)
6
P
P,M
P
P
-5
P,l\!
P
P
P
P,M
P,M
P
P
P
P
P
7
5·10
-.J
10+
5-10
5-10
5-10
5-10
5·10
5-10
10+
5-10
5-10
5-10
5·10
5·10
5·10
8
W
W,llP
W,HP
W
W
W
w w W
W
\V
W
W,HP
W
W
IN
P,M,H -5 W
\V
\V
\V
P 5·10
-5
P
p
P
P
5·10
5·]0
MCW W,HP
-5 W,HI'
CHW W,HI'
9
5-10
PO
-5
PO
5-10
PO
5·10
PO
·5
PO
PO
5-10
5·10
PO
PO
5-10
PO
PO
-5
-5
PO
PO
-5
Communications
10
5-10
-5
-5
BS
5-10
BS
5-10
5-10
-5
BS
BS
5-10
5- 10
BS
5-10
-5
BS
DS
-5
BS
-5
-5
BS
---------- Un-Inhabited --.--.---~.---
176 1040
461 2016
118 653
135 825
158 726
3 22
2022 )1728
103 493
181 lOG"
138 721
55 365
P
P,M
P
P
P
-5
.J-]O W,HP
MeW W,HP
·5 W,HP
-5 W,HP
·5 W
·5 W
P,M,H H,D W,lll'
W,lll
W.IIP
\V,HP
W,HP
P
P
P
·5
5·10
·5
-5
-5
-5
PO
·5
-5
-5
-5
PO
.!)
·5
-5
5-10
5-10
BS
BS
-5
BS
-5
BS -5
[IS
5-10
10+

DIRECTORY Land use
App
roach
to
village
11
I<R
I<R
PR
PR
KR
PR
1m I(R
KR
PR
PR
I\R
KR
PR
KR.
1m PR
PR
KR
PR
KR
PR
PR
KR PR
PR
KR PR
KR
PR
KR
KR
KR
KR
Nearest town and
distance
(in kms.)
12
Power sllpply
13
MAHBUBNAGAR 32 EA
VICARABAD 42
MAHBUBNAGAR 24
ED,EAG
EA
MAHBUBNAGAR M ED
MAHBUBNAGAR 33
MAHBUBNAGAR 32 ED
MAHBUBNAGAR 33
MAHBUBNAGAR n ED
MAHBUI3NAGAR 32
MAHBUBNAGAR 32 ED,EAG
MAHBUBNAGAR ~ ED
MAHBUBNAGAR ~ EA
MAHBUBNAGAR ~ EA
MAHBUBNAGAR W EA
MAHBUBNAGAR 30 EA
MAHBUBNAGAR ~ EA
MAHBUBNAGAR 25 EA
MAHBUBNAGAR 28 ED,BAG
MAHBUBNAGAR 25 EA
MAHBUBNAGAR 25 EA
VICARABAD
VICARABAD
VICARABAD
44 EA
35 EA
32 EA
----- Un-Inhabited ----
VICARABAD
VICARABAD
VICARABAD
VICARABAD
VICARABAD
VICARABAD
VICARABAD
VICARABAD
VICARABAD
VICARABAD
VICARABAD
38 EA
33 EA
23 EA
24 EA
32 EA
30 EA
38 EA
33 EA
31 EA
34 EA
44 EA
Forest
14
97
Land use
(i.e. area under different types of land use ill h •• tares rounded upto 2 decimal places)
Irrigated by Source
15
Un-Irri
gated
16
CultLlI'
able
Waste
Ii
Ar~a not
avai
lable for
cultivation
18
Loca
tion Code
No.
28. KULKACHARLA M.P.P.(Concld .. )
100.00
110.00
891.42
235.93
335.53
1436.60
498.46
297.88
511.35
13.43
9.80
453.25 TI<:125.00,WE;48.01
N.A
TI(;128.00,WE:60.00,TW:l0.00
WE;42.00,TK;·IO.OO
N.A
522.00 WE:34.00,TK:I0.00
267.00
326.00
189.00
TK;65.00,O;35.00,WE;30.00
W;3.00
WE:20.00,TK:19.00
TK; 130.00, WE; i5.00.TW;25.00
325.74
1519.6;'
238.82
894.36
295.56
-177.71
433.60
1·15.3.64
'l'13.75
152.50
367.22
54.43
36.70
347.40
15/.n
105.09
1564.,15
927.72
5.87
599.35
141.,S5
'289.09
li2.40
NA
H1.41
589.93
694.76
28.56
304.02
139.92
1342.99
217.34
18.91
98.-11
98.80
19.01
57.15
48.:19
17.07
81.41
23.01
:J:J.91
(j:'.G'l
34.07
97.80
1101.20
42.70
'\02.52
21. 75
1.69
1:.10.00
21j~.uO
22.00
N.A
5.00
;;6.00
185.00
25.00
:HI.OO
15.00
2'\1.80
123.87
58.23
40.66
234.64
50.38
67.86
933.45
:H.97
21.13
'lOO.OO
111.00
40.47
:198.26
44.50
5.15
107.13
158.80
116.50
2.90
4.35
11
12
17
18
19
20
21
22
23
24
25
26
?7
!8
2\1
30
29. PARGI M.P.P.
0.19
104.00
N.A
19.00
82.00
(i. DO
12.00
85.00
1.00
258.00
1.00
25.20
:j5.00
23.0()
2
3
4
6
7
8
9
10
11
I
13
14
15

RANGA REDDY DISTRICT
Loca~
tion Name of village
Code
No.
29.PARGI M.P.P. (Concld .. ) 16. GADSINGAPUR
17.
18.
19.
20.
21.
22.
23.
RANGAMPALLE
RAMREDDIPALLE
SONDEPUR
BABAPUR
ROOPKHANPET
SULTHANPUR
NARAYANPUR
24. RAGHAVAPUR
25. SYED MALKAPUR
26. KADLAPUR
27.
28.
29.
30.
31.
NAGULAPALLE
MADHATtAM
RAPOLE
YABAJIGUDA
TONDAPALLE
32. ClIlTYAL
33. I\HUDAVANPUR
31. JAFFERPALLE
:~5. RAVALPALLE
36. SYEDPALLE
37. HEERAPUR
30.PUDUR M.P.P.
I.
2.
3.
.1.
5.
6.
7.
8.
9.
10.
11.
12.
1:1.
14.
Hi.
MANNEGUDA (PAIGAH)
YENKEPALLE
)\1IRZAPUR
!\IANNEGUDA (SARFECAS)
KANDLAPALLE
ANGADICHITTAMPALLE
POTHIREDDIGUDA
BAKAPUR
KOTHAPALLE
CHEELAPUR
GANGUPALLE
PUDUR
THIPPAPUR
THIMM,\PUR
CHANGOMUL
REGADllVIAMIDlPALLE
Total area
of the village
(I II hectares)
3
590.84
1121.79
72.62
288.94
260.62
463.77
602.~8
812.20
518,40
493.72
!)98.93
264.26
906.09
1578.27
4:18.27
\122.68
719.20
294.61
316.R7
986.62
83.37
125.86
740.9tl
627.67
423.70
687.56
687.56
144.47
287.33
4ii.53
167.54
445.96
2216.86
201l,41
183.32
1491.26
446.77
98
Tot ill Number
of households
and populiltion
Am('njtie~ available
VILLAGE Amenities and
(If not aViiilable wit.hin the village, the distance ill brOild
ranges viz., -5 I{IIlS., 5-10 Kills. and 10+ 1{llls. of the
nearest place where the Tacility available IS given)
House
holds
Popu- Educa- r-1edkal Drinking Post and Commu
nicati( n" lation tional water Telegraph
4
308 162·1
310 1699
39 16,)
56 283
99 550
354 2138
215 H99
22-1 1347
83 167
136 757
172 997
337 1936
41" 2:163
99 ,,78
16~ 995
220 1117
181 j(J:l5
7i 429
82 469
274 IG73
12 66
233 1313
191 967
207 1236
238 1393
259 1525
34 203
47 347
104 729
158 920
138 876
514 3192
18 30:1
460 2900
146 745
6
p
I'
-5
p
p
p
p
p
p
I'
p
7
Mcw 5-10
-5
5-10
-5
MCW
CHW
CHW
-5
-5
5-10
(potable)
8
W,HP
W,HP
W,llP
W,HP
W,Hp
W,HI'
W,HP
W,Hp
W,HP
W,llP
W.HP
9
PO
5-10
-5
;'-10
5-10
PO
-5
-5
-5
---- ------ Un-Inhabited ----------------
I',M
r p
p
P.M
P
J>
I'
P
5-10
~1C\\'
-5
0-10
II
-5
-5
;'-10
5-10
lOt
W.HP
W,HI'
\\' ,HP
W,HP
\\',HP
W.HP
W,III'
W,HP
W,HP
W,HP
PO
PO
- :)
PO
PO
-5
PO
lOt
------ --.--.- Un-Inhahitod -- -------
P cmv P CHW
P MeW,eHW
P -5
P,M,1l CHW
P -5
P
P
P
-5
-5
-5
P,t-I,B I\IC\\',PIlC
T,W,IIP -5
W,HP ·5
W,TW,HI' PO,PHONE
W,HP
W
W,ltp
W.IIP
W,IIP
W,IIP
W.1I1'
W,IIP
PO
PO,PHONE
-5
-5
-5
-G
PO, PHONE
-- - -.----.---- Un-Inhabited .----
p
P,!\!
P
-5 W,IIP
Mew,pHC,ellW W,HP
ellw W,HP
PO,PHONE
-5
10
BS
ns -5
BS
-5
-5
Bs
-5
BS
5-10
5-111
fls
-.1
flS
BS
tiS
BS -5
BS
-5
-5
BS
-5
BS
US
5-10
-5
-5
-5
as
-5
BS -5
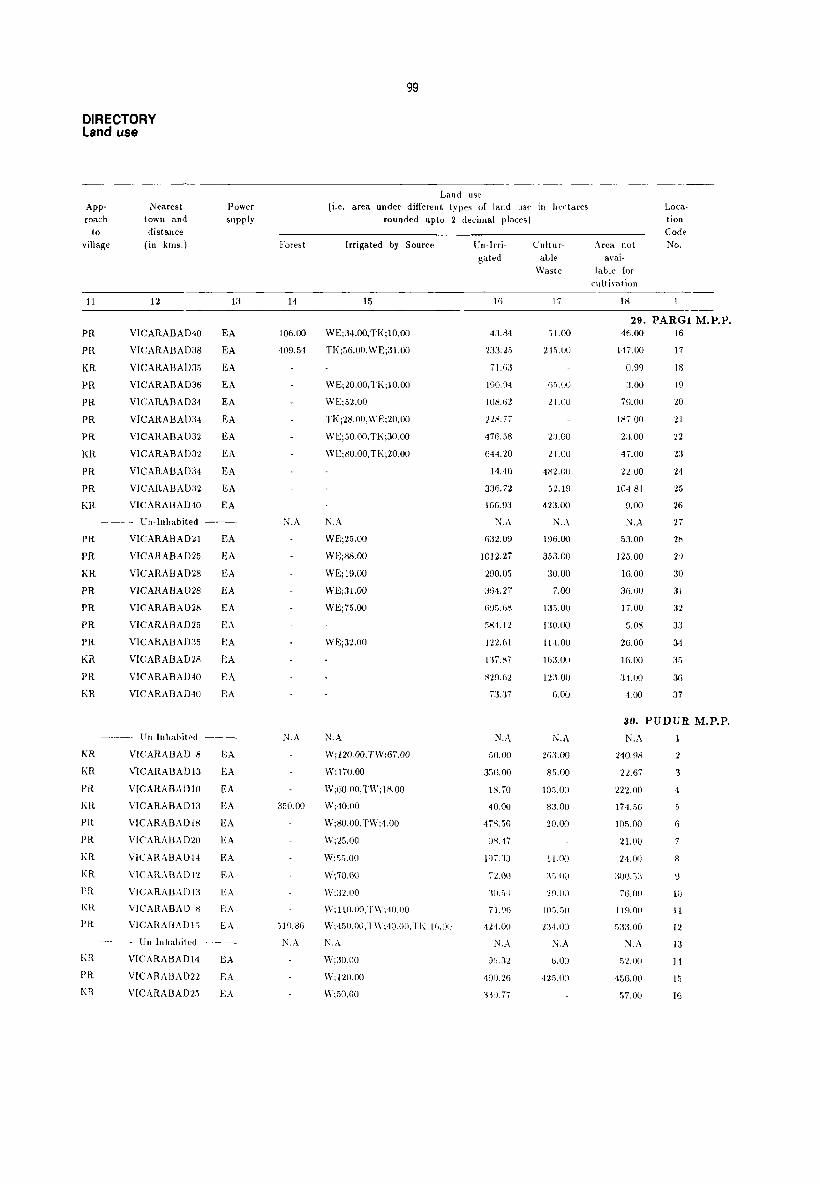
DIRECTORY Land use
App
roach
to
village
11
PR PR
KR PR PR PR PR KR
PR PR KR
Nearest
town and
<iistance
(in kms.)
12
VICARABAD40
VICARABAD38
VICARABAD35
VICARABAD36
VICARABAD34
VICARABAD34
VICARABAD32
VICARABAD32
VICARABAD34
VICARABAD32
VICARABAD40
Power
supply
13
EA
EA
EA
EA
EA
EA
EA
EA
EA
EA EA
----.- Un-Inhabited ------
PR PR
KR PR PR PR
PR KR PR KR
I(R
KR
PR KR
PR I'R
I,ll
KR PR
KR I'R
KIl
PR KR
VICARABAD21
VICAHABAD25
VICARABAD28
VICARABAD28
VICARABAD28
VICARABAD25
VICAltABAD:J5
VICARABAD2i1
VICARABADIO
VICARABAD·lO
EA
EA EA
EA
EA
EA
EA
EA
EA
EA
------- Un-Inhabited ----
VICARABAD 8
VICARABAD 13
VICARABADlO
VICARABAD13
VICARABAD 18
VIC ARABAD20
VICARABAD 14
VICARABADI'l
VICARABAD 1.1
VICAIlABAD /l
VICAIlABADIG
-------- Un-Inhabited --
VICARABADH
VICARAI3AD22
VICARABAD25
EA
EA
FA lOA
EA
EA
EA
EA EA
FA E.-\
EA
EA
EA
Forest
14
]06.00
409.54
N.A
N.A
350.00
01'l.86
N.A
99
Land use (i.e. area under different types of land lise In hectares
rounded upto 2 decimal places I
Irrigated by Source
15
WE;34.00, TKjl0.00
TK;ii6.00,WE;31.00
WE;20.00,TKjl0.00
WEj52.00
TK j28.00, \\' Ej20.00
WEj50.00, TI(j30.00
WE;80.00, TJ\j20.00
N.A
WE;25.00
WE;88.00
WE;19.00
W£;,11.00
WEj75.00
WEj32.00
N.A
WjI20.00.TW;67.00
W;170.00
W;GO.OO,T\\'; 18.00
Wj40.00
W:80.00,TW;·1.00
Wj25.00
W;55.00
W;7Q.OO
W;:12.00
W; IIO.UO.T\\';·Hl.110
W;4:10,00, I \V;40,OO,Tl(; I(i.ill)
N.A
\\'j30.00
W;120.00
W;50.00
Un-Irri
gated
lG
43.84
233.2,)
7l.G3
190.'14
Ill8.(,2
218.77
·JiG.58
641.20
14.40
3:36.72
166.93
N.A
632.09
1012.27
290.05
36·1.27
6~lG.(i1\
01-14.12
Ill-GI
N.A
50.00
3;)0.00
18.70
40.00
4iK,,,r;
98.47
1'17,3:]
71.00
:10. 0·1
71. ~)()
·tHOO
N.A
4')0.26
Cultur
able
Waste
17
"l.OO
21:',00
(,;).00
2 J.()U
2:1.()O
21.0()
4xl.OO
:1Z.Hl
423.00
N.A
196.00
3.5,3.00
30.00
7.00
13G.0()
1:10.00
111.00
Hn.U(J
12:1.0(J
6.00
N.A
263.00
8;;.00
10S.00
8:1.00
20.00
11.00
:F>.OO
2'l.OO
Z:I·L()()
[\i,A
6.00
-12:;.00
A rc<>. not
a\'aj·
lable for
cllitivat.ion
IK
Loca
tion Code
No.
29. PARGf M.P.P. 46.00
14i.00
0.99
J.OO
79.00
I1l7.00
23.00
47.00
12.00
10·1.81
9.00
:-J,A
53.00
125.00
16.00
:J(;.OO
17.00
5.08
26.00
16.00
],1.(10
4.00
16
17
18
19
20
11
n 2.1
H
25
26
27
2K
2')
30
31
32
3]
34
3:}
3G
37
30. PUDUR M.P.P.
N.A
240.91l
22.67
222.00
174,06
100.00
2l.(\()
noo :\llO.:,:\
76.00
lW.OO
;-,:uoo N.A
52,00
4Sf),OO
57.00
2
-3
G
7
8
9
10
II
12
13
1·1
15
16

RANGA REDDY DISTRICT
Loca-tion Name of village Code No.
2
Total area of the village (In hectares)
3
30.PUDUR M.P.P. (Concld .. ) 17. MITTAKANKAL
18. QU'l'HUBULLAPUR
19.
20.
21.
22.
23.
24.
25.
26.
27.
28.
29.
30.
31.
32.
33.
34.
MEDIKONDA
RAI<AMCHERLA
THiRMALAPUR
SOMANGURTHY
I<ERVELLI
SINGAII>ALLE
PEDDADMANTllAL
MEDIPALLE (KALAN)
1,ODMOOR
KANKAL
MANCHANPALLE
GHATPALLE
TURKAYENKEPALLE
NIZAMPETMEDIPALLE
CHINTALAPALLE
PUDGURTHY
31.SHABAD M.P.P.
l.
2.
3.
4.
5.
6.
7.
8,
9.
10.
U.
12.
13.
14.
15.
16.
17.
18.
19.
20.
21.
22.
23.
24.
25.
BOBBILIGAl\l
TIRUMALAPUR
ETLAERRAVALY
TADLAPALLE
RUDRARAM
CHANDlNVALLf~
HAYATHABAD
SOLUPET
MADDlJR
PEDDAVED
DAMERLAPALLE
NAGARKUNTA
BHONGIRPALLE
MACHANPALLE
POLARAM
POTHUGAL
REGADIDOS WADA
KOMERABANDA
OBAGUNTA
SHABAD
MANMARRI
KAKLOOR
ANANTHAWARAM
KESAVARAM
RANGAPUR
378.78
464.68
535.80
293.80
385.26
913.37
515.57
138.00
1318.06
585.17
607.84
2066.72
1254.12
475.50
260.21
718.32
593.27
259.40
910.54
266.69
520.42
1541.J.1
499.79
1061.89
479.15
1005.64
937.65
~86 . .'\2
G18.76
662.87
176.04
884.24
241.19
564.99
1224.98
230.67
222.58
6604.86
1681.06
1152.54
359.76
346.41
253.74
100
Total Number
of households a.nd population
HOIlseholds
Population
4
121 782
168 942
79 ·13·1
100 53,1
80 578
350 1959
175 870
88 481
470 2512
188 ]]41
239 J.J21
451 2793
420 2329
67 427
190 VOg
221 l:li4
172 1007
158 838
173 969
90 579
177 1088
583 3412
144 M9
268 1460
211'\ 1178
269 H7:!
208 1469
129 G·15
292 IG3!
194 1029
40 272
236 noo
63 :128
199 J 202
256 151"
157 87G
50 287
2307 12370
618 3192
818 4276
160 831
71 382
122 7-11
AlIIellities available
VILLAGE Amenities and
(If not available within the village, the distance ill broad ranges viz., -5 Kms., 5-10 Kills. and 10+ I< illS. of the
nearest place where the facility available i. given)
Educa- Medical tional
p
p
p
P
P
P
l'
P
6
-5
cHW
-5
ellW
7
-5
rdCW.CI!W
CHW
eliW
Drinking Post and water Telegraph
(potable)
8
T,W,IlP -5
W.J[I' -5
·5
-s
PO
-·5
9
\\' JIP
W,l[l'
W,HP
\V.II P
W,HP
W,HP 5-10
P ellW W,HP PO,PHONE
PO P cl-iw W,HP
P CHW W,HP
P,I\I,H MCW,CHW,SMP W,TW
P,M
P
P
l'
I'
I'
p
p
p
p
I'
I'
p
P
-5
P
p
p
·5
p
p
p
p
P
P
~lCW ,Cli\\,
-5
CHW
CIlW
·5
ellW
5-10
JO+ -5
5-10
-5
PIle
5-1D
10+
10+
-5
10+ 5-JO
·5
5-10
5·10
5-10
5-10
5-10
5-10
P,M,H PHC
P 5-10
P 5-10
P
P
P
lOt -5
-5
W,HP
\Y,lIP
iV,tlP
',\, ,Ill'
W,R
\\' ,Ill'
w \V
1'W
T
T,W
T
T
T
T
T
T
T
I'\\'
T
\II
T,W
\V
W
W
T
T
T
T
T.W
T
PO
PO,PHONE
PO,PHONE
·5
1'0
PO,PIlONE
-5
·5
·5
PO
-5
PO
PO
-5
-~
5-10
)-10
PO
·5
·5
PO
PO
PO
5-JO
5·10
5-10
CommllnicatiOl.s
10
5-10
-5
-5
I3S
-5
BS
·5
·5
BS
·5
·5
ns BS
·5
-5
BS
ns -5
5-10
5-10
BS
-5
BS
BS
BS
·5
·5
-5
-5
BS
-5
ns .5-10
us BS
5-10
5-10
BS
-5
BS
-:'5
BS
-5

DIRECTORY land use
Approach
to village
11
KR
[(R
KR
PR
KR
PR
KR
KR
KR
KR
KR
PR
PR
PR
KR
KR
KR
KR
KR
KR
PR
PR KR
KR
PR KR
1m KR
KR
PR
KR
PR
KR
PR
PR
KR
KR
PR KR
PR PR
PR
KR
Nearest town and distance
(in kms.)
12
VICARABAD 26
VICARABAD 25
VICARABAD 16
VICARABAD 14
VICARABAD 15
VICARABAD 18
VICARABAD 18
VICARABAD 18
VICARABAD 14
VICARABAD 16
VICARABAD 28
VICARABAD 20
VICARABAD 24
VICARABAD 28
VIC ARAB AD 28
VICARABAD 25
VICARABAD 24
VICARABAD 25
HYDERABAD70
HYDERABAD57
HYDERABAD60
HYDERABAD49
HYDERABAD47
HYDERABAD45
HYDERABAD36
HYDERABAD40
HYDERABAD40
HYDERABAD35
HYDERABAD35
HYDERABAD50
HYDERABAD50
HYDERABAD50
HYDERABAD50
l:!YDERABAD55
HYDERABAD55
HYDERABAD70
HYDERABAD72
HYDERABAD60
HYDERABAD45
HYDERABAD50
HYDERABAD58
HYDERABAD55
HYDERABAD42
Power supply
13
ED
EA
EA
EA
EA
EA
EA
EA
EA
EA
ED
EA
EA
EA
EA
EA
EA
EA
EA
EA
EA
EA
EA
EA
EA EA EA
EA
EA
EA
EA
EA
EA
EA
EA
EA
EA EA
EA
EA
EA
EA
ED
Forest
14
216.00
101
Land use (i.e. area under different types of lat\d use in hectares
rounded u pto 2 decimal place~)
Location Code No. Irrigated by Source
15
W;25.OO
W;35.OO
W;30.00
W;65.OO
W;40.OO,O;25.00
W;95.OO
W;25.OO
W;40.00
W;42.OO
WE;25.oo
W;25.00
W;75.OO
W;124.00,TW;6.00
W;13.OO
W;45.OO
W;75.OO
W;70.00
W;40.OO
TI<;4.05
Un-Irrigated
16
266.7R
:133.5H
168.00
14.80
116.26
346.37
60.57
47.00
865.06
200.17
500.84
1053.72
.128.12
309.50
135.21
232.32
9.27
164.40
347.34
206.14
254.34
769.08
180.46
309.49
359.72
241.31
352.45
176.12
139.08
270.82
69.24
362.50
111.27
207.60
370.18
141.87
91.:18
2636.45
583.06
638.44
234.48
225.07
205.58
Culturable
Waste
17
50.00
11.00
254.00
150.00
25.00
6.00
194.00
25.00
221.00
220.00
133.00
84.00
20.00
117.00
275.00
485.55
54.51
204.01
696.94
257.61
665.18
92.14
645.03
508.69
106.72
443.96
381. 2:;
\)2.40
480.09
Inill
293.3·1
731.11
61. 12
t 22.(i!)
3417.60
1010.00
391.30
88.43
76.40
40.·17
Area not avai
lable for cultivation
18
30. PUDUR. M.P.P. (Concld .. )
:i7.00
1I'j.10
83.80
6·1.00
179.00
250.00
236.00
26.00
190.00
360.00
82.00
718.00
663.00
69.00
60.00
294.00
239.00
55.00
17
18
II)
20
21
22
23
24
25
26
27
28
22
30
31
32
33
34
31. SHABAD 'A.P.
77.65
6.04
62.07
75.12
61.72
87.22
27.29
119.30
76.51
3.68
35.72
10.80
14.10
36.65
6.14
64.05
123.69
27.68
8.S5
550.81
88.00
122.80
36.85
44,94
3.64
2
3
4
5
6
7
8
9
10
11
12
13
14
15
16
17
18
19
20
21
22
23
24
2,\
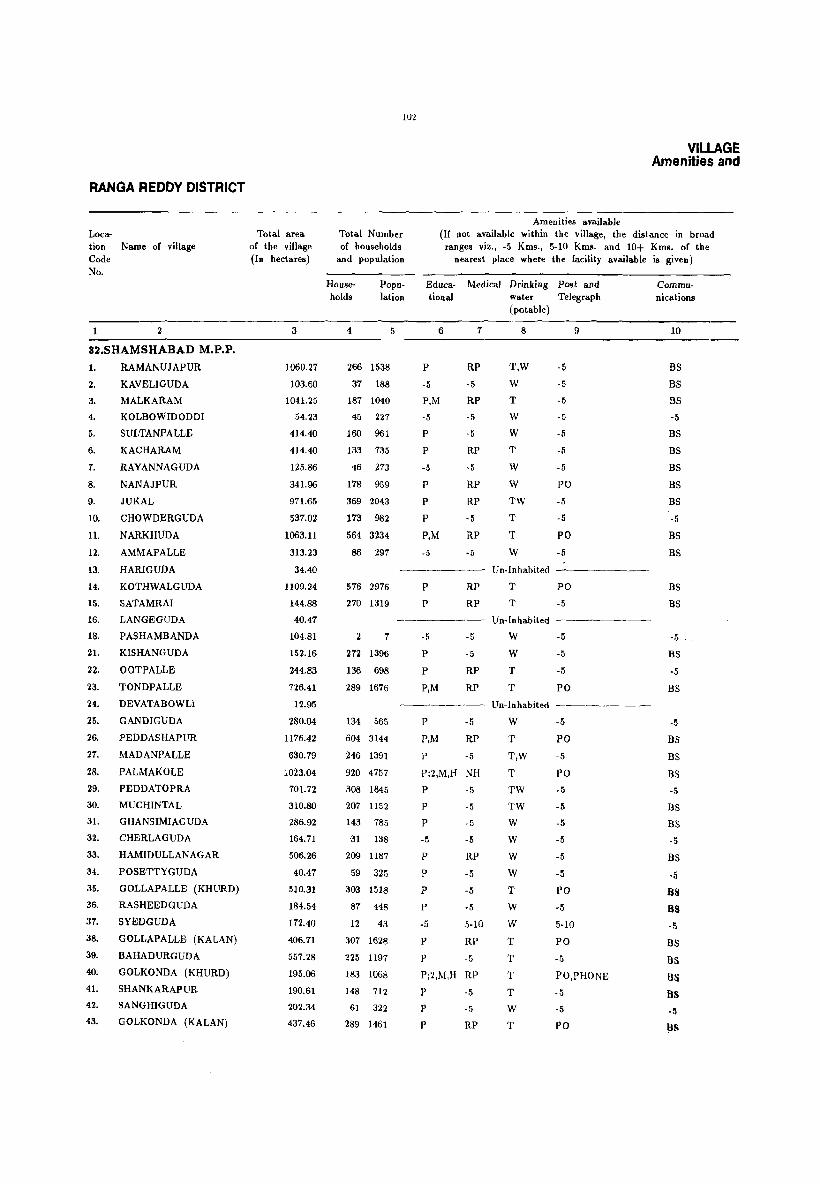
RANGA REDDY DISTRICT
Loca-tion Name of village Code No.
2
32.SHAMSHABAD M.P.P.
1.
2.
3.
4.
5.
6.
1.
8.
9.
10.
11.
12.
13.
14.
15.
16.
IS.
21-
22.
23.
24.
25.
26.
21.
28.
29.
30.
31.
32.
33.
34.
35.
36.
31.
38.
39.
40.
41.
42.
43.
RAMANUJAPUR
KAVELiGUDA
MALKARAM
KOLBOWIDODDI
SULTANPALLE
KACHARAM
RAYANNAGUDA
NANAJPUR
JUKAL
CHOWDERGUDA
NARKHUDA
AMMAPALLE
HARIGUDA
KOTHWALGUDA
SATAMRAI
LANGEGUDA
PASHAMBANDA
KISHANGUDA
OOTPALLE
TONDPALLE
DEVATABOWLl
GANDIGUDA
PEDDASHAPUR
MADANPALLE
PALMAKOLE
PEDDATOPRA
MUCHINTAL
G HANSIMIAG UDA
CHERLAGUDA
HAMIDULLANAGAR
POSETTYGUDA
GOLLAPALLE (KHURD)
RASHEEDGUDA
SYEDGUDA
GOLLAPALLE (KALAN)
BAHADURGUDA
GOLKONDA (KHURD)
SHANKARAPUR
SANGHIGUDA
GOLKONDA (KALAN)
Total area of the village (In hectares)
3
1060.21
103.60
1041.25
54.23
414.40
414.40
125.86
341.96
971.65
537.02
1063.11
313.23
34.40
1109.24
144.88
40.47
104.81
152.16
244.83
726.41
12.95
280.04
1176.42
630.19
1023.04
701. 72
310.80
286.92
164.71
506.26
40.41
510.31
184.54
172.40
406.71
557.28
195.06
190.61
202.34
437.46
102
Total Number of households
and population
Households
Population
4
266 1538
31 188
187 1040
45 227
160 961
133 735
46 273
178 959
369 2043
113 982
564 3234
86 297
576 2976
270 1319
2 1
272 1396
136 698
289 1676
134 565
604 3144
246 1391
920 4757
308 1845
207 1152
143 785
'31 138
209 1187
59 325
303 1518
87 448
12 43
307 1628
225 1197
183 1068
148 712
61 322
289 1461
5
Amenities avajlable
VILLAGE Amenities and
(If not available within the village, the distance in broad ranges viz., -5 Kms., 5-10 Kms. and 10+ Kms. of the
nearest place where the facility available is given)
Educa- Medical Drinking Post and tiona! water Telegraph
(potable)
6
P
-5
P,M
-5
P
P
-5
P
P
P
P,M
1
RP
-5
RP
-5
-5
RP
·5
RP
RP
-5
RP
-5 -5
P
P
RP
RP
-5 -5
P
P
P,M
-5
RP
RP
P -5
P,M RP
P -5
P;2,M,H NH
P
P
P
-5
-5
-5
-5 -5
P RP
P -5
P -5
P -5
-5 5-10
P RP
P -5
P;2,M,H RP
P
P
P
-5
-5
RP
8
T,W
W
T
W
W
T
W
W
TW
T
T
W
Un-Inhabited
T
T
-5
-5
-5
-5
-5
-5
-5
PO
-5
-5
PO
-5
PO
-5
9
Un-Inhabited --------
W -5
W
T
T
Un-Inhabited
W
T
T,W
T
TW
TW
W
W
W
W
T
W
W
T
T
T
T
W
T
-5
-5
PO
-5
PO -5
PO
-5
-5
-5
-5
-5
-5
PO
-5
5-10
PO
-5
PO,PHONE
-5
-5
PO
Communications
10
BS
BS
BS
-5
BS
BS
BS
BS
BS
-5
BS
BS
BS
as
-5 -
BS
-5
BS
-5
BS
BS
BS
-5
BS
BS
-5
BS
-5
Bli Bli -5
BS
BS
ns BS -I}
8S

DIRECTORY Land use
Approach
to village
11
PR
PR
PR
KR
PR
PR
PR
KR
PR
Nearest town and distance
(in kms.)
12
Power supply
13
HYDERABAD 36 EA
HYDERABAD 36 EA
HYDERABAD 30 EA
HYDERABAD 28 EA
HYDERABAD 8
SHAMSHABADll
SHAMSHABADll
SHAMSHABAD15
SHAMSHABAD 7
EA
EA
ED,EAG
EA
EA
KR SHAMSHABAD 3 EA
PR SHAMSHABAD 6 EA
PR SHAMSHABAD 5 EA
--_ Un-Inhabited --_
KR HYDERABAD 4 EA
PR HYDERABAD 5 EA
KR
PR
--- Un-Inhabited ----
HYDERABAD 3 EA
SHAMSHABAD 2 EA
KR HYDERABAD 2 EA
PR SHAMSHABAD 2 EA
KR
PR
PR
PR
KR
KR
PR KR
PR PR PR
KR
KR
PR PR
PR KR KR PR
-~_ Un-Inhabited --_
SHAMSHABAD 5 EA
SHAMSHABAD 5 EA
SHAMSHABAD 7 EA
SHAMSHABAD 8 EA
SHAMSHABAD 8 EA
SHAMSHABAD 8 EA
SHAMSHABAD 8 EA
SHAMSHABAD 8 EA
SHAMSHABAD 7 EA
SHAMSHABAD 7 EA
SHAMSHABAD 8 EA
SHAMSHABAD 8 EA
SHAMSHABAD 9 EA
SHAMSHABAD 9 EA
SHAMSHABAD 7 EA
SHAMSHABAD 7 EA
SHAMSHABAD 6 EA
SHAMSHABAD 7 EA
SHAMSHABAD 7 EA
Forest
14
103
Land use (i.e. area under different types of land use in hectart'
rounded up to 2 decimal places)
Irrigated by Source
15
Un-Irrigated
16
Culturable
Waste
17
Area not avai ..
lable for cultivation
18
Location Code No.
32. SHAMSHABAD M.P,P. WjI70.00,TWj6.00
Wi 26.OO
450.69 W;195.00,TW;10.00
W;24.00
Wj81.00,TWjI5.00
WjI50.00,TWjI8.00
Wj96.00
WiI52.00
Wj270.00,TWjI6.00
Wj54.00,TW:4.00
Wj250.00,TWj75.00
W:33.00
N.A N.A
270.17 Wi 149.00,TWjl0.00
W:18.00,TW;1O.00
.N.A N.A
N.A
W;20.00
W ;33.00, TW ;2.00
W;48.00
WjI22.00
N.A
113.94 Wj39.00,TW:4.00
Wj80.97,TW;27.52
. W:85.00,TWiI3.00
TK :493.00, W; 253.00, TW :30.00
Wi260.00
Wi21O.00,TW:18.00
W;33.00
W j45.00, TW i7.00
W :33.00, TW ;15.00
W;38.00
W;120.00,TW:17.00
Wi37.OO
Wj33.00,TWjl0.oo
W;144.oo,TWjI5.00
Wi 120.00,TW:30.00
Wi I50.oo,TW;13.13
W:71.00
W:29.00,TW:16.00
W:181.oo,TW:20.00
631.84
69.91
199.00
10.23
19.17
93.07
5.56
23.65
250.41
178.53
316.92
186.03
N.A
497.02
63.51
N.A
29.47
75.88
103.61
198.83
N.A
43.00
905.00
147.42
29.01
6.44
59.47
176.10
34.61
160.00
263.00
77.00
67.00
91.00
250.00
45.20
5.92
Ib3.0G
OAI
116.:.11
169.05
71.10
8.10
49.11
211.09
113.26
275.14
70.14
N.A
121.05
13.22
N.A
::19.21
::Il.2l
::14.02
165.25
N.A
63.00
79.08
207.16
76.05
268.12
9.19
16.30
30.00
159.08
HU6
30.00
;3.::12
41.00
82:l5
56.46
83.04
120.24
86.37
7.28
70.25
20.00
130.18
82.23
16.20
117.20
224.15
187.23
146.05
24.06
N.A
62.00
40.15
N.A
16.10
10.06
59.20
240.33
N.A
17.10
83.85
178.21
111.98
167.16
14.14
61.52
48.10
139.18
2.47
100.15
40.54
59.08
115.71
75.03
31.93
63.15
29.10
110.30
2
3
'l
5
6
7
8
9
10
11
11
1.3
14
15
16
18
21
22
23
24
25
26
27
28
2<)
30
3[
32
33
34
35
36
37
38
39
40
41
42
43

104
RANGA REDDY DISTRICT
VILLAGE Amenitie.s and
-------------------------------------------------------------------------------------Loca-tion Name of village Code No.
2
33.MAHESWARAM M.P.P. 1.
2.
3.
4.
5.
6.
7.
8.
9.
10.
11.
12.
13.
14.
15.
16.
17.
18.
19.
20.
21.
22.
23.
24.
25.
26.
27.
28.
29.
30.
31.
n 33.
VENKANNAGUDA
GOLLOOR
NANDIPALLE
NAGARAM
NAGIREDDIPALLE
AMEERPET
TOOPRA (KHURD)
KALWAKOLE
PENDYAL
DABILGUDA
MAMSANPALLE
GANGARAM
SIRIGIRIPUR
BAGHMANKHAL
ALMASGUDA
MANKHAL
SARDARNAGAR
RAVIRYAL
KONGAR (KHURD)(A)
KONGAR (KHURD)(B)
IMAMGUDA
SREENAGAR
MALIKDANGUDA
MOHABATNAGAR
THUMMALOOR
MAH;ESWARAM
GHATPALLE
PUBBACHERLA
SUBHANPUR
DILWARGUDA
KaLLA PADKAL
AKANPALLI
PORANDLA
Total area of the village (In hectares)
3
121.81
735.31
566.05
576.68
673.80
617.55
866.94
668.94
944.79
249.29
1045.30
421.68
579.51
298.25
95.91
3083.29
269.12
1135.04
227.84
1768.88
834.06
997.04
292.99
206.79
2302.66
2117.31
691.61
820.70
644.66
113.31
783.87
556.44
1060.27
34.IBRAHIMPATNAM M.P.P. 1.
2.
3.
4.
5.
KONGARA KALAN
ADIBATLA
BONGLOOR
CHINTAPALLEGUDA
RAMDASPALLE
1767.66
1346.79
349.65
335.53
1019.81
Total Number of households
and population
Householdll
Population
4
8 47
271 1436
96 545
454 2648
117 642
508 3196
160 1065
386 2112
230 1361
125 632
261 1436
89 428
181 1007
10 41
5
Amenities available (If not available within the village, the distance in broad
ranges viz., -5 Kms., 5-10 Kms. and 10+ Kms. of the nearest place where the facility available is given)
Educa- Medical tional
6
-5
PjZ,AC
P,M
P,AC
P
7
-5
5-10
CHW,RP
-5
P,M,H,AC CHW,RP
P
Pj3,AC
P,AC
P
P,AC
AC
P
-5
5-10
5-10
5-10
5-10
5-10
-5
-5
-5
Drinking water (potable)
8
W
TW,HP
TW,HP
T,TW,HP
'l'W,HP
T,TW
TW,HP
T,W,HP
TW
TW,HP
TW
T,W
TW,HP
W
Post and Telegraph
10+
-5
-5
9
PO,PTO,PHONE
5-10
PO,PHONE
5-10
po
-5
5-10
5-10
-5
-5
-5
Communications
10
-5
BS .
5-lQ
BS
5-1.0
BS
hS
-5
-5
-5
BS
-5
BS
-5
------ Un-Inhabited ------
1427 7701
243 1395
539 2921
382 2206
101 594
41 215
64 363
401 2268
1122 5619
222 1183
238 1137
265 13'78
33 182
262 1459
144 759
164 887
755 4336
429 2208
147 741
57 248
109 602
P;2,Mj2,H CWC,HC,RP T,TW,HP,N PO,TO,PHONE
P -5 TW,HP-5
P,M,H
P,M,H
FPC,CHW,RP T,TW,HP PO
CHW,RP T,TW,HP PO
------- Un-Inhabited -------
P
-5
-5
-5
TW PO
TW,SP -5
---~ Un-Inhabited ------
P
P,M,AC
Pj3,M,H
P
Pj2
P,M
-5
P,AC
P
P,AC
P,M
P
P
P
P
5-10
-5
TW,HP
TW,N
MCW,PHC,RP T,W,TW
5-10 TW,llP
CHW,RP
5-10
5-10
10+
10+
CHW,RP
CHW
RP
RP
5-10
5-10
W,HP
TW
W,HP
T,TW
W,HP
TW,HP
W,HP
W,HP
W,HP
W,HP
W,HP
5-10
PO
PO,PHONE
5-10
PO,PHONE
-5
-5
-5
-5
-5
PO,PHONE
PO,PHONE
-5
-5
PO
BS
BS
BS
BS
B" " LS
-5
BS BS
BS
BS 5-10
-5
BS 5-10
5-10
u<, Ud
-5
BS
BS

DIRECTORY Land use
Approach
to village
11
KR
PR
KR
PR
KR
PR
PR
KR
KR
KR
PR
PR
Nearest town and distance
(in kms.)
12
Power supply
13
HYDERABAD32 EA
HYDERABAD28 EA
HYDERABAD22 EA
HYDERABAD20 EA
HYDERABAD28 EA
HYDERABAD33 EA
HYDERABAD34 EA
HYDERABADz9 EA
HYDERABAD28 EA
HYDERABAD26 EA
HYDERABAD26 EA
HYDERABAD27 EA
PR HYDERABAD26 EA
KR HYDERABAD28 EA
PR
PR
PR
PR
PR
PR
PR
PR
PR
PR
PR
KR
PR
PR
KR
KR
PIt
PIt
PIt
KIt
PR
---- Un-Inhabited -~-
HYDERABAD18 EA
HYDERABAD12 EA
HYDERABAD12 EA
HYDERABAD19 EA
---- Un-Inhabited --~
HYDERABAD18 EA
HYDERABAD19 EA
---- Un-Inhabited ----
HYDERABAD26 EA
HYDERABAD30 EA
HYDERABAD28 EA
HYD3RABAD32 EA
HYDERABAD30 EA
HYDERABAD34 EA
HYDERABAD31 EA
HYDERABAD38 EA
HYDERABAD33 EA
HYDERABAD40 EA
HYDERABAD19
HYDERABAD22
EA
EA
HYDERABAD17 EA
HYDERABAD18 EA
HYDERABAD29 EA
105
Land use (i.e. area under different types of land use in hectares
rounded upto 2 decimal places) Location Code No. Forest
14
Irrigated by Source
15
TKi10.70,WEi5.00,TWEi4.00
WEi50.( J, TI(i16.36, TWE;9.00
145.03 Wi25.OO,TWE,20.00
221.38 WEiI5.24,TKi14.50,TWE;4.20
WE;25.00,TWEi 15.20, TIC; 10. 20
TKi50.99,W;48.00,TWE;12.00
WE,22.24,TWEil8.00,TK,17.08
TKi33.59,TWE;Z9.41, WE;6.00
WE,38.00,TWE;24.00,TK,22.00
WE,20.00,TICiI2.00,TWE;6.00
WE;26.00,TJ(,12.00,TWE,9.21
WE, 16. 26, TJ(;8. 20,TWE;6. 14
125.92 TWE;62.00,WE;58.00,TIC;22.00
TKi35.00
N.A N.A
276.09 WEi85.00,TWEi45.oo,TKi25.00
74.87
N.A
WE,25.00,TWE,22.00
TKi70.00,WEiI5.00,TWEi5.oo
TKi85.79,WEi6.07,TWE;4.86
N.A
WE;13.76
247.27 TWEi22.oo,TI(;22.00, WE; 18.00
N.A N.A
TWE,20.oo,TK,5.00
161.87 TWEi64.72,WE,39.28,TK;15.00
199.91 TKi72.05, WEi45.00, TWE; 22.00
WE;35.00,TWE;28.oo,TK;22.00
W E;70.00, TJ(j40.00, TWEi30.00
Wi150.29,TWE;75.71,TK,15.00
WEi67.00
WE,60.oo,TKi50.17, TWEi30.OO
WE;15.oo,TWEj4.30
Wj60.oo,TWj20.00,TK;10.00
315.25 WEi66.77
WE;445.15
WEi34.80
WEi18.21
WEi40.40
Un-Irrigated
16
66.03
462.90
307.64
217.36
561.09
438.92
665.92
534.94
654.02
189.51
903.78
331.24
289.24
249.69
N.A
2542.20
201.18
901.99
40.47
N.A
62.14
6,10.17
N.A
154.60
1297.08
1693.71
552.02
625.00
297.84
30.01
400.86
261.00
810.11
1106.41
798.44
302.70
134.35
565.56
Culturable
Area not avai·
Waste lable for cultivation
17 18
33_ MAHESWARAM M.P.P.
8.00
J61.62
4.04
32.86
48.56
35.1:3
;J:;.61
71.3.';
5.62
62.72
55.84
12.14
4.66
N.A
50.00
12.94
5.66
N.A
g.oo 1fi.60
N.A
20.23
370.61
46.53
28.29
20.00
33.37
9.30
87.04
175.00
39.22
28.08
35.43
64.34
71.14
13.75
67.64
108.57
29.39
135.42
16.16
31.56
4.00
10.21
8.90
N.A
60.00
8.00
143.05
10.12
N.A
750.16
32.00
N.A
6.96
354.10
38.11
26.30
35.70
72.45
7.00
155.80
101.14
120.64
3
4
6
7
8
9
10
11
12
13
14
F.
16
17
18
19
20
21
22
23
24
25
26
27
28
29
3(J
31
32
33
34. IBRAHIMPATNAM M.P.P. 97.12
42.50
170.82
243.98
182.11
60.70
12.15
12.15
169.87
1
2
3
4
5

RANGA REDDY DISTRICT
Loca-tion Name of village Code No.
2
Total area of the village (In hectares)
3
34.IBRAHIMPATNAM M.P.P. (Coneld .. ) 6. ISMAILSHAPAMPU 4.86
7. IBRAHIMPATNAM(KHALSA) 2519.57
8. NAGANPALLE
9. POLKAMPALLE
10. NARREPALLE
11. DANDUMAILARAM
12. MUKNOOR
13. RAINGUDA
14. YENGALAGUDA
15.
16.
17.
RAIPOLE
TATTIKHANA
ALIMlYAKUNTA
18. IBRAHIMPATNAM (BAGATH)
19. MANGALPALLE
20. FEROZGUDA
21. RAMREDDIGUDA
22. POCHARAM
23. YELMINEDU
24. TADLAKALVA
25. YERRAKUNTA
26. TURKAGUDA
27. KAPPAPAHAD
28. TOOLEKALAN
35.MANCHAL M.P.P. 1.
2.
3.
4.
5.
6.
7.
KHANAPUR
MALLlKARJUNAGUDA
MANORABAD
SABITHNAGAR
LINGAMPALLE
THALLAPALLIGUDA
NALLACHERU
8. THIPPAIGUDA
9. CHITTAPUR
10. MANCHAL
11. JAINAMMAGUDA
12. NO MULA
13. AGAPALLE
14. KAGAZGHAT
15. JAPALA
16. RANGAPUR
948.00
1392.52
467.00
1276.78
520.02
224.20
104.00
993.50
21.45
56.25
2079.27
2296.18
341.96
140.02
645.88
2509.85
57.06
55.85
78.10
1058.65
1368.64
400.23
188.18
120.19
125.05
525.69
562.11
53.42
381.21
1241.98
1624.40
151. 76
1176.01
697.68
657.21
1188.15
555.63
106
Total Number of households.
and population
Households
4
Population
5
Amenities available
VILLAGE Amenities and
(If not available within the village, the distance in bl'oad ranges viz., -5 Kms., 5-10 Kms. and 10+ Kms. of the
nearest place where the facility available is given)
Educa- Medical Drinking Post and tional water Telegraph
(potable)
6 7 8 9
Comn .nications
10
--------- Un-Inhabited
1418 8001
308 1526
488 2578
192 986
944 4812
199 1019
P;4,M;4, H,PHC,D, W,TK,TW PO,PTO,PHONE H,JC FPC,RP
P
P
P
P,M
p
5-10 W,HP
RP;2 W,TW
5-10 W,TW
PHC,RP;3 W,TW
-5 W,TW
-5
PO
-5
PO,PHONE
-5
-------- Un-Inhabited --------
111 624
774 4290
2089 12697
691 3755
P 5-10 W,TW
P,M,H PHC,RP;3 T,TW
P,M,H,C H
P RP
Un-Inhabited
Un-Inhabited
T,W
W,HP
-5
PO,PHONE
P'lu
P(j,PHONE
-------.- Un·lnhabited ---~----
203 1099
158 947
529 2947
P
p
-5
5-10
W,HP
W,HP
W,HP
-5
PO
PO
------- Un-Inhabited ---------
13 78
136 792
298 1753
323 1857
185
31 144
42 162
311 1484
253 1331
p
P
P
P
P
-5
-5
P,M
P,M
5-10
5-10
5-10
RP
W
W,HP
W,TW
W,HP
H,RP T,W
-5
-5
-5
5-10
Un-Inhabited
HP
HP
HP
T,TW
-5
-5
PO
PO
-5
PO
-5
PO
PO
------- Un-Inhabited -----------
186 965
235 1212
774 4062
307 1564
247 1439
152 839
391 1960
200 917
P 5-10 HP -5
P,M -5 HP PO
P,M,H PHC N PO,TO
Un-Inhabited --------
P,M -5 HP -5
P,M -5 HP PO
P 5-10 HP PO
P,M,H·5 N PO
P,M PHC HP PO,PHONE
BS
BS
BS
BS
BS
Bf
-5
BS
BS
BS
-5
IlS
BS
-5
-5
-5
BE.
BS
BS
BS
BS
BS
BS
BS
BS
BS
DE>
BS
BS

DIRECTORY Land use
Approach
to village
Nearest town and distance
(in kms.)
Power supply
11
PR
PR
PR
PR
PR
PR
, KR
PR
12 13
-- Un-Inhabited --
HYDERABAD24 EA
HYDERABAD30 EA
HYDERABAD32 EA
HYDERABAD35 EA
HYDERABAD44 EA
HYDERABAD38 EA
-- Un-Inhabited --
HYDERABAD33
HYDERABAD33
EA
EA
-- Un-Inhabited --_
--_ Un-Inhabited --
PR HYDERABAD24 EA
PR HYDERABAD16 EA
KR KR PR
KR
KR KR
PR
PR
KR KR
KR
KR
-_ Un-Inhabited ---
HYDERABAD22
HYDERABAD22
EA EA
HYDERABAD37 EA
-- Un-Inhabited ~--
HYDERABAD24 EA
HYDERABAD30 EA
HYDERABAD30 EA
HYDERABAD36 EA
HYDERABAD27 EA
--_ Un-Inhabited ---
HYDERABAD35
HYDERABAD32
HYDERABAD32
HYDERABAD36
EA
EA
EA
EA
--_ Un-Inhabited --
KR HYDERABAD35 EA
KR
PR
HYDERABAD37
HYDERABAD34
EA
EA
--_ Un-Inhabited --
PR HYDERABAD30 EA
PR HYDERABAD30 EA
KR HYDERABAD33 EA
PR
PR
HYDERABAD38 EA
HYDERABAD39 EA
Forest
14
107
Land use (i.e. area under different types of land use in hectares
rounded upto 2 decimal places)
Irrigated by Source
15
Un-Irrigated
16
Culturable
Waste
17
Area not avai
lable for cultivation
18
Location Code No.
34. IBRAHIMPATNAM M.P.P. (Coneid .. )
N.A N.A
1181.68 WEj227.43,GCj84.18
57.87 TK;34.80,WEj30.76
38.04 GCjOO.65,WEj24.28
WEj20.25,GCj12.14,Wj4.05
314.94 WEj21O.44,GCj50.58
N.A
N.A
N.A
195.87
N.A
780.33
N.A
308.37
N.A
N.A
N.A 316.04
326.31
224.21
304.12
218.39
WEj37.23,GCi3.24,Wjl.21
N.A
WE;20.24,GC,3.64,W;1.21
WEjI25.45,GCj29.54,Wj4.86
N.A N.A GCj130. 59, WE; 10.52, W ;2.83
WEj50.58
N.A
WE;16.19 .
WE;64.75
WE;212.46
N.A
W;8.09
WEj10.12
GC;45.73,WEi27.11
Wj56.65
Wi88.00
N.A
W,33.00
Wi47.00
WilOO.OO
Wi80.00
N.A
W;56.00
Wj99.00
W,458.00
N.A WiI52.00
Wj73.00
Wi l02.OO
Wj112.00
Wj124.00
N.A
320.92
560.89
934.01
286.52
204.36
288.14
N.A 60.10
240.79
N.A
N.A
615.93
1245.56
N.A 111.:19
485.63
1004.02
N.A
18.21
56.66
681.08
487.24
49.40
N.A
77.00
25.00
290.00
251.00
N.A
123.02
858.00
1101.40
N.A
353.00
148.37
150.00
712.03
52.58
N.A
290.16
165.92
155.00
80.94
212.07
127.07
N.A 9.31
107.24
N.A N.A
36.59
466.60
N.A
30.76
189.29
N.A
22.21
8.49
221.06
71.23
162.ll0
t\.A
N.A
N.A
N.A
415.20
97.76
150.54
63.10
284.39
63.13
N.A
8.90
485.62
N.A
N.A
982.81
337.57
N.A 12.54
64.74
323.75
N.A 7.28
2.83
83.67
445.15
'1'
8
9
10
11
12
13
14
15
16
17
18
19
20
21
22
23
25
213
27
28
35. MANCHAL M.P.P.
100.1'3
1",,\
10.19
53.05
135.69
231.11
N.A
202.19
284.98
65.00
N.A 354.97
150.00
181.00
60.00
IvO.GO
3
4
5
6
7
8
9
10
11
12
13
14
15
16
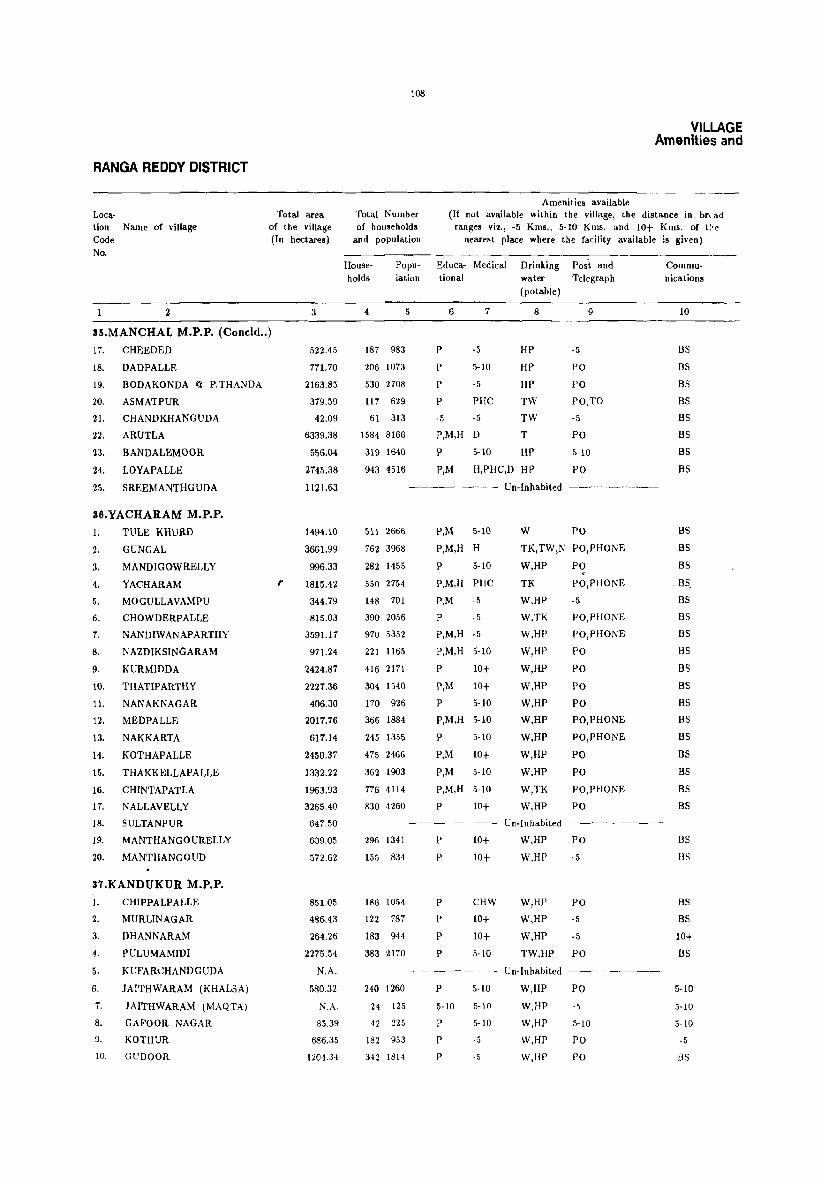
RANGA REDDY DISTRICT
Loca-tion Name of village Code No.
2
Total area of the village (In hectares)
3
35.MANCHAL M.P.P. (Coneld .. )
17. CHEEDED
18. DADPALLE
19. BODAKONDA @ P.THANDA
20. ASMATPUR
21.
22-
23.
24.
25.
CHANDKHANGUDA
A RUTLA
BANDALEMOOR
LOYAPALLE
SREEMANTHGUDA
36.YACHARAM M.P.P.
1-
2.
3.
4.
5.
TULE KHURD
GUNGAL
MANDIGOWRELLY
YACHARAM
MOGULLAVAMPU
6. CHOWDERPALLE
7. NANDIWANAPARTHY
8. NAZDlKSINGARAM
9. KURMIDDA
10. THATIPARTHY
11. NANAKNAGAR
12. MEDPALLE
13. NAKKARTA
14. KOTHAPALLE
15. THAKKELLAPALLE
16. CHINTAPATLA
17. NALLAVELLY
18. SULTANPUR
19. MANTHANGOURELLY
20. MANTHANGOUD
37.KANDUKUR M.P.P. 1-
2.
3.
4.
5.
6.
CHIPPALPALLE
MURLlNAGAR
DHANNARAM
PULUMAMIDI
KUFARCHANDGUDA
JAITHWARAM (KHALSA)
7. JAITHWARAM (MAQTA)
8. GAFOOR NAGAR
9. KOTHUR
10. GUnOOR
r
522.45
771.70
2163.85
379.59
42.09
6339.38
556.04
2745.38
1121.63
1494.10
3661.99
996.33
1815.42
344.79
815.03
3591.17
971.24
2424.87
2227.36
406.30
2017.76
617.14
2450.37
1332.22
1963.93
3265.40
647.50
609.05
572.62
851.05
486.43
264.26
2275.54
N.A.
580.32
N.A.
85.39
686.35
1204.34
108
Amenities available
VILLAGE Amenities and
Total Number of households
and population
(If not available within the village, the distance in br, ad ranges viz., -5 Kms., 5-10 Kms. and 10+ Kms. of C'e
nearest place where the facility available is given)
House
holds Popu- Educa- Medical Drinking Posi and lation tional water Telegraph
(potable)
4
187 983
206 1073
530 2708
11 '7 629
61 313
1584 8166
319 1640
943 4516
511 2666
762 3968
282 1455
550 2754
148 701
390 2056
970 5352
221 1165
416 2171
304 1540
1'70 926
366 1884
245 1355
475 2466
362 1903
776 4114
830 4260
296 1341
155 834
186 1054
122 '78'7
183 944
383 2170
240 1260
24 125
42 225
182 953
342 1811
5
P
P
P
P
-5
6 7
-5
5-10
-5
PHe
-5
8
HP
HP
HP
TW
TW
P,M,H D T
P 5-10 HP
P,M H,PHC,D HP
9
-5
PO
PO
PO,TO
-5
PO
5-10
PO
------- Un-Inhabited
P,M 5-10
P,M,H H
P 5-10
P,M,H PHC
P,M -5
P -5
P,M,H -5
P,M,H 5-10
PlOt
P,M 10+
P 5-10
P,M,H 5-10
P
P,M
P,M
5-10
10+
5-10
P,M,H 5-10
P lOt
W PO
TK,TW,N PO,PHONE
W,HP PO
TK
W,HP
W,TK
W,HP
W,HP
W,HP
W,HP
W,HP
W,HP
W,HP
W,HP
W,HP
W,TK
W,HP
" PO,PHONE
-5
PO,PHONE
PO,PHONE
PO
PO
PO
PO
PO, PHONE
PO,PHONE
PO
PO
PO,PHONE
PO
--------- Un-Inhabited -----------
P
P
P
P
P
P
10+
10+
CHW
10+
10+
5-10
P 5-10
5-10 5-10
P 5-10
P ·5
P ·5
W,HP
W,HP
PO
-5
W,HP PO
W,HP -5
W,HP -5
TW,HP PO
Un-Inhabited
W,HP
W.HP
W,HP
W,HP
W.HP
PO
-, :\-10
PO
PO
Communications
10
BS
BS
BS
BS
BS
BS
BS
BS
BS
BS
BS
BS BS
BS
BS
BS
BS
BS
BS
BS
BS
BS
BS
BS
BS
BS
BS
BS
BS
10+ BS
5-10
5-10
5-10
-5
OS
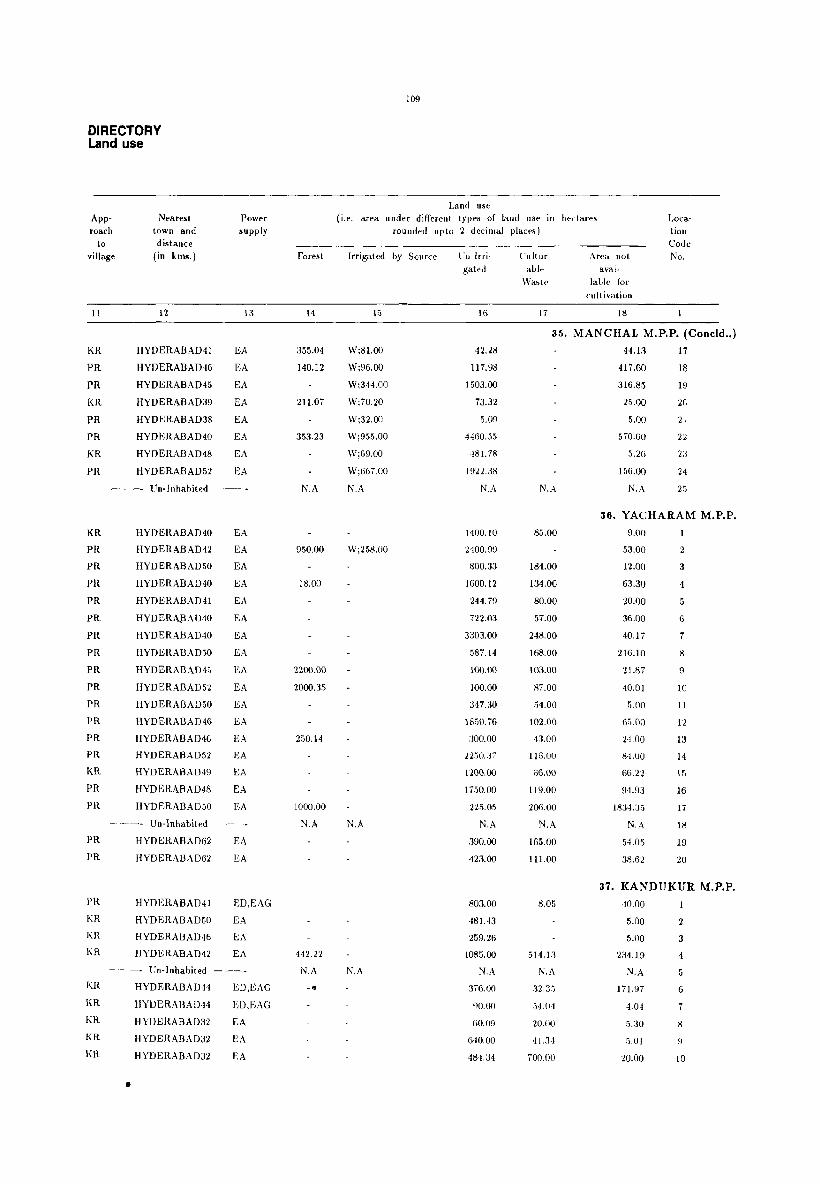
DIRECTORY Land use
Approach
to village
11
KR
PR
PR
KR
PR
PR
KR
PR
Nearest town and distance
(in km •. )
12
HYDERABAD41
HYDERABAD46
HYDERABAD45
HYDERABAD39
HYDERABAD38
HYDERABAD40
HYDERABAD48
HYDERABAD52
Power supply
13
EA
EA
EA
EA
EA
EA
EA
EA
-~~- Un-Inhabited ----
KR
PR
PR
PR
PR
PR
PR
PR
PR
PR
PR
PH.
PR
PR
KR
PR
PR
PR
PH.
PR KR
KR
KR
KR
KR
KR
KR
KR
HYDERABAD40
HYDERABAD42
HYDERABAD50
HYDERABAD40
HYDERABAD41
HYDERA!3AD40
HYDERABAD40
HYDERABAD50
HYDERABAD45
HYDERABAD52
HYDERAI3AD50
HYDERABAD46
HYDERABAD46
HYDERABAD52
HYDERABAD49
HYDERABAD48
HYDERABAD50
EA
EA
EA
EA
EA
EA
EA
EA
EA
EA
EA
EA
EA
EA
EA
EA
FA
- --~- Un-Inhabited ----
HYDERABAD62
HYDERABAD62
HYDERABAD41
HYDERABAD50
HYDERABAD46
HYDERABAD42
EA
EA
ED,EAG
EA
EA
EA
----- Un-Inhabited ----
•
HYDERABAD44
HYDERABAD44
HYDERABAD32
HYDERABAD32
HYDERABAD32
ED,BAG
ED, BAG
EA
EA
EA
Forest
14
355.04
140.12
211.07
353.23
N.A
950.00
18.00
2200.00
2000.35
250.14
1000.00
N.A
442.22
N.A
-II
109
Land use (i.e. area under different types of land us~ III
rounded upto 2 decimal places)
Irrigated by Source L'II-Irri
gated
('ult lit·
able
hectares
Area. nol
avai-
Location Code
No.
Wastp lab Ie for
15
W;81.00
W;96.00
W;314.00
W;70.20
\\';32.00
W;955.00
W;69.00
W;G67.00
N.A
W;258.00
N.A
N.A
16
42.28
117.98
J 503.00
73.32
5.09
4460.55
,181.78
1922.38
N.A
1400.10
2400.99
800.33
1600.12
244.79
722.03
3303.00
587.14
100.00
100.00
347.30
1850.76
~OO.OO
nG(U7
1200.00
1750.00
225.05
N.A
390.00
423.00
803.00
481.43
259.26
1085.00
N.A
376.00
90.00
GO.09
6·10.00
48-1.:14
cuitivatioll
17 18
35. MANCHAL M.P.P. (Concld .. )
N.A
8~.00
18,1.00
134.00
80.00
57.00
248.00
168.00
103.00
87.00
5,1.00
102.00
,1.3.00
llG,OO
66.00
119.00
206.00
N.A
165.00
111.00
8,05
514.13
N.A
32.3:;
54.0,1
20.00
4J.J4
700.00
44.13
417.60
316.85
25.00
5.00
570.60
5.2G
156.00
N.A
17
18
19
2f.
2,
22
23
24
25
36. YACHARAM M.P.P.
9.00
53.00
12.00
63.30
20.00
36.00
40.17
216.10
21.1'\7
40.01
5.00
6;'.00
24.00
84.00
66.22
9H)3
1834.:j5
N,A
54.05
38.62
3
4
6
7
8
9
10
11
12
13
14
15
16
17
18
19
20
37. KANDUKUR M.P.P.
40.00
5.00
5.00
2:i4.19
N.A
171.97
4.0·1
5.:10
5.01
20.00
3
-1
5
6
7
8
9
10
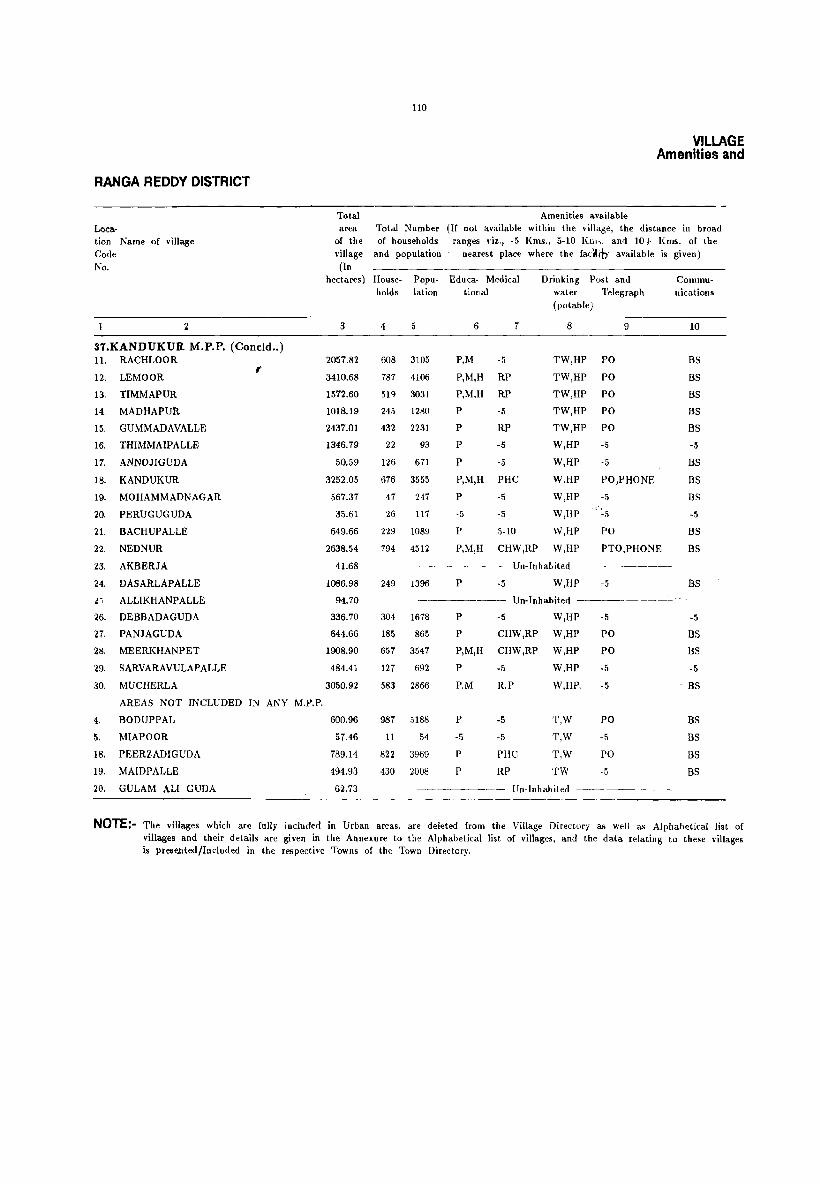
RANGA REDDY DISTRICT
Loca.-tion Na.me of village Code No.
2
37.KANDUKUR M.P.P. (Concld .. ) ll. RACHLOOR
12. LEMOOR
13. TIMMAPUR
14. MADHAPUR
15. GUMMADAVALLE
16. THIMMAIPALLE
17. ANNOJIGUDA
18. KANDUKUR
19. MOHAMMADNAGAR
20. PERUGUGUDA
21. BACHUPALLB
22. NEDNUR
23. AKBERJA
24. DASARLAPALLE
ALLIKHANPALLE
26. DEBBADAGUDA
27. PANJAGUDA
28. MEERKHANPET
29. SARVARAVULAPALLE
30. MUCHERLA
AREAS NOT INCLUDED IN ANY M.P.P.
4. BODUPPAL
5. MIAPOOR
18. PEERZADIGUDA
19. MAIDPALLE
20. GULAM ALI GUDA
Total area
of the village (In
llO
Amenities available
VILLAGE Amenities and
Total Number (If not available within the village, the distance in broad of households ranges viz., -5 Kms., 5-10 KIl". and 10+ Kms. of the
and population nearest place where the fa~~ity available is given)
hectares) Households
Popu- Educa- Medical lation tional
Drinking Post and water Telegraph
COlllmunications
3
2057.82
3410.68
1572.60
1018.19
2437.01
1346.79
50.59
3252.05
567.37
35.61
649.66
2638.54
41.68
1086.98
94.70
336.70
644.66
1908.90
484.41
3050.92
600.96
57.46
789.14
494.93
62.73
4 5
608 3105
787 4106
519 3031
245 1280
432 2231
22 93
126 671
676 3555
47 247
26 117
229 1089
794 4512
249 1396
304 1678
185 865
651 3547
127 692
583 2866
987 5188
11 54
822 3969
430 2008
(potable)
6 7 8 9
P,M -5 TW,HP PO
P,M,H RP TW,HP PO
P,M,H RP TW,HP PO
P -5 TW,HP PO
P RP TW,HP PO
P -5 W,HP -5
P -5 W,HP -5
P,M,H PHC W,HP PO,PHONE
P -5 W,HP -5
-5 -5 W,HP '''~5
P 5-10 'N,HP PO
P,M,H CHW,RP W,HP PTO,PHONE
Un-Inhabited ----------
P ·5 W,HP -5
Un-Inhabited -------"-:..-
P -5 W,HP
P CHW,RP W,HP
P,M,H CHW,RP W,HP
P -5 W,HP
P.M R.P W,HP.
P
-5
P
P
-5
-5
PHC
RP
T,W
T,W
T,W
TW
-5
PO PO
-5
-5
PO -5
PO -5
--------- Un-Inhabited
10
BS
BS
BS
BS
BS
-5
BS
as as -5
BS
as
BS
-5
BS
BS
-5
BS
BS
BS
BS
BS
NOTE:- The villages which are fully included in Urban areas, are deleted from the Village Directory as well as Alphabetical list of villages and their details are given in the Annexure to the Alphabetical list of villages, and the data relating to these villages is preswted/lnduded in the respective Towns of the Town Directory.

111
Land use Power (i.e. area under different types of land use in hectares Loca-supply rounded upto 2 decimal places) tion
Code Forest Irrigated by Source Un-Irri- Cultur- Area not No.
gated able avai-\Va&te lable for
cultivation
13 14 15 16 17 18 1
37. KANDUKUR M.P.P. (Coneld .. )
D30 EA 384.63 1126.19 547.00 11
D22 EA 1177.54 1390.00 453.14 390.00 12
D45 EA 391.60 300.00 881.00 13
D44 EA 663.05 300.00 55.14 14
D32 EA 536.30 1489.51 220.85 190.35 15
D38 EA 285.00 746.46 315.33 16
D36 EA 36.42 9.31 4.86 Ii
D33 EA 2070.00 536.20 645.85 18
D37 EA ZOO.OO 315.32 52.05 19
040 EA 33.19 2.00 0.42 20
041 EA 291.00 35.40 4.66 21
038 EA 953.00 800.00 885.5·1 22
ed ---- N.A N.A N.A N.A N.A 23
050 EA 400.98 681.00 5.00 24
ed --- N.A N.A N.A N.A N.A 25
043 EA 301.54 24.16 11.00 26
D42 EA 263.09 241.20 140.37 27
045 EA 1386.30 213.31 309.29 28
042 EA 342.42 61.52 80.47 29
40 EA 1392.32 1424.67 233.93 30
AREAS NOT INCLUDED IN ANY MP.','
D 5 ED WEj39.66 166.33 89.03 305.94 4
DlO EA WEj12.14 36.42 6.07 2.83 5
DI0 EA Wjl01.19,GCj34.40 298.19 236.85 118.51 18
DB EO 107.24 WEj23.07 202.35 16.75 145.52 19
ed ---- N.A N.A N.A N.A N.A 20

SI. Name of Mandai
No. Praja Parish ad
Prilllary
school
Middle
school
111
Matric/*
Sec.school
APPENMANDALWISE ABSTRACT OF EDUCATIONAL
Educational
HS/PUC/*
I/le College
(graduate &
above)
Adult
literacy
class/C*
Others
Village.
with
nc.
educa
tional
faci-
Vi 11- Insti- ViII- Insti- Vill- Insti- Vill- Insti- ViII- Insti- Vill- Inati- ViII- Insti- lilies
ages tutions ages tutions ages tutions ages tutions ages tulions ages tutions ages tutions
1 MARPALLE
2 MOMINPET
3 NAWABPET
4 SHANKARPALLE
7 QUTIiBULLAPUR
8 MEDCHAL
9 SHAMIRPET
11 KEESARA
12 GHATKESAR
14 HAYATHNAGAR
15 SAROORNAGAR
16 RAJENDRANAGAR
17 MOINABAD
18 CHEVELLA
19 VICARABAD
20 DHARUR
21 BANTARAM
n PEDDAMUL
23 TANDUR
24 BASHEERABAD
25 YELAL
26 DOMA
21 GANDEED
28 KULKACHARLA
29 PARGI
30 PUDUR
31 SHABAD
32 SHAMSHABAD
33 MAHESWARAM
34 IBRAHIMPATNAM
2 3
26
23
2Z
23
12
25
27
13
17
28
9
16
25
35
24
35
22
29
31
29
31
27
25
27
31
32
23
30
25
22
35 MANCHAL IS
36 YACHARAM 1~
37 KANDUKUR 25
AREAS NOT INCLUDED IN ANY MPP 3
4
28 7
23 6
24 6
26 8
12 4
27 7
27 11
13 6
19 8
30 10
10 5
17 4
32 15
40 8
24 5
37 6
25 8
30 4
31 6
29 6
31 6
27 5
26 6
27 7
31 4
32 6
23
32 6
32 8
26 6
18 10
19 11
25 7
3
6 7
8 3
6 3
6 4
9 3
4 2
7 5
11 3
6 4
8 3
10 5
4
15 6
8 2
5
6
8 3
4
6
6
6
5 3
6 4
7 3
4
6 3
6 2
9 5
9 3
10 3
11 6
7 5
TOTAL 810 858 224 230 95
8 9
3
3
4
3
2
5
3
4
3
5
6
2
3
2
3
3
1
3
3
3
3
6
96 2
10 11 12
2
7
15
15
10
2 4 4 49
14 15 16
2
7 3 3
15
15
10
49 8 8
17
2
2
2
2
3
~
3
2
7
4
3
54
* Sec.school - Secondary school; HS - Higher Secondary; PUC - Pre- University Course I - Intermediate; JC - Juni',r College;
C - Centres.

DIX (I) MEDICAL AND OTHER AMENITIES
Mat.&CWC/* PHC/*
Dispensary Hospital Mat.Homel Health
CWC Centre
113
Medical
Family
Planning
Centre
Primary
Health
Sub·centre
Community
Health
Workers
Others
Viii· Insti· ViIl· Insti· Viii· Insti· Viii· Insti· ViII· Insti· Viii· Insti· ViII· Num· ViII· Insti·
ages tutions ages tutions ages tutions ages tutions ages tutions a.ges tutions ages bers age~ tutions
18
4
3
3
2
3
4
9
4
4
44
19
7
3
3
2
3
4
10
4
4
2
48
20
2
2
2
2
2
2
2
2
2
2
2
29
21
2
2
2
2
2
2
2
2
3
2
2
2
31
22
2
2
2
2
5
6
2
27
23
3
2
2
5
6
28
24
2
2
2
3
1
2
3
8
8
2
3
2
2
2
3
4
59
25
2
2
3
3
1
2
1
3
8
8
2
3
2
2
2
3
4
60
26
6
27 28 29
4 4
6 5 5
30
5
6
6
5
13
3
2
2
5
5
2
3
19
6
90
31
5
2
6
6
5
13
3
2
5
5
2
3
19
6
4
32
3
2
5
10
5
10
5
2
2
2
25
5
3
2
2
16
8
9
7
90 133
33
:I
4
6
13
5
13
8
2
2
2
32
7
3
2
2
16
8
14
7
160
VBlages SI.
with no No.
medical
facility
34
18
20
16
14
6
Ii
16
2
3
4
7
8
9
12 11
10 12
13 14
5 15
14 16
5 17
31 18
21 19
34 20
23 II
2 22
25 23
25 24
27 25
23 26
20 21
27 28
25 29
12 30
23 31
21 32
22 33
11 34
15 35
17 36
18 37
2
590
• Mat. & cwe . Maternity a.nd Child Welfare Centre; Mat. Home . Maternity Home ewc . Child Welfare Centre; PHC • Primary
Healtl, Celltre.

114
APPEN· MANDALWISE ABSTRACT OF EDUcATIONAL
DRINKING WATER
SI. Name of MandaI Tap Well Tank Tube- River FoulI- Canal Others More Villages with
No. Praja Parishad well tain than no drinking
one water facility
liource of any type
2 35 36 37 38 39 40 41 42 43 44
MARPALLE 28 4
2 MOMINPET 6 23 22 21
3 NAWABPET 22 4 6
4 SHANKARPALLE 13 23 15 22
7 QUTHBULLAPUR 7 5 6
8 MEDCHAL 5 15 3 23 18
9 SHAMIRPET 29 24 24
11 KEESARA 13 6 11 11
12 GHATKESAR 15 8 9
14 HAYATHNAGAR 29 4 3
15 SAROORNAGAR 7 10 8 9
16 RAJENDRANAGAR 7 15 2 8 15
17 MOINABAD 8 21 20 21
18 CHEVELLA 34 12 14
19 VICARABAD 24 7 7
20 DHARUR 37 3
21 BANTARAM 3 22 22 14 23
22 PEDDAMUL 4 29 26 28
23 TANDUR 8 29 31 6 33
24 BASHEERABAD 3 29 15 18
25 YELAL 8 30 1.5 4 22
26 DOMA 28 28 28
27 GANDEED 27 27 27
28 KULKACHARLA 30 9 9
29 PARGI 35 33 33
30 PUDUR 32 31 31
31 SHABAD 17 9 3
32 SHAMSHABAD 18 18 3 2
33 MAHESWARAM 9 8 42 24
34 IBRAHIMPATNAM 21 20 21
35 MANCHAL 3 17 2
36 YACHARAM 17 4 15 17
37 KANDUKUR 21 33 27
AREAS NOT INCLUDED IN ANY MPP 3 3 3
TOTAL 144 734 31 535 H 26 544
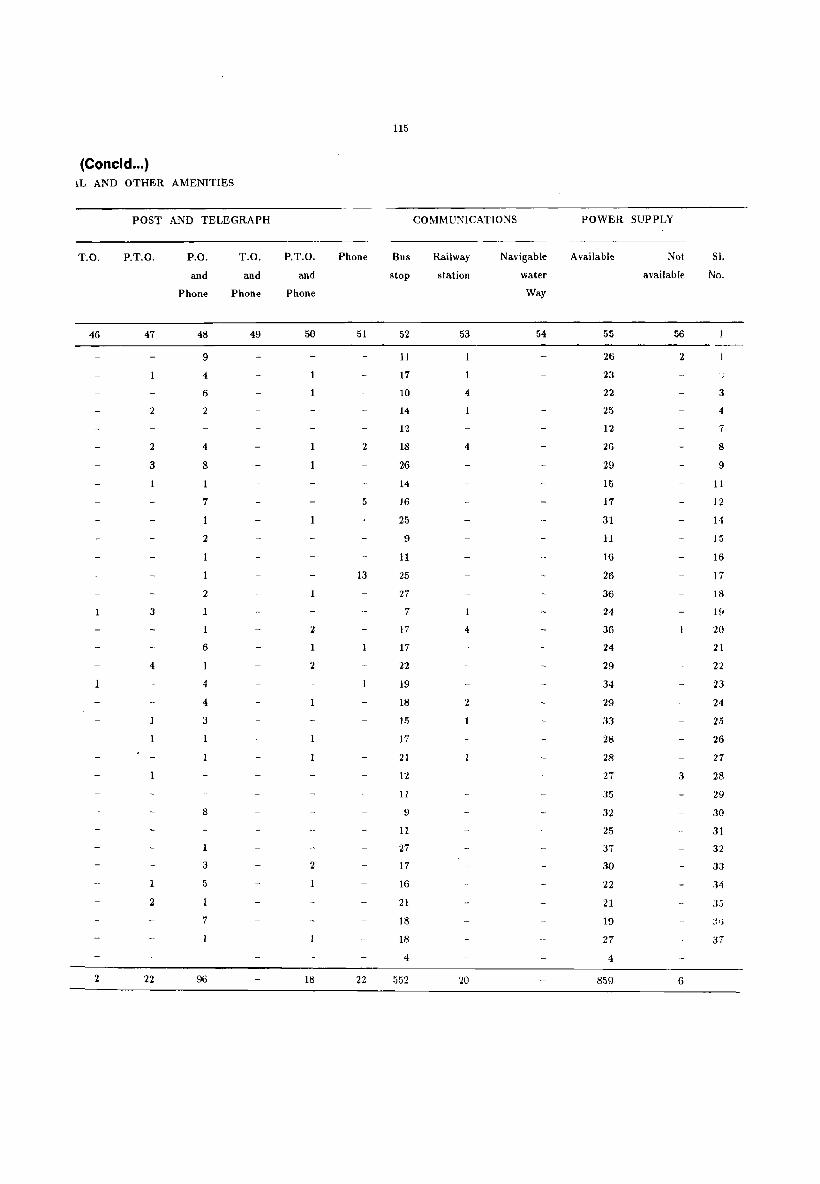
115
(Concld ... ) ~L AND OTHER AMENITIES
POST AND TELEGRAPH COMMUNICATIONS POWER SUPPLY
T.O. P.T.O. P.O. T.O. P.T.O. Pllone Bus Railway Navigable Available Not 51.
and and and stop station water available No.
Phone Phone Phone Way
46 47 48 49 50 51 52 53 54 55 56
9 11 26 2
4 17 23 ';
6 10 4 22 3
2 2 14 25 4
12 12 7
2 4 2 18 4 20 8
3 8 26 29 9
1 14 15 11
7 5 16 17 12
25 31 14
2 9 11 15
11 16 16
13 25 26 17
2 27 36 18
3 7 24 1!1
2 17 4 36 20
6 17 24 21
4 2 22 29 22
4 19 34 23
4 18 2 29 24
3 1.5 33 25
17 28 26
21 28 27
12 27 3 28
11 35 29
8 9 32 30
11 25 31
27 37 32
3 2 17 30 33
5 16 22 34
2 21 21 Jj
7 18 19 :.~ I j
18 27 37
4 4
2 22 96 18 22 552 20 859 6
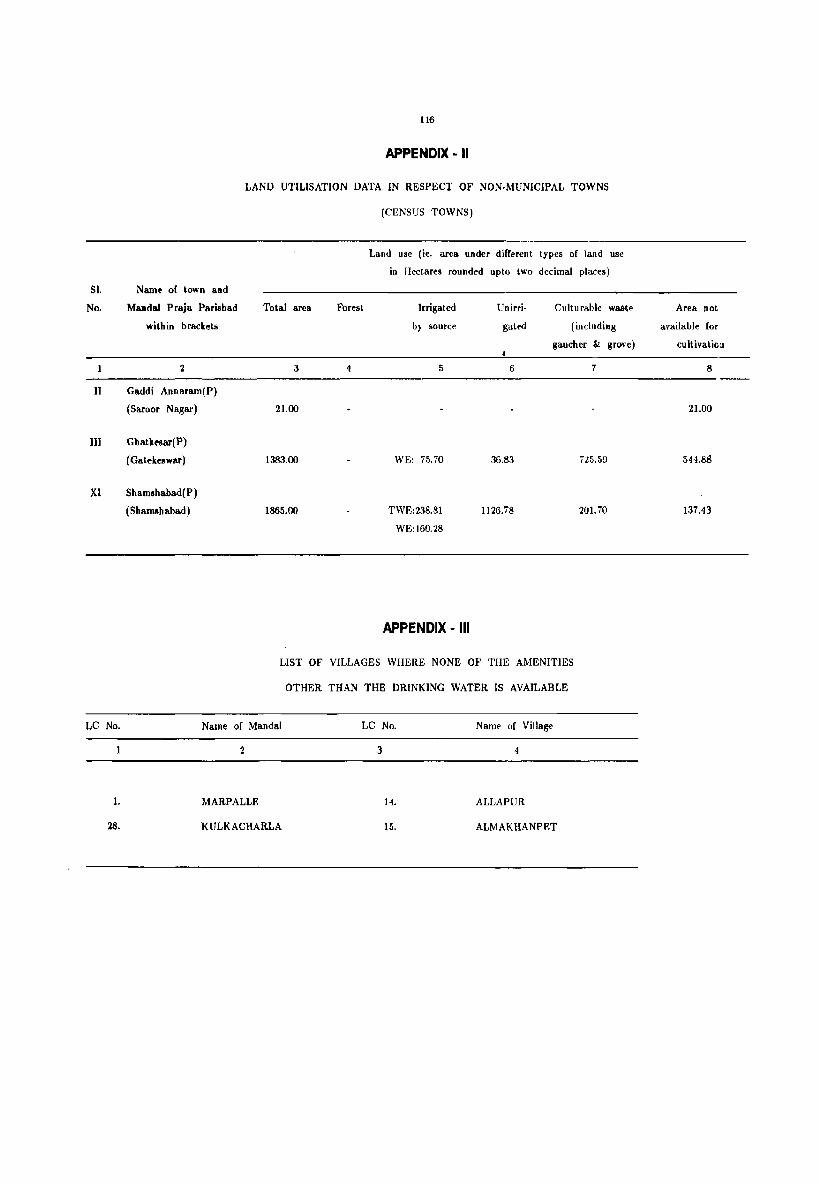
116
APPENDIX - II
LAND UTILISATION DATA IN RESPECT OF NON·MUNICIPAL TOWNS
(CENSUS TOWNS)
Land use (ie. area under different types of land use
in Hectares rounded upta two decimal places)
SI. Name of town and
No. Mandai Praja Parishad Total area Forest Irrigated Unirri- Culturable wa&c;c Area not
within brackets by source gated (including available for
gaucher & grove) cultivatioa
2 3 4 5 6 7 8
II Gaddi Annaram(P)
(Saroor Nagar) 21.00 21.00
III Ghatkesar(P)
(Gatekeswar ) 1383.00 WE: 75.70 36.83 725.59 541.8S
Xl Shamshabad(P)
(Shamshabad) 1865.00 TWE:238.81 1126.78 201.70 137.43
WE:160.28
APPENDIX· III
LIST OF VILLAGES WHERE NONE OF THE AMENITIES
OTHER THAN THE DRINKING WATER IS AVAILABLE
LC No. Name of MandaI LC No. Name of Village
2 3 4
1. MARPALLE 14. ALLAPUR
28. KULKACHARLA 15. ALMAKHANPET
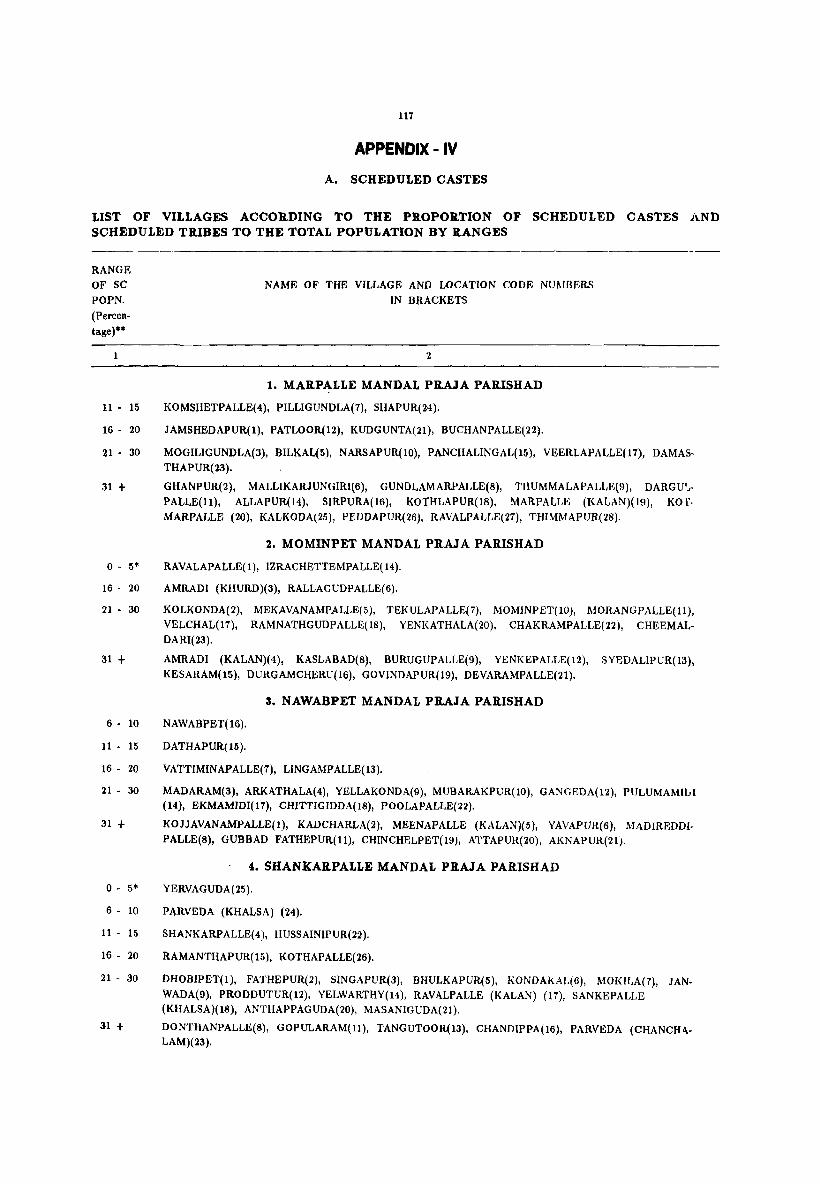
117
APPENDIX - IV
A. SCHEDULED CASTES
LIST OF VILLAGES ACCORDING TO THE PROPORTION OF SCHEDULED CASTES AND SCHEDULED TRIBES TO THE TOTAL POPULATION BY RANGES
RANGE OF SC
POPN.
(Percen
tage)"''''
11 - 15
16 - 20
21 - 30
31 +
o - 5*
16 - 20
21 - 30
31 +
6 - 10
11 - 15
16 - 20
21 - 30
31 +
o - 5*
6 - 10
11 - 15
16 - 20
21 - 30
31 +
NAME OF THE VILLAGE AND LOCATION CODE NUMBERS
IN BRACI<ETS
2
1. MARPALLE MANDAL PRAJA PARISHAD
KOMSHETPALLE(4), PILLIGUNDLA(7), SHAPUR(24).
JAMSHEDAPUR(1), PATLOOR(12), KUDGUNTA(21), BUCHANPALLE(22).
MOGILIGUNDLA(3), BILKAL(5), NARSAPUR(10), PANCHALlNGAL(15), VEERLAPALLE(17), DAMASTHAPUR(23).
GHANPUR(2), MALLIKARJUNGlRI(6), GUNDLAMARPALLE(8), THUMMALAPALLE(9), DARGU'JPALLE(ll), ALLAPUR(H), SIRPURA(16), KOTHLAPUR(18), MARPALLE (KALAN)(19), KO 1'MARPALLE (20), KALKODA(25), PEDDAPUR(26), RAVALPALLE(27), THIMMAPUR(28).
2. MOMINPET MANDAL PRAJA PARISHAD
RAVALAPALLE(l), IZRACHETTEMPALLE(14).
AMRADI (KHURD)(3), RALLAGUDPALLE(6).
KOLKONDA(2), MEKAVANAMPALLE(5), TEKULAPALLE(7), MOMINPET(lO), MORANGPALLE(ll), VELCHAL(17), RAMNATHGUDPALLE(18), YENKATHALA(20), CHAKRAMPALLE(22), CHEEMALDARI(23).
AMRADI (KALAN)(4), KASLABAD(8), BURUGUPALLE(9), YENKEPALLE(12), SYEDALIPUR(13), KESARAM(15), DURGAMCHERU(16), GOVINDAPUR(19), DEVARAMPALLE(21).
NAWABPET(16).
DATHAPUR(15).
3. NAWABPET MANDAL PRAJA PARISHAD
VA TTIMINAPALLE(7), LING AMP ALLE( 13).
MADARAM(3), ARKATHALA(4), YELLAKONDA(9), MUBARAKPUR(lO), GANGEDA(12), PULUMAMIIA (14), EKMAMlDI(17), CHITTIGlDDA(18), POOLAPALLE(22).
KOJJAVANAMPALLE(l), KADCHARLA(2), MEENAPALLE (KALAN)(5), YAVAPUR(6), MADIREDDIPALLE(S), GUBBAD FATHEPUR(l1), CHINCHELPET(19), ATTAPUR(20), AKNAPUR(21).
4. SHANKARPALLE MANDAL PRAJA PARISHAD
YERVAGUDA(25).
PA.RVEDA (KHALSA) (24).
SHANKARPALLE(4), HUSSAINIPUR(22).
RAMANTHAPUR(15), KOTHAPALLE(26).
DHOBIPET(l), FATHEPUR(2), SINGAPUR(3), BHULKAPUR(5), KONDAKAL(6), MOKILA(7), JANWADA(9), PRODDUTUR(12), YELWARTHY(14), RAVALPALLE (KALAN) (17), SANKEPALLE (KHALSA)(18), ANTHAPPAGUDA(20), MASANIGUDA(21).
DONTHANPALLE(8), GOPULARAM(ll), TANGUTOOR(13), CHANDIPPA(16), PARVEDA (CHANCH<\LAM)(23).

118
APPENDIX - IV
A. SCHEDULED CASTES
LIST OF VILLAGES ACCORDING TO THE PROPORTION OF SCHEDULED CASTES AND SCHEDULED TRIBES TO THE TOTAL POPULATION BY RANGES
RANGE
OF SC
POPN.
(Percentage)**
6 - 10
11 - 15
16 - 20
21 - 30
31 +
0- 5*
6 - 10
11- 15
16 - 20
21 - 30
31 +
0- 5*
6 - 10
11 - 15
16 - 20
21 - 30
31 +
0- 5*
6 - 10
11 • 15
16 - 20
21 - 30
31 +
NAME OF THE VILLAGE AND LOCATION CODE NUMBERS
IN BRACKETS
2
7. QUTHBULLAPUR. MANDAL PRAJA PARISHAD
DUNDIGAL(3), SAMBHUPUR(8), KOMPALLE(17).
BOWRAMPET(7).
GAGILAPUR(I), DOMMARA POCHAMPALLE(4), MALLAMPET(9), DULAPALLE(16).
BAHADURPALLE(5), BACHPALLE(lO).
NAGLUR(2), NIZAMPET(ll).
8. MEDCHAL MANDAL PRAJA PARISH AD
RAVALKOLA(7), GOSAIGUDA(24).
RAJ BOLLARAM(22), MUNIRABAD(25), SEETHARIGUDA(26).
KONAIPALLE(4), YELLAMPET(5), YADARAM(9), SRIRANGAVARAM(15). GOUDAVELLE(19).
NUTHANKAL(2), GIRMAPUR(18). MEDCHAL(20), PUDOOR(21), GHANPUR(23).
SOMARAM(6), DABIRPUR(13), BANDA MADHARAM(14), POCHAMPALLE(28).
MAISIREDDIPALLE(3), SHAHAZADIGUDA(8), MURAHARIPALLE(lO), ATEVELLE(12), RAILAPUR(17), KANDLAKOI(27).
UDDEMARRI(17).
KESAVARAM(9).
9. SHAMIRPET MANDAL PRAJA PARISHAD
TURKAPALLE(I), NAGISETTIPALLE(8), JAGGAMGUDA(14), THUMKUNTA(28), JAWAHARNAGAR(30J.
POTHARAM(3), ANANTHARAM(4), LAKSHIMAPUR(6), SAMPANBOLE(10), ALIABAD(13), ADRASPALLE(15), PONNAL(21).
KOTHUR(2), NARAYANPUR(5), MOODUCHINTALAPALLE{7), LALGADIMALAI(PET(ll), KESAVA
PUR(19), BOMRASPET(22), SHAMIRPET(23), DEVAR YAMJAL(24), POTHAIPALLE(26), ANTAIPALLE(29).
MAJIDPUR(12), HOSH'.' ARPALLE(18).
11. KEESARA MANDAL PRAJA PARISHAD
YADGARPALLE (EAST)(6).
AHMADGUDA(13).
KEESARA(5), GODMAKUNTA(14), BOGARAM(16).
CHEERIYAL(8), NAGARAM(ll).
KUNDANPALLE(lO). RAMPALLE(15).
DHARMAVARAM(2), NARSAMPALLE(3), YADGARPALLE (WEST)(4).
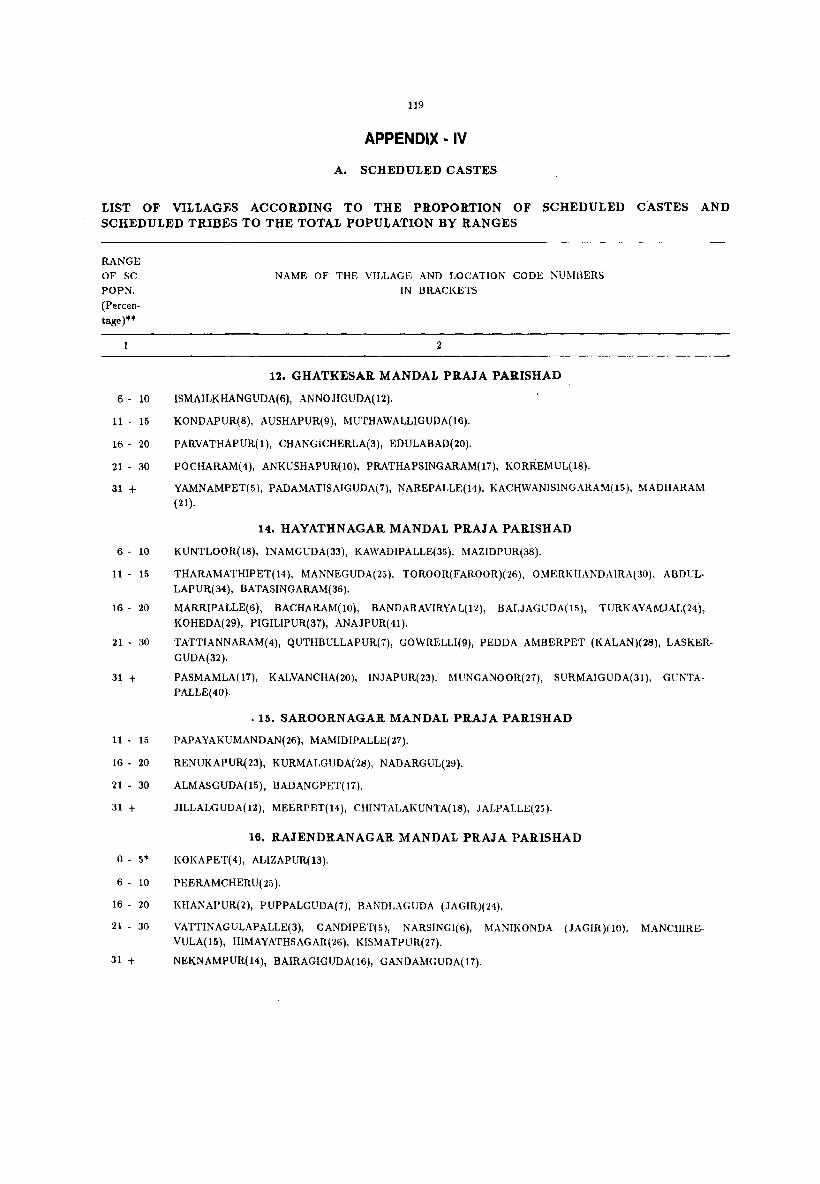
119
APPENDIX· IV
A. SCHEDULED CASTES
LIST OF VILLAGES ACCORDING TO THE PROPORTION OF SCHEDULED CASTES AND SCHEDULED TRIBES TO THE TOTAL POPULATION BY RANGES
RANGE
OF SC
POPN.
(Percen
tage)**
6 - 10
11 - 15
16 - 20
21 - 30
31 +
6 - 10
11 - 15
16 - 20
21 - 30
31 +
11 - 15
16 • 20
21 • 30
31 +
o - 5*
6 - 10
16 - 20
21 • 30
31 +
NAME OF THE VILLAGE AND LOCATION CODE NUl\ItiERS
IN BRACKETS
2
12. GHATKESAR MANDAL PRAJA PARISHAD
ISMAILKHANGUDA(6), ANNOJIGUDA(12).
KONDAPUR(8), AUSHAPUR(9), MUTHAWALLIGUDA(16).
PARVATHAPUR(l), CHANGICHERLA(3), EDULABAD(20).
POCHARAM(4), ANKUSHAPUR(lO), PRATHAPSINGARAM(17). KORREMUL(18).
YAMNAMPET(5), PADAMATISAIGUDA(7), NAREPALLE(14), KACHWANISINGARAM(15), MADHARAM
(21).
14. HAYATHNAGAR MANDAL PRAJA PARISHAD
KUNTLOOR(18), INAMGUDA(33), KAWADIPALLE(35), MAZIDPUR(38).
THARAMATHIPET(14), MANNEGUDA(25), TOROOR(FAROOR)(26), OMERKHANDAIRA(30), ABDUL·
LAPUR(34), BATASINGARAM(36J.
MARRIPALLE(6), BACHARAM(lO), BANDARAVIRYAL(12), BALJAGUDA(15), TURKAYAMJAL(24),
KOHEDA(29), PIGILIPUR(37), ANAJPUR( 41).
TATTIANNARAM(4), QUTHBULLAPUR(7), GOWRELLI(9), PEDDA AMBERPET (KALANJ(28), LASKER·
GUDA(32).
PASMAMLA(17), KALVANCHA(20), INJAPUR(23J, MUNGANOOR(27j, SURMAIGUDA(31), GUNTA
PALLE(40).
·15. SAROORNAGAR MANDAL PRAJA PARISHAD
PAPAYAKUMANDAN(26), MAMIDIPALLE(27).
RENUKAPUR(23), KURMALGUDA(28), NADARGUL(29).
ALMASGUDA(15), BADANGPET(17).
JILLALGUDA(12), MEERPET(14), CHINTALAKUNTA(18), JALPALLE(25).
16. RAJENDRANAGAR MANDAL PRAJA PARISHAD
KOKAPET(4), ALIZAPUR(13).
PEERAMCHERU(25).
KHANAPUR(2), PUPPALGUDA(7), BANDLAGUDA (JAGIR)(24).
VATTINAGULAPALLE(3), GANDIPET(5), NARSINGI(6), MANIKONDA (JAGIR)(lO), MANCHIREVULA(15), HIMAYATHSAGAR("l6), KISMATPUR(27).
NEKNAMPUR(14), BAIRAGIGUDA(16), GANDAMGUDA(17).
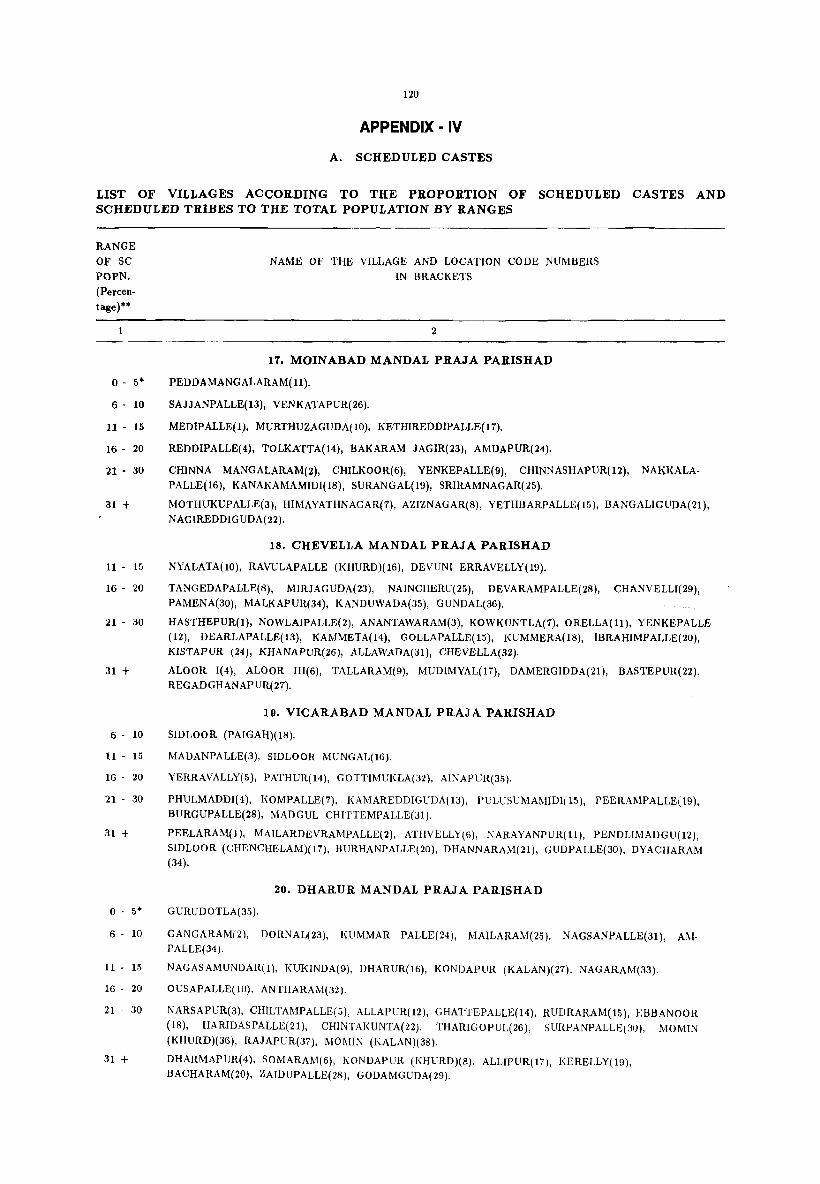
120
APPENDIX - IV
A. SCHEDULED CASTES
LIST OF VILLAGES ACCORDING TO THE PROPORTION OF SCHEDULED CASTES AND SCHEDULED TRIBES TO THE TOTAL POPULATION BY RANGES
RANGE
OF SC
POPN.
(Percentage)**
o - 5*
6 - 10
11- 15
16 - 20
21 - 30
31 +
11 - 15
16 - 20
21 - 30
31 +
6 - 10
11 - 15
16 - 20
21 - 30
31 +
o - 5*
6 - 10
11 - 15
16 - 20
21 - 30
31 +
NAME OF THE VILLAGE AND LOCATION CODE NUMBERS
IN BRACKETS
2
17. MOINABAD MANDAL PRAJA PARISHAD
PEDDAMANG ALARAM( 11).
SAJJANPALLE(13), VENKATAPUR(26).
MEDIPALLE(l), MURTHUZAGUDA( 10), KETHIREDDIPALLE( 17).
REDDIPALLE(4), TOLKATTA(14), BAKARAM JAGIR(23), AMDAPUR(24).
CHINNA MANGALARAM(2), CHILKOOR(6), YENKEPALLE(9), CHINNASHAPUR(12), NAKKALA
PALLE(16), KANAKAMAMIDI(18), SURANGAL(19), SRIRAMNAGAR(25).
MOTHUKUPALLE(3), HIMAYATHNAGAR(7), AZIZNAGAR(8), YETHBARPALLE( 15), BANGALIGUDA(21),
NAGIREDDIGUDA(22).
18. CHEVELLA MANDAL PRAJA PARISHAD
NYALATA(lO), RAVULAPALLE (KHURD)(16), DEVUNI ERRAVELLY(19).
TANGEDAPALLE(8), MIRJAGUDA(23), NAINCHERU(25), DEVARAMPALLE(28), CHJ\NVELLI(29),
PAMENA(30), l\lALKAPUR(34), KANDUWADA(35), GUNDAL(36).
HASTHEPUR(l), NOWLAIPALLE(2), ANANTAWARAM(3), KOWKUNTLA(7), ORELLA(ll), YENKEPALLE
(12), DEARLAPALLE(13), KAMMETA(14), GOLLAPALLE(15), KUMMERA(18), lBRAHIMPALLE(20), KISTAPUR (24), KHANAPUR(26), ALLAWADA(31), CHEVELLA(32).
ALOOR 1(4), ALOOR III(6), TALLARAM(9), MUDIMYAL(17), DAMERGIDDA(21), BASTEPUR(22), REGADGHANAPUR.(27).
19. VICARABAD MANDAL PRAJA PARISHAD
SIDLOOR (PAIGAH)(18).
MADANPALLE(3), SIDLOOR MUNGAL(16).
YERRAVALLY(5), PATHUR(14), GOTTIMUKLA(32), AINAPUR(35).
PHULMADDI(4), KOMPALLE(7), KAlvIAREDDIGUDA(13), PULUSUMAMlDI(15), PEERAMPALLE(19), BURGUPALLE(28), MADGUL CHITTEMPALLE(31).
PEELARAM(1), MAILARDEVRAMPALLE(2), ATHVELLY(6), NARAYANPUR(ll), PENDLIMADGU(12),
SIDLOOR (CHENCHELAM)(17), BURHANPALLE(20), DHANNARAM(21), GUDPALLE(30), DYACHARAM (34).
20. DHARUR MANDAL PRAJA PARISHAD
GURUDOTLA(35).
GANGARAM(2), DORNAL(23), Ii:UMMAR PALLE(24), MAILARAM(25), NAGSANPALLE(31), MIPALLE(34).
NAGASAMUNDAR(l), KUKINDA(9), DHARUR(16), KONDAPUR (KALAN)(27), NAGARAM(33).
OUSAPALLE(lO), ANTHARAM(32).
NARSAPUR(3), CHlLTAMPALLE(5), ALLAPUR(12), GHATTEPALLE(14), RUDRARAM(15), EBBANOOR
(18), HARlDASPALLE(21), CHlNTAKUNTA(22), THARIGOPUL(26), SURPANPALLE(30), MOMIN (KHURD)(36), RAJAPUR(37), MOMIN (KALAN)(38).
DHARMAPUR(4), SOMARAM(6), KONDAPUR (KHURD)(8), ALLIPUR(17), KERELLY(19), BACHARAM(20), ZAIDUPALLE(28), GODAMGUDA(29).
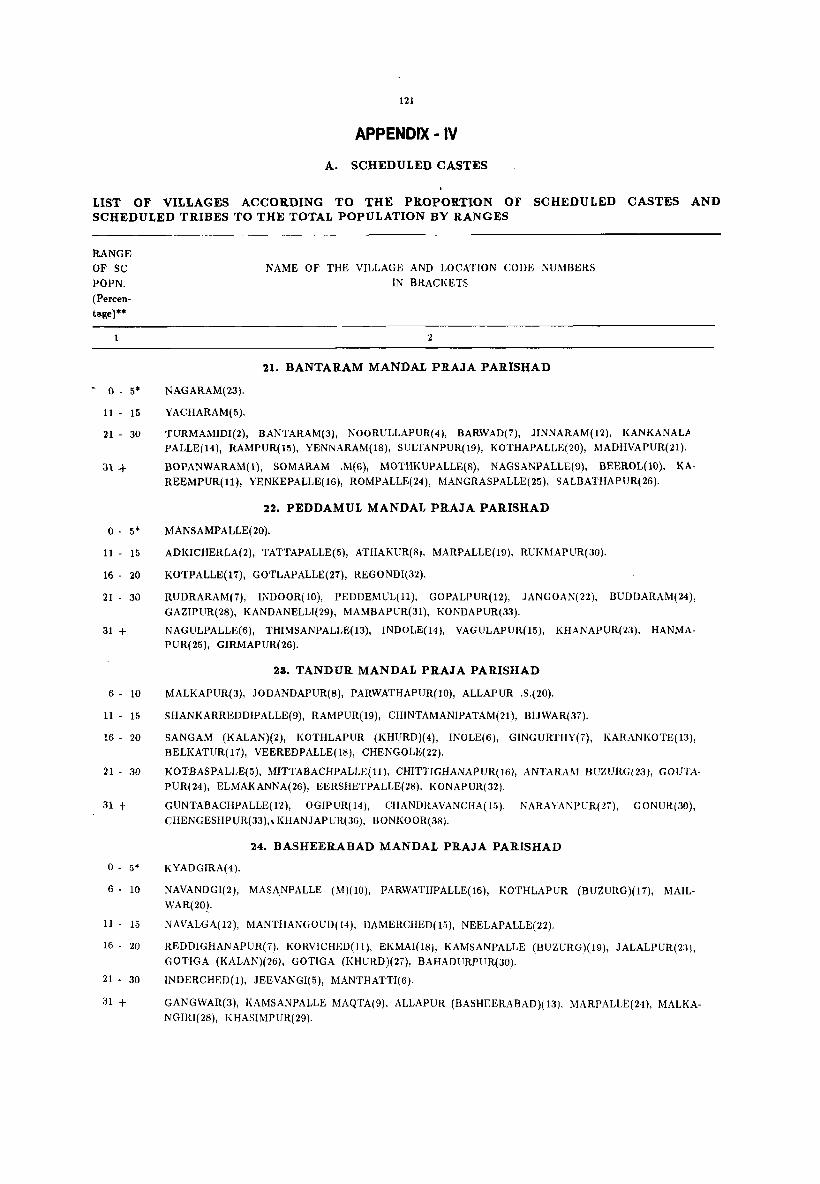
121
APPENDIX - IV
A. SCHEDULED CASTES
LIST OF VILLAGES ACCORDING TO THE PROPORTION OF SCHEDULED CASTES AND SCHEDULED TRIBES TO THE TOTAL POPULATION BY RANGES
RANGE
OF SC
POPN.
(Percentage)**
- 0 - 5*
11 - 15
21 - 30
31 +
o - 5*
11 - 15
16 - 20
21 - 30
31 +
6 - 10
11 - 15
16 - 20
21 - 30
NAGARAM(23).
YACHARAM(5).
NAME OF THE VILLAGE AND LOCATION CODE NUl\1BERS
IN BRACKETS
2
21. BANTARAM MANDAL PRAJA PARISHAD
TURMAMIDI(2), BANTARAM(3), NOORULLAPUR(4l, BARWAD(7), JINNARAM(12), KANKANAL.A
PALLE(14), RAMPUR(15), YENNARAM(18), SULTANPUR(19), KOTHAPALLE(20), MADHVAPUR(21).
BOPANWARAM(I), SOMARAM .M(6), MOTHKUPALLE(8), NAGSANPALLE(9), BEEROL(lO), KA
REEMPUR(ll), YENKEPALLE(16), ROMPALLE(24), MANGRASPALLE(25), SALBATHAPUR(26).
22. PEDDAMUL MANDAL PRAJA PARISHAD
MANSAMPALLE(20).
ADKICHERLA(2), TATTAPALLE(5), ATHAKUR(8). MARPALLE(H), RUKMAPUR(30).
KOTPALLE(17), GOTLAPALLE(27), REGONDI(32).
RUDRARAM(7), INDOOR(lO), PEDDEMUL(ll), GOPALPUR(12), JANGOAN(22), BUDDARAM(24),
GAZIPUR(28), KANDANELLI(29), MAMBAPUR(31), KONDAPUR(33).
NAGULPALLE(6), THIMSANPALLE(13), INDOLE(14), VAGULAPUR(l5), KHANAPUR(23), HANMA
PUR(25), GIRMAPUR(26).
23. TANDUR MANDAL PRAJA PARISHAD
MALKAPUR(3), JODANDAPUR(8), PARWATHAPUR(10), ALLAPUR .S.(20).
SHANKARREDDIPALLE(9), RAMPUR(19), CHINTAMANIPATAM(21), BIJWAR(37).
SANG AM (KALAN)(2), KOTHLAPUR (KHllRD)(4), INOLE(6), GINGURTHY(7), KARANKOTE(13),
BELKATUR(17), VEEREDPALLE(18), CHENGOLE(22).
KOTBASPALLE(5), MITTABACHPALLE(l1), CHITTIGHANAPUR(16), ANTARAl'Il BUZVRG(23), GOVTAPUR( 24), ELMAKANNA(26), EERSHETPALLE(28), KONAPUR( 32).
31 + GUNTABACHPALLE(12), OGIPUR(14), CHANDRAVANCHA(I.5), NARAYANPUR(27), GONUR(30),
CHENGESHPUR(33),. KHANJAPUR(36), BONKOOR(38).
0- 5*
6 - 10
11- 15
16 - 20
21 - 30
31 +
24. BASHEERABAD MANDAL PRAJA PARISHAD
KYADGIRA(4).
NAVANDGI(2), MASA,NPALLE (1'11)(10), PARWATHPALLE(16), KOTHLAPUR (BUZURG)(11), MAILWAR(20).
NAVALGA(12), MANTHANGOUD(14), DAMERCHED(15), NEELAPALLE(22).
REDDIGHANAPUR(7), KORVICHED(ll), EKMAI(18), KAMSANPALLE (BUZURG)(19), JALALPUR(2:1),
GOTIGA (KALAN)(26), GOTIGA (KHURD)(27), BAHADURPtTR(30).
INDERCHED(l), JEEVANGI(5), MANTHATTI(6).
GANGWAR(3), KAMSANPALLE MAQTA(9). ALLAPUR (BASHEERABAD)(13). MARPALLE(H), MALKANGIRI(28), KHASIMPUR(29).

122
APPENDIX - IV
A. SCHEDULED CASTES
LIST OF VILLAGES ACCORDING TO THE PROPORTION OF SCHEDULED CASTES AND SCHEDULED TRIBES TO THE TOTAL POPULATION BY RANGES
RANGE
OF SC
POPN. (Percentage)'"
6 - 10
11 - 15
16 - 20
21 - 30
31 +
6 - 10
11 - 15
16 - 20
21 - 30
31 +
o - 5*
6 - 10
11- 15
16 - 20
21 - .30
31 +
o - 5+
6 - 10
11 - 15
16 - 20
21 - 30
NAME OF THB VILLAGE AND LOCATION CODE NUM9ERS
IN BRACKETS
2
25. YELAL MANDAL PRAJA PARISHAD
GANGASAGAR(9), MUDDAIPET(34).
BANAPUR(8), YELAL(17), DOULAPUR(27j, MUI(UNDAPUR(30), DEVANOOR(331.
MAZRASANGAM(4), KAMALAPUR(6), ADHALIPUR(7), ACHUTHAPUR(ll), PAGDIAL(12), JUNT
PALLE(26).
AGNOOR(l), RAGHAPUR(5), RASNAM(lO), NAGASAMlJDAR(15), VISWANA'l'HPUR(l6), YENKA
PALLE(24), GIRIJAPUR(28), GORJ:;PALLE(32).
[(OKAT(3), ANNASAGAR(13), BHAGAIPALLE(l1l, HAJIPUR(18), JAKKEPALLE(19), BENNUR(21),
LAKSHMINARAYANAPUR(22), CHENNARAM(23), PAYARKAMPALLE(25), THiMMAIPALLE( 29), KISH· TAPUR(31).
26- DOMA MANDAL PRAJA PARISHAD
BUDLAPUR( 1), BRAHMANPALLE( 14), BATLA CHANDRARAM(25).
DONGAYANKEPALLE(8), DORNALPALLE(9). RAKONDA(17), DIRSAMPALLE(22), DADAPUR(27).
KISHTAPUR(2), OOTPALLE(4), BOMPALLE(5), SIVAREDDIPALLE(6), GUDUR(7), TIMMAIPALLE(12),
MOTHKUR(20), KONDAIPALLE(23).
BACHPALLE( 10), DOMA(11), AINAPUR(21), GUMDAL(28).
POTHREDDYPALLE(3), BADAMPALLE(16), PALEPALLE(18), KHAMMAM NACHARAM(19),
MALLEPALLE (261.
2'1. GANDEED MANDAL PRAJA PARISHAD
BAISPALLE(10), REDDIPALLE(ll), MANSOORPALLE(18), SANGAIPALLE(29).
BALSULGONDA(16), CHOWDERPALLE(22), MOHAMADABAD(28).
JINNARAM(3), PEDDAVARVAL(6), RUSUMPALLE(8), PAGDIYAL(15j, NANCHERLA(20j, MANGAMPET(23).
VENNACHED(2), CHINNAVARVAL(7), GOVINDPA.LLE(14), KOMREDDIPALLE(19), MUKARLABAD(24).
SALARNAGAR(5), GANDEED(9), SALKERPET(12), KONDAPUR(17), GADRIAL(21), JULAPALLE(25).
KAPLAPUR(I), CHELMILLA( 4).
28. KULKACHARLA MANDAL PRAJA PARISHAD
ALLAf'UR(9), LINGAMPALLE(lO), CHAKALPALLE(30j.
PUTTAPAHAD(16), ANANTHASAGAR(17j.
KOLKACHARLAi_4), BOMREDDlPALLE(5), BANDAYELKACHERLA(6), MUJAHIDPUR(8), TlRUMALA
PUR(l2), KUSUMASAMUDRAM(18), MANDIPAL(21), MARKAL(27).
SALVEED(2), IPPAIPALLE(131, VEERAPUR(n), KOTHAPALLE(24), MALKAPUR(26).
CHELLAPUR(I), GHANAPUR(3), PEERAMPALLE(7), ANTHARAM(14), CHOWDAPUR(20j, PURSAMPALLE(25), l<ANMANJ';ALVA(28), MAGULLAPALLE(29).

123
APPENDIX - IV
A. SCHEDULED CASTES
LIST OF VILLAGES ACCORDING TO THE PROPORTION OF SCHEDULED CASTES AND SCHEDULED TRIBES TO THE TOTAL POPULATION BY RANGES
RANGE
OF SC
POPN.
(Percen
tage)**
o - 5*
11 - 15
16 - 20
21 - 30
3l +
11 - Hi
16 - 20
21 - 30
31 +
16 - 20
21 - 30
31 +
o - 5*
6 - 10
11 - 15
16 - 20
21 - 30
31 +
NAME OF THE VILLAGE AND LOCATION CODE NUMBERS
IN BRACKETS
2
29. PARGI MANDAL PRAJA PARISHAD
BASIREDDIPALLE(8), RAMREDDIPALLE( 18).
RANGAPUR(7), PARGI(ll), RUKUMPALLE(12), RANGA1 .... IPALLE(17).
IBRAHIMPUR(l), CHIGRALPALLE(13), GOVINDAPUR(14), BABAPUR(20), IWOPKHANPET(21), 1<AD
LAPUR(26).
MITTAKODUR(2), NASKAL(6), GADSINGAPUR(16), SULTHANPUR(22), SYEUMALKAPUR(25j, MAD
HARAM(28), RAPOLE(29), RAVALPALLE(35), SYEDPALLE(a6).
LAKHANAPUR(3), BARKATPALLE(5), NARAYANPUR(23), RAGHAVAPUR(24), YABAJIGUDA(JO),
TONDAPALLE(31), CHITYAL(32), KHUDAVANPUR(33j, JAFFERPALLE(34j, HEERAPUR(3'ij.
30. PUDUR MANDAL PRAJA PARISHAD
POTHIREDDIGUDA(7).
MIRZAPUR(3), MANNEGUDA (SAREFCASj(4), KOTHAPALLE(9j, CHANGOMUL(15), REGADI-
MAMIDIPALLE(16), KERVELLI(23), CHINTALAPALLE(33).
KANDLAPALLE(5), CHEELAPUR(lO), PUDUR(12), THlMMAPUR(14), MEDIKONDA(19), RA1<AM
CHERLA(20), SOMANGURTHY(22), MEDlPALLE KALAN(26), KANKAL(28), PUDGURTHY(34).
YENKEPALLE(2), ANGADICHITTAMPALLE(6), BAKAPUR(8), GANGUPALLE(ll), MITTAKANKAL( l~)
QUTHBULLAPUR(18j, PEDDAUMANTHAL(25), KODMOOR(27), MANCHANPALLE(29), GHATPALLE,30j,
TURKAYENKEPALLE(31), NIZAMPPET MEDIPALLE(32).
31. SHABAD MANDAL PRAJA PARISHAD
RVDRARAM(5), SOLIPET(8), MADDUR(9), DAMERLAPALLE(Il).
BOBBILGAM(1), ETLAERRAVALY(3), TADLAPALLE(4), CHANDENVALLE(6), HAYATHABAD(7),
PEDDAVED(lO), NAGARKUNTA(12), MACHANPALLE(14), POLARAM(15). POTHUGAL( 16), RE
GADIDOSWADA(17), KOMERABANDA(18), SHABAD(20), MANMARRI('.!I), KAI\LOOR(22), KE· SAVARAM(24), RANGAPUR(25).
TIRUMALAPUR(2), BHONGIRPALLE(13), OBAGUNTA(19), ANANTHAWARAM(23).
32. SHAMSHABAD MANDAL PRAJA PARISHAD
GHANSIMIAGUDA(31 ).
OOTPALLE(22), GANDIGUDA(25), MADANPALLE(27).
KAVELIGUDA(2), RAYANNAGUII.\(7), TONDPALLEP3).
CHOWDERGUDA(lO), NARKHUDA(l1), K!SHANGUDA(21), PEDDASHAPUR(26), RASHEEDGUDA(3(j).
GOLLAPALLE KALAN(38).
KACHARAM(6), NANAJPUR(8), JUKAL(9), KOTHWALGUDA(14), PALMAKOLE(28), PEDDATOPRA(29), HAMIDULLANAGAIt(33), SHANKARAPUR(41).
RAMANUJAPUR(l), MALKARAM(3), KOLBOWIDODDI(1), SULTANPALLE(5), AMMAPALLE(12), SATAMRAI(15), PASHAMBANDA(18), MUCHINTAL(30), CHERLAGUDA(32), POSETTYGUDA(34), GOLLAPALLE (KHURD)(35), SAYYED GUDA(37), BAHADURGUDA(39), GOLKONDA (KHURD)(40), SANGHIGUDA(42), GOLKONDA (KALAN)(43).

124
APPENDIX - IV
A. SCHEDULED CASTES
LIST OF VILLAGES ACCORDING TO THE PROPORTION OF SCH[UULED CASTES AND SCHEDULED TRIBES TO THE TOTAL POPULATION BY RANGES '
RANGE
OF SC POPN.
(Percen
tage)·'"
1
6 - 10
11 - 15
16 - 20
21 - 30
::11 +
6 - 10
11 - 15
16 - 20
21 - 30
31 +
o - 5*
6 - 10
11 - 15
16 - 20
21 - 30
31 +
o - 5*
11 - 15
16 - 20
21 - 30
31 +
NAME OF THE VILLAGE AND LOCATION CODE NUMBERS
IN BRACKETS
2
33. MAHESWARAM MANDAL PRAJA PARISHAD
BAGHMANKHAL(14), IMAMGUDA(21).
MANSANP ALLE( 11), MAHESWARAM( 26).
NAGARAM(4), AMEERPET(6), TOOPRA KHURD(7), SIRIGIRIPUR(13), MANKHAL(16), RAVIRYAL(18),
SREENAGAR(22), THUMMALOOR(25), DUBBACHERLA(28), SUBHANPUR(29).
KALWAKOLE(8), PENDYAL(9), GANGARAM(12), SARDAR NAGAR(17), KONGAR KHURD (A)(19), MOHABATNAGAR(24), GHATPALLE(27), PORANDLA(33).
GOLLOR(2), NANDIPALLE(3), NAGIREDDIPALLE(5). DABILGUDA(lO), KOLLAPADKAL(31), AKAN
PALLE(32).
34. IBRAHIMPATNAM MANDAL PRAJA PARISHAD
BONGLOOR(3).
KONGARA KALAN(l), NARREPALLE(lO), DANDUMAILARA.M(ll), RAIPOLE(l5). POCHARA.M(22).
ADIBATLA(2), IBRAHIMPATNAM (KHALSA)(7), MANGALPALLE(19).
IBRAHIMPATNAM (BAGATH)(18), YELIMINEDU(23), TURKAGUDA(26), KAPPAPAHAD(27).
CHINTAPALLEG{}DA(4), RAMDASPALLE(5), NAGANPALLE(8), POLKAMPALLE(9), MUKNOOR(12), YENGALAGUDA(14), RAMREDDIGUDA(21), YERRAKUNTA(25), TOOLEI{ALAN(28).
U. MANCHAL MANDAL PRAJA PARISHAD
BODAKONDA @ PENIKARLA THANDA(19).
DADPALLE( 18), LOYAPALLE(24).
CHANDKHANGUDA(21), BANDALEMOOR(23).
LINGAMPALLE(5), CHITTAPUR(9), ARUTLA(22).
THALLAPALLIGUDA(6), THIPPAIGUDA(8), MANCHAL(10), AGAPALLE(13), JAPALA(15), RANGAPUR(16), CHEEDED (17), ASMATPUR(20).
KHANAPUR(I), MANORABAD(3), SABITHNAGAR(4), NOMULA(12), KAGAZGHAT (14).
18. YACHARAM MANDAL PRAJA PARISHAD
MANTHANGOUD(20).
MANTHANGOWRELLY( 19).
NAKKARTA(13).
GUNGAL(2), YACHARAM(4), MOGULLAVAMPU(5), CHOWDERPALLE(6), NANDIWANAPARTHY(7),
KURMIDDA(9), KOTHAPALLE(14), THAKKELLAPALLE(15), CHINTAPATLA(16), NALLAVELLY(17).
TULEKHURD(I), MANDIGOWRELLY(3), NAZDIK SINGARAM(8), THATIPARTHY(lO), NANAKNAGAR(ll), MEDPALLE(12).
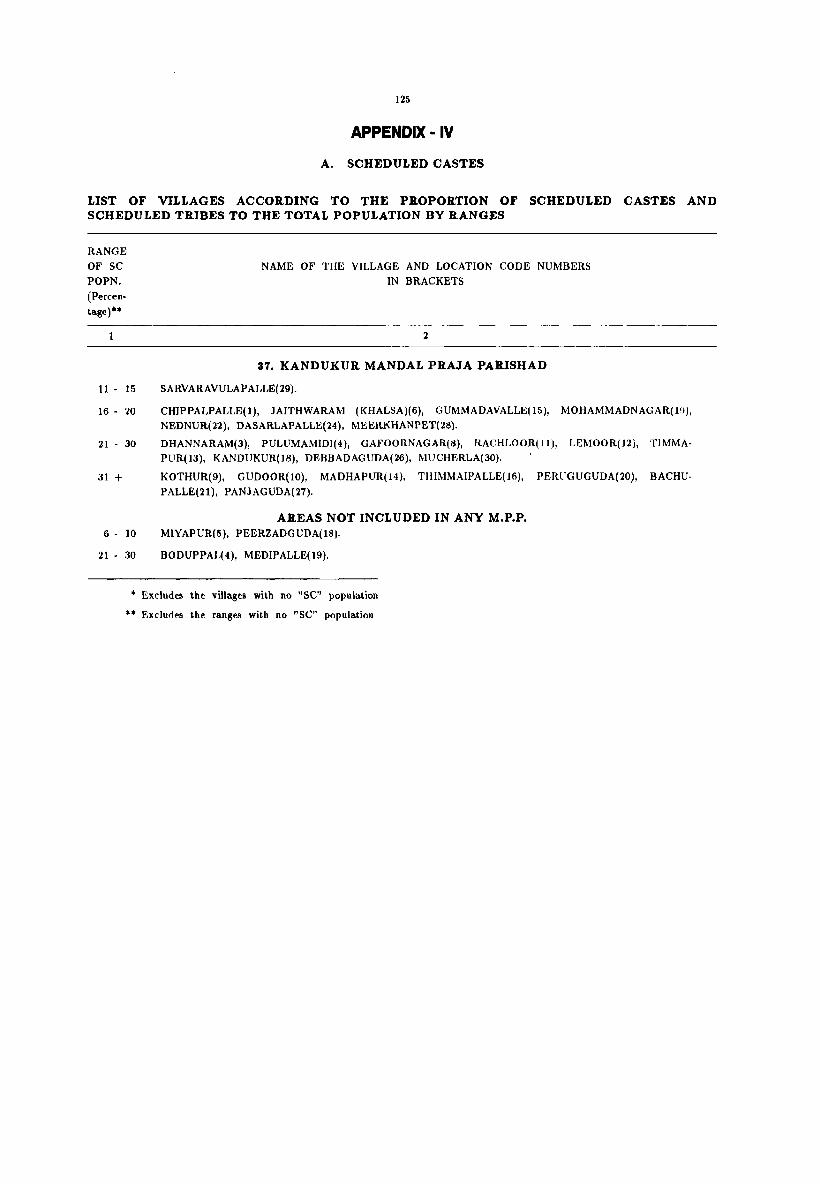
125
APPENDIX - IV
A. SCHEDULED CASTES
LIST OF VILLAGES ACCORDING TO THE PROPORTION OF SCHEDULED CASTES AND SCHEDULED TRIBES TO THE TOTAL POPULATION BY RANGES
RANGE
OF SC
POPN. (Percen. tage)··
11 • 15
16 • 20
21 • 30
31 +
6· 10
21 • 30
NAME OF THE VILLAGE AND LOCATION CODE NUMBERS
IN BRACKETS
2
37. KANDUKUR MANDAL PRAJA PARISHAD
SARVARAVULAPALLE( 29).
CHIPPALPALLE(l), JAITHWARAM (KHALSA)(6), GUMMADAVALLE(15), MOHAMMADNAGAR(I(),
NEDNUR(22), DASARLAPALLE(24), MEERI<HANPET(28).
DHANNARAM(3), PULUMAMIDI(4), GAFOORNAGAR(8), RACHLOOR(ll), LEI\100R(12), TlMMA· PUR(I3), KANDUKUR(18), DEBBADAGUDA(26), MUCHERLA(30).
KOTHUR(9), GUDOOR(lO), MADHAPUR(I4), THIMMAIPALLE(16), PERUGUGUDA(20), BACHU·
PALLE(21), PANJAGUDA(27).
AREAS NOT INCLUDED IN ANY M.P.P. MIYAPUR(5). PEERZADGUDA(18).
BODUPPAL(4). MEDIPALLE(19).
* Excludes the villages with no "SC" population
** Excludes the ranges with 110 "Se" population
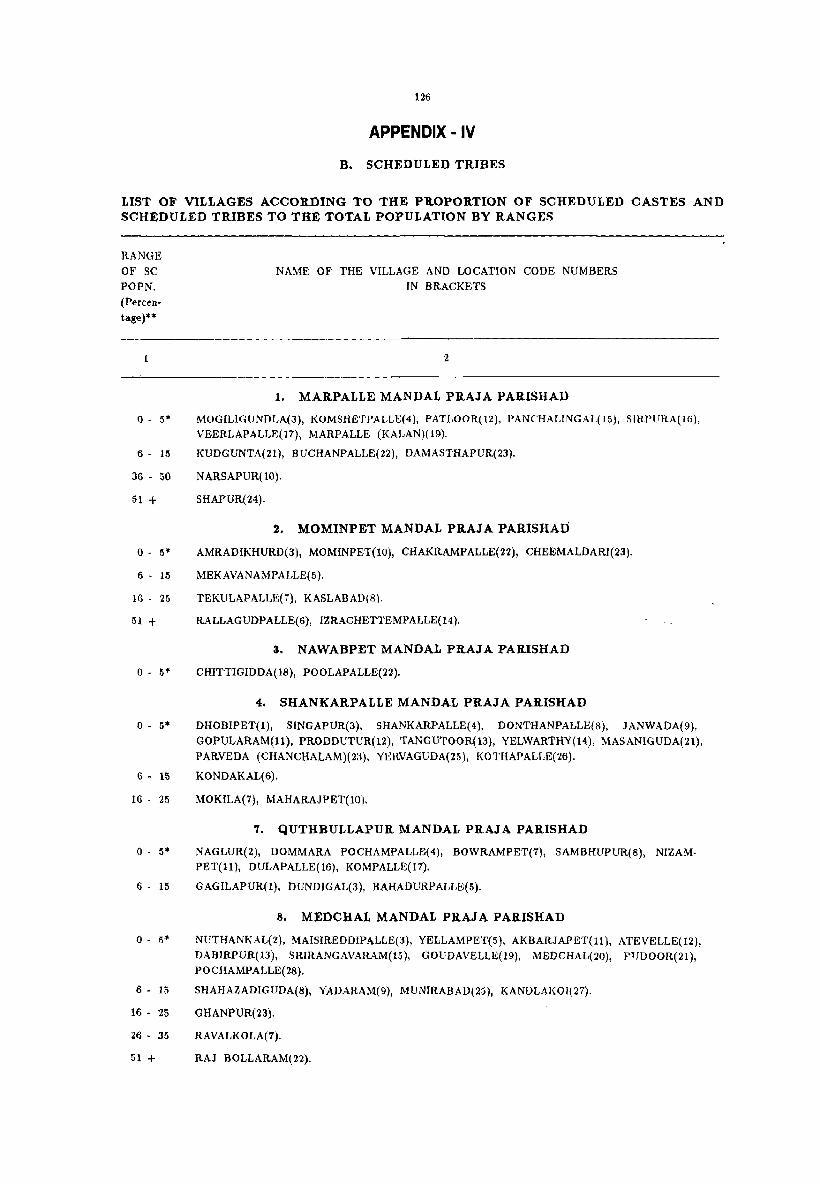
126
APPENDIX - IV
B. SCHEDULED TRIBES
LIST OF VILLAGES ACCORDING TO THE PROPORTION OF SCHEDULED CASTES AND SCHEDULED TRIBES TO THE TOTAL POPULATION BY RANGES
RANGE OF SC POPN.
(Percentage)**
o - 5*
6 - 15
36 - 50
51+
o - 5*
6 - 15
16 - 25
51 +
NAME OF THE VILLAGE AND LOCATION CODE NUMBERS IN BRACKETS
2
1. MARPALLE MANDAL PRAJA PARISH AD
MOGILIGUNDLA(3), KOMSHETPALLE(4), PATLOOR(12), PANCHALINGAL( 15), SIRPURA(IG), VEERLAPALLE(17), MARPALLE (KALAN)(19).
KUDGUNTA(21), BUCHANPALLE(22), DAMASTHAPUR(23).
NARSAPUR(10).
SHAPUR(24).
2. MOMINPET MANDAL PRAJA PARISHAD
AMRADIKHURD(3), MOMINPET(lO), CHAKRAMPALLE(22), CHEEMALDARI(23).
MEKAVANAMPALLE(5).
TEKULAPALLE(7), KASLABAD(8).
RALLAG UDPALLE( 6), IZRACHETTEMPALLE( 14).
3. NAWABPET MANDAL PRAJA PARISHAD
o - 5* CHITTIGIDDA(18), POOLAPALLE(22).
o - 5*
6 - 15
16 - 25
4. SHANKARPALLE MANDAL PRAJA PARISHAD
DHOBIPET(l), SINGAPUR(3), SHANKARPALLE(4), DONTHANPALLE(8), JANWADA(9),
GOPULARAM(ll), PRODDUTUR(12), TANGUTOOR(13), YELWARTHY(14), MASANIGUDA(21), PARVEDA (CHANCHALAM)(23), YERVAGUDA(25), KOTHAPALLE(26).
KONDAKAL(6).
MOKILA(7), MAHARAJPET(lO).
7. QUTHBULLAPUR MANDAL PRAJA PARISHAD
o - 5* NAGLUR(2), DOMMARA POCHAMPALLE(4), BOWRAMPET(7), SAMBHUPUR(8), NIZAMPET(ll), DULAPALLE(16), KOMPALLE(17).
6 - 15 GAGILAPUR(l), DUNDIGAL(3), BAHADURPALLE(5).
o - 5*
6 - 15
16 - 25
26 - 35
51 +
8. MEDCHAL MANDAL PRAJA PARISHAD
NUTHANKAL(Z), MAISIREDDIPALLE(3), YELLAMPET(5), AKBARJAPET(ll), ATEVELLE(12), DABIRPUR(13), SRIRANGAVARAM(15), GOUDAVELLE(19), MEDCHAL(20), J'TJDOOR(21), POCHAMPALLE(28).
SHAHAZADIGUDA(8), YADARAM(9), MUNIRABAD(25), KANDLAKOI(27).
GHANPUR(23).
RAVALKOLA(7).
RAJ BOLLARAM(22).

127
APPENDIX - IV
B. SCHEDULED TRIBES
LIST OF VILLAGES ACCORDING TO THE PROPORTION OF SCHEDULED CASTES AND SCHEDULED TRIBES TO THE TOTAL POPULATION BY RANGES
RANGE OF SC
POPN.
(Percentage)**
o - 5*
6 - 15
16 - 25
51 +
o - 5*
o - 5*
6 - 15
16 - 25
o - 5"
6 - 15
51 +
o - 5*
6 - 15
NAME OF THE VILLAGE AND LOCATION CODE NUMBERS
IN BRACKETS
2
9. SHAMIRPET MANDAL PRAJA PARISHAD
KOTHUR(2), POTHARAM(3), ANANTHARAM(4), MOODUCHINTALAPALLE(7), KESAVARAM
(9), SAMPANBOLE(10), MAJIDPUR(12), ALIABAD(13), JAGGAMGUDA(14), HOSHYAR
PALLE(18), KESAVAPUR(19), BOMRASPET(22), SHAMIRPET(23), DEVAR YAMJAL(24), POTHAIPALLE (26), THUMKUNTA(28), JAWAHARNAGAR(30).
TURKAPALLE(I), LAKSHIMAPUR(6).
NAGISETTIPALLE(8).
LINGAPUR(16).
11. KEESARA MANDAL PRAJA PARISHAD
DHARMAVARAM(2), YADGARPALLE (WEST)(4), KEESARA(5), YADGARPALLE. (EAST)(6),
CHEERIYAL(8), KEESARA DAIRA(9), KUNDANPALLE(lO), NAGARAM(ll), AHMADGUDA(13),
GODMAKUNTA(14), RAMPALLE(15), BOGARAM(16).
12. GHATKESAR MANDAL PRAJA PARISHAD
PARVATHAPUR(l), CHANGICHERLA(3), POCHARAM(4), KONDAPUR(8), AUSHAPUR(9), NAREPALLE(14), KACHWANISINGARAM(15), PRATHAPSINGARAM(17), KORREMUL(18), EDULABAD(20).
YAMNAMPET(5), ISMAILKHANGUDA(6).
PADAMATISAIGUDA(7), ANNOJIGUDA(12), MADHARAM(21).
14. HAYATHNAGAR MANDAL PRAJA PARISHAD
TATTIANNARAM(4), GOWRELLI(9), BACHARAM(lO), THARAMATHIPET(14), PASMAMLA (17), INJAPUR(23), TURKAYAMJAL(24), TOROOR(FAROOR)(26), PEDDA AMBERPET
(KALAN)(28), KOHEDA(29), OMERKHANDAIRA(30), SURMAIGUDA(31), LASKERGUDA(32),
ABDULLAPUR(34), KAWADIPALLE(35), BATASINGARAM(36), MAZIDPUR(38), GUNTA
PALLE(40), ANAJPUR(41).
MARRIPALLE(6), QUTHBULLAPUR(7), INAMGUDA(33).
TATTI KHANA(5).
15. SAROORNAGAR MANDAL PRAJA PARISHAD
JILLALGUDA(12), BADANGPET(17), JALPALLE(25), MAMIDIPALLE(27), NADARGUL(29).
MEERPET( 14).
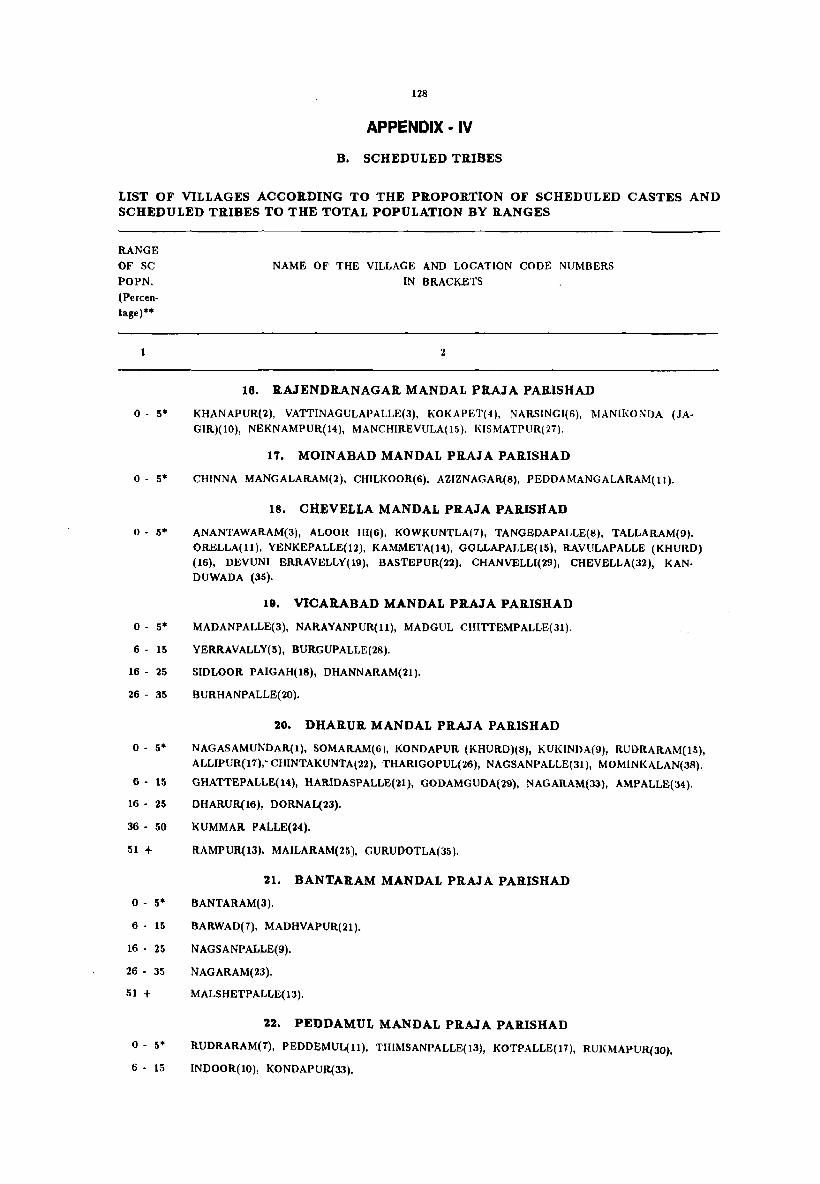
128
APPENDIX .. IV
B. SCHEDULED TRIBES
LIST OF VILLAGES ACCORDING TO THE PROPORTION OF SCHEDULED CASTES AND SCHEDULED TRIBES TO THE TOTAL POPULATION BY RANGES
RANGE
OF SC
POPN.
(Percentage)**
1
NAME OF THE VILLAGE AND LOCATION CODE NUMBERS
IN BRACKETS
2
16. RAJENDRANAGAR MANDAL PRAIA PARISHAD
o - 5* KHANAPUR(2), VATTINAGULAPALLE(3), KOKAPET(4), NARSINGI(6), MANII<ONI)A (JAGIR)(10), NEKNAMPUR(14), MANCHIREVULA(15). KISMATPUR(27).
17. MOINABAD MANDAL PRAJA PARISHAD
o - 5* CHINNA MANGALARAM(2), CHILKOOR(6), AZIZNAGAR(8), PEDDAMANGALARAM(ll).
18. CItEVELLA MANDAL PRAJA PARISHAD
o - 5* ANANTAWARAM(3), ALOOR 1II(6) , KOWKUNTLA(7), TANGEDAPALLE(8), TALLARAM(9), ORELLA(U), YENKEPALLE(12), KAMMETA(14), GOLLAPALLE(15), RAVULAPALLE (KHURD) (16), DEVUNI ERRAVELLY(19), BASTEPUR(22), CHANVELLI(29), CHEVELLA(32), KANDUWADA (35).
o - 5*
6 - 15
16 - 25
26 - 35
o - 5*
6 - 15
16 - 25
36 - 50
51 +
0- 5*
6 - 15
16 - 25
26 - 35
51 +
19. VICARABAD MANDAL PRAJA PARISHAD
MADANPALLE(3), NARAYANPUR(ll), MADGUL CHITTEMPALLE(31).
YERRAVALLY(5), BURGUPALLE(28).
SIDLOOR PAIGAH(18), DHANNARAM(21).
BURHANPALLE(20).
20. DHARUR MANDAL PRAIA PARISHAD
NAGASAMUNDAR(l), SOMARAM(6), KONDAPUR (KHURD)(8), KUKINDA(9), RUDRARAM(15), ALLIPUR(17),' CHINTAKVNTA(22), THARIGOPUL(26), NAGSANPALLE(31), MOMINKALAN(38).
GHATTEPALLE(14), HARIDASPALLE(21), GODAMGUDA(29), NAGARAM(3l), AMPALLE(34).
DHARUR(16), DORNAL(23).
KUMMAR PALLE(24).
RAMPUR(13), MAILARAM(25), GURVDOTLA(35).
21. BANTARAM MANDAL PRAIA PARISHAD
BANTARAM(3).
BARWAD(7), MADHVAPVR(21).
NAGSANPALLE(9).
NAGARAM(23).
MALSHETPALLE( 13).
22. PEDDAMUL MANDAL PRAIA PARISHAD
0- 5* RUDRARAM(7), PEDDEMUL(ll). THIMSANPALLE(13), KOTPALLE(17), RU1(MAPUR(30).
6 - 15 INDOOR(10), KONDAPUR(33).
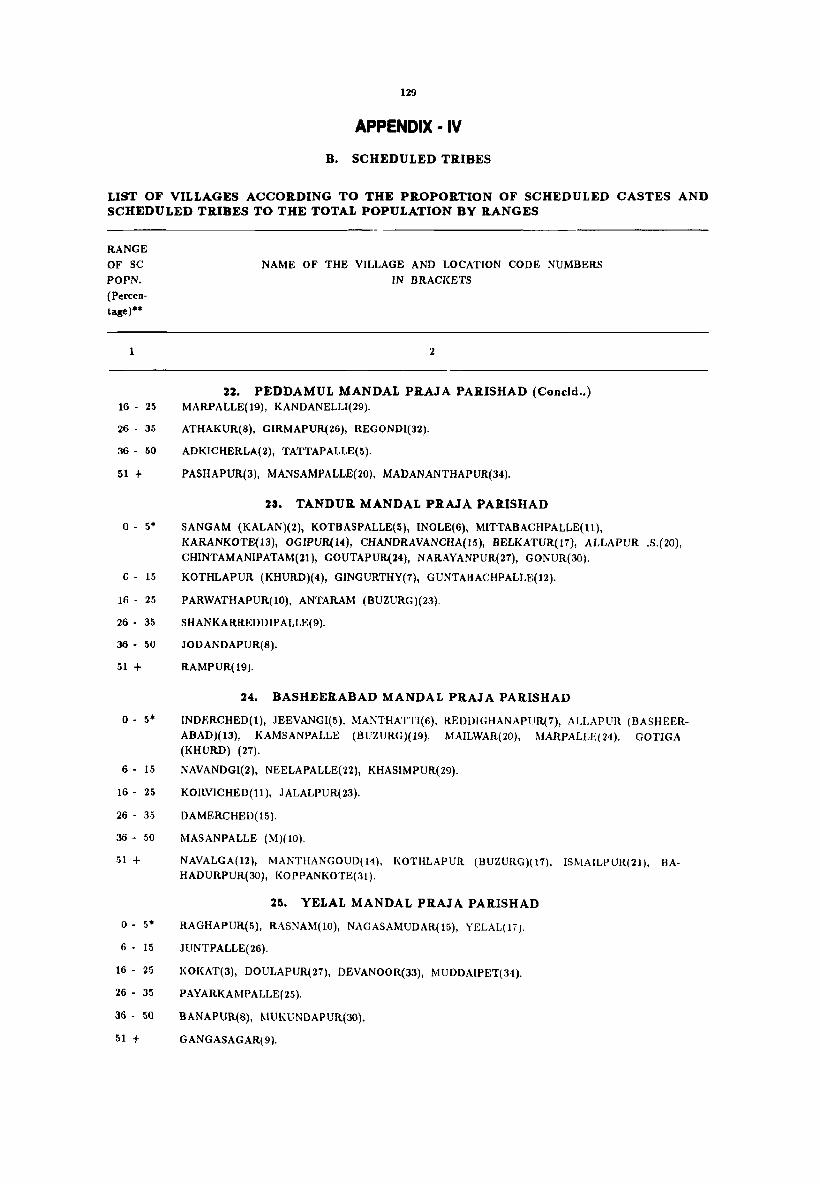
129
APPENDIX· IV
B. SCHEDULED TRIBES
LIST OF VILLAGES ACCORDING TO THE PROPORTION OF SCHEDULED CASTES AND SCHEDULED TRIBES TO THE TOTAL POPULATION BY RANGES
RANGE
OF SC
POPN.
(Percentage)**
16 - 25
26 - 35
36 - 50
51 +
c - 15
16 - 25
26 - 35
36 - 50
51 +
o - 5*
6 - 15
16 - 25
26 - 35
36 - 50
51 +
o - 5*
6 - 15
16 - 25
26 - 35
36 - 50
51 +
NAME OF THE VILLAGE AND LOCATION CODE NUMBERS
IN BRACKETS
2
22. PEDDAMUL MANDAL PRAJA PARISHAD (Concld .• ) MARPALLE( 19), KANDANELLI(29).
ATHAKUR(8), GIRMAPUR(26), REGONDI(32).
ADKICHERLA(2), TATTAPALLE(5).
PASHAPUR(3), MANSAMPALLE(20), MADANANTHAPUR(34).
23. TANDUR MANDAL PRAJA PARISHAD
SANGAM (KALAN)(2), KOTBASPALLE(5), INOLE(6), MITTABACHPALLE(ll),
KARANKOTE(13), OGIPVR(14), CHANDRAVANCHA(15), BELKATVR(17), ALLAPVR .5.(20),
CHINTAMANIPATAM(21), GOVTAPUR(24), NARAYANPUR(27), GONUR(JO).
KOTHLAPUR (KHURD)(4), GINGURTHY(7), GUNTABACHPALLE(12).
PARWATHAPUR(10), ANTARAM (BUZURG)(23).
SHANKARREDDlPALLE(9).
JODANDAPUR(8).
RAMPUR(19).
24. BASHEERABAD MANDAL PRAJA PARISHAD
INDERCHED(l), JEEVANGI(5), MANTHATTI(6), REDDIGHANAPUR(7), ALLAPUR (BASHEER
ABAD)(13), KAMSANPALLE (BUZURG)(19), MAILWAR(20), ~fARPALLE(24). GOTIGA (KHURD) (27).
NAVANDGI(2), NEELAPALLE(22), KHASIMPUR(29).
KORVICHED(ll), JALALPUR(23).
DAMERCHED(15).
MASANPALLE (M)(lO).
NAVALGA(12), MANTHANGOUD(H), KOTHLAPUR (BUZURG)(17), ISMAILPUR(21), BAHADURPUR(JO), KOPPANKOTE(31).
25. YELAL MANDAL PRAJA PARISHAD
RAGHAPUR(5), RASNAM(lO), NAGASAMUDAR(15), YELAL(17J.
JUNTPALLE( 26).
KOKAT(3), DOULAPUR(27), DEVANOOR(33), MUDDAIPET(34).
PAYARKAMPALLE(25 ).
BANAPUR(8), MUKUNDAPUR(JO).
GANGASAGAR( 9).
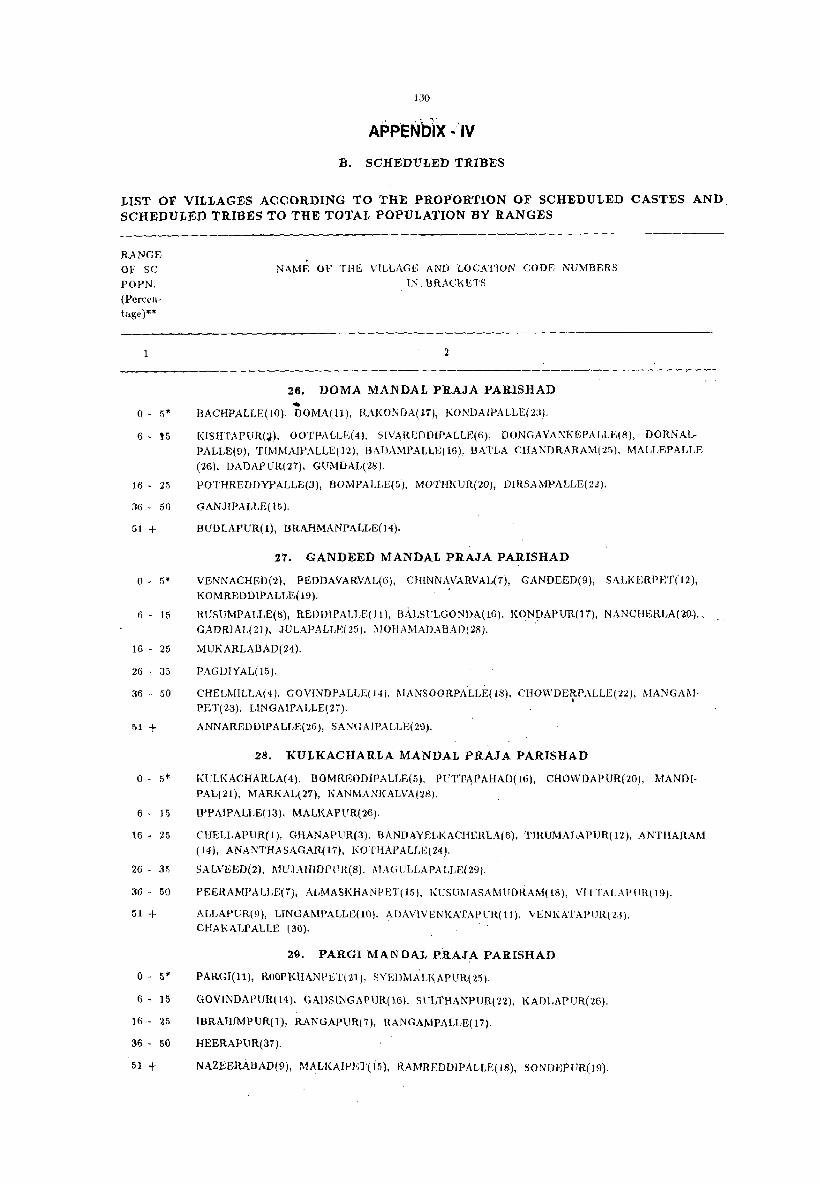
I' " ": -: ~ ~
APPENblX ·IV
B. SCHEDULED TRIBES
LIST OF VILLAGES ACCORDING TO THE PROPORTION OF SCHEDULED CASTES AND. SCHEDULED TRIBES TO THE TOTAL POPULATION BY RANGES
RANGE
OF SC
POPN. (Pe['(:en
tage)"'·*
o - 5*
6 • 15
16 • 25
36 • 50
51 +
o - 5*
6 - 15
16 - 25
26 - 35
36 - 50
51 +
o - 5*
6 - 15
16 - 25
26 - 3ri
36 - 50
51 +
o - 5*
6 - 15
16 - 25
36 • 50
51 +
NAME OF THE VILLAGE AND LOCATiON CODE NUMBERS
IN BRACKETS
2
26. DOMA MANDAL PRAJA PARISHAD .. BACHPALLE(lO), DOMA(ll), RAKONDA(.l7), KONDAIPALLE(2:J).
KISHTAPURW, OOTPALLE(4), S[VAREDDIPALLE(6), DONGAYANKEPALLE(8), DORNAL
PALLE(9), TIl\lMAIPALLE(12), BADAMPALLE(16), BATLA CHANDRARAM(25), MALLEPALLE
(26), DADAPUR(27). GUMDAL(2!3),
POTHREDDYPALLE(3), BOl\lPALLE(51, MOTHKUR(20), OIRSAMPALLE(22),
GANJIPALLE(15).
BUDLAPUR( 1), BRAHMANPALLE(H),
27. GANDEED MANDAL PRAJA PARISHAD
VENNACHED(2), PEDDAVARVAL(6), CliINNAVARVAL(7), CANDEEO(9), SALKERPET(12),
KOMREDDIPALLE(19). .
RUSUMPALLE(8), REDDlPALLE(11), BALSULGONDA(16), KONJ;JAPUR(17), NANCHERLA(20),.
CADRIAL(21), JULAPALLE(25), l\!oIlAMADABAD.(28). .
MUI{ARLABAD(Z4).
PAGDIYAL(15).
CHELr>.IILLA(1). COVINDPALLE(l4), l\IANSOORPALLE(18), CII(HVDE~PALLE(:.I2), MAN(,Al\I
PET(23}, LINGAIPALLE(27),
ANNAREDDIPALLE(26), SANGAIPALLE(29).
28. KULKACHARLA MANDAL PRAJA PARISHAD
KULKACHARLA(4), BOMREODIPALLE(S), PUT'E,\PAHAD(161, CHOWDAPUR(20), MANDI
PAL(21), MARKAL(27), I\ANMANKALVA(28).
IPPAIPALLE( 13), MALl(APLTR(26).
CHELLAPUR(1), GfiANAPUR(3), BANDAYEL,KACHERLA(6). TlRUMALAPUR(12), ANTHARAM
(14), ANANTHASACAR(17), KOTHAPALLE(Z4),
SALVEED(2), l\WJAHIDP{TR(8), l\UGULLAPALLE(Z9).
PEERAMPALLE(7), ALMASKHANPET(15), KUSUl\IASAl\1lfDRAM(18), VITTALAPllR(19).
ALLAPUR(9), LINGAMPALLE( 10). ADAVIVENKATAPUR( 111. VENKATAPlJR( 2:1),
CI-lAKALPALLE (30).
29. PARGI MANDAL PRAJA PARISHAD
PARGf(ll), ROOPKHANI'}-;'i'(21), SYEDMALI\APUR(25).
GOVINDAPUR(14), GADSINGAPUR(16), SULTHANPUHfZ2), KADLAPUR(26).
IBRAHIMPUR(l), RANGAPUR(7). RANGAMPALLE(17).
HEERAPUR(37).
NAZEERABAD(9), MALKAIPET(15), RAMREDDIPALLE(18), SONDEPUR(19).
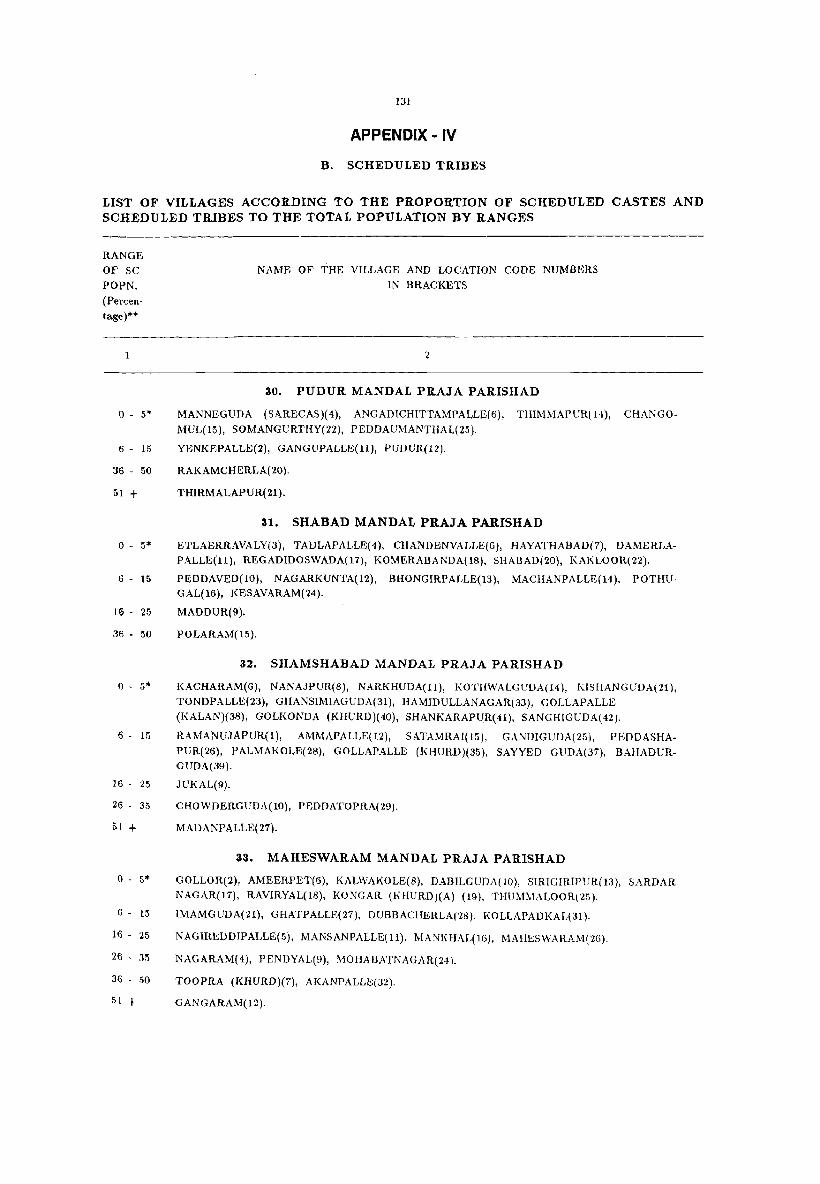
131
APPENDIX - IV
B. SCHEDULED TRIBES
LIST OF VILLAGES ACCORDING TO THE PROPORTION OF SCHEDULED CASTES AND SCHEDULED TRIBES TO THE TOTAL POPULATION BY RANGES
RANGE
OF SC
POPN.
(Percentage)**
NAME OF THE VILLAGE AND LOCATION CODE NUMBERS
IN BRACKETS
1 2
o - 5*
6 - 15
36 - 50
51 +
o - 5*
6 - 15
16 - 25
36 - 50
o - 5"
6 - 15
16 - 25
26 - 35
51 +
0- 5*
6 - 15
16 - 25
26 - 35
36 - 50
51 +
30. PUDUR MANDAL PRAJA PARISHAD
MANNEGUDA (SARECAS)( 4), ANGADICHITTAMPALLE(6), THIMMAPURlll), CHANGO·
MUL(15), SOMANGURTHY(2Z), PEDDAUMANTHAL(25).
YENKEPALLE(2), GANGUPALLE(ll), PUDUR(12).
RAKAMCHERLA(20 ).
THIRMALAPUR(21).
31. SHABAD MANDAL PRAJA PARISH AD
ETLAERRAVALY(3), TADLAPALLE( 4), CHANDENVALLE(6), HAYATHABAD(7), DAMERLA
PALLE(ll), REGADIDOSWADA(17), KOMERABANDA(18), SHABAD(20), KAKLOOR(22).
PEDDAVED(10), NAGARKUNTA(12), BHONGIRPALLE(13), MACHANPALLE(14), POTHUGAL(16), KESAVARAM(24).
MADDUR(9).
POLARAM(15).
32. SHAMSHABAD MANDAL PRAJA PARISHAD
KACHARAM(6), NANAJPUR(8), NARKHUDA(ll), KOTHWALGUDA(14), KISHANGUDA(21),
TONDPALLE(23), GHANSIMIAGUDA(31), HAMIDULLANAGAR(33), GOLLAPALLE
(KALAN)(38), GOLKONDA (KHURD)( 40), SHANKARAPUR( 41), SANGHIGUDA(42).
RAMANVJAPUR(I), AMMAPALLE(12), SATAMRAI(15), GANDIGUOA(25), PEDDASHA
PUR(26), PALMAKOLE(28), GOLLAPALLE (lmURD)(35), SAYYED GVDA(37), BAHADVRGUDA(39).
JUKAL(9).
CHOWDERGUDA(IO), PEDDATOPRA(29j.
MADANPALLE(27).
33. MAHESWARAM MANDAL PRAJA PARISHAD
GOLLOR(2), AMEERPET(6), KALWAKOLE(8), DABILGUDA(10), SlRIGIRIPUR(13), SARDAR NAGAR(17), RAVIRYAL(18), KONGAR (KHURD)(A) (19), TIIUl\1l\lALOOR(25).
IMAMGUDA(21), GHATPALLE(27), DUBBACHERLA(28), KOLLAPADKAL(31).
NAGIREDDIPALLE(5), MANSANPALLE(ll), MANKHAL(16), MAHESWARA1VI(26).
NAGARAM(4), PENDYAL(9), MOHABATNAGAR(24).
TOOPRA (KHURD)(7), AKANPALLE(32).
GANGARAM(lZ).

132
APPENDIX - IV
B. SCHEDULED TRIBES
LIST OF VILLAGES ACCORDING TO THE PROPORTION OF SCHEDULED CASTES AND SCHEDULED TRIBES TO THE TOTAL POPULATION BY RANGES
RANGE OF SC POPN. (Percentage)**
o - 5*
6 - 15
o - 5*
6 - 15
16 - 25
36 - 50
51 +
o - 5*
6 - 15
26 - 35
51 +
o - 5*
6 - 15
16 - 25
26 - 35
51 +
o - 5*
6 - 15
NAME OF THE VILLAGE AND LOCATION CODE NUMBERS IN BRACKETS
2
34. IBRAHIMPATNAM MANDAL PRAJA PARISHAD
ADIBATLA(2), BONGLOOR(3), RAMDASPALLE(5), IBRAHIMPATNAM (KHALSA)(7), NA
GANPALLE(8), POLKAMPALLE(9), NARREPALLE(10), DANDUMAILARAM(ll), RAIPOLE(15),
IBRAHIMPATNAM (BAGATH)(18), MANGALPALLE(19), RAMREDDIGUDA(21), YELIM
INEDU(23), TOOLEKALAN(28).
KONGARA KALAN(l).
35. MANCHAL MANDAL PRAJA PARISHAD
LINGAMPALLE(5), THALLAPALLIGUDA(6), THIPPAIGUDA(8), MANCHAL(lO), NOMULA(12),
JAPALA(15), CHEEDED(17).
RANGAPUR(16).
ARUTLA(22).
DADPALLE(18), BANDALEMOOR(23), LOYAPALLE(24).
BODAKONDA @ PENIKARLA THANDA(19).
36. YACHARAM MANDAL PRAJA PARISHAD
GUNGAL(2), MANDIGOWRELLY(3), YACHARAM(4), NAZDIK SINGARAM(8), THATIPARTHY(lO), MEDPALLE(12), NAKKARTA(13), KOTHAPALLE(14), CHINTAPATLA(16), NALLAVELLY(17).
NANDIWANAPARTHY(7), KURMIDDA(9).
THAKKELLAPALLE( 15).
MANTHANGOWRELLY(19), MANTHANGOUD(20).
37_ KANDUKUR MANDAL PRAJA PARISHAD
JAITHWARAM (KHALSA)(6), GUDOOR(lO), LEMOOR(12), TIMMAPUR(13), KANDUKUR(18), BACHUPALLE(21), NEDNUR(22), MEERKHANPET(28), MUCHERLA(30).
RACHLOOR(ll), GUMMADAVALLE(15), DEBBADAGUDA(26).
DASARLAPALLE( 24).
PULUMAMID I( 4).
MURLINAGAR(2), SARVARAVULAPALLE(29).
13. UPPAL MANDAL PRAJA PARISHAD
BODUPPAL(4), MIYAPUR(5), PEERZADGUDA(18).
MEDIPALLE(19). Areas not included in any MPP
* Excludes the villages with no "ST" population
** Excludes the ranges with no "ST" population

SECTION II TOWN DIRECTORY

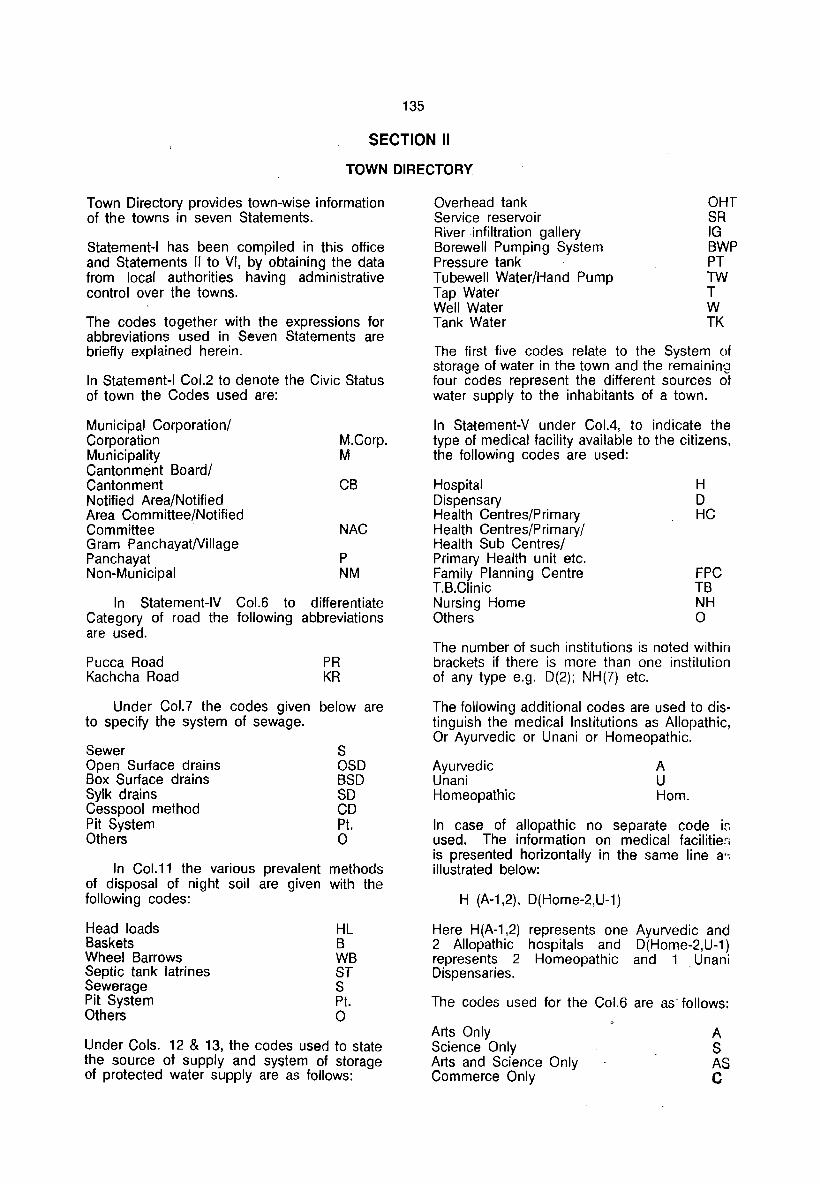
135
SECTION II
TOWN DIRECTORY
Town Directory provides town-wise information of the towns in seven Statements.
Statement-I has been compiled in this office and Statements" to VI, by obtaining the data from local authorities having administrative control over the towns.
The codes together with the expressions for abbreviations used in Seven Statements are briefly explained herein.
In Statement-I Col.2 to denote the Civic Status of town the Codes used are:
Municipal Corporation/ Corporation Municipality Cantonment Board/ Cantonment Notified Area/Notified Area Committee/Notified Committee Gram PanchayatNillage Panchayat Non-Municipal
M.Corp. M
CB
NAC
P NM
In Statement-IV Col.6 to differentiate Category of road the following abbreviations are used.
Pucca Road Kachcha Road
PR KR
Under Col.7 the codes given below are to specify the system of sewage.
Sewer Open Surface drains Box Surface drains Sylk drains Cesspool method Pit System Others
S OSD BSD SO CD Pt. o
In Col.11 the various prevalent methods of disposal of night soil are given with the following codes:
Head loads Baskets Wheel Barrows Septic tank latrines Sewerage Pit System Others
HL B WB ST S Pt. o
Under Cols. 12 & 13, the codes used to state the source of supply and system of storage of protected water supply are as follows:
Overhead tank Service reservoir River infiltration gallery Borewell Pumping System Pressure tank Tubewell Water/Hand Pump Tap Water Well Water Tank Water
OHT SR IG BWP PT TW T W TK
The first five codes relate to the System of storage of water in the town and the remaining four codes represent the different sources ot water supply to the inhabitants of a town.
In Statement-V under Col.4, to indicate the type of medical facility available to the citizens, the following codes are used:
Hospital Dispensary Health Centres/Primary Health Centres/Primary/ Health Sub Centres/ Primary Health unit etc. Family Planning Centre T.B.Clinic Nursing Home Others
H o HC
FPC TB NH o
The number of such institutions is noted within brackets if there is more than one institution of any type e.g. 0(2); NH(7) etc.
The following additional codes are used to distinguish the medical Institutions as Allopathic, Or Ayurvedic or Unani or Homeopathic.
Ayurvedic Unani Homeopathic
A U Hom.
In case of allopathic no separate code if, used. The information on medical facilitier; is presented horizontally in the same line a", illustrated below:
H (A-1,2), O(Home-2,U-1)
Here H{A-1,2) represents one Ayurvedic and 2 Allopathic hospitals and D(Home-2,U-1) represents 2 Homeopathic and 1 Unani Dispensaries.
The codes used for the Col.6 are as" follows:
Arts Only Science Only Arts and Science Only Commerce Only
A S AS C
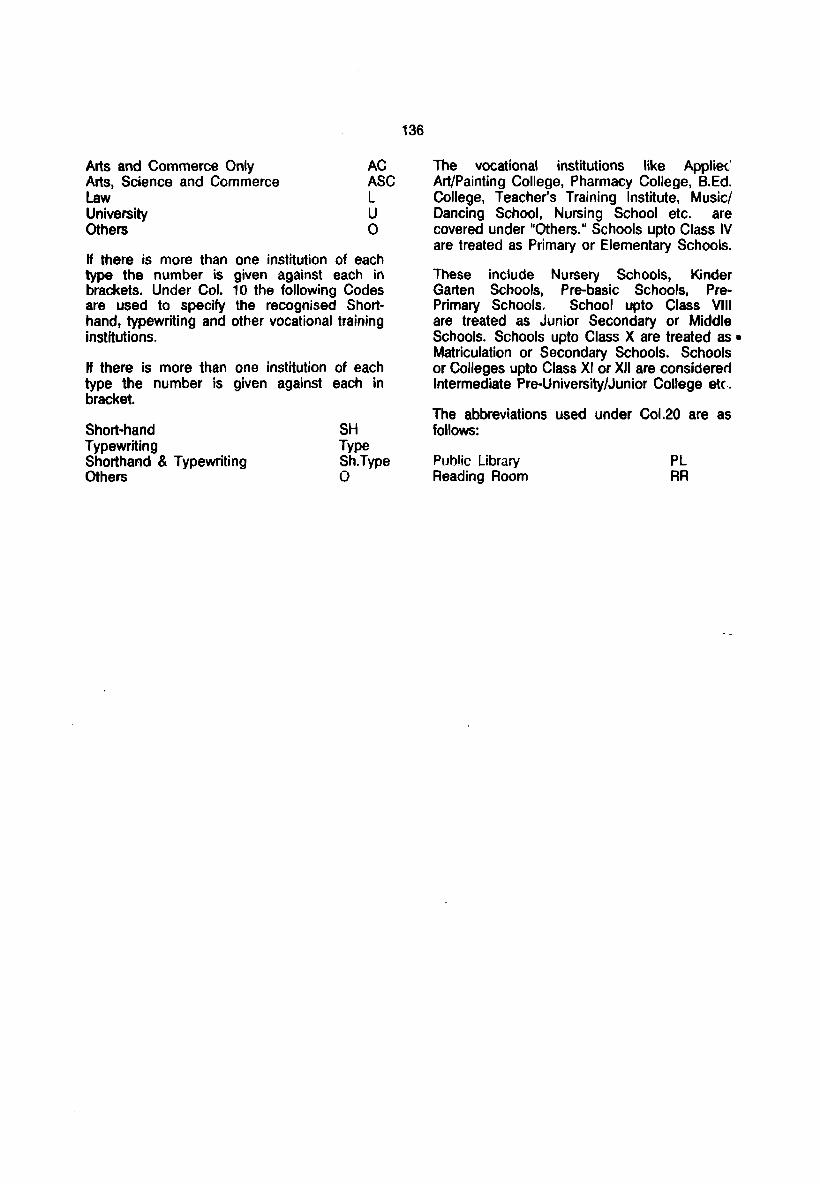
Arts and Commerce Only Arts, Science and Commerce Law University Others
AC ASC L U o
H there is more than one institution of each type the number is given against each in brackets. Under Col. 10 the following Codes are used to specify the recognised Shorthand, typewriting and other vocational training institutions.
If there is more than one institution of each type the number is given against each in bracket.
Short-hand Typewriting Shorthand & Typewriting Others
SH Type Sh.Type o
136
The vocational institutions like Applie( Art/Painting College, Pharmacy College, 8.Ed. College, Teacher's Training Institute, Musicl Dancing School, Nursing School etc. are covered under "Others." Schools upto Class IV are treated as Primary or Elementary Schools.
These include Nursery Schools, Kinder Garten Schools, Pre-basic Schools, PrePrimary Schools. School upto Class VIII are treated as Junior Secondary or Middle Schools. Schools upto Class X are treated as • Matriculation or Secondary Schools. Schools or Colleges upto Class XI or XII are considererl Intermediate Pre-University/Junior College etc..
The abbreviations used under Col.20 are as follows:
Public Library' Reading Room
PL RR

TOWN DIRECTORY FOLLOWS
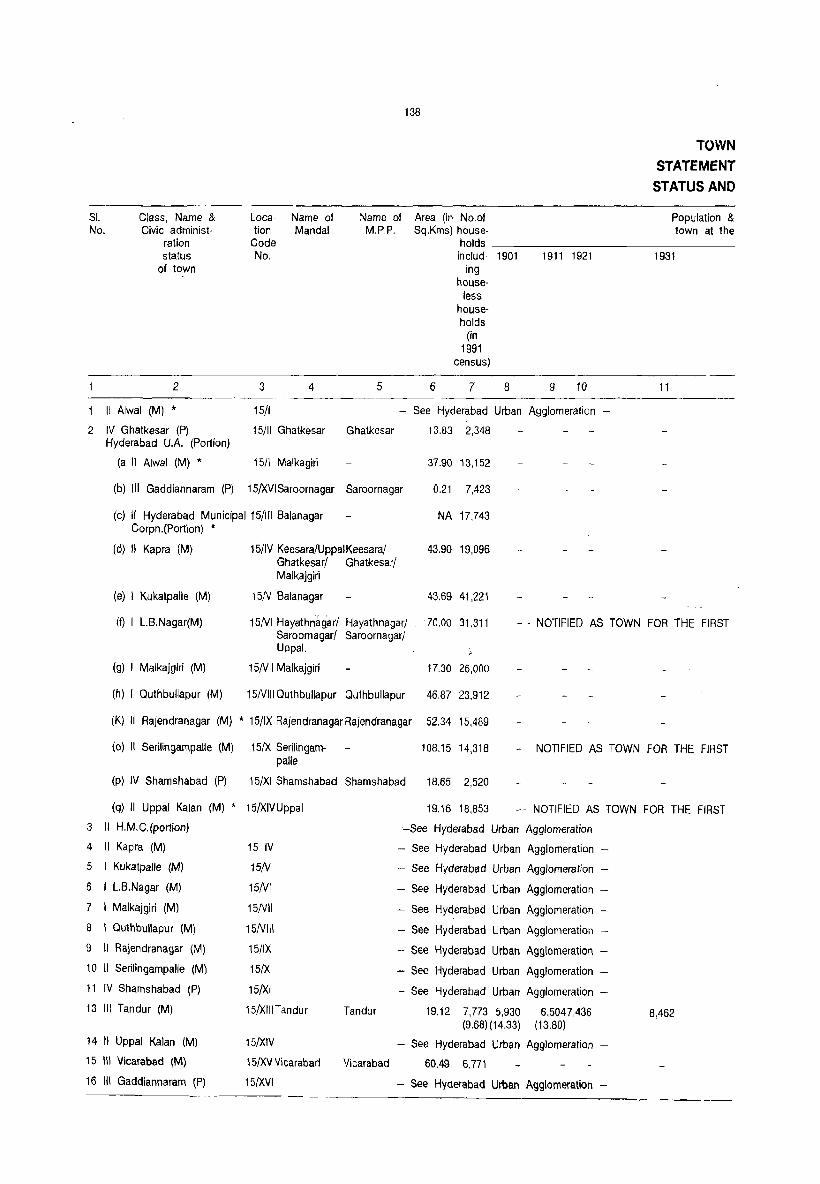
SI. No.
Loca- Name of tion Mandai
138
Name of Area (in No.of M.P.P. Sq.Kms) house-
TOWN STATEMENT STATUS AND
Population & town at the
Class, Name & Civic administ
ration status
Code holds _______________ _
No. of town
2 3 4 5 6
includ- 1901 ing
house-less
house-holds
(in 1991
census)
7 8
1911 1921
9 10
II Alwal (M) * 15/1 - See Hyderabad Urban Agglomeration -
2 IV Ghatkesar (P) Hyderabad U.A. (Portion)
15/11 Ghatkesar Ghatkesar 13.83 2,348
(a \I Alwal (M) * 15/1 Malkagiri 37.90 13,152
(b) '" Gaddiannaram (P) 15/XVISaroornagar Saroornagar
(c) II Hyderabad Municipal 15/1f1 Balanagar Corpn.(Portion) *
(d) II Kapra (M) 15/IV Keesara/UppaIKeesara/ Ghatkesar/ Ghatkesar/ Malkajgiri
15/V Balanagar
0.21 7,423
NA 17,743
43.90 19,096
43.69 41,221
1931
11
(e) I Kukatpalle (M)
(f) I L.B.Nagar(M) 15M Hayathriaqar/ Hayathnagai"/ 70.00 31,311 - - NOTIFIED AS TOWN FOR THE FIRST Saroornagar/ Saroornagar/ Uppal.
(g) I Malkajgiri (M) 15Ni1 Malkajgiri 17.30 26,000
(h) I Quthbullapur (M) 15/VIII Quthbullapur Quthbullapur 46.87 23.912
(K) " Rajendranagar (M) * 15/IX Rajendranagar Rajendranagar 52.34 15,489
(0) 11 Serilingampalle (M)
(p) IV Shamshabad (P)
(q) II Uppal Kalan (M) •
3 JJ H.M.C.(portion)
4 11 Kapra (M)
5 I KukatpaJle (M)
6 I L.B.Nagar (M)
7 I Malkajgiri (M)
8 I Quthbullapur (M)
9 " Rajendranagar (M)
10 " Serilingampalle (M)
11 IV Shamshabad (P)
13 111 Tandur (M)
14 " Uppal Kalan (M)
15 III Vicarabad (M)
16 III Gaddiannaram (P)
15(X Serilingampalle
108.15 14,318 NOTIFIED AS TOWN FOR THE FIRST
15/XI Shamshabad Shamshabad 18.65 2,520
15/XIV Uppal
15 IV
15/V
15/V1
15/V1I
15/V1I1
15/IX
15(X
15/X1
15/XIIITandur
15/XIV
15(XV Vicarabari
15(XVI
Tandur
Vicarabad
19.16 18,853 -- NOTIFIED AS TOWN FOR THE FIRST
~See Hyderabad Urban Agglomeration
- See Hyderabad Urban Agglomeration -
- See Hyderabad Urban Agglomeration -
- See Hyderabad Urban Agglomeration -
- See Hyderabad Urban Agglomeration -
- See Hyderabad Urban Agglomeration -
- See Hyderabad Urban Agglomeration -
- See Hyderabad Urban Agglomeration -
- See Hyderabad Urban Agglomeration -
19.12 7,773 5,930 (9.68) (14.33)
6,5047,436 (13.80)
- See Hyderabad Urban Agglomeration -
60.49 6,771
- See Hyderabad Urban Agglomeration -
8,462

139
DIRECTORY I
GROWTH HISTORY
growth rate of the Den- Sex Ratio Censuses of sity SI.
(1991 1971 1981 1991 No. 1941 1951 1961 1971 1981 1991 Census) Census Census Census
12 13 14 15 16 17 18 19 20 21
- See Hyderabad Urban Agglomeration - 1.
9,773 12,645 914 872 907 2. (29.39)
14,943 14,844 19,750 39,249 67,271 1,775 940 961 963 (a) (-0.66) (33.05) (98.73) (71.40)
9,693 35,187 167,557 887 (b) (263.Q1)
42,714 93,774 93,455 NA B88 B96 927 (c) (119.54) (-0.34)
15,367 87,747 1,999 916 923 (d) (471.01)
5,941 13,509 26,167 56,659 186,963 4,279 927 921 901 (e) (j27.39) (93.70) (116.53) (229.98)
'TIME IN 1991 CENSUS - 155,514 2,222 931 (0
12,376 13,910 25,543 65,776 127,178 7,351 927 929 967 (g) (12.39) (83.63) (157.51) (93,35)
24,002 106,591 2,274 892 896 U) (344.09)
8,038 84,548 1,615 911 (k) (951,85)
TIME IN 1991 CENSUS - 72,320 669 908 (0)
5,070 5,790 7,632 11,172 15,366 824 925 931 952 (p) (14.20) (31.81) (46,38) (37,54)
TIME IN 1991 CENSUS - 75,660 3,941 914 (q)
- See Hyderabad Urban Agglomeration - 3
- See Hyderabad Urban Agglomeration - 4.
- See Hyderabad Urban Agglomeration - 5,
- See Hyderabad Urban Agglomeration - 6,
- See Hyderabad Urban Agglomeration - 7,
-- See Hyderabad Urban Agglomeration - 8.
- See Hyderabad Urban Agglomeration - 9.
- See Hyderabad Urban Agglomeration - 10,
- See Hyderabad Urban Agglomeration - 11. 9,280 15,480 16,736 22,008 32,450 45,517 2,381 961 946 959 13, (9.67) (66.81) (8,11) (31.50) (47.45) (40,27)
-- See Hyderabad Urban Agglomeration - 14,
6,874 9,033 13,110 20,737 39,215 648 936 916 965 15. (31.41) (45.13) (58.18) (89,11)
- See Hyderabad Urban Agglomeration - 11',
* Inclusive of Out Growth(s),

SI. No.
1
2
3.
4.
5.
6.
7.
a. 9.
10.
11.
13.
14.
15.
16.
Class and Name of Town
2
II AlWAl
IV GHATKESAR
HYDERABAD U.A. (PORTION)
(a) II ALWAl
(b) III GADDIANNARAM
(c) II HYDERABAD MUNICIPAL CORPN. (PORTION)
(d) II KAPAA
(e) I KUKATPALLE
(~ I L.B.NAGAR
(g) I MALKAJGIRI
0) I QUTHBULLAPUR
(k) II RAJENDRA NAGAR
(0) II SERILINGAMPALLE
(p) IV SHAMSHABAD
(q) II UPPAL KALAN
HYDERABAD MUNICIPAL CORPN. (PORTION)"
KAPAA
KUKATPALLE
L.B.NAGAR
MALKAJGIRI
QUTHBULLAPUR
RAJENDRA NAGAR
SERILINGAMPALLE
V SHAMSHABAD
III TANDUR
II UPPAL KALAN
III VICAAABAD
III GADDIANNARAM
140
TOWN
STATEWiENT
PHYSICAL ASPECTS AND
PHYSICAL ASPECTS NAME OF AND
Rain fall (in mm)
Temperature (in Centigrade)
State Headquarters Hyderabad
District Headquarters
Hyderabad Maximum Minimum
3 4 5 6 7
- See Hyderabad Urban Agglomeration --
697.a 41.0 38.0 23 23
942.0 42.0 28.0 16 ,6
733.0 41.0 27,0 12 12
---- N.A. ----
1,041.8 42.0 21.0 18 18
743.5 42.0 27.0 14 14
640.0 42.0 11.0 14 14
1,248.0 42.0 31,0 13 13
n2.2 42.4 9,1 24 t-4
501.8 40.0 17.0 15 i5
590.0 43.0 29.0 26 26
680,2 40.0 15.0 16 16
n2.2 42.0 29.0 21 21
- See Hyderabad Urban Agglomeration --
- See Hyderabad Urban Agglomeration --
- See Hyderabad Urban Agglomeration --
- See Hyderabad Urban Agglomeration --
- See Hyderabad Urban Agglomeration --
- See Hyderabad Urban Agglomeration --
- See Hyderabad Urban Agglomeration --
- See Hyderabad Urban Agglomeration --
- See Hyderabad Urban Agglomeration --
918.4 42.9 11.0 144 144
- See Hyderabad Urb" Agglomeration--
1,156.0 43.7 35.0 66 86
- See Hyderabad Urban Agglomeration --
** No separate body is functioning and as such in part- II (A) only' 14 towns in the district

DIRECTORY
"
141
LOCATION OF TOWNS, 1989
ROAD DISTANCE (IN KMS) FROM
Sub-Division/ Mandai
8
HYDERABAD EAST(23)/ GHATKESAR (0)
CHEVELLA(61 )/ MALKAJGIRI(9)
HYDERABAD EAST(15)/ SAROORNAGAR (3)
HYDERABAD EAST(23)1 KEESARA(10)
CHEVELLA(16)/ BALANAGAR(5)
HYDERABAD EAST(5)1 SAROORNAGAR(5)
CHEVELLA(11 )1 MALKAJGIRI (0)
HYDERABAD EAST(24)1 QUTHBULLAPUR(O)
CHEVELLA(20)/ RAJENDRANAGAR(O)
CHEVELLA(22)/ SERILINGAMPALLE(O)
CHEVELLA(24)/ SHAMSHABAD(O)
HYDERABAD EAST(12)/ UPPAL(O)
VICARABAD(42)/ TANDUR (0)
VICARABAD(O)/ VICARABAD(O)
Nearest city with population of one
lakh and more
Railway Station Bus Route
9 10 11
- See Hyderabad Urban Agglomeration -
HYDERABAD GHATKESAR GHATKESAR (23) (0) (0)
HYDERABAD ALWAL ALWAL (16) (0) (0)
HYDERABAD MALAKPET DILSUKHNAGAR (12) (5) (2)
N.A.
HYDERABAD CHERLAPALLE KAPRA (18) (8) (0)
HYDERABAD SANATHNAGAR KUKATPALLE (14) (3) (0)
HYDERABAD HYDERABAD L.B.NAGAR (14) (14) (0)
HYDERABAD MALKAJGIRI MALKAJGIRI (13) (0) (0)
HYDEAABAD SANATHNAGAR QUTHBULLAPUR (24) (7) (0)
HYDERABAD SHIVARAMPALLE RAJENDRANAGAR (15) (6) (0)
HYDERABAD LlNGAMPALLE LlNGAMPALLE (26) (1) (0)
HYDERABAD UMDANAGAR SHAMSHABAD (16) (4) (0)
HYDERABAD SECUNDERABAD UPPAL (21) (16) (0)
- See Hyderabad Urban Agglomeration -
- See Hyderabad Urban Agglomeration -
- See Hyderabad Urban Agglomeration -
- See Hyderabad Urban Agglomeration -
- See Hyderabad Urban Agglomeration -
- See Hyderabad Urban Agglomeration -
- See Hyderabad Urban Agglomeration -
- See Hyderabad Urban Agglomeration -
- See Hyderabad Urban Agglomeration -
HYDERABAD TANDUR TANDUR 0~ ~ ~
- See Hyderabad Urban Agglomeration -
HYDERABAD VICARABAD VICARABAD (66) (0) (0)
- See Hyderabad Urban Agglomeration -
Navigable river/ canal (if within
10 Kms.)
12
SI. No.
1.
2.
(a)
(b)
(c)
(d)
(e\
(f)
(g)
0)
(k)
(0)
(p)
(q)
3.
4
5.
6.
7.
8.
9
10
11.
13.
14.
15.
16

142
TOWN
STATEMENT
MUNICIPAL
SI. Class and Civic RECEIPT (IN RS. '00) Total No. Name of admini- Receipt
Town stration Receipt Revenue Govern- Loan Advance Other status through derived men! sources
(in 1990) taxes, from grant (specify) etc. Munici-
pal pro-perties
and power apart from
taxation
2 3 4 5 6 7 8 9 10
II ALWAL M - See Hyderabad Urban Agglomeration -
2 IV GHATKESAR P 2,073 5,098 1,295 8,466
II HYDERABAD U.A (PORTION)
(a) II ALWAL • M 19,526 10 5,653 2,000 2,000 51,45; 80,640
(b) III GADDIANNARAM P 61,593 5,122 66,715
(e) II HYDERABAD MUNICIPAL CORPN. (PORTION)* MC --N.A. --
(d) It KAPAA M 57,998 8,295 3,940 70,233 - "-
(e) I KUKATPALLE M 103,512 9,298 9,700 26,589 149,()99
(1) I L.B.NAGAR M 25,659 105,490 2,302 - 133,451
(g) I MALKAJGIRI M 51,580 82,600 21,760 - 155,940
0) I QUTHBULLAPUR M 42,309 8,176 14,035 64,520
(k) II RAJENDRANAGAR * M 15.403 12,627 9,016 8,161 45-;207
(0) II SERIUNGAMPALLE M 69,372 72 13,426 82,870
(p) IV SHAMSHABAD P 4,034 2,141 1,562 7,737
(q) II UPPAL KALAN * M 39,105 168 8,123 32,977 80,373
3. II HYDERABAD MUNICIPAL CORPN. (PORTION) Me - See Hyderabad Urban Agglomeration -
4. II KAPRA M - See Hyderabad Urban Agglomeration -
5. I KUKATPALLE M - See Hyderabad Urban Agglomeration -
6. I L.B.NAGAR M - See Hyderabad Urban Agglomeration -
7. I MALKAJGIRI M - See Hyderabad Urban Agglomeration -
8. I QUTHBULLAPUR M - See Hyderabad Urban Agglomeration -
9. II RAJENDRANAGAR .. M - See Hyderabad Urban Agglomeration -
10. II SERILINGAMPALLE M - See Hyderabad Urban Agglomeration -
11. IV SHAMSHABAD P - See Hyderabad Urban Agglomeration -
13. III TANDUR M 18,320 2,570 2,440 2,990 26,320
14. II UPPAL KALAN * M - See Hyderabad Urban Agglomeration -
15. III VICARABAD M 18,320 2,570 2,440 12,990 36,320
16. III GADDIANNARAM p - See Hyderabad Urban Agglomeration -
* Including out growrth(s)

DIRECTORY
III
FINANCE, 1988-89
General Administration
11
1,324
21,586
6,696
6,245
16,546
6,710
24,920
5,169
12,295
15,984
1,793
21,937
3,840
3,840
Public safety
12
1,980
2,785
32,402
11,480
2,314
563
EXPENDITURE (IN RS. '00)
Public Public health Works
and con-veniences
13 14
143
Public Insti
tutions
15
- See Hyderabad Urban Agglomeration -
601 1,190
1,250 9,057
9,464 30,410
N.A
10,183 25,103 12,437
17,675 61,562
11,963 2,371
36,080 35,070
14,006 12,044 150
3,822 4,238
5,064 10,762
5,439 1,327 189
18,987 8,706
- See Hyderabad Urban Agglomeration -
- See Hyderabad Urban Agglomeration -
- See Hyderabad Urban Agglomeration -
- See Hyderabad Urban Agglomeration -
- See Hyderabad Urban Agglomeration -
- See Hyderabad Urban Agglomeration -
- See Hyderabad Urban Agglomeration -
- See Hyderabad Urban Agglomeration --
- See Hyderabad Urban Agglomeration -
12,230 2,450
- See Hyderabad Urban Agglomeration ~
12,230 2,450
- See Hyderabad Urban Agglomeration -
Other (Specify)
16
3,370
33,499
2,015
7,503
45,820
2,270
22,637
37,684
142
10,990
10,990
Total Expendi
ture
17
8,465
68,177
48,585
53,968
135,688
66,864
109,820
56,320
20,355
70,057
8,890
49,630
29,510
29,510
SI. No.
1.
2.
(a)
(b)
(c)
(d)
(e)
(f)
(g)
U) (k)
(0)
(p)
(q)
3.
4.
5.
6:
7.
8.
9.
10.
11.
13.
14.
15.
16.
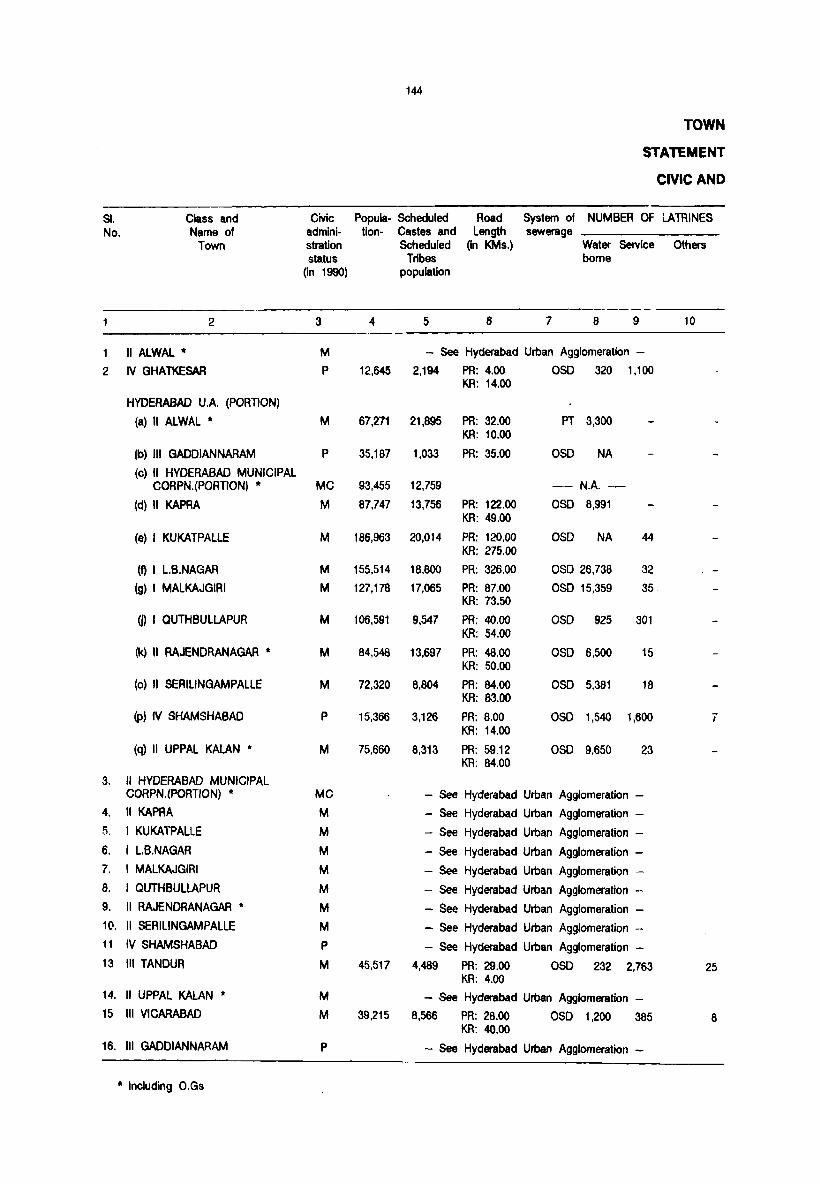
144
TOWN
STATEMENT
CIVIC AND
81. Class and Civic Popula- Scheduled Road System of NUMBER OF LATRINES No. Name of admini- tion- Castes and Length sewerage
Town stration Scheduled (in KMs.) Water Service Others status Tribes borne
On 1990) population
2 3 4 5 6 7 8 9 10
1 II ALWAL • M - See Hyderabad Urban Agglomeration -
2 IV GHATKESAR P 12,645 2,194 PA: 4.00 050 320 1,100 KR: 14.00
HYDERABAD U.A. (PORTION)
(a) II ALWAL * M 67,271 21,895 PA: 32.00 PT 3,300 KR: 10.00
(b) III GAODIANNARAM P 35,187 1,033 PR: 35.00 OSO NA
(c) II HVDERABAD MUNICIPAL CORPN.(PORTlON) * MC 93,455 12,759 - N.A. ~
(d) II KAPAA M 87,747 13,756 PR: 122.00 OSO 8,991 KR: 49.00
(e) I KUKATPALLE M 186,963 20,014 PR: 120.00 OSO NA 44 KR: 275.00
(f) I L.B.NAGAR M 155,514 18,800 PR: 326.00 OSO 26,738 32
(g) I MALKAJGIRI M 127,178 17,065 PR: 87.00 OSO 15,359 35 KR: 73.50
OJ I QUTHBULLAPUR M 106,591 9,547 PR: 40.00 OSO 925 301 KR: 54.00
(k) II RAJENDRANAGAR * M 84,548 13.697 PR: 48.00 OSO 6.500 15 KR: 50.00
(0) II SERILINGAMPALLE M 72.320 8.804 PR: 84.00 OSD 5,381 18 KR: 83.00
(p) IV SHAMSHABAO P 15,366 3,126 PR: 8.00 OSO 1,540 1,600 7 KR: 14.00
(q) II UPPAL KALAN * M 75,660 8,313 PR: 59.12 OSO 9,650 23 KR: 84.00
3. II HVDERABAO MUNICIPAL CORPN.(PORTION) * MC - See Hyderabad Urban Agglomeration -
4. II KAPAA M - See Hyderabad Urban Agglomeration -5. I KUKATPALLE M - See Hyderabad Urban Agglomeration -
6. I L.B.NAGAR M - See Hyderabad Urban Agglomeration -7. I MALKAJGIRI M - See Hyderabad Urban Agglomeration -8. I QUTHBULlAPUR M - See Hyderabad Urban Agglomeration -9. II RAJENORANAGAR * M - See Hyderabad Urban Agglomeration -1(1. " SERILINGAMPALLE M - See Hyderabad Urban Agglomeration -11 IV SHAMSHABAD P - See Hyderabad Urban Agglomeration -13 III TANOUR M 45,517 4,489 PR: 29.00 050 232 2,763 25
KR: 4.00 14. II UPPAL KALAN * M - See Hyderabad Urban Agglomeration -15 III VlCARABAD M 39,215 8,566 PR: 28.00 OSO 1,200 385 8
KR: 40.00 16. m GADOIANNARAM P - See Hyderabad Urban Agglomeration -
* Including O.Gs

145
~y
'-'lENITIES, 1989
'ROTECTED WATER Fire ELECTRIFICATION (NO,OF CONNECTIONS) SI. SUPPLY fighting No.
service Dome- Indust- Commer- Road Others urce System of stic rial cia I Lighting ,t storage with (Points) pply capacity in
'OOO(Litres)
2 13 14 15 16 17 18 19
See Hyderabad Urban Agglomeration 1.
T OHT(208) TARNAKA(16) 2,890 18 315 600 NA 2,
T lHT(983) SECUNDERABAD(12) 10,000 25 300 1,558 (a)
T' IG(NA) TARNAKA(5) NA NA NA 1,010 NA (b)
--- N.A. (c)
T IG(2,250) SECUNDERABAD(12) 12,019 438 1,047 4,750 346 (d)
T IG(2,093) SANATHNAGAR(10) 7,700 734 924 1.207 NA (e)
T IG(2,867) HYDERABAD(14) 30,000 250 1,800 6,285 NA (f)
BW IG(4,095) SECUNDERABAD(8) 26,466 55 509 5,635 30 (g)
,TW OHT(1,820) SANATHNAGAR(5) 12.870 1,456 920 4,435 NA m ,TW IG(3,185) HYDERABAD(15) 7,000 1,000 800 1,900 NA (k)
W,T IG(1.365) PATANCHERU(7) 5,168 111 154 2.185 278 (0)
T OHT(114) HYDERABAD(16) 2,500 30 350 550 NA (p)
T OHT(2,843) HYDERABAD(21 ) 8,544 130 550 2.754 NA (q)
- See Hyderabad Urban Agglomeration 3,
- See Hyderabad Urban Agglomeration 4,
- See Hyderabad Urban Agglomeration 5.
- See Hyderabad Urban Agglomeration 6.
- See Hyderabad Urban Agglomeration 7.
- See Hyderabad Urban Agglomeration 8.
- See Hyderabad Urban Agglomeration 9,
- See Hyderabad Urban Agglomeration 10,
- See Hyderabad Urban Agglomeration 11,
TK OHT(1,863) HYDERABAD(144) 3,498 89 585 1,200 NA 13.
• - See Hyderabad Urban Agglomeration 14 .
,TW IG(5,464) YES 1,205 101 632 700 NA 15.
- See Hyderabad Urban Agglomeration 16.

SI. No.
* Class and Name of town
2
II ALWAL
146
Name of slum
3
Ambedkar weaker section ward no 21 Ambedkarnagar Yapral Ward no 5 Ambedkarnagar khanajiguda ward no 12 Ashoknagar Subhashnagar ward no 11 Bandambai T urkapally ward no 28 Bapujinagar Yapral Ward no 5 Barshapet kowkoor ward no 2 Bhagathsinghnagar Yapral ward no 3 Bhoopeshnagar Yapral Ward no 3 Chinna Kandiguda Dinsibasthi ward no 25 Ekalavyanagar (Gopalnagar) Ekalavyanagar weaker section ward no 26 Erukalabasthi Yapral Ward no 4 Gollaguda Subhashnagar ward no Harijanabasthi old Alwal ward no 19 Harijanabasthi ward no 23 Harijanabasthi, Kummaribasti, Lothukunta ward no 10 Indiranagar Yapral Ward no 7 Indiranagar weaker section Khanajiguda, ward no 12 Jaijawaharnagar Yapral Ward no 7 Karkhana Machabollarum Khanajiguda village ward no 12 Kindibasthi Yapral Ward no 4 Kothabasthi Alwal ward no 15 Kothabasthi Machabollarum ward no 27 Kothabasthi Venkatapuram ward no 9 Kothabasthi weaker section Kowkoor village ward no 1 Kummaribasthi Machabollarum ward no 23 Kummaribasthi old Alwal ward no 19 Old Alwal ward no 19 Sanjay Gandhinagar
11
Area of slum
(in Sq. Kms)
4
NA
TOWN
STATEMENT
CIVIC AND OTHER AMENITIES
Population of slum (approxi
mate)
5
5961 !
256 1,438
1
402
559 207 387 479
1,198 338
1,239 285,
46°1
5621 233
768
931 1,1601
287 1,191
1,207 265
1,039 419 741
1,056
494
711 1,073
676
472
2,639 825
Paved Roads
(in Kms)
6
N.A
System of Sewerage
7
OSD

DIRECTORY
IVA
IN NOTIFIED SLUMS, 1989
NUMBER OF LATRINES Method of dis-
Private Community posal of night soil
Water Service Others borne
8 9 10 11 12
NA NA NA NA
147
No.of tap points/pu-blic hydr-ants inst-ailed for
supply of protected
water
13
NA
ELECTRIFICATION (NO.OF CONNECTIONS)
Domestic Road Lighting points
14 15
NA NA
Others
16
NA

SI. No.
* Class and Name of town
2
II ALWAL (Concld .. )
II KAPRA
148
Name of slum
3
Kowkoor Ward no Subhashnagar Ward no 12 Turkapally Bollarum ward no 28 Venkatapuram old village ward no 13 Venkatapuram ward no 14 Yadavbasthi Yapral Ward no 5 Yapral old village Ward no 3 Yapral old village Ward no 6
Ambedkamagar Nacharam Ashoknagar Mallapur Babanagar Nacharam Bakshiguda Chinna cherlapally Errakunta Nacharam Erukalawada Nacharam Gandhinagar Harijanwada Hanumannagar Indiranagar Meerpet Indiranagar kapra Kandiguda village Kapra village Krishnareddy colony (Lambadi basti) Kushaiguda Lingamaiah colony Mallapur Mallapur B C wada Mallapur Harijanwada NTR Nagar Mallapur Nehrunagar Mallapur Nirmalnagar Pedda Cherlapally Harijanawada Puckatnagar Cherlapally Rajeevnagar S.T.housing colony Shantagiri colony kapra Singamchervu Nacharam Subashnagar Mallapur Vampuguda Vampuguda housing colony Velva rna gar (Ammuguda) Weaker section colony Cherlapally Yellareddyguda
Area of slum
(in Sq. Kms)
4
NA
TOWN
STATEMENT
CIVIC AND OTHER AMENITIES
Population of slum (approxi
mate)
5
1,116 1,756
904
1,061 576 855 320
310 1,493
578 231 474
1,269 275 960 281
1,185 443 925 868 541
2,941 224
2,304 1,012
515 3,422 1,321
433 509
1,209 518 528 235 421 209 493 451 765 705
Paved Roads
(in Kms)
6
19.02
System of Sewerage
7
OSD
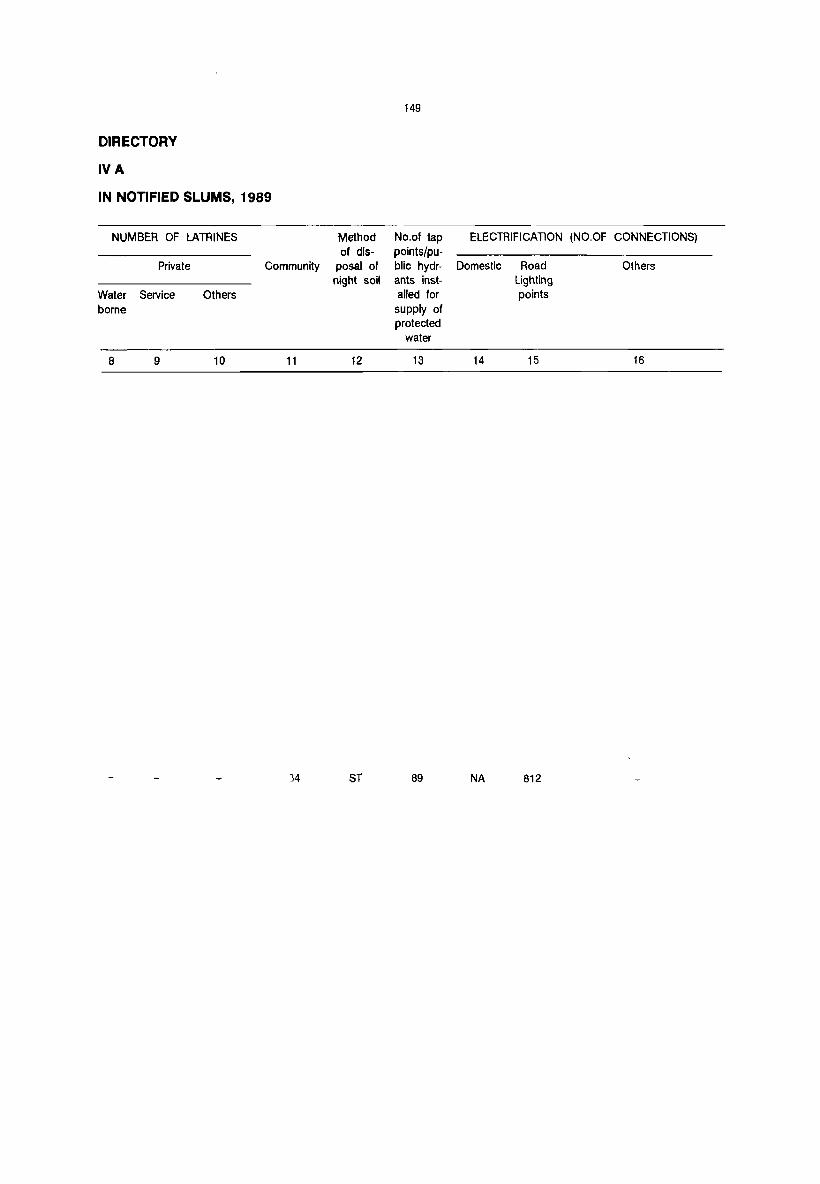
149
DIRECTORY
IVA
IN NOTIFIED SLUMS, 1989
NUMBER OF LATRINES Method No.of tap ELECTRIFICATION (NO.OF CONNECTIONS) of dis- pOints/pu-
Private Community posal of blic hydr- Domestic Road Others night soil ants inst- Lighting
Water Service Others ailed for points
bome supply of protected
water
8 9 10 11 12 13 14 15 16
34 5T 89 NA 812
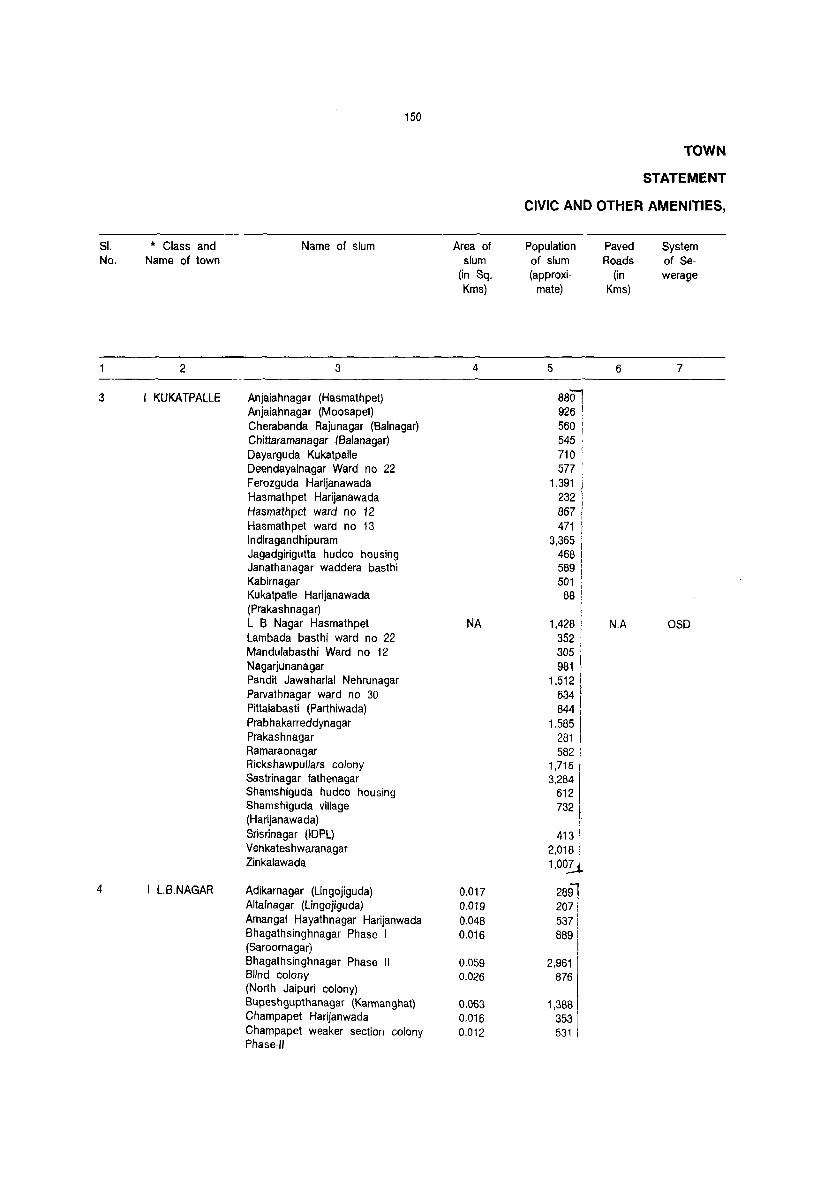
SI. No.
3
4
* Class and Name of town
2
KUKATPALLE
I L.B.NAGAR
150
Name of slum
3
Anjaiahnagar (Hasmathpet) Anjaiahnagar (Moosapet) Cherabanda Rajunagar (Balnagar) Chittaramanagar (Balanagar) Dayarguda Kukatpalle Deendayalnagar Ward no 22 Ferozguda Harijanawada Hasmathpet Harijanawada Hasmathpet ward no 12 Hasmathpet ward no 13 Indiragandhipuram Jagadgirigutta hudco housing Janathanagar waddera basthi Kabimagar Kukatpalle Harijanawada (Prakash nagar) L B Nagar Hasmathpet Lambada basthi ward no 22 Mandulabasthi Ward no 12 Nagarjunanagar Pandit Jawaharlal Nehrunagar Parvathnagar ward no 30 PiUalabasti (Parthiwada) Prabhakarreddynagar Prakashnagar Ramaraonagar Rickshawpullars colony Sastrinagar fathenagar Shamshiguda hudco housing Shamshiguda village (Harijanawada) Srisrinagar (lDPL) Venkateshwaranagar Zinkalawada
Adikarnagar (Lingojiguda) Altafnagar (Lingojiguda) Amangal Hayathnagar Harijanwada Bhagathsinghnagar Phase I (Saroornagar) Bhagathsinghnagar Phase II Blind colony (North Jaipuri colony) Bupeshgupthanagar (Karman ghat) Champapet Harijanwada Champapet weaker section colony Phase-II
Area of slum
(in Sq. Kms)
4
NA
0.D17 0.019 0.048 0.016
0.059 0.026
0.063 0.016 0.012
TOWN
STATEMENT
CIVIC AND OTHER AMENITIES,
Population of slum (approxi
mate)
5
8801 926 i
560 : 545 : 710 I
577 1,391
232 867 471
3,365 , 4681 589 ; 501 I
88
1,428 352 305 I
981 \
1,512 1 634
1 844 ; 1,585 i
281 : 5821
1,716
1 3,284 612 732 ! l , 413 !
2,018 : 1,00lL
2891 , 207 i 537 i 889 i
I 2,961
876
1,388 353 531
Paved Roads
(in Kms)
6
N.A
System of Sewerage
7
OSD

151
DiRECTORY
IVA
IN NOTIFIED SLUMS, 1989
NUMBER OF LATRINES Method No.of tap ELECTRIFICATION (NO.OF CONNECTIONS) of dis- points!pu-
Private Community posa) of bUc hydr- Domestic Road Others night soil ~mts inst- Lighting
Water Service Others ailed for points borne supply of
protected water
8 9 10 11 12 13 14 15 16
NA NA NA NA NA NA NA NA

SI. No.
5
.. mass and Name of town
2
I L.B.NAGAR (Concld .. )
I MALKAJGIRI
152
Name of slum
3
Champapet weaker section colony Phase I Cherukuthota basthi (Saroornagar) Dasaribasthi Champapet Dr Ambedkar colony (Bammanaganti) Fathullaguda village Gunti Jangaiahnagar colony Phase I andll Hayathnagar Jaipuri colony south Nagole Kothapet B C colony Kothapet Harijanwada Kothapet Municipal colony Lingojiguda Phase landJl Mallikharjunanagar Mansoorabad Harijanwada NTR Nagar (Saroornagar) Nagole Harijanwada Rajeevgandhinagar Roshandowla Champapei Sahebnagar Harijanwada Sahebnagar near Patelguda Sahebnagar weaker section colony Sudeerkumar weaker section colony Sulthanwalva Harijanwada Phase landJl Tyagarajanagar weaker section colony
Babujagjeev&nramnagar Bhagathnagar Bodabanda Chandabagh Chintalbasthi Dodlabasthi Ekalavyanagar Hanumannagar Indira Nehrunagar Jayagiri Laxminarsimha Swamy nagar Keshavnagar Mahatma Gandhi Nagar Old Heredbat Old Neredmet Parthiwada
Area of slum
(in Sq. Kms)
4
0.020
0.019 0.016 0.028 0.188 0.048
0.006 0.076 0.048 0.050 0.016 0.040 0.025 0.067 0.150 0.045 0.063 0.136 0.220 0.042 0.039 0.030 0.048
0.027
NA
TOWN
STATEMENT
CIVIC AND OTHER AMENITIES,
Population of slum (approxi
mate)
5
312
1 388 322 884 420
1,303
254 130
1,058 587 840 235 477 318
6,614 610
3,277 284 625 420
1,336 248 406
308
":l 1,123 570
390 I 604 402 ! 702
1,669 5,596
785
5691 1,157 : 1,596 i 1,142 !
5931
Paved Roads
(in Kms)
6
8.17
2.59
System of Sewerage
7
080
OSO

DIRECTORY
IVA
IN NOTIFIED SLUMS, 1989
NUMBER OF LATRINES Method of dis-
Private Community posal of night soil
Water Service Others bome
8 9 10 11 12
ST
19 WB,ST
153
No,of tap points/pu· blic hydr-ants inst-ailed for supply of protected
water
13
36
107
ELECTRIFICATION (NO,OF CONNECTIONS)
Domestic Road Lighting pOints
14 15
NA 435
NA 610
Others
16
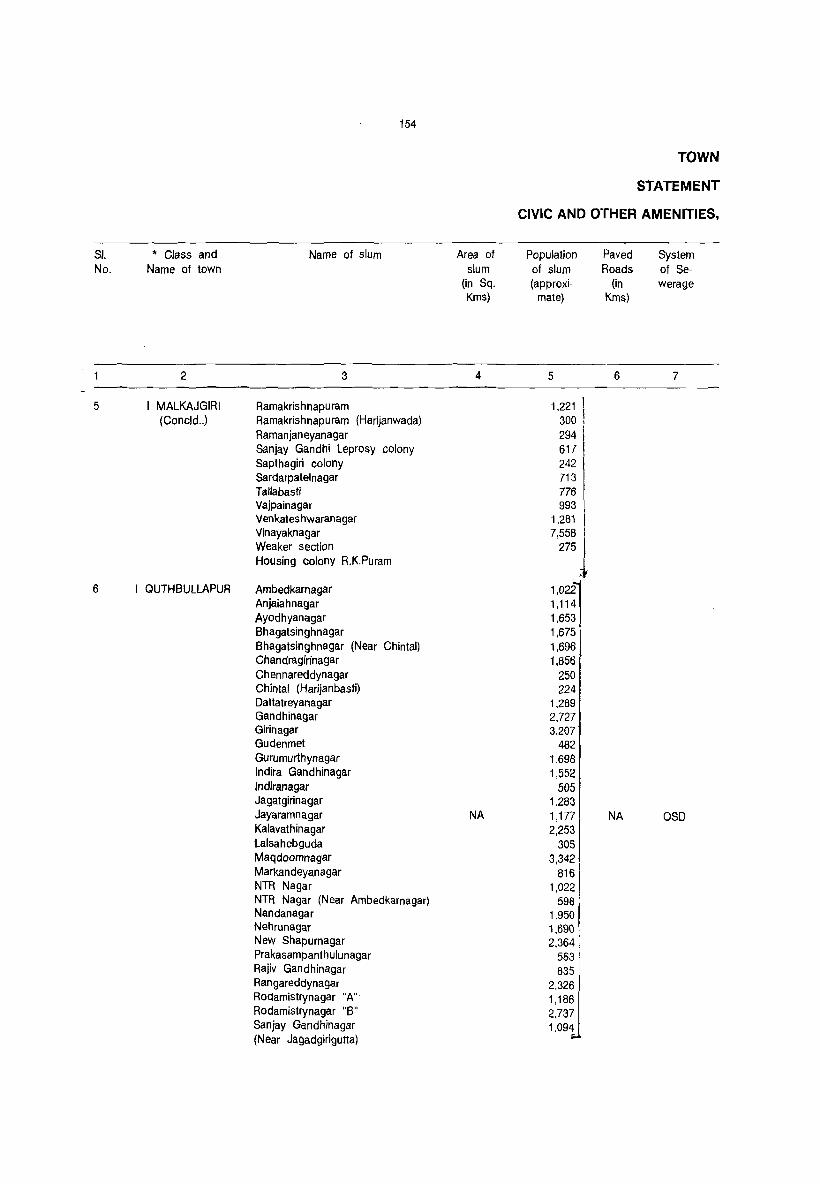
Sl. No.
5
6
* Class and Name of town
2
I MALKAJGIRI (Concld .. )
I QUTHBULLAPUR
154
Name of slum
3
Ramakrishnapuram Ramakrishnapuram (Harijanwada) Ramanjaneyanagar Sanjay Gandhi Leprosy colony Sapthagiri colony Sardarpatelnagar Tallabasti Vajpainagar Venkateshwaranagar Vinayaknagar Weaker section Housing colony R.K.Puram
Ambedkamagar Anjaiahnagar Ayodhyanagar Bhagatsinghnagar Bhagatsinghnagar (Near Chintal) Chandragirinagar Chennareddynagar Chintal (Harijanbasti) Dattatreyanagar Gandhinagar Girinagar Gudenmet Gurumurthynagar Indira Gandhinagar Indiranagar Jagatgirinagar Jayaramnagar Kalavathinagar Lalsahebguda Maqdoomnagar Markandeyanagar NTR Nagar NTR Nagar (Near Ambedkarnagar) Nandanagar Nehrunagar New Shapurnagar Prakasampanthulunagar Rajiv Gandhinagar Rangareddynagar Rodamistrynagar "A" Rodamistrynagar "6" San jay Gandhinagar (Near Jagadgirigutta)
Area of slum
(in Sq. Kms)
4
NA
TOWN
STATEMENT
CIVIC AND OTHER AMENITIES,
Population of slum (approxi
mate)
5
1,221 I 300 i
294 I
617 242 713 776 993
1,281 7,558
275
1,022 1,114 1,653 1,675 1,696 1,856
250 224
1,289 2,727 3,207
482 1,698 1,552
505 1,283 1,177 2,253
305 3,342
816 1,022
598 1,950 1,690 2,364
563 835
2,326 1,186 2,737 1,09,!
Paved Roads
(in Kms)
6
NA
System of Sewerage
7
aso
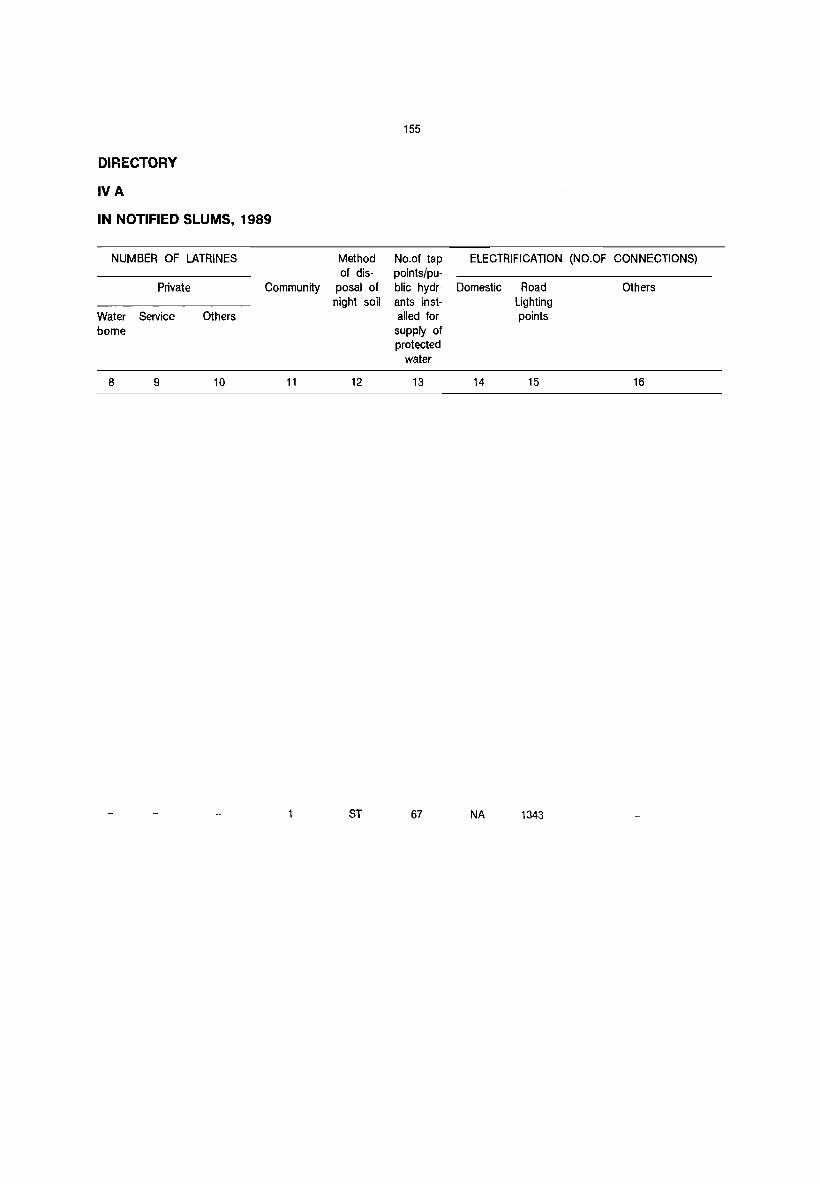
155
DIRECTORY
IVA
IN NOTIFIED SLUMS, 1989
NUMBER OF LATRINES Method No.of tap ELECTRIFICATION (NO.OF CONNECTIONS) of dis- points/pu-
Private Community posal of blic hydr- Domestic Road Others night soil ants inst- Lighting
Water Service Others ailed for points borne supply of
protected water
8 9 10 11 12 13 14 15 16
ST 67 NA 1343

SI. No.
6
7
8
* Class and Name of town
2
I QUTHBULLAPUR (Concld .. )
II RAJENDRANAGAR
II SERILINGAMPALLE
156
Name of slum
3
Sanjay Gandhinagar Sanjaypuri Shirdi Saibabanagar Shivalayanagar Sri Ramnagar Srinivasanagar Sub hash Chandrabosenagar Suraram weaker section colony Umadevinagar Vajpayeenagar Attapur Harijanbasti Attapur weaker section colony Bagathguda Budvel village Errabad (Rajivnagar) Gaganpahad Weaker section colony Gaganpahad Harijanbasthi Hassannagar Hassannagar (Mad ina Masjeed) Hyderguda village Jalalbabanagar Kattedan (Netajinagar) Mahamoodnagar Mailardevpalle Mailardevpalle Harijanbasthi Manikyamma Harijanbasti Premavathipet Harijanbasti Rajendranagar Harijanbasti Rambagh Harijanbasti Shiavjinagar Shivarampalle Harijanbasti Shivarampally weaker section colony Upperpalle village
Emmkunta Gangaram (Chandanagar) Gopanpally tanda Gopinagar Gowljdoddi Kondapur Maqthamahaboobpet Nankramguda Raidurga
Area of slum
(in Sq. Kms)
4
NA
NA
TOWN
STATEMENT
CIVIC AND OTHER AMENITIES,
Population of slum (approxi
mate)
5
6,437 J
1.206 2,385
635 2,087 1,049 1,869 3,068
390 1,872
64-
1,252 199
1,306 316 694
720 1,174 1,785 1,475 1,074
587 3,853 1,436
744 791
1,072 1,381
893 499 362 742
698
546 1.411
568 3,912
533 985 573
2,068 4,651
Paved Roads
(in Kms)
6
23.24
NA
System of Sewerage
7
OSO
080

DIRECTORY
IVA
IN NOTIFIED SLUMS, 1989
NUMBER OF LATRINES
Private
Water Service borne
8 9
Others
10
Method of dis
Community posal of night soil
11 12
3 ST
No.of tap pOints/public hydrants installed for supply of protected
water
13
32
154
ELECTRIFICATION (NO.OF CONNECTIONS)
Domestic Road
14
NA
NA
Lighting points
15
445
544
Others
16

SI. No.
8
9.
10.
* Class and Name of town
2
II SERILINGAMPAlLE .(Concld .. )
II UPPAL KALAN
HYOERABAO (MC) PORTION
( *) For class 1&11 towns only
158
Name of slum
3
Shanthinagar (Chandanagar) Social Welfare colony (Chandanagar) Taranagar 18/92 Taranagar 9/91 Taranagar survey no 28 Weaker Section Colony Miyapur
Beerappagadda Chilukanagar I Chilukana~ar II Chilukanag8:r. III Chilukanagar IV Church colony Gandhinagar Gandhinagar (Ramanthapur) Indiragandhinagar ward no 14 lambadibasthi (Habsiguda) Navarangguda Nethajinagar Old Ramanthapur Rajendranagar Ramreddynagar Shantinagar Swaroopnagar Vasavinagar & Venkatareddynagar Viveknagar
NA
TOWN
STATEMENT
CIVIC AND OTHER AMENITIES,
Area of slum
(in Sq. Kms)
4
0.120 0.070 0.030 0.060 0.080 0.060 0.040 0.030 0.007 0.008 0.020 0.015 0.320 0.060 0.040 0.050 0.120 0.120 0.060
NA
Population of slum (approxi
mate)
5
2,202 321
516 583 338
1,081
1,881 1,047 1,843
766 1,385
525 820 422 541 911 968 465
1,016 1,165
834 1,434
700 1,547
742
Paved Roads
(in Kms)
6
13.67
System of Sewerage
7
OSO
159
DIRECTORY
IVA
IN NOTIFIED SLUMS, 1989
NUMBER OF LATRINES Method No.of tap ELECTRIFICATION (NO. OF CONNECTIONS) of cjis- points/pu-
Private Community posal of blic hydr- Domestic Road Others night soil ants inst- Lighting
Water Service Others ailed for points borne supply of
protected water
8 9 10 11 12 13 14 15 16
---NA---
NA---

SI. No.
2
" ALWAL
Class and Name of
Town,
2
IV GHATKESAR
II HYDERABAD U,A.(PORTION)
(a) " ALWAL *
(b) III GADDIANNARAM
(c) II HYOERABAD MUNICIPAL CORPORATION (PORTION)
(d) " KAPRA
(e) I KUKATPALLE
(f) I LB.NAGAR
(g) I MALKAJGIRI
0) I QUTHBULLAPUR
(k) " RAJENDRANAGAR *
160
MEDICAL FACILITIES
Popula· Hospi· Beds in tion talsl Medical
dis- institu-pen sa· tions ries! noted T.B. in Col.
Clinics No.4 etc.
3 4 5
TOWN
STATEMENT
MEDICAL, EDUCATIONAL,
Arts/Science/ Medical Conimerce Colleges
Colleges (of degree level and above)
6 7
Engineer- Poly· ing Col· technics
leges
8 9
EDUCATIONAL
Recognised short
hand, Type writing
and voca· tional 'irain·
ing Ins· titutions
10
- See Hyderabad Urban Agglomeration -
12,645 H 67 Hyderabad Hyderabad Hyderabad Hyderabad Type: 3 D(8) (23) (23) (23) (23)
67,271 H 50 ASC(1) Hyderabad Hyderabad Hyderabad Type: 20 D(20) (16) (16) (16)
FPC(2) NH(8)
35,187 H(4) 90 ASC(3) Hyderabad Hyderabad Hyderabad Type :9 0(21) (12) (12) (12) Shorthand: 1 0 NH(5)
93,455 -- NA- -87,747 H(6) 100 Hyderabad Hyderabad Hyderabad Hyderabad Type: 11
0(t6) (18) (18) (18) (18) HC
NH(4) 80
186,963 H(8) 60 Hyderabad Hyderabad 1 Hyderabad Type: 6 (14) (14) (14)
155,514 H(13) 173 ASC(1) Hyderabad Hyderabad Hyderabad Type :36 0(25) L(1) (14) (14) (14) Sheorthand:3 HC(3) FPC(3) NH(13)
127.178 H(6) 30 ASC(3) Hyderabad Hyderabad Hyderabad Type: 6 D(60) AC (2) (13) (13) (13) NH(6)
106,591 H(2) 40 Secunderabad Hyderabad Hyderabad Hyderabad Type: 3 D(18) (10) (24) (24) (24) NH(6)
84,548 H(2) 122 ASC(1) Hyderabad Hyderabad Hyderabad Shorthand:3 D(37) (15) (15) (15) NH(4) + 0

DIRECTORY
V
161
RECREATIONAL AND CULTURAL FACILITIES, 1989
FACILITIES
Higher secon-daryl
Intennedi-ate/PUC
(pre-Univer sity/
Junior col-lege level)
11
2
5
4
2
4
4
SECUNDERA BAD (10)
Secon-dary/ Matri-cula-tion
12
3
15
9
12
4
17
3
Number of NUMBER OF RECREATIONAL AND CULTURAL working FACILITIES
Jun- Pri- Adult women's iar mary u- Hostels with Stadia Cinema Auditorial Public se- scho- tera- number of Drama! Libra-
cond- ols cy cl- seats Community ries ary asses/ Halls includ-
& Mid- Cen- ing die ters, reading
Scho- others rooms ols (spe-
cify)
13 14 15 16 17 18 19 20
-- See Hyderabad Urban Agglomeration --
5 8 13
28 10
2 15
_- N.A.--
7 23
18 15
11 32 21
8 48
2 16 8
4 10
9
3
5 3
7
4
4 2
3 9
2
PL:1
PL:2 RR:2
PL:1
PL:2
PL:2
PL:23 . RR:2
PL:1
PL:1
PL:1
SI. No.
1.
2.
(a)
(b)
(c)
(d)
(e)
(f)
(g)
(j)
(k)
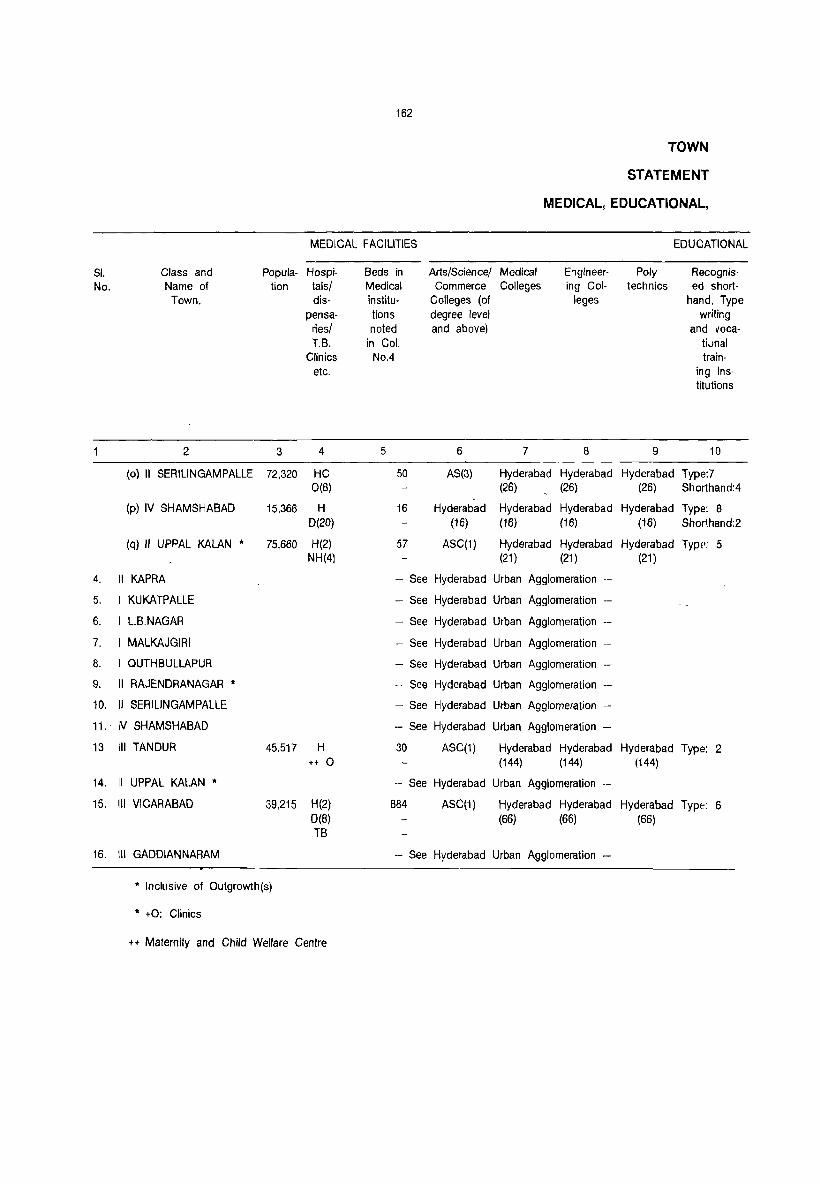
SI. No.
4.
5.
6.
7.
8.
9.
10.
11 ..
13
14.
15.
16.
162
TOWN
STATEMENT
MEDICAL, EDUCATIONAL,
MEDICAL FACILITIES EDUCATIONAL
Class and Name of
Town.
2
(0) II SERILINGAMPALLE
(p) IV SHAMSHABAD
(q) " UPPAL KALAN *
II KAPRA
I KUKATPALLE
I L.B.NAGAR
I MALKAJGIRI
I QUTHBULLAPUR
II RAJENDRANAGAR *
II SERILINGAMPALLE
IV SHAMSHABAD
III TANDUR
II UPPAL KALAN *
III VICARABAD
III GADDIANNARAM
Popula- Hospi-tion tals/
3
72,320
15,366
75,660
45,517
39,215
dispensa
ries/ T.B.
Clinics etc.
4
HC 0(8)
H 0(20)
H(2) NH(4)
H ++0
H(2) 0(8) T8
* Inclusive of Outgrowth(s)
* +0: Clinics
++ Maternity and Child Welfare Centre
Beds in Medical institutions
Arts/Science/ Medical Engineer- Poly-Commerce Colleges
Colleges (of ing Col- technics
noted in Col.
NoA
5
50
16
57
- See
- See
- See
-- See
degree level and above)
6
AS(3)
Hyderabad (16)
ASC(1)
Hyderabad
Hyderabad
Hyderabad
Hyderabad
- See Hyderabad
- See Hyderabad
- See Hyderabad
- See Hyderabad
30 ASC(1)
- See Hyderabad
884 ASC(1)
- See Hyderabad
leges
7 8 9
Hyderabad Hyderabad Hyderabad (26) (26) (26)
Hyderabad Hyderabad Hyderabad (16) (16) (16)
Hyderabad Hyderabad Hyderabad (21) (21) (21)
Urban Agglomeration -
Urban Agglomeration -
Urban Agglomeration
Urban Agglomeration
Urban Agglomeration
Urban Agglomeration
Urban Agglomeration
Urban Agglomeration -
Hyderabad Hyderabad Hyderabad (144) (144) (144)
Urban Agglomeration -
Hyderabad Hyderabad Hyderabad (66) (66) (66)
Urban Agglomeration
Recognised short
hand. Type writing
and vocatiunal train-
ing Ins-titutions
10
Type:? Shorthand:4
Type: 8 Shorthand:2
Type; 5
Type: 2
Typ8: 6

163
DIRECTORY
V
RECREATIONAL AND CULTURAL FACILITIES, 1989
FACILITIES Number of NUMBER OF RECREATIONAL AND CULTURAL working FACILITIES
Higher Secon- Jun- Pri- Adult women's SI.
secon- dary/ ior mary Li- Hostels with Stadia Cinema Auditoria/ Public No.
daryl Matri- se- scho- tera- number of Drama/ Libra-
Intermedi- cula- cond- 015 cy cl- seats Community ries
ate/PUC tion ary asses/ Halls includ-
(pre- & Mid- Cen- ing Univer die ters, reading
sity/ Scho- others rooms Junior ols (spe-
cal- cify) lege level)
11 12 13 14 15 16 17 18 19 20
2 3 25 PL:2 (0) RR:3
3 3 9 PL:1 (p)
3 3 8 20 2 4 PL:2 (q)
--- See Hyderabad Urban Agglomeration 4.
--- See Hyderabad Urban Agglomeration 5.
--- See Hyderabad Urban Agglomeration 6.
--- See Hyderabad Urban Agglomeration 7.
--- See Hyderabad Urban Agglomeration 8,
--- See Hyderabad Urban Agglomeration 9.
--- See Hyderabad Urban Agglomeration 10.
--- See Hyderabad Urban Agglomeration --- 11,
--- See Hyderabad Urban Agglomeration 12.
10 3 14 6 5 2 PL:2 13.
--- See Hyderabad Urban Agglomeration 14.
6 10 6 6 2 PL:1 15. RR:3
--- See Hyderabad Urban Agglomeration -_ 16.

81. No,
1
2
3,
4,
5,
6,
7,
S,
g,
10,
11,
13
14,
15
16,
164
TOWN
STATEMENT
TRADE, COMMERCE,
Names of Three Most Important Names of Three Most Important Commodities Exported
Class and Name of Town 1 st
2 3
II Alwal
IV Ghatkesar Pulses
Hyderabad U,A,(Portion)
(a) II Alwal * Rice
(b) III Gaddiannaram Fruits
(c) II Hyderabad(MC) Portion
(d) " Kapra T,V, Spare Parts
(e) I Kukatpalle Aluminum, Alloys, Chemicals& Petrol;
(f) I L.B,Nagar Fruits
(g) I Malkajgiri Coal
U)I Quthbullapur Chemicals
(k) " Rajendranagar * Fertilizers
(0) II Serilingampalle Vegetables
(p) IV Shamshabad Fertilizers
(q) " Uppal Kalan * II Hyderabad(MC) Portion
II ~apra
I Kukatpalle
I L.B,Nagar
I Malkajgiri
Quthbullapur
II Rajendranagar * II Serilingampalle
IV Shamshabad
III Tandur Rice
II Uppal Kalan *
III Vicarabad Jowar
III Gaddiannaram
( *)Inclusive of out growths,
Commodities Imported
2nd 3rd 1 st 2nd
4 5 6 7
-- See Hyderabad Urban Agglomeration
Edible Oil Wheat Tea Powder Rice
Wheat Jowar Vegetables
Fruits
-- N,A,--
Electronic Raw Material for T,V, Sets Borewe" Rigs Component Items Bcrewell Rigs
Iron&steel Medicines Detonator& Detonating Fuse
Timber Paddy Drugs Fruits
Firewood Sugar Battery Cells Soft Drinks
Iron Plastic Raw Drugs Engg,Eqpmnt Material
Jowar&Rice Oil Seeds Plastic Material Oil
Rice Petrol Aluminium Cables Grapes
Wheat Jowar Vegetables Grapes
Cigarettes Biscuits
-- See Hyderabad Urban Agglomeration
-- See Hyderabad Urban Agglomeration
-- See Hyderabad Urban Agglomeration
-- See Hyderabad Urban Agglomeration
-- See Hyderabad Urban Agglomeration
-- See Hyderabad Urban Agglomeration
-- See Hyderabad Urban Agglomeration
-- See Hyderabad Urban Agglomeration
-- See Hyderabad Urban Agglomeration
Wheat Sugar Pulses Jowar
-- See Hyderabad Urban Agglomeration --
Rice Onions Paper Pulp Electrical Goods
-- See Hyderabad Urban Agglomeration --
3rd
8
Milk, Vegetables
Leather Goods& Bags
Airomatic Ellgg,
Tobacca Cigars
Bearings & Oil Engines
Plastic Goods
Biscuits
Milk
Flowers
Shabad stones
Plastic Goods
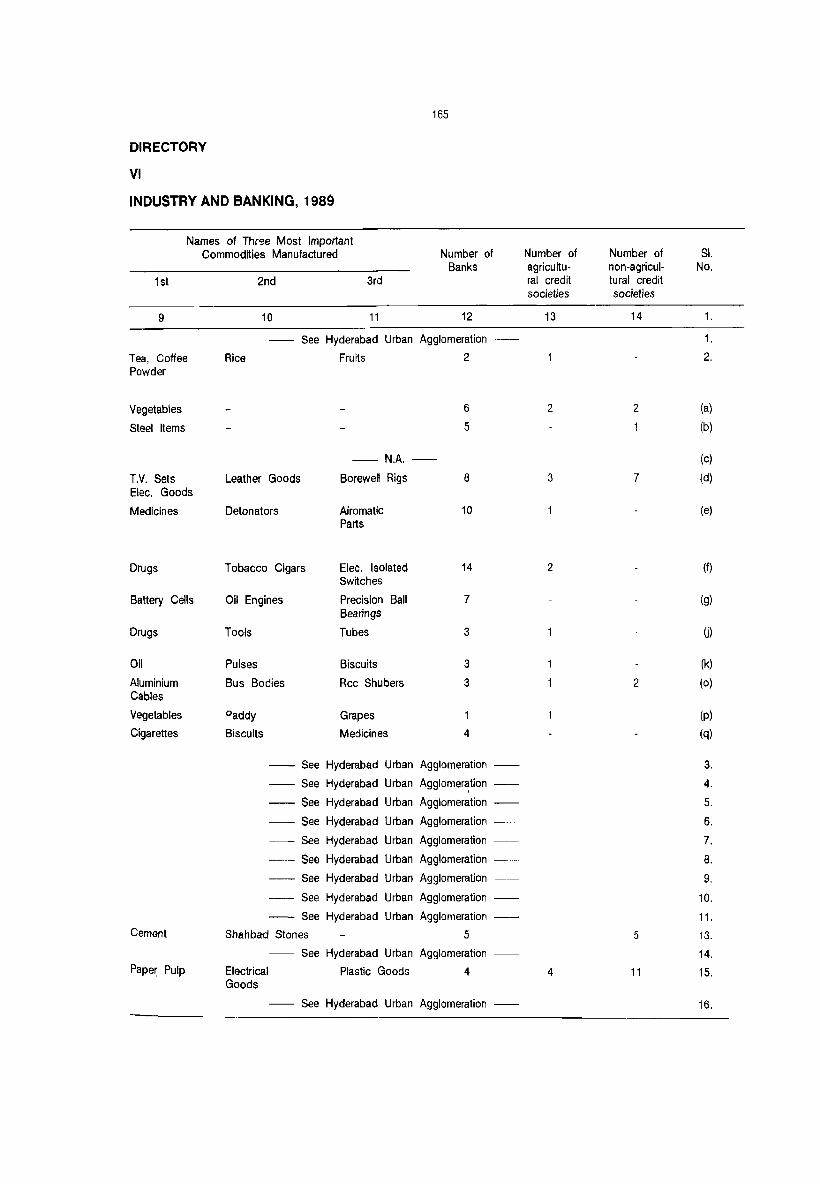
165
DIRECTORY
VI
INDUSTRY AND BANKING, 1989
Names of Thrge Most Important Commodities Manufactured Number of Number of Number of 81.
Banks agricultu- non-agricul- No. 1 st 2nd 3rd ral credit tu ral credit
societies societies
9 10 11 12 13 14 1.
See Hyderabad Urban Agglomeration 1.
Tea, Coffee Rice Fruits 2 2. Powder
Vegetables 6 2 2 (a)
Steel Items 5 1 (b)
-N.A.- (c)
T.V. Sets Leather Goods Borewell Rigs B 3 7 (d) Elec. Goods
Medicines Detonators Airomatic 10 (e) Parts
Drugs Tobacco Cigars Elec. Isolated 14 2 (f) Switches
Battery Cells Oil Engines Precision Ball 7 (g) Bearings
Drugs Tools Tubes 3 (j)
Oil Pulses Biscuits 3 (k)
Aluminium Bus Bodies Rcc 8hubers 3 2 (0) Cables
Vegetables Paddy Grapes 1 (p)
Cigarettes Biscuits Medicines 4 (q)
-- See Hyderabad Urban Agglomeration 3.
-- See Hyderabad Urban Agglomer~tion 4.
-- See Hyderabad Urban Agglomeration 5.
-- See Hyderabad Urban Agglomeration 6.
-- See Hyderabad Urban Agglomeration 7.
-- See Hyderabad Urban Agglomeration 8.
-- See Hyderabad Urban Agglomeration 9.
-- See Hyderabad Urban Agglomeration 10.
-- See Hyderabad Urban Agglomeration 11. Cement Shahbad Stones 5 5 13.
See Hyderabad Urban Agglomeration 14. Paper Pulp Electrical Plastic Goods 4 4 11 15.
Goods
See Hyderabad Urban Agglomeration 16.

SI. No.
1 2 3 4
166
APPENDIX
Towns showing their outgrowths with Population
Name of the town with
Location code
2
15/IX Rajendranagar (M) 15/XIV Uppal Kalan (M) 15/1 Alwal (M) 15/111 Hyderabad(MC)(Portion)
Population of core town
3
84,520 75,644 66,471 79.258
Outgrowth
4
Shahzadibegum Maktabibisahebgu da Singaipalle Balapur Kothapet Venkatapur Mallapur Hydershakot
Population of outgrowth
5
28 16
800 697~
3594 911 748
1969

PART - B
PRIMARY CENSUS ABSTRACT


169
PRIMARY CENSUS ABSTRACT
Explanatory Note:
The important statistics relating to residential houses, households and population etc., down to the level of village/ward, in rural/urban areas respectively may be seen from the P.C.A. which is compiled based on manual processing of household schedule Part-II i.e. from population records. In the format of Primary Census Abstract certain changes have been made. In the 1981 Census, the P.C.A. had 28 columns with four fold classification of workers. Whereas in 1991, the number of columns are increased from 28 to 42 due to addition of columns accomodating population of children in the age group 0-6 and nine fold classification of workers. The salient points such as definitions etc., have already been explained at some length under the Chapter titled "Census Concept".
The column "Population 0-6" is an addition to the P .C.A. in 1991 Census. This will enable the data users to compute effective literacy.
While presenting the data in P .C.A., the villages, Census towns and out growths to the statutory towns have been arranged Mandai Praja Parishad wise in the their ascending order of the L.e. Nos. The data pertaining to towns/Cities/Urban Agglomeration are presented in the end after the last M.P.P.of the District. The wards in each town have also been arranged in the ascending order of wards. The villages fully merged in towns or treated as outgrowths at 1991 census have not been listed in (i)Alphabetical list of villages (ii)Village directory and (iii)PCA (Rural). However, details of such villages have been given in the annexure to the alphabetical list of villages before V.D. of the first MandaI. Also, these villages have not been considered for counting of total number of villages, under "Important statistics" of the district.
In case of villages which are partly included in towns, the word "Rural" has been added in brackets after the name of the village, and particulars of rural portion only have been presented against such villages. An alphabetical list of villages together with their L.C. Nos.at 1991 census and their corresponding L.C.Nos at 1981 census together with erstwhile taluk is given bef?re the village directory, Mandai Praja Panshad wise for the entire district. The readers may refer this list to locate the village for which data on P.C.A. is required.
As per the 1991 Census count the population of Rangareddy district is as fdllows:
Total Rural Urban
Persons 20,82,479 16,00,903 4,81,576
Males 10,52,012 8,05,269 2,46,743
Females 10,30,467
7,95,634 2,34,833
The Particulars of the persons including houseless persons like the permanent dwellers and the wandering tribes, have been presented in the Primary Census Abstract.
The column wise description relates to village/town primary census abstract.
Columns No. 1 fj 2: L.C. No. and name of village/town/ward respectively.
Column No.3: Area of the village in hectares and of town in sq. Kilometres.
Area particulars in respect of villages are given in hectares upto two decimal places, and for the towns the area figures are indicated in Sq. Kms. upto two decimal places. In case of the villages for which the area fi~ures are not available, the abbreviation "N.A:' IS recorded in the column.
Column 4 Number of occupied residential houses:- All "Census Houses" which are occupied as either wholly or partly at the time of the Census enumeration, for each village/town are given in this column. Houses wflich are found vacant at the time of Census count are not reckoned as occupied residential houses. The information has been compiled from the Abridged Houselists.
Column 5. Number of Households:The total number of households enumerated at the census enumeration includes "Institutional" and "houseless" households also.
Column 6,7 and S. Total Popula-tion (including institutional and houseleBB Popu~ation):- The total population enumerated as on the Sunrise of 1 st March, 1991 is furnished in column No.6, while the sex wise break up is given in the next two columns. The institutional Population refers to such of those who were enumerated in institutions like hostels, hospitals, boarding houses, Messes, residential hostels, rescue homes, Jails, Ashrams etc., and houseless population includes persons who do not have any fixed place of residence but go on moving from place to place, camp at night or just live on the streets, in gardens, or in open places.
Columns 9 fj 10. Population 0-6:- Sex wise break up of children under age group 0-6 is given in these two columns.
Columns 11 & 12. Scheduled Castes'The sex wise break up of the Schedule'd 9astes enumerated according to the "notified list of scheduled castes" is given in these columns.

Columns 13 fj 14. Scheduled Tribes:The sex wise break up of Scheduled Tribes according to the "Notified Scheduled Tribes" is given in these columns. The reader may refer for the details of the notified list of SC/ST communities under the Chapter "Census Concepts ".
Columns 15 tJ 16. Literates:. A person who can read and write with understanding in anyone language is considered as literate. Sex wise break up of persons so considered as literate is given under these two columns. Children below 7 years of age have been treated as illiterate even though some school going children might have actually picked up reading and writing.
Columns 17 to 38 Main workers:These clean pairs of column deal with the main workers. Out of these, the first pair indicates the total number of main workers by sex and the,remianing 10 pairs indicate further break up according to their field of economic activity. For the concept of the work, the reader may refer item 11 of Census concepts.
Columns 19 tJ 20. Cultivators (1):These two columns tell about the number of male and female workers who satisfied the condition laid down in the definition of cultivators. The reader may refer to census concepts for the definition. A cultivator may be an employer, a single worker, or an unpaid worker on farm. The reader may refer the chapter on "Census Concepts" given at the beginning of volume for further details.
Columns 21 tJ 22 Agricultural Labourers (II}:-A person working in another person's land for wages in cash or kind or both is an agricultural lanbourer. Sex wise break up of the persons is given under these two columns.
Columns 23 fj 24. Livestock, F01'estry, Fishing, Hunting tJ Plantations, Orcha1'ds and Allied Activities (III):- Persons engaged in livestock, forestry, fishing, hunting, plantations, Orchards and allied activities are included under this category sex wise break up of category is given under these columns.
Columns 25 fj 26. Mining and Quar1'ying (IV):- Persons who are engaged in mining and quarrying works, are included under this category and sex wise break up of this category is given under these columns.
Columns 27 to 30. Manufacturing, Processing, Servicing and repairs Columns
170
27 fj 28:- Household inGustry V(a) (HHI) is defined as an industry conducted by the head of the household himself or herself and/or by the members of the household at home or within the village in rural areas and in urban areas if the Industry is located within the precincts of the house where the household lives. The industry is not run on the scale of a registered factory which would qualify or ha!.; to be registered under the Indian Factorie~; Act. For further guidance, the reader may refer the chapter "Census Concepts"
Columns 29 fj 30 V(b) (Other than Household Industry):- The particulars of persons working in other than household industry are given under these columns with sex-wise break up.
Columns 31 fj 32 Constructions (VI):The persons engaged in construction & allied works are indicated under these two columns by sex break up.
Columns 33 fj 34 Trade fj Commerce (VII):- All such persons who are engaged
. in trade and commerce are presented under these tw~ columns by sex break up.
Columns 35 fj 36 Transport, Storage fj Communications (VIII):- The persons engaged in Transport, Storage and Communications are grouped together and presented· under these two columns.
Columns 37 fj 38 Other Services (IX):. Persons who are engaged in other services other than the above 8 categories come under this category. The Pooled Particulars of all such perosns are furnished under these two columns by sex break up.
Columnns 39 fj 40 Marginal Workers:Persons who are workers but have worked only to a marginal extent as per census Concept during the reference year are reported under these two columns. Such workers are considered together and reported here sex wise, irrespective of the economic sector in which they work.
Columns 41 tJ 42 Non- Workers:· Those persons who are not economically active are treated as non-workers irrespective of age and sex. A sex wise break up of such persons is given in these two columns. The aggregate of the main workers, marginal workers and non-workers would be equal to the total population of the unit.


H2
DISTRICT PRIMARY
51. Name of Districtj Total/ Area in No. of No. of Total Population
No. M.P.P./ Rural/ Sq. Kms. Occupied House· (InclUding Institutionsl
Town Urban ReSidential hOlds and Houseless PopUlation)
Houses
p M F
(1 ) (2) (3) (4) (5) (6) (7) (8) (9)
15 RANGAREDDI DISTRICT T 7493.00 486410 494564 2551966 1314560 1237406 R 6923.16 243680 246634 1346789 688394 658395 U 569.84 242730 247930 1205177 626166 579011
MAAPAlLE M.P.P. T 234.40 7300 7399 41231 21159 20072 R . 234.40 7300 7399 41231 21159 20072 U
2 MOMINPET M.e.p. T 178.30 6519 6595 36960 18779 18181 R 178.30 6519 6595 36960 18779 18181 U
3 NAWABPET M.P.P. T 161.80 6069 6073 35684 18317 17367 R 161.80 6069 6073 35684 18317 17367 U
4 SHANKARPALLE M.P.P. T 142.70 8865 8865 50082 25791 24291 R 142.70 8865 8865 50082 25791 24291 U
7 QUTHBUlLAPUR M.P.P. T 98.40 5491 5517 28169 14863 13306 A 98.40 5491 5517 28169 14863 13306 U
8 MEDCHAL M.P.P. T 188.10 9081 9081 46647 23975 22672 R 188.10 9081 9081 46647 23975 22672 U
9 SHAMIRPET M.P.P. T 200.42 10835 10835 55334 28515 26819 R 198.60 1067'2 10672: 54534 28095 26439 U 1.82 163 163 800 420 380
SINGAIPAlLE (C. G) U 1.82 163 163 800 420 380
11 KEESARA M.P.P. T 113.90 5223 5223 27217 14066 13151 R 113.90 5223 5223 27217 14066 13151 U
12 GHATKESAR M.P.P. T 133.13 8584 8584 44978 23434 21544 R 119.30 6236 6236 32333 16803 15530 U 13.83 2348 2348 12645 6631 6014
GHATKESAR (P) U 13.83 2348 2348 12645 6631 6014

CENSUS ABSTRACT
Total Population in the
age group (0 - 6)
Scheduled Castes
p M
(10) (11 )
458200 232313 260354 131475 197846 100838
8059 8059
7320 7320
6263 6263
9608 9608
5234 5234
7974 7974
9439 9281 158 158
5154 5154
8266 6164 2102 2102
4166 4166
3752 3752
3184 3184
4921 4921
2647 2647
3978 3978
4737 4649
88 88
2607 2607
4295 3217 1078 1078
F p
(12) (13)
225887 439386 128879 297205 97008 142181
3893 11751 3893 11751
3568 10021 3568 10621
3079 10290 3079 10290
4687 11191 4687 11191
2587 4413 2587
3996 3996
4702 4632
70 70
2547 2547
3971 2947 1024 1024
4413
8339 8339
11278 10905
373 373
4760 4760
8818 6789 2029
2029
M
(14)
224289 151844 72445
6029 6029
5442 5442
5274 5274
5825 5825
2268 2268
4245 4245
5807 5609 198 198
2444 2444
4610 3529 1081 1081
F
(15)
215097 145361 69736
5722 5722
5179 5179
5016 5016
5366 5366
214!i 2145
4094 4094
5471 5296 175 175
2316 2316
4208 3260 948 948
173
Scheduled Tribes
p
(16)
109394 87517 21877
1451 1451
M F
(17) (18)
56438 52956
44740 42777 11698 10179
759 759
692 692
2090 1105 2090 1105
985 985
166 73 166
1163 1163
1273 1273
2669 2669
1342 1337
5 5
367 367
1367 1202 165 165
73
618 618
650 650
1395 1395
695 692
3 3
180 180
695 604
91 91
93 93
545 545
623 623
1.274
1274
647 645
2 2
187 187
672 598 74 74
Literates SI. No.
------.-_-p
(19)
1027386 347592 679794
M
(20)
654055 252040 402015
7818 6017 7818 6017
7658 5984 7658 5984
8625 6970 8625 6970
14246 10370 14246 10370
9150 6591 9150 6591
17447 17447
17664 17354
310 310
11590 11590
12195 11989
206 206
8794 6139 8794 6139
19060 12613 12200 8292 6860 6860
4321 4321
F
(21)
373331 95552
277779
1801 1801
1674 1674
1655 1655
3876 3876
2559 2559
5857 5857
5469 5365 104 104
(1)
15
2
3
4
7
B
9
2655 11 2655
6447 12 3908 2539 2539

St No.
Name of District/
M.P.P./
Town
(1) (2)
15 RANGAREDDI DISTRICT
MARPALLE M.P.P.
2 MOMINPET M.P.P.
3 NAWABPET M.P.P.
4 SHANKARPALLE M.P.P.
7 QUTHBULlAPUR M.P.P.
8 MEDCHAL M.P.P.
9 SHAMIRPET M.P.P.
SINGAIPALLE (C.G)
11 KEESARA M.P.P.
12 GHATKESAR M.P.P.
GHATKESAR (P)
Total/
Rural/
Urban
(3)
T
" U
i R U
T R U
T
R
U
T
R
U
T
R
U
T
R U
T
R
U
U
T
R
U
T
R
U
U
174
DISTRICT PRIMARY
INDUSTRIAL CATEGORIES Of'
Total Main Workers Cultivators Agricultural Labourers
(I-IX) (I) (!I)
P M F P M F P M
(22) (23) (24) (25) (26) (27) (28) (29)
1012876 685186 327690 256505 170726 85779 288925 122850 642287 378150 264137 246151 162547 83604 260247 106926 370589 307036
20277 20277
17365 17365
17279 17279
23124 23124
12496 12496
20596 20596
26928 26601
327 327
11766 11766
16443 12853
3590 3590
11535 11535
10031 10031
10001 10001
14254 14254
8049 8049
13302
13302
16244 16023
221 221
7468 7468
11675 8664 2991 2991
6355:1
8742 8742
7334 7334
7278 7278
8870 8870
4447 4447
7294 7294
10684 10578
106 106
4298 4298
4768 4169 599 599
10354
9542 9542
8868 8868
9238 9238
9892 9892
2357 2357
4695 4695
7938 7924
14 14
2557 2557
2083 1789 294 294
8179
6056 6056
5649 5649
5853 5853
6454 6454
1589 1589
3185 3185
4936 4924
12 12
1779 1779
1585 1409 176 176
2175
3486 3486
3219 3219
3385 3385
3438 3438
768 768
1510 1510
3002 3000
2
2
776 778
496 380 118 118
28618
9241 9241
6905 6905
6577 6577
9294 9294
3721 3721
8669 8669
11569 11449
120 120
3975 3975
5236 4641
397 397
15924
4250 4250
3042 3042
2915 2915
4391 4391
1617 1617
4122 4122
5463 5404
59 59
1620 1620
2533 2294
239 239
F
(30)
166075 153321
12754
4991 4991
3663 3863
3662 3662
4903 4903
2104 2104
4547 4547
6106 6045
61 61
2355 2355
2705 2547
158
158

CENSUS ABSTRACT
MAIN WORKERS
Livestock, Forestry
Fishing, Hunting and
Plantations, Orchards
p
(31)
19485 15619 3866
77
77
34 34
99
99
354 354
718 718
1052 1052
545 543
2
2
361
361
455 418
37 37
& Allied Activities
(III)
M
(32)
16053 12989 3064
74 74
32 32
89
89
289 289
491
491
756 756
449
447 2
2
316 316
388
353 35
35
F
(33)
3432 2630
802
3
3
2 2
10 10
65 65
227 227
296
296
96
96
45 45
67
65 2
2
p
Mining and
Quarrying
(IV)
M F
(34) (35) (36)
15710 10589 5121 10787 7082 3705 4923
4
4
28 28
21
21
125 125
399 399
173
173
487 487
580 580
326
241
85
85
3507 1416
4 4
15 15
12
12
67
67
240 240
112 112
335
335
357 357
234 184
50
50
13 13
9
9
58 58
159 159
61
61
152 152
223 223
92
57 35
35
p
175
Manufacturing,
Processing, Servicing
and Repairs in
Household Industry
(Va)
M F
(37) (38) (39)
3170 2624
Manufacturing,
Proce:;sing. Servicing
and RepairS in other
than HOLisehuld Industry
(Vb)
p
(40)
140188 28568
M
(41)
124797 23936
F
(42)
10176 7006 8268 5644 1908 1362 546 111620 100861
15391 4632
10759
116 116
127 127
63
63
387 387
83 83
279 279
432 432
179
179
228
161
67
67
66
66
102 102
43 43
308 308
55
55
186 186
263 263
105
105
180
124 56
56
50
50
25 25
20
20
79 79
28 28
93 93
169 169
74 74
48 37 11
11
215 215
169
169
203 203
645 645
3002 3002
1859 1859
1745 1651
94
94
1655
1655
3539 2401 1138
1138
201 201
152 152
188 188
628 628
2205 2205
1636
1636
1387 1330
57 57
1359 1359
2987
1909
1078
1078
14 14
17 17
15
15
17 17
797 797
223 223
358 321
37
37
296
296
552 492
SO SO
51. No.
(1 )
15
2
3
4
7
8
9
11
12

176
DISTRICT PRIMARY
IN DUSTRIAl CAT EGORIES a F
SI. Name of Distrlctj Total/ Constructions Trade and Commerce Transporl. Storage
No. M.P.P./ Rural/ & Communications
Town Urban
(VI) (VII) (VIII)
P M F P M F P M F
(1) (2) (3) (43) (44) (45) (46) (47) (48) (49) (50) (51)
15 RANGAREDDI DISTRICT T 45286 37380 7906 80415 69943 10472 43830 41673 2157 R 8214 6956 1258 24426 20078 4348 9251 9023 228
U 37072 30424 6648 55989 49865 6124 34579 32650 1929
MARPALlE M.P.P. T 81 80 360 339 21 85 84
R 81 80 360 339 21 85 84 U
2 MOMINPET M.P.P. T 61 61 295 258 37 227 223 4
R 61 61 295 258 37 227 223 4 U
3 NAWABPET M,P.P. T 61 60 285 231 54 214 212 2 R 61 60 285 231 54 214 212 2 U
4 SHANKARPAlLE M.P.P. T 200 183 17 974 882 92 226 224 2 R 200 183 17 974 882 92 226 224 2 U
7 aUTHBULLAPUR M.P.P. T 312 262 50 620 521 99 192 190 2 R 312 262 50 620 521 99 192 190 2 U
8 MEDCHAl M.P.P. T 252 229 23 1125 1001 124 552 543 9 R 252 229 23 1125 1001 124 552 543 9 U
9 SHAMIRPET M.P.P. T 700 593 107 1295 1064 231 506 497 9 R 696 589 107 1288 1058 230 491 483 8 U 4 4 7 6 15 14
SINGAIPALlE (O.G) U 4 4 7 6 15 14
11 KEESARA M.P.P. T 533 407 126 790 637 153 326 319 7 R 533 407 126 790 637 153 326 319 7 U
12 GHATKESAR M.P.P. T 639 536 103 1486 1218 268 921 877 44 R 456 374 82 990 795 195 547 511 36 U 183 162 21 496 423 73 374 366 8
GHATKESAR (P) U 183 162 21 496 423 73 374 366 8
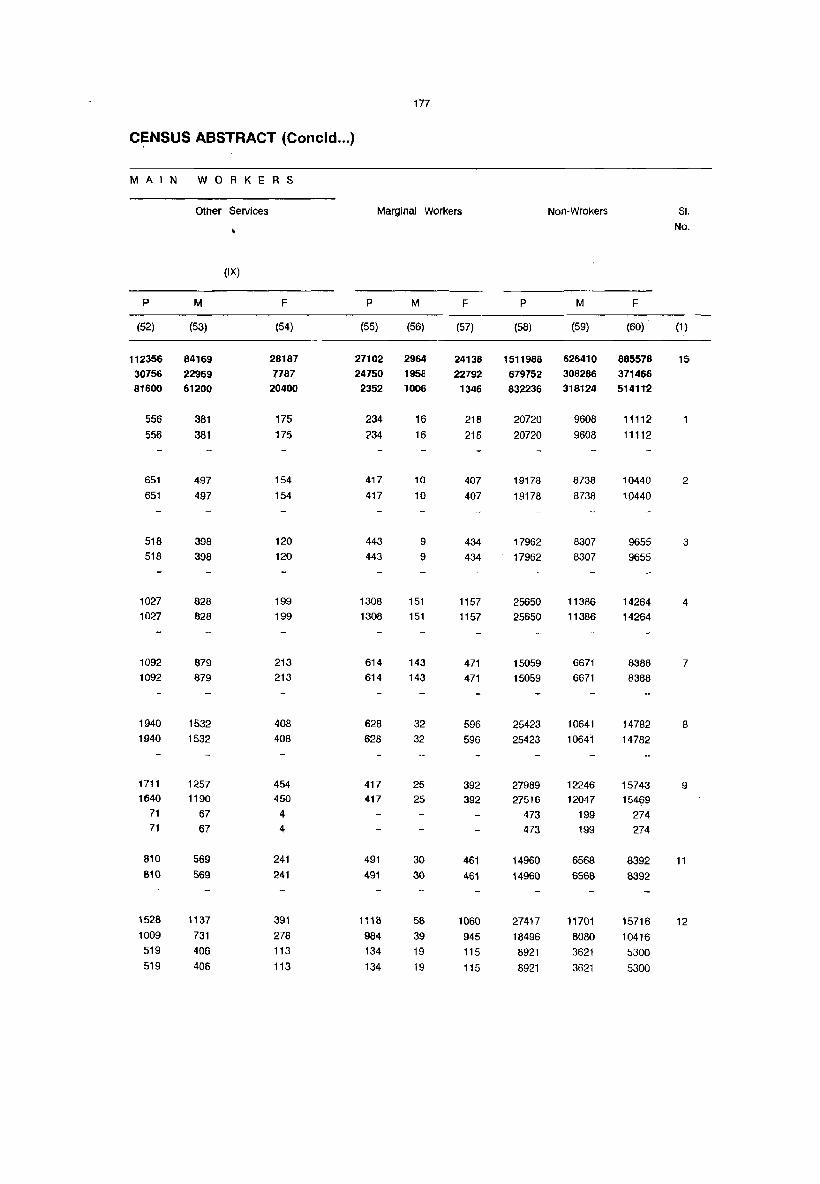
177
C~NSUS ABSTRACT (Concld ... )
M A IN WORKER S
Other Services Marginal Workers Non-Wrokers Sl.
No.
(IX)
P M F P M F P M F
(52) (53) (54) (55) (56) (57) (58) (59) (60) (1 )
112356 84169 28187 27102 2964 24138 1511988 626410 885578 15 30756 22969 7787 24750 195B 22792 679752 308286 371466 81600 61200 20400 2352 1006 1346 832236 318124 514112
556 381 175 234 16 218 20720 9608 11112 556 381 175 234 16 218 20720 9608 11112
651 497 154 417 10 407 19178 8738 10440 2 651 497 154 417 10 407 19178 8738 lD440
518 398 120 443 9 434 17962 8307 9655 3 518 398 120 443 9 434 17962 8307 9655
1027 828 199 1308 151 1157 25650 11386 14264 4 1027 828 199 1308 151 1157 25650 11386 14264
1092 879 213 614 143 471 15059 6671 8388 7 1092 879 213 614 143 471 15059 6671 8388
1940 1532 408 628 32 596 25423 10641 14782 8 1940 1532 408 628 32 596 25423 10641 14782
1711 1257 454 417 25 392 27989 12246 15743 9 1640 1190 450 417 25 392 27516 12047 15469
71 67 4 473 199 274 71 67 4 473 199 274
810 569 241 491 30 461 14960 6568 8392 11 810 569 241 491 30 461 14960 6568 8392
1528 1137 391 1118 58 1060 27417 11701 15716 12 1009 731 278 984 39 945 18496 8080 10416 519 406 113 134 19 115 6921 3621 5300 519 406 113 134 19 115 8921 3621 5300

178
DISTRICT PRIMARY
SI. Name of District; Total/ Area in No. of No. of Total Population
No. M.P.P.! Rural! Sq. Kms. Occupied House- (Including Institutional
Town Urban Residential holds and Houseless Population)
Houses
P M F
(1) (2) (3) (4) (5) (6) (7) (8) (9)
14 HAYATHNAGAR M.P.P. T 286.30 10574 11258 59505 31317 28188 R 286.30 10574 11258 59505 31317 28188 U
15 SAROORNAGAR M. P. P. T 314.12 14246 14309 73828 38717 35111 R 296.90 4866 4866 26413 f3711 12702 U 17.22 9380 9443 47415 25006 22409
BAtAPUR (O.G) U 13.56 1194 1194 6975 3667 3308 KOTHAPET (O.G) U 2.32 539 539 3594 1834 1760 VENKATAPUR (O.G) U 0.29 152 152 911 472 439 MALLAPUA (0. G) U 0.84 135 135 748 388 360
GADDIANNARAM (P) U 0.21 7360 7423 35187 18645 16542
16 RAJENDRANAGAR M.P.P. T 134.42 5312 5312 31933 16664 15269 R 133.20 5081 5081 29964 15660 14304 U 1.22 231 231 1969 1004 965
HYDERSHAKOT (O.G) U 1.22 231 231 1969 1004 965
17 MOINABAD M.P.P. T 198.30 7725 7929 45811 23666 22145 R 198.30 7725 7929 45811 23666 22145 U
18 CHEVELLA M.P.P. T 286.30 8517 8573 49946 25516 24430 R 286.30 8517 8573 49946 25516 24430 U
19 VICARABAD M. P. P. T 154.60 4521 4580 25861 13131 12730 R 154.60 4521 4580 25861 13131 12730 U
20 DHAAUR M.P.P. T 220.40 6291 6291 35774 18045 17729 A 220.40 6291 6291 35774 18045 17729 U
21 BANTARAM M.P.P. T 187.80 5222 5248 29574 14915 14659 R 187.80 5222 5248 29574 14915 14659 U
22 PEOOAMUL M.P.P. T 270.90 7320 7320 41667 20870 20797 R 270.90 7320 7320 41667 20870 20797 U
23 TANDUR M.P.P. T 210.00 7301 7580 37841 19016 18825 R 210.00 7301 7580 37841 19016 18825 U
24 BASHEERABAD M.P.P. T 209.60 6400 6400 34888 17287 17601 R 209.60 6400 6400 34888 17287 17601 U

179
CENSUS ABSTRACT
Tolal Population In lhe
age group (0 - 6)
Scheduled Casles Scheduled Tribes LIterates
p M
(10) (11)
10167 5178 10167 5178
11567 5848 4546 2230 7021 3618 1172 5~6
749 391 166 96 153 77
4761 2508
6046 3029 5746 2887 300 142 300 142
9312 4682 9312 4682
9439 4760 9439 4760
5236 2676 5236 2676
7268 3677 7288 3677
5965 3010 5965 3010
8643 4316 8643 4316
7767 3945
7767 3945
6825 3448 6&25 3448
F p M
(12) (13) (14)
4989 4989
5719 2316 3403 626 358 90
76 2253
11157 5919 11157 5919
9113 4783 6385 3364 2728 1419 1488 782 410 220 65 25 95 46
670 346
3017 7611 3909 2859 7205 3703
158 406 206 158 406 206
4630 10608 5534 4630 10608 5534
4679 11923 6153 4679 11923 6153
2560 7066 3529 2560 7066 3529
3611 7322 3703 3611 7322 3703
2955 8892 4442 2955 8892 4442
4327 8741 4385 4327 8741 4385
3822 7328 3687 3822 7328 3687
3377 5988 2940 3377 5988 2940
F
(15)
5238 5238
4330
3021
1309 706 190
40 49
p
(16)
772 772
1072 598 474 111
M
(17)
420 420
631 313 318 52
324 363 266
3702 226 120 3502 226 120 200 200
5074 37 24 5074 37 24
5770 279 151 5770 279 151
3537 1095 559 3537 1095 559
3619 3739 1895 3619 3739 1895
4450 984 513 4450 984 513
4356 7259 3659 4356 7259 3659
3641 1943 1015 3641 1943 1015
3048 5976 3045 3048 5976 3045
F p
(18) (19)
352 18775 352 18775
441 39295 285 8641 156 30648 59 2511
M
(20)
13716 13716
23679 5833
17846 1708
1467 941 315 226 191 145
97 26144 14826
106 12037 7870 106 11366 7451
671 419 671 419
13 12011 8823 13 12011 8823
128 12614 9945 128 12614 9945
536 5111 4066 536 5111 4066
1844 7879 5895 1844 7879 5895
471 5834 4431 471 5834 4431
3600 8170 6044 3600 8170 6044
928 8359 6089 928 8359 6089
2931 7580 5568 2931 7580 5568
F
(21)
5059 5059
15616 2814
12802 803
546 89 46
11318
51. No.
(1 )
14
15
4167 16 3915
252 252
3188 17 3188
2669 18
2669
1045 19 1045
1984 20 1984
1403 21 1403
2126 22 2126
2270 23
2270
2012 24 2012

51. NO.
(1 )
Name of Dlstrlcl/ M.P.P.!
Town
(2)
14 HAYATHNAGAR M.P.P.
15 SAROORNAGAR M.P.P.
BALAPUR (O.G) KOTHAPET (O.G)
VENKATAPUR (0. G) MAlLAPUR (O.G)
GADDIANNARAM (P)
16 RAJENDRANAGAR M.P.P.
HYDERSHAKOT (O.G)
17 MOINABAD M.P.P.
18 CHEVElLA M.P.P.
19 VICARABAD M.P.P.
20 DHARUR M.P.P.
21 BANTARAM M.P.P.
22 PEDDAMUl M.P.P.
23 TANDUR M.P.P.
24 BASHEERABAD M.P.P.
Total/ Rural! Urban
(3)
T R U
T
R U
U
U
U
U
U
T
R U U
T
R U
T
R U
T R
U
T
R
U
T
R U
T R U
T
R u
T
R
U
180
DISTRICT PRIMARY'
INDUSTRIAL CATEGORIES OF
Total Main Workers Cultivators Agricultural labourers
(I-IX)
P M
(22) (23)
26047 16938
26047 16938
25337 18953
11217 7302
14120 11651
2456 1655
844 763
386 240 402 214
10032 8779
11951 8162
11262 7656
669 504 669 504
22928 13014
22928 13014
23854 13670 23854 13670
12949 7389
12949 7389
17671 9951
17671 9951
15220 8577
15220 8577
20545 11685 20545 11685
18914 10971
18914 10971
17256 9642
17256 9642
(I)
F P M F P M
(24) (25) (26) (27) (28) (29)
9109 5062 3328 1734 9520 4386
9109 5062 3328 1734 9520 4386
6384 3096 1959 1137 5002 2387
3915 2297 1419 878 3868 1895
2469 799 540 259 1134 492
801 81
146 188
1253
476 288 188 703 299 80 80 132 76
17 8 9 106 25
125 66 59 169 70
101 98 3 24 22
3789 1562 991 571 3773 1593
3624 1449 905 544 3516 1434
165 113 66 27 257 159
165 113 as 27 257 159
9914 9138 5481 3657 9417 4023
9914 9138 5481 3657 9417 4023
10184 12319 7525 4794 8718 3804 10184 12319 7525 4794 8718 3804
5560 7215 4467 2748 4470 1922
5560 7215 4467 2748 4470 1922
7720 8736 5721 3015 7028 2654
7720 8736 .5721 3015 7026 2654
6643 7128 4558 2570 6643 2909
6643 7128 4558 2570 6643 2909
8860 9754 6644 3110 8126 2917 8860 9754 6644 3110 8126 2917
7943 4609 3535 1074 7911 2758
7943 4609 3535 1074 7911 2758
7614 6108 4321 1787 6508 1987
7614 6108 4321 1787 6508 1987
(II)
F
(30)
5134
5134
2615
1973
642
404
56 81
99
2
2180
2082 98
98
5394 5394
4914 4914
2548
2548
4374
4374
3734
3734
5209 5209
5153
5153
4521
4521

CENSUS ABSTRACT
MAIN WORKERS
UvestOCI<, Forestry
Fishing, Hunting and Plantatlon,Orchards & Allied Activities
p
(31)
1496 1496
322 196
126
52
19 6
4a
546 540
6
6
1034 1034
199
199
165 165
181
181
168 168
217 217
321 321
418 418
(III)
M
(32)
1126
1126
280 176 104 40
1
14 3
46
453
447 6
6
823 823
192 192
157 157
173 173
162 162
210 210
301
301
389 389
F
(33)
370 370
42 20
22
12
5 3 2
93
93
211 211
7
7
8 8
8 6
6 6
7 7
20
20
29
29
p
(34)
573 573
679 431 248
91 37 74 36 10
848
832
16 16
184 184
114
114
86
86
79 79
217 277
390 390
2639 2639
1380 1380
Mining and Quarrying
(IV)
M F p
181
ManufactUring, Processi ng, Servicing
and Repairs in Household Industry
(Va)
M F
(35) (36) (37) (38) (39)
366 207 624 419 366 207 624 419
515 164 65 49 317 198
72 37 52 27 10.
656
640
16 16
142
142
97 97
72 72
53
53
14a 14a
221 221
1661
1661
838
838
114 50 19
22 9
192
192
42 42
17 17
14 14
26 26
129 129
169 169
978 978
542 542
31
34
25 8
90
89
353 353
346 346
165 165
119 119
106 106
226 226
370 370
489 489
21 28 20 7
73 72
236 236
242 242
113
113
79 79
75 75
187 187
217
217
239 239
205 205
16 10 6
5
17 17
117
117
104 104
52 52
40 40
31 31
39 39
153 153
250
250
Manufacturing, Processing, Servicing
and Repairs in other than HousehOld Industry
(Vb)
p
(40)
3681 3681
2943
968
1975 171 89
5 11
1699
785
733 52 52
469 469
294 294
119
119
267 267
143 143
253 253
1277 1277
587 587
M
(41)
3124 3124
2647 799
1848
153 88
5
8
1594
695 652 43
43
379 379
273 273
112
112
216 216
134 134
229 229
1196
1196
472 472
F
(42)
557 557
296
169 127
18
1
3 105
90
81
9
9
90 90
21
21
7
7
51 51
9
9
24 24
81
81
115
115
51. No.
(1)
14
15
16
17
18
19
20
21
22
23
24

51. No.
Name of District! M.P.P./
Town
Total/ Rural/ Urban
(1) (2) (3)
14 HAYATHNAGAR M.P.P. T
R U
15 SAROORNAGAR M.P.P. T
R
U
BALAPUR (O.G) U
KOTHAPET (O.G) U
VENKATAPUR (O.G) U
MALLAPUR (O.G) U
GADDIANNARAM (P) U
16 RAJENDRANAGAR M.P.P. T
R
U
HYDEASHAKOT (O.G) U
17 MOINABAD M.P.P. T
R
U
18 CHEVELLA M.P.P. T
19 VICARABAD M.P.P.
20 DHARUR M.P.P.
21 BANTARAM M.P.P.
22 PEDDAMUL M.P.P.
23 TANDUR M.P.P.
2~ BASHEERABAD M.P.P.
R
U
T R
U
T R U
T R
U
T R U
T
R
U
T R
U
182
DISTRICT PRIMARY
INDUSTRIAL CATEGORIES OF
Constructions Trade and Commerce
(VI) (VII)
P M F P M
(43) (44) (45) (46) (47)
647 543 104 1901 1600
647 543 104 1901 1600
1704 1419 285 3998 3501
944 707 237 973 758
760 7.2 48 3025 2743
103 100 3 249 186
75 73 2 150 144
60 58 2 51 32 19 19 21 12
503 462 41 2554 2369
710 597 113 962 629
675 570 105 950 601
35 27 8 32 28
35 27 8 32 28
228 221 7 744 659
228 221 7 744 659
120 107 13 574 506
120 107 13 574 506
182 182
78
78
66 66
116 116
204
204
89 89
130 130
74
74
61
61
113 113
160
160
86
86
52
52
4 4
5 5
3 3
44 44
3
3
143 143
389
389
281 281
665 665
820
820
747
747
117 117
323 323
236 236
557
557
587
587
601
601
F
(48)
301
301
497
215
282
63 6
19 9
185
153 149
4
4
85
85
68
68
26 26
66 66
45
45
108 108
233
233
146 146
P
TranSl-'ort. Storage & Communications
(VIII)
M F
(49) (50) (51)
915 890
915 890
2135 2062
432 425
1703 1637
186 185
128 128
9 8 5 5
1375 1311
540 535
523 518
17 17
17 17
286 284
286 284
158 155
158 IS!'
65
65
259 259
45
45
175
175
124
124
255
255
65 65
238
238
44
44
157 157
123
123
25
25
73
7 66
64
5 5
2 2
3
3
21
21
18 18
17
17

183
CENSUS ABSTRACT (Concld ... )
M A I N WORKER S
Other Services Marginal Workers Non-Wrokers SI.
No.
(IX)
p M F P M F P M F
(52) (53) (54) (55) (56) (57) (58) (59) (60) (1 )
1628 1156 472 753 40 713 32705 14339 18366 14 1628 1156 472 753 40 713 32705 14339 18366
5393 4134 1259 751 210 541 47740 19554 28186 15 1077 785 292 583 74 509 14613 6335 8278 4316 3349 967 168 136 32 33127 13219 19908 400 312 88 4519 2012 2507 144 129 15 3 2 2747 1070 1677 45 38 7 525 232 293 10 4 6 346 174 172
3717 2866 851 165 135 30 24990 9731 15259
2115 1740 375 307 17 290 19675 8485 11190 16 1975 1619 356 307 17 290 18375 7985 10390 140 121 19 1300 500 800
140 121 19 1300 500 800
1075 766 309 348 57 291 22535 10595 11940 17 1075 766 309 348 57 291 22535 10595 11940
1012 769 243 838 83 755 25254 11763 13491 18 1012 769 243 838 83 755 25254 11763 13491
339 234 105 452 78 374 12460 5664 6796 19 339 234 105 452 78 374 12460 5664 6796
535 420 115 840 98 742 17263 7996 9267 20 535 420 115 840 98 742 17263 7996 9267
363 250 113 841 41 800 13513 6297 7216 21 363 250 113 841 41 800 13513 6297 7216
623 450 173 798 37 761 20324 9148 11176 22 623 450 173 798 37 761 20324 9148 11176
639 433 206 745 36 709 18182 8009 10173 23 639 433 206 745 36 709 18182 8009 10173
675 471 204 655 26 629 16977 7619 9358 24 U5 471 204 655 26 629 16977 7619 9358

184
DISTRICT PRIMARY
SI. Name of District/ Total/ Area in No. of No. 01 Tolal Populalion
No. M.P.P) Rural/ Sq. Kms. Occupied House- (Including Institutional
Town Urban Residential holds and Houseless Population)
Houses
P M F
(1 ) (2) (3) (4) (5) (6) (7) (8) (9)
25 YELAL M.P.P. T 189.40 5925 6275 33879 16748 17131 R 189.40 5925 6275 33879 16748 17131 U
26 DOMA M.P.P. T 172.00 6502 6508 35413 17684 17729
R 172.00 6502 6508 35413 17684 17729 U
27 GANDEED M.P.P. T 239.50 8780 8892 48771 24324 24447
R 239.50 8780 8892 48771 24324 24447
U
28 KULKACHARLA M.P.P. T 229.60 8391 8455 46550 23369 23181
R 229.60 8391 8455 46550 23369 23181 U
29 PARGI M.P.P. T 190.10 8086 8121 46172 23313 22859 R 190.10 8086 8121 46172 23313 22859 U
30 PUDUR M.P.P. T 209.50 6504 6514 37900 19244 18656 R 209.50 6504 6514 37900 19244 18656 U
31 SHABAD M.P.P. T 207.50 7804 7842 43360 22059 21301 R 207.50 7804 7842 43360 22059 21301
U
32 SHAMSHABAD M.P.P. T 189.34 10739 10796 59629 30821 28808 R 170.60 8208 8265 44235 22935 21300 U 18.74 2531 2531 15394 7886 7508
SHAHZADI BEGUM(OG) U 0.09 11 11 28 16 12 SHAMSHABAD (P) U 18.65 2520 2520 15366 7870 7496
33 MAHESWARAM M.P.P. T 302.50 8344 8544 46863 24025 22838 R 302.50 8344 8544 46863 24025 22838 U
34 IBRAHIMPATNAM M.P.P. T 235.00 10072 10371 57896 29800 28096 R 235.00 10072 10371 57896 29800 28096 U
35 MANCHAL M.P.P. T 244.20 7166 7?61 37106 19071 18035 R 244.20 7166 7.:061 37106 19071 18035 U
36 YACHARAM M.P.P. T 354.20 8132 8229 42911 22069 20842 R 354.20 8132 8229 42911 22069 20842 U
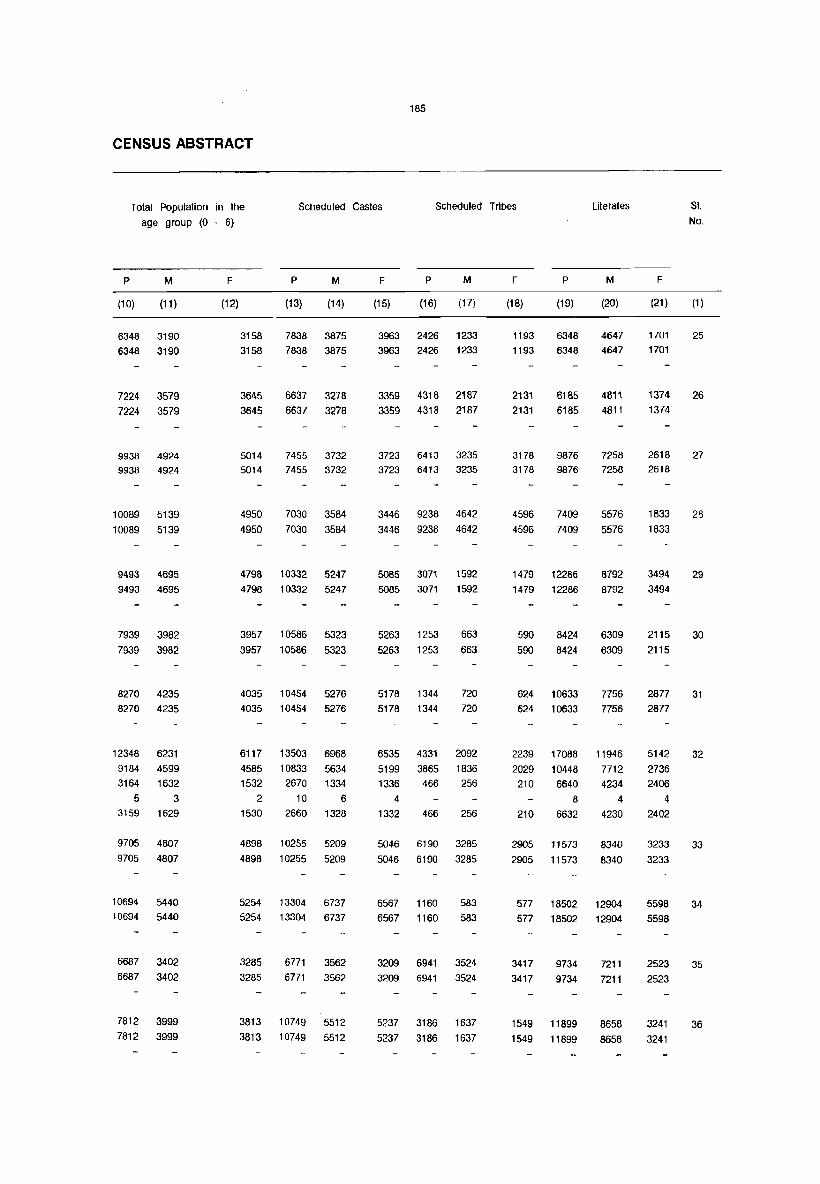
185
CENSUS ABSTRACT
Total Population in the
age group (0 - 6)
Scheduled Castes Scheduled Tribes
p M
(10) (11)
6348 3190 6348 3190
7224 3579 7224 3579
9938 4924 9938 4924
10089 5139 10089 5139
9493 4695 9493 4695
7939 3982 7939 3982
8270 4235 8270 4235
12348 6231 9184 4599 3164 1632
5 3 3159 1629
9705 4807 9705 4807
10694 5440 10694 5440
6687 3402 6687 3402
7812 3999 7812 3999
F p M
(12) (13) (14)
3158 7838 3875 3158 7838 3875
3645 6637 3278 3645 6637 3278
5014 7455 3732 5014 7455 3732
4950 7030 3584 4950 7030 3584
4798 10332 5247 4798 10332 5247
3957 10586 5323 3957 10586 5323
4035 1 0454 5276 4035 10454 5276
6117 13503 6968 4585 10833 5634 1532 2670 1334
2 10 6 1530 2660 1328
4898 10255 5209 4898 10255 5209
5254 13304 6737 5254 13304 6737
3285 6771 3562 3285 6771 3562
3813 10749 5512 3813 10749 5512
F p M
(15) (16) (17)
3963 2426 1233 3963 2426 1233
3359 4318 2187 3359 4318 2187
3723 6413 3235 3723 6413 3235
3446 9238 4642 3446 9238 4642
5085 3071 1592 5085 3071 1592
5263 1253 663 5263 1253 663
5178 1344 720 5178 1344 720
6535 4331 2092 5199 3865 1836 1336 466 256
4
1332 466 256
5046 6190 3285 5046 6190 3285
6567 1160 583 6567 1160 583
3209 6941 3524 3209 6941 3524
5237 3186 1637 5237 3186 1637
F p
(18) (19)
1193 6348 1193 6348
2131 6185 2131 6185
3178 9876 3178 9876
4596 7409 4596 7409
1479 12286 1479 12286
590 8424 590 8424
624 10633 624 10633
2239 17088 2029 10448 210 6640
8
210 6632
2905 11573 2905 11573
577 18502 577 18502
3417 9734 3417 9734
1549 11899 1549 11899
Literates
M
(20)
4647 4647
4811 4811
7258 7258
5576 5576
8792 8792
6309 6309
7756 7756
11946 7712 4234
4
4230
8340 8340
12904 12904
7211 7211
8658 8658
F
(21)
1701 1701
1374 1374
2618 2618
1833 1833
3494 3494
2115 2115
2877 2877
5142 2736 2406
4
2402
3233 3233
5598 5598
2523 2523
3241 3241
51. No.
(1 )
25
26
27
29
30
31
32
33
34
35
36
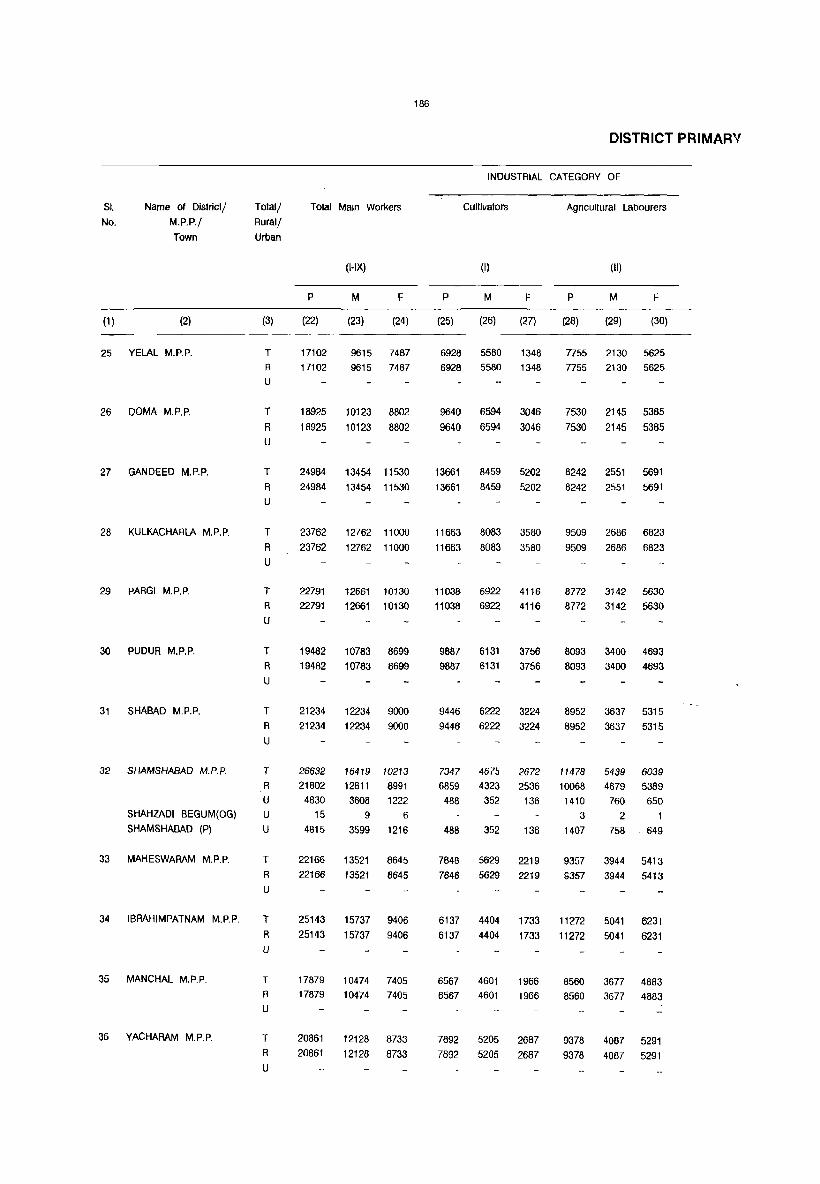
51.
No.
Name of District/
M.P.P./
Total/
Rural/
Town Urban
(1) (2)
25 YELAL M.P.P.
26 DOMA M.P.P.
27 GANDEED M.P.P.
28 KULKACHARLA M.P.P.
29 PARGI M.P.P.
30 PUDUR M.P.P.
31 5HABAD M.P.P.
32 SHAMSHABAD M.P.P.
SHAHZADI BEGUM(OG)
SHAMSHABAD (P)
33 MAHESWARAM M.P.P.
34 IBRAHIMPATNAM M.P.P.
35 MANCHAL M.P.P.
36 YACHARAM M.P.P.
(3)
T
R
U
T R U
T
R U
T
R U
T
R
U
T
R U
T R
U
T R U
U U
T
R U
T R u
T
R
U
T R
U
Total Main Workers
(HX)
P M F
(22) (23) (24)
17102 9615 7487 17102
18925
18925
9615 7487
10123 8802
10123 8802
24984 13454 115,30
24984 13454 11530
23762 12762 11000
23762 12762 11 000
22791 12661 10130
22791 12661 10130
19482 1 0783 8699
19482 10783 8699
21234 12234 9000
21234 12234 9000
26632 16419 10213
21602 12811 8991 4830
15 4815
3608 1222
9 6
3599 1216
22166 13521 8645
22166 13521 8645
25143 15737 9406
25143 15737 9406
17879 10474 7405
17879 10474 7405
20861 12128 8733
20861 12128 8733
186
DISTRICT PRIMARV
INDUSTRIAL CATEGORY OF
Cultivators Agricultural Labourers
(I) (II)
P M F P M F
(25) (26) (27) (28) (29) (30)
6928 5580 1348 7755 2130 5625 6928 5580 1348
9640
9640
6594
6594
3046
3046
13661 8459 5202
13661 8459 5202
11663 8083 3580
11663 8083 3580
11038 6922 4116
11038 6922 4116
9887 6131 3756
9887 6131 3756
9446 6222 3224
9446 6222 3224
7347 4675 2672
6859 4323 2536
488 352 136
488 352 136
7848 5629 2219
7848 5629 2219
7755 2130 5625
7530
7530
2145 5385
2145 5385
8242 2551 5691
8242 2551 5691
9509 2686 6823
9509 2686 6823
8772 3142 5630
8772 3142 5630
8093 3400 4693
8093 3400 4693
8952 3637 5315
8952 3637 5315
11478 5439 6039
10068 4679 5389
1410 3
1407
760
2 758
650
1
649
9357 3944 5413
G357 3944 5413
6137 4404 1733 11272 5041 6231
6137 4404 1733 11272 5041 6231
6567 4601 1966 8560 3677 4883 6567 4601 1966 8560 3677 4883
7892 5205 2687 9378 4087 5291 7892 5205 2687 9378 4087 5291

187
JSABSTRACT
)RKERS
tock, Forestry
ling, Hunting and
allon,Orchards llied Activities
(III)
Mining and
Quarrying
(IV)
Manufacturing,
Processing, Servicing
and Repairs in Household Industry
(Va)
Manufacturing,
Processing, Servicing and Repairs in other
than Household Industry (Vb)
SI.
NO.
2)
is is
14
14
12
12
8
8
2 2
5 5.
F p M F p M
(33) (34) (35) (36) (37) (38)
6 27 15 12 393 233
6 27 15
70 14 12
70 14 12
68 168 124
68 168 124
75 64 63 75 64 63
38 22 22
38 22 22
4 100 54
4 100 54
21 132 88
21 132 88
12 393 233
2 183 135
2 183 135
44 323 217
44 323 217
354 192
354 192
171 157
171 157
46 95 68
46 95 68
44 245 176
44 245 176
288 711 450 261 232 167
282 703 442 261 230 165 6 8 8 2 2 5
8 8 2 2
173
173
79
79 55
55
149 108 85 149 108 85
55 28
55 28
42 111
42 111
17
17
80 80
24 394 288.
24 394 288
23 517 404
23 517 404
11 221 165
11 221 165
31 118 88
31 118 88
F p M
(39) (40) (41)
160 257 224
160 257 224
48 142 122
48 142 122
106 329 276
106 329 276
162 264 224
162 264 224
14 229 219
14 229 219
27 106 103 27 106 103
69 433 405 69 433 405
65 1498 1354
65 935 854
563 500
2 2
561 498
106 963 763
106 963 763
113 1623 1317
113 1623' 1317
56 504 459
56 504 459
30 685 528
30 685 528
F
(42) (1)
33 25
33
20 26
20
53 27
53
40 28
40
10 29 10
3 30
3
28 31 28
144 32
81
63
63
200 33
200
306 34 306
45 35
45
157 36
157

1~
DISTRICT PRIMARY •
l~nUSTRIAL CATEGORY OF
Sl. No.
Name of District/ M.P.P./
Total/
Rural/ TOWll Urban
P
Constructions
(VI)
M F
Trade and Commerce
(VII)
P M F
(1) (2) (3) (43) (44) (45) (46) (47) (48)
25 YELAL M.P.P.
26 OOMA M,P.P.
27 GANDEED M.P.P.
28 KUlKACHARLA M.P.P.
29 PARGI M.P.P.
30 pUOUR M.P.P.
31 SHABAD M.P.P.
32 SHAMSHABAD M.P.P.
SHAHlAOl BEGUM(OG)
SHAMSHABAD (P)
33 MAHESWARAM M.P.P.
34 IBRAHIMPATNAM M.P.P.
35 MANCHAl M.P.P.
36 YACHARAM M.P.P.
T
R U
T
R U
T R U
T R
U
T R
U
T
R U
T R U
T R U
U
U
T R U
T
R
U
T R U
r R
U
149 137
149 137
88 63
88 63
68 63 68 63
64 60
64 60
145 131
145 131
68 64
68 64
116 103
116 103
399 372 243 234
156 138
156 138
285 241
285 241
300 264
300 264
67 64
67 64
231 188
231 188
12 553 408
12 553 408
25 364 316
25 384 316
5 568 442 5 568 442
4 541 415
4 541 415
14 710 631 14 710 631
4 364 328
4 364 328
13 575 500
13 575 500
27 1600 1324
9 608 458
18 992 1166
18 992 866
44 1012 808
44 1012 808
36 1735 1425
36 1735 1425
3 649 455 3 649 455
43 812 637
43 812 637
145
145
68
68
126
126
126
126
79 79
36 36
75
75
276
150
126
126
204 204
310
310
194 194
175
175
P
(49)
83 83
49
49
90 90
44
44
297 297
137
137
179
179
501
264 237
237
338 338
737 737
228 228
268 268
Transpurt, Storage & Communications
(VIII)
M
(50)
83 83
47 47
88
88
44 44
292 292
134
134
177
177
498
264 234
234
332 332
707
707
227
227
265
265
F
(51)
2
2
2 2
5 5
3
3
2 2
3
3
3
6 6
30
30
3 3

189
CENSUS ABSTRACT (Concld ... )
M A I N WORKER S
Other Services Marginal Workers Non-Wrokers SI.
No.
(IX)
P M F P M F P M F
(52) (53) (54) (55) (56) (57) (58) (59) (60) (1 )
593 447 146 1058 57 1001 15719 7076 8643 25
593 447 146 1058 57 1001 15719 7076 8643
441 305 136 338 4 334 16150 7557 8593 26
441 305 136 338 4 334 16150 7557 8593
875 642 233 1525 113 1412 22262 10757 11505 27
875 642 233 1525 113 1412 22262 10757 11505
617 428 189 742 22 720 22046 10585 11461 28 617 428 189 742 22 720 22046 10585 11461
1091 867 224 256 74 182 23125 10578 12547 29 1091 867 224 258 74 182 23125 10578 12547
506 379 127 387 33 354 18031 8428 9603 30 506 379 127 387 33 354 18031 8428 9603
819 610 209 1272 90 1182 20854 9735 11119 31 819 610 209 1272 90 1182 20854 9735 11119
1680 1242 438 892 114 778 32105 14288 17817 32 800 582 218 885 113 772 21548 10011 11537 880 660 220 7 6 10557 4277 6280
1 1 12 7 5 860 660 220 6 5 10545 4270 6275
1056 800 256 1308 90 1218 23389 10414 12975 33 1056 800 256 1308 90 1216 23389 10414 12975
1798 1323 475 1219 124 1095 31534 13939 17595 34 1798 1323 475 1219 124 1095 31534 13939 17595
689 498 191 1087 79 1008 18140 8518 9622 35 689 498 191 1087 79 1008 18140 8518 9622
1022 748 274 928 76 852 21122 9865 11257 36 1022 748 274 928 76 852 21122 9865 11257
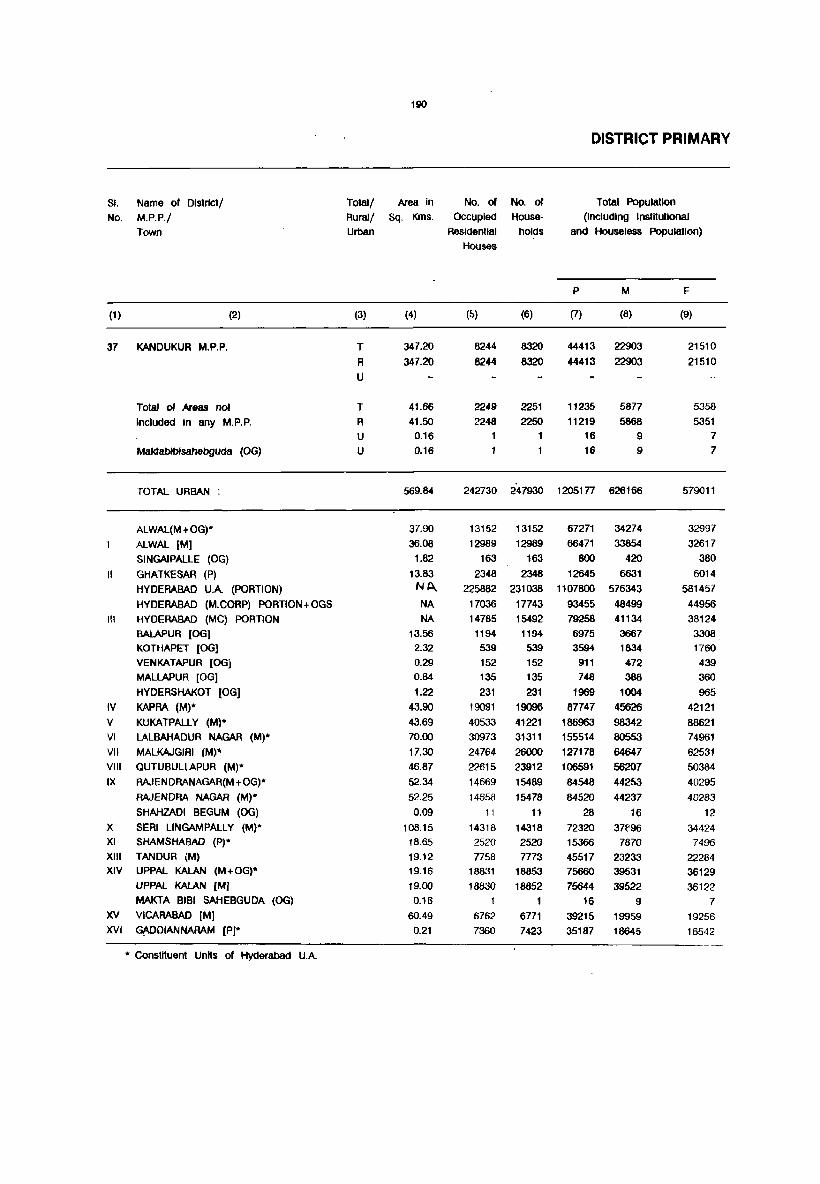
190
DISTRICT PRIMARY
51. Name of Dlstrlct/ Total/ Area in No. of No, of Total Populallon
No. M.P.P,/ Rural/ Sq. Kms. OcCUple<l House- (Including Institutional
Town Urban Residential holds and Houseless Population)
Houses
P M F
(1 ) (2) (3) (4) (5) (6) (7) (8) (9)
37 KANDUKUR M.P,P, T 347.20 8244 8320 44413 22903 21510
R 347.20 8244 8320 44413 22903 21510 U
Total of Areas not T 41.66 2249 2251 11235 5877 5358
Included In any M.P,P. R 41.50 2248 2250 11219 5868 5351 U 0.16 16 9 7
MaktablblsahebgUda (OG) U 0.16 16 9 7
TOTAl URBAN 569.84 242730 247930 1205177 626166 579011
ALWAl(M+OG)* 37.90 13152 13152 67271 34274 32997
ALWAL [M] 36.08 12989 12989 66471 33854 32617 51NGAIPAlLE (OG) 1.82 163 163 800 420 380
II GHATKESAR (P) 13.83 2348 2348 12645 6631 6014 HYDERABAD UA (PORTION) NA, 225882 231038 1107800 576343 581457 HYDERABAD (M,CORP) PORTION+OGS NA 17036 17743 93455 48499 44956
III HYDERABAD (Me) PORTION NA 14785 15492 79258 41134 38124 BAlAPUR lOG) 13.56 1194 1194 6975 3667 3308
KOTHAPET lOG] 2.32 539 539 3594 1834 1760 VENKATAPUR lOG) 0.29 152 152 911 472 439 MALLAPUR lOG] 0.84 135 135 748 388 360 HYDERSHAKOT [OG] 1.22 231 231 1969 1004 965
IV KAPRA (M)* 43.90 19091 19096 87747 45626 42121 V KUKATPALL Y (M)* 43.69 40533 41221 186963 98342 88621 VI LALBAHADUR NAGAR (M)* 70.00 30973 31311 155514 80553 74961 VII MALKAJGIRI (M)· 17.30 24764 26000 127178 64647 62531 VIII aUTUBULLAPUR (M)* 46.87 22615 23912 106591 56207 50384 IX RAJENDRANAGAR(M + OG)* 52.34 14669 15489 84548 44253 40295
RAJENDRA NAGAR (M)* 52.25 14658 15478 84520 44237 40283 SHAHZADI BEGUM (OG) 0.09 11 11 28 16 12
X SERI L1NGAMPALL Y (M)* 108.15 14318 14318 72320 37t'96 34424 XI 5HAMSHABAD (P)* 18.65 2520 2520 15366 7870 7496 XIII TANDUR (M) 19.12 7758 7773 45517 23233 22284 XIV UPPAl KAlAN (M+OG)* 19.16 18831 18853 75660 39531 36129
UPPAL KALAN (M] 19,00 16830 18852 75644 39522 36122 MAKTA BIBI 5AHEBGUDA (OG) 0,16 1 16 9 7
XV VICARABAD [M] 60,49 6762 6771 39215 19959 19256 XVI GtJ)DIANNARAM (P)* 0.21 7360 7423 35187 18645 16542
• Constituent Unns of Hyderabad UA

CENSUS ABSTRACT
Total Populallon in the age group (0 • 6)
p
(10)
8749 8749
2234 2231
3 3
197846
9767 9609
158 2102
180563 15864 13304
1172 749 186 153 300
13322 31627 23534 18283 19184 16388 16383
5 12803 3159 8075
11871 11868
3 7106 4761
M
(11)
4406
4406
1151 1148
3 3
100838
4965 4877
88 1078
92029 8067
6815 546
391 96
77 142
6779 16146 12152 9245 9811 8302 8299
3 6456 1629 4167 5969 5966
3
3564
2508
F
(12)
4343 4343
1083 1083
97008
4802 4732
70 1024
88534 7797 6489 626 358
90 76
158 6543
15481 11382 9038 9373 8086 8OB4
2 6347 1530 3908 5902 5902
3542 2253
191
Scheduled Castes Scheduled Tribes
p
(13)
10934 10934
M
(14)
5658 5658
2369 1202 2353 1193
16 9 16
142181
20661 20288
373 2029
129328 11436 8972 1488 410
65 95
406 11576 16634 16599 15051 8076
12036 12026
10 6715 2660 3941 7214 7198
16 6883
670
9
72445
10367 10169
198 1081
65846 5853 4574 782 220
25 46
206
5932 8457 8386 7560 4248 6219 6213
6 3511 1328 1996 3639 3630
9
3522 346
F p M
(15) (16) • (17)
5276 3210 1673 5276 3210 1673
1167 1160
7 7
69736
10294 10119
175 948
63482 5583 4398 706 190 40 49
200 5644 8177 8213
7491 3828
5817 5813
4
3204
1332 1945 3575 3568
7 3361
324
276 276
21877
1234 1229
5
165 19481 1323 1212
111
2180 3380
2201 2014 1471 1661
1661
2089 466 548
1099 1099
1683 363
140 140
11698
654 651
3
91 10360
655 603 52
1135 1772 1212 1040
776 888
888
1096 256 332 610 610
915
266
F
(18)
1537 1537
136 136
10179
580 578
2 74
9121 668 609
59
1045 1608
989 974 695 773 773
993 210 216 489 489
768 97
p
(19)
10063
10063
4584 4574
10 10
679794
41801 41491
310 6860
635189 51580 46405
2511 1487 315 191 671
54856 105714 95540 85434 53580 32933 32925
8 36212 6632
20983 44763 44753
10 16762 26144
Literates
M
(20)
7361 7361
2908
2902 6 6
402015
23966 23760
206 4321
375073 30450 27011 1708
941
t 226 145 419
31673 63719 55391 47709 33315 21095 21091
4
22136 4230
13099 26563 26557
6 9522
1482$
F
SI.
NO.
(21) (1)
2702 37 2702
1676 1672
4
4
277779
17835 17731
104 2539
260116 21130 19394
803 546
89 46
252 23183 41995 40149 37725 20265 11838 11834
4
14076 2402 7884
18200 18196
4
7240 11318

SI.
No.
(1)
Name of District/
M.P.P./
Town
(2)
37 KANDUKUR, M.P.P.
Total of Areas not
included in any M.P.P,
Maklabibisahebguda (OG)
TOTAL URBAN :
ALWAL(M+OG)*
ALWAL 1M)
SINGAIPALLE (OG)
II GHATKESAR (P)
HYDEAABAD UA (PORTION)
HYDERABAD (M.CORP) PORTION+OGS*
1/1 HYDERABAD (MC) PORTION
BALAPUR lOG)
KOTHAPET lOG)
VENKATAPUR lOG]
MALLAPUR lOG)
HYDERSHAKOT fOG]
IV KAPAA (M)
V KUKATPALLY (M)·
VI LALBAHADUR NAGAR (M)-
VII MALKAJGIRI (M)-
VIII QUTUBULLAPUR (M)-
IX RAJENDRANA8AR(M + OG)
RAJENDRA NAGAR (M)
SHAHZADI BEGUM (OG)
X SEAl LlNGAMPALL Y (M)'
XI SHAMSHABAD (P)'
XIII TANDUR (M)
XIV UPPAL KALAN (M + OG)'
UPPAL KALAN 1M)
MAKTA BIBI SAHEBGUDA (OG)
XV VICARABAD 1M)
XVI GADDIANNARAM IP]'
• Constituent Units of Hyderabad UA
192
DISTRICT PRIMARY
INDUSTRIAL CATEGORIES OF
Total/ - Total Main WorKers Cultivators AgricUltural Labourers
Rural(
Urban
(3)
T
R
U
T
R
U
U
(I-IX) (I) (II)
P M F P M F P M
(22) (23) (24) (25) (26) (27) (28) (29)
21848 12761 9087 7626 5367 2259 11028 4801
21848 12761 9087 7626 5367 2259 11028 4801
4073
4068
5
5
2944 1129
2942 1126
2 3
2 3
286 226
282 225
4
4
60 1334
57 1334
3
3
662 662
370589 307036 63553 10354 8179 2175 28678 15924
20380 16311
20053 16090
327 221
3590 2991
340973 284359
27010 22776
22253 19400
2456 1655
844 763
386 240
402 214
669 504
27688 22940
59875 51119
46296 38609
36487 30562
34537 29876
28150 21726
28135 21717
15 9 22251 18319
4815 3599
13259 10678
23452 19743
23447 19741
5 2 12767 9008
10032 8779
4069
3963
106
599
56614
4234
2853
801
81
146
188
165
4748
8756
7687
5925
4661
6424
6418
6
3932
1216
2581
3709
3706
3
3759
1253
884 715 169 2538 1414
870 703 167 2418 1355
14 12 2 120 59
294 176 118 397 239
7326 5800 1526 21154 12147
834 549
23 21 476 288
80 80
17 8
125 66
113 86
354 296
559 516
1019 833
165 152
424 375
i058 701
1058 701
1068 867
488 352
949 862
372 346
368 345
4 1
1785 1341
101 98
285 1454
2 87
188 703
132
9 106
59 169
27 257
58 1212
43 1536
186 3938
13 187
49 915
357 3140
357 3137
3
201 2459
136 1407
87 2619
26 2344
23 2344
3
444 4508
3 24
695
66 299
76
25
70
159
684
1059
2515
129
583
1426
1424
2
1193
758
1277
1669
1669
2261
22
F
(30)
6227
6227
672
672
12754
1124
1063
61
158
9007
759
21
404 56
81
99
98 528
477 1423
58
332
1714
1713
1266
649
1342
675
675
2247
2
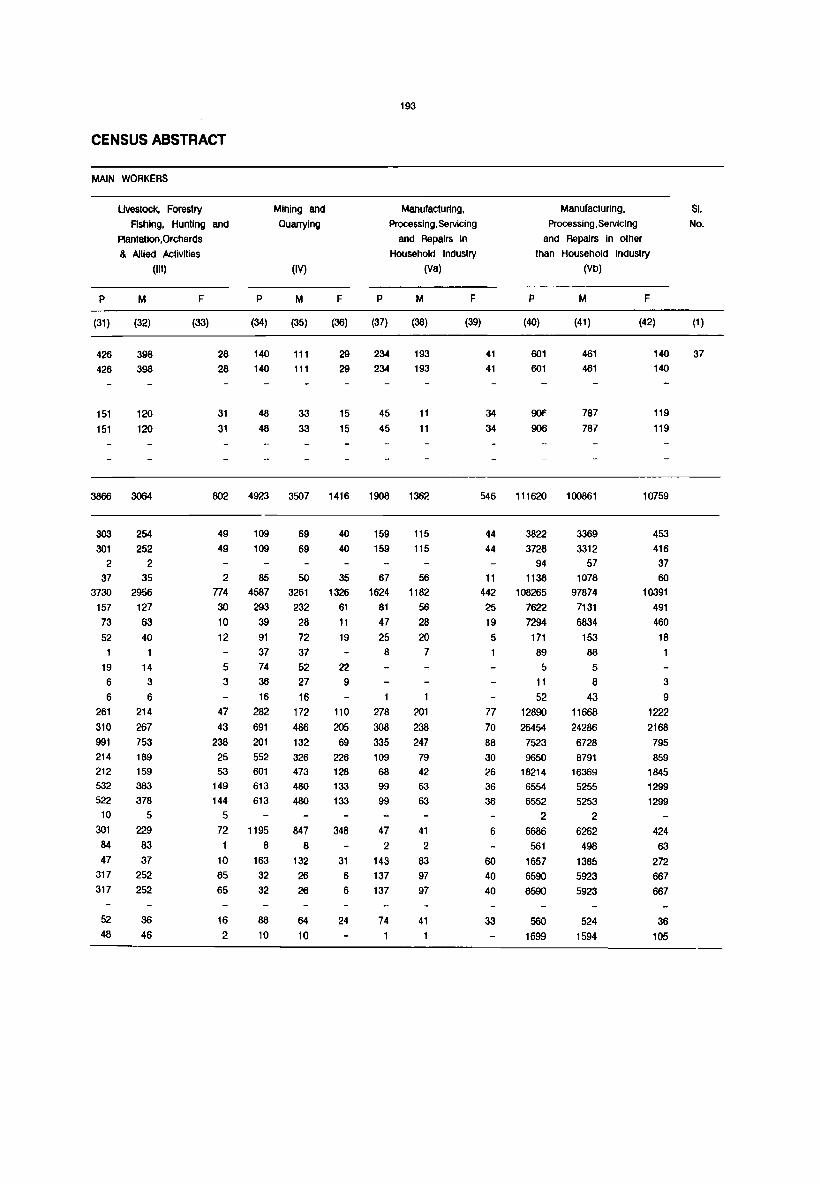
CENSUS ABSTRACT
MAIN WORKERS
p
(31)
426
426
151
151
3866
303
301
2
37
3730
157
73
52
1
19
6
6
261
310
991
214 212
532
522
10
301
84
47
317
317
52
48
Uvestock, Forestry
Ashlng, Hunting and
Plantatlon,Orchards
& Allied Activities
M
(32)
398
398
120
120
3064
254
252
2 35
2956
127
63
40
1
14
3 6
214
267
753
189
159
383
378
5 229
83
37
252
252
36
46
(III)
F
(33)
28
28
31
31
802
49
49
2 774
30
10
12
5 3
47
43
238
25
53
149
144
5 72
10
65
65
16
2
p
(34)
140
140
Mining and
Quarrying
(IV)
M
(35)
111
111
48 33
48 33
4923 3507
109 69
109 69
85 50
4587 3261
293 232
39 28
91 72
37 37
74 52
36 27
16 16
282 172
691 486
201 132
552 326
601 473
613 480
613 480
1195 847
8 8 163 132
32 26
32 26
88 64
10 10
F p
193
Manufacturing,
Processlng,Servicing
and Repairs In
Household Industry
(Va)
M F p
Manufacturing,
Processing, Servicing
and Repairs in other
than Household Industry
(Vb)
M F
(36) (37) (38) (39) (40) (41) (42)
29
29
234
234
193
193
15 45 11
15 45 11
1416 1908 1362
40 159 115
40 159 115
35 67 56
1326 1624 1182
61 81 56
11 47 28
19 25 20
22 9
8 7
110 278 201
205 308 238
69 335 247
226 109 79
128 68 42
133 99 63
133 99 63
348 47 41
2 2
31 143 83
6 137 97
6 137 97
24 74 41
41
41
601
601
34 90f
34 906
546 111620
44 3822
44 3728
94
11 1138 442 108265
25 7622
19 7294
5 171
89
5 11
52
77 12890
70 26454
88 7523
30 9650
26 18214
36 6554
36 6552
2
6 6686
561
60 1657
40 6590
40 6590
33 560
1699
461
461
787
787
100861
3369
3312
57
1078
97874
7131
6834
153
88
5 8
43
11668
24286
6728
8791
16369
5255
5253
2 6262
498
1385
5923
5923
524
1594
140
140
119
119
10759
453
416
37
60
10391
491
460
18
3
9
1222
2168
795
859
1845
1299
1299
424
63
272
667
667
36
105
Sl.
No.
(1 )
37

SI.
No.
Name of District/
M.P.P./
Town
(1) (2)
37 KANDUKUR M.P.P.
Tolal of Areas nol Included in any M.P.P.
Maktabibisahebguda(OG)
TOTAL URBAN;
ALWAL(M + OG)·
ALWAL [M)
SINGAIPALLE (OG)
II GHATKESAR (P)
HYDERABAD UA (PORTION)
HYDERABAD (M.CORP) PORTION+OGS·
III HYDERABAD (MC) PORTION
BALAPUR lOG)
KOTHAPET [OG)
VENKATAPUR lOG)
MALLAPUR lOG)
HYDERSHAKOT lOG)
IV KAPRA (M)
V KUKATPALLY (M)·
VI . LALBAHADUR NAGAR (M)·
VII MALKAJGIRI (M)*
VIII QUTUBULLAPUR (M)*
IX RAJENDRANAGAR(M + OG)*
RAJENDRA NAGAR (M)
SHAHZADI BEGUM (OG)
X SERI LlNGAMPALL Y (M)*
XI SHAMSHABAD (P)·
XIII TANDUR (M)
UPPAL KALAN (M+OG)·
XIV UPPAL KALAN [M) MAKTA BIBI SAHEBGUDA (OG)
XV VICARABAD [M]
XVI GADDIANNARAM [Pl·
Total/
Rural/ Urban
(3)
T
R
U
T
R U
U
* Constituent Units of Hyderabad UA
194
DISTRICT PRIMARY
NDUSTRIAL CATEGORIES OF
Conslruclions Trade and Commerce
(VI) (VII)
P M F P M
(43) (44) (45) (46) (47)
135 119 16 627 475
135 119 16 627 475
254 208 46 374 313
254 208 46 374 313
37072 30424 6648 55989 49865
2464 2117 347 2662 2247
2460 2113 347 2655 2241
4 4 7 6
183 162 21 496 423
36000 29536 6464 50163 44463
3110 2605 505 4668 4183
2818 2328 490 4165 3781
103 100 3 249 186
75 73 2 150 144
60
19
35
3529
6162
5026
4188
58 2 51 19 21
27 8 32 2616 913 26~3
4847 1315 7973
4215 811 8493
3608 580 6549
32
12
28
2307
7032
7616
5683
4974 4079 895 3885 3549
2287 1839 448 3960 3398
2287 1839 448 3960 3398
1701 1416 285 2326 2100
156 138 18 992 866
527 422 105 3686 3491
1900 1594 306 3478 3113
1900 1594 306 3478 3113
362 304 58 1644 1488
503 462 41 2554 2369
F
(48)
152
152
61
61
P
(49)
186
186
254
254
6124 34579
415 1747
414 1732
15
73 374
5700 32287
485 2379
384 2034
63 186
6 128
19
9
4
316
941
877
866
336
562
562
226
126
195
365
365
156
185
9 5
17
1963
4529
5710
6793
1799
2682
2682
1319
237
1039
1754
1754
879
1375
Transport, Storage
& Communications
(VIII)
M
(50)
184
184
253
253
F
(51)
2 2
32650 1929
1614
1600
14
366
30391
2255
1912
185
128
8 5
17
1740
4301
5402
6226
1745
2643
2643
1253
234
1033
1667
1667
860
1311
133
132
8
1896
124
122
223
228
308
567
54
39
39
66
3
6 87
87
19
64

195
CENSUS ABSTRACT (Concld ... )
M A IN WO R K E R S
Other Services Marginal Workers Non-WroKers Sl.
No.
(IX)
p M F P M F P M F
(52) (53) (54) (55) (56) (57) (58) (59) (60) (1 )
645 652 193 967 39 948 21578 10103 11475 37 645 652 193 967 39 946 21576 10103 11475
421 331 90 62 2 60 7100 2931 4169 420 330 90 62 2 60 7089 2924 4165
11 7 4 11 7 4
61600 61200 20400 2352 1006 1346 632236 318124 514112
5692 4397 1295 133 46 67 46756 17917 26641 5621 4330 1291 133 46 87 46285 17718 28p67
71 67 4 473 199 274 519 406 113 134 19 115 6921 3621 5300
75837 56749 19088 2120 959 1161 764707 291025 473682 6412 4943 1469 621 231 390 65824 25492 40332 5673 4339 1334 618 230 388 56387 21504 34883 400 312 88 4519 2012 2507 144 129 15 3 2 2747 1070 1677 45 36 7 525 232 293 10 4 6 346 174 172
140 121 19 1300 500 800 4296 3042 1254 70 21 49 59969 22665 37324
11353 8087 3266 336 229 109 126750 46994 79756 13060 10166 2692 269 116 173 108929 41828 67101 8080 5379 2701 73 34 39 90616 34051 56567 3445 2502 943 92 23 69 71962 26306 45654 7225 5536 1687 139 45 94 56259 22482 33777 7225 5538 1687 138 45 93 56247 22475 33772
12 7 5 5149 4111 1038 109 38 71 49960 19539 30421 880 660 220 6 1 5 10545 4270 6275
2429 1956 473 35 4 31 32223 12551 19672 6526 5056 1472 65 40 45 52123 19748 32375 6527 5055 1472 85 40 45 52112 19741 32371
11 7 4 2815 2089 726 63 24 39 26385 10927 15458 3717 2866 851 165 135 30 24990 9731 15259
• Constituent Units 01 Hyderabad UA
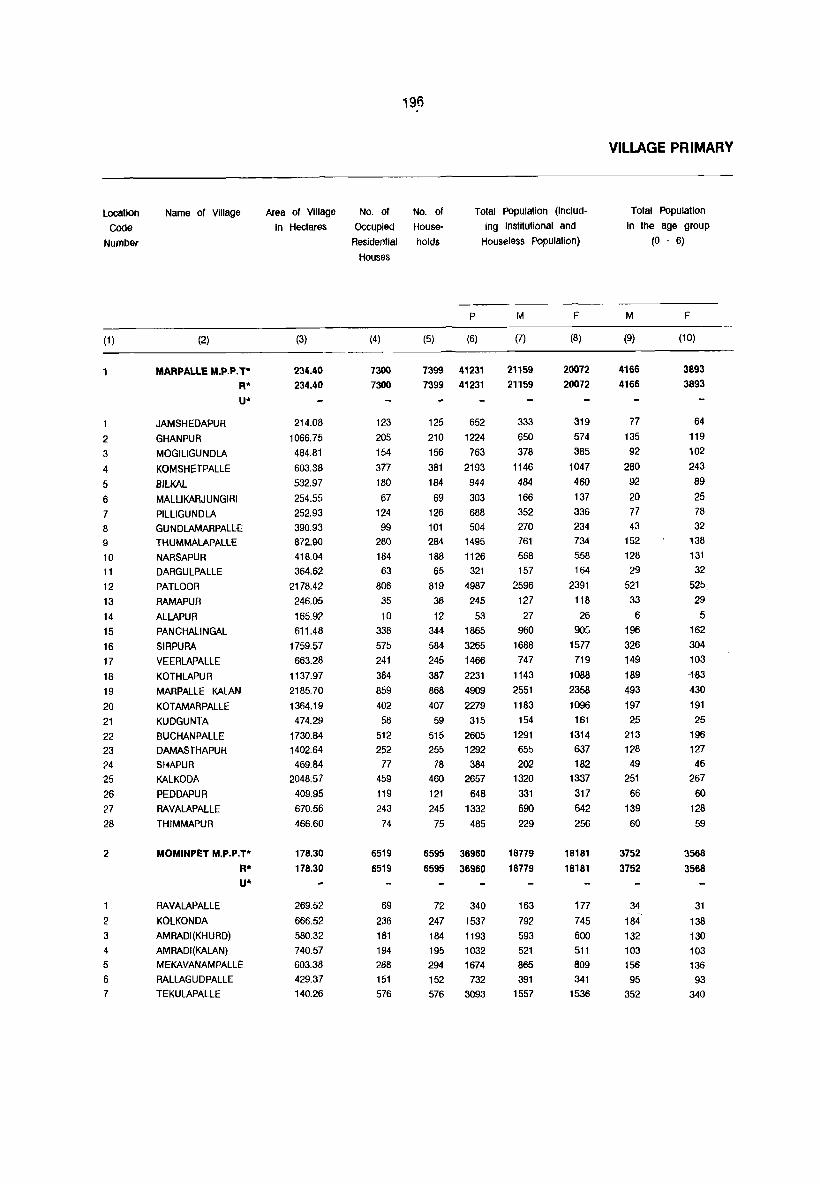
Location
Code Number
(1)
2
3 4
5 6
7 8
9
10 11
12 13 14 15 16 17 18 19 20 21 22
23 24 25 26 27 28
2
1
2
3
4
5
6 7
Name of Village
(2)
MARPALlE M.P.P. T" R* u*
JAMSHEDAPUR
GHANPUR
MOGILIGUNDLA
KOMSHETPALLE
BILKAL
MALLIKARJUNGIRI
PILLIGUNDLA GUNDLAMARPALL£ THUMMALAPALLE
NARSAPUR DARGULPALLE
PATLOOR
RAMAPUR
ALLAPUR PANCHALINGAL
SIRPURA
VEERLAPALLE
KOTHLAPUR
MARPALLE KALAN
KOTAMARPALLE
KUDGUNTA
BUCHANPALLE
DAMASTHAPUR SHAPUR KALKODA
PEDDAPUR
RAVALAPALLE
THIMMAPUR
MOMINPET M.P.P.T"" R* u*
RAVALAPALLE
KOLKONDA
AMRADI(KHURD)
AMRADI(KALAN} MEKAVANAMPALLE
RALLAGUDPALLE
TEKULAPALLE
Mea of Village No. of
in Hectares Occupied
(3)
234.40 234.40
214.08 1066.75 484.81 603.38 532.97 254.55 252.93 390.93 872.90 418.04 364.62
2178.42 246.05 165.92 611.48
1759.57 663.28
1137.97 2185.70 1364.19 474.29
1730.84 1402.64 469.84
2048.57 409.95 670.56 466.60
178.30 178.30
269.52 666.52 580.32 740.57 603.38 429.37 140.26
Residential
Houses
(4)
7300 7300
123 205 154 377 180 67
124 99
280 184 63
806 35 10
338 575 241 384 859 402 58
512 252 77
459 119
243 74
6519 6519
69 236 181 194 288
151 576
196
No. of
House
holds
Total pOpulation (Includ
ing Institutional and
Houseless Population)
P
(5) (6)
7399 41231 7399 41231
125 652 210 1224 156 763 381 2193 184 944 69 303
126 688 101 504 284 1495 188 1126 65 321
819 4987 36 245 12 53
344 1865 584 3265 245 1466 387 2231 868 4909 407 2279 59 315
515 2605 255 1292 78 384
460 2657 121 648 245 1332 75 485
6595 36960 6595 36960
72 340 247 1537 184 1193 195 1032 294 1674 152 732 576 3093
Iv1
(7)
21159 21159
333 650
378 1146 484 166 352 270 761 568 157
2596 127 27
960 1688 747
1143 2551 1183 154
1291 655 202
1320 331 690 229
18779 18779
163 792 593 521 865 391
1557
F
(8)
20072 20072
319 574 385
1047 460
137 336 234 734
558 164
2391 118
26 90S
1577 719
1088 2358 1096
161
1314 637 182
1337
317
642 256
18181 18181
177 745 600 511 809 341
1536
VILLAGE PRIMARY
Total Population
In the age group
(0 - 6)
M
(9)
4166 4166
77 135 92
280 92 20 77
43 152 128 29
521 33 6
196
326 149 189 493 197 25
213 128 49
251 66
139 60
3752 3752
34 184 132 103 156 95
352
F
(10)
3893
3893
64 119 102 243 89 25 78 32
138 131 32
525 29
5
162 304 103 -183 430
191 25
196
127 46
267 60
128 59
3568 3568
31 138 130 103 136
93 340

197
CENSUS ABSTRACT
INDUSTRiAl CATEGORIES OF MAIN WORKERS
SchedUled
castes
Scheduled
TribeS
Lilerates Total Main
Workers
Cullivators
M F M
(11 ) (12) (13)
6029 5722 759
759 6029 5722
60
208
94
176
126
85
52
89
233 172
53 519
27
280
587
169
472
934
382
22
249 148
26 384
110
244
128
5442
5442
7
172
110
233 238 75
340
55
187 102 5
159 19
120 71
43
84 233 170 207
53
453 128
22 244 2
526 5
168 11
440
882 64
343
32 10
274 127 148 41
22 140 429
98
217
147
5179 1105
5179 1105
10
154
108 3
218 219 63 66 282
321 245
(I - IX) (I)
F M F M F M F
(14) (15) (16) (17) (18) (19) (20)
692 6017 1801 11535 8742 6056 3486
692 6017 1801 11535 8742 6056 3486
91
188
5 130
11 289
148
21
83
65 148
215 65
15 96 869
24
5 347
519
12 167
255
51 1006
442
9 29
121 305 40 125
127 3
398
78 182
24
985 5984
985 5984
56
179
5 145
171 59 232
240 74 246 494
43 179
24 354
22 221
84 614
36 287
13 122
9 185
5 164
48 448
25 329
89
287 1270
6 72
3 14
94 499
106 911
34 441
85 683
466 1200
122 657
4 100
58 809 17 414
2 123 131 668
15 180
56 377
6 125
1674 10031
1674 10031
18 93
56 447
38 322
52 302 73 510 12 219
123 867
49 97
250 223
206 125
247 231
176 203
90 104
78 138
20 110 216 245
289 62 83 26
750 550
49 33
11 12
394 292
866 389
378 307
613 483
848 454
617 379
78 91
803 547 297 278
105 610 213
149 118 342 258
128 87
7334 5649
7334 5649
80 58
404 141
247 191
207 201 483 372
173 122 495 587
1
125
69
64
19
29
60
3 137
32 21
160
9 117
324
224
352
306
356
55
428
148
123
84
155
85
3219
3219
33
107
90
99 337 75
237
M
(21)
4250
4250
79
98
56
234
74
17
29
39
185
266
59
505
35
2
134
439 66
161
437
254
4
244 136
121
398
52
95
31
3042
3042
23
284
102
56 88 95
188
Agricullural
Labourers
(II)
F
(22)
4991
4991
46
119
125
156
155
61
14
13 76
255
60
553
49
2
250
523
133
257
478
256
21
368
148 105
482
61
180
43
3863
3863
46
291
143
102 128
98 226
location Code
Number
(1)
1
2
3 4
5 6 7
8 9
10
11
12
13
14
15
16
17 18
19
20
21
22
23 24 25
26 27
28
2
1
2
3 4
5
6 7

198
VILLAGE PRIMARY
I N D U STRIAL C ATEGORIES o F
Location Name of Village Livestock. Forestry Mining and Manufacturing, Manufacturing,
Code Flshing,Hunllng and Quarrying Processing,Serviclng Processlng,Servicing
Number Plantation, Orchards and Repairs in and Repairs In other
and allied activities Household Industry than Household Industry
(III) (IV) (Va) (Vb)
M F M F M F M F
(1 ) (2) (23) (24) (25) (26) (27) (28) (29) (30)
MARPALLE M.P.P. T 74 3 4 66 50 201 14 R 74 3 4 66 50 201 14 U
1 JAMSHEDAPUR 2 GHANPUR 2 6 3 MOGILIGUNDLA 5 2 6 2 4 KOMSHETPALLE 5 12 5 25 2 5 BILKAL 6 MALLIKARJUNGIRI 7 PILLIGUNDLA 3 1 7 2 8 GUNDLAMARPALLE 7 3 3 9 THUMMALAPALLE 3 2 3 10 NAR8APUR 1 11 DARGULPALLE 12 PATLOOR 10 4 6 31 13 RAMAPUR
14 ALLAPUR 15 PANCHALINGAL 17 6 7 12 3 16 SIRPURA 2 16 7 7 17 VEERLAPALlE 6 11 7 9 18 KOTHLAPUR 4 2 9 19 MARPALLE KALAN 9 3 6 9 43 :3 20 KOTAMARPALLE 4 21 KUDGUNTA 3
22 BUCHANPALLE 8 23 DAMASTHAPUR
24 SHAPUR
25 KAlKODA 3 13 26 PEDDAPUR 3 27 RAVALAPALLE 11 28 THIMMAPUR 2
2 MOMINPET M.P.P. T 32 2 15 13 102 25 152 17 R 32 2 15 13 102 25 152 17 U
1 RAVALAPALLE 7 2 KOLKONDA 3 2 2 3 AMARADHI (KHURD) 6 "6 9 3 4 AMARADHI (KALAN) 10 4 9 5 MEKAVANAMPALLE 3 9 6 RALLAGUDPAlLE 7 TEKULAPALLE 17 15

lS}9
CENSUS ABSTRACT
M A IN WORKERS
Constructions Trade and Transport, Other Marginal Non~v'lorKers Location Commerce Storage & Co~ Services Workers COde
mmunicalions Number
(VI) (VII) (VIII) (IX)
M F M F M F M F M F M F
(31) (32) (33) (34) (35) (36) (37) (38) (39) (40) (41) (42) (1)
80 339 21 84 381 175 16 218 9608 11112 80 339 21 84 381 175 16 ,218 9608 11112
2 2 154 270 1 14 10 5 296 324 2
2 18 8 8 157 179 3 20 43 20 24 19 8 138 524 662 4
3 1 4 2 197 284 5 1 44 47 6
4 1 3 167 258 7 2 3 106 214 8
3 8 313 518 9 239 269 10
4 2 68 81 11 16 80 4 13 60 26 2 46 1324 1595 12
3 55 69 13 13 15 14
9 9 4 2 18 13 461 510 15 2 13 4 6 37 8 5 24 772 687 16
9 10 22 14 6 306 335 17 12 1 11 460 475 18
14 100 8 24 110 42 1351 1510 19 2 4 12 3 526 479 20
2 2 54 83 21 8 7 482 511 22
241 339 23 79 77 24
2 20 18 5 2 651 725 25 3 4 4 151 168 26
4 8 7 313 300 27 3 2 104 128 28
61 258 37 223 4 497 154 10 407 8738 10440 2 61 258 37 223 4 497 154 10 407 8738 10440
4 70 97 4 4 8 3 345 340 2 7 2 3 4 3 8 271 345 3
2 7 1 1 12 5 219 304 4 6 5 8 3 24 10 355 326 5
1 172 16B 6 2 10 6 12 35 24 194 689 847 7
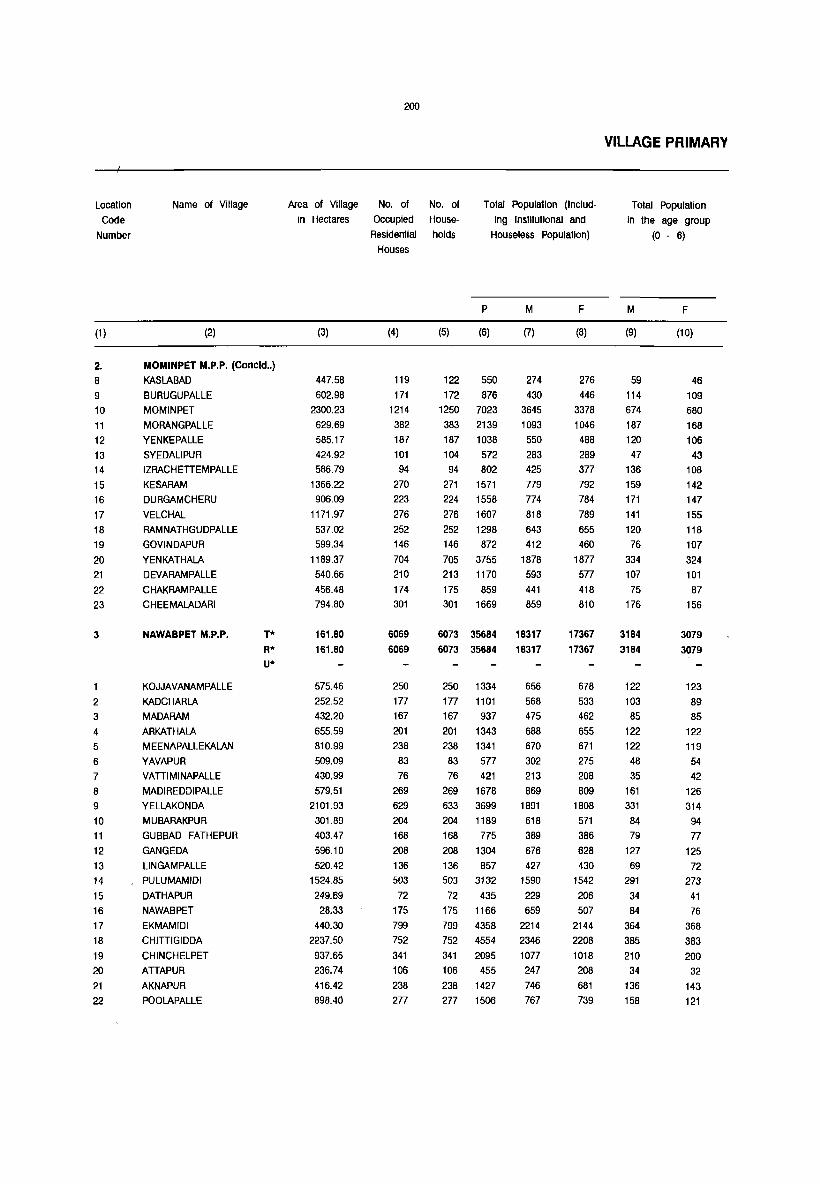
Location
Code
Number
(1 )
2. 8 9
10
11
12
13
14
15
16
17
18
19
20
21
22 23
3
1
2
3 4
5
6
7
8 9
10
11
12
13
14
15
16
17
18
19
20
21
22
Name ot Village
(2)
MOMINPET M.P.P. (Concld .. )
KASLABAD
BURUGUPALLE
MOMINPET
MORANGPALLE YENKEPALLE
SYEDALIPUR IZRACHETTEMPALLE
KESARAM
DURGAMCHERU
VELCHAL
RAMNATHGUDPALLE
GOVINDAPUR
YENKATHALA
DEVARAMPALLE
CHAKRAMPALLE
CHEEMALADARI
NAWABPET M.P.P.
KOJJAVANAMPALLE
KADCHARLA
MADARAM
ARKATHALA
MEENAPALLEKALAN
YAVAPUR
VATTIMINAPALLE
MADIREDDIPALLE
YELLAKONDA
MUBARAKPUR
GUBBAD FATHEPUR
GANGEDA
LlNGAMPALLE PULUMAMIDI
DATHAPUR
NAWABPET
EKMAMIDI
CHITTIGIDDA
CHINCHELPET
ATTAPUR
AKNAPUR
POOLAPALLE
T* R* U*
200
Area of Village No. of No. of Total Population (Includ
ing Institutional and
Houseless Population)
in Hectares Occupied House-
(3)
447.58
602.98
2300.23
629.69
585.17
424.92
586.79
1366.22
906.09
1171.97
537.02
599.34
1189.37
540.66
456.48 794.80
161.80
161.80
575.46
252.52
432.20
655.59
810.99
509.09
430.99
579.51
2101.93
301.89
403.47
596.10
520.42
1524.85
249.69
28.33
440.30
2237.50
937.65
236.74
416.42
898.40
Residential holds
Houses
(4)
119
171
1214
382
187
101
94
270
223
276
252
146
704
210
174
301
6069
6069
250
177
167
201
238
83
76
269
629
204
168
208
136
503
72
175
799
752
341
106
238
277
P
(5) (6)
122 550
172 876
1250 7023
383 2139
187 1038
104 572
94 802
271 1571
224 1558
276 1607
252 1298
146 872
705 3755
213 1170
175 859
301 1669
M
(7)
274
430
3645
1093
550
283 425
779
774
818
643
412
1878
593
441
859
6073 35684 18317
6073 35684 18317
250 1334
177 1101
167 937
201 1343
238 1341
83 577
76 421
269 1678
633 3699
204 1189
168 775
208 1304
136 857
503 3132
72 435
175 1166
799 4358
752 4554
341 2095
106 455
238 1427
277 1506
656
568
475
688
670
302
213
869
1891
618
389
676
427
1590
229
659
2214
2346
1077
247
746
767
F
(8)
276
446
3378
1046
488
289
377
792
784
789
655
460
1877
577
418
810
17367
17367
678
533
462
655
671
275
208
809
1808
571
386
628
430
1542
206
507
2144
2208
1018
208
681
739
VILLAGE PRIMARY
Total Population
in the age group
(0 - 6)
M
(9)
59
114
674
187
120
47
136
159
171
141
120
76
334
107
75
176
3184
3184
122
103
85
122
122
48
35
161
331
84
79
127
69
291
34
84
364
385
210
34
136
158
F
(10)
46
109
680
168
106
43
108
142
147
155
118
107
324
101
87
156
3079
3079
123
89
85
122
119
54
42
126
314
94
77
125
72
273
41
76
368
383
200
32
143
121

201
CENSUS ABSTRACT
INDUSTRIAL CATEGORIES OF MAIN WORKERS
Scheduled castes
Scheduled Tribes
literates Total Main Workers
CuHivators
M F M
(11) (12) (13)
145 144 56
261 270 966
311
258
113
3 275
301 237
166
190
428
255
100
258
5274
866
301
234
89
12
6 421
265
321
231
164
220
428
224
97 13
223 10
5016 73
5274 5016 73
307
262 108 198
260
149
34
263 475
186 122 143 70
471
21
102
471 623 404 124
285 196
320
242
121
193
255
136 32
249
470
150 136
127 79
448
29
480
630
356
111
248 204
67
6
(I IX) (I)
F M F M F M F
(14) (15) (16) (17) (18) (19) (20)
47 58 25 164 173 139 140 107 37 244 246 164 144
1466
400
159
461
141
22
1644
589
291
78 10 159 371 55 10 182
148 31 447
199 37 382
314 92 428
288 111 369 124 43 218
608 123 1071
219 65 318
10 100 8 294
7 310 86 471
93 6970 1655 10001
927 524
406 269
105 140
88 97
173 169
375 393
204 183
271 223
258 249
194 60
885 670
294 172
233 288
413 237
7278 5853
202
106
7 45
165
283 54
111
131
33 352
85
228 155
3385
93 6970 1655 10001 7278 5853 3385
268
114
119
243
216
74
101
357
707
162 164
297
200 678 98
471
652
84 1024
443
105 239
9 238
107
21 12 73
65
12 23 58
154
23 57 qg 51
207
15
98
133
233 132
13
43
56
347
295
294
393
365
166
123 459
1104
366
331 224
64 236
271 152
351 161
311 135
140 149
112 93
220 224 842 838
228 289
243 189 144
347 1~6 272
232 228 147
819 513 425
135 151 90
266 139 142
1200 1012 498
1280 704 766
573 514 299
140 120 87
418 343 210
436 389 272
187
27
128
149
90
126
85
54
591
151
79
47 136 169 103
80
297
302
286
46 22
230
M
(21)
15
68
656
198
99
52
6
33 119
120
99 153
269
127
4 188
2915
2915
44 40
132
201
202
15
24 152
138 60
86
39 61
288
38
32 484 397 149
36 188
109
Agricultural
Labourers
(Ii)
F
(22)
33
96
653
292
93
42
7
84
142 155
126 158
499
203
5 241
3662 3662
136 35
137 197
213
14
27 147 214 75
107
56
84 330
48 39
670 392 207
65
321
148
Location Code Number
(1)
2 (Concld .. ) 8
9 10
11
12 13
14
15
16
17
18
19
20
21 22 23
3
2 3
4
5
6
7 8
9
10
11 12 13 14
15
16 17 18
19 20 21
22
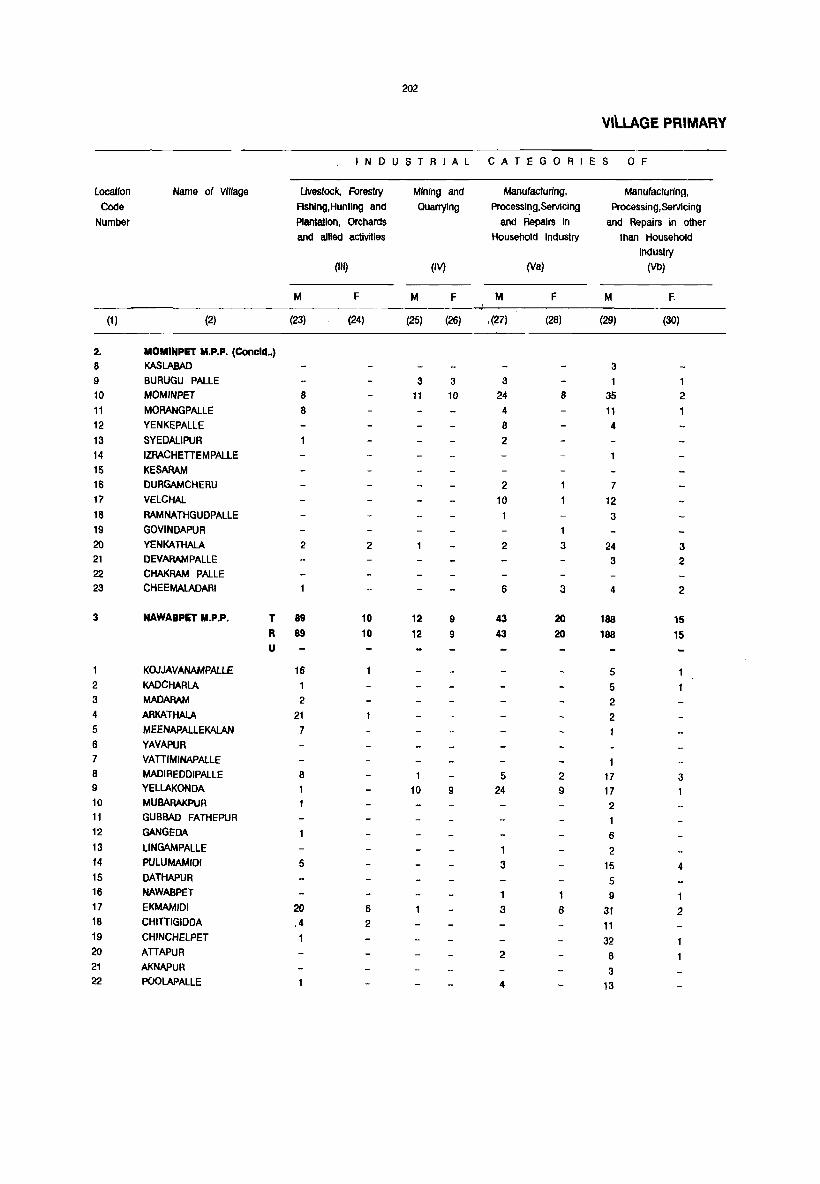
202
VilLAGE PRIMARY
IN 0 U STRIAL CATEGORI E S o F
Location Name of Village Uvestock, Forestry Mining and Manufacturing, Manufacturing,
Code Ashlng,Hunting and Quarrying Processing,Servicing Processing,Servicing
Number Plantation, Orchards and Repairs in and Repairs in other
and allied activities Household Industry than Household Industry
(III) (IV) (Va) (Vb)
M F M F M F M F
(1) (2) (23) (24) (25) (26) 1(27) (28) (29) (30)
2. MOMINPET M.P.P. (Concld •• ) 8 KASlABAD 3 9 BURUGU PALLE 3 3 3 1 1 10 MOMINPET 8 11 10 24 8 35 2 11 MORANGPALLE 8 4 11
12 YENKEPALLE 8 4 13 SYEDALIPUR 2
14 IZRACHETIEMPALLE
15 KESARAM 16 DURGAMCHERU 2 7 17 VELCHAL 10 12 18 RAMNATHGUDPALLE 3 19 GOVINDAPUR 1 20 YENKATHALA 2 2 2 3 24 3 21 DEVARAMPALLE 3 2 22 CHAKRAM pALLE 23 CHEEMALADARI 6 3 4 2
3 NAWABPET M.P.P. T 89 10 12 9 43 20 188 15 R 89 10 12 9 43 20 188 15 U
KOUJAVA~PALLE 16 5 2 KADCHARLA 5 3 MADARAM 2 2 4 ARKATHAlA 21 2 5 MEENAPALLEKALAN 7 6 YAVAPUR 7 VATIIMINAPALLE 8 MADIREDDIPALLE 8 1 5 2 17 3 9 YELLAKONDA 10 9 24 9 17 10 MUBARAKPUR 2 11 GUBBAD FATHEPUR 1 12 GANGEDA 6 13 LlNGAMPALLE 1 2 14 PULUMAMIDf 5 3 15 4 15 DATHAPUR 5 16 NAWABPET 1 1 9 17 EKMAMIDI 20 6 3 8 31 2 18 CHITIIGIDDA .4 2 11 19 CHINCHELPET 32 20 ATIAPUR 2 8 21 AKNAPUR 3 22 PCIOLAPAllE 4 13
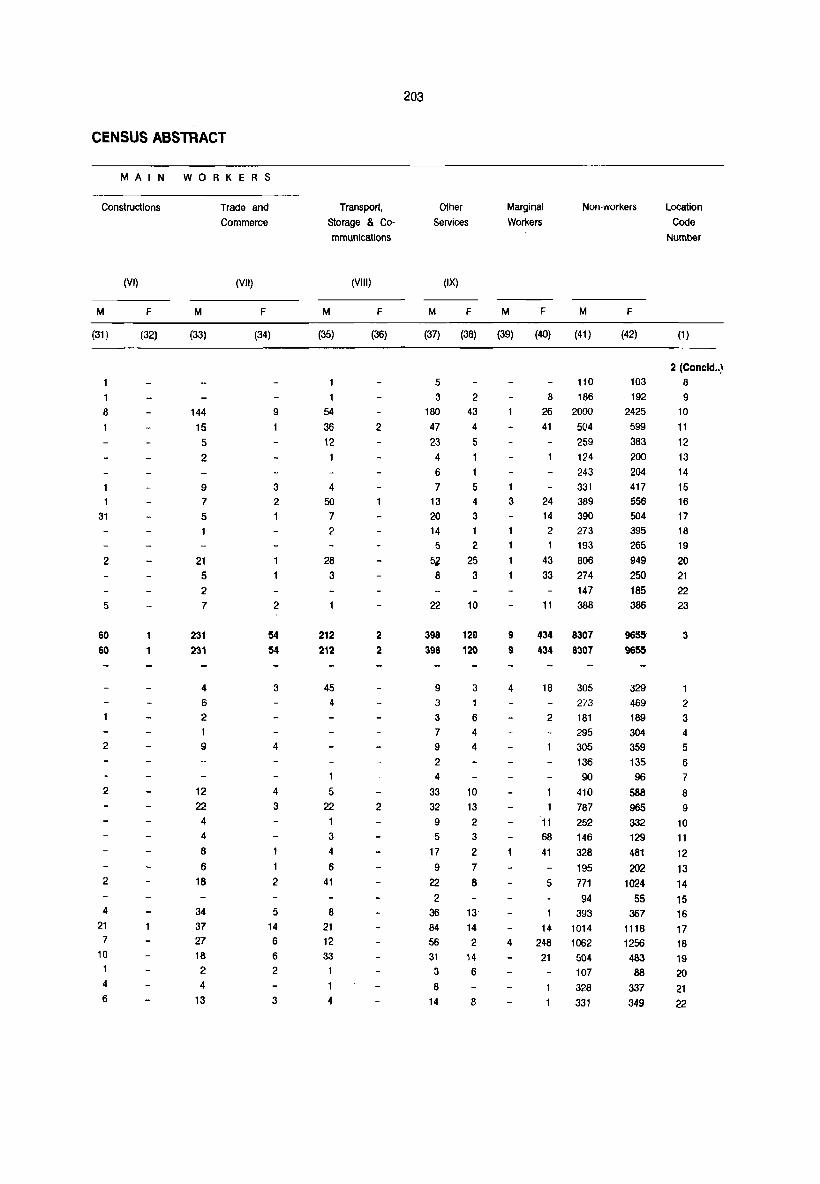
CENSUS ABSTRACT
MAIN WORKERS
Constructions
M
(31)
1
1
8
31
2
5
60 60
2
2
2
4
21 7
10 1
4 6
(VI)
F
(32)
M
(33)
144 15
5 2
9
7
5
21 5 2
7
231
231
4
6
2 1
9
12
22
4 4
8
6 18
34 37 27 18
2 4
13
Trade and
Commerce
(VII)
F
(34)
9
1
3
2
2
54
54
3
4
4
3
2
5 14 6
6
2
3
Transport,
Storage & Co
mmunications
M
(35)
1
54 36 12
4 50
7
2
28 3
212 212
45 4
1
5 22
3
4
6 41
8 21 12
33
1
1
4
(VIII)
F
(36)
2
2
2
2
203
Other
Services
(IX)
M F
Marginal
Workers
M F
Non-workers
M F
(37) (38) (39) (40) (41) (42)
5
3 180 47 23
4
6
7
13
20 14 5
~ 8
22
398 398
9
3
3
7
9
2
4
33
32 9
5
17 9
22 2
36 84 56 31
3
8 14
2 43
4 5
1
5 4
3
1
2
25 3
10
120
120
3
1
6
4
4
10 13 2
3
2
7 8
13'
14
2
14 6
8
1 3
9
9
4
4
110 8 186
26 2000 41 504
259 124 243 331
24 389 14
2
1
43 33
11
390
273 193 806 274 147 388
434 8307 434 8307
18 305 273
2 181
295 305 136 90
410 787
11 252
68 146 41 328
195 5 771
94 393
14 1014 248 1062
21 504 107 328
331
103 192
2425 599 383 200 204 417 556 504 395 265 949 250 185 386
329
469 189 304 359 135
96
588 965
332 129
481
202 1024
55 367
1118
1256 483
88
337
349
Location
Code
Number
(1)
2 (Concld .. ~
8
9
10 11
12
13
14 15 16 17 18
19
20 21
22 23
3
1
2 3 4
5
6 7 8 9
10 11 12
13 14
15 16
17 18 19
20
21 22

Location
Code Number
(1 )
4
2
3 4
5 6 7 8
9 10 11 12 13 14 15 16 17 18 19 20 21 22
23 24 25 26
7
1
2
3 4
5
7
8
9
10
Name of Village
(2)
SHANKARPALLE M.P.P. T* ft* U*
DHOBIPEI
FATHEPUR
SINGAPUR
SHANKARPALLE BHULKAPUR KONDAKAL MOKILA
DONTHANPALLE JANWADA
MAHARAJPET
GOPULARAM
PRODDUTUR TANGUTOOR
YELWARTHY RAMANTHAPUR
CHANDIPPA
RAVALPALLE KALAN
SANKEPALLE (KHALSA) SANKEPAlLE (PAIGAH)
ANTHAPPAGUDA MASANIGUDA HUSSAINIPUR
PARVEDA (CHANCHALAM)
PARVEDA KHALSA
YERVAGUDA
KOTHAPAlLE
QUTHBULLAPUR M.P,P. T*
It* U*
GAGILAPUR
NAGLUR DUNDIGAl
DOMMARA POCHAMPALLE BAHADURPALLE BOWRAMPET SAMBHUPUR
MALLAMPET BACHPAlLE
204
Area of Village No. of No. of Total Population (Includ
Ing Institutional and
Houseless Population)
in Hectares Occupied House·
(3)
142.70 142.70
3219.27 694.03 787.11 788.33 893.54
1483.98 844.17 560.49
1904.04 235.53 314.44
1064.32 1229.19 1072.41 261.43 603.38 301.09 218.53
1.00
410.35 163.09 152.97 784.68 632.52 163.09 493.72
98.40 98.40
797.63 509.09
2027.87 722.36 578.29
1446.58 62.32
236.74 1214.88
Residential holds Houses
(4)
8865
8865
1090 226 454
1176 428 566 441 95
780 224 214 395 405 315 128 202 294 214
175 192
20 98
341 135 257
5491 5491
258 111
1177
328 406
675 71
280 269
P M
(5) (6) (7)
8865 50082 25791 8865 50082 25791
1090 6011 226 1379 454 2426
1176 6649 428 2421 566 3205 441 95
780 224 214 395 405 315 128 202 294 214
2430 594
4918 1064 1040 2141 2335 1937 663
1153 1640 1038
3046 697
1257 3510 1214 1642 1262 312
2571 552 549
1098 1216 967 351 587 824 528
F
(8)
24291 24291
2965 682
1169 3139 1207 1563 1168 282
2347 512 491
1043 1119 970 312 566 816 510
Un·lnhabited ---175 192 20 98
341
1208 619 589 1052 537 515
145 73 72
135 257
511 1808
821 1493
5517 28169 5517 28169
268 2017 111 566
1178 6482 334 1650 406 1908
676 3721 71 363
280 1347 269 1240
264 937 429 749
14863 14863
1386 286
3285 796 994
1965 184 722 653
247 871 392 744
13306 13306
631 280
3197 854 914
1756 179 625 587
VILLAGE PRIMARY
Total Population
In the age group (0 . 6)
M
(9)
4921 4921
586
139 213 638 202 319 266 77
521 113 86
167 237 196 59
109 174 107
146 98 12 55
177 90
134
2647 2647
116 56
641 172 169 364
47 126 127
F
(10)
4687 4687
582 126 220 522 225 341 246
61 468
90 87
171 197 212 44
112 . -173
116
134 99 18 62
149 93
139
2!$87 2587
132 62
581 182 204 339
46 134
106
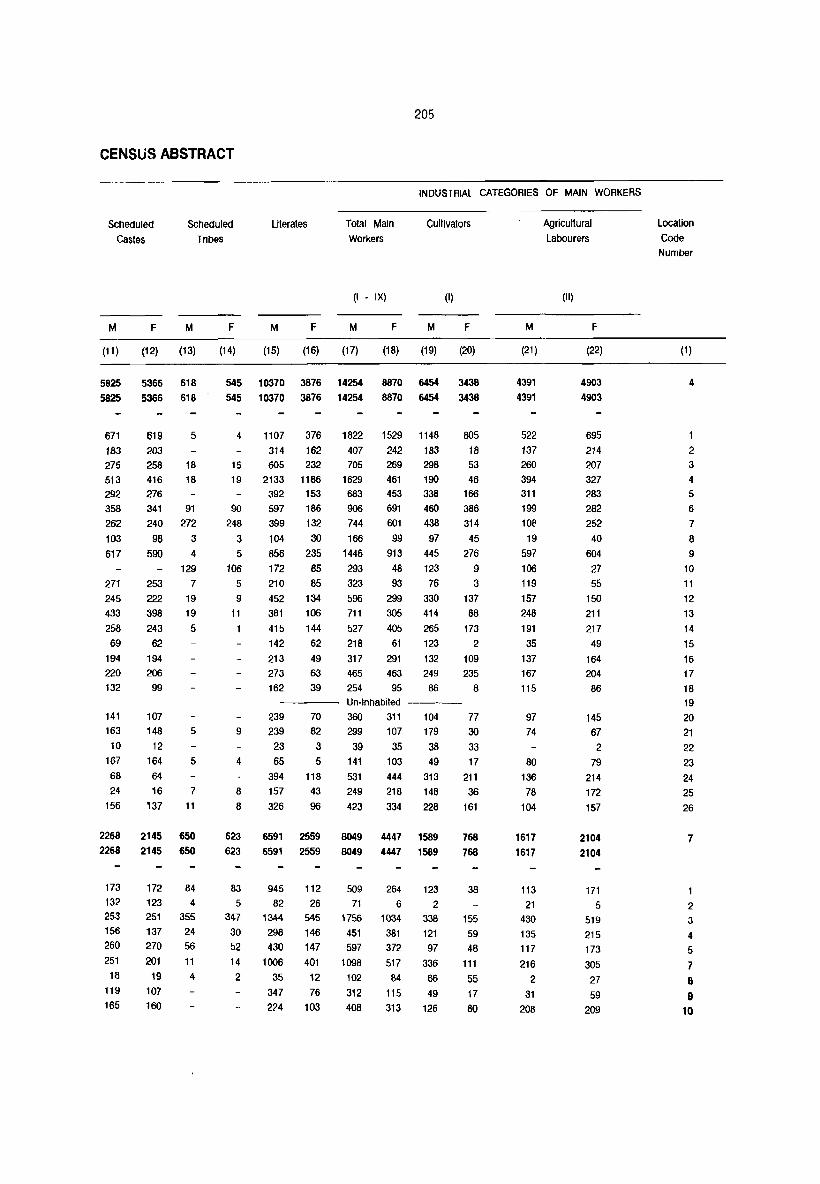
205
CENSUS ABSTRACT
INDUSTRIAL CATEGORIES OF MAIN WORKERS
Scheduled Castes
Scheduled Tribes
Literates Total Main Workers
Cultivators
M
(11 )
5825
5825
671
183 275
513 292
358
262
103
617
271
245
433
258
69
194
220 132
141
163
10
F
(12)
5366
5366
619
203
M
(13)
618
618
5
258 18 416 18 276
341 91
240 272
98 3 590 4
129
253 7
222 19
398 19
243 5 62
194
206
99
107 148
12
5
167 164 5
68 64
24 16 7
156 137 11
2268 2145 650
2268 2145 650
173 172 84 132 123 4 253 251 355
156 137 24 260 270 56
251 201 11
18 19 4
119 107
165 160
(I IX)
F
(14)
545
545
M F
(15) (16)
10370 3876
10370 3876
M
(17)
14254
14254
F
(18)
8870
8870
M
(19)
6454
6454
4 1107 376 1822 1529 1148
314 162 407 15 605 232 705
19 2133 1186 1629 392 153 683
90 597 186 906
248 399 132 744
3 104 30 166
5 856 235 1446
106 172 85 293
5 210 85 323
9 452 134 596
11 381 106 711
1 415 144 527
142 62 218
213
273
162
49 63
39
317 465
254
242 183 269 298
461 190 453 338
691 460
601 438
99 97
913 445
48 123
93 76
299 330
305 414
405 265
61 123
291
463
95
132 249
86
(I)
F
(20)
3438
3438
805 18 53
46 166
386
314
45
276
9 3
137
88
173
2
109 235
8
Un-Inhabited ----
9
4
8
8
623
623
83
5 347
30
52
14
2
239 239
23
70
82
3 65 5
394 118
157 43
326 96
6591 2559
6591 2559
945 112
82 26 1344 545
298 146
430 147
1006 401
35 12
347 76
224 103
360 311
299 107
39 35
104
179
38
141 103 49
531 444 313
249 218 148
423 334 228
8049 4447 1589
8049 4447 1589
509 264 123
71 6 2 1756 1034 338
451 381 121
597 372 97
1098 517 336
102 84 66
312 115 49
408 313 126
77
30
33
17
211
36
161
768
768
38
155 59
48
111
55 17
80
M
(21)
4391
4391
522
137
260
394 311
199
10e
19
597
106
119
157
248
191
35
137 167
115
97
74
80
136
78
104
1617
1617
113
21 430
135
117
216
2
31
208
Agricultural Labourers
(II)
F
(22)
4903
4903
695
214 207
327 283
282
252
40
604
27
55
150
211
217
49
164
204
86
145
67
2 79
214
172
157
2104
2104
171
5 519
215
173
305
27
59
209
Location Code Number
(1 )
4
2 3
4
5 6
7
8 9
10
11
12
13
14
15
16
17
18 19
20
21
22
23
24
25
26
7
2
3
4
5
7 8 e
10

206
VILLAGE PRIMARY
I N D USTRIAL CATEGOR I E S o F
Location Name of Village Livestock, Forestry Mining and Manufacturing, Manufacturing,
Code Fishing,Hunting and Quarrying Processing,Servicing Processing,Servicing
Number Plantation, Orchards and Repairs in and Repairs in other
and allied activities Household Industry than Household Industry
(III) (IV) (Va) (Vb)
M F M F M F M F
(1) (2) (23) (24) (25) (26) (27) (28) (29) (30)
4 SHANKARPALLE M.P.P. T 289 65 67 58 308 79 628 17
R 289 65 67 58 308 79 628· 17
U
DHOBIPET 12 2 2 8 6 20 2 FATHEPUR 7 16 3 SINGAPUR 3 13 9 4 SHANKAAPALLE 4 44 2 113 5 BHULKAPUR 1 2 2 4 6 KONDAKAL 30 1 5 22 6 113 7 MOKILA 47 17 49 13 24 6 DONTHANPALLE 13 1 12 9 JANWADA 36 14 33 131 .1 10 MAHARAJPET 4 4 4 17 11 GOPULARAM 46 11 7 3 34 10 12 PRODDUTUR 19 18 17 13 TANGUTOOR 14 2 3 14 YELWARTHY 6 9 4 17 15 RAMANTHAPUR 19 8 1 5
16 CHANDIPPA 5 6 11 17 RAVALPALLE KALAN 3 5 5 18 10 18 SANKEPALLE (KHALSA) 5 19 SANKEPALLE (PAIGAH) Un-Inhabited ---20 ANTHAPPAGUDA 28 19 50 48 7 19 21 MASANIGUDA 2 3 3 3 14 22 HUSSAINIPUR 23 PARVEDA (CHANCHALAM) 3 4 6 24 PARVEDA KHALSA 2 4 1 25 25 YERVAGUDA 3 6 4 26 KOTHAPALLE 14 22 5 12
7 QUTHBULLAPUR M.P.P. T 491 227 240 159 55 28 2205 797 R 491 227 240 159 55 28 2205 797 U
GAGILAPUR 5 3 7 5 99 30 2 NAGLUR 3 3 DUNDIGAL 31 9 9 4 17 8 449 242 4 DOMMARA POCHAMPALLE 20 5 5 109 76 5 BAHADURPALLE 9 12 5 1 2 242 123 7 BOWRAMPET 47 2 20 11 266 56 8 SAMBHUPUR 2 1 22 9 MALLAMPET 7 180 32 10 BACHPALLE 25 8

CENSUS ABST-RACT
MAIN WORKERS
Constructions
M
(31)
183 183
4
4 32
9 5
17 28 5
10
2
5
2 11 1
31
7
2
6
262 262
24
49 14 49 12 2
9 9
(VI)
F
(32)
17 17
5
1
2
9
50 50
5 10
M
(33)
882 882
36 16 41
447 9
31 23
3 79 18 13 17
12 17 5
13 6 IT
34 10
12 10 20
521 521
12 1
128 20 38
103
4
21 11
Trade and
Commerce
(VII)
F
(34)
92 92
6
4
28
3
12
3
6 2
16
2
2
99 99
9
23
7
7
3 4
207
Transport,
Storage & Co
mmunications
Other
Services
Marginal
Workers
Nor,-workers
M
(35)
224 224
7
5 10
124 1
11 11
2 18
2
2
4
1
3
1
2 3
1
(VIII)
F
(36)
2
2
2
(IX)
M F M F M
(37) (38) (39) (40) (41)
828 199 151 1157 11386 828 199 151 1157 11386
63 41 67
281 17
26 39 3
78 14 16 33 16
14 20
6
13 6
14
8 5
50 1
12 3
3 5 7
8
11 3
10 9
3 7
4 73 7 7
24
24
2 2
13 4
2
100
2
51 242 212 153 171
10 35
8
2
1224 290 5£.2
1881 530 736 518 142
1052 252 219 478 505
416 133 268 357 274
Un-Inhabiled---
4 10 6 6 68 78
253 238
6 2 3
190
190
16
45
7
21
3
2
2
12 1
2 32
4
14
879 879
109
44 260
27 25 75
3
11 27
2 16 2
9
213 143 213 143
8 2
72 13 13 1 6
26 8 1
4 116 12
5
471 471
8
169
50
87
34 123
406 180 325
6671 6671
875 215
1516 344 397 859 82
294 245
F
(42)
14264 14264
1423
436 898
2678 654 870 567
132 1192
252 245 573 804 530 251 275 345
413
210 330
37 144
422 173 410
8388
8388
359 274
1994
473 542
1189
95 423 274
Location
Code
Number
(1 )
4
1
2 3
4
5
6
7
8 9
10 11
12 13 14 15 16
17
18 19 20 21 22
24 25 26
7
1
2
3 4
5
7
8
9
10
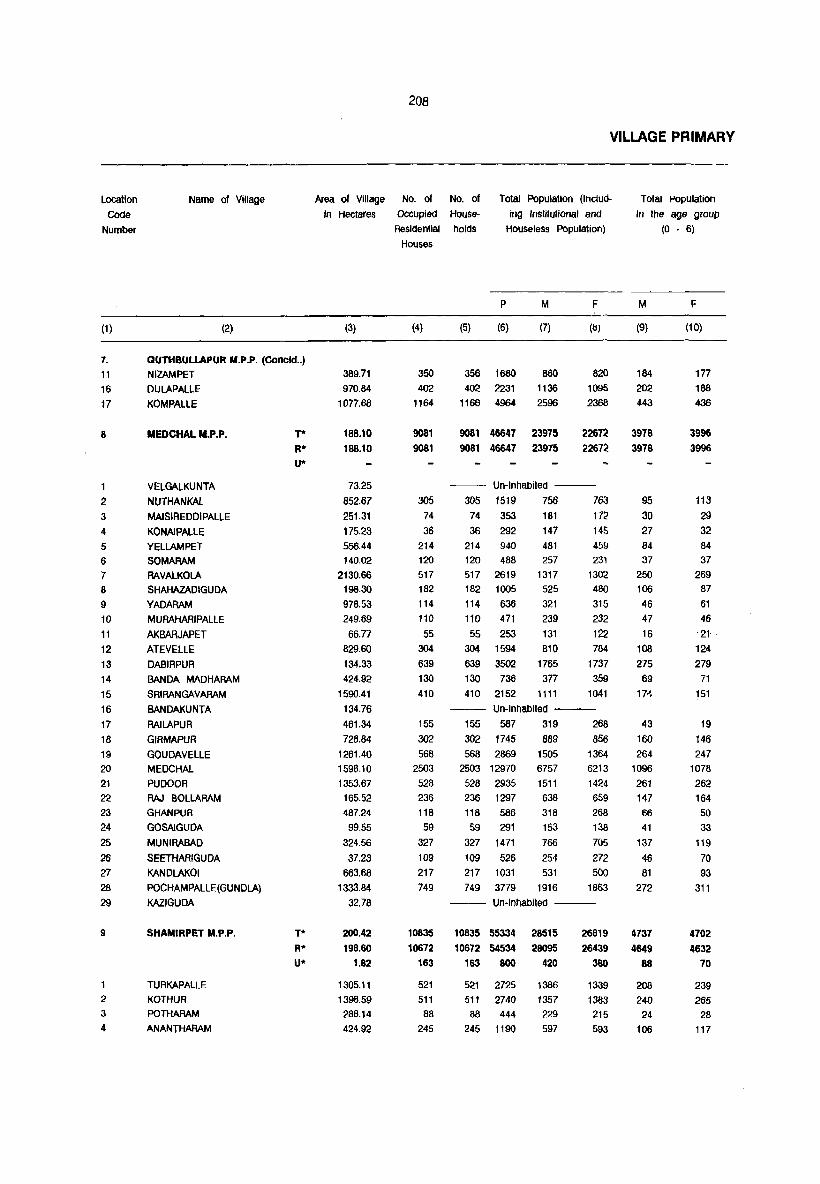
Location
Code
Number
(1)
7.
11
16
17
8
1 2 3
4 5 6
7
8
9
10
11 12 13 14
15 16
17 18
19 20
21 22 23
24
25 26 27
28
29
9
2
3
4
Name of Village
(2)
aUTMBUllAPUR M.P.P. (Coneld .. )
NIZAMPET
DULAPALLE'
KOMPALLE
MeDCHAL M.P.P.
VELGALKUNTA
NUTHANKAL
MAlSIREDDIPALLE
KONAIPALLE
YELLAMPET SOMARAM RAVALKOLA SHAHAZADIGUDA
YADARAM MURAHARIPALLE
AKBARJAPET
ATEVELLE
DABIRPUR BANDA MADHARAM
SRIRANGAVARAM
BANDAKUNTA
RAILAPUR
GIRMAPUR
GOUDAVELLE MEDCHAL PUDOOR RAJ BOLLARAM GHANPUR GOSAIGUDA
MUNIRABAD
SEETHARIGUDA
KANDLAKOI
POCHAMPALLE(GUNDLA)
KAZIGUDA
SHAMIRPET M.P.P.
TURKAPALLE I<OTHUR POTHARAM ANANTHARAM
T*
R* U*
T*
R* u*
208
VILLAGE PRIMARY
Area of Village No. of No. of Total Population (Includ- Total I'Opulation
In the age group
(0 - 6)
In Hectares Occupied House- log Institutional and
(3)
389.71
970.84
1077.68
188.10
188.10
73.25
852.67
251.31 175.23
556.44 140.02
2130.66 198.30
978.53
249.69
66.77
829.60
134.33 424.92
1590.41
134.76
461.34 72B.B4
1261.40
1598.10
1353.67
165.52
487.24 99.55
324.56
37.23
663.68 1333.84
32.78
200.42 198.60
1.82
1305.11
1398.59 288.14
424.92
Residential holds Houseless Population)
Houses
(4)
350 402
1164
9081 9081
305 74
36
214 120 517 182
114
110
55
304 639
130
410
155
302 568
2503 528
236
118 59
327
109 217
749
10835
10672 163
521 511
88 245
p M
(5) (6) (7)
356 1680 860
402 2231 1136
1166 4964 2596
9081 46647 23975 9081 46647 23975
F
(Il)
820
1095
2368
22672 22672
Un-Inhabited ---
305 74
36
1519 756
353 181
292 147
214 940 120 488
517 2619 182 1005
114 636
110 471
55 253 304 1594
481 257
1317 525
321
239
131
810
639
130
410
3502 1765
736 377
2152 1111
763
172 145
459 231
1302 480
315 232 122 784
1737
359 1041
Un-Inhabited ---
155 302
587 319
1745 BB9 568 2869 1505
2503 12970 6757
528 2935 1511 236 1297
118 586
59 291
327 1471
109 526 217 1031
638 318 153
766
254 531
749 3779 1916
268
B56 1364 6213 1424 659
268 138
705
272
500 1863
Un-Inhabited ---
10835 55334 10672 54534
163 800
521 2725
511 2740
88 444
245 1190
28515 28095
420
1386
1357 229
597
26819 26439
380
1339 1383 215 593
M
(9)
184
202
443
3978 3978
95 30
27 84 37
250 106
46
47
16
108
275 69
17{
43
160 264
1096
261
147 66 41
137 46 81
272
4737 4649
88
208 240
24 106
F
(10)
177 188 436
3996 3996
113 29 32 84
37
269 87
61
46
21-124
279
71 151
19 146
247 1078 262 164
50 33
119
70 93
311
4702 4632
70
239
265
28
117

209
CENSUS ABSTRACT
INDUSTRIAL CATEGORIES OF MAIN WORKERS
Scheduled
Castes
Scheduled
Tribes
Literates Total Main
Workers
Cultivators
M F M
(11) (12) (13)
275 266 29 215 207 17 251 232 66
4245 4094 1395 4245 4094 1395
146 84 22 61 55
195 41
117
264 491 82
144
103 159 175
1059 257 49 52
2
68 23
179 416
5807 5609
198
197 411 43 90
144 67 16 73 47
164 43
113
256 490
71 147
78 158 143
1098 235
45 45
4
65 18
172 402
5471 5296
175
188 422
48 97
5 5
2
358 63 24
4
42 45
8
59 213
3
356 68
71
30 39
695 692
3
93 9
. (I IX) (I)
F M F M F M F
(14) (15) (16) (17) (18) (19) (20)
24 112 43 537 216 104 69 13 568 294 614 351 129 102 53 1200 654 1594 794 98 34
1274 11590 5857 13302 1274 11590 5857 13302
7294 3185 1510 7294 3185 1510
7 5
3
359 57 25
2
27 31
5
58 128
5
389 49
49
32 43
647 645
2
86 13 2 3
Un-Inhabited ----
370 147 448 255 272 123 14 45 101 54 37 46 12 80 57 7
161 68 281 169 74 82 32 165 130 85
487 182 764 553 266 157 44 283 208 52 138 59 204 170 68 63 22 149 118 35 47 13 89 63 24
465 261 425 165 93 851 342 1046 699 267 165 63 223 159 85 687 287 627 283 129
Un-Inhabited
127 43 365 181 857 500
4236 2426 557 273 180 50 80 17 33 13
237 179 100 28 345 200 740 370
179 171 524 293 853 563
3514 770 337 191 76
42:2 155 317
1079
1160 318 272 124 68
380 134 199 529
143 221 169 158 210 132
43 13
159 33
88
322
8
4
48 14 93
1
15 16 4
7
99 44 82
165 142 118 34 64 86 4 8
161 30 23
112 ------- Un-Inhabited - ----
12195 11989
206
443 471 107 194
5469 5365
1~
172 167 33 65
16244 16023
221
771 804 152
360
10684 10578
106
495 681 130 286
4936 4924
12
271 26.7 101 238
3002 3000
2
199 160 85
205
M
(21)
80 60
204
4122 4122
52 45 66 82 68
36& 206 48 27 38
181 436 40
197
198 264 755 202 134 146
52 159 75
131 152
5463 5404
59
263 286 29 40
Agricultural
Labourers
(II)
F
(22)
58 157 206.
4547 4547
109 41 52 93
112 408 206 106 62 46
152 557 89
18i
2
139 342 724 152 155
120 60
187 97
161
194
6106 6045
61
258 425 35 50
Location
Code
Number
(1)
7 (Concld __ )
11
16 17
8
2 3
4 5
6
7
8
9
10 11 12 13 14 15 16 17 18 19 20 21 22 23 24 25 26 27 28 29
9
1
2
3
4

210
VILLAGE PRIMARY
I N D U STRIAL CATEGOR I E S o F
Location Name of Village livestocK, Forestry Mining and Manufacturing, Manufacturing,
Code Fishing,Hunting and Quarrying Processing, Servicing Processing, Servicing Number Plantation, Orchards and Repairs in and Repairs In other
and allied activities Household Industry than Household Industry
(III) (IV) (Va) (Vb)
M F M F M F M F
(1 ) (2) (23) (24) (25) (26) (27) (28) (29) (30)
7. QUTHBULLAPUR M.P.P. (Concld .. )
11 NIZAMPET 81 12 33 4 3 159 47 16 DULAPALLE 17 18 5 6 220 37 17 KOMPALLE 278 179 170 139 431 146
8 MEDCHAL M.P.P. T 756 296 112 61 186 93 1636 223 R 756 296 112 61 186 93 1636 223 U
1 VELGALKUNTA Un·lnhabited 2 NUTHANKAL 18 3 1 2 16 9 3 MAISIREDDIPALLE 5 8 4 4 KONAIPAlLE 2 5 YElLAMPET 72 7 5 3 9 6 SOMARAM 10 7 RAVALKOLA 15 11 5 9 39 5 8 SHAHAZADIGUDA 1 9 YADARAM 19 15 16 5 10 MURAHARIPALLE 51 29 19 9 10 1 11 AKBARJAPET 7 4 12 ATEVEllE 5 7 34 1 13 DABIRPUR 23 3 20 5 61 3 14 BANDA MADHARAM 8 22 22 4 15 SRIRANGAVARAM 2 2 16 26 16 BANDAKUNTA Un·lnhabited 17 RAILAPUR 9 4 4 18 GIRMAPUR 2 11 4 6 27 19 GOUDAVEllE 67 26 2 12 11 86 11 20 MEDCHAl 118 28 10 5 60 26 897 104 21 PUDOOR 55 32 17 11 27 11 87 14 22 RAJ BOLARAM 15 2 2 2 23 20 23 GHANPUR 1 24 GOSAIGUDA 6 25 MUNIRABAD 23 21 11 3 26 SEETHARIGUDA 32 5 27 KANDLAKOI 7 51 5 28 . POCHAMPALLE(GUNDLA) 252 143 5 2 190 35 29 KAZIGUDA Un·lnhablted
9 SHAMIRPET M.P.P. T 449 96 335 152 263 169 1387 358 R 447 96 335 152 263 169 1330 321 U 2 57 37
1 TURKAPAlLE 17 15 3 31 3 2 KOTHUR 52 24 20 20 14 30 11 3 POTHARAM 5 2 5 3 4 ANANTHARAM 7 8 23 14

CENSUS ABSTRACT
MAIN WORKERS
Constructions
M
(31)
7
10 77
229 229
3
3
5 1
8
12 2
24 3
8
3
27
88
13 5
6
6
11
593 589
4
12 48
(VI)
F
(32)
2
32
23 23
3
9
6
1
2
107
107
4
6
M
(33)
24 52
107
1001
1001
25 3
17 2
14 14 31 1
4 20 83 21 31
9
18 70
483 59
15
4
14
13 50
1064
1058 6
65 28 2
17
Trade and
Commerce
(VII)
F
(34)
8
9 24
124
124
6
2 3
10
1
9
5
3
11 48 1 2
4
6
10
231 230
11 7
4
211
Transport.
Storage & Co
mmunications
(VIII)
M F
Other
Services
(IX)
M F
Marginal
Workers
M F
Non-workers
M F
(35) (36) (37) (38) (39) (40) (41) (42)
8
25 64
543 543
9
9
38
95 165
16
20 34
1532 408
1532 408
Un-Inhabited---
12 45 11
1 2
5 2 17 11
2
18 13 38 4
4
41 42
5
10
30 301 17
6
5 4
13 34
497 483 14
45 26
3
4
14 1
42 87 40
16
211 Un-Inhabited----
1
4
25 2
14
7
1
13 28 5
126 43 644 178 83 31
5 5
45
11
7 63
Un-Inhabited-·--
4 1
4
31
9
8
1257 454 1190 450
67 4
51
33
8
24
16
26 6
12
3
32
32
7
2
4
12
5
25 25
2
8
156 320 522
1002
596 10641
596 10641
13
1
25
1
88 9
47 1
22 153
39
3
194
308 80 67
193 92
552 242 117 90 40
385 719
154 484
140 365 652
3239 741 289 127
77 339 99
214 836
392 12246 392 12047
199
50
39
613
545 77
236
448 744
1573
14782 14782
495 118 87
265 101
749 272
145
114 58
531 1029
200 758
97
516 800
5031 953 348
144 70
322
138 301
1140
15743 15469
274
794 663 85
307
Location
Code
Number
(1 )
7 (Concld .. )
11 16 17
8
2
3 4
5 6
7
8
9 10 11 12 13
14 15 16 17 18 19 20 21 22 23 24 25 26 27
28 29
9
1
2 3
4

Location
Code
Number
(1)
9 5 6 7
8
9 10
11
12
13
14
15
16
17
18
19
20
21
22
23
24
26
27
28
29
30
11
1 2
3 4
5
6
7
8
9
10
11
13
Name of Village
(2)
SHAMIRPET M.P.P. (Concld .. ) NARAYAN PUR LAKSHIMAPUR MOODUCHINTALAPAlLE NAGISETIIPALlE KESAVARAM
SAMPANBOLE LAlGADIMALAKPET
MAlIDPUR ALiABAD JAGGAMGUDA
ADRASPALLE LlNGAPUR
UDDEMARRI HOSHYARPAllE
KESAVAPUR YAKHATPURA PONNAL BOMRASPET SHAMIRPET DEVAR YAMJAL
POTHAIPALLE
MAN DAI PALLE THUMKUNTA ANTAIPALLE
JAWAHAR NAGAR
KEESARA M.P.P.
THIMMAIPALLE DHARMAVARAM NARSAMPAllE YADGARPALLE (WEST)
KEESARA
YADGARPALLE (EAST)
HARIDASPALLE
CHEERIYAL
KEESARA DAIRA KUNDANPAlLE NAGARAM
AHMADGUDA
T*
R*
U·
212
Area of Village No. of No. of Total Population (InClud·
ing Institutional and
Houseless Population)
In Hectares Occupied House·
(3)
199.51
543.90
282.47
157.83
652.76
446.77
1864.79
186.56
1050.56
562.11
525.69
188.18
962.34
50.99
2564.26
496.14
1187.75
1423.68
1458.08
1883.00
218.93
117.36
1534.56
443.53
2418.80
113.90
113.90
610.67
441.51
210.03
414.40
2918.18
212.46
314.44
1134.33
163.09
663.68
1419.26
158.64
Residential holds
Houses
(4)
106
387
283
128
333
143
697
178
824
386
300
68
294
199
109
95
331
428
1005
1145
213
67
536
77
975
5223
5223
150 135
78
177
1201
299
14
484
104
159
781
198
P
(5) (6)
106 575
387 2043
283 1480
128 684
333 1847
143 881
697 3581
178 882
824 4274
386 1870
300 1656
68 397
294 1591
199 887
109 572
95 491
331 1793
428 2101
1005 5678
1145 5832
213 1130
67 376
536 2704
77 372
975 3738
M
(7)
278
1061 755
356
924
476
1802
481
2240
986
842
208
838
449
292
251
909
1100
2956
3055
580
196
1406
183
1902
5223 27217 14066
5223 27217 14066
150 756 135 617
78 369
177 776
1201 6470
299 1701
14 70
484 2548
104 614
159 792
781 3902
198 975
403
304
187
410
3442
861
43
1284
311
398
2050
494
F
(8)
297
982
725
328
923
405
1779
401
2034
884
814
189
753
438
280
240
884
1001
2722
2,' 17
550
180
129B
189
1836
13151
13151
353 313
182
366
3028
840
27
1264
3u3
394
1852
481
VILLAGE PRIMARY
Total Population
in the age group (0 • 6)
M
(9)
39
162
129
52
184
94
314
73
347
161
174
64
133
63
49
51
1f'0
1 "'J 4e5
442
91
26
264
33
356
2607
2607
70 63
35
91
616
175
9
238
68
64
317
99
F
(10)
47
179
145
53
173
62
343
72
350
127
173
38
127
59
31
49
164
··116. 469
461
80
28
234
37
366
2547
2547
66
86
36
79
539
186
3 243
48
86
323
103

213
CENSUS ABSTRACT
INDUSTRIAL CATEGORIES OF MAIN WORKERS
Scheduled
Castes
Scheduled
Tribes
Literates Total Main
WorKers
Cultivators
M
(11)
82
215
206
47
58
88
F
(12)
80
196
188
49
65
73
437 424
M
(13)
74
3
64
19
5
152 136 9
355 332 13
116 96 12
142 132
208
21 19
274 258 2
86 86 2
184 164
306 275 11
692 660 25
720 680 55
176 164 6
202 184 46
43 48
266 232 34
2444 2316 180 2444 2316 180
111
81 228 512
24
230
115
413
34
100
75
214
482 22
248
103
379
27
9
19
33
2
6
7
13
6 16
(I IX)
F M F M
(14) (15) (16) (17)
42 166
72
2
59
18
116
381 311
195
393
173
156 . 646
126 440
97 207
213 509
93 272
733 315 1013
4 290 101 278
15 1155 504 1186
10 359 113 579
169 63 479
189 50 6 110
473 191 478 3 102 43 277
3 112 58 184
97 45 157
347 160 545
8 391 217 653
21 1360 629 1663
56 1700 851 1659
4 306 140 323
78 29 121 48 626 307 793
80 43 104 28 777 386 1094
187 6139 2655 7468 187 6139 2655 7468
194
10 35
65
19 77
34 1356
4 360
23
4 601
3 154
12 164
16 1213 13 248
73 230
13 176
22 115
17 257
483 1672
160 468
10 27
212 690
93 158
99 224
592 1023
131 268
F
(18)
170
511
366
158
417
194
M
(19)
149
303
151
76
249
97
654 275
13 126
737 275
478 202
422 153
110 12
356 160
233 89
171 111 134 131
486 221
471 197
1045 498
746 271
208 54
103 45
306 122
83 13
414 67
4298 1779 4298 1779
140 115
95
190
1030
178
15 486 137
139
283
96
51
45
75
369
185 16
175 96
30 157
31
(I)
F
(20)
160
250
98
50
151
70
136
1 117 113
41
4
113 71 88
107 188
103
306
85
30
27
3
1
38
778
778
6
36
5
126
47
14 157 40
6
44 16
M
(21)
4
232 158
60
134
127
281
51
413
230 297
97
146
163
50
9
246
331 544
582
140
58
281
62
90
1620 1620
57
68
17
59
422
126
201
10 50
114
34
Agricultural
Labourers
(II)
F
(22)
3
208
195
79
235
107
368
3 451
332
369
106
187 153
78
27
286
343 571
526
146
76
248 69
111
2355 2355
121
37 40
114
587
101
267
90
75 110 32
Location
Code
Number
(1)
9 (Concld .. )
5 6
7
8
9
10
11
12
13
14
15
16
17
18
19
20 21
22 23
24
26
27
28
29
30
11
2 3
4
5 6
7
8 9
10 11 13
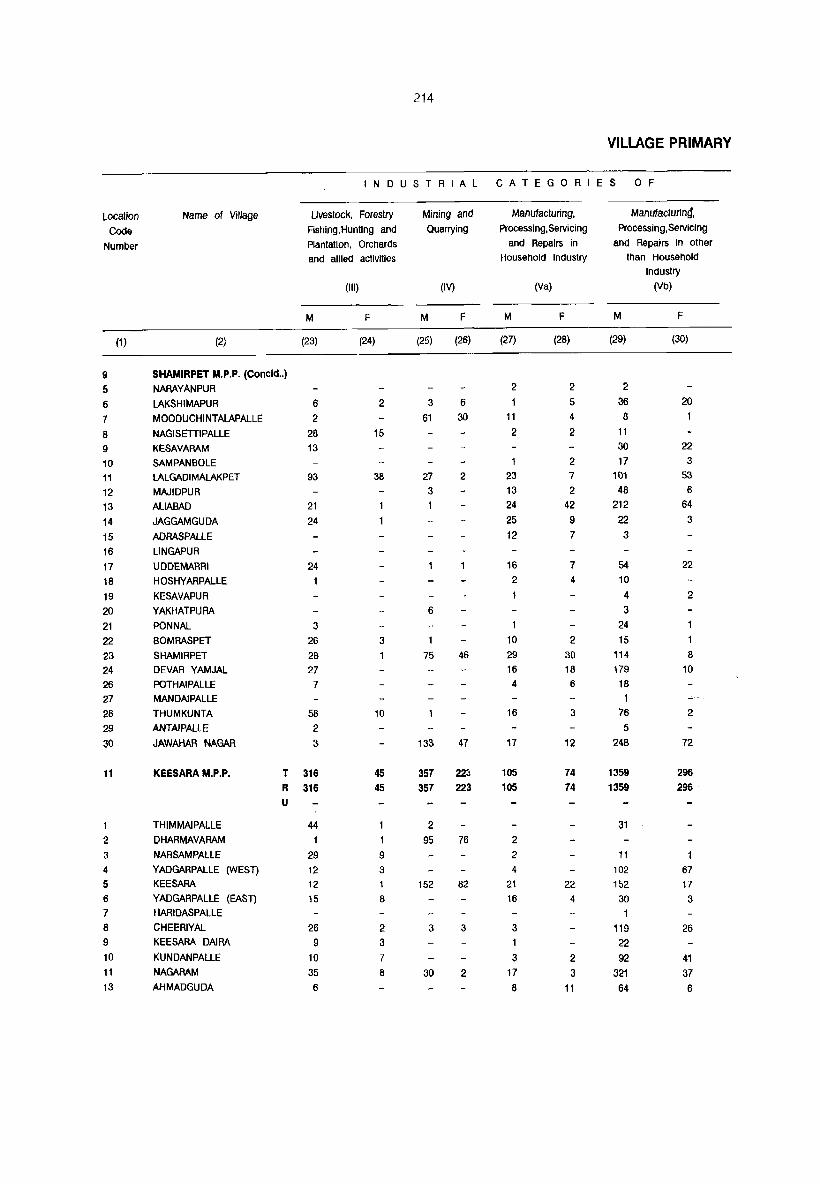
214
VILLAGE PRIMARY
INDUSTRIAL CATEGOR ES OF
Location
Code Number
9
5 6 7 8
9 10
11
12 13
14 15
(1)
Name of Village
(2)
SHAMIRPET M.P.P. (Concld .. )
NARAYANPUR
LAKSHIMAPUR MOODUCHI NTALAPALLE
NAGISETIIPALLE
KESAVARAM
SAMPANBOLE LALGAD1MALAKPET
MAJIDPUR ALiABAD
JAGGAMGUDA
ADRASPALLE
Livestock, Forestry
Fishing,Hunting and Plantation, Orchards and allied activities
M
(23)
6
2
28 13
93
21
24
(Iii)
F
(24)
2
15
38
16 LlNGAPUR
17
18
19 20 21 22
23
24 26 27
28 29
30
11
1 2 3
4
5 6 7
8
9
10
11 13
UDDEMARRI
HOSHYARPALLE
KESAVAPUR
YAKHATPURA
PONNAL
BOMRASPET
SHAMIRPET DEVAR YAMJAL POTHAIPALLE MAN DAIPALLE
THUMKUNTA
ANTAIPAl-lE
JAWAHAR NAGAR
KEESARA M.P.P.
THIMMAIPALLE
DHARMAVARAM
NARSAMPALlE
YADGARPAlLE (WEST) KEESARA
YADGARPALLE (EAST) HARIDASPALlE
CHEERIYAL
KEESARA DAIRA
KUNDANPAlLE
NAGARAM
AHMADGUDA
24
3
26
28 27
7
58
2
3
T 316
R 316
U
44
29 12 12 15
26
9
10 35
6
3
10
45 45
9
3
8
2 3
7
8
Mining and
Quarrying
M
(25)
3
61
27
3
1
6
75
133
357
357
2
95
152
3
30
(IV)
F
(26)
6
30
2
46
47
22:1 223
76
82
3
2
Manufacturing,
Processing, Servicing and Repairs in
Household Industry
M
(27)
2
11
2
23 13
24 25 12
16
2
1
10
29 16
4
16
17
105 105
2 2 4
21 16
3 1
3
17
8
(Va)
F
(28)
2
5
4 2
2 7
2 42
9
7
7 4
2 30
18
6
3
12
74 74
22 4
2
3
11
Manufacturin!1, Processlng,Servicing
and Repairs In other than Household
Industry
M
(29)
2
36 8
11
30
17 101
48 212
22 3
54 10
4 3
24 15
114
179
18
1 76 5
248
1359
1359
31
11
102 152
30 1
119 22 92
321
64
(Vb)
F
(30)
20
22
3
53
6
64 3
22
2
8 10
2
72
296 296
67 17
3
26
41 37 6
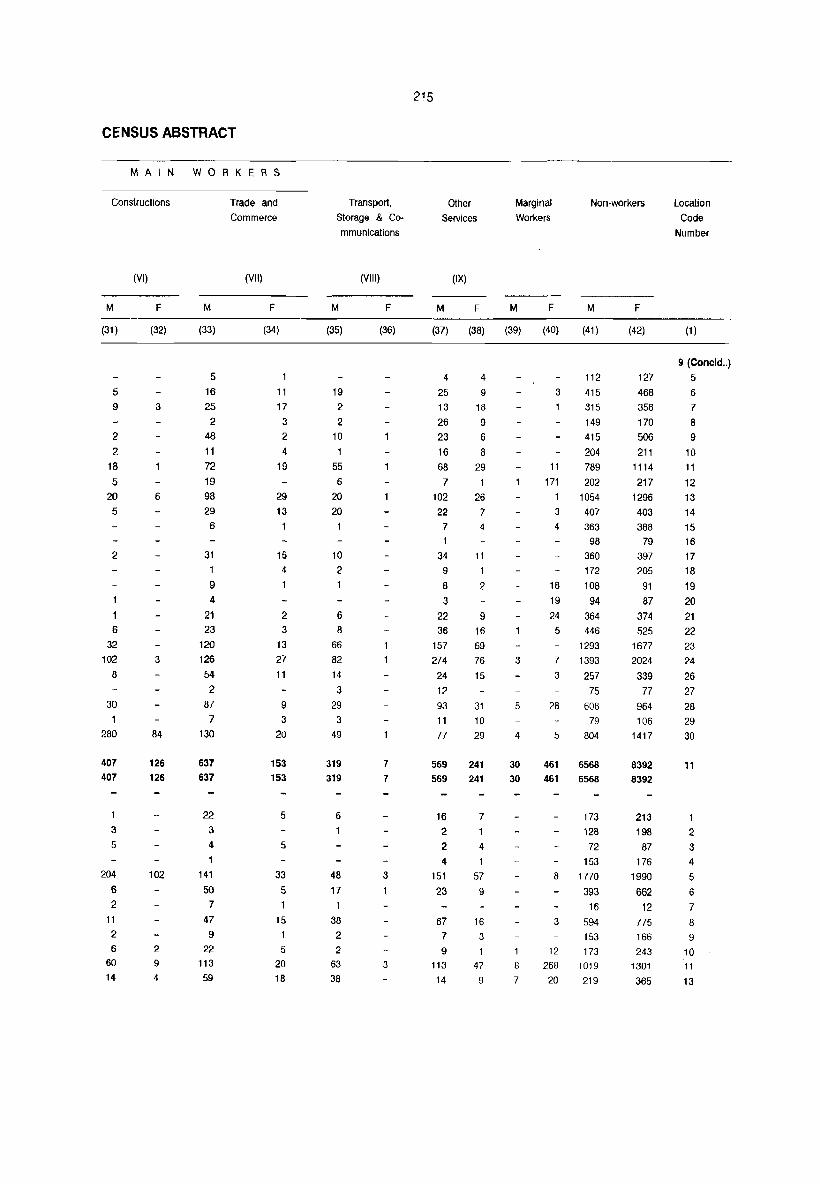
CENSUS ABSTRACT
MAIN WORKERS
Constructions
M
(31)
5 9
2 2
18
5 20 5
2
6
32 102
8
30
280
407 407
3
5
204
6 2
11 2 6
60 14
(VI)
F
(32)
3
6
3
84
126 126
102
2
9
4
M
(33)
5 16
25 2
48
11
72 19
98
29 6
31 1 9 4
21 23
120 126 54 2
87
7
130
637 637
22 3
4
1
141 50
7 47
9
22 113
59
Trade and
Commerce
(VII)
F
(34)
11
17 3 2 4
19
29
13
15 4
2 3
13 27 11
9
3
20
153 153
5
5
33
5
15
5 20 18
Transport,
Storage & Co
mmunications
M
(35)
19 2
2 10
55
6
20 20
10 2
6
8 66 82 14
3
29 3
49
319 319
6
48
17 1
38 2
2
63 38
(VIII)
F
(36)
7
7
3
3
Other Services
M
(37)
4
25 13 26 23
16
68
7 102 22
7
34 9
8
3 22 36
157 274
24 12 93
11
77
569 569
16 2
2
4
151
23
67 7
9
113 14
(IX)
F
(38)
4
9
18 9
6
8 29
1
26 7
4
11
1
2
9
16 69 76
15
31 10
29
241 241
7
4
1
57
9
16 3
1
47 9
Marginal WorkerS
Non-workers
M
(39)
3
5
4
30
30
1
8
7
F M
(40) (41)
112
3 415
315 149 415 204
11 789
171 202 1 1054 3 407
4 363
98
360 172
18 108 19 94 24 364 5 446
1293 7 1393
3 257 75
28 608
79
5 804
461
461 6568 6568
173 128
72 153
8 1770
393
16 3 594
153
12 173 268 1019
20 219
F
(42)
127 468
358
170 506 211
1114 217
1296 403 388
79
397 205
91 87
374
525 1677
2024
339
77 964 106
1417
8392 8392
213 198
87
176
1990
662 12
775
166
243 1301
365
Location Code
Number
(1)
9 (Concld .. )
5
6
7
8 9
10 11 12 13 14 15
16
17 18 19 20 21
22 23 24
26 27 28 29 30
11
2
3
4
5
6
7 8
9
10 11
13

Location
Code
Number
(1 )
11 14 15 16
12
1
3
4
5 6
7
8
9
10 12 13 14 15 16 17 18 19 20 21
14
3 4 5
6
7 8 9
10 11
12 13 14 15 16 17
Name of Village
(2)
KEESARA M.P.P. (Concld .. )
GODMAKUNTA
RAMPALLE
BOGARAM
GHATKESAR M.P.P.
PARVATHAPUR
CHANGICHERLA
POCHARAM
YAMNAMPET
ISMAILKHANGUDA
PADAMETHSAIGUDA
KONDAPUR
AUSHAPUR
ANKUSHAPUR ANNOJIGUDA
MAJARGUDA
NAREPALLE
KACHWANI SINGARAM MUTHAWALLIGUDA PRATHAPSINGARAM KORREMUL
BADESAHEBGUDA
EOULABAD
MADHARAM
T*
R* U·
HAVATHNAGAR M.P.P. T*
R*
U*
HATHIGUDA
TATTI ANNARAM
TATTI KHANA
MARRIPALLE QUTHBULLAPUR THIMMAIGUDA GOWRELLI
BACHARAM DAIRA
BAN DARAV I RYAL
AKBARJA
THARAMATHIPET BALJAGUDA
POCHAMPALLEWADA PASMAMLA
216
Area of village No. of No. of Total Population (Includ
ing Institutional and
Houseless Population)
in Hectares Occupied House-
(3)
358.96 2176.39 813.82
133.13 119.30
13.83
74.06 1055.01 700.10 388.09 152.57 135.57 862.62 919.04 844.58 300.28 33.18
507.07 401.85 111.69 487.24
1327.32 NA
1580.29 869.26
286.30
286.30
39.25 601.36 238.36 581.13 702.94 153.38 287.33 744.22
34.40 738.55
N.A
1159.83 236.14
4.86 1155.37
Residential holds
Houses
(4)
215 865 363
8584 6236 2348
315 255 198 403 139 83
355 599 367 278
188 220 107
331 986
1360 52
10574 j 10574
210 4
119 331 70
358 238
472
496 96
354
P
(5) (6)
215 1306
865 4441 363 1880
8584 44978 6236 32333 2348 12645
315 1619 255 1364 198 1022 403 1870 139 729
83 305 355 2155 599 2831 367 2090 278 1360
M
(7)
657 2283 939
23434 16803
6631
855 694 537 937 366 151
1254 1456 1065 762
F
(8)
649 2158
941
21544 15530
6014
764 670 485 933 363 154 901
1375 1025
598 Un-Inhabited ----
188 220 107
1017 528 489 1145 617
331 1605 986 5167
603
308 827
2625
542 309
778
2542
1360 52
Un-Inhabited ---
7181 3702 3479 256 133 123
11258 59505 31317 11258 59505 31317
28188 28188
217 4
121 334
72 371 241
508
516 98
411
Un-Inhabited ---
1091 562 529 31 16 15
753 1828 424
1694 1455
387 942 209 897 749
Un-Inhabited ---
366 886 215 797 706
2690 1383 1307 Un-Inhabited ---
3040 1595 1445 542 282 260
Un-Inhabited -- -
2183 1137 1046
VILLAGE PRIMARY
Total Population
in the age group
(0 - 6)
M
(9)
146 433 183
4295 3217 1078
165 145 134 198 65 34
157 330 199 150
119 102
52 147 487
703 30
5178 5178
107 4
59 104 42
119
119
224
259 72
231
F
(10)
154 425 170
3971 2947 1024
145 135 104 199
66 33
137 295 203 123
102 96 53
115 495
619 27
4989 4989
96
1
55 106 44
129 114
236
244 54
221
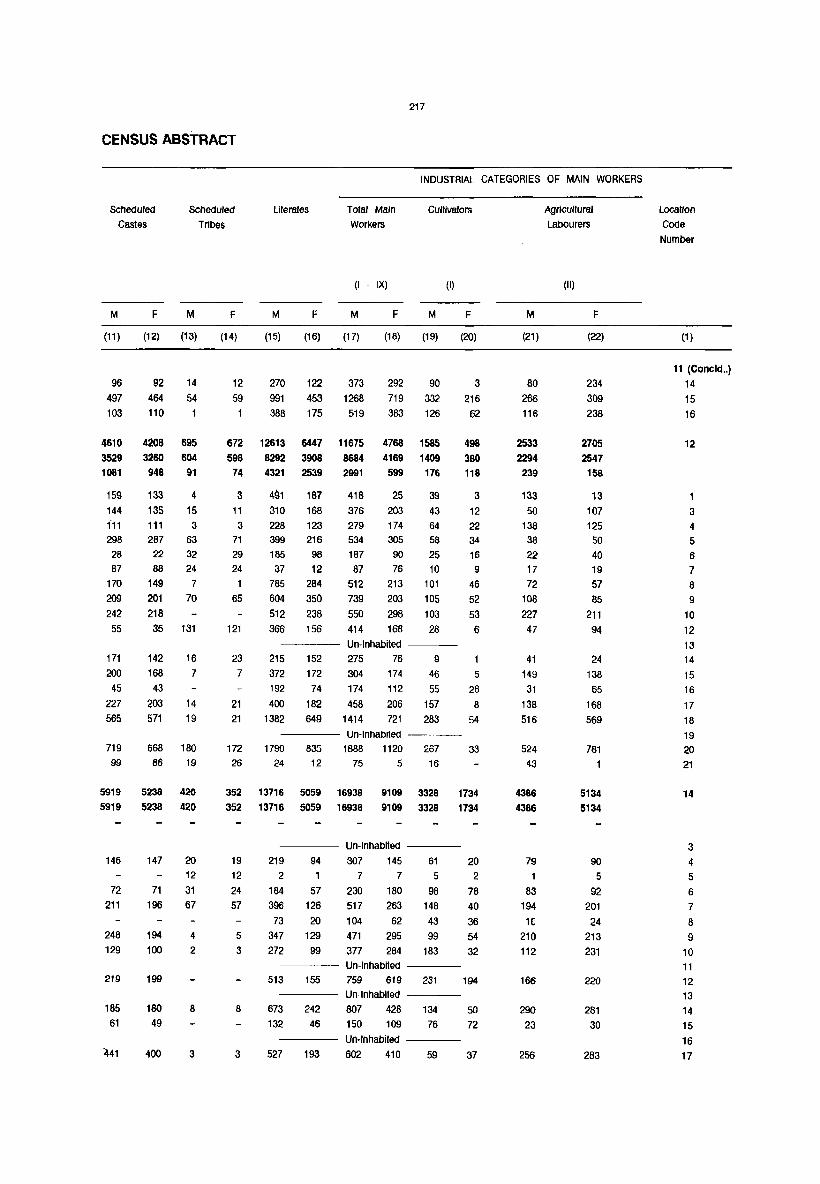
217
CENSUS ABSTRACT
INDUSTRIAL CATEGORIES OF MAIN WORKERS
Scheduled
Castes
Scheduled
Tribes
LIterates Total Main
Workers
Cultivators
M F M
(11) (12) (13)
96 92 14
497 464 54
103 110
4610 4208 695
3529 3260 604
1081 948 91
159
144 1·11
298
28 87
170
209
242
55
171
200
45
227
565
719
99
5919
5919
146
72
211
248
129
219
185
61
441
133 4
135 15
111 3 287 63
22 32 88 24
149 7
201 70
218
35 131
142 16
168 7
43
203 14
571 19
668 180
86 19
5238 420
5238 420
147
71
196
194
100
199
180
49
400
20
12
31 67
4
2
8
3
(I IX) (I)
F M F M F M F
(14) (15) (16) (17) (18) (19) (20)
12 270 122 373 292 90 3
59 991 453 1268 719 332 216
388 175 519 383 126 62
672 12613 6447 11675 4768 1585 498
598
74
3 11 3
71
29
24
1
65
121
23
7
21
21
172
26
8292 3908 8684 4169 1409
4321 2539 2991 599 176
491 187
310 168
228 123 399 216
185 98
37 12
785 284
604 350
512 238
366 156
215 372
192
400
1382
152
172 74
182
649
418
376
279 534
187 87
512
739
550
414
25
203 174 305
90
76
213
203 298
168
39
43
64 58
25
10
101
105
103
28 Un-Inhabited ---275 76
304 174
174 112
458 206
1414 721
9
46
55
157 283
---- Un-Inhabited ----1790
24 83G 12
1888 1120
75 5 267 16
380
118
3
12
22 34
16
9
46
52
53
6
5
26
8
54
33
352 13716 5059 16938 9109 3328
352 13716 5059 16938 9109 3328 1734
1734
19
12 24 57
5 3
8
3
---- Un-Inhabited ----
219 94
2 1 184 57
396 126
73 20
347 129
272 99
307 145
7 7
230 180
517 263
104 62
471 295
377 284
61
5 98
148
43 99
183 ---- Un-Inhabited ----
513 155
673 242
132 46
527 193
759 619 231 Un-Inhabited ----
807 428
150 109 134
76
Un· Inhabited ----
602 410 59
20
2
78
40
36
54
32
194
50 72
37
M
(21)
80
266 116
2533
2294
239
133 50
138
38
22 17
72
108
227
47
41
149
31 138 516
524 43
4386
4386
79
1
83
194
1(
210
112
166
290 23
256
Agricultural
Labourers
(II)
F
(22)
234
309
238
2705
2547
158
13
107
125
SO 40
19
57
85
211
94
24
138
65
168
569
781
5134
5134
90
5
92
201
24
213 231
220
281 30
283
Locallon
Code
Number
(1 )
11 (Concld .. )
14
15
16
12
1
3 4 5
6 7
8
9
10 12
13 14
15
16
17 18
19 20
21
14
3
4 5 6
7
8
9 10
11
12 13 14
15
16 17
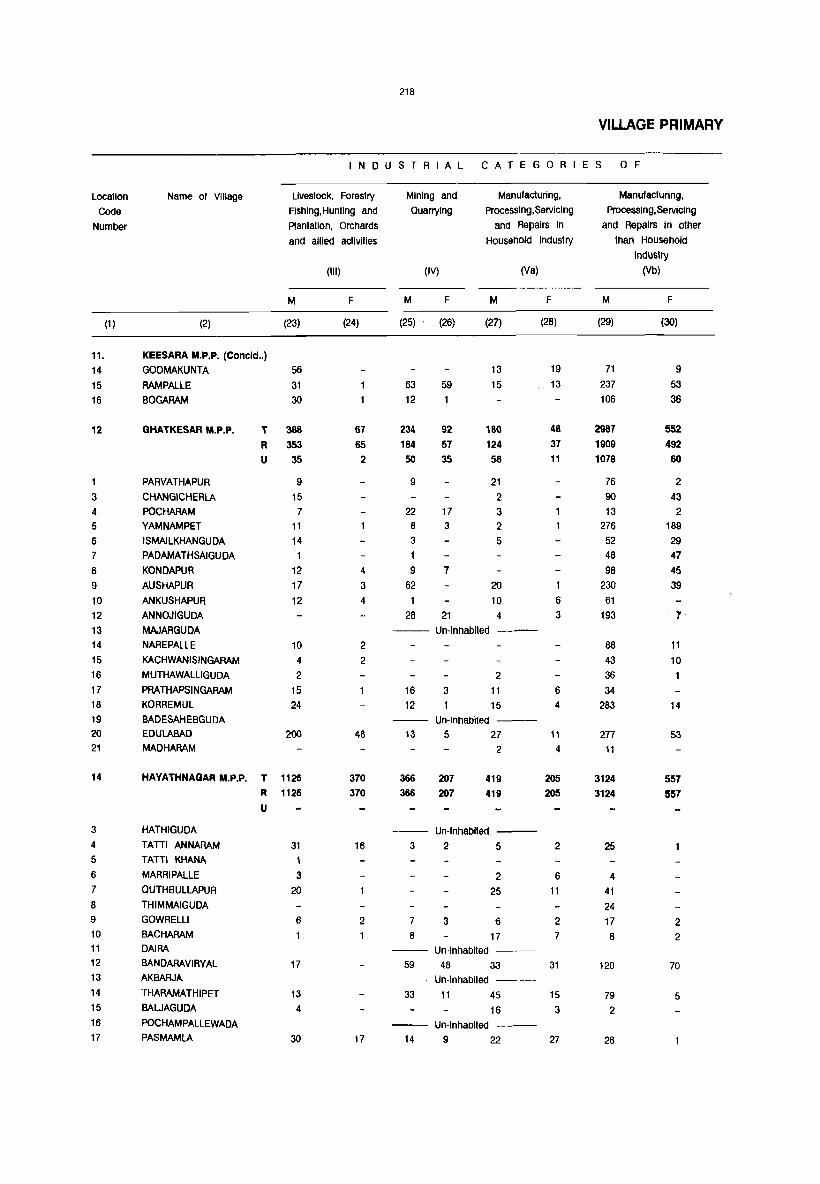
Location
Code
Number
11.
14 15 16
12
1
3
4 5
6 7
8
9
10 12
13 14 15
16
17 18 t9 20 21
14
3 4
5
6
7
8 9
10 11
12 13 14
15 16
17
(1)
218
VILLAGE PRIMARY
INDUSTRIAL CATEGORIES OF
Name of village Livestock, Forestry Flshlng,Hunting and
Plantation, Orchards
and allied activities
M
(2) (23)
KEESARA M.P.P. (Concld .. ) GODMAKUNTA 56
31 30
RAMPALLE
BOGARAM
GHATKESAR M.P.P.
PARVATHAPUR
CHANGICHERLA POCHARAM YAM NAM PET ISMAILKHANGUDA PADAMATHSAIGUDA
KONDAPUR
AUSHAPUR
ANKUSHAPUR ANNOJIGUDA
MAJARGUDA NAREPALLE
KACHWANISINGARAM
MUTHAWALLIGUOA
PRATHAPSINGARAM KORREMUL BADESAHEBGUOA EOULABAD MADHARAM
T 388
R 353
U 35
9
15
7 11 14
1 12 17
12
10 4
2
15
24
200
HAYATHNAGAR M.P.P. T 1126
R 1126
U
HATHIGUOA
TATTI ANNARAM TATTI KHANA
MARRIPALLE QUTHBULLAPUR
THIMMAIGUDA GOWRELLI
BACHARAM DAIRA
BAN OARAVIRYAL AKBARJA
THARAMATHIPET
BALJAGUDA
POCHAMPALLEWADA PASMAMLA
31 1
3 20
6
17
13 4
30
(III)
F
(24)
67
65
2
4
3
4
2 2
48
370
370
16
2
17
Mining and Quarrying
Manufacturing, Processing, Servicing
and Repairs in HousehOld Industry
M
(25)
63 12
234 184
50
9
22 8
3 1
9
62
1 28
16
12
(IV)
F
(26)
59
92
57 35
17 3
7
21
M
(27)
13
15
180
124 56
21
2 3 2
5
20
10 4
Un-Inhabited
3
2
11
15
(Va)
-- Un-Inhabited _--
F
(28)
19 13
48 37 11
6
3
6 4
13 5 27 11
366
366
207 207
2 4
419
419 205 205
Un-Inhabited 3 2 5 2
7 8
3
2
25
6 17
Un-Inhabited _--
6
11
2 7
59 48 33 31 Un-Inhabited _--
33 11 45 15
16 3 Un-lnhaOlted __ -
14 9 22 27
Manufacturing,
Processing, Servicing
and Repairs In other than Household
Industry
M
(29)
71 237
106
2987 1909
1078
76
90
13 276
52 48 98
230
61
193
88
43 36
34 283
277
11
3124 3124
25
4
41
24 17 8
120
79
2
28
(Vb)
F
(30)
9
53
36
552
492
60
2
43 2
189 29
47 45 39
7
11
10 1
14
53
557
557
2
2
70
5
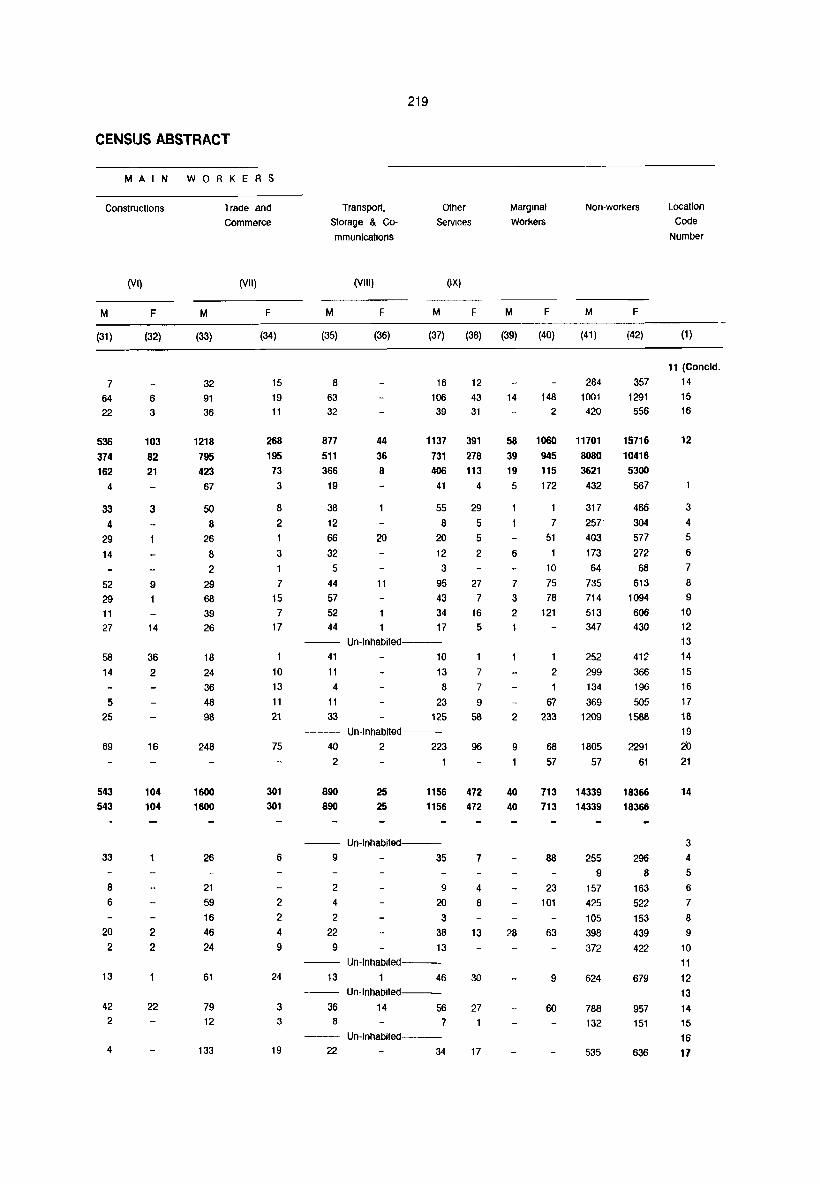
CENSUS ABSTRACT
MAIN WORKERS
Constructions
M
(31)
7
64
22
536
374
162 4
33 4
29
14
52 29
11
27
58
14
5
25
69
543
543
33
8
6
20
2
13
42 2
4
(VI)
F
(32)
6 3
103
82 21
3
9
1
14
36
2
16
104
104
2 2
22
M
(33)
32 91
36
1218 795
423
67
50
8
26 8
2 29
68
39
26
18
24 36
48 96
246
1600
1600
26
21 59
16
46 24
61
79
12
133
Trade and
COmmerce
(VII)
F
(34)
15 19
11
266 195
73
3
6
2
3
1
7
15
7 17
10 13 11
21
75
301 301
6
2
2
4 9
24
3 3
19
Transport,
Storage & Co
mmunications
(VIII)
M F
219
Other
Services
(IX)
M F
Marginal
Workers
M F
Non-workers
M F
Location
Gode
Number
(35) (36) (37) (38) (39) (40) (41) (42) (1 )
6 63 32
877 511 366
19
38
12 66 32 5
44 57
52 44
41 11
4
11
33
40 2
890
890
16 106
39
12
43
31
44 36
8
1137 391
731 278
406 113
41 4
55
8 20 20
12 3
11 95
43 34
17
Un-Inhabited---
10 13 8
23 125
Un-Inhabiled---
2 223
1
29
5 5
2
27 7
16 5
7
7
9
56
96
25 25
1156 472
1156 472
Un-Inhabited---
9 35 7
2
4
2 22
9
9
20
3
38 13
Un-Inhabited---
13 1 46 Un-Inhabited---
36 14 56
8 7 Un-Inhabited---
22 34
4
8
13
30
27
17
14 148 2
284
1001
420
58 1060 11701
39 945 8080
19
5
6
7
3
2
2
9
1
40 40
28
115 172
1
7
51
10
75 78
121
2 1
67 233
68
57
3621
432
317 257-403 173
64
735 714
513 347
252 299
134
369
1209
1805 57
713 14339
713 14339
88
23 101
63
9
60
255 9
157 425
105 398 372
624
788 132
535
11 (Concld_
357 14
1291 15
556 16
15716
10416
5300
567
466 304
577
272
68
613 1094
600
430
412
366
196
505 1588
2291
61
18366 18366
296 8
163 522 153 439 422
679
957 151
636
12
3
4
5
6
7 8
9
10
12 13
14 15
16 17 16 19
2'0
21
14
3
4 5 6
7
8
9
10 11
12 13
14
15
16 11

Location Code
Number
(1)
14. 18 20 23 24 25 26 27 28 29 30 31 32 33 34 35 36 37 38 39 40 41
15
12 13 14 15 16 17 18 23 25 26 27 28 29
16
2 3 4 5 6 7 8 9
10
Name of Village
(2)
HAYATHNAGAR M.P.P. (COncld .. ) KUNTLOOR KALVANCHA INJAPUR TURKAYAMJAL MANNEGUDA TOROOR (FAROOR) MUNGANOOR PEDDA AMBERPET (KALAN) KOHEOA OMERKHANDAIRA SURMAIGUDA LASKERGUDA INAMGUDA ABDULLAPUR KAWADIPALLE BATASINGARAM PIGILIPUR MAZIDPUR SAGARPUMP GUNTAPALlE ANAJPUR
SAROORNAGAR M.P.P.
JILLALGUDA MEDBOWLI MEERPET ALMASGUDA DAWOODKHANGUDA BADANGPET CHINTALAKUNT", RENUKAPUR JALPALLE PARAYAKUMANDAN MAMIDIPALLE KURMALGUDA NADARGUL
RAJENDRANAGAR M.P.P.
GUNGURTHY KHANAPUR VATIINAGULAPALLE KOKAPET GANDIPET NARSINGI PUPPALGUDA MAQTHA KOUSARALI MANIKONDA (KHALSA) MANIKONDA (jAGIR)
T* R* U*
T* R* U·
220
Area of Village No. of No. of Total Population (Includ-in Hectares Occupied House- ing Institutional and
(3)
1108.84 26.30
439.89 2052.56 340.34 974.08 309.58
1614.29 3698.82
SO.59 427.35 285.30 110.48 679.87
1031.54 1087.39 647.50
1154.97 39.25
252.93 1217.70
114.12 96.90 17.22
249.69 121.81 401.64 365.43 21.04
531.35 46.54 97.12
1070.80 1740.00 897.92 369.07
1934.39
134.42 133.20
1.22
26.30 816.65
1447.56 706.58
2167.49 690.33 972.05
2.83 9.31
808.56
Residential holds Houseless Population) Houses
(4)
377 58
413 978 104 750 142 920 638
1028 43
150 153 267 243 562
77 223
181 519
14246 4866 9380
604
1042 229
440 27 9
321 79
870 144
1101
5312 5081
231
236 384 385 208 944 327
435
P M F
(5) (6) (7) (8)
400 2231 1156 211
1075 203 68 414
428 1069 109 793 143
1002 693
1194 52
151 155 277 252 565
78 227
186 523
2457 1304 1153 6230 3265 2965
470 250 220 4289 2150 2139
792 407 385 4960 2597 2363 41".;1 2144 1887 4228 2481 1747
239 126 113 861 451 410 687 376 311
1710 927 783 1410 726 684 3253 1713 1540
399 216 183 1148 577 571 Un-Inhabited ---
964 519 445 3001 1562 1439
14309 73828 38717 35111 12702 22409
4866 26413 13711 9443 47415 25006
604 3005 1536 1469 Un-Inhabited ---
1042 229
440 27 9
321
5089 2595 2494 1306
2422 112
31 1710
659
1245 59 18
861
647
79 462 300
1176 53 13
849 162
2668 870 5478 28~0
144 709 370 1101 6089 3257
5312 31933 16664 5081 29964 15660
231 1969 1004
339 2832
15269 14304
965
Un-Inhabited --236 384 385 208 944 327
435
1716 908 808 2204 2080 1083 5576
1116 1058 552
2876
1088 1022 531
2700 1851 967 884 Un-Inhabited --Un-Inhabited ----2254 1190 1064
VILLAGE PRIMARY
Total Population in the age group
(0 - 6)
M
(9)
203 46
218 566
35 385 82
445 304 358
28 66 69
164 117 298 30
108
95 221
5848 2230 3618
197
444 115
207 13
167 37
508 73
469
3029 2887
142
187 246 196 114 516 174
245
F
(10)
176 47
195 508 37
403 79
439 320 376
27
77 64
147 128 275
24 123
10 234
5719 . 2316 3403
212
462 136
218 7 4
168 41
560 53
455
3017 2859
158
157 243 209 112 455 208
219

221
CENSUS ABSTRACT
INDUSTRIAL CATEGORIES OF MAIN WORKERS
Scheduled Castes
Scheduled Tribes
Literates Total Maln Workers
Cultivators
M IF M
(11) (12) (13)
83 86 205 192 413 355 11 562 522 94
27 29 301 310 5 160 147 560 507 25 409 313 20 250 209 7
85 81 3 106 91 9
25 15 32 137 118 8 76 69 4
239 155 14 43 36 42 37 23
164 320
145 285 18
4783 4330 631 3364 3021 313 1419 1309 318
472 457 4
957 142
254 26 2
327 31
426 62
665
929 241 141
250 16 18 3
304 37 29
347 10 56
487 5
:1909 3702 120 3703 3502 120 206 200
150 352
11 130 782 197
301
153 319
16 133 753 175
276
7 13
9
26
3
F
(14)
10 83
6
17 13
6 2
11 26 4 6 2
15
2
18
M F
(15) (16)
561 267 49 2
669 269 1474 581 125 56 764 268 162 70
1037 477 1028 374 1495 463
13 3 206 99 140 54 468 176 366 113 764 266 94 22
215 78
196 552
46 213
(I IX) (I)
M F M F
(17) (18) (19) (20)
621 374 106 100 117 108 4 670 397 1 09 85
1836 1010 356 159 143 106 65 48
1168 642 303 166 188 122 10 9
1247 460 191 44 1047 662 227 174 1842 515 112 65
72 62 13 11 240 143 39 23 233 79 19 29 ~34 265 102 73 356 93 137 20 847 312 100 20 128 101 60 8 305 219 24 2
Un-Inhabited 282 93 831 544
63 151
17 65
441 23679 15616 18953 6384 1959 1137 285 5833 2814 7302 3915 1419 878 156 17846 12802 11651 2469 540 259
5 515 276 834 446 52 27 ---- Un-Inhabited
212 1129 294
16 654 24
41 334 178
11 1089 138
1478
653 1390 675 32 139 358 230 144
Un-Inhabited ----310 652 275 l15 17 30 29 11
13 B 1 136 477 219 53 26 127 32 11
591 1495 711 355 47 204 155 77
619 1722 1135 568
15 107
77
17
263 44
328
106 7870 4167 8162 3789 991 571 544
27 106 7451 3915 7658 3624 905
3 9
12
37
2
419 252 504 165 86
---- Un-Inhabited 388 351 403 304
1560 441
138 490 307 104 107 622 476 205 164 588 427 118 180 249 78 2
1153 1393 360 74 140 494 180 30
Un-Inhabited ------ Un-Inhabited ----
558 297 624 405 29
53 190 126
19 5
18
M
(21)
61 103 146 706 15
194 54
291 289 82 30 45 3
116 48
151 35
118
70 399
2387 1895 492
363
177 100
76 12 2
166 32
323 44
600
1593 1434 159
59 242 97
4
160 95
144
Agricultural LabOurers
(II)
F
(22)
153 99
236 541 26
295 72
253 386 131 34 82 25
169 46
222 86
168
48 392
2615 1973 642
338
146 106
89 27
8 149 25
305 105 675
2180 2082
98
162 272 233 14
158 117
210
Location Code Number
(1)
14 (Concld .. ) 18 20 23 24 25 26 27 28 29 30 31 32 33 34 35 36 37 38 39 40 41
15
12 13 14 15 16 17 18 23 25 26 27 28 29
16
2 3 4 5 6 7 8 9
10

location Code
Number
14. 18 20 23 24 25 26 27 28 29 30
31 32 33 34 35 36 37 38 39 40 41
15
12 13 14 15
16 17 18 23 25 26 27 28 29
16
1
2 3 4 5 6 7 8 9 10
(1 )
222
VILLAGE PRIMARY
INDUSTRIAL CATEGORIES OF
Name of Village
(2)
UvestocK, Forestry Fishlng,Hunting and Plantation, Orchards and allied activities
(III)
M F
(23) (24)
HAYATHNAGAR M.P.P. (ConcldOo) KUNTlOOR 52 KALVANCHA 7 INJAPUR TURKAYAMJAL MANNEGUDA rOROOR(FAROOR) MUNGANOOR PEDDA AMBERPET (KALAN) KOHEDA OMERKHANDAIRA SURMAIGUDA LASKERGUDA INAMGUDA ABDULLAPUR KAWADIPALLE BATASINGARAM PIGILIPUR MAZIDPUR SAGARPUMP GUNTAPALLE ANAJPUR
SAROORNAGAR M.P.P.
JILLALGUDA MEDBOWU MEERPET ALMASGUDA DAWOODKHANGUDA BADANGPET CHINTALAKUNTA RENUKAPUR JALPALLE PAPAYAKUMANDAN MAMIDIPALlE KURMALGUDA NADARGUL
RAJENDRANAGAR M.P.P.
GUNGURTHY KHANAPUR VATTINAGULAPALLE KOKAPET GANDIPET NARSINGI PUPPALGUDA MAQTHA KOUSARALI MANIKONDA (KHALSA) MANIKONDA OAGIR)
99 233 48
144 4
204 40 21 25 27 6 4 6
28 2
10
18 22
T 280 R 176 U 104
5
10 4
6
10 14 5
43 5
74
T 453 R 447 U 6
50 55 36
6 55 22
3
10 7
31 116 32 9 1
55 2
10 16 13
14
8
6
2
42 20 22
2
3
7
7
93 93
5 2 8 3
14 4
Mining and Quarrying
Manufacturing, ProceSSing. Servicing
and Repairs in Household Industry
(IV)
M F M
(25) (26) (27)
47
1 18
116 26 4
20 4
1 2
30
3
73 23 1 3
-- Un-Inhabited
2
515 1434 317 114 198 50
3 -- Un-Inhabited
14
47
28
79 39
1
6 1
2
2
28
49 21 28
70 46 4 7 6 5
(Va)
-- Un-Inhabited ---95 15 2
2 3
128
9 43 3
5
3
656 192 73 72 640 192
16
115
96 16 44 32
151
Un-Inhabited 59 9
4 4
9
3 13 11 6
Un-Inhabited .....,._ Un-Inhabittd ---
108 '7
F
(28)
5
17
5
24 9 2
5 6
2
26
16 10
6
2
3
2
3
17 17
6
7
Manufacturing, ProceSSing, Servicing
and Repairs In other than Household
Industry
M
(29)
36
84 169
3 53 24
116 106
1518
2 41 61
53 48
171
5 104
108 74
2647 799
1848
72
272 13
57
4
95 42
112 34 98
695 652
43
21 14 47 30
250
56
19
(Vb)
F
(30)
5 88
5 2
19 14
270
2
4 9 2
33
13 9
296 --169 127
6
112
4
29 6 5 1 6
90 81
9
4
2 27 24
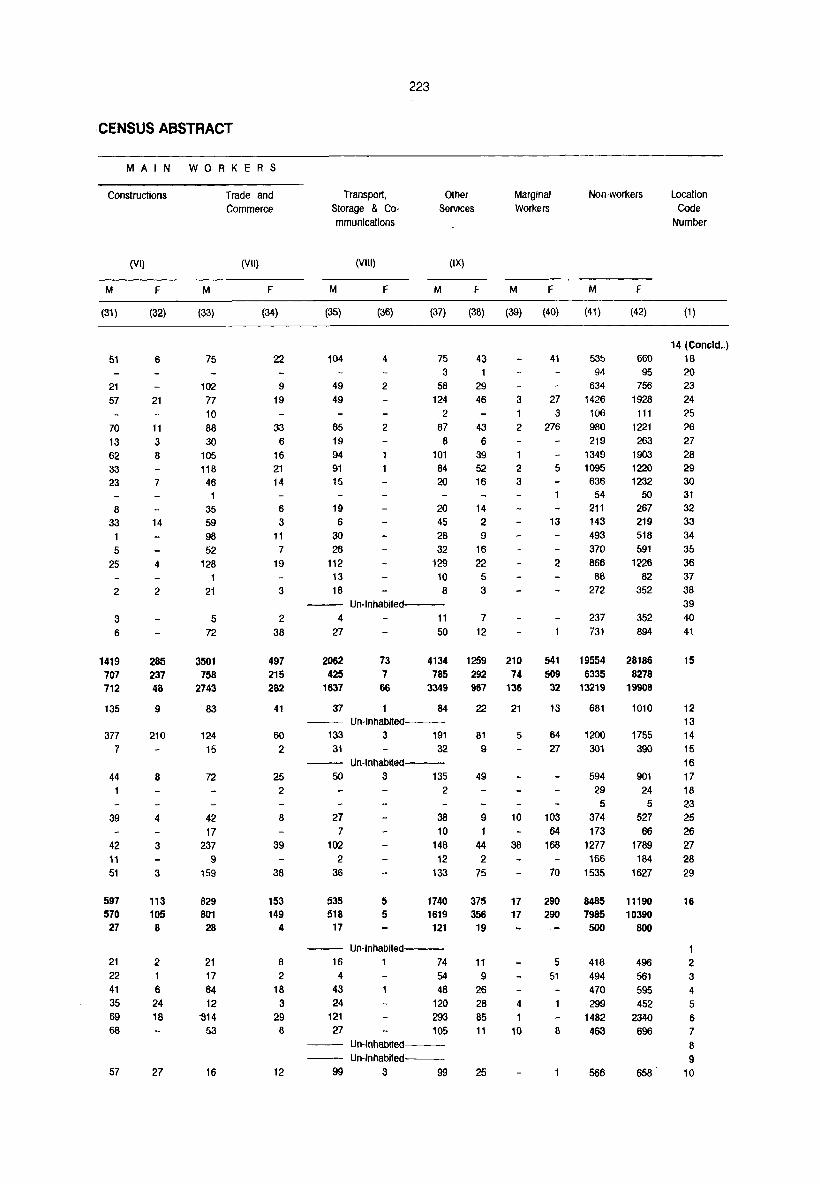
· CENSUS ABSTRACT
MAIN WORKERS
constructions
M
(31)
51
21
57
70 13 62 33 23
8 33
1 5
25
2
3 6
1419 701 712
135
377 7
44
39
42 11 51
597 570 27
21 22 41 35 69 68
57
(VI)
F
(32)
6
21
11 3 8
7
14
4
2
285 231 48
9
210
8
4
3
3
113 105 8
2 1 6 24 18
27
M
(33)
75
102 77 10 88 30
105 118 46 1
35 59 98 52
128 1
21
5 72
3501 158
2743
83
124 15
72
42 17
237 9
159
829 801 28
21 17 64 12
~14
53
16
Trade and Commerce
(VII)
F
(34)
22
9 19
33 6
16 21 14
6 3
11 7
19
3
2 38
497 215 282
41
60 2
25 2
8
39
38
153 149
4
8
2 18
3 29
8
12
Transport, Storage & Communications
M
(35)
104
49 49
85 19 94 91 15
19 6
30 28
112 13 18
(VIII)
F
(36)
4
2
2
223
Other Services
(IX)
M F
Marginal Workers
M F
(37) (38) (39) (40)
75 43 41 3
58 29 124 46 3 27
2 3 87 43 2 276
8 6 101 39 84 52 2 5 20 16 3
20 14 45 2 13 28 9 32 16 1~ ~ 2 10 6
5 3
Un-tnhabited---4 11
27 50 7
12
Non-workers Location Code
Number
M
(41)
535 94
634 1426 106 980 219
1349 1095 636 54
211 143 493 370 866 88
272
237 731
F
(42) (1)
14 (Concld .. ) 660 18 95 20
756 23 1928 24
111 25 1221 26
263 27 1903 28 1~ 29 1232 30
50 31 267 32 219 33 518 34 591 35
1m 36
82 352
352 894
37 38 39 40 41
2062 425
1637
73 7 66
4134 1259 210 785 292 74
3349 967 136
541 19554 28186 509 6335 8278 32 13219 19908
15
37 M Un-Inhablted---
133 3 191 31 32
Un-Inhablted---50 3 135
27 7
102 2
36
535 518 17
5 5
2
38 10
148 12
133
1740 1619 121
Un-Inhablted---16 1 74
4 54 43 46 24 120
121 293 27 105
Un-Inhabited--Un-Inhablted---
99 3 99
22
81 9
49
9 1
44 2
75
375 356 19
11 9
26 28 65 11
25
21
5
10
38
17 17
4 1
10
13
64 27
103 64
168
70
290 290
5 51
8
681
1200 301
594 29 5
374 173
1277 166
1535
1010
1755 390
901 24 5
527 66
1789 184
1627
8485 11190 7985 10390 500
418 494 470 299
1482 463
566
800
496 561 595 452
2340 696
12 13 14 15 16 17 18 23 25 26
27 28 29
16
2 3 4 5 6 7 8 9
10

Location
Code
Number
(1)
16
11
12
13
14
15
16
17
22
23
24
25 26
27 37
39
17
1
2
3
4
5 6
7
8
9
10
11
12
13
14
15
16
17
18
19
20 21
22 23
24
25
26
Name of Village
(2)
RAJENDRANAGAR M.P.P. (Concld .. )
POKKALWADA
PANJASHAJAMAL BOWLI
AliZAPUR
NEKNAMPUR
MANCHIREVULA
BAIRAGIGUDA
GANDAMGUDA
SOGBOWLI
JANIBEGUM
BANDLAGUDA (JAGIR)
PEERAMCHERU HIMAYATHSAGAR KISMATPUR
PALLECHERU
SIKANDERGUDA
MOINABAD M.P.P.
MED1PALLE
CHINNA MANGALARAM
MOTHUKUPALLE
REDDIPALLE
CHANDANAGAR
CHILKOOR
HfMAYATHNAGAR AZIZNAGAR YENKEPALLE MURTHUZAGUDA
PEDDAMANGALARAM
CHINNASHAPUR
SAJJANPALLE
TOLKATIA
YETHBARPALLE
NAKKALAPALLE
KETHIREDDIPALLE
KANAKAMAMIDI
SURANGAL
NAZEEBNAGAR BANGALIGUDA NAGIREDDIGUDA BAKARAM JAGIR
AMDAPUR
SRIRAMNAGAR
VENKATAPUR
r" R" U"
224
VILLAGE PRIMARY
Area of Village No. of No. of Total Population (InclUd
ing Institutional and
Houseless Population)
in Hectares Occupied House
Residential holds
Houses
(3)
792.05
4.86
157.83
251.71
914.59
102.39
203.56
40.06
4.05
577.48
153.78 278.40
417.23 51.26
76.08
198.30
198.30
1064.73
1473.05
360.98
176.04
112.10
2708.55
730.46 866.83
738.14 321.32
1762.40
142.45
204.77
836.08
505.05
533.37
1074.84
1579.89
1188.96
235.53 42.90
454.87 755.55
725,19
940.08
279.64
(4)
33
132
489
38
38
296
107 348
681
7725
7125
273
606
99
114
131 788
405
713 288 167
731
67
53
180
99
154
394
563
418
38 11
230 339
397
254
213
P M F
(5) (6) (7) (8)
Un-Inhabited --
Un-Inhabited ----
33 202 107 95
132 758
489 2892
38 196
38 257
394
1532
100
130
364
1360
96
127
Un-Inhabited ---
Un-Inhabited -------
296 2048 1183 865
107 589 306 283 348 2062
681 4196
1045 2196
Un-Inhabited
1017 2000
Un-Inhabited ---
7929 45811 23666
7929 45811 23666
274 1896 982
612 3311 1698
102 579 303
114 739 383
131 749 392 818 4909 2477
406 2357 1263 778 4424 2400
310 1902 1008
173 969 489
731 4268 2209
67 324 168
62 311 163
180 1202 616
99 594 307
154 915 483
394 2209 1144
596 3136 1598
427 2732 1390
38 191 93 11 53 26
245 1331 689 340 1919 959
399 2122 1067
255 1437 720
213 1232 639
22145
22145
914
1613
276
356
357 2432
1094 2024
894
480
2059
156
148
586
287
432 1065
1538
1342
98
27
642 960
1055
117
593
Total Population
in the age group
(0 - 6)
M
(9)
22
74
305
16
21
155
53 182 381
4682
4682
193
347
77
68
83 509
233 397
207 91
419
37
31
166
67
90
232
317
311
21
5
151 180
183
143
124
F
(10)
18
68
285
19
24
157
61
217 407
4630
4630
196
333
56
7i
67
480
234 413
173 117
415
32
28
143
57
93 194
330
312
20
6
176 200
202
169
113'

225
CENSUS ABSTRACT
-------------------------------------- -- - ------
Scheduled
CastE!S
M F
(11) (12)
Scheduled
Tribes
M F
(13) (14)
Literates
M F
(15) (16)
Total Main
Workers
(I - IX)
M F
(17) (18)
INDUSTRIAL CATEGORIES OF MAIN WOHKERS
Cultivators
(I)
M F
(19) (20)
M
(21)
Agricultural
Labourers
(II)
F
(22)
t"cation '~()d()
Numbe:
---------------------------------------_ .- .. _--
4
237
379
94 88
180
27
249
522
5534
5534
129 428
200
77
649
394 961
255
73 143
48
17 100
100
119
159
368
26
418 169
198
Hi5
64
2
204
354
87
81
.;.i6
22
279 482
5074 5074
135 447 176 63
683
395 599 230
74 66
46
13
101
98
120
161 346
304
27 379
182
201
173
55
3 12
47
24 24
4
2
17
Un-Inhabited
Un· Inhabited ----
3
7
28 16
124 68
588 242
33 19
47 36
58 25 223 111
743 309
62 25
69 47
9
28
72
2 13
2 20
14
Un-Inhabited ---
Un·lnhabited ----
768
101
511
33 1246
327 52
284
692
446 189
159
487
951
60
111
514
65
6
22 126
7 5
5
79 Un-Inhabited ---
Un-Inhabited ----
13 8823 3188 13014 13 8823 3188 13014
332 99 573 2 593 251 902
106 20 180
151 52 206
223 95 210
3 818 317 1377
516 231 727
4 1085 331 1218
270 101 565
162 44 292
4 955 365 1121
66 23 90
74 20 97 189 37 320
57 25 180
206 54 248
388 127 661
739 288 859 403 210 742
18
5
202 331
445
201
288
7
47 120
170
47 107
47 14
452 574
605 420
334
9914 5481 9914 5481
415 317 375 452 171 101
131 102 142 122
1119 281
449 135
905 470 453 105 222 112
924 439
79 55
93 76 274 211 116 111
159 175
536 269
673 472
487 282 42 19 20 3
354 192
528 298
586 350 397 251 264 81
3657 3657
153
118
61 49
99
187
43
356
54
105
367
44
67 159
70 115
142
308
244
11
6
120
217 309
205 48
14
49
90
23 29
75 57
70 226
4023 4023
185
172 54 48
18
719 277
Hl4
383 60
270 25 18
48
60
51 192
236
286
23 10
132 171
174 100
127
19
85
230 25
42
111
47 50
307
5394
5394
241
22 \ 11(1
;,1
8(j'"
321 409 3i'2
82
435
35
25
106
4~
43 313
3S1
199 31 14
199 2~5
258
170
201
16 :Concld .. )
11
12 13 14
15
16
17 22 23
24
25 26
27 37 39
17
1
2 3 4 ,.J
6
7 8 9
10
11
12 13 14 15
16
17 18
19 20
21 22
23 24
25
26

226
VILLAGE PRIMARY
I N D U S T R I A L CATEGORI E S a F
Location Name of Village Livestock, Forestry Mining and Manufacturing, Manufacturing,
Code Fishing,Hunting and Quarrying Processing,Servicing Processing, Servicing
Number Plantation, Orchards and Repairs in and Repairs in other
and allied activities Household Industry than Household Industry
(III) (IV) (Va) (Vb)
M F M F M F M F
(1) (2) (23) (24) (25) (26) (27) (28) (29) (30)
16 RAJENDRANAGAR M.P.P. (Concld .. )
11 POKKALWADA Un-Inhabited -_-
12 PANJASHAJAMALBOWU Un-Inhabited ---
13 ALiZAPUR 3 4 8
14 NEKNAMPUR 8 19
15 MANCHIREVULA 51 159 10 2 92 11
16 BAIRAGIGUDA 3 17 GANDAMGUDA
22 SOGBOWLI Un-Inhabited ---
23 JANIBEGUM Un-Inhabited -__ -
24 BANDLAGUDA(JAGIR) 10 7 7 27 6
25 PEERAMCHE~U 9 1 3 15 26 HIMAYATHSAGAR 53 21 6 9 27 KISMATPUR 82 34 13 2 4 45 6 37 PALLECHERU Un-Inhabited ---
39 SIKANDERGUDA Un-Inhabited ---
17 MOINABAD M.P.P, T 823 211 142 42 236 117 379 90
R 823 211 142 42 236 117 379 90 U
MEDIPALLE 17 4 1 5 2 CHINNA MANGALARAM 85 2 47 18 28 20 3 MOTHUKUPALLE 19 4 REDDIPALLE 3 2 6 5 5 CHANDANAGAR 5 9 6 CHILKOOR 165 68 2 14 6 26 7 HIMAYATHNAGAR 108 32 13 13 28 3 8 AZllNAGAR 135 49 6 12 74 32 9 YENKEPALLE 8 5 13 10 MURTHUZAGUDA 25 3 26 17 3 3 30 8 11 PEDDAMANGALARAM 93 38 14 3 41 29 46 13 12 CHINNASHAPUR 13 SAJJANPALLE 1 14 TOLKATIA 15 8 5 15 YETHBARPALLE 6 16 NAKKALAPALLE 5 3 1 17 KETHIREDDIPALLE 27 5 73 60 8 1 18 KANAKAMAMIDI 16 6 26 2 19 SURANGAL 11 7 15 5 19 7 20 NAZEEBNAGAR 21 BANGALIGUDA 22 NAGIREDDIGUDA 28 8 7 16 13 23 BAKARAM JAGIR 17 4 3 2 17 a 24 AMDAPUR 7 11 5 1 25 SRI RAM NAGAR 6 8 2 3 12 fi 26 VENKATAPUR 44 4 11
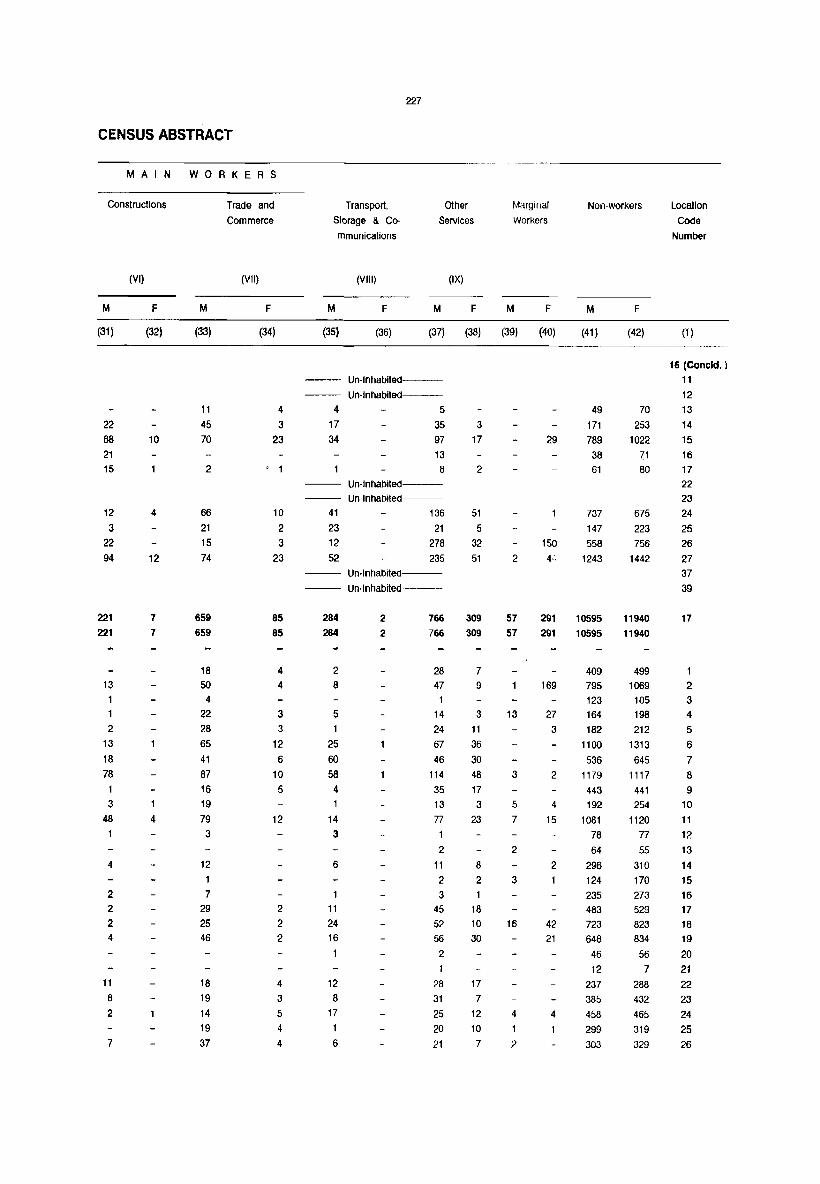
CENSUS ABSTRACT
MAIN WORKERS
Constructions
M
(31)
22
68
21 15
12 3
22 94
221
221
13
1
2
13
18 78
3
48
4
2
2
2
4
11
8
2
7
(VI)
F
(32)
10
4
12
7
7
1
4
M
(33)
11
45 70
2
66 21 15
74
659 659
18 50 4
22 28 65
41 87 16 19 79 3
12 1
7
29 25 46
18 19 14 19 37
Trade and
Commerce
(VII)
F
(34)
4
3 23
, 1
10
2
3
23
85 85
4 4
3 3
12 6
10 5
12
2
2 2
4
3
5
4
4
Transport,
Storage & Co
mmunications
(VIII)
M F
227
Other
Services
(IX)
M F
Marginal
Workers
M F
NOll-workers
M F
(35) (36) (37) (38) (39) (40) (41) (42)
-- Un-Inhablled--
Un-Inhablled---4 5
17 35 34 97
13 8
Un-Inhabited--Un-Inhabited---
41 136 23 21 12 278 52 235
284
284
2 8
5
25
60 58
4
1
14 3
6
11
24 16
12 8
17
1
6
Un-Inhabiled--
Un-Inhabited---
2
2
766
766
28 47
14 24 67
46 114 35 13 77
2
11 2 3
45 52 56
2
28
31
25 20 21
3
17
2
51 5
32 51
309 309
7 9
3
11 36 30 48 17 3
23
8
2
18 10 30
17 7
12
10 7
2
57
57
13
3
5
7
2
3
16
4
2
29
49 171 789 38 61
737 147 558
1243
291 10595 291 10595
169
27 3
2
4
15
2
42 21
4
409
795 123 164 182
1100 536
1179
443 192
1081 78 64
296 124 235 483 723
648
46 12
237 385 458 299
303
70 253
1022 71 80
675 223 756
1442
11940 11940
499 1069
105 198 212
1313
645 1117
441 254
1120
77 55
310 170 273 529 823 834
56 7
288 432 465 319 329
Location
Code
Number
(1)
16 (Concld. ) 11 12 13 14 15 16 17
22 23 24 25 26 27 37 39
17
2 3
4
5
6
7 8 9
10
11 12 13
14 15 16
17
18 19
20 21 22 23 24 25 26
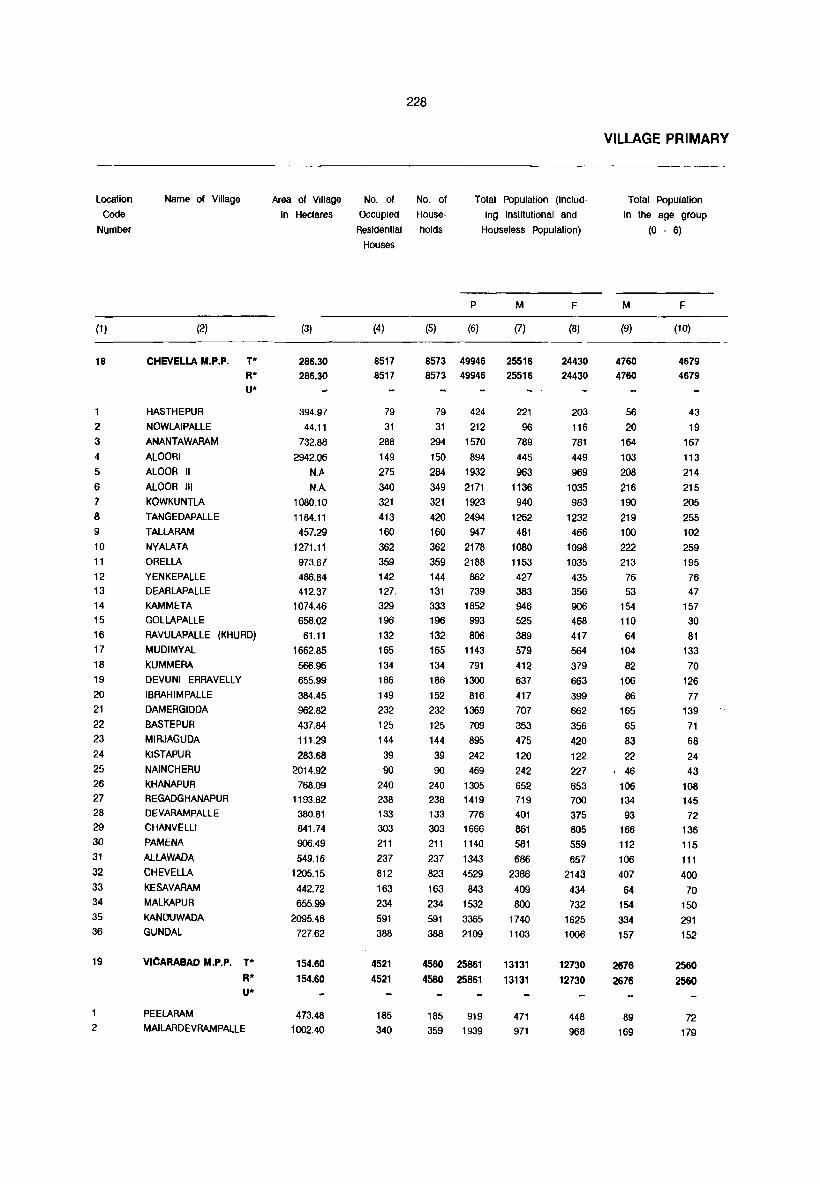
Location
Code
Number
(1 )
18
1
2 3
4
5
6 7 8 9
10
11
12
13
14
15
16
17
18
19
20
21
22
23
24
25
26
27
28
29
30 31
32
33 34
35
36
19
2
Name of Village
(2)
CHEVELLA M.P.P. T*
HASTHEPUR
NOWLAIPALLE ANANTAWARAM
ALOORI ALOOR II
ALOOR III
KOWKUNTLA
lANGEDAPALLE TALLARAM
NYALATA ORELLA
YENKEPALLE DEARLAPALLE KAMMETA
R* U*
GOLLAPALLE
RAVULAPALLE (KHURD) MUDIMYAL KUMMERA DEVUNI ERRAVELLY
IBRAHIMPALlE DAMERGIDDA
BASTE PUR MIRJAGUDA
KISTAPUR NAINCHERU KHANAPUR REGADGHANAPUR DEVARAMPALLE CHANVELLI PAMENA
ALLAWADA
CHEVELLA
KESAVARAM MALKAPUR
KANDUWADA GUNDAL
VICARABAD M.P.P. T*
R* u·
PEELARAM MAlLARDEVRAMPALLE
228
Area of Village No. of No. of Total Population (Includ
ing Institutional and
Houseless Population)
In Hectares OCcupied House-
(3)
286.30
286.30
394.97
44.11
732.88
2942.06
N.I> NA
1080.10
1184.11
457.29
1271.11
973.67
486.84
412.37
1074.46
658.02
61.11
1662.85
566.96
655.99
384.45
962.82
437.84
111.29
283.68
2014.92
768.09 1193.82
380.81
841.74
906.49
549.16
1205.15
442.72
655.99
2095.46
727.62
154.60
154.60
473.48
1002.40
Residential holds
Houses
(4)
8517
8517
79
31
288
149
275
340
321
413
160
362
359
142 127.
329
196
132
165
134
186
149
232
125
144
39
90
240
238
133
303
211 237
812
163
234
591
388
4521
4521
185 340
P M
(5) (6) (7)
8573 49946 25516
8573 49946 25516
79 424
31 212
294 1570
150 894
284 1932
349 2171
321 1923
420 2494
160 947
362 2178
359 2188
144 862
131 739
333 1852
196 993
132 806
165 1143
134 791
186 1300
152 816
232 1369
125 709
144 895
39 242
90 469
240 1305
238 1419
133 776
303 1666
211 1140
237 1343
823 4529
163 843
234 1532
591 3365
388 2109
4580 25861
4580 25861
185 919
359 1939
221
96 789
445
963
1136
940
1262
481
1080 1153
427
383 946
525
389
579
412
637
417
707
353
475
120
242
652 719
401
861
581
686
2386
409
800
1740
1103
13131
13131
471
971
F
(8)
24430
24430
203
116
781
449
969
1035
983
1232
466
1098
1035
435
356
906 468
417 564
379
663
399
662
356
420
122
227
653
700
375
805
559
657
2143
434
732
1625
1000
12730
12730
448
968
VILLAGE PRIMARY
Total Population
in the age group
(0 - 6)
M
(9)
4760
4760
56
20
164
103
208
216
190
219
100
222 213
76
53
154
110
64
104
82
106
86
165
65
83
22
46
106
134
93
166
112
106
407
64
154
334
157
2676
2676
89
169
F
(10)
4679
4679
43
19
167
113
214
215
205
255
102
259
195
76
47
157
30
81
133
70
126
77
139
71
68
24
43
108 145
72
136
115
111
400
70
150
291
152
2560
2560
72
179
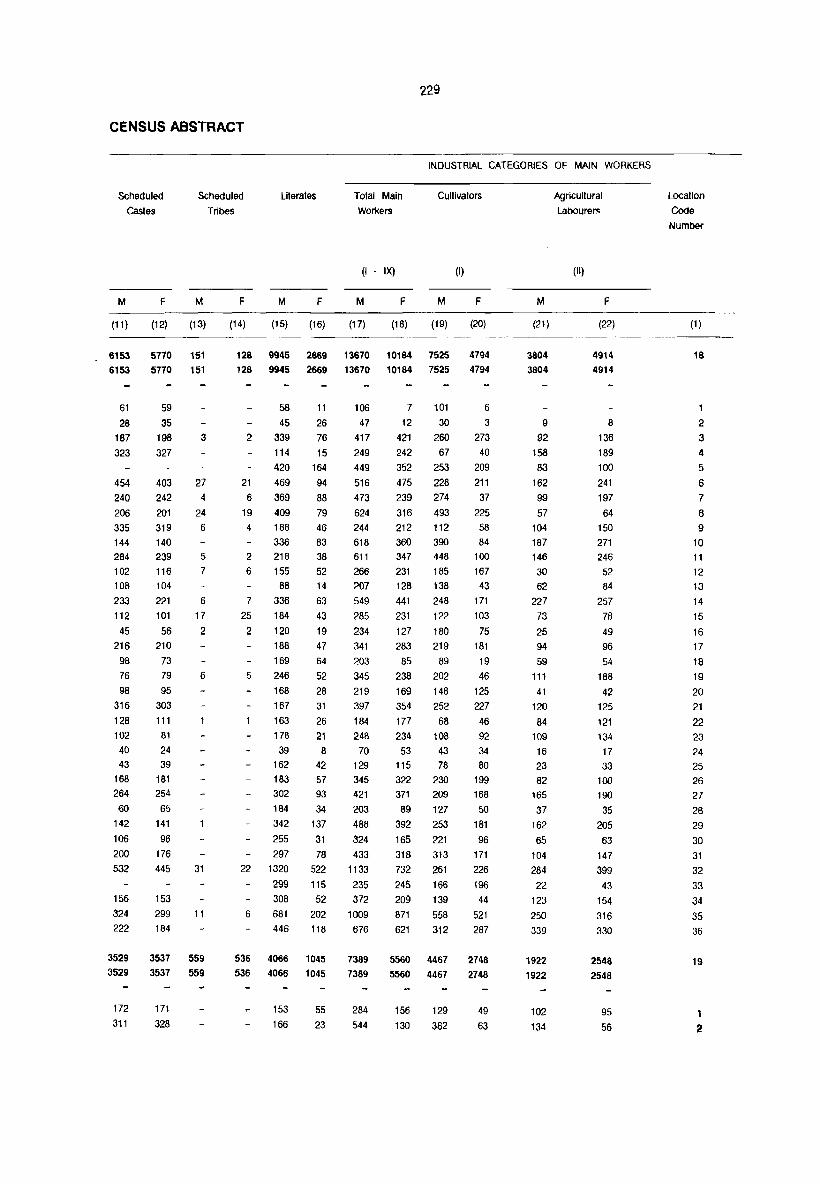
229
CENSUS ABSTRACT
INDUSTRIAL CATEGORIES OF MAIN WORKERS
Scheduled
Castes
Scheduled Tribes
Literates Total Main Workers
Cultivators
M
(11)
6153
6153
61
28
187
323
454
240
206
335
144 284
102
108 233
112
45
216
98
76
98
316
128 102
40
43
168
F
(12)
5770
5710
59
35
198
327
403 242
201 319
140 239
116
104
221
101 56
210 73
79
95
303
111
81
24
39
181 264 254
60 65
142 141
106 96
200 176
M
(13)
151
151
3
27
4
24
6
5
7
6
17
2
6
532 445 31
156 153
324 299 11
222 184
3529 3537 559
3529 3537 559
172
311 171
328
(I IX) (I)
F M F M F M F
(14) (15) (16) (17) (18) (19) (20)
128 9945 2669 13670
128 9945 2669 13670
58 11 106
45 26 47
2 339 76 417
114 15 249
420 164 449
21 469 94 516
6 369 88 473
19 409 79 624
4 188 46 244
336 83 618
2 218 38 611
6 155 52 266
88 14 207 7 336 63 549
25 184 43 285
2 120 19 234
188 47 341
169 64 203
5 246 52 345
168 28 219
167
163
178
39
162
183
31
26
21
8 42
57
397
184
248
70
129
345
10184 7525
10184 7525
7 101 12 30
421 260
242 67
352 253
475 228
239 274
316 493
212 112
360 390
347 448
231 185
128 138
441 248
231 122
127 180
283 219
85 89
238 202
169 148
354 252
177 68
234 108
53 43
115 78
322 230
4794
4794
6
3
273
40
209
211
37
225
58
84
100
167
43
171
103
75
181
19
46
125
227
46
92
34
80
199 302 93 421 371 209 168
184 34
342 137
255 31
297 78
22 1320 522
299 115 308 52
6 681 202
446 118
536 4066 1045
536 4066 1045
153
166
55
23
203 89 127 50
488 392 253 181
324 165 221 96
433 318 313 171
1133 732 261 226
235 245 166 196
372 209 139 44
1009 871 558 521
676 621 312 287
7389 5560 4467 2748
7389 5560 4467 2748
284
544
156
130
129
382
49
63
M
(21)
3804
3804
9
92
158
83
162
99 57
104
187
146
30
62
227
73
25
94
59
111 41
120
84
109 16
23
82
165
37
162
65
104
284
22
123
250
339
1922
1922
102
134
Agricultural LabOurer:
(II)
F
(22)
4914
4914
8
136
189
100
241
197
64
150
271 246
52
84
257
78
49
96
54
188
42
125
121
134
17
33 100
190
35
205
63
147
399
43
154
316
330
2548
2548
95
56
Location
Code
Number
(1)
18
1
2
3
4
5
6 7
8
9 10
11
12
13
14
15
16
17
18
19
20
21 22
23
24
25
26
27
28 29
30
31
32
33
34
35
36
19
1
2
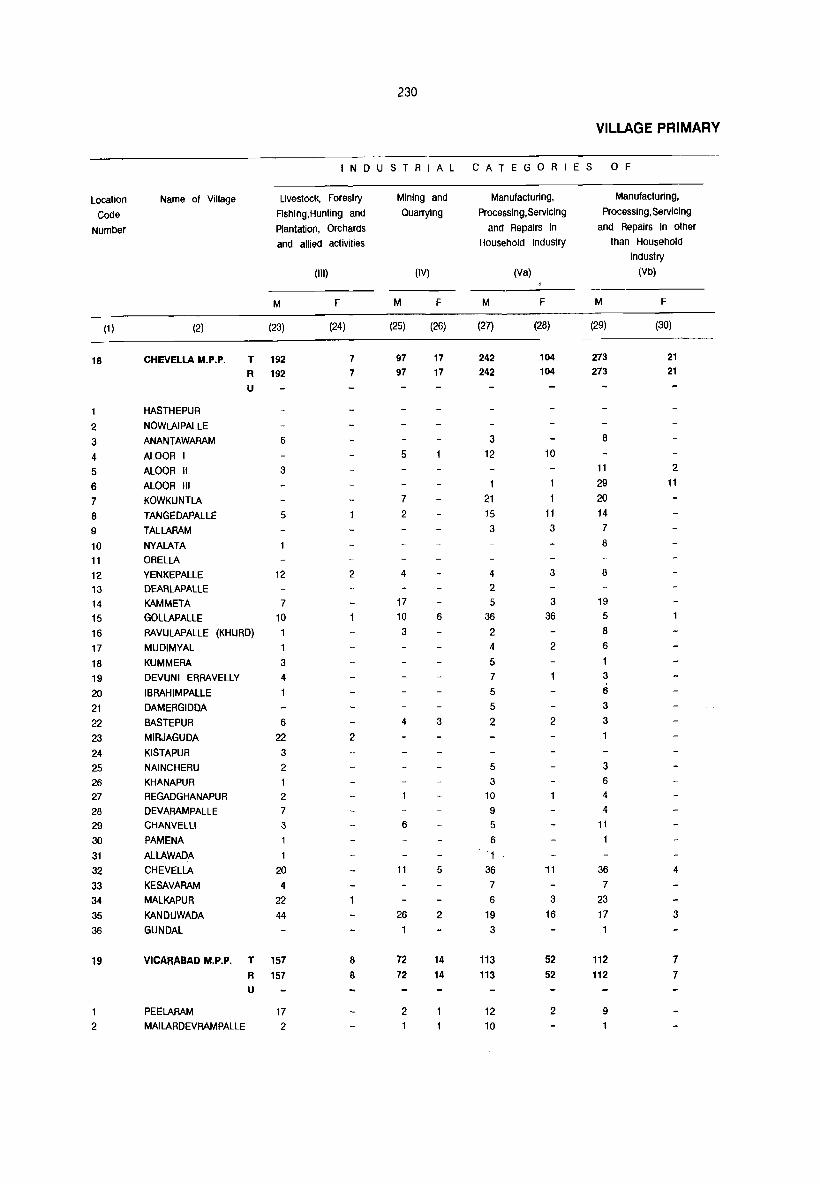
230
VILLAGE PRIMARY
I N D U STRIAL CATEGOR I E S o F
Location Name of Village Livestock, Forestry Mining and Manufacturing, Manufacturing,
Code Fishing,Hunting and Quarrying Processing,Serviclng Processlng,Servlclng
Number Plantation, Orchards ana Repairs In and Repairs In other
and allied actiVities HousehOld Industry than Household Industry
(III) (IV) (va) (Vb)
M F M F M F M F
(1) (2) (23) (24) (25) (26) (27) (28) (29) (30)
18 CHEVELLA M.P.P. T 192 7 97 17 242 104 273 21
R 192 7 97 17 242 104 273 21
U
1 HASTHEPUR
2 NOWLAIPALLE
3 ANANTAWARAM 6 3 8
4 ALOOR I 5 12 10
5 ALOOR II 3 11 2
6 ALOOR III 29 11
7 KOWKUNTLA 7 21 20
8 TANGEDAPAlLE 5 2 15 11 14
9 TAlLARAM 3 3 7
10 NYALATA 8
11 ORELLA
12 YENKEPALlE 12 2 4 4 3 8
13 DEARLAPAllE 2
14 KAM M ETA 7 17 5 3 19
15 GOLLAPALLE 10 10 6 36 36 5
16 RAVULAPALLE (KHURD) 3 2 8
17 MUDIMYAL 4 2 6
18 KUMMERA 3 5 1
19 DEVUNI ERRAVElLY 4 7 3
20 IBRAHIMPALLE 1 5 6
21 DAMERGIDDA 5 3
22 BASTE PUR 6 4 3 2 2 3
23 MIRJAGUDA 22 2
24 KISTAPUR 3
25 NAINCHERU 2 5 3
26 KHANAPUR 3 6
27 REGADGHANAPUR 2 10 4
28 DEVARAMPALLE 7 9 4
29 CHANVElLi 3 6 5 11
30 PAMENA 6
31 ALLAWADA 1
32 CHEVELLA 20 11 5 36 11 36 4
33 KESAVARAM 4 7 7
34 MALKAPUR 22 6 3 23
35 KANDUWADA 44 26 2 19 16 17 3 36 GUNDAL 3
19 VICARABAD M.P.P. T 157 8 72 14 113 52 112 7
R 157 8 72 14 113 52 112 7
U
1 PEELARAM 17 2 12 2 9
2 MAILARDEVRAMPALLE 2 10

CENSUS ABSTRACT
MAIN WORKERS
Constructions
M
(31)
107
107
13
1
2
4
1
2
1
5
3 3
2
2
3
2
4
7
33 1
5 10
130 130
2
(VI)
F
(32)
13 13
8
4
52 52
M
(33)
506
506
3
8
2
15
44 17
12
7
8 4
12
8 16
4
5
6
6
2
4
7
2
4
4
8
4 14
6
5 184
14 26 39
5
117
117
4
5
Trade and
Commerce
(VII)
F
(34)
68
68
2 5
2
2
4
1 2
2
28 4
3
2 3
26 26
2
Transport,
Storage & Co
mmunications
M
(35)
155
155
3 7
5
9
2
3
2
9 4
2
3
3
5
2
3
7
2
2
3
4
3
8
3 22 4
12 21
1
65
65
(VIII)
F
(36)
3
3
231
Other
Services
Marginal Workers
Non-workers
(IX)
M F M
(37) (38) (39)
769 243 83 769 243 83
2 5
20 4
77 39 32 21 8
10 9
8
5 12
7
9
7 38
8 9
11
8
5 5
8 19 19
11 27
9
6 246
10
16 25 14
234 234
6 8
3
2
39 6
4
13
5
1
5
8
2
2
2
11
3
2
2
4
6
2
1
22 11
4 4
2
57
2
4
10
105 105
7 10
19
22
4
5
4
10
9
1
7
78
78
F M
(40) (41)
755 11763
755 11763
36 2
16
5
191
4
44 2
4
1
3
81
19
7
118
123
41
4
12
10 31
374
374
55
115
49 371 196
495 620 467 638 237 440 542 161
176
39l 236 155
238 204 292 198 310 165
226 50
113
307 298 198
373 247 253
1253
165
427 724 427
5664 5664
187 427
F
(42)
13491 13491
196
68 358 207 601 560 739 916
254 547 688 200 184
463 233 289 278 213 425 230 308 160 179
69
111
331
329 168 413 271
298 1407
177
513
723 385
6796 6796
292
783
Location
Code
Number
(1)
18
1
2 3
4
5
6
7
8
9
10
11
12
13
14 15
16 17
18
19
20 21
22 23 24 25 26 27 28 29 30 31
32 33
34 35
36
19
1
2

Location
Code
Number
(1)
19
3
4
5 6
7
11
12
13
14
15
16
17
18
19
20
21
25
28
30
31
32
33
34 35
20
1
2
3
4
5
6
7 8 9
10
11
12
13
14
15
Name of Village
(2)
VICARA8AD M.P.P. (Concld .. )
MADANPALLE
PHULMADDI
YRRAVALLY
ATHVELlY KOMPAlLE
NARAYANPUR
PENDLIMADGU
KAMAREDDIGUDA
PATHUR
PULUSUMAMIDI
SIDLOOR MUNGAL
SIDLOOR (CHENCHELAM)
SIDLOOR PAIGAH
PEERAMPALLE
BURHANPALLE
DHANNARAM
MACHANPALLE BURGUPALLE
GUDPALLE
MADGUL CHITIEMPALLE
GOTIIMUKLA
MADHARAM
DYACHARAM
AINAPUR
DHARUR M.P.P.
NAGASAMUNDAR
GANGARAM
NARSAPUR
DHARMAPUR
CHILTAMPALLE
SOMARAM
KACHARAM
KONDAPUR KHURD
KUKINDA
OUSAPALLE
BURUGADDA
ALLAPUR
RAMPUR
GHATIEPALLE
RUDRARAM
T* R* U*
232
Area of Village No. of No. of Total Population (Includ
ing Institutional and
Houseless Population)
in Hectares Occupied House-
(3)
488.43
1528.09
382.08 555.23
506.26
418.04
386.47
280.04
344.79
667.73
671.37
734.50
788.33
401.45
309.58
787.11
884.24
903.66
642.23
1067.15
612.36
314.04
307.56
203.15
220.40
220.40
1507.45
565.34
530.95
424.37
969.34
441.51
308.77
287.50 542.28
151.76
345.60
244.02
483.60
718.32
533.37
Residential holds
Houses
(4)
304
369
197
249
154
156
98
103
118
250
160
120
223
180
88
263
166
85
375
225
84
29
6291
6291
508
139
89
80
163
157
29 107 189
96
76
93
140
158
p
(5) (6)
307 1583
370 2082
199 977
251 1418
154 785
157 782
101 530
103 590
118 583
252 1481
160 1152
121 821
224 1345
180 861
88 528
266 1574
M
(7)
801
1076
498
710
378
375
272
289
293
771
578
422
694
457
256
784
F
(8)
782
1006
479
708
407
407
258
301
2\10
7'0
399
651
404
272
790
Un-Inhabited ---166
85
376
245
866 448 418
641 330 311
2271
1439
1167
735
1104
704
Un-Inhabited ~--
84
29
558 286 272
136
6291 35174
6291 35774
508 2973
139 782
89 479
80 429
163 959
157 998
29 200 107 620 189 1152
96 564
69
18045 18045
1453
401
239
220
474
509
95
315
579
286
67
17729
17729
1~20
381
240
209
485
489
105 305 573
278
Un-Inhabited --
76
93
140
158
413 209 204
648
688
693
321
341
332
327
347
361
VILLAGE PRIMARY
Total Population
in the age group
(0 - 6)
M
(9)
137
230
93
133
65
65
48
50
40
142
159
99
163
84
58
171
106
74
270
156
56
19
3671
3677
311 82
61
47
97
94
14
70
85
69
39
91
72 63
F
(10)
139
229 101
129
70
79
48
56
37
127 120
83
136
66
73
169
108 67
248
145
61
18
3611
3611
326
!;l1
50
42
108 99
27 64
113 60
43
91
66
81
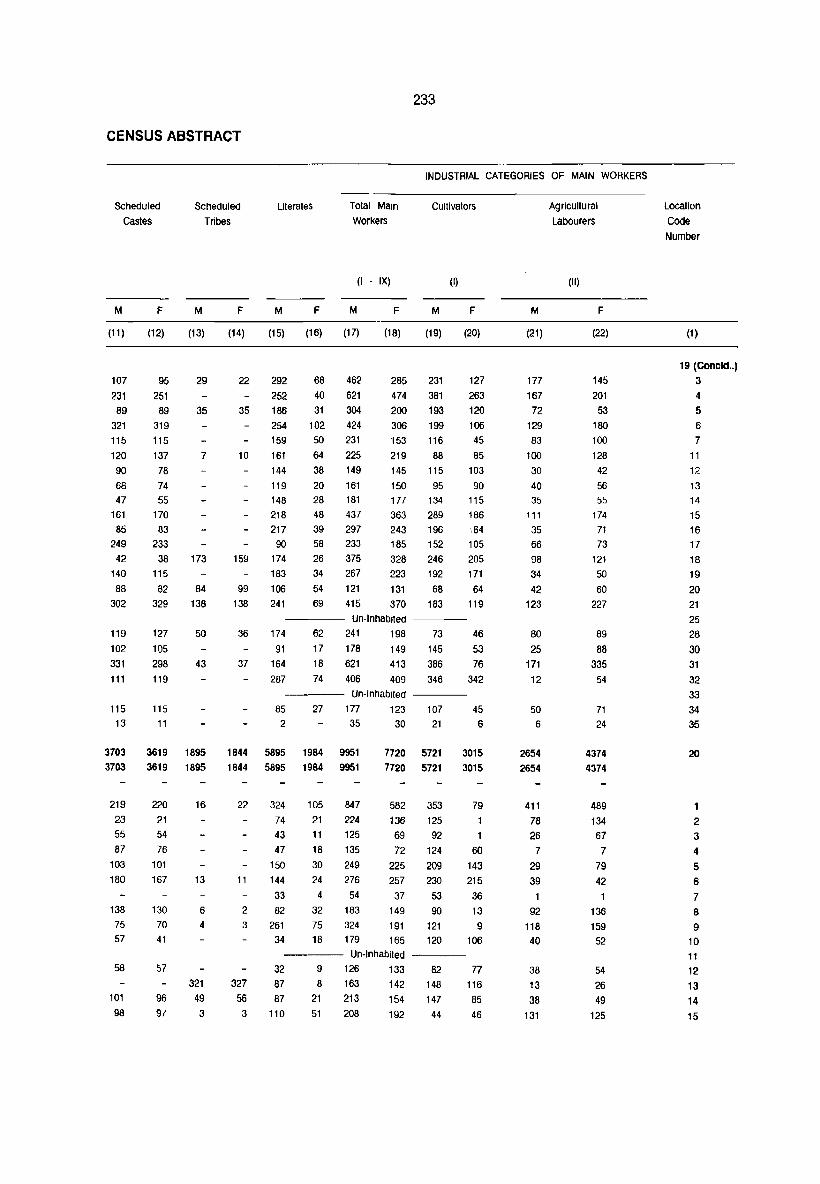
233
CENSUS ABSTRACT
INDUSTRIAL CATEGORIES OF MAIN WORKERS
Scheduled
Castes
M F
Scheduled Tribes
M F
literates
M F
Total Main
Workers
(I IX)
M F
Cultivators
(I)
M F
(11) (12) (13) (14) (15) (16) (17) (18) (19) (20)
107 95 29 22 292 68 462 285 231 127 231 251 252 40 621 474 381 263 89 89 35 35 186 31 304 200 193 120
321 115 120 90 68 47
161
85 249 42
140 88
302
119
102 331 111
115
13
3703 3703
219 23 55
87 103 180
138 75 57
58
101 98
319 115 137 78 74 55
170 83
233 38
115
82 329
127 105 298 119
115
11
3619 3619
220
21 54 76
101 167
130
70 41
57
96
97
7
173
84 138
50
43
1895 1895
16
13
6
4
321
49 3
10
159
99 138
254
159 161 144 119
148 218 217 90
174 183
106
241
102 50 64 38 20 28 48 39 58
26 34 54 69
424 231 225 149 161
181
437 297 233 375 267 121 415
306
153 219 145 150 177 363 243 185 328 223 131 370
Un-Inhabited
199
116 88
115
95 134 289 196
152 246 192 68
183
106
45 85
103 90
115
186 ,64 105 205 171 64
119
36 174
91
164 287
62 17 18 74
241 198 73 46 178 149 145 53
37 621 413 386 76 406 409 346 342
---- Un-Inhabited ----85 27 177 123 107
21 2 35 30
1844 5895 1844 5895
22 324 74 43 47
150
11 144 33
2 82 3 261
34
1984 9951 1984 9951
105 847 21 224 11 125 18 135 30 249 24 276 4 54
32 183 75 324 18 179
1720 5721 1720 5721
582 353 136 125 69 92 72 124
225 209 257 230 37 53
149 90
191 121 165 120
45 6
3015 3015
79 1
1
60 143 215 36
13 9
106 ---- Un-Inhabited ~---
327 56 3
32 9 126 133 87 8 163 142 87 21 213 154
110 51 208 192
82 148 147
44
77 116
85
46
M
(21)
177 167 72
129
83 100
30 40 35
111
35 66 98
34 42
123
80 25
171 12
50 6
2654 2654
411
78 26
7
29 39
1
92 118
40
38 13 38
131
Agricultural
LabOurers
(II)
F
(22)
145 201 53
180 100 128 42 56 55
174 71 73
121 50
60 227
89
88 335
54
71 24
4374 4374
489 134 67 7
79 42
1
136
159
52
54 26 49
125
Location
Code Number
(1 )
19 (Concld .. )
3 4 5 6
7
11 12 13
14 15 16 17 18 19 20 21 25 28 30 31 32 33 34 35
20
2 3 4
5 6
7 8 9
10
11
12 13 14
15

234
VILLAGE PRIMARY
I N D U STRIAL CATEGOR I E S o F
Location Name of Village livestocK. Forestry . Mining and Manufacturing. Manufacturing.
Code Fishing. Hunting and Quarrying Processing.Servicing Processing. Servicing
Number Plantation. Orchards and Repairs in and Repairs in other and allied activities Household IndUstry than Household
Industry
(III) (IV) (Va) (Vb)
M F M F M F M F
(1 ) (2) (23) (24) (25) (26) (27) (28) (29) (30)
19. VICARABAD M.P.P. (Concld .. )
3 MADANPALLE 9 3 6 1 8
4 PHULMADDI 29 3 2 16
5 YRRAVALLY 3 3 25 16
6 ATHVELLY 23 2 11 8 10
7 KOMPALLE 5 3 2
11 NARAYANPUR 5 4 7 4 4
12 PENDLIMADGU 1
13 KAMAREDDIGUDA 4 2 5 6
14 PATHUR 4 1
15 PULUSUMAMIDI 8 2 5
16 SIDLOOR MUNGAL 4 6 9 17 SIDLOOR (CHENCHELAM) 4
18 SIDLOOR PAIGAH 5 12 5 19 PEERAMPALLE 8 5 2
20 BURHANPALLE 2 2 5 1
21 DHANNARAM 4 11 7 30 13 6
25 MAC HAN PALLE Un-Inhabited 28 BURGUPALLE 3 2 30 GUDPALLE 31 MADGUL CHITIEMPALLE 2 24 9 32 GOTTIMUKLA 8 6 33 MADHARAM Un-Inhabited 34 DYACHARAM 10 5 35 AI NAPUR 6
20 DHARUR M.P.P. T 173 8 53 26 79 40 216 51
R 173 8 53 26 79 40 216 51 U
1 NAGASAMUNDAR 24 12 9 2 GANGARAM 10 4 3 NARSAPUR 2 4 DHARMAPUR 4 5 CHILTAMPALLE 6 SOMARAM 7 KACHARAM 8 KONDAPUR KHURD 9 KUKINDA 25 3 4 3 14 10 OUSAPALLE 10 6 3 2 11 BURUGADDA Un-Inhabited 12 ALLAPUR 2 13 RAM PUR 1 14 GHA TTEPALLE 5 2 3 15 RUDRARAM 11 16 6 3 2

CENSUS ABSTRACT
MAIN WORKERS
Constructions
M
(31)
5
1
5 5 4
3
3
1
11
6
16
56
5 6
74 74
5
1
10
3
4
(VI)
F
(32)
52
4
4
2
M
(33)
9
7 4
19 10 4 2
2 14 4
2 3
8
6
5
6
323
323
12 5
1
2
10
4
5
Trade and
Commerce
(VII)
F
(34)
4
3
4 3
2
66
66
2
8
2
Transport,
Storage & Co
mmunications
(VIII)
M F
235
Other
Services
(IX)
M F
Marginal
Workers
M F
Non-workers
M F
Location
Code
Number
(35) (36) (37) (38) (39) (40) (41) (42) (1)
4
3
4 2
4
5
1
7 4
1
1 2
10 14 2
24
8
6
3
4
13
18 5
5 16
8
7 27
Un-Inhabited---
13 8
2
3
238
238
2
2
8
17 19
Un-Inhabited----
3
21 21
420 420
31
2
2
10 5
18
--Un-Inhabited---
3
3 10 4
8
4
5
6
3
1
7 2
8
5
1
3
10 7 2
10
5
115
115
2
1
2
14
2
9
33 16
20
8
98
98
2
37 6
11
121
111
50
14
11
339 455 161 270 147 150 123
128 112 334 281
189 319 190 135 349
207 152
545
321
109
34
742 7996 742 7996
89
94 35
3
26
604 140 108
85
225
233
41 132 255 107
83 158 128
124
19 (Concld
486 3 532 4 158 5
291 6
254 7
188 11
113 12
151
113 347 331 214 323 181
141
370
219 162 691
281
138 37
9267 9267
849 151
136
134
260 232
68
156
382 113
71 159
193 169
13
14 15
16
17 18 19
20 21
25 28 30 31
32 33
34 35
20
1
2
3
4
5 6
7 8
9 10 11
12 13
14 15
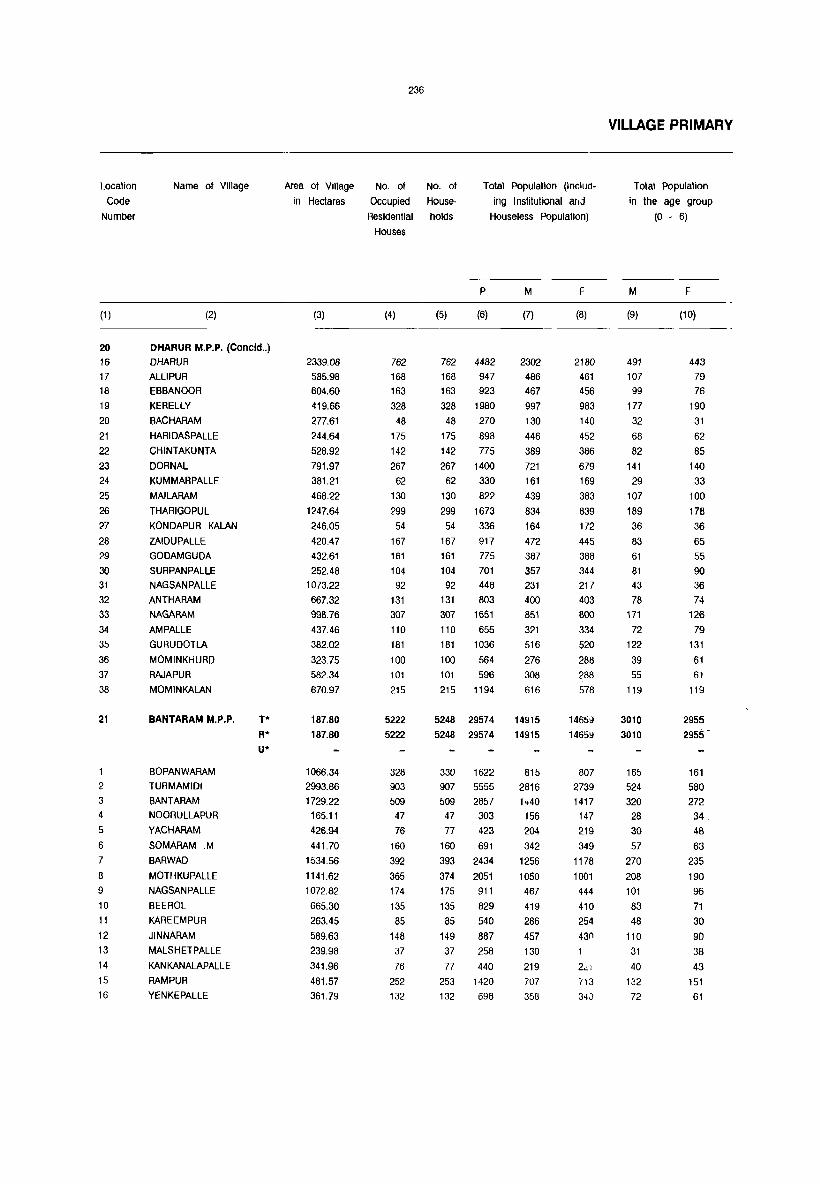
Location
Code
Number
(1)
20
16
17
18
19
20
21
22
23 24
25
26 27 28
29
30
31
32 33
34 35
36
37
38
21
2
3
4
5
6
7
8
9
10
11
12 13
14 15
16
Name of Village
(2)
DHARUR M.P.P. (Concld .. )
DHAAUR
ALLIPUR
EBBANOOR
KERELLY
BACHARAM
HARIDASPALLE
CHINTAKUNTA
DORNAL
KUMMARPALLE
MAILARAM
THARIGOPUL
KONDAPUR KALAN
ZAIDUPALLE
GODAMGUDA
SURPANPALLE
NAGSANPALLE
ANTHARAM
NAGARAM
AMPALLE
GURUDOTLA
MOMINKHURD
RAJAPUR
MOMINKALAN
BANTARAM M.P.P.
BOPANWARAM TURMAMIDI
BANTARAM
NOORULLAPUR
YACHARAM
SOMARAM .M
BARWAD
MOTHKUPALLE
NAGSANPALLE
BEEAOL
KAREEMPUR
JINNARAM
MALSHETPALLE
KANKANALAPALLE
RAMPUR
YENKEPALLE
T* R* U*
236
Area of Village No. of No. of Total Population (Indud·
ing Institutional arid
Houseless Population)
in Hectares Occupied House·
(3)
2339.08
585.98
604.60
419.66
277.61
244.64
528.92
791.97
381.21
468.22
1247.64
246.05
420.47
432.61
252.48
1073.22
667.32
998.76
437.46
382.02
323.75
582.34
670.97
187.80
187.80
1066.34
2993.86
1729.22
165.11
426.94
441.70
1534.56
1141.62
1072.82
665.30
263.45
589.63
239.98
341.96
481.57
361.79
Residential holds
Houses
(4)
762
168
163
328
48
175
142
267
62
130
299
54
167
161
104
92
131
307
110
181
100
101
215
5222
5222
328
903
509
47
76
160
392
365
174
135
85
148
37
76 252
132
P
(5) (6)
762 4482 168 947
163 923
328 1980
48 270
175 898
142 775
267 1400
62 330
130 822
299 1673
54 336
167 917
161 775
104 701
92 448
131 803
307 1651
110 655
181 1036
100 564
101 596
215 1194
5248 29574
M
(7)
2302 486
467
997
130
446
389
721
161
439
834
164
472
387
357
231
400
851
321
516
276
308
616
14915
5248 29574 14915
330 1622
907 5555
509 2857
47 303
77 423
160 691
393 2434
374 2051
175 911
135 829
85 540
149 887
37 258
77 440
253 1420
132 698
815
2816
1440
156
204 342
1256
1050
467
419
286
457
130
219
707
358
F
(8)
2180
461
456
983
140
452
386
679
169
383
839
172
445
388
344
217 403
800
334
520
288
288
578
14659 1465!J
807
2739
1417
147
219
349
1178
1001
444
410
254
43n 1
2..:.: (13
340
VILLAGE PRIMARY
Total Population
in the age group
(0 . 6)
M
(9)
491
107
99
177
32
68
82
141
29
107
189
36
83
61
81
43 78
171
72
122
39
55
119
3010
3010
165
524
320
28
30
57 270
208
101
83
48
110
31
40
132
72
F
(10)
443 79
76
190
31
62
85
140
33
100
178
36
65
55
90
36
74
126 79
131
61
61
119
2955
2955
161
580
272
34 48
63
235
190
96
71
30
90
38
43 151
61
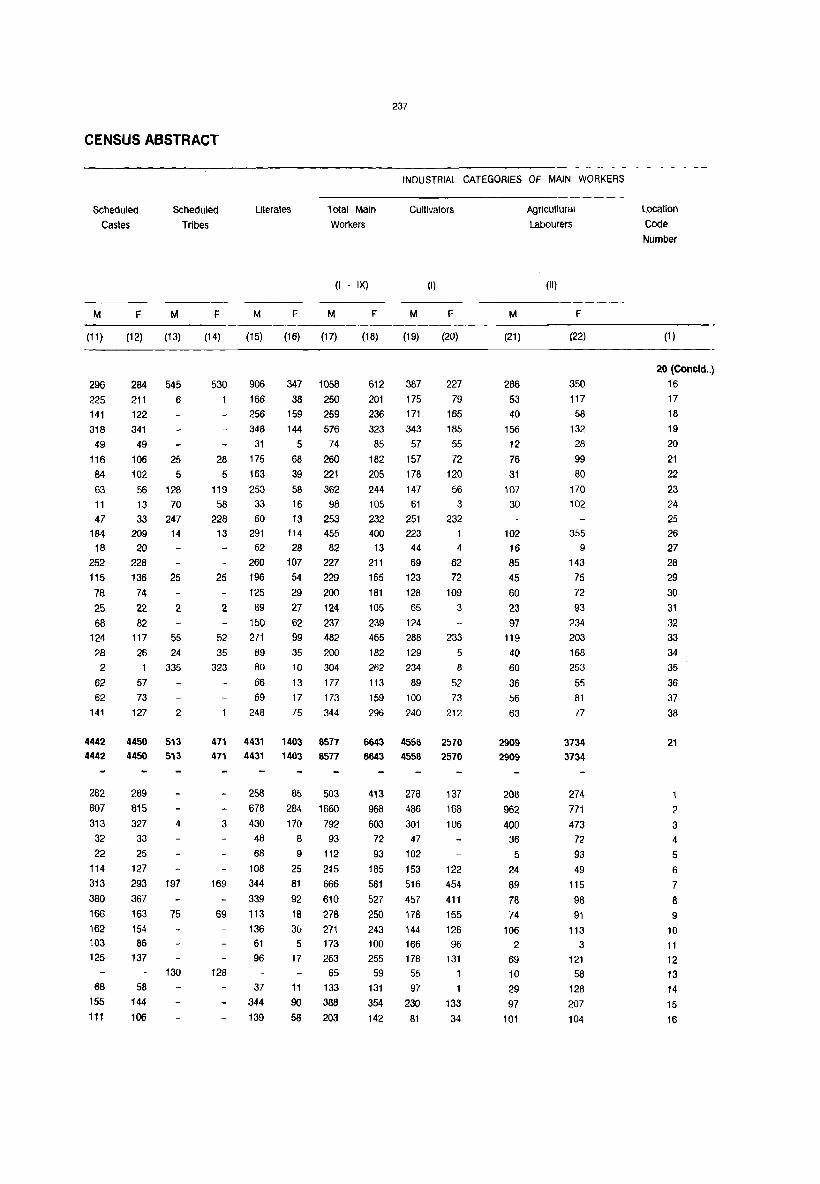
237
CENSUS ABSTRACT
INDUSTRIAL CATEGORIES OF MAIN WORKERS
Scheduled Castes
Scheduled
Tribes
Literates Total Main Workers
Cultivators
M
(11 )
296
225 141
318
49
116
84
63
11
47 184 18
252
115
78
25
68
124
28
2 62
62 141
F M
(12) (13)
284 545
211 6
122
341
49
106 25
102 5 56 128
13 70
33 247 209 14
20
228
136 25
74
22 2
82
117 55
26 24
1 335
57
73
127 2
4442 4450 513
4442 4450 513
282 289
807 815
313 327 4
32 33
22 25
114 127
313 293 197
380 367
166 163 75
162 154 103 86
125 137
68
155
111
58
144
106
130
(I IX) (I)
F M
(14) (15)
530 906
166
256
348
31
28 175
5 163
119 253
58 33
228 60 13 291
62
260
25 196
125
2 89
150
52 271
35 89
323 80
66
69
248
F M
(16) (17)
347 1058
38 250
159 259
144 576
5 74
68 260
39 221
58 362
16 98
13 253 114 455
28 82
107 227
54 229
29 200 27 124
62 237
99 482
35 200
10 304
13 177
17
75
173
344
471 4431 1403 8577
471 4431 1403 8577
258 85 503
678 284 1660
3 430 170 792
48 8 93
68 9 112
108 25 215
169 344 81 666
339 92 610
69 113 18 278
136 30 271
61 5 173 96 17 263
128 65 37
344
139
11
90 58
133
388
203
F M
(18) (19)
612 387
201 175
236 171
323 343
85 57
182 157
205 178
244 147
105 61
232 251 400 223
13 44
211 69
165 123
181 128
105 65 239 124
465 288
182 129
21)2 234
113 89
159
296
100
240
F
(20)
227
79
165
185
55
72
120
56
3
232
4
62
72
109
3
233
5
8
52
73
212
6643 4558 2570
6643 4558 2570
413 278 137
968 486 168
603 301 106 72 47
93 102
185 153 122
581 516 454
527 457 411
250 178 155 243 144 126 100 166 96
255 178 131 59 55
131
354 142
97
230
81
1
133
34
M
(21)
286 53
40
156
12
76
31
107
30
102 16
85
45
60 23
97
119
40
60 36
56
63
2909
2909
208 962 400 36
5
24
89
78 74
106
2
69 10
29 97
101
Agricultural
Labourers
(II)
F
(22)
350
117
58
132 28
99
80
170
102
355
9
143
75
72
93 234 203 168
253
55
81
77
3734
3734
274 771 473
72
93
49 115
98
91
113 3
121 58
128
207 104
Location COde Number
(1)
20 (Concld .. )
16
17
18
19
20
21 22 23
24
25 26 27
28
29 30
31
32 33 34
35
36
37
38
21
2
3 4
5 6
7
8 9
10 11
12
13
14
15
16

238
VILLAGE PRIMARY
INDUSTRIAL CATEGOR I E S o F
Location Name of Village Livestock, Forestry Mining and Manufacturing, Manufacturing, Code Fishing,Hunting and Quarrying Processing,Servicing Processing, Servicing
Number Plantation, Orchards and Repairs in and Repairs in other and allied activities Household Industry than Household
Industry
(III) (IV) (Va) (Vb)
M F M F M F M F
(1 ) (2) (23) (24) (25) (26) (27) (28) (29) (30)
20. DHARUR M.P.P. (Concld .. ) 16 DHARUR 6 4 31 2
17 ALLIPUR 5 5 1
18 EBBANOOR 3 9 2
19 KERELLY 7 3 12
20 BACHARAM 3 2
21 HARIDASPALLE 4 3 2 4
1. CHINTAKUNTA 3
23 DORNAL 27 2 2 4 7
24 KUMMAR PALLE 3
25 MAILARAM
26 THARIGOPUL 14 5 3 4 29 23
27 KONDAPUR (KALAN) 1 14 5
28 ZAIDUPALLE 4 2 1
29 GODAMGUDA 2
30 SURPANPALLE
31 NAGSANPALLE 6 14 5
32 ANTHARAM 5
33 NAGARAM 1 3 5 1 3 23 7
34 AMPALLE 15 3 3 5 3
35 GURUDOTLA 4 2
36 MOMINKHURD 21 19
37 RAJAPUR 4 4 4 1
38 MOMINKALAN 8 2 4
21 BANTARAM M.P.P. T 162 6 148 129 75 31 134 9
R 162 6 148 129 75 31 134 9
U
BOPANWARAM
2 TURMAMIDI 2 10 2 48 5
3 BANTARAM 18 8 3 7
4 NOORULLAPUR 4 2
5 YACHARAM 6 SOMARAM (MALA) 17 2 3
7 BARWAD 7 4 3 10
8 MOTHKUPALLE 8 2 4 13
9 NAGSANPALLE 13 2 1
10 BEEROL 5 4 11 KAREEMPUR
12 JINNARAM 10
13 MALSHETPALLE 14 KANKANALAPALLE 1 3
15 RAMPUR 5 4 3 7
16 YFNKEPALLE 4

CENSUS ABSTRACT
MAtN WORKERS
Constructions
M
(31)
3
2
3
4
4
10 1
6
9
5
2
61
61
12
2
4 4
7
4
2
3
(VI)
F
(32)
5
5
M
(33)
148
6
3
19
3
5 22
1
29 2
4
2
17 5
1
4
2
8
236
236
7
76 20
1
4
18
14 3
2
4
2
24 3
Trade and
Commerce
(VII)
F
(34)
9
4
4
4
12
6
2
3
1
45 45
9 4
6 3
3
Transport, Storage & Communications
M
(35)
112
4
23
10
26 -33
4
8
1
2
5
44
44
15 2
2
1
2 4
2
3
(VIII)
F
(36)
5
15
239
Other
Services
(IX)
M F
Marginal
Workers
M F M
(37) (38) (39) (40) (41)
81 4
30 28
2
10 2
13
1
2
33
31
22
7
9
26
3
8
5
14
250 250
9
48 34
1
3
7
15 27
3
10 4
17 7
17 4
9 2
2
2
11
5 2
1
3
13
4
7
113
113
2
13
17
8
5
12 3 4
3
7
4
35
13
2
2
41 41
7
19
13
2
2 1244 70
256
3
3
5
74
27
50
4
201 208 420 56
186
168 359
63
186 379
69 245 158
157
107
163 367 121
210
99 135 272
800 6297
800 6297
312
9 1149 80 629
63
92
30 114 64 590
5 440
23 189 148
66 113 194 65 86
34 317
44 155
F
(42)
Location
Code
Number
(1)
20 (Concld .. ) 1566 16 190 220 404 55
267 181 432 64
146 439
85
234 222 163
112 164 335 152 231 125 129 278
7216
7216
394 1762 734
75 126 134
533
469 171
167 88
175 69 89
325 154
17 18 19 20
21 22 23 24 25 26 27 28 29 30 31
32 33 34 35 36 37
38
21
1
2
3 4
5 6
7
8
9 10 11
12 13 14 15 16

Location
Code
Number
(1 )
21 17
18 19 20 21
22
23
24
25 26
22
2 3
4
5 6
7
8 9 10 11
12
13 14 15
16 17 18 19
20 21 22
23 24 25 26 27
28 29 30
Name of Village
(2)
BANTARAM M.P.P. (Concld .. )
MANNAPUR
YENNARAM SULTANPUR
KOTHAPALLE MAOHVAPUR
POMMAPUR
NAGARAM
ROMPALLE
MANGRASPALLE
SALBATHAPUR
PEDDEMUL M.P.P.
RAMACHANDRAPUR
ADKICHERLA PASHAPUR RAM PUR
TATIAPALLE
NAGULPALLE
RUDRARAM
ATHAKUR
BAIRAMPALLE
INDOOR
PEDDEMUL
GOPALPUR
THIMSANPALLE
INDOLE
VAGULAPUR
DARYAPUR KOTPAlLE
HEERAPUR
MARPALLE
MANSAMPALLE
DUGGAPUR
JAN GOAN
KHANAPUR
BUDDARAM
HANMAPUR
GIRMAPUR
GOTLAPALLE
GAZIPUR
KANDANELLI RUKMAPUR
T* R* U*
240
Area of Village No. of No. of Total Population (Includ
ing Institutional and
Houseless Population)
in Hectares Occupied House-
(3)
273.97
803.70 395.78 483.60 297.85
138.00
543.09
1197.82
352.48 472.27
270.90 270.90
R41.74
254.93
616.33 228.57
838.89
526.90
673.80
676.63
2462.51
1362.57
441.80
433.01
1007.66
276.40
128.69 484.00
296.63 613.50
320.51
373.93
998.36
373.52
764.85
390.93
229.05
746.64
664.09 1118.14 296.63
Residential holds
Houses
(4)
324 75
231 73
87
297
61 255
7320 7320
384 140
796
293
134
143
413
806
146
57
120
118
784
226 151
76
337
66
121
110
67
139
217
461 172
P M F
(5) (6) (7) (8)
Un·lnhabited -----
325 1600 771 829 76 445
232 1286 73 402
218
656 190
227
630 212
Un·lnhabited -----
87
299
61
255
531 278 253
1640
310
1441
794
153
733
7320 41667 20870
7320 41667 20870
Un-Inhabited
384 2279 140 902
1136 451
846
157
708
20797 20797
1143 451
Un·lnhabited ---
796
293
134
143
413
806
146
57
120
118
784
226 151
4895 2548 2347
1636 820 816
649 328 321
844 394 450
Un· Inhabited -----
2353 1154 1199
4729 2431 2298
808
324
716
639
400
154
370
303 Un-Inhabited .-_-
408
170 346
336
4655 2368 2287 Un· Inhabited • __
1140 549 591
752 372 380
76 361 191
903
137
321
302
174
396
686
170
917
142
334
270
212
391 677
337 1820
66 279
121 655
110 572 67 386
139 787
217 1363
461 2678 172 911
1328 440
1350 471
VILLAGE PRIMARY
Total population
in the age groupl
(0 - 6)
M
(9)
137
55 132 42
75
162 34
154
4316 4316
282 106
661
143 71
83
203 449
82 24
84 58
440
120
99 31
166
25
69 60
38
79
133
258 89
F
(10)
169 51
108 46
55
170
41
152
4327 4327
266
122
652 136
56 133
213
451 80
40 97
64
420
124
116
31 141 27 68
51 55 83
125
258 75
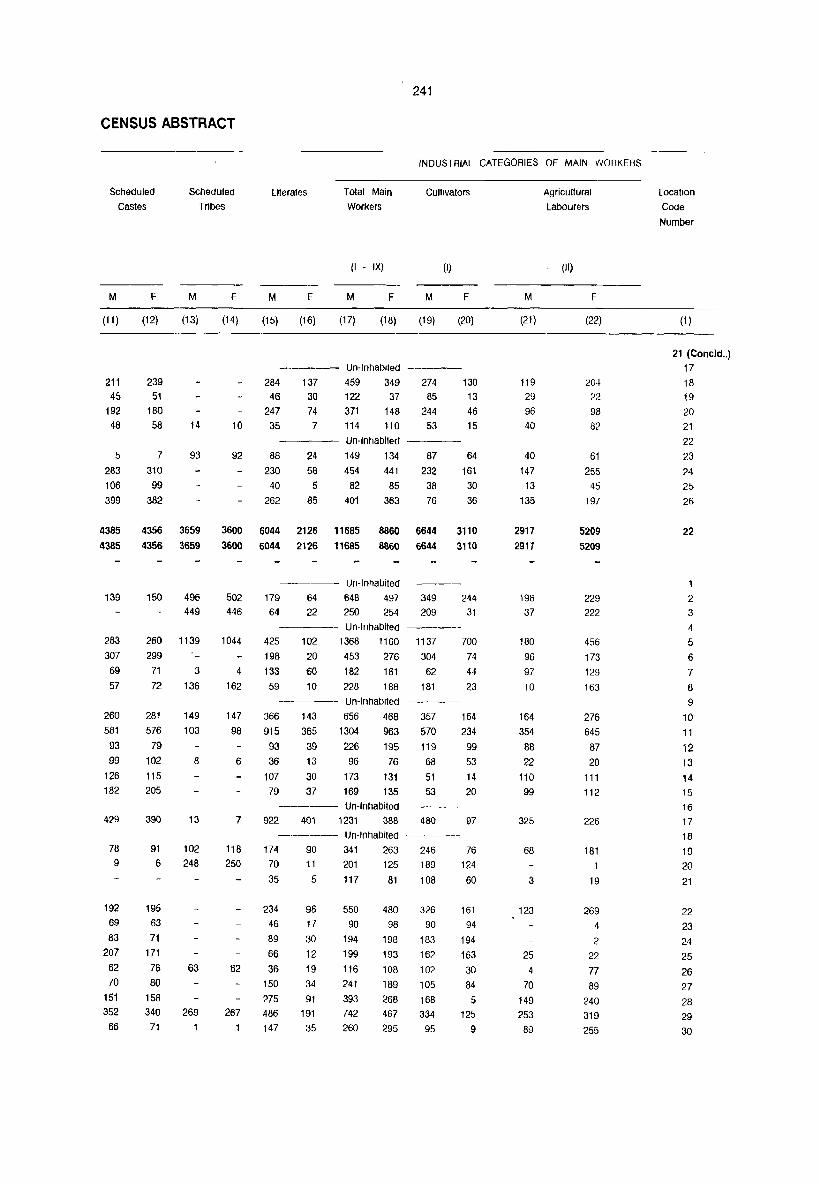
241
CENSUS ABSTRACT
INDUSTRIAL CATEGORIES OF MAIN WORKERS
Scheduled
Castes
M
(11 )
211 45
192 48
5 283
106
399
F
(12)
239 51
180 58
7
310
99
382
Scheduled
Tribes
M F
(13) (14)
14 10
93 92
Literates
M F
(15) (16)
Total Main
Workers
(I IX)
M F
(17) (18)
------- Un-Inhabited
284 137 459 349 46 30 122 37
247 74 371 148 35 7 114 110
------ Un-Inhabited
88 24 149 134
230 58 454 441
40 5 82 85
262 85 401 363
Cultivators
(I)
M F
(19) (20)
274 130 85 13
.244 46 53 15
87 64
232 161
38 30
76 36
4385
4385
4356 3659 3600 6044 2126 11685 8860 6644 3110
139
283
307
69
57
260
581
93
99
126
182
429
78
9
192 69
83
207
62
70
151 352 66
4356 3659
150
260
299
71
72
281
576
79
102
115 205
390
91 6
195
63
71
171
78
80
158 340
71
496 449
1139
3
136
149
103
8
13
102 248
63
269
3600 6044 2126 11685 8860 6644 3110
502 446
1044
4
162
147
98
6
7
118 250
62
267
Un-Inhabited
179 64 648 497 64 22 250 254
------- Un-Inhabited
425 102 1368 1160
198 20 453 276
133 60 182 181
59
366
915
93
36
107 79
10
143
365
39
13
30 37
228 188 Un-Inhabited
656 468
1304 963
226 195
96 76
173 131
169 135 --------- Un-Inhabited
922 401 1231 388
------- Un-Inhabited
174 90 341 263 70
35
234
46
89
66
36
150
275 486 147
11
5
98
17
30
12
19
34
91
191
35
201
117
550
90
194
199
116
241
393 742
260
125
81
480
98
198
193
108
189
268
467
295
349 244
209 31
1137 700
304 74
62 44
181 23
357 164
570 234
119 99
68 53
51 14
53 20
480 97
246 76
189 124
108 60
326 90
183
162
102
105
168 334
95
161
94
194
163
30
84
5 125
9
M
(21)
119 29
96 40
40
147
13
135
2917
2917
198 37
180
96
97 10
164
354
88
22
110
99
325
68
3
123
25
4
70
149 253
89
Agricultural
Labourers
(II)
F
(22)
204
22
98
82
61
255 45
197
5209
5209
229 222
456
173
129
163
276
645
87
20
111 112
226
181
1
19
269
4
2
22
77
89
240 319
255
Location
Code
Number
(1)
21 (Concld .. )
17
18 i9
20 21
22
23
24
25
26
22
1 2 3
4
5
6
7
8
9 10
11
12
13
14
15
16 17
18
19
20
21
22
23
24
25
26
27
28
29
30

242
VILLAGE PRIMARY
I N 0 U STRIAL CAT EGO R E S o F
Location Name of Village LivestocK, Forestry Mining and Manufacturing, Manufacturing,
Code Fishlng,Hunting and Quarrying Processing,Servlcing Processing, Servicing Number Plantation, Orchards and Repairs in and Repairs In other
and allied activities Household Industry than Household Industry
(III) (IV) (Va) (Vb)
M F M F M F M F
(1) (2) (23) (24) (25) (26) (27) (28) (29) (30)
21, BANTARAM M.P.P. (Concld .. )
17 MANNAPUR un-Inhabited
18 YENNARAM 6 6 18 19 SULTANPUR 3 20 KOTHAPALLE 5 4 3 21 MAOHVAPUR 9 7 2 22 POMMAPUR Un-Inhabited ---23 NAGARAM 17 3 24 ROMPALLE 26 13 9 11 2 25 MANGRASPALLE 12 11 10 1 26 SALBATHAPUR 16 3 117 109 10
22 PEDDAMUL M.P.P. T 210 7 221 169 187 39 229 24 R 210 7 221 169 187 39 229 24 U
1 RAMACHANDRAPUR Un-Inhabited ---2 ADKICHERLA 9 8 24 2 5 3 PASHAPUR
4 RAMPUR Un-Inhabited ---5 TATTAPALLE 3 4 3 7 6 NAGULPALLE 11 14 23 6 7 RUDRARAM 4
8 ATHAKUR 21 5 9 BAIRAM PALLE Un-Inhabited ---10 INDOOR 11 30 15 20 6 11 11 PEDDAMUL 39 6 61 23 23 1 12 GOPALPUR 8 1 1 13 THIMSANPALLE 2 3 14 INDOLE 2 15 VAGULAPUR 7 16 DARYAPUR Un-Inhabited 17 KOTPALLE 16 26 3 51 27 8 18 HEERAPUR Un-Inhabited 19 MARPALLE 2 1 7 20 MANSAMPALLE 5 21 DUGGAPUR 22 JANGOAN 3 46 42 4 4 12 23 KHANAPUR
24 BUDDARAM 2 25 HANMAPUR 1 26 GIRMAPUR 2 27 GOTLAPALLE 36 2 4 4 3 28 GAZIPUR 4 6 4 3 25 29 KANDANELLI 11 44 2 30 RUKMAPUR 13 2 8 2

CENSUS ABSTRACT
MAIN WORKERS
Constructions
M
(31)
6
3
1
2
3
8
113 113
3
5
2
2 20
25
2
3
15 9
(VI)
F
(32)
3
2
3 3
2
M
(33)
15
3 5
8 2
23
557 557
30
18
10
4
7
31
98 7
8
152
7
5
4 24
6
4
3 11 23
29
18
Trade and Commerce
(VII)
F
(34)
4
6
5
108 108
4
2
2 2
1
20
2
2
15
1
3
6
1
7
7 12 8
Transport, Storage & Communications
(VIII)
M F
243
Other
Services
(IX)
M F
Marginal Workers
M F
Non-workers
M F
Location COde
Number
(35) (36) (37) (38) (39) (40) (41) (42) (1 )
--Un-Inhabited---
5 16
3
3 9 4
--Un-Inhabited---3
13 4
4
157 157
lB lB
12
450
450
--Un-Inhabited---
5 24 3
--Un-Inhabited-~-
3 13 5
11 2
--Un-Inhabited-~-
8 22 21 112
3
2 10
--Un-Inhabited---
25 3 104 --Un-Inhabited---
11 2
4
2
2 13 18
1
13
7
3
5
1
10 10 42 8
8
3 2
3
8
9
173
173
10
2 4
5
5
38 6
6
35
5
2
3 11 8 5
37 37
8
10
5
100
87 254
2
312 96
285 76
129 340
71 332
761 9148 761 9148
8 487
201
1180
367 146
166
498 13 1127 10 174
58
197
134
377 1129
92
16 207
208 161
74 353
47
127 103 58
155 293 581 180
21 (Concld .. )
17
380 18 103 19 228 101
119 405
72 343
11176
11176
638 197
1187 539 140 261
731 1322
203 94
214
201
1522
328
163 89
436
44 136
77
104
202 393 676
176
20
21 22 23
24 25 26
22
2
3 4
5
6 7
8
9
10 11 12 13 14 15 16 17 16 19 20
21 22
23 24 25
26 27 26 29 30

Location
Code
Number
(1)
22
31
32
33
34
23
2
3
4
5
6 1 8
9
10
11
12 13
14 15
16 17
18
19
20
21
22
23
24
25
26
27 28 29 30
32
33
36
37
38
Name of Village
(2)
PEDDEMUL M.P.P. (Concld .. )
MAMBAPUR
REGONDI
KONDAPUR
MADANANTHAPUR
TANDUR M.P.P.
KHANJAPUR
SANGAM KAlAN MALKAPUR
KOTHLAPUR KHURD
KOTBASPALLE
INOLE GINGURTHY
JODANDAPUR
SHANKARREDDIPALLE
PARWATHAPUR
MITTABACHPALlE
GUNTABACHPALLE KARAN KOTE OGIPUR
CHANDRAVANCHA
CHITTIGHANAPUR BELKATUR
VEEREDPALLE
RAMPUR
ALLAPUfI .S,
CHINTAMANIPATAM
CHENGOlE
ANTARAM BUZURG
GOUTAPUR
GOPANPALLE
ELMAKANNA
NARAYANPUR EERSHETPALLE MACHANOOR GONUR
KONAPUR
CHENGESHPUR
KHANJAPUR
BIJWAR
BONKOOR
T* R* U*
.244
Area of Village No. of No. of Tolal Population (InclUd
ing Institutional and
Houseless Population)
in Heclares Occupied House-
(3)
604,60
503.43
799.23
134.76
210.00 210.00
138.00
1235.91
581.13
406.30
471.86
297.04
1482.76
1545.90 556.85
605.00
585.58
327.39 1930.35
701.32 803.20
330.22 937.65
403.88
406.30
1103.98
1390.93
918.13
830.01
426.54
168.35
726.41
691.02 142.45 236.71 421.30
209,22
341.15
271.54
612.29
157.02
Residential holds
Houses
(4)
409
227
111
96
7301 7301
293
510
145
244
172
422
179
105
106
178
70 1393
117 143
111 246
124
83 524
87
324
419
192
12
195
242 83
1
140
69
129
96
120
27
P
(5) (6)
409 2301
227 1080
111 637
96 516
M
(7)
1090
522
330
272
7580 37841 19016 7580 37841 19016
F
(6)
1211
558
307
244
18825 18825
Un· Inhabited ---
296 1544 750 '194
533 2771 1378 1393
160 873 445 428
254 1369 682 687
175 927
448 2215
204 1026
105 552
106 581
180 913
71 339 1413 6374
117 692
147 718
112 580
262 1322
125 516
88 469
536 2797
92 473
335 1744
443 2087
201 1134
12 80
204 974
247 1296
87 498 1 2
153 735
78 339 145 639
96 505 125 623
29 134
460
1102
526 279
282
446
166 3355
343 355
287
659
253
226
1375
233 861
1068
600
37
485
638 262
1
361
166
318 253
295
69
467
1113
500
273
299
467
173 3019
349
363 293 663
263
243
1422
240
883 1019
534
43
489
658
236
374
173
321
252 328
65
VILLAGE PRIMARY
Total Population
in the age group
(0 . 6)
M
(9)
199
117
76
71
3945 3945
142
260
116
154
99
241
109
63
59
83
50 707
61 66
52
124
47
53
326 43
156
220
135
11
102
106 63
80
28
51
57
65
16
F
(10)
205
131
52
55
3822 3822
153
277
89
154
109
223 T 14
60
70
77
45 643
67
72
47
127
38
66 289
54
144
213
105
13
108
127
58
70
16
60
51 I
75 a

245
CENSUS ABSTRACT
INDUSTRIAL CATEGORIES OF MAIN WORKERS
Scheduled
Castes
SchedUI&d
Tribes
Literates Total Main
Workers
Cultivators
M
(11)
247 102 72
3687 3687
158 92 72
155 66
204 41 39 15
116 64
533 120 121
91
113 42 27
118 35
149 294
155
100 241
62
141
49 111
80 37 26
F M
(12) (13)
270 100 173
62 37 270
3641 1015 3641 1015
144 91 72
169 88
216 36
33 19
113 70
514 125 104
75 108 40 43
127 34
154 301 137
107 216 57
147 48
110 79 41
23
6
25 15 24 88
187 98 65 26 22 49 13
5
151 15 7
188 7
21
2
(I - IX)
F M F M
(14) (15) (16) (17)
427 130 622 204 143 38 299 38 72 19 200
244 18 136
928 6089 2270 10971 928 6089 2270 10971
F M
(16) (19)
594 273 291 120 179 140 119 63
7943 3535 7943 3535
(I)
Un-Inhabited ---
9
26 12 25 73
206
335 78
192 175 323
186 82 97 66 65 133 22 124 30 37 24 1501 16 104 3 96
85 3 248
74 150 41
13 408 9 43
230 142 323
5 216 3
117
15 270 113
1
3 121 69
109
99 56
11
71 78 16 69 69 85 10 16 70 30 8
732 27 46 49 93 42 10
128 11
95 106
82
34
76 38
58 24 28 51 12 4
446 192 193 123 60 79 53
794 552 232 141 392 313 253 230 649 517 318 310 177
163 275 89
1899 190 226 167 402 152 128 793 125 527 566
304 24
298
381 143
1
207
89 184
127 195
43
153 134 170 91 140 80 286 108 100 24 959 184 116 62 169 59 60 81
171 143 39 82 95 77
665 175 111 37 499 222 503 274 224 93
23 9 279 108 309 138
125 110 1 1
172 105
84 49 154 78 128 75 197
46 97 13
F
(20)
114 24 48 2
1074 1074
49 25 17 68 29
124 6
7
42 75 1
82 1
36 10 11. 6
32 43 26 70
108
33
56
6
7
62 36
5
M
(21)
139 125
31 58
2758 2758
95 87 18
114 84
145 95 39 53 65 17
310 20
135 43
152 56 39
114
60 171 201 97 6
145 148
14
62 20 69 29 43 12
Agricultural
Labourers
(II)
F
(22)
389 253 126 114
5153 5153
133
300 72
142
166 285 125 145 59
149 67
523 71
140 47
134 31 59
285 67
357 364 173
20 267 234 117
1
163 81
148 65
140 23
Location
Code Number
(1 )
22 (Concld. ) 31 32 33 34
23
1
2 3 4 5
6 7
8
9
10 11 12 13 14 15 16 17 18 19
20 21 22 23 24 25 26 27 28 29 30 32 33 36 37 38
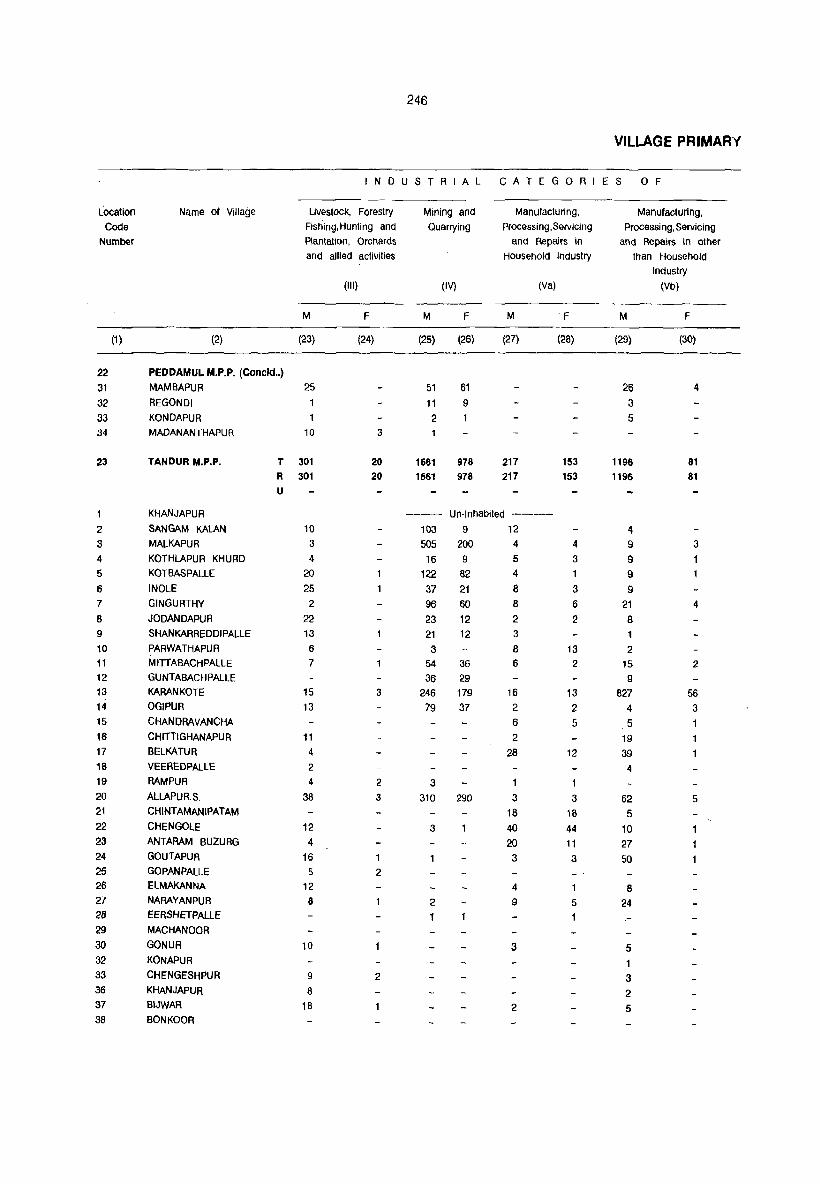
246
VILI-4GE PRIMARY
I N 0 USTRIAL CAiEGOR I E S o F
Location Name of Village livestock, Forestry Mining and Manufacturing, Manufacturing, Code Fishing,Hunting and Quarrying Processing, Servicing Processing, Servicing
Number Plantation, Orchards and Repairs in and Repairs in other and allied activities Household Industry than Household
Industry (III) (IV) (Va) (Vb)
M F M F M F M F
(1 ) (2) (23) (24) (25) (26) (27) (28) (29) (30)
22 PEDDAMUL M.P.P. (Concld .. ) 31 MAMBAPUR 25 51 61 26 4 32 REGONDI 11 9 3 33 KONDAPUR 2 5 34 MADANANTHAPUR 10 3
23 TANDUR M.P.P. T 301 20 1661 978 217 153 1196 81 R 301 20 1661 978 217 153 1196 81 U
KHANJAPUR Un· Inhabited ----
2 SANGAM KALAN 10 103 9 12 4 3 MALKAPUR 3 505 200 4 4 9 3 4 KOTHLAPUR KHURD 4 16 9 5 3 9 5 KOTBASPALLE 20 122 82 4 1 9 6 INOLE 25 37 21 8 3 9 7 GINGURTHY 2 96 60 8 6 21 4 8 JODANDAPUR 22 23 12 2 2 8 9 SHANKARREDDIPALLE 13 21 12 3 1 10 PARWATHAPUR 6 3 8 13 2 11 MITTABACHPALLE 7 54 36 6 2 15 2 12 GUNTABACHPALLE 36 29 9 13 KARAN KOTE 15 3 246 179 16 13 827 56 14 OGIPUR 13 79 37 2 2 4 3 15 CHANDRAVANCHA 6 5 5 16 CHITIIGHANAPUR 11 2 19 .1 17 BEU<ATUR 4 28 12 39 1 18 VEEAEDPALlE 2 4 19 RAMPUR 4 2 3 20 ALLAPURS. 38 3 310 290 3 3 62 5 21 CHINTAMANIPATAM 18 18 5 22 CHENGOLE 12 3 40 44 10 23 ANTARAM BUZURG 4 20 11 27 24 GOUTAPUR 16 3 3 50 25 GOPANPALLE 5 2 26 ELMAKANNA 12 4 8 27 NARAYANPUR 8 2 9 5 24 28 EERSHETPALLE 1 1 29 MACHANOOR
30 GONUR 10 3 5 32 KON.APUR 33 CHENGESHPUR 9 2 3 36 KHANJAPUR 8 2 37 BIJWAA 18 2 5 38 BONKOOR
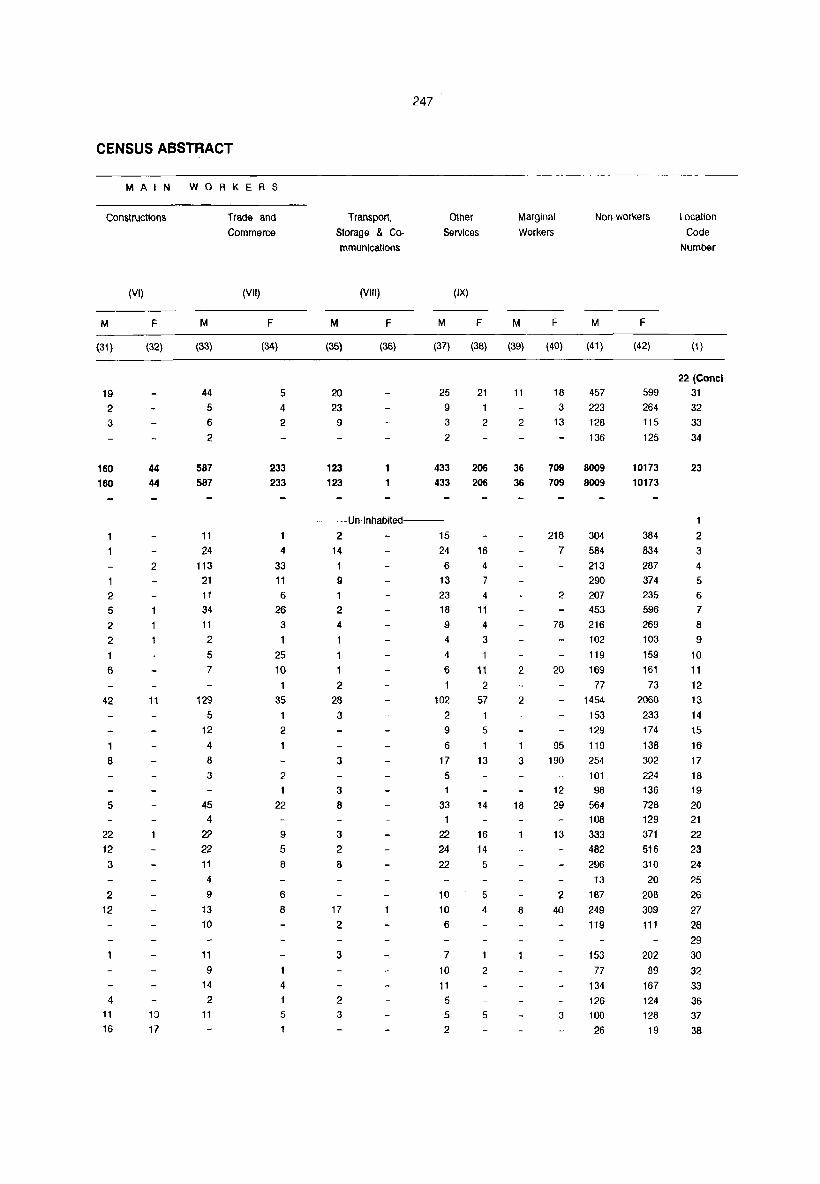
247
CENSUS ABSTRACT
---------------------------------- """ --------"---MAIN WORKERS
Constructions
M
(31)
19
2 3
160 160
2
5
2
2
1
6
42
1
8
5
22 12 3
2 12
4
11
16
(VI)
F
(32)
44
44
2
11
11
17
M
(33)
44 5 6
2
587 587
11 24
113 21 11 34 11 2
5 7
129
5 12
4
8
3
45 4
22
22 11
4
9
13 10
11 9
14 2
11
Trade and Commerce
(VII)
F
(34)
5 4
2
233 233
4
33
11 6
26 3
25 10
1
35 1
2
1
2
1
22
9
5
8
6
8
1
4
5
Transport,
Storage & Co" mmunications
(VIII)
M F
Other
Services
(IX)
M F
Marginal
Workers
M F
Non"workers
M F
Location
Code
Number
(35) (36) (37) (38) (39) (40) (41) (42) (1 )
20 23
9
123 123
25
9 3
2
433
433
--Un"lnhabited---
2 15
14 24
9
1
2
4
1
1
2 28 3
3
3
8
3
2
8
17 2
3
2
3
6 13 23
18
9 4
4
6
102 2
9
6
17 5 1
33
1
22 24 22
10 10
6
7 10 11
5 5
2
21 1
2
206
206
16 4
7 4
11
4
3
1
11 2
57 1
5
1
13
14
16 14
5
5 4
2
5
11
2
36 36
2
2
1
3
18
8
18 3
13
457 223 128
136
709 8009 709 8009
218 7
304 584 213 290
2 207 453
78 216 102
119
20 169
77
1454 153 129
95 119 190 254
12 29
13
2
40
3
101
98
564 108 333
482
296 13
167 249 119
153 77
134 126 100
26
22 (Conel
599 31 264 32 115 33
125 34
10173 10173
384 834 287 374 235 596 269 103
159 161
73 2060
233 174
138 302 224 136 728 129 371
516 310 20
206 309 111
202
89 167 124 128 19
23
1
2
3
4
5 6
7
8
9
10
11 12 13
14 15 16
17 18
19 20 21 22 23 24 25 26
27 28 29 30 32
33
36 37
38

Location
Code Number
(1 )
24
1
2 3
4 5 6
7
8
9
10 11
12 1~
14 15 16 17 18 19 20 21 22 23 24 25 26 27 28 29 30 31
25
1
2 3
4
5
Name of Village
(2)
BASHEERABAD M.P.P. T* R* U·
INDERCHED
NAVANDGI GANGWAR
KYADGIRA
JEEVANGI
MANTHATTI
REDDIGHANAPUR
SHAPUR MAOTA
KAMSANPALLEMAOTA
MASANPALLE(M) KORVICHED
NAVALGA
ALLAPUR (BASHEERABAD)
MANTHANGOUD
DAMERCHED
PARWATHPALLE KOTHLAPUR BUZURG
EKMAI
KAMSANPALLE BUZURG MAl LWAR
ISMAILPUR
NEELAPALLE
JALALPUR
MARPALLE
MANTHLAPUR
GOTIGA KALAN
GOTIGA KHURD
MALKANGIRI
KHASIMPUR
BAHADURPUR
KOPPANKOTE
YELAL M.P.P.
AGNOOR
AASOOLPUR
KOKAT
MAZRASANGAM
RAGHAPUR
T'" R· U·
248
Area of Village No. of No. of Total Population (Includ
ing Institutional and Houseless Population)
in Hectares Occupied House-
(3)
209.60 209.60
326.99 940.08 352.48 398.61
11758.35 1073.63 716.29 271.95 314.04 309.99 346.01
1466.98 523.66 701.92
1230.65 543.90 536.21
1862.36 536.61
1406.68 380.81 282.47 459.70 919.44 301.09 828.15 547.94 179.68 532.56 591.24 265.07
189.40 189.40
1401.73 236.34
1800.44 378.38 235.53
Resldenllal holds
Houses
(4)
6400 6400
102 1048
75 132 418 259 200
67 135 315 470
92 191 416 197 107 476 116 500
60 104 102 107
114 173
69 195 95 65
5925 5925
367
378 160
87
P M
(5) (6) (7)
6400 34888 17287 6400 34888 17287
102 554 1048 6110
75 359 132 712 418 2130 259 1377 200 1087
277 3083 165 357
1024 669 547
F
(8)
17601 17601
277 3027 194 355
1106 708 540
Un-Inhabited ----
67 135 315 470
303 144 159
92 191 416 197
625 1755 2896 503
1060 2131
931 107 641 476 2636 116 654 500 2803 60 270
104 617 102 562 107 524
318 876
1461 231 526
1091 470 308
1295 310
1368 135 298 277 242
307 879
1435 272 534
1040 461 333
1341 344
1435 135 319 285 282
Un-Inhabited ----
114 173 69
195 95 65
608 312 296 841 321 962 560 356
6275 33879 6275 33879
396 162 471 28£ 186
16748 16748
367 2042 998
445 159 491 272 170
17131 17131
1044 Un-Inhabited ---
399 172 105
2281 1135 873 434 555 283
1146 439 272
VILLAGE PRIMARY
Total Population
in the age group
(0 - 6)
M
(9)
3448 3448
52 621
23 74
166 151 106
24 68
192 286
45 119 229
98 69
241 51
281 37 67 50 33
62 75 33
102
58 35
3190 3190
180
243 74 33
F
(10)
3377 3377
43 587 34 74
204
121 88
18 72
196 301 68
118 196 83 61
200 66
288 39 73 68 33
60 80 32 92 54 28
3158 3158
183
224 55 34

249
CENSUS ABSTRACT
INDUSTRIAL CATEGORIES OF MAIN WORKERS
Scheduled Castes
Scheduled Tribes
Literates Total Main
WorKers
Cultivators
M F M
(11) (12) (13)
2940 3048 3045 2940 3048 3045
69 53 3
314 327 341 67 79 11 11
280 309 6 156 158 9 104 116 2
85 26
158
200
125 69
156
47 27
228 51
117
40 56
139
61
72
82 153
47
3875 3875
228
399 76 73
96
29 147 201 143
76 140
35 35
222 56
118
44 59
159
60 86 79
168 42
127 165 776
9
345 378
208
12 56
133 40 68
4
13
35 151
164
3963 1233 3963 1233
254
404 82 73
236
(I IX) (I)
F M F M
(14) (15) (16) (17)
2931 5568 2012 9642 2931 5568 2012 9642
3 106 35 171 339 1460 725 1434
73 43 95 122 22 201
5 392 157 611 8 226 84 378 3 227 64 321
F M F
(18) (19) (20)
7614 4321 1787 7614 4321 1787
139 126 72 496 211 25 85 50 3
136 34 6 496 253 42 336 173 53 308 157 29
---- Un-Inhabited
122 176 725
12 333 352
229
13 49
132
54 54 3
8
27 135 149
36 14 91 83 51
275 307 100 179 98
154 43
461 73
527 21
74 73 66
12 48 95 21 45 52
38 2
157 17
189 5
28 17 21
216 467 804 132 240 659 248 192 720
203 793
81
175 174
166
183 418 673
14 34
686 217 226 657 230 759 80
159 165 166
------ Un-Inhabited
75 11 178 64 138 48 221 156 25 4 96 72
114 36 299 314 51
21
20
2
161
115 162
98
30 7 134 100 122 2
410 200 58 3
148 3
557 594 67
123 4
296 13 80
315 33
68 65 86 67 88 87
127 10
116 19
80 31 41 33
146 116
156 143
69 27
1193 4647 1701 9615 1193 4647 1701 9615
7487 5580 1348 7487 5580 1348
214
394 102 537 299 ---- Un-Inhal>lted
367 162 615 447 210 80
83 35
231 167
232 164
259 67
277 128 169 69
45 11
M
(21)
1987 1987
32 163
10 9
209 144 68
53 32 51
155 56 3
20
136 40
177
74 166
8
56 57 23
29 59 19 84
2
32
2130 2130
151
180 34
104
A\lricultural
Labourers
(II)
F
(22)
4521 4521
59 245
58
45 416 259 254
75 64
179 407
6 6
22
212 220 534 194 559
8
84 73
150
40 81 31
156
16 68
5625 5625
212
291
145
location Code
Number
(1 )
24
2 3
4 5 6
7
8
9
10 11 12 13 14 15 '16 17 18 19
20 21 22 23 24 25 26 27 28
29 30
31
25
2
3 4
5

250
VILLAGE PRIMARY
I N D U STRIAL CATEGOR I E S o F
Location Name of Village Livestock, Forestry Mining and Manufacturing, Manufacturing,
Code Fishing,Hunting and Quarrying Processing,Servicing Processing, Servicing
Number Plantation, Orchards and Repairs in and Repairs in other
and allied activities Household Industry than Household
Industry (III) (IV) (Va) (Vb)
M F M F M F M F
(1 ) (2) (23) (24) (25) (26) (27) (28) (29) (30)
24 8ASttEERABAD M.P.P. T 389 29 838 542 239 250 472 115 R 389 29 838 542 239 250 472 115 U
1 INDERCHED 3 4 3
2 !W>.VANDGI 18 2 107 51 31 6 213 65 3 GANGWAR 15 14 11 2 3 3
4 ~ADGIRA 35 80 80 2 24 2 5 JEEVANGI 14 74 22 6 3 11
6 MANTHATII 9 8 7 12 1 7 REDDIGHANAPUR 20 20 6 8 SHAPUR MAQTA Un-Inhabited
9 KAMSANPALLEMAQTA 2 10 MASANPALLE(M) 1 39 19 -c 3 11 ~ORVICHED 8 252 230 6 , 12 NAVALGA 18 105 28 26 19 34 6
13 ALLAPUR (BASHEERABAD) 2 3 4 14 MANTHANGOUD 1 40 16 3 8 15 DAMERCHED 27 3 11 60 5
16 PARWATHPALLE 19 7 3 17 KOTHLAPUR BUZURG 16 2 1 2 18 EKMAI 9 101 59 2 3 49 5 19 KAMSANPALLE BUZUAG 18 12 3 8 21 2 20 MAl LWAR 48 2 56 86 43 13 21 ISMAILPUR 4 7 1 22 NEELAPALLE 21 4 2 2 23 JALALPUR 19 2 2 2 24 MARPALLE 7 3 3 25 MANTHLAPUR Un-Inhabited 26 GOTIGA KALAN 17 5 27 GOTIGA KHURD 11 3 9 20 8 2 17 5 28 MALKANGIRI 22 2 8 29 KHASIMPUR 15 35 28 2 2 30 BAHADURPUR 31 KOPPANKOTE 9 2
25 YELAL M.P.P. T 358 6 15 12 233 160 224 33 R 358 6 15 12 233 160 224 33 U
1 AGNOOR 24 2 10 5 2 RASOOlPUR Un-Inhabited 3 KOKAT 6 2 51 2 4 MAZRASANGAM 3 7 5 RAGHAPUR 3

CENSUS ABSTRACT
MAIN WORKERS
Constructions
M
(31)
86 86
35 1
6 1
2
3
3
2
2 2
12
3
12
137 137
5
9
(VI)
F
(32)
3 3
2
12
12
M
(33)
601 601
3 289
1 8
17 19 19
1
6
10 27
2
7 16
7 2
38 2
96
3
1
3
8
2
9 2 2
408
408
28
27
6 5
Trade and Commerce
(Vii)
F
(34)
146 146
4
27
2 3 4
9
7
4
7
1
17
11
18
5
2
5 4
2 10 3
145 145
6
4
17 3
-~ ~
251
Transport. Other Services
Marginal
Workers Non-workers
Storage & eommunlcatlons
(VIII)
M F
(IX)
M F M
(35) (36) (37) (38) (39)
238 238
17 17
471 204 26 471 204 26
150
1
2
4
19
14
3 197
4
8 19
8
16
--Un-Inhabited---
4
1
4
3
2 19
7
7
8 3
13 25 5
14 10 8 6
39
4
49
3
2
5
--Un-Inhablted---
2 6
3 14
3
2 6
2
62
5 1
9
11
10
6
6
2 2 1
4
25
43
2
10 2
16
5
F M
(40) (41)
629 7619 629 1619
3 106
116 1633
70 156
7 413 291
225
22 48
13 14
130
164
3
2
125
28
102 408 657
98 265
432 222 116
575
107 575
54 123 103 76
134 175 66
172
126
71
83
83
447 447
146 146
57 1001 7076 57 1001 7076
15 40 --Un-Inhabited---
11 51
9
7
11
20
4
80 461
3 75 fi17
203 8 116
F
(42)
9358 9358
135 2413
109
219 603 371 232
54
124 448 748
128 336
354
244 107
684
114
673
55
160 120
114
232 164
59 177
110
71
8643
8643
665
624 207 100
Location
Code Number
(1)
24
2
3
4 5
6
7
8
9
10 11
12
13 14 15 16
17
18 19
20 21 22 23 24
25 26 27 28 29 30 31
25
1
2
3
4
5

location Code
Number
(1 )
25. 6 7 8 9
10 11 12 13 14 15 16 17 18 19 20 21 22 23 24 25 26 27 28 29 30 31 32 33 34
26
1
2 3
4
5
6 7
8 9
10
Name of Village
(2)
YELAL M.P.P. (Concld .. ,
KAMALAPUR ADHALIPUR BANAPUR GANGASAGAR
RASNAM
ACHUTHAPUR
PAGDIAl
ANNASAGAR
BHAGAIPAllE
NAGASAMUDAR
VISWANATHPUR
YELAl
HAJIPUR JAKKEPALLE AMBERPET BENNUR LAKSHMINARAYANAPUR CHENNARAM
YENKAPALlE PAYARKAMPALLE
JUNTPAlLE DOULAPUR
GIRIJAPUR THIMMAIPALLE
MUKUNDAPUR KISHTAPUR
GOREPAllE DEVANOOR
MUDDAIPET
DOMA M.P.P_
BUDLAPUR
KISHTAPUR
POTHREDDYPALLE
OOTPALLE
BOMPALLE
SIV AREDDI PALLE
GUDUR
DONGAYANKEPAlLE
DORNALPAllE BACHPALLE
T* R* U*
252
Nea of Village No. of No. of in Hectares Occupied House
Residential holds
Houses
Total Population (Includ
ing Institutional and
Houseless Population)
(3)
9OS.52 326.58 731.27
1527.28 977.31 402.66 535.40 581.53 356.12 460.13 223.39
1062.70 492.91 511.12
4.45 735.31 284.49 370.69 228.00 693.40
2856.26 263.85 213.67 928.35 320.91 274.38 516.38 737.34 283.68
172_00 172_00
306.35 991.88 252.93 958.70 300.47 458.51 696.63 303.51 373.52 414.49
(4)
150 60 63 69
300 70
294 91 58
155 143 582 167 174
31 234 84
t80 116 108 737 48 38
247 72 68
137 288 169
6502 6502
148 425 69
172 324 256 168 184 166 164
P
(5) (6)
161 832 71 376 71 . 445 77 461
315 1727 97 531
306 1675 111 485 67 250
173 932 144 775
612 3023 168 895 174 795 35 171
245 1290 93 537
198 970 116 636 110 642 764 4174 52 295 43 241
257 1472 87 494 68 407
157 870 291 1726 169 1001
6508 35413 6508 35413
148 933 425 2480 69 374
172 1017 324 1752 256 1348 168 937 184 943 166 1044 164 941
M
(7)
413 172 232 225 828 255 814 253 139 459 403
1463 445 379
88 621 261 489 327 318
:1053 138 128 744 259 205 439 853 495
17684 17684
459 1290 198 490 890
676 447 454 545 477
F
(8)
419 204 213 236 899 276 861 232 111 473 372
1560 450 416 83
669 276 481 '309 324
2121 157 113 728 235 202 431 873 506
17729 17729
474 1190
176 527 862 672 490 489 499 464
VILLAGE PRIMARY
Total Population In the age group
(0 - 6)
M
(9)
65 28 50 61
158 49
118 49 31 72 92
217 76 74 18
127 43 94 68 65
428 27 19
149 70 32
101 172 107
3579 3579
95 220
40 141
192 130 88 92
112 91
F
(10)
71 46 34 72
189 49
125 38 14 85 66
268 86 76 15
112 53 83 53 68
423 31 17
117 55 30 81
187 118
3645 3645
119 235
27 110 151 140 99 86
110
96

253
CENSUS ABSTRACT
INDUSTRIAL CATEGORIES OF MAIN WORKERS
Scheduled
Castes
Scheduled
Tribes
LHerates Total Main
Workers
Cultivators
M
(11)
60
25
29
17 214
55 153
109
51
127
84
199
139
136
235
108
188
79
109
344
17 27
239
28
69
101
127 30
3278
3278
41
193
78
102
164
125 71
63
61
112
F
(12)
70
36
M
(13)
33 118
24 159
225 7
52
169
104
43
150
78
158 45
155
134
231
113
174
83
113 81
374 184
16 21
23
227
32 129 74
90
134 138
35 113
3359 2187
3359 2187
45 301
207 187
68 39
95 52
165 158
138 100
78
80 43
50 62 104 20
(I IX)
F M F M F M
(14) (15) (16) (17) (18) (19)
109
32
100 17
170 5
4 221
45 104
27
24
2 116
110
40 696
62
75
11
147
73 172
102
91 41
181 550
29 51
19
229
116 31
32
119
138 218
107 158
2131 4811
2131 4811
300 112
193 447
35 20
63 157
139 227
92 268
103
36 158 58 123
23 121
26
4
254
102
127
112 74 458
13 162
42 490
11 152
9 86
26 276
50 227
306 768
7 278
37 230
2 53
87 403
26 148
83 296 20 214
6 181
175 1188
24 77
5 80
117 418
8 136
2 144
27 251
78 506 52 248
1374 10123
1374 10123
26 283
54 676 6 103
51 269 62 487
91 423
52 269 63 264
18 338
36 259
127 233
55 59
42 102
120 4 415 224
150 122
320 349
118 140
58 76
188 153
176 108
386 206
233 200
42 146
44 39
360 177
155 79
273 197
208 162
176 138
1105 696
76 49
70 65
305 182
109 100
120 136
215 230
463 333
236 125
8802 6594
8802 6594
233 216
648 367
95 90
261 191 439 323
389 214
213 210
195 148
266 192
271 189
(I)
F
(20)
94
1
97
102
3 118
102
17
2 7
13
61
13
54
98
87
8 24
12
3
30
124
3
3046
3046
111
257
18
179 184
117
1
80
80
197
M
(21)
1
22
24
107
160
8 72
5
26
58
132
58 47
7
164
48
35
25
38
280
11
13
131
20
5
6 99
58
2145
2145
56 236
11
17
93
130
14
66 84
66
Agricultural
LabOurers
(II)
F
(22)
19
54
42
119
301
36
314
55 65
162
209
222 27 42
337 83
260
146
78
966
57
46
282
80
120
182
318
210
5385
5385
120
375 75 63
235 245 205
101
174
73
Location
Code Number
(1)
25 (Concld .. ) 6
7
8
9 10
11
12
13
14
15
16
17 18
19
20
21
22
23
24
25
26
27 28
29
30
31
32
33
34
26
1
2 3 4
5 6
7
8
9 10

254
VILLAGE PRIMARY
I N D U STRIAL C ATEGORI E S o F
Location Name of Village Livestock, Forestry Mining and Manufacturing, Manufacturing,
COde Fishing,Hunting and Quarrying Processing, servicing Processing, servicing
Number Plantation, Orchards and Repairs In and Repairs in other
and allied activities H()usehold Industry than Household
Industry
(III) (IV) (Va) (Vb)
M F M F M F M F
(1 ) (2) (23) (24) (25) (26) (27) (26) (29) (30)
25. VELAL M.P.P. (Concld .. )
6 KAMAlAPUR 3 9 5
7 ADHALIPUR 2 3
8 BANAPUR
9 GANGASAGAR
10 RASNAM 3 3 5 9 6
11 ACHUTHAPUR 15 4 4 5
12 PAGDIAL 23 9 2
13 ANNASAGAR 5 2
14 BHAGAIPALlE
15 NAGASAMUDAR 34 5 3 3 16 VISWANATHPUR 27 2 22 6
17 VElAL 38 76 87 52 19 18 HAJIPUR 7 1 5 19 JAKKEPALLE 15 2
20 AMBERPET 2
21 BENNUR 22 11 22 LAKSHMINARAYANAPUR 2
23 CHENNARAM 24 2 12 24 YENKAPALLE 2 7 4 25 PAY ARKAMPALLE
26 JUNTPALLE 63 1 39 20 9
27 DOULAPUR 8 11
26 GIRIJAPUR
29 THIMMAIPALLE 30 3 8 2
30 MUKUNDAPUR 1 31 KISHTAPUR
32 GOREPALLE
33 DEVANOOR 2 19 7 9 1 34 MUDDAJPET 1 7 12 16 5
26 DOMA M.P.P. T 384 70 12 2 135 48 122 20 R 384 70 12 2 135 48 122 20 U
BUDLAPUR 3 2 KISHTAPUR 19 2 8 5 6 3 POTHREDDYPALLE
4 OOTPALLE 23 2 3 5 5 BOMPALLE 17 2 6 3 6 3 6 SIVAREDDIPAlLE 9 5 6 2 7 GUDUR 21 1 4 5 8 DONGAY ANKEPALLE 15 2 6 4 9 DORNALPALl£ 39 3 10 BACHPALLE
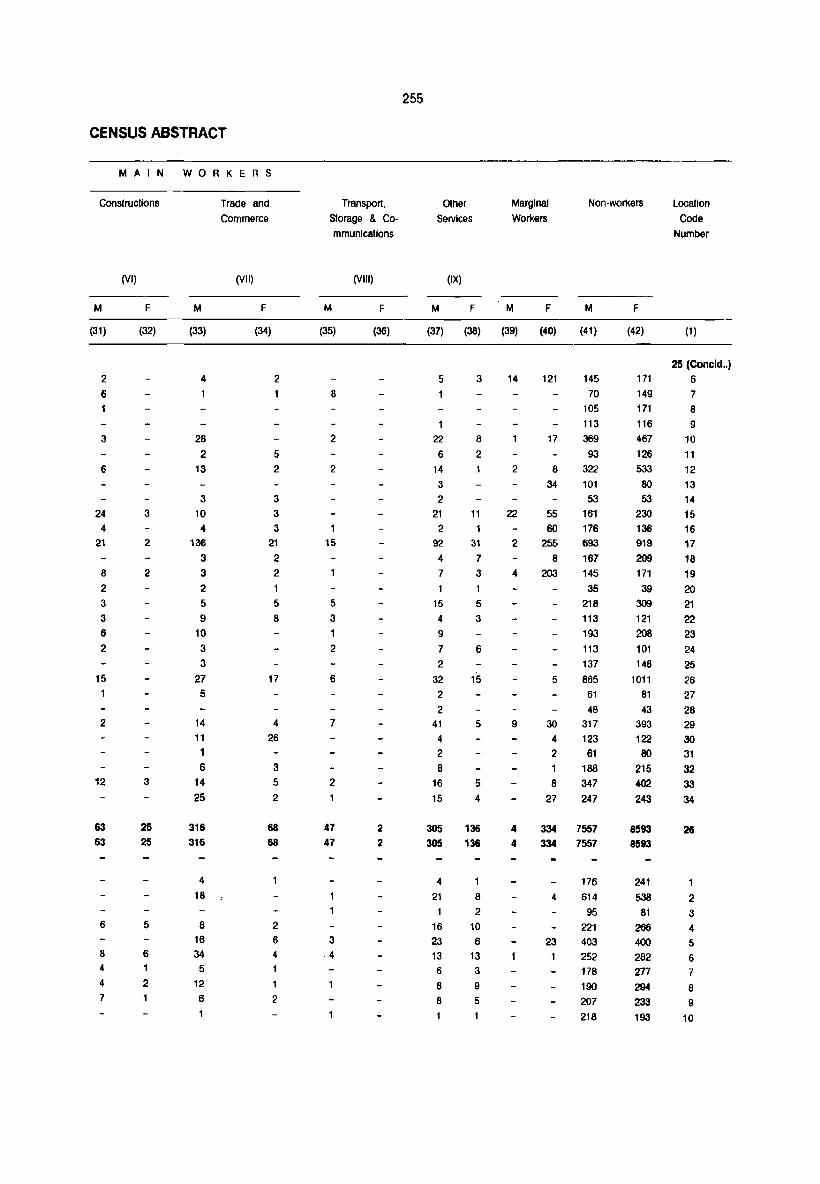
CENSUS ABSTRACT
MAIN WORKERS
Constructions
M
(31)
2
6
3
6
24 4
21
8
2 3
3 6
2
15
2
12
63 63
6
8 4
4 7
(VI)
F
(32)
3
2
2
3
25
25
5
6 1
2
M
(33)
4
28 2
13
3 10 4
136
3 3 2 5
9
10 3 3
27 5
14 11
1
6 14 25
316
316
4
18
8 16 34 5
12
6
Trade and Commerce
(VII)
F
(34)
2
5 2
3
3 3
21
2 2
5
8
17
4
26
3
5
2
68
68
2 6
4
1
1
2
Transport, Storage & Communications
M
(35)
8
2
2
15
5 3
2
6
7
2
47 47
3 4
(VIII)
F
(36)
2
2
255
Other Services
(IX)
M F
Marginal
Workers
M F
Non-workers
M F
Locallon
Code Number
(37) (38) (39) (40) (41) (42) (1 )
5
22
6
14 3
2
21 2
92
4 7
1 15
4 9
7 2
32 2
2 41 4 2
8 16 15
305 305
4
21 1
16 23 13
6
8
8
3
8
2
11 1
31
7
3
1 5
3
6
15
5
5 4
136 136
8
2
10 6
13 3
9
5
14
2
22
2
4
9
4
4
121
17
8
34
55 60
255
8 203
5
30
4
2
8 27
145 70
105 113 369
93 322 101 53
161 176 693
167 145 35
218 113
193
113 137 865
61 48
317 123
61 188 347 247
334 7557 334 7557
4
23
176 614
95 221 403
252 178
190
207
218
25 (Concld .. ) 171 6 149 7 171 116 467 126 533
80 53
230
136 919
209 171
39 309
121
208 101 148
1011 81
43 393
122
80
215 402
243
8593
8593
241
538 81
266 400
282 277 294 233
193
8
9
10 11 12
13 14 15 16 17
18 19
20
21
22 23 24 25 26
27 28 29 30
31 32 33 34
26
1
2 3
4 5
6 7
8 9
10

Location
Code Number
(1)
26.
11
12
13 14
15
16
17
18 19
20
21
22
23 24 25
26 27 28
27
1
2 3
4 5 6
7
8
9
10
11 12
13 14
15
16
17 18
19
20
Name of Village
(2)
OOMA M.P.P. (Concld .. ) DOMA
TIMMAIPALLE
L1NGANPALLE
BRAHMANPALLE GANJIPALLE
BADAMPALLE RAKONDA
PALEPALLE KHAMMAM NACHARAM
MOTHKUR
AINAPUR
DIRSAMPALLE
KONDAIPALLE ANANTHAREDDIPALLE BATLA CHANOMRAM MAlLEPALlE
DADAPUR
GUMDAL
GANDEED M.P.P. T*
KAPLAPUA
VENNACHED JINNARAM
CHELMllLA SALARNAGAR PEDDAVARVAL CHINNAVARVAl
RUSUMPALLE GANOE ED BAISPALLE
REDDIPALLE
SALKERPET
VARAHAGIRIPALLE GOVINDPALLE
PAGDIYAL BALSULGONDA
KONOAPUR MANSOORPALLE KOMREDDIPALLE NANCHERLA
R* U"
256
Area of Village No. of No. of Total Population (Includ·
ing InStitutional and
Houseless Population)
in Hectares Occupied House·
(3)
768.50 233.91
1122.19
714.67 416.42
397.40 436.65
399.02
239.57
1405.07
1169.13
937.65
561.30
339.94
220.15
466.20
1124.62
811.39
239.50
239.50
449.60
1374.31 284.49
894.44
170.78 911.75 281.66
563.32
904.07
Residential holds
!-louses
(4)
724
90
41
212
120
177
141
238 53
660
378 400 175 33
50
185
476
273
8780
8780
100
1191 115 78 76
255 149 197 484
21
269 426
P
(5) (6)
724 3972
90 435
41 251
212 919 120 608 177 796 141 701
238 1159 57 316
660 3577
378 2185 400 2187 175 725 33 166 50 327
185 1010
478 2757
273 1553
8892 48771 8892 48771
M
(7)
1981 213
139
483
298 392 354
545
148
1726
1113 1091
376 82
166 492
1368
791
24324 24324
100 520 240 1212 6188 3023
115 703 341
78 392 183
76 361 176
:,?55 1453 731
149 823 406 215 1144 547 506 2733 1382
21 102 5S
279 1626 793 426 2355 1204
F
(8)
1991
222
112
436 310
404
347
614
168 1851
1072 1096
349 84
161
518 1389
762
24447
24447
280
3165
362
209 185
722 417 597
1351
46
833 1151
93.08
526.49
1060.27 509.50
521.23 --- Un·lnha.bited ---
1365.41 396.59
555.23
609.05
1016.57 2136.33
42
419
209 163
125 375 747
42 230 123 419 2221 1131
212 1163 575 163 1057
125 749 375 2076
758 4403
534
384 1026
2186
107
1090
586
523
365 1050
2217
VILLAGE PRIMARY
Total Population
In the age group (0 . 6)
M
(9)
360 43
28
98 69
69
76
105
26
395
239
204
49
17
36 102
298
164
4924 4924
37 543
80
57 40
173
100 114
267 8
164 232
42 210
121
100 83
203
457
F
(10)
372 55
29 75 76 75 62
116 34
437 210
251 48
21 42
111 273
183
5014 5014
42 569
66
48
31
164 112 138
273
9
150
210
30
220 130
117 81
217 489

257
CENSUS ABSTRACT
INDUSTRIAL CATEGORIES OF MAIN WORKERS
Scheduled
castes Scheduled
Tl1bes
Uterates Total Main
Wol1<ers Cultivators
M
(11)
416 38
117 41
172 45
310 278 157 70
19 177
182 216
3732
F M
(12) (13)
432 2 39 16
29 298 120
127 62
57 22
190 52
327 307
275 139 169 65 13
15 11 183 42 193 98 206 65
3723 3235
(I • IX)
F M F M F M
(14) (15) (16) (17) (18) (19)
843 247 1045 654 526 19 36 6 140 133 79
27 2 85 63 52 244 16 2 252 227 234 120 58 3 171 134 53
51 52 15 235 195 164 13 100 42 227 158 163
141 88 321 271 135 43 12 93 101 77
327 426 125 968 931 623 313 89 607 594 458
182 154 28 666 573 269
13 116 44 219 191 212 26 7 52 31 39
8 54 25 108 90 78 46 99 34 261 274 267
109 358 99 789 698 637 59 211 47 493 474 388
3178 7258 2618 13454 11530 8459
(I)
F
(20)
153 31 27
169
10 2
37 85
94 340
129 151
15 28
265 170 96
5202 3732 3723 3235 3178 7258 2618 13454 11530 8459 5202
76 521
51 63 50
99
80 86
334 2 9
285
25
164
48 122
8 197 301
90
538 56
70 54
101 79 89
335 3 8
274
18
67
85
9
22 40 22
92 31
55
146 322
55 84
110 35 9 177
206 13 313 296
89 26 135 63 1070 440 1728
121 34 162 W 35 12 ~
30 6 96
6 132 26 446 19 91 24 237 35 67 9 331 7 506 225 725
11 29 85 272 117 446 31 397 173 686
171 61 1546 1072 178 73 113 48 110 72 406 335 255 204 234 192 708 466
27 28 441 281 608 475
---- Un-Inhabited ----
51 2 50 60 45 302 286 84 666 391 455 70 158 42 330 300 212 32 84 20 352 352 197
153 108 26 229 184 174 11 276 88 602 477 322
303 701 242 1198 1082 641
36 711
70 48 56
247 236 120 374
21 206
342
8 182 100
15 11
160 516
M
(21)
247 41 16 9
81
54
16 128
1
213 109
306
2
10 24
74 41
2551 2551
49 234 27 18 21 58
18 73
156
90 88
13 118 54
130 45
187 253
Agricultural
Labourers
(II)
F
(22)
460 97 34 36
127 179 146 227
10 771 244 415
36 16
62
507 352
5691 5691
125 692 73 59 52
144
13 95
318 6
217 238
52 193 176 331 169 298 456
location
COde
Number
(1)
26 (Concld .. )
11 12
13 14 15
16 17
18 19
20
21
22
23 24
25 26 27 28
27
2 3
4
5
6 7
8 9
10 11
12
13 14 15 16 17 18 19 20

258
VILLAGE PRIMARY
1 N 0 U STRIAL CATEGORI E S o F
Location Name 01 Village LIvestock, Forestry Mining and Manufacturing, Manufacturing, COde RShlng,Hunllng and Quarrying Processing, Servicing Processlng,Servlclng
Number Plantation, Orchards and Repairs In and Repairs in other and allied actMlles Household Industry than Household
Industry (III) (IV) (Va) (Vb)
M F M F M F M F
(1) (2) (23) (24) (25) (26) (27) (28) (29) (30)
26. DOMA M.P.P. (Concld .. )
11 DOMA 6 24 2 26 12 TIMMAIPALLE 16 13 L1NGANPALLE 15 14 BRAHMANPALLE 4 15 GANJI PALLE 34 6 16 BADAMPALLE 6 17 RAKONDA 37 10 18 PALEPALLE 8 10 19 KHAMMAM NACHARAM 9 6 20 MOTHKUR 45 29 13 14 21 AlNAPUR 2 1 2 22 OIRSAMPALLE 38 2 22 18 7 23 KONOAiPALLE
24 ANANTHAREDOIPALLE 2 25 BATLA CHANDRARAM 4 26 MALLEPALLE 9 6 27 DADAPUR 3 7 2 24 1 7 3 28 GUMDAL 23 7 9 11 7
27 GANDEED M.P.P. T 592 68 124 44 217 106 276 53
R 592 68 124 44 217 106 276 53 U
KAPLAPUR 7 3 2 VENNACHED 105 13 16 56 42 49 15 3 JINNARAM 23 4 12 24 3 4 CHElMILLA 21 5 5 SALARNAGAR 1 6 PEDDAVARVAL 17 3 17 7 CHINNAVARVAL 6 1 B RUSUMPALLE 6 29 9 6 12 9 GANDEED 9 10 6 5 11 2 10 BAISPALLE
11 REDDIPALLE 20 4 2 8 3 7 2 12 SALKERPET 29 2 2 5 3 28 12 13 VARAHAGIRIPALLE Un·lnhabited 14 GOVINDPALLE
15 PAGDIYAL 9 2 8 24 12 16 BALSULGONDA 22 15 5 17 KONDAPUR B 18 MANSOORPALLE 19 KOMREDDIPALLE 40 12 9 3 7 20 NANCHERLA 87 24 22 21 18 6 29

CENSUS ABSTRACT
MAIN WORKERS
Constructions
M
(31)
4
7
1 10
6
5
63 63
8
7
2
2
2
4
2
6
(VI)
F
(32)
4
2
3
5
5
M
(33)
102
2 2
3
2 16 3
24 6
10 2
4
22 11
442 442
5
73 11
1
8 5
3 19
10 14
12 9
9 2
8 63
Trade and
Commerce
(VII)
F
(34)
17
2
1
2
2
8
3
3
2
1
7 2
126 126
1
26
3
3
2
4
3
3
3
8
3
24
259
Transport. Other Services
Marginal WorKers
Non-workers Location Code
Number Storage & C0-
mmunications
(VIII)
M F M
(IX)
F M F M
(35) (36) (37) (38) (39) (40) (41)
17
2 2
2
1
3
4
2
2
1
88
88
6
5
4
2 2
92
1
2 1
6
7
15 1
23 20 11
3
2 1
8
11
642
642
9
109
6
1
2
7
1
10 42
26
40
--Un-Inhablled---2
5 4
1
2 12 2
21 10 7 6
25 67
20
2
4
24
4
3
2
2
8
7
2
203
8
22 49
2
2
8
8
3
935 73 54
231 127 155 127 224
55 758 506 425 157 30
58
211 579 298
233 113 1412 10151 233 113 1412 10751
8
46 2
11 2
4
7
8 6
9 10 3 3
3
32
3
9
11
7
5
12 16
2
4
10 65
18
7
14
74 27
6
18
229 60
20 81
21
102 1286
168
85 80
285 169 211
657 27
346 517
63 453 229
182 155 422 984
F
(42) (1)
26 (Concld •. ) 1134 11
89 12 49 13
209 14 168 15. 187 16 140 17 341 18 65 19
912 20 478 21 515 158
52 71
244 688 288
11505
11505
99
1554 166
89 75
302 162
289 616
19 386
525
47 470 228
171 161
492 1114
22
23 24 25 26 27 28
21
1
2 3 4
5
6
7
8 9
10 11
12 13
14 15
16
17
18 19
20
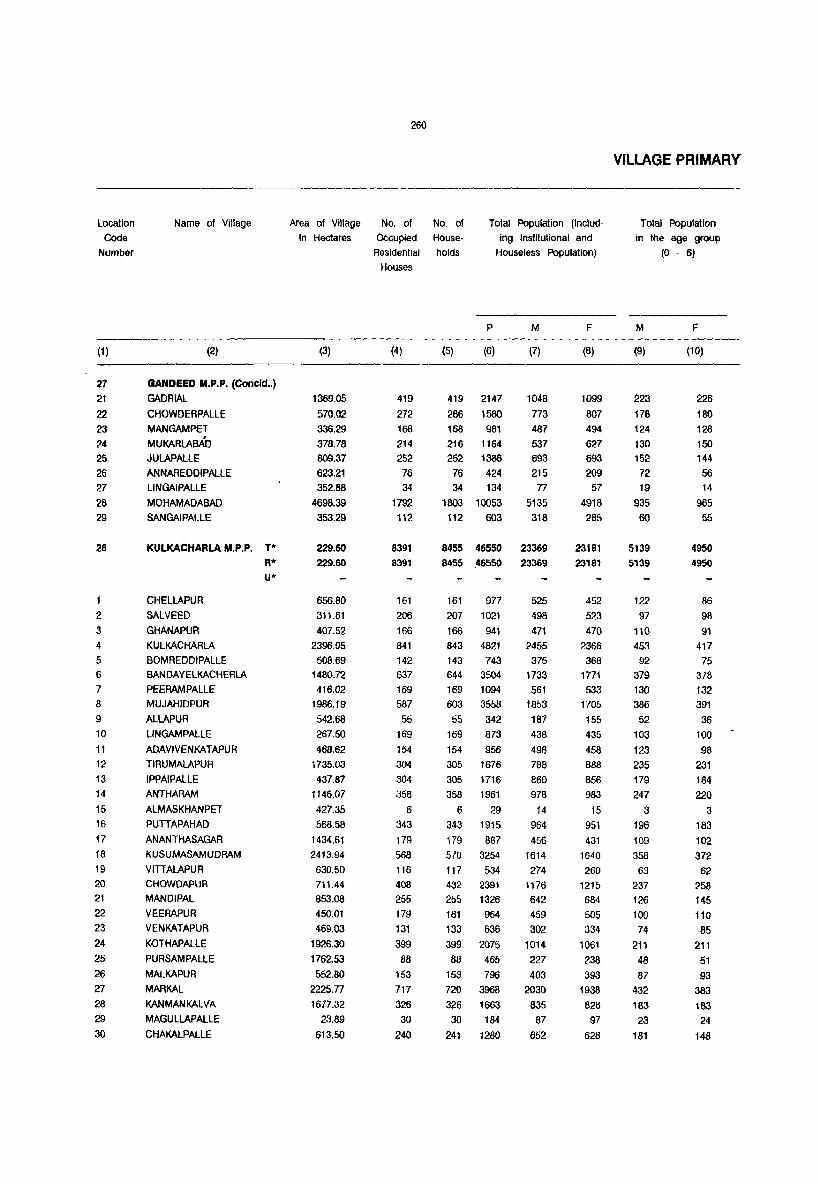
location
Code Number
(1 )
27 21
22 23
24 25 26
27
28 29
28
2 3 4
5 6
7 8
9 10
11
12
13 14
15 16
17 18 19
20 21
22 23
24
25 26 27 28 29 30
Name of Village
(2)
GANDEED M.P.P. (Concld .. ) GADRIAl
CHOWDERPAllE
MANGAMPET
MUKARL.ABAD JULAPALlE
ANNAREDDIPALLE
lINGAIPAllE
MOHAMADABAO
SANGAIPALlE
KULKACHARLA M.P.P. T* ft*
U*
CHElLAPUR
SAlVEED
GHANAPUR
KUlKACHARLA
BOMREODIPAllE BANDAYELKACHERLA
PEEAAMPAlLE MUJAHIDPUR
ALLAPUR
LlNGAMPALLE
ADAVIVENKATAPUR
TIRUMALAPUR
I PPAIPALLE
ANTHAAAM
AlMASKHANPET PUTIAPAHAD
ANANTHASAGAR
KUSUMASAMUDRAM
VinALAPUR
CHOWDAPUR MANOIPAl
VEEAAPUR
VENKATAPUR
KOTHAPAlLE
PU RSAM PAlLE
MAlKAPUR
MARKAL
KANMANKALVA
MAGULLAPALLE
CHAKALPALLE
260
Area of Village No. of No. of Tolal Population (Includ· ing Institutional and
Houseless Population)
in Hectares Occupied House·
(3)
1369.05
570.02 336.29
378.78 809.37
623.21
352.88
4698.39 353.29
229.60
229.60
656.80
311.61
407.52 2396.95 508.69
1460.72
416.02 1966.19
542.68
267.50
468.62
1735.03
437.67
1146.07
427.35
568.58
1434.61
2413.94 630.50 711.44
853.08
450.01 469.03
1926.30
1762.53
552.80
2225.77
1677.32
23.89 613.50
Residential holds
Houses
(4)
419
272 168
214 252
76 34
1792
112
8391 8391
161
206 166 841
142 637 169
587
55
169
154 304 304 358
6 343
179
568 116 408
255 179 131 399
88 153
717
326 30
240
p
(5) (6)
419 2147 286 1580
M
(7)
1048
773 168 981 487
216 1164 537 252 1386 693
76 424 215 34 134 77
1803 10053 5135 112 603 318
8455 46550 23369
8455 ,46550 23369
161 977
207 1021
166 941
843 4821
143 743 644 3504 169 1094
603 3558
55 342
169 873 154 956
305 1676 305 1716 358 1961
6 29
343 1915
179 887
570 3254 117 534 432 2391
255 1326
181 964 133 636
399 2075 88 465
153 796
720 3968 326 1663 30 184
241 1280
525 498
471 2455 375
1733
561 1853
187 438
498 788
860
978
14 964
456
1614 274
1176
642
459 302
1014 227
403
2030
835 87
652
F
(8)
1099
807 494 627 693
209
57
4918 285
23181
23181
452 523
470
2366 368
1771
533
1705 155
435
458 888
856 983
15 951
431 1640
260 1215
684
505
334
1061
238
393 1938
628
97 628
VILLAGE PRIMARY
Total Population
in the age group (0 • 6)
M
(9)
223 178
124 130
152 72 19
935 60
5139
5139
122 97
110 453
92 379 130 386
52 103
123
235 179 247
3
196 109
358 63
237
126 100 74
211
48 87
432
183 23
181
F
(10)
226 180 128
ISO 144
56 14
965 55
4950 4950
86
98
91 417 75
378 132
391 36
100 98
231
184
220
3 183
102
372 62
258
145 110 85
211 51 93
383
183 24
148

261
CENSUS ABSTRACT
INDUSTRIAL CATEGORIES OF MAIN WORKERS
Scheduled
Castes
Scheduled
Tribes
literates Total Main
Workers CUltivators Agricultural
labOurers
M
(11)
252
73 71
111
160
527
17
3584
3684
118 90
121 354
59
269
148 262
3 27
84
151
231
90 47
203
280
63
88
176 59
64
307 240
23 5
F M
(12) (13)
246 146
78 379 78 194
126 109
146 66
209
31
480 473
15 278
3446 4642
3446 4642
92 107 88 142
101 65 368 105
49 4 253 305
143 215
247 582
3 131 21 249
445
104 169
135 54
234 230
5 86 32 41 98
212 646
140
264 11
65 10
96
246
151 157
60
62 22
264 25
236 45
27 25 2 357
F M
(14) (15)
179 210
404 118
207 87
130 118
75 120
204 27
26 3 442 2086
249 53
4596 5576
4596 5576
102 60 162 76
96 70 105 913
7 82 311 501
196 70 537 538
103 8 254 50
406 68 192 218
54 253
223 268
6 4 24 355
107 95
638 224
125 12
9 239
6 182
84
280 19 170 97
45
35 116
37 635 37 201
33 13 341 80
(I - IX)
F M F M
(16) (17) (18) (19)
63 644 656 469
44 449 276 347
29 280 174 163
20 315 187 210
43 386 239 324
14 92 79 3 43 34 15
799 2506 2058 1496
11 188 182 79
1833 12762 11000 8083
1833 12762 11000 8083
14 278 17 219
19 288 284 239
7 286 277 253
325 1307 1094 553
18 211 203 103 173 936 847 546
15 320 211 159 145 882 582 575
2 94 99 94
8 241 254 212
12 285 265 199
91 428 482 266
90 479 466 262
84 546 466 360
9 10 9 121 554 469 325
22 283 278 199
66 652 762 554
5 155 144 101
132 732 645 499
66 349 268 171 43 275 270 183
4 169 165 146 14 594 541 479
23 126 43 110 22 231 211 171
230 1044 972 585 69 440 424 252
1 45 27 24 12 321 224 235
(I)
F
(20)
429
94
80 46
188
9
696
3580
3580
3 59
159 162
47 124 68 68
216 186
184
227 238
140
212 266
93
230
94
50
133
48
9
157
257 144
6
M
(21)
142
49
49 14 33
89 28
408
107
2686
2686
44
24 6
399 64
249 148 195
21
75 93
169 48
63
36 234
30
77
90
79
11
63
3
15
207
163
16
64
(II)
F
(22)
217 170 84
122
40
79
25
1066
181
6823 6823
10 211
108 799
148 684
135
485
99
38
75
270
216
176 10
282
57 467 48
383
156 214 30
480 30
44 655 274
27 210
location
COde
Number
(1)
21 (Concld .. ) 21
22
23 24
25 26
27
28
29
28
1 2
3 4
5 6
7 8
9 10
11
12
13 14 15 16
17
18
19
20
21
22
23
24 25
26
27 28 29
30

262
VILLAGE PRIMARY
I N D USTRIAL CATEGOR I E S o F
Location Name of Village Livestock, Forestry Mining and Manufacturing, Manufacturing,
Code Flshing,Hunting and Quarrying Processing, Servicing Processlng,Serviclng
Number Plantation, Orchards and Repairs in and Repairs In other
and allied activities Household Industry than Household Industry
(III) (IV) (Va) (Vb)
M F M F M F M F
(1) (2) (23) (24) (25) (26) (27) (28) (29) (30)
27 OANDEED M.p.P.(COncld .. ) 21 GADRIAL 8 7 2
22 CHOWDERPALLE 18 9
23 MANGAMPET 25 I 3 3 1 3
24 MUKARLABAD 35 2 9 2 4 2 16 6
25 JULAPALLE 2 4 3 1
26 ANNAREDOIPALLE 27 LlNGAIPALLE
28 MOHAMADABAO 102 15 37 10 59 8
29 SANGAIPALLE
28 KULKACHARLA M.P.P. T 567 75 63 192 162 224 40
R 567 75 63 192 162 224 40 U
CHELLAPUR 2 3 2 ')ALVEED 2 7 4 8 3 GNANAPUR 18 3 2 3 4 KULKACHARLA 89 3 8 19 79 48 4 5 BOMREDDIPALLE 25 2 2 5 6 BANDAYELKACHERLA 17 17 11 20 4 7 PEERAMPALLE 3 8 MUJAHIDPUR 7 24 3 9 ALLAPUR 10 LlNGAMPALLE 11 ADAVIVENKJ\TAPUR 1
12 TIAUMALAPUR 29 7 2 10 8 9 13 I PPAIPALLE 12 11 5 14 ANTHARAM 62 34 8 2 32 5 15 ALMASKHANPET 16 PUTIAPAHAD 63 13 17 7 4 7 3 17 ANANTHASAGAR 32 3 8 3 18 KUSUMASAMUDAAM 13 2 6 12 19 VITIALAPUR 18 2 20 CHOWDAPUR 61 22 5 14 21 MANDIPAL 20 10 4 22 VEERAPUR 3 23 VENKATAPUR 5 24 KOTHAPALLE 28 6 9 25 PURSAMPAUE 7 26 MALKAPUR 8 10 23 6 27 MARKAL 73 5 33 16 17 1 28 KANMANKALVA 9 1 2 29 MAGULLAPALLE 30 CHAKALPAlLE 8

CENSUS ABSTRACT
MAIN WORKERS
Constructions
M
(31)
3 5 5
16
60 60
7
1
3
3
2
4
9
2 3
11
13
(VI)
F
(32)
2
4 4
2
M
(33)
11 13 12 14
7
133
415
415
2
3
2 73
6
35
3
39
7
3
7 14
13
32
4
23 3
33
30 2
3
6
3
3 56 4
:,
Trade and Cnmmerce
(VII)
F
(34)
3
6 5 4
4
16
126 126
3 1
20
4
7
4
11
1 2 4
6
12
1
5
2
9
5 3
2 3
2
16
2
Transport, Storage & C0-mmunications
M
(35)
11
2
33
44 44
11 1
2
4
2
4
2
9
1
(VIII)
F
(36)
263
Otller Services
(IX)
M F
Marginal Workers
M f
Non-workers
M F
Location
Code Number
(37) (38) (39) (40) (41) (42) (1)
6
9
6 6
13
4
5 3 3 3
209 59
2
428 189
428 189
6 4
100
2
48
7
34
6
11
17 19
32 4
12 1
24
23
1
3
7
2
53 9 2
3 6 6
25 2
17 4
15
3 11
5 5
15
2
6
17
9
3 2
4 1
2
22 2
•
2 5
34
22
22
3
2
10
2
3
7 164 106
166 111
402 319 206 222 307
123
27 (Concld .. )
436 21 365 22 214 23
272 24 343 25 129
34 23
205 2593 2655
26 27
26 29 130 103
720 10585 11461
720 10585 11461
239 1 2
38
32
2
15
24 127
85
15
7
10
87
2 24 7
2
244 210 165
1148
164
793 240
971
93 197
213
360
381
432
5 400
173 760 119
441
293 184
133
420
100
172 986
395 42
331
196
238
191
1234
165
692 320
1106 56
181 193 405
366 390
5 397 153
863
116 563
416
225 169
520
108
180
942 397
70 402
26
1
2
3 4
5 6
7
8
9
10 11 12 13
14
15 16 17
18
19
20 21
22 23 24 25 26 27 28
29
30

Location Code
Number
(1)
29
1
2 3
4
5
6
7
8 9
10
11
12
13
14
15
16
17
18
19
20
21
22
23
24
25
26
27 28
29
30
31
32
33 34
35
36
37
30
2
Name of Village
(2)
PARGI M.P.P.
IBRAHIMPUR
MITIAKODUR
LAKHANAPUR
ANNARAM
BARKATPALLE
NASKAL
RANGAPUR
BASIREDDIPALLE
NAZEERABAD
SHAKAPUR
PARGI
RUKUMPALLE
CHIGRALPALLE
GOVINDAPUR
MALKAIPET
GADSINGAPUR
RANGAMPALLE
RAMREDDIPALLE
SONDEPUR
BABAPUR
ROOPKHANPET
SULTHANPUR
NARAYANPUR
RAGHAVAPUR
SYEDMALKAPUR
KADLAPUR
NAGULAPALLE
MADHARAM
RAPOLE
YABAJIGUDA
TONDAPALLE
CHITYAL
KHUDAVANPUR JAFFERPALLE
RAVALPALLE
SYEDPALLE
HEERAPUR
PUDUR M.P.P.
T* R* U*
T* R* U"
MANNEGUDA (PAIGAH)
YENKEPALLE
Area of Village No. of
In Hectares Occupied
(3)
190.10 190.10
898.00
1010.09
380.40
235.53
467.41
1237.93
756.76
307.56
900.02
165.92
2071.99
236.34
337.91
363.41
310.80
590.84
1121.79
72.62 288.94
260.62
463.77
602.58
812.20
518.40
493.72
598.93
264.26
906.09
1578.27
355.05
438.27
922.68
719.20
294.61
316.87
986.62
83.37
209.50
209.50
125.86
740.98
Residential Houses
(4)
8086 8086
221
329
99
173
459
116
133
156
3 2011
103
181
130
55
308
308
39
56 99
354
275
224
83
134
172
337
415
99
168
220
181 77
82
274
12
6504
6504
233
264
No. of Households
Total Population (Including Institutional and
Houseless PopUlation)
P M
(5) (6) (7)
8121 46172 23313
8121 46172 23313
221 1235
329 1864
100 532
578
926
259
F
(8)
22859
22859
657
938
273
-- Un-Inhabited ---176 1040 527 513
461 2516 1252 1264
118 653
135 825
158 726
3 22
2022 11728
103 493
181 1065
138 721
55 365
308 1624
310 1699
39 165
56 283
99 550
354 2138
275 1499
224 1347
83 467
136 757
172 997
324
420
374
8 6106
256
558 342
190
805
837
73
153
267
1075
756
677
239
382
477
329
405
352
14
5622 237
507
379
175
819
862
92
130 283
1063
743
670
228
375
520
Un-Inhabited ---337
415
99
168
1936 954 982
2363 1196 1167
578
995
220 1317
181 1035
77 429
82 469
274 1673
12 66
301
491
662
500
232
242
840
34
6514 37900 19244
6514 37900 19244
277
504
655
535 197
227
833
32
18656
18656
-- Un-Inhabited ---233 1313 696 617
VILLAGE PRIMARY
Total Population In the age group
(0 - 6)
(9)
4695
4695
130
205
51
95
232
82
81
113
1
1126
65
126
54 51
155
154
21
32
56
215
118
155
48
96
102
212
267
56 94
125
107
40
54
168
8
3982
3982
145
F
(10)
4798
4798
145
196
59
97
220
74
87
86
2 1200
57
91
83
52
128
162
30
30
58
237
154
160 46
77 126
219
211
43
116
141
128
34
60
183
6
3957
3957
122
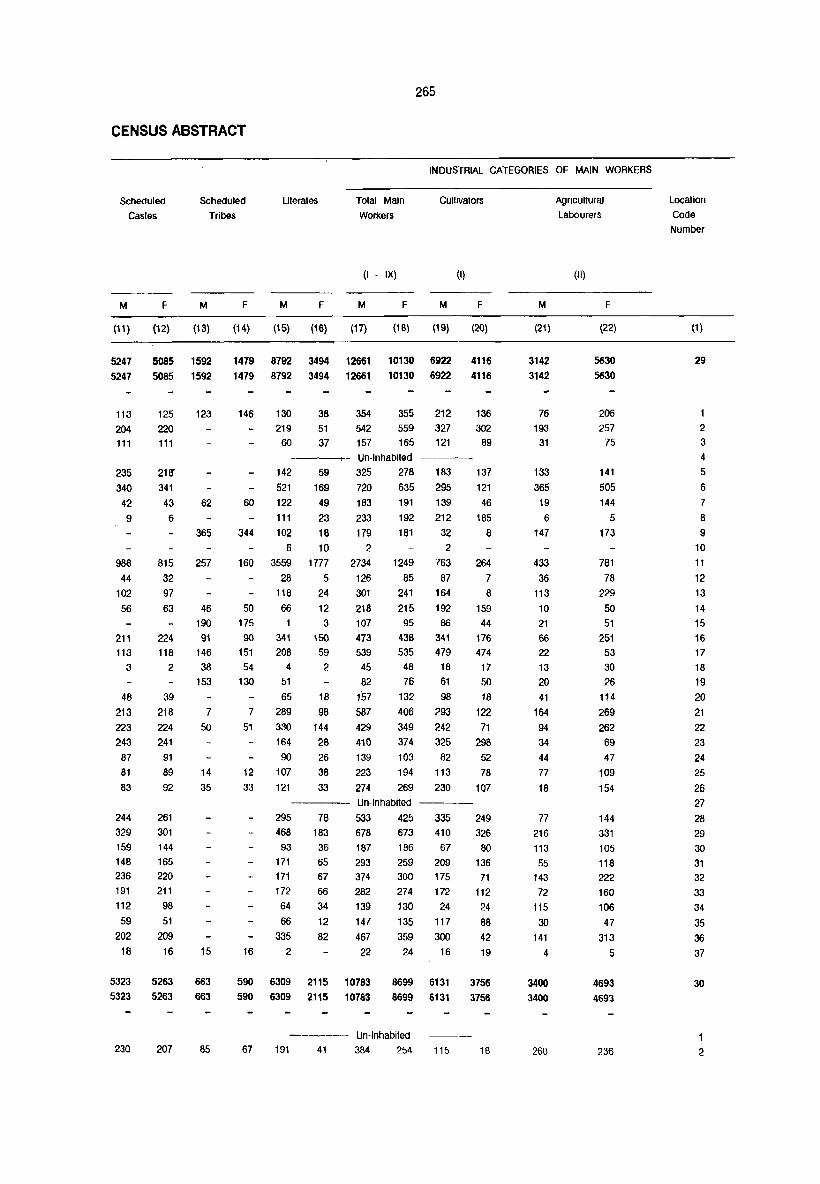
265
CENSUS ABSTRACT
INDUSTRIAL CATEGORIES OF MAIN WORKERS
Scheduled
Castes
Scheduled
Tribes
Literates Total Main
Workers
Cultivators
M F M
(11) (12) (13)
5247 5085 1592 5247 5085 1592
113 204 111
235 340
42 9
988
44 102
56
211 113
3
48 213
223 243 87 81
83
244
125 220 111
216'
341 43
6
815 32 97 63
224 118
2
39 218
224 241
91 89
92
261 329 301 159 144 148 165 236 220 191 211 112 98
59 51 202 209
18 16
5323 5263 5323 5263
230 207
123
62
365
257
46 190
91 146 38
153
7
50
14
35
15
663 663
85
(I - IX) (I)
F M F M F M F
(14) (15) (16) (H) (lB) (19) (20)
1479 8792 3494 12661 10130 6922 4116 1479 8792 3494 12661 10130 6922 4116
146 130 219
60
38 51 37
354
542 157
355 212 559 327 165 121
136 302
89 Un-Inhabited ----
142
521 59
169
325 278 183 137
121 46
185
8
720 635 295
60 122 49 183 111 23 233
344 102 18 179 6 10 2
160 3559 1777 2734 28 5 126
118 24 301
50 66 12 218 175 1 3 107 90 341 150 473
151 208 59 539
54 4 2 45 130 51 82
65 18 157
7 289 98 587 51 330 144 429
164 28 410
90 26 139 12 107 38 223
33 121 33 274
191 139
192 212 181 32
2
1249 763 85 87
241 164
215 192 95 86
438 341 535 479
48 18 76 61
132 98 406 293
349 242 374 325
103 82 194 113
269 230
264
7
8 159 44
176
474 17 50 18
122
71
298
52 78
107 Un-Inhabited ----
295 78 533 425 335 249 468 183 678 673 410 326
93 36 187 186 67 80 171 65 293 259 209 136 171 67 374 300 175 71 172 66 282 274 172 112 64 34 139 130 24 24 66 12 147 135117 88
335 82 467 359 300 42 16 2 22 24 16 19
590 6309 2115 10783 8699 6131 3756 590 6309 2115 10783 8699 6131 3756
------ Un-Inhabited 67 191 41 384 254 115 18
M
(21)
3142 3142
76 193
31
133
365 19
6
147
433
36 113 10 21 66
22
13 20
41 164
94 34
44
77
18
77 216 113 55
143 72
115
30 141
4
3400 3400
260
AgriCUltural
Labourers
(II)
F
(22)
5630 5630
206 257
75
141
505 144
5
173
781 78
229
50 51
251 53 30 26
114 269
262 69
47 109
154
144
331
105 118 222
160 106
47 313
5
4693 4693
236
Locallon Code
Number
(1 )
29
2 3 4
5 6 7
8
9 10 11
12 13
14 15 16 17 18 19
20
21
22
23
24 25
26 27
28 29 30 31 32
33 34
35 36
37
30
2

266
VILLAGE PRIMARY
I N 0 U STRIAL CATEGOR I E S o F
Location Name of Village Livestock, Forestry Mining and Manufacturing, Manufacturing,
Code Flshlng,Hunling and Quarrying Processing, Servicing Processing, Servicing
Number Plantation, Orchards and Repairs in and Repairs in other
and allied activities Household Industry than Household
Industry
(III) (IV) (Va) (Vb)
M F M F M F M F
(1) (2) (23) (24) (25) (26) (27) (28) (29) (30)
29 PAROl M,P,P. T 278 38 22 157 14 219 10 R 278 38 22 157 14 219 10 U
1 IBRAHIMPUR 35 3 6 3 2 MITIAKODUR 2 13 3 LAKHANAPUR
4 ANNARAM Un-Inhabited ---5 BARKATPAlLE 1 6 NASKAL 3 4 19 7 RANGAPUR 2 5
8 BASIREDDIPALLE
9 NAZEERABAD
10 SHAKAPUR
11 PARGI 60 17 11 53 5 118 3 12 RUKUMPAlLE
13 CHIGRALPAlLE 3 2 14 GOVINDAPUR 11 3 2 15 MALKAlPET
16 GADSINGAPUR -3 9 7 17 RANGAMPALLE 8 5 4 2 18 RAMREDDIPAlLE 12 19 SONDEPUR
20 BABAPuJI 7 3 21 ROOPI<HANPET 26 7 19 3 22 SULTHANPUR 24 5 8 7 23 NARAYANPUR 26 7 24 RAGHAVAPUR 3 25 SYEOMALKAPUR 8 6 26 I<ADLAPUR 3 27 NAGULAPAllE Un-Inhabited ---28 MADHARAM 41 5 10 29 RAPOLE 2 6 5 3 30 YABAJIGUDA
31 TONDAPALLE 4 4 32 CHITYAl 19 2 8 33 KHUDAVANPUR 2 2 34 JAFFERPALLE
35 RAVALPALLE
36 SYEOPALLE 3 4 37 HEERAPUR
30 PUDUR M.P.P, T 122 4 54 46 68 27 103 3 R 122 4 54 46 68 27 103 3 U
MANNEGUDA (PAlGAH) Un-Inhabited ---2 YENKEPALLE

CENSUS ABSTRACT
MAIN WORKERS
Constructions
M
(31)
131 131
2
4
1
59
1 3
17 2
2
1
3
28 5
3
64
64
(VI)
F
(32)
14 14
5
9
4
4
M
(33)
631 631
8
3 11 7
444
5
1
21 3
3 25 18 10 3 3
4
16 14 t
10 7 7
5
328 328
Trade and
Commerce
(VII)
F
(34)
79 79
4
4
38
2
2
2
4
3
2
2
5
5
3
36 36
267
Transport. Other
SeNices
Marginal Workers
Non-workers
Storage & Communications
(VIII)
M F M
(IX)
F M F M
(35) (36) (37) (38) (39) (40) (41)
292
292
5
5
867 224 74 182 10578 867 224 74 182 10578
11 5 3
--Un-Inhabiled---5
3
2
239
5
3
1
3 7
6
5
5
20 5
13
554 2
11 1
21
17
2
33
28 5
6
6
16 ---Un-Inhabited---
3 18 5 15
3
3 2
134 134
3
3
6
8
15 25
14 2
379 379
--Un-Inhabited---
8
6
4
2
131
4
8
3
6
6
3
1
5 7
17
7
5
5
2
127 127
43
7 10
6
4
2
33 33
88
13
28
2
9
13
4
15
1
7
354 354
224 384
102
202
532 141 144 195
6
3365 120
257 124 83
326 298
28 71
110
488 327 266
100
158 199
421
516 114
198 288 218 93
95 373
12
8428 8428
312
F
(42)
12547 12547
302 379
108
235
629 138
125
171
14 4360
124 266 164 80
379 327
44
54 142 657 393 296
112
177
236
556
487 90
245 355
261 67 92
474
8
9603
9603
363
Locallon Code
Number
(1)
29
2 3 4
5 6
7
8
9
10 11
12
13
14 15
16 17
18 19 20 21
22 23
24 25 26 27 28 29
30
31 32 33
34 35 36 37
30
1
2

Location
Code
Number
(1)
30.
3
4 5
6
7
8
9
10
11
12
13
14 15
16 17 18
19
20 21
22
23 24 25 26 27 28 29
30 31
32
33 34
31
1
2 3
4
5
6
Name of Village
(2)
PUDUR M.P.P. (Conct;L) MIRZAPUR
MANNEGUDA (SARECAS)
KANDLAPALLE ANGADICHITIAMPALLE
POTHIRED01GUDA
BAKAPUR
KOTHAPALLE
CHEELAPUR
GANGUPALLE
PUDUR
THIPPAPUR
THIMMAPUR
CHANGOMUL
REGADIMAMIDIPALLE
MITIAKANKAL
aUTHBULLAPUR
MEDIKONDA
RAKAMCHEFILA
THIRMALAPUR
SOMANGURTHY
KERVELLI
SIRGAIPALLE
PEDDAU MANTHAL
MEDIPALLEKALAN
KODMOOR
KANKAL
MANCHANPALlE
GHATPALLE
TURKAYENKEPAllE
NIZAMPPET MEDIPALLE
CHINTALAPALlE
PUDGURTHY
SHABAD M.P.P.
BOBSILGAM
TIRUMALAPUR
ETLAERRAVALY
TADLAPAllE
RUDRARAM
CHANDENVALLE
r* R* U*
Nea of village
in Hectares
(3)
627.67
423.70
687.56
687.56
144.47
287.33
477.53
167.54
445.96 2216.86
208.41
183.32
1491.26
446.77
37B.7B 464.68
535.80
293.80
385.26
913.37
515.57
138.00
1318.06
585.17
607.84
2066.72
1254.12
475.50
26021 718.32
593.27
259.40
207.50
207.50
910.54
266.69
520.42
1541.14
499.79 1061.89
268
No. of
Occupied
Residential Houses
(4)
191
207
238
259 33 47
104
158
138
514
45
460
146
121 168
79
100
80 350 175
88 470
188
239
447 420
67
190 220 172
157
7804
7804
173
90 177
556
144
265
No. of
Households
Total Population (Includ
Ing Institutional and Houseless Population)
P
(5) (6)
191 967
207 1236
238 1393
259 1525 34 203
47 347
104 729 158
138
514
920 876
3192
M
(7)
508
637
694
771 105
161 361 452
421 1734
F
(8)
459
599
699
754
98
186
368
468 455
1458
Un-Inhabited ---48
460
146
121
168
303 160 143
79
100
80 350
2900 745 782
942 434 534 578
1959 175 870
88 481
470 2542 188 1141
239 1321
451 2793
420 2329
67 427
190 999
221 1274
172 1007
158 838
1842 43360
7842 43360
173 969 90 579
177 1088
583 3412
144 849
268 1460
1462
372 387 479
214
267
294
961
421
253
1297 571
682
1398 1184
205
504
649 516
428
22O!j!k ..... 22059
500
275
561 1717
433
751
1438 373
395 463 220 267
284 998
449 228
1245 570
639
1395
1145 222
495 625
491
410
21301
21301
469 304
527
1695
416 709
VILLAGE PRIMARY
Total Population
in the age group
(0 - 6)
M
(9)
107
160
141
159
15 36
90
86 110
363
35
291
53
67
89
37
65 78
202
105
51
235 132 143
283 241
48
80
145
101
89
4235
4235
lOB
47
99
332 75
138
F
(10)
105
175
146
154
21
47
79
98 133
323
32
314
50 71
89
40 72
82 193
108
43
231
120 120
291
229 61
93 134
91
90
4035
4035
95 72
77 347
83 121
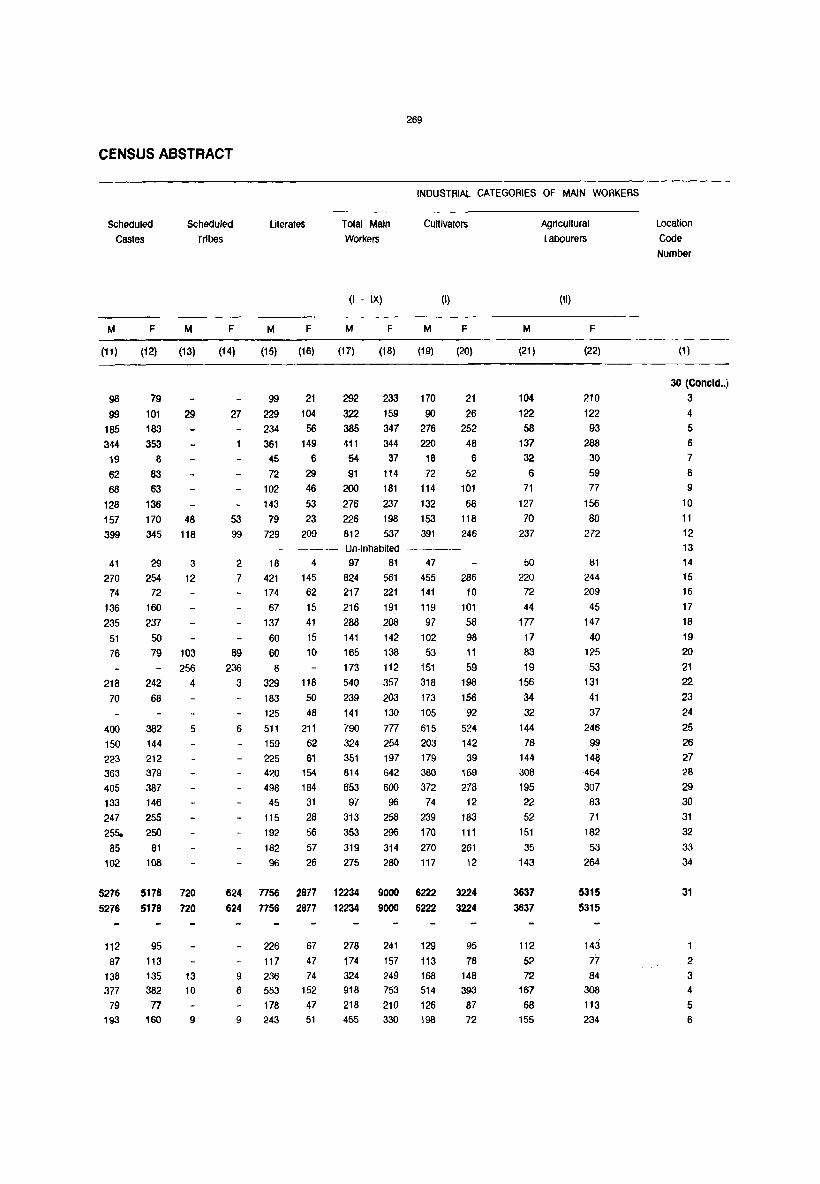
269
CENSUS ABSTRACT
INDUSTRIAL CATEGORIES OF MAIN WORKERS
Scheduled
Castes Scheduled
Tribes Literates Total Main
Workers CUltivators
M F M
(11) (12) (13)
98 79
99 101 29 185 183 344 353 19 8
62 83 68 63
128 136 157 170 48
399 345 118
41 270
74
136 235
29
254 72
160 237
51 50
3
12
76 79 103
256
218 242 4 70 68
400 382 5 150 144 223 212
363 379 405 387 133 146
247 255
255. 250 85 81
102 108
5276 5178 720
5276 5178 720
112 87
138 377 79
193
95 113 135 382 77
160
13 10
9
(I IX) (I)
F M F M F M F
(14) (15) (16) (17) (18) (19) (20)
99 21 292 233 170 21
27 229 104 322 159 90 26 234 56 385 347 276 252
361 149 411 344 220 48
45 6 54 37 18 6
72 29 91 114 72 52
102 46 200 181 114 101
143 53 276 237 132 68
53 79 23 226 198 153 118
99 729 209 812 537 391 246 Un-Inhabited ----
2
7 18
421 174
67 137
4 97 81 47 145 62 15 41
824 561 455 217 221 141
119 97
216 191 288 208
60 15 141 89 60 10 165
236 8 173 3 329 118 540
183 50 239
125 48 141
6 511 211 790 159 62 324 225 61 351 420 154 814 498 184 653 45 31 97
115 28 313 192 56 353
182 57 319 96 26 275
624 7756 2877 12234
624 7756 2877 12234
9
6
9
226 117 236
553 178 243
67 47 74
152 47 51
278
174 324 918 218 455
142 102 138 53 112 151
357 318 203 173
130 105
777 615 254 203 197 179 642 380
600 372 96 74
258 239 296 170
314 270 280 117
9000 6222
9000 6222
241
157 249 753
210 330
129
113 168
514 126
198
286 10
101
58 98 11 59
198 156 92
524 142 39
169 278 12
183 111 261 12
3224
3224
95
78 148 393 87 72
M
(21)
104
122 58
137 32
6
71
127
70 237
50
220 72
44 177
17
83 19
156
34
32 144
78 144 306
195 22 52
151
35 143
3637
3637
112
52 72
167
68 155
Agricultural Labourers
(II)
F
(22)
210
122 93
288 30
59 77
156 80
272
81 244 209
45 147
40
125
53 131
41 37
246 99
148 464 307 83 71
182
53 264
5315
5315
143 7'7 84
308
113 234
Location Code
Number
(1)
30 (Concld •• ) 3 4 5 6
7
8
9 10
11 12 13 14 15 16
17 18
19 20 21 22 23 24
25
26 27 28
29 30 31
32
33 34
31
1
2 3 4
5 6

270
VILLAGE PRIMARY
IN D U STRIAL CATEGOR I E S o F
Location Name of Village Livestock, Forestry Mining and Manufacturing, Manufacturing,
Code Fishing.Hunting and Quarrying Processing. Servicing Processing. Servicing
Number Plantallon. Orchards and Repairs In and Repairs in other
and allied activities Household Industry than Household Industry
(III) (IV) (Va) (Vb)
M F M F M F M F
(1 ) (2) (23) (24) (25) (26) (27) (28) (29) (30)
30. PUDUR M.P.P. (Concld .. )
3 MIRlAPUR 3 3 4 MANNEGUDA (SARECAS) 13 5 5 KANDLAPALLE 15 4
6 ANGADICHITIAMPALLE 3 7 7 POTHIREDDIGUDA 2
8 BAKAPUR 2 2 4 9 KOTHAPALLE
10 CHEELAPUR 4 2 5 7
11 GANGUPALLE 1 12 PUDUR 8 4 3 26 13 THIPPAPUR Un-Inhabited
14 THIMMAPUR
15 CHANGOMUL 4 16 8 17 16 REGADIMAMIDIPALLE
17 MITIAKANKAL 7 44 44 18 QUTHBULLAPUR 1 3
19 MEDIKONDA 12 2 20 RAKAMCHERLA 6 1 21 THIRMALAPUR 22 SOMANGURTHY 4 3 4 23 KERVELLI 4 24 SIRGAIPALLE 25 PEDDAUMANTHAl 1 26 MEOIPALLE (KALAN) 10 6 3 27 KODMOOR 1 1 3 28 KANKAL 14 9 9 29 MANCHANPALLE 21 6 7 30 GHATPALLE
31 TURKAYENKEPAllE 1 32 NIZAMPPET MEDIPALLE 3 3 33 CHINT AlAPALLE 2 34 PUDGURTHY 4
31 SHABAD M.P.P. T 318 21 88 44 116 69 405 28 R 316 21 88 44 176 69 405 28 U
1 BOBBILGAM 10 7 5 2 TIRUMAlAPUR
3 ETLAERRAVALY 4 2 4 17 4 TADLAPAlLE 18 3 50 27 8 2 32 5 RUDRARAM 10 4 6 CHANDENVALLE 40 3 2 12 9
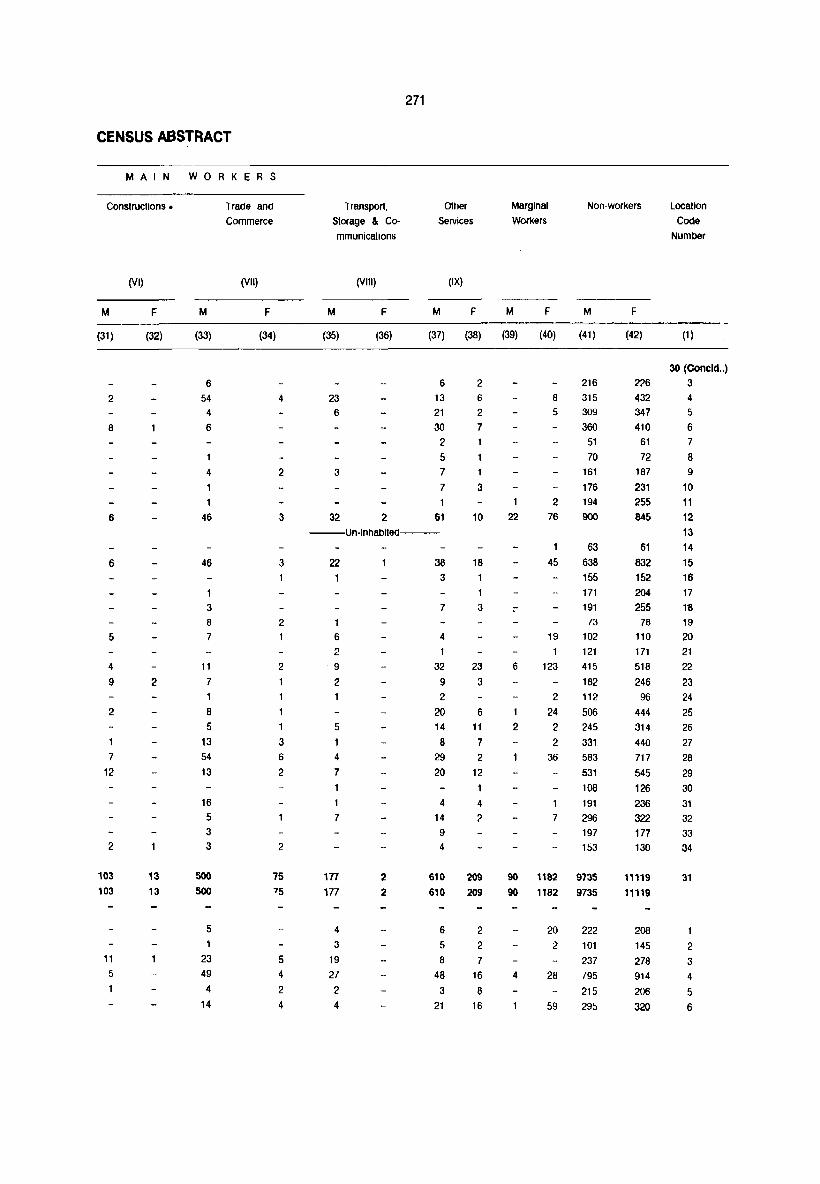
CENSUS ABSTRACT
MAIN WORKERS
Constructions.
M
(31)
2
8
6
6
5
4
9
2
7
12
2
103 103
11
5
1
(VI)
F
(32)
2
13 13
M
(33)
6
54 4
6
4
1
46
46
1
3 8
7
11
7
1
8
5
13
54 13
16 5
3 3
500 500
5 1
23 49 4
14
Trade and
Commerce
(VII)
F
(34)
4
2
3
3
2
1
2
1
3
6
2
2
75 75
5 4
2
4
Transport,
Storage & Co
mmunications
(Viii)
M F
271
Other
Services
(IX)
M F
Marginal
Workers
M F
Non-workers
M F
Locallon
COde
Number
(35) (36) (37) (38) (39) (40) (41) (42) (1 )
23 6
3
32 2
6
13 21 30
2 5 7
7
61 --Un-Inhabited---
22
1
6
2
9
2
5
4
7
7
177 177
4
3
19 27 2
4
2 2
38
3
7
4
1
32 9 2
20 14 8
29 20
4 14 9
4
610 610
6
5
8
48 3
21
2
6
2
7
1
3
10
18
1
3
23
3
6 11
7
2 12
4
2
209
209
2 2
7
16 8
16
22
6
1
2
8
5
2 76
45
19 1
123
2
24 2
2 36
7
216 315 309
360
51 70
161 176 194 900
63
638
155
171
191 73
102 121
415 182
112
506
245 331
583
531
108
191
296 197 153
90 1182 9735 90 1182 9735
4
20 2
28
59
222 101
237 795
215
295
30 (Concld .. )
226 3 432 347
410 61 72
187
231 255
845
61 832 152 204
255 78
110
171 518
246 96
444 314
440 717
545 126 236 322
177 130
11119 11119
208
145 278 914
206
320
4
5 6
7
8
9
10
11 12
13 14 15 16 17
111 19 20
21 22
23
24 25
26 27 28 29 30
31
32 33
34
31
2
3
4
5
6

Location
Code
Number
(1)
3t. 7 8 9
10
11
12
13
14
15
16
17 18
19
20
21
22
23
24
25
32
1
2
3
4
5
6
7
8
9
10
11
14
15
16 18
Name of Village
(2)
SHABAD M.P.P. (Concld .. )
HAYATHABAD
SOUPET
MADDUR
PEDDAVED
DAMERLAPALLE
NAGARKUNTA
BHONGIRPALLE
MACHANPALLE
POLAFIAM POTHUGAL
REGADIDOSWADA
KOMERABANDA
OBAGUNTA SHABAD
MANMARRI
KAKLOOR ANANTI"IAWARAM
KESAVARAM
RANGAPUR
SHAMSHABAD M.P.P. T*
R* U·
RAMANUJAPUR
KAVEUGUDA
MALKARAM KOLBOWIDODDI
SUL TANPALLE
KACHARAM
RAYANNAGUDA
NANAJPUR
JUKAL
CHOWDERGUDA NARKHUDA
AMMAPALLE
'HARIGUQ~
KOTHWALGUDA
SATAMRAI
LANGERGUDA PASHAMBANDA
272
Area of Village No. of No. of Total Population (Includ
Ing Institutional a~d
Houseless Populatiqn)
In Hectares Occupied House-
(3)
479.15
1005.64
937.65
286.52
618.76
662.87
176.04
884.24
241.19
564.99
1224.98
230.67
222.58
6604.86
1681.06
1152.54
359.76
346.41
253.74
182.34
170.60
18.74
1060.27
103.60
1041.25
54.23
414.40
414.40
125.86
341.96
971.65
537.02
1063.11
313.23
34.40
1109.24
144.88
40.47 104.81
Residential holds
HoUses
(4)
218
265
208
129
292
194
40
236
63
199
256
157
50
2305
618
818
160 71
120
10739
8208
2531
266
37
187
45
160
133
46
178
369
173 564
86
576
270
2
P M
(5) (6) (7)
218 1178 611
269 1473 778
208 1469 766
129 645 318
292 1634 848
194 1029 537
40 272 137
236 1300 662 63 328 168
199 1202 600
256 1518 773
157 876 425
50 287 150
2307 12370 6210
618 3192 1648
818 427fl 2208
160 831 407
71 382 198
122 741 378
10796 59629 30821
8265 44235 22935
2531 15394 7886
266 1538
37 lB8
187 1040
45 227
160 961
133 735
46 273
178 959
369 2043
173
564
86
982
3234
297
795
93
530
111
482
392
145
491
1064
490
1677
159
F
(8)
567 695
703
327
786
492
135
638
160
602
745
451
137
6160
1544
2068
424
184
363
28808
21300
7508
743
95
510
116
479
343
128
468
979
492
1557
138
Un-Inhabited ----
576
270
2
2976 1565 1411
1319 678 641
Un,lnhabited
7 5 2
VILLAGE PRIMARY
Total Population
in the age group
(0 - 6)
M
(9)
105
131
193
58 174
86
33
139
37
135
157
89
34 1188
313
382
62
43
77
6231
4599 1632
162
22
108
27
99
82
22 110
195
110
350
33
336
133
F
(10)
95
110
150
60
142
66
28
134
28
134
165
102
26 1194
287
357
70
31
61
6117 4585 1532
173
23
100
29
102
65
17
110
209
143
305
26
340
151

273
CENSUS ABSTRACT
INDUSTRIAL CATEGORIES OF MAIN WORKERS
Scheduled
Castes
Scheduled
Tribes
Literates Total Main
Workers
Cultivators
M
(11)
173
142
154
84
153
128
62
166
43 153 248
99
76
1442
383
520
131
51
82
6968
5634
F M
(12) (13)
157 17
133
144 160
90 35 136 2
118 50 59 17
147 99 47 70
170 78
211 5
104 19 72
1467 117
352
526
148 57 19
78
6535 2092 5199 1836
1334 1336 256
92 288 11
167
52 148
91
18
135
226
150
281
57
377
297
3
259
15
166
54
148
83
14 128
212
3
287
48
367
300
2
5 223
4 11
9
13
100
(I - IX)
F M F M
(14) (15) (16) (17)
14 203 81 345
273 100 432
143 153 44 426
32 102 17 196
3 235 67 486 37 156 45 294 16 55 23 69
91 246 86 362
65 43 5 90
62 209 106 341
4 251 103 452
20 105 34 258
42 2 79
99 2393 993 3373
552 250 883
930 370 1230
41 2 241 13 64 20 105
150 91 205
2239 11946 5~2 16419 2029 7712 2736 12811
210
96
7 197
270
10
8
4234 2406 3608
141 15
44
2 166 85
30 7 119 50
158 50 35 17
125 34
310 101
116 237
662 170 54 34
476
48 323
61
288 217 88
299
596
237
922 96
F M
(18) (19)
143 156 177 314
188 286
187 120
415 322
286 191
61 37
348 186 102 62
231 309 275 221
234 145
77 27
2510 1472
559 493
870 344
217 172
84 21
96 96
10213 4675
8991 4323
1222
365
52
352
268
)5 261 155
53 20
250 118
154 146
69 65
285 147
439 245
57 125
681 343
66 17
(I)
F
(20)
61
107
72 70
210
140
24
123
56 131
n 73
4
653 286 142
90
10
27
2672
2536
136
110
24 116
13
84
84 56 75
126
12
263
8 Un-Inhabited ----
12 104
272 97
203 38
2
876 646 210 147
400 190 41
Un-Inhabited ------2
32
M
(21)
85
62
106
60
68 95
26
107
23
27
108
101
51
1112
269
502
58 68
83
5439
4679
760
135
12 110
32 155
64 23
118
249 46
224 75
341
139
Agricultural
labourers
(II)
F
(22)
66
66
114 111 179
144 37
204
44 98
163
152
73 1711
251
676
119
63
65
6039 5389
650
248 28
119
40
164 ,6~
13
202
291
24 304
58
316
133
Location
Code
Number
(1 )
31 (Concld .. )
7
8 9
10
II
12
13
14
15
16
17
18
19
20 21
22 23
24
25
32
2
:3
4 5 6 7 8
9 10
11
12
13
14 15
16
18

~i4
VILLAGE PRIMARY
I N 0 U STRIAL CATEGOR I E S o F
Location Name of village Livestock, Forestry Mining and Manufacturing, Manufacturing,
Code Fishing,Hunting and Quarrying Processing, Servicing Processing, Servicing
Number Plantaiion, Orchards and Repairs In and Repairs in other
and allied activities Household Industry than Household Industry
(111) (IV) (Va) (Vb)
M F M F M F M F
(1 ) (2) (23) (24) (25) (26) (27) (28) (29) (30)
31. SHABAD M.P.P. (Coneld .. )
7 HAYATHABAD 9 4 7 22
8 SOLI PET 4 9 9 MADDUR 4 8 6 10 PEDDAVED 4 2 2 11 DAMERLAPAllE 26 8 2 29 3 12 NAGARKUNTA 2 13 BHONGIRPAllE 2 14 MACHANPAllE 19 9 6 15 15 POLARAM 1 2 2 16 POTHUGAl 17 REGADIDOSWADA 40 4 16 6 9 3 30 18 KOMERABANDA 3 3 4 19 OBAGUNTA 20 SHABAD 100 3 13 5 63 24 125 20 21 MANMARRI 19 12 1 24 4 22 KAKlOOR 10 23 14 61 1 23 ANANTHAWARAM 2
24 KESAVARAM 6 6 25 RANGAPUR 8
32 SHAMSHABAD M.P.P. T 898 288 450 261 167 65 1354 144 R 810 282 442 261 165 65 854 81 U 88 6 8 2 500 63
RAMANUJAPUR 2 4 16 2 KAVELIGUDA 3 MAL KARAM 4 3 19 2 4 KOlBOWIDODDI 9 5 SUl t ANPAllE 2 3 6 KACHARAM 2 2 7 RAYANNAGUDA 8 NANAJPUR 8 3 8 3 9 JUKAl 11 17 1 18 4 10 CHOWDERGUDA 22 2 4 11 13 3 11 NARKHUDA 94 54 4 26 3 44 2 12 AMMAPALLE 2 1 13 HARIGUDA Un·lnhabited ---14 KOTHWAlGUDA 25 2 210 158 3 13 2 15 SATAMRAI 17 4 24 3 113 11 16 LANGERGUDA Un-Inhabited 18 PASHAMBANDA
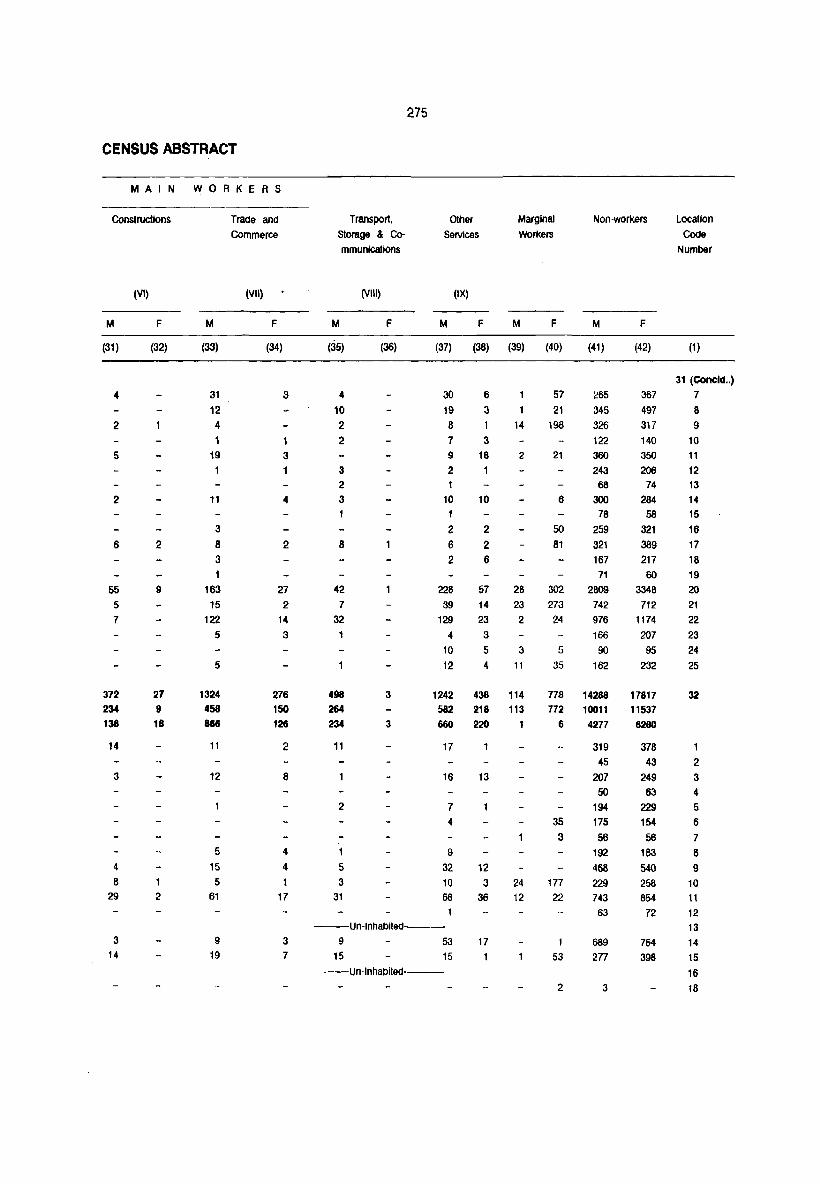
CENSUS ABSTRACT
MAIN WORKERS
constructions
M
(31)
4
2
5
2
6
55 5
7
372 234 138
14
3
4
8 29
3 14
(VI)
F
(32)
2
9
27 9 18
2
M
(33)
31 12
4
1 19
1
11
3 8 3
163
15 122
5
5
1324 458
866
11
12
5 15
5 61
9
19
Trade and COmmerce
(VII)
F
(34)
3
1 3
4
2
27 2
14 3
276 150
126
2
8
4
4
t
17
3
7
275
Transport, Storage & Communlcallons
Other Services
Marginal Workers
Non-workers Locallon Code
Number
(VIII) (IX)
M F M F M F M F
(36) (37) (38) (39) (40) (41) (42) (1)
4
10
2 2
3 2
3
8
42
7
32
30 19 8
7 9
2 1
10 1
2 6
2
228 39
129
" 10
12
6
3 1
3 18
10
2
2
6
57 14 23 3
5
4
14
2
28
23 2
3
11
498 264 234
3
3
1242 438 114 582 218 113 660 220
11
2
5 3
31
17
16
7
4
9
32 10 66
--Un-Inhablled---9 53
15 15 --Un-Inhabiled---
13
12 3
36
17
24 12
57
21 198
21
6
50
81
302
273 24
5
35
~65
345 326 122 360
243 68
300
78 259 321 167
71 2809 742 976
166
90
162
31 (Concld .. ) 367 7 497 8
317 9 140 10 350 11
206 12
74 284
58
321 389 217
60
3348
712 1174
207 95
232
13
14 15 16
17 18 19 20 21 22 23 24 25
778 14288 17817 32 772 10011 11537
6 4277 6280
35
3
177
22
1
53
2
319 45
207 50
194 175
56 192 468 229 743 63
689 277
3
378 43
249 63
229 154 56
163
540 258 854
72
764
398
2 3 4
5 6
7
8 9
10 11
12
13 14 15 16
18
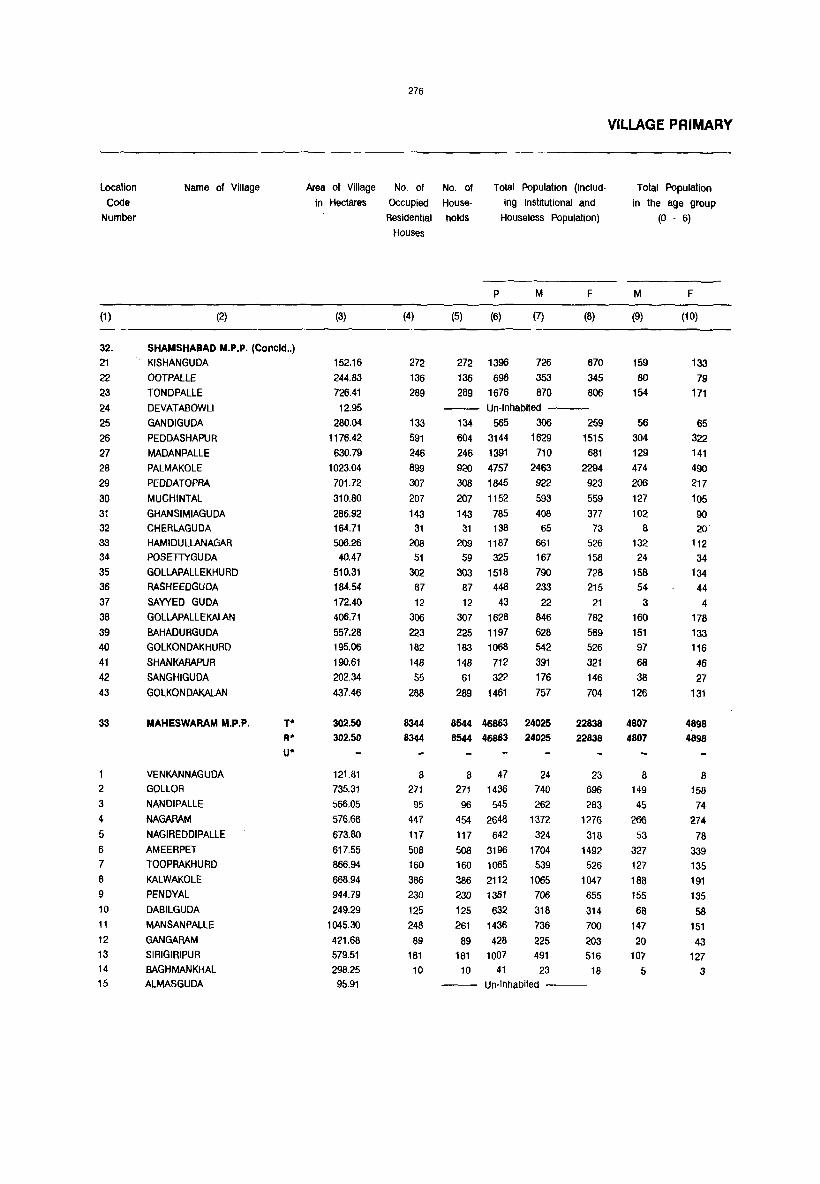
location
Code
Number
(1)
32. 21 22 23 24 25 26 27 28 29
30 31 32 33 34 35 36 37 38 39 40 41 42 43
33
1
2 3
4
5 6 7
8
9 10 11
12 13 14 15
Name of Village
(2)
SHAMSHABAD M.P.P. (Concld .. )
KISHANGUDA
OOTPALLE
TONDPAllE
DEVATABOWU
GANDIGUDA
PEDDASHAPUR
MADANPALLE
PAlMAKOlE
PEDDATOPRA
MUCHINTAl
GHANSIMIAGUDA CHERLAGUDA HAMIDUlLANAGAR POSETTYGUOA
GOlLAPAlLEKHURD RASHEEDGUDA
SAYVED GUDA
GOlLAPALLEKALAN
BAHADURGUDA GOLKONDAKHURD
SHANKARAPUR
SANGHIGUDA
GOlKONDAKALAN
MAHESWARAM M.P.P.
VENKANNAGUDA GOLLOR
NANDIPALLE
NAGARAM
NAGIREDDIPALLE
AMEERPET TOOPRAKHURD
KALWAKOLE
PENDYAL
DABILGUDA
MANSANPALLE
GANGARAM SIRIGIRIPUR BAGHMANKHAL ALMASGUDA
T'" R'" U·
276
Area of Village No. of No. of Total Population (InclUd
ing Institutional and
Houseless PopUlation)
In Hectares Occupied House-
(3)
152.16 244.83 726.41
12.95 280.04
1176.42 630.79
1023.04 701.72 310.80 286.92 164.71 506.26
40.47 510.31 184.54 172.40 406.71 557.28 195.06 190.61 202.34 437.46
302.50
302.50
121.81 735.31 566.05 576.68 673.80 617.55 866.94 668.94 944.79 249.29
1045.30 421.68 579.51 298.25
95.91
Residential holds
Houses
(4)
272 136 289
133 591 246 899 307 207 143
31 208
51 302 87 12
306 223 182 148 55
288
8344
8344
8 271 95
447 117
508 160 386 230
125 248 89
181
10
P
(5) (6)
272 1396 136 698 289 1676
M
(7)
726 353 870
F
(8)
670 345
806 Un-Inhabited ---
134 565 306 259 604 3144 246 1391 920 4757 308 1845 207 1152 143 785
31 138
209 1187 59 325
303 1518 87 448 12 43
307 1628 225 1197 183 1068 148 712
61 322 289 1461
1629 710
2463 922 593 408
65 661
167 790 233
22 846 628 542 391 176 757
8544 46863 24025
8544 46863 24025
8 271
96 454 117 508 160
386 230 125 261
89 181
10
47 1436
545
2648 642
3196 1065 2112 1361 632
1436
428 1007
41
24 740 262
1372 324
1704 539
1065 706 318 736
225 491
23
1515 681
2294
923 559 377 73
526 158
728 215
21 782 569 526 321 146 704
22838 22838
23 696 283
1276 318
1492
526 1047 655 314
700
203 516
18 Un-Inhabited ---
VILLAGE PRIMARY
Total Population
in the age group
(0 - 6)
M
(9)
159 80
154
56 304 129 474 206 127 102
a 132 24
158 54
3 160 151 97
68 38
126
4807 4807
8 149 45
266 53
327 127 188 155 68
147 20
107 5
F
(10)
133 79
171
65 322 141 490
217 105 90 20
112 34
134 44
4
178 133 116 46 27
131
4898 4898
8 158
74 274 78
339 135 191 135 58
151
43 127
3

277
CENSUS ABSTRACT
INDUSTRIAL CATEGORIES OF MAIN WORKERS
Scheduled
Castes
Scheduled
Tribes
Literates Total Main
Workers
Cultivators
M
(11)
144
27 110
27 270
43 551 222 210
2 39
146
110 319
48
12 143
263 207
93
66
281
5209
5209
299 172
262 119
313 83
312 167 169
104. 49
92
F
(12)
117
24 113
22 265
41
540
226 201
2 40
127 101
288
32
16 127
246 184
84 62
256
M
(13)
2
26 222 525 174 234
17
6
110
4
4
44
3 4
5046 3285
5046 3285
297 33 183
233 374
114 70
258 15 106 263 326 6 137 208 151 7
97 124
55 127
111 13
3
F
(14)
M F
(15) (16)
337
109 152 59
5 460 116
(I - IX)
M F M
(17) (18) (19)
365
182 461
118
127 57 54
270 126
(I)
F
(20)
10 36
57
---- Un-Inhabited ----
21
185 517
177 251
144 672
126 914 227 191
76 217 23
295 88
35
174 100 12 162 182 337
120 159
928 604 401 158
1321 826 527 459
349 298 14 134 27
15 4
4 178 19 91 52
106 319 90
59 16
2 5 1 8 381 154
24 161 59
4 247 77
4 179 81 59 18
276 111
212
40
326 85
450 118
15 484
349
300
232 103 460
2905 8340 3233 13521
2905 8340 3233 13521
12 2 12 31 334 150 397
47 7 158 340 248 . 84 . 783
71 79 35 194
12 755 238 884
224 90 38 312 5 385 128 643
177 215 BO 401 6 107 29 170
120 186 74 462 97 47 18 157
10 176 64 255
14 4 17
160 61
27 4
241 122 69 29
377 270 79 39
11 2
268 144
321 157 273 69
218 146 79 37
340 99
8645 5629
8645 5629
13 11 268 193
105 34
495 443
176 118
645 286 247 233 547 282 336 263 163 114 388 199
118 71
98 120
7 10
3
126 52
152 91
113 37
1
39
31
170
30
58
108
84
138 17 31
2219
2219
12 55
13 126
22
155
167 184 212
116
129
13
6
---- Un-Inhablted ----,:--
M
(21)
131
71 216
47 300 142
249 361
105 142
34
151 16 99
48
9 88
168 158
62 57
301
3944 3944
1
78 103
223 61
240 46
158 82 36
184
85
45
Agricultural
Labourers
(II)
F
(22)
62
77
199
43
321 100 457 364
158 121 26
190 35
199
45
11
160
201 178
74 62
298
5413 5413
1'18
92 337
153 379
78
316 112
45
234
118
58
Location
Code
Number
(1 )
32 (Concld .. ) 21 22 23
24
25 26 27 28
29 30
31
32 33
34
35 36 37
38
39 40 41
42
43
33
2
3 4
5
6
7 8
9 10 11 12
13 14
15

278
VILLAGE PRIMARY
INDUSTRIAL CATEGORI E S o F
Location Name of Village !JVestock, Forestry MIning and Manufacturing, Manufacturing,
Code Flshlng,Hunting and Quarrying Processlng,Servlclng Processing, Servicing Number Plantation, Orchards and Repairs In and Repairs In other
and allied actiVIties Household Industry than Household Industry
(III) (IV) (Va) (Vb)
M F M F M F M F
(1) (2) (23) (24) (25) (26) (27) (28) (29) (30)
32. SHAMSHABAD M.P.P. (Concld .• ) 21 KISHANGUDA 93 26 9 6 19 3 22 OOTPALLE 24 9 2 3 4 23 TONDPALLE 2 10 26 24 DEVATABOWLI Un-Inhabited ---25 GANDIGUDA 56 33 49 19 26 PEDDASHAPUR 203 105 40 2 45 8 27 MADANPALLE 28 1 2 18 28 PALMAKOLE 32 2 103 88 29 31 249 24 29 PEDDATOPRA 2 20 30 MUCHINTAL 14 2 3 2 40 31 GHANSIMIAGUDA 3 32 CHERLAGUDA 33 HAMIDULLANAGAA 7 5 7 34 POSETTYGUDA 4 16 35 GOLlAPALLE (KHURO) 25 2 27 36 RASHEEDGUDA 5 9 2 5 37 SAVYED GUDA 4 38 GOLlAPALLE (KAlAN) 106 34 23 2 53 39 BAHADURGUDA 5 2 1 3 40 GOLKONDA (KHURD) 17 3 13 41 SHAN KARAPU R 8 3 42 SANGHIGUDA 3 43 GOLKONDA (KALAN) 15 23
33 MAHESWARAM M.P.P. T 661 173 55 24 288 106 763 200 R 661 173 55 24 288 106 763 200 U
VENKANNAGUDA 2 GOLLOR 68 55 2 7 3 NANDIPALLE 8 4 NAGARAM 3 46 24 5 NAGIREDDIPALLE 2 8 1 6 AMEERPET 43 3 45 24 88 4 7 TOOPRA (KHURD) 1 22 8 KALWAKOLE 78 5 2 18 9 14 9 PEN DYAL 7 9 5 8 10 DABILGUDA 6 3 11 MANSANPALLE 30 16 12 2 12 GANGARAM 13 SIRIGIRIPUR 22 5 12 3 2 14 BAGHMANKHAL 15 ALMASGUDA -~ Un·lnhablted ---

CENSUS ABSTRACT
MAIN WORKERS
Constructions
M
(31)
10
2 15
3
31 4
52
3
4
2 8
6
17
2
241
241
4
5 1
19
13 4
27
(VI)
F
(32)
4
44 44
11
14
M
(33)
27 17
16
2
53 7
116
6
13
10
4
2
15 8
11
9
2
B08 808
6
3
32
2
73 3
21
10 5
14
15
Trade and
Commerce
(VII)
F
(34)
4 1
3
18 4
37 1
13
7
7
3
204
204
5
8 1
46 2 4
3
Transport.
Storage & C0-mmunications
(VIII)
M F
279
Other
Services
(IX)
M F
Marginal
WOrkers
M F
Non-workers
M F
Location
Gode
Number
(35) (36) (37) (38) (39) (40) (41) (42) (1)
12 3
19
7 6
30
--Un-Inhabited---
3 2 36
8 47 5 2
1
3 12
7
3
11
3 6
2 3
332
332
23
5
8 1
11
15
7
4
2
3
6 6
56
10 107 13 10 5
16
5
10
27 3
21
4
2 17
800
800
16
4
22
79 4
42 11
6
16
10 3
--Un-Inhablled---
6
11
25
31 3
10
9 2
4
7
4
10 2
9
256
256
4
34
18 3
2
5
4
7
14 1
34
6
6
4
20
213 26 77
3
7
96
17
19
360 164
409
132 700
295 1141
361
244 196
19 334
82 340 115
7
362
273 242
159 73
293
90 1218 10414 90 1218 10414
17
19
17
60
25
4
60 51
11
114
12
343 104
589 130 803 208 421
305 148 274 68
219 6
32 (Concld .. )
552 21
198 2~
536 23
159 911 310
1442 387 258 217 39
285 88
351 136
10 418 231 253 103
67 345
12975
12975
10 368 178 756 138 787 228
489 319
151
312
85 304
11
24 25 26 27 28 29 30
31 32
33 34 35 36
37 38 39
40 41
42 43
33
1
2
3
4
5
6
7
8 9
10 11
12
13
14
15
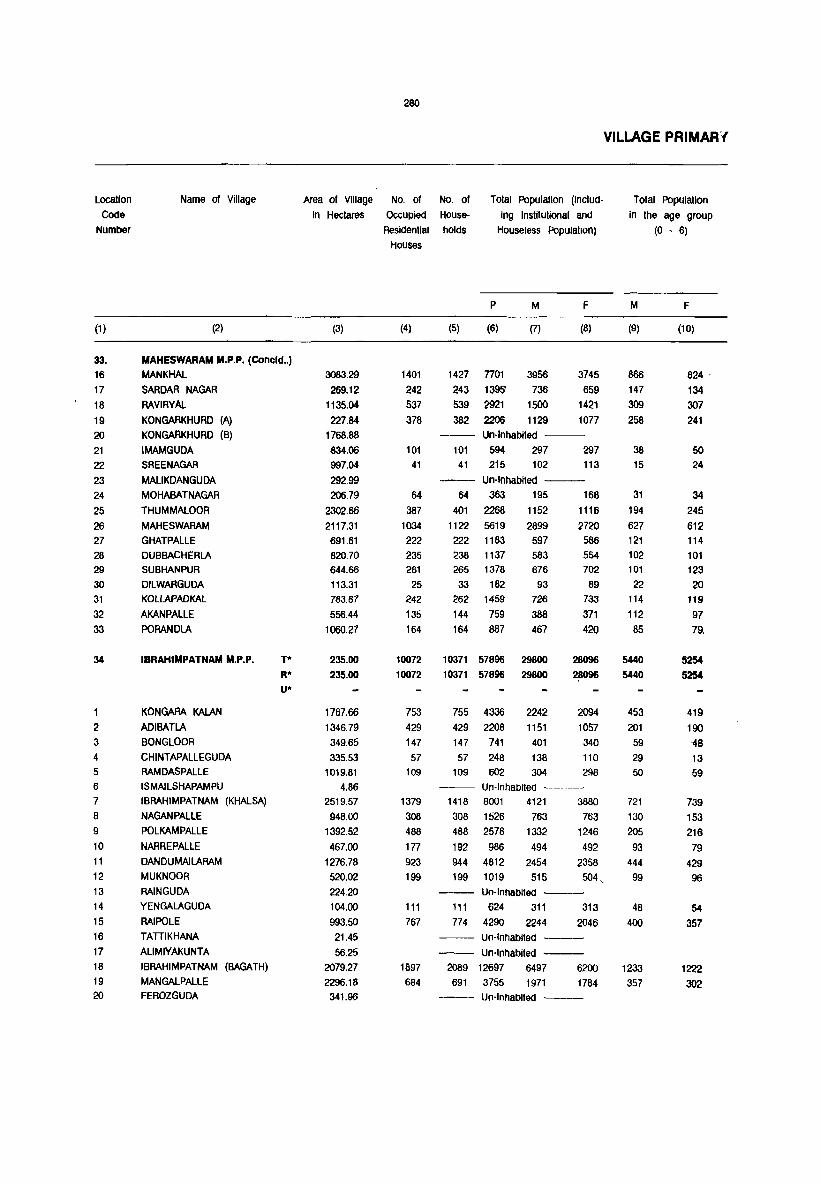
Location
Code
Number
(1 )
33.
16
17 18
19 20
21 22
23 24 25
26 27 28 29
30 31
32
33
34
1
2 3
4
5
6 7
8 9
10 11
12 13
14
15
16
17
18 19 20
Name of Village
(2)
MAHESWARAM M.P.P. (Concld .. ) MANKHAL
SARDAR NAGAR
RAVIRYAl
KONGARKHURD (A) KONGARKHURD (B)
IMAMGUDA SREENAGAR
MALiKDANGUDA MOHABATNAGAR
THUMMALOOR
MAHESWARAM GHATPALLE DUBBACHERLA SUBHANPUR
DILWARGUDA KOLLAPADKAL
AKANPALLE PORANDLA
IBRAHIMPATNAM M.P.P.
KONGARA KALAN
ADIBATLA
BONGLOOR CHINTAPALLEGUDA RAMDASPALLE ISMAILSHAPAMPU IBRAHIMPATNAM (KHALSA)
NAGANPALLE
POLKAMPALLE
NARREPALLE
DANDUMAILARAM MUKNOOR
RAINGUDA
YENGALAGUDA
RAIPOLE
TATIIKHANA
ALiMIYAKUNTA IBRAHIMPATNAM (BAGATH) MANGALPALLE FEROZGUDA
T* R* U*
280
VILLAGE PRIMAR~(
Area of village No. of No. of Total Population (Includ
Ing Institutional and
Houseless Population)
In Hectares Occupied House-
(3)
3083.29
269.12
1135.04
227.84 1768.88
834.06 997.04
292.99
206.79
2302.66
2117.31 691.61 820.70 644.66
113.31 783.87
556.44
1060.27
235.00
235.00
1767.66
1346.79
349.65
335.53 1019.81
4.86
2519.57
948.00
1392.52
467.00
1276.78
520.02 224.20
104.00
993.50
21.45
56.25 2079.27 2296.18 341.96
Residential holds
Houses
(4)
1401
242 537
378
101 41
64
387 1034
222 235 261
25 242 135 164
10072
10072
753 429
147
57 109
1379
308
488
177
923
199
111
767
1897
684
(5)
1427
243
539
382
101 41
64
401
1122 222
p M F
(6) (7) (8)
7701 3956 3745
1395' 736 659
2921 1500 1421 2206 1129 1077 Un-Inhabited ---
594 297 297 215 102 113
Un-Inhabited ---363 195 168
2268 1152 1116
5619 2899 2720 1183 597 586
238 1137 583 676
554 702 265 1378
33 182 262 1459
144 759
164 887
93 726
388 467
89 733
371
420
10371 57896
10371 57896
29800
29800
28096
28096
755 4336
429 2208
147 741
57
109
248
602
2242 1151
401
138
304
2094 1057
340 110
298 Un-Inhabited ---
1418
308
488
192
8001 4121 3880
1526 763 763 2578
986
944 4812
199 1019
1332
494
2454 515
1246 492
2358
504 .. Un-Inhabited ---
"1 624 311 313
774 4290 2244 2046
Un-Inhabited --
Un·lnhabited ---2089 12697 6497 6200 691 3755 1971 1784 -- Un-Inhabited ---
Total PopUlation
In the age group
(0 - 6)
M
(9)
866 147
309
258
38 15
31
194
627 121 102 101
22 114
112
85
5440
5440
453
201
59
29 50
721 130
205
93
444 99
48
400
1233 357
F
(10)
824 .
134 307
241
50 24
34
245
612 114
101 123 20
119
97
79.
5254 5254
419
190
-48
13
59
739
153
216
79
429 96
54
357
1222 302
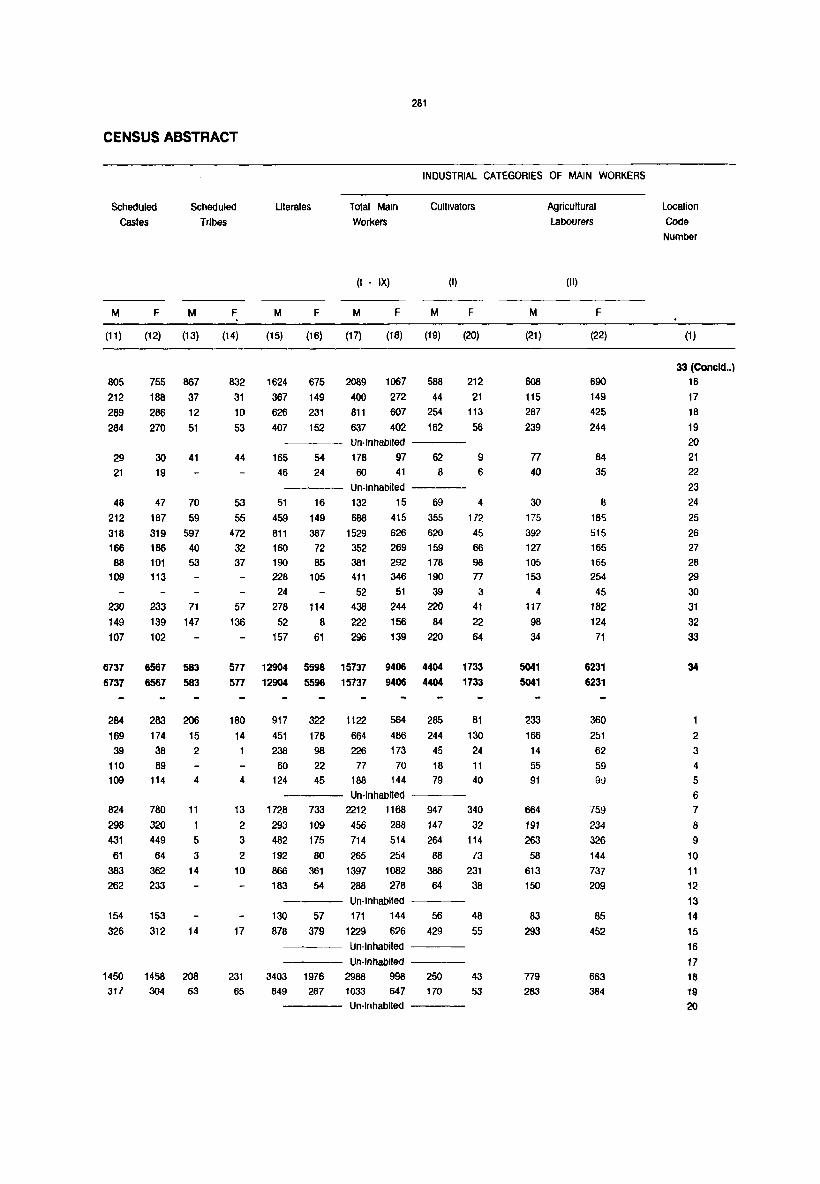
281
CENSUS ABSTRACT
INDUSTRIAL CATEGORIES OF MAIN WORKERS
Scheduled
Castes
Scheduled
Tribes
M F M
(11) (12) (13)
805 755 867
212 188 37
289 286 12
284 270 51
29
21
48
212
318 166
88 109
230
149
107
30 41
19
47 70
187 59
319 597
186 40
101 53 113
233 71
139 147
102
F
(14)
832
31
10
53
44
53
55 472
32 37
57
136
Literates
M F
(15) (16)
1624 675
367 149
626 231
407 152
165
46
51
459 811 160
190
228
24
278 52
157
54 24
16
149
387 72 85
105
114
8 61
Total Main
Workers
Cultivators
(I IX) (I)
M F M F
(17) (18) (19) (20)
2089 1067 588
400 272 44
811 607 254
637 402 162
Un-Inhabited ----
178 97 62
8 60 41
Un-Inhabited ----
132 15 69
355
620
159
688 415
1529 626
352 269
381 411
52
438 222 296
292 178 346 190
51 39
244 220
156 84
139 220
212
21
113
56
9
6
4 172
45
66
98
n 3
41
22 64
6737 6567 583 577 12904 5598 15737 9406 4404 1733
6737 6567 583
284 169
39
110 109
824 298
431
61
383
262
154
326
1450
317
283 206
174 15
38 2
89 114 4
780 11
320
449 5
64 3 362
233
153
312
14
14
1458 208
304 63
577 12904 5598 15737 9406 4404 1733
180 14
4
13
2 3
2
10
17
231 65
917 451 238
60 124
1728 293 482
192
866
183
322
176
98
22
45
733
109 175
80
361
54
1122 564
664 486 226 173
77 70
188 144
285 244
45 18
79
Un-Inhabited ----2212 1168
456 288
714 514
265 254 1397 1082
288 278
947 147
264 88
386
64 ---- Un-Inhabited
130 878
57 379
171 144
1229 626
56
429 ---- Un-Inhabited
--- Un-Inhabited ----3403 1976
849 287 2988 998 1033 647
250
170
Un-Inhabited ----
81
130 24 11
40
340
32
114
73 231
38
48 55
43
53
M
(21)
608 115
287 239
77
40
30 175
392
127
105
153
4
117
98
34
5041 5041
233
166
14
55 91
664
191
263
58
613
150
83
293
779
263
Agricultural
labOurers
(II)
F
(22)
690 149
425
244
84 35
8 185
515
165
165
254
45
182 124
71
6231
6231
360
251
62
59 9u
759
234 326
144
737
209
85
452
663 384
Location
Code
Number
(1 )
33 (Concld .• )
16
17
18
19
20
21
22 23
24
25
26
27 28
29
30 31 32
33
34
1
2 3
4 5
6
7 8
9
10
11
12
13
14
15
16
17 18
19
20

282
VILLAGE PRIMARY
I N D U STRIAL CATEGOR I E S o F
Location Name of Village livestock. Forestry Mining and Manufacturing. Manufacturing.
Code Fishing. Hunting and Quarrying Processing. Servicing Processing. Servicing Number Plantation. Orchards and Repairs in and Repairs In other
and allied activities HousehOld Industry than Household Industry
(III) (IV) (Va) (Vb)
M F M F M F M F
(1) (2) (23) (24) (25) (26) (27) (28) (29) (30)
33. MAHESWARAM M.P.P. (Concld .. )
16 MANKHAL 134 36 2 6 2 187 52 17 SARDAR NAGAR 41 18 2 15 11 71 35 18 RAVIRYAL 20 3 12 5 15 4 58 4 19 KONGAR (KHURD) (A) 3 14 128 74 20 KONGAR (KHURD) (B) Un-Inhabited ---21 IMAMGUDA 9 4 22 SREENAGAR 3 5 23 MAUKDANGUDA Un-Inhabited ---24 MOHABATNAGAR 10 2 25 THUMMALOOR 64 42 5 18 6 3 26 MAHESWARAM 57 27 13 58 27 GHATPALLE 13 2 16 14 4 28 DUBBACHERLA 9 20 9 10 29 SUBHANPUR 3 16 3 10 30 DILWARGUDA 4 3 31 KOLLAPADKAL 24 19 2 6 32 AKANPALLE 17 9 3 3 33 PORANDLA 30 4
34 IBRAHIMPATNAM M.P.P. T 767 149 85 23 404 113 1317 306 R 767 149 85 23 404 113 1317 306 U
KONGARA KALAN 75 3 27 17 11 2 171 46 -2 ADIBATLA 18 5 4 90 53 3 BONGLOOR 47 36 47 12 4 CHINTAPALLEGUDA 2 5 RAMDASPALLE 3 3 8 6 ISMAILSHAPAMPU Un-Inhabited ---7 IBRAHIMPATNAM (KHALSA) 118 11 26 31 7 91 5 8 NAGANPALLE 14 1 5 3 1 42 3 9 POLKAMPALLE 58 5 6 5 22 1 10 NARREPALLE 37 10 51 8 11 DAN DUMAILARAM 78 13 44 8 74 8 12 MUKNOOR 6 6 6 15 4 13 RAlNGUDA Un-Inhabited ---14 YENGALAGUDA 5 3 5 15 RAIPOLE 76 5 7 77 36 103 25 16 TAnlKHANA Un-Inhabite<l ---17 ALiMIYAKUNTA Un-Inhabite<l ---18 IBRAHIMPATNAM (BAGATH) 57 12 9 2 62 7 274 22 19 MANGAlPALLE 89 28 52 3 232 107 20 FEROZGUDA Un-Inhabited ---

CENSUS ABSTRACT
MAIN WORKERS
Constructions
M
(31)
60
9 26 4
5 3
22
2 17
5
10 2
264 264
35 4
36
9 1
13 28 10
48
47 9
(VI)
F
(32)
2
1
3
2
2
6 2
36
36
11
5
11
3
2
M
(33)
2()7
42 45 27
13
3 19
180 18 23 14
24 5 3
1425
1425
158
99 31 1 2
119 15
59 7
62 14
4 84
618 64
Trade and Commerce
(VII)
F
(34)
34
15
24 10
6
9 10
5 3
2 6
3 4
310 310
18 21 25
2
11 8
46 3
29 12
20
65 22
Transport. Storage & Communications
(VIII)
M F
283
Other Services
(IX)
M F
Marginal
Workers
M F
(35) (36) (37) (38) (39) (40)
155
22
12 7
4 143 33 21 401 39 22
~ 26 14
53 17
--Un-lnhBhited---
4 8 2
--Un-lnhBhited---8 6 5 38
25
2
5 3
3
2 148 11
14 17
1
15 4 5
2
5
39 12 14
9
5 2
2
3 6
2 1
62
83
29
22 7
1
2
133 29
109
Non-workers Location
Code Number
M
(41)
1846 336 689
492
119 42
61 463
1367
239 202 265 39
287 166 171
F
(42) (1)
33 (Concld .. ) 2277 16
386 17
800 18
675 19
200
72
91
618
2065
295 255 355 36
356 186 172
20
21 22
23 24 25 26 27 28 29
30
31 32 33
707
707
30
30
1323 475 124 1095 13939 17595 34 1323 475 124 1095 13939 17595
57
6
14
3
70
32 28
2 --Un-lnhBhited---
45 135 13 10
5
38 13
17 31
6
73 10
--Un-Inhabited---5 12
39 73 --Un-Inhabited---
--Un-Inhabited---
260 29 632 67 67
--Un-Inhabited---
26 27 14
30
9
17 5
52
8
8
32
153 49
38
5
38
19
22
280 2
173 2
92 10
20
7
211
26
249
1082
487 175
61 116
1904
307 580
229 1056
227
140 996
3487
937
1250 569 167
40 154
2539 473 640
228 1256
219
5176
888
1
2
3
4
5
6 7
8
9
10
11
12 13
14 15 16
17
18 19 20
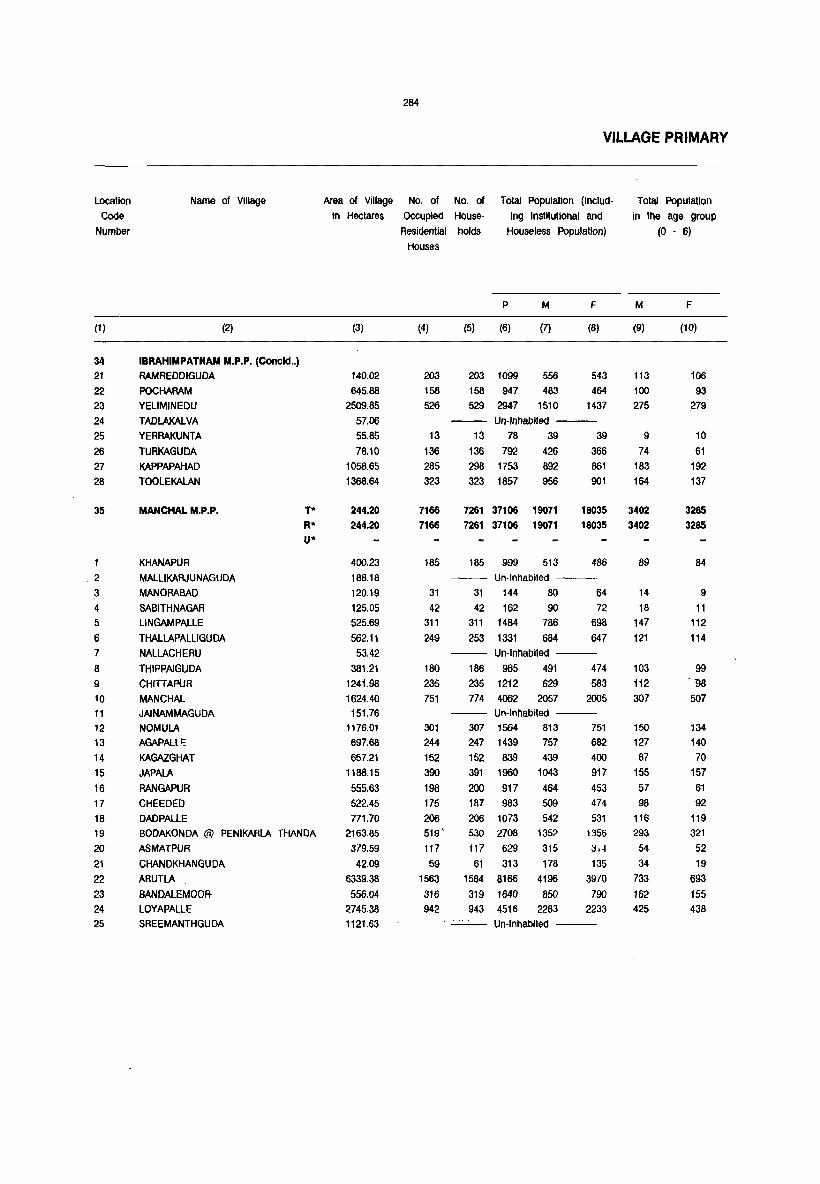
Location
Code
Number
(1)
34 21
22 23
24
25
26 27 28
35
.2
3
4 5
6 7
8 9
10 11
12 13
14 15
16 17
18 19
20
21 22
23 24 25
Name of Village
(2)
IBRAHIMPATNAM M.P.P. (Concld .. ) RAMREDDIGUDA
POCHARAM
YELIMINEDU
TADLAKALVA
YERRAKUNTA
TURKAGUDA
KAPPAPAHAD
TOOLE KALAN
MANCHAL M.P.P.
KHANAPUR
MALLIKARJUNAGUDA
MANORABAD
SABITHNAGAR
lINGAMPALLE
THALLAPALLIGUDA
NALLACHERU
THIPPAlGUDA
CHITTAPUR
MANCHAL JAlNAMMAGUDA
NOMULA
AGAPAUt: KAGAZGHAT
JAPALA
RANGAPUR
CHEEDED
DADPALLE
T" R* U*
BODAKONDA @ PENIKARLA THANDA
ASMATPUR
CHANDKHANGUDA
ARUTLA
BANDALEMOOA-LOYAPALLE
SREEMANTHGUDA
284
VILLAGE PRIMARY
Area of Village No. of No. of Total Population (Includ- Total Population
In the age group
(0 - 6)
in Hectares Occupied House- Ing Institutional and
(3)
140.02
645.88 2509.85
57.06 55.85
78.10 1058.65 1368.64
244.20 244.20
400.23
188.18 120.19
125.05 525.69
562.11
53.42
381.21 1241.98
1624.40 151.76
1176.01 697.68 657.21
1188.15
555.63 522.45 771.70
2163.85
379.59
42.09 6339.38
556.04 2745.38 1121.63
Residential holds Houseless Population)
Houses
(4)
203
158 526
13
136
285 323
P M
(5) (6) (7)
203 1099 556
158 947 483 529 2947 1510
F
(8)
543
464 1437
Un-Inhabited ---
13 78 39 39
136 792 426 366
298 1753 892 861 323 1857 956 901
M
(9)
113
100 275
9
74 183 164
7166 7166
7261 37106 19071 7261 37106 19071
18035 3402 18035 3402
185
31
42 311
249
180 235
751
301 244 152
390
198 175
185 999 513 486
Un-Inhabited ---
31 144 80 64 42 162 90 72
311 1484 786 698
253 1331 684 647 Un-Inhabited ---
186 965 491 474 235 1212 629 583 774 4062 2057 2005
Un-Inhabited ---
307 1564 813 751 247 1439 757 682
152 839 439 400 391 1960 1043 917
200 917 464 453 187 983 509
206 206 1073 542
474
531 1356 3,-1
135
3970
519' 530 2708 1352
117 117 629 315
59 61 313 178 1563 1584 8166 4196
316 319 1640 850
942 943 4516 2283 790
2233
Un-Inhabited ---
89
14
18 147
121
103 112
307
150
127
87
155
57 98
116 293
54
34
733
162 425
F
(10)
106
93 279
10
61
192 137
3285 3285
84
9
11
112
114
99 00
507
134
140
70 157
61 92
119
321
52
19
693
155 438

285
CENSUS ABSTRACT
INDUSTRIAL CATEGORIES OF MAIN WORKERS
Scheduled
castes Scheduled
Tribes Ulerates Total Main
Workers Cultivators
M
(11)
239
67
424
39
108
F
(12)
237
65
387
39
87
M
(13)
2
27
F
(14)
3
26
M F
(15) (16)
265
239
629
18
207
66
67
265
4
68
(I - IX)
M F
(17) (18)
313 126
252 157
860 643
M
(19)
131
42
339
(I)
F
(20)
32
133
Un-Inhabited ----22 17
222 142
7
132
3
63
270 260 303 66 492 377 140 64
373 359 6 6 449 166 546 506 141 105
3562 3209 3524 3417 7211 2523 10474 7405 4601 1966
3562 3209 3524 3417 7211 2523 10474 7405 4601 1966
185
63 72
118
152
125
115
460
274
158
153
237
108 136
53
14 89 29
701
113
207
170
54
60 114
149
112 103
447
228
142 123
2 10
2
5
5
223 6
102 46
117 5
53 232
11 1216
80 19
610 ·739
94 390
198 864
251 129 279 66 112
---- Un-Inhabited ----
2
13
23
32 313
268
11 12
123 82
51 42
50 43
458 399
335 214
8 22
197
100
---- Un-Inhabited ----
184 93 267 195 98
272 87 346 289 146 7 951 479 1109 751 357
---- Un-Inhabited ----
2 301 104 459 300 127
455 150 347
217
253
166
78
69
443
143
68
223 84
4 366
41 233
4 179 214 230
1221 329
123
78 731 1581
356 384 821 433
126 631 201
65 238 107
52 254 207
62 285 281
77 762 703
21 174 22
17 97 5
558 2290 1588
90 481 482
81 1344 1091
147
526
63
62
864
322
649
Un-Inhabited ----
9
2 19
162
34
43
97
142
86 17 35
24 17 54
147
317
4
1
356
261
139
M
(21)
102 73
274
14
31
271 340
3677
3677
82
39
19
134 124
126
143 477
214
159
87 135
52 148
105 141
73
21
867 54
477
Agricultural
labourers
(II)
F
(22)
88
139
432
14
65
275 394
4883
4883
54
38
20 202
160
138
165
549
180 219
116
161
87 141
131
337
9
4 1071
200 001
location
Code Number
(1 )
34 (Concld •• ) 21
22 23
24 25 26
27 28
35
2
3 4
5
6 7
8 9
10 11
12 13
14 15
16
17
18 19
20
21
22 23
24 25
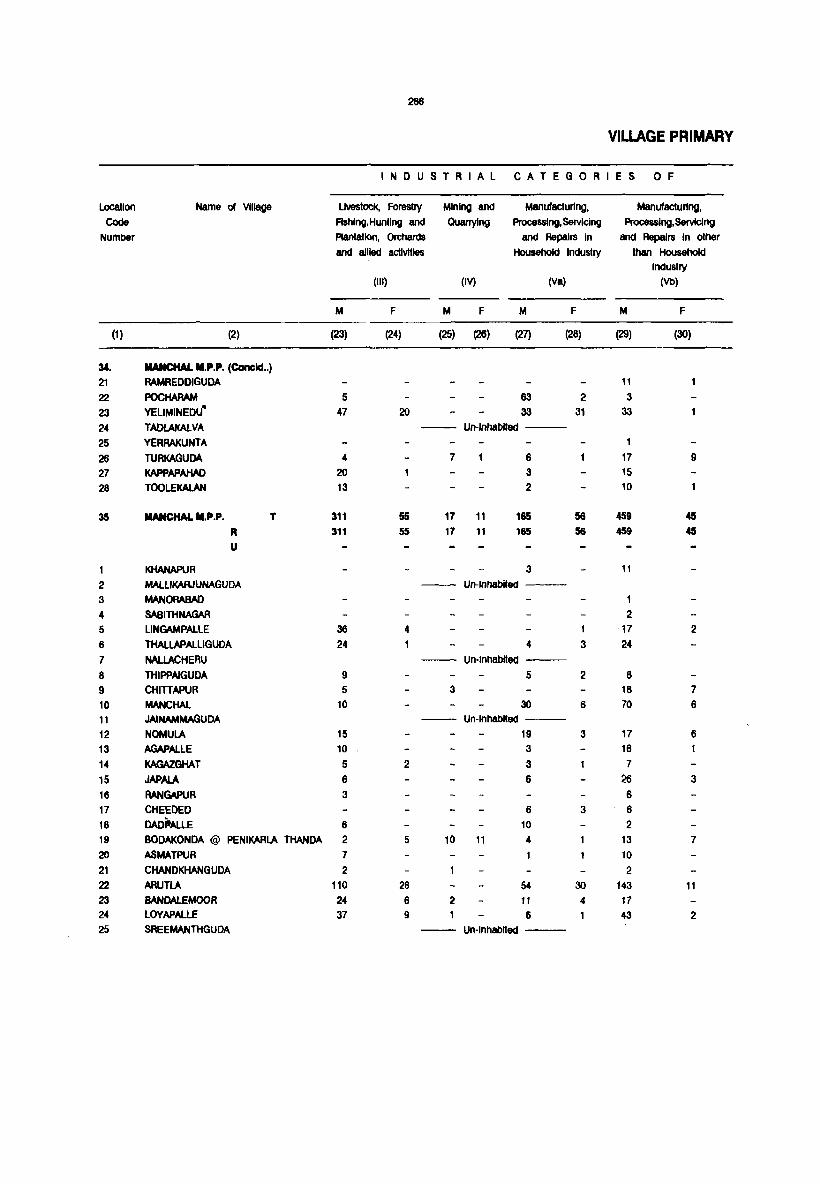
286
VILLAGE PRIMARY
INDUSTRIAL CATEGORIES o F
Location Name of Village UvestOCk, Forestry Mining and Manufacturing. Manufacturing.
COde Flshlng.Huntlng and Quarrying ProceSSlng.Selvlclng Processing. ServIcIng Number Plantation. OrchardS and RepaIrs In and Repairs In other
and allied activities Household Industry than Household Industry
(III) (IV) (Va) (Vb)
M F M F M F M F
(1) (2) (23) (24) (25) (26) (27) (28) (29) (30)
M. IlANCHAL M.P.P. (Conclcl .. )
21 RAMREDDIGUDA 11 22 POCHARAM 5 63 2 3 23 YELIMINEDU· 47 20 33 31 33 24 TADI.AI<AL VA -- Un-Inhabited
25 YERRAKUNTA 1
26 TURKAGUDA 4 7 6 17 9 27 KAPPAPAHAD 20 3 15 28 TOOLEKAlAN 13 2 10
35 MANCHAL M.P.P. T 311 55 17 11 165 66 459 45
R 311 55 17 11 165 66 459 45
U
KHANAPUR 3 11 2 MALLIKARJUNAGUDA -- Un-Inhabited 3 MANORABAD 1 4 SABITHNAGAR 2 5 LlNGAMPALLE 36 4 1 17 2 6 THALLAPALLIGUDA 24 1 4 3 24 7 NALLACHEAU un-Inhabited ---
8 THIPPAIGUDA 9 5 2 8 9 CHmAPUA 5 3 18 7 10 MANCHAL 10 30 6 70 6
11 JAlNAMMAGUDA -- Un-Inhabited ---
12 NOMULA 15 19 3 17 6
13 AGAPALLE 10 3 16 14 KAGAZGHAT 5 2 3 1 15 JItPAI.A 6 6 26 3
16 RANGAPUR 3 6 17 CHEEDED 6 3 6 18 DADPtALLE 6 10 2 19 BODAKONDA @ PENIKARLA THANDA 2 5 10 11 4 13 7 20 ASMATPUR 7 10 21 CHANDKHANGUDA 2 2 22 ARUTLA 110 28 54 30 143 11 23 BANDAlEMOOR 24 6 2 11 4 17 24 LOYAPALLE 37 9 6 43 2 25 SREEMANTHGUDA -- Un-Inhabited

CENSUS APSTRACT
MAIN WORKBRS
Constructions
M
(31)
2 10 5
3
3
64
64
12
7
9
4
17 3 4
(VI)
F
(32)
2
3
3
2
M
(33)
3
12 35
14 12 12
455
455
27
2 22 32
7
15 51
26 24 12 1 3
4
5
37
5
4 109
7
61
Trade and Commerce
(VII)
F
(34)
8 9
2
5
4
194
194
14 13
2 3
15
8
8
5
10 2
2
17
4
58 7
25
Transport. Storage & Communications
(VIII)
M F
287
Other Services
(IX)
M F
Marginal
Workers
M F
Non-workers
M F
location Code
Number
(35) (36) (37) (38) (39) (40) (41) (42) (1)
56
28 29
8
16
65
--Un-Inhabiled---
2 9
8
227 227
9
6 22 17
498
498
35
--Un-Inhabited---
1
4 3
6
37
20 --Un-Inhabited---
3 11 2
29 13 78
~Un-Inhablted---
10 22 24 12 4
4 3
14 3
2 25
32 41
29
22
10 26 19
9 14 11
2
101
9 25
--Un-Inhablted---
5
8
15
1
12 4
191
191
2
2
4
14 3
10 16 33
15
8 7
3
7
3
7 4
34 4
14
22
243 231 650
17
204
400
410
79 1008 8518 79 1008 8518
23
2 2
10
5
3
3
29
180
100
6
25 46
10 210
49
234
29 40
328 326
222 281 938
349
410 222 412 223 254 257 587
118 141 55 80
138 1877
1 369
? 939
34 (Concld .. )
417 21 307
794
21 224
462 393
9622 9622
240
22
29 299
333
273
269
1208
385
428 224
506 345
267
250
604 174
75 2244
307
1140
22 23 24 25 26 27 28
35
1
2 3
4
5
6
7
8 9
10 11
12 13
14 15
16 17
18 19
20
21 22
23 24 25
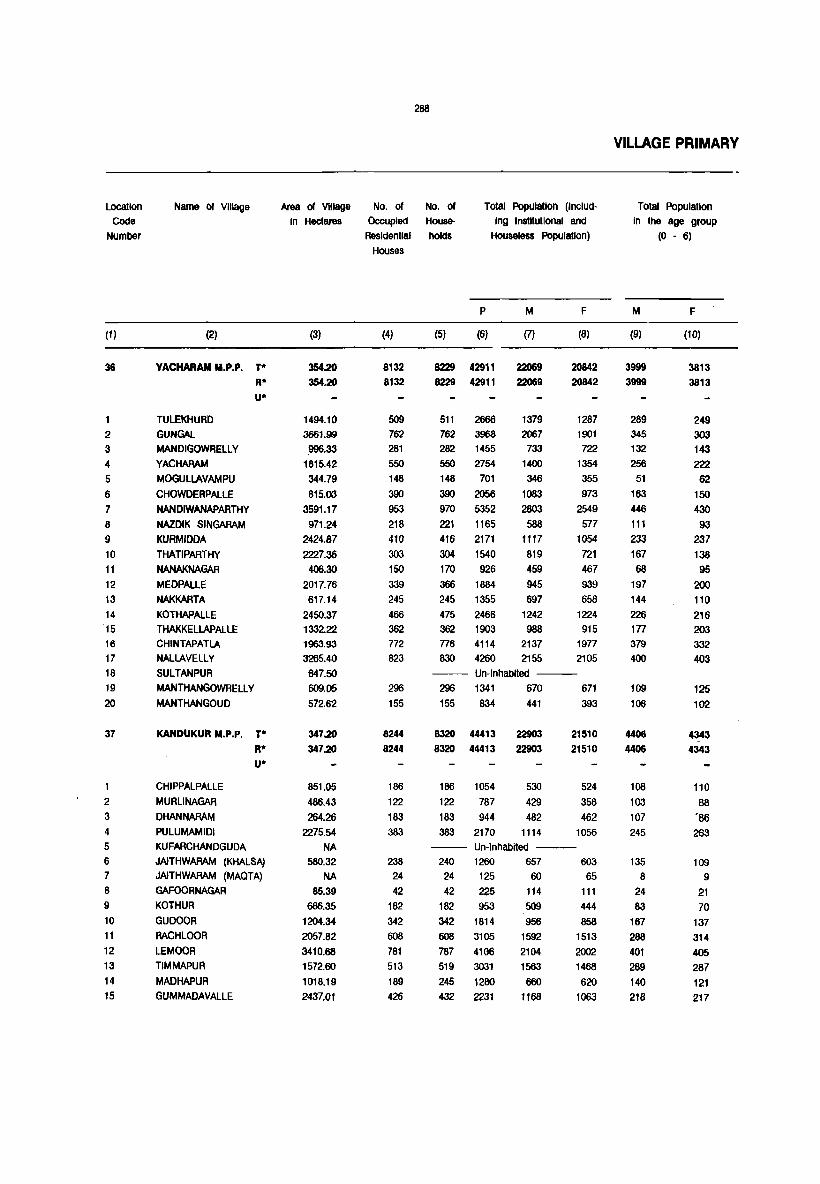
Locallon
COde
Number
(1 )
36
2
3 4
5
6 7
8
9 10 11
12
13 14
15
16 17
18
19
20
37
1
2
3
4 5
6 7
8 9
10 11
12
13 14 15
Name of Village
(2)
YACHARAM M.P.P. T*
R* U*
TULEKHURD GUNGAL
MANDIGOWRELLY YACHAAAM
MOGULLAVAMPU
CHOWDERPALLE
NANDIWANAPARTHY
NAZDIK SINGARAM
KURMIDDA
THATIPARTHY
NANAKNAGAR
MEDPALLE
NAKKARTA
KOTHAPALLE THAKKELLAPALLE CHINTAPATLA NALLAVELLY
SULTANPUR
MANTHANGOWRELL Y
MANTHANGOUD
KAHDUKUR M.P.P. T*
R" U*
CHIPPALPALLE
MURLINAGAR
OHANNARAM
PULUMAMIDI KUFARCHANDGUDA JAiTHWARAM (KHALSA) JAiTHWARAM (MAQTA) GAFOORNAGAR KOTHUR
GUOOOR AACHLOOR
LEMOOR TIM MAPU R
MADHAPUR GUMMADAVALLE
288
Area of Village No. of No. of Total POpUlation (Includ
Ing Institutional and
Houseless Population)
In Hectares Occupied House-
(3)
354.20 354.20
1494.10
3661.99
996.33 1815.42
344.79
815.03
3591.17
971.24
2424.87
2227.36 406.30
2017.76
617.14
2450.37 1332.22 1963.93
3265.40 647.50
609.05
572.62
347.20 347.20
851.05
486.43 264.26
2275.54
NA 580.32
NA 85.39
686.35 1204.34 2057.82
3410.68
1572.60
1018.19 2437.01
Residential holds
Houses
(4)
8132 8132
509 762
281
550
148
390 953
218
410
303
150 339
245
466
362 772 823
296
155
8244
8244
186
122
183
383
238 24
42
182
342 608
781
513
189
426
P M
(5) (6) (7)
8229 42911 22069
8229 42911 22069
511 2666
762 3968
282 1455
550 2754
148 701
390 2056
970 5352
221 1165
416 2171
304 1540
170 926
366 1884
245 1355
475 2466
362 1903 776 4114 830 4260
1379
2067
733
1400 346
1083
2803 588
1117
819
459
945
697
1242
988
2137
2155
F
(8)
20842
20842
1287
1901
722
1354 355
973
2549
577 1054 721
467
939
658
1224
915
1977 2105
-- Un-Inhabited ---
296 1341 670 671
155 834 441 393
8320 44413 22903
8320 44413 22903
186 1054
122 787
183 944
383 2170
530
429
482
1114
21510
21510
524
358
462
1056
-- Un-inhabited ----240 1260 657 603
~ 1~ 60 ~
42 225
182 953
342 1814
608 3105
787 4106
519 3031
245 1280
432 2231
114 509
956
1592
2104
1563
660 1168
111
444
858
1513
2002 1468
620
1063
VILLAGE PRIMARY
Total Population
In the age group
(0 - 6)
M
(9)
3999 3999
289
345
132
256
51
163
446
111
233
167
68 197
144
226 177
379
400
109
106
4406
4406
108
103
107 245
135
8
24
83
167
288 401 289 140 218
F
(10)
3813 3813
249
303 143 222 62
150
430
93
237
138 95
200 110
216 203
332 403
125
102
4343 4343
110
88 '86
263
109
9
21
70
137 314
405
287
121
217
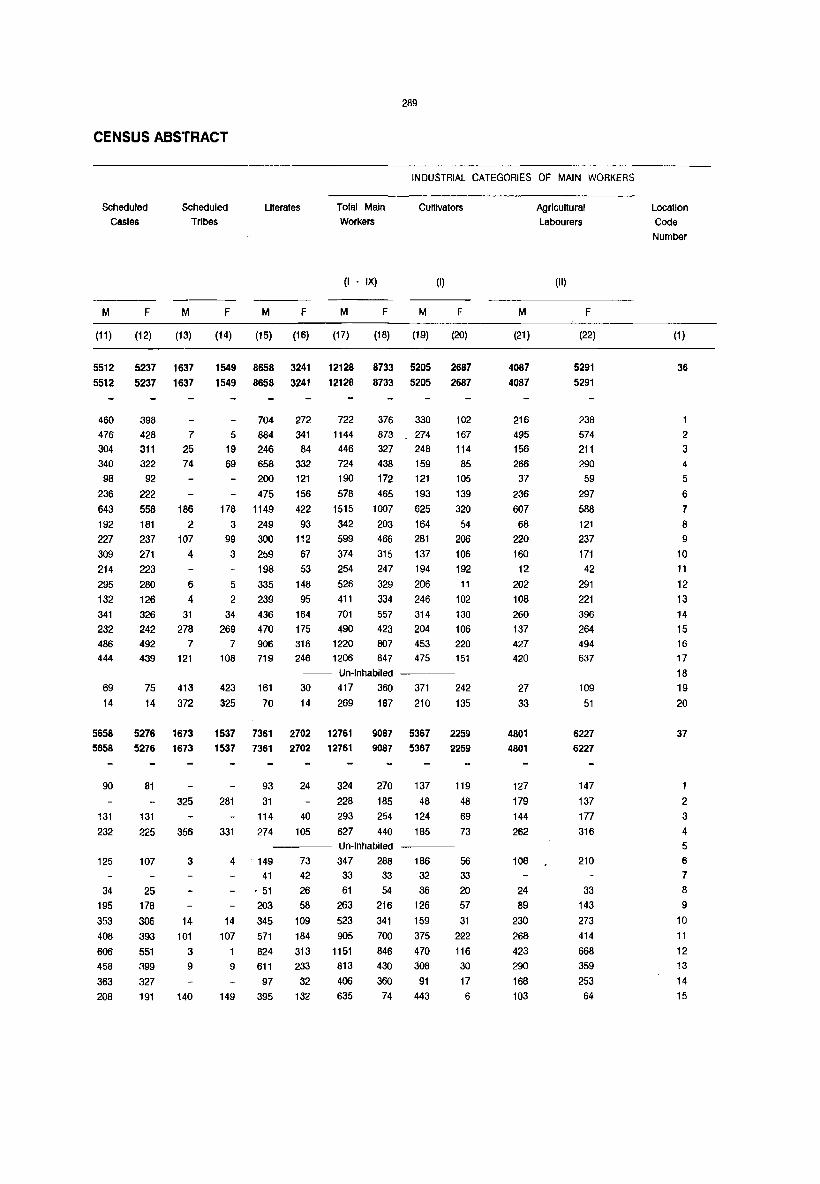
289
CENSUS ABSTRACT
INDUSTRIAL CATEGORIES OF MAIN WORKERS
Scheduled Castes
Scheduled Tribes
Literates Total Main Workers
Cultivators
M
(11 )
5512 5512
460
476 304 340 98
236 643 192 227 309 214 295 132 341 232 486 444
69 14
F M
(12) (13)
5237 1637 5237 1637
398 428 7 311 25 322 74
92 222
558 186 181 2 237 107 271 4 223 280 6 126 4
326 31 242 278 492 439
75 14
7
121
413 372
(I - IX)
F M F M
(14) (15) (16) (17)
1549 8658 3241 12128 1549 6658 3241 12128
704 272 722 5 884 341 1144
19 246 84 446 69 658 332 724
200 121 190 475 156 578
178 1149 422 1515 3 249 93 342
99 300 112 599 3 259 67 374
198 53 254 5 335 148 526 2 239 95 411
34 436 164 701 269 470 175 490
F M
(18) (19)
6733 5205 8733 5205
376 330 873 274 327 248 438 159 172 121 465 193
1007 625 203 164 466 281 315 137 247 194 329 206 334 246 557 314 423 204
(I)
F
(20)
2687 2687
102 167 114 85
105 139 320
54 206 106 192
11 102 130 106
7
108 906 719
316 246
1220 807 453 220
423 325
161 70
30
14
1206 847 475 151 Un-Inhabited 417 360 371 242 269 187 210 135
5658 5276 1673 1537 7361 2702 12761 9087 5367 2259 5658 5276 1673 1537 7361 2702 12761 9087 5367 2259
90
131 232
125
34 195 353 408 606 458 363 208
81
131
225
107
25 178 306 393
551 399 327 191
325
356
3
14 101
3 9
140
281
331
93 31
114 274
4 . 149
14 107
9
149
41 . 51 203 345 571 824 611 97
395
24
40 105
73 42 26 58
109 184 313 233
32
132
324 228 293 627
270 185 254 440
137 48
124 185
Un-Inhabited ----
347 288 33 33 61 54
263 216 523 905
1151
813 406 635
341 700 846 430 360
74
186 32 36
126 159 375 470 308
91 443
119 48 69 73
56 33 20 57 31
222 116 30 17 6
M
(21)
4087 4087
216 495 156 266 37
236 607 68
220 160
12 202 108 260 137 427 420
27 33
4801 4801
127 179 144
262
108
24 89
230 268 423 290
168
103
Agricultural Labourers
(II)
F
(22)
5291 5291
238 574 211 290 59
297 588 121 237 171
42 291 221 396
264 494
637
109 51
6227 6227
147 137 177
316
210
33 143 273 414 668
359 253 64
Location Code Number
(1 )
36
2
3 4
5 6
7
8 9
10 11 12 13 14 15 16 17 18 19 20
37
2
3
4
5 6
7 8
9
10 11
12 13
14 15

29u
VILLAGE PRIMARV
I N D U STRIAL CAT EGO R I E S o F
Location Name of Village Livestock. Forestry Mining and Manufacturing. Manufacturing.
Code Fishing.Hunting and Quarrying Processing. Servicing Processing. Servicing
Number Plantation. Orchards and Repairs in and Repairs in other
and allied activities Household Industry than Household
IndUstry
(III) (IV) (Va) (Vb)
M F M F M F M F
(1 ) (2) (23) (24) (25) (26) (27) (28) (29) (30)
36 YACKARAM M.P.P. T 302 42 80 31 88 30 528 157
R 302 42 80 31 88 30 528 157
U
1 TULEKHURD 23 9 2 5 40
2 GUNGAL 51 5 14 4 62 45
3 MANDIGOWRELL Y 2 2 11
4 YACHARAM 6 2 2 42 11
5 MOGULLAVAMPU 4 5
6 CHOWDERPALLE 11 8 36 9
7 NANDIWANAPARTHY 15 1 16 1~ 58 27
8 NAZDIK SINGARAM 19 2 17 2
9 KURMIDDA 19 10 6
10 THATIPARTHY 15 14 3 2 16 5
11 NANAKNAGAR 21 3 7
12 MEDPALLE 4 14 18
13 NAKKARTA 3 1 2 2 14
14 KOTHAPALLE 10 2 8 1 46 15
15 THAKKELLAPALLE 6 30 11 2 47 20
16 CHINTAPATLA 47 6 4 7 7 51 16
17 NALLAVELLY 42 6 23 13 4 1 35 5
18 SULTANPUR Un-Inhabited ---19 MANTHANGOWRELL Y 2 2
20 MANTHANGOUD 4 15
37 KANDUKUR M.P.P. T 398 28 111 29 193 41 461 140 R 398 28 111 29 193 41 461 140 U
1 CHIPPALPALLE 33 17 2 MURLINAGAR
3 DHANNARAM 5 4 PULUMAMIDI 59 4 14 3 5 KUFARCHANDGUDA Un-Inhabited ---6 JAITHWARAM (KHALSA) 9 6 5 2 4 7 JAITHWARAM (MAQTA)
8 GAFOORNAGAR
9 KOTHUR 14 1 2 11 10 GUDOOR 29 2 14 5 9 4 11 RACHLOOR 55 11 5 6 54 12 12 LEMOOR 37 4 3 9 4 40 15 13 TIMMAPUR 38 50 10 29 12 14 MADHAPUR 28 6 9 93 72 15 GUMMADAVALLE 7 4 17 15
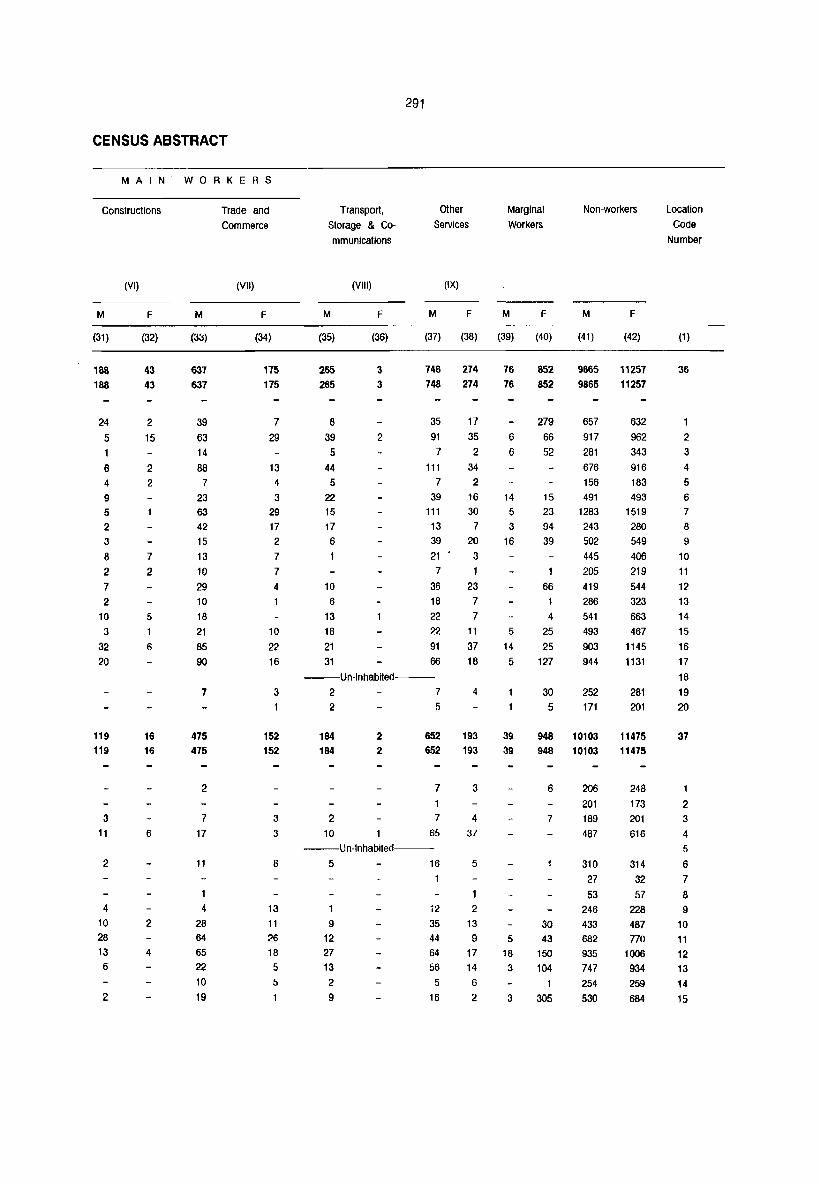
CENSUS ABSTRACT
MAIN WORKERS
Constructions
M
(31)
188
188
24
5 1
6 4
9 5
2
3
8 2
7 2
10
3
32 20
119 119
3
11
2
4
10 28 13 6
2
(VI)
F
(32)
43 43
2
15
2 2
7
2
5
6
16 16
6
2
4
M
(3:1)
637 637
39 63 14 88 7
23 63
42
15 13 10 29 10 18 21 85 90
7
475 475
2
7
17
11
4 28 64
65 22 10
19
Trade and
Commerce
(VII)
F
(34)
175 175
7
29
13 4 3
29 17
2
7 7 4
10 22 16
3
152 152
3 3
8
13 11 26 18
5
5
1
291
Transport,
Storage & Co
mmunications
Other
Services
Marginal
Workers
M
(35)
265 265
8
39 5
44
5
22 15 17 6
1
10 6
13 18 21 31
(VIII)
F
(36)
3
3
2
(IX)
M F M
(37) (38) (39)
748 274 76 748 274 76
35 17 91 35 6 7 2 6
111 34 7
39 111
13
39 21 7
36 18 22
22 91 66
2
16 30 7
20
3
23 7
7
11
37 18
14 5
3
16
5
14
5 --Un-Inhabited---
2 7
2
184 184
2
10
2
2
5
652 652
7 1
7 65
--Un-Inhabiled---
5 16
9
12 27 13
2
9
,2 35 44 64 56 5
16
4
193 193
3
4 37
5
2
13 9
17
14
6 2
39 39
5 18 3
3
F
(40)
852
852
279 66 52
15 23 94 39
1
66
4
25 25
127
30 5
M
(41)
9865 9865
657 917 281 676 156 491
1283 243 502 445 205 419 286 541 493 903
944
252 171
948 10103 948 10103
6
7
30 43
150
104
1
305
206 201 189
487
310
27 53
246 433 682 935 747 254 530
F
(42)
11257
11257
632 962 343 916 183 493
1519 280 549 406 219 544 323 663 467
1145 1131
281 201
11475 11475
248 173
201 616
314
32 57
228 487 770
1006
934 259 684
Location
Code
Number
(1 )
36
2
3 4 5 6
7
8
9
10 11
12 13
14
15 16 17 18 19 20
37
1
2
3
4
5
6
7
8 9
10 11
12 13 14 15

Location
COde
Number
(1)
37
16 17 18 19 20 21 22 23 24 25 26 27 28
Name of Village
(2)
KANDUKUR M.P.P. (Concld .. )
THIMMA1PALLE
ANNOJIGUDA KANDUKUR
MOHAMMADNAGAR PERUGUGUOA
SACHUPALLE
NEDNUR
AKBERJA
DASARLAPAlLE
ALLIKHANPALLE
DEB BADAGU DA
PANJAGUDA
MEERKHANPET
292
Area of Village No. of No. of
in Hectares Occupied House-
(3)
1346.79 50.59
3252.05 567.37
35.61 649.66
2638.54 41.68
1086.98 94.70
336.70 644.66
1908.90
Residential holds
Houses
(4) (5)
22 22 126 126 676 676
47 47 26 26
229 229 794 794
249 249
304 304 185 185 657 657
VILLAGE PRIMARY
Total Population (Includ
Ing Institutional and
Houseless Population)
P M F
(6) (7) (8)
93 47 46 671 326 345
3555 1849 1706 247 126 121 117 64 53
1089 565 524 4512 2296 2216
Un-Inhabited -_-
1396 709 687 Un-Inhabited ---
1678 884 794 865 444 421
3547 1845 1702
Total Population
In the age group
(0 - 6)
M F
(9) (10)
7 11 80 72
343 307 23 29 21 9
103 111 386 442
155 155
182 167 91 103
292 316 29 SARVARAVULAPALLE 484.41 127 127 . 692 365 327 96 108 30 MUCHERLA 3050.92 583 583 2866 1445 1421 311 276
AREAS NOT INCLUDED IN ANY MPP 41.50 2248 2250 11219 5868 5351 1148 1083
4 BODUPPAL 600.96 987 987 5188 2726 2462 544 465 5 MIYAPUR 57.46 11 11 54 28 26 7 10 18 PEERZADGUDA 789.14 822 822 3969 2050 1919 389 399 19 MEDIPALLE 494.93 428 430 2008 1064 944 208 209 20 GULAM ALiGUDA 62.73 Un-Inhabited ---
Note:-
The District Total 'Geographical Area' figures are as supplied by the SUNeyor General, India. Figures for urban areas are those
supplied by the Local Bodies. Area figures for Rural Areas are derived by subtracting the total Urban area of the district from the
total area of the district. The total of the area figures of the Mandals When totalled will not tally with the district area figures
because the former represents land use area and are derived from the figures supplied by the State Govemment. Similarly, the area
fiQures of all Villages, when added up will not tally with the Mandai figure.
T* jR* jU* Area figures are In square kilometres.
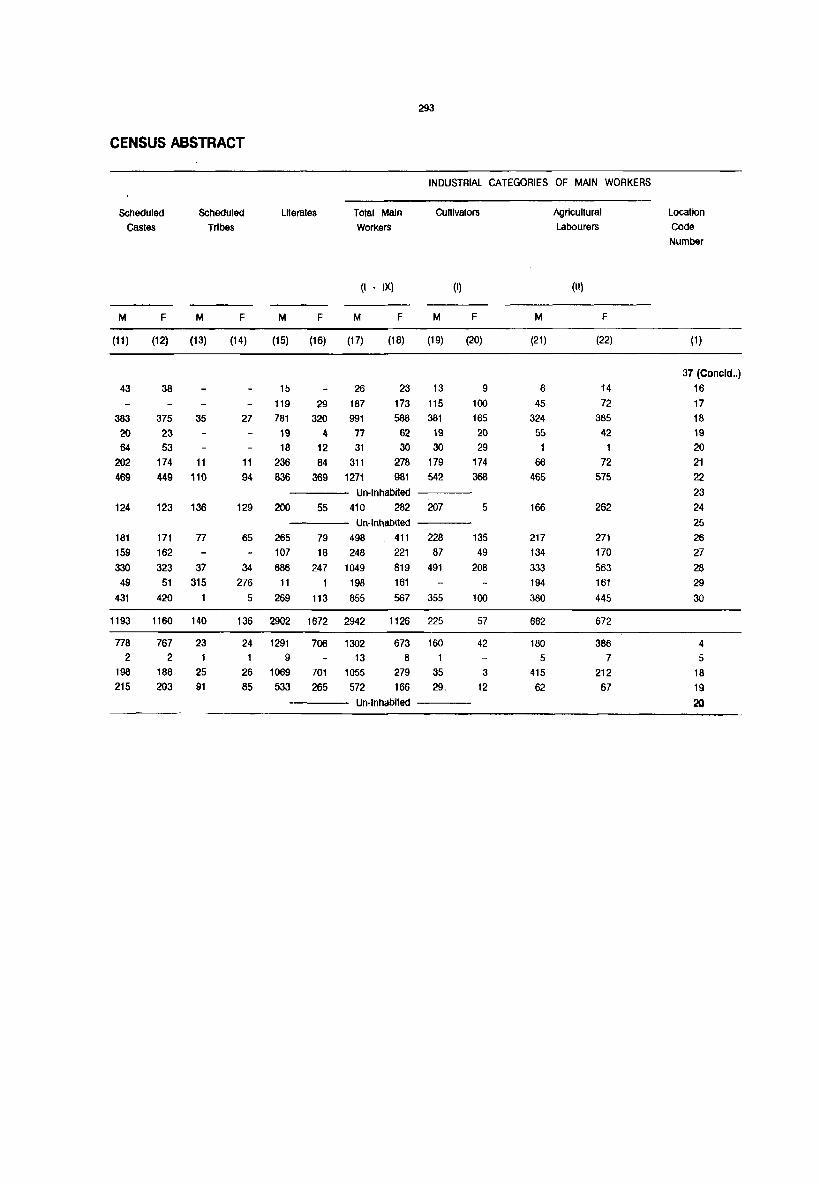
293
CENSUS ABSTRACT
INDUSTRIAL CATEGORIES OF MAIN WORKERS
Scheduled Scheduled Literates Tolal Maln Cultivators Agricultural Location
castes Tribes Workers Labourers Code
Number
(I IX) (I) (II)
M F M F M F M F M F M F
(11) (12) (13) (14) (15) (16) (17) (18) (19) (20) (21) (22) (1)
37 (Concld .. ) 43 38 15 26 23 13 9 6 14 16
119 29 187 173 115 100 45 72 17 383 375 35 27 781 320 991 588 381 165 324 385 18
20 23 19 4 77 62 19 20 55 42 19 64 53 18 12 31 30 30 29 1 1 20
202 174 11 11 236 84 311 278 179 174 66 72 21 469 449 110 94 836 369 1271 981 542 368 465 575 22
Un-Inhabited 23 124 123 136 129 200 55 410 282 207 5 166 262 24
Un-Inhabited 25 181 171 77 65 265 79 498 411 228 135 217 271 26 159 162 107 18 248 221 87 49 134 170 27 330 323 37 34 686 247 1049 819 491 208 333 563 28
49 51 315 276 11 1 198 161 194 161 29 431 420 5 269 113 855 567 355 100 380 445 30
1193 1160 140 136 2902 1672 2942 1126 225 57 662 672
778 767 23 24 1291 706 1302 673 160 42 180 386 4 2 2 1 9 13 8 1 5 7 5
198 188 25 26 1069 701 1055 279 35 3 415 212 18 215 203 91 85 533 265 572 166 29. 12 62 67 19
Un-Inhabited 20

294
VILLAGE PRIMARY
I N D U STRIAL CATEGORI E S o F
Location Name of village Livestock, Forestry Mining and Manufacturing, Manufacturing, Code Fishing,Hunting and Quarrying Processlng,Servlclng Processing,Servicing
Number Plantation, Orchards and Repairs In and Repairs in other and allied activities Household Industry than Household
Industry (III) (IV) (Va) (Vb)
M F M F M F M F
(1) (2) (23) (24) (25) (26) (27) (28) (29) (30)
37 KANDUKUR M.P.P. (Concld .. )
16 THIMMAIPALLE 3 1
17 ANNOJIGUDA 12 1
18 KANDUKUR 43 19 2 45
19 MOHAMMADNAGAR 20 PERUGUGUDA
21 BACHUPALLE 24 8 3
22 NEDNUR 4 27 8 7 45 10
23 AKBERJA Un-Inhabited
24 DASARLAPALLE 2 7
25 ALUKHANPALLE Un-Inhabited
26 DEBBADAGUDA '1 1 16 2
27 PANJAGUDA 2 1 7
28 MEERKHANPET 25 39 14 3 45 4
29 SARVARAVULAPALLE
30 MUCHERLA 4 27 3 18 4
Areas not included in any M.P.P. 120 31 33 15 11 34 787 119
4. BODUPPAL 68 22 17 9 2 16 433 67
5. MOYAPUR 1 5
18. PEERZADGUDA 48 8 2 2 173 20
19. MEDIPALLE 4 16 5 7 15 176 32
20. GALAMAUGUDA Un-Inhabited
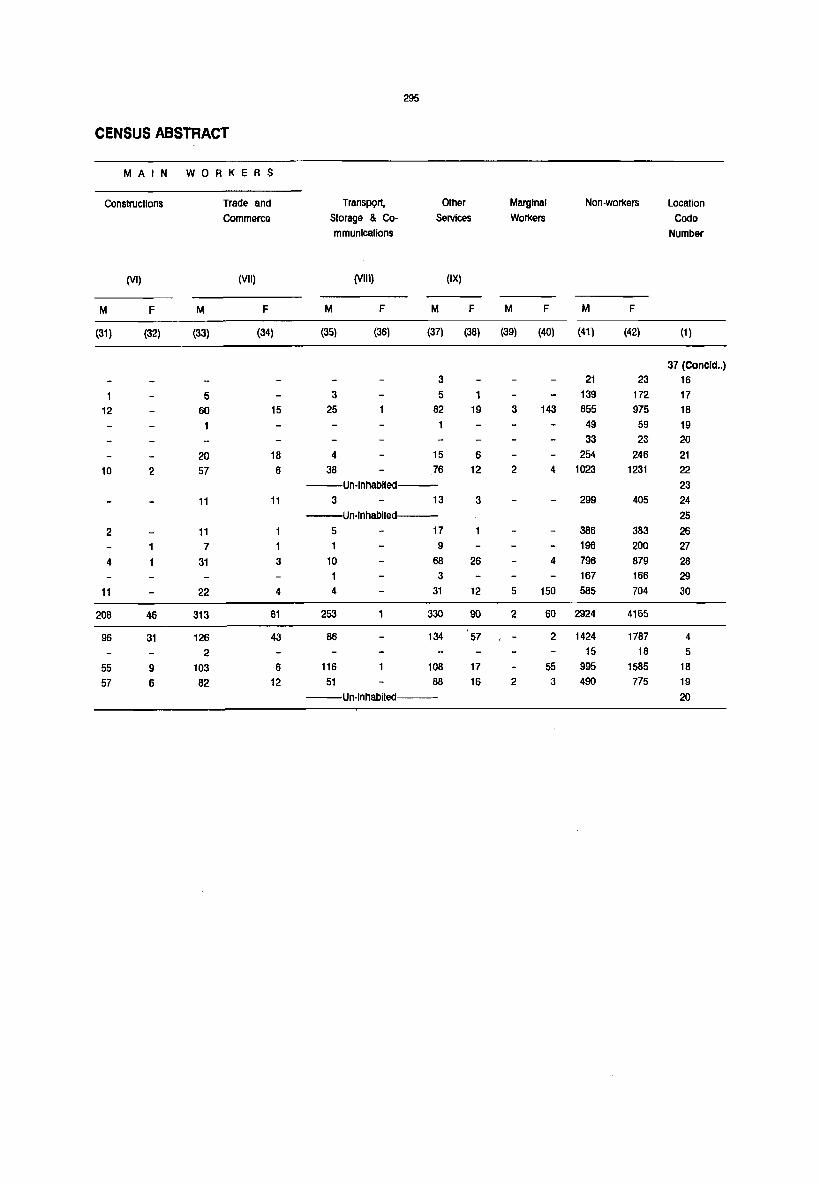
295
CENSUS ABSTRACT
M A I N WORKERS
Constructions Trade and TransPQrI, Other Marginal Non-workers Location
Commerce Storage & Co- Services Workers Code
mmunlcallons Number
(VI) (VII) (VIII) (IX)
M F M F M F M F M F M F
(31) (32) (33) (34) (35) (36) (37) (38) (39) (40) (41) (42) (1)
37 (Concld •. )
3 21 23 16
5 3 5 139 172 17
12 60 15 25 82 19 3 143 855 975 18
1 49 59 19
33 23 20
20 18 4 15 6 254 246 21
10 2 57 6 38 76 12 2 4 1023 1231 22
--Un-Inhablled--- 23
11 11 3 13 3 299 405 24
--Un·lnhablted--- 25
2 11 5 17 386 383 26
7 1 9 196 200 27
4 31 3 10 68 26 4 796 879 28
1 3 167 166 29
11 22 4 4 31 12 5 150 585 704 30
208 46 313 61 253 330 90 2 60 2924 4165
96 31 126 43 86 134 57 2 1424 1787 4
2 15 18 5
55 9 103 6 116 108 17 55 995 1585 18
57 6 82 12 51 88 16 2 3 490 775 19
--Un-Inhabited--- 20

Location
Code
Number
Name of Town/wardj
Block/
Locality
(1) (2)
02/15/1 ALWAL 1M)
Ward
SINGAIPALLE lOG)
02/15/11 GHATKESAR [P)
Ward
02/15/IV KAPRA 1M)
Ward
02/15/V KUI(ATPALLV [M)
Ward
2
3 4
5
1
2 3 4
5 6
7
8 9
1
2
3 4
5
6
2
3
4
5 6
7 8 9
10
02/15/V1 LALBAHADUR NAGAR 1M)
Ward
2
3 4
5
Area of
Town/Ward
In Sq. Kms.
(3)
0.00
22.00
22.00
0.00
1.00
1.00
0.00
No. of
Occupied
Residential
Houses
(4)
13152
7776 2184
427 989
1613
163
2348
256 195 386 142 158 295 516 289 111
19Q91
7720 1628 2927 3512 2915 389
40533
16102 2705 3198 1651 575
6718 4615 2373 1120 1476
30973
3474 1533 3968 1995 2218
296
No. of
House
holds
(5)
13152
7776 2184 427 989
1613
163
2348
256 195 386 142 158 295 516 289 111
19096
7720 1628 2927 3517 2915 389
41221
16191 2705 3198 1651 575
6718 5138 2403 1150
1492
31311
3474 1533
3998 1999
2250
Total Population (InClud
ing Institutional and
Houseless Population)
p M
(6) (7)
67271 34274
38486 19679 11689 5913 2197 1133 4949 2542 9150 4587
800 420
12645 6631
1382 1063 1886 730 998
717 557 993 364 515
1590 869 2926 1536
1450 757 620 323
87747 45626
35449 18274 7755 4061
14283 7481 16816 8753 11554 6090 1890 967
186963 98342
71403 37734 11662 6142 14324 7507 7414 3873 2895 1521
29642 15725 23195 12141 11408 5990 6701 3431 8319 4278
155514 80553
17062 8899 8102 4210
19096 9871 10571 5576
11083 5818
F
(8)
32997
18807 5776 1064 2407 4563
380
6014
665
506 893 366 483 721
1390 693 297
12121
17175 3694 6802 8063 5464
923
88621
33669 5520
6817 3541
1374 13917 11054 5418 3270 4041
74961
8163 3892 9225 4995
5265
TOWN PRIMARY
Total Population
in the age group
(0 - 6)
M
(9)
4965
2684 916 204 387 686
88
1078
143 107 172
49 74
139 237 106
51
6779
2405 670
1396 1291 879 138
16146
6295 983
1274 619 324
2594 1778 937 564
778
12152
1110
125 1778
920
827
F
(10)
oUI02
2528 965 179 400 660
70
1024
122
104 151 59 72
113
246 118 39
6543
2368
633-1363 1263 788 128
15481
5987 921
1250 611 296
2474 1702 933 531 776
11382
1014 615
1737 835
772
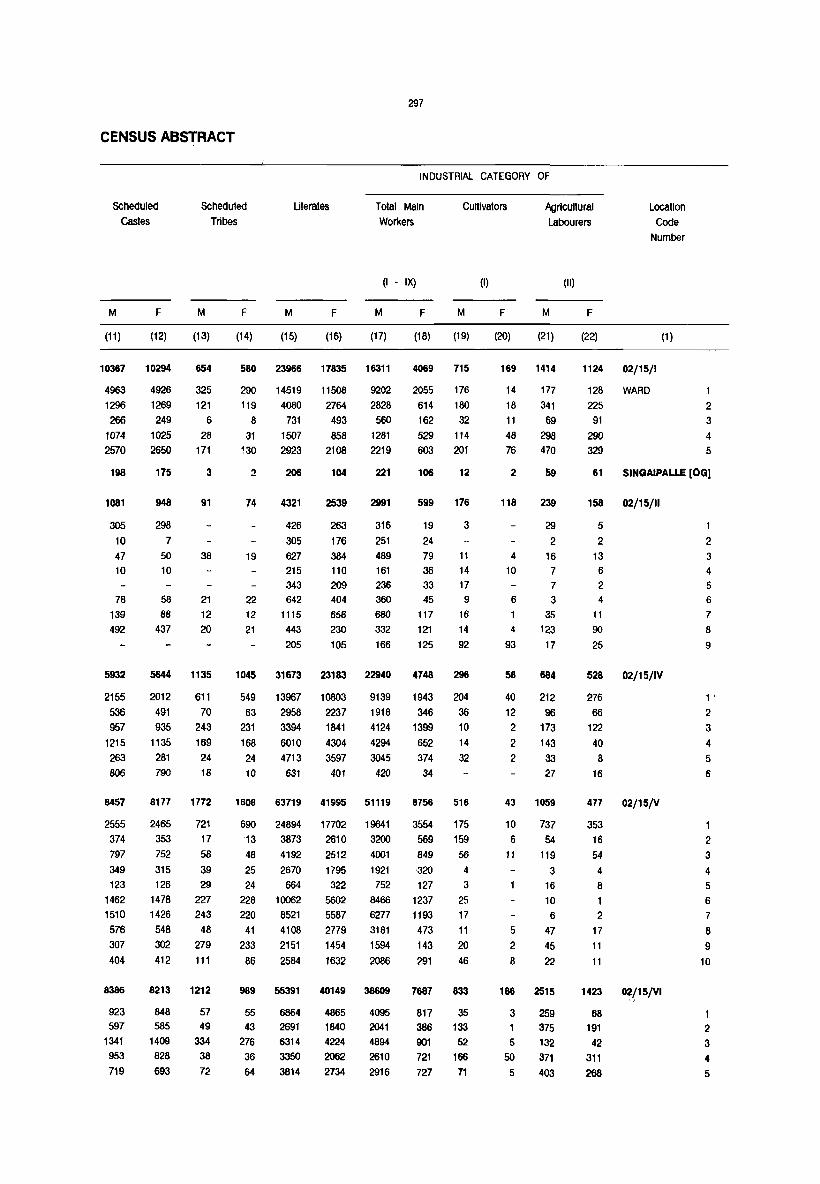
CENSUS ABSTRACT
SchedUled Castes
M F
Scheduled Tribes
M F
(11) (12) (13)
Literates
M F
297
INDUSTRiAl CATEGORY OF
Total Main Workers
(I - IX)
M F
Cultivators
(I)
M F
Agricultural Labourers
(II)
M F
Location Code
Number
(18) (19) (20) (21) (22) (1)
10367 10294 654 580 23966 17835 16311 4069 715 169 1414 1124 02/15/1
4963
1296
266 1074
2570
4926
1269
249
1025
2650
325
121
6 28
171
290 14519 11508
119 4080 2764
8 731 493
31 1507 858
~30 2923 2108
9202 2055 176
2828 614 180
560 162 32
1281 529 114
2219 603 201
14
18
11
48
76
177
341
69
298 470
128 WARD
225
91
290 329
1
2 3
4
5
198 175 3 206 104 221 106 12 2 59 61 SINOAIPALLE [00)
1081
305
10
47 10
78
139
492
5932
2155
536 957
1215
263
806
8457
2555
374
797
349
123
1462
1510
576
307
404
8386
923 597
1341
953
719
948
298
7
91
50 38
10
58 21
88 12 437 20
5644 1135
2012 611
491 70
935 243
1135 169
281 24
790 18
8177 1772
2465 721
353 17
752 58
315 39
126 29
1478 227
1426 243
548 48
302 279
412 111
8213 1212
848 57 585 49
1409 334
828 38
693 72
74 4321
426
305
19 627 215 343
22 642
12 1115
21 443
205
1045 31673
549 13967
63 2958
231 3394
168 6010
24 4713
10 631
1608 63719
690 24894
13 3873
48 4192
25 2670
24 664
228 10062
220 8521
41 4108
233 2151
86 2584
989 55391
55 6864
43 2691
276 6314
36 3350
64 3814
2539
263
176
2i91
316
251
384 489
110 161
209 236
404 360
658 660
230 332
105 166
23183 22940
10803 9139
2237 1918
1841 4124
4304 4294
3597 3045
401 420
41995 51119
17702 19641
2610 3200
2512 4001
1795 1921
322 752
5602 8466
5587 6277
2779 3181
1454 1594
1632 2086
40149 38609
4865 4095 1840 2041
4224 4894
2062 2610
2734 2916
599 176
19
24
79 36
33 45
117
121
125
4748
1943
346
1399
652
374
34
8756
3554
569
849
·320
127
1237
1193
473
143
291
7687
817 386
901
721
727
3
11
14 17 9
16
14
92
296
204
36
10
14
32
516
175
159
56
4
3
25
17
11
20
46
833
35 133
52
166 71
118 239
29 2
4 16 10 7
7 6 3 1 35
4 123
93 17
58 684
40 212
12 96
2 173
2 143
2 33
27
43 1059
10 737
6 54
11 119
3 16
10
6
5 47
2 45
8 22
186 2515
3 259
375
5 132
50 371
5 403
158 02/15/11
5 2
13 6 2 4
11
90
25
528
276
66
122
40
8 16
477
353
16
54
4
8 , 2
17
11
11
1423
68 191
42
311
268
02/15/IV
02/15/V
02/15/V1
1
2 3 4 5 6
7
8
9
1 '
2 3
4
5
6
2
3
4
5
6
7
8 9
10
2
3 4
5
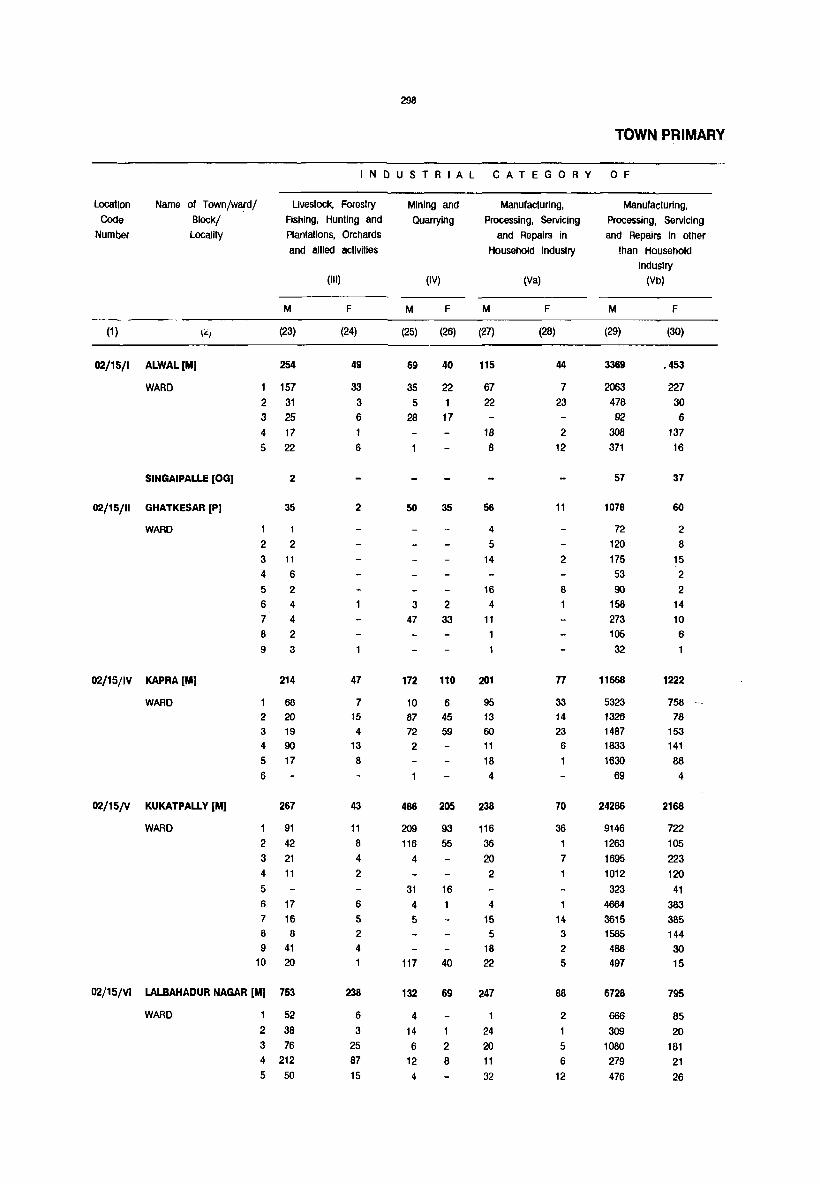
298
TOWN PRIMARY
INDUSTRIAL CATEGORY OF
location
COde Number
Name of Town/ward/
Block/ locality
Uvestock. Forestry
Fishing, Hunting and
Plantations, Orchards
and allied acllvities
(III)
M F
Mining and
Quarrying
(IV)
M F
Manufacturing,
Processing, Servicing
and Repairs in
Household Industry
(Va)
M F
Manufacturing,
Processing, Servicing
and Repairs In other
than Household Industry
(Vb)
M F -----------------------------------------------------------------------------
02/15/1 ALWAL [M]
WARD
SINGAIPALLE [OG]
02/15/11 GHATKESAR [PI
WARD
(23)
254
157
2 31
3 25
4 17
5 22
1
2
2
35
1
2
3 11 4 6 5
6 7
8
9
2
4
4
2
3
02/15/IV KAPRA (M] 214
WARD 68
02/15/V KUKATPALLY (M]
WARD
2 20 3 19 4 90
5 17
6
267
1 91
2 42 3 21 4 11
5
6 17 7 16
8 8
9 41 10 20
02/15/VI LALBAHADUR NAGAR (M] 753
WARD 1 52
2 38
3 76 4 212
5 50
(24)
49
33
3
6
6
2
47
7
15
4 13
8
43
11
8 4 2
6
5 2
4
238
6
3 25
87 15
(25)
69
35
5 28
50
3
47
172
10 87 72 2
486
209 116
4
31
4
5
117
132
4
14
6 12
4
(26)
40
22
17
35
2 33
110
6 45
59
205
93
55
16
40
69
1
2
8
(27)
115
67
22
1.8 8
56
4
5
14
16
4
It 1
201
95 13
60
11
18
4
238
116 36
20 2
4 15 5
18
22
247
1
24 20
11
32
(28)
44
7
23
2
12
11
2
8
1
77
33 14 23
6
70
36
1
7
14 3
2 5
88
2
1
5
6
12
(29)
3369
2063 478 92
308 371
57
1078
72 120 175
53
90
158
273 105 32
11668
5323 1326
1487 1833
1630 69
24286
9146 1263 1695
1012 323
4664 3615 1585
486
497
6728
666 309
1080 279 476
(30)
.453
227 30
6
137 16
37
60
2
8
15 2
2
14
10 6
~222
758 78
153
141 88
4
2168
722 105 223 120
41
383
385 144
30
15
795
85
20
181
21
26

CENSUS ABSTRACT
Constructions
M
(31)
2117
1457
286
40
55 275
4
162
20 16
58
10
7
5 37
9
2616
749
73
1076
428
157
133
4847
1584
293
603
211
73
571
674
348
203
287
4215
288 208
629
196
313
(VI)
F
(32)
347
305
24
5
13
21
4
1
3
1
11
913
120
29
659 84 17
4
1315
398 83
289
30
22
144
211
70
10
58
811
51
8
190
15
72
MAIN WORKERS
Trade and
Commerce
Transport,
Storage &Co
mmunlcallons
M
(33)
2247
1374
466
73
106 222
6
423
45
36
70
12
36
102
91
15 16
2301
976
104
282
460 432
53
7032
2170
450
640
218
99
1294
858
543
305
455
7616
1017
353
947
473
569
(VII)
F M
(34) (35)
415 1614
200 927
148 344
8 55
12 118
46 156
14
73 366
3 112
5 38
15 45
5 22
10 28
11 36
14 61
7 22
3 2
316 1140
129 390
27 73
55 506
73 476
32 265
30
941 4301
313 1286
35 341
69 448
37 156
11 100
199 740
157 402
49 240
27 287 44 301
8n 5402
97 468
41 139
104 1184
71 389
95 336
(VIII)
F
(36)
133
109
10
3
3 7
8
3 2
1
2
223
33
8
146
19
16
228
78
61
9
8
2
26
26
7
9
2
308
49
10
103
19
15
299
Other
Services
Marginal
Workers
Non-worKers location
Code
Number
(IX)
M F M
(37) (38) . (39)
4397 1295 46
2769 1010 31
675 132 13
146 15
247 36
493 98 2 67 4
406 113 19
30 6 4 32 7 89 26
37 12
33 8
36 4 105 35 9
41 13
3 2 4
3042 1254 21
1112 541 7
90 52
439 176 7
837 274 6
461 202
103 9
8087 3266 229
4127 1540 44
446 199 36
395 183 304 118 10
107 26
1137 476
669 393 134
394 176 4
189 48
319 107
10168 2892 116
1305 456 71
448 110 7
768 244 7
501 133 2
662 219 5
F M
(40) (41)
87 17917
31 10446
12 3072
573
1261
44 2366
199
115 3621
60 397
2 305
4 503
203
279
509
40 847
425
8 153
49 22665
14 9128
4 2143
15 3350
13 4453
3 3044
547
109 46994
48 18049
7 2906
9 3505
1942
769
3 7259
36 5730
2 2805
2 1837
2192
173 41828
15 4733
62 2162
36 4970
11 2964
17 2897
F
(42) (1)
28841 02/15/1
16721 1
5150 2
902 3 1878 4 3916 5
274 SINGAIPAllE lOG}
5300 02/15/11
586
480 2 810 3
330 4
449 5 676 6
1233 7
572 8 164 9
37324 02/15/IV
15218 1
3344 2
5383 3
7398 4
5087 5
889 6
79756 02/15/V
30067 1
4944 2 5959 3
3220 4 1247 5
12677 6 9825 7
4943 8 3125 9
3749 10
61101 02/15/V1
7331 1
3444 2
8288 3
4263 4
4521 5
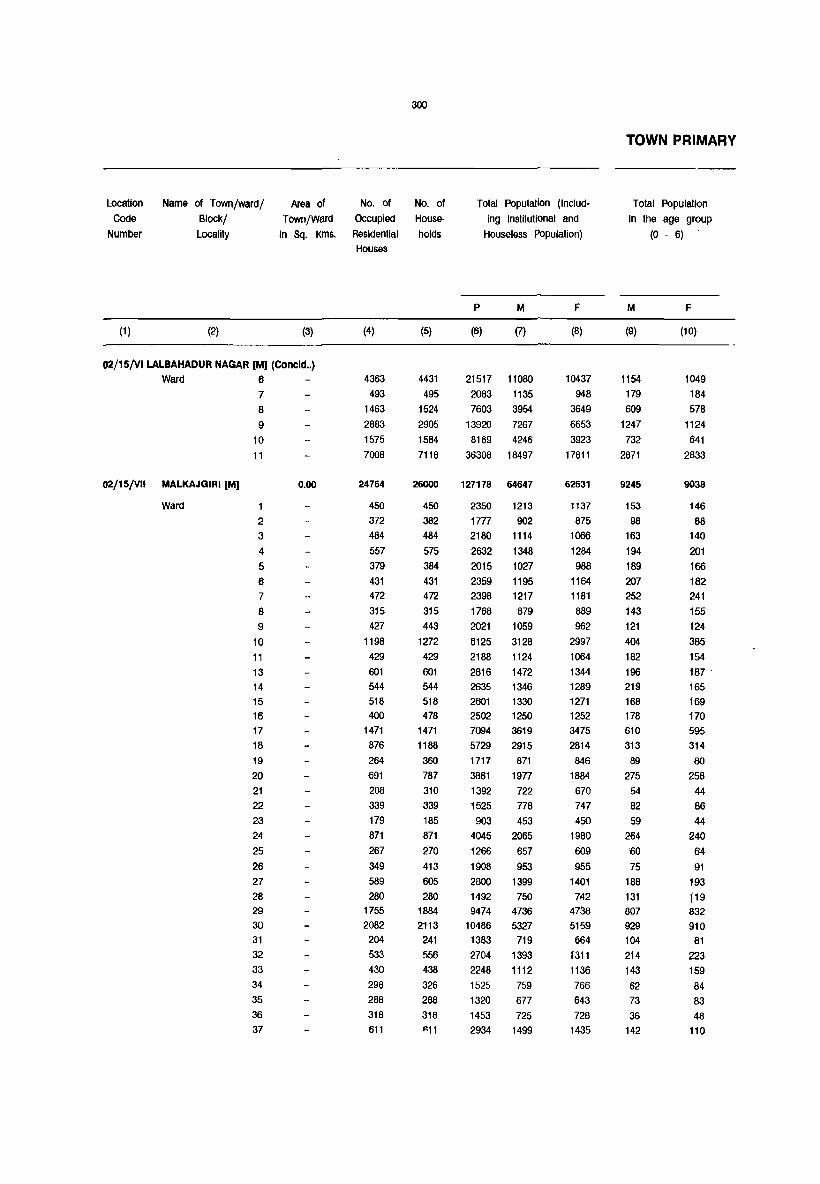
Location Code
Number
(1 )
Name of Town/ward/ Block/ Locality
(2)
Area of Town/ward
in Sq. Kms.
(3)
02/15/V1 LALBAHADUR NAGAR 1M] (Concld .. ) Ward 6
02/15/V1I MALKAJGIRI [M]
Ward
7
8
9
10 11
1
2
3
4 5 6 7
8 9
10 11 13 14 15 16 17 18 19 20 21 22 23 24 25 26 27 28 29 30 31 32 33 34 35 36 37
0.00
No. of Occupied Residential Houses
(4)
4363 493
1463 2883 1575 7008
24764
450 372 484 557 379 431 472 315 427
1198 429
601 544 518 400
1471
876 264 691 208 339 179 871 267
349 589 280
1755 2082 204 533 430 298 288 318 611
300
No. of House
holds
(5)
4431 495
1524 2905 1584 7118
26000
450 382 484 575 384 431 472 315 443
1272 429
601 544 518 478
1471 1188
360
787 310 339 185 871 270 413 605 280
1884 2113 241 556 438 326 288 318 flll
Total PopUlation (Including Institutional and
Houseless Population)
p M
(6) (7)
21517 11080 2083 1135 7603 3954
13920 7267 8169 4246
36308 18497
127178 64647
2350 1213 1777 902 2180 1114 2632 1348 2015 1027 2359 1195 2398 1217 1768 879 2021 1059 6125 3128 2188 1124 2816 1472 2635 1346 2601 1330 2502 1250 7094 3619 5729 2915 1717 871 3861 1977 1392 722 1525 778 903 453
4045 2065 1266 657 1908 953 2800 1399 1492 750 9474 4736
10486 5327 1383 719 2704 1393 2248 1112 1525 759 1320 677 1453 725 2934 1499
F
(8)
10437 948
3649 6653 3923
17811
62531
1137 875
1066
1284 988
1164 1181 889 962
2997 1064 1344 1289 1271 1252 3475 2814 846
1884 670 747 450
1980 609 955
1401 742
4738 5159 664
t311 1136 766 643 728
1435
TOWN PRIMARY
Total Population In the age group
(0 - 6)
M
(9)
1154 179 609
1247 732
2871
9245
153
98
163 194 189 207 252 143 121
404 182 196
219 168 178 610 313 89
275 54 82 59
264 60 75
188 131 807 929
104
214 143 62 73 36
142
F
(10)
1049 184 578
1124 641
2833
9038
146 88
140 201 166 182 241 155 124 385 154 187 -
165 169 170 595 314
80
258 44 86 44
240 64 91
193 119 832
910 81
223 159 84 83 48
110

CENSUS ABSTRACT
Scheduled Castes
M
(11)
338
189 259
1054 464
1549
7560
44 14 49 29 4
23 90
227 19
340 588 78
173 124
125 1009
130
25 158
30 20 16 42
149 65 10
199
958 743 315 360 238
16 101
27 151
F
(12)
354 169 251
1024 476
1576
7491
42 12 47 32
6
14 89
231 29
333 544
71 209 117
133
1001
160 20
145 40 19 10
41 142 72 10
200 942
714 301 348
255 21
106
43
155
Scheduled Tribes
M
(13)
129 3
47 133
'1 343
1040
12 2
26 3 3 2
5 6
8 29 20 14 16
19 51 24 4
307
2 5
202
5
50 35
16 8
4 8
5
F
(14)
101 1
27 115
5 266
974
12 6
30 4 2
2
3
4 6
43 16 14 9
19 44 14
7
267 2
3
168 1
7
49 33
15 8
3 9
3
Literates
M
(15)
9464 593
2489 4826 2818
12168
47709
1021
790
827 1098 766 886 753 627 869
2574 614
1155
995 1119 1003 2259 2546 756
1428 660
695 379
1597 425 868
1039 398
3032
3297 490 878 849 696
523 663
1282
F
(16)
7961 254
1649 3304 1874 9382
37725
865
722 644 865 599 671 545 480 679
2126 393 856 785 981 840
1446 2186 686
1056 566
636 377
1423 432 823
827 268
2150 2279
379 647 710 657 431
528
1063
301
INDUSTRIAL CATEGORY OF
Total Main Workers
(I • IX)
M
(17)
5071 634
1974 3523 2066
8785
30562
563 437 563 642 450 532 561 386 525
1480 536 691 614 618 574
1741 1378
424 941 325 385 213
1006 319 489 698 383
2170 2570
310
649 541 346 296 317 675
F
(18)
946 281 404 603 296
1605
5925
109 108 126 100 44 45 61 41 69
221 74
124 97
163 122
277
226 108 261 101
103 55
310 76
140 115
106 337
400 84
177
126
89 117 106
159
Culllvators
M
(19)
39
66 48
118
16 89
152
3
2
2 6
3
2
7 5
2
2
3
2
3
1
1 14 27 2 3 3
2
2
15
(I)
F
(20)
2 44 9
28 2
37
13
1
3
1
2
Agricultural Labourers
(II)
M F
(21) (22)
Location Code
Number
(1)
02/15/VI (Concld .. ) 70
107 62 Ward 6
65 130 187 416
129
2
3
2
4
5 4
6
31
49 15
100 71 73 67
170
58
3
4
7
2
18 19
7 8
9 10 11
02/15/V1I
1
2
3
4
5
6 7
8
9
10 11 13 14 15 f6
17 18 19 20
21 22 23 24 25 26 27 28 29 30 31 32 33
34
35 36 37

302
TOWN PRIMARY
IN 0 USTRIAl CATr:GO R Y 0 F.
Location Name of Town/ward/ Livestock. Forestry Mining and Manufacturing. Manufacturing.
COde Block/ Fishing. Hunting and Quarrying Processing. Servicing Processing. Servicing Number Locality Plantations. Orchards and Repairs in and Repairs in other
and allied activities Household Industry than Household Industry
(III) (IV) (Va) (Vb)
M F M F M F M F
(1 ) (2) (23) (24) (25) (26) (27) (28) (29) (30)
02/15/V1 LALBAHADUR NAGAR [M) (Concld .. ) Ward 6 52 6 15 19 695 58
7 45 20 13 .3 114 22 8 75 39 5 2 42 14 400 52
9 21 2 54 47 39 36 711 64 10 23 6 2 16 2 502 53
11 109 29 16 9 30 6 1496 213
02/1S/V11 MALKAJGIRI [M] 189 25 326 226 79 30 8791 859
WARD 2 5 135 18
2 3 1 131 22 3 4 16 4 169 10 4 4 10 2 218 11 5 7 157 5 6 3 231 8
7 3 3 203 12 8 123 12 9 182 15
10 6 426 35 11 10 97 6
13 5 3 166 15 14 4 4 163 10
15 7 6 192 t13-
16 4 213 18
17 7 4 486 43 16 12 367 27
19 2 3 104 8 2Q 4 7 13 205 23 21 2 100 19 22 2 108 13 23 53 10 24 9 5 5 5 240 32 25 91 5 26 3 1 109 10 27 2 7 6 198 24 28 16 3 74 19 29 23 6 1 565 55 30 19 2 3 2 668 72 31 102 36 32 61 72 4 135 9 33 8 24 10 1 91 12 34 90 11 35 32 31 65 8 36 137 19 37 2 222 19

CENSUS ABSTRACT
Constructions
M
(31)
269 60
363
641 213
1035
3608
13 5
60 31 32 51
100
45 25 85
136 72 60 46 13
373 58 19
114 2
4 5
69 38
25 114 128
437 663 35 67 82
4
44 12
52
(VI)
F
(32)
58 5
72 76 35 229
580
2
2
11 1
4 4
15 2
12 29
16
4
47 9 7
36
28 2
11
19 21
38 78 2
11
27
18 3 10
MAIN WORKERS
Trade and
Commerce
Transport,
Storage &Communlcalions
M
(33)
726
91
378 606
394 2062
5683
149 110 106 152 123 87 95
79 99
306 65
145 130 103 97
210 213 72
176 39 81 49
212 49
123 118 86
397 501
75 105 122 86 50
68
162
(VII)
F M
(34) (35)
75 493
47 92 34 271 70 404 32 290
211 1336
866 6226
21 17 35 24 10 11 11
6 12 29
14 15 15 16 12 29 29
4
34
11 19
8 35 11 18 17
25 80
76
8
21 14 11
10 11
22
152 101 85
105 59
74
88
68 102
362 179 151 159 128 147 411
432 130
229
115 111 46
215 53
121 135 45
331 371 30
106 55 77
24 28
68
(VIIt)
F
(36)
29 11 6
7
4
55
567
18 9
11 13 5
2 3 6 7
21 2
16 11 13 16 29 28 22 27 22 26 6
43 24
15 8
3 12 15 5
6 5 14 4
10 9
303
Other
Services
(IX)
M F
(37) (38)
2693 655
46 29 327 105 799 200
423 95 2196 646
5379 2701
102 85
117 120
70 78 67 71
113 289 48
140 88
140 98
246 294 94
175 67 78 59
248 84
105
122 32
328 301
66
167 155 87 78
72 154
47 58 52
48 20 20 20 15 33
123 23 55 56
105 75
125 132 66
121
49 45
31 167 32 85
41 33
129
137 32 57 58
53 46
63 97
Marginal
Workers
Non-workers Location
Code Number
M
(39)
3
1 2
6
11
34
3 6
2
3
7 6 2
2
F M
(40) (41)
6 6006 4 500
4 1979 3 3742
2174 15 9701
39 34051
3
5
13 13
650
464
551 706 577 663 656 493 534
1647 588 778 726 712 674
1878 1537
447 1036 397 393
240 1059
335
464
701 367
2559 2751
407 744 571 413 381
408
822
F
(42) (1)
02/15/V1 (Concld .. ) 9485 Ward 6
663 7 3241 8
6047 9 3627 10
16191 11
56567 02/15/V1I
1028 767 940
1184 944
1119 1120 848 893
2776 990
1217 1187 1108 1129 3198 2588
738 1623 569 644
395 1670
533
815
1286 635
4388
4746 580
1134 1010 677
526
622
1276
1
2 3 4
5 6 7 8 9
10 11 13 14 15 16 17 18 19 20
21 22
23 24 25 26
27 28 29
30
31 32 33
34 35 36
37
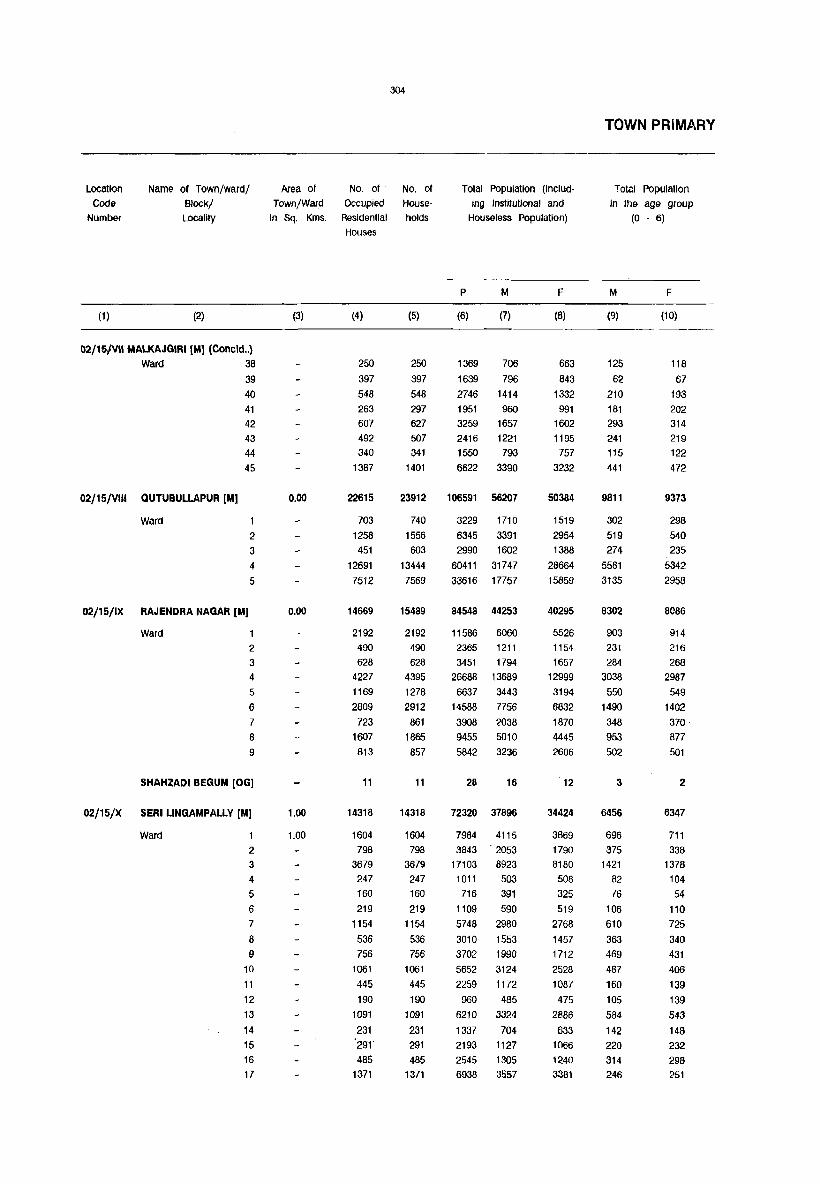
Location
Code
Number
(1)
Name of Town/ward/
Block/ Locality
(2)
02/151'111 MAlKAJGIRI [M] (Concld .. ) Ward 38
02/15/VIII QUTUBULLAPUR [M]
Ward
39 40 41 42 43 44 45
1
2
3 4
5
02/15/IX RAJENDRA NAGAR [M]
Ward
2
3 4
5
6
7
8
9
SHAHZADIBEGUM[OGI
02/15/X SERI LlNGAMPALLV [M)
Ward
2
3 4
5 6 7
8 9
10 11 12 13 14 15 16 17
304
Area 01 No. 01 No. 01
Town/Ward Occupied House-
In Sq. Kms. Residential holds
Houses
(3) (4)
250 397 548 263 607 492 340
1387
(5)
250 397 548 297 627 507 341
1401
Total PopUlation (InclUd
ing Institutional and
Houseless Population)
p M
(6) (7)
1369 706 1639 796 2746 1414 1951 960 3259 1657 2416 1221 1550 793 6622 3390
F
(8)
663 843
1332 991
1602 1195 757
3232
0.00 22615 23912 106591 56207 50384
0.00
1.00
1.00
703 1258 451
12691 7512
14669
2192 490 628
4227 1169 2809 723
1607 813
11
14318
1604 798
3679 247 160 219
1154 536 756
1061 445 190
1091
231 '291
485 1371
740 1556
603 13444 7569
15489
2192 490 628
4395 1278 2912
861 1865 857
11
14318
1604 798
3679 247 160 219
1154 536 756
1061 445 190
1091
231 291 485
1371
3229 1710 6345 3391 2990 1602
60411 31747 33616 17757
84548 44253
11586 6060 2365 1211 3451 1794
26688 13689 6637 3443
14588 7756 3908 2038 9455 5010 5842 3236
28 16
72320 37896
7984 4115 3843 2053
17103 8923 1011 503
716 391 1109 590 5748 2980 3010 1553 3702 1990 5652 3124 2259 1172
960 485 6210 3324 1337 704 2193 1127 2545 1305 6938 3557
1519 2954 1388
28664 15859
40295
5526 1154 1657
12999 3194 6832 1870 4445 2606
12
34424
3869 1790 8180
508 325 519
2768 1457 1712 2528 1081
475 2886
633 1066
1240 3381
TOWN PRIMARY
Total PopUlation
In the age group
(0 - 6)
M
(9)
125 62
210 181 293 241 115 441
9811
302 519 274
5581 3135
8302
903 231 284
3038 550
1490 348 953
502
3
6456
696
375 1421
82 76
106 610 363 469 487 160 105 584 142 220 314 246
F
(10)
118
67 193 202 314 219 122 472
9373
298 540 235
5342 2958
8086
914 216 268
2987 549
1402 370 -
877
501
2
6347
711 338
1378 104 54
110 725 340 431 406 139 139 543 148 232 298 251

305
CENSUS ABSTRACT
INDUSTRIAL CATEGORY OF
Scheduleo castes
Scheduled Tribes
Literates Total Main Workers
Cultivators Agric1Jltural labOurers
Location Code
Number
M
(11)
106 3
33 20 98 91 26
494
4248
325 250 307
2116 1250
6219
1419 163 544 656 904
889 634 796 208
6
3511
339
36
485 30 23
171 64
112 231 344
267 103 472
250 161 202 221
F
(12)
100 8
37 24 92 85 19
472
3828
275 237 280
1968 1068
5817
1429 143 488 584 816 786 646 734 187
4
M
(13)
2
2
36 8
98
776
42 11
13 404 306
888
140 3
18 230
61 199 149 80 8
3204 1096
345 67 28 8
465 177 31 8 16
144 42 20
103 188 182 153 271 120 253 54
91 416 38 223 35 149
197 212 248 16
(I - IX)
(14)
2
4
40 10 7
108
M
(15)
395 732
1081 643 913 765 676
2647
F
(16)
190 713 906 491 639 522 557
2086
695 33315 20265
24 956 528 7 2079 1241 1 933 536
353 20062 12671 310 9285 5289
773 21095 11838
66 4002 2417 2 576 291
26 979 535 216 5100 2982
54 2315 1572 183 3611 1982 139 839 401 83 2539 1271 4 1130 383
4 4
M
(17)
336
396 686 449 809 601 391
1546
29876
999 1985
765 16627
9500
21726
2815 616 963
6310 1507 4105 1208 2710 1483
9
993 22136 14076 18319
64 2468 1550 1849 6 1381 855 1022
153 5574 3865 4609 7 300 206 300
54 14 236 268 97 310
17 1494 822 1434 181 439 173 766 153 1152 632 859
91 2222 1498 1269 49 726 504 599
187 92 297 24 1723 891 1510 28 341 184 323
487 174 542 207 371 176 754 13 2949 2343 1640
F
(18)
23 131 114 63
227 118 55
217
4661
290 375 242
2345 1409
6424
948 305 443 895 481
1207 639
1058 442
6
M
(19)
2
9
22
1
2
375
41 56 22 63
193
701
59 92
153 92
6
125 100 56 18
3932 867
210 25 121 22 735 89
41 12 129 30
79 12 189 46 228 110 78 33
240 9 261 20 172 18 277 29 77 20
223 239 616 117 256 36
(I)
F
(20)
2
49
10 2
11 2
24
357
30 45 82 32
60 46 38 23
M
(21)
3
583
47 71
195 111 159
1426
276 59
169 105
8
393 89
171 154
2
201 1193
3 142 8 22
23 114 1 50
26 13 1 27 3 170 8 65
79 3 11 8 127 8 39
28 71 1 42
44 117
34 65
2 39
(It)
F
(22) (1)
02/15/VII (Concld .. ) Ward 38
2 39
332
45 54
116
31 86
1714
327 183 265 107
13 313 156
174 175
02/15/VIII
02/15/IX
40 41 42 43 44 45
1
2
3
4
5
1
2
3
4
5 6
7
8
9
SHAHZADI BIGUM lOG)
1266 02/15/X
60 1 17 2 1~ 3
23 4 36 5 ~ 6 54 7 23 8 47 9 3 10
152 11 54 12 74 13 49 14
136 15 285 16 64 17

306
TOWN PRIMARY
INDUSTRIAL CATEGORY OF
Location Code
Number
Name of Town/ward/ BIOCk/ Locality
Livestock, Forestry Fishing, Hunting and Plantations, Orchards and allied activities
M
(1) (2) (23)
02/15/V11 MALKAJGIRI [M](Concld •. )
Ward 38 2
02/15/V111 QUTUBUl.lJlPUR [MJ
WARD
39 40 41 42 43 44 45
4 1
2
9
4
159
1 9 2 51 3 23 4 57 5 19
02!15/IX RAJENDRA NAGAR 1M] 383
WARD 56 2 7 3 22 4 48
5 20 6 14
7 126
a 60
9 25
SHAHZADI BEGUM IOGl 5
02/15/X SERI UNGAMPAllY 1M] 229
WARD 1 14
2
3 22 4 31
5 29
6 7 7 4 8 20 9 6
10 10
11 15
12 6 13 26
14 15 7 16 28 17 3
(III)
F
(24)
53
18
10
24
149
23
2
3
2 1
93
16
3
5
72
4
5 15
6
2
3
8
5
23
Mining and Quarrying
M
(25)
57
7
65 50
2
473
17
33
198
225
(IV)
F
(26)
5 65 29
128
5
29 41
53
480 133
61
92 20
32 3
13 40 40
179
847
10
3
77
74
11
153
5 6
3e
98
145
2 1
221 5
9
12 3
6
1
3
19 23
57
348
1
2
23
25
90
2 2 10
45 11
135 2
Manufacturing, Processing, Servicing
and Repairs in Household Industry
M
(27)
2
3
42
8 1
2
24 7
63
7
4
11 5
5 6
8 14
3
41
13
2
4
6
2
2
9
(Va)
F
(28)
5
26
4
18
3
36
5
4 3
2
7
8
6
6
4
ManufactUring, Processing, Servicing and RepairS in other
than Household Industry
M
(29)
104
128
334
138 288
215 218
330
16369
396 1136 292
9952
4993
5255
325
43
91 1249 182
1565 456
1131
211
2
6262
672 384
2155
125 23
103 410 69 97
170
228 60
283 44 33
165 1241
(Vb)
F
(30)
7
18
28
9
21 19
16
52
1845
57
153 39
975 621
1299
67
2 2
186
20 443 128
427 24
424
21 27
96 2 4
11
20 10
9 5
34 3
22
5 4
104 47
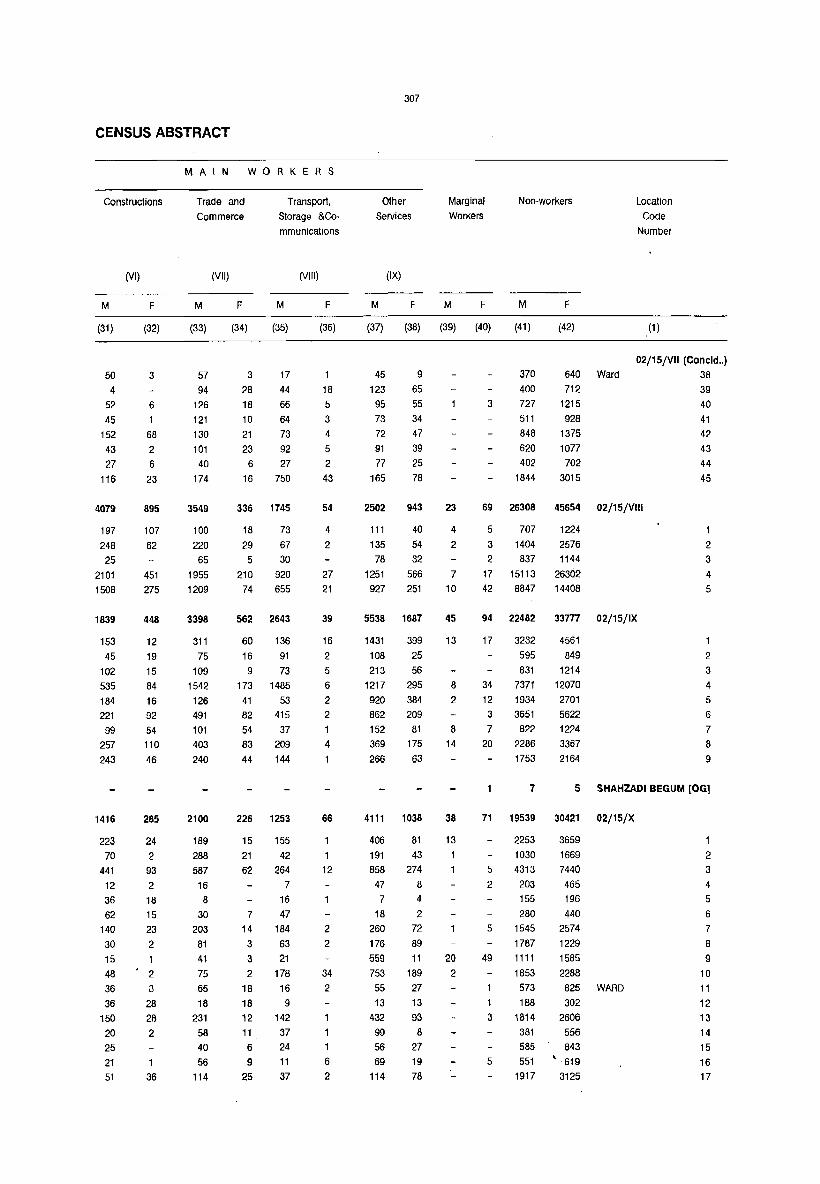
CENSUS ABSTRACT
Constructions
M
(31)
50 4
52 45
152 43 27
116
4079
197 248 25
2101 1508
1839
153 45
102 535 184 221 99
257 243
1416
223 70
441 12 36 62
140 30 15 48 36 36
150 20 25 21 51
(VI)
F
(32)
3
6
1 68 2 6
23
895
107 62
451 275
448
12 19 15 84 16 92 54 110 46
285
24 2
93 2
18 15 23 2
2
3
28 28 2
36
MAIN WORKERS
Trade and Commerce
Transport, Storage &Co·
mmunications
M
(33)
57 94
126 121 130 101 40
174
3549
100 220 65
1955 1209
3398
311 75
109 1542
126 491 101 403 240
2100
189 288 587 16
8
30 203
81 41 75 65 18
231 58 40 56
114
(VII)
F
(34)
3
28 18 10 21 23
6
16
M
(35)
17 44 66 64 73 92 27
750
336 1745
18 73 29 67
5 30 210 920 74 655
562 2643
60 136 16 91
9 73 173 1485
41 53 82 415 54 37 83 209
44 144
226 1253
15 21 62
7
14 3
3
2
18 18 12 11
6
9
25
155 42
264 7
16 47
184 63 21
178 16
9 142 37 24 11
37
(VIII)
F
(36)
18 5
3
4 5
2
43
54
4
2
27 21
39
16 2
5
6
2 2
1
4
1
66
1
12
2 2
34 2
1
6
2
307
Other Services
(IX)
M F
Marginal WorKers
M F
Non-workers
M F
Location Code
Number
(37) (38) (39) (40) (41) (42) (1 )
45 123
95 73 72 91 77
165
9
65 55 34 47 39 25 78
2502 943
111 40 135 54
78 32 1251 566 927 251
5538 1687
1431 399 108 25 213 56
1217 295 920 384 862 209 152 81 369 175 266 63
4111 1038
406 191 858
47 7
18 260 176 559 753
55 13
432 99 56 69
114
81 43
274 8
4
2
72 89 11
189 27 13 93
8
27 19 78
23
4
2
7
10
45
13
8
2
8
14
38
13
20 2
3
370 400 727 511 848 620 402
1844
69 26308
5 707 3 1404 2 837
17 15113 42 8847
94 22482
17 3232 595 831
34 7371 12 1934 3 3651 7 822
20 2286 1753
02/15/V1I (Concld .. )
640 Ward 38 712 39
1215 40 928 41
1375 42 1077 43 702 44
3015 45
45654 02/15/V1II
1224 2576 2 1144 3
26302 4 14408 5
33777 02/15/IX
4561 849 2
1214 3 12070 4
2701 5 5622 6 1224 7 3367 8 2164 9
7 5 SHAHZADI BEGUM [OG]
71 19539 30421 02/15/X
5
2
5
49
1
3
5
2253 1030 4313 203 155 280
1545 1787 1111 1853 573 188
1814 381 585 551
1917
3659 1669 7440 465 196 440
2574 1229 1585 2288 825 WARD 302
2606 556
843 619
3125
2
3
4 5
6
7 8
9 10 11 12 13 14 15 16
17

Location
Code
Number
Name of Town/ward/
BIOCK/
Locality
(1) (2)
02/15/XI SHAMSHABAD [PI
Ward
02/15/XIII TANDUR 1M]
Ward
02/15/XIV UPPAL KALAN [M]·
Ward
2
3
4
5
6
7
8
9
10 11 12
2
3
4
5
6
7
8
2
3
MAKTA BIBI SAHEBGUDA (OG)
02/15/XV VICARABAD (M)
Ward
02/15/XVI GADDIANNARAM [PI
WARD
1
2 3
4 5
6
7
1
2
3 4
5
308
Area of No. of
Town/Ward Occupied
in Sq. Kms. Residential
Houses
(3)
1.00
1.00
0.00
0.00
1.00
1.00
1.00
1.00
(4)
2520
353 270 203 230 149 314 216 195 190 133 167 100
7758
1570 646 526 564
1078 1059 727
1588
18831
1807 7383 9640
6762
157 429 295
4803
367
252 459
7360
237 266 391 243 265
No. of
House
holds
Total PopUlation (Includ
ing Institutional and
Housele$s Population)
p M
(5) (6) (7)
2520 15366 7870
353 270 203 230 149 314 216 195 190 133 167 100
2024 1038 1839 949 1246 666 1713 910
1735 1234 1325 1173 899
665 603
857 423 892 642 690 576 438 336 363
7773 45511 23233
1575 648 531 564
1079 1059 728
1589
9201 4760 3755 1925 3104 1596 3082 1580 6269 3236 6386 3209 4089 2095 9631 4832
18853 75660 39531
1807 8288 4317 7405 34649 18144 9640 32707 17061
16 9
6771 39215 19959
157 911 440 429 2487 1284 295 1761 876
4803 27540 13955 376 2337 1226 252 1605 841 459 2574 1337
7423 35187 18645
237 270 409
267 265
1142
1264 607 660
2015 1126 1284 692 1255 646
F
(8)
7496
986 890 580 856 487 843 592 635 597 461 329 240
22284
4441 1830 1508 1502 3033 3177
1994
4799
36129
3971 16505 15646
7
19256
471
1203
885 13585
1111
764 1237
16542
535 604 889 592 609
TOWN PRIMARY
Tolal PopUlation
in the age group
(0 - 6)
M
(9)
1629
222 229 140 201 83
182 125 123 112
83 67 62
4167
918 333 295 237 557 523 333 971
5969
547 2809 2610
3
3564
103 306 168
2401 198 161 227
2508
65 62
140 94
75
F
(10)
1530
193 187 128 238
78 161 126 128 94
83 62 52
3908
638
341
260 219
548 499 318
885
5902
527 2768 2607
3542
124 285 191
2335 206 162 239
2253
58
75
128 73 70

309
CENSUS ABSTRACT
INDUSTRIAL CATEGORY OF
Scheduled Casles
Scheduled Tribes
Literates Total Main Workers
Cultivators Agricultural Labourers
Location Code
Number
M
(11 )
1328
57
64 19
77
18 120
57
45
523
34
59
255
1996
342
220
133
29 60
76 181
953
3639
506 2275 647
9
F M
(12) (13)
1332 256
61 13
60 91
9 2
76 86 121 3
112 54 6
46 7 544 2 37
54 40
156
1945
306
218
126
16 47
103
188
941
3575
462
2286 620
7
4
332
117
8
54
15
94
2
5
37
610
333 166 109
3522 3361 915
184 202
64 53 401 133 112 1
2308 2205 21 0
330 307 143
146 138 133
357 344 27
346 324 266
4 3
24 30
5
6
16 28
4
5
97 23
F M
(14) (15)
210
7
68
2
62 3
8
4
4
32
4230
677
540 362
281
294
532 403
329
295
161
149
207
216 13099
92 2336
7 889
37 1019
8 1125
18 2002 2 1898
3 1459
49 2371
489 26563
285 3362 124 11368 80 11827
6
F
(16)
2402
438
230 233
96 271
315 235
94 234
90
118
48
(I IX)
M F M
(17) (16) (19)
3599 1216 352
496 146 13
364 47 39
309 69 9
388 35 1 189 33 5
424 147 77 289 69 21
348 142 28 233 136 19
248 207 121
171 110 8
140 75 11
7884 10678 2581 862
263
150
1130 2135
432 898
753 739
759 741
1218 1507 1443 1431
925 1007
1224 2220
638
320
99 96
207
178
171
872
44
60 61
74
53
157
18200 19743 3709 346
2656 2112 7106 9312 8434 8317
4 2
516 1859 1331
3
31 177 137
768 9522 7240 9008 3759 1341
81 16
378 509 236
3 367 154 84 7146 6254
156 546 297
130 230 34
17 643 249
97 14826 11318
6
240 213 91
598 314 101
409 149 141
5960 1890 506
642 407 172
502 470 127
657 316 203
8779 1253 98
2
(I)
19
472 570 832 566
551
382 465
502 450
477
302 323 473 334
316
50 54 84
85
71
4
12 6.
F M
(20) (21)
136 758
2 72
58 3 12
88
13 88 1 48
3 162
10 14
99 45 2 91
2
87
20
2
2 7
3 3
5
45
26
12
10
3
80
1277
314
218 9
79 192
58
47
360
1669
5
1286 378
444 2261
5 146
3 200
13 164
161 938
70 225
109 361
83 227
3 22
(II)
F
(22) (1)
649 02/15/XI
59 1
8 2 2 3 ~ 4
5
~ 6
~ 7 112 8
M 9
67 10 84 11
69 12
1342 02/15/XIII
348 1
244 2 17 3 ~ 4 1~ 5 50 6
31 7
482 8
675 02/15/XtV
5 1
~4 2 1~ 3
MAKTA BIBI SAHEBGUDA (OG)
2247 02/15/XV
208 1
~1 2
lV 3
822 4
239 5
360 6
~O 7
2 02/15/XVI
1
2 3
4
5
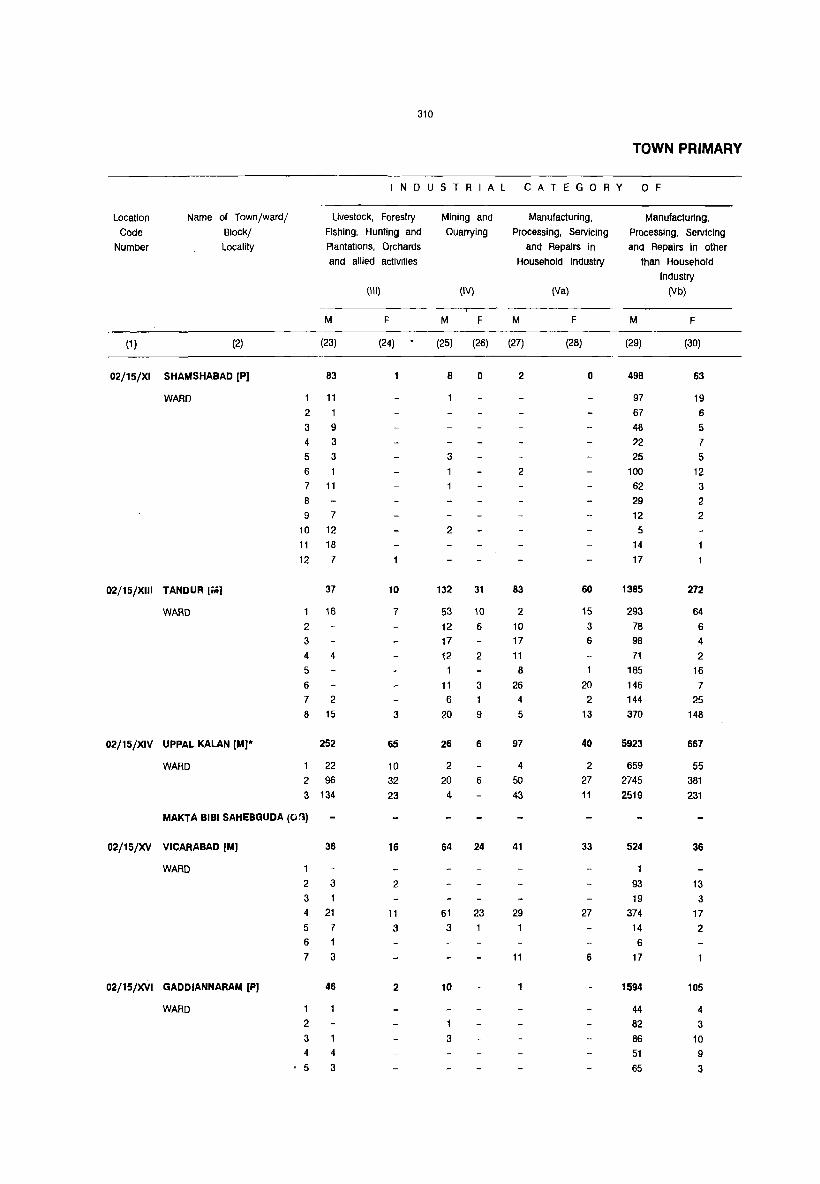
310
TOWN PRIMARY
I N D U S T R I A L CATEGO R Y o F
Location Name of Town/ward/ Livestock, Forestry Mining and Manufacturing, Manufacturing,
Code Block/ Fishing, Hunting and Quarrying Processing, Servicing Processing. Servicing
Number Locality Plantations, Orchards and Repairs in and Repairs in other
and allied activities Household Industry than Household
Industry
(III) (IV) (Va) (Vb)
M F M F M F M F
(1) (2) (23) (24) (25) (26) (27) (28) (29) (30)
02/15/XI SHAMSHABAD [PI 83 8 0 2 0 498 63
WARD 11 97 19
2 1 67 6 3 9 48 5
4 3 22 7
5 3 3 25 5
6 2 100 12
7 11 62 3 8 29 2 9 7 12 2
10 12 2 5
11 18 14
12 7 17
02/15/XIII TANDUR [;';j 37 10 132 31 83 60 1385 272
WARD 16 7 53 10 2 15 293 64
2 12 6 10 3 78 6
3 17 17 6 98 4
4 4 12 2 11 71 2 5 8 185 16
6 11 3 26 20 146 7 7 2 6 4 2 144 25
8 15 3 20 9 5 13 370 148
02/15/XIV UPPAL KALAN [M)· 252 65 26 6 97 40 5923 667
WARD 22 10 2 4 2 659 55
2 96 32 20 6 50 27 2745 381
3 134 23 4 43 11 2519 231
MAKTA BIBI SAHEBGUDA (O~)
02/15fXV VICARABAD [M] 36 16 64 24 41 33 524 36
WARD 1
2 3 2 93 13 3 1 19 3 4 21 11 61 23 29 27 374 17 5 7 3 3 14 2 6 1 6
7 3 11 6 17
02/15/XVI GADDIANNARAM [PI 46 2 10 1594 105
WARD 1 44 4 2 82 3 3 1 3 86 10 4 4 51 9 5 3 65 3

CENSUS ABSTRACT
Conslruclions
M
(31)
138
10
14 21
19
11
12
7
40
3
422
84
37
19 7
31 78 62
104
1594
210 721
663
304
8 4
248
36
8
462
20 7
33
21
16
(VI)
F
(32)
18
1
2
3
7
2
2
105
18
3
4
2
21 28
29
306
73 137
96
58
47
11
41
11
2
MAIN WORKERS
Trade and
Commerce
Transport.
Storage &Co
mmunicalions
M
(33)
866
141
84
78
255 80
43 65
66
25
14
9
6
3491
557
175
208
322
710
608
369
542
3113
354 1240
1519
1488
103
33
1233 43
76
2369
87
96
140
118
100
(VII)
F M
(34) (35)
126 234
30 49
21 27 9 23
12
6 11
11
16
8
5 9
29 22 27
21
11
8
3
195 1033
74 271
19 67
7 167 16 30 18 98 14 97 29 85
18 218
365 1667
37 182
195 736
133 749
156 860
3 30
2 12
136 740 12 27
3 51
185 1311
10
8 12
10
13
29
32
62
54
32
(VIII)
F
(36)
3
2
1
6
4
87
25
30
32
19
15 2
2
64
4
3 3
3
4
Other
Services
(IX)
M F
311
Marginal
Workers
M F
Non-workers
M F
Location
Code
Number
(37) (38) (39) (40) (41) (42) (1)
660 220
102 33
74 10
109 48
14 45
72 47
29
95
35 23
15
12 19 9
14
20
31
22
2
1956 473
282 81
151 37
160 55 145 29 221 37
333 59 235 50
429 125
5056 1472
643 308
2241 495 2171 669
4
3
40
3
1
36
2089 726 24
2"
60 12 35 4 6
1810 631 11 114 67
7 1 61 11 6
2866 851 135
119
101
135
80
100
31 39
59
52
49
5 4270
542
585 3 356
2
469 234 468 353
342
343
190 165
223
6275 02/15/XI
840 1
843 2 508 3
821 454
696
523
493
459 254 219
165
4
5
6 7
8
9
10 11
12
31 12551 19672 02/15/XIII
8 2624
1027
857 5 839
11 1729
2 1775 1 1088
4 2612
45 19748
5 2202 7 8831
33 8708
3795
1510 2
1409 3 1401 4 2815 5 2997 6 1822 7
3923 8
32375 02/15/XIV
3450 1 14639 2 14282 3
7 4 MAKTA.BIIWSAHEBGUDAt(~
39 10927 15458 0J4~5/YN
200 258 /1 685 868 2 461 736 3
9 7984 11686 4 25 584 679 5
339 294 6 4 674 917 7
30 9731 15259 02/15/XVI
5
305
337 653
358
330
485
550 800 507
538
1
2
3 4
5

312
TOWN PRIMARY
Location Name of Town/ward/ Area of No. of No. of Total Population (Includ- Total Population
COde Block/ Town/ward Occupied House- ing Institutional and in the age group
Number Locality In Sq. Kms. Residential holds Houseless Population) (0 - 6)
Houses
P M F M F
(1) (2) (3) (4) (5) (6) (7) (8) (9) (10)
02/15/XV1 GADDIANNARAM [PI (Concld .. ) Ward 6 205 205 992 526 466 66 58
7 295 295 1475 811 664 94 86 8 224 224 1105 549 556 77 64
9 271 271 1220 639 581 81 86 10 328 328 1570 828 742 105 88 11 396 396 1968 1012 956 149 136 12 272 272 1324 686 638 117 96 13 352 352 1587 818 769 106 128 14 377 380 1834 986 848 154 116 15 313 313 1427 732 695 110 80
16 307 307 1470 791 679 110 103 17 555 555 2629 1393 1236 215 185 18 456 456 2109 1151 958 155 128 19 339 339 1627 860 767 116 106 20 241 241 1131 608 523 55 68 21 327 329 1598 836 762 116 98 22 444 444 1952 1037 915 153 128 23 256 268 1209 651 558 93 95
HYDERABAD (MC) PORTION + OGS 1.00 17036 17743 93455 48499 44956 8067 7797
02/15/111 HYDERABAD (Me) PORTION 14785 15492 79258 41134 38124 6815 6489
WARD 7 HYD (MC)PORTION 4550 4654 24025 12651 11374 1992 1902
WARD 8 HYD (Me) PORTION 6515 6582 35041 18077 lG964 3533 3309
WARD 24 HYD(MC) PORTION 3720 4256 20192 10406 9786 1290 1278
HYDERSHAKOT [OOJ 1.00 231 231 1969 1004 965 142 158
BALAPUR [00] 1194 1194 6975 3667 3308 546 626
KOTHAPET lOG) 539 539 3594 1834 1760 391 358
MALLAPUR (OG] 135 135 748 388 360 77 76
VENKATAPUR (OG) 152 152 911 472 439 96 90

313
CENSUS ABSTRACT
!NOUSTRIAl CATECOAY or-
Scheduled
Castes
Scheduled
Tribes
Literates Total Main
Worl\o;!rs
Cultl'Jalors Agricultural
Labourers
location Code
Number
M
(11)
7 34
10
57 10 26 20
1
8
41 14 23 13 12
4
F M
(12) (13)
10 37
7
58
5
29
24 3
12 37 9
18 9 9
3
7
5
1
2 4
1 13
8
12 3
70 9
5
5853 5583 655
4574 4398 603
799 787 44 2546 2452 232 1229 1159 327
206 200
782 706 52
220 190
46 49
25 40
F M
(14) (15)
10
7
1 3
1
13
448 703 451 504 723 799
491 679 807 565
8 618 6 1105 3 948 8
5 6
632 521 631 775 435
F
(16)
356
509
386 356
578 625 396
544 597 447 462 831 699 472 367 541 592 284
(I - IX)
M F M
(17) (18) (19)
228 358 279 325 385 357 314 435
464 359 356
686 550 404
278 365 538 350
31 51 32 47 65 47 29
54 33
53 53
101 68 59 40 60
53 33
7
1
5
5 3
1
1
5 2
6
12 5
8
1
5
6
668 30450 21130 22776 4234 549
609 27011 19394 19400 2853 21
35 9364 6695 227 10133 6784 347 7514 5915
419 252
5978 783 8237 1032 5185 1038
504 165
4
5
12
86
59 1708 803 1655 801 288
941 546 763 81 80
145 46 214 188 66
226 89 240 146 8
(I)
F
(20)
2
M
(21)
7
2
10
285 695
2 66
2
53 11
27 159
188 299
76
59 70
9 25
(II)
F
(22) (1 )
Ward 02/15/'X:tI1 (Concld .. )
6
2
. 759 HYD (MC) PORTION+OGS
21 02/15/111
7
8 9
10 11 12 13 14 15 16 17
18 19
20
21 22
23
WAnD 7 HYD (MC)PORTION
17 WARD 8 HYD (MC) PORTION 4 WARD 24 HYD(MC) rORTION
9lI HYO£RSHAKOT lOG)
404 BALAPUR (OG)
56 KOTHAPET (OG)
99 MALLAPUR lOG)
81 VENKATAPUR (OG)

314
TOWN PRIMARY
I N 0 U S T R I A l CAT EGO R Y o F
location Name of Town/ward/ Uves10ck. Forestry Mining and Manufacturing. Manufacturing.
Code BloCk/ Fishing, Hunting and Quarrying Processing, Servicing Processing, Servicing
Number locality Plantations. Orchards and Repairs in and Repairs in other
and allied activities Household Industry than Household
Industry
(III) (IV) (Va) (Vb)
M F M F M F M F
(1) (2) (23) (24) (25) (26) (27) (28) (29) (30)
02/15/XVI GADDIANNARAM [P) (Concld,,)
Ward 6 34
7 61 6
8 43 1
9 1 55 2
10 2 4 65 8
11 2 66 4
12 2 93 1
13 85 4
14 56 1
15 1 57 9
16 3 61 3
17 5 112 9
18 7 144 8
19 43 2
20 59 6
21 66 3
22 105 4
23 10 61 4
HYDERABAD (MC) PORTlON+OGS 127 30 232 61 56 25 7131 491
02/15/111 HYDERABAD (MC) PORTION 63 10 26 11 28 19 6634 460
WARD 7 HYD (MC)PORTION 10 4 1 8 3173 206
WARD 6 HYD (MC) PORTION 10 4 7 4 1 2645 170
WARD 24 HYD(MC) PORTION 43 2 21 6 19 17 1016 84 ~
HYDERSHAKOT lOG) 6 16 43 9
BALAPUR lOG) 40 12 72 19 20 5 153 18
KOTHAPET lOG) 37 7 88
MALlAPUR [OG) 3 3 27 9 8 3
VENKATAPUR [OG) 14 5 52 22 5

CENSUS ABSTRACT
Construcllons
M
(31)
12
13
9
9 12
23
5
11
10
10
8
48
28
60
15
25
46
21
2605
2328
245
1538 545
27
100
73
19
58
(VI)
F
(32)
2
2
2
5 2
1
2
6
505
490
34
347
109
8
3
2
2
MAIN WORKERS
Trade and
Commerce
Transport,
Storage &Co
mmunications
(VII)
M F M
(33) (34) (35)
54 6 32
84 6 58
66 2 35
126 7 28
82 8 62
69 6 71
75 3 40
110
137
76
92
183
124
114
62
100
150
124
4183
3781
975
1453
1353
28
186
144
12
32
11 68
4 119
8 71
15 60
11 118
5 52
11 52
4 37
13 59
4 75
8 65
485 2255
384 1912
93 337
96 907
195 668
4 17
63 185
6 128
9 5
19 8
(VIII)
F
(36)
1
3 1
3
5 3
4
6
4
4
2
2
6
124
122
30
12
80
Other
Services
(IX)
M F
315
Marginal
Workers
M F
Non-workers
M F
(37) (38) (39) (40) (41) (42)
Location
Code
Number
(1)
95 22 298 435
02/15/XVI (Concld .. )
6 134 36 453 613
123 28 270 524
101 34 314 534
153 47 443 677
122 30 135 23 520 886
97 21 372 608
159
129
142
126
208
190
126
105
111
147
63
38
18
28
30
74
49
43
29
40
39
15
383
522
373
435
707 601
456
330
471
499 301
715
815
642
626
1135
890
708 483
701
862
525
4943 1469 231 390 25492 40332 HYD (Me) PORTlON+OGS
4339 1334 230 388 21504 34883 02/15/111
7 8
9 10
11
12
13
14
15
16
17
18
19
20
21
22
23
1224 414 58 17 6615 10574 WARD 7 HYD (MC)PORTION
1618 380 3 2 9837 15930 WARD 8 HYD (MC) PORTION
1497 540 169 369 5052 8379 WARD 24 HYD(MC) PORTION
121 19 500 800 HYDERSHAKOT (OG]
312 88 2012 2507 BALAPUR (OG]
129 15 2 1070 1677 KOTHAPET lOG]
4 6 174 172 MALLAPUR lOG]
38 7 232 293 VENKATAPUR (OG)
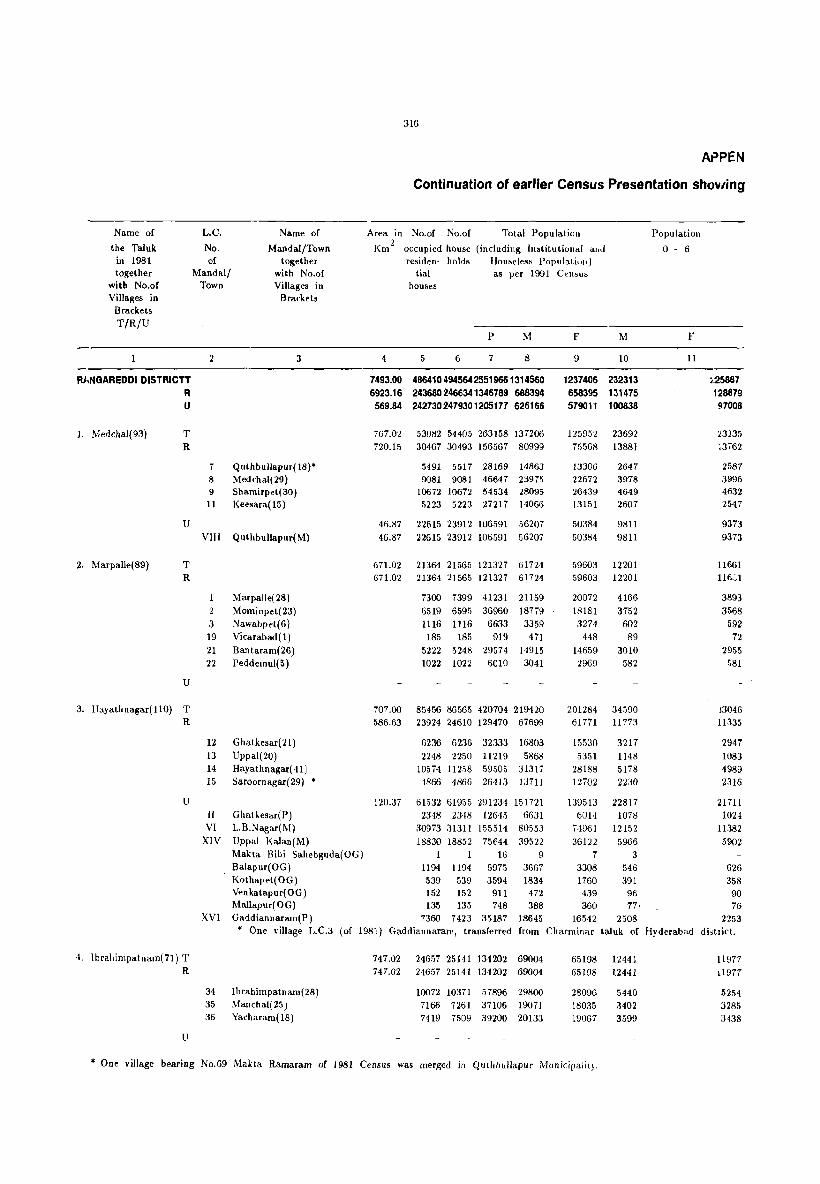
Name of
the Thluk in 1981 together
with No.of Villages in
Brackets
T/R/U
AMGAREDDI DISTRICTT R U
1, Medchal(93)
2. MarpaUe(89)
T R
U
T R
u
L.C.
No. of
Mandal/ Town
Name of
Mandal/Town together
with No.of Villages in
Brackets
2 3
7 quthbullapur(18)* 8 Medchal(29) 9 Shamirpet(30) 11 Keesara( 15)
VIII Quthbullapur(M)
1 Marpalle(28)
2 Mominpet(23) J Nawabpet(6) 19 Vicarabad ( 1 )
21 Bantaram(26) 22 peddemul(5)
316
A~PEN
Continuation of earlier Census Presentation showing
Area in No.of No.of Total Populatioll
Km 2
occupied h()use (including III~titutioll,,1 ""J residen- holds lIouseless Populatiull)
tial as per 1991 Censu. houses
p M F M
4 5 6 7 8 9 10
7493.00 48641049456425519661314560 1237406 232313 6923.16 2436802466341346789 688394 658395 131475 569.84 2427302479301205177 626166 579011 100838
767.02 53082 54405 263158 137206 720.15 30467 30493 156567 80999
5491 5517 28169 14863 9081 9081 46647 23975
10672 10672 54534 28095 5223 5223 27217 14066
46.87 22615 23912 106591 56207
46.87 22615 23912 106591 56207
671.02 21364 21565 121327 61724 671.02 21364 21565 121327 61724
7300 7399 41231 21159
6519 6595 36960 18779 1116 1116 6633 3359
185 185 919 471
5222 5248 29574 14915 1022 1022 6010 3041
1259.52 23692 75568 13881
13306 22672 26439 13151
50384 50384
2647 3978 4649 2607
9811
9811
59603 12201 59603 12201
20072 4166
18181 3752 3274 602
448 89
14659 3010 2%9 582
Population
o - 6
F
11
~:25887
128879 97008
23135 ~3762
2587 3996 4632 2547
9373
9373
11661 116:;1
3893
3568 592
72
2955 581
3. Hayathnagar(llO) T 707.00 85456 86565 420704 219420 201284 34590 J3046 11335 R 586.63 23924 24610 129470 67699 61771 11773
12 Ghatkesar(21) 6236 6236 32333 16803 13 Uppal(20) 2248 2250 11219 5868 14 Hayathnagar(41) 10574 11258 59505 31317 15 Saroornagar(29) * 4866 4866 26413 1J711
15530 3217
5351 1148 28188 5178 12702 2230
2947
1083 4989 2316
U 120.37 61532 61955 291231 151721 139513 22817 21711 II Ghatkesar(P) 2348 2348 12645 6631 60H 1078 1024 VI L.B.Nagar(M) 30973 31311 155514 80553 W)61 12152 11382
XIV Uppal Kalan(M) 18830 18852 75644 39522 36122 5966 5902 Makta Bihi Sahebguda(OG) 1 1 16 9 7 3 BaJapur(OG) 1194 1194 5975 3667 3308 546 626 Kothapet(OG) 539 539 3594 1834 1760 391 358 Venkatapur(OG) 152 152 911 472 439 96 90 Mallapur(OG) 135 135 748 388 360 77, 76
XVI Gaddiannaram(P) 7360 7423 35187 18645 16542 2508 2253 * One village L.C.3 (of 1981) Gaddiannaram, transferred from Charminar taluk of Hyderabad di,trict.
4, Ibrahimpatnam(71) T 747.02 24657 25141 134202 69004 65198 12441 11977 11977 R 747.02 24657 25141 134202 69004 65198 12441
34 Ibrahimpatnam(28) 10072 10371 57896 29800 28096 5440 35 Manchal(25) 7166 7261 37106 19071 18035 3402 36 Yacharam{l8) 7419 7509 39200 20133 19067 3599
U
* One village bearing No.69 Makta Ramaram of 1981 Census was merged in Quthbullapur MUllicipali(j,
5254 3285 3438

317
DIX
Total Rural and Urban Population of each Taluk
Scheduled Castes
M
12
224289 151844 72445
18814 14566
2268 4245 5609 2444
4248 4248
18106 18106
6029 5442 1284 172
4442 737
28530 14005
3529 1193 5919 3364
14525 1081 8386 3630
9 782 220
25 46
346
15275 15275
6737 3562 4976
F
13
215097 145361 69736
17679 13851
2145 4094 5296 2316
3828 3828
17499 17499
5722 5179 1267 171
4450 710
26724 12679
3260 1160 5238 3021
14045 948
8213 3568
7 706 190 40 49
324
14505 14505
6567 3209 4729
Scheduled Tribes
M
14
56438 44740 11698
3693 2917
650 1395 692 180
776 776
2390 2390
759 1105
513 13
3708 1477
604 140 420 313
2231 91
1212 610
52
266
5633 5633
583 3524 1526
F
15
52956 42777 10179
3424 2729
623 1274 645 187
695 695
2155 2155
692 985
471 7
3079 1371
598 136 352 285
1708 74
989 489
59
97
5441 5441
577 3417 1447
Literates
M
16
654053 252038 402015
69624 36309
6591 11590 11989 6139
33315 33315
18727 18727
6017 5984 1034
153 4431 1108
134864 30743
8292 2902
13716 5833
104121 4321
55391 26557
6 1708 941 226 145
14826
28212 28212
12904 7209 8099
F
17
373331 95552
277779
36701 16436
2559 5857 5365 2655
20265 20265
5691 5691
1801 1674
290 55
1403 468
87143 13453
3908 1672 5059 2814
73690 2:;39
40149 18196
4
803 546 89 46
11318
11183 11183
5598 2523 3062
Industrial Category of Main Workers
Total Main Workers
(I-IX) Cultivators
M
18
685186 378150 307036
74718 44842
804S 13302 16023 7468
29876 29876
33860 33860
11535 10031
1860 284
8577 1573
108860 35866
8684 2942
16938 7302
72994 2991
38609 19741
2 1655 763 240 214
8'779
37366 37366
15737 10474 11155
F
19
327690 264137 63553
31278 26617
4447 7294
10578 4298
4661 4661
24997 24997
8742 7334 1468
156 6643
654
32783 18319
-1169 1126 9109 3915
14464 599
7687 3706
3 801
81 146 188
1253
24763 24763
9406 7405 7952
M
20
170726 162547
8179
11852 11477
1589 3185 4924 1779
375 3;5
180:.!:! 180:.!:3
GO!j(i
S6·j9 1057 129
4558 584
8276 6381
1409 225
3328 1-119
189::;
liG 8~n
:\4::;
1 288 80 8
66 98
13792 13792
4404 4601 4787
F
21
85779 83604 2175
6105 6056
768 1510 3000
778
49 49
10162
10162
:1486 3219
707 49
2570 131
3638 3049
380 57
1734 878
::;89 118 186 23
3 188
9 59
3
6074 6074
1733 1966 2375
SI.No.
"

Name of The taluk in 1981 togeth er
with No.of villages in Brackets
RANGAREDDI DISTRICTT R U
1. Medchal(93)
2. Marpalle(89)
T R
u
T R
u
J. Hayathnagar( 110) T R
u
l. Ibrahimpatnam(71) T R
u
L.C. No. of
Mandal/ Town
2
7
8
9 11
VIII
3 19 21 22
12 13 14 15
II VI
XIV
XVI
34 35 36
II Agricultural Labourers
M
22
122850 106926 15924
13346 12763
1617 4122 5404 1620
583 583
11471 11471
4250 3042
634 102
2909 534
14152 92:37
2294 662
4386 1895
4915 239
2515 1669
299 76 25 70 22
12425 12425
5041 3677 3707
F
23
166075 153321 12754
15383 15051
2104 4547 6045 2355
332 332
13864 13864
4991 3863
732 95
3734 449
13224 10326
2547 672
5134 1973
2898 158
1423 675
404 56 81 99 2
15997 15997
6231 4883 4883
318
APPEN
Continuation of earlier Census Presentation showing
Industrial Category of Main Workers
III Livestock
Forestry Fishing Hunting &£ Plantations
Orchards and Allied Activities
M
24
16053 12989 3064
2169 2010
491 756 447 316
159 159
348 348
74 32 47 17
162 16
2919 1775
353 120
1126 176
1144 35
753 252
40 1
14 3
46
1346 1346
767 311 268
F
25
3432 2630 802
717 664
227 296 96 45
53 53
13 13
3 2 2
6
813 486
65 31
370 20
327 2
238 65
12
5 3 2
231 231
149 55 27
IV Mining and
Quarrying
V
Manufacturing Processing Servicing and Repairs
(a) Household Industry
(b) Other than Household Industry
M
26
10589 7082 3507
1517 1044
240 112 335 357
473 473
195 195
4 15
2 148 . 26
1306 900
184 33
366 317
406 50
132 26
72 37 52 27 10
182 182
85 17 80
F M
27 28
5121 7006 3705 5644 1416. 1362
723 595
159 61
152 223
128 128
146 146
13
1 129
3
651 609
55 186 263 105
42 42
306
306
66 102
12 75 51
553 1003 393 575
57 124 15 11
207 419 114 21
160 35 69
6
19
22 9
65 65
23 11 31
428 56
247 97
20 7
644 644
404 165
75
F
29
3170 2624 546
390 364
28 93
169 74
26 26
109 109
50 25
2 31
1
431 286
37 34
205 10
145 11 88 40
5
197 197
113 56 28
M
30
124797 23936
100861
22899 6530
2205 1636 1330 1359
16369 16369
547 547
201 152
15 9
134 36
22196 6619
1909 787
3124 799
15577 1078 6728
5923
153 88
5
8 1594
2282 2282
1317 459 506
F
31
15391 4632
10759
3482 1637
797 223 321 296
1845 1845
50 50
14 17 2
9 8
2986 1337
492 119 557 169
1649 60
795 667
18
3 105
503 503
306 45
152

DIX (Concld ... )
Total Rural and Urban Population of each Taluk
VI
Constructions
M
32
37380 6956
30424
5566 1487
262 229 589 407
4079 4079
232 232
80 61 3 2
61 25
8515 1832
374
208
543 707
6683 162
4215 1594
100 73 58 19
462
505 505
264 64
177
F
33
7906 1258 6648
1201 306
50 23
107
126
895 895
6 6
5
1655 469
82 46
104 237
1186 21
811 306
3 2 2
41
75
75
36 3
36
Industrial Category of Main Workers
VII Trade & Commerce
M
34
69943 20078 49865
6766 3217
521 1001 1058 637
3549 3549
1019 1019
339 258
22 4
236 160
17361 3466
795 313
1600 758
13895 423
7616 3113
186 144 32 12
2369
2489 2489
1425 455 609
F
35
10472 434a 6124
942 606
99 124 230 153
336 336
129 129
21 37
7 2
45 17
2369 772
195 61
301 215
1597 73
877 365
63 6
19 9
185
670 670
.310 194 166
VlIl Transport Storage & Communi-
cations
M
36
41673 9023
32650
3280 1535
190 543 483 319
1745 1745
427 427
84 223
49
44 26
11151 2079
511 253 890 425
9072
366 5402 1667
185 128
8 5
1311
1192
1192
707
227 258
F
37
2157 226
1929
80 26
2 9
8 7
54 54
9 9
4
1 3
538 69
36 1
25 ';
469 8
308
87
31 31
30
.3
319
IX Olher
Services
M
38
84169 22969 61200
6672 4170
879 1532 1190 569
2502 2502
1282 1282
381 497 33 6
250 115
21981 3002
731 330
1156 785
18979
406 10168 5055
1 312 129 38
4 2866
2509 2509
1323 ·j98
688
F
39
28187 n87
20400
2255 1312
213 408 450 241
943 943
509
509
175 154
18 7
113 42
6576 1132
278 90
472 292
5444 113
2892 1472
88 15 i 6
851
917 917
475 191
251
Marginal Worker.
M
40
2964 1958 1006
253 230
143 32
25 30
23 23
79
79
16
to 4
41 8
466 155
39 2
40 74
311 19
116 40
135
263 263
124 79 60
F
41
24138 22792
1346
1989 1920
471 596 392 461
69 f9
1824 1824
218 407
21
800
378
2592
2227
945 60
713 509
365 U5 173 45
2
30
2916 2916
1095 1008 813
Non-workers
M
42
626410 308286 318124
62235 35927
6671 10641 12047
6568
26308
26308
27785 27785
9608 13',:18 1495
187 .;291 1460
110094 31678
8080 2924
14339
6335
78416 3621
41828 19741
-7 2012 1070 132 174
9731
31375 31375
13939 8518 8918
F
43
885578 371466 514112
92685 47031
8388 14782 15469 8392
45654 45654
32182
32182
11112 10440 1785 292
7216 1937
165909 41225
10416 4165
18366 8278
124684 5300
67101 32371
-4 2507 1677
293
172 15259
37519 37519
17595 9622
10302
SI.No
3
4

Name of
the Taluk ill 1981 together
with No.of Villages in
Brackets
T/R/U
5. Maheswaram(65) T R
U
6. Rajendranagar( 117) T R
7. Chevella(llO)
8. Vicarabad(I08)
U
T R
U
T R
U
L.C.
No. of
Mandal/ Town
2
33
36 37
4
5 6 16 17 32
V X IX
XI
4
17
18 31 32
3
19 20 30
....
Name of
Mandai/Town together
with No.of Villages in
Brackets
3
Maheswaram(33)
Yacharam(2) I(andukur(30)
Shankarpalle( 1) Serilingarnpalle(26) Balanagar (8) Rajendranagar( 40) Mominabad(7) Shamshabad(35)
Kukatpalle(M) Serilingalllpalle(M) Rajendranagar(M) Shahzadi Begum(OG) Shamshabad(P) Hydershakot( OG)
Shankarpalle( 25) * Mominabad(19)
Chevella(36) • Shahbad(25) Shamshabad( 8)
320
APPEN
Continuation of earlier Census Presentation showing
Area in
Km2
4
612.00 612.00
No.of No.of
occupied house residen- holds
tial
Total Population
(including Institutional and Houseless PopUlation) as per 1991 Census
houses
P 1\1
5 6 7 8
17301 17584 94987 48864 17301 17584 94987 48864
8344 8544 46863 24025 713 720 3711 1936
8244 8320 44413 22903
F
9
M
10
46123 9613 4(j123 !)613
22838 4807 1775 400
21510 4406
542.09 88062 89761 451257 236314 214943 41732 43142 9057 317.95 15791 15982 90091 46949
224.H
780 780 4918 2571 2.347 521 ---- Entire Urban Mandai _------- Entire Urban Mandai ----
5081 5081 29964 15660 14.304 2887 2774 2908 16895 8822 7156 7213 38314 19896
72271 73779 361166 189365 40533 41221 186963 9834'2 14318 14318 72320 37896
14658 15478 84520 44237 11 11 28 16
2520 2520 15366 7870 231 231 1969 1004
8073 1682 18418 3967
171801 32675 88621 16146 34,124 6·156
40283 8299 12 3
7496 1629 965 142
938.07 30409 30573 173307 88678 84629 17027 84629 17027 938.07 30409 30513 173307 88678
8085 8085 45164 23220 4951 5021 28916 14844 8517 8573 49946 25516 7804 7842 43360 22059 1052 1052 5921 3039
21944 4400 14072 3000 24430 4760 21301 4235
2882 632
PopUlation
0-6
F
11
9616 9616
4898 375
4343
40577 f1975
468
2859 1682 3966
31602 15481 6:147 8084
2 1530 158
l6500 16500
4219 :'948 4679 1035 619
* One village III Shankarpalle and two villages in Chevella are newly sprullgup after 1981.
Nawabpel( 16) Vicarabad(34) * Dharur(38) PUdur(21)
646.08 25910 25986 150251 76489 585.59 19148 19215 111036 56530
4953 4957 29051 14958 4336 4395 24942 12660 6291 6291 35774 18045 3568 3572 21269 10867
73762 14669 54506 11105
14093 2582 12282 2587 17729 3677 10402 2259
14367 10825
2487
2488 3611 2239
x_y Vicarabad(M) 60.49 60.49
6762 6771 39215 19959 6762 6771 39215 19959
19256 3564 19256 3564
3542 3542
.. One Village ill Vicarabad M.P.P. is newly sprungup after 198! Census.
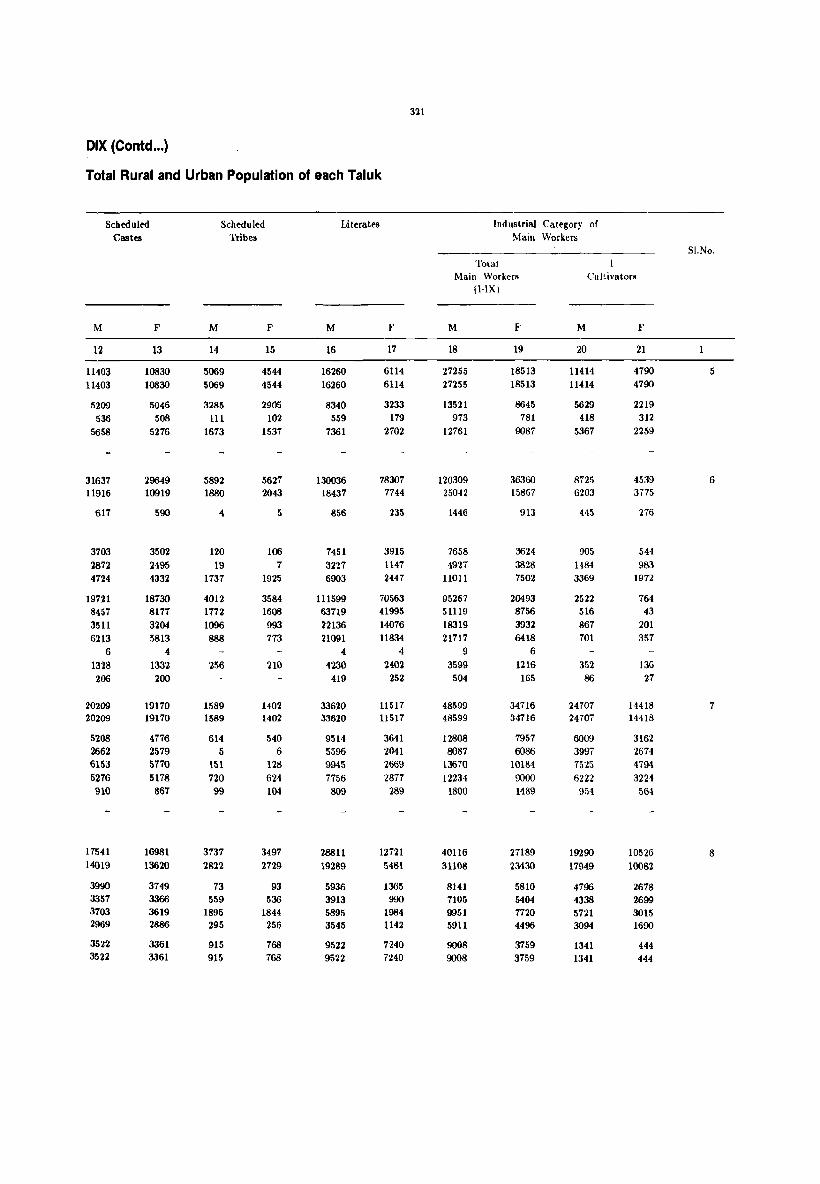
DIX (Contd ... )
Total Rural and Urban Population of each Taluk
SchedUled CB8tes
M
12
11403 11403
5209 536
5658
31637 11916
617
3703 2872 4724
19721 8457 3511 6213
6 1328 206
20209 20209
5208 2662 6153 5276 910
17541 14019
3990 3357 3703 2969
3522 3522
F
13
10830 10830
5046 508
5276
29649 10919
590
3502 2495 4332
18730 8177
3204 5813
4 1332 200
19170 19170
4776 2579 5770 5178 867
16981 13620
3749 3366 3619 2886
3361 3361
Scheduled Tribes
M
14
5069 5069
3285 111
1673
5892 1880
4
120 19
1137
4012 1772
1096 888
256
1589 1589
614 5
151 720 99
3737 2822
73 559
1895 295
915 915
F
15
4544 4544
2905 102
1537
5627 2043
5
106 7
1925
3584 1608 993 773
210
1402 1402
540 6
128 624 104
3497 2729
93 536
1844 256
768 768
Literates
M
16
16260 16260
8340 559
7361
130036 18437
856
7451 3227 6903
111599 63719 22136 21091
4 4230
419
33620 33620
9514 5596 9945 7756 809
28811 19289
5936 3913 5895 3545
9522 9522
F
17
6114 6114
3233 179
2702
78307 7744
235
3915 1147 2447
70563 41995 14076 11834
4 '1402
252
11517 11517
3641 2041 2669 2877 289
12721 5481
1365 990
1984 1142
7240 7240
321
Ind ustrial Category of Maill Workers
Tolal Main Workers
(I-IX) Cultivators
M
18
27255 27255
13521 973
12761
120309 25042
1446
7658 4927
1l01l
95267 51119 18319 21717
9 3599 504
48599 48599
12808 8087
13670 12234
1800
40116 31108
8141 7105 9951 5911
9008 9008
F
19
18513 18513
8645 781
9087
36360 15867
913
3624 3828 1502
20493 8756 3932 6418
6 1216 165
34116 34716
7951 6086
10184 9000 1489
27189 23430
5810 5404 1720 4496
3159 3759
M
20
11414 11414
5629 418
5367
8725 6203
4-15
905 1484 3369
2522 516 867 701
352 86
24707 24707
6009 3997 75"l5 6222 954
19290 17949
4796 4338 5721 3094
1341 1341
F
21
4790 4790
2219 312
2259
4539 3775
276
544 983
1972
764 43
201 357
136 27
1H18 14418
3162 2674 4794 3224 564
10526 10081
2678 2699 3015 1690
444 444
SI.No.
5
6
1
8

Name of
The taluk in
1981 together
with No.of villages in Bra.ckets
5. Maheswaram(65) T R
u
6. Rajendranagar(117) T R
7. Chevella(llO)
8. Vicarabad(108)
U
T R
U
T R
U
L.C. No.
of
Mandal/ Town
2
33 36 37
4
5
6
16 17 32
V X IX
Xl
4 17 18 3) 32
3 19 20 30
II Agricult ural
Labourers
M
22
9125 9125
3944 380
480)
12532 7937
597
1434 1876
4030
4595 1059 1193
1424
2 758 159
14031 14031
3794 2147 3804 3637 649
11042 R781
2281 1820 2654 2026
2261 2261
F
23
12048 12048
5413
408 6227
13814 9610
604
2082 2417 4507
4204 477
1266 1713
1
649 98
18387 18387
4299 2977 4914 5315 882
14640 12393
2930 2453 4374 2636
2247 2247
32Z
APPEN
Continuation of earlier Census Presentation showing
Industrial Category of Main Workers
III Livestock
Forestry Fishing
Hunting & Plantations
Orchards and Allied Activitie~
M
24
1093 1093
661 34
:398
2703 1735
36
417 461 791
9G8 257 229 378
5 83 G
1142
1112
253 362 192 316
19
470
434
42 140 173 79
36 36
F
25
216 216
173 15 28
810 545
14
93 158 280
265 43 72
144
5
1
134 134
51 53 7
21 2
43
27
8 8 8 3
16 16
IV
Mining and
Quarrying
V Manufacturing Processing
Servicing and Repairs
M F
(a) Household Industry
M F
(b) Other thall Household Industry
M F
26 27 28 29 30 31
166 166
55
III
2943 1106
53 494 53 494
~4 288
13 29 193
1138 635 452 290
33 Entire Urban Mandai -
Entire Urban Mandai
640 192 72 32 2 36
433 258 149
1837 486 847 480
8 16
370 370
66 110 97 88 9
248 184
12 70 5.1 49
64 64
686 345 205 238 348 41 133 63
2
162 909 162 909
58 275
40 200 17 242 44 176
3 16
118 308 94 267
9 43 13 101 26 79 46 44
24 24
41 41
149 149
106
41
1246 1246
763 n
461
207 38116 95 1772
17 19 58
131
652 174 815
112 36344 70 24286 6 6262
36 5253
356 356
78
98 104 69 7
164 131
20 50 40 21
33 33
2 498
43
1419 1419
497 205 273 405 39
1087
563
173 103 216
71
524 524
345 345
200 5
140
4175 212
81
51 79
3%3 216L 424
1299
63
9
106 106
16 39 21 28 2
I" 7
51 3
36 36

323
DIX (Concld ... )
Total Rural and Urban Population of each Taluk
VI Constructions
M
32
371 371
241 11
119
')211 944
28
570 129 217
8267 4847 1416 1839
J38 27
474 474
155 92
107 103 17
586 282
57 128 74 23
304 304
F
33
67 67
44 7
16
2189 115
105
9
2074 1315
285 448
18 8
49 49
17 6
13 13
116 58
52 4
1
58 58
Industrial Category of Main Workers
VII Trade & Commerce
M
34
1311 1311
80B 28
475
14979 1555
79
B01 246 429
13424 7032 2100 3398
866 28
2251 2251
803 413 506 500 29
2333 845
209 113 323 200
1488 1488
F
35
365 365
204 9
152
2196 337
12
149 40
136
1859 9-11
226 562
126 4
282 282
80 45 68 75 14
312 156
47 24 66 19
156 156
VIII Transport Storage & Communi-
IX Other
Services
M
36
523 523
332 7
184
9400
952
18
518 167 249
8448 4301 1253 2643
234 17
670 670
206 117 155 177
15
1419 5,59
163 64
238 94
R60
860
cations
F
37
8
8
6
2
343 7
M
38
1512 1512
800
60 652
21065 2548
78 Entire urban Mandai Entire urban Mandai
5 1619 2 322
336 228 66 39
3
7 7
2
3 2
45
25
2
21 3
19 19
529
18517 8087 -il11 5538
660 121
2626 2626
750 444 769 610
53
3:333 1244
365
228 420 231
2089 2089
F
39
472 472
256
23 193
6949 719
5
356
155 203
6230 3266 1038 1687
220 19
815 815
194 154 243 209
15
1115
389
102 98
1}5 74
726 726
Marginal Workers
M
40
145 145
90 16 39
518 205
73
17
3 112
313 229 38 45
306
306
78
54
83 90
230 206
5 78 98 25
24 24
41
1205 2205
1218 39
948
1547 1268
242
290 2
734
2,9 109
71
93
1 5
3179 3179
915 289 755
1182 38
1709
1670
41:3 374 742 141
39 39
Non-workers
]II
42
2146,1
H46·!
10,114 947
10103
115487 21702
1052
7985 :3892 1'l7'i:]
~)J785
4(;994
19G39 'H475
7 4270
500
39773 39773
10334 6703
11763 9735 1238
36l4.3
2:;216
(jBn 5477
7996
4931
10927 10927
F
25405 25405
12975 955
11475
177036 26007
1192
10390 4243
101112
151029 79756
30421 33772
5 6275 800
46734 46734
13072 7697
13491 11119 1355
44864 29406
7870 6504 9267
5765
15458 15458
SI.No,
5
6
7

324
APPEN
Continuation of earlier Census Presentation showing
Name of L.C. Name of Area in No.of No.of Total Population Populali. n
the 1'aluk No. Mandai/Town Km2 occupied house (induding Institutional and o - "
in 1981 of together residell- holds Houseless Population)
together Mandal/ with No.of tial as per 1991 Census
with No.of Town Villages in houses
Villages in Brackets
Brackets
T/R/U p 1\1 F M F
1 2 3 4 5 6 7 Ii U 10 11
9. Thndur(132) T 920.06 33682 34326 187782 94113 93669 18484 18011 R 900.94 25924 26553 142265 70880 71385 14317 14103
22 Peddemul(29) 6298 6298 35657 17829 17828 3734 3746
23 1'andur(38) 7301 7580 37841 19016 18825 3945 3822
24 Baslleerabad(31 ) 6400 6400 34888 17287 17601 3448 3.377
25 Yelal(34) 5925 6275 33879 16748 17131 3190 3158
U 7758 7773 45517 23233 22284 4167 3008
XII! Tandur(M) 19.12 7758 7773 45517 23233 22284 4167 3'108
10.Pargi( 137) T 957.02 34695 34918 193537 97067 96470 20060 2L125
R 957.02 34695 34918 193537 97067 96470 20060 20125
26 Doma(28) 6502 6508 35413 17684 17729 3579 3645
27 Gandeed(Z9) 8780 8892 48771 24324 24447 4924 5014 28 KUlkacharla(30) 8391 8455 46550 23369 23181 5139 4950 29 Pargi(37) 8086 8121 46172 23313 22859 4695 4798
30 Pudur(13) 2936 2942 16631 8377 8254 1723 1718
U
11. VaIlabhnagar(19)T 118.03 71792 73740 361454 185681 175773 27804 26872 R
10 Malkajgiri (12) ~-- Entire Urban Mandai --~--
6 Balanagar (6) ~--- Entire Urban Mandai ---_-11 Keesara (1) ---- Fully included in urban
U 118.Q3 71792 73740 361454 185681 175773 2780·1 26872 VII Malkajgiri(M) 24764 26000 127178 64647 62531 9245 9')38
IV Khapra(M) 19091 19096 87747 45626 42121 6779 6,,43
I Alwal(M) 12989 12989 66471 33854 32617 4877 1'732
Singaipalle(OG) 163 163 800 420 380 88 70 HYDERAnAD (Me) Portion H785 15492 iD2:i8 ·11134 38124 6815 6489
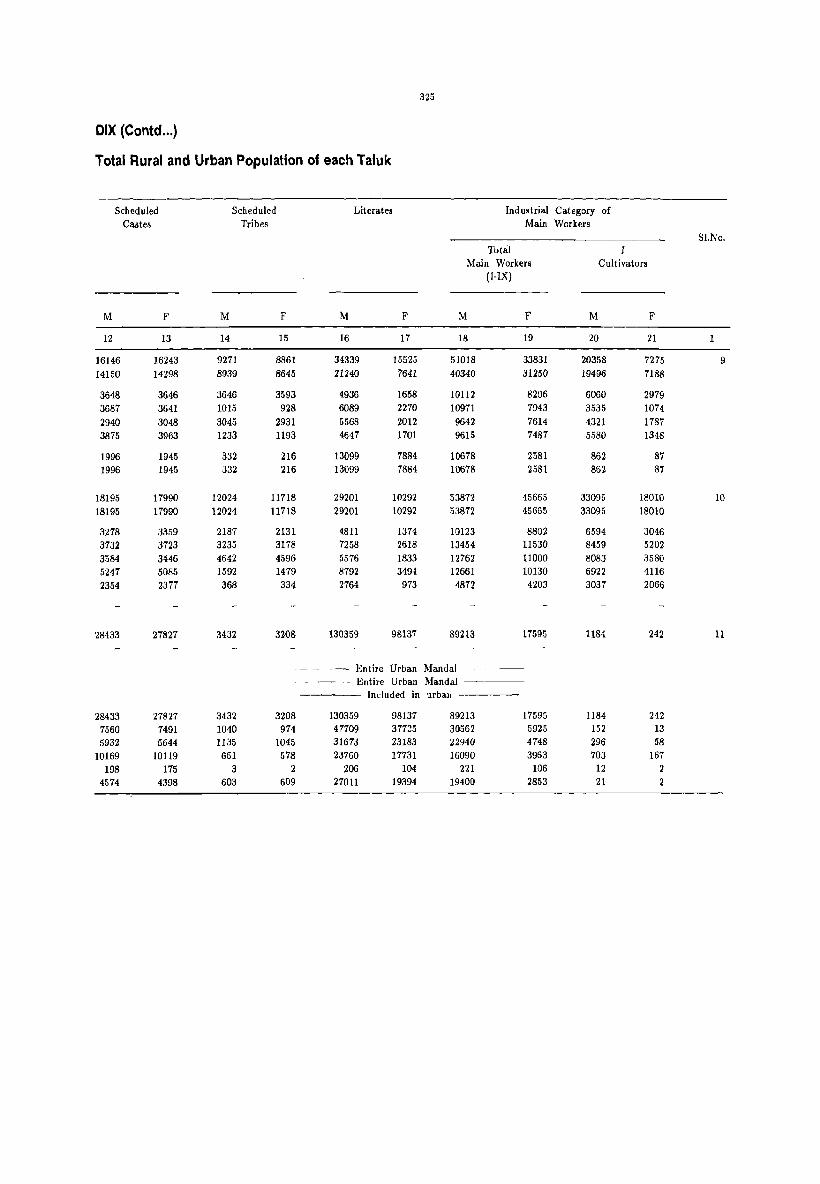
325
DIX (Contd ... )
Total Rural and Urban Population of each Taluk
Scheduled Scheduled Literates Industrial Category of Castes Tribes Main Workers
SI.No. Tota:!
Main Workers Cultivators (I-IX)
M F M F M F M F M F
12 13 14 15 16 17 18 19 20 21
16146 16243 9271 8861 34339 15525 51018 33831 20358 7275 9 14150 14298 8939 8645 21240 7641 40340 31250 19496 7188
3648 3646 3646 3593 4936 1658 10112 8206 6060 2979 3687 3641 1015 928 6089 2270 10971 7943 3535 1074 2940 3048 3045 2931 5568 2012 9642 7614 4321 1787 3875 3963 1233 1193 4647 1701 9615 7487 5580 1348
1996 1945 332 216 13099 7884 10678 2581 862 87 1996 1945 332 216 13099 7884 10678 2581 862 87
18195 17990 12024 11718 29201 10292 53872 45665 33095 18010 10 18195 17990 12024 11718 29201 10292 53872 45665 33095 18010
3278 3359 2187 2131 4811 1374 10123 8802 6594 3046 3732 3723 3235 3178 7258 2618 13454 11530 8459 5202 3584 3446 4642 4596 5576 1833 12762 11000 8083 3580 5247 5085 1592 1479 8792 3494 12661 10130 6922 4116 2354 2377 368 334 2764 973 4872 4203 3037 2066
28433 27827 3432 3208 130359 98137 89213 17595 1184 242 11
--_ Entire Urban MandaI --- Entire Urban Mandai ----
Included in urban
28433 27827 3432 3208 130359 98137 89213 17595 1184 242 7560 7491 1040 974 47709 37725 30562 5925 152 13 5932 5614 1135 1045 31673 23183 22910 4748 296 58
10169 10119 651 578 23760 17731 16090 3963 703 167 198 175 3 2 206 104 221 106 12 2
4574 1398 603 609 27011 19394 19400 2853 21 2

326
APPEN
Continuation of earlier Census Presentation showing
Industrial Category of Main Workers
Name of L.C. II III IV V The taluk in No. Agricultural Livestock Mining Manufacturing Processing 1981 together of Labourers Forestry Fishing and Servicing and Repairs
with No.of Mandai/ Hunting !.t. Quarrying villages in Town Plantations (a) (b) Brackets Orchards and Household Other than
Allied Activities Industry Household Industry
M F M F M F M F M F
2 22 23 24 25 26 27 28 29 30 31
9. Tandur(132) T 10535 21401 1279 72 2841 1729 908 661 3470 517
R 9258 20059 1242 62 2709 1698 825 601 2085 245 22 2383 4760 194 7 195 166 136 38 193 16 23 2758 5153 301 20 1661 978 217 153 1196 81 24 1987 4521 389 29 838 542 239 250 472 115 25 2130 5625 358 6 15 12 233 160 224 33
V 1277 1342 37 10 132 31 83 60 1385 272 XII 1277 1342 37 10 132 31 83 60 1385 272
1O.Pargi(137) T 11898 25586 1864 252 226 47 725 336 873 123 R 11898 25586 1864 252 226 47 725 336 873 123
26 2145 5385 384 70 12 2 135 48 122 20 27 2551 5691 592 68 124 44 217 106 276 53 28 2686 6823 567 75 63 192 162 224 40 29 3142 5630 278 38 22 157 14 219 10 30 1374 2057 43 5 24 6 32
V
11. Vallab hnagar( 19) T 2293 1731 720 131 595 387 423 170 30662 2994 R
10 Entire Urban Mandai 6 Entire Urban Mandai 11 Entire Urban Mandai
U 2293 1731 720 131 595 387 423 170 30662 2994 VII 129 58 189 25 326 226 79 30 8791 859 IV 684 528 214 47 172 110 201 77 11668 1222 I 1355 1063 252 49 69 40 115 44 3312 416
59 61 2 57 37 66 21 63 10 28 11 28 19 6834 460

DIX (Concld ... )
Total Rural and Urban Population of each Taluk
VI Constructions
M F
32 33
893 167 471 62
88 3 160 44 86 3
137 12
422 105 422 105
358 51 358 51
63 25 63 5 60 4
131 14 41 3
10669 2330
10669 2330 3608 580 2616 913 2113 347
4 2328 490
Industrial Category of Main Workers
VII Trade & Commerce
M F
34 35
5484 810 1993 615
397 91 587 233 601 146 408 145
3491 195 3491 195
1932 416 1932 416
316 68 442 126 415 126 631 79 128 17
14018 1981
14018 1981 5683 866 2307 316 2241 414
6 1 3781 384
VIII Transport Storage & Communi-
cations
M F
36 37
1608 39 575 33
131 15 123 1 238 17 83
1033 6 1033 6
511 9 511 9
47 2 88 2 44
292 5 40
11492 1045
-_ Entire urban -_ Entire urban -- Fully included
11492 1045 6226 567 1740 223 1600 132
14 1 1912 122
327
IX Other
Services
M F
38 39
3642 1160 1686 687
335 131 433 206 471 204 447 146
1956 473 1956 473
2390 835 2390 835
305 136 642 233 428 189 867 224 148 53
17157 6584
Mandal Mandai in urban--
17157 6584 5379 2701 3042 1254 4330 1291
67 4 4339 1334
Marginal Workers
M F
40 41
152 2753 148 2722
29 383 36 709 26 629 57 1001
4 31 4 31
221 2861 221 2861
4 334 113 1412
22 720 74 182 8 213
331 563
331 563 34 39 21 49 46 87
230 388
Non-workers SI.No.
M F
42 43
42943 57085 9 30392 37413
7688 9239 8009 10173 7619 9358 7076 8643
12551 19672 12551 19672
42974 47944 10 42974 47944
7557 8593 10757 11505 10585 11461 10578 12547 3497 3838
96137 157615 11
96137 157615 34051 56567 22665 37324 17718 28567
199 274 21504 34883
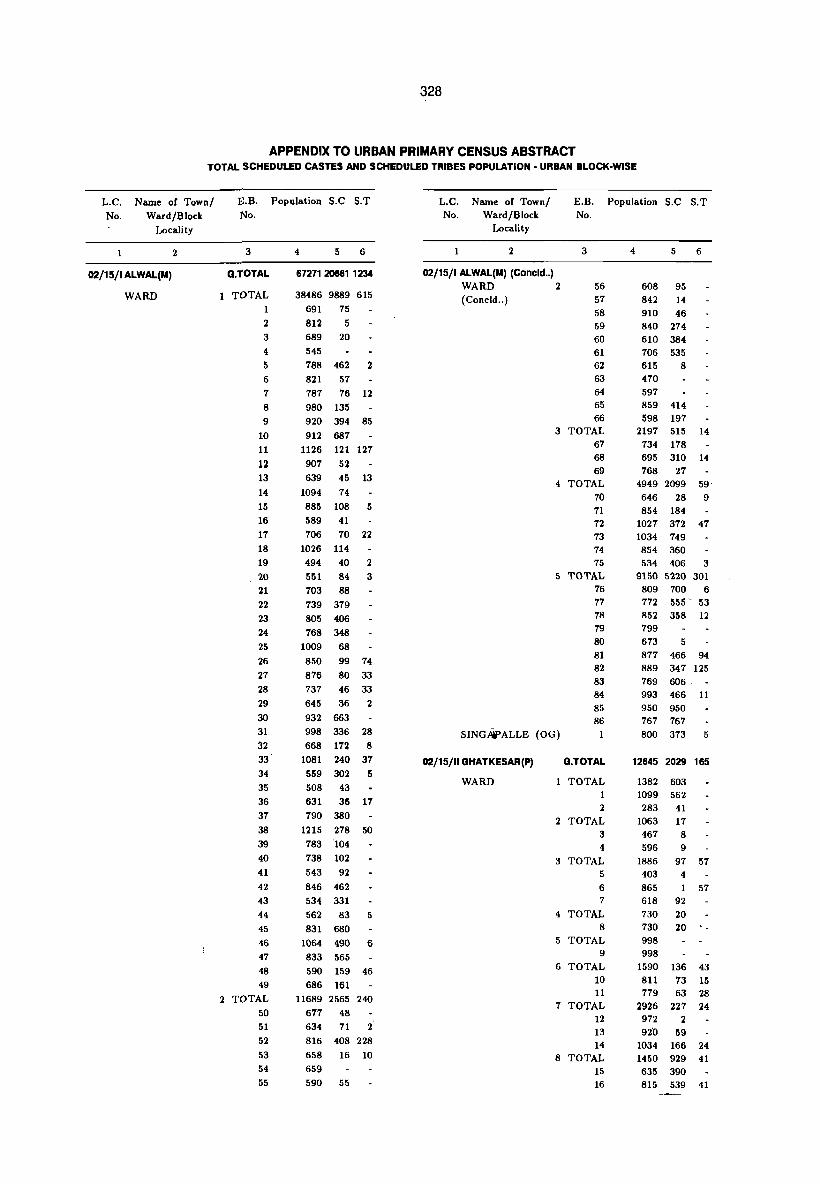
328
APPENDIX TO URBAN PRIMARY CENSUS ABSTRACT TOTAL SCHEDULED CASTES AND SCHEDULED TRIBES POPULATION - URBAN BLOCK-WISE
L.C. Name of Town/ No. Ward/Block
Locality
1
02/15/1 ALWAL(M)
WARD
2
E.B. Population S.C S. T No.
3
(i.TOTAL
TOTAL 1
2
3
4
5
6
1
8
9
10
11
12
13
14
15 16
11
18 19
20
21
22
23
24
25
26
21
28
29
30
31
32
33
34
35
36
31
38
39
40
41
42
43
44 45
46 41
48 49
2 TOTAL 50
51
52
53
54
55
4 5 6
67271 20661 1234
38486 9889 615
691 15
812 5 689 20
545
188 462 2
821 51
181 16 12
980 135
920 394 85
912 681
1126 121 121
901 52
639 45 13
1094 14
885 108 5 589 41
106 10 22
1026 114 494 40 2
551 84 3
103 88 139 319
805 406
168 348
1009 68
850 99 14
816 80 33 131 46 33
645 36 2
932 663
998 336 28
668 112 8
1081 240 31
559 302 5
508 43
631 36 11 190 380
1215 218 50
183 104 138 102
543 92
846 462
534 331
562 83 5
831 680
1064 490 6 833 565
590 159 46
686 161
11689 2565 240
611 48 634 11 2'
816 408 228
658 16 10 659
590 55
L.C. Name of Town/ No. Ward/Block
E.B. Population S.C S.T No.
Locality
2 3
02/15/1 ALWAL(M) (Concld .. ) WARD 2 56
51
58 59 60 61 62 63
64 65 66
(Concld .. )
3 TOTAL 61 68 69
4 TOTAL 10 11 12 13 14 15
5 TOTAL 16 11 18 19 80
81 82 83 84 85 86
SINGAIPALLE (OG)
02/15/11 GHATKESAR(P) G.TOTAL
WARD 1 TOTAL
2
2 TOTAL 3 4
3 TOTAL 5
6 1
4 TOTAL 8
5 TOTAL 9
6 TOTAL 10 11
1 TOTAL 12 13 14
8 TOTAL 15 16
4 5
608 95 842 14 910 46 840 214 610 384 106 535 615 8 470 591 859 414 598 191
6
2191 515 14 134 118 695 310 14 168 21
4949 2099 59 646 28 9 854 184
1021 312 41 1034 149 854 360 534 406 3
9150 5220 301 809 100 6 112 555 53 852 358 12 799 613 5 811 466 94 889 341 125 169 606 993 466 11 950 950 161 161
800 313 5
12645 2029 165
1382 603 1099 562 283 41
1063 11 461 8 596 9
1886 91 51 403 4 865 1 51 618 92 730 20 130 20 998 998
1590 136 43 811 13 15 119 63 28
2926 221 24 912 2 920 59
1034 166 24 1450 929 41 635 390 815 539 41

329
APPENDIX TO URBAN PRIMARY CENSUS ABSTRACT TOTAL SCHEDULED CASTES AND SCHEDULED TRIBES POPULATION - URBAN BLOCK-WISE
L.C. Name of Town/ E.B. Population S.C S.T No. Ward/Block No.
Locality
1 2 3
02/15/11 GHATKESAR(P) (Concld •• )
WARD 9 TOTAL
02/15/1V KAPRA(M)
WARD
17
G.TOTAL
1 TOTAL
1 2
3
4 5
6
7
8
9 10
11
12
13
14
15
16
17
18
19
20
21
22
23
24
25
26
27
28
29
30
31
32
33
34
35
36
37
38
39
40
41
42
43
44
45
2 TOTAL
46 47
48
49
50
51
4
620
620
5 6
an47 11576 2180
35449 4167 1160
968 30 427
1022 415 14
976 504 61
870 191 62
577 57 10
343 32
751 190
535 79
666 666 660 163
436
454
533
571
9
16
866 51
903 70
769
917
10
17
6
5
896 21 3
777 37 12
793 26 7
702
759 35
840 93 40
719 199 53
1036 109 9
888 87 23
826 62 353
997 88
958 102
977 109 7
846 129 10
883 82
1051 70
877 101
566 43 6
731 41 4
932 107 7 956 27 5
729 19
845 45 16
768 12 5
937 23 14
662
681 7755 1027 133
818 238
523 92
647 13
178 16
710 182
136 81
14
59
12
L.C. Name of Town/ E.B. Population S.C S.T No. Ward/Block No.
Locality
2 3
02/15/1V KAPRA(M) (Conld .. )
WARD 2 52
53 54
55
56
57
58
(Concld .. )
3 TOTAL
59 60
61
62
63
64
65
66 67
68
69
70
71
72 73
74
75
76
77
78
4 TOTAL
79
80
81
82
83
84
85
86
87 88
89 90
91
92
93
94
95
96
97
98
99
100
101
102 103
104 5 TOTAL
105
106
107
4 5 6
911 157 20
633 iJ 18 616 59 10
492 14
700 2
556
835 100 14283 1892 474
697 610 7 4
771 163 17
471 176
591 96 15
621 6
605
591 49
645 77 7
435 4 21
'2426 635 58
513
868
723 95 2
476 71
1085 88 244 627 95 77
584 559 330 29
385
16816 2350 337
609 13
687 12 1133 12
894 44 3
776 56 2
919 612 21
891 83
677 27 41
858 701
701 595 612 384
750 49 6
564 15 28
754 154 222
534 113
525 40
153 15
924 15 14
613 56
504 18
874
296 437
430 11554
if1 1~2 666
14
7 2 9
544 52
48
9
6
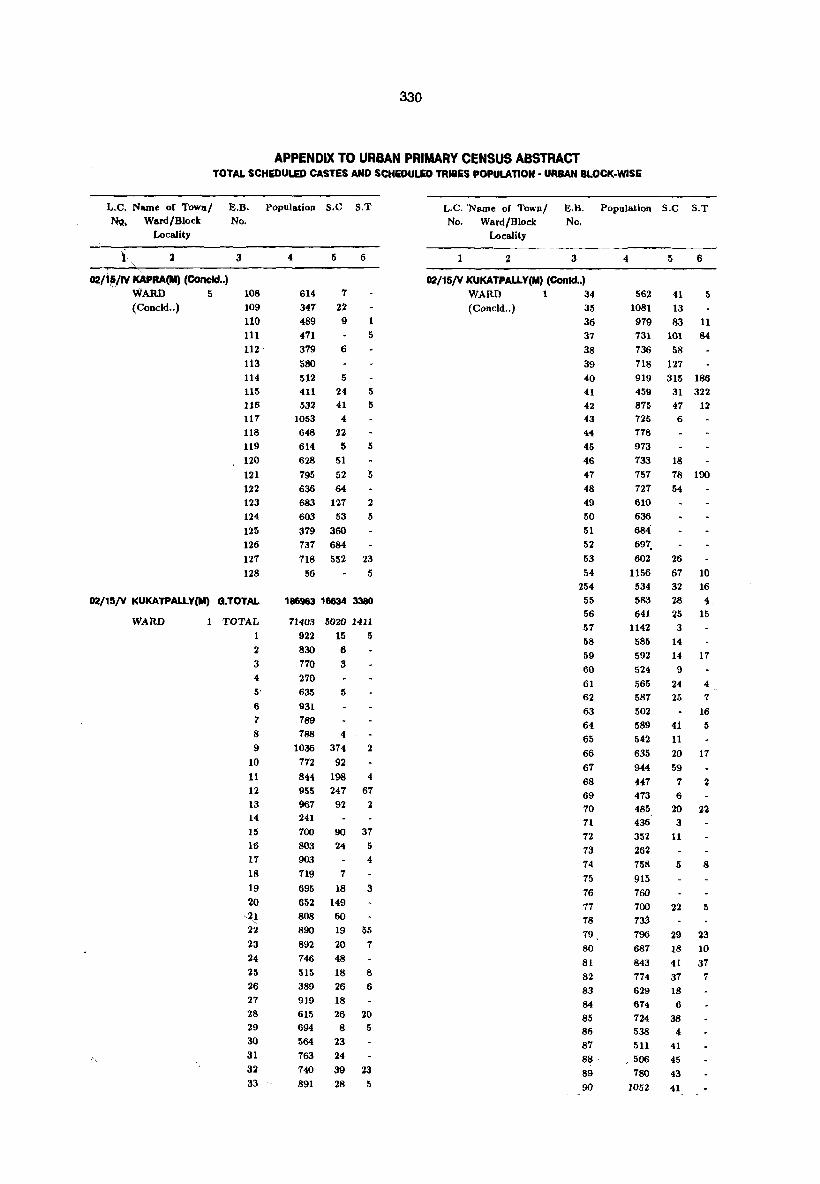
330
APPENDIX TO URBAN PRIMARY CENSUS ABSTRACT TOTAL SCHEDULED CASTES AND SCHEDULED TRIBES POPULATION· URBAN 8LOCI(·WlSE
L.C. Name of Town/ E.B. Population S.C S.T N'l, Ward/Block No.
Locality
2 3
02/1S/fV KAPRA(M) (Concld •. ) '.'
WARD 5 108
(Condd .. ) 109
110 111 112 .
113 114 115
116 U1
U8 119 120
121
122 123
124
125
126
127
128
02/15/V KUKATPALLY(M) a.TOTAL
WARD 1 TOTAL
1 2 3 4 5'
6
7 8
9
10
11 12
13 14
15 16 17
18
19 20
~ 22
23 24
25 26
27
28 29
30
31 32
33
614
347 489
471 379
580 512
5
1
22
9
6
411 24
532 41 1053 4 648 22
614 5 628 51 795 52
636 64 683 127
603 53
379 360 737 684
6
1 5
5
IS
5
5
2 5
718 552 23
56 5
186963 16634 3380
71403 5020 1411
922 15 5 830 6
770 3
210
635
931
789
5
188 4
1036 374 2
772 92 844 198 4 955 241 67
961 92 2 241
700 90 37 803 24 5 903 4
719 7
695 18 3 652 149 808 60
890 19 55
892 20 7
146 48
515 18 8
389 26 6 919 18
615 26 20 694 8 5 564 23
763 24 740 39 23
891 28 5
L.C. 'Name of Town/ E.B. Population S.C S.T
No. Ward/Block No. Locality
1 2 3
02/15/V KUKATPALLV(M) (Contd .. ) WARD 1 3. (Condd .. ) 35
36 37
38
39
40 41
42 43 H 45 46 47
48 49
50
51 52
53
54 254
55 56 51
58 59
60
61 62
63
64 65
66
67
68 69 10 11
72
73 74
75 76 77 18
79 80
81
82
83
84 85 86
87
88
89
90
4
562
1081
979
5 6
41 5
13
83 11 731 101 84
736 58 718 127 919 315 186 459 875 125
118
973 733
757 727 610
636
684 691.
31 322
47 12 6
18
78 190
602 26
1156 67 10 534
583 641
1142
585 592
524
565 587 502
589 542
635
944 447 473 485 436
352
262
32 16 28 4 25 15 3
14
14 17
9
24 4 25 7
16
41 5 11 20 17
59 7 2 6
20 22 3
11
758 5 8
915 760
700 22 5 7~
796 29 23 681 18 10
843 41 37
774 37 7 629 18
614 6 724 38 538 ..
511 41
" 506 45 780 43
1052 41

331
APPENDIX TO URBAN PRIMARY CENSUS ABSTRACT TOTAL SCHEDULED CASTES AND SCHEDULED TRIBES POPULATION - URBAN BLOCK-WISE
L.C. Name of Town/ E.B. No. No. Wa.rd/Block
Locality
1 2 3
02/15fV KUKATPALLY(M) (Contcs .. ) WARD 1 91
(Concld .. ) 92
93
94
95
96
97
98
99
100
101
102
103
104
2 TOTAL
105
106
107
108
109
110 111
112
113
114
115
116
117
118
3 TOTAL
119
120
121
122
123
124
.125 126 127
128 129
130
131
132
133
134
4 TOTAL
135
136 137
138
139
140
141 142
143 144
Population S C S. T
4
367
573
5
25
31
507 21
555 31
478 26
6
801 437 74
84 165
487 62 20
572 482
161
623 10
22 358 23
9
595 141 8
575 139 7
11662 727 30
891
869 707
653
990
978
8
24
10
34
1213 98 11 798 6 744 37 14
637 231
548 57 4
1194 102
777 95
663 25
14324 1549 106 970 14
953 58
1046 315
935
979
1229
778
969
6
2
11
35
5 1031 156
7
9
798 25 28
789 48 62
939 435
649 160
1002 27 723 252
534 7414 6611 64
989 158 3
596 2 856 12 53
656 15
938 131 2 887 107
189 14
655 34
854 178
794 13 6
L.C. Name of Town/ E.B. No. No. Ward/Block
Locality
2 3
02/15/V KUKATPALLY(M) (Contd .. ) WARD 5 TOTAL
145 146
147
148 6 TOTAL
149
150
151
152
153
154
155
156
157
158
159
160
161
162
163
164 165 166 167
168 169
170
171
172
173
174 175 116
171
118
179
180
181
182 183 184 185
186
1 TOTAL
181
188 189
190
191
192
255 193
196
194 195
197
198
199 '
Population S.C S.T
4 5 6
2895 249 53
711 86
661 7
736 81 32
181 14 21
29642 2940 455
180
871
814 696
6 40
26
742
715 3
787
830 23
909 31
981 240
818 220
810
577
730
881 833
13
4
856 18
629 763 166
653 125 708 89
218 80
73
6
997 95 19
993 212 16
804 458 31
746 144 31
658
671 24
956 28
795 107 21
899 212 13
803
713 5 141
425 22 639 107 27 767 18
1199 154 28 845 250 9
23195 2936 463
897 12 5
754 28 6 538 82 11
599 316 lIS
814 323 21
810 38 42
449 50 211
408 25 ;}66 28 t:ll 6
11~5 130
771 29 53 682
~80

332
APPENDIX TO URBAN PRIMARY CENSUS ABSTRACT TOTAL SCHEDULED CASTES AND SCHEDULED TRIBES POPULATION - URBAN BLOCK-WISE
L.C. Name of Town/ E.B. Population S.C S.T
No. Ward/Block No.
Locality
2 3
02/15/V KUKATPAlLY(M) (Concld .. ) WARD 7 256
(Concld .. ) 200 201 202 203 204 205
206
207
208
209
210 247
248
249
250
251
252
253
8 TOTAL
211 212 213 214 215 :;:16
217
218 219
220 221
222 223 224
9 TOTAL
225
226
227
228 229
230 231
232
10 TOTAL
233
234
235 236 237 238
239
240
241
)42 243
244 i!45
246
4 5
457 173
798 329 1019 370 1011 273
6
832 100 5 126 3
626 12
702 36
219 63 1193 40 75
915 99 11 1083 72 702 82 5 848
677
805
739 1084 602
52
57
99
7
5
11408 1124 89 953 203 15
917 600
234
87 39
8 820 141
4
862 208 42
990 2 707
753
877
40
45
50
67
2 9
1073 1068
874
680
126 10 74 7
6701 723
817 763
34 609 512
44
871 400
1024 85
796 151 799 64 358 908 16 3
8319
902 1001
599
377
712
816 197
25 32
35
5 7
1074 79
257 112 450 213
714 99 37 604 141 10
199 20 98
816 55 20
297 8 317 17
L.C. Name of Town/ E.B. Population S.C S.T
No. Ward/Block No.
Locality
2 3
02/15/VI LB.NAGAR(M) G.TOTAL
WARD TOTAL
2
3
4
5
6
7
8
9
10 11
12 13 14 15 16 17 18 19 20
21 2 TOTAL
22
23
24
25
26
27 28 29 30
31
32 33
3 TOTAL
34 35
36
37
38 39
40
41 42
43 44
45
46 47
488 49 50
51 52
53 5,1
55
4 5 6
155514 16599 2201
17062 1771 112 901 157 369 12 375 5 773 21 619 198 463 343 7 951 30
1231 146 36 693 52 947 14 7
638 17 13 916 2
1000 913
1014
42 19 66 5
1112 188 837 433 12
1160 32 9 1018
724
5
9
408 1
8102 1182· 92
687 776 114
601 393
670 47 888 608 664
18
7 7 69 45
638 49 4 855 126 15 734 68 3 536 21 11 445 270 7
19096 2750 610 791 16 801 30
1026 58 4 831 7 978 221 85
1029 395 33
751 34
744
869
938
995
891 996
53 84 20
119 105
362 86
780 5 808 270
1019 50 23 974 12 27 928 313 116 587 297
708 222 6 753 98 184
899 18 7

333
APPEimlX TO URBAN PRIMARY CENSUS ABSTRACT TOTAL SCHEDULED CASTES AND SCHEDULED TRIBES POPULATION· URBAN BLOCK·WISE
L.C. Name of Town/ E.B.
No. No. Ward/Block
Locality
2 3
02/15/V1 I..B.NAGAR(M) (Conld .. )
WARD 4 TOTAL
56
57
58
59
60
61
62
63
64
65
66 67
68
69
70
71
72
5 TOTAL
73
74
75
76
77
78
79
80
81
82
83
84
85
6 TOTAL
86
87
88
89
90
91
92
93
94
95
96
97
98
99
100
101
102
103
104 105
106
107
108
109
110
Population S.C S.T
4 5 6
10571 1781 74
960
172
726 208
829 572
929 38 20
769
888 3 789 317 6
771 19 4
413 35 2
623 175 6
753 337 2
568
71
232 9 13
406 7 8
672 4 10
11083 1412 136
743 280
627
728 416 33
960 134 6
876 271
1031 54 72
1020 21 10
795 7
1267 86
1028 62
806
417
785
21517
784
845
756
1013
817
542
768
588
656
725
790
732
739
799
697
765
735
725
47
18
23 6
692 230
13
41
58
15
8
15
62
29
20
5 4
27
22
30
5
4
793 195 181 770
738
637
789
802
996
11
22
20
12
2
L.C. Name of Town/ E.B.
No. No. Ward/Block
Locality
2 3
02/15/V1 L.B.NAGAR(M) (Conld .. ) WARD 6 111
(Coneld .. ) 112
113
114
7 TOTAL
115
116
117
8 TOTAL
118
119
120
121
122
123
124
125
126
127
128
129
130
9 TOTAL
131
132
133 134
135
136
137
138
139
140
141 142
143
144
145
146
147
148
149
10 TOTAL
150
151 152 153
154
155 156
157 158
159
160 11 TOTAL
161
162
163
164
Population S.C S.T
5 6
802
400
451
8~3
13 26
42 4
11
17
2083 358
864 177
144 22
1075 159
7
4
4
7603 510 74
949 9
494 111
523 119
886 32
628 43
479 61 18
390
604
475
329
276
753
6
40
4 6
88
5
817 42
13920 2078 248
832 10 12
422 3
587 420 7
972 575 28
1023 7
639 30 11
312 3
1113
1183
438
429
862
19
297
275
13
4
45
20
15
751 25 14
869 56 41
749 45 20
404 126
833 136 16
723 18
779 20 15
8169 940 12
866 65 2
582 11
447
568 7
798 13
877 371
585 426
763 H 1267
775
641
8 15
7
3
36308 3125 609
952 136
611 14
451
986

334
APPENDIX TO URBAN PRIMARY CENSUS ABSTRACT TOTAL SCHEDULED CASTES AND SCHEDULED TRIBES POPULATION· URBAN BLOCK·WISE
L.C. Name of Town/ E.B. Population S.C S.T
No. Ward/Block No. Locality
1 2 3
02/15/V1 LB.NAGAR(M) (Contd .. ) WARD 11 165
166
167
168
169
170
171
172
173
174
175
176
177
178
179
180
181
182
183
184
185
186
187
188
189
190
191
192
193
194
195
196 197
198
199
200
201
202
203
204
205
206
207
208
209
210
211
212
(Concld .. )
02/15/VII MALKAJGIRI (M) G.TOTAL
WARD 1 TOTAL
2
3
2 TOTAL
4
5
4
1348
1399
1065
5
57
201
56
990 28
519 10
447 18
6
15
87
1007 153 30
310 259
614 6
542 4 5
364 37 2
625 13 5
395 4
940
980
195
23
844 5 901 27 13
917 7
475 5
400 4
1218
1009 22 652 266 4
778 49 41
950 54 12
822 21 39
723 70 199
935 25
773 121
842 515
620 122
764 106
802 47
627 40 13
1082 185 27
1092 107
785 97
399 19
904 94
319 38 28
370 39 70
319 26 5
1085 4
26
23
112 5
127178 15051 2014
2350 86 24
711 54
621 6 2
1018 26 22
1777 26 8
1168
609 26 8
L.C. Name of Town/ E.B. Population S.C S.T
No. Ward/Block No. Locality
2 3
02/15/V1I MALKAJGIRI (M) (Contd .. ) WARD 3 TOTAL
6 7
8
9
4 TOTAL 10'
11
12
5 TOTAL
13 14
6 TOTAL
15
16
17
7 TOTAL
18
19 8 TOTAL
20
21
9 TOTAL
22
23
24 10 TOTAL
25
26
27
28
29
30 31
11 TOTAL 32
33
34
13 TOTAL
35
36
37
14 TOTAL
38
39
40
41 15 TOTAL
42
43
44 16 TOTAL
45
46
47 17 TOTAL
4R
49
4
2180
628 511
569 472
2632
628
846
1158
2015
935
1080
2359
763
816
780
5
96
35 12 49
61
19
42
10
10
37
15
22
6
56
20 28
8
7
7
5
3 2
4
4
2398 179 8
986
1412 1768
1058
710
2021
517
621
883
7
172 8 458 10
427 5
3L 5
48 14
26 3 22 11
6125 673 72
928 114 13
582 67
899 149 18
1261 29
1073 77
763 147 33 619 90 8
2188 1132 36 906 588 9
517 218 6
765 326 21
2816 149 28
1379 42 22 714 37 6
723 70
2635 382 25 746 76
641 146 5
701 96 20
547 64
2601 241 779 65 661 76
1161 100
2502 258 38
1215 147 30
667 34 8
620 77
7094 2010 95 1389 297 21
1148 385 19
711 2-18 13
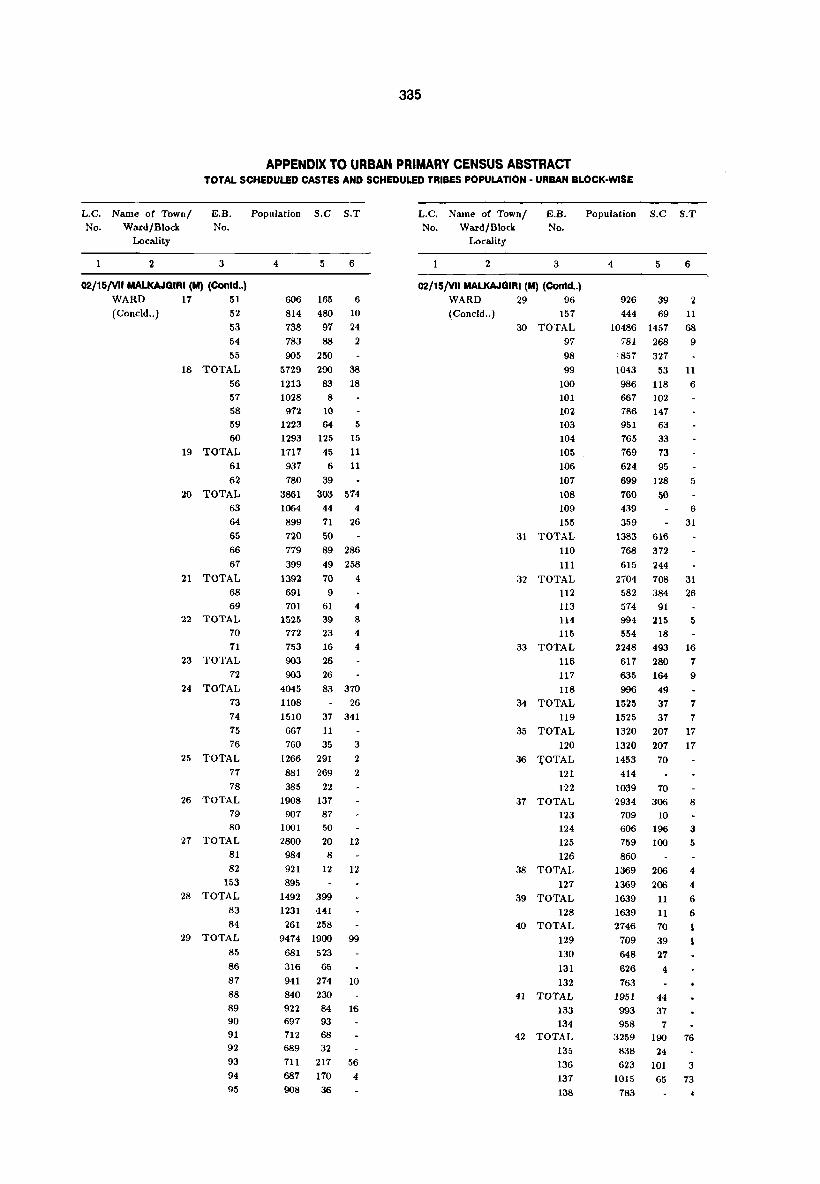
335
APPENDIX TO URBAN PRIMARY CENSUS ABSTRACT TOTAL SCHEDULED CASTES AND SCHEDULED TRIBES POPULATION - URBAN BLOCK-WISE
L.C. Name of Town/ E.B. PopUlation S.C S.T
No. Ward/Block No. Locality
2 3
02/15/V1I MALkAJGIRI (M) (Contd .. ) WARD 17 51
(Coneld .. ) 52
53
54
55
18 TOTAL
56 57
58 59
60
19 TOTAL 61
62
20 TOTAL
63
64
65
66
67
21 TOTAL
68 69
22 TOTAL 70
71
23 TOTAL
72
24 TOTAL
73
74
75 76
25 TOTAL
77
78
26 TOTAL
79 80
27 TOTAL
81
82
153
28 TOTAL
83
84
29 TOTAL
85
86
87
88 89 90 91 92
93
94 95
4 5
606 165
814 480
738 97
783 88 905 250
6
6
10
24
2
5729 290 38
1213 83 18
1028
972
8
10 1223 64 5
1293 125 15
1717 45 11
937 6 11
780 39
3861 303 574
1064
899
720 779
399
44 4
71 26
50
1392
691
701
89 286
49 258
70 4
1525 772
753
903
903
9 61 39
23
16
26
26
4
8
4
4
4045
1108 1510
83 370
667
760
1266 881
385
26
37 341
11 35 3
291 2 269 2
22 1908 137
907 87
1001 50
2800 20 12
984 8
921 12 12
895
1492 399
1231 HI
261 258
9474 1900 99
681 523
316 65
941 274 10 840 230
922 84 16 697 93 712 68 689 32
711 217 56
687 170 4
908 36
L.C. Name of Town/ E.B. Population S.C S.T
No. Ward/Block No. Locality
2 3
02/15/V1I MAlKAJGIRI (M) (Contd •. ) WARD 29 96
(Coneld .. ) 157
30 TOTAL
97
98
99
100 101
102 103
104
105
106
107
108
109
155
31 TOTAL
110
111
32 TOTAL
112
113
114
115
33 TOTAL
116
117
118 34 TOTAL
119 35 TOTAL
120
36 1'OTAL
121
122 37 TOTAL
123 124
125
126 38 TOTAL
127
39 TOTAL
128 40 TOTAL
129
130
131
132
41 TOTAL
133
134 42 TOTAL
135
136 137
138
4 5 6
926 39 444 69
10486 1457
2 11 68
9 781 268
'857 327
1043 53 11
986 118 6 667 102
786 147
951
765
769
63
33
73 624 95
699 128
760 50
5
439 6
359 31
1383 616
768 372
615 244
2704 708 31
582 384 26 574 91
994 215 5
554 18
2248 493 16
617 280 7 635 996
1525
1525
1320
1320
1453
414
1039
164
49
37
37
207
207
70
70 2934 306
709 10
606 196
759 100
860
1369 206
1369 206
1639 11 1639 11 2746 70
709 39
648 27
626 4
763
1951 44
993 37
958 1
9
7 7
17
17
8
3 5
4 4
6
6
1 1
3259 190 76
838 24
623 101 3
1015 65 73
783

336
APPENDIX TO URBAN PRIMARY CENSUS ABSTRACT TOTAL SCHEDULED CASTES AND SCHEDULED TRIBES POPULATION - URBAN BLOCK-WISE
L.C. Name of Town/ E.B. Population S.C S.T L.C. Name of Town/ E.B. Population S.C S. T No. Ward/Block No.
Locality
2 3
02/15/V11 MALKAJGIRI (M) (Concld .. ) WARD 43 TOTAL
139
140 141
44 TOTAL
142
156
45 TOTAL
143
144
145
146 147
148
149
150
151 152
154
02/15/V111 QUTHBUUAPUR(M) G.TOTAL
WARD 1 TOTAL
1
2
3
4 5
6
2 TOTAL
7
8 9
10
11 12
13
14 15 16
17
3 TOTAL
18
19
20
21
22 23
24
25
26
4 TOTAL
27
28 29
30
31
4 5 6
2416 176 18 676 71 18
651 74
1089 31. 1550 45 8
1191 40 8
359 5 6622 966 206
1308 159
888 17
594 189 121
431 75
501 103 60
442 32
520 61 12
427 98 13
534 90
366 98
611 44
106591 80761471
3229 600 66
597 11 23
370 113 6 373 1 2
661 239 19
571 137
657 99 16
6345 487 18
746 52 5
442 248 489 30 579 37
684 43 5
792 6
802 6 162 10
65 13
907 10
677 32 8
2990 587 14
642 149
215 11 357
164 5 2
596 138 6
112 18 477 86 6
246 111
181 69
581073890 744
885 773 89 8
949 205 3
751 12 8
15~ .~~~_
No. Ward/Block No.
Locality
1 2 3
02/15/V111 QUTHBUUAPUR(M) (Contd .. )
WARD 4 33
(Contd .. ) 34
35
36
37 38
39
40 41
42
43
44
45
46 47
48
49 50
51
52
53
54
55 56
57
58
59
60
61 62
63
64 65
66 67
68 69
70
71 72
73
74
75
76 77
78
79 80
81
82 83
84 85 86 87
88
89
4 5 6
854
813 23 943 73 30
612 83 57
752 30 9 722 26 6
1121 65
590 76
414 14
131 81
716 195 6
343 88 15
692 168 1020 109
843 107 405
536 92
738 21
719 39
520 10
282 12 5 686 20 4
689 9
666 51 679 9
398 25
216 38
714 80
906 73
932 15 3 399 342 330 524 7 26
148
561 8 20 746 38
895 30 4 752 19 623
801 26 10
967 27
1063 9 7
364
427
622 47 U.1. 580 66 441 109 18 323 5
754 9 8 70
906 35
154 441 42
194 24 496
388

33(
APPENDIX TO URBAN PRIMARY CENSUS ABSTRACT TOTAL SCHEDULED CASTES AND SCHEDULED TRIBES POPULATION· URBAN BLOCK·WISE
L.C. Name of Town/
No. Ward/Block
Locality
2
E.B. Population S.C S. T
No.
3 4 5 6
02/15/VIII QUTHBULLAPUR(M) (Contd .. )
WARD 4 91
(Condd .. ) 92 93 94 95
96
97
98
99
100 101
102
103 104
105 106 107 108 109 110
111 112
113 114 115 116 117
118
119
120 121 122 123 124
185 189
191
194 198
199 5 TOTAL
125 126
127
128 129 130 131
132 133
134 135 136 137
138
139
886 3 1302 10
571 11
789 23 4
660 37 6
347
183
590 20
85
694 36 842 11
669
797 110
606 44 681 56 8 731 100 3 796 39 9
529 24 860 14 692 54 334 18
236 60
225 10 6
770 80 591 9
756 6
667
516 27 2
383
794 31 558 48 297 33 275 21 18
184 366 22 292 12 550 65 10 533 90 3 337
226 5
35920 2512 629
827 169
98 98
393 59 14 249 176 251 27 302 829 - 10 908 213 181
395 89 54
721
45 12 5
615 58 472
678
415
11
41
')
140 133 5
141 451 34 3
L.C. Name of Town/
No. Ward/Block E.B. Population S.C S.T
No.
Locality
2 3
02/15/VIIl QUTHBULLAPUR(M) (Concldoo)
WAltD 5 1-12
(Concld .. ) 143 144
145 146
147 148
149
150 151 152 153 154
155 156 157
151> 159
160
161 162 163 164 165 166
167
168
169 170
171 172 173 171 175
176
177 178 179
180&181
182 183
184 186
187
188 190 192 193
195 197 196
02/15/IXRAJENDRANAGAR(M) (UOTAL
WARD 1 TOTAL
1
2
4 5 C
662 5 633 35 628 8 9
1685 92 139 527 23
691 6 61 3
385 65 2 638 90 505 24 9 362
71
405 12
557 39
686 129 563 11
5·10 7 811 ;14
6:18
145 86
396 648 2
1105 96 17
301 614 484 17
539 20 419
189 145 4 356
332
387 478 21
767 5 133
286 43 7 467 38 576 4
502 85 4
619 103
582 5
296 26 39
55 7 189
807 33 590 27 104 4
748
IHI 216 100
8454812036 1661
11586 2848 206
853 162 7
578

338
APPENDIX TO URBAN PRIMARY CENSUS ABSTRACT TOTAL SCHEDULED CASTES AND SCHEDULED TRIBES POPULATION - URBAN BLOCK-WISE
L.C. Nrune of Town/ B.B. Population S.C S.T
No. Ward/Block No.
Locality
2 3
02/15/IX RAJENDRANAGAR(M) (Conld .. ) WARD 1 5
(Coneld .. ) 6
7
8 9
10
11
12
13
14
15
16
17
18
2 TOTAL 19
20
21 22
23 3 TOTAL
24
25
26 27 28
29
4 TOTAL 30
31
32 33 34
35
36
37
38
39
40
41
42
43
44 45
46
47
48
49
50
51
52 53
54
55
56
57
58
59
4
791
685
704
579
642
746
673
752 382
915
725
353
236 758
2365
5
9
582
443
128 160
24
110 124
45
569
378
35
79
306
805 3
747 186
6
6
20 10
9
4
6
59
20 7
7
2 49
5
423 93 5
222
168 24
3451 1032 44
996
778 670
337 92 35
321
667 222
352 48 9
26688 1240 446
895
873 135 131
543 5 298
922 237 8
765 169
656 244
786
863
17
23 571 27
669
606 14
542 61
663 297
855 2 888
623 828
537
520
750
743
707
562
172 826
785
326
402 694 776
9
5
4
L.C. Name of Town/ B.B. No.
Population S.C S.T
No. Ward/Block
Locality
2 3
02/15/IX RAJENDRANAGAR(M) (Conld .. ) WARD 4 60
(Coneld .. ) 61
62 63 64
65 66 67
68
5 TOTAL 69
70
71
72
73
74
75
76
77
78
79
80 6 TOTAL
81
82
83
84
85
86
87
88
89
90
91
92
93
34
95
96 97
98
7 TOTAL 99
100 101
102
103
104
8 TOTAL 105
106
107
108 109
110
111 112 113
114
544
667
636
985
629
1176 1017
376 310
5 6
6637 1720 115
771 38 4
825 364
407 327
227
799
26
56 725 345
7
960 410 67
450 24 9 189
625 63 5 158 8
501 59 23
14588 1675 382
882 8 8 897 11
1192 611 33
946 28 3
829 125 112 759 7 24 627 20
953 63 ·i5
258
778 34 26
539 119 34 786 llO 17
750 480
34
28 19
749 324 35
1051 47 1094 117 15
1018 3908 1280 288
963 126 7 713 609 624 169 147
537 55 99
167 31 4
904 290 31
9455 1530 163
997 19
320 2 6
452 8 781 135 4 673 622
618 290 16
574 27
483 89 2
831 697
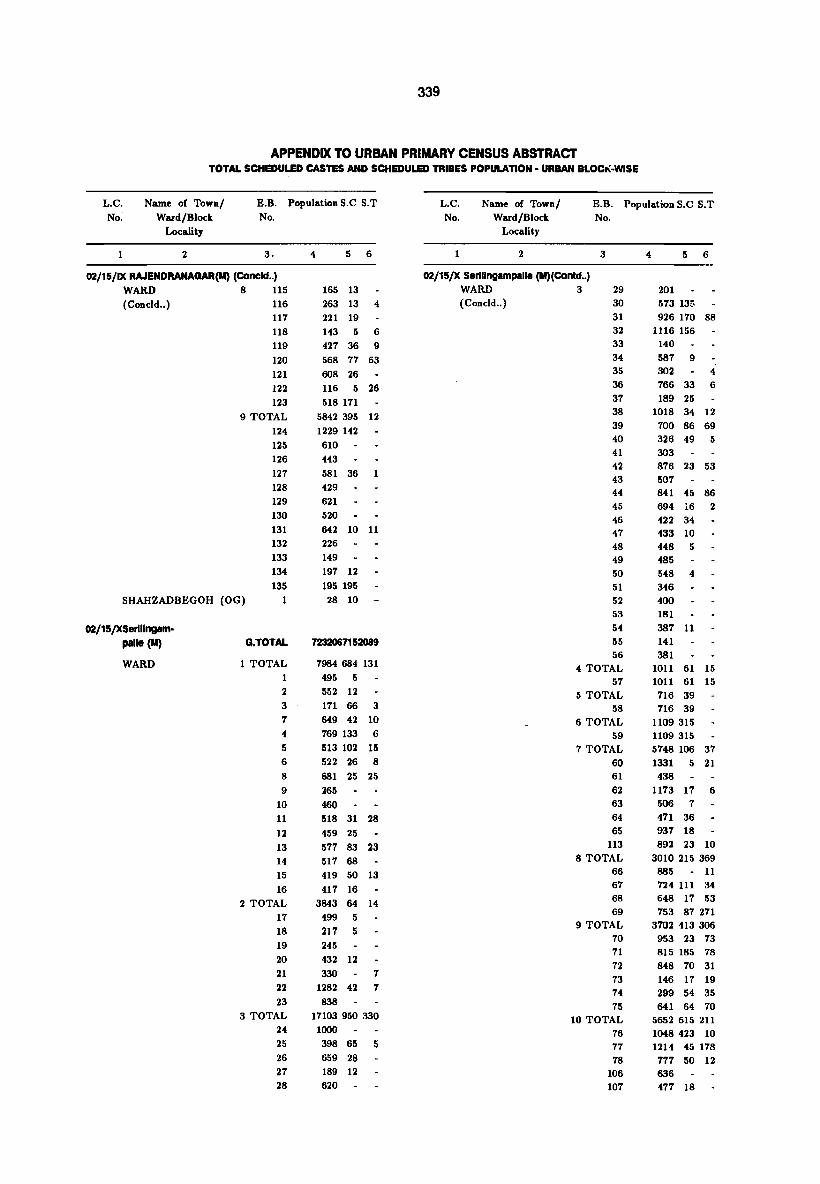
339
APPENDIX TO URBAN PRIMARY CENSUS ABSTRACT TOTAL SCHEDULED CASTES AND SCHEDULED TRIBES POPULATION - URBAN BLOCr(-WlSE
L.C.
No. Name of Town/
Ward/Block Locality
E.B. Population S.C S.T
No.
1 2 3.
02/15/1X RAJENDRANAGAR(M) (Concld .. )
WARD 8 115 (Condd .. ) 116
117 118
119 120 121
122 123
9 TOTAL
124 125 126
127 128 129 130
131 132 133 134
135
SHAHZADBEGOH (OG)
02/15/XSerillngam
palle (M)
WARD
O.TOTAL
1 TOTAL 1
2
3 7
4
5 6
8
9
10 11
12 13 14
15
16
2 TOTAL 17 18
19 20 21 22 23
3 TOTAL 24 25
26 27 28
4 5 6
165 13 263 13 4 221 19 143 5 6 427 36 9 568 77 63
608 26 116 5 26
518 171 5842 395 12
1229 142 610 443
581 36 1 429 621 520
642 10 11 226 149
197 12
195 195 28 10
7232067152089
7984 684 131 495 5 552 12
171 66 3 649 42 10 769 133 6 513 102 15 522 26 8
681 25 25
265
460 518 31 28
459 25 577 83 23 517 68 419 50 13
417 16 3843 64 14
499 5 217 5
245 432 12 330 7
1282 42 7 838
17103 950 330 1000 398 65 5 659 28 189 12 620
L.C. No.
1
Name of Town/ Ward/Block
Locality
2
E.B. Population S.C S.T No.
3 4 5 6
02/15/X Serillngampalle (M)(Contd .. ) WARD 3 29
30 31 32 33 34 35 36 37 38 39 40 41 42 43 44 45 46 47 48 49 50 51 52 53 54 55 56
(Concld .. )
4 TOTAL 57
5 TOTAL 58
6 TOTAL 59
7 TOTAL 60 61 62 63 64 65
113 8 TOTAL
66 67 68 69
9 TOTAL 70 71 72 73 74 75
10 TOTAL 76 77 78
106 107
201 573 135 926 170 88
1116 156 140 587 9 302 4 766 33 6 189 25
1018 34 12 700 86 69 326 49 5 303 876 23 53 507 841 45 86 694 16 2 422 34 433 10 448 5
485 548 4 346 400 181 387 11 141 381
1011 61 15 1011 61 15 716 39 716 39
1109315 1109315 5748 106 37 1331 5 21
438 1173 17 6
506 7 471 36 937 18 892 23 10
3010 215 369 885 - 11
724 111 34 648 17 53 753 87271
3702413306 953 23 73 815 185 78 848 70 31 146 17 19 299 54 35 641 64 70
5652 615 211 1048 423 10 1214 45 178 777 50 12 636 477 18

340
APPENDIX TO URBAN PRIMARY CENSUS ABSTRACT TOTAL SCHEDULED CASTES AND SCHEDULED TRIBES POPULATION· URBAN BLOCl(·II\IISE
L.C. Name of Town/ E.B. Population S.C S.T
No. Ward/Block No. Locality
2 3
02/15/X Serillngampalle (M)(Contd •• ) WARD 10 108
(Coneld •. ) 109
111
11 TOTAL 79
80
110 12 TOTAL
81
13 TOTAL
82 83
84 85
86 87
88 14 TOTAL
89
90 91
15 TOTAL
92
93
94
16 TOTAL 95
96 97
17 TOTAL
98
99
100 101
10?
103
104 105
112
o:J./15/XI SHAMSHABAD(P) a.TOTAL
WARD 1 TOTAL
1
2
2 TOTAL
3
4 3 TOTAL
5 6
4 TOTAL
7
8 5 TOTAL
9 6 TOTAL
10
4 5 6
272 16 4
588 4 640 59 7
2259 520 103
789 352
673 111 103
797 57
960 194
960 194
6210 888 62
1096 11 18 895 72 2
921 274 926 168
933 329 11 747 12
692 22 31
1337 473 63
586 350
474 42 54
277 81 9
2193 310
556
445 1192 310
2545 399 419 944 162 127
954 203 258 647 34 34
6938 469 29
708 8 565 202 3
494 156 936 50 3
580
539 7
583
1189 7
1344 39 23
15366 2660 466
2024 118 20 1068 42 5
956 76 15
1839 124 1:;9
893 77
946 47 159 1246 28 4
998 28 4
248
1713 153 168
775
938 153 168
910 139 6
910 139 6 1735 232
915 112
L.C. Name of Town/ E.B. Population S.C S.T
No. Ward/Block No. Locality
2 3
02/15/XJ SHAMSHA8AD(P) (ConoId .. ) WARD6(Concld .. ) 11
02/15/XIII TANDUR(M)
WARD
7 TOTAL 12 13
8 TOTAL 14
15 9 TOTAL
16 17
10 TOTAL 18
11 TOTAL 19
12 TOTAL 20 21
O.TOTAL
1 TOTAL 1 2
3
4
5 6 7 8 9
10 11 12
2 TOTAL 13 14
15 16 17
3 TOTAL 18
19 ZO Z1
4 TOTAL 22 23
24 25 26
5 TOTAL 27 28
29
30
31 32 33 34 35
4 5 6
820 120 1234 111 16 835 45 399 66 16
'1325 93 11 432 44
893 49 11 1173 1067 6
720 653 453 414 6 899 71 899 71
665 113 72 665 113 72 603 411 4
65 538 411 4
45517 3941 548
9201 648 209 749 73 5 950
585 200 30 619 16
994 22 90 897 10 6 675 21 5 710 28 2 680 32
749 26 6
701 59 53 892 71 12
3755 438 15 828 245 820 49 700 86 834 39 15 573 19
3104 259 91 735 1 11
1036 115 4 1113 121 64 220 2Z 12
3082 45 23 499 677 22
911 17 17
387. 3 608 3 6
6269 107 112
1014 63 28 849 6
647 23
496 3
905 77 920 510 215 15 4 218

341
APPENDIX TO URBAN PRIMARY CENSUS ABSTRACT TOTAL SCHEDULED CASTES AND SCHEDULED TRIBES POPULATION· URBAN BLOCK·WISE
L.C. Name of Town/ E.B. Population S.C S.T No. Ward/Block No.
Locality
2 3
02/15/X111 TANDUR(M) (Concld .. ) WARD5(Concld .. ) 36
6 TOTAL 37
38
39
40
41
42
43
44
45
46
47
48
7 TOTAL 49
50
51
52
53
54
55
8 TOTAL 56
57
58
59
60
61
62
63
64
65
66
67
68
69
70
02/15/XIV UPPAL KALAN(M) G.TOTAL
WARD TOTAL
2
3 4
5 6 7
8
9
10
11
12
13
2 TOTAL 14
15
4 5 6
495
6386 181 4
208 29 388
742
490
292
582 24
301 155
758
847 14
786 104 4
837 10
4089 369 8
859 4 4
835 224
758 5
361
559 7
265
452 129 4
96311894 86
281 58 67
1019 561 19
704 390
627 608
592 179
868 60
887 7
613
285
500 31
353
863
547
474 1018
75660 7214 1099
8288 970 618
935 703 3
698 114 86
VI VI VI 681 456 3 13
1063 9 31
1030 23
965 33 21
208 97
454 - 324
962 58 43
348
488 27
34649 4561 292
1140 20 112
L.C. Name of Town/ E.B. Population S.C S.T No. Ward/Block No.
Locality
2 3
02/15/XIV UPPAL KALAN(M) (Contd .. ) WARD 2 16
(Coneld .. ) 17 18
19 20
21
22
l16
23 24
25
26
27
28
29
30
31 32
33 34
35
36
37
38
39
40
41
42
43
H
45
46 47
48 49
50
51
52
53 54
55
56
57
58
59
60
61 62
63
64
65
66
3 TOTAL 67
68
69
70
71 72
4 5 6
672 18
450 8 734 32
471 25 453 18
1004 650 9
841 678
290 23 6
916 669
276
708 255
497 13
384
666 4
821
216
767 242
931
664 873 22
898 35
941 143
684 32 6
771 47 6
479 24
259 27
740
522 28
657 44 3 843 76
763 71 44
709 200
586 117 3 539
878 34
759 9 8
778 88 112
807 59 1
978 190 4
143 5
238 21
155 5
161 22
779 4 12
845 19
907 70
239 13 450 10 14
724 152 6
930 199 27
903 92 4
698 56 19
32707 1667 189
956 5
279 6
612 268
987 58 19
836 9 34
939 20 3

342
APPENDIX TO URBAN PRIMARY CENSUS ABSTRACT TOTAL SCHEDULED CASTES AND SCHEDULED TRIBES POPULAnON • URBAN BLOCK·WlSE
L.C.
No. Name of Town/
Ward/Block Locality
E.B. Population S.C S.T
No.
1 2 3
02/15/XN UPPAL KALAH(N) (Concld .. ) WARD 3 73
(Condd .. ) 74
75 76
77 78 79
80
81
82
83
84 85
86
87 88 89
90 91
92
93 94
95
96 97 98
99 100
101 102 103
104
105
106
107
108
109 110
III 112
113
114
115
MAKTABIBISAHEBGUDA (OG) 1
02/15jXVVJCARABAD(M)
WARD
G.TOTAL
1 TOTAL
1
2 2 TOTAL
3
4
5
6 7
8
4 5 6
211 15 287 25 645 41 5 757 103 6 756 350
746 28 7
483 4
792 22
670 7
627 4
607 755 46 693 23
811 5 950 5 740 30
691 28 12
837 36 16
558
807 769 3
793 50 14 822 38
658 782 14
548 5
508 7 684 5
730 26 12
553 2 7
550 5
876 13
384 23
527 18
394 46
222 46 459 17
1026 50 11
842 64 4
587 41
1039 34 20
626 32 4
296 5
16 16
3921568831683
911 386 616 128
295 258 2487 117 779
528
576 7
576 107
579 3 551
114 - 114
114 - 114
L.C. No.
1
Name of Town/ Ward/Block
Locality
2
E.B. Population S.C S.T No.
3 4 5 6
02/15/XV VlCARABAD(N) (COncld .. ) WARD 3 TOTAL
9 10 11
4 TOTAL 12 13 14 15 16 17 18 19 20 21 22 23 24 25 26 27 28 29 30 31 32 33
34 35 36 37 38 39 40 41 42 43 44 45 46 47 48 49
5 TOTAL 50 51 52
1761 245 4 117 768 17 876 228 4
275404513 294 611 46 12 237 35 794 181 20 875 53 13 567 51 16 678 44 26 963 252 115 330 857 10 1 724 53 919 62 3 930 71 8 913 133 21 933 132 1 440 11 640 609 96 10
1060 47 854 17 605 31 3 628 755 64 9 911 261 36 983 977
1041 489 655 537 9
986 840 476 32 324 155
519 80 1122 229
643 54 535 33 851 261 656 537 539 7
2337 637 299 259 276
346 346 53 278 - 278 54 55
6 TOTAL 56 57 58 59
7 TOTAL 60 61 62 63
528 160 650 131 21
1605 284 263 741 179 10 205 315 14 344 91 253
2574 701 44 702 49 20 561 84 603· - 24 444 304
64 264 264

343
APPENDIX TO URBAN PRIMARY CENSUS ABSTRACT TOTAL SCHEDULED CASTES AND SCHEDULED TRIBES POPULATION - URBAN BLOCK-WISE
L.C. Name of Town/
No. Ward/Block
E.B. Population S.C S.T
No.
Locality
2 3
02/15/XVIGADDI ANNARAM(P) G.TOTAL
WARD 1 TOTAL
2
2 TOTAL
3
4
3 TOTAL
5
6
4 TOTAL
7
8 5 TOTAL
9
10
6 TOTAL
11
12
7 TOTAL
13
14
8 TOTAL
15
16
9 TOTAL 17
18
19
10 TOTAL
20
21
11 TOTAL
22
23
24
12 TOTAL 25
26
13 TOTAL 27
28
14 TOTAL
29
30
15 TWAL
31
32
16 TOTAL
33
34
17 TOTAL 35
36
37
18 TOTAL 38
4 5 6
35187 670 363
1142 10 11
701 6
441 10 5
1264 3
315
949 3
2015
1127
888
40 97
40 97
1284 58 42
983 58 42
301
1255 9
379
876 9
992 17 17
604 7 388 17 10
1475 71
485 10
990 61
1105
625
480 1220 17 12
184
660 12 12
376 5
1570 2
550
1020 2
1968 115 5
752 29 5
653 5
563 81
1324 15 5
648 5
676 15
1587 55 2 771 19 2
816 36
1834 44 26
1022 44 4
,812
1427
706
721
1470
820
650
2629
4
4
22
20 16
12 13'
8 3
78 18
928 25 5
870 13 13
831 40
2109 23 6
771 3 6
L.C. Name of Town/ No. Ward/Block
E.B. Population S.C S.T No.
Locality
2 3
02/15/XVI GADDI ANNARAM(P) (Concld .. )
WARD 18 39
(Coneld .. ) 40
19 TOTAL H
·12
20 TOTAL 43
44
21 TOTAL 45
46 22 TOTAL
47
48
49
23 TOTAL
50
51
HYDERABAD (M.C.)
PORTION +OG TOTAL
02/15/IIIHYDERABAD (M.C.) PORTION G.TOTAL WARD 7 TOTAL
1
2
3
4
5
6
7
8
9
10
11 12
13
14
15
16 17
18
19
20
21
22
23
24
25
26
27
28
29
8 TOTAL 1
2
3
-1
4 5 6
594 20 744
1627 41 78
883 32 73
74-1 9 5
1131 22 14
1002 10 11
129
1598
12 3
21 11 972 21 5
626 6 1952
325 725
902 1209
224
985
7
7
93455114361323
79258 89721212 24025 1586 79
970 53 928 6
804 122
800 11 964 108 4
893 14 12
945 232 10
814 63
634 26
897 69
823 52 4
956 120
812
875 38 886 73
785 29
597 34 4
783 9
706 15 3 844 46
856 3
748 161
753 13 22
949 74
770 47
737
1130 36 7 745 119 12
621 13 35041 4998 459
441 5 30
772 191 104 656 156 12
543 321
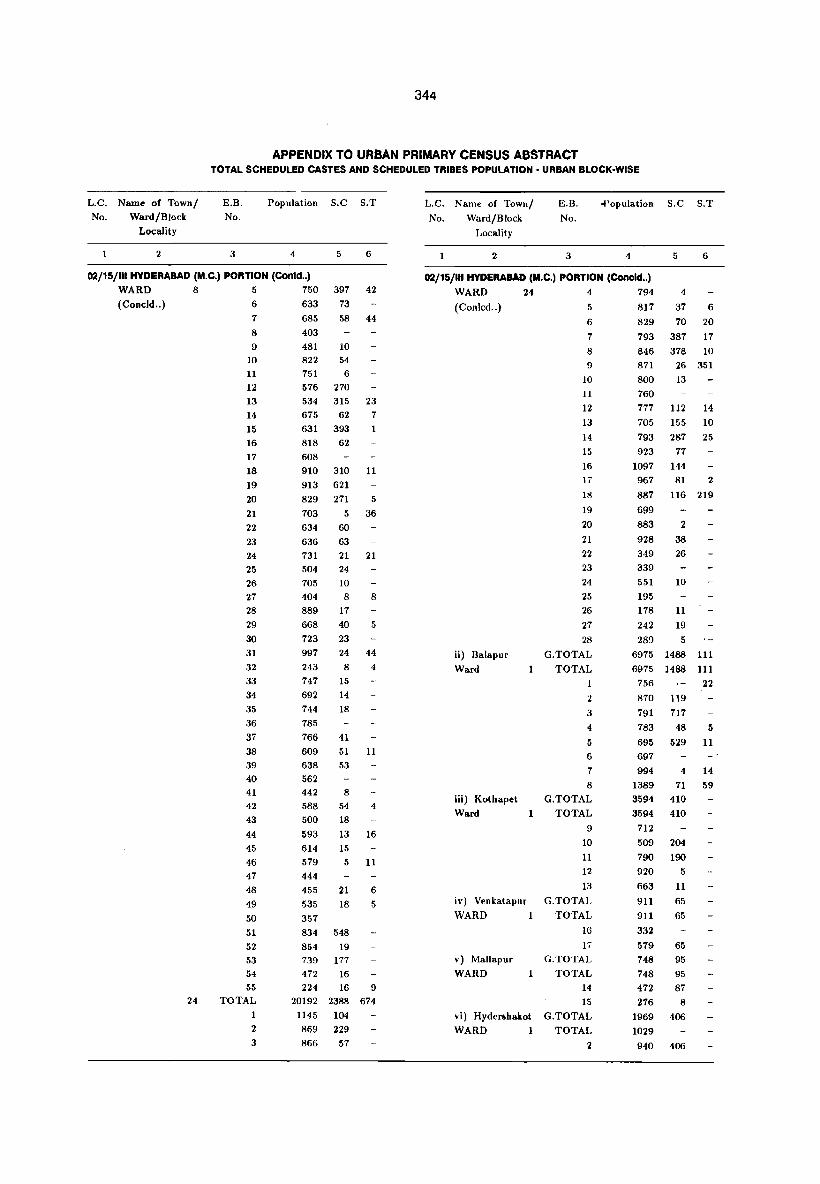
344
APPENDIX TO URBAN PRIMARY CENSUS ABSTRACT TOTAL SCHEDULED CASTES AND SCHEDULED TRIBES POPULATION - URBAN BLOCK-WISE
L.C. Name of Town/
No. Ward/Block
Locality
2
E.B. No.
3
Population S.C S.T
4 5 6
02/15/111 HYDERABAD (M.C.) PORTION (Contd .. )
WARD 8 5 750 397 42 (Coneld .. ) 6 633 73
24
7
8
9 10 11
12 13 14 15 16 17 18 19 20 21 22 23 24 25 26 27 28 29 30 31 32 33
34 35 36 37 38 39 40 41 42 43 44 45 46 47 48 49 50 51 52 53 54 55
TOTAL
1
2 3
685 403 481
58 44
10 822 54 751 6 576 270 534 315 23 675 62 7 631 393 1 818 62 608 910 310 11 913 621 829 271 5 703 5 36 634 60 636 63 731 21 21 504 24 705 404 889 668 723 997 243 747 692 744 785 766 609 638 562 442 588 500 593 614
579 444 455 535 357
10 8 8
17 40 5 23 24 44
8 4
15 14
18
41 51 11 53
8
54 4 18 13 16 15 5 11
21 18
6 5
834 548 854 19 739 177 472 16 224 16 9
20192 2388 674 1145 104 869 229 866 57
L.C. Name of Town/
No. Ward/Block
Locality
2
E.B. No.
3
.Population S.C S.T
4 5 6
02/15/111 HYDERABAD (M.e.) PORTION (Concld .. )
WARD 24 4 794 4
37 (Conled .. )
ii) Balapur
Ward
iii) Kothapet
Ward
iv) Venkatapur
WARD 1
v) Mallapur
WARD
vi) Hydershakot
WARD 1
5
6
7
8 9
10
11
12 13
14
15 16 17
18
19 20
21 22 23 24 25 26 27
28 G.TOTAL
TOTAL 1
2
3
4
5
6
7
8
G.TOTAL
TOTAL
9
10 11
12 13
G.TOTAL
TOTAL
16 17
G.TOTAL
TOTAL
14
15 G.TOTAL
TOTAL
2
817 6
829 70 20 793 387 17 846 378 10 871 26 351 800 13 760 777 112 14
705 155 10 793 287 25 923 77
1097 144 967 81 2
887 116 219
699 883 2 928 38
349 26 339 551 10 195 178 11 242 19 289 5
6975 1-188 111 6975 1488 111
756 22
870 119 791 717 783 48 5 695 529 11 697 994 4 14
1389 71 59 3594 410 3594 410
712 509 204 790 190 920
663
911 911
332 579 748 748 472 276
1969 1029
5
11
65 65
65 95 95 87
8
406
940 406

345
STATEMENT SHOWING THE DETAILS OF THE AREAS INCLUDED IN THE ENUMERATION BLOCKS OF URBAN AREAS OF RANGA REDDY DISTRICT
WARD/BLOCK/ E.B. House Nos. Descripdon of
LOCALITY No. No. the area covered in
From To each enulll<'fation Block
1 2 3 4 5
I ALWAL (M) TOWN (CLASS - II) ALWAL MANDAL
WARD 1 1-1-1 1-1-UO Old Alwal
2 1-2-1 1-2-129/3 -do-
3 1-3-1 1-3-72 -do-
4 1-3-73 1-3-159 -do-
5 H-1 1-4-127/1 -do-
6 1-5-1 1-5-26/8 Temple Alwal, Fathe Balaiah Colony
7 1-5-27 1-5-70/1/F -do-
8 1-5-70/11 1-5-160 -do-
9 1-5-161· 1-5-350 -do-
lO 1-6-1 1-6-129 -do-
II 1-7-1 1-7-100(3) Temple Alwal 12 1-8-1 1-8-120 -do-
13 1-8-121 1-8-160/3 -do-H 1-9-1 1-9-98/1 -do-15 1-10-1 1-10-71/1(7) -do-16 1-10-72 1-10-125 -do-
17 1-10-126 1-10-173 -do-18 1-11-1 1-11-131(2) -do-
19 1-12-1 1-12-42(2) -do-20 1-12-43(1) 1-12-147/1 -do-
21 1-13-1 1-13-106/3 Lothukunta 22 1-14-1 1-14-100 Alwal Lothkunta
23 1-15-1 1-15-111 Venkatraopet
24 1-16-1 1-16-70 Sainagar Colony
25 1-16-71 1-16-151 Sainagar Colony 26 1-17-1 1-17-43/2(2) Ramnagar Colony 27 1-17-44 1-17-113 Ramnagar Colony 28 1-18-1 1-18-55/12 MES Colony 29 1-18-56/1 1-18-99 MES Colony 30 1-19-1 1-19-103 Ketha Basthi
31 1-19-104 1-19-172/3/1 Ketha BMthi 32 1-20-1 1-20-38 Venkatapur
33 1-20-38/1 1-20-100/B -do-34 1-21-1 1-21-52(1) -do-
35 1-21-53 1-21-104(1) -do-36 1-22-1 1-22-104/C -do-37 1-23-1 1-23-104 Bhoodevinagar 38 1-23-105 1-23-182/1 -do-39 1-24-1 1-24-70 Indiranagar Colony
40 1-24-71 1-24-127/1 -do-41 1-24-128 1-24-157/4 -do-42 1-25-1 1-25-47 Gollaguda
1-26-1 1-26-58
43 1-27-1 1-27-73/1(5) Subhashnagar 44 1-28-1 1-28-101(4) -do-45 1-29-1 1-29-113 -do-46 1-30-1 1-30-108 -do-47 1-31-1 1-31-115/5 -do-48 1-31-116 1-31-191 -do-49 1-32-1 1-32-78 -do-
1-33-1 1-33-46/2 ~dv-

346
STATEMENT SHOWING THE DETAILS OF THE AREAS INCLUDED IN THE ENUMERATION BLOCKS OF URBAN AREAS OF RANGA REDDY DISTRICT
WARD/BLOCK/
LOCALITY No.
1
WARD 2
3
4
5
Singaipalle (OG)
to Alwal (M)
E.B.
No.
2
50
51
52
53
54
55
56 57
58
59
60
61
62
63
64 65
66
67
68
69
70
71
72
73 74
75
76
77
78
79
80 81
82
83
84
85
86
1
House Nos.
From To
3 4
Description of
the area covered in
each enumeration Block
5
I ALWAL (M) TOWN (CLASS - II) ALWAL MANDAL (Concld .. )
2-1-1
2-J-1
2-2-1
2-2-75
2-3-1
2-3-59/1
2-3-118/3
2-3-139
2-4-1/1
2-4-58/1 2-5-1
2-6-1
2-6-46(1)
2-7-1
2-7-77(1)
2-8-1 2-9-1
2-9-76
2-10-1
3-1-1
3-2-1
3-3-8
3-4-3/4
4-1-1
4-1-89
4-3-1 4-2-1
4-4-1
4-5-1
4-6-1
4-7-1
5-1-1
5-1-158
5-2-1
5-3-1
5-3-162
5-4-1
5-5-1 5-6-1
5-7-1
5-8-1
5-9-1 5-12-1
5-9-68
5-10-1
5-11-1
NA
2-1-76
2-1-62
2-2-74/1
2-2-211
2-3-58/2
2-3-118/3(4)
2-3-138
2-3-157/2
2-4-57
2-4-115/F
2-5-75/2
2-6-45(2)
2-6-124/1(2)
2-7-76 2-7-134
2-8-72/17 2-9-75/2
2-9-128/2
2-10-43
3-1-104(1)
3-2-91(1)
3-3-95(1)
3-4-28(D)
4-1-88
4-1-161
4-3-66
4-2-124
4-4-131/5 4-5-142(3)
4-6-33
4-7-57
5-1-157/10
5-1-208/1
5-2-108
5-3-161
5-3-194
5-4-108
5-5-115
5-6-104
5-7-113
5-8-140/2
5-9-67/10
5-12-66(4)
5-9-213/6/B 5-10-111
5-11-11
NA
Akbarjah Machabollaram, Market area
Machabollaram Market area
Machabollaram, 7-Temples area
Machabollaram, Erkal Basti
Machabollaram
Machabollaram
Machabollaram, Krishnanagar
Machabollaram, Krishnanagar
Machabollaram, Hanuman Tekdi
Machabollaram, Hanuman Tekdi
Machabollaram, Kammari Basti
Machabollaram, Harij anawada
-do-
Machabollaram Tenugu
-do-
Machabollaram, Reddi Basthi Kothabasti, Machabollaram
Shivambad
Buttemguda, J Bollaram
Bandar Turkapally
-do-
-do-
Kowkoor School area
-do-
-do-
Kowkoor, Kinda Basti
Kowkoor Harijan Basti
Kowkoor
-do-Kowkoor Harijan Basti and Weaker
Section Yapral &Bhagath Singh Nagar
-do-
Yapral
Yapral
Yapral_
Yapral
Yapral
Yapral
Yapral Erukula Basti
Yapral Bhoopatinagar
Yapral Bapuji Nagar Indiranagar
Bapujinagar
J J Nagar
J J Nagar
Singaipalle
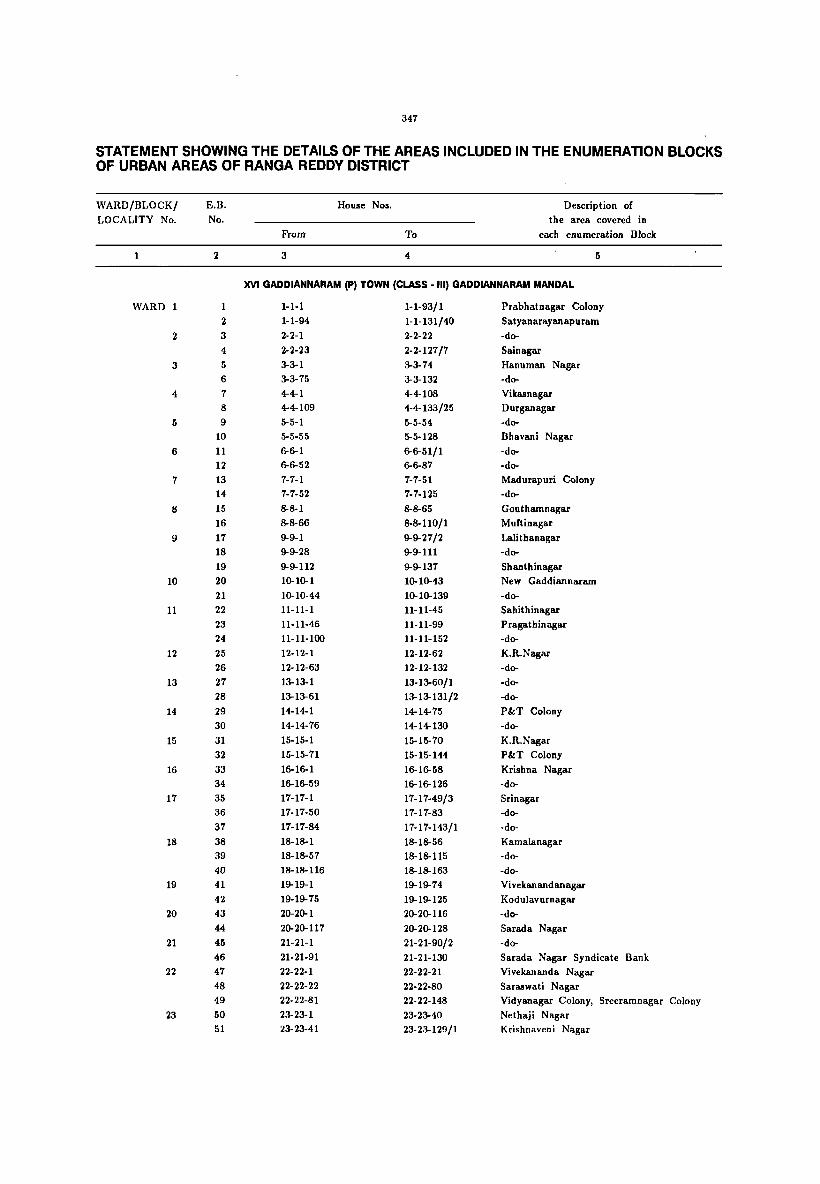
347
STATEMENT SHOWING THE DETAILS OF THE AREAS INCLUDED IN THE ENUMERATION BLOCKS OF URBAN AREAS OF RANGA REDDY DISTRICT
WARD/BLOCK/ E.B. House Nos. Description of
LOCALITY No. No. the area covered in From To each enumeration Block
2 3 4 5
XVI GADDIANNARAM (P) TOWN (CLASS - III) GADDIANNARAM MANDAL
WARD 1 1-1-1 1-1-93/1 Prabhatnagar Colony
2 1-1-94 1-1-131/40 Satyanarayan apuram
2 3 2-2-1 2-2-22 -do-
4 2-2-23 2-2-127/7 Sainagar
3 5 3-3-1 3-3-74 Hanuman Nagar
6 3-3-75 3-3-132 -do-
4 7 4-4-1 4-4-108 Vikasnagar 8 4-4-109 4-4-133/25 Durganagar
5 9 5-5-1 5-5-54 -do-lO 5-5-55 5-5-128 Bhavani Nagar
6 11 6-6-1 6-6-51/1 -do-12 6-6-52 6-6-87 -do-
7 13 7-7-1 7-7-51 Madurapuri Colony 14 7-7-52 7-7-125 -do-
8 15 8-8-1 8-8-65 Gouthamnagar 16 8-8-66 8-8-110/1 Muftinagar
9 17 9-9-1 9-9-27/2 Lalithanagar 18 9-9-28 9-9-111 -do-
19 9-9-112 9-9-137 Shanthinagar
10 20 10-10-1 10-10-43 New Gaddiannaram 21 10-10-44 10-10-139 -do-
II 22 11-11-1 11-11-45 Sahithinagar 23 11-11-46 11-11-99 Pragathinagar
24 11-11-100 11-11-152 -do-
12 25 12-12-1 12-12-62 K.R.Nagar 26 12-12-63 12-12-132 -do-
13 27 13-13-1 13-13-60/1 -do-28 13-13-61 13-13-131/2 -do-
14 29 14-14-1 14-14-75 P&T Colony
30 14-14-76 14-14-130 -do-
15 31 15-15-1 15-15-70 K.R.Nagar
32 15-15-71 15-15-144 P&T Colony
16 33 16-16-1 16-16-58 Krishna Nagar 34 16-16-59 16-16-126 -do-
17 35 17-17-1 17-17-49/3 Srinagar 36 17-17-50 17-17-83 -do-37 17-17-84 17-17-143/1 -do-
18 38 18-18-1 18-18-56 Kamalanagar 39 18-18-57 18-18-115 -do-40 18-18-116 18-18-163 -do-
19 41 19-19-1 19-19-74 Vivekanandanagar 42 19-19-75 19-19-125 Kodulavurnagar
20 43 20-20-1 20-20-116 -do-44 20-20-117 20-20-128 Sarada Nagar
21 45 21-21-1 21-21-90/2 -do-46 21-21-91 21-21-130 Sarada Nagar Syndicate Bank
22 47 22-22-1 22-22-21 Vivekananda Nagar 48 22-22-22 22-22-80 Saraswati Nagar 49 22-22-81 22-22-148 Vidyanagar Colony, Sreeramnagar Colony
23 50 23-23-1 23-23-40 Nethaji Nagar 51 23-23-41 23-23-129/1 Krishnaveni Nagar

348
STATEMENT SHOWING THE DETAILS OF THE AREAS INCLUDED IN THE ENUMERATION BLOCKS OF URBAN AREAS OF RANGA REDDY DISTRICT
WARD/BLOCK/ E.B. House Nos. Description of
LOCALITY No. No. the area covered in
From To each enumeration Block
2 3 4 5
III HYDERABAD (Me) PORTION
WARD 7 1 7-2-1 7-2-49/132/114 Sanathnagar '}. 7-'}.-49/15/ A/55 7-2-62 Sanathnagar
3 7-2-63 7-2-138 Sanathnagar
4 1-'}.-139 1-2-209 Sanathnagar
5 1-2-209/A 7-2-271 Sanathnagar
6 1-2-272 7-2-302 Sanathnagar
7 1-2-303 7-2-371 Sanathnagar
8 1-2-372 7-2-467 Sanathnagar
9 1-2-467 7-2-541 Sanathnagar
10 1-2-548/1 7-2-624 Sanathnagar
11 1-2-625 7-2-704 Sanathnagar
12 7-2-705 7-2-797 Sanathnagar
13 7-2-198 7-2-918 Sanathnagar
14 7-2-918/1 7-2-999 Sanathnagar
15 7-2-1000 7-2-1055 Sanathnagar
16 7-2-1071 7-2-1087/1/4 Sanathnagar
11 7-2-1OS1/E/ 7-2-1OS7/E/ Sanathnagar
H/3/A 14/13/ A/6
18 7-H087/A/1 7-2-1087/1/74 Sanathnagar
19 7-2-1OS7/A/51/A 7-2-1087/A/4 Sanathnagar
20 7-2-1OS1/A/149 7-2-1137/A Sanathnagar
21 1-2-1137/B 7-2-1235 Sanathnagar·
22 7-2-1211/1/1 7-2-1279 Sanathnagar
23 7-2-1280 7-2-1338 Sanathnagar
24 7-2-1329/1 1-2-1j99/4 Sanathnagar
25 7-2-1405 7-2-1475 Sanathnagar
26 7-2-1516 7-2-1590 Sanathnagar
27 7-2-1591 1-2-1654 Sanathnagar
28 7-2-1668 1-2-1188 Sanathnagar
29 7-2-1789 7-2-1860 Sanathnagar
1 8-4-64 8-4-339 Erragadda
2 8-4.-329/1/ A 8-4.-345/B /2 Erragadda
8-4-315/21/38 8-4-323 Erragadda
3 8-4-324 8-4-325/30 Erragadda
8-4-367/1 8-4-367/104 Vinayakrao Nagar
4. 8-4-367/105 8-4-367/228 Vinayakrao Nagar
5 8-4-367/229 8-4-361/358 Bora Banda
8-4-369/1 8-4-369/41 Bora Banda
6 8-4-369/48 8-4-369/300 Bora Banda
7 8-4-369/301 8-4-369/378 Bora Banda
8-4-369/220 8-4-369/239 Bora Banda
8 8-4-369/101 8-4-369/240 Bora Banda
9 8-4.-369/518 8-4-369/458 Bora Banda
10 8-4-369/459 8-4-369/505 Bora Banda
8-4-369/523 8-4-369/594/'P Bora Banda
11 8-4-369/595/P 8-4-369/652/0 Bora Banda
8-4-369/653/B 8-4-369/761/G Bora Banda
12 8-4-369/776/J 8-4-369/574/P Bora Banda
8-4-367/D /168 8-4-367/265 Swaraj Nagar

349
STATEMENT SHOWING THE DETAILS OF THE AREAS INCLUDED IN THE ENUMERATION BLOCKS OF URBAN AREAS OF RANGA REDDY DISTRICT
WARD/BLOCK/ E.B. House Nos. Description of
LOCALITY No. No. th e area covered in
From To each enumeration Block
1 2 3 4 5
III HYDERABAD (MC) PORTION (Contd .. )
WARD 8 13 8-4-361/B/218 S.4-361/D /280 Bora Banda
(Coneld .. ) 14 8-4-368/1 8-4-368/109 Sultan Nagar
15 8-4-368/110 S.4-368/212 Sultan Nagar
16 8-4-368/213 8-4-368/216/43 Sultan Nagar
8-4-369/211 8-4-369/111/C Sultan Nagar 11 8-4-369/211/112 8-4-368/26/ A Sultan Nagar
18 8-4-312/1 8-4-319/11 Sultan Nagar 19 8-4-319/1/ A S.4-319/52 Sultan Nagar
20 8-4-319/53 S.4-319/55/2 Erragadda
8-4-380/1/9 8-4-380/1/30/C Erragadda
21 8-4-380/1/30/D 8-4-380/1/13/ A Erragadda 22 8-4-380/1/13/B 8-4-380/3/3 Erragadda
23 8-4-385/1 s.4-390/ A/8 Erragadda 24 8-4-390/ A/12/ A 8-4-403/13/1 Erragadda
25 8-4-403/15 8-4-494/9 Erragadda
26 8-4-421/4/1 8-4-543/20/2 Sulthan Nagar 21 8-4-543 8-4-546/B/12 Erragadda
8-4-544/26 8-4-544/50/20 Erragadda
28 8-4-544/51/1 8-4-544/80/1 Erragadda 29 8-4-544/15/B 8-4-544/M/4 Erragadda 30 8-4-544/59/1 8-4-544/5/22 Erragadda 31 8-4-546/12 8-4-548/37 Erragadda 32 8-4-548 8-4-548/210 Erragadda
8-4-548/E/45 8-4-548/E/82 Erragadda
33 8-4-548/E/83 8-4-548/E/50/49 Erragadda 34 8-4-549/1 8-4-549/116 Erragadda
35 8-4-549/111 8-4-549/165 Erragadda 36 8-4-549/201 8-4-549/235 Erragadda 31 8-4-549/236 8-4-549/320 Erragadda
8-4-550/1 8-4-550/32 Erragadda
38 8-4-550/33 8-4-550/138 Erragadda 39 8-4-369/211/1 8-4-369/211/111 Erragadda
40 8-4-369/211/112 8-4-369/211/243 Erragadda 41 N.R.R.Puram Labour Erragadda
Commissioner Qtrs 1 to 100
42 Quarters M/101 200 Erragadda
8-4-311/B/1 S.4-311/B/154 Erragadda 43 Qtrs No.201 300 Erragadda
44 Qtrs No.301 400 Erragadda 45 Qtrs No.401 500 Erragadda 46 8-4-310/1 8-4-310/125 Erragadda 47 8-4-370/126 8-4-370/250 Erragadda 48 8-4-370/251 S.4-370/375 Erragadda 49 8-4-370/376 S.4-370/500 Erragadda 50 8-4-370/501 8-4-370/617 Erragadda 51 Qtrs No.1 184 Erragadda
(Labour Commissioner Quarters III Vet) 52 8-4-369/211 8-4-369/211 Erragadda
/65/176/1 /65/176/114 53 8-4-369/169/1 8-4-369/169/74 Erragadda 54 8-4-369/211 S.4-369/211/ Erragadda
65/85 412

350
STATEMENT SHOWING THE DETAILS OF THE AREAS INCLUDED IN THE ENUMERATION BLOCKS OF URBAN AREAS OF RANGA REDDY DISTRICT
WARD/BLOCK/ E.B. House Nos. Description of
LOCALITY No. No. the area covered in
From To each enumeration Block
1 2 3 4 5
III HYDERABAD (Me) PORTION (Contd .. )
WARD 8 55 8-4-544/59/11 8-4-544/59/71 Erragadda
(Concld .. ) 8-4-544/74/78 8-4-544/74/100 Erragadda
24 1 1-8-472 1-8-533 Begumpet
2 1-8-534 1-8-597 Begumpet
3 1-8-598 1-8-637 Begumpet
4 1-8-638 1-8-717 Begumpet
5 1-8-718 1-8-790 Begumpet
6 1-8-791 1-8-875/A Begumpet
7 1-8-1 1-8-30/72 Ghast Road, Minister Road 8 1-8-450 1-8-489 Ghast Road, Minister Road
9 Lalbahadur Sastry Slum Ghast Road, Minister Road 10 1-8-510/A 1-8-510/48 Ghast Road, Minister Road
1-8-518/303 1-8-518/307/1 Ghast Road, Minister Road
11 1-8-518/64 1-8-518/216 Ghast Road, Minister Road
12 1~11-87 1-11-90 Begumpet
13 1-11-90 1-11-110/86 Begumpet
14 1-11-110/81 1-11-111/5 Begumpet
15 1-11-1U/5/B 1-11-127 Begumpet
16 1-11-128 1-11-168 Begumpet
17 1-11-169 1-11-197/7 Begumpet
18 1-11-198 1-11-208 Begumpet
19 1-11-209 1-11-220 Begumpet
20 1-11-221 1-11-248/3 Begumpet
21 1-11-247 l-U-256/C Begumpet
22-28 11th Block NA NA
Mallapur (OG) 14 3-1 3-100/1 Mallapur
4-1 4-6 15 5-1 5-43/6
Venkatapur (OG) 16 2-1 2-73 Venkatapur
17 1-1 1-100
Hydershakot (OG) 1 1-1 1-71 Hydershakot
2 1-72 1-120 2-1 2-44/2
Balapur (OG) 1 1-1 1-133
2 2-1 2-130 3 3-1 3-149 Balapur
4 4-1 4-64/4/1 5 4-65 4-151 6 5-1 5-100
7 5-101 5-157/i 6-1 6-38/3
8 7-1 7-44/14 Kothapet (OG) 9 1-1 1-100
10 2-1 2-100 11 3-1 3-66/4 Kothapet
4-1 4-64 12 5-1 5-100
7-1 7-45 13 6-1 6-89
8-1 8-26
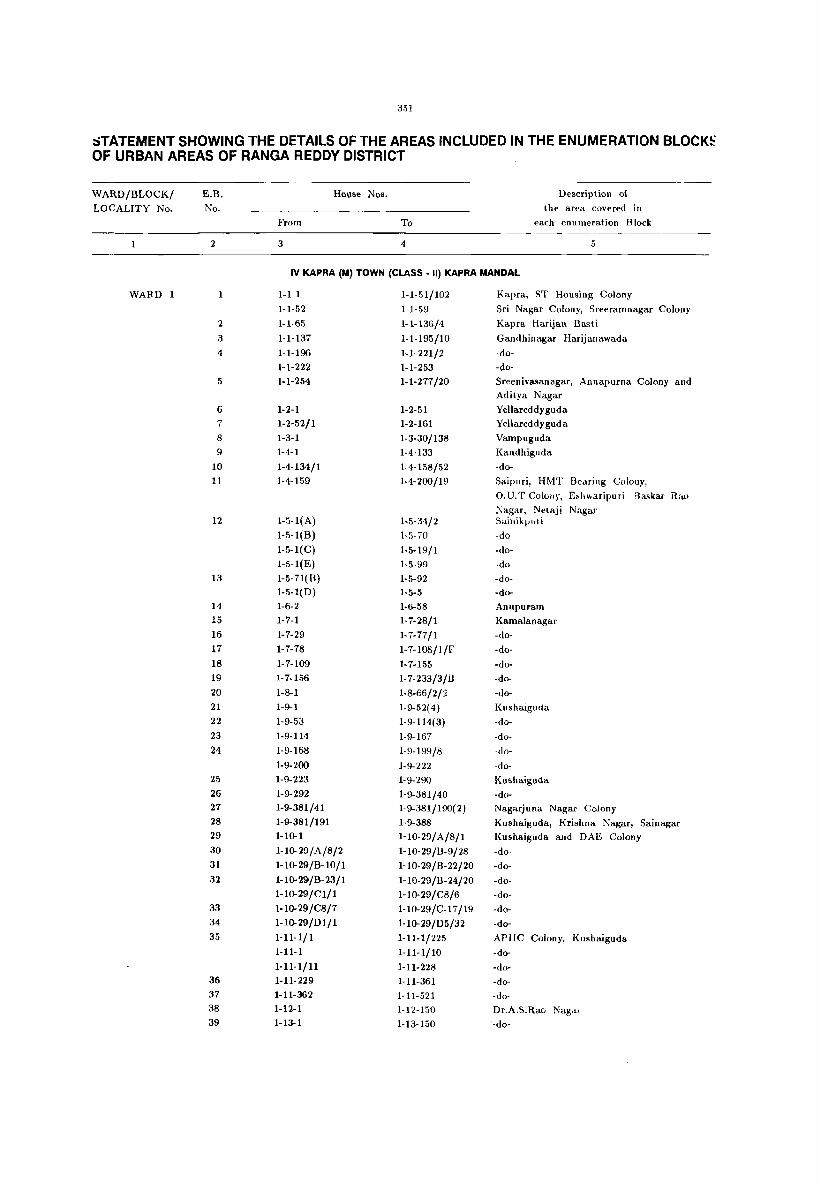
351
tiTATEMENT SHOWING THE DETAILS OF THE AREAS INCLUDED IN THE ENUMERATION BLOCK~ OF URBAN AREAS OF RANGA REDDY DISTRICT
WARD/BLOCK/ LOCALITY No.
1
WAFD 1
E.B.
No.
2
1
2
3
4
5
6
7
8
9
10
11
12
13
14
15
16
17 18
19
20
21
22
23
24
25
26 27
28
29
30
31
32
33 34
35
36 37
38
39
House Nos.
From To
3 4
Description of
the area covered in
each enumeration Block
5
IV KAPRA (M) TOWN (CLASS. II) KAPRA MANDAL
1-1-1
1-1-52
1-1-65
1-1-137
1-1-196
H-222
1-1-254
1-2-1
1-2-52/1
1-3-1
1-4-1
1-4-134/1
1+159
1-5-1(A)
1-5-1(B)
1-5-1( C)
1-5-1(E)
1-5-71(B) 1-5-1(0) 1-6-2
1-7-1
1-7-29
1-7-78
1-7-109
1-7-156
1-8-1
1-9-1
1-9-53
1-9-114
1-9-168
1-9-200 1-9-223
1-9-292
1-9-381/41
1-9-381/191 1-10-1
1-10-29/A/8/2
1-10-29/8-10/1
1-10-29/8-23/1
1-10-29/Cl/1
1-10-29/C8/7
1-10-29/01/1
1-11-1/1
1-11-1
1-11-1/11
1-11-229
1-11-362
1-12-1
1-13-1
1-1-51/102
1-1-59
1-1-136/4
1-1-195/10
1-1-221/2
1-1-253
1-1-277/20
1-2-51
1-2-161
1-3-30/138 1-4-133
1-4-158/52
1-4-200/19
1-5-34/2
1-5-70
1-5-19/1 1-5-99
1-5-92
1-5-5
1-6-58
1-7-28/1
1-7-77/1
l-7-108/I/F
1-7-155
1-7-233/3/8
1-8-66/2/2 1-9-52( 4)
1-9-114(3)
1-9-167
1-9-199/8
1-9-222
1-9-290
1-9-381/40
1-9-381/190(2) 1-9-388
HO-29/ A/8/l
1-10-29/B-9/28
1-10-29/B-22/20
1-10-29/8-24/20
1-10-29/C8/6
1-10-29/C-17/19
1-10-29/05/32
1-11-1/225
1-11-1/10
1-11-228
1-11-361
1-11-521
1-12-150
1-13-150
Kapra, ST Housing Colony
Sri Nagar Colony, Sreeramnagar Colony
Kapra Harijan Basti
Gandhinagar Harijanawada
-do-
-do-
Sreenivasanagar, Annapurna Colony and Aditya Nagar
Yellareddyguda
Yellareddyguda
Vampuguda
Kandhiguda
-do-
Saipuri, HMT Bearing Colony,
O.U.T.ColoIlY, Esh .. aripuri ~askar Rao
Nagar, Netaji Nagar Sainikl'IJli
-do-
-do-
-do-
-do--do-
Anupuram
Kamalanagar
-do-
-do-
-do-
-do-
-do-
Kushaiguda
-do-
-do-
--do-
-do-
Kushaiguda
-do-Nagarjuna Nagar Colony
Kushaiguda, Krishna Nagar, Sainagar Kushaiguda and OAE Colony
-do-
-do-
-do-
-do-
-do-
-do-
APlIC Colony, Kushaiguda
-do-
-do-
-do-
-do-
Or.A.S.Rau Nagar
-do-

352
STATEMENT SHOWING THE DETAILS OF THE AREAS INCLUDED IN THE ENUMERATION BLOCKS OF URBAN AREAS OF RANGA REDDY DISTRICT
WARD/BLOCK/
LOCALITY No.
WARD 1
(Concld .. )
2
3
4
B.B. No.
2
40
41
42
43
44
45
46
47
48
49
50
51 52
53
54
55
56
57
58
59
60
61
62
63
64
65
66 67
68
69
70
71
72
73
74
75
76
77
78 79
80
81
82
83
84
85
86
House Nos.
From To
4
De~cril )n of
the ar"a covered in
each enumeration Block
5
IV KAPRA 1M) TOWN (CLASS. II) KAPRA MANDAL IContd .. )
1-14-1
1-15-1
1-16-1
1-17-1
1-18-3
1-19-1
2-1-1
2-2-1
2-3-1
2-4-1
2-5-1
2-6-1 2-7-1
2-7-160
2-7-307
2-7-453
2-7-612
2-8-1
2-9-1
2-10-11
3-1-1
3-1-7
3-1-71
3-1-145
3-2-1
3-2-60
3-3-1
3-4-1
3-4-24/1
3-4-41/1 3-5-1
3-6-1
3-7-1
3-8-1
3-9-1
3-10-1
3-10-2/1
3-10-2/154
3-10-2/301
3-10-2/451
3-11-1/1 4-1-1
4-1-60/1
4-1-81/4/ A
4-1-114
4-1-221
4-2-1
4-2-66
4-3-1
1-14-150
1-15-150
1-16-150
1-17-148
1-18-150
1-19-97
2-1-104
2-2-99/1
2-3-71
2-4-28/3
2-5-55/117
2-6-44/29 2-7-159
2-7-306 2-7-452
2-7-611
2-7-765
2-8-54
2-9-50
2-10-636/19
3-1-6/132
3-1-70/A
3-1-144
3-1-200
3-2-59/C
3-2-104 3-3-66/2
3-4-24 3-4-41
3-4-41/163
3-5-43
3-6-51
3-7-115
3-8-107
3-9-32
3-10-69
3-10-2/150
3-10-2/300
3-10-2/450
3-10-2/575
3-11-104
4-1-59/2
4-1-80/43
4-1-113
4-1-220
4-1-233/74
4-2-65/1
4-2-143/2
4-3-41/H
Dr.A.S.Rao Nagar
-do-
-do-
-do-
-do-
Dr.A.S.Rao Nagar, Rukminipuri, Tya-
garayanagar Laxmipuri, Brindavan
dhyanagar Pedda Cherlapally
-do-
Chinna Cherlapally
E.N.Reddy Colony
Nagar and Ayo-
Bharathnagar Colony, Cherlapally
FCI Quarters and Factory
HCL "~uarters HCL Q'uarters HCL Quarters
HCL Quarters
HCL Quarters
HCL Quarters
APlle Sheds
E.C.Nagar Old Village &VivekanaRdanagar Colony
-do-
-do-
Old Village Mallapur
-do-
-do--do-
Narasimhanagar Colony -do-
-do-
Krishll!\nagar Colony
Subhashnagar, Marriguda
Ashoknagar
-do-
-do-
IDA Mallapuram
-do-
Nehrunagar
-do-
-do-
HCL Colony Snehapuri Nacharam
Snehapuri and P&T Colony
VST Colony, Sreenagar, Bhavani Nagar
VST Colony &Rajivnagar
Rajiv Nagar, VST Colony, Kartikeyana
gar Ambedkarnagar, Nacharam viIlage
Nacharam village
Nachatam village
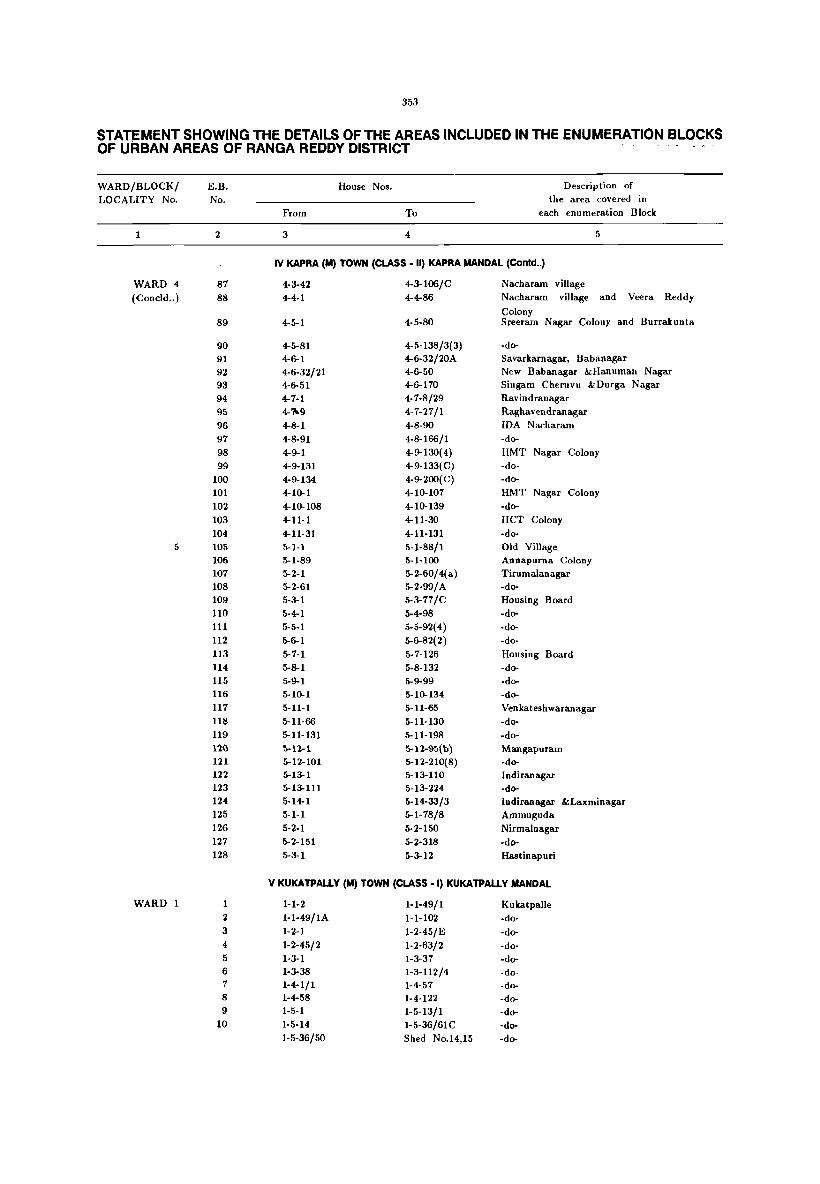
353
STATEMENT SHOWING THE DETAILS OF THE AREAS INCLUDED IN THE ENUMERATION BLOCKS OF URBAN AREAS OF RANGA REDDY DISTRICT
WARD/BLOCK/ LOCALITY No.
1
WARD 4 (Coneld .. )
5
WARD 1
E.B. No.
2
87 88
89
90 91 92 93 94 95 96 97 98 99
100 101 102 103 104 105 106 107 108 109 110 111 112 113 114 115 116 117 118 119 l'l(}
121 122 123 124 125 126 127 128
1 2
3
4 5
6 7 8 9
10
House Nos.
From To
3 4
Description of the area covered in
each enumeration Block
5
IV KAPRA (M) TOWN (CLASS - II) KAPRA MANDAL (Contd .. )
4-3-42 4-4-1
4-5-1
4-5-81 4-6-1 4-6-32/21 4-6-51 4-7-1 4-'j\o9
4-8-1 4-8-91 4-9-1 4-9-131 4-9-134 4-10-1 4-10-108 4-11-1 4-11-31 5-1-1 5-1-89 5-2-1 5-2-61 5-3-1 5-4-1 5-5-1 5-6-1 5-7-1 5-8-1 5-9-1 5-10-1 5-11-1 5-11-66 5-11-131 5-12-1 5-12-101 5-13-1 5-13-111 5-14-1 5-1-1 5-2-1 5-2-151 5-3-1
4-3-106/C 4-4-86
4-5-80
4-5-138/3(3) 4-6-32/20A 4-6-50 4-6-170 4-7-8/29 4-7-27/1 4-8-90 4-8-166/1 4-9-130( 4) 4-9-133(C) 4-9-2OO(C) 4-10-107 4-10-139 4-11-30 4-11-131 5-1-88/1 5-1-100 5-2-60/4(a) 5-2-99/A 5-3-77/C 5-4-98 5-5-92(4) 5-6-82(2) 5-7-126 5-8-132 5-9-99 5-10-134 5-11-65
5-11-130 5-11-198 5-12-~5(b)
5-12-210(8) 5-13-110 5-13-224 5-14-33/3 5-1-78/8 5-2-150 5-2-318 5-3-12
Nacharam village Nacharam village and Veera Reddy
Colony Sreeram Nagar Colony and Burrakunta
-do-Savarkarnagar, Babanagar New Babanagar &Hanuman Nagar Singam Cheruvu &Durga Nagar Ravindranagar Raghavendranagar IDA Nacharam -do-HMT Nagar Colony -do--do-HMT Nagar Colony -do-nCT Colony -do-Old Village Annapurna Colony Tirumalanagar -do-Housing Board -do--do--do-Housing Board -do--do--do-Venkateshwaranagar -do--do-Mangapuram -doIndiranagar -do-Indiranagar &Laxminagar Ammuguda Nirmalnagar -do-Hastinapuri
V KUKATPALLY (M) TOWN (CLASS -I) KUKATPALLY MANDAL
1-1-2 1-1-49/1A 1-2-1 1-2-45/2 1-3-1 1-3-38 1-4-1/1 1-4-58 1-5-1 1-5-14 1-5-36/50
1-1-49/1 1-1-102
1-2-45/E 1-2-63/2 1-3-37 1-3-112/4 1-4-57 1-4-122 1-5-13/1 1-5-36/61C Shed No.14,15
Kukatpalle -do--do--do--do--do--do--do--do--do--do-
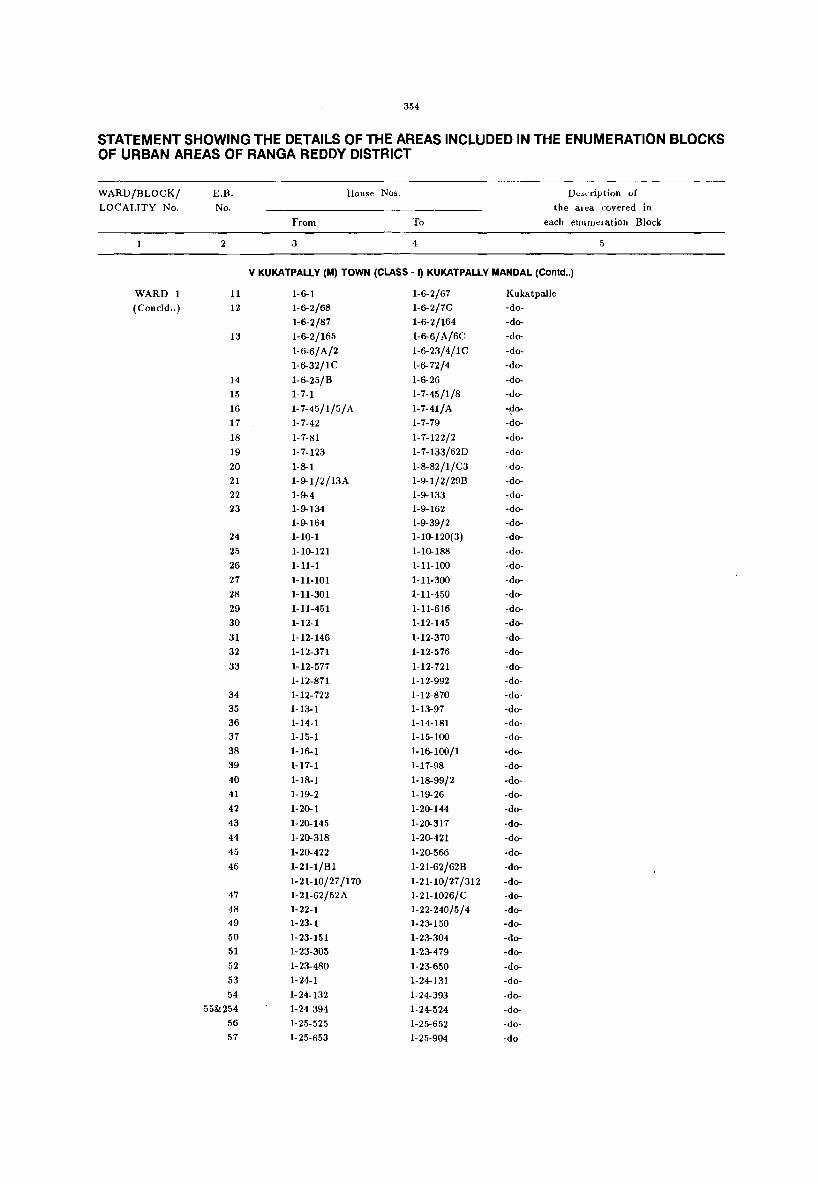
354
STATEMENT SHOWING THE DETAILS OF THE AREAS INCLUDED IN THE ENUMERATION BLOCKS OF URBAN AREAS OF RANGA REDDY DISTRICT
WARD/BLOCK/ E.B. House Nos. D".cTiption of
LOCALITY No. No. the a.ea covered in
From To each cllun'''lation Block
2 3 4 5
V KUKATPALLY (M) TOWN (CLASS - I) KUKATPALLY MANDAL (Conld .. )
WARD 1 11 1-6-1 1-6-2/67 Kukatpalle
(Coneld .. ) 12 1-6-2/68 1-6-2/7C -do-
1-6-2/87 1-6-2/164 -do-
13 1-6-2/165 1-6-6/A/6C -do-
1-6-6/A/2 1-6-23/4/1C -do-
1-6-32/1C 1-6-72/4 -do-
14 1-6-25/B 1-6-26 -do-
15 1-7-1 1-7-45/1/8 -do-
16 1-7-45/1/5/A 1-7-41/A -flo-
17 1-7-42 1-7-79 -do-
18 1-7-81 1-7-122/2 -do-
19 1-7-123 1-7-133/62D -do-
20 1-8-1 1-8-82/1/C3 -do-
21 1-9-1/2/13A 1-9-1/2/29B -do-
22 1-9-4 1-9-133 -do-23 1-9-134 1-9-162 -do-
1-9-164 1-9-39/2 -do-
24 1-10-1 1-10-120(3) -do-
25 1-10-121 1-10-188 -do-
26 1-11-1 1-11-100 -do-
27 1-11-101 1-11-300 -do-
28 1-11-301 1-11-450 -do-
29 1-11-451 1-11-616 -do-
30 1-12-1 1-12-145 -do-
31 1-12-146 1-12-370 -do-
32 1-12-371 1-12-576 -do-
33 1-12-577 1-12-721 -do-
1-12-871 1-12-992 -do-
34 1-12-722 1-12-870 -do-35 1-13-1 1-13-97 -do-36 1-14-1 1-14-181 -do-37 1-15-1 1-15-100 -do-
38 1-16-1 1-16-100/1 -do-39 1-17-1 1-17-98 -do-
40 1-18-1 1-18-99/2 -do-41 1-19-2 1-19-26 -do-
42 1-20-1 1-20-144 -do-
43 1-20-145 1-20-317 -do-
H 1-20-318 1-20-421 -do-
45 1-20-422 1-20-566 -do-
46 1-21-1/Bl 1-21-62/628 -do-
1-21-10/27/170 1-21-10/27/312 -do-47 1-21-62/52A 1-21-1026/C -do-48 1-22-1 1-22-240/5/4 -do-49 1-23-1 1-23-150 -do-50 1-23-151 1-23-304 -do-51 1-23-305 1-23-479 -do-
52 1-23-480 1-23-650 -do-53 1-24-1 1-24-131 -do-54 1-24-132 1-24-393 -do-
55&254 1-24-394 1-24-524 -do-56 1-25-525 1-25-652 -do-57 1-25-653 1-25-904 -do-

355
STATEMENT SHOWING THE DETAILS OF THE AREAS INCLUDED IN THE ENUMERATION BLOCKS OF URBAN AREAS OF RANGA REDDY DISTRICT
WARD/BLOCK/ E.B. House Nos. Description of
LOCALITY No. No. the area covered in From To each enumeration Block
1 2 3 4 5
V KUKATPALLY (M) TOWN (CLASS - I) KUKATPALLY MANDAL (Contd •. )
WARD 1 58 1-26-1 1-26-132 Kukatpalle
(Concld .. ) 59 1-26-133 1-26-265 -do-
60 1-26-266 1-26-397 -do-61 1-26-398 1-26-528 -do-
62 1-27-529 1-27-661 -do-63 1-27-662 1-27-794 -do-
(:)4 1-27-795 1-27-927 -do-
65 1-27-928 1-27-1056 -do-
66 1-28-1 1-28-125 -do-
67 1-28-126 1-28-375 -do-
68 1-28-376 1-28-500 -do-
69 1-29-501 1-29-626 -do-
70 1-29-627 1-29-752 -do-7l 1-29-753 1-29-878 -do-
n 1-29-879 1-29-1000 -do-
73 1-3(}'1001 1-30-1100 -do-
74 1-3(}'1101 1-30-1320 -do-
75 1-31-2M/l/l 1-31-2M/l/23 -do-
1-31-2M/1/24 1-31-2M/1/46 -do-
76 1-31-2M/l/47 1-31-2M/1/69/6 -do-
1-31-2M/1/70/1 1-31-2M/l/92/6 -do-77 1-31-22/1/1 1-31-22/1/26/1 Kukatp"lIe
78 1-31-22/1/27 1-31-22/12/52 -do-
79 1-31-22/1/53 1-31-22/12/65 -do-
1-31-22/1/66 1-31-22/12/78 -do-
80 1-31-22/1/79 1-31-22/12/91 -do-
1-31-22/1/92 1-31-22/12/104 -do-81 1-31-22/1/105 1-31-22/12/118 -do-
1-31-22 / 1/119 1-31-22/12/132 -do-
82 1-31-22/1/133 1-31-22/12/146 -do-
1-31-22/1/147 1-31-22/12/158 -do-
1-31-159/C 1-31-193/C -do-
83 1-32-1 1-32-151 -do-
84 1-32-152 1-32-311 -do-
85 1-32-312 1-32-469 -do-
86 1-32-470 1-32-629 -do-
87 1-32-630 1-32-789 -do-
88 1-32-790 1-32-949 -do-
89 1-32-950 1-32-1189 -do-
90 1-32-1190 1-32-1399 -do-1-32-1410 1-32-1739 -do-
91 1-33-1/ A 1-33-34 -do-92 1-33-35 1-33-95/5 -do-
93 1-34-1 1-34-67/6 -do-94 1-35-25/40 1-35-26/5 -do-
1-35-35/95C 1-35-35/210C -do-95 1-35-26/6 1-35-39 -do-96 1-36-1 1-36-215/C -do-97 1-36-216/C 1-36-293/C -do-
98 1-37-I/C 1-37-00/5 -do-99 1-38-I/C 1-38-168/C -do-
100 1-39-1/C 1-39-60!C!1 ·do-

356
STATEMENT SHOWING THE DETAILS OF THE AREAS INCLUDED IN THE ENUMERATION BLOCKS OF URBAN AREAS OF RANGA REDDY DISTRICT '
WARD/BLOCK/
LOCALITY No.
WARD 1
(Coneld .. )
2
3
4
5
E.B.
No.
2
101
102
103 104
105 106
107
108
109
110
111 112
113
114 115
116
117 118
119 120
121 122
123 124
125
126
127
128
129 130
131 132
133
134
135
136 137
138
139
140
141
142 143 144
145 146
147
148
\.
House Nos. Description of
the area covered in
From To each enumeration Block
3 4 5
V KUKATPALLY (M) TOWN (CLASS -I) KUKATPALLY MANDAL (Contd .. )
1-4().1/C 1-40-250/C Kukatpalle
1-40-251/C 1-40-381/C -do-
1-41-1/C 1-41-165/C -do-
1-41-166/C 1-41-342/C -do-
2-1-1 2-1-100 Bagh Ameeri
2-2-1 2-2-100 -do-
2-3-1 2-3-47 -do-
2-3-48 2-3-100 -do-
2-4-1 2-4-1oo/AC1 Bagh Ameeri, Vivekanandanagar
2-5-1 2-5-72 -do-
2-5-73 2-5-121 -do-
2-6-1 2-6-40 -do-
2-6-40/Cl 2-6-61/C -do-
2-1-1 2-1-46 Hydernagar &Shamshiguda
2-1-47 2-1-1OO/6C1 -do-
2-2-1 2-2-13/189C -do-
2-2-13/190/C 2-2-13/329C -do-
2-2-14 2-2-49 -do- .
2-1-1 .2-1-46/108C Uagh Ameeri-Shamshiguda
2-1-46/109C 2-1-48 -do-
3-1-1 3-1-87 Moosapet
3-2-1 3-2-78 -do-
3-2-79 3-2-107/2/C -do--
3-3-1 3-3-85 -do-
3-4-1 3-4-103 -do-
3-4-103/1 3-4-217 -do-
3-4-217/1 3-4-217/144 -do-
3-5-1 3-5-107/1 -do-
3-5-108 3-5-202 -do-
3-5-203 3-5-300 -do-
3-6-1 3-6-63 Dayarguda, Sangeethnagar
3-6-66/1 3-6-137 -do--
3-7-1 3-7-75 -do-
3-8-1 3-8-165 Rajivgandhinagar
3-8-166 3-8-301/72 -do-
3-8-301/73 3-8-301/296 -do-
4-1-1 4-1-63/6 Babbuguda
4-1-63/1 4-1-65/4 -do-
4-1-66 4-1-103/1 -do-
4-1-103/2 4-1-156 -do-
4-1-157 4-1-223 -do--
4-2-1/2 4-2-80 Kabeernagar Ramaraonagar
4-3-1 4-3-57 -do-
4-3-58 4-3-75 -do-
4-4-1 4-4-89 -do-
4-5-1 4-5-111 -do-
4-5-112 4-5-201 -do-
5-1-1 5-1-83/1 Allapur 5-1-84 5-1-147 -do-
5-1-1 5-1-55 Zinkalawada
5-1-56 5-1-109/ A -do-
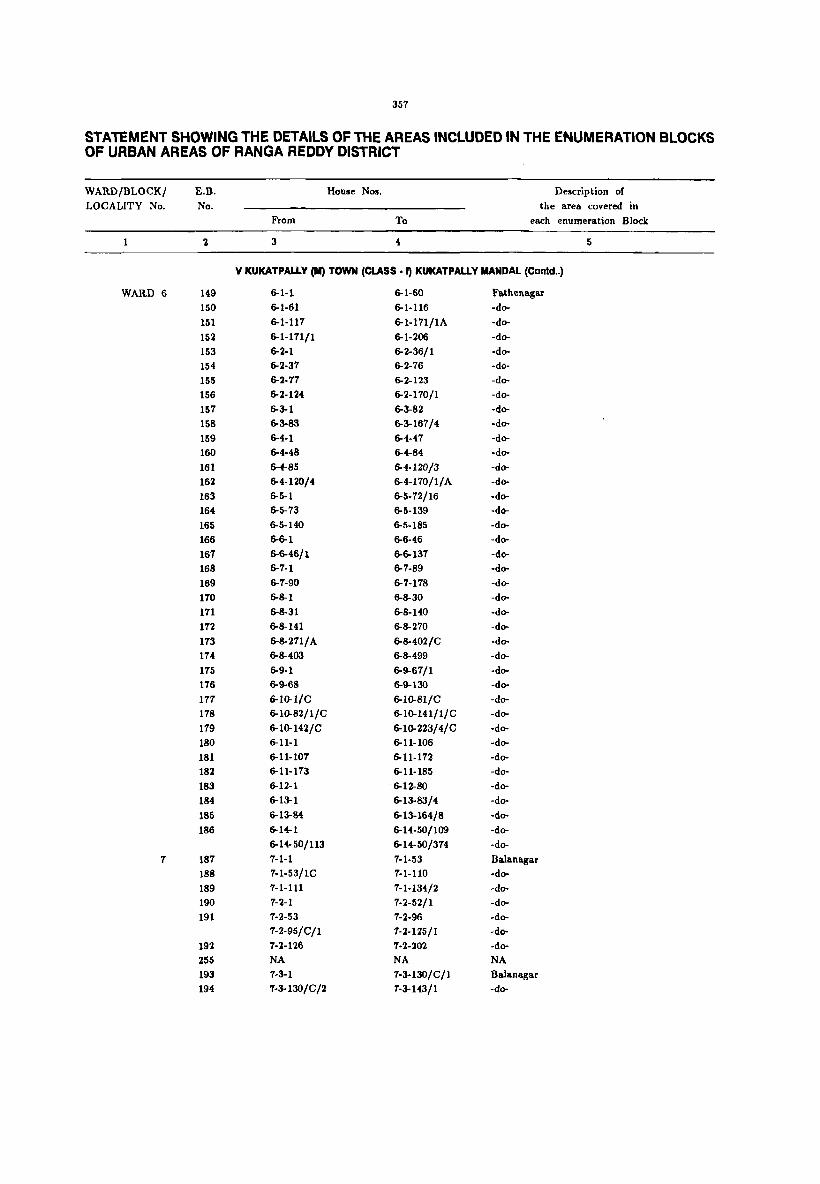
357
STATEMENT SHOWING THE DETAILS OF THE AREAS INCLUDED IN THE ENUMERATION BLOCKS OF URBAN AREAS OF RANGA REDDY DISTRICT
WARD/BLOCK/ E.B. House Nos. Description of
LOCALITY No. No. the area covered in From To each enumeration Block
1 2 3 4 5
V KUKATPALLY (II) TOWN (CLASS. I) KUKATPALLY MANDAL (Contd .. )
WARD 6 149 6-1-1 6-1-60 Fa,thenagar
150 6-1-61 6-1·116 -do-
151 6-1-117 6-1-171/1A -do-
152 6-1-171/1 6-1-206 -do-
153 6-2-1 6-2-36/1 -do-
154 6-2-31 6-2-76 -do-
155 6-2-11 6-2-123 -do-
156 6-2-124 6-2-110/1 -do-
157 6-3-1 6-3-82 -do-
158 6-3-83 6-3-161/4 -do-
159 6-4-1 6-4-47 -do-
160 6-4-48 6-4-84 -do-
161 6-4-85 6-4-120/3 -do-
162 6-4-120/4 6-4-170/1/A -do-
163 6-5-1 6-5-72/16 -do-
164 6-5-73 6-5-139 -do-
165 6-5-140 6-5-185 -do-
166 6-6-1 6-6-46 -do-
167 6-6-46/1 6-6-137 -do-168 6-1-1 6-1-89 -do-
169 6-7-90 6-7-178 -do-
170 6-8-1 6-8-30 -do-
111 6-8-31 6-8-140 -do-
172 6-8-141 6-8-270 -do-
173 6-8-211/A 6-8-402/C -do-
174 6-8-403 6-8-499 -do-
175 6-9-1 6-9-67/1 -do-
176 6-9-68 6-9-130 -do-
177 6-10-1/C 6-10-81/C -do-178 6-l0-82/1/C 6-10-HI/l/C -do-
119 6-10-142/C 6-10-223/4/C -do-
180 6-11-1 6-11-106 -do-
181 6-11-107 6-11-172 -do-
182 6-11-173 6-11-185 -do-
183 6-12-1 6-12-80 -do-
184 6-13-1 6-13-83/4 -do-
185 6-13-84 6-13-164/8 -do-
186 6-14-1 6-14-50/109 -do-6-14-50/113 6-14-50/374 -do-
7 187 7-1-1 7-1-53 Balanagar
188 7-1-53/1C 7-1-110 -do-
189 7-1-111 7-1-134/2 -do-190 7-2-1 1-2-52/1 -do-
191 1-2-53 1-2-96 -do-7-2-95/C/1 7-2-1Z5/1 -do-
192 1-2-126 1-2-202 -do-255 NA NA NA 193 7-3-1 7-3-l30/C/l Balanagar
194 1-3-130/C/2 1-3-143/1 -do-
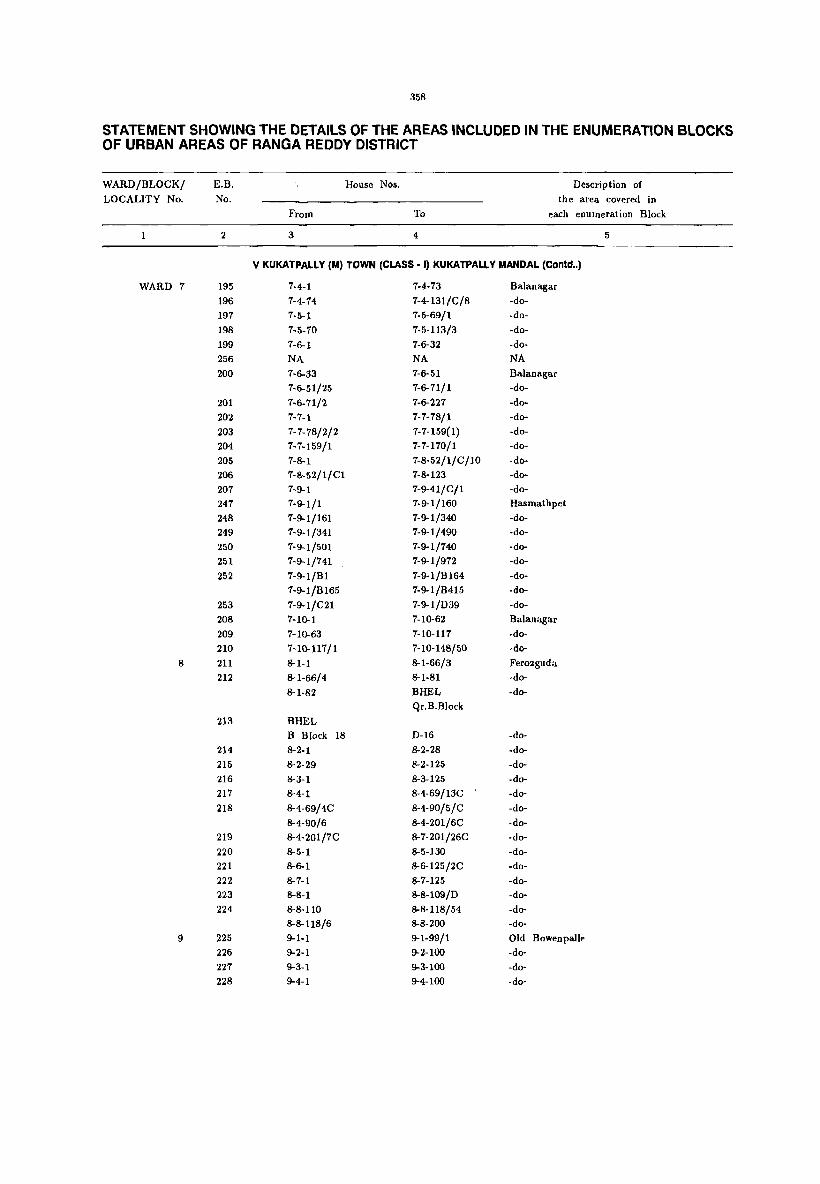
358
STATEMENT SHOWING THE DETAILS OF THE AREAS INCLUDED IN THE ENUMERATION BLOCKS OF URBAN AREAS OF RANGA REDDY DISTRICT
WARD/BLOCK/ E.B. House Nos. Description of
LOCALITY No. No. the area covered in
From To each enumeration Block
2 3 4 5
V KUKATPALLY (M) TOWN (CLASS -I) KUKATPALLY MANDAL (Contd .. )
WARD 7 195 7-4-1 7-4-73 Balanagar
196 7-4-74 7-4-131/C/8 -do-
197 7-5-1 7-5-69/1 -do-
198 7-5-70 7-5-113/3 -do-
199 7-6-1 7-6-32 -do-
256 NA NA NA
200 7-6-33 7-6-51 Balanagar
7-6-51/25 7-6-71/1 -do-
201 7-6-71/2 7-6-227 -do-
202 7-7-1 7-7-78/1 -do-
203 7-7-78/2/2 7-7-159(1) -do-
204 7-7-159/1 7-70170/1 -do-
205 7-8-1 7-8-52/1/C/IO -do-
206 7-8-52/1/C1 7-8-123 -do-
207 7-9-1 7-9-41/C/1 -do-
247 7-9-1/1 7-9-1/160 Hasmathpet
248 7-9-1/161 7-9-1/340 -do-
249 7-9-1/341 7-9-1/490 -do-
250 7-9-1/501 7-9-1/740 -do-
251 1-9-1/141 7-9-1/972 -do-
252 7-9-1/Bl 7-9-1/BI64 -do-
1-9-1/B165 7-9-1/B415 -do-
253 7-9-1/C21 7-9-1/D39 -do-208 1-10-1 1-10-62 Balanagar
209 1-10-63 7-10-111 -do-
210 1-10-117/1 7-10-148/50 -do-
8 211 8-1-1 8-1-66/3 Ferozguda
212 8-1-66/4 8-1-81 -do-
8-1-82 BHEL -do-Qr.B.BIock
213 BHEL B Block 18 D-16 -do-
214 8-2-1 8-2-28 -do-
215 8-2-29 8-2-125 -do-
216 8-3-1 8-3-125 -do-217 8-4-1 8-4-69/13C -do-
218 8-4-69/4C 8-4-90/5/C -do-
8-4-90/6 8-4-201/6C -do-219 8-4-201/7C 8-7-201/26C -do-
220 8-5-1 8-5-130 -do-221 8-6-1 8-6-125/2C -do-
222 8-7-1 8-7-125 -do-223 8-8-1 8-8-109/D -do-
224 8-8-110 8-8-118/54 -do-
8-8-118/6 8-8-200 -do-
9 225 9-1-1 9-1-99/1 Old Bowenpallp
226 9-2-1 9-2-100 -do-227 9-3-1 9-3-100 -do-
228 9-4-1 9-4-100 -do-

359
'EMENT SHOWING THE DETAILS OF THE AREAS INCLUDED IN THE ENUMERATION BLOCKS RBAN AREAS OF RANGA REDDY DISTRICT
/BLOCK/
LITY No.
1
Ward 9
(Coneld .. )
10
WARD 1
E.B. No.
2
229
230
231
232
233
234
235
236
237
238
239
240
241
242
243
244
245
246
1
2 3
4
5
6
7
8
9
10
11
12
13
14
15
16
17
18
House Nos.
From To
3 4
Description of
the area covered in
each enumeration Block
5
V KUKATPALLY (M) TOWN (CLASS· I) KUKATPALLY MANDAL (Concld .. )
9--5·1
9--5-45
9--6-1
9--6-84/C/14
9--6-39/128
Plot ,No.2
10-1-1
10-1-51/2
10-1-54/9
10-1-79
10-2-1
10-2-32/6
10-2-68/1
10-2-102
10-3-1
10·3-11/4
10·3-40
10-3-78/1
10-4--1
10-4--27
10-5-1
10-6-12/1
9--5·44
9--5·105
9--6-84/5
9--6-39/127
9--6·39/30
Plot No.91
10-1-51/C5
10-1-47/Cl
10-1-77/3
10-1·130
10-2-32/5
10-2-68/4
10-2-101
1(1..2·130
10·3·25C
10.3.39/1C
10·3·78
10-3-130
10-4-26
10-4-90/1
10-5-101/4
10-6-94
Old Bowenpalle
·do·
·do-
·do·
-do-
-do-
Hashmathpet
-do-
-do-
-do-
-do-
-do-
-do-
-do-
-do-
-do-
-do-
-do-
-do-
-do-
-do-
-do-
VI I..B.NAGAR (M) TOWN (CLASS-I) L.B.NAGAR MANDAL
1-1-1
1-1-39
1-2-1
1-2-34
1-3-1
1-4-1
1-5-1
1-5-26
1-5-62/3
1-6-1
1-6-26
1-6-53/3
1-7-1
1-7-57
1-8-1
1-8-43
1-8-46/134
1·8·49/3
1-1-38
1-1-48/24/3A
1-2-33
1.2-107/3/1
1-3-72
1-4-58/2
1-5-25/4
1-5-62/2A
1-5-74/8
1-6-25/3
1-6-5:1
1-6-96
1-7--'56'/ A
1-7-104/7
1-8-12/2
1-8-46/1:33
1-8-49/2
1-8-100/2
Old Village of Mohan nagar
Old village part of S ingeri colony
Annadata Ricemill &Old Village part
Water Pump Room Area &Old Village
Village Hanuman temple area &
Ward Office
Village Sreenivas Oil Factory thota
New Maruthinagar
Old Maruthinagar, Mandir area
New Maruthi Nagar, Panigiri area and
Kothap"t Ward Watpr Tank Area
Ramalayam &Chaitllanyapllri part por
tion Chaitanyapllri part portion
Chaithanyapllri, Super Industry, Indi
ran agar Chaithanyapuri part, ConllYlunity Hall
Library ChaithanyapuJ'i kBlls route
New Dilsukhnagar, Thrinethra godowns
Municipal Colony, Kr<~llthinagar, Com
munity Hall Ganeshpuri, :'-1unicipal Colony quar-
t('rs Vidyuthnagar, Andhra Bank, !'lew Dil-
suknagar Kallilkadurga Temple

360
STATEMENT SHOWING THE DETAILS OF THE AREAS INCLUDED IN THE ENUMERATION BLOCKS OF URBAN AREAS OF RANGA REDDY DISTRICT
WARD/BtOCK/
LOCALITY No.
Ward 1
(Coneld .. )
2
3
4
E.B. No.
2
19
20
21
22
23 24
25
26
27
28
29 30
31
32 33
34
35
36
37 38
39
40 41
42 43
44
45
46 47
48 49
50 51
52
53
54 55
56
57
House Nos.
From To
3 4
Description of
the area covered in
each enumeration Block
5
VI L.B.NAGAR (M) TOWN (CLASS-I) L.B.NAGAR MANDAL (eOnld .. ) 1-9-1 1-9-45/2 Dwarakapuram, Panch
Pharmaceuticals
1-9-46
1-10--1
2-1-1
2-2-1 2-3-1
2-3-71
2-4-1
2-4-45/B
2-4-70/15
2-5-1
2-5-278
2-6-1
2-7-1
2-8-1
3-1-1
3-1-48/1
3-1-80
3-2-1
3-2-76
3-2-130/98
3-3-1 3-3-60
3-3-94
3-4-1
3-4-71/A
3-5-1
3-5-71 3-6-1
3-7-1 3-7-77
3-8-1
3-8-20/5/50
3-8-20/5/275
3-8-20/5/432
3-8-20/5/90 3-8-30
4-1-1
4-1-118
4-2-1
4-:1-1
1-9-99 1-10-20
2-1-100
2-2-100
2-3-70/17
2-3-100/A
2-4-45/5
2-4-70/14 2-4-78/198
2-5-277' 2-5-839
2-6-88/5
2-7-330 2-8-37
3-1-48/B
3-1-79
3-1-106/4
3-2-75
3-2-130/97
3-2-151/17 3-3-59 3-3-90
3-3-150 3-4-71
3-4-157
3-5-70/8 3-5-150 3-6-70
3-7-76
3-7-147
3-8-20/5/49 3-8-20/5/274
3-8-20/5/431
3-8-20/5/589 3-8-29
3-8-75/13
4-1-117
4-1-143
4-2-109
4-3-121/5
Dwarakapuri part, portion
Dwarakapuri, Backside of Dilsukhnagar
Bus Depot Nagole Ward
Nagole Old Village
Old Village Harijan Basthi Old Village part & Snehapuri
Snehapuri Part
Snehapuri Colony Part
Snehapuri Colony &Sainagar Colony Co-Operative Bank Colony
Jaipur Colony Jaipur Colony part &Bhid Colony
Bandla Guda
Mallikarjun Nagar Fathulaguda
Mansoorabad Ward
Shivapuri Colony, Gouthamnagar, Dana
puram Maruthinagar, Bank Colony Venture
III &Danapuram Danapuram Part of SBH Venture II
Part SBH Venture II part SBH Venture II Part, Gunti Jangaiah
Colony Gunti Jangaiah Colony part
Huda Colony, Majeed line L.B.Nagar Near Ring Road
L.B.Nagar Part
L.B.Nagar Part &Pump Room Area
Kallu Compound, area of Citizen School area Ward Office area &L.B.Nagar (part)
RTC Colony &L.B.Nagar part SBH Venture I Colony and Siris Fac
tory Mansoorabad Old Village
Christians Colony
Highway Colony
Rajivnagar Colony (part)
-do-
-do-
RTC Colony (part)
Chandrapuri Colony & Central Bank
Colony Ha1.athnagar Ward
Kurma Basthi, Muslim Basthi & Govt.
Hospital Area Mudiraj B!..3thi part,
Mudiraj Basthi part, High School Area
Hanugal llarijanwada, Sitarampuram,
Poultry farm
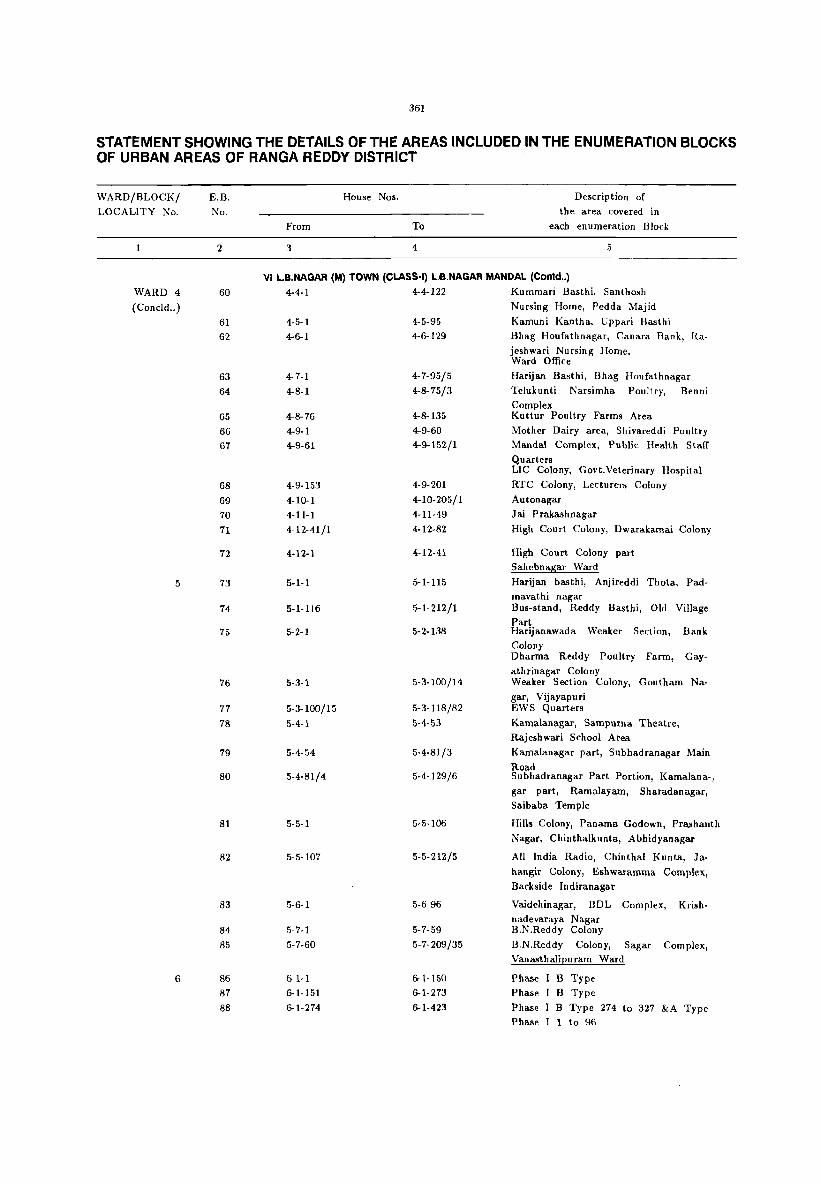
361
STATEMENT SHOWING THE DETAILS OF THE AREAS INCLUDED IN THE ENUMERATION BLOCKS OF URBAN AREAS OF RANGA REDDY DISTRICT
WARD/BLOCK/
LOCALITY No.
WARD 4
(Coneld .. )
5
6
E.B.
No.
2
60
61
62
63
64
65
66
67
68
69
70
71
72
73
74
75
76
77
78
79
80
81
82
83
84
85
86
87
88
House Nos.
From To
3 4
Description of
the area covered in
each enumeration Block
5
VI L.B.NAGAR (M) TOWN (CLASS·I) L.B.NAGAR MANDAL (Contd .. )
4-4·1
4·5-1
4-6-1
4-7-1
4-8-1
4-8-76
4-9·1
4-9-61
4-9-153
4-10-1
4-11-1
4-12.41/1
4·12-1
5-1-1
5-1-116
5-2-1
5-3-1
5-3-100/15
5-4-1
5-4-54
5-4-81/4
5-5-1
5-5-107
5-6-1
5-7-1
5-7·60
6-1-1
6-1-151
6-1-274
4-4-122
4-5-95
4-6-129
4-7-95/5
4-8-75/3
4-8-135
4-9-60
4-9·152/1
4-9-201
4-10-205/1
4-11-49
4·12-82
5-1-115
5-1-212/1
5-2-138
5-3-100/14
5-3-118/82
5-4-53
5-4-81/3
5-4-129/6
5-5-106
5-5-212/5
5-6-96
5-7-59
5-7-209/35
6-1-150
6-1·273
6-1-423
Kummari Basthi, Santhosh
Nursing Home, Pedda Majid
Kamuni Kantha, Uppari Basthi
Hhag Houfathnagar, Canara Bank, Ra
jeshwari Nursin g Horne, Ward Office
Harijan Basthi, Bhag Houfathnagar
Telukunti Narsirnha Poult ry, Henni
Complex Kuttur Poultry Farms Area
Mother Dairy area, Shivareddi Poultry
Mandai Complex, Public Health Staff
Quarters LIC Colony, Govt.Veterinary Hospital
RTC Colony, Lecturers Colony
Autonagar
Jai Prakashnagar
High Court Colony, Dwarakamai Colony
High Court Colony part
Sahebnagar Ward
Harijan bast hi, Anjireddi Thota, Pad
mavathi nagar Bus-stand, Reddy Basthi, Old Village
Part Harijanawada Weaker Section, Bank
Colony Dharma Reddy Poultry Farm, Gay-
athrinagar Colony Weaker Section Colony, Goutham Na-
gar, Vijayapuri EWS Quarters
Kamalanagar, Sampurna Theatre,
Rajeshwari School Area
Kamalanagar part, Subhadranagar Main
Road Subhadranagar Part Portion, Kamalana·)
gar part, Ramalayarn, Sharadanagar, Saibaba Temple
Hills Colony, Panama Godown, Pr1\Shanth
Nagar, Chinthalkunta, Abhidyanagar
All India Radio, Chinthal Kunta, Ja
hangir Colony, Eshwaramma Complex,
Backside Indiranagar
Vaidehinagar, BDL Complex, Krish
nadevaraya Nagar B.N.Reddy Colony
B.N.Reddy Colony, Sagar Complex, Vanasthalipurarn Ward
Phase I B Type
Phase I B Type
Phase I B Type 274 to 327 &A Type Phase lIto 96

362
STATEMENT SHOWING THE DETAILS OF THE AREAS INCLUDEO IN THE ENUMERATION BLOCKS OF URBAN AREAS OF RANGA REDDY DISTRICT
WARD/BLOCK/ LOCALITY No.
WARD 6
( Coneld .. )
7
8
E.B.
No.
2
89
90
91
92
93
94
95
96
97
98
99
100
101
102
103
104
105
106
107
108
109
110
111
112
113
114
115 116
117
118
119
120
121
122
123
124
125
126 127
128
129
House Nos.
From To
3 4
Description of
the area covered in
each enumeration Block
5
VI L.B.NAGAR (M) TOWN (CLASS.I) L.B.NAGAR MANOAL (Contd .. )
6-1-424
6-2-1
6-2-146
6-2-289
6-2-439
6-3-1
6-3·151
6-3-301
6-3-451
6-3·601
6-3-751
6-3-901
6-3-1048
6-3-1196
6-3-1346
6-3·1496
6-3-1563
6-3-1713
6-3-1863
6-3-1998
6-3-2148
6-3-2298
6-4-1
6-4-151
6-5-1
6-5-50
7·1-1
7·2·1
7-2-18/5
8-1-1
8-1-109
8-5-1
8-5·59
8-2-82
8-3-1
8-3-89
8-6-1
8-6-51
8-6-77
8-2-1
8-2-35/60
6-1-622
6-2·145
6-2-288
6-2-438
6-2-568
6-3-150
6-3-300
6-3·450{2
6-3-600
6-3-750
6-3·900
6-3-1047
6-3-1195
6-3-1345
6-3-1495
6-3-1562
6-3-1712
6-3·1862
6-3-1997
6-3-2147
6-3-2297
6-3-2502
6-4-150
6-4-215
6-5-49
6-5-256/1
7-1-107/3 7-2-18
7-2-118/1
8-1·108
8-1·150/18
8-5-58
8-5·128/10
8-2·156/68
8-3-83/4
8-3-174
8-6-50/1
8-6-76/7 8-6-113
8-2-35/59
8-2-82/2
Phase I A Type 97 to 199 C
Type Phase I 2 to 28
Phase II A Type 200 to 344
Phase II A Type 345 to 380 B Type
Phase II 328-439 Phase II B Type 440 to 589
Phase II B Type 590 to 621&C Type Phase II 92-196 Phase III B Type
Phase II B Type
Phase III B Type
Phase III B Type
Phase III B Type
Phase III B Type
Phase III B Type
Phase III B Type
Phase III B Type
Phase III B Type
Phase III B Type 1496-1507 &C Type
Pllase III 1-55 Phase III C Type 56-207
Phase III C Typ.e 208--357
Phase III C Type 358-492
Phase III C Type 493-641
Phase III C Type 642-791
Phase III C Type 792-933 Phase III
A Type 1-65 Open Notes Phase II
Open Notes Phase II
Self Finance Colony Phase V Tl-1 to
Tl-49 Self Finance Colony Phase V TI-50 to
Tl·86 & T2-lt090 &T3-1 to 81 Baira
me.lguda Ward Old Village Bairamalguda
Old Village Bairamalguda(part) &
Kir Kir Nagar, Seethllramnagar
Mallikarjunnagar &Old Village Part
Karmanghat Ward Raghavendranagar, Old, Village, Kurma
Basthi Old Village, Ward Office
EWS Quarters part
EWS Quarters
Me.llikarjunnagar, Behind Petrol Pump
FC Godown, Poultry Farm
Bhootesh Gupta Nagar part
Bhootesh Gupta Nagar
RTC Colony, FCr Colony part
FCr Colony, Venkatrarnana Colony
Sreenivas Colony
Old Village part, Rice Mills, Near
Ring Road Maruthinagar, Hanuman Temple, rDPL
Colony

363
STATEMENT SHOWING THE DETAILS OF THE AREAS INCLUDED IN THE ENUMERATION BLOCKS OF URBAN AREAS OF RANGA REDDY DISTRICT
WARD/BLOCK/ LOCALITY No.
1
WARD 8
(Coneld .. ) 9
10
11
E.B. No.
2
130
131
132
133
134
135
136
137
138
139
140
141
142
143
144
145
146
147
148
149
150
151
152
153
154
155
156
157
158
159
160
161
162
163
164
165
166
167
House Nos.
From To
3 4
Description of
the area covered in
each enumeration Block
5
VI L.B.NAGAR (M) TOWN (CLASS-I) L.B.NAGAR MANDAL (Contd •• )
8-4-1 8-4-32/7 Green Park Colony
Champapet Ward
9-1-1
9-1-83
9-2-1
9-2-58
9-3-1
9-3-81
9-4-1
9-4-28
9-5-1
9-5-106
9-6-1
9-6-44
9-6-134/1
9-9-1
9-7-138
9-1-01
9-8-1
9-7-1
9-7-70
10-1-1
10-1-70/1
10-2-1
10-2-62
10-3-1
10-3-67
10-4-1
10-4-64/27
10-5-1
10-6-1
10-6-98
11-1-1
11-1-91
11-2-1
11-2-48
11-3-1
11-4-1
11-4-80
9-1-82
9-1-135
9-2-57
9-2-15" /2
9-3-80
9-3-138/2
9-4-27
9-4-113
9-5-89/1 9-5-152
9-6-43
9-6-134
9-6-169/1
9-9-136/4
9-7-183/1
9-1-088
9-8-166
9-7-69
9-7-137
10-1-70/1
10-1-102/19
1O-2-61( 4)
10-2-137
10-3-66
10-3-146/1/1
10-4-64/26
10-4-126/1
10-5-130/2
10-6-97
10-6-158/4/1
11-1-90
11-1-157
11-2-47
11-2-143
11-3-151
11-4-79
11-4-150/416
Old Village Part, Reddy Reddy Basthi Part
Basthi part
Harijan Basthi Quarters Harijan Basthi, Katika Basthi
Katika Basthi part
Kummari Basthi
Mankalamma thota, Muslim Basthi part Muslim Basthi part
Reddy Basthi part, State Bank Colony Harijan Basthi, Sulthan Valva
Bhavani Nagar Part
Bhavaninagar Part, Rice Mills
Bhavani Nagar part
Reddy Colony part, Swathi Nursing
Home, Triveni School
Maruthinagar
Roshan Dowla
Pochamma Gadda &Maruthinagar
Maruthinagar
Ring Road, Maruthinagar Lingojiguda Ward
Old Village Part, Tapovan Colony
Rice Mills Area, Karmanghat
Chowrastha, Bhagyanagar Colony
Old Village Part
Old Village Post Office Area Old Village Police Statioh left portion
Old Village Harijan Basthi
Harijan Colony, Old Harijan Basthi
part Adhikarinagar, Vijayapuri Colony, Al-
thafnagar Kameshwar Roo Colony, High School
Area Khadi Bhandar Area, Brundavan Colony
Sainagar Colony, Brundavan Colony part Saroornagar Ward
Ward Office, Shivalayam, Revathi Rice Mill Area Bapunagar, Harijan Basthi
Masjid Area &Sayedgalli
Old Village part
Mahilamandali, Ramalayam, Gantachutta Steel factory Venkateshwara Colony
Sreenivas Colony, Sujatha Pu blic School
area Water tank, Kummari Sastlli

364
STATEMENT SHOWING THE DETAILS OF THE AREAS INCLUDED IN THE ENUMERATION BLOCKS OF URBAN AREAS OF RANGA REDDY DISTRICT
WARD/BLOCK/ LOCALITY No.
1
WARD 11
(Concld .. )
E.B. No.
2
168
169
170
171
172
173
174,
175
176
177
178
179
180
181
182
183
184
185
186
187
188
189
190
191
192
193
194
195
196
197
198
199
200
201
202
203
204 to 212
House Nos.
From To
3 4
Description of the area covered in
each enumeration Block
5
VI La.NAGAR (M) TOWN (CLASS-I) La.NAGAR MANDA!. (Concld .. ) 11-5-1
11-5-105
11-6-1
11-6-42
11-6-120
11-7-1
11-7-75
11-8-1
11-8-43
11-9-1
11-9-30
11-10-1
11-10-120
11-11-1
11-11-87/7
11-12-1
11-12-124
11-13-1
11-13-27/11/3
11-13-109/1
11-14-1
11-14-1/151
11-14-1/301
11-14-1/528
11-14-1/705
11-14-1/861
11-14-1/1051
11-14-1/1201
11-14-1/1351
11-14-1/1501
11-14-2
11-15-1
11-1&,1
11-17-1
11-18-1
11-18-96
11-19-1
11-5-101
11-5-150
11-6-41/3
11-&,119
11-6-157/1
11-7-74
11-7-146
11-8-42
11-8-132
11-9-29
11-9-130/2
11-10-86
11-10-145
11-11-87/6
11-11-172/1
11-12-123
11-12-171/2/A
11-13-27/11/2
11-13-97/1
11-13-203
11-14-1/150
11-14-1/300
11-14-1/527
11-14-1/704
11-14-1/750
11-14-1/900
11-14-1/1200
11-14-1/1350
11-14-1/1500
11-14-1/1650
11-14-163
11-15-102
11-1&.138
11-17-129/1
11-18-95
11-18-150
11-19-131
Venkateshwara Colony, Venkateshwara Temple Area Mandai Complex, Primary Health Work-ers Basthi Syndicate Bank Colony, Ganta Chutta Godown! Pochamma Temple Area, Syndicate Bank Colony part Cherkuthota 13asthi, Community Hall Area Huda Colony C Type Quarters Huda Colony B Type Quarters Huda Employees Colony Huda Employees Colony Part, Kranthinagar Narasimhapuri Colony Laxminagar, All India Radio Station Area Laxminagar part,Saikrupa Hospital Area &£ Pattidar Bhavan Area SBI Colony part SBI Colony &Vijayapuri Color.y Indirallagar Colony Telephone colony, Sowbhagyapuramcolony
R K Puram, Income Tax Colony R K Puram Part, Income Tax Colony part Alkapuri Colony Alkapuri Colony, Masjid Area &:
Haripuri Yadavanagar Colony Vasavi Colony, Bank Colony Haripuri, NTR Nagar, Church NTR Nagar NTR Nagar Masjid Area NTR Nagar - do -
NTR Nagar Backside of V M House NTR Nagar - do -- do -V.M. House, Govt. Poultries, DVM Degree College Thakshasila Public School Doctors' Colony, Police Quarters, Sports Stadium Bhagathsingh Nagar, Community Hall Bhagathsingh Nagar part, Masjid Area Bhagathsingh Part, Pochamma Temple Bhagathsingh Part Bhagath Singh Part &Pochamma Temple Area
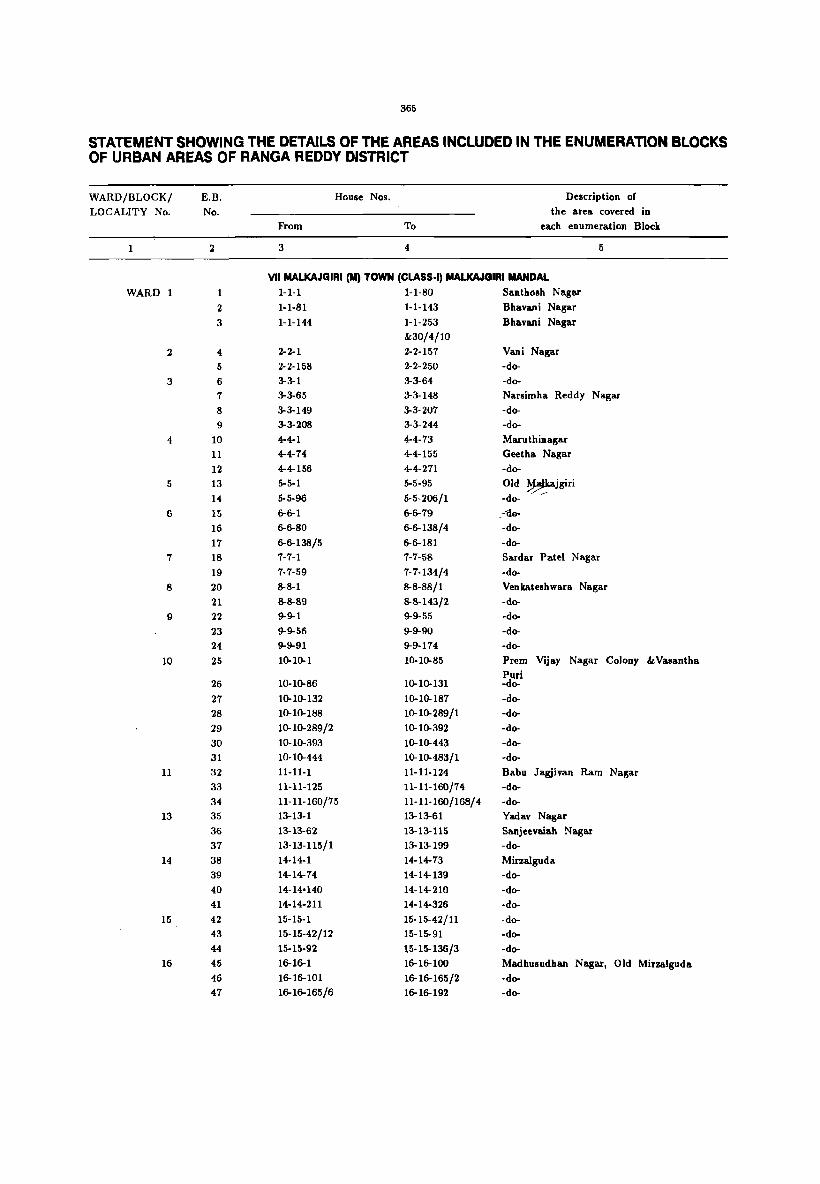
365
STATEMENT SHOWING THE DETAILS OF THE AREAS INCLUDED IN THE ENUMERATION BLOCKS OF URBAN AREAS OF RANGA REDDY DISTRICT
WARD/BLOCKI E.B. House Nos. Description of
LOCALITY No. No. the area covered in
From To each enumeration Block
1 2 3 4 5
VII MALKAJGIRI (M) TOWN (CLASS-I) MALKAJGIRI IlANDAL WARD 1 1 H-l 1-1-80 Santhosh Nagar
2 1-1-81 1-1-143 Bhavani Nagar
3 1-1-144 1-1-253 Bhavani Nagar
&30/4/10
2 4 2-2-1 2-2-157 Vani Nagar
5 2-2-158 2-2-250 -do-
3 6 3-3-1 3-3-64 -do-
7 3-3-65 3-3-148 Narsimha Reddy Nagar
8 3-3-149 3-3-207 -do-
9 3-3-208 3-3-244 -do-
4 10 4-4-1 4-4-73 Maruthinagar
11 4-4-74 4-4-155 Geetha Nagar
12 4-4-156 4-4-271 -do-
5 13 5-5-1 5-5-95 Old ~jgiri
14 5-5-96 5-5-206/1 -do-
6 15 6-6-1 6-6-79 -"da-
16 6-6-80 6-6-138/4 -do-
17 6-6-138/5 6-6-181 -do-
7 18 7-7-1 7-7-58 Sardar Patel Nagar
19 7-7-59 7-7-134/4 -do-
8 20 8-8-1 8-8-88/1 Venkateshwara Nagar
21 8-8-89 8-8-143/2 -do-
9 22 9-9-1 9-9-55 -do-
23 9-9-56 9-9-90 -do-
24 9-9-91 9-9-174 -do-
lO 25 10-10-1 10-10-85 Prem Vijay Nagar Colony &Vasantha
Puri 26 10-10-86 10-10-131 -do-
27 10-10-132 10-10-187 -do-
28 10-10-188 10-10-289/1 -do-
29 10-10-289/2 10-10-392 -do-
30 10-10-393 10-10-443 -do-
31 10-10-444 10-10-483/1 -do-
II 32 11-11-1 11-11-124 Babu Jagjivan Ram Nagar
33 11-11-125 11-11-160/74 -do-
34 11-11-160/75 11-11-160/168/4 -do-
13 35 13-13-1 13-13-61 Yadav Nagar
36 13-13-62 13-13-115 Sanjeevaiah Nagar
37 13-13-115/1 13-13-199 -do-
14 38 14-14-1 14-14-73 MirzaIguda
39 14-14-74 14-14-139 -do-
40 14-14'140 14-14-210 -do-41 14-14-211 14-14-326 -do-
15 42 15-15-1 15-15-42/11 -do-43 15-15-42/12 15-15-91 -do-
44 15-15-92 15-15-136/3 -do-
16 45 16-16-1 16-16-100 Madhusudhan Nagar, Old Mirzalguda 46 16-16-101 16-16-165/2 -do-47 16-16-165/6 16-16-192 -do-

366
STATEMENT SHOWING THE DETAILS OF THE AREAS INCLUDED IN THE ENUMERATION BLOCKS OF URBAN AREAS OF RANGA REDDY DISTRICT
WARD/BLOCK/ LOCALITY No.
1
WARD 17
18
19
20
21
22
23 24
25
26
27
28
29
E.a. No.
2
House Nos.
From To
3 4
Description of
the area covered in
each enumeration Block
5
VlI MALKAJOIRI (III) TOWtf (CLASS-9 MAlKAJGIRI MANDAL (Contd .. ) 48 17-17-1 17-17-58 Jyothinagar, JLNS Nagar &lndira Nehru
Nagar 49
50
51
52
53
54 55
56
67
58
59
60
61
62 63
64
65
66
67
68
69
70
71
72 73
74
75
76
77 78
79 80
81
82&153 83
84 85
86
87
88
89
90 91
92 93
94
17-17-59
17-17-119/20
17-17-251 17-17-365
11-17-475
17-11-640 17-17-803
18-18-1
18-18-92
18-18-201
18-18-308
18-18-412 19-19-1
19-19-71 20-20-1
20-20-85 20-20-182
20-20-330
20-20-464
21-21-1
21-21-73
22-22-1
22-22-74
23-23-1 24-24-1
24-24-60/12
24-24-108/2
24-24-143/2
25-25-1 25-25-40/27
26-26-1 26-26-94
27-27-1
27-21-16/19/5
21-27-16/41
28-28-1
28-28-117/1 29-29-1
29-29-86
29-29-151
29-29-301 29-29-451
29-29-601 29-29-751
29-29-901 29-29-1051
29-29-1201
17-17-119/19
11-17-250
17-17-364 17-17-474
17-17-639
17-17-802 17-17-951
18-18-91/2 IIH8-200
18-18-307
18-18-411
18-18-510/1
19-19-70/1
19-19-150
20-20-84/2
20-20-181
20-20-329 20-2().463
20-20-556
21-21-72
21-21-140/1
22-22-73
22-22-152
23-23-78/9/4
24- 24-60/11
24-24-108/1
24-24-143/1
24-24-150/7
25- 25-40/26
25-25-61/9
26-26-93
26-26-156
27-21-16/19/A
27-27-16/40
27-21-146/1 28-28-117
28-28-157
29-29-85/2
29-29-150
29-29-300
29-29-450
29-29-600
29-29-750 29-29-900
29-29-1050
29-29-1200
29-29-1350
-do--do--do--do--do--do-Hanumanpet &
Mallikarjuna Nagar
-do--do-
-do-
Goutham Naga.r
-do-Dayanand Nagar
-do--do-
-do--do-Uttam Nagar
-do-
R K Nagar
-do--do-Shivapuri, Vishnupuri
-do-
Virnaladevinagar
Anand Bagh, Bank Colony and East
Anand Bagh -do--do-Chanikyapuri, Safilguda station & Balramnagar, Sardar Nagar
Krupa Complex & Neredmet
-do--do--do-
Neredmet, Vinayalmaga.r,
Kakatiyanagar, Deendayal Nagar
-do-
-do-
-do--do-
-do--do-
-do-
-do-
-do-

367
STATEMENT SHOWING THE DETAILS OF THE AREAS INCLUDED IN THE ENUMERATION BLOCKS OF URBAN AREAS OF RANGA REDDY DISTRICT
WARD/BLOCK/ E.B. House Nos. Description of
LOCALITY No. No. the area covered in
From To each enumeration Block
2 3 4 5
VII MALKAJGIRI (M) TOWN (CLASS-I) MALKAJGIRI MANDAL (Contd .. ) WARD 29 95 29-29-1351 29- 29-1444/1 Neredmet, Vinayaknagar,
(Coneld .. ) 96 29-29-1444/2 29-29-1509 -do-
157 NA NA NA
30 97 30-30-1 30-30-101/2 Old Safilguda
98 30-30-102 30-30-215 Vinayaknagar
99 30-30-216 30-30-296 Chandragiricolony, Gokulnagar Officers Colony
100 30-30-297 30-30-300 Prasanthi Nagar
101 30-30-301 30-30-450 Old Safilguda
102 30-30-451 30-30-600 Vinayaknagar, Chandragiri Colony
103 30-30-601 30-30-750 Gokul Nagar
104 30-30-751 30-30-900 Officers' Colony
105 30-30-901 30-30-1050 Pragathi Nagar
106 30-30-1051 30-10-1200 -do-
107 30-30-1201 30-30-1350 -do-
108 30-30-1351 30-30-1500 -do-
109 30-30-1501 30-30-1600 -do-
155 NA NA NA
31 110 31-31-1 31-31-63/C Pragathi Nagar
111 31-31-64 31-31-150 Ramakrishnapurarn
32 112 32-32-1 32-32-60/C R. K. Purarn &
113 32-32-61 32-32-67/44 Balaji Colony
114 32-32-67/45 32-32-77/20/1 -do-
115 32-32-77/6 32-32-96/1/3 -do-
33 116 33-33-1 33-33-27/1 Officers' Colony
117 33-33-27/2 33-33-61/1 R. K. Puram &
118 33-33-61/2 33-33-170/2 Shakthinagar
34 119 34-34-1 34-34-122 Raghavendranagar, Vivekanandapuram
& Bhavani Colony 35 120 35-35-1 35-35-79/2 G. K. Colony, Saptagiri, Brundavan
Colony 36 121 36-36-1 36-36-70 Defence Colony
122 36-36-71 36-36-149 -do-
37 123 37-37-1 37-37-40 Defence Colony, Jagjeevanra.m Nagar, Sree Colony & Madhura Nagar
124 37-37-41 37-37-72 -do-
125 37-37-72 37-37-104 -do-
126 37-37-104/1 37-37-109 -do-
37-37-109/A/1 37-37-127/6 -do-
38 127 38-38-1 38-38-50 Ambedkar Nagar, Rohini ~olony, Shiv-an8,gar
39 128 39-39-1 39-39-210 Vayupuri
40 129 40-40-1 40-40-55/2 Moulali, Jawaharnagar
130 40-40-55/3 40-40-74/1 -do-
131 40-40-74/2 40-40-74/85 -do-
132 40-40-75 40-40-80/5 -do-
41 133 41-41-1 41-41-61 Old Moulali 134 41-41-62 41-41-101 -do-
42 135 42-42-1 42-42-26/15/23 Patel Nagar
136 42-42-26/15/24 42-42-26/15/193 Gayathri Nagar
137 42-42-26/15/194 42-42-51 -do-
438 42-42-51/1 42-42-112/4 -do-

368
STATEMENT SHOWING THE DETAILS OF THE AREAS INCLUDED IN THE ENUMERATION BLOCKS OF URBAN AREAS OF RANGA REDD~ DISTRICT
WARD/BLOCK/ E.B. House Nos. Description of
LOCALITY No. No. the area covered in From To each enumeration Block
2 3 4 5
VII MALKAJGIRI (M) TOWN (ClASS-I) MALKAJGIRI MANDAL (COnCld •• ) WARD 43 139 43-43-1 43-43-98 Housing Board
140 43-43-99 43-43-138 Hanuman Nagar
141 43-43-139 43-43-254 -do-
44 142 .44-44-1 44-44-63 Industrial
44-44-63/E/l 44-44-63/104 156 NA NA NA
45 143 45-45-1 45-45-100/27 Upparguda, Prasanth Nagar
144 45-45-100/28 45-45-121/53 -do-
145 45-45-121/54 45-45-143/21 -do-
46 146 46-46-1 46-46-141 Leprosy Colony
147 NA NA NA
148 NA NA NA
149 NA NA NA
150 NA NA NA
151 NA NA NA
152 NA NA NA
154 NA NA NA
VIII QUTHBULLAPUR (M) TOWN (ClASS·I) QUTHBULLAPUR MANDAL
WARD 1 1-1-1 1-1-100 Suraram
2 1-2-1 1-2-92/4 -do-
3 1-3-1 1-3-353 Weaker Section Colony
4 1-3-401 1-3-800 -do-
5 1-3-801 1-3-1000 -do-
6 1-3-1001 1-3-1200 -do-
2 7 2-1-1 2-1-116 J eedimetla Village
8 2-1-117 2-1-167 -do-
2-2-1 2-2-10/18 -do-
9 2-2-10/19 2-2-10/115 -do-
lO 2-2-11/22 2-2-11/150 -do-
II 2-2-14 2-2-110 -do-
2-2-111 2-2-131/15 -do-
2-2-58/1A 2-2-58/37 -do-
12 2-2-60/ A/14 2-2-60/ A/94 -do-
13 2-2-60/A/95 2-2-60/A/254 -do-
H 2-3-1 2-3-150 Industrial Area, Jeedimetla
15 2-4-1 2-4-140 -do-
16 Q.No.l Q.No.323 S. R. Naik Nagar
17 Q No.324 Q No.514 -do-
3 18 3-1-1 3-1-100/3 Petbasheerabad
19 3-2-1 3-2-47 -do-
20 3-2-48 3-2-100/1 -do-
21 3-3-1 3-3-29/4 -do-
22 3-3-29/5 3-3-87 -do.
23 3-3-88 3-3-100/1 -do-
24 3-4-1 3-4-67 -do-
25 3-4-68 3-4-100 -do.
26 3-5-1 3-5-28/1 -do-
4 27 4-1-1 4-1-123 Quthbullapur Village
28 4-1-130/1 4-1-130/156 -do-
29 4-2-1 4-2-115 -do-
30 4-3-1 4-3-80/1 -do-

369
STATEMENT SHOWING THE DETAILS OF THE AREAS INCLUDED IN THE ENUMERATION BLOCKS OF URBAN AREAS OF RANGA REDDY DISTRICT
WARD/BLOCK!
LOCALITY No.
WARD 4
(Contd .. )
E.B.
No.
2
House Nos.
From To
3 4
Description of
the area covered in
ea.ch enumera.tion Block
5
VIII QUTHBULLAPUR (M) TOWN (CLASS-I) QUTHBULLAPUR MANDAL (Contd .. )
31 4-3-81 4-3-125/1 Quthbullapur Village
32
33
34
35
36
189
191
31
199
38
39
40
41
42
194
198
43
44
45
46
47
185
48
49
50
51
52
53
54
55
56
57
58
59
60
62
63
4-4-1
4-4-41
4-5-1
4-5-2/10
4-5-90/13
4-5-144/1
4-5-144/101
4-5-85/4/169
4-5-144/229
JS 1
J 1
D 1
WI
4th Ward E1
W 151
S 1 4-6-1
4-7-1
4-8-1
4-8-17
4-8-96
4-8-100/1
4-8-125/1
4-8-104
4-9-1
4-9-1/41/A
4-9-1/18
4-9-1/9
4-9-1/1
4-9-1/95
4-9-1/205
4-58-5/2 A 1
C 1
A 110
B
4-10-1
4-11-1
4-11-51
4-12-1
4-12-64
4-12-151
4-13- 1
4-13-65
4-14-1
4-15-1
4-17-1
4-17-78
315
4-4-40
4-4-66/42
4-5-90/12
4-5-38
4-5-125
4-5-144/100
4-5-144/311
4-5-85/4/192
4-5-144/261
JS 24
J 16
D 11
W 158/2
4th Ward E
W 288
S 63
4-6-123
4-7-125
4-8-67/1
4-8-95/6/ A
4-8-99/1
4-8-125/1
4-8-451
4-8-177
4-9-126
t-9-94
4-9-1/139
4-9-1/37
4-9-1/23/3
4-9-1/204
4-9-1/334
4-58-5/40(1)
A 120
C 168
A 120/1
B 144
4-10-77/7
4-11-50
4-11-130/3
4-12-63
4-12-150
4-12-241
4-13-64
4-13-125
4-14-91
4-15-125
4-17-71
4-11-125
-do·
-do-
Chintal
-do-
-do-
-do-
-do·
SBI Colony
Shiva Nagar
HMT Colony
-do-
-do-
-do-
Encroached hut in Ravikunta CAyod
hya Nagar) -do-
-do-
Chintal
Quthbullapur, Ambedkarnagar
-do-
-do-
Quthbullapur, Srinivasnagar
-do·
Vajpae Nagar
Ranga Nagar
Quthbullapur, Chekupa!ly Colony
-do·
-do-
-do-
-do-
Quthbullapur, Weaker Section Colony
Quthbullapur, Bapunagar
Srinivas Nagar
IDPL Colony
-do-
-do-
-do-
Sow bhagyanagar
Sumitranagar
-do
Adarshnagar
-do-
-do-
Indira Gandhi Nagar
-do-
Indira Gandhi Nagar
Gurumurthy Nagar
-do-
-do-
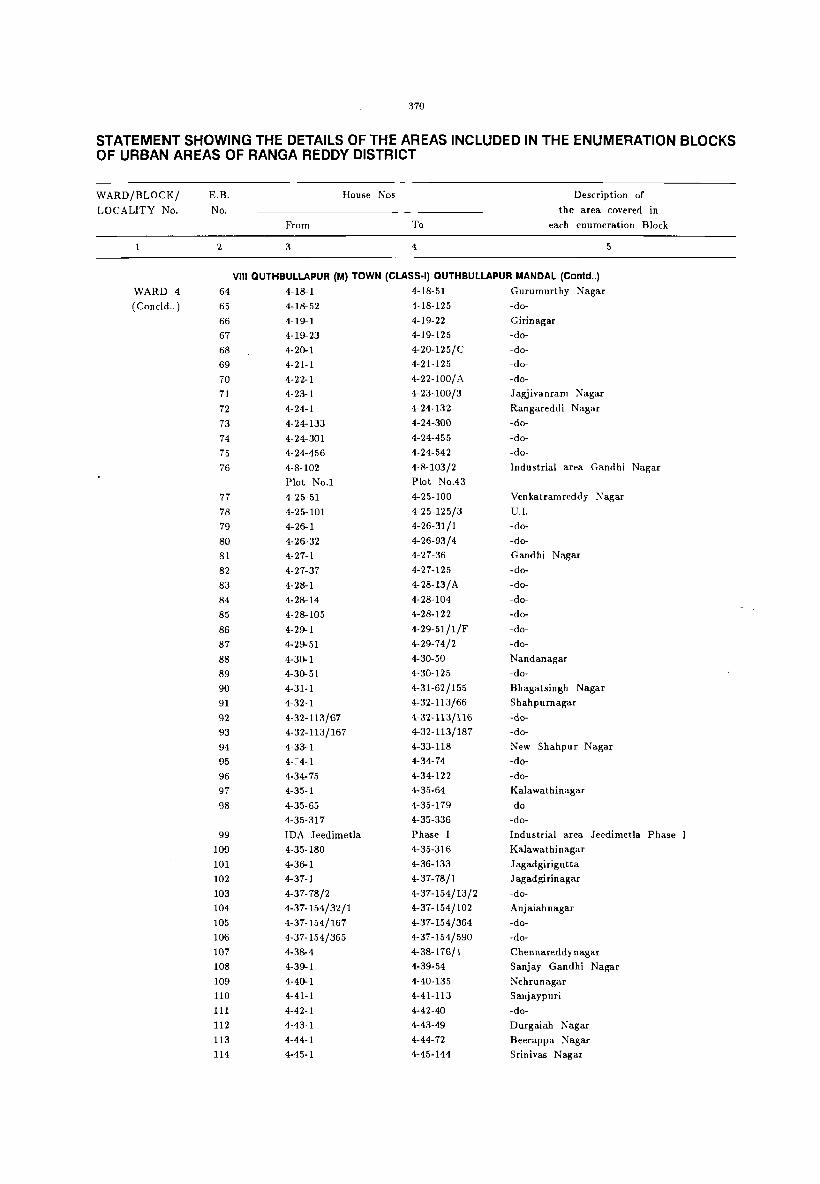
370
STATEMENT SHOWING THE DETAILS OF THE AREAS INCLUDED IN THE ENUMERATION BLOCKS OF URBAN AREAS OF RANGA REDDY DISTRICT
WARD/BLOCK/
LOCALITY No.
1
WARD 4
(Concld .. )
E.B.
No.
2
64
65
66
67
68
69
70
71
72
73
74
75
76
77
78
79
80
81
82
83
84
85
86
87
88
89
90
91
92
93
94
95
96
97
98
99
100
101
102
103
104
105
106
107
108
109
110
111
112
113
114
House Nos
From To
3 4
Description of
the area covered in
each enumeration Block
5
VIII QUTHBULLAPUR (M) TOWN (CLASS·I) QUTHBULLAPUR MANDAL (Contd .. )
4-18-1
4-18-52
4-19-1
4-19-23
4-20-1
4-21-1
4-22-1
4·23-1
4-24-1
4-24-133
4-24-301
4-24-456
4-8-102
Plot No.1
4-25-51
4-25-101
4-26-1
4-26-32
4-27-1
4-27-37
4-28-1
4-28-14
4-28-105
4-29-1
4-29-51
4-30-1
4-30-51
4-31-1
4-32-1
4-32-113/67
4-32-113/167
4-33-1
4·~4-1
4-34-75
4-35-1
4-35-65
4-35-317
IDA Jeedimetla
4-35-180
4-36-1
4-37-1
4-37-78/2
4-37-154/32/1
4-37-154/167
4-37-154/365
4-38-4
4-39-1
4-40-1
4-41-1
4-42-1
4-43-1
4-44-1
4-45-1
4-18-51
1·18-125
4-19-22
4-19-125
4-20-125/C
4-21-125
4-22-100/ A
4-23-100/3
4-24-132
4-24-300
4-24-455
4-24-542
4-8-103/2
Plot No.43
4-25-100
4-25-125/3
4-26-31/1
4-26-93/4
4-27-36
4-27-125
4-28-13/A
4-28-104
4-28-122
4-29-51/1/F
4-29-74/2
4-30-50
4-30-125
4-31·62/155
4-32-113/66
4-32-113/116
4-32-113/187
4-33-118
4-34-74
4-34-122
4-35-64
4-35-179
4-35-336
Phase I
4-35-316
4-36-133
4-37-78/1
4-37-154/13/2
4-37-154/102
4-37-154/364
4-37-154/590
4-38-176/1
4-39-54
4-40-135
4-41-113
4-42-40
4-43-49
4-44-72
4-45-144
Gurumurthy Nagar
-do-
Girinagar
-do-
-do-
-do-
-do-
Jagjivanram Nagar
Rangareddi Nagar
-do-
-do-
-do-
Industrial area Gandhi Nagar
Venkatramreddy Nagar
U.L
-do-
-do-
Gandhi Nagar
-do-
-do-
-do-
-do-
-do-
-do-
Nandanagar
-do-
Bhagatsingh Nagar
Shahpurnagar
-do-
-do-
New Shahpur Nagar
-do-
-do-
Kalawathinagar
-do-
-do-
Industrial area Jeedimetla Phase I
Kalawathinagar
Jagadgirigutta
J agadgirinagar
-do-
Anj aiah nagar
-do-
-do-
Chennareddynagar
Sanjay Gandhi Nagar
Nehrunagar
Sanjaypuri
-do-
Durgaiah Nagar
Beerappa Nagar
Srinivas Nagar

371
STATEMENT SHOWING THE DETAILS OF THE AREAS INCLUDED IN THE ENUMERATION BLOCKS OF URBAN AREAS OF RANGA REDDY DISTRICT
WARD/BLOCK/
LOCALITY No.
WARD 4
(Concld .. )
E.B. No.
2
House Nos.
From To
3 4
Description of
the area covered In
each enumeration Block
5
VIII QUTUBULLAPUR (M) TOWN (CLASS-I) QUTUBULLAPUR MANDAL (Conld .. )
115 4-48-1 4-48-58/3 Ganesh Nagar
116 4-48-68 4-48-167 -do-
117 4-48-168 4-48-253 Suryanagar
118 4-50-1 4-50-250 Magdoom Nagar
119 4-50-251 4-50-500 -do-
120 4-51-1 4-51-500 -do-
121 4-52-1 4-52-309/29 -do-
122
123
124
125
126
127
128
129
130
131
132
133
134
135
136
137
138
139
140
141
142
143
141
115
146
147
148
149
150
151
152
153
154
155
lS6
l·:~
158
159
160
161
162
163
161
4-53-1
4-54-1
4-55-1
5-1-1
5-2-1
5-2-25
5-3-1
5-4-1
5-4-50
5-5-1
5-6-1
5-6-128/2
5-7-1
5-7-194/5
5-8-1
5-8-109
5-9-1 5-H}'}
5-11-1
5-11-31
5-11-94
5-11-138
5-12-1
5-12-101
5-13-1
5-13-101
5-14-1
5-14-177/1
5-15-1
5-15-57
!l-16-1
5-16-127/1
5-16-181
5-17-1
5-17-67
5-18-1
5-19-1
5-20-1
5-21-1
5-22-1
5-22-7/201 !)·23-1
:;-21-1
5-21-94/2
4-53-120
4-54-140
4-55-145
5-1-150/1
5-2-24
5-2-83/1
5-3-66/1
5-4-49
5-4-83/3
5-5-127
5-6-128/1
5-6-200
5-7-194/4
5-7-200
5-8-108
5-8-200
5-9-165
5-10-88
5-11-30
5-11-93/I/A
5-11-158
5-11-156
5-12-100
5-12-200
5-13-100
5-13-199
5-14-177
5-14-188i
5-15-56
5-15-179/9
5-16-126
5-16-180
5-16-200
5-17-66
5-17-192
5-18-200
5-19-200/3
5-20-186
5-21-200
5-22-7/179
5-22-124
5-23-118/5
5-24·94/1
5-24-214/37
-do-
-do-
-do-
Gajularamaram Village
-do-
-do-
Lalsabguda
-do-
-do-
Markandeya Nagar
Nehrunagar
-do-
Sanjay Gandhi Nagar
-do-
-do-
-do-
-do-
-do-
-do-
-do-
-do-
-do-
New L.B.Nagar
-do-
-do-
-do-
Vivekananda Nagar
-do-
-do-
-do-
Rodanlistrynagar A
-do-
-do-
Rodamistrynagar B
-do-
-do-
-do-
Indiranagar
APIlC Colony
DP Colony
-do-
Allllri Seetaramaraju i\'agar
NTR !'Iagar road
Chandragiri Nagar
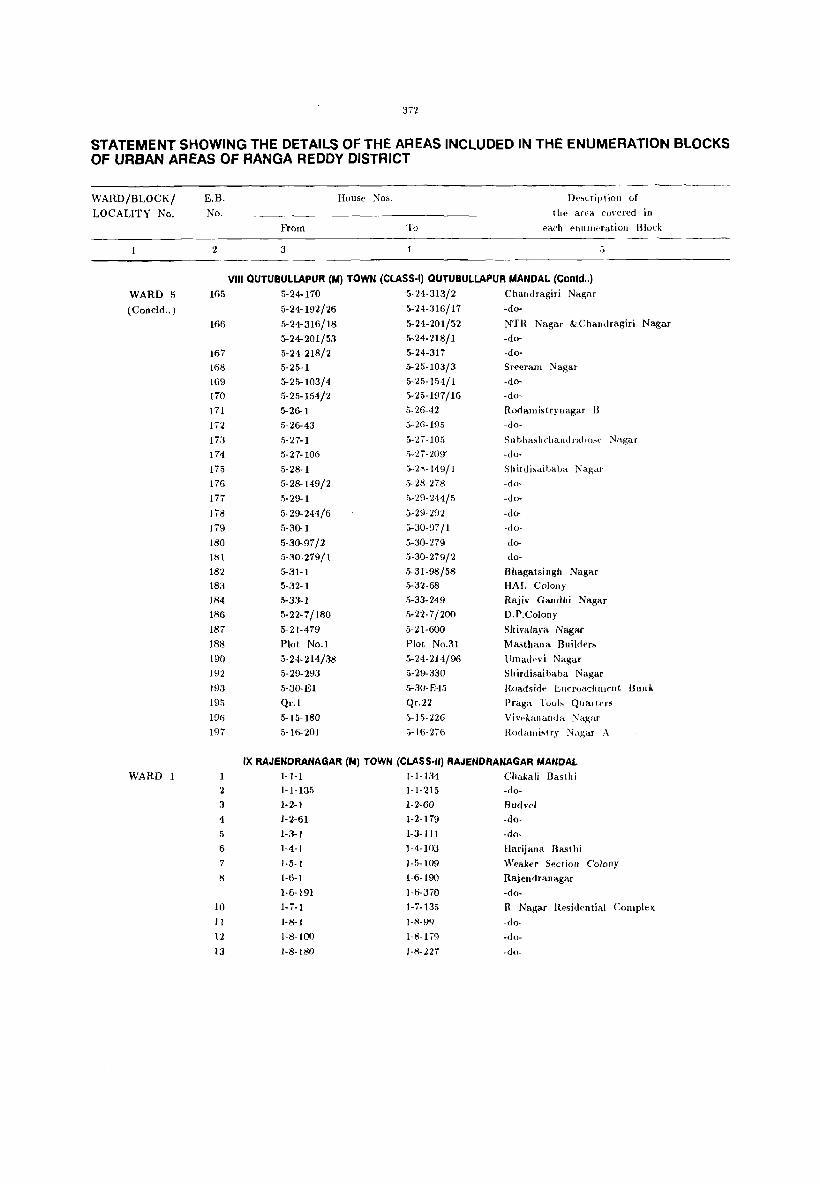
372
STATEMENT SHOWING THE DETAILS OF THE AREAS INCLUDED IN THE ENUMERATION BLOCKS OF URBAN AREAS OF RANOA REDDY DISTRICT
WARD/BLOCK/
LOCALITY No.
WARD 5
(Concld .. )
WARD 1
E.B. No,
'1.
165
166
167
168
169
170
171
172
173
174
175
176
177
178
179
180
181
182
183
184
186
187
188
190
192
t9:l
195
196
197
2
3 oj
5
6
7
8
10
II
12
13
House :'-los,
From
3
To
4
D(',crip I ion of
the ar('a em'ered in
each i'llllllli'ratioll Block
VIII QUTUBULLAPUR (M) TOWN (CLASS-I) QUTUBULLAPUR MANDAL (Contd .. )
5-24-170
5-24-192/26
5-24-316/18
5-24-201/53
5-24-218/2
5-25-1
5-25-103/4
5-25-154/2
5-26-1
5-26-43
5-27-1
5-27-106
5-28-1
5-28-149/2
5-29-1
5-29-244/6
5-3!} 1
5-3!}97/2
5-30-279/1
5-31-1
5-32-1
5-33-1
5-22-7/180
5-21-479
Plot No.1
5-24-214/38
5-29-293
5-30-El
Qr.l
5-15-180
5-11>.201
5-24-313/2
5-24.:H6/17
5-24-201/52
5-24-218/1
5-24-317
5-25-103/3
5-25-154/1
5-25-197/16
5-26-42
5-2G-195
5-27-105
;'-27-209'
5-2X-149/1 5-2/'l-27R
5-29-2-14/5
5-29-2~)2
5-30-97/1
5-30-279
5.30--279/2
5-31-98/58
5-32-68
5-33-249
5-22· 7/200
5-21-600
Plot No.31
5-24-214/96
:"-29-330
5-.3()-E45
Qr.22
5-15-;126
::'-16-276
Chandragiri Na!;ar
-do-
NTR Nagar &Chandragiri Nagar
-do-
-do-
Sreeram Nagar
-do--do-
Rodamis(rynagar B
-do-
Su b),as),c),alld mho,,' Nagar
~do-
ShirJi,aiimba Nagar
-do~
-do·
-do~
-do-
-do-
-do-
Bhagatsingh Nagar HAL Colony
Rajiv Gandhi Nagar
D.P.Colony
Shivalaya Nagar
Masthana Builders
Umadcvi Nagar
Shirdisaibaba Nagar
Road,ide E"croitchlllCnl, Bunk
I'raga Tool, Quarters
Vi\'E'kanauda Nagar
Rodallli,t ry :'-i "bar ,\
IX RAJENDRANAGAR (M) TOWN (CLASS-II) RAJENDRANAGAFI MANOAL
1-1-1
1-1-135
1-2-1
1-2-61
1-3-1
1-4-1
1-5-1
1-6-1
1-6-191
I-j-1
1-8-1
1-8-100
1·8·180
l-l-Ut 1-1-215
1-2-60
1-2·179
1-3-111
1-4-103
1-.1-109
1-15-190
1-6-370
1-7-135
1-8-0[)
1-8-179
1-8-'227
Chakali Basthi
-do-
Budvel
-do-
-do-
Harijana BasI hi
Weaker Sec! iOIl Colony
Rajendranagar
-do-
R Nagar Residential Complex
-do~
-do-
-do-

373
STATEMENT SHOWING THE DETAILS OF THE AREAS INCLUDED IN THE ENUMERATION BLOCKS OF URBAN AREAS OF RANGA REDDY DISTRICT
WARD/BLOCK/ LOCALITY No.
1
WARD 1
(Coneld .. )
2
3
4
E.B. No.
2
House Nos.
From
3
To
4
DeSl;ril'tion of
the area covered in
each enumeration Block
5
IX RAJENDRANAGAR (M) TOWN (CLASS·II) RAJENDRANAGAR MANDAL (Concld .. )
14
15
16 17
18
19
20
21
22
23
24 25
26 27
28
29
30
31
32
33
34
35
36
37
38
39
40
41
42
43
44
45
46
47
48
49
50
51 52
53 54
55 56
57
58
59
60
61
62
63
64
65 66
1-9-1
1-9-141
1-10-1 1-11-1
1-11-37
2-1-1
2-2-1
2-3-1
2-4-1
2-5-1
3-1-1
3-2-1
3-3-1 3-4-1
3-4-61
3-5-1
4-1-1
4-2-1
4-3-1
4-4-1
4-5-1
4-6-1
4-7-1
4-8-1
4-9-1
4-9-124 4-10-1
4-10-127/1
4-10-127/118
4-11-1
4-12-1
4-13-1
4-13-121
4-13-261
4-13-361
4-14-1
4-14-94
4-15-1
4-15-118
4-16-1
4-16-38
4-17-1
4-17-147
4-18-1
4-18-67
4-19-1
4-19-113
4-20-1
4-20-102
4-21-1
4-22-1
4- 23-1 4-24-1
1-9-140
1-9-237
1-10-72
1-11-36
1-U-112
2-1-157
2-2-185
2-3-184
2-4-125
2-5-67
3-1-174 3-2-165
3-3-100
3-4-60
3-4-188
3-5-128
4-1-188
4-2-168
4-3-162
4-4-182
4-5-166
4-6-199
4-7-198
4-8·144 4-9-123
4-9-300 4-10-127
4-10-127/117
4-10-127/320
4-11-157
4-12-175
4-13·120
4-13-260
4-13-360
4-13-470
4·14·93
4-14-189
4-15-117
4-15-190
4-16-37
4-16-157
4-17-14~
4-17-195
4-18-66
4-18-199
4-19-199
4-19-187
4-20-101
4-20-198
4-21-161
4-22-119
4-23-158
4-24-176
Harij ana Basthi
-do·
SIRD &PDUA Residential Quarters Why Ranava Reddy
Budvel Rly Station
Upperpalle
-do-
-do-
-do-
-do-
Hyderguda -do-
-do-
-do-
-do-
-do-
Athapur
-do-
Pochamma Basthi
Weaker Section Colony
-do·
Rambagh
Sivaji Nagar
Sainagar
Musk Mahal
Sikh Chalki S Kayam Nagar
lalal Baba Nagar
-do-
Pahadi
Saleema Nagar
Mahendhbad
9 No.
-do-
-do-
-do-
Hassan Nagar
-do-
-do-
-do--do-
-do-
-do-
-do-
-do-
-do-
Hassan Nagar &Mahmud Nagar
-do·
-do-
-do-
-do-
-do-
-do-
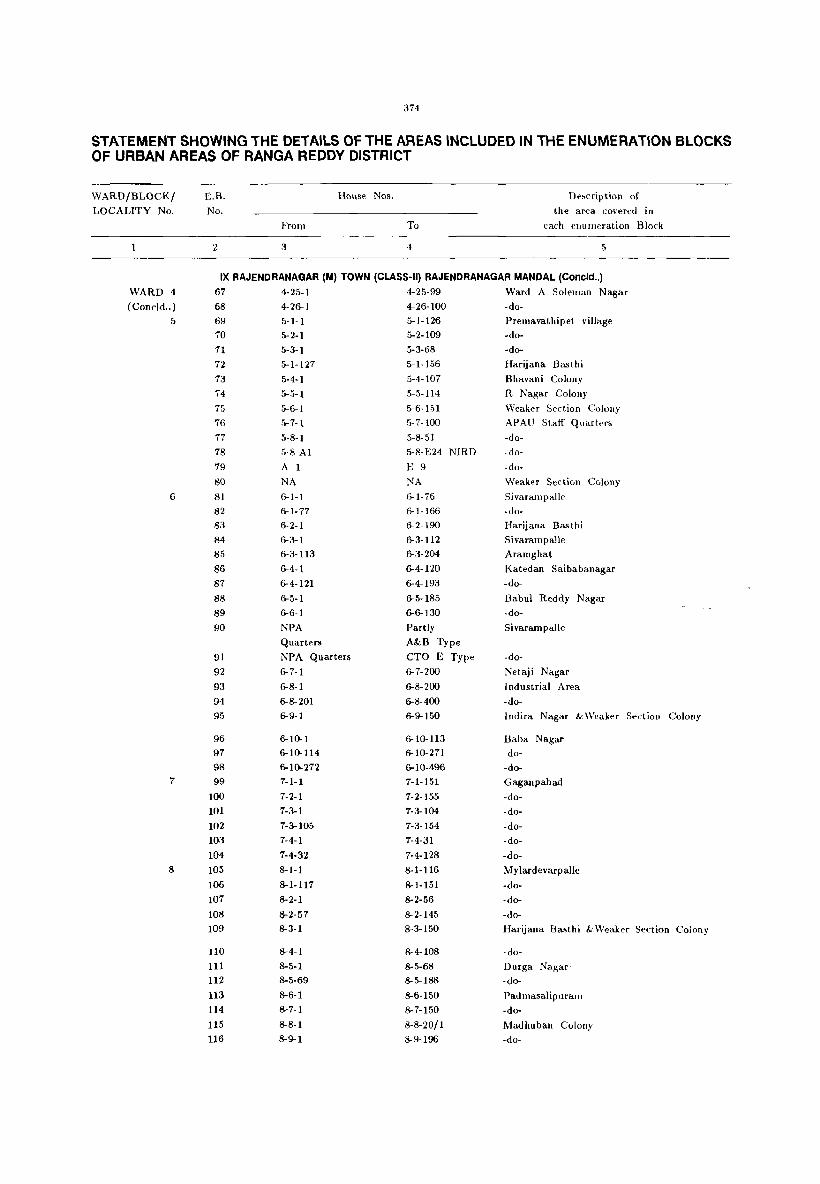
374
STATEMENT SHOWING THE DETAILS OF THE AREAS INCLUDED IN THE ENUMERATION BLOCKS OF URBAN AREAS OF RANGA REDDY DISTRICT
WARD/BLOCK/
LOCALITY No.
WARD 4
(Coneld .. )
5
6
7
8
E.B. No.
2
House Nos.
From
3
To
De,cription of
the area covered in
each ellumeration Block
5
IX RAJENDRANAGAR (M) TOWN (CLASS-II) RAJENDRANAGAR MANDAL (Concld .. )
67
68
69
70
71
72
73
74
75
76
77
78
79
80
81
82
83
84
85
86
87
88
89
90
91
92
93
94
95
96
97
98
99
100
101
102
103
104
105
106
107
108
109
110
111 112 113
114
115 116
4-25-1
4-26-1
5-1-1
5-2-1
5-3-1
5-1-127
5-4-1
5-5-1
5-6-1
5-7·1
5-8-1
5-8-A1
A 1
NA
6-1-1
6-1-77
6-2-1
6-3-1
6-3-113
6-4-1
6-4-121
6-5-1
6-6-1
NPA
Quarters
NPA Quarters
6-7-1
6-8-1
6-8-201
6-9-1
6-10-1
6-10-114
6-10-272
7-1-1
7-2-1
7-3-1
7-3-105
7-4-1
7-4-32
8-1-1
8-1-117
8-2-1
8-2-57
8-3-1
8-4-1
8-5-1 8-5-69
8-6-1
8-7-1
8-8-1
8-9-1
4-25·99
4-26-100
5-1-126
5-2-109
5·3-68
5-1-156
5-4-107
5-5-114
5-6-151
5-7·100
5-8-51
5-8- E24 NIRD
E 9 NA
6-1-76
6-1·166
6-2-190
6-3-112
6-3-204
6-4·120
6-4-193
6-5·185
6-6-130
Partly
A&B Type
CTO E Type
6-7-200
6-8-200
6-8-400
6-9-150
6-10-113
6-10-271 6-1 ().496
7-1-151
7-2-155
7·3·104
7-3-154
7-4-31
7·4·128
8-1-116
8-1·151
8-2·56
8-2-145
8-3-150
8-4-108
8-5·68 8-5-188
8-6-150
8-7·150
8-8-20/1
8-9-196
Ward A Soleman Nagar
-do-
Premavathipet village
-do-
-do-
Harijana Basthi
Bhavani Colony
R Nagar Colony
Weaker Section ColollY
APAU Staff Quarters
-do-
-do-
-do-
Weaker Section Colony
SivarampaJle
-do-
Harijana Basthi
Sivarampalle
Aramghat
Katedan Saibabanagar
-do-
Babul Reddy Nagar
-do-
Sivarampalle
-do-
Netaji Nagar
Industrial Area
-do-
Indira Nagar &: Weaker Section Colony
Baba Nagar
-do-
-do-
Gaganpahad
-do-
·do-
-do-
-do-
-do-
Mylardevarpalle
-do-
-do-
-do-
Harijana Basthi &Weaker Section Colony
-do-
Durga Nagar
-do
Padmasalipuram
-do-
Madhuban Colony
-do-
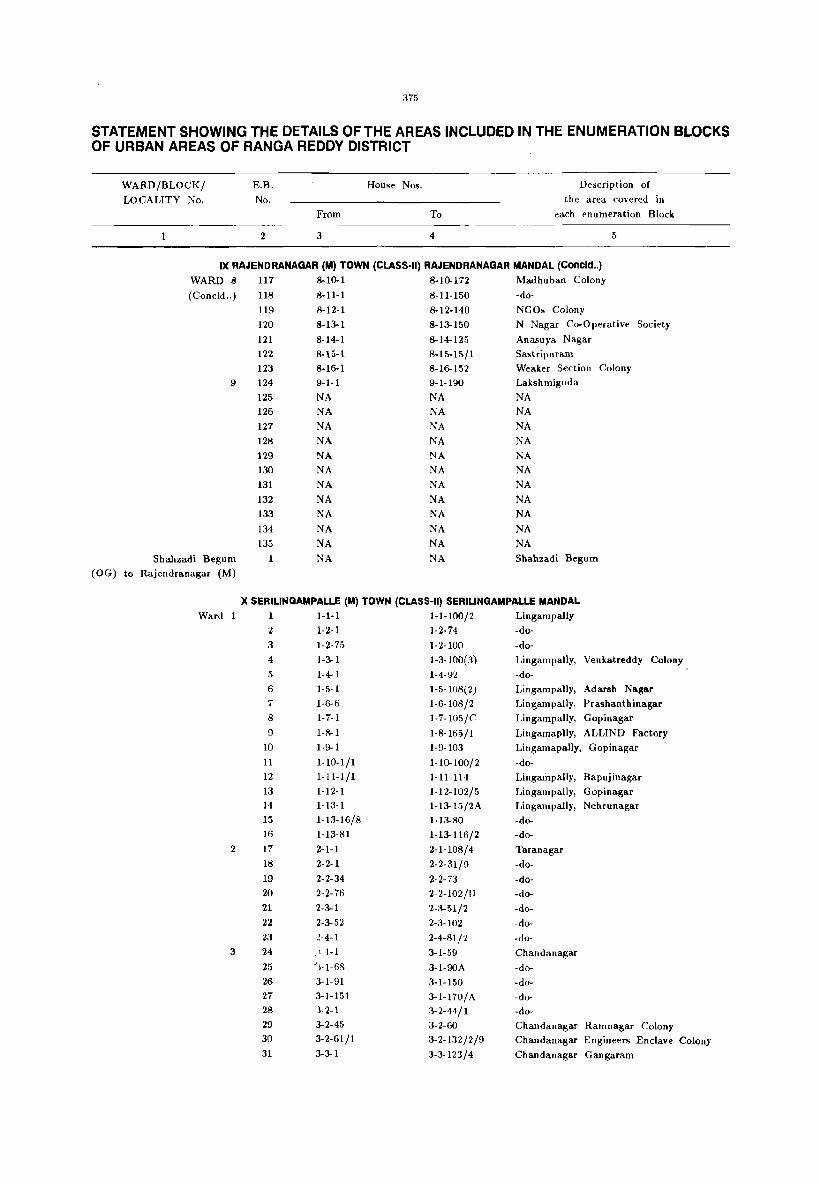
375
STATEMENT SHOWING THE DETAILS OF THE AREAS INCLUDED IN THE ENUMERATION BLOCKS OF URBAN AREAS OF RANGA REDDY DISTRICT
WARD/BLOCK/
LOCALITY No.
E.B.
No.
2
House Nos.
From
3
To
4
Description of
the area covered in
each enumeration Block
5
IX RAJENDRANAGAR (M) TOWN (CLASS.II) RAJENDRANAGAR MANDAL (Concld .. )
WARD.3 117 8-10-1 8-10-172 Madhuban Colony
(Concld .. ) -do-118 8-U-l 8-U-150
9
Shahzadi Begum (OG) to Rajendranagar (M)
119 8-12·1
120 8·13-1
121 8·14·1 122 8-15·1
123 8-16-1
124 9·1·1
125 NA 126 NA
127 NA
128 NA
129 NA
130 NA
131 NA
132 NA 133 NA
134 NA
135 NA
1 NA
8-12·140
8·13-150
8·14·125 8.15-15/ 1
8-16--152
9-1-190
NA
NA
NA
NA
NA NA
NA
NA
NA
NA
NA
NA
NGOs Colony
N Nagar Co-Operative Society
Anasuya Nagar
Sastripuram
Weaker Section Colony
Lakshmiguda
NA NA
NA
NA
NA
NA
NA
NA
NA
NA
NA
Shahzadi Begum
X SERILINGAMPALLE (M) TOWN (CLASS-II) SERIUNGAMPALLE MANDAL
Ward 1 1-1-1 1·1-100/2 Lingampally
2 1·2·1 1·2·74 ·do·
3 1·2·75 1·2·100 -do-
4 1-3-1 1-3.100(3) Lingampaily, Venkatreddy Colony
5 1-4-1 1-4-92 -do-6 1-5-1 1-5-108(2) Lingampally, Adarsh Nagar 7 1-6--6 1·6-108/2 Lingampally, Prashanthinagar 8 1-7-1 1-7-105/e Lingampally, Gopinagar
9 1-8-1 1-8-165/1 Lingamaplly, ALLIND Factory 10 1-9-1 1·9·103 Lingamapaliy, Gopinagar
11 1·10-1/1 1·10-100/2 -do-12 1-11-1/1 1-11-114 Lingalnpally, Bapujinagar
13 1-12-1 1·12.102/5 Lingampally, Gopinagar 14 1-13-1 1-13-15!2A Lingampally, Nehrunagar 15 1.13·16/8 1-13-80 ·do-16 1-13-81 1-13-116/ 2 ·do-
2 17 2-1-1 2-1-108/4 Taranagar 18 2-2-1 2-2-31/9 ·do-19 2-2-34 2-2-73 -do-20 2-2-76 2-2-102/D -do-21 2·3-1 2-3-51/2 -do-n 2-3-52 2-3-102 -do-
23 '1-4-1 2·4·81/2 -do-3 24 ,\ 1-1 3-1-59 Chandanagar
25 °1_1_68 3-1-90A -do-26 3-1-91 3-1-150 -do-27 3-1-151 3-1-170/ A -do-28 .3-2-1 3-2-44/1 -do-29 3-2-45 3-2-60 Chandanagar Ramnagar Colony 30 3-2-61/1 3- 2-132 /2/9 Chandanagar Engineers Enclave Colony 31 3-3-1 3-3-123/4 Chandanagar Gangaram

376
STATEMENT SHOWING THE DETAILS OF THE AREAS INCLUDED IN THE ENUMERATION BLOCKS OF URBAN AREAS OF RANOA REDDY DISTRICT
WARD/BLOCK/ LOCALITY No.
Ward 3
(Coneld .. )
4
5
6
7
8
9
10
E.B. No.
2
House Nos.
From
3
To
4
Description of
the area covered III
each enumeration Block
5
X SERILINGAMPALLE (M) TOWN (CLASS·II) SERILINGAMPALLE MANDAL (COOld .. )
32
33 34 35
36
37
38
39
40
41
42 43
44 45
46
41
48
49
50
51
52
53
54
55
56
57
58
59
60
61
62
63
64
65
113
66
67
68
69
70
71
72
73
74
75
76
3-4-1
3-4-126
3-5-1
3-5-81
3-5-99
3-6-1
3-6-17
3-7-1
3-7-101
3-7-157
3-8-1
3-8-101
3-9-1
3-10-1
3-10-93
3-11-1
3-12-1
3-13-1
3-14-1
3-15·1
3-16-1
C-3-419
3-17-51
C-3-419
3-18-1
C3-469
3-17-1
C3-369
3-19-1
4-1-59/8/5/1
5-1-1
6-1-1
7-1-1
Plot 1
7-1-66
7+/0/1
7-3-2/1
7-3-30/1
7-3-35/1
7-2-1
-NA-
8-1-1
8-1-49/A
8-2-1/1
8-2-1
9--1-1
9--2-1
A1-1
Police Quarters
AI-401
AI-441
A2-01
10-1-1
3-4-125
3-4-140
3-5-80/5
3-5-90/3/2
3-5-164/1
3-6-16
3-6-129
3-7-100(3)
3-7-156
3-7-200
3-8-100
3-8-204
3-9-149
3-10-92
3-10-177
3-11-128
3-12-130
3-13-122
3-14-110
3-15-100
3-16-100
C-3-468
3-17-100
C-3-468
3-18-89
C3-550
3-17-50
C3-418
3-19-144
4-1-59/119
5-1-111
6-1-111/3
7-1-65
Plot 25/1
7-1-106
7-1-/0/239
7-3-23/50
7-3-31/29
7-3-36/50
7-2-99
-NA-
8-1-49
8-1-109
8-2-101
8-2-133
9--1-99
9-2-44/B
200
440 493
400 10-1-82
Chandanagar Gangaram
-do-
-do-
-do-
-do-Chandanagar Railway track
Chandan agar, Subashnagar
Chandanagar, Shantinagar
-do-
Chandanagar, Weaker Section
Chandan agar, Shantinagar Huts
Chandanagar, T Anjaiahnagar
Chandan agar, Indiranagar
-do-
Chandan agar, Ernikunta
Chandanagar, Huda Colony
Huda Colony
-do-
-do-
-do-
-do-
-do-
-do-
-do-
-do-
-do-
-do-
-do-
Chandanagar, Huda Colony
Madinaguda
Maqtba Mahaboobpet
Miyapur
Oeeptisrinagar Colony
Hafeezpet
-do-
-do-
-do-
-do-
-do-
-do-
-NA-
Kondapur
-do-
Kanamet Izzatnagar
-do-
Kothab.lda
-do-
Kondapur
Kondapur 8th Bn
APSP
-do-
-do-
Gachibowli

377
STATEMENT SHOWING THE Dt:TAILS OF THE AREAS INCLUDED IN THE ENUMERATION BLOCKS OF URBAN AREAS OF RANGA REDDY DISTRICT
WARD /BLOCK/ LOCALITY No.
1
Ward 10
(Coneld .. )
11
12
13
14
15
16
17
E.B. No.
2
House Nos.
F'tom
3
To
4
Description of
the area. covered in
each enumeration Block
5
X SERILINGAMPALLE (M) TOWN (CLASS-II) SERILINGAMPALLE MANDAL (Concld .. )
77 10-2-1 10-2-64/1 Ga.chibowli
78 10-2-55/1 10-2-55/44 -do-
106
107
108
109
111
79
80
110
81
82
83
84
85
86
87
88
89
90
91
92
93
94
95
96
97
98
99
100
101
102
103
101
105
112
A &C Type
26 A B
46 A
61 B Type
-NA-
11-1-1
11-1-73
-NA-
12-1-1
13-1-1
13-2-1
13-3-1
13-4-1
13-5-1
13-5-74
13-6-1
13-7-1
14-1-1
14-2-1
14-3-1
15-1-1
15-1-60
15-2-1
16-1-1
16-2-1
16-2-100/18
17-1-1
17-2-1
17-3-1
2054 BHEL Qrs.
3.Z
243
592
743
-NA-
25 B Type
45 B Type
68 B Type
5 E Type
-NA-
11-1-72/1
11-1-98
-NA-
12-1-86/11
13-1-125
13-2-125
13-3-120
13-4-125
13-5-73
13-5-125
13-6-62/2
13-7-4/14
14-1-100
14-2-60/2
14-3-70
15-1-59
15-1-125
15-2-122
16-1-100/164
16-2-100
16-2-100/227
17-1-121(2)
Gachibowli Qrtrs GPRA
-do-
-do-
-do-
-NA-
Madhapur V
-do-
-NA-
Guttalabegumpet
Raidurga
-do-
-do-
-do-
Durg Paiga
-do-
Raidurg Paiga
-do-
Khajaguda(V)
Khajaguda(V) Weaker Section
-do-
Nanakramguda
-do-
-do-
GopanpalJy
GopanpalJy, Gowlidoddi
-do-
Nallagandla(V)
17-2-114 -do-
17-3-79 -do-
2124 BHEL Qrs. MIG BHEL Quarters
>117 MIG -do-
417 MIG -do-
742 MIG -do-
1037 MIG -do-
-NA- -NA-

378
STATEMENT SHOWING THE DETAILS OF THE AREAS INCLUDED IN THE ENUMERATION BLOCKS OF URBAN AREAS OF RANGA REDDY DISTRICT
WARD/BLOCK/ LOCALITY No.
WARD 1
2
3
4
E.B. No.
2
2
3
4
5
6
7
8
9
10
11
12
13
14
15
16 17
18
19
20
21
22
23
24
25
26
House Nos.
From To
3 4
Description of
the area covered in
each enumeration Block
5
XIII TANDUR (M) TOWN (CLASS-III) TANDUR MANDAL 1-1-1
1-1-91
1-2-1
1-2-101
1-3-1
1-3-91
H-1
1-5-1
1-5-101
1-6-1
1-6-83
1-7-1
1-7-76
1-8-1
2-1-1
2-1-54
2-1-101
2·2·1
2-2-101
2·2·201
3-1-1
3-2-1
3-2-143
3-3-1
4-1·1 4-2-1
4-2-85/4 4-2-101
4-2-166
4-3-1
1-1-90
1-1-144
1-2-100
1-2-168
1-3-90
1-3-161
1-4-138
1-5-100
1-5-175
1-6-82/1
1-6-142/1
1-7-75
1-7-148
1-8-105
2-1-53
2-1-100
2-1-184
2-2-100
2-2-200
2-2-293
3-1-60
3-2-110
3-2·219
3-3-80
4-1-123
4-2-85/3
4-2-99/4
4-2-165/1 4-2-210
4-3-43
St.Marks High School, Old Shanthappa Hospital Ashur Khana, Malreddipally
Hanman temple, Primary School Malred
dipally Darga MarriChettu
Indiranagar, hajjamgally area
Indiranagar, Dasarigally area
Indiranagar, Ram mandir, Masjid
S.T.Hostel area
Indiranagar, Vithal flour Mill area Indiranagar, Gundu Peerlu and
Vivekananda Public School Area Indiranagar, Boyagally area
Indiranagar, Raghavendra Colony Area Indiranagar, Guru Mandir area
Indiranagar, S.T.Girls Hostel Area Gareebnagar, C.M.S.Govt.High School
No.1 area' Naidu Polish Machine &Cocila Cottage
Area New Nalanda Public School area
Shaipur Kunta, Ashurkhana area
Shaipur Brahmamgari temple, Darga and Hanman temple ShaipUf Masjid, Flour Mill area
Shakthi Complex and Sanjaygandhinagar Colony Municipal Offke Building, Library, Bus
Depot Shanthamahal theatre, Govt Junior
College R&B area Dak Bunglow, Kummergally, Registra-
tion Office area Venkateshwara Colony
&Khan Colony area
Railway Quarters Area
Chincholi Road Gunj
Shaukarpet area
Shaukarpet, Vignanpuri Colony areas
Gumastanagar Colony Area Vijaya Vidyalaya High School Opp.
Old Shanthappa's Hospital Area

379
STATEMENT SHOWING THE DETAILS OF THE AREAS INCLUDED IN THE ENUMERATION BLOCKS OF URBAN AREAS OF RANGA REDDY DISTRICT
WARD/BLOCK/ LOCALITY No.
1
WARD 5
6
7
8
E.B. No.
2
27
28
29
30
31
32
33
34
35
36
37
38
39
40
41
42
43
44 45
46
47
48
49
50
52
53
54
55
56
57
58
59
60
61
62
63
64
65
66 67
House Nos.
From To
3 4
Description of the area covered in
each enumeration Block
5
XIII TANDUR (M) TOWN (CLASS-III) TANDUR MANDAL (Contd .. ) 5-1-1
5-1-108
5-2-1
5-3-1
5-4-1
5-5-1
5-5-101
5-6-1
5-6-37
5-7-1
6-1-1
6-2-1
6-2-64
6-3-1
6-4-1
6-4-64
6-5-1
6-5-61/2 6-6-1
6-7-1
6-8-1
6-8-51
7-1-1
7-1-101
7-2-1
7-4-1
7-5-1
7-6-1
7-7-1
8-1-1
8-1-32/1 8-2-1
&
8-3-1
8-4-1
8-5-1
8-6-1 8-7-1
8-7-36
8-8-1
8-8-33
5-1-107
5-1-214
5-2-115
5-3-102
5-4-150
5-5-lDO
5-5-171
5-6-36
5-6-67
5-7-103
6-1-41
6-2-63
6-2-162
6-3-56
6-4-63
6-4-163
6-5-61/1 6-5-78
6-6-111
6-7-99
6-8-50
6-8-143
7-1-100
7-1-175
7-2-111/6
7-4-105
7-5-131
7-6-67
7-7-75
8-1-32
8-1-127
8-2-81
8-2-162
8-3-73
8-4-114
8-5-121
8-6-76
8-7-35/1 8-7-79
8-8-32 8-8-119
Edga Area
Edga and Jammi Majid Area, Ghana
purgalli Opp. State Bank of Hyderabad area Sharar Gaily Sharaf gaily Jamai Majid Opposite
area and Ghanapurgally area
Gunj and PasarigaIly area Gunj and Dhangergally areas Old" Tarkari" bazar area
Nayeem Khan floor mill area
KhasabgaIly area, Madina Masjid area
Anwar Miya Petrol Pump Area Akkamahadevi Mahila Mandali Area,
Old" Tarkari" Bazar area &Mochigalli
areas Mochigally, Dhobigally areas
Bhadreshwar Nowbathkhana area
Nagareshwara temple area
Nagareshwara temple and Gandhichowk areas Kanyapatashala High School area Bhadreshwara Rath Road area Herur Gaily area
Waddergally area
Shamsheergunj &Durga areas Gandhinagar Colony Area
Seetarampet area and New Vegetable
market Meat Market Areas
Seetarampet Area, Old MM
Court Areas
Marwadi Bazar Area
Bhavigi Bhadreshware temple area
Police Station, CommerciaI Tax: Office
Telephone exchange &Church areas
Chengol Gudiselu &Station Majid area
Man ik n agar, MandaI Development Office
MandaI Revenue Office, &S.T.Offlce Area Maniknagar &Sweepers Colony areas
Old Tandur Harijanawada area -do-
Opposite Harijanawada, Old Tandur
Khasabgally, Hanman Mandir No.ll School Girls High School Old Tandur
HajjamgaIly, Telugugadda Old Tandur
Mollagally Old Tandur &Opposite
Hanman Temple area Old Tandur Pochamma Temple Area &
Jamai Masjid area, Old Tandur area Venkateshwara temple, MomingaIly, Darga areas, Old Tandur

380
STATEMENT SHOWING THE DETAILS OF THE AREAS INCLUDED IN THE ENUMERATION BLOCKS OF URBAN AREAS OF RANGA REDDY DISTRICT
WARD/BLOCK/ E.B.
LOCALITY No. No.
2
WARD 8 68
(Concld .. ) 69
70
HABSHIGUDA WARD WARD 1
2
3 4
5
6
7
8 9
10
11
12
13
UPPAL WARD
WARD 2 14 15
16
17 18
19 20
21
22
23
24 25
26 27
28
29
30 31
32 33
34
35
36
House Nos.
From To
3 4
Description of
the area covered in
each enumeration Block
5
XIII TANDUA (M) TOWN (CLASS-Il1) TANDUR MANDAL (COncld .. ) 8-9-1 8-9-63 Ashurkhana area
8-10-1 8-10-40 Nowbhat Khan area, Gadi Ashurkhana
area, Old Tandur 8-10-41 8-10-142 Panduranga Temple &Gadi area Old
Tandur
XIV UPPAL KALAN (M) TOWN (CLASS-II) UPPAL KALAN MANDAL
1-1-1 1-1-79/B
1-1-80 1·1-135
1-1-135/1 1-1-135/106 1-2-1 1-2-73
1-2-74 1-2-100/2
1-3-in 1-3-94
1-4-1 1-4-90
1-5-1 l-5-83/A 1-6-1 1-6-33
1-6-34 1-6-140
1-7-1 1-7-42
1-8-1 1-8-50
1-9-1 1-9-45
2-1-1 2-1-83/1
2-1-83/2 2-1-98
2-2-1 2-2-88
2-2-89 2-2-123
2-2-124 2-2-141
2-2-l41/1 2-2-186/3 2-3-1 2-3-61
2-3-62 2-3-176
2-4-1 2-4-123
2-5-1 2-5-116
2-5-117 2-5-145 2-6-1 2-6-66
-NA- -NA-
2-7-1 2-7-32
2-7-33 2-7-112 2-8-1 2-8"111
2-8-112 2-8-137
2-9-1 2-9-84
2-9-85 2-9-179 2-10-1 2-10-88
2-10-89 2-10-180 2-11-1 2-11-81
2-11-82 2-11-140
Street No.1, Harijanawada
P &T Colony
Huda Complex Kakatiyana.gar Colony
-do-
Jayanagar Street No.4,5,6
New Found land Colony, Sneha Nagar Colony Vivekananda Nagar Colony Lambada Colony
-do-Vignanpuri Colony, Santhoshnagar Colony
S. S. Nagar Colony
Ravindranagar Colony
Ravindranagar
Saraswathi Nagar
Raj Colony
Venkateshwara Colony, Suryanagar Colony
Laxmareddy Colony Old Hanumasai
Hanumasai Vijayapuri Colony
-do-
Shanthinagar
-do-Gandhinagar, Swaroopnagar and
Vivekananda Colony
Harijanawada
Bharathnagar Harijanabasthi
-NA-Telugu Basthi
Kurmabasthi -do
Telugubasthi Old Village, Uppal
-do-main Road, Uppal
Kummaribasthi
Dhobibasthi
Srinagar Colony
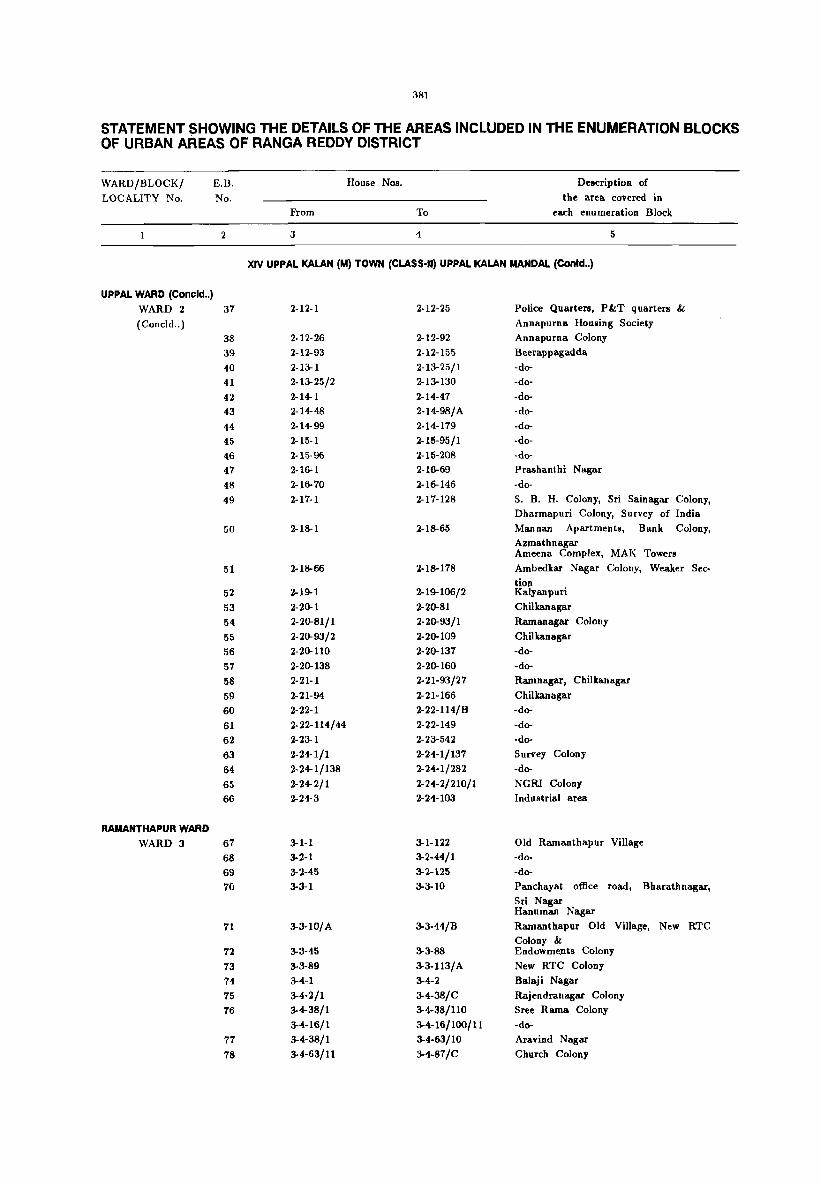
381
STATEMENT SHOWING THE DETAILS OF THE AREAS INCLUDED IN THE ENUMERATION BLOCKS OF URBAN AREAS OF RANGA REDDY DISTRICT
WARD/BLOCK/ LOCALITY No.
UPPAL WARD (Concld .. )
E.B.
No.
2
WARD 2 37
(Coneld .. )
RAMANTHAPUR WARD WARD 3
38 39
40
41
42 43
44 45
46 47
48
49
50
51
52
53
54
55 56
57
58
59 60
61 62
63
64
65 66
67
68
69 70
71
72
73 74
75
76
77
78
House Nos.
From To
3 4
Description of
the area covered in
each enumeration Block
5
XIV UPPAL KAlAN (M) TOWN (CLASS-II) UPPAL KALAN MANDAL (Contd .. )
2-12-1
2·12·26 2-12-93
2·13-1 2-13-25/2
2-14-1 2-14-48
2-14-99
2-15-1
2-15-96
2·16-1 2-16-70
2-17·1
2-18-1
2-18-66
2-19-1
2-20-1
2-20-81/1
2-20-93/2 2-20-110
2-20-138
2·21-1
2-21-94
2-22-1
2-22-114/44 2-23-1
2-24-1/1 2-24-1/138
2-24-2/1 2-24-3
3-1-1
3-2-1
3-2-45 3-3-1
3-3-10/ A
3-3-45
3-3-89
3-4-1
304-2/1 3-4-38/1
3-4-16/1 3-4-38/1
304-63/11
2-12-25
2-12-92
2-12-155
2-13-25/1 2-13-130
2-14-47
2-14-98/A 2-14-179
2-15-95/1 2-15-208 2-16-69
2-16-146
2-17-128
2-18-65
2-18-178
2-1g.: 106/2
2-20-81
2-20-93/1
2-20.109
2-20-137
2-20-160
2-21-93/27
2-21-166
2-22-114/B
2-22-149 2-23-542
2-24-1/137
2-24-1/282
2-24-2/210/1 2-24-103
3-1-122
3-2-44/1 3-2-125
3-3-10
3-3-44/B
3-3-88
3-3-113/A 3-4-2
3-4-38/C
3-4-38/110
3-4-16/100/11 3-4-63/10
3-4-87/C
Police Quarters, P&T quarters "
Annapurna Housing Society
Annapurna Colony
Beerappagadda
-do-
-do-
-do--do-
-do--do-
-do-Prashanthi Nagar
-do-
S. B. H. Colony, Sri Sainagar Colony, Dharmapuri Colony, Survey of India
Mannan Apartments, Bank Colony,
Azmathnagar Ameena Complex, MAK Towers
Ambedkar Nagar Colony, Weaker Sec
tion Kalyanpuri
Chilkanagar Ramanagar Colony
Chilkanagar
-do-
-do-Ramnagar, Chilkanagar
Chilkanagar -do-
-do--do-
Survey Colony
-do-
NGRI Colony Industrial area
Old Ramanthapur Village
-do-
-do-
Panchayat office road, Bharathnagar,
Sri Nagar Hanuman Nagar
Ramanthapur Old Village, New RTC Colony & Endowments Colony
New RTC Colony
Balaji Nagar
Rajendranagar Colony
Sree Rama Colony
-do-Aravind Nagar
Church Colony

382
STATEMENT SHOWING THE DETAilS OF THE AREAS INCLUDED IN THE ENUMERATION BLOCKS OF URBAN AREAS OF RANOA REDDY DISTRICT
WARD/BLOCK/
LOCALITY No.
E.B.
No.
2
House Nos.
From
3
To
4
Description of
the area cO\Tered in
each enumeration Block
5
XIV UPPAL KALAN (M) TOWN (CLASS-II) UPPAL KALAN MANDAL (Concld .. )
RAMANTHAPUR WARD (Concld .. )
WARD 3 79 3-4-88 3-4-112/B Uppal,Uppal-koti Main Road
(Concld .. ) 80 3-5-1 3-5-44 Indiranagar
81 3-5-45 3-5-81 -do-
82 3-5-81/A 3-5-125 -do-
83 3-6-1 3-6-55/6 -do-
84 3-6-55/C 3-6-80 -do-
85 3-6-81 3-6-125 -do-
86 3-7-1 3..:: (,9 .do-
87 3-7-'70 3-7-'129/1 Near Satyanarayana Ternple
88 3-8-1 3-8-60 Nehtunagar &Main Road
89 3-8-61 3-8-152 -do-
90 3-9-1 3-9-46/5 Sharadanagl\r Colony
91 3-9-46/6 3-9-56/6 -do-
92 3-9.57 3-9-100 .do-
93 3-10-1 3-10-20/52 RTC Colony
94 3-1O-20/52A 3-10-25 -do-
95 3-10-26 3-10-37/2 -do-
96 3-10-38 3-1O-93/B/2 Goklenagar
97 3-10-93/lA 3-10-125/ A2 -do-
98 3-11-1 3-11-49 Old Goklenagar
99 3-11-50 3-11-118/A -do-
100 3-12-1 3-12-52/2 Ganesh Nagar
101 3-12-52/3 3-12-123 P.S.Colony
102 3-13-1 3-13-85 Madhuranagar
103 3-13-85/A 3-13-126/3 Srinivasapurarn
104 3-14-1 3-14-36j8B -do-
105 3-14-36/8C 3-14-36/1 Viveknagat
106 3-14-36/2 3-14-60 -do-
107 3-14-61 3-14-125/1 Vinayakanagar
108 3-15-1 3-15·38 Navrang guda
109 3-15-38/1 3-15-118 -do-
110 3-16-1 3-16-91/6 Nehrunagar
111 3-16.92A 3-16-102/E Venkatreddy Nagar
112 3-16·102/E1 3-16-108/10 -do-
113 3-16·105/11 3-16-111 Vysya. Colony, Venkatreddy Nagar
114 &115 3-17-1 3-17·75 Gandhi Nagar
Maktabibi Sahebguda
(OG) to Uppal kalan (M) NA NA Ma.ktabibi Saheb guda.
XV VICAMBAD (U) TOWN (CLASS·III) VICARABAD MANDAL WARD 1 1 1-1-1 1-1-1240 Kothrepally village
2 1-2-1 1-2-65 -do-
2 3 2-1-1 2-1-129/A Shivareddypet \Tillage
4 2-2-1 2-2-129 -do-
5 2-3-1 2-3-801 A -do-
6 2-4-1 2-4-32 S R Pet Industrial Estate
2-4-33 2-4-91/61 Venkatapur Thanda
7 2-5-1 2-1-2/25 -do-
8 2-6-1 2-6-28 MaduJagadda Thanda
3 9 3-1-1 3-1-19/1 Yennepalli Village 10 3-2-1 3-2-49 -do-
II 3-2-50 3-2-176 -do-
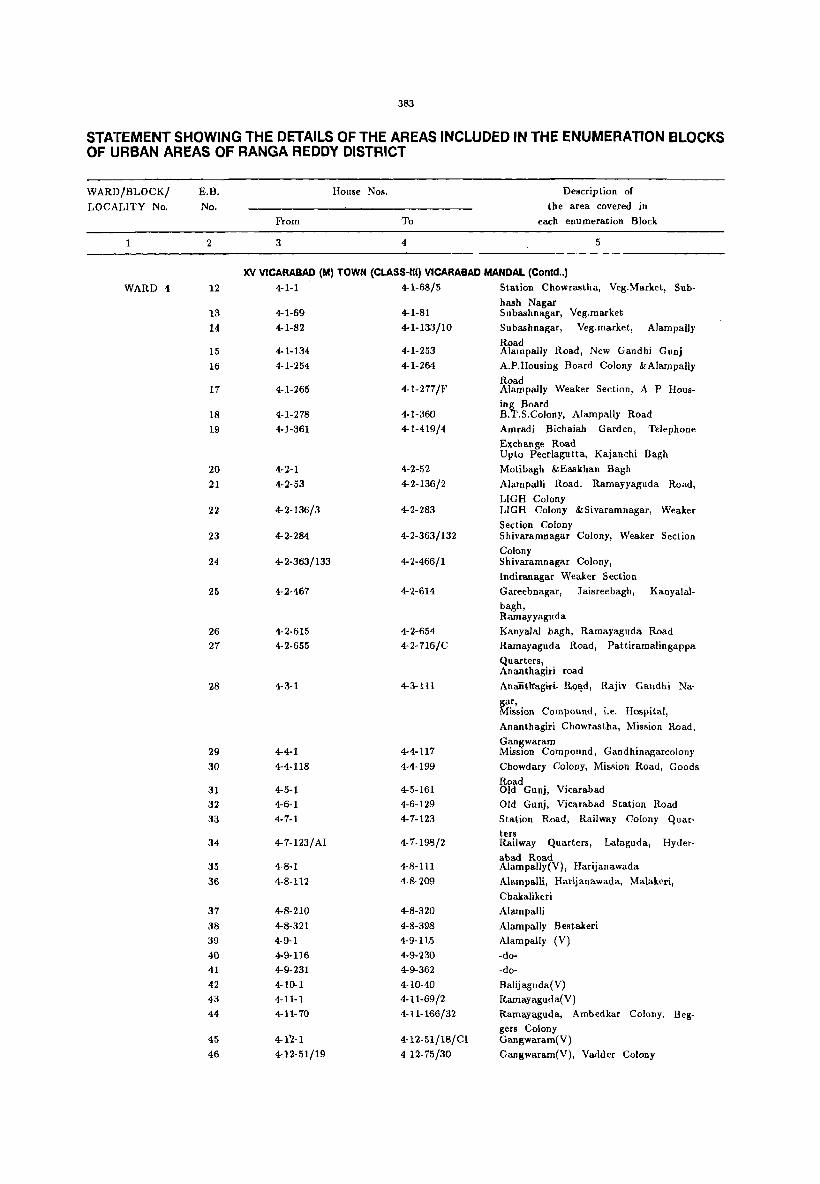
383
STATEMENT SHOWING THE DETAILS OF THE AREAS INCLUDED IN THE ENUMERATION BLOCKS OF URBAN AREAS OF RANGA REDDY DISTRICT
WARD/BLOCK/
LOCALITY No.
1
WARD 4
E.B.
No.
2
12
13
14
15
16
17
18
19
20
21
22
23
24
25
26 27
28
29
30
31 32 33
34
35
36
37
38 39
40
41
42 43
44
45
46
House Nos.
From To
3 4
Description of
the area covered in
each enumeration Block
5
'IN V1CARABAD (M) TOWN (CLASS·III) V1CARABAD MANDAl (Contd .• )
4-1·1 4-1-68/5 Station Chowrastha, Veg.Market, Sub·
4-1·69
4-1·82
4-1·134
4·1·254
4-1·265
4-1·278
4-1·361
4-2-1
4-2·53
4-2·136/3
4-2-284
4-2.363/133
4-2-467
4-2-615
4-2·655
4-3-1
4-4·1
4-4-118
4-5-1 4-6-1
4-7-1
4-7-123/ AI
4-8-1
4-8-112
4-8-210
4-8-321 4-9-1
4-9·116
4-9-231
4-10-1
4-11·1
4-11-70
4-1'2-1
4-12·51/19
4-1-81
4-1-133/10
4~1-253
4-1-264
4.1-277/F
4·1-360
4-1-419/4
4-2-52
4-2-136/2
4-2-283
4·2-363/132
4-2-466/1
4-2-614
4-2-654
4-2-716/C
4-3-111
4-4-117
4-4-199
4-5-161 4-6-129
4-7·123
4-7-198/2
4-8-111
4-8-209
4-8·320
4-8-398
4-9-115
4-9-230
4-9-362
4-10-40 4.11.69/2
4-11-166/32
4-12.51/18/CI
4-12-75/30
hash Nagar Subashnagar, Veg.market
Subashnagar, Veg.market, AlampaUy
Road Alampally Road, New Gandhi Gunj
A.P.Housing Board Colony &Alampally
Road Alampally Weaker Section, A P Hous-
ing Board B.T.S.Colony, Alampally Road
Amradi Bichaiah Garden,
Exchange Road Upto Peerlagutta, Kajanchi
Motibagh &Easkhan Bagh
Telephone
Bagh
Alampalli Road, Ramayyaguda Road,
LIGH Colony LIGH Colony &Sivaramnagar, Weaker
Section Colony Shivaramnagar Colony, Weaker Section
Colony Shivaramnagar Colony,
Indiranagar Weaker Section
Gareebnagar, Jaisreebagh, Kanyalal.
bagh, Ramayyaguda
Kanyalal bagh, Ramayaguda Road
Ramayaguda Road, Pattiramalingappa
Quarters, Ananthagiri road
Anantlraghl- R9~, Rajiv Gandhi Na
gar, Mission Compound, i.e. Hospital,
Ananthagiri Chowrastha, Mission Road,
Gan6waram MiSSIOn Compound, Gandhinagarcolony
Chowdary Colony, Mission Road, Goods
Road Old Gunj, Vicarabad Old Gunj, Vicarabad Station Road
Station Road, Railway Colony Quar· ters Railway Quarters, Lalaguda, Hyder·
abad Road Alampally(V), Harijanawada
Alampalli, Harijanawada, Malakeri,
Chakalikeri
Alampalli
Alampally Bestakeri
Alampally (V)
-do· -do-
Balijaguda(V) Ramayaguda(V)
Ramayaguda, Ambedkar Colony, Beggers Colony Gangwaram(V)
Gangwaram(V), Vadder Colony

384
STATEMENT SHOWING THE DETAILS OF THE AREAS INCLUDED IN THE ENUMERATION BLOCKS OF URBAN AREAS OF RANGA REDDY DISTRICT
WARD/BLOCK/ LOCALITY No.
WARD 4
(Coneld .. )
5
6
7
E.B. No.
2
47
48
49
50
51
52
53
54
55
56
57
58
59 60
61
62
63
64
House Nos.
From To
3 4
Description of
the area covered in
each enumeration Block
5
xv VICARABAD (M) TOWN (CLASS-III) VICARABAD MANDAL (Concld .. ) 4-12-30/A 4-12-160 Gangwaram(V), Weaker Section
Colony, Madu Colony
4-12-161
4-12-225
5-1-1
5-2-1
5-3-1
5-4-1
5-5-1
5-6-1
6-1-1
6-2-1
6-2-43
6-3-1
7-1-1
7-2-1
7-3-1
7-4-1
7-5-1
4-12-224
4-12-240/B
5-1-59
5-2-58
5-3-74
5-4-83
5-5-120
5-6-110
6-1-109/1
6-2-42
6-2-116
6-3-51
7-1-100
7-2-100
7-3-99
7-4-100/2
7-5-38/31
S.C. Colony, Gangwaram, Harijanawada
Gangwaram
Ananthagiripalli(V)
AnanthagiripalIi, Wadder Colony
Ananthagiripalli, Harijanawada, Weaker
Section Ananthagiripalli(V), Chenchu Colony,
S.T.Colony Ananthagirigutta, T.B.Sanitorium, Labour
huts Ananthagiri T.B.Sanitorium, T.B.Hospital
Nurses Quarters, Rest House
Girgetpalli Village, Harijanawada, Weaker
Section Girgetpalli(V)
Ananthagiripalli, Weaker Section, Sugar
Factory Girgetpalli(V), S.T.Colony, S.C.Colony
Kothagaddi Village
-do-
-do-
Kothagaddi(V), S.C.Colony
-do-

385
APPENDIX SHOWING THE DETAILS OF THE HAMLETS TOGETHER WITH POPULATION, MANDAL-WISE IN RANGA REDDY DISTRICT
L.C.No. Name of the* Population of L.C.No. Name of the* Population of Village/Hamlet the Hamlet Village/Hamlet the Hamlet
1 MARPALLE M.P.P. 4 SHANKARPALLE M.P.P. (Concld .. )
- NIL-9 JANWADA
Mirjaguda 1015 2 MOMINPET M.P.P. Miyankhanguda 371
2 KOLKONDA 14 YELWARTHY Chinnakolkonda 696 Kojjaguda 463
5 MEKAVANAMPALLY 21 MASANIGVDA Rallagutta thanda 650 Kachireddyguda 187
6 RALLAGUDPALLY Mancheriaguda 113 Mityanayak thanda 98 23 PARVEDA( CHANCHALAM)
Somla naik thanda 150 Lachireddyguda 92 Lachyanaik thanda 146 24 PARVEDA(KHALSA) Yellammagadda thanda 54 Kothaguda 283 Guttameedi thanda 69
7 TEKULAPALLY 7 QUTHBULLAPUR M.P.P.
Suddodka thanda 170 3 DVNDIGAL
Maqtha thanda 316 Lambadi thanda 619
10 MOMINPET Lambadi thanda II 316
Chandrayanpally 925 Alipur VI
4 DOMMARPOCHAMPALLE 14 IZRACHITTEMPALLY
Pallegutta thanda 135 Salarguda 66
9 MALLAMPET 18 RAMNATHGVDPALLY
Mallareddiguda 525 Maheswaram 137
23 CHEEMALDARI 8 MEDCHAL M.P.P.
Balreddyguda 394 19 GOWDAVELLY
3 NAWABPET M.P.P. Gyanapur 429 Badiragadi 378
9 YELLAKONDA 20 MEDCHAL
Mawthabkhanguda 314 Kistapur
Ramannaguda 135 1720
21 PUDOOR Gollaguda 330 Sayanna.guda 107
Arkalguda 413 22 RAJBOLLARAM
17 EKMAMIDI Rajbollaram thanda
Moolamada 507 768
28 POCHAMPALLE Kummariguda 349
Maisammaguda Mamdanpalli 797
693
18 CHITTIGIDDA 9 SHAMIRPET M.P.P.
Ethiraj palli 655 13 ALIABAD
Thimmareddipalli 609 Pittalaguda 655
Nagireddipalli 388 15 ADRASPALLE
Kesavapalli thanda 850 Yellaguda 125
22 POOLAPALLI 23 SHAMIRPET
Nareguda 494 Vpparapalle 1533
4 SHANKARPALLE M.P.P. Balaguda 1120
24 DEVARYAMJAL DHOBIPET
Hakeempet Gajulaguda
115 1156
Yelgalguda 658 Laxmareddyguda 813 Bayannaguda 230 11 KEESARA M.P.P.
Chinnareddyguda 237 5 KEESARA
Alankhanguda 722 Kapugudem 310
2 FATHEPUR Unnguda 406
Banglagadda 660 Ankireddipalle 1706
4 SHANKERPALLE 11 NAGARAM
Ayyappareddyguda 557 Dammaiguda 1969
6 KONDAKAL 15 RAMPALLE
Lambada thanda 155 Kareemguda 1246
Seriguda 650 Ramp ailed aira 404
7 MOKILA Zaffarguda 209
Lambada thanda 714 Lalanguda 207
8 DONTHANPALLI 16 BOGARAM
Pillagundla 293 Barashaguda 1048
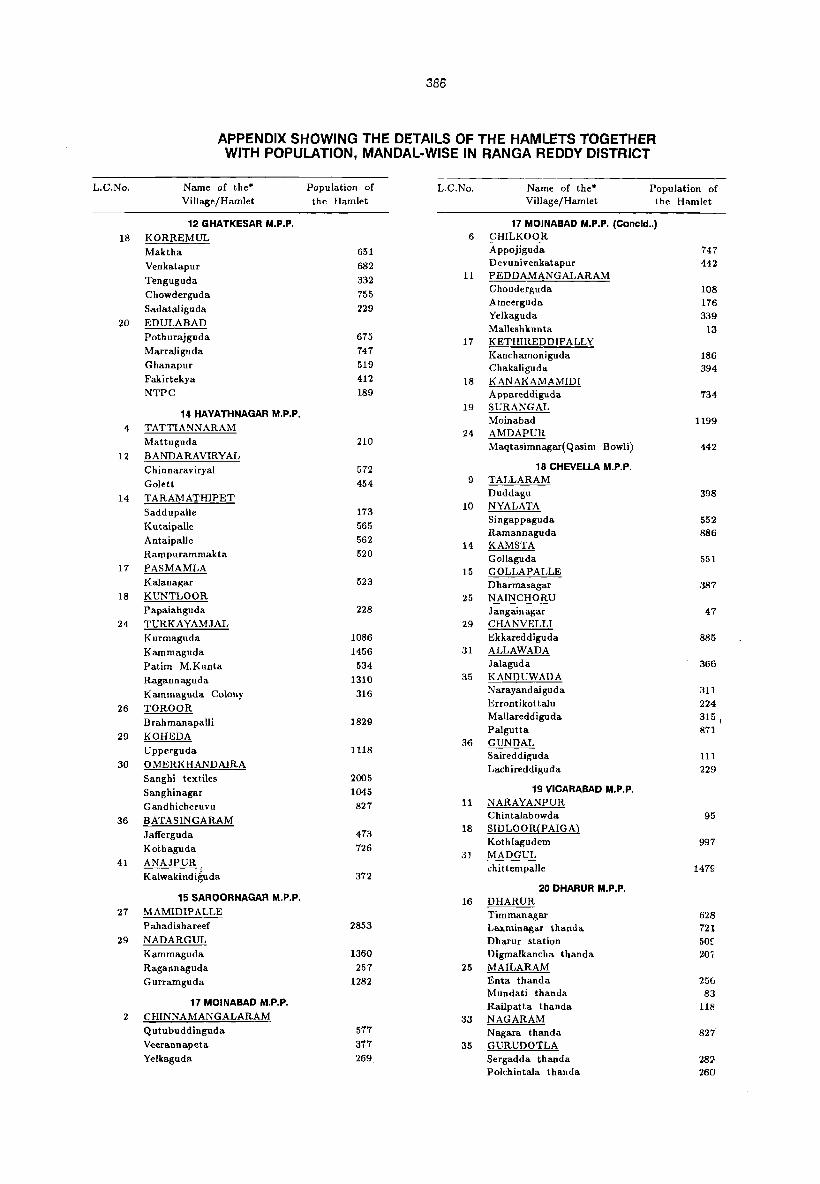
386
APPENDIX SHOWING THE DETAILS OF THE HAMLETS TOGETHER WITH POPULATION, MANDAL~WISE IN RANGA REDDY DISTRICT
L.C.No. Name of the* Population af L.C.No. Name of the* Population of Village/Hamlet the Hamlet Village/Hamlet the Hamlet
12 GHATKESAR M.P,P. 17 MOINABAD M.P,P, (Concld .. )
18 KORREMUL 6 CHILKOOR
Maktha 651 Appojiguda 747
Venkatapur 682 Devunivenkatapur 442
Tenguguda 332 11 PEDDAMANGALARAM
Chowderguda 755 Chouderguda 108
Sadataliguda 229 Ameerguda 176 Yelkaguda 339
20 EDULABAD Malleshkunta 13
Pothurajguda 675 17 KETHIREDDIPALLY MarraJiguda 747 Kanchamoniguda 186 Ghanapur 519 ChakaJiguda 394 Fakirtekya 412 18 KANAKAMAMIDI NTPC 189 Appareddiguda 734
19 SURANGAL 14 HAVATHNAGAR M.P.P.
Moinabad 1199 4 TATTIANNARAM 24 AMDAPUR
Mattuguda 210 Maqtasimnagar( Qasim Bowli) 442 12 BANDARAVIRYAL
Chinnaraviryal 572 18 CHEVELLA M.P.P.
Galett 454 9 TALLARAM
14 TARAMATHIPET Duddagu 398
Saddupalle 173 10 NYALATA
Kutaipalle 565 Singappaguda 552 Ramannaguda 886
Antaipalle 562 14 KAMSTA
Rampurammakta 520 Gollaguda 551 17 PASMAMLA 15 GOLLAPALLE
Kalanagar 523 Dharmasagar 387 18 KUNTLOOR 25 NAINCHORU
Papaiahguda 228 Jangainagar 47 24 TURKAYAMJAL 29 CHANVELLI
Kurmaguda 1086 Ekkareddiguda 885 Kammaguda 1456 31 ALLAWADA
Patim M.Kunta 534 Jalaguda - 366
Ragannaguda 1310 35 KANDUWADA
Kammaguda Colony 316 N arayandaiguda 311
26 TOROOR Errontikottalu 224
Brahmanapalli 1829 Mallareddiguda 315 I
Palgutta 871 29 KOHEDA
36 GUNDAL Upperguda 1118 Saireddiguda 111
30 OMERKHANDAIRA Lachireddiguda 229 Sanghi textiles 2005 Sanghinagar 1045 19 VICARABAD M.P.P.
Gandhicheruvu 827 11 NARAYANPUR
36 BATASINGARAM Chintalabowda 95
Jafferguda 473 18 SIDLOOR(PAIGA) Kothlagudem 997
Kothaguda 726 3] MADGUL
41 ANAJPUR chittempalle 1479 Kalwakindiguda 372
20 DHARUR M.P.P. 15 SAROORNAGAR M.P,P. 16 DHARUR
27 MAMIDIP ALLE Tim man agar 628 P ahadishareef 2853 Laxminagar thanda. 721
29 NADARGUL Dharur station 50, Kammaguda 1360 Digmalkancha thanda 207 Ragannaguda 257 25 MAILARAM
Gurramguda 1282 Bnta thanda 256 Mundati thanda 83
17 MOINABAD M.P.P. Railpatta thanda 118 2 CHINNAMANGALARAM 33 NAGARAM
Qutubuddinguda 577 Nagara thanda 827 Veerannapeta 377 35 GURUDOTLA Yelkaguda 269 Sergadda thanda 287-
Polchintala thanda 26U

387
APPENDIX SHOWING THE DETAILS OF THE HAMLETS TOGETHER WITH POPULATION, MANDAL-WISE IN RANGA REDDY DISTRICT
L.C.No. Name of the* Population of L.C.No. Name of the* Population of Village/Hamlet the Hamlet Village/Hamlet the Hamlet
21 BANTARAM M.P.P. 27 GANDEED M.P.P. (Concld .. )
2 TURMAMIDI 2 VENNACHED (Concld .. ) Baswapur 1183 Gollagudem 199
8 RUSUMPALLE 22 PEDDAMUL M.P.P.
Vaddegudiselu 551 2 ADIKICHERLA 9 GANDEED
Orenti thanda 423 Jangamreddipalle 692 Bujmedi thanda 600 Anchanpalle 369
5 TATTAPALLE 11 REDDIPALLE Rachakatta thanda 241 Chennaipalle 338 Omlanaike thanda 764 12 SALKERPET Jairam thanda 485 Rangareddipalle 1004 Siddanna thanda 312 15 PAGDIYAL Bandameedipalle 1000 Tavvugadda thanda 595
7 RUDRARAM 16 BALSULGONDA Narsapuram 270 Buddibanda thanda 632
11 PEDDAMUL 19 KO MREDDIPALLE Bandapalle 597 Ashireddypalle 585
17 KOTPALLE 20 NANCHERLA Buggapur 449 Dasaipalle 876 Annasagar 666 28 MOHAMMADABAD
Lingampalle 408 Shaikpalle 1161
32 REGONDI Dharmapur 857
Chaitanyapuri 360 Kanchanpalle 909 Venkatareddipalle 1673
23 TANDUR M.P.P. 29 SANGAIPALLE 20 ALLAPUR(S) Bapankunta thanda 290
Sirigiripet 1600
23 ANTARAM(BUGORG} 28 KULKACHERLA M.P.P.
Dasthagiripet 768 4 KULKACHERLA
Chapa.lgeda 423 24 BASHEERABAD M.P.P. Kamonapalle 947
2 NAVANGIBASHEERABAD Bhojanaik thanda 203 Basheerabad 5271 6 BANDAYELKACHERLA
25 YELAL M.P.P. Govinda thanda 543
1 AGNOOR Gopinaik thanda 209
Malreddypalle 262 Ram nagar 570 8 MUJAHEDPUR
17 ~ Ramreddipa.lly 489 Govindraopet 219 LAKSHMINARAYANPUR
Potigadda thand!!. 147 22
Patelcheru thanda 135 Lakshminarayanpur makte 253
Dayanaik thanda 287 26 JUNTIPALLE
Chakalpally thanda 225 Akkampalle 1440 Manchikunta thanda 82 Pagdipalle 1742 Kitchannakunta thanda 88
29 TIMMAIPALLE 14 ANTHARAM Bandameedipalle 558 Chinna Antharam Thanda 557
26 DOMA M.P.P. Chinthalakundu Thanda 410
9 DORNALPALLE 18 KUSUMASAMUDRAM
Godugonipalle 566 Rampur 1245
11 DOMA 20 CHOWDAPUR
Yelreddipalle 149 Kichannapa.lle ~3
Udanraopalle 461 Hanumaipalle 150
20 MOTHKUR Bureddipalle 128
Mailaram 873 22 VERAPUR
27 DADAPUR Pandivanipalle 522
Kothapalle 748 30 CHAKALPALLE Chaka.lpalle thanda 667
27 GANDEED M.P.P.
2 VENNACHED 29 PARGI M.P.P.
JakkalapaUe 1029 11 PARGI
Janampalle 488 Mallemaniguda 1269
Lingampalle 724 Sultannagar 589

388
APPENDIX SHOWING THE DETAILS OF THE HAMLETS TOGETHER WITH POPULATION, MANDAL·WISE IN RANGA REDDY DISTRICT
L.C.No. Name of the* Population of L.C.No. Name of the· Population of Village/Hamlet the Hamlet Village /Hamlet the Hamlet
29 PARGI M.P.P. (Concld .. ) 31 SHABAD M.P.P. (Concld .. )
11 PARGI (Coneld .. ) 20 SHABAD (Coneld .. )
Yerragaddapalli 384 Gopigadda 230
Nahatnagar 122 21 MANIMARRI
Kistammagudlu 388 Bodampahad 1220
23 NARAYANAPUR Appareddiguda 448
Laxmidevipalle 505 Lingareddiguda 166
29 RAP OLE 22 KAKLOOR
Polkampalle 538 Sardarnagar 1710
Narasaiahguda 393 Kurvaguda 1007
30 PUDUR M.P.P. 32 SHAMSHABAD M.P.P.
1 RAMANJAPUR 2 YENKEPALLE Bootiguda 439
Chenchupalle 215 Thanda 172 3 MIRZAPUR 9 JUKAL
Seriguda 399 Pilloniguda 515 15 CHANGEMUL Yerakunta 321
Barlapalle 308 Alikta thanda 436 22 SOMANGURTHY 11 NARKHUDA
Devanonigudem 295 Boorkunta thanda 439 23 KERVELLE Kavvaguda 1062
Imampalle 835 14 KOTWALGUDA
29 MANCHANPALLE Marlaguda 1245
Meuiyapur 227 21 KISHANGUDA
Matugudem 257 Doddi 304
32 NIZAMPET MEDPALLE 26 PEDDASHAPUR
Nizampet 132 Burjugadda thanda 375 27 MADANPALLE
31 SHAHBAD M.P.P, Mekalabanda thanda 371 4 THALLAPALLE New thanda 575
Nagaraoguda 472 28 PALAMAKOLE Laxmaraoguda 480 Pillo'niguda 773 Venkammaguda 333 Mekalabanda thanda -702
Thimmareddiguda 1004 35 GOLLAPALLE(CHUROCHINNA)
5 RUDRARAM Galwaguda 685
Devunigadda 132 38 GOLAPALLE KALAN
8 SOLIPET Ananthareddyguda 674
?eddasolipet 357 43 GOLKONDA KALAN
11 DAMARLAPALLE Raikunta 132
Lingareddiguda 531 33 MAHESHWARAM M.P.P. Saireddiguda 609 2 GOLLOOR Nandarkhanpet 493 Bhairthi thanda 204
14 MANCHANPALLE Habibullaguda 341 Antireddiguda 456 4 NAGARAM
17 REGADIDOSWADA Enuguchevy thanda 456
Maqtaguda 482 Enugumadi thanda 263
20 SHABAD 5 NAGIREDDIPALLE
Patelguda 178 Kojjarlavampu thanda 141
Seriguda 231 7 TOOPRA (KHURDl
Yelgondaguda 559 Paddamma thanda 279
Keshavaguda 431 Cheruvakamma thanda 235 8 KALWAKOLE
Muddemiguda 1133 Kothakapubasti
Cherlaguda 830 150
Manikyammaguda 852 Golloniguda 283
9 PENDYAL Mallareddyguda 555 Ramachandraguda 529 ShankerpalJeguda 469 12 GANGARAM Kummariguda 1407 Gangaram thanda 224 Merrapur 78 16 MANKHAL Aspalleguda 397 Harshaguda 1476 Seetarampur 697 Jandamarri thanda 160 Maryapur 208 Maktakancha 203 Narellaguda 349 Babusaheb than<ia 46
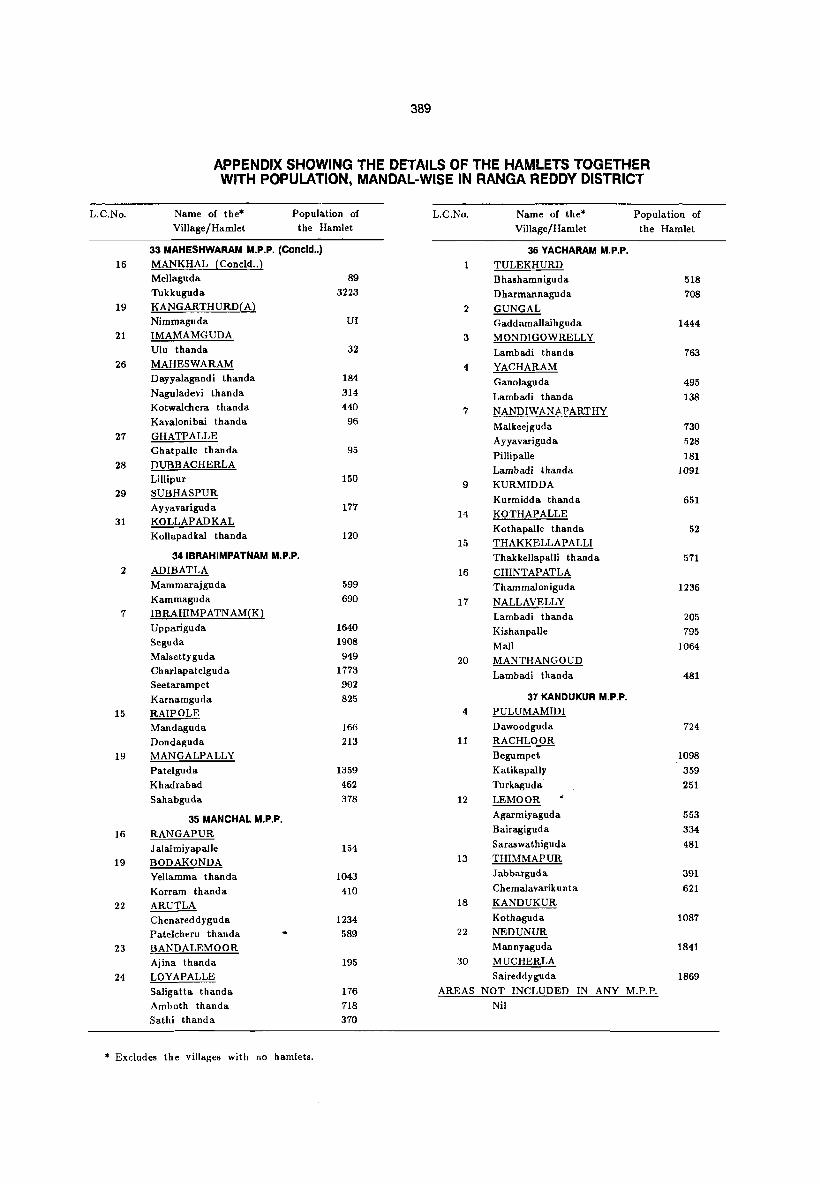
L.C.No.
16
19
21
26
27
28
29
31
2
7
15
19
16
19
22
23
24
389
APPENDIX SHOWING THE DETAILS OF THE HAMLETS TOGETHER WITH POPULATION, MANDAL-WISE IN RANGA REDDY DISTRICT
Name of the*
Village/Hamlet
Population of
the Hamlet
33 MAHESHWARAM M.P.P. (Concld .. )
MANKHAL (Coneld .. )
Mellaguda
Tukkuguda
KANGARTHURD(A)
Nimmaguda
IMAMAMGUDA
Ulu thanda
MAHESWARAM
Dayyalagandi thanda
NaguJadevi thanda
Kotwalchera thanda
Kavalonibai thanda
GHATPALLE
Ghatpalle thanda
DUBBACHERLA
Lillipur
SUBHASPUR
Ayyavariguda
KOLLAPADKAL
Kollapadkal thanda
34 lBRAHIMPATNAM M.P.P.
ADIBATLA
Mammarajguda
Kammaguda
IBRAHIMPATNAM(K)
Uppariguda
Seguda
Malsettyguda
Charlapatelguda
Seetarampet
Karnamguda
RAIPOLE
Mandaguda
Dondaguda
MANGALPALLY
Patelguda
Khadrabad
Sahabguda
35 MANCHAL M.P.P.
RANGAPUR
J alalmiyapalle
BODAKONDA
Yellamma thanda
Korram thanda
ARUTLA
Chenareddyguda
Patelcheru thanda
BANDALEMOOR
Ajina thanda
LOYAPALLE
Saligatta thanda
Amboth thanda
Sathi thanda
89
3223
UI
32
184
314
440 96
95
150
177
120
599
690
1640 1908
949 1773 .902
825
166
213
1359 462 378
154
1043
410
1234 589
195
176 718 370
L.C.No.
2
3
4
7
9
14
15
16
17
20
4
11
12
13
18
Name of the*
Village/Hamlet
36 YACHARAM M.P.P.
TULEKHURD
Bhashamniguda
D harman naguda
GUNGAL
Gaddamallaihguda
MONDIGOWRELLY
Lambadi thanda
YACHARAM
Ganolaguda
Lambadi thanda
NANDIWANAl'ARTHY
Malkeejguda
Ayyavariguda
Pillipalle
Lambadi thanda
KURMIDDA
Kurmidda thanda
KOTHAPALLE
Kothapalle thanda
THAKKELLAPALLI
Thakkellapalli thanda
CHINTAPATLA
Thammaloniguda
NALLAVELLY
Lambadi thanda
Kishanpalle
Mall
MANTHANGOUD
Lambadi thanda
31 KANDUKUR M.P.P.
PULUMAMIDI
Dawoodguda
RACHLOOR
Begumpet
Katikapally
Turkaguda
LEMOOR
Agarmiyaguda
Bairagiguda
Saraswathiguda
THIMMAPUR
Jabbarguda
Chemalavarikunta
KANDUKUR
Kothaguda
22 NEDUNUR
Mannyaguda
30 MUCHERLA
Saireddyguda
Population of
the Hamlet
518
708
1444
763
495
138
730 528
181
1091
651
52
571
1236
205 795
1064
481
724
1098
359
251
553
334
481
391
621
1087
1841
1869 AREAS NOT INCLUDED IN ANY M.P.P.
Nil
* Excludes the villages with nO hamlets.


PRIMARY CENSUS ABSTRACT
SCHEDULED CASTES/SCHEDULED TRIBES

392
Sl.
No.
Name of
District;
M.P.P./
Town
Total/ No. of Total Scheduled Caste
Population Rural/ households
Urban with S.c.
(1) (2) (3)
15 RANGAREDDI DISTRICT T R U
MARPALLE M.P.P.
2 MOMINPET M.P.P.
3 NAWABPET M.P.P.
4 SHANKARPALLE M.P.P.
7 aUTHBULLAPUR M.P.P.
a MEDCHAL M.P.P.
9 SHAMIAPET M.P.P.
SINGAIPALLE (O.G)
11 KEESARA M.P.P.
12 GHATKESAR M.P.P.
GHA TKESAR (P)
T
R U
T R U
T
R
U
T R
U
T
R U
T
R U
T R U
U
T R
U
T R
U
U
members
p M F
(4) (5) (6) (7)
85729 439386 224289 215097 57023 297205 151844 145361 28706 142181
2164 2164
11751 11751
2016 10621 2016 10621
1782 10290 1782 10290
1850 11191 1850 11191
946 4413 946
la13 1813
2183 2110
73 73
1012 1012
1785 1396 389 389
4413
8339 8339
11278 10905
373 373
4760 4760
8818 6789 2029 2029
72445 69736
6029 6029
5442 5442
5274 5274
5825 5825
2268 2268
4245 4245
5807 5609 198 198
2444 2444
4610 3529 1081 1081
5722 5722
5179 5179
5016 5016
5366 5366
2145 2145
4094 4094
5471 5296
175 175
2316 2316
4208 3260 948 948
PRIMARY CENSUS ABSTRACT
Total Sche<1uled Caste
Population in the
age group (0 - 6)
P M
(8) (9)
84251 42401 58752 29540 25499 12861
2231 1143 2231 1143
2168 1139 2168 1139
1905 956 1905 956
2257 1144 2257 1144
834 438 834 438
1389 705 1389 705
1853 957 1790 917
63 40 63 40
938 479 938 479
1746 917 1384 736 362 181 362 181
F
(10)
41850 29212 12638
1088 1088
1029 1029
949 949
1113 1113
396 396
684 684
896 873
23 23
459 459
829 648 181 181
Literates
P M F
(11) (12) (13)
106766 74469 32297 46970 36937 10033 59796 37532 22264
1522 1152 370 1522 1152 370
1278 1111 167 1278 1111 167
1538 1312 226 1538 1312 226
1711 1426 285 1711 1426 285
869 644 225 869 644 225
2258 1663 595 2258 1663 595
2232 1716 516 2080 1609 471 152 107 45 152 107 45
1075 767 308 1075 767 308
2626 1837 789 1729 1235 494 897 602 295 897 602 295

FOR SCHEDULED CASTES
10tal Main
Workers
CuniVators
p
(14)
206798 159955 46843
6362 6362
5746 5746
5133 5133
5634 5634
2291 2291
4262 4262
6361
6204 157 157
2409 2409
3821 3251 570 570
(I-IX)
M
(15)
120780 86271 34509
F
(16)
86018
73684 12334
p
(17)
40370 39488
882
(I)
M
(18)
27856 27175
681
3350 3012 1737 1162 3350 3012 1737 1162
2968 2778 1929 1236 2968 2778 1929 1236
2846 2287 1723 1131 2846 2287 1723 1131
3158 2476 1045 3158 2476 1045
1302 1302
989
989
2419 1843
313
313
632 2419 1843 632
3496 2865 1028 3394 2810 1028 102 55
102 55
1345 1064 1345 1064
2391 1430 1934 1317 457 113 457 113
335 335
224 204 20 20
698 698
197 197
422 422
642
642
229 229
191 183
8 8
F
(19)
12514 12313
201
575 575
693 693
592 592
347 347
116 116
210 210
386 386
106 106
33
21 12 12
393
INDUSTRIAL CATEGORIES OF MAIN WORKERS
Agricultural
labourers
livestock, Forestry,
Fishing, Hunting and
Plantations, Orchards
& Allied activities
(II) (III)
p M F p M
(20) (21) (22) (23) (24)
114275 51319
103802 45983 10473 5336
62956 3533 2770 57819 2741 2205 5137 792 565
4449 2065 2384 4449 2065 2384
3581 1542 2039 3581 1542 2039
3189 1505 1684 3189 1505 1684
13 13
10 10
20 20
4201 4201
2113 2088 112 2113 2088 112
1034
1034 438
438
596 109
596 109
12 12
10 10
19 19
98 98
64 64
2662 1226 1436 216 140 2662 1226 1436 216 140
4588 2250 2338 81 69 4499 2212 2287 79 67
89 38 51 2 2 89 38 51
1409 620 789 1409 620 789
2154 1082 1072 1968 964 1004
186 118 68 186 118 68
2
51 51
56
48 8 8
2
35 35
39 32
7
7
F
(25)
763 536 227
14 14
45
45
76 76
12 12
16 16
17 16
p
Mining and
Quarrying
(IV)
M F
(26) (27) (28)
200S 1355 650 1513 995 518
492 360 132
3
3
6 6
3
3
6
6
8
8
8
8
3 3
3
3
2 2
5 5
3
3
7
7
3 3
5 5
SI.
No.
(1 )
15
2
3
4
7
8
9
46 46
32 14 11 32 14
52 52
31 21 12 31 21
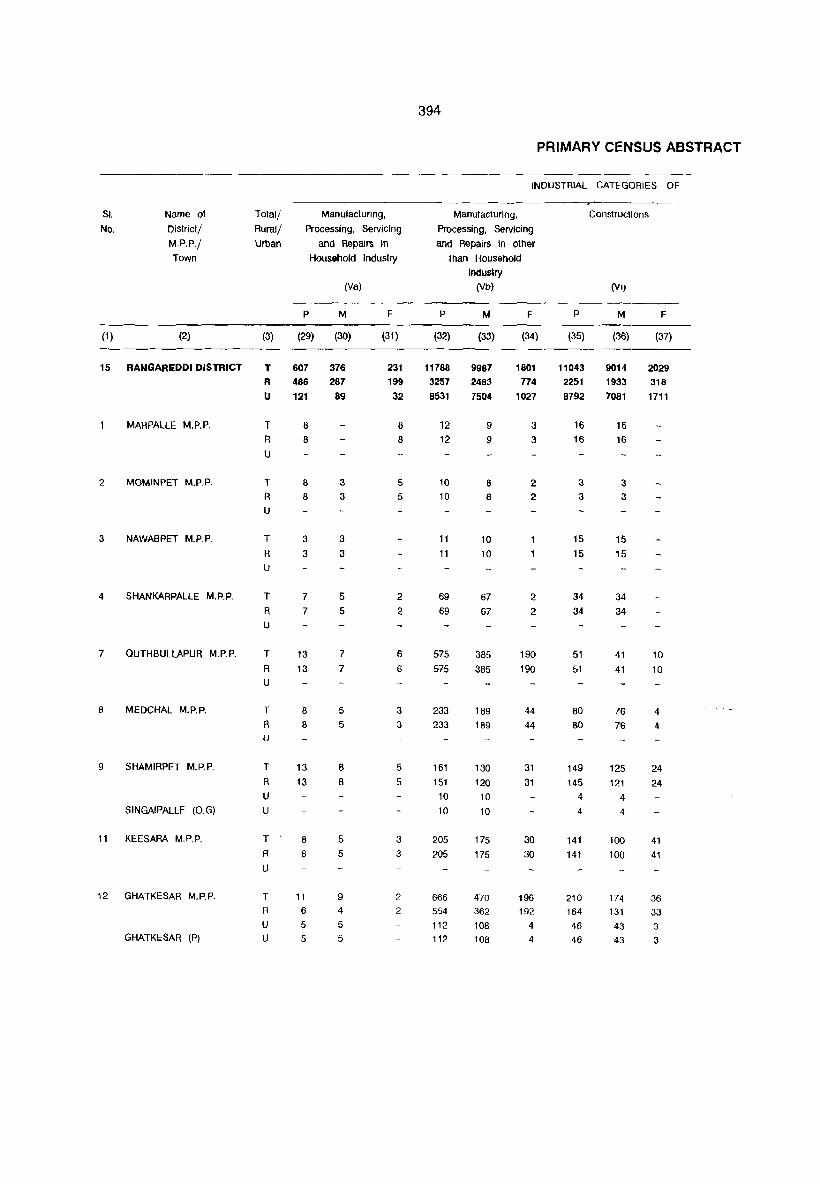
394
PRIMARY CENSUS ABSTRACT
INDUSTRIAL CATEGORIES Of
SI. Name of Total/ Manufacturing, Manufacturing, Constructions
No. Dlstrlct/ Rural/ Processing, Servicing Processing. Servicing
M.P.P'; Urban and Repairn in and Repairs in other
Town Household Industry than Household
Industry
(Va) (Vb) (VI/
P M F P M F P M F
(1) (2) (3) (29) (30) (31) (32) (33) (34) (35) (36) (37)
15 RANGAREDDI DISTRICT T 607 376 231 11788 9987 1801 11043 9014 2029 A 486 287 199 3257 2483 774 2251 1933 318 U 121 89 32 8531 7504 1027 8792 7081 1711
MARPAlLE M.P.P. T 8 8 12 9 3 16 16 R 8 8 12 9 3 16 16 U
2 MOMINPET M.P.P. T 8 3 5 10 B 2 3 3 R 8 3 5 10 8 2 3 3 U
3 NAWABPET M.P.P. T 3 3 11 10 15 15 R 3 3 11 10 15 15 U
4 SHANKARPALLE M.P.P. T 7 5 2 69 67 2 34 34 R 7 5 2 69 67 2 34 34 U
7 QUTHBULLAPUR M.P.P. T 13 7 6 575 385 190 51 41 10 R 13 7 6 &75 385 190 51 41 10 U
8 MEDCHAL M.P.P. T 8 5 3 233 189 44 80 76 4 R 8 5 3 233 189 44 80 76 4 U
9 SHAMIRPET M.P.P. T 13 8 5 161 130 31 149 125 24 R 13 8 5 151 120 31 145 121 24 U 10 10 4 4
SINGAIPALLE (O.G) U 10 10 4 4
11 KEESARA M.P.P. T 8 5 3 205 175 30 141 100 41 R 8 5 3 205 175 30 141 100 41 U
12 GHATKESAR M.P.P. T 11 9 2 666 470 196 210 174 36 R 6 4 2 554 362 192 164 131 33 U 5 5 112 108 4 46 43 3
GHATKESAR (P) U 5 5 112 108 4 46 43 3

FOR SCHEDULED CASTES
MAIN WORKERS
Trade and Commerce
p M
(38) (39)
4472 3250 1324 957 3148 2293
10 10
17 17
10 10
35 35
19 19
63 63
109
105 4
4
52 52
80 44
36 36
8
8
16
16
8
8
28 28
13 13
47 47
70
67 3
3
34 34
60 35 25 25
(VII)
F
(40)
1222 367 855
2 2
2
2
7
7
6
6
16 16
39
38
18 18
20
9
11 11
Transport, Storage
&Communications
(VIII)
p M
(41) (42)
5834 5430 1506 1452 4328 3978
15 15
79 79
15 15
77
77
116 114 116 114
36 35 36 35
17 17 17 17
106 105 106 105
68
63 5 5
42 42
64
60 4
4
42 42
199 193 108 106
91 87 91 87
F
(43)
404 54
350
2
2
2
2
4
3
6
2
4
4
395
Other Services Marginal Workers Non-workers SI.
No.
(IX)
p M F p M
(44) (45) (46) (47) (48)
12871 9423 3587 2801
3448 5435 786 4980
515 348
9284 6622 2662 455 167
99 99
103 103
43 43
60 60
70 70
39 39
94 79 94 79
154 135 154 135
254 206 254 206
156 131
113 90 43 43
120 120
41 41
73 73
169 142 103 86 66 56 66 56
39 107 39 107
33 96 33 96
4 196 4 196
15 303 15 303
19 129 19 129
48 124 48 124
25 92
23 92
2
2
47 118 47 118
27 294 17 245 10 49 10 49
8
8
4
4
6
6
35 35
20 20
2
2
2
2
13 13
5 4
F p
(49) (:'0)
4920 227153 4632 132270
M
(51)
102994 65225
F
(52)
124159 67045
(1 )
15
288 94883 37769 57114
99 .5282 99 -5282
92 92
190 190
268 268
109 109
122 122
90
90
105 105
289 241
48 48
4779 4779
4961 4961
5254 5254
1993 1993
3953 3953
4825
4609 216 210
2233 2233
4703 3293 1410 1410
2671 2671
2470 2470
2422 2422
2632 2632
946 946
1824 1824
2309
2213 96 96
1086 1086
2214 1591
623 623
2611 2611
2309 2309
2539 2539
2622 2622
1047 1047
2129 2129
2516
2396 120 120
2
3
4
7
8
9
1147 11 1147
2489 12
1702 787 787

SI. No,
(1)
Name of
District/
M,P,P,/
Town
(2)
14 HAYATHNAGAR M,P,P,
Totalj No, of
Ruralj households
Urban with S,C,
members
(3) (4)
396
Total SchedUled Caste
Population
P M F
(5) (6) (7)
T
R U
2176 11157 5919 5238 5236 2176 11157 5919
15 SAROORNAGAR M,P,P, ' T 1765 1251
514 270
77
9113 4783 4330
3021
1309 BALAPUR (O,G)
KOTHAPET (O,G)
VENKATAPUR (O.G)
MALLAPUR (O.G)
GADDIANNARAM (P)
16 RAJENDRANAGAR M.P.P.
HYOERSHAKOT (O,G)
17 MOINABAO M,P,P,
18 CHEVELLA M.P.P.
19 VICARABAO M,P,P,
20 DHARUR M,P,P.
21 BANTARAM M.P.P.
22 PEDDAMUL M,P,P,
23 TANDUR M,P,P.
24 BASHEERABAD M.P.P,
R
U
U
U
U
U
U
T
R U
U
T
R U
T
R
U
T
R U
T
R U
T
R U
T
R U
T
R U
T
R U
12
17
138
6385 3364
2728 1419 1488 782
410 220 65 25
95 46
670 346
1370 7611 3909 1307 7205 3703
63 406 200 63 406 206
1868 10608 5534
1868 10608 5534
2083 11923 6153
2083 11923 6153
1286 7066 3529
1286 7066 3529
1338
1338
1640
1640
1702
1702
1470
1470
1534
1534
7322 3703
7322 3703
6892 4442
6892 4442
6741 4365
6741 4385
7328 3687
7326 3687
5986 2940 5986 2940
706
190 40
49
324
3702 3502
200
200
5074 5074
5770
5770
3537
3537
3619
3619
4450
4450
4356
4356
3641
3641
3046
3048
PRIMARY CENSUS ABSTRACT
Total Scheduled Caste
Population in the
age group (0 - 6)
p M
(8) (9)
2091 1067
2091 1067
1692 1218
474 255
75
12 24
106
862 620
242 130
46
4
7
55
1440 722 1377 692
63 30
63 30
2276 1136
2276 1136
2397 1214
2397 1214
1508 745
1508 745
1711
1711
1823
1823
1728
1728
1484
1484
1069
1089
747
747
905
905
659
859
753
753
558
558
F
(10)
1024 1024
830 598
232 125
29 8
17
53
718
685
33 33
1140
1140
1183
1183
763
763
964
964
918
918
869
869
731
731
531 531
Literates
P M F
(11 ) (12) (13)
1871 1541' 330 1871 '541 330
2696 1864 832 1701 1139 562
995 725 270 432 364 68
134 110 24 27 18 9
24 20 4 378 2\3 165
2578 164!> 929 2428 1559 869
150 90 60 150 90 60
1816 1457 359
1816 1457 359
1741 1510 231
1741 1510 231-
756 630 126
756 630 126
1078
1078
1029
1029
960
960
745
745
612
612
812 266
812 266
827 202
827 202
772 188
772 188
592 153
592 153
497 115
497 115

397
FOR SCHEDULED CASTES
p
Total Main
Workers
(!-IX)
M F
(14) (15) (16)
5790 3266 2524
5790 3266 2524
4056 2528 1528 2993 1841 1152 1063 687 376 628 370 258 137 98 39 24 15 9
48
226
28
176
20
50
3021 1879 1142
2915 1786 1129
106 93 13
106 93 13
p
(17)
521
521
141 129 12
8
3
217 210
7
7
5670 2965 2705 1161 5670 2965 2705 1161
6334 3298 3036
6334 3298 3036
3730 2005 1725
3730 2005 1725
1686
1686
1345
1345
4207 2188 2019 1563
4207 2188 2019 1563
5115 2639 2476 1571 5115 2639 2476 1571
5021 2646 2375 1976
5021 2646 2375 1976
4258 2249 2009 748
4258 2249 2009 748
3473 1845 1628 1030
3473 1845 1628 1030
INDUSTRIAL CATEGORIES OF MAIN WORKERS
Cultivators Agricultural
Labourers Livestock, Forestry,
Fishing, Hunting and
Plantations, Orchards
& Allied activities
Mining and
Quarrying
(I) (Ii) (III)
M F p M F p M
(18) (19) (20) (21) (22) (23) (24)
379 142 3885 1853 2032 301 206
379 142 3885 1853 2032 301 206
103 38 2277 1141 1136 43 38
94 35 1793 934 859 34 32 9 3 484 207 277 9 6
7 360 144 216 8 6
2
77 41
6 32
9
15
7
36 6
17
2
143 136
7
7
74 1401 566 545
21
21
835 144 107
74 1374 829 144 107
27
27
6
6
774 387 3933 1719 2214 162 136
774 387 3933 1719 2214 162 136
1097 589 4428 2013 2415
1097 589 4428 2013 2415
874 471 2235 999 1236
874 471 2235 999 1236
979 584 2435 1023 1412
979 584 2435 1023 1412
989 582 3170 1412 1758
989 582 3170 1412 1758
1284 692 2810 1173 1637
1284 692 2810 1173 1637
592 156 2690 1061 1629
592 156 2690 1061 1629
785 245 2026 744 1282
785 245 2026 744 1282
48
48
43
43
32
32
42 42
50
50
60
60
48
48
46
46
41
41
32
32
40 40
48
48
56 56
45
45
F
(25)
95
95
5 2 3 2
p
(26)
80
80
78 70 8
8
(IV)
M
(27)
55
55
60
53 7
7
37 150 115 37 147 112
26
26
2
2
2
2
3 3
3 3
17 17
17 17
2 243 127 2 243 127
2 29 12
2 29 12
4 498 314
4 498 314
3 214 140
3 214 140
F
(28)
25 25
18 17
35 35
116 116
17
17
184
184
74 74
Sl. No.
(1 )
14
15
16
17
18
19
20
21
22
23
24
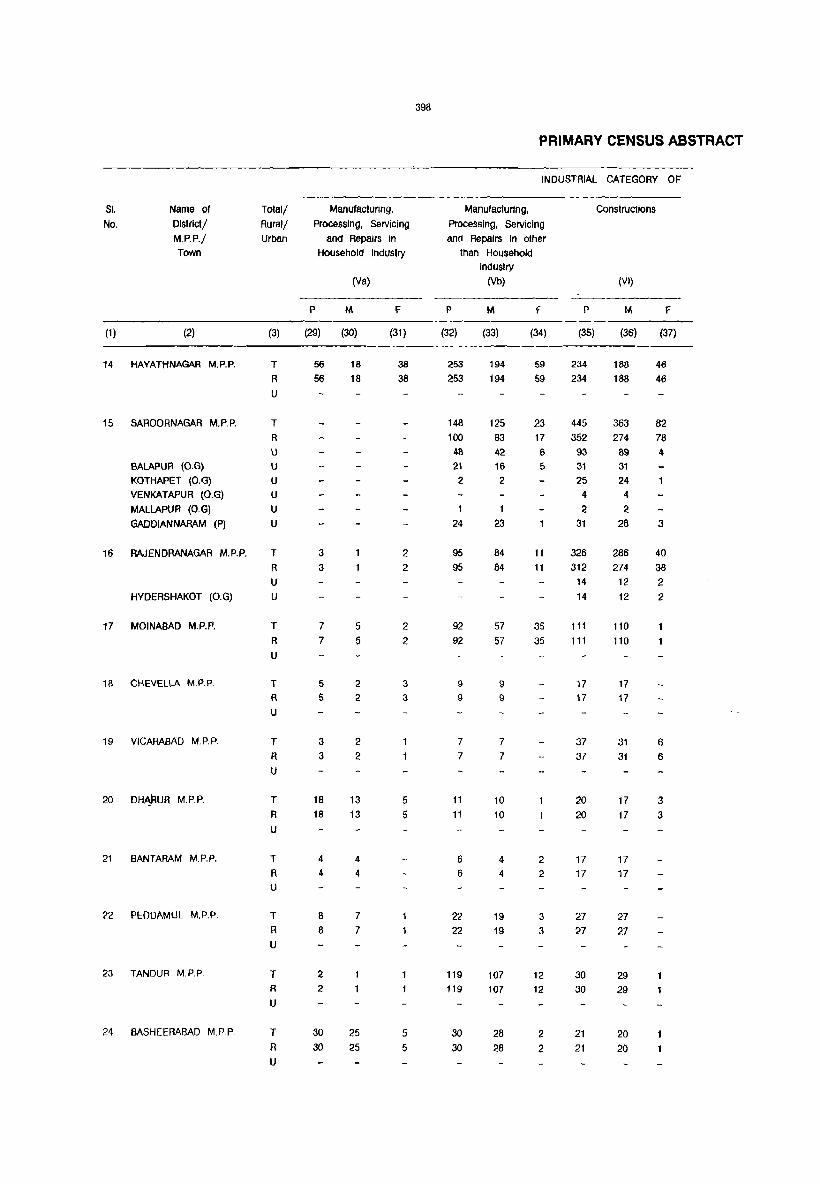
SI.
No. Name of District! M.P.P./
Town
(1) (2)
14 HAVATHNAGAR M.P.P.
15 SAROORNAGAR M.P.P.
BALAPUR (O.G)
KOTHAPET (O.G)
VENKATAPUR (O.G)
MALLAPUR (0. G)
GADDIANNARAM (P)
16 RAJENDRANAGAR M.P.P.
HYDERSHAKOT (O.G)
17 MOINABAD M.P.P.
18 CHEVELw\ M.P.P.
19 VICARABAD M.P.P.
20 DH~UR M.P.P.
21 BANTARAM M.P.P.
22 PEDDAMUL M.P.P.
23 TANDUR M.P.P.
24 BASHEERABAD M.P P.
Totalj Ruralj Urban
(3)
T
R
U
T R U
U
U
U
U
U
T R U
U
T
R U
T
R U
T R U
T
R
U
T
R U
T R U
T R
U
T R U
Manufacturing, Processing, Servicing
and Repairs in Household Industry
(Va)
P M
(29) (30)
56 18
56 18
3
3
7
7
5 5
3
3
18 18
4
4
8 8
2 2
30 30
5 5
2 2
2 2
13 13
4
4
7
7
25 25
F
(31)
38
38
2 2
2
2
3
3
5 5
5 5
398
PRIMARY CENSUS ABSTRACT
INDUSTRIAL CATEGORY Or::
Manufacturing, Processing, Servicing an<! Repairs in other
Inan Household Industry
(Vb)
p M
(32) (33)
253 194
253 194
148 100
48
21
2
24
95
95
92 92
9
9
7 7
11
11
6 6
22
22
119
119
30 30
125 83
42 16
2
1
23
84 84
57 57
I)
9
7
7
10 10
4
4
19
19
107
107
28 28
f
(34)
59 59
23 17
6 5
11 11
35 35
2 2
3
3
12
12
2 2
Constructions
(VI)
p M F
(35) (36) (37)
234 188 46
234 188 46
445 352 93 31
25
4
2 31
326 312 14 14
111
111
17 17
37
37
20 20
17 17
27
27
30 30
21 21
363 274
89 31
24
4
2 28
286 274
12
12
110
110
17
17
31
31
17 17
17 17
27
27
29 29
20
20
82 78
4
3
40 38
2 2
6
6
3 3
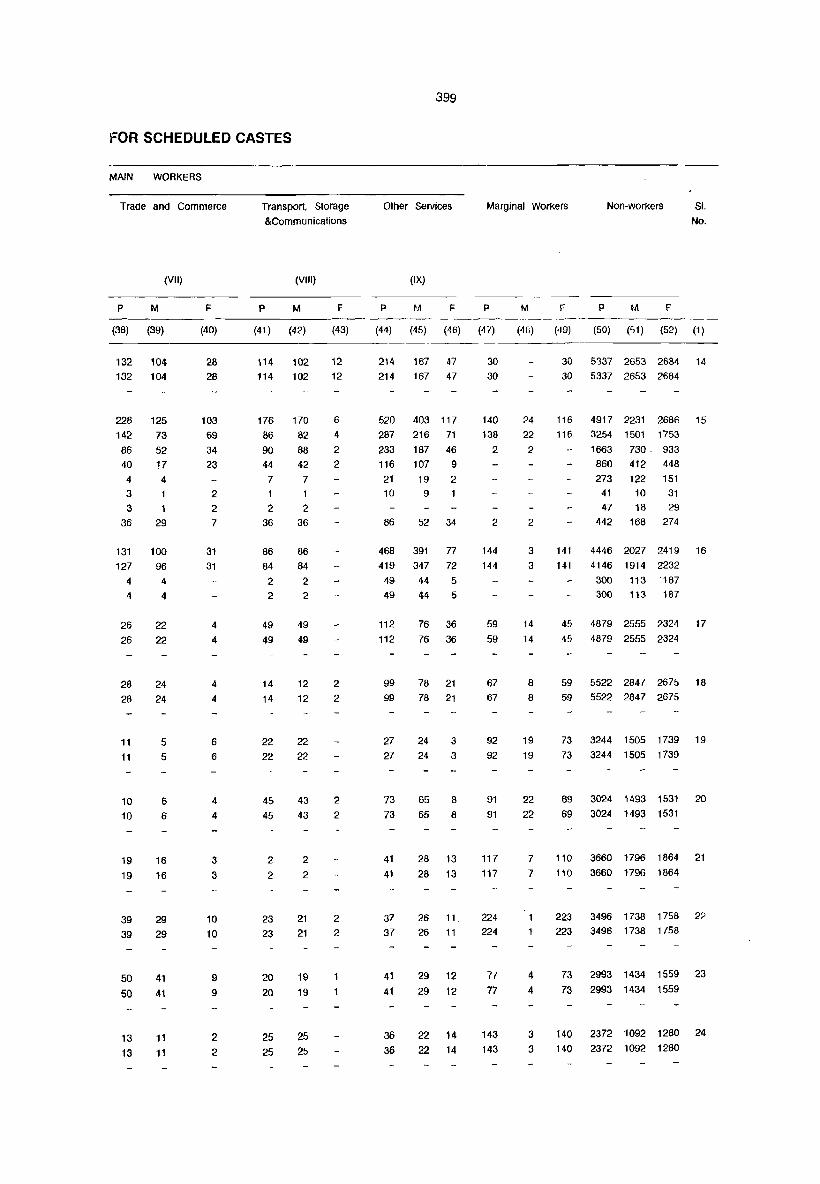
fOR SCHEDULED CASTES
MAIN WORKERS
Trade and Commerce
(VII)
p M
(38) (39)
132 104 132 104
228 125 142 73 86 40
4
3
3
36
52 17 4
29
131 100 127 96
4 4 4 4
26 22 26 22
28 28
11
11
10 10
19 19
39
39
50
SO
13
13
24 24
5
5
6
6
16 16
29 29
41
41
11 11
F
(40)
28 28
103 69 34 23
2
2
7
31 31
4
4
4
4
6
6
4
4
3
3
10 10
9
9
2 2
Transport, Storage
&Communications
(VIII)
p M
(41) (42)
114 102 114 102
176 170 86 82
90 44
7 1
2 36
86 84
2 2
49 49
14 14
22 22
45 45
2
2
23 23
20
20
25 25
88
42 7 1
2 36
86 84
2 2
49 49
12 12
22 22
43 43
2
2
21 21
19 19
25 25
F
(43)
12 12
6
4
2 2
2
2
2
2
2
2
399
Other Services Marginal WorKers Non-worKers SI.
No.
(IX)
p M F p
(44) (45) (46) (47)
214 167 47 214 167 47
520 403 117 267 216 71 233 187 46 116 107 9
21 10
86
19 2 9
52 34
468 391 77
419 347 72 49 44 5
49 44 5
112 76 36 112 76 36
99 99
27 27
73 73
41
41
37 37
41
41
36 36
78 21 78 21
24 24
65 65
3
3
8
8
28 13
28 13
26 11 26 11
29 12
29 12
22 14 22 14
30 30
140 138
2
2
144 144
59 59
67 67
92 92
91 91
117 117
224 224
77 77
143 143
M F p
(4[;) (49) (50) (51) (52) (1)
24 22 2
2
3
3
14 14
8
8
19 19
22 22
7
7
4
4
3 3
30 5'337 2653 2684 14 30 5337 2653 2684
116 4917 2231 2686 15 116 3254 1501 1753
1663 730. 933 860 412 448 273 122 151
41 10 31 47 18 29
442 168 274
141 4446 2027 2419 16 141 4146 1914 2232
300 113 ·,87 300 113 187
45 4879 2555 2324 17 45 4879 2555 2324
59 5522 2847 2675 18 59 5522 2847 2675
73 3244 1505 1739 19 73 3244 1505 1739
69 3024 1493 1531 20 69 3024 1493 1531
110 3660 1796 1864 21 110 3660 1796 1864
223 3496 1738 1758 22 223 3496 1738 1758
73 2993 1434 1559 23
73 2993 1434 1559
140 2372 1092 1280 24 140 2372 1092 1260

SI.
No.
Name of
Dlstrlct/
M.P.P./
Town
(1) (2)
25 YELAL M.P.P.
26 DOMA M.P.P.
27 GANDEED M.P.P.
28 KULKACHARLA M.P.P.
29 PARGI M.P.P.
30 PUDUR M.P.P.
31 SHABAD M.P.P.
32 SHAMSHABAD M.P.P.
SHAHZADI BEGUM(OG)
SHAMSHABAD (P)
33 MAHESWARAM M.P.P.
34 IBRAHIMPATNAM M.P.P.
35 MANCHAL M.P.P.
36 YACHARAM M.P.P.
400
Total/ No. of Total Scheduled Caste
RUrai/ households Population
Urban WIth S.C.
members
(3)
T R U
T R U
T
R U
T
R
U
T
R U
T
R U
T
R U
T
R U
U
U
T R
U
T R
U
T
R
U
T
R
U
(4)
1562
1562
1358
1358
1451
1451
P M
(5) (6)
7838 3875
7838 3875
6637 3278
6637 3278
7455 3732
7455 3732
1160 7030 3584
1160 7030 3584
1869 10332 5247
1869 10332 5247
1927 10586 5323
1927 10586 5323
2016 10454 5276
2016 10454 5276
2588 13503 6968
2150 10833 5634
438 2670 1334
3 10 6 435 2660 1328
1920 10255 5209
1920 10255 5209
2560 13304 6737
2560 13304 6737
1396 6771 3562
1396 6711 3562
2219 10749 5512
2219 10749 5512
F
(7)
3963 3963
3359
3359
3723
3723
3446
3446
5085
5085
5263
5263
5178
5178
6535'
5199
1336
4
1332
5046 5046
6567
6567
3209 3209
5237
5237
PRIMARY CENSUS ABSTRACT
Total Scheduled Caste
Population In the
age group (0 - ttl
P
(8)
1473
1473
1304
1304
1443
1443
M
(9)
742
742
619
619
677
677
1545 804
1545 804
2080 1042
2080 1042
2187 1135
2187 1135
2030 1029
2030 1029
2817 1442
2310 1162
507 280
2 2 505 278
2165 1047
2165 1047
2600 1285
2600 1285
1194 634
1194 634
2087 1019
2087 1019
F
(10)
731
731
685
685
766
766
741
741
1038
1038
1052
1052
1001
1001
1375
1148
227
227
1118
1118
1315
1315
560
560
1068
1068
P
(11)
671
671
497
497
735
735
Uterates
M F
(12) (13)
553 118
553 118
445
445
657
657
52
52
78
78
483 403 80
483 403 80
1710 1330 380
1710 1330 380
,1284 1024 260
1284 1024 260
1425 1162 263
1425 1162 263
2474 1867 607
1535 1265 270
939 602 337
939 602 337
1511 1188 323
1511 1188 323
2829 2229 600
2829 2229 600
1575 1284 291
1575 1284 291
2090 1689 401
2090 1689 401
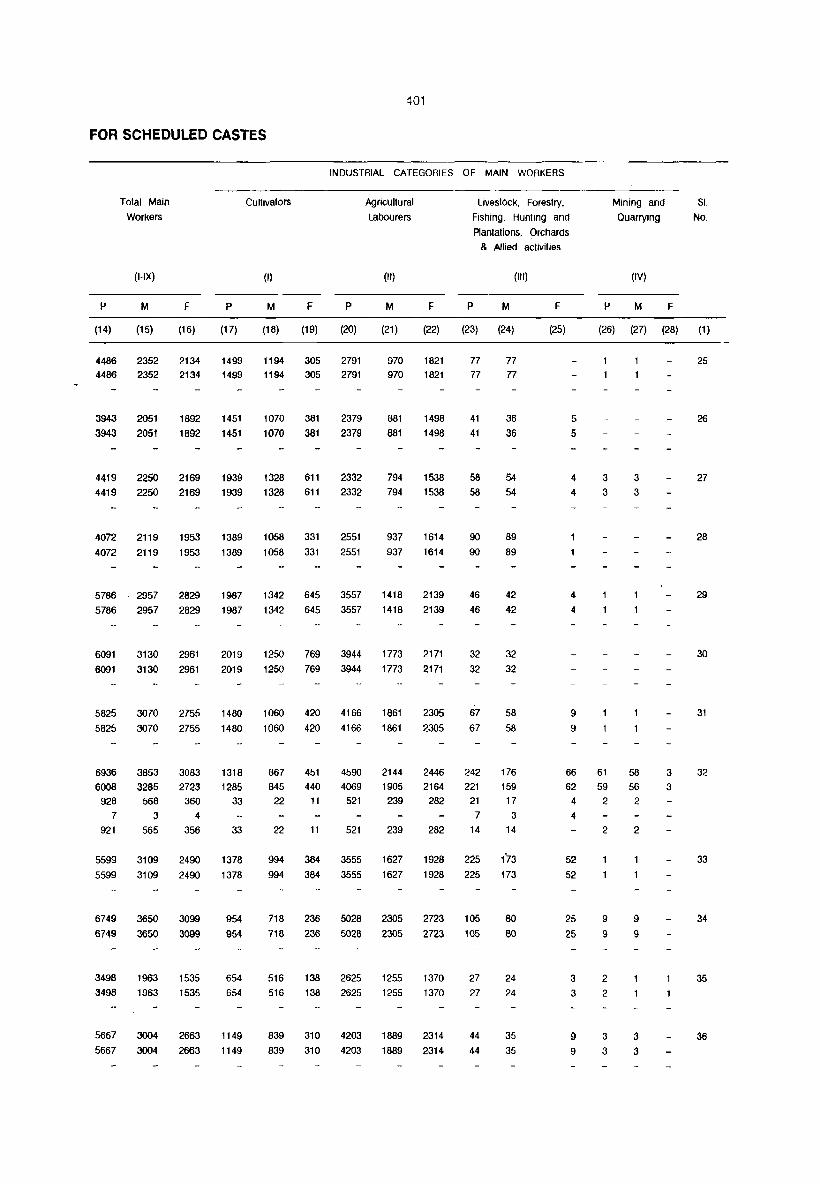
FOR SCHEDULED CASTES
p
Total Main
Workers
(I-IX)
M F
Cultivators
(I)
p M F
401
INDUSTRIAL CATEGORIES OF MAIN WORKERS
p
AgricUltural
Labourers
(II)
M F
Liveslock, Forestry,
Fishing, Hunting and
Plantations, Orchards
& Allied activities
(iii)
p M F p
Mining and
Quarrying
(IV)
M
Sl.
No.
F
(14) (15) (16) (17) (18) (19) (20) (21) (22) (23) (24) (25) (26) (27) (28) (1)
4486 2352 2134 1499 1194 305 2791 4486 2352 2134 1499 1194 305 2791
3943 2051 3943 2051
1892 1451 1892 1451
1070 381 1070 381
4419 2250 2169 1939 1328 611 4419 2250 2169 1939 1328 611
4072 2119 1953 4072 2119 1953
1389 1058 331 1389 1058 331
2379 2379
2332 2332
2551 2551
970 1821 970 1821
881 881
1498 1498
794 1538 794 1538
937 1614 937 1614
5786 2957 2829 1987 1342 645 3557 1418 2139 5786 2957 2829 1987 1342 645 3557 1418 2139
6091 6091
3130 2961 3130 2961
2019 1250 769 3944 1773 2171 2019 1250 769 3944 1773 2171
5825 3070 2755 1480 5825 3070 2755 1480
1060 420 4166 1861 1060 420 4166 1861
2305 2305
77 77
41 41
58 58
90
90
46 46
32 32
67 67
77 77
36 36
54 54
89 89
42 42
32 32
58 58
6936 3853 3083 1318 6008 3285 2723 1285
867 451 4590 2144 2446 242 176 845 440 4069 1905 2164 221 159
928 568 360 33 7 3 4
921 565 356 33
5599 3109 2490 1378 5599 3109 2490
6749 3650 3099 6749 3650 3099
3498 1963 1535 3498 1963 1535
5667 3004 2663 5667 3004 2663
1378
954 954
654 654
1149 1149
22 11 521 239 282 21 17 7 3
22 11 521 239 282 14 14
994 384 3555 1627 1928 225 '-73 994 384 3555 1627 1928 225 173
718 236 5028 2305 2723 105 718 236 5026 2305 2723 105
516 138 2625 1255 1370 516 138 2625 1255 1370
839 310 4203 1889 2314 839 310 4203 1889 2314
27 27
44
44
80 80
24 24
35 35
5
5
4
4
4
4
9
9
3 3
3 3
66 61 58 62 59 56
4 2 2
4
52 52
25 25
3
3
9
9
2
9
9
2
2
3
3
2
9
9
3
3
3
3
25
26
27
28
29
30
31
32
33
34
35
36
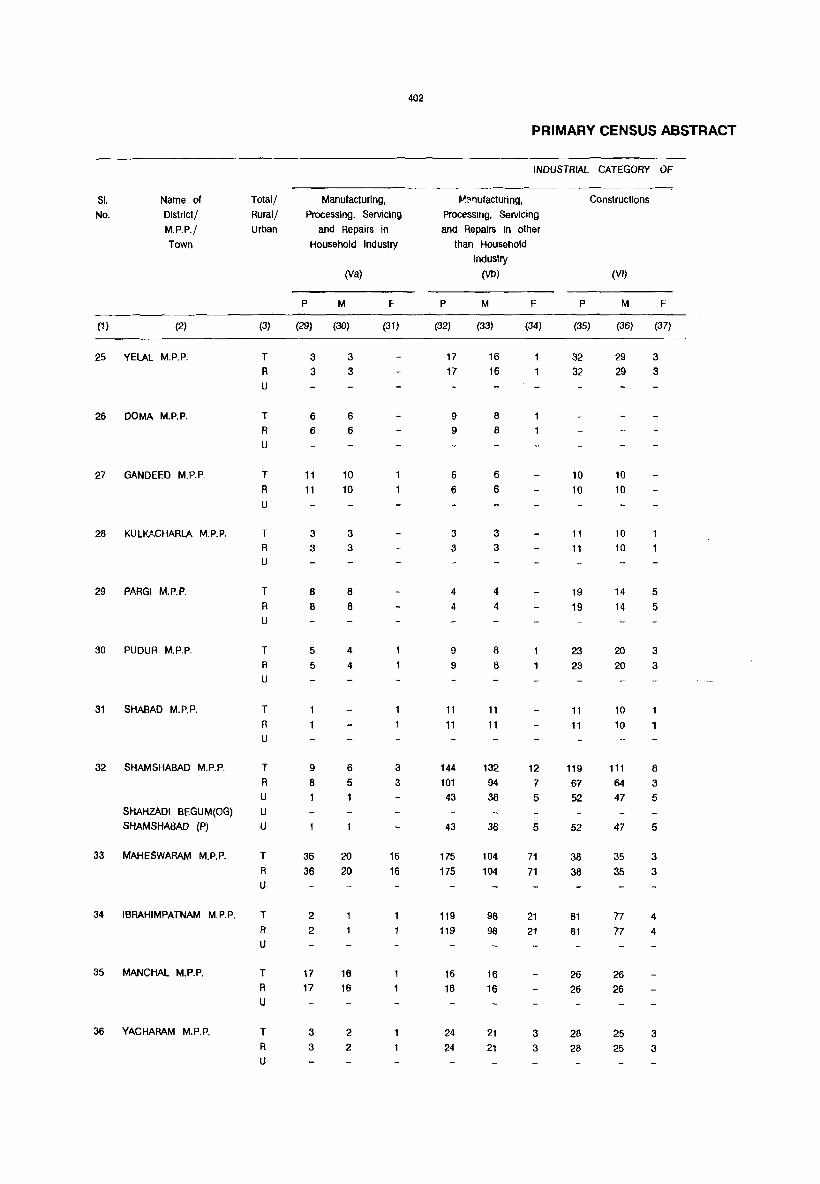
402
PRIMARY CENSUS ABSTRACT
INDUSTRIAL CATEGORY OF
51. Name of Total! Manufacturing, ~"''1ufacturing, Constructions
No. Oistrictj Rural! Processing, Servicing Processing, Servicing
M.P.P.! Urban and Repairs in and Repairs in other
Town Household Industry than Household
Industry
(Va) (Vb) (VI)
P M F P M F P M F
(1 ) (2) (3) (29) (30) (31) (32) (33) (34) (35) (36) (37)
25 YELAL M.P.P. T 3 3 17 16 32 29 3 R 3 3 17 16 32 29 3 U
26 OOMA M.P.P. T 6 6 9 8
R 6 6 9 8
U
27 GANDEED M.P.P. T 11 10 6 6 10 10 R 11 10 6 6 10 10 U
28 KULKACHARLA M.P.P. T 3 3 3 3 11 10 R 3 3 3 3 11 10 U
29 PARGI M. P. P. T 8 8 4 4 19 14 5 R 8 8 4 4 19 14 5 U
30 PUDUR M.P.P. T 5 4 9 8 23 20 3 R 5 4 9 8 23 20 3 U
31 SHABAD M.P.P. T 11 11 11 10 R 11 11 11 10 U
32 SHAMSHABAD M.P.P. T 9 6 3 144 132 12 119 111 8
R 8 5 3 101 94 7 67 64 3 U 43 38 5 52 47 5
SHAHZADI BEGUM(OG) U
SHAMSHABAD (P) U 43 38 5 52 47 5
33 MAHESWARAM M.P.P. T 36 20 16 175 104 71 38 35 3 R 36 20 16 175 104 71 38 35 3 U
34 IBRAHIMPATNAM M.P.P. T 2 119 98 21 81 77 4 R 2 119 98 21 81 77 4 U
35 MANCHAL M.P.P. T 17 16 16 16 26 26 R 17 16 16 16 26 26 U
36 YACHARAM M.P.P. T 3 2 24 21 3 28 25 3 R 3 2 24 21 3 28 25 3 U
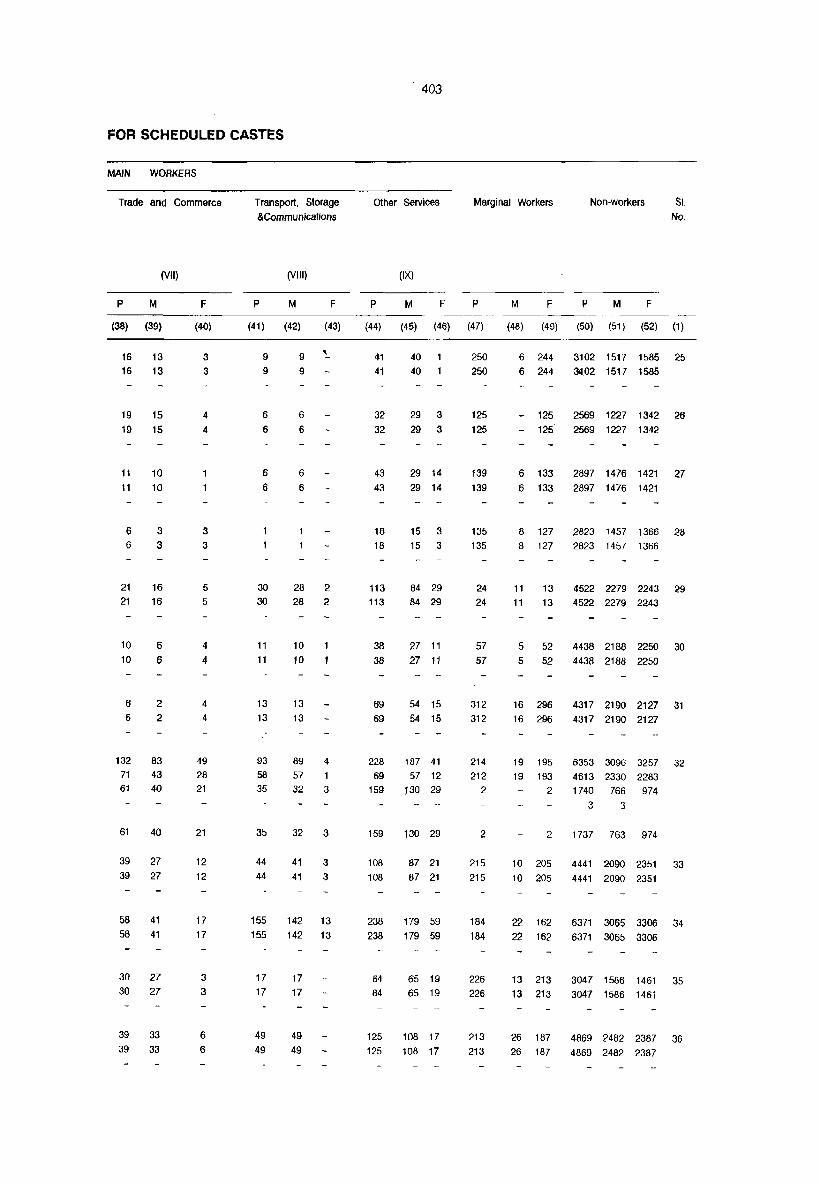
FOR SCHEDULED CASTES
MAIN WORKERS
Trade and Commerce
(VII)
p M
(38) (39)
16 13
16 13
19 15
19 15
11
11
6 6
21
21
10
10
6
6
10
10
3 3
16
16
6
6
2 2
132 83
71 43
61 40
61 40
39 27
39 27
58 41
58 41
30 27
30 27
39 33
39 33
F
(40)
3
3
4
4
3
3
5
5
4
4
4
4
49
28
21
21
12
12
17
17
3 3
6 6
Transport, Storage &Communicalions
(VIII)
p M F
(41) (42) (43)
9
9
6
6
6
6
30
30
11
11
13
13
93
58
35
35
9 ~
9
6
6
6
6
28 2 28 2
10
10
13
13
89 4 57 1 32 3
32 3
44 41 3
44 41 3
155 142 13
155 142 13
17
17
49
49
17
17
49
49
403
Other Services Marginal Workers Non-workers SI.
(IX)
p M F p
(44) (45) (46) (47)
41
41
32
32
43
43
18
18
113 113
38
38
69
69
40
40
29 3
29 3
29 14
29 14
15 3 15 3
84 29
84 29
27 11
27 11
54 15
54 15
228 187 41
69 57 12
159 130 29
159 130 29
108 87 21
108 87 21
238 179 59
238 179 59
84 65 19
84 65 19
125 108 17
125 108 17
250
250
125
125
139
139
135
135
24
24
57
57
312
312
214
212
2
2
215
215
184
184
226
226
213
213
No.
M F p M F
(48) (49) (50) (51) (52) (1)
6 244 3102 1517 1585 25
6 244 30:1.02 1517 1585
- 125 2569 1227 1342 26
- 125 2569 1227 1342
6 133 2897 1476 1421 27
6 133 2897 1476 1421
8 127 2823 1457 1366 28
8 127 2823 1457 1366
11 13 4522 2279 2243 29
11 13 4522 2279 2243
5 52 4438 2188 2250 30
5 52 4438 2188 2250
16 296 4317 2190 2127 31
16 296 4317 2190 2127
19 195 6353 3096 3257 32
19 193 4613 2330 2283 2 f 740 766 974
3 3
2 1737 763 974
10 205 4441 2090 2351 33
10 205 4441 2090 2351
22 162 6371 3065 3306 34
22 162 6371 3065 3306
13 213 3047 1586 1461 35
13 213 3047 1586 1461
26 187 4869 2482 2387 36
26 187 4869 2482 2387
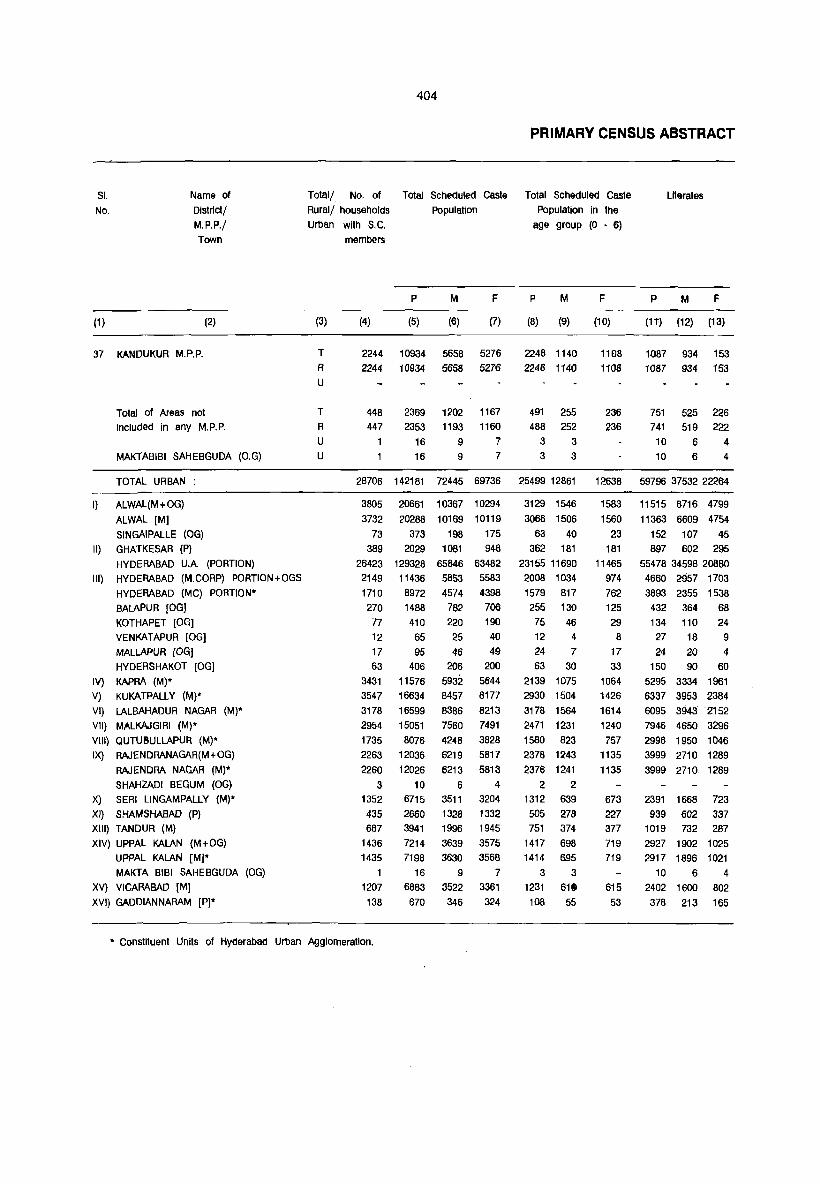
SI.
No.
(1)
Name of
District!
M.P.P./
Town
(2)
37 KANDUKUR M.P.P.
Total of Areas not
included in any M.P.P.
MAKTABIBI SAHEBGUDA (O.G)
404
Total/ No. of Total Sche<luled Caste
Rural/ households Population
Urban with S.C.
(3)
T
R U
T
R
U U
members
P M F
(4) (5) (6) (7)
2244 10934 5658 5276 2244 i0934 5658 5276
448 447
1
2369 1202 1167 2353 1193 1160
16 9 7 16 9 7
PRIMARY CENSUS ABSTRACT
Total Scheduled Caste
Population in the
age group (0 • 6)
P M
(8) (9)
2248 1140 2248 i140
491 255 488 252
3 3 3 3
F
(10)
1198 1i08
236 236
Literates
P M F
(11) (12) (13)
1087 934 153 i067 934 153
751 525 226 741 519 222 10 6 4 10 6 4
TOTAL URBAN 28706 142181 72445 69736 25499 12861 12638 59796 37532 22264
I) ALWAL(M + OG)
ALWAL [M]
SINGAIPALLE (OG)
II) GHATKESAR (P)
HYDERABAD UA (PORTION)
III) HYDERABAD (M.CORP) PORTION+OGS
HYDERABAD (MC) PORTION*
BALAPUR fOG]
KOTHAPET [OG]
VENKATAPUR [OG]
MALLAPUR [OG]
HYDERSHAKOT [OG]
IV) KAPRA (M)*
V) KUKATPALLY (M)*
VI) LALBAHADUR NAGAR (M)*
VlI) MALKAlGIRI (M)*
VlIl) QUTU8ULLAPUR. (M)·
IX) RAJENDRANAGAR(M+OG)
RAJENDRA NAGAR (M)*
SHAHZADI BEGUM (OG)
X) SERI LlNGAMPALLY (M)*
XI) SHAMSHABAD (P)
XIII) TANDUR (M)
XIV) UPPAL KALAN (M+OG)
UPPAL KALAN [M]"
MAKTA BIBI SAHEBGUDA (OG)
XV) VICARABAD [M]
XVI) GADDIANNARAM [Pl·
3805 3732
73 389
20661 10367 10294 20288 10169 10119
373 198 175 2029 1081 948
26423 129328 65846 63482 2149 11436 5853 5583 1710 8972 270 1488 77 410 12 65 17 95 63 406
3431 11576 3547 16634 3178 2954 1735 2263 2260
3 1352 435 687
1436 1435
1207 138
16599 15051 8076
12036 12026
10 6715 2660 3941 7214 7198
16 6883 670
4574 4398 782 706 220 190 25 40 46 49
206 200 5932 5644 8457 8177 8386 8213 7560 7491 42(8 3828 6219 5817 6213 5813
6 4 3511 3204 1328 1332 1996 1945 3639 3575 3830 3568
9 7 3522 3361 346 324
.. Conslltuent Units of Hyderabad Urban Agglomeration.
3129 1546 3066 1506
63 40 362 181
23155 11690 2008 1034 1579 817 255 130 75 46 12 4
24 7 63 30
2139 1075 2930 1504 3178 1564 2471 1231 1580 823 2378 1243 2376 1241
2 2 1312 639 505 278 751 374
1417 698 14i4 695
3 3 1231 61. 108 55
1583 1560
23 181
11465 974 762 125 29
8
17 33
1064 1426 1614 1240 757
1135 1135
673 227 377 719 719
615 53
11515 6716 4799 11363 6609 4754
152 107 45 897 602 295
55478 34598 20880 4660 2957 1703 3893 2355 1538 432 364 68 134 110 24
27 18 9
24 20 4 150 90 60
5295 3334 1961 6337 3953 2384 6095 3943 2152 7946 4650 3296 2996 1950 1046 3999 2710 1289 3999 2710 1289
2391 1668 723 939 602 337
1019 732 287 2927 1902 1025 2917 1896 1021
10 6 4
2402 1600 802 378 213 165
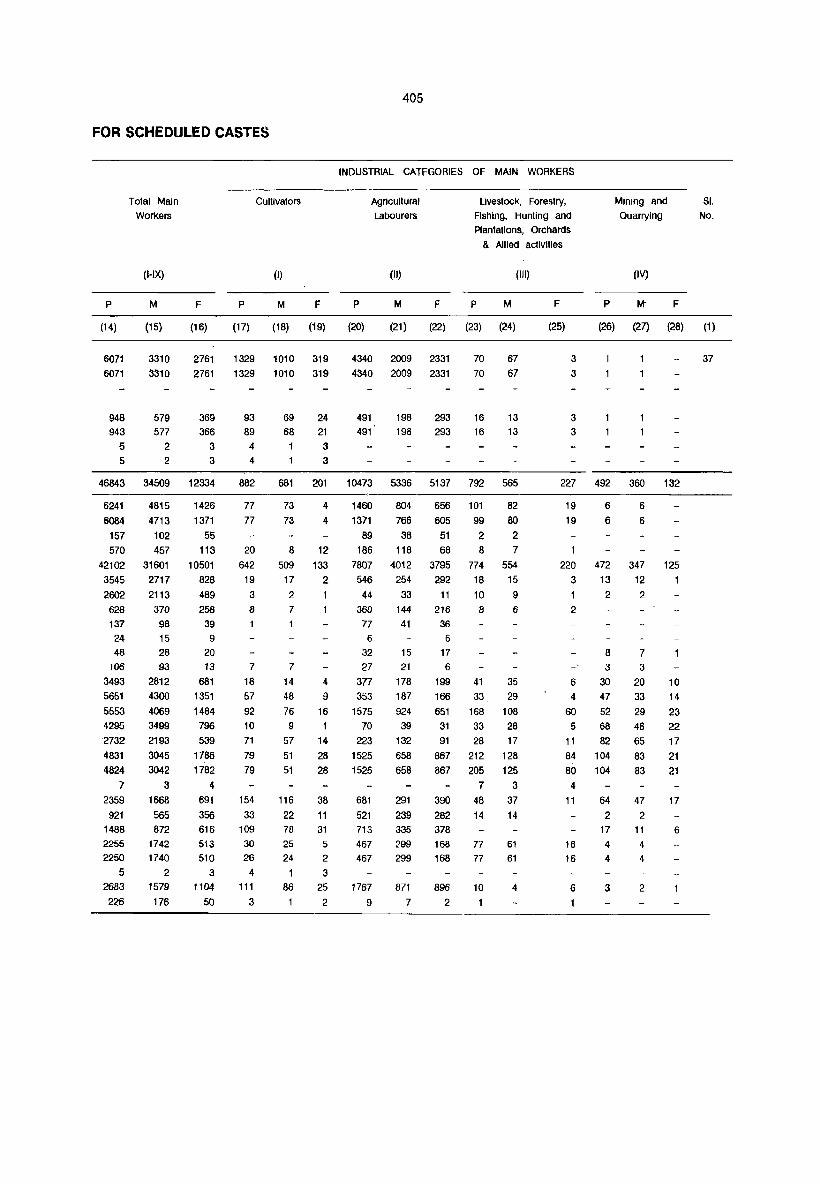
FOR SCHEDULED CASTES
p
(14)
6071
6071
948 943
5 5
Total Main
Workers
(!-IX)
M
(15)
3310
3310
579 577
2
2
Cultivators
(I)
F p M F
(16) (17) (18) (19)
2761 1329 1010 319
2761 1329 1010 319
369 366
3 3
93 89
4
4
69
68
1
24 21
3 3
405
INDUSTRIAL CATEGORIES OF MAIN WORKERS
p
Agricultural
LallOurers
(Ii)
M F
Livestock, Forestry,
Fishing, Hunting ancJ
Plantations, Orchards
& Allied activities
(iii)
p M F
(20) (21) (22) (23) (24) (25)
4340 2009 2331
4340 2009 2331
491 491
198
198
293
293
70
70
16 16
67
67
13
13
3
3
3 3
p
Mining and
Quarrying
(IV)
F
SI. No.
(26) (27) (28) (1 )
37
46843 34509 12334 882 681 201 10473 5336 5137 792 565 227 492 360 132
6241
6084
157
570
4815
4713
102
457
42102 31601
3545 2717
2602 2113
628 370
137 98
24 15 48 28
106 93
3493 2812
5651 4300
5553 4069
4295 3499
2732 2193
4831 3045
4824 3042
7 2359
921 1488
2255 2250
5 2683
226
3 1668
565
872
1742 1740
2 1579
176
1426
1371
55
113
10501
828
489
258
39 9
20 13
681
1351
1484 796
539
1786
1782
4
691
356 616
513 510
3
1104
50
77
77
20
642
19
3
8
7
18
57
92
10
71
79
79
154
33 109
30 26
4
111
3
73
73
8
4
4
12
509 133
17 2
2 7
7
14 4 48 9
76 16
9
57 14
51 28
51 28
116
22 78
25 24
1
86
38
11 31
5 2
3
25
2
1460
1371
89
186
804
766
38
118
7807 4012
546 254
44 33
360 144
77 41
6
32 15
27 21
377 178
353 187
1575 924
70 39
223 132
1525 658
1525 658
681
521
713
467 467
1767
9
291
239 335
299 299
871
7
656 101
605 99
51 2 68 8
82
80
2
7 3795 774 554
292 18 15
11 10 9
216 8 6
36
6
17 6
199 41 35
166 33 29
651 168 108
31 33 28
91 28 17
867 212 128
867 205 125
390
282
378
168 168
896
2
7
48
14
77 77
10
3
37
14
61
61
4
19
19
220
3
2
6 4
60
5 11
84
80
4
11
16
16
6
6
6
472
13
2
8 3
30 47
52
68
82
104
104
64
2 17
4
4
3
6
6
347
12
2
7
3
20
33
29
46
65
83
83
47
2
11
4
4
2
125
10 14
23
22 17
21
21
17
6

406
PRIMARY CENSUS ABSTRACT
INDUSTRIAL CATEGORIES OF
SI. Name of Total/ Manufacturing, Manufacturing, Constructions
No. Distrlctj Rural/ Processing, Servicing Processing, Servicing
M.P.P'; Urban and Repairs in and Repairs in other
Town Household Industry than Household
Industry
(Va) (Vb) (VI)
P M F P M F P M F
(1 ) (2) (3) (29) (30) (31) (32) (33) (34) (35) (36) (37)
37 KANDUKUR M.P.P. T 163 91 72 28 17 11 27 25 2 R 163 91 72 28 17 11 27 25 2 U -' J
Total of Areas not T 10 10 171 150 21 51 47 4 included in any M.P.P. R 10 10 171 150 21 51 47 4
U
MAKTABIBI SAHEBGUDA (O.G) U
TOTAL URBAN : 121 89 32 8531 7504 1027 8792 7081 1711
ALWAL(M + OG)· 15 8 7 996 888 108 1052 925 127
ALWAL [M] 15 8 7 986 878 108 1048 921 127
SINGAIPALLE (OG) 10 10 4 4 II GHATKESAR (P)· 5 5 112 108 4 46 43 3
HYDERABAD UA (PORTION) 98 75 23 8162 7238 924 8529 6868 1661
III HYDERABAD (M.CORP) PORTION + OGS· 3 2 768 712 56 950 713 237
HYDERABAD (MC) PORTION 3 2 744 693 51 874 640 234
BALAPUR lOG] 21 16 5 31 31
KOTHAPET lOG] 2 2 25 24
VENKAT('.PUR lOG] 4 4
MALLAPUR lOG] 1 2 2 HYDERSHAKOT lOG] 14 12 2
IV KAPRA (M)· 34 31 3 1094 979 115 761 628 133 V KUKATPALLY (M)· 20 17 3 1761 1539 222 1220 909 311
VI LALBAHADUR NAGAR (M)· 6 3 3 358 323 35 1312 1087 225 VII MALKAJGIRI (M)· 6 5 864 765 99 1253 1047 206 VIII QUTHBULLAPUR (M)· 1 1 1069 958 111 711 531 180 IX RAJENDRANAGAR(M + OG)· 3 2 425 336 89 535 413 122
RAJENDRA NAGAR (M) 3 2 425 336 89 535 413 122 SHAHZADI BEGUM (OG)
X SERI LlNGAMPALLY (M)* 6 4 2 452 403 49 221 189 32 XI SHAMSHABAD (P)· 1 43 38 5 52 47 5 XII TANDUR (M) 6 5 228 134 94 124 85 39 XIV UPPAL KALAN (M+OG)· 3 2 308 274 34 431 351 80
UPPAL KALAN [M] 3 2 308 274 34 431 351 80 MAKTA BIBI SAHEBGUDA (OG)
XV VICARABAD [M] 12 4 8 29 24 5 93 85 8 XVI GADDIANNARAM [P]* 24 23 1 31 28 3

FOR SCHEDULED CASTES
MAIN WORKERS
Trade and Commerce
(VII)
p M
(38) (39)
15
15
31
31
14
14
24
24
F
(40)
7
7
3148 2293 855
500 374 126
496 371 125 4 3 1
36 25 11
2972 2165 807
275 216 59
221 189 32
40 17 23
4 4 3 2 3 2 4 4
168 142 26
388 289 99
450 317 133 407 310 97
119 96 23
267 147 120
267 147 120
99 71
61 40
63 48
202 134
202 134
77
36
55
29
28
21
15
68
68
22
7
Transport, Storage &Communications
(VIII)
p M F
(41) (42) (43)
14
14
27
27
14
14
27
27
4328 3978 350
513
508
478 35
474 34
5 4 1
91 87 4
4013 3676 337 293 255 38
237 201 36
44 42 2
7 7 1 1 2 2 2 2
430 364 66 986 545 41
613 547 66
895 838 57
154 149 5
202 193 9
202 193 9
110 101 9
35. 32 3 62 62
146 138 8
146 138 8
162
36
153 9
36
407
Other Services Marginal Workers Non-workers 51. No.
(IX)
p M F p
(44) (45) (46) (47)
84
84
57
56
62 22
62 22
50 49
1
1
7 7
9284 6622 2662
1521 1177 344
1476 1136 342
43 41 2
66 56 10
8633 6157 2476 661 521 140
465 342 123
116 107 9 211 19 2
10 9
49 44 5
540 421 119 1186 704 482
927 655 272
689 412 277
274 187 87
1479 1034 445
1479 1034 445
524 409 115
159 130 29 166 114 52
587 455 132
586 454 132
419 295 124
86 52 34
280
280
16 16
455
51
51
49
403
66
66
10 74
65 10
17
40 40
40 2 2
26
26
1
2
M F p M F
(48) (49) (50) (51) (52) (1)
8 272 4583 2340 2243 37
8 272 4583 2340 2243
15 1405 622 783
15 1394 615 779
11 7 4 11 7 4
167 288 94883 37769 57114
15 36 14369 5537 8832
15 36 14153 5441 8712
216 96 120
48 1410 623 787 II
165 236 86623 34080 52743
32 34 7825 3104 4721 III
32 34 6304 2429 3875
860 412 448
273 122 151
41 10 31
47 18 29
300 113 187
3 7 8073 3117 4956 IV 59 15 10909 4098 6811 V
6 59 10981 4311 6670 VI 4 6 10746 4057 6689 VII
3 14 5327 2052 3275 VIII
20 20 7165 3154 4011 IX
20 20 7162 315\ 4011
9 31
2
12 14
12 14
2
3 3
4316 1834 2482 X
1737 763 974 XI 2451 1123 1328 XII
4933 1885 3048 XIV
4922 1878 3044
11 7 4
4199 1943 2256 XV
442 168 274 XVI

SI. No.
(1)
Name of
Dlstrict/
M.P.P./
Town
(2)
15 RANGAREDDI DISTRICT
MARPALLE M.P.P.
2 MOMINPET M.P.P.
3 NAWABPET M.p.p.
4 SHANKARPALLE M.P.P.
7 QUTHBULLAPUR M.P.P.
8 MEDCHAL M.P.P.
9 SHAMIRPET M.P.P.
SINGAIPALLE (0. G)
11 KEESARA M. P. P.
12 GHATKESAR M.P.P.
GHATKESAR (P)
Totall No. of Rural/ households
Urban With S.T.
members
(3) (4)
408
Total Scheduled Tribe
Population
P M F
(5) (6) (7)
T
R
U
20074 109394 56438 52956
T
R U
T
R
U
T
R U
T R
U
T
R U
T
R
U
T
R U
U
T
R u
T
R U
U
15707 87517 44740 4367 21877 11698
258
258
372 372
27 27
214 214
271 271
457
457
266 265
92 92
291 262 29
29
1451 1451
759 759
2090 1105 2090 1105
166 73 166 73
1163 1163
1273 1273
618
618
650 650
2669 1395 2669 1395
1342 695 1337 692
5
5
367
367
1367 1202
165 165
3
3
180 180
695
604 91 91
42777 10179
692 692
985 985
93 93
545 545
623
623
1274 1274
647 645
2
2
187 187
672 598 74 74
PRIMARY CENSUS ABSTRACT
Total Scheduled Tribe
population in the
age group (0 - 6)
P M
(8) (9)
25526 12953 21169 10643-4357 2310
292 292
335 335
32 32
186 186
310
310
581 581
293 293
66 66
344 312 32 32
181 181
177 177
17 17
99 99
162 162
288 288
158 158
28 28
173 153
20 20
F
(10)
12573 10526 2047
111 111
158 158
15 15
87 87
148 146
293
293
135
135
38 38
171
159 12 12
Literates
p M F
(11) (12) (13)
14514 11332 3182 8127 6817 1310 6387 4515 1872
38 38
188
188
24 24
215 215
178 178
537 537
188 188
56 56
220
184
36 36
38 38
180
180
21 21
209
209
136
136
443
443
147
147
40 40
155
126 29
29
8
8
3 3
6
6
42 42
94 94
41 41
16. 16
65 58
7 7

FOR SCHEDULED TRIBES
p
Total Main
Workers
(I-IX)
M F
Cultivators
(I)
p M F
409
INDUSTRIAL CATEGORIES OF MAIN WORKERS
p
Agricultural
Labourers
(II)
M F p
Livestock, Forestry,
Fishing, Hunting and
Plantation, Orchards
& Allied activities (ltl)
M F
(14) (15) (16) (17) (18) (19) (20) (21) (22) (23) (24) (25)
52074 29359 22715 20774 13678 7096 18908. 7186 11722 1315 902
44170 23893 20277 20562 13507 7055 17520 6503 11017 1190 815
7904 5466 2438 212 171 41 1388 683 705 125 87
796 796
1035
1035
89
89
542 542
648
648
1205
1205
711
709 2 2
213
213
579
514
65
65
408
408
531
531
39
39
305 305
368
368
693
693
387
386
115
115
348
306 42 42
388
388
504 504
50
50
237 237
280
280
512
512
324
323
98
98
231
208 23 23
179
179
729
729
79
79
298 298
80
80
149
149
72
72
19
19
97
97
82
82
381 348
381 348
35 44
35 44
188 110 188 110
56 24
56 24
105 lOS
44
44
17
17
44
44
28 28
2
2
580 286
580 286
286 137
286 137
10 4
10 4
135 135
160
160
51
51
72
72
749 379
749 379
450 233
448 232 2
2
4
4
187
170
17
17
2
2
92
80
12
12
294
294
149
149
6
6
84
84
88
88
370
370
217
216
2
2
95
90
5
5
2
2
2
2
42 26 42 26
15 10
15 10
43 28 43 28
42 26
42 26
9
9
3 3
5
5
3 3
413
375
38
16
16
5
5
15
15
16
16
4
4
p
Mining and
Quarrying
(IV)
M
51. No.
F
(26) {27) (28) (1)
765 468 297 15
579 358 221
186 110 76
8 3
8 3
22 15
22 15
2
2 2
2
5
5
7
7
2
3
4
7
8
9
11
11
5
5
6 11
2
2
2
6
12

410
PRIMARY CENSUS ABSTRACT
INDUSTRIAL CATEGORY OF
SI. Name of Totalj Manufacturing, ManUfacturing, Constructions
No. District/ Rural/ Processing, Servicing Processing, Servicing
M.P.P.j Urban and Repairs in and Repairs In other
Town Household Industry than Household
Industry
(Va) (Vb) (VI)
P M F P M F P M F
(1) (2) (3) (29) (30) (31) (32) (33) (34) (35) (36) (37)
15 RANOAREDDI DISTRICT T 1271 653 618 2638 1705 933 2367 1522 845 R 1120 592 528 1583 870 713 362 229 133 U 151 61 90 1055 835 220 2005 1293 712
MARPALlE M.P.P. T 22 14 8 5 2 3 R 22 14 8 5 2 3 U
2 MOMINPET M.P.P. T 8 4 4 4 2 2 R 8 4 4 4 2 2 U
3 NAWABPET M.P.P. T
R U
4 SHANKARPAllE M.P.P. T 48 28 20 5 3 2 A 48 28 20 5 3 2 U
7 aUTHBUlLAPUR M.P.P. T 9 6 3 285 149 136 2 2 A 9 6 3 285 149 136 2 2 U
8 MEDCHAL M.P.P. T 48 24 24 108 64 44 12 9 3 R 48 24 24 108 64 44 12 9 3 U
9 SHAMIRPET M.P.P. T 42 16 26 56 26 30 20 16 4 A 42 16 26 56 26 30 20 16 4 U
SINGAIPAllE (O.G) U
11 KEESARA M.P.P. T 42 20 22 115 65 50 25 12 13 A 42 20 22 115 65 50 25 12 13 U
12 GHATKESAR M.P.P. T 35 18 17 177 98 79 56 37 19 R 34 17 17 168 92 76 56 37 19 U 1 9 6 3
GHATKESAR (P) U 9 6 3

FOR SCHEDULED TRIBES
MAIN WORKERS
Trade and Commerce
(VII)
P M F
(38) (39) (40)
952 637 315 370 219 151 582 418 164
3 3 3 3
24 12 12 24 12 12
21 15 6 21 15 6
9 8 9 8
2 2 2 2
41 27 14 10 8 2 31 19 12 31 19 12
Transport, Storage
&Communications
(VIII)
P M F
(41) (42) (43)
1493 1415 78 523 502 21 970 913 57
28 28 28 28
17 17 17 17
7 7 7 7
4 3 4 3
48 46 2 47 45 2
411
Other services
(IX)
P M F
(44) (45) (46)
1591 1193 398 361 298 63
1230 895 335
6 5 6 5
8 7 8 7
2 2
2 2
23 18 5
23 18 5
56 50 6
56 50 6
12 10 2
12 10 2
11 9 2 7 7 4 2 2 4 2 2
Marginal Workers
P M F
(47) (48) (49)
1449 124 1325 1407 110 1297
42 14 28
61 61 61 61
9 8 9 8
68 12 56 68 12 56
9 8 9 8
4 4 4 4
26 26 26 26
Non-workers
P M F
(50) (51) (52)
55871 26955 28916 41940 20737 21203 13931 6218 7713
655 351 304 655 351 304
1055 574 481 1055 574 481
76 34 42 76 34 42
560 313 247 560 313 247
616 281 335 616 281 335
1396 690 706 1396 690 706
622 307 315 619 305 314
3 2 3 2
150 65 85 150 65 85
762 347 415 662 298 364 100 49 51 100 49 51
Sl.
No.
(1)
15
2
3
4
7
8
9
11
12

Sl.
NO,
Name of
DISlrlctj
M.P.P./
TOWn
(1) (2)
14 HAYATHNAGAR M.P.P.
15 SAROORNAGAR M.P.P.
BALAPUR (O.G) KOTHAPET (O.G)
VENKATAPUR (O.G)
MALLAPUR (O.G) GADDIANNARAM (P)
16 RAJENORANAGAR M.P.P.
Total/ No. of
Rural/ households
Urban with S. T.
members
(3)
T R U
T
R U
U
U
U
U U
T R
U
(4)
155
155
199 133 66
19
47
41
41
412
Total Scheauled Tribe
Population
p
(5)
772 772
1072 598 474 111
363
226 226
M
(6)
420 420
631 313 318
52
266
120 120
F
(7)
352 352
441 285 156 59
97
106 106
HYOERSHAKOT (O.G) U
17 MOINABAD M.P.P.
18 CHEVELLA M.P.P.
19 VICARABAO M.P.P,
2Q OHARUR M.P.P.
21 BANTARAM M.P.P.
22 PEDDAMUL M.P.P.
23 TANDUR M.P.P.
24 BASHEERABAD M.P.P.
T
R U
T R U
T
R U
T R U
T R
U
T
R U
T
R
U
T R U
6
6
53 53
192
192
37 37
279 279
1095 1095
612 3739 612 3739
144
144
1267
1267
341 341
1009
1009
984 984
7259 7259
1943 1943
5976
5976
24 24
151
151
559 559
1895
1895
513 513
3659 36$9
1015
1015
30<15 3045
13 13
128 128
536 536
1844 1844
471 471
3600 3600
926 928
2931 2931
PRIMARY CENSUS ABSTRACT
Total Scheduled Tribe
Population In the
age group (0 - 6)
p
(8)
122 122
213 137 76 19
57
45
45
7
7
52 52
293 293
948
948
253 253
1834 1834
490
490
1392 1392
M
(9)
69 69
121
72 49
6
41
24 24
2 2
30 30
140
140
465
465
133 133
876 876
253
253
686
686
F
(10)
53 53
92 65 27
11
16
21 21
5
5
22 22
153 153
483 483
120 120
958 958
237 237
706 706
Literates
p M F
(11) (12) (13)
109 90 19 109 90 19
365
83 282
36
246
54 54
29 29
58 58
136 136
376 376
86 86
504
504
254 254
621 621
289 62
227 24
203
36 36
15 15
48 48
135 135
326 326
81 81
416
416
188 188
538 538
76 21 55 12
43
18 18
14 14
10 10
50
50
5 5
88 88
66 66
83 83

FOR SCHF.DULED TRIBES
p
Total Main
Workers
(I-IX)
M F
Cultivators
(I)
p M F
413
INDUSTRIAL CATEGORIES OF MAIN WORKERS
p
Agricultural
Labourers
(II)
M F
livestock. Forestry. Fishing. Hunting and
Plantations. Orchards
& Allied activities (III)
p M F P
Mining and
Quarrying
(IV)
M F
SI.
No.
(14) (15) (16) (17) (18) (19) (20) (21) (22) (23) (24) (25) (26) (27) (28) (1)
431
431
374
280 94 33
61
91
91
14
14
135 135
503
503
1824 1824
505
505
239
239
236
169 67
23
44
58 58
8
8
71 71
266
266
990
990
250 250
1~ 192
138
111 27
10
17
33
33
6 6
64 64
237
237
25
25
10 10
228
228
834 1069 834 1069
255 353
255 353
17
17 8 8
7 3 7 3
118 11,0
118 110
679 390
679 390
194 159 194 159
224 113
224 113
31
25 6
6
29
29
4
4
32 32
162
162
14
12 2
2
12
12
2 2
14 14
70
70
572 181
572 181
109 25 109 25
111
111
17
13 4
4
17
17
2
2
18 18
92
92
391
391
84 84
3746 1990 1756 2234 1561 673 1429 360 1069 3746 1990 1756 2234 1581 673 1429 360 1069
983 547 436 263 219 44 983 547 436 263 219 44
2960 1626 1334 1597 994 603 2960 1626 1334 1597 994 603
435 160
435 160
665 177
665 177
275
275
488 4BB
34
34
22
22
3
3
24
24
20
20
24 24
29 29
55 55
21
21
13
13
19
19
17 17
21
21
26
26
42
42
13
13
9
9
2
2
5
5
3 3
3
3
33
33
3
3
20
20
13
13
2
2
3 87 48 39
3 87 48 39
13 346 213 133
13 346 213 133
14
15
16
17
18
19
20
21
22
23
24

414
PRIMARY CENSUS ABSTRACT
INDUSTRIAL CATEGORY OF
SI. Name of Total/ Manufacturing, Manufacturing, COllstruclions
No .• Distrlct/ Rural/ Processing, Servicing Processing, Servicing
M.P.P./ Urban and Repairs in and Repairs in other
Town Household Industry than Household
Industry
(Va) (Vb) (VI)
P M F P M F P M F
(1) (2) (3) (29) (30) (31) (32) (33) (34) (35) (36) (37)
14 HAYATHNAGAR M.P.P. T 61 27 34 36 22 14 29 22 7 R 61 27 34 36 22 14 29 22 7 U
15 SAROORNAGAR M.P.P. T 43 30 13 144 63 81 A 33 23 10 123 56 67 U 10 7 3 21 7 14
BALAPUR (O.G) U 6 4 2 5 3 2 KOTHAPET (O.G) U
VENKATAPUR (O.G) U
MALLAPUR (O.G) U
GADDIANNARAM (P) U 4 3 16 4 12
16 RAJENDRANAGAR M.P.P. T 5 2 3 5 4 4 3
A 5 2 3 5 4 4 3 U
HYDERSHAKOT (O.G) U
17 MOINAt;lAD M.P.P. T
R • U
18 CHEVELLA M.P.P. T 66 36 30 21 9 12 R 66 36 30 21 9 12 U
19 VICARABAD M.P.P. T 92 57 35 6 6 6 6
R 92 57 35 6 6 6 6 U
20 DHARUR M.P.P. T 23 13 10 29 13 16 2 2 A 23 13 10 29 13 16 2 2 U
21 BANTARAM M.P.P. T 21 12 9 A 21 12 9 U
22 PEDDl!a'v1UL M.P.P. T 16 11 5 3 2 2 2 A 16 11 5 3 2 2 2 U
23 TANDUR M.P.P. T 58 32 26 24 22 2 8 6 2 A 58 32 26 24 22 2 8 6 2 U
24 BASHEERABAD M.P.P. T 71 33 38 134 85 49 4 4 R 71 33 38 134 85 49 4 4 U

FOR SCHEDULED TRIBES
MAIN WORKERS
Trade and Commerce
p M
(38) (39)
8
8 5 5
20 16 13 9
7 7 3 3
4
3 3
7
7
18
18
4
3
:3
5
5
7
7
14 11
14 11
65 21
65 21
11
11 9
9
(VII)
F
(40)
3
3
4
4
2
2
11
11
3
3
44 44
2 2
Transport, Storage &Communications
(VIII)
p M
(41) (42)'
7
7 7
7
76 72 49 46
27 26
7 7
20 19
14 14 14 14
5
5
76
76
3
3
6 6
5
5
66
66
3
3
6
6
47 45
47 45
F
(43)
4 3
10
10
2
2
415
other Services Marginal Workers Non-workers SI. No.
(IX)
p M
(44) (45)
6
6 4 4
27 21
4 3
23 18
6 4
17 14
6
6
4
4
4
4
11
11
2
2
6
6
3
3
4
4
10
10
2
2
20 18
20 18
8
8
7
7
30 24
30 24
F p M
(46) (47) (48)
2
2
6
1
5
2
3
5
5
4
4
5
5
46
46
2 79
2 79
41
41
6 146
6 146
_.
4
4
12
12
F p M F
(49) (50) (51) (52) (1)
5 336 181 155 14
5 336 181 155
697 395 302 15
317 144 173
380 251 129
78 29 49
302 222
134
134
23
23
3 140
3 140
62
62
16
16
79
79
80
72 16
72
7 17
7
61 18
61
5 587 293 294 19
5 587 293 294
42 1869 901
42 1869 901
968 20
968
479 263 216 21
479 263 216
67 3434 1657 1777 22
67 3434 1657 1777
41 919 468 451 23
41 919 468 451
145 2870 1418 1452 24
145 2870 1418 1452

51,
No,
Name ot Districtj
M,P,P,j
Town
(1) (2)
25 YELAL M,P.P,
26 DOMA M,P.P,
27 GANOEED M.P.?,
28 KUlKACHAALA M,P.F
29 PARGI M.P.P.
30 PUDUR M.P.P.
31 SHABAD M.P.P.
32 SHAMSHABAD M.P.P.
SHAHZADI BEGUM(OG)
SHAMSHABAD (P)
33 MAHESWARAM M.P.P.
34 IBRAHIMPATNAM M.P,P.
35 MANGHAl M. P. P.
36 YACHARAM M,P.P.
Total/ No, of
Ruralj households
Urban with S,T,
members
(3)
T
R
U
T
R
U
T R
U
T
R U
T
R
U
T
R U
T
R
U
T
R U
U
U
T
R U
T
R U
T
R
U
T
R
U
(4)
395
395
867 667
1135
1135
1766 1766
564
564
114
114
227
'227
702 616
86
86
1151
1151
217
217
1364
1364
6:>2
622
416
Total Scheduled Tribe
PopUlation
P
(5)
2426
2426
4318
4318
6413
6413
9238
9238
3071 3071
1253
1253
1344 1344
4331
3865 466
466
6190 6190
1160
1160
6941 6941
3186
3186
M
(6)
1233
1233
2187 2187
3235 3235
4642
4642
1592
1592
663
663
720
720
2092
1836
256
256
3285
3285
583
583
3524
3524
1637
1637
F
(7)
1193
1193
2131
2131
3178
3178
4596 4596
1479
1479
590
590
624
624
2239
2029
210
210
2905
2905
577
577
3417
3417
1549
1549
PRIMARY CENSUS ABSTRACT
Total Scheduled Tribe
Population In the
age group (0 - 6)
P
(8)
624
624
1076 1076
1630
1630
2440 2440
843 843
348 348
354 354
937
862
75
75
1522
1522
273 273
1616
1616
700
700
M
(9)
302 302
531
531
793 793
1226 1226
440 440
177
177
199
199
456 415
41
41
811 811
159 159
795
795
343
343
F
(10)
322 322
545 545
837 837
1214 1214
403 403
171 171
155 155
481 447
34
34
711 711
114
114
821 821
357 357
Literates
P M
(11) (12)
185 139
185 139
139 132
139 132
514 514
516 516
384
384
70
70
423 423
446
446
355 355
64 64
F
(13)
46 46
7 7
91
91
70
70
29 29
6 6
136
136
120 - 1~
330
236
94
94
298 298
267 267
769 769
411
411
120 16
290
215 75
75
263 26:l
144
144
662 662
341 341
40 21
. 19
19
35
35
123 123
107 107
70 70

417
FOR SCHEDULED TRIBES
INDUSTRIAL CATEGORIES OF MAIN WORKERS
Total Main
Workers Cultivators Agricultural
Labourers
p
(14)
1197
1197
(I-IX)
M
(15)
646
646
F
(16)
551
551
p
(17)
591
591
2454 1276 1178 1369 2454 1276 1178 1369
(I) (II)
M F p M
(18) (19) (20) (21 )
425 166
425 166
862 507 862 507
458 138
458 138
910 289 910 289
3157 1637 1520 1659 1065
3157 1637 1520 1659 1065 594 1318 459
594 1318 459
F
(22)
320
320
621
621
859
859
4503 2386 2117 2629 4503 2386 2117 2629
1757 1757
872 1595 872 1595
440 1155
440 1155
1631
1631
671 671
661
661
816
816
370 370
348 348
1927 1127 1751 1012
176 115
176 115
815 815
301 301
313
313
800 739
61
61
3300 1873 1427 3300 1873 1427
444 301 143 444 301 143
3723 1970 1753 3723 1970 1753
787 787
349 349
284
284
616 616
1518 151B
83 83
1760 1760
1748 1748
926 926
822 1111 8221111
523 264 523 264
220 129 220 129
188 188
96
96
781 248 781 248
295 131 295 131
287 117 287 117
420 196 1030 512 420 196 935 449
1102 1102
79 79
1213 1213
95
95
416 1316 416 1316
4 141 4 141
547 1690 547 1690
63
63
475 475
100 100
560 560
656 455 656 455
458 159 458 159
533 533
164 164
170 170
518 486
32
32
841 841
41
41
1130 1130
299 299
Livestock, Forestry,
Fishing, Hunting ana
Plantations, Orcharas
& Allied activities
(III)
p M F
(23) (24) (25)
11
11
125 125
77
77
175 175
43 43
94 91
3
3
144 144
33
33
93
93
7
7
11
11
89 89
55
55
122
122
27 27
57
54 3
3
92 92
15
15
66 66
7
7
36 36
22
22
53 53
16 16
37 37
52 52
18
18
27
27
p
Mining and
Quarrying
(IV)
M
SI.
No.
F
(26) (27) (28) (1 )
9 9
2 2
19
19
24 24
4
4
7 7
2 2
10
10
22 22
3
3
2
2
9
9
2
2
25
26
27
28
29
30
31
32
33
34
35
36

418
PRIMARY CENSUS ABSTRACT
INDUSTRIAL CATEGORY OF
SI. Name of Total! Manufacturing, ManUfacturing, Constructions
No. District! Rural! Processing, Servicing Processing, Servicing
M.P.P·i Urban and Repairs In and Repairs in other
Town Household Industry than Household
Industry
(Va) (Vb) (VI)
P M F P M F P M F
(1) (2) (3) (29) (30) (31) (32) (33) (34) (35) (36) (37)
25 YELAL M.P.P. T 60 34 26 12 8 4 5 4 R 60 34 26 12 8 4 5 4 U
26 DOMA M.P.P. T 19 14 5 18 12 6
R 19 14 5 18 12 6 U
27 GANDEEO M.P.P. T 27 17 10 55 26 29 R 27 17 10 55 26 29 U
28 KULKACHARLA M.P.P. T 42 19 23 17 7 10 15 14 R 42 19 23 17 7 10 15 14 U
29 PARGI M.P.P. T 8 6 2 R 8 6 2 U
30 PUDUR M.P.P. T 10 4 6 R 10 4 6 U
31 SHABAD M.P.P. T 52 21 31 8 2 6
R 52 21 31 8 2 6 U
32 SHAMSHABAD M.P.P. T 19 9 10 38 23 15 13 12 R 19 9 10 14 12 2 7 7 U 24 11 13 6 5
SHAHZADI BEGUM(OG) U
SHAMSHABAD (P) U 24 11 13 6 5
33 MAHESWARAM M.P.P. T 57 28 29 150 71 79 2 R 57 28 29 150 71 79 2
U
34 IBRAHIMPATNAM M.P.P. T 54 34 20 108 !iA 54 R 54 34 20 108 54 54 U
35 MANCHAL M.P.P. T 51 27 24 18 9 9 3 3 R 51 27 24 18 9 9 3 3 U
36 YACHARAM M.P.P. T 13 7 6 112 58 54 3 2 R 13 7 6 112 58 54 3 2 U
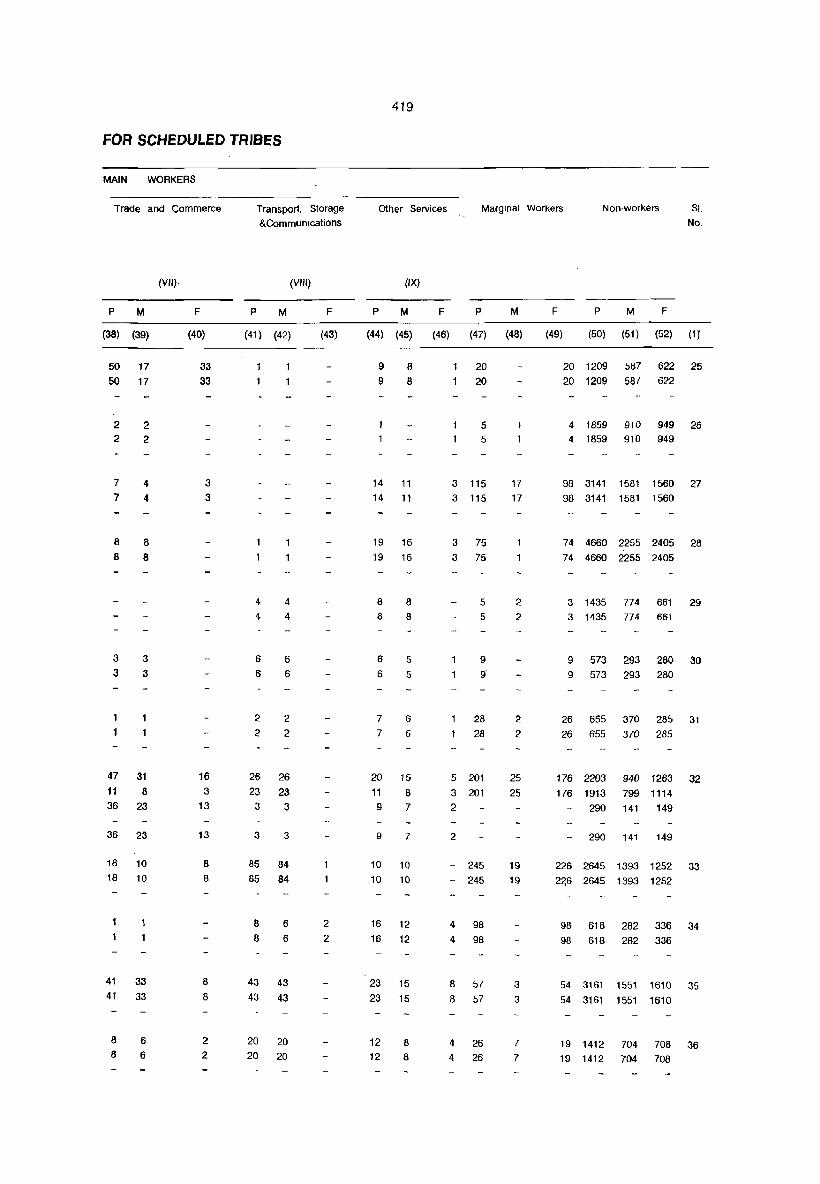
FOR SCHEDULED TRIBES
MAIN WORKERS
Trade and Commerce
p M
(38) (39)
50 50
2 2
7
7
8
8
3
3
17 17
2 2
4
4
8
8
3
3
47 31 11 8
36 23
36 23
18 10 18 10
41 33
41 33
8
6 6
6
(VII)-
F
(40)
33 33
3
3
16 3
13
13
8
8
8
8
2 2
Transport, Storage &Communications
(VIII)
p M
(41) (42)
4
4
6
6
2
2
4
4
6
6
2
2
26 26 23 23
3 3
3 3
85 84 85 84
8
8 6
6
43 43 43 43
20 20
20 20
F
(43)
2 2
419
Other Services Marginal Workers Non-workers SI.
(IX)
p M F p M
(44) (45) (46) (47) (48)
9
9 8
8
14 11
14 11
19 16 19 16
8
8
6
6
7
7
8
8
5 5
6
6
20 15 11 8
9 7
9 7
10 10 10 10
16 12 16 12
23 15 23 15
12 12
8 8
20 20
5 5
3 115 3 115
3 75 3 75
5
5
9
9"
28 28
5 201 3 201 2
2
- 245 - 245
4 98 4 98
8 57 8 57
4 26 4 26
17 17
2
2
2 2
25 25
19 19
3
3
7
7
No.
F p M F
(49) (50) (51) (52) (1 J
20 1209
20 1209 587 622 25 587 622
4 1859 910 949 26 4 1859 910 949
98 3141 1581 1560 27 98 3141 1581 1560
74 4660 2255 2405 28 74 4660 2255 2405
3 1435 774 661 29 3 1435 774 661
9 573 293 280 30 9 573 293 280
26 655 370 285 31 26 655 370 285
176 2203 940 1263 32 176 1913 799 1114
290 141 149
290 141 149
226 2645 1393 1252 33
2~6 2645 1393 1252
98 618 282 336 34 98 618 282 336
54 3161 1551 1610 35 54 3161 1551 1610
19 1412 704 708 36 19 1412 704 708

51.
No.
(1)
Name of
Districtj
M.P.P·I
Town
(2)
37 KANDUKUR M.P.P.
Total of Areas not
included in any M.P.P.
Total/ No. of
Rural! households
Urban with S.T.
members
(3) (4)
420
PRIMARY CENSUS ABSTRACT
Total Scheduled Tribe Total Scheduled Tribe Literates
P
(5)
Population Population in the
age group (0 - 6)
M F P M F P M F
(6) (7) (8) (9) (10) (11) (12) (13)
T
R U
443 3210 1673 1537 833 407 426 218 187 31
31
T
R
U
443 3210 1673 1537 833 407
55
55
276
276
t40
140
136
136
68
68
32
32
426 218 187
36
36
66
66
51
51
15
15
MAKTABIBI SAHEOBGUDA (O.G) U
TOTAL URBAN 4367 21877 11698 10179 4357 '2310 2047 6387 4515 1872
ALWAL(M + OG)*
ALWAL [M]
SINGAIPALLE (OG)
II GHATKESAR (P)
HYDERABAD U.A (PORTION)
III HYDERABAD (M.CORP) PORTION+OGS*
HYDERABAD (Me) PORTION
BALAPU R lOG]
KOTHAPET lOG]
VENKATAPUR lOG]
MALLAPUR lOG]
HYDERSHAKOT lOG}
IV KAPRA (M)*
V KUKATPALLY (M)*
VI LALBAHADUR NAGAR (M)·
VII MALKAIGIRI (M)·
VIII QUTHBULLAPUR (M)·
IX RAJENDRANAGAR(M + OG)
RAJENDRA NAGAR (M)·
SHAHZADI BEGUM (OG)
X SERI LlNGAMPALLY (M)*
XI SHAMSHABAD (P)·
XIII TANDUR (M)
XIV UPPAL KALAN (M + OG)*
UPPAL KALAN [M]
MAKTA BIBI SAHEBGUDA (OG)
XV VICARABAD [M}
XVI GADDIANNARAM [Pl·
254 1234 654
253 1229 651
5 3 29 165 91
3980 19481 10360
259 1323 655
240 1212 603
19 111 52
485 2180 1135
659 3380 1772
477 2201 1212
426 2014 1040
285 1471 776
360 1661 888
360 1661 888
408 2089 1096
86 466 256
83 548 332
234 1099 610
234 1099 610
275 1683 915
47 363 266
• Consliluent Units of Hyderabad Urban agglomeration.
580 244 127 117 313 219 94
578 244 127 117 313 219 94
2 74 32 20 12 36 29 7
9121 3971 2100 1871 5705 3961 1744
668 241 109 132 537 334 203
609 222 101 121 . 501 310 191
59 19 8 11 36 24 12
1045 501 256 245 662 445 217
1608 712 358 354 912 633 279
989 526 296 230 580 407 173
974 403 203 200 826 521 305
695 279 168 111 273 184 89
773 343 178 165 383 295 88
773 343 178 165 383 295 88
993 334 175 159 561 418 143
210 75 41 34 94 75 19
216 85 44 41 240 193 47
489 256 1 ~8 108 318 227 91
489 256 148 108 318 227 91
768 269 146 123 406 332 74
97 57 41 16 246 203 43

421
FOR SCHEDULED TRIBES
Total Main
Workers
P
(14)
1599 1599
108
108
(HX)
M
(15)
897
897
70
70
INDUSTRIAL CATEGORIES OF MAIN WORKERS
Cultivators
(I)
F P M F P
Agricultural
Labourers
(II)
M F
Livestock, Forestry,
Fishing, Hunting and
Plantations, Orchards
& Allied activities
(III)
p M F
(16) (17) (18) (19) (20) (21) (22) (23) (24) (25)
702 421 284 137 1074 550 524
702 421 284 137 1074 550 524
38
38
34
34
19
19
15
15
16
16
5
5
10
10
5
5
6
6
p
Mining and
Quarrying
(IV)
M F
SI. No.
(26) (27) (28) (1 )
4
4
2
2
2 2
37
7904 5466 2438 212 171 41 1388 683 705 125 87 38 186 110 76
551 348 203 549 347 202
2 1
65 42 23
6969 4917 2052
402 316 86
369 293 76
33 23 10
863 584 279
1022 799 223
797 576 221
669 489 180
584 411 173
632 401 231
632 401 231
807 546 261 176 115 61
148 113 35
405 288 117
405 288 117
722
61
394
44
328
17
33
33
115
19
19
57
9
2 2
88
17
17
77
9
9
46
9
1
85
16
16
38
10 10
11
3
94 60
92 59
2 1
17 12
780 4j0
14 7 8 5 6 2
186 90
15 7 108 65
4 4 43 27
92 46
92 46
116 34
95 63
29 17
13 7
13 7
34
33
1
5
370 123
7 3
3 3
4
96 5
8 2 43 35
8 16 24
46 25
46 25
82 9 32 3
12 2
6 8 6 8
562 244 318
85
2
2
5
19
8
15
25
25
3
3
2 3
3
38
16
9
6
5
5
28
28
2 173
9
9
13
35 10
2 13
12
12
51
11
16
16
1
102
5
5
9
22 6
6
6
30
7
12 12
1 II
71
4 III 4
4 IV
13 V
4 VI
VII
6 VIII
6 IX
6
21 X
XI 4 XII
XIV
XV XVI

422
PRIMARY CENSUS ABSTRAC1'
INDUSTRIAL CATEGORY OF
51. Name of Total/ ManufactUring, Manufacturing, Constructions
No. Districtj Rural/ Processing, Servicing Processing, Servicing
M.P.P.; Urban and Repairs in and Repairs in other
Town Household Industry than Household Industry
(va) (Vb) (VI)
P M F P M F P M F
(1) (2) -(3) (29) (30) (31) (32) (33) (34) {3S} (36) (37)
37 KANDUKUR M.P.P. T 31 18 13 35 20 15 R 31 18 13 35 20 15 U
Total of Areas not T 11 2 9 20 15 5 10 5 5 included in any M.P.P. R 11 2 9 20 15 5 10 5 5
U MAKTABIBI SAHEBGUDA (O.G) U
TOTAL URBAN : 151 61 90 1055 835 220 2005 1293 712
AlWAl(M+OG}* 14 3 11 43 34 9 223 127 96 AlWAl [M] 14 3 11 43 34 9 223 127 96 SINGAIPALLE COG)
II GHATKESAR (P) 9 6 3 HYDERABAD UA (PORTION) 132 51 81 1026 812 214 1993 1285 708
III HYDERABAD (M.CORP) PORTION+OGS* 8 8 65 58 7 164 130 34 HYDERABAD (MC) PORTION 8 8 59 54 5 159 127 32 BALAPUR lOG] 6 4 2 5 3 2 KOTHAPET lOG] VENKATAPUR lOG)
MALLAPUR lOG] HYDERSHAKOT lOG]
IV KAPRA (M)* 38 16 22 145 126 19 251 156 95 V KUKATPALlY (M)* 7 6 1 179 158 21 284 190 94 VI LAlBAHADUR NAGAR (M)* 14 8 6 67 52 15 223 128 95 VII MALKAJGIRI (M)* 35 11 24 75 68 7 126 88 38 VIII QUTUBUlLAPUR (M)* 6 3 3 147 106 41 279 187 92 IX RAJENDRANAGAR(M + OG)* 92 56 36 160 96 64
RAJENDRA NAGAR (M) 92 56 36 160 96 64 SHAHZADI BEGUM (OG)
X SERI lINGAMPAlL Y (M)* 9 4 5 119 83 36 89 69 20 XI SHAMSHABAD (P)* 24 11 13 6 5 XiII TANDUR (M) 10 6 4 11 8 3 12 8 4 XIV UPPAL KALAN (M + OG) 66 57 9 172 105 67
UPPAL KALAN [M] 66 57 9 172 105 67 MAKTA BIBI SAHEBGUDA (OG)
XV VICARABAO 1M) 8 3 5 9 9 XVI GADDIANNARAM [P)* 4 3 16 4 12
* Constituent Units of Hyderabad Urban agglomeration.

FOR SCHEDULED TRIBES
MAIN WORKERS
Trade and Commerce
P M
(38) (39)
11 11
7
7
582 418
31 19
20 19
4 3 527 377
103 83
31 22 31 22
40 27 35 24 9 8 9 8
24 22
114 86
27 23 72 29 72 29
36 23 32 26 29 23
3 3
4 4
(VII)
F
(40)
4
4
164
12
150
20 9
9
13
11
1
2
28 4
43
43
13
6
6
Transport, Storage
&Communications
(VIII)
P M
(41) (42)
17 17 17 17
970 913
17 17 36 36
916 859
164 161 38 37
38 37
177 156
107 95
35 30 35 30
28 26
211 203
38 36
45 44
45 44
3 3
50 49 43 42 7 7
20 19
F
(43)
57
57
3
21 12
5
5
2
8
2
423
Other Services Marginal Workers
(IX)
p M F P M
(44) (45) (46) (47) (48)
9
9
7
7
6
6
5 5
1230 895
4 2
27 20 15 14
1184 859 72 53 75 56
75 56
201 125 82 62
71 52 71 52
19 17
175 126
292 218
114 90
114 90
9 7 57 39
51 35 6 4
17 14
3 15 3 15
2
2 2
2
335 42
2
7
325 42
19 2 19 5
19 5
76 20 19 15
19 15
2
49 13
74 5
24 24
2
18 16
2
3
2
2
14
14
3
3
3 3
8
F
(49)
14 14
2
2
28
28 2 2
2
12
12
5 5
2
2
Non-workers SI.
No.
P M F
(50) (51) (52) (1)
1596 775 821 37 1596 775 821
166
166 70 96
70 96
13931 6218 7713
100 49 51
400 219 181 961 521 440
12470 5429 7041 1402 636 766
689 319 370
689 319 370
1345 551 794
1317 551 766
668 303 365
665 301 364
3 2 1
887 365 522
2345 965 1380
1277 550 727 1029 487 542
1029 487 542
290 141 149 919 339 580 841 310 531
78 29 49
302 222 .-s0
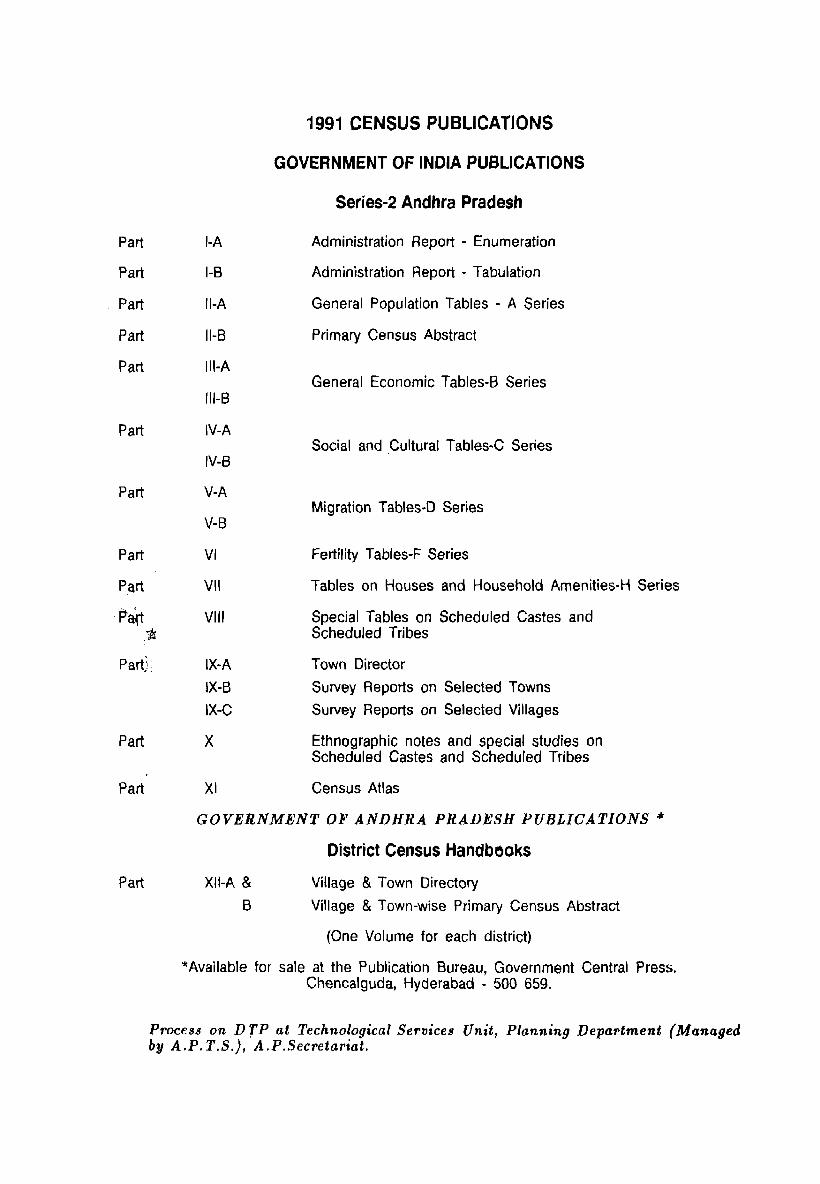
Part
Part
Part
Part
I-A
1-8
II-A
II-B
Part I II-A
111-8
Part IV-A
IV-8
Part V-A
Part
Part
Pa{t .~
Part
Part
V-B
VI
VII
VIII
IX-A
IX-B
IX-C
X
XI
1991 CENSUS PUBLICATIONS
GOVERNMENT OF INDIA PUBLICATIONS
Series-2 Andhra Pradesh
Administration Report - Enumeration
Administration Report - Tabulation
General Population Tables - A Series
Primary Census Abstract
General Economic Tables-8 Series
Social and Cultural Tables-C Series
Migration Tables-D Series
Fertility Tables-F Series
Tables on Houses and Household Amenities-H Series
Special Tables on Scheduled Castes and Scheduled Tribes
Town Director
Survey Reports on Selected Towns
Survey Reports on Selected Villages
Ethnographic notes and special studies on Scheduled Castes and Scheduled Tribes
Census Atlas
GOVERNMENT OF ANDHRA PRADESH PUBLICATIONS * District Census Handbooks
Part XII-A & Village & Town Directory
8 Village & Town-wise Primary Census Abstract
(One Volume for each district)
*Available for sale at the Publication Bureau, Government Central Press. Chencalguda, Hyderabad - 500 659.
Process on D TP at Technological Services Unit, Planning Department (Managed by A.P.T.S.), A.P.Secretariat.