District Census Handbook, 2 Kozhikode - Linguistic Survey Of ...
Upload
khangminh22Category
view
0download
0
CENSUS 1971
SERIES-S
GUJARAT
DISTRICT CENSUS HANDBOOK
PART X-C-II (with oW Prints of Part X-C-I)
ANALYTICAL REPORT ON CENSUS AND
RELATED STATISTICS
SOCIO-ECONOMIC &
CULTURAL TABLES (RURAL AREAS)
AND HOY§I~G TABLES
BHARUCH DISTRICT
C. C. DOCTOR (' f the Jndiao Administrative Service
Director of Census Operations Gujarat
CENSUS OF INDIA 1971
LIST OF PUBLICATIONS
Census of India 1971-Series-5-Gujarat is being published in the following parts:
Part Number
I-A
I-B
I-C
II-A
II-B
II-C(i)
CentraJ Government Publications
Subject covered
General Report
Detailed Analysis of the Demographic, Social, Cultural and Migration Patterns
Subsidiary Tables
General Population Tables ( 'A' Series)
Economic Tables (IB' Series)
Distribution of Population; Mother Tongue and Religion, Scheduled Castes & Scheduled Tribes.
II-C (ii) Other Social & Cultural Tables and Fertility Tables, Tables on Household Composition, Single Year Age, Marital Status, Educational Levels, Scheduled Castes & Scheduled Tribes, etc., Bilingualism.
III
lV-A IV-B
V
VI-A
VI-B
VI-C
VII
VlII-A
VIII-B
IX
Establishments Report and Tables ( 'E' Series).
Housing Report and Housing Subsidiary Tables.
Housing Tables.
Special Tables and Ethnographic Notes on Scheduled Castes & Scheduled Tribes. Town Directory.
Special Survey Report on Selected Towns,
Survey Report on Selected Villages.
Special Report on Graduate and Technical Personnel.
Administration Report-Enumeration,} For official use only
Administration Report-Tabulation.
Census Atlas.
Sta.te Government Publications DISTRICT CENSUS HANDBOOK
X-A Town and Village Directory.
X-B Village and Townwise Primary Census Abstract.
X-C-I Departmental Statistics and Full Count Census Tables.
X-C-Il Analytical report on Census and Related Statistics, Socio Economic and Cultural Tables (Rural Areas), and Housing Tables.
X -C-U (Supplement) Urban Sample Tables.
CONTENts
PREFACE I. Analytical Report 00 Ceosus and Related Statistics
A. INTRODUCTION
(1) History of District Census Handbook, (2) Scope of District Census Handbook, (3) Definitions and Concepts.
B. LOCATION AND PHYSICAL FEATURES
PAGES i - ii
3-10
10-12
(I) Location, (2) Physiography, (3) Soils, (4) Forests, (5) Minerals, (6) Rivers, (7) Climate and Temperature, (8) Rainfall.
C. ADMINISTRATIVE SET-UP
(I) Administrative Divisions, (2) Revenue, (3) Parliamentary and Assembly constituencies, (4) Judiciary, (5) Police, (6) Jails, (7) Local Self Government.
D. TERRITORIAL AND OTHER CHANGES
(I) Opening of New Areas for Settlement of Population, (2) Growth or Decay of Urban Centres, (3) Changes in Functional Category of Towns.
E. MAJOR EVENTS
(I) Scarcity, (2) Floods, (3) Earthquake.
F. ECONOMIC AND OTHER ACTIVITIES DURING THE DECADE
(I) Agriculture, (2) Irrigation, (1) Agricultural Produce Markets, (4) Co-operation, (5) Warehouses, (6) Livestock and Animal Husbandry, (7) Fisheries, (8) Industries, (9) Trade and Commerce, (10) Electricity and Power, (11) Transport and Communications, (12) Prices, (13) Joint Stock Companies, (14) Banking, (15) lnsurance, (16) Education, (17) Medical and Public Health, (18) Agrarian Reforms and Agrarian Developments.
12-17
]8-19
19-21
21-42
G. DEMOGRAPHIC CHANGES DURING THE DECADE 43-65
(I) General, (l) Density and Decadal Variation in Population, (3) Sex Ratio, (4) Household Size, (5) Urban Population, (6) Houseless Population, (7) Institutional Population, (8) Growth of PopUlation, (9) Size of Village, (10) PopUlation by Age .. nd Sex, (Ii) Literacy, (2) Mother Tongue, (\3) Religion, (14) Workers and Non-Workers, (15) Scheduled Castes, (16) Scheduled Tribes, (17) Establishments, (18) Housing.
H. SETTLEMENT PATTERN AND SOCIAL DEMOGRAPHY (Including Tables) 65-88
(I) Rural Areas, (2) Urban Areas. H.1 Distribution of villages with reference to area in hectares 70-71 H.2 Distribution of inhabited villages by selected amenities, infrastructural and land use data
with reference to distance from nearest town 72-75 H.3 Distribution of inhabited villages by selected demographic characteristics and distance from nearest town 76-79 H.4 Average size of villages by distance range from nearest town by size class 80
H.5 Distribution of inhabited villages by size class of population having selected servicing institutions and demographic c;haracteristics 80- 82
H.6 Medical and Postal facilities per 100 km'. of rural area at taluka level 82 H.7 Distribution of villages by density per km'. and aver'ie distance from nearest town 83 H.8 Distribution of inhabited villages by proportion of scheduled castes and seheduled tribes population
and density of population 14 H.9 Ranking of villages of different size classes by amenity scores 85 H.IO Selected demographic characteristics in towns by size class of population H.ll Selected demographic characteristics by density of population of towns H.12 Distribution of towns by size class of population and functional category H.13 Functional category and growth rate of towns H.14 Female workers as percentage of total female population in towns by size class of population H.IS Per capita Receipt and Expenditure of local bodies in towns by size class of population H.16 per capita Receipt and Expenditure of local bodies in old and new towns H.18 Per capita Receipt and Expenditure of local bodies in towns by functional category H.19 Educational and Medical facilities per 1,000 population in towns by size class of populatioo H.20 Medical facilities in towns by functional category
1II
86
86 86 87 87 87 88 88 88 88
11 Tables
SECTION-I DEPARTMENTAL STATISTICS (Detailed contents are given on pages iii and iv in Pari II Tables)
SECTION-II CENSUS TABLES BASED ON FULL COUNT (Detailed contents are given on pages v and vi in Part II Tables)
SECTION-III SOCIO ECONOMIC AND CULTURAL TABLES (RURAL AREAS) AND HOUSING TABLES
Explanatory note to Sample Census Tables
B-Economic Tables t'oOote
Table B-III ParI B Classification of workers and non-workers according to main activity by educational levels in rural areas only.
Table B-IV Part A Industrial Classification of persons at work other than at cultivation as main activity by sex and divi5ions, major groups and minor groups (Rural)
Appendix-Distribution of workers in manufacturing, processing, servicing and repairs by hOLlsehold industry and nOll-household industry (Rural)
Table B-VI Part B (i) Occupational classification of persons at work accordinr to main activity other than cultivation by sex and age groups in rural areas only
ANNEXURE-National Classification of Occupations
Table B-VI Part B (ii) Occupational classification of persons at work according to main activity other than cultivation classifiell by sex and educa tional levels in rural areas only
Table B-VII Secondary work i.e, Persons having main activity (i) Cultivators, (ii) agricultural labourers, (iii) household industry, (iv) non-household industry and (v) non-workers classified by sex and by secondary work , (i) household industry, (ii) cultivator, (iii) agricultural labourer or (iv) non-household industry, trade, business or service (Rural)
Table B-VIII Persons classified as non-workers according to main activity cross-classified by sex, age groups and type of activity (Rural) ,
C-Social and Cultural Tables Note
Table C-II Age and Marital Status
Table C-III Part-A-Age, Sex and Education in rural areas
D-Migration Tables Note
Table D-I Population classified by place of birth (Rural)
Appendix-I Persons born in other districts of the State and enumerated in this district
Appendix-II Persons born in tbis district but enumerated in other districts of the state
Table D-VI Migrants classified by place of last residence age group, duration of residence and marital status (Rural)
H-Honsing Tables Note
Table H-I Census Houses and the uses to which they are put
Table H-II Distribution of Census Houses by predominant material of wall and predominant material of roof
Appendix-Distribution of residential Census Houses by material of wall cross classified by material of roof
Table H-lIi Census Households classified by number of members and by number of rooms occupied
Table H-IV Households classified by size and tenure status
IV
PAGES
3-48
51-137
14H87
141
142-143
144-145
146-147
148-149
150-159
160-161
162-165
166
166
167
168-169
168-169
171
172-173
174
175
176-181
183
184-185
184-185
186
187
187
PREFACE
The District Census Hand Book Volumes of 1971 were divided into three parts. Part A contained the town and village directories and B contained the Urban Block and villagewise Primary Census abstracts. These two parts were brought out within a record time of one year after the taking of the Census. Part C-l containing the departmental statistics and the full count Census tables was also published within six months of the first publications named above.
The sample tables took a little longer time. as the mechanical data processing for urban areas. which was first to be done at the national level could not be completed untilI the tables for all the States were received. checked antI cleared by the Registrar General, India. It was for this reason that his special pelmission was obtained to publish the available data as part C-I so as not to withhold from the scholars. administrators and planners what was already compiled and ready for publication.
The present combined volume C·l. C-II contains in addition to what has been already published separately as Col. the analytical and interpretative reports on the districts based on the published data of 1971 Census and tr..TOWS some highlights on the demographic changes which have occured during the decade. A number of hypotheses have been tested in their application to the data of each district. The results in some cases have been startling while in others have been just as expected. It further includes sample tables of all the rural areas of the State. The urban sample tables are being published as an annexture to this volume separately in the near future.
The idea about including in this volume a portion about the decadal changes that had occured was first conceived by our Directorate. Similarly the work of testing the various hypotheses suggested by Dr. Roy Burman was first done in Gujarat State and sent to the Registrar General for approval. Both these points were examined critically by the Registrar General and cleared for inclusion in Part C-II. It is with a deep sense of satisfaction that I place them before the readers as an interesting feature.
H-1OO7
The analysis of whatever data was available to us. was completed at the time I was about to leave the Census Organisation in March 1974. But the task was incomplete. It had to be supplemented by additional analysis of further data as and when it became available after the sample tables were compiled. The Census Organisation was also being slowly wound up at this stage. and it was posing a very serious problem in my mind as to how the work already done could be well rounded and properly supplemented after I had left and the organisation shrunk to the intercensal level. Shri P. B. Buch. Director of the Bureau of Economics and Statistics came to my rescue at this stage and promised to take over the loose threads and weave them into a strong and fine yarn from the moment the wanting data became available. What is now presented in this volume in the form of analytical essays is the combined effort of the Census Organisation and the State Bureau of Economics and Statistics. Shri Buch has taken great pains. not only in interpretation of fresh data, but also in going through the interpretations done before he stepped in and made valuable suggestions for reducing the bulk of the present volume. He has read every line of what is written here and weighed every word that is printed. While I claim general responsibility for the contents of this volume. I would like to give full credit to Shri Buch for the spirit of love and dedication with which he has volunteered to take the entire load for the publication of this volume from the stage at which I had left it. I have great pleasure in placing on record here. that none could have done the work better. My grateful thanks are to him and his excellent team of workers. which included among others Sarva Shri G. R. Shaikh, Deputy Director; C. P. Vyas, Research Officer; S. M. Shelke. Research Assistant; B. R. Patel. Research Assistant and V. A. Dhagia. Tabulation Officer. These persons greatly helped in maintaining the continUity of work.
With the publication of this volume the District Hand Book Series of 1971 Census are completely out. It is hoped that they would prove useful to students. administrators and plannm and also the general reader for whose benefit much labour and pain has been
shared by a team of dedicated workers to all of whom I am deeply indebted.
I would be failing in my duties if I do not acknowledge here the deep debt of gratitude lowe to Shri A. Chandra Shekhar, lAS, Registrar General, India and Dr. B. K. Roy Burman, Dy. Registrar General, India for the valuable suggestions and guidance I have received from them from time to time.
AHMADABAD,
8th April, 1975.
I am equally indebted to Shri L. R. Dalal, I.C.S .• Chief Secretary to the Government of Gujarat for the sustained interest taken by him in all matters connected with Census. But for his support and encouragement it would not have become possible to bring out this volume even at this stage.
ii
C. C. DOCTOR, Director of Census Operations, Gujarat
now Administrator, Municipal Corporation. Ahmadabad.
I ANALYTICAL REPORT ON CENSUS AND
RELATED STATISTICS

ANALYTICAL REPORT
A. INTRODUCTION
J. History of District Census Handbook
In 1941, the population figures were exhibited according to communities in the "Village Handbooks" published by the erstwhile Government of Bombay. In 1951, the basis of classification of the Census was changed from a social to an economic one and the figures were given in the Primary Census Abstract according to eight Livelihood Classes. The Primary Census Abstract contained the basic information in respect of every village and town. A decision to bring out the District Census Handbooks giving the Primary Census Abstract and important Census tables for every district of the State was taken for the first time in 1951. Census statistics given in the Primary Census Abstract related to the area of the village,. number of houses and house holds, total population, house less and institutional population, literates and agricultural and non-agricultural classes distributed under eight main Livelihood Classes. These Census statistics were further supplemented by the addition of useful administrative information on the availability of amenities in villages and towns on items like post offices, railway stations, the distance of a bazzar from the village, primary schools, village panchayats l co-operative societies, etc. This was a unique achievement of the Indian Census. The 1951 series of District Census Handbooks, however, varied in content and size from state to state depending upon the resources offered by the State Governments. It was, therefore, decided during the Census of 1961 that the District Census Handbooks of 1961 Census should contain a certain minimum of statistical data, maps and other useful information to be adopted uniformly throughout the country. Thus the District Census Handbook of 1961 Census differed widely in the matter of content and coverage from that published in the 1951 Census. The District Census Handbooks of 1961 were sub-divided into the following three parts :-
PART I - THE DISTRICT (i) Introductory Essay
(ii) Brief Gazetteer of Place Names PART II - STATISTICS
(i) Census Tables
3
(ii) VilIagewise List of Industrial Establishments (iii) Handicraft Tables (iv) Departmental or Official Statistics
PART III - VILLAGE DIRECTORY (i) Explanatory Note (ii) Village Directory
(iii) Taluka Maps
Besides Census data, the 1961 District Census Handbooks covered villagewise and townwise infol'mation on the availability of different types of amenities such as educational facilities, public health and medical facilities, supply of drinking water, electricity and its uses etc., shown by means of abbreviations placed against the name of each village. Thus, in the 1961 Census an attempt was made to make the District Census Handbooks more informative.
During the 1971 Census, efforts have been made to compile both census and non-census statistics in a uniform manner under an enlarged perspective. The District Census Handbook of 1971 Census has been divided into three sub-parts with a view to making the census and non-census information available to the data users as quickly as possible. Part A of the District Census Handbook contains the Town Directory and Village Directory. Part B contains the Primary Census Abstracts and Part C contains the Introductory Essay, Official Statistics, Census tablels, etc. The details of the contents in each of the parts are described in
the following paragraphs.
2. Scope of Distric:t Census Handbook 1971
The District Census Handbooks are the only publications which incorporate the data down to the village and block level of a town, which are urgently and frequently required by the data users. They are constantly referred to for several purposes by the administrator, planner, policy maker and academician. The delay in the publication of the District Census Handbooks would reduce the value of these very useful publications. In order to avoid delay in the publication the District Census Handbooks of 1971 are sub-divided into three parts, two of which are combined in one volume. and the third published separately. The details of the contents of each of the parts are as follows ;
PAR.T A-Town and Village Directory· Part A contains the non-census statistics of each
village and town. The Town Directory portion furnishes the data for each town in the district in seven statements covering (I) the civic administration status of town and the functional category of towns and their growth of population since 1901; (2) physica.! aspects and location; (3) town finance; (4) civic and other amenities; (5) medical, educational, recreational and cultural facilities; (6) trade, industry commerce and banking facilities and (7) population by religion.
The Village Directory Section of Part A gives particulars of amenities available for each village in the matter of educational and medical institutions, power supply, drinking water facilities. post and telegraph facilities, communications, particulars of land
use, weekly markets and places of religious, historical and archaeological interest in the village. Part B-Primary Census Abstract
Part B gives for each village and for each block and ward of a town the primary census data incor" porating area of the town in square kilometres, and of village in acres and gunthas, number of occupied residential houses. number of households, total population and its brea~ up by sex, scheduled caste and scheduled tribe popUlation, literate population, and working population by nine br.oad industrial categories namely (1) cultivators. (2) agricultural labourers, (3) those working in livestock, forestry, fishing, planta-
ons, etc., (4) in mining and quarrying, (5) in manufacturing, processing, servicing and, repairing, (6) in construction, (7) in trade and commerce, (8) in traRSport, storage, and communications, and (9) in other services and the non-working population.
The non-censul data of the village directory and town directory were collected from the local bodies, The village wise details regarding different types of amenities available in the village; land u,e data an4 other information were collf;cled in the village directory
form through the Taluka Panchayat offices. These forms were filled in by the village officials and were scrutinised by the Statistical Assistants. at the. Taluka leveL The District Statistical Officers supervised the work and carried out percentage scrutiny. The details regarding the number of villages having pOlt and telegraph facilities in the State, those connected with electric power supply, those having all weather and fair weather bus facilities and those without drinldn~
4
water facilities etc., were obtained from the concerned departments by the Office of the Dir ector of Census Oeratiot:ls. The information recorded in the village directory forms was cross checked with the data obtained from concerned departments, confirmed and made up-ta-date.
The non-census data for each of the towns were obtained from the municipal authorities in case of municipal towns and for other towns the data were obtained from the concerned Nagar and Gram Panchayats. The information received from the concerned municipalities and panchayats was scrutinised and cross checked with other publis!led official statistics for a few items wherever it was possible.
Part C-Departmental Statistics, Census Tables and
Analytical Report
Part C incorporates the administrative statistics pertaining to the district in v:l1ious fields of development. The other census tables pertaining to the district and talul<as will also be reproduced here. A write up indicating the cbanges in the socio-economic and demoaraphic characteristics of the district in the last decade would also be given.
Departmental Statistics
An effort has been made to present in this part of the Handbook the basic data of the district in 68 different tables based on the data cullected from various administrative departmen~s of the State Government and the Government of IndiJ as well as from various statutory organisations like the Gujarat Electricity Board, the Life Insurance Corporation of India, the Food Corporation of India, the Reserve Bank of India, Central and State Warehousing Corporations etc. A mere glance at the contents of the tables presented in this volume would show that they provide a deep insight into the infrastructure of the district which will prove useful not only to the administrator and the social, political and research worker but also to the framers of the District and the State plans. It has also been devised in order to provide interesting material to an intelligent and prudent reader who wants to know more about the district. The tables highlight the structural changes that have undergone in various spheres of activity in the district during the period 1961-1971. An attempt has heen made to present the data talukawise as far as possible in order to facilitate inter-regional comparisons within the district.
The tables on administrative statistics included in thj: present series of Handbooks are more or less deyised on the lines of the District Census Handbooks of 1961 Census so as to make the data comparable. In addition to these, some useful data on agricultural research stations, veterinary and animal husbandry institutions, rest houses, land revenue collections, secondary school certificate examinations, forests, composition of Panchayat bodies etc. have also been included.
The tables on administrative statistics have been grouped under 18 different heads as listed below :
I Rainfall and Temperature II Vital Statistics
III Agriculture, including Forests IV Livestock V Co-operation
VI Fisheries VII Factories
VIII Electricity IX Medical and Public Health X Education
XI Administration XII Public Entertainment, Presses and Journals
XIII Transport and Communications XIV Local Bodies XV Warehousing
XVI Prices XVII Joint Stock Companies, Insurance, Banks
and Co-operative societies XVIII Fairs and Festivals and Ancient Monuments.
Cmsus Tables
For the first time in the Census history considerable part of the 1971 Census datd has been processed on electronic computors. However, the manual sorting could not be altogether avoided. For the· purpose of providing the primary census data and the data on mother tongue, religion and scheduled caste and scheduled tribe and broad age-groups the Individual Slips were processed manually during 1971 Census at the Regional Tabulation Ofices as was being done at the previous censuses. The data pertaining to 20 % of the Urban Individual Slips was transferred on to punch cards and thence to magnetic tape and all the cross-tabulation for the urban data is being generated by processing it on electronic computors. The cross-tabulation of the rural data is being derived from 10% sample of the Individual slips which were processed manually. The tabulation of the House-
s
list data was also processed on 20% sample basis. The establishment scbedules were processed on full count basis. The data relating to the homing and establishments bas been processed on electronic computor.
Thus the 1971 Census was a pioneer in the introduction of sampling procedures to a considerable extent. Careful studies were made of the 1961 schedules as also the 1971 pre-test schedules before evolving the optimum sampling size and tbe procedures so as to yield data within reasonable margin of error.
During 1971 Census it was decided to prepetre a number of tables under the following series
A Series - General Population Tables B Series - Economic Tables C Series - Social and Cultural Tables D Series - Migration Tables E Series - Establishment Tables F Series - Fertility Tables G Series - Special Tables for Degree Holders and
Technical Personnel H Series - Housing Tables
As in the 1961 Census all the G.'llSUS Tables of 1971 Census that give data down to the District level Or below have been incorporated in the Part C of the District Census Handbook of 1971. The Census Tables of 1971 Census that can be reproduced ill the District Census Handbooks Part C in so far as they relate to the district are:
Tables A-I to A-IV, B-I to B-IV Part A, B-IV Part D, B-IV Parts A(i) and A(ii) , B-VI Parts BO) and B(ii). B-VII, B-VIII, C-I Part A, C-IU Part A, C-III Part-B, C-V, C-VIl, C-VIII Parts A & Band their appendices, D-l, D-I Appendix-I. Appendbt-II, D-III and D-IV for each city D-V, D-VI, E-1 to E-IV and H-I to H-IV.
However, to achieve the objectives of making the data available to the consumers as soon as possible after it has become ready without having to wait for the completion of other cross tabulations which may take quite some time, it was planned to release the Census tables by splitting up into two volumes as follows:
I. Part C-I (Full Count Census Tables) 2. Part C-I1 (Remaining Tables) But as the urban sample tables which were
mechanically processed are likely to take some time, it is felt desirable to publish Part C-U without urban

sample tables so that the available material can be released for the data users.
The following tables based on full count were included in Part C-I of District Census Handbook which has already been published.
A-I to A-IV with their appendices, B-1 Part-A, B-I1, CoY, C-VII, C-VITI Part A and its appendix, c-vm Part B and its appendix, and E-1 to E-IV.
The remaining tables without urban sample tables have been incorporated in the present volume. The tables already published in Part C-I have also been included in this volume for ready reference.
3. Definitions and Concepts During 1971 Census Operations large mass of
data of a varied nature such as demographic, social and economic characteristics was collected. In order to ensure accuracy in the collection of information of such a varied nature various terms used were well defined during the 1971 Census Operations. In the ensuing paragraphs the definitions and concepts of some important terms are explained. (i) Villare
'Village' is a revenue village which is an administrative rather than a demographic unit. The definitivn of the term 'Village' has practically remained the same during the entire census period. In short, it is a revenue cadastrally surveyed village which has a separate entity and a distinct number assigned to it in the revenue records of the State. It may consist of a single village with a cluster of houses or a number of hamlets with separate clusters of houses. In forest areas it may even consist of scattered houses situated on the fields within the boundaries of the village. It may be inhabited or uninhabited. (ii) Urban Area
It is customary in every country to classify the population as rural and urban. Such a classification is helpful in assessing the differentials in the social, economic, cultural and demographic characteristics of the population. Urbanisation is the result of economic social and migrational processes. The identification of rural and urban areas and the distribution of population by urban and rural is a great service rendered by the census for the proper understanding of the interplay of various forces.
There was no uniform criterion prescribed for distinguishing urban areas from rural in our country
tm the Census of 1.9S1. The definition of town, there-
6
fore, varied from state to state and a place was treated as urban, if in the opinion of the State Government or the Superintendent of Census Operations it was deemed to possess urban characteristics. In view of the increasing importance of the study of urbanisation in all its aspects the need for a uniform understanding of the term by strictly defining the concept of 'town' was emphasised at the 1961 Census. For the purpose of 1961 Census 'town' was defined as a place having a municipality or a cantonment or a place with a population of 5,000 and over, if 75 per cent of its male population pursued non-agricultural activities. These tests were applied in respect of places other than municipalities or cantonments with reference t.o their population during 1961 Census. There were however, certain exceptional cases where an area had a population of less than 5,000 but had definite urban characteristics. These were newly found commercial areas, large urban housing settlements or places of tourist importaGce where all civic amenities were provided. All such cases were examined 10
detail in cunsultation with the Collectors of the Districts and lists drawn were got approved by tbe Stale Government and the Registrar General, before they were finally accepted as such.
Tbe list of urban areas, for the purpose of 1971 Census, was likewise finalised in consultation WIth tbe State Government. The following criteria were applied fGr the purpose of determiuing any area as urban at 1971 Censui.
(I) All places where there is a Municipal Corporation, or a Municipality or a Town Commitlee or a Notified area O( a Ccmtollment Board have been treated as urban areas.
(2) The remaining places were recognised as enjoying urban characteristics and declared as urban areas only if the following conditions were fulfilled:
(a) The estimated popUlation at 1971 Census should be at least 5,000.
Cb) The density of population per sq. kilometre should nat be below 400.
(c) 75 per cent of the male wvrking population should follow non-agricultural pursuits, and
Cd) In the opinion of tbe Director of Census Operations any other place where predominant
urban characteristics are noticed.
(iii) Ward
All large towns were usually divided into well established Mohallas or localities or wards bearings distinct local names and covered by roads, streets, lanes and by-lanes. In some cities, instead of a locality the electoral ward of tbe city or town was taken as the major unit into wbich the city or town is divided, so 10Dg as it was a well recognised unit with definite boundaries and was likely to be fairly permanent.
(iv) Block Eacb town was divided into convenient blocks each
block consisting of a group of adjoining streets or other compact local area with well-defined boundaries.
The formation of blocks during the first stage of Census Operations was on the basis of the number
of houses; but durin~ the second sta~e of Census, blocks were formed on tbe basis of the population.
"Enumerator's Block" was formed on the basis of the population. Tn rural arell, tbe block consisted of 750 to 1,000 persons; wbile, in tbe urban areas, it comprised of 600 to 750 persons. The above were tbe ideal limits for the blocks of rural and urban areas respectively; but in exceptional circumstances. the limit of rural block was lowered down to the tUDe of 600. and/or raised to the tune of 1,150. Similarly, in urban area, the limit of the block: was lowered down upto 500 or raised upto 850. But. these limits were changed only in exceptional cases. Ordinarily the rural block was within 7S\) to 1.000 and urban block was within 600 to 750 persons. (v) Hou~e
A "Census House" is a building or part of a building having a separate main entrance from the road or common courtyard or staircase etc., tlsed or recognised as 1\ ~eparate unit. It may be inhabited or vacant. It may be used for a residential or nonresidential purpose or .both.
If a building bas a number of flats or blocks which afe indepl'ndent of one another having separate entrances of their own from the road or a common staircase or a cornman courtyard leading to a main gale, tbey will be considt'red as separate censUs houses. If within a large enclO!;ed area tbere are separate buildings, tben each such building will be considered one or more separate census houses. If all the structures within an enclosed compound are together treated as one building then each structure with a separate entrance should be treated as a separate census house.
7
(vi) Household A household is a group of persons who comm
only live together and would take tbe meals from a common kitchen unless the exigendes of work prevented any of them from doing so. There may be 'onemember household, two-member household or multimember bOllsehold.' For census purposes each one of tbese types is regan'ed as a c. Household." Again, there may he a bousehold of persons related by blood or household of unrelated persons; the latter are boarding bouses, hostels, residential hotels, orpbanages, rescue homes, ashrams etc. These are called "InstilUtional Housebolds ". (vii) Scheduled Costes and Scheduled Tribes
A person belonging to any of tbe caste or tribe, given hereunder, is considered to be belonging to that Scheduled Caste or Scheduled Tribe as the case may be. A list of such Scheduled Castes and Scheduled Tribes recognised for the Gujarat State is furnished as under:
Scheduled Castes:- Througbout tbe State except Jamnagar, Rajkot, Surendranagar, Bhavnagar, Amreli, Junagadh aDd Kutch district: 1 Ager 2 Baked or Bant 3 Bhambi, Bhambhi, Asadaru, A~odi, Chamadia,
Cbamar, Chambhar, Chamgar, Haralayya, Harali, Kbalpa, Machigar, Madar, Madig, Telegn Mochi, Kamati Mochi, Mocbigar, Ranigar, Rohidas, Robit or Samgar.
4 Bhangi, Mehtar, Olgana, Rukbi, Malkana, Halat-khor, Lalbegi, Balmiki, Korar or Zadmalli
5 Chalvadi or Channayya 6 Chenna Dasar or Holaya Dasar 7 Dhor, Kakkayya or Kankayya 8 Garoda or Garo 9 HaUeer
10 Halsar, Hadar, Hulasvar or Halasvar 11 Holar or Yalhar 12 Holaya or Holer 13 Lingader 14 Mahar, Taral or Dhegu Megu 15 Mahyavansbi, Dedb Yankar or Maru Vankar 16 Mang, Matang Of Minimadig 17 Mang-Garudi 18 Meghval or Menghvar 19 Mukri 20 Nadia or Hadi 21 Pasi
22 Shenva, Chenva, Sedma or Rawat 23 Tirgar or Tirbanda 24 Turi
In the district of Daogs and Umbergaon tsluka of Valsad district:
Mochi In Jamnagar, Rajkot, Surendranagar, Bhavnagar,
Amrelj and Junagadh districts: 1 Bawa (Oedh) or Dedh-Sadbu 2 Bbangi or Rukhi 3 Chamadia 4 Chamar, Nalia or Rohit 5 Dangashia 6 Garoda 7 Gilrmataog 8 Radi 9 Megbwal
10 Senva 11 Shemalia 12 Tbori 13 Turi 14 Turi-Barot or Dedb-Barot 15 Vankar, Dh,db or Antyaj
In the district of Kutch: 1 Bbangi 2 Chamar 3 Garoda 4 Megbwal 5 Turi 6 Turi-Barot
Scheduled Tribes :-- Throughout the State except Jamnagar, Rajkot, Surendranagar, Bbavnagar, Amreli, Junagadh and Kulch districts: 1 Barda 2 Bavacha or Bamcha 3 Bhil, including Bbil Garasia, Dboli Bhil, Dungri
Bhil, Dungri Garasia, Mewasi Bhil, Rawal Bhil, Tadvi Bhtl, Bhagalia, Bhilala, Pawra, Vasava and Vasave
4 Chodhara 5 Dhanka, including Tadvi, Tetaria and Valvi 6 Dhoclia 7 Dubla, including Talavia or Halpati 8 Gamit or Gamta or Gavit, including Mavcbi,
Padvi, Vasava, Vasave and Valvl. 9 Gond or Rajgond
10 Katbodi or Katkarj, including Dhor Katbodi or Dhor Katkari and Son Kiltbodi or Son Kalhri
11 Kokns, Kokni, Kukna
12 Koli Obor, Tokre Koli, Ko]cha or Kolgba 13 Nllikda or Nayaka, including Cholivaia
Nayaka, Kapadia Nayaka, Mota Nayaka and Nana Nayakll.
14 Pardhi, ineluding Advicbincber and Phanse Pardbi
15 Patelia 16 Pomla 17 Rathwa 18 Varli 19 Vitolia, Kotwalia or Barodia
In the Dangs district: Kunbi In SUrat and Valslld Districts: (a) in Umbergaon taluka, Koli Malhar, Koli
Mahadev or Dongar Koli (b) in tbe other talukas, Chaudhri In the Jamnagar, Rajkot, Surendrdnagar, Bhav
nagar, Amreli and Junagadh districts: Siddi In Ness areas in the forests of Alech, Gir and
Barada: 1 Bharwad 2 Charan 3 Rabari
In SUreodranagar district: Padhar In Kutch district:
1 Bbil 2 Dbodia 3 Koli 4 Paradhi 5 Vaghri
(viii) LUera!6 A person who can both read and write with
understanding in any language is to be taken as literate. A 'persons who can merely read but canDot write is not a literate.
It is Dot necesmy that a person who is lit· erate should have received any formal education or should have passed any minimtlm educational standard. (ix) Worker and Non-Worker
During 1971 Census a question was asked to every individual about his main activity I. e. how be engaged himself mostly. For the purpose of this question, all persons were divided ioto two broad streams of main activity namely, (1) as workers and (2) as non-workers as the type

of main activity that the person returned himself as engaged in mostly •. (a) -Worker
A 'worker' was defined as a person whose main activity was participation in any economically productive work by his pbysical or mental activity. Work
involved not only actual work but effective supervision and direction of work.
Tbe reference period for this purpose was one week prior to the date of enumeration in case of regular work in trade, profession service or b~siness
and ODe year prIor to the date of enumeration in case of certalD types of works wbicb were not carried on throughout the year such as, cultivallon, livestock keeping, plantation work, some types of household ind ustry etc.
Pmons belonging to the category of workers were sub-dIvided into 9 main induslClal categories namely;
I CUlllvators
11 Agrlcultural Labourers III Persons engaged in Livestock, Forestry,
Flsbing, Huntwg. and Plantations, Orcbards
and Allied Activities IV Mining and Quarrying V Manufacturing, Processing, Servicing and
Repairs, in (a) Housebold Industry and - (b) Other than household industry.
VI Construction VII Trade and Commerce VIII Transport, Storage and Communications and
IX Other Services Definitions were prescrihed to segregate the
following activities from other categories of workers. (I) Cultivators, (2) Agricultural Laboure;s and (3) Persons engaged in Household Industry.
Cultivator For purposes of the Census a person is work
ing as Cultivator if he or she is engaged in cultivation by oneself or by supervision or direction in one's capacity as the owner or lrssee of land held from Govemment or as a tenant of land held from private persons or institutions for payment of money, kind or share.
Cultivation involves ploughing, sowing and harvesting and production of cereals and millet crops such as wheat, paddy, jowar, bajra, ragi
Bh-2
etc., and pulses, raw jute and kindred fibre crop, cotton etc., and other crops such 81 sugar cane, groundnuts tapioca, etc., but does not include fruit growing, vegetable growing or keeping orchards or groves· or working on plantations like tea, coffec, rubber, cinchona and other medIcinal plantations.
A persoll who merely owns I.wd but has given oul land to another person or persons for cultivation for money, kind or share of crop and who ,does not even supervise or direct cultivation of land, will not be treated as working as cultivator, Similarly. 8
person working in another person's land for wages in cash, kind or share (A.gricultural labourer) will not be treated as cultivator. Agricultural Labourer
A person who works in another perSon's land for wages 10 money, kInd or share shoLlld be regarded as an agricultural lilbourer. He bas no IISk in the cultivation but be merdy works in another person's land for wages. The labourer could have no fight of lease or contract on land 00 which he works.
Household Industry A Household Industry is defioed as an indu
stry conducted by the head of tbe household himselff
herself and/or mainly by the members of the bausebold at home or within the village in rural areas and only within tbe premises of the house where the household lives in urban areas. The industry should Dot be run on the scale of a registered factory.
(b) Non-worker Persons not engaged in any of these activities
were treated as non-workers and were sub-divided into seven broad heads namely (I) household duties, (2) Students, (3) Retired persons or rentiers, (4) Dependents (5) Beggars (6) Inmates of a penal, mental or charitable in&titutiou or convicts of jails etc,. and (7). Other non-workers,
In 1961 Census emphasis was laid on work 60 that all people Who worked including family workers who were not in receipt of any income or worktng children who could not earn enough for their marnlenence had also been included as WOI kers. An adult woman who was engaged in hilmeh"ld dUlles but not doing any other produc(iVt! work 10 augment tbe
family's resources was Bot considered as a worker. If, however, in addition to her household work she engaged herself in work such as rice pounding for sale or wages, or in d,\me~tic servlce~ for wages for
otbers or minding cattle or selling firewood or making
and selling cowdung cakes or grass etc., or any such work she was treated as a worker.
In case of seasonal work, if a person had some regular work of more tban one hour a day thro-
\ ugbout the greater part of the working season, he/she was considered as a worker. In case of regular employment in any trade, profession, service, business or commerce, if a person was employed during any of tbe fifteen days preceding the day of visit he/she was recorded as a worker.
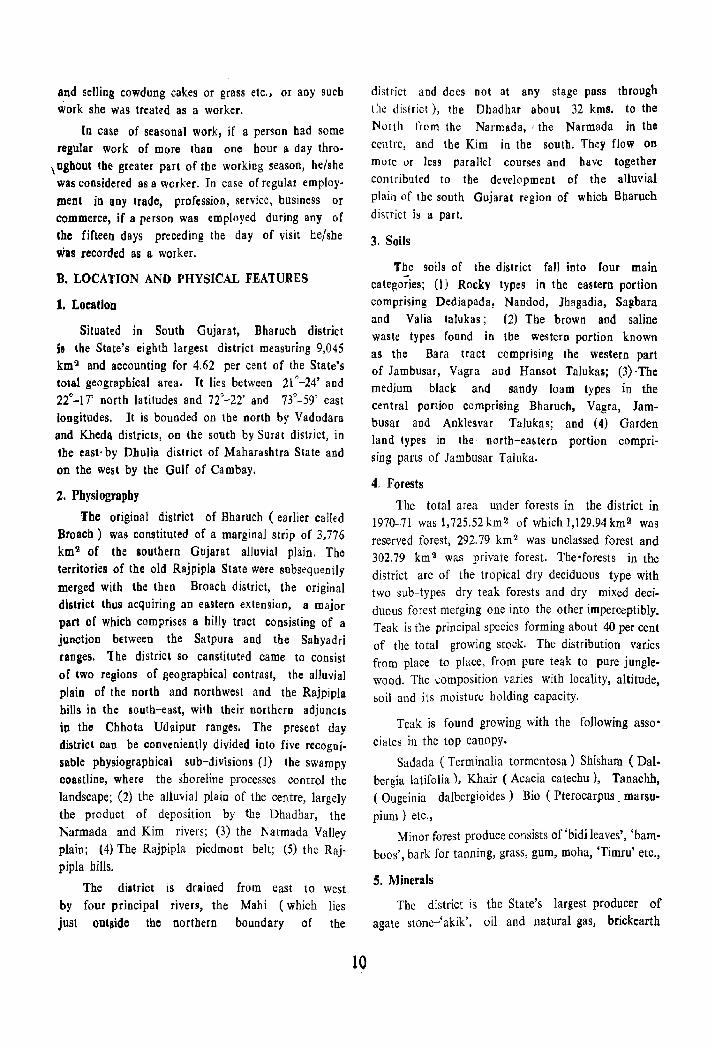
B. LOCAtION AND PHYSICAL FEATURES
1. Location
Situated in South Gujarat, Bharuch district is the State's eighth largest district measuring 9,045 kmll and accounting for 4.62 per cent of the State's total geographical area. It lies between 21 °-24' and 22°-17' nortb latitudes and 7t-22' and 73°-59' east longitudes. It is bounded on tbe north by Vadodara and Kheda districts, on the south by Surat district, in the east· by Dh ulia dislrict of Maharashtra State and on the west by the Gulf of Cambay.
2. Physiography
He original district of Bharuch ( earlier called Broach) was constituted of a marginal strip of 3,776 kmll of the southern Gujarat alluvial plain. The territories of the old RajpipJa State were subsequently
merged with the then Broach district, the original district thus acquiring an eastern extension, a major part of which comprises a hilly tract consisting of a junction between the Satpura and the Sahyadri ranges. The district so canstituted came to consist of two regions of geographical contrast, the alluvial plain of the north and northwest and the Rajpipla hills in the south-east, with their northern adjuncts in the Chhota Udaipur ranges. The present day district can be conveniently divided into five recognisable physiographical sub-divisions (I) the swampy coastline, where the shoreline processes control the landscape; (2) the alluvial plain of the centre, largely the product of deposition by the Dhadhar, the Narmada and Kim rivers; (3) the Narmada Valley plain; (4) The Rajpipla piedmont belt; (5) the Rajpipla hills.
The district is drained by four principal rivers, the
just outside the northern
from east to west Mahi (which lies
boundary of the
10
district and does not at any stage pass through the district), tbe Dhadhar about 32 kms. to the NOlth from the Narmada, I the Narmada in the centre, and the Kim in the soulh. They flow on more or less parallel courses and have together contributed to the development of the alluvial plain of the south Gujarat region of which Bbaruch district is a pari.
3. Soils
The soils of the district fall into rour main categories; (I) Rocky types in the eastern portion comprising Dediapada, Nandod, Ibagadia, Sagbara and Valia talukas; (2) The brown and saline waste types found in tbe western portion known as the Bara tract comprising the western part of Jambusar, Vagra aud Hansot Talukas; (3) -The medium black and sandy loam types in the central portion comprising Bharuch, Vagra, Jambusar and Anklesvar Talukas; and (4) Garden land types in the· nortb-ea~tern portion comprising parts of Iambusar Taluka.
4. Forests
The total area under forests in the district in 1970-71 was 1,72S.52km2 of which 1,129.94km2 was reserved forest, 292.79 km 2 was unclassed forest and 302.79 km 2 was private forest. The·forests in the district are of the tropical dry deciduous type with two sub-types dry teak forests and dry mixed deciduous forest merging one into the other imperceptibly. Teak is the principal species forming about 40 per cent of the total growing stock. The'distribution varies from place to place, from pure teak to pure junglewood. The .:ompositioll varies with locality, altitUde, soil and its moisture holding capacity.
Teak is found growing with the following asso' ciates in the top canopy.
Sadada (Terminalia tormentosa) Shisham ( Dal· bergia latifolia ), Khair ( Acacia catechu), Tanachh, (Ougeinia dalbergioides) Bio (Pterocarpus. marsu
pium) etc.,
Minor forest produce consists of 'bidi leaves', 'bamboos', bark for tanning, grass, gum, moha, 'TimIu' etc.,
5. Minerals
The district is the State's largest producer of agate stone-'akik'. oil and natural gas, brickearth
and chalcedeny pebbles and is also the repository of the State's largest known deposits of agate stone. In addition to calcite, fluorite and limestone among the other major minerals boulder, gravel, ordinary clay and sand and trap are among the minor commercially worked in the district. Other commercially workable deposits includes lignite and dolomite, bentonite and tuller's earth.
Oil and natural gas structure in Anklesvar area is the State's largest oil field today. At present about 2.8 to 3 million tonnes of crude oil is supplied to Koyli Refinery near Vadodara through Anklesvar group gathering station. Production of natural gas is estimated at about 3 million cubic metres per day from all the oil fields of Gujarat, of which the share of Anklesvar field is estimated at over 1.1 million cubic metres per day.
6. Rivers
The Narmada, Dhadhar and Kim rivers are the major rivers of the district. Each river h1s an estuary of several miles but none except the Narmada and for a short distance, the Dhadhar are useful for navigation. The principal river, Narmada, originates in the table lands of Malva in Madhya Pradesh and has a course of about 1,332,8 km. Its length in Gujarat is relatively small and it is fed on the way by the Kaveri, Amravati, Karjan and Dev rivers between the boundaries of Bharuch and Vadodara districts. After flowing through the district in a westward direction the river widens out into an estuary around the Gulf of Cambay where it is 21 kms. wide.
The Dhadhar, with a course of 112 km. in length and a drainage area estimated at 4800 km 2 • meets the Gulf of Cam bay about 32 km, south of the estuary of the Mahi.
The Kim river with a course of 112 km. in length and a drainage area estimated at 1800 km2
•
meets the Gulf of Cambay about 16 km. south of the estuary of the Narmada. Rising in the Rajpipla Hills, the Kim, for the first part of its course passes through the Nandod taluka and Valia taluka territory. For the remaining 32 km. the river winds in a westerly direction between the Anklesvar taluka on the right and the Olpad taluka of Surat district on the left.
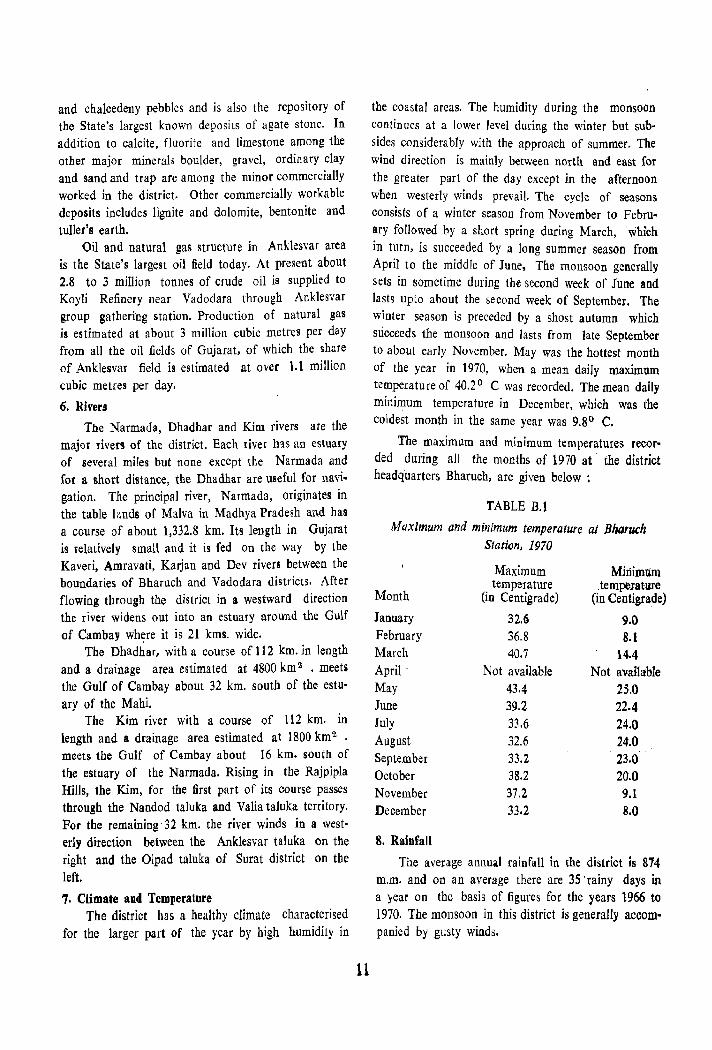
7. Climate and Temperature The district has a healthy climate characterised
for the larger part of the year by high humidity in
11
the coastal areas, The humidity during the monsoon continues at a lower level during the winter but subsides considerably with the approach of summer. The wind direction is mainly between north and east for the greater part of the day except in the afternoon when westerly winds prevail, The cycle of seasons consists of a winter season from November to February followed by a short spring during March, which in turn, is succeeded by a long summer season from April to the middle of June, The monsoon generally sets in sometime during th€ second week of June and lasts upto about the second week of September. The winter season is preceded by a shost autumn which succeeds the monsoon and lasts from late September to about early November. May was the hottest month of the year in 1970, when a mean daily maximum temperature of 40.20 C was recorded. The mean daily minimum temperature in December, which was the coldest month in the same year was 9,8 0 C.
The maximum and minimum temperatures recorded during all the months of 1970 at' the district headquarters Bharuch, are given below :
TABLE B.t
Maximum and minimum temperature at Bharuch Station, 1970
Maximum Minim'am
Month temperature temperatme
(in Centigrade) (in Centigrade)
January 32.9 9.0 February 36.8 8.1 March 40.7 14.4 April' Not available Not available May 43.4 25.0 June 39.2 22.4 July 33.6 24.0 August 32.6 24.0 September 33.2 23.0 October 38.2 20.0 November 37,2 9.1 December 33.2 8.0
8. Rainfall
The average annual rainfall in the district is 874 m.m. and on an average there are 3S'rainy days in a year on the basis of figures for the years 1966 to 1970. The monsoon in this district is generally accompanied by gusty winds.
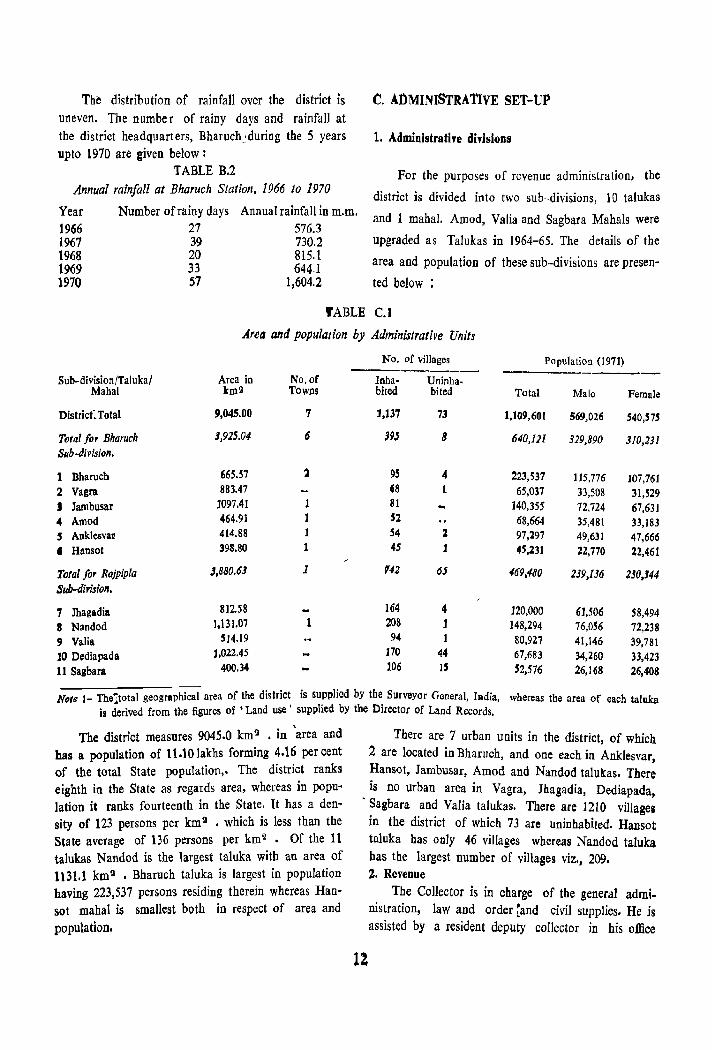
Tbe distribution of rainfall over the district is uneven. The numbe r of rainy days and rainfall at the district headquarters, Bharuch,durillg the 5 years up to 1970 are given below:
TABLE B.2 Annual rainfall at Bharuch Station, 1966 to 1970
Year 1966 1967 1968 1969 1970
Number of rainy days 27 39 20 33 57
Annual rainfall in m.m. 576.3 730.2 815.1 644.1
1,604.2
C. AOMINISTRAT1VE SET-UP
1. Administrative divisions
For the purposes of revenue administration, the
district is divided into two sub-divisions, 10 talukas
and 1 mahal. Amod, Valia and Sagbara Mahals were
upgraded as Talukas in 1964-65. The details of the
area and population of these sub-divisions are presen
ted below
fABLE C.I
Sub-division/Talukal Mahal
DistricL Total
Total for Bharuch Sub-Jirision.
1 Bharucb 2 Vagra J Jarohusar 4 Arood 5 Anklesvar
• Hansot
Total for Rajpipla Sub-division.
7 Jhagadia 8 Nandod 9 Valia ]0 Dediapada lJ Sagbara
Area and population by Administrative Units
Area in kill\!
9,045.00
3,925.04
665.57 883.47
]097.41 464.91 414.88 398.80
J,880.6J
812.58 1,131.07
514.19 1,022.45
400.34
No.of Towns
7
6
1 1 1 1
1
1
No. of villages
Inha- Uninha-bited bited
1,137 73
395 8
95 4
'8 1 81 52 54 ~
45 1
'142 6$
164 4 208 1 94
170 44 106 15
Note 1- The:total geographical area of the district is supplied by the Surveyor General, Iadia, is derived from the figures of • Land use' supplied by the Director of Land Records.
Population (1971)
Total Male Female
1,109,601 569,OUJ 540,575
640,121 329,890 J10,231
223,537 115,776 J07,761 65,037 33,508 31,529
]40,355 72,724 67.631 68,664 35,481 33,183 97,297 49,631 47,666 45,231 22,770 22,461
469,480 239,136 230,144
120,000 61,506 58,494 148,294 76,056 72,238 80,927 41,146 39,781 67,683 34,260 33,423 52,576 26,168 26,408
whereas the area of each taluka
The district measures 9045.0 km~ • in 'area and There are 7 urban units in the district, of which has a population of 11.101akhs forming 4.16 per cent 2 are located in Bharuch, and one each in AnkIesvar, of the total State population,. The district ranks Hansot, Jambusar, Amod and Nandod taluIms. There eighth in the State as regards area, whereas in popu- is no urban area in Vagra, Jbagadia, Dediapada, lation it ranks fourteenth in the State. It has a den- . Sagbara and Valia talukas. There are 1210 villages sity of 123 persons per km~ • which is less than the in the district of which 73 are uninhabited. Hansot State average of 136 persons per km2
• Of the 11 taluka has only 46 villages whereas Nandod taluka talukas Nandod is the 1argest taluka with an area of bas the largest number of villages viz., 209. 1131.1 kmll . Bharuch taluka is largest in popUlation 2. Revenue having 223,537 persons residing therein whereas Han- The Collector is in charge of the general ad mi. sot mahal is smallest both in respect of area and nistration, law and order rand civil supplies. He is population. assisted by a resident deputy collector in his office
and two deputy col1ectors in charge of two sub-divisions baving their headquarters at Bharuch and Rajpipla. There are 10 mamlatdars in cbarge of 10 taluka offices and a mabalkari in Hansot mahal. All the revenue functions were executed by the conector, deputy collectors and marulatdars till the establishment of the Panchayat Raj on 1-4-1963 whereafter a large number of functions relating to revenue administration have, been transferred to the panchayats.
3. Par1iamentary and Assembly ~ Constituencies
Under the Delimitation of Parliamentary and
Assembly Constit.uencies Order, 1966, one seat is allotted to this district for the purpose of election to
the House of People and seven seats for the State Assembly. The particulars of the area comprising the territorial extent of Bh 1ruch Parliamentary Constituency and seven assembly constituencies comprised within it are shown below:
A. Bharuch Parliarrentary Constituency
The whole of Bharuch District.
B. Assembly Constituencies
TABLE C.2
Territorial extent of ASJembly Constituencies
SI. Name of No. Constituency
Jambusar
2 Vagra
3 Bharuch
Extent of constituencies
All villages of Jambusar Taluka and 7 villages of Amod Taluka. All villages of Vagra Taluka, 48 villages of Amod taluka and 40 villages of Bharuch Taluka. All villages of Bharuch taluka excluding those comprised in Vagra Assembly Constituency referred to at (2) above and excluding two villages. Taria and Dhanturia which are included in Anklesvar Assembly Constituency as referred to in (4) below.
The seats of Jhagadia, Nandod and Dediapada Assembly Constituencies are reserved for the Scheduled Tribes. The parliamentary constituencies and assembly constituencies are being revised on the basis of 1971 census data by the Delimitation Commission.
Elections The district bas one seat for parliament and seven
seats for assembly constituencies out of which 3 seats have been reserved for scheduled tribes. During the last decade (1962 to 1971) general elections for the
SI. Name of No. Constituency
4 Anklesvar
5 Jhagadia
6 Nandod 7 Dediapada
Extent of constituencies
All villages of AnkJesvar taluka arrl Hansot Mahal and also two villages, Taria and Dhanturia villages of Bharuch taluka.
All villages of Jhagadia taluka and 46 villages of Valia taluka. All villages of Nandod taluka. All villages of Dediapada and Sagbara taluka and 56 villages of Valia taluka (i. e. excluding those referred to at 5. above).
parliamentary constituency were held in the years 1962, 1967 and 1971, whereas thl! elections for assembly constituencies were held in the years 1962 and 1967.
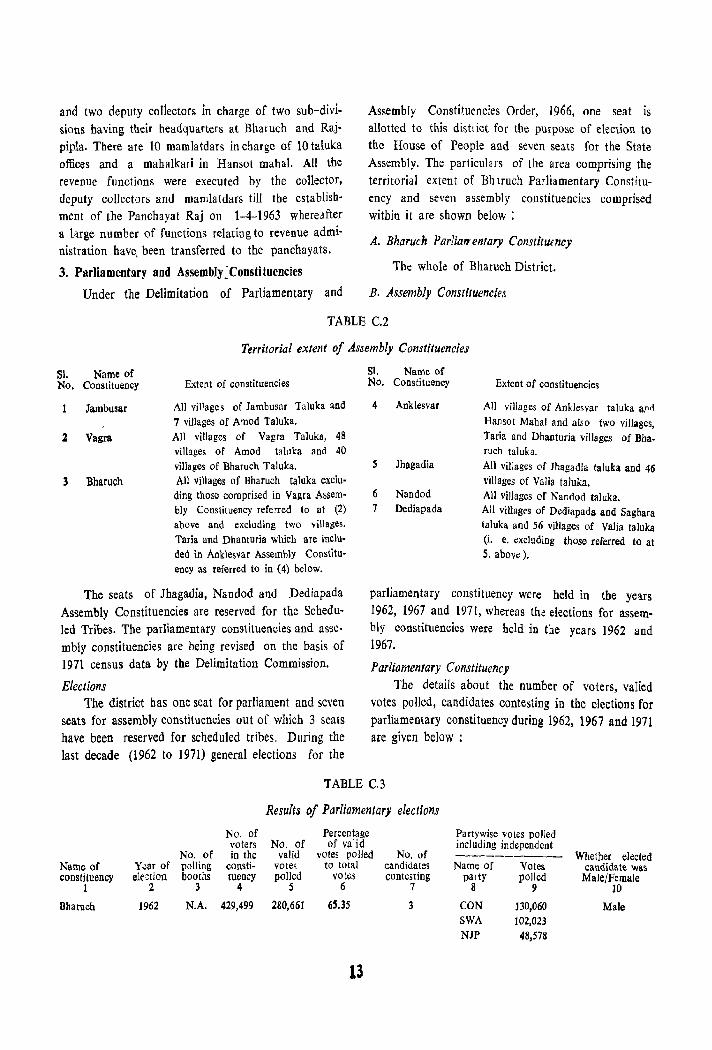
Parliamentary Constituency The details about the number of voters, vaIied
votes polled, candidates contesting in the elections for parliamentary constituency during 1962, 1967 and 1971 are given below :
TABLE C.3
Name of constituency
1
Bharuch
No. of Yi.lar of polling ele·;tion booths
2 3
1962 N.A.
No. of voters in the
constituency
4
429,499
Results of Parliamentary elections
No. of valid
votes polled
5
280,661
Percentage of valid
votes polled to total
votes 6
65.35
13
No. of candidates contesting
7
3
Partywise votes polled including independent
Name of party
8
CON
SWA
Votes polled
9
130,060 102,023
NJP 48,578
Whether elected candidate was
Male/Female 10
Male
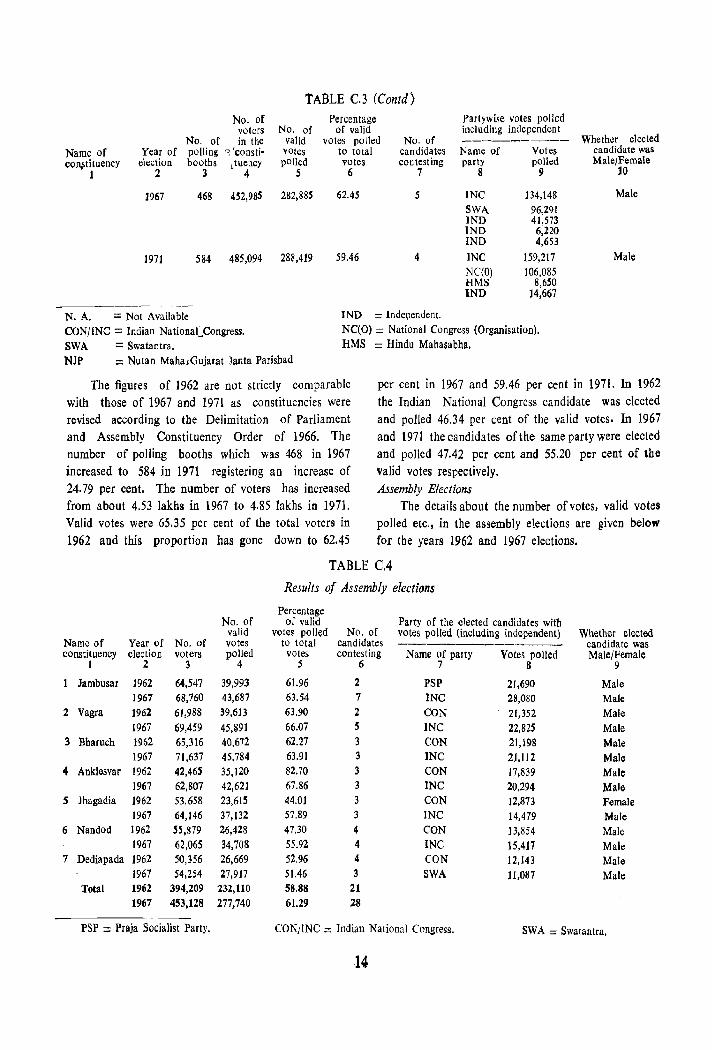
TABLE C.3 (Contd)
No. of voters No. of
No. of in the valid Name of Year of polling '3 'consti- VOtes cOD,'ltituency election booths )uency pOlled
1 2 3 4 5
1967 468 452,985 282,885
1971 584 485,094 288,419
N. A. = Not Available CON/INC = Indian NalionatCongress. SWA = Swatantra. NJP = Nulan MahasGujaral Janta Parishad
Percentage of valid
votes polled No. of to total candidates votes contesting
6 7
62.45 5
59.46 4
IND = Independent.
partywise votes polled including independent
Name of Votes party polled
8 9
INC SWA IND IND IND
INC NC(O) HMS IND
134,148 96,291 41,573 6,220 4,653
159,217 106,085
8,650 14,667
NC(O) = National Congress (Organisation). HMS = Hindu Mahasabha.
Whether elected candidate was Male/Female
10
Male
Male
The figures of 1962 are not strictly comparable with those of 1967 and 1971 as constituencies were revised according to the Delimitation of Parliament and Assembly Constituency Order of 1966. The number of polling booths which was 468 in 1967 increased to 584 in 1971 registering an increase of 24.79 per cent. The number of voters has increased from about 4.53 lakhs in 1967 to 4.85 lakhs in 1971. Valid votes were 65.35 per cent of the total voters in 1962 and this proportion has gone down to 62.45
per cent in 1967 and 59.46 per cent in 1971. In 1962 the Indian National Congress candidate was elected and polled 46.34 per cent of the valid votes. In 1967 and 1971 the candidates of the same party were elected and polled 47.42 per cent and 55.20 per cent of the valid votes respectively.
No. of valid
Name of Year of No. of votes constituency election voters po lied
I 2 3 4
Jambusar 1962 64,547 39,993 1967 68,760 43,687
2 Vagra 1962 61,988 39,613 1967 69,459 45,291
3 Bharuch 1962 65,316 40,672 1967 71,637 45,784
4 Anklesvar 1962 42,465 35,120 1967 62,807 42,621
S Jhagadia 1962 53.658 23,615 1967 64,146 37,132
6 Nandod 1962 55,879 26,428 1967 62,065 34,708
7 Dediapada J962 50,356 26,669 1967 54,254 27,917
Total 1962 394,209 232,110 1967 453,128 277,740
PSP = Praja Socialist Party.
Assembly Elections The details about the number of votes, valid votes
polled etc., in the assembly elections are given below for the years 1962 and 1967 elections.
TABLE C.4
Results of Assembly elections
Percentage of valid Party of the elected candidates with
votes polled No. of votes polled (including independent) Whether elected to total candidates ----------------- candidate was votes contesting Name of palty Votes polled Male/Female
5 6 7 8 9
61.96 2 PSP 21,690 Male 63.54 7 INC 28,080 Male 63.90 2 CON 21,352 Male 66.07 5 INC 22,825 Male 62.27 3 CON 21,198 Male 63.91 3 INC 21,112 Male 82.70 3 CON 17,839 Male 67.86 3 INC 20,294 Male 44.01 3 CON J2,873 Female 57.89 3 INC 14,479 Male 47.30 4 CON 13,854 Male 55.92 4 INC 15,417 Male 52.96 4 CON 12,143 Male 51.46 3 SWA 11,087 Male 58.88 21 61.29 28
CON/INC = Indian National Congress. SWA = Swatantra.
14
In the seven constituencies in 1962 in all 21 candidates had contested elections and 28 candidates contested in 1967. The percentage of valid votes to total vo'tes in these assembly constituencies was 58.88 per CCl)t in 1962 and 61.29 per cent in 1967. It varied from a minimum of 44.01 per cent in Jhagadia constituency to a maximum of 82.70 per cent in Anklesvar constituency in 1962, whereas in 1967 tbe minimum percentage of valid votes polled was 51.46 in Dediapada constituency and maximum was 67.86 per cent in Anklesvar constituency.
4. Judiciary
(i) Judicial Set-up
The judicial set up of Bharuch district comprises one District and Sessions Judge, one Civil Judge (Senior Division) and seven Civil Judges (Junior Division) and Judicial Magistrates, First Class.
The court of District and Sessions Judge and the courts of Civil Judges (Senior Division ), Civil Judges (Junior Division) and Judicial Magistrates, First Class function under the supervison of the Gujarat High Court. The court of District and Sessions Judge is the highest judicial authority in the district, the other courts being subordinate to it. The court of the District and Sessions Judge and those of Civil Judges (Senior Division) are situated at the district headquarters and the courts of Civil Judges (Junior Division) and Judicial Magistrates, First Class are situated at taluka headquarters and also at district headquarters.
(iiJ Powers of the courts
The District and Sessions Judge is the highest judicial authority at the district level, both in respect of civil and criminal matters. The District and Sessions Judge exercises both original and appellate jurisdiction. The District court is the principal court of original civil jurisdiction in a dbtrict. It is also the court of appeal for the purpose of decrees and orders passed by the subordinate civil courts in which an appeal can be preferred, provided, the subject matter of the suit decided by' the Civil Judge does not exceed Rs. 10,000 in value. Where the value of the subject matter of the suit exceeds the said amount an appeal lies direct to the High Court. 10 criminal matters, the District and Sessions Judge in his latter capacity tries cases which are committed to his court by Magistrates after preliminary inquiry. He also hears appeals against
IS
orders of conviction and sentence passed by magistrates where such appeals are provided for by law. Similarly he has jurisdiction to hear appeal against orders of conviction passed by an Assistant Sessions Judge provided the sentence imposed consequent upon the conviction does not exceed imprisonment for a term of 4 years.
The courts of Civil Judge (Senior Division) have unlimited original civil jurisdiction and the courts of Civil Judg~s (Junior Division) have original juris· diction in the matters in which the value of the subject matter of the suit does not exceed Rs. 10,000. The Civil Judges arc also Judicial Magistrates of the First Class and they exercise both civil and crimial jurisdiction, except when they are required to exercise only the civil jurisdiction or only the criminal jurisdiction as the case may be. They are also invested with powers of a Small Cause 'Court to try suits of the value ranging from Rs. 200 to Rs. 1,500.
There are 3 Juvenile Courts in the district, one each at Bharuch, Rajpipla and Jambusar. The Judicial Magistrates of these places are the Presidents of the Juvenile Courts assisted by two Honorary Magistrates.
5. Police
There is a Superintendent of Police at the district level assisted by two sub-divisional officers, one at Bharuch and the other at Rajpipla. There were 3 inspectors and 36 sub-inspectors in the district in 1970-71. There were 5 police prosecutors to assist the police administration in legal proceedings. There were 17 police stations and 34 out posts at the end of 1970. The total strength of police including temporary force was 1293. Accordingly there was one police per 6.89 km. 2 of area and 855 population in the district. The number of cognisable crimes investigated per police was 5.45.
The highest number of cognisable crimes was reported in the year 1961 (1223). Of these, 52 were for murder, 3 for dacoity, 19 for robbery, 196 for house breaking, 303 for thefts, 14 for riots, and 636 for other offences. The total number of offences recorded, declined to 812 during 1967 after which there was a steady increase in the number of offences reported and 1,090 offences were reported during 1970. There seems to be a general reduction in the number of cognisable offences reported excePt riots. There were 27 cases of riots registered in 1970 as against 14 in 1961.
6. Jails
There were two jails in the district at the end of 1970 with at authorised accomodation for 144 males and 8 females. During the year 1970, L033 convicts were received, and 1,037 convicts discharged. The daily average of convicts was 51 during 1970. 1,887 under trial prisoners were received and 1,835 were discharged during this period. The daily average of these prison
ers was 83. Only 25 persons who were unable to provide security, were received in and discharged from jails during 1970.
7. Local Self Government
(i) Present Set up
With a view to achieving the objective of democratic decentralisation at all levels, the Gujarat Panchayats Act, 1961 has been brought into force from 1-4-1963. The Panchayat Raj envisages three tier system consisting of gram or nagar panchayats at the village level, taluka panchayat lit the taluka level and the district panchayats at the district level. The district local boards forming part of the then local self government have been replaced by the district panchayats. But the municipal form of local self government has been retained and at present municipalities are func
tioning in the towns having population of more than 20,000. Areas with a popUlation ranging from 10,000 to 20,000 are given status of nagar panchayats and the areas below 10,000 population have been c1as~ified
as gram pancbayats.
According to the provisions of the Gujarat Panchayats Act of 1961, a gram panchayat consists of not less than 9 and not mOre than 15 members depending upon the population of the village. The nJgar pancbayat consists of not less than 15 and not more than 21 members depending upon the population of the nagar. The taluka panchayat consists of ex-officio, co-opted and associate members. The district panchayat consists of ex-officio, elected and associate members. Provision has been made to reserve seats for women, scheduled castes and scheduled tribes in all the tiers of panchayats.
The District Development Officer is the chief executive officer of the district. He is generally borne on the cadre of the Indian Administrative Service and is appointed by the Government. The chief executive officer of the taluka panchayat is the Taluka Development Officer who is also appointed by the Govern-
16
ment. Both these officers are secretaries of their respective panchayats. These panchayats function through various committees appointed for different groups of functions under the Act. At present there are four statutory committees, namely Executive, Production, Education and Public works. Two non-statutory committees have been constituted by the District Panchayat, namely Social Welfare and Health.
(ii) Functions
The functions of the three tiers of panchayats have been elaborately detailed in the three schedules of the Act. In addition, the functions of collecting land revenue (including cesses ) and dues recoverable as arrears of land revenue, levied or assessed under the Land Revenue Code and all other functions and duties of a village accountant under the Land Revenue Cude have been transferred 10 gram/nagar panchayats. The powers exercised and functions performed by the district school boards have been similarly transferred to the District Panchayat. The functions relating to agriculture, animal husbandry, public health, medical relief, family planning, social welfare, cottage and small scale industries, statistics and ayurvedic institutions have been transferred on an agency basis to the district panchayat.
(iii) Staff
To enable the panchayats to carry out the numerous activities entrusted to them, the Government bas transferred and deputed a number of its employees alongwith these functions transferred. The staff of the district school board has also been transferred to the district panchayats. The recruitment to the nongazetted posts is being done by the Panchayat Services Commission constituted for this purpose.
(iv) Funds
The panchayats have been given necessary funds to execute the schemes transferred to them. Provision has been made in the Act for levying taxes by different types of panchayats, such as tax on buildings, pilgrim tax, tax on fairs and other entertainments, tax on bicycles or vehicles drawn by animals, sanitary tax, etc., and fees like levy fee on the markets, cart stands, tonga stands, supply of water from wells and tanks for purposes other than the domestic use and for cattle. The taluka panchayats and the district panchayat can request the Government for increase in stamp
duty. Moreover, provision has been wade in the Act
for grants to the panchayats for their activities. The Act provides that the Slate Government will
give grants to the panchayats on the basis of the average pf tbe land revenue collected during the three preceding years, after deducting therefrom the expenditure on the salaries and training of the secretaries of gram panchayats (~nd village accountants and crediting 5 per cent uf the amount to the State Equalisation Fund. Fifty per cent of the balance will be distributed among gram and nagar panchayats, 25 per cent among taluka panchayats and ten per cent among the district panchayats. Out of the remaining 15 per cent of the land revenue 7~ per cent will be carried to the District Equalisation Fund and 7~ per cent to the Gram Encouragement Fund.
(v) Working of local bodies There are three municipalities in the district viz.,
Bharuch, Rajpipla and Anklesvar. At the beginning of tbe decade i. e. in 1961 there were four municipalities but with the implementation of the Panchayat Raj from 1-4-1963, lambusar municipality was converted into a nagar panchayat. Of the total population of 1,109,601 of the district, a population of 142,172 is covered by the municipalities. There are in all 85 seats in these municipalities of which 7 are reserved for women, 8 for scheduled castes and 11 for scheduled tribes. The total income uf these municipalities in the year 1969-70 was Rs. 84.83 lakhs, of which Rs. 37.32 lakhs were derived from rates and taxes. The total expenditure during the same year was Rs. 88 lakhs, of which Rs. 31. 72lakhs were spent on public health and conveniences, Rs. 13.55 Jakhs on education, Rs. 6.01 lakhs on general administration and Rs. l.80 lakhs on public safety.
The panchayat set up consists of one district panchayat, 11 taluka pancbayats and 661 gram panchayats. and one nagar panchayat as on 1-1-1971. The total number of seats in the 661 gram panchayats was 6,056. Of these, 1322 seats were reserved for women, 572 for scheduled castes and 1,093 for scheduled tribes. The remaining i. e. 3,OM were nonreserved seats. On these non-reserved seats 3,014 members were in position on 1-1-]971, 2,843 being elected members and 171 nominated members. Of the total 2,987 reserved seats 2,913 members were in position as on 1-1-1971, 2,728 members being elected and 185 nominated.
In all there were 5,571 elected members and 356 Bh-3
members were nominated. The proportion of female members to total members in position was 22.19 percent.
Of the total 19 seats in the only nagar panehayat in tbis district as on 1-1-1971, 16 seats were non-reserved and 3 were reserved. All the 19 seats were filled in by election and there were no nominated members on these sealS.
There were tot:"ly 828 members in the 11 taluka panchayats as on l-I-1971. Of these 666 were exofficio members, 87 were co-opted members and 75 were asso,late members.
The composition of the District Panchayat on 1-1-1971 was 11 ex-officio members, 11 elected representatives of the taluka panchayats, 22 elected repres~ntatives from among the women, 5cheduled castes, schedukd tribes and others and 14 associate members. In addition t·) these the chairman of the District Education Committee was also the member of the District Panchnyat.
The IOlal income of the gram and nagar panehayats at the end of 1969-70 was Rs. 66.96 lakhs, of which 24.12 lakhs Were derived from rates and taxes, and Rs. 27. 70 lakhs from gr,lllts. The total expenditure of these gram ~nd n~gar pJTIchayats during tbis period was Rs. 64.55 lakhs, of which Rs. 19.45 lakhs were spent on santtt;tion and h~alth, Rs. 17.90 lakhs on public works, Rs. 7.14 lakhs on education and culture, and Rs. 14J6 bkhs on planning and administration.
Out of a total revenue of Rs. 349.90 lakhs of the district and taluka plllchayats, more than 85 per cent of the amount was received by way of grants. The gr~nts fd panc!1<1yat schemes and functions were of the order of Rs. 123.60 lakh~, whm:3S Rs. 153.11 lakhs were received for State schemes and functions. The share of local rutes and taxfS was 4 48 per cent of the total rt>vtnue.
17
The total expenditure of tfle dbtrict and taluka panchayats during this period amounted to Rs. 334.90 lakhs. The expenditure on edt:c ation amounted to Rs. 100.38 lakhs accountiog for 29.97 per cent of the total expenditur~. Next important item of expenditure was public works which i1bsorb~d 19.80 per cent of the total expenditure. 8.3 per cent was spent on communIty development proJects, 5.&6 per cent on irrigation, 4.89 per cent on health md sanitation and 3.72 per C\?pt en agriculture. G¢ neraladministration absorbed 6.S\) per c;;;nt of tbe tot"l expmditure.
D. TERRITORIAL AND OTHER CHANGES
t. Opening of new areas for settlement of population
With the striking of oil and natural gas in the western part gf tbe distrkt around Anklesvar, a colony bas been c(lnstructed near Aoklesvar by the Oil and Na I ural Gas Commission to accomodate the oil project ;.tatf. With tbe exception of tbis, thtre are no other areas developed for the settlement of population
during the decade.
2. Growtb or decay of urban centres
Dur:ng 1961 Census 4 areas were d"c1an'd as urban. Tbt:y were Bbarucb, RBjpipla, Aokl('svar and
Jambmar. During 1971 Census three more areas viz., Palej, > mod and Hamot have been given urban status. PJI j, bowever, bas attained UIban status for the first time during 1971 Census, Whereas Amod and Hamal \\bich were enjoying urban status durmg 1951 Census had been declassified during 1961 Census. It would be intere~ting to Dote that, of the 7 towns of the diwict 6 towns are situated in the western tract of alluv at plain while only one town namely Rajpipla is siludted in tbe eastern hIlly tract of Rajpipla
Division.
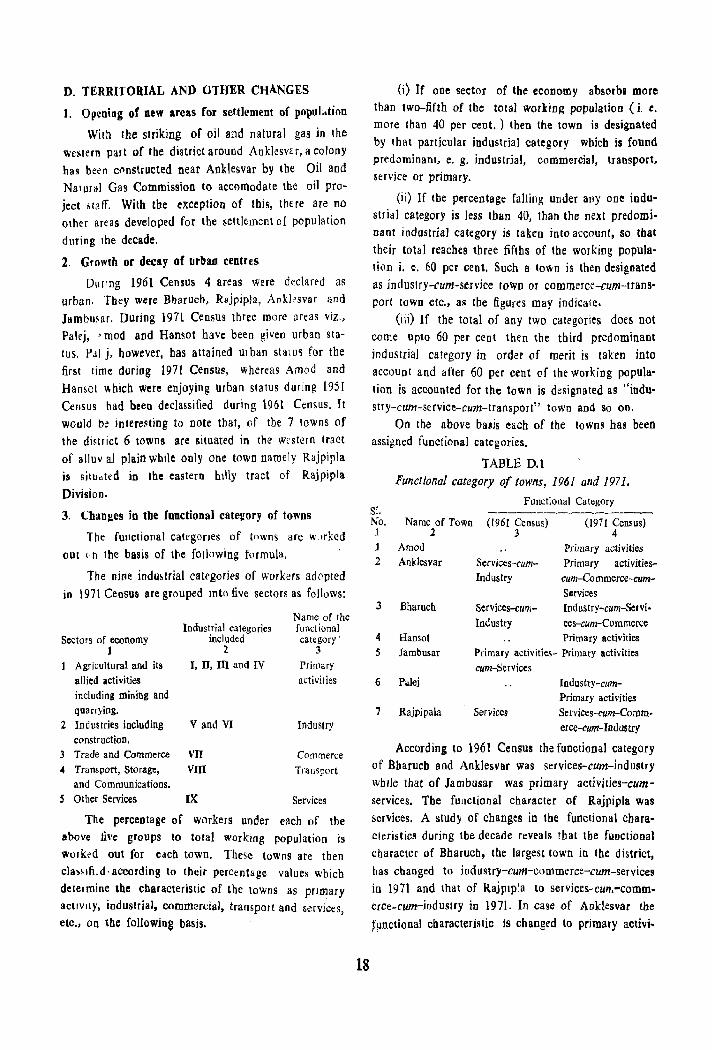
3. t:hanges in the functional catel!ory of towns
The functional categories of tnwns are w ,rked out (·n the basis of lloe fOllowing formula.
The nil1p. industrial categories or workers adopted in 1971 Census are grouped IOta five sectors as follows:
Industrial categories included
2 Sectors of economy
1 Agricultural and its allied activities including mining and quarrying.
I, II, m and IV
2 Industries including V and VI construction.
3 Trade and Commerce VII 4 Transport, Storage, VllI
and Communications. S Other Services IX
Name of the functional category'
3 Primary activities
Industry
Commerce Transport
Services
The percentage of workers under each of the above Jive groups to total working population is wurk~d out for each town. These towns are then cla~~lfi.d· according to their percentage values wbich determine tbe characteristic of tbe towns as primary actiVity, industrial, commercial, transport and services, etc" on the following basis.
18
(i) l( one sector of tbe economy absorbs more than two-fifth of tbe total working population (i. e. more tban 40 per cent. ) then tbe town is designated by that particular industrial category which is found predominant, e. g. industrial, commercial, transport, service or primary.
(ii) If tbe percentage falling under anyone industrial category is Jess tban 40, than tbe next predominant industrial category is taken into account, so tbat tbeir total reacbes three fifths of tbe working population j. e. 60 per cent. Such a town is tben designated as industry-cum-service town or commerce-cum-transport tOWD etc., a~ tbe figures may indicate.
(iii) If the total of any two categories does not come upto 60 per cent then the third predominant industrial category in order of merit is taken into account and after 60 per cent of tbe working population is accounted for the town is designated as "industry-cum-service-cum-transport" town and So on.
On tbe above basis each of the towns has been assigned functional categories.
S1. No. 1
J 2
3
4 5
6
TABLE D.l
Functional category of towns, 1961 and 1971.
Name of Town 2
Amod Anklesvar
Bharuch
Hansol Jambusar
Palej
Functional Category
(1961 Census) 3
Services-cumIndustry
Services-cumIndustry
(1971 Census) 4
Primary activities Primary activitiescum-Commerce--cum-Services lnd ustry-cum-Sel vi· ces-cum-Commerce Primary activities
Primary 8ctivities- Primary activities cum-Services
Industry-cumPrimary activities
7 Rajpipala Services Services-{'um-Comm. erce-Cum-Industry
According to 1961 Census the functional category of Bharuch and Anklesvar was services-cum-indnstry whIle tbat of Iambusar was primary activities-cumservices. The functional character of Rajpipla was services. A study of changes in tbe functional characteristics during tbe decade reveals thai the functional character of Bharucb, tbe largest town in tbe district, has changed to iodustry-cum-commerce-cum-services in 1971 and that of Rajptp'a to services-cuf1.-commerce-cum-industry in 1971. In case of Aoklesvar the fpDctional cbaracteristic is changed to primary activi·
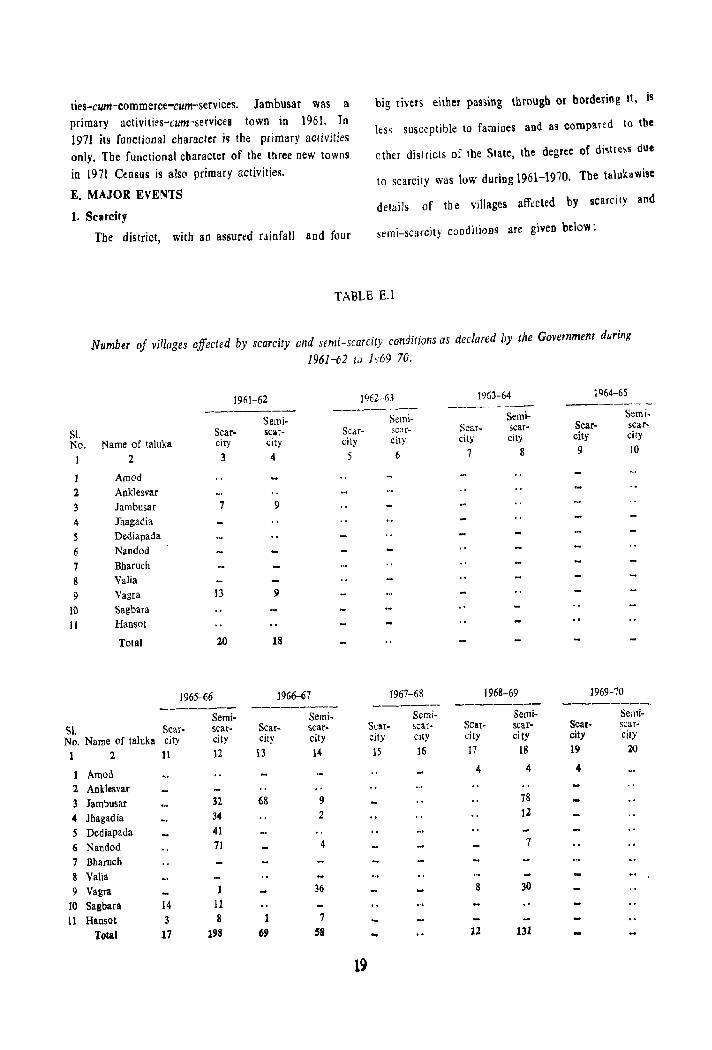
tif:'s-cum-commeree-cum-services. lambusar was a primary aetivities-cum-sefviccl town in 1961. In 1971 its functional character i9 the primary activities only. The functional cbaracter of the three new towns in 1971 Census is also primary activities.
E. MAJOR EVENTS
1. Scarcity
The district, with an assur(d rainfall and four
big rivers either passing through or bordering It, is
less susceptible to famines and as compared to the
ether disl rielS of the State, the degree of di~tre~s due
to scarcity was low during 1961-1970. The talukawise
details of the villages aff~cted by scarcity and
semi-scarcity conditions are given below:
TABLE B.1
Sl. No. 1
2 3 4 S 6 7 8 9
10 II
Sl.
Number of 'Villages affected by scarcity and semi-scarcity conditions as declared by the Government during 1961-62 t,} 1~'69 70.
Name of taluka 2
1961-62 1962-63 1963-64 1964-65
--------- --------- -----~-- --------- -Semi- Semi- Semi- Semi-
Scar- 5car- Scar- scar- Scar- scar- Scar- scar-
city city city city city city city city
3 4 5 6 7 8 9 10
Amod Anklesvar Jambusar 7 9 Jhagadia Dediapada Nandod Bharuch Valia Vagra 13 9
Sagbara Hansol
Total 20 18
1965-66 1966-67 1967-68 1968-69 1969-70
------- --------- ------- -------- -------_ Semi- Semi- Semi- Semi- Semi-
Scar- scar- Scar- scar- Scar- scar- Scar- scar- Scar- scar-
No. Name of taluka city city city city city city city city city city 20
1 2 11 12 13 14 15 16 17 18 19
1 Amod 4 4 4
2 Anklesvar 3 Jambusar 32 68 9 78
4 Jhagadia 34 2 12
5 Dediapada 41
6 Nandod 71 4 7
7 Bharuch 8 Valia 9 Vagra 1 36 8 30
]0 Sagbara 14 11
11 Hansot 3 8 1 7
Total 17 193 69 58 12 131
19
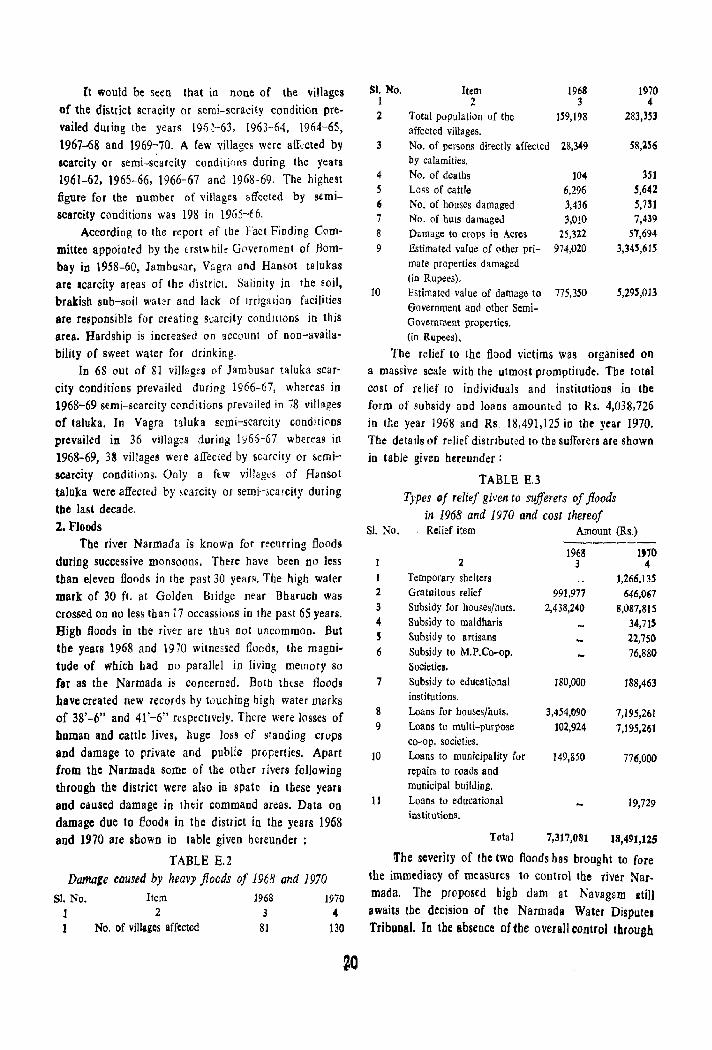
It would be seen that in none of the villages of the district scracity or semi-scracity condition prevailed duling the years 1961-63, 1963-64, 1964-65, 1967-68 and 1969-70. A few villages were aff:cted by
scarcity or semi-s~arcity conditjons during the years 1961-62, 1965-66, 1966-67 and 1968-69. The highest figure for the number of villages affected by semiscareity conditions was 198 in 1965-~ 6.
According to the report ef tbe Fact Finding Committee appointed by the trst\\ hilr Government of Bombay in 1958-60, Jambusar, VagrR and HanSOI talukas are Icarcity areas of the district. SailOity in the soil, brakish sub-soi1 water and lack of irrigation facilities are responsible for creating scarcity condmons in this area. Hardship is increased on account of non-availa· bility or sweet water for drinking.
In 68 out of 8 I villages of Jambusar taluka scar' city conditions prevailed during 1966-67, whereas in 1968-69 semi-scarcity c0f1ditions prevailed in 78 villages of taluka. In Vagra t'lluka semi-scarcity conditions prevailed in 36 villages during ly6S-67 whereas in 1968-69, 33 villages were affected by sC<lfcilY or semiscarcity conditions. Only a ftw villages of Hansol taluka were affected by :,carcilY or semhcarcity during tbe last decade. 2. Floods
The river Narmada is known for recurring floods during successive monsoons. There bave been no less than eleven floods in the past 30 years. The high water mark of 30 ft. at Golden BIidge near Bbaruch was crossed on no less than 17 occassions in the past 65 years. High floods in tbe river are thus not uncommon. But the years 1968 and 1970 witnessed fiood~, the magni. tude of which bad no parallel in living memory so faf as the Narmada is concerned. Both these floods have created Dew records by touching higb water marks of 38'-6" and 41 '-6" rtSpecllve!y. There were losses of bumall aDd catlle lives, huge loss of standing crops and damage to private and public properties. Apart from the Narmada some of the other livers following through the district were also in spate in these yean and caused damage in thtir command areas. Data on damage due to fiood~ in the district in the years 1968 and 1970 are sbown in table given hereunder ;
TABLE E.2 Damage caused by heavy floods of 1968 and 1970
SI. No. Item 1 2 I No. of villages affected
1968 3
81
1970 4
130
~o
SI. No. 1 2.
3
4 5 6 7
8
9
10
Item 2
Total population of the affected villages. No. of persons directly affected by calamities. No. of deaths Loss of cattle No. of houses damaged No. of huts damageJ Damage to crops in Acres Estimated value of other pri-mate properties damaged (in Rupees), Estimated value of damage to Government and other Semi-Government properties. (in Rupees).
1968 197() 3 4
]S9,198 283,3S3
28,349 58,256
104 3Sl 6,296 5,642 3,436 5,731 3,010 7,439
25,322 57,694 974,020 3,)43,615
775,350 5,295,013
The relief to the flood victims was organised on a massive scale witb the utmost promptitude. The total cost of relief 10 individuals and institutions in tbe form of subsidy and loans amounted to Rs. 4,038,726 in the year 1968 and Rs. 18,491,125 in thr year 1970. The detatls of relief distributed to the sufferers are shown in table given hereunder:
TABLE B.3 Types of relief given to sufferers of floods
in 1968 and 1970 and cost thereof 81. No. Relief item Amount (Rs.)
2
3
4 5 (;
7
8 9
10
11
2 Temporary shelters Gratuitous relief Subsidy for houses/huts. Subsidy to maldharis Subsidy to artisans Subsidy to M.P.Co-op. SOCieties. Subsidy to educational institutions. Loans for houses/huts. Loans to multi-purpose co-op. societies. Loans to municipality for repairs to roads and municipal building. Loans to educational institutions.
19611 1t70 3 4
991,977 2,438,240
180,000
3,454,090 102,924
149,850
1,266.135 646,067
8,087,815 34,715 22,750 76,880
188,463
7,195,261 7,195,261
776,000
19,729
Total 7,317,081 18,491,125
the severity of tbe two floods has brought to fore the immediacy of measures to control the river Nar. mada. The proposed higb dam at Navagsm still awaits the decision of tbe Narmada Water Dispute. TribuDal. In tbe absence of the overall control through
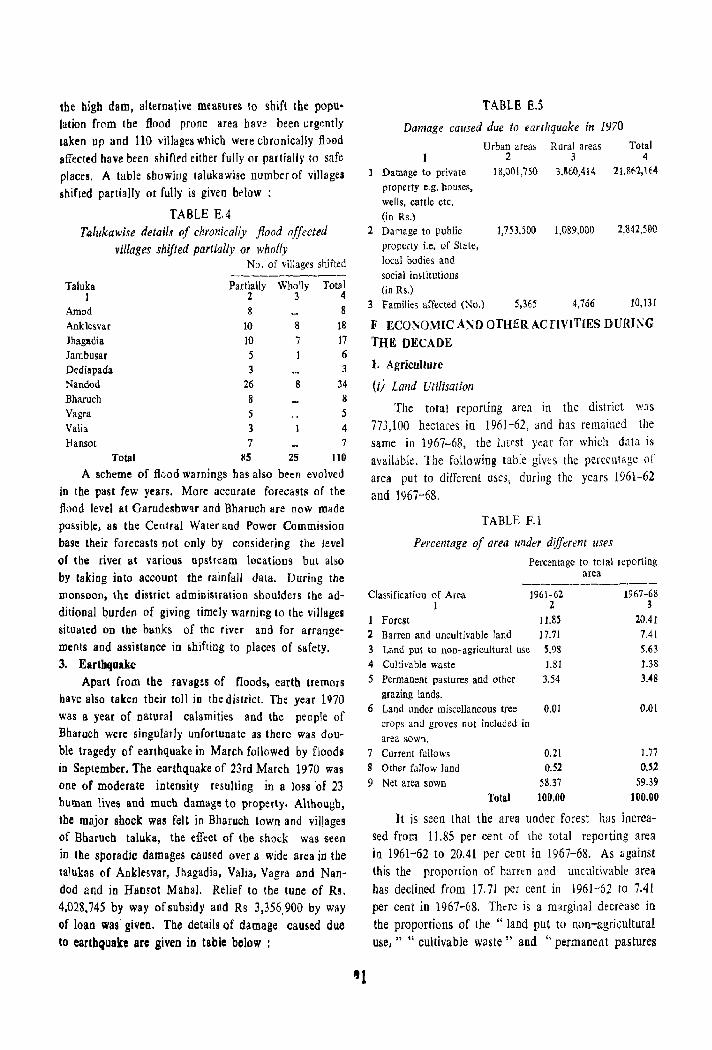
the bigh dam, alternative measureS to shift the population fwm the flood prone area have been urgently taken )IP and 110 villages which were chronically fbod affected have been sbiflf'd either fully or partially to safe places. A table showing talukawise number of villages shifted partially or fully is given below :
TABLE E.4 Taiukawise details (If chronically flood offected
villages shifted partially or wholly
Taluka ]
Amod Anklesvar Jhagadia Jambusar Dediapada Nandod Bharuch Vagra Valia Hansot
Total
No. of villages shifted
Partially 2 8
10 10 5 3
26 8 5 3 7
~5
Wholly Total 3 4
8
8 IS 7 17 1 6
8
3
34 8
5 4 7
25 110
A scheme of fIeod warnings bas also been evolved in tbe past few years. More accurate forecasts of tbe flood level at Garudeshw'lf and Bharuch are now made possible, as the Central Water and Power Commission base their foreca~ls not only by considering the level of the river at various upstrt:am locations but also by taking into account the rainfall dala. During the monsoon, the district administration shoulders the ad
ditional burden of giving timely warning to the villages situated on the banks of the river and for arrangements and assistance in ~hifting to places of safety. 3. Earthquake
Apart froro the ravages of floods. earth tremors have also taken their toll in the district. The year 1970 was a ~ear of natural calamities and tbe peopJe of Bharucb were singularly unfortunate as there was dou
ble tragedy of earthquake in Marcb followed by floods in September. The earthquake of 23rd March 1970 was one of moderate intensity resulting in a loss 'of 23 human lives and much damage to property. Althougb, the major shock was felt in Bharuch town and viJ)ages of Bharuch taluka, the effect of the shock was seen
in Ihe sporadIc damages caused over II wide area in the talukas of AnkJesvar, Jbagadia, Valia, Vagra and Nandod and in Hansot MahaI. Relief 10 the tune of Rs. 4,028.745 by way of subsidy and Rs 3,356900 by way of loan was given. The details of damage caused due to eartbQuake are given in table below :
TABLE E.S
Damage caused due to earthquake in 1970
Urban areas Rural areas Total 2 3 4
Damage to private 18,001,750 3,860,414 21,862,H4 property C.g. houses, wells, cattle etc. (in Rs.)
2 Damage to public 1,753,500 1,089,000 2,842,SGO property Le. of State, local bodies and social in&titutions (in Rs.)
3 Families affected (No.) 5,365 4,766 10,131
F ECO~OMIC AND OTHER ACTiVITIES DURING
THE DECADE
1. Agriculture
(i) Land Utilisation
The total reporting area in the district was 773,100 hectares in 1961-62, and has remained the same in 1967-68, the Litest year for which data is availtlbk. The following table gives the perccn!age of area put to different uses, during the years 1961-62 and 1967-68.
TABLE F.l
Percentage of area under different uses Percentage to total lepofting
area
Classification of Area 1961-62 1967-68 1 2 3
Forest 11.8' 20.41 2 Barren and uncultivable Jand 17.71 7.41 3 Land put to non-agricultural use 5.98 5.63 4 Cultivable waste 1.81 1.38 5 Permanent pastures and other 3.54 JAB
grazing lands. 6 Land under miscellaneous tree 0.01 0.01
crops and groves Dot included in area sown.
7 Current fallows 0.21 1.77 8 Other fallow land 0.52 0.52
9 Net area sown 58.37 59.39
Total 100.00 100.00
It is seen that the area under forest has increased from 11.85 per cent of the total reporting area in 1961-62 to 20.41 per cent in 1967--68. As lJgainst this the proportion of barren and uncultivable area
has declined from 17.71 per cent in 1961-62 to 7.41 per cent in 1967-68. There is a mo,rginal decrease in the proportions of the " land put to non-agricultural use, " " cultivable waste" and "permanent pastures
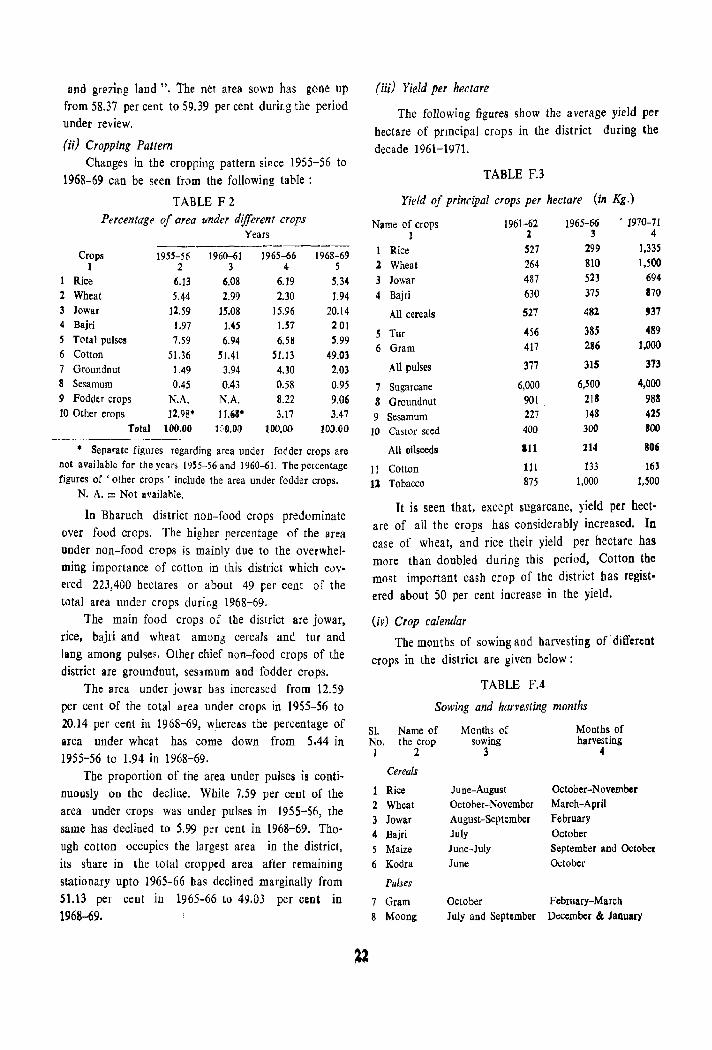
and grazing land ". The net area SOWn has gone up from 58J7 per cent to 59.39 per cent duriLg the period under review.
(ii) Cropping Pattern Changes in the cropping pattern since 1955-56 to
1968-69 can be seen from the following table:
TABLE F 2 Percentage of area under different crops
Years
Crops 1955-56 1960-61 1965-66 1968-69 1 2 3 4 5
I Rice 6.13 6.08 6.19 5.34 2 Wheat 5.44 2.99 2.30 1.94 3 Jowar 12.59 15.08 15.96 20.14 4 Bajri 1.97 1.45 J.S7 201 S Total pulses 7.59 6.94 6.58 5.99 6 Cotton 51.36 51.41 51.13 49.03 7 Groundnut 1.49 3.94 4.30 2.03 8 Sesamum 0.45 0.43 0.58 0.95 9 Fodder crops N.A. N.A. 8.22 9.06 10 Other crops ]2.98* I LiS' 3.17 3.47
Total 100.00 LO.OO 100.00 100.00
• Separate figures regarding area under fodder crops are not available for the years 1955-56 and 1960-61. The percentage figures of ' other crops' include the area under fodder crops.
N. A. = Not available.
In Bbaruch district non-food crops predominate over food crops. The higher percentage of the area under non-food crops is mainly due to the overwhelming importance of cotton in this district which covered 223,400 bectares or about 49 per cent of the total area under crops during 1968-69.
The main food crops of tbe district are jowar, rice, bajri and wheat amon5 cereals and tUT and lang among pulse,. Other chief non-food crops of the district are groundnut, sesamum and fodder crops.
The area under jowar has increased from 12.59 per cent of the total area under crops in 1955-56 to 20.14 per cent in 1968-69, whereas the percentage of area under wheat has come down from 5.44 in 1955-56 to 1.94 in 1968-69.
The proportion of the area under pulses is continuously 00 the decline. While 7.59 per cent of the area under crops was under pulses in 1955-56, the same has declined to 5.99 per cent in 1968-69. Though cotton occupies the largest area in the district, its snare in the total cropped area after remaining stationary upto 1965-66 bas declined marginally from 51.13 per cent in 1965-66 to 49.03 per cent in 1968-69.
~a
(iii) Yield per hectare
The following figures show the average yield per
hectare of pnncipal crops in the district during the
decade 1961-1971.
TABLE FJ
Yield of principal crops per hectare (in Kg.)
Name of crops 1961-62 1965-66 • 1970-71 1 l 3 4
1 Rice S27 299 1,335
1 Wheat 264 810 1,500
3 Jowar 487 523 694
4 Bajri 630 375 170
All cereals 527 482 937
5 Tur 456 385 489
6 Gram 417 286 1,000
All pulses 377 315 373
7 Sugarcane 6,000 6,SOO 4,000
8 Groundnut 901 218 983
9 Sesamum 227 148 m 10 Castor seed 400 300 800
All oil seeds 111 214 806
11 Cotton 111 133 163
11 Tobacco 875 1,000 1,500
It is seen that, except sugarcane, yield per hectare of all tbe crops has considerably increased. In case of wheal, and rice their yield per hectare has more than doubled during this period, Cotton tbe most important cash crop of the district has registered about 50 per cent increase in the yield.
(iv) Crop calendar
Tbe months of sowing and harvesting of' different
crops in the district are given below:
TABLE F.4
Sowing and harvesting months
S1. Name of Months of Months of No. the crop sowing harvesting 1 2 3 4
Cereals
Rice June-August October-November 2 Wheat October-November March-April 3 Jowar August-,September February 4 Bajri July October 5 Maize June-July September and October 6 Kodra June October
Pulses
7 Gram October February-March 8 Moong July and September December & January
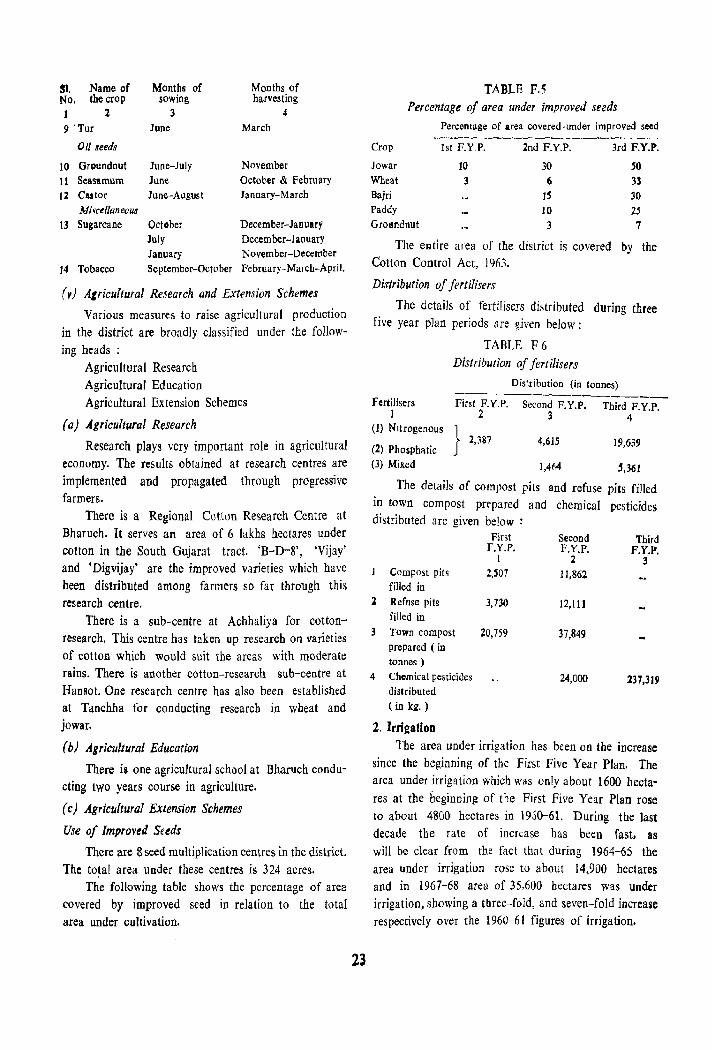
SI. Name of No. the crop 1 2 9 'Tur
Oil seeds
10 Groundnut
11 Seasamum 12 Clltor
Mi.lullaneous
13 Sugarcane
Months of sowing
3 June
June-July June June-August
October July
Months of harvesting
4 March
November October & February January-March
December-January December-January
January November-December
14 Tobacco September-October February-March-April.
(vj Alricu/tural Research and Extension Schemes
Various measures to raise agricultural production in the district are broadly classified under the following beads:
Agricultural Research Agricultural Education Agricultural Extension Schemes
(aj Agricultural Research
Research plays very important role in agricultural economy. The results obtained at research centres are implemented and propagated through progressive farmers.
There is a Regional Cotton Research Centre at Bharuch. It serves an area of 6 lakhs hectares under cotton in the South Gujarat tract. 'B-D-8', 'Vijay' and 'Digvijay' are the improved varieties which have been distributed among farmers so far through this research centre.
There is a sub-centre at Achhaliya for cottonresearch. This centre has taken up research on varieties of cotton which would suit the areas with moderate rains. There is another cotton-research sub-centre at Hansol. One research centre has also been established at Tanchha for conducting research in wheat and jowar.
(b) Agricultural Education
There is one agricultural school at Bharuch conducting two years course in agriculture.
(c) Agricultural Extension Schemes
Use of Improved Seeds
There are 8 seed multiplication centres in the district. The total area under these centres is 324 acres.
The following table shows the percentage of area covered by improved seed in relation to the total area under cultivation.
23
TABLE F.5 Percentage 0/ area under improved seeds
Percentage of area covered ·under improved seed
Crop 1st F.YP. 2nd F.Y,P. 3rd F.Y.P.
lowar 10 30 50 Wheat 3 6 33 Bajri IS 30 Paddy 10 25 Grollndnut 3 7
The egtire area of the district is covered by the Cotton Control Act, 1963.
Distribution of fertilisers
The details of fertilisers distributed during three five year plan periods are ~iven below:
TABLE F 6 Distribution of fertilisers
Distribution (in tonnes)
Fertilisers 1
Fi;;F. Y.P-. -;;;;dJryJ>-:-ThlrdF.¥.P:-234
(I) Nitrogenous } 2,387
(2) Phosphatic (3) Mixed
4,615 19,639
1,464 ',361
The details of compost pits and refuse pits filled in town compost prepared and chemical pesticides distributed are given below :
Compost pits filled in
l Refuse pits filled in
TOwn compost prepared ( in tonnes)
4 Chemical pesticides distributed (in kg. )
2. Irrigation
First F.Y,P.
1
2,S07
3,730
20,759
Second F.Y.P.
2 11,86:2
12,111
37,849
24,000
Third F.Y.P.
3
237,319
The area under irrigation has been on tbe increase since the beginning of the First Five Year Plan. The area under irrigation which was only about l600 hectares at the beginning of the First Five Year Plan rose to about 4800 hectares in 1950-61. During the last decade the rate of increase has been fast, as will be clear from the fact that during 1964-65 the area under irrigation rose to about 14,900 hectares and in 1967-68 area of 35,600 hectares was under irrigation, showing a three-fold, and seven-fold increase respectively over the 1960-61 figures of irrigation.
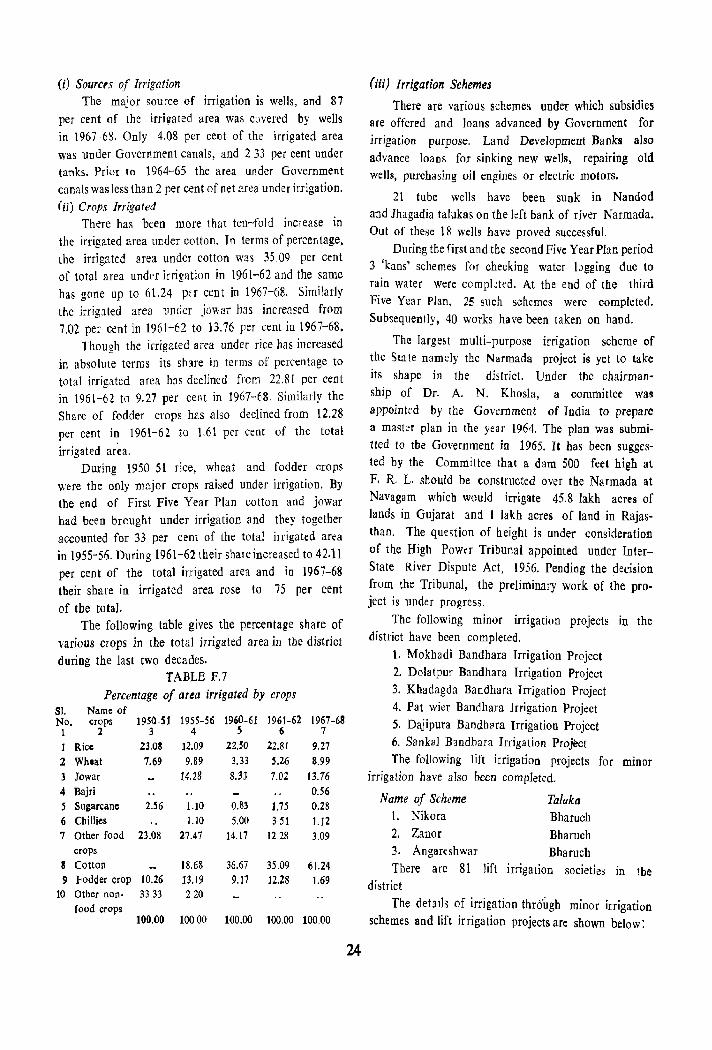
(i) Sources of Irrigation The major source of irrigation is wells, and 87
per cent of the irrigated area was cDvered by wells in \967-68. Only 4.08 per cent of the irrigated area was under Government canals, and 2 33 per cent under tanks. Prior to 1964-65 the area under Government canals was less than 2 per cent of net area under irrigation. (ii) Crops Irrigated
There has been more that ten-fold increase in the irrigated area under cotton. In terms of percentage, the irrigated area under cotton was 35 09 per cent of total area under irrigation in 1961-62 and the same has gone up to 61.24 pn cent in 1967-68. Similarly the irrigated area under jowar has increased from 7.02 per cent in 1961-62 to 13.76 per cent in 1967-68.
Though the irrigated an'a under rice has increased in absolute terms its share in terms of percentage to total irrigated area has declined from 22.81 per cent in 1961-62 to 9.27 per cent in 1967-~8. Similarly the Share of fodder crops has also declined from 12.28 per cent in 196\-62 to 1.61 per cent of the total
irrigated area. During \950-51 rice, wheat and fodder crops
were the only major crops raised under irrigation. By the end of First Five Year Plan cotton and jowar had been brought under irrigation and tbey together accounted for 33 per cent of the total iiTigated area in 1955-56. During 1961-62 their share increased to 42.11 per cent of the total irrigated area and in 1967-68 tbeir share in irrigated area rose to 75 per cent
of tbe total. The following table gives the percentage share of
various crops in the total irrigated area in tbe district during the last two decades.
TABLE P.7 Percentage of area irrigated by crops
51. Name of No. crops 1950-51 1955-56 1960-61 1961-62 1967-68
1 2 3 4 S 6 7
1 Rice 23.03 12.09 22 . .50 22.81 9.27
2 Wheat 7.69 9.89 3. 33 S.26 8.99
3 lowar 14.28 8.33 7.02 13.76 4 Bajri 0.56 5 Sugarcane 2.S6 1.10 0.83 1.75 0.28
6 Chillies 1.10 5.00 3.51 1.12 7 Other food 23.08 27.47 14.17 12.28 3.09
crops 8 Cotton 18.68 36.67 35.09 61.24 9 Fodder crop 10.26 13.19 9.17 12.28 1.69
10 Other non· 33.33 220 food crops
100.00 10000 100.00 100.00 100.00
24
(iii) Irrigation Schemes
There are various schemes under which subsidies are offered and loans advanced by Government for irrigation purpose. Land Development Banks also advance loans for sinking new wells, repairing old wells, purchasing oil engines or electric motors.
21 tube wells have been suok in Nandod and Ihagadia talukas on the left bank of river Narmada. Out of these 18 wells have proved successful.
During tbe first and the second Five Year Plan period 3 'kans' schemes for checking water logging due to rain water were compktrd. At the end of the third Five Year Plan, 25 such schemes were completed. Subsequently, 40 works have been taken on hand.
The largest mUlti-purpose irrigation scheme of the State namely the Narmada project is yet to take its shape in the district. Under tbe chairmanship of Dr. A. N. Khosla, a committee was appointed by the Government of India to prepare a master plan in the year 1964. The plan was submitted to the Government in 1965. It has been suggested by the Committee that a dam 500 feet high at F. R. L should be constructed over the Narmada at Navagam which would irrigate 45.8 lakh acres of lands in Gujarat and I lakh acres of land in Rajasthan. The question of height is under consideration of the High Power Tribunal appointed under InterState River Dispute Act, 1956. Pending the decision from the Tribunal, the preliminary work of the project is under progress.
The following minor irrigation projects in the district have been completed.
1. Mokhadi Bandhara Irrigation Project 2. Dolatpur Bandhara Irrigation Project 3. Khadagda Bandhara Irrigation Project 4. Pat wier Bandhara Irrigation Project 5. Dajipura Bandbera Irrigation Project 6. Sanka] B30dhara Irrigation Project
The following lift irrigation projects for minor irrigation have also been completed.
Name of Scheme Taluka 1. Nikora Bharuch 2. Zanor Bharuch 3. Angareshwar Bharuch
There are 81 lift irrigation societies in tbe district
The detaIls of irrigation thr6"ugh minor irrigation schemes and lift irrigation projects are shown below:
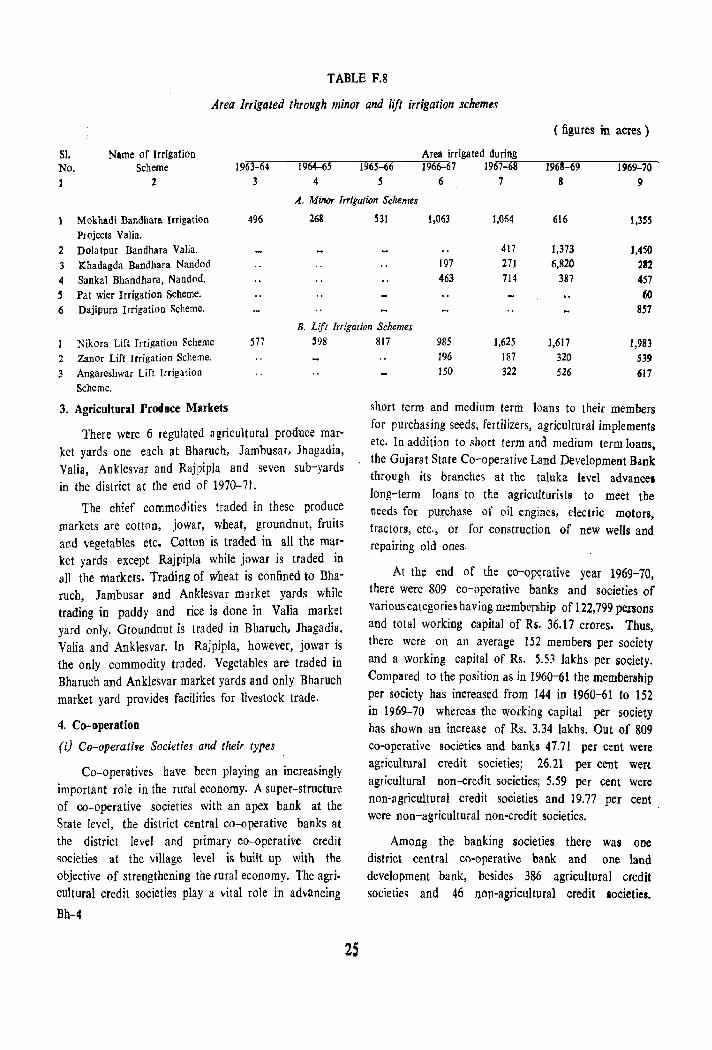
TABLE F.8
Area Irrigated through minor and lift irrigation schemes
( figures in acres)
SI, Name of Irrigation Area irrigated during No. Scheme 1963 64 1964-65 1965-66 1966-67 1967-68 1968-69 1969-70 1 2 3 4 5 6 7 8 9
A. Minor Irrigation Schemes
Mokhadi Bandhara Irrigation 496 268 531 1,063 1,064 616 1,355 Projects Valia.
2 Dolatpur Bandhara Valia. 417 1,373 1,450 3 Khadagda Bandhara Nandod 197 271 6,820 212 4 Sankal Bhandhara, Nandod. 463 714 387 457 5 Pat wier Irrigation Scheme. 110 6 Dajipura Irrigation Scheme. 857
B. Lift Irrigation Schemes
Nikora Lift Irrigation Scheme 577 598
2 Zanor Lift Irrigation Scheme. 3 Angareshwar Lift Irrigation
Scheme.
3. Agricultural Produce Markets
There were 6 regulated agricultural produce market yards one each at Bharuch, Jambusar, Jhagadia, Valia, Anklesvar and Rajpipla and seven sub-yards in the district at the end of 1970-71.
The chief commodities traded in these produce markets are cotton, jowar, wheat, groundnut, fruits and vegetables etc. Cotton is traded in all the market yards except Rajpipla while jowar is traded in all the markets. Trading of wheat is confined to Bharuch, Jambusar and Anklesvar market yards while trading in paddy and rice is done in Valia market yard only. Groundnut is traded in Bharuch, Ihagadia. Valia and Anklesvar. In Rajpipla, however, jowar is the only commodity traded. Vegetables are traded in Bharuch and Anklesvar market yards and only Bharuch market yard provides facilities for livestock trade.
4. Co-operation
(i) Co-operative Societies and their types
Co-operatives have been playing an increasingly important role in the rural economy. A super-structure of co-operative societies with an apex bank at the State level, the district central co-operative banks at the district level and primary co-operative credit societies at the village level is built up with the objective of strengthening the lUfal economy. The agricultural credit societies play a vital role in advancing
Bb-4
2S
817 985 1,625 1,617 1,983 196 187 320 539 150 322 526 617
sharI term and medium term loans to their members for purchasing seeds, fertilizers, agricultural implements etc. In addition to short term and medium term loans , the Gujarat State Co-operative Land Development Bank through its branches at the taluka level advances long-term loans to the agriculturists to meet the needs for purchase of oil engines, electric motors, tractors, etc., or for construction of new wells and repairing old ones.
At the end of the co-op~rative year 1969-70, there were 809 co-operative banks and societies of various categories having membership of 122,799 persons and total working capital of Rs. 36.17 ccores. Thus there were on an average 152 members per societ; and a working capital of Rs. 5.S3 lakhs per society. Compared to the position as in 1960-61 the membership per society has increased from 144 in 1960-61 to 152 in 1969-70 whereas the working capital per society has shown an increase of Rs. 3.34 lakhs. Out of 809 co-operative societies and banks 47.71 per cent were agricultural credit societies; 26.21 per cent wen agricultural non-credit societies; 5.59 per cent were non-agricultural credit societies and 19.77 per cent were non-agricultural non-credit societies.
Among the banking societies there was one district central co-operative bank and one land development bank, besides 386 agricultural credit societies and 46 non-agricultural credit societies.
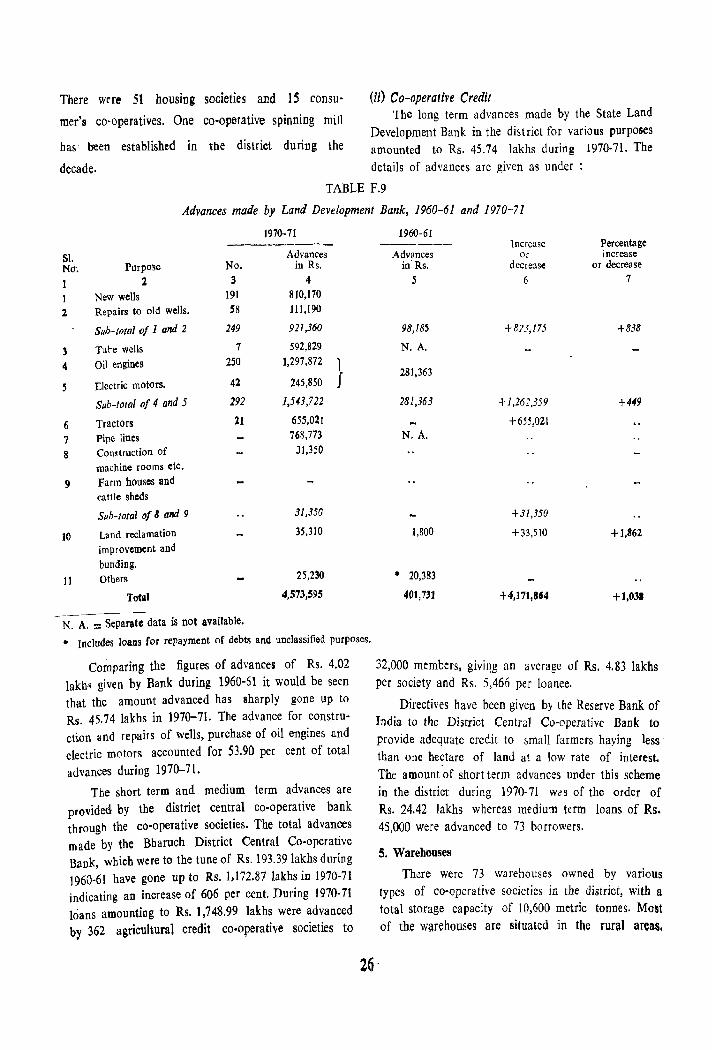
There were 51 housing societies and 15 consu-
mer's co-operatives. One co-operative spinning mill
has' been established in tbe district during the
decade.
(ii) Co-operative Credit The long term advances made by the State Land
Development Bank in the district for various purposes amounted to Rs. 45.74 lakhs during 1970-71. The details of advances are given as under
TABLE F.9
Advances made by Land Development Bank, 1960-61 and 1970-71
51. No;
I 2
3 4
5
6 7 8
Purpose :1
New wells Repairs to old wells.
Sub-total of 1 and 2
Tube wells Oil engines
Electric motors.
Sub-fotal of 4 and 5
Tractors Pipe lines Construction of machine rooms etC.
9 Farm houses and cattle sheds
10
II
Sub-total of 8 and 9
Land reclamation
improvement and bunding. Others
Total
1970-71
Advances No. in Rs. 3 4
191 S8
249
7 250
42
292
21
810,170 111,1~0
921,360
592,829 1,297,872
245,850
1,H3,722
655,021 768,773
31,350
31,350
35,310
25,230
4,573,595
N. A. = Separate data is not available.
}
.. Includes loans for repayment of debts and unclassified purposes.
Comparing the figures of advances of Rs. 4.02 lakhs given by Bank during 1960-61 it would be seen that the amount advanced has sharply gone up to Rs. 45.74 lakhs in 1970-71. The advance for construction and repairs of wells, purchase of oil engines and electric motors accounted for 53.90 per cent of total advances during 1970-71.
The short term and medium term advances are provided by the district central co-operative bank through the co-operative societies. The total advances made by the Bbaruch District Central Co-operative Bank, which were to the tune of Rs. 193.391akhs during 1960-61 have gone up to Rs. 1,172.87 lakhs in 1970-71 indicating an increase of 606 per cent. During 1970-71 loans amounting to Rs. 1,748.99 lakhs were advanced by 362 agricultural credit co-operative societies to
26
1960-61
Advances in Rs.
5
98,185
N. A.
281,363
281,363
N. A.
1,800
• 20,383
401,731
Increase Or
decrease
6
+873,175
+ 1,262,359
+655,021
+31,350
+ 33,510
+4,171,864
Percentage increase
or decrease 7
+838
+449
+1,862
+1,031
32,000 members, givi~g an average of Rs. 4.83 lakhs per society and Rs. 5,466 per loa nee.
Directives have been given by the Reserve Bank of India to the District Central Co-operative Bank to provide adequate credit to small farmers haying less than one hectare of land at a low rate of interest. The amount of short term advances under this scheme in the district during 1970-71 was of the order of Rs. 24.42 lakhs whereas medium term loans of Rs. 45,000 were advanced to 73 borrowers.
5. Warehouses
Thl!re were 73 warehouses owned by various types of co-operative societies in the district, with a total storage capacity of 10,600 metric tonnes. Most of the warehouses are situated in the rural areas.
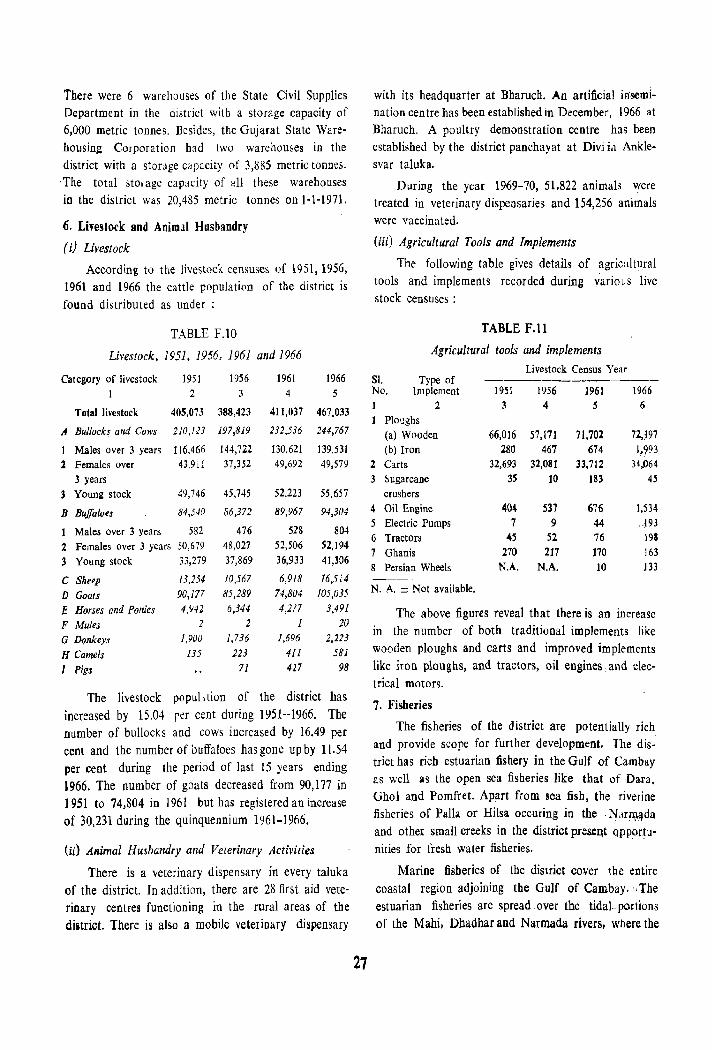
There were 6 warehouses of the State Civil Supplies Department in the district with a storage capacity of 6,000 metric tonnes. Besides, the Gujarat State Warehousin2 Corporation had two warehouses in the district with a storage capacity of 3,885 metric tonnes. The total sto,age capacity of 011 these warehouses in tbe district was 20,485 metric tonnes on 1-\-1971.
6. Liyestock and Animal Husbandry
(i) Livestock
According to the livestock censuses of 1951, 1956, 1961 and 1966 the cattle populati(lil of tbe district is found distributed as under :
TABLE F.IO
Livestock, 1951, 1956, 1961 and 1966
Category of livestock 1
1951 2
1956 3
1961 4
1966 5
To1al livestock 405,073 388,423 411,037 467,033
A Bullocks and Cows
Males over 3 years 2 Females over
210,123 197,819
116,466 144,722 43,911 37,352
3 years Younl: stock 49,746 45,745
B Buffaloes 84,540
1 Males over 3 years 582 2 Females over 3 years 50,679 3 Young stock 33,279
C Sheep 13,254 D Goats 90,177
E Horses and Ponies 4,942 F Mules 2 G Donkeys
H Camels
I Pigs
1,900
135
86,372
476 48,027 37,869
10.567 85,289 6,344
2 1,736
223 71
232.536
130,621 49,692
52,223
244,767
139.531 49,579
55,657
89,967 94,304
518 804 52,506 36,933
6,918
74,804 4,277
1 1,696
411 427
S2,194 41,306
16,514 105,O}5
3,491 20
2,213 581
98
The livestock popui.tion of the district has
increased by 15.04 r~r cent during 1951--1966. The number of bullOCkS and cows increased by 16.49 per cent and the number of buffaloes has gone up by 11.54 per cent during the period of last 15 years ending 1966. The number of goats decreased from 90,177 in 1951 to 74,804 in 1961 but has registered an increase of 30,231 during the quinquennium 1961-1966.
(ii) Animal Husbandry and Vererinary Activities
There is a veterinary dispensary in every taluka of the district. In addition, there are 28 first aid veterinary centres functioning in the rural areas of the district. There is also a mobile veterinary dispensary
27
with its headquarter at Bharuch. An artificial insemination centre has been established in December, 1966 at
Bharuch. A poultry demonstration centre has been established by the district panchayat at Divi in Anklesvar taluka.
During the year 1969-70, 51,822 animals wcre treated in veterinary dispensaries and 154,256 animals were vaccinated.
(iii) Agricultural Tools and Implements
The following table gives details of agricultural tools and implements recorded during various live stock censuses:
TABLE F.ll
Agricultural tools and implements
Livestock Census Year SI. Type of ------------------No. Implement 1951 1956 1961 1966
1 2 3 4 S 6
1 Plo!!ghs (a) Wooden 66,016 57,171 71,702 12,m (b) Iron 280 467 674 1~993
2 Carts 32,693 32,081 33,712 34,064
3 Sugarcane 35 10 183 4~
crushers 4 Oil Engine 404 537 676 ],534
5 Electric Pumps 7 9 44 . j93
6 Tractors 45 52 76 19. 7 Ghanis 270 217 170 163
8 Persian Wheels N.A. N.A. 10 J33 --~
N. A. = Not available.
The above figures reveal that there is an increase in the number of both traditional implements like wooden ploughs and carts and improved implements like iron ploughs, and tractors, oil engines. and elec-trical motors.
7. Fisheries
The fisheries of the district are potentially rich and provide scope for further development. lhe dis~ trict has rich estuarian fishery in the Gulf of Cambay as well as the open sea fisheries like that of Dara. Ghol and Pomfret .. Apart from sea fisb, the riverine fisheries of Palla or Hilsa occuring in the Narll\\lJda and other small creeks in the district pras.eQt qpP()ftunities for fresh water fisheries.
Marine fisheries of the district cover the entire coastal region adjoining the Gulf of Cambay .. , The estuarian fisheries are spread over the tida).. portions of the Mabi, Dhadhar and Narmada rivers, where the
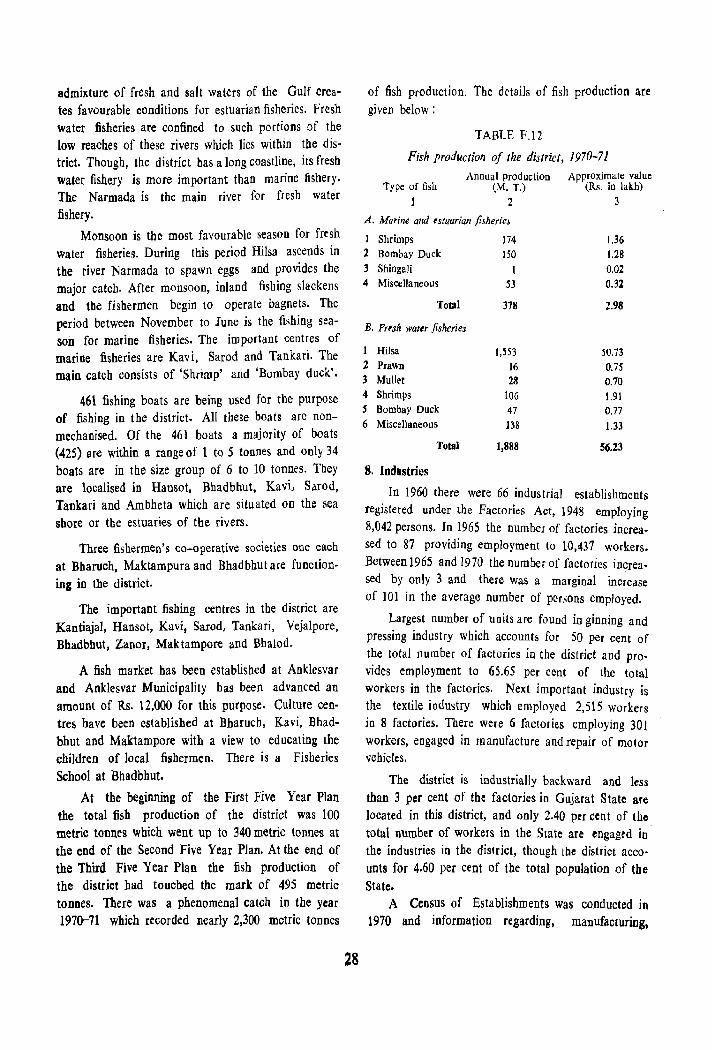
admixture of fresh and salt waters of the Gulf crea· tes favourable conditions for estuarian fisheries. Fresh water fisheries are confined to such portions of the low reaches of these rivers which lies within the dis· trict. Though, the district has a long coastline, its fresh water fishery is more important than marine fishery. The Narmada is the main river for fresh water fishery.
Monsoon is the most favourable season for fresh water fisheries. During tbis period Hilsa ascends in tbe river Narmada to spawn eggs and provides the major catcb. After monsoon, inland fishing slackens and the fishermen begin to operate bagnets. The period between November to June is the fishing seasoil for marine fisheries. The important centres of marine fisheries are Kavi, Sarod and Tankari. The main catch consists of 'Shrimp' and 'Bombay duck'.
461 fishing boats are being used for the purpose of fishing in the district. All these boats are nonmechanised. Of the 461 boats a majority of boats (425) are within a range of 1 to 5 tonnes and only 34 boats are in the size group of 6 to 10 tonnes. Tbey are localised in Hansot. Bhadbbut, KavL Sarod, Tankari and Ambheta which are situated on the sea shore or the estuaries of the rivers.
Three fishermen's co-operative societies one each at Bharuch, Maktampura and Bhadbhut are functioning in the district.
The important fishing centres in the district are Kantiajal, Hansot, Kavi, Sarod, Tankari, Vejalpore, Bhadbhut, Zanor, Maktampore and Bhalod.
A fish market bas been established at Anklesvar and Anklesvar Municipality has been advanced an amount of Rs. 12,000 for this purpose. Culture centres have been established at Bharucb, Kavi, Bhadbhut and Maktampore with a view to educating the children of local fishermen. There is a Fisheries School at Bhadbhut.
At the beginning of the First Five Year Plan the total fish production of the district was 100 metric tonnes which went up to 340 metric tonnes at the end of the Second Five Year Plan. At the end of the Third Five Year Plan the fish production of the district had touched the mark of 495 metric tODDes. There was a phenomenal catch in the year 1970-71 which recorded nearly 2,300 metric tonnes
28
of fish production. the details of fish production are given below:
TABLE F.12
Fish production of the district, 1970-71
Type of fish 1
Annual production (M. T.)
2
A. Marine and estuarian fisheries
1 Shrimps 174 2 Bomhay Duck 150 3 Shingali 4 Miscellaneous 53
Total 378
B. F!tsh wattr fisheries
1 Hilsa 1,553 2 Prawn 16 3 Mull~t 23 4 Shrimps 106 S Bombay Duck 47 6 Miscellaneou s 138
Total 1,888
8. Industries
Approximate value (Rs. in lakh)
3
1.36 1.28 0.02 0.32
2.98
50.73 0.75 0.70 1.91 0.77 1.33
56.23
In 1960 there were 66 industrial establishments registered under the Factories Act, 1948 employing 8,042 persons. In 1965 the number of factories increased to 87 providing employment to 10,437 workers. Between 1965 and 1970 the number of factories increased by only 3 and there was a marginal inc;ease of 101 in the average number of per~ons employed.
Largest number of units are found in ginning and pressing industry which accounts for 50 per cent of the total number of factories in the district and provides employment to 65.65 per cent of the total workers in the factories. Next important industry is the textile industry which employed 2,515 workers in 8 factories. There were 6 factories employing 301 workers, engaged in manufacture and repair of motor vehicles.
The district is industrially backward and less than 3 per cent of the factories in Gujarat State are located in this district, and only 2.40 per cent of the total number of workers in the Slate are engaged in the industries in the district, though the district accounts for 4.60 per cent of the total population of the State.
A Census of Establishments was conducted in 1970 and information regarding, manufacturing,
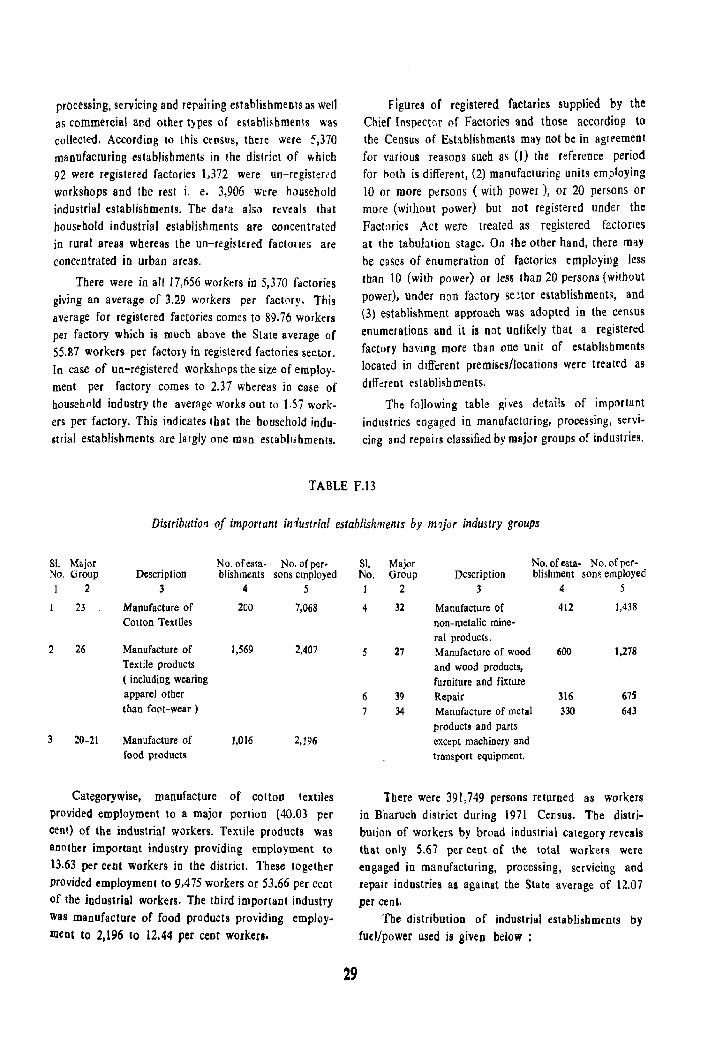
processing, servicing and repairing establishments as welt as commercial and other types of establi~hmellls was collected. According to this census, tbere were ~,370
manufacturing establishments in the district of which 92 were rt'gistered factories 1,372 were un-registered workshops and the rest i. e. 3,906 were household indu~trial establishments. The data also rtveals that housrbold industrial establishments are concentrated in rural areas wbereas the un-registered factories are concentrated in urban areas.
There were in all 17,656 workers in 5,370 factories giving an average of 3.29 workers per factory. This average for registered factories comes to 89.76 workers per factory wbich is much above the State average of 55.87 workers per factory in registered factories sector. In case of un-registered workshops the size of employment per factory comes to 2.37 whereas in case of househllld industry the average works out to 1.57 workers per fdctory. This indicates that the household industrial establishments are largly one man establlshmenls.
Figures of registered factalies supplied by the Chief Inspector of Factories and those according to the Census of E~tablishmeots may not be in ag{~emenl for various reasons such as (I) the reference period for both is different, (2) manufacturing units employing 10 or more persons (with power ), or 20 persons or more (without power) but not registered under the Factories Act were treated as registered factories at the tabulation stage. On the other hand, there may be cases of enumeration of factories employing less ,ban 10 ( with power) or less than 20 persons (witbout power), under non factory se~tor establishments, and (3) establishment approach was adopted in the cen~us enumerations and it is not unlikely that a registered factory having more tban one unit or establishments located in different premises/locations were trealed as different establishments.
The following table gives details of important industries engaged in manufacturing, processing, servicing and repairs classified by major groups of industries.
TABLE F.B
Distribution of important industrial establishments by m7jor industry groups
Sl. Major NO.ofesta· No. of per· No. Group Description blishments sons employed 1 2 3 4 5
23 Manufacture of 200 7,068 Cotton Textiles
2 26 Manufacture of 1,569 2,407 Textile products ( including wearing apparel other than foot-wear)
3 20-21 Manufacture of 1,016 2,196 food products
Categorywise, manufacture of cotton textiles provided employment to a major portion (40.03 per
cent) of the industrial workers. Textile products was another important industry providing employment to 13.63 per cent workers in the district. These together provided employment to 9,475 workers or 53.66 per cent of the industrial workers. The third important industry was manufacture of food products providing employment to 2,196 to 12.44 per ceot workers.
29
S1. Major No. of esta· No. of per-No. Group Description blishment son~ employed
1 2 3 4 5
4 32 Manufacture of 412 1,438
non-metalic mine· ral products.
5 27 Manufacture of wood 600 1.278 and wood products, furniture and fixture
6 39 Repair 316 675
7 34 Manufacture of metal 330 643
products and parts except machinery and transport equipment.
There were 391,749 persons returned as workers in Bharuch district during 1971 Cellsus. The distribution of workers by broad industrial category reveals that only 5.67 per cent of the total workers were engaged in manufacturing, processing, servicing and repair industries as against the State average of 12.07 per cent.
The distribution of industrial establishments by fuel/power used is given below
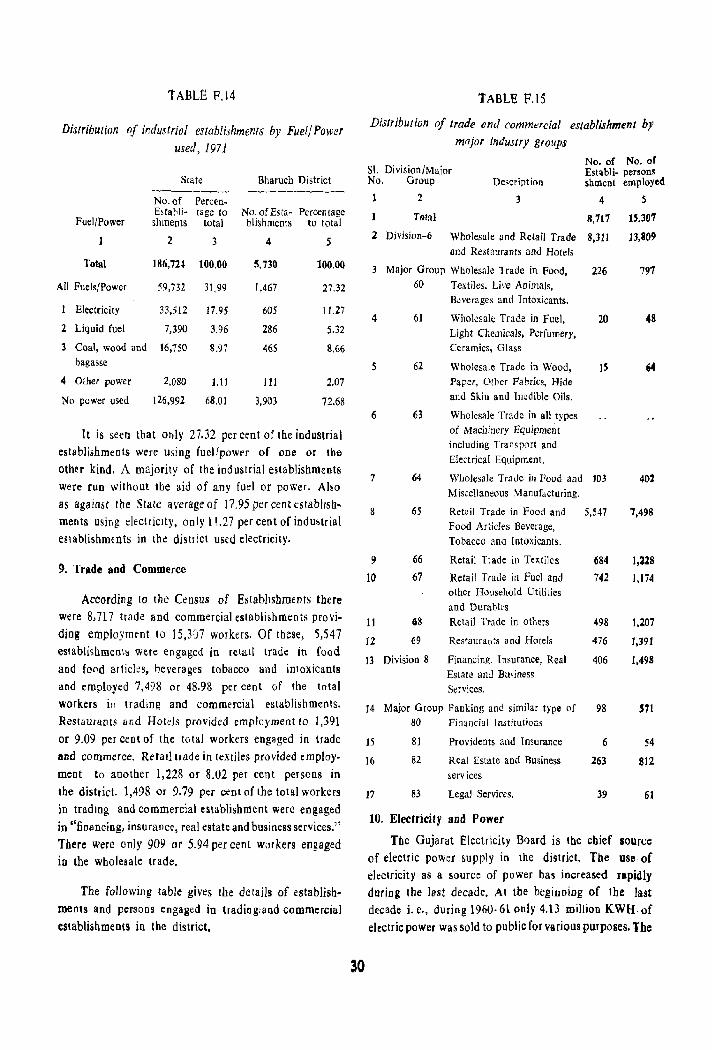
tABLE P.14
Distribution of industrial establishments by Fuel/ Power used, 1971
State Bharuch District
Fuel/Power
Total
All Fuels/Power
Electricity
2 Liquid fuel
No. of PercenE,tahli- tage to shments total
2 3
186,724 100.00
59,732 31.99
33,512 17.95
7,390 3.96
3 Coal, wood and 16,750
bagasse 8.97
4 Other power
No power used
2,080 1.11
126,992 68.01
NO.ofEsta- Percentage blishments to total
4 5
5,730
1,467
605
286
465
111
3,903
100.00
27.32
11.27
5.32
8.66
2.07
72.68
It is seen that only 27.32 per cent of tbe industrial establishments were using fuellpowf'f of one Dr tbe other kind. A majority of the iod ustrial establishments were run without tbe aid of any fuel or power. Also as against Ihe State average of 17.95 per cent t:stabJrsb· ments using electriCity. only 11.27 per cent of industrial establishments in the district used electricity.
9. Trade and Commerce
According to the Census of Estabhshmfnls tbere were 8,717 trade and commercial establishments provi. ding employmtnt to 15,307 workers, Of tbese, 5,547 establi~bmen\s were en gaged in wall trade in food and food articles, heverages tobacco and intoxicants and employed 7,498 or 48.98 per cent of the total workers in tradmg and commercial establishments. Restaurants ar;d Hotds provided employment to 1,391
or 9.09 per cent of the total workers engaged in trade aDd commerce. Retail trade in textiles provided employment to another 1,228 or 8.02 per cent persons in the district. 1,498 or 9.79 per cent of the total workers in trading and commercial establishment were engaged in "financing, insu rance, real estate and business services." Tbere were only 909 or 5.94 per cent W(lI kers engaged in the Wholesale trade.
The following table gives the details of establishments and persons engaged in trading:and commercial establishments in the district.
30
tABLE P.IS
Distribution of tlade end commercial establishmt:nt by mfljor industry groups
SI. Division/Major No. GrouD Description
3
No. of No. of Establi- persons shment employed
2
1 Total
4
8,717
2 Division-6 Wholesale Dnd Retail Trade 8,311 and Restaurants and Hotels
3 Major Group Wholesale Trade in FOod,
4
5
6
60 Textiles, Live Animals, Beverages and Intoxicants.
61
62
63
Wholesale Trade in Fuel, Light Chemicals. Perfumery, Ceramics, Glass
Wholesale Trade in Wood, Paper, Other Fabrics. Hide and Skin and Inedible Oils.
Wholesal e Trade in all types of Machinery Equipment including Transport <Ind Electrical Equipment,
226
20
15
7 64 Wholesale Trade in Food and 103 Miscellaneous Manufacturing.
8 65 Retail Trade ill Food and 5,547
9
I(}
11
12
66
67
68
69
Food Articles Beverage, Tobacco and Intoxicants.
Retail Trade in Textiles
Retail Trade in Fuel and other Household Utilities
and Durabks Retail Trade in others
Restauraots and Hotels
13 Division 8 Financing, Insurance, Real Estate and BUliness Services,
14 Major Group I'ankinr, and similar type of
15
16
17
80 Financial Institutions
81
82
83
Providents and 1 nsurance
Real Estate and Business ,crv ices
Legal Servires,
10. Electricity and Power
684
742
498
476
406
98
6
263
39
5
!S,307
13.809
797
48
402
7,498
1,128
1.174
1.207
1,391
1,498
54
812
61
The Gujarat Electricity Board is tbe chief aouree of eleclric power supply in the district. The use of electricity as a source of power has increased rapi4ly during the last decade. At the beginning of Ibe last decade i. e., during 1960- 6l only 4.13 million KWH of electric power was sold to public for various purposes. The
salts increased more tban three fold in tbe next five years and during 1965-66 a total 14.16 million KWH of electric power was sold 10 public. Tbe next quinqlJennium saw furtber apid progress and at tbe end of
1970-71, 62.24 million KWH of electric power was sold to . public for various purposes.
Categorywise, tht' utilisation of electricity for indull1fial purposes has shown 1izeable increase during
the last decade. Whereas only 1.01 million KWH of dectri'c pJwer was consumed for industrial purposes durin, 1960-61 the consumption under this category increased to 40.79 million KWH in 1970-71. More tban two-thirds of tbe total increase in the consumption of electricity during tbe decade has been absorbed by tbis category. Copsumption of electricity under tbe category 'othe.r purposes' has increased from 1.07 million
KWH in 1960-61 to 16.11 million KWH in 1970-71. Tbe utilisation of electricity under the category 'Dom
estic Consumption' has increased from 1 million KWH in 1960-61 to 4.14 millioll KWH in 1970-71. Tbere is a marginal increase of O;}5 million KWH in the consumpaion of rlectricity under 'Commercial Light
and Small power' during tbe decade from 1.05 million KWH in 1960-61, to 1.20mllli(1n KWH in 1970-71.
11. Transport and Communications
(j) Roads
Vast improvements have taken place in ·the road system of tbe district during the decade. At the beginning of the last decade the total road lengtb was
823 km. comprising 155 km. Aspbalt roads, 19 km. of cement concrete roads, 340 km. of water boundmacadam roads and 309 km. of other lower types of roads. The road length has increased by 73.27 per cent in 1969-70. The increase bas been more pronounced in case of asphalt roads i. e. from 155 km. in 1960-61 to 570 km. in 1969--70, an increase of 267.74 per cent. The length of other lower types of roads has also increased from 309 km. in 1960-61 to 575 km. in 1969-70 Le. an increase of 86,08 per cent. There has been a decrease in the mileage of water bound macadam roads i. e. from 340 km. in 1960-61 to 262 km. in
1969-70.
The district bad 42 km. of National Highways, 141 km. of State high ways, 260 km. of major district
road5, 306 km. of other district roads and 74 km. of
Village roads in 1960-61. There has not been any change in the length of National Higbways during tbe last decade. The length of State Highways hal increased to 381 km. in 1970, showing an increase of 170.21 per cent Similarly length of major district roads and otber district roads havil iocrrased by 46.15 per cent and 42 16 per cent respectively during tbis period. Village roads have also increased from 74 km. in 1960-61 to 190 km. ill 1969-70. The proportion of road length per 100 sq. km. of area works out to 15.77 km lit in 1969-70, showing an increase of 6.67 km. over 1960-61 figures of road mileage of 9.10 km. per 100 sq km.
(it) Railways
There were 264 km. of railw,IYs ill the district as on 31st March 1970, of which 50 km were broad guage aod 214 kill. narrow guage. There are 48 railway stationq in the district. All the taluka headquarters of (be district ex.cept Dedi!ipada, SlIgbara, Valia and Hansot are c,)nnected by rail. The prnportion of railway length per 100 sq. km. of area comes to 2.92 km.
(iii) Ports
There are 4 ports in the district of wbich Bharucb is an intermediate and the other three viz., Kavi, Dahej aDd Tankari are minor ports. These· ports i handle only costal trade. In 1950-51 the total cargo
handled at these ports was of the order of 390,097' tonnes, of which Dabej accounted. for 333,456 tonDes.; The total volume of trade in 1960-61 declined to 30,571 tonnes and at the end of tbe decade i. e. in 1969-70 the tonnage of imports and exports carg() handled at tbe ports in the district was 7,654 tonnes only.
(iv) Post and Telegraph
There were 373 P(1SI offices iocluding 39 sub-post offices and 334 branch offices as on 31-3-1969. Besides these there were 105 experimental and temporary post offices functioning in the district. There was one Head Post and Telegraph office and 16 posts and telegraph" sub-offices.
The following table' gives tbe details of PQstal. facililies in the district during 1961, 1965 and
1969 :
• The ratio for 1960-61 and 1969-70 has been worked out on the basis of the provision!! geographical ar~a figures suppli~ by the Surveyor General, India.
31
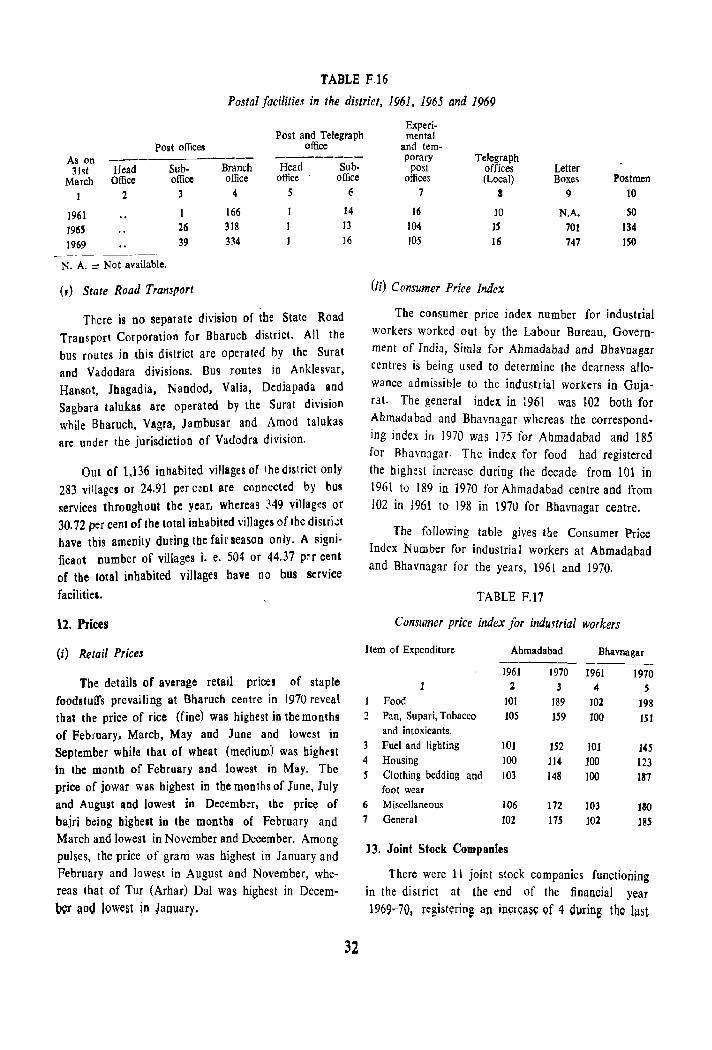
TABLE F.15
Postal facilities in the district, 1961, 1965 and 1969
Experi· Post and Telegraph mental
Post offices office and tem· As on ------------ ------- porary Telegraph 31st Head Sub- Branch Head Sub·
March Office office office office office
1 2 3 4 5 6
1961 I 166 I 14
1965 26 318 1 13
1969 39 334 16 -~--~-
N. A. = Not available.
(v) State Road Transport
There is no separate division of the State Road Transport Corporation for Bbarucb district. All the bus routes in this di~trict are operated by tbe Surat and Vadodara divisions. Bus routes in AIlklesvar, Hansot, Jbagad ia, N andod, Valia, Dediapada and Sagbara talukas are operated by the Surat division while Bbaruch, Vagra, Jambusar and Amod talukas are under the jurisdiction of Vadodra division.
Out of 1,136 inhabited villages of the district only 283 villages or 24.91 per c~nt are connected by bus services throughout the year, whereas 349 villages or 30.72 per cent of the total inhabited villages of tbe distri.:t have this amenity during the fair season only. A signi· ficant number of villages i. e. 504 or 44.37 p~r cent of the lotal inhabited villages have no bus service
facilities.
12. Prices
(i) Retail Prices
The details of average retail prices of staple foodstuffs prevailing at Bharuch centre in 1970 reveal that the price of rice (fine) was highest in the months of February, March, May and JUDe and lowest in September while that of wheat (medium) was bight'st In the month of February and lowest in May. The price of jowar was highest in the months of June, July aod August aod lowest in Decemb:::r, the price of bajri b~ing highest in the months of February and March and lowest in November and December. Among pulses, the price of gram was highest in January and February and lowest in August and November, whereas that of Tur (Arhar) Dal was highest in Decem· b~r and lowest in January.
32
post offices Letter offices (Local) Boxes Postmen
7 a 9 10
16 10 N.A. 50 104 IS 701 134 105 16 747 ISO
(ii) Consumer Price Index
The consumer price index number for industrial workers worked out by the Labour Bureau, Govern· ment of India, Simla fur Ahmadabad and Bhavnagar centres is being used to determine the dearness allo· wance admissible to the industrial workers in Guja· rat. The general index. in :961 was 102 both for Ahmadabad and Bhavnagar whereas the correspond· ing index in 1970 was 175 for Ahmadabad and 185 for Bhavnlgar. The index for food had registered the highest increase during the decade from 101 in 1961 to 189 in 1970 for Ahmadabad centre and from 102 in 1961 to 198 in 1970 for Bhavnagar centre.
The following table gives the Consumer Price Index Number for industrial workers at Ahmadabad and Bhavnagar for the years, 1961 and 1970.
TABLE F.17
Consumer price index for industrial workers
Item of Expenditure Ahmadabad Bhavnagar ------ -----1961 1970 1961 1970
2 3 4 5 Food 101 189 102 198
2 Pan, Supari, Tobacco 105 159 100 151 and intoxicants.
3 Fuel and lighting 101 152 101 145 4 Housing 100 114 100 123 5 Clothing bedding and 103 148 ]00 187
foot wear 6 Miscellaneous 106 172 103 180 7 General 102 175 102 185
13. Joint Stock Companies
There were 11 joint stock companies functioning in the di strict at the end of the financial year 1969-70, Tesist~ring an jl1cr~iI~e Qf 4 O\l:ring the last
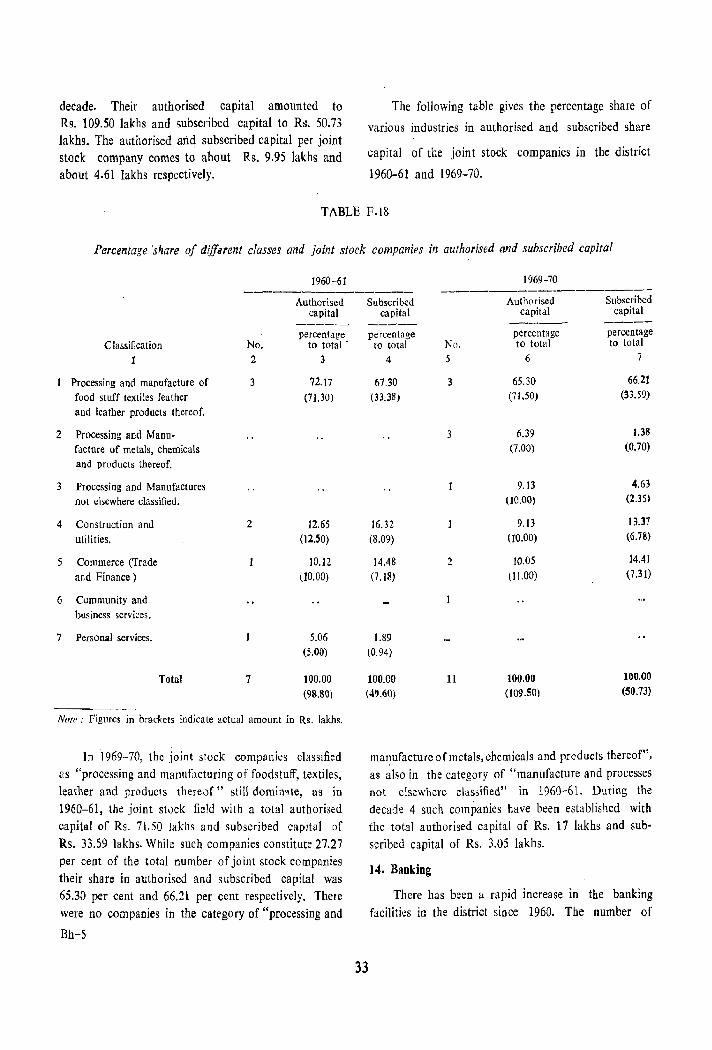
decade. Their authorised capital amounted to Rs. 109.50 lakhs and subscribed capital to R~. 50.73 lakhs. The authorised and subscribed capital per joint stock company comes to about Rs. 9.95 lakhs and about 4.61 lakhs respectively.
The following table gives the percentage share of
various industries in authorised and subscribed share
capital of the joint stock companies in the district
1960-61 and 1969-70.
TABLE F.18
Percentage share of different classes and joint stock companies in authorised {md subscribed capital
1960-61 1969-70 ------------------ -----------------
Authorised capital
-----percentage
Classification No. to total'
2 3
Processing and manufacture of 3 72.17 food stuff textiles leather (71.30) and leather products thereof.
2 Processing and Manu-
facture of metals, chemicals
and products thereof.
3 Processing and Manufactures
not elsewhere classified.
4 Construction and 2 12.65 utilities. (1:2.50)
5 Commerce (Trade 10.12 and Finance) (lD.OO)
6 Community and
business services.
7 Personal services. 5.06 (5.00)
Total 7 100.00 (98.80)
Note,' Figures in brackets indicate actual amount in Rs. lakhs.
In 1969-70, the joint stock companies classified 3S "processing and manufacturing of foodstuff, textiles, leather and producls thereof" still dominate, as in 1960-61, the joint stuck field with a total authorised capital of Rs. 71.50 Jakhs and subscribed capital of B.s. 33.59 lakbs. While such companies constitute 27.27 per cent of the total number of joint stock companies their share in authorised and subscribed capital was 65.30 per cent and 66.2l per cent respectively. There were no companies in the category of "processing and
Bh-5
Subscribed Authorised Subscribed capital capital capital
----- ---~--- -----percentage percentage percentage
IO total No. to total to total
4 5 6 7
67.30 3 65.30 66.21
(33.38 ) (71.50) (33.59)
3 6.39 1.38 (7.00) (0.70)
9.13 4.63
(10.00) {2.3S1
16.32 9.13 13.37
(8.09) (10.00) (6.78)
14.48 2 10.05 14.41
(7.18) (11.00) (7.31)
1.89
(0.94)
100.00 11 100.00 1011.00
(49.60) (109:50) (50.73)
manufacture of metals, chemicals and preducts thereof", as also in the category of "manufacture and processes not elsewhere classified" in 1960-61. During the decade 4 such companies have been established with the total authorised capital of Rs. 11 lakhs and subscribed capital of Rs. 3.05 lakbs.
33
14. Banking
There has been a rapid increase in the banking facilities in the district since 1960. The number of
scheduled and non-scheduled banks which waS 7 in . 1960, increased to 11 in 1965 and at the end of the
year 1970 there were 28 scheduled banks functioning in the district. Similarly, the number of co-operative banks rose from 20 in 1960-61 to 31 in 1965-66 and 38 in 1969-70.
15. Insurance
In 1960. 2,777 life insurance policies were issued and a sum of Rs. 80 lakhs was insured in the district, whereas in 1970-71, 3125 life insurance policies were issued and a record sum of Rs. 219 lakhs was insured in the district.
16. Education
Education plays an important role in the national development programme. Primary education bas been made compulsory both for boys and girls in the age group of 6 to 11 years. Efforts are being made by the State Government to provide at least One primary school in each village of the State so that this fundamental necessity can be within the reach of every citizen. Till the formation of Pane hay at Raj, the primary Education in the rural areas was looked after by the district school board. With the introduction of the Panchayat Raj the functions of primary education have been transferred to the district pancbayats in the rural areas. In the municipal areas, this subject is under the municipalities.
The progress made during the last decade in primary, secondary and higher education shows that the number of primary schools increased from 1,028 in 1961-62 to 1,166 in 1969-70, showing an increase of 13.42 per cent. The number of students enrolled in these schools has gone up from 120,691 in 1961-62 to 163,042 in 1969-70 indicating an increase of 35.09 per cent. The number of primary school teachers has gone up from 2,967 in 1961-62 to 4,222 in 1969-70 showing an increase of 42.30 p.:!r cent. Out of a total enrolment of 163,042 pupils in primary schools in 1969-70, 38.65 per cent were girls.
994 or 79 08 per cent of the total villages in the district have primary sch()ols (1970-71). There is no taluka in the district where all the villages have primary schools. In Anklesvar, Hansot, Bharuch, Jambusar, Amod, Vagra and Valia talukas, more than 90 per cent of the villages have primary schools. About 55 per cent of tbe villages of Dediapada and 44 per cent of the
Sagbara taluka are yet to be provided with primary schools. The proportion of single teacher schools to total schools in the district during 1970-71 was 40.51 per cent. The proportion of such schools is more in Nandod, Jhagadia, Dediapada and Sagbara talukas. There is one primary school per every 7.35 km.\! of rural area Talukawise variation is considerable in this regard. the minimum ( 4.99 km.2 ) being in Valia taluka and maximum ( 12.80 km.1I ) being in Vagra taluka. The proportion of pupils per 1,000 popUlation which was 119.25 in 1960-61 has gone up to 129 in 1970-71. There are large variations between the talukas in this regard also. The talukas below the district average are Anklesvar, Nandod, Jhagadia, Valia, Dediapada and Sagbara. Dediapada taluka being lowest on the ladder. The average number of scholars, per school, which was 93.40 in 1960-61 has gone up to 118 in 1970-71. The talukas below this average are Nandod, Jhagadia, Valia, Dediapada and Sagbara. The number of pupils per teacher in the primary schools has gone down from 39.94 in 1960-61 to 35 in 1970-71. This proportion in talukas is quite even except in Anklesvar, Nandud and Amod where there are 25, 42 and 49 students per teacher respectively. In most of the talukas it ranges from 30 in Bharuch taluka to 35 in Jambusar, Vagra, Valia and Sagbara talukas.
The number of secondary schools has increased from 57 in 1961-62 to 110 in 1969-70. The number of teachers has also increased. The number of students in the Secondary schools has almost doubled from 15,523 students in 1961-62 to 30,952 in 1969-70.
34
Bharuch and Rajpipla were the only centres for secondary school certificate examination till 1962. In 1963 Anklesvar centre was opened and Jambusar centre was opened in 1966. Thus at the end of 1970 there were 4 centres in the district. Of these Bbaruch and Rajpipla are the only centres for both March and October examinations. Duriog 1961, 2,680 students appeared at the S. S. C. Examination. Of these 981 or 36.61 per cent students were successful. During 1970 the number of students appearing increased by 3,909 to 6,589 and that of successful studeots by 1,760 to 2,741. The proportion of successful candidates was 41.60, tbe highest during the decade. The number of students appearing at and the numbers passing the S. S. C. Examination are given in the fonowing table:
TABLE F.19
Results 0 S. S. C. Examination in the District
No. of students Percen tage of ------------ successful Year Appeared Passed candidates
1 2 3 4
1961 2,680 981 36.61
1962 3,334 ],207 36.20
1963 3,829 1,371 35~81
1964 4,l3S 1,479 35.77
1965 5,312 2,049 38.57
1966 5,584 2,182 39'.08
1967 6,148 2,328 37.87 1968 7,047 2,547 36.14
1969 6,563 2,581 39.43
J970 6,S89 2,741 41.60
There was only one college in Bharucb district as on 31-3-1961 (excluding graduates, basic training centre at Rajpipla). There is an addition of 5 colleges during the last decade. Thus at the end of march 1971 there were in all 6 colleges in the district, Of these, 3 colleges are in Bharuch, two in Rajpipla and one in Jambusar. There is also a Polytechnic in Bharuch. Of the three colleges in Bharuch town, one provides higher education in commerce, the other in law and the third in arts and science faculties. Rajpipla has one arts and science college and one Government Ayurved and Pharmacy college affiliated to the Gujarat Ayurved University. The college at Jambusar has arts and commerce branches of higher education. An tbese colleges except the Ayurved and Pharmacy college are affiliated to the South Gujarat University.
17. Medical and Public Health
(i) Medical Institutions
There were 2 allopathic hospitals and 21 dispensaries in 1960. There is an addition of 1 hospital and 2 dispensaries during the last decade. The number cf beus in these hospitals has increased from \52 in \96()
to 193 in 1970 showing an increase of 26.97 per cent. The number of indoor and outdoor patients treated in these units has increased from 3,466 and 97,367 respectively in 1960 to 7,559 and 209,009 respectively
in 1970.
The number of ayurvedic dispensaries in the district has increased from 1 in 1961 to 2 in t 971. The number of outdoor patients has increased from 910 in 1961 to 10,531 in 1971.
35
There were 13 Primary health centres in the district at the end of 1966-67. Their number increased by one in 1968-69, after whicb there is no increase. The number of rural dispensaries which was 186 in 1966-67 increased by 18 to 204 in 1969-70. The number of patients treated io these institutions rose from 254,674 in 1966-67 to 323,621 in 1969-70 indicating an increase of 27.07 per cent during this period. There are two maternal and child health centres in the district since 1966-67. The number of family planning centres in 1966-67 was 14. Their number increased by 2 to 16 io 1967-68. But it declined by 2 to 14 in 1968-69. In 1969-70 also there were 14 such centres. The number of persons benefitted from these centres rose from 6,031 in 1966-67 to 8,561 in lS69-70.
(ii) Public health activities
Among various public health schemes small POK
vaccination and revaccination and B.C.G. vaccination are very important. Outing 1961,27,518 children were treated with primary smail pox vaccination and 283,988 persons were revaccinated. The number of children treated with primary vaccination in 1970 was 46,389 and 50,888 persons were revaccinated. The data regarding B.C.G. vaccination reveals that 6 of the 1l talukas of the district were covered by B.C.G. vaccination programme in 1970 and in all 44,541 persons were vaccinated.
(iii) Vital Statistics
Based on the registration data the birtb rate in rural areas which was 35.9 per 1,000 population has shown a declining trend during the last decade and during 1970 this figure stood at 30.6. In urban areas the birth rate in 1961 which was 44.3 has al~o shown a steady declining trend and during 1970 it stood at 39.4. For all these years the birth rate in urban areas has been higber than that in rural areas. The data regarding female births per t ,000 males indicate tbat the male births are more than the female births in all these years both in rural as well as urban areas.
The death rate in rural areaS has declined from 15.0 in 1961 to 10.9 in 1970, though a lower death rate than this is observed during 1968 when it was 10.1 per 1,000 population. The death rate in urban areas has however shown an increasing trend during the decade from 11.8 in 1960 to 12.3 in 1970.
(iv) Causes of deaths
Examination of the cause of deaths shows that there are stray cases of small pox and cholera. Small pox is almost eradicated as will' be evident from the fact that 67 deaths due to small pox were reported during 1961, whereas during 1970 only 10 cases of deaths due to this disease were reported. The number of deatbs due to Cholera decli ned from 9 in 1961 to I in 1970. 'Fever' continues to be the single most important cause of deaths throughout the decade. There is a considerable decline in the number of deaths due to respiratory diseases. From 1,764 deaths due to this disease in 1961 the number has gradually come down to 340 in 1970. Similarly the deaths due to dysentery and diarrhorea have come down from 239 in 1961 to 161 in 1970. The deaths due to wounding or accidents have also shown a declining trend during the decade. As against 246 deaths in 1961, the deaths due to this reason in 1970 numbered 184.
18. Agrarian reforms and agrarian developments
(i) Reforms
Originally the Bharuch District consisted of, in addition to the Ryotwari lands and villages, the following special land tenures.
(1) Personal Inam (2) Talukdari (3) Bhagdari and Narvadari (4) Jagir (5) Miscellaneous alienations (6) Devastban lnam (7) Hereditary watan lands (8) Pragana and Kulkarni watan (9) Bandhi jama, udhad and ugadia tenure
(10) Sagbari and Mevasi estates
The erstwhile Bombay state as well as GujanJt State has enacted as many as 29 Terlure Abolition Laws abolishing all the intermediary tenures during 1949 to 1969. All the lands in the Bharuch District have now become Ryotwari Lands and tbe holders tbereof have directly become liable to pay land revenue to Government and direct relations between the holders of lands and Government, bave now been established. The scheme of the Tenure Abolition Laws of Gujarat provides not only for the abolition of tenures but also for the upgrading the tenant-cultiva-
tors to the status of oc~upants with or without payment of occupancy price according to the nature of occupancy rights enjoyed by them. Wherever the Tenure Abolition Law does not provide for conferment of occupancy rights on any holder, the holder has an opportunity of obtllining purchase rights over the land held by him under the compulsory purchase provision of the BJmbay Tenancy and Agricultural Lands Act, 1948. Thus no holder of land under any of the intermediary tenures already abolished is left without an opportunity of securing occupancy rights.
36
The holders directly become occupants and whatever liability of Occupancy price rests on them is recorded as a liability in tbe record of rights, wbere be is recorded as an occupant. The implementation of the Abolition Laws is tbus simple and ql:lick so far as conferment of occupancy right& is concerned. Tbe number of persons who have become occupants under tbe various, Tenure Abolition Laws and the area of ldod acquired by them in Bharuch district is not separately available. But as many as 10.21 lakh persons have become occupants of 103.60 lakh acres of land and as many as 507,941 intermediaries have been abolished in the whole State. Total villages covered under these laws are 12,121 and the total area covered is 143.80 1akh acres in tbe State.
As regards the tenancy reforms the beginning was made as early as in 1939 when the first Tenancy Act had been enacted in the former Bombay State. Subsequently, the Act was replaced by the present comprehensive legislation in 1948. Tbis too was subsequently amended in 1955-56, when the tiller's day provisions were incorporated in the Act. By tbat provisiun, all the tenants were deemed to have purch3sed tbe lands held by them on lease from their landlords, on the first day of April 1957 (referred to as "tiller's day" ).
The revenue machinery who bad to implement tbe Act bad only to fix the purchase price within the limit of 20 times to 200 times the assessment of the land. Under the compulsory purcbase provision of the Tenancy Act, as many as 7.72 lakh tenants have acquired purchase rights over more than 24.59 laku acres of land in the whole State. These figures relate up to 30-6-70. Separate figures for Bharuch district are not available.

Under the provisions of the Tenallcy Act no land owner can resume the land from his tenant except under an· order of a Mamlatdar. Taking of possession by the landlord directly from his tenant is therefore statutorily prohibited. However under the following circumstances a land owner can apply to the mamlatdar for resumption of his lands 0) A tenant can surrender his tenancy rights by surrendering his interest there~n in favour of the landlord. Such surrenders have to be registered and also to be verified by
tbe mamlatdar ·before permitting the landlord to act upon them. Now after the compulsory purchase provision, there is no scope left for securing lands by surrenders as all the tenants have become purchasers and their purchase price has also been fixed. Tenancy relations however subsist in the case of tenants of the exempted .categories of landlords. The exempted categories of the landlords are widows, minors, persons with mental and physical disability and the members of the armed forces. Their tenants have not become deemed purchasers because their landlords are placed in the exempted categories and only in case of these tenants there is a possibility of surrender. UPIO 30-6-1970, 43 cases of surrender have been sanctioned which covered 611 acres of land in Bharuch District.
(2) A landlord can also apply for resumption of land jf his tenant has failed to pay the rent of any revenue year within the stipulated period or that the tt:nant has sub-divided, sub-let, or assigned the land in contravention of the provisions of the Act, or has failed to cultivate tbe land personally or has done any act which is destructive 'or permanently injurious to the lalld. Such types of cases would also be very few in number, because as stated earlier most of the tenants have now become purchasersowners of tbe lands Upto 30-6-1970 384 cases of such types have been registered and the total land resumed under this category is 1,094 acres.
(3) At the time when the Tenancy Act was enacted in 1948, the land owner were given an opportunity to apply for possession of the lands for nonafide persl)nal cultivation, subject to fulfilment of certain conditions. The time limit for making such an application expired on 31-12-1956. Thereafter again by an amendment in the Act, the small Jand owners,
37
whose income did not exceed Rs. 1,500 and whose leased holding did not exceed an economic holding, were given an opportunity to apply for possession of the lands for bonafide personal cultivation subject to certain conditions. The last date for making such an application was 31-3-1962 which has expired. Total number of cases registered under this section in the district are 1,076. The figures of area involved in these suits are not available.
Special Agricultural Lands Tribunals were appointed in each taluka for implementation of the provisions of the tenancy legislation. The jurisdiction of the Civil Courts is barred under the provisions of the Act. There have thus been lesser delays and fewer litigations in regard to tenancy matters.
(ii) Security of tenancy
There is a provision made in the Tenancy Act, for security of tenancy. Under section 29(2) of the Act, no land owner can take direct possession of the land from the tenant. Whenever a landlord wants to take possession of the land from his tenant, he has to make an application to the Mamlatdar stating the grounds on which he is entitled to possession. Mamlatdar after holding an inquiry pass such order thereon as he deems fit. Provision is so strict that even if a tenant relinquishes the land, the land owner cannot take possession of it, except under an order of a mamlatdar. There cannot therefore be any dispute relating to security of tenancy. The legal provision made in section 29 of the Act have succeeded in giving complete security of the tenure.
If a tenant is illegaly dispossessed by his landlord, then he can apply for restoration of possession, to the mamlatdar and if the tenant's c1ilim for restoration of possession is proved to be right then the roamlatdar restores possession to bim.
There is another provision made in section 4 B of the Tenancy Act which prohibits termination of
tenancy by efflux of time. No tenancy of any land can therefore be terminated merely on the ground that the period fixed by agreement, or usage for its duration has expired. The scheme of the Act is such that once a person becomes a tenant of the land, his tenancy cannot be terminated at the sweet will of the landlord. It can be terminated only under
certain circumstances and that too by an order of a mamlatdar.
(iii) Security of share cropper and dispute about share and terms and conditions of c~ltivation by share cropper.
There is no share cropping system prevalent in Gujarat. Cash rent is prescribed for each parcel of land. The terms and conditions of cultivation are also prescribed. It is not a matter to be agreed upon between the tenant and a land owner. It is legally provided by a statute. Under section 8 of the Tenancy Act, maximum and minimum limit of rent has been fixed. Such rent is not to exceed five times the assessment of the land or rupees 20 per acre whichever is less and shall not be less than twice the assessment of the land, provided that where the amount equal to twice tbe assessment exceeds the sum of twenty rupees, the rent shall be twice the assessment of the land. The mamlatdar in accordance with the above provision has to fix the cash amount of rent for each parcel of land within his jurisdiction. Accordingly cash rent has been fixed for each parcel of land by Mamlatdars. If any land owner recovers rent in exceeds of the rent fixed by law he has to refund the excess amount togetherwith the compensation to the tenant as may be determined by the mamlatdar. He is also liable to certain penalty prescribed by rules. As regards terms and conditions of cultivation, it is provided in the Tenancy Act that (0 the landlord is not liable to make any contribution towards thl! cost of cultivation. (2) The tenant is liable to pay the land revenue and certain other cesses (3) Landlord shall not levy any cess, rate, vero, huk or tax, or service of any discriptioD or denomination whatsoever other than rent fixed by law from his tenant. (4) Whenever from
any cause the payment of land revenue is suspended or remitted, wholly or partially, the landlord has to suspend or remit, wholly or partially, as the case may be the rent of land, lawfully payable to him by his tenant.
As observed earlier most of the tenants have become owners of the lands cultivated by them by virtue of the tiller's day provision made in the Tenancy Act. Very few tenants now remain as tenants. It may be that by mutual understanding crop sharing
38
system may be prevailing in some cases, but their percentage will probably be very less. Such cases mostly do not come to light because of mutual understanding between the parties. There may be some cases in which the names of tenants may not have been entered in the record of rights in order to save the Jand frDIll deemed purchase.
(iv) Service tenure including commutation of rent in service to cash
There is no service tenure existing in the Gujarat State. Gujarat State has passed as many as 29 Tenure Abolition laws abOlishing all the tenures including service tenure. Most of the above laws have been passed before 1961. Since there is no service tenure existing in the whole of the Gujarat State, the question of commutation of rent in service to cash does not arise.
(v) Commutation of rem in kind to cash
In Gujarat the rent in kind is prohibited. Cash rent has been fixed for eacb parcel of land. Under section 9 of the Tenancy Act, the mamlatdar has to fix the rate of rent payable by a tenant for the Jease of different classes of land in each village within his jurisdiction. Accordingly the rate of cash rent has been fixed and notified by all the mamlatdars for each class of land in all tbe villages. There is therefore no question of commutation of rent in kind to cash.
(vi) Rent disputes
As observed earlier cash rent has been notified for all villages anil for all types of land under the provisions of the Tenancy Act. Such rent can be enhanced or reduced by the mamlatdar or the Collector only on an application made to him by the land owner or the tenant. Reduction in rent can be made when there is deterioration of the land by flood or other cause beyond the control of the tenant and the land has been wholly or partially rendered unfit for cultivation. The enhancement in the rent has to be made wben there is any improvement made in the land at the expense of tbe landlord and thereby there is an increase in tbe agricultural produce of the land. The disputes regarding quantum of rent would be fare because cash rent has been fixed statutorily
for each land and no enhancement or reduction can
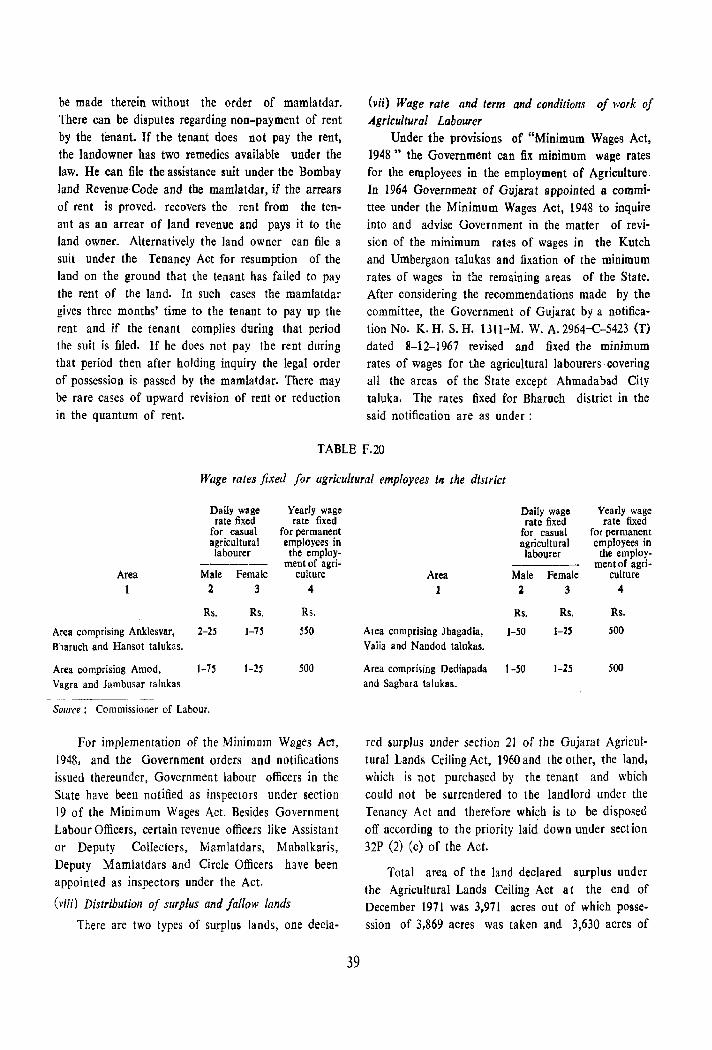
be made therein without the order of mamlatdar. There can be disputes regarding non-payment of rent by the tenant. If the tenant does not pay the rent, the landowner has two remedies available under the law. He can file the assistance suit under the Bombay land Revenue Code and the mamlatdar, if the arrears of rent is proved. recovers the rent from the tenant as an arrear of land revenue and pays it to the land owner. Alternatively the land owner can file a suit under the Tenancy Act for resumption of the land on the ground that the tenant has failed to pay the rent of the land. In such cases the mamlatdar gives three months' time to the tenant to pay up the rent and if the tenant complies during that period the suit is filed. If he does not pay the rent during that period then after holding inquiry the legal order of possession is passed by the mamlatdar. There may be rare cases of upward revision of rent or reduction in the quantum of rent.
(vii) Wage rate and tum and conditions of work of Agricultural Labourer
Under the provisions of "Minimum Wages Act, 1948" the Government can fix minimum wage rates for the employees in the employment of Agriculture. In 1964 Government of Gujarat appointed a committee under the Minimum Wages Act, 1948 to inquire into and advise Government in the matter of revision of the minimum rates of wages in the Kutch and Umbergaon ta1ukas and fixation of the minimum rates of wages in the remaining areas of the State. After considering the recommendations made by the committee, the Government of Gujarat by a notification No. K. H. S. H. 1311-M. W. A. 2964-C-5423 (T) dated 8-12-1967 revised and fixed the minimum rates of wages for the agricultural labourers covering all the areas of the State except Ahmadabad City taluka. The rates fixed for Bharoch district in the said notification are as under :
TABLE F.20
Wage rates fixed for agricultural employees ill the district
Daily wage Yearly wage rate fixed rate fixed
for casual for permanent agricultura I employees in labourer the employ-
------ ment of agri-Area Male Female culture
2 3 4
Rs. Rs. Rs.
Area comprising Anklesvar, 2-25 1-75 550 Bharuch and Hansot talukas.
Area comprising Amod, 1-75 1-25 500 Vagra and Jambusar talukas
Source: Commissioner of Labour.
For implementation of the Minimum Wages Act, 1948, and the Government orders and notifications issued thereunder, Government labour officers in the State have been notified as inspectors under section 19 of the Minimum Wages Act. Besides Government Labour Officers, certain revenue officers like Assistant or Deputy Collectors, Mamlatdars, Mahalkaris, Deputy Mamlatdars and Circle Officers have been appointed as inspectors under the Act.
(viii) Distribution of surplus and fallow lands
There are two types of surplus lands, one decla-
39
Daily wage Yearly wage rate fixed rate fixed
for casual fOI permanent agricultural employees in labourer the employ-
------ ment of agri-Area Male Female culture
1 2 3 4
Rs. Rs. Rs.
Alea comprising Jhagadia, 1-50 1-2S 500 Valia and Nandod talukas.
Area comprising Dediapada 1-50 1-25 500 and Sagba! a talukas.
red surplus under section 21 of the Gujarat Agricultural Lands Ceiling Act, 1960 and the other, the land. which is not purchased by the tenant and which could not be surrendered to the landlord under the Tenancy Act and therefore which is to be disposed off according to the priority laid down under sect ion 32P (2) (c) of the Act.
Total area of the land declared surplus under the Agricultural Lands Ceiling Act a t the end of December 1971 was 3,971 acres out of which possession of 3,869 acres was taken and 3,630 acres of
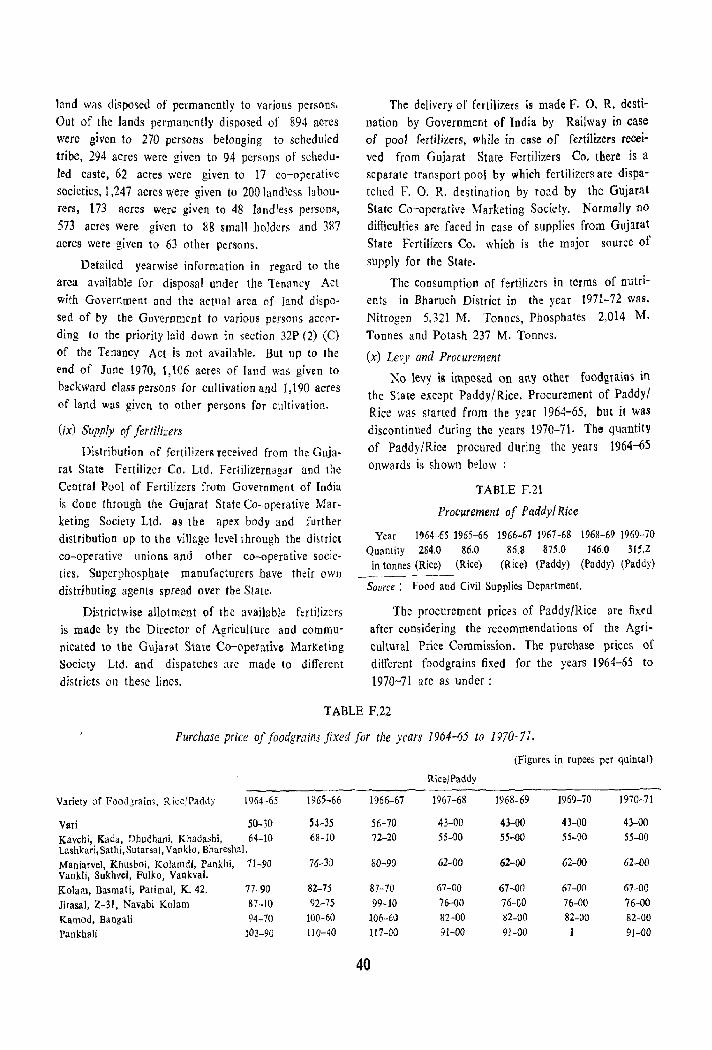
land was disposed of permanently to various persons. Out of the lands permanently disposed of 894 acres were given to 270 persons belonging to scheduled tribe, 294 acres were given to 94 persons of scheduled caste, 62 acres were given to 17 co-operative societies, 1,247 acres were given to 200 landless labourers, 173 acres were given to 48 landless persons, 573 acres were given to 88 small holders and 387 acres were given to 63 other persons.
Detailed yearwise information in regard to the area available for disposal under the Tenancy Act with Governmrnt and the actual area of land disposed of by tbe Government to various persons according to the priority laid duwn in section 32P (2) (C)
of the Tenancy Act is not available. But up to Ihe end of June 1970, 1,106 acres of land was given to backward class persons for cultivation and 1,190 acres of land was given to other persons for cultivation.
(ix) Supply of fertilizers
Distribution of fertilizers received from the Gujarat Slate Fertilizer Co. Ltd. Fer!ilizernagar and the Central Pool of Fertilizers from Government of India
is done through the Gujarat State Co-operative Marketing Society Ltd. as the apex body and further distribution up to the village level through the district co-operative unions and other co-operative societies. Superphosphate manufacturers have their own distributing agents spread over the State.
Districtwise allotment of the available f~rtjlizcrs
is made by tbe Director of Agriculture and communicated to the Gujarat State Co-operative Marketing Society Ltd. and dispatches are made to different districts Oll these lines.
The delivery of fertilizers is made F. O. R. destination by Government of India by Railway in case of pool fertilizers, while in case of fertilizers received from Gujarat State Fertilizers Co. there is a separate transport pool by which fertilizers are dispatched F. O. R. destination by road by Ihe Gujarat State Co-operative Marketing Society. Normally no difficulties are faced in case of supplies from Gujarat State Fertilizers Co. which is the major source of supply for the State.
The consumption of fertilizers in terms of nutrients in Bharuch District in the year 1971-72 was, Nitrogen 5,321 M. Tonoes, Phosphates 2,014 M. Tonnes and Potash 237 M. Tonnes.
(x) Levy and Procurement
No levy is imposed on any otber food grains in the State except Paddy/Rice. Procur~ment of Paddy/ Rice was started from the year 1964-65, bUt it was discontinued during the years 1970-71. The quantity of Paddy/Rice procured during the years 1964-65 onwards is shown below :
TABLE F.21
Procurement of Paddy/ Rice
'{ear 1964-65 1965-66 1966-67 1967-68 1968-69 1969-70 Quantity 284.0 86.0 86.8 875.0 146.0 m.Z in Icnnes (Rice) (Rice) (Rice) (Paddy) (Paddy) (Paddy)
SOI/ree: Food and Civil Supplies Department.
The procurement prices of Paddy/Rice are fixed after considering the recommendations of the Agricultural Price Commission. The purchase prices of different foodgrains fixed for the years 1964-65 to 1970-71 are as under;
TABLE F.22
Purchase price of foodgrains fixed for the years /964-65 to 1970-71.
(Figures in rupees per quintal)
Rice/paddy
Variety of Foodjraim, Rice/Paddy 1964-65 1965-66 1966-67 1967-68 1968-69 1969-70 1970-71
Vari 50-30 54-35 56-70 43-00 43-00 43-00 43-00 Kavchi, Kada, Dhudhani, Khadashi, 64-10 68-10 72-20 55-00 55-00 55-00 55-00 Lashkari, Sathi, Sutarsal, Van kl 0, Bhareshal. Maniarvel, Khusboi, Kolamdi, Pankhi, Vankli, Sukhvel, Fulko, Vankval.
11-90 76-30 80-90 62-00 62-00 62-00 62-00
Kolam, Basmati, Pari mal, K.42. 77-90 82-75 87-70 67-00 67-00 67-00 67-00 Jirasal, Z-31, Navabi Kolam 87 ·10 92-75 99-10 76-00 76-00 76-00 76-00 Kamod. Bangali 94-70 100-60 106-6\l 82-00 »2-00 82-00 82-00 Pankhali 103-90 ]]0-40 117-00 91-00 91-00 1 91-00
40
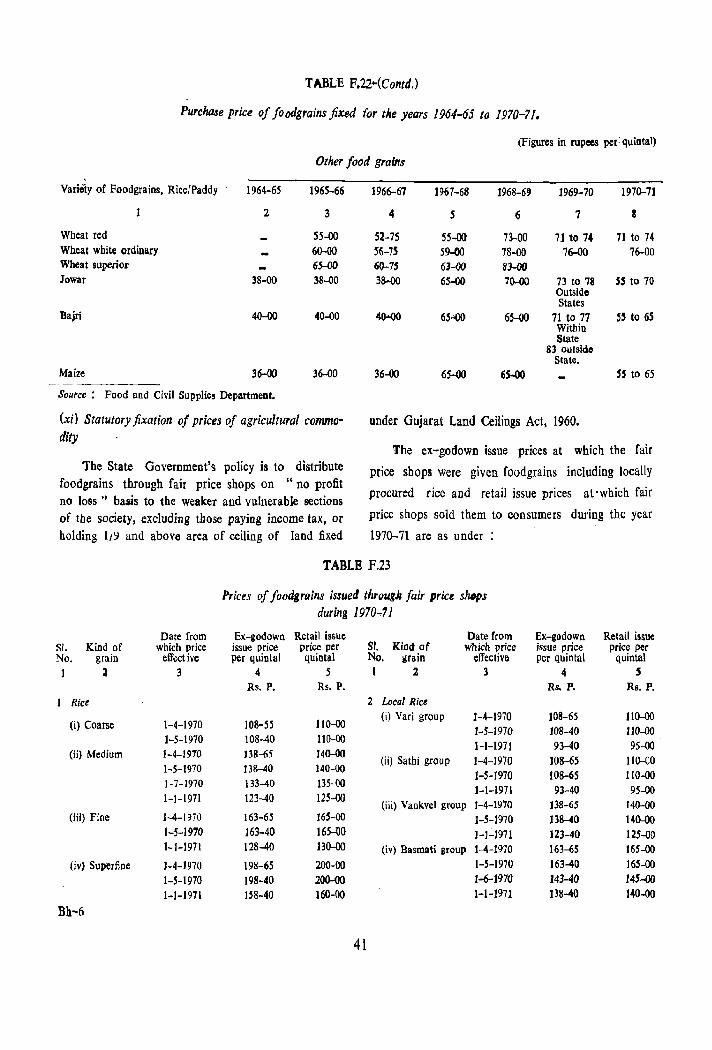
TABLE F.22"(Contd.)
Purchase price of footigrains fixed for the years 1964-65 to 1970-71.
(Figures in rupees per: quintal)
Other food grains
Variety of Foodgrains, Rice/Paddy 1964-65 1965-66
2 3
Wheat red 55-00 Wheal white ordinary 60-00 Wheat superior 65-00 lowar 38-00 38-00
Bajri 40-00 40-00
Maize 36-00 36-00
Source: Food and Civil Supplies Department.
(xi) Statutory fixation of prices of agricultural commo· dity
The State Government~s policy is to distribute foodgrains through fair price shops on "no profit no loss" basis to the weaker and vulnerable sections of tbe society, excluding those paying income tax, or holding 1/9 and above area of ceiling of land fixed
1%6-67 1967-68 1968-69 1969-70 1970-71
4 5 6 7 8
51-75 55-00 73-00 71 to 74 71 to 74 ~6-7S 59-00 78-{)0 76-00 76-00 60-75 63-00 83-00 38-00 65-00 70-00 73 to 78 55 to 70
Outside States
40-00 6S':'()() 65-00 71 to 17 S5 to 6S Within State
83 outside State.
36-00 65-00 6S"'()() 55 to 6S
under Gujarat Land Ceilings Act, 1960.
The ex-godown issue prices at which the fair
price shops were given foodgrains including locally
procured rice and retail issue prices at ·which fair
price shops sold them to consumers during the year
1970-71 are as under
TABLB F.23
Date from SI. Kind of which price No. grain eff~ctive
1 l 3
Rice
(i) Coarse 1-4-1970 1-5-1970
(ii) Medium 1-4-1970 1-5-1970 J -7-1970 1-1-1971
(iii) Fine 1-4-1970 1-5-1970 1-1-1971
(jv) Superfine 1-4-1970 1-5-1970 1-1-1971
Bh-6
Prices of foodgrains issued througn fair price sMps during 1970..,71
Ex-godown Retail issue Date from issue price price per SI. Kind of which price per quintal quintal No. grain effective
4 5 1 2 3 Rs. P. Rs. P.
2 Local Rice
110-00 (i) Vari group ]-4-1970
108-55 1-5-1970
108-40 110-00 1-1-1971
138-65 140-00 (ii) Sathi group 1-4-1970
138-40 140-00 1-5-1970
133-40 135-00 1-1-1971
123-40 125-00 (iii) Vankve1 group 1-4-1970
163-65 165-00 1-5-1970 163-40 165-UO 1-1':'1971 128-40 130-00 (iv) Basmati group 1--4-1970
198-65 200-00 }-S-1970
198-40 2O<HJ0 1-6-1970 158-40 160-00 1-1-1971
41
Ex-godown Retail issue issue price price per per quintal quintal
4 5 Rs. P. Rs. P.
108-65 110-00 108-40 110-00 93-40 95-00
J08-65 110-00 108-65 110-00 93-40 95-00
138-65 140-00 138-40 140-00 123-40 125-00 163-65 165-00 163-40 165-00 143-40 145-00 138-40 140-00

TABLe F.23-(Conld.)
Prices (If foodgrains issued through fair price shops during }970-71
Date from Retail issue Date from Retail issue SI. Kind of which price
Ex-godown issue price price per SI. Kind of which price
Ex-godown issue price price per
No. grain effective per quintal quintal 1 I 3 4 S
Rs. P. Rs. P.
(v) Jirasal group 1-4-1970 163-65 165-00 1-5-1970 163-40 165-()O l-l-U71 J58-40 160-00
(vi) Kamod group 1-4-1970 198-65 200-00 1-5-1970 198-40 200-00 1-6-1970 183-40 185-00 1-1-1971 ]63-40 165-00
(vii) Pankhali group ]-4-]970 198-65 200-00 1-5-1970 ]98-40 200-00 1-6-1970 )83-40 18'-00 1-1-1971 178-40 180-00
3 Wheal
(i) O. S. Red. 1-4-1970 86-65 81-00 White and Indigenous
(ii) O. S. Red, 1-5-1970 86-40 88-00 White and Mexican
(iii) Dara and 1-5-J970 88-40 90-00 Superior
Source: Food :and Civil Supplies Department.
The Government purchase the edible oilfoilseeds
from the open market. Distribution of edible oil is
made at the subsidised rate, which are lower than
the economic price, as well as the market price. The
pricing policy of Government is same throughout the State.
No. grain effective per quintal quintal t :I 3 , I
4
5
6
7
Is.P. Rs. P.
(iv) Amber coloured 3-5-1970 92-40 94-00 indigenous
(v) O. S. Red and 1-6-1970 83-40 85-00 Mexican
(vi) O. S. White 1-6-1970 86-40 81-00
(vii) Amber coloured 1-6-1970 92-40 94-00 indigenous
(viii) O. S. Red and 2-11-1970 7~40 78-00 White and indio geDous Red
(ix) Amber colour· 2-11-1970 33-40 85-00 eu indigenous
Milo ]-5-1970 57-40 59-00
Maize 1-5-1970 68-40 70-00
Bajro 1-5-1970 73-40 7S-00 17-10-1970 53-40 55-00
lowar
(i) N. P. Jowar 1-5-1970 78-40 80-00
(ii) U. P. Jowar 1-5-J970 68-40 70-00
(xii) Rationing
There is no statutory rationing in the State. But
Government distributes food grains through fair price
shops to weaker and vulnerable sections of tbe soci
ety on the basis of "no profit no loss". The number
of fair price shops in the district is given below :
TABLE F.24
Number of Fair Price shops functioning in the district
As on 31·12·70 ------------------Name of
district 1
Bharuch
Co-opera· live 2
165
Pancha· prj. yat vale 3 4
6 75
Source J Food and Civil Suppliel Department.
Others Total
S 6
246
42
As on 31·12·71 -----------..------Co·opera· Paneha- Pri. Others Total
tive yat vale 7 8 9 10 II
99 5 64 S 173
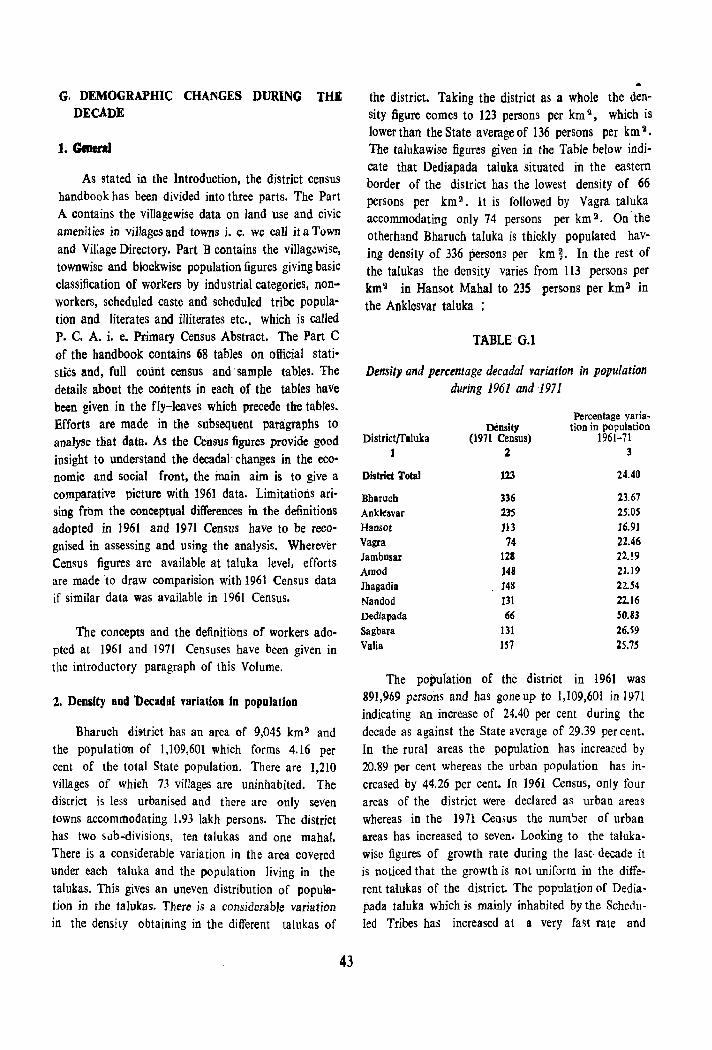
G. DEMOGRAPHIC CHANGES DURING THE DECADE
1. GeaeraI
As stated in the Introduction, the district census handbook has been divided into three parts. The Part A contains the village wise data on land use and civic amenities in villages and towns i. e. we call it a Town and Village Directory. Part B contains the villag.!wise, townwise and blockwise population figures giving basic classification of workers by industrial categories, nonworkers, scheduled caste and scheduled tribe population and literates and illiterates etc., which is called P. C. A. i. e. Primary Census Abstract. The Part C of the handbook contains 68 tables on official statistics and, full count census and· sample tables. The details about the contents in each of the tables have been given in the fly-leaves which precede the tabtes. Efforts are made in the subsequent paragraphs to analyse that data. As the census figures. provide good insight to understand the decadal· changes in the economic and social front, the main aim is to give a comparative picture with 1961 data. LimitatiotiS arising from the· conceptual differences in the definitions adopted in 1961 and 1971 Census have to be recognised in assessing and using the analysis. Wherever Census figures are available at taluka level, efforts are made ·to draw comparision with 1961 Census data if similar data was available in 1961 Census.
The concepts and the definitions of workers adopted at 1961 and 1971 Censuses have been given in the introductory paragraph of this Volume.
2. Density and 1>eeadal variation in population
Bharuch diittrict has an area of 9,045 km 2 and the population of 1,109,601 Which forms 4.16 per cent of the total State population. There are 1,210 villages of which 73 villages are uninhabited. The district is less urbanised and there are only seVen towns accommodating 1.93 lakh persons. The district has two sLlb..cdivisions, ten talukas and one mahal. There is a considerable variation in the area covered under each taluka and the population living in the talukas. This gives an uneven distribution of population in the talukas. There is a considerable variation in the density obtaining in the different talukas of
43
the district. Taking the district as a whole the density figure comes to 123 persons per km \I, which is lower than the State average of 136 persons per km 2.
The talukawise figures given in the Table below indicate that Dediapada talnka situated in the eastern border of the district has the lowest density of 66 persons per km 2 • It is followed by Vagra taluka accommodating only 74 persons per km \I. On' the otherhand Bharuch taluka is thickly populated having density of 336 persons per km~. In the rest of the talukas the density varies from 113 persons per km'J in Hansot Mahal to 235 persons per km II in the Anklesvar taluka :
TABLE OJ
DensitF and percentage decadal variation in population during 1961 and 1971
Percentage varia-Density tion in population
Districtrrlluka (l971 Census) 1961-71 1 :z 3
District Total 123 24.40
Bbaruch 336 23.67
Anklcsvar 235 25:05 Hanso! J13 16.9J Vagra 74 22.46 Jambusar 121 22.!9 Amod 148 21.19 Jbagadia 14!1 22.54
Nandod J3l 22.16 Dediapada 66 50,83
Sagbara 131 26.;9
Valia 157 25.75
The population of the district in 1961 was 891,969 persons and has goneup to 1,109,601 in 1971 indicating an increase of 24.40 per cent during the decade as against the State average of 29.39 per cent. In the rural areas the population has increafed by 20.89 per cent whereas the urban population has increased by 44.26 per cent. In 1961 Census, only four areas of the district were declared as urban areas whereas in the 1971 Cenms the number of urban areas has increased to seven. Looking to the taluka· wise figures of growth rate during the last· decade it is noticed that the growth is not uniform in the different talukas of the district. The population of Dediapada taJuka which is mainly inhabited by the Scheduled Tribes has increased at a very fast Tate and
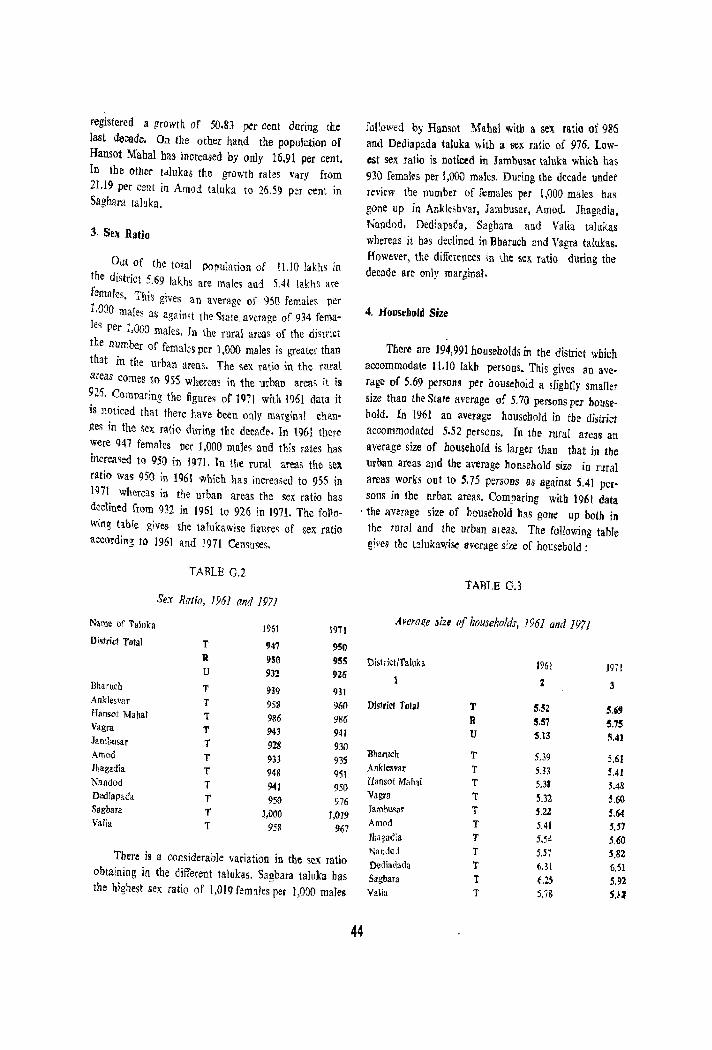
registered a growth of 50.83 per cent during the last de~ade. On the other haud the population of Hansot Mahal has increased by only 16.91 per cent. In the other talukas the growth rales vary from 21.19 per cent in Amod taluka to 26.59 p~r cent in Sagbara ta luka.
3. Sex Ratio
Out of (he total population of 11.10 lakhs in the district 5.69 lakhs are males an1 SAl lakhs are
femab. This gives an average of 9S0 females per LOao males as against the State average of 934 fema. les per 1,000 male>. In the rural areas of the district the number of females per 1,000 males is greater than that in the urban areas. The <sex ratio in the rllral areas comes to 955 whereas in the urban areas it is 926. Comparing the figures of I'm with 1961 data it is noticed that there have been only marginal chan. _ges in the sex ratio during tbe decade. In 1961 there were 947 fe.mal~s per 1,000 males and this rates has increased to 950 in In!. Tn the rural areas the sex ratio was 950 in 1961 which has increased to 955 in 1971 whereas in the urban areas the sex ratio flas declined from 932 in 1961 to 926 in 1971. The follo. witl!~ table gives the talukawise figures of sex ratio according to 1961 and 1971 Censuses.
TABLE G.2
Sex Ratio, 1961 and 1971
Name of Taluka 1961 1971 D j~!rict Total T 947 950
R 950 955 U 93l 9Ui
Bharucn T 939 931 Anklesvar T 95$ 96() HanSDt Mahat T 986 986 Vagra T 943 941 lam1:>usar T 928 930 AmDd r 933 935 Jhagadia T 948 951 Nandod T 941 950 Dooiapada T 95D \}76 Sagbara T J,OOO 1,0]9 Valia T 958 967
There is a considerable variation in tbe sel( ratio Obtaining in the different talukas. Sagbara taluka bas the bighest sex ralio of 1,019 femflles per 1,000 males
followed by Hansot Mahal with a sex ratio of 986 and Dediapada taluka with a sex ratio of 976. Lowest sex ratio is noticed in lambusar taluka which has 930 females per 1,000 males. During tbe decade undet review the number of females per 1,000 males bas gone up in Ankleshvar, Jambusar, Amod. Jhagaaia, Nal1dod, Dediapaoa, Sagbara and Valia talukas \vhereas it has declined in Bharucfl and Vagra talukas. However, the differences in the sell. ratio during the decade BTe only marginal.
4. Hopsebold Size
!bere are 194,991 households in the district which accommodate Il.I0 lakh persons. This gives an average of 5.69 persons per hOl:lsebold a srightly smaller size than the Stale average of 5.70 persons per bousehold. In 1961 an average household in tbe district accommodated 5.52 persons. In the rural areas an average size of houseflold is larger than tbat in tbe urban areas and the average hou&ehold size in Iural areas works out to 5.75 persons as against 5.41 persons in the urban areas. Comparing with 1961 data
. the average size of hOllsehold h,1S gone up both in the rural and the urban 81eas. The following table gives tbe talukawise average size of housebold :
TABLE 0.3
Average size oj households, 1961 and 1971
District/Tallika 1961 J97 !
2 3
Districl T IJtal T 5.52 S.6' R 5.57 S.7S U S.l3 5.41
Bharuch T 5.39 5.61 lInklesvar T 5.33 5.41 Hansot Mahal T 5.3S 5.48: Vagra T ~.32 3.60 JJ!mh\l~r T 5.22 5.64 Amod T 5.4' 5.57 Jbagac:a T 5.54 5.60 Nandoj T 5.57 '.82 Pediadada T 6.31 6.51 Sagbara T ~.25 5.92 Valia T 5.78 S.~3
44
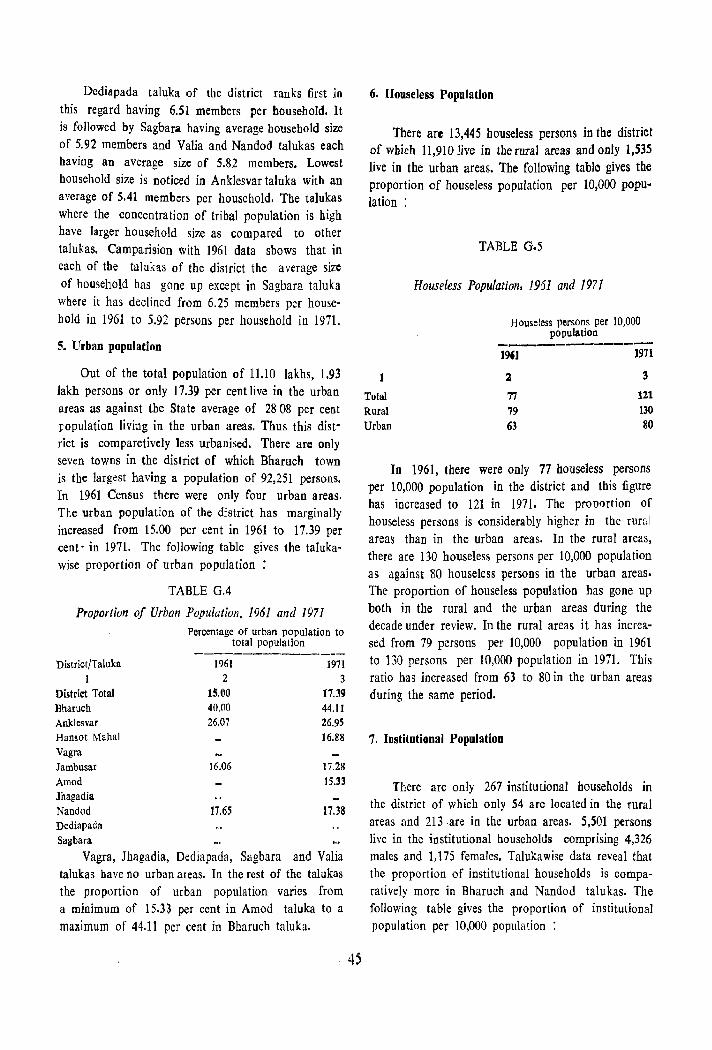
Dedillpada taluka of tbe district ranks first in this regard having 6.51 members per bousehold. It is followed by Sagbara baving average bousebold size of 5.92 members and Valia and Nandod talukas each baving an average size of 5.82 members. Lowest household size is noticed in Anklesvar taluka with an average of 5.41 members per household. The talukas where the concentration of tribal population is high have larger household size as compared to other talukas. Camparision with 1961 data shows that in each of the talukas of the district the average size of household has gone up except in Sagbara taluka where it has declined from 6.25 members per household in 1961 to 5.92 persons per household in 1971.
5. Urban population
Out of the total population of 11.10 lakhs, 1.93 lakh persons or only 17.39 per cent live in the urban areas as against the State average of 2808 per cent ropulation living in the urban areas. Thus this district is comparetively less urbanised. There are only seven towns in the district of which Bharuch town is the largest having a population of 92,251 persons. In 1961 Census there were only four urban areas. The urban population of the district has marginally increased from 15.00 per cent in 1961 to 17.39 per cent· in 1971. The following table gives the talukawise proportion of urban population
TABLE G.4
Proportion of Urban Population. 1961 and 1971 Percentage of urban population to
total population
District/Taluka 1
District Total Bharuch Anklesvar Hansot Mahal Vagra Jambusar AIDod Jhagadia Nandod Dediapada Sagbara
1961 1971 2 3
15.00 17.39 40.00 44.11 26.07 26.95
16.88
16.06 17.28 J5.33
17.65 17.38
Vagra, Jhagadia, Dediapada, Sagbara and Valia talukas have no urban areas. In the rest of the talukas the propurtion of urban population varies from a minimum of 15.33 per cent in Amod taluka to a maximum of 44.11 per cent in Bharueh talul::a.
45
6. Houseless Population
There are 13,445 houseless persons in the district of which 11,910 live in the rural areas and only 1,535 live in the urban areas. The following table gives the proportion of houseless population per 10,000 population :
Total
Rural Urban
TABLE G.S
Houseless Population, 1961 and 1971
Houseless persons per 10,000 population
----------------196]
:z 77 79 63
]911
3
121 130 80
In 1961, there were only 77 houseless persons per 10,000 population in the district and this figure has increased to 121 in 1971. The proportion of houseless persons is considerably higher in tbe rural areas than in the urban areas. In the rural areas, there are 130 houseless persons per 10,000 population as against 80 houseless persons in the urban areas. The proportion of houseless popUlation has gone Up both in the rural and the urban areas during the decade under review. In the rural areas it has increased from 79 persons per 10,000 population in 1961 to 130 persons per 10,000 popUlation in 1971. This ratio has increased from 63 to 80 in the urban areas during the same period.
7. Institutional Population
There are only 267 institutional households in the district of which only 54 are located in the rural areas and 213 ·are in the urban areas. 5,501 persons live in the institutional households comprising 4,326 males and 1,175 females. Talukawise data reveal that the proportion of institutional households is comparatively more in Bharuch and Nandod talukas. The following table gives the proportion of institutional popUlation per 10,000 population :
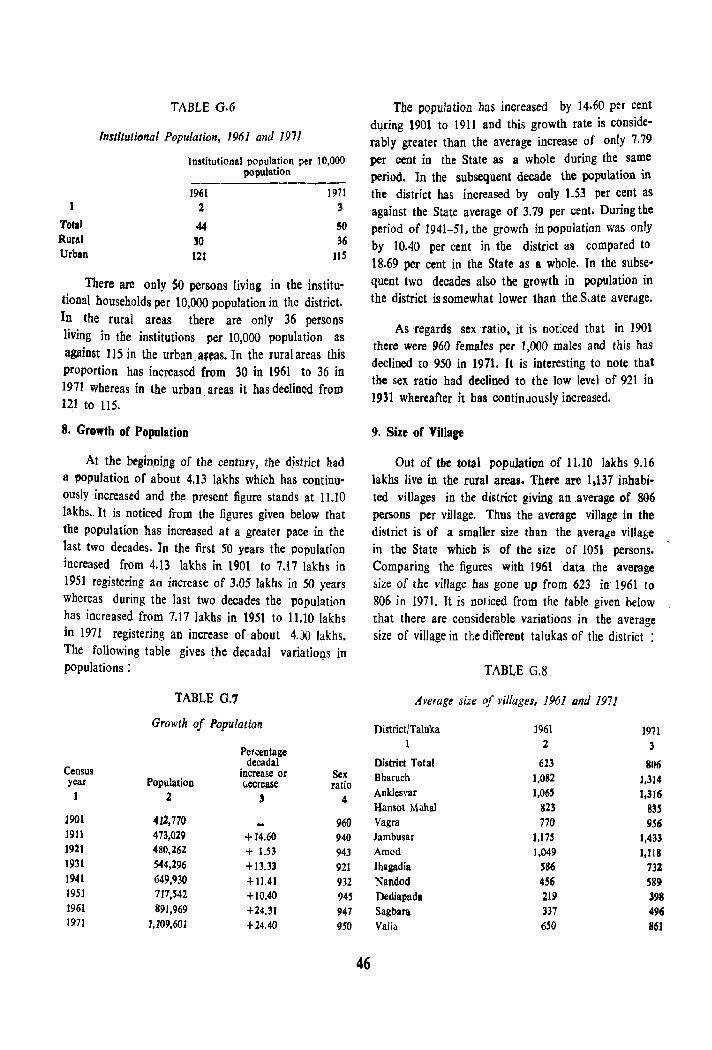
Total Rural Urban
TABLE G.6
Inslilutirmal Population, 1961 and 1971
Institutional population per 10,000 population
1961 1971 2 3
44 5Q
]0 36 121 115
There are only SO persons living in the institutional bouseholds per 10;000 population in the district. In the rural areas there are only 36 persons living in the institutions per 10,000 population as against 115 in the urbanJ!.f,as. In the rural areas this proportion has increased from 30 in 1961 to 36 in 1971 whereas in the urban. areas it has declined from 121 to llS.
8. Growth of PopulatioD
At the beginpipg of the century, the district had a population of about 4.13 lakhs which has continuously increased and th~ present figure stands at 11.10 lakhs. It is noticed from the figures given below that the population has increased at a greater pace in the last two decades. In the first 50 years the population increased from 4.13 lakhs in 1901 to 7.17 Iakhs in 1951 registering an increase of 3.05 lakhs in 50 years whereas during the last two decades the population has increased from 7.17 lakbs in 1951 to 11.10 lakhs in 1971 registering an increase of about 4.)0 lakhs. The following table gives the decadal variatioI;ls in populations:
TABLE G.7
Growth of Population
Percentage decadal
Census increase or Sex year Population tiecrc.ase ratio
1 2 , 4
1901 412,770 960 1911 473,{)29 +14.60 940 1921 480,262 + 1.53 943 1931 544,296 +]3.33 921 1941 649.930 + 11.41 932 1951 717,542 + 10.40 945 1961 891,969 +24.31 947 197J 1,109,601 +24.40 950
The PQPuJation has increased by 14.60 per cent during 1901 to 1911 and tbis growth rate is considerably greater than the average increase of only 7.79 per cent in the State as a whole during the same period. In the subsequent decade the population in the district has increased by only 1.53 per cent as against the State average of 3.79 per cent. During the period of 1941-51. tbe growth in population was only by 10.40 per cent in the district as compared to 18.69 per cent in the State as a whole. In the subse· quent two decades also the growth in population in the district is somewhat lower than theSmte averdge.
46
As regards sex ratio, it is noticed that in 1901 there were 960 females per 1,000 males and this has declined to 950 in 1971. It is interesting to note that the sex ratio had declined to the low level of 921 in 1931 whereafter it bas cODtin,lOusly increased.
9. Size of Village
Out of tbe total population of 11.10 lakhs 9.16 lakhs live in the rural areas. Thtre are 1.137 inhabited villages in the district giving an average of 806 persons per village. Thus the average village in the district is of a smaller size than the avera~e villa&il in the State which is of the size of 1051 persons. Comparing the figures with 1961 data the average size of the village has gone up from 623 in 1961 to 806 in 1971. It is noticed from the table given below that there are considerable variations in the average size of village in the different talukas of the district
TABLE G.8
Average size of villages, 1961 ana 1971
DistrictjTaluka 1961 J971 1 2 3
District Total 623 8.06 Bharuch ].082 1,314 AnklC5var 1,065 1,316 Hansol Mahal 823 83S Vagra 770 956 lambusar ],17S 1,433 Amod 1,049 1,118 Jhaa.adia 586 732 Nandod 456 589 Dediapad. 219 398 Sagbara 337 496 Valia 6'0 861
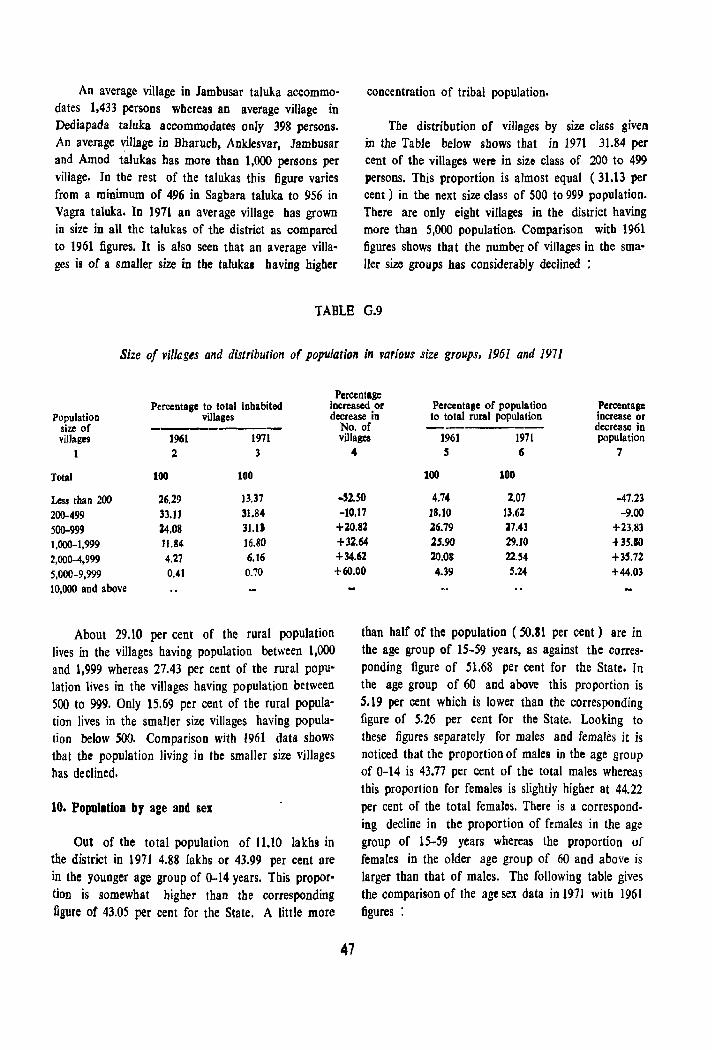
An average village in Iambusar taluka accommodates 1,433 persons whereas an average village in Dediapada taluka accommodates only 398 persons. An average village in Bharuch, Anklesvar, Jambusar and Amod talukas has more than 1,000 persons per village. In tbe rest of the talukas this figure varies from a minimum of 496 in Sagbara taluka to 956 in Vagra taluka. In 1971 an average village has grown in size in all the talukas of the district as compared to 1961 figures. It is also seen that an average villages is of a smaller size in the taluka! having higher
concentration of tribal population.
The distribution of villages by size class given in the Table below shows that in 1971 31.84 per cent of the villages were in size class of 200 to 499 persons. This proportion is almost equal (31.13 per cent) in the next size class of 500 to 999 population. There are only eight villages in the district having more than 5,000 population. Comparison with 1961 figures shows that the number of villages in the smaller size groups has considerably declined :
TABLE G.9
Size of villages and distribution of population in various size groups, 1961 and 1971
Percentage Percentage to total inhabited increased or Percentage of population Percentage
Population villages decrease in to total rural population increase or size of No. of decrease in villages J961 1971 villages 1961 1971 population
1 2 3 4 5 6 7
Total 100 100 100 100
Less tha n 200 26.29 13.37 ..,lJO 4.74 2.07 -47.23
200-499 33.11 31.84 -10.17 IS.to 13.62 -9.00
500-999 Z4.08 31.11 +20.82 26.79 37.43 +23.83
1,000-1,999 11.84 16.80 +32.64 25.90 29.]0 +35.10
2,000--4,999 4.27 6.16 +34.62 20.0S 22.S4 +35.72
5,000-9,999 0.41 0.70 +60.00 4.39 5.24 +44.03
10,000 and above
About 29.10 per cent of the rural population lives in the villages having population between 1,000 and 1.999 whereas 27.43 per cent of the rural population lives in the viUages having population between 500 to 999. Only 15.69 per cent of the rural population Jives in the smaller size villages having population below 500. Comparison with 1961 data shows tbat the population living in the smaller size villages has declined.
10. Population by age aod sex
Out of the total population of 11. to lakhs in the district in 1971 4.88 lakhs or 43.99 per cent are in the younger age group of 0-14 years. This proportion is somewhat higher than tbe corresponding figure of 43.05 per cent for the State. A little more
41
than half of the population (SO.81 per cent) are in the age group of 15-59 years, as against the corresponding figure of 51.68 per cent for the State. In the age group of 60 and above this proportion is 5.19 per cent which is lower than the corresponding figure of 5.26 per cent for the State. Looking to these figures separately for males and females it is noticed that the proportion of males in the age group of 0-14 is 43.77 per cent of the total males whereas this proportion for females is slightly higher at 44.22 per cent of the total females. There is a corresponding decline in tbe prOp6rtion of females in the age group of 1S-59 years whereas the proportion of females in the older age group of 60 and above is larger than that of males. The following table gives the comparison of the age sex data in 1971 witb 1961 figures :

TABLE G.IO
Percentage Distribution of population by broad age groups, 196] and 1971
Age group 1
Total
0-14 15-59
60 + Age not stated
]961 1971
Persons Males Females Persons Males Females 2 3 4 5 6 7
100 100 100 100 100 100
43.34 43.17 43.S2 43.99 43.77 44.22 52.66 52.85 52.46 50.81 51.01 50.52
3.99 3.96 4.01 5.19 5.14 5.25
0.01 0.02 O.ot O.ot 0.01 0.01
Tbe proportion of population in tbe younger age group of 0-14 has only marginally increased from 43.34 per cent of the total population in 1961 to 43.99 per cent in 1971. Whereas this proportion for the age group of 15-59 has considerably gone down from 52.66 per cent to 50.81 per cent during the decade. The proportion of population in the older age group of 60 and above has considerably gone up from 3.99 per cent in 1961 to 5.19 per cent in 1971.
11. Literacy
Out of the total population of 11.10 lakh per'sons in the district, about 3.96 lakhs are literate. Tbis gives an average literacy rate of 35.73 per cent which is only marginally below the State average of 35.79 per cent. Looking to the literacy rates separately for males and females, it is seen that the literacv among males is 46.41 per cent and among females it is only 24.49 per cent. These figures are nearer to the corresponding figures for the State which are 46.11 per cent for the males and 24.75 per cent for the females. Looking to these figures separately for the rural and urban areas it is seen that literacy rate in the rural areas is 31.85 per cent and in the urban areas it is 54.13 per cent. The literacy among males in tbe rural areas is 42.76 per cent as against 63.47 per cent in the urban areas. Similarly the proportion of literates among the rural females is 20.43 per cent as against 44.05 per cent in the urban areas. Comparison with 1961 figures shows tbat literacy has only marginally increased in the district during the last decade. The following table gives the talukawise figures of literacy :
TABLE G.ll
Literacy ( including 0-4 age group) in total, . rural and urban areas by 3ex, 1961 and 1971
Percentage of literates
-----------~--------1961 197J District/Taluka Persons Males Females Persoris Males Females
1 234 567
District Total T 34.26 46.39 21.44 R 31.40 43.64 18.50 U 50.47 61.87 38.24
Bharuch T 4'.72 59.89 32.70 R 43.78 58.Q7 28.52 U 49.64 62.54 38.75
Ar,klesvar T 40.43 52.21 28.13 R 36.58 48.64 24.08 U 51.33 62.22 39.75
Hansot Mahal T 41.65 55.43 27.61 R 41.65 55.43 27.61 U
Vagra R 35.93 51.00 19.94
Jambusar T 37.18 51.19 22.09 R 35.38 49.74 19.95 U 46.62 58.70 33.40
Amod T 41.33 54.39 27.33 R 41.33 54.39 27.33 U
JJ.agadia R 27.68 38.56 16.20
Nandod T 28.70 40.09 16.59 R 23.89 35.29 11.86 U 51.14 62.01 39.17
35.73 46.41 24.49 31.85 42.76 20.43 54.13 63.47 44.05
48.91 59.79 37.21 44.5J 56.54 31.63 54.29 63.86 44.30
40.50 50.16 30.44 35.31 45.35 24.90 1 54.55 63.10 45.56
44.8i 55.45 34.03 43.24 54.69 31.65 52.53 59.15 45.86
38.09 50.90 24.48
40.16 53.04 26.31 38.08 51.34 23.86 50.08 61.11 38.11
43.58 54.42 31.98 4].99 53.19 30.03 52.34 61.22 42.79
28.44 38.43 17.94
30.35 41.07 19.03 24.66 35.S5 13.29 57.36 66.74 47.13
Dediapada R 11.04 18.25 3.44 13.11 23.75 5.45
SagJara R 14.78 24.54 .5.CI 14.39 22.94
R 23.77 33.54 13.56 2S.91 35.Jl
5.92
IS.99
There is considerable variation in the literacy rates obtaining in the different talukas of tbe diitrict. Bharuch taluka with the literacy rate of 48.91 per cent ranks first in the district. It is followed by Hansot roabal with 44.81 per cent literates, Amod taluka with 43.58 per cent literates and Anklesvar taluka with 40.50 per ceDt literates. On the other hand Dediapada tal uk a with 13.11 per cent literates and
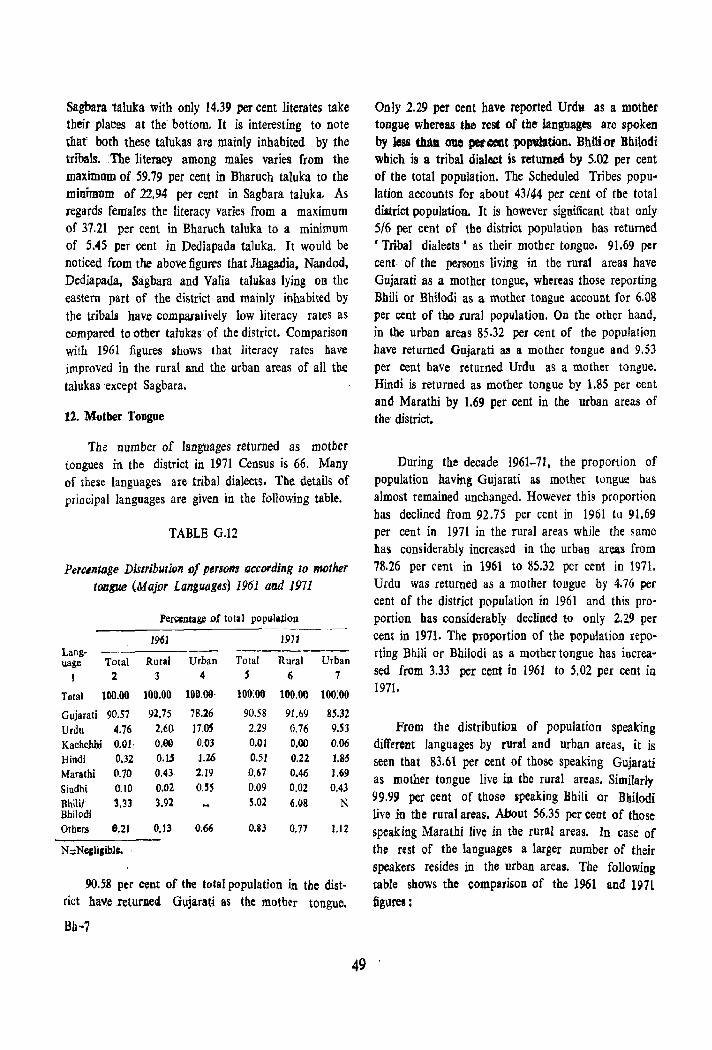
Sagbara taluka with only 14.39 per cent literates take their places at the bottom. It is interesting to note that both these talukas are mainly inhabited by the triba!s. .The literacy among males varies from the maximum of 59.79 per cent in Bharuch taluka to th~ minimum of 22.94 per cent in Sagbara taluka. As regards females the literacy varies from a maximum of 37.21 per cent in Bharuch taluka to a minimum of 5.45 per cent in Dediapada taluka. It would be noticed from t~ above figures that .Ihaga.dia, Nandod, Dediapada. Sagbara and Valia talukas lying 011 the eastern part of the district and mainly inhabited by the tribals have comparatively low literacy rates as compared to otber talukas· of the district. Comparison with 1961 figures shows that literacy rates have improved in the rural and the urban areas of all the talukas except Sagbara.
12. M1)ther Tougue
The number of languages returned as motller tongues in tbe district in 1971 Census is 66. Many of these languages are tribal dialects. Tbe details of principal languages are given in the following table.
TABLE G.12
Perclntage Dislribution "/ persons according to mother tongue (Major Languages) 1961 and 1971
Perccntagl) of total population
1961 1971 Lang- --------uage Total Rural Urban Total Rural Urban
1 2 3 4 S 6 1
Total 100.00 100.00 100.00- I()O:OO 100.00 100:00
Gujarati 90.51 92.75 78.26 90.58 91.69 85.32 Urdu 4.76 2.60 17.05 2.29 0.76 9.53 Kachcbht 0.01: 0.00 O.OJ 0.01 0.00 0.06 Hindi 0.32 O.U J.U 0.51 0.22 1.B5 Marathi (l.70 0.43 2.19 .0.67 0.46 1.69
Sindhi 0.10 0.02 0.55 0.09 0.02 0.43
Bhili/ 3.31 3.92 5.02 6.08 N Bhilodi Others 0.21 0.13 0.66 0.83 0.77 J.J2
N;;::Negli,ible.
90,5.8 per cent of the total population in the district have .returned. Gujarati 8S the motber tongue.
Bh-7
Only 2.29 per cent have reported Urdu as a motber tongue whereas the rest of the languages are spoken by less thaa one percent PO_tiOD. Bhiticr Bhilodi which is a tribal dialect is returned by 5.02 per cent of the total population. The Scheduled Tribes population accounts for about 43/44 per cent of tbe total dis.trict population. It is however significant that only 5/6 per cent of the district population bas returned 'Tribal dialects' as their mother tongue. 91.69 per cent of the persons living in the rural areas have Gujarati as a mother tongue, whereas those reporting Bhili or Bhilodi as a mother tongue account for 6.08 per cent of tho JUral population. On the other hand, in the urban areas 85.32 per cent of tbe population have returned Gujarati as a mother tongue and 9.53 per cent bave returned Urdu as a mother tongue. Hindi is returned as mother tongue by 1.85 per cent and Marathi by 1.69 per cent in the urban areas of th e district.
During the decade 1961-71, the proportion of population having Gujarati as mother tongue has almost remained unchanged. However this proportion has declined from 92.75 per cent in 1961 to 91.69 per cent in 1971 in the rural areas while the same has considerably increased in the urban areas from 78.26 per rent in 1961 to 85.32 per cent in 1971. Urdu was returned as a mother tongue by 4.76 per cent of the district population in 1961 and this proportion has considerably declined tQ only 2.29 per cent in 1971. The proportion of the population reporting Bbili or Bhilodi as a mother tongue has increased from 3.33 per cent in 1961 to 5.02 per cent in 1971.
From the distributioR of population speaking different Janguages by rural and urban areas, it is seen tbat 83.61 per cent of those speaking Gujarati as mother tongue live ill the rural areas. Similarly 99.99 per cent of those ipeaking BhiH or Bhilodi live in the rural areas. About 56.35 per cent of those speaking Marathi live in the rural areas. In case of the rest of the languages a larger number of their speakers resides in the urban areas. The following table shows the comparison of the 1961 and 1971 figures :
49 .
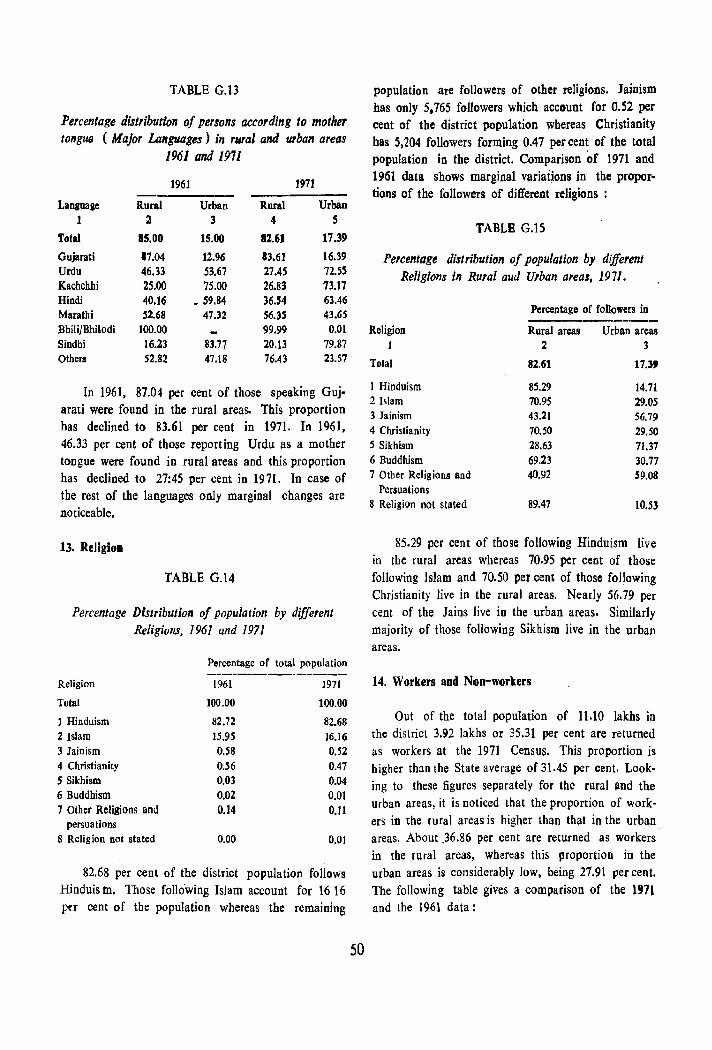
TABLE G.13
Percentage distribution of persons according to mother tongue ( Major Languages) in ,,,ral and urban areas
1961 and 1971
1961 1971
Language Rural Urban Rural Urban 1 2 3 4 5
Total 85.00 15.00 82.61 17.39 Gujarati 17.04 12.96 13.61 16.39 Urdu 46.33 53.67 27.4S 72.55 Kachchhi 25.00 75.00 26.83 73.17 Hindi 40.16 • 59.84 36.'4 63.46 Marathi 52.68 47.32 56.35 43.65 Bhili/Bhilodi 100.00 99.99 0.01 Sindhi 16.23 83.77 20.13 79.87 Others 52.82 47.18 76.43 23.57
In 1961, 87.04 per cent of those speaking Gujarati were found in the rural areas. This proportion has declined to 83.61 per cent in 1971. In 1961, 46.33 per cent of those reporting Urdu as a mother tongue were found in rural areas and this proportion has declined to 27:45 per cent in 1971. In case of the rest of the languages only marginal changes are noticeable.
13. ReligioD
TABLE G.l4
Percentage Distribution of population by different Religions. 1961 and 1971
Percentage of total population
Religion 1961 1971
Total 100.00 100.00 1 Hinduism 82.72 82.68 2 Islam 15.9S 16.16 3 Jainism 0.58 0.52 4 Christianity 0.S6 0.47 5 Sikhism 0.03 0.04 6 Buddhism 0.02 0.01 7 Other Religions and 0,]4 0.11
persuations S Religion not stated 0.00 0.01
82.68 per cent of the district population follows Hinduis tn. Those following Islam account for 1616 per cent of tbe population whereas the remaining
50
population are followers of other religions. lainism has only 5,765 followers which account for 0.52 per cent of the district population whereas Christianity has 5,204 followers forming 0.47 per cent of the total population in the district. Comparison of 1971 and 1961 data shows marginal variations in the proportions of the followers of different religions :
TABLE G.15
Percentage distribution of population by different Religions in Rural aud Urban areas, 1971.
Percentage of followers in ----Religion Rural areas Urban areas I 2 3
Total 82.61 17.3'
1 Hinduism 85.29 14.71 2 Islam 70.95 29.0S 3Iaioism 43.21 56.79 4 Christianity 70.50 29.50 S Sikhism 28.63 71.37 6 Buddhism 69.23 30.77 7 Other Religions and 40.92 59.08
Persuations 8 Religion not stated 89.47 10.53
85.29 per cent of those following Hinduism live in the rural areas whereas 70.95 per cent of those following Islam and 70.50 per cent of those following Christiani ty live in tbe rural areas. Nearly 56.79 per cent of the Jains live in the urban areas. Similarly majority of those following Sikhism live in the urban areas.
14. Workers and Non-workers
Out of the total population of 11.10 lakhs in the district 3.92 lakhs or 35.31 per cent are returned as workers at the 1971 Census. This proportion is higher than the State average of 31.45 per cent. Looking to these figures separately for the rural and the urban areas, it is noticed that the proportion of workers in the rural areas is higher than that in the urban. areas. About )6.86 per cent are returned as workers in the rural areas, whereas this proportion in the urban areas is considerably low, being 27.91 per cent. The following table gives a comparison of the 197, and the 1961 data:
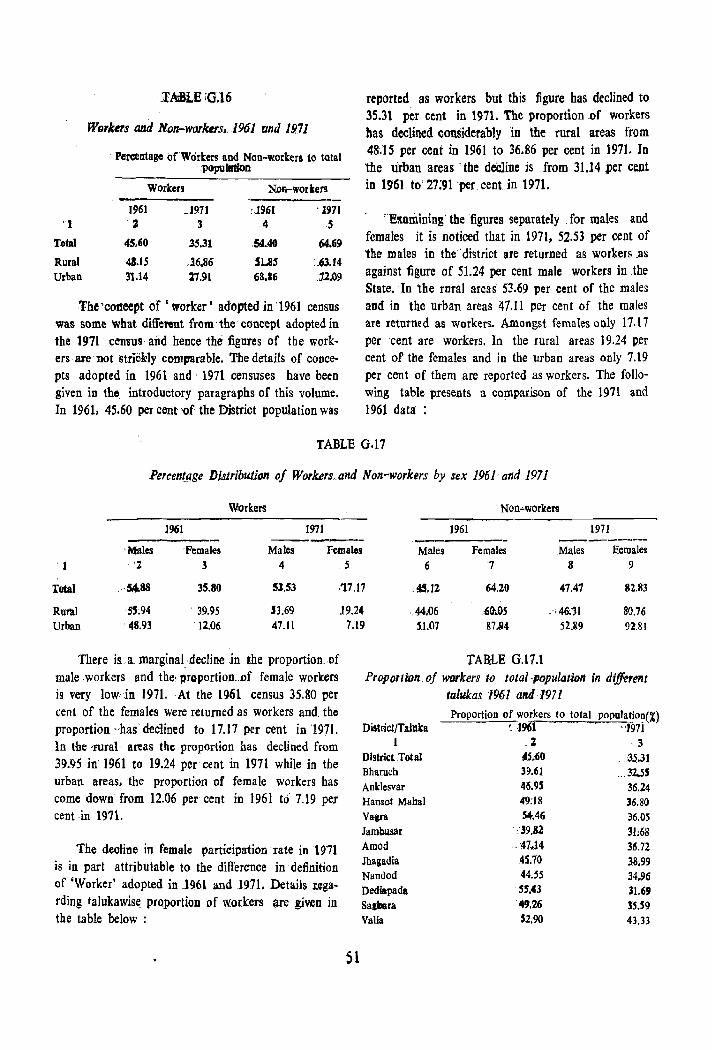
"I
TDtaI
Rural Urban
_,!AlBLE ;0.16
WBlkers and Non-warkers •. 1961 and 1971
Percentage ofWorkcrs and Non-workers to t<ltal ;populdon
Workers Noli-wor kers
1961 _J971 'J9061 < 1971 '3 3 4 .5
45.60 35.31 .54.40 64.69
48.15 36.86 SUS :~.I4
31.14 17.91 . 68.16 .J2.Q9
The 'coneept of • worker I adopted in'1961 cens.us was snme what different from' the' concept adopted in the 1971 ~en~us arid hence 'the figures of tbe worken are not striCli!ly comparable. The details of concepts adopted in 1961 and' 1971 censuses have been given in the, introductory paragraphs of this volume. In 1961, 45.60 per cent 'of the District population was
reported as workers but this figure has declined to 35.31 per cent in 1971. The proportion .of workers bas declined conSiderably in the rural areas from 48;15 per cent in 1961 to 36.86 per cent in 1971. In the urban areas' the decline is from 31.14 J)er cent in 1961 to' 27;91 'per centin 1971.
"Eumining'the figures separately ,for males and females it is noticed that in 1971, 52.53 per cent of the males in the 'district 8re returned as workers ,as against ngure of 51.24 per cent male workers in the State. In the rnral areas 53.69 per cent of the males and in the urban areas 47.11 per cent of the males are returned as workers. Amongst females only 17.l7 per 'cent are workers. In the rural areas 19.24 p~r cent of the females and in the urban areas only 7.19 per cent of them are reported as workers. The following table presents a comparison of the 1971 and 1961 data
TABLE G.17
Percen~~ge DJ.uribution of Workers, and Non-workers by sex 1961 and 1971
Workers . Non-workers
1961 1971 1961 1971 ----- ----- ---------'Males 'Females Males Females Males Females .Males females
'2 3 4 , 5 6 7 8 9
Total ·54.88 35.80 51.53 '17.17 .45.12 64.20 47.47 82,83
Rural '55;94 ' 39.95 53.69 19.24 ·,4&.(16 .'0.05 ;4&.,1 80.76 Urban ' 48.93 12.06 47.11 7.19 11.07 87.94 Sa9 92.81
TABLE G.17.1 There is. a marginal decline in the propor1ioR of male workers and the! proportion of female workers is very lowdn 1971. ·At the L961 census 35.80 per cent of the females were returned as workers and the proportion··has·declined to 17.17 per cent in 1971. In the ·rural,' areas the proportion has declined from 39.~5 in 1961 to 19.24 per cent in 19n while in the urban areas, the proportion of female workers has come down' from 12.06 per cent in 1961 to 7.19 per cent in 1971.
Proportion of Wf1lkers to total population in dijJerenr talukas 1961 and 1971
The decline in female participation rate in 1911 is in part attributable to the difference in definition of 'Worker' adopted in J961 and 1971. Details ~garding talukawis(( proportioD of workers are given in the table below :
51
District/T.alnka 1
Distriet Total Bharucb Anklesvar Hanso! Mahal Vagra Jambusar Amod Jhagadia Nandod Dediapad. SaC_fa Valia
Proportion of workers to total popuJatio~(%) ~"J961 '''1971
. 2 . 3 45.iiO . ,3~.3J 39.61 .,.32.5S 45.9S 36.24 49:18 36.80 S4A6 36.05
, :'39.82 31;68 - 47J4 36.72
45.70 3&,99 44.55 34.96 55.43 31.69 '49.26 35.59 52.90 43.33
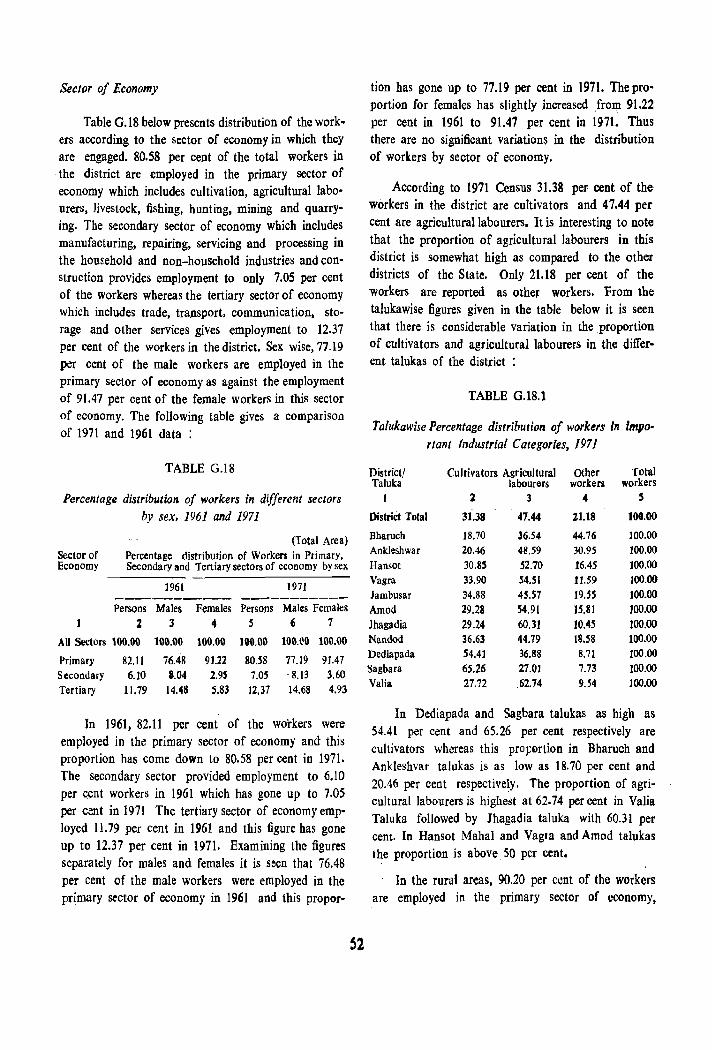
Sector of Economy
Table G.18 below presents distribution of the workers according to the sector of economy in which they are engaged. 80.58 per cent of the total workers in the district are employed in the primary sector of economy which includes cultivation, agricultural labourers, livestock, fishing, hunting, mining and quarrying. The secondary sector of economy which includes manufacturing, repairing, servicing and processing in the household and non-household industries and construction provides employment to only 7.05 per cent of the workers wbereas the tertiary sector of economy which includes trade, transport, communication, storage and other services gives employment to 12.37 per cent of the workers in the district. Sex wise, 77.19 per cent of the male workers are employed in the primary sector of economy as against the employment of 91.47 per cent of the female workers in this sector of economy. The following table gives a comparisoll of 1971 and 1961 data :
TABLE G.18
Percentage distribution of workers in different sectors by sex, 1961 and 1971
(Total Are a) Sector of Percentage distribution of Workers in Primary, Economy Secondary and Tertiary sectors of economy by sex
1961 1971 ----------- ----------Persons Males Females Persons Males Females
2 3 4 5 6 7
AU Sectors 100.00 100.00 100.00 100.00 100.CO 100.00
Primary 82.11 76.48 91.22 80.58 77.19 91.47 Secondary 6.10 S.04 2.95 7.05 . 8.13 3.60 Tertiary 11.79 14.48 5.83 12.37 14.68 4.93
In 1961, 82.11 per cent of the workers were employed in the primary sector of economy and this proportion has come down to 80.58 per cent in 1971. The secondary sector provided employment to 6.10 per Gent workers in 1961 which has gone up to 7.05 per cent in 1971 The tertiary sector of economyemployed 11.79 per cent in 1961 and this figure has gone up to 12.37 per cent in 1971. Examining the figures separately for males and females it is seen that 76.48 per cent of the male workers were employed in the primary sector of economy in 1961 and this propor-
52
tion has gone up to 77.19 per cent in 1971. The proportion for females has slightly increased from 91.22 per cent in 1961 to 91.41 per cent in 1971. Thus there are no significant variations in the distribution of workers by sector of economy.
According to 1971 Census 31.38 per cent of the workers in the district are cultivators and 47.44 per cent are agricultural labourers. It is interesting to note that the proportion of agricultural labourers in tbis district is somewhat high as compared to the other districts of the State. Only 21.18 per cent of the workers are reported as othef workers. From the talukawise figures given in the table below it is seen that there is considerable variation in the proportion of cultivators and agricultural labourers in the different talukas of the district :
TABLE G.18.1
Talukawise Percentage distribution of worbrs in important Industrial Categories, 1971
District! Cultivators Agricultural Other 'fotal Taluka labourers workers workers
1 2 3 .. 5
District Total 31.38 47.4" 21.18 100.00
Bharuch J8.70 36.54 44.76 JOO.OO Ankleshwar 20.46 48.59 30.95 100.00 Hansot 30.85 52.70 16.45 100.00 Vagra 33.90 S4.SI ll.59 100.00 Jambusar 34.88 45.57 J9.SS JOO.oo Amod 29.28 54.91 15.81 ]00.00 Jhagadia 29.24 60.31 10.45 ]00.00 Nandod 36.63 44.79 18.58 100.00 Dediapada 54.4J 36.88 8.71 100.00 Sagbara 65.26 27.01 7.73 100.00 Valia 27.72 .62.74 9.54 100.00
In Dediapada and Sagbara talukas as high as 54.41 per cent and 65.26 per cent respectively are cultivators whereas this prop9rtion in Bharuch and Ankleshvar talukas is as low as 18.70 per cent and 20.46 per cent respectively. The proportion of agricultural labourers is highest at 62.74 per cent in Valia Taluka followed by Jhagadia taluka with 60.31 per cent. In Hansot Mahal and Vagra and Amod talukas the proportion is above 50 per cent.
In the rural areas, 90.20 per cent of the workers are employed in the primary sector of !,'Conomy,
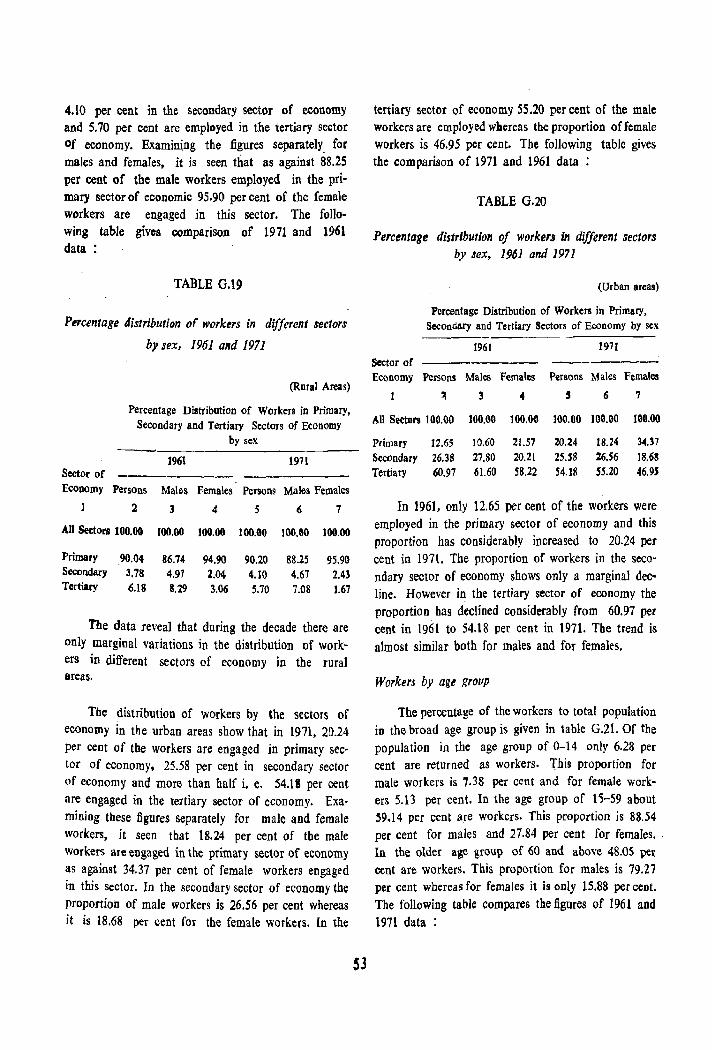
4.10 per cent in the secondary sector of economy and 5.70 per cent are employed in the tertiary sector of economy. Examin~ng the figures separately for males and females, it is seen that as against 88.25 per cent of the male workers employed in the primary sector of economic 95.90 per cent of the female workers are engaged in this sector. The following table gives comparison of 1971 and 1961 data
TABLE 0.19
Ptrcentage distribution of worktrs in different sectors
by sex, 1961 and 1971
Sector of Economy
(Rural Areas)
Percentage Distribution of Workers in Primary, Secondary and Tertiary Sectors of Economy
by sex
1961 1971
--------Persons Males Females Persons Males Females
2 3 4 5 6 7
All Seeton 100.00 100.00 100.00 100.00 100.00 100.00
Primary 90.04 86.74 94.90 90.20 88.25 95.90 Secondary 3.78 4.97 2.04 4.10 4.67 2.43 Tertiary 6.18 8.29 3.06 5.70 7.08 1.67
The data reveal that during the decade there are only margioal variations in the distribution of workers in different sectors of economy in the rural areas.
Tbe distribution of workers by 'he sectors of economy in the urban areas show that in 1971. 20.24 per cent of the workers are engaged in primary sector of economy. 25.58 per cent in secondary sector of economy and more than half i. e. 54.18 per cent are engaged in the tertiary sector of economy. Examining these figures separately for male and female workers, it seen tbat 18.24 per cent of tbe male workers are engaged in the primary sector of economy as against 34.37 per cent of female workers engaged in this sector. In the secondary sector of economy the proportioD of male workers is 26.56 per cent whereas it is 18.68 per cent for tbe female workers. In the
53
tertiary sector of economy 55.20 per cent of the male workers are employed wh.ereas tbe proportion of female workers is 46.95 per cent. The following table gives the comparison of 1971 and 1961 data
TABLE 0.20
Percentage distribution of worker" in different sectors by sex, 1961 and 1971
(Urban areas)
Percentage Distribution of Workers in Primary, Secondary and Tertiary Sectors of Economy by sex
1961 1971 Sector of Economy Persons Males Females Persons Males Female!
3 s 6 7
All Sectors 100.00 100.00 100.00 100.00 100.00 100.00
Primary 12.65 Secondary 26.38 Tertiary 60.97
10.60 21.57 20.24 27.80 20.21 25.S8 61.60 58.22 54.18
18.24 34.37 26.56 18.68 55.20 46.9S
In 1961. only 12.65 per cent of the workers were employed in the primary sector of economy and this proportion has considerably increased to 20.24 per cent in 1971. The proportion of workers in the secondary sector of economy shows only a marginal decline. However in the tertiary sector of economy the proportion bas declined considerably from 60.97 per cent in 1961 to 54.t8 per cent in 1971. The trend is almost similar both for males and for females.
Workers by agt grollp
The percentage of the workers to total population in the broad age group is given in table G.21. Of the population in the age group of 0-14 only 6.28 per cent are returned as workers. This proportion for male workers is 7.38 per cent and for female workers 5.13 per cent. In the age group of 15-59 about 59.14 per cent are workers. This proportion is 88.54 per cent for males and 27.84 per cent for females .. In the older age group of 60 and above 48.05 per cent are workers. This proportion for males is 79.27 pcr cent whereas for females it is only 15.88 per cent. The following table compares the figures of 1961 and 1971 data:
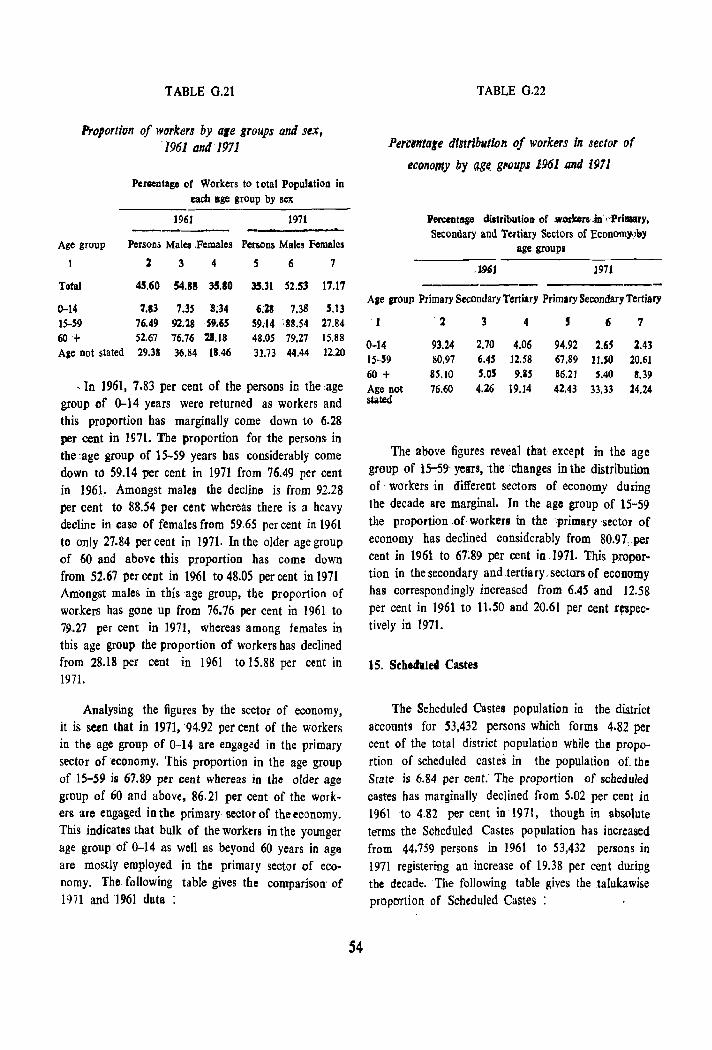
TABLE G.21
Proportion of workers by ale groups and sex, -1961 and 1971
Perlentage of Workers to total Population in each age group by sex
-----
Age group
Total
0-14 15-59
60 + Ale not stated
1961 1971
Persons Males .Females Persons Males Females
2 3 4
45.60 54.88 35.110
7.'3 7.35 8;34 76.49 92.28 SUS 52.67 76.76 21.18 29.38 36.84 18.46
s 6 7
35.31 52.53 17.17
U8 7.38 5.13 59.14 88.54 27.84 48.05 79.27 15.88 3].73 44.44 12.20
, In 1961, 7.83 per cent of the persons in the age grou p of 0-14 years were returned as workers and this proportion has marginally come down to 6.28 per cent in 1971. The proportion for the persons in the :age group of 15-59 years bas considerably come down to 59.14 per cent in 1971 from 76.49 per cent in 1961. Amongst males the decline is from 92.28 per cent to 88.54 per cent whereas there is a heavy decline in case of females from 59.65 per cent in 1961 to only 27.84 per cent in 1971. In the older age group of 60 alld above this proportion has come down from 52.67 J)cr cent in 1961 to 48.05 per cent in 1971 Amongst males in this age group, the proportion of workers bas gone up from 76.76 per cent in 1961 to 79.27 per cent' in 1971, whereas among females in this age group the proportion of workers bas declined from 28.18 per cent in 1961 to 15.88 per cent in 1971.
Analysing the figures by the sector of economy, it is seen that in 1971, 94.92 per cent of the workers in the age group of 0-14 are engaged in the primary sector of economy. This proportion in the age group of 15-59 is 67.89 per cent wbereas in the older age group of 60 and above, 86.21 per cent of the workers are engaged in the primary sector of the economy. This indicates that bulk of the workers in the younger age group of 0-14 as well as beyond 60 years in age are mostly employed in the primary sector of economy. The foUowing table gives the comparison' of 1911 and 1961 data :
54
TABLE 0.22
Ptrctntage distribution of workers in. sector of
economy by ag~ g1'OUpS 1961 and 19.71
Percentage distributioQ of lVedters·Jn ,,-PrIIlllll'Y. Secondary and Tertiary Sectors of EconomY'lDY
age groups
.1961 1971
----------A,e group Primary Secondary Tertiary Primary Secondary Tertiary
I '2 3 4 5 Ii 7
0-14 93.24 2.70 4.06 94.92 2.'5 2.43 15-59 80.97 6.45 12.58 67.89 IUO 20.61 60 + 85.10 5.05 9.15 86.21 MO 8.39 Age not 76.60 4.26 19.14 42.43 33.33 24.24 stated
The above figures reveal that except in the age group of 15-59 years, the changes in the distribution of . workers ,in different sectors of economy during the decade are marginal. In the age group of 15-59 the proportion of workers in the 'primary sector of economy has declined considerably from SO.n.per cent in 1961 to 67:89 per cent in 1971. This proportion in the secondary and ..tertiary .. sectors of economy has correspondingly increased from 6.45 and 12.58 per cent in 1961 to 11.50 and 20.61 per.cent r~pectively in 1971.
15. Scheduled Castes
The Scheduled Castes population in the district accounts for 53,432 persons which forms 4.82 per cent of the total district population wbile the proportion of scheduled castes in the population of the State is 6.84 per cent. The proportion of scheduled castes has marginally declined from 5.02 per cent in 1961 to 4.82 per cent in 1971, though in absolute terms the Scheduled Castes population has increased from 44,759 persons in 1961 to 53,432 persons in 1971 registering an increase of 19.38 per cent during the decade. The following table gives the talukawise proportion of Scheduled Castes :
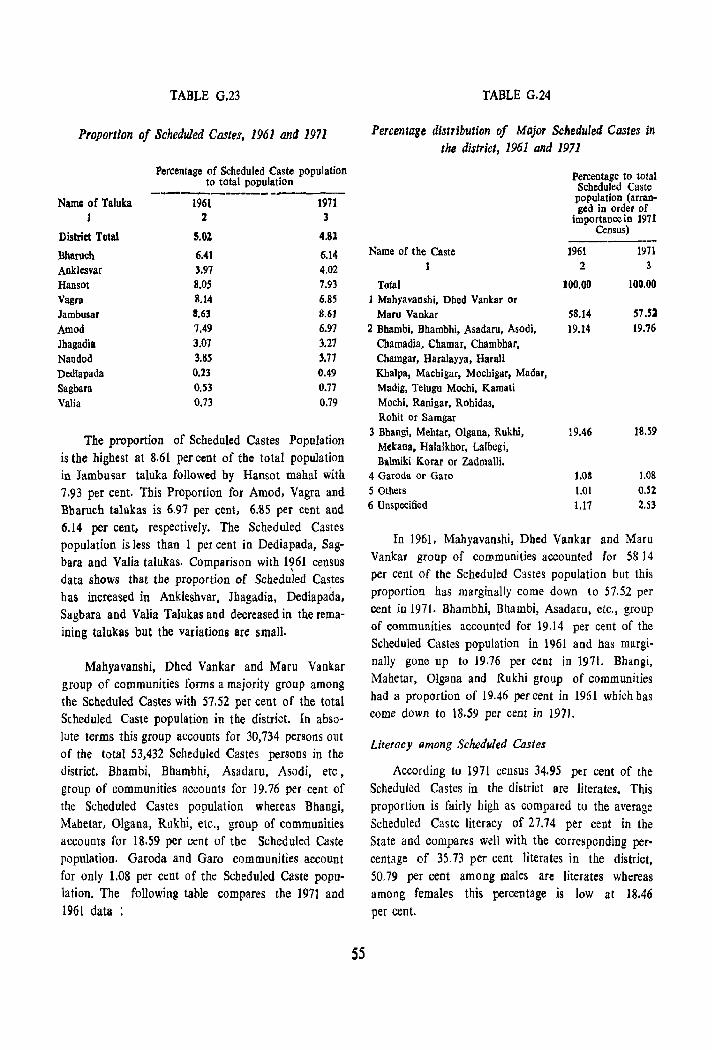
TABLE G.23
Proportion of Scheduled Castes, 1961 antI 1971
Name of Taluka 1
District Total
Bbaruch Anklesvar Hansot Vagra Jambusar Amod Jhagadia Nandod Dediapada Sagbara Valia
Percentage of Scheduled Caste population to total population
1961 1971 2 3
5.0:! 4.81
6.41 6.14 3.97 4.02 8.05 7.93 8.14 6.85 8.63 8.6J 7.49 6.97 3.07 3.27 3.~S 3.77 0.23 0.49 0.53 0.77 0.73 0.79
The proportion of Scheduled Castes Population is the highest at 8.61 per cent of the total population in Jambu sar taluka followed by Hansot mahal with 7.93 per cent. This Proportion for Amod, Vagra and Bbaruch talukas is 6.97 per cent, 6:85 per cent and 6.14 per cent, respectively. The Scheduled Castes population is less than 1 per cent in Dediapada, Sagbara and Valia talukas. Comparison with 1961 census , data shows that the proportion of Scheduled Castes has increased in Ankleshvar, Jhagadia, Dediapada, Sagbara and Valia Talukas and decreased in the remaining talukas but the variations are small.
Mahyavanshi, Dhed Vankar and Maru Vankar group of communities forms a majority group among the Scheduled Castes with 57.52 per cent of the total Scheduled Caste population in the district. In absolute terms this group accounts for 30,734 persons out of the total 53,432 Scheduled Castes persons in the district. Bhambi, Bhambhi, Asadaru, Asodi, etc, group of communities accounts for 19.76 per cent of the Scheduled Castes population whereas Bhangi, Mabetar, Olgana, Rukhi, etc., group of communities accounts for 18.59 per cent of tbe Scheduled Caste population. Garoda and Garo communities account for only 1.08 per cent of the Scbeduled Caste population. The followin~ table compares the 1971 and 1961 data :
55
TABLE G.24
Percentage distribution of Major Scheduled Castes in the district, 1961 and 1971
Name of the Caste 1
Total I Mahyavanshi, Dhed Vankar or
Maru Vankar 2 Bhambi, Bhambbi, Asadaru, Asodi,
Chamadia. Chamar, Chamhbar, Chamgar, Haralayya, HaraH Khalpa, Machigar, Mochigar, Madar, Madig, Telugu Mochi, Kamati Mochi, Ranigar, Rohidas, Rohit or Samgar
3 Bhangi, Mehtar, Olgana, Rukhi, Mekana, Halalkhor, Lalbegi, Balmiki Korar or Zadmalli.
4 Garoda or Garo 5 Others 6 Unspecified
Percentage to total Scheduled Caste population (arranged in order of
importance in 1971 Census)
]961 2
100.00
58.14 19.14
19.46
1.0S 1.01 1.17
1971 3
100.00
57.52 19.76
18.59
1.0&
O.SZ 2.53
In 1961, Mahyavanshi, Dbed Vankar and Maru Vankar group of com.munities accounted for 58 14 per cent of the Scheduled Castes population but this proportion has marginally come down to 57.52 per cent in 1971. Bhambhi, Bhambi, Asadaru, etc., group of communities accounted for 19.14 per cent of the Scheduled Castes population in 1961 and has marginally gone up to 19.76 per cent in 1971. Bhangi, Mahetar, Olgana and Rukhi group of communities had a proportion of 19.46 per cent in 1961 which has come down to 18.59 per cent in 1971.
Literacy pmong Scheduled Castes
According to 1971 census 34.95 pllf cent of the Scheduled Castes in the district are literates. This proportiun is fairly high as compared to the average Scheduled Caste literacy of 27.74 per cent in the State and compares well with the corresponding percentage of 35.73 per cent literates in the district, 50.79 per cent among males are literates whereas among females this percentage is low at 18.46 per cent.
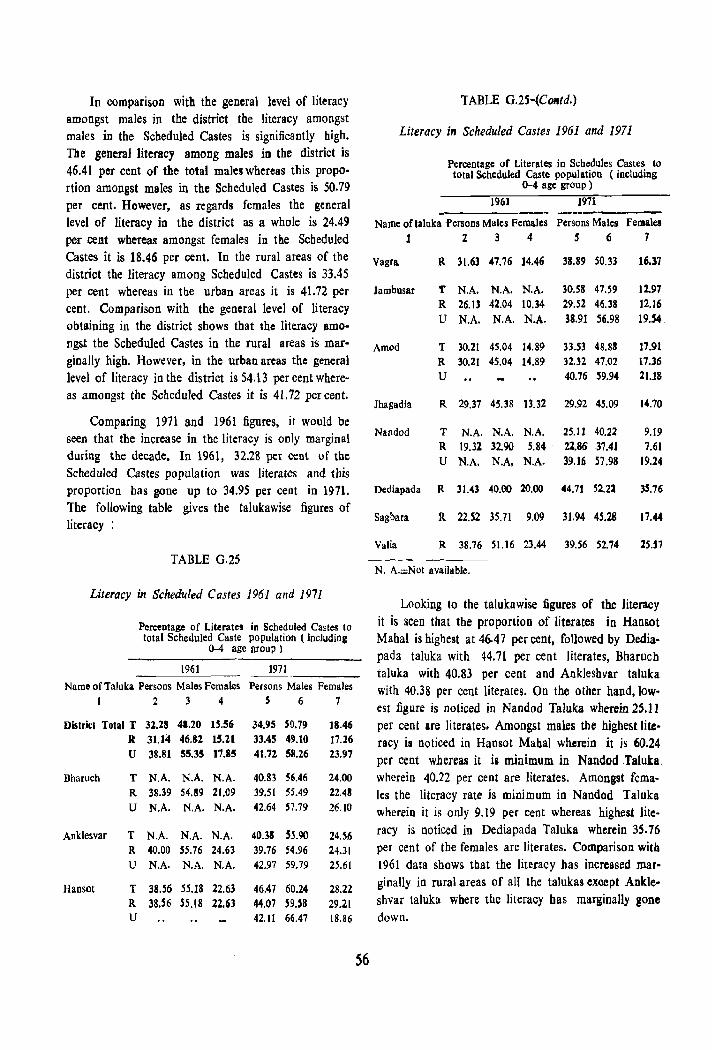
In comparison with the general level of literacy amongst males in the district the literacy amongst males in the Scheduled Castes is significantly high. The general literacy among males in the district is 46.41 per cent of the total males whereas this proportion amongst males in the Scheduled Castes is 50.79 per cent. However, as regards females the general level of literacy in the district as a whole is 24.49 per cent whereas amongst females in the Scheduled Castes it is 18.46 per cent. In the rural areas of the district the literacy among Scheduled Castes is 33.45 per cent whereas in the urban areas it is 41.72 per cent. Comparison with the general level of literacy obtaining in the district shows that the literacy amongst the Scheduled Castes in the rural areas is marginally high. However, in the urban areas the general level of literacy in the district is 54.13 per cent whereas amongst the Scheduled Castes it is 41.72 per cent.
Comparing 1971 and 1961 figures, it would be seen that the increase in the literacy is only marginal during the decade. In 1961, 32.28 per cent of tbe Scheduled Castes population was literates and this proportion has gone up to 34.95 per ceot in 1971. The following table gives the talukawise figures of literacy :
TABLE G.25
Literacy in Scheduled Castes 1961 and 1971
Percentage of Literates in Scheduled Castes to total Scheduled Caste population ( including
0-4 age group)
1961 1971
Name of Taluka Persons Males Females Persons Males Females 1 234 S 67
Districi Total T 32.28 41.20 15.56 34.95 50.79 18.46 R 31.14 46.82 15.21 33.45 49.10 17.26 U 38.81 55.35 17.85 41.72 58.26 23.97
Bharuch T N.A. N.A. N.A. 40.83 56.46 24.00 R 38.39 54.89 21.09 39.51 55.49 22.48 U N.A. N.A. N.A. 42.64 57.79 26.10
Anklesvar T N.A. N.A. N.A. 40.38 SBO 24.56 R 40.00 S5.76 24.63 39.76 54.96 24.31 U N.A. N.A. N.A. 42.97 59.79 25.61
Hansol T 38.56 55.18 22.63 46.47 60.24 28.22 R 38.56 55.18 22.63 44.07 59.S8 29.21 U 42.11 66.47 18.86
56
TABLE G.2S-iCOItd.)
Literacy ill Scheduled Castes 1961 and 1971
Percentage of Literates in Schedules Castes to total Scheduled Caste population (includillg
0-4 age group)
1961 1971
Name oftaluka Persons Males Females Persons Males Females 1 2. 3 4 567
Vagra. R 3(.63 41.76 14.46 38.89 SO.33
Jambusar T N.A. N.A. N.A. 30.58 47.59 R 26.13 42.04 10.14 29.52 46.38 U N.A. N.A. N.A. 38.91 56.98
Amod T 30.2[ 45.04 14.89 33.53 48.88 R 30.21 45.04 14.89 32.32 47.02 U 40.76 !l9.94
Jhagadia R 29.37 45.38 13.32 29.92 45.09
Nandod T N.A. N.A. N.A. 25.11 40.22 R 19.32 32.90 5.84 . 22.86 37.41 U N.A, N.A. N.A. 39.16 57.98
Dediapada R 31.43 40.00 20.00 44.71 52.2l
Sagbara It 22.52 35.71 9.09 31.94 45.28
16.31
12.97 12.16 19.54
17.91 17.36 21.18
1"'0
9.[9 1.61
19.24
35.76
17.44
Valia R 38.76 51.16 23.44 39.56 52.74 25.S7
N. A.=Not available.
Looking to the talukawise figures of the Jiteracy it is seen that the proportion of literates in Hansot Mahal is highest at 46.47 per cent, followed by Dediapada taluka with 44.71 per cent literates, Bharuch taluka with 40.83 per cent and Ankleshvar taluka with 40.38 per cent literates. On the other hand, Jowest figure is noticed in Nandod Taluka wherein 25,11 per cent are literates. Amongst males the highest literacy is noticed in HaDsot Mahal wherein it is 60.24 per cent whereas it is minimum in Nandod Taluka. wherein 40.22 per cent are literates. Amongst females the literacy rate is minimum in Nandod Talnka wherein it is only 9.19 per cent whereas highest literacy is noticed in Dediapada Taluka wherein 35.16 per cent of the females are literates. Com.parison with 1961 data shows that the literacy has increased mar· ginally in rural areas of all the talukas except Ankleshvar taluka where the literacy bas marginally gone down.
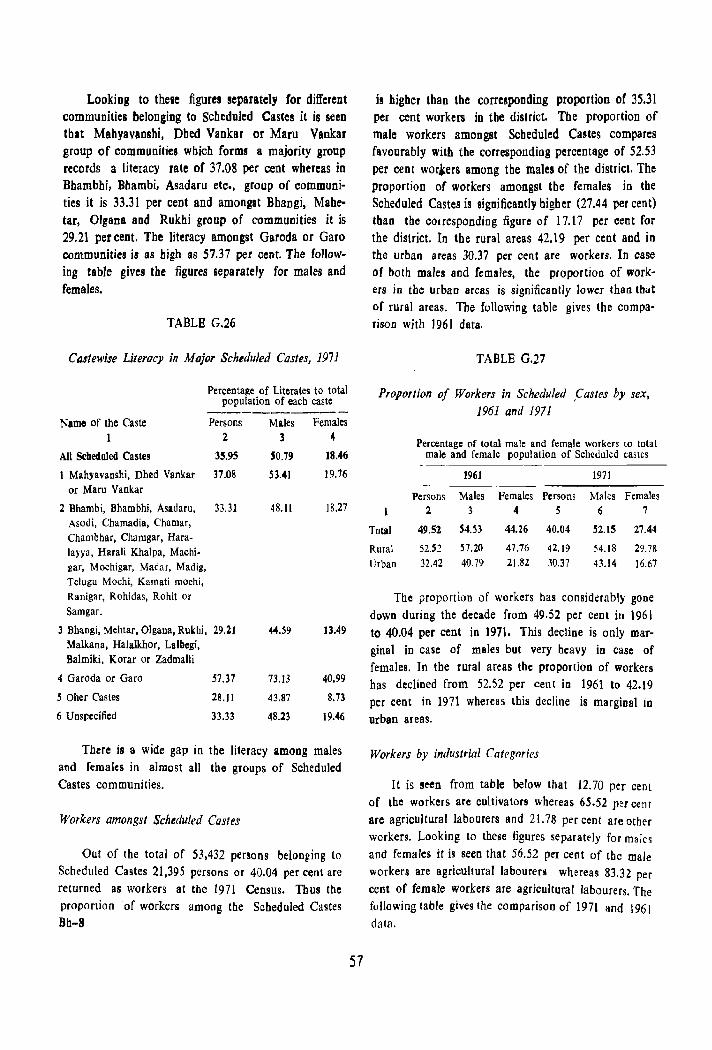
Looking to theBe figurel separately for different communities belonging to Scheduled Castes it is seen that Mahyavanshi, Dhed Vankar or Maru Vankar group of communities which forms a majority group records a literacy rate of 37.08 per cent whereas in Bhambbi, Bhambi, Asadaru etc., group of communities it is 33.31 per cent and amongst Bhangi, Mahetar, Olgaoa and Rukhi group of communities it is 29.21 per cent. The literacy amongst Garoda or Garo communities is as high as 57.37 per cent. The following table gives the figures separately for males and females.
TABLE G.26
Costewise Literacy in Major Schtduled Castes, 1971
Percentage of Literates to total population of each caste
Name of the Caste 1
All Scheduled Castes
Persons 2
3S.95
1 Mahyavanshi, Dhed Vankar 37.08 or Maru Vankar
2 Bhambi, Bhambhi, Asadaru, 33.31 Asodi, Chamadia, Chamar, Chambhar, Chamgar, Hara-layya, Harali Khalpa, Machi· gar, Mochigar, Madar, Madig, Telugu Mochi, Kamati mochi, Ranigar, Rohidas, Rohit or Samgar.
3 BhaDgi, Mehtar, Olgana, Rukhi, 29.2J Malkana, Halalkhor, Lalbegi, Balmiki, Korar or Zadmalli
4 Garoda or Garo
5 Oher Castes 6 Unspecified
57.37
28.11
33.33
Males 3
50.79
53.41
48.11
44.59
73.13
43.87
48.23
Females 4
18.46
19.76
18.27
13.49
40.99
8.73
19.46
There is a wide gap in the literacy among males aud females in almost all the groups of Scheduled Castes communities.
Workers amongst Scheduled Castes
Out of the total of 53,432 persons belonging to Scheduled Castes 21,395 persons or 40.04 per cenl are returned as workers at tbe 1971 Census. Thus the proportion of workers among the Scheduled Castes Bh-8
57
is higher tban the corresponding proportion of 35.31 per cent workers in the district. The proportion of male workers amongst Scheduled Castes compares favourably with the corresponding percentage of 52.53 per cent worfers among the males of the district. The proportion of workers amongst the females in the Scheduled Castes is significantly higher (27.44 per cent) tban the corresponding figure of 17.17 per cent for the district. In the rural areas 42.19 per cent and in the urban areas 30.37 per cent are workers. In case of both males and females, the proportion of workers in the urban areas is significantly lower than that of rural areas. The following table gives the comparison with 1961 data.
TABLE 0.27
boportion of Workers in Scheduled ,castes by sex, 1961 and 1971
Total
Rural Urban
Percentage of total male and female workers to total male and female population of Scheduled castes
1961 1971
Persons Males Females Persons Males Females 2 3 4 5 6 7
49.52 54.53 44.26 40.04 S2.lS 27.44
52.5~ 57.20 47.76 42.19 54.18 29.7&
32.42 40.79 21.8.2 30.37 43.14 16.67
Tbe proportion of workers has considerably gone down during the decade from 49.52 per cent in 1961 to 40.04 per cent in 1971. This decline is only marginal in case of males but very heavy in case of females. In the rural areas the proportion of workers has declined from 52.52 per cent in 1961 to 42.19 per cent in 1971 whereas this decline is marginal in urban areas.
Workers by industrial Categnries
It is seen from table below that 12.70 per cent of the workers are cultivators whereas 65.52 p~r cent are agricultural labourers and 21.78 per cent are other workers. Looking to these figures separately for males and females it i§ seen that 56.52 per cent of the male workers are agricultural labourers whereas 83.32 per cent of female workers are agricultural labourers. The following cable gives the comparison of 1971 and 1961 data.
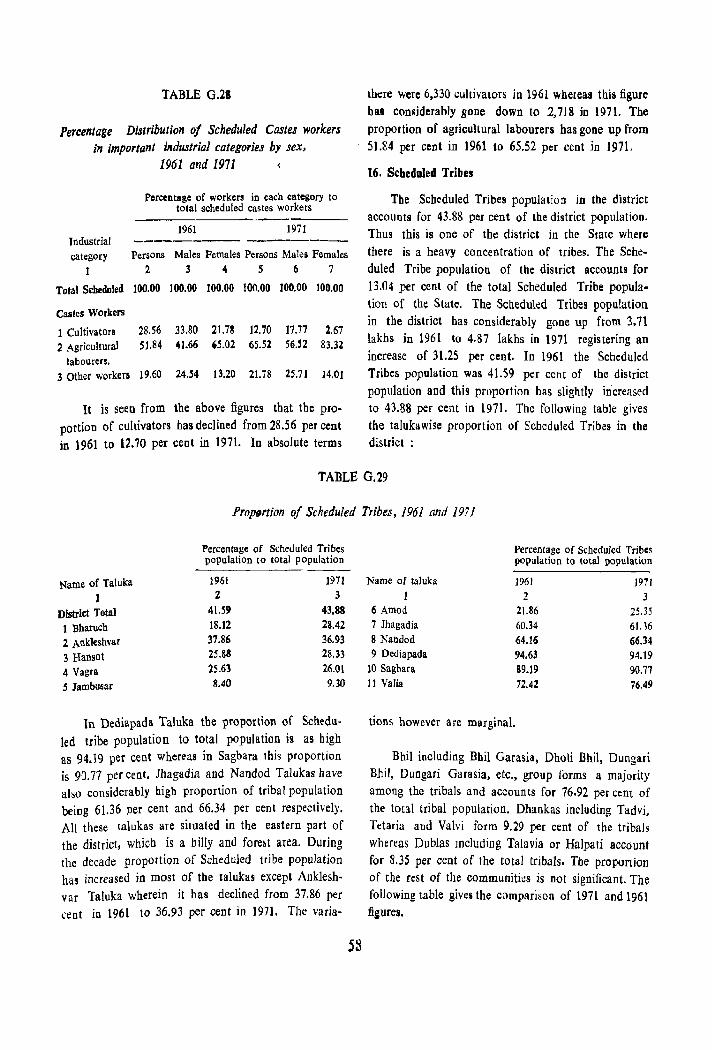
TABLE 0.28
Percentage Distribution of Scheduled Castes workers in important industrial categories by sex,
Industrial category
1
Total Stheduled
Castes Workers
1 Cultivators 2 Agricultural
labourers. 3 Other workers
1961 and 1971 {
Percentage of workers in each category to total scheduled castes workers
1961 1971 --------- --------_ Persons Males Females Persons Males Females
2 3 4 S 6 7
100.00 100.00 100.00 100.00 100.00 100.00
28.56 33.80 21.78 12.70 17.77 1.67 51.84 41.66 '5.02 65.51 56.S2 83.32
19.60 24.54 13.20 21.78 25.71 14.01
It is seen from the above figures tbat tbe proportion of cultivators has declined from 28.56 per cent in 1961 to 12.70 per ceot in 1971. In absolute terms
there were 6,330 cultivators in 1961 whereas this figure has considerably gone down to 2,718 jn 1971. The proportion of agricultural labourers has gone up from 51.84 per cent in 1961 to 65.52 ptr cent in 1971.
16. Scheduled Tribes
The Scheduled Tribes popUlation in the district accounts for 43.88 per cent of the district population. Thus this is one of the district in the Slate where there is a heavy concentration of tribes. The Scheduled Tribe population of the district accounts for 13.04 per cent of the total Scheduled Tribe popUlation of the State. The Scheduled Tribes population in the district has considerably gone up from 3.71 lakhs in 1961 to 4.87 lakhs in 1971 registering an increase of 31.25 per cent. In 1961 the Scheduled Tribes population was 41.59 per cent of the district population and this proportion has slightly in"creased to 43.88 per cent in 1971. The follOWing table gives the talukawise proportion of Scheduled Tribes in the district
TABLE 0.29
Prop,rtion of Scheduled Tribes, 1961 and 1971
Name of Taluka 1
District Total 1 Bharuch 2 Ankleshvar
3 Hansot 4 Vagra 5 Jambusar
Percentage of Scheduled Tribes population to total population
1961 1971 2 3
41.59 43.88 18.12 28.42 37.86 36.93 25.88 28.33 25.63 26.01 8.40 9.30
In Dediapada Taluka the proportion of Scheduled tribe population to total population is as bigh as 94.19 per cent whereas in Sagbara this proportion is 90.77 per cent. Jhagadia and Nandod Talukas have also considerably high proportion of tribal population being 61.36 per cent and 66.34 per cent respectively. All these talukas are situated in the eastern part of the district, which is a billy and fore~t area. During the decade proportion of Scheduled tribe population has increased in most of the talukas except Ankleshvar Taluka wherein it has declined from 37.86 per ceot in 19M to 36.93 per cent in 1971. The varia-
58
Name of taluka
1 6 Amod 7 Jhagadia 8 Nandod 9 Dediapada
10 Sagbara 11 Valia
Percentage of Scheduled Tribes population to total population
1961 1971 2 3
21.86 25.35 60.34 61. 16 64.16 66.34 94.63 94.19 89.19 90.77 72.42 76.49
tions however are marginal.
Bhil including Bbil Garasia, Dholi Bhi\, Dungari Bhil, Dungari Garasia, etc., group forms a majority among the tribals and accounts for 76.92 per cent of the total tribal population. Dhankas including Tadv}, Tetaria and Valvi form 9.29 per ceot of the tribals whereas Dublas lllcluding Talavia or Halpati account for 8.35 per cent of the total tribals. Tbe proportion of the rest of the communities is not significant. The following table gives the comparison of 1971 and 1961 figures.
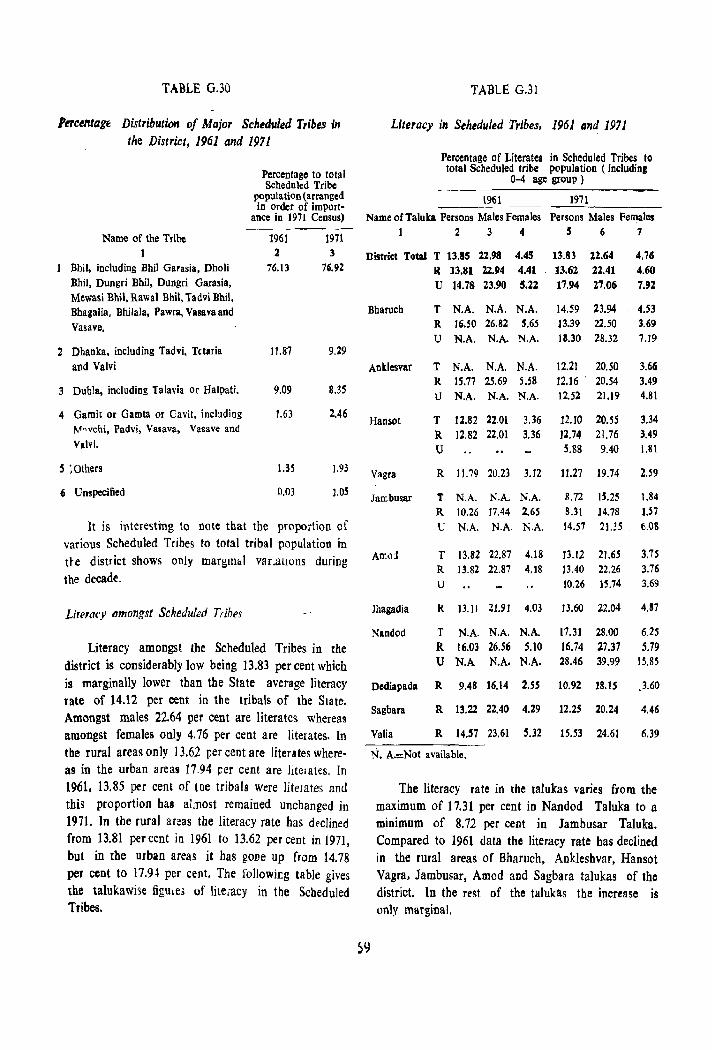
TABLE G.30
Ptrcentage Distribution of Major Scheduled T,ibes in the District, 1961 and 1971
Name of the Tribe 1
Bhil, including Bbil Garasia, Dboli Bhil, Dungri Bhil, Dungri Garasia, Mewasi Bhil, Rawal Bhil, Tadvi Bhil. Bhagalia. Bhilala, Pawra, Vasavaand Vasave.
2 Dhanka. including Tadvi, Telaria and Valvi
3 Dubla, including Talavia or Halpati.
4 Gamit or Gamta or Cavil, inchding ~~"vchi, Padvi, Vasa va, Vas ave and
Valvi.
S ;Others
6 Unspecified
Percentage to total Scheduled Tribe
population (arranged in order of import
ance in 1971 Census)
1961 1971 2 3
76.13 76.92
11.87
9.09
1.63
1.35
0.03
9.29
8.35
2.46
].93
].os
It is interesting to note that the proportion of various Scheduled Tribes to total tribal population in ite district shows only margmlil var.ations during the decade.
Literacy amongst Scheduled Tribes
Literacy amongst the Scheduled Tribes in the district is considerably low being 13.83 per cent which is marginally lower than the State average literacy rate of 14.12 per cent in tbe tribals of the Slate. Amongst males 22.64 per cent are literates whereas amongst females only 4.76 per cent are literates. In the rural areas only 13.62 per cent are Iiterlltes whereas in the urban areas 17.94 per cent are literates. In 1961. 13.85 per cent of toe tribals were literates and this proportion has atnost remained unchanged in 1971. In the rural areas the literacy rate bas declined from 13.81 per cent in 1961 to 13.62 per cent in 1971, but in the urban areas it has gone up from 14.78 per cent to 17.94 per cent. The following table gives the talukawise figUle3 of literacy in the Scbeduled Tribes.
TABLE G.31
Literacy in Sehtduled Tribes. 1961 lind 1971
Percentage of Literates in Scheduled Tribes to Iota I Scheduled tribe population ( including
0-4 age group)
\961 19'11
Name of Taluka Persons Males Females Persons Males Females 1 234 567
District Total T 13.115 22.98 4.45 R 13.81 22.114 4.41 U 14.78 23.90 5.22
13.83 22.64
13.62 21.41 17.94 2'7.06
4.76 4.60 7.9Z
Bharuch T N.A. N.A. N.A. 14.59 23.94 4.53 R 16.50 26.82 5.65 13.39 22.50 3.69 U N.A. N.A. N.A. 13.30 28.32 7.19
Anldesvar T N.A. N.A. N.A. R 15.77 25.69 5.58 U N.A. N.A. N.A.
12.21 20.50 12.16 ' 20.54 12.52 21.19
3.66 3.49 4.81
Hansot T 12.82 22.01 3.36 R 12.82 22.01 3.36 U
12.10 20.55 1l.74 21.76
3.34 3.49 1.81
59
Vagra
Jarr.busar
Arr.oj
Jhagadia
Nandod
S.SS 9.40
R 11.79 20.23 3.12 11.27 19.74 2.59
T N.A. N.A. N.A. R 10.26 17.44 2.65 t; N.A. N.A. N.A.
T 13.82 22.87 4.18
R 13.82 22.87 4.18 U
8.72 IUS 1.84 8.31 14.57
14.78 I.57
2U5. 6.08
13.12 21.6; 3.75 13.40 22.26 3.76 10.26 IS.74 3.69
R 13.11 :U.91 4.03 13.60 22.04 4.87
T N.A. N.A. N.A. R 16.03 26.56 5.10 U N.A N.A. N.A.
17.3] 28.00 16.74 27.37 28.46 39.99
6.25 5.79
15.85
Dediapada R 9.48 16.14 2,SS 10,92 18.15 .3.60
Sagbara R 13.22 22.40 4.29 12.25 20.24 4.46
Valia R 14.57 23.61 5.32 15.53 24.61 6.39
N. A.:::Not available.
The literacy rate in the talukas varies from the maximum of 17.31 per cent in Nandod Taluka to a minimum of 8.72 per cent ID Jambusar Taluka. Compared to 1961 data the literacy rate bas declined in the rural areas of Bharuch, Ankleshvar, Hansot Vagra. Jambusar, Amod and Sagbara talukas of the district. In the rest of the talukas the increase is only marginal.
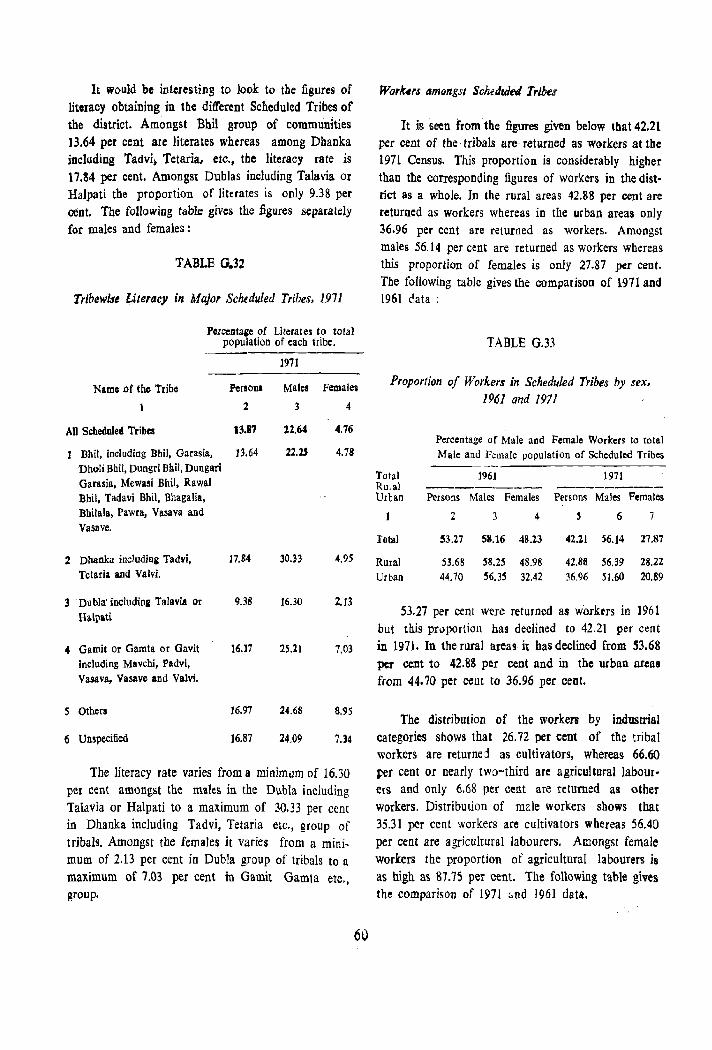
It would be interesting to look to the figures of literacy obtaining in the different Scheduled Tribes of the district. Amongst Bhil group of communities 13.64 per cent are literates whereas among Dhanka including Tadvi, Tetaria. etc., the literacy rate is 17.M per cent. Amongst Dublas including Talavia or Halpati the proportion of literates is only 9.38 per cent. The following tab1.c gives the figures separately for males and females:
TABLE 0.32
r,ibewise Literacy in Mqjor Schtduled Tribes, 1971
Perccstage of Literates to total population of each tribe.
1971
Name of the Tribe Person. Malcs Females
234
All Scheduled Tribes 13.87
2
3
4
S
6
Bhil, including Bhil, Garasia, 13.64 Dholi Bhil, Dungri Buil, Dungan Garasia, Mewasi Bhil, Rawal Bhil, Tadavi Bhit, Bhagalia, Bhilala, Pawra, Vasava and Vasave.
Dhanka including Tadvi,
Tetaria and Valvi.
Dubla' includina Talavia or
Halpati
Gamit or Gamta or Gavit
including Mavchi, Padvi,
Vasava, Vasave and YaM.
Others
Unspecified
17.84
9.38
·16.17
16.97
16.87
12.64
22.25
30.33
16.30
25.21
24.68
24.09
4.76
4.78
4.95
2.13
7.03
8.95
7..34
The literacy rate varies from a minimum of 16.30 per cent amongst the males in the Dubia including Talavia or Halpati to a maximum of 30.33 per cent in Dhanka including Tadvi, Tetaria etc., group of tribals. Amongst the females it varies from a minimum of 2.13 per cent in Dubla group of tribals to a maximum of 7.03 per cent in Gamit Gamta etc., group.
60
Work"s am(mgsl Scheduled Tribes
It is seen from the figures given below that 42.21 per cent of the tribals are returned as workers at the 1971 Census. This proportion is considerably higher thim the corresponding figures of workers in the district as a whole. In the rural areas 42.88 per cent are returned as workers whereas in the urban areas only 36.96 per cent are returned as workers. Amongst males 56.14 per cent are returned as workers whereas this proportion of females is only 27.87 per cent. The following table gives the comparison of 1971 and 1961 data:
TABLE G.33
Proportion of Workers in Scheduled Tribes by sex, 196} and 1971
Total RUlal Urtan
Total
Rural Urban
Perccntage of Male and Female Workers to t.otal
Male and Female population of Scheduled Tribes
1961 1971
Persons Males Females Persons Males Females
2 3 4 6 7
5U7 58.16 48.23 42.21 S6.14 27.87
53.68 S8.2S 48.98 42.88 56.39 28.22 44.70 56.35 32.42 36.96 51.60 20.59
53.27 per cent were returned as wOrkrrs in 1961 but this proportion has declined to 42.21 per cent in 1971. In the rural area'J it has declined from S3.68 per cent to 42.88 per cent and in the urban a!.cas from 44.70 per cent to 36.96 per cellI.
The distribution of the workers by industrial categories sbows that 26.72 per cent of the tribal workers are returne:i as cultivators, whereas 66.60 per cent or nearly two-third are agricultural labourers and only 6.68 per cent are returned al other workers. Distribution of male workers shows that 35.31 per cent workers arc cultivators whereas 56.40 per cent are agricultural labourers. Amongst female workers the proportion of agricultural labourers is as high as 87.75 per cent. The following table gives the comparison of 1971 :.nd 1961 data.
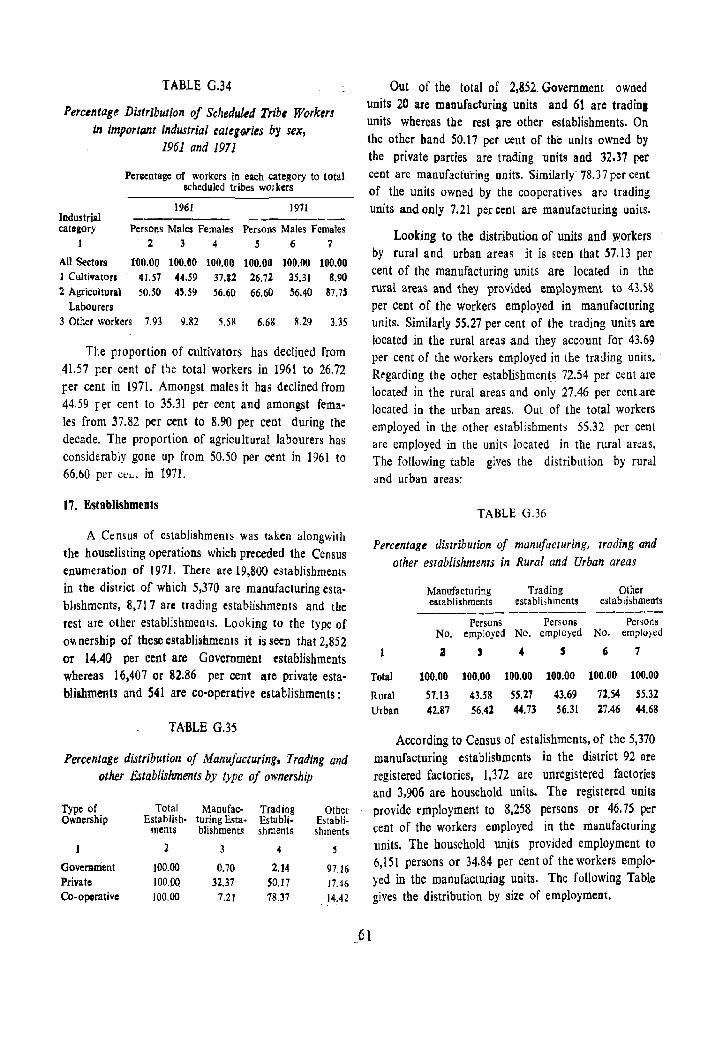
TABLE G.34
Percentag~ Distribution oj Schedukd Tribe Workm in import~t industrial categories by sex,
Industrial category
1
All Sectors 1 CuItivatorl 2 Agricultural
Labourers
1961 and 1971
Pereentage of workers in each category to total scheduled tribes workers
1961 1971 ------ -----Persons Males Females Persons Males Females
2 3 4 5 6 7
roo.oo 100.00 100.00 100.00 100.00 100.00 41.57 44.59 37.S2 26.72 35.31 8.90
50.50 4~.59 56.60 66.60 56.40 87.75
3 Other workers 7.93 9.82 5.58 6.68 8.29 3.35
rte proportion of cultivators has declined from 41.57 per cent of t!'le total workers in 1961 to 26.72 per cent in 1971. Amongst males it has declined from 44.59 rer cent to 35.31 per cent and amongst females from 37.82 per cent to 8.90 per cent during the decade. The proportion of agricultural labourers has considerably gone up from 50.50 per cent in 1961 to 66.60 per (;t: ..... in 1971.
17. Establishments
A Census of establishments was til ken alongwilh the houselisting operations which preceded the Census enumeration of 1971. There are 19,800 establishments in the district of which 5,370 are manufacturing establishments, 8,717 arc tradi11g establishments and tbe rest are other establishments. Looking to the type of oMership of these establishments it is seen that 2,852 or 14.40 per cent are Government establishments whereas 16,407 or 82.86 per cent are private establishments and 541 are co-operative establishments:
TABLE G.35
Percentage distribution of Milnujaclurillg, Trading and other Establishments by type of ownership
Type of Total Manufac- Trading Other Ownership Establish· turing Esta- Establi· Establi-
ments blishments shments shments
2 3 4 S
Govemwnt 100.00 0.70 2.14 97.16 Private IOO.OU 32.37 50.17 17.46 Co-operative 100.00 7.21 78.37 14.42
Out of the total of 2,852. Government owned units 20 are manufacturing units and 61 are tradina units whereas the rest !ire other establishments. On the other band 50.17 per cent of the units owned by the private parties are trading units and 32.31 per cent are manufacturing units. Similarly' 78.37 per cent of the units owned by the cooperatives are trading units and only 7.21 per cent are manufacturing units.
Looking to the distribution of units. and workers by rural and urban areas it is seen that 57.13 per cent of the manufacturing units are located in the
rural areas and they provided employment to 4;'S& per cent of the workers employed in manufacturing units. Similarly 55.27 per cent of the trading units are located in the rural areas and they account for 43.69 per cent of the workers employed in the trading units •. R~garding the other establishments 72.54 per cent are located in the rural areas and only 27.46 per cent~re located in the urban areas. Out of the total workers employed in the other establishments 55.32 per cent are employed in the units located in the rural ar~as. The following table gives the distribution by rural and urban areas:
TABLE 0.36
Percentage distribution oj manufacturing, trading and other establishments in Rural and Urban areas
Manufacturing Trading Other esmblishments establishments estabiishments
--------- -----Persons Persons Persons
No. employed No. employed No. emplo)ed
a , 4 S 6 7
Total 100.00 100.00 100.00 100.00 100.00 100.00
Rural 57.13 43.5& 55.21 43.69 72.54 55.32 Urban 42.87 56.42 44.73 56.31 27.46 44.68
.. 61
According to Census of estalishments, of the 5,370 manufacturing establisbments in the district 92 are registered factories, 1,372 are unregistered factories and 3,906 are household units. The registered units provide employment to 8,258 persons or 46.75 per cent of the workers employed in the manufacturing units. The household units provided employment to 6,151 persons or 34.84 per cent of the workers employed in the manufacturing units. The following Table gives the distribution by size of employment.
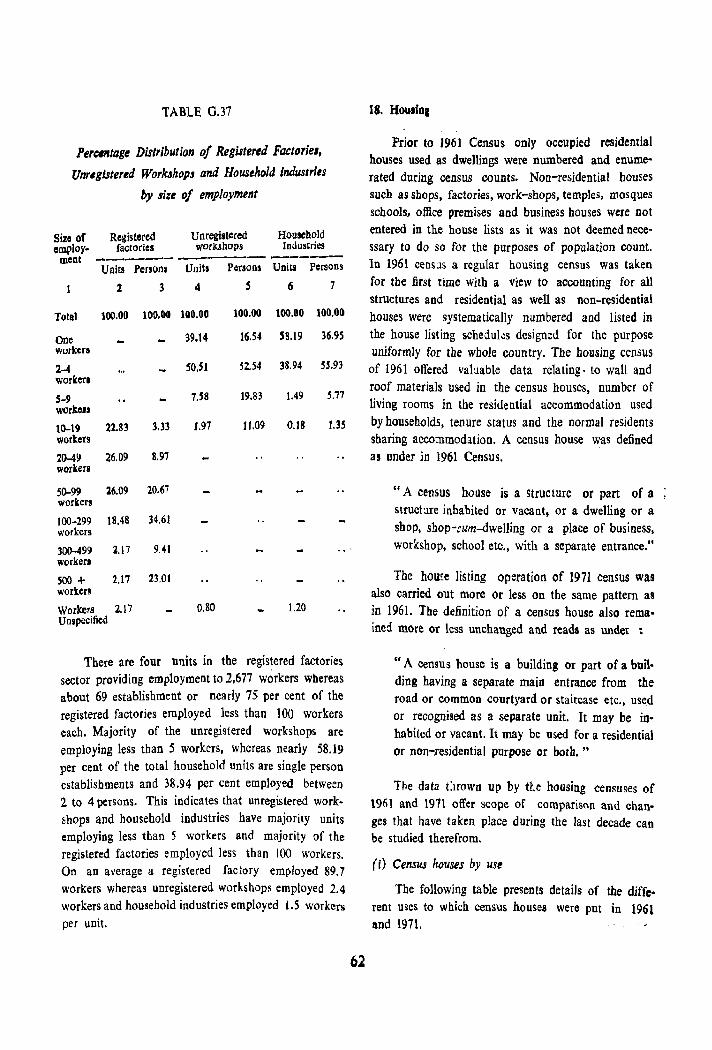
TABLE 0.37
Percllltage Distribution of Registered Foetoriel,
Unrlgister,d Workshop" and Household industries
by sizI of employment
Size of Registered Unregistered Household employ- factories workshops Industries
ment ------- -------Units Persona Units Persons Units Persons
2 3 4 S 6 7
Total 100.00 100.00 100.00 100.00 100.00 100.00
One 39.14 16.54 58.19 36.9S workers
2-4 SO.S! 52.54 38.94 5S.93 worken
S-9 7.58 19.83 1.49 5.71 worke ..
10-19 22.83 3.33 1.97 11.09 0.18 1.35 workers
20-49 26.09 8.97 workers
50-99 26.09 20.67 workers
100-299 18.48 34.61 workers
300-491) 1.17 9.41 worker.
SOO + 2.17 23.01 workers
Workers 2.17 0.80 1.20 Unspecified
There are four units in the registered factories sector providing employment to 2,677 workers wbereas about 69 establishment or nearly 75 per cent of the registered factories employed less than 100 workers each. Majority of the unregistered workshops are employing less than 5 workers, whereas nearly 58.19 per cent of the total household units are single person establishments and 38.94 per cent employed between 2 to 4 persons. This indicates that unregistered work~hops and household industries have majority units employing less than 5 workers and majority of the registered factories employed less than 100 workers. On an average a registered factory employed 89.7 workers whereas unregistered workshops employed 2.4 workers and household industries employed 1.5 workers per unit.
62
18. Housina
Prior to 1961 Census only occupied reSidential houses used as dwellings were numbered and enumerated during census counts. Non-residential houses such as shops, factories, work-shops, temples, mosques schools, office premises and business houses were not entered in the house lists as it was not deemed necessary to do so for the purposes of population count. In 1961 cenS:lS a regular housing census was taken for the first time With a view to accounting for all structures and residential as well as non-residential houses were systematically numbered and listed in the house listing scheduks designed for the purpose uniformly for the whole country. The housing census of 1961 offered valuable data relating. to wall and roof materials used in the census houses, number of living rooms in the residential accommodation used by households, tenure status and the normal residents sharing acco:nmodation. A census house was defined as under in 1961 Census.
" A census house is a structure or part of a struchlre inhabited or vacant, or a dwelling or a shop, shop-:um-dwelling or a place of business, workshop, school etc., with a separate entrance."
The hou~e listing operation of 1971 census was also carried out more Or less on the same pattern as in 1961. The definition of a census house also remained more or less unchanged and reads as under :
" A census house is a building or part of a building having a separate main entrance from the road or common courtyard or staircase etc., used or recognised as a separate unit. It may be inhabited or vacant. It may be used for a residential or non-residential purpose or both. "
The data t:1Town up by tte housing censuses of \9111 and 1911 offer scope of comparison and changes that have taken place during the last decade can be studied therefrom.
(i) Census houses by use
The following table presents details of the different uses to which census houses were put in 1961 and 1971,

TABLE 0.38 Census houses by use, 1961 and 1971
Usc of census house Number of census houses
'961 J971 Percentage increase
2 3 4 Total census houses 217,370 248.590 14.36
Dwellings 156,062 173,195 10.98 Shop or workshop-cum- 2,272 5,995 163.86 dwellings Shop and Business houses 6,169 6,230 0.99 Factories, workshops and 1.141 2,S60 124.36 worksheds Others 37,071 43,430 17.15 Vacant 14,655 17,180 17.23
In 1961 Census, about 2.t7 Iakh census houses were recorded. The number has gone up to 2.48 lakhs in 1971 showing an increase of 14.36 per cent during the decade. The increase is noticed both in the residential as well as non-residential census houses. The increase in ceasus houses may not necessarily mean addition of new houses during the decade, but may also be due to reasons like sub-division of 1961 units in 1971.
As between 1961 and 1971 the member of dwelling units increased by 10.98 per cent and shops and workshop cum-dwellings show an increase of 163.86 per cent. The total non-residential census houses increased by 22.98 per cent. The vacant houses show an increase of 17.23 per cent during the decade. The following table gives tbe percentage distribution of census houses by use in the rural and urban areas of the district:
TABLE G.39 Percentage distrihution of Census Houses hy use,
1961 and 1971
Use of house
I Total ceosus bouses
Dwellings Shop or workshop-Cllm -dwellings. Shops and business houses Factories workshop and worksheds Other Vacant
eeT ~us houses by use ( in percentage) 1961 197J -----
Total Rural Urban Total Rural Urban 2 3 4 S 6 7
100.00 100.00 100.00 ]00.00 ]00.00 100.00
71.80 73.30 64.79 69.67 70.52 66.19 1.05 0.95 1.47 2.41 2.28 2.95
2.84 1.63 8.47 2.5 J 1.41 7.01
O.5~ 0.27 1.71 1.03 0.55 3.00
17.05 18.27 11.41 17.47 18.87 J 1.74 U4 5.58 12.15 6.91 6.37 9.11
The proportion of dwelling units has decreased only in the rural areas. The proportion of shop or workshop-cum-dwellings has increased both in the rural and the urban areas whereas the proportion of shops and business houses bas slightly declined in both the areas. The proportion of factories, workshops and worksheds has increased in rural as well as urban areas, whereas the proportion of vacant houses has declined mainly in the urban areas.
63
(ii) Wall and roof material
Data on wall and roof material recorded duriDg the house listing operations is indicative of the quality of census houses in the district. The figures given hereunder show that majority of census houses have mud walls and the percentage of such houses is 39 per cent. Burnt bricks are the next important wall material and census houses having walls made of burnt bricks from 33.44 per cent of the total census houses, Use of grass, leaves, reeds or bamb·: 0 as wall materidl is ranking third in this area and was recorded for about 25.48 per cent or the structures. Use of unburnt bricks is insignific!1nt. The following figures would show rural urban differences in tbe materials used in the walls of census houses:
TABLE 0.40
Percentage distribution of census houses by Wall Material, 1971
Wall material Total Rural
2 3
Total 100.00 100.00
Mud 39.01 44.37
Stone 0.28 0.35
Burnt bricks 33.44 23.45
Unburnt bricks 0.48 0.49
Grass, leaves, reeds or 25.48 30.47
bamboo Wood 0.60 0.47
Cement concrete 0.06 0.04
G. J. Sheets 0.59 0.31
Other material 0.06 0.05
Urban
4
100.00
17.00 0.02
74.40 0.46 5.00
l.I5 0.15 1.72 0.10
In the rural areas about 44 per cent of the census houses have mud walls and in the urban areas this proportion is 17 per cent. Only 23.45 per cent of the
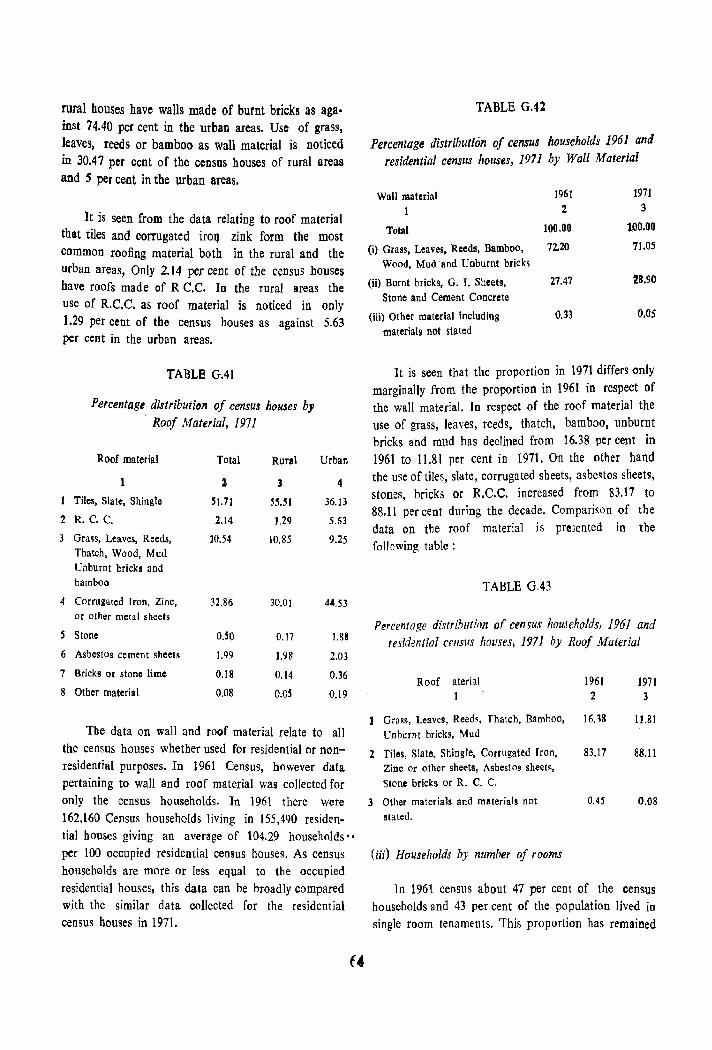
rural houses have walls made of burnt bricks as aga· inst 74.40 per cent in the urban areas. Use of grass, leaves, reeds or bamboo as wall material is noticed in 30.47 per cent of the census houses of rural areas and 5 per ceDt in the urban areas.
It is seen from the data relating to roof material that tiles and corrugated iraq zink form the most common roofing material both in the rural and the urban areas, Only 2.14 per cent of the census bouses have roofs made of R C.C. In the rural areas the use of R.C.C. as roof material is noticed in only 1.29 per cent of the census houses as against 5.63 per cent in the urban areas.
2
3
4
S
6
7
8
TABLE G.41
Percentage distribution of census houses by . Roof Material, 1971
Roof material Total Rural
:z 3
Tiles, Slate, Shingle 51.71 55.51
R. C. C. 2.14 1.29
Gra ~s, Leaves, Reeds, 10.54 10.85 Thatch, Wood, Mud Unburnt bricks and bamboo
Corrugated Iron, Zinc, 32.86 30.01 or other metal sheets
Stone O.~O 0.17
Asbestos cement sheets 1.99 ].98
8ricks or stone lime 0.18 0.14
Other material 0.08 O.O~
Urban
4
36.13
5.63
9.25
44.53
1.88
2.03
0.36
0.19
The data on wall and roof material relate to all the census houses whether used for residential or nonresidential purposes. In 1961 Census, however data pertaining to waJl and roof material was collected for only the census households. In 196\ there were 162,160 Census households living in 155,490 residential houses giving an average of 104.29 households" per 100 occupied residential census houses. As census househ01ds are more or less equal to the occupied residential houses, this data can be broadly compared with the similar data collected for the residential census houses in 1971.
(4
TABLE GA2
Percentage distribution of census households 1961 and residential census houses, 1971 by Wall Material
Wall material 1961 1 2
Total 100.00
(i) Grass, Leaves, Reeds, Bamboo, 72.20 Wood, Mud 'and Unburnt bricks
(ii) Burnt bricks, G. T. Sheets, 27.47 Stone and Cement Concrete
(iii) Other material including 0.33 materials not stated
1971 3
toO.OO
71.05
28.90
0.05
It is seen that the proportion in 1971 differs only marginally from the proportion in 1961 in respect of the wall material. In respect of the roof material the use of grass, leaves, reeds, thatch, bamboo, unburnt bricks and mud has declined from 16.38 per cent in 1961 to 11.81 per cent in 1971. On the other hand the use of tiles, slate, corrugated sheets, asbe~tos sheets, stones, bricks or R.C.C. increased from 83.17 to 88.11 per cent during the decade, Compariwn of the data on the roof material is pre3ented in the fol1nwing table:
2
3
TABLE 0.43
Percentage distrihution of census households, 1961 and residential census houses, 1971 by Roof Material
Roof aterial 1961 1971 2 3
Grass, Leaves, Reed~, Thatch, Bamboo, 16.38 11.&1 Unbllrnt bricks, Mud
Tiles, Slato. Shingle, Corrugated [ron, 83.17 88.11 Zinc or other shef'ts, Asbestos sheets, Stone bricks or R. C. C.
Other materials and materials not 0.45 0.08 stated.
(iii) Households by number of rooms
In 1961 census about 47 per cent of the census households and 43 per cent of the population lived in single room tenaments. This proportion has remained
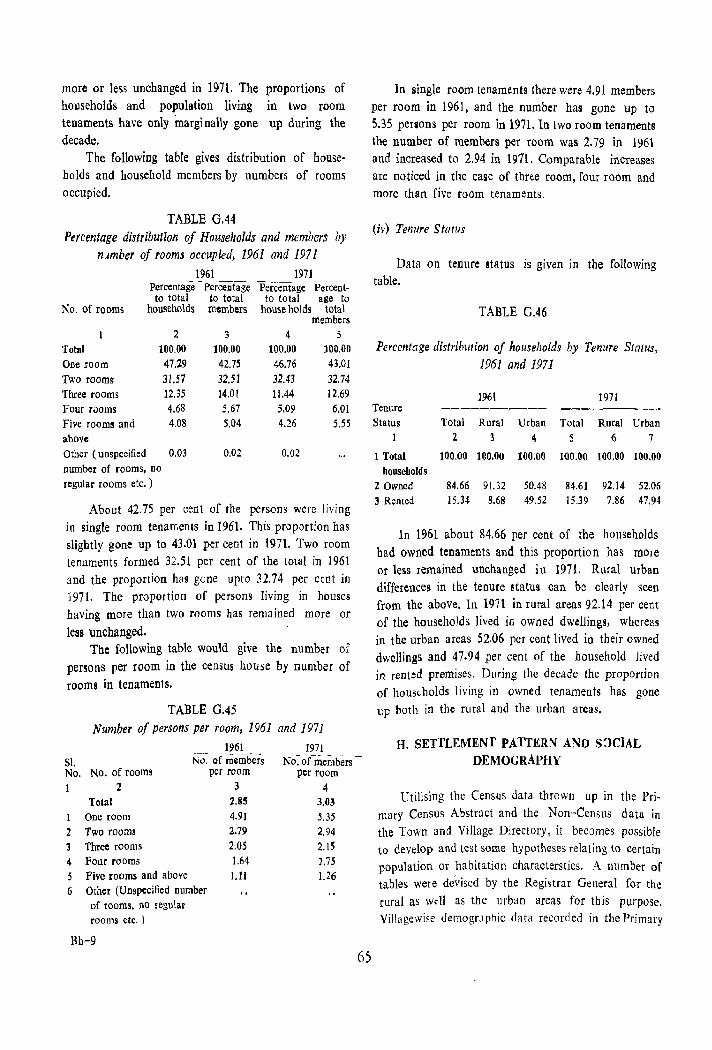
more or less unchanged in 1971. The households and population living tenaments have only marginally gone decade.
proportions of in two room up during the
The following table gives distribution of housebolds and household members by numbers of rooms occupied.
TABLE G.44 Percentage distribution of Households and members by
nilmher of rooms occupied, 1961 and 1971
cc-----,-- 1961 1971 Percentage Percentage Percentage Percent· to total to total to total age to
No. of rooms households members households total members
2 3 4 5 Total 100.00 100.00 100.00 100.00
One room 47.29 42.7S 46.76 43.01 Two rooms 31.57 32.51 32.43 32.74 Three rooms 12.35 14,01 11.44 12,69
Four rooms 4.68 5.67 5.09 6.01 Five rooms and 4.08 5.04 4.26 5.55 above Other (unspecified 0.03 0.02 0.02
number of rooms, no regular rooms etc. )
About 42.75 per cent of the persons were jiving in single room tenatLems in 1961. This proportion has slightly gone up to 43.01 per cent in 1971. Two room tenaments formed 32.51 per cent of the total in 1961 and the proportion has gene upto 32.74 per cent in 1971. The proportion of persons living in houses having more than two rooms bas remained mOre or
less unchanged. Tbe following table would give the number of
persons per room in the cemus house by number of rooms in tenaments.
TABLE GA5 Number of persons per room, 1961 and 1971
Sl. No. No. of rooms
1961 No. of members
per room
1971 No.o(rmmbers
pcr room I 2
Total 1 One room 2 Two room! 3 Three rooms 4 Four rooms 5 Five rooms and above 6 Other (Unspecified number
of rooms, no regular rooms etc. )
Bh-9
3 2.85
4.91 2.79
2.05 1.64 1.11
4 3.03
5.35
2.94 2.IS 1.75 1.26
6)
In single room tenaments there were 4.91 members per room in 1961, and the number has gone up to 5.35 persons per room in 1971. In two room tenaments the number of members per room was 2.79 in 1961 and increased to 2.94 in 1971. Comparable increases are noticed in the case of three room, four room and more than five room tenaments.
(iv) Tenure Status
Data on tenure status is given in the following table.
TABLE 0.46
Percentage distribution of households by Tenure Statlls, 1961 and 1971
1961 1971 Tenure --------- --------. Status Total Rural Urban Total Rural Urban
1 2 3 4 5 6 7
1 Total 100,00 100.00 100.00 100,00 100.00 100.00 households
2 Owned 84.66 91.32 50.48 84.61 92.14 52.06 3 Rented 15.34 8.68 49.52 15.39 7,86 47.94
In 1961 about 84.66 per cent of the households had owned ten aments and this proportion has mOre or less remained unchanged in 1971. Rural urban differences in the tenure status can be clearly seen from the above. In 1971 in rural areas 92.14 per cent of the households lived in owned dwellings, whereas in the urban areas 52.06 per cent lived in their owned dwellings and 47.94 per cent of the household lived in rented premises. During the decade the proporrion of houstholds living in owned tenaments has gone up both in the rural and the urban areas.
H. SETTLEMENT PATTERN AND S~CIAL DEMOGRAPHY
Utilising the Census data thrown up in the Pri· mary Census Abstract and the Non-Census data in the Town and Village Directory, it becomes possible to develop and test some hypotheses relating to certain population or habitation characters tics. A number of tables were devised by the Registrar General for the rural as well as the urban areas for this purpose. Village wise demographic data recorded in the Primary
Census Abstract aod non-census data recorded in the Village Directory available from the District Census Handbook were processed on comput~r in the Bureau of Economics and Statistics of the State Government. The tables for the rural areas are generated at the district and taluka level. The data on the urban areas were processed manually and as far as possible townwise tables are prepared with a view to studying inter-town variations in the district. The tables generated for the rural areas and for urban areas are presented at the end of Ihis note. It is observed from the tables for the rural areas that because the Dumber of villages in a taluka is comparatively small, the distributions developed do not lead to substantiation or otherwise of the various hypotheses, at the taluka level. At the district level, however, the picture becomes somewhat clearer. The talukawise data are presented in tbis volume in order that the data users may find them useful for research studies for sub-regions in a district. A short summary of the findings is recorded hereunder tablewise.
1. Rural Areas
Table H.1 gives the distribution of villages by size class of village area. It is seen tbat in Bharuch district there are 1,209 villages out of which area for 1 village in Anklesvar taluka is not separately available. The distribution of villages given in the table shows that maximum number of villages (462 or 38.21 per cent) are in the size class of 201-500 hectares. The next important size class is of 501-1000
hectares wherein 376 villages are recorded. As many as 177 villages have more than 1,000 hectares of area. Villages having less than 200 hectares of area are 193 or slightly less than 16 per cent of the total villages. The talukawise figures given in the table also show more or less similar distributions.
Table H.2 gives the distribution of the villages by selceted amenities, infra-structure and laod use data by distance from the nearest town. It is seen tbat the primary school facilities are available inmore than 85 per cent of the villages. All the villages within the distance range of 3 kms. from urban centre have primary school facilities whereas only one village in the distance range of 3-5 km. from the town is devoid of this facility. 400 out of 487 villages in the
66
distance range of 21-50 kms. and 146 out of 218 villages beyond 50 kms. from the town have primary school facilities. Only 80 villages in the district have higber secondary schools and these villages fall in all distance ranges. It is interesting to note lhat as many as 30 out of 487 villages in the distance range of 21-50 km. from nearest town have secondary or higher secondary schools. The population size of a village and location of the primary/secondary school in nearby non-urban centre are also relevant considerations in such an analysis and distance from the nearest town is not the sole d~terillinant for location of schooling facilities.
It is seen that 216 villages are connected with electric power supply. Only 2 out of 218 villages beyond the distance of SO kms. from the nearest town are connected with electricity, The distribution of villages by the distance range from the nearest to.vn indicates) tbat broadly speaking tbe proportion of villages conntcted with electricity declines with the increJse in the distance from the nearest town.
The distribution of the villages according to the rail and road facilities available to the villages indicates that the proportion of villages connected by pucca road declines with the increase in the distance from the nearest town. The proportion of CultIvable waste land to total cultivated land by the distance range from the nearest town is seen to be highest at 21.50 rer cent in the villages located witUn 3 kms. from the nearest town whereas it is lowest at 6.92 per cent in the vil1ag~s situated beyond 50 kms. Tae proportion of cultivable waste varies within a narrow range in other distance ranges and no definite pattern is noticed.
Table H.3 sbows distribution of the villages by distance from the nearest town and selected demographic characteristics. It is seen that the average population per village is highest in the villages .itliated in the distance range of 16-20 kms. at 1,199 persons per village and also higb in the villages in the distance ranges of less than 3 and 3-5 kms. It is lowest in the villages beyond 50 kms. and also low in the villages in the distance range of 21-50 kms. No definite trend either increasing or decreasing is noticed in relation to distance from the nearest town.

The average number of households per census bouse given in col. 5 of the table shows little difference in the averages of the villages of all the distance ranges. A study of sex ratio by distance ranges from nearest town also does not indicate any definite differences. However, it is interesting to note that the number of females per one thousand males is lowest in the villages within 3 kms. of the town and also low io the villages in the distance range of 3-5 km. than in the villages in other distance ranges. The sex ratio is however bigbest in the villages situated beyond 50 kms.
The literacy rale varies witbin a narrow range uplo the distance of 20 km. and does not indicate any definite pattern. It is however seen to be lowest at 13.80 per cent in the villages situated beyond 50 km. and also low in the villages in the ranges of 21-50 km.
The data on the proportion of workers to total workers given in col. 8 of tbe table sbows tbat tbe proportion of workers varies within a narrow mar&in in the different distance ranges and no definite trend is noticed. The percentage distribution of workers by tbe sectors of economy shows that tbe proportion of workers engaged in the primary sector of economy is lowest in the villages situated within 3 kms. from the nearest town where it is 81.18 per cent. This proportion increases in the next distance range of 3-5 kms. where it is 85.41 per cent. [n the other distance raolles the variations are narrON, but it is highest in tbe villag~s
beyond 50 krn. from tile nearest town. It can be, however, inferred that due to the urban impact the proportion of workers in the secondary and tertiary sectors il more in the villages situated witbin a range of 5 kms. from tbe town tban tbose further away from the towns. It is also seen that the proportion of female workers is higher in the villages situated within the distance of 3 kms. from the Dearest town than in those beyond this distance. It is further seen that this proportion declines with the increase in the distance from the nearest town. It is interesting to note that the female workers are engaged in primary sec.or III all the distance ranges.
Table H.4 gives tbe average ~jze of population per village by distance from the nearest town by size class of the town. It reveals that average population size of the villages situated within 3 kms. from the towns having 5",lI\)lJ-9~,999 pUl'ulatlOn is greater than
limilar villages situated from lawns baving less Ihan 50,000 population. The average population size per village declines wilh the increase io the distance range from the towns having popUlation between 50,000 and 99,999 with exception in the distance range of 16-20 km. Similar trend is not noticed for the villages situated in the different langes frum the towns having less than 50,000 population.
67
Table H. 5 provides interesting data about selected servicing institutions aod demographic characteristics by the population size of the villages. It is seen that the proportion of villages having post offices increases witb the size of the villages except in the villages in the population range of 5,000-9,999. Only 7 out of 152 viIla~es having less than 200 population are having a post office, and only 30 out of 363 villages in the population range of 200 to 499 bave post office facility. Out of 78 villages having more than 2,000 population as many as 76 villages have post offices.
It is interesting to note from col. 5 of the table that average distance from the nearest town decreases with the increase in the population size of the villages. This means that larger size villages are situated nearer a town than the smaller size Villages. As already seen earlier, the villages situated nearer the town with a population between 50,000 and 99,999 (Bharucb) are bigger in size. The sex ratio by size class of villages shows a declining trend with the increase in the size class of villages with an exception in the size class of 5,000-9,999. It is however, seen that the literacy also sbow a declining trend with the increase in the size class of villages except in the size class of 5,000- 9,999.
The figures of proportion of workers show th'llt the proportion varies within a narrow margin in all the different population sizes. However, the proportion of workers is lower in the villages having population between 5,000-9,999 tban those baving smaller population and does not indicate any definite trend.
Table H.6 gives tbe Dumber of medical and postal institutions per 100 km 2 of rural area in different talukas of tbe district. The number of medical institution varies from a minimum of 1.08 per 100 km ~ of rural area in Dediapada hluka to a maximum of 5.25 per 100 km 2 • or rural area in Valia taluka. Tbe
numbec of post offices per 100 km~. of rural area varies (rom a minimum of 1.86 in Dediapada taluka to a maximum or 10.72 in Bharuch taluka.
Table H.7 gives the average distance per village
from the nearest town by density of population. It
shows that the average distance of tbe village from
ethe narest town declines with the increase in tbe
density of villages upto the density range of 10t-200
persons per km ~. It is also seen that the average
distance from the nearest town is higher in the villa
ges having a density upto SO persons per kmll than
that in the villages having a density of more than SO
persons per km~.
Table H.8 shows tbe relationship between the
density of population of villages and the proportion
of Scheduled Caste and Scheduled Tribe population.
As regards Scheduled Castes it can be seen that the
average density of population per hectare increases
with the increase in the proportion of Scheduled
Caste population.
In case of scheduled tribes it is observed that
there are as many as 712 or more than SO per cent
villages where the propOltion of scheduled tribes is
more than SO per cent in each village. Of tbese,
there are 601 villages where this proportion is more
than 75 per cent in each village. The average density
of population per hectare shows a direct relationshIp
with the proportion of scheduled tribe in the villages
up to the proportion range of 51 to 7S per cent.
However the lowest proportion at 0.98 persons p;!r
hectare in the villages witb more than 75 per cent
scheduled tribe population needs further study.
Table H.9 seeks to provide some inSIght into
the infrastructure of villages as it takes into account
the combined amenities score per village by popula
tion size class. The details of score values assigned to
each of the amenities is as under :
68
Amenities available in the villages and Ihe scores assigned to each of them.
Amenities Electricity /Electricity for Agriculture only, University.
2 Railway Station, Telephone, College, Other industrial school, Training school, Art school.
3 Secondary School, Hospital, Maternity and Child welfare Centre, Health Centre. T. B. Clinics, Post and Telegraph office.
4 Middle school, Nursing Home, Tap water, Tube welll Hand Pump, Post office.
S Primary School. Dispensary, Family Planning Centre, Veterinery Hospital! Dispensary etc.
6 Well, Tank, Canal J River, etc. Pucca Road, Kutcha Road, Navigable River/ Canal, Other communication facility.
Score for each item
6
5
4
3
2
While assigning the scores weightages have been given to the various amenities in the villages primarily on consideration of their scarcity value. The significant contribution that a particular item can make in the infrastructure for development in the rural areas has also been taken into account to some extent in 2iving the weiglltages. The table shows that large size villages have higher amenities score than smaller size villages. The average amenities score for the villages having less than 200 population is only 4.12 and the amenity score is higher for each successive size class of popUlation the score being as high as 26.25 per village for the villages having more than 5,000 population, indicating a direct relationsnip between the size of popUlation of villages and the amenities in villages. The average amenity Score per village in the district is 9.71. It is however, observed that villages of Bharuch, Anklesvar, Hansot, Vagra, Jhagadia, Jambusar, Amod and Valia talukas have comparatively higher amenity scores than the district average while the amenity scores are slightly lower as compared to the district avelage in the case of villages of Nandod taluka. Villages of Dediapada and Sagbara talukas, however, have very low amenity scores.
2. Urban Areas
Tables H.IO to H.20 relate to urban areas of the district. As stated earlier the details are given townwise as well as according to size class of towns. But the distribution of towns by size class at the district level results in a very small number of towns in the different size classes.
Out of 7 towns in the district, one town viz. Bharuch is in the size class of 50,000-99,999 population, 3 towns are in the popUlation range of 20,000-49,999. One town has population between 10,000 and 19,999 and two towns have population between 5,000 and 9.999. It is seen that the growth of population in class II town during the decade is slightly less than that of the class III towns. The density per hectare in class II town (Bharuch) is much higher than in the towns of smaller size. The number of females per thousand males is slightly lowerer in class II town than that in class III, IV and V towns. It is interesting to note that the proportion of Scheduled Caste popUlation is lowest in class III towns and lower in class II towns than in class IV and V towns and does not show any definite pattern.
The proportion of scheduled tribe popUlation in the district varies within narrow range in different size class of towns and no definite trend is observed. Townwise the proportion is observed to be high in Rajpipla and Anklesvar towns as compared to other towns. Further the proportion of scheduled tribes in the towns of this district is fairly high as compared the towns or other districts of the State except Surat and Val sad districts. This can be attributed to the high proportion of scheduled tribes in the district. Tbe literacy rate is higher in class II town than in class III, IV and V towns.
Table H. II gives household size, sex ratio and literacy rate according to density of towns. It reveals no definite trend. The household size varies within a narrow margin. The sex ratio varies from a minimum of 870 in Palej town to a maximum of 979 in Hansot town. The proportion of literates varies from a minimum of 50.08 per cent in lambusar town to the maximum of 57.36 per oent in Rajpipla town.
Table H.12 gives the distribution of towns by functional categories and Table H.13 shows the
69
changes in the functional category and the growth rate in the last two Censuses. It is interesting to note that Anklesvar has shown fastest increase at 32.81 during 195Hi1 whereas population in Jambusar town has increased at a rapid rate of 31.47 in 1961-71 but no definite relationship can be established with the functional categories.
Table H.14 which gives the townwise as well as size class wise proportion of female workers, indicates that the proportion varies from a mimimum of 6.20 per cent in class II towns to a maximum of 12.08 per cent in class V towns, and shows an inl::re"si Ilg trend with the decline in the populatiun of the towns. Table H.t5 gives the per capita receipt and expenditure of local bodies by size class of towns. The figures reveal neither increasing nor decreasing trend as regards total income or expenditure in different size classes of towns. Table H.l6 furnishes data on per capita income and expenditure in old and new towns. New towns are those which have come into existence for the first time during 1951 Census or thereafter. The table reveals that the per capita receipt in old towns is less than that in new towns. The per capita expenditure is also lower in old towns than that in new towns. But per capita expenditure on public health and conveniences and on public institutions in old towns, is higher than that in new towns.
Table H.l8 gives the income and expenditure by functional categories of the town. It would be clearly seen that the per capita receipt and expenditure in the towns having industry or commerce as one of the functional categories is more than that in the towns in other functional categories. Table H.19 shows the educational and medical facilities per one thousand popUlation in the towns by size class, which reveals that number of secondary schools per 1,000 population is highest in class V towns. The figures of number of primary schools per 1,000 popUlation do not show any trend and vary within a very narrow margin in all size classes. The number of beds in medical institutions per 1,000 population also does not indicate any definite trend. Table H.20 shows the number ofbeds per one thousand population by functional cate gory of towns. It is seen that the number of beds per one thousand popUlation is greater in the towns having functional category of industry or other categories in combination with it.
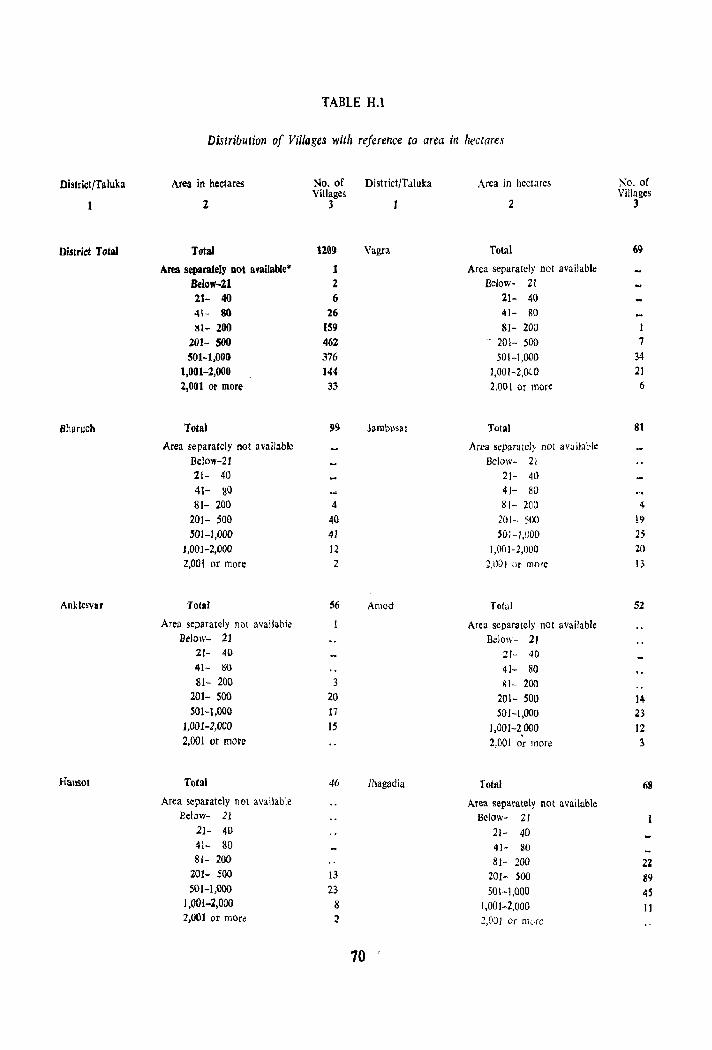
TABLE H.I
Distribution of Villages with reference to area in hectares
DistrictlTaluka Area in hectares No. of District/T .:Iluka Area in hectares No. of Villages Villages
Z 3 2 3
District Total Total 1109 Vagra Total 69
Area separately Dot available· 1 Area separately nol available Below-Zl 2 Below- 21 21- 40 6 21- 40 4l- 80 26 41- 80 111- 200 159 81- 200 I
201- SOO 462 - 201- 500 7 501-1,000 376 501-1,000 34
1,001-2,000 144 1,O()I-2,OLO 21 2,001 or more 33 2.00 I or more 6
Bharuch Total 99 }ambll,ar Total 81
Area separately not a vai/able Area separntcJ} not aY~ ilable Below-21 Below- 21 2(- 40 21- 40 41- 80 4(- 80 81- 200 4 81- 200 4
201- 500 40 201- 500 19 501-1,000 4) SOl-I,OOO 2;
1,001-2,000 12 ),00)-2,000 20 2,001 or more 2 2,O[)1 or more 13
Anklesvar Total 56 Amod Total 52
Area separately not available Area separately nOI available Below- 21 BelolV- 21
21- 40 21- 40 41- 80 41- 80 81- 200 3 81- 200
201- 500 20 201- 500 14 SOl-l,OOC 17 50H,00O 23
J,001-2,000 15 1,001-2000 12 2,001 or more 2,001 o~ more l
Hallsot Total 46 Jl1agadia Total 68
Area separately not a\'ailab\e Area separately not available Below- 21 Below- 21
21- 40 21- 40 41- 80 4J- SO 81- 200 81- 200 2Z
201- 500 13 201- sao 89 501-1,000 23 501-1,000 4S
J ,OOl-Z,OOO 8 1,001-2,000 II 2,001 or mOre :2 2,001 Or nwre
70 I
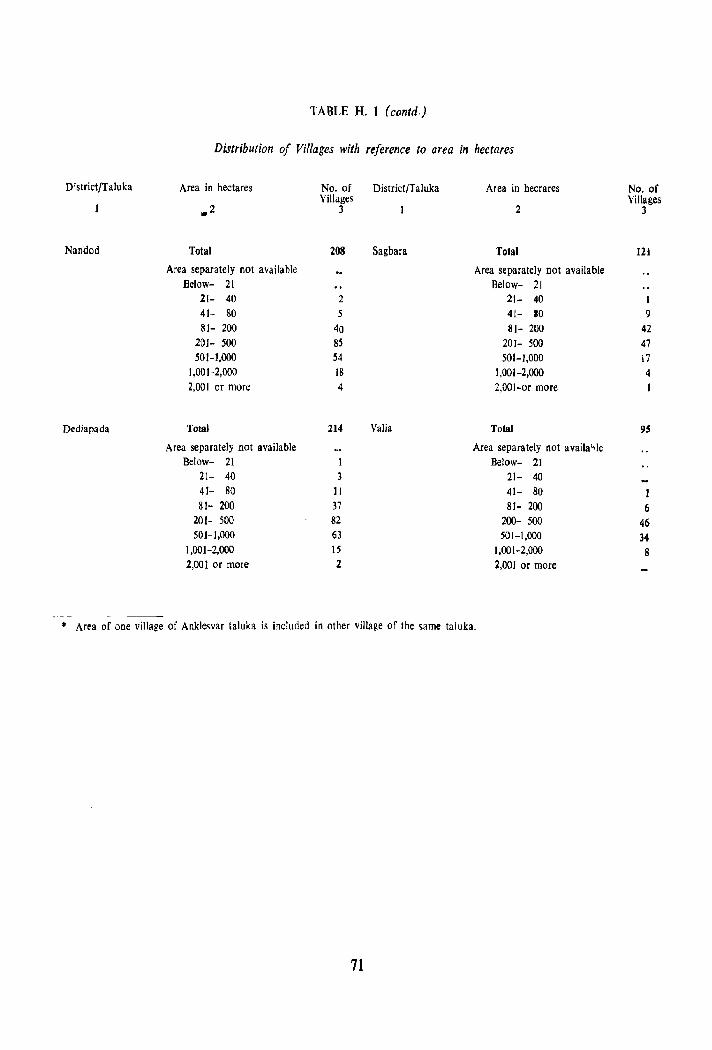
TABLE H. I (contd.)
Distribution of Villages with reference to area in hectares
District/Taluka Area in hectares No. of District/Taluka Area in hecrares No. of Villages Villages
.. 2 3 2 3
Nandod Total 208 Sagbara Total 121
Area separately not available Area separa tely not available Below- 21 Below- 21
21- 40 2 21- 40 41- 80 5 41- 10 9
81- 200 40 81- 200 42 201- 500 8S 201- 500 47 501-1,000 54 501-1,000 17
1,001-2,000 18 1,001-2,000 4 2,001 or more 4 2,OOI-or more 1
Dediapada Total 214 Valia Total 95
Area separately not available Area separately not availa"le Below- 21 1 Below- 21
21- 40 3 21- 40 41- 80 II 41- 80 1 81- 200 37 81- 200 6
201- 500 82 200- 500 46 501-1,000 63 501-1,000 34
1,001-2,000 15 1,001-2,000 8 2,001 or more 2 2,001 or more
• Area of one village of Anklewar taluka is included in other village of the same taluka,
71
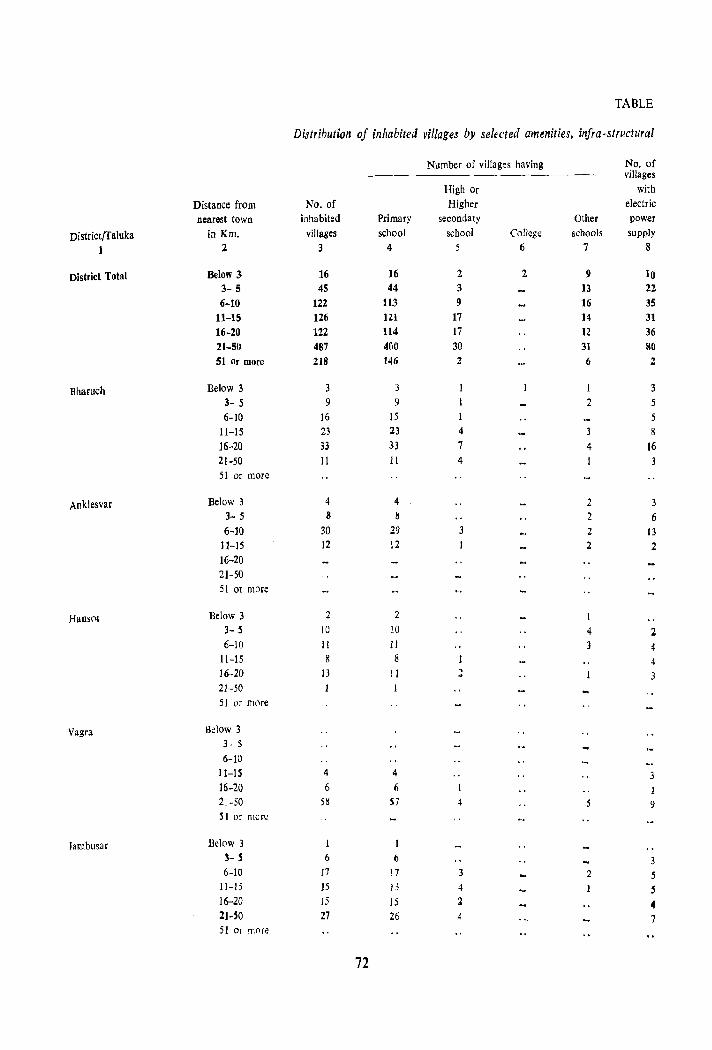
TABLE
Distribution of inhabited villages by selected amenities, infra--structural
Number of villages having No. of villages
High Or with
Distance from No. of Higher electric
nearest town inhabited Primary secondary Other power
District/Taluka in Km. villages school school College schools supply
1 :2 3 4 5 6 7 8
District Total Below 3 16 16 2 2 9 10 3- 5 45 44 3 13 22
6-10 122 113 9 16 3S 11-15 126 Hi 17 14 31 16-20 122 114 17 12 36 21-50 487 4()0 30 31 80
51 Or more 218 146 2 6 2
Bharuch Below 3 3 3 I 3- 5 9 9 2 5 6-10 16 15 5
11-15 23 23 4 3 8
16-20 33 33 7 4 ]6 21-50 11 II 4 3 51 or more
Anklesvar Below 3 4 4 2 3 3- 5 8 8 2 6 6-10 30 29 3 2 13
11-15 12 12 2 2 16-20 21-50 51 or more
Hansot Below 3 2 2 3- S 10 10 4 2 6-10 II 11 3 4
11-15 8 4 16-20 JJ 11
, .. 3 21-50 51 or mNe
Vagra Below 3 3 - 5
6-10 II-IS 4 4 3 16-20 6 6 1 21-50 5~ 57 4 9 Sl or more
Jambusal Below 3 1
3- S 6 6 3 6-10 17 17 3 2 5
11-15 15 J3 4 S 16-20 15 15 2 4 lHO 27 26 7 51 Or rr.nre
72
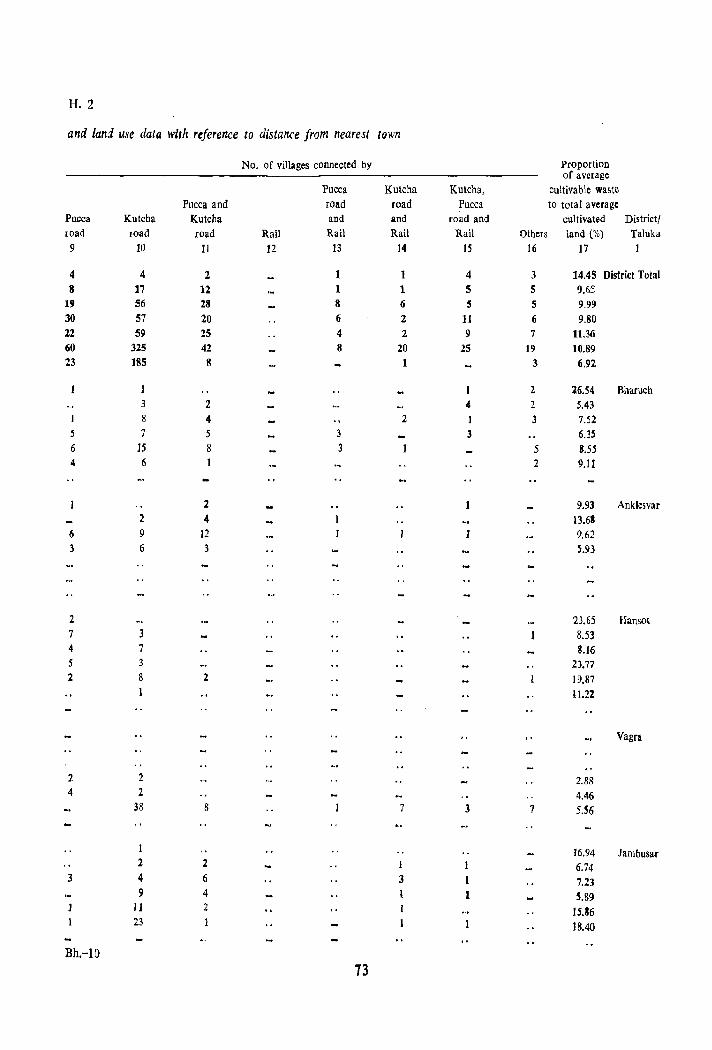
H. 2
and land use data with reference to distance from nearest town
No. of villages connected by Proportion of average
Pucca Kutcha Kutcha, Cultivable wa&te Pucca and road road Pucca to total average
Pucca Kutcha Kutcha and and road and cultivated District! road road road Rail Rail Rail Rail Others land (%) Taluka 9 10 11 12 13 14 15 16 17 I
4 4 2 1 4 3 14.45 District Tolal 8 17 11 1 1 5 5 9.65
19 56 28 8 6 5 5 9.99 30 57 20 6 2 11 6 9.80 22 59 25 4 2 9 7 11.36 60 325 42 8 20 25 19 10.89 23 185 8 1 3 6.92
2 26.54 Bharuch 3 2 4 2 5.43 8 4 2 I 3 7.52
5 7 5 3 3 6.35 6 15 8 3 5 8.55 4 6 2 9.11
2 9.93 Anklesvar 2 4 13.68
6 9 12 9.62 3 6 3 5.93
2 23.65 Hansot 7 3 8.53 4 7 8.16 5 3 23.77 2 8 2 19.87
11.2%
Vagra
2 2 2.88 4 2 4.46
38 8 7 3 7 5.S6
1 16.94 Jambusar 2 2 1 I 6.74 4 6 3 1 7.23 9 4 1 5.89
IJ 2 15.36 23 1 18.40
Bh.-1O 73
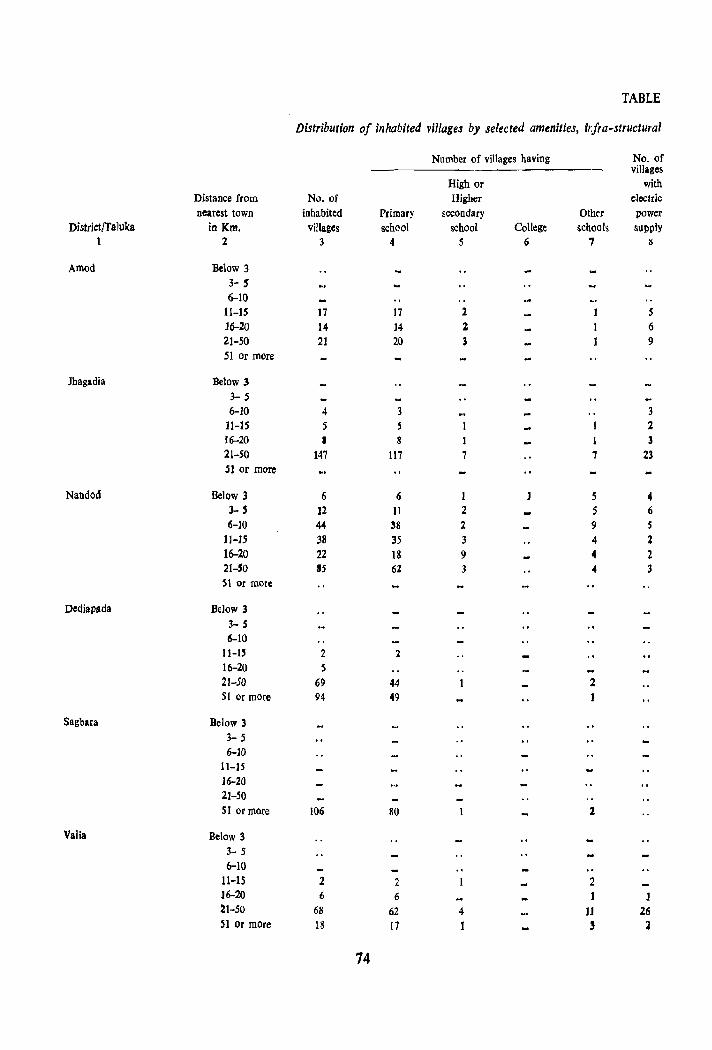
TABLE
Distribution of inhabited vil/age.s by selected amenities, irJra-structural
Number of villages having No. of villages
High or with Distance from No. of Higher electric nearest town inhabited Primary secondary Othrr power
District/Taluka in Km. villages school school College schools supply 1 2 3 4 5 6 7 ~
Amod Below 3 3- ,-6-10
11-15 17 17 1 5 16-20 14 14 2 6 21-50 21 20 J 9 51 or more
Jhagadia Below 3 3- 5 6-10 4 3 3
11-15 5 S 2 16-20 I 8 1 1 3 21-50 147 117 7 1 23 SI or more
Nandod Below 3 6 6 1 5 4 3- 5 ]2 Il 2 5 6 6-10 44 38 2 9 S
Jl-]5 38 35 3 4 2 16-20 22 18 9 4 2 21-'0 '5 62 3 -4 3 51 or more
Dediapada Below 3 3- S 6-10
11-15 2 2 16-20 5 21-50 69 44 2 51 or more 94 49
Sagbara Below 3 3- 5 6-10
11-15 16-20 21-50 51 or more 106 80 2
Valia Below 3 3- 5 6-10
11-15 2 2 2 16-20 6 6 21-50 68 62 4 JJ Z6 51 Or mOre 18 17 1 3 2
74
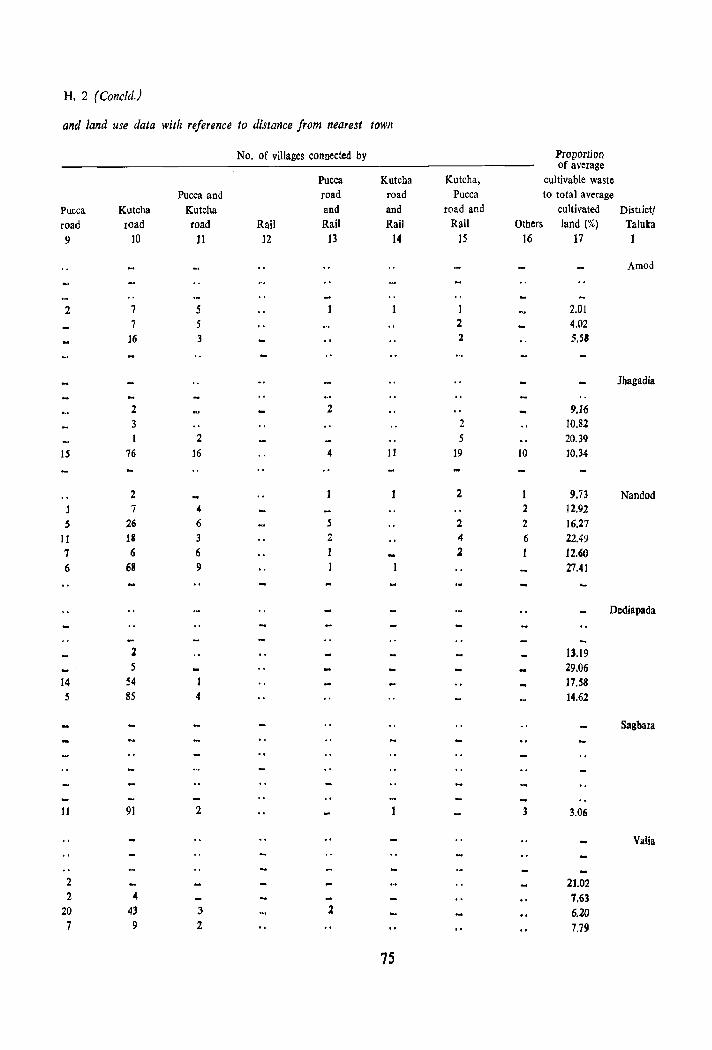
H. 2 (Concld.J
and land use data with reference to distance from nearest town
No. of villages connected by Proportion of average
Pucca Kutcha Kutcha, cultivable waste Pucca and road road Pucca to total average
Pucca Kutcha Kutcha and and road and cultivated DistIict/ road road road Rail Rail Rail Rail Others land (%) Taluka 9 10 11 12 13 14 15 16 17 1
Amod
2 7 5 2.01 7 5 2 4.02
16 3 2 5.51
Jhagadia
2 2 9.16 3 2 10.82
2 5 20.39 15 76 16 4 11 19 10 10.34
2 2 9.73 Nandod 7 4 2 12.92
5 26 6 5 2 2 16.27 1J 18 3 2 4 6 22.49 7 6 6 1 2 I 12.60 6 68 9 27.41
Dediapada
2 13.19 29.06
14 54 17.58 5 85 4 14.62
sagbara
11 91 2 3 3.06
Valia
2 21.02 2 4 7.63
20 43 3 2 6.20 7 9 2 7.79
75

TABLE
Distribution of inhabited villages by selected demographic
Distance No. of Average Average No. of Literacy Proportion from inhabited population number females rate of workers
nearest villages per households per (%) to total town village per 1,000 population
District/Taluka in km. censlls house males (%)
] 2 3 4 5 6 7 8
District Total Below 3 16 1,070 1.07 900 36.99 39.82
3- 5 45 1,090 1.09 933 38.54 37.90
6-10 122 956 1.05 973 43.57 39.41
11-15 126 940 1.08 954 37.10 37.15
16-20 122 1,199 1.07 943 41.74 36.08
21-50 487 745 1.06 952 29.28 ' 37.07
51 or more 218 486 1.02 992 13.80 34.94
Bharucb Below 3 3 1,996 1.04 929 33,64 40.87
3-5 9 1,554 1.08 913 48.58 30.92
6-10 16 987 1.10 1,012 42.72 35.24
11-15 23 1,046 1.20 945 46.15 36.85
16-20 33 1,454 1.08 941 45.25 37.33
21-50 11 1,555 1.08 948 41.41 37.51
51 or moro
Anklesvar Below 3 4 947 1.02 958 35.35 39.70 3- 5 8 1,659 1.18 922 32.88 43.30 6-10 30 1.241 1.03 989 36.08 37.79
11-15 12 1,399 1.05 967 35.52 37.38 16-20 21-50 51 or more
Hansot Below 3 2 510 1.03 948 27.77 40.04 3- 5 10 732 1.07 981 41.25 37.78 6-10 11 734 1.03 989 41.60 4],03
11-15 8 700 1.06 999 44.82 38.09 16-20 13 J,105 1.09 986 44.79 36.70 21-50 1,227 1.02 1,031 53.55 36.67 51 or more
Vagra Below 3 3- 5 6-10
11-15 4 1,191 1.12 1,003 37.82 42.90 16-20 6 1,216 1.10 917 42.46 38.14 21-50 58 913 1.07 935 3US 35.38 51 or more
Jambusar Below 3 324 1.41 841 25.93 39.51 3- 5 6 808 LO) 910 32.10 34.37 6-10 17 1.226 1.04 944 28.33 34.S7
JI-15 15 1,200 1.04 921 39.06 31.68 16-20 15 1,770 1. OS 930 41.83 31.70 21-50 27 1,687 1.05 935 35.76 32.49 51 or more
76
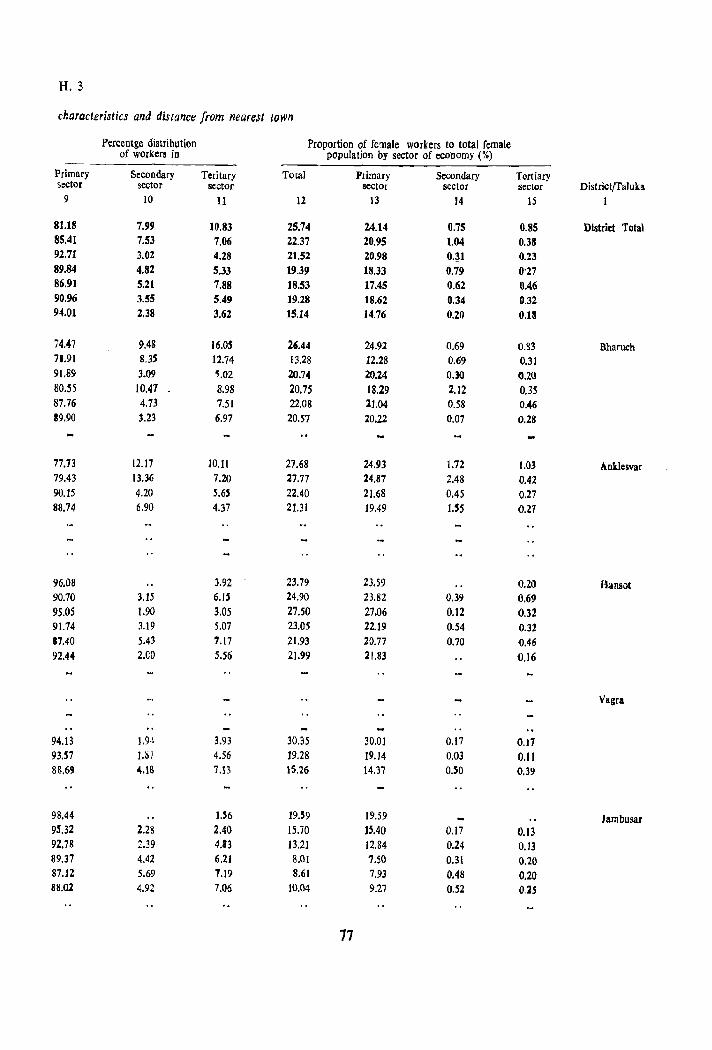
H.3
characteristics and distance from nearest town
Percentge distri bution Proportion of female workers to total female of workers in population by sector of economy (%)
Primary Secondary Teritary Total Primary Secondary Tertiary sector sector sector sector 5ector sector DistrictjTaluka
9 10 11 12 13 14 15 1
81.18 7.99 10.83 25.74 24.14 0.75 0.85 District Total 85.41 7.53 7.06 22.37 20.95 1.04 0.38 92.71 3.02 4.28 21.52 20.98 0.~1 0.%3 89.84 4.82 5.33 19.39 18.33 0.79 0'27 86.91 5.21 7.88 18.53 17.45 0.62 0.46 90.96 3.55 5.49 19.28 18.62 0.34 0.32 94.01 2.38 3.62 15.14 14.76 0.20 O.l!
74.47 9.48 16.0S 2'.44 24.92 0.69 0.83 Bharuch 71.91 8.35 12.74 13.28 12.28 0.69 0.31 91.89 3.09 'i.02 20.74 20.24 0.30 0.20 80.55 10.47 8.98 20.75 18.29 2.12 0.35 87.76 4.73 7.51 22.08 21.04 0.58 0.46 89.90 3.23 6.97 20.57 20.22 0.07 0.28
77.73 12.17 10.11 27.68 24.93 1.72 1.03 Anklesvar 79.43 13.36 7.20 27.77 24.87 2.48 0.42 90.15 4.20 5.65 22.40 21.68 0.45 0.27 88.74 6.90 4.37 21.31 19.49 I.S5 0.27
96.08 3.92 23.79 23.59 0.20 Hansot 90.70 3.15 6.IS 24.90 23.82 0.39 0.69 95.05 1.90 3.05 27.50 27.06 0.12 0.32 91.74 3.19 5.07 23.05 22.19 0.54 0.32 87.40 5.43 7.17 21.93 20.77 0.70 Q.46 92.44 2.CO 5.56 21.99 21.83 n.l6
Vagnl
94.13 ).9~ 3.93 30.35 30.01 0.17 0.17 93.57 1.!)) 4.56 19.28 19.14 0.Q3 0.11 88.69 4.18 7.n 15.26 14.37 O.SO 0.39
98.44 1.56 19.59 19.59 lambusar 95.32 2.28 2.40 15.70 15.40 0.17 n.ll 92.78 2.39 4.13 1l.21 12.84 0.24 0.13 89.37 4.42 6.21 8.01 7.50 0.31 0.20 87.12 5.69 1.19 8.61 7.93 0.48 0.20 88.01 4.92 7.06 10,04 9.27 0.52 0.25
77
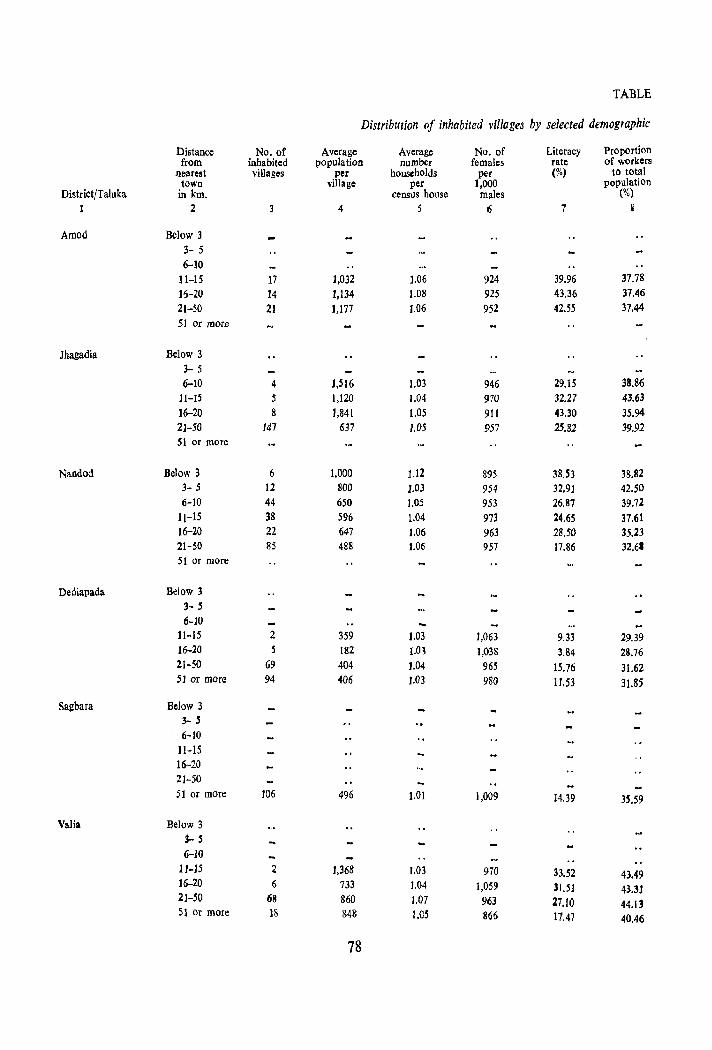
TABLE
Distribution of inhabited villages by selected demographic
Distance No. of Average Average No. of Literacy Proportion from inhabited population number females rate of workers
nearest villages per households per (%) to total town village per 1,000 population
District/Taluka in km. census house males (%) I 2 4 5 6 7 i
Arood Below 3 3- 5 6-10
11-15 17 1,032 1.06 924 39.96 37.78 16-20 14 1,134 1.08 925 43.36 37.46
21-50 21 1,177 1.06 952 42.55 37.44 51 or more
Jhagadia Below 3 3- 5 6-10 4 1,516 1.03 946 29.15 38.86
11-15 5 1,120 [.04 970 32.27 43.63 16-20 8 1,841 1.05 911 43.30 35.94 21-50 147 637 1.05 957 25.82 39.92 51 or more
Nandod Below 3 6 ],000 1.]2 895 38.53 38.a2 3- 5 12 800 1.03 954 32.91 42.50 6-10 44 650 1.05 953 26.87 39.72
II-IS 38 596 1.04 973 24.65 37.61 16-20 22 647 1.06 963 28.50 35.23 21-50 85 488 1.06 957 17.86 32.6' 51 or more
Dediapada Below 3 3- 5 6-10
11-15 2 359 1.03 1,063 9.33 29.39 16-20 S 182 1m 1,038 3.84 28.76 21-50 69 404 ].04 965 15.76 31.62 51 or more 94 406 1.03 980 11.53 31.85
Sagbara Below 3 3- 5 6-10
11-15 16-20 21-50 51 or more 106 496 1.01 1,009 14.39 35.59
Valia Below 3 3- 5 6-10
11-15 2 1,368 1.03 970 33.52 43.49 16-20 6 733 1.04 1,059 J1.51 43.31 21-50 68 860 1.07 963 27.10 44.13 51 or more 18 848 1.0S 866 17.47 40.46
78
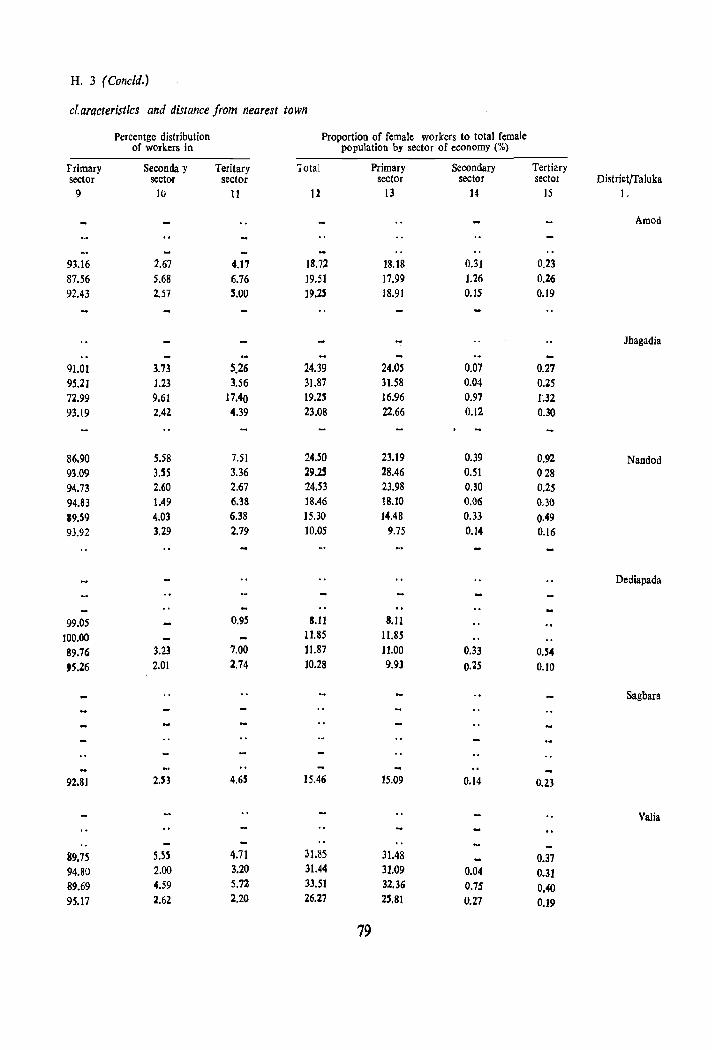
H. 3 (Concld.)
cT.arC(cteristics and distance from nearest town
Percentge distribution Proportion of female workers to total female of workers in population by sector of economy (%)
Frimary Seconda -y Teritary Total Primary Secondary Tertiary sector sector sector sector sector sector District/Taluka
9 10 11 12 13 ]4 15 1.
Amed
93.16 2.67 4.17 18.72 18.]8 0.31 0.23 87.56 5.68 6.76 19.51 17.99 1.26 0.26 92.43 2.57 !!.OO 19.25 18.91 0.15 0.19
- Jhagadia
91.01 3.73 5.26 24.39 24.05 0.07 0.27 95.21 1.23 3.56 31.87 31.58 0.04 0.25 72.99 9.61 17.40 19.2.S 16.96 0.97 1.32 93.19 2.42 4.39 23.08 22.66 0.12 0.30
86.90 5.58 7.51 24.50 23.19 0.39 0.92 Nandod 93.09 3.55 3.36 29.25 28.46 0.51 028 94.73 2.60 2.67 24.53 23.98 0.30 0.25 94.83 1.49 6.38 ]8.46 18.10 0.06 0.30
19.59 4.03 6.38 15.30 14.48 0.33 0.49 93.92 3.29 2.79 10.05 9.75 0.14 0.16
Dediapada
99.05 0.95 S.lI 8.11
100.00 11.85 11.85
89.76 3.23 7.00 11.87 11.00 0,33 0.54
'5.26 2.01 2.74 ]0.28 9.93 OJ5 0.10
Sagbara
92.81 2.53 4.65 15.46 15.09 0.14 0.23
Valia
89.75 5.55 4.71 31.85 31.48 0.37 94.80 2.00 3.20 31.44 31.09 0.04 0.31 89.69 4.59 5.72 33.51 32.36 0.75 0...0 95.17 2.62 2.20 26.27 25.81 0.27 0.19
79
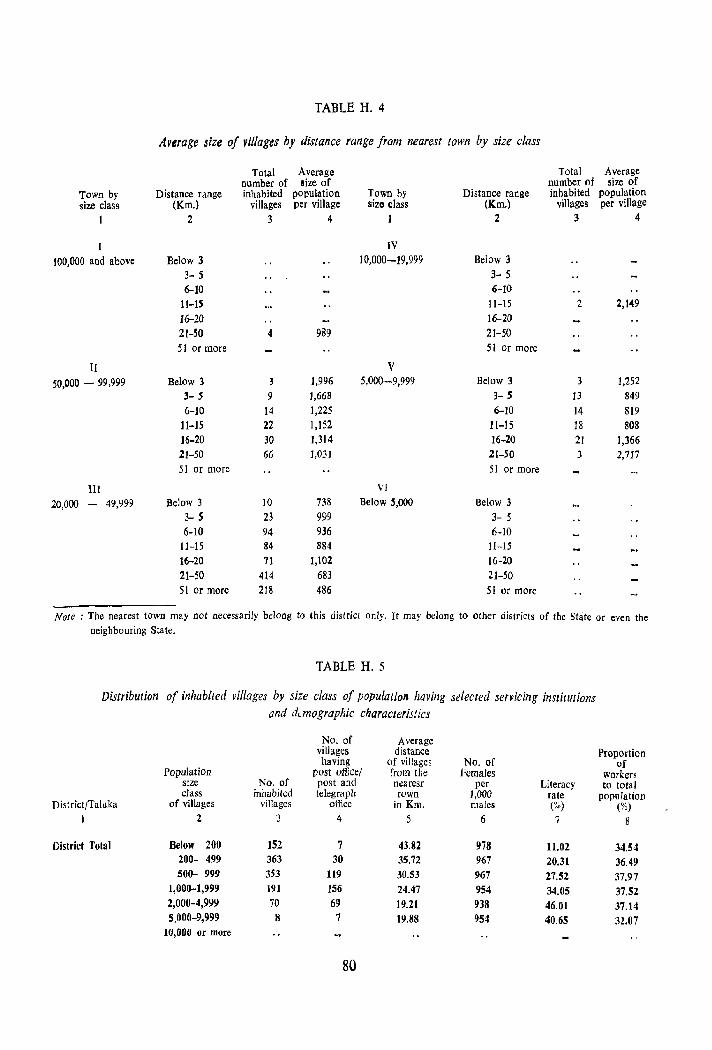
Town by size class
100,000 and above
II 50,000 - 99,999
III 20,000 - 49,999
TABLE H. 4
Average size of villages by distance range from nearest town by size class
Total number of
Distance range inhabited (Km.) villages
2 3
Below 3 3- 5 6-10
1l-lS 16-20 21-50 4 51 or more
Below 3 3 3- 5 9
6-10 14 11-15 22 16-20 30 21-50 66 51 or more
Below 3 10 3- 5 23 6-10 94
11-15 84 16-20 71 21-50 414 51 or more 218
Average size of
population per village
4
989
1,996 1,668 1,225 1,152 1,314 1,031
738 999 936 884
1,102 683 486
Town by size class
IV 10,000-19,999
V 5,000-9,999
VI Below S,OOO
Distance range (Km.)
2
Below 3 3- 5 6-10
II-l5 16-20 21-50 51 or more
Below 3 3- 5 tHO
11-15 16-20 21-50 51 or more
Below 3
3- 5 6-10
Jl-1S
16-20 21-50 51 or mare
Total Average number of size of inhabited population
villages per village 3 4
2
3
13 14 18 21 3
2,149
1,252 849 819 808
1,366 2,717
Note: The nearest town may not necessarily belong to this dislrict only. It may belong to other districts of the State or even the neighbouring State.
TABLE H. 5
Distribution of inhabited villages by size class of population having selected servicing institutions and demographic characteristics
No. of Average villages distance having of villages No. of
Population post officel from the Females size No. of post and n~aresr per Literacy class inhabited telegraph town 1,000 rale
DistrictjTaluka of villages villages office in Km. males (~~)
I 2 3 4 5 6 7
District Total Below 200 152 7 43.82 978 11.02 200- 499 363 30 35.72 967 20.31 500- 999 353 119 30.53 967 27.52
1,000-1,999 191 156 24.47 954 34.05 2,000-4,999 70 69 19.21 938 46.01 5,000-9,999 8 7 19.88 954 40.65
10,000 or more
80
Proportion of
workers to total
population (%)
8
34.54 36.49 37.97 37.52 37.14 3Z.07
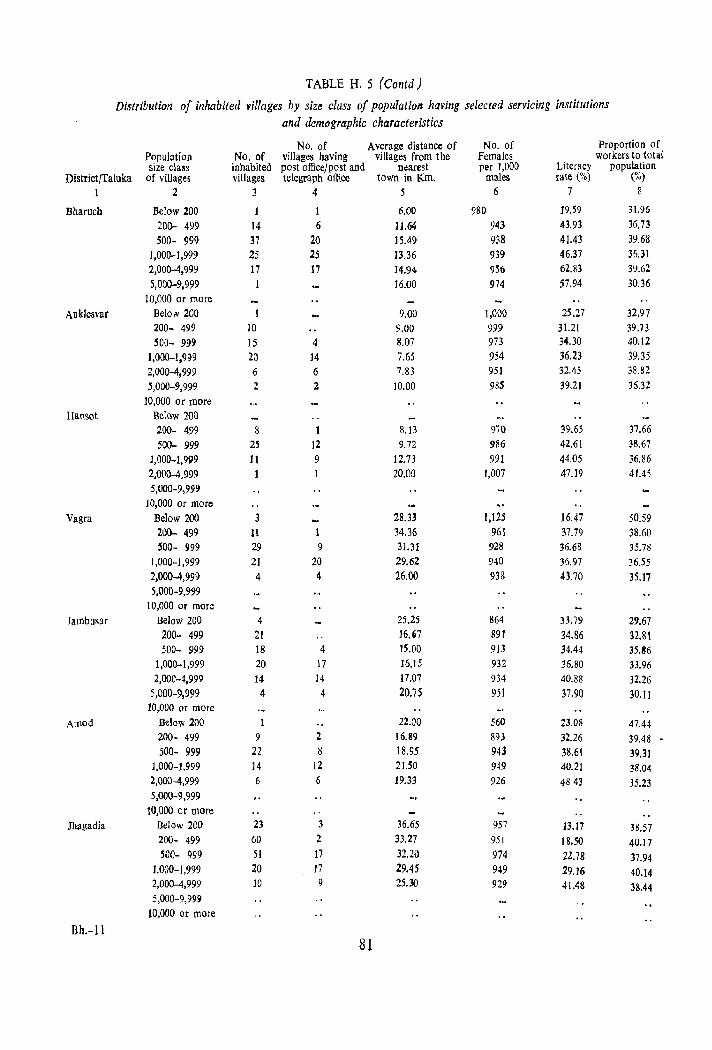
TABLE H. 5 (Contd)
Distribution of inhabited villages by size class of population having selected servicing institutions and demographic characteristics
No. of Average distance of No. of Proportion of Population No. of villages having villages from the Females workers to total size class inhabited post office/post and nearest per 1,000 Literacy population
District/Taluka of villages villages telegraph office town in Km. males rate (%) (%)
1 2 3 4 5 6 7 8
Bharuch Below 200 1 6.00 980 19.59 31.96
200- 499 14 6 11.64 943 43.93 36.73
500- 999 37 20 15.49 938 41.43 39.68
1,000-1,999 25 25 13.36 939 46.37 36.31
2,000-4,999 17 17 14.94 956 62.83 39.62
5,000-9,999 1 16.00 974 57.94 30.36 10,000 or more
Anklesvar Below 200 9.00 1,000 25.27 32.97 200- 499 10 9.00 999 31.21 39.73 SOO- 999 15 4 8.07 973 34.30 40.12
1,000-1,999 2l) 14 7.65 954 36.23 39.35
2,000-4,999 6 6 7.83 951 32.45 38.82
5,000-9,999 2 2 10.00 98S 39.21 36.32
10,000 or more Hansot Below 2(J0
200- 499 8 8.13 970 39.65 37.66
500- 999 25 12 9.72 986 42,61 38.67
1,000-1,999 11 9 12.73 991 44.05 36.86 2,000-4,999 20.00 1,007 47.19 41.45 5,000-9,999
10,000 or more Vagra Below 200 3 28.33 1,125 16.47 50.59
200- 499 II 34.36 961 37.79 38.60 500- 999 29 9 31.31 928 36.68 35.78
1,000-1,999 21 20 29.62 940 36.97 36.55
2,000-4,999 4 4 26.00 933 43.70 35.17 5,000-9,999
10,000 or more Jambusar Below 200 4 25.25 864 33.79 29.67
200- 499 21 16 .• 7 891 34.86 32.81 500- 999 18 4 IS.00 913 34.44 35.86
1,000-1,999 20 17 16.15 932 36.80 33.96 2,OOC-4,999 14 14 17.07 934 40.88 32.26
5,000-9,999 4 4 20.75 951 37.90 30.11 10,000 or more
Amod Below 200 1 22.00 560 23.08 47.44 200- 499 9 2 16.89 893 32.26 39.48 500- 999 22 ~ 18.95 943 38.61 39.31
1,000-1,999 14 12 21.50 949 40.21 38.04 2,000-4,999 6 6 19.33 926 4843 35.23 5,000-9,999
10,000 or more Jhagadia Below 200 23 3 36.65 957 13.17 38.57
200- 499 60 2 33.27 951 18.50 40.17 500- 999 51 17 32.20 974 22.78 37.94
1,000-1,999 20 17 29.45 949 29.16 40.14 2,000-4,999 10 9 25.30 929 41.48 38.44 5,000-9,999
10,000 or more
Bh.-ll 81
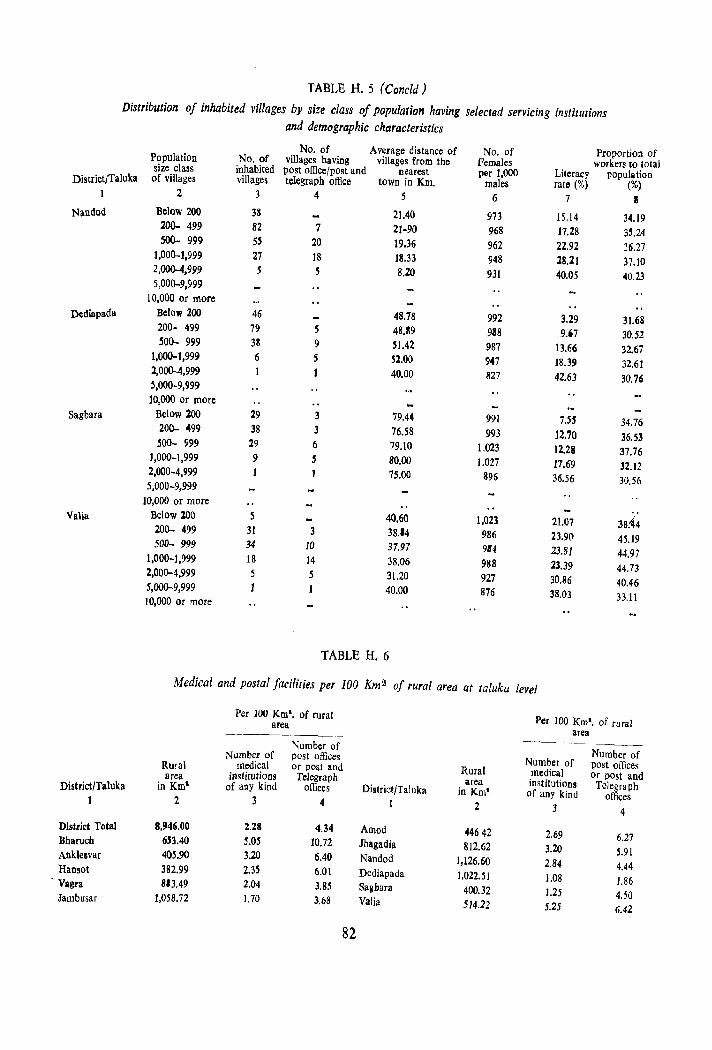
TABLE H. 5 (Concld)
Distribution of inhabited vtllages by size class of population having selected servicing institutions and demographic characteristics
No. of Average distance of No. of Proportion of Population No. of villages having villages from the Females workers [0 total size class inhabited post office/post and nearest per 1,000 Literacy population DistrictjTaluka of villages villages telegraph office town in Km. males rate (%) (%) 1 2 3 4 5 6 7 8
Nandod Below 200 38 21.40 973 15.14 34.19 200- 499 82 7 21-90 968 17.28 3'-24 500- 999 5S 20 19.36 962 22.92 36.27
1,000-1,999 27 18 IS.33 948 l8.21 37.10 2,000-4,999 5 S 8.20 931 40.05 40.23 5,000-9,999
10,000 or more Dediapada Below 200 46 48.78 992 3.29 31.68
200- 499 79 5 48.89 988 9.'7 30.52 500- 999 38 9 51.42 987 13.66 32.67
1,000-1,999 6 5 52.00 947 18.39 32.61 2,000-4,999 1 40.00 827 42.63 30.76 5,000-9,999 10,000 or more
Sagbara Below 200 29 3 79.44 991 7.55 34.76 200- 499 38 3 76.58 993 12.70 36.53 500- 999 29 6 79.10 1.023 12.28 37.76 1,000-1.999 9 5 80.00 1.027 17.69 32.12 2.000-4.999 1 75.00 896 36.56 30.56 5.000-9,999 10.000 or more
Valia Below 100 5 40.60 1,023 21.07 3S:.i4 200- 499 31 3 38.14 986 23.90 45.19 500- 999 34 10 37.97 984 23.81 44.97 1.000-1.999 18 14 38.06 988 23.39 44.73 2.000-4.999 5 5 31.20 927 30.86 40.46 5,000-9.999 1 1 40.00 876 38.03 33.11 10.000 or more
TABLE H. 6
Medical and postal facilities per 100 Km 2 of rural area €It taluka level
Per 100 Krn'. of rural Per 100 Km'. of rural area
area Number of
Number of Number of post offices Number of post offices Rural medical or post and Rural medical Or post and area institutions Telegraph area institutions Telegraph District/Taluka in Km' of allY kind offices District/Tal uka in Km' of any kind offices 1 2 3 4 1 2 3 4
District Total 8,946.00 2.28 4.34 Amod 44642 2.69 6.27 Bharuch 6S3.40 5.05 10.72 Jhagadia 812.62 3.20 5.91 Anklelvar 405.90 3.20 6.40 Nandod 1,126.60 2.84 4.44 Hansot 382.99 2.35 6.01 Dediapada 1,022.51 1.08 1.86 VagTa 8'3.49 2.04 3.85 Sa&bara 400.32 1.25 4.50 Jambusar 1,058.72 1.70 3.68 Valia 514.22 5.25 6.42
82
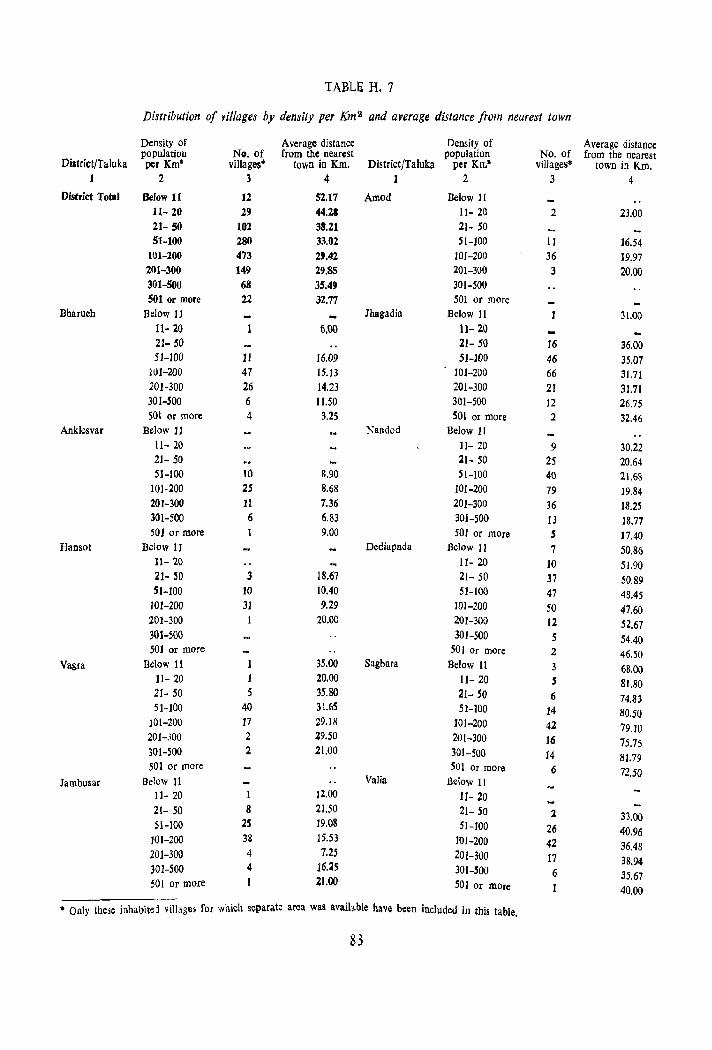
TABLE H. 7
Distribution of Yi/lages by density per /{m'A and average distance from nearest town
Density of Average distance Density of Average distance population NQ. of from the nearest population No. of from the nearest
Di.trictjTaluka per Km" villages· town in Km. District!Taluka per Krr.· villages· town in Km. ] 2 3 4 I 2 3 4
District Total Below 11 12 52.17 Amod Below 11 11- 20 29 44.21 11- 20 2 23.00 21- 50 102 38.21 21- SO 51-100 280 33.02 51-100 11 16.54
101-200 473 2'.42 101-200 36 19.97 201-300 149 29.85 201-300 3 20.00 301-500 68 35.49 301-500 501 or more 22 32.77 501 or mOre
Bharuch Below 11 Ihagadia Below 11 31.00 11- 20 6.00 11- 20 21- SO 21- 50 16 36.00 51-100 11 16.09 51-100 46 35.07
1111-200 47 15.13 101-200 66 31.71 201-300 26 14.23 201-300 21 31.71 301-500 6 11.50 301-500 12 26.75 SOl or more 4 3.25 501 or more 2 32.46
Anklesvar Below 11 Nandod Below II 11- 20 11- 20 9 30.22 21- 50 :11- 50 25 20.64 51-100 10 8.90 51-100 40 21.68
101-200 25 8.68 101-200 79 19.84 201-300 11 7.36 201-300 36 18.25 301-500 6 6.83 301-500 13 18.77 501 or more 9.00 501 or mOre S 17.40
Hansot Below 11 Dediapada Below 11 7 50.86 11- 20 11- 20 10 51.90 21- SO 3 18.67 21- 50 37 50.89 51-100 10 10.40 51-100 47 48.45
101-200 31 9.29 101-200 50 47.60 201-300 20.00 201-300 12 52.67 301-500 301-500 5 54.40 501 or more 501 Or more 2 46.50
Vagra Below 11 35.00 Sagbara Below 11 3 68.00 ll- 20 1 20.00 11- 20 5 81.80 21- 50 5 35.80 21- SO 6 74.83 51-100 40 31.65 51-100 14 80.50
101-200 17 29.18 101-200 42 79.10 201-300 2 29.50 201-300 16 75.75 301-500 2 21.00 301-500 J4 81.79 501 or more 501 or more 6 72.50
Jambusar Below 11 Valia Below 11 11- 20 1 JZ.OO 11- 20 21- 50 8 21.50 21- SO 2 33.00 51-100 25 19.08 51-100 26 40.96
101-200 32 IS.53 101-200 42 36.48 20J-300 4 7.25 201-300 17 38.94 301-500 4 16.35 301-S00 6 35.67 501 or more 21.00 501 or mOre I 40.00
* Only these inhabitd villages for which separate area was available have been included ill this table.
83
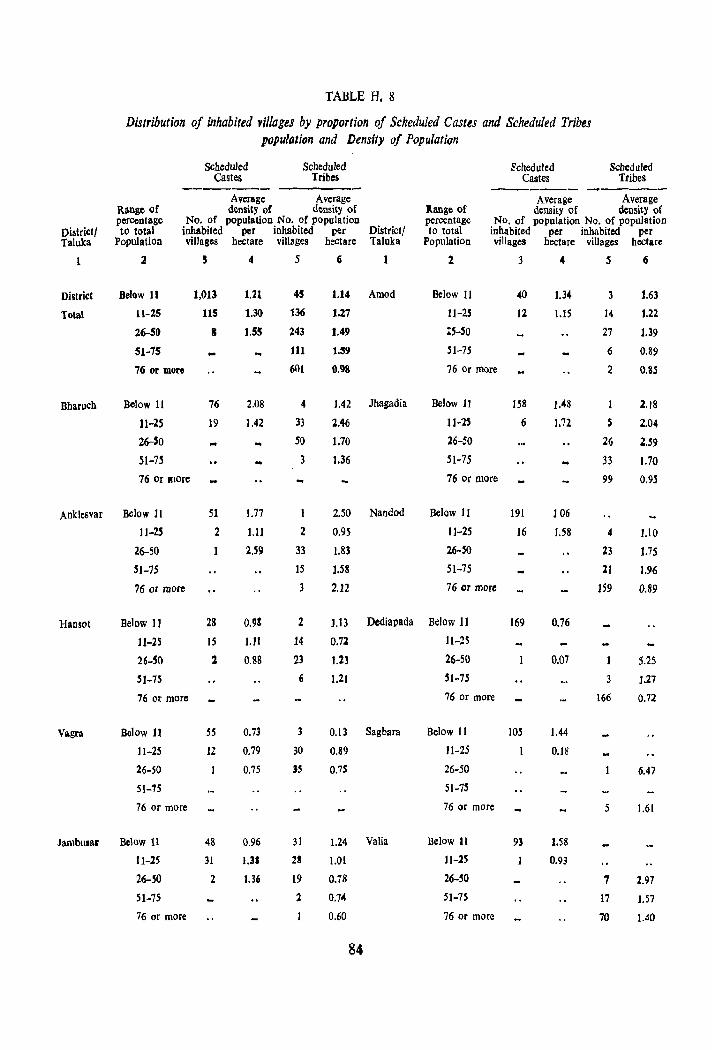
TABLE H. 8
Distribution of inhabl'ted vi//ages by proportion of Scheduled Castes and Scheduled Tribes population and Density of Population
Scheduled Scheduled 5'cheduled Scheduled Castes Tribes Castes Tribes -------- -_----- -----Average Average Average Average
Range of density or dtnsity of ltange of density of density of percentage No. of population No. of population percentage No. of population No. of population
Districtl to total inhabited per inhabited per District! to total inhabited per inhabited per Taluka Population villages hectare villages hectare Taluka Population villages hectare villages hectare
1 2 , 4 5 6 2 3 4 S 6
District Below 11 1,013 1.21 45 1.14 Amod Below II 40 1.34 3 1.63
Total 11-25 115 1.30 136 1.l7 11-25 12 1.15 14 1.22
26-50 8 1.55 243 1.49 IS-SO 27 ].39
51-75 111 1.59 SHS 6 0.89
76 or more 601 0,98 76 Or more 2 O.SS
Bharuch Below 11 76 2.08 4 1.42 Jhagadia Below H 158 1.48 2.18
11-25 19 1.42 33 2.46 11-25 6 1.72 S 2.04
26-50 SO 1.70 26-50 26 2.59
51-15 3 1.36 51-75 33 1.70
76 or 1II0re ... 76 or more 99 0.95
Anklesvar Below 11 51 1.77 1 2.50 Nandod Below 11 191 106
11-25 2 1.11 2 0.95 11-25 16 1.58 4 1.10
26-50 2.59 33 1.83 26-50 23 1.75
51-7S IS 1.58 51-75 21 1.96
76 or more 3 2.12 76 or more 159 0.89
Hansot Below 11 28 0.9& 2 1.13 Dediapada Below 11 169 0.76
11-25 15 J.lI 14 0.72 11-25
26-50 1 0.88 23 1.23 26-50 0.07 5.25
51-7S 6 1.21 SI-7S 3 1.27
76 or more 76 or more 166 0.72
Vagra Below 11 5S 0.73 3 0.13 Sagbara Below 11 lOS 1.44
11-25 12 0.79 30 0.89 JI-25 0.}8
26-50 0.75 3S 0.75 26-50 6.47
51-75 51-75
76 or more 76 or more 5 1.61
Jambusal Below 11 48 0.96 31 1.24 Valia Below 1l 93 1.58
11-25 31 1.31 23 1.01 11-25 0.93
26-50 2 1.36 19 0.78 26-~O 7 2.97
51-75 :1 0.74 51-75 17 1.57
76 or more 0.60 76 or more 70 1.40
84
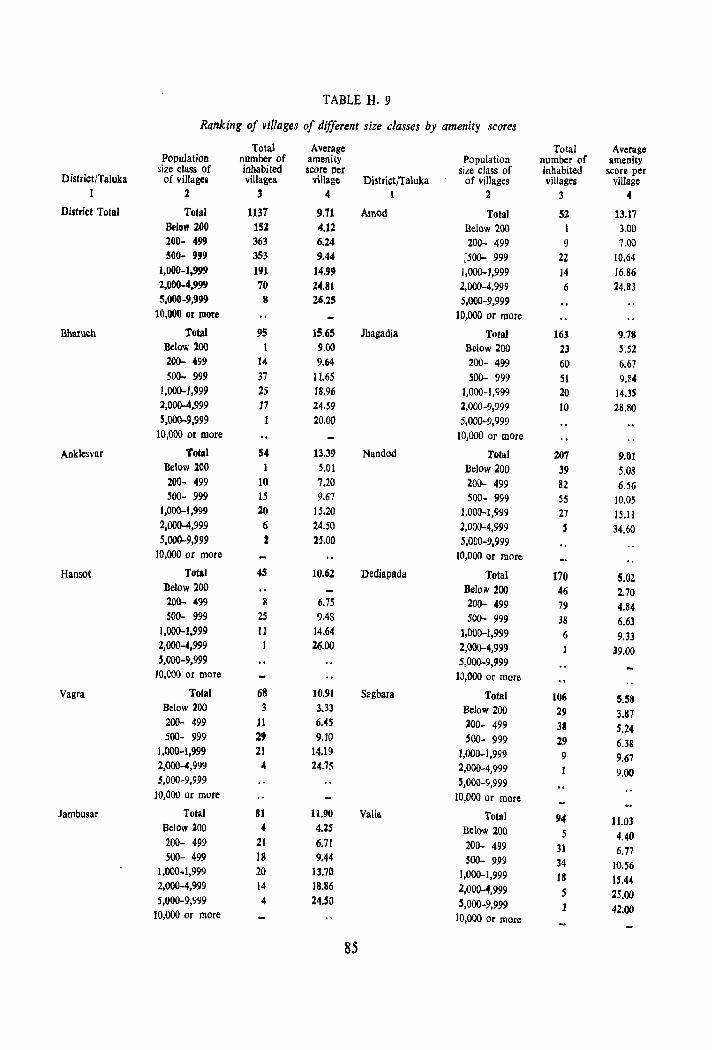
TABLE H. 9
Ranking of villages of different size classes by amenity scores
Total Average Total Average Population number of amenity Population number of amenity
size class of inhabited score per size class of inhabited score per District/Taluka of villages villages village District/Taluka of villages villages village
1 2 3 4 l' 2 3 4
District Total Total 1137 9.71 Amod Total 52 13.17 Below 200 152 4.11 Below 200 1 3.00 200- 499 363 6.Z4 200- 499 9 7.00 500- 999 353 9.44 [SOO- 999 22 10.64
1,000-1,999 191 14.99 1,000-1,999 14 16.86 2,000-4,999 70 24.81 2,000-4,999 6 24.83 5,000-9,999 8 26.25 S,OOO-9,999
10,000 or more 10,000 or mOre
Bharuch Total 95 15.65 Jhagadia Total 163 9.78 Below 200 9.00 Below 200 23 5.52 200- 499 14 9.64 200- 499 60 6.67 SOO- 999 37 11.65 500- 999 51 9.84
!,OOO-I,999 25 18.96 1,000-1,999 20 lOS 2,000-4,999 17 24.59 2,000-9,999 10 28.80 5,000-9,999 1 20.00 5,000-9,999
10,000 or more 10,000 or more
Anklesvar Total 54 13.39 Nandod Total 207 9.01 Below lOa 1 5.01 Below 200 39 5.08 200- 499 10 7.20 200- 499 82 6.56 500- 999 15 9.67 500- 999 55 10.05
1,000-1,999 20 15.20 1,000-1,999 27 15.11 2,000-4,999 6 24.50 2,000-4,999 S 34.60 5,000-9,999 2 25.00 5,000-9,999
10,000 or more JO,OOO or more
Hansot Total 45 10.62 Dediapada Total 170 5.02 Below 200 Below 200 46 2.70 200- 499 II 6.75 200- 499 79 4.84 500- 999 25 9.48 500- 999 38 6.63
1.000-1.999 11 14.64 1,000-1,999 6 9.33 2,000-4.999 26.00 2,000-4,999 39.00 5,000-9,999 5,000-9,999
10,COO or more 10,000 or more
Vagra Total 68 10.91 Sagbara Total 106 5.58 Below 200 3 3.33 Below 200 29 3.87 200- 499 11 6.45 200- 499 31 5.24 500- 999 2' 9.10 500- 999 29 6.38
1,000-1,999 21 14.19 1,000-1,999 9 9.67 2,000 .... ,999 4 24.75 2,000-4,999 9.00 5,000-9,999 5,000-9,999
10,000 or more 10,000 or more
Jambusar Total 81 11.90 Valia Total 94 11.03 Below 200 4 4.25 Below 200 5 4.40 200- 499 21 6.71 200- 499 31 6.77 500- 499 ]8 9.44 500- 999 34 10.56 1,000-1,999 20 13.70 1,000-1,999 18 15.44 2,000-4,999 14 18.86 2,000-4,999 5 25.00 5,000-9,999 4 24.50 5,000-9,999 42.00 10,000 or more ]0,000 or more
85
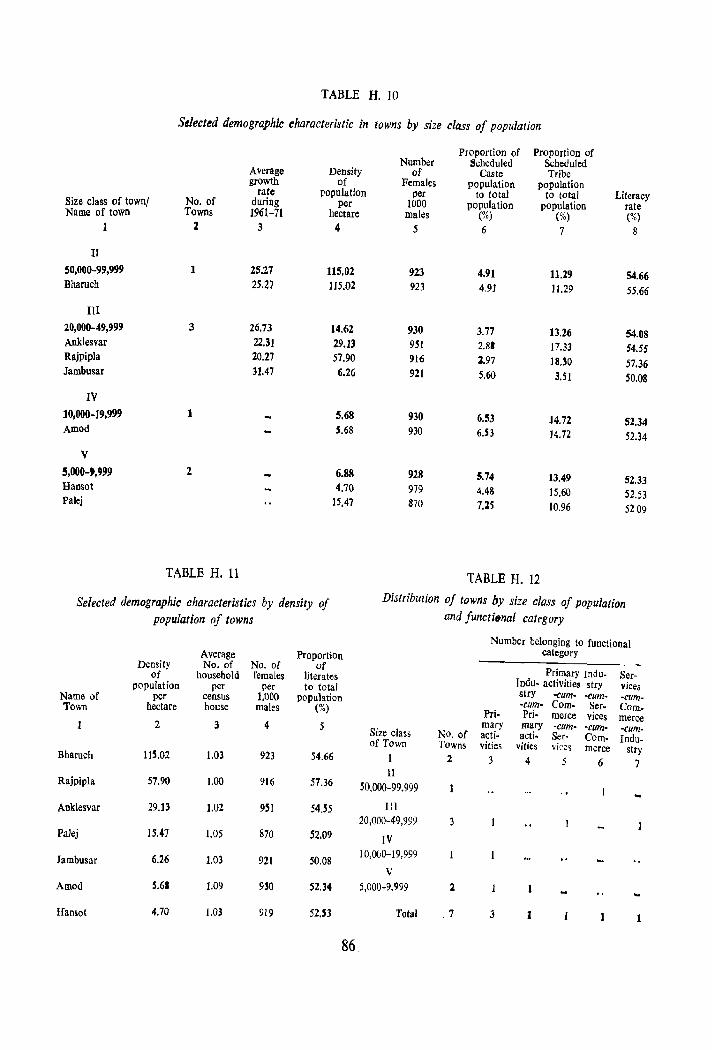
TABLE H. 10
Selected demographic eharacteristic in towns by size class of population
Proportion of Proportion of Number Scheduled Scheduled
Average Density of Caste Tribe growth of Females population population
rate population per to total to total Literacy Size class of town! No. of during per 1000 population population rate Name of town Towns 1961-71 hectare males (%) (%) (%) 1 2 3 4 5 6 7 8
II
50,000-99,999 1 25.27 115.02 923 4.91 11.29 54.66 Bharuch 25.27 115.02 923 4.91 11.29 55.66
III 20,000-49,999 3 26.73 14.62 930 3.77 13.26 54.08 Anklesvar 22.31 29.13 951 2.8' 17.33 54.55 Rajpipla 20.27 57.90 916 2.97 18.30 57.36 Jambusar 31.47 6.26 921 5.60 3.51 50.08
IV 10,000-19,999 1 5.68 930 6.53 14.72 52.34 Amod 5.68 930 6.53 14.72 52.34
V 5,000-t,999 2 6.88 928 5.74 13.49 52.33 Ransot 4.70 979 4.48 15.60 52.53 Palej 15.47 870 7.25 10.96 5209
TABLE H. 11 TABLE H. 12
Selected demographic characteristics by density of Distribution of towns by size class of population
population of towns and functi,mal catrgory
Number belonging to functional Average Proportion category
Density No. of No. of of Primary Indu- Ser-of household females literates
Indu. activities stry vices population per per to total Name of per census 1,000 population stry -cum- -cum- -cum-
-cum- Com- Scr. Com-Town hectare house males (%) Pri- Pri· merce vices merce 2 3 4 5 mary mary -cum- -cum- -cum-Size class No. of act i- actio Ser- Com- Indu-of Town Towns vities vities vices meree stry Bharuch 115.02 1.03 923 54.66 1 2 3 4 5 6 7
II Rajpipla 57.90 1.00 916 57.36 50,000-99,999
Anklesvar 29.13 1.02 951 54.55 III 20,000-49,999
Palej 15.47 1.05 870 52.09 IV
lambusar 6.26 1.03 921 50.08 1 0,0l>0-19, 999
V Amod 5.6. 1.09 930 52.34 5,000-9,999 2
Hanso! 4.70 1.03 919 52.53 Total 7 3 1
86
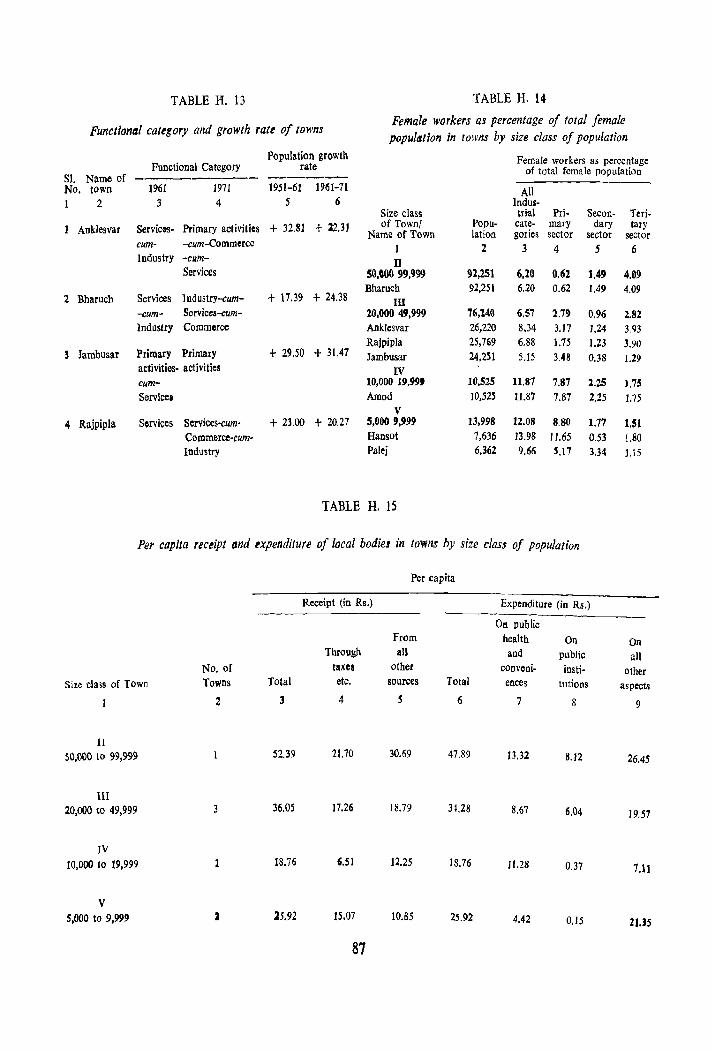
TABLE H. 13 TABLE H. 14
Functional cattgory and growth rate of towns Female workers as percentage of total female population in towns by size class of population
Population growth Female workers as percentage Functional Category rate of total female population
SI. Name of ------No. town 1961 1971 1951-61 1961-71 All 1 2 3 4 5 6 Indus-
Size class trial Pri- Secon- Ted-AnkJesvar Services. Primary activities + 32,81 + 22.31 of Town! Popu- cate- mary dary tary
Name of Town Jation gories sector sector sector cum· -cum-Commerce 1 2 3 4 5 6 Industry -cum- n
Services 50,000 99,999 92,251 6,20 0,62 1.49 4,09 Bharuch 92,251 6,20 0.62 1.49 4,09
2 Bbaruch Services I ndustry-cum- + 17.39 + 24.38 III -cum- Services-cum- 20,000 49,999 '76,140 6,S7 2,79 0.96 2.82 Industry Commerce Anklesvar 26,220 8.34 3.17 1.24 3.93
Rajpipla 25,769 6.88 1.75 1.23 3.90 3 Jarobusar Primary Primary + 29.50 + 31.47 Jambusar 24,251 5.15 148 0.38 1.2~
activities- activities IV cum- 10,000 19,999 10,525 U,87 7,87 2.25 ),75 Service. Amod 10,525 U.S7 7.87 2.25 1.75
V 4 Rajpipia S~rvices Services-cum· + 23.00 + 20,27 5,0009,999 13,998 12.08 8,80 1.77 1.51
Commerce·cum- Hansol 7,636 13.98 11.65 0.53 1.80 Industry Palej 6,362 9.66 S.17 3,34 1.15
TABLE H. 15
Per capita receipt and expenditure of local bodie.r in lowns by size class of population
Per capita
Receipt (in Rs.) Expenditure (in Rs.)
011 public From health On On
Through all and public all No. of taxes other conveni- insti- other
Size clais of Town Towns Total etc. sources Total ences tutions aspects
2 3 4 5 6 7 8 9
II 50,000 to 99,999 52,39 21.70 30.69 47,89 13.32 8.12 26.45
1lI 20,000 to 49,999 3 36.05 17.26 18.79 3US 8,67 6,04 19,57
IV 10,000 to 19,999 18.76 6.51 12.25 18.76 11.28 0.37 7.11
V 5,000 to 9,999 .35.92 15.Q7 10.85 25.92 4.42 0,15 2US
87
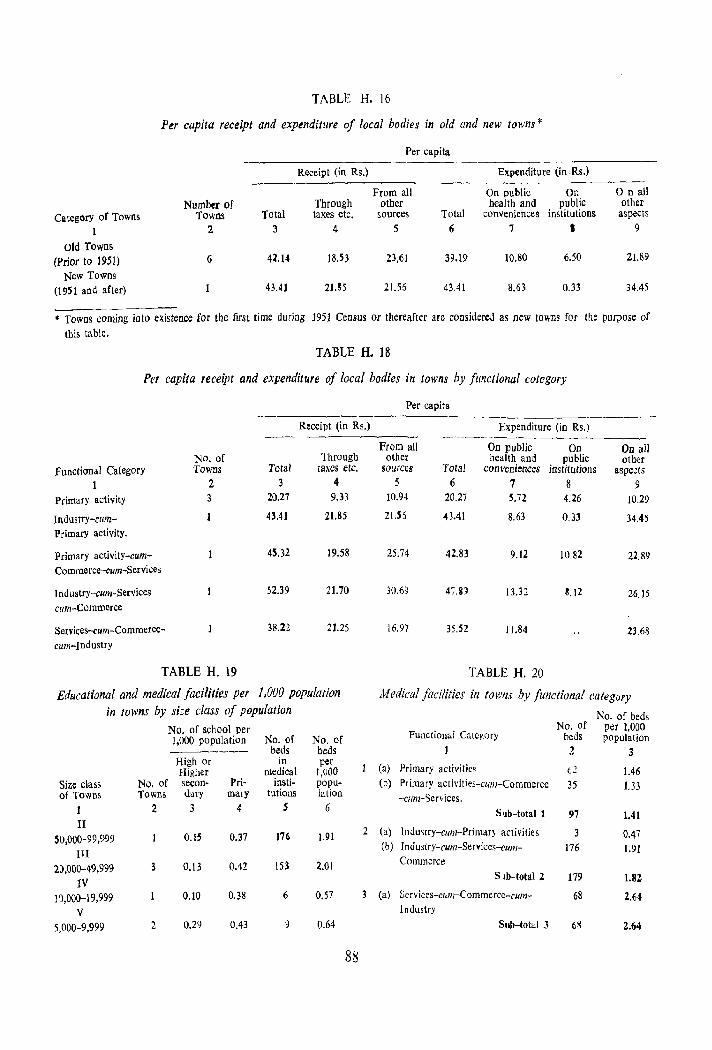
TABLE H. 16
Per capita receipt and expenditure of local bodies in old and new towns *
Per capita
Receipt (in Rs.) Expenditure (in Rs.)
From all On public Or. On all Number of Through other health and public other
Category of Towns Towns Total taxes etc. &Ources Total conveniences institutions aspects
1 2 3 4 5 6 7 , 9
Old Towns (Prior to 1951) 6 42.14 18.53 23.61 39.19 10.80 6.50 21.89
New Towns (1951 and after) 43.41 2U5 21.56 43.41 8.63 0.33 34.45
$ Towns coming iuto existence for the first time during 1951 Census or thereafter are considered as new towns for the purpose of
this table.
TABLE H. 18
Per capita receipt and expenditure of local bodies in towns by functional cotegory
Per capita
Receipt (in Rs.) Expenditure (in Rs.) -.~---
From all On public On On all NO. of Through other health and public other
Functional Category Towns Total taxes etc. sources Total conveniences institutions aspects 1 2 3 4 5 6 7 8 9
Primary activity 3 20.27 9.33 10.94 20.27 5.72 4.26 )0.29
Industry-cum- 1 43.41 21.85 21.55 ~3.41 8.63 0.33 34.45 Primary activity.
Primary activity-cum- 45.32 19.58 25.74 42.83 9.12 10.82 22.89 Commerce-cum-Services
Industry-cum-Services 52.39 21.70 30.69 47.SJ 13.32 8.12 26.15 cum-Commerce
Services-cum-Commerce- 38.22 21.25 16.97 35.52 11.84 23.68 cum-Industry
TABLE H. 19 TABLE H. 20
Educational and medical facilities per 1,000 population Medical facilities itl toWtlS by functional category in towns by size class of population No. of beds
No. of school per No. of per 1,000 1,000 population No. of No. of Functiom.l Category beds population -------- beds beds 1 2 3
High Or in per (n) Primary activities Higher medical 1,000 t2 1.46
Size class No. of secon· Pri- insti- popu- (b) Primary activities-cunt-Commerce 35 1.33 of Towns Towns dary mary tutions lalion -clim-Services.
1 2 3 4 j 6 Sub-total 1 97 1.41 II
2 (a) Indumy-cum-Primar} activities SO,OOO-99,999 0.]5 0.37 176 1.91 3 0.47
III (b) Industry-cum-Services-cum- 176 1.91
2:>.000-49,999 3 0.13 0.42 153 2.01 Commerce
IV S lb-total 2 179 1.82
1 ,),000-19,999 0.10 0.38 6 0.57 3 (a) Services-cltm-Commerce-cum- 68 2.64
V Industry
5.000-9,999 2 0.29 0.43 9 0.64 Sub-tok] 3 68 2.64
88
II TABLES \ With off prints of Part X-C-I
fr,'m pagf's iii- ix and 1 to 138)

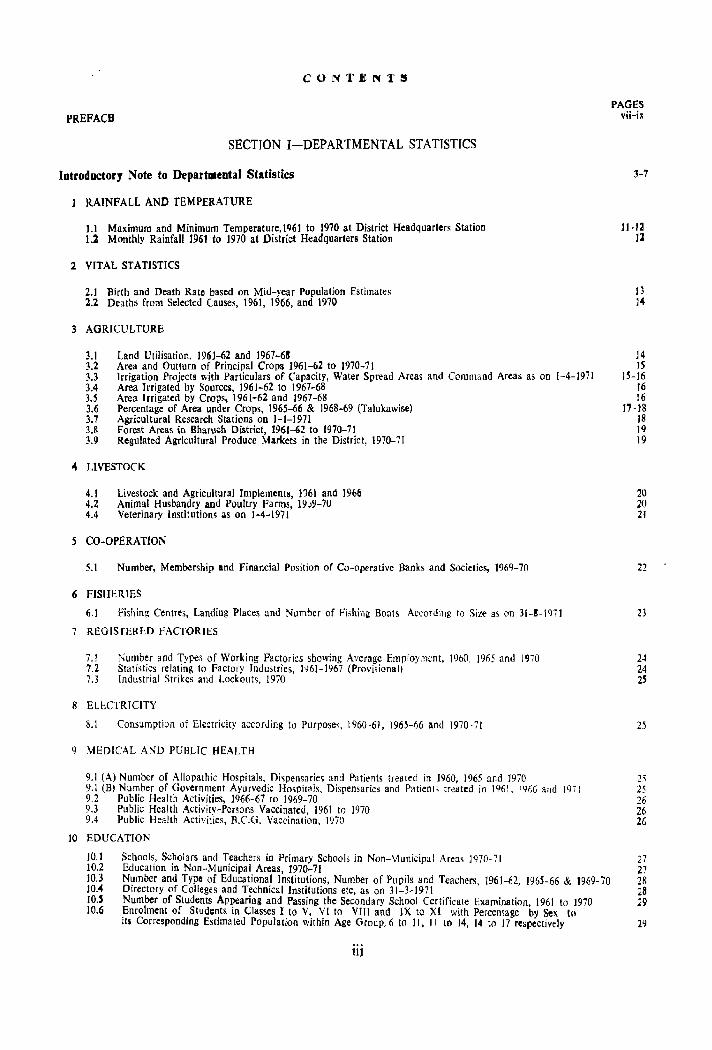
CONTEN1':!!!
PREFAce
SECTION I-DEPARTMENTAL STATISTICS
Introductory Note to Departmental Statistics
RAINFALL AND TEMPERATURE
1.1 Maximum and Minimum Temperature.IQ6J to 1970 at District Headquarters Station 1.2 Monthly Rainfall 1961 to 1970 at District Headquarters Station
2 VITAL STATISTICS
2.1 Birth and Death Rate based on Mid-year Population Estimates 2.2 Deaths from Selected Causes. 1961. 1966. and 1970
3 AGRICULTURE
PAGES viHx
3-7
11-12 1]
)3 14
3.1 Land Utilisation. 1961-62 and 1967-68 J4 3.2 Area and Outtum of Principal Crops 1961-62 to 1970-71 15 3.3 Irrigation Projects with Particulars of Capacity, Water Spread Areas and Command Areas as on 1-4-1971 15-16 3.4 Area Irrigated by Sources, 1961-62 to 1967-68 16 3.5 Area Irrigated by Crops, 1961-62 and J967-68 16 3.6 Percentage of Area under Crops, 1965-66 & 1968-69 (Talukawise) 17-18 3.7 Agricultural Research Stations on 1-1-1971 18 3.8 Forest Areas in Bharuch District. 1961-62 to 1970-71 19 3.9 Regulated Agricultural Produce Markets in the District, 1970-71 19
4 LIVESTOCK
4.1 Livestock and Agricultural Implements, ],}61 and 1966 4.2 Animal Husbandry and Poultry Farms, 19019-70 4.4 Veterinary Institutions as on 1-4-1971
5 CO-OPERATION
5.1 Number, Membership and Financial Position of Co-operative flanks and Societies, 1969-70
6 FISHERIES
6.1 Fishing Centrl';. landing Places and Number of Fi,hing Boats According to Size as on 31-8-1971
7 REGISTERED FACTORIES
7.1 Number and Types of Working Factories showing Average Emrloy;nent. 1960. 1905 and 1970 7.2 Statistics relating to Factory Industries. J961-1967 (Provisional) 7.3 Industrial Strikes and Lockouts, 1970
8 ELECTRICITY
8.1 Consumption of Electricity accorJing to Pllrpose~. 1960-61. 1965-66 lind 1970-71
9 MEDICAL AND PUBLIC HEALTH
9.1 (A) Number of Allopathic Hospitals, ()i~pensarie~ and Patients treated in 1960, 1965 and 1970 9.1 (B) Number of Government AYlIrvedic Hospitals, Dispensaries and Patients tr~ated in 1961, i'l6G and 1971 9.2 Public Health Activities, 1966-67 to 1969-70 9.3 Public Health Activity-Persons Vaccinated. 1961 to 1970 9.4 Public Health Activities, B.C.G. Vaccination, 1970
10 EDUCATION
20 20 21
22
23
24 24 2S
25
2'i 25 26 26 26
10.1 Schools, Scholars and Teachers in Primary Schools in Non-Municipal Arc:.Js 1970-71 27 10.2 Education in Non-Municipal Areas. 1970-71 27 10,3 Number and Type of Educational Institutions. Number of Pupils and Teachers, 1961-62, 1965-66 & 1969-70 28 10.4 Directory of Colleges and Technical Institutions etc. as on 31-3-1971 28 10.' Number of Students Appearing and Passing the Secondary School Certificate Examination. 1961 to 1970 29 10.6 Enrolment of Students in Classes I to V, VI to VIII and IX to Xl with Percentage by Sex to
its Corresponding Estimated Population within Age Group, 6 to 11. II to 14. 14 to 17 respectively 29
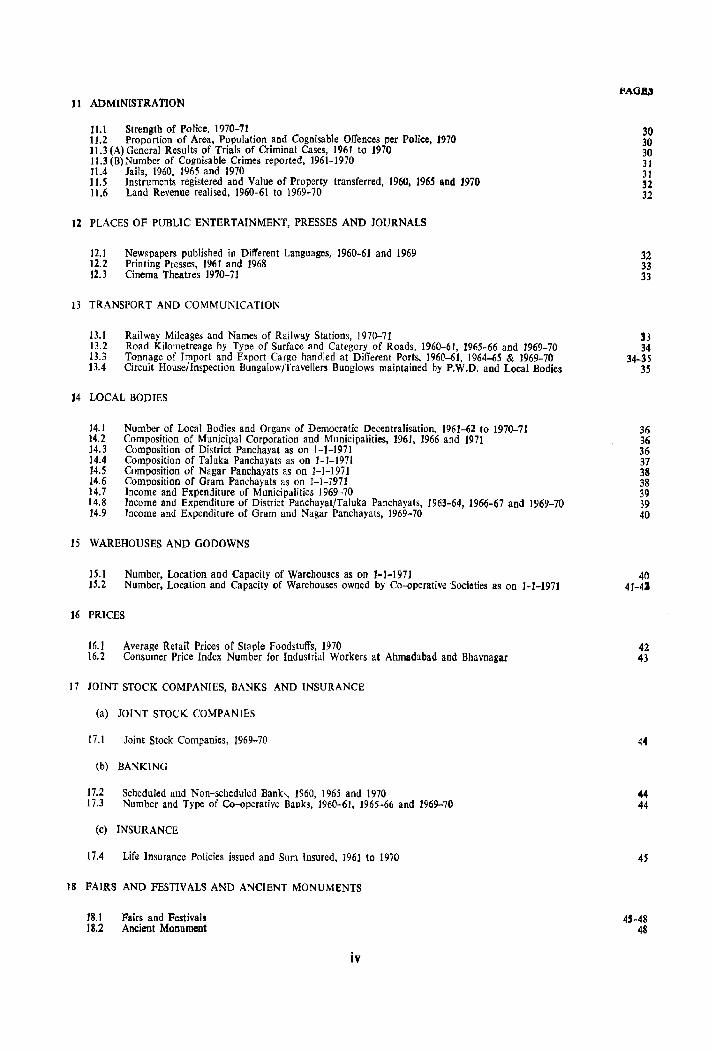
] 1 ADMINISTRATION
11.1 Strength of Police, 1970-71 11.2 Proportion of Area, Population and Cognisable Offences per Police, J970 11.3 (A) General Results of Trials of Criminal Cases, 1961 to J970 11.3 (B) ~umber of Cognisable Crimes reported, 1961-1970 JI.4 Jails, 1960, 1965 and 1970 11.5 Instruments registered and Value of Property transferred, 1960, 1965 and J970 11.6 Land Revenue realised, 1960-61 to 1969-70
12 PLACES OF PUBLIC ENTERTAINMENT, PRESSES AND JOURNALS
12.1 Newspapers published in Diff'erenl Languages, 1960-6J and 1969 12.2 Printing Presse<l, 1961 and 1968 12.3 Cinema Theatres 1970-71
J3 TRANSPORT AND COMMUNICATION
13.1 Railway Mileages and Names of Railway Stations, 1970-71 13.2 Road Kilometreage by Type of Surface and Category of Roads, 1960-61, J965-66 and ]969-70 13.3 Tonnage of Import and Export Cargo handled at Different Ports, 1960-61, 1964-65 & 1969-70 13.4 Circuit House/Inspection Bungalow/Travellers Bunglows maintained by P.W.D. and Local Bodies
14 LOCAL BODIES
]4.1 Number of Local Bodies and Organs of Democratic Decentralisation, 1961-62 to 1970-71 14.2 Composition of Municipal Corporation and Municipalities, 1961, 1966 and 1971 14.3 Composition of District Panchayat as on 1-1-1971 14.4 Composition of Taluka Panchayats as on 1-1-1971 14.5 Composition of Nagar Panchayats as on 1-1-1971 14.6 Composition of Gram Panchayats as on 1-1-1971 14.7 Income and Expenditure of Municipalities 1969-70 14.8 Income and Expenditure of District Par,chayat/Taluka Panchayats, 1963-64, 1966-67 and 1969-70 ]4.9 Income and Expenditure of Gram and Nagar Panchayats, 1969-70
15 WAREHOUSES AND GODOWNS
15. I Number, Location and Capacity of Warehouses as on 1-1-1971 15.2 Number, Location and Capacity of Warehouses owned by Co-operative Societies as on 1-1-1971
16 PRICES
16.1 Average Retail Prices of Staple Foodstuffs, 1970 16.2 Consumer Price Index Number for Industrial Workers at Ahmadabad and Bhavnagar
17 JOINT STOCK COMPANIES, BANKS AND INSURANCE
(a) JOINT STOCK COMPANIES
17.1 Joint Stock Companies, 1969-70
(b) BANKING
17.2 Scheduled and N(m-scheduled Banb, 1960, 1965 and 1970 17.3 Number and Type of Co-operative Banks, 1960-61, 1965-66 and 1969-7C
(c) INSURANCE
17.4 Life Insurance Policies issued and Sum Insured, 1961 to 1970
18 FAIRS AND FESTIVALS AND ANCIENT MONUMENTS
18.1 Pairs and Festivals 18.2 Ancient Monument
iv
30 30 30 31 31 32 32
32 33 33
33 34
34-35 35
36 36 36 37 38 38 39 39 40
40 41-43
42 43
44
44 44
45
45-48 48
SECTiON II-CENSUS. TABLES BASED ON FULL COUNT
Introductory ~ote to Cen3us Tables
Note
Table A-I
Appendix II
Tabh: A-Il
Appendix
Table A-III
Appendix
Table A-IV
Appendix I
A-General Po:?u!atioD Tablel
Area, Houses and Population
Number of Villages with a Population of 5,000 and over and Towns with a Population under 5,000
Decadal Variation in Population duriog Seventy Years
District showing 1961 Population according to its Territorial Jurisdiction in 1961, Changei in Area and Population of 1961 adjusted to Jurj;QJction of J971
Villages classified by Population
Vilb.;les c:assified by Population-Summary
Towns and Urban Agglomerations classified by Population in 1971 with Variation since 1901
New Towns added in 1971 and Towns in 1961 Declassified in 1971
Explanatory Note-A Each New Town added in 1971 showing the Name of Village with its Land Revenue Record No.
PAGES
SJ-57
59 ... liO
61
62
63
63
64-6'
64-65
66-67
67
Area and Populati@ln as in 1961 now constituting Town 68
App~ndix n Chan:;es in Area of Towns (with Population) between 1961 and )971 and Reasons for Changes in Area
Special Appendix Statement showing the Constituent Villages of each of the Towns at 1971 Census
8-EcODomic Tables
Note
Table B-I Part-A Workers and Non-workers according to Main Activity clasified by Sex and Age-groups
Table B-I1 Workers and Non-workers in Cities and Non-city Urban Areal according to Main Activity clalsified by Sell and A~e-Broups
v
68
68
59
70-71
72-75
Net.
Table C-V
Table C-VII
Table C-VIII
Part-A
Appendilt
Part-B
Appendix
Note
Table E-I
C-Sodal aoel Cultural Tablet
Motber Tongue (Alphabetical Order)
Religion
Scheduled Caites and Scheduled Tribes
Classification by Literacy and Industrial Category of Workers and Non·workers according to Main Activity among Scheduled Castes
Scheduled Castes classified by Literates and Illiterates
Classification by Literacy and Industrial Category of Workers and Non-workers according to Main Activity among Scheduled Tribes
Scheduled ,Tribes classifkd by Literates and IlIierates
E-EstablisbmeDt Tables
Distribution of Establishments by Broad I Types
Table E-I! Part-A Distribution of Manufacturing, Processing or Servicing Establishments other than Household Industries classified by Registered Factories, Unregistered Workshops and Size of Employment
Tabl~ E-!I Part-B Distribution of Manufacturing, Processing or Servicing Establishments other than Household Industries classified by Industry. Fuel(Power or Mannal used and Size of Employment
TaoJe E-U Part-C Distribution of Household Industry Establishments classified by Industry, Fuel/Power used and Size of Employment
Table E·II1
Table E-IV
AnncJlure
Distribution of Trade/Commercial Establishments classified by the Type of Business or Trade and Size of Employment
Distribution of Establishments (other than Manufacturin:l". Processing or Servicing or Business and Trade Establishments) by Size of Employment
National Industrial Classification, 1970 (Divisions and Major Groups)
vi
rA.GO
77
71-85
86-87
88-89
90-95
96-97
98-10S
106-108
109
!lO-lll
112-123
1204 129
130 -131
131-135
136-137
PREFACE
The District Census Handbook Volumes for 1971 Census have been brought out in record time. Part A and B of the District Census Handbook Volumes 1971 have been already brought out within about a year of the Census count. Part A contains the Town and Village Directories and Part B contains the Primary _ Census Abstract. Part C which is now being published contains the departmental statistics and the full count Census tables. The departmental statistics have been collected from various departments of the State and Central Governments and statutory bodies and Corporations. The Census tables which have been presented in this volume are only the full count tables.
It was our original intention to include in Part C of the District Census Handbook all full count and sample tables. But since the sample tables which are being mechanically complied at the national level are not likely to become available for quite some time, due to a variety of reasons, we thought, it would not be proper to withhold the publication of departmental statistics and full count tables which are already compiled. any longer than necessary.
I, therefore made a special request to the Registrar General, India, to allow me to split up Part C into two-C-I and C-I1-and publish immediately in Part C-I the departmental statistics and full count tables and defer the publication of Part c-n which will contain the sample tables and other data as originally contemplated. This request of mine had the active support of the State Director of the Bureau of Economics and Statistics, since he was withholding during the current year, the publication of the Statistical Abstracts of the Districts which were customarily published every year. In delaying the publication of the data already collected, on the ground that we were waiting for the sample tables to get ready. we would be depriving the administrative departments of the State Government of some very valuable material, at a time when they were formulating tho Fifth Five Year Plan for the State.
T-D-I
We, therefore, strongly pleaded the case before the Registrar General during his visit to Gujarat in June 1972 and he very kindly agreed to permit us to publish Part C-I in the present form.
District level statistical data on various socioeconomic topics have assumed very great importance at a stage when the State is forging ahead with the formulation of its fifth developmental plan. It would facilitate considerably the task of the framers or the district and State plans, if they had with them the basic statistical data which would provide a deep insight into the infrastructure that obtains in each District. It would enable them to undertake technoeconomic appraisal of the resources available and the felt needs of the district. Structural changes that have taken place during the past decade and the inter-regional disparities within the district could be properly gauged with the help of the statistical data that is here provided.
The present volume-Part C-I of the District Census Handbook: has been divided into two sections. Section I contains the departmental statistics which are grouped under eighteen different heads and comprise of as many as sixty eight tables. The data has been collected from the departments of the State and Central Governments and statutory Corporations, like Life Insurance Corporation of India, Food Corporation of India, Central Ware Housing Corporation and the Gujarat Electricity Board etc. The State Bureau of Economics and Statistics have checked the data flowing from various sources and have not only vouchsafed the authenticity and accuracy of the data presented here, but have also supplemented it with some very useful data which was in their possession. The compilation of the departmental statisti~ has been a joint endeavour of this Directorate and the State Bureau of Economics and Statistics.
Section II of thi~ volume contains thirty one Census tables based on full count, including appendices. All the tables and appendices of A leriel-General
Population Tables A-I to A-IV - according to the publication plan of 1971 Census have been included here. They contain information about Area, Houses and Population, Decadal variation since 1901, villages classified by popUlation, towns and urban agglomeration Classified by population in 1971 with variation since 1901. Only two tables from B series, which contain the economic tables-B-J Part A and B-IIhave been included here. They relate to workers and non-workers according to main activity classified by sex and age groups and workers and non-workers in cities and non-city urban areas according to main activity by sex and age groups.
The C series tables contain social and cultural tables. Only three tables and three Appendices out of this series, which are on full count have been included here. They contain data on Mother tongue, Religion, Scheduled Castes, Scheduled Tribes etc.
The entire set of six Establishment Tables have been included here. The Establishment Schedule was canvassed a year before the taking of the Census. The data was coded and transferred on punch cards, and later taken on magnetic tapes which were fed to the electronic computer and the tables were generated centrally by the Data Processing Division of Registrar General's office.
ACKNOWLEDGEMENTS
The whole hearted help and co-operation which I have received in compiling this Volume from Shri P. B. Buch. Director of the Bureau of Economics and Statistics. deserves a special mention. But for his infectious enthusiasm. this Volume would not have seen the light of the day as early as it has done. His thorough knowledge of the stage of statistical preparedness .of the various departments of the State Government. and his intimate knowledge of the extent to which any data furnished by them could be accepted unquestioningly, and the degree of scrutiny to which certain data should be subjected. has been a source of immense help to us. Each table presented here has been carefully scanned by him and wherever the data furnished has been found to be incomplete or inconsistent in any manner, the concerned department has been asked to re-check and confirm. His colleagues, Shri M. A. MaIavde, Research Officer. Demo-
Till
graphy and KUill. J yotsna Shah from the Bureau. who patiently went on checking the data and compiling the tables with admirable sincerity till the end also deserve a special mention. They stuck: to the time limit originally set and honoured the commitment made by their Director about handing over of the manuscripts of the tables entrusted to them. within limits wbich at the outset appeared to be a sheer impossibility. My sincere and heartfelt thanks are due to them and their illustrious leader for the patience and perservance with which they have completed this assignment.
My thanks are as much due to my valued colleague, Shri S. C. Merh. Deputy Director in charge of the District Census Handbook Unit for the care and devotion he has bestowed on the accurate compilation of the tables embodied in this Volume. We had come to a working arrangement with the Bureau that while the entire responsibility for the compilation of certain tables would be taken by the Unit working in this Directorate under Shri Merh, the remaining tables would be compiled and checked at the Bureau itself. It gives me great pleasure to place on record that the work done in this Unit under the leadership of Shri Merh was both fast and accurate. They had also to supervise and check the entire material, prepared by them and received from the Bureau before and after it was typed. Shri Merh was ably assisted in this work by Sarvashri S. M. Shelke and D. S. Gosai both Research Assistants from the Bureau who spared no pains to ensure that the data compiled and typed was faultless in every respect. Many thanks are also due to the three Statistical Assistants. Sarvasbri J. A. Brahmachari. G. U. Shaikh and U. K. Shah, who have worked very sincerely on the compilations entrusted to them. Similar thanks are also due to a number of Assistant Compilers and Typists. who have worked hard to make this publication possible.
The Census tables have been prepared in the Central Tabulation Unit. specially carved for the purpose, under Shri V. A. Dhagia, Tabulation Officer, and supervised by Shri K. F. Patel, Deputy Director of Census Operations (HQ). This unit has done its work with the utmost sincerity and dedication. Shri Dhagia, i'lS an officer of proved ability, has not only delivered the goods in time but set an example worthy of emulation by producing solid results without much ado and
complete harmony with his team, Shri B. 1. Patel, Tabulation Officer, lIlld his team has prepared the 'A' series tables and it must be said to their credit that they hjlve been found nearly flowless on scrutiny by Registrar General's office. I have to acknowledge my very sincere thanks to both the Tabulation Officers, who are veterans in the field and to Shri K. F. Patel, Deputy Director of Census Operations tHO), under whose able guidance they have worked and produced results which speak for themselves.
In the end, I shall be failing in my duties if I do not place on record my very sincere and heartfelt thanks to Shri A. Chandra Sekhar, Registrar General, India and Dr. B. K. Roy Burman, Deputy Registrar General. India for the very valuable and instructive suggestions received from them from time to time. I am particularly grateful to them both for allowing me to publish this Volume in slight deviation from the publication programme envisaged earlier.
I am deeply indebted to Shri L. R. Dalal, ICS., Chief Secretary to the Government of Gujarat, for
AHMADABAD.
5th August. 1972.
IX
having agreed to my proposals to bring out Part Col of the District Census Handbook Volumes as a separate publication.
I am grateful to Shri J. 1. Mistry, Deputy Secretary in the General Administration Department for always having shown readiness to appreciate our point of view, and expedited the issue of Government orders at a speed which can be called uniformly exlraordinary. I am ever so grateful to the General Administration Department for the kind and sympathetic attitude they have always taken to all matters emanating from the Census Organisation.
Shri G. J. Gonsalves, Director' of Government Printing and Stationery, Government of Gujarat, took special interest to see that the agency fixed for printing executed the work without any loss of time. I am grateful to him and his Deputy Director, Shri T. A. Saifuddin for the valuable help given to us from time to time.
C. C. DOCTOR. Director of Census Operations.
Gujaral.

'SECTION I
.. Departmental Statistics

INTRODUCTORY NOTij
Departmental Statistics
An effort has been made to present in this part of the Handbook the basic data of the district in 6)<, dift'erent tables prepared from the material collected from various administrative departments of the State Govern.ment and the Government of India as well as from various statutory organisations like the Gujarat Electricity Board, the Life Insurance Corporation of India, the Food Corporation of India, the Reserve Bank, Central and State Warehousing Corporations etc. A mere glance at the contents of the tables presented in this volume ,,'ould show that they provide a. deep insight into the infrastructure of the district which will pro"e useful not only to the administrator and the social, Folitical and research worker but also to the framers of the District and the State plans. It has also been devised in order to provide interesting material to the reader who wan1s to know mOlE about the District. The tables highlight the structural changes that have undergone in various spheres of activity in the district during the period 1961-1971. An attempt has been made t,o present the data taluka.wise as far as possible in order to facilitate inter-regional comparisons 'Within the district.
The tables on departmental statistics included in the present series of Handhooks are more or less devised on the lines of the District Census Handbooks of 1961 Census so as to make the data comparable. In addition to these, some useful data on agrioultural researoh stations, veterinary and animal husbandry institutions, rfst houses, land revenue collections, secondary school certificate examinations, foresis, composition of Panchayati Raj bodies, etc., have also been included.
The tables on departmental statistics have been grouped under 18 different heads as listed below :-
I Rainfall and Temperature II Vital Statistics III Agriculture, including Forests IV Livestock V Cooperation VI Fisheries VII Factories VIII Electricity IX ~Iedical and Public Health X Edncation
XI Administration XII Public Entertainment, Presses and Journals XIII Transport and Communications XIV Local Bodies XV Warehousing XVI Prices XVII Joint Stook Companies, Insurance, Banks
and Cooperative Societies XVIII Fairs and Festivals and Ancient
Monnments
A brief description of the contents of the tables included under each of the above groups is given in the following palagraphs :-
I-R.ainfall and Temperature
This f!loup contains two tables--one on rainfall and the other on temperatures in the district.
Table No. 1.1 gives the mean maximum, mean minimum, highest and lowest temperatures recorded at the district headquarter stations-monthwise for the years 1961 to 1970. Table No. 1.2 gives the monthViise details of rainfall and rainy days recorded at the district headquarter stations for t he years 1961 to 1970.
II-Vital Statistics
This group contains two tables-one on birth and death rates based on mid-year population estimates and the second on the number of dtaths ill the district by selected caUSeS.
Table No.2.] gives the birth and death rates for a period of ten years 1961 io 1~70-based on mid-year popUlation estimated by and the number of births and deaths registered for each district by the Directorate of Health Servioes, Ahmadabad. The mid-year population has been estimated by projecting the 1961 pOIJulation arrived at the time of 1961 Census. The figures of births and deaths have been compiled on 1 he basis of d;strict and taluka returns received in the State Health Department. Table No. 2.2 giYes the fi~res of deaths ill the district by selected causes for the years 1961, 1966 and 1970.
3

m-Agriculture
This group contains nine tables which give important data pertaining to the agricultural sector of the district's economy.
Table No. 3.1 gives the details of utilisation of land in the distrif't for the vears 1961-62 and 1967·68. It shows the figures for cultivated and un-oultivated land, barren, fallow and cultivable waste land etc. Table No. 3.2 gives the figures of area and outturn of principal crops for the years 1961-62 to 1970-71, highlighting the oropping pattern of the district. Table No. 3.3 giv6s details of the irrigation projects in the distriC't with particulars of capacity, water spread and command areaS as on 1st April 1971. Table No. 3.4 gives details of irrigated areas by SourceS of irrigation for the years 1961-62 to 1967-68. Table No. 3.5 gives the details of ar-ea under irrigated crops for years 1961-62 and 1967-68. Table No. 3.6 is an interesting table which gives talukawise percentage of areas under different crops for the years 1965-66 and 1968-69 showing the relative importance of the cropS' viz·a-vis th& total area under such orops in the district as well as the total mopped area of the talukas. These percentages have been oaloulated on the basis of provisional talukawise figures maintained by the State Department of Agri(;ulture. Tabl€' No. 3.7 gives thu details of the location of agricultural research stations in the district as in 1969-70 with a brief description of the nature of activities carriEd out at each oentre. Table No. ::!.8 gives the area. under different tyPfS of forests in the district for the years 1961-62 1969-70. The forests have been divided into four broad categories, namely, Reserved, Protected, Unclassified and Private-the first three of whioh are under the control of the State Forest Department. ThEse figures are made available for the iirst time by the Chief Conservator of Forests. Table No. 3.9 gives the market plaCES whele 8. major portion of the agricultural produce of the district is being marketed. The table contains the names of produce Markets regulated under the Agricultural Produce Markets Act of 19:19 giving details of main yards, subyards, year of establishment and the agricultural commodities bought and sold in those marketL The information embodied in this table pertains to the year 1970-71. '
IV -Livestock
This group contains four tables which give the details of livestock wealth, animal husbandry promotion and pOllltry farms located in the district. Table No. 4.1 gives the results of livestock Censuses conducted in the' district by the State's Bureau of Economics and Stat,istics in the years 1961 and 1966. Table No. 4.2 gives the details of the location of animal husbandry, and poultry farms in the district as in 1969-7(). It givf's further details about the agency of management, year of establishment and a brief description of the activities being oarried out in those farms. Table No. 4.3 whioh is very similar to the preceding tablb, gives details of various animal husbandry and poultry rearing activites in the district as in 1970-71. Table No. 4.4 gives a list of various types of veterinary institutions available in the distriot viz., veterinary hospitals, veterinary dispensaries and sub· dispensaries, first aid veterinary oentres, crOSS-breeding centres, artificial insemination centres and sub-centres, mobile veterinary dispensaries etc,
V -Co-operation
This group includes only one table, namely, No. oJ which ~hows the number, membership and financial position of cO'operativ( societies in the district for 1969·70. The table shows the number of different types of oo-opera~ive societies, both credit and nOll-oredit, with details of membership, working capital, loans, share {lllopital, reserve and other fnnds and deposits.
VI-Fishin2'
This group includes only one tahle, namely, No. 6.1 which gives the details of fishing oentres, landing (JIaces and number of fishing boa1s according to size in the district as on 31st Mal(lh 1911. Th~ tahle also give;:. the information about the TI'lmhr of fishermen's roopfrative societies .:md their membership in these societies.
VII-Registered Factories
This group meludes three tables on factory and industrial establishments and strikes and lockouts Itt those establishment in the district,
Table No. 7.1 gives the number and types of working factmjps showing a,eraf!e emp~oymEllt therein for the years 1960, 1965 and 1970. The wOlking far-tories have I·een shown under variol'S indl:strial c1ilsses accorclillg
4
to the Standard Industrial Classification adopted by the State Factories Department. Table No. 7.2 giTes the statistics relating to factory induRtries in the district for the years 1961 to 1967. This table is based on the results of annual survey of industries bl'ing conducted by the State Bureau of Economics and Statistics in collaboration with the Central Statistical Organisation, New Delhi. The table has been divided into two parts of which the first part give~ the actual figures of person~ employed, productive capital, ex-factory value of output and net value .added by manufacture for all industries covered under the annual survey in the State. The second part shows the district's relative share in those very items in terms of percentages of the State totals. Table No. 7.3 shows the details of industrial strikes and lockouts which took place in the district during 1970. The table gives details of the induRtry codes of the units affected by such strikes and 10 kouts, number of such events, units affecterl aml the numbH of mandays lost.
VIII-Electricity
This group includes only one table viz., No. 8.1 which gives the data on the consumption of electricity according to purposes in the district for the years 1960-61, 1965-66 and 1970-71. The data pertains to power houses run by the State Electricity Board as well as those run by private licenooes. The consumption has been classified into four broad clas~es viz. domestic, commercial light and small power, industrial and other purposes.
IX-Medical and Public Health
This group contains five tables giving data on medical and public health facilities available in the dilitrict.
Table No. 9.l(A) gives the number of allopathic hospitals and dispensaries in the district with detailij of beds available and the outdoor and indoor patients treated for the yearl! 1960, 1965 and 1970 while table No. 9.1(B) gives similar data for Ayurvedic medical institutions for the years 1961, 1966 and 1971. Table No. 9.2 gives details of public health activities in the ctistrict for the years 1966-67 to 1969-70. This table gives the number of primary health centres, rural dispensaries, maternal and child health centres and family planning centres existing in the district in those years alongwith the' number of persons treated therein. Table No. 9.3 gives the data on another important activity of the State Health Department, viz., small-pox vaccination in the district for a period of ten years from 1961 to 1970. The table gives yearwise figures of primary vaccinations and revaccinations carried out by the State Health Department in those years. Table No. 9.4 gives details of B.C.G. vaccination programme in the district. It shows the number of persons vaccinated in the talukas in which this programme was laullch('d in 1970.
X-Education
'rhis group includes six tables glVlng valuable information on primary, secondary, collegiate and technical education in the district.
Table No. 10.1 gives the data on schools, 'icholars and teachers in non-municipal areas of the district for the year 1970-71. The data in this table have been presented talukawise and contains, besides the number of schools, students and teachers, information on villages with or without schools. Table No. 10.2 gives the statistical data about education in non-municipal areas of the district for the year 1970-71 and includes taluka'wise data on average attendance of pupils per school and the number of students per thousand of population per primary school and per teacher in primary school. Table No. 10.3 gives an overall picture of education in the district and gives details of institutions, pupils and teachers in four broad categories namely, primary, eecondary, higher and others for the years 1961-62, 1965-66 and 1969-70. The figures for pupils and teachers have been given sexwise. Table No. lOA gives an inventory of colleges and technical institution existing in the district as on 31st March 1971. The table No. 10.5 gives the centrewise data on candidates appearing and passing at the Secondary School Certificate Examination for the years 1961 to 1970. Figures in this table are shown separately for the March and October examinations. Table No. 10.6 ehow~ the figures of enrolment of students in Classes I to V, VI to VIII and IX to XI with percentages by sex to its corresponding estimated population within age groups 6 to 10, 11 to 14, and 14 to 17 respectively for the years 1960-61, 1965-66 and 1969-70.
XI-Administration
This group includes ~even tablee giving Tital data on admini~tration in the district.
Table No. ILl shows the etrength of the police force in the di~trict for the year 1970-71 by YarioUi categories of personnel and also by permanent and temporary etatue. It may be noted that Central Police establishments Buch as Railway Police, Special Reserve Police, Police Training Schools and Inspector General of Police'.
est,ablishments have been excluded from the per view of this table. Table No. lLl gives the districtwise data on the proportion of area, population and cognisable offences per police for the year 1970. Table No. 11.3(A) gives the results of the trials of criminal cases for the years 1961 to 1970. The table shows the number of offences reported and the manner in which the cases were disposed off. Table No. 11.3(B) gives the number of cognisable offences reported in the district for the years 1961 to 1970. The offences have been classified in eight broad categories according to the nature of offences. Table No. 11.4 gives the data on jails of the district for the yearH 1960, 1965 and 1970. The table shows the number of prisons and their :mthorised accommodation along with the category of prisoners including those received and discharged during the relevant years. Table No. 11.5 gives the data on instruments registered, and the value of property tranllferred during the years 1960, 1965 and 1970. The table covers both n.ovable and immovable properties and also compulwry and optional registrations. Tpblc ~o. 11.6 gives the figures of eollection of land revenue in the district for the years 1960-61 to 1969-70.
XII-Places of Public Entertainment, Presses and Journals
This group consists of three tables giving statistics of newspapers and journals publiRhed in tae district, printing presses and cinema theatres.
Table No. 12.1 gives the figure~ of newspapers published in different languages in the diHtrict for the years 1960-61 and 1969. The jOll.rnals have bl'en cla~sified in~o daily, weekly, fortnightly, monthly, quarterly and others and have been differently shown for English, Gujarati, Hindi and other languages. Table No. 12.2 gives the talukawise data on the number of printing presses which existed in the district in the years 1961 and 1968. Table No. 12.3 give1\ the talukawise location and number of cinema threatres as in 1970-71 with details of monthy averages of spectators. The touring talkies have also been included iu this table.
XIII--Transport and Communications
This group include" four table~ on transport and communication facilities available in the di~trict.
Table No. 13.1 gives details of railway mileages and the railway stltions in the dibtrict for the year UJ70-7l. The railway mileages have been shown separately for different guages of railway Ene and the railway stations have been shown talukawise. Table No. 13.2 shows the road kilometreage by type of surface and category of road in the distrlct for the years 1960-61, 1964-65 and 1969-70. The data hwe been pre:,ented for National Highways, State Highways, Major District Roads, Other District Roads and Village Road~ and the 8urface has been classified by asphalt, cement concrete, water bound mlwadum and murram and other lower types. Table No. 13.:3 gives the tonnage of import and esport cargo handled at each port of the district for the years 1960-61, 1964-65 and 1969-70. Separate figures have been given for foreign and coastal traffic and also for sailing and steamer vessels. Table No. 13.4 gives the list of Atithi qrahas (circuit houses), Hshram grallas (inspection bungalows), Al'am grahs (rest houses) and Dharamshalas in the district maintained by the State P. W. D., Panchayats and Municipalities for the use of travelling officers and the public. The details of the maintaining authorities have also been shown in the table.
XIV-Local Bodies
This group includes statistical information pertaining to the in~titutioll~ of local self-government namely Municipalities, Municipal Corporations and District, Taluka, Nagar and Gmm Panchayats.
Table No. 14.1 gives the number of local bodies and organs of democratic decentralisation in the district for the years 1961-62 to 1970-71. The table covers Municipal Corporations, Municipalitie~, District Local Board~ and District, Taluka, Nagar and Gram Panchayats. Table No. 14.2 shows the composition of Municipal Corporations and Municipalities in the district for the years 1961, 1966 and 1971. Besides the data. on the total number of seats, the table gives details of reserved seats for scheduled castes, scheduled tribes and women and also of those categories returned against unreserved seats. Table No. 14.3 shows the composition of the District Panchayat as on 1st January 1971. It covers all associate, elected and ex-officio members of the District Panchayat. Similarly table No. 14.4 shows the composition of the, Taluka Panellayats of the district as on 1st January, 1971 and tables No. 14.5 and 14.6 show the oomposition of the Nagar and Gram Panchayats respectively. Table No. 14.7 shows the details of ineome and expenditure of the municipalities of the distrid for the year 1970-71 while the RubBequent table No. H. 8 gives the details of the income and expenditure of Taluka and District Panchayats for the years ]963-64, 1966-67 and 1969-70. Table Ko. 14.9 gives similar data for the Gram and Nagar Panchayats for the year 1969-70.
6
xv - Warehouses and Godowns
Thi!> group contain!> thre,e ta,bles which show details of the facilities for storage and warehousing in the district.
Table No. 15.1 give~ the details of the location and capacity of warehouses of the district owned by the State Civil Supplies Department, Central Warehousing Corporation and the Gujarat State Warehousing Corporation as on 1st January 1971. Table No. 15.2 gives details of godowns owned by co-operative socie~ie~ of the district and their cap3cities as on 1st January, 1971. The names of the societies and the talukas of their location I.ave also been shown. Table No. 15.3 gives the location and capacity of warehouses of the Food Corporation of India in the district.
XVI-Price:o
This group includes two t&bles, one on average retail prices of staple food-stuffs and the other on the consumer price index.
Table No. 16.1 shows the average retail prices of staple food-stuffs monthwise recorded at the district headqu,{rter town in 1970. The commodities included in this table are cereals namely rice (medium), wheat, jowar and bajri and pulses namely arhar dal (tur), moong and udid. Table No. 16.2 gives the consumer price inLex numbers for industrial worker at the Ahmadabad and Bhavnagar centres for the years 1961 to 1970. Besides general indices, the group indices have also been shown. Figures for the years 1961 to 1969 have bp,en shown for full years while those for 1970 have been shown rnonthwise.
XVII-Joint Stock Companies, Banks and Insurance
This group contains four tables which give vital data on various financial institutions of the district.
Table No. 17.1 gives the details of the Joint Stock Companies registered in the district for the year 1969-70. The companies have been class:fied into 10 industrial classes and their number, authorised capital and subscribed capital have been shown in the table. Table No. 17.2 gives the number of scheduled and non-scheduled banks in the district for the yean; 1960, 1965 and 1970. Table No. 17.3 gives the number and type of co-operative banks ill the district for the years 1960-61, 1965-66 and 1969-70. The table covers all types of cooperative banks including Vllld Development Banks, Industrial Banks and Urban Cooperative banks. Table No. 17.4 shows the data pertaining to Life Insurance policies issued and sums insured in the district for the years 1961 to 1970. The table also gives the number of authorised agents during the relevant years.
XVIII~Fairs and Festivals and Ancient Monuments
This group contains two tables, one on fairl'. and festivals and the other on ancient monuments.
Table No.. 18.1 gives the detailed talukawise information aboutthe fairs and festivals of the district, their occasion dates, estimated congregation and transport facilities available for going to such fairs and festivals. Table No. 18.2 gives a list of ancient monuments protected both by the State Government as well as the Union Government and a brief description of each of them and the periorl. during which they were raised.
Uniform table numbers have been adopted in the handbooks for all the districts. Wherever a particular table is not ?1pplieable to or could not be compiled for want of information in any particular district, it has heen omitted. It would therefore appear in such cases that the sequence has been broken.
To facilitate further reference, the source of information for compiling the table as well as explanatory notes about ~he units they refer to and other relevant particulars have been given at the foot of the table. The following abbreviatiolls have been used in the tables.
(1) ~. A.=Not AV<1ilable (2) =NIL
7

DEPARTMENTAL
STATISTICS

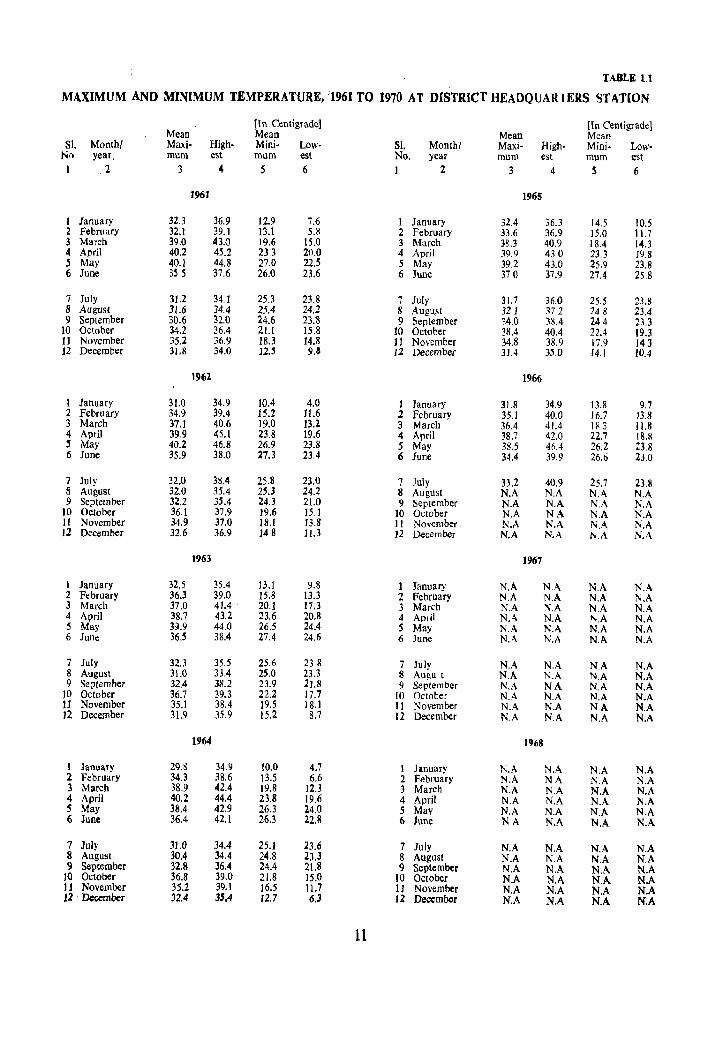
TABLE 1.1
MAXIMUM AND MINIMUM TEMPERATURE, il961 TO 1970 AT DISTRICT HEADQUARIERS STATION
[In Centigrade] {In Centigrade] Mean Mean Mean Mean
Sl. Month! Maxi· High· Mini· Low· Sl. Monthl Maxi· High- Minj· Low-N/) year. mum est mum est No. year mum est mum est 1 2 3 4 5 6 ] 2 3 4 S 6
1961 1965
r January 32.3 36.9 12.9 7.6 I January 32.4 36.3 14.5 10.5 2 February 32.1 39.1 13.1 5.8 2 February 33.6 36.9 15.0 11.7 3 March 39.0 43.0 19.6 15.0 3 March 38.3 40.9 18.4 14.3 4 April 40.2 45.2 233 20.0 4 April 39.9 430 23.3 19.8 5 May 40.1 44.8 27.0 22.S 5 May 39.2 43.0 25.9 23.8 6 June 35.5 37.6 26.0 23.6 6 June 37.0 31.9 27.4 25.8
7 July 31.2 34.] 25.3 23.8 7 July 31.7 36.0 25.5 23.8 8 August 31.6 34.4 25.4 24.2 8 August 32.1 37.2 148 23.4 9 September 30.6 32.0 24.6 23.8 9 September 34.0 38.4 244 23.3
10 October 34.2 36.4 21.1 15.8 10 October 38.4 40.4 22.4 19.3 11 November 35.2 36.9 18.3 14.8 11 November 34.8 38.9 17.9 143 12 December 31.8 34.0 12.j 9.3 12 J)eccmber 31.4 3.5.0 14.1 10.4
1962 1966
1 January 31.0 34.9 10.4 4.0 I January 31.8 34.9 13.8 9.7 2 February 34.9 39.4 15.2 J 1.6 2 February 35.1 40.0 16.7 13.8 3 March 37.1 40.6 19.0 13.2 3 March 36.4 41.4 18.3 11.8 4 April 39.9 45.1 23.8 19.6 4 April 38.7 42.0 22.7 18.8 , May 40.2 46.8 26.9 23.8 5 May 38.5 46.4 26.2 a8 6 June 35.9 38.0 27.3 23.4 6 June 34.4 39.9 26.6 23.0
7 July 32.0 38.4 25.8 23.0 7 July 3U 40.9 25.7 23.8 8 August 32.0 35.4 25.3 24.2 8 August N.A N.A NA N.A 9 September 32.2 35.4 24.3 21.0 9 September N.A N.A N.A N.A
10 October 36.1 37.9 19.6 15.1 ]0 October N.A NA N.A N.A II November 34.9 37.0 18.1 13.8 Il November N.A N.A N.A N.A 12 December 32.6 36.9 148 11.3 12 December N.A N.A l\.A N.A
1963 1967
I January 32.5 35.4 13.1 9.8 1 January N.A N.A N.A N.A 2 February 36.3 39.0 15.8 13.3 2 February N.A N.A N.A N.A 3 March 37.0 41.4 . 20.1 17.3 3 March N.A N.A N.A N.A 4 April 38.7 43.2 23.6 20.8 4 April N.A N.A "'.A N.A 5 May B.9 44.0 26.5 24.4 5 May N.A N.A N.A N.A 6 June 36.S 38.4 27.4 24.6 6 June N.A N.A N.A N.A
7 July 32.3 35.5 25.6 238 7 July N.A N.A N.A N.A 8 August 31.0 33.4 25.0 23.3 8 Augu t N.A N.A N.A N.A 9 September 32.4 38.2 23.9 2).8 9 September N.A NA N.A N.A
10 October 36.7 39.3 22.2 17.7 10 October N.A N.A N.A N_A 11 November 35.1 38.4 19.5 18.1 II November N.A N.A NA N.A 12 December 31.9 35.9 15.2 8.7 12 December N.A N.A N.A N.A
1964 1968
I Janua.ry 29.8 34.9 10.0 4.7 I January N.A N.A N.A N.A 2 February 34.3 38.6 13.5 6.6 2 February N.A NA N.A N.A 3 March 38.9 42.4 19.8 12.3 3 March N.A N.A N.A N.A 4 April 40.2 44.4 23.8 19.6 4 April N.A N.A N.A N.A 5 May 38.4 42.9 26.3 24.0 5 May N.A N.A N.A N.A 6 June 36.4 42.1 26.3 22.8 6 June NA N.A N.A N.A
7 July 31.0 34.4 25.1 23.6 7 July N.A N.A N.A N.A 8 August 30.4 34.4 24.8 23.3 8 August N.A N.A N.A N.A 9 September 32.8 36.4 24.4 21.8 9 September N.A NA NA N.A
10 October 36.8 39.0 21.8 15.0 10 October N.A N.A N.A N.A 11 November 35.2 39.1 16.5 11.7 11 November N.A N.A N.A N.A 12 December 32.4 35.4 12.7 6.3 12 December N.A N.A N.A N.A
11
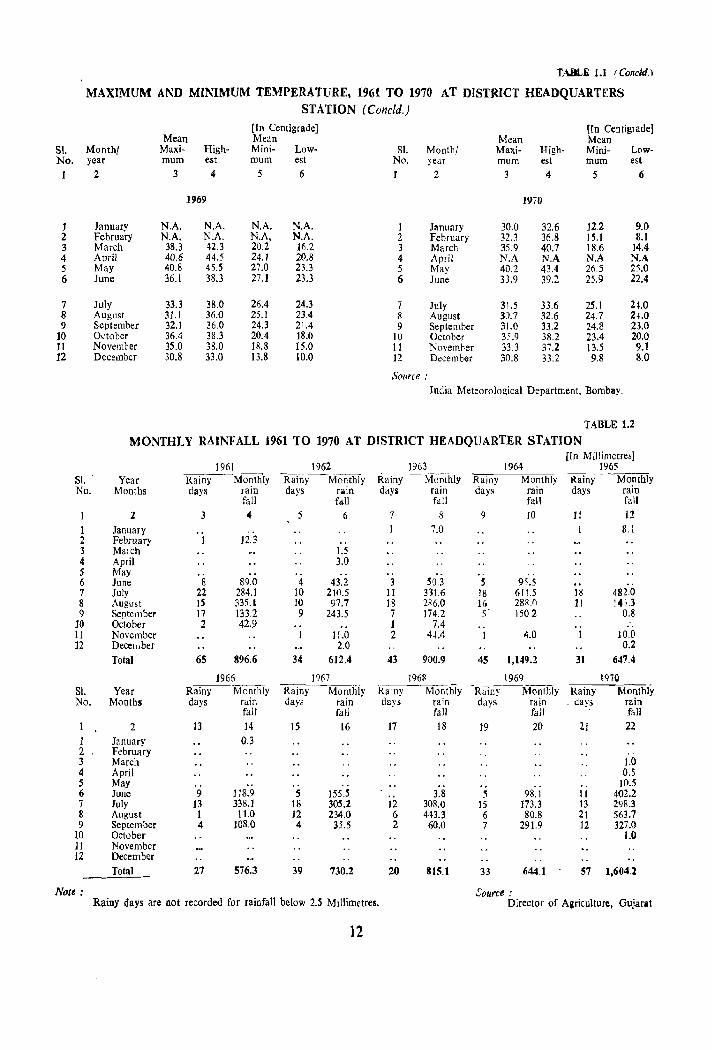
TABLE 1.1 (Concki.)
MAXIMUM AND MINIMUM TEMPERATURE, 1961 TO 1970 AT DISTRICT HEADQUARTERS STATION (Cone/d.)
[Tn Centigrade] [Tn Centigrade) Mean Mean Mean Mean
SI. Month/ Maxi- High- Mini- Low- Sl. Month/ Maxi- High- Mini- Low-No. year mum est mum est No. year mum est mum est
1 2 3 4 5 6 I 2 3 4 5 6
11169 1970
J January N.A. N.A. N.A. N.A. I January 30.0 32.6 12.2 9.0 2 February N.A. N.A. N.A, N.A. 2 February 32.3 36.8 15.1 8.1 3 March 38.3 U.3 20.2 16.2 3 March 35.9 40.7 18.6 14.4 4 April 40.6 44.5 24.1 20.8 4 April N.A N.A N.A N.A 5 May 40.8 45.S 27.0 23.3 5 May 40.2 43.4 26.S 25.0 6 June 36.1 38.3 27.1 23.3 6 June 33.9 39.2 25.9 .22.4
7 July 33.3 38.0 26.4 24.3 7 July 31.5 33.6 25.1 ao 8 August 31.1 36.0 25.1 23.4 R August 3v.7 32.6 24.7 2-1.0 9 September 32.1 36.0 24.3 21.4 9 September 31.0 33.2 24.8 23.0
10 October 36.4 38.3 20.4 18.0 10 October 3.1.9 38.2 23.4 20.0 II Novemcer 35.0 38.0 18.8 15.0 11 Novemr·er 33.3 37.2 13.5 9.1 12 December 30.8 33.0 13.8 10.0 12 December 30.8 33.2 9.8 8.0
Source: India Meteorological Department, Bombay.
TABLE 1.2
MONTHLY RAINFALL 1961 TO 1970 AT DISTRICT HEADQUARTER STATION [In Millimetres]
1961 1962 1963 1964 1965 Si. Year Rainy Monthly Rainy Monthly Rainy -Monthly Rainy Monthly Rainy Monthly No. Months days rain days rain days rain days rain days rain
fall fall fall fall fall
2 4 5 6 7 8 9 10 11 12 1 January 7.0 8.1 2 February 1 12.3 .. 3 Malch 1.5 4 April 3.0 5 May .. .. 6 June 8 89.0 4 43.2 3 ~O.3 5 95.S .. 7 July 22 284.1 10 21(l.5 11 331.6 18 611.5 ]8 482.0 8 August ]5 335.1 10 97.7 18 286.0 16 28R () I! 14,.3 9 September 17 133.2 9 243.5 7 174.2 S· 1502 0.8
10 October 2 42.9 1 7.4 .. II November 11.0 2 4M 1 4.0 1 10.0 12 Decelllber 2.0 0.2
Total 65 896.6 34 612.4 43 900.9 45 1,149.2 31 647.4
1966 1967 J96R 1969 1970 Sl. Year Rainy Monthly Rainy Monthiy Rainy Monthly R~iny ]\fonthly Rainy Monthi}t No. Months days rain days rain days rain days rain . days rain
falJ fall fall fall fall
2 13 14 15 16 17 18 19 20 21 22
I January 0.3 2 February 3 March 1.0 4 April 0.5 5 May .. .. .. . . " 10.5 6 June 9 118.9 5 155.5 3.8 5 98.1 II 402.2 7 July 13 338.1 18 305.2 12 308.0 15 173.3 ]3 298.3 8 August 1 11.0 12 234.0 6 443.3 6 80.8 21 563.7 9 September 4 108.0 4 35.5 2 60.0 7 291.9 12 327.0
10 October 1.0 ] I November 12 December
Total 27 576.3 39 730.2 20 815.1 33 644.1 57 1,604.2
Note: [;ource : Rainy days arc not recorded for rainfall below 2.S Millimetres. Director of Agriculture, Gujar.1
12
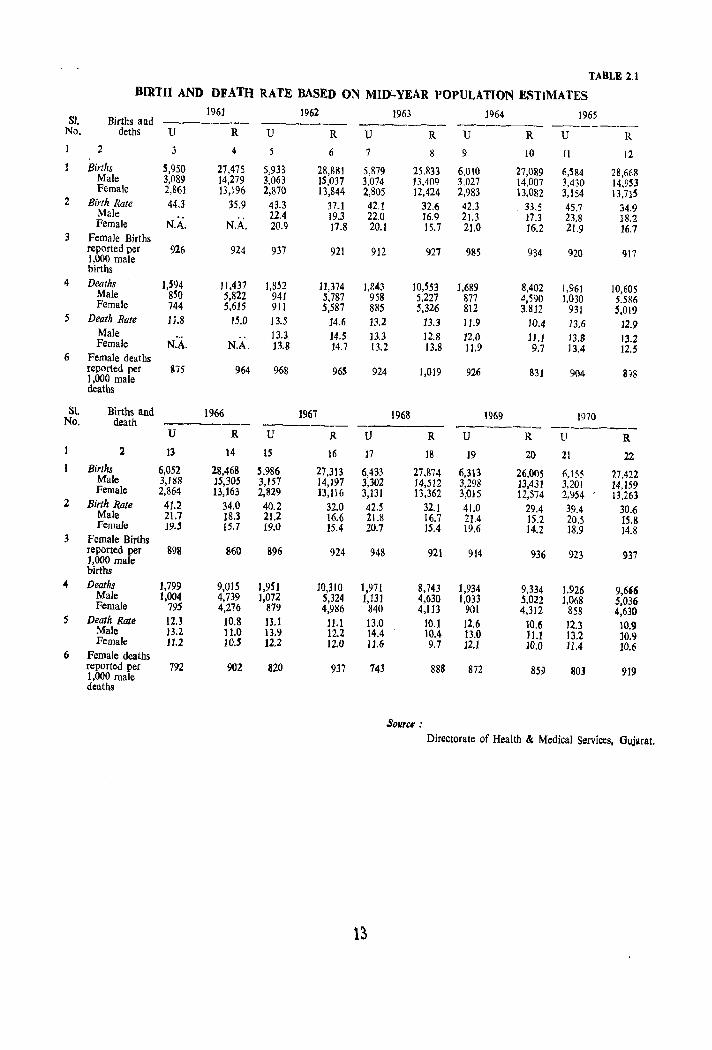
TABLE 2.1
BIRTH AND DEATH RATE BASED ON MID~YEAR POPULATION ESTIMATES 1961 1962 1963 1964 1965 SI. Births and -------- ------- ------- -------- ---------No. deths U R U R U R U R U R
3 4 5 6 7 8 9 10 11 12 Births 5,950 27,475 5,933 28,88] 5,879 25.833 6,010 27,089 6,S84 28,66R Male 3,089 14,279 3,063 ]5,037 3.074 13,409 3,027 14,007 3,430 14,953 Female 2,861 13,196 2,870 13,844 2,805 12,424 2,983 13,082 3,154 13,71S
2 Birth Rate 44.3 35.9 43.3 37.1 42.1 32.6 42.3 33.5 45.7 34.9 Male 22.4 19.3 22.0 16.9 21.3 17.3 23.8 18.2 Female N.A. N.A. 20.9 17.8 20.1 15.7 21.0 16.2 21.9 16.7 3 Female Births
reported per 1,000 male
926 924 937 921 912 927 985 934 920 917 births
4 Deaths 1,594 11,437 I,m 11,374 1,843 10,B3 1,689 8,402 1,961 10,605 Male 8S0 5,822 941 5,787 958 5,227 877 4,590 1,030 5,586 Female 744 5,615 911 5,587 885 5,326 812 3,812 931 5,019 5 Death Rale 11.8 15.0 13.5 14.6 13.2 13.3 11.9 10.4 13.6 12.9
Male .. 13.3 14.5 13.3 12.8 12.0 11.1 13.8 13.2 Female N.A. N.A. 13.8 14.7 13.2 13.8 11.9 9.7 13.4 12.5 6 Female deaths
reported per 1,000 male
375 964 968 965 924 1,019 926 831 904 SiS
deaths
S\. Births and 1966 1967 1968 1969 1970 No. death ------ ------ ------_ ---------U R U R U R U R U R 2 13 14 15 16 17 18 19 20 21 22
Births 6,052 28,468 5,986 27,313 6,433 27,874 6,313 26,005 6,155 27,422 Male 3,188 15,305 3,157 14,197 3,302 14,512 3,298 13,431 ],201 14,159 Female 2,864 13,J63 2,829 B,Jl6 3,131 13,362 3,015 12,574 2,954 13,263 2 Birth Rate 41.2 34.0 40.2 32.0 42.5 32.1 41.0 29.4 39.4 30.6 Male 21.7 18,3 21.2 16.6 21.8 16.7 21.4 15.2 20.5 15.8 Female 19.5 15,7 19.0 15.4 20.7 15.4 19.6 14,2 18.9 14.8 3 Female Births
reported per 898 860 896 924 948 921 914 936 923 937 1,000 male births
4 Deaths 1,799 9,015 1,9S] ]0,310 1,971 8,743 1,934 9,334 1,926 9,666 Male 1,004 4,739 1,072 5,324 1,131 4,630 1,033 5,022 1,068 5,036 Female 795 4,276 879 4,986 840 4,113 901 4,312 858 4,630 5 Death Rate 12.3 10.8 13.1 11.1 13.0 10.1 12.6 10.6 12.3 10.9 Male 13.2 11.0 13.9 12.2 14.4 10.4 13.0 11.1 13.2 10.9 Female 11.2 10.5 12.2 12.0 11.6 9.7 12.1 10.0 11.4 10.6 6 Female deaths
reported per 792 902 820 937 743 888 872 859 80l 919 1,000 male deaths
Sour" : Directorate of Health'" Medical Services, Gujarat.
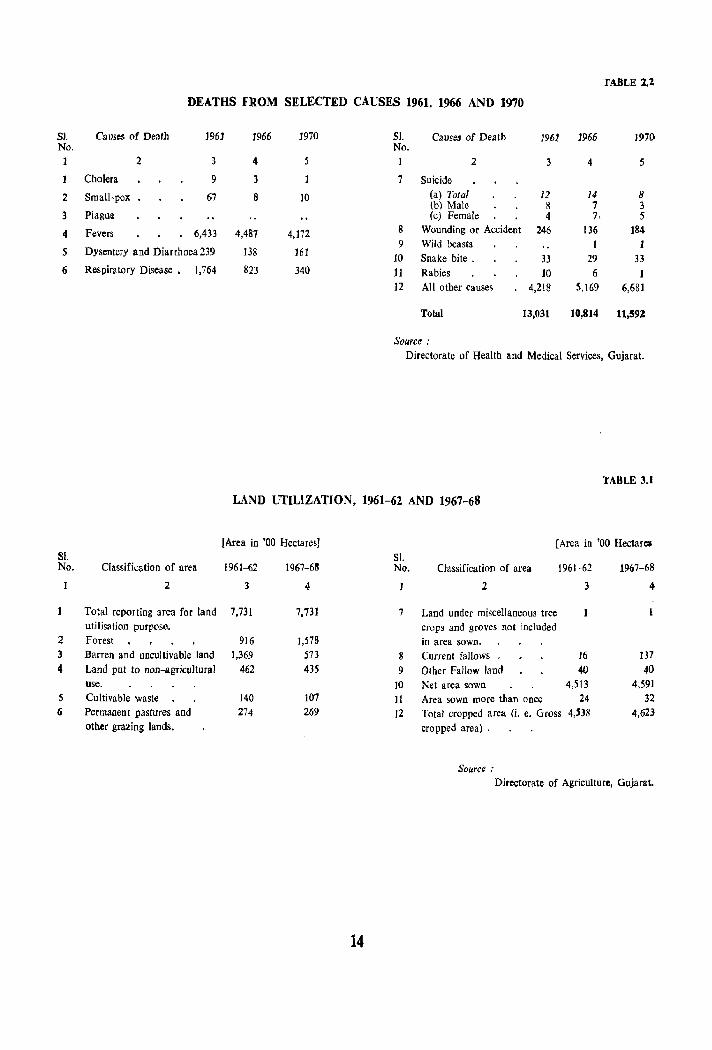
TABLE l.Z
DEATHS FROM SELECTED CAUSES 1961, 1966 AND 1970
51. Causes of Death J961 1966 1970 SI. Causes of Death 1961 1966 1970 No. No. 1 2 3 4 5 1 2 3 4 5
Cholera 9 3 7 Suicide
2 Small-pox 67 8 10 (a) Total 12 14 8 (b) Male 8 7 3
3 Plague (c) Female 4 7. 5
4 Fevers 6,433 4,487 4,172 8 Wounding or Accident 246 136 184 9 Wild beasts
5 Dysentery and Diarrhoea 239 138 161 10 Snake bite. 33 29 33
6 Respir~tory Disease. 1,764 823 340 11 Rabies 10 6 1 12 All other Causes 4,218 5,169 6,681
Total 13,031 10,814 11,592
Source : Directorate of Health and Medical Services, Gujarat.
TABLE 3.1
LAND UTILIZATION, 1961-62 AND 1967-68
IArea in '00 Hectares) [Area in '00 Hectares 81. SI. No. Classification of area 1961-62 1967-68 No. Classification of area 1961-62 1967-68
2 3 4 2 3 4
Total reporting area for land 7,731 7,731 Land under miscellaneous tree utilisation purpose. crops and groves not included
2 Forest 916 1,578 in area sown. 3 Barren and uncultivable land 1,369 .573 8 Current fallows . 16 137 4 Land put to non-agricultural 462 435 9 Other Fallow land 40 40
use. 10 Net area sown 4,513 4,591 5 Cultivable waste 140 107 11 Area sown more than once 24 32 6 Perrnanen t pastures and 274 269 12 Total cropped area (i. e. Gross 4,H8 4,623
other grazing lands. cropped area) .
Source:
Directorate of Agriculture, Gujarat.
14
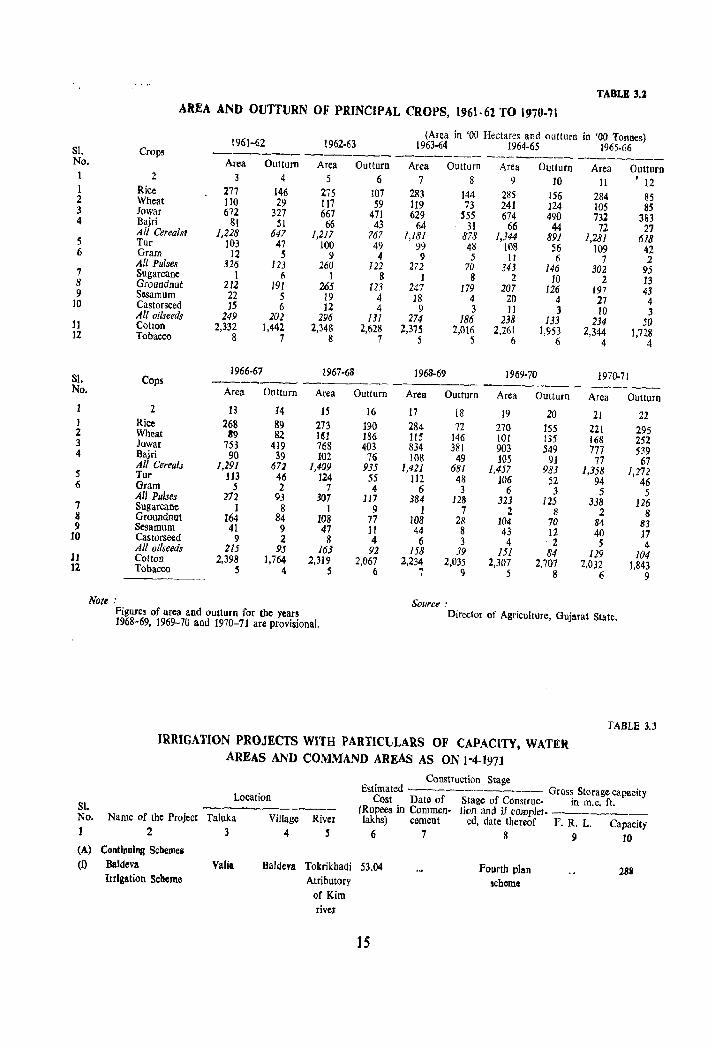
TABLE 3.1
AREA AND OUTTVRN OF PRINCIPAL CROPS, 1961-62 TO 1970-71
(Area in '00 Hectares and <luttufn in '00 Tonoes) 1961-62 1962·63 1963-64 1964·65 1965.66 81. Crops -------- -------- _-------- ~------- ---------No. Area Outturn Area Oullurn Area Outlurn Area Outturn Area Outturn
1 2 3 4 5 6 7 8 9 10 11 ' 12 I Rice 277 146 2i5 107 283 144 285 156 284 85 2 Wheat 110 29 117 59 119 73 241 124 105 85 3 Jowar 672 327 667 471 629 555 674 490 732 383 4 Bajri 81 51 66 43 64 31 66 44 72 27 All Cereals. 1,228 647 1,217 767 1,181 878 1,344 891 1,281 618 5 Tur )03 47 100 49 99 48 108 56 109 42 6 Gram 12 5 9 4 9 5 II 6 7 2 All Pulses 326 123 260 122 272 70 343 146 302 95 7 Sugarcane 1 6 1 8 1 8 2 10 2 13 8 Groundoat 212 191 265 rZ3 247 179 207 126 197 43 9 Sesamum 22 5 19 4 18 4 20 4 27 4 10 Castorseed 1S 6 12 4 9 3 11 3 10 .3 All Qilseeds 249 202 296 J3I 274 186 238 133 234 50 11 Cotton 2,332 1,442 2,348 2,628 2,375 2,016 2.261 1,953 2,344 1,728 12 Tobacco 8 7 8 7 5 S 6 6 4 4
1966-67 1967-68 1968-69 1969-70 1970-71 81. Cops ------- ------ -------- -------- -------No. Area Outturn Area Outturn Area Outturn Area Outturn Area Outturn 2 13 14 15 16 17 18 19 20 21 22
) Rice 268 89 273 190 284 72 270 155 221 295 2 Wheat 89 82 Itil 186 115 146 101 1j5 168 252 3 JowaI 753 419 768 403 834 381 903 549 777 5~9 4 Bajri 90 39 102 76 108 49 105 91 77 67 All Cereals 1,291 672 1,409 935 /,421 681 1,457 983 1,358 1,272 5 Tur 113 46 124 55 112 48 106 52 94 46 6 Gram 5 2 7 4 6 3 6 3 5 5 All Pulses 272 93 307 117 384 128 323 125 338 126 7 Sugarcane 1 8 I 9 1 7 2 8 2 8 8 Groundnut 164 84 108 77 108 28 104 70 84 83 9 Sesamum 41 9 47 11 44 8 43 12 40 17 10 Castorseed 9 2 8 4 6 3 4 2 S 4 All oi/seeds 215 95 163 92 158 39 1.51 84 129 104 11 Cotton 2,398 1,764 2,319 2,067 2,234 2,035 2,307 2,707 2,032 1,843 12 Tobacco 5 4 5 6 7 9 5 8 6 9
Note: Source,'
Sl. No. 1
(A)
(i)
Figures of area and outtum for the years 1968-69, 1969-70 and 1970-71 are provisional.
Director of Agriculture, Gujarat State.
TABLE 3.3
IRRIGATION PROJECTS WITH PARTICULARS OF CAPACITY, WATER AREAS AND COMMAND AREAS AS ON 1~4.1971
Construction Stage
Location Estimated ------------- Gross Storage capacity
Cost Date of Stage of Construe- in m.c. ft.
Name of the Project Taluka 2 3
Continuing Schemell Baldeva Irrigation Scheme
Valia
Village 4
River S
(Rupees in Commcn- lion and if complet- _______ _ lakhs) cement ed, date thereof F. R. L. Capacity
6 7 8 9 10
BllldeYA Tokrikhadi 53.04 Atributory
Fourth plan schems
2811
of Kim rivtJ
15
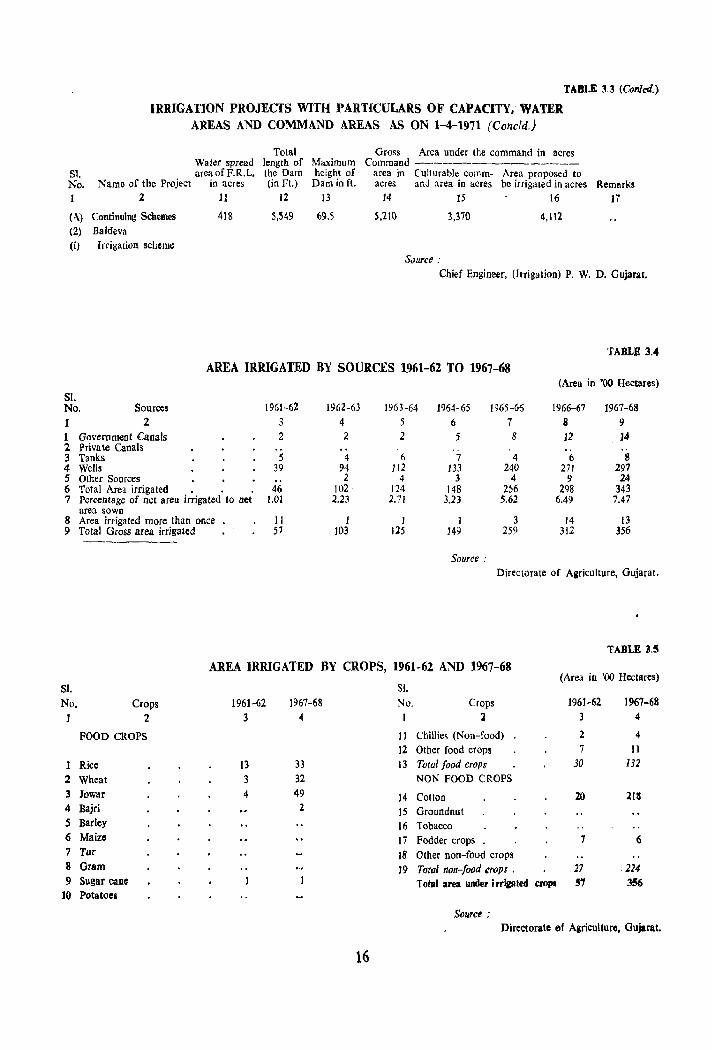
TABLE 3.3 (Corr/t:d.)
IRRIGATION PROJECTS WITH PARTICULARS OF CAPACITY, WATER AREAS AND COMMAND AREAS AS ON 1-4-1971 (Coneld.)
Water spread S1. areaofF.R.L. No. Name of the Project in acres 1 2 11
(A) Continuing Schemes 418 (2) Baldeva (i) Irrigation scheme
Total length of the Dam (in FI.)
12
5,549
Maximum height of
Damillft. 13
69.5
Gross Area under the command in acres Command ---------------
area in CulturabJe comm- Area proposed to acres and :\rea in acres be irrigated in acres
14 15 16
5,210 3,370 4,112
Source:
Remark~
17
Chief Engineer, (Irrigation) P. W. D. Gujarat.
TABLE 3.4
AREA IRRIGATED BY SOURCES 1961-62 TO 1967-68 (Area in '00 Hectares)
SI. No. Sources 1961-62 1962-63 1963-64 1964-65 1965-66 1966-67 1967-68 1 ... 3 4 5 6 7 8 9 ... 1 Government Canals 2 2 2 5 8 12 14 2 Private Canals .. .. 3 Tanks 5 4 ~ 7 4 6 8 4 Wells 39 94 112 133 240 271 291 5 Other Sources 2 4 3 4 9 24 6 Total Area irrigated • • . 46 102 124 148 2;6 298 343 7 Percentage of net area irrigated to net 1.01 2.23 2.71 3.23 5.62 6.49 7.47
area sown 8 Area irrigated more than once 11 1 J 1 3 14 13 9 Total Gross area irrigated 57 103 125 149 259 312 356
Source: Directorate of Agriculture, Oujarat.
TABLE H
AREA IRRIGATED BY CROPS, 1961-62 A~D 1967-68 (Area in '00 Hectares)
SI. SI.
No. Crops 1961-62 1967-68 No. Crops 1961-62 1967-68 ] 2 3 4 1 2 4
FOOD CROPS 11 Chillies (Non-food) 2 4
12 Other food crops 7 11
Rice )3 33 13 Total food crops 30 132 2 Wheat 3 32 NON FOOD CROPS 3 Iowar 4 49 14 Colton 20 :m 4 Bajri :2 15 Groundnut 5 Barley 16 Tobacco 6 Maize 17 Fodder crops 7 6 7 Tur 18 Other non-food crops 8 Gram 19 Total non-food crops . 27 224 9 Sugar callll T otaJ area under i rripled cropa 57 356
]0 Potatoel
Source: Directorate flf Agriculture, Ouj .. rat.
16
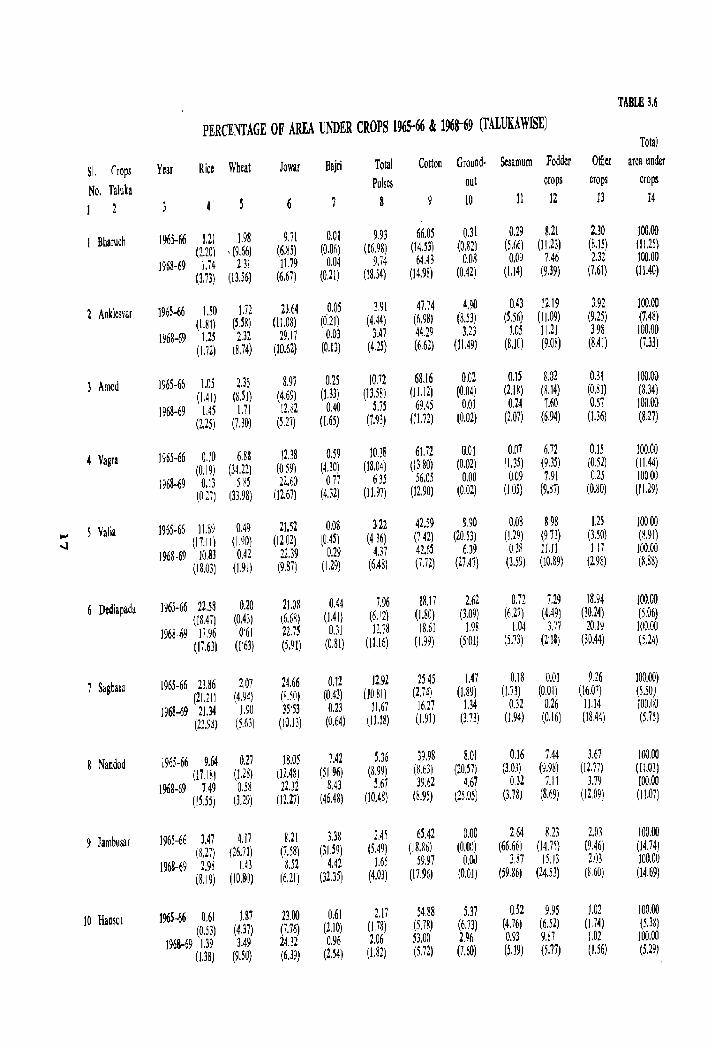
TABLE 3.6
PERCENTAGE OF AREA UNDER CROPS 1965-66 & 1968-69 (TALUKAWISE) Total
SI. rrops Year Rice Wheat Iowa! Bajri Total Colton Ground· Sesamum Fodder Oilier area under
No. Taluka Pulses Dut crops crops crops
I 2 4 8 10 11 12 13 14
I Bharuch 1965-66 1,21 1.98 9,71 0,01 9.93 66,05 0,31 0,29 8,21 2.30 100,00
(2.20) \ (9.66) (6.~j) (0.06) (16,98) (14.53) (0.82) (1,66) (11.23) (B.15) (11.25)
1968-69 1.74 2.31 11.79 0.04 9.74 64.43 0,08 0.09 7.46 2,32 100.00
(3,73) (13.56) (6.67) (0,21) (18.14) (14.98) (0.42) (1.14) (9.39) (7.61) (11.40)
2 Anklesvar 1965-66 1.l0 1.72 23.64 0,05 3,91 47.74 4.90 0,43 12.19 3.92 100.00
(1.81) (~.~8) (11.08) (0.21) (4.44) (6.98) (8.531 (S.56) (11.09) (9,25) (7,48)
1968-69 1.25 2.32 29.17 0.03 3.47 44.29 3.23 1.05 1].21 398 100.00
(1.12) \U4) (10.62) (0.13) (4.25) (6.62) (11.49) (8,10) (9.08) (8,41) (7.33)
3 Amod 1965-66 1.05 2.35 8.97 0.25 10.72 68,16 0.02 O.IS 8.02 0031 100.00
(1.41) (8.51) (4.69) (1.33) (13.51) (11.12) (0.04) (2.18) (~.14) (0.81) (8.34)
1968-69 1.45 1.71 12.82 0.40 5,75 69.45 0.01 0.24 7.60 0,57 10000
(2,25) (7.10) (5,27) (1,65) (7.9J) (11.72) (0.02) (2.07) (6.94) (I.J6) (8.27)
4 Vagra 1965-66 0.]0 6.83 12,)8 0.59 10.]8 61.72 0.01 0.07 6.72 0.15 100.00
(0,19) (34.22) (059) (4,30) (I8,04) (1380) (0,02) (1.35) (9.35) (052) (11.44)
1968-69 0.13 H5 22.60 077 635 56.05 0.00 009 7.91 0.25 10000
(027) (33.98) 02.67) (4,32) (11,97) (12.90) (0.02) (1.05) (9.87) (0.80) (11.29)
~ S Valia 1965-66 II.S9 0.49 21.52 0,03 3.22 42.59 9,90 0.08 898 1.2S 10000
oJ (17.11 ) (1.90) (1202) (045) (416) (742) (2053) (1.29) (9.73) (1.50) (8.91)
1968-69 10.81 0.42 22.39 0.29 4.31 42.65 6.39 0.18 1 1.11 117 100.00
(18.0l) 0.91) (9.87) (1.29) (6.48) (7.72) (27.4i) (3.59) 00,89) (2,%) (S.8~)
6 D.diapada 1965-66 22.58 0.20 21.08 0.44 7.96 18.17 2.62 0,72 i.29 18.94 100.00
(18.47) (0.43) (6.68) (1.41) (6, [2) (1.80) (109) (6.27) (4.49) (30.24) (5.06)
1968-69 17,96 0'61 22.75 OJI 12.78 18.61 1.98 1.04 3.77 20.1Y 100.00
(lWI (1'63) (5,91) (0,81) (11.16) (1.99) (1'01) (5.73) (2'lS) (30.44) (:.24)
7 Sagbala 1965-66 2J.86 2.07 2(66 0.12 12.92 2545 1.47 0.18 0.01 9.26 100.00)
(21.211 (4.94) (UO) (043) (10.81) (2.74) (1,89) (1.71) (0.01) (1M?) (S.SO)
1968-69 21.34 1.90 35'53 0.23 11.67 16.27 1.14 0.32 0.26 11.14 lOOm
(22.9~) (5.631 (10,13) (0.64) U 1.l8) (1.91) (J.73) (1,94) (0.16) (18.44) (5.71)
8 Nandod 1961-66 9.64 0.27 18.05 7.42 5.36 39.98 8.01 0.16 7.44 3.67 100.00
(17.18) (1.28) (12.48) (51.96) (8.99) (S.63) (20.m (103) (9.98) (12.77) (11.03)
1968-69 7.49 0.58 22.32 8.43 S,67 39.62 4.67 0.32 7.11 3.79 100.00
(15.55) (3.29) 02.27) (46.48) (10.48) (8.95) (25.05) (3.78) (8.69) (12,09) (11.07)
9 Jambusar 1965-66 3.47 4.17 8.21 3.38 2.4; 65.42 0.00 2.64 8.23 2.03 100.00
(8,27) (26.71) (7,)8) (31.59) (5,49) (J8.R6) (0.00) (66.66) (14.15) (9.46) (14.74)
1968-69 2.91 1.43 8.52 4,42 1.65 59.97 0.00 3.87 15.13 2.03 100.00
(8.19) (10.80) (6.21) (32.35) (4.03) (17.96) (0,01) (59.86) (24.53) (~,60) (14.69)
10 Hanset 1965-66 0.61 1.87 23.00 0.61 2.17 54.88 5.37 0.S2 9.95 1,02 100,00
(0.53) (4.37) (7.76) (2.10) (l.78) (5.78) (6.73) (4.76) (6.52) (1.14) (5,38)
1968·59 1.39 3.49 24.32 0.96 2.06 53.00 2.Q6 0.93 9.87 1.02 100,00
(1.38) (9.10) (6J9) (2.54) (1.82) (5.72) (7.60) (5,19) (j.77) (1.56) (5.29)
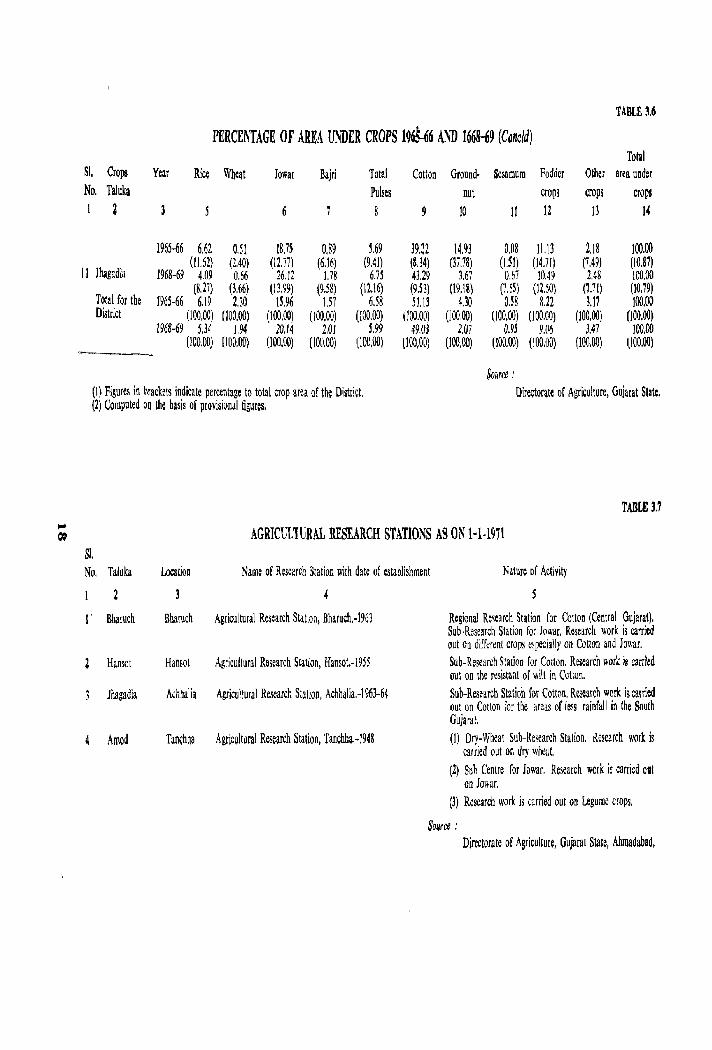
TABLE 3.6
PERCENTAGE OF AREA UNDER CROPS 1965-66 AND 1668-69 (Cone/d) Total
Sl. Crops Year Rice Wbeat Jowar Bajri Total Cotton Ground· Sesamum Fodder Other area under No, Taluka Pulses nut crop; crops crops 1 2 g 10 II 12 13 14
1965-66 6.62 OJ! 18.75 0.S9 H9 39.22 14.93 0.08 11.13 2.18 100,00
II Jhagadia (11.62) (2.40) (12.77) (6.16) (9.41) (S,34) (37.78) (LSI) (14.71) (7.49) (10.87)
1968-69 4.09 0.66 26.12 1.78 6.75 43.29 3.67 0.67 10.49 2.48 100.00
Total for the (8.27) (3,66) (l3.99) (9.58) (12.16) (9,53) (19,\8) (1.15) (12,50) (7.11) (10,79)
1965-66 6.19 2,)0 15.96 1.57 6,58 51,13 4.l0 O,SS 8.22 3.17 100.00 District (100,00) (l00.00) (100,00) (100,00) (l00.00) (100.00) (100,00) (100.00) (100.00) (100,00) (lOQ,()(])
1968'09 5.34 1.94 20.14 2,01 5.99 49.03 2,07 0.95 9,06 3.47 100,00 (l00,00) (100,00) (100,00) [100,00) (100,00) !lOG,OO) (l00,00) (100,00) (100,00) {lOO,oo) (100,00)
Source,' (\) Figures in brackets indicate percentage to total crop area of th~ District, (2) Computed OQ the basis of provisional figures,
Directorate of Agr~ulture, Gujarat Slate.
SI. No, Taluka
I' Bbaruch
, Hansot
Jhagadia
Amod
TABLE ],7
AGRICUL1URAL RESEARCH STATIONS AS ON 1-1·1971
Location Name of Research Station with date of establishment
4
Bharuch Agricultural Research Station, Bharuch,-1963
Hansot Agricultural Research Station, Hansot.-1955
Achhalia Agricultural Research Station, Achhalia,-1963-64
Tanchha Agrlcultoral Research Station, Tanchha,-1948
Nature of Acti vi\y
Regional Relelrch Station for Cotton (Central Gujarat). Sub ·Research Station for Jowar. Research work is carried out on different crops especially on Cotton and Jowar. Sub-Research Station for Cotton. Reiearch work is carrled out on the resistant of wilt in Cotton. Sub-Research Station for Cotton. Research work i~ callied out on Cotton for the areas of less rainfall in the South Gujaral. (I) Dry-Wheat Sub-Research Station, Research work is
carried out on dry wheal. (2) Sllb-Centre for Jowar. Research work i! carried out
on Iowar, (3) Research work is carried out on Legume crops,
Source: Directorate of Agriculture, Gujarat State, Allmadabad,
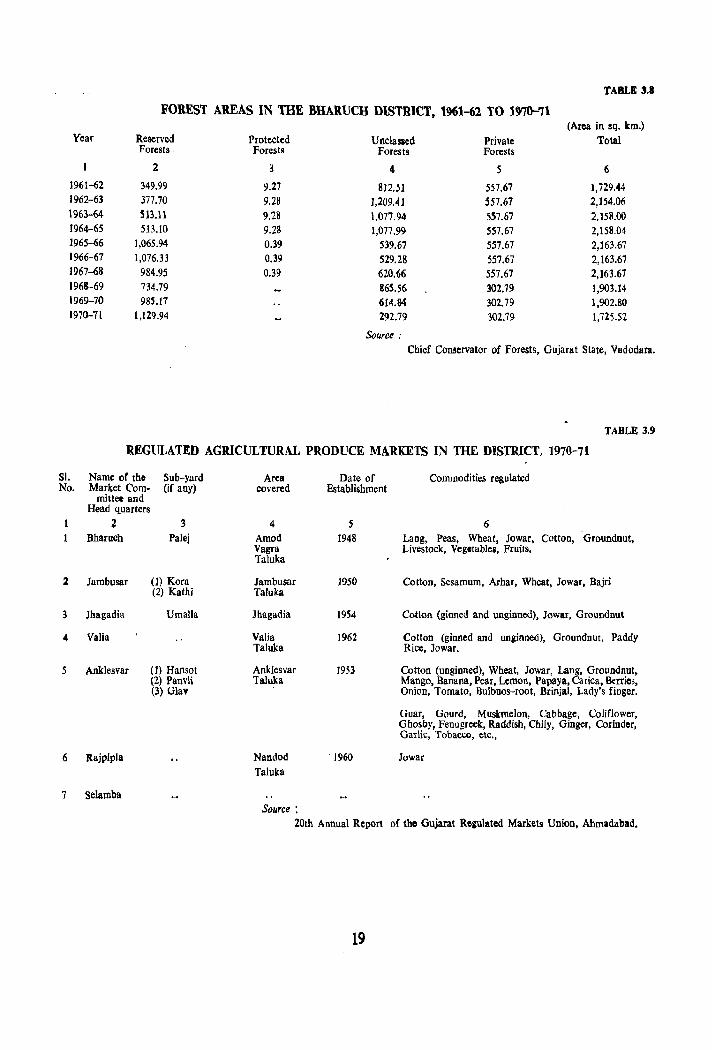
TABLE U
FOREST AREAS IN mE BHARUCH DISTRICT. 1961-62 TO W71l-'71
Year Reserved Protected Forests Forests
2 :I
1961---62 349.99 9.27 1962-63 377.70 9.28 1963-64 513.11 9.28 1964-65 513.10 9.28 1965-66 1,065.94 0.39 1966-67 1,076.33 0.39 1967-68 984.95 0.39 1968-69 734.79 1969-70 98S.17 1970-71 1,129.94
Unclassed Forests
4
812 . .51 1,209.41 1,077.94 1,077.99
539.67 529.28 620.66 865.56 614.84 292.79
Source ..
Private Forests
5
557.67 557.67 557.67 557.67 557.67 557.67 557.67 302.79 302. 79 302.79
(Area in sq. km.) Total
6
1,729.44 2,154.06 2,158.00 2,158.04 2,163.67 2,163.67 2,163.67 1,903.14 1,902.80 1,725.52
Chief Conservator of Forests, Gujarllt State, Vadodara.
TABLE 3.9
REGULATED AGRICULTURAL PRODUCE MARKETS IN THE DISTRICT, 1970-71
SI. Name or the Sub-yard Area Date of Commodities regulated No. Market Com- (if any) covered Establishment
mit1ec and Head quarters
2 3 4 5 6 Bharuch Palej Amod 1948 Lang, Peas, Wheat, Jowar, Cotton, 'Oroundnut,
Vagra Taluka
Livestock, Vegetables, Fruits.
2 Jambusar (1) Kora Jambusar 1950 Cotton, Sesamum, Arhar, Wheat, Jowar, Bajd (2) Kathi Taluka
3 Jhagadia Umalla Jhagadia 1954 Cotton (ginned and unginned), Jowar, Groundnut
4 Valia Valia 1962 Cotton (ginned and unginned), Groundnut, Paddy Taluka Rice, Jowar.
5 Anklesvar (1) Hansot Anklesvar 1953 Cotton (unginned), Wheat, Jowar, Lang, Groundnut, (2) Panvli Taluka Mango, Banana, Pear, Lemon, Papaya, Carica, Berrie;, (3) Glav Onion, Tomato, Bulbuos-root, Brinjal, Lady's finger.
Guar, Gourd, Muskmelon, Cabbage, Coliflower, Ghosby, Fenugreek, Raddish, Chily, Ginger, Corinder, Garlic, Tobacco, etc.,
6 Rajpipla Nandod 1960 Jowar Taluka
7 selamba Source:
20th Annual Report of the Gujarat Regulated Markets Union, Ahmadabad.
19
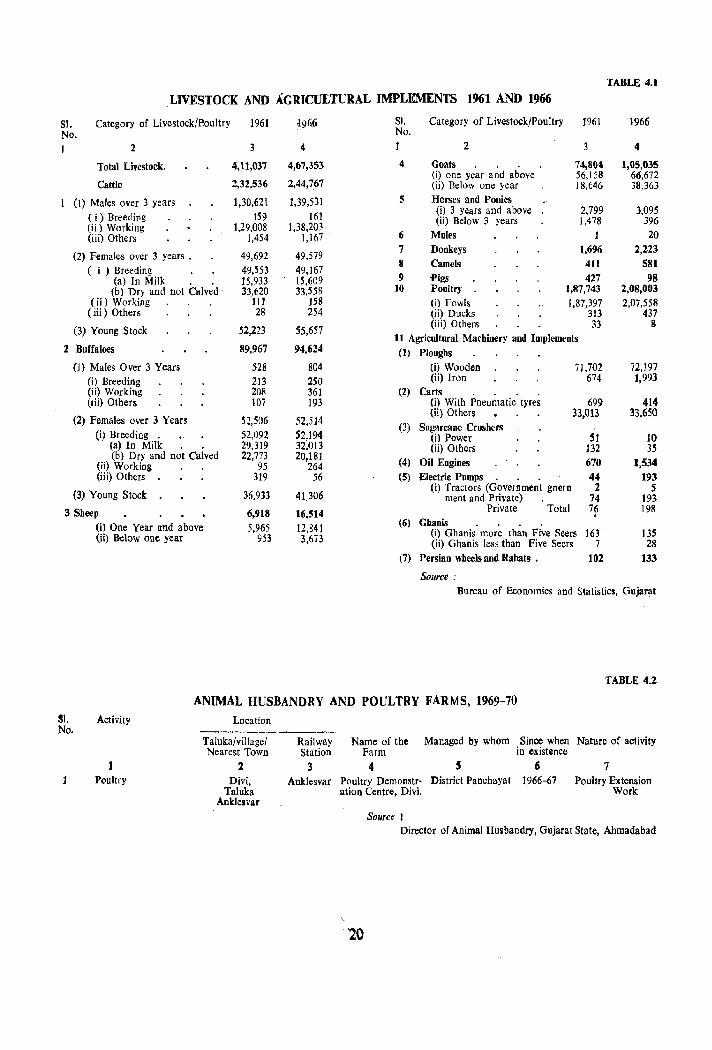
TABLE 4.1
LIVESTOCK AND AGRICULTURAL IMPLEMENTS 1961 AND 1966
Sl. Category of Livestock/Poultry 1961 1966 SI. Category of Livestock/Poultry 1961 1966 No. No.
I 2 3 4 1 2 4
Total Livestock. 4,11,037 4,67,353 4 Goats 74,80<1 1,05,035
Cattle 2,32,536 2,44,767 (i) one year and above 56,158 66,672 (ii) Below one year 18,646 38,363
(I) Males over 3 years 1,30,621 1,39,531 5 Horses and Ponies
( i ) Breeding 159 161 (i) 3 years and above 2,799 3,095
Oi) Working 1,29,008 1,38,203 (ii) Below 3 years 1,478 396
(iii) Others 1,454 1,167 6 Mules 1 20
(2) Females over 3 years . 49,692 49.579 7 Donkeys 1,696 2,221
( i ) Breeding 49,553 49,167 8 Camels 411 581
(a) In Milk 15,933 IS,609 9 .pigs 427 98 (b) Dry aud not Calved 33,620 33,558 10 PoultrY 1,87,743 2,08,003
(ii) Working III 158 (i) Fowls 1,87,397 2,07,558 ( iii) Other s 28 254 Oi) Ducks 313 437
(3) Young Stock 52,223 55,657 (iii) Others 33 8
11 Agricultural Machinery and Implements 2 Buffaloes 89,967 94,624 (1) Ploughs
(1) Males Over 3 Years 528 804 (i) Wooden 71,702 72,197 (il Breeding 213 250 (ii) Iron 674 l,993 (ii) Working 208 361 (2) Carts . . ~ . (Iii) Others 107 193 (i) With Pneumatic tyres 699 414
(2) Females over 3 Years 52,S06 52,514 (ii) Others 33,013 33,650
(3) Sugarcane Crushers (i) Breeding . 52,092 52,194 (i) Power 51 10
(a) In Milk 29,319 32,013 (ii) Others 132 35 (b) Dry and not Calved 22,773 20,181
(4) Oil Engines 670 1,534 (ii) Working 95 264 (iii) Others 319 56 (5) Electrie Pumps . . . 44 193
(3) Young Stock 36.933 41,306 (i) Tractors (Government gnern 2 5
ment and Private) 74 193 3 Sheep 6,918 16,514 Private Total 76 198
(i) One Year and above 5,965 12,841 (6) Ghanis .. . . .
(ii) Below one year 953 3,673 (i) Ghanis more than Five Seers 163 135 (ii) Ghanis less than Five Seers 7 28
(7) Persian wheels and Rahats , 102 133
Source: Bureau of Economics and Statistics, Gujarat
TABLE 4.2
ANIMAL HUSBANDRY AND POULTRY FARMS, 1969-70 SI. No.
Activity
p(lultry
Location
Taluka/village/ Nearest Town
2 Divi,
Taluka Anklesvar
Railway Station
3 Anklesvar
Name of the Managed by whom Since when Nature of activity Farm i [) ex istence
4 S 6 7 Poultry Demonstr- District Panchayat 1966-67 Poultry Extension ation Centre, Divi. Work
Source I Director of Animal Husbandry, Gujarat State, Ahmadabad
'20
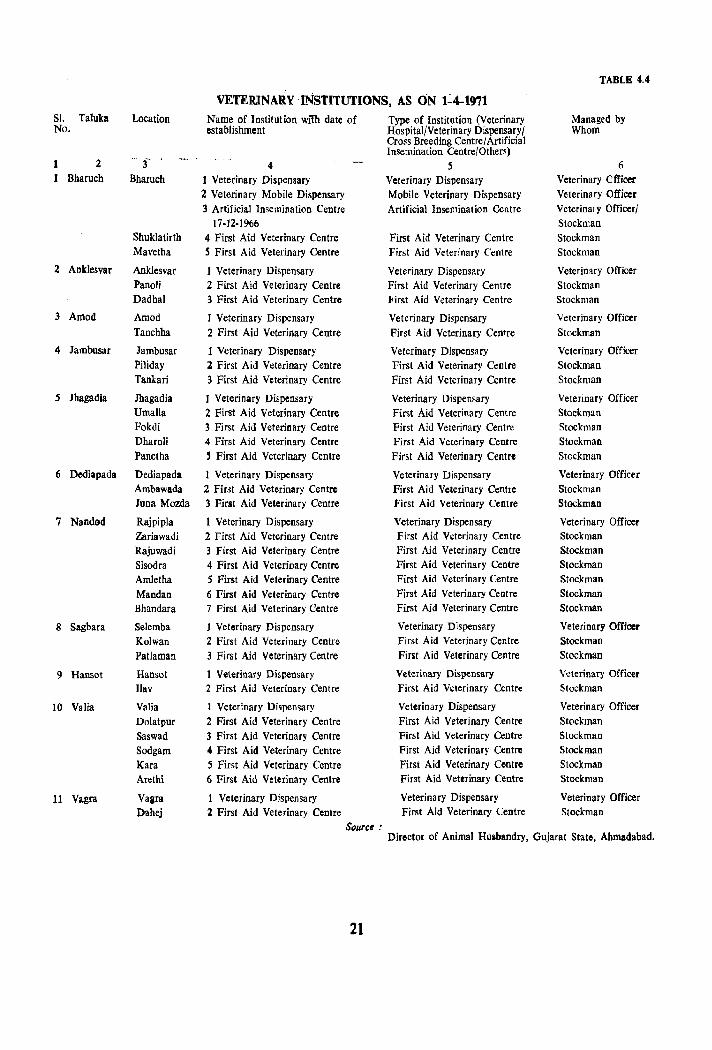
TABLE 4.4
VETERINARY INSTITUTIONS, AS ON 1~4-1971 51. Taluka Location Name of Institution with date of Type of Institution (Veterinary Managed by No. establishment Hospital/Veterinary Dispensary/ Whom
Cross Breeding Centrel Artificial Insemination Centre/Others) ...
1 2 f 4 5 6 I Bharuch Bharuch 1 Veterinary Dispensary Veterinary Dispensary Veterinary Cfficer
2 Veterinary Mobile Dispensary Mobile Veterinary Dispensary Veterinary Officer 3 Artificial Insemination Centre Artificial Insemination Centre Veterinal y Officer/
17-12-1966 Stockrr.an Shuklatirth 4 First Aid Veterinary Centre First Aid Veterinary Centre Stockman Mavetha S First Aid Veterinary Centre First Aid Veterinary Centre Stockman
2 Anklesvar Anklesvar 1 Veterinary Dispensary Veterinary Dispensary Veterinary Officer Panoli 2 First Aid Veterinary Centre First Aid Veterinary Centre Stockman Dadhal 3 First Aid Veterinary Centre First Aid Veterinary Centre Stockman
3 Amod Amod 1 Veterinary Dispensary Veterinary Dispensary Veterinary Officer Tanchha 2 First Aid Veterinary Centre First Aid Veterinary Centre Stockman
4 Jambusar Jambusar 1 Veterinary Dispensary Veterinary Dispensary Veterinary Officer Piliday :z First Aid Veterinary Centre First Aid Veterinary Centre Stockman Tankari 3 First Aid Veterinary Centre First Aid Veterinary Centre Stockman
S Jhagadla Jhagadia 1 Veteri nary Dispensar y Veterinary Dispensary Veterinary Officer UmaHa 2 First Aid Veterinary Centre First Aid Veterinary Centre Stockman Fokdi 3 First Aid Veterinary Centre First Aid Veterinary Centre Stockman Dharoli 4 First Aid Veterinary Centre First Aid Veterinary Centre Stockman Panetha 5 First Aid Veterinary Centre First Aid Veterinary Centre Stockman
6 Dediapada Dediapada 1 Veterinary Dispensary Veterinary Dispensary Veterinary Officer Ambawada 2 Fir&t Aid Veterinary Centre First Aid Veterinary Centre Stockman Juna Mazda 3 First Aid Veterinary Centre First Aid Veterinary Centre Stockman
7 Nandod Rajpipla 1 Veterinary Dispensary Veterinary Dispensary Veterinary Officer Zariawadi 2 First Aid Veterinary Centre First Aid Veterinary Centre Stockman Rajuwadi 3 First Aid Veterinary Centre First Aid Veterinary Centre Stockman Sisodra 4 First Aid Veterinary Centre First Aid Veterinary Centre Stockman Amletha S First Aid Veterinary Centre First Aid Veterinary Centre Stockman Mandan 6 First Aid Veterinary Centre First Aid Veterinary Centre Stockman Bhandara 7 First Aid Veterinary Centre First Aid Veterinary Centre Stockman
8 Sagbara Selemba 1 Veterinary Dispensary Veterinary Dispensary Veterinary Officer Kolwan 2 First Aid Veterinary Centre First A id Veterinary Centre Stockman Patlaman 3 First Aid Veterinary Centre First Aid Veterinary Centre Stockman
9 Hansol Hansot 1 Veterinary Dispensary Veterinary Dispensary Veterinary Officer lIav 2 First Aid Veterinary Centre First Aid Veterinary Centre Stockman
10 Valia Valia I Veterinary Dispensary Veterinary Dispensary Veterinary Officer Dolatpur 2 First Aid Veterinary Centre First Aid Veterinary Centre Stockman Saswad 3 First Aid Veterinary Centre First Aid Veterinary Centre Stockman Sodgam 4 First Aid Veterinary Centre First Aid Veterinary Centre Stockman Kara 5 First Aid Veterinary Centre First Aid Veterinary Centre Stockman Arethi 6 First Aid Veterinary Centre First Aid Veterinary Centre Stockman
11 Vagra Vagra 1 Veterinary Dispensary Veterinary Dispensary Veterinary Officer Dahej 2 First Aid Veterinary Centre First Aid Veterinary Ccntre Stockman
Sourc' : Director of Animal HUibandry, Gujarat State, Ahmadabad.
21
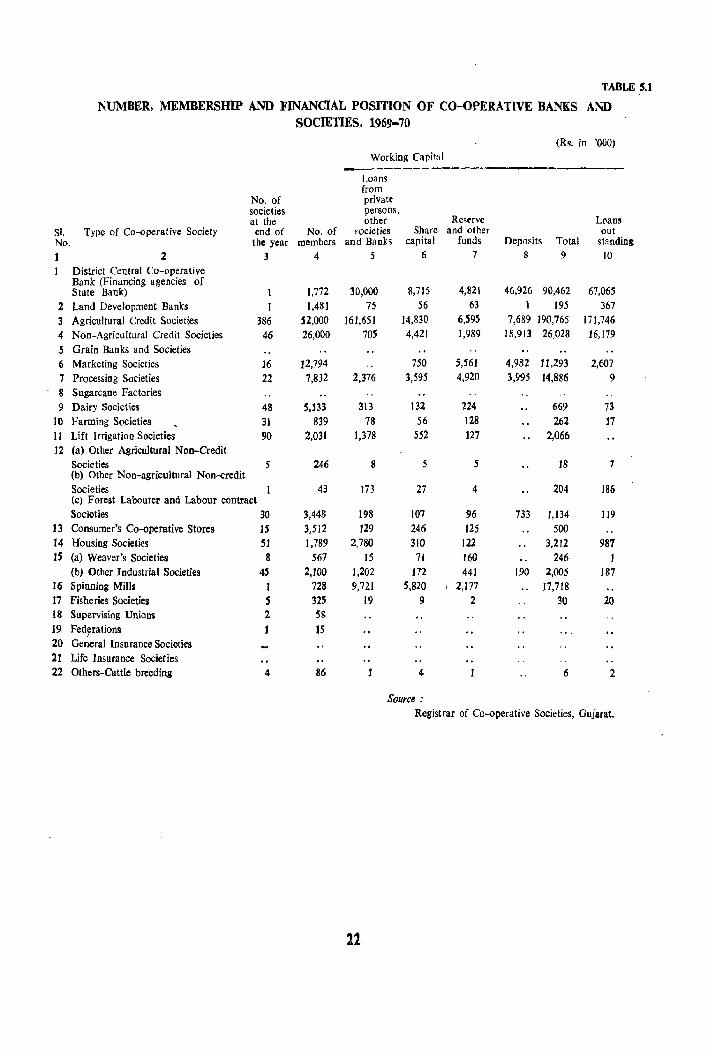
TABLE 5.1
NUMBER, MEMBERSHIP AND FINANCIAL POSITION OF CO-OPERATIVE BANKS AND SOCIETIES, 1969-70
(Rs. in '000) Working Capital
---~--------
Loans from
No. of private societies persons, at the other Reserve Loans
51. Type of Co-operative Society end of No. of focieties Share and other out No. the year members and Banks capital funds Deposits Total standing
2 3 4 5 6 7 8 9 10
District Central Co-operative Bank (Financing agencies of
4,821 46.926 State Bank) 1 1,772 30,000 8,715 90,462 67,065
2 Land Development Banks 1 1,481 75 56 63 1 195 367 3 Agricultural Credit Societies 386 S2,OOO 161,651 14,830 6,595 7,689 190,765 171,746
4 Non-Agricultural Credit Societies 46 26,000 70S 4,421 1,989 18,913 26,028 16,179
S Grain Banks and Societies 6 Marketing Societies 16 12,794 750 ;,561 4,982 11,293 2,607
7 Processing Societies 22 7,832 2,376 3,595 4,920 3,995 14,886 9 8 Sugarcane Factories 9 Dairy Societies 48 5,133 313 132 224 669 73
10 Farming Societies 31 839 78 56 128 262 17 11 Lift lrrigatioo Societies 90 2,031 1,378 552 127 2,066 12 (a) Other Agricultural Non-Credit
Societies 5 246 8 5 5 18 7 (b) Other Non-agricultural Non.-<redit Societies 43 )73 27 4 204 J86 (e) Forest Labourer and Labour contract Societies 30 3,448 198 107 96 733 1,134 119
13 Consumer's Co-operative Stores 15 3,512 129 246 125 500 14 Housing Societies 51 1,789 2,780 310 122 3,212 987 15 (a) Weaver's Societies 8 567 15 71 160 246
(b) Other Industrial Societies 4S 2,100 1,202 J72 441 190 2,005 187 16 Spinning Mills 1 728 9,721 5,820 I 2,177 17,718 17 Fisheries Societies S 32S 19 9 2 30 20 18 Supervising Unions 2 SS 19 Fedyratioos 1 15 20 General Insurance Societies 21 Life Insurance Societies 22 Others-Cattle breeding 4 86 4 6 2
Source:
Registrar of Co-operative SOCieties, Gujarat.
12
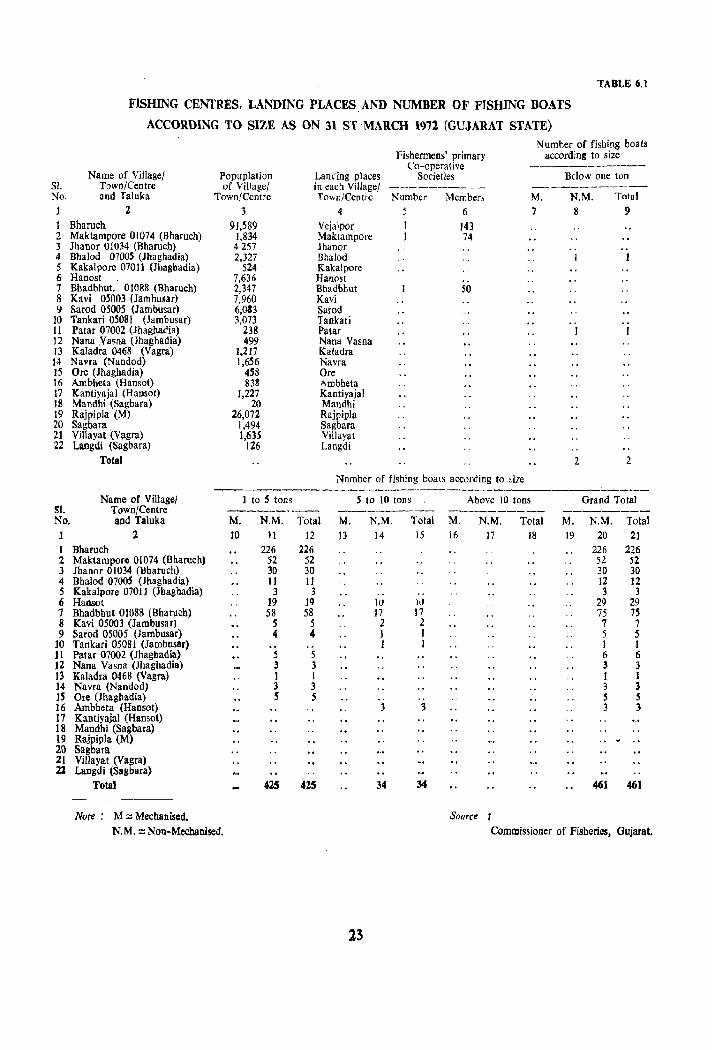
TABLE 6.1
FISHING CENTRES, LANDING PLACES.AND NUMBER OF FISHING BOATS
ACCORDING TO SIZE AS ON 31 ST MARCH 1972 (GUJARAT STATE)
Name of Village! SI. Town/Centre No. and faluka
1 2 I Bharuch 2 Maktampore 01074 (Bharuch) 3 Jhanor 01034 (Bharuch) 4 Bhalod 0700S (Jhaghadia) 5 Kakalpore 07011 (Jbagbadia) 6 Hanost 7 Bhadbbut. 01088 (Bbarucb) 8 Kavi 05003 (Jambusar) 9 Sarod 05005 (Jambusar)
10 Tankari 05081 (Jambusar) 11 Patar 07002 (Jhaghadia) 12 Nana Yasna (Jhagbadia) 13 Kaladra 0468 (Vagra) 14 Navra (Naodod) 15 Ore (Jhaghadia) 16 Ambheta (Hansol) 17 Kantiyajal (Hansol) 18 Mandhi (Sagbara) 19 Rajpipla (M) 20 Sagbara 21 Villayat (Vagra) 22 Laogdi (Sagbara)
Total
Name of Village/ SL Town/Centre No. and Taluka
2 1 Bharuch 2 Maktampore 01074 (Bharuch) 3 Jhanor 01034 (Bharuch) 4 Bhalod 0700S (Jhaghadia) 5 KakaJpore 07011 (Jhagbadia) 6 Hansot 7 Bhadbhut 01088 (Bharuch) 8 Kavi 05003 (Jambusar) 9 Sarod 05005 (Jambusar)
10 Tankari 05081 (Iambus!r) 11 Palar 07002 (Jhagbadia) 12 Nana Vasna (Jhaghadia) 13 Kaladra 0468 (Vagra) 14 Navra (Nandod) IS Ore (Jhaghadia) 16 Ambheta (Hansot) 17 Kantiyajal (Hansot) 18 Mandhi (Sagbara) 19 Rajpipla (M) 21) Sagbara 21 Villayat (Vagra) 2% Langdi (Sagbara)
Total
Note: M ;;;; Mechanised.
Popuplation of Viltage!
Town/Centre 3
91,589 1,834 4257 2,327
524 7,636 2,347 7,960 6,0&3 3,073
238 499
1.217 1,656
458 838
1,221 20
26,072 1,494 1,635
126
1 to 5 tons
Lancing places in each Village! TOINn/Centre
4 Vejalpor Maktampore Jhanor Bhalod Kakalpore Hanos! Bhadbhut Kavi Sarod Tankari Palar Nana Vasna Kaladra Navra Ore Ambbeta Kantiyajal Mandhi RajpipJa Sagbara Yillayat Langdi
Fishermens' primary Co-operative
Sodeties
Number Member, 6
143 74
50
Nnmber of fishing boats according to ,ize
5 to 10 tons Above 10 tons
Number of fishing boats according to size
M. 7
BdoN one ton
N.M. 8
Total
9
.. J
1 1
2 2
Grand Total
M. N.M. Total M. N.M. Total M. N.M. Total M. N.M. Total 10 11 J2
226 226 52 52 30 30 11 11 3 3
19 19 58 58
5 5 4 4
5 3 1 3 5
425
.. 5 3 I 3 5
425
13 14 15
lU hI 17 17
2 2 I I J I
.. 3 3
34 34
16 17 18 19 20 21 226 226 52 ~2 30 30 12 12 3 3
29 29 75 7$ 7 7 5 5 1 1 6 6 3 3 I I 3 3 5 5 3 3
461 461
Source N.M. ;;;; Non-Mechanised. Commissioner of Fisheries, Gujarat.
23
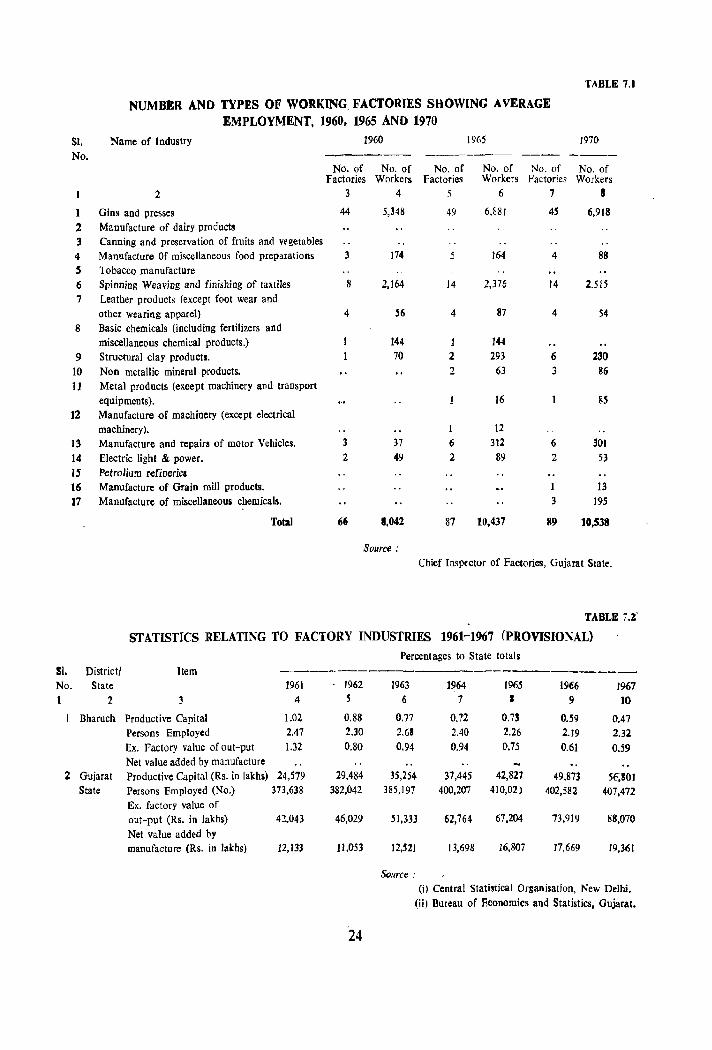
TABLE 7.1
NUMBER AND TYPES OF WORKING. FACTORIES SHOWING AVERAGE EMPLOYMENT, 1960, 1965 AND 1970
SI. Name of Industry 1960 1965 1970
No. _----- -------- ----No. of No. of No. of No. of No. of No. of
Factories Workers Factories Workers Factories Workers
2 3 4 6 7 I
1 Gins and presses 44 5,348 49 6,881 45 6,918
2 Manufacture of dairy products
3 Canning and preservation of fruits and vegetables
4 Manufacture Of miscellaneous food preparations 3 174 5 164 4 88 S Tobacco manufacture
6 Spinning Weaving and finishing of tax tiles 8 2,164 14 2.376 14 2.515 7 Leather products (except foot wear and
other wearing apparel) 4 56 4 87 4 54
8 Basic chemicals (including fertilizers and miscellaneous chemical products.) 144 1 144
9 Structural clay products. 70 2 293 6 230
10 Non metallic mineral products. 2 63 3 S6 1J Metal products (ellcept machinery and transport
equipments). 16 85 12 Manufacture of machinery (except electrical
machinery). 12
13 Manufacture and repairs of motor Vehicles. 3 37 6 312 6 301
14 Electric light & power. 2 49 2 89 2 53 15 Petrolium refineries 16 Manufacture of Grain mill products. 13 17 Manufacture of miscellaneous chemicals, 3 195
Total 66 1.042 87 10,437 89 10,538
Source: Chief Illspcctor of Factories, Gujarat State.
TABLE 7,Z
STATISTICS RELATING TO FACTORY INDUSTRIES 1961-1967 (PROVISIONAL)
51, District! No. State
1 2
Bharuch
2 Gujarat State
Item
:3
Productive Capital Persons Employed
Ex. Factory value of out-put Net value added by manufacture
Productive Capital (Rs. in lakhs) Persons Employed (No.)
Ex. factory value of out-put eRs, in lakhs)
Net value added by manufacture (Rs. in lakhs)
----1961 1962
4 5
1.02 0.88 2.47 2.30
1.32 0.80
24,579 29,484 373,638 382,042
42,043 46,029
12,133 11,053
24
Percentages to State totals
1963 1964 1965 1966 1967 6 1 I 9 10
0.77 0.72 0.73 0.59 0.47 2.68 2.40 2.26 2.19 2.32 0.94 0.94 0.7S 0.61 0.59
35,254 37,445 42,827 49.873 56,801 385,197 400,207 410,02) 402,582 407,472
~1,333 62,764 67,204 73,919 88,070
12,521 13,698 16,807 17,669 19,361
Source: (i) Central Statbtical Orgaftisation, New Delhi.
(ii) Bureau of Economics and Statistics, Gujarat.
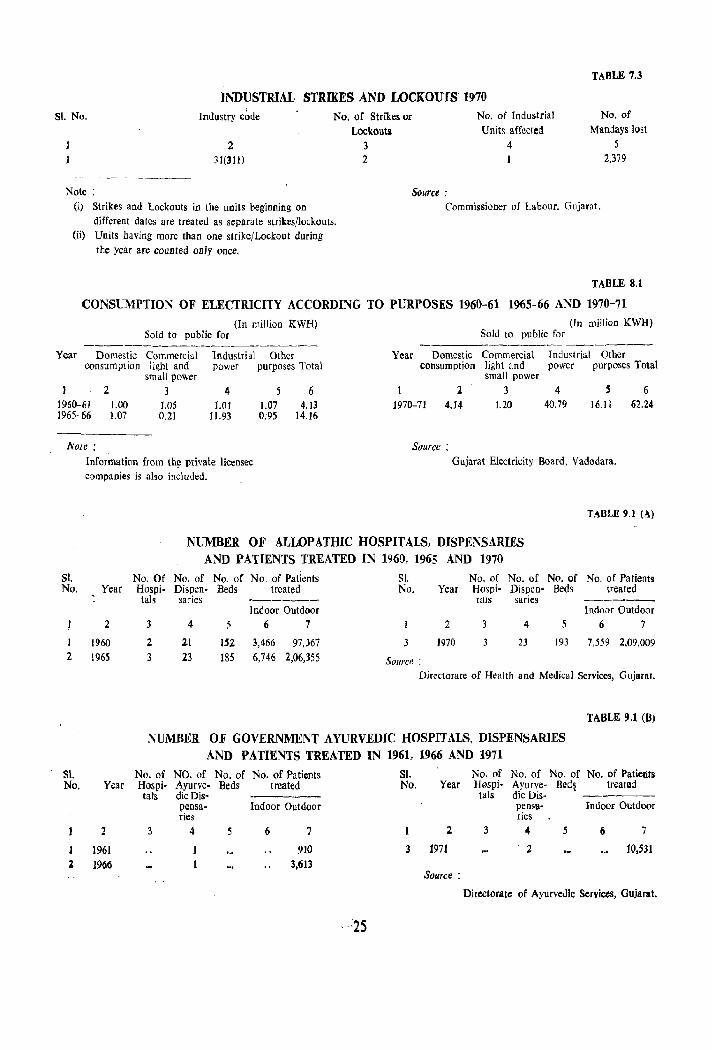
TABLE 7.3
INDUSTRIAL STRIKES AND LOCKOUfS 1970 SI. No. Industry cbde No. of Strikes or
Lockouts
No. of Industrial Units affecfed
No. of Mandays lost
5
Note:
2 31(311)
(i) Strikes and Lockouts in the units beginning on different dates are treated as separate strikes/lockouts.
(ii) Units having more than one strike/Lockout during the year are counted only once.
3 2
4 1 2,379
S(}urce : Commissioner of Labour. Gujarat.
TABLE 8.1
CONSUMPTION OF ELECTRICITY ACCORDING TO PURPOSES 1960-61 1965-66 AND 1970-71
(In million KWH) Sold to public for
Year Domestic Commercial consumption light and
small power 2 3
1960-61 1.00 1965-66 1.07
Note:
1.05 0.21
1 ndustrial Other power purposes Total
4 1.01
11.93
6 1.07 4.13 0.95 14.16
Information from the privaie licensee . companies is also included.
Year Domestic consumption
2 1970-71 4.14
Source:
(In million KWH) Sold to public for
Commercial Industrial Other light and power purposes Total small power
3 4 S 6 1.20 40.79 16.11 62.24
Gujarat Electricity Board. Vadodara.
TABLE 9.1 (A)
NUMBER OF ALLOPATHIC HOSPITALS, DISPENSARIES AND PATIENTS TREATED IN 1960, 1965 AND 1970
S1. No. Year
2
I 1960 2 1965
S1. No. Year
1 2
J 1961 2 1966
No. Of No. of No. of No. of Patients S], No. of No. of No. of No. of Patients Hospi· Dispen. Beds treated No. Year Hospi- Dispen- Beds treated tals saries -_----- talS saries ------_
Indoor Outdoor Indoor Outdoor 4 .5 6 7 2 3 4 5 6 7
2 21 1'2 3,466 97,367 3 1970 23 193 7,559 2,09,009
3 23 185 6,746 2,06,355 Source:
Directorate of Health and Medical Services, Gujaral.
TABLE 9.1 (B)
NUMBER OF GOVERNMENT AYURVEDlC HOSPITALS, DISPENSARIES AND PATIENTS TREATED IN 1961, 1966 AND 1971
No. of NO. of No. of No. of Patients SI. No. of No. of No. of No. of Patients Hospi- Ayurve- Beds treated tals die Dis- ---_-- No. Year Hospi- Ayurve- Bed~ treated
tals dic Dis- -----pensa- Indoor Outdoor pensa- Indoor Outdoor ries ries
3 4 5 6 7 1 2 3 4 5 6 7
1 910 3 1971 2 ID,531 3,613
Source 1
Directorate of Ayurvedic Services, Gujarat.
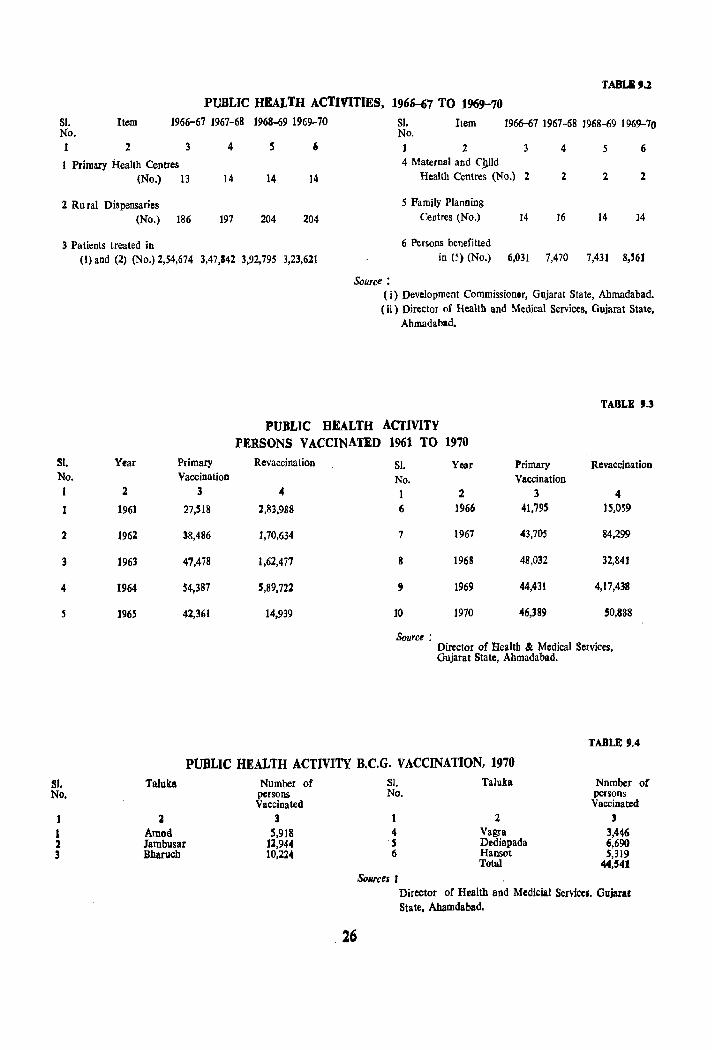
TABUU
PUBLIC HEALTH ACTIVITIES, 1966-67 TO 1969-70 51. Item 1966-67 J967-68 1968-69 1969-70 51. Item 1966-67 1967-68 1968-69 1969-70 No. No. 1 2 3 4 5 , 1 2 3 4 5 6
1 Primary Health Centres 4 Maternal and q~ild
(No.) 13 14 14 14
2 Rural Dispensaries (No.) 186 197 204 204
3 Patients treated in (1) and (2) (No.) 2,54,674 3,47,142 3,92,795 3,23,621
PUBLIC
Health Centres (No.) 2 2 2 2
5 Family Planning Centres lNo.) 14 16 14 14
6 Persons benefitted in (5) (No.) 6,031 7,470 7,43J 8,56J
Source: (i) Development Commissioner, Gujarat State, Ahmadabad. ( ii) Director of Health and Medical Services, Gujarat State,
Ahmadabad.
TABLE !1.3
HEALTH ACTIVITY PERSONS VACCINATED 1961 TO 1970
Sl. Year No. I 2
1961
2 1962
3 1963
4 1964
S 1965
81. No.
J 1 1 3
Primary Revaccination 51. Year Primary Revaccination Vaccination No. Vaccination
3 4 1 2 3 4 27,518 2,83,988 6 1966 41,795 15,059
38,486 1,70,634 7 1967 43,705 84,299
47,478 1,62,477 8 19611 48,032 32,84J
54,387 5,89,722 , 1969 44,431 4,17,438
42,361 14,939 10 1970 46,389 50,888
Source: Director of Health " Medical Services, Gujarat State, Ahmadabad.
TABLE 11.4
PUBLIC HEALTH ACTIVITY B.C.G. VACCINATION, 1970 Talulca Number of
persons Vaccinated
2 3 Amod 5,918 lambusar ll,944 Bhal1lcb 10,224
26
51. Taluka No.
Nnmber of persons Vaccinated
4 S 6
SOllrces I
2 Vagra Dediapada Hansot Total
)
3,446 6,690 5,319
44,541
Director of Health and Medicial Servlcci. Gujarat State, Ahamdabad.
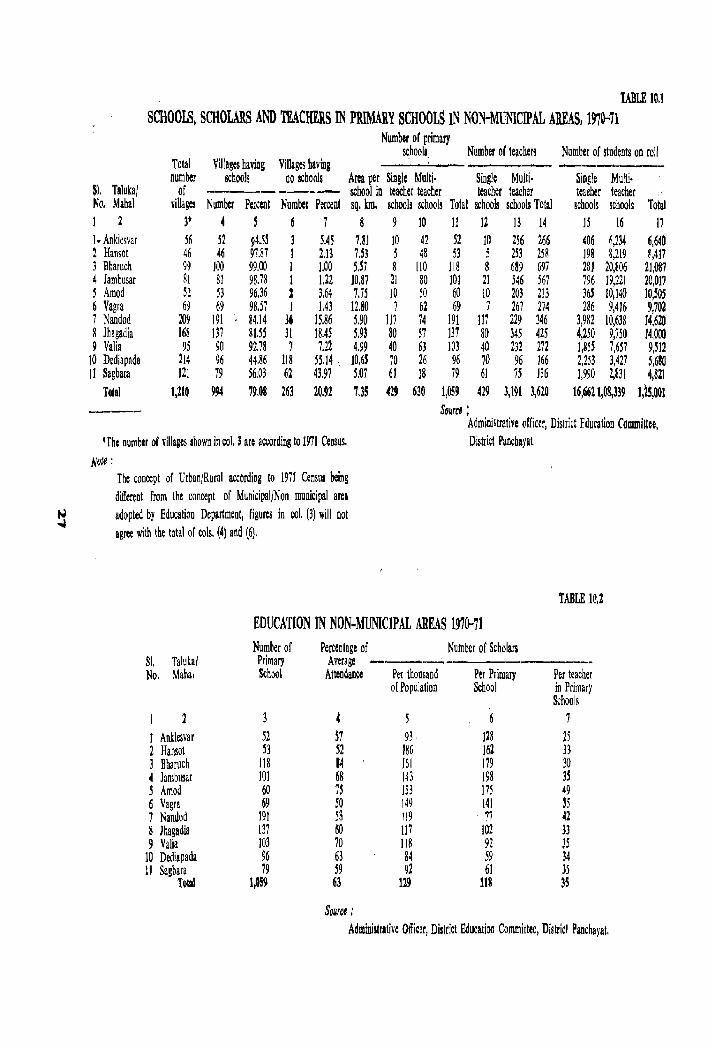
TABLE 10.1
SCHOOLS, SCHOLARS AND TEACHERS IN PRIMARY SCHOOLS IN NON~MUNICIPAL AREAS, 1970--71 Number of primary
scbool. Number of teachers Number of students on roll Total Villages having VlIIages baviog ---.:....,..___ --number schools no schools Area per Single Multi· Single Multi· Single Multi·
Sl. Taluka/ of --------- school in teacher teacher teacher teacher Icaeher teacher No. Mahal villages Number Percent Number Percent sq. kIn, school! schools Total schools scbools Total Ichools schools Totat I 2 3· 4 S 6 7 8 9 10 11 12 13 14 15 16 17 I. Anklesvar 56 52 94.53 3 5.45 7.81 10 42 52 10 256 266 406 6,234 6,640 1 Hansot 46 46 97.87 I 2.13 7.S3 5 48 53 5 25) 258 198 8,219 FA17 j Bharuch 99 100 99.00 I 1.00 5.57 8 110 118 8 689 697 281 20,806 21,087 4 Jambusar 8[ 81 98.78 1 1.22 10.87 2[ 80 101 21 546 567 796 19,22[ 20,011 5 Amod S2 53 96.36 2 3.64 7.75 10 50 60 10 203 2[3 365 10,140 10,505 6 Vagra 69 69 98.57 I 1.43 12.80 7 62 69 7 267 274 286 9,415 9,702 7 Nandod 209 191 84.14 3' 15.86 5.90 117 74 191 117 229 346 3,982 10,638 14,620 8 Jhagadia 168 137 81.55 31 18.45 5.93 80 57 m 80 345 425 4,250 9,750 14,000 9 Valia 95 90 92.78 7 7.22 4.99 40 63 103 40 232 272 1,855 7,657 9,512
10 Dediapada 214 96 44.86 118 55.14 \ 10.65 70 26 96 70 96 166 2,253 3,427 5,680 11 Sagbara 121 19 56.03 62 43.97 5.07 61 18 79 61 i5 116 1,990 ~831 4,821
Tolal 1,210 994 79.08 263 20.92 7.35 429 630 1,059 429 3,191 3,620 16,6621,08,339 t,~,OOl ------- SourCl :
Administrative officer, District Education Committee, 'The number 0( villages shown in col. 3 are according to 1971 Census. District Pancbayat.
NQte: The concept of Urban/Rural according to 1971 Censul being different from the concept of Municipal/Non municipal arel
~ adopted by Education Department, figures in col. (3) will not agree with tbe total of cols. (4) and (6).
TABLE 1~,2
EDUCATION IN NON·MUNICIPAL AREAS 197().-71 Number of Percentage of Number of Scholars
81. Taluka/ Primary Average ----~- ---------No. Mahal School Attendance Per thousand Per Primary Per teacher
of Population School in Primary Schools
1 4 6 7
I Anklesvar 52 S7 93 128 25 2 Hansot 53 S2 li6 16l 33 3 Bharuch 118 84 161 179 30 4 Jambusar 101 68 143 198 35 5 Amod 60 7S 153 175 49 6 Vagra 69 50 149 141 35 7 Nandod ]91 58 119 77 42 8 Jhagadia 137 60 117 102 33 9 Valia 103 70 118 92 35
10 Dediapada 96 63 84 59 34 II Sagbara 79 59 92 61 35
Tor.! 1,059 6~ 129 US 3S
Source : Administrative Offielr, District Education Committee, Districl Panchayat.
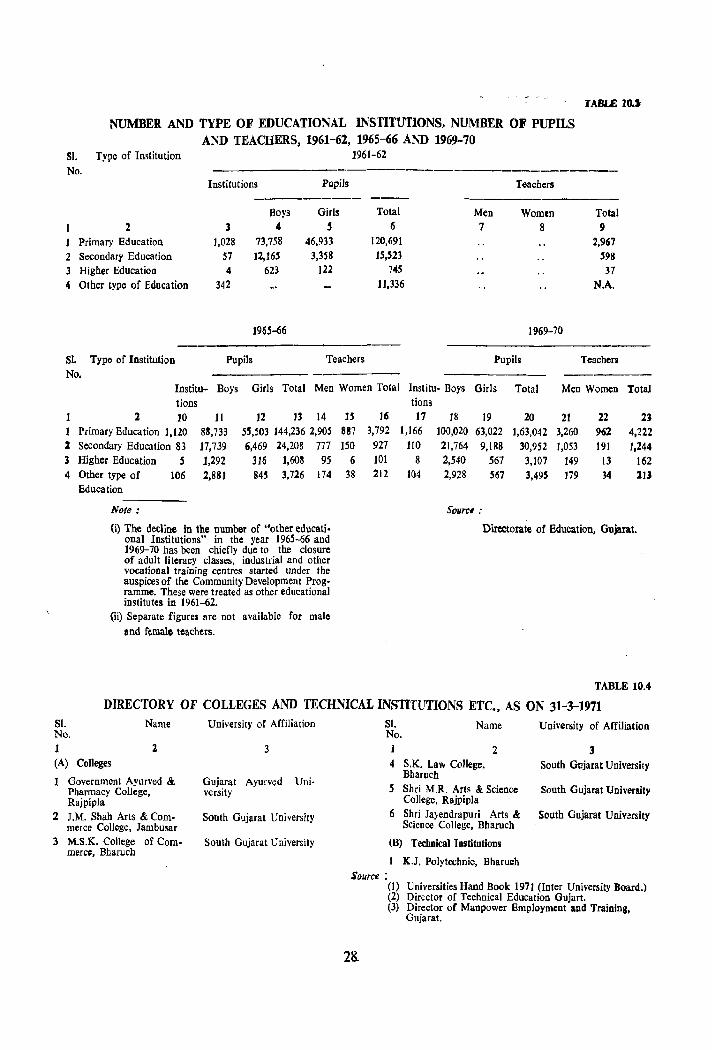
TABLE 10"
NUMBER AND TYPE OF EDUCATIONAL INSTITUTIONS, NUMBER OF PUPILS AND TEACHERS, 1961-62, 1965-66 AND 1969-70
SI. Type of Imtitution 1961-62
No. --------------
2 Primary Education
2 Secondary Education 3 Higher Education
'" Other type of Education
SI. Type of Institution No.
Institutions Pupils
--------Boys Girls
3 4 , 1,028 73,758 46,933
57 12,165 3,358 4 623 122
342
1965-66
Pupils Teachers
Total 6
120,691 15,S23
745 11,336
Men 7
Teachers
Pupils
Women 8
1969-70
Total 9
2,9" 598
37 N.A.
Teachers
------Institu- Boys Girls Total Men Women Total dons
Institu- Boys tions
Girls Total Men Women Total
2 10 11 Primary Education 1,120
2 Secondary Education 83 3 Higher Education 5 4 Other type of 106
Education
Note:
8S,733 17,739 1,292 2,881
12 13 14 55,503 144,236 2,90S 6,469 24,208 777
316 1,608 95 845 3,726 174
(i) The decline in the number of "other educati· onal Institutions" in the year 1965-66 and 1969--70 has been chiefly due to the closure of adult literacy classes, industrial and other vocational training centres started under the auspices of the Community Development Programme. These were treated as other educational institutes in 1961-62.
(ii) Separate figures are not available for male end femalo teachers.
15 16 17 887 3,792 1,166 150 927 110
6 101 8 38 212 104
18 19 20 21 22 2J 100,020 63,022 1,63,042 3,260 962 4,222 21,764 9,1118 30,952 1,053 191 1,244 2,540 567 3,107 149 13 162 2,928 567 3,49S 179 34 lU
Sourc, :
Directorate of Bducation, Gujarat.
TABLE 10.4
DIRECTORY OF COLLEGES AND TECHNICAL INSTITUTIONS ETC •• AS ON 31-3-1971 ffi. Name No. I 2 (A) Colleges
Government Ayurvecl & Pharmacy College, Rajpipla
2 J.M. Shah Arts & Commerce College, Jambusar
3 M.S.K. College of Com· meICI, Bharuch
University of Affiliation
3
Gujarat Ayurved University
South Gujarat U oi versity
South Gujarat University
SI. Name University of Affiliation No. 123 4 S.K. Law College, South Gujarat University
Bharuch S Shri M.R. Arts & Science South Gujarat University
College, Rajpipla 6 Shri Jayendrapuri Arts & South Gujarat Univmity
Science College, Bharuch
(B) Technical Institutions
1 K.J. Polytechnic, Bharuch Source:
28.
(I) Universities Hand Book 197J (Inler University Board.) (2) Director of Technical Education Gujart. (3) Director or Manpower Employment and Trainini,
Gujaral.
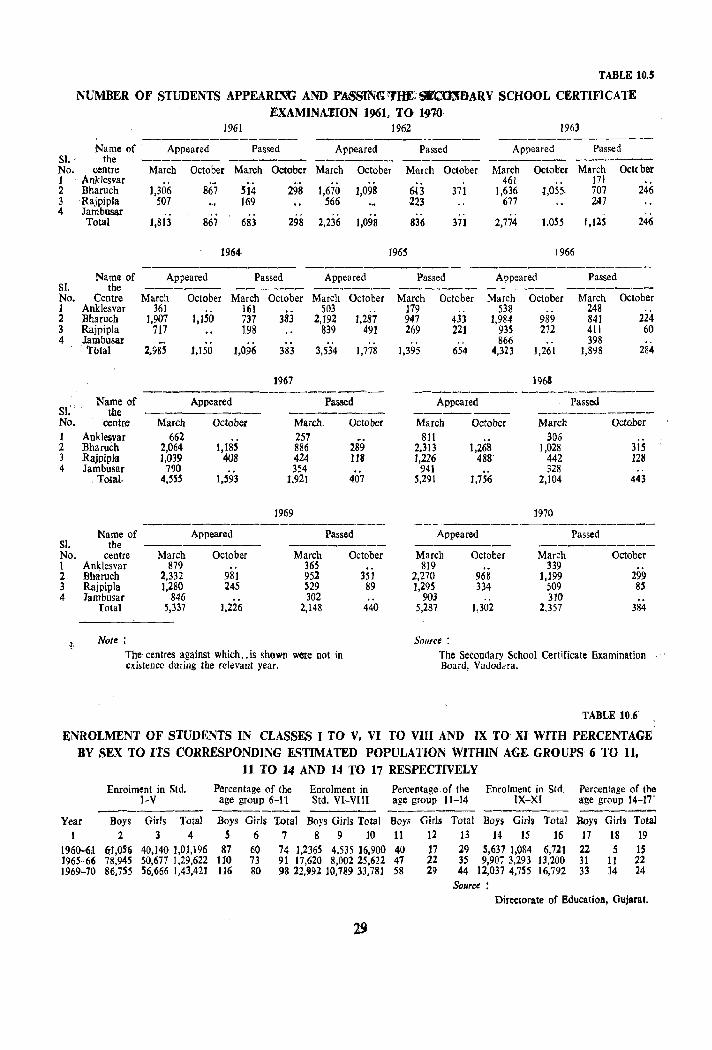
81. -No.
TABLE 10.5
NUMBER OF STUDENTS APPEARING AND P'A-5S1NG:1'HE:SB:OrJf)ARY SCHOOL CERTIFICATE EXAMINA'EION 1961, TO 197'()
1961 1962 1963 -------------- ---------------
Name of Appeared Passed Appeared Passed Appeared Passed the ._------- ----- -------_ ------ ------- ~----
centre March October March October March October March October March O<:tolrer March Ockbar 1 . Anklesvar
Si4 .. 461 171
2 Bharuch 1,306 867 298 1,670 1,098 613 371 1,636 1,055- 707 246 3 . Rajpipla 507 169 566 223 677 247 4 Jambusar .. "
Total 1,813 867 683 298 2,236 1,098 836 37] 2,774 1.055 1,125 246
1964 196j 1966
Name of Appeared Passed Appeared Passed Appeared Passed 81. tbe ------- ------ ----- ------- ----- -------No. 1 2 3 4
8C No. 1 2 3 4
Sl. No. 1 2 3 4
Centre March October March October March October Anklesvar 361 161 503 Bharuch 1,907 1,150 737 383 2,192 1,287 Rajpipla 717 198 839 491 Jamhusar . Total 2,985 1,150 1,096 383 3,534 1,778
1967 ---- ---
Name of Appeared Passed the --------
centre March October March. October Anklesvar 662 257 Bharucb 2,064 1,185 886 289 Rajpiplii 1,039 408 424 118 lambusar 790 354
.1otal 4,555 1,593 1,921 407
1969 ---------------~-.---
Name of Appeared Passed the -------- --------
centre March October March October Anklesvar 879 365 Bharuch 2,332 981 952 351 Rajpipla 1,280 245 529 89 Jambusar 846 302
Total 5,337 J,226 2,148 440
Note;
The· centres against which .. is shown were not in ellistence during the relevant year.
March October March October March October 179 538 248 947 433 1,984 989 841 224 269 221 935 272 411 60
.. 866 ., 398 J,395 654 4,323 1,261 1,898 2E4
1968 _-_-_....---------_ ..... --------Appeared Passed
------- ----._-------March October March October
811 306 2.313 1,26& 1,028 315 1,226 488 442 128
941 328 .. 5,291 1,756 2,104 443
1970 ---._-------------------
Appeared Passed ----------March October March October
819 339 2,270 968 ],199 299 1,295 334 509 8S
903 .. 310 5,287 1,302 2,357 384
Source:
The Secondary SchOOl Certificate Examination Board, Vadodara.
TABLE 10.6-
ENROLMENT OF STUDENTS IN CLASSES I TO V, VI TO VIII AND IX TO Xl WITH PERCENTAGE BY SEX TO ITS CORRESPONDING ESTIMATED POPULATION WITHIN AGE- GROUPS 6 TO 11.
11 TO 14 AND 14 TO 17 RESPECTIVELY
Enrolment in Std. Percentage of the Enrolment in Percentage. of the Enrolment in Std. Percentage of the I-V age group 6--1'1 Std. VI-VIII age group 11-14 IX-XI age group 14'--11'
-------- ------- ----- ------ ------ ------Year Boys Girls Total Boys Girls Total Boys Girls Total Boys Girls Total Boys Girls Total Boys Girls Total
1 2 3 4 5 6 7 8 9 10 11 12 13 14 15 16 17 18 19 I 960:-{;1 61,Q~6 40,140 1,01,196 87 60 74 1,2365 4,535 16,900 40 17 29 5,637 1,084 6,721 22 5 IS 1965~6 78,945 50,677 1,29,622 110 73 91 17,620 8,002 25,622 47 22 35 9,90-;' 3,293 13,200 31 11 22 1969-70 86,755 56,666 1,43,421 116 80 98 22,'92 10,789 33,781 58 29 44 12,037 4,755 16,792 33 14 24
Source: Directorate of Educatioll, Gujaral.
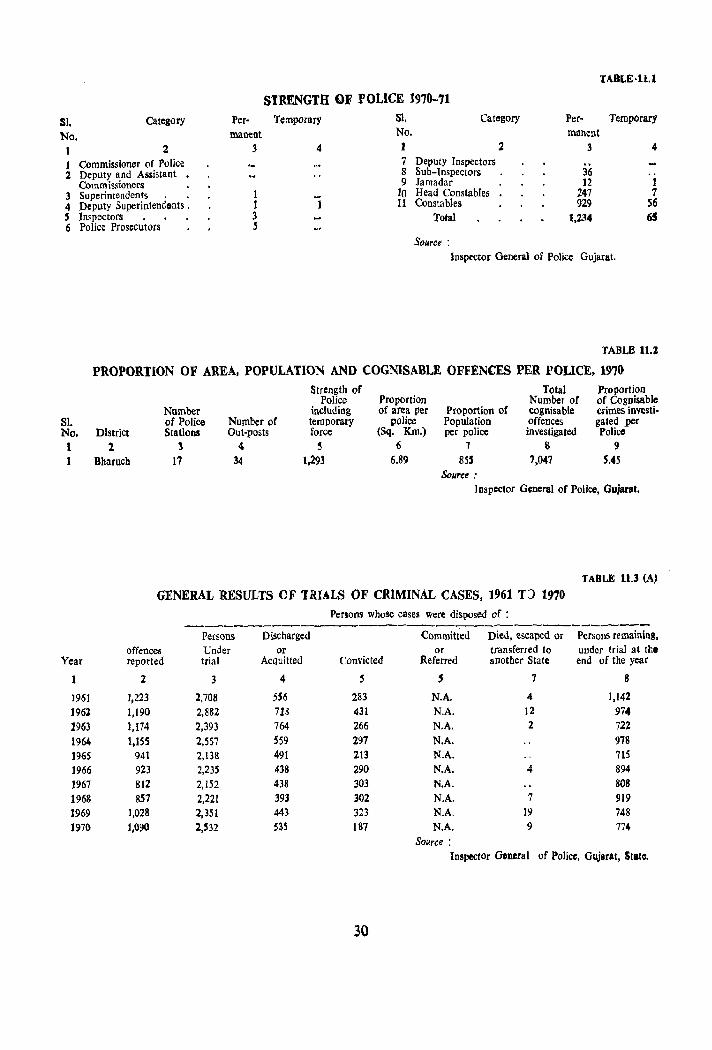
rABLE·ll.l
STRENGTH OF POLICE 1970-71
SI. Category Per- Temporary SI. Category Per- Temporary
No. manent No. manent
1 2 3 4 J 2 3 4
1 Commissioner of Police 7 Deputy Inspectors 2 Deputy and Assistant 8 Sub-Inspectors 36
Commissioners 9 lamadar 12 I 3 Superintendents . • 1 JO Head Constables 247 7 4 Deputy Superintendents. 1 11 Constables 929 56 5 Inspectors 3 Total 1,234 65 6 Police Prosecutors 5
Source: Inspector General of Police Gujarat.
TABLE 11.:1
PROPORTION OF AREA, POPULATION AND COGNISABLE OFFENCES PER I'OLICE, 1970 Strength of Total Proportion
Police Proportion Number of of Cognisable Number including of area per Proportion of cognisable crimes investi-
81. of Police Number of temporary police PopUlation offences gated _per No. District Stations Out-posts force (Sq. Km.) per police investigated Police 1 :2. 3 4 5 6 1 1.\ 9
t Bharuch 17 34 1,293 6.89 85' 7,047 5.45 Source;
Inspector General of Police, Gujaral.
TABLE 11.3 (A)
GENERAL RESULTS OF TR.IALS OF CRIMINAL CASES, 1961 TJ 1970 Penon! whose cases were disposed of :
-------~----------Persons Discharged Committed Died, escaped or Persons remaining,
offences Under or or transferred to under trial at the Year reported trial Acquitted Convicted Referred another State end of the year
2 3 4 5 $ 7 8
1961 1,223 2,708 SS6 283 N.A. 4 1,142 1962 1,190 2,882 713 431 N.A. 12 974 1963 1,174 2,393 764 266 N.A. 2 722
1964 1,155 2,557 S59 297 N.A. 978 1965 941 2,138 491 213 N.A. 715 1966 923 2,235 438 290 N.A. 4 894 1967 812 2,152 438 303 N.A. 808 1968 857 2,221 393 302 N,A. 7 919 1969 1,028 2,351 443 313 N,A. 19 748 1970 1,090 2,532 m 187 N.A. 9 774
Source: Inspector General of Police, Gujarat, State.
30
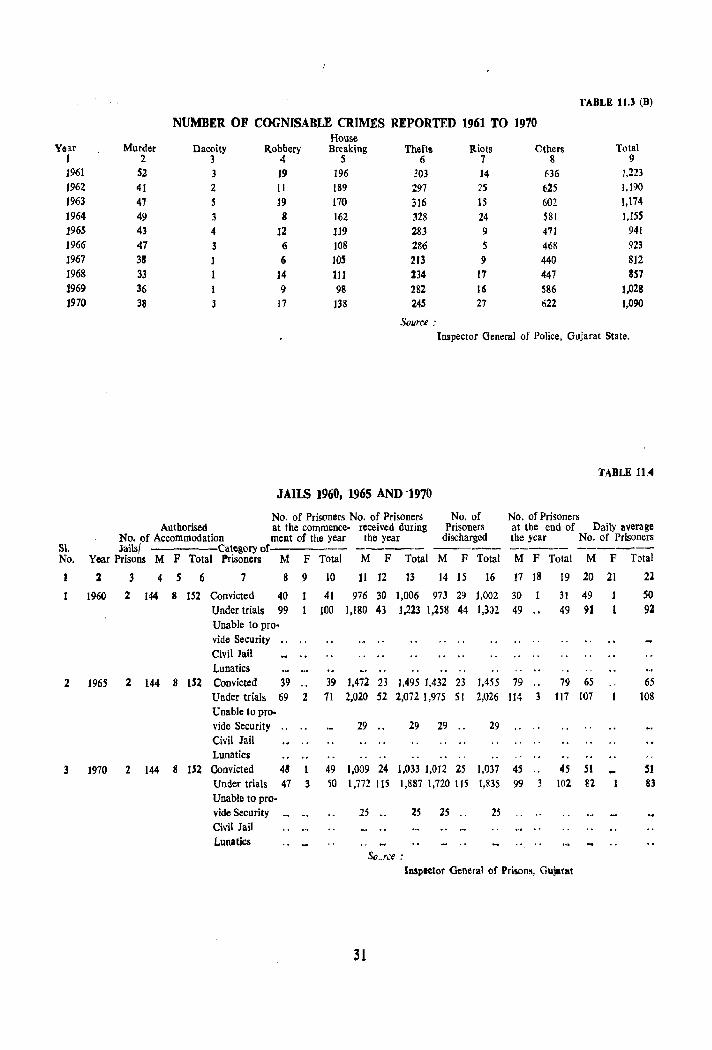
TABLE 11.3 (B)
NUMBER OF COGNISABLE CRIMES REPORTED 1961 TO 1970 House
Year Murder Dacoity Robbery Breaking Thefts Riots Others Total 1 2 3 4 5 6 7 8 9 1961 52 3 19 196 303 14 636 1,223 1962 41 2 11 189 297 25 625 1,190 1963 47 S 19 170 316 IS 601 1,174 1964 49 3 8 162 328 24 581 I.ISS 1965 43 4 12 JJ9 283 9 471 941 1966 47 3 6 108 286 S 468 923 1967 38 J 6 105 213 9 440 812 1968 33 1 14 111 234 17 447 8S7 1969 36 I 9 98 282 16 586 1,028 1970 38 3 17 138 245 27 622 1.090
Source: Inspector Oenel1l1 of Police, Gujarat State.
TABLE 11.4
JAILS 1960, 1965 AND -1970
No. of Prisoners No. of Prisoners No. of No. of Prisoners Authorised at the commence· received during Prisoners at the end of Daily average
No. of Accommodation ment of the year the year discharged tbe year No. of Prisoners 51. Jails/ -----Category of----- -_--- ---- ----- ------No. Year Prisons M F Total Prisoners M F Total M F Total M F Total M F Total M F Total
2 3 4 5 6 7 8 9 10 II 12 13 14 15 16 17 HI 19 20 21 21
1960 2 144 8 152 Convicted 40 41 976 30 1,006 973 29 1,002 30 31 49 1 SO Under trials 99 100 1,180 43 1,223 1,258 44 1,302 49 .. 49 91 1 92 Unable to pro· vide Security ... .. Civil Jail Lunatics
2 1965 2 144 8 lS2 Convicted 39 .. 39 1,472 23 1,495 1.432 23 1,4.55 79 .. 79 65 65 Under trials 69 2 71 2,020 52 2,072 1,975 51 2,026 1f4 3 117 101 108 Unable to pro. vide Security 29 .. 29 29 .. 29 Civil Jail Lunatics
3 1970 2 144 8 152 Convicted 48 1 49 1,009 24 1.033 1,012 25 ),037 45 .. 45 SI Sl Under trials 47 3 ~o 1,77::! lIS 1,887 1,720 115 1,K~5 99 3 102 82 n Unable to pro-vide Security 25 .. 25 25 .. 25 Civil Jail Lunatics .. ..
So .. ree: IDSpc¢tor General of Prison~, Gujarllt
31
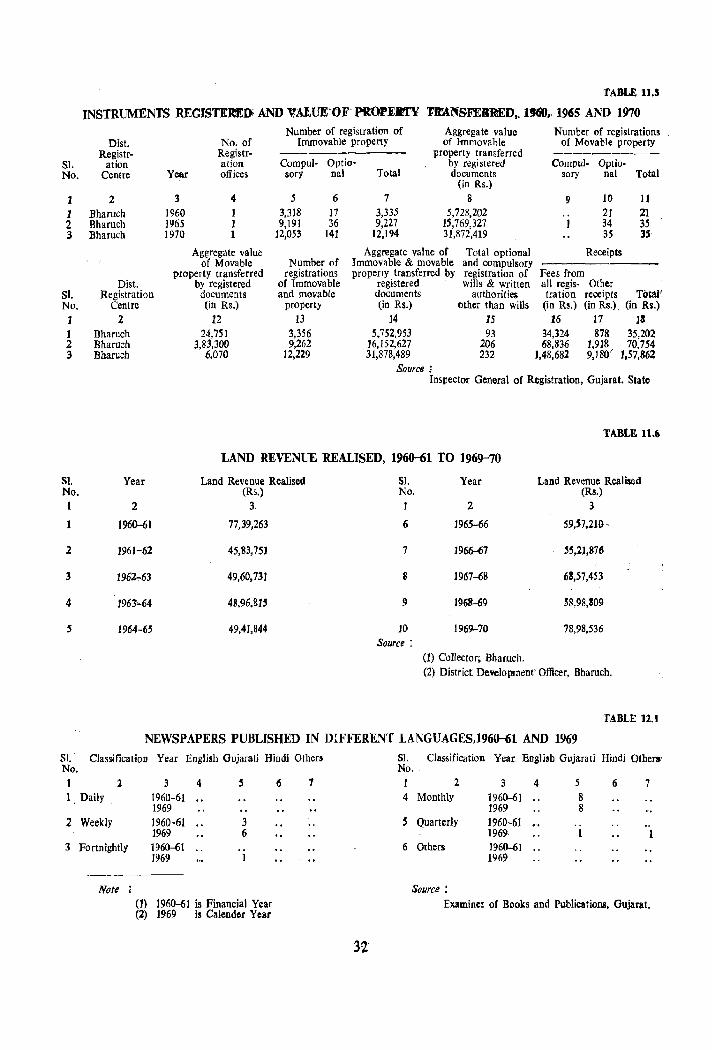
TABLE U.5
INSTRUMENTS REGISTERED AND ltAl.UE:OF' PttOI'EJrf\' TR'ANSFEJmED;. 1!ltlO" 1965 AND 1970
Number of registration of Aggregate value Number of registrations Dis!. No. of Immovable property of Immovable of Movable property
Registr- Registr- --------- property transferred ----------SI. alion alion Compul- Optio- by regi stered Compul- Optio-No. Centre Year offices sory nal Total documents sory nal Total
(in Rs.)
2 3 4 5 6 7 8 9 10 11
1 Bhamch 1960 3,3]8 17 3,335 5,728,202 .. 21 21 2 Bhamch ]'165 '1,191 36 9,227 15,769,327 1 34 35 3 Bharuch 1970 12,053 141 12,194 31,872,419 35 3S
Aggregate value Aggregate value of Total optional Receipts of Movable Number of Immovable & movable and compulsory
property transferred registrations properlY transferred by registration of Fees from Disl. by registered of Immovable registered wills & written all regis- Other
81. Registration documents and movable documents authorities tration receipts Total' No. Centre (in Rs.) property (in Rs.) other than wills (in Rs.) (in Rs.) . (in Rs.)
1 2 12 13 14 15 16 17 1& 1 Bharuch 24,751 3,356 5,752,953 93 34,324 878 35,202 2 Bharuch 3,83.300 9,262 16.152,627 206 68,836 1,918 70,754 3 Bharuch 6,070 12,229 31,878,489 232 1,48,682 9,180' 1,57,862
Source 1 Ins~ector General of Registration, Gujarat. State
TABLE 11.6
LAND REVENUE REALISED, 1960-61 TO 1969-70
SI. Year Land Revenue Realised SI. Year Land Revenue Realised No. (Rs.) No. (Rs.) I 2 3 J 2 3
1960-61 77,39,263 6 1965-66 59,57,210,
2 1961-62 45,83,751 7 1966-67 ~S,21,876
3 1962.,.63 49,60,731 8 1967-68 611,57,453
4 1963~64 48,96,815 9 1968-69 S8,98,Il09
5 1964-65 49,41,844 10 1969-70 78,98,536 Source:
0) Collector. Bhamch. (2) District Development' Officer, Bharuch.
TABLE 12.1
NEWSPAPERS PUBLISHED IN DIFFERE:'>IT LANGUAGES,196O-61 AND 1969
51. Classification Year English Gujarati Hindi Others SI. Classification Year English Gujarati Hindi Olher.· No. No .. 1 :2 3 4 S 6 7 1 2 3 4 S 6 7 1 . Daily 1960-61 .. 4 Monthly 1960-61 .. 8
2 Weekly
3 Fortnightly
Note
1969 1960-61 .. 3 1969 6 1960-61 .. 1969 1
(I) 1960-6 J is Financial Year (2) J 969 is Calender Year
1969 8
S Quarterly 1960-61 .. 1969 1 I
6 Others ]960-61 .. 1969
Source: Examiner of Books and Publications, Gujarat.
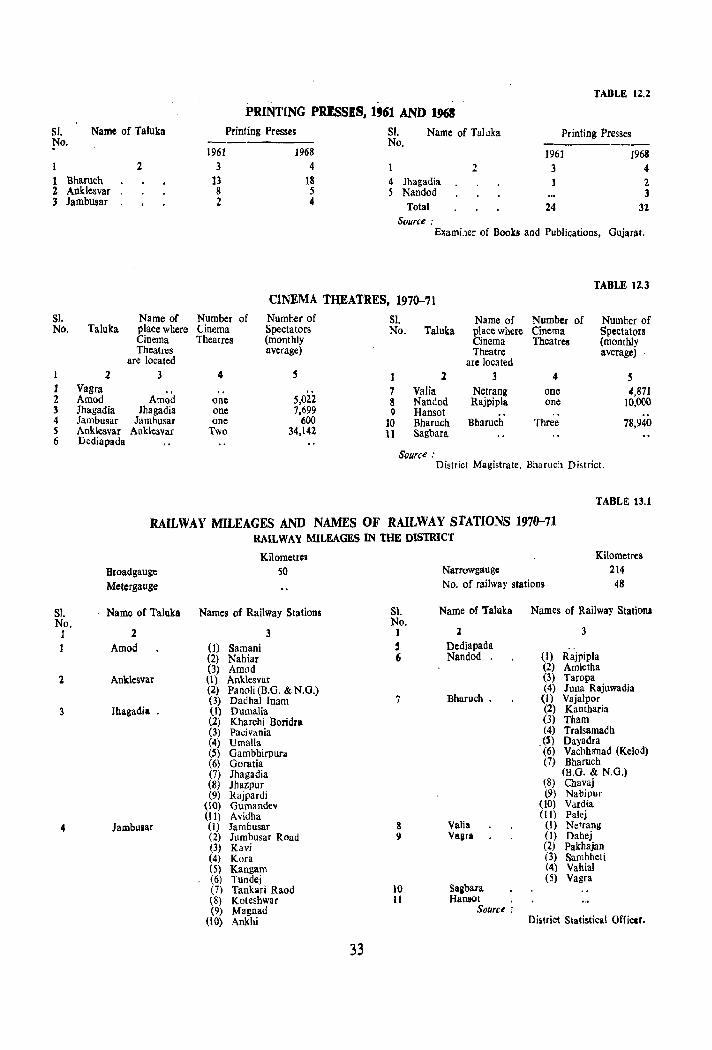
51. Name of Taluka No.
1 2 1 Bharuch 2 Anklesvar 3 Jambusar
Sl. Name of No. Taluka place where
Cinema Theatres
are located 123 1 Vagra ., 2 Amod Amod :3 Jhagadia Jhagadia 4 Jambusar Jambusar S Anklesvar AnkleSVaf 6 Dediapada
. .. PRINTING PRESSES, 1'61 AND 1968
Printing Presses SI. Name of Tal Jka No.
1961 1968 3 4 2
13 18 4 Jhagadia 8 5 5 Nandod 2 4 Total
Source:
TABLE 12.2
Printing Presses
]96] 3
24
1968 4 2 3
32
ExamLler of Books aad Publications, Gujarat.
TABLE 12.3 CINEMA THEATRES, 1970-71
Number of Number of Sl. Name of Number of Number of Cinema Spectators No. Taluka place where Cinema Spectators Theatres (monthly Cinema Theatres (monthly
average) Theatre average) are located
4 S J 2 3 4 S 7 Valia Netrang one 4,871
one 5,022 8 Nandod Rajpipla one 10,000 one 7,699 9 Hansot .. one 600 ]0 Bharuch Bharuch Three 78,940
Two 34,142 11 Sagbara
Source: District Magistrate, Bharuc!1 District.
TABLE 13.1
RAILWAY MILEAGES AND NAMES OF RAILWAY SrATIONS 1970-71 RAILWAY MILEAGES IN tHE DISTRICT
Kilometrei Kilometres
Broadgauge SO Narrowgauge 214
Mctcrgauge No. of railway stations 48
S1. Name of Taluka Names of Railway Stations 81. Name of Taluka Names of Railway Stations No, No. 1 2 3 ] 1 3
Amod (1) Sam ani , Dediapada (2) Nahiar 6 Nandod (I) Rajpipla (3) Amod (2) Amletha
1 Anklesvar (1) Anklesvar (3) Taropa (2) Panoli (B.G. & N.G.) (4) Juna Rajuwadia (3) Dadhallnam 7 Bharuch . (I) Vajalpor
3 Ihagadia . (1) Dumalia (2) Kantharia (2) Kharchi Boridr. (3) Tham (3) Pacivania (4) Tralsamadh (4) Umalla (5) Dayadra (S) Gambhirpura (6) Vacbha'nad (Kclod) (6) Goratia (7) Bharuch (7) Ibagadia (B.G. & N.G.) (8) Jhazpur {8) Chavaj (9) Rajpardi (9) Nabipur
(10) Gumandc'l' (10) Vardia (\1) Avidha (II) Palej
lambusar (1) Jambusar & Valia (1) Netrang (2) lumbusar Road 9 Vaara (I) Dahej (3) Kavi (2) Pakhajan (4) Kora (3) Sambbeti (5) Kangam (4) Vahial (6) Tundej (5) Vagra (7) Tankari Raod 10 Sagbara (8) Koteshwar II HallSQt (9) Magnad Source :
(10) Ankhi Diatrict Statistical Officer.
33
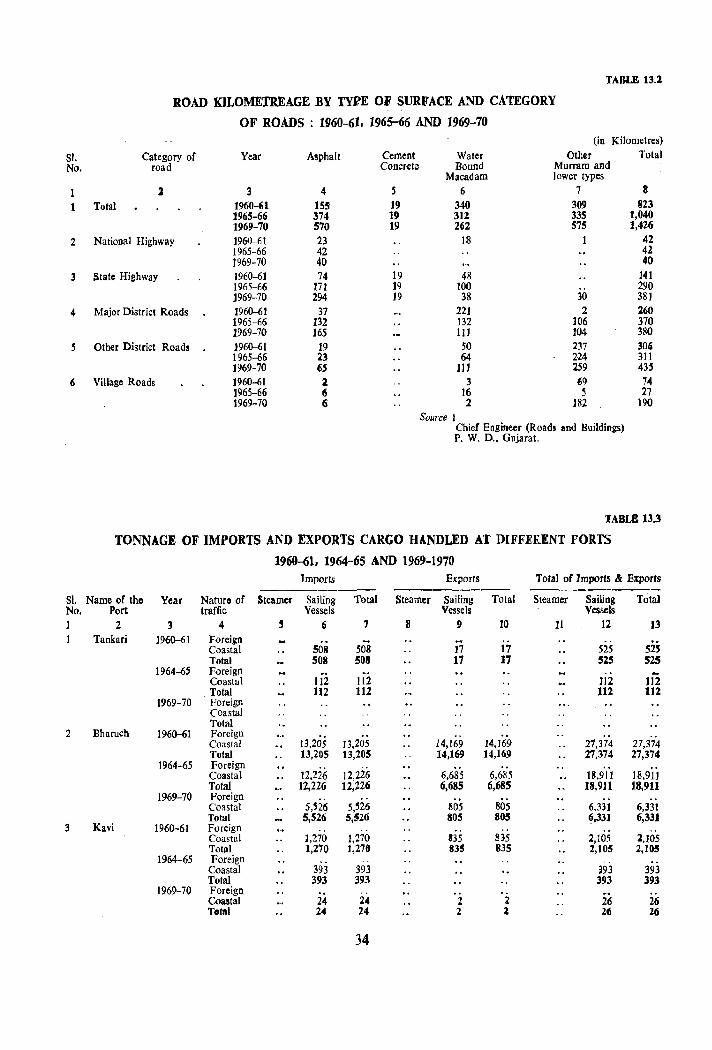
TABLE 13.1
ROAD KILOME'J'REAGE BY TYPE OF SURFACE AND CATEGORY
OF ROADS: 1960-61, 1965-66 AND 1969-70 (in Kilometres)
SI. Category of Year Asphalt Cement Water Other Total No. road Concrete Bound Murram aDd
Macadam lower types
1 3 4 5 6 7 8
1 Total 1960-61 ISS- 19 340 309 823 1965-66 374 19 31Z 335 1,040 1969-70 570 19 262 575 1,426
2 National Highway 1964)-61 23 18 42 1965-66 42 42 1969-70 40 40
3 State Highway 1960-61 74 19 48 141 1965-66 171 19 100 290 ]969-70 294 19 38 30 381
4 Major District Roads 1960-61 37 221 2 260 1965-66 132 132 ]06 370 1969-70 165 III 104 380
S Other District Roads J960-61 ]9 50 237 304 1965-66 23 64 224 311 1969-70 tiS ]J1 259 435
6 Village Roads 1960-61 2 3 {)9 74 1965-66 6 16 S 27 1969-70 6 2 182 190
Source I Chief Engineer (Roads and Buildings) P. W. D .• Gujarat.
TABLE 13.3
TONNAGE OF IMPORTS AND EXPORTS CARGO HANDLED AT DIFFERENT PORTS
1969-61, 1964-65 AND 1969-1970 Imports Exports Total of Imports & Exports
-------- -------- -----------SI. Name of the Year Naturo of Steamer Sailing Total Steamer Sailing Total Steamer Sailing Total No. Port traffic Vessels Vessels Vessels 1 2 3 4 , 6 7 8 9 ]0 11 12 13
Tankari 1960-61 Foreign Coastal S08 508 J7 17 S25 52S Total 508 508 17 17 525 525
1964-65 Foreign ... Coastal 112 112 112 112
. Total 112 112 112 112 1969-70 Foreign
Coastal Total
2 Bharuch 1960-61 Foreign 27,374 Coastal 13,205 13,205 14,169 14,169 27,374
Total 13,205 13,205 14,169 14,169 27,374 27,374 1964-65 Foreign
Coastal 12,226 12,226 6,685 6,685 18,911 18,911 Total 12,226 12,226 6,685 6,685 18,911 18,911
1969-70 Foreign Coastal 5,526 5,526 805 805 6,331 6,331 Total 5,526 5,S26 805 805 6,331 6,331
3 Kavi 1960-61 Foreign Coastal 1,270 1,270 835 835 2,105 2,105 Total 1,270 1,270 835 835 2,105 2,105
1964-65 Foreign .. Coastal 393 393 393 393 Total 393 393 393 393
1969-70 Foreign Coastal 24 24 2 2 26 26 Total 24 24 2 2 26 26
34
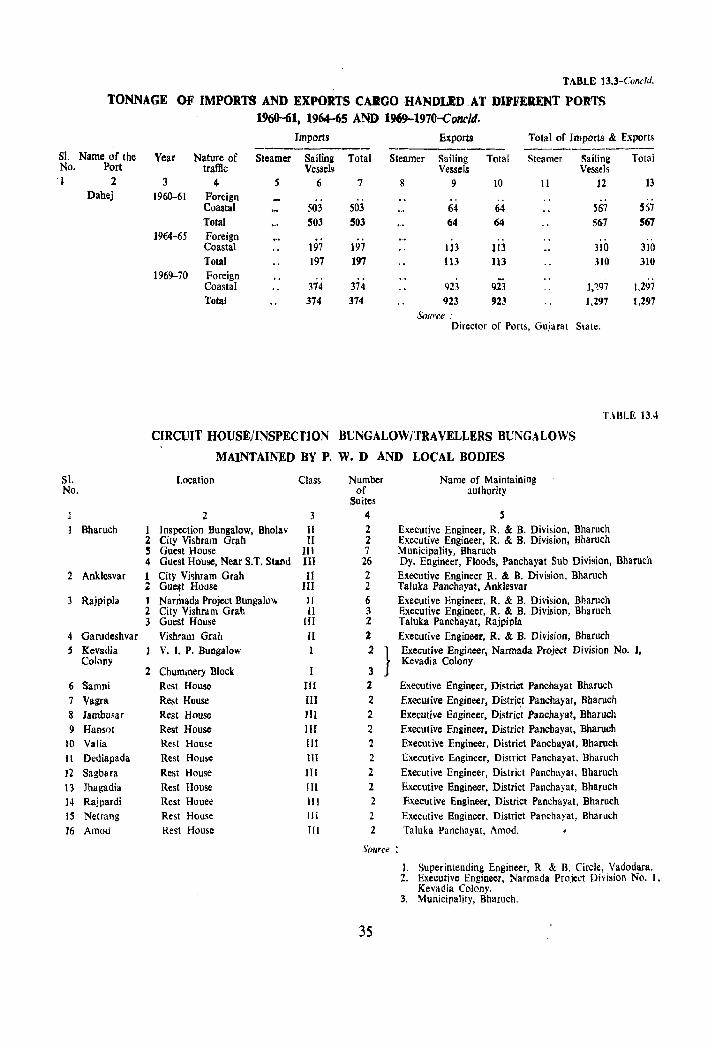
SI. No. 1
SI. No.
2
3
4 S
6
7 8 9
10 It 12 13 14 IS 16
TABLE 1l.3-Conc/d.
TONNAGE OF IMPORTS AND EXPOR.TS CARGO HANDLED .AT DIPFEltENT POlt'fS
Name of the Port
2 Dabej
Bharuch 1 2 ~ 4
Anklesvar 1 Z
Rajpipla 1 2 3
Garudeshvar Kevadia Colony
2 SarnDi Vagra Jambusar Hansot Valia Dediapada Sagbara Jhagadia Rajpardi Netrang Amod
1960-61, 1964-65 AND 1969-1970-Conc/d. Imports Exports Total of Imports & Exports
------------Year Nature of Steamer Sailing Total Steamer Sailing Total Steamer Sailing Total
traffic Vessels Vessels Vessels 3 4 5 6 7 8 9 10 II 12 13
1960-61 Foreign Coastal 503 503 64 64 567 S57 Total 503 503 64 64 567 567
1964-65 Foreign .. Coastal 197 191 113 JJ3 310 310 Total 197 197 113 113 310 310
1969-70 Foreign .. Coastal 374 374 923 923 1,197 t,297
Total 374 374 923 923 1,297 1,297
Sow'ce: Director of Ports, Gujarat State.
HBLE 13.-1
CIRCUIT HOUSE/INSPECTION BUNGALOW /TRA VELLERS BUNGALOWS
MAINTAINED BY P. W. D AND LOCAL BODIES
Location Class Number Name of Maintaining of authority
Suites 2 3 4 S
Inspection Bungalow, Bholav 11 2 Executive Engineer, R. & B. Division, Bharuch City Vishram Grah II 2 Executive Engineer, R. & B. Division. Bharuch Guest House III 7 Municipality, Bharuch Guest House, Near S.T. Stand III 26 Dy. Engineer, Floods, Panchayat Sub Division, Bharuch City Vi~hrarn Grab II 2 Executive Engineer R. & B. Division, Bharuch Gu~t House HI 2 Taluka Panchayat, Anklesvar Narmada Project Bungalow Jl 6 Executive Engineer, R. & B. Division, Bharucb City Vishrarn Grah II 3 Executive Engineer, R. & B. Division, Bharuch Guest House III 2 Taluka Panchayat, Rajpipla Vishram Grah II 2 Executive Engineer, R. & B. Division, Bharuch V. I. P. Bungalow 2 } Executive Engineer, Narmada Project Division No. J.
Kevadia Colony Chummery Block 3 Rest House III 2 Executive Engineer, District Panchayat Bharuch Rest House III 2 Executive Engineer, Distri~t Panchayat, Bharuch Rest House III 2 Executive Engineer, District Panchayat, Bharuch Rest House II[ 2 Executive Engineer, District Panchayat, Bharuch Rest House 111 2 Executive Engineer, District Panchayat, Bharuch Rest House 1Il 2 Executive Engineer, District Panchayat. Bharuch Rest House III 2 Executive Engineer, District Panchayat, Bharuch Rest House '" 2 Executive Engineer, District Panchayat, Bharuch Rest Hauee III 2 Executive Engineer, District Panchayat, Bharuch Rest Hause III 2 Executive Engineer, District Panchayat, Bharuch Rest House III 2 Taluka Panchayat, Amod.
,'l'ol/ree :
]. Superintending Engineer, R. & B. Circle, Vadodara. 2. Executive Engineer, Narmada Project Division No. I.
Kevadia Colony. 3. Municipality, Bhamch.
35
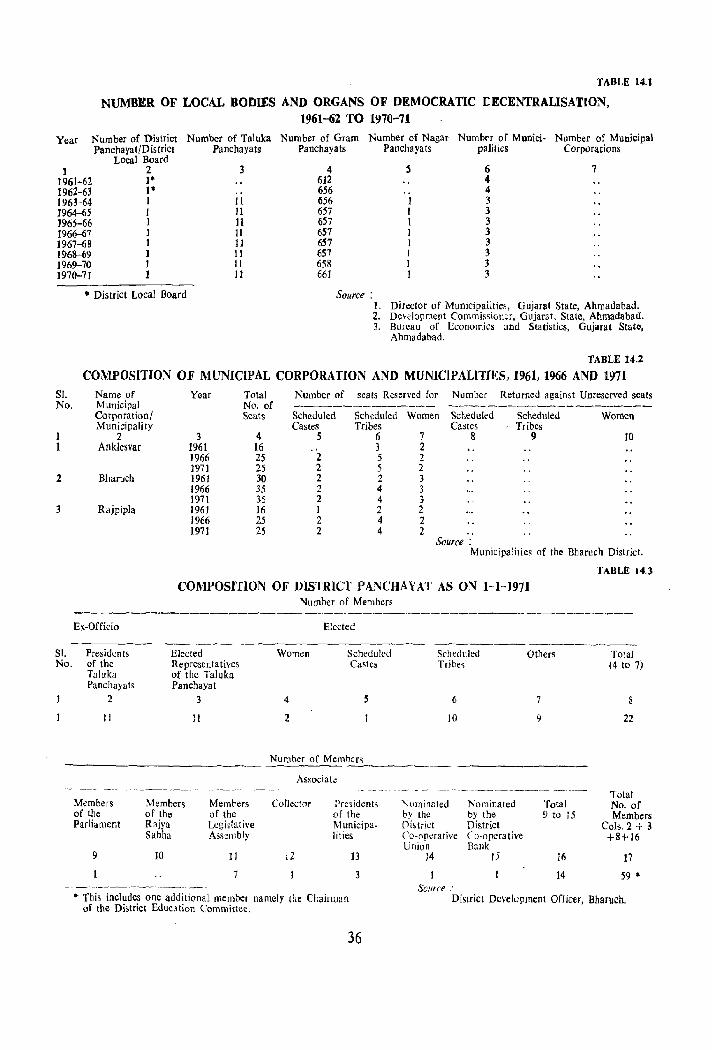
TABLE 14.1
NUMBER OF LOCAL BODIES AND ORGANS OF DEMOCRATIC [[CENTRALISATION, 1961-62 TO 1970-71
Year Number of District Number of Taluka Number of Gram Number of Nagar Numb('r of Munici- Number of Municipal Panchayat/District Panchayats Panchayats Panchayats palities Corporations
Local Board 1 2 3 4 S 6 7
1961-62 ]* 612 4 1962-63 1* 656 " 4 1963-64 1 II 656 1 3 1964-65 I 11 657 I 3 1965-66 I 11 657 1 3 1966-67 1 11 6S7 I 3 1967-68 1 11 6S7 I 3 1968-69 1 11 657 I 3 1969-70 J II 658 I 3 1970-71 1 11 661 1 3
• District Local Board Source: J. Dir.:ctor of Municipaiities, Gujarat State, Ahmadabad. 2. Development CommissiGner, Gujarat. State, Ahmadabad. 3. Bureau of Economics and Statistics, Gujarat State,
Ahmadabad.
TABLE 14.2
COMPOSITION OF MUNICIPAL CORPORATION AND MUNICIPALITIES, 1961, 1966 AND 1971
51. No.
2
3
Name of Municipal Corporation/ Municipality
2 Anklesvar
Bharucb
Rajpipla
E~-Officio
Year Total Number of seats Reserved for Number Returned against Unreserved seats No. of ------------_-- ---------------..------Seats Scheduled Scheduled Women Set.eduled Scheduled Women
Castes Tribes Castes Tribes 3 4 5 6 7 8 9 JO
1961 16 3 2 1966 25 2 5 2 1971 25 2 5 :2 1961 30 2 2 3 1966 35 2 4 3 1971 35 2 4 3 1961 16 I 2 2 1966 25 2 4 2 1971 25 2 4 2
SouTce : Municipalities of the Bharuch District.
TABLE 14.3
COMPOSITION OF DISTRICT PANCHAYAT AS O~ 1-1-1971 Number of Members
Elected
----------------"_--SI. Presidents Elected
Representatives of the Taluka Panchayat
Women Scheduled Castes
Schedukd Tribe~
Others TOlal 14 to 7) No. of the
Taluka Panchayats
2
II
3
II
- ~- -----. "._------- -.
Members Members of the of the Parliament Rajya
Sabha
I} 10
Meml:ers of the Legislative Ass~Jllbly
II
7
4
2
5
Number of Menlber~
Associak
Collector
12
Pre~idcnts of the Municipa. lities
13
• This includes one additional member namely the Chairman of the District EduclItion Committee.
36
6
10
Nominated by the l1i.trict Co-ooerative Unio'n
14
Scurce :
Nominated by the District Co-operative Bunk
15
7
9
Total 9 to 15
16
14
8
22
Total No. of Members
Cols.2 + 3 +8+16
17
59 •
District Dcvelopm~nt Officer, Bharuch.
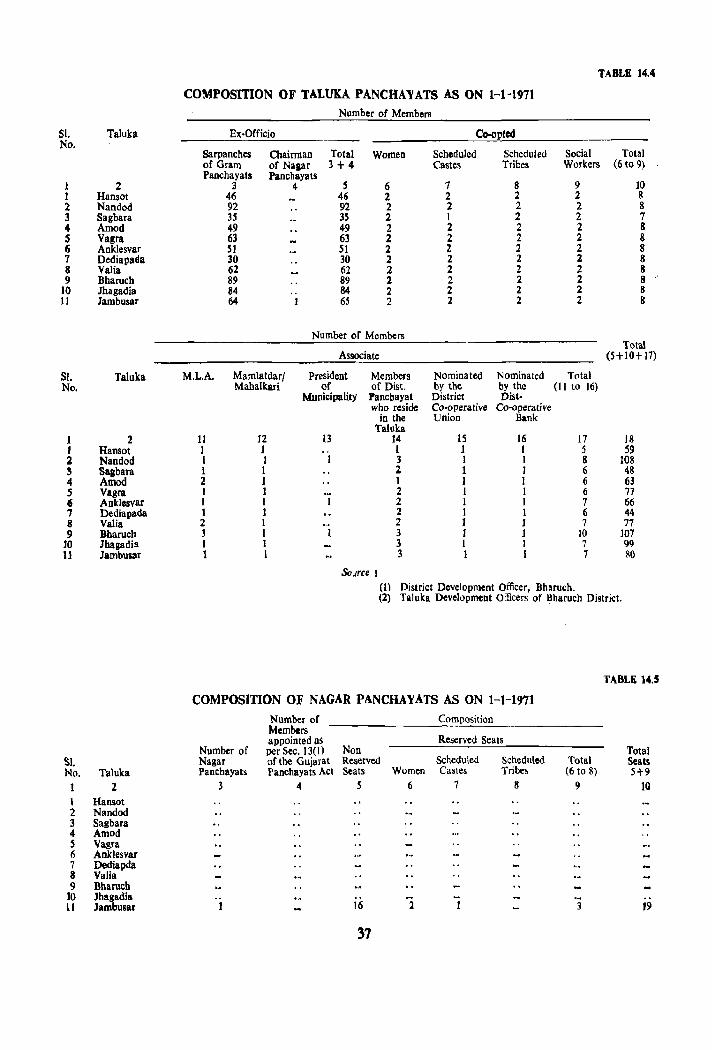
TABLE 14.4
COMPOSmON OF TALUKA PANCHAYATS AS ON 1-1-1971
Number of Members
51. Taluka Ex·Officio Co-opted No.
Sarpanches Chairman Total Women Scheduled Scheduled Social Total of Gram of Nalar 3+4 Castes Tribes Workers (6 to 9) Panchayats Panchayats
1 2 :3 4 S 6 7 8 9 10 1 Hansot 46 46 2 2 2 2 8 2 Nandod 92 92 2 2 2 2 8 3 Sagbara 3S 35 2 1 2 2 7 4 Amod 49 49 2 2 2 2 8 S Vagra 63 63 2 2 2 2 8 6 Anklesvar 51 51 2 2 2 2 8 7 Dediapaila 30 30 2 2 2 2 8 8 Valia 62 62 2 2 2 2 8 9 Bharucb 89 89 2 2 2 2 8
10 Jhagadia 84 84 2 2 2 2 8 11 lambusar 64 6S 2 2 2 2 8
Number of Members Total
Associate (5+10+17)
SI. Taluka M.L.A. Mamlatdar/ President Members Nominated Nominated Total No. Mabalkari of of Dist. by the by the (II to 16)
Municipality Panehayat District Dist· who reside Co-operative Co-operative
in the Union Bank Taluka
1 2 II 12 13 14 15 16 17 18 1 Hansot I 1 1 J I 5 59 2 Nandod 1 1 1 3 1 1 8 108 S Sasbara 1 I 2 1 1 6 48 4 Amod 2 1 I 1 I 6 63 5 Vagra I 1 2 I 1 6 77 6 Ankllsvar 1 1 2 1 1 7 66 7 Dediapada I 1 2 1 1 6 44 8 Valia 2 1 2 1 1 7 77 9 Bharueb 3 I J 3 1 J )0 107
10 Jhagadia I I 3 1 1 7 99 11 lambusar 1 1 3 1 1 7 110
SO.lrce I (I) District Development Officer, Bharuch. (2) Talulea Development Officers of Bharuch District.
TABLE 14.5
COMPOSITION OF NAGAR PANCHAyATS AS ON 1-1-1971
Number of Composition Members appointed as Reserved Seats
Number of per Sec. 13(1) Non Total SI. Nagar of the Gujarat Reserved Scheduled Scheduled Total Scats No. Taluka Panchayats Panchayats Act Seats Women Castes Tribes (6 to 8) 5+9
1 2 3 4 5 6 7 8 9 lQ
1 Hansat 2 Nandod 3 Sagbara 4 Amod S Vagra 6 Anklesvat 7 Dediapda 8 Valia 9 Bharuch
10 Jhagadia .. 11 lambusar 1 16 1 1 3 19
37
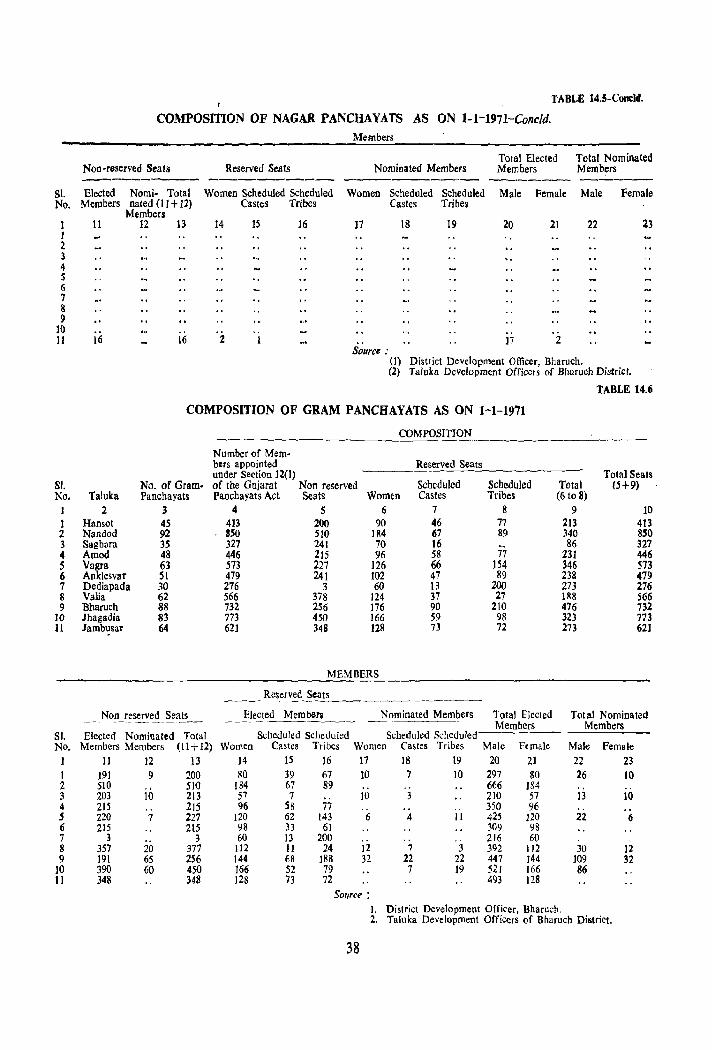
TABLE 14.S-Concld.
COMPOSITION OF NAGAR PANCHAYATS AS ON 1-1-1971-Conc/d. Members
Total Elected Total Nominated Non-reserved Seats Reserved Seats Nominated Members Members Members
51. Elected Nomi- Total No. Members nated (11+ 11)
Women Scheduled Scheduled Castes Tribes
Women Scheduled Scheduled Male Female Male Female Castes Tribes
1 1 2 3 4 S 6 7 8 I)
10 11
SI. No. 1 1 2 3 4 5 6 7 8 9
10 11
SI. No.
1 I 2 3 4 , 6 7 8 9
10 11
Members 11 12 13 14 15 16 17 18 19 20 21 22 23
.. " 16 16 2 1 17 2
SOllrce : (I) District Development Officer, Bharuch. (2) Taluka Development Officers of Bharuch District.
TABLE 14.6
COMPOSITION OF GRAM PANCHAYATS AS ON 1-1-1971
COMPOSITION
Number of Mem-bers appointed Reserved Seats under Section 12(1) Total Seats
No. of Gram- of the Gujarat Non reserved Scheduled Scheduled Total (5+9) Taluka Panchayats Panchayats Act Seats Women Castes Tribes (6 to 8)
2 3 4 S 6 7 8 9 10 Hansot 4S 413 200 90 46 77 213 413 Nandod 92 350 510 184 67 89 340 8'0 Sagbara 3S 327 241 70 16 86 327 Amod 48 446 215 96 58 77 231 446 Vagra 63 573 227 126 66 154 346 573 Anklesvar SI 479 241 102 47 89 m 479 Dediapada 30 276 3 60 13 200 273 276 Valia 62 566 378 124 31 27 lR8 566 Bharuch 88 732 2S6 176 90 210 476 732 Jhagadia 83 773 450 166 59 98 323 713 Jambusar 64 621 348 128 73 72 273 621
MEMBERS
Reserved Seats ------Non reserved Seats Elected Members Nominated Members Total Elected Total Nominated
Members Members Elected Nominated Total Scheduled Seheduled Scheduled Scheduled
Members Members (11+12) Women Castes Tribes Women Castes Tribes Male Female Male Female 11 12 13 14 15 16 17 18 19 20 2] 22 23
191 9 200 SO 39 67 10 7 10 297 80 26 10 510 510 184 67 89 .. 666 184 203 10 213 57 7 .. 10 3 210 57 13 10 215 .. 215 96 58 77 .. .. ., 350 96 220 7 227 120 62 143 6 4 II 42S 120 22 6 215 215 98 33 61 309 98
3 3 6() 13 200 .. 216 60 357 20 377 112 11 24 J2 7 3 392 I J2 30 12 191 65 256 144 68 lS8 32 22 22 447 144 109 32 390 60 450 166 52 79 7 19 521 166 86 348 348 128 73 72 493 128
SOllrce :
I. District Development Officer, Bharuch. 2. Taluka Development Officers of Bharuch District.
38
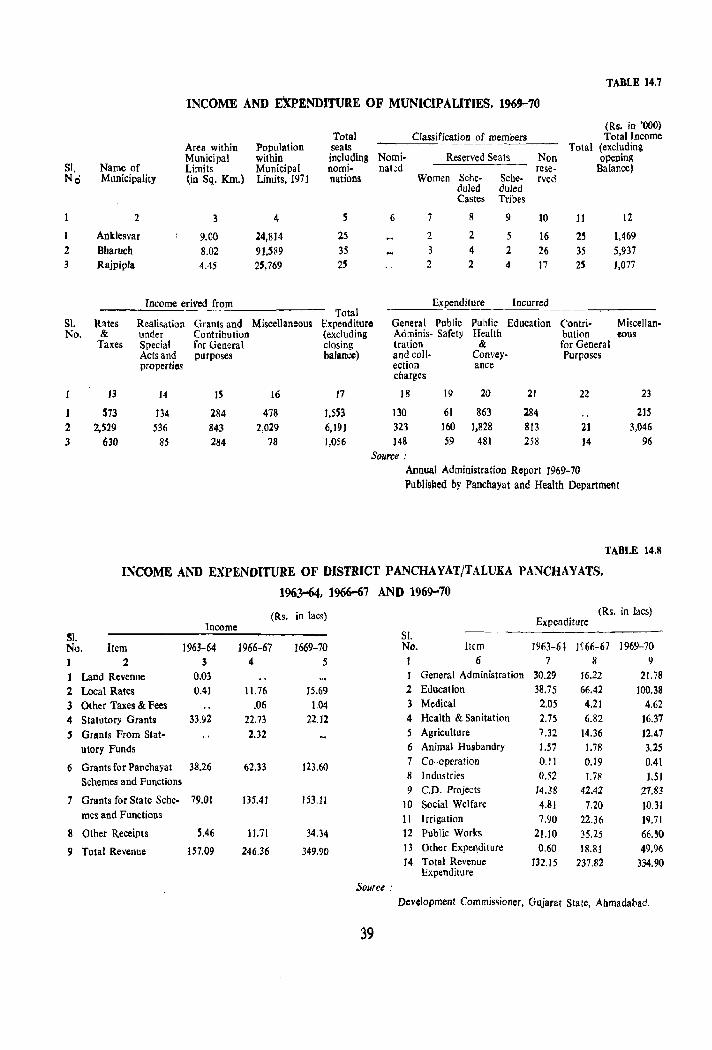
TABLE 14.7
INCOME AND EXPENDITURE OF MUNICIPALITIES, 1969-70
(Rs. in '000) Total Classification of members Total Jncome
Area within Population seats Total (excluding Municipal within including Nomi· Reserved Seats Non opening
SI. Name of Limits Municipal nomi· nat;d rese· Balance) No Municipality (in Sq. Km.) Limits, 1971 nations Women Sche· Sche· fYed
duled duled Castes Tribes
2 3 4 6 7 8 9 10 11 12
1 Anklesvar 9.00 24,814 25 2 2 5 ]6 2~ 1,469 2 Bbaruch 8.02 91,589 35 3 4 2 26 35 5,937 3 Rajpipla 4.45 25,769 25 2 2 4 17 2S 1,077
Income erived from Total
Expenditure Incurred
SI. Rates Realisation Grants and Miscellaneous Expenditure General Public Public Education ('ontri· Miscellan· No. & under Contribution (excluding Ad minis· Safety Health bution evus
Taxes Special for General closing tration & for General Acts and purposes balance) and coil· Convey· Purposes properties eetion
charges anee
13 14 IS 16 17 18 19 20 21 22 23
573 134 284 478 1,553 130 61 863 284 215 2 2,529 536 843 2,029 6,191 323 160 1,828 813 21 3,046 3 630 85 284 78 1,056 148 59 481 258 14 96
Source: Annual Administration Report 1969-70 Publisbed by Panchayat and Health Department
TABLE 14.8
INCOME AND EXPENDITURE OF DISTRICT PANCHAYAT/TALUKA PANCHAYATS,
1963-64, 1966-67 AND 1969-70
(Rs. in lacs) (Rs. in lacs) Income Expenditure
51. SI. No. Item 1963-64 1966-67 1669-70 No. It(m 1963-61- ]566-67 1969-70
1 2 3 4 5 I 6 7 8 9
1 Land Revenue 0.03 J General Administration 30.29 16.22 21.78
2 Local Rates 0.41 11.16 15.69 2 Education 38.15 66.42 100.38
3 Other Taxes & Fees .06 ].04 3 Medical 2.05 4.21 4.62
4 Statutory Grants 33.92 22.73 22.12 4 Health & Sanitation 2.75 6.82 16.37
5 Grants From Stat· 2.32 5 Agriculture 7.32 14.36 12.47
utory Funds 6 Animal Husbandry 1.57 1.711 3.25
6 Grants for PaDchayat 38.26 62.33 123.60 7 Co-operation 0.11 0.19 0.41
Schemes and Functions 8 Industries a.52 1.78 1.51 9 CD. Projects 14.38 42.42 27.8J
7 Grants for State Sehe· 79.01 135.41 153.11 10 Social Welfare 4.81 7.20 10.31 mes and Functions 11 Irrigation 7.90 22.36 19.71
8 Other Receipts 5.46 11.71 34.34 12 Public Works 21.10 35.25 66.~0
9 Total Revenue 1S7.09 246.36 349.90 13 Other Expenditure 0.60 18.8J 49.96 J4 Total Revenue 132.15 237.82 334.90
Expenditure Source:
Development Commissioner, Gujarat State, Ahmadabad.
39
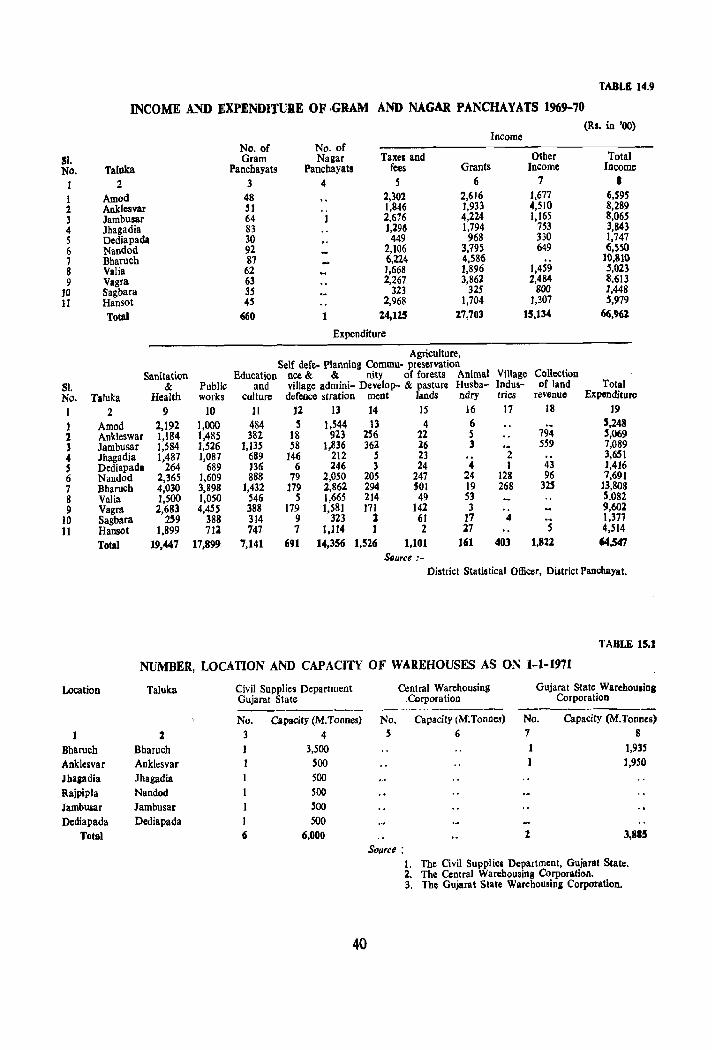
TABLE 14.9
INCOME AND EXPENDITUIE OF GRAM AND NAGAR PANCHAYATS 1969-70 (Rs. in '00)
Income No. of No. of
SI. Gram Nagar Taxes and Other Total No. Taluka Panchayats Pancbayats fees Grants Income Illcome
J 2 3 .. 5 6 7 I
1 Antod 48 2,~01 2,616 J,677 6,S9S 2 Anklcsvar 51 .. 1,846 1,933 4,510 8,289 3 Jambusar 64 I 2,676 4,224 1,165 8,065 .. Jhagadia 83 1,296 1,794 753 3,843 5 Dediapada 30 449 968 330 1,747 6 Nandod 92 2,106 3,795 649 6,550 1 Bharucb 81 6,224 4,586 ]0,810 8 Valia 62 1,668 1,896 1,459 5,023 9 Vagra 63 2,267 3,862 2,484 8.613
10 Sagbara 35 323 325 800 1,448 11 Hansot 45 2,968 1,704 J,307 5,919
Total 660 1 1.4,1Z5 1.7,703 15,134 66,961
Expenditure
Agriculture, Self defe- Planning Commu· preservation
Sanitation Education nee & & nity of forests Animal Village Collection 51. & Public and village admini- Develop- & pasture Husba- Indus- of land Total No. Taluka Health works culture defence slration ment lands ndry tries revenue Expenditure
1 2 9 10 11 12 U 14 15 16 11 18 19
1 Amod 1,192 1,000 484 5 1,544 13 4 6 ~. 5,248 1 Ankleswar 1,184 1,485 382 18 923 256 22 S 194 5,069 , Jamhusar 1,584 1,526 1,13S 58 1,836 361 26 3 .~ 559 7,089 4 Jhagadia 1,487 1,087 689 146 212 , 23 2 3,651 , Dediapada 264 689 136 6 246 3 24 .. I 43 J,4J6 6 Nandod 2,365 1,609 888 79 2,050 20S 247 24 128 96 7,691 7 Bharuch 4,030 3,898 1,432 179 2,862 294 SOl 19 268 32S 13,808 8 Valia 1,500 1,050 546 5 1,665 214 49 53 S,082 9 Vagra 2,683 4,455 388 179 1,581 171 142 3 9,602
10 Sagbara 259 388 314 9 323 1 61 17 4 1,371 11 Hansot 1,899 712 747 7 1,114 J 2 27 5 4,514
Total 19,447 17,899 7,141 691 14,356 1,526 1,101 161 403 1,822 64,547 &Juree ;-
District Statistical Officer, District Pancbayat.
TABLE 15.1
NUMBER, LOCATION AND CAPACITY OF WAREHOUSES AS ON 1-1-1971
Location Taluka Civil Supplies Department Central Warehousing Gujarat State Warehousing Gujara! State .Corporation Corporation ---------- ---------- -------No. Capacity (M.Toones) No. Capacity (M;Tonoes) No. Capacity (M.Toones)
l 3 4 5 6 7 8
Bharuch Bharuch I 3,500 1 1,935
Anklelvar Anklesvar 1 500 1,950
Ihaaadia Jhagadia 500 Rajpipla Nandod 500
lambusar Jambusar '00 Dcdiapada Dediapada I 500
Total 6 6,000 2 3,815 Source:
1. The Civil SUpplies Department, Gujarat State. 2. The Central Warehousing Corporation. 3. Tbe Gujarat State Warehousina Corporation.
40
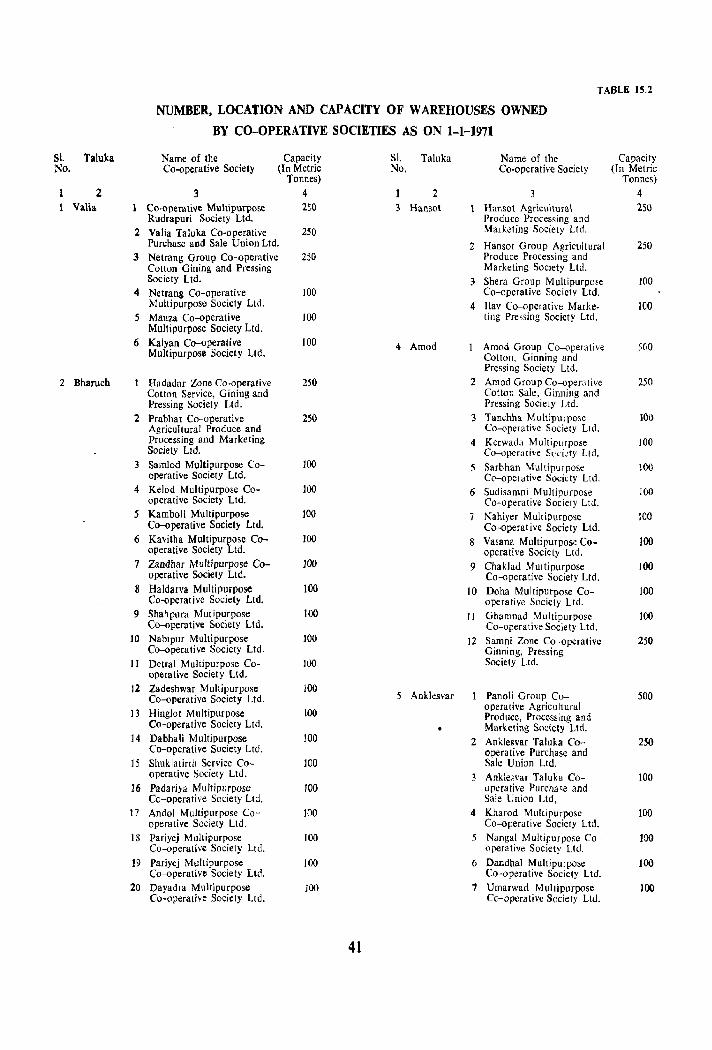
TABLE 15.2
NUMBER, LOCATION AND CAPACITY OF WAREHOUSES OWNED
BY CO-OPERATIVE SOCIETIES AS ON 1-1-1971
SI. Taluka Name of the Capacity SI. Taluka Name of the Capacity No. Co-operative Society (In Metric No. Co-operative Society (In Metric
Tonnes) Tonnes) 2 3 4 2 4
Valia Co-operative Multipurpose 250 3 Hansot Hansot Agricultural 250 Rudrapuri Society Ltd. Produce Processing and
2 Valia Taluka Co-operative 2S0 Marketing Society Ltd. Purchase and Sale Union Ltd. 2 Hansot Group Agricultural 250
3 Netrang Group Co-operiltive 250 Produce Processing and Cotton Gining and Pressing Marketing Society Ltd. Society Ltd. 3 Shera Group Multipurpose 100
4 Netrang Co-operative 100 Co-operative Soc iety Ltd. Multipurpose Society Ltd. 4 Hav Co-operative Marke- JOO
5 Mauza Co--operative 100 ting Pressing Society Ltd. Multipurpose Society Ltd.
6 Kalyan Co-operative 100 4 Amod Amod Group Co-operative 500 Multipurpose Society Ltd. Cotton, Ginning and
Pressing Society Ltd. 2 Bharuch Hadadar Zone Co-operative 250 2 Amod Group Co--operative 250
Cotton Service, Gining and Cotton Sale. Ginning and Pressing Society Ltd. Pressing Society Ltd.
2 Prabhat Co-operative 250 3 Tanchha MUltipurpose 100 Agricultural Produce and Co-operative Society Ltd. Processing and Marketing 4 Kcrwada Multipurpose 100 Society Ltd. Co--operative SC('i-:ly Ltd.
3 Samlod Multi[JUrpose Co- 100 5 Sarbhan MUltipurpose 1()() . operative Society Ltd. C('-operative Society Ltd,
4 Kelod Multipurpose Co- 100 6 Sudisamni Multipurpose 100 operative Society Ltd. Co-operative Society Ltd.
5 KamboH Multipurpose 100 7 Nahiyer Multipurpose 100 Co--operative Society Ltd. Co-operative Society Ltd.
6 Kavitha Multipurpose Co- 100 8 Vasana Multipurpose Co- 100 operative Society Ltd. operative Society Ltd.
7 Zandhar Multipurpose Co- 100 9 Chaklad Multipurpose 100 opera ti ve Society Ltd. Co--operative Society Ltd.
8 Haldarva Multipurpose 100 10 Doha Multipurpose Co- 100 Co-operative Society Ltd. operative Society Ltd.
9 Shahpura Mutipurpose 100 II Ghamnad Multipurpose 100 Co-operative Society Ltd. Co-operative Society Ltd.
10 Nabipur Multipurpose Co-operative Society Ltd.
100 12 Samni Zone Co-operative Ginning, Pressing
250
II Detral Multipurpose Co- 100 Society Ltd. operative Society Ltd.
12 Zadeshwar Multipurpose 100 5 Ankksvar Pano)i GrollP Co- 500 Co-operative Society Ltd.
operative Agricultural 13 Hinglot Multipurpose 100 Produce, Processing and
Co-operative Society Ltd. Marketing Society Ltd. 14 Dabhali Multipurpose 100 2 Ank!esvar Taluka Co- 250
Co-operative Society Ltd. operative Purchase and 15 Shuklatirth Service Co- 100 Sale Union Ltd,
operative Society Ltd. Anklesvar Taluka Co- 100 16 Padariya Multipurpose 100 operative Purcha,e and
Co-operative Society Ltd. Sale Union Ltd, 17 Andol Multipurpose Co- 100 4 Kharod Multipurpose 100
operative Society Ltd. Co--operative Society Ltd. 18 Pariyej Multipurpose 100 5 Nanga! MUltipurpose Co- 100
Co-operative Society Ltd. operative Society Ltd. 19 Pariyej Multipurpose 100 6 Dandhal Multipurpose 100
Co--operative Society Ltd. Co-operative Society Ltd. 20 Dayadra Multipurpose 100 7 Umarwad Multipurpose 100
Co-operative Society Ltd. Co-operative Society Ltd.
41
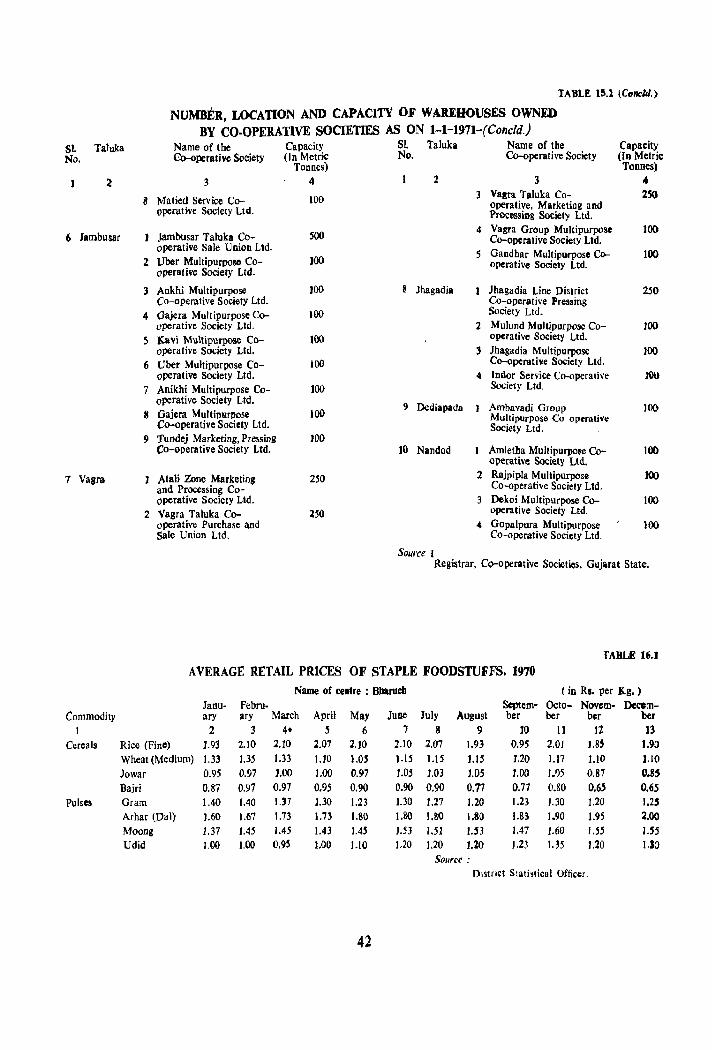
TABLE 15.1 tConeld.)
NUMBER, LOCATION AND CAPACI1'\' OF WAREHOUSES OWNED BY CO· OPERATIVE SOCIETIES AS ON 1-1-1971-(Concld.)
SI. Taluka Name of the Capacity SI. Taluka Name of the Capacity No. C<HIperative Society (In Metric No. Co-operative Society (In Metric
Tonnes) TODnes)
2 3 4 2 3 .. 8 Matied Service Co- 100 Vagra Taluka eo- 2S()
operative, Marketing and operative Society Ltd. Processing Society Ltd. , Jambusar Jambusar Taluka Co- SOO 4 Vagra Group Multipurpose ]00 Co-operative Society Ltd.
operative Sale Union Ltd. S Gandhar Multipurpose CI>- 100
2 Door Multipurpose Co- JOO operative Society Ltd. operative Society Ltd.
3 Ankhi Multipurpose 100 8 Jhagadia Jhagadia Line District 250 Co-operative Society Ltd. Co-operative Pressing
4 Oajera Multipurpose Co- 100 Society Ltd. operaHve Society Ltd. 2 Mulund Multipurpose Co- 100
5 Kavi Multipurpose Co- 100 operative Society Ltd. operative Society Ltd. 3 Jhagadia Multipurpose 100
6 Ober Multipurpose Co- 100 Co-operative Society Ltd. operative Society Ltd. 4 Indor Service Co-operative .HlO
7 Anikhi Multipurpose Co- 100 Society Ltd. operative Society Ltd.
9 Dediapada Ambavadi Group 100 S Oajera Multipurpose 100 Multipurpose Co-operative
Co-operative Society Ltd. Society Ltd. 9 fundej Marketing, Pressing 100
Co-operative Society ltd. 10 Nandod Amletha Multipurpo~ Co-operative Societ~ Ltd.
100
7 Vagra 1 Atali Zone Marketing 250 2 Rajpipla Mullipurpose JOO and Processing Co- Co-operative Society Ltd. operative Society Ltd. 3 Dekoi Multipurpose Co- 100
2 'Vagra Taluka Co- 250 operative Society Ltd. operative Purchase and 4 Gopalpura Multipurpose 100 Sale Union Ltd. Co-operative Society Ltd.
Source I Registrar, Co-operative Societies, GlIjarat State.
TABLE 16.1
AVERAGE RETAIL PRICES OF STAPLE FOODSTUFFS, 1970 Name of centre : Bbarueb ( in Rs. per Kg.)
Iaou- Febru· Septem· Octo- Novem· Dcc:e:n-Commodity ary ary March April May June July August ber ber ber ber
I 2 3 4· 5 6 7 8 9 to lJ 12 13 Cereals Rice (Fine) 1.93 2.10 2.10 2.07 2.10 2.10 2.07 1.93 0.95 2.0J US 1.90
Wheat (Medium) 1.33 1.35 1.33 1.10 1.05 ].15 1.15 1.15 1.20 I.l7 1.10 1.10 Jowar 0.9.5 0.97 1.00 1.00 0.97 1.0.5 1.03 1.05 1.00 1.0.5 0.87 0.85 Bajri 0.87 0.97 0.97 0.95 0.90 0.90 0.90 0.77 0.77 O.SO O.6S 0.65
Pulses Gram 1.40 1.40 1.37 ].30 1.23 ].30 1.27 ].20 1.23 1.30 ].20 1.25 Arhar (Dal) ].60 1.67 1.73 1.73 1.80 1.80 1.80 1.80 1.83 1.90 1.95 2.00 Moong 1.37 1.45 1.45 1.43 1.4.S 1.53 1.51 1.53 1.47 1.60 1.55 1.55 Udid 1.00 1.00 0.9S 1.00 1.10 1.20 1.20 1.20 1.23 1.35 ].20 ).S:>
Source .-District Slati~tical Om'CL
42

TA8LE 16.2
CONSUMER PRICE INDEX NUMBERS FOR INDUSTRIAL WORKERS AT AHMADABAD AND BHAVNAGAR
Centre I Ahmadabad Pan, Supari, Clothing, tobacco and Fuel and bedding and
Averaee for Year/Marth Food intoxicants lighting Housing footwear Miscellaneous General 1 2 3 4 5 6 7 8
1961 101 105 101 100 103 106 102 1962 103 109 104 101 108 109 104 1963 105 111 109 101 109 114 107 1964 124 112 112 J02 119 119 121 1965 I3S 118 120 104 120 126 129 1966 150 m ]26 106 120 138 140 1967 189 135 132 109 125 151 167 1968 180 148 140 JlO 130 159 165 1969 III 149 147 112 m 162 167 1970 189 159 152 114 148 172 17S
January 1970 181 JS7 IH 114 144 ]69 ]70 February 1970 182 157 152 114 144 169 170 March 1970 184 157 ISl 114 144 169 171 April 1970 187 IS' 152 114 145 170 174 May ]970 191 m 152 114 14' 171 176 JulIO 1970 193 158 150 114 145 174 177 July 1970 190 158 ISO m 146 172 175 Aueust 1970 188 1'7 ISO lJ.5 148 173 174 September 1970 192 160 m IlS ]48 176 177 October 1970 196 158 153 m lSI 177 181 November 1970 190 165 IS3 lIS U7 175 177 December 1970 190 165 154 lIS IS8 17' 177
&urce : Labour Bureau, Government of India, Simla.
TABLE 16.2-(Concld.)
CONSUMER PRICE INDEX NUMBERS FOR INDUSTRIAL WORKERS AT AHMADABAD AND BHAVNAGAR-(Concld.)
Centre I Dhavnagar Pan, Supari, Clothing, tobacco and Fuel and bedding and
Averaie (or Year/Month Food intoxicants lighting Housing footWear Miscellaneous General 1 2 3 4 S 6 7 a
1961 102 100 101 100 100 103 )02 1961 10.5 102 101 101 10] lOS J04 1963 lOS 118 104 103 101 108 lOS 1964 122 122 III 104 103 109 117 1965 142 124 123 103 109 117 132 1966 156 129 130 101 114 129 143 1967 188 140 144 110 142 159 171 1968 ]92 ISl 158 116 158 161 177 1969 191 148 153 120 165 159 176 1970 198 151 145 123 187 180 185
January 1970 196 149 151 122 174 171 182 Pebruary 1970 197 149 149 122 183 171 183 March 1970 199 149 150 122 18] 172 184 April 1970 199 ISO 146 122 184 178 18S May 1910 199 150 143 122 187 119 18S lune 1970 197 ISO 142 122 187 179 184 July 1970 199 150 140 124 189 179 18$ August 1970 202 150 142 124 190 . 181 188 September 1970 204 ISO 143 124 190 184 190 October 1970 200 150 144 124 192 185 188 November 1970 195 ISO 145 124 19' 18' 185 December 1970 193 168 146 124 195 189 185
Sour~ :
Labour Bureau, Governmtat of India, Simla.
43
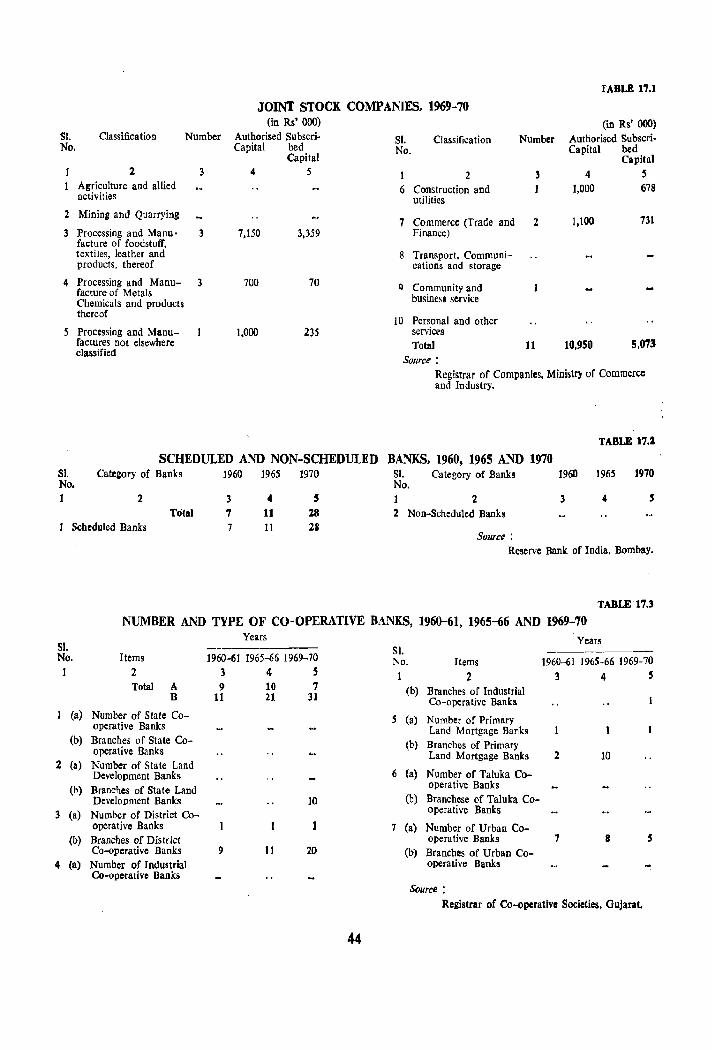
TABLE 1'7.1
JOINT STOCK COMPANIES, 1969-70 (in Rs' 000) (in Rs' OOO)
SI. Classification Number Authorised 5ubscri- 51. Classification Number Authorised Subscri-No. Capital bed No. Capital bed
Capital Capital 2 3 4 5 I 2 3 4 S
Agriculture and allied 6 Construction and 1,000 678 activities utilities
2 Mining and Quarrying 7 Commerce (Trade and 2 1,100 731
3 Processing and Manu· 3 1,150 3,359 Finance) facture of foodstuff, textiles, leather and 8 Transport, Communi-products, thereof cations and storage
4 Processing and Manu- 3 700 70 Q Community and facture of Metals Chemicals and products business service
thereof 10 Personal and other
5 Processing and Manu- 1,000 235 services factures not elsewhere Total 11 10,950 5,073-classified
Source: Registrar of Companies, Ministry of Commerce and Industry.
TABLE 17.2
SCHEDULED AND NON-SCHEDULED BANKS, 1960, 1965 AND 1970 51. Category of Banks 1960 1965 1970 No.
SI. Category of Banks 1960 1965 1970 No.
t 2 3 4 , 1 2 3 4 S To'tal 7 11 28 2 Non-Scheduled Banks
Scheduled Banks 7 11 2J Source:
Reserve Bank of India, Bombay.
TABLE '17.3
NUMBER AND TYPE OF CO-OPERATIVE BANKS, 1960-61, 1965-66 AND 1969-70 Years Years
SI. --------- SI. ---------No. Items 1960-61 1965-66 1969-70 No. Items 1960-61 1965-66 1969-70 1 2 3 4 5 1 2 3 4 S
Total A 9 10 7 (b) Branches of Industrial B 11 21 31 Co-operative Banks (a) Number of State Co- S (a) Number of Primary
operative Banks Land Mortgage Banks (b) Branches of State Co- (b) Branches of Primary
operative Banks Land Mortgage Banks 2 10 2 (a) Number of State Land
(a) Development Banks 6 Number of Taluka Co-
(b) Branches of State Land operative Banks
DeveloDment Banks 10 (b) Branchese of Taluka Co-
3 (a) Number of District Co- operative Banks
operative Banks 7 (a) Number of Urban eo-(b) Branches of Dis trict operative Banks 7 8 S
Co-operative Banks 9 11 20 (b) Branches of Urban Co-4 (a) Number of Industrial operative Banks
Co-operative Banks Source:
Registrar of Co-operativo Societies, Gujarat.
44
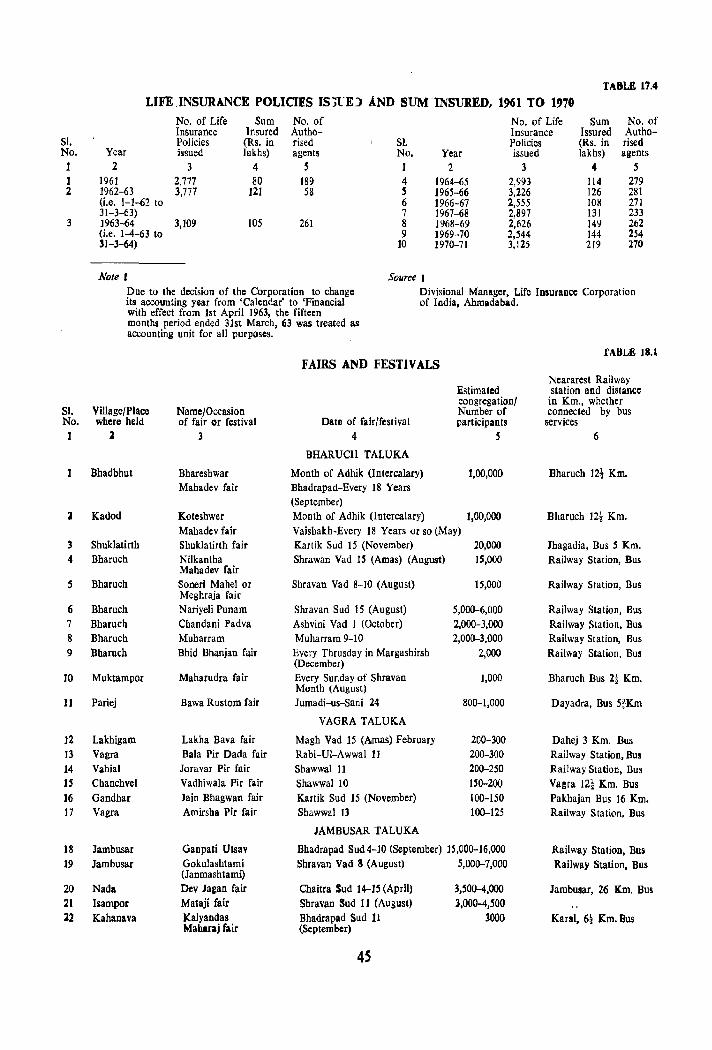
SI. No. 1 1 2
3
81. No. 1
l
3 4
5
6 7 8 9
10
IJ
12 13 14 15 16 17
18 19
20 21 22
TABLE 17.4
LIFE INSURANCE POLICIES IS]l"E.) AND SUM INSURED, 1961 TO 1978
No. of Life Sum No. of No. of Life Sum No. of Insurance Insured Autho- Insurance Issured Autho-Policies (Rs. in rised SI. Policies (Rs. in rised
Year issued Jakhs) agents No. Year issued lakhs) agents 2 3 4 S J 2 3 4 5
1961 2,777 80 189 4 1964-65 2,993 114 279 1962-63 3,771 121 58 S 1965-66 3,226 126 281 (i.e. 1-1-62 to 6 1966-67 2,555 108 271 31-3-63) 7 1967-68 2,897 131 233 ]963-64 3,109 105 261 8 1968-69 2,626 149 262 (i.e. 1-4-63 to 9 1969-70 2,544 144 254 31-3-64) 10 1970-71 3,l25 219 270
Note r Source I Due to the decision of the Corporation to change Divisional Manager, Life Insurance Corporation its accounting year from 'Calendar' to 'Financial of India, Ahmadabad. with effect from 1st April 1963, the fifteen months period ended 31st March, 63 was treated as accounting unit for all purposes.
Village/Place Name/Occasion where held of fair or festival
l 3
Bhadbhut Bhareshwar Mahadev fair
Kadod Koteshwer Mahadev fair
Shuklatirth Shuklatirth fair Bharuch Nilkantha
Mahadev fair Bharuch Soneri Mahel or
Meghraja fair Bharuch N ariyeli Punam Bharuch Chand ani Padva Bharuch Mubarram Bharuch Bhid Bhanjan fair
Muktampor Maharudra fair
Pariej Bawa Rustom fair
Lakhigam Lakba Bava fair Vagra Bala Pir Dada fair Vahial Jora var Pir fair Chanchvel Vadhiwala Pir fair Gandhar Jain Bhagwan fair Vagra Amirsha Pir fair
Jambusar Ganpati Ulsav Jambusar Gokulashtami
(Janmasbtami) Nada Dev lagan fair Isampor Mataji fair Kahaniva Kalyandas
Maharaj fair
F'AIRS AND FEST! V ALS
Date of fair/festival 4
BHARUCH TALUKA
Month of Adhik (Intercalary) Bhadrapad-Evety 18 Years (September)
Estimated congregation/ Number of participants
5
1,00,000
Month of Adhik (Intercalary) Vaisbakh-Every 18 Years or so (May) Kartik Sud 15 (November)
1,00,000
20,000 IS,OOO Shrawan Vad IS (Amas) (August)
Sbravan Vad 8-10 (August) 15,000
Shravan Sud 15 (August) 5,000-6,000 Ashvini Vad 1 (October) 2,000-3,000 Muharram 9-10 2,000-3.000 Every Thrusday in Margashirsh 2,000 (December) Every Sunday of Sbravan 1,000 Month (August) Iumadi-us-Sani 24 800-1,000
VAGRA TALUKA
Magh Vad 15 (Amas) February 200-300 Rabi-UI-Awwal 11 200-300 Shawwal 11 200-250 Shawwal 10 IS0-200 Kartik Sud 15 (November) 100-150 Shawwal 13 100-125
JAMBUSAR TALUKA
Bhadrapad Sud 4-10 (September) lS,OOO-J6,ooO Shravan Vad 8 (August) 5,000-7,000
Chaitra Sud 14-15 (April) Shravan Sud 1J (August) Bhadrapad Sud 11 (September)
45
3,500-4,000 3,000-4,500
3000
TABLE 1S.1
Neararest Railway station and distance in Km., whether connected by bus
services 6
Bharuch 121 Km.
Bharuch 12~ Km.
Jhagadia, Bus 5 Km. Railway Station, Bus
Railway Station, Bus
Railway Station, Bus Railway Station, Bus Railway Station, Bus Railway Station, Bus
Bbarucb Bus 2~ Km.
Dayadra, Bus 5tKm
Dahej 3 Km. Bus Railway Station, Bus Railway Station, Bus Vagra l2~ Km. Bus Pakhajan Bus 16 Km. Railway Station. Bus
Railway Station, Bus Railway Station, Bus
Jambusar, 26 Km. Bus
Karal, 6! Km. Bus
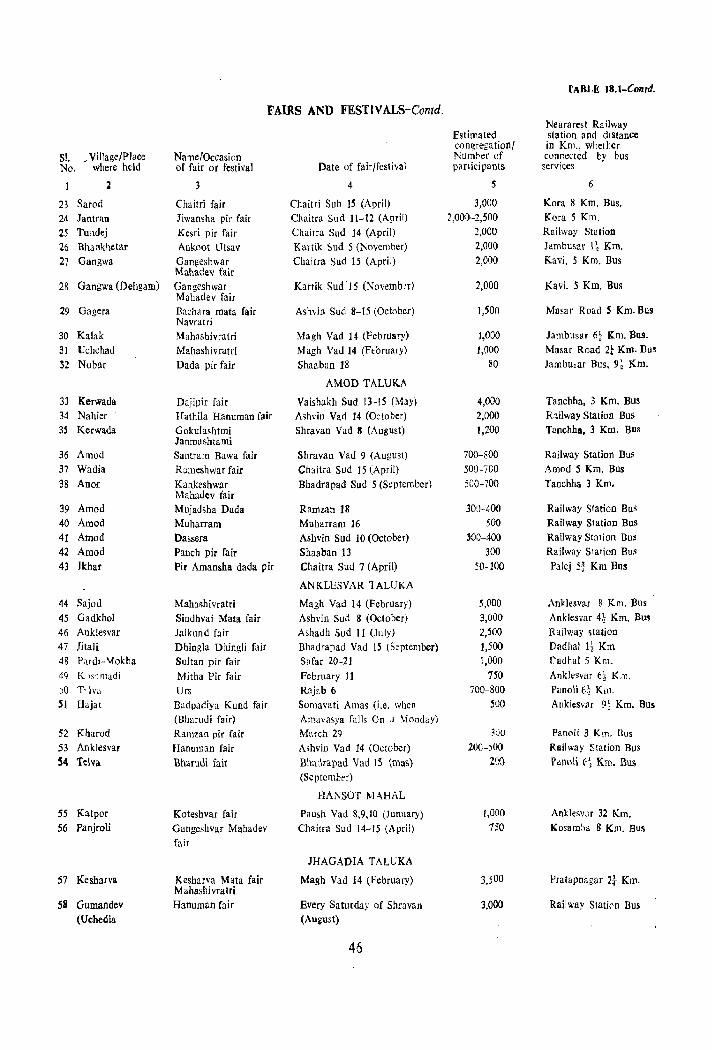
TABLE 18.1-Contd.
FAIRS AND FESTIVALS-Contd. Neararest Ra ilway
Estimated station and distance congregationl in Krn., whether
SI. _ Village/Place Name/Occasion Number of connected by bus No. where held of fair or festival Date of fair/festival panicipants services
:2 3 4 S 6
23 Sarod Chaitri fair Chaitri Sub 15 (April) 3,000 Kora 8 Km. Bus.
24 Jantran Jiwansha pir fair Chaitra Sud 11-12 (April) 2,000-2,500 Kora 5 Km.
25 Tundej Kesri pir fair Chaitra Sud 14 (April) 2,000 Railway Station
26 Bhankhetar Ankoot Utsav Kartik Sud 5 (November) 2,000 Jarnbusar I! Km.
27 Gangwa Gangeshwar Chaitra Sud 15 (April) 2,000 Kavi, 5 Krn. Bus Mahadev fair
28 Gangwa (Dehgam) Gangeshwar Karlik Sud 15 (Novemb:r) 2,000 Kavi. 5 Km. Bus Mahadev fair
29 Gagera Bachara mata fair Ashvin Sud 8-15 (October) 1,500 Masar Road 5 Km. Bus Navratri
30 Kalak Mahashivratri Magh Vad If (February) 1,000 Jambusar 6t Km. Bus.
31 Uchchad Mahashivratri Magh Vad 14 (February) 1,000 Masar Road 2t Km. Bus
S2 Nobar Dada pir fair Shaaban 18 80 Jambu,ar Bus. 9!- l{m.
AMOD TALUKA
33 Kerwada Dajipir fair Vaishakh Sud 13-IS (May) 4,000 Tanchha, J Km. Bus 34 Nahier Hathila Hanuman fair Ashvin Vad 14 (October) 2,000 R-:ilway Station Bus 35 Kerwada Gokulashtmi Shravan Vad II (August) 1,200 Tnnchha. 3 Km. Blls
Janmashtami 36 Amod Santrarn Bawa fair Shravan Vad 9 (August) 700-800 Railway Station Bus 37 Wadia Rameshwar fair Cbaitra Sud 15 (April) 500-700 Amod :5 Km. Bus
38 Anor Kankeshwar Bhadrapad Sud 5 (S~ptember) 500-700 Tanchha 3 Km. Mahadev fair
39 Amod Mujadsha Dada Ramzan 18 300-400 Railway Station Bus 40 Amod Muharram Muharram 16 500 Railway Station Bus
41 Amod Dassera Ashvin Sud 10 (October) 300-400 Railway Station Bus
42 Amod Panch pir fair Shaaban 13 300 Railway Station Bus
43 Ikhar Pir Amansha dada pir Chaitra Sud 7 (April) 50-100 Palej 5~ Km Bus
ANKLESYAR TALUKA
44 Sajod Mahashi vratri Magh Vad 14 (February) 5,000 Anklesvar 8 Km. Bus
45 Gadkhol Sindhvai Mata fair Ashvin Sud 8 (October) 3,000 Anklesvar 4~ Km. Bus
46 Anklesvar Jalkund fair Ashadh Sud 11 (July) 2,500 Railway station 47 Iitali Dhingla Dhingli fair Bhadrapad Vad 15 (September) 1,500 Dadhal Ii Km 48 Pardl-Mokha Sultan pir fair Safar 20-21 1,000 Cadl-.al 5 Km.
49 K'S"111adi Mitha Pir fair February 11 750 AnkJesvar 6~ K ,no SO T'lva Urs Raj:tb 6 700-800 P~Doli 6} Km. 51 Haja! Badpadiya Kund fair Somavati Amas (i.e, when 500 AnklesvJr 9: Km. Bus
(Bharudi fair) Amavasya falls On a Monday) 52 Kharod Ramzan pir fair March 29 30() Panoli 3 Km. Bus
53 Anklesvar Hanllman fair Ashvin Vad 14 (October) 200-,00 Railway Station Bus
54 '[elva Bharudi fair BhaJrapad Vad 15 (ma,) 2'J{I Paooli (,~ Km. Bus (September)
HANSOT l\l AHAL
55 Katpor Koteshvar fair Pau;h Vad 8,9,10 (Junuary) 1,000 Anklesv.lr 32 Km. 56 Panjroli Gangeshvar Mahadev Chaitra Sud 14-15 (April) 750 Kosam::,a 8 Km. Bus
fair
JHAGADIA TALUKA
57 ICesharva Kesharva Mata fair Magh Vad 14 (February) 3,500 Pratapnagar 2t Km. Mahasbivratri
58 Gumandev Hanuman fair Every Saturday of Shravan 3.000 Rail"'ay Statkn Bus (Uchedia (August)
46
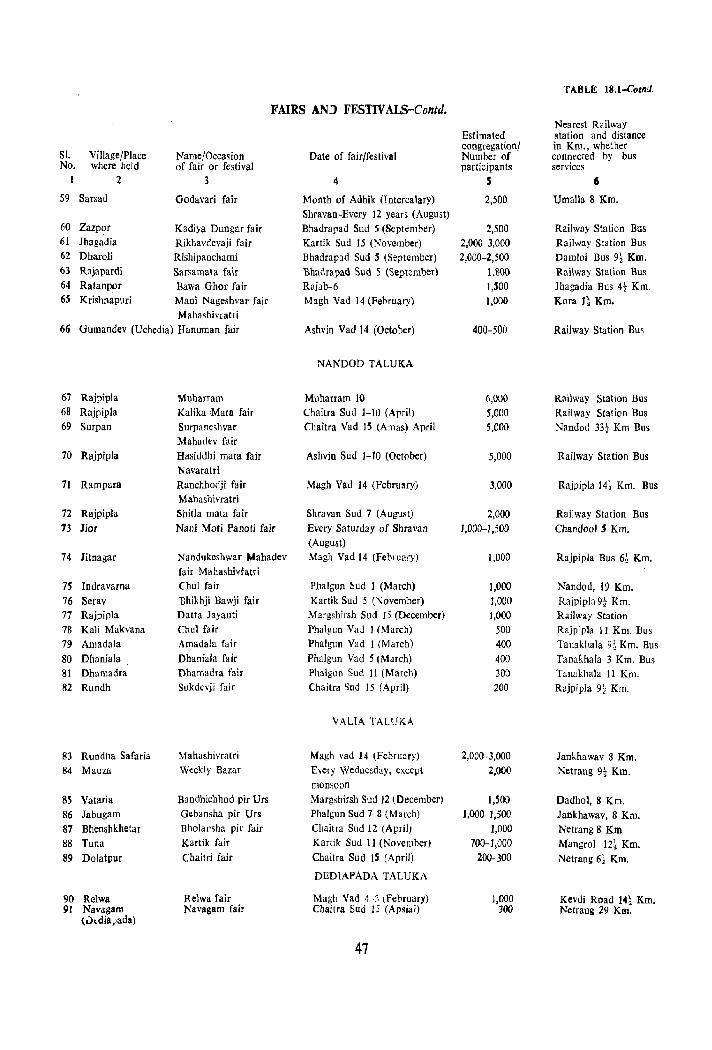
TA8LE lS.1-CQlnd.
FAIRS AN] FESTIV ALS-Contd. Nearest Railway
Estimated station and distance congregation/ in Km., whether
S1. Village/Place Name/Occasion Date of fair/festival Number of connected by bus No. where held of fair or festival participants services
1 2 3 4 5 6
59 Sarsad Godavari fair Month of Adhik (Intercalary) 2,500 Umalla 8 Km. Shravan-Every 12 years (August)
60 Zazpor Kadiya Dungar fair Bhadrapad Sud 5 (September) 2,500 Railway Station Bus 61 Jhagadia Rikhavdevaji fair Karlik Sud 15 (November) 2,000-3,000 Railway S~ation Bus 62 Dharoli Rishipanchami Bhadrapad Sud 5 (September) 2,000-2,500 Damloi Bus 9! Km. 63 Rajapardi Sarsamal a fair Bhadrapad Sud 5 (Sept~m"er) 1,800 Railway Station Bus 64 Ratanpor Bawa Ghor fair Rajab-6 I,SOO Jhagadia Bus 41 Km. 6S Krishnapuri Mani Nageshvar fair Magh Vad 14 (February) 1,000 Kora H Km.
M ahashivratri 66 Gumandev (Uchedial Hanuman fair Ashvin Vad 14 (October) 400-500 Railway Station Bus
NANDOD TALUKA
67 Rajpipla Muharram Muharram 10 6,000 Railway Station Bus 68 Rajpipla Kalika Mata fair Chaitra Sud 1-10 (April) 5,000 Railway Station Bus 69 Surpan Surpaneshvar Chaitra Vad IS (knas) April 5,000 Nandod 33~ Km Bus
Mahadev fair 70 Rajpipla Hasiddhi mala fair Ashvin Sud 1-10 (October) 5,000 Railway Station Bus
Navaratri 71 Rampara Ranchhodji fair Magh Vad 14 (February) 3,000 Rajpipla 14t Km. Bus
Mahashivratri n Rajpipla Shilla mata fair Shravan Sud 7 (August) 2,000 Railway Station Bus 73 Jiar Nalli Moti Panoti fair Every Saturday of Shra van 1,000-1,500 Chandaol j Km.
(August) 74 Jitnagar Nandukeshwar Mahadev Magh Vad 14 (February) 1,000 Rajpipla Bus 6~ Km.
fair Mahashivfatri 75 Indravarna (hul fair Phalgun Sud 1 (March) 1,000 Nandod, 19 Km. 76 Serav Bhikhji Bawji fair Karlik Sud 5 (November) 1,000 Rajpipla 9} Km. 77 Rajpipla Datta Jayanli Margshirsh Sud 15 (December) 1,000 Railway Station 78 Kali Makvana Chul fair Phalgua Vad 1 (March) 500 Rajp;pla 11 Km. Bus 79 Amadala Amadala fair Phalgun Vad 1 (March) 400 Tanakhala n Km. Bus 80 Dhaniala Dhaniala fair Phalgun Vad 5 (March) 400 Tanakhala 3 Km. Bus 81 Dhamadra Dhamadra fair Phalgun Sud 11 (March) 300 Tanakhala 11 Km. 82 Rundh Sukdevji fair Chaitra Sud 15 (April) 200 Rajpipla 9~ Km.
VALlA TALUKA
83 Rundha Safaria M ahashivratri Magh vad 14 (February) 2,000-3,000 ]ankhawav 8 Km. 84 Mauza Weekly Bazar Every Wednesday, except 2,000 Netrang 9~ Km.
monsoon 85 Vataria Bandhichhod pir Urs Margshirsh Sutll2 (December) 1,500 Dadhol, 8 Km. 86 Jabugam Gebansha pir Urs Phalgun Sud 7-8 (March) 1,000-1,500 Jankhawav, 8 Km. 87 Bhenshkhetar Bholansha pir fair Chaitra Sud 12 (April) 1,000 Netrang 8 Km 88 Tuna Kartik fair Kartik Sud 11 (November) 700-1,000 Mangrol mKm. 89 Dolatllur Chailri fair Chailra Sud 15 (April) 200-300 Netrang 61 Km.
DEDlAPADA TALUKA
90 Relwa Relwa fair Magh Vad 4·<, (February) 1,000 Kevdi Road 14~ Km. 91 Navagam J'\avagam fair Chaitra Sud J5 (Apsial) 300 Netraog 29 Km.
\":kdia"ada)
47
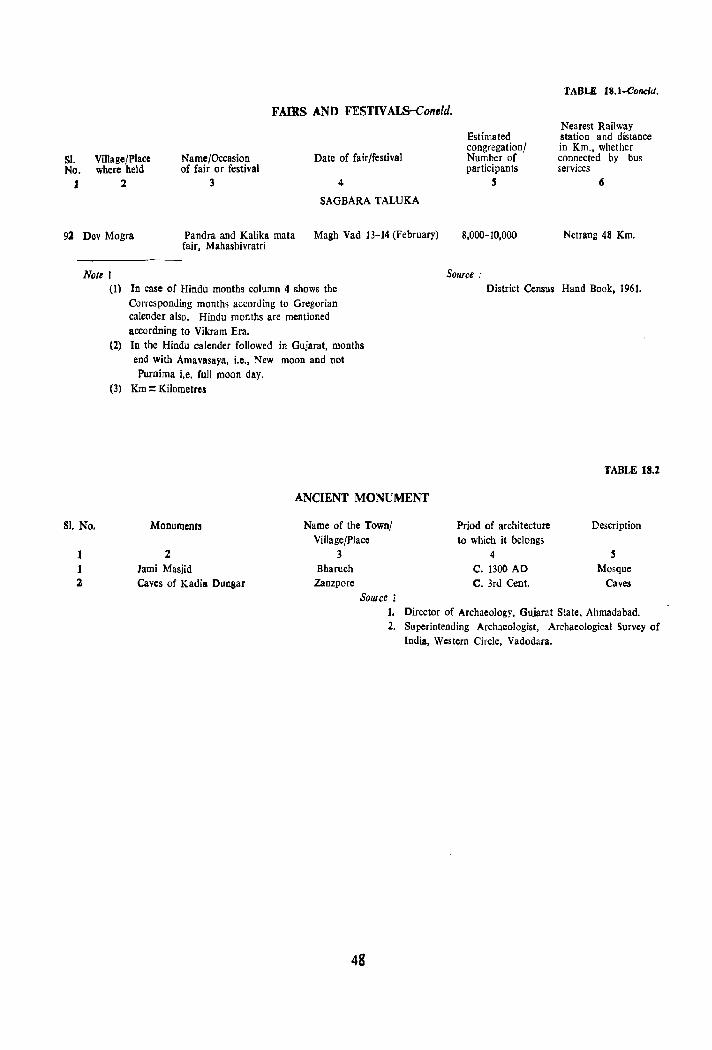
tABLE 18.1-Concld.
FAIRS AND FESTIV ALS-Con,[d.
SI. Village/Place Name/Occasion of fair or festival
Date of fair/festival No. where held
1 2 3 4
SAGBARA TALUKA
92 Dev Mogra Pandra and Kalika mata Magh Vad 13-14 (February) fair, Mahashivratri
Note I
81. No.
1 1 2
(I) In case of Hindu months column 4 shows the Corresponding months according to Gregorian calender also. Hindu months are mentioned accordning to Vikram Era.
(2) In the Hindu calender followed in Gujarat, months end with Amavasaya, i.e., New moon and not Puroima i.e. full moon day.
(3) Km::: Kilometres
Monuments
2 Jami Masjid Caves of Kadia Dungar
ANCIENT MONUMENT
Name of the Town! Village/Place
3 Bharuch
Zanzpore Source i
Estimated congregation/ Number of participants
S
8,000-10,000
Source:
Nearest Railway station and distance in Km., whether connected by bus services
6
Netrang 48 Km.
District Census Hand Book, 1961.
Priod of architecture to which it belongs
4 C. 1300 AD C. 3rd Cent.
TABLE 18.2
Description
S Mosque
Caves
1. Director of Archaeology. Guiarat State, Ahmadabad.
48
2. Superintending Archaeologist, Archaeological Survey of India, Western Circle, Vadodara.

SECTION II
CENSUS TABLES (BASED ON FULL COUNT)

INTRODUCTORY NOTE TO CENSUS TABLES
Though for the first time in the Census history considerable part of the 1971 Census data has been processed on electronic computer, the manual sorting could not be altogether avoided. For the purpose of providing the primary census data and the data on mother tongue, religion and scheduled castes and scheduled tribes and broad age-groups the Individual Slips were processed manually during 1971 Census at the Regional Tabulation Offices as was being done at the previous censuses. The data pertaining to 20 per cent of the Urban Individual Slips was trans
ferred on to punch cards and thence to magnetic tape and all the cross-tabulation for the urban data is bemg generated by processing it on electronic computer. The cross-tabulation of the rural data is being derived from 10 per cent sample of the Individual Slips which were processed manually. The tabulation of the Houselist data was also processed on 20 per cent sample basis. The establishment schedules were processed on full count basis. The data relating to the housing and establishments has been processed on electronic comput~r.
Thus, the 1971 Census was a pioneer in the introduction of sampling procedures to a considerable extent. Careful studies were made of the 1961 schedules as also the 1971 pre-test schedules before evolving the optimum sampling size and the procedures so as to yield data within reasonable margin of error.
It was decided to prepare a numb~r of tables under the following series :-
A-Series General Population Tables
B-Series Economic Tables
C-Series Social and Cultural Tables
D-Series Migration Tables
E-Series Establishment Tables
F-Series Fertility Tables
G-Series Special Tables for Degree Holders and Technical Personnel
51
H-Series Housing Tables
It has been decided to publish the following tables based on full count in the present volume.
A-SERIES GENERAL POPULATION TABLES
A-I
Appendix I to Table A-I
Annexure to Appendix I
Appendix II to Table A-I
Appendix III
Area, Houses and PopUlation
Statement showing 1961 Territorial Units constituting the present set up of the District
Particulars of villages involved in changes of territories included in Cols. 3 and 6 of Appendix I
Number of villages with popUlation of 5,000 and over and towns with a population under 5,000
to Table A-I Houseless and Institutional Population
A-II
Appendix to Table A-ll
A-Ill
Appendix to Table A-III
Decadal Variation in Population since 190r
District showing 1961 popUlation according to their territorial jurisdiction in 1961, changes in area and popUlation of 1961 adjusted to jurisdiction of 1971
Villages classified by Population
Statement showing the sub-totals of the groups of villages with a popUlation (I) less than 500, (2) 500-1,999, (3) 2,000-4)999 and (4) 5;000 and above at district level
A-IV
Appendix I to Table A-IV
Towns and Urban Agglomerations classified by Population in 1971 with variation since 1901
New Towns added in 1971 and Towns in 1961 declassified in 1971
Appendix I-List A to Table A-IV List of places with a population
under 5,000 treated as towns for the first time in 1971
Appendix I-List B to Table A-IV List of places with a population
under 5,000 in 1961 which were treated as towns in 1961 but have been omitted from the list of towns in 1971
Appendix II to Table A-IV Changes in area of towns (with
popUlation) between 1961 and 1971 and reasons for change in area
Special Appendix to Table A-IV Statement showing the constituent
villages of each of the tow'ns at the 1971 Census
B-SERIES ECONOMIC TABLES
B-1 Payt-A
B-I1
Workers and non-workers according to main activity classified by sex and age-groups
Workers and non-workers in cities and non-city urban areas according to main activity classified by sex and age-groups
C-SERIES SOCIAL AND CULTURAL TABLES
c-V
c-vn
C VIII Part-A
Mother Tongue
Religion
Classification by literacy and industrial category of workers and non-workers according to main activity among Scheduled Castes
52
Appendix to Table C-VIII Part-A Scheduled Castes classified by lite
rates and illiterates
C-VUl Part-B Classification by literacy and indus
trial category of workers and nonworkers according to main activity among Scheduled Tribes
Appendix to Table C-VIII Part-8 Scheduled Tribes classified by lite
rates and illiterates
E-SERIES ESTABLISHMENT TABLES
E-I Distribution of Establishments by Broad Types
E-II Part-A Distribution of Manufacturing, Processing or Servicing Establishments other than Household Industries classified by Re'gistered Factories, Unregistered Workshops and Size of Employment
E-U Part-B Distribution of Manufacturing, Processing or Servicing Establishments other than Household Industries classified by Industry, Fuel/Povicr or Manual used and Size of Employment
E-II Part-C Distribution of Household Industry Establishments classified by Industry, Fuel/Power used and Size of Employment
E-I1I
E-IV
Distribution of Trade/Commercial Establishments classified by the Type of Business or Trade and Size of Employment
Distribution of Establishments (other than Manufacturing, Processing or Servicing or Business and Trade Establishments) by Size of Employment
Primary Census Abstract has already been published in Distfict Census Hand Book Part A & B volume.
The release of Census tables has thus been split up into two volumes as follows ;-
(1) District Census Hand Book Part C-I Full Count Tables
(2) District Census Hand Book Part C-U Sample Tables
This has been so planned as to achieve the objective of making the data available to the con
sumers as soon as possible after it has become ready without having to wait for the completion of other cross-tabulations which may take quite some time.
In the 1971 Census an attempt has beeb made to collect comparable data as also break
new groun<ls in view of the growing need for basic data. It is in the field of economic questions that a significant departure has been made at the 1971 Census. In the earlier Indian Censuses in
come or economic independence was made criterion for measuring the economy of the country. At the 1931 Census an intermediate category of economic semidependence was introduced and it
was called 'working dependent'. In 1941 this category was known as partly dependent, and earning dependent in 1951. At the 1961 Census, stress was laid on work so that all people who work, including family workers, who are not in receipt
of any income, and/or who Clnnot earn enough for their maintenance, could also be included as
'worker,'. At the 1971 Census the main activity of a person is first ascertained according as he
spends his time basically as a 'worker' producing goods and services or as a 'non-worker'. For regular work in industry, trade or service the, refe
rence period is the week prior to the' enumeration (a fortnight in 1961) and for seasonal work such as agriculture. etc. the last one year. The person is categorised according to the main activity
returned by an individual. Where a person, who is basically a non-worker such as a student or
housewife, does make some marginal contribution
to work. that secondary work is recorded in a separate question of the individual slip. Experience of the 1961 Census had shown that ,census was
not proper agency to collect reliable data on
unemployment as such. Therefore the t 971 Ce~sus
53
does not ask a question on unemployment directly but the unemployed are expected to fall in the residuary category of non-workers and data
in respect of them will be provided which has to be utilised subject to all the limitations.
It is a census tradition to present data by rural and urban areas. Village or Town is recog~ nised as the basic area of habitation. In all Censuses throughout the world tbis dichotomy
of rural and urban areas is recognised and the data are generally presented for the rural and urban areas separately. In the rural areas the ,smallest area. of habitation viz., tbe village
generally follows th~ limit~ of a revenue village that is recognised by the nOlmal district admini,stration. The revenue village need not necessarily be a single agglomeration of tbe habitations. But
the revenue village has a definite surveyed boundary aod each village is a separate administrative
unit. It may have ODe or more hamlets. The entire revenue village is one unit. There may 'be unsur
veyed villages within forests, etc.
It is in defining the urban areas that several problems generally arise. However, for the 1971 ,Census the definition adopted for an urban 8rea
generally follows that of 1961 which is as
f'lilows :-
(a) All places- with a municipality, corporation or cantonment or notified town area.
(b) All other places which satisfied the following criteria :
( i) a minimum popUlation of 5.000
(ii) at least 75 ,per cent of tbe male working
,population was non-agriCUltural,
(iii) a density of population of at least 400
per sq. km. (i.e. 1,000 per sq. mile).
The Director of Census of each State is, however, given some discretion in respect of some
marginal cases, in consultation with tbe State Government, to include some places that bad other distinct urban characteristics and to exclude
undesrrving cases.
In several areas around a core city or 5fatutory town have come up fairly large well recognised rairway colonies, university campuses, port areas, military camps, etc., and even though these are olltside statutory Iimits of a corporation, municipality or cantonment, they fall within the revenue boundary of the place by which the town itself is known. It may not be altogether realistic to treat such areas lying outside tbe statutory limits of a fown as rural units and at the same time each such individual area by itself may not satisfy the minimum popUlation Emit to qualify it to be treated as an independent urban unit. Such areas deserve to be reckoned alongwitb the main town and the conlinuous spread including such urban outgrowths would deserve to be treated as an integrated urban area, what is being called urhan agglomeration at the 1971 Census. There are different situations
in whicb urban agglomerations would be constituted, for example:
(a) A city with continuous outgrowth (the part of outgrowth being out of the statutory limi1s but falTing within the boundaries of the adjoining village or villages),
(b) One town with similar outgrowth or two or more adjoining towns with tbeir outgrowths as in (a}, and
(c) A city and one or more adjoining towns with their outgrowth all of which forming a continuous spread.
The distribution of p(lpufation by broad indmtrial cate!!ories has been made on 1961 pattern except for the fact that Category III of 1961 has been divided into two categorie~, viz., Category nI-Workers in livestock, forestry, fishing, hunting, plantation. C1rchards and allied activities and C'ltegory IV-Workers in mining and quarrying. Category IV of 1961, namely workers at household industry have been brought under Category V, namely, workers in manufacturing, servicing, repairing, etc. But the two will be diltinguished by suffixes like 'a' and 'b' viz., Category V (a)-Workers at household industry and C tegory V (b)-Workers in manufacturing, etc. other than household industry. There is DO
54
other change to the remainIng broad industrial categories of workers and non-workers except for the fact tbat 'business services' as also tea stalls and restaurants which were included in Category IX at the 1961 Census will now be included in Category VII, viz., worker in trade and commerce.
The pres(.'nt volume pr(.'sents the district census tables based on fun count.
The following extracts (rom the manual of instructions to enumerators on the basis of wbich these tables are compiled will be useful for appreciating thc contents of these tables.
Census Hoase
A 'census house' is a building or part of a building having a separate main entrance from
the road or common courtyard or stair-case, etc .• used or recognised as a separate unit. It may be inhabited or vacant. It may be used for a residential or non-residential purpose or both.
Household
A 'household' is a group of persons who commonly live together and would take their mears [wm a common kitchen unless the exigencies of work prevented any of them from doing so.
Institutional Household
It is a household where a group of unrelated peBons stay together such as a boarding house~ hostel, hotel, chummery, ctc.
Establishment
An 'e>tablishment' is a ptace where goods are
produc:,d or manufactured not solely for domestic consumption or where servicing and lor repairing js d(lne such as factory, workshop or bousebold
industry or servicing and/or repair workshop or a place where retail or wholesale business is carried on or commercial services are rendered or liln office, publi::: or private or a place of entertainment or where educational. reljgious. social or entertainment services are rendered. It is necessary
that in all these places one or more persons should be actually working. Thus, an esta.blishment will cover manufacturing, trade and other establishments where people work.
Main Activity
Every person wiII be asked what his main activity is, tbat is, how he engages bimself mostly. For the purpose of this question, all persons will get themselves divided into two broad streams of main activity namely, (1) as workers and (2) as non-workers according as the type of main activity tbat the person returns himself as engaged in mostly.
Worker
A 'worker' is a person wbose main activity is participation in any economically productive work by his pbysical or mental activity. Work includes not only actual work but effective supervision and direction of work.
Reference period: The reference period is one week prior to the date of enumeration in the case of regular work in trade, profession, service Or business. If a person had participated in any such regular work on any one of the days during this reference period and this has been returned as his main act vity, the person will be categorised accordingly. A person who Ilormally works but had b~en absent from work during this refaence period on account of illness or travel, holiday, temporary breakdown fltrike, etc., the peaon shOUld be tfP3te>d as engaged in regular work in which he would have otherwise been employed but for his temporary abseoc~. Person'! under training iuch as apprentices with or witbout stipend~ Of wages should be considered as economically active and recorded as working. A person who has merely been offered work but has not actually joined it, is not to be treated as engaged in work.
There are certain types of works hich a e I)ot carried on throughout tbe year such as cultivation, Jivestock keeping, plantation work, some types of bouse hold industry, etc. A person's main activity should be Bscertained with reference to sucb work in the last one year even if he was
5S
not economically active in the week prior to enumeration. It is likely that even wben a person is engaged in some other work during tbe period of one week prior to tbe date of enumeration, tbe main activity of the person may be cultivation, agricultural labour (lr some other work attended to normally by bim in the course of tbe year. Care must be taken to see that the main activity is properly ascertained in such case3. For example, a person's main activity may be agricultural labour and in the week prior to enumeration be may be engaged as a sugarcane factory labourer or as a road cooly. He should be categorised for his main activity as agricultural labourer only as returned by him as he engages himself mostly in that work and tbe otber work should be treated as his subsidiary work.
A man or woman who is eng~ged primarily in household duties such as cookin'il for own bousebold performing one's own household duties or boy or a girl who is primarily a student attending institution, even if such a person helps in the family economic activity but not as a full time worker should not be treated as a worker for the main activity. On th~ other hand, if a person is primarily engaged in some economic activity but at the same time does also attend to some household chorr:s or attends a night school etc., he or 6he should be treated basicalJy as a
worker for the mlin activity and categorised accordingly.
A pelson who merely receives an income such as a rent receiver or a pensioner who does not have to work for receiving the inc,)me, will not
be treattO as economically active unless the person is also engaged in some economic activity and if that activity i, returned ~8 the main activity of the individual.
Cultivator
For purposes of tbe cenSllS a person is working as Cultivator if he or fhe is engaged in cultivation by oneself Of by supervisiun or direction in one's capacity as tbe owner or lessee of land heJd from Government. or as tenant of land beld from private persollS or institutions for payment of money. kind or share.
Cultivation involves ploughing, sowing and harv~sting and production of cereals and millet
crops such as wheat, paddy, jowar, bajra, ragi etc., and pulses, raw jute and kindred fibre crop. cotton, etc., and other cropil sucb as sugarcane, grouDdnuts, tapioca, etc., and does not include frujt
growing. vegetable growing or keeping otchards or groves or working of plantations like tea, coffee
rubber. cinchona and other medicinal plantations.
A person who merely owns land but has given out land to another person or persons for
cultivation for money, kind or share of crop and who does not even supervise or direct cultivation of land, will not be treated as working as cultivator. Similarly, a person working in another person's land for wages in cash, kind or share (Agricultural labourer) will not be treated as cultivator in this question.
Agricultural Labourer
A person who works in another person's
land for wages in money, kind or share should be regarded as an agricultural labourer. He has no risk in the cultivation but he merely works in another person's land for wages. The labourer
could have no right of lease or contract on land on which he works.
Hoosehold Indu~try
A 'household IIldustry' is defined as an industry conducted by the Head of household himsdf/
herself and/or mainly by the members of the household at home or within the village in rural areas and only within tbe prenJises of the hoa,e
where the household lives in urban arcas. The industry should not be run on the scale of a registered factory.
Age
Record the age of the person in total years completed last birthday. Very often there is a tendency on the part of the individuals to returo 'years ruoning' rather than the 'years completed'.
Make sure that only tbe actual Dumber of years
completed is recorded.
56
In respect af infants who might not have completed one year by the day of enumeration
tbeir age in completed years should be invariably sho\lln as '0' Js tbey have not yet completed ooe year of age and add '[nfant' in brackets. As was stated under general instructions make sure that
infants even if a day old are invariably enumerated. You should not enter the age in months. The age of an infant who bas not yet completed one year should in variably be noted as to' only.
Religion
In answering this question use the following abbreviatioDs :
H Hinduism
I Islam
C Christianity
S Sikhism
B Buddhism
J Jainism
For others record the actual religion as returned fully.
If a person ~ays that he has no religion, It
may be recorded accordingly. Do not mistake
religion for caste which will not be recorded here.
Scheduled Castes or Scheduled Tribes
You have been furnished with a list of scheduled castes and scheduled tribes notified for
your area.
Ascertain if the person enumerated belongll
to a scheduled caste or scheduled tribe and jf be does. then record tbe name of the scheduled caste or scheduled tribe which should find place in the li8t furnished to) you. The anSwer should
be recorded against tbe correct rectangle provided for the purpose against this question. For a
person who is not a member of any scheduled
caste or scheduled tribe write 'X' in both the
rectangles.
If tbe person belonging to a scbeduled casle or scheduled tribe returns his caste or tribe by synonym or generic name of a caste or a tribe, it should be entered only if it finds a place in the list furnished to you. Do not write the names of scheduled castes in general terms as 'Harijan' or 'Achhut'. YOll should ascertain the name of the caste when it is returned and write it in the rectangle provided for recording the name. Similarly, do Dot write the names of scheduled tribes in general term as 'Adivasi'. You should ascertain the Dame of the tribe when it is returned and write it in the rectangle with broken lines pro..-ided for recording the same. If a person is negligent and insists on calling himself merely 'Harijan' or 'Acbhut' or 'Adivasi' as tbe case may be, tell bim tbat tbis description is not adequate for census purposes and persuade him to give out the actual name of the caste or tribe. You should make all efforts to ascertain tbe correct name of the scheduled caste or scheduled tribe as found in the notified list. If tbe person merely claims to be a scheduled caste or scheduled tribe but says that be does not belong to any of tbe notified communities applicable to tbe area, he will not be entered as a scheduled caste or scheduled tribe.
Scheduled castes can belong only to the Hindu or Sikh religions. If a person belongs to scheduled caste, there will be either 'H' or'S' in the answer to question 10. Scheduled tribes may belong to any religion.
Mother Tongue
Mother Tongue is tbe language spoken in childhood by the person's mother to the person.
57
If tbe mother died in infancy, the language mainly spoken in the person's home in Childhood will be the mother tongues. In the case of infants and deaf-mutes the language usually spokf'n by the mother shall be recorded.
Record mother ton'!ue in full whatever' be the llame of the language as returned and avoid use of abbreviations. You are Dot expected to determine if the language returned by a person is the dialect of another major language and sO on. You should not try to establish any relationship between religion and mother tongue. You are bound to record tbe language as returned by the person as his motlier tongue and you should not entrr into any argument with him and try to recorct anything other than what is returned. If you bave reason to suspect tbat in any area due to any organised movement, mother tongue was not being truthfully returned. you should record the mother tongue as actu'llly returned by the respondent and make a report to your superior Census Officers for varification. You are not authorisfd to make any cDrrection on your own.
A printed list showing the names of Schedul~d Castes/Scheduled Tribes recognised according to the President's Order was given to the enumerator.
The otber district census tables based on the sample count will be published in District Census Hand Book Part C-II volume.
A brief note intruducing each series sf tables is given in the flyleaf concerning the table.

A-GENERAL POPULATION TABLES
A-I Area, Houses aDd PopulatioD
This is the basic population table for the census and furnishes data for District/Taluka/Mahal{ City/Town/Urban Agglomeration for total, rural and urban areas separately. It presents area in sq. kms., density of population per sq. km., number of inhabited and uninhabited villages, number of towns, number of occupied residential houses, households and population by males and females according to the 1971 Census. In the case of area for territorial units lower than the district such as, villages, towns and talukas, the figures as supplied by the State Director of Land Records or other local authority have been shown, as the Surveyor General computes area figures for the district as a wbole. For the district, bowever, Surveyor General's area figures bave been shown.
As the method adopted for r.:>unding off area figures, of Jess tban one Km.· given in Part B of tbe District Census Hand Book Volumes is different from tht" method adopted in Tables of ASeries given in the present volume, tbere is a slight difference between the two figures. at some places.
This table is similar to its counterpart in 1961 except for the fact tbat the 'town group' has been replaced by 'Urban Agglomeration'. The concept of urban agglomeration has been discussed in the introductory Dote.
As in 1961 tbere are three appendices to this table.
Appendix I
This appendix shows 1961 lerritorial units constituting the present sel-up of eacb unit. This appendix has been supplemented with an annexure showing particulars of villages involved in changes of territories in cols. 3 and 6 (If Appendix I.
Appendix II
One of tbe criterili for a place to be declared as town is that it should normally have a population of 5.000 and over. For various reasons many places with a population of 5,000 and over are not treated as towns while a number of places with less than 5,000 population are treated as towns. This appendix, as in 1961. will give the number of such places with their popUlation.
Appendix 111
This appendix is intended to furnish figures for the number of houseless aod institutional households, and houseless and institutional population separately.
A-Il Decadal Variation in Population since 1901
This table is similar to ils predecessor in 1961 and furnishes data on populatiun and variation of population from 1901 to 1971. This is a very important table as it gives the growth of popUlation from decade to decade.
The appendix to (bis table as in 1961, will spell out tbe adjustments necessary to bring the 1961 Census population of the district to the jurisdiction of the district as at 1971 Census.
59
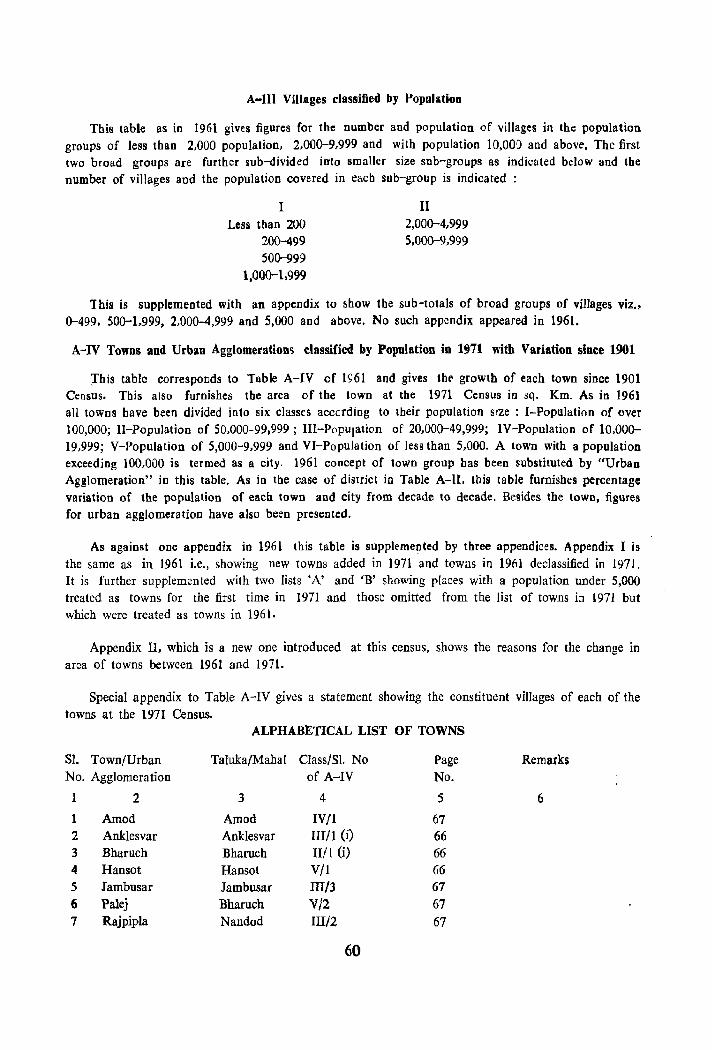
A-III Villages classified by Population
This table as in 1961 gives figures for the number and population of villages in the population groups of less than 2,000 population, 2,000-9,999 and with population 10,000 and above. The first two broad groups are further sub-divided into smaller size sub-groups as indicated below and the number of villages and the population covered in each sub-group is indicated
I Less than 200
200-499 500-999
1,000-1,999
II 2,000-4,999 5.000-9,999
This is supplemented with an appendix to show the sub-totals of broad groups of villages viz .• 0-499. 500-1,999, 2,000-4,999 and 5,000 and above. No such appendix appeared in 1961.
A-IV Towns and Urban Agglomeration'> classified by Population in 1~71 with Variation since 1901
:This table corresponds to Table A-IV of lS61 and gives thl:' growth of each town since 1901 CensUs. This also furnishes tbe area of the town at tbe 1971 Census in sq. Km. As in 1961 all towns have been divided into six classes acccrding to tbeir population sIze : I-Population of over 100,000; II-Population of 50,000-99,999; III-Population of 20,000-49,999; IV-Population of 10,000-19,999; V-Population of 5,000-9,999 and VI-Population of Jess than 5,000. A town with a population exceeding 100,000 is termed as a city. 1961 concept of town group bas been substituted by "Urban Agglomeration" in this table. As in the case of district in Table A-II, tbis table furnishes percentage variation of the population of each town and city from decade to decade. Besides the town, figures for urban agglomeration have also been presented.
As against one appendix in 1961 this table is supplemented by three appendices. Appendix I is the same as in 1961 i.e., showing new towns added in 1971 and towns in 1961 declassified in 1971. It is further supplemented with two lists 'A' and IB' showing places with a popUlation under 5,000 treated as towns for the first time in 1971 and those omitted from the list of towns in 1971 but which were treated as towns in 1961.
Appendix II, which is a new one introduced at this cenSllS, shows the reasons for the change in area of towns between 1961 and 1971.
Special appendix to Table A-IV gives a statement showing the constituent villages of each of the towns at the 1971 Census.
ALPHABETICAL LIST OF TOWNS
S1. Town/Urban Taluka/Mahal Class/S1. No Page Remarks No. Agglomeration of A-IV No.
1 2 3 4 5 6
1 Amod Amod IV/I 67 2 Anklesvar Anklesvar IIIIl (i) 66 3 Bharuch Bbaruch III 1 (i) 66 4 Han sot Hansot V!1 66 5 Iambusar Iambusar III/3 67 6 Palej Bharuch V/2 67 7 Rajpipla NandQd III/2 67
60
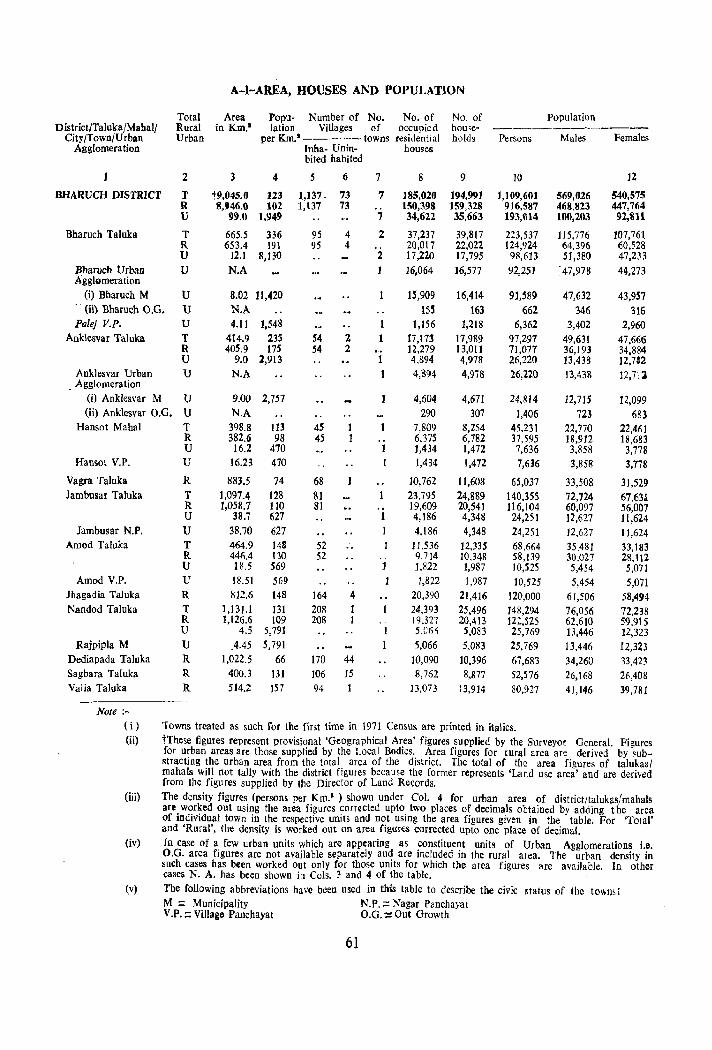
D istrict/TalukajMahal{ City ITown/U rban
Agglomeration
BHARUCH DISTRICT
Bharuch Taluka
Bharuch Urban Agglomeration
(i) Bharuch M - - (ii) Bharuch 0.0.
Total Rural Urban
2
T R lJ
T R U U
U U
Palej V.P. U Anklesvar Talnka T
R U
Anklesvar Urban U Agglomera tion
OJ Anklesvar M U (ii) Anklesvar 0.0. U
Hansot Mahal T R U
Hansot V.P. U
Vagra Taluka R Jambusar Taluka T
R U
Jambusar N.P. U Amod Taluka T
R U
Amod V.P. U Jhagadia Taluka R Nandod Taluka T
R U
Rajpipla M U Dediapada Talnka R Sagbara Taluka R Valia Taluka R
Note ;-
A-I-AREA, HOUSES AND POPULATION
Area Popu- Number of No. No. of in Km.· lation Villages of occupied
per Km.I _____ towns residential
3 4
t9,045.0 123 8,U6.0 102
99.0 1,949
665.5 336 653.4 191
12.1 8,130 N.A
8.02 11,420 N.A 4.11 1,548
414.9 2.35 405.9 175
9.0 2,913 N.A
9.00 2,757 N.A
398.8 ll3 382.6 98
16.2 470 16.23 470
883.5 74 1,097.4 128 1,058.7 110
38.7 627 38.70 627 464.9 14S 446.4 130 18.5 569 18.51 569 81Z.6 148
1,131.1 131 1,126.6 109
4.5 5,791 .4.45 5,791
1,022.5 66 400.3 131 514.2 157
Inha- Un in- houses bited habited
5 6
1,137. 73 1,137 73
95 4 95 4
54 54
45 45
68 81 81
52 52
164 208 208
170 106 94
2 2
4
44 15
7
7
7
2
2 1
1 1
.-1 I
8
185,020 150,398 34,622
37,237 20,017 17,220 16,064
15,909 155
1,156 17,173 12,279 4,894 4,894
4,604 290
7,809 6.37S 1,434 1,434
10,762 23,795 19,609 4,186 4.186
11,536 9.714 1.822 1,822
20,390 24,393 19.327 5.C6~
5,066 10,090 8,762
13,073
No. of hou,eholds
9
194,991 159,328 35,663
39.817 22,022 17,795 16,577
16,414 163
1,218 17,989 13,011 4,978 4,978
4,67I 307
8,254 6,782 1,472 t,472
11,608 24,889 20,541 4,348 4,348
12,335 10.348 1,987 1,987
21,416 25,496 20,413 5,083 5,083
10,396 8,877
13,914
Persons
10
1,109,601 916,587 193.014
223,537 124,924 98,613 92,251
91,589 662
6,362 97,297 71,077 26,220 26,2:20
24,814 1,406
45,231 37.595 7,636 7,636
65,037 140.355 116,104 24,251 24,251 68,664 58,139 10,525 10,525
120,000 148,294 ]2J.,525 25,769 25,769 67,683 52,576 80,927
Towns treated as such for the first time in 1971 Census are printed in italics.
Population
Males
569,026 468.823 100,203
115,776 64,396 51,380
. 47,978
47,632 346
3,402 49,631 36,193 13,438 13,438
12,715 723
22,770 18,912 3,858 3,858
33,508 72,724 60,097 12,627 12,627 35.481 30,027 5,454 5,454
61,506 76,056 62,610 13,446
13.446 34,260 26,168 41,146
Females
12
540,575 447,764
92,1111
107,761 60,528 47,233 44,273
43,m 316
2,960 47,666 34,884 12,732 12,7[2
12,099 683
22,461 18.683 3,778 3,778
31,529 67.631 56,007 11,624 11 ,624 33,183 28.112 5,071 5,071
58,494 72,238 59,915 12,323 12,323 33,423 26,408 39,78J
(i)
(ii) tThese figures represent provisional 'Geographical Area' figures supplied by the Surveyor General. Figures for urban areas are those supplied by the Local Bodies. Area figures for rural area are derived by ~ubstracting the urban area from the total area of the district. The total of the area figures of talukasl mahals will not tally with the district figures because the former represents 'Land use area' and are derived from the figures supplied by the Director of Land Records.
(iii)
(iv)
(v)
The density figures (persons per Km.' ) shown under Col. 4 for urban area of district/talukas/mahals are worked out using the area figures corrected upto two places of decimals obtained by adding t he area of individual town in the respective units and not using the area figures given in the table. For 'Total' and 'Rural', the density is worked out on area figures corrected upla one place of decimal. In case of a few urban units which are appearing as constituent units of Urban Agglomerations i.e. O.G. area figures are not available separately and are included in the rural area. The urban density in such cases has been worked Out only for those units for which the area figures are available. In other cases N. A. has been shown in Cols. 3 and 4 of the table. The following abbreviations have been used in this table to describe the civic status of the tOYins! M ;:: Municipality N.P.;:: Nagar Pcnchayat V.P.;: Village Panchayat D.G. ~ Out Growth
61

A-I AREA. HOUSES AND. P,OPULATION
APPENDIX II
Number of villages with a population or 5,000 and over and towns witb a population under 5,000
Note :- Talukas where there is nothing to show for this statement have been excluded
District/Taluka/Mahal
BHARUCH DISTRICT Bharuch Anklesvar Jambusar Valia
District/Taluka/Mahal
BHARUCH DISTRICT
Bharuch Taluka
Anklesvar Taluka
Hansot Mahal
Vagra Taluka
Iambusar Taluka
Amod Taluka
Jhagadia Taluka
Nandod Taluka
Dcdiapada Taluka
Sagbara Talnka
Valia Taluka
Villages with a population of 5,000 and over .------
Percentage of total, rural population of the di ~trict
Number Population
2 3 4
8 47,J86 5.2" 1 5,728 0.62 2 12,438 1.36 4 24,816 2.71
5,004 0.55
Towns with a population of under 5,000
Percentage of total urban Population
Number Population of the district
5 6 7
A-I AREA, HOUSES AND POPULATION
APPENDIX III
Heuseless and Institutional Population
Total Houseless Population Institutional Population Rural -----Urban No. of Persons Males Females No. of Persons Males Females
House- Ho.use-h.,lds holds
2 3 4 5 6 7 8 9 JO
T 3,178 1.3,445 7,653 5,792 267 5,501 4,326 1,175 R 2,708 11,910 6,722 5,188 54 3,278 2,653 625 U 470 1,535 931 604 213 2,223 1,673 550
T 783 3,332 1,884 1,448 108 1,855 1,630 225 R 544 2,526 1,385 1,141 9 680 650 30 U 239 806 499 307 99 ],]75 980 I9~
T 467 2,141 1,261 880 27 199 128 71 R 427 1,998 1,182 816 2 41 41 .. U 40 143 79 64 25 158 87 7]
T 185 856 467 389 5 140 105 3~ R 165 832 451 381 2 122 87 3S U 20 24 16 S 3 18 18
R 470 J,996 1,072 924 S 119 105 14
T 271 1,24] 711 530 27 127 101 26 R 218 1,004 510 434 .. U 53 237 141 96 27 127 101 26
T 288 1,226 706 520 17 74 59 IS R 234 1,051 600 45] I 4 4 U 54 175 ]06 69 16 70 55 IS R 233 739 433 306 12 509 397 112
T III 331 192 139 50 1,199 867 332 R 47 181 ]02 79 7 524 435 89 U 64 ISO 90 60 43 675 432 243 R 63 280 15] 129 8 696 5J8 178 R 40 221 146 75 4 397 254 143 R 267 ],082 630 4'2 4 186 162 24
62
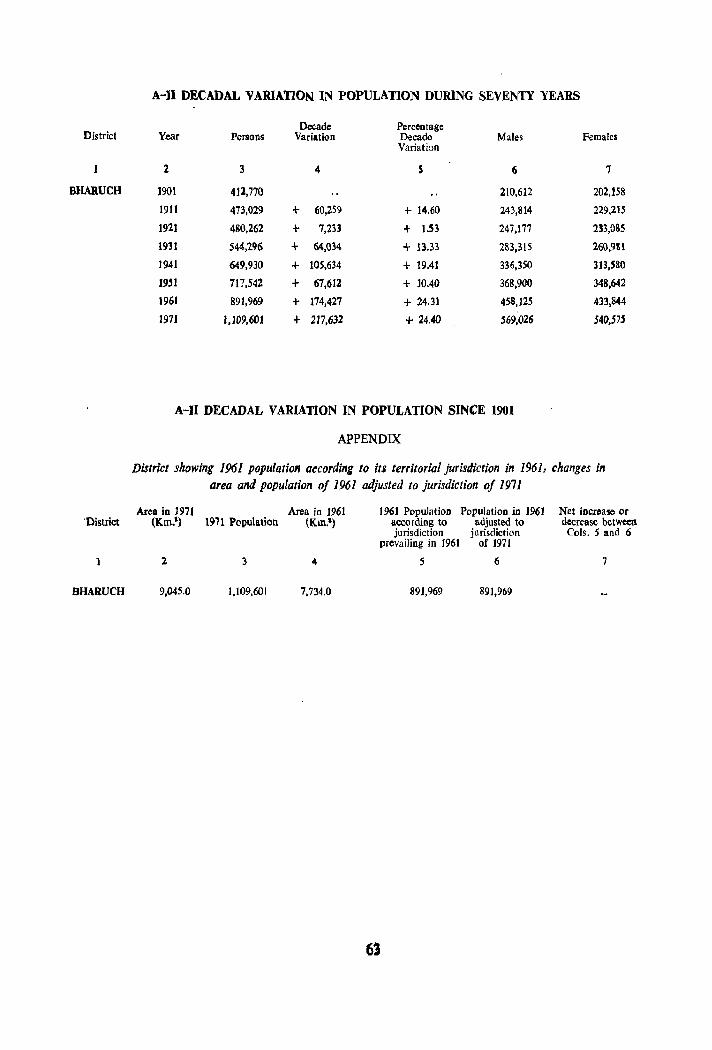
District
BHARUCH
District
BHARUCH
A-ll DECADAL VARIATION IN POPULATION DURING SEVENTY YEARS
Decade Percentage Year Persons Variation Decade Males Females
Variation
2 3 4 S 6 7
1901 411,770 210,612 202,158
1911 473,029 + 60,259 + 14.60 243,814 229.215
1921 480,262 + 7,233 + 1.53 247,177 233,085
1931 544,196 + 64,0)4 + 13.33 283,315 260,9111
1941 649,930 + 105,634 + 19.41 336,350 313,580
1951 717,542 + 67,612 + 10.40 368,900 348,642
1961 891,969 + 174,427 + 24.31 458,125 433,844
197J J,J09,601 + 217,632 + 24.40 569,026 540,575
A-II DECADAL VARIATION IN POPULATION SINCE 1901
APPENDIX
District showing 1961 population according to its territorial jurisdiction in 1961, changes in area and population of 1961 adjusted to jurisdiction of 1971
Area in 197J Area in 1961 1961 Population Population in 1961 Net increase or (Km!) 1911 Population (Km.') according to adjusted to decrease between
jurisdiction jurisdiction Cols. 5 and 6 preVailing in 1961 of 1971
2 3 4 5 6 7
9,045.0 1,109,601 7,734.0 891,969 891,969
63
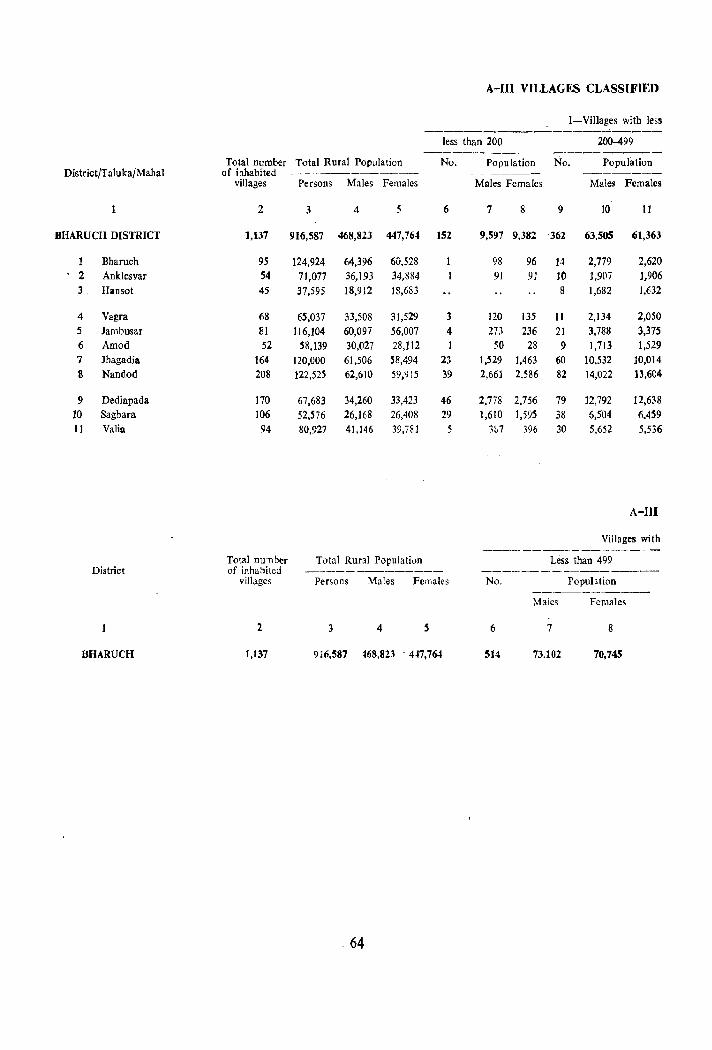
A-Ill VILLAGES CLASSIFIED
I-Villages with Ie,s -------------------------
less than 200 200-499 ----------- ---------
Total number Total Rural Population No. Population No. Popufation District/Taluka/Mahal of inhabited ~-~---------- ------ --------
villages Persons Males Females Males Females Males Females
2 3 4 5 6 7 8 9 10 II
BHARUCH DISTRICT I,B7 916,587 468,823 447,764 152 9,597 9,382 362 63,505 61,363
Bharuch 95 124,924 64,396 60.528 98 96 14 2,779 2,620 2 Anklesvar 54 71,077 36,193 34,884 91 91 JO ],9(17 J,906 3. Hansot 45 37,595 18,912 13,683 8 1,682 J,632
4 Vagra 68 65,037 33,508 31,529 3 120 135 II 2,134 2,050 5 Jambusar 81 116,104 60,097 56,007 4 273 236 21 3,788 3,375 6 Amod 52 58,139 30,027 28,112 50 28 9 1,713 1,529 7 Jhagadia 164 120,000 61,506 58,494 23 1,529 1,463 60 10,532 10,014 II Nandod 208 122,525 62,6]0 59,915 39 2,661 2.586 82 14,022 13,6C4
9 Dediapada 170 67,683 34,260 33,423 46 2,778 2,756 79 12,792 12,638 10 Sagbara 106 52,576 26,168 26,408 29 1,610 1,595 38 6,504 6.459 11 Valia 94 80,927 41,146 39,781 5 3b7 396 30 5,652 5,536
A-Ill
Villages wi th
Total nUl1ber Total Rural Population Less than 499 District of inhabited --------------_
villages Persons Males Females No. Population
Males Females
2 3 4 S 6 7 8
BHARUCH 1,137 9i6,587 468,1123 - 4~7,764 514 73.102 70,745
64
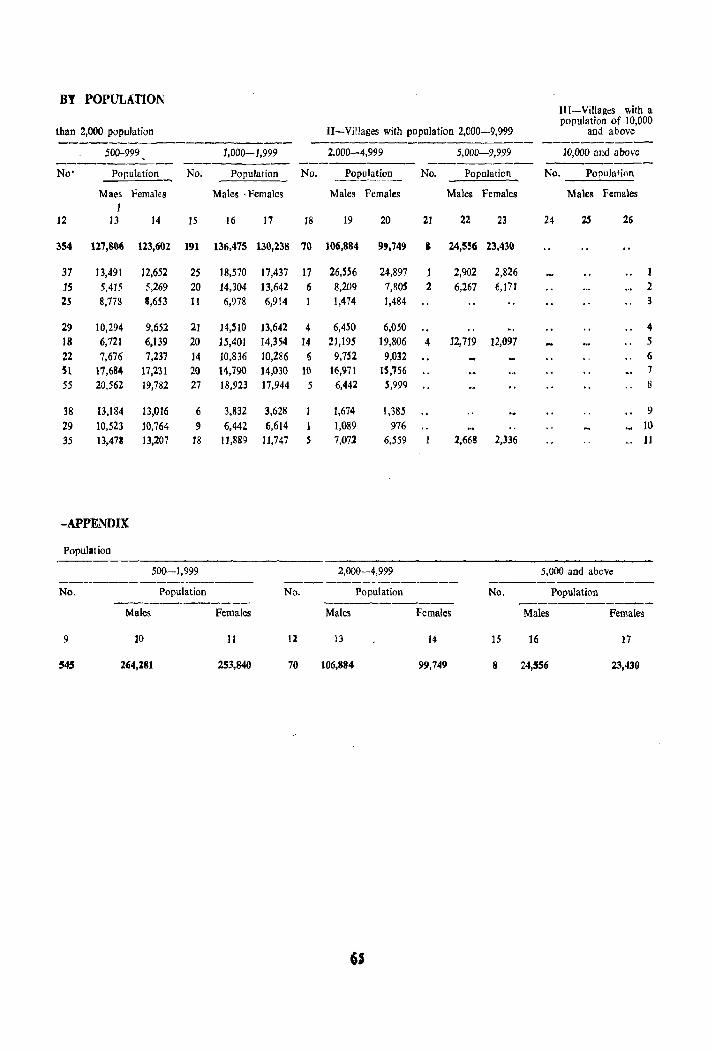
BY POPULATION III-Villages with a population of 10,000
than 2,000 population II-Villages with population 2,000-9,999 and above ------------------------ ---~------------------- ---------
500-999 1,000-1,999 2.000-4,999 5,000-9,999 10,000 and above --------- --------- ----------- ---------- ---------No' Population No. Population No. Population No. Population No. Population
Maes Females Males, Females Males Females Males Females Males Females 1
12 13 14 15 16 17 18 19 20 21 22 23 24 25 26
354 127,806 123,602 191 136,475 130,238 70 106,884 99,749 I 24,556 23,430
37 13,491 12,652 25 18,570 17,437 17 26,556 24,897 2,902 2,826 1 15 5,415 5,269 20 14,304 13,642 6 8,209 7,805 2 6,267 6,171 2 25 8,778 &,653 11 6,978 6,914 1,474 1,484 3
29 10,294 9,652 21 14,510 13,642 4 6,450 6,050 4 18 6,721 6,139 20 15,401 14,354 14 21,195 19,806 4 12,719 12,097 5
22 7,676 7,237 14 10,836 10,286 ~ 9,752 9,032 6 SI 17,684 17,231 20 14,790 14,030 10 16,971 15,756 7
55 20,562 19,782 27 18,923 17,944 5 6,442 5,999
38 13,184 13,016 6 3,832 3,628 1,674 1,385 9
29 10,523 10,764 l) 6,442 6,614 1,089 976 .• 10 35 13,478 J3,207 18 t 1,889 JJ,747 5 7,072 6,559 2,668 2,336 .~ . 1l
-APPENDIX
population
500-1,999 2,000-4,999 5,000 and above ---------_------ -----------------
No. Population No. Population No. PopUlation -----------
Males Females Males Females Males Females
9 10 11 tl B 14 15 16 17
!4S 2(i4,281 253,840 70 106,884 99,749 8 24,556 23,430
6)
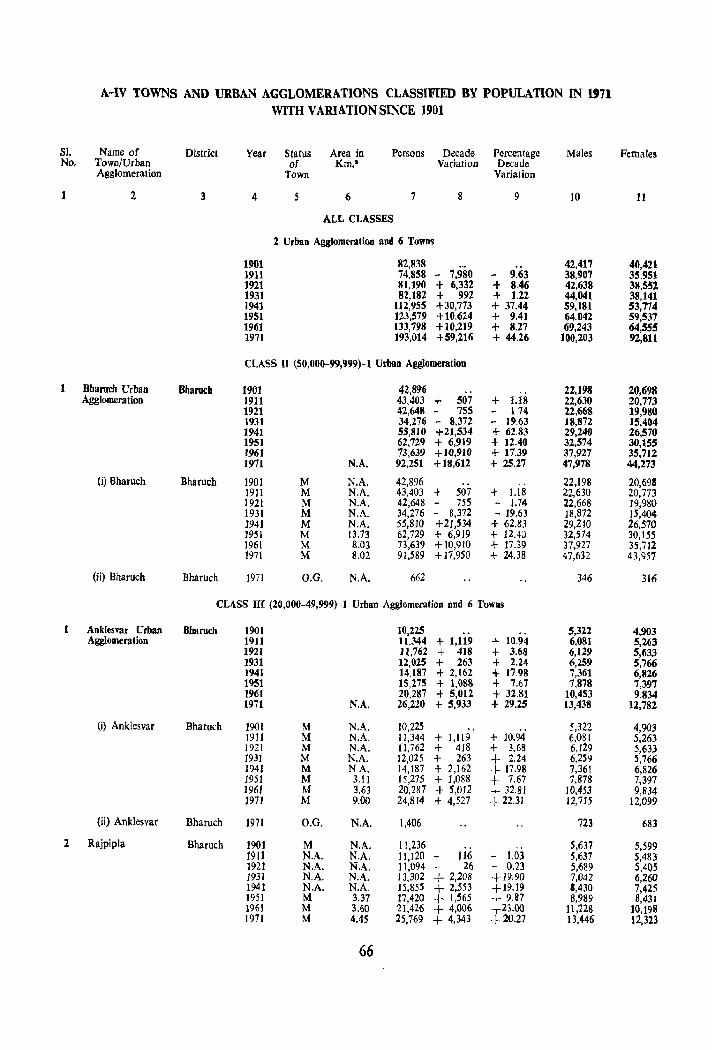
A-IV TOWNS AND URBAN AGGLOMERATIONS CLASSIFIED BY POPULATION IN 1971 WITH VARIATION SINCE 1901
SI. Name of District Year Status Area in Persons Decade Percentage Males Females No. Town/Urban of Km.' Variation Decade
Agglomeration Town Variation
2 3 4 5 6 7 8 9 10 11
ALL CLASSES
2 Urban Agglomeration and 6 Towns
1901 82,838 42,417 40,421 1911 74,858 - 7.980 - 9.63 38,907 35,951 1921 81,190 + 6.332 + 8.46 42,638 38,552 1931 82,182 + 992 + 1.22 44,041 38,141 1941 112,955 +30,773 + 37.44 59,181 53,774 1951 123,579 +10,624 + 9.41 64.042 59,537 1961 133,798 +10,219 + 8.27 69,243 64,555 1971 193,014 +59,216 + 44.26 100,203 92,811
CLASS II (50,000-99,999)-1 Urban Agglomeration
1 Bharuch Urban Bharuclt 1901 42,896 22,198 20,698 Agglomeration 1911 43,403 + 507 + 1.18 22,630 20,773
1921 42,648 - 755 - 174 22,668 19,980 1931 34,276 - 8,372 - 19.63 18,872 15,404 1941 55,810 +21,534 + 62.83 29,240 26,570 1951 62,729 + 6,919 + 12.40 32,574 30,155 1961 73,639 +10,910 + 17.39 37,927 35,712 1971 N.A. 92,251 +18,612 + 25.27 47,978 44,273
(i) Bharuch Bharuch 1901 M ~.A. 42,896 .. 22,198 20,69& 1911 M N.A. 43,403 t 507 + J.lS 22,630 20,773 ]921 M N.A. 42,648 - 755 - 1.74 22,668 19,980 ]931 M N.A. 34,276 - 8,372 - 19.63 18,872 lS,404 1941 M N.A. 55,810 +21,534 + 62.83 29,2l0 26,570 1951 M 13.73 62,729 + 6,919 + 12.40 32,574 30,IS5 1961 M 8.03 73,639 +10,910 + 17.39 37,927 35,712 1971 M 8.02 91,589 + 17,950 + 24.38 47,632 43,957
(ii) Bharuch Bharuch 1971 O.G. N.A. 662 346 316
CLASS III (20,000-49,999)-1 Urban Agglomeration and 6 Towns
Anklesvar Urban Bbaru£h 1901 10,225 5,322 4,903 Agglomeration 1911 1l.344 + 1,119 + 10.94 6,081 5,263
1921 11,762 + 418 + 3.6.'1 6,129 5,633 1931 12,025 + 263 + 2.24 6,259 5,766 1941 14,187 + 2,162 + 1798 7,361 6,826 1951 15,275 + 1.088 + 7.67 7,878 7,397 1961 20,287 + 5,012 + 32.81 10,453 9,834 1971 N.A. 26,220 + 5,933 + 29.25 13,438 12,782
(i) Anklesvar Bharuch 19{)1 M N.A. 10,125 5,322 4,9{)3 ]911 M N.A. 11,344 + 1,119 + 10.94 6,081 5,263 1921 M N.A. 11,762 + 418 + 3.68 6,129 5,633 1931 M N.A. 12,025 + 263 + 2.24 6,259 5,766 1941 M NA. 14,187 + 1,162 + 17.98 7,361 6,826 1951 M 3.11 15,275 + 1,088 + 7.67 7,878 7,397 1961 M 3.63 20,287 + 5,012 + 32.81 10,453 9,834 1971 M 9.00 24,814 + 4,527 +22.31 12,715 12,099
(ii) Anklesvar Bharuch 1971 O.G. N.A. 1,406 723 683
2 Rajpipla Bharuch 1901 M N.A. 11,236 5,637 5,599 1911 N.A. NA lJ,120 - 116 - 1.03 5,637 5,483 1921 N.A. N.A. 11,094 - 26 - 0.23 5,689 5,405 1931 N.A. N.A. 13,302 + 2,208 +19.90 7,042 6,260 1941 N.A. NA 15,855 + 2,553 +19.19 1,430 7,425 1951 M 3.37 17,420 + 1,565 + 9.87 8,989 8,431 1961 M 3.60 21,426 + 4,006 +23.00 11,'228 10,198 1971 M 4.45 25,769 + 4,343 + 20.27 13,446 12,323
66
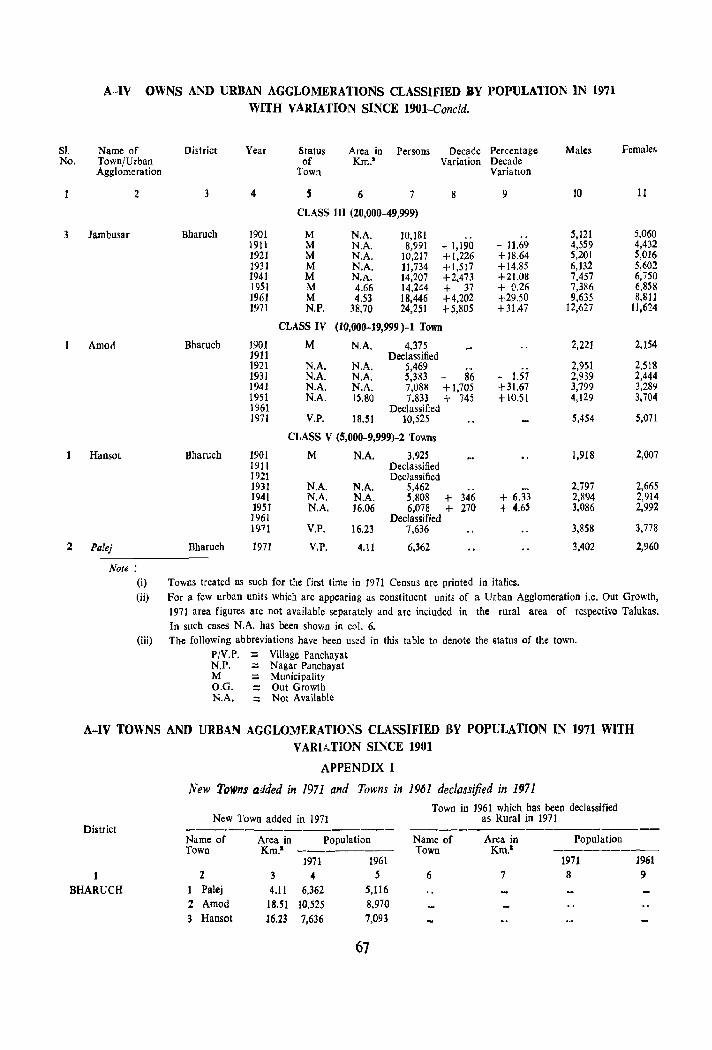
SI. No.
3
2
A-IV OWNS AND URBAN AGGLOMERATIONS CLASSIFIED BY POPULATION IN 1971 WITH VARIATION SINCE 1901-Concld.
Name of District Year Status Area in Persons Decade Percentage Males Females Town/Urban of Km.' Variation Decade Agglomeration Town Variallon
2 3 4 , 6 7 9 10 11
CLASS III (20,000-49,999)
Jambusar Bharuch 1901 M N.A. 10,181 .. 5,121 5,060 1911 M NA 8,991 - 1,190 - 11.69 4,559 4,432 1921 M NA 10,217 +1.226 +18.64 5,201 5,016 1931 M N.A, 11,734 +1,517 +14.85 6,]32 5,602 1941 M N.A. 14,207 +2,473 +21.08 7,457 6,750 1951 M 4.66 14.244 + 37 + 0.26 7,386 6,858 1961 M 4.53 18.446 +4,202 +29.50 9,635 8,811 1971 N.P. 38.70 24,251 +5,805 +31.47 12,627 11,624
CLASS IV (10,000-19,999 )-1 Town
Amod Bharuch 1901 M NA 4,375 2,221 2,154 1911 Declassified 1921 N.A. N.A. 5,469 2,951 2,518 1931 N.A. N.A. 5,333 86 - 1.57 2,939 2,444 1941 N.A. N.A. 7,08M +1,705 +31.67 3,799 3,289 1951 N.A. J5.80 7,833 + 745 +10.51 4,129 3,704 1961 Declassified 1971 V.P. 18.51 10,525 5,454 5,071
CLASS V (5,000-9,999)-2 Towns
Hansot Bharuch 1901 M N.A. 3,925 1,918 2,007 19]] Declassified 1921 Declassified 1931 N.A. N.A. 5,462 .. 2,797 2,665 1941 N.A. N.A. 5,808 + 346 + 6.33 2,894 2,914 1951 N.A. 16.06 6.078 + 270 + 4.65 3,086 2,992 1961 Declassified 1971 V.P. 16.23 7,636 3,858 3,778
Palej Bharuch 1971 V.P. 4.11 6,362 3.402 2,960
Note: (i) Towns treated as such for the first time in 1971 Census are printed in italics. (ii) For a few urban units which arc appearing as constituent units of a Urban Agglomeration i.e. Out Growth,
1971 area figures are not available separately and are included in the rural area of respective Talukas. In such cases N.A. has been shown in col. 6.
(iii) The following abbreviations have been used in this table to denote the status of the town. P{V.P. := Village Panchayat N.P. := Nagar Panchayat M := Municipality O.G. =: Out Growth N.A. :: Not Available
A-IV TOWNS AND URBAN AGGLOMERATIO~S CLASSIFIED BY POPULATION IN 1971 WITH V ARIATlON SINCE 1901
District
APPENDIX I
New Towns added in 1971 and Towns in 1961 declassified in 1~71
New Town added in 1971
Name of Area in Population Town Km.· --------
1971 1961
Town in 1961 which has been declassified as Rural in 1971
Name of Area in Population Town Km.' --------
1971 1961
1 BHARUCH 1
2 Palej
3 4
4.11 6,362 S 6 7 8 9
5,116 2 Amod IS.51 10,525 8,970 3 Hansot 16.23 7,636 7,093
67
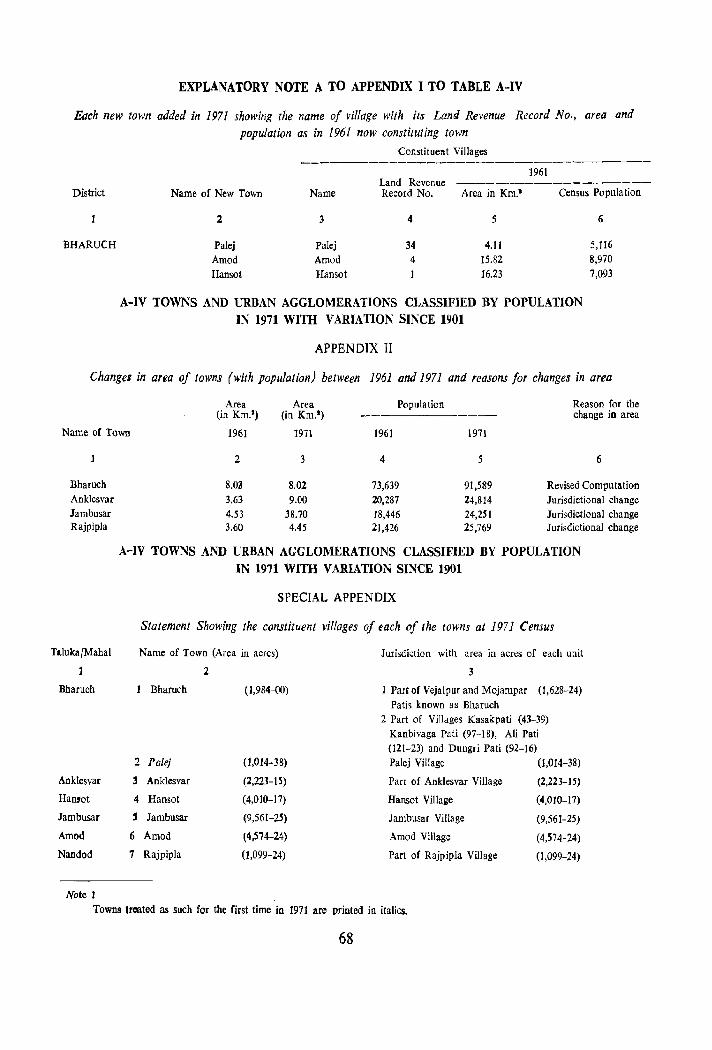
EXPLANATORY NOTE A TO APPENDIX I TO TABLE A-IV
Each new town added in 1971 showing the name of village with its Land Revenue Record No., area and population as in 1961 now constituting town
District
BRARUCR
Constituel'lt Villages
1961 Land Revenue -----------_._----
Name of New Town Name Re:ord No. Area in Km.1 Census Population
2 3 4 S 6
Palej Palej 34 4.11 5,116 Amod Amod 4 15.82 8,970
Ransot Ransot 16.23 7,093
A-IV TOWNS AND URBAN AGGLOMERATIONS CLASSIFIED BY POPULATION IN 1971 WITH VARIATION SINCE 1901
APPENDIX II
Changes in area of towns (with population) between 1961 and 1971 and reasons for changes in area
Area Area Population Reason for the (in Km.') (in Km.l) ----------- change in area
Name of Town 1961 1911 1961 1971
Bharuch Anklesvar Jambusar Rajpipla
TIJuka/Mahal
Bharuoh
Anklesvar
Ransot
Jambusar
Amod
Nandod
Note I
2 3 4 5 6
8.03 8.02 73,639 91,589 Revised Computati0n 3.63 9.00 20,287 24,814 Jurisdictional change 4.53 38.70 18,446 24,251 Jurisdictional change 3.60 4.45 21,426 25,769 Jurisdictional change
A-IV TOWNS AND URBAN AGGLOMERATIONS CLASSIFIED BY POPULATION
IN 1971 WITH VARIATION SINCE 1901
SPECIAL APPENDIX
Statement Showing the constituent villages of each of the towns at 1971 Census
Name of Town (Area in acres)
2
1 Bharuch (1,984-{)0)
2 Palej 0,014-38)
3 Anklesvar (2,223-15)
4 Hansot (4,010-17)
S Jambusar (9,561-2S)
6 Amod (4,574-24)
7 Rajpipla (1,099-24)
Jurisdiction with area in acres of each unit
3
1 Part of Vejalpur and Mojampar (1,628-24) Patis known as Bharuch
2 Part of Villages Kasakpati (43-39) Kanbivaga Pati (97-18), Ali Pati (121-23) and Dungri Pati (92-16) Palej Village (1,014-38)
Part of Anklesvar Village
Ransot Village
Jambusar Village
Amod Village
Part of Rajpipla Village
(2,223-15)
(4,010-17)
(9,561-2S)
(4,574-24)
(1,099-24)
Towns treated as such for the first time in 1971 are printed in italics.
68
B-ECONOMIC TABLES
B-1 Part-A Workers and Non-workers according to maio activity classified by sex and age-groupS
This is the basic economic table and is similar to its predece5sor in 1961. It shows distribution of the entire popUlation into two broad classes of 'workers' and for 'non-workers'. Workers arc further classified into 9 broad industrial categories as shown in the table. As against four agegroups in 1961 each category has been cross-classified into eight age-groups viz., 0-14, 15-19, 20-24, 25-29, 30-39, 40-49, 50-59, 60+. The age-groups adopted in 1961 were 0-14, 15-34, 35-59, 60+. Splitting of the two age-groups of 15-34 and 35-59 into six in 1971 will be of special significance to researchers for demographic studies.
B-II Workers and Non-workers in cities and non-city urban areas according to main activity classified by sex and age-groups
This table is similar to Table B-1 Part A with the difference that it will be confined to the presentation of data for City/Non-City Urban/Town/Urban Agglomeration.
It corresponds to Table B-II of 1961.
69
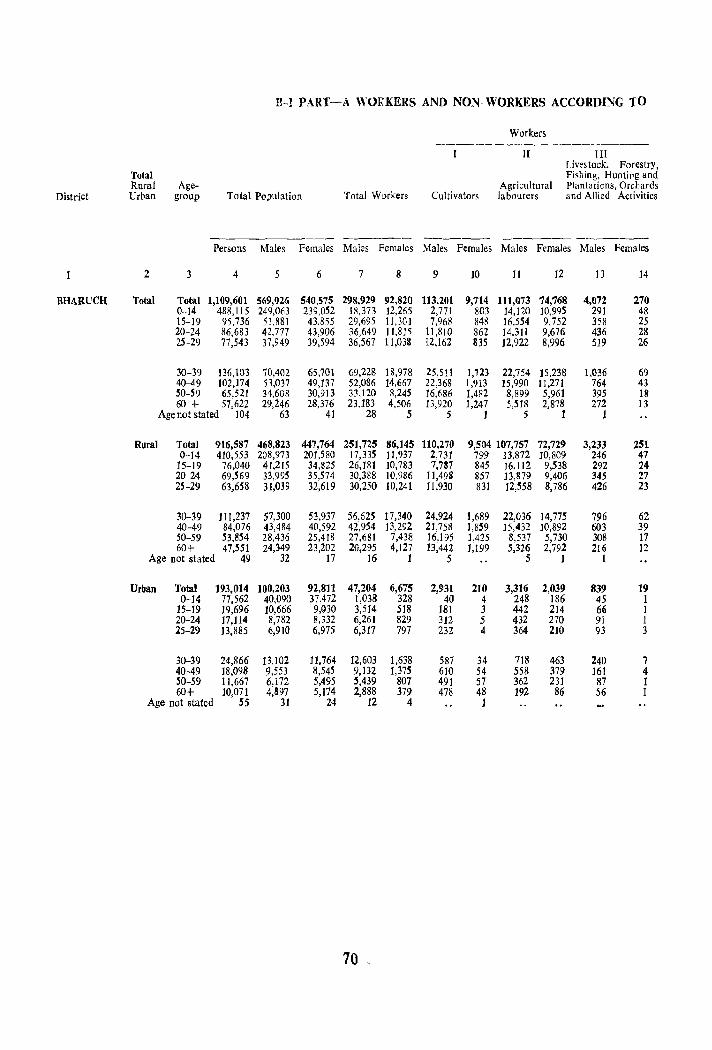
B-1 PART-A 'WORKERS AND NON WORKERS ACCORDING TO
Workers ----------- ----_---
II III Livestock. Forestry,
Total Fishing, Hunting and Rural Age- Agricultural Plantations, Orchards
District Urban group Total Population Total Workers Cultivators labourers and Allied Activities
--------.-- _-----. --__.----- _----- --------Persons Males Females Males Females Males Females Males Females Males Females
2 3 4 5 6 7 8 9 10 11 12 13 14
BHARUCH Total Total 1,109,601 569,026 540,575 298,929 92,820 113.201 9,714 111,073 74,768 4,072 270 0-14 488,115 249,063 239.052 18,373 12,265 2,771 803 14,120 10,995 291 48 15-19 95,736 51,881 43.855 29,695 11,301 7,968 848 16,554 9,752 358 25 20-24 86,683 42,777 43,906 36,649 11,815 11,810 862 14,311 9,676 436 28 25-29 77,543 37,949 39,594 36,567 11,038 12,162 835 12,922 8,996 519 26
30-39 136,103 70,402 65,701 69,228 18,978 25,S1I ],723 22,754 lS,238 1,036 69 40-49 102,174 53,037 49,137 52,086 14,667 22,368 1,913 15,990 11,271 764 43 SO-59 65,521 34,608 30,913 33.120 8.245 16,686 1,482 8,899 5,961 395 18 60 + 57,622 29,246 28,376 23,183 4,506 13,920 1,247 5,518 2,878 272 J3
Age not stated 104 63 41 28 5 5 1 5 I 1
Rural Total 916,587 468,823 447,764 251,725 86,145 110,270 9,504 107,757 72,729 3,233 251 0-14 410,553 208,973 20],580 17,335 11,937 2,731 799 13,872 10,809 246 47
15-19 76,040 41,215 34,825 26,181 10,783 7,737 845 16,112 9,538 292 24 20-24 69,569 33,995 35,574 30,388 10.986 11,498 857 13,879 9,406 345 27 25-29 63,658 31,039 32,619 30,250 10,241 11,930 831 12,558 8,786 426 23
30-39 111,237 57,300 53,937 56,625 17,340 24,924 1,689 22,036 14,775 796 62 40-49 84,076 43,484 40,592 42,954 13,292 21,758 1,859 15,432 JO,892 603 39 50-59 53,854 28,436 25,418 27,681 7,438 16,195 1,425 8,537 5,730 308 17 60+ 47,551 24,349 23,202 20,295 4,127 13,442 1,199 5,326 2,792 216 12
Age not stated 49 32 17 16 1 5 5 1 I
Urban Total 193,014 100,203 92,811 47,204 6,675 2,931 210 3,316 2,039 839 19 0-14 77,562 40,090 37,472 1,038 328 40 4 248 186 45 1
15-19 19,696 10,666 9,030 3,514 518 181 3 442 214 66 I 20-24 ]7,114 8,782 8,332 6,26] 829 312 5 432 270 91 1 25-29 13,885 6,910 6,975 6,317 797 232 4 364 210 93 3
30-39 24,866 13,102 11,764 12,603 1,638 587 34 718 463 240 7 40-49 ]8,098 9,553 8,545 9,132 1,375 610 54 558 379 161 4 SO-59 11,667 6,172 5,495 5,439 807 491 57 362 231 87 1 60+ 10,071 4,897 5,174 2,888 379 478 48 192 86 56 1
Age not stated S5 31 24 12 4 1
70 '
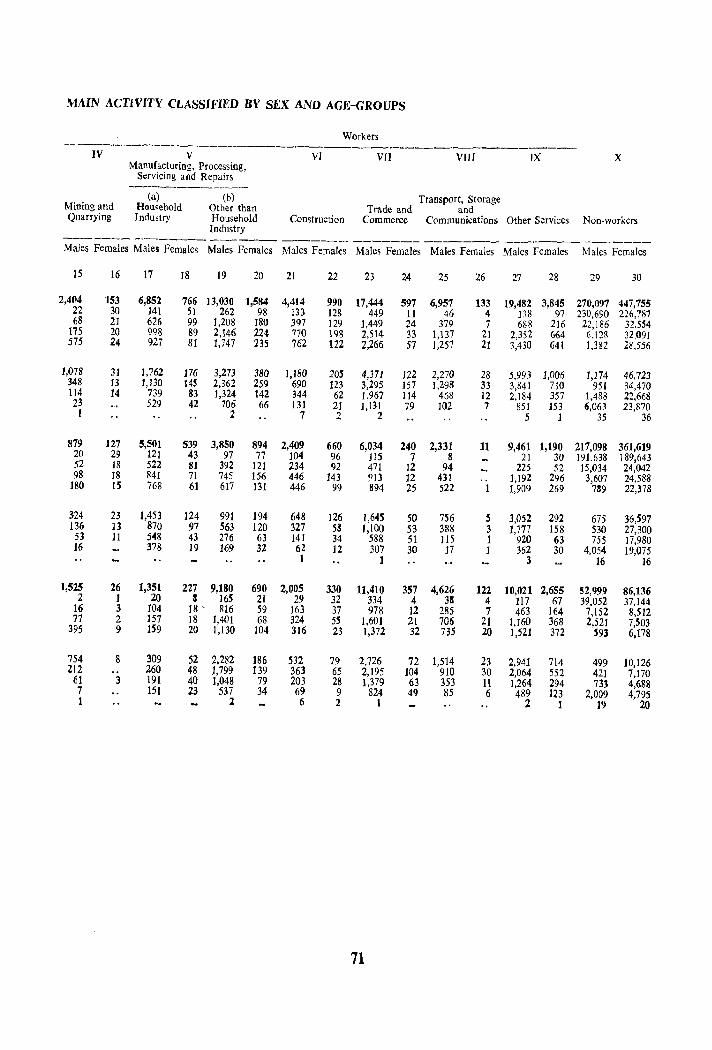
MAIN ACTIVITY CLASSIFIED BY SEX AND AGE-GROUPS
Workers -~----------------------------------------------------IV V VI VII Vlll IX X
Manufacturing, Processing, Servicing and Repairs
--------.-----(a) (b) Transport, Storage
Mining and Household Other than Trade and and Quarrying Industry Household Construction Commerce Communkations Other Services Non-workers
Industry ------- ---------------- ------- ------_ ------ -------Males Females Males Females Males Females Males Females Males Females Males Females Males Females Males Females
15 16 17 18 19 20 21 22 23 24 25 26 27 28 29 30
2,404 153 6,852 766 13,030 1,584 4,414 990 17,444 597 6,957 133 19,482 3,845 270,097 447,755 22 30 J41 51 262 98 IH 128 449 I I 46 4 138 97 230,690 226,787 68 21 626 99 J,208 180 397 129 1,449 24 379 7 688 2J6 22,186 32.554
175 20 998 89 2,146 224 770 198 2,514 33 1,137 21 2,352 664 6.l2R 32,091 575 24 927 81 1,747 235 762 122 2,266 57 1,257 21 3,430 641 1,382 28,556
1,078 31 1,762 176 3,273 380 1,180 205 4,371 122 2,270 28 5,993 1,006 1,174 46,723 348 13 1,130 145 2,362 259 690 123 3,295 157 1,298 33 3,841 710 951 34,470 114 14 739 83 1,324 142 344 62 1,967 lJ4 468 12 2,184 357 1,488 22,668 23 529 42 706 66 131 21 1,131 79 102 7 851 153 6,06~ 23,870 1 2 7 2 2 5 1 35 36
879 127 5,501 539 3,850 894 2,409 660 6,034 240 2,331 11 9,461 1,190 217,098 361,619 20 29 121 43 97 77 104 96 115 7 8 21 30 191,638 189,643 52 J8 522 81 392 121 234 92 471 12 94 225 52 15,034 24,042 98 18 841 71 745 156 446 143 913 12 431 1,192 296 3,607 24,588
180 15 768 61 617 131 446 99 894 25 522 1 1,909 269 789 22,378
324 23 1,453 ]24 991 194 648 126 ],645 50 756 5 3,052 292 675 36,597 136 13 870 97 563 120 327 58 1,100 53 388 3 ],777 158 530 27,300 53 11 548 43 276 63 141 34 588 51 115 1 920 63 755 17,980 16 378 19 169 32 62 12 307 30 17 1 362 30 4,054 19,075
1 1 3 16 16
1,525 26 1,351 227 9,180 690 2,005 330 11,410 357 4,626 122 10,021 2,655 52,999 86,136 2 1 20 a 165 21 29 32 334 4 38 4 117 67 39,052 37,144
16 3 104 18 . 816 59 163 37 978 12 285 7 463 164 7,152 8,512 77 2 157 18 1,401 68 324 55 1,601 21 706 21 1,160 368 2,521 7,503
395 9 159 20 1,130 104 316 23 1,372 32 135 20 1,521 372 S93 6,178
754 8 309 52 2,282 ]86 532 79 2,726 72 1,514 23 2,941 714 499 ]0,126 212 260 48 1,799 139 363 65 2,]95 ]04 910 30 2,064 552 421 7,170
61 3 191 40 1,048 79 203 28 1,379 63 353 11 ],264 294 731 4,688 7 151 23 537 34 69 9 824 49 85 6 489 123 2,009 4,795 1 2 6 2 1 2 1 ]9 20
71
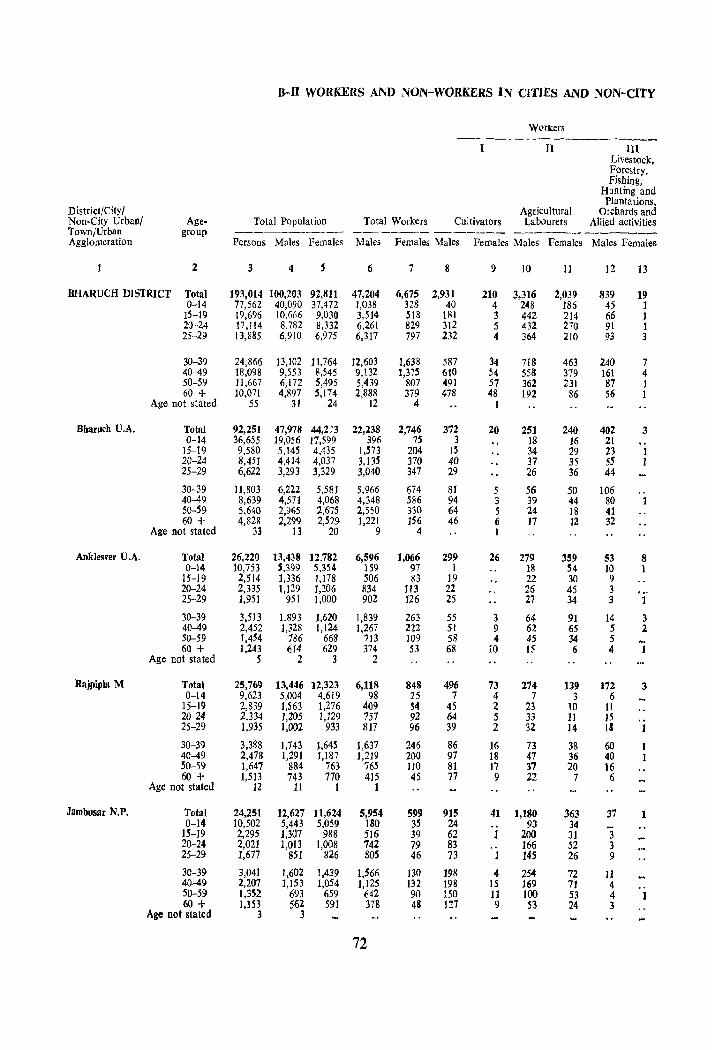
8-ll WORKERS A~D NON-WORKERS IN CITIES AND NON-CITY
Wl'rlCers ---------~------~-
II III Livestock, Forestry, Fishing,
Hunting and Plantations,
District/Cityl Agricultural Orchards and Non-City Urbani Age- Total Population Total Workers Cultivators Labourers Allied activities Town/Urban group ----~------ ----_.- ------- ------ --~-----
Agglomeration Persons Males Females Males Females Males Females Males Females Males Females
2 3 4 5 6 7 8 9 10 ]J 12 13
BHARUCH DISTRICT Total 193,014 100,203 92,811 47,204 6,675 2,931 210 3,316 2,039 839 19 0-14 77,562 40,090 37,472 ].038 328 40 4 248 186 45 ]
15-19 19,696 10,666 9,030 3,514 518 181 3 442 214 66 1 20-24 17,114 8,782 8,332 6,261 829 312 5 432 :no 91 1 25-29 13,885 6,910 6,975 6,317 797 232 4 364 210 93 3
30-39 24,866 13,102 11,764 12,603 1,638 587 34 718 463 240 7 40-49 18,098 9,553 8,545 9.132 1,375 610 54 558 379 161 4 50-59 11,667 6,172 5,495 5,439 807 491 57 362 231 87 1 60 + 10,071 4,897 5,174 2,888 379 478 48 192 86 56 1
Age not stated 55 31 24 12 4 I
Bharuch U.A. Total 92,251 47,978 44,2;3 22,238 2,746 372 20 251 240 402 3 0-14 36,655 19,056 17,599 396 7S 3 18 16 21 ..
15-19 9,580 5,145 4,435 I,S73 204 IS 34 29 23 I 20-24 8,451 4,414 4.037 3.13S 370 40 37 35 55 1 25-29 6,622 3,293 3,329 3,040 347 29 26 36 44
30-39 11,803 6,222 5,581 5,966 674 81 5 56 50 106 40-49 8,639 4,571 4,068 4,348 S86 94 3 39 44 80 SO-59 5,640 2,965 2,675 2,550 330 64 5 24 18 41 60 + 4,828 2,299 2,529 1,221 156 46 6 17 12 32
Age not stated 33 13 20 9 4 1
Allklesver U.A. Total 26,220 13,438 12.782 6,596 1,066 299 26 279 359 53 8 0-14 10,753 5,399 5,354 159 97 1 18 54 10 1
15-19 2,514 ]'336 J,178 506 83 19 22 30 9 20-24 2,335 1,129 1,206 834 113 22 26 45 3 25-29 1,951 951 1,000 902 126 25 27 34 3
30-39 3,513 1,893 J,620 1,839 263 55 3 64 91 14 3 40-49 2,452 1,328 1,124 1,267 222 51 9 62 65 5 2 50-59 1,454 786 668 713 109 58 4 45 34 5 60 + 1,243 614 629 374 53 68 10 15 6 4 1
Age not stated 5 2 3 2
Rajpipla M Total 25,769 13,446 12,323 6,118 848 496 73 274 139 172 3 0-14 9,623 5,004 4,619 98 25 7 4 7 3 6
15-19 2,839 1,563 1,276 409 S4 45 2 23 10 11 20-24 2.334 1,205 1,129 757 92 64 5 33 11 15 .. 25-29 1,935 1,002 933 817 96 39 2 32 14 IS 1
30-39 3,388 1,743 1,645 1,637 246 86 16 73 38 60 40-49 2,478 1,291 1,187 1,219 200 97 18 47 36 40 50-59 1,647 884 763 765 110 81 17 37 20 16 60 + 1,513 743 770 415 45 77 9 22 7 6
Age not stated 12 11 I 1
Jambusar N.P. Total 24,251 12,627 ]1,624 5,954 599 915 41 1,180 363 37 1 0-14 10,502 5,443 5,059 180 35 24 93 34
15-19 2,295 1,307 988 516 39 62 1 200 :II 3 20-24 2,021 1,013 1,008 742 79 83 .. 166 52 3 25-29 1,677 851 826 80S 46 73 1 145 26 9
30-39 3,041 1,602 1,439 1,566 130 198 4 254 72 II 40-49 2,207 1,153 I,OS4 1,125 132 198 15 169 71 4 .. SO-59 1,352 693 659 642 90 150 11 100 53 4 ] 60+ 1,153 562 591 378 4& 127 9 53 24 3
Age not stated 3 3
72
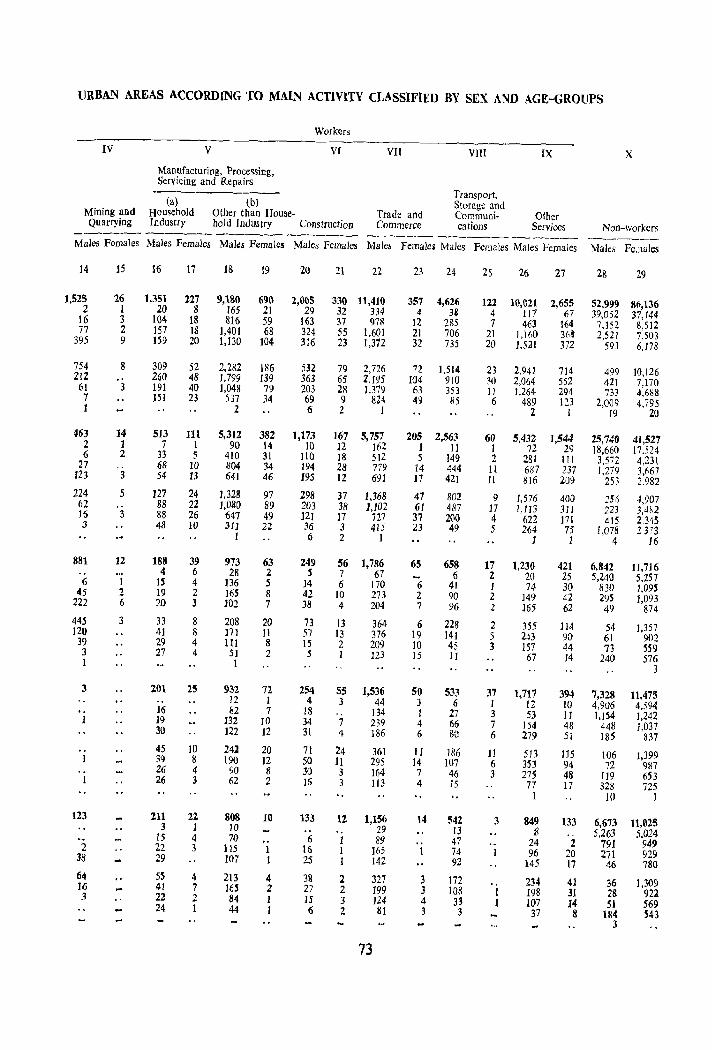
URBAN AREAS ACCORDING TO MAIN ACTIVITY CLASSIFIED BY SEX AND AGE-GROUPS
Workers
IV V VI VII VIII IX X
Manufacturing, Processing, Servicing and Repairs
Transport, (a) (b) Storage and
Mining and Household Other than House- Trade and Communi- Other Quarrying Industry hold Industry Construction Commerce cations Services Non-workers ------ ------ ------ ----_ --_-...-- ---_--- -------- ---------Males Females Males Females Males Females Males Females Males Females Males Females Males Females Males Fe.nales
14 15 16 17 18 19 20 21 22 23 24 25 26 27 28 29
1,525 26 1,351 227 9,1&0 690 2,005 330 11,410 357 4,626 122 10,021 2,655 52,999 86,136 2 1 20 8 165 21 29 32 334 4 3B 4 117 67 39,052 37,144 16 3 104 18 816 59 163 37 978 12 285 7 463 164 7,152 8,512 77 2 157 18 1,401 68 324 55 1,601 21 706 21 1,160 36lt 2,521 7,503 395 9 159 20 1,130 104 316 23 1,372 32 735 20 1,521 372 59J 6,178
754 8 309 52 2,282 186 532 79 2,726 72 1,514 23 2,941 714 499 10,126 212 260 48 1,799 139 363 65 2,195 104 9[0 30 2,064 552 421 7,170 61 3 191 40 1,048 79 203 28 1.379 63 353 1l },264 294 733 4.688 7 151 23 537 34 69 9 824 49 85 6 489 1::3 2,009 4,795 1 2 6 2 1 2 I 19 20
463 14 513 111 5,312 382 1,173 167 5,757 205 2,563 60 5,432 1,544 25,740 41,527 2 1 7 I 90 14 10 12 162 1 11 I 72 29 18,660 17,524 6 2 33 5 410 31 IlO 18 512 5 149 2 281 111 3,572 4,231 27 68 10 804 34 194 28 779 14 444 II 687 237 1,279 3,667 123 3 54 13 641 46 195 12 691 17 421 11 816 209 253 2.982 224 5 127 24 1.328 97 298 37 1.368 47 802 9 1,576 400 256 4,907 62 88 22 1,080 89 203 38 1,102 61 487 17 1,113 311 223 3.4~2 16 3 88 26 647 49 121 17 727 37 200 4 622 171 415 2.345 3 48 10 311 22 36 3 415 23 49 5 264 75 1,078 2)73 1 6 2 1 1 1 4 16
881 12 188 39 973 63 249 S6 1,786 65 658 17 1,230 421 6.842 11,716 " 4 6 28 2 S 7 67 - 6 2 20 25 5,240 5,257 6 1 IS 4 136 S 14 6 170 6 41 1 74 30 830 1,095 45 2 19 2 ]6S 8 42 10 273 2 90 2 149 42 29S 1,093 222 6 20 3 102 7 38 4 204 7 96 2 ]65 62 49 874
445 3 33 8 208 20 73 13 364 6 228 2 355 114 54 ],357 120 41 8 171 ]I 57 13 376 19 141 5 243 90 61 902 39 29 4 111 8 15 2 209 10 4~ 3 157 44 73 SS9 3 27 4 51 2 5 I ]23 15 11 67 14 240 576 1 I 3
3 201 25 932 72 254 55 1,536 50 533 37 1,717 394 7,328 11.475 .. 12 I 4 3 44 3 6 1 12 10 4.906 4,594 " 16 82 7 18 '. 134 1 27 3 53 11 1,154 1,242 1 19 132 10 34 7 239 4 66 7 154 48 448 1,037 30 122 12 31 4 186 6 80 6 279 51 185 837 .. 45 10 241 20 71 24 361 11 186 II 513 115 106 1,399 1 39 8 190 12 50 11 295 14 107 6 353 94 72 987 .. 26 4 90 II 30 3 164 7 46 3 275 48 119 653 1 26 3 62 2 16 3 113 4 15 77 17 328 725
1 10 I
123 211 22 8<l& 10 133 12 1,156 14 542 3 849 133 6,673 11,025 3 1 10 .. '. 29 13 S 5,263 5,024 15 4 70 .. 6 1 89 47 ."' 24 2 791 949 2 22 3 115 1 16 1 165 1 74 1 96 20 271 929 38 29 107 1 25 1 142 92 145 17 46 780 64 SS 4 213 4 38 2 327 3 172 234 41 36 1,309 16 41 7 16.5 2 27 2 199 3 108 I 198 31 28 922 3 22 2 84 1 IS 3 124 4 33 J 107 14 51 569 24 1 44 I () 2 81 3 3 37 8 184 543
3
73
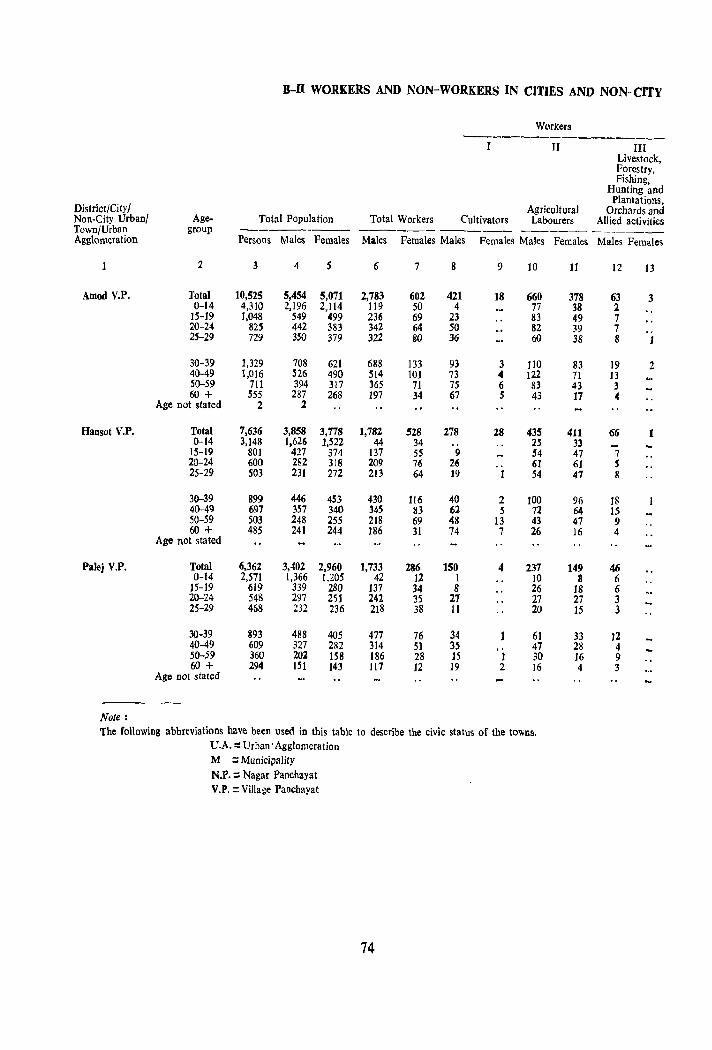
B-ll WORKERS AND NON-WORKERS IN CITIES AND NON-CITY
W~)rkers
---------------------II III
Livestock, Forestry, Fishing,
Hunting and Plantations,
District/City/ Agricultural Orchards and Non-City UrbanI Age. Total Population Total Workers Cultivators Labourers Allied activities Town/Urban group --------- ------ ------- ------ -------Agglomeration Persons Males Females Males Females Males Females Males Females Males Females
2 3 4 5 6 7 8 9 10 11 12 13
Amod V.P. Total 10,525 5,454 5,071 2,783 602 421 18 660 378 63 3 0-14 4,310 2,196 2,114 119 50 4 77 38 2
15-19 1,048 549 499 236 69 23 83 49 7 20-24 825 442 383 342 64 50 82 39 7 25-29 729 350 379 322 80 36 60 38 8 1
30-39 1,329 708 621 688 133 93 3 110 83 19 2 40-49 1,016 526 490 514 101 73 4 122 71 13 SO-59 711 394 317 365 71 75 6 83 43 3 60 + 555 287 268 197 34 67 5 43 17 4
Age not stated 2 2
Hansot V.P. Total 7,636 3,858 3,778 1,782 528 278 28 435 411 66 1 0-14 3,148 1,626 1,522 44 34 2S 33
15-19 801 427 374 137 55 9 54 47 7 20-24 600 282 318 209 76 26 61 61 S 25-29 503 231 272 213 64 19 1 54 47 8
30-39 899 446 453 430 116 40 2 100 96 18 40-49 691 357 340 345 83 62 5 72 64 15 50-59 503 248 255 218 69 48 13 43 47 9 60 + 485 241 244 186
Age not stated 31 74 7 26 ]6 4
Palej V.P. Total 6,362 3,402 2,960 1,733 286 150 4 237 149 46 0-14 2,571 1,366 1.205 42 12 I 10 8 6
15-19 619 339 280 137 34 8 26 18 6 20-24 548 297 211 242 35 27 21 27 3 25-29 468 232 236 218 38 II 20 15 3
30-39 893 488 405 477 16 34 61 33 12 40-49 609 327 2H2 314 51 35 47 28 4 50-59 360 20Z 158 186 28 15 1 30 16 9 60 + 294 lSl 143 117 12 19 2 16 4 3
Age not stated
Note: The following abbreviations have been used in this table to describe the civic status of the towns.
U.A.::: Urban' Agglomeration M ;:; Municipality N.P.;:; Nagar Panchayat V.P. = Village Pancbayat
74
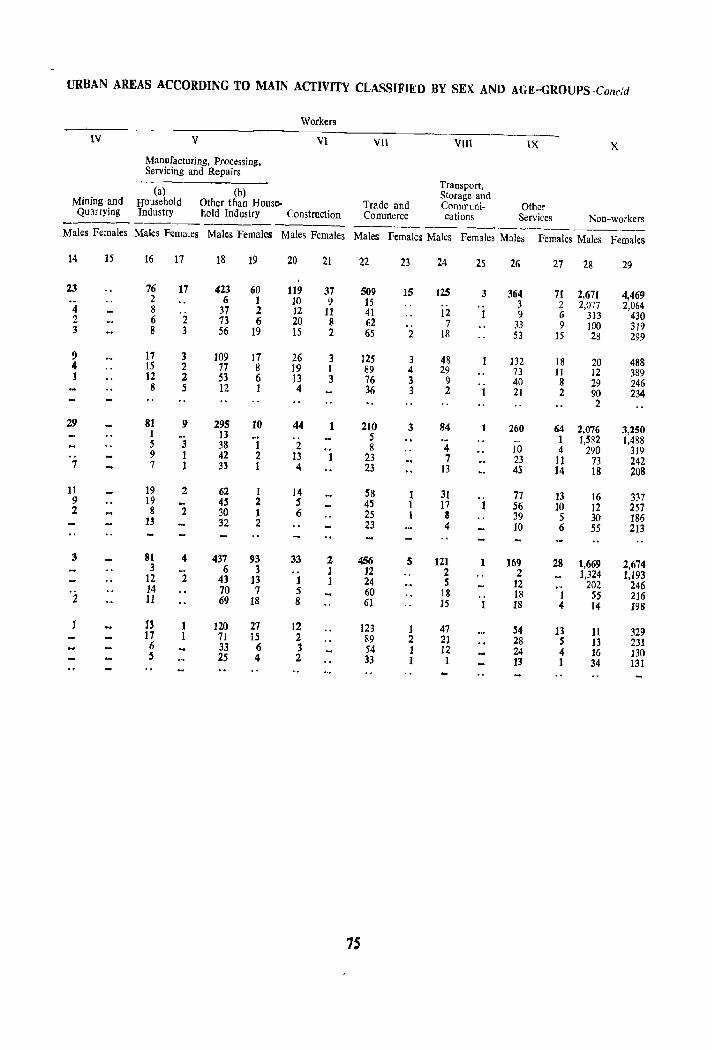
URBAN AREAS ACCORDING TO MAIN ACTIVITY CLASSIFIED BY SEX AND AGE-GROUPS-Conc:d
Workers
IV V VI VII VllI IX X Manufacturing, Processing, Servicing and Repairs
Transport, (a) (b) Storage and Mining and Household Other than House- Trade and Communi- Other Quarrying Industry hold Industry Construction Commerce cations Services Non-workers ------ ------ ------ ------ -----------------Males Females Males Females Males Females Males Females Males Females Males Females Males Females Males Females
14 15 16 17 18 19 20 21 22 23 24 25 26 27 28 29
23 76 17 423 60 119 37 509 15 125 3 364 71 2,611 4,469 2 6 1 10 9 15 3 2 2,077 2,064 4 8 37 2 12 11 41 12 1 9 6 313 430 2 6 2 73 6 20 8 62 7 33 9 100 319 3 8 3 56 19 15 2 65 2 18 53 15 28 299
9 17 3 ]09 J7 26 3 125 3 48 132 18 20 488 4 15 2 77 8 19 1 B9 4 29 73 11 12 389 1 12 2 53 6 13 3 76 3 9 40 8 29 246 8 5 12 1 4 36 3 2 1 21 2 90 234 2
29 81 9 295 10 44 1 210 3 84 1 260 64 2,076 3,250 1 13 5 -- I 1,582 1,488 5 3 38 1 2 8 4 ]0 4 290 319 9 1 42 2 13 1 23 7 23 11 73 242 7 7 1 33 1 4 23 13 45 14 18 208
11 19 2 62 1 14 58 1 31 77 13 16 337 9 19 45 2 5 4S 1 17 1 56 10 12 257 2 8 2 30 1 6 25 1 II 39 5 30 ]86 13 32 2 23 4 ]0 6 55 213
3 81 4 437 93 33 2 456 5 121 1 169 28 1,669 2,674 3 6 3 1 12 2 2 1,324 1,193 12 2 41 13 1 1 24 S 12 202 246 -i 14 70 7 5 60 18 18 1 55 2]6 11 69 18 8 61 15 1 18 4 14 198
13 ]20 27 12 123 1 47 54 13 11 329 17 7] 15 2 89 2 21 28 5 13 231 6 33 6 3 54 1 12 24 4 16 130 5 25 4 2 33 I 1 13 1 34 131
1S

C-SOCIAL AND CULTURAL TABLES
C-V Mother Tongue
This table corresponds to Table C-V of 1961. In this table mother tongues have been given in alphabetical order. The figures for the district have been presented for total/rural/urban areas, while taluka figures have been presented for total area only. The separate figures for town/town agglomeration have also been presented. In 1961 the table was presented for total, rural and urban areas for the district and
for rural area only for taluka/mahal.
C-VII Religion
This table like its corresponding Table C-VII in 1961 has been prepared on full count for total, rural and urban population. It gives the distribution of the population by religion. The units for presentation of figures for this table in 1961 were total/rural/urban areas for the district and rural area for talukas. The units for presentation of figures for this table in 1971 are total/rural/urban areas for the district/
t~luka/mahal/city/town/urban agglomeration.
c-vm Scheduled Castes and Scheduled Tribes (Part A and B) Classification by literacy and industrial category of workers and Don-workers according to main activity among Scheduled Castes/ Scheduled Tribes
This table has been prepared for total. rural and urban popUlation on full count. It gives the total population of Scheduled Castes and Scheduled Tribes and their distribution by literacy and classification of workers into different industrial categories and the total number of non-workers. This is a general table that is prepared for the Scheduled Castes and Scheduled Tribes. The table gives figures for district/taluka/ mahallcity/town/urban agglomeration.
Appendix to Table C-VIlI Part A gives individual castewise details on literacy for total/rural/urban areas for district/taluka/mahaI/city/town/urban agglomeration. Appendix to Table C-VIII Part B gives similar details for individual Scheduled Tribe.
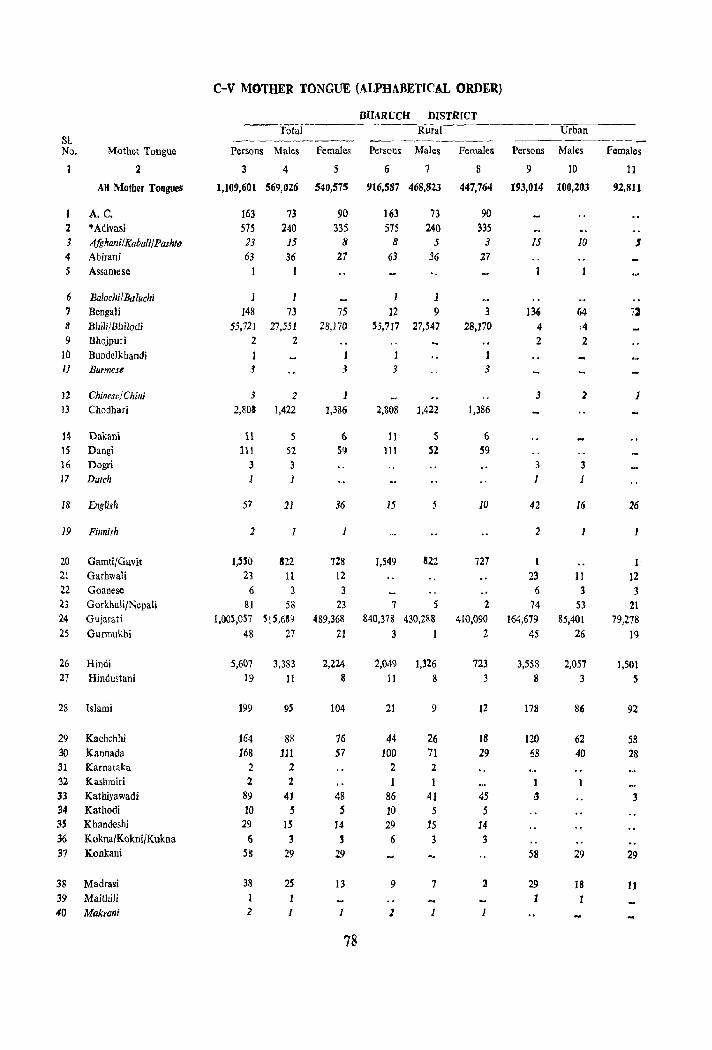
SI. No. Mother Tongue
2
AH Mother Tongues
A.C. :z *Adivasi 3 Afghani/Kabuli/Pasht() 4 Ahirani 5 Assamese
6 Balochi/Baluchi 7 Bengali 8
9 10 11
Bhili/Bhilodi Bhojpuri Bundelkhandi Burmese
12 Chinese/Chilli 13 Chodhari
14 Dakani 15 Dangi 16 Dogri 17 Dutch
18 English
19 Finnish
20 Gamti/Gavit Zl GarhwaH 22 Goanese 23 GorkhalifNcpali 24 Gujarati 25 Gurmukhi
26 Hindi 27 Hindustani
28 Islami
29 Kachchhi 30 Kannada 31 Karnataka 32 Kashmiri 33 Kathiyawadi 34 Kathodi 35 Khandeshi 36 Kokna/Kokni/Kukna 37 Konkani
38 Madrasi 39 Maithili 40 Makrani
c-v MOTHER TONGUE (ALPHABETICAL ORDER)
BHARUCH DISTRrCT --10Ial----- Rural---------U;-;-;-rb-a-n---
Persons Males Females Persons Males Females Persons Males
3 4
1,109,601 569,026
163 575 23 63
1
1 148
55,721 2
1 J
73 240 15
36
73 27,551
2
3 2 2,808 1,422
1\ 111
3
57
2
5 52 3 1
21
1
],SSO 822 23 11
6 3 8] 58
1,005,051 515,659 48 27
5,607 3,383 19 11
199 95
J64 88 J68 111
2 2 2 2
89 41 10 5
29 15
6 3 58 29
38 25 I 2 1
5
540,575
90 335
8 27
75 28,170
3
1 ],386
6 S9
36
1
728 12
3
23 489,368
21
2,224 8
104
76 57
48 S
14 3
29
13
1
78
6 7
916,587 468.823
163 575
8
63
J 12
73 240
5
36
1 9
55,717 27,547
1 3
2,808 ],422
II III
15
5 52
1,549 822
7 5 840,378 430.288
3 1
2,049 1,325 11 8
21 9
44 26 100 71
2 2 1
86 41 10 5 29 15 6 3
9 7
1 1
8
447,764
90 335
3
27
3 28,170
3
1,386
6 S9
10
727
2 410,090
2
723 3
12
18
29
45 5
14 3
2
1
9 10
193,014 100,203
15
13Ii 4 2
3
3
42
2
1
23 6
74 164,679
45
3,558 8
178
120 58
58
29 1
10
2
3 1
Iii
11 3
53 85,401
26
2.057 3
86
62 40
29
i8
Females
11
92.811
s
1
26
1
1 12 3
21 79,278
19
1,501 5
92
58 28
29
11
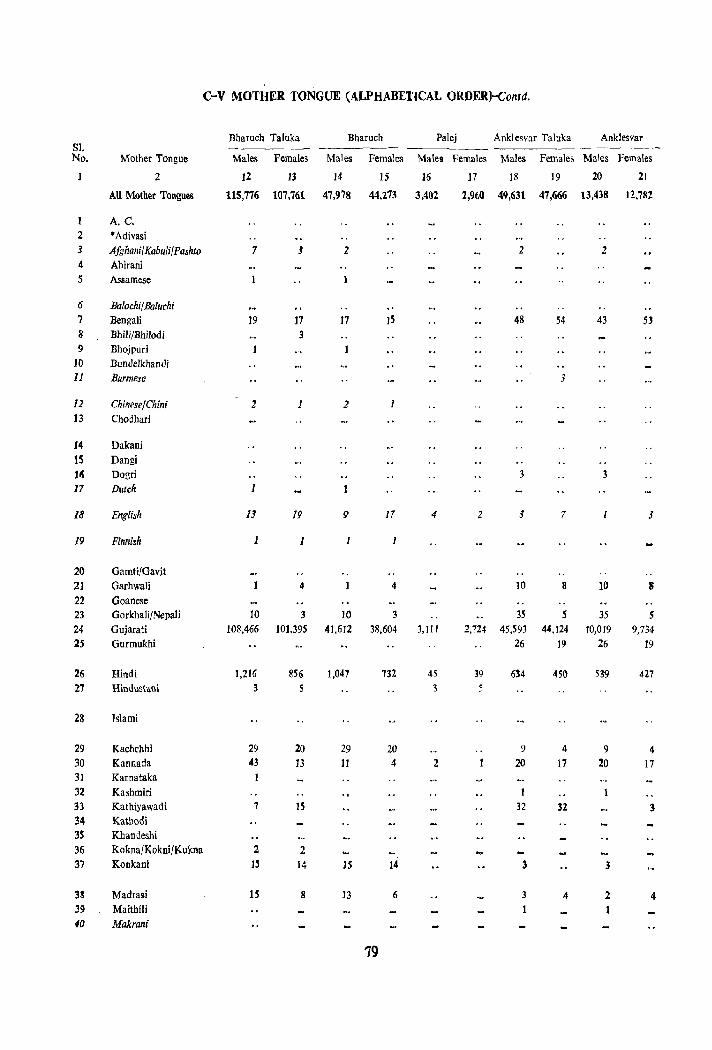
c-v MOTHER TONGUE (ALPHABETICAL ORDER)-Conrd.
Bharuch Taluka Bharuch Palej Anklesvar Taluka Anklesvar SI. No. Mother Tongue Males Females Males Females Males Females Males Females Males females
2 12 13 14 15 16 17 18 19 20 21
AU Moth~r Tongues l1S,776 107,761 47,978 44,273 3,402 2,960 49,631 47,666 13,438 12,782
I A. C. 2 *Adivasi 3 Afghani/Kabuli/Pashto 7 ~ 2 2 2 4 Ahirani 5 Assamese
6 Balochi/Baluchi 7 Bengali 19 17 17 )5 48 54 43 53 8 Bhili/Bhilodi 3 9 Bhojpuri
10 Bundelkhandi 11 Burmese 3
12 Chinese/Chini 2 1 2 13 Chodhari
14 Dakani 15 Dangi HI Dogri 3 3
17 Dutch I
18 English 13 19 9 I7 4 2 3 7 J
19 Finnish 1 1 1 1
20 Gamti/Gavit 21 Garhwali 4 4 10 8 10 8 22 Goanese 23 Gorkhali/Nepali 10 10 35 S 35 5 24 Gujarati 108,466 101,395 41,6)2 38,604 3,111 2,724 45,593 44.124 10,019 9,734 25 Gurmukhi 26 19 26 19
26 Hindi 1,216 856 1,047 732 45 39 634 450 539 427 27 Hindustani 3 3
28 Islami
29 Kachchhi 29 20 29 20 9 4 9 4 30 Kannada 43 13 lJ 4 2 20 17 20 17 31 Karnataka 32 Kashmiri 33 Kathiyawadi 7 IS 32 32 3 34 Kathodi 3S Khandeshi 36 Kokna/Kokni/Kukna 2 2 37 Konkani IS 14 IS 14 3 3
38 Madrasi IS 8 13 6 3 4 2 4 39 Maithfli 40 Makrani
19

c-v MOTHER TONGUE" (ALPHABETCIAL OR1JER,t-:-Conrd.
Hansot Mabal Hansot Vagra Taluka lambusar Taluka Sl. No. Mother Tongue Males Females Males Females Males Females Males Females
2 22 23 24 25 26 27 28 29
All Mother Tongues 22,770 22,461 3,858 3,778 33,508 31,529 72,724 67,631
A.C.
2 ·Adivasi 3. Afghani! Kabuli/ Pashto 4 Ahirani 5 Assamese
6 Ba/oeni! Baluehi 7 Bengali 4 4 II Bhili/Bhilodi 7 9 9 Bhojpuri
10 BundelkhanJi 11 Burmese
12 Chinese/Chin; ]3 Chodbari
14 Dakani 15 Dangi 16 Dogri 17 Dutch
18 English J
19 Finnish
20 Gamti/Gavit 21 Garhwali 22 Goanese 23 Gorkbali/Nepali 2 I 2 5 24 Gujarati 20,945 20,513 2,394 2,162 32,838 30,917 69,448 64,552 25 Gurmukhi
26 Hindi 28 J] 21 10 ~9 10 260 193 27 Hindustani
a lslami
29 Kachchhi 5 2 8 3
30 Kannada 3 5 2
Jl Karnataka 31 Kashmiri 33 Kathiyawadi 34 Kllthodi 3S Khandeshi 36 Kokna/KokniJKukna 37 KonkaDi
18 Madrasi 3 39 Maithili 40 Makrani
80
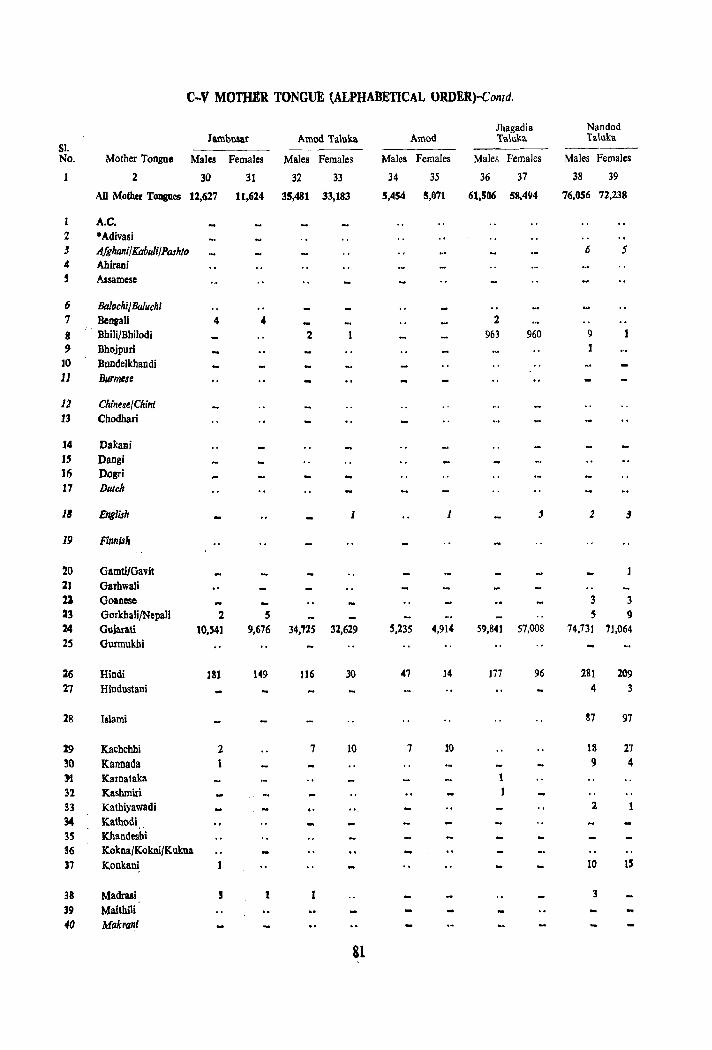
c-v MOTHER TONGUE (ALPHABETICAL ORDER)-Comd.
Jhagadia Nandod JlUllbusar Amod Talnka Amod 'Taluka Taluka
SI. No. Mother Tongue Males Females Males Females Males Females Males Females Males Females
2 30 31 32 33 34 35 36 37 38 39
AU Mother Tongues 12.627 11,624 35,481 33,183 5,454 5,071 61,506 58.494 76.056 72,238
1 A.C. 2 ·Adivasi J Afghani/KfIbuliJPashfo 6 5 4 Ahiraoi , Assamcse
6 Balochi/&Iuchl 7 BCllIali 4 4 2
8 BhiliJBhilodi 2 963 960 9 1 9 Bhojpuri 1
JO Bundelkhandi 11 Bur1lllse
12 Chinest/Chini 13 Chodhari
J4 Dakani 15 Daogi ]6 Dogri 17 Dutch
18 English 1 J .1 2 J
19 Finnish
20 Gamti/Gavit 21 GarhwaIi U Go.nesc 3 3 23 Gorkhali/Nepali 2 5 S 9 24 Gujarati 10,54] 9,676 34.725 32,629 5,235 4,914 59,841 57,008 74,731 71,064 2S Ourmukhi
26 Hindi 181 149 116 30 47 14 177 96 281 209 27 Hindustani 4 3
28 Islami 87 97
19 Kachcbbi 2 7 10 7 10 18 27
30 Kannada 1 9 4 )l Kamataka 1 32 Kashmiri 1 33 Kathiyawadi " 1
34 Kathodi 35 Khandesbi 36 Kokna/Kokni/Kukna 37 Konkan~ 10 IS
38 Madraai S I 3
39 Maithili /fO Makrani
81
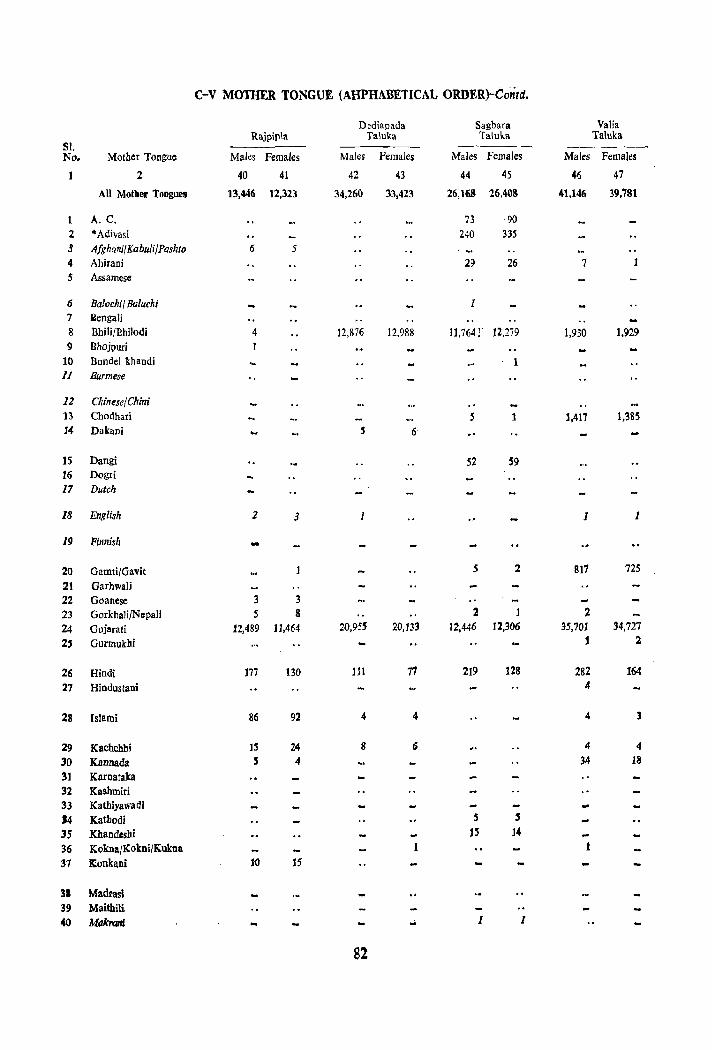
C-v MOTHER TONGUE (AHPHABETICAL ORDER)-Contd.
Dediapada Sagbara Valia Rajpipla Taluka Taluka Taluka
Sl. ------_ No. Mother Tongue Males Females Males Females Males Females Males Females
2 40 41 42 43 44 45 46 47
All Mother Tongues 13,446 12,323 34,260 33,423 26,168 26.403 41,146 39,731
A. C. 73 90 2 ·Adivasi 240 335 .3 Afghani/Kabuli/Pashto 6 5
4 Ahirani 29 26 7 5 Assamese
6 Balochi/ Baluchi 1 7 liIengali 8 Bhili/Bhilodi 4 12,876 12,988 11,764]" 12,279 1,930 1.929 9 Bhojpud
10 Bundel khandi 1 11 Burmese
12 Chinese/Chin; 13 Chodhari S ],417 1,385 14 Dakani S 6
15 Dangi 52 59 16 Dogri
17 Dutch
18 English 2 3 J 1
19 Finnish -20 Gamti/Gavit 5 2 817 725
21 Garhwali 22 Goanese 3 3 23 GorkhalijNepaJi 5 8 :I 2 24 Gujarati 12,489 11,464 20,955 20,133 12,446 12,306 35,701 34,727 2, Gurmukhi 1 2
26 Hindi 177 130 111 77 219 128 282 164 27 Hindustani 4
28 Islami 86 92 4 4 4 3
29 Kachchhi 15 24 8 6 4 4
30 Kannada 5 4 34 18
31 Karnataka 32 Kashmiri 33 Kathiyawadl .4 Kathodi
, S
3S Khandcshi 15 14
36 Kokna/Kokni/Kukna 1 1
37 ltonkani 10 15
31 Madrasi 39 Maithili 40 Makranl 1 1
82
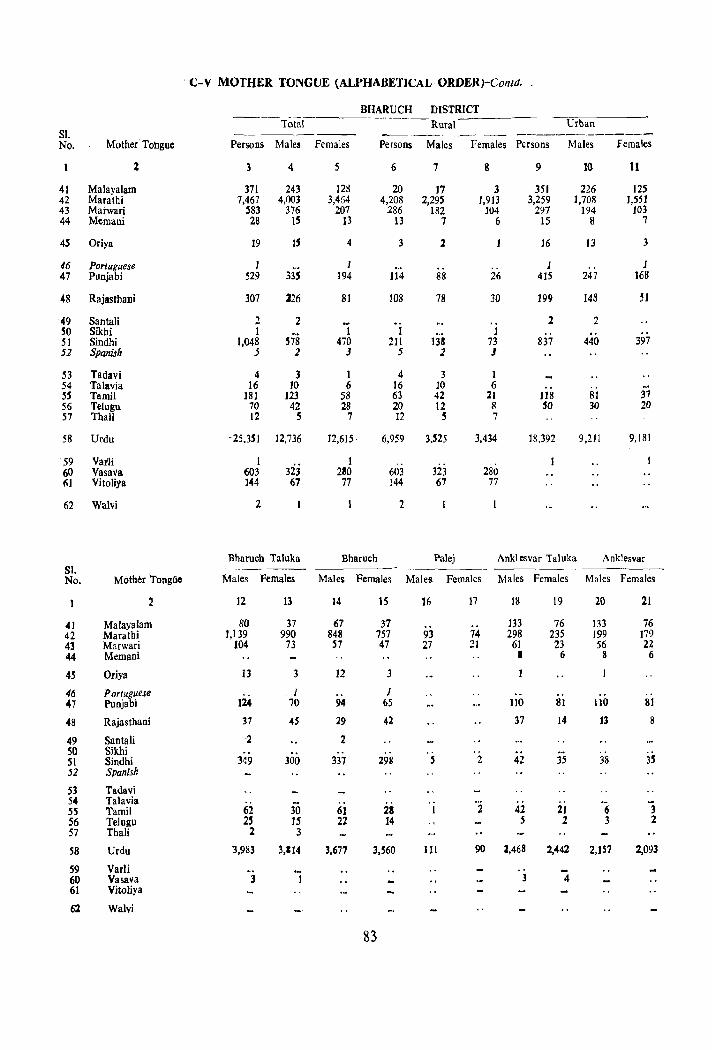
-C-V MOTHER TONGUE (ALPHABETICAL ORDER)-Contd.
BHARUCH DISTRICT --- -_- ----._-_ Total Rural Urban
SI. ---_--_---- -------.-------No. Mother Tongue Persons Males Females Persons Males Females Persons Males females
2 3 4 5 6 7 8 9 10 11
41 Malayalam 371 243 128 20 17 3 351 226 125 42 Maralhi 7,467 4,003 3,454 4,208 2,295 1,913 3,259 1,70~ 1,551 43 Marwari 583 376 207 286 182 104 297 194 103 44 Memani 2B 15 13 13 1 6 15 8 7
45 Oriya 19 15 4 2 16 13 3
46 Portuguese 1 1 1 .. J 47 Punjabi 529 m 194 114 88 26 415 247 168
48 Rajasthani 307 226 81 108 78 30 199 148 31
49 Santali 2 2 2 2 50 Sikbi 1 ~. 1 1 1 51 Sindhi 1,048 578 470 211 l33 73 837 440 397 52 Spanish j 2 3 5 2 J
53 Tadavi 4 3 1 4 3 1 54 Talavia 16 10 6 16 10 6 55 Tamil )81 123 58 63 42 II 118 81 37 56 Telugu 70 42 28 20 12 8 50 30 20 57 Thali 12 5 7 ]2 5 7
58 Urdu -25,351 12,736 12,615 6,959 3,525 3,434 18,392 9,211 9.181
-59 Vatli I 3ij
1 280 60 Vasava 603 280 603 323
61 Vitoliya ]44 67 77 144 67 77
62 Walvi 2 2
Bharuch Taluka Bharuch Palej Ankl csvar Taluka Anklesvar SI. - -----No. Mother 'Tongue Males Females Males Females Males Females Males Females Males Females
2 12 13 14 15 16 17 18 19 20 21
41 Malayalam 80 37 67 37 133 76 133 76 42 Marathi ],139 990 848 757 93 74 298 235 199 179 43 Marwari 104 73 57 47 27 21 61 23 56 22 44 Memani I 6 8 6
45 Oriya 13 3 12 3
46 Portuguese _ J J .. .. 47 Punjabi 124 70 94 65 ]10 81 no 8]
48 Rajastbani 37 45 29 42 37 14 13 8
49 Santali 2 2 50 Sikhi -' 51 Sindhi 349 300 337 298 5 2 42 35 38 3S 52 Spanish
53 Tadavi 54 Talavia 55 Tamil 62 30 61 2& 1 2 42 21 6 3 56 Telugu 2' 15 22 J4 5 2 3 2 57 Thali 2 3
58 Urdu 1,983 3,114 3,677 3,560 111 90 2,468 2,442 2,157 2,093
59 Varli 60 Vasava 3 I 3 4 61 Vitoliya
62 Walvi
83
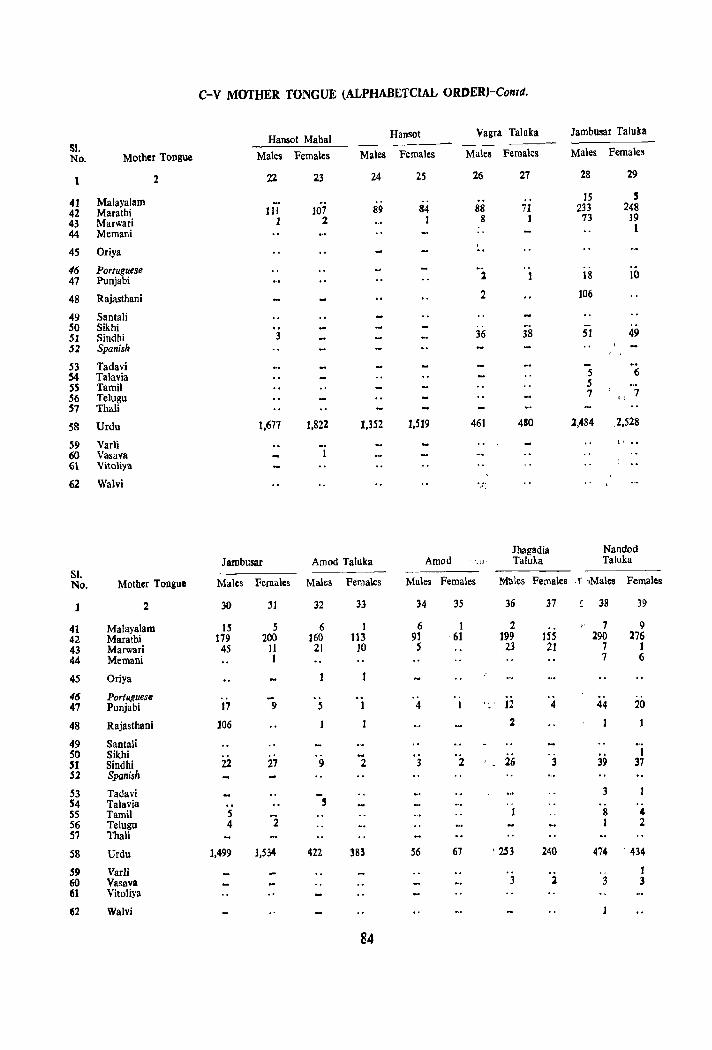
c-v MOTHER TONGUE (ALPHABETCIAL ORDER)-Conrtl.
Hansot Mabal Hansot Vagra Taluka Jambusar Taluka
SI. No. Mother Tongue Males Females Males Females Males Females Males Females
2 22 23 24 25 26 27 28 29
41 Malayalam .. 15 5
42 Marathi III 107 89 84 88 7I 233 248
43 Marwari 1 2 1 8 1 73 19 44 Memani .. 1
, 45 Oriya
46 Portuguese .. .. 47 Punjabi 1 1 18 10
48 Rajasthani 2 106
49 Santali SO Sikhi 51 Sindhi 3 36 38 51 49 $2 Spanish
53 Tadavi 54 Talavia 5 6
SS Tamil 5
56 Telugu 7 " 7 57 Thali
58 Urdu 1,677 1,822 1,352 1,519 461 410 l,484 2,528
59 Varli l( _.
60 Vasava 1 61 Vitoliya
62 Walvi ."
Jhagadia Nandod Jambusar Amod Taluka Amod . ',U' Taluka Taluka
81. No. Mother Tongue Males Females Males Females Males Females Males Females r ,Males Females
1 2 30 31 32 33 34 35 36 37 38 39
41 Malayalam 15 5 6 1 6 1 2 7 9 42 Marathi 179 200 160 113 91 61 199 155 290 276 43 Marwari 45 11 21 10 S 23 21 7 I 44 Memani 1 7 6
45 Oriya
46 Portuguesfl .. .. 47 Punjabi 17 9 .5 4 1 " , 12 4 44 20
48 Rajasthani 106 2
49 Santali 50 Sikhi 1 51 Sindhi 22 27 9 2 3 2 26 3 39 37 52 Spanish
53 Tadavi 3 54 Talavia .. , .. 55 Tamil 5 '2
1 8 4 56 Telugu 4 1 2 57 Thali
58 Urdu 1,499 1,534 422 383 56 67 ' 253 240 474 . 434
59. Varli I 60 Vasava 3 2 3 3 til Vitoliya
62 Walvi
84
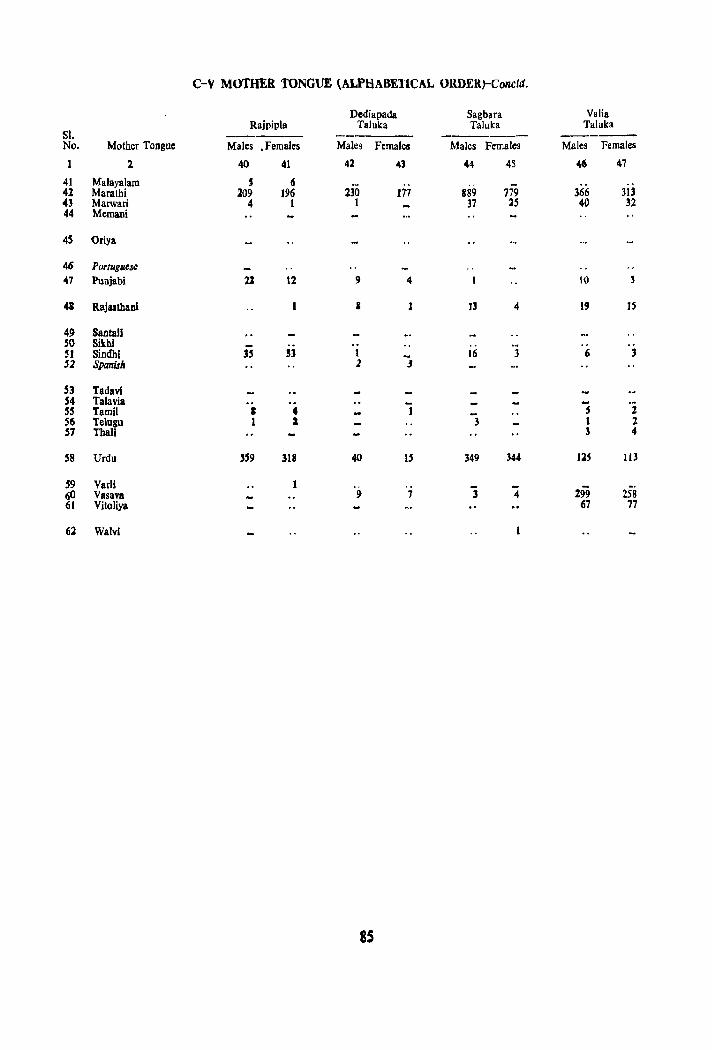
c-v MotHER fONGUE (ALPHABETICAL ORDER)-Concld.
Dediapada Sagbara Valia Rajpipla Taluka Taluka Taluka
81. ------ ------ ------- ------No. Mother Tongue Males • Females Males Females Males Females Males Females
2 40 41 42 41 44 45 46 47
41 Malayalam S 6 42 Marathi 209 196 2]0 J77 889 779 3ti6 313 43 Marwari 4 1 1 37 2S 40 32 44 Memani
45 Oriya
46 Portugll,ese
47 PUlljabi 22 12 9 4 10 3
41 Rajalthani II n 4 19 15
49 SantalJ SO Sikhl 5J Sindhi 3' 53 1 16 3 6 3 52 Spanish 2 j
S3 Tadavi 54 Talavia .. 55 Tamil I 4 1 S 2 56 Telugu 1 :a 3 1 2 57 Thall 3 " 58 Urdu 359 318 40 U 349 344 12S ll3
'9 VarU 1 299 60 Vasava 9 7 4 258
61 Vitoliya 67 77
62 Walvl
8S
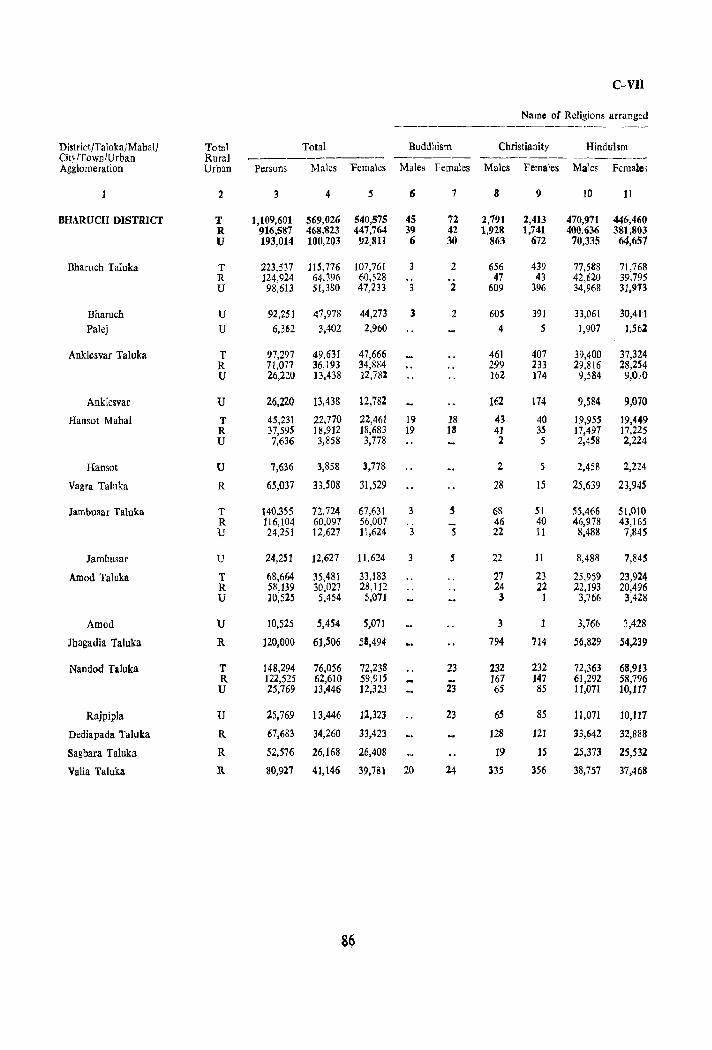
C-VIl
Name of Religions arranged -----------------------
Distriet/TalnkaJMahall Total Total Buddhism Christianity Hinduhm City/Town/Urban Rural ------------ ----- --------- --------Agglomeration Urban Persons Males Femaks Males Females Males Fcma1es Males Femalc;
2 3 4 5 6 7 8 9 10 11
BHARUCH DISTRICT T 1,109,601 569,026 540,575 45 72 2,791 2,413 470,971 446,460 R 916,587 468.823 447,764 39 42 1,928 1,741 400.636 381,803 U 193,014 100,203 92,1111 6 30 863 672 70,335 64,651
Bharuch TaJuka T 223,537 115,776 107,761 2 656 439 77,588 71,768 R 124,924 64,396 60,528 .. 47 43 42,620 39,795 U 98,613 51,380 47,233 3 2 609 396 34,968 31,973
Bharuch U 92,251 47,978 44,273 3 2 605 391 33,061 30,411
Paiej U 6,362 3,402 2,960 4 5 1,907 1,561
Anklesvar Taluka r 97,297 49,631 47,666 461 407 39,400 37,324 R 71,077 36.193 34,884 299 233 29,816 28,254 U 26,2~0 13,438 J2,78% 162 174 9,584 9,070
Anklesvar U 26,220 13,438 12,782 162 174 9,584 9,070
Hanso! Mahal T 45,231 22,770 22,461 19 18 43 40 19,955 19,449 R 37,595 18,912 18,683 19 18 41 35 17,497 17,225 U 7,636 3,858 3,778 2 5 2,458 2,224
Hansot U 7,636 3,858 3,778 2 5 2,458 2,224
Vagra Taluka R 65,037 33,508 31,529 28 15 25,639 23,945
Jambusar Taluka T 140,355 72,724 67,631 3 5 68 51 55,466 51,010 R 116,104 60,097 56,007 .. 46 40 46,978 43,165 U 24,251 12,627 11,624 3 5 22 11 8,488 7,845
Jambusar U 24,251 12,627 11,624 3 5 22 11 8,488 7,845
Amod Taluka T 68,664 35,481 33,183 27 23 25,959 23,924 R 58,139 30,027 28,112 24 22 22,193 20,496 U 10,525 5,454 5,071 3 1 3,766 3,428
Amod U 10,525 5,454 5,071 3 1 3,766 3,428
Jhagadia Talnka R 120,000 61,506 58,494 794 714 56,829 54,239
Nandod Taluka T 148,294 76,056 72,238 23 232 232 72,363 68,913 R 122,525 62,610 59,91S 167 147 61,292 58,796 U 25,769 13,446 12,323 23 65 85 11,071 10,117
Rajpipia U 25,769 13,446 ll,323 23 65 85 11,071 10,117
Dediapada Taluka R 67,683 34,260 33,423 128 121 33,642 32,888
Sagbara Taluka R 52,576 26,168 26,408 19 15 25,373 25,532
Valia Tllluka R 80,927 41,146 39,781 20 14 335 356 38,757 37,468
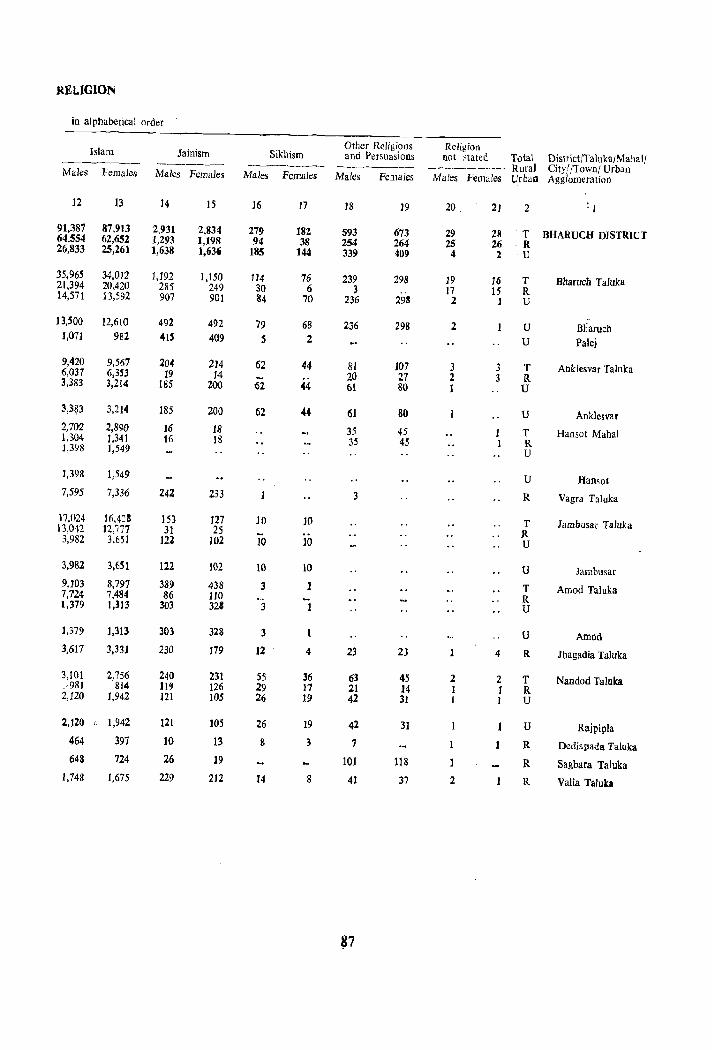
REl.IGION
in alphabetical order
Other Religions Religion Islam Jainism Sikhism and Persuasions not stated Total District/TaiukalMahalj ~----- -----_- ------- ------- -------- Rural City/fTown/ Urban Males Females Males Females Males Females Males Females MaJes Females Urban Agglomeration
12 13 14 15 16 17 18 19 20 21 2 : I
91,387 87,913 2,931 2,834 279 182 593 673 29 28 T 8HARUCH DISTRICT 64,554 62,652 1,293 1,198 94 38 254 264 25 26 -R 26,833 25,261 1,638 1,636 185 144 339 409 4 2 -u 35,965 34,012 1,192 1,150 114 76 239 298 19 16 T Bbaruch Taluka 21,394 20.420 285 249 30 6 3 17 15 R 14,571 13,592 907 901 84 70 236 298 2 1 U
-13,SOO 12,610 492 492 79 68 236 298 2 U BJiaruch 1,071 982 41S 409 S 2 U Palej
9,420 9,567 204 214 62 44 81 107 3 3 T Anklesvar Taluka 6,037 6,353 19 14 20 27 2 3 R 3,383 3,214 185 200 62 44 61 80 I U
3,3~3 3,214 185 200 62 44 61 80 U Aoklesvar 2.702 2,890 16 18 35 45 1 T Hansot Mahal 1,304 1,341 16 18 35 45 J R 1,398 1,549 U
1,398 1,549 U Hansol 7,595 7,336 242 233 3 R Vagra Taluka
17,024 16,4:3 153 127 10 10 T Jambusar Taluka 13,042 12,777 31 25 R 3,982 3,651 122 102 10 10 U
3,982 3,fiSl 122 102 10 10 U Jambusar 9,103 8,791 389 438 3 T Amod Taluka 7,724 7,484 86 110 - R 1.379 1,313 303 328 3 I U
1,379 1,313 303 328 3 1 U Amod 3.617 3.331 230 179 12 4 23 23 4 R Jhagadia Taluka
3,101 2,756 240 231 55 36 63 45 2 2 T Nandod Taluka . 981 814 11~ 126 29 17 21 14 I 1 R 2,120 1,942 121 105 26 19 42 31 I 1 U
2,120 L 1,942 121 105 26 19 42 31 U Rajpipla 464 397 10 13 g 3 7 R Oediapada Ta!uka 648 724 26 19 101 118 R Sagbara Taluka
1,748 1,675 229 212 J4 8 41 37 2 R Valia Taluka
~7
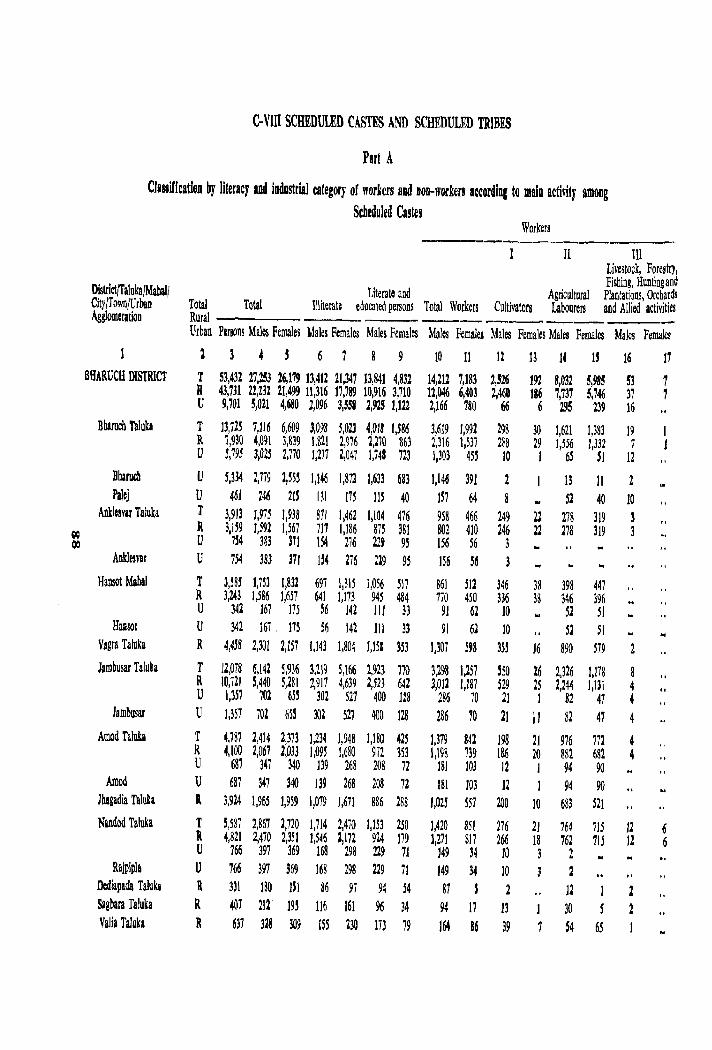
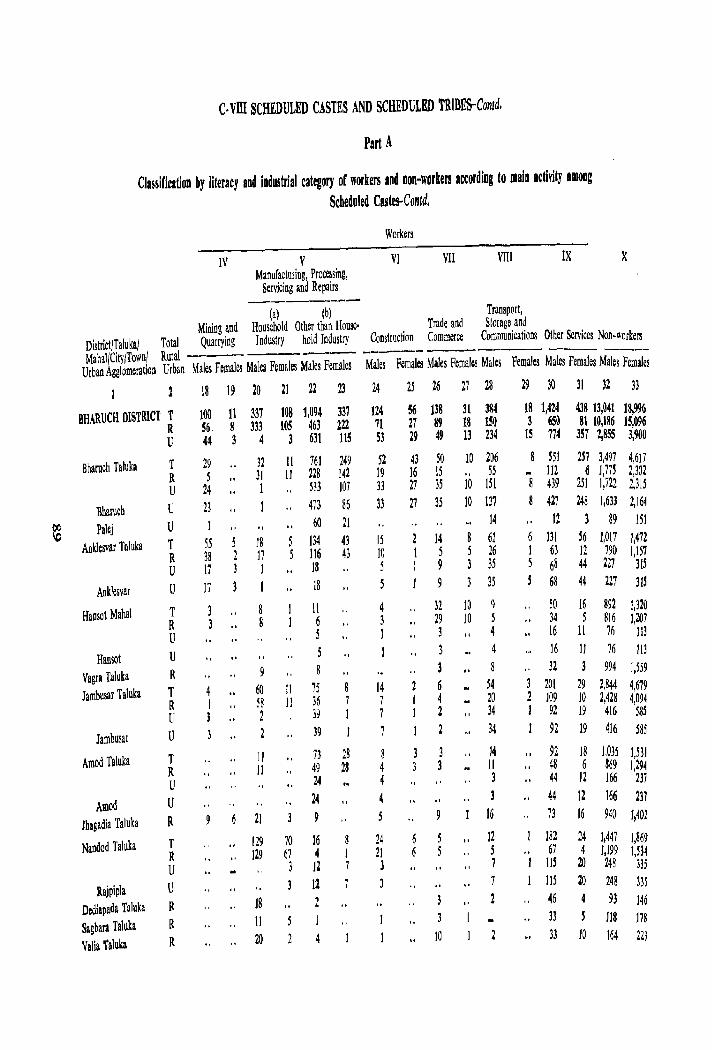
C· vrn SCHEDULED CASTES AND SCHEDULED TRIBES-Contd,
PArt A
ClassificatloD by literacy and Industrial category of workers and non-workers according to main activity among Scheduled Castes-Contd.
Workers
IV V VI VII VIII IX X Manufacturing, Processing,
ServiCing and Repairs -------
(a) (b) Transport, Mining and Household Other than House· Trade and Storage and
District/Talukaj Total Quarrying Industry hold Industry Construction Commerce Communications Other Services Non-workers
Mahal/City/Town/ Rural ----------- -------- - --- -----Urban Agglomeration urban Males Females Males Females Males Females Males Females Males Females Males Females Males Females Males Female!
1 2 18 19 20 21 22 23 24 25 26 27 23 29 30 31 32 33
BHARUCH DISTRICT T 100 11 337 109 1,094 337 124 56 138 31 384 18 1.424 438 13,041 18,996
R 56. 8 333 105 463 222 71 27 89 18 150 3 650 81 10,186 15,096
U 44 3 4 3 631 115 S3 29 4~ 13 234 15 774 357 2,855 3,900
Bharoch Taluka T 29 12 II 761 249 52 43 50 10 206 '51 2S7 3,497 4,617
R 5 31 II 228 142 19 16 15 .. 55 .. 112 6 1,775 2,302
U 24 1 533 107 33 27 35 10 151 8 439 251 1,722 2,315
Bharucb U 23 I " 473 86 33 27 35 10 137 421 248 1,633 2,164
co Palej U I " 60 21 14 12 3 89 151
\0 Anklesvar Taluka T 55 5 18 5 134 43 15 2 14 8 61 6 13l 36 1,017 1,472
R 38 2 11 5 116 43 10 1 5 5 26 I 63 12 790 1,157
U 11 3 I 18 5 1 9 3 35 5 68 44 227 315
Anklesvar U 17 3 I 18 5 1 9 35 5 68 44 227 31S
Hansot Mahal T 3 11 32 10 tl 50 16 892 1,320
R 3 6 29 10 5 34 5 816 1,207
U 5 3 4 16 11 76 Il3
Hansot U 5 3 4 16 11 76 !13
Vagra Taluka R 8 32 3 994 1,559
Jambusar Taluka T 60 11 75 B 14 2 6 .. 54 3 201 29 2,844 4,679
R 58 II 36 7 7 1 4 20 2 109 10 2,428 4,094
U 2 39 1 7 I 2 34 I 92 19 416 58S
Jambusar U 2 39 1 7 1 34 1 92 19 416 585
Amod Taluka T 11 73 28 8 3 14 92 18 1,035 1,531 R 11 49 21 4 3 11 48 6 !69 1,294
U 24 .. 4 3 44 12 166 217
Amod U 24 4 3 44 12 166 237
Ihagadia Taluka R 21 9 16 73 16 940 1,402
Nandod Taluka T " 129 70 16 24 6 12 182 ~4 1,447 1,869
R .. 129 67 4 21 6 5 .. 67 4 1,199 I,m u l 12 3 7 I 11$ 20 248 315
R.ajpip1a U 12 7 lJ5 20 24& l31
Dcciiapada Taluka R 18 2 46 4 93 146
Sagbara Taluka R 11 33 5 118 178
Valia Taluka R 20 10 33 10 164 22J
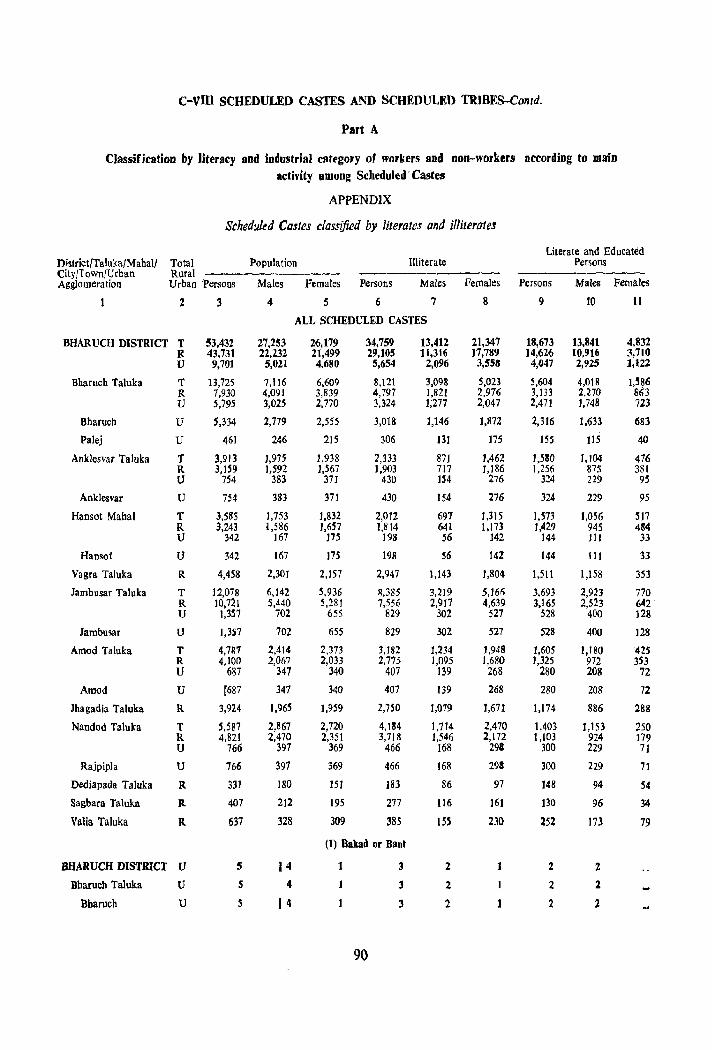
c-vrn SCHEDULED CASTES AND SCHEDULED TRIBES-Conrd.
Part A
Classification by literacy and industrial clItfgory of workers aDd non-workers according to maiD activity among Scheduled' Castes
APPENDIX
Scheduled Castes classified by literates and illiterates
Literate and Educated District/Taluka/Mahal/ Total Population Illiterate Persons City/Town/Urban Rural ---------- ---------Agglomeration Urban 'Persons Males Females Persons Males Females Persons Males Females
2 3 4 5 6 7 8 9 10 11
ALL SCHEDULED CASTES
BHARUCH DISTRICT T 53,432 27,253 26,179 34,759 13,412 21,347 18,673 13,841 4.832 It 43,731 22,232 21,499 29,105 11,316 17,789 14,626 10.916 3,710 V 9,701 5,021 4.680 5,654 2,096 3,558 4,047 2,925 1,122
Bharuch Taluka T 13,725 7.116 6,609 8,121 3,098 5,023 5,604 4,018 1,'86 It 7,930 4,091 3,839 4,797 1,821 2.976 3,133 2,270 863 V 5,795 3,025 2,770 3,324 1;277 2,047 2,471 1,748 723
Bharucb U S,334 2,779 2,555 3,018 1,146 1,872 2,316 1,633 683
Palej U 461 246 215 306 131 175 ISS 115 40
Anklesvat Taluka T 3,913 1,975 1,938 2,333 871 1,462 1,580 J,I04 476 R 3,159 1,592 1,~67 1,903 717 1,186 1,256 875 381 U 754 383 371 430 154 276 n4 229 95
Anklesvar V 754 383 371 430 154 276 324 229 95
Hansot MahaI T 3,58$ 1,753 1,832 2,012 697 ],315 1,573 1,056 517 R 3,243 l,586 1,657 1,814 641 1,173 1,429 945 484 V 342 167 175 198 56 142 144 111 33
Hansot U 342 167 175 198 56 142 144 lIr 33
Vagra Taluka R 4,458 2,301 2,157 2,947 1,143 1,804 1,511 1,158 353
Jamhusar Taluka T 12,078 6,142 5,936 1l.385 3,219 5,1611 3,693 2,923 770 R 10,721 5,440 S,28] 7,556 2,917 4,639 3,165 2,523 642 U 1,3S7 702 655 829 302 527 528 400 128
Jambusar U 1,3S7 102 655 829 302 527 528 400 128
Amod Taluka T 4,787 2,414 2,373 3.182 1,234 1,948 1,605 1,180 425 R 4,100 2,067 2,033 2,775 1,095 1,680 1,325 972 353 U 687 347 340 407 139 268 280 208 72
Amod U [687 347 340 407 139 268 280 208 72
Jhagadia Taluka R 3,924 1,965 1,959 2,750 1,079 1,671 1,174 886 288
Nandod Taluka T 5,587 2,867 2,720 4.184 1.714 2,470 1,403 ],153 250 R 4,821 2,470 2,351 3.718 1.546 2,172 1,103 924 179 U 766 397 369 466 168 291 300 229 71
Rajpipla U 766 397 369 466 168 291 300 229 71
Dediapada Taluka R 331 180 151 183 86 97 148 94 54
Sagbara Taluka R 407 212 195 277 116 161 130 96 34
Valia Taluka R 637 328 309 385 15S 230 252 173 79
(1) Baud or Bant
BHARUCH DISTRICT V 5 14 1 3 2 1 2 :z Bbaruch Taluka U S 4 J 3 2 2 2
Bbaruch U 5 14 1 3 2 2 2
90
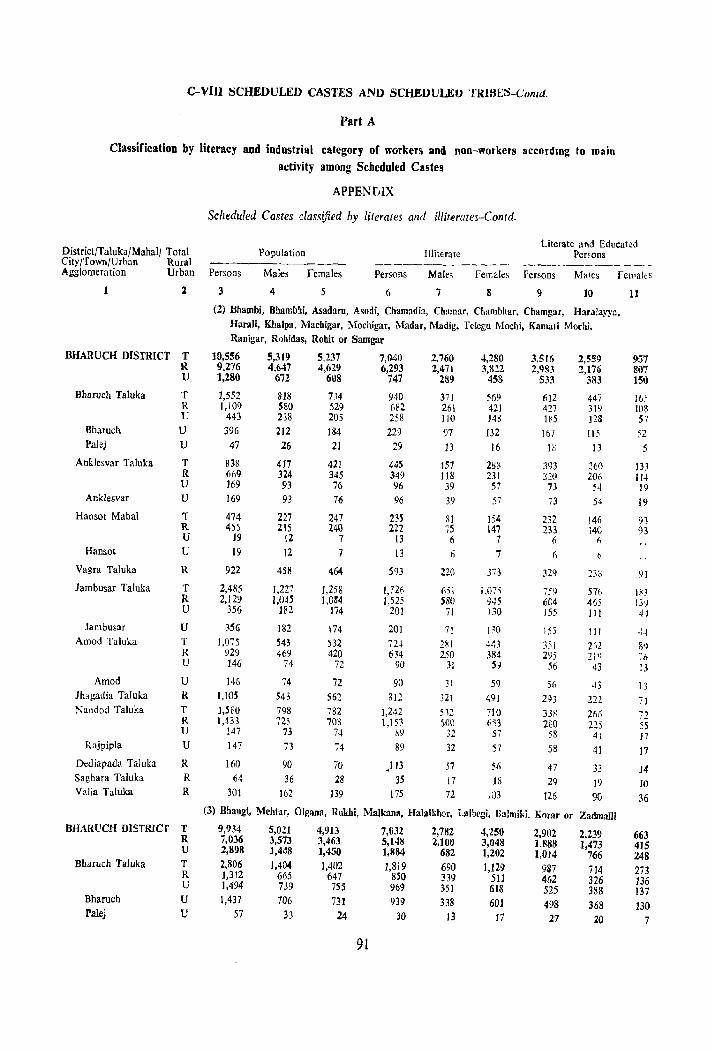
C-VlH SCHEDULED CASTES AND SCHEDULEU TRI8ES-Comd.
Part A
Classification by literacy and industrial category of workers and non-workers accordmg to rollin
activity among Scheduled Castes
APPENf)IX
Scheduled Castes classified by litera res and iIIiterates-C ontd.
Literate and Educated District/Taluka/Mahal/ Total Population llliterate Perwns City /Town/U rban Rural ----------- ------------- -------------Agglomeration Urban Persons Males Females Persons Males Femdes Fersons Males Females
1 3 4 5 6 7 8 9 10 11
(2) Bhambi, Bhamb!!i. Asadaru, Asodi, Chamadh, Chamar, Chambhar, Chamgar, Haralayya. Harali, Khalpa, Machigar, Mochigar, :\fadar, Madig, Telegu Mo~hi, Kamati Mochi. Ranigar, Rohidas, Rohit or Samgar
BHARUCH DISTRICT T 10,556 5,319 5,237 7,040 1,760 4,280 3.516 2,559 957 R 9,276 4.647 4,629 6,293 2,471 3,822 2,983 2,176 E07 U 1,280 672 608 747 289 453 533 333 150
Bharuch Taluka T 1,552 818 7.14 940 371 569 612 447 16.' R 1,109 580 529 682 261 421 427 319 lO3 U 443 238 205 258 110 148 1~5 m 57
Bharuch U 396 212 184 229 97 132 167 115 :.2 Palej U 47 26 21 29 13 16 IS J3 j
Anklesvar Taluka T 838 417 421 445 157 28S 393 260 133 R 669 324 345 349 118 231 320 206 114 U 169 93 76 96 39 57 73 54 19
Anklesvar U 169 93 76 96 39 57 73 54 19 Hansol Mabal T 474 227 247 235 RI 154 232 146 93
R 455 215 240 222 75 147 233 14G 93 U 19 12 7 13 6 7 6 ~
Hansot U 19 12 7 13 6 7 f, b
Vagra Taluka R 922 458 464 593 220 373 329 133 9J lambusar Taluka T 2,485 1,227 1,258 1,726 651 1,075 i~9 576 1~3
R 2,129 1,045 I,O.!4 1.525 580 9~5 6C4 4~5 139 U 356 ]82 174 201 71 130 155 III H
Jambusar U ~S6 182 174 201 71 PO 155 111 .1..1 Amod Taluka T 1,075 543 534 72~ 2~1 443 351 2:,2 89
R 929 469 420 634 250 384 295 ZIG ;'" U 146 74 72 90 3l 59 56 43 13 Amod U 146 74 72 90 ! 1 59 56 .13 13
Jbagadia Taluka R 1,105 543 562 812 321 491 293 222 71 Nandod Taluka T 1,580 798 782 J,242 5,2 710 338 20G 72 R 1,433 "7~. 708 1,153 500 653 2S0 225 55
,_, U 147 73 74 ~9 32 57 58 41 17
Rajpipla U 147 73 '74 89 32 57 58 41 17 Dediapada Taluka R 160 90 70 )13 57 56 47 33 14 Sagbara Taluka R 64 36 28 3S 17 J8 29 19 10 Valia Taluka R 301 162 139 175 72 lll3 126 90 36
(3) Bhangi, Mehtar, Olgana, Rukhi, Malkana. Halal"h~r, Lalbegi, Balmiki, Korar or Zadmalli
BHARUCH DISTRICr T 9,934 5,021 4,913 7,032 2,782 4,253 2,902 2,239 663 R 7,036 3,573 3,463 5,148 2,100 3,048 1.888 1,473 415 U Z,898 1,448 1,450 1,884 682 1,202 1,014 766 248 Bharuch Taluka T 2,806 1,404 1,402 1,819 690 1,129 987 714 273 R 1,312 665 647 850 339 511 462 326 136 U 1,494 739 7S5 969 351 618 525 338 137
Bharuch U 1,437 706 731 939 338 601 498 368 130 Palej U 57 33 24 30 13 17 27 20 7
91
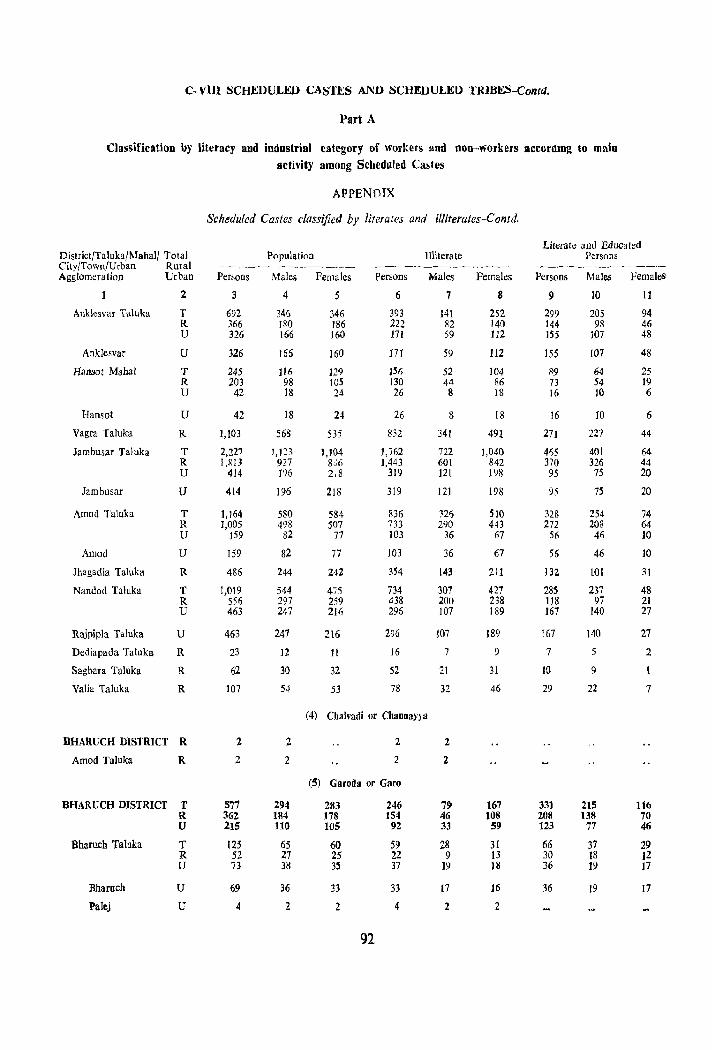
C-VlU SCHKDULED CASTES AND SCHEDULKI) nUHES-Comel.
Part A
Classification by literacy and industrial category of workers ~nd non-workers accordlDg to main
activity among Scheduled Ca~tes
APPENOIX
Scheduled Castes classified by literates and illiterates-C ontd.
Literate and Educated District/Taluka/Mahal/ Total Population Illiterate Persons City/Town/Urban Rural ~-,------~---- -~------------ -------------Agglom~ration Urban Persons Males Females Persons Males Females Persons Males Females
2 3 4 5 6 7 8 9 10 11
Anklesvar Taluka T 692 346 346 393 141 252 299 205 94 R 366 180 186 222 82 140 144 98 46 U 326 166 160 171 59 112 155 107 48
Anklesvar U 326 166 160 171 59 112 155 107 48
H8nsot Mahal T 245 116 129 jS(; 52 104 R9 64 25 R 203 98 105 130 44 86 73 54 19 U 42 18 24 26 8 18 16 10 6
Hansot U 42 18 24 26 8 18 16 10 6
Vagra Taluka R 1,103 568 535 832 341 491 271 227 44
Jambusar Taluka T 2,227 J,123 J,104 1,762 722 1,040 465 401 64 R 1,~13 927 8,:6 1,443 60l 842 370 326 44 U 414 196 2,8 319 121 198 95 75 20
lambusar U 414 196 218 319 121 198 95 75 20
Amod Taluka T 1,164 580 584 836 326 SIO 328 254 74 R 1,005 498 507 733 290 443 272 208 64 U 159 82 77 103 36 67 56 46 10
Amod U 159 82 77 103 36 67 56 46 10
Jhagadia Taluka R 486 244 242 354 143 211 132 101 31
Nandod Taluka T 1,019 544 475 734 307 427 285 237 48 R 556 297 259 438 200 238 118 97 21 U 463 247 216 296 107 189 167 140 27
Rajpipla Taluka U 463 241 216 296 107 189 161 140 27
Dediapada Taluka R 23 12 11 16 7 9 7 2
Sagbara Taluka R 62 30 32 52 21 31 10 9 1
Valia Taluka R 107 S4 53 78 32 46 29 22 7
(4) Cbalvadi or Channayya
BHARUCH DISTRICT R 2 2 2 2
Amod Taluka R 2 2 2 2
(5) Garoda or Garo
BHARUCH DISTRICT T 577 294 283 246 79 167 331 215 116 R 362 184 178 154 46 108 208 138 70 U 21S 110 105 92 33 59 123 77 46
Bharuch Taluka T 125 65 60 59 Z8 31 66 37 29 R 52 27 25 22 9 13 30 18 12 U 73 38 35 37 ]i) 18 36 19 ]7
Bharuch U 69 36 33 33 17 16 36 19 17
Palej U 4 2 2 4 2 2
92
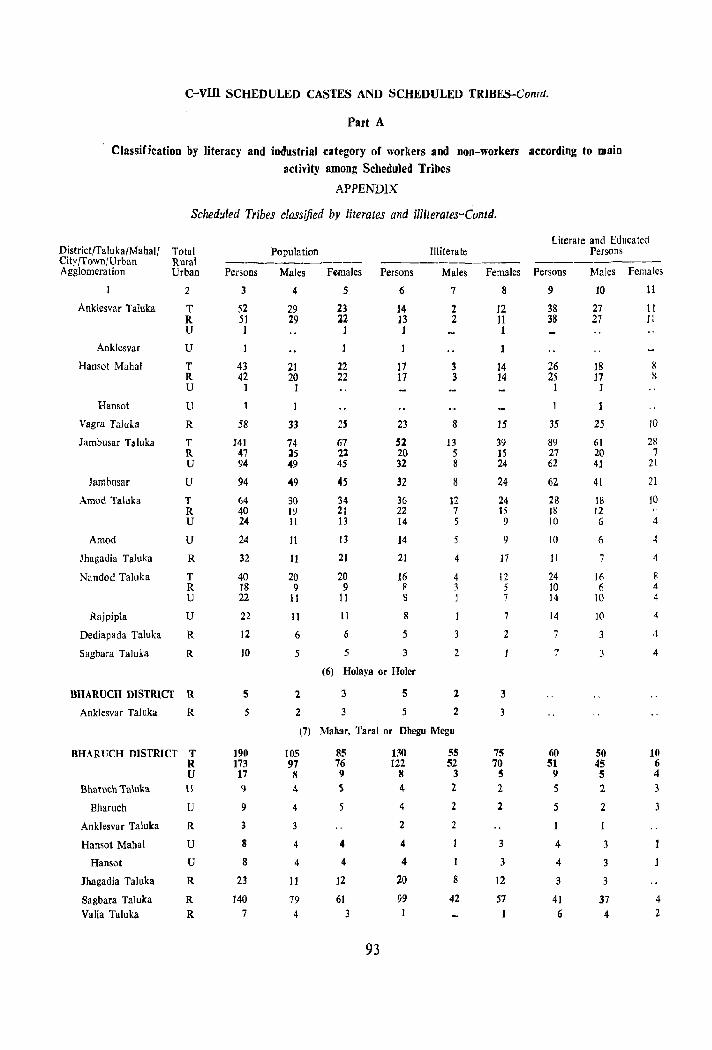
c-vm SCHEDULED CASTES AND SCHEDULED TRlBES-Comd.
Part A
Classification by literacy and industrial category of workers and Don-workers according to main activity among Scheduled Tribes
APPENDIX
Sched:i'ed Tribes classified by literates and illiterates-Contd.
Literate and Educated DistrictlTaluka/Mahal1 Total Population Illiterate Persons City/Town/Urban Rural ----------- --------A gglomera t ion Urban Persons Males Females Persons Males Females Persons Males Females
2 3 4 S 6 7 8 9 10 11
Anklesvar Taluka T 52 29 23 14 2 12 38 27 II R 51 29 22 13 2 11 38 27 11 U 1 1 1 1
Anklesvar U 1 1 1 1
Hanso! Mahal T 43 21 22 17 3 14 26 18 8 R 42 20 22 17 3 14 25 17 11 U 1 1 1 ]
Hansol U 1 1 1
Vagra Taluh R 58 33 25 23 8 15 3S 25 10
Jarnbusar Taluka T 141 74 67 '2 13 39 89 61 28 R 47 15 22 20 5 15 27 20 7 U 94 49 4S 32 8 24 62 41 21
Jambusar U 94 049 045 32 8 24 62 41 21
Arnod Talllka T 64 30 34 36 12 24 28 18 10 R 40 19 21 22 7 15 18 12 U 24 11 13 14 5 9 10 6 4
Amod U 24 11 13 14 9 to 6 -I
Jhagadia Ta1uka R 32 11 21 21 4 17 11 7 4
Nandod Taluka T 40 20 20 16 4 12 24 16 8 R 18 9 9 R 3 5 10 6 4-
U 22 II II 8 I 7 14 10 4
Rajpipla U 22 11 11 8 7 14 10 4
Dediapada Taluka R 12 6 6 5 2 7 3 4
Sagbara Taluka R 10 5 5 3 2 ... 3 4 ,
(6) Holaya or Holer
BHARUCH DISTRICT R S 2 3 S 2 3
Anklesvar Taluka R S 2 3 5 2 3
(7) Mahar, Taral or Dhegu Megu
BHAR{)CH DISTRICT T 1911 105 8S 130 S5 75 60 SO 10 R 173 97 76 122 52 70 51 45 6 U 17 8 9 8 3 5 9 5 4
BhllTuch Taluka U 9 ... S 4- 2 2 5 2 3
Bharuch U 9 4 5 4 2 2 5 2 3
Anklesvar Taluka R 3 3 2 2 1
Hansot Mahal U 8 4 4 4 3 4 3
Hansot U 8 4 4 4 3 4 3
Jhagadia Taluka R 23 11 12 20 8 12 3 3
Sagbara Taluka R 140 79 61 99 42 57 41 37 4
Valia Taluh R 7 4 3 1 6 4 2
93
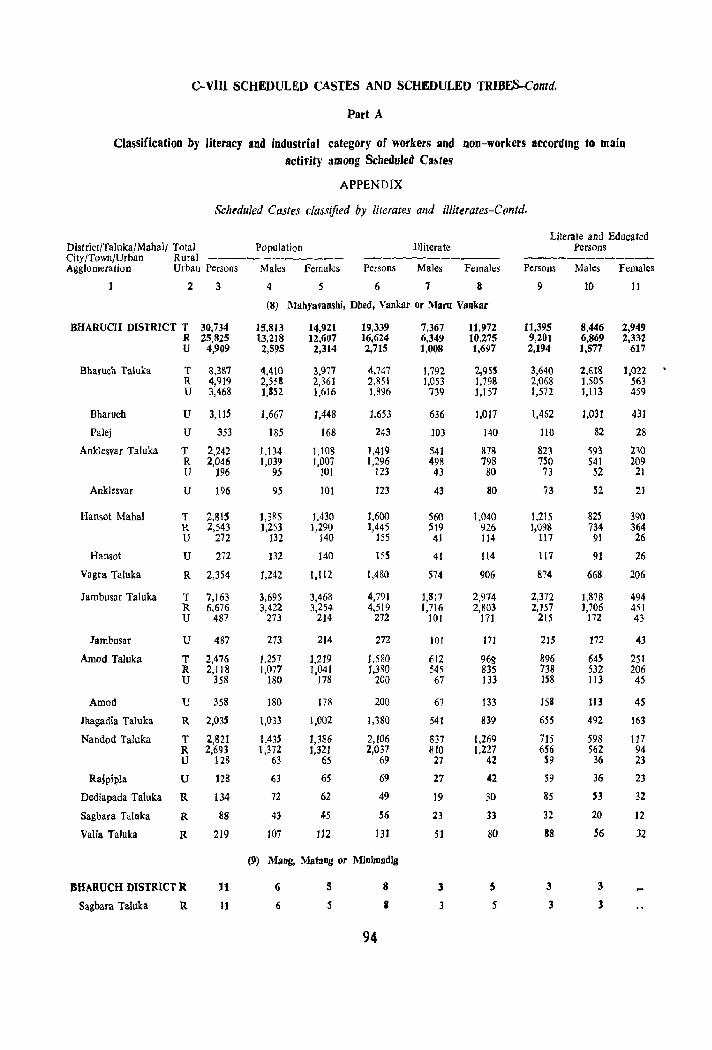
C-VIU SCHEDULED CASTES AND SCHEDULED TRIBES-conrd.
Part A
Classification by literacy and industrial category of workers lind non-workers according to main activity among Scheduled Ca~tes
APPENDIX
Scheduled Castes classified by literates and illiterates-Contd.
Literate and Educated District/Taluka/Mahal/ Total Population Illiterate Persons City/Town/Urban Rural ----------- --------- ----------Agglomeration Urban Persons Males Females Persons Males Females Persons Males Females
2 3 4 5 6 7 8 9 ]0 11
(8) Mahyavanshi, Dhed, Vankar or Maru Vankar
BHARUCH DISTRICT T 30,734 15,813 14,921 19,339 7,367 11,972 11,395 8,446 2,949 R 25,825 13,218 12,607 16,624 6,349 10,275 9,201 6,869 2,332 U 4,909 2,595 2,314 2,715 1,008 1,697 2,194 1,577 617
Bharuch Taluka T 3,387 4,410 3,977 4,747 1,792 2,95~ 3,640 2,61& 1,022 R 4,919 2,558 2,361 2,851 1,053 1,798 2,068 1,505 563 U 3,468 ],IS2 1,616 ],896 739 1,157 1,572 1,113 459
Bharucb U 3,11S 1,667 1,448 1.653 636 1,017 1,462 1,031 43]
Palej U 353 185 168 243 ]03 ]40 110 82 28
Anklesvar Taluka T 2,242 1,134 1,108 1,419 541 87& 823 593 230 R 2,046 1,039 1,007 1,296 498 798 7S0 54] 209 U 196 95 101 123 43 80 73 52 21
Anklcsvar U 196 95 101 123 43 80 73 52 21
Hansot Mahal T 2,m 1,3R5 1.430 1,600 560 1,040 1.215 825 390 R 2,543 },253 1,290 1,445 519 926 ],098 734 364 U 272 J32 140 155 41 114 117 91 26
Hansot U 272 132 140 155 41 114 117 91 26
Vagra Taluka R 2,354 1,242 1,112 1,480 574 906 874 668 206
Jambusor Taluka T 7,163 3,695 3,468 4,791 1,817 2,974 2,372 ],878 494 R 6,676 3,422 3,254 4,519 1,716 2,803 2,157 1,706 451 U 487 273 214 272 101 171 215 172 43
lambusar U 487 273 214 272 101 171 21S 172 43
Amod Taluka T 2.476 1.257 1,219 1.580 612 96g 896 645 251 R 2,118 1,077 1,041 1,380 545 835 738 S32 206 U 358 180 178 200 67 133 IS8 113 45
Amod U 358 180 178 200 67 133 ISS 113 45
Jhagadia Taluka R 2,Q3S 1,033 1,002 1,380 541 839 6SS 492 163
Nandod Taluka T 2,821 1.43S 1,386 2,106 837 1,269 715 593 111 R 2,693 1,372 1,321 2,037 810 1.227 656 562 94 U 128 6> <is 69 27 42 S9 36 23
Ra;pipla U 128 63 65 69 27 42 S9 36 23
Dediapada Taluka R 134 72 62 49 19 30 85 53 32
Sagbara Talllka R 88 43 45 56 23 33 32 20 12
Valia Taluka R 219 107 112 131 51 80 88 36 n
(9) Mang, Matang or Miniroadig
BHARUCH DISTRICT R 11 6 5 8 3 5 3 3
Sagbara Taluka R 11 6 5 I 3 5 3 3
94

C-VID SCHEDULED CASTES AND SCHEDULED TRIHES-Contd.
Part A
Classification by literacy aod industrial category of workers snd non-workers IIccording IC main activity among Scheduled Castes
APPENDIX
Sched'.lled Castes classified by literates and illiterates-Concld.
District/Taluka/MahaJI Total Population Illiterate City/Town/Urban Rural -----------Agglomeration Urban Persons Males Females Persons Males Females
2
BHARUCH DISTRICT U Bharuch Taluka U
Bharuch U
BHARUCH DISTRICT T R U
Bharuch Taluka U Bharuch U
Nanuod Taluka R
BHARUCH DISTRICT T R U
Bharuch TaJuka T R U
Bharuch U Anklesvar Taluka U
Anklesvar Jambusar Taluka
Jambusar
U U U
3
I)
9 9
3D 25 5 5 5
25
21) 10 19 II 10 1
12 12 6 6
BHARUCH DISTRICT T 1.3SD
Bharuch Taluka
Bharuch Anklesvar Taluka
Anklesvar Vagra Taluka Iambusar Taluka
R 1,006 U 344
T 816 R 52& U 288 U 28~
T 69 R 19 U 50
U 50
R 21 R 56
Amod Taluka R 6
243 102
Jhagadia Taluka R Nandod Taluka T
R U
RajpipJa U Dediapada Taluka R Sagbara Taluka R Valia Taluka R
96 6 6 l
32 3
4
5 5
5
5 6
{to) Menghval or Mengbvar 4 5 4 5
4 5
7
1
1 1
(11) Shellva, Chenva, Sedma or Rawat 17 13 28 15 12 13 25 12 5 J 3
5 3 3 3
12
14 5 9 6 5 1 1
6
6
2 2
651 486 165
395 256 139 139 38 15 23 23
2\ 2
123 58 55 3 3
13
13 :5 (12) Turi
15 21 5 8
10 13 5 , 5 8
6 8 6
4 4
8 5 S
(13) Unspecified 699 1)00 520 716 179 184
421 533 272 3R4 149 149 149 149 31 47 4 16
27 3! 27 31 21 19 35 49 4
120 44 41 3 3 2
19 2
4 ]6)
61 57 4 4
24
95
12
1 3 4
3 3
3 3
:m 276
61
206 ]56 50 SO 23 13 10 10
15 I
62 22 21 1
8
8
4
4 4
13 13
13
14 5 9
5 5
S 5 4
4
563 440 123
327 228 99 99 24 3
21 ~1
19
34 3
101 39 36
3 3
16
literate and Educated Persons
Persons
9
4
4
4
2
2 2 2
il 2 6
3 2 I
4
4 1 1
450 290 160
283 144 139 139 22
3 19
19 2 7 2 80 41 39 2
2 2 8 3
Males Fe~lalcs
10
4 4 4
2
2 2 2
7 2 5 3 2 I J 3 3
314 210 104
189 100 89 89 15 2
13 13
6
61 36 34 2 2
II
136 80 56
94 44 50 SO
'7 1 6 6
2
19
5 5
2 3
2
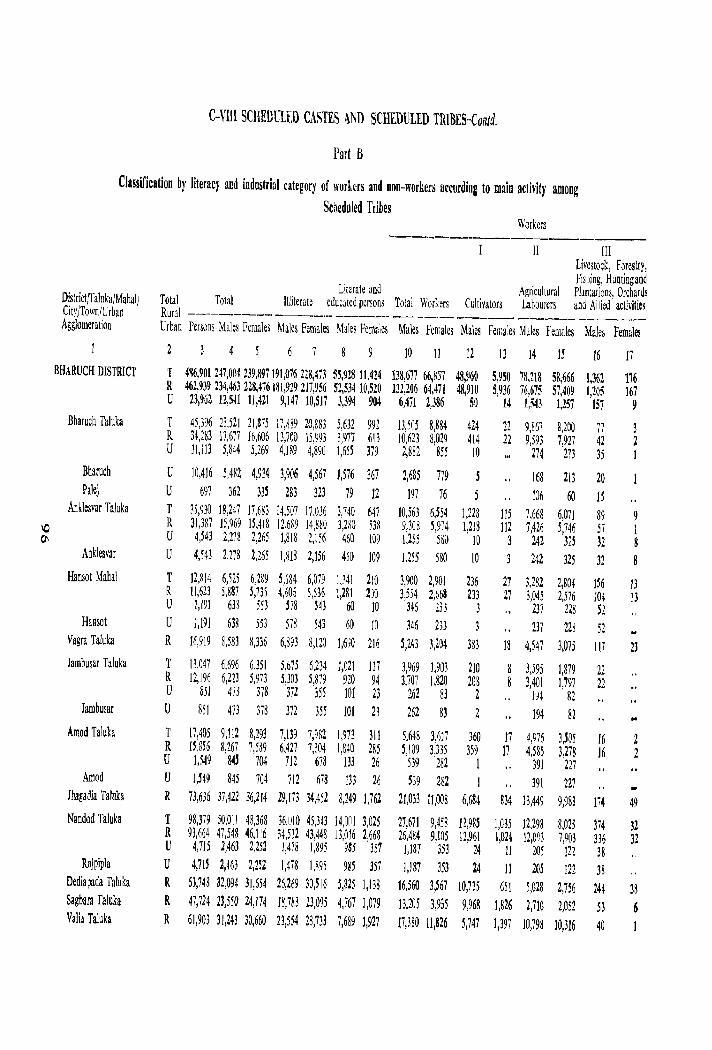
C-VIIl SCHEDULED CASTES AND SCHEDULED TRIBES-Conid.
llart B
Classification by literacy and industrial category of worlers and Don-workers according to main activity among Scned~led Tribes
Workers ----"-------_._----------
II III Livestock, Forestr1, Fisbing, Hantingand
Literate and Agricultural Pbn:alions, Orchard! District/Taluka/Mahall Total Total Illiterate edu:ated persons Total Workers Cultivators Labourers and AWed activities City/Town/Urban Rural ----------- ---____________________________________ Agglomeration Urban Persons Males Females Males Females Males Femnles Males Females Males Females Jlales Females Males Females
10 11 12 13 14 " ]6 17 BHARUCH DISTRICT T 4~6,901 247,On4 239,897191,016 228,473 55,928 11,424 138,677 66,857 48,%0 5,950 78,218 58,666 1,362 176 R 462,939 234,463 228,476181,929 217,956 52,534 10,520 132,206 64,471 48,910 5,936 76,675 57,409 1,205 167
U 23,962 12,541 11,42l 9,147 10,517 3,394 904 6,471 2,386 50 14 1,543 1,257 157 9 Bharuch Taluka T 45,396 23,521 21,875 17,H!9 20,883 5,632 992 13,505 8,884 424 21 9,167 i,LOO 77 3 R 34,283 17,677 16,606 13,700 15,993 3,977 613 10,623 8,029 4[4 22 9,593 7,927 42 2
U lJ,113 5,844 5,269 4,189 4,890 1,655 379 2,8i2 855 10 274 213 35 [
Bharuch U 1O,4J6 5,482 4,9J4 3,906 4,567 1,576 367 2,685 779 168 213 20 Palej U 697 362 33S 283 323 79 12 197 76 106 60 15
Anklesvar Tal uka r 35,9JO 18,247 17,683 14,507 17,036 3,740 647 10.563 6,554 1,228 115 7,668 6,071 89 9 10 R 31,387 15,969 [5,418 12,6S9 [4,830 3,280 538 9,308 S,974 1,21B 112 7,426 S,746 57 1
'" U 4,543 2,278 2,265 1,818 2,[56 460 109 l,lSS 580 10 3 242 323 32 8 Anklesvar U 4,543 2,278 2,265 1,818 2,1% 450 109 1,255 580 10 242 325 32
Hansot Mahal T 12,814 6,525 6,289 5,184 6,079 ])41 110 3,900 2,901 236 27 3,282 2,804 156 13 R 11,623 5,887 I,m 4,605 5,536 1,281 2)0 3,554 2,668 233 27 3,045 2,576 104 13 V 1,19] 633 553 m 143 60 10 346 233 3 237 228 52 HaRsot U 1,191 63S 55) 573 543 IiO 10 346 213 3 237 228 52
Vagra Taluka R 16,919 8,583 8,336 6,893 8,120 1,690 216 5,243 3,204 m 13 4,547 3,075 117 21 Jambusar Taluka T 13,047 £,696 6.351 5,675 6,234 1,021 117 3,969 1,903 210 3,595 1,879 22 R 12,196 6,223 5.973 j,303 5,879 910 94 J,i07 1,820 208 3,401 1,797 22 V 851 473 378 37Z 355 101 23 262 83 2 194 82
lambusar U Sil 473 378 372 355 101 23 262 83 194 82 • Amod Taluka T 17,405 9,112 8,293 7,139 7,982 1,973 W 5.648 3,617 360 17 4,976 3,505 16 2 R 15,856 8,267 7,589 6,427 7,304 1,840 285 ~,109 3,335 359 17 4,585 3,278 16 2 U 1,549 84' 704 712 678 ll3 26 539 282 1 391 217
Amod U 1,549 845 704 712 678 133 26 539 282 I 391 227 • Jhagadia Taluka R 73,636 37,422 36,214 29,173 34,452 8,249 1,762 21,033 11,008 6,684 834 13,449 9,98l 174 49 Nando d Taluka T 98,379 50,011 48,368 36.010 41,343 14,001 3,025 27,671 9,458 11,98S 1,035 12,298 8,025 374 32 R 93.664 47,548 46,1:6 34,5J2 43,448 13,016 2,668 26,4E4 9,105 12,96[ 1,024 12,O9~ 7,90~ 336 32 U 4,715 2,463 2,252 1,478 1,895 985 357 1,187 353 24 II 205 J22 38
Rajpipla U 4,71S 2,463 2,212 1,478 1,895 9S5 357 l,l87 353 24 11 205 122 38 Dediapada Taluka R 63,748 32,OH 31,654 26,269 30,516 5,825 1,1 3~ 16,560 3,567 10,735 651 5,028 2,756 244 33 Sagbara Talllka R 47,724 2l,i5Q 24,174 18,783 23,095 4,767 1,079 13,205 3,935 9,968 1,826 2,710 2,052 53 6 Valia Taluka R 61,90> 31,243 30,660 23,554 2~,733 7,689 1,927 17,380 11,826 5,747 1,397 10,798 10,316 40
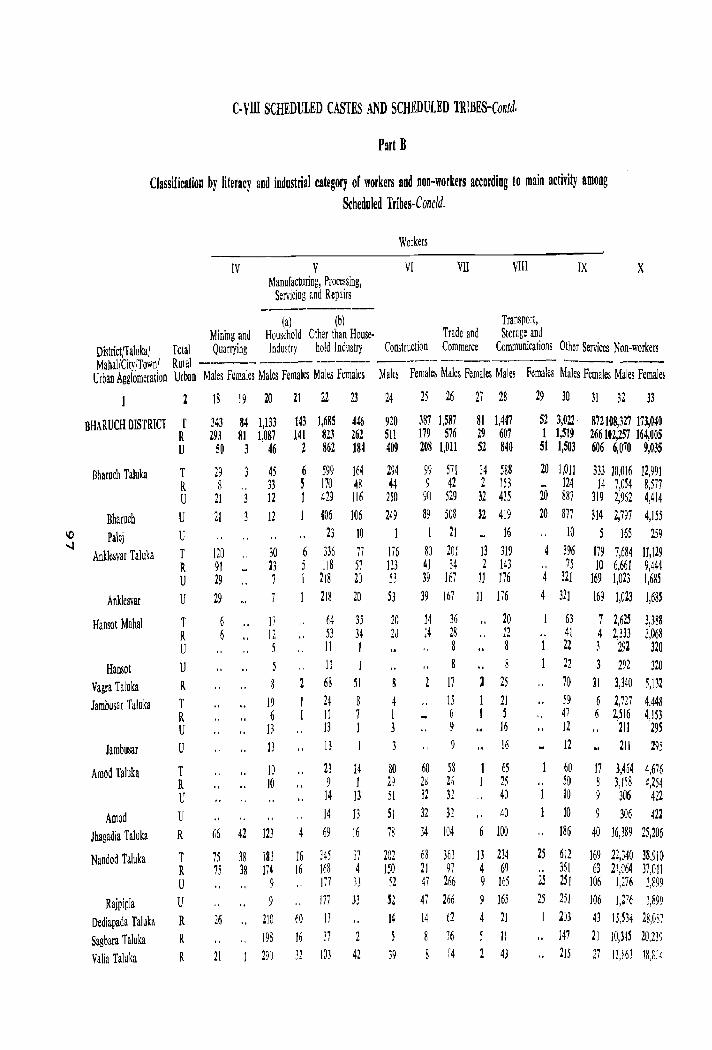
C- VIIT SCHEDULED CASTES AND SCHEDULED TRIBES-Contd,
Psrt B
Classification by literacy and industrial category of workers and non-workers according to main activity among Scheduled Tribes-Concld.
Werkers
IV V VI VII VIlI IX X Manufacturing, Procelsing,
Servicing and Repairs -----------
(a) (b) Transport, Mining and Household Other than House· Trade and Storage and
District/Taluka/ Total Quarrying Industry hold Industry Construction Commerce Communications Other Services Non-workers MahalICity/Town! RUlal ------- ---~- ------- ------ --------- ~-- ----
Urban Agglomeration Urban Males Females Males Females Males Females Males Females Males Females Males Females Males Females Males Fem~ei
18 19 20 21 22 23 24 25 26 27 28 29 30 31 32 33
BHARUCH DISTRICT T 343 84 1,133 143 1,685 446 920 387 1,587 81 1,447 52 3,022· 872108,327 173,040 R 293 81 1,081 141 823 262 5\1 179 576 29 607 1 1,519 266102,257 164,005 U 50 3 46 2 862 18~ 409 208 1,On 52 840 51 1,503 606 6,070 9,035
Bharuch Taluka T 29 3 45 6 599 164 294 99 571 34 588 20 J,Oll 333 10,016 12,991 R 8 " 33 5 170 48 44 9 42 2 153 124 14 7,054 8,577 U 21 3 12 I 429 116 250 90 529 32 435 20 887 319 2,962 4,414
Bharuch U 21 3 12 406 106 249 89 508 32 419 20 877 314 2,797 4,155 10 Palej U 23 10 I 21 16 10 165 259 -.J
Anklesvar Taluka T 120 30 6 336 77 176 80 20J 13 319 396 179 7,684 11,129 R 91 23 5 118 57 123 41 34 2 143 " 75 10 6,661 9,444 U 29 7 1 218 20 53 39 167 II 176 4 321 169 1,023 1,685
Anklesvar U 29 7 218 20 53 39 167 II 176 4 32] 169 1,023 1,68S
Hansot Mahal T 17 c4 35 20 14 36 ,., 20 63 7 2,625 3,388 R 12 53 34 2J 14 28 .. 12 .. 41 4 2,m 3,068 U 5 II 1 8 8 1 22 3 292 320
Hansot U 11 8 8 22 292 320
Vagra Taluka R 8 68 51 17 25 70 11 3,340 5,132
!ambusar Taluka T 19 24 8 4 15 21 59 6 2,727 4.448 R 6 11 7 I ... 6 S 47 6 2,516 4,153 U 13 13 1 3 9 16 12 211 295
Jambusar U J3 13 1 9 16 12 211 295
Amod Taluka T 10 2) 14 80 60 58 1 65 60 17 3,464 4,676 R 10 9 1 29 2S ~( 1 25 50 ~ 3,118 4,254 .~ " U 14 13 51 32 32 40 1 10 9 306 422
Amod U 14 !3 51 32 32 40 1 10 306 422
Jbagadia Taluka R 66 42 123 69 16 78 34 104 ]00 " 186 40 16,389 25,206
Nandod Taluka T 75 38 III 16 ~45 ]7 202 68 36J 13 234 25 612 169 22,340 38,910 R 75 38 174 16 168 4 150 21 97 4 61) 361 63 21,064 37,011 u 9 m }J )2 47 Zh6 9 16) 2S 2S 1 106 1,276 1,899
RajpipJa U 9 m 3) 52 47 266 165 25 25] 106 1,216 1,899
Dediapada Taluka R 26 .. 210 60 17 14 14 12 21 2J3 43 15,5J4 28,087
Sagbara Taluka R .. 198 16 J7 8 76 11 .. 147 2) ]0,315 20,2J9
Valia Taluka R 21 290 J2 IOJ 42 39 8 f4 4) .. 215 27 13,861 JS,S"4
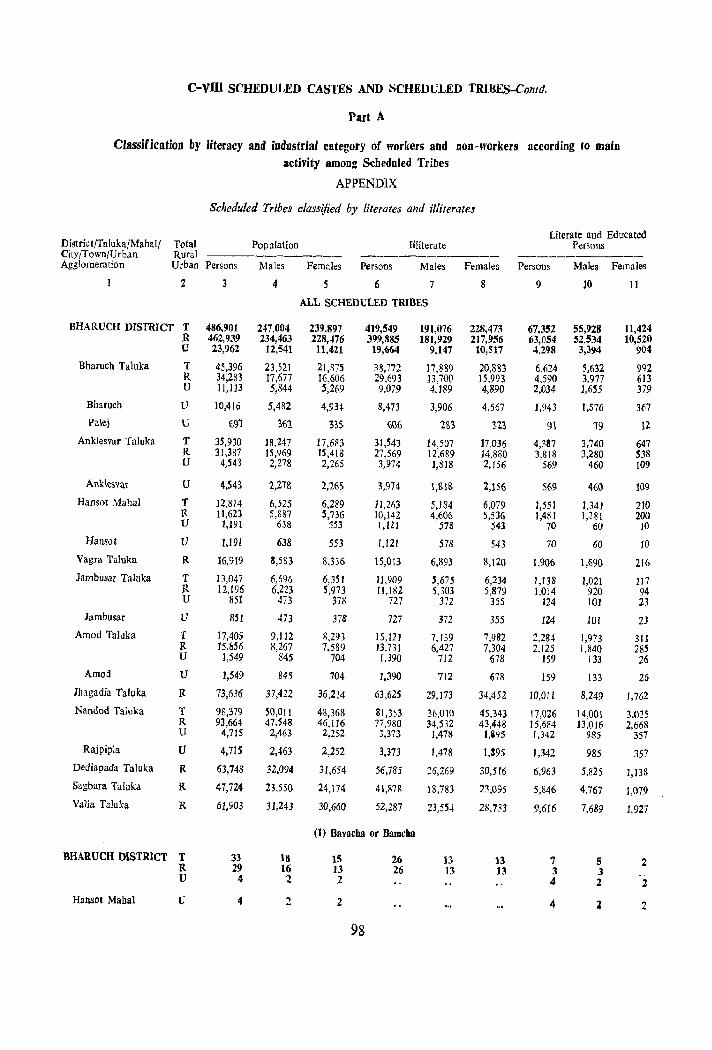
c-vm SCHEDULED CASTES AND SCHEDULED TRIBES-Con/d.
Part A
Classification by literacy and industrial category of workers and non-workers according to maio activity amoD2 Scheduled Tribes
APPENDIX
Scheduled Tribes classified by literates and illiterates
Literate and Educated District/Taluka/Mahal/ Total Population TlIiterate Persons City/Town/Urban Rural ~----...--------- ------------ ---------Agglomeration Urban Persons Males Females Persons Males Females Persons Males Females
2 3 4 5 6 7 8 9 10 11
ALL SCHEDULED TRIDES
BHARVCH DISTRICT T 486,901 247,004 239.897 419,549 191,076 22R,473 67,352 55,928 11,424 R 462,939 234,463 228,.176 399,885 181,919 217,956 63,054 52,534 10,520 U 23,962 12,541 11,421 19,664 9,147 10,517 4.298 3,394 904
Bharuch Taluka T 45,396 23,521 21,875 38,772 17,889 20.883 6,624 5,632 992 R 34,283 17,677 16,606 29,693 13,700 15,993 4,590 3,977 613 U 11,113 5,844 5,269 9,079 4,189 4,890 2,034 1,655 379
Bharuch V 10,416 5,482 4,934 8,473 3,906 4,567 1,943 1,576 367
Pale} U fi91 %2 335 Wfi 1\\3 ';,23 9t 19 12 AnkJesvar Taluka T 35,930 18,247 17,683 31,543 14,507 17,036 4,387 3,740 647
R 31,387 15,969 15,418 27,569 12.689 14.880 3,818 3,~80 S38 U 4,S43 2,278 2,265 3,974 1,818 2,156 569 460 109
Anklesvar U 4,543 2,278 2,265 3,914 1,81& 2,156 569 460 109
Hamo! Mahal T 12,814 6,525 6,289 11,263 5,184 6,079 1,551 1,34J 210 R 11,623 5,887 5,736 10,142 4,606 5,536 1,48 I I,m 200 U 1,191 638 553 1,121 578 543 70 60 10
Hansot V 1,191 638 553 1,121 578 543 70 60 10 Vagra Taluka R 16,919 8,583 8,336 15,013 6,893 8,120 1.906 1,690 216
Jambusar Talllka T 13,047 6,696 6,351 11,909 5,675 6,234 1,138 1,021 117 R 12,196 6,223 5,973 1I,182 5,303 5,879 1,014 920 94 U 851 473 378 727 372 355 124 101 23
Jambusar V SSt 473 378 727 372 355 124 101 23 Amod Taluka T 17,40) 9,112 R,293 IS,121 7,139 7,982 1,284 1,973 311
R IS,SS6 8,267 7,589 13,731 6,427 7,304 2,125 1.840 285 U 1,549 845 704 1.390 712 678 IS9 133 26
Amod V I,S49 845 704 1,390 712 673 159 133 26 Jbagadia Taluka R 73,636 37,422 36,214 63,625 29,173 34,452 10,011 8,249 1,762 Nandod Taluka T 98,379 50,011 48,368 81,353 36.010 45,343 17,026 14,001 3,025
R 93,664 47.548 46,116 77,980 34,532 43,448 15,684 13,016 2,668 U 4,715 2,463 2,252 3,373 1,478 1,&95 1,342 985 357
RajpipJa U 4,71S 2,463 2,252 3,373 1,478 1,395 1,342 985 357 Dediapada Taluka R 63,74S 32,094 31,654 56,785 26,269 30,516 6,963 5,825 1,138 Sagbara Taluka R 47,724 23,550 24,174 41,878 18,783 23,()95 5,546 4,767 1,079 Valia Taluka R 61,903 31,243 30,660 52,287 23,5.5~ 28,733 9,616 7,689 1,927
(1) Bavacba or Bamcba
BHARUCH DISTRICT T 33 18 15 26 13 13 7 5 2 R 29 16 13 26 13 13 3 3 U 4 2 2 4 2 2
Hansot Mabal V 4 2 2 4 2 2
98
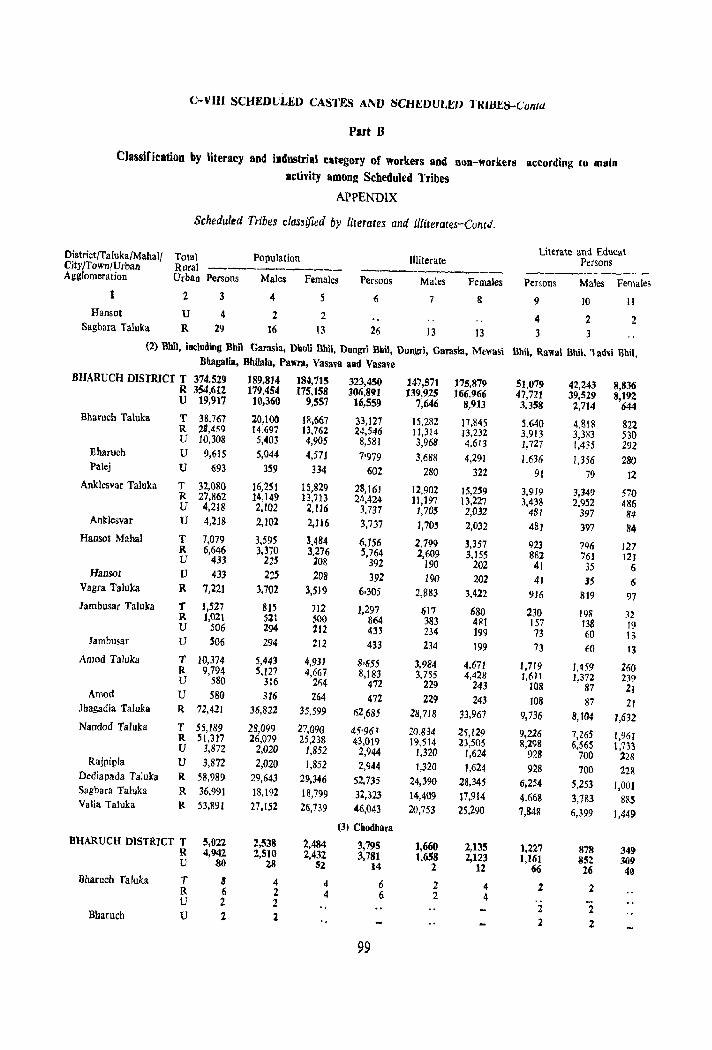
C-VIlI SCHEDULED CASTES AND SCWmVLEU TKUJES-ConleJ
Part B
Classification by literacy and industrial category of workers and oOR-workers according to main activity amoDI: Scbeduled Tribes
APPENDIX
Scheduled Tribes classified by lilerates and i/lilerares-ContJ.
Literate and Educat District/Taluka/Mahall Total Population Illiterate Persons City/Town/Urban Rural ---------- ----------Agglomeration Urban Persons Males Females Persons Males Females Persons Males Females 2 3 4 5 6 7 8 9 10 II
Hansot U 4 2 2 4 2 2 Sagbara Taluka R 29 16 13 26 13 13 3 3
(2) Bbil, including BbU Gorasia, Dboli BbU, Dungrl ShU, DOl1gri, Garasla, Mewasl Bbil, Rawal Rbil, Tad~i Bbil, BbagaJia, BhiIala, Pawra, Vasava aod Vasave
BHARUCH DISTRICT T 374,529 189,814 184,715 323,450 147,571 175,879 5},079 42,243 8,836 R 354,612 179,454 175,158 306,891 139,925 166,966 47,721 39,529 8,192 U 19,917 10,360 9,557 16,559 7,646 8,913 3,358 2,714 644 Bharuch Taluka T 38,767 20,100 J8,667 33,127 15.282 ]1 ,845 S.640 4,81R 822 R 28,459 14,697 13,762 24,546 11,314 13,232 3,913 3,383 530 U 10,308 5,403 4,905 8,581 3,968 4,613 1,727 1,435 292
E.haruch U 9,615 5,044 4,571 7'979 3,688 4,291 1,636 1,356 280 Palej U 693 359 334 602 280 322 91 79 12 Anklesvar Taluka T 32,080 16,251 15,829 28,16J 12,902 15,259 3,919 3,349 570 R 27,862 14,149 13,7)3 24,424 11,197 13,227 3,438 2,952 486 U 4,218 2,102 2,116 3,737 1,705 2,032 481 397 84 Anklesvar U 4,218 2,]02 2,116 3,737 1,703 2,032 48} 397 84 Haasot Mahal T 7,079 3,595 3,484 6,156 2,799 3,357 923 796 127 R 6,646 3,370 3,276 5,764 2,609 3,155 882 76J 12J V 433 225 l08 392 190 202 41 35 6 Hansot V 433 225 208 392 190 202 41 J5 (; Vagra Taluka R 7,221 3.702 3,519 6,305 2,883 3,422 916 819 97 lambusar Taluka T 1,527 81.5 712 1,297 617 680 230 19S J2 R 1,021 52l 500 864 383 4RI 157 138 19 U 506 294 212 433 234 199 73 60 13 Jambusar U S06 294 212 433 234 199 73 60 f3 Amod Taluka T 10,374 5,443 4,931 8'655 3,984 4,671 1,719 I,~59 260 R 9,794 5,127 4,667 8,183 3,755 4,428 1,611 1,372 239 U 580 316 264 472 229 243 108 87 21 Arnod U 580 316 264 472 229 243 108 87 21 Jhagadia Taluka R 72,421 36,822 35,599 62,685 28,718 33,967 9,736 8,104 1,632 Nartdod Taluka T 55,189 28,099 27,090 45-96t 20.834 25,129 9,226 7,265 1,961 R SI,317 26,079 25,238 43,019 19,514 23,505 8,298 6.565 1,733 U 3,872 2,020 1,852 2,944 1.320 1,624 928 700 228 Rajpipla U 3,872 2,020 1,852 2,944 1,320 1,624 928 700 22R Dediapllda Taluka R 58,989 29,643 29,346 52,735 24,390 28,345 6,254 5,253 f,OOI Sagbara Taluka R 36,991 18,192 18,799 32,323 14,4(l9 17,914 4.668 3,183 8FS Valia Taluka R 53,891 27,152 26,B9 46,Q43 20,753 25,290 7,848 6,399 1,4411
(3) Chodbara BHARUCH DISTRICT T 5,022 2,538 2,484 3.795 ],660 2,135 1.227 878 349 R 4,942 2,510 2,432 3,781 1,658 2,123 1,161 852 309 U 80 28 52 14 2 12 66 26 411
Illtarucb fa luka T 8 4 4 6 2 4 2 2 R 6 2 4 6 2 4 U 2 2 2 2 Bbaruch U 2 2 2 2
99
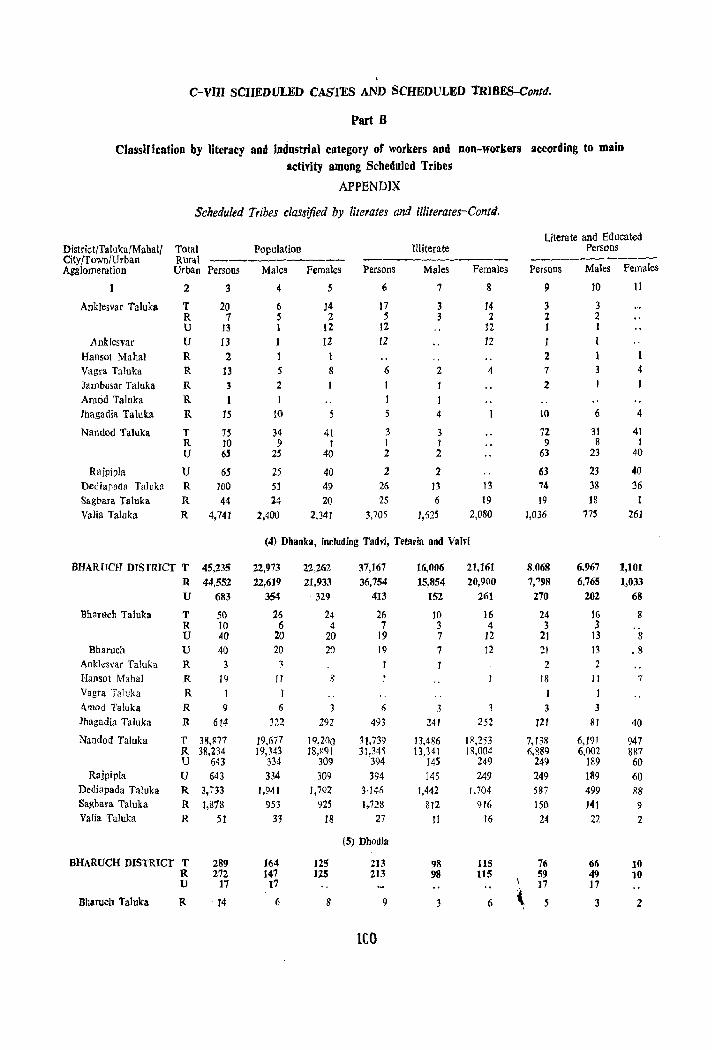
C-VIII SCHEDVLED CASTES AND SCHEDULED TRIBES-Contd.
Part B
Classification by literacy and industrial category of workers and Don-workers according to main activity among Scheduled Tribes
APPENDIX
Scheduled Tribes classified by literates and illiterates-Contd.
literate and Educated District/Taluka/Mahall Total Population Illiterate Persons City/Town/Urban Rural ---------- -----------Agglomeration Urbao Persons Males Females Persons Males Females Persons Males Females
2 3 4 5 6 7 8 ') 10 11
Anklesvar Taluka T 20 6 14 17 3 14 3 3 R 7 5 2 5 3 2 :z 2 U 13 1 12 12 12 1 I
AnkIesvar U 13 1 12 12 12 I
Hallso! Mahal R 2 2 1 Vagra Taluka R 13 5 8 6 2 4 7 4
Jambusar Taluka R 3 2 2 Amod Taluka R 1 I Jhagadia Taluka R 15 lO 5 4 10 6 4
Nandod Taluka T 75 34 41 3 3 72 31 41 R 10 9 I 1 1 9 8 1 U 65 25 40 2 2 63 23 40
Rajpipla U 65 25 40 2 2 63 23 40 Dediapada Taluka R 100 51 49 26 13 13 74 38 36 Sagbara Taluka R 44 14 20 2S 6 19 19 18 Valia Taluka R 4,741 2,400 2,341 3,705 1,625 2,080 1,036 77$ :261
(4) Dhanka, including Tadvi, Tetaria and Valvi
BHARlTCH mSfRICT T 45,235 22,973 22,262 37,167 16,006 21,161 8,068 6.967 1,101
R 44,552 22,619 21,933 36,754 15,854 20,900 7,"98 6,765 1,033 U 683 354 329 413 152 261 270 202 68
Bharnch Taluka T 50 26 24 26 10 16 24 16 8 R 10 6 4 7 3 4 3 3 U 40 20 20 19 7 12 21 13 8
Bharuch U 40 20 20 19 7 12 21 13 .8 Ankles~ar Taluka R 3 I 2 2 Hansot Mahal R 19 T1 3 18 II 1
Vagra Taluka R I I 1 I Amod Taluka R 9 6 3 Ii 3 3 3 Jhagadia Taluka R 614 322 292 493 241 252 121 81 40
Nandocl TaIuka T 38,~77 19,677 1 9, ZOO ) 1,739 13,486 1~,253 7,138 6,191 947 R 38,234 19,343 18,R'l1 3l,34'i 13,341 lR,004 6,RSQ 6,002 887 U 643 334 309 394 145 249 249 189 60
Rajpipla U 643 334 309 394 145 249 249 189 60 Dediapada Taluka R 3,733 1,941 1,792 3·146 1,442 1.704 587 499 88 Sagbara Taluka R 1,878 953 925 1.728 812 916 J50 14J 9 Valia Taluka R 51 33 18 27 tl 16 24 22 2
(5) Dhodia
BHARUCH DISTRICT T 289 164 125 213 98 ns 76 66 10 R 272 147 125 213 98 115 59 49 10 U 17 17 17 17
Bharuch Taluka R 14 6 8 9 6 ( 5 3 2
lCO
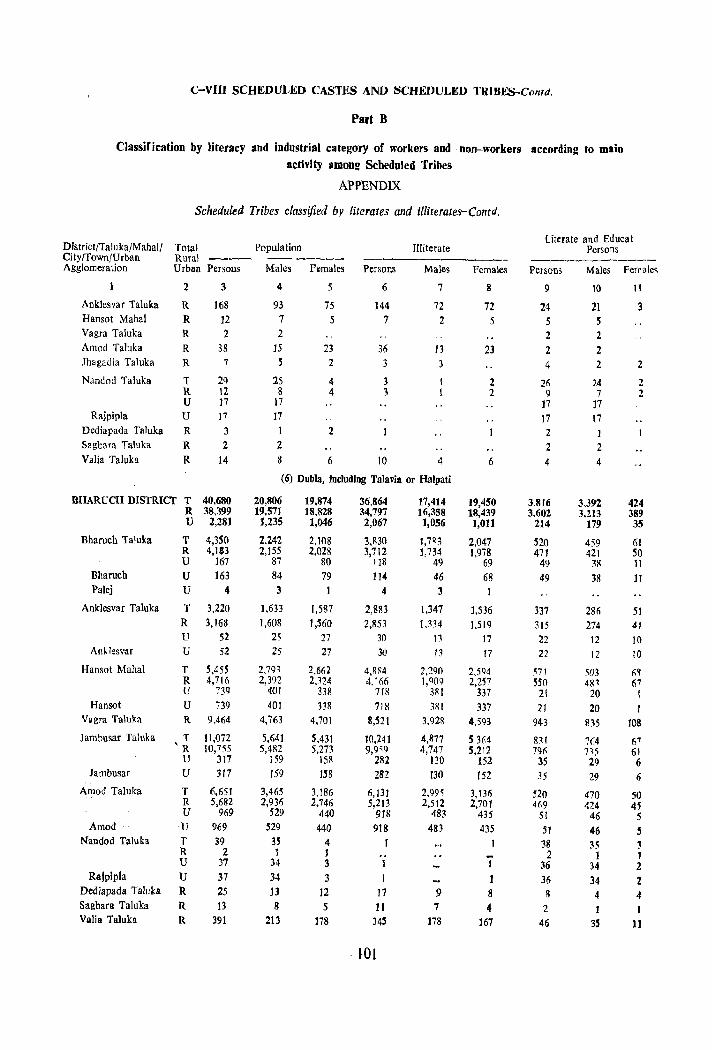
C-VIIl SCHEDULED CASTES AND SCHEDULED TRIBES-Coma.
Part B
Classification by literacy and industrial category of workers and non-workers according to main actil'ity amon~ Scheduled Tribes
APPENDIX
Scheduled Tribes classified by literates and illirerales-Contd.
Literate and Educat DistrictfTalukajMahall Total Population Illiterate Persons CityfTown/Urban Rural ------------ ---------Agglomeration Urban Persons Males Females Persons Males Females Person> Males Females
2 3 4 5 6 7 g 9 10 II
Anklesvar Taluka R 168 93 75 144 72 72 24 21 3 Hansot Mahal R 12 7 5 7 2 5 5 5 Vagra Taluka R 2 2 2 2 Amod Taluka R 38 15 23 36 13 23 2 2 Jhagadia Taluka R 7 S 2 3 4 2 2
Nandod Taluka T 29 25 4 3 2 26 24 2 R 12 8 4 3 2 9 7 2 U 17 17 ]7 17
Rajpipla U 17 17 ]7 t7 Dediapada Taluka R 3 1 2 2 ]
Sagbara Taluka R 2 2 2 2 Valia TaJuka R 14 8 6 10 4 6 4 4
(6) DubIa, including Talavia or Halpati
BHARUCH DISTRICT T 40,680 20,806 19,874 36.864 17,414 19,450 3.816 3,392 424 R 38,399 19,571 18,828 34,797 16,358 18,439 3,602 3,213 389 U 2,281 1,235 1,046 2,067 1,056 ],011 214 179 35
Bharuch Taluka T 4,350 2,242 2,108 3,830 1,7R3 2,047 520 459 61 R 4,183 2,155 2,028 3,712 1,734 1,978 471 421 SO U ]67 87 80 1]8 49 69 49 38 11
Bharuch U 163 84 79 114 46 68 49 38 11 Palej U 4 3 4 3
Anklesvar Taluka T 3,220 1,633 1,587 2,883 1,347 1,536 337 286 51 R 3,168 1,608 1,560 2,853 1,3]4 1.519 315 274 41 U 52 25 27 30 n 17 22 12 10
Anklesvar U 52 25 27 30 13 17 22 12 10
Hansot Mahal T SASS 2,79~ 2,662 4,RR4 2,290 2,594 91 503 6q R 4,716 2,392 2J24 4. 166 1,009 2,251 S50 4R1 67 U 739 101 338 718 311( 337 21 20 1
Hansot V 739 401 338 718 381 337 21 20 Vagra Taluka R 9,464 4,763 4,701 8,521 3,928 4,593 943 835 108 Jambusar Taluka T 11,072 5,641 5,431 10,241 4,~77 5JM 8~1 7(;4 67 'R 10,155 5,482 5,273 9,9'9 4,747 5,212 7% 7',5 61
U 317 159 158 282 130 152 35 29 6 Jamhusar U 317 159 158 282 130 152 35 29 6
Amod Taluka T 6,651 3,465 3,186 6,131 2.99~ 3,136 520 470 50 R 5,682 2,936 2,746 5,213 2,512 2,701 41i9 424 45 U 969 529 440 918 483 435 Sl 46 5
Amod U 969 529 440 918 483 435 51 46 5 Nandod Taluka T 39 3S 4 38 35 3
R 2 1 J 2 1 1 U 37 34 3 1 I 36 34 2
Rajpjpla U 37 34 3 1 1 36 34 2 Dediapada Tallika R 25 13 12 17 9 8 g 4 4 Sagbara Taluka R 13 8 5 II 7 4 2 1 Valia Taluka R 391 213 178 345 178 167 46 35 11
- WI
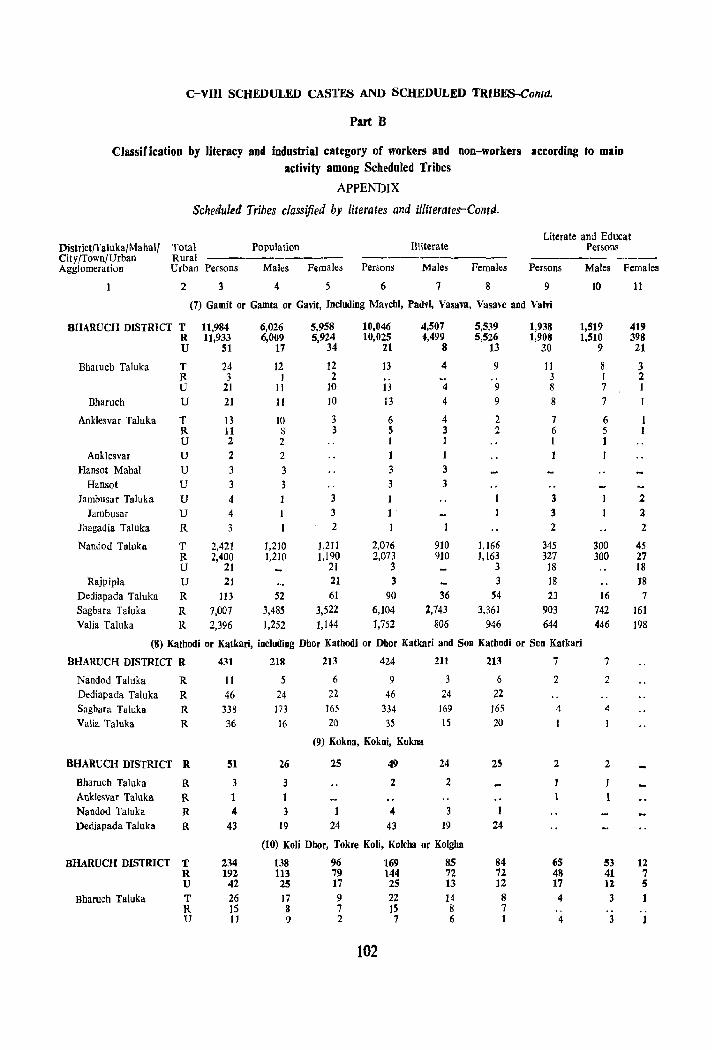
C-VIll SCHEDULED CASTES AND SCHEDULED TRIBES-Coma.
Part B
Classification by literacy and industrial category of workers and non-workers according to maio activity among Scheduled Tribes
APPENDIX
Scheduled Tribes classified by literates and illiterates-Contd.
literate and Educat District{I'aluka/Mahal, Total Population Illiterate Persons City/Town/Urban Rural ---------- -------Agglomeration Urban Persons Males Fo:roales Persons Males Females Persons Males Females
2 3 4 5 6 7 8 9 ]0 11
(7) Gamit or Gamta or Garit, Including Marchi, Padvi, Vasava, Vasave and Valvi
BHARUCH DISTRICT T 11,984 6,026 5,958 10,046 4,507 5,539 1,938 1,519 419 R 11,933 6,009 5,924 10,025 4,499 5,526 1,908 1,510 398 U 51 17 34 21 8 13 30 9 21
Bharuch Taluka T 24 12 12 ]3 4 9 II 8 3 R 3 1 2 .. k • 3 I 2 U 21 II 10 13 4 9 8 7 I
Bharuch U 2] II 10 13 4 9 8 7 1
Anklesvar Taluka T 13 10 3 6 4 2 7 6 R II S 3 5 3 2 6 5 U 2 2 I 1 I 1
Anklesvar U 2 2 ] 1 Han~ot Mahal U 3 3 3 3
Hanso! U 3 3 3 3 Jambusar Taluka U 4 3 3 2
Jarobusar U 4 1 3 3 2 Jhagadia Taluka R 3 I 2 2 2
Nandod Taluka T 2,42] ],210 1,211 2,076 910 1,166 345 300 45 R 2,400 1,210 1,190 2,073 910 1,163 327 300 27 U 21 21 3 3 18 18
Rajpipla U 21 21 3 3 18 18 Oediapada Taluka R 113 52 61 90 36 S4 23 16 7 Sagbara Talllka R 7,007 3,485 3,522 6,104 2,743 3,361 903 742 161 Valia Taluka R 2,396 1,252 1,144 1,752 806 946 644 446 198
(8) Kathodi or Katkari, including Dhor Kathodi or Dhor Katkari and Son Kathodi or Son Katkari
BHARUCH DISTRICT R 431 218 213 424 211 213 7 7
Nandod Taluka R II 5 6 9 6 2 2 Oediapada Taluka R 46 24 22 46 24 22
Sagbara Taluka R 338 173 165 334 169 165 4 4
Valia Taluka R 36 16 20 35 IS 20
(9) Kokna, Kokni, Kukna
BHARUCH DISTRICT R 51 26 25 49 24 25 2 2
Bharuch Taluka R 3 3 2 2 Anklesvar Taluka R 1 1 Nandod Taluka R 4 3 4 Dediapada Taluka R 43 19 24 43 19 24
(10) Koli Dhor, Tokre Koli, Kolcba or Kolgba
BHARUCH DISTRICT T 234 138 96 169 85 84 65 53 12 R 192 113 79 144 72 72 48 41 7 U 42 25 17 25 13 12 17 11 5
Bharuch Taluka T 26 17 9 22 14 8 4 3 1 R 15 8 7 ]5 8 7 .. .. .. U IJ 9 2 7 6 ] 4 3 1
102

C-VIU SCHEDULED CASTES ANU !SCtlEDlJLEIJ nUBI<::s-.cortra,
Part B
Classification by literacy and industrial category of workers and non-workers accordIng to maio
acti''Vity among Scheduled Tribes
District/Taluka/Mabal/ Total City/Town/Urban Rural
APPENDIX
Scheduled Tribes classified by literates and ilIiterates-Contd.
Population Illiterate Literate and Educated
Persons
Agglomeration Urban Persons Males
4
Females Persons Males Females Persons Males Females
Bharuch Anklesvar Taluka
Anklesvar Vagra Taluka Jambusar Taluka
lambusar Amod Taluka Nandod Taluka
Rajpipla
2
u U lJ R U U R U U
3
II
3 3
107 1 I
70 27 27
9 3 3
60 1
1 45 12 12
5
2
47
25 15 15
6
7
74
1 55 17 17
7
6
34
1 30 6
6
8
40
25 11 II
9
4
3 3
33
15 10 10
(11) Naikda or Nayaka, including Cholivala Nayaka, Kapadia Nayaka, Mota Nayaka and iSana Nayaka
BHARUCH DISTRICT T R U
Bharuch Taluka T
Bharuch Anklesvar Taluka
Anklesvar Hanoot Mahal
Hansot Vacira Taluka
Jambusar Ta1uka Amod Taluka
Na.ndod Taluka
Rajpipia Dediapada TaJuka Sagbara Taluka Valia Taluka
R V V U U T R U V R
R R
T R U V
R
R R
BHARUCH DISTRICT T R U
Hansot Mahal U Hansot U
Vagra Taluka R Nandod Taluka T
R U
RajpipJa U Sa&bara Ialuka R
1,545 1,516
2')
101 89 12 12 12 12 89 86
3 3
12
lJ
237
150 148
2
2 37
886 12
761 747 14 54 47 7 7
3 3
46 44 2 2 6
3
119
73 71
2 2
17 433
7
784 769 15 47 42 ,
5 9
9 43 42 ]
1
6
6 118
77 77
20 453
5
1,429 1,410
19 96 87 9 9 7 7
86 83
3 3
11
6 214
144 144
35 819 II
66-' 657
7 50 45 ,
43 41
2 2 5
2 97
67 67
15 379
6
(12} Pardhi, including Advichincber and Phanse Pardhi
57 50 7
6
6 38 7 6 1
6
32 28 4
3
3 21 S 4 1 1 3
25 22 3
3 3
17 1 2
3
103
49 47 2 1
2 38 3 3
26 26
21 2 2
3
765 753 12 46 42 4 4 7 7
43 42
I 1 6
4 117
7i 77
20 440
23 21 2
2 2
17 1 1
116 106
111 5 2 3 3
S
5 3 3
3 23
6 4 2 2
2 67
8 3 S
4 4
4 3 1
I ...
10
3 3 3
26
J5 6
6
97 90 7
4 2 2 2
3
3 3 3
22
6 4 2 2 2
54
6 2 4 3
3
3 2 1
J
II
7
4 4
19 16 3
I .. J 1
2
2
13
2 1 1
1 1
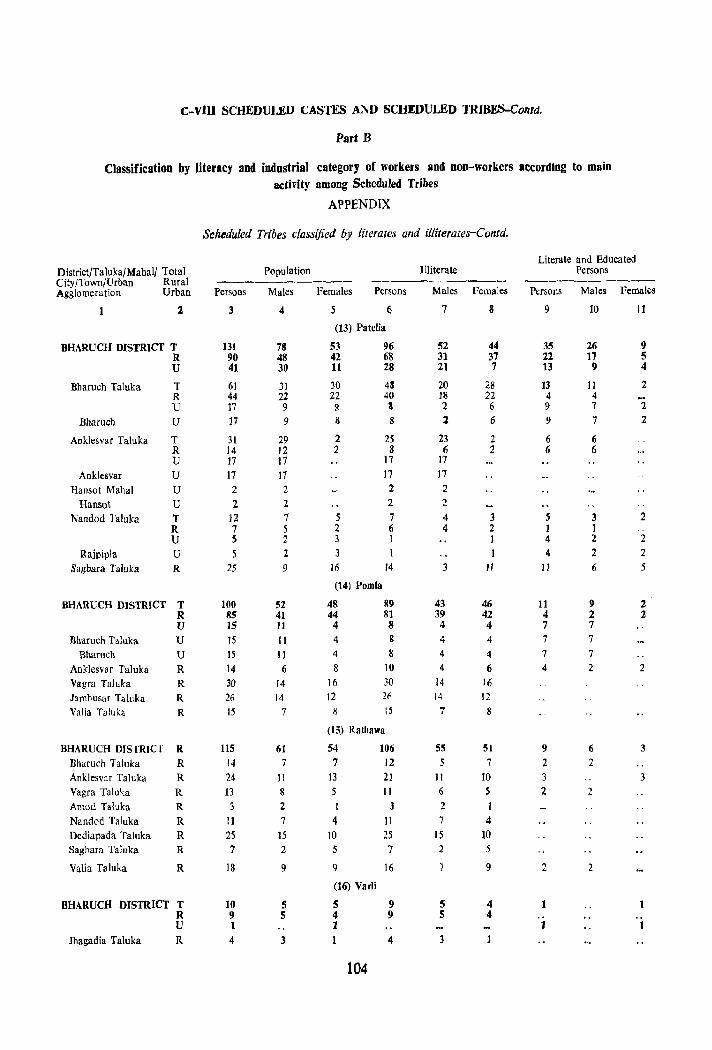
c-vlll SCHEDULED CASTES AND SCHEDULED TRIBES-Coflta.
Part B
Classification by literacy and industrial category of workers and non-workers aCcording to main activity among ScbeduJed Tribes
APPENDIX
Scheduled Tribes classified by literates and illiterate;s-Contd.
Literate and Educated District/Taluka/Mahal/ Total Population IlJiterate Persons City/Town/Urban Rural ----------- -----------Agglomeration Urban Persons Males Females Persons Males Females Persons Males Females
2 3 4 5 6 7 8 9 10 II
(13) Patella
BHARUCH DISTRICT T 131 78 53 96 52 44 35 26 9 R 90 48 42 68 31 37 22 17 5 U 41 30 II 28 21 7 13 9 4
Bharuch Taluka T 61 31 30 45 20 28 13 II 2 R 44 22 22 40 18 22 4 4 U 17 9 8
, 2 6 9 7 2
Bharuch U 17 9 8 8 2 6 9 7 2
Anklesvar Taluka T 31 29 2 25 23 2 6 6 R 14 12 2 8 6 2 6 6 U 17 17 17 17
Anklesvar U 17 17 17 J7
Hansot Mahal U 2 2 2 2
Hansot U 2 2 2 2
Nandod Taluka T 12 7 5 7 4 3 S 3 2 R 7 5 2 6 4 2 1 1 U S 2 3 I I 4 2 2
Rajpipla U 5 2 3 I I 4 2 2 Sagbara Taluka R 25 9 16 14 3 11 II 6 5
(14) Pomla
BHARliCH DISTRICT T 100 52 48 89 43 46 11 9 2 R 85 41 44 81 39 42 4 2 2 V 15 11 4 8 4 4 7 7
Bbaruch Taluka U 15 11 4 8 4 4 7 7
Bharuch U IS 11 4 8 4 4 7 7
Anklesvar Taluka R 14 6 8 10 4 6 4 2 2 Vagra Taluka R 30 14 16 30 14 16
Jambusar Taluka R 26 14 12 211 14 12 Valia Taluka R 15 7 8 15 7 S
(15) RathalVa
BH,<\RUCH DrS fRIC r R 115 61 54 106 55 51 9 6 3
Bharuch Taluka R 14 7 7 12 5 7 2 2 Anklesvar Taluka R 24 11 13 21 11 10 3 3
Vagra Taluka R 13 8 5 11 6 S 2 2
Amod Taluka R 3 2 I 3 2 I Nandod Taluka R 11 7 4 11 7 4 Dediapada Taluka R 25 15 10 25 15 10 SagbaTa Taluka R 7 2 5 7 2 5
Valia Taluka R 18 9 9 16 9 2 2
(16) Varli
BHARUCH DISTRICT T 10 5 5 9 5 4 1 R 9 5 4 9 5 4 U 1 1 1 I
Jhagadia Taluka R 4 3 1 4 3
104
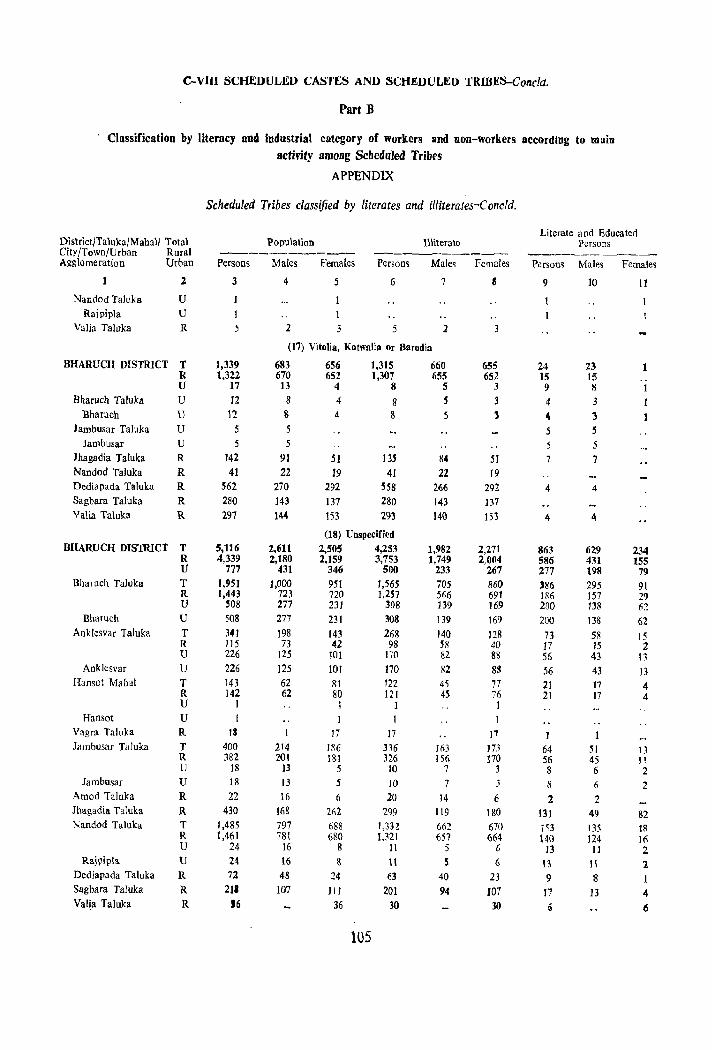
C-VIU SCHEDULED CASTES AND SCHEDULE!) TRlBES-Collcla.
Part B
Classification by literacy and industrial category of workers and non-workers accordtng to main activity among Scheduled Tribes
APPENDIX
Scheduled Tribes classified by literates and illiterates-Concld.
Literate and Educated DistrictjTalukalMahal/ Total Population Uliterate Persons City/Town/Urban Rural ------------ ----~-----
Agglomeration Urban Persons Males Females Persons Males Females P~rsons Males Females
2 3 4 5 6 7 8 9 10 11
Nandod Taluka U Rajpipla U I
Valia Taluka R 5 2 3 5 2 3
(17) Vitolia, Kotwalia or Barodia
BHARVCH DISTRICT T 1,339 683 656 1,315 660 655 24 23 1 R 1,322 670 652 1,307 655 652 15 15 .. U 17 13 4 8 5 3 9 S 1
Bharuch Taluka V 12 8 4 8 5 3 4 3 Bharuch U 12 11 4 8 5 l 4 3
Iambusar Taluka U 5 5 5 5 Jarnbusar V 5 5 5 5
Jhagadia Taluka R 142 91 51 13' 84 51 7 7 Nandod Taluka R 41 22 19 41 22 19 Dediapada Taluka R 562 270 292 558 266 292 4 4 Sagbara Taluka R 280 143 137 280 143 137 Valia Taluka R 297 144 153 293 ]40 153 4 4
(18) Unspecified BHARUCH DISTRICT T 5,116 2.611 2.505 4,253 1,982 2,271 863 629 234
R 4,339 2,180 2;159 3,753 1,749 2,004 586 431 155 U 777 431 346 500 233 267 277 198 79
Bharuch Taluka T 1,951 1,000 951 1,565 705 860 186 295 91 R 1,443 723 720 1,257 566 691 186 157 29 U S08 277 23J 308 139 169 200 138 62
Bharuch U 508 277 231 308 139 169 200 138 62 Anklesvar Taluka T 341 198 143 26& 140 128 7J 5~ 15
R 115 73 42 98 58 40 17 15 2 U 226 125 101 no 82 88 56 43 p,
Anklesvar V 226 125 101 170 82 88 56 43 J3 Hanso! Ma hal T J43 62 81 122 45 77 21 17 4
R 142 62 80 121 4S 76 21 17 4 U I 1 1 I
Hanso! V Vagra Taluka R IS 17 17 17 Jambusar TaJuka T 400 2J4 186 316 )63 173 64 51 lJ
R 382 201 181 326 156 ]70 56 45 !l U 18 13 5 10 7 3 8 6 2
Jambusar U 18 13 5 10 7 3 8 6 2 Amod Taluka R 22 16 6 20 14 6 2 2 Jhagadia Taluka R 430 ]6g 262 299 119 180 131 49 82 Nandod Taluka T 1,485 797 688 1,332 662 670 153 135 IR
R 1,461 781 680 1,321 657 664 140 124 Hi U 24 16 8 II 5 (, 13 11 2
Rajpipla U 24 16 II 11 5 6 !3 II 2 Dediapada Taluka R 72 48 24 63 40 23 9 ~ I Sagbara Taluka R 2]. 107 11 J 201 94 107 17 13 4 Valia Taluka R 56 36 30 30 6 6
105
E-ESTABLISHMENT TABLES
E-I Distribution of Establishments by Broad Types
This is a new table for the 1971 Census and is prepared for total, rural and urban areas for District/City and gives the distribution of all establishments by three broad types viz., (1) manufacturing, processing or servicing establishments: (2) trade or business establishments and (3) other establishments in each of (a) Government or quasi-government (b) private and (c) co-operative sectors of the economy. The manufacturing, processing or servicing establishments are further classified as registered factories, unregistered workshops and household industries. The trade or business establishments are classified as wholesale, retail and otbers. Lastly the 'other e&tablishments' are classified as educational institutions, public health institutions and others.
With a view to understand the significance of statistics incorporated in E-series tables, the concepts and definitions of the terms occurring in the tables are given below.
An "Establishment" is a place where goods are produced or manufactured not solely for domestic consumption or where servicing and/or repairing is done such as factory, workshop or household industry or servicing and/or repair workshop or a place where n:tail or wholesale business is carried on or commercial services are rendered or an office, public or private or a place of en~ertainment or where educational, religious, social or entertainment services are rendered. It is necessary that in all these places one or more persons should be actually working. Thus an establishment will cover manufacturing,
trade and other establishments where people work.
Examples
A factory or a workshop or workshop-cum-residence or a trading or other establishment, i.e. where some kind of production, processing, repair or servicing is undertaken or where goods or articles are made and sold, or some business is being carried on such as a grocery shop, a pan shop, restaurant, bank, hotel, or an office is functioning such as Government office, comme:'cial office, or an institution is being run such as school, college, h:>spital, dispensary, etc., and where one or more persons are working.
An establishment may occupy a census house or a group of census houses or a part of a census house.
An establishment has been treated as a Government/quasi-Government imtitution if the Central or State Government or a Local Authority such as the: Zilla Parishad, City Corporation or Municipality, etc., completely owns or has a majority of shares as to control thl! management of the establishment.
Private establishments are those owned and managed by private individU!lls Or corporate bodies not being co-operative institution or Government or quasi-Guvernment institutions.
Establishments registered under the CO-Dperative Societies Registration Law of the State, alone fall in the category of "Co-operative".
A 'Household Industry' is defined as an industry conducted by the head of the household himself! herself and/or mainly by the members of the household at home or within the village in rural areas, and only within the premises of the house where t~e h:msehold lives in urban areas. The industry should not be run on the scale of a registered factory.
Registered Factory:- A factory which is registered under the Indian Factories Act should be treated as a "Registered Factory". Any other worksbop merely licenced by the Municipal or any other aythority
106
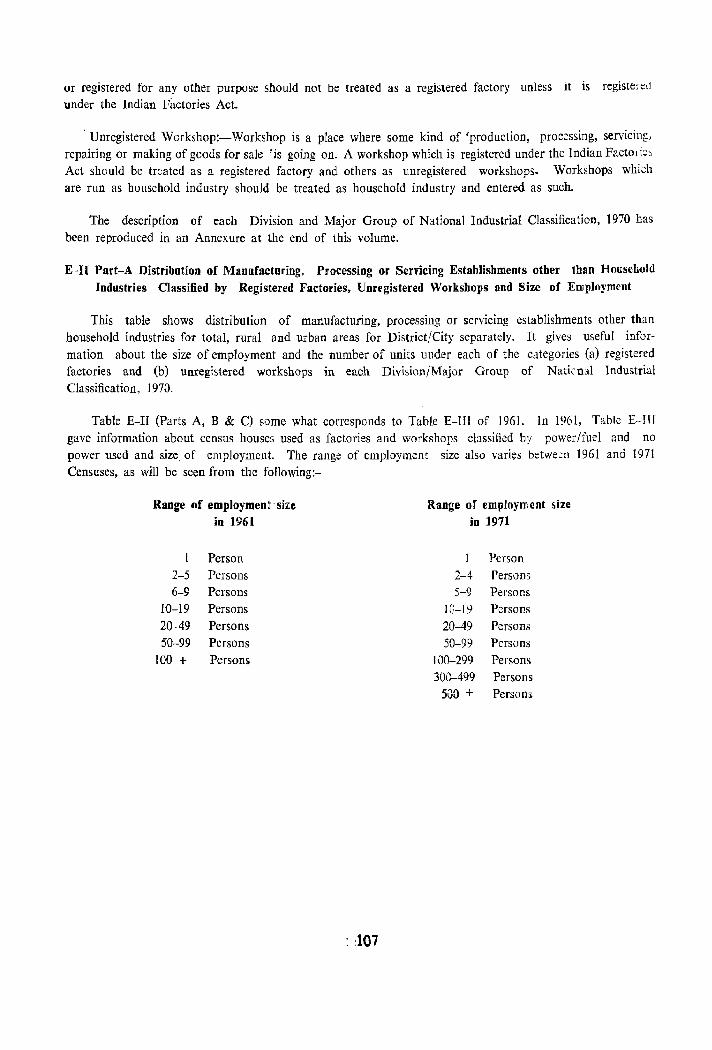
or registered for any other purpose should not be treated as a registered factory unless it is registe:-ed
under the Indian Factories Act.
Unregistered Workshop:-Workshop is a place where some kind of (production, processing, servicil1l,;.
repairing or making of gcods for sale 'is going on. A workshop which is registered under the Indian Facto! ie,
Act should be treated as a registered factory and others as unregistered workshops. Workshops whidl
are run as household industry should be treated as household industry and entered as such.
The description of each Division and Major Group of National Industrial Classification, 1970 has
been reproduced in an Annexure at the end of this volume.
E -11 Part-A Distribution of Manllfacturing, Processing or Servicing Establishments other tban H ollsehold
Industries Classified by Registered Factories. Unregistered Workshops and Size of Employment
This table shows distribution of manufacturing, processing or servicing establishments other than household industries for total, rural and urban areas for District/City separately. It gives useful infor
mation about the size of employment and the number of units under each of the categories (a) registered
factories and (b) unregistered workshops in each Division/Major Group of Nati('nal Industrial
Classification, 1970.
Table E-II (Parts A, B & C) some what corresponds to Table E-lIl of 1961. In 1961, Table E-III
gave information about census houses used as factories and workshops classified by powerifuel and no
power used and size. of employment. The range of employment size also varies betwe:n 1961 and 1971 Censuses, as will be seen from the following:-
Range of employment-size Range of employment size
in 1961 in 1971
Person Person
2-5 Persons 2-4 Persons 6-9 Persons 5-9 Persons
10-19 Persons IC-19 Persons
20-49 Persons 20-49 Persons
50-99 Persons 50-99 Persons
100 + Persons WO-299 Persons
300-499 Persons
S00 + Persons
: :107
E-II Part-B Distribution of Manufacturing, Processing or Servicing Establisbments other than Household Industries classified by Industry, Fuel/Power or Manual used and Size of Employment
In this table, the number of factories and workshops are presented for total, rural and urban areas for District/City and by Division/Major Group of National Industrial Classification, 1970 and by size of employment. This gives information about the kind of fuel or power used in the industries.
E-I1 Part-C Distribution of Household Industry Establishments classified by Industry, Fuel/Power used and Size of Employment
This table furnishes information of household industry establishments by Division and Major Group of National Industrial Classification, 1970 about the kind of fuel or power used by broad employment size groups for total, rural and urban areas for D!strict/City separately.
E -III Distribution of Trade/Commercial Establishments classified by tbe Type of Business or Trade aud Size of Employment
This is a new table for 1971 and is prepared for the trade/commercial establishments classified by the type of business or trade and size of employment for total, rural and urban areas for District/City. All trade/commercial establishments are classified under each Division/Major Group of National Indu~
strial Classification, 1970.
E-IV Distribution of Establishments (otber tban Manufacturing, Processing or Servicing or Bosiness and Trade Establishments) by Size of Employment
This table gives the distribution of establishments (other than manufacturing, processing or servlclllg or business and trade establishments) by size of employment for total, rural and urban areas for Districtl City in each Division and Major Group of National Industrial Classification, 1970. All establishments (other than manufacturing, processing or servicing or business and trade) further gives employment .by broad groups in each Division/Major Group of National Industrial Classification, 1970. This table which has been attempted for the first time in 1971 Census also provides frame for the establishments not covered by Table E-II (Part A & B) and E-III.
101
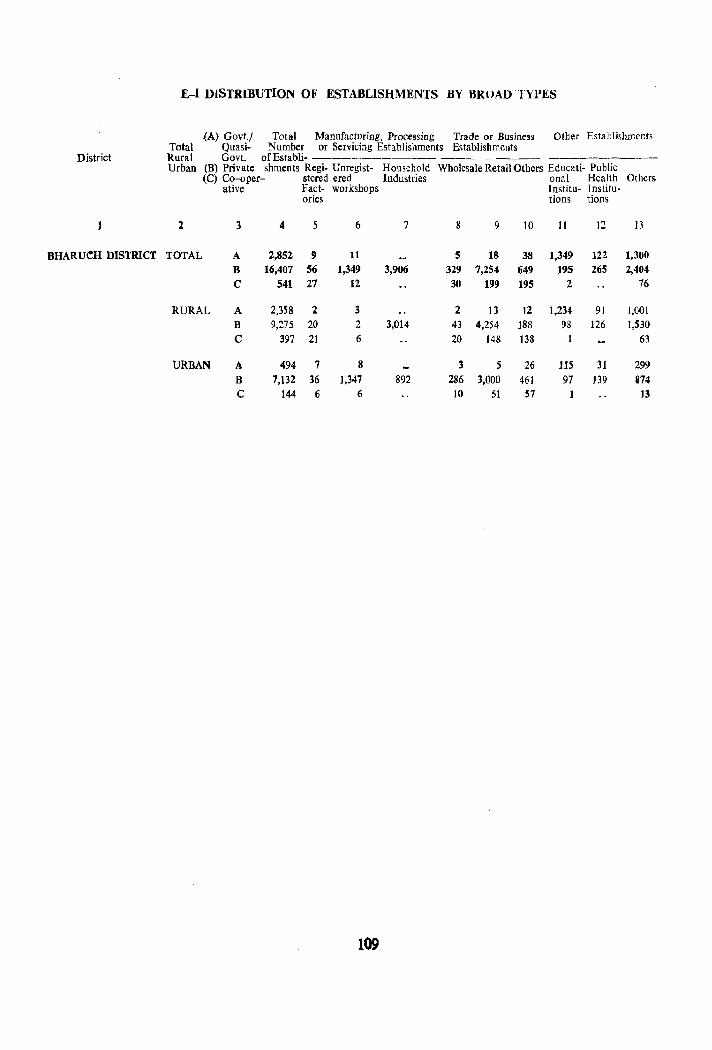
E-I DISTRIBUTION OF ESTABLISHMENTS BY BROAD TYPES
(A) Govt./ Total Manufacturing, Processing Trade or Business Other Establishments Total Quasi- Number or Servicing Establishments Establishments
District Rural Govt. ofEstabli- ---------- --------- ---------Urban (B) Private shments Regi- Unregist- Household Wholesale Retail Others Educati- Public
(C) Co-oper- stered ered Industries onal Health Others ative Fact- workshops Institu- Tnstitu-
Dries tions tions
2 3 4 5 6 7 g 9 10 11 12 J3
BHARU~H DISTRICT TOTAL A 2,852 9 11 5 18 38 1,349 122 1,300 B 16,407 56 1,349 3,906 329 7,254 649 195 265 2,404 C 541 27 12 30 199 195 2 76
RURAL A 2,358 2 3 2 13 12 1,234 91 I,GOI B 9,~75 20 2 3,014 43 4,254 188 98 126 I,BO C 397 21 6 20 148 138 63
URBAN A 494 7 8 3 5 26 115 31 299 B 7,132 36 1,347 892 286 3,000 461 97 139 274 C 144 6 6 10 51 57 13
109
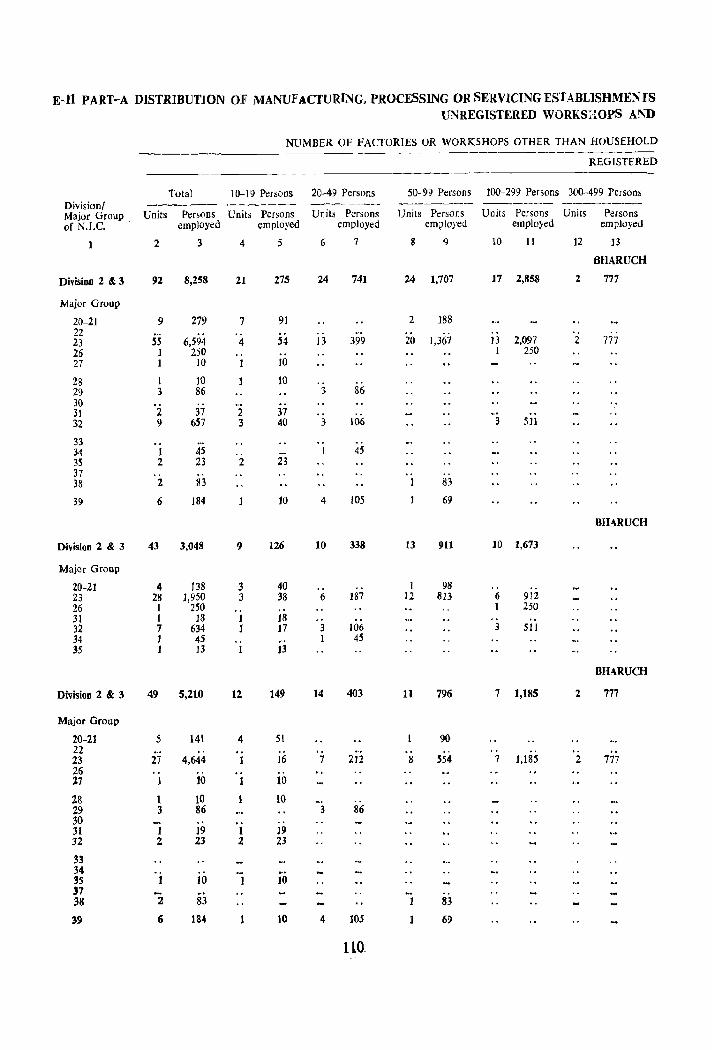
E-ll PART-A DlSTRIBUTlON OF MANUFACTURING, PROCESSING OR SERVICING ESTABLISHMENTS UNREGISTERED WORKSaOPS AND
NUMBER OF FACTORIES OR WORKSHOPS OTHER THAN HOUSEHOLD
REGISTERED
Total 10-19 Persons 20-49 Persons 50- 99 Persons 100-299 Persons 300-499 Persons Divisionl ------ ----- ----- ------- ------ ------....-Major Group Units Persons Units Persons Units Persons l)nits Persons Units Persons Units Persons of N.I.C. ' employed employed employed employed employed employed
2 3 4 5 6 7 g 9 10 11 12 13
6HARlICH
Division 2 & 3 92 8,258 21 275 24 741 24 1,707 17 2,858 2 777
Major Group
20-21 9 279 7 91 2 188 22 .. .. "
23 5S 6,594 4 54 13 399 20 1,367 13 2,097 2 777 26 1 250 .. .. 1 250 27 1 10 1 10
28 1 10 to 29 3 86 3 86 30 31 2 37 2 37 .. 32 9 657 3 40 3 106 3 511
33 .. .. 34 1 4S I 45 35 2 23 2 23 37 38 2 83 I 83
39 6 184 10 4 105 69
BHARlICH
Division 2 & 3 43 3,048 ') 126 10 338 I3 911 10 1,673
Major Group
20-21 4 138 3 40 .. .. I 98 .. 23 28 1,950 3 38 6 187 12 813 6 912 26 I 250 .. 1 250 31 1 18 1 18 32 7 634 1 17 3 106 3 511 34 1 45 " 1 45 35 1 13 1 13
BHARUCH
Division 2 & 3 49 5,210 12 149 14 403 11 796 7 1,185 2 777
Major Group
20-21 5 141 4 51 90 22 .. .. 23 27 4,644 1 16 7 212 8 554 7 1,185 2 777 26 .. 27 1 10 1 10
28 1 10 1 10 29 3 86 3 86 30 .. 31 1 19 I 19 32 2 23 2 23
33 34 35 1 10 1 10 37 38 2 83 1 83
3!> 6 184 10 4 105 69
llQ
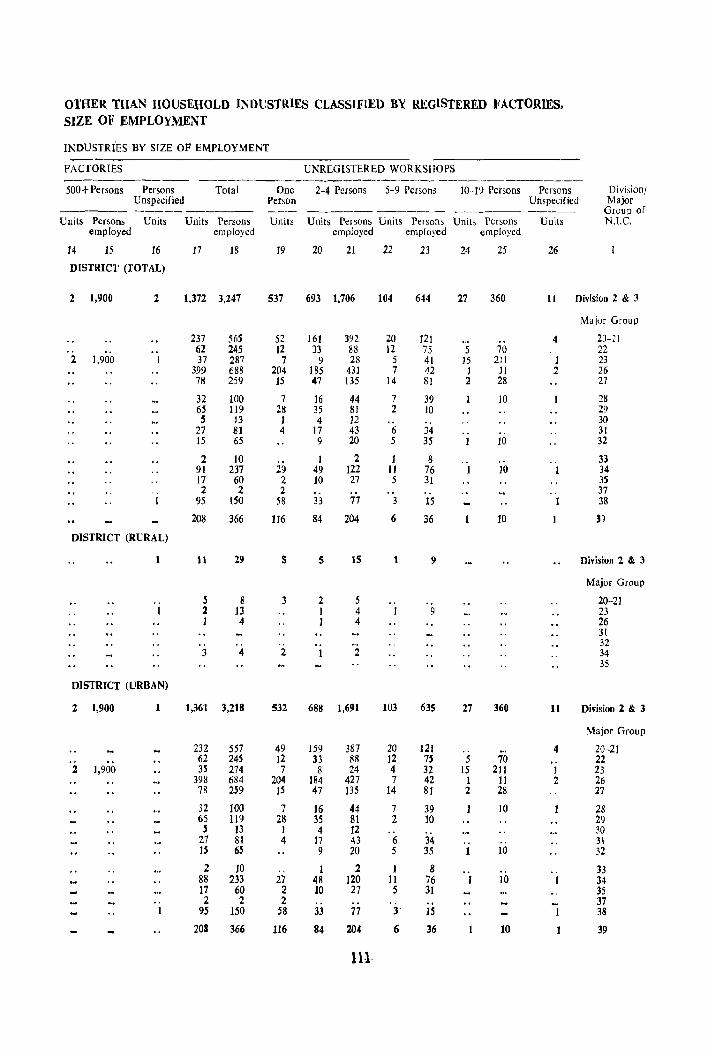
OTHER THAN HOUSEHOLD INDt;STRIES CLASSIFIED BY REGISTERED FACTORIES, SIZE OF EMPLOYMENT
INDUSTRIES BY SIZE OF EMPLOYMENT
FACrORIES UNREGISTERED WORKSHOPS ----------- ----------_._----------"-.- ---------------500 + Pe rsons Persons Total One 2-4 Persons 5-9 Persons 10--19 Persons Persons Divi,ionl
Unspecified Person Unspecified Major ------ ----- ------ ----- ------- --_-- --- Group of Units Persons Units Units Persons Units Units Persons Units Persons Units Persons Units N.te.
employed employed employed employed employed
14 15 16 17 18 19 20 21 22 23 24 25 26
DISTRICT (TOTAL)
2 J,900 2 1,372 3,247 537 693 1,706 104 644 27 360 11 Division 2 & 3
Major Group
237 56S 52 161 392 20 121 •..• 4 20-21 .. .. 62 245 12 33 88 12 75 5 70 22 2 1,900 I 37 287 7 9 28 5 41 15 211 1 23
399 688 204 185 431 7 42 1 1 ) 2 26 711 259 15 47 135 14 81 2 28 27
32 100 7 16 44 7 39 10 28 65 119 28 35 81 2 10 29 5 13 1 4 12 .. 30
27 81 4 17 43 6 34 .. " 31 15 65 9 20 5 35 1 10 32
2 10 1 2 1 8 .. .. 33 91 237 29 49 122 II 76 I 10 34 17 60 2 10 27 5 31 3S 2 2 2 .. 37
95 ISO 58 33 77 3 15 1 38
208 366 116 84 204 6 36 10 31
DISTRICT (RURAL)
1 11 29 5 5 IS 1 9 Division 2 & 3
Major Group
S 8 2 5 .. 20-21 I 1 13 I 4 J 9 23
1 4 1 4 26 31
.. .. 32 3 4 2 1 2 34
35
DISTRICT (URBAN)
2 J,900 1,361 3,218 532 688 1,691 103 635 27 360 11 Division 2 & 3
Major Group
232 557 49 159 387 20 121 .. 4 20-21 62 245 12 33 88 J2 7S 5 70 .. 22
2 1,900 35 274 7 8 24 4 32 15 211 I 23 398 684 204 184 427 7 42 1 II 2 26 78 259 15 47 135 14 81 2 28 27
32 100 7 16 44 7 39 10 28 65 119 28 35 81 2 10 29 S 13 I 4 12 .. 30
27 81 4 17 43 6 34 .. .. 31 15 6S 9 20 5 35 1 10 32
2 10 .. 1 2 1 8 .. 33 88 233 27 48 120 11 76 1 10 1 34 17 60 2 10 27 5 31 35 2 2 2 .. 37
95 150 58 33 77 3 15 1 38
208 366 116 84 204 6 36 10 39
111
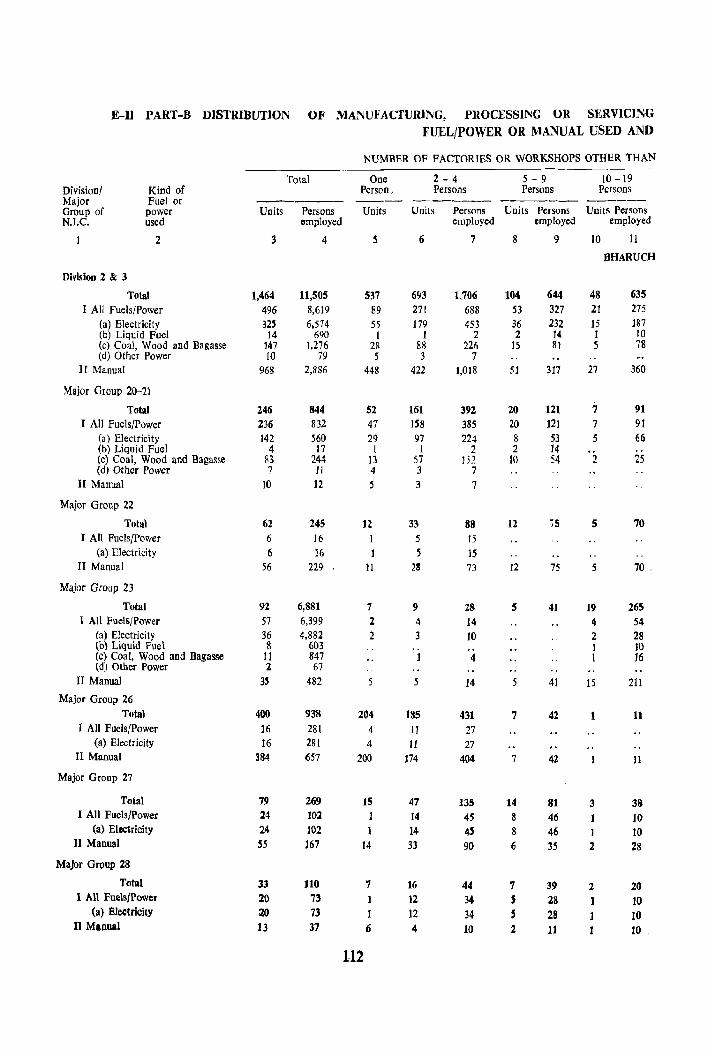
E-Il PART-B DISTRIBUTION OF MANUFACTURJNG, PROCESSING OR SERVICING
Division/ Major Group of N.I.C.
Kind of Fuel or power used
2
Division 2 & 3
Total I All Fuels/Power
(a) Electricity (b) Liquid Fuel (c) Coal, Wood and Bagasse (d) Other Power
II Manual
Major Group 20-21
Total I All Fuels/Power
(a) Electricity (b) Liquid Fuel (c) Coal, Wood and Bagasse (d) Other Power
II Manual
Major Group 22
Total I All Fuels/Power
(a) Electricity II Manual
Major Group 23
Total I All Fuels/Power
(a) Electricity (b) Liquid Fuel (cl Coal, Wood and Bagasse (d) Other Power
II Manual
Major Group 26 Total
I All Fuels/Power (a) Electricity
II Manual
Major Group 27
Total I All Fuels/Power
(a) Electricity II Manual
Major Group 28
Total I All Fuels/Power
(a) Electricity II Maoual
FUEL/POWER OR MANUAL USED AND
NUMBER OF FACTORIES OR WORKSHOPS OTHER THAN ------------------------ - -~
Total One 2 - 4 5 - 9 10 -19 Person, Persons Persons Persons
Units Persons Units Units Persons Units Persons Units Persons
3
1,464 496 32'
14 147 10
968
246 236 ]42
4 B3 7
]0
62 6
6 56
92 57 36 & II 2
35
400 16 16
384
79 24 24 55
33 20 20 13
employed employed employed employed
4
11,505 8,619 6,574
6<)0 1,276
79 2,886
844 832 560
17 244
11
12
245 16 16
229
6,881 6,399
4,882 603 847 67
482
938
281 281 657
269 102 ]02 167
110 73 73 37
s
537 89 55 1
28 5
448
52 47 29
1 J3 4 5
12 1 J
1l
7 2 2
204 4 4
200
15 1 1
14
112
7 1
1 6
6
693 271 179
I 88 3
422
161 158 97 1
57 3 3
33 5 5
23
9
4 3
1
5
185 11 ]]
174
47 ]4
14 33
16 12 12 4
7
1,706 688 453
2 226
7 ],018
392 385 22.4
2 ]i'!
7
7
88 15 ]5 73
28 14 10
4
14
431 27 27
404
135 45 45 90
44 34 34 10
104 53 36 2
15
51
20 20 8 2
10
12
12
5
7
7
14 8
8 6
7 S 5 2
9
644 327 232 14 8]
317
121 121 53 14 54
75
41
41
42
42
81 46 46 35
39
28 28 11
10
48 21 15 1 5
27
7 7 5
2
5
5
19
4 2 ]
1
15
1
3
2
2 ]
1
11
BHARUCH
635 275 187 10 78
360
91
91 66
25
70
70 .
265 54 28 10 16
211
11
11
38 10 10 28
20 10 10 10 .
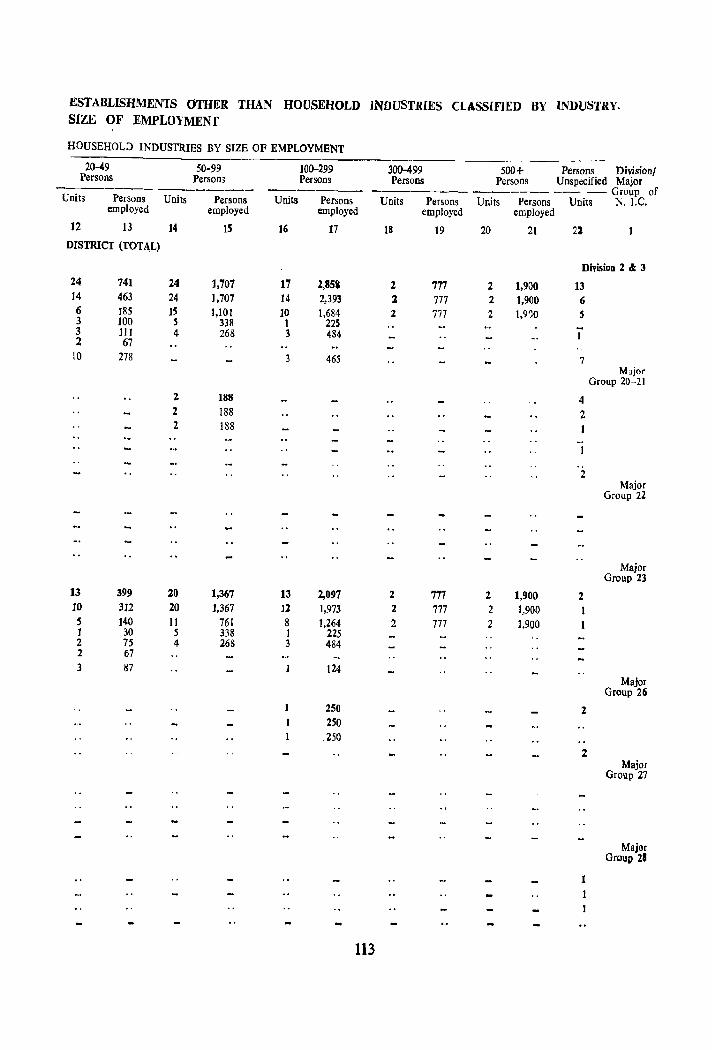
ESTABLISHMENTS OTHER THAN HOUSEHOLD JNDUSTRIES CLASSIFIED BY INDUSTRY. SIZE OF EMPLO),MENf
HOUSEHOL::> INDUSTRIES BY SIZE OF EMPLOYMENT
20-49 50-99 Persons Person>
------- -------Units Persons Units Persons Units
employed employed
12 13 14 15 16
DISTRICT (TOTAL)
24 741 24 1,707 17 14 463 24 1,707 14 6 I8S IS 1,101 10 3 100 S 338 1 3 ] II 4 268 3 2 67
10 278 3
2 188 2 188 2 188
13 399 20 1,367 13 10 312 20 J,3~7 12 S 140 11 761 8 1 30 5 338 1 2 75 4 268 3 2 67
3 87
1
100-299 Persons
300-499 500+ Persons Divisionl Persons Persons Unspecified Major
Persons -------- ------- -_. -- Group of
employed
17
2,85& 2,393 1,684
225 484
465
2,097 1,973 1,264
225 484
124
250 250
.250
113
Units PClfsons Units Persons Units N. I.e.
18
2 :z 2
2 2 2
employed employed
19
777 777 777
777 777 777
20
2 2 2
2 2 2
21
1,900 1,900 1,9')0
1,900 1,900 1,900
22
DivisioD 1 & 3
13 6 S
1
7
4
2
_. I
2
2
2
2
1
Major Group 20-21
Major Group 22
Major Group 23
Major Group 26
Major Group 27
Major Group 2'
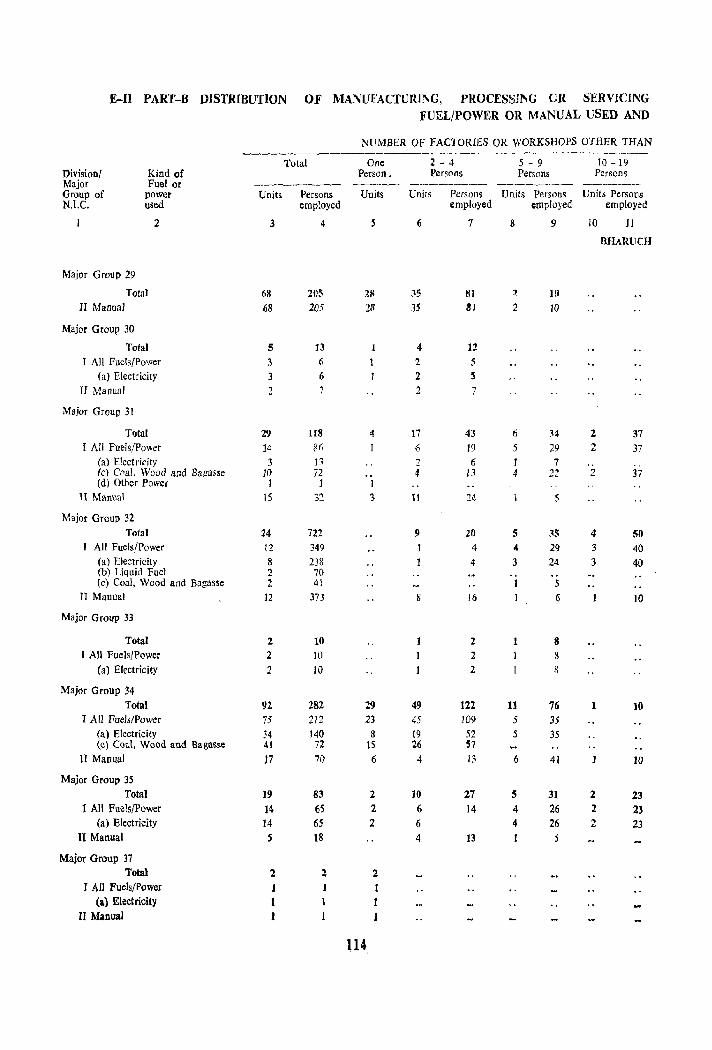
E-II PART-B DISTRIBUTION OF MANUFACTURING, I)ROCESSING CR SERVICING
FUEL/POWER OR MANUAL USED AND
NUMBER OF FACTORIES OR WORKSHOPS OTHER THAN ---------~~-~-.-
Total One 2 - 4 5 - 9 10 -19 Division/ Kind of Person, Persons Persons Persons Major Fuel or ------.- --- --------- ------- -----Group of power Units Persons Units Units Persons Units Persons Units Persons N.I.C. used employed employed employed employed
2 3 4 S 6 7 8 9 10 11
BHARUeH
Major Group 29
Total 68 21)5 211 35 81 1 10 II Manual 68 205 28 35 31 2 10
Major Group 30
Total 5 13 I 4 12 I All Fuels/Power 3 6 1 2 5
(a) Electricity 3 6 I 2 n Manual 2 7 2 7
Mujor Group 31
T>otal 29 118 4 11 43 6 34 2 37 r All Fnels!Po\~er 14 8fi 1 6 19 5 29 2 37
(a) Electricity 3 J1 2 6 1 7 (e) Cpal, Wood aDd Bagasse 11) 72 .. 4 13 4 22 2 37 (d) Other POlVer 1 1 I
1I Manual 15 .~ ,~ 3 11 ?A 5
Major GroulJ 32 Total 24 722 9 20 5 35 4 SO
All FuelsfPower 12 349 4 4 29 40 (a) Electricity 8 238 4 3 24 3 40 (b) Liquid Fuel 2 70 (c) Coal, Wood and Bagasse 2 41 5
11 Manual 12 373 16 6 10
Major Group 33
Total 2 10 2 1 8
I All Fuels/Power 2 10 2 1 8
(a) Electricity 2 10 2 8
Major Group 34 Total 92 282 29 49 122 11 76 1 10
I All Fuels/Power 75 212 23 45 109 5 35 (a) Electricity 34 140 8 19 52 5 35 (c) Coal, Wood and Baga!'.se 41 n 15 26 57
II Manual 17 70 6 4 13 6 41 10
Major Group 35 Total 19 83 2 10 27 5 31 2 23
1 All Fuels/Power 14 65 2 6 14 4 26 2 23 (a) Electricity 14 65 2 6 4 26 2 23
II Manual 18 4 13 I
Major Group 37 Total 2 2 2
I All Fuels/Power 1 I (8.) Electricity 1 1 1
II Manual 1
114
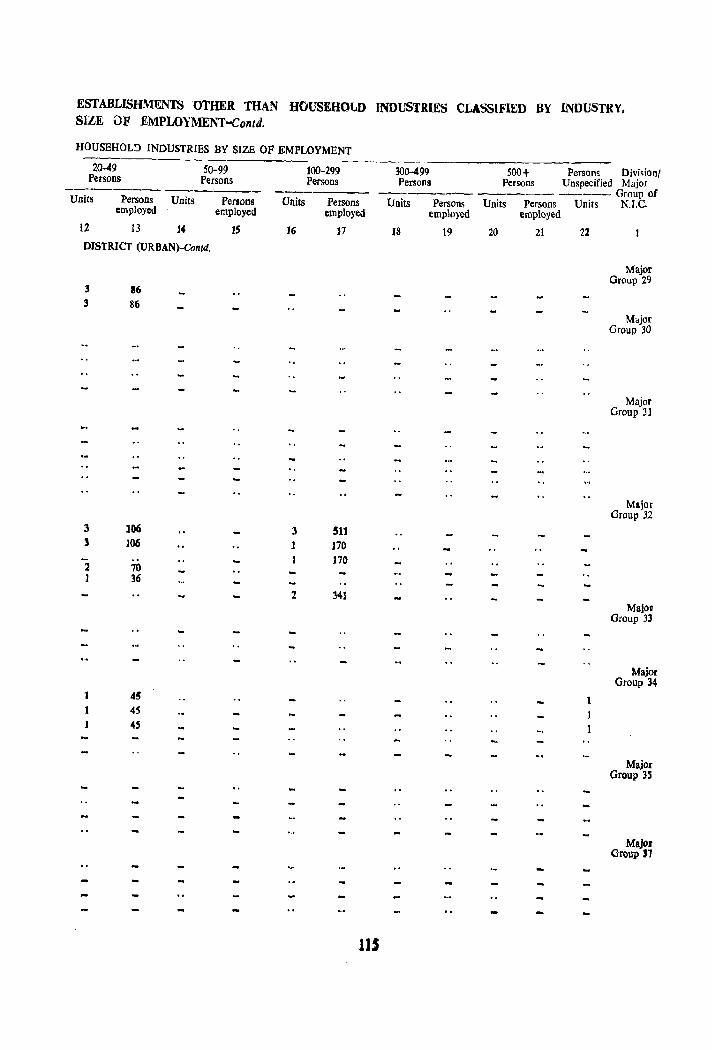
ESTABLISHM~NTS OTHER THAN HOUSEHOt.D INDUSTRIES CLASSIFIED BY iNDUSTRY, SIZE OF EMPLOYMENT-Contd.
HOUSBHOLD INDUSTRIES BY SIZE OF EMPLOYMENT
20-49 Persons
50-99 Persons -------- --------
Units Persons Units employed
12 13 ,.
DISTRICT (URBAN)-Colltd.
3 86 3 86
3 106 3 J06
2 70 1 36
1 45 1 45
4S
Perlons employed
IS
100-299 Persons
300-499 500+ Persons Division! Penons Persons Unspecified Major
Units Persons ------- ----- ----- Group of
Units POIrsons Units Persons Units N.I.C. employed employed employed
16 17 J8 19 20 21 22
3 511 1 J70
170
2 341
1
1 1
115
Major Group 29
Major Group 30
Major Group 3]
Major Group 32
Major Group 33
Major Group 34
Major Group 3S
MajOJ Group 37
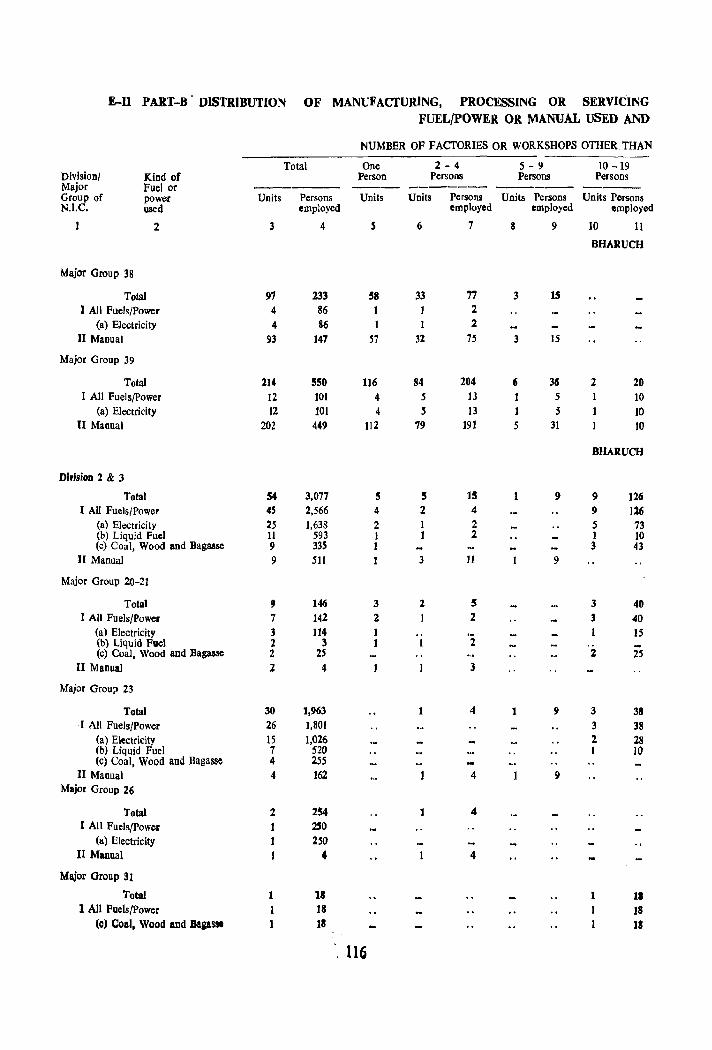
E-U PART-B DISTRIBUTION OF MANUFACfURING, PROCESSING OR SERVICING FUEL/POWER OR MANUAL USED AND
NUMBER OF FACTORIES OR WORKSHOPS OTHER THAN
Total One 2-4 5 - 9 10 -19 Division/ Kind of Person Persons Persons Persons Major Fuel or ---- -------- ------ ----Group of power Units Persons Units Units Persons Units Persons Units Persons N.I.C. used employed employed employed employed
1 2 3 4 5 6 7 8 9 10 11
BHARUCH
Major Group 38
Total 97 233 S8 33 77 3 15 I All Fuels/Power 4 86 1 2
(a) Electricity 4 86 1 2
II Manual 93 147 57 32 75 3 15
Major Group 39
Total 214 5S0 116 84 204 Ii 311 2 20 I All Fuels/Power 12 101 4 5 13 5 10
(a) Electricity 12 101 4 5 13 5 10 II Manual 202 449 III 79 191 5 31 10
BHARUCH
Di,isioD 2 & 3
Total 54 3,077 S 5 15 1 9 9 126 I All Fuels/Power 45 2,566 4 2 4 9 126
(a) Electricity 25 1.638 2 2 S 73 (0) Liquid Fuel 11 593 I 2 1 10 (c) Coal, Wood and Bagasse 9 335 1 3 43
II Manual 9 511 3 II 9
Major Group 20-21
Total 9 146 3 2 5 3 40 I All Fuels/Power 7 142 2 2 3 40
(a) Electricity 3 114 1 IS (b) Liquid Fuel 2 3 1 1 2 (c) Coal, Wood and Bagasse 2 25 2 25
II Manual 1 4 3
Major Group 23
Total 30 1,963 4 1 9 3 38 I All Fuels/Power 26 1,801 3 38
(a) Electricity 15 1,026 2 28 (b) Liquid Fuel 7 520 I 10 (c) Coal, Wood and Bagasse 4 255
II Manual 4 162 4 9 Major Group 26
Total :z 254 1 4 I All FuelS/Power 250
(a) Electricity 250 II Manual 4 4
Major Group 31
Total 1 18 1 11 t All Fuels/Power 1 18 18
(c) Coal, Wood and BapsSl IS IS
116
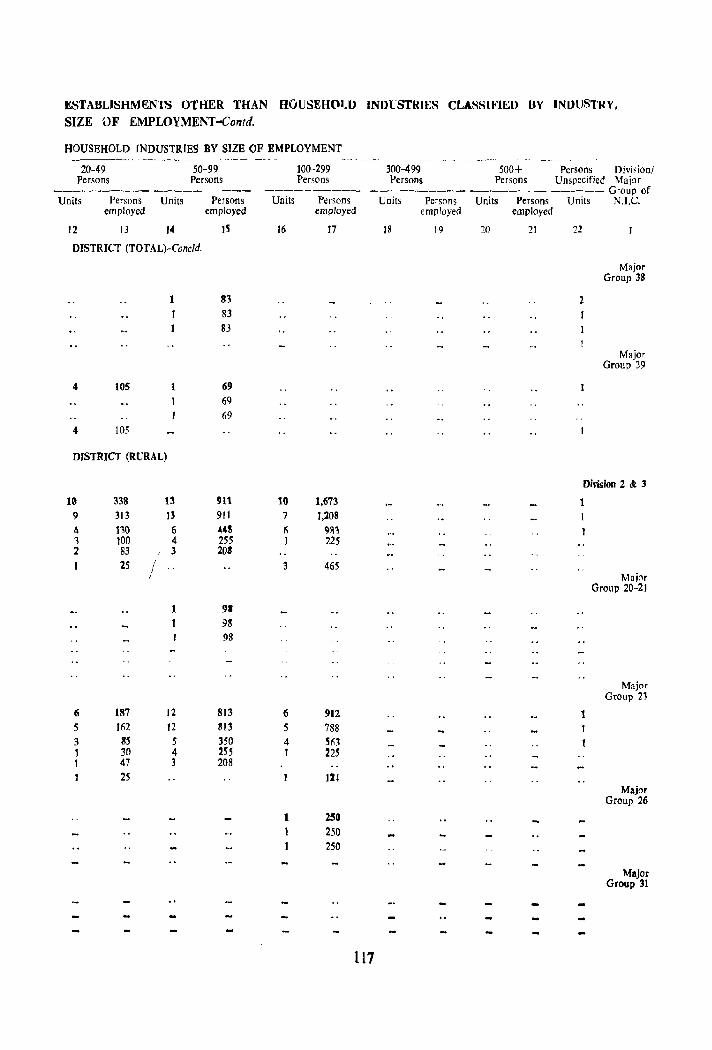
ESTABLlSHMEN1S OTHER THAN HOUSEH(U.D rNDl'STRIES CLASS1FlIW BY INDUSTRY, SIZE OF EMPLOYMENT-Contd.
HOUSEHOLD INDUSTRIES BY SIZE OF EMPLOYMENT
20-49 Persons
Units Persons Units employed
50-99 Persons
Persons employed
12 13 14 IS
DISTRICT (TOTAL)-Concld.
4 lOS
4 105
DISTRICT (RURAL)
10 9 4 'I 2
1
338 13
313 13
no 6 100 4 83 3
25 ! .. I
83 83 83
69 69 69
911 911 44S 255 20'
1 9.
6 5 3 ] 1 1
187 162 85 30 47 25
1 98
12 12 5 4 3
98
813 813 350 255 208
100-299 300-499 500+ Persons Divj,ionl Persons Persons Persons Unspecified Major
--------- ---------- ----- - ------ Group of Units Persons Units Persons Units Persons Units N.I.C.
employed employed employed
16
10 7 Ii I
3
6 5 4 1
17
1,673
1,208 983 225
465
912 788 Sf'i1 225
12~
1 250 t 250
250
18 19 20 21
117
22
2
Major Group 38
Major Group 39
Division 2 & J
1
I
1
Major Group 20-21
Major Group 23
Major Group 26
Major Group 31
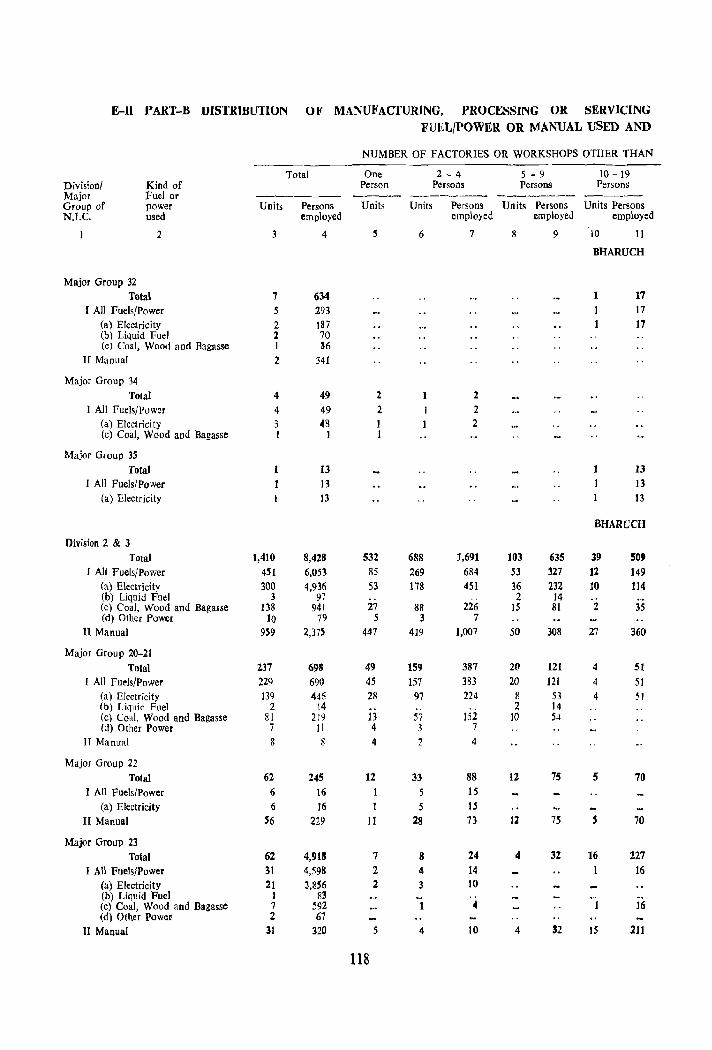
E-Il PART-H UlSTRIHUTlON OF MANU~'AcrURJNG, PROCESSING OR SERVICING
FUEL/POWER OR MANUAL USED AND
NUMBER OF FACTORIES OR WORKSHOPS OTHER THAN
Total One 2 - 4 5 - 9 10 -19 Division/ Kind of Person Persons Persons Persons Major Fuel or ------- ----- ------- -------- -----Group of power Units Persons Units Units Persons Units Persons Units Persons N.I.C. used employed employed employed employed
2 3 4 S 6 7 8 9 10 11
BHARUCH
Major Group 32 Total 7 634 1 17
I All Fuels/Power 5 293 1 17 (a) Electricity 2 187 17 (b) Liquid Fuel 2 70 (c) Coal, Wood and Bagasse 1 36
J[ Manual 2 341
Major Group 34 Total 4 49 2 2
I All Fuels/Power 4 49 2 2 (a) Electricity 3 48 2 (c) Coal, Wood and Bagasse I 1
Major Group 35 Total 1 13 13
I All Fuels/Power 13 13 (a) Electricity 13 13
BHARUCH
Division 2 & 3 Total 1,410 8,428 532 688 1,691 103 635 39 SO,
I All Fuels/Power 451 6,053 85 269 684 53 327 12 149 (a) Electricity 300 4,936 53 118 451 36 232 10 114 (b) liquid Fuel 3 97 .. 2 14 (c) Coal, Wood and Bagasse 138 941 27 88 226 15 81 2 35 (d) Other Power 10 79 5 3 7
II Manual 9.59 2,375 447 419 ],007 50 308 27 360
Major Group 20-21 Total 237 698 49 159 387 20 121 4 51
I All Fuels/Power 220 690 45 157 383 20 121 4 51 (a) Electricity J3Q 446 28 97 224 8 53 4 51 (b) Liquin Fuel 2 14 .. 2 14 (c) Coal, Wood and Bagasse 81 219 13 57 152 10 54 (d) Other Power 7 II 4 3 7
II Manual 8 8 4 2 4
Major Group 22 Total 62 24S 12 33 88 12 7S 5 70
I All Fuels/Power 6 16 1 5 15 (a) Electricity 6 16 1 5 15
II Manual ~6 229 II 28 73 12 75 S 70
Major Group 23 Total 62 4,918 7 8 24 4 32 16 227
I All Fuels/Power 31 4,59& 2 4 14 16 (a) Electricity 21 3,856 2 3 10 (b) Liquid Fuel J 83 (e) Coal, Wood and Bagasse 7 592 1 4 1 16 (d) Other Power 2 67
11 Manual 31 320 5 4 10 4 32 IS 211
118
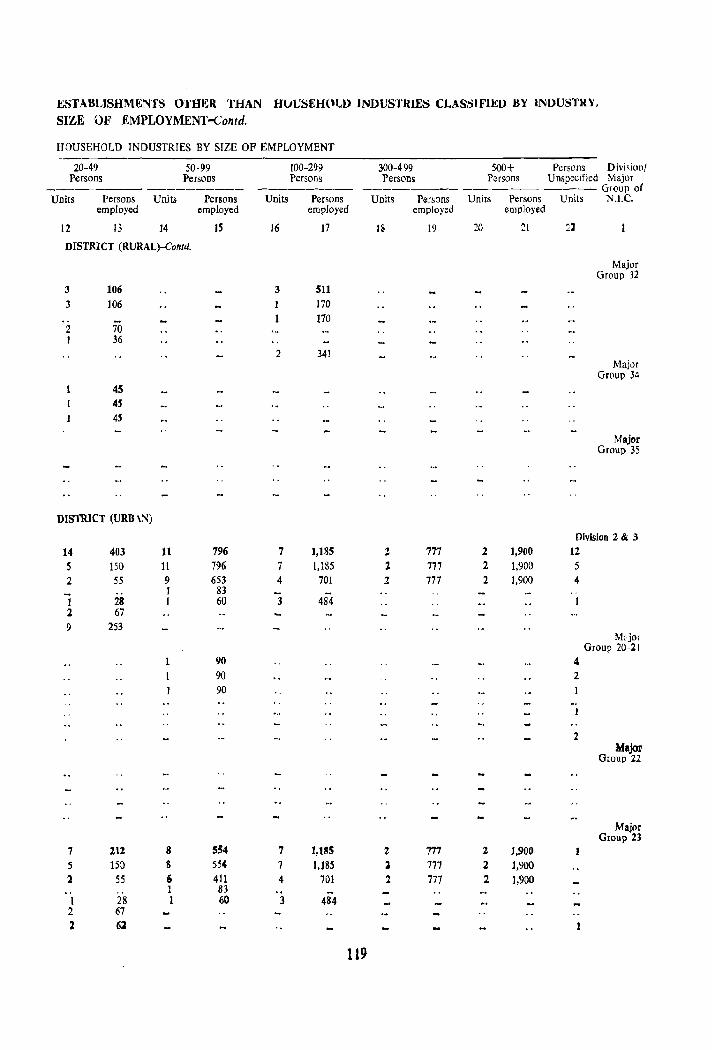
ESTABLISHMI!:N'fS OTHER THAN HuUSEHl'{,l) INDUSTRIES CLASSIFIJ<;O BY lNOUSTR,\"
SIZE OF EMPLOYMENT-Contd.
HOUSEHOLD INDUSTRIES BY SIZE OF EMPLOYMENT
20-49 Persons
50-99 Persons
Units Persons Units Persons employed employed
12 13 14
DISTRICT (RURAL)-Contd.
3
3
2 1
106 106
70 36
1 45
7 5 1 ..
1 2 2
4S 45
212 150
55
28 67 61
S S Ii 1 1
554 5~4
411 83 60
100-299 Persons
300-499 500+ Persons Division/ Persons Persons Unspecified Major
--------- ------- ----- Group of Units Persons
employed
16
3
17
511 170 170
2 341
7 1,185 7 1,185 4 701
3 484
119
Units Persons Units Persons Units N.I.C. employed employed
18 19 20 21
Z 777 2 1,900 1 777 2 1,900 2 777 2 1,900
21
1
Major Group 32
Major Group 34
Major Group 35
Major Group 23
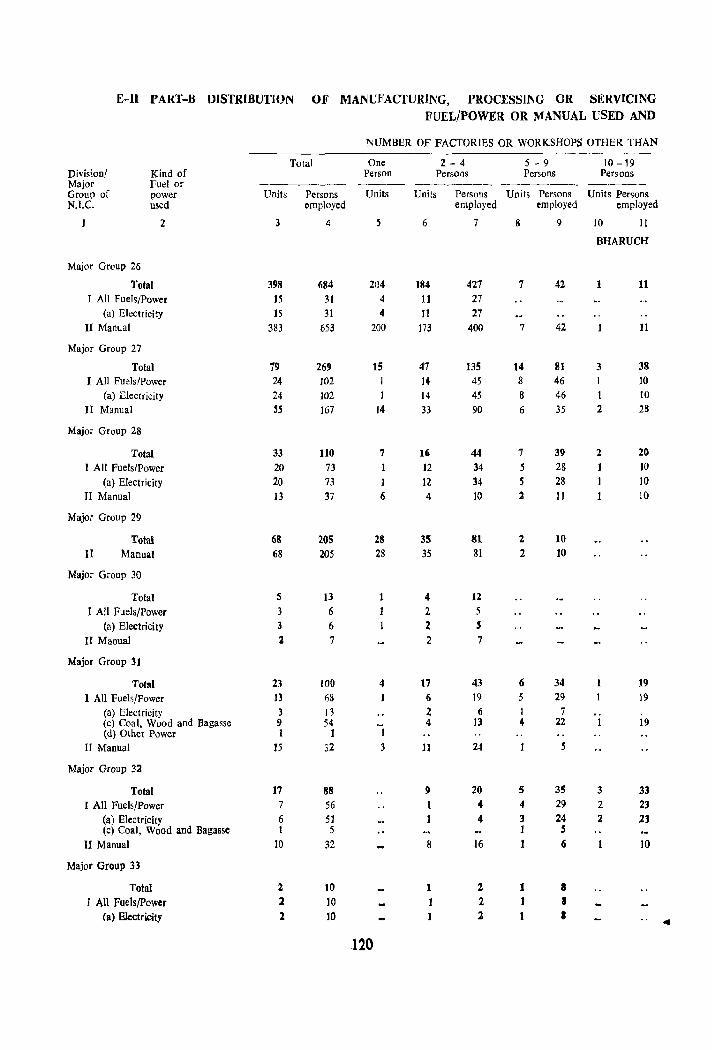
E-1l PART-H UJSTRlBUTlON OF MANUl"ACrURING, PROCESSING OR SERVICJNG FUEL/POWER OR MANUAL USED AND
NUMBER OF FACTORIES OR WORKSHOPS OTHER THAN ~-----
Total One 2 - 4 5 - 9 10 -19 Division/ Kind of Person PerSO,lS Persons Persons Major Fuel or ------- --- -------- ------- -----Group of power Units Persons Units Units Persons Units Persons Units Persons N.I.C. used employed employed employed employed
2 3 4 5 6 7 8 9 10 11
BHARUCH
Major Group 26
Total 398 684 204 184 427 7 42 11 J All Fuels/Power 15 31 4 11 27
(a) Electricity 15 31 4 11 27 II Manual 383 653 200 173 400 7 42 11
Major Group 27
Total 79 269 15 47 135 14 81 3 38 I All Fuels/Power 24 102 14 45 8 46 10
(a) Electricity 24 J02 ) 14 45 8 46 10 II Manual S5 167 14 33 90 6 35 2 28
Major Group 28
Total 33 110 7 16 44 7 39 2 20 I All Fuels/Power 20 73 12 34 .5 2S 10
(a) Electricity 20 73 I 12 34 5 28 10
II Manual 13 37 6 4 10 2 11 10
Major Group 29
Total 68 20S 28 3S 81 2 10 II Manual 68 205 28 35 81 2 10
Major Group 30
Total 5 13 1 4 12
I All Fuels/Power 3 6 1 2 5 (a) Electricity 3 6 1 2 S
II Manual 2 7 2 7
Major Group 31
Total 23 100 4 17 43 6 34 19
I All Fuels/Power 13 liS 6 \9 5 29 19
(a) Electricity 3 13 2 6 1 7 (c) Coal. Wood and Bagasse 9 54 4 13 4 22 1 19 (d) Other Power 1 1 1
II Manual 15 32 3 11 24 5
Major Group 32
Total 17 88 9 20 S 3S 3 33 I All Fuels/Power 7 56 4 4 29 2 23
(a) Electricity 6 51 4 3 24 2 23 (c) Coal, Wood and Bagasse 1 5 1 5
II Manual 10 32 8 16 1 6 10
Major Group 33
Total 2 10 1 2 1 II
I All Fuels/Power 2 10 1 2 1 a (a) Electricity 1 10 2 I
"!II
120
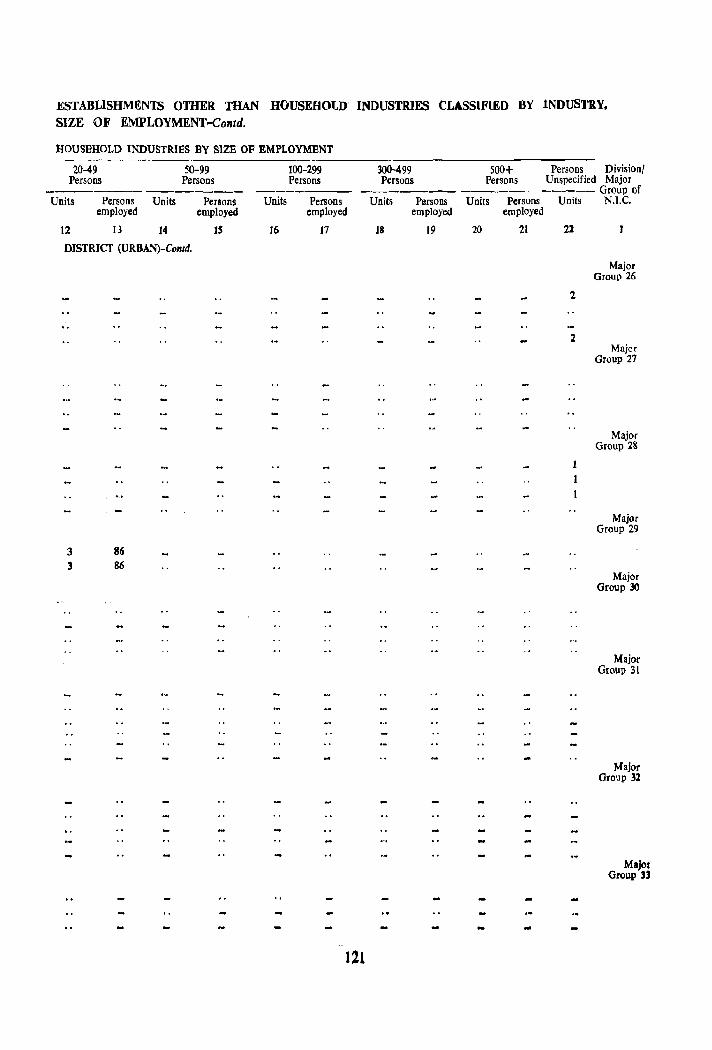
ESTABLISHMENTS OTHER THAN HOUSEHOtD INDUSTRIES CL&SSIFlED BY INDUSTRY, SIZE OF EMPLOYMENT-Contd.
lJOUSBHOLD INDUSTRIES BY SIZE OF EMPLOYMENT ------------------------------------20-49 50-99 100-299
Persons Persons Persons
Units Persons Units employed
12 13 14
DlSTRICT (URBAN)-Contd.
3 86 3 86
Persons employed
IS
Units
16
Persons employed
17
121
300-499 Persons
Units Persons employed
J8 19
500+ Persons Division! Persons Unspecified Major
------ Group of Units Persons Units N.I.C.
employed
20 21 21
2
2
1
1
Major Group 26
Majer Group 27
Major Group 2&
Major Group 29
Major Group 30
Major Group 31
Major Group 32
Major Group U
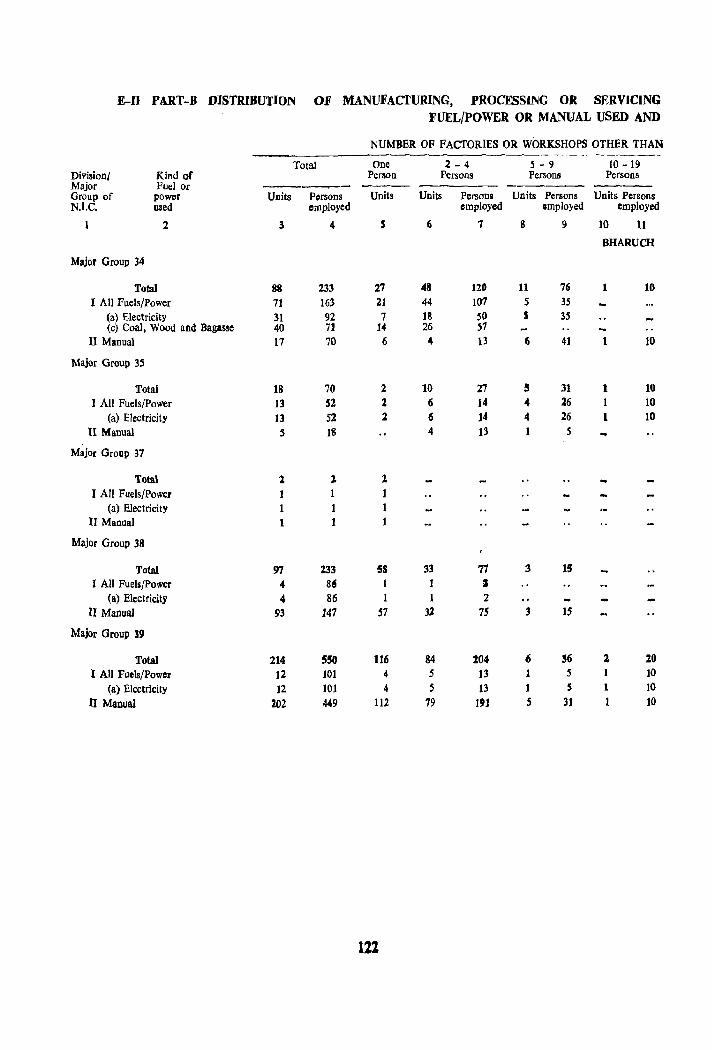
E-D PART-B DISTRIBUTION OF MANUFAcrURING, PROCESSING OR SERVICING FUEL/POWER OR MANUAL USED AND
NUMBER OF FACTORIES OR WORKSHOPS OTHER THAN
Total One 2-4 5 - 9 10 -19 Divisionl Kind of Person Persons Persons Persons Major Fuel or --------,.-- ---- ------ ------ ----Group of power Units Persons Units Units Persons Units Persons Units Persons N.I.C. used Clmployed employed employed employed
2 3 4 5 6 7 8 9 10 11
BHARUCH
Major Group 34
Total 88 233 27 48 120 11 76 1 10 I All Fuels/Power 71 163 21 44 107 5 3S
(a) Electricity 31 92 7 18 50 S 35 (c) Coal, Wood and Bagasse 40 71 14 26 57
II Manual 17 70 6 4 13 6 41 10
Major Group 35
Total 18 70 2 10 27 5 31 1 10 I All Fuels/Power 13 52 2 6 14 4 26 1 10
(a) Electricity 13 52 2 6 14 4 26 1 10 II Manual 5 18 4 13 S
Major Group 37
Total 1 1- 1. I All Fuels/Power 1 1 1
(a) Electricity 1 1 11 Manual 1
Major Group 38
Total 97 233 58 33 77 3 15 I All Fuels/Power 4 86 3
(a) Electricity 4 86 1 1 1. II Manual 93 147 57 32 75 3 15
Major Group 39
Total 214 550 116 84 204 6 36 ~ 20 I All Fuels/Power 12 101 4 5 13 1 5 10
(a) Electricity 12 101 4 S 13 1 S 1 10
II Manual 202 «9 112 79 19J S 31 1 ]0
III
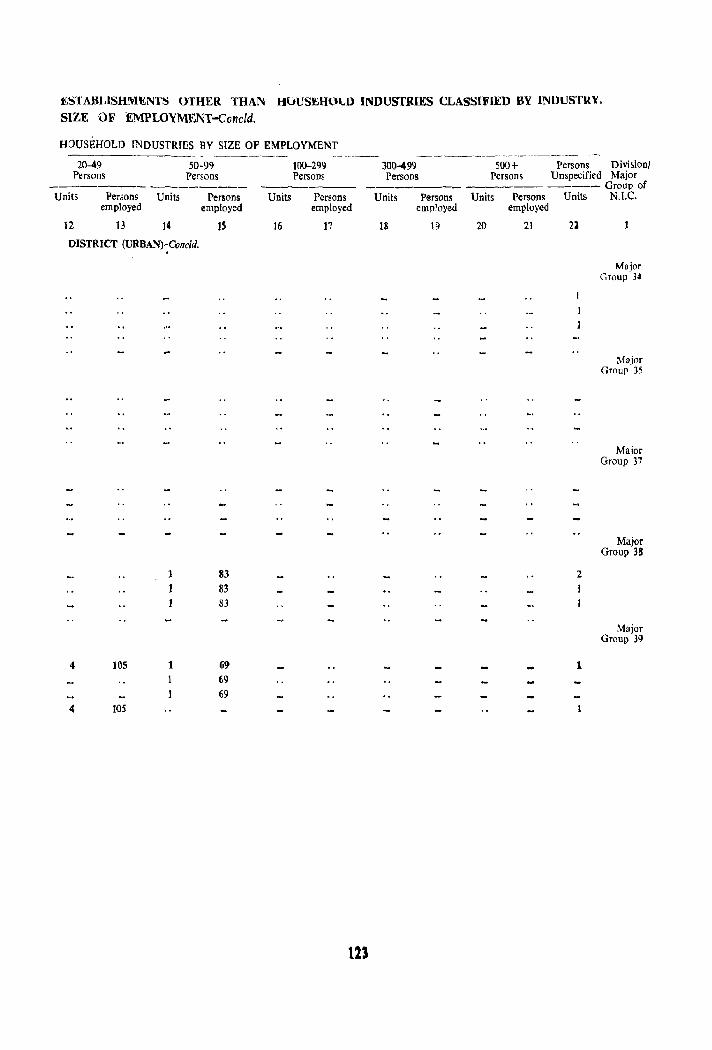
.l£STAHLlSHM~NTS OTHER THAN HVUSEH()t,l) INDUSTRIES CLASSIFIED BY INUUSTRY. SIZE OF £MPLOYMENT-Concld.
HOUSEHOLD INDUSTRIES BY SIZE OF EMPLOYMENT
20-49 Persons
50-99 Persons
--~--- -------Units Persons Units Persons
employed employed
12 13 14 1S
DISTRICT (URBAN)~Concld.
1 83 1 83
83
" 105 1 6'> 69 69
4 105
Units
16
]00-299 Persons
300-499 500+ Persons Divisionl Persons Persons Unspecified Major
_______ ----- ----- Group of Persons
employed
17
1ll
Units P~rsons Units Persons Units N.l,C. employed employed
18 19 20 21 21
2
I
1
Major Group 34
Major Group 35
Major Group 37
Major Group 38
Major Group 39
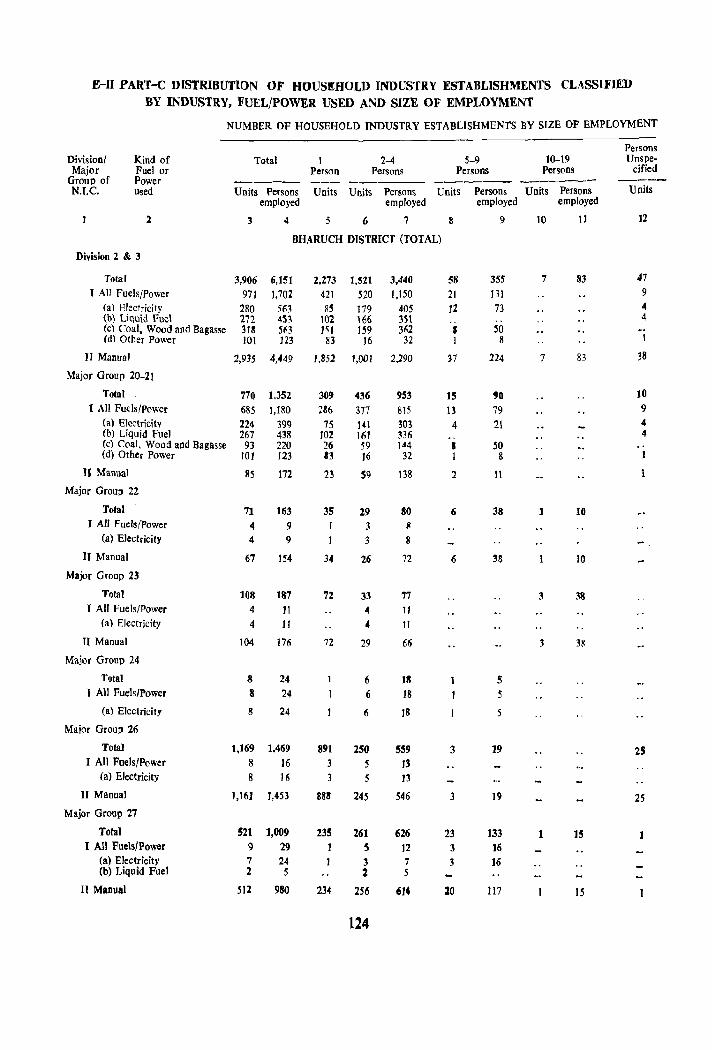
E-II PART-C DISTRIBUTION OF HOUSEHOLD INDUSTRY ESTABLISHMENTS CLASSIFIED
BY INDUSTRY, FUEL/POWER USED AND SIZE OF EMPLOYMENT
NUMBER OF HOUSEHOLD INDUSTRY ESTABLISHMENTS BY SIZE OF EMPLOYMENT
Persons Divisionl Kind of Total 2-4 5-9 10-19 Unspe-Major Fuel or Person Persons Persons Persons dfied
Group of Power --- -_--- ----- -----_- ----N.T.C. used Units Persons Units Units Persons Units Persons Units Persons Units
employed employed employed employed
l 3 4 5 6 7 8 9 10 11 12
BHARUCH DISTRICT (TOTAL)
Division 2 &. 3
Tolal 3,906 6,151 2.273 l,S21 3,440 58 355 7 83 47
I All Fuels/Power 971 1,702 421 m 1,150 21 J3I 9 (a) Electricity 280 56~ ~5 179 405 12 73 4 (b) Liquid Fuel 272 451 102 166 m .. 4 (c) Coal, Wood aod Bagasse 313 563 151 159 362 • ~O (d) Other Power 101 123 83 16 32 1 8 I
If Manual 2,935 4,449 1,852 1,001 2,290 J7 224 7 83 38
Major Group 20-21
Total 770 1,352 309 436 953 15 90 10 I All FuelS/Power 685 1,180 186 377 815 13 79 9
(a) Electricity 224 399 7S HI 303 4 21 4 (b) Liquid Fuel 267 438 102 161 336 .. 4 (c) Coal, Wood and Bagasse 93 220 26 59 ld4 1 SO .. (d) Other Power 101 123 13 16 32 I 8 I
II Manual 8S 172 23 59 138 2 ]I 1
Major Group 22
Total 71 163 35 29 SO (i 38 1 10 I All Fuels/Power 4 9 3 II
(a) Electricity 4 9 3 8 -II Manual 67 IS4 34 26 72 6 38 10
Major Group 23
Total 108 187 72 33 77 3 38 I All Fuels/Power 4 11 4 11
(a) Electricity 4 II 4 11
TI Manual 104 176 72 29 66 38
Major Group 24
Total 8 24 6 J8 5 I All Fuels/Power 8 24 6 18 5
(a) Electricity 8 24 6 18
Major Group 26
Total 1,169 1.469 891 250 559 3 19 25 I All Fuels/Power 8 16 3 .5 13
(a) Electricity 8 16 3 5 J3
II Manual 1,16] 1,453 883 245 546 3 19 25 Major Group 27
Total 521 1,009 235 261 626 23 133 1 15 1 I All Fuels/Power <) 29 I S 12 3 ]6
(a) Electricity 7 24 ] 3 7 3 ]6 (b) Liquid Fuel 2 5 2 5
n Manual 512 980 234 256 614 :20 117 15
124
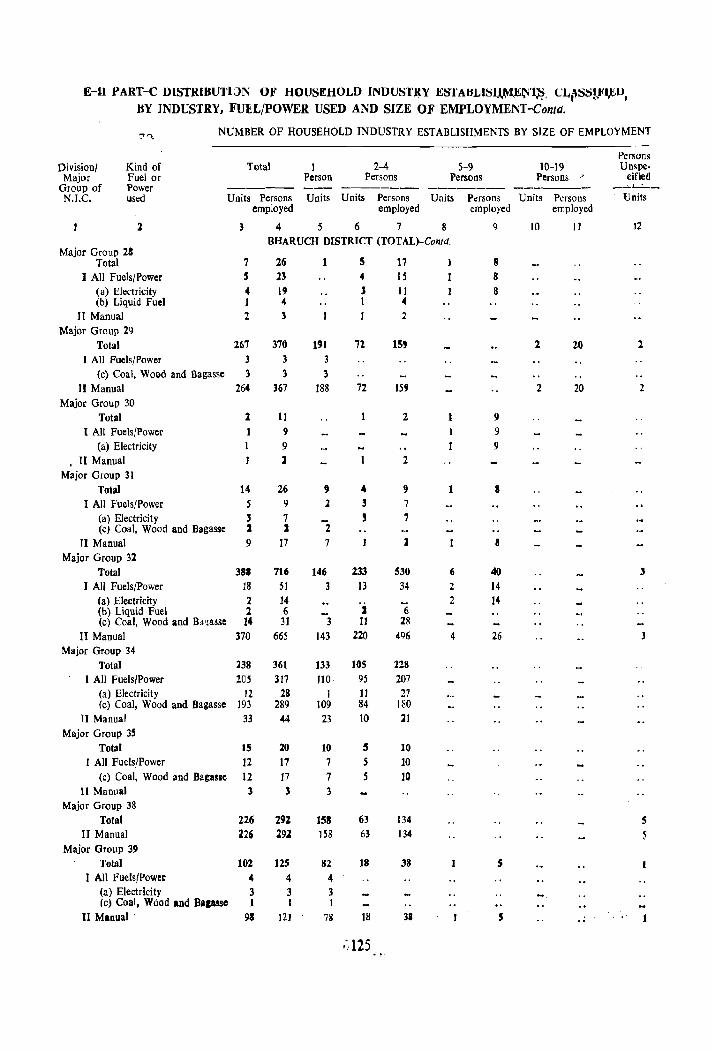
E-ll PART-C DlSTRIHUTI:JN OF HOUSEHOLD INDUSTRY ESTABLlS~.J:;~'1~. CL~S:;!,,<·I,t:1J.
HY JNDUSTRY, FUEL/POWER USED AND SIZE OF EMPLOYMENT-Conto.
:''\ NUMBER OF HOUSEHOLD INDUSTRY ESTABLISHMENTS BY SIZE OF EMPLOYMENT
Persons Division/ Kind of Tgtal I 2-4 5-9 10-19 Unspe. Major Fuel or Person Persons Persons Persons ~ cifiet!
Group of Power ---- ------ ------ _....:...L-:"'__
N.I.C. used Units Persons Units Units Persons Units Persons Units Persons Units employed employed employed employed
2 3 4 5 6 7 8 Q 10 II 12
BHARUCH DISTRICT (TOTAL)-Contd. Major Group 2S
5 Total 7 26 17 8
I All Fuels/Power , 23 4 I' 8 (a) EleC'tricity 4 19 l 11 8 (b) Liquid Fuel I 4 I •
II Manual 2 3 I 2 Major Group 29
Total 267 370 191 '12 15' 1 II) 1 I All Fuels/Power 3 3 3
(c) Coal, Wood and Bagasse 3 3 3
II Manual 264 367 188 72 159 2 20 2 Major Group 30
Total 1 II 1 I 9 I All Fuels/Power 9 9
(a) Electricity 9 9
II Manual :I 2 Major Group 31
Total 14 26 , 4 9 8 I All Fuels/Power S 9 1 3 7
(a) Electricity 3 7 , 7 (c) Coal, Wood and Bagasse :I I 2
II Manual 9 17 7 I 8 Major Group 32
Total 381 716 146 233 530 6 40 J
I All Fuels/Power 18 51 3 13 34 2 14 (a) Electricity 2 14 2 14 (b) Liquid Fuel 1 6 I 6 (c) Coal, Wood and Bd'lllSSC 14 31 3 ]1 28
II Manual 370 665 143 220 41)6 4 26 Major Group 34
Total 238 361 133 105 228 I All Fuels/Power 20S 317 no 95 207
(a) Electricity 12 28 I 11 27 (e) Coal, Wood and Bagasse 193 289 109 84 180
II Manual 33 44 23 10 21 Major Group 35
Total IS 20 10 5 10 1 All Fuels/Power 12 17 7 S 10
(c) Coal, Wood and Bagasse 12 17 7 S 10 1I Manual J 3 3
Major Group 38 Total 226 291 1511 63 134 5
II Manual 226 292 158 63 134 ~ Major Group 39
Total 102 125 82 18 33 S I All FuelS/Power 4 4 4
(a) Electricity 3 3 3 (c) Coal, Wood and Ba,lSse 1 I I
II Manual' 91 121 78 18 31 S ..
. ~ 125
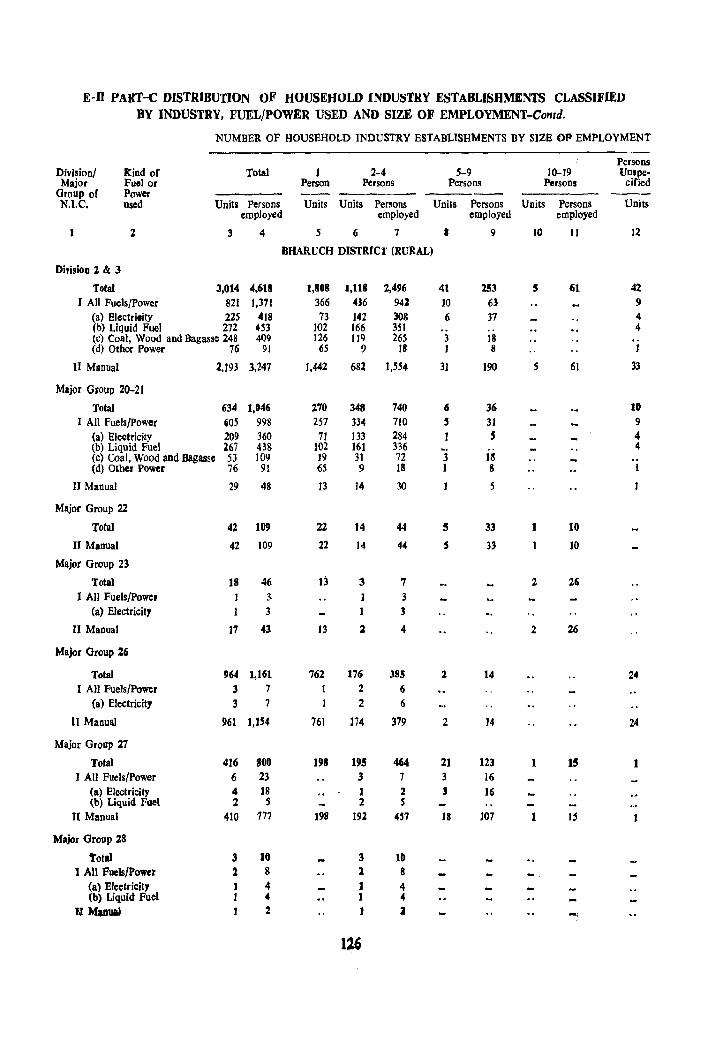
E-n PART-C O1STRIBunON OF HOUSEHOLD INDUSTRY ESTABLISHMENTS CLASSIFIED BY INDUSTRY, FUEL/POWER USED AND SIZE OF EMPLOYMENT-Contd.
NUMBER OF HOUSEHOLD INDUSTRY ESTABLISHMENTS BY SIZB OP EMPLOYMENT
Persons Divisionl Kind or Total 1 2-4 5-9 10-19 Unspe-Major Fuel or Person Persons Persons Persons cified
Group of Power ----- ------ -----N.I.C. used Units Persons Units Units Persons Units Persons Units Persons Units
employed employed employed employed
2 3 4 5 6 7 I 9 10 II 12
BHARUCH DISTRICt' (RURAL)
Division 2 & 3
Total 3,014 4,618 1,808 1,118 2,496 41 253 5 61 42 J All Fuels/Power 821 I,m 366 436 942 10 63 9
(a) I:!lectrioity 225 418 73 142 308 6 37 4 (b) Liqllid Fuel 272 m 102 166 351 .. ., 4 lc) Coal, Wood and Bagasse 248 409 126 119 265 3 ]8 (d) Other Power 76 91 65 9 ]8 1 8 1
II Manual 2.193 3,247 1,442 682 1,554 31 190 5 61 33
Major Group 20-21
Total (;34 1,046 270 348 740 «I 36 10 I All Fuels/Power 605 998 257 334 710 , 31 9
(a) Electricity 209 360 71 133 284 , 4 (b) Liquid Fuel 267 438 ]02 16] 336 4 (c) Coal, Wood and Bagasse 53 109 19 31 72 3 II! (d) Other Power 76 91 65 9 18 1 S 1
II Manual 29 48 13 14 30 5
Major Group 22
Total 42 109 22 ]4 44 5 33 I 10
II Manual 42 109 22 14 44 5 33 JO
Major Group 23
Total 18 46 13 3 7 2 26 I All Fuels/powe. 3 I 3
(a) Electricity 3 1 3
II Manual 17 43 13 2 4 2 26
Major Group 26
Total 964 1,161 762 176 385 1 14 24 I All Fuels/Power 3 7 I 2 6
(a) Electricity 3 7 1 2 6
II Manual 961 ],154 761 J74 379 2 14 24
Major Group 27
Total 416 800 198 195 464 21 123 1 15 1 I All FuelsfPower 6 23 3 7 3 16
(a) Electricity 4 18 1 2 1 16 (b) Liquid Fuel 2 5 2 S
II Manual 410 777 198 19l 457 18 107 1 15
Major Group 28
Total 3 10 3 10 1 All FuelsfPower 2 8 :I 8 -.
(a) Electricity 4 J 4 (b) Liquid Fuel 4 1 4
U Manual 2 1 J
126
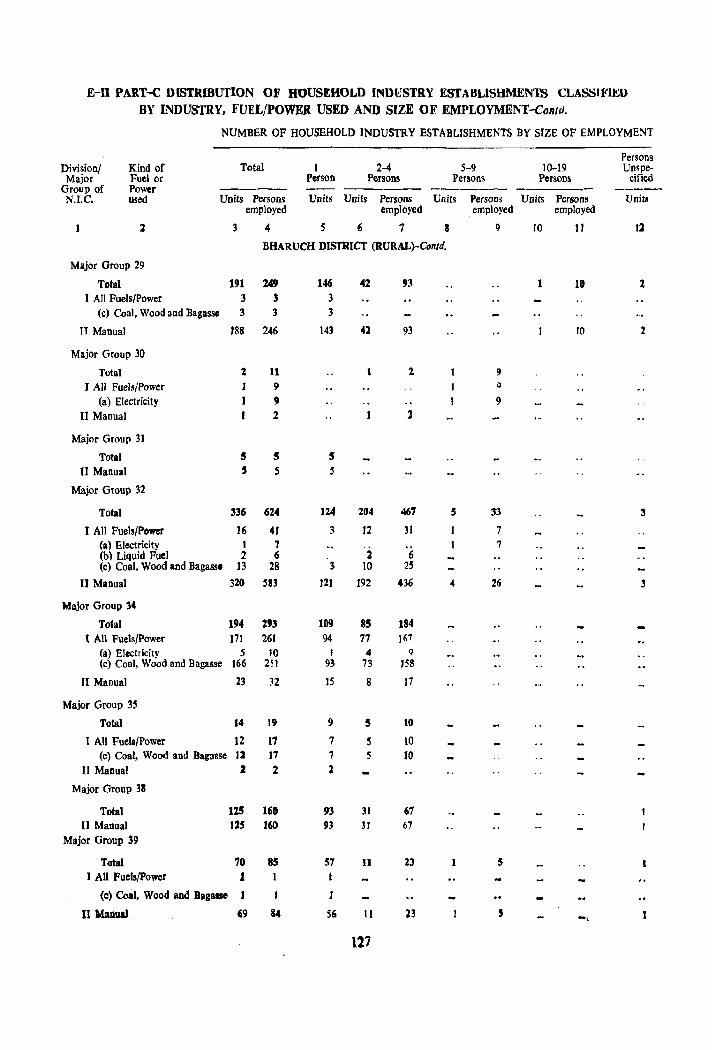
E-lI PART-C DISTRIBUTION OF HOUSEHOLD INDUSTRY ESfA8LISHMENTS CLASSIFIKU
BY INDUSTRY, FUEL/POWER USED AND SIZE OF EMPLOYMENT-Contd.
NUMBER OF HOUSEHOLD INDUSTRY ESTABLISHMENTS BY SIZE OF EMPLOYMENT
Persons Division/ Kind of T0tal J 2-4 5-9 10-19 Unspe-Major Fuel or Person Persons Persons Persons cified
Group of Power ------ ----N.r.C. used Units Persons Units Units Persons Units Persons Units Persons Units
employed employed employed employed
2 3 4 5 6 7 8 9 10 1J 12
BHARUCH DISTRICT (RURAL)-Contd.
Major Group 29
Total 191 249 146 042 93 1 10 1 I All Fuels/Power 3 3 3
(c) Coal, Wood and Bagasse 3 3 3
n Manual 188 246 143 41 93 10 2
Major Group 30
Total 1 11 1 1 1 9
I All Fuels/Power 1 9 0
(a) Electricity ] 9 9 II Manual 1 2 2
Major Group 31
Total 5 5 5 II Manual , 5 5
Major Group 32
Total 336 624 124 204 467 5 33 3
I All Fuels/Power 16 41 3 12 31 7 (a) Electricity 1 1 7 (b) Liquid Fuel 2 6 2 6 (c) Coal. Wood and Bagass. ]3 28 3 10 2S
II Manual 320 583 121 192 436 4 26 3
Major Group 34
Total 194 m 109 85 184 1 All Fuels/Power 171 261 94 77 161
(a) Electricity 5 10 1 .. 9 (c) Coal, Wood and Bagasse 166 251 93 73 158
II Manual 23 n IS 8 17
Major Group 3S
Total 14 19 9 5 10
I All Fuels/Power 12 17 7 5 10 (c) Coal, Wood and Bagasse 12 17 7 5 JO
II Manual 2 2 1
Major Group 38
Total 125 160 93 31 67 II Manual 125 160 93 31 67
Major Group 39
Total 70 85 57 11 23 1 5 I All Fucls/powcr J j
(c) Coal, Wood and Bagasse I I 1
11 Manual. 69 8.- 56 11 23 , -. 127
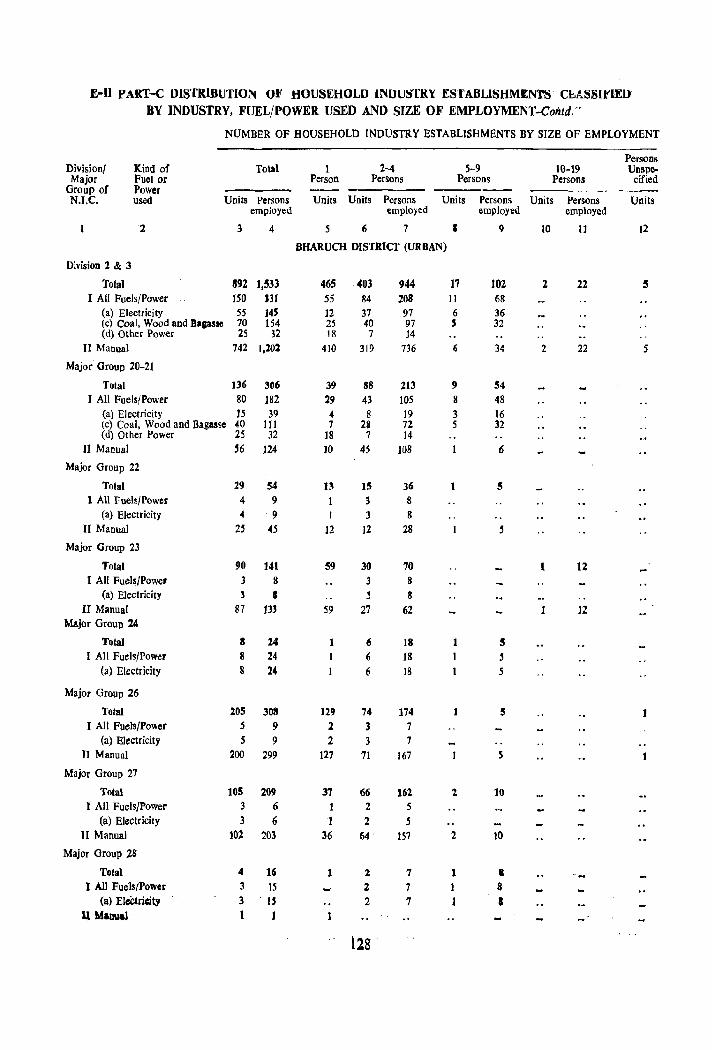
E-ll P ART-C DISTRIBUTION QIi' HOUSEHOLD INDUSTRY ESTABLISHMENTS CbASS(JilEll BY INDUSTRY, FUEL/POWER USED AND SIZE OF EMPLOYMENT-COIltd."
NUMBER OF HOUSEHOLD INDUSTRY ESTABLISHMENTS BY SIZe OF EMPLOYMENT
Persons Divisionl Kind of Total 1 1-4 5-9 10-1.9 Unspe-Major Fuel or Person Persons Persons Persons dfied
Group of Power --- --- -----N.I.C. used Units Persons Units Units Persons Units Person~ Units Persons Units
employed employed employed employed
2 3 4 5 6 7 I 9 10 11 12
BHARUCH DISTRICT (URBAN)
D:vislon 2 & 3
Total 892 1,533 465 403 944 17 102 2 22 5 I All Fuels/Power 150 131 55 114 208 11 68
(a) Electricity 55 14S 12 37 97 6 36 (c) Coal, Wood and BaSlsse 70 154 25 40 97 S 32 (d) Other Power 25 32 18 7 14
II Manual 742 1,202 410 319 736 6 34 2 22 5
Major Group 20-21
Total 136 306 39 88 213 9 54 1 All Fuels/Power 80 182 29 43 105 8 48
(a) Electricity 15 39 4 8 19 3 16 (c) Coal, Wood and Bagasse 40 1JI 7 28 72 5 32 (d) Other Power 25 32 ]8 7 14
II Manual '6 124 ]0 45 108 6
Major Group 22
Total 29 54 B 15 36 1 5 I All Fuels/Power 4 9 I 3 8
(a) Electricity 4 9 1 3 8
II Manual 2~ 45 12 12 28 ~
Major Group 23
Total 90 141 59 30 70 1 12 I All Fuels/Power 3 8 3 8
(a) Electricity 3 I 3 8 II Manual 87 133 59 27 62 12
M&jor Group 24
Total 3 24 1 6 18 1 5 I All Fuels/power 8 24 6 18 I 5
(a) Electricity 8 24 6 18 S
Major Group 26
Total 205 303 129 74 174 5 1 I All Fuels/Po'oler S 9 l 3 7
(a) Electricity 5 9 2 3 7 n Manual 200 299 127 71 167 5
Major Group 27
Total 105 209 37 66 162 2 10 I All Fuels/Power 3 6 1 2 5
(a) Electricity 3 6 1 2 5 II Manual 102 203 36 64 ]57 2 10
Major Group 28
Total 4 16 1 2 7 1 • I All Fue]s!power 3 15 2 7 I 8
(a) EleCtricity 3 IS 2 7 1 • 11 Manila}· 1 1
tag
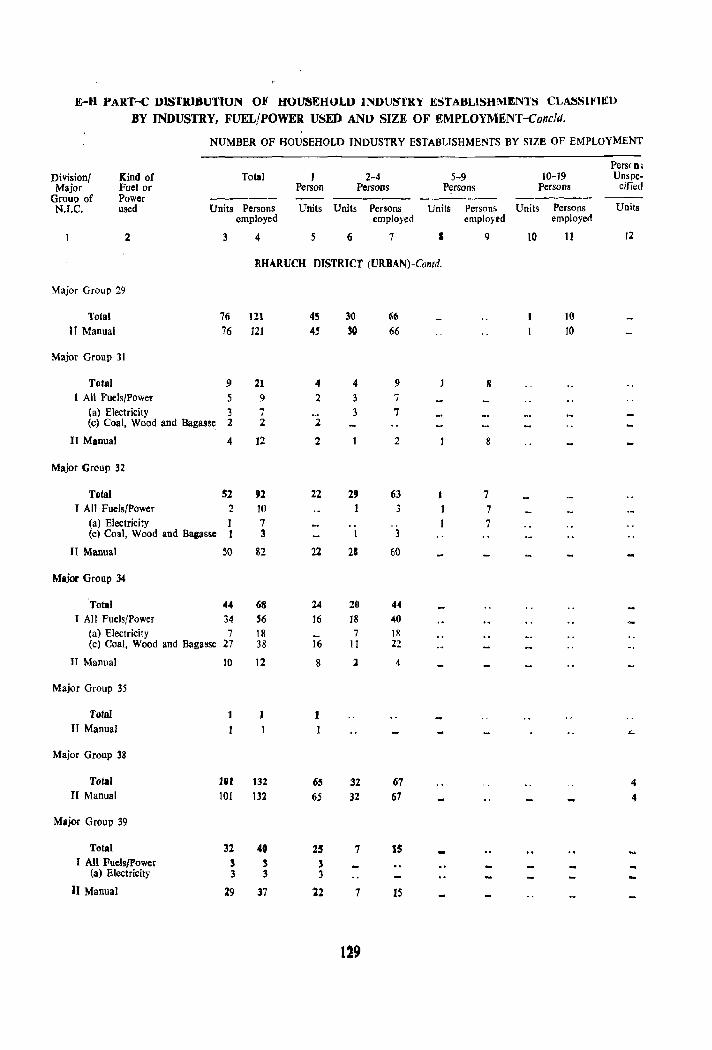
IHI P ART-C OlSTRIBU1'lON Oil' HOUSEHOLD INDUSTRY ESTABLlSHMt:NTS CLASSlnlL!)
BY INDUSTRY, FUEL/POWER USED ANI> SIZE OF EMPLOYMENT-Concld.
NUMBER OF HOUSEHOLD INDUSTRY ESTABLISHMENTS BY SIZE OF EMPLOYMENT
Pers( DJ
Division/ Kind of Total I 2-4 5-9 10-19 Unspe-Major Fuel or Person Persons Persons Persons cified
Group of Power ----- ------- ------ -----N.I.C. used Units Persons Units Units Persons Units Persons Units Persons Units
employed employed employed employed
2 3 4 5 6 7 I 9 10 II 12
HHARUCH DISTRICT (URBAN)-Contd.
Major Group 29
l'olal 76 121 45 30 66 10
Jl Manual 76 121 4S 30 66 10
Major Group 31
Total 9 21 4 4 9 8 I All Fuels/Power 5 9 2 3 7
(a) Electricity 3 7 3 7 (c) Coal, Wood and Bagasse, 2 2 2
II Manual 4 12 2 2 8
Major Group 32
Total 52 92 %2 29 63 ) 7 I All Fuels/Power 2 10 3 I 7
(a) Electricity 1 7 7 (c) Coal, Wood and Baaasse 1 3 1 3
II Manual 50 82 22 21 60
Major Group 34
Total 44 68 24 20 44 I All Fuels/Power 34 S6 16 18 40
(a) Electricity 7 18 - 7 lR (c) Coal, Wood and Bagasse 27 38 16 11 22
11 Manual 10 12 8 1 4
Major Group 35
Total 1 1 1 II Manual 1 ...
Major Group 38
Total llH 132 65 32 67 " II Manual 101 132 65 32 67 4
Major Group 39
Total 32 40 25 7 15 I All Fuels/Power 3 3 3
(a) Electricity 3 3 3
II Manual 29 37 12 7 15
129
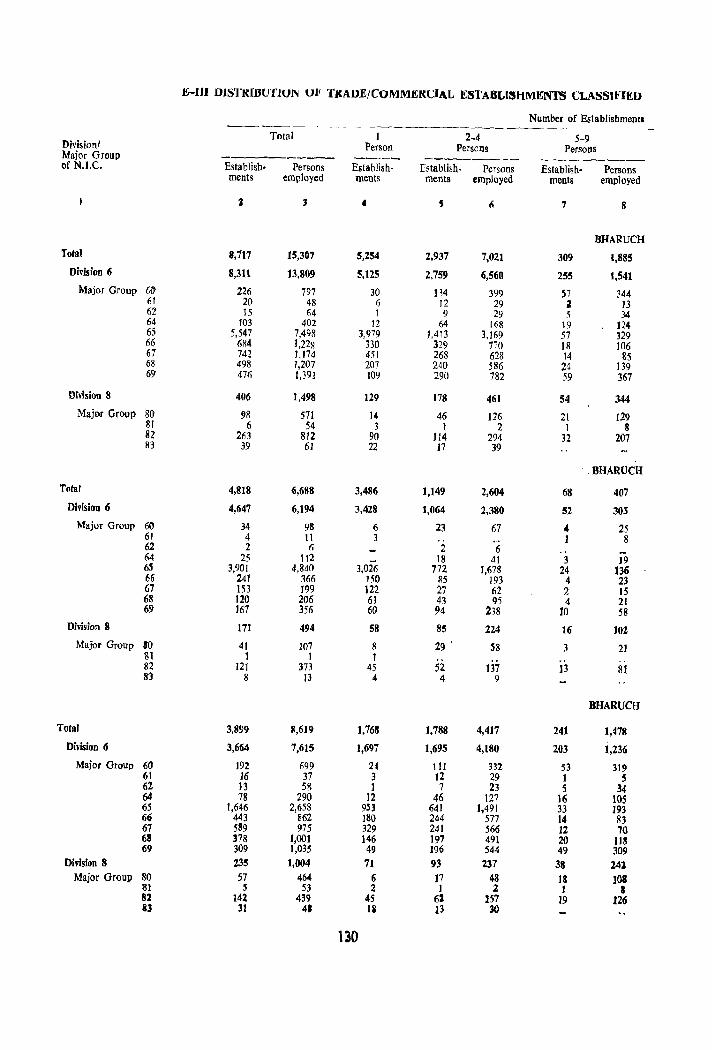
E-UI DISTRIBUTlUN m TRADE/COMMERCIAL ESTABLISHMENtS CLASSIf<'IED
Number of Establishments ---- -~---~
Tota) I 2-4 5-9 Division! Person Persons Persons Major Group --------- ---- ------- --_,.__----of N.l.C. Establish- Persons Establish· Establish· Persons Establish- Persons
ments employed ments ments employed meots employed
:I • S Ii 7 8
BHARUCH Total 8,717 15,307 5,254 2,937 7,021 309 1,885
Division 6 8,311 13,809 5,125 2,759 6,560 255 1,541 Major Group 6(J 226 797 30 134 399 57 ~44
61 20 48 6 12 29 2 13 62 15 64 1 9 29 5 34 64 103 402 12 64 168 19 124 65 5,547 7,498 3,979 1,413 3,169 57 329 66 684 1,22~ 330 329 7iO 18 106 67 742 1.174 m 268 628 14 85 68 498 1,207 207 240 586 24 139 69 476 1,391 109 290 782 59 367
Division 8 406 1,498 129 178 461 54 344 Major Group sa 98 571 14 46 126 21 129
81 6 54 3 1 2 1 8 82 263 812 90 J14 294 32 207 83 39 61 22 17 39
,BHARUCH Total 4,818 6,688 3,486 1,149 2,604 68 407
Division 6 4,647 6,194 3,428 1,064 2,380 S2 303 Majur Group 60 34 98 6 23 67 4 25
61 4 11 3 .. 1 8 62 2 (i 2 6 64 25 112 18 41 3 19 65 3,901 4,840 3,026 772 1,678 24 136 66 241 366 150 85 193 4 23 67 153 199 122 27 62 2 15 68 120 206 61 43 95 4 21 69 167 356 60 94 238 JO 58
Division 8 171 494 58 85 224 16 102 Major Group 10 41 107 8 29 ' 58 3 21
81 1 1 1 82 121 373 45 52 137 13 81 83 8 13 4 4 9
BHt\RUCH
Total 3,899 8,619 1,768 ],788 4,417 241 1,~78
Division 6 3,664 7,615 1,697 1,69S 4,180 203 1,236 Major Group 60 192 699 24 III 332 53 319
61 16 37 3 12 29 1 5 62 13 58 I 7 23 5 34 64 78 290 12 46 127 16 105 65 1,646 2,658 9.53 641 1,491 33 193 66 443 862 J80 244 577 14 83 67 589 975 329 241 566 12 70 68 378 1,001 146 197 491 20 118 69 309 1,035 49 196 544 49 309
Division 8 235 1,004 71 93 237 38 241 Major Group 80 57 464 6 17 48 1& 108
81 5 53 2 I 2 1 a 82 142 439 45 62 157 19 126 83 31 4. Ii 13 30
130

DY 'ftll!;.TYPE 01<' .8LJSINESS OR TRADE AND !SIZE 01<' EMPLOYMEN'I
by Size of Employment ._--_---------- --'
10-19 20-49 50-99 100+ Persons Division! Persons Persons Persons Persons Unspecified Major Group ---1---- ------- -------- -------- ------ of NJ.C, Establish~ Persons Establish- Persons Establish- Persons Establish- Persons Establish-Illents employed ments employed ments emJ)loyed ments employed ments
9 10 11 1'2 13 14 15 16 17
DISTRICT (TOTAL)
44 557 12 332 1 56 1 202 159 Total 26 312 3 69 1 202 142 6 Di,jsion 2 24 3 60 Major Group
61
- 62 6 78 20 1 64 1 " 21 96 6S 2 22 S 66 1 10 8 67 4 44 1 29 1 202 21 68 9 ]13 1 20 8 69
18 245 9 263 1 56 17 8 DivisioD 11 162 5 140 80 Major Gronp
1 41 81 7 23 3 82 I 56 16 82 83
OISTRICT (RURAL)
5 66 3 69 1 56 106 Total 2 32 2 49 99 6 Division
60 61
Major Group
.. .. 62 2 32 J 20 1 64 79 65 2 66 2 67
1 29 11 68 3 69
3, 34 20 56 7 8 Division
80 Major Group .. - III 3 34 1 20 1 56 G 82 83
DISTRICT (LitBAN)
39 491 9 263 1 202 S3 Total 24 280 1 20 1 202 43 6 Division 2 24 2 60 Major Group
61 - 62 4 46 .. 64 2 21 17 65 :I 22 3 66 1 10 .. 6 67 4 44 1 202 10 68 9 115 1 20 5 69 15 111 8 243 10 8 Division 11 162 5 140 80 Major Group
49 1 41 111 4 :. 62 10 82 lIS
l31
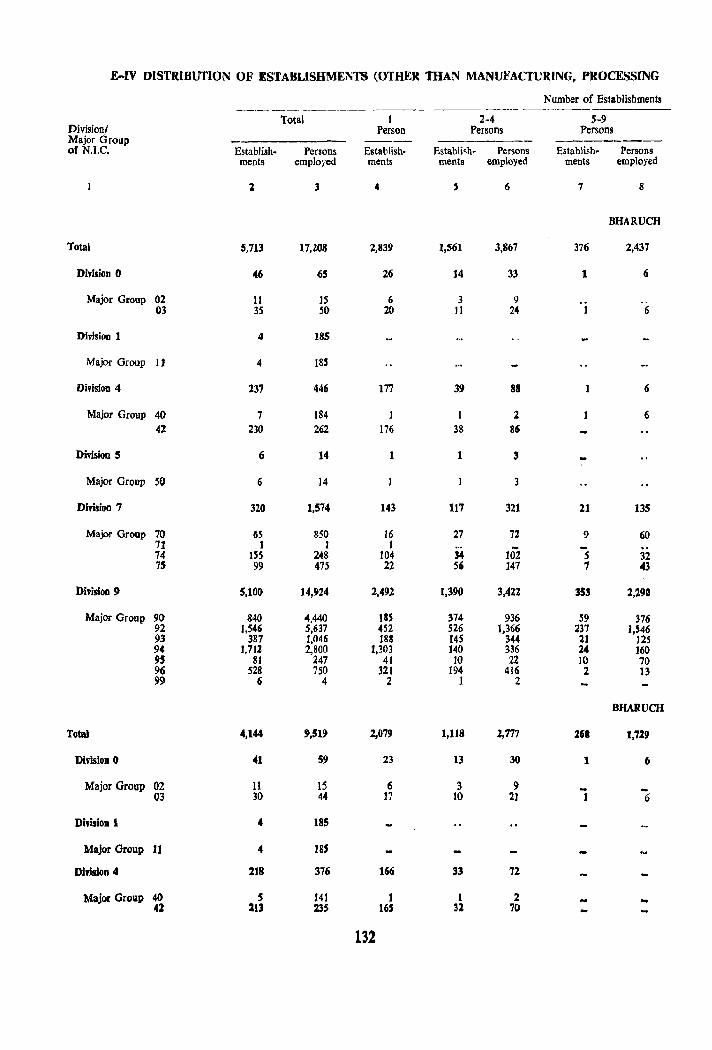
E-IV DISTRIBUTION OF ESTABLISHMENTS (OTHER mAN MANUFACfURING. PROCESSING
Number of Establishments ------ ------ --~---
Total I 2-4 5-9 Division/ Person Persons Persons Major Group ---------- ---- --------of N.I.C. Establish- Persons Establish- Establish- Persons Establish- Persons
ments employed ments ments employed ments employed
Z 3 4 S 6 7 8
BHARVCH
Total 5,713 17,208 2,B39 1,561 3,867 376 2,437
Division 0 46 65 26 14 33 1 6
Major Group 02 11 15 6 3 9 03 35 ~O 20 J1 24 1 6
Divisioo 1 4 185
Major Group 11 4 185
Division 4 237 446 177 39 88 6
Major Group 40 7 184 I 2 6 42 230 262 176 38 86
Division 5 6 14 1 1 3
Major Group 50 6 14 3
Division 7 320 1,574 143 117 321 21 135
Major Group 70 65 850 16 27 72 9 60 71 1 1 1 -74 ISS 248 104 14 102 5 32 75 99 475 22 5. 147 1 43
DivisioD !) 5,100 14,924 2,492 1,390 3,422 353 2,290
Major Group 90 840 4,440 liS 374 936 S9 376 92 1,546 5,637 452 526 1,366 237 1,546 93 387 1,046 18S 145 344 21 125 94 1,712 2,800 1,303 140 336 24 160
" 81 247 41 10 22 10 70 96 528 750 321 194 416 2 13 99 6 4 2 1 2
BHARUCH
Total 4,144 9,519 2,079 1,118 2,777 263 l,7%9
Division 0 oC1 59 23 13 30 1 6
Major Group 02 11 15 6 3 9 - -03 30 44 17 10 21 1 6
Division 1 4 185
Major Group II 4 185
DirisioD 4 218 376 166 33 72
Major Group 40 S 141 1 1 2 ... 42 213 235 165 32 70
132
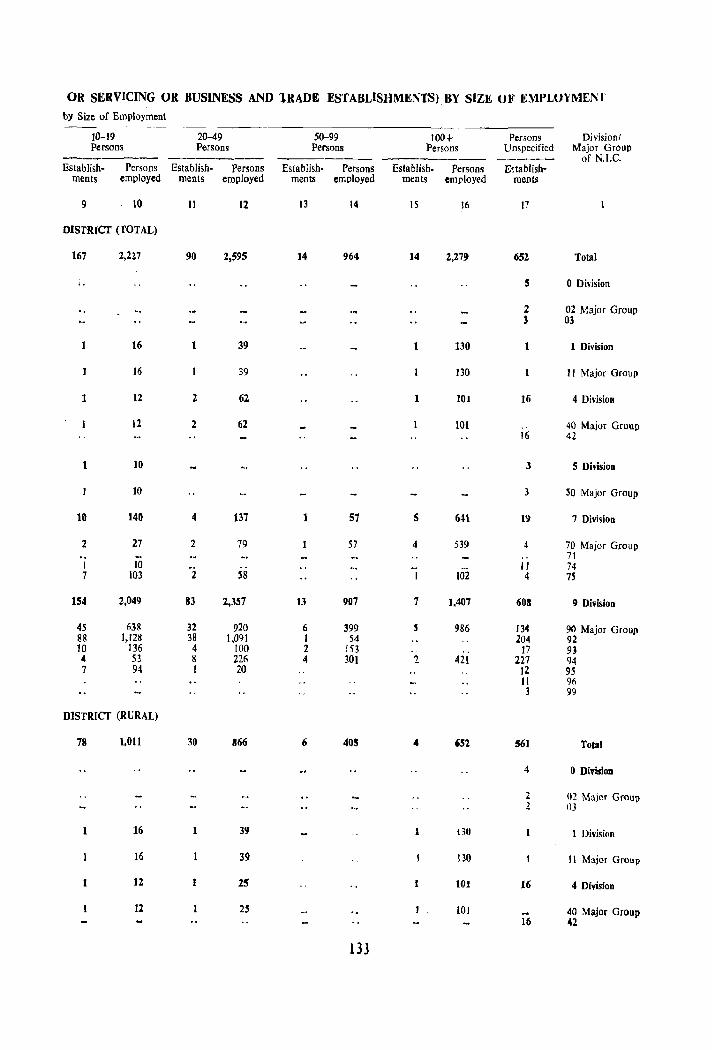
OR SERVICING OR .BUSINESS AND TRADE ESTABLISHMENTS) .BY SIZI£ otl' EMPLOYMENT by Size of Employment
10-19 20-49 50-99 100+ Persons Division! P~rsons Persons Persons Persons Unspecified Major Group
--~---- -------- -------_ -------- ------- of N.I.C. Establish- Persons Establish- Persons Establish- Persons Establish- Persons E~tablish-
ments employed ments employed ments employed ments employed ments
9 10 11 12 13 14 15 16 17
DISTRICT (fOTAL)
167 2,227 90 2,595 14 964 14 2,279 652 Total
5 o Division
2 02 Major Group 3 03
16 1 39 1 130 1 Division
16 39 130 II Major Group
1 12 2 62 101 16 4 Division
12 2 62 101 40 Major Group 16 42
10 3 5 Division
]0 3 SO Major Group
10 140 4 m 1 57 5 641 19 7 Division
2 27 2 79 57 4 539 4 70 Major Group .. 71 I 10 _. I I 74 7 103 2 S8 I 102 4 7S
154 2,049 83 2,357 13 907 7 1,407 60S 9 Division
45 638 32 920 6 399 5 986 134 90 Major Group 88 1,128 38 1,091 I 54 204 92 10 136 4 100 2 !53 17 91 4 53 8 226 4 301 2 421 227 94 7 94 1 20 12 95
II 90 3 99
DISTRICT (RURAL)
78 1,011 30 866 6 405 .. 652 561 TOIDI
4 o Divi$ioD
2 (12 Major Gruut) 2 03
1 16 1 39 011 t Division
16 39 no II Major Group
1 12 1 2S 101 16 4 Division
12 25 10J 40 Major Group 16 42
133
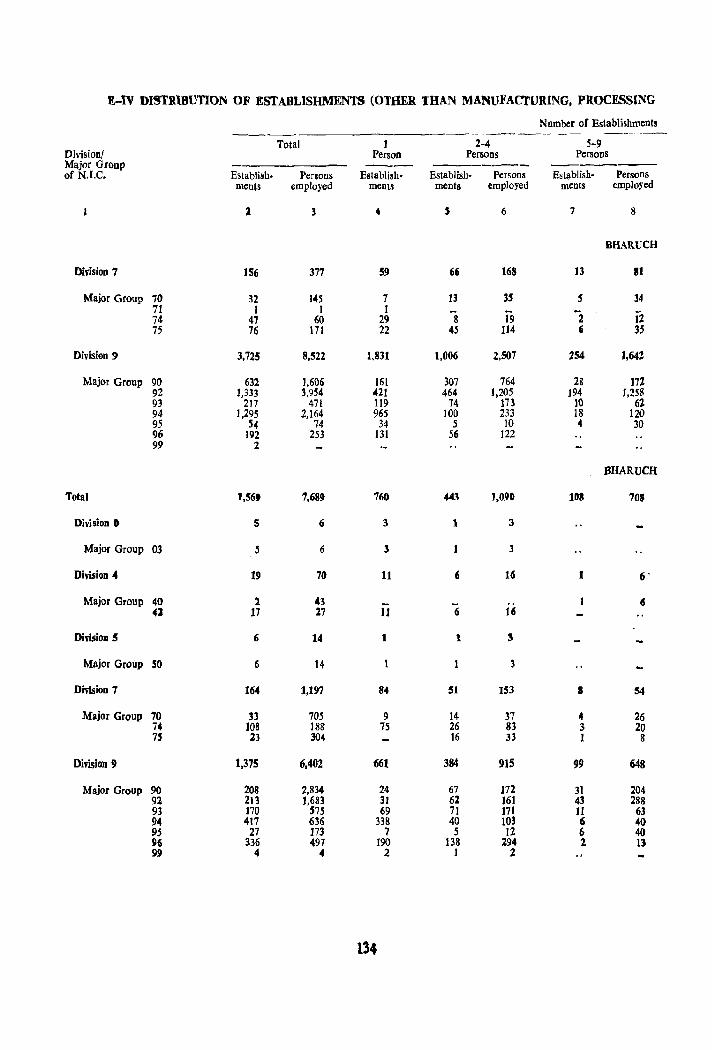
I!.-IV DISTRIBUTION OF ESTABLISHMENTS (OTOER THAN MANUFACTURING, PROCESSING
Number oC Establishments ---- _---- ---.---
Total 1 2-4 5-9 Division/ Person Persons Persons Major Group -------- -- _------of N.I.C. Establish· Persons Establish· Establish- Persons Establish- Persons
ments employed ments ments employed ments employed
2 3 4 S 6 7 8
BHARUCH
Division 7 IS6 377 59 66 168 13 81
Major Group 70 32 14S 1 13 35 5 34 71 1 I 1 12 74 47 60 29 S 19 2 75 76 171 22 45 114 , 35
Division 9 3,725 8,522 1,831 1,006 2,507 254 1,642
Major Group 90 632 1,606 161 307 764 28 172 92 1,333 3,954 421 464 1,205 194 1,258 93 217 471 119 74 m 10 62 94 1,295 2,164 965 100 233 18 120 9S 54 74 34 5 10 4 30 96 192 253 131 56 122 99 2
BHARUCH
Total 1,56, 7,689 760 443 1,090 IDS 70S
Division f) 5 6 3 1 3
Major Group 03 S 6 l 3
Division 4 19 70 11 6 16 1 6'
Major Group 40 1 43 6 41 17 27 11 6 16
Division 5 6 14 1 1 3
Major Group 50 6 14 3
Division 7 164 1,197 84 51 IS3 8 54
M,jor Group 70 33 705 9 14 37 4 26 74 108 188 75 26 83 3 20 7' 23 304 16 33 1 8
Division 9 1,375 6,402 661 384 915 99 648
Major Group 90 208 2,834 24 67 172 31 204 91 213 1,683 31 62 161 43 288 93 170 '75 69 71 m 11 63 94 417 6~6 338 40 103 6 40 9S 27 173 7 5 12 6 40 96 336 497 190 138 294 :z 13 99 4 4 2 1 2
134
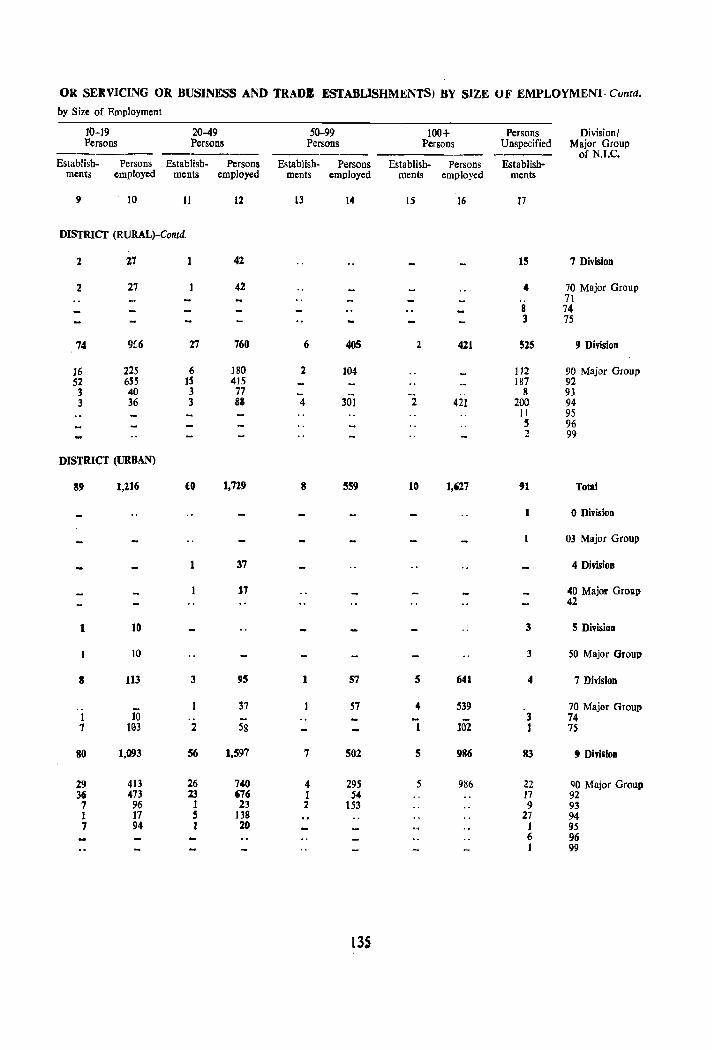
OR SE.KVICING OR BUSINESS AND TRADE ESTABLISHMENTS) BY SIZE UF EMPLOYMENT-Camd.
by Size of Employment
10-19 20-49 ·50-99 100+ Persons Divisionl Persons Persons Persons Persons Unspecified Major Group
------- ---- of N.I.C. Establish- Persons Establish- Persons Establish- Persons Establish- Persons Establish-
ments employed ments employed ments employed menls employed ments
9 10 J1 12 13 14 15 16 J7
DISTRICT (RURAL)-Contd.
2 27 1 42 15 7 Division
2 27 42 4 70 Major Group 71
8 74 3 75
74 9~6 27 760 6 405 2 421 525 9 Division
16 225 6 180 2 104- 112 90 Major Group 52 655 1S 415 187 92 3 40 3 77 - 8 93 3 36 3 81 4 301 2 421 200 94-
11 95 5 96 2 99
DISTRICT (URBAN)
39 1,216 CO 1,729 8 SS9 10 1,'27 91 Total
1 o Division
03 Major Group
1 37 4 Division
J7 40 Major Grollp 42
1 10 3 S DivisioB
10 3 50 Major Group
S 113 3 9S 1 57 5 641 " 7 DivisioD
.. 37 57 4 539 70 Major Group 1 10 3 74 7 103 2 58 ]02 1 7S
80 1,093 56 1,597 7 502 5 986 83 9 Division
29 413 26 740 4 295 5 986 22 QO Major Group 36 473 23 '76 1 54 17 92 7 96 1 23 2 153 9 93 1 17 5 138 27 94 7 94 1 20 J 95
6 96 J 99
13S
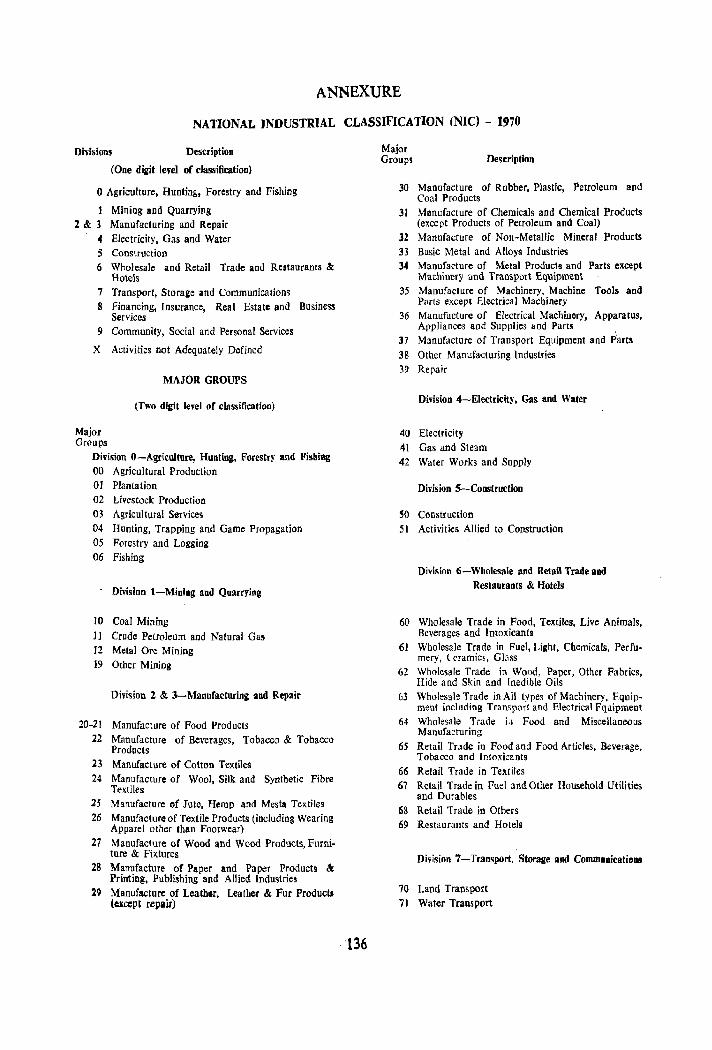
ANNEXURE
NATIONAL INDUSTRIAL CLASSIFICATION (NIC) - 1970
Divisions Description
(One digit level of r1assification)
o Agriculture, Hunting, Forestry and Fishing
Mining and Quarrying 2 & 3 Manufacturing and Repair
4 Electricity, Gas and Water 5 Construction 6 Wholesale and Retail Trade and Restaurants &:
Hotels 7 Transport, Storage and Communications 8 financing, Insurance, Real Estate and Business
Services 9 Community, Social and Personal Services
X Activities not Adequately Defined
Major Groups
MAJOR GROUPS
(Two digit level or classification)
Division O-Agriculture, Hunting, Forestry and Fishing 00 Agricultural Production OJ Plantation 02 Livestock Production 03 Agricultural Services ()4 Hunting, Trapping and Game Propagation 05 Forestry and Logging 06 Fishing
Division 1-Mining and Quarrying
10 Coal Mining 11 Crude Petroleum and Natural Gas 12 Metal Ore Mining J9 Other Mining
Division 2 & 3-Manuracturing aod Repair
20-21 Manufacture of Food Products 22 Manufacture of Beverages, Tobacco & Tobacco
Products 23 Manufacture of Cotton Textiles 24 Manufacture of Wool, Silk and Synthetic Fibre
Textiles 25 Manufacture of Jute, Hemp and Mesta Textiles 26 Manufacture of Textile Products lincluding Wearing
Apparel other than Footwear) 27 Manufacture of Wood and Wood Products, Furni
ture & Fixtures 28 Manufacture of Paper and Paper Products &;
Printing, Publishing and Allied Industries 29 Manufacture of Leath.r, Leather & Fur Product.
(except repair)
'136
Major Groups Description
30 Manufacture of Rubber, Plastic, Petroleum and Coal Products
31 Manufacture of Chemicals and Chemical Products (except Products of Petroleum and Coal)
32 Manufacture of Non-Metallic Mineral Products 33 Basic Metal and Alloys Industries 34 Manufadure of Metal Products and Parts except
Machinery and Transport Equipment 35 Manufacture of Machinery, Machine Tools and
Parts except Electrical Machinery 36 Manufacture of Electrical Machinery, Apparatus,
Appliances and Supplies and Parts 37 Manufacture of Transport Equipment and Parts 38 Other Manufacturing Industries 39 Repair
Division 4-Electricity, Gas and Water
40 Electricity 41 Gas and Steam 42 Water Works and Supply
Division S-Construction
~o Construction 51 Activities Allied to Construction
Division 6-Wholesale and Retail Trade and Restaurants & Hotels
60 Wholesale Trade in Food, Textiles, Live Animals, Beverages and Intoxicants
61 Wholesale Trade in Fuel, Light, Chemicals, Perfumery, (eramics, Gl~ss
62 Wholesale Trade in Wood, Paper, Other Fabrics, Hide and Skin and Inedible Oils
63 Wholesal:! Trade in All types of Machinery, Equipment including Transport and Electrical Equipment
64 Wholesale Trade i.l Food and Miscellaneous Manufacturing
65 Retail Trade in Food and Food Articles. Beverage, Tobacco and Intoxicants
66 Retail Trade in Textiles 67 Retail Trade in Fuel and Other Household Utilities
and Durables 68 Retail Trade in Others 69 Restaur:luts and Hotels
Division 7-Transport, Storage and Communications
70 Land Transport 71 Water Transport

Major Groups
DeseriptieD
72 Air Transport 73 Services incidental to Transport 74 Storage and Warehousing 7S Communications
Division 8-Financing, Insurance, Real Estate and Business Services
80 Banking and Similiar Type of Financial Institutions 81 Providents and Insurance 82 Real Estate and Business Services 83 Legal Services
Division !I-Community, Social and Personal Services
90 Public Administration & Defence Scrviees
137
Major Groups
Descripti.n
91 Sanitary Services 92 Education, Scientific and Research Services 93 Medical & Health Services 94 Community Services 95 Recreational & Cultural Services 96 Personal Services 98 International and other Extra Territorial Bodies
Services 99 Services not elsewhere classified
Division X-Activities not Adequately Defined
XO Persons without any Affiliation to any particular industry (including fresh entrants to labour force)
Xl Activities not Adequately Defined (Other than that in XO)

SECTION III
SOCIO-ECONOMIC AND CULTURAL TABLES
(RURAL AREAS) AND
HOUSING TABLES


EXPLANATORY NOTE TO SAMPLE CENSUS TABLES
Full count Census tables have been published in Part C-I of the District Census Handbooks of Gujarat ~iate. This volume viz., Part C-II presents (i) information on important socio-economic, cultural and migration characteristics of the population in the rural areas of the district and (ii) Housing tabies fot both the tural and the urban areas of the district. Tbe data of the urban sample is being centrally processed and tables covering the socio-economic, cultural and migration characteristics of tlle tifb':in population will be published separately.
The socio-economic, cultural and migration tables for the rural areas are based on to per cent sainple of the rural population and all the housing tables are based on 20 per cent sample of censu's houses. The major difference between the tables publi~hed in previous censuses and in 1971 Census is iIi'at tiIl r961 some tables provided only san'rp~ values. In the '1 ~ 71 Celis lis tabulations the tables present estimates based on the samples.
Part C-II of the District Census Handbook contains 6 tables of B series, 2 tables of t series, 2 tables of D series, all relating to rural areas and 4 tables of 1I ~edes tor tdtaI, rnial, urban and city areas of the district. Explanatory short notes are given as a fly leaf preceding die tabks of different series.
i41
B-ECONOMIC TABLES
Two tables viz., B-1 Part-A and B-II based on full count have been published in Part C-I
of the District Census Handbook of 1971.
This volume contains six tables pertaining to rural areas glvmg details regarding educational level of workers and non-workers by main activity, industrial classification of workers in nonagricultural industries by sex and divisions, major groups and minor groups, their classification by age-group, sex, educational levels and division and groups of national classification of occupations, secondary work of persons with main activity as workers or non-worker and types of activities of non-workers by sex and age-groups.
B-III Part-B gives classification of workers and non-workers according to main activity by educational levels in rural areas. The educational levels depicted in Part-B are as under
1. Illiterate 2. Literate (without educational level) 3. Primary 4. Middle 5. Matriculation or Higher Secondary 6. Non-technical diploma or certificate not equal to degree. 7. Technical Diploma or Certificate not equal to degree and 8. Graduate and above.
This table corresponds to Table B-II1 Part-B of 1961 with slight changes in industrial categories and educational levels.
Table B-IV Part-A gives industrial classification of persons at work other than cultivation as main activity by Sex and Divisions, Major groups and Minor groups of Ihe National Industrial classifications, 1970 (N. I. C. 1970), which has been adopted with suitable modifications wherever necessary.
The table is supplemented with an appendix giving information similar to that contained in Table B-IV Part-C of 1961 in so far as it relates to workers engaged in household industry and non-household industry in Manufacturing, Processing, Servicing and Repairing.
Table B-VI Part-B (i) gives occupational classification of persons at work in rural areas according to main activity olher than cultivalion by sex and age-groups.
This table is a new addition and provides details of workers following non-agricultural pursuits as their main activity classified by occupations upto Divisions and Groups of National Classification of Occupations (N. C. O. 1968). The population under each Division and Group of National ·Classification of Occupations is classified by sex and nine age-groups viz., 0-14. 15-19. 20-24, 25-29, 30-39, 40-49, 50-59, 60 + and Age not stated.
A list of occupational codes indicating the occupations they denote is given in the annexure at the end of the table.
Table B-VI Part-B (ii) ghes occurational classification of persons at work in rural areas according to main activity other than cultivation classified by sex and educational levels.
This is also a new table and is prepared upto divisions and groups of National Classifica
tion of Occupations, which is further cross-classified by sex and broad educational levels, such as Primary. Middle. Matric1ilation or Higher Secondary and Graduate and above.
142
Table B-VII (rural) is a new and comprehensive table of 1971 Census providing statistics of main activity and' secondary work of population in the rural areas. The persons having main activity . as cultivator; agricultural labourer; working at household industry ; at non-household industry, trade business or service and non-worker are further cross-tabulated in case of persons whose secondary work is either (i) as cultivator or (ii) as agricultural labourer or (iii) at household industry or (iv) at non-household industry, trade, business, service etc.
In Table B-VIII (rural), as against eight categories of non-working' population in 1961 Census, the data is presented for seven categories of non-workers in this table, the last category , Others' largely comprising the Unemployed '. This table is comparable at district level to the Table B-IX 'of 1961 Census wherein the details of non-working popUlation by sex and broad age groups such as 0-14, 15-34, 35-59, 60 + and 'Age not stated' are given for each type of activity of non-working population. As against five broad age-groups in 196 I Census, this table presents here nine age-groups viz., 0-14, 15-19, 20-24, 25-29, 30-39, 40-49, 50-59, 60 T and age not stated.
143

B-1II PART-B CLA:SSIFICATION OF WORKERS AND NON":WORKERS ACCORDING
Workers --------- -II III IV Liv~Ock,
Forestry Hunting,
& Plantations Agricultural Orchards and Mining and
Educational Leyels Total Population Total Workers Cultivators labourers allied activiti.es Quarrying ----------- ----------- ------------
P M F M P M F M F M F M F 2 3 4 5 6 7 8 9 10 11 12 13 14
Total 916,587 468,823 447,764 251,725 86,145 110,270 9,504 107,757 72,729 3,233 251 879 127
Illiterate 614,628 268,359 356,269 126,782 80,053 43,688 8,298 74,574 69,110 2,290 141 323 107 Literate ( without 164,521 105,903 58,618 6J,657 4,005 3J,355 831 22,943 2,910 546 268 20
educational level) * Primary 85,449 60,337 25,]12 42,857 1,319 25,892 365 7,886 608 199 - 179 Middle 27,87.5 22,188 5,687 11,819 162 6,585 1,957 11 99 79 Matriculation or 10,868 9,257 1,1111 6,277 222 2,592 10 387 20 89 10 30
Higher Secondary Non-technical diploma 1,756 1,360 396 1,291 294 69 10
or certificate not equal to degree
Technical diploma or 258 248 10 179 10 10 certificate not equal to degree Graduate and above 1,232 1,171 61 863 20 79 10
• Includes figures of educational Ic.vels not classifiable.
Note: - .. In Gujarat State only two levels of education are recognised viz. (i) Primary (from Std. I to VII) and (ii) Seco· ndary (Std. VIIt to XI). With a view to presenting these figures on uniform basis as for the rest of the country and to cnsurc comparability of figures presented in All India Tables, the 'Middle' level hali been introduced These figures have been classified for the following levels according to the standard mentioned against each of them.
(i) Primary-Passed Standard V but not vm (ii) Middle-Passed Standard VIlI but not XI
(iii) Higher Secondary Passed Standard Xl but had not acquired a University degree or Diploma.
Persons have been classified in ' Primary' level if they have passed Standard V. If they were reading VI or VII or VlIl, but had not passe,j VIII, they have been classified under 'primary' level. Those who have passed the Standard YIU have been classified under 'Middle', This will include those reading in IX, X or XI Standard but not passed XI. Those who have passed sta.nd~rd XI but not passed any University degree or diploma. examination, have been classified under 'Higher Secondary.'
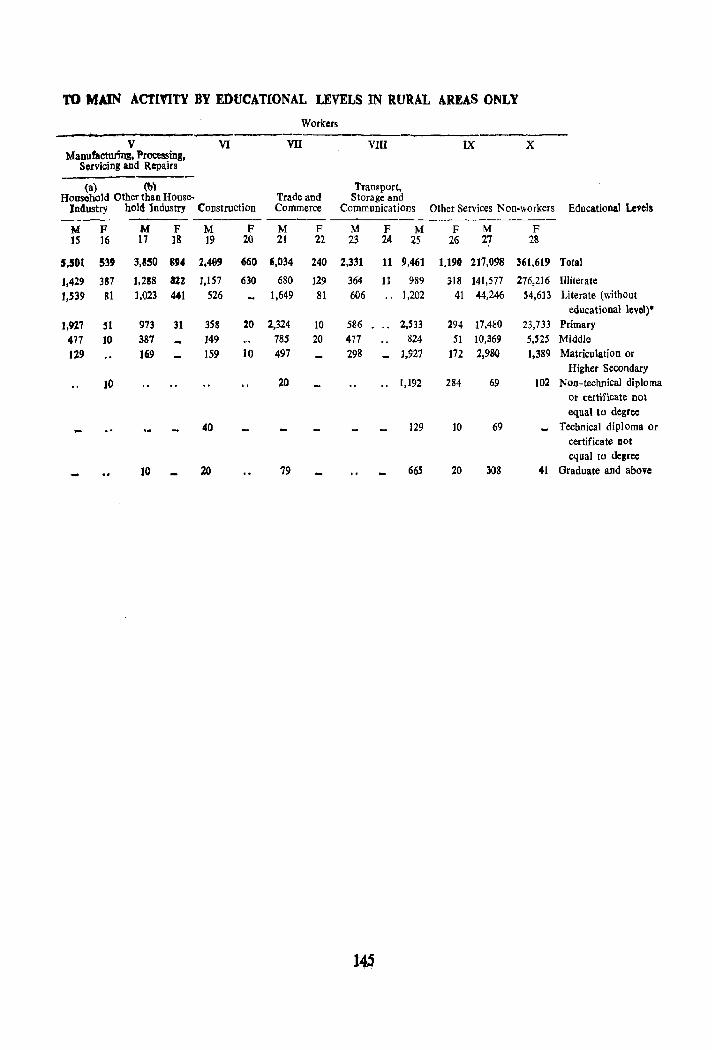
TO MAIN ACTl'ITY BY EDUCATIONAL LEVELS IN RURAL AREAS ONLY
Workers ---------------------------V VI VII VIII IX X
Manufaeturing, Processing, Servicing and Repairs
(a) (tI) Household Other than HOuse- Trade and
Transport, Storage and
Industry hold Industry Construction Commerce Communications Other Services Non-workers Educational Levels ----- ------ -----
M F M F M F M F M F M F M F J5 J6 17 18 19 20 21 22 23 24 25 26 27 28
5,501 539 3,150 8114 2,46' 660 6,034 240 2,331 11 9,461 1,19' 217,098 361,619 Total
J,429 387 1,218 azz 1,1S7 630 680 129 364 11 989 318 141,577 276,216 Illiterate
1,539 81 1.0:23 441 526 1,649 81 606 " 1,202 41 44,246 54,613 Literate (wilhout educational level)·
1,927 51 973 31 358 20 2,324 10 586 2,S33 294 17,480 23,733 Primary 477 10 387 149 785 20 471 824 51 10,369 s,ns Middle
129 J69 159 10 497 298 - 1,927 172 2,980 1,389 Matriculation or Higher Secondary
10 20 .. 1,192 284 69 102 Non-technical diploma or certificate not equal to degree
40 129 10 69 - Technical diploma or certificate Dot eq ual to degree
lO 20 79 665 20 308 41 Graduate and above
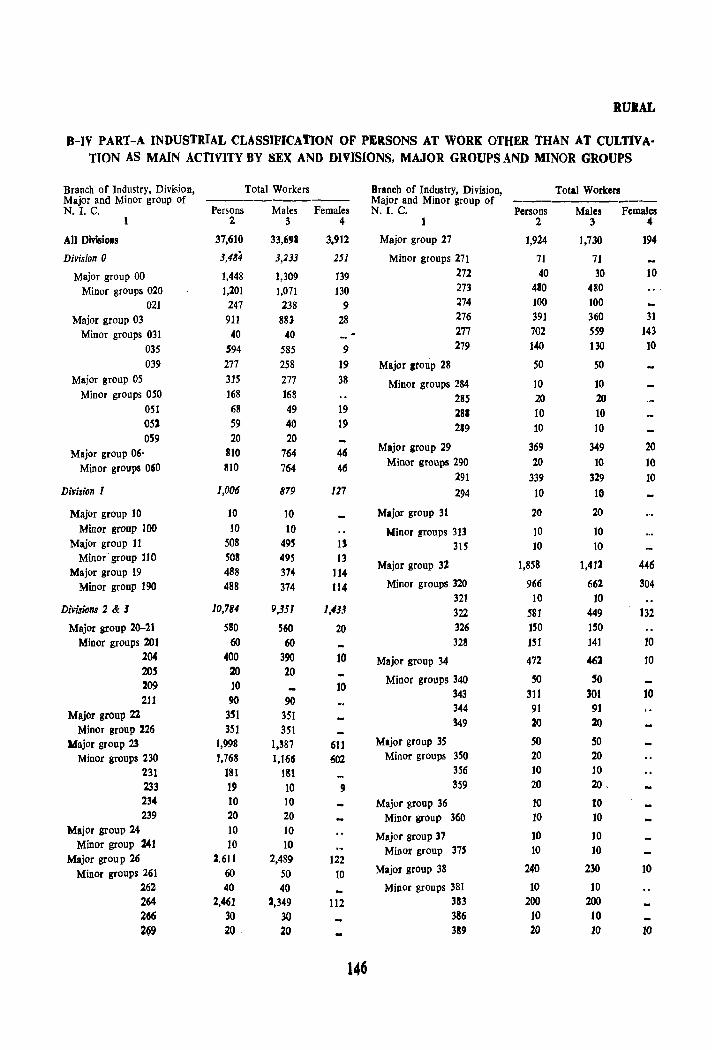
RUIAL
8-IV PART-A INDUSTRIAL CLASSIFICATION OF PERSONS AT WORK OTHER THAN AT CULTIVA-TION AS MAIN ACTIVITY BY SEX AND DIVISIONS, MAJOR GROUPS AND MINOR GROUPS
Branch of Industry, Division, Total Workers Branch of Industry, Division, Total Workers Major and Minor group of ---------- Major and Minor group of N. 1. C. Persons Males Females N. I. C. Persons Males Females
2 3 4 2 3 4
All DivisioDs 37,610 33,691 3.912 Major group 27 1,924 1,730 194
Division 0 J,4B4 3,233 251 Minor groups 271 71 71 Major group 00 1,448 1,309 139 272 40 30 10
Minor groups 020 1,201 ],071 ]30 273 410 480 021 247 238 9 274 ]00 100
Major group 03 911 883 28 276 391 360 31
Minor groups 031 40 40 277 702 559 143
035 594 585 9 279 140 130 10
039 277 258 19 Major ,roup 28 SO SO Major group 05 315 277 38 Minor groups 284 10 10
Minor groups 050 168 168 285 20 20 051 68 49 19 281 10 10 052 59 40 19 219 10 10 OS9 20 20
Major group 06· 810 764 46 Major group 29 369 349 20
Minor groups 060 810 764 46 Minor groups 290 20 10 10 291 339 329 10
Division 1 1,006 879 127 294 10 10
Major group 10 10 10 Major group 31 20 20 Minor group 100 10 JO Minor groups 313 10 10
Major group II 508 m Il 31S 10 to Minor group no 50S 495 13
Major group 32 1,8S8 1,4]2 446 Major group J9 488 374 114
Minor group 190 488 374 114 Minor groups 320 966 662 304 321 10 10
DivisWns 2 & J 10,784 9,351 1,433 322 S81 449 132 Major group 20--21 580 560 20 326 150 150
Minor groups 201 60 60 328 151 141 10 204 400 390 10 Major group 34 472 462 10 205 20 20
Minor groups 340 50 50 209 10 10 2U 90 90
343 311 301 10
Major group 22 3S1 351 344 91 91
Minor group 126 351 351 349 20 20
Major group 23 1,998 1,~87 61J Major group 35 SO SO
Minor groups 230 1,768 1,166 S02 Minor groups 350 20 20 231 ]8] ]81 356 10 10 233 19 ]0 9 359 20 20, 234 10 10 Major group 36 10 10 239 20 20 Minor group 360 10 10
Major group 24 10 10 Major group 17 10 10 Minor group 241 10 10 Minor group 375 10 10
Major grou p 26 2.611 2,489 122 Minor groups 261 60 50 10 Major group 38 240 230 10
262 40 40 Minor groups 381 10 10 264 2,461 J,349 112 383 200 200 266 30 30 386 10 10 269 20 20 389 20 10 JO
146

RURAL
B-IV PART-A INDUSTRIAL CLASSIFICATION OF PERSONS AT W(JRK OTHER THAN AT CULTIVA. TION AS MAIN ACTIVITY BY SEX AND DIVISIONS, MAJOR GROUPS AND MINOR GROUPS-(Contd.)
Branch or Industry, Division, Total Workers Branch of Industry, Division, Total Workers Major and Minor group of -------_.---- Major and Minor group of -----------
N. I. C. Persons Males Females N.1. C. Persons Males Females
2 3 4 1 2 3 4
Major group 39 231 231 Major group 69 489 470 19
Minor groups 390 20 20 Minor groups 690 200 190 10
391 30 30 691 289 l80 9
392 40 40 Division 7 2,342 2,331 Jl
393 10 10 Major grOup 70 1,843 1,833 10 Minor groups 700 811 807 4
394 40 40 701 699 691 2 399 91 91 702 70 70
Division 4 283 283 703 239 239
Major group 40 192 192 704 20 20 70S 3 3
Minot groups 400 10 10 706 1 .. 1 401 182 182 Major group 71 40 40
Major IIroup 42 91 91 Minor groups 710 20 20 Minor group 420 91 91 712 20 20
Division 5 3,069 2,409 660 Major group 72 10 10
Major group 50 3,069 2,409 660 Minor group 721 10 10
Minor groups 500 1,014 890 124 Major group 73 10 10
501 1,230 879 351 Minor group 730 10 10 503 815 630 185 Major group 75 439 438 509 10 10 Minor groups 7S0 429 428
Division 6 6,074 5,834 240 751 10 10 Major group 60 70 70 Division 8 200 200
Minor groups 600 30 30 Major group 80 130 130 601 30 30 Minor groups 800 120 120 607 10 10 801 10 10
Major group 61 10 10 Major group 82 20 20 Minor group 611 10 10 Minor groups 821 10 10
Major group 62 40 40 829 10 10
Minor group 621 40 40 Major group 83 50 50 Minor group 830 50 SO
Major group 64 20 20 Division 9 10,368 9,178 1,190
Mioor groups 645 10 10 Major group 90 2,362 2,302 60
649 10 10 Major group 65 3,829 3,656
Minor groups 900 30 30 .. 173 901 838 778 60
Minor groups 650 2,592 2,477 115 902 1,464 1,464
651 767 729 38 903 30 30
652 JOO 100 Major group 92 4,900 4,170 730
653 130 110 20 Minor groups 920 101 91 10 921 4,799 4,079 720
654 150 150 Major group 93 816 666 150
655 20 20 Minor groups 930 796 646 150
659 70 70 931 20 20 Major group 66 329 319 10 Major group 94 888 838 50
Minor groups 660 319 309 10 Minor groups 940 833 808 30 661 10 10 941 40 20 20
Major group 67 229 220 9 949 10 10 Minor groups 670 30 30 Major group 95 30 30
671 20 20 Minor groups 952 Ji) 10 672 10 10 959 20 20 679 169 160 9
Major group 96 1,110 930 180 Major group 68 1,058 1,029 29 Minor groups 960 251 71 180
Minor group. 680 40 40 961 142 142 681 10 10 962 697 697
682 10 10 969 20 20
684 !O 10 Major group 99 262 242 20 689 988 959 29 Minor group 995 2e2 242 20
147
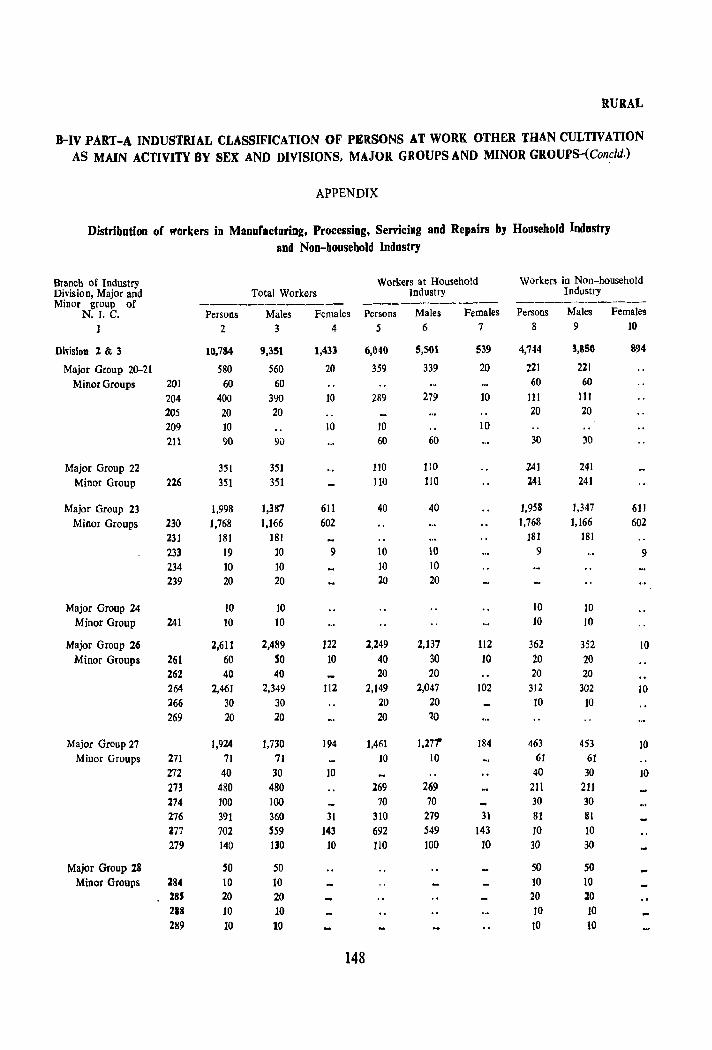
RURAL
8-IV PART-A INDUSTRIAL CLASSIFICATION OF PERSONS AT WORK OTHER THAN CULTIVATION AS MAIN ACTIVITY BY SEX AND DIVISIONS, MAJOR GROUPS AND MINOR GROUrS-(Concld.)
APPENDIX
Distribution of workers in Manufacturing. Processing, Servicing and Repairs by Household Industry and Non-household Industry
Branch of Industry Workers at Household Workers in Non-household Division, Major and Total Workers Industry Industry Minor group of -----_ .. _----- ------------ ----------
N. I. C. Persons Males Females Persons Males Females Persons Males Females
2 3 4 5 6 7 8 9 10
Division 2 & 3 10,7$4 9.351 1,433 6,040 5,501 539 4,744 3,850 894
Major Group 20-21 580 560 20 359 339 20 221 221
Minor Groups 201 60 60 60 60
204 400 390 10 289 279 10 111 III 205 20 20 20 20
209 10 10 10 10
211 90 90 60 60 30 30
Major Group 22 351 351 110 110 241 241
Minor Group 216 351 351 110 110 241 241
Major Group 23 1,998 1,387 611 40 40 1,958 1,347 611
Minor Groups 230 1,768 1.166 602 1,768 1,166 602
231 181 181 181 181
233 19 10 9 10 10 9 9 234 to 10 10 10 239 20 20 20 20
Major Group 24 10 10 10 10 Minor Group 241 10 10 10 10
Major Group 26 2,611 2,489 122 2,249 2,137 112 362 352 10 Minor Groups 261 60 50 10 40 30 10 20 20
262 40 40 20 20 20 20 264 2,461 2,349 112 2,149 2,047 102 312 302 10 266 30 30 20 20 10 10 269 20 20 20 ~O
Major Group 27 1,924 1,730 194 1,461 1,271 184 463 453 10 Minor Groups 271 71 71 10 lO 61 61
272 40 30 10 40 30 10 m 480 480 269 269 211 211 274 100 100 70 70 30 30 276 391 360 31 310 279 31 81 81
i77 702 559 143 692 549 143 10 10 279 140 IJO 10 110 100 10 30 30
Major Group 28 SO 50 50 50 Minor Groups 284 10 10 10 10
28S 20 20 20 20 288 10 10 10 10 289 10 10 10 10
148
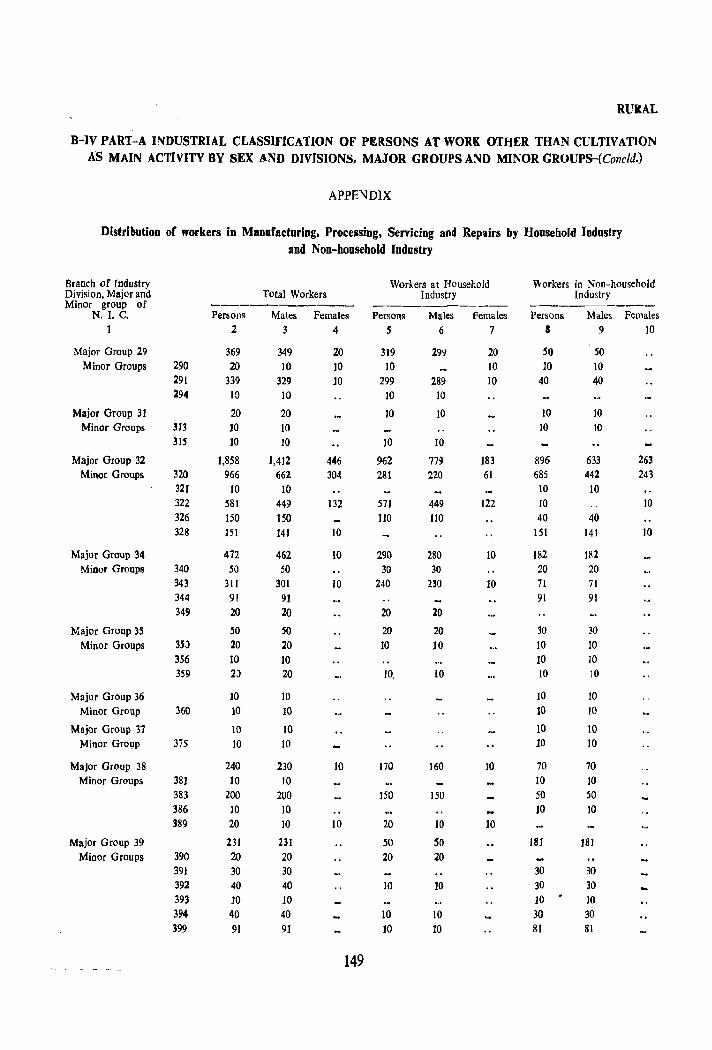
RUIAL
B-IV PART-A INDUSTRIAL CLASSIFICATION OF P1l:RSONS AT WORK OTHER THAN CULTIVATION AS MAIN ACTIVITY BY sEX AND DIVISIONS, MAJOR GROUPS AND MINOR GROUPS-(Concld.)
APPENDIX
Distribution of workers in Manufacturing. ProcessiDg, ServiciDg and Repairs by Household Industry and Non-household Industry
Branch of Industry Workers at Household Workers in Non-household Division, Major and Total Workers Industry Industry Minor group of ----------- ---------- -----------N. 1. C. Persons Males Females Persons Males Pemales Persons Males Females
2 3 4 S 6 7 S 9 10
Major Group 29 369 349 20 319 299 20 SO SO Minor Groups 290 20 10 10 10 10 10 10
291 339 329 10 299 289 10 40 40 294 10 10 ]0 10
Major Group 31 20 20 10 10 10 10 Minor Groups 313 10 10 10 10
315 10 10 10 10
Major Group 32 1,858 1,412 446 962 77:.1 183 896 633 263 Minor Groups 320 966 662 304 281 220 61 685 442 243
321 10 10 10 10 322 581 449 132 S71 449 122 ]0 10 326 150 150 110 lIO 40 40 328 ]51 141 10 151 141 10
Major Group 34 472 462 to 290 280 10 182 182 Minor Groups 340 50 50 30 30 20 20
343 31] 301 10 240 230 10 71 71 344 91 91 91 91 349 20 20 20 20
Major Group 35 SO SO 20 20 30 30 Minor Groups 35J 20 20 10 10 10 10
356 10 10 10 10 359 2J 20 10. 10 10 JO
Major Group 36 10 10 )0 )0
Minor Group 360 10 ]0 10 10
Major Group 37 10 10 10 10 Minor Grol,lp 375 10 10 10 10
Major Group 38 240 230 10 170 160 10 70 70 Minor Groups 381 10 10 10 10
383 200 200 150 150 50 SO 386 10 10 10 10 389 20 10 10 20 10 10
Major Group 39 Z31 231 50 SO 181 181 Minor Groups 390 20 20 20 20
391 30 30 30 30 392 40 40 10 10 30 30 393 ]0 10 ]0 10 394 40 40 10 10 30 30 399 91 91 10 10 81 81
149
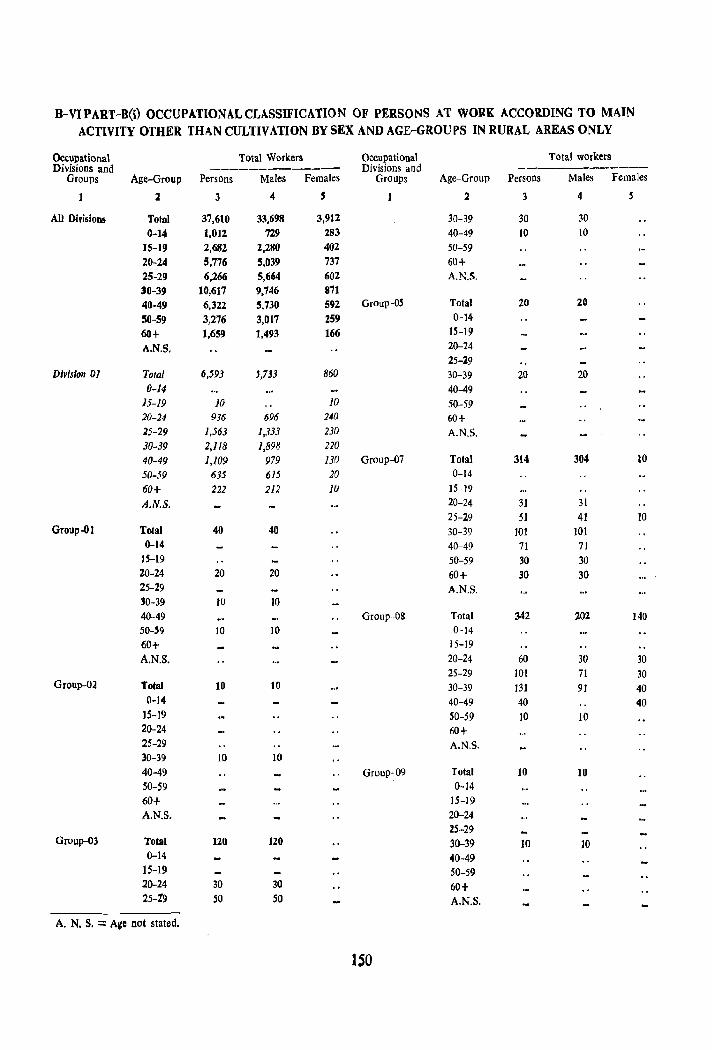
B-VIPART-B(i) OCCUPATIONAL CLASSIFICATION OF PERSONS AT WORK ACCORDING TO MAIN
ACTIVITY OTHER THAN CULTIVATION BY SEX AND AGE-GROUPS IN RURAL AREAS ONLY
Occupational Total Workers Occupational Total workers Divisions and ------------ Divisions and -------------
Groups Age-Group Persons Males Females Groups Age-Group Persons Males Females
2 3 4 S 2 3 4 S
All Di,isioQS Total 37,610 33,61)8 3,1)12 30-39 30 30 0-14 1,012 729 283 40-49 10 10
15-19 2,682 2,280 402 50-59 20-24 5,776 5.039 737 60+ 25-29 6,266 5,664 602 A.N.S. 30-39 10,617 9,746 871 40-49 6,322 5,730 592 Group-OS Total 20 20
SO-59 3,276 3,017 259 0-14
60+ 1,6S9 1.493 166 lS-19
A.N.S. 20-24 25-29
Diviswn 01 Total 6,593 ',733 860 30-39 20 20 0-14 40-49
15-19 10 10 50-59 20-24 936 696 240 60+ 25-29 1,563 1,333 230 A.N.S. 30-39 2,118 1,898 220
40-49 1,109 979 ]30 Group-07 Total 314 304 10
50-59 635 615 20 0-14
60+ 222 212 10 15-19
A.N.S. 20-24 31 31 25-29 51 41 10
Group-Ot Total 40 40 30-39 101 101 0-14 40-49 71 71
IS-19 50-59 30 30 20-24 20 20 60+ 30 30 25-29 A.N.S. 30-39 10 10 40-49 Group-08 Total 342 202 140 50-59 10 10 0-14 60+ 15-19 A.N.S. 20-24 60 30 30
25-29 101 71 30 Group-02 Total 10 10 30-39 131 91 40
0-14 40-49 40 40 ]5-19 SO-59 10 10 20-24 60+ 25-29 A.N.S. 30-39 10 10 40-49 Group-09 Total 10 10 50-59 0-14 60+ 15-19 A.N.S. 20-24
25-29 Group-03 Total 120 120 30-39 10 10
0-14 40-49 15-19 50-59 20-24 30 30 60+ 25-2'9 50 50 A.N.S.
A. N. S. = ASc not stated.
ISO
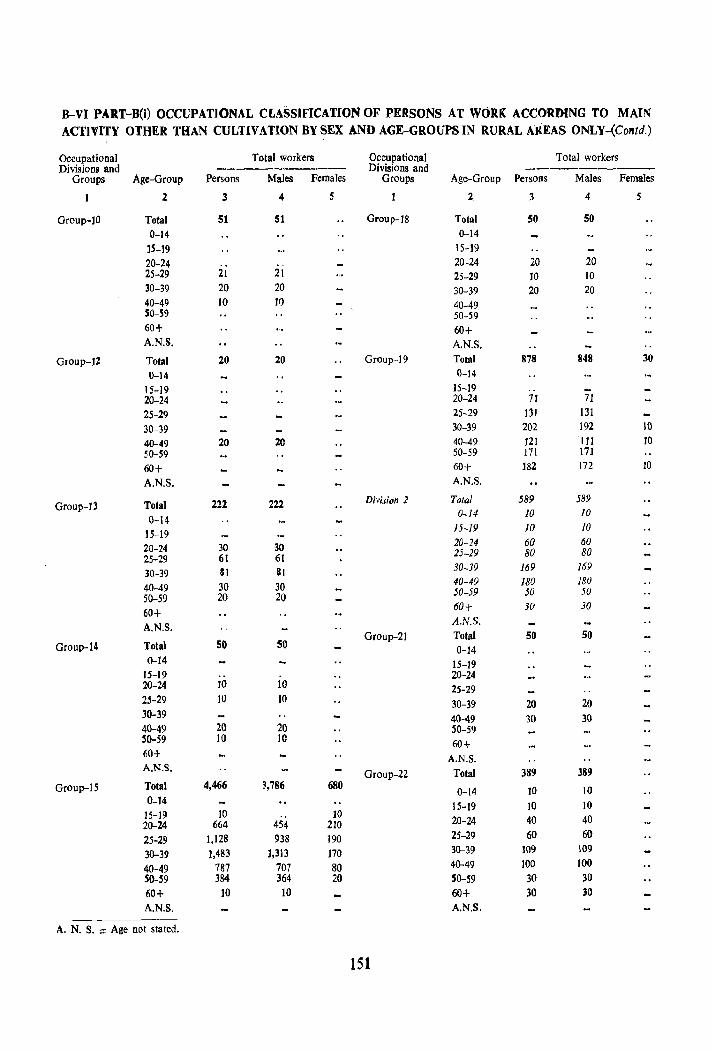
B-VI PART-D(i) OCCUPATIONAL CLASSlflCATION OF PERSONS AT WORK ACCORDING TO MAIN ACTIVITY OTHER THAN CULTIVATION BY SEX AND AGE-GROUPS IN RURAL AREAS ONLY-(Contd.)
Occupational Total workers Occupational Total workers Division. and ----------- Divisions and ------------
Groups Age-Group Persons Males Females Groups Age-Group Persons Males Females
2 3 4 5 2 3 4 5
Group-JO Total 51 51 Group-IS Total 50 50
0-14 0-14 ]5-19 15-19 20-24 20-24 20 20 25-29 21 21 25-29 10 10 30-39 20 20 30-39 20 20 40-49 10 10 40-49 50-59 50-59 60+ 60+ A.N.S. A.N.S.
Group-J2 Total 20 20 Group-19 Total 878 848 30
0-14 0-]4
15-19 15-19 .. -20-24 20-24 71 71
25-29 25-29 131 131
30-39 30-39 202 192 10
40-49 20 20 40-49 121 III 10 50-59 50-59 171 171
60+ 60+ J82 172 10
A.N.S. A.N.S.
Group-I) Total 222 222 Division 2 Total 589 589
0-14 0-14 IO /0
15-19 15-/9 10 10
20-24 30 30 20-24 60 60
25-29 61 61 25-29 80 80
30-39 SI 81 30-39 169 169
40-49 30 30 40-49 180 180
50-59 20 20 50-59 50 5U
60+ 60+ 30 30
A.N.S. A.N.S.
50 Group-21 Total 50 50
Group-14 Total SO 0-14 0-14 15-19
15-19 .. 20-24 20-24 10 10 25-29 25-29 10 10 30-39 20 20 30-39 40-49 30 30 40-49 20 20 SO-59 SO-59 10 10 60+ 60+ A.N.S. A.N.S.
Group-22 Total 389 389 Group-IS Total 4,466 3,786 680 0-14 10 10
0-14 15-19 10 10 15-19 10 10
20-24 40 40 20-24 664 454 210 25-29 1,128 938 190 25-29 60 60
30-39 ],483 1,3]3 170 30-39 109 109
40-49 787 707 80 40-49 100 100 SO-59 384 364 20 SO-59 30 30
60+ 10 10 60+ 30 30
A.N.S. A.N.S.
A. N. S. ::= Age not stated.
151
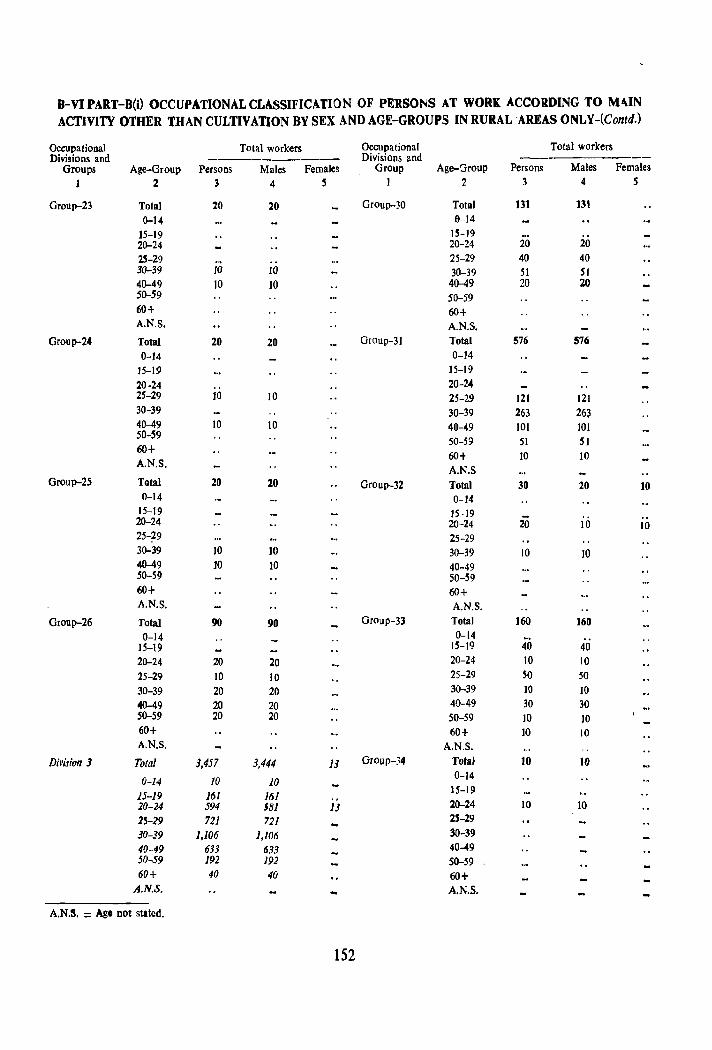
B-VIPART-B(i) OCCUPATIONAL CLASSIFICATION OF PERSONS AT WORK ACCORDING TO M<\IN ACTIVITY OTHER THAN CULTIVATION BY SEX AND AGE-GROUPS IN RURAL AREAS ONLY-(Contd.)
Occupational Total workers Occupational Total workers Divisions and ------------ Divisions and -----------
Groups Age-Group Persons Males Females Group Age-Group Persons Males Females
1 2 3 4 5 I 2 3 4 5
Group-23 Total 20 20 Group-30 Total 131 131
0-14 0-14
15-19 15-19 20-24 20-24 20 20
25-29 .. 25-29 40 40 30-39 10 10 30-39 51 51 40-49 10 ]0 40-49 20 :zo 50-59 SO-59 60+ 60+ A.N.S. A.N.S.
Group-24 Total 20 20 Group-31 Total 576 576
0-14 0-14 15-19 15-19
20-24 20-24 25-29 10 10 25-29 121 121 30-39 30-39 263 26~ 40-49 10 10 40-49 101 101 50-59 60+
50-59 51 51
A.N.S. 60t 10 10 A.N.S
Group-25 Total 20 20 Group-32 Total 30 20 10 0-14 0-14
15-19 15 -19 20-24 20-24 20 10 10 25-~9 25-29 30-39 10 10 30-39 10 10 40-49 10 10 40-49 50-59 50-59 60+ 60+ A.N.S. A.N.S.
Group-26 Total 90 90 Group-33 Total 160 160 0-14 0-14
15-19 lS-19 40 40 20-24 20 20 20-24 to 10 25-29 10 10 25-29 SO 50 30-39 20 20 30-39 10 10
40-49 20 20 40-49 30 30 50-59 20 20 50-59 10 10 60+ 60+ 10 10 A.N.S. A.N.S.
Division 3 Total 3,457 3,444 13 Group-34 Total ]0 10
0-14 10 10 0-14
15-19 161 161 15-19
20-24 594 $81 13 20-24 10 10
25-29 721 721 25-29
30-39 1,106 1,106 30-39
40-49 633 633 40-49 50-59 192 192 SO-59 60+ 40 40 60+
A.N.S. A.N.S.
A.N.S. = AgI not stated.
152
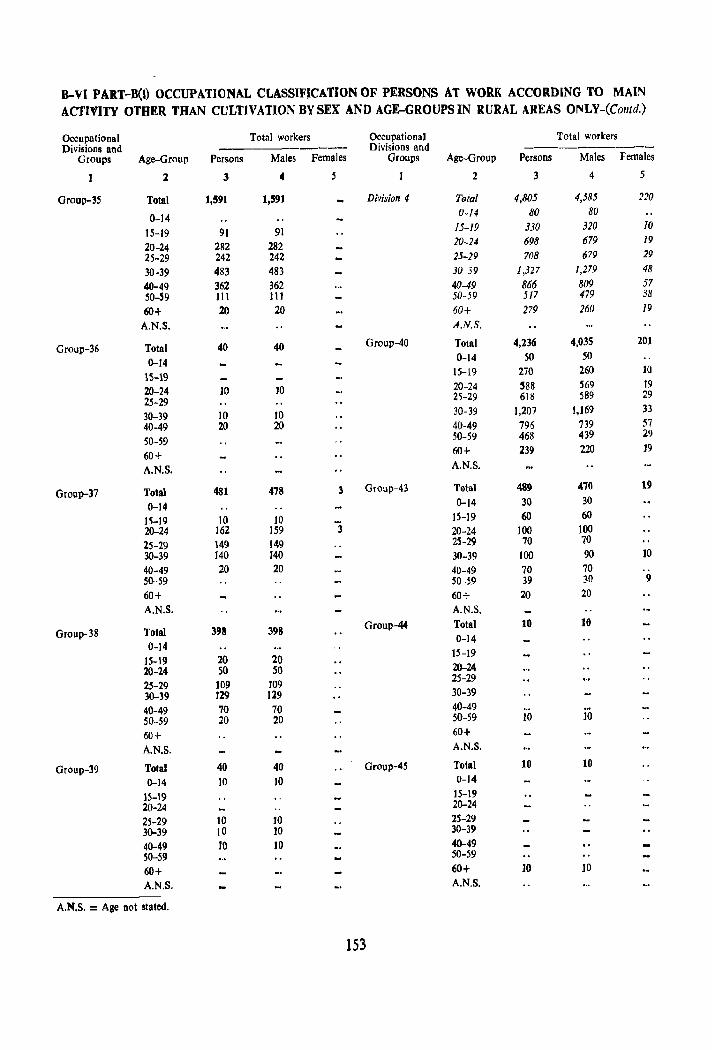
B-VI PAR.T-B(I) OCCUPATIONAL CLASSIFJCATION OF PERSONS AT WOR.K ACCORDING TO MAIN AClnITY OTHER THAN CULTIVATION BY SEX AND AGE-GROUPS IN RURAL AREAS ONLY-CCOII/d.)
Occupational Total workers Occupational Total workers Divisions and Divisions and ------------
Groups Age-Group Persons Males Females Groups Age-Group Persons Males Females
2 3 4 5 2 3 4 5
Group-35 Total 1,591 1,591 Division 4 Tofal 4,805 4,585 220
0.-14 0-/4 80 80
15-19 91 91 15-19 330 320 10
20-24 282 282 20-24 698 679 19
25-29 242 242 25-29 708 679 29
30-39 483 483 30 39 1,327 1,279 48
40-49 362 362 40-49 866 809 57 50-59 III 111 50-59 517 479 38
60+ 20. 20. 60+ 279 260 19
A.N.S. A.N.S.
Group-36 Total 40. 40. Group-40 Total 4,236 4,035 201
0-14 0-14 SO SO
15-19 IS-19 270 260 10
20-24 10. 10 20-24 588 S69 19
25-29 25-29 618 589 29
30-39 10 10 30-39 1,207 1,169 33
40.-49 20 20 40-49 796 739 57
50.-59 50-59 468 439 29
60+ 60+ 239 220 19
A.N.S. A.N.S.
Group-37 Total 481 478 3 Group-43 Total 489 470 19
0-14 0-14 30 30
15-19 10 10 15-19 60 60 20-24 162 159 3 20-24 10.0. 100
25-29 149 149 2S-29 70 70
30-39 140 140 30-39 100 90 10
40-49 20 20 40-49 70 70 .. 5Q.·59 50-59 39 30 9
60+ 60.+ 20 20
A.N.S. A.N.S.
Group-38 Total 3911 398 Group-44 Total 10 10
0-14 0.-14
15-19 20 20. 15-19
20.-24 50 50. 20-24
25-29 109 10.9 25-29
30--39 129 119 30.-39
40-49 70 70. 40-49 50.-59 20 20. 50-59 10. 10
60+ 60.+
A.N.S. A.N.S.
Group-19 Total 40 40. Group-45 Total 10 10
0-14 10. 10. 0-14
15-19 15-19 20-24 20-24
25-29 10 10 25-29 30-39 10. 10. 30-39
40-49 10 10 40-49 50-59 50.-59
60.+ 60+ 10. 10
A.N.S. A.N.S.
A.N.S. = Age not stated.
153
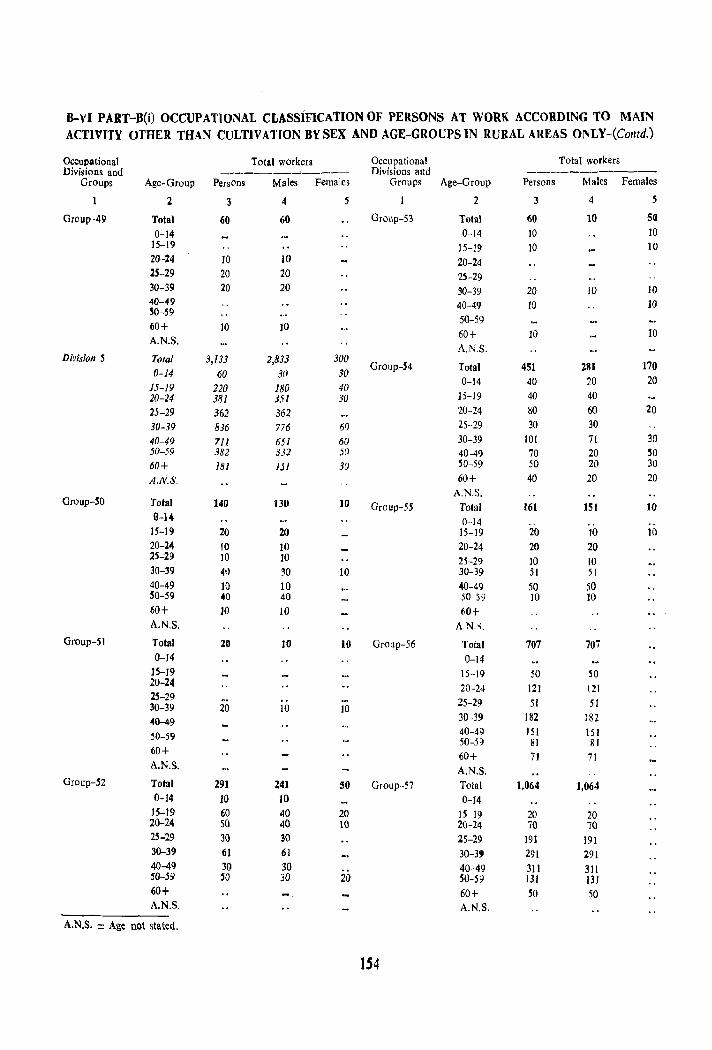
B-VI PAIT-D(i) OCCUPATIONAL CLASsiFICATION OF PERSONS AT WORK ACCORDING TO MAIN ACTIVITY OTHER THAN CULTIVATION BY SEX AND AGE-GROUPS IN RURAL AREAS ONLY-(Colltd.)
Occupational Total workers Occupational Total workers Divisions and _---------'---- Divisions and ---------
Groups Age-Group Persons Males Females Groups Age-Group Persons Males Females
2 3 4 2 3 4 5
Group-4!il Total 60 60 Group-53 Total 60 10 SO 0-14 0-14 10 10
15-19 15-19 10 10 20-24 10 JO 20-24 25-29 20 20 25-29 30-39 20 20 30-39 20 10 10 40-49 40-49 10 10 50-59 60+ 10 10
50-59
A.N.S. 60+ 10 ]0
A.N.S. Division 5 TOlal 3,133 2,833 300
0-14 60 30 30 Group-54 Total 451 281 170
15-19 220 180 40 0-14 40 20 20
20-24 381 351 30 15-19 40 40
25-29 362 362 20-24 80 60 20
30-39 836 776 60 25-29 30 30
40-49 711 651 60 30-39 101 7[ 30 50-59 382 332 50 40-49 70 20 50 60+ 18/ 151 30 50-59 50 20 30
A.N.S. 60+ 40 20 20
Group-50 A.N.S.
Total 140 130 ]0 Group-55 Total 161 ]51 10 0-14 0-14 ..
15-19 20 20 15-19 20 10 10 20-24 [0 JO 20-24 20 20 25-29 10 10 25-29 10 10 30-39 41) 30 10 30-39 51 51 40-49 10 10 40-49 50 50 SO-59 40 40 50-59 10 10 60+ 10 10 60+ A.N.S. A.N.~.
Group-51 Total 20 10 10 Group-56 Total 707 707 0-14 0-14
15-19 15-19 50 50 20-24
20-24 121 121 2S-29 30-39 20 10 10
25-29 51 51
40-49 30-39 182 182
50-59 40-49 151 151 50-5'J 81 81
60+ 60+ 71 71 A.N.S. A.N.S.
Group-52 Total 291 241 50 Group-57 Total ],064 1,064 0-14 10 10 0-14
15-19 60 40 20 lS-19 20 20 20-24 SO 40 10 20-24 70 70 25-29 30 30 25-29 191 191 30-39 61 61 30-3' 291 291 40-49 30 30 40-49 311 311 50-59 SO 30 20 50-59 131 131 60+
-~ 60+ 50 50 A.N.S. A.N.S.
A.N.S. = Age not stated.
154
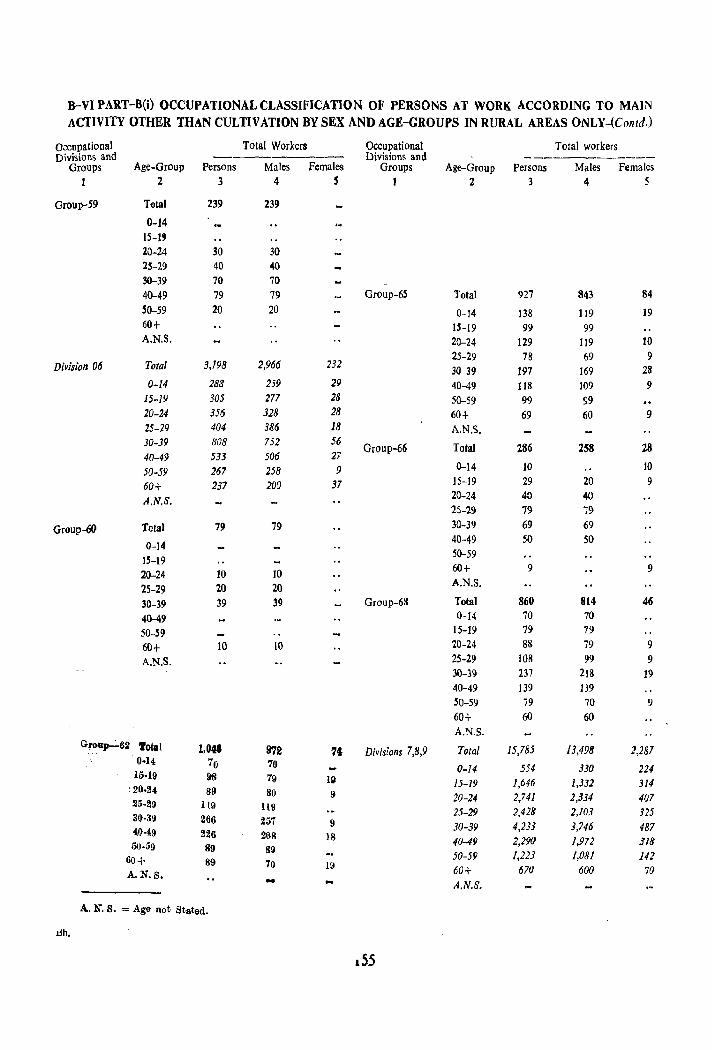
B-VI PART-B(i) OCCUPATIONAL CLASSIFICATION OF PERSONS AT WORK ACCORDING TO MAIN ACTIVITY OTHER THAN CULTIVATION BY SEX AND AGE-GROUPS IN RURAL AREAS ONLy-(eonld.)
o~cupational Total Workers Occupational Total workers Divisions and --------- Divisions and ------------
Groups Age-Group Persons Males Females Groups Age-Group Persons Males Females 1 2 3 4 5 1 2 3 4 5
Grou~59 Total 239 239
0-14 15-19 20-24 30 30 25-29 40 40 30-39 70 70 40--49 79 79 Group-6S Total 927 843 84
50-59 20 20 0-14 138 119 19 60+ 15-19 99 99 A.N.S. 20-24 129 119 10
25-29 78 69 9 Division 06 Total 3,198 2,966 232
30-39 197 169 28 0-14 288 259 29 40-49 118 109 9
15-19 305 277 28 50-59 99 99 20-24 356 328 28 60+ 69 60 9 25-29 404 386 18 A.N.S. 30-39 808 752 56
Group-66 Total 286 258 28 40-49 533 506 27 50-59 267 258 9 0-14 10 10
60+ 237 200 37 15-19 29 20 9
A.N.S. 20-24 40 40 25-29 79 79
Group-60 Total 79 79 30-39 69 69
0-14 40-49 50 50
15-19 50-59
20-24 10 10 60+ 9 9
25-29 20 20 A.N.S.
30-39 39 39 Group-6& Total 860 814 46
40-49 0-14 70 70
50-59 15-19 79 79
60+ 10 10 20-24 88 79 9
A.N.S. 25-29 108 99 9 30-39 231 218 19 40-49 139 139 50-59 79 70 9 60+ 60 60 A.N.S.
G1iOU~62 Total 1,048 972 74 Divisions 7,8,9 Total 15,785 13,498 2,287 0·14 70 70 0-14 554 330 224
15·19 98 79 l~ }5-19 1,646 1,332 314 , 20.24 89 80 9 20-24 2,741 2,334 407 25·29 119 119 25-29 2,428 2,103 325 30·39 266 257 9 4,233 3,746 487 30-39 40-49 226 208 18 2,290 1,972 318 50·59 89
40-49 89
60+ 89 50-59 1,223 1,081 142 70 19 670 600 A.N.S. 60+ 70 ..
A.N.S.
A. N. S. = Age not Stated.
dh.
,55
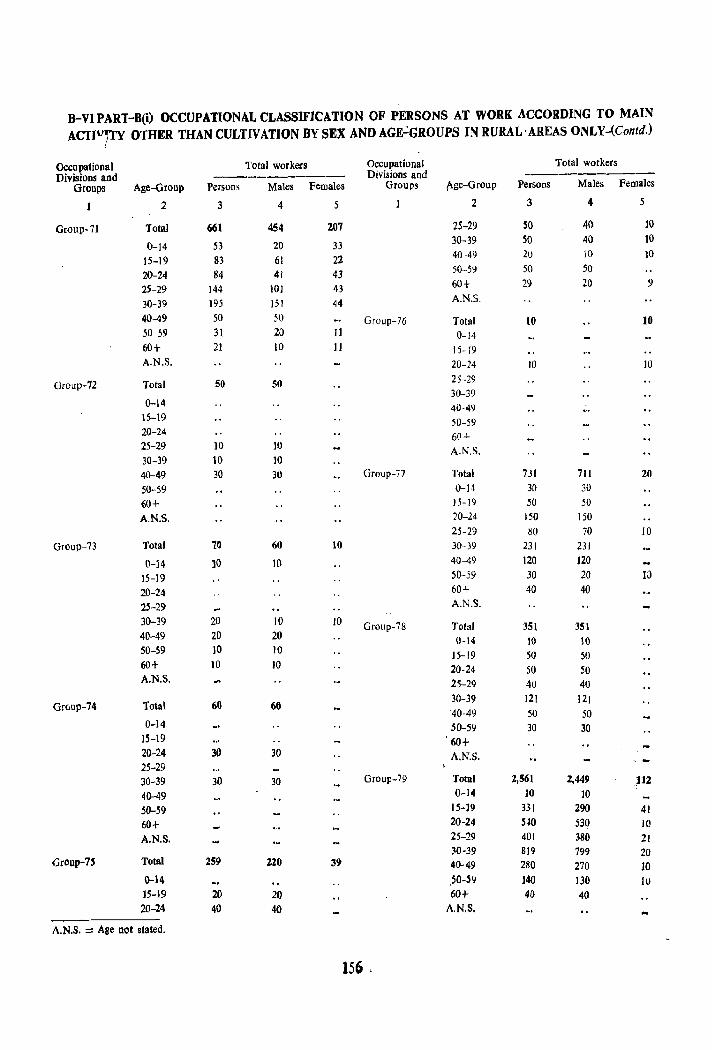
B-VI PART-B(i) OCCUPATIONAL CLASSIFICATION OF PERSONS AT WORK ACCORDING TO MAIN ACTIufTY OTHER THAN CULTIVATION BY SEX AND AGE"':'GROVPS IN RURAL' AREAS ONLY-(Contd.)
Occupational Total workers Occupational Total workers Divisions and ---------- Divisions and ---------
Groups Age-Group Persons Males Females Groups Age-Group Persons Males Females
2 3 4 5 2 3 4 5
Group-71 Total 661 454 207 25-29 50 40 10
0-14 53 20 33 30-39 SO 40 10
15-19 83 61 22 40-49 20 10 10
20-24 84 41 43 50-59 50 50
25-29 144 ]01 43 60+ 29 20 9
30-39 195 151 44 A.N.S.
40-49 50 50 Group-76 Total 10 10 50-59 31 20 II 0-14 60+ 21 10 II 15·-19 A.N.S. 20-24 10 10
Gcoup-72 Total 50 50 25-29 30-39
0-14 40-49 15-19 50-59 20-24 60+ 25-29 }O 10 A.N.S. 30-39 10 10 40-49 30 30 Group-77 Total 731 711 20
50-59 0-14 30 30
60+ 15-19 50 50
AN.S. 20-24 150 150 25-29 80 70 10
Group-73 Total 10 60 10 30-39 231 231
0-14 ]0 10 40-49 120 )20
15-19 50-59 30 20 W
20-24 60+ 40 40
25-29 A.N."'.
30-39 20 10 10 Group-78 Total 40-49 20 20
351 351 0-14 10 10
50-59 )0 ]0 ]5- 19 50 50 60+ 10 10 20-24 50 50 A.N.S. 25-29 40 40
GrGup-74 Total 60 60 30-39 121 121 40-49 50 50
0-14 50-59 30 30 15-19 '60+ 20-24 30 30 A.N.S. 25-29 30-39 30 30 Group-79 Total 2,561 2,449 112
40-49 0-14 10 10
50-59 15-]9 331 290 41 60+ 20-24 HO 530 10
A.N.S. 25-29 401 380 21 W-39 819 799 20
Group-7S Total 259 220 39 ~0-49 280 270 10 0-14 ,50-59 140 130 lu 15-19 20 20 60+ 40 40 20-24 40 40 A.N.S.
A,N.S. ::: Age not stated.
156 '
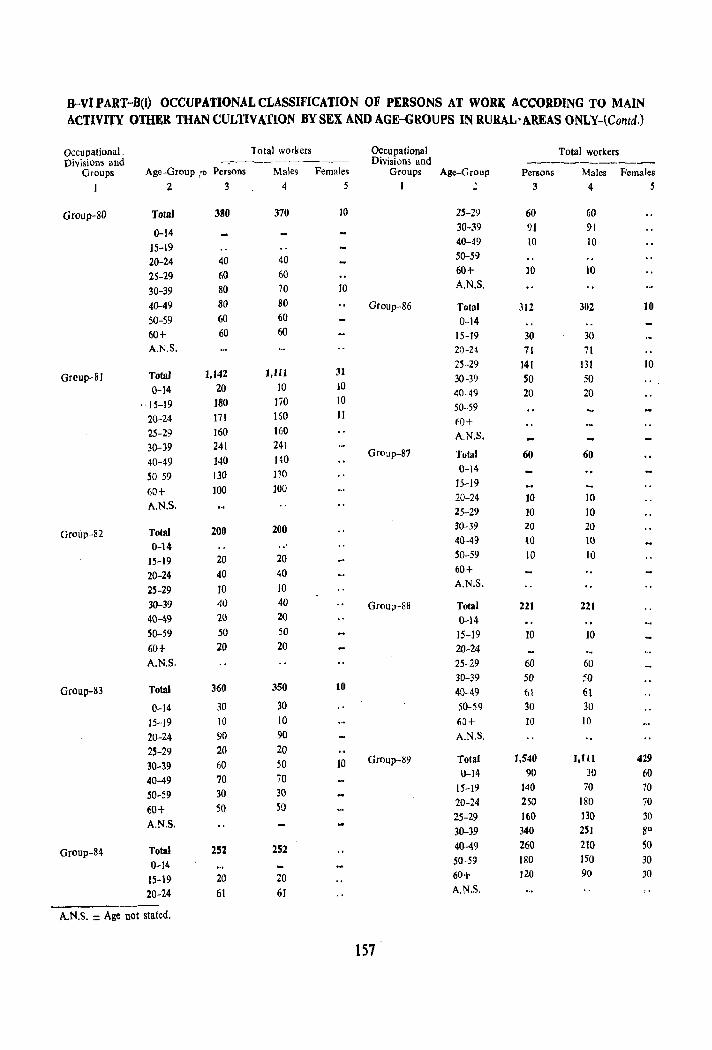
B-VI PART-B(I) OCCUPATIONAL CLASSIFICATION OF PERSONS AT WORK ACCORDING TO MAIN ACTlVlfY OTHER THANCULTlVATION BY SEX AND AGE-GROUPS IN RURAL-AREAS ONLY-(Comd.)
occupational. T 0la1 workers Occupational Total workers Divisions and ---c------------ Divisions and ------------
Groups Age-Group ,'0 Persons Males Females Groups Age-Group Persons Males Females 2 3 4 I ~ 3 4 5
Group-SO Total 380 370 10 25-29 60 60
0-14 30-39 91 91
15-19 40-49 10 10
20-24 40 40 50-59
25-29 60 60 60+ ]0 10
30-39 80 70 10 A.N.S.
40-49 80 80 Group-86 Total 312 302 10 SO-59 60 60 0-14 60+ 60 60 15-19 30 30 A.N.S. 20-2~ 71 71
25-29 141 131 10 Grcup-Sl Total 1,142 1,111 31
30-39 SO 50 0-14 20 10 10
40-49 20 20 . 15-19 180 170 10
50-59 20-24 171 160 II
·(0+ 25-29 160 160 A.N.S. 30-39 241 241
Group-8? 40-49 140 140 Total 60 60
130 130 0-14 SO-59
100 100 15-19 60+ A.N.S.
20-24 10 10 25-29 10 10
Group-82 Total 200 200 30-39 20 20 40-49 10 \0
0-14 .. 15-19 20 20 SO-59 10 10
20-24 40 40 60+
25-29 10 10 A.N.S.
30-39 40 40 Group-S8 Total 221 221 40-49 20 20 0-14 SO-59 50 50 15-19 ]0 ]0 60+ 20 20 20-24 A.N.S. 25-29 60 60
30-39 50 50 Group-83 Total 360 350 10 40-49 61 61
0-14 30 30 50-59 30 30
15-19 10 10 6J+ ]0 10
2U-24 90 90 A.N.S.
2S-29 20 20
30-39 60 SO 10 Group-89 Total 1,540 1,111 419
70 70 0-14 90 30 60 40-49
30 30 15-19 140 70 70 50-59
50 50 20-24 250 180 70 60+ A.N.S.
25-29 160 ]30 30 30-39 340 2S1 8"
Group-84 Total 251 252 40-49 260 210 50
0-14 50-59 180 150 30
15-19 20 20 60+ 120 90 30
20-24 61 6] A.N.S.
A.N.S. = Age not stated.
157
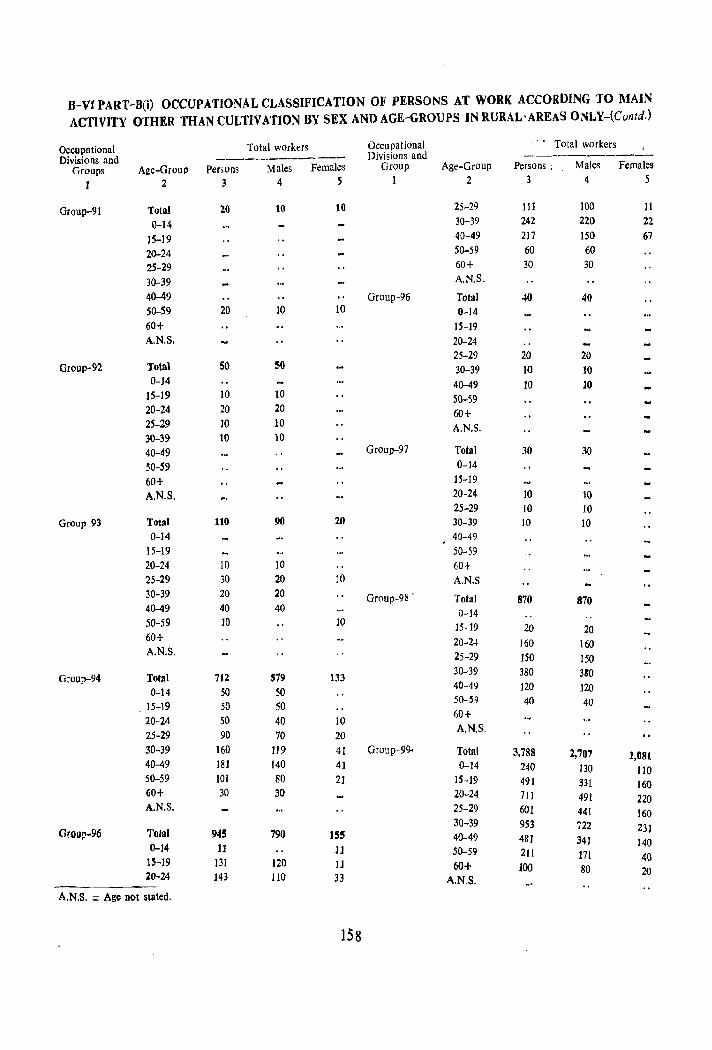
B-V[ PART-B(i) OCCUPATIONAL CLASSIFICATION OF PERSONS AT WORK ACCORDING TO MAIN
ACTIVITY OTHER THAN CULTIV ATIO~ BY SEX AND AGE-GROUPS IN RURAL' AREAS O.sLY-(Contd.)
Occupational Total workers Occupational '. Total workers !
Divisions and ------------ Divisions and -----------Groups Age-Group Persons Males Females Group Age-Group Persons; Males Females
J 2 3 4 5 I 2 3 4 5
Group-91 Total 20 10 10 25-29 III 100 11
0-14 30-39 242 220 22
15-19 40-49 217 ISO 67
20-24 SO-59 60 60
25-29 60+ 30 30
30-39 A.N.S.
40-49 Group-96 Total 40 40 50-59 20 10 10 0-14 60+ IS-19 A.N.S. 20-24
25-29 20 20 Group-92 Total 50 SO 30-39 10 10
0-14 40-49 10 10 15-19 10 10 50-59 20-24 20 20 60+ 25-29 10 10 A.N.S. 30-39 10 10 40-49 Group-97 Total 30 30
50-59 0-14
60+ 15-19
A.N.S. 20-24 10 10 25-29 10 JO
Group-93 Total 110 90 20 30-39 10 10 0-14 40-49
15-19 50-59 20-24 10 10 60-!-25-29 30 20 JO A.N.S 30-39 20 20 Group-98 . 40-49 40 40
Total 870 870 0-14
50-59 10 10 60+
15-19 20 20
A.N.S. 20-24 160 160 25-29 150 150
Group-94 Total 712 579 133 30-39 380 310
0-14 50 50 40-49 120 ]20
15-19 50 50 50-59 40 40
20-24 50 40 10 60+
25-29 90 70 20 A.N.S.
30-39 160 119 41 Group-99- Total 3,788 40-49 181 140
2,707 1,081 41 0-14 240 130 110
50-59 101 80 21 15-19 491 331 160 60+ 30 30 20-24 71] 491 220 A.N.S. 25-29 601 441 160
Groul'-96 Tolal 945 30-39 953 i22 231 790 155 40-49
0-14 481 34] 140 11 11 50-59
15-19 131 120 2J1 171 40
1J 60+ 100 20-24 143 llO 33
80 20 A.N.S.
A.N.S. = Age not stated.
158
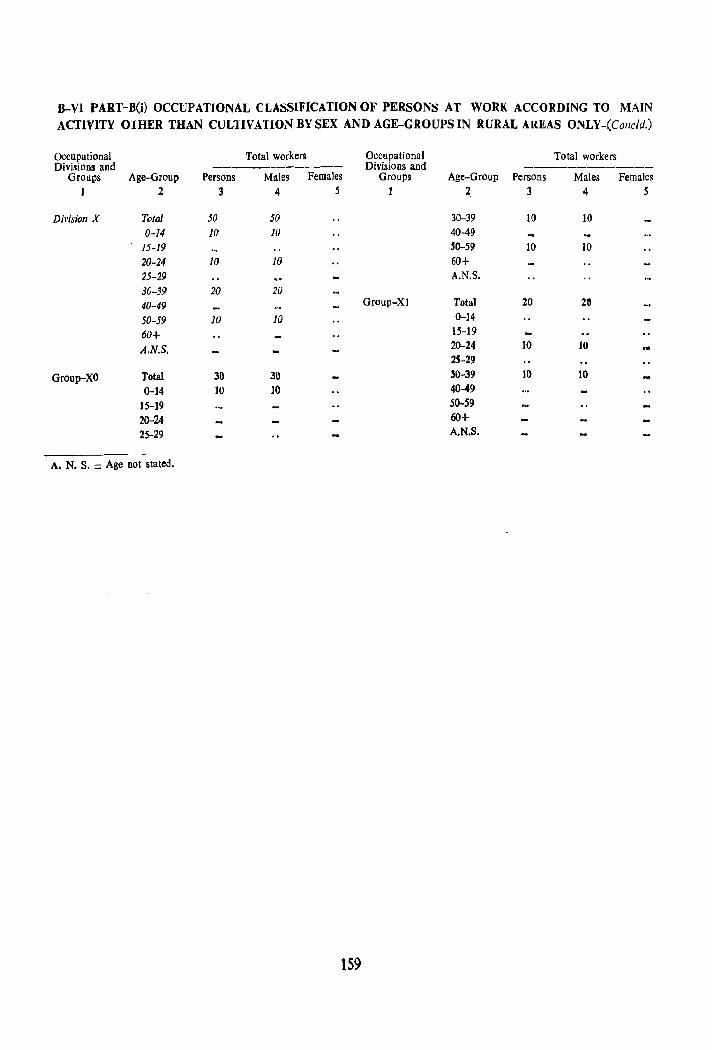
B-VI PART-B(i) OCCUPATIONAL CLASSIFICATION OF PERSONS AT WORK ACCORDING TO MAIN
ACTIVITY OIHER THAN CULTIVATION BY SEX AND AGE-GROUPS IN RURAL Al{EAS ONLY-(Collcld.)
Occupational Total workers Occupational Total workers Divisions and ---------- Divisions and -----------
Groups Age-Group Persons Males Females Groups Age-Group Persons Males Females 1 2 3 4 5 1 2. 3 4 5
Division X Total 50 50 30-39 10 10
0-14 10 10 40-49 15-19 SO-59 10 10 20-24 10 IO 60+
25-29 A.N.S. 30-39 20 20 40-49 Group-Xl Total 20 20
50-59 10 10 0-14
60+ 15-19
A.N.S. 20-24 10 10 25-29
Group-XO Total 30 30 30-39 10 10 0-14 10 10 40-49
15-19 SO-59 20-24 60+
25-29 A.N.S.
A. N. S. = Age not stated.
159
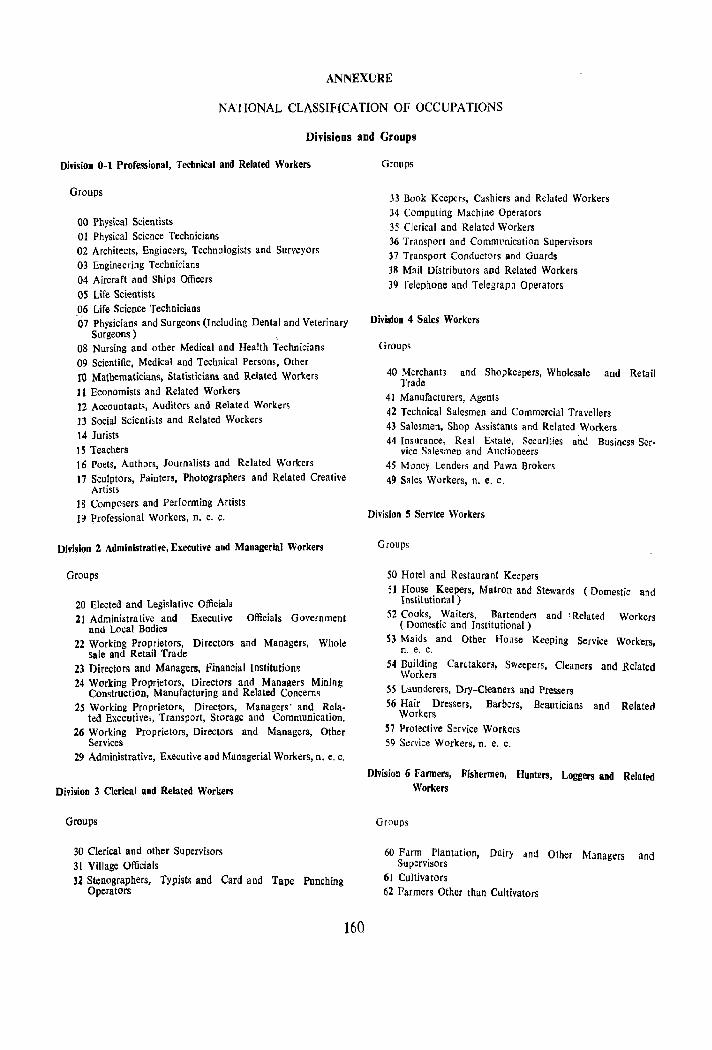
ANNEXURE
NAtIONAL CLASSIFlCATION OF OCCUPATIONS
Divisions and Groups
Division 0-1 Professional, Technical and Related Workers
Groups
00 Physical Scienlists 01 Physical Science Technicians 02 Architects, Engineers, Technologists and Surveyors 03 Engineering Technicians 04 Aircraft and Shi ps Officers 05 Life Scientists
<06 Life Science Technicians 07 Physicians and Surgeons (Including Dental and Veterinary
Surgeons) 08 Nursing and other Medical and Health Technicians 09 Scientific, Medical and Technical Persons, Other fO Mathematicians, Statisticians and Related Workers 11 Economists and Related Workers 12 Accountants, Auditors and Related Workers 13 Social Scientists and Related Workers
14 Jurists 15 Teachers 16 Poets, Authors, Journalists and Related Workers 17 Sculptors, Painters, Photographers and Related Creative
Artists 18 Composers and Performing Artists 19 I;'rofessional Workers, n. e. c.
Division 2 Administrative, Executive aod Managerial Workers
Groups
20 Elected and Legislative Officials 21 Administrative and Executive Officials Government
and Local Bodies 22 Working Proprietors, Directors and Managers, Whole
sale and Retail Trade 23 Directors and Managers, Financial Inslitution~ 24 Working Proprietors, Directors and Managers Mining
Construction, Manufacturing and Related Concerns 2S Working Proprietors, Directors, Managers' and Rela·
ted Executive" Transport, Storage and Communication. 26 Working Proprietors, Directors and Managers, Other
Services 29 Administrative, Executive aDd Managerial Workers, n. e. c.
Division 3 Clerical and Related Workers
Groups
30 Clerical and other Supervisors 31 Village Officials 32 Stenographers, Typists and Card and Tape Punching
Operators
160
Groups
33 Book Keepers, Cashiers and Related Workers 34 Computing Machine Operators 35 Clerical and Related Workers 36 Transport and Communication Supervisors 37 Transport Conductors and Guards 38 Mail Distributors and Related Workers 39 Telephone and Telegraph Operators
Division 4 Sales Workers
Groups
40 Mcrchanl3 and Shopkeepers, Wholesale and Retail Trade
41 Manufacturers, Agents 42 Technical Salesmen and Commercial Travellers 43 Salesmen, Shop Assistants and Related Workers 44 Insurance, Real E~tate, Securities and Business Ser.
vice Salesmen and Auctioneers 45 Money Lenders and Pawn Brokers 49 Sales Workers, n. e. c.
Division 5 Service Workers
Groups
50 Hotel and Restaurant Keepers 51 House Keepers, Matron and Stewards (Domestic and
Institutional) 52 Cooks, Waiters. Bartenders and' Related Workers
( Domestic and Institutional) 53 Maids and Other House Keeping Service Workers,
n. e. c.
S4 Building Car~taker$, Sweepers, Cleaners and Related Workers
S5 Launderers, Dry-Cleaners and Pressers 56 Hair Dressers, Barbers, Beauticians and Related
Workers 57 Protective Service Workers 59 Service Workers, n. e. c.
DivisiOlJ 6 Farmers, Fishermen, Hunters, Loggers and Related Workers
Groups
60 Farm Plantation, Dairy and Other MJnagers and Supervisors
61 Cultivators 62 Farmers Other than Cultivators
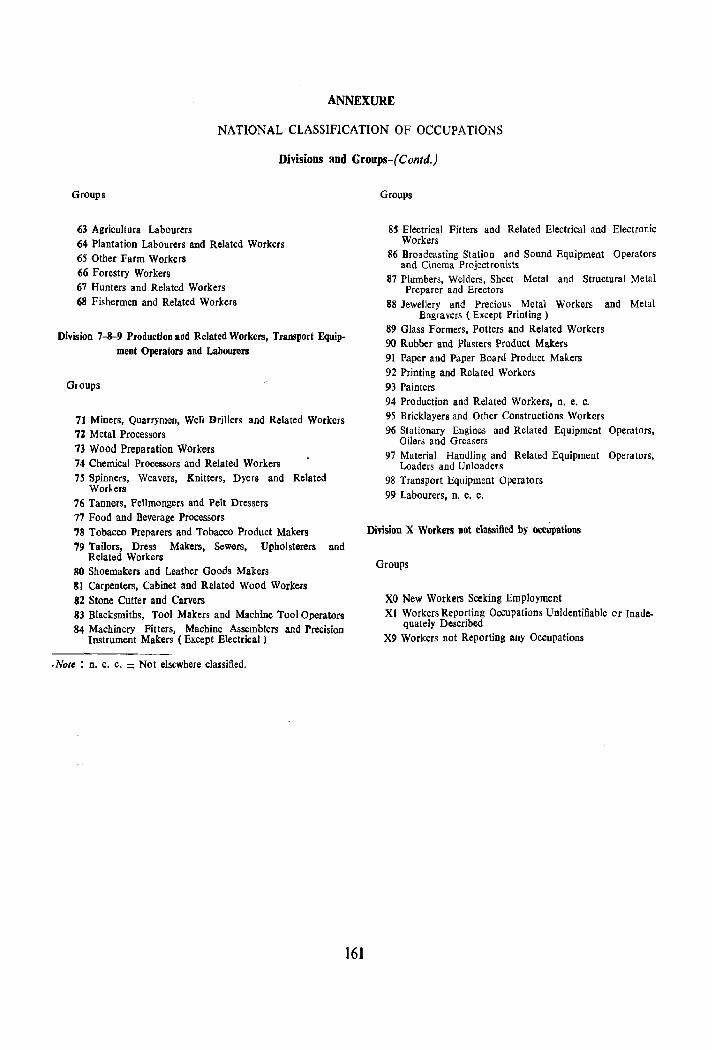
ANNEXURE
NATIONAL CLASSIFICATION OF OCCUPATIONS
Divisions and Groups-(Contd.)
Groups
63 Agricultura Labourers 64 Plantation Labourers and Related Workers 65 Other Farm Workers 66 Forestry Workers 67 Hunters and Related Workers 68 Fishermen and Related Workers
Division 7-8-9 Production and Related Workers, Transport Equipment Operators and Labourers
Groups
71 Miners, Quarrymen, Well Drillers and Related Workers 77. Metal Processors 73 Wood Preparation Workers 74 Chemical Processors and Related Workers 75 Spinners, Weavers, Knitters, Dyers and Related
Workers 76 Tanners, Fellmongers and Pelt Dressers 77 Food and Beverage Processors 78 Tobacco Preparers and Tobacco Product Makers 79 Tailors, Dress Makers, Sewers, Upholsterers and
Related Workers 80 Shoemakers and Leather Goods Makers 81 Carpenters, Cabinet and Related Wood Workers 82 Stone Cutter and Carvers 83 Blacksmiths, Tool Makers and Machine Tool Operators 84 Machinery Fitters, Machine Assemblers and Precision
Instrument Makers (Except Electrical)
.Nole : n. e. c. = Not elsewhere classified.
161
Groups
8j Electrical Filters and Related Electrical and Electronic Workers
86 Broadcasting Station and Sound Equipment Operators and Cinema Projectronists
87 Plumbers, Welders, Sheet Metal and Structural Metal Preparer and Erectors
88 Jewellery and Precious Metal Workers and Metal Engravers (beept Printing)
89 Glass Formers, Potters and Related Workers 90 Rubber and Plasters Product Makers 91 Paper and Paper Board Product Makers 92 Printing and Related Workers 93 Painters 94 Production and Related Workers, n. e. c. 95 Bricklayers and Other Constructions Workers 96 Stationary Engines and Related Equipment Operators,
Oilers and Greasers 97 Material Handling and Related Equipment Operators,
Loaders and Unloaders 98 Transport Equipment Operators
99 Labourers, n. e. c.
Division X Workers not classified by occupations
Groups
XO New Workers Seeking Employment XI Workers Reporting Occupations Unidentifiable or Inade
quately Described X9 Workers not Reporting any Occupations
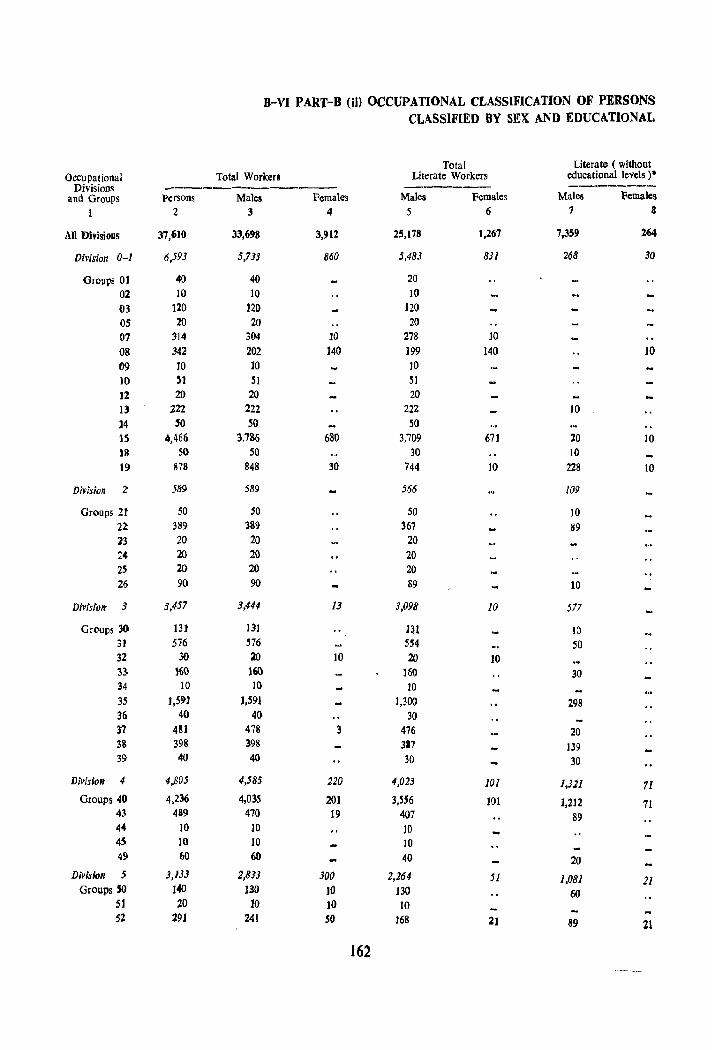
B-VI PART-B (ii) OCCUPATIONAL CLASSiFICATION OF PERSONS CLASSIFIED BY SEX AND EDUCATIONAL
Total Literate ( without Oeeu pational Total Worken Literate Workers educational levels)*
Divisions ----------- ------- -------and Groups Persons Males Females Males Females Males Females
1 2 3 4 5 6 7 8
All DivisioDs 37,610 33,698 3,912 25,178 1,267 7,359 264
Division 0-1 6,593 5,733 860 5,483 831 268 30
Groups OJ 40 40 20 02 10 10 10 03 t20 J20 120 05 20 20 20 07 314 304 10 278 10 08 342 202 140 199 140 10 09 10 10 10 to Sl 51 51 12 20 20 20 13 222 222 222 10 J4 50 50 SO 15 4,466 3,785 680 3,709 671 20 10 )8 50 50 30 10 19 878 848 30 744 10 228 10
Division 2 539 589 566 109
Groups. 2t 50 50 50 10 22 389 389 367 89 23 20 20 20 24 20 20 20 2S 20 20 20 26 90 90 89 10
DMsiolt J 3,457 3,444 13 3,098 10 577
Groups 30 131 131 131 1:l 3! 576 576 554 SO 32 30 20 10 20 10 :;3- 160 16() ]60 30 34 10 10 10 35 ),591 J,591 1,300 298 36 40 4() 30 37 481 478 3 476 20 38 398 398 317 139 39 40 40 30 30
Division 4 4,805 4,585 220 4,023 101 1,321 71 Groups 40 4,236 4,035 201 3,m 101 1,212 71
43 489 470 19 407 89 44 10 10 10 4S 10 10 10 4!} 60 60 40 20
Division 5 3,IJJ 2,833 300 2,264 51 1,081 21 Groups SO 140 130 10 130 60
51 20 10 10 10 52 291 241 SO 168 2J 89 21
162
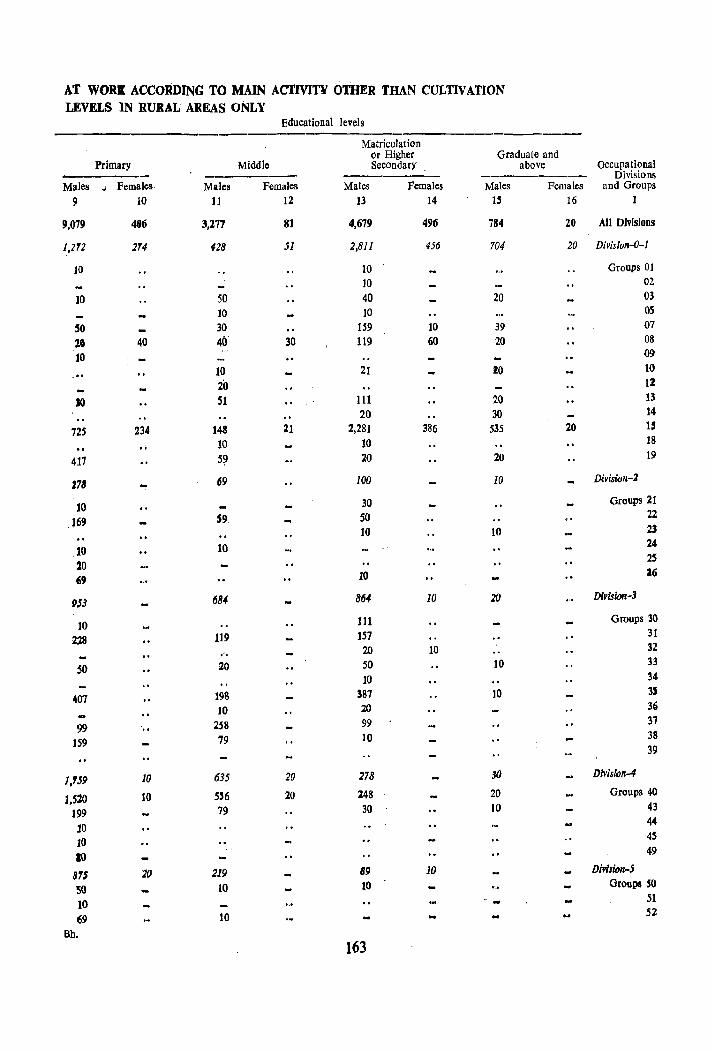
AT WORK ACCORDING TO MAIN ACTIVIT\' OrnER THAN CULTIVATION LEVELS IN RURAL AREAS ONLY
Educational levels
Matriculation or Higher Graduate and
t Primary Middle Secondary above Occupational ------ -------- Divisions
Males ..; Females Males Females Males Females Males Females and Groups
9 10 11 12 13 14 15 16 1
9,079 496 3,277 81 4,679 496 784 20 All Divisions
1,212 214 428 51 2,811 456 704 20 Division-O-l
10 10 Groups 01
10 02
JO 50 40 20 03
10 10 05
SO 30 159 10 39 07
20 40 40 30 119 60 20 08 , ]0 09
10 21 10 10
20 12
'JO 51 III 20 13
20 30 14
725 234 148 21 2,281 386 535 20 15
10 10 18
417 5~ 20 20 19
Z78 69 100 10 Division-2
10 30 Groups 21
l69 59, 50 22
10 10 23
,10 10 24
20 25
69 10 16
95J 684 864 10 20 Divisicn-3
10 111 Groups 30
228 119 157 31
,', 20 10 32
SO 20 50 10 33
10 34
407 198 381 10 35
10 20 36
99 258 99 37 .. 159 79 10 38
39
1,159 10 635 20 278 30 Division-4
1,520 10 5'6 20 248 20 Groups 40
199 79 30 10 43
10 44
10 45
10 49
81S 10 219 89 10 Division-S
SO 10 10 Groups SO
10 51
69 10 52
Bh. 163
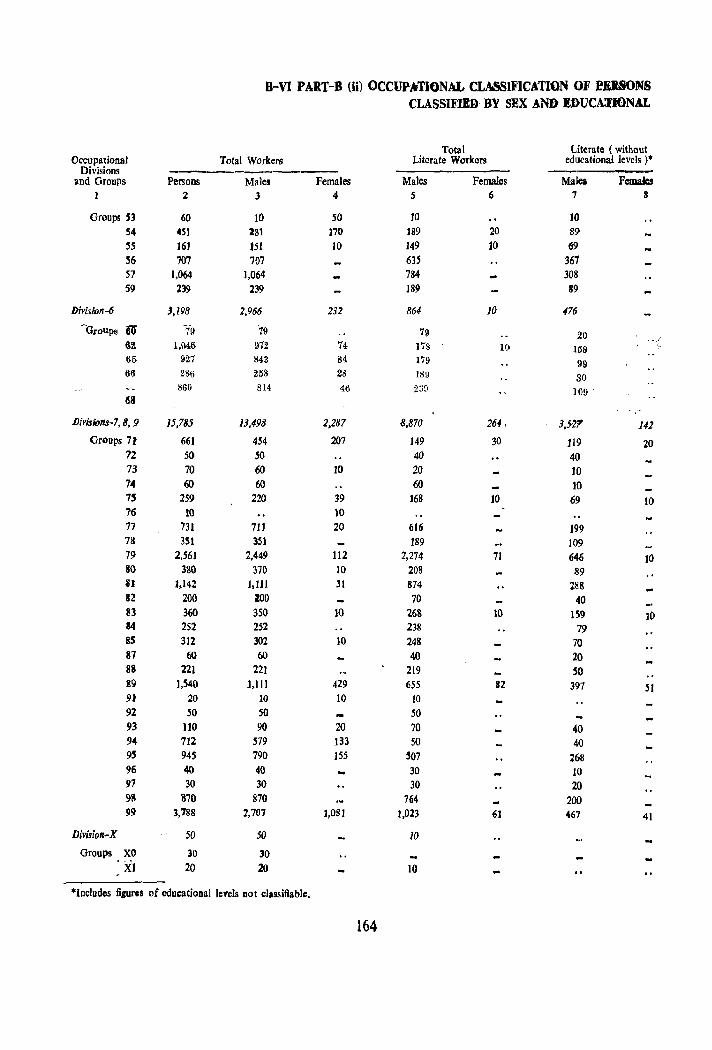
8-VI PART-D (ii). OCCUP'A'TIONAL CLASSIFICATION OF PDSOMS CLASSIFIED BY SEX AND EDUCA:I'IONAL
Total Literate ( without Occupational Total Workers Literate Workers educational levels )*
Divisions ------------------and Groups Persons Males Females Males Females Male& FcoWes I 2 3 4 5 6 7 8
Groups 53 60 10 SO 10 10 S4 451 181 ]70 lB9 20 89 55 161 151 10 149 10 69 56 707 707 635 367 57 1,064 1,064 784 308 59 239 239 189 89
Divisioff-6 ',198 2,966 232 864 }O 476
-Groups 60 'f9 -79 79 20 Ill! 1,\)4,6 912 74 17S 10 158 65 927 843 84 179 99 66 286 25S 2~ 189 30
860 814 118
46 23n 169
Divisions-7, 8, 9 J5,785 /3,498 2,287 8,870 264- • 3,52'1' Ul Groups 7J 661 454 207 149 30 119 . 20
12 50 SO 40 40 73 70 60 10 20 10 74 60 60 60 10 7~ 259 220 39 168 10 69 10 16 JO 10 77 731 7J] 20 616 199 78 351 3S1 189 109 79 2,561 2,449 112 2,274 71 646 10 80 3&0 370 10 208 89 III 1,142 I,m 31 874 288 82 200 ZOO 70 40 83 360 350 10 268 10 lS9 10 14 252 252 238 79 85 312 302 ]0 248 70 87 60 60 40 20 88 221 22J 219 SO 89 ],540 1,111 429 655 12 397 51 9J 20 10 10 10 92 50 SO 50 93 110 90 20 70 40 94 712 579 133 50 40 9~ 945 790 155 507 268 96 40 40 30 10 97 30 30 30 20 ~8 870 870 764 200 99 3,788 2,707 1,081 1,023 6] 467 41
Division-X 50 50 10
Groups XO 30 30 . Xl 20 20 10
*Includcs figures of educational leyels not classifiable.
164
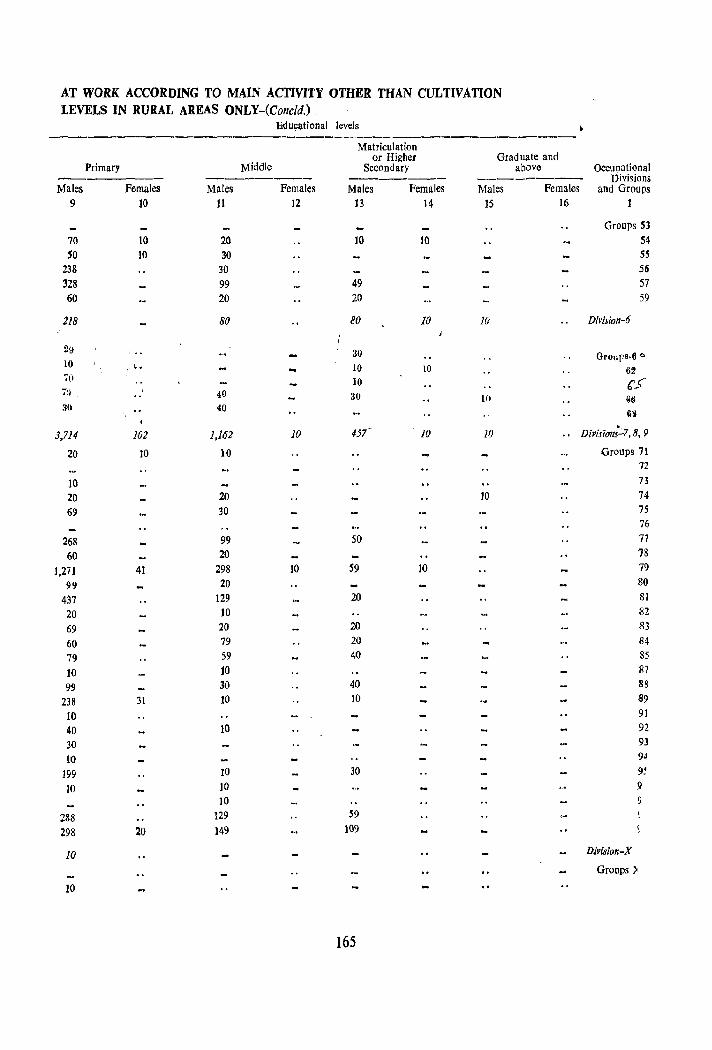
AT WORK ACCORDING TO MAIN ACTIVITY OTHER THAN CULTIVATION LEVELS IN RURAL AREAS ONLY-(Concld.) .
EUucational levels • --------------_--------------------_._---Matriculation
or Higher Graduate and Primary Middle Secondary above Occupational
--------- -------- ---------- -------- Divisions Males Females Males Females Males Females Males Females and Groups
9 ]0 ]I 12 13 14 15 16 1
Groups 53 70 10 20 10 10 54 SO 10 30 55
238 30 56 328 99 49 57 60 20 20 59
218 80 80 10 10 Division-6
29 30 Groups·6 (>
10 ," ~ "'I 10 10 6l!
7(l 10 cS' 7:l 40 30 W ljij 30 40 IIi!
3,714 102 1,162 10 457 10 10 .. Divisions";_7, 8, 9
20 10 10 Groups '11 72
10 73
20 20 ]0 '14
69 30 '15 76
268 99 50 77
60 20 78
1,27] 41 298 10 S9 10 79
99 20 80
437 129 20 81
20 10 82
69 20 20 83
60 79 20 84
79 59 40 85
10 10 87
99 30 40 88
238 31 10 10 89
10 91
40 10 92
30 93
10 94
199 10 30 9~
!O 10 9 10
288 129 59
298 20 149 109
10 DiviJion-X
Groups)
10
165

H-VlI SECONDARY WORK, i. e. PERSONS H-AVING MAIN ACTIVITY (0 CULtIVATORS, (it) AGRICULTURAL LABOURERS, (iii) HOUSEHOLD INDUSTRY, (iv) NON-HOUSEHOLD INDUSTRY AND (v) NON-WORKERS CLASSIFIED BY SEX AND BY SECONDARY WORK (i) HOUSEHOLD INDUSTRY, (ii) CULTIVATOR, (iii) AGRICULTURAL LABOURER OR (iv) NON-HOUSEHOLD INDUSTRY, T.RADE,
BUSINESS OR SERVICE
Secondary Work -,----Non-household Indu-
Agricul tural Household stry, Trade, Business Cultivator Labourer Indu&try or Service
----- ------ --------Main Activity Rural Males Females Males Females Males Females Males Females
1 1 1 4 5 6 7 8 9 10
Total Rural 1,664 1,340 800 3,760 530 280 1,750 230
Cultivator 530 10 460 1,310 Agricultural labourer 160 ]0 60 40 260 70 Household Industry 160 30 Non-household Industry, Trade, 1,254 10 130 50 10 20 120 Business or Serv ice Non workers 90 1,320 140 3,700 220 30 160
B-VUI PERSONS CLASSIFIED AS NON-WORKERS ACCORDING TO MAIN ACTIVITY CROSS-CLASSIFIED BY SEX, AGE-GROUPS AND TYPE OF ACTIVITY
Total nOD-working Total population Students Household duties Rural Age- -~------- ------- ------
Di~trict Urban Group Persons Males Females Males Females Males Females 2 3 4 5 6 7 8 9 10
Hharuch Rural Total 571,717 217,098 361,619 82,559 38,369 2,049 173,08'
0-14 381,281' 191,638 189,643 68,273 34,807 1,290 18,758 15-19 39,076 15,034 24,042 12,195 3,462 360 19,650 20-24 28,19' 3,607 24,588 1,82t S() 140 24,148 25-19 23,167 789 22,378 227 20 69 22,168 30-39 37,272" 675 36,597 32 53 36,307 40-49 27,830 530 27,300 67 26,640 50-59 18,735 755 17,980 30 15,841 60 + 23,129 4,054 19,075 40 9,567 A.N.S. 32 Iti 16 8
Dependents and Retired, rentier & rnmates of penal,
persons of Beggars, VagraDts, mental & charitable infants independentn1eans etc. institutions Others
Age- --------- ------- ------- ---------Group Males Females Males Females Males Females Males Females Males Females 3 11 12 13 14 15 16 17 18 19 20
Total 128.232 149.274 557 450 441 290 360 2,900 150 0-14 121,665 136,018 50 40 180 130 20
15-19 1,309 870 10 20 ]60 1,000 40 10-24 461 270 10 30 1,142 90 25-29 207 160 20 30 266 30-39 285 220 10 lOS 70 190 40-49 260 630 29 10 116 20 58 50-59 m 2,032 79 60 50 40 JO 30 60 + 3,485 9.058 429 '80 60 70 10 30 A.N.S. 4 16 4
A. N. S. = Age Bot stated.
166
C-SOCIAL AND CULTURAL TABLES
Tables based on full count viz., C-V, C-VII and C-VIII ParIs A and B witb their appendices have bien published in Part C-I of the District Census Handbook. In the present volume the following two tables giving estimates as based on 10 per cent sample of rural individual slips are published.
Table C-II (rural) gives data on age and marital status of the rural population.
This table corresponds to Table C-I1 of 1961 prepared on full count basis and Table C-III of 1951 prepared on the basis of a 10% sample. The age groups and marital status categories are tbe same as in 1961 but differ from Table C-UI of 1951. In place of the three categories of marital status viz., unmarried, married and widowed or divorced adopted in 1951 census the 1961 and 1971 Census tables give five categories viz., (1) never married, (2) married, (3) widowed, (4) divorced/separated and (5) un-specified.
Table C-III Part-A rural gives information on age, sex and education in the rural areas. Comparable tables of previous censuses are Table C-IV of 1951 Census prepared on 10 p!r cent sample basis and Table C-III Part-A of 1961 Census prepared on full count basis and for all areas.
The age groups in this table are 0-4, 5-9, 10-14, 15-19, 20-24, 25-34, 35+ and Age not stated. The educational levels correspond to table B-'111 Part-B. This table provides a measure of literacy in the population as well a~ in the different age-groups.
167
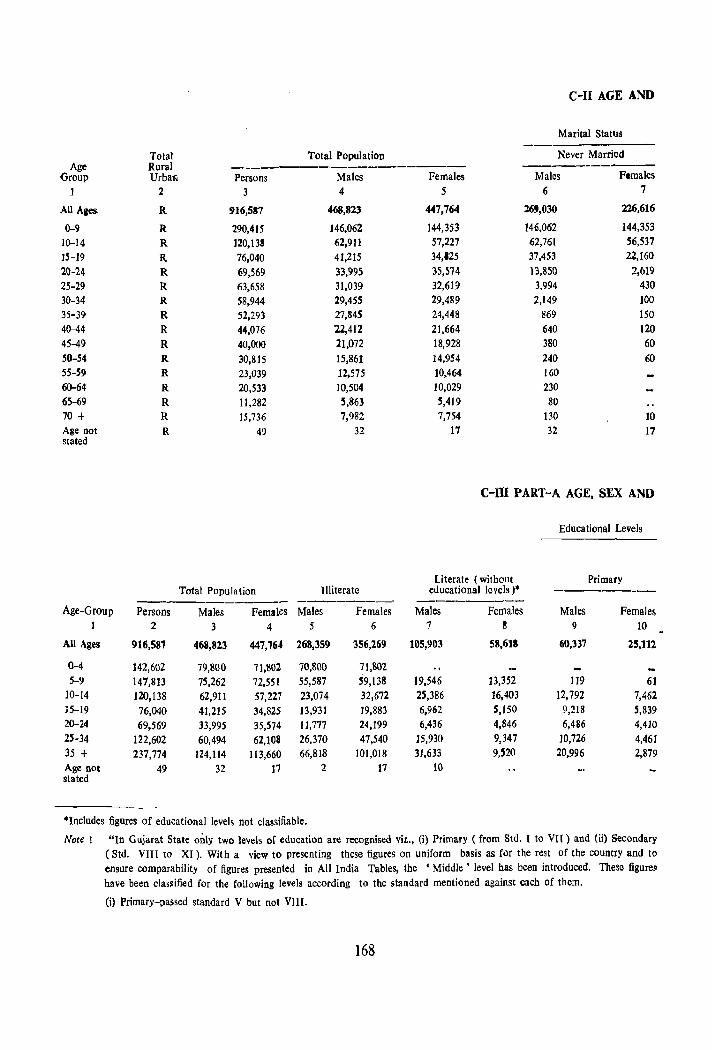
C-II AGE AND
Marital Status
Total Total Population Never Married Age Rural ------------------------ ----------
Group UrbaN Persons Males Females Males Females
J 2 3 4 5 6 7
All Alles R 916,587 468,823 447,764 26',030 226,616
0-9 R 290,415 146,06:! 144,353 146,062 144,353
10--14 R 120,138 62,911 57,227 62,761 56,537
15-19 R 76,040 41,215 34,125 37,453 22,160
20-24 R 69,569 33,995 35,574 13,850 2,619 25-29 R 63,658 31,039 32,619 3,994 430 30-34 R 58,944 29,455 29,489 2,149 100 35-39 R 52,293 27,845 24,448 869 150 40--44 R 44,076 '22,412 21,664 640 120 45-49 R 40,000 21,072 18,928 380 60 50-54 R 30,815 15,861 14,954 240 60 55-59 R 23,039 12,575 10,464 160 60-64 R 20,533 10,504 10,029 230 65-69 R 11,282 5,863 5,419 80 70 + R 15,736 7,982 7,754 130 10 Age not R 49 32 17 32 17 stated
c-IlI PART-A AGE, SEX AND
Educational Levels
Literate (without Primary Total Population Illiterate educational levels)* ---------
-----------~ -------- ----------Age-Group Persons Males Females Males Females Males Females Males Females 1 2 3 4 5 6 7 8 9 10
All Ages 916,587 468,823 447,764 268,359 356,269 105,903 58,618 60,337 25,112
0-4 142,602 79,800 71,802 70,800 71,802 5-9 147,813 75,262 72,551 55,587 59,138 19,546 13,352 119 61
10-14 120,[38 62,9[1 57,227 23,074 32,672 25,386 ]6,403 12,792 7,462 j5-19 76,040 41,215 34,825 13,931 19,883 6,962 5,150 9,218 5,839 20-24 69,569 33,995 35,S74 11,777 24,199 6,436 4,846 6,486 4,410 25·34 122,602 60,494 62,108 26,370 47,540 ]5,930 9,347 10,726 4,461 35 + 237,774 124,114 113,660 66,818 101,018 31,633 9,520 20.996 2,879 Age not 49 32 17 2 17 10 stated
-Includes figures of educational levels not classifiable.
Note j "In Gujarat State only two levels of education are recognised viz., (i) Primary ( from Std. I to VII) and (ii) Secondary (Std. VIII to XI). With a view to presenting these figures on uniform basis as for the rest of the country and to ensure comparability of figures presented in All India Tables, the 'Middle' level has been introduced. These figure~ have been classified for the following levels according to the standard mentioned against each of them.
(i) Primary-passed standard V but not VIII.
168

MARTAL STATUS
Merital StatU9
Married Widowed Divoreed or Unspecified separated status --------- -------- Age
Males Females Males Females Males Females Males Females Group 8 9 10 11 12 13 14 15 1
183,911 187,959 12,640 30,670 3,231 2,519 All Ages
0-9 ISO 690 10-14
3,592 J2,375 40 70 130 220 IS-19 ]9,306 32,075 240 230 599 650 20-24 26,132 31,449 371 320 542 420 25-29 26,216 28,449 520 690 500 250 30-34 25,717 22,577 839 1,401 420 320 35-39 20,571 19,188 961 2,136 240 220 40-44 19,161 1S,524 1,301 3,195 230 149 45-49 13,893 10,645 1,628 4,149 100 100 50-54 10,757 6,50S ],578 3,909 80 SO 55-59 8,383 4,650 1,831 5,289 60 90 60-64 4,632 2,385 1,031 3,014 120 20 65-69 5,342 1,447 2,300 6,267 210 30 70 +
Age Dot Iltated
EDUCATION IN aURAL AREAS
Males IJ
22,188
10 1,649 9,326 5,373 3,337
: 2,483 JO
Educational Levels
Non-technical Technical diploma or
Matriculation certificate diploma or certificate Graduate
or Higher not equal not equal and Middle Secondary to degree to degree above
--------Females._ Males Females Males Females Males Females Males Females Age-group
J2 13 14 15 16 17 18 19 20 I
5,687 9,257 1,611 1,360 396 248 10 1,171 61 All Ages
0-4 5-9
690 10 10-14 3,335 1,748 618 20 10 15-19 1,145 3,357 730 159 203 50 357 41 20-24
426 2,692 192 675 122 129 10 635 10 25-34 91 1,450 71 506 71 69 159 10 3H
10 Age not stated
(ii) Middle-passed standard VIII but not XI.
(iii) Higher Secondary passed Standard XI but had not acquired a University degree or Diploma. Persons have been classified in ' Primary' level if they have passed standard V. If they were reading VI or VII or VIII, but had not passed VIII, they have been classified under 'primary' level. Those who have passed the Standard YIn have been classified under' Middle '. This will include those reading in IX, X or XI Standard but not passed XI. Those who have passed standard XI but not passed any University degree or diploma examination, have been classified under ' Higher Secondary'.
169

D-MIGRATION TAfiLES
ThoYSh migration tabJes wen compiled aad published in the State volume Part U-C during J961 Census. they wer~ not reproduced in the District Census Handbooks. In 1971 Census it was decided to incorporate migration tables in the District Census Handbooks so far as they relate to the districts. These tables included in this part are D-J (with its two apPolldi®s) and O-VI. The major difference between the migration table of 1961 Census and those of 1971 Census is that the 1971 data is presented wit4 refere1lCe to the last resi. dence anQ. Dot to birth place exrept in the case of Table D-I which is related to place of birtll.
Tab" D-I (J'llIII!,I) gives the distribution of population by birth place accordiog to rural an4 urban ,areas. It ~rresponds to Table D~II of 1961 Census in which the place of birth was classified as rural/urban for those individuals whose birth place happened to be within the country. Similarly the place of enumeration was classified separately by rural and urban areas. This gave the indication of rural/urban migration based on the place of birth. The same;. pattero bas been followed during 1971 Census.
There are two appendices v~, O-I Appendix I and D-I Appendix II which provide information on tbe inter-district migration. While Appendix I gives data regarding in-migration of persons born in the districts of the State otber than the district of enumeration, Appendix II furnishes details of out-migration of persons born in the district Qf enumeration. Both the appendices are new additions and meant for presentation in the the District Census Handbooks only.
Table D-VI (rural) is a new table for 1971 Census and provides information on migrants based on the place of last residence, by age-groups, marital status, duration of residence and sex.
171
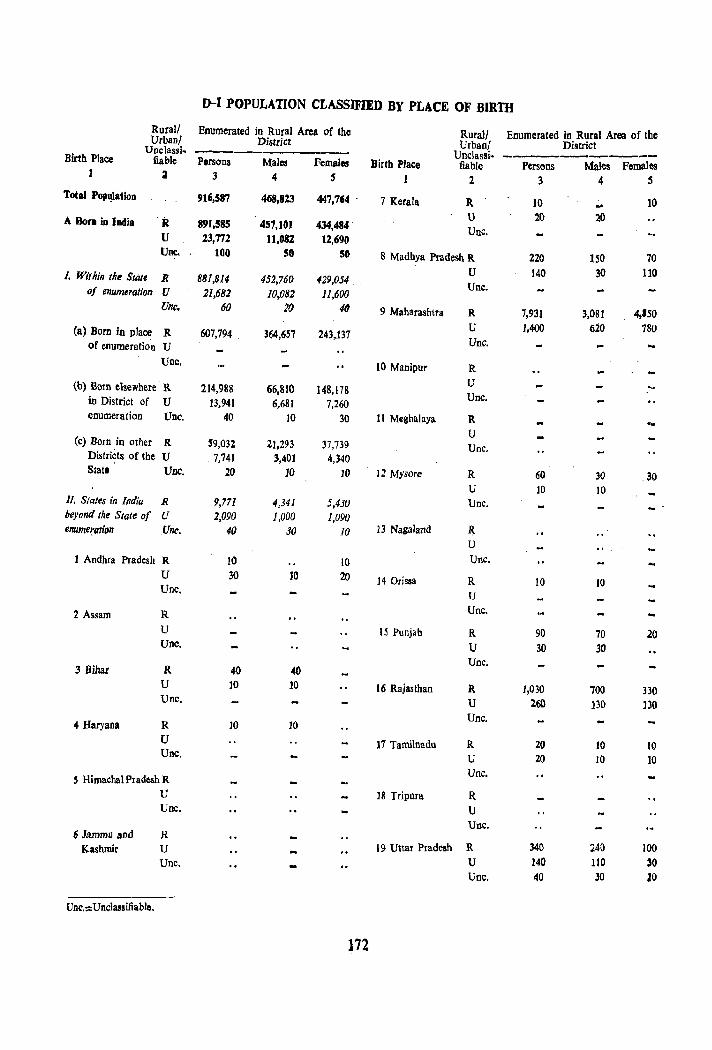
D-J POPULA'IION CLASSIFIED BY PLACE OF BIRTH
Rural/ Enumerated in Rural Area of the Rural! Enumerated in Rural Area of the UrbanI District UrbanI District Unclassi. UncJassi. --------.-----Birth Place tiable Persons Males Females Birth Place fiab!e Persons Males Females 1 2 3 4 5 I 2 3 4 5
Total Pop~atioD 916,587 468,823 447,"4 . 7 Kerala R 10 10 U 20 20 A 801'11 iD Jodia R 891,585 457,]01 434,484 . Unc. U 23,772 11,082 12,690
Une. 100 SO 50 8 Madhya PradeshR 220 ]50 70 U 140 30 110 I. Within the StaU R 881,814 452,760 <129,054 Unc. oj enumeration U 21,682 10,082 ll,600
Une. 60 20 4ft 9 Maharashtra R 7,931 3,081 4,'50 U 1,400 fi20 780 (a) Born in place R 607,794 364,657 243.137 Unc. of enumeration U
Unc. 10 Manipur R U (b) Born elsewhere R 214,988 66,810 148,178 Unc. in District of U 13,941 6,681 7,260
enumeration Unc. 40 10 30 11 Meghalaya R . .. U
(c) Born in other R ~9,03Z 21.293 37,739 Unc. Districts of the U . 7,741 3,401 4,340 Stal' Unc. 20 10 10 12 Mysore R 60 30 30
U 10 10 II. States in India R 9,771 4,341 5,430 Unc. beyond the Stote of U 2,090 1,000 1,090 enumeration .one. 40 30 10 13 Naga1and ~
U J Andhra Pradesh R 10 10 Unc.
U 30 JO 20 14 Orissa R 10 10 Vnc.
U
2 Assam R Unc.
U 15 Punjab R 90 70 20 Unc. U 30 30
3 Bihar R 40 40 Unc.
V 10 10 16 Rajasthan R 1,030 700 330 Vnc. U 260 130 no
4 Hatyana R 10 10 Unc.
U 17 Tamilnadu R 20 10 10 Vnc. U 20 10 10
S Himachal Pradesh R Unc.
V 18 Tripura R Voc. U
Unc. 6 Jammu and R
Kashmir V 19 Uttar Pradesh R 340 240 100 Vnc. U J40 110 30
Unc. 40 30 10
Unc.:::Uoclassifiable.
172
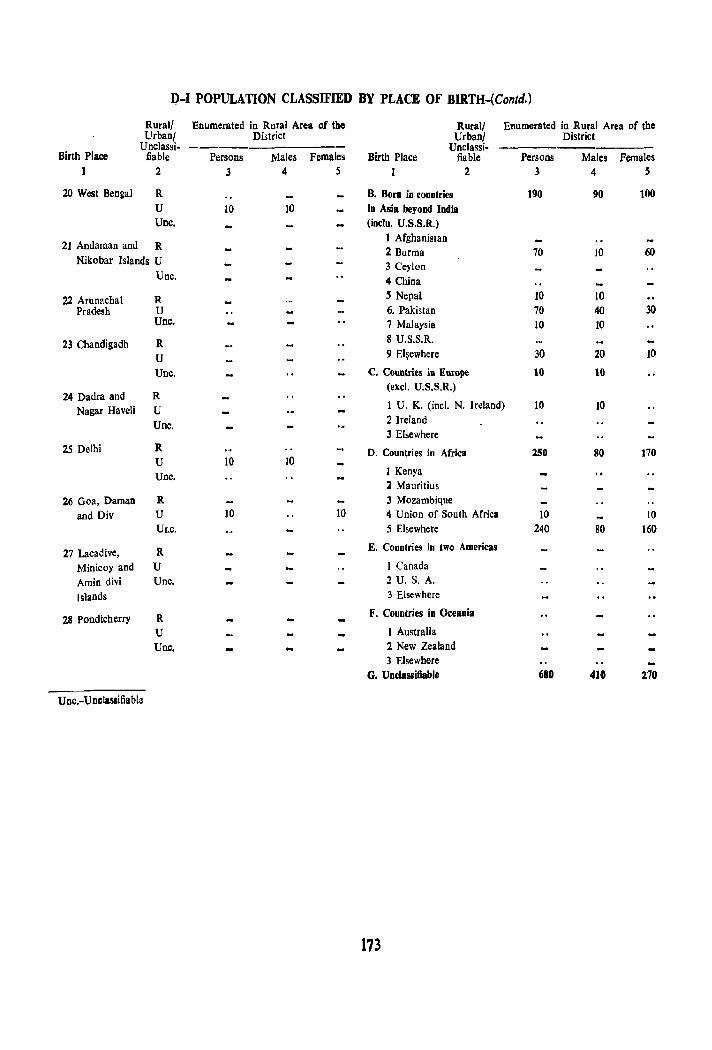
D-I POPULATION CLASSIFIED BY PLACE OF BIRTH-(Contd.)
Rural! Enumerated in Rural Area of the Rural/ Enumerated in Rural Area of the Urban! District UrbanI District
Unclassi- UncJassi-Birth Place fiable Persons Males Females Birth Place fiable Persons Males Females
1 2 3 4 5 J 2 3 4 S
20 West Bengal R B. Born in countries 190 90 100 U 10 10 in Asia beyond India Uoc. (indu. U.S.S.R.)
21 Andaman and R 1 Afghanistan 2 Burma 70 10 60
Nikobar Islands U 3 Ceylon Unc. 4 China
22 Arunachal R S Nepal ]0 10 Pradesh U 6. Pakistan 70 40 30
Unc. 7 Malaysia 10 10
23 Chandigadh R 8 U.S.S.R.
U 9 EI~ewhere 30 20 ]0
Unc. C. Countries in Europe HI 10
24 Dadra and R (excl. U.S.S.R.)
Nagar Haveli U 1 U. K. (incl. N. Ireland) 10 ]0
Unc. 2 Ireland 3 Elsewhere
25 Delhi R D. Countries in Africa 150 80 170 U 10 10 Unc. I Kenya
:z Mauritius 26 Goa, Daman R 3 Mozambique
and Div U 10 10 4 Union of South Africa 10 10 ULC. 5 Elsewhere 240 80 160
27 Lacadive, R E. Countries in two Americas
Minicoyand U I Canada
Amin divi Unc. 2 U. S. A.
Islands 3 Elsewhere
28 Pondicherry R F. Countries in Oceania
U 1 Australia
Unc. 2 New Zealand 3 Elsewhere
G. Un~laSlifiable 610 410 270
Unc.-Unclassifiable
173

D-I POPULATION CLASSIFIEJ) BY PLACE OF BIRTH
APPENDIX-I
Persons borD in other districts of the State and enumerated iu this district
Enumerated in the district Enumerated in tM district Rural/ ----- Rurall UrbanI Rural UrbanI Rural
District of Unclassi· ---- District of Unclassi· ---------birth fiable Males Females birth tiable Males Females
1 2 3 4 1 2 3 4
Total Mahesana
Rural 21,293 37,739 Rural 110 70
Urban 3,401 4,340 Urban 60 20
Unci assifiable 10 10 Unclassifiable
Jamnagar Gandhinagar Rural 140 40
Rural Urban 10
Urban 10 Unclassifiable Unclassifiable
Rajkot Ahmadabad Rural 40 20
Urban 20 10 Rural 220 290
Unclassifiable Urban 310 430
SUrendranagar Unclassifiable
Rural 130 ISO Kheda Urban 30 20 Rural 1,410 2,020 Unclassitiable Urban 370 300
lJhavnagar Unclassifiable
Rural 1,690 1,660 Panch Mahals Urban ]70 190
Rural 900 770 Unclassifiable
Urban 180 210 Amreli UnclassifiabJe 10
Rural 310 220 Urban 10 Vadodara Unclassifiable Rural 9,022 21,059
Junagadb Urban 1,171 1,640
Rural 10 10 Unclassifiable 10
Urban 40 30 Unclassifiable Sural
Rural 6,331 10,740 Kutch Urban 760 1,190
Rural 30 10 Unclassifiable Urban 50 40
Un classifiable Valsad !Janas Kantha Rural 760 600
Rural 30 Urban 200 180 Urban 20 20 Unc1assifiable Unclassifiable
Sabar Kantha Tile Dangs
Ruta 140 80 Rural 20
Urban 20 30 Urban
Unclassifiable Unclassifiable
174

D-l POPULATION CLASSlFJ~D l'Y PLACE OF BIRTH-(Concld.) RURAL
APPENDIX-II
Persons born in this district but eBumerated in otber districts of the State
Enumerated in
----------------~~-----.---------------------------Birth place Jamnagar Raikot Surendranagar Bhavnagar Amreli Junagadh .Rural/ District District District Di~trict Diltrict District Urbani -~----- ------- ----- ------- -----
Ul)classifiablc Mal'$ Females Males Females M!lles Females Males Females Males Females Males Females 1 2 3 4 5 (j 7 8 9 10 11 12 13
llural 40 20 10 10 50 530 10 10 Urban 10 10 30 30 10 30 100 50 30 Unclassifiable
Enumerated in --------------------------------'-.--------------
Birth place Kutch Banas Kantha Sabar Kantba Mah~aDa Gandhinagar Ahmadabad Rural! District District District District District District
Ur.!>an! ------- ----_-- ------ -------- --_--_ -----U nclassifia ble Males Females Males Females Males Females Males Females Males Females Males Females
1 14 )5 16 17 18 19 20 21 22 23 24 2S
Rural 20 20 10 50 520 340 50 160 20 80 310 480 Urban 10 20 SO 100 SO 70 50 90 170 270 U Dclassifiablc 10
Enumerated in ---------------------------------------------------Birtb place Kbeda Panch Mahals Vadodara Surat Valsad The Dangs
Rural! District District District District District District Urban! ----- ------ ------ ------ ----- -----_
Unclaslifiable Males F,males Males Females Males Females Males Females Males Females Males Females I 26 27 28 29 30 31 32 33 34 35 36 37
Rur"'l l,430 5,340 220 500 9,772 23,0'0 7,382 10,060 sao 410 60 30 Urban 560 J,200 40 200 1,2J] 2,530 670 780 150 180 10 Unclassifiable
175
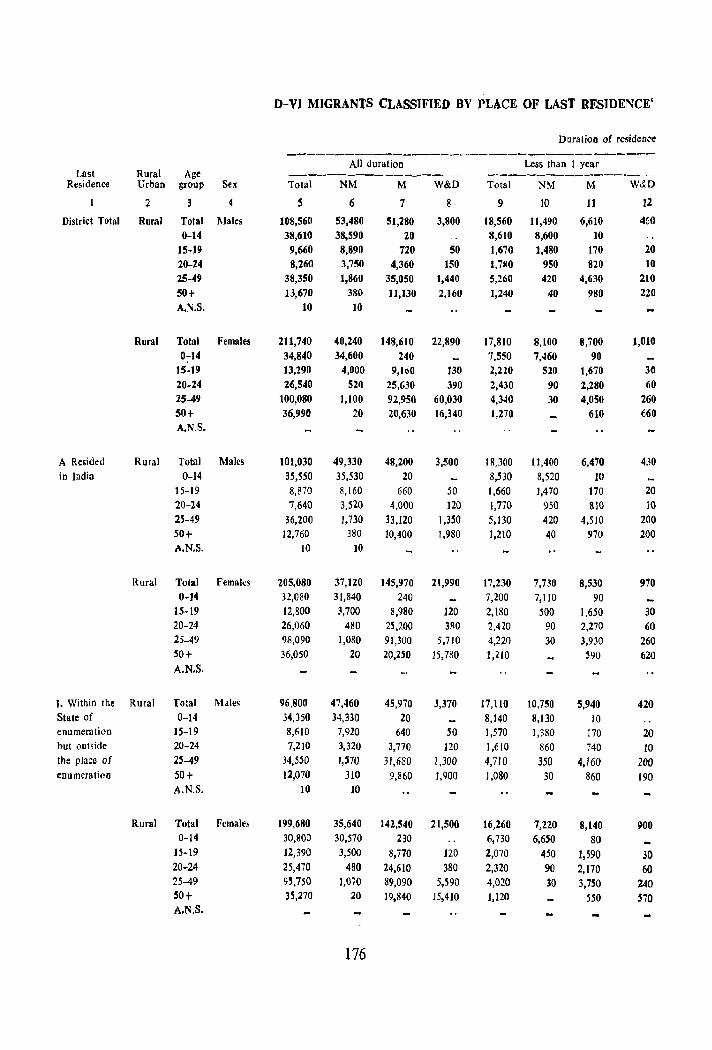
D-VI MIGRANTS CLASSIFIED BY PLACE OF LAST RESIDENCE'
Duration of residence
-------------------------------"'-----All duration Less than 1 year
Last Rural Age ------------------ ---_-------------Residence Urban group Sex Total NM M W&D Total ~M M W&D
2 5 6 7 8 9 10 11 12
District Total Rural Tolal Males 108,560 53,480 51,280 3,800 18,560 11,490 6,610 460 0-14 38,610 38,590 20 8,610 8,600 10
15-19 9,660 8,890 720 50 1,670 1,480 170 20 20-24 8,260 3,75() 4,360 150 1,7110 950 820 10 25-411 38,350 1,860 35,050 1,440 5,260 420 4,630 210
50+ 13,670 380 11,130 2,160 1,240 40 980 220 A.N.S. 10 10
Rural Total Females 211,740 40,240 148,610 22,890 17,810 8,100 8,700 1,010 0-14 34,840 34,600 240 7,550 7,460 90
15-19 13,290 4,000 9,160 )30 2,220 520 1,670 30 20-24 26,540 5ZQ 25,630 390 2,430 90 2,280 60 25-49 100,080 1,100 92,950 60,030 4,340 30 4,050 260 50+ 36,990 20 20,630 16,340 1,270 610 660 A.N.S.
A Resided Rural Total Males 101,030 49,330 48,200 3,500 18,300 11,400 6,4iO 430 in India 0-14 35,550 35,530 20 8,530 8,520 10
15-19 8,870 8,160 660 50 1,660 1,470 170 20 20-24 7,640 3,520 4,000 120 1,770 950 810 10 25-49 36,200 1,730 33,120 1,350 5,130 420 4,510 200 50+ 12,760 380 10,400 1,980 1,210 40 970 200 A.N.S. 10 10
Rural Total Females 205,080 37,1Z0 145,970 21,990 17,230 7,730 8,530 970 0-1" 32,080 31,840 240 7,200 7,110 90
15-19 12,800 3,700 8,980 120 2,180 500 1,650 30 20-24 26,060 480 25,200 380 2,420 90 2,270 60 25-49 98,090 1,080 91,300 5,710 4,220 30 3,930 260 50+ 36,050 20 20,2S0 15,780 1,210 ~90 62Q A.N.S.
t. Within the Rural Total Males 96,800 47,460 45,970 3,370 17,110 10,750 5,940 420 State of 0-14 34,350 34,330 20 8,140 8,130 10 enumeration 15-19 8,610 7,920 640 50 1,570 1,380 170 20 but outside 20-24 7,210 3,320 3,770 120 1,610 860 740 10 the place of 25-49 34,550 I, SID 31,680 J ,300 4,710 350 4,160 200 enumeration 50+ 12,070 310 9,860 1,900 1,080 30 860 190
A.N.S. 10 10
Rural Total Females 199,680 35,640 14:'.,540 21,500 16,:'.60 7,220 8,140 900 0-14 30,800 30,570 230 6,730 6,650 80
15-19 12,390 3,500 8,770 120 2,070 450 ],590 30 20-24 25,470 480 24,610 380 2,320 90 2,170 60 25-49 95,750 I,OiO 89,090 5,590 4,020 30 3,750 240 SOt 35,270 20 19,840 15,410 1,120 550 570 A.N.S.
176
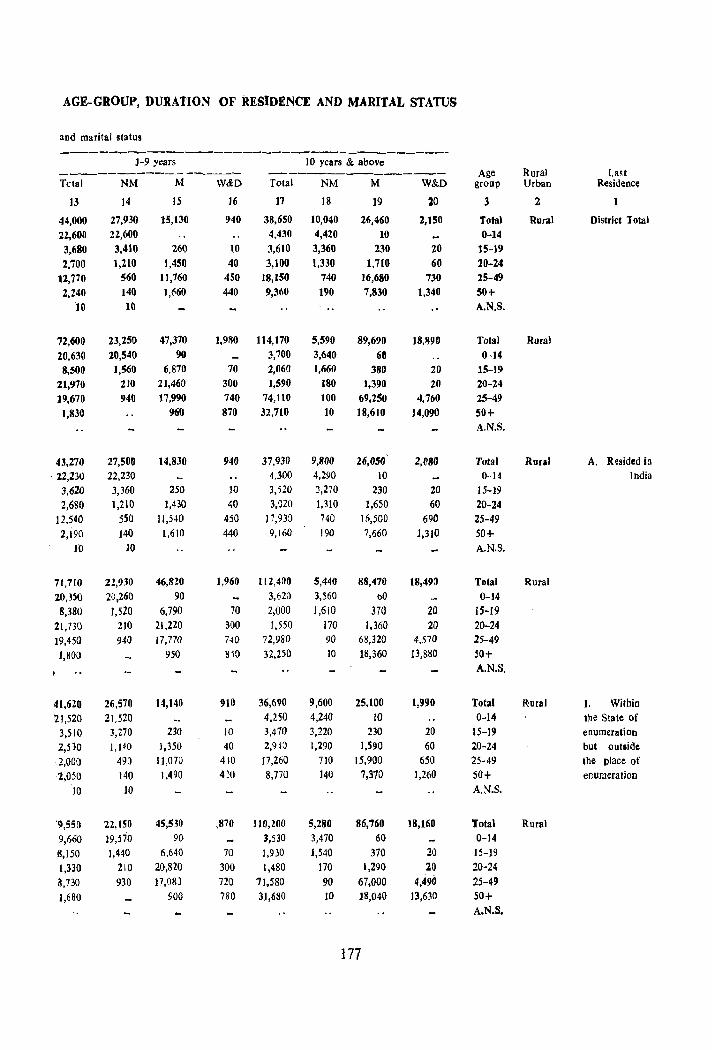
AGE-GROUP, DURATION OF RESIDENCE AND MARITAL STATUS
and marital status
------------_--------_--_-------------_. --1-9 years 10 years & above
------------------- ------------------- Age Rural last Tctal NM M W&D Total NM M W&D group Urban Residence
]3 14 15 16 17 18 ]9 20 3 2
44,000 27,930 15,130 940 38,650 10,040 26,460 2,150 Tota) Rural District Total 22,600 22,600 4,430 4,420 10 0-14 3.680 3,410 260 \0 :\,610 3,360 230 20 15-19 2,700 1,2l0 1,450 40 3,100 1,330 1,710 60 20-24
12,770 560 11,760 450 J8,150 740 16,680 730 25-49 2,240 140 J,660 440 9,360 190 7,830 1,340 50+
10 10 " A.N.S.
72,600 23,250 47,370 ],980 114,170 5,590 89,690 18,1190 Total Rural
20,630 20,540 90 3,'100 3,640 60 0-14 8,500 1,560 6,870 70 2,060 1,660 3Sl} 20 15-19
21,970 210 21,460 300 ],590 ISO 1,390 20 20-24 19,670 940 17,990 740 74,110 100 69,250 4,760 25-49 1,830 960 870 32,710 10 18,610 14,090 50+
A.N.S.
43,270 27,500 14,830 940 37,930 9,800 26,050 2,1180 Total Rural A. Resided ia . 22,230 22,230 4,300 4,290 10 0-14 India
3,620 3,360 250 10 3,520 3,270 230 20 15-19 2,680 1,210 1,430 40 3,020 1.310 1,650 60 20-24
12,540 550 11,540 450 17,93:) 740 J6,500 690 25-49 2,190 140 1,610 440 9,160 ! 90 7,660 1,310 50+
ro 10 A.N.S.
71.710 2!,930 46,8Z0 1,960 111,490 5,440 88,470 18,49:1 Total Rural
20,350 20,260 90 3,620 3,560 00 0-]4
8,380 1,520 6,790 70 2,000 1,610 370 20 15-19 21,730 210 21,220 300 1,550 170 1,360 20 20-24 ]9,450 94() 17,770 740 72,980 90 68,3Z0 4.570 25-49
],800 950 850 32,250 10 18,360 13,880 50+ A.N.S.
41,620 26,570 14,140 910 36,690 9,600 25,100 1,990 Total Rural I. Within 21,520 21,520 4,250 4,240 10 0-14 the State of
3,510 3,270 230 10 3,470 3,220 230 20 15-19 eDumeration 2,530 1,1 40 J,350 40 2,9~O 1,290 1,590 60 20-24 but out.ide
,2,000 49J 11,070 410 17,260 710 15,900 650 25-49 tbe place of
2,050 140 1,490 4~O 8,770 140 7,370 1,260 50+ enumeration
10 10 A.N.S.
'9,5S() 22,150 45,53(1 ,870 110,200 5,280 86,760 ]8,160 Total Rural 9,660 19,570 90 3,530 3,470 60 0-14 8,150 1,440 6,640 70 1,930 1,540 370 20 15-19
1,330 210 20,820 300 1,480 170 1,290 20 20-24
a,730 930 ]1,08) 720 71,580 90 67,000 4,490 25-49
1,680 900 780 31,680 10 18,040 J3,630 50+ A.N.S.
]77
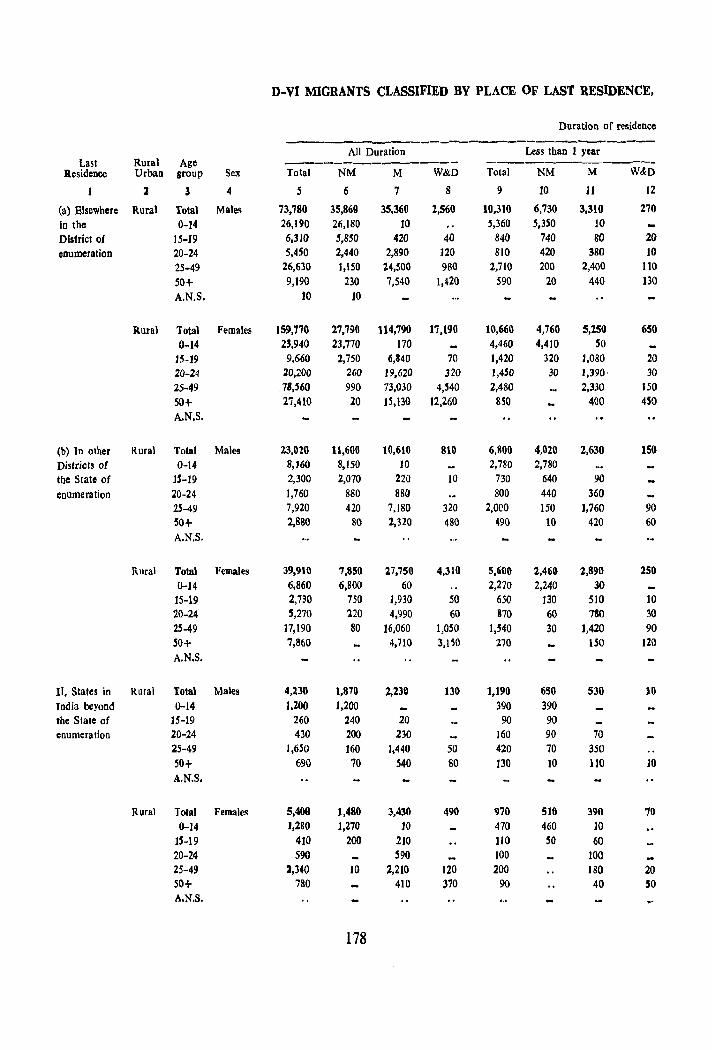
D-VI MIGRANTS CLASSIFIED BY PLACE OF LAST RESIDENCE,
Duration of residence
--------------------------All Duration Less than 1 year Last Rnral Age ---------------- -----------------_
Residence Urban group Sex Total NM M W&D Total NM M W&:D
2 3 4 5 6 7 8 9 10 11 12
(a) Elsewhere Rural Total Males 73,780 35,860 35,360 2,560 10,310 6,730 3,310 270
in the 0-14 26,190 26,180 10 S,360 5,350 10 District of 15-19 6,310 5,850 420 40 840 740 80 20
enumeration 20-24 5,4S0 2,440 2,890 120 810 420 380 10
25-49 26,630 1,150 24,500 980 2,710 200 2,400 110
50+ 9,190 230 7,540 1,420 590 20 440 130
A.N.S. 10 10
Rural Total Females 159,770 27,790 114,790 17,190 10,660 4,760 5,250 650
0-14 23,940 23,770 170 4,460 4,410 SO
15-19 9,660 2,750 6,840 70 1,420 320 1,080 20 20-24 20,200 260 19,620 320 1,4S0 30 1,390 30 25-49 .78,560 990 73,030 4,540 2,480 2,330 150
50+ 27,410 20 15,130 12,260 850 4()O 450 A.N.S.
(b) In other Rural Total Males 23,020 1l,600 10,610 810 6,800 4,020 2,630 156 Districts of 0-14 8,'60 8,150 10 2,780 2,780 tbe State of 1$-19 2,300 2,070 220 10 730 640 90 enumeration 20-24 1,760 880 880 800 440 360
25-49 7,920 420 7,180 320 2,OeO 150 1,760 90 50+ 2,880 80 2,320 480 490 10 420 60 A.N.S.
Rural Total Females 39,910 7,850 27,750 4,310 5,600 2,460 2,890 250 0-14 6,860 6,800 60 2,270 2,240 30 15-19 2,730 750 1,930 50 650 130 510 10 20-24 5,270 220 4,990 60 170 60 710 30 25-49 17,190 80 16,060 1,0SO 1,540 30 J,420 90 SO+ 7,860 4,710 3.150 270 ISO 120 A.N.S.
II. States in Rural Total Males 4,230 1,870 2,230 130 1,190 650 530 10 India beyond 0-14 1,200 1,200 390 390 the State of 15-19 260 240 20 90 90 enumeration 20-24 430 200 230 160 90 70
25-49 1,650 160 1,440 50 420 70 350 50+ 690 70 540 80 130 10 110 10 A.N.S.
Rural Total Females 5,409 1,480 3,430 490 970 516 390 70 0-14 1,280 J,270 JO 470 460 10
15-19 410 200 210 110 SO 60 20-24 590 590 100 100 25-49 2,340 10 2,210 120 200 180 20 50+ 780 410 370 90 40 50 A.N.S.
178
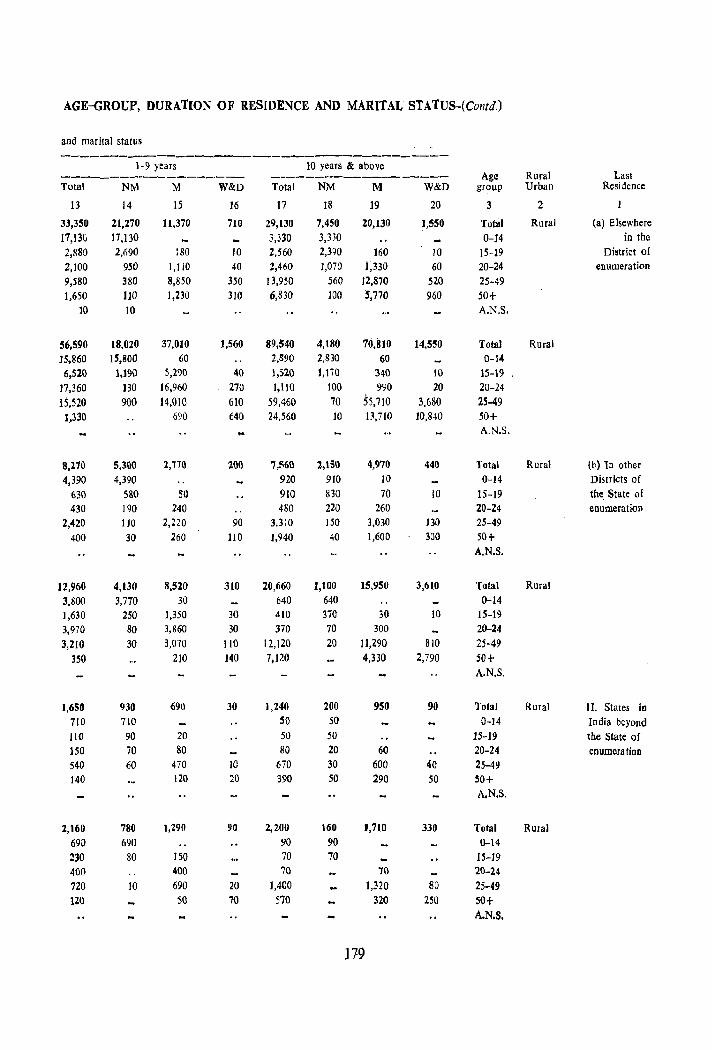
AGE-GROUP, DURATION OF RESIDENCE AND MARITAL STATUS-(Contd.)
and marital status
-----------------------------------------1-9 years ]0 years & above ----_----------_--- ----------------- Age Rural Last Total NM M W&D Total NM M W&D group Urban Residence
13 14 15 16 17 18 19 20 3 2
33,350 21,270 11,370 710 29,130 7,450 20,130 1,550 Total Rural (a) Elsewhere
17,13u 11,130 3,330 3,3JO 0-14 in the
2,880 2,MO 180 10 2,560 2,390 160 10 15-19 District of
2,100 950 1,llO 40 2,460 1,070 1)30 60 20-24 enumeration
9,580 380 8,850 350 13,950 560 12,870 520 25-49
1,650 110 1,230 310 6,830 100 5,770 960 50+ ]0 10 A.N.S.
56,590 18,020 37,010 1,560 89,540 4,180 70,i110 14,550 Total Rural 15,860 IS,800 60 2,S90 2,830 60 0-14 6,520 ],190 5,290 40 1,520 ],170 340 10 ]5-19 ,
17,360 130 16,960 270 ],110 100 990 20 20-24
15,520 900 14,010 610 59,460 70 55,710 3,680 25-49 1,330 690 640 24,560 10 13,710 10,840 50+
A.N.S.
8,170 5,300 2,710 200 7,!o'60 1,151) 4,970 440 Total Rural (b) In other
4,390 4,390 920 910 10 0-14 Dimicts of
630 580 SO 910 830 70 10 15-19 the. State of 430 190 240 480 220 260 20-24 enumeration
2,420 110 2,220 90 3,310 150 3,030 130 25-49
400 30 260 110 ),940 40 1,600 3:10 50+ A.N.S.
12,960 4,130 8,520 310 20,660 1,100 15,950 3,610 Total Rural
3,800 3,770 30 640 640 0-14
1,630 250 1,350 30 410 370 30 10 15-19
3,970 80 3,860 30 370 70 300 20-24
3,210 30 3,070 110 12,120 20 11,290 BIO 25-49
350 210 J40 7,J7.0 4,330 2,790 50+ A.N.S.
1,650 930 690 30 J,240 200 950 90 Total Rural II. States in 710 710 50 50 0-14 In dia beyond JlO 90 20 50 50 15-19 the State of 150 70 80 80 20 60 20-24 enumeration 540 60 470 IC 670 30 600 40 25-49 140 120 20 390 50 290 50 50+
A,N.S.
2,160 780 1,290 90 2,200 160 1,710 330 Total Rural 69\) 690 90 90 0-14 :m 80 150 70 70 15-19 400 400 70 '10 20-24
720 10 690 20 1,400 1,320 88 25-49 120 50 10 570 320 250 50+
A.N.S.
119
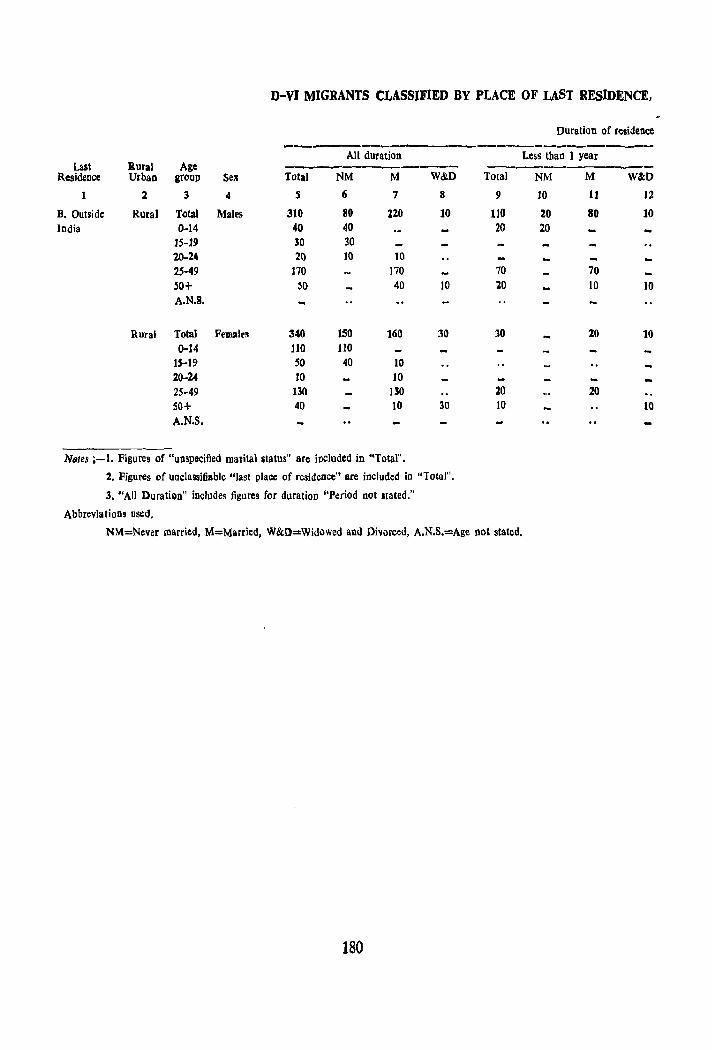
D-VI MIGRANTS CLASSIFIED BY PLACE OF LAST RESIDENCE,
Duration of residence
------All duration Less than 1 year
Last Ilural Age ---------- --------Residence Urbao group SeJl Total NM M W&D Total NM M W&D
2 3 4 S 6 7 8 9 10 IJ 12
B. Outside Rural Total Males 310 80 220 10 110 20 80 10 India 0-14 40 40 20 20
J5-J9 30 30 20-24 20 10 10 25-49 170 170 70 70 50+ SO 40 10 20 10 10 A.N.S.
Rural Total Femalrs 340 150 160 30 :10 20 10 0-14 no 110
15-19 50 40 10 rlO-24 JO 10 25-49 130 1.50 20 20 50+ 40 10 30 10 10 A.N.S.
Notes ;-1. Figures or "unspecified marital&tatus" are included in "rotal".
2. Figures of unclassifiable "Jast place of residence" are included in "Total".
3. "All Duration" includes figures for duration "Period not Jtated."
Abbreviations used.
NM=Never married, M=Married, W&Il=Widowed and Divorced, A.N.S.=Age not stated.
180
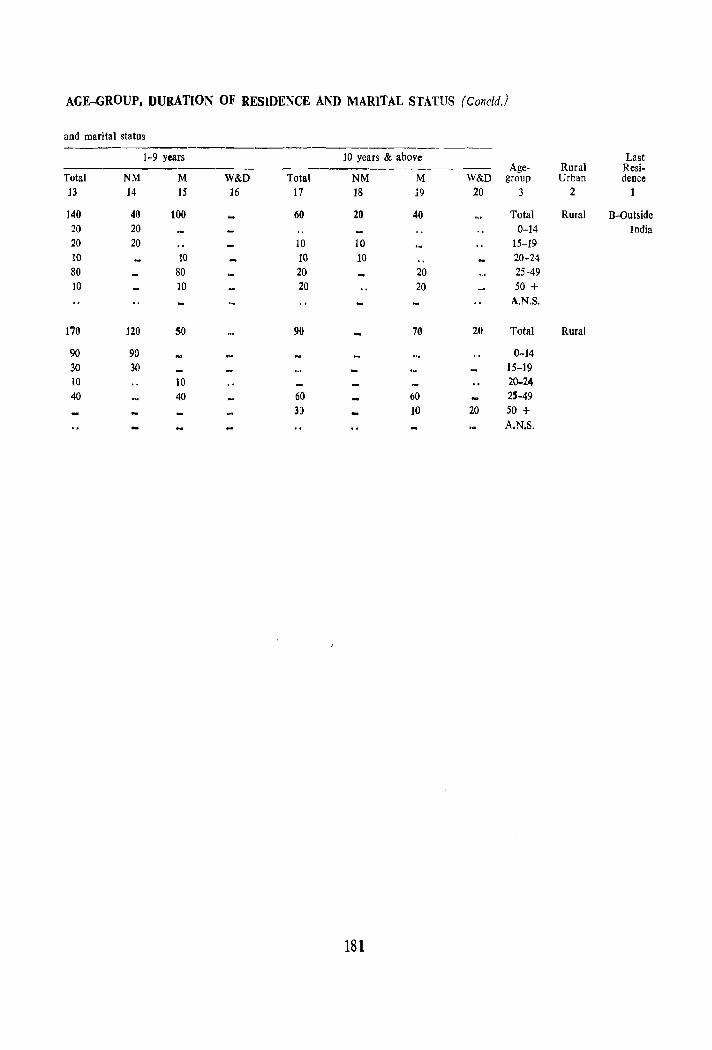
AGE-GROUP. DURATION OF RESiDENCE AND MARITAL STATUS (Concld.)
and marital status
1-9 years 10 years & above Last Age- Rural Resi-
Total NM M W&D Total NM M W&D group Urban dence 13 14 15 16 17 18 19 20 3 2 1
140 40 100 60 20 40 Total Rural B-outside 20 20 0-14 India 20 20 10 10 15-19 10 10 10 10 20-24 80 80 20 20 25-49 10 10 20 20 50 +
A.N.S.
170 120 SO 90 70 20 Total Rural
90 90 0-14 30 30 15-19 10 10 20-24 40 40 60 60 25-49
30 10 20 50 + A.N.S.
181

"-HOUSING TABLIS
The 1961 Housing Census was the first of its kind in the history of Indian Census. In 1961 Census a comprehensive house list for collecting detailed information regarding each census house, and industrial establishments formed part of the statutory census schedules. Detailed information on housing such as use, catego ry, tenure status, material of wall and roof, number of rooms in a census household and of persons residing therein, as well as data relating to establishments, workshops and factories was collected.
During 1971 also housing data on more or less similar lines has been collected and following tables have been compiled from the houselists taking a 20 per cent sample of Census Houses.
H-l Census houses and the uses to which they are put. H-II Distribution of Census houses by predominant material of wall and predominant material of
roof. Appendix-Distribution of Residential Census Houses by material of wall cross-classified by material of roof.
H-III Households classified by number of members and by number of rooms occupied. H-IV Households classified by size and tenure status.
The major difference in 1961 and 1971 tabulation is that while in 1961 tables were presented down to taluka level and towns with popUlation of 50.000 or more, during 1971 they have been presented upto district and city level only. The 1961 cities were taken as the base for tabulation of 1971 houseIisting data. Further 1971 housing tables sive estimates based on a 20 per cent sample as against the sample figures given in all tables of 'E' series except Table E-I in 1961 Census.
Table H-I gives estimates of Census Houses and tbe uses to which they are put. This table corresponds to Table E-l of 1961 witb a few changes.
Table H-II gives distribution of Census Houses by predominant material of wall and predominant material of roof, giving the structural condition of the houses according to the type of material used for wall and roof. This table corresponds to Table E-IV of 1961 with the difference that in 1971 this table is preparer! for census houses while in 1961 Census bouseholds living in census houses used wholly or partiy as dwellings were classified by material of wall and roof.
Table H-III gives distribution of households classified by number of members and by number of rooms occupied. The table will help in the measurement of congestion and overcrowding in households. This table corresponds to ta ble E-V of 1961 Census excepting that additional information for households with unspecified number of rooms and households with details unspecified are shown in 1971. Institutional households are not reckoned for the purpose of this table.
Table H-IV gives distribution of households classified by size and tenure status :and gives information on composition of households e. g. households having one person, two persons, etc., and by their tenure status i. e. whether living in owned or rented houses. The institutional households are excluded from this table.
This table is similar to Table E-II of 1961 Census. In 1961 Census, however, households living in cen.sus houses used wholly or partly as dwelling were classified by tenure status, whereas in 1971 Census bouseholds with number of members are cross-classified by tenure Status.
183
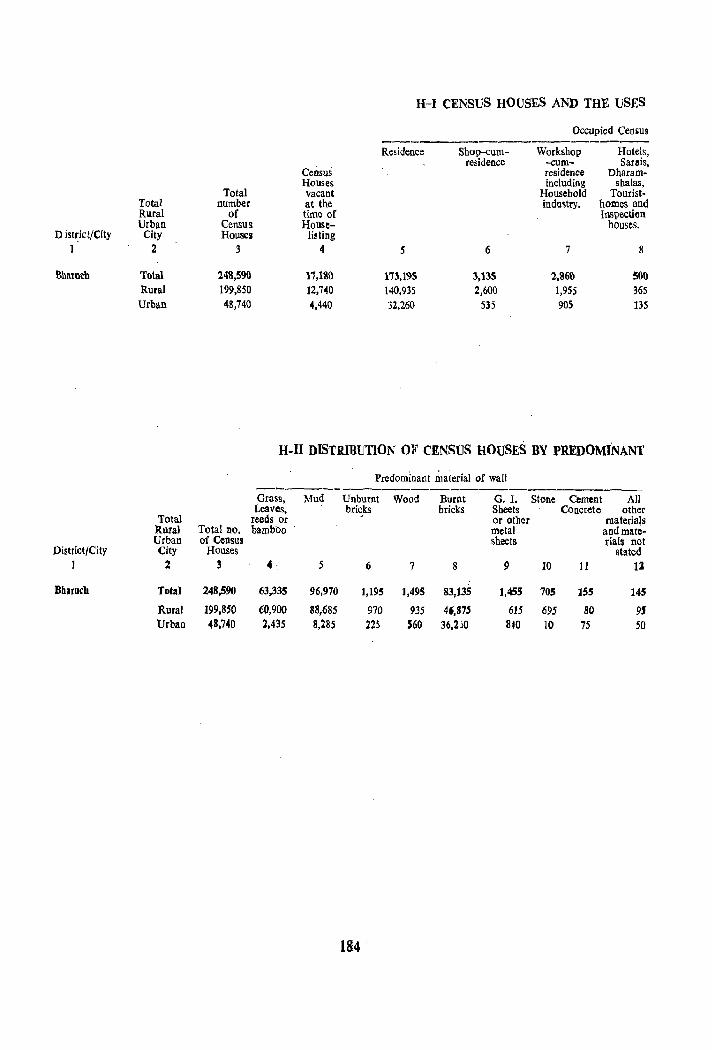
H-I CENSUS HOUSES AND THE USES
Occupied CemiUs ----------------------Residence Shop-cum- Workshop Hotels,
residence -cum- Sarais, Census residence Dharam-Houses including sbalas,
Total vacant Household Tourist-Total number at the industry. homes and Rural of time of Inspection Urban Census House- houses.
District/City City Houses listing 1 2 3 4 5 6 7 8
Bharueb Total 248,S90 17,130 17~,19S 3,135 2,360 500 Rural 199,850 12,740 140,935 2,600 1,955 365 Urban 4S,740 4,440 32,260 535 90S 135
H-ll DISTRIBUTION OF CENSUS HOUSES BY PREDOMINANT
Predominant ~aterial of wall -------Grass, Mud Unburnt Wood Burnt G.I. Stone Cement All Leaves, bricks bricks Sheets Concrete other
Total reeds or or other materials Rural Total no. bamboo metal and mate· Urban of Census sheets rials not
District{City City Houses stated 1 2 3 4, 5 6 7 8 9 JO 11 1l
Dharuch Tota] 248,590 63,335 96,970 1,195 1,495 83,135 1,455 705 155 145
Rural 199,850 60,900 88,685 970 935 46,875 615 695 80 9' Urban 48,740 2,435 8,285 m S50 36,2,)0 840 10 75 50
184

TO WHICH THEY ARE PUT
Houses used as -------------------------------------Shors Business Factories, Restaurants, Places of Place of Others exclu- houses Workshops Sweetmeat entertain worship ding and ofEces and shops and men! and (e. g. Temple,
eating Worksheds eating places community Church, houses gathering Mosque.
(Panchayat- Gurudwara Total ghar) exclu- etc. Rural ding places Urban of worship. City District/City
9 10 II 12 ]3 ]4 ]S 2 I
4,700 1,530 2,560 385 35 2,695 39,815 Total Bharuch
I,S50 965 1,100 120 10 2,060 35,150 Rural
2,850 565 1.460 265 25 635 4,665 Urban
MATERIAL OF WALL AND PREDOMINANT MATERIAL OF ROOF
Predominant material of roof ..... ---------------------_ ....... _-_ .... __,.--_.,.__-
Grass, Leaves, Tiles, Corrugated Asbestos Brick Stone Concrete All other mate-reeds, thatch, Slate, Iron, Zinc Cement and RBCf rials and mate-wood, mud, Shingle or other Sheets lime R.C.C. rials not stated. Total
unburnt bricks metal sheets. Rural or bamboo Urban
City Distric:t/City 13 14 15 16 17 18 19 20 2 1
26,190 128,550 81,685 4,955 450 1,255 5,310 195 Total Bharucb
21,680 110,940 59,980 3,965 275 340 2,565 105 Rural
4,510 17,610 21,705 990 175 915 2,745 90 Urban
185
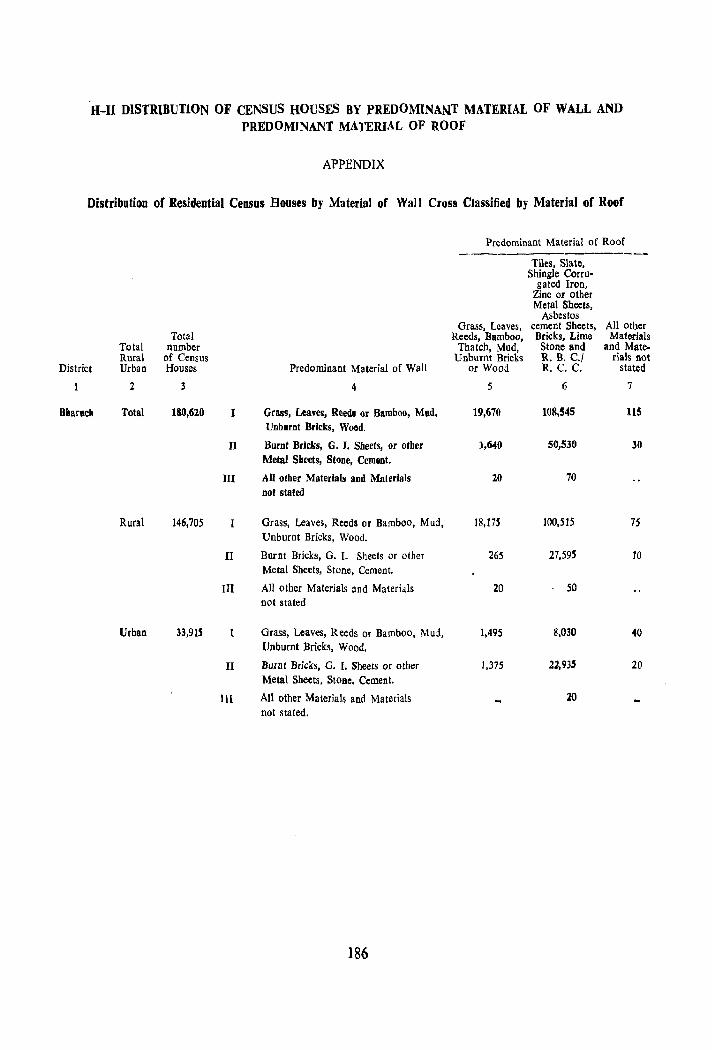
OR-II DISTRIBUTiON OF CENSUS HOUSES BY PREDOMINA~T MATERIAL OF WALL AND PREDOMINANT MATERIAL OF ROOF
APPENDIX
Distribution of Residential Census Bouses by Material of Wall Cross Classified by Material of Roof
Predominant Material of Roof --_--------------
Tiles, Slate, Shingle Corru-
gated Iron, Zinc or other Metal Sheets,
Asbestos Grass, Leaves, cement Sheets, All other
Total Reeds, Bamboo, Bricks, Lime Materials Total number Thatch, Mud, Stone and and Mate-Rural of Census Dnburnt Bricks R. B. C.! rials not
District Urban Houses Predominant Material of Wall or Wood R. C. C. stated
2 3 4 5 6 7
Bharucb Total 1&0,620 I Grass, Leaves, Reeds or Bamboo, Mud, 19,670 108,545 115 Unburnt Bricks, Wood.
II Burnt Bricks, G. I. Sheets, or other 1,640 50,530 30 Metal Sheets, Stone, Cement.
III All other Materials aDd Materials 20 70 not stated
Rural 146,705 Grass, Leaves, Reeds or Bamboo, Mud, 18,m IOO,SIS 7S Unbumt Bricks, Wood.
II Burnt Bricks, G. I. Sheets or other 265 27,595 10 Metal Sheets, Stone, Cement.
III All other Materials and Materials 20 50 not stated
Urban 33,915 Grass, Leaves, Reeds or Bamboo, Mud, 1.495 8,030 40 Unburnt Bricks, Wood.
II Burnt Bricks, G. I. Sheets or other 1,375 22,935 20 Metal Sheets. Stone. Cement.
III All other Materials and Materials 20 not stated.
186
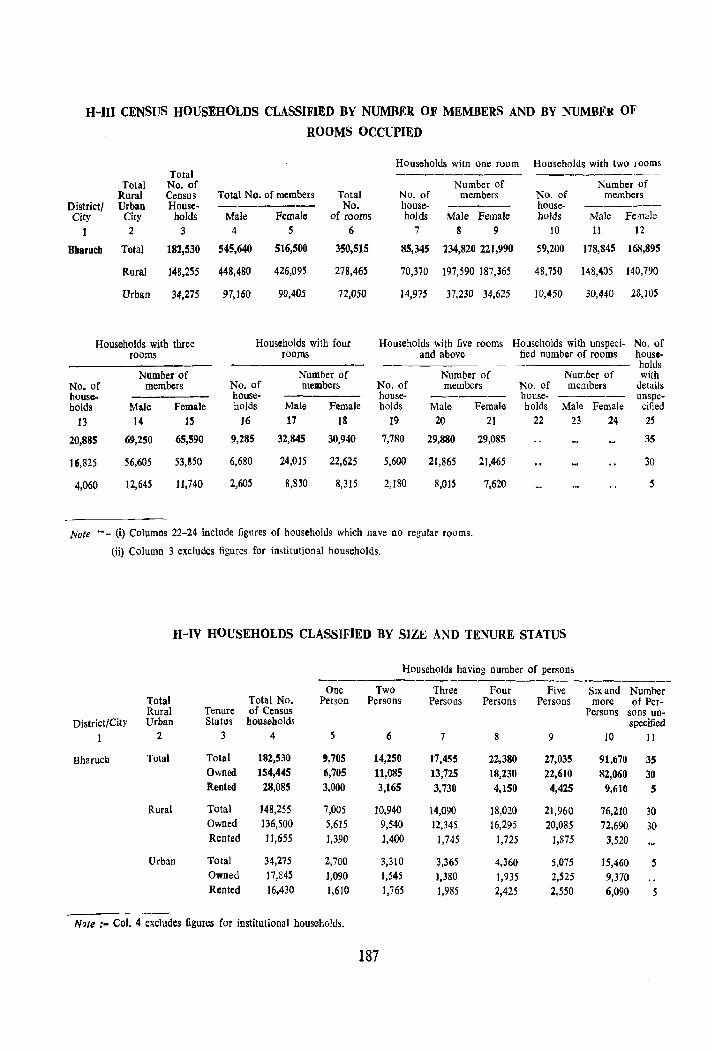
H-III CENSUS HOUSEHOLDS CLASSIFIED BY NUMBER OF MEMBERS AND BY NUMBER OF
ROOMS OCCUPIED
District/ City
1
Bharuch
Total Rural Urban
City 2
Total
Total No. of Census House-holds
3
182,530
Total No. of members
Male 4
545,640
Female 5
516,500
Total No.
of rooms 6
350,515
Rural 148,255 448,480 426,095
90,405
278,465
72,050 Urban 34,275 97,160
Households with three rooms
No. of households
13
20,885
16,825
4,060
Number of members
Male Female 14 15
69,250
56,605
12,645
65,590
53,350
11,740
Households with four rooms
No. of households
16
9,285
6,680
2,605
Number of members
Male Female 17 18
32,845 30,940
24,015 22,625
8,830 8,315
Households with one room Households with two rooms
No. of households
7
85,345
Number of members
Male Female 8 9
234,820 221,990
70,370 197,590 187,365
14,975 37,230 34,625
No. of households
10
59,200
Number of members
Male Female 11 J2
178,845 168,895
48,750 148,405 140,790
10,450 30,440 28, lOS
Households with five rooms Households with unspeci- No. of households with
No. of households
19
7,780
5,600
2,180
and above fied number of rooms
Number of members
Male Female 20 21
29,880
21,865
8,015
29,085
21,465
7,620
No. of bouseholds
22
NUlLber of members
Male Female 23 24
details unspecified
25
35
30
5
Note ... - (i) Columns 22-24 include figures of households which have no regular rooms.
(ii) Column 3 excludes figures for institutional households.
H-IV HOUSEHOLDS CLASSIFIED BY SIZE AND TENURE STATUS
HousehOlds having number of persons -------------------------------
One Two Three Four Five Six and Number Total Total No. Person Persons Persoas Persons Persons more of Per-Rural Tenure of Census Persons sons un-
District/City Urban Status households specified 1 2 3 4 S 6 7 8 9 10 11
Bharuch Total Total 182,530 ',705 14,250 17,455 22,380 27,035 91,670 35 Owned 154,445 6,705 11,085 13,725 18,230 22,610 82,060 30 Rented 28,085 3,000 3.165 3,730 4,150 4,425 9,610 5
Rural Total 148,255 7,005 10,940 14,090 18,020 21,960 76,210 30 Owned 136,500 5,615 9,540 12,345 16,295 20,085 72,690 30 Rented 11,655 1,390 1,400 1,745 1,725 1,875 3,520
Urban Total 34,275 2,700 3,310 3,365 4,360 5,075 15,460 S Owned 17,E4S 1,090 1,545 1,380 1,935 2,S25 9,370 Rented 16,430 1,610 1,765 1,985 2,425 2,550 6,090 5
N'Jte :- Col. 4 excludes figures for institutional households.
187


ERRATA DISTRlcr : BHARUCH
Part X-C-II
Page Particular;; of Col. For Read No. Entry No.
1 2 3 4 5
4 4
5
]0
11
13
16
17
18 II 18 18
18
20
22
24
30
31
31
33
34 34 35
36
37
38
42
45
I ANALYTICAL REPORT Part B-frimary Census Abstract
Line 11 . . Ons, Para 2 line 17 aerations
Census Tables
lions. Operations.
Para 5 line 2 B-IV Parts B-VI Parts A (i) and A (ii) A (i) and
A (ii) Physiography
Line 9 Canstituted Minerals
Line 10 tullers Parliamentary constituency
Line I Valied Jails
Line 2 at Working of local bodies
Line 9 of the last para • • 4 89
Growth or decay of urban centres
Constitutea
fuller's
Valid
an
4.89
Line ] Dur ng During Line 4 mod Amod L~S ~j ~~ Line 11 alluv al Alluvial
Changes in the functional category of towns. Para 5 line l
Floods than then rtem! of Table E. 2 2 mate
Cropping pattern Item 4 of Table F.2 5 201
Sources of irrigation Line 4
Trade and Commerce 2 33 Heading of establi-Table F. 15 shment
Electricity and Power Line 4 apid
Roads para 2. line ]0 42 ]6
Joint stock companies para 2, last 1960-61 and line 1969-70
Education Para 3, line I Para 5, line 12 Heading of Table F.l9
Reforms Line II
Security of Tenancy
79 08 Proportien
Results 0
(8) Pragana
LiRe 8 Pass Security of share cropper
Line 18 Exceeds Statutory fixation of price~
Below Table F. 23 Para I line 1 Purchase
Urban Population Line 3 28 08
vale
2.01
2.33 establishments
rapid
42.16
during 1960-61 and 1969-70
79.08 Percentage
Results of
(8) Pargana
Passes
Excess
Purchases
28,08
Page Particulars of Col. For No. Entry No.
1 2 3 4
46
SO
50
51
52
53
53 54
55
S5
62 62
63
63 63
65
6S
67 68
69 71
76
77
77
77
78
Growth of Population Line 13 Populations
Mother tongue Para below Table G. 13 line 6 2i;45
Religion Para below Table G. 14 line 2 16 16
Workers and Non-workers Table G. 16 (Rural) 3 36,86
Sector of Economy Table G. 18-Heading (Total Area) Line 6 in para appearing above Table G. 19 economic
workers by Age-group Line 9 48 05
Table G. 22 Heading Sector
Scheduled castes Table G. 24 Sr. No.3 Mekana Para below Table G.24 line 2 58 14 Establishments Table G. 37 One workers Para below Table G. 37 line 3 establiment
Census houses by use Para 1 below Table G. 38line I member
Wall and roof material line 9 bambo line] I or
Tenure status Para below Table G. 46 line 8 household line 9 rent
Rural areas Para 11, line ]2 show Para 14 line 7 ent narest
Urban areas Para 4. line 8 oent Table H. I-Valia 2 200-500
Table H-J-Jam-busar distance range 6-10 km. 7 28.33
Heading of col. 11 11 Teritary sector
Table H. 3 Bharuch distance range 21-50 km. 11 6.97
Table H. 3 Bharuch distance range 11-15 km. 13 18.29
Table H. 3 Valia distance range 51 or more km. 6 866
Read
5
Population
27.45
16.16
36.86
(Total Areas)
economy
48.05
Sectors
Malkana
58.14
One worker
establishments
number
bamboO of
households rented
shows the nearest
cent 201-500
38.33 Tertiary sector
6.87
11.21
966
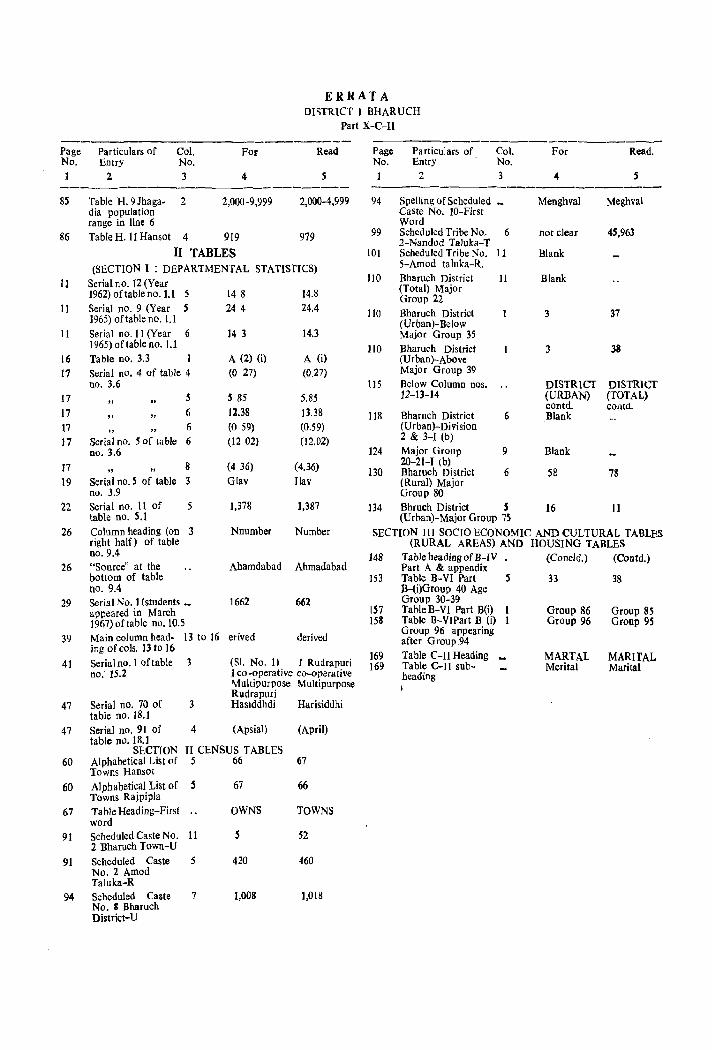
ERRATA DISTRICT I BHARUCH
Part X-C-II
-------------------------------Page Particulars of Col. For Read Page Particulars of Col. For Read. No. Entry No. No. Entry No. ] 2 3 4 5 ] 2 3 4 5
----------------------------85 Table H. 9 Jhaga- 2 2,000 -9,999 2,000-4,999 94 Spelling of Scheduled _ Menghval Meghval
dia population Caste No. 10-First range in line 6 Word
86 Table H. 11 Hansot 4 919 979 99 Scheduled Tribe No. 6 not clear 45,963 2-Nandod Taluka-T
II TABLES 101 Scheduled Tribe No. 11 Blank (SECTION I : DEPARTMENTAL STATISTICS) 5-Amod taluka-R.
1] Serial no. 12 (Year 110 Bharuch District 11 Blank (Total) Major 1962) of table no. 1.1 5 14 8 14.8 Group 22
11 Serial nO. 9 (Year 5 244 24.4 110 Bharuch District 3 37 1965) of table no. 1.1 (Urban)-Below 11 Serial nO. 11 (Year 6 ]4 3 14.3 Major Group 35
1965) of table no. I.l 110 Bharuch District 3 38 16 Table no. 3.3 A (2) (i) A (i) (Urban)-Above 17 Serial nO. 4 of table 4 (0 27) (0.27) Major Group 39
no. 3.6 lIS Below Column nos. .. DISTRICT DISTRIL'T 17 S S 85 5.85 12-13-14 (URBAN) (TOTAL)
17 6 12.38 13.38 contd. couto.
" 118 Bharuch District 6 Blank 17 6 (0 59) (0.59) (Urban)-Division
17 Serial nO. 5 of table 6 (12 02) (12.02) 2 & 3-1 (b)
no. 3.6 ]24 Major Group 9 Blank
17 8 (4 36) (4.36) 20-21-1 (b) " " 130 Bharuch District 6 58 78
19 Serial no. S of table 3 Glav Ilav (Rural) Major no. 3.9 Group 80
22 Serial no. 11 of 5 1,378 ],387 134 Bhruch District 5 16 11 table nO. 5.1 (Urban)-Major Group 7S
26 Column heading (on 3 Nnumber Number SECTION III SOCIO ECONOMIC AND CULTURAL TABLES right half) of table (RURAL AREAS) AND HOUSING TABLES no. 9.4 148 Table heading of B-IV (Coneld.) (Contd.)
26 "Source" at the Ahamdabad Ahmadabad Part A & appendix bottom of table 153 Table B-VI Part 5 33 38 no. 9.4 B-O)Group 40 Age
29 Serial No. I (students _ 1662 662 Group 30-39 appeared in March 157 Table B-VI Part B(i) Group 86 Group 85 1967) of table no. 10.5 158 Table B-VIPart B (i) Group 96 Group 95
39 Main column head- 13 to 16 erived derived Group 96 appearing after Group .94
ir.g of cols. 13 to 16 169 Table C-II Heading MARTAL MARIrAL Serial no. I of table (SI. No. Il J Rudrapuri -41 169 Table C-II sub- Merital Marital
no. 15.2 J co-operative co-operative heading Multipurpose Multipurpose ) Rudrapuri
47 Serial no. 70 of 3 Hasiddhdi Harisiddhi table no. 18.]
47 Serial no. 91 of 4 (Apsial) (April) table no. 18.1
SECTION II CENSUS TABLES 60 Alphabetical List of 5 66 67
Towns Ransot
60 Alphabetical List of S 67 66 Towns Rajpipla
67 Table Heading-First .. OWNS TOWNS word
91 Scheduled Caste No. II S 52 2 Bharuch Town-U
91 Scheduled Caste 5 420 460 No.2 Amod Taluka-R
94 Scheduled Caste 7 1,008 1,018 No. 8 Bharuch District-U
Copyright © 2022 FDOKUMEN