Microbial characteristics of methanogenic sludge consortia developed in thermophilic U ASB reactors

APPLIED AND ENVIRONMENTAL MICROBIOLOGY,0099-2240/99/$04.0010
Oct. 1999, p. 4618–4629 Vol. 65, No. 10
Copyright © 1999, American Society for Microbiology. All Rights Reserved.
Distribution of Sulfate-Reducing and Methanogenic Bacteria inAnaerobic Aggregates Determined by Microsensor
and Molecular AnalysesCECILIA M. SANTEGOEDS,1 LARS RIIS DAMGAARD,2 GIJS HESSELINK,3 JAKOB ZOPFI,1
PIET LENS,4 GERARD MUYZER,5 AND DIRK DE BEER1*
Max Planck Institute for Marine Microbiology, D-28359 Bremen, Germany1; Department of Microbial Ecology,Institute of Biology, DK-8000 Aarhus C, Denmark2; and Paques Bio Systems BV, 8560 AB Balk,3
Subdepartment of Environmental Technology, Wageningen Agricultural University,6700 EV Wageningen,4 and Netherlands Institute for Sea Research,
1790 AB Den Burg,5 The Netherlands
Received 26 March 1999/Accepted 16 June 1999
Using molecular techniques and microsensors for H2S and CH4, we studied the population structure of andthe activity distribution in anaerobic aggregates. The aggregates originated from three different types ofreactors: a methanogenic reactor, a methanogenic-sulfidogenic reactor, and a sulfidogenic reactor. Microsen-sor measurements in methanogenic-sulfidogenic aggregates revealed that the activity of sulfate-reducingbacteria (2 to 3 mmol of S22 m23 s21 or 2 3 1029 mmol s21 per aggregate) was located in a surface layer of50 to 100 mm thick. The sulfidogenic aggregates contained a wider sulfate-reducing zone (the first 200 to300 mm from the aggregate surface) with a higher activity (1 to 6 mmol of S22 m23 s21 or 7 3 1029 mol s21
per aggregate). The methanogenic aggregates did not show significant sulfate-reducing activity. Methanogenicactivity in the methanogenic-sulfidogenic aggregates (1 to 2 mmol of CH4 m23 s21 or 1029 mmol s21 peraggregate) and the methanogenic aggregates (2 to 4 mmol of CH4 m23 s21 or 5 3 1029 mmol s21 per aggregate)was located more inward, starting at ca. 100 mm from the aggregate surface. The methanogenic activity was notaffected by 10 mM sulfate during a 1-day incubation. The sulfidogenic and methanogenic activities wereindependent of the type of electron donor (acetate, propionate, ethanol, or H2), but the substrates weremetabolized in different zones. The localization of the populations corresponded to the microsensor data. Adistinct layered structure was found in the methanogenic-sulfidogenic aggregates, with sulfate-reducing bac-teria in the outer 50 to 100 mm, methanogens in the inner part, and Eubacteria spp. (partly syntrophic bacteria)filling the gap between sulfate-reducing and methanogenic bacteria. In methanogenic aggregates, few sulfate-reducing bacteria were detected, while methanogens were found in the core. In the sulfidogenic aggregates,sulfate-reducing bacteria were present in the outer 300 mm, and methanogens were distributed over the innerpart in clusters with syntrophic bacteria.
Methanogenic and sulfidogenic granular sludge consists ofwell-settling microbial aggregates that develop by the mutualattachment of bacterial cells in the absence of a carrier mate-rial (28). These aggregates contain a variety of bacterial speciesinvolved in the anaerobic degradation of organic matter, in-cluding hydrolytic, fermentative, acidogenic, acetogenic, homo-acetogenic, sulfate-reducing, and methanogenic bacteria. Theseaggregates develop spontaneously in wastewater treatment sys-tems of the upflow anaerobic sludge bed (UASB) reactor de-sign under a variety of operation conditions (28).
The formation, composition, and functioning of UASB gran-ules has been investigated by a variety of analytical techniques(60). To characterize the bacterial species present, varioustypes of activity tests, in combination with molecular, micro-bial, and physiological assays, have been applied to granularsludge samples, as well as to individual aggregates (60). Thespatial distribution of the bacterial species present withinUASB aggregates has been studied by using light, electron, andlaser-scanning microscopy on either intact or sectioned indi-vidual aggregates (31). Based on these observations, concep-
tual models have been postulated to describe the distributionof acidogens, syntrophic and methanogenic bacteria withinUASB aggregates (12, 14, 31). These models proposed a mul-tilayered structure with H2-consuming bacteria located at theoutside of the aggregate, methanogens located in the innerpart, and H2-producing bacteria located between the two lay-ers.
By the same analytical techniques, however, a homogeneousdistribution of the different populations present in UASB gran-ules was determined as well (13). The use of molecular tech-niques has been particularly useful for the identification andlocalization of the different microbial populations present inmethanogenic granular sludge. Slot-dot blot hybridization ofthe 16S rRNA extracted from granules allow to both identifyand quantify the methanogenic, syntrophic, and sulfate-reduc-ing populations (40, 42, 46). The application of fluorescent insitu hybridization (FISH) with specific probes for a bacterialspecies or population further allows their detection and local-ization within granular sludge (16, 52). By using the FISHtechnique, different layered population structures have beendetermined in different UASB aggregates cultivated on differ-ent substrates (15, 16, 52).
Although these investigations considerably improved ourunderstanding of the granular sludge composition and anat-omy, there is still a lack of knowledge about the distribution of
* Corresponding author. Mailing address: Max Planck Institute forMarine Microbiology, Celsiusstrasse 1, D-28359 Bremen, Germany.Phone: 49-421-2028836. Fax: 49-421-2028580. E-mail: [email protected].
4618
on March 14, 2016 by guest
http://aem.asm
.org/D
ownloaded from

microbial activities within granular sludge. Population distri-butions determined by molecular probes do not necessarilycorrespond to microbial activity distributions, since bacterialpopulations can have very low or unusual activities. Activitydistributions in anaerobic granular sludge are poorly docu-mented, since in situ activity measurements require specificanalytical tools, e.g., microsensors. The activity distribution offermentative and methanogenic populations in UASB aggre-gates has been measured with micrometer resolution by usingmicrosensors for pH and glucose (10, 26, 27). One study indi-cated an inhomogeneous activity distribution, with acetogenicand methanogenic activity being predominantly located in, re-spectively, the outer layer (150 to 200 mm) and the center ofthe aggregates (27).
The population dynamics between sulfate-reducing bacteria(SRB) and methanogenic bacteria (MB) are crucial in govern-ing the metabolic properties of granular sludge. Their dynam-ics were studied in detail by using molecular techniques (40, 42,46), but their in situ activity distributions have not yet beenreported. Recently, two novel microsensors, i.e., a CH4 bio-sensor (8) and a H2S microsensor (19), have been developed tostudy the microbial ecology of sediments. In the present study,both microsensors were used to determine the in situ methan-ogenic and sulfate-reducing activity in anaerobic aggregates.These localized activity measurements were combined withmolecular techniques to analyze on a microscale the structure,population (sulfate-reducing, methanogenic, and syntrophicbacteria) and activity distribution of three different types ofaggregates with different degrees of sulfate-reducing activity.
MATERIALS AND METHODS
Aggregates. Aggregates were retrieved from three different UASB reactors. (i)Methanogenic-sulfidogenic aggregates originate from a UASB reactor treatingwastewater from a potato-processing plant (Leusden, Belgium). These aggre-gates were subcultured for several months at 30°C by batchwise feeding twice aweek. The feed (pH 6 to 7) contained a volatile-fatty-acids (VFA) mixture (13.8mM acetate, 4.7 mM propionate, and 2.3 mM butyrate), supplemented with 20mM NaSO4, 4 mM NH4Cl, 0.32 mM NaHPO4, 0.2 mM MgCl2, and traceelements. (ii) Methanogenic aggregates were obtained from a UASB reactortreating paper mill wastewater (Eerbeek, The Netherlands). These aggregateswere subcultured for 3 months at 30°C by batchwise feeding three times a week.The feed (pH 7) contained a VFA mixture (6.25 mM acetate, 7.15 mM propi-onate, and 5.00 mM butyrate), supplemented with 5.2 mM (NH4)Cl, 10.2 mMNaH2PO4, 6.8 mM K2HPO4, 0.45 mM MgSO4 z 7H2O, 0.04 mM CaCl2, and traceelements. (iii) Sulfidogenic aggregates were sampled directly from a full-scaleUASB reactor treating ethanol (12 mM) and sulfate (7 mM) containing waste-water (pH 7 to 7.5, 30 to 35°C) at Emmen (The Netherlands). All types of ag-gregates had diameters that were between 1 and 2 mm. The methanogenic andmethanogenic-sulfidogenic aggregates were smooth and almost spherical, where-as the sulfidogenic aggregates had a rather loose structure and an irregular surface.
Microsensor measurements. For microsensor measurements, aggregates wereattached to insect needles (150 mm, Minutie; Entomologie Vermandel b.v.,Hulst, The Netherlands) in an incubation cell at 30°C. The medium in the cellwas kept anaerobic by continuous bubbling with N2 or argon, which resulted incirculation and mixing of the medium. The flow rate, judged from movement ofsuspended particles, was 1 to 3 mm/s. Anoxicity was checked with an oxygenmicrosensor (47). Before measurements, the aggregates were preincubated 1 dayin the measurement medium. The latter consisted of 5.2 mM (NH4)Cl, 10.2 mMNaH2PO4, 6.8 mM K2HPO4, 0.45 mM MgCl2, and 0.04 mM CaCl2, plus micro-nutrients, at pH 7.0 for the methanogenic-sulfidogenic and methanogenic aggre-gates. The measurement medium for the sulfidogenic aggregates contained 0.19mM (NH4)Cl and 10 mM KH2PO4 at pH 7.2. During the microsensor measure-ments, the media were supplemented with different concentrations of acetate,propionate, ethanol, H2, and sulfate. The phosphate buffer in the media ensureda constant pH in the aggregates, which was confirmed with pH microelectrodes(48).
Microsensors, mounted on micromanipulators, were positioned at the aggre-gate surface with the aid of a dissection microscope. Microprofiles were recordedby penetrating the aggregate with microsensors in steps of 50 or 100 mm.
Hydrogen sulfide microsensors. Sulfide concentration profiles were measuredwith H2S microsensors (19, 25) with a tip diameter of ca. 10 mm and a 90%response time of ,0.5 s. The microsensors were calibrated at 30°C in a dilutionseries as described previously (24). The concentration of total dissolved sulfide(H2S 1 HS2 1 S22) in the dilution series was determined by a spectrophoto-
metric method (6). Since the sensor was calibrated in medium of the same pH asthe measuring medium and the aggregate, no pH correction was necessary. Thesensor had a linear response to H2S concentrations of up to 1,000 mM. Thedetection limit of the microsensors was 1 to 3 mM total sulfide.
Methane microsensors. Methane microsensors were constructed and inocu-lated with the methane-oxidizing bacterium Methylosinus trichosporium (8). Mi-crosensor tip diameters were 25 to 30 mm, and 90% response times were 30 to100 s. Since all measurements were performed under anoxic conditions, anoxygen-scavenging guard capillary (9) was not applied. Calibrations were per-formed at 30°C, before and after measurements, as described previously (9).Interference from H2S, CO2, and H2 were tested by exposing the sensor tip toknown concentrations or mixing ratios of these compounds. The response to H2Swas 25% of the response to CH4. Corrections of the methane profile were madeby subtracting 25% of the corresponding H2S concentration, measured with theH2S microsensor. CO2 did not interfere. Some methane biosensors exhibitedsimilar responses to H2 and methane due to culture contamination. However, H2interference was insignificant since microsensor measurements in aggregatesshowed H2 concentrations to be less than 5 mM. Methane profiles were onlymeasured in methanogenic-sulfidogenic and methanogenic aggregates since nomethane biosensor was available for measurements with sulfidogenic aggregates.
Diffusivity microsensors. Microscale diffusivity sensors with a diameter ofapproximately 70 mm were used (49). Acetylene was used as the tracer substanceinstead of H2 (7) to avoid interference by the H2 metabolism in the aggregates.A two-point calibration in agar and glass beads (49) was performed before themeasurements were made. The spatial resolution of this sensor was estimated tobe ca. 300 mm, a value insufficient for detection of detailed spatial distribution ofdiffusivity. Therefore, the stable readings in the center of the aggregate weretaken to represent the entire aggregate.
Flux and activity calculations. Diffusive fluxes were calculated by using Fick’sfirst law:
Jn 5 2Deff
dCn
drn5 2Deff
Cn 1 1 2 Cn 2 1
rn 1 1 2 rn 2 1
where Jn is the flux at point n (mmol m22 s21), Deff is the effective diffusioncoefficient (m2 s21), dCn/drn is the concentration gradient at point n (mmol m23
m21), C is the substrate concentration (mmol m23), and r is the distance fromthe aggregate center. The molecular diffusion coefficient (Dw) for oxygen at 30°Cis 2.75 3 1029 m2 s21 (4). The Dw for methane and sulfide was determined bymultiplying the Dw of oxygen by 0.8495 and 0.7573, respectively (4), yieldingvalues of 2.34 3 1029 m2 s21 for methane and 2.08 3 1029 m2 s21 for sulfide.The Deff of these compounds within the aggregates was found by correcting Dwwith the ratio of the diffusivity in aggregates and in water, as determined with thediffusivity microsensor. The local activities of methanogenesis and sulfate reduc-tion were calculated by assuming spherical geometry, i.e., considering the aggre-gate buildup from concentric layers. The rates (Rn [mmol m23 s21]) in each layern were found by subtracting the fluxes into and out of the layer, divided by thevolume of the layer:
Rn 54prn 1 1
2 3 Jn 1 1 2 4prn 2 12 3 Jn 2 1
43prn 1 1
3 243prn 2 1
3
5
3 3 Srn 1 12 3 Jn 1 1 2 rn 2 1
2 3 Jn 2 1
rn 1 13 2 rn 2 1
3 DAggregate fixation and slicing. After microsensor analysis, the aggregates were
fixed for in situ hybridization by overnight incubation in paraformaldehyde (4%[wt/vol] in phosphate-buffered saline [PBS]) at 4°C and subsequently washed inPBS. Then they were embedded for ca. 12 h in OCT compound (Sakura FinetekUSA, Torrance, Calif.) and frozen at 220°C. The aggregates were sectioned witha cryomicrotome (Microm HM 505 E) at 218°C. The slices (10 mm thick) werecollected on gelatin-coated microscopic slides, air dried, and dehydrated in anethanol concentration series (50, 80, and 96% [vol/vol]).
Nucleic acid extraction and PCR amplification. DNA and RNA was extractedfrom the aggregates by a combined bead beating (2 min at maximum speed with0.75 to 1.0-mm glass beads), lysis (10 mg of lysosyme per ml for 1 h at 37°C, 1%[wt/vol] sodium dodecyl sulfate (SDS), and 0.25 mg of protinase K per ml for 30min at 55°C), and hot phenol-chloroform-isoamyl alcohol treatment (57). Theribosomal DNA (rDNA) was enzymatically amplified as described by Muyzer etal. (35) by using the eubacterial primer GM5F with GC-clamp and the universalprimer 907R (Table 1). The rRNA was amplified according to the method ofTeske et al. (57). A hot-start, touch-down PCR program was used for all ampli-fications to minimize nonspecific amplification (35).
DGGE analysis of 16S rDNA fragments. Denaturing gradient gel electro-phoresis (DGGE) was performed by using the D-Gene system (Bio-Rad) and thefollowing specifications: 13 TAE (40 mM Tris, 20 mM acetic acid, and 1 mMEDTA at pH 8.3), 1-mm thick gels, a denaturant gradient from 35 to 65%urea-formamide, a temperature of 60°C, and a constant voltage of 100 V for 17 h(35, 36). DGGE gels were photographed on a UV transillumination table (302nm) with a Polaroid camera. Photos were scanned and inversed.
VOL. 65, 1999 SULFATE-REDUCING AND METHANOGENIC BACTERIA 4619
on March 14, 2016 by guest
http://aem.asm
.org/D
ownloaded from

Blotting and hybridization analysis of DGGE gels. DGGE gels were blottedand hybridized with group-specific probes for SRB as described previously (50).The probes used (Table 1) were probe 660 (specific for Desulfobulbus species),687 (targeting Desulfovibrio species, as well as some members of the Geobacter,Desulfomonas, Desulfuromonas, Desulfomicrobium, Bilophila, and Pelobacter gen-era), and probe 804 (targeting Desulfobacter, Desulfobacterium, Desulfosarcina,Desulfococcus, and Desulfobotulus species) developed by Devereux et al. (11).
Excision and amplification of DGGE bands. DGGE bands were carefullyexcised on a UV transillumination table and transferred to a 1.5-ml tube with 500ml of water and approximately 500 ml of glass beads 0.75 to 1.0 mm in diameter.The acrylamide bands were disrupted by bead beating at maximum speed twicefor 1 min. The samples were left overnight at 4°C, and the DNA was subse-quently amplified by adding 1 to 10 ml of the samples’ supernatant to the PCRmixture. The PCR was then performed as described above. A second DGGE wasrun to confirm that the amplified bands had the same position in the gel as theexcised bands. Prior to sequencing, the PCR products were purified by using theQIAquick PCR purification kit (Qiagen, Inc.).
Sequencing and phylogenetic analysis. Amplified DGGE bands were se-quenced by using the Applied Biosystems PRISM Dye Terminator CycleSequencing Ready reaction kit supplied with AmpliTaq DNA polymerase. Thesequencing products were analyzed with the Applied Biosystems 377 DNA se-quencer. The partial sequences, which were 536 to 581 nucleotides long, wereadded to the 16S rRNA parsimony tree of the Technical University of Munich byusing the program package ARB (56).
FISH. The protocol described by Manz et al. (32) was used for FISH of theaggregate slices with probe ARC915 for Archaea bacteria (55); probe SRB385for the detection of general sulfate reducers of the delta subdivision; probes 221and 660 for group-specific SRB (Devereux et al. [11]); probes DSV698, DSD131,DSV407, DSV1292, DSV214, DSS658, DSB985, DSBO224, DSMA488, andDSR651 developed by Manz et al. (33); and probe NON338 as a negative control(Table 1). The probe MPOB described by Harmsen et al. (16) was used fordetection of syntrophic bacteria (Table 1).
The probes were synthesized and labeled with a hydrophilic sulfoindocyaninedye CY3 or CY5 by Interactiva GmbH (Ulm, Germany). The hybridizationbuffer contained 0.9 M NaCl, a percentage (vol/vol) of formamide as shown inTable 1, 20 mM Tris-HCl (pH 7.4), and 0.01% (wt/vol) SDS. The probe con-centrations were 5 ng/ml. Hybridization was performed for 1 to 2 h at 46°C. Theaggregate slices were washed at 48°C for 15 min in a washing buffer containing
20 mM Tris-HCl (pH 7.4), 0.01% (wt/vol) SDS, and a concentration of NaCl asmentioned in Table 1. The specimens were microscopically examined with aZeiss LSM 510 confocal laser scanning microscope (Carl Zeiss, Jena, Germany),equipped with two HeNe lasers (543 and 633 nm). The hybridizations shown inthe figures are representative for several independent hybridizations on severalaggregates.
Sulfur analysis. For sulfur (S0 and sulfanes in polysulfides) determination,three to five aggregates were put into a reaction tube and immediately fixed with20 ml of ZnCl2 (2%). During this treatment, polysulfides are converted to S0 andZnS. S0 was extracted by shaking the samples with pure methanol (high-pressureliquid chromatography [HPLC] grade) for 6 h. Identification, and quantificationof zerovalent sulfur was performed by HPLC by using a Sykam S1100 pump(Gilching, Germany), a Zorbax ODS column (125 by 4 mm, 5 mm; Knauer,Germany), and an Sykam S3000 UV detector (265 nm). A mixture of 0.25%acetic acid (pH 4) and 100% methanol (10/90 [vol/vol]) was used as eluent; theflow rate was 1.2 ml/min. Under these conditions S0 eluted as cyclo-octasulfur(S8) at 5.4 min. The precision for injection of a 100 mM S0-standard was 0.5% s.d.(n 5 8), the detection limit was about 1 mM. A second method was used toconfirm the identity of S0, based on the reaction of S0 with SO3
22: S0 1 SO322
3 S2O322 (22). A few aggregates were incubated with 1 ml of 5% Na2SO3
solution for 2 h at 90°C after fixation with ZnCl2, followed by extraction andanalysis as described above. The presence or absence (after the sulfite treatment)of S0 in the methanol extracts was also confirmed by UV spectroscopy.
RESULTS
Diffusivity measurements. Diffusivity microsensor measure-ments showed an approximately constant Dapp in the methan-ogenic-sulfidogenic aggregates of 50% of that in water. There-fore, the Dapp of methane and sulfide were assumed to be 50%of their Dw, i.e., 1.17 3 1029 m2 s21 for methane and 1.04 31029 m2 s21 for sulfide. These values were used to calculate thefluxes and activities in the aggregates from the microprofiles.
Endogeneous sulfide and methane microprofiles. In all me-thanogenic-sulfidogenic (Fig. 1A), methanogenic (Fig. 1B),
TABLE 1. Oligonucleotide probes used for PCR amplification and in situ hybridization analyses
Probe Positiona Sequence (59339) Target (reference) Formamide(%)b
NaCl(mM)c
GM5Fd 341–357 CCTACGGGAGGCAGCAG Bacteria (36) –e –e
907R 907–928 CCGTCAATTCCTTTGAGTTT All organisms (universal probe) (36) – –ARC915 915–934 GTGCTCCCCCGCCAATTCCT Archaea (55) 40EUB338 338–355 GCTGCCTCCCGTAGGAGT Bacteria (1) 20 225f
SRB385 338–355 CGGCGTCGCTGCGTCAGG SRB of the delta proteobacteria (2) plus several gram-positivebacteria (e.g., Clostridium) (45)
35 80f
DSV698 698–717 GTTCCTCCAGATATCTACGG Desulfovibrio (33) 35 88DSD131 131–148 CCCGATCGTCTGGGCAGG Desulfovibrio (33) 20 250DSV407 407–424 CCGAAGGCCTTCTTCCCT Desulfovibrio (33) 50 31.2DSV1292 1,292–1,309 CAATCCGGACTGGGACGC Desulfovibrio (33) 35 88DSV214 214–230 CATCCTCGGACGAATGC Desulfomicrobium (33) 10 500DSS658 658–678 TCCACTTCCCTCTCCCAT Desulfosarcina (33) 60 15.6DSB985 985–1,004 CACAGGATGTCAAACCCAG Desulfobacter (33) 20 250DSBO224 224–242 GGGACGCGGACTCATCCTC Desulfobotulus (33) 60 15.6DSMA488 488–507 GCCGGTGCTTCCTTTGGCGG Desulfomonile (33) 60 15.6DSR651 651–668 CCCCCTCCAGTACTCAAG Desulforhopalus (33) 35 88221 221–240 TGCGCGGACTCATCTTCAAA Desulfobacterium (11) 35 88660 660–679 GAATTCCACTTTCCCCTCTG Desulfobulbus (11) 60 15.6687 687–702 TACGGATTTCACTCCT Desulfovibrio (11) plus members of the genera Geobacter,
Desulfomonas, Desulfuromonas, Desulfomicrobium, Bilophila,and Pelobacter spp.
– –
804 804–821 CAACGTTTACTGCGTGGA Desulfobacterium spp., Desulfobacter, Desulfococcus, Desulfo-sarcina, and Desulfobotulus spp. (11)
– –
MPOB 222–240 ACGCAGGCCCATCCCCGAA Syntrophic propionate-oxidizing strains MPOB (Syntropho-bacter fumaroxidans) and KOPROP1 and Desulforhabdusamnigenus (although these last two strains have one mis-match with the probe) (16, 17)
20 900
NON338 338–355 ACTCCTACGGGAGGCAGC None (negative control) (32) 0 900
a Position in the 16S rRNA of E. coli (5).b Formamide concentration in hybridization buffer.c Sodium chloride concentration in washing buffer.d This primer has the following GC-clamp at the 59 end: 59-CGCCCGCCGCGCCCCGCGCCCGTCCCGCCGCCCCCGCCCG-39.e –, Probe not used for FISH.f Plus 5 mM EDTA in washing buffer.
4620 SANTEGOEDS ET AL. APPL. ENVIRON. MICROBIOL.
on March 14, 2016 by guest
http://aem.asm
.org/D
ownloaded from

and sulfidogenic (Fig. 2A) aggregates, endogenous sulfide pro-duction was measured in the absence of sulfate, even after onenight’s incubation in a sulfate- and electron donor-free me-dium. In addition, endogeneous methane production was ob-served in the methanogenic-sulfidogenic and methanogenic ag-gregates (Fig. 1). The addition of 10 mM sulfate significantlyincreased the sulfide production, without affecting the meth-ane production in the methanogenic-sulfidogenic aggregates(Fig. 1A). In the methanogenic aggregates, only a negligible
amount of sulfide (,6 mM) was measured which, like themethanogenic activity, was not affected by the presence orabsence of sulfate (Fig. 1B). All three types of aggregatescontained large amounts (up to 59 mol m23) of S0 (Table 2).
Microprofiles after addition of substrates. The productionof methane and sulfide were stimulated by volatile fatty acids(acetate, propionate, and/or butyrate), ethanol, or H2 (Fig. 2).The sulfidogenic sludge, fed only ethanol for more than 1 year,was also able to metabolize both H2 and acetate, since upon
FIG. 1. Sulfide and methane microsensor profiles (lines) and activity values (bars) in methanogenic-sulfidogenic (A) and methanogenic (B) aggregates in thepresence (h, open bars) or absence (■, closed bars) of sulfate. No external electron donor was supplied during the measurements. The aggregate surface is at distanceof 0 mm, the center of the aggregates is at a distance of ca. 0.9 mm.
TABLE 2. Characteristics and activities of the different aggregates used in this study
Bacterialtype
Growth conditions Activity valuesa
Sulfurconcn insideaggregates
(mM)bOriginalsubstrate
Subculturemedium
Sulfateconcn duringsubculturing
(mM)
Methane Sulfide
Production(mmol m23 s21)
Conversion/aggregate(mmol/s)
Production(mmol m23 s21)
Conversion/aggregate(mmol/s)
Sulfidogenic Ethanol NAc 7 ND ND 1–6 7 3 1029 ;28Methanogenic-
sulfidogenicPotato starch
wastewaterVFA mixtured 20 1–2 1 3 1029 2–3 2 3 1029 ;21
Methanogenic Papermillwastewater
VFA mixture 0.45 2–4 4.5 3 1029 0.02–0.06 8 3 10211 ;59
a Calculated from the microprofile measurements (conversion per aggregate values were calculated from integrated local values). ND, not determined.b Elemental sulfur and polysulfide.c NA, not applicable.d Low-chain VFA were the main electron donors present in the reactor liquid.
VOL. 65, 1999 SULFATE-REDUCING AND METHANOGENIC BACTERIA 4621
on March 14, 2016 by guest
http://aem.asm
.org/D
ownloaded from

their addition sulfide developed instantly (Fig. 2A). The sulfideproduction rates by H2 were comparable to that by ethanol.Figure 2A shows that these substrates were consumed in dis-tinctly different zones within the aggregate: sulfate reductionwas stimulated by H2 in the outer 200 mm depth and by ethanolat a depth of between 200 to 400 mm. Sulfidogenesis withacetate as the substrate was mainly located in the outer 200 mmof the aggregate. Acetate was metabolized with a specific sul-fidogenic activity half of that with ethanol as the substrate (Fig.2A).
Both acetate and propionate induced sulfidogenic activity inthe outer 100 to 150 mm of the methanogenic-sulfidogenicaggregates. These substrates also induced methanogenic activ-ity, which only started from 300 mm onwards inside the aggre-gate (Fig. 2B). Sulfate reduction was not affected when me-thanogenic-sulfidogenic aggregates were supplied with 1 mMnitrate (data not shown).
The addition of the VFA mixture to the methanogenic ag-gregates did not affect the sulfide microprofile but induced asubstantial methane production predominantly in the core ofthe aggregates (Fig. 2C). Addition of 50 mM BES completely
inhibited the methane production after 3.5 h of incubation(Fig. 3).
Activity profiles. Sulfide production was in all aggregatesrestricted to the outer layer, while methane was produceddeeper in the aggregates. In the sulfidogenic aggregates, sul-fate reduction is restricted to the outer 200 to 300 mm (Fig.2A). In the methanogenic-sulfidogenic aggregates, sulfide pro-duction was localized in the outer 50 to 100 mm, while methaneproduction was exclusively detected below a depth of 100 mm(Fig. 2B). Also in the methanogenic aggregates, methane isproduced only in the core, starting at 200 mm from the surface(Fig. 2C). Table 2 summarizes the average activity values forthe three types of aggregates, as derived from the profilespresented in Fig. 1 to 3.
Population analysis by DGGE. The DGGE analyses re-vealed that the three aggregates contained a different commu-nity composition on the DNA level as well as on the RNA level(Fig. 4). In all aggregates less cDNA bands (reverse transcrip-tase PCR [RT-PCR]-amplified 16S rRNA fragments) wereseen than rDNA bands (PCR-amplified 16S rDNA fragments).Blotting of DGGE gels and hybridization of these blots with
FIG. 2. Steady-state microsensor profiles (lines) and activity values (bars) of sulfide and methane in aggregates in the presence of 10 mM SO422. (A) Sulfidogenic
aggregate after one night without electron donor (■, closed bars), with the addition of 7 mM ethanol (h, open bars), with H2 saturation (3, crossed bars), and withthe addition of 7 mM acetate (F, shaded bars). (B) Methanogenic-sulfidogenic aggregate after one night without electron donor (■, closed bars), with addition of 1mM acetate (3, crossed bars), and with 1 mM propionate (h, open bars). (C) Methanogenic aggregate after one night of incubation without electron donor (■, closedbars) and with the addition of a VFA mixture (6 mM acetate, 7 mM propionate, and 5 mM butyrate; h, open bars). The aggregate surface is at a distance of 0 mm,the center of the aggregate is approximately at a distance of 0.6 mm for the sulfidogenic aggregates (A) and at a distance of 0.9 mm for both the methanogenic-sulfidogenic (B) and the methanogenic (C) aggregates. The profiles in the upper and lower parts of graph A are obtained from two different sulfidogenic aggregatesand were measured at different times.
4622 SANTEGOEDS ET AL. APPL. ENVIRON. MICROBIOL.
on March 14, 2016 by guest
http://aem.asm
.org/D
ownloaded from
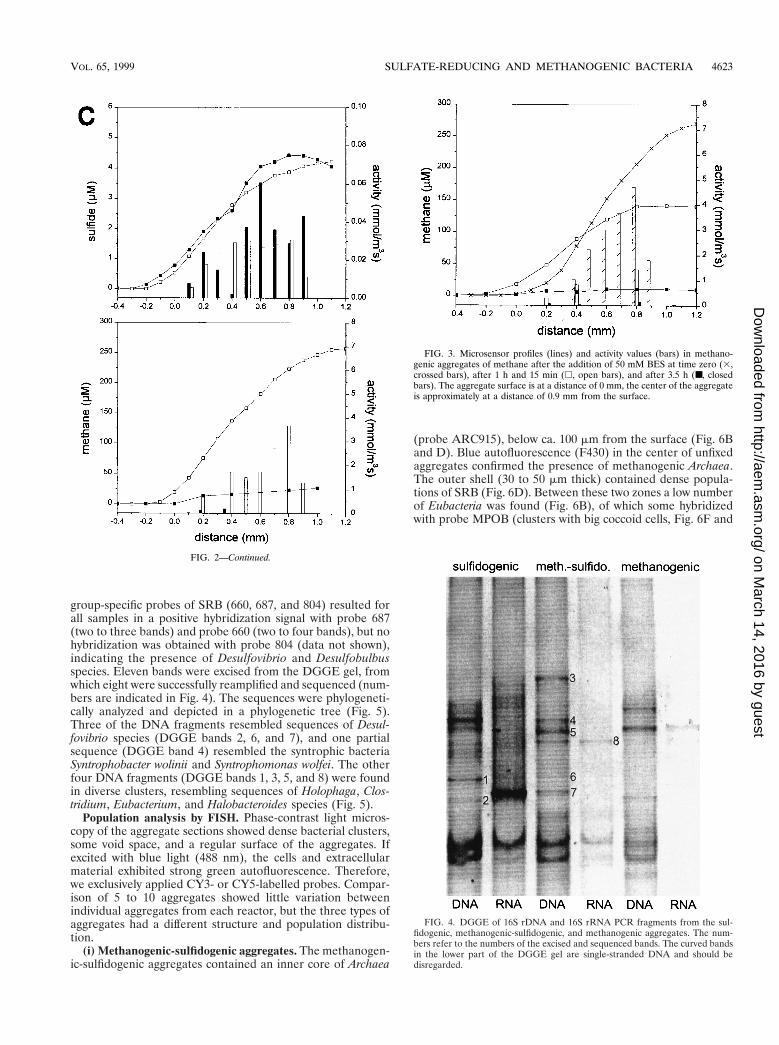
group-specific probes of SRB (660, 687, and 804) resulted forall samples in a positive hybridization signal with probe 687(two to three bands) and probe 660 (two to four bands), but nohybridization was obtained with probe 804 (data not shown),indicating the presence of Desulfovibrio and Desulfobulbusspecies. Eleven bands were excised from the DGGE gel, fromwhich eight were successfully reamplified and sequenced (num-bers are indicated in Fig. 4). The sequences were phylogeneti-cally analyzed and depicted in a phylogenetic tree (Fig. 5).Three of the DNA fragments resembled sequences of Desul-fovibrio species (DGGE bands 2, 6, and 7), and one partialsequence (DGGE band 4) resembled the syntrophic bacteriaSyntrophobacter wolinii and Syntrophomonas wolfei. The otherfour DNA fragments (DGGE bands 1, 3, 5, and 8) were foundin diverse clusters, resembling sequences of Holophaga, Clos-tridium, Eubacterium, and Halobacteroides species (Fig. 5).
Population analysis by FISH. Phase-contrast light micros-copy of the aggregate sections showed dense bacterial clusters,some void space, and a regular surface of the aggregates. Ifexcited with blue light (488 nm), the cells and extracellularmaterial exhibited strong green autofluorescence. Therefore,we exclusively applied CY3- or CY5-labelled probes. Compar-ison of 5 to 10 aggregates showed little variation betweenindividual aggregates from each reactor, but the three types ofaggregates had a different structure and population distribu-tion.
(i) Methanogenic-sulfidogenic aggregates. The methanogen-ic-sulfidogenic aggregates contained an inner core of Archaea
(probe ARC915), below ca. 100 mm from the surface (Fig. 6Band D). Blue autofluorescence (F430) in the center of unfixedaggregates confirmed the presence of methanogenic Archaea.The outer shell (30 to 50 mm thick) contained dense popula-tions of SRB (Fig. 6D). Between these two zones a low numberof Eubacteria was found (Fig. 6B), of which some hybridizedwith probe MPOB (clusters with big coccoid cells, Fig. 6F and
FIG. 3. Microsensor profiles (lines) and activity values (bars) in methano-genic aggregates of methane after the addition of 50 mM BES at time zero (3,crossed bars), after 1 h and 15 min (h, open bars), and after 3.5 h (■, closedbars). The aggregate surface is at a distance of 0 mm, the center of the aggregateis approximately at a distance of 0.9 mm from the surface.
FIG. 4. DGGE of 16S rDNA and 16S rRNA PCR fragments from the sul-fidogenic, methanogenic-sulfidogenic, and methanogenic aggregates. The num-bers refer to the numbers of the excised and sequenced bands. The curved bandsin the lower part of the DGGE gel are single-stranded DNA and should bedisregarded.
FIG. 2—Continued.
VOL. 65, 1999 SULFATE-REDUCING AND METHANOGENIC BACTERIA 4623
on March 14, 2016 by guest
http://aem.asm
.org/D
ownloaded from

H). The use of group-specific probes for SRB resulted in hy-bridizations with probe DSV698 and 660 of cells in the outerlayer (Fig. 7B and D). No hybridization was observed with theother group-specific SRB probes (Table 1).
(ii) Sulfidogenic aggregates. The different populations insulfidogenic aggregates were more dispersed. Figure 6A illus-trates their irregular surface, clearly showing eubacterial bud-dings at several locations. The SRB were mainly situated at theouter 200 to 300 mm of the aggregate (Fig. 6C) but did notform a compact shell as in methanogenic-sulfidogenic aggre-gates (Fig. 6D). Cells hybridizing with probe MPOB werescattered over the interior part (Fig. 6E and G). The methan-ogens were present in clusters in the inner part of the aggre-gate, often forming a very compact core (Fig. 6A, C, and E andFig. 7A). DSS658 was the only specific SRB probe that hybrid-ized with sulfidogenic aggregates, clearly showing clusters ofcoccoid cells at the surface and more inward (Fig. 7C). Strongautofluorescence, especially with higher formamide concentra-tions, hampered quantitative analysis of the FISH results.
(iii) Methanogenic aggregates. The methanogenic aggre-gates contained hardly any SRB (Fig. 7A), and no cells hybrid-
izing with the MPOB probe could be detected. The methano-gens were present in clusters in the inner part of the aggregate.
DISCUSSION
Architecture of UASB aggregates. The structural study withmolecular techniques could not be performed on the sameindividual aggregates used for the functional analyses withmicrosensors; however, comparison of 5 to 10 aggregates fromeach reactor show little variation. Thus, the observations, ob-tained with different techniques on different individual aggre-gates, can be compared well. This study clearly showed thatdifferent spatial arrangements of the SRB and MB populationsoccur in anaerobic aggregates. SRB and MB were distributedin a layered structure in the methanogenic-sulfidogenic andsulfidogenic aggregates (Fig. 6 and 7), which resulted in azonation where their activity is predominant (Fig. 1 to 3). Thedifferences in structure of the different types of aggregates canbe attributed to the wastewater compositions (Table 2). Thedevelopment of different types of aggregates, depending on thesubstrate, has been reported previously (12, 13).
FIG. 6. FISH analysis to study the population distribution within sulfidogenic and methanogenic-sulfidogenic aggregates by using various probes labeled with CY3and CY5. The photographs are overlays of two confocal microscopic images. Panels: A and B, EUB338 (artificial color blue) and ARC915 (artificial color red)hybridizations of sulfidogenic (A) and methanogenic-sulfidogenic (B) aggregates; C and D, SRB385 (artificial color green) and ARC915 (artificial color red)hybridization of sulfidogenic (C) and methanogenic-sulfidogenic (D) aggregates; E and F, ARC915 (artificial color red) and MPOB (artificial color white) hybridizationof sulfidogenic (E) and methanogenic-sulfidogenic (F) aggregates; G and H, SRB385 (artificial color green) and MPOB (artificial color white) hybridization ofsulfidogenic (G) and methanogenic-sulfidogenic (H) aggregates. The scale bar is 20 mm, and the arrows indicate the aggregate surface.
FIG. 5. Phylogenetic analysis of the partial sequences derived from excised DGGE bands depicted in Fig. 4. The phylogenetic parsimony tree was calculated withthe ARB program. The bar indicates 0.1 estimated change per nucleotide.
4624 SANTEGOEDS ET AL. APPL. ENVIRON. MICROBIOL.
on March 14, 2016 by guest
http://aem.asm
.org/D
ownloaded from

VOL. 65, 1999 SULFATE-REDUCING AND METHANOGENIC BACTERIA 4625
on March 14, 2016 by guest
http://aem.asm
.org/D
ownloaded from

The core of all three types of aggregates was composed ofMB, whereas SRB were mainly present in an outer shell, as wasalso found by Sekiguchi et al. (52). The low SRB populationdensity in the center of the aggregates contrasts with the factthat SRB can outcompete methanogens because of their morefavorable thermodynamics for acetate and H2 (23, 51, 62).Diffusional limitation of sulfate has been suggested as a reasonfor the maintenance of MB in the core of aggregates treatingsulfate-rich wastewaters (43). From our in situ activity mea-surements, we calculated that this cannot be the case for theaggregates used in this study. We suggest that the MB core ofthe primary inoculum is conserved and that SRB colonize thiscore in a later development stage. A similar outgrowth of SRBafter methanogenic granular sludge was fed a mixture of pro-pionate and sulfate was observed by Harmsen et al. (16). Be-sides adaptation of the primary inoculum to a different sub-strate, also new granules are formed during reactor operation.The initial aggregation might be mediated by methanogens,
which have better attachment characteristics than SRB (18,38), while SRB attach later on during aggregate development.
The inner core of the methanogenic-sulfidogenic aggregateswas one solid cluster of MB, surrounded by a layer of syntro-phic bacteria (Fig. 6B, D, and E). The core of the sulfidogenicaggregates contained several smaller clusters of MB with dis-persed syntrophs (Fig. 6A and C and Fig. 7A). Indeed, theformation of clusters of methanogens in juxtaposition withsyntrophic bacteria offers both groups of bacteria a nutritionaladvantage.
Endogenous microprofiles. Microsensor measurement ofH2S and CH4 profiles indicated that both the SRB and MBpopulations were also active in the absence of externally sup-plied electron donor for at least 24 h (Fig. 1), as was also foundby de Beer et al. (10). This indicates that both SRB and MBmetabolize some pool of storage material, either bound toparticles, polymers or cells. E-donors were, however, limitedwithin the aggregates, and the activity of both the SRB and MB
FIG. 7. FISH analysis to localize specific SRB populations within the aggregates. (A) Probe SRB385 (artificial color green) and ARC915 (artificial color red)hybridization of methanogenic aggregates. This photograph is an overlay of two confocal microscopic images. (B and D) Hybridization with probe 660 (artificial colorpurple) (B) and probe 698 (artificial color purple) (D) in a methanogenic-sulfidogenic aggregate. (C) Hybridization with probe 658 (artificial color purple) in asulfidogenic aggregate. The scale bar is 20 mm, and the arrows indicate the aggregate surface.
4626 SANTEGOEDS ET AL. APPL. ENVIRON. MICROBIOL.
on March 14, 2016 by guest
http://aem.asm
.org/D
ownloaded from

increased considerably upon addition of an electron donor(Fig. 2).
The S0 found might be the source of sulfide in sulfate-freemedium (Fig. 1), either by sulfur reduction or sulfur dispro-portionation (58). However, it is unclear how the S0 wasformed in the absence of an electron acceptor. We took care toavoid exposure to oxygen, so it is unlikely that this could causethe high S0 concentrations observed (Table 2). A reverse sulfurdisproportionation might be an interesting possibility, but ithas not yet been demonstrated and could not explain both thepresence of sulfur and the formation of sulfide.
Characteristics of the SRB population. The sulfate reduc-tion rates in the aggregates are up to 1,000 times higher thanthose reported for sediments, i.e., 0.0009 mmol of S22 m23 s21
(25) and 0.002 to 0.01 mmol of S22 m23 s21 (3). However, arealistic comparison is only possible between systems with sim-ilar cell densities. Comparable activities have been measuredin the anaerobic zones of biofilms, i.e., 0.2 mmol of S22 m23
s21 (24) or 8 mmol of S22 m23 s21 (37). From the H2S fluxesand the number of SRB (determined by FISH) in the metha-nogenic-sulfidogenic aggregates, the specific sulfate reductionrate was calculated to be 25 fmol SO4
22 cell21 day21. Thisvalue is in the high-end range of the specific sulfate reductionrates reported (21).
The methanogenic-sulfidogenic aggregates contained Desul-fovibrio spp., as well as Desulfobulbus spp. These two SRBspecies were absent in the sulfidogenic granules, which con-tained predominantly the nutritionally versatile Desulfosarcinaand/or Desulfococcus species. The H2S microprofiles measuredin the sulfidogenic aggregates suggest that different, spatiallyseparated, H2- and ethanol-consuming SRB populations arepresent in the outer 400 mm (Fig. 2A). These populationscould, however, not be differentiated by the FISH probes ap-plied. Few of the specific SRB probes (Table 1) yielded apositive signal in the aggregates (Fig. 7B to D). Probably, theseaggregates contain SRB populations, for which specific probesstill need to be developed. Several acetate-utilizing SRB spe-cies are known, such as Desulfobacter, Desulfobacterium, De-sulfococcus, Desulfosarcina, and Desulfotomaculum species.Desulfobacter species were not detected by the DGGE andFISH analyses, confirming other studies that Desulfobacter isunimportant in methanogenic aggregates (40, 46). Desulfosar-cina or Desulfococcus species are likely to be responsible forthe degradation of acetate in the sulfidogenic aggregates. Thepresence of other acetotrophic SRB species cannot be ex-cluded, as recently Desulforhabdus amnigenus (41) and Desul-fobacca acetoxidans (39) have been isolated from granularsludge. More research with specific 16S rRNA probes for thesenewly described organisms is needed to examine their presencein the anaerobic aggregates.
The low SRB population density in the methanogenic ag-gregates (Fig. 2C and 7A) is somewhat surprising. SRB aregenerally assumed to be more robust than MB (62) and havethe ability to use other metabolic pathways, such as fermenta-tion (62) or syntrophic growth with methanogens (63). Themedium on which the methanogenic aggregates were subcul-tured contained sulfate (0.45 mM), which could have sup-ported the growth of SRB. Apparently, this small amount ofsulfate could not support the development of a substantialSRB population.
Characteristics of the MB population. The methanogenicrates in the aggregates were 10 times higher than the methan-ogenic activities measured in sediments (0.1 to 0.6 mmol ofCH4 m23 s21 [34]) and during sewage sludge digestion (0.6mmol of CH4 m23 s21 [54]). The rod-shaped morphology ofthe methanogens in the center of the aggregates resembles that
of Methanosaeta species (64). This obligate acetoclastic me-thanogenic species was also found to be present in the core ofother layered granules (14, 27, 31, 52). Methanosaeta speciesare the least sensitive among the methanogens for acetatediffusional limitations because of their higher affinity for ace-tate compared to other methanogens (13, 14, 20). This, to-gether with their ability to form close frameworks and/or mats(44), explains their presence in the center of the aggregates.
Although MB were found in sulfidogenic granules (Fig. 6A,C, and E), no methane production was detected by activitytests (data not shown). Indeed, MB survive long starvationtimes (28), while maintaining their ribosomes (46).
The CH4 microprofiles showed that methanogenesis was notaffected by the addition of sulfate (Fig. 1 and 2). The literatureconcerning this phenomenon is contradictory. Methanogenesiswas inhibited by sulfate addition in sediments (30, 62) andanaerobic digestors (29, 46). Others reported no effect at all onmethanogenesis under sulfate-rich conditions in the same en-vironments (53, 59, 64). The differences between these obser-vations might be explained by substrate availability or by theadaptation times of SRB populations.
Characteristics of the syntrophic population. Methanogenscannot use propionate as an electron donor. The increase inmethanogenic activity by propionate addition (Fig. 2B) illus-trates the dependency of methanogens on propionate-oxidiz-ing syntrophic bacteria. The DGGE analysis suggested thepresence of a relative of Syntrophobacter wolinii and Syntroph-omonas wolfei (Fig. 5), whereas the FISH analysis with probeMPOB (Fig. 6G and H) suggested the presence of strainMPOB, classified as Syntrophobacter fumaroxidans (17). Ac-cording to recent studies, Syntrophobacter spp. were capable ofoxidizing propionate by sulfate reduction (15, 62). The Desul-fobulbus layer at the surface of the methanogenic-sulfidogenicaggregates (Fig. 7B) indicates that syntrophic bacteria cannotoutcompete Desulfobulbus spp. in this granular sludge devel-oped under sulfate-rich conditions.
The MPOB-like cells grew more inwards than did the SRB.Methanogens can grow syntrophically with acetate- and H2-producing bacteria either in juxtaposition in the core or asadjacent layers within the aggregate (16, 52, 63). The lattertype of syntrophy was found in methanogenic-sulfidogenic ag-gregates (Fig. 6F). Syntrophic bacteria were found betweenlayers of SRB and MB, providing both groups with H2 andacetate, as postulated by MacLeod et al. (31). In the sulfido-genic granules (Fig. 6E), MPOB-like cells were surrounded byMB cells, indicating that the MPOB-like cells indeed growsyntrophically with MB.
Concluding remarks. Combining microsensors and molecu-lar techniques provided direct information about sulfate reduc-tion and methanogenesis in UASB aggregates. Data on thecommunity structure could be related to the metabolic func-tions of the respective populations. SRB were mainly found inthe outer layer (,200 mm) and MB were predominantly in thecore of UASB aggregates. For further detailed investigation,microsensors for the substrate H2 and additional oligonucleo-tide probes for newly isolated syntrophic and SRB populationsare under development.
ACKNOWLEDGMENTS
This work was financially supported by a personal grant to BoBarker Jørgensen from the Korber Foundation (Hamburg, Germany),the Max Planck Society (Munich, Germany), and the European Union(project MICROMARE contract MASCT 950029).
We thank Helle Ploug for fruitful discussions; Rudi Amann for hissupport; Gaby Eickert, Anja Eggers, Vera Hubner, and Lars B. Ped-
VOL. 65, 1999 SULFATE-REDUCING AND METHANOGENIC BACTERIA 4627
on March 14, 2016 by guest
http://aem.asm
.org/D
ownloaded from

ersen for technical assistance with the microsensors; and Ramon Ros-sello-Mora for his help with the phylogenetic analysis.
REFERENCES1. Amann, R., I. Krumholz, and D. A. Stahl. 1990. Fluorescent-oligonucleotide
probing of whole cells for determinative, phylogenetic, and environmentalstudies in microbiology. J. Bacteriol. 172:762–770.
2. Amann, R., J. Stromley, R. Devereux, R. Key, and D. A. Stahl. 1992. Mo-lecular and microscopic identification of sulfate-reducing bacteria in multi-species biofilms. Appl. Environ. Microbiol. 58:614–623.
3. Blaabjerg, V., K. N. Mouritsen, and K. Finster. 1998. Diel cycles of sulphatereduction rates in sediments of a Zostera marina bed (Denmark). Aquat.Microb. Ecol. 15:97–102.
4. Broecker, W. S., and T.-H. Peng. 1974. Gas exchange rates between air andsea. Tellus 26:21–35.
5. Brosius, J., T. J. Dull, D. D. Sleeter, and H. F. Noller. 1981. Gene organi-zation and primary structure of a ribosomal RNA operon from Escherichiacoli. J. Mol. Biol. 148:107–127.
6. Cline, J. D. 1969. Spectrophotometric determination of hydrogen sulfide innatural waters. Limnol. Oceanogr. 14:454–458.
7. Damgaard, L. R., and N. P. Revsbech. 1999. Unpublished data.8. Damgaard, L. R., and N. P. Revsbech. 1997. A microscale biosensor for
methane containing methanotrophic bacteria and an internal oxygen reser-voir. Anal. Chem. 69:2262–2267.
9. Damgaard, L. R., N. P. Revsbech, and W. Reichard. 1998. Use of an oxygen-insensitive microscale biosensor for methane to measure methane concen-tration profiles in a rice paddy. Appl. Environ. Microbiol. 64:864–870.
10. de Beer, D., J. W. Huisman, J. C. Van den Heuvel, and S. P. P. Ottengraf.1992. The effect of pH profiles in methanogenic aggregates on the kinetics ofacetate conversion. Water Res. 26:1329–1336.
11. Devereux, R., M. D. Kane, J. Wilfrey, and D. A. Stahl. 1992. Genus- andgroup-specific hybridization probes for determinative and environmentalstudies of sulfate-reducing bacteria. Syst. Appl. Microbiol. 15:601–609.
12. Fang, H. H. P., H. K. Chui, and Y. Y. Li. 1994. Microbial structure andactivity of UASB granules treating different wastewaters. Water Sci. Tech-nol. 30:87–96.
13. Grotenhuis, J. T. C., M. Smit, C. M. Plugge, X. Yuansheng, A. A. M. VanLammeren, A. J. M. Stams, and A. J. B. Zehnder. 1991. Bacteriologicalcomposition and structure of granular sludge adapted to different substrates.Appl. Environ. Microbiol. 57:1942–1949.
14. Guiot, S. R., A. Pauss, and J. W. Costerton. 1992. A structured model of theanaerobic granule consortium. Water Sci. Technol. 25:1–10.
15. Harmsen, H. J. M., A. D. L. Akkermans, A. J. M. Stams, and W. M. De Vos.1996. Population dynamics of propionate-oxidizing bacteria under methan-ogenic and sulfidogenic conditions in anaerobic granular sludge. Appl. En-viron. Microbiol. 62:2163–2168.
16. Harmsen, H. J. M., H. M. P. Kengen, A. D. L. Akkermans, A. J. M. Stams,and W. M. De Vos. 1996. Detection and localization of syntrophic propi-onate-oxidizing bacteria in granular sludge by in situ hybridization using 16SrRNA-based oligonucleotide probes. Appl. Environ. Microbiol. 62:1656–1663.
17. Harmsen, H. J. M., B. L. M. van Kuijk, C. M. Plugge, A. D. L. Akkermans,W. M. de Vos, and A. J. M. Stams. 1998. Description of Syntrophobacterfumaroxidans sp. nov., a syntrophic propionate-degrading sulfate-reducingbacterium. Int. J. Syst. Bacteriol. 48:1383–1387.
18. Isa, Z., S. Grusenmeyer, and W. Verstraete. 1986. Sulfate reduction relativeto methane production in high-rate anaerobic digestion: microbial aspects.Appl. Environ. Microbiol. 51:580–587.
19. Jeroschewski, P., C. Steuckart, and M. Kuhl. 1996. An amperometric mi-crosensor for the determination of H2S in aquatic environments. Anal.Chem. 68:4351–4357.
20. Jetten, M. S. M., A. J. M. Stams, and A. J. B. Zehnder. 1990. Acetatethreshold values and acetate activating enzymes in methanogenic bacteria.FEMS Microbiol. Ecol. 73:339–344.
21. Jørgensen, B. B. 1978. A comparison of methods for the quantification ofbacterial sulfate reduction in coastal marine sediments. Geomicrobiology 1:49–64.
22. Karchmer, J. H. 1979. The analytical chemistry of sulfur and its compounds.Wiley-Interscience, New York, N.Y.
23. Kristjansson, J. K., P. Schonheit, and R. K. Thauer. 1982. Different Ksvalues for hydrogen of methanogenic bacteria and sulfate reducing bacteria:an explanation for the apparent inhibition of methanogenesis by sulfate.Arch. Microbiol. 131:278–282.
24. Kuhl, M., and B. B. Jørgensen. 1992. Microsensor measurements of sulfatereduction and sulfide oxidation in compact microbial communities of aerobicbiofilms. Appl. Environ. Microbiol. 58:1164–1174.
25. Kuhl, M., C. Steuckart, G. Eickert, and P. Jeroschewski. 1998. A H2Smicrosensor for profiling biofilms and sediments: application in an acidiclake sediment. Aquat. Microb. Ecol. 15:201–209.
26. Lens, P., D. De Beer, C. Cronenberg, S. Ottengraf, and W. Verstraete. 1995.The use of microsensors to determine population distribution in UASBaggregates. Water Sci. Technol. 31:273–280.
27. Lens, P. N. L., D. De Beer, C. C. H. Cronenberg, F. P. Houwen, S. P. P.Ottengraf, and W. H. Verstraete. 1993. Heterogeneous distribution of mi-crobial activity in methanogenic aggregates: pH and glucose microprofiles.Appl. Environ. Microbiol. 59:3803–3815.
28. Lettinga, G. 1995. Anaerobic digestion and wastewater treatment systems.Antonie Leeuwenhoek 67:3–28.
29. Li, Y.-Y., S. Lam, and H. H. P. Fang. 1996. Interactions between methano-genic, sulfate-reducing and syntrophic acetogenic bacteria in the anaerobicdegradation of benzoate. Water Res. 30:1555–1562.
30. Lovley, D. R., D. F. Dwyer, and M. J. Klug. 1982. Kinetic analysis of com-petition between sulfate reducers and methanogens for hydrogen in sedi-ments. Appl. Environ. Microbiol. 43:1373–1379.
31. MacLeod, F. A., S. R. Guiot, and J. W. Costerton. 1990. Layered structure ofbacterial aggregates produced in an upflow anaerobic sludge bed and filterreactor. Appl. Environ. Microbiol. 56:1598–1607.
32. Manz, W., R. Amann, W. Ludwig, M. Wagner, and K.-H. Schleifer. 1992.Phylogenetic oligodeoxynucleotide probes for the major subclasses of pro-teobacteria: problems and solutions. Syst. Appl. Microbiol. 15:593–600.
33. Manz, W., M. Eisenbrecher, T. R. Neu, and U. Szewzyk. 1998. Abundanceand spatial organization of gram-negative sulfate-reducing bacteria in acti-vated sludge investigated by in situ probing with specific 16S rRNA targetedoligonucleotides. FEMS Microbiol. Ecol. 25:43–61.
34. Mountfort, D. O., and R. A. Asher. 1981. Role of sulfate reduction versusmethanogenesis in terminal carbon flow in polluted intertidal sediment ofWaimea Inlet, Nelson, New Zealand. Appl. Environ. Microbiol. 42:252–258.
35. Muyzer, G., T. Brinkhoff, U. Nubel, C. Santegoeds, H. Schafer, and C.Wawer. 1998. Denaturing gradient gel electrophoresis (DGGE) in microbialecology, p. 1–27. In A. D. L. Akkermans, J. D. van Elsas, and F. J. de Bruijn(ed.), Molecular microbial ecology manual, vol. 3.4.4. Kluwer, Dordrecht,The Netherlands.
36. Muyzer, G., E. C. de Waal, and A. G. Uitterlinden. 1993. Profiling of complexmicrobial populations by denaturing gradient gel electrophoresis analysis ofpolymerase chain reaction-amplified genes encoding for 16S rRNA. Appl.Environ. Microbiol. 59:695–700.
37. Okabe, S., T. Matsuda, H. Satoh, T. Itoh, and Y. Watanabe. 1998. Sulfatereduction and sulfide oxidation ion aerobic mixed population biofilms. WaterSci. Technol. 37:131–138.
38. Omil, F., S. J. W. H. Oude Elferink, P. Lens, L. Hulshoff-Pol, and G.Lettinga. 1997. Effect of the inoculation with Desulforhabdus amnigenus andpH or O2 shocks on the competition between sulfate reducing and methan-ogenic bacteria in an acetate fed UASB reactor. Biores. Technol. 60:113–122.
39. Oude Elferink, S. J. W. H., W. M. Akkermans-van Vliet, J. J. Bogte, andA. J. M. Stams. Desulfobacca acetooxidans gen. nov. sp. nov., a novel acetate-degrading sulfate reducer isolated from sulfidogenic granular sludge. Int. J.Syst. Bacteriol., in press.
40. Oude Elferink, S. J. W. H., H. T. S. Boschker, and A. J. M. Stams. 1998.Identification of sulfate reducers and Syntrophobacter sp. in anaerobic gran-ular sludge by fatty-acid biomarkers and 16S rRNA probing. Geomicrobiol-ogy 15:3–17.
41. Oude Elferink, S. J. W. H., R. N. Maas, H. J. M. Harmsen, and A. J. M.Stams. 1995. Desulforhabdus amnigenus gen. nov. sp. nov., a sulfate reducerisolated from anaerobic granular sludge. Arch. Microbiol. 164:119–124.
42. Oude Elferink, S. J. W. H., W. J. C. Vorstman, A. Sopjes, and A. J. M. Stams.1998. Characterization of the sulfate-reducing and syntrophic population ingranular sludge from a full-scale anaerobic reactor treating papermill waste-water. FEMS Microbiol. Ecol. 27:185–194.
43. Overmeire, A., P. Lens, and W. Verstraete. 1994. Mass transfer limitation ofsulfate in methanogenic aggregates. Biotechnol. Bioeng. 44:387–391.
44. Patel, G. B. 1984. Characterization and nutritional properties of Methanotrixconcilii sp. nov., a mesophilic, aceticlastic methanogen. Can. J. Microbiol. 30:1383–1396.
45. Ramsing, N. B., H. Fossing, T. G. Ferdelman, F. Andersen, and B. Tham-drup. 1996. Distribution of bacterial populations in a stratified fjord (Mar-iager Fjord, Danmark) quantified by in situ hybridization and related tochemical gradients in the water column. Appl. Environ. Microbiol. 62:1391–1404.
46. Raskin, L., B. E. Rittmann, and D. A. Stahl. 1996. Competition and coex-istence of sulfate-reducing and methanogenic populations in anaerobic bio-films. Appl. Environ. Microbiol. 62:3847–3857.
47. Revsbech, N. P. 1989. An oxygen microelectrode with a guard cathode.Limnol. Oceanogr. 55:1907–1910.
48. Revsbech, N. P., and B. B. Jørgensen. 1986. Microelectrodes: their use inmicrobial ecology. Adv. Microb. Ecol. 9:293–352.
49. Revsbech, N. P., L. P. Nielsen, and N. B. Ramsing. 1998. A novel microsen-sor for determination of apparent diffusivity in sediments. Limnol. Ocean-ogr. 43:986–992.
50. Santegoeds, C. M., T. G. Ferdelman, G. Muyzer, and D. De Beer. 1998.Structural and functional dynamics of sulfate-reducing populations in bac-terial biofilms. Appl. Environ. Microbiol. 64:3731–3739.
51. Schonheit, P., J. K. Kristjansson, and R. K. Thauer. 1982. Kinetic mecha-nism for the ability of sulfate reducers to outcompete methanogens for
4628 SANTEGOEDS ET AL. APPL. ENVIRON. MICROBIOL.
on March 14, 2016 by guest
http://aem.asm
.org/D
ownloaded from

acetate. Arch. Microbiol. 132:285–288.52. Sekiguchi, Y., Y. Kamagata, K. Nakamura, A. Ohashi, and H. Harada. 1999.
Fluorescence in situ hybridization using 16S rRN-targeted oligonucleotidesreveals localization of methanogens and selected uncultured bacteria inmesophilic and thermophilic sludge granules. Appl. Environ. Microbiol. 65:1280–1288.
53. Senior, E., E. B. Lindstrom, I. M. Banat, and D. B. Nedwell. 1982. Sulfatereduction and methanogenesis in the sediment of saltmarsh on the EastCoast of the United Kingdom. Appl. Environ. Microbiol. 43:987–996.
54. Smith, P. H., and D. T. Mah. 1966. Kinetics of acetate metabolism duringsludge digestion. Appl. Microbiol. 14:368–371.
55. Stahl, D. A., and R. Amann. 1991. Development and application of nucleicacid probes, p. 207–248. In E. Stackebrandt and M. Goodfellow (ed.), Nu-cleic acid techniques in bacterial systematics, vol. 8. John Wiley & Sons, Ltd.,London, England.
56. Strunk, O., O. Gross, B. Reichel, M. May, S. Hermann, N. Stuckmann, B.Nonhoff, M. Lenke, T. Ginhart, A. Vilbig, T. Ludwig, A. Bode, K.-H. Schlei-fer, and W. Ludwig. 1998. ARB: a software environment for sequence data.Department of Microbiology, Technische Universitat Munchen, Munich,Germany.
57. Teske, A., C. Wawer, G. Muyzer, and N. B. Ramsing. 1996. Distribution ofsulfate-reducing bacteria in a stratified fjord (Mariager Fjord, Denmark) asevaluated by most-probable-number counts and denaturing gradient gel
electrophoresis of PCR-amplified ribosomal DNA fragments. Appl. Environ.Microbiol. 62:1405–1415.
58. Thamdrup, B., K. Finster, J. W. Hansen, and F Bak. 1993. Bacterial dispro-portionation of elemental sulfur coupled to chemical reduction of iron ormanganese. Appl. Environ. Microbiol. 59:101–108.
59. Ueki, K., A. Ueki, K. Takahashi, and M. Iwatsu. 1992. The role of sulfatereduction in methanogenic digestion of municipal sewage sludge. J. Gen.Appl. Microbiol. 38:195–207.
60. Verstraete, W., D. de Beer, M. Pena, G. Lettinga, and P. Lens. 1996. An-aerobic bioprocessing of waste. World J. Microbiol. Biotechnol. 12:221–238.
61. Wallrabenstein, C., E. Hauschild, and B. Schink. 1995. Syntrophobacterpfenningii sp. nov., new syntrophically propionate-oxidising anaerobe grow-ing in pure culture with propionate and sulfate. Arch. Microbiol. 164:346–352.
62. Widdel, F. 1988. Microbiology and ecology of sulfate- and sulfur-reducingbacteria, p. 469–585. In A. D. J. Zehnder (ed.), Biology of anaerobic micro-organisms. John Wiley & Sons, New York, N.Y.
63. Winfrey, M. R., and J. G. Zeikus. 1977. Effect of sulfate on carbon andelectron flow during microbial methanogenesis in freshwater sediments.Appl. Environ. Microbiol. 33:275–281.
64. Wu, W.-M., M. K. Jain, E. C. De Macario, J. H. Thiele, and J. G. Zeikus.1992. Microbial composition and characterization of prevalent methanogensand acetogens isolated from syntrophic methanogenic granules. Appl. Mi-crobiol. Biotechnol. 38:282–290.
VOL. 65, 1999 SULFATE-REDUCING AND METHANOGENIC BACTERIA 4629
on March 14, 2016 by guest
http://aem.asm
.org/D
ownloaded from
Copyright © 2022 FDOKUMEN