Modulation of the chromatin phosphoproteome by the Haspin protein kinase
Upload
independentCategory
view
2download
0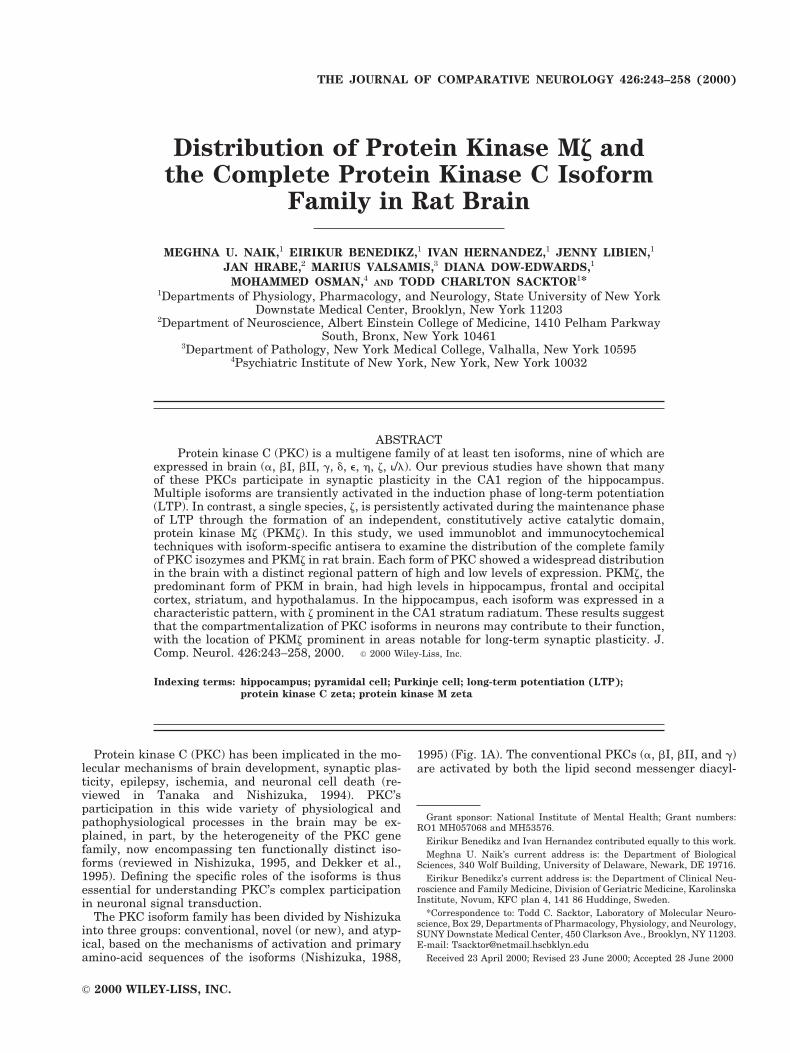
Distribution of Protein Kinase Mz andthe Complete Protein Kinase C Isoform
Family in Rat Brain
MEGHNA U. NAIK,1 EIRIKUR BENEDIKZ,1 IVAN HERNANDEZ,1 JENNY LIBIEN,1
JAN HRABE,2 MARIUS VALSAMIS,3 DIANA DOW-EDWARDS,1
MOHAMMED OSMAN,4AND TODD CHARLTON SACKTOR1*
1Departments of Physiology, Pharmacology, and Neurology, State University of New YorkDownstate Medical Center, Brooklyn, New York 11203
2Department of Neuroscience, Albert Einstein College of Medicine, 1410 Pelham ParkwaySouth, Bronx, New York 10461
3Department of Pathology, New York Medical College, Valhalla, New York 105954Psychiatric Institute of New York, New York, New York 10032
ABSTRACTProtein kinase C (PKC) is a multigene family of at least ten isoforms, nine of which are
expressed in brain (a, bI, bII, g, d, e, h, z, i/l). Our previous studies have shown that manyof these PKCs participate in synaptic plasticity in the CA1 region of the hippocampus.Multiple isoforms are transiently activated in the induction phase of long-term potentiation(LTP). In contrast, a single species, z, is persistently activated during the maintenance phaseof LTP through the formation of an independent, constitutively active catalytic domain,protein kinase Mz (PKMz). In this study, we used immunoblot and immunocytochemicaltechniques with isoform-specific antisera to examine the distribution of the complete familyof PKC isozymes and PKMz in rat brain. Each form of PKC showed a widespread distributionin the brain with a distinct regional pattern of high and low levels of expression. PKMz, thepredominant form of PKM in brain, had high levels in hippocampus, frontal and occipitalcortex, striatum, and hypothalamus. In the hippocampus, each isoform was expressed in acharacteristic pattern, with z prominent in the CA1 stratum radiatum. These results suggestthat the compartmentalization of PKC isoforms in neurons may contribute to their function,with the location of PKMz prominent in areas notable for long-term synaptic plasticity. J.Comp. Neurol. 426:243–258, 2000. © 2000 Wiley-Liss, Inc.
Indexing terms: hippocampus; pyramidal cell; Purkinje cell; long-term potentiation (LTP);
protein kinase C zeta; protein kinase M zeta
Protein kinase C (PKC) has been implicated in the mo-lecular mechanisms of brain development, synaptic plas-ticity, epilepsy, ischemia, and neuronal cell death (re-viewed in Tanaka and Nishizuka, 1994). PKC’sparticipation in this wide variety of physiological andpathophysiological processes in the brain may be ex-plained, in part, by the heterogeneity of the PKC genefamily, now encompassing ten functionally distinct iso-forms (reviewed in Nishizuka, 1995, and Dekker et al.,1995). Defining the specific roles of the isoforms is thusessential for understanding PKC’s complex participationin neuronal signal transduction.
The PKC isoform family has been divided by Nishizukainto three groups: conventional, novel (or new), and atyp-ical, based on the mechanisms of activation and primaryamino-acid sequences of the isoforms (Nishizuka, 1988,
1995) (Fig. 1A). The conventional PKCs (a, bI, bII, and g)are activated by both the lipid second messenger diacyl-
Grant sponsor: National Institute of Mental Health; Grant numbers:RO1 MH057068 and MH53576.
Eirikur Benedikz and Ivan Hernandez contributed equally to this work.Meghna U. Naik’s current address is: the Department of Biological
Sciences, 340 Wolf Building, University of Delaware, Newark, DE 19716.Eirikur Benedikz’s current address is: the Department of Clinical Neu-
roscience and Family Medicine, Division of Geriatric Medicine, KarolinskaInstitute, Novum, KFC plan 4, 141 86 Huddinge, Sweden.
*Correspondence to: Todd C. Sacktor, Laboratory of Molecular Neuro-science, Box 29, Departments of Pharmacology, Physiology, and Neurology,SUNY Downstate Medical Center, 450 Clarkson Ave., Brooklyn, NY 11203.E-mail: [email protected]
Received 23 April 2000; Revised 23 June 2000; Accepted 28 June 2000
THE JOURNAL OF COMPARATIVE NEUROLOGY 426:243–258 (2000)
© 2000 WILEY-LISS, INC.

glycerol (DAG) and Ca21. Novel PKCs (d, e, h, and u) areactivated by DAG, but not by Ca21. Atypical PKCs (z andi/l) are activated by neither DAG nor Ca21 directly, but byan alternate set of lipid second messengers, includingarachidonic acid (Nakanishi and Exton, 1992), phosphati-dylinositol 3,4,5-trisphosphate (Nakanishi et al., 1993),and ceramide (Muller et al., 1995). (i [Selbie et al., 1993]and l [Akimoto et al., 1994] appear to be human andmouse homologues, respectively. For convenience, this pa-per will refer to i/l as i.) In addition to these canonicalPKC forms, there are other PKC-related kinases. Theseinclude kinases with distantly related regulatory domains(Palmer et al., 1995) and protein kinase D/PKCm (Jo-hannes et al., 1994; Valverde et al., 1994), which possessesa catalytic domain closer to the calmodulin-dependentkinases than to the three groups of PKC (Dekker et al.,1995). These PKC-related kinases were not examined inthis study.
Of PKC’s many functions in the brain, the enzyme’s rolein synaptic plasticity has been studied in the greatestdetail. In the CA1 region of the hippocampus, PKC iso-forms have been implicated in both the initial inductionand the sustained maintenance phases of LTP (Klann etal., 1993; Sacktor et al., 1993; reviewed by Schwartz,1993). During the induction phase of LTP, multiple PKCisoforms, a, bI, bII, d, and h, are transiently activated bya brief translocation from their inactive state in cytosol totheir active conformation on membrane (Sacktor et al.,1993). In contrast, in the maintenance phase of LTP, asingle species, the atypical isoform z, is persistently acti-vated through the generation of a free, independentlyactive catalytic domain, PKMz (Fig. 1A; Sacktor et al.,1993; Osten et al., 1996a). Conversely, PKMz, along withPKCs g and e, decreases in the maintenance of homosyn-aptic long-term depression (LTD) in CA1 (Hrabetova andSacktor, 1996).
LTP and LTD are general mechanisms for long-termsynaptic plasticity and occur in many regions of the brain
(see review by Malenka, 1994). Therefore, the participa-tion of nearly all PKC isoforms during specific phases ofLTP or LTD in CA1 suggests that the isozymes might actas a functional family unit during activity-dependent plas-ticity in other areas of the brain as well. Such an assemblewould imply a coordinate expression of PKC isoforms inneurons that runs counter to the prevailing notion thatonly subsets of PKC isoforms are expressed in individualneuronal cell types (reviewed by Tanaka and Saito, 1992).A study of the expression of the complete cohort of PKCisoforms in parallel, however, has not been performed,and, moreover, the distribution in brain of several of thenonconventional isozymes has not been described. In par-ticular, PKMz, which may have a specific role in the long-term maintenance of changes of synaptic strength, has notbeen examined outside the CA1 region of the hippocam-pus. To address these issues comprehensively, we usedspecific antisera to characterize the distribution of allknown forms of PKC in rat brain.
MATERIALS AND METHODS
PKC isozyme antisera
Animal use was approved by the State University ofNew York Downstate Medical Center animal care and usecommittee and conformed to NIH guidelines. All reagents,unless otherwise stated, were from Sigma (St. Louis, MO).Peptides used as immunogens were synthesized by Pen-insula Laboratories (Belmont, CA) or Multiple PeptideSystems (San Diego, CA) and consisted of an NH2-terminal cysteine followed by the sequences of thecarboxyl-terminal variable regions for PKC isozymes: a,PQFVHPILQSAV; bI, SYTNPEFVINV; bII, SFVNSE-FLKPEVKS; g, PDARSPTSPVPVPVM; d, NPKYEQFLE;e, YFGEDLMP; z, EYINPLLLSAEESV; h, INQDEFRNF-SYVSPELQL; and u, FSNFSFINPGMETLICS. The u an-tiserum was a generous gift from Dr. Shigeo Ohno, Yoka-
Fig. 1. Structure and expression of the PKC isozyme family. A: Di-agrammatic structure of the major domains of the conventional (a, bI,bII, and g), novel (d, u, h, and e), and atypical (z and i) PKC isoforms.Conventional PKCs have a DAG binding region, consisting of twotandem cysteine-rich repeats (dark and light gray boxes) and a Ca21
binding domain (open box). Novel (or new) PKCs have only the DAG
binding regions. Atypical PKCs possess only the first cysteine-richregion. The catalytic domain is shown in black. PKM is the indepen-dent catalytic domain of PKC. B: Immunoblot showing the expressionof the nine neural PKCs in rat hippocampus and PKCu (*) in ratskeletal muscle. Only z shows a prominent PKM form at 55 kDa.Molecular weights in kDa are on the left.
244 M.U. NAIK ET AL.

hama, Japan (Osada et al., 1992); antiserum made incollaboration with Dr. Kathryn Miles, State University ofNew York Downstate Medical Center, gave similar results(Hilgenberg and Miles, 1995).
The peptides were coupled to maleimide-activated bo-vine serum albumin (BSA; Pierce, Rockford, IL), accordingto the manufacturer’s instructions. Peptide conjugateswere mixed with Titermax (CytRx, Norcross, GA) andinjected intramuscularly into female New Zealand rab-bits, 1–3 weeks of age. After one to three boosts at 4-weekintervals, the antisera were affinity-purified on Sul-pholink gel columns (Pierce), to which the immunizingpeptide had been conjugated according to the manufactur-er’s instructions. The antisera to i/l were a mouse mono-clonal antibody prepared against the l catalytic domain(Transduction Laboratories, Lexington, KY) and a rabbitpolyclonal antiserum generated against a i/l-specific pep-tide derived from the l hinge (a generous gift from Dr.Shigeo Ohno, Yokahama, Japan). Both antisera gaveequivalent results on immunoblot; the rabbit polyclonalantibody was used for immunocytochemistry.
Preparation of tissues for immunoblotting
Sprague-Dawley rats (aged 4–5 weeks) were anesthe-tized with halothane. The hippocampus or skeletal muscle(for PKCu) were rapidly dissected, frozen on dry ice, andwashed 3 times with homogenization buffer (50 mM Tris-HCl, pH 7.5, 1 mM EDTA, 1 mM EGTA, 0.1 mM phenyl-methylsulfonyl fluoride, 5 mM benzamidine, 17 kallikreinunits/ml aprotinin, 0.1 mM leupeptin) at 4°C. The tissueswere homogenized with a motorized pestle in a Teflon-glass Potter-Elvehjem tissue grinder, containing 1 ml of4:1 (vol/vol) homogenization buffer/sodium dodecyl sulfate(SDS)-sample buffer (10% SDS, 0.313 M Tris-HCl, 50%glycerol, pH 6.8), and heated to 90°C for 10 minutes. Totalprotein was determined by assay with bicinchoninic acid(Pierce), followed by addition of 2-mercaptoethanol to 5mM, final concentration.
Immunoblotting
The total protein loaded into each lane for SDS-polyacrylamide gel electrophoresis (SDS-PAGE) was10–30 mg/cm-lane. Following electrophoretic transfer, thenitrocellulose membrane (Schleicher & Schuell, Keene,NH) was blocked for 1 hour with 1% BSA, 1% hemoglobin,in 10 mM Tris-HCl, 150 mM NaCl, 0.2% Nonidet P-40(TBSN). The nitrocellulose lane for each sample was cutinto strips, which were incubated for 1 hour at room tem-perature in one of the PKC antisera at an optimal concen-tration (a, 1:4,000; bI, 1:1,000; bII, 1:600; g, 1:4,000; d,1:2,000; e, 1:1,000; h, 1:500; u, 1:500; z, 1:2,000; i, 1:1,000).The strips were then washed 4 times for 8 minutes inTBSN, followed by alkaline-phosphatase detection (Pro-mega, Madison, WI) with secondary goat anti-rabbit oranti-mouse antiserum at 1:2,500 dilution in TBSN with1% BSA for 1 hour. Bands were in the linear range ofdetection with respect to total protein loaded on the gel, asdetermined by densitometric scanning with National In-stitutes of Health Image software on an XRS 6cx scanner(OmniMedia, Torrance, CA). Specificity of antisera wasdemonstrated by preincubation with appropriate immu-nizing peptides at 2 mg/ml for 2 hours at room tempera-ture.
Perfusion fixation
The low/high pH method of formaldehyde fixation de-scribed by Berod et al. (1981) was used with minor modi-fications. Three-week-old rats were anesthetized by intra-peritoneal injection with sodium pentobarbital (45 mg/60g body weight; Anpro Pharmaceutical, Arcadia, CA). Theanimals were perfused through the aorta for 3 minuteswith 2% paraformaldehyde in 0.1 M sodium acetate buffer(pH 6.5) at 4°C, followed by a 30-minute perfusion with 2%paraformaldehyde in 0.1 M sodium borate buffer (pH 8.5).The brains were removed and postfixed in the pH 8.5solution overnight at 4°C and then processed into paraffin.
Immunocytochemical staining
Paraffin sections (10 mm) were first washed with 0.1 MTris-HCl (pH 7.6) (solution A), 3 times for 5 minutes,followed by 0.5% hydrogen peroxide in solution A for 30minutes to inactivate endogenous peroxidases. The sec-tions were then washed in solution A for 5 minutes, fol-lowed by 0.1% Triton X-100 in solution A (solution B),twice for 10 minutes. Sections were incubated in 10%normal goat serum and 0.005% BSA in solution B (solu-tion C) for 1 hour at room temperature, followed by incu-bation overnight at 4°C in solution C with primary anti-sera at optimized dilutions (a, 1:50; bI, 1:200; bII, 1:200; g,1:500; d, 1:500; e, 1:250; h, 1:200; z, 1:500; i, 1:50). Incontrols, sections were incubated with solution C, insteadof primary, or primary preincubated with immunizingpeptides, as described above for immunoblots.
After washing twice for 10 minutes with solution B, thesections were incubated for 1 hour in goat-antirabbit bio-tinylated antibody (Vector, Burlingame, CA) at 1:200 di-lution in solution C. The sections were washed twice for 10minutes with solution B and incubated for 1 hour inavidin-biotinylated horseradish peroxidase complex (Vec-tor) in solution C. Sections were stained by incubation for5–30 minutes with 5 mg diaminobenzadine, 3 mg/ml glu-coseoxidase, 0.2 g/ml ammonium chloride, 0.25 g/mlb–D(1)-glucose, in 0.1 M Tris-HCl (pH 7.6). The reactionwas stopped with distilled water, and the sections weredehydrated in graded alcohol and xylene and placed undercoverslips with Permount (Polysciences, Warrington, PA).Images were obtained by photomicroscopy with a ZeissAxiovert 10 (Figs. 3, 4) or digitally with a NikonMicrophot-SA, by using Adobe Photoshop (Figs. 2, 5–8).
Brain regions
Following anesthesia and rapid dissection as describedabove, the whole brain was placed into isopentane at235°C for 3 minutes and then set on dry ice for 3 minutes.The brain was transferred into M-1 embedding matrix(Lipshaw, Pittsburgh, PA), placed on dry ice until firm,and then stored at 270°C. Sections (1 mm) were cut witha guided razor blade and transferred to dry ice; the brainregions were then identified and dissected. The sampleswere then homogenized as described above, except thatthe regions were ground by hand in plastic homogenizers.
Hippocampal subregions
Hippocampal slices (450 mm) were prepared as previ-ously described (Sacktor et al., 1993). Slices were trans-ferred to 1:1 (vol/vol) propylene glycol/0.9 M NaCl, andCA1, CA3, and dentate gyrus regions, or lamellar subre-gions of CA1 were dissected on powdered dry ice. To obtain
245DISTRIBUTION OF PKC ISOZYMES IN BRAIN
sufficient total protein, lamellae were summated from 25slices, obtained from a single animal. In all experiments, nrefers to number of animals.
Statistics
The density of bands on immunoblot was analyzed byusing two-way analysis of variance without interactions.To eliminate the effect of variations among different ex-perimental animals, which were processed on separateimmunoblots, both brain region and experimental animalwere used as factors in the analysis. This allowed us toremove the variations due to experimental procedure (e.g.,efficacy of transfer to nitrocellulose, time of development)and to determine the differences among various regionsfor each isoform. Analysis of variance assumed that anexperimental value vij measured in animal i in a region jcan be linearly composed as vij 5 vo 1 ai 1 bj 1 eij, wherevo is the mean value for all regions and all animals, aispecifies region effect, bj specifies the animal effect, and eijis random error. If the regional differences were signifi-cant at the P , 0.05 level, we then examined which re-gions were significantly different by using Scheffe orTukey test for multiple comparisons. The transformeddata, in which the effect of animal had been removed, arepresented in Table 1. The data (in arbitrary units) werescaled and shifted to obtain comparable values between 0and 10, by using vij
transformed 5 ai 1 eij.
RESULTS
Characterization of PKC isozymes andPKMz in hippocampus
Conventional and novel PKCs. Immunoblots withisoform-specific carboxy-terminal antisera demonstratedthat all four of the conventional isoforms and three of thefour novel PKC isoforms are present in rat hippocampus(Fig. 1B). The molecular weights of the isoforms were (inkDa): a, 82; bI, 80; bII, 81; g, 81; d, 76; e, 95; h, 105 (meanof five determinations). PKCu (Mr 5 82, shown from skel-etal muscle in Fig. 1B) was found only in trace amounts inthe hippocampus (data not shown). These sizes are appro-
priate to the primary amino-acid sequences of theisozymes, with the exception of PKCh, which in brainappears at a higher molecular weight than PKCh in lung(Sublette et al., 1993). Although our carboxy-terminal an-tisera can detect PKM made from PKC in vitro (N. Blaceand T. Sacktor, unpublished observations), no substantialamount of PKM derived from these typical isoforms wasconsistently observed in hippocampus (Fig. 1B). On occa-sion, however, minor amounts of PKM forms could bedetected for PKCs a, bI, and d (data not shown).
Atypical PKCs. In contrast to the conventional andnovel PKCs, the carboxy-terminal sequences of the twoatypical PKC species, z and i, are identical in 12 of 14residues. Thus antisera to the carboxy-terminal of z, pre-viously used in most studies to detect PKCz, are likely tocross-react with PKCi. In the hippocampus this antiserumrecognizes both PKC and PKM forms, Mr 5 72 and 55kDa, respectively (Fig. 1B), as well as several minorbands, most prominently a high-molecular weight species,;160 kDa (Sacktor et al., 1993, not observed in Fig. 1B),and a band at ;76 kDa (observed, for example, in thesamples of striatum, hypothalamus, and thalamus in Fig.9). To determine whether PKCi is also expressed as aPKM form in brain, we used a monoclonal antibody spe-cific to the catalytic domain of i (Signal Transduction,Lexington, KY), which recognizes recombinantly ex-pressed PKCi/l, as well as PKMi/l, but not PKCz (I.Hernandez, J. Libien, and T. Sacktor, unpublished obser-vations). This antibody detected PKCi in hippocampus,Mr 5 72 (Fig. 1B), but only a minor amount of PKMi.These results indicate that the single atypical isoform z isthe major source of stable PKM in the hippocampus.
Immunocytochemical analysis of PKCisoforms in brain
Inspection of immunocytochemical staining of sectionsof rat brain revealed a widespread distribution with aunique pattern of high and low levels of expression foreach of the neural PKC isoforms (Fig. 2A–I). The wide-spread staining was not due to background signal becausethere was little staining when the primary antiserum was
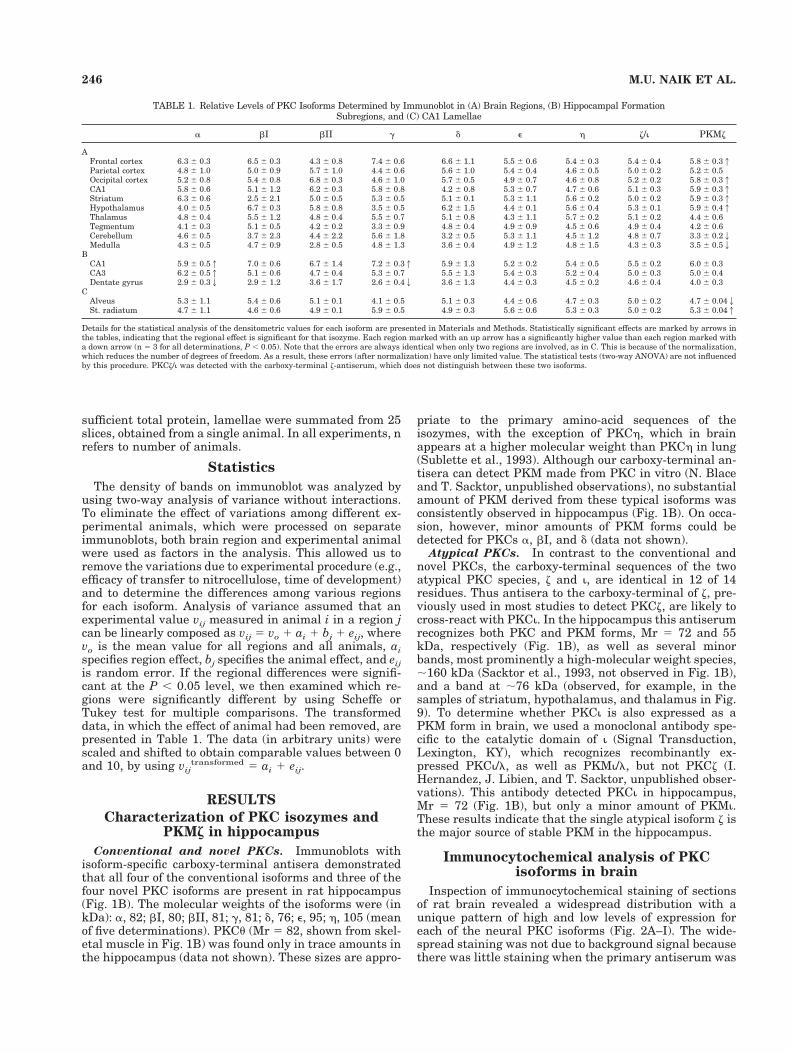
TABLE 1. Relative Levels of PKC Isoforms Determined by Immunoblot in (A) Brain Regions, (B) Hippocampal FormationSubregions, and (C) CA1 Lamellae
a bI bII g d e h z/i PKMz
AFrontal cortex 6.3 6 0.3 6.5 6 0.3 4.3 6 0.8 7.4 6 0.6 6.6 6 1.1 5.5 6 0.6 5.4 6 0.3 5.4 6 0.4 5.8 6 0.31Parietal cortex 4.8 6 1.0 5.0 6 0.9 5.7 6 1.0 4.4 6 0.6 5.6 6 1.0 5.4 6 0.4 4.6 6 0.5 5.0 6 0.2 5.2 6 0.5Occipital cortex 5.2 6 0.8 5.4 6 0.8 6.8 6 0.3 4.6 6 1.0 5.7 6 0.5 4.9 6 0.7 4.6 6 0.8 5.2 6 0.2 5.8 6 0.31CA1 5.8 6 0.6 5.1 6 1.2 6.2 6 0.3 5.8 6 0.8 4.2 6 0.8 5.3 6 0.7 4.7 6 0.6 5.1 6 0.3 5.9 6 0.31Striatum 6.3 6 0.6 2.5 6 2.1 5.0 6 0.5 5.3 6 0.5 5.1 6 0.1 5.3 6 1.1 5.6 6 0.2 5.0 6 0.2 5.9 6 0.31Hypothalamus 4.0 6 0.5 6.7 6 0.3 5.8 6 0.8 3.5 6 0.5 6.2 6 1.5 4.4 6 0.1 5.6 6 0.4 5.3 6 0.1 5.9 6 0.41Thalamus 4.8 6 0.4 5.5 6 1.2 4.8 6 0.4 5.5 6 0.7 5.1 6 0.8 4.3 6 1.1 5.7 6 0.2 5.1 6 0.2 4.4 6 0.6Tegmentum 4.1 6 0.3 5.1 6 0.5 4.2 6 0.2 3.3 6 0.9 4.8 6 0.4 4.9 6 0.9 4.5 6 0.6 4.9 6 0.4 4.2 6 0.6Cerebellum 4.6 6 0.5 3.7 6 2.3 4.4 6 2.2 5.6 6 1.8 3.2 6 0.5 5.3 6 1.1 4.5 6 1.2 4.8 6 0.7 3.3 6 0.22Medulla 4.3 6 0.5 4.7 6 0.9 2.8 6 0.5 4.8 6 1.3 3.6 6 0.4 4.9 6 1.2 4.8 6 1.5 4.3 6 0.3 3.5 6 0.52
BCA1 5.9 6 0.51 7.0 6 0.6 6.7 6 1.4 7.2 6 0.31 5.9 6 1.3 5.2 6 0.2 5.4 6 0.5 5.5 6 0.2 6.0 6 0.3CA3 6.2 6 0.51 5.1 6 0.6 4.7 6 0.4 5.3 6 0.7 5.5 6 1.3 5.4 6 0.3 5.2 6 0.4 5.0 6 0.3 5.0 6 0.4Dentate gyrus 2.9 6 0.32 2.9 6 1.2 3.6 6 1.7 2.6 6 0.42 3.6 6 1.3 4.4 6 0.3 4.5 6 0.2 4.6 6 0.4 4.0 6 0.3
CAlveus 5.3 6 1.1 5.4 6 0.6 5.1 6 0.1 4.1 6 0.5 5.1 6 0.3 4.4 6 0.6 4.7 6 0.3 5.0 6 0.2 4.7 6 0.042St. radiatum 4.7 6 1.1 4.6 6 0.6 4.9 6 0.1 5.9 6 0.5 4.9 6 0.3 5.6 6 0.6 5.3 6 0.3 5.0 6 0.2 5.3 6 0.041
Details for the statistical analysis of the densitometric values for each isoform are presented in Materials and Methods. Statistically significant effects are marked by arrows inthe tables, indicating that the regional effect is significant for that isozyme. Each region marked with an up arrow has a significantly higher value than each region marked witha down arrow (n 5 3 for all determinations, P , 0.05). Note that the errors are always identical when only two regions are involved, as in C. This is because of the normalization,which reduces the number of degrees of freedom. As a result, these errors (after normalization) have only limited value. The statistical tests (two-way ANOVA) are not influencedby this procedure. PKCz/i was detected with the carboxy-terminal z-antiserum, which does not distinguish between these two isoforms.
246 M.U. NAIK ET AL.
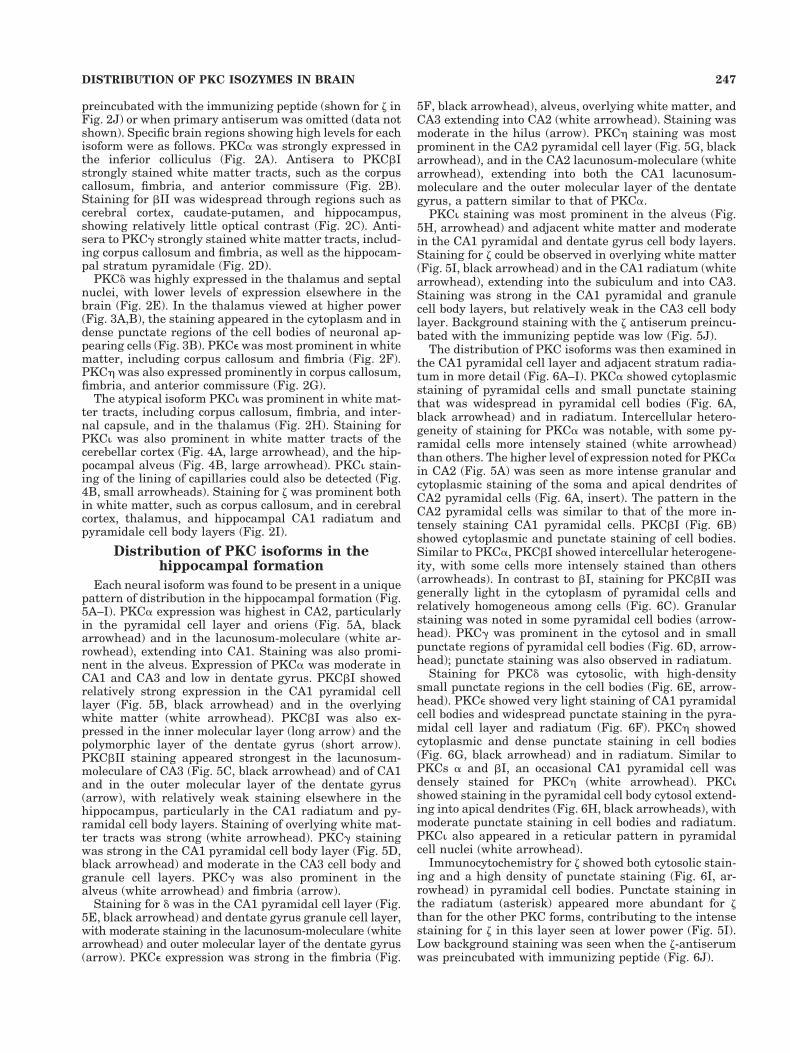
preincubated with the immunizing peptide (shown for z inFig. 2J) or when primary antiserum was omitted (data notshown). Specific brain regions showing high levels for eachisoform were as follows. PKCa was strongly expressed inthe inferior colliculus (Fig. 2A). Antisera to PKCbIstrongly stained white matter tracts, such as the corpuscallosum, fimbria, and anterior commissure (Fig. 2B).Staining for bII was widespread through regions such ascerebral cortex, caudate-putamen, and hippocampus,showing relatively little optical contrast (Fig. 2C). Anti-sera to PKCg strongly stained white matter tracts, includ-ing corpus callosum and fimbria, as well as the hippocam-pal stratum pyramidale (Fig. 2D).
PKCd was highly expressed in the thalamus and septalnuclei, with lower levels of expression elsewhere in thebrain (Fig. 2E). In the thalamus viewed at higher power(Fig. 3A,B), the staining appeared in the cytoplasm and indense punctate regions of the cell bodies of neuronal ap-pearing cells (Fig. 3B). PKCe was most prominent in whitematter, including corpus callosum and fimbria (Fig. 2F).PKCh was also expressed prominently in corpus callosum,fimbria, and anterior commissure (Fig. 2G).
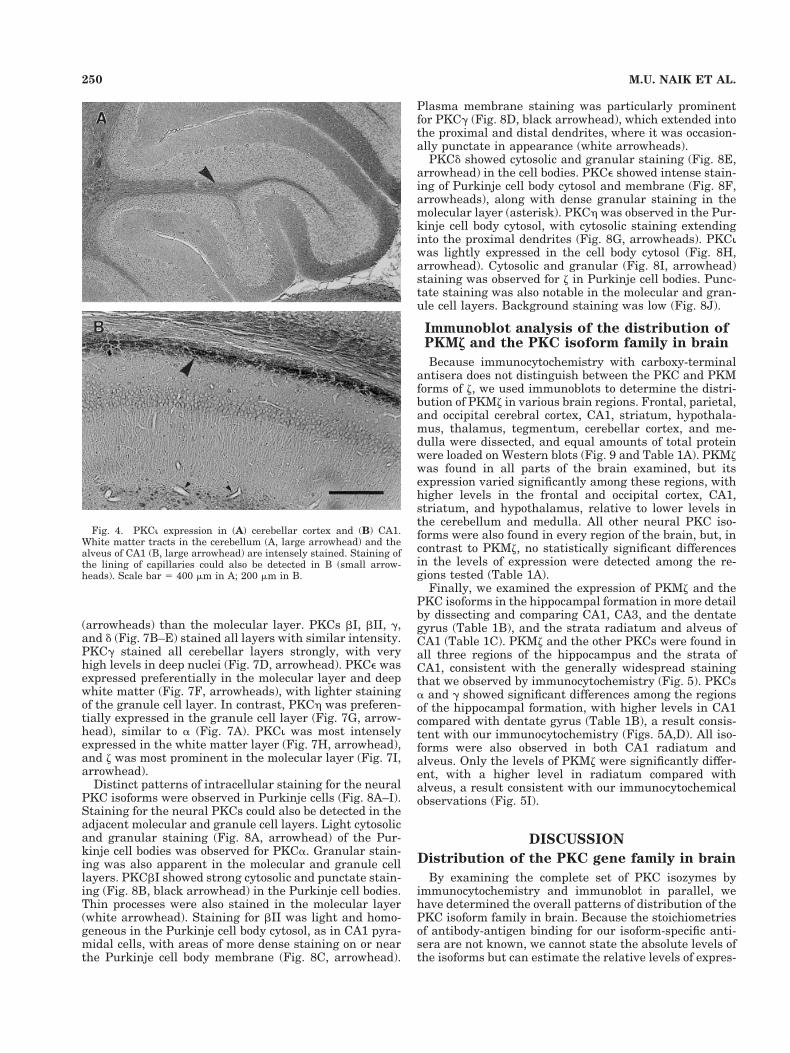
The atypical isoform PKCi was prominent in white mat-ter tracts, including corpus callosum, fimbria, and inter-nal capsule, and in the thalamus (Fig. 2H). Staining forPKCi was also prominent in white matter tracts of thecerebellar cortex (Fig. 4A, large arrowhead), and the hip-pocampal alveus (Fig. 4B, large arrowhead). PKCi stain-ing of the lining of capillaries could also be detected (Fig.4B, small arrowheads). Staining for z was prominent bothin white matter, such as corpus callosum, and in cerebralcortex, thalamus, and hippocampal CA1 radiatum andpyramidale cell body layers (Fig. 2I).
Distribution of PKC isoforms in thehippocampal formation
Each neural isoform was found to be present in a uniquepattern of distribution in the hippocampal formation (Fig.5A–I). PKCa expression was highest in CA2, particularlyin the pyramidal cell layer and oriens (Fig. 5A, blackarrowhead) and in the lacunosum-moleculare (white ar-rowhead), extending into CA1. Staining was also promi-nent in the alveus. Expression of PKCa was moderate inCA1 and CA3 and low in dentate gyrus. PKCbI showedrelatively strong expression in the CA1 pyramidal celllayer (Fig. 5B, black arrowhead) and in the overlyingwhite matter (white arrowhead). PKCbI was also ex-pressed in the inner molecular layer (long arrow) and thepolymorphic layer of the dentate gyrus (short arrow).PKCbII staining appeared strongest in the lacunosum-moleculare of CA3 (Fig. 5C, black arrowhead) and of CA1and in the outer molecular layer of the dentate gyrus(arrow), with relatively weak staining elsewhere in thehippocampus, particularly in the CA1 radiatum and py-ramidal cell body layers. Staining of overlying white mat-ter tracts was strong (white arrowhead). PKCg stainingwas strong in the CA1 pyramidal cell body layer (Fig. 5D,black arrowhead) and moderate in the CA3 cell body andgranule cell layers. PKCg was also prominent in thealveus (white arrowhead) and fimbria (arrow).
Staining for d was in the CA1 pyramidal cell layer (Fig.5E, black arrowhead) and dentate gyrus granule cell layer,with moderate staining in the lacunosum-moleculare (whitearrowhead) and outer molecular layer of the dentate gyrus(arrow). PKCe expression was strong in the fimbria (Fig.
5F, black arrowhead), alveus, overlying white matter, andCA3 extending into CA2 (white arrowhead). Staining wasmoderate in the hilus (arrow). PKCh staining was mostprominent in the CA2 pyramidal cell layer (Fig. 5G, blackarrowhead), and in the CA2 lacunosum-moleculare (whitearrowhead), extending into both the CA1 lacunosum-moleculare and the outer molecular layer of the dentategyrus, a pattern similar to that of PKCa.
PKCi staining was most prominent in the alveus (Fig.5H, arrowhead) and adjacent white matter and moderatein the CA1 pyramidal and dentate gyrus cell body layers.Staining for z could be observed in overlying white matter(Fig. 5I, black arrowhead) and in the CA1 radiatum (whitearrowhead), extending into the subiculum and into CA3.Staining was strong in the CA1 pyramidal and granulecell body layers, but relatively weak in the CA3 cell bodylayer. Background staining with the z antiserum preincu-bated with the immunizing peptide was low (Fig. 5J).
The distribution of PKC isoforms was then examined inthe CA1 pyramidal cell layer and adjacent stratum radia-tum in more detail (Fig. 6A–I). PKCa showed cytoplasmicstaining of pyramidal cells and small punctate stainingthat was widespread in pyramidal cell bodies (Fig. 6A,black arrowhead) and in radiatum. Intercellular hetero-geneity of staining for PKCa was notable, with some py-ramidal cells more intensely stained (white arrowhead)than others. The higher level of expression noted for PKCain CA2 (Fig. 5A) was seen as more intense granular andcytoplasmic staining of the soma and apical dendrites ofCA2 pyramidal cells (Fig. 6A, insert). The pattern in theCA2 pyramidal cells was similar to that of the more in-tensely staining CA1 pyramidal cells. PKCbI (Fig. 6B)showed cytoplasmic and punctate staining of cell bodies.Similar to PKCa, PKCbI showed intercellular heterogene-ity, with some cells more intensely stained than others(arrowheads). In contrast to bI, staining for PKCbII wasgenerally light in the cytoplasm of pyramidal cells andrelatively homogeneous among cells (Fig. 6C). Granularstaining was noted in some pyramidal cell bodies (arrow-head). PKCg was prominent in the cytosol and in smallpunctate regions of pyramidal cell bodies (Fig. 6D, arrow-head); punctate staining was also observed in radiatum.
Staining for PKCd was cytosolic, with high-densitysmall punctate regions in the cell bodies (Fig. 6E, arrow-head). PKCe showed very light staining of CA1 pyramidalcell bodies and widespread punctate staining in the pyra-midal cell layer and radiatum (Fig. 6F). PKCh showedcytoplasmic and dense punctate staining in cell bodies(Fig. 6G, black arrowhead) and in radiatum. Similar toPKCs a and bI, an occasional CA1 pyramidal cell wasdensely stained for PKCh (white arrowhead). PKCishowed staining in the pyramidal cell body cytosol extend-ing into apical dendrites (Fig. 6H, black arrowheads), withmoderate punctate staining in cell bodies and radiatum.PKCi also appeared in a reticular pattern in pyramidalcell nuclei (white arrowhead).
Immunocytochemistry for z showed both cytosolic stain-ing and a high density of punctate staining (Fig. 6I, ar-rowhead) in pyramidal cell bodies. Punctate staining inthe radiatum (asterisk) appeared more abundant for zthan for the other PKC forms, contributing to the intensestaining for z in this layer seen at lower power (Fig. 5I).Low background staining was seen when the z-antiserumwas preincubated with immunizing peptide (Fig. 6J).
247DISTRIBUTION OF PKC ISOZYMES IN BRAIN
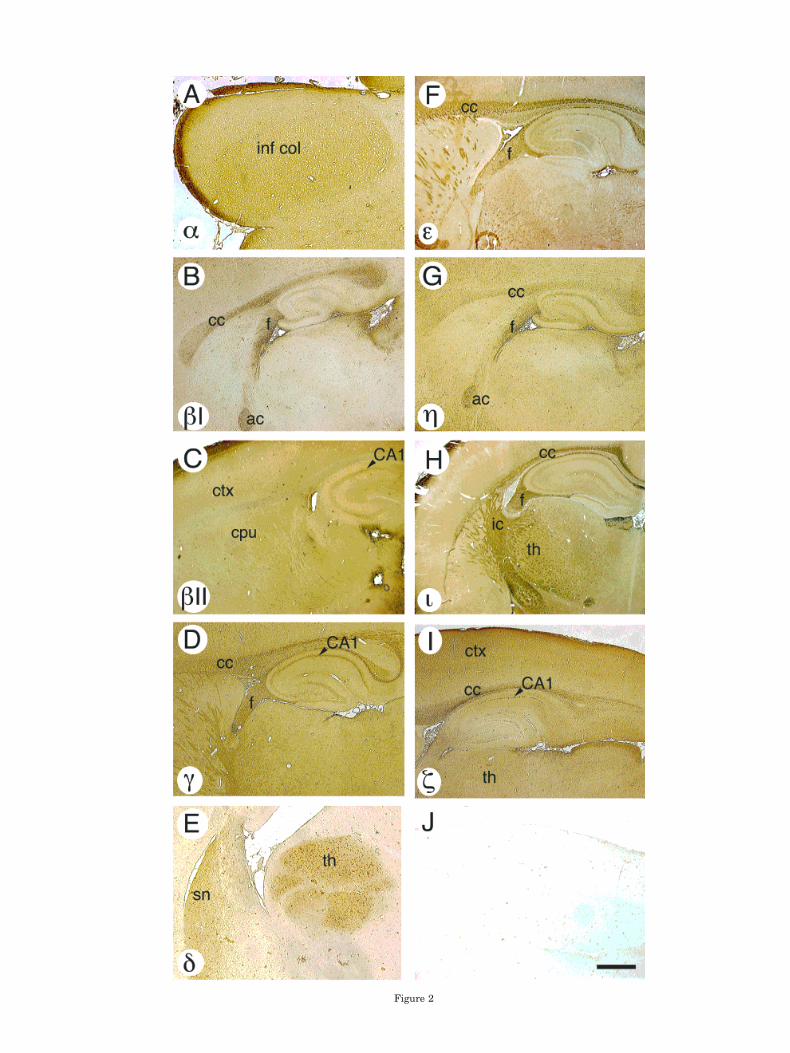
Figure 2
Distribution of PKC isoforms in thecerebellum
To determine whether a widespread distribution withheterogeneous levels of expression was a general patternfor the PKC family, we examined the distribution of thePKC isoforms in the cerebellum. As in the hippocampalformation, all neural PKC isozymes were found in thecerebellum (Fig. 7A–I), with some isoforms showing pat-terns of relatively high and low levels in specific struc-tures. Staining for PKCa was more prominent in the gran-ule cell layer (Fig. 7A) and deep cerebellar nuclei
Fig. 3. PKCd expression in thalamus. Neuronal appearing cells are intensely stained in discreteregions within their somata and moderately stained throughout their cytoplasm. Enclosed area in A isshown expanded in B. Scale bar 5 200 mm in A; 50 mm in B.
Fig. 2. Regions of prominent immunostaining of PKC isoforms inrat brain. A: a. inf col, inferior colliculus. B: bI. cc, corpus callosum; f,fimbria; ac, anterior commissure. C: bII. CA1 arrowhead, pointing toCA1 pyramidal cell layer; ctx, cerebral cortex; cpu, caudate-putamen.D: g. cc, corpus callosum; f, fimbria, CA1 pyramidal cell layer. E: d. sn,septal nuclei; th, thalamus. F: e. cc, corpus callosum; f, fimbria. G: h.cc, corpus callosum; f, fimbria; ac, anterior commisure. H: i. cc, corpuscallosum; f, fimbria; ic, internal capsule; th, thalamus. I: z. ctx, cere-bral cortex; cc, corpus callosum; th, thalamus; arrowhead, CA1 pyra-midal cell layer. J: The z antiserum preincubated with immunizingpeptide shows a low level of background staining. All sections aresagittal, except for the coronal section in H. Scale bar 5 1 mm inB–D,F–J; 425 mm in A; 860 mm in E.
249DISTRIBUTION OF PKC ISOZYMES IN BRAIN
(arrowheads) than the molecular layer. PKCs bI, bII, g,and d (Fig. 7B–E) stained all layers with similar intensity.PKCg stained all cerebellar layers strongly, with veryhigh levels in deep nuclei (Fig. 7D, arrowhead). PKCe wasexpressed preferentially in the molecular layer and deepwhite matter (Fig. 7F, arrowheads), with lighter stainingof the granule cell layer. In contrast, PKCh was preferen-tially expressed in the granule cell layer (Fig. 7G, arrow-head), similar to a (Fig. 7A). PKCi was most intenselyexpressed in the white matter layer (Fig. 7H, arrowhead),and z was most prominent in the molecular layer (Fig. 7I,arrowhead).
Distinct patterns of intracellular staining for the neuralPKC isoforms were observed in Purkinje cells (Fig. 8A–I).Staining for the neural PKCs could also be detected in theadjacent molecular and granule cell layers. Light cytosolicand granular staining (Fig. 8A, arrowhead) of the Pur-kinje cell bodies was observed for PKCa. Granular stain-ing was also apparent in the molecular and granule celllayers. PKCbI showed strong cytosolic and punctate stain-ing (Fig. 8B, black arrowhead) in the Purkinje cell bodies.Thin processes were also stained in the molecular layer(white arrowhead). Staining for bII was light and homo-geneous in the Purkinje cell body cytosol, as in CA1 pyra-midal cells, with areas of more dense staining on or nearthe Purkinje cell body membrane (Fig. 8C, arrowhead).
Plasma membrane staining was particularly prominentfor PKCg (Fig. 8D, black arrowhead), which extended intothe proximal and distal dendrites, where it was occasion-ally punctate in appearance (white arrowheads).
PKCd showed cytosolic and granular staining (Fig. 8E,arrowhead) in the cell bodies. PKCe showed intense stain-ing of Purkinje cell body cytosol and membrane (Fig. 8F,arrowheads), along with dense granular staining in themolecular layer (asterisk). PKCh was observed in the Pur-kinje cell body cytosol, with cytosolic staining extendinginto the proximal dendrites (Fig. 8G, arrowheads). PKCiwas lightly expressed in the cell body cytosol (Fig. 8H,arrowhead). Cytosolic and granular (Fig. 8I, arrowhead)staining was observed for z in Purkinje cell bodies. Punc-tate staining was also notable in the molecular and gran-ule cell layers. Background staining was low (Fig. 8J).
Immunoblot analysis of the distribution ofPKMz and the PKC isoform family in brain
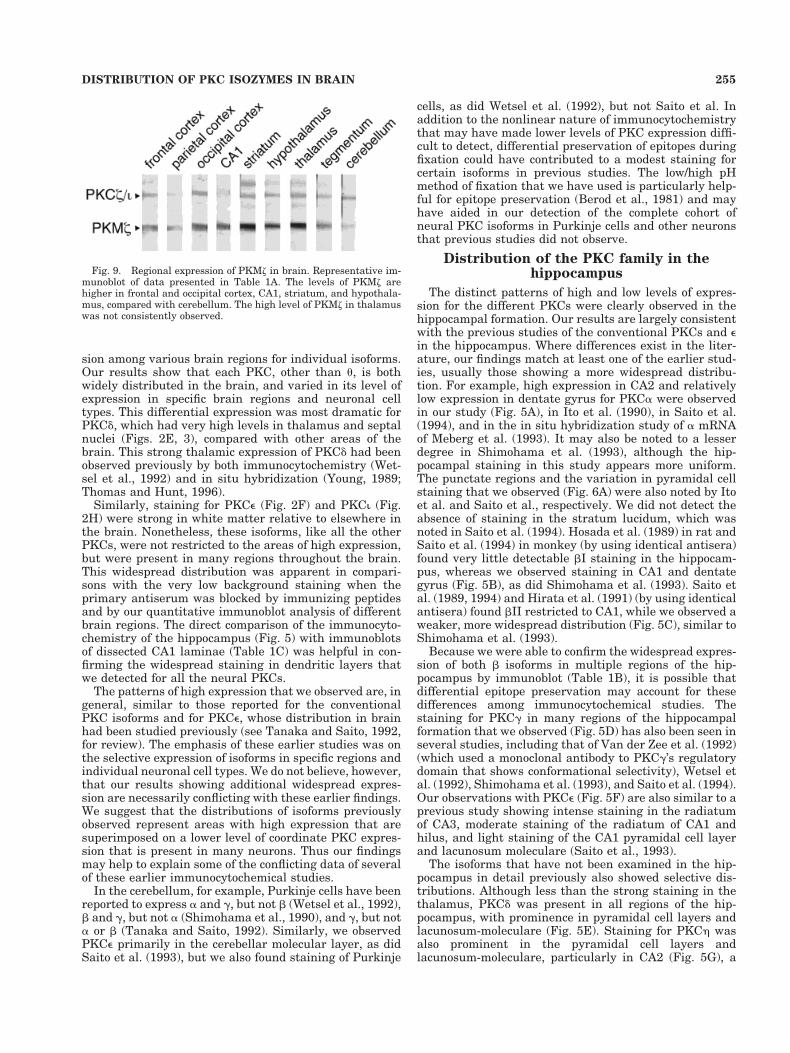
Because immunocytochemistry with carboxy-terminalantisera does not distinguish between the PKC and PKMforms of z, we used immunoblots to determine the distri-bution of PKMz in various brain regions. Frontal, parietal,and occipital cerebral cortex, CA1, striatum, hypothala-mus, thalamus, tegmentum, cerebellar cortex, and me-dulla were dissected, and equal amounts of total proteinwere loaded on Western blots (Fig. 9 and Table 1A). PKMzwas found in all parts of the brain examined, but itsexpression varied significantly among these regions, withhigher levels in the frontal and occipital cortex, CA1,striatum, and hypothalamus, relative to lower levels inthe cerebellum and medulla. All other neural PKC iso-forms were also found in every region of the brain, but, incontrast to PKMz, no statistically significant differencesin the levels of expression were detected among the re-gions tested (Table 1A).
Finally, we examined the expression of PKMz and thePKC isoforms in the hippocampal formation in more detailby dissecting and comparing CA1, CA3, and the dentategyrus (Table 1B), and the strata radiatum and alveus ofCA1 (Table 1C). PKMz and the other PKCs were found inall three regions of the hippocampus and the strata ofCA1, consistent with the generally widespread stainingthat we observed by immunocytochemistry (Fig. 5). PKCsa and g showed significant differences among the regionsof the hippocampal formation, with higher levels in CA1compared with dentate gyrus (Table 1B), a result consis-tent with our immunocytochemistry (Figs. 5A,D). All iso-forms were also observed in both CA1 radiatum andalveus. Only the levels of PKMz were significantly differ-ent, with a higher level in radiatum compared withalveus, a result consistent with our immunocytochemicalobservations (Fig. 5I).
DISCUSSION
Distribution of the PKC gene family in brain
By examining the complete set of PKC isozymes byimmunocytochemistry and immunoblot in parallel, wehave determined the overall patterns of distribution of thePKC isoform family in brain. Because the stoichiometriesof antibody-antigen binding for our isoform-specific anti-sera are not known, we cannot state the absolute levels ofthe isoforms but can estimate the relative levels of expres-
Fig. 4. PKCi expression in (A) cerebellar cortex and (B) CA1.White matter tracts in the cerebellum (A, large arrowhead) and thealveus of CA1 (B, large arrowhead) are intensely stained. Staining ofthe lining of capillaries could also be detected in B (small arrow-heads). Scale bar 5 400 mm in A; 200 mm in B.
250 M.U. NAIK ET AL.
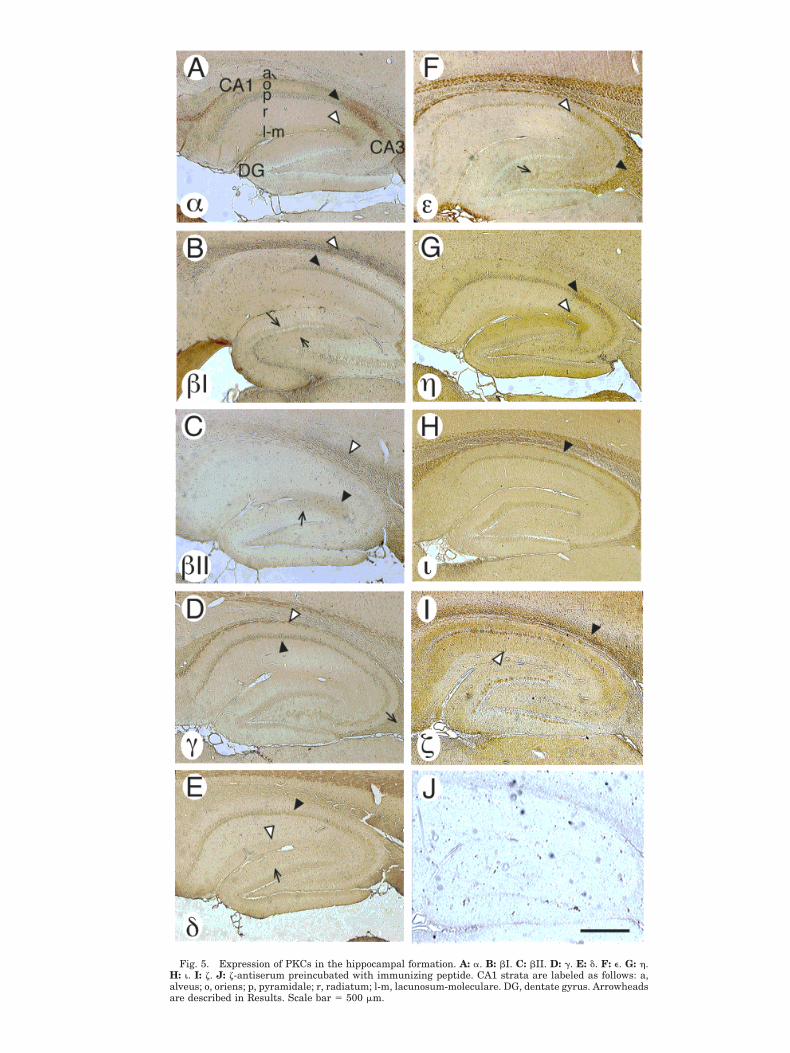
Fig. 5. Expression of PKCs in the hippocampal formation. A: a. B: bI. C: bII. D: g. E: d. F: e. G: h.H: i. I: z. J: z-antiserum preincubated with immunizing peptide. CA1 strata are labeled as follows: a,alveus; o, oriens; p, pyramidale; r, radiatum; l-m, lacunosum-moleculare. DG, dentate gyrus. Arrowheadsare described in Results. Scale bar 5 500 mm.
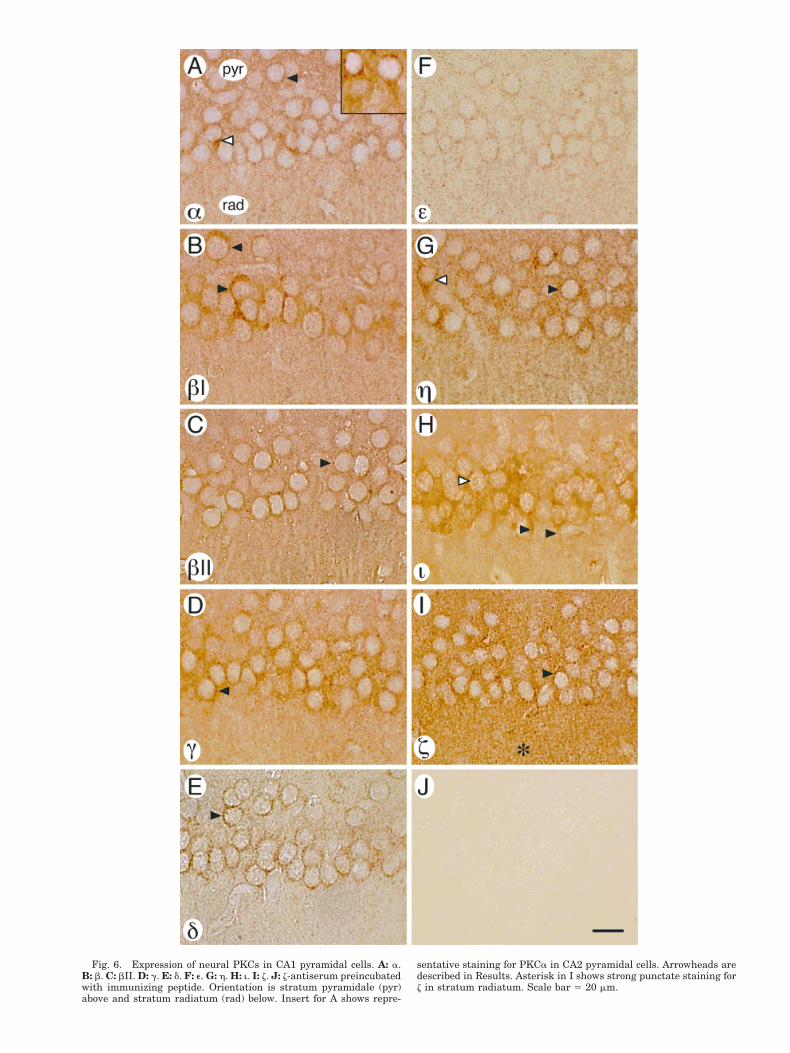
Fig. 6. Expression of neural PKCs in CA1 pyramidal cells. A: a.B: b. C: bII. D: g. E: d. F: e. G: h. H: i. I: z. J: z-antiserum preincubatedwith immunizing peptide. Orientation is stratum pyramidale (pyr)above and stratum radiatum (rad) below. Insert for A shows repre-
sentative staining for PKCa in CA2 pyramidal cells. Arrowheads aredescribed in Results. Asterisk in I shows strong punctate staining forz in stratum radiatum. Scale bar 5 20 mm.
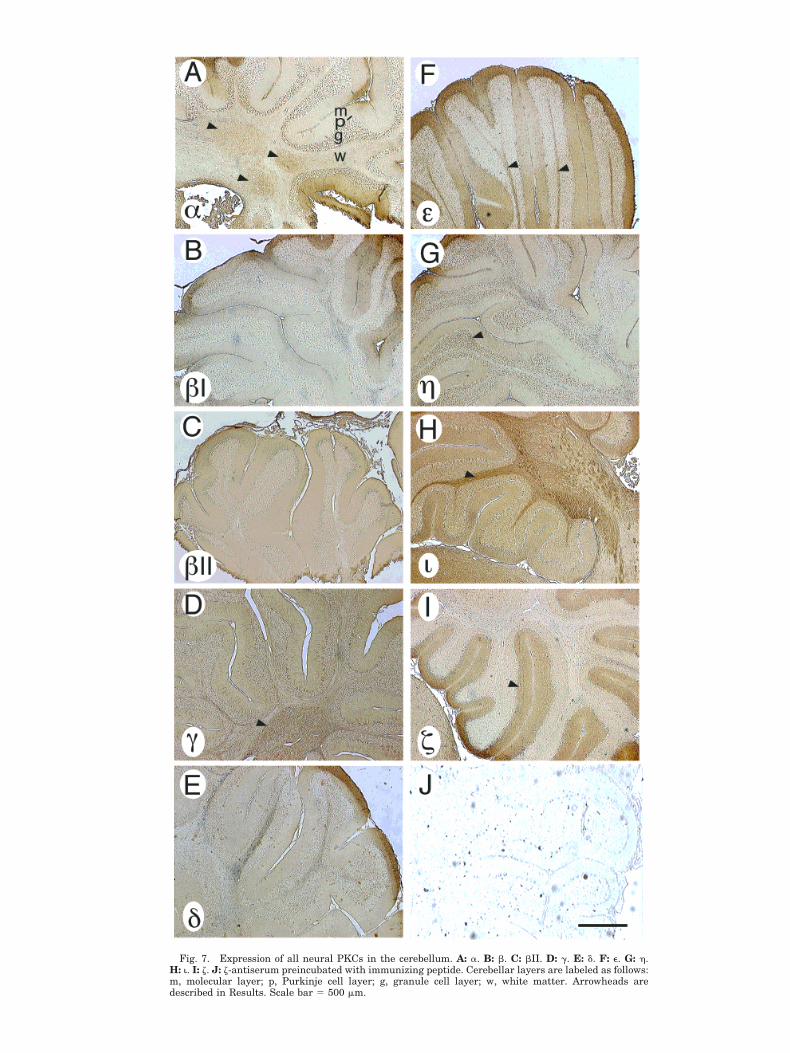
Fig. 7. Expression of all neural PKCs in the cerebellum. A: a. B: b. C: bII. D: g. E: d. F: e. G: h.H: i. I: z. J: z-antiserum preincubated with immunizing peptide. Cerebellar layers are labeled as follows:m, molecular layer; p, Purkinje cell layer; g, granule cell layer; w, white matter. Arrowheads aredescribed in Results. Scale bar 5 500 mm.

Fig. 8. Expression of all neural PKCs in cerebellar Purkinje cells. A: a. B: bI. C: bII. D: g. E: d. F: e.G: h. H: i. I: z. J: z-antiserum preincubated with immunizing peptide. Orientation is the molecular layer(mol) above the Purkinje cell layer and the granule cell layer (gr) below. Arrowheads are described inResults. Asterisk in F shows strong staining for e in the molecular layer. Scale bar 5 40 mm.
sion among various brain regions for individual isoforms.Our results show that each PKC, other than u, is bothwidely distributed in the brain, and varied in its level ofexpression in specific brain regions and neuronal celltypes. This differential expression was most dramatic forPKCd, which had very high levels in thalamus and septalnuclei (Figs. 2E, 3), compared with other areas of thebrain. This strong thalamic expression of PKCd had beenobserved previously by both immunocytochemistry (Wet-sel et al., 1992) and in situ hybridization (Young, 1989;Thomas and Hunt, 1996).
Similarly, staining for PKCe (Fig. 2F) and PKCi (Fig.2H) were strong in white matter relative to elsewhere inthe brain. Nonetheless, these isoforms, like all the otherPKCs, were not restricted to the areas of high expression,but were present in many regions throughout the brain.This widespread distribution was apparent in compari-sons with the very low background staining when theprimary antiserum was blocked by immunizing peptidesand by our quantitative immunoblot analysis of differentbrain regions. The direct comparison of the immunocyto-chemistry of the hippocampus (Fig. 5) with immunoblotsof dissected CA1 laminae (Table 1C) was helpful in con-firming the widespread staining in dendritic layers thatwe detected for all the neural PKCs.
The patterns of high expression that we observed are, ingeneral, similar to those reported for the conventionalPKC isoforms and for PKCe, whose distribution in brainhad been studied previously (see Tanaka and Saito, 1992,for review). The emphasis of these earlier studies was onthe selective expression of isoforms in specific regions andindividual neuronal cell types. We do not believe, however,that our results showing additional widespread expres-sion are necessarily conflicting with these earlier findings.We suggest that the distributions of isoforms previouslyobserved represent areas with high expression that aresuperimposed on a lower level of coordinate PKC expres-sion that is present in many neurons. Thus our findingsmay help to explain some of the conflicting data of severalof these earlier immunocytochemical studies.
In the cerebellum, for example, Purkinje cells have beenreported to express a and g, but not b (Wetsel et al., 1992),b and g, but not a (Shimohama et al., 1990), and g, but nota or b (Tanaka and Saito, 1992). Similarly, we observedPKCe primarily in the cerebellar molecular layer, as didSaito et al. (1993), but we also found staining of Purkinje
cells, as did Wetsel et al. (1992), but not Saito et al. Inaddition to the nonlinear nature of immunocytochemistrythat may have made lower levels of PKC expression diffi-cult to detect, differential preservation of epitopes duringfixation could have contributed to a modest staining forcertain isoforms in previous studies. The low/high pHmethod of fixation that we have used is particularly help-ful for epitope preservation (Berod et al., 1981) and mayhave aided in our detection of the complete cohort ofneural PKC isoforms in Purkinje cells and other neuronsthat previous studies did not observe.
Distribution of the PKC family in thehippocampus
The distinct patterns of high and low levels of expres-sion for the different PKCs were clearly observed in thehippocampal formation. Our results are largely consistentwith the previous studies of the conventional PKCs and ein the hippocampus. Where differences exist in the liter-ature, our findings match at least one of the earlier stud-ies, usually those showing a more widespread distribu-tion. For example, high expression in CA2 and relativelylow expression in dentate gyrus for PKCa were observedin our study (Fig. 5A), in Ito et al. (1990), in Saito et al.(1994), and in the in situ hybridization study of a mRNAof Meberg et al. (1993). It may also be noted to a lesserdegree in Shimohama et al. (1993), although the hip-pocampal staining in this study appears more uniform.The punctate regions and the variation in pyramidal cellstaining that we observed (Fig. 6A) were also noted by Itoet al. and Saito et al., respectively. We did not detect theabsence of staining in the stratum lucidum, which wasnoted in Saito et al. (1994). Hosada et al. (1989) in rat andSaito et al. (1994) in monkey (by using identical antisera)found very little detectable bI staining in the hippocam-pus, whereas we observed staining in CA1 and dentategyrus (Fig. 5B), as did Shimohama et al. (1993). Saito etal. (1989, 1994) and Hirata et al. (1991) (by using identicalantisera) found bII restricted to CA1, while we observed aweaker, more widespread distribution (Fig. 5C), similar toShimohama et al. (1993).
Because we were able to confirm the widespread expres-sion of both b isoforms in multiple regions of the hip-pocampus by immunoblot (Table 1B), it is possible thatdifferential epitope preservation may account for thesedifferences among immunocytochemical studies. Thestaining for PKCg in many regions of the hippocampalformation that we observed (Fig. 5D) has also been seen inseveral studies, including that of Van der Zee et al. (1992)(which used a monoclonal antibody to PKCg’s regulatorydomain that shows conformational selectivity), Wetsel etal. (1992), Shimohama et al. (1993), and Saito et al. (1994).Our observations with PKCe (Fig. 5F) are also similar to aprevious study showing intense staining in the radiatumof CA3, moderate staining of the radiatum of CA1 andhilus, and light staining of the CA1 pyramidal cell layerand lacunosum moleculare (Saito et al., 1993).
The isoforms that have not been examined in the hip-pocampus in detail previously also showed selective dis-tributions. Although less than the strong staining in thethalamus, PKCd was present in all regions of the hip-pocampus, with prominence in pyramidal cell layers andlacunosum-moleculare (Fig. 5E). Staining for PKCh wasalso prominent in the pyramidal cell layers andlacunosum-moleculare, particularly in CA2 (Fig. 5G), a
Fig. 9. Regional expression of PKMz in brain. Representative im-munoblot of data presented in Table 1A. The levels of PKMz arehigher in frontal and occipital cortex, CA1, striatum, and hypothala-mus, compared with cerebellum. The high level of PKMz in thalamuswas not consistently observed.
255DISTRIBUTION OF PKC ISOZYMES IN BRAIN

pattern similar to PKCa (Fig. 5A). Staining for PKCi wasnotable in the alveus (Figs. 4B, 5H), consistent with itsstrong staining of other white matter tracts of the brain(Figs. 2H, 4A). In contrast to the other isoforms, stainingfor z was prominent in CA1 radiatum (Fig. 5I), an obser-vation confirmed by immunoblot (Table 1C). The increasein z signal appeared localized specifically to the radiatumbecause there was a sharp drop in staining intensity at theborder between the CA1 radiatum and the lacunosum-moleculare. A similar decrease in intensity was seen be-tween the higher level of staining in the oriens and thelower level in the alveus.
Intracellular compartmentalization of thePKC family in neurons
Heterogeneous distribution of the PKC isoform familywas also observed at the subcellular level in the patternsof staining of the isoforms within CA1 pyramidal andcerebellar Purkinje cells. Intracellular compartmentaliza-tion of PKC isoforms has recently been described as animportant mechanism for their functional specificity (Ki-ley et al., 1995; Mochly-Rosen, 1995; Jaken, 1996). Thepotential mechanisms for intracellular compartmentaliza-tion of PKCs in neurons include: 1) localized production ofisoform-selective lipid second messengers (Nishizuka,1995); 2) association with specific PKC binding proteins,e.g., receptors for activated C-kinase (RACKs; Mochly-Rosen, 1995); and 3) binding to cytoskeletal proteinsthrough isoform-specific carboxy-terminal variable re-gions (Blobe et al., 1996) or by other domains in thekinases (Prekeris et al., 1996).
The variations in subcellular distribution that we ob-served among the isoforms include the degree of mem-brane binding, extension into the dendritic tree, numberand distribution of punctate areas of isoform compartmen-talization, and nuclear localization. In the cerebellar Pur-kinje cells, for example, prominent membrane stainingwas most notable for PKCg, which extended into the den-dritic tree (Fig. 8D). Although intrasomatic granulationwas characteristic of almost all the PKCs, PKCbII hadrelatively few intrasomatic granules (Figs. 6C, 8C). Nu-clear localization was notable particularly for PKCi inCA1 pyramidal cells (Fig. 6H). This nuclear localization ofPKCi may be related to the staining for atypical PKCreported in the nuclei of neocortical pyramidal and cere-bellar Purkinje cells (Hagiwara et al., 1990), in isolatednuclei of bovine cerebral cortex (Rosenberger et al., 1995),and in the nuclear matrix of PC12 cells (Wooten et al.,1997; Zhou et al., 1997).
Implications for the role of PKC isoforms insynaptic plasticity
Our observation that most PKC isoforms are expressedin CA1 pyramidal cells is consistent with the evidence fora coordinated regulation of the isozymes during activity-dependent synaptic plasticity at the Schaffer collateral/commissural-CA1 synapse. During the induction phase ofLTP, multiple PKC isoforms translocate to the membrane-particulate fraction in concert (Sacktor et al., 1993). Inaddition, during very high-intensity stimulation LTP pro-tocols, the levels of the all neural PKCs increase in concertthrough de novo protein synthesis (Osten et al., 1996a).This coordinated regulation of PKC isoforms during syn-aptic plasticity does not necessarily imply that their func-tions are redundant. The translocation to the membrane-
particulate compartment of multiple PKC isoforms duringLTP induction, for example, may result in divergent signaltransduction pathways, perhaps mediated through spatialtargeting of the isoforms within neurons. This divergencewould be expected for initial LTP induction because itinvolves a highly complex set of signal transductionevents, including the activation of multiple kinases(Klann, 1991, 1993; O’Dell et al., 1991; Frey et al., 1993;Lisman, 1994; Zhuo et al., 1994; Blitzer, et al., 1995;English and Sweatt, 1997), proteases (Cerro et al., 1990;Denny et al., 1990; Fitzpatrick et al., 1992), and macro-molecular synthesis (Stanton and Sarvey, 1984; Krug etal., 1984; Frey et al., 1988; Otani et al., 1989, Osten et al.,1996a).
PKMz and long-term synaptic plasticity inthe brain
Whereas LTP induction involves the regulation ofmultiple PKC isoforms, LTP maintenance correlateswith the formation and persistence of PKMz (Sacktor etal., 1993; Osten et al., 1996a,b; Hrabetova and Sacktor,1996). In this study, we find that the formation of PKMis selective to the z isoform, although minor amounts ofPKM were occasionally detected for other isozymes, par-ticularly a, bI, d, and i. PKMz showed a pattern ofdistribution that was unique among all forms of PKC,with higher levels of expression in rostral structures,such as cerebral cortex, striatum, and hippocampus,and lower levels in caudal structures, cerebellum, andmedulla. Although long-term synaptic plasticity may bea property of neurons throughout the nervous system, itis a prominent feature of forebrain structures, wherePKMz is relatively high. On the other hand, becausePKMz increases and decreases in LTP and LTD, respec-tively (Hrabetova and Sacktor, 1996), persistent bidi-rectional changes in PKMz may occur even where levelsare relatively low. Thus the relative abundance of PKMzmay be of less significance than the presence of theenzyme in a region of the brain.
The pattern of localization of z within the hippocampusis also a special feature of this isoform, with a largeamount of punctate staining in the CA1 radiatum (Figs.5I, 6I). Whether these punctate regions prove to be syn-aptic or perisynaptic remains to be determined by immu-noelectronmicroscopy. These regions of high-intensitystaining, however, suggest that the levels of z may beisolated in specific spatial domains within the radiatum.Taken together with our physiological observations of per-sistent increases and decreases of z in LTP and LTD at theSchaffer collateral/commissural-CA1 synapse, these find-ings suggest the possibility that the compartmentalizationof z within neurons may contribute to synapse specificityduring long-term neuronal plasticity.
ACKNOWLEDGMENTS
We thank Elizabeth Sublette, Sabina Hrabetova, andNancy Blace for their comments on the manuscript.
LITERATURE CITED
Akimoto K, Mizuno K, Osada SI, Hirai SI, Tanuma SI, Suzuki K, Ohno S.1994. A new member of the third class in the protein kinase C family,PKCl, expressed dominantly in an undifferentiated mouse embryonal
256 M.U. NAIK ET AL.
carcinoma cell line and also in many tissues and cells. J Biol Chem269:12677–12683.
Berod A, Hartman BK, Pujol FJ. 1981. Importance of fixation in immuno-histochemistry: use of formaldehyde solutions at variable pH for thelocalization of tyrosine hydroxylase. J Histochem Cytochem 29:844–850.
Blitzer RD, Wong T, Nouranifar R, Iyengar R, Landau EM. 1995. Postsyn-aptic cAMP pathway gates early LTP in hippocampal CA1 region.Neuron 15:1403–1414.
Blobe GC, Stribling DS, Fabbro D, Stabel S, Hannun YA. 1996. Proteinkinase C bII specifically binds to and is activated by F-actin. J BiolChem 271:15823–15830.
Cerro Sd, Larson J, Oliver MW, Lynch G. 1990. Development of hippocam-pal long-term potentiation is reduced by recently introduced calpaininhibitors. Brain Res 530:91–95.
Dekker LV, Palmer RH, Parker PJ. 1995. The protein kinase C andprotein kinase C related gene families. Current Opin Struct Biol5:396 – 402.
Denny JB, Polan-Curtain J, Ghuman A, Wayner WJ, Armstrong DL. 1990.Calpain inhibitors block long-term potentiation. Brain Res 534:317–320.
English JD, Sweatt JD. 1997. A requirement for the mitogen-activatedprotein kinase cascade in hippocampal long term potentiation. J BiolChem 272:19103–19106.
Fitzpatrick JS, Shahi K, Baudry M. 1992. Effect of seizure activity andcalpain inhibitor 1 on LTP in juvenile hippocampal slices. Int J DevNeurosci 10:313–319.
Frey U, Krug M, Reyman KG, Matthies H. 1988. Anisomycin, an inhibitorof protein synthesis, blocks late phases of LTP phenomena in thehippocampal CA1 region in vitro. Brain Res 452:57–65.
Frey U, Huang Y-Y, Kandel ER. 1993. Effects of cAMP simulate a latestage of LTP in hippocampal CA1 neurons. Science 260:1661–1664.
Hagiwara M, Uchida C, Usuda N, Nagata T, Hidaka H. 1990. z-relatedprotein kinase C in nuclei of nerve cells. Biochem Biophys Res Com-mun 168:161–168.
Hilgenberg L, Miles K. 1995. Developmental regulation of a protein kinaseC isoform localized in the neuromuscular junction. J Cell Sci 108:51–61.
Hirata M, Saito N, Kono M, Tanaka C. 1991. Differential expression ofthe bI- and bII-PKC subspecies in the postnatal developing ratbrain; an immunocytochemical study. Brain Res Dev Brain Res62:229 –238.
Hosoda K, Saito N, Kose A, Ito A, Tsujino T, Ogita K, Kikkawa U, Ono Y,Igarashi K, Nishizuka Y, Tanaka C. 1989. Immunocytochemical local-ization of the bI subspecies of protein kinase C in rat brain. Proc NatlAcad Sci USA 86:1393–1397.
Hrabetova S, Sacktor TC. 1996. Bidirectional regulation of protein kinaseMz in the maintenance of long-term potentiation and long-term depres-sion. J Neurosci 16:5324–5333.
Ito A, Saito N, Hirata M, Kose A, Tsujino T, Yoshihara C, Ogito K,Kishimoto A, Nishizuka Y, Tanaka C. 1990. Immunocytochemical lo-calization of the a subspecies of protein kinase C in rat brain. Proc NatlAcad Sci USA 87:3195–3199.
Jaken S. 1996. Protein kinase C isozymes and substrates. Curr Opin CellBiol 8:168–173.
Johannes FJ, Prestle J, Eis S, Oberhagemann P, Pfizenmaier K. 1994.PKCm is a novel, atypical member of the protein-kinase-C family. J BiolChem 269:6140–6148.
Kiley SC, Jaken S, Whelan R, Parker PJ. 1995. Intracellular targeting ofprotein kinase C isoenzymes: functional implications. Biochem SocTrans 23:601–605.
Klann E, Chen S-J, Sweatt JD. 1991. Persistent protein kinase activationin the maintenance phase of long-term potentiation. J Biol Chem266:24253–24256.
Klann E, Chen S-J, Sweatt JD. 1993. Mechanism of protein kinase Cactivation during the induction and maintenance of long-term poten-tiation probed using a selective peptide substrate. Proc Natl Acad SciUSA 90:8337–8341.
Krug M, Lossner B, Ott T. 1984. Anisomycin blocks the late-phases oflong-term potentiation in the dentate gyrus of freely moving rats. BrainRes Bull 13:39–42.
Lisman J. 1994. The CaM kinase II hypothesis for the storage of synapticmemory. Trends Neurosci 17:406–412.
Malenka RC. 1994. Synaptic plasticity in the hippocampus: LTP and LTD.Cell 78:535–538.
Meberg PJ, Barnes CA, McNaughton BL, Routtenberg A. 1993. Proteinkinase C and F1/GAP-43 gene expression in hippocampus inverselyrelated to synaptic enhancement lasting 3 days. Proc Natl Acad SciUSA 90:12050–12054.
Mochly-Rosen D. 1995. Localization of protein kinases by anchoring pro-teins: a theme in signal transduction. Science 268:247–251.
Muller G, Ayoub M, Storz P, Rennecke J, Fabbro D, Pfizenmaier K. 1995.PKCz is a molecular switch in signal transduction of TNF-a, bifunc-tionally regulated by ceramide and arachidonic acid. EMBO J 14:1961–1969.
Nakanishi H, Exton JH. 1992. Purification and characterization of the zisoform of protein kinase C from bovine kidney. J Biol Chem 267:16347–16354.
Nakanishi H, Brewer KA, Exton JH. 1993. Activation of the z isozyme ofprotein kinase C by phosphatidylinositol 3,4,5-trisphosphate. J BiolChem 268:13–16.
Nishizuka Y. 1988. The molecular heterogeneity of protein kinase C and itsimplication for cellular recognition. Nature 334:661–665.
Nishizuka Y. 1995. Protein kinase C and lipid signaling for sustainedcellular responses. FASEB J 9:484–496.
O’Dell TJ, Kandel ER, Grant SGN. 1991. Long-term potentiation in thehippocampus is blocked by tyrosine kinase inhibitors. Nature 353:558–560.
Osada S-i, Mizuno K, Saido TC, Suzuki K, Kuroki T, Ohno S. 1992. A newmember of the protein kinase C family, nPKCu, predominantly ex-pressed in skeletal muscle. Mol Cell Biol 12:3930–3938.
Osten P, Valsamis L, Harris A, Sacktor TC. 1996a. Protein synthesis-dependent formation of protein kinase Mz in LTP. J Neurosci 16:2444–2451.
Osten P, Hrabetova S, Sacktor TC. 1996b. Differential downregulation ofprotein kinase C isoforms in spreading depression. Neurosci Lett 221:37–40.
Otani S, Marshall CJ, Tate WP, Goddard GV, Abraham WC. 1989. Main-tenance of long-term potentiation in rat dentate gyrus requires proteinsynthesis but not messenger RNA synthesis immediately post-tetanization. Neuroscience 28:519–526.
Palmer RH, Ridden J, Parker PJ. 1995. Cloning and expression patterns oftwo members of a novel protein-kinase-C-related kinase family. EurJ Biochem 227:344–351.
Prekeris R, Mayhew MW, Cooper JB, Terrian DM. 1996. Identification andlocalization of an actin-binding motif that is unique to the epsilonisoform of protein kinase C and participates in the regulation of syn-aptic function. J Cell Biol 132:77–90.
Rosenberger U, Shakibaei M, Buchner K. 1995. Localization of non-conventional protein kinase C isoforms in bovine brain cell nuclei.Biochem J 305:269–725.
Sacktor TC, Osten P, Valsamis H, Jiang X, Naik MU, Sublette E. 1993.Persistent activation of the z isoform of protein kinase C in the main-tenance of long-term potentiation. Proc Natl Acad Sci USA 90:8342–8346.
Saito N, Kose A, Ito A, Hosoda K, Mori M, Hirata M, Ogita K, Kikkawa U,Ono Y, Igarashi K, Nishizuka Y, Tanaka C. 1989. Immunocytochemicallocalization of bII subspecies of protein kinase C in rat brain. Proc NatlAcad Sci USA 86:3409–3413.
Saito N, Itouji A, Totani Y, Osawa I, Koide H, Fujisawa N, Ogita K, TanakaC. 1993. Cellular and intracellular localization of e-subspecies of pro-tein kinase C in rat brain; presynaptic localization of the e-species.Brain Res 607:241–248.
Saito N, Tsujino T, Fukada K, Tanaka C. 1994. a-, bII- and g-subspecies ofprotein kinase C localized in the monkey hippocampus: pre- and post-synaptic localization of g-subspecies. Brain Res 656:245–256.
Schwartz JH. 1993. Cognitive kinases. Proc Natl Acad Sci USA 90:8310–8313.
Selbie LA, Schmitz-Peiffer C, Sheng Y, Biden TJ. 1993. Molecularcloning and characterization of PKCi, an atypical isoform of proteinkinase C derived from insulin-secreting cells. J Biol Chem 268:24296 –24302.
Shimohama S, Saitoh T, Gage FH. 1990. Differential expression ofprotein kinase C isozymes in rat cerebellum. J Chem Neuroanat3:367–375.
Shimohama S, Saitoh T, Gage FH. 1993. Changes in protein kinase Cisozymes in the rat hippocampal formation following hippocampal le-sion. Hippocampus 3:43–56.
Stanton PK, Sarvey JM. 1984. Blockade of long-term potentiation in rat
257DISTRIBUTION OF PKC ISOZYMES IN BRAIN

hippocampal CA1 region by inhibitors of protein synthesis. J Neurosci4:3080–3088.
Sublette E, Naik M, Jiang X, Osten P, Valsamis H, Osada Si, Ohno S,Sacktor TC. 1993. Evidence for a new isoform of protein kinase C in rathippocampus. Neurosci Lett 159:175–178.
Tanaka C, Nishizuka Y. 1994. The protein kinase C family for neuronalsignaling. Annu Rev Neurosci 17:551–567.
Tanaka C, Saito N. 1992. Localization of subspecies of protein kinase Cin the mammalian central nervous system. Neurochem Int 21:499 –512.
Thomas KL, Hunt SP. 1996. Postsynaptic gene expression and long-termpotentiation in the hippocampus. In: Fazeli MS, Collingridge GL, edi-tors. Cortical plasticity: LTP and LTD. Oxford: bios Scientific Publish-ers. p 103–136.
Valverde AM, Sinnett-Smith J, Van Lint J, Rozengurt E. 1994. Molecularcloning and characterization of protein kinase D: a target for diacyl-glycerol and phorbol esters with an unusual catalytic domain. ProcNatl Acad Sci USA 91:8572–8576.
Van der Zee EA, Compaan JC, de Boer M, Luiten PG. 1992. Changes in
PKCg immunoreactivity in mouse hippocampus induced by spatialdiscrimination learning. J Neurosci 12:4808–4815.
Wetsel WC, Khan WA, Merchenthaler I, Rivera H, Halpern AE, PhungHM, Negro-Vilar A, Hannun YA. 1992. Tissue and cellular distributionof the extended family of protein kinase C isoenzymes. J Cell Biol117:121–133.
Wooten MW, Zhou G, Wooten MC, Seibenhener ML. 1997. Transport ofprotein kinase C isoforms to the nucleus of PC12 cells by nerve growthfactor: association of atypical z-PKC with the nuclear matrix. J Neu-rosci Res 49:393–403.
Young WS III. 1989. Levels of transcripts encoding a member of the proteinkinase C family in the paraventricular and supraoptic nuclei are in-creased by hyperosmolality. J Neuroendo 1:79–82.
Zhuo M, Hu Y, Schultz C, Kandel ER, Hawkins RD. 1994. Role of guanylylcyclase and cGMP-dependent protein kinase in long-term potentiation.Nature 368:635–639.
Zhou G, Seibenhener ML, Wooten MW. 1997. Nucleolin is a protein kinaseC-z substrate. Connection between cell surface signaling and nucleus inPC12 cells. J Biol Chem 272:31130–31137.
258 M.U. NAIK ET AL.
Copyright © 2022 FDOKUMEN