Distribution Agreement - Emory ETD
357
Distribution Agreement In presenting this thesis or dissertation as a partial fulfillment of the requirements for an advanced degree from Emory University, I hereby grant to Emory University and its agents the non-exclusive license to archive, make accessible, and display my thesis or dissertation in whole or in part in all forms of media, now or hereafter known, including display on the world wide web. I understand that I may select some access restrictions as part of the online submission of this thesis or dissertation. I retain all ownership rights to the copyright of the thesis or dissertation. I also retain the right to use in future works (such as articles or books) all or part of this thesis or dissertation. Signature: ____________________________________ _____________ Daniel Barros Domingues da Silva Date
-
Upload
khangminh22 -
Category
Documents
-
view
0 -
download
0
Transcript of Distribution Agreement - Emory ETD
Distribution Agreement In presenting this thesis or dissertation as a partial fulfillment of the requirements for an advanced degree from Emory University, I hereby grant to Emory University and its agents the non-exclusive license to archive, make accessible, and display my thesis or dissertation in whole or in part in all forms of media, now or hereafter known, including display on the world wide web. I understand that I may select some access restrictions as part of the online submission of this thesis or dissertation. I retain all ownership rights to the copyright of the thesis or dissertation. I also retain the right to use in future works (such as articles or books) all or part of this thesis or dissertation. Signature: ____________________________________ _____________
Daniel Barros Domingues da Silva Date

Crossroads: Slave Frontiers of Angola, c.1780-1867
By
Daniel Barros Domingues da Silva Doctor of Philosophy
______________________________________ David Eltis, Ph.D.
Advisor
______________________________________ Clifton Crais, Ph.D. Committee Member
______________________________________ Kristin Mann, Ph.D. Committee Member
Accepted:
______________________________________ Lisa A. Tedesco, Ph.D.
Dean of the James T. Laney School of Graduate Studies
_________________ Date

Crossroads: Slave Frontiers of Angola, c.1780-1867
By
Daniel Barros Domingues da Silva
B.A., Universidade Federal do Rio de Janeiro, 2004
M.A., Emory University, 2009
Advisor: David Eltis, Ph.D.
An abstract of
A dissertation submitted to the Faculty of the James T. Laney Graduate School of
Emory University in partial fulfillment of the requirements for the degree of
Doctor of Philosophy in History
2011

Abstract
Crossroads: Slave Frontiers of Angola, c.1780-1867
By Daniel Barros Domingues da Silva
The origins of slaves leaving Angola provide a way for understanding who Africans regarded as eligible for enslavement and sale across the Atlantic. Historians have long attributed the large number of slaves leaving Angola in the nineteenth century to wars waged by rulers living in the interior of West Central Africa, especially from the Lunda Empire. According to them, these rulers participated in the trade to exchange prisoners of war for foreign commodities, which they used to create alliances, raise armies and expand their influence throughout the region. This generated a vicious cycle of violence, with rulers seeking more captives in areas increasingly located farther from the coast. As a consequence, these scholars argue, Angolans lived in a constant state of warfare that served as a continuous source of slaves to the Americas. However, archival records show that slaves came from regions much closer to the coast than previously thought. This dissertation traces the origins of slaves leaving Angola based on lists of liberated Africans compiled in Havana, Cuba and Rio de Janeiro, Brazil between 1832 and 1849 in addition to slave registers made by Portuguese colonial officials in Luanda, Benguela and Novo Redondo, in Angola between 1854 and 1856. It shows that the slaves embarked belonged to 21 linguistic groups and 116 ethnicities spread throughout the interior of West Central Africa. The majority were Kikongo, Kimbundu and Umbundu speakers, who came from places outside the influence of the Lunda Empire. This dissertation also examines the demographic profile of the slave population leaving Angola, the patterns of consumption of Africans who participated actively in the trade, and the stories of those who survived the transatlantic passage and reported their experiences of enslavement. It shows that African perceptions of gender and age as well as taste for foreign goods played an important role in the trade, affecting decisions about who was eligible for enslavement and sale on the coast and who was not. Additionally, it demonstrates that prisoners of wars were not the only victims of the trade. Slaves leaving Angola also included people convicted of crimes, debts, and witchcraft, or simply kidnapped. Finally, this dissertation throws light on the issue of the impact of the slave trade on Africa. It shows that, during the nineteenth century, the incidence of military conflicts in the region was lower than previously thought, as wars of imperial expansion were not the primary means of enslavement in Angola. It also shows that the goods used to purchase slaves in the interior did not undermine the local economy and that the demographic impact of the trade was unevenly distributed, with some ethnic and linguistic groups more affected than others. These findings have profound implications for the history of Angola and for current knowledge about impact of the transatlantic slave trade on Africa.

Crossroads: Slave Frontiers of Angola, c.1780-1867
By
Daniel Barros Domingues da Silva
B.A., Universidade Federal do Rio de Janeiro, 2004
M.A., Emory University, 2009
Advisor: David Eltis, Ph.D.
A dissertation submitted to the Faculty of the James T. Laney Graduate School of
Emory University in partial fulfillment of the requirements for the degree of
Doctor of Philosophy in History
2011

Acknowledgements
This dissertation has been made possible with the unstinting support of
scholars and colleagues in the field, friends and family as well as the financial
backing of various institutions. It was my former advisor, Manolo Garcia
Florentino, who first brought me on board the Voyages Database Project and
encouraged me to apply to graduate school at Emory University. I came to Emory
in 2004, began my classes, field work, took comprehensive exams, completed
dissertation research, which involved excursions to Europe, Africa and South
America, while at the same time continuing my involvement in Voyages and
composing papers for publication. I consider the dissertation as a departure point
for future work.
My studies at Emory have been exciting and constructive because of my
professors and colleagues. I would like to extend particular thanks to the
following for stimulating my interest in my chosen field and being supportive of
my efforts: Clifton Crais, James Roark, Kristin Mann, Pamela Scully, and Susan
Socolow. David Eltis, as my advisor, has been a constant source of inspiration,
support and encouragement. Amongst my peer group, I am particularly grateful
to Alessandra Ribeiro, Alex Fernando Borucki, Fabrício Pereira Prado, Nafees
Mohammed Khan, Rafael Ioris, Kelly and Philip Misevich, Leah and Nathan
Charles Hofer, and Maria and Jorge Dávila.
As a Portuguese speaking student, I was fortunate to have professors in
the English as a Second Language Department, especially Beverly Ford and Grace
Canseco, who helped me improve my speaking and writing skills in English.
Thank you also to Suzan Eltis for reviewing and editing my dissertation

manuscript as well as many other papers that I submitted for publication and
presented at conferences in Europe and North America. Further, thanks to both
the staff of the Department of History, Alison Rollins, Becky Herring, Marcy
Alexander, Patricia Stockbridge and Rosalyn Page, and to the directors of the
International Student and Scholar Programs at Emory University, in particular
Joan Lindsey. Their support in helping me keep school records and immigration
documents in order has been invaluable during my years at Emory.
As an international researcher, I am indebted to professional colleagues
and friends from North America, Europe and, of course, Africa. In the United
States, I am particularly grateful to Freddye Hill, John K. Thornton, Joseph C.
Miller, Linda Heywood, Olatunji J. “Balogun” Ojo, Roquinaldo Amaral Ferreira,
Walter Hawthorne and Warren Whatley. In Portugal, I will be forever indebted to
António de Almeida Mendes and Paulo Silveira e Sousa. This is a pertinent
occasion to include Brazilian friends who lived in Portugal when I was conducting
research there, notably Carmen Alveal, Antônio Wilson Silva de Souza and Cleber
Reis. In Angola, I am grateful for both the help of António Araújo da Silva and his
family, who welcomed me into their home as one of their own, and that of the
archivists of the Aquivo Histórico Nacional de Angola, Domingos Mateus Neto,
Fernando Miguel Gonçalo and Rosa Cruz e Silva, who is presently Minister of
Culture of Angola.
I would like to acknowledge the support of various institutions, namely, the
Andrew W. Mellon Foundation, the Calouste Gulbenkian Foundation, the Council
on Library and Information Resources of the Library of the Congress, the Luso-
American Foundation for the Development of Portugal, and Emory University,
with resources from the Department of History, the Institute of African Studies,
and the James T. Laney Graduate School.

I have to thank my parents, Suzete and Alvaro Augusto Domingues da
Silva, my brother, David Barros Domingues da Silva, and the new members of my
family: my parents in law, Janete and Braz Borges, Renato Borges, and my
brother’s fiancé, Simone Araújo, who was extremely helpful the last time we had
to renew our American visa in São Paulo. I am also thankful for the help of my
grandparents, Leyla and Alvaro Domingues da Silva, now deceased, who
supported me during my early years of training as a historian in Rio de Janeiro. I
also wish to express my gratitude to my friends in Brazil, notably Alexandre
Vieira Ribeiro, Juliana Beatriz Almeida de Souza, Thaís and André Guidio de
Almeida, and Luiza and Sérgio Kawata.
But most of all I am deeply indebted to my wife, Lívia Cristina Miranda
Borges Domingues, who supported me throughout my studies since we left Brazil
in 2004. This has been at the cost of her own career and professional
development. Lívia, thank you for enduring with patience and understanding my
absences from home when I had to conduct research overseas. I truly appreciate
your efforts and will be forever thankful for your help and companionship. This
dissertation is dedicated to you.

Table of Contents
Introduction – A Quest for Origins 1
Chapter One – Old Trade, New Age
The Transatlantic Slave Trade from Angola in the Century of Abolition, 1781-
1867 14
Chapter Two – Merchants, Brokers and Traders
The Organization of the Slave Trade from Angola in the Nineteenth Century 45
Chapter Three – Slaving Frontiers
The Origins of Slaves Leaving Angola in the Nineteenth Century 90
Chapter Four – Of Men, Women and Children
A Demographic Profile of Slaves Leaving Angola in the Nineteenth Century 117
Chapter Five – On Goods and People
African Patterns of Consumption in Angola in the Nineteenth Century 146
Chapter Six – Embracing Dependants, Releasing Slaves
Experiences of Enslavement in Angola in the Nineteenth Century 173
Conclusion – Redefining the Frontiers 205

Appendix A – Volume of the Transatlantic Slave Trade from West Central Africa,
1781-1867 212
Appendix B – Origins Data of Slaves and Liberated Africans from Angola, 1832-
1856 223
Appendix C – Prices of Slaves Leaving Luanda, 1780-1830 309
Appendix D – Imports at Luanda, 1785-1864 312
Bibliography 325

List of Figures
Figure 1.1 – Slaves Leaving West Central Africa by National Carrier, 1781-1867
34
Figure 1.2 – Slaves Leaving West Central Africa by Port of Embarkation, 1781-
1867 38
Figure 2.1 – Wind and Sea Currents of the North and South Atlantic 47
Figure 2.2 – Lines of Equal Coefficient of Variability of Rainfall in Angola 84
Figure 2.3 – Seasonal Variations in the Slave Trade from Luanda, 1736-1808 86
Figure 3.1 – Estimated Number of Slaves Leaving Angola by Linguistic Groups,
1831-1855 102
Figure 3.2 – Estimated Number of Kikongo Slaves Leaving Angola by Ethnic
Groups, 1831-1855 108
Figure 3.3 – Estimated Number of Kimbundu Slaves Leaving Angola by Ethnic
Groups, 1831-1855 111
Figure 3.4 – Estimated Number of Umbundu Slaves Leaving Angola by Ethnic
Groups, 1831-1855 114
Figure 4.1 – A Sugar Mill, Brazil, 1816 125
Figure 4.2 – African Women Working the Fields Near the Kwango River, 1881 130
Figure 5.1 – Comparison between Prince and Number of Slaves Leaving Luanda
by Decades, 1780s-1830s 149

List of Tables
Table 1.1 – Slaves Leaving West Central Africa, 1781-1867 21
Table 1.2 – Slaves Leaving West Central Africa by Region of Disembarkation (in
Thousands), 1781-1867 29
Table 2.1 – Percentage of Slaves Leaving West Central Africa Distributed by
Region of Departure and Home Port of the Vessels that Carried
Them, 1781-1867 48
Table 2.2 – Concentration of Ownership of Vessels Embarking Slaves at West
Central Africa, 1781-1867 57
Table 2.3 – Number of Slaves Shipped by Anselmo da Fonseca Coutinho, 1768-
1806 70
Table 2.4 – Size of Coutinho’s Slave Shipments, 1768-1806 72
Table 2.5 – Structure of Ownership in Coutinho’s Shipment of Slaves (in Row
Percentages), 1768-1806 73
Table 3.1 – Percentage of Slaves Leaving Angola by Distance Traveled between
Their Origins in the Interior and Their Ports of Embarkation (in
Kilometers), 1831-1855 105
Table 4.1 – Percentage of Male Slaves Leaving West Central Africa by Region of
Disembarkation, 1781-1867 122
Table 4.2 – Percentage of Male Slaves Leaving West Central Africa by Port of
Embarkation, 1781-1867 128
Table 4.3 – Percentage of Slave Children Leaving West Central Africa by Region of
Disembarkation, 1781-1867 138

Table 4.4 – Percentage of Slave Children Leaving West Central Africa by Port of
Embarkation, 1781-1867 140
Table 5.1 – Commodities Imported at Luanda (in Thousands of Réis), Selected
Years, 1785-1864 155
Table A.1 – Estimated Number of Slaves Leaving West Central Africa by National
Carrier (in Thousands), 1781-1867 214
Table A.2 – Estimated Number of Slaves Leaving West Central Africa by Region of
Disembarkation (in Thousands), 1781-1867 215
Table A.3 – Estimated Number of Slaves Leaving West Central Africa by Port of
Embarkation (in Thousands), 1781-1867 221
Table B.1 – Designations of Origin Available in the List of Liberated Africans from
the Brigantine Aguila, 1832 226
Table B.2 - Designations of Origin Available in the List of Liberated Africans from
the Brigantine Marte, 1835 226
Table B.3 - Designations of Origin Available in the List of Liberated Africans from
the Goleta Amalia, 1835 227
Table B.4 - Designations of Origin Available in the List of Liberated Africans from
the Goleta Diligencia, 1835 227
Table B.5 - Designations of Origin Available in the List of Liberated Africans from
the Goleta Empresa, 1836 228
Table B.6 - Designations of Origin Available in the List of Liberated Africans from
the Goleta Joven Reyna, 1835 228
Table B.7 - Designations of Origin Available in the List of Liberated Africans from
the Goleta Matilde, 1837 232
Table B.8 - Designations of Origin Available in the List of Liberated Africans from
the Bergantim Brilhante, 1838 233

Table B.9 - Designations of Origin Available in the List of Liberated Africans from
the Bergantim Carolina, 1839 234
Table B.10 - Designations of Origin Available in the List of Liberated Africans from
the Bergantim Órion, 1835 235
Table B.11 - Designations of Origin Available in the List of Liberated Africans from
the Bergantim Paquete de Benguela, 1840 236
Table B.12 - Designations of Origin Available in the List of Liberated Africans from
the Bergantim Rio da Prata, 1834 236
Table B.13 - Designations of Origin Available in the List of Liberated Africans from
the Brigue Escuna Feliz, 1838 237
Table B.14 - Designations of Origin Available in the List of Liberated Africans from
the Brigue Leal, 1839 242
Table B.15 - Designations of Origin Available in the List of Liberated Africans from
the Escuna Duquesa de Bragança, 1834 243
Table B.16 - Designations of Origin Available in the List of Liberated Africans from
the Patacho Especulador, 1839 245
Table B.17 - Designations of Origin Available in the List of Liberated Africans from
the Unknown Vessel, c.1840 248
Table B.18 – Designations of Origin Available in the Slave Register of Benguela,
1855-1856 248
Table B.19 – Designations of Origin Available in the Slave Register of Luanda,
1855-1856 258
Table B.20 – Designations of Origin Available in the Slave Register of Novo
Redondo, 1855-1856 267
Table B.21 – Estimated Number of Slaves Embarked from the Ports North of
Luanda by Linguistic and Ethnic Group, 1831-1855 270

Table B.22 – Estimated Number of Slaves Embarked from Luanda by Linguistic
and Ethnic Group, 1831-1855 276
Table B.23 – Estimated Number of Slaves Embarked from the Ports South of
Luanda by Linguistic and Ethnic Group, 1831-1855 284
Table B.24 – Estimated Number of Slaves Leaving Angola by Linguistic and Ethnic
Group, 1831-1855 305
Table C.1 – Prices of Slaves Leaving Luanda as Reported by Colonial Officials,
1780-1830 310
Table C.2 – Prices of Slaves Leaving Luanda Deflated by Decades, 1780-1830 311
Table D.1 – Commodities Imported at Luanda by Categories (in Thousands of
Réis), 1785-1864 313
Table D.2 – Commodities Imported at Luanda by Categories (in Row Percentages),
1785-1864 315
Table D.3 – Alcohol Imported at Luanda (in Thousands of Réis), 1802-1864 317
Table D.4 – Apparel and Notions Imported at Luanda (in Thousands of Réis),
1802-1864 318
Table D.5 – Asian Textiles Imported at Luanda (in Thousands of Réis), 1802-1864
319
Table D.6 – European Textiles Imported at Luanda (in Thousands of Réis), 1802-
1864 320
Table D.7 – Foodstuff Imported at Luanda (in Thousands of Réis), 1802-1864 321
Table D.8 – Ironware and Other Metals Imported at Luanda (in Thousands of
Réis), 1802-1864 322
Table D.9 – Miscellany Articles Imported at Luanda (in Thousands of Réis), 1802-
1864 323
Table D.10 – Weapons Imported at Luanda (in Thousands of Réis), 1802-1864 324

Abbreviations
AHNA Arquivo Histórico Nacional de Angola, Luanda, Angola
AHI Arquivo Histórico do Itamaraty, Rio de Janeiro, Brazil
AHU Arquivo Histórico Ultramarino, Lisbon, Portugal
ANRJ Arquivo Nacional, Rio de Janeiro, Brazil
BNA British National Archives, Kew, England
BNRJ Biblioteca Nacional, Rio de Janeiro, Brazil
Cod. Codice
CU Conselho Ultramarino, Lisbon, Portugal
Doc. Document
FO Foreign Office Series, London, England
SEMU Secretaria de Estado da Marinha e Ultramar, Lisbon, Portugal

Introduction
A Quest for Origins
Angola, in West Central Africa, was the principal source of slaves for the
transatlantic slave trade. Estimates suggest that, from the sixteenth century
until the suppression of the trade in the mid-nineteenth century, more than 5.6
million Africans embarked on slave vessels on the coast of West Central Africa.1
As a result of European economic development and the suppression of the trade
in the North Atlantic, the majority of these Africans were carried to Brazil, in
South America, between the late eighteenth and the mid-nineteenth centuries.
Researchers have focused on the number and destination of slaves shipped but
the inland origins of slaves carried from Angola remains a largely neglected field
of study. However, a detailed analysis of archival sources located in Angola,
Brazil, England, and Portugal sheds new light on the origins of thousands of
slaves shipped from Angola. It questions long held assumptions about who was
eligible for enslavement and sale across the Atlantic.
Scholars have often associated the huge number of slaves sold into the
trade with major political developments in the interior of Africa; notably with
processes of state formation and imperial expansion. They believe that the
enslavement and subsequent sale of slaves required such great resources that
only individuals who commanded significant numbers of followers could perform
1 See estimates available in David Eltis et al., “Voyages: The Trans-Atlantic Slave Trade Database,” Online database, 2008, www.slavevoyages.org/.
1

these activities. J. D. Fage, for example, suggests that the slave trade tended to
integrate, strengthen and develop political authority, but to weaken or destroy
more segmentary societies in Africa.2 A. A. Boahen claims that the slave trade
constituted the principal source of income for many rulers and military leaders,
who had a monopoly over the sale and enslavement of individuals on the African
coast.3 Similarly, Patrick Manning argues that most of the slaves sold into the
trade were captured by rulers, who succeeded in profiting and expanding at the
expense of their neighbors.4 Finally, Martin Klein, stresses that the trade
required such large resources that rulers and raiding bands of professional
warriors dominated the enslavement and sale of slaves across the Atlantic.5
In Angola, the origins of slaves sold into the trade are frequently
associated with the expansion of the Lunda Empire and the formation of the
Imbangala Kingdom of Kasanje. Based on oral traditions collected in the mid-
nineteenth century, in addition to Portuguese documentary evidence, Jan
Vansina, David Birmingham and Joseph Miller argue that the Lunda expansion
began long before the eighteenth century. According to them, Lunda dissidents
led by a man named Kinguri acting in accordance with Imbangala traditions left
their country after Luba hunters assumed control over the government. En route
to a new environment, they encountered Portuguese soldiers, who were
themselves at war with their neighbors on the coast of Angola. Since the
Portuguese were short of manpower, they welcomed the arrival of and recruited
2 J. D. Fage, “Slavery and the Slave Trade in the Context of West African History,” Journal of African History 10, no. 3 (1969): 402. 3 A. A. Boahen, “New Trends and Processes in Africa in the Nineteenth Century,” in General History of Africa, ed. J. F. A. Ajayi, vol. 6 (London: Heinemann, 1989), 61. 4 Patrick Manning, Slavery and African Life: Occidental, Oriental, and African Slave Trades (New York: Cambridge University Press, 1990), 132. 5 Martin A. Klein, “The Impact of the Atlantic Slave Trade on the Societies of the Western Sudan,” Social Science History 14, no. 2 (1990): 237.
2

the newcomers, who proved to be great warriors. Further, they offered to
exchange their prisoners of war for rare commodities imported from Europe,
Asia, and the Americas. The Lunda expatriates regarded this exchange as an
opportunity to amass wealth and power. As a consequence, they continued to
provide military support for the Portuguese. Over time, the Lunda expatriates
named themselves Imbangala and founded a new state, the Kingdom of Kasanje,
at the confluence of the Lucala and Kwango rivers. The Portuguese regarded this
newly formed kingdom as the principal supplier of slaves shipped from Angola.6
However, recent research suggests that the supply of slaves sold on the
coast did not necessarily depend on processes of state formation and imperial
expansion within Africa. David Northrup, for example, notes that the sale of
slaves in the Bight of Biafra, a major source of slaves for the transatlantic trade,
was conducted mostly without the participation of African rulers. According to
him, decentralized societies such as the Aro, Efik, Igbo and Ibibio dominated the
slave trade in the Bight of Biafra.7 These societies were generally organized in
clans or lineages headed by one or more individuals who had a vote in decisions
affecting the entire society. Walter Hawthorne and Andrew Hubbell also question
the emphasis scholars have traditionally placed on the role of state formation and
imperial expansion in the transatlantic slave trade. In their view, scholars have
underestimated the ability of decentralized societies to organize themselves and
6 This is evidently a summary of a major debate Jan Vansina, David Birmingham and Joseph Miller had in the pages of the Journal of African History. The principal references to this debase include Jan Vansina, “The Foundation of the Kingdom of Kasanje,” Journal of African History 4, no. 3 (1963): 355-374; David Birmingham, “The Date and Significance of the Imbangala Invasion of Angola,” Journal of African History 6, no. 2 (1965): 143-152; Jan Vansina, “More on the Invasions of Kongo and Angola by the Jaga and the Lunda,” Journal of African History 7, no. 3 (1966): 421-429; Joseph C. Miller, “The Imbangala and the Chronology of Early Central African History,” Journal of African History 13, no. 4 (1972): 549-574. 7 David Northrup, Trade without Rulers: Pre-Colonial Economic Development in South-Eastern Nigeria (Oxford: Clarendon Press, 1978), 89-100.
3

participate actively in the supply of slaves from Africa.8 Similarly, David Eltis has
suggested that processes of state formation and imperial expansion did not
necessarily result in more slaves being sold into the trade. In an analysis of the
slave trade, he noted that the number of slaves shipped from the Bight of Benin
declined immediately after the Dahomean annexation of Allada and Ouidah in
1724 and 1727, respectively.9 In short, an event commonly regarded as a major
factor in the expansion of the slave trade may actually have resulted in fewer
slaves.
Additionally, more recent studies of the Lunda expansion cast doubt on the
role of the slave trade in processes of state formation and imperial expansion in
West Central Africa. They show that the Lunda expansion began much later than
previously thought and may not have been responsible for the large number of
slaves sold on the coast of Angola. Based on an extensive study of kings’ lists,
Jean Luc Vellut claims that the Lunda expansion began in the late seventeenth
century or at the beginning of the eighteenth century.10 John Thornton dates the
Lunda expansion from the same period, but he believes that it reached its
maximum size, both geographically and demographically, only in 1852 with the
death of Mwant Yav Nawej II, the first event recorded in writing in Lunda
history.11 Jeffrey Hoover, using linguistic data, argues that Imbangala traders
8 Walter Hawthorne, “The Production of Slaves where There Was No State: The Guinea-Bissau Region, 1450–1815,” Slavery and Abolition 20, no. 2 (1999): 97-98; Andrew Hubbell, “A View of the Slave Trade from the Margin: Souroudougou in the Late Nineteenth-Century Slave Trade of the Niger Bend,” Journal of African History 42, no. 1 (2001): 28. See also Martin A. Klein, “The Slave Trade and Decentralized Societies,” Journal of African History 42, no. 1 (2001): 49. 9 David Eltis, “The Volume and Structure of the Transatlantic Slave Trade: A Reassessment,” William and Mary Quarterly 58, no. 1 (2001): 34. 10 Jean-Luc Vellut, “Notes sur le Lunda et la Frontière Luso-Africaine (1700-1900),” Études d’Histoire Africaine 3 (1972): 68. 11 John K. Thornton, “The Chronology and Causes of Lunda Expansion to the West, c.1700-1852,” Zambia Journal of History 1 (1981): 1.
4

introduced the figure of Kinguri into Lunda traditions, probably in the nineteenth
century, to elevate the status of their own founding ancestors, who were not
originally Lunda.12 In other words, the frequently mentioned Lunda expansion,
said to have begun long before the eighteenth century, may not have happened as
previously believed. Jan Vansina, after revising his original position, went even
further. Although he believes that the Lunda spread north of Angola, he claims
that until 1846 there are no records of Lunda conquest to the south in what is
now eastern Angola.13 As a result, the slave trade would have offered little
stimulus for Lunda expansion and the formation of many states in West Central
Africa, including the Kingdom of Kasanje. As Vansina reflected upon the
implications of this finding, “if the Kinguri story had only been subjected to
critical appraisal from the outset, we historians would now be much more
advanced than we are today.”14
Despite these studies, many scholars still regard the trade as the principal
cause and effect of the Lunda expansion. Joseph Miller, for instance, argues that
in the nineteenth century the source of slaves shipped from Angola moved
further east, as successive Lunda kings raided and plundered the populations
living near the borders of their territories.15 Achim von Oppen claims that the
search for slaves to export was the principal motivation behind the eastward
movement of the trading frontier.16 Jan Vansina, in spite of his revision, believes
12 Jeffrey J. Hoover, “The Seduction of Ruweej: Reconstructing Ruund History (The Nuclear Lunda: Zaire, Angola, Zambia)” (Ph.D., New Haven: Yale University, 1978), vol. 1, 213-214. 13 Jan Vansina, “It Never Happened: Kinguri’s Exodus and Its Consequences,” History in Africa 25 (1998): 401. 14 Ibid., 403. 15 Joseph C. Miller, Way of Death: Merchant Capitalism and the Angolan Slave Trade, 1730-1830 (Madison: University of Wisconsin Press, 1988), 146-147. 16 Achim von Oppen, Terms of Trade and Terms of Trust: The History and Contexts of Pre-Colonial Market Production around the Upper Zambezi and Kasai (Münster: LIT Verlag, 1994), 59-61.
5

that the Lunda expansion north and the spreading of the Lunda influence in
eastern Angola was undoubtedly linked to the slave trade.17 Finally, John
Thornton argues that, in the eighteenth century, the Lunda became increasingly
attracted to the western lands, because it brought them closer to their trading
partners and shortened the routes to the coast; as well as increasing the potential
number of prisoners of war. According to him, “one might see the Lunda
expansion as something of an extended slave raid which ultimately turned much
of the land between the Lunda homeland and the Kwango River into a
systematically pillaged source of slaves.”18 In sum, despite the new research, the
association of the slave trade from Angola with the Lunda expansion remains
deeply ingrained in scholarly wisdom.
This dissertation argues that scholars have overstated the relationship
between the transatlantic slave trade and the Lunda expansion in the interior of
West Central Africa. It traces the origins of slaves carried across the Atlantic at
the peak of the slave trade and demonstrates that the majority of the Africans
sold as slaves on the coast were victims of internal conflicts within their own
societies, rather than victims of the imperial expansion of states situated in the
remote interior of Angola. Chapter One provides an assessment of the volume and
distribution of slaves shipped from West Central Africa in the age of abolition
based on data available in “Voyages: The Trans-Atlantic Slave Trade Database;”
much of which I have added to that source through my own archival research.19
It shows that the number of slaves shipped from West Central Africa increased
between the late eighteenth and the first half of the nineteenth century as a result
17 Vansina, “It Never Happened,” 403. 18 Thornton, “The Chronology and Causes of Lunda Expansion,” 7. 19 Eltis et al., “Voyages.”
6
of the demand for primary commodities in Europe and the suppression of the
slave trade in the North Atlantic. Although scholars usually argue that the Lunda
expansion was behind the massive number of slaves shipped from Angola in this
period, an analysis of the slave trade from West Central Africa clearly shows that
the number of slaves shipped varied mostly as a result of events taking place
across the Atlantic. The driving force shaping the transatlantic slave trade from
Angola was demand rather than supply.
Chapter Two provides an analysis of the organization of the transatlantic
slave trade from West Central Africa. It shows that the transportation and sale of
slaves from the interior of Angola across the Atlantic depended essentially on
three categories of commercial agents: merchants, brokers, and traders. All three
worked independently of the military power of both the Lunda and the Imbangala.
The first operated at the ports of departure for slave vessels, especially in Brazil,
from where they collated all the commodities used to purchase slaves and
coordinated the shipment of slaves across the Atlantic. The second comprised a
very diverse group, based on the coast of West Central Africa. It included
Portuguese and Brazilian subjects living in Angola, descendents of mixed
relations between Portuguese and Africans, as well as subjects and rulers of
various African polities located on the coast of West Central Africa. They acted as
brokers responsible for exchanging slaves brought from the interior for the
commodities imported overseas. Finally, the third group included traders who
served as middlemen between brokers and slave suppliers in the interior of
Angola. They were mostly Africans and the progeny of unions between Africans
and Portuguese expatriates. Although some individuals had multiple roles, the
slave trade from Angola depended largely on these three central groups.
7

Chapter Three traces the inland origins of slaves leaving Angola in the
nineteenth century based on two sets of documents. The first are lists of liberated
Africans compiled between 1832 and 1849 by the courts of mixed commission in
Havana, Cuba, and Rio de Janeiro, Brazil. These lists were created to inhibit the
re-enslavement of Africans rescued from slave vessels by anti-slave trade naval
cruisers. They provide details on 4,601 individuals, including their name, age,
sex, height and place of origin. The second set of documents is the slave registers
of Angola compiled by Portuguese colonial officials in Luanda, Benguela and Novo
Redondo between 1854 and 1856. These registers, which were also compiled to
prevent freed Africans from being re-enslaved, contain identical information to
the lists of liberated Africans in Havana and Rio de Janeiro. The registers record
details for 11,264 individuals. These documents, in addition to the records
available in the “Voyages Database,” show that slaves shipped from Angola came
from regions much closer to the coast than previously thought; namely the
Kikongo, Kimbundu, and Umbundu speaking regions.
Parallel research on the origins of slaves shipped from Angola confirms the
findings of Chapter Three. Mariana Cândido, in an analysis of the slave registers
of Benguela and Caconda, notes that the majority of the slaves living under
Portuguese rule in these regions came mostly from the Umbundu speaking people,
located in the central plateau of Angola.20 José Curto, analyzed on records of
runaway slaves published in the Boletim Oficial de Angola between 1850 and
1876, shows that slaves living under Portuguese rule in Luanda hailed from a
wide range of places, with the majority coming from the neighboring regions of
20 Mariana P. Cândido, “Enslaving Frontiers: Slavery, Trade and Identity in Benguela, 1780-1850” (Ph.D., Toronto: York University, 2006), 230-241.
8

Luanda and the Kwanza River.21 In short, although these studies focus on the
second half of the nineteenth century, they confirm in large measure the findings
of Chapter Three, suggesting that the majority of Africans captured for the slave
trading markets of Angola originated not in the deep interior of West Central
Africa, but rather in regions located much closer to the coast.
Chapters Four, Five, and Six seek to understand the transatlantic slave
trade from an African perspective. Chapter Four provides a demographic profile
of the men, women and children sold as slaves on the coast of Angola based on
archival records in addition to data available in the “Voyages Database.” It shows
that the slave trade from Angola was largely shaped by African conceptions of
gender and age. David Eltis and Stanley Engerman note that, in contrast to the
conventional wisdom, men were not the dominant demographic category in the
transatlantic slave trade. Their work suggests that adult male slaves comprised
much less than half of the total number of slaves carried across the Atlantic.22
Herbert Klein and Ugo Nwokeji also argue that African conceptions of gender and
age played a critical role in the slave trade. They show that slaves sold into the
transatlantic trade varied according to gender and age, suggesting that African
enslavers and traders had specific criteria for determining who remained a
captive on the continent and who was sold on the coast.23 The slave trade from
Angola was no exception; it followed similar patterns as these other regions of
slave embarkation.
21 José C. Curto, “The Origin of Slaves in Angola: The Case of Runaways, 1850-1876” (presented at the Seventh European Social Science and History Conference, Lisbon, 2008), 6-9. 22 David Eltis and Stanley L. Engerman, “Was the Slave Trade Dominated by Men?,” Journal of Interdisciplinary History 23, no. 2 (1992): 240-246. 23 Herbert S. Klein, “African Women in the Atlantic Slave Trade,” in Women and Slavery in Africa, ed. Claire C. Robertson and Martin A. Klein (Madison: University of Wisconsin Press, 1983), 35-37; G. Ugo Nwokeji, “African Conceptions of Gender and the Slave Traffic,” William and Mary Quarterly 58, no. 1 (2001): 52.
9

Chapter Five provides an analysis of the motivations of Africans for
enslaving other Africans and selling them into the trade, based on prices of slaves
from Luanda, the principal port of slave embarkation in Angola. It shows that
Africans who enslaved and sold other Africans into the trade were motivated
primarily by economic factors. Philip Curtin suggested that Africans were driven
by political motives to sell other Africans into the slave trade. He argued that the
number of slaves embarked from the coast between the Senegal and Gambia
rivers did not correspond to the demand for slaves overseas, since an increase in
price did not result in more slaves being shipped. He attributed the variation in
the number of slaves carried from Senegambia to the political situation in the
region’s hinterland, which was often characterized by widespread violence and
warfare.24 Curtin’s argument clearly favored the association of the slave trade
with processes of state formation and imperial expansion, and it directly
connected the two phenomena. However, Philip Le Veen, David Richardson, and
David Eltis, among others, challenged this position based on various series of
prices of slaves shipped from different African regions. Their work shows that the
supply of slaves on the coast did respond to variations in demand as measured by
price.25 In Angola, the available evidence indicates that the supply of slaves also
responded to variations in price, suggesting that Africans were economically
motivated to participate in the slave trade, which in turn undermines the
24 Philip D. Curtin, Economic Change in Precolonial Africa: Senegambia in the Era of the Slave Trade (Madison: University of Wisconsin Press, 1975), vol. 1, 156-168. 25 E. Philip Le Veen, “The African Slave Supply Response,” African Studies Review 18, no. 1 (1975): 9; David Richardson, “Prices of Slaves in West and West Central Africa: Toward an Annual Series, 1698-1807,” Bulletin of Economic Research 43, no. 1 (1991): 43-48; David Eltis, Economic Growth and the Ending of the Transatlantic Slave Trade (New York: Oxford University Press, 1987), 15 and 182-183.
10

association of this activity with processes of state formation and imperial
expansion.
One can also study African motivations for engaging in the slave trade by
looking at the commodities for which they traded slaves. David Richardson and
George Metcalf, for example, argue that African patterns of consumption shed
new light on the motives of Africans for enslaving other Africans and selling them
into the transatlantic slave trade.26 Hence, in addition to price series, Chapter
Five analyzes lists of imports at Luanda and Benguela for several years between
1777 and 1866. These lists show that Africans traded slaves for a wide variety of
commodities imported from Europe, Asia, and the Americas. Although weapons
formed a significant percentage of the commodities for which slaves were traded,
textiles and alcoholic beverages were in fact of greater value. The fact that
Africans imported more trade commodities than war commodities, indicates that
economic gains were the primary motivation for their participation in the slave
trade. This questions the assumption that the slave trade was a major cause and
effect of political developments in the interior of Africa.
Finally, Chapter Six analyzes specific cases of enslavement in the interior
of Angola found in both primary and secondary sources to examine further the
question of who was eligible for enslavement and sale across the Atlantic. Because
the slave trade has been commonly associated with processes of state formation
and imperial expansion, scholars have tended to see slaves shipped from Africa
merely as victims of war. However, wars and raids were not the only means of
26 David Richardson, “West African Consumption Patterns and Their Influence on the Eighteenth Century English Slave Trade,” in The Uncommon Market: Essays in the Economic History of the Atlantic Slave Trade, ed. Henry A. Gemery and Jan S. Hogendorn (New York: Academic Press, 1979), 304-305; George Metcalf, “A Microcosm of Why Africans Sold Slaves: Akan Consumption Patterns in the 1770s,” Journal of African History 28, no. 3 (1987): 377-378.
11

enslavement. Africans could also become slaves by trickery, judicial proceedings
or even voluntary enslavement. Causes of the last phenomenon included
catastrophic events such as famine and drought. In any event, recent research
suggests that enslavement and the sale of slaves on the coast depended primarily
on Africans perceptions of who was eligible for enslavement. David Eltis and
Nathan Huggins, for example, argue that identity was a crucial element in
determining who remained captive on the continent and who was sold into
Atlantic markets.27 Robin Law calls attention to the juridical nature of African
slavery, stressing differences between legal and illegal enslavement in the
interior of the continent.28 Chapter Six provides an analysis of different processes
of enslavement to explore what induced Africans to enslave and sell other
Africans into the transatlantic slave trade.
The slave trade from Angola was one of the largest and longest waves of
coerced migration in history. Many scholars have long believed that the majority
of the slaves sold on the coast came from the deep interior of West Central Africa,
victims of wars waged by the Lunda Empire. However, this dissertation shows
that Africans sold as slaves from Angola came from regions much closer to the
coast than previously thought. They were enslaved by other Africans in various
ways and shipped to the coast by individuals linked to a complex trading network
created to carry thousands of men, women and children as slaves across the
Atlantic. Clearly economics motivated Africans to enslave and sell other Africans,
but these individuals acted according to their own dictates and mores to
27 David Eltis, The Rise of African Slavery in the Americas (New York: Cambridge University Press, 2000), 57-61; Nathan Irvin Huggins, Black Odyssey: The Afro-American Ordeal in Slavery (New York: Pantheon Books, 1977), 20. 28 Robin Law, “Legal and Illegal Enslavement in West Africa, in the Context of the Trans-Atlantic Slave Trade,” in Ghana in Africa and the World: Essays in Honor of Adu Boahen, ed. Toyin Falola (Trenton: Africa World Press, 2003), 513-514.
12

determine who was and was not eligible for enslavement. In the final analysis,
these conventions fitted well with the overall operation of the transatlantic slave
trade and made Angola the principal source of slaves for the Americas well into
the nineteenth century.
13
Chapter One
Old Trade, New Age
The Transatlantic Slave Trade from Angola
in the
Century of Abolition
In the late eighteenth century, the slave trade from Angola entered a new
age of social, political, economic and ultimately ideological change. Economic
growth and industrialization in Europe, particularly in Britain, increased the
demand for primary commodities imported from the Americas, such as sugar,
cotton, rice and tobacco. These commodities were produced with slave labor
brought from Africa. As the demand for these primary commodities increased, so
did the demand for slaves carried across the Atlantic. Ironically, although slavery
was wide spread in the Americas, some Europeans had begun to question the
morality of an institution that deprived some individuals of their liberty for the
benefit of others.1 Moreover, they became increasingly persuaded that slave labor
was inferior to free labor, because slaves were not motivated to work as hard as
free laborers.2 As a consequence, at the beginning of the nineteenth century, the
1 David Brion Davis, Inhuman Bondage: The Rise and Fall of Slavery in the New World (New York: Oxford University Press, 2006), 231-249. 2 Seymour Drescher, The Mighty Experiment: Free Labor versus Slavery in British Emancipation (New York: Oxford University Press, 2002), 9-23. The main source for this argument is Adam Smith, An Inquiry into the Nature and Causes of the Wealth of Nations (London: W. Strahan and T. Cadell, 1776), vol. 1, 471-472.
14
transatlantic slave trade declined as some nations began to retreat from the
business. In 1807, for example, both the US congress and the British parliament
prohibited their citizens from participating in the slave trade. Soon after the
British initiated a campaign to suppress the entire trade from Africa.3
This new era of antislavery sentiment had a profound impact on the slave
trade from Angola. Despite British efforts to suppress the trade, the number of
slaves embarked from the coast of West Central Africa remained high, as the
center of gravity in the commerce shifted from the North to the South Atlantic.
During the eighteenth century, the transatlantic slave trade expanded largely
because of the demand for slaves in the British and French Caribbean. British and
French slave traders were the principal suppliers of slaves for the Caribbean.
They purchased the majority of their slaves on the coast of West Africa, north of
the Equator. However, as these nations withdrew from the business at the
beginning of the nineteenth century, the slave traffic in the North Atlantic
declined. Other nations sought to tap the sources of slaves previously dominated
by British and French slave traders; notably Portugal, Spain and Brazil. In order
to prevent this from happening, Britain signed treaties with these nations
restricting their subjects from carrying on the slave trade. In 1815, for example,
an Anglo-Portuguese treaty prohibited Portuguese slave traders from carrying
slaves north of the Equator.4 Brazil, independent from Portugal since 1822,
tacitly agreed to the terms of this 1815 treaty, and Brazilian slave traders were
legally banned from purchasing slaves from African regions located north of the
3 Roger Anstey, The Atlantic Slave Trade and British Abolition, 1760-1810 (Atlantic Highlands: Humanities Press, 1975), 396-398; Paul Finkelman, “Regulating the African Slave Trade,” Civil War History 54, no. 4 (2008): 379. 4 Leslie Bethell, The Abolition of the Brazilian Slave Trade: Britain, Brazil and the Slave Trade Question, 1807-1869 (Cambridge: Cambridge University Press, 1970), 13-14; João Pedro Marques, Os Sons do Silêncio: O Portugal de Oitocentos e a Abolição do Tráfico de Escravos (Lisbon: Imprensa de Ciências Sociais, 1999), 103-104.
15

line.5 In 1817, Britain signed a similar treaty with Spain, except that the
prohibition was to apply to both sides of the Equator.6 Moreover, Britain sent
warships to patrol the coast of West Africa to intercept vessels violating these
agreements. It further established mixed commission courts around the Atlantic
to adjudicate vessels accused of illegal slave trading.7 In sum, as the British
increased their efforts to suppress the slave trade in the North Atlantic, the
number of slaves in the South Atlantic continued high well into the nineteenth
century, making Angola a major source of slaves for the Americas.
Some major figures in the field believe that in the nineteenth century a
rising demand for slaves in the Americas pushed the sources of slaves shipped
from Angola deeper into the interior of West Central Africa. Joseph Miller, for
example, argues that the shifting origins of slaves formed a kind of frontier zone,
which he termed slaving frontiers. He has claimed that since the sixteenth
century the slaving frontiers of Angola moved gradually from the coast to the
interior of West Central Africa. In the nineteenth century, Miller argues, these
frontiers had reached the populations living beyond the valley of the Kwango
River, forcing thousands of Africans into slavery.8 Paul Lovejoy also believes that
in the nineteenth century the slave trade pushed the source of slaves to the
interior of West Central Africa. According to him, the demand for slaves in the
Americas required many Lunda and Luba warlords to adjust to the new demands
5 Bethell, The Abolition of the Brazilian Slave Trade, 13-14. 6 David R. Murray, Odious Commerce: Britain, Spain, and the Abolition of the Cuban Slave Trade (New York: Cambridge University Press, 1980), 70-71. 7 Leslie Bethell, “The Mixed Commissions for the Suppression of the Transatlantic Slave Trade in the Nineteenth Century,” Journal of African History 7, no. 1 (1966): 79-83; David Eltis, Economic Growth and the Ending of the Transatlantic Slave Trade (New York: Oxford University Press, 1987), 85-103. 8 Joseph C. Miller, Way of Death: Merchant Capitalism and the Angolan Slave Trade, 1730-1830 (Madison: University of Wisconsin Press, 1988), 140-146 and Map 5.1.
16

on the coast and search for slaves deep in the interior of West Central Africa.9
Patrick Manning claims that the journey of a slave coffle from the interior of
Angola doubled as the slave trade continued to expand in the nineteenth century,
resulting in a sharp decline in the populations living in the interior of West
Central Africa.10 In short, many scholars believe that the nineteenth century
slave trade from Angola pushed the slaving frontiers deep into the interior of
West Central Africa.
However, an analysis of the slave trade shows that there is insufficient
evidence to support the idea of a nineteenth century expansion of the slaving
frontiers of Angola. After the abolition of the British and American slave trades,
Portuguese, Brazilian, and Spanish traders increased their activities along the
coast of West Central Africa. Stimulated by the demand for primary products in
Europe and the demand for labor in the Americas, they tapped slave sources
previously dominated by their competitors. As a result, the number of slaves
shipped from Angola increased temporarily, especially after 1815, with the
suppression of the slave traffic in the North Atlantic. In 1830, Brazil, the
principal market for slaves shipped from Angola, enacted a law abolishing the
slave trade, a requirement of a treaty signed four years earlier with Great Britain.
This treaty established that Britain would recognize Brazilian independence from
Portugal if Brazil took affirmative action to abolish the slave trade.11 Since the
Brazilian economy was largely dependent on slave labor, the government signed
the treaty but turned a blind eye to the activities of many slave traders. As a
9 Paul E. Lovejoy, Transformations in Slavery: A History of Slavery in Africa, 2nd ed. (New York: Cambridge University Press, 2000), 149. 10 Patrick Manning, Slavery and African Life: Occidental, Oriental, and African Slave Trades (New York: Cambridge University Press, 1990), 70. 11 Bethell, The Abolition of the Brazilian Slave Trade, 60-61; Marques, Os Sons do Silêncio, 153-154.
17

consequence, the 1830 law was never really enforced, and Brazil continued to
receive captives from Africa.
After 1830, the number of slaves shipped from Angola fell to levels below
those that pertained in the years prior to the prohibition of the slave traffic in the
North Atlantic. In this period, Brazil and the Spanish Americas challenged British
efforts to suppress the trade. They remained open to slaves brought from regions
north of the Equator, as well as to new sources of captives such as Mozambique, in
Southeast Africa. Thus, contrary to the conclusions of many scholars, in the
nineteenth century Portuguese, Brazilian and Spanish traders did not expand
their activities along the coast of West Central Africa but continued to purchase
there avoiding the British naval forces and using both traditional as well as new
ports of embarkation. However, the size of the Iberian trade along the coast of
Angola was insufficient to move the slaving frontiers further into the interior of
West Central Africa. At least in this respect, the trade from Angola between the
late eighteenth and the mid-nineteenth century followed a pattern of continuation
rather than expansion. This pattern can be better explained with the help of
“Voyages: The Trans-Atlantic Slave Trade Database.”12
“Voyages” is the most complete database of slaving voyages available to
the public. It contains information on almost 2 million slaves shipped from Angola
between 1781 and 1867, the last year a vessel was reported to have embarked
slaves on the coast of West Central Africa.13 However, “Voyages” provides not
only a database of shipping records but also estimates of slaves shipped according
12 David Eltis et al., “Voyages: The Trans-Atlantic Slave Trade Database,” Online database, 2008, www.slavevoyages.org/. 13 David Eltis, “The Nineteenth Century Transatlantic Slave Trade: An Annual Time Series of Imports into the Americas Broken Down by Region,” Hispanic American Historical Review 67, no. 1 (1987): 128-129.
18

to both national carriers and regions of embarkation and disembarkation. These
estimates were built using the information from the database itself and secondary
sources to supplement periods for which the database lacks information about the
number of slaves embarked and disembarked. “Voyages” estimates that
approximately 2.8 million Africans embarked as slaves from the coast of West
Central Africa between 1781 and 1867, 29 percent more than the number of
slaves embarked available in the database of shipping records. However, this
figure can certainly be modified further.
“Voyages” drew on records of maritime activity in the Americas. After the
prohibition of the slave trade in the North Atlantic, many slave traders from
Bahia, in Northeast Brazil, asked the Portuguese and later Brazilian authorities
for licenses to purchase slaves at Cabinda or Molembo, on the coast of West
Central Africa, instead of their traditional ports of slave embarkation at the Bight
of Benin, in West Africa. However, most of them did in fact purchase their slaves
at the Bight of Benin and used the licenses to deceive British naval officers should
the latter interfere with them while carrying a slave cargo loaded north of the
Equator.14 As a consequence, from 1816 until 1830, when the trade from Brazil
became illegal, this bias in the sources was transferred to the shipping records
available in “Voyages.” David Eltis was the only historian to address this problem
by reallocating to the Bight of Benin all slaves originally recorded to have been
14 Alexandre Vieira Ribeiro, “O Tráfico Atlântico de Escravos e a Praça Mercantil de Salvador, c.1680-1830” (M.A., Rio de Janeiro: Universidade Federal do Rio de Janeiro, 2005), 58, 61 and 137; Pierre Verger, Fluxo e Refluxo: O Tráfico de Escravos entre o Golfo de Benin e a Bahia de Todos os Santos dos Séculos XVII a XIX (São Paulo: Corrupio, 1987), 414-419.
19

shipped from the ports north of the Congo River to Bahia.15 However, the
resources now available provide an alternative interpretation of this issue.
The “Voyages” database allows users to fine tune their search. In order to
improve the accuracy of the estimates, the share of slaves carried in Portuguese
and Brazilian vessels from Cabinda and Molembo to Bahia between 1816 and
1830 can be discounted from the remaining ports and subtracted from the total
number of slaves carried from West Central Africa. The database shows that in
the fifteen years prior to 1816 Bahia purchased only 2,237 slaves from Cabinda,
while between 1816 and 1830, this number increased to 41,059. Further, it
shows that Bahia did not purchase a single slave from Molembo in the fifteen
years before 1816, but between 1816 and 1830, there are records indicating
some 46,333 slaves leaving Molembo for Bahia. As the 1815 treaty may have
indeed forced some Bahian slave traders to purchase slaves in West Central
Africa, it seems plausible that, between 1816 and 1830, only a fraction of the
slaves recorded in the database actually embarked from Cabinda and Molembo to
Bahia. Hence, the number of slaves leaving these ports for Bahia between 1816
and 1830 in the estimates was reduced to approximately 63 percent of the
observable totals. This percentage represents the midpoint between the share of
the number of slaves carried from West Central Africa to Bahia from 1801 to
1815 and those from 1816 to 1830. Similarly, the number of slaves shipped from
Cabinda and Molembo in the database was reduced to 63 percent to correct for
the overrepresentation of these ports in the total estimated number of slaves
embarked from West Central Africa in these fifteen years on the “Voyages”
15 David Eltis, “Slave Departures from Africa, 1811-1867: An Annual Time Series,” African Economic History, no. 15 (1986): 146.
20

estimate page. The final results of these adjustments are available in Appendix A
and summarized below in Table 1.1.
Table 1.1 – Slaves Leaving West Central Africa, 1781-1867
Periods Number of slaves
embarked Average of slaves
embarked per year
1781-1807 974,190 36,081
1808-1830 913,884 39,734
1831-1850 730,474 36,524
1851-1867 156,779 9,222
All Years 2,775,327 31,900
Source: Appendix A, Table A.1.
Table 1.1 shows the number of slaves shipped from West Central Africa
between the late eighteenth and the mid-nineteenth century using four key
periods. The first begins in the 1780s, with the expansion of the demand for
slaves in the Americas and ends in 1807, with the abolition of the British slave
trade. The second period begins in 1808, with the transference of the Portuguese
court to Rio de Janeiro, in Southeast Brazil, and the opening of the Brazilian ports
for direct trade. This period ends in 1830, with the proclamation of the first
Brazilian law abolishing the slave trade. This was a critical period in the trade
from Angola, since the center of gravity of the trade shifted from the North to the
South Atlantic, where Angola is located. The third period begins in the following
year, when the slave trade from Angola became increasingly regarded as an
illegal activity, and ends in 1850, when Brazil did in fact close its ports to all
vessels carrying slaves from Africa. Finally, the fourth period represents the
period of decline of the slave trade from Angola, between 1851 and 1867, the last
21

year in which there are records of slaves being shipped from the coast of West
Central Africa.
Although the slave trade varied widely within each of these periods, the
supply of slaves from West Central Africa remained relatively constant from the
late eighteenth until the mid-nineteenth century. In the first period, ships
belonging to various nationalities embarked an average 36,080 slaves per year
from the coast of West Central Africa. This figure increased approximately 9
percent in the following period, to 39,735 slaves per year, as a result of the
suppression of the trade in the North Atlantic. However, in the third period, the
average number of slaves embarked declined to levels similar to those found in
the years prior to the abolition of the British trade. Between 1831 and 1850, the
average number of slaves shipped from West Central Africa declined to 36,525
per year. The traffic from Angola declined significantly only after the abolition of
the Brazilian trade in 1850. After this year the average number of slaves shipped
from West Central Africa declined 75 percent to about 9,220 slaves per year. It is
thus apparent that from the late eighteenth to the mid-nineteenth century, West
Central Africa served as steady source of slaves for the Americas.
The slave trade from Angola varied mostly as a result of the demand for
slaves in the Americas and the British efforts to suppress the transatlantic slave
trade. In the late eighteenth century, demand from the Americas had increased
the competition for slaves along the coast of West Central Africa. The Portuguese
were the principal traders in this region. They had been present in Angola since
the sixteenth century and controlled two ports of slave embarkation, Luanda and
Benguela. British and French traders used to purchase most of their slaves in
West Africa, but as the demand for slaves across the Atlantic increased, they
extended their activities to the coast of West Central Africa. However, in contrast
22

to the Portuguese, they embarked most of their slaves at ports controlled by
independent African polities such as Cabinda, Molembo, Loango and other ports
around the mouth of the Congo River. In the late eighteenth century, the presence
of British and French slavers on the coast of Angola increased so much that the
Portuguese began to report their activities to the Colonial Office in Lisbon. In
1782, for example, Manoel da Silva Ribeiro Fernandes, a slave trader in the
service of the Portuguese colonial government, sailed for the ports north of
Luanda and reported that the French conducted a lively trade at Cabinda and
Loango.16 In 1793, the Portuguese governor of Angola, Manoel de Almeida e
Vasconcelos, noted that the British trade at Ambriz had significantly reduced the
supply of slaves at Luanda from the north of Angola.17 In short, in the late
eighteenth century, the competition for slaves on the coast of Angola increased,
with British and French traders threatening the activities of the Portuguese.
However, from the last decade of the eighteenth to the first decade of the
nineteenth century, the competition for slaves in Angola tended to decline as a
result of first, the Haitian Revolution and second, the abolition of the British slave
trade. In 1791, the slaves of Saint Domingue, a French colony in the Caribbean,
rebelled against their masters because of the brutal conditions that they endured.
The rebellion spread throughout the island to reach an unprecedented scale
culminating with the rebels’ independence in 1804. They renamed Saint
Domingue, Haiti, the first modern state founded by people of African ancestry in
the Americas. Before the rebellion, Saint Domingue was the major sugar producer
16 Relação de uma viagem à costa ao norte de Luanda por Manoel da Silva Ribeiro Fernandes ao Senhor Ajudante de Ordens Pedro José Corrêa Quevedo, 15 August 1782, AHU, CU, Angola, box 65 doc. 64. 17 Manoel de Almeida e Vasconcelos to Martinho de Melo e Castro, 25 April 1793, AHU, CU, Angola, box 78 doc. 57.
23

in the Americas and served as the principal destination for slaves embarked in
French vessels from the coast of West Central Africa. However, with the
independence of Haiti, the French slave trade almost collapsed, significantly
reducing the number of slaves shipped in French vessels from West Central
Africa. In the ten years preceding the slave rebellion, for example, French slave
traders shipped about 128,840 from the coast of West Central Africa but, in the
ten years following the rebellion, this figure declined to 32,615 slaves, almost all
of whom arrived in the 1791-1793 period. Particularly after 1793, the Haitian
Revolution clearly reduced the competition for slaves on the coast of West Central
Africa.
The abolition of the British slave trade in 1807 further reduced the
international competition for slaves on the Angolan coast. After the Haitian
Revolution, the British represented the only real competition for the Portuguese
in the slave trade from the region. The British expanded their slaving activities
along the coast of West Central Africa by shipping many of the captives who were
previously carried in French vessels. In the ten years preceding the slave
rebellion in Saint Domingue, for example, British slave traders shipped 16,710
slaves from the coast of West Central Africa, but in the following ten years this
figure increased massively to 115,720 slaves. Thus, the British slave trade from
West Central Africa increased as a result of the Haitian Revolution and the
subsequent collapse of its French counterpart. However, with the abolition of the
British trade in 1807, the slaving activities of the British along the coast of West
Central Africa came to a complete halt. Overall, the international competition for
slaves on the coast of West Central Africa declined significantly, resulting in a
new phase in the exodus of captives from Angola.
24

After the abolition of the British slave trade, Iberian carriers increasingly
dominated the shipment of captives from Angola. Iberian carriers consisted of
vessels belonging to Portugal and Spain, as well as the Iberian America – Cuba,
Brazil, Puerto Rico and Uruguay. However, between 1808 and 1830, Portuguese
and Brazilian slave traders carried the majority of the slaves shipped in Iberian
vessels from Angola. In 1808, the Prince Regent Dom João VI transferred the
Portuguese court to Rio de Janeiro to escape the invasion of Lisbon by Napoleonic
troops under command of General Junot. After arriving in Brazil, Dom João
opened Brazilian ports for the first time to international trade, especially with the
British, who had escorted the Portuguese royal family across the Atlantic.18 The
transference of the Portuguese court and the opening of the Brazilian ports
increased the population of Rio de Janeiro significantly. Census data for Rio de
Janeiro shows that the city’s population increased 14 percent in this period, from
46,944 in 1803 to 54,255 in 1808.19 As the city’s inhabitants depended largely on
slave labor, the increase in the population of Rio de Janeiro also stimulated the
expansion of the slave trade from Angola.
However, the major source of increased demand for slaves from Angola
was the growth of Brazilian commercial agriculture. Since the late eighteenth
century, Brazilian agriculture benefited from the decline of gold production in
Goiás and Minas Gerais, two captaincies situated in the interior of Brazil. Gold
had been the principal commodity exported from Brazil but, in the mid-
18 Alan K. Manchester, “The Transfer of the Portuguese Court to Rio de Janeiro,” in Conflict and Continuity in Brazilian Society, ed. Henry H. Keith and S. F. Edwards (Columbia: University of South Carolina Press, 1969), 148-163. 19 Dauril Alden, “Late Colonial Brazil, 1750-1808,” in The Cambridge History of Latin America, ed. Leslie Bethell, vol. 2 (New York: Cambridge University Press, 1984), 605, Table 3; Mary C. Karasch, Slave Life in Rio de Janeiro, 1808-1850 (Princeton: Princeton University Press, 1987), 61, Table 3.1.
25

eighteenth century, production in Goiás and Minas Gerais gradually declined.20
Many individuals sought to invest in other activities such as the production of
sugar, rice and cotton. Sugar producers in Brazil, in particular, also benefited
from the Haitian Revolution, which had ruined their competitors in Saint
Domingue. Sugar exports from Bahia, for example, increased from about 480,000
arrobas in 1788 to 746,600 arrobas in 1798. Sugar exports from Pernambuco
also increased, from about 275,000 arrobas in 1790 to 560,000 arrobas in 1807.
Similarly, sugar exports from Rio de Janeiro expanded from 200,000 arrobas in
1790 to 487,200 in 1800.21 Thus, as gold exports from Goiás and Minas Gerais
declined, the traditional centers of sugar production in Brazil ensured that
demand for Angolan captives remained high.
The expansion of Brazilian agricultural exports was not limited to sugar.
Exports of rice and cotton, for instance, also increased during the late eighteenth
and early nineteenth centuries. The majority of the rice and cotton exported from
Brazil was produced in the captaincies of Maranhão and Pará, located in the
Amazon Basin. Rice was produced mostly for consumption in Portugal, while
cotton was grown for export to the larger European market. By 1781, rice
exports from Pará and Maranhão, as well as from Rio de Janeiro, were
sufficiently large to allow Portugal to ban the entry of all foreign rice.22 Cotton
production in Pará and Maranhão also increased significantly, spreading quickly
to other captaincies. In 1799, for example, the Bishop of Olinda, a meticulous
observer of the Brazilian economy of that time, noted that in Pernambuco cotton
20 Virgílio Noya Pinto, O Ouro Brasileiro e o Comércio Anglo-Português: Uma Contribuição aos Estudos da Economia Atlântica no Século XVIII, 2nd ed. (São Paulo: Companhia Editora Nacional, 1979), 114. 21 Alden, “Late Colonial Brazil,” 627-631. 22 Ibid., 641; Manuel Nunes Dias, Fomento e Mercantilismo: A Companhia Geral do Grão Pará e Maranhão (1755-1778) (Belém: Universidade Federal do Pará, 1970), vol. 1, 431-452.
26

exports “almost equaled the value of sugar and all other products combined.”23 As
a consequence, between 1780 and 1800, Brazil emerged as a major cotton
supplier for the Lancashire factories during the Industrial Revolution in England,
ranking just after the British West Indies and the Mediterranean.24
Table 1.2 below confirms that Brazil was the principal market for slaves
embarked from West Central Africa. Brazil alone served as the destination for
about 74 percent of all slaves shipped between the late eighteenth and the mid-
nineteenth century. The remaining slaves were carried to different areas of the
Caribbean, Mainland North America and British enclaves in Africa, where naval
cruisers conducted many detained slave vessels. The Africans rescued by British
naval forces were generally liberated at a mixed commission court established in
Sierra Leone, West Africa, for the adjudication of vessels accused of illegal slave
trading. However, these individuals were rarely repatriated. In Brazil, the
majority of the slaves shipped from West Central Africa disembarked in Rio de
Janeiro, Southeast Brazil. Table 1.2 shows that over 1.4 million slaves were
shipped to Southeast Brazil alone. Pernambuco was the second principal market
for slaves, serving as destination for about 312,200 slaves embarked from the
coast of West Central Africa to Brazil. Bahia appeared in third place, receiving
approximately 243,300 slaves, and the captaincies of Pará and Maranhão, in
Amazonia, served as the destination for about 47,600 slaves shipped from West
Central Africa to Brazil. In short, from the late eighteenth until the mid-
nineteenth century, Brazil had a profound connection to Angola, serving as the
principal market not only for slaves shipped from West Central Africa, but also for
23 Cited in Alden, “Late Colonial Brazil,” 637. 24 Thomas Ellison, The Cotton Trade of Great Britain (London: Effingham Wilson, 1886), 86; William Henry Johnson, Cotton and Its Production (London: Macmillan, 1926), 190-191.
27

captives carried off all African regions that supplied captives to the Americas,
including Southeast Africa.
28

To
tal
47
.7
24
3.1
31
2.2
1,4
20
.1
34
.1
14
9.9
17
5.7
28
8.8
10
3.6
2,7
75
.4
18
51
-18
67
-
1.1
0.0
3.1
- - -
13
5.3
17
.2
15
6.8
18
31
-18
50
1.3
20
.9
63
.8
56
5.6
6.4
2.5
-
48
.2
21
.7
73
0.5
18
08
-18
30
21
.4
12
7.0
14
4.8
51
4.8
15
.8
4.6
2.4
78
.6
4.5
91
3.9
17
81
-18
07
25
.0
94
.1
10
3.6
33
6.6
11
.9
14
2.8
17
3.3
26
.7
60
.2
97
4.2
Su
b-r
egio
ns
Am
az
on
ia
Ba
hia
Pe
rna
mb
uco
SE
Bra
zil
Oth
er
Reg
ion
s
Bra
zil
Bri
tish
Ca
rib
bea
n
Fre
nch
Ca
rib
bea
n
Sp
an
ish
Ca
rib
bea
n
Oth
er
All
reg
ion
s
Ta
ble
1.2
– S
lav
es L
eav
ing
Wes
t C
entr
al
Afr
ica
by
Reg
ion
of
Dis
emb
ark
ati
on (
in T
hou
san
ds)
, 17
81
-18
67
No
te: O
ther
reg
ion
s in
clu
de
Ma
inla
nd
No
rth
Am
eric
a, t
he
Du
tch
Ca
rib
bea
n, t
he
Da
nis
h W
est
Ind
ies
an
d A
fric
a.
So
urc
e: A
pp
end
ix A
, Ta
ble
A.2
.
29

Those slaves shipped from Angola were employed in several regions in the
interior of Brazil. Studies focusing on the Brazilian internal slave trade are in
their infancy, but the first results show that slaves disembarked in Brazil from
Africa were distributed to several places. Between 1760 and 1779, for example,
about 30 percent of all slaves landed at Bahia were transported to regions far into
the interior of Brazil.25 The majority of this group continued to be sent to the
former gold districts of Minas Gerais, which received 18 percent of all slaves
shipped to the interior of Brazil.26 However, in the nineteenth century, Maranhão
became the major destination for all slaves sent from Bahia. Between 1811 and
1820, for example, about 30 percent of all captives sold from Bahia, both Africans
and descendents of Africans born in Brazil, went to Maranhão.27 Slaves arriving
in Rio de Janeiro were also sold to several regions in the interior of Brazil.
Between 1819 and 1830, for instance, approximately 43 percent of Rio de
Janeiro landings were redirected from the city to other Brazilian markets.28 The
majority of them were sent to Minas Gerais, which received 59 percent of the
total shipped from Rio de Janeiro. By this time, Minas Gerais had become a major
producer of food for the internal market.29 A further 24 percent went mostly to
São Paulo, in Southeast Brazil, where they were employed in sugar and coffee
plantations.30 Most of the remainder, about 10 percent, went to Rio Grande do
25 Ribeiro, “O Tráfico Atlântico,” 101. 26 Ibid., 107. 27 Ibid., 115. 28 Roberto Guedes and João Luís Fragoso, “Alegrias e Artimanhas de uma Fonte Seriada: Os Códices 390, 421, 424 e 425: Despachos de Escravos e Passaportes da Intendência de Polícia da Corte, 1819 – 1833,” in Tráfico Interno de Escravos e Relações Comerciais no Centro-Sul do Brasil, Séculos XVIII e XIX, ed. IPEA (Brasília: Instituto de Pesquisa Econômica Aplicada, 2000), calculated from Table 3. 29 Ibid., calculated from Table 4; Amilcar Martins Filho and Roberto B. Martins, “Slavey in a Non-Export Economy: Nineteenth Century Minas Gerais Revisited,” Hispanic American Historical Review 63, no. 3 (1983): 556-565. 30 Guedes and Fragoso, “Alegrias e Artimanhas de uma Fonte Seriada,” calculated from Table 4.
30

Sul, in South Brazil, where they were used in various activities but particularly in
jerk beef production.31
The opening of the Brazilian ports meant that foreign shipping, especially
British shipping, was able to transport plantation produce at lower costs. This, in
turn, stimulated the Brazilian slave trade from Angola. The Lloyd’s Register of
Shipping shows that, after the British abolished their slave trade, they redeployed
their slaving fleet to the commodity trade in the tropics. Since these vessels were
originally designed to sail in the warm waters of Africa, they had their hulls
covered with copper sheets, which better protected them from sea worms and
made them both faster and more durable. British ex-slavers sailed for several
places in the Caribbean and South America, such as Jamaica, Bahamas, Antigua,
Dominica, Havana, and Lima. However, at the beginning of the nineteenth
century, Brazil served as the single major destination for all British ex-slavers.
Lloyd’s Register of Shipping indicates that 33 percent of all voyages undertaken
by British ex-slavers between 1808 and 1811 went to Brazil.32 Although Angola
represented just one, albeit the major, source of slaves for Brazil, slaves brought
from this region probably produced a significant percentage of the commodities
that these British ex-slavers carried to Europe. Thus, the opening of the Brazilian
ports meant lower costs for Brazilian commerce and a higher demand for slaves.
The British connection to the slave trade from Angola was not limited to
the transportation of produce cultivated by Angolan slaves in Brazil. The spread
of British credit following the opening of the Brazilian ports for international
trade also fueled the slave trade from Angola. David Eltis examined trade cargoes
31 Ibid. 32 David M. Williams, “Abolition and the Re-Deployment of the Slave Fleet, 1807-11,” Journal of Transport History 11, no. 2 (1973): 106-111.
31
used to purchase slaves brought to Cuba and Brazil, in addition to reports of naval
officers and British consuls, and estimated the size of the British participation in
the transatlantic slave trade after 1807. He found that British subjects
contributed significantly to the nineteenth century slave trade. According to him,
they “owned, managed, and manned slaving adventures; they purchased newly
imported Africans in the Americas; they supplied ships, equipment, insurance,
and most important of all trade goods and credit to foreign slave traders.”33
British firms could wait up to two years to receive the returns of their
investments. This was particularly useful to Brazilian traders, given the scarcity
of credit available in most financial centers in Brazil. 34
Iberian carriers dominated the slave trade from Angola only after the
suppression of the slave traffic in the North Atlantic. Figure 1.1 shows that
Iberian slave traders increased their activities along the coast of West Central
Africa in the aftermath of Portugal and Spain ratifying the treaties of 1815 and
1817 with Britain. These treaties in fact prohibited them from carrying slaves
north of the Equator, although in the case of the 1817 Anglo-Spanish treaty this
ban was to extend to the whole of the Atlantic (north and south) from May, 1820.
Many Iberian slave traders, who had been purchasing slaves on the coast north of
the Equator, now began to search for alternative sources of slaves south of the
Equator. This shift increased the Portuguese slave trade from Angola
significantly. The estimates available show that the number of slaves shipped in
Iberian vessels from the coast of West Central Africa increased from an average of
33 David Eltis, “The British Contribution to the Nineteenth Century Trans-Atlantic Slave Trade,” Economic History Review 32, no. 2 (1979): 211. 34 Ibid., 220. See also David Eltis, “The British Trans-Atlantic Slave Trade after 1807,” Maritime History 4, no. 1 (1974): 8-9; Eltis, Economic Growth and the Ending of the Transatlantic Slave Trade, 58-59; Miller, Way of Death, 505-508.
32

26,090 slaves per year between 1806 and 1815 to an average of 43,340 slaves
per year between 1816 and 1825.
A large number of these slaves were embarked from ports controlled by
several independent African polities situated north of Luanda. These ports had
been selling most of their slaves to non-Iberian carriers, such as the British and
the French. However, with the abolition of the British slave trade and the Haitian
Revolution, Iberian carriers extended their slaving activities to these ports,
especially after 1815, when many slave traders who did not have commercial
connections at the Portuguese controlled ports, such as Luanda and Benguela,
began to purchase slaves from ports previously dominated by British and French
carriers, mainly north of the Congo River. Additionally, Portuguese slave traders
based in Brazil found it more economical to purchase slaves at the African
controlled ports than at the Portuguese ports on the coast of Angola, because
Africans collected lower taxes on slaves embarked than their Portuguese
competitors further south.35 Therefore, after 1815 the Iberian slave trade from
the ports north of Luanda increased. The shipping records available in the
“Voyages” Database indicate that after 1815 Iberian carriers shipped almost all
their Angolan slaves from ports north of Luanda, even after adjusting for the bias
available in the sources documenting the slave trade from Cabinda and Molembo
to Bahia.
35 Roquinaldo Amaral Ferreira, “Dos Sertões ao Atlântico: Tráfico Ilegal de Escravos e Comércio Lícito em Angola, 1830-1860” (M.A., Rio de Janeiro: Universidade Federal do Rio de Janeiro, 1996), 86-89.
33
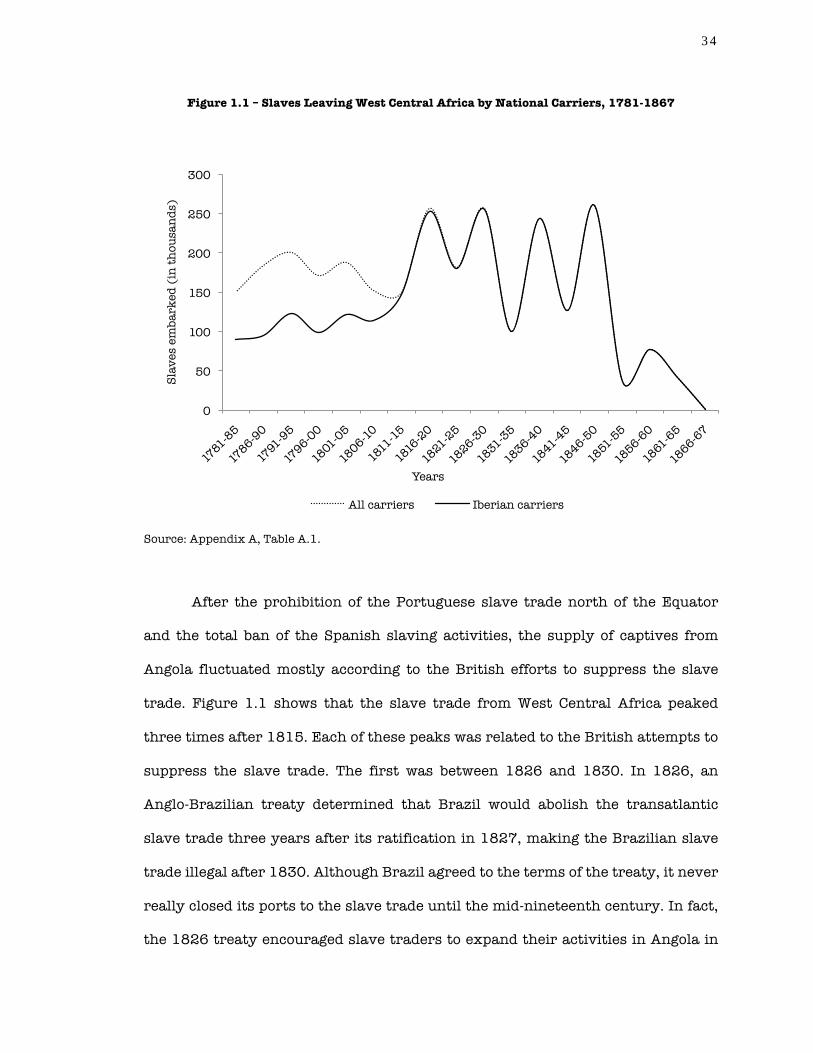
Figure 1.1 – Slaves Leaving West Central Africa by National Carriers, 1781-1867
Source: Appendix A, Table A.1.
After the prohibition of the Portuguese slave trade north of the Equator
and the total ban of the Spanish slaving activities, the supply of captives from
Angola fluctuated mostly according to the British efforts to suppress the slave
trade. Figure 1.1 shows that the slave trade from West Central Africa peaked
three times after 1815. Each of these peaks was related to the British attempts to
suppress the slave trade. The first was between 1826 and 1830. In 1826, an
Anglo-Brazilian treaty determined that Brazil would abolish the transatlantic
slave trade three years after its ratification in 1827, making the Brazilian slave
trade illegal after 1830. Although Brazil agreed to the terms of the treaty, it never
really closed its ports to the slave trade until the mid-nineteenth century. In fact,
the 1826 treaty encouraged slave traders to expand their activities in Angola in
0
50
100
150
200
250
300S
lav
es e
mb
ark
ed (
in t
ho
usa
nd
s)
Years
All carriers Iberian carriers
34

the interlude before it took effect. Many slave traders invested heavily prior to
the government’s anticipated closing of the African slave trade. The number of
slaves shipped from West Central Africa increased from about 180,380 slaves
embarked between 1821 and 1825 to 254,860 slaves between 1826 and 1830.
Between 1836 and 1840 the trade from Angola peaked for a second time as
a result of two important events in Europe. The first was the abolition of the
Portuguese slave trade. In 1836, the Portuguese government published a law
prohibiting the slave trade from all Portuguese possessions in Africa, including
Luanda and Benguela.36 However, at that time the government lacked the means
to enforce the law, and once again many slave traders expanded their activities
before the ban could be implemented in Luanda and Benguela. The second event
was the passage of Lord Palmerston’s bill in 1839 by the British Parliament.
When this bill became law it allowed the British navy to capture any vessel flying
Portuguese colors suspected of trading slaves on the African coast and take it
before a British domestic court.37 The act was a clear violation of international
law, but it signaled to slave traders that their active days were coming to an end.
In anticipation, many traders again rushed to Angola, increasing the number of
slaves shipped from West Central Africa from approximately 99,660 between
1830 and 1835 to 243,800 slaves between 1836 and 1840.
None of these measures was in fact entirely effective, so that there is a yet
a third peak in the Angolan traffic, this time between 1846 and 1850, when the
British changed their focus from the Portuguese to the Brazilian slave trade. In
1845, the British Parliament approved Lord Aberdeen’s act, a measure similar to
the 1839 legislation but applicable to Brazilian vessels as well as vessels carrying
36 Marques, Os Sons do Silêncio, 203-214. 37 Bethell, The Abolition of the Brazilian Slave Trade, 156-164.
35

no registration papers and thus without any national affiliation. Once more the
British navy could seize such vessels and have them condemned in British
courts.38 In the same year, the British and Portuguese established a mixed
commission court as well as a naval station at Luanda, from where they could
better patrol the coast of West Central Africa.39 Additionally, in 1850 British
naval interventions at two Brazilian ports had a huge impact throughout the
country.40 These actions were a major violation of Brazilian sovereignty, and they
served as a final call for Brazilian authorities to pass and enforce new legislation
against the slave trade. These measures prevented Iberian traders from using
traditional ports of embarkation, and led them to expand their activities north
and south of Luanda. As a result, the number of slaves shipped from West Central
Africa increased from about 126,600 between 1841 and 1845 to 260,400
between 1846 and 1850.
The supply of slaves from Angola also varied in response to important
events in the Atlantic. Figure 1.2 shows the estimated numbers shipped from
West Central Africa by place of embarkation. In the late eighteenth century, ports
situated north of Luanda shipped the majority of the slaves carried from West
Central Africa. These ports included Ambriz, Cabinda, Loango, Molembo and the
mouth of the Congo River, in addition to some other smaller places like Kilongo
and Mayumba. Independent African polities such as the kingdoms of Kongo,
Kakongo, Loango and Ngoyo controlled these ports and had sold most of their
slaves to non-Iberian slave traders. British and French slave traders, in
particular, conducted such a lively trade in these ports that the Portuguese tried
38 Ibid., 259-266. 39 Bethell, “The Mixed Commissions,” 79. 40 Eltis, Economic Growth and the Ending of the Transatlantic Slave Trade, 215-216.
36

to halt this commerce by attacking and occupying some of them. In 1783, for
example, the Portuguese occupied Cabinda and built a small fort on the coast to
prevent the sale of slaves to foreign traders. However, in the following year, a
French squadron arrived at Cabinda and formed an alliance with the local rulers
that forced the Portuguese to destroy their own fort and leave the area.41 In 1788,
the Portuguese government at Luanda made another attempt to reduce the
competition for slaves from the northern ports by waging a war against the
Marquis of Musulu, a dissident of the Kingdom of Kongo. The Marquis of Musulu
controlled the port of Ambriz, where British slave traders purchased many of the
slaves they carried from Angola. The Portuguese sought to intercept this
commerce from the interior and built a fort at the mouth of the River Loge. In
view of what had happened in Cabinda, however, the colonial office in Lisbon
ordered the governor of Angola to recall his forces and destroy the fort two years
after the war.42 The ports north of Luanda thus remained open for international
commerce throughout the late eighteenth century.
41 Governmental Board of Angola to Martinho de Melo e Castro, 11 July 1783, AHU, CU, Angola, box 66 doc. 68, 69, 70 and 74; Pedro Álvares de Andrade to Martinho de Melo e Castro, 12 February 1784, AHU, CU, Angola, box 68 doc. 29; Pedro Álvares de Andrade to Martinho de Melo e Castro, 24 March 1784, AHU, CU, Angola, box 68 doc. 54; António Máximo de Sousa Magalhães to Martinho de Melo e Castro, 8 October 1784, AHU, CU, Angola, box 69 doc. 34. 42 Manoel de Almeida e Vasconcelos to Martinho de Melo e Castro, 23 April 1791, AHU, CU, Angola, box 76 doc. 18; Manoel de Almeida e Vasconcelos to Martinho de Melo e Castro, 31 December 1791, AHU, CU, Angola, box 76 doc. 102; Manoel de Almeida e Vasconcelos to Martinho de Melo e Castro, 17 March 1792, AHU, CU, Angola, box 77 doc. 31. See also David Birmingham, Trade and Conflict in Angola: The Mbundu and their Neighbours under the Influence of the Portuguese, 1483-1790 (Oxford: Clarendon Press, 1966), 157-158; Jan Vansina, Kingdoms of the Savanna: A History of Central African States until European Occupation (Madison: University of Wisconsin Press, 1966), 182 and 191; Phyllis M. Martin, The External Trade of the Loango Coast, 1576-1870: The Effects of Changing Commercial Relations on the Vili Kingdom of Loango (Oxford: Clarendon Press, 1972), 137-138; Anne Hilton, The Kingdom of Kongo (New York: Clarendon Press, 1985), 211.
37
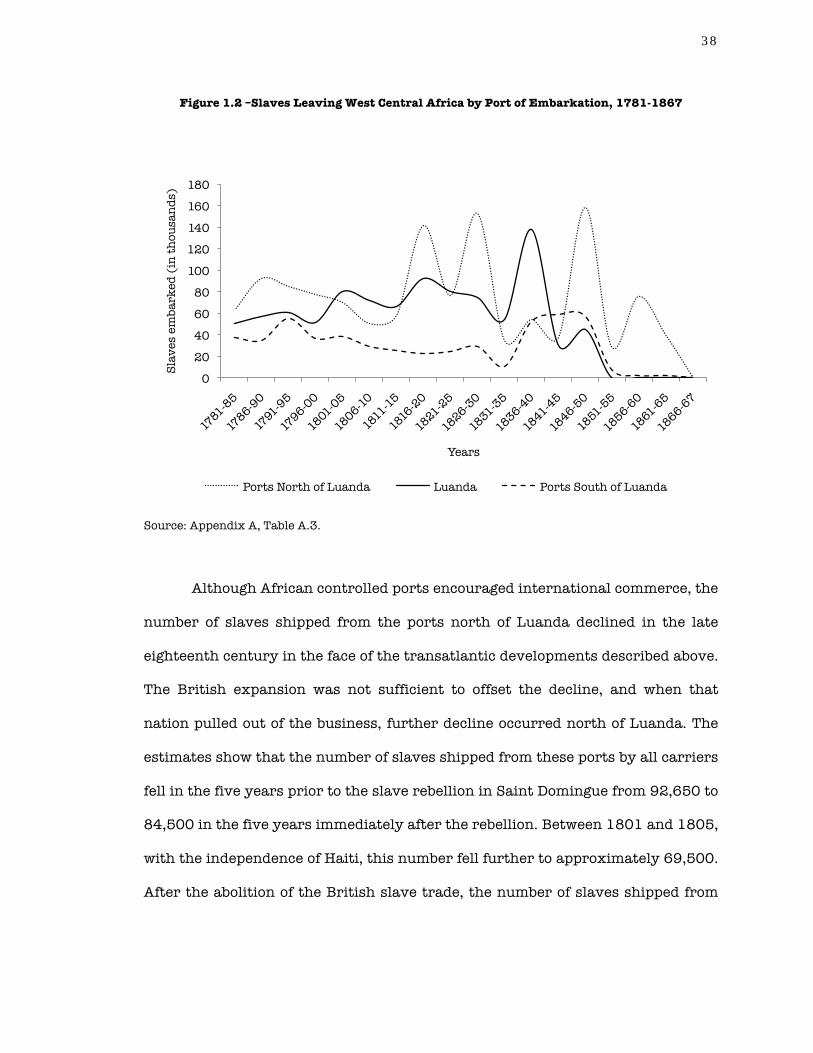
Figure 1.2 –Slaves Leaving West Central Africa by Port of Embarkation, 1781-1867
Source: Appendix A, Table A.3.
Although African controlled ports encouraged international commerce, the
number of slaves shipped from the ports north of Luanda declined in the late
eighteenth century in the face of the transatlantic developments described above.
The British expansion was not sufficient to offset the decline, and when that
nation pulled out of the business, further decline occurred north of Luanda. The
estimates show that the number of slaves shipped from these ports by all carriers
fell in the five years prior to the slave rebellion in Saint Domingue from 92,650 to
84,500 in the five years immediately after the rebellion. Between 1801 and 1805,
with the independence of Haiti, this number fell further to approximately 69,500.
After the abolition of the British slave trade, the number of slaves shipped from
0
20
40
60
80
100
120
140
160
180S
lav
es e
mb
ark
ed (
in t
ho
usa
nd
s)
Years
Ports North of Luanda Luanda Ports South of Luanda
38

the ports north of Luanda declined further to 50,590, a figure barely half the
number shipped before the slave rebellion of Saint Domingue.
In contrast, the slave trade from Luanda increased during the late
eighteenth century. Luanda was the single largest port of slave embarkation on
the coast of Angola. It shipped about 34 percent of all slaves embarked from West
Central Africa between 1781 and 1867. The Portuguese had dominated this port
since the sixteenth century, except for a brief period between 1641 and 1648,
when the Dutch captured Luanda from the Portuguese. In the late eighteenth
century, the number of slaves shipped from Luanda increased as Brazilian
plantations, supplied by Portuguese traders, took advantage of first the Haitian
Revolution and second the abolition of the British trade that supplied Brazilian
competitors in the British Caribbean. Luanda and the northern ports shared some
internal supply routes. Thus, as the activities of British and French slave traders
in the northern ports declined, many of the slaves that were previously sold
through these ports were diverted for sale at Luanda. The estimates show that,
compared to the late eighteenth century, the slave trade from Luanda increased
significantly at the beginning of the nineteenth century. In the first ten years of
the nineteenth century, for example, the number of slaves shipped from Luanda
increased approximately 27 percent from what it had been in the last ten years of
the eighteenth century.
South of Luanda, on the other hand, slave departures declined
continuously from the late eighteenth century until the mid-1830s. Benguela and
Novo Redondo were the principal ports of embarkation in this region. Benguela
alone shipped almost all of the slaves embarked from these ports. Lesser ports of
embarkation south of Luanda included Benguela Velha, Quicombo, Salinas and the
mouth of the Kwanza River, which slave traders used occasionally as clandestine
39

ports of slave embarkation during the era of slave trade suppression. The
majority of the slaves shipped from such ports originated from different regions
than those embarked at Luanda and the ports north of Luanda. They came from
the central plateau of Angola, an area dominated by several African polities in
conflict with one another, such as the kingdoms of Kakonda, Mbailundu, Viye and
Wambu. Although wars between African polities generally produced large
numbers of slaves, the conflicts in the Angolan highlands did not have had the
same effect, as the trend line for the southern ports in Figure 1.2 clearly shows.
In any event, in the nineteenth century the supply of slaves on the coast of
Angola varied greatly with efforts to suppress the transatlantic slave trade.
Figure 1.2 shows that soon after the tightening of restrictions on the slave trade
north of the Equator, the number of slaves shipped from both Luanda and the
ports north of it increased. Portuguese traders shipped the majority of the slaves
embarked from these ports. Many of these traders may never have previously
purchased slaves in this part of the continent. They had probably trading slaves
in regions north of the Equator, such as the Bights of Benin and Biafra. However,
as the pressure on the slave trade in those areas increased, they sought to
purchase slaves in other regions, such as Angola or Mozambique. The African
controlled ports north of Luanda emerged as an ideal alternative for many such
traders. They did so because they probably had a surplus of slaves to sell as a
result of the Haitian Revolution and the abolition of the British slave trade, and
second, because their competitors who regularly traded at Luanda and Benguela
had few connections in the northern ports. Finally, African rulers taxed the trade
less than their Portuguese competitors at Luanda and Benguela. As late as 1847,
the British commissioner at Luanda noted that “the abandonment of the port of
Luanda for that of Ambriz, the resort now of almost all the foreign vessels, is
40

partly accounted for… by their having no duties to pay at the latter.”43 Hence, the
number of slaves shipped from the ports north of Luanda increased sharply after
1816.
The outflow from the northern ports of Angola peaked again between 1826
and 1830, as a result of Brazilian independence and the Anglo-Brazilian treaty of
1826. Following the independence of Brazil in 1822, many Brazilian traders had
further expanded their activities in these ports, reducing the revenue that they
generated at Luanda and the ports south of Luanda, which still remained part of
the Portuguese Empire.44 Rumors that a fleet commanded by Lord Cochrane, in
the service of the Brazilian government, was departing from Pernambuco to
capture Luanda led the Portuguese authorities there to strengthen their
defenses.45 Given the political conflict between Portugal and Brazil, many traders
preferred to send their vessels to purchase slaves at the African controlled ports
north of Luanda. The Anglo-Brazilian treaty of 1826 further induced traders to
expand their activities in these ports because it specified a date for the abolition
of the Brazilian slave trade. Hence, many traders rushed to the northern ports in
order to purchase slaves before Brazil closed its ports to slaves arriving from
Africa. These developments explain the 1826-1830 peak in the volume of the
trade.
After 1830, the number of slaves embarked from ports north of Luanda
declined, while exports from Luanda and the ports south of Luanda increased. In
43 H.M.’s Commissioners to Viscount Palmerston, 14 February 1848, in Great Britain, Irish University Press Series of British Parliamentary Papers: Slave Trade (Shannon: Irish University Press, 70), vol. 36, 105. 44 José Joaquim Lopes de Lima, Ensaios sobre a Statistica das Possessões Portuguezas (Lisbon: Imprensa Nacional, 62), vol. 3, 165-168. 45 Nicolau de Abreu Castelo Branco to Count of Sub-Serra, 23 February 1825, AHU, CU, Angola, box 147 doc. 34. See also Boris Fausto, Historia do Brasil, 8th ed. (Sao Paulo: Editora da Universidade de São Paulo, 2000), 144.
41
1825, Portugal recognized Brazilian independence, provided that Brazil would
compensate the Portuguese for financial losses and would not support the
independence of any other Portuguese colony.46 This agreement favored slave
traders, because it allowed them to resume their activities at Portuguese ports on
the African coast. Many traders based in Brazil, notably in Bahia and Rio de
Janeiro, developed commercial relations with their counterparts based in Luanda
and Benguela, thereby increasing the number of slaves shipped from these ports
at the beginning of the 1830s.47 However, the expansion of the trade from Luanda
and the ports south of it was short lived. In 1836, the Portuguese government
banned trading from its possessions in Africa.48 Additionally, British
policymakers began to pursue the suppression of the transatlantic trade more
aggressively, following the passage of the previously mentioned Palmerston and
Aberdeen acts of 1839 and 1845, respectively, as well as the establishment of a
mixed commission court at Luanda.49 Furthermore, Britain in addition to France,
Portugal and the United States of America increased the number of warships
patrolling the African coast to discourage the transatlantic trade.50 As a result,
the number of slaves shipped from Luanda and the ports south of Luanda
declined in the 1840s.
Even so, as long as Brazil remained open for the trade and African rulers
continued to supply slaves, captive departures from Angola remained high.
46 Paulo Bonavides and Roberto Amaral, Textos Políticos da História do Brasil, 3rd ed. (Brasília: Senado Federal, 2002), vol. 1, 812-815. 47 Ferreira, “Dos Sertões ao Atlântico,” 82-85; Mariana P. Cândido, “Enslaving Frontiers: Slavery, Trade and Identity in Benguela, 1780-1850” (Ph.D., Toronto: York University, 2006), 101-113; Mariana P. Cândido, “Merchants and the Business of the Slave Trade in Benguela c. 1750-1850,” African Economic History 35 (2007): 4-11. 48 Marques, Os Sons do Silêncio, 203-214. 49 Bethell, The Abolition of the Brazilian Slave Trade, 156-164 and 259-266; Bethell, “The Mixed Commissions,” 79. 50 Eltis, Economic Growth and the Ending of the Transatlantic Slave Trade, 94-95.
42

Between 1846 and 1850, the trade from Angola reached its highest level in the
nineteenth century. Approximately 260,000 enslaved Africans were sold into the
transatlantic trade from Angola in that period alone. The majority of them
embarked at the African controlled ports north of Luanda. Despite aggressive
legislation and the reinforcement of warships patrolling the African coast, the
trade from Angola declined significantly only after 1850, when Brazil finally
closed its ports to all vessels carrying slaves from Africa.51 Following the abolition
of the Brazilian trade, some traders continued to sail to Angola to purchase
slaves. Most of these exports were shipped to Cuba, the principal destination for
the last victims of the transatlantic trade. However, the numbers shipped from
Angola after 1850 never came close to matching those taken to Brazil prior to
that year.
From the late eighteenth until the mid-nineteenth century, Angola was a
major source of slaves for the Americas. The slave rebellion in Saint Domingue
and the abolition of the British trade decreased the number of slaves shipped
from West Central Africa. However, with the growing restrictions on the trade
north of the Equator, the average numbers shipped from West Central Africa
recovered to levels matching those of the years when British and French slave
traders were still engaged in the commerce from Angola. In this period, Iberian
carriers expanded their activities on the coast of West Central Africa by tapping
sources previously dominated by British and French traders north of Luanda. The
expansion of Brazilian commercial agriculture, the transference of the
Portuguese court to Rio de Janeiro, the opening of the Brazilian ports to
international trade and the spread of British capital in Brazilian markets all
51 Bonavides and Amaral, Textos Políticos da História do Brasil, vol. 2, 212-214.
43

contributed to the expansion of the Iberian trade from Angola. The number of
slaves shipped from West Central Africa remained high well into the nineteenth
century.
Changing opinion about the morality and viability of slavery in Europe and
the Americas had a profound impact on the Angolan trade. At first glance, it
appears that this shift was particularly negative in Angola. Yet, when suppression
of the trade focused initially on the North Atlantic, Angola emerged as the
principal source of captives for the Americas. That said, the slave rebellion in
Saint Domingue and the abolition of the British trade spared the population of
Angola from the effects of an even more rapidly expanding trade. Had the French
recovered Saint Domingue from the insurgents and the British remained active in
the trade, the numbers shipped from Angola would probably have been higher
than they actually were. In that case, the demand for slaves might indeed have
expanded the slaving frontiers deep into interior of West Central Africa, as many
scholars have posited. However, these developments did not occur. The slave
rebellion of Saint Domingue, the abolition of the British trade, and the campaign
for the suppression of the transatlantic trade checked, in large measure, the
expansion of the Iberian trade. The impact of the trade on the interior of Angola
was thus less extensive than scholars have generally believed, as will be seen in
the following chapters.
44

Chapter Two
Merchants, Brokers and Traders
The Organization of the Slave Trade from
Angola in the Nineteenth Century
In the nineteenth century, a complex network of merchants, brokers and
traders governed the trade from Angola. Merchants based in Portugal and Brazil
organized most of the shipments to the Americas. They financed these voyages
individually or in groups, which sometimes included captains of slave ships.
Merchants purchased their captives from brokers located along the coast of West
Central Africa. These brokers controlled the supply of human cargo on the coast,
but they depended on traders who transported captives from the interior to the
coast. Although these categories are analyzed separately, in reality they
frequently overlapped. Brokers, for example, often tried to break into the
shipping business and finance transatlantic voyages themselves. Traders, on the
other hand, had to work hard to accumulate sufficient contacts and resources to
operate as brokers on the coast of Angola. Nevertheless, these categories will be
examined separately to provide a better understanding of how slaves left Angola
in the final years of the traffic across the Atlantic. This chapter will also examine
environmental factors and their effects on the trade
Patterns of wind and sea currents prevailing in the Atlantic largely shaped
the direction of the Angolan trade. Both wind and sea currents flow in the same
45

direction throughout the year, changing little from one season to the next.1
However, the Atlantic gyres, to use the correct term, differ north and south of the
Equator. Figure 2.1 shows these movements in schematic perspective. In the
North Atlantic, the wind and sea currents move clockwise like a giant wheel,
while in the South Atlantic they move counterclockwise. The gyres on either side
of the Atlantic are separated by the doldrums, which are calm waters flowing
around the Equator. Captains, who had to sail from one part of the ocean to
another, had to cross the doldrums, which greatly prolonged the length of voyage.
1 Luiz Felipe de Alencastro, O Trato dos Viventes: Formação do Brasil no Atlântico Sul (São Paulo: Companhia das Letras, 2000), 57-63; Alfred W. Crosby, Ecological Imperialism: The Biological Expansion of Europe (New York: Cambridge University Press, 1986), 104-132; Daniel B. Domingues da Silva, “The Atlantic Slave Trade to Maranhão, 1680-1846: Volume, Routes and Organisation,” Slavery and Abolition 29, no. 4 (2008): 485-487; Joseph C. Miller, Way of Death: Merchant Capitalism and the Angolan Slave Trade, 1730-1830 (Madison: University of Wisconsin Press, 1988), 318-324.
46

Figure 2.1 – Wind and Sea Currents of the North and South Atlantic
Source: Adapted from Daniel B. Domingues da Silva, “The Atlantic Slave Trade
to Maranhão, 1680-1846: Volume, Routes and Organization,” Slavery and
Abolition 29, no. 4 (2008): 486.
Gyres determined the trade routes, and those in the North Atlantic differed
significantly from those in the South Atlantic. In the former, the wind and sea
patterns facilitated the shipment of slaves through the classic triangular trade in
which vessels sailed from Europe to Africa and then to the Americas, from where
they returned to their homeports in Europe. In the latter, the wind and sea
currents facilitated a bilateral trading system, in which vessels departed from the
Americas to Africa, and returned directly to their homeports in the Americas. The
47

trade between Angola and Brazil provides a clear example of how the Atlantic
gyres shaped the routes of the trade. Portuguese and Brazilian vessels loading
slaves in Angola sailed both north and south of the Equator. However, as Table
2.1 shows, the majority of the slaves shipped to regions north of the Equator, in
this case Amazonia, were carried in vessels that had departed from Portugal. The
majority of the slaves shipped from Angola to regions south of the Equator, such
as Bahia, Pernambuco and Southeast Brazil, were carried in vessels that had
departed from Brazilian ports.
Table 2.1 – Percentage of Slaves Leaving West Central Africa Distributed by Region of
Departure and Home Port of the Vessels that Carried Them, 1781-1867
Regions of disembarkation Regions where slaving venture
organized Amazonia Bahia Pernambuco SE Brazil
Portugal 54.6 1.7 6.8 2.6
Amazonia 8.2 0.0 0.0 0.0
Bahia 10.1 88.8 2.2 1.5
Pernambuco 12.2 1.8 81.7 1.0
SE Brazil 15.0 7.5 8.6 94.6
Others 0.0 0.2 0.7 0.3
Totals 100.0 100.0 100.0 100.0
Note: Others in regions of departure include Cuba, Rio de la Plata, India, Southeast Africa,
and unspecified regions in Brazil.
Source: David Eltis et al., "Voyages: The Trans-Atlantic Slave Trade Database," Online
database, 2008,
http://slavevoyages.org/tast/database/search.faces?yearFrom=1781&yearTo=1866&mjby
ptimp=60700
Compared to other regions in the Americas, the patterns of wind and sea
currents of the South Atlantic allowed merchants based in Brazil to supply their
48

own regions with slaves. Table 2.1 shows that about 89 percent of the captives
shipped from Angola to Bahia were carried in vessels that had departed from
Bahia. This pattern is also evident in other Brazilian regions situated south of the
Equator. In Pernambuco, for example, about 82 percent of the slaves embarked in
Angola came in vessels that had departed from Pernambuco and about 95 percent
of the slaves shipped to Southeast Brazil had embarked in vessels whose
homeport was also in Southeast Brazil. Vessels leaving from any of these regions
sailed southwards propelled by the Brazilian Current running along the coast of
Brazil until they were able to catch the West Wind Drift that would take them
across the Atlantic. When they were in sight of the African coast, they sailed
northwards along the coast of Angola propelled by the Benguela Current until
they reached their destination in Africa. To return, vessels leaving Angola to
Brazil re-entered the Benguela Current sailing northwards until they were able to
switch to the South Equatorial Current and cross the Atlantic to Brazil. As soon as
they reached the Brazilian coast, they sailed southwards propelled by the
Brazilian Current until arriving at their final destination.
The voyage between Angola and Brazil was one of the shortest of the trade.
Vessels leaving Angola for Pernambuco between the late eighteenth and the mid-
nineteenth century crossed the Atlantic on average in 47 days. To Bahia they
took a little over a month, 37 days on average, and to Southeast Brazil they took
about 51 days.2 These ships were amongst the largest carriers in the trade. The
average number of slaves carried per vessel from Angola to Pernambuco was
2 Calculated based on a sample of 41 records of vessels sailing from West Central Africa to Bahia, 19 to Pernambuco and 236 to Southeast Brazil between 1781 and 1842 available in the Voyages Database.
49

about 450; to Bahia, 377; and to Southeast Brazil, 451.3 Although ships carried
such large numbers of slaves, the mortality rate during the voyage was
surprisingly low. From the late eighteenth century until the end of the trade,
deaths at sea averaged about 5 percent of the total number of slaves shipped from
Angola to Bahia and about 7 percent to Pernambuco and Southeast Brazil.4 The
pattern of wind and sea currents in the South Atlantic provided merchants based
in Brazil with an advantage over their European counterparts in the slaving
business from Angola.
The connections between the eastern Brazilian ports and Angola were not
only based on ecological features. These two regions were also connected
historically. In 1630, when the Dutch invaded Pernambuco, they discovered that
the majority of the slaves used in the Portuguese sugar plantations came from
Angola. Johannes de Laet, drawing from Portuguese records collected after the
occupation, noted that “from Angola alone in the years 1620, 21, 22, 23, being
four years, to the Captaincy of Pernambuco have been disembarked 15,430
Blacks.”5 The Dutch, like most Europeans at that time, regarded the sugar
industry of Pernambuco as a highly profitable, and they sought to continue
supplying the plantations there with Angolan slaves, using similar trading routes
as the Portuguese. In 1641, the Dutch sailed for Angola and captured Luanda,
3 Calculated based on a sample of 146 records of vessels sailing from West Central Africa to Bahia, 94 to Pernambuco and 1,209 to Southeast Brazil between 1781 and 1849 available in the Voyages Database. 4 Calculated based on a sample of 129 records of vessels sailing from West Central Africa to Bahia, 30 to Pernambuco and 1,161 to Southeast Brazil between 1781 and 1847 available in the Voyages Database. 5 Joannes de Laet, Iaerlijck Verhael van de Verrichtingen der Geoctroyeerde West-Indische Compagnie in derthien Boecken. Tweede Deel: Boek IV-VII (1627-1630), ed. S. P. L’Honoré Naber (’s-Gravenhage: Martinus Nijhoff, 1932), 139. I would like to thank Rik van Welie for this reference.
50

which then, as later, served as the major port of embarkation and the capital of
the Portuguese government in Angola.6
However, the Dutch occupation of Luanda was shortlived. In 1648,
Salvador Corrêa de Sá e Benevides recaptured Luanda with a fleet assembled in
Rio de Janeiro. Salvador de Sá was governor of Rio de Janeiro, where he owned
land and slaves. After retaking Luanda, he reorganized the Portuguese colony in
Angola appointing members of his expedition to key offices in the government.7
Through this process, he created strong ties between Brazil and Angola. Another
factor strengthening links between Brazil and Angola was the appointment of
Brazilian officers, such as João Fernandes Vieira and André de Vidal Negreiros, to
positions in the government of Angola. Both men had distinguished themselves in
the 1650s during the reconquest of Pernambuco.8 They had the distinction of
being among the longest serving governors in Angola. Governors of Angola were
generally appointed for a three year period, but João Fernandes Vieira served for
about four years, between 1658 and 1661, and André de Vidal Negreiros served
for almost six years, between 1661 and 1666.9
The discovery of gold in the interior of Brazil in the 1690s had a similar
impact on Brazilian-Angolan ties. The development of gold production attracted a
6 Alencastro, O Trato dos Viventes, 210-215; C. R. Boxer, “Salvador Correia de Sá e Benevides and the Reconquest of Angola in 1648,” Hispanic American Historical Review 28, no. 4 (1948): 489-492; C. R. Boxer, Salvador de Sá and the Struggle for Brazil and Angola, 1602-1686 (London: University of London Press, 1952), 240-242; Ralph Delgado, História de Angola (Lisbon: Banco de Angola, 1970), vol. 2, 215-224. 7 Carlos Dias Coimbra, ed., Livro de Patentes do Tempo do Sr. Salvador Correia de Sá e Benevides (Luanda: Instituto de Investigação Científica de Angola, 1958), passim. 8 Alencastro, O Trato dos Viventes, 221-238; Boxer, “Salvador Correia de Sá e Benevides and the Reconquest of Angola in 1648,” 504-511; Boxer, Salvador de Sá and the Struggle for Brazil and Angola, 1602-1686, 261-269; Delgado, História de Angola, vol. 2, 376-393; Evaldo Cabral de Mello, Olinda Restaurada: Guerra e Açúcar no Nordeste, 1630-1654 (Rio de Janeiro: Editora Forense-Universitária, 1975), 171-208. 9 “Catálogo dos Governadores do Reino de Angola,” Arquivos de Angola 3, no. 34-36, 1 (1937): 497-500; Elias Alexandre da Silva Corrêa, História de Angola, ed. Manuel Múrias (Lisbon: Editorial Ática, 1937), vol. 1, 275-284.
51

large number of Portuguese immigrants to Brazil.10 They settled not only in the
mining centers but also on the coast, especially in Bahia, Pernambuco and Rio de
Janeiro, which served as the main ports of entry to the gold producing areas.
Moreover, they expected to tap some of the wealth coming in and out of the
interior by engaging in trading activities in these regions. In Pernambuco, the
arrival of these immigrants caused great conflicts with the local community,
because gold exports had increased the prices of commodities imported from
abroad, including slaves.11 Sugar planters, for example, became increasingly
indebted to traders who had migrated from Portugal. However, in Bahia and Rio
de Janeiro the local community was able to accommodate the newcomers with
less friction. Planters in Bahia and Rio, on the one hand, regarded the arrival of
Portuguese immigrants as an opportunity both to build commercial alliances and
raise the status of their families by creating direct links with the metropolis. The
immigrants, on the other, viewed the planters as an important means of getting
access to local power and prestige, and they began to marry daughters of planter
families.12 A strong community of local merchants emerged in Bahia and Rio de
Janeiro, which increasingly dominated the Angolan trade.
10 C. R. Boxer, The Golden Age of Brazil, 1695-1750: Growing Pains of a Colonial Society (Berkeley: University of California, 1962), 35-36; Virgílio Noya Pinto, O Ouro Brasileiro e o Comércio Anglo-Português: Uma Contribuição aos Estudos da Economia Atlântica no Século XVIII, 2nd ed. (São Paulo: Companhia Editora Nacional, 1979), 51-53. 11 Evaldo Cabral de Mello, A Fronda dos Mazombos: Nobres Contra Mascates, Pernambuco, 1666-1715 (São Paulo: Companhia das Letras, 1995), 177-180. 12 Rae Jean Flory, “Bahian Society in the Mid-Colonial Period: The Sugar Planters, Tobacco Growers, Merchants and Artisans of Salvador and the Recôncavo, 1680-1725” (Ph.D., Austin: University of Texas, 1978), 98-109; João Luís Ribeiro Fragoso, “A Nobreza da República: Notas sobre a Formação da Primeira Elite Senhorial do Rio de Janeiro (Séculos XVI e XVII),” Topoi, no. 1 (2000): 58-60; John Norman Kennedy, “Bahian Elites, 1750-1822,” Hispanic American Historical Review 53, no. 3 (1973): 423-424; Antônio Carlos Jucá Sampaio, “Famílias e Negócios: A Formação da Comunidade Mercantil Carioca na Primeira Metade do Setecentos,” in Conquistadores e Negociantes: Histórias de Elites no Antigo Regime nos Trópicos. América Lusa, Séculos XVI a XVIII, ed. João Luís Ribeiro Fragoso, Antônio Carlos Jucá de Sampaio, and Carla Maria de Carvalho de Almeida (Rio de Janeiro: Civilização Brasileira, 2007), 234-260; David Grant Smith, “The Mercantile Class of Portugal and Brazil in the Seventeenth Century: A Socioeconomic Study of the Merchants of Lisbon and Bahia, 1620-1690” (Ph.D., University of Texas, 1975), 288-290 and 400-402.
52

In the mid-eighteenth century, the Portuguese government tried to limit
the control of Brazilian merchants over the trade from Angola. In 1755 and 1759,
the Portuguese Prime Minister, Sebastião José de Carvalho e Melo, created two
trading companies based in Lisbon; the Companhia Geral do Comércio do Grão
Pará e Maranhão and the Companhia Geral do Comércio de Pernambuco e
Paraíba. The minister granted the two companies a monopoly over all maritime
trade, including the slave trade, to the northern captaincies of Brazil as well as to
Pernambuco and its neighboring captaincies, Alagoas, Paraíba, Rio Grande do
Norte and Ceará.13 In Bahia, the government also tried to limit the control of local
merchants over the slave trade by terminating the Mesa do Bem Comum, the
trading board of the Bahian merchants.14
A further government initiative reformed the taxes on slaves shipped from
Angola in 1758. Although this revision was couched in the language of free trade,
it in fact provided the state with more control over the commerce. Before 1758,
slaves shipped from Angola were taxed on the basis of a measurement of a
potential unit of labor called peça da Índia, which implied a healthy adult slave,
male or female, of a certain height. Children, people with disabilities and adults
shorter than the designated height were considered for purposes of tax collection
as a fraction of a peça da Índia.15 However, following the 1758 reform, officials
13 António Carreira, As Companhias Pombalinas de Navegação, Comércio e Tráfico de Escravos entre a Costa Africana e o Nordeste Brasileiro (Bissau: Centro de Estudos da Guiné Portuguesa, 1969), 31-33 and 249-252; Manuel Nunes Dias, Fomento e Mercantilismo: A Companhia Geral do Grão Pará e Maranhão (1755-1778) (Belém: Universidade Federal do Pará, 1970), vol. 1, 207-225; José Ribeiro Júnior, Colonização e Monopólio no Nordeste Brasileiro: A Companhia Geral de Pernambuco e Paraíba (1759-1780) (São Paulo: HUCITEC, 1976), 82-83. 14 Alexandre Vieira Ribeiro, “A Cidade de Salvador: Estrutura Econômica, Comércio de Escravos e Grupo Mercantil (c.1750-c.1800)” (Doctorate, Rio de Janeiro: Universidade Federal do Rio de Janeiro, 2009), 375-377; Pierre Verger, Fluxo e Refluxo: O Tráfico de Escravos entre o Golfo de Benin e a Bahia de Todos os Santos dos Séculos XVII a XIX (São Paulo: Corrupio, 1987), 105-108. 15 Philip D. Curtin, The Atlantic Slave Trade: A Census (Madison: University of Wisconsin Press, 1969), 22-23; Enriqueta Vila Vilar, Hispanoamerica y el Comercio de Esclavos (Seville: Escuela de Estudios Hispano-Americanos, 1977), 189-190. Curtin implied that only male slaves could be
53
began to collect taxes on each individual embarked, rather than on the basis of
peça da Índia. Merchants consequently faced increased taxation. The reform
created a single unified tax rate, which comprised, more or less, the sum of all
taxes previously levied over the peças de Índia.16 This measure was especially
harmful to merchants who shipped slaves in vessels carrying efeitos próprios,
that is, carrying commodities belonging to the vessels’ owners. In 1684, a law
limiting the carrying capacity of slave vessels also imposed a ranking on the
departure of vessels from Luanda carrying slaves purchased with efeitos
próprios. Merchants who wished to go to the front of the departure queue had to
pay an additional fee, called preferências, of 2,000 réis for each slave embarked,
but merchants who declined the opportunity were exempt from this fee.17 As the
1758 tax reform unified all taxes, it forced those who opted for the regular
departure schedule to pay an additional fee without obtaining any benefit.
Another way that the Portuguese government tried to reduce Brazilian
control over the slave trade was to appoint individuals loyal to Lisbon to major
offices in the government of Angola. In 1764, Francisco Inocêncio de Sousa
Coutinho assumed the governor’s position in Angola and introduced a series of
measures, such as the development of the wax and ivory trade, aimed at reducing
the colony’s dependence on the human trafficking. He was also responsible for the
first attempt to build a European iron factory in the interior of Angola in a place
called Nova Oeiras, between the Lukala and Luina rivers. Sousa Coutinho
considered peças da Índia, but the documents cited by Vila Vilar clearly state that female slaves could also be considered peças da Índia. 16 Dom José I, “Ley para Ser Livre, e Franco o Commercio de Angola, e dos Portos, e Sertões Adjacentes,” Arquivos de Angola 2, no. 13-15, 1 (1936): 532-533; Dom José I, “Ley sobre a Arecadação dos Direitos dos Escravos, e Marfim, que Sahirem do Reino de Angola, e Pórtos da sua Dependencia,” Arquivos de Angola 2, no. 13-15, 1 (1936): 538-539. 17 Dom Pedro II, “Ley sobre as Arqueações dos Navios que Carregarem Escravos, 28 de Março de 1684,” Arquivos de Angola 2, no. 11-12, 1 (1936): 315.
54

governed Angola for almost eight years, between 1764 and 1772.18 His
successors were loyal to the central administration in Lisbon, and those who tried
to maintain Sousa Coutinho’s policies did so more or less successfully. Miguel
António de Melo, for example, governor between 1797 and 1802, was able to
continue some of these policies, founding another iron factory at Trombeta, in the
present day province of Cuanza Norte.19 Despite these efforts, merchants based in
Bahia, Pernambuco and Rio de Janeiro still maintained large control over the
trade from Angola.
Brazilian based merchants organized shipments from Angola through
individual enterprises or in partnership with others. The “Voyages Database”
provides an indication of the frequency with which they engaged in the trade by
listing the names of individuals and firms that sponsored slaving voyages across
the Atlantic. The data are particularly rich for the period from the late eighteenth
century until 1830, when the trade to Brazil became illegal. The database names
those who financed slaving expeditions for 43 percent of all voyages to Bahia
between 1781 and 1830; 64 percent to Pernambuco; and 52 percent to Southeast
Brazil. In the Bahia sample, there are 130 individuals who sponsored slaving
voyages in this period, 21 of whom are also named as ship captains. In addition to
these individuals, the Bahia sample contains references to 24 firms or
partnerships organized under the names of individual dealers.20 The Pernambuco
sample identifies 105 merchants, of whom 20 were also captains, as well as 23
18 Corrêa, História de Angola, vo. 2, 29-44; “Catálogo dos Governadores do Reino de Angola,” 526-531; Ana Madalena Trigo de Sousa, “Uma Tentativa de Fomento Industrial na Angola Setecentista: A ‘Fábrica do Ferro’ de Nova Oeiras (1766-1772),” Africana Studia 10 (2007): 293-305. 19 Miguel António de Melo to Rodrigo de Sousa Coutinho, 18 March 1800, in Arquivos de Angola ser. 1, vol. 4, nos. 52-54 (1939): 295-300; Miguel António de Melo to Rodrigo de Sousa Coutinho, 5 April 1800, in Arquivos de Angola ser. 1, vol. 4, nos. 52-54 (1939): 307-308. 20 These records appear in the database with a star (*) next to the name of the partnership representative.
55

firms. Finally, the sample for Southeast Brazil includes 196 merchants, 35 of
whom also appear as captains, in addition to 18 firms organized under the names
of individual entrepreneurs.
The trade between Angola and Brazil generated some degree of
concentration of ownership. Table 2.2 shows that the traffic was largely
concentrated in the hands of a few individuals and companies. In Bahia, 3
merchants financed 10 or more voyages to Angola. They represented about 2
percent of all traders, but their names appear associated with 44 voyages, or
about 14 percent of all voyages that had embarked slaves in Angola. In
Pernambuco, 6 merchants, representing about 5 percent of all dealers, appear
associated with 112 voyages, or approximately 32 percent of all voyages. Finally,
in Southeast Brazil the slave trade from Angola was also considerably
concentrated, with 23 merchants and companies financing 10 or more voyages.
They represented about 11 percent of all traders, and their names were
associated with 520 voyages, or about 57 percent of all those that shipped slaves
from Angola to Southeast Brazil.
56

Table 2.2 – Concentration of Ownership of Vessels Embarking Slaves at West Central Africa,
1781-1867
Regions Range of voyages
Number of merchants
Percentage of merchants
Number of voyages
Percentage of voyages
1 to 3 138 89.6 187 60.9 4 to 6 8 5.2 41 13.4 7 to 9 5 3.2 35 11.4 10 and over 3 1.9 44 14.3
Bahia
Total 154 100 307 100
1 to 3 109 85.2 146 42.2 4 to 6 6 4.7 30 8.7 7 to 9 7 5.5 58 16.8 10 and over 6 4.7 112 32.4
Pernambuco
Total 128 100 346 100
1 to 3 161 75.2 218 24.1
4 to 6 21 9.8 101 11.2
7 to 9 9 4.2 65 7.2
10 and over 23 10.7 520 57.5
SE Brazil
Total 214 100 904 100
Source: Same as Table 2.1.
Small investors, defined here as financing on average 1 to 3 voyages, also
played an important role in the trade from Angola. They were the majority of the
individuals engaged in the commerce. Public acceptance of slavery and the slave
trade was so widespread that anyone who had some capital available could
participate in the business without questioning its morality. In Bahia, small
investors numbered 138 individuals, who comprised about 89 percent of all
merchants, and their names appear associated with 187 voyages, or
approximately 61 percent of all voyages. In Pernambuco, 109 individuals
invested in 1 to 3 voyages, comprising about 85 percent of all merchants, but they
financed 146 voyages, or about 42 percent of the total. In Southeast Brazil, the
participation of small investors was less important than in Bahia and
Pernambuco. There were 161 of them engaged in the Angolan trade. They made
57

up about 75 percent of all dealers, but their names were associated with a mere
218 voyages, or about 24 percent of all voyages.
In the period of the legal trade, before 1831, the activities of experienced
entrepreneurs are easier to trace than those of small investors. Slave traders who
participated frequently in the traffic were usually members of the social, political
and economic elite of Brazil. Abundant records of their lives survive in the
archives, which historians have used to reconstruct the careers of some. These
big traders generally had prestigious titles granted by institutions like the Ordem
de Cristo or Order of Christ.21 They also had a seat at the administration of
relevant institutions like the Santa Casa da Misericórdia, an important source of
credit in many cities in Portugal and Brazil.22 These individuals included men
such Elias Coelho Sintra in Pernambuco, Pedro Rodrigues Bandeira in Bahia, and
the well known Elias Antônio Lopes in Rio de Janeiro, who donated the palace at
the Quinta da Boa Vista to the Portuguese royal family, who lived there during
their residence in Brazil between 1808 and 1821.23 The activities of the masses of
small investors are more difficult to unearth, because they left few records of
their lives. Although the names of hundreds of them survive, historians have not
been able to collect sufficient information to establish profiles of these individuals.
After 1830, the activities of traders in general are more difficult to trace
because the traffic to Brazil became illegal. Individuals continued to finance
21 Manolo Florentino, Em Costas Negras: Uma História do Tráfico Atlântico de Escravos entre a África e o Rio de Janeiro, Séculos XVIII e XIX (São Paulo: Companhia das Letras, 1997), 204-208; Alexandre Vieira Ribeiro, “O Comércio de Escravos e a Elite Baiana no Período Colonial,” in Conquistadores e Negociantes: Histórias de Elites no Antigo Regime nos Trópicos. América Lusa, Séculos XVI a XVIII, ed. João Luís Ribeiro Fragoso, Carla Maria de Carvalho de Almeida, and Antônio Carlos Jucá de Sampaio (Rio de Janeiro: Civilização Brasileira, 2007), 332-334. 22 Flory, “Bahian Society in the Mid-Colonial Period: The Sugar Planters, Tobacco Growers, Merchants and Artisans of Salvador and the Recôncavo, 1680-1725,” 262; Ribeiro, “O Comércio de Escravos e a Elite Baiana,” 333-334. 23 Marcus J. M. de Carvalho, Liberdade: Rotinas e Rupturas do Escravismo no Recife, 1822-1850 (Recife: Universidade Federal de Pernambuco, 2002), 118; Florentino, Em Costas Negras, 207; Ribeiro, “O Comércio de Escravos e a Elite Baiana,” 330-331.
58

slaving voyages by forming partnerships for specific voyages. However, the
prominence achieved by some merchants suggests that during these years the
trade was becoming increasingly concentrated in the hands of a few individuals,
who had developed the necessary contacts to bypass the authorities and assure
the successful delivery of large numbers of slaves annually to Brazil. Such
merchants included Joaquim Pereira Marinho in Bahia, Gabriel José Antônio in
Pernambuco, and Manoel Pinto da Fonseca in Rio de Janeiro, who promoted their
major trading status to remind the Brazilian slave owning class of their
services.24 Public acceptance of slavery and the associated trade was such that
traders had no need to cover up their activities. Dependency on the trade gave
merchants access to important centers of decision making in national politics.25
Additionally, it allowed them to mix with the Brazilian aristocracy, largely
consisting of planters and slave owners.26 Major traders had considerable
standing in Brazilian society.
Although these merchants organized the logistics of the trade and took
much of the credit for the successful disembarkation of slaves, they were not
acting alone. They relied on an extensive commercial network that linked not
only Brazil, Portugal and Angola, but also involved the United States and Great
Britain. Until the beginning of the nineteenth century, much of the merchandise
used to purchase slaves was produced in Portugal and Brazil. Some of it was
textiles imported from the Portuguese colonies in Asia. Merchants in Brazilian
ports then assembled these commodities and exchanged them for slaves in
24 Carvalho, Liberdade: Rotinas e Rupturas do Escravismo no Recife, 1822-1850, 118; Mary C. Karasch, “The Brazilian Slavers and the Illegal Slave Trade, 1836-1851” (M.A., Madison: University of Wisconsin, 1967), 12-15; Cristina Ferreira Lyrio Ximenes, “Joaquim Pereira Marinho: Perfil de um Contrabandista de Escravos na Bahia, 1828-1887” (M.A., Salvador: Universidade Federal da Bahia, 1999), 1-21. 25 Karasch, “The Brazilian Slavers and the Illegal Slave Trade, 1836-1851,” 14-15. 26 Ibid.
59

Angola. After the opening of the Brazilian ports to international trade in 1808,
Brazilian traders increasingly used British goods, particularly textiles, to buy
slaves because they knew that Africans in Angola found the quality of the British
textiles to be superior to those of the Portuguese.27 Additionally, the industrial
revolution in Britain reduced the production costs of some goods, which was
reflected in their price in the international market.28 Finally, reductions in
customs duties granted in 1810 to British commodities imported into Brazil made
their prices more competitive with locally produced goods and those imported
from other places in Europe or Asia.29 Slave merchants based in Brazil began to
rely on British traders to assemble most of the manufactured goods destined for
Angola.
After 1830, the organization of the trade from Angola became increasingly
internationalized. Roquinaldo Ferreira notes that as the British increased their
efforts to abolish the slave trade, merchants expanded their trading networks to
places outside Brazil, especially to Cuba and the United States.30 From those
places, they organized slaving expeditions free from interference by the Brazilian
authorities as well as the British navy. These merchants contracted with
Portuguese and Spanish traders located in these countries to obtain vessels,
goods, documents, as well as the American flag to use in their slaving
expeditions.31 American registration papers, in particular, served as an
27 Miller, Way of Death, 349; Karasch, “The Brazilian Slavers and the Illegal Slave Trade, 1836-1851,” 27-35. 28 David Eltis, Economic Growth and the Ending of the Transatlantic Slave Trade (New York: Oxford University Press, 1987), 47. 29 Boris Fausto, Historia do Brasil, 8th ed. (Sao Paulo: Editora da Universidade de São Paulo, 2000), 122-124. 30 Roquinaldo Amaral Ferreira, “Dos Sertões ao Atlântico: Tráfico Ilegal de Escravos e Comércio Lícito em Angola, 1830-1860” (M.A., Rio de Janeiro: Universidade Federal do Rio de Janeiro, 1996), 100-103. 31 David Eltis, “The British Trans-Atlantic Slave Trade after 1807,” Maritime History 4, no. 1 (1974): 9; Eltis, Economic Growth and the Ending of the Transatlantic Slave Trade, 134 and 157;
60

important factor in the illegal trade because, in contrast to the Brazilian
government, the United States had not granted the British the right to search
American vessels.32
Merchants based in Brazil were not the only businessmen using
international networks to organize slaving expeditions. Planters in the southern
United States willing to re-open the transatlantic trade also tapped these
networks to organize clandestine voyages. Charles Lamar from Georgia provides
perhaps the most emblematic case. In 1858, Lamar made a deal with Captain
William Corrie. They purchased a racing yacht built in Long Island, fitted it with
the help of Portuguese traffickers based in New York, and sent it to Angola.33 The
Wanderer embarked 350 slaves at Ambriz and 47 days later it arrived at Jekyll
Island, Georgia.34 The slaves brought in the yacht were quickly sold to planters in
Georgia, South Carolina and Florida.35 Eventually, the American authorities
discovered Lamar’s plot and arrested him and his associates in Georgia. They
were charged with piracy and slave trading, but none was convicted. Lamar’s
slaving expedition was one of the last successful disembarkations of slaves from
Africa in the United States, but it clearly shows that after 1830 the organization
of the Angolan trade extended far beyond Brazil.
The Portuguese connection to the trade between Cuba and Angola was
more important than that to the United States. William Gervase Clarence-Smith
Karasch, “The Brazilian Slavers and the Illegal Slave Trade, 1836-1851,” 27-35; Miller, Way of Death, 505-509. 32 Ferreira, “Dos Sertões ao Atlântico,” 176. 33 Erik Calonius, The Wanderer: The Last American Slave Ship and the Conspiracy that Set Its Sails (New York: St. Martin’s Press, 2006), 45-52 and 66-82. 34 David Eltis et al., “Voyages: The Trans-Atlantic Slave Trade Database,” Online database, 2008, voyage id 4974, www.slavevoyages.org/. See also Emory University, Robert W. Woodruff Library, Manuscripts, Archives and Rare Book Library, Mss 172, Wanderer (Ship) Records, Logbook of the yacht “Wanderer.” 35 Calonius, The Wanderer, 125-133; Tom Henderson Wells, The Slave Ship Wanderer (Athens: University of Georgia Press, 1967), 24-29.
61
has long called attention to the participation of Portuguese merchants in this
business. According to him, Cuban slave traders often relied on the commercial
expertise of Portuguese merchants in order to obtain false documents, colors, and
provisions to carry slaves from Angola as well as other regions controlled by the
Portuguese. In fact, as Clarence-Smith notes, Cuban dependence on Portuguese
trading networks stemmed not only from a need for commercial expertise but
also from a “lack of internationally recognized and occupied colonial possessions
in Sub-Saharan Africa.”36 More recently, Roquinaldo Ferreira has pointed out that
Portuguese merchants based in Angola played a key role in the supply of slaves to
Cuba during the illegal period of the traffic. These merchants included men like
António Severino de Avellar and Guilherme José da Silva Correia, also known as
Guilherme do Zaire. They lived in Luanda but usually assisted Cuban vessels to
load slaves at ports located north of Luanda, especially at Ambriz and at the
mouth of the Congo River.37 The Cuban trade from Angola increased significantly
in this period, from an annual average of 1,400 captives embarked in the 1840s
to 10,200 in the 1850s.38 The demand for labor on the Cuban sugar plantations
was the principal factor responsible for this increase, but the Portuguese
commercial networks no doubt facilitated the process.
The trade from Angola depended on merchants established on the coast of
West Central Africa. Some of them were Africans who acted as brokers or
middlemen responsible for purchasing slaves in the interior and selling them to
transatlantic traders. At embarkation ports such as Cabinda, Molembo and
Loango, rulers regulated the supply of slaves by nominating a representative to
36 William Gervase Clarence-Smith, “The Portuguese Contribution to the Cuban Slave and Coolie Trades in the Nineteenth Century,” Slavery and Abolition 5, no. 1 (1984): 26-27. 37 Ferreira, “Dos Sertões ao Atlântico,” 100-106. 38 Calculated from the estimates available in Appendix A, Table A.2.
62

collect taxes before granting traders the right to purchase them. These
individuals could not enforce a monopoly so they seldom left their capitals
unattended to interfere in commercial affairs on the coast. In return for captives,
rulers sought a mix of foreign commodities, such as firearms, gunpowder, textiles
and alcohol. They distributed these goods to loyal followers to consolidate their
own power, and they provided them on credit to traders supplying slaves from
the interior to the coast.39 In this way, rulers maintained a nexus of commercial
power on the coast, as a counter to the interior, where the centers of political life
were generally located.
The agents of African rulers on the coast held titles directly connected to
their functions. In Loango, they were known as mafuco or mafouk and in Cabinda
and Molembo as mambuco or mambouk. These agents were usually the first
people traders met when they arrived at these northern Angolan ports. They
collected taxes from traders either at their vessels or in tents on the shore. The
negotiations were usually lengthy and they involved displays of power with no
little amount of rum consumed on both sides. Generally, traders from Europe and
the Americas sponsored this feast alone. Once an agreement was reached with the
tax collectors, however, they set up shop on the shore and began to negotiate with
anyone interested in selling slaves.40 Such negotiations could take a long time, but
they usually involved lower costs for traders than their encounters with royal
officials. The price paid for slaves was negotiated with each seller separately.41
The trade at ports dominated by decentralized states was similar to that at
ports controlled by centralized states, except in two respects. At the former,
39 Miller, Way of Death, 40-70 and 94-103. 40 Phyllis M. Martin, The External Trade of the Loango Coast, 1576-1870: The Effects of Changing Commercial Relations on the Vili Kingdom of Loango (Oxford: Clarendon Press, 1972), 97-99; Miller, Way of Death, 184-185. 41 Martin, The External Trade of the Loango Coast, 100-103; Miller, Way of Death, 175-180.
63

rituals and processions commonly preceded commercial exchanges. Additionally,
the transatlantic merchants usually bartered one on one with the community
leaders, rather than their representatives. In 1782, for example, Manoel da Silva
Ribeiro Fernandes sailed to the ports north of Luanda and described his
encounter with a prince of Nsoyo, a former province of the old Kingdom of Kongo,
which by that time was no longer the centralized society that it had been in
previous centuries. His description provides a vivid account of how decentralized
societies conducted the slave trade.
The prince came with about three hundred men carrying drums, flutes and
lugubrious instruments as well as firearms; most of them were no longer working
and neither had gunpowder of quality. Others were carrying wooden clubs, knives,
cassava roots and corn stalks. They were all wearing dresses made of straws. The
prince looked like a woman, wearing the same dress as the princess when I met
her, and the headdress of a grenadier, in addition to a large sword on his side, and a
Crucifix of the Lord in his hands. He then entered the Church between six blacks
holding knives, marched through the sacristy, passed around a gate in front of the
altar, knelt before the principal chapel [...] shouted and all the people in front of the
Church's door entered, knelt and began to sing a song. After they finished, the
prince left the sacristy, marched around the Church, re-entered the sacristy, and
then left the building through its main door towards a square, where he ordered
two chairs to be placed, distant a fathom from each other, one for him and another
for me. He then sat and summoned me. I sat and dealt directly with him.42
From the late eighteenth to the mid-nineteenth century, a number of
families with historic connections to the trade dominated the supply of slaves at
42 Relação de uma viagem à costa ao norte de Luanda por Manoel da Silva Ribeiro Fernandes ao Senhor Ajudante de Ordens Pedro José Corrêa Quevedo, 15 August 1782, AHU, CU, Angola, cx. 65 doc. 64.
64

the principal embarkation points north of Luanda. Phyllis Martin notes that this
was the case at Cabinda, in the Kingdom of Ngoyo. Some of these families had
famous ancestors or connections to the royal court at Mbanza Ngoyo. Others,
such as the Franque family at Cabinda, gained prominence because of wealth
garnered during the trade.43 The family’s founder, Kokelo, was a servant of a
French trader who had died at Cabinda and left his possessions to his African
employee. Kokelo continued to participate in the trade, rising from a minor figure
in the community to a successful broker and merchant.44 His descendents
followed him into the trade, and expanded the family’s influence. Perhaps, the
most important such man was Francisco Franque, who at the age of eight was
sent to be educated in Brazil. At the beginning of the nineteenth century,
Francisco Franque returned to Cabinda and assumed the family’s business just as
the Dutch, French, and British traders were withdrawing from Cabinda. Francisco
Franque of course remained in business on the basis of his connection with Bahia
and Rio de Janeiro, and the Franque family became one of the principal slave
suppliers on the whole West Central African coast.45
The supply of captives at the Portuguese ports of embarkation was
different. At Luanda, Benguela and Novo Redondo, individuals from many
different backgrounds dominated the supply. Some of them were Portuguese
expatriates while others were Luso African Creoles, that is descendents of unions
of Portuguese expatriates and Africans. Traders originally from Brazil also
operated at these ports, working as representatives of trading houses at Bahia,
Pernambuco and Rio de Janeiro. Finally, some of the traders operating at these
43 Phyllis M. Martin, “Family Strategies in Nineteenth Century Cabinda,” Journal of African History 28, no. 1 (1987): 71. 44 Ibid. 45 Ibid., 73.
65

ports were African, who had assimilated Portuguese language, manners and
costumes. Perhaps, the most notable example was that of Dona Ana Joaquina dos
Santos e Silva, a woman who emerged in the nineteenth century as one of the
wealthiest merchants in Luanda.46 Some sources claim that she was the daughter
of a Portuguese trader with a mestiça woman from Luanda, but others suggest
that she was born an African slave.47 In either way, collectively these individuals
made up just a small percentage of the total population living in the Portuguese
ports of slave embarkation. Census records from Benguela, for example, show
that merchants comprised less than 2 percent of the total population living in the
port between 1796 and 1815.48 However, since the trade was the principal
economic activity in Benguela, they were also the wealthiest residents.
The central administration in Lisbon regulated the trade from Portuguese
Angola. It established customs houses at the principal ports called feitorias or
alfândegas, where colonial officials supervised both the disembarkation of
merchandise brought from abroad and the embarkation of slaves to the Americas.
These bureaucrats were also responsible for collecting taxes levied on slave
departures.49 The 1758 tax law, as we have seen, allowed vessels carrying efeitos
próprios to load slaves and depart as soon as they were ready, instead of leaving
46 Carlos Alberto Lopes Cardoso, “Dona Ana Joaquina dos Santos Silva: Industrial Angolana da Segunda Metade do Século XIX,” Boletim Cultural da Câmara Municipal de Luanda 37 (1972): 5; Júlio de Castro Lopo, “Uma Rica Dona de Luanda,” Portucale 3, no. 16-17, 2 (1948): 126-127. 47 Douglas L. Wheeler, “Angolan Woman of Means: D. Ana Joaquina dos Santos e Silva, Mid-Nineteenth Century Luso-African Merchant-Capitalist of Luanda,” Santa Barbara Portuguese Studies Review 3 (1996): 284-285. 48 Mapa das Pessoas Livres e Escravos... 15 June 1796, AHU, CU, Angola, box 83 doc. 66; Mapa das Pessoas Livres e Escravos... 1797, AHU, CU, Angola, box 85 doc. 28; Ocupação dos Habitantes da Paróquia de São Felipe de Benguela, 1809, AHU, CU, Angola, box 121 doc. 32; Ocupação dos Habitantes da Paróquia de São Felipe de Benguela, 1810, AHU, CU, Angola box 121A doc. 36; Ocupação dos Habitantes da Paróquia de São Felipe de Benguela, 1815, AHU, CU, Angola, box 131 doc. 45. Mariana Cândido believes that the merchant community of Benguela comprised between 3 and 17 percent of the total population of this port, but her calculations clearly included traders operating between Benguela and the interior. See Mariana P. Cândido, “Merchants and the Business of the Slave Trade in Benguela c. 1750-1850,” African Economic History 35 (2007): 9. 49 António Miguel de Mello, “Regimento da Alfandega da Cidade de Saõ Paulo d’Assumpçaõ Capital do Reino de Angola, 21 de Outubro de 1799,” Arquivos de Angola 2, no. 11-12, 1 (1936): 410-414.
66

by order of arrival. The new regulation also specified age specific taxes. Adult
slaves, males or females, were taxed 8,700 réis, small children 4,350 réis, and
nursing infants were tax free, if embarked with their mothers.50 This system of
tax collection remained in effect until 1836, when the Portuguese prohibited all
transatlantic trading from their African possessions. When the traffic banned,
traders increasingly moved their activities to African controlled or clandestine
ports north and south of Luanda.
Portuguese export duties were collected from merchants rather than
captains of slave vessels. The trade from Angola was an expensive and risky
business. Capital always seems to have been scarce and the purchase of slaves in
the interior was made possible by merchandise advanced on credit from overseas.
This arrangement was necessitated by the fact that African traders in the interior
demanded payment at the moment of the exchange. As a consequence, merchants
in Portuguese Angola became indebted to their counterparts in Portugal and
Brazil.51 Yet they bore most of the risks until slaves were sold in the Americas.
Above all, these merchants had more to lose from deaths of captives in transit
than their counterparts in Portugal or Brazil, on whose ships they dispatched
their captives.
High risks ensured that only a few individuals would become major slave
merchants. A successful career in Portuguese Angola required several years of
experience in trading slaves. The service records of Anselmo da Fonseca Coutinho
provide insight into just how much experience a slave merchant had to
accumulate before he or she became a major supplier. In 1806, the Governor and
Captain General of Angola, Fernando António de Noronha, submitted these
50 Dom José I, “Ley sobre a Arecadação,” 537-538. 51 Miller, Way of Death, 298-300; José Carlos Venâncio, A Economia de Luanda e Hinterland no Século XVIII: Um Estudo de Sociologia Histórica (Lisbon: Editorial Estampa, 1996), 175-178.
67

records to the Portuguese Regent Prince, showing Coutinho’s contribution to the
colony’s royal revenue. They included two lists of his trading activities spanning a
period of almost 40 years, from 1768 until 1806, and thus comprise the most
extensive record available of slaves shipped by a single merchant based in
Luanda.52 More important, they provide a rare opportunity to trace the career of
a successful merchant.
Anselmo da Fonseca Coutinho, son of António da Fonseca Coutinho, Knight
of the Order of Christ, was born in Luanda.53 Little is known about Coutinho’s
early years at this point, but as an adult he was clearly ambitious and climbed to
the top of Luanda’s social ladder by accumulating titles and high military rank. In
1784, the Portuguese Queen Dona Maria confirmed Coutinho in the rank of
Colonel of the Auxiliary Troops of Massangano, in the interior of Angola.54 Two
years later, the queen made him knight of her own house and granted him a
symbolic stipend of 600 réis per month.55 Coutinho was then promoted to Colonel
of the Militia of Luanda. In 1799, he followed in his father’s footsteps and became
Knight of the Order of Christ; the most distinguished title in the Portuguese
Empire.56 He was able to apply for this title thanks to his sister, Dona Ana Maria.
She had declined to inherit the remuneration and recognition of all services
performed by their father for the Crown in favor of her brother, who had brought
52 Certidão de António José Manzoni de Castro, 31 May 1796, enclosed in the Petição de Anselmo da Fonseca Coutinho, s.d., AHU, CU, Angola, box 115 doc. 45 and Certidão de António Martiniano José da Silva e Sousa, 10 March 1806, enclosed in the Petição de Anselmo da Fonseca Coutinho, s.d., AHU, CU, Angola, box 115 doc. 45. 53 Atestação de Manuel de Almeida e Vasconcelos, 7 February 1793, AHU, CU, Angola, box 115 doc. 45. Instrumento em Pública Forma Sobrescrito por Felipe Benício e Rosa Mascarenhas, 8 June 1795, AHU, CU, Angola, box 115 doc. 45. 54 ANTT, Registo Geral de Mercês, Dona Maria I, Book 16, f. 126. 55 Idem. 56 ANTT, Registo Geral de Mercês, Dona Maria I, Book 29, ff. 224v and 243.
68

her up from childhood.57 Finally, sometime between 1807 and 1810, Governor
and Captain General of Angola, António Saldanha da Gama, promoted Coutinho to
commander of the Militia of Luanda.58
Clearly the governors of Angola had a favorable opinion of Anselmo da
Fonseca Coutinho. The Baron of Moçâmedes (1784-1790), for instance, referred
to him as “the most trustworthy merchant in Luanda.”59 Manuel de Almeida e
Vasconcelos (1790-1797) called Coutinho “one of the most condign vassals of His
Majesty,” and Fernando António de Noronha (1802-1806) said that Coutinho was
a “credit worthy and useful inhabitant of Angola.”60 All these comments derived
from the commercial power of Coutinho. In fact, between 1768 and 1806,
Coutinho alone embarked about 5 percent of all slaves shipped from Luanda. As
the slave trade was the principal economic activity of this port, this ratio
impressed the highest authorities in Angola. 61
Coutinho’s records suggest that the career of a successful merchant
required many years to build capital and access internal sources of slaves. Table
2.4 shows the number of slaves shipped by Coutinho over a period of
approximately 40 years, drawn from the two aforementioned lists copied from
the customs books of Luanda. It indicates that he took almost half of this 40 year
period to become a major merchant, shipping slaves only occasionally during the
first 12 years of activity. Coutinho became a major merchant only after 1785,
57 Instrumento em Pública Forma Sobrescrito por Felipe Benício e Rosa Mascarenhas, 8 June 1795, AHU, CU, Angola, box 115 doc. 45. 58 João de Oliveira Barbosa to Conde das Galvêas, 2 December 1810, AHU, CU, Angola, box 121A doc. 31. 59 Atestação do Barão de Moçâmedes, 6 October 1790, AHU, CU, Angola, box 115 doc. 45. 60 Atestação de Manuel de Almeida Vasconcelos, 2 January 1796, AHU, CU, Angola, box 115 doc. 45. Atestação de Fernando António de Noronha, 27 February 1806, AHU, CU, Angola, box 115 doc. 45. 61 Calculated based on records of slaves shipped from Luanda available in José C. Curto, “A Quantitative Reassessment of the Legal Portuguese Slave Trade from Luanda, Angola, 1710-1830,” African Economic History, no. 20 (1992): 20-25. Note that Curto’s figures may include untaxed slaves, while part of Coutinho’s lists of shipment does not, so this percentage is likely to be higher.
69

when he was able to load a couple of vessels per year with captives, assuming 350
as the average carrying capacity of each vessel. The first list of shipments
includes no dates of embarkation, but both followed the books’ chronological
order, allowing distribution of Coutinho’s shipments according to the opening and
closing dates of each book. Although the first book is dated 9 May 1767, the first
list begins in the following year, presumably when Coutinho shipped his first
slaves, and ends 31 May 1796. The second list continues from this date until 10
March 1806.
Table 2.3 – Number of Slaves Shipped by Anselmo da Fonseca Coutinho, 1768-1806
Lists Periods Number of years Number of slaves Number of slaves
per year
1 January 1768 to 11 January 1780
12.0 478 40
12 January 1780 to 4 February 1785
5.1 733 145 1
5 February 1785 to 31 May 1796
11.3 7,933 701
31 May 1796 to 16 October 1798
2.4 1,865 787
2 17 October 1798 to 10 March 1806
7.4 5,833 789
Total 38.9 16,842 433
Sources: Certidão de António José Manzoni de Castro, 31 May 1796, enclosed in the Petição
de Anselmo da Fonseca Coutinho, s.d., AHU, CU, Angola, box 115 doc. 45 and Certidão de
António Martiniano José da Silva e Sousa, 10 March 1806, enclosed in the Petição de
Anselmo da Fonseca Coutinho, s.d., AHU, CU, Angola, box 115 doc. 45.
Coutinho’s records also shed light on the commercial strategies that
Luandan merchants employed. As already noted their profits were vulnerable to
70

shipboard mortality, so they devised ways to reduce this risk. One means was to
distribute their slaves across several vessels. Luanda was a busy slaving port
with a large number of vessels arriving and leaving annually. The frequency of
vessels calling at the port allowed merchants to make small shipments of slaves
in several different vessels. Stanley Engerman and others have noted that
mortality at sea was very unevenly distributed. Most vessels had very low
mortality, but a few had a very high number of deaths.62 Coutinho’s strategy
reduced the risk of losing an entire cargo at sea in the event a vessel was
captured, destroyed, or sank. It also allowed Luandan merchants to dispose
quickly of a highly vulnerable commodity. Slaves often arrived from the journey
to the coast exhausted, undernourished and, as a consequence, susceptible to
disease. Their condition tended to deteriorate further while on the coast, as
merchants often had too many slaves on their properties. Crowded barracoons
increased the risks of famine and contagious diseases. This reality put a premium
on selling slaves as soon as possible. Table 2.5 shows the size of Coutinho’s
shipments between 1768 and 1806. It indicates that this major merchant
typically shipped his slaves in small numbers per vessel. In fact, Coutinho rarely
shipped a full cargo of slaves at any one time. The majority of his shipments
consisted of no more than 50 slaves per vessel, but in fact almost half of all his
shipments, 48 percent, ranged between 1 and 10 slaves only. No doubt other
merchants followed a similar strategy.
62 Stanley L. Engerman et al., “Transoceanic Mortality: The Slave Trade in Comparative Perspective,” William and Mary Quarterly 58, no. 1 (2001): 100-102.
71

Table 2.4 – Size of Coutinho’s Slave Shipments, 1768-1806
Size of shipments Number of vessels
1-50 207
51-100 10
101-150 2
151-200 7
201-250 5
251-300 4
301-350 3
351 over 17
Total 255
Source: Same as Table 2.4.
Partnering with other merchants, not only in Europe and the Americas but
also in Africa, also reduced risk. Such business arrangements meant that
individuals invested less capital in a voyage than they would if they undertook
the entire enterprise alone. Table 2.6 shows the structure of ownership of the
slaves Coutinho dispatched between 1768 and 1806. It indicates that almost 60
percent of his shipments were made in partnership with others. He sent only
about 30 percent of the slaves on his own account in addition to 10 percent on
behalf of others. However, the table also indicates that partnerships became
possible only after a merchant had gained experience and developed a sound
reputation. At the beginning of his career, from 1768 through 1785, Coutinho
owned outright the majority of the slaves he embarked. This long period of
apprenticeship in the slave trade eventually provided him with sufficient
experience and resources to attract other merchants as partners. As the man
succeeded in his career, his joint ventures widened to include shipments made on
behalf of others. Since slaves were at risk of dying before they reached markets in
72

the Americas, well established merchants in Luanda were willing at times to offer
their services as agents for others in the business.
Table 2.5 – Structure of Ownership in Coutinho’s Shipment of Slaves (in Row Percentages),
1768-1806
List Approximate years
of shipment On Coutinho’s
account In partnership
On behalf of others
1768-1780 90.4 9.6 -
1780-1785 78.2 21.8 - 1
1785-1796 33.8 66.2 -
1796-1798 16.5 43.1 40.4 2
1798-1806 24.0 61.3 14.8
Total 32.2 58.4 9.4
Source: Same as Table 2.4
Luandan and Benguelan merchants understood that owning the vessels
that shipped their goods reduced their exposure to risk. To increase their control
over the itineraries of voyages and the conditions under which slaves were
carried, they often tried to break into the shipping business after accumulating
sufficient resources. Coutinho’s records show that he owned three vessels, which
he used both to ship slaves and to rent out to the government: the Curveta Rainha
dos Anjos, the Bergantim Flor do Mar, and the Sumaca Santo António e Almas.63
Coutinho used the first two in the slave trade, although in 1799 he loaned the
second one out for a military expedition to Benguela organized by Governor and 63 Carta de Ofício de Miguel António de Melo, 9 May 1799, AHU, CU, Angola, box 115 doc. 45. Petição de Anselmo da Fonseca Coutinho a Miguel António de Melo, s.d., AHU, CU, Angola, box 115 doc. 45. The Voyages Database provides information on only two records of slaving voyages with Coutinho’s name as owner; one for an unnamed ship, which set sail in 1799, and the other for the Bergantim Flor do Mar, which sailed between 1810 and 1811. Eltis et al., “Voyages,” voyage id 46,313 and 49,898.
73

Captain General of Angola, Miguel António de Melo. Coutinho always seems to
have reserved the Sumaca Santo António e Almas for state activities but, at some
point in the government of Miguel António de Melo (1797-1802), French
privateers captured the Curveta Rainha dos Anjos while it was delivering slaves
to Rio de Janeiro. Coutinho thereupon asked the governor to release his sumaca
from the royal service so he could use it in the trade.
Luandan merchants like Coutinho were, of course, responsible for the
sustenance of their slaves until the moment of embarkation. During the period of
the legal trade, they kept them in quintais, that is, in the backyard of their
properties at the major ports, where the supply of water and food was frequently
a major concern.64 Luanda had only one well, in addition to the city cisterns at the
fort of São Miguel and the Public Granary of Luanda. It was located at some
distance from the coast, in the neighborhood of Maianga. Moreover, it was not
very reliable because of its brackish water and the high demand placed on it.65
During periods of water shortage, colonial officials entertained the idea of building
a canal that would connect Luanda to the Kwanza River, but it was never
pursued.66 As a consequence, merchants had to import potable water from the
Bengo River, about 20 kilometers north of Luanda. African traders dominated
this thriving trade in water from the Bengo River. They loaded barrels with the
precious liquid, transported them along the coast in canoes, and distributed them
to Luandan residents. Unfortunately, slave merchants sometimes stored these
barrels in poor conditions, which allowed the water to become contaminated.67 As
64 Ferreira, “Dos Sertões ao Atlântico,” 66-70; Miller, Way of Death, 390. 65 Miller, Way of Death, 395-396; Venâncio, A Economia de Luanda e Hinterland, 60-61. 66 See, for example, José de Oliveira Barbosa to Conde das Galvêas, 31 July 1813, AHU, CU, Angola, box 125 doc. 46. 67 Miller, Way of Death, 396-397; Venâncio, A Economia de Luanda e Hinterland, 61.
74

a result, slaves contracted diarrhea and dysentery, two of the principal causes of
death in the trade.
Food was another major concern. Until the mid-eighteenth century, most
slave provisions were produced on Jesuit farms near Luanda or brought from
Brazil.68 However, with the expulsion of the Jesuits from the Portuguese Empire
in 1759, Africans and Luso-Africans became increasingly responsible for food
supplies.69 In Luanda, for example, African and Luso-African food producers sold
their grains at the Public Granary of Luanda, founded in 1764 by Governor Sousa
Coutinho.70 These grains included cassava, maize and beans. They were produced
mostly in arimos or farms near Luanda, located along the Bengo, Icolo, Zenza, and
Dande rivers. In 1844, Commander Lopes de Lima noted that this region “could
well be called the granary of Luanda.”71 Although Luanda was situated near rich
sources of grains, they did not save the city from periodic shortages. As Jill Dias
and Joseph Miller have observed, Angola suffered prolonged periods of drought
and famine.72 In 1792, one of these famines was so severe that the governor was
compelled to allow food producers in Luanda to sell cassava flour at the Public
Granary according to the market price as opposed to the price established by the
government.73 In 1841, another period of severe drought struck the city, followed
by an invasion of locusts originating northwest of Luanda. George Tams, a
68 Arlindo Manuel Caldeira, “Os Jesuítas em Angola nos Séculos XVI e XVII: Tráfico de Escravos e ‘Escrúpulos de Consciência’,” Trabalho Forçado Africano: Articulações com o Poder Político, Revista do Centro de Estudos Africanos da Universidade do Porto 3 (2007): 59; Venâncio, A Economia de Luanda e Hinterland, 83-88. 69 Miller, Way of Death, 270-271, 297-298 and 351-355. 70 “Catálogo dos Governadores do Reino de Angola,” 527; Miller, Way of Death, 352; Corrêa, História de Angola, vol. 2, 31; Venâncio, A Economia de Luanda e Hinterland, 65. 71 José Joaquim Lopes de Lima, Ensaios sobre a Statistica das Possessões Portuguezas (Lisbon: Imprensa Nacional, 62), vol. 3, 194. 72 Jill R. Dias, “Famine and Disease in the History of Angola, c.1830-1930,” Journal of African History 22, no. 3 (1981): 350-359; Joseph C. Miller, “The Significance of Drought, Disease and Famine in the Agriculturally Marginal Zones of West-Central Africa,” Journal of African History 23, no. 1 (1982): 20-22. 73 Manoel de Almeida e Vasconcelos, 5 October 1792, AHU, CU, Angola, cod. 1634, 11.
75

German physician who had traveled to Angola in that year, witnessed this event
and noted that it “was the second swarm that had threatened Luanda within six
years; the preceding one took the same direction, and evidently sought the more
luxuriant regions to the south.”74 Severe periods of famine usually followed such
invasions, exacting a huge toll on slaves awaiting passage to the Americas.
Problems with supplies could trigger contagious diseases, especially
smallpox, often associated with the large number of men, women, and children
held in the slave yards. In 1782, the Portuguese government addressed this issue
by creating quarantine stations at the principal ports of disembarkation in the
Americas.75 However, at the point where slaves boarded the vessel this problem
remained largely neglected. In 1804, Governor Noronha considered inoculating
slaves to prevent the spread of smallpox in Luanda and reduce slave mortality at
sea. This idea came from an experiment conducted on a French vessel, which
reputedly lost only one captive at sea after transporting 250 inoculated slaves.
The governor ordered the city physician to replicate the experiment in Luanda,
but there is no evidence that he did so.76 In 1814, the Governor of Benguela, João
de Alvelos Leiria, informed his superior at Luanda, that he allowed vessels to
embark more slaves than their legal capacity, because the city was overcrowded
with captives awaiting embarkation. “There are 1,400 slaves in this situation,” he
wrote, “with many more arriving from the interior, but we can already feel the
74 Georg Tams, Visit to the Portuguese Possessions in South-Western Africa (London: T. C. Newby, 1845), vol. 2, 39. 75 Jaime Rodrigues, De Costa a Costa: Escravos, Marinheiros e Intermediários do Tráfico Negreiro de Angola ao Rio de Janeiro, 1780-1860 (São Paulo: Companhia das Letras, 2005), 284. 76 Fernando António de Noronha to Visconde de Anadia, 2 August 1804, AHU, CU, Angola, box 110 doc. 33.
76

consequences with the spread of smallpox and famine.”77 The threat of epidemics
was constant.
During the period of the illegal trade, traffickers in Portuguese Angola
faced an additional challenge. In 1836, Portugal prohibited the embarkation of
slaves from all of its African possessions. A few years later, in 1844, the British
increased their antislave trade patrols off West Central Africa, and the
Portuguese allowed them to establish a naval station as well as a mixed
commission court at Luanda. Slave merchants responded by moving their
operations to clandestine points away from the traditional ports of embarkation,
such as Kilongo, Mayumba, and Penido, situated north of Luanda, and Quicombo,
Salinas, Benguela Velha and the mouth of the Kwanza River, to the south of the
city. The exact location of some of these places, for example, Alecuba, Ambona,
Bomara, Cape Mole and Grenada Point, remains unclear.
By this time, slave merchants could no longer rely on their quintais, official
sources of provisions, and other infrastructure that had previously formed the
basis of their operations. They now had to transport slaves rapidly to more
remote locations prearranged with captains of slave vessels, where slaves were
held in barracoons, a word meaning shelter or warehouse derived from the
Portuguese barracão or the Spanish barracón.78 These barracoons were built at
some distance from the shore in order to conceal their presence from antislave
trade cruisers patrolling the coast.79 Some of the merchants engaged in the illegal
77 João de Alvelos Leiria to José de Oliveira Barbosa, 19 October 1814, AHU, CU, Angola, box 129 doc. 63. See also João de Alvelos Leiria to José de Oliveira Barbosa, 26 October 1814, AHU, CU, Angola, box 129 doc. 63; João de Alvelos Leiria to António de Araújo de Azevedo, 18 November 1814, AHU, CU, Angola, box 129 doc. 63; and Abaixo Assinado dos Negociantes de Benguela, s.d., AHU, CU, Angola, box 129 doc. 63. 78 “Merriam-Webster Dictionary Online”, 2011, barracoon, http://www.merriam-webster.com/. 79 Ferreira, “Dos Sertões ao Atlântico,” 38-42. Joseph Miller equates the barracoons of the illegal period of the slave trade from Angola to the quintais of the legal period. See Miller, Way of Death, 387-401.
77
slave trade went to great lengths to secure a successful dispatch, even shipping
slaves at night. George Tams met Arsênio Pompeu Pompílio de Carpo, one of the
greatest Luandan slave merchants active during the period of the illegal trade,
and described his strategy to bypass the authorities and secretly embark slaves
for the Americas.
A rapid mode of traveling was indispensable to Mr. Arsênio, for he was often
obliged to take very long journeys on horse back during the night, when his
personal presence was suddenly required at the place where his slaves were
embarked. Considerable and repeated losses had induced him to adopt the plan of
embarking the slaves during the night at a distance from Luanda. One morning,
when I paid him a professional visit on account of a chronic disorder of the liver, to
which he had become subject by his long residence in different parts of Brazil, he
told me that; although he was so ill, he had ridden sixteen leagues during the
preceding night, in order to be present at the embarkation of his slaves to the south
of the river Dande.80
Traders from the interior who supplied Arsênio and his fellow merchants
were mostly Africans or Luso-Africans. Merchants and colonial officials on the
coast called them by different terms that changed over time, but usually derived
from the regions where they purchased slaves or the community from which the
traders themselves originated. One of the earliest terms used to designate these
traders was Pombeiros, from the Kikongo Pumbu. In the sixteenth and
seventeenth centuries, many slaves shipped from Angola came from regions near
Malebo Pool, which Kikongo speakers called Pumbu. The coastal merchants
incorporated the word Pumbu into their vocabulary as Pombo, and began calling
80 Tams, Visit to the Portuguese Possessions in South-Western Africa, vol. 1, 251-252.
78
all traders travelling between the interior and the coast Pombeiros.81 This term
was still widely used in the eighteenth and nineteenth centuries, even though
Malebo Pool was no longer an important source of slaves.
Another term commonly applied to traders was Ambaquista, which
emerged in the eighteenth century and was widely used in the nineteenth, when
traders operating from Ambaca began to dominate the supply chain. Ambaca was
a major slave trading post located about 220 kilometers southeast of Luanda.
Traders operating at this post usually obtained slaves in the immediate interior of
Luanda, between the rivers Dande and Kwanza. However, in the nineteenth
century, there are references to Ambaquistas trading in regions as far south as
the central plateau of Angola.82 Eventually, Aviados, Volantes, Ambulantes,
Sertanejos, Feirantes, Quimbares or Kimbares also became synonyms for
Pombeiros.83 Initially, each term referred to a specific aspect of the trade, but by
the nineteenth century they all were used to designate traders operating in the
interior.
Traders operating between the interior and the coast numbered in the
hundreds, if not the thousands. In 1809, the census returns of Benguela show
that there were about 412 “traders who traveled to the interior with commodities
81 Willy Bal, “Portugais Pombeiro, Commerçant Ambulant du ‘Sertão’,” Annali dell’Istituto Universitario Orientalis, Naples 7 (1965): 148-151; David Birmingham, Trade and Conflict in Angola: The Mbundu and their Neighbours under the Influence of the Portuguese, 1483-1790 (Oxford: Clarendon Press, 1966), 17, note 1; Mariana P. Cândido, “Enslaving Frontiers: Slavery, Trade and Identity in Benguela, 1780-1850” (Ph.D., Toronto: York University, 2006), 99; Miller, Way of Death, 189-190. 82 Ferreira, “Dos Sertões ao Atlântico,” 215-216; Beatrix Heintze, Pioneiros Africanos: Caravanas de Carregadores na África Centro-Ocidental entre 1850 e 1890 (Lisbon: Caminho, 2002), 229-259; Miller, Way of Death, 644. 83 Bal, “Portugais Pombeiro,” 152-161; Manolo Florentino, “The Slave Trade, Colonial Markets, and Slave Families in Rio de Janeiro, Brazil, ca.1790-ca.1830,” in Extending the Frontiers: Essays on the New Transatlantic Slave Trade Database, ed. David Eltis and David Richardson (New Haven: Yale University Press, 2008), 283-284; Jan Vansina, “Ambaca Society and the Slave Trade c.1760-1845,” Journal of African History 46, no. 1 (2005): 8-9.
79

of merchants from this port”.84 This number would have been much larger if
porters used in the caravans had been included in the count. The average size of
the caravans is unclear, but it must have varied significantly. Joseph Miller says
that Pombeiros usually organized small scale caravans with five or eight porters
at most, but “twenty to one hundred slaves would not have been an uncommon
range of sizes for commercial expeditions in the eighteenth century.”85 In the
nineteenth century, the size of caravans increased to accommodate the overseas
demand for products in addition to slaves. Miller believes that in this period the
largest caravans included about 1,000 porters.86 Isabel Castro Henriques argues
that such caravans averaged about 1,500 people.87 Maria Emília Madeira Santos
claims that they were larger still. According to her, they “always had over a
thousand people but many included three thousand or more.”88 This last view
seems implausible.
The recruitment of porters also varied significantly. Traders from Kasanje
and Lunda typically recruited them from within their own families, viewing the
caravan trade as a family enterprise.89 Africans and Luso-Africans from
Portuguese Angola usually recruited porters from the various chiefdoms
subjected to Portuguese suzerainty. These chiefdoms were obliged by vassal
contracts to provide the Portuguese ports of slave embarkation with a certain
number of porters to carry commodities in caravans between the coast and the
84 Ocupações dos Habitantes da Paróquia de São Felipe de Benguela, 1809, AHU, CU, Angola, box 121 doc. 32. A copy of this document is also available in AHU, CU, Angola, box 121A doc. 32. 85 Miller, Way of Death, 191. 86 Ibid. 87 Isabel Castro Henriques, Percursos da Modernidade em Angola: Dinâmicas Comerciais e Transformações Sociais no Século XIX, trans. Alfredo Margarido (Lisbon: Instituto de Investigação Científica Tropical; Instituto da Cooperação Portuguesa, 1997), 408. 88 Maria Emília Madeira Santos, Nos Caminhos de África: Serventia e Posse (Angola, Século XIX) (Lisbon: Instituto de Investigação Científica Tropical, 1998), 18. 89 Henriques, Percursos da Modernidade, 405-406.
80

interior of Angola.90 These porters received little or no payment, and they were
subject to mistreatment and abuse by caravan leaders. In 1839, the Portuguese
government in Lisbon attempted to prohibit the use of porters recruited by force,
but traders continued to use coercion to recruit from chiefdoms under Portuguese
rule. Many chiefs barred recruitment in their own territories because they viewed
the work as humiliating or wanted to exploit such labor for their own benefit.
Roquinaldo Ferreira notes that some chiefs used porters in their own caravans,
while others took bribes from their subjects in exchange for exemption from this
service.91
Merchandise from the coast was exchanged for slaves at different places in
the interior, according to where the best prices or trading terms could be found.
Traders usually purchased slaves directly from African suppliers in the interior
of Angola, but in the eighteenth century the Portuguese colonial government
designated a number of feiras or fairs where traders were supposed to exchange
wares for slaves. Most of these fairs were located in the Kingdom of Kasanje, with
which the Portuguese entertained regular diplomatic relations.92 The Portuguese
government created these fairs to undermine the effects of the reviro, a
commercial strategy that traders in the interior used to maximize their
purchasing power. The Pombeiros used the Portuguese commodities they had
obtained in Luanda to purchase captives that they then sold to British and French
traders operating north of Luanda. The Pombeiros subsequently returned to the
90 Carlos Couto, Os Capitães-Mores em Angola no Século XVIII: Subsídios para o Estudo da sua Actuação (Luanda: Instituto de Investigação Científica de Angola, 1972), 245-256; Ferreira, “Dos Sertões ao Atlântico,” 195-197 and 213-220; Beatrix Heintze, “Luso-African Feudalism in Angola? The Vassal Treaties of the Sixteenth to the Eighteenth Century,” Revista Portuguesa de História 18 (1980): 123-124. 91 Ferreira, “Dos Sertões ao Atlântico,” 214-220. 92 Cândido, “Enslaving Frontiers,” 126; Ferreira, “Dos Sertões ao Atlântico,” 198-220; Henriques, Percursos da Modernidade, 109-115; Miller, Way of Death, 582-589; Venâncio, A Economia de Luanda e Hinterland, 156-162.
81

interior taking with them the British and French goods, considered by local
peoples superior to the Portuguese commodities from Luanda. Once back in the
interior, they bargained for a greater number of slaves than the first transaction
had yielded. The reviro thus allowed Pombeiros to accumulate significant
resources, which may have rivaled those of the coastal merchants based in
Luanda.93
A trading board based at Luanda, called Junta de Comércio, was
responsible for organizing the slave fairs in the interior of Angola, which were
intended to prevent practices such as the reviro. The board appointed both
directors and clerks to check the items exchanged for slaves. This practice
limited the activities of Pombeiros. Furthermore, it provided merchants on the
coast with a clearer idea of the destination of their commodities and the number
of slaves for which they were exchanged.94 The slave fairs remained important
centers of slave supply until the beginning of the nineteenth century. Moreover,
when the British and French withdrew from West Central Africa, traders in the
interior could no longer use the reviro to maximize their purchasing power. The
Pombeiros then gradually abandoned the fairs and resorted to trading directly
with African suppliers in the interior of Angola.
Assessments of the supply of slaves from the interior to the coast must
take into account the seasons and the agricultural calendar of the populations
living inland from the coast. Generally, historians have argued that seasonal
variations in the slave trade occurred as a function of the demand for labor in the
Americas. They have viewed the crop cycle of the slave plantations in the
93 Ferreira, “Dos Sertões ao Atlântico,” 198; Miller, Way of Death, 276-279. 94 Ferreira, “Dos Sertões ao Atlântico,” 199; Miller, Way of Death, 586-589; Venâncio, A Economia de Luanda e Hinterland, 156-157.
82

Americas as shaping the seasonal variations in the trade to the Americas.95
However, records of vessels arriving at Luanda compiled by Portuguese customs
officials between 1736 and 1808 suggest a different interpretation.96 They show
that the slave trade varied according to the climate, as well as the agricultural
calendar of the populations living in the interior of Angola. These records include
the name of the vessels and date of their arrival at Luanda. The compilers of the
“Voyages Database” compared this information with documents produced in the
Americas showing the number of slaves carried in each vessel and added it to
their database of slaving voyages. Combined, this data allows us to calculate the
number of slaves leaving Luanda monthly between the eighteenth and nineteenth
centuries.
Angolans calculated the seasons according to variations in rainfall, which
served as an important indication of the optimal time to plant, harvest and
process food. Further, rainfall determined the most suitable periods to wage wars
and organize long distance trade expeditions. However, climate figures are
meaningless for large areas because of variations in topography and latitude from
region to region. Figure 2.2 shows that the patterns of rainfall in Angola vary
significantly between the coast and the interior. As Jill Dias noted, the
irregularity in precipitation increases in a southwesterly direction from the
95 Herbert S. Klein, “The Portuguese Slave Trade From Angola in the Eighteenth Century,” Journal of Economic History 32, no. 4 (1972): 900. In another version of this article, Klein acknowledges that the number of slaves shipped from Angola varied significantly throughout the year, but dismissed the climatic evidence as having any influence on this variation. According to him, “while the rainy season can be said to have been of some influence, it does not appear to be the predominant factor.” He then attributes the seasonal variation of the Portuguese slave trade from Angola to American demands. One should note, however, that gold was the principal commodity exported from Portuguese America during the mid-eighteenth century, and it did not require seasonal imports of labor force. See Herbert S. Klein, The Middle Passage: Comparative Studies in the Atlantic Slave Trade (Princeton: Princeton University Press, 1978), 33-34. 96 These records are described in detail at Klein, “The Portuguese Slave Trade from Angola,” 894-905; Klein, The Middle Passage, 23-37; Corcino Medeiro dos Santos, “Relações de Angola com o Rio de Janeiro (1736-1808),” Estudos Históricos, no. 12 (1973): 5-66.
83

central plateau towards the coast, reaching an extreme near Moçâmedes.97 Given
the irregular distribution of rainfall throughout Angola, the number of slaves
shipped from Luanda has to be measured against the levels of rainfall in their
regions of provenance.
Figure 2.2 – Lines of Equal Coefficient of Variability of Rainfall in Angola
Source: Dario X. de Queirós, Variabilidade das Chuvas em Angola (Luanda: Serviço Meteorológico de
Angola, 1955). Reproduced from Jill Dias, “Famine and Disease in the History of Angola, c.1830-
1930,” Journal of African History 22, no. 3 (1981): 351.
97 Dias, “Famine and Disease in the History of Angola,” 350.
84

As will be seen in the following chapter, most slaves leaving Luanda came
from regions within 400 kilometers of the coast. The majority were Kimbundu
and Kikongo farmers, who planted most of their crops along the main rivers of the
region, such as the Kwanza to the south and the Bengo and Dande to the north.
However, because they did not use irrigation, they depended heavily on the rain.
Fortunately, the patterns of rainfall in this region are dependable compared to
other places, varying only between 15 and 25 percent of the country’s average.
Malanje is located within the region of provenance of the majority of the slaves
shipped from Luanda. Meteorologists have recorded the levels of precipitation
there for 396 months between 1951 and 1984.98 This data can be compared to the
number of slaves embarked and used to determine the seasonal variations in the
trade from Luanda.
Figure 2.3 shows that the number of captives leaving Luanda peaked
during the middle of the year, between May and August. This corresponds with
the region’s driest season of the year, known as cacimbo. In this season, about
47,200 slaves on average were shipped whereas, in the other seasons, the
average number of slaves embarked was considerably lower; 35,400 between
January and April, and 34,000 between September and December. The
seasonality of the slave trade from Luanda also aligns with the agricultural
calendar of the populations living in the hinterland. Italian Capuchins, who
traveled widely throughout Kimbundu and Kikongo territories during the
seventeenth century, noted that Africans in this region experienced two
agricultural cycles. The first began at the end of January, with the cultivation of
98 Robert Hoare, “WorldClimate: Weather and Climate Data Worldwide,” Online database, 1996, www.worldclimate.com/.
85

the land, and ended with the harvest at the end of April. The second cycle, which
started in September, after the dry season ended in December. The Capuchins
further noted that between May and August Africans neither sowed nor
harvested.99
Figure 2.3 – Seasonal Variations in the Slave Trade from Luanda, 1736-1808
Sources: David Eltis et al., “Voyages,” www.slavevoyages.org/ and Robert Hoare, “WorldClimate,”
www.worldclimate.com/.
99 Mário José Maestri Filho, A Agricultura Africana nos Séculos XVI e XVII no Litoral Angolano (Porto Alegre: Universidade Federal do Rio Grande do Sul, 1978), 52-56; Adriano Parreira, Economia e Sociedade em Angola na Época da Rainha Jinga, Século XVII (Lisbon: Estampa, 1990), 29-31.
0
50
100
150
200
250
0
10
20
30
40
50
60
70
Jan Feb Mar Apr May Jun Jul Aug Sep Oct Nov Dec
Precip
itatio
n (m
m)
Nu
mb
er o
f sl
aves
(in
th
ou
san
ds)
Months
Slaves embarked from Luanda Average rainfall in Malanje
86

Traders in Portugal and Brazil knew that the number of slaves available
for sale at Luanda peaked between May and August, so they increased the
number of vessels available for the trade during these months, keeping the
average number of slaves embarked per month constant throughout the year. The
records available in the “Voyages Database” show that, between 1736 and 1808,
371 vessels embarked slaves at Luanda between January and April, 499 between
May and August, and 348 between September and December. In other words, the
number of vessels loading slaves between May and August was at least 26 percent
higher than in the other months. Nevertheless, the average number of slaves
embarked per month remained relatively constant throughout the year, with 382
between January and April, 378 between May and August, and 391 between
September and December.
The constant flow of slaves leaving Luanda provided the Brazilian
plantations and mines with a regular supply of coerced labor throughout the year.
The sugar plantations greatly benefited from this steady supply of slaves because
of the lengthy agricultural cycle. As Stuart Schwartz noted, the pace of labor on
the Brazilian sugar plantations continued incessantly for about eight to nine
months, beginning in late July or August and ending in May of the following
year.100 Since the trade from Luanda peaked just before the beginning of the
harvesting season, it would appear that it was oriented to provide these
plantations with a fresh contingent of labor from Africa. However, given the
diversification of the Brazilian exports at this time, sugar was clearly not the only
force driving the demand for slaves. Rice, cotton, and tobacco were also produced
with slave labor, but were not necessarily grown and processed at the same time
100 Stuart B. Schwartz, Sugar Plantations in the Formation of Brazilian Society, Bahia, 1550-1835 (New York: Cambridge University Press, 1985), 100-101.
87

as sugar cane.101 Moreover, during the eighteenth century, gold rather than sugar
was the principal commodity exported from Brazil, and gold was not produced in
cycles.102 Service, another important sector of the Brazilian economy, also
employed large numbers of slaves, especially in the cities, and it operated
independently of the calendar on the sugar plantations.103 Finally, Portuguese
policies aimed at controlling inflation and protecting monopolistic rights also
shaped the traffic.104 Overall these factors combined indicate that the seasonal
fluctuations in the number of slaves leaving Luanda varied more according to
supply than demand.
Merchants, brokers and traders played a central role in the transatlantic
slave trade from Angola. They bought ships, imported commodities, and mobilized
many other resources to secure the transportation of slaves from the interior of
Angola to the Americas, especially Brazil. They came from different backgrounds
but had similar interests, such as the accumulation of wealth, power and prestige.
To achieve their goals, they employed several commercial strategies aimed at
reducing risks and maximizing profits. Some of these strategies included
partnerships and the transportation of small numbers of slaves in different
vessels. Traders had to factor in environmental issues that determined certain
aspects of the trade. The most relevant were no doubt the gyres of the South
Atlantic and the patterns of rainfall in the interior of Angola. Additionally, as the
101 Dauril Alden, “Late Colonial Brazil, 1750-1808,” in The Cambridge History of Latin America, ed. Leslie Bethell, vol. 2 (New York: Cambridge University Press, 1984), 627-653; José Jobson de A. Arruda, O Brasil no Comércio Colonial (São Paulo: Editora Ática, 1980), 604-630. 102 Pinto, O Ouro Brasileiro e o Comércio Anglo-Português, 112-117; A. J. R. Russell-Wood, “Colonial Brazil: The Gold Cycle, c.1690-1750,” in The Cambridge History of Latin America, ed. Leslie Bethell, vol. 2 (New York: Cambridge University Press, 1984), 593-600. 103 Alden, “Late Colonial Brazil,” 606-607. 104 In this sense, the law of 1684 and the tax reform of 1758 are particularly important. One should also note the period of activity of the trading companies of Grão Pará and Maranhão, and Pernambuco and Paraíba, which had the monopoly of the slave trade to these areas between the 1750s and 1770s. See the discussion above.
88

trade became increasingly illegal, they had to devise ways to avoid antislave trade
cruisers patrolling the coasts of Africa and the Americas. Despite these
limitations, merchants, brokers and traders successfully carried out their
activities well into the nineteenth century.
89

Chapter Three
Slaving Frontiers
The Origins of Slaves Leaving Angola
in the
Nineteenth Century
Scholars of the transatlantic trade have in general suggested that the
origin of slaves shipped from Angola during the nineteenth century was deep in
the interior of West Central Africa. According to this view, the demand for slaves
in the Americas stimulated the expansion of the slaving frontier to the border of
present day Angola with the Democratic Republic of the Congo and the majority of
slaves shipped were prisoners of wars waged by the Lunda Empire. However,
lists of liberated Africans from Cuba and Brazil, in addition to slave registers
made by Portuguese colonial officials in Angola, reveal a different pattern.
Analysis of these new sources shows that in the nineteenth century slaves came
from several places, with the majority coming from regions much closer to the
coast than previously thought. Furthermore, these records suggest that slaves
and enslavers were not unknown to one another. They came from different ethnic
groups, but often spoke the same language and shared similar values.
Additionally, these records show that the impact of the trade on the African
populations was more localized than commonly assumed, with the majority of the
those shipped originating from a few specific areas near the ports of embarkation.
90

Scholars’ knowledge of the origins of the slaves shipped from Angola
derives largely from oral traditions collected in the second half of the nineteenth
century. These traditions suggest that a group of Lunda dissidents left their
country at the beginning of the sixteenth century after Luba hunters assumed
control over their territory, located at the Upper Kasai River. These Lunda
dissidents moved west and met many people en route with whom they founded
new polities such as the Imbangala Kingdom of Kasanje, located at the confluence
of rivers Kwango and Lui. Inevitably, some of these encounters were violent and
the thousands who became prisoners of war were made available for sale to
European slave traders coming from Europe or the Americas. African rulers soon
realized what they had to gain from the sale of slaves on the coast of Angola. The
slave trade provided them with rare commodities such as guns, textiles and
alcohol that they used to build alliances, raise armies and expand their power
throughout the interior of West Central Africa.1
According to the prevailing view, in the nineteenth century this practice of
exchanging foreign merchandise for prisoners of war continued with disastrous
consequences for the populations of Angola and beyond. Africans searched for
slaves in regions further and further away from the coast. Joseph Miller has
stated:
Because the richest returns from converting goods into people came from
spreading textiles and imports widely into areas where they remained rare, or
from employing guns to capture slaves in the regions farthest from home, the 1 This paragraph summarizes a long debate about the foundation of the kingdoms of West Central Africa. Important references to this debate include Jan Vansina, “The Foundation of the Kingdom of Kasanje,” Journal of African History 4, no. 3 (1963): 355-374; David Birmingham, “The Date and Significance of the Imbangala Invasion of Angola,” Journal of African History 6, no. 2 (1965): 143-152; Jan Vansina, “More on the Invasions of Kongo and Angola by the Jaga and the Lunda,” Journal of African History 7, no. 3 (1966): 421-429; Joseph C. Miller, “The Imbangala and the Chronology of Early Central African History,” Journal of African History 13, no. 4 (1972): 549-574.
91

transformation of the African political economies acquired an expansive
geographical momentum that drove its violence off toward the east. From the
earliest period of slave exporting in western central Africa, the political revolutions
thus moved toward the interior, leaving behind them a growing commercialized
area under new regimes oriented toward the Atlantic trade.2
Miller concludes that in the nineteenth century the slave trade had spread to the
deep interior of West Central Africa resulting in dramatically disruptive changes
to those living in this region.
The lists of liberated Africans from Cuba and Brazil and the slave registers
of Angola provide evidence that calls for a revision of this view. Both sources were
created to protect freed Africans from re-enslavement. In 1819, the British, in
association with other powers, established mixed commission courts in Havana,
Cuba and Rio de Janeiro, Brazil to adjudicate vessels suspected of violating
international treaties restricting the sale of slaves across the Atlantic.3 The
courts confiscated the slave traders’ property and freed all Africans found on
board. Clerks of the courts then recorded information about all surviving
recaptives in bound registers, including names, age, sex, and height, as well as
country or nation of origin. The lists of liberated Africans from Cuba and Brazil
contain information about 454 Africans shipped from the Congo River, 922 from
Loango, 94 from Mayumba, 1,235 from Ambriz, 1,059 from Luanda, and 837
from Benguela. In total, the lists provide information on 4,601 Africans shipped
from West Central Africa between1832 and 1840.4
2 Joseph C. Miller, Way of Death: Merchant Capitalism and the Angolan Slave Trade, 1730-1830 (Madison: University of Wisconsin Press, 1988), 140. 3 Leslie Bethell, “The Mixed Commissions for the Suppression of the Transatlantic Slave Trade in the Nineteenth Century,” Journal of African History 7, no. 1 (1966): 79-81. 4 The lists of liberated Africans from Cuba are available on line at David Eltis et al., “Voyages: The Trans-Atlantic Slave Trade Database,” Online database, 2008, www.slavevoyages.org/. The originals
92

By contrast, Portuguese colonial officials compiled the slave registers of
Angola between 1855 and 1856. These records were part of a process undertaken
by the Portuguese colonial administration in Lisbon for the gradual emancipation
of slaves and continued freedom of Africans living under Portuguese rule in
Africa.5 They provide the same kind of information as the lists of liberated
Africans from Cuba and Brazil, and indeed they may have been modeled on their
Mixed Commission counterparts. Colonial officials registered slaves living under
Portuguese rule on the coast as well as in the interior of Angola. However, since
the registers listed the slave population that remained in Angola, as opposed to
those sold across the Atlantic, not all of them provide information adequate for
tracing the origins of slaves shipped to the Americas. Moreover, the continued
presence of the Portuguese in the interior of Angola during the mid-nineteenth
century further biased this source because it incorporated into the registers vast
numbers of people that were previously outside Portuguese influence, such as the
Kasanje, whose kingdom the Portuguese invaded in 1850. This invasion resulted
later in the construction of the Portuguese forts of Duque de Bragança and Tala
Mungongo, where many Kasanje were listed in the slave registers of Angola.6
Therefore, only the registers compiled at the coastal settlements seem reliable for
tracing the origins of slaves sold overseas. are kept in the BNA, FO 313, vols. 58 (Aguila), 60 (Joven Reyna and Marte) and 61 (Marte, Amália, Diligencia, Empresa, and Matilde). The lists of liberated Africans from Brazil are available in the ANRJ, cod. 184, vol. 4 (Especulador, Leal, and Paquete de Benguela), cod. 471 (Duque de Bragança, Rio da Prata, Órion, Brilhante, Feliz, and Carolina), and in the AHI, lata 4, maço 3 (Brilhante and a vessel without name). 5 Visconde d’Athoguia, “Decreto de 14 de Dezembro de 1854,” Diário do Governo (Lisbon, December 28, 1854), 305 edition, sec. Ministério dos Negócios da Marinha e Ultramar, Seção do Ultramar. 6 António Rodrigues Neves, Memoria da Expedição à Cassange Commandada pelo Major Graduado Francisco Salles Ferreira em 1850, Escripta pelo Capitão Móvel d’Ambriz António Rodrigues Neves (Lisbon: Imprensa Silviana, 1854), passim; Douglas L. Wheeler, “The Portuguese in Angola, 1836-1891: A Study in Expansion and Administration” (Ph.D., Boston: Boston University, 1963), 126-180; René Pélissier, História das Campanhas de Angola: Resistência e Revoltas, 1845-1941 (Lisbon: Editorial Estampa, 1997), vol. 1, 107-144; Jill R. Dias, “Angola,” in Nova História da Expansão Portuguesa: O Império Africano, 1825-1890, ed. Valentim Alexandre and Jill R. Dias, vol. 10 (Lisbon: Editorial Estampa, 98), 408-412.
93

The Angolan registers do, however, include a large number of slaves who
were originally intended for sale into the transatlantic trade. The rapid growth of
the slave populations of the coastal settlements before and after the abolition of
the Brazilian trade confirms this hypothesis. In Luanda, for example, the slave
population increased from 2,749 in 1844 to 6,020 in 1850 and to 14,294 in 1856,
when Governor José Rodrigues Coelho do Amaral reported in summary the total
number of slaves registered in Angola to the colonial office in Lisbon.7 In
Benguela, the slave population increased from 2,438 in 1844 to 2,634 in 1850
and to 5,566 in 1856.8 Figures on the size of the slave population of Novo
Redondo are not available, but they must have followed a similar upward trend,
culminating with a population of 1,154 in 1856.9 Slave registers for Luanda
survive for 7,522 Africans, about 53 percent of the total slave population
registered at that port.10 Records of captives registered at Benguela are available
for 2,588 Africans, or 46 percent of the total slave population originally
registered.11 Finally, the slave registers of Novo Redondo appear to be complete,
with 1,154 registered.12 In short, the slave registers of Luanda, Benguela and
7 Angola, Almanak Estatístico da Província d’Angola e suas Dependências para o Anno de 1851 (Luanda: Imprensa do Governo, 1852), 8; José Joaquim Lopes de Lima, Ensaios sobre a Statistica das Possessões Portuguezas (Lisbon: Imprensa Nacional, 62), vol. 3, mapa no. 1; José C. Curto, “The Anatomy of a Demographic Explosion: Luanda, 1844-1850,” International Journal of African Historical Studies 32, no. 2/3 (1999): 402-403; José C. Curto and Raymond R. Gervais, “The Population History of Luanda during the Late Atlantic Slave Trade, 1781-1844,” African Economic History, no. 29 (2001): 58-59. José Rodrigues Coelho do Amaral to the State Secretary of the Navy and Overseas Affairs, 11 February 1856, AHU, Angola, Papéis de Sá da Bandeira, sala 12, maço 822. 8 Angola, Almanak Estatístico da Província d’Angola, 9; Lopes de Lima, Ensaios sobre a Statistica das Possessões Portuguezas, vol. 3, mapa no. 1; Mariana P. Cândido, “Enslaving Frontiers: Slavery, Trade and Identity in Benguela, 1780-1850” (Ph.D., Toronto: York University, 2006), 135. José Rodrigues Coelho do Amaral to the State Secretary of the Navy and Overseas Affairs, 11 February 1856, AHU, Angola, Papéis de Sá da Bandeira, sala 12, mç 822. 9 José Rodrigues Coelho do Amaral to the State Secretary of the Navy and Overseas Affairs, 11 February 1856, AHU, Angola, Papéis de Sá da Bandeira, sala 12, mç 822. 10 AHNA, cod. 2467, 2482, 2524, 2784, 2846, 2862, 3186, 3254, 3260 (Luanda), and box 135 (Luanda). 11 AHNA, cod. 3160 (Benguela). 12 AHNA, cod. 2830 (Novo Redondo).
94

Novo Redondo provide information on 11,264 enslaved Africans, most of whom
were originally intended for sale into the transatlantic trade.
When combined, the lists of liberated Africans from Cuba and Brazil in
addition to the slave registers of Angola provide information about 15,864
Africans who were enslaved in the interior of West Central Africa during the
nineteenth century. However, only about 50 percent of them provide information
useful for tracing origins of slaves. In the nineteenth century, Africans had
differing concepts of origins and identity, They responsed to questions such as
“where did you come from?” or “what is your nationality?” in different ways.
Hence, most of the 15,864 individuals gave replies that are not useful for the
purposes of this study. For example, 814 did not specify a place of origin; 120
referred to places outside West Central Africa, such as Mozambique, São Tomé,
and Zanzibar, and 223 individuals mentioned what seem to be names of places no
longer known. Additionally, 456 individuals referred to rivers such as Kwanza or
Kwango as their country of origin but, since they did not provide any clues about
where they had come from along these rivers, it is impossible to infer their
origins. A further 2,432 Africans did provide a known place of origin, but most of
them referred to major slave trading posts situated on the coast or in the interior
of Angola, such as Ambaca, Benguela, Boma, Cabinda, or Encoje. Finally, 4,207
individuals indicated a broad and vague country of origin such as Angola or
Congo.
Despite the number of records with no geographic information, 7,612
Africans, close to half of all individuals listed, gave an ethnonym as an answer.
Scholars have normally hesitated to use ethnonyms to trace the origins of slaves
carried across the Atlantic. They have worried that slaves may have actually
identified themselves according to the ethnonyms listed in the European
95

documents. In addition, traders may have imposed ethnonyms on slaves carried
across the Atlantic, or slaves themselves may have adopted new ethnonyms as
they left Africa and sought to blend into a new milieu in the Americas.13 Also,
enslaved Africans could have been captured and owned by different masters in
Africa before they were sold into the Atlantic markets. They may have
assimilated the identity or ethnicity of their previous owners before they arrived
in the Americas.14 All these concerns have made historians very cautious about
using ethnonyms to trace the origins of captives leaving Africa.
Although these are serious issues, we can have some confidence in the
ethnonyms available in the lists of liberated Africans from Cuba and Brazil as well
as in the slave registers of Angola. Both sources were created soon after Africans
landed in the Americas or, in the case of the Angolan registers, while they were
13 Robert W. Slenes, “‘Malungu, Ngoma Vem!:’ África Coberta e Descoberta no Brasil,” Revista USP 12 (92): 51-54; Robin Law, “Ethnicity and the Slave Trade: ‘Lucumi’ and ‘Nago’ as Ethnonyms in West Africa,” History in Africa 24 (1997): 205-209; Michael Angelo Gomez, Exchanging Our Country Marks: The Transformation of African Ties in the Colonial and Antebellum South (Chapel Hill: University of North Carolina Press, 1998), 2-4 and 144; Mariza de Carvalho Soares, Devotos da Cor: Identidade Étnica, Religiosidade e Escravidão no Rio de Janeiro, Século XVIII (Rio de Janeiro: Civilização Brasileira, 2000), 224-230; D. B. Chambers, “Ethnicity in the Diaspora: The Slave-Trade and the Creation of African ‘Nations’ in the Americas,” Slavery and Abolition 22, no. 3 (2001): 26-27; Beatriz Gallotti Mamigonian, “To Be a Liberated African in Brazil: Labour and Citizenship in the Nineteenth Century” (Ph.D., University of Waterloo, 2002), 46-47; Gwendolyn Midlo Hall, “African Ethnicities and the Meanings of ‘Mina’,” in Trans-Atlantic Dimensions of Ethnicity in the African Diaspora, ed. Paul E. Lovejoy and David V. Trotman (New York: Continuum, 2003), 64-66; Edward A. Alpers, “‘Mozambiques’ in Brazil: Another Dimension of the African Diaspora in the Atlantic World,” in Africa and the Americas: Interconnections during the Slave Trade, ed. José C. Curto and Renée Soulodre-La France (Trenton: Africa World Press, 2005), 43-68; Robin Law, “Ethnicities of Enslaved Africans in the Diaspora: On the Meanings of ‘Mina’ (Again),” History in Africa 32 (2005): 248. 14 Philip D. Curtin, Economic Change in Precolonial Africa: Senegambia in the Era of the Slave Trade (Madison: University of Wisconsin Press, 1975), vol. 1, 34-35; Suzanne Miers and Igor Kopytoff, “African ‘Slavery’ as an Institution of Marginality,” in Slavery in Africa: Historical and Anthropological Perspectives (Madison: University of Wisconsin Press, 1977), 10-24; Miller, Way of Death, 225; Slenes, “Malungu, Ngoma Vem!,” 54-55; Joseph C. Miller, “Central Africa during the Era of the Slave Trade, c.1490s-1850s,” in Central Africans and Cultural Transformations in the American Diaspora, ed. Linda M. Heywood (New York: Cambridge University Press, 2002), 42-43; Paul E. Lovejoy, “Ethnic Designations of the Slave Trade and the Reconstruction of the History of Trans-Atlantic Slavery,” in Trans-Atlantic Dimensions of Ethnicity in the African Diaspora, ed. Paul E. Lovejoy and David V. Trotman (New York: Continuum, 2003), 15; Linda M. Heywood and John K. Thornton, Central Africans, Atlantic Creoles, and the Foundation of the Americas, 1585-1660 (New York: Cambridge University Press, 2007), 169-170; Paul E. Lovejoy, “Transatlantic Transformations: The Origins and Identities of Africans in the Americas,” in Africa, Brazil, and the Construction of Trans-Atlantic Black Identities, ed. Boubacar Barry, Elisée Soumonni, and Livio Sansone (Trenton: Africa World Press, 2008), 97-98.
96

still in Africa. Additionally, both sets of documents were created with the
assistance of people familiar with the languages and cultures of the individuals
recorded. The lists of liberated Africans from Cuba, for instance, include the
names of the translators who assisted the court commissioners in registering the
recaptives. They were often slaves or freed Africans who had previously come
from Angola and become fluent in Spanish and Portuguese. The Brazilian lists are
less clear, but they must also have been created with the help of African
translators, since the courts there followed the same guidelines as in Cuba.
Furthermore, Rio de Janeiro had such a large slave population that many of the
languages spoken in Angola were also spoken in the city. As Mary Karasch notes,
travelers visiting Rio often remarked on the babble of tongues spoken in the
streets.15
In Angola, Portuguese colonial officials registered slaves under similar
circumstances. Given the lengthy presence of the Portuguese on the coast of
Angola, they were well acquainted with neighboring populations. Also, they had
been compiling censuses of the populations living under Portuguese rule in
Angola since the late eighteenth century, and colonial officials had considerable
experience with the bureaucratic requirements of such activities.16 Furthermore,
the guidelines for slave registration encouraged slave owners to present all their
slaves to colonial officials, since in theory they automatically freed unregistered
slaves.17 They also specified that an inspector should be present at the moment of
15 Mary C. Karasch, Slave Life in Rio de Janeiro, 1808-1850 (Princeton: Princeton University Press, 1987), 214-215. 16 Curto and Gervais, “The Population History of Luanda during the Late Atlantic Slave Trade, 1781-1844,” 4-26; José C. Curto and Raymond R. Gervais, “A Dinâmica Demográfica de Luanda no Contexto do Tráfico de Escravos do Atlântico Sul, 1781-1844,” Topoi, no. 4 (2002): 86-97. 17 Visconde d’Athoguia, “Decreto de 14 de Dezembro de 1854,” Title 1, Article 2, 1574.
97

the registration.18 There are few reasons to doubt the capacity of local officials
and inspectors to engage with African slaves. Although Portuguese was the
dominant language of the administration, the every day languages spoken by the
local population of Portuguese Angola were usually West Central African. In fact,
Kimbundu was the dominant language spoken in Luanda well into the nineteenth
century.19 This fact is all the more important given that at that time Luanda was
the largest European center in Africa south of the Sahara, with the possible
exception of Cape Town.
Africans had no reason to hide their ethnicity when questioned by court or
Portuguese officials. The lists of liberated Africans from Cuba and Brazil were
created to protect Africans from re-enslavement. The slave registers of Angola
had a similar purpose. They were created to inhibit the enslavement of free
Africans, as well as the re-enslavement of Africans who had gained their freedom
after registration. Furthermore, as will be seen below, the ethnonyms available in
the lists of liberated Africans and the slave registers align with data from the
analysis of other documents used to measure the impact of the slave trade on
Africa. The number and proportion of Nsundi or Ndongo slaves leaving Angola in
the nineteenth century from the registers, for example, match reports about
warfare, predatory trade, and depopulation in the areas where these ethnic
groups lived. The form in which some of these ethnonyms appear in the
documents also attests to their authenticity. Designations such as “Muxicongo”
and “Camundongo” literally mean “I am Kongo” and “I am an inhabitant of
18 The guidelines specify that the inspection of the slaves should follow the “Regulamento de 25 de Outubro de 1853.” See Ibid., Title 1, Article 1, 1574; Visconde d’Athoguia, “Regulamento que Faz Parte do Decreto de 25 de Outubro de 1853, Publicado no Diário do Governo no. 268, de 14 de Novembro de 1853,” Diário do Governo (Lisbon, November 29, 1853), 281 edition, sec. Ministério dos Negócios da Marinha e Ultramar, Seção do Ultramar, Article 7, 1601. 19 Jan Vansina, “Portuguese vs Kimbundu: Language Use in the Colony of Angola (1575-c.1845),” Bulletin des Séances de l’Academie Royale des Sciences d'Outre Mer 47 (March 2001): 276-278.
98

Ndongo,” in Kikongo and Kimbundu, respectively. Therefore, they are not
inventions of slave traders or colonial officials, but real expressions of African
identity. Finally, although slaves may have been traded several times before they
entered the transatlantic traffic, it is doubtful whether the majority of them spent
sufficient time enslaved in Africa to adopt the ethnicity of their owners. As will be
seen in the next chapter, slaves leaving Angola in the nineteenth century were
relatively young, suggesting that they were first generation slaves sold across the
ocean soon after their enslavement. All in all, the ethnonyms available in the lists
of liberated Africans as well as the slave registers provide reliable information
about the origins of slaves leaving Angola in this period.
While ethnonyms often appear with different spellings, they can be
organized into modern ethnic and linguistic groups and located on a map of West
Central Africa. Research suggests that the ethnolinguistic map of West Africa,
another region that served as a major source of slaves for the transatlantic slave
trade, shows remarkable continuity throughout the years from the beginning of
the slave trade to the present.20 Preliminary analyses of the Bantu languages of
Southeast Africa, also a region deeply affected by the slave trade, yield similar
results.21 Furthermore, Portuguese colonial records, in addition to field studies
and historical research, provide scholars with a number of maps, lists and other
resources that have enabled them to reconstruct the ethnolinguistic map of
Angola for the nineteenth century.22 The ethnonyms available in the lists of
20 P. E. H. Hair, “Ethnolinguistic Continuity on the Guinea Coast,” Journal of African History 8, no. 2 (1967): 247-249. 21 P. E. H. Hair, “From Language to Culture: Some Problems in the Systemic Analysis of the Ethnohistorical Records of the Sierra Leone Region,” in The Population Factor in African Studies, ed. R. P. Moss and R. J. A. R. Rathbone (London: University of London Press, 1975), 74. 22 These resources include but are not limited to João Carlos Feo Cardoso de Castello Branco e Torres, Memórias Contendo a Biographia do Vice Almirante Luis da Motta Feo e Torres, a História dos Governadores e Capitaens Generaes de Angola desde 1575 até 1825, e a Descripção Geographica e Politica dos Reinos de Angola e Benguella (Paris: Fantin, 1825), Map; Lopes de Lima,
99

liberated Africans and the slave registers of Angola have been compared with
these sources and organized into modern ethnic and linguistic groups. Africans
who claimed they came from or were affiliated with the Lunda, Muatianvo and
Muatianbo, for example, were considered as belonging to the Lunda ethnic group
– part of the Ruund linguistic group, located east of the Upper Kasai River. After
adjusting for the variations in spelling, the records show that slaves shipped from
Angola in these years came from 116 ethnicities belonging to 21 linguistic groups
spread throughout the interior of West Central Africa.
The records also provide the means to estimate the number of slaves
shipped by linguistic and ethnic groups. In 1969, Philip Curtin noted that the
number of captives leaving from Angola varied according to ports of embarkation,
and he suggested that different regions in the interior supplied these ports with
slaves. Curtin argued that captives embarking at ports north of Luanda usually
came from the basin of the Congo River; slaves leaving from ports south of
Luanda originated from the central plateau of Angola; and slaves shipped from
Luanda itself came not only from its immediate interior but also from the central
Ensaios sobre a Statistica das Possessões Portuguezas, vol. 3, Maps; José de Oliveira Ferreira Diniz, Populações Indígenas de Angola (Coimbra: Imprensa da Universidade, 1918), Maps; Mário Milheiros, Notas de Etnografia Angolana, 2nd ed. (Luanda: Instituto de Investigação Científica de Angola, 1967), Lists; Mário Milheiros, Índice Histórico-Corográfico de Angola (Luanda: Instituto de Investigação Científica de Angola, 1972), Lists; José Redinha, Distribuição Étnica de Angola (Luanda: Centro de Informação e Turismo de Angola, 1962), Lists and Map; Jan Vansina, Kingdoms of the Savanna: A History of Central African States until European Occupation (Madison: University of Wisconsin Press, 1966), Maps and Index; Phyllis M. Martin, The External Trade of the Loango Coast, 1576-1870: The Effects of Changing Commercial Relations on the Vili Kingdom of Loango (Oxford: Clarendon Press, 1972), Maps and Index; Anne Hilton, The Kingdom of Kongo (New York: Clarendon Press, 1985), Maps and Index; Robert W. Harms, River of Wealth, River of Sorrow: The Central Zaire Basin in the Era of the Slave and Ivory Trade, 1500-1891 (New Haven: Yale University Press, 1981), Maps and Index; Karasch, Slave Life in Rio de Janeiro, 1808-1850, Appendix A; Gladwyn Murray Childs, Kinship and Character of the Ovimbundu: Being a Description of the Social Structure and Individual Development of the Ovimbundu of Angola, with Observations Concerning the Bearing on the Enterprise of Christian Missions of Certain Phases of the Life and Culture Described (London: Reprinted for the International African Institute & for the Witwatersrand U.P. by Dawson, 1969), Maps and Index; John K. Thornton, Africa and Africans in the Making of the Atlantic World, 1400-1800, 2nd ed. (New York: Cambridge University Press, 1998), Maps and Index; Paul M. Lewis, “Ethnologue: Languages of the World”, 2009, http://www.ethnologue.com/.
100

plateau and the basin of the Congo River.23 Indeed, Luanda was a case apart,
because it was by far the largest singe departure point in the history of the
transatlantic trade.24 It is now possible to use estimates of the number of slaves
shipped from Luanda and the ports north and south of it to arrive at the
approximate numbers of slaves leaving Angola by ethnic and linguistic origins.25
Recent studies show that between 1831 and 1855, the period covered by
the lists of liberated Africans and the slave registers of Angola, the ports north of
Luanda shipped 313,375 slaves. The ports south of it shipped approximately
186,510, while Luanda alone shipped about 267,330.26 Since the lists of liberated
Africans and the slave registers provide information on the port of departure or,
in the case of the slave registers, the places of registration of the Africans listed,
data have first been grouped according to these three regions of embarkation.
Next, the ratio of linguistic and ethnic groups for each of these three regions have
been multiplied by the estimated numbers shipped from Luanda and the ports
north and south of it. This operation is important because, for example, five
percent shipped from Luanda who were Kongo is considerably more than five
percent shipped from any of the ports north of Luanda who were Kongo. After
this operation was complete, the resulting ethnolinguistic subtotals for the three
regions have been aggregated and projected on a map of West Central Africa.
23 Philip D. Curtin, The Atlantic Slave Trade: A Census (Madison: University of Wisconsin Press, 1969), 260-262. 24 An up to date ranking of the largest ports of slave embarkation is available in David Eltis and David Richardson, Atlas of the Transatlantic Slave Trade (New Haven: Yale University Press, 2010), Table 5, 90. 25 The estimates are available in Appendix A, Table A.3. 26 Daniel B. Domingues da Silva, “The Coastal Origins of Slaves Leaving West Central Africa, c.1780-1867” (Paper presented at the 124th Annual Meeting of the American Historical Association, San Diego, 2010), Appendix A.
101

Figure 3.1 – Estimated Number of Slaves Leaving Angola by Linguistic Groups, 1831-1855
Source: Appendix B, Table B.24. Figure 3.1 shows the result of this procedure. It displays the estimated
number of slaves shipped from Angola between 1831 and 1855 by linguistic
groups. The map makes immediately apparent that slaves came from a wide
variety of places across West Central Africa. As scholars have already stressed, in
102

the nineteenth century slaves were drawn into the trade from regions situated
increasingly farther from the coast.27 Certainly, Figure 3.1 shows that the
enslavement zone at that time covered a vast area of approximately 2.5 million
square kilometers; a region larger than the territory of the United States east of
the Mississippi River. Moreover, captives came from different ecological
environments ranging from the Equatorial forest in the north to the arid lands
around the Cunene River in the south. In the east, they came from places as
distant as the Kasai or Zambeze rivers. Scholars have rightly stressed the extent
to which the transatlantic trade expanded throughout the interior of West Central
Africa during the nineteenth century.
However, Figure 3.1 shows that most of the slaves shipped from Angola
during this period did not come from these remote regions. It clearly indicates
that the majority belonged to the Kikongo, Kimbundu, and Umbundu linguistic
groups, all of whom lived west of the Kwango River. By the nineteenth century,
these groups had long served as sources of slaves for the transatlantic trade.
Kikongo slaves first appeared in the historical record in the early sixteenth
century, when Portuguese traders sailed for Angola to purchase slaves for their
sugar plantations at São Tomé, in the Bight of Biafra.28 Kimbundu slaves are first
mentioned shortly thereafter, as Portuguese traders expanded their activities in
Luanda, where they founded a colony in 1576.29 Umbundu slaves began to appear
in the records somewhat later, around the late seventeenth century, just before 27 See, for example, Miller, Way of Death, 146-147; Achim von Oppen, Terms of Trade and Terms of Trust: The History and Contexts of Pre-Colonial Market Production around the Upper Zambezi and Kasai (Münster: LIT Verlag, 1994), 59-61; Jan Vansina, “It Never Happened: Kinguri’s Exodus and Its Consequences,” History in Africa 25 (1998): 403; John K. Thornton, “The Chronology and Causes of Lunda Expansion to the West, c.1700-1852,” Zambia Journal of History 1 (1981): 7. 28 David Birmingham, Trade and Conflict in Angola: The Mbundu and their Neighbours under the Influence of the Portuguese, 1483-1790 (Oxford: Clarendon Press, 1966), 24-25; Hilton, The Kingdom of Kongo, 55-59; Vansina, Kingdoms of the Savanna, 52-54; Miller, Way of Death, 140-146. 29 Birmingham, Trade and Conflict in Angola, 32-33 and 46-51; Vansina, Kingdoms of the Savanna, 125-130; Miller, Way of Death, 140-146.
103

the Portuguese built the first military garrisons in the Angolan highlands.30 By
the nineteenth century Kikongo, Kimbundu and Umbundu speakers were well
established targets of the transatlantic trade.
Slaves shipped from Angola traveled the longest distances between the
point of enslavement in the interior and the port of embarkation compared to all
African regions. However, these distances were shorter than most scholars claim.
Patrick Manning, for instance, contends that in the nineteenth century slaves
shipped from Angola came from places situated between 600 and 700 kilometers
from the coast.31 Joseph Miller argues that slaves shipped from Angola at this
time traveled in caravans departing from Lunda, 500 kilometers distant from
Kasanje, which in turn is located about 300 kilometers from the coast.32 However,
Table 3.1 suggests slaves shipped from Angola in the nineteenth century traveled
much shorter distances than this. It shows the percentage of Africans with known
ethnonyms available in the lists of liberated Africans and the slave registers of
Angola by ports of embarkation and the distances they traveled between the
interior and the ports from which they embarked (or where they were
registered). It demonstrates that the majority traveled distances no greater than
400 kilometers, with the average distance traveled ranging between 200 and 300
kilometers.
30 Birmingham, Trade and Conflict in Angola, 140-141; Vansina, Kingdoms of the Savanna, 197-200; Miller, Way of Death, 140-146; Roquinaldo Amaral Ferreira, “Transforming Atlantic Slaving: Trade, Warfare and Territorial Control in Angola, 1650-1800” (Ph.D., Los Angeles: University of California, 2003), 71-80; Cândido, “Enslaving Frontiers,” 21-22. 31 Patrick Manning, Slavery and African Life: Occidental, Oriental, and African Slave Trades (New York: Cambridge University Press, 1990), 70. 32 Miller, Way of Death, 195.
104

Table 3.1 Percentage of Slaves Leaving Angola by Distance Traveled between Their Origins in
the Interior and Their Ports of Embarkation (in Kilometers), 1831-1855
Distances
(Km) Ports North of
Luanda Luanda Ports South of Luanda Total
0-100 10.4 0.2 21.2 11.0 101-200 5.4 15.7 10.5 11.8 201-300 7.8 33.5 21.3 24.1 301-400 20.3 15.1 17.9 17.1 401-500 6.9 2.0 11.8 7.1 501-600 12.8 24.5 13.2 17.8 601-700 34.9 0.6 0.7 6.0 701-800 0.9 1.1 0.3 0.7 801 over 0.7 7.2 3.0 4.3 Total 100.0 100.0 100.0 100.0
Source: Appendix B, Tables B.21, B.22, and B.23.
Yet even this average range of 200 to 300 kilometers is probably biased
upwards. The distances that form the basis of Table 3.1 are measured from the
heartland of the specified linguistic group. However, many Lunda slaves probably
originated from areas close to the Kwango River, whereas they were counted in
this study as coming from beyond the Kasai River, the traditional heartland of the
Ruund speaking people to which the Lunda belong. This attribution explains the
high percentages of Africans coming from regions situated between 500 and 700
kilometers from the coast. Additionally, many Africans who embarked at Luanda
but claimed to have come originally from the basin of the Congo River or the
Angolan highlands probably did not travel overland from these regions directly to
Luanda. They must have traveled first to one of the ports north or south of
Luanda and then completed their journey to Luanda by sea. As a consequence,
Table 3.1 is biased towards greater distances, suggesting that the journey
between the interior and the coast was longer than it actually was in reality.
105
One of the major implications of the above argument is that it is likely that
Africans shipped from Angola became slaves more as a result of internal conflicts
within their own societies than as victims of large scale wars waged throughout
the interior. Scholars claim that in the nineteenth century the majority of the
slaves shipped from Angola were prisoners of wars waged by Ruund speakers
from the Lunda Empire. They argue that Lunda rulers were responding to the
demand for slaves on the coast of Angola by extending their military activities
throughout the interior of West Central Africa. This aggression gave them control
over the flow of foreign commodities introduced in the interior via trade to the
Americas. Rulers could use these commodities as an important source of revenue
and a way of building dependency and loyalty among their subjects.33
The thesis of connecting the origins of slaves shipped from Angola to the
expansion of the Lunda Empire received further support from research focusing
on slavery in Africa. Scholars have long stressed that outsiders were usually the
principal targets of enslavement and sale into the trade. Orlando Patterson
claims, for example, that natal alienation of slaves was a key component of slave
status in any given society.34 Claude Meillassoux argues that Africans regarded
outsiders as the principal candidates eligible for enslavement. He maintains that
the slave was above all “the alien par excellence, if not the alien in an absolute
sense.”35 In short, the idea that outsiders were perfect candidates for
enslavement has shaped much of the current scholarship focusing on the
question of who was eligible for enslavement and sale across the Atlantic. These
33 Ibid., 78-94 and 146-147; Oppen, Terms of Trade and Terms of Trust, 59-61; Vansina, “It Never Happened,” 403; Thornton, “The Chronology and Causes of Lunda Expansion,” 6-8. 34 Orlando Patterson, Slavery and Social Death: A Comparative Study (Cambridge: Harvard University Press, 1982), 44. 35 Claude Meillassoux, The Anthropology of Slavery: The Womb of Iron and Gold, trans. Alide Dasnois (Chicago: University of Chicago Press, 1991), 28.
106

views fit well with the idea that the majority of the slaves shipped from Angola in
the nineteenth century were prisoners of wars.
However, the data presented in this chapter suggest that the majority of
the captives shipped from Angola during the nineteenth century had more in
common with their captors than historians have commonly assumed. Figures 3.2,
3.3 and 3.4 show the estimated number of slaves shipped from Angola by ethnic
group for each of the three principal language groups from which slaves were
drawn in the interior of West Central Africa: the Kikongo, Kimbundu and
Umbundu speaking peoples. Together these three language groups account for 72
percent of the men, women, and children registered in the Brazilian, Cuban and
Angolan sources as leaving West Central Africa. The Lunda Empire subjugated
none of them. They were enslaved mostly as a result of internal conflicts within
their own language communities. Figure 3.2, for example, shows the estimated
number of Kikongo speaking slaves leaving Angola in the nineteenth century
broken down by ethnic group. The majority came from the former Kingdom of
Kongo, which in the nineteenth century was largely fragmented as a result of
years of civil wars. However, smaller numbers also came from neighboring
polities, such as the kingdoms of Ngoyo, Kakongo, and Yaka.
107

Figures 3.2 – Estimated Number of Kikongo Slaves Leaving Angola by Ethnic Groups,
1831-1855
Source: Same as Figure 3.1.
The majority of the Kikongo speaking captives shipped from Angola in the
nineteenth century belonged to the Nsundi ethnic group. The Nsundi inhabited a
province of the old Kingdom of Kongo that went by the same name. In the
nineteenth century, the Nsundi became victims of a sophisticated trading
network dominated by Kikongo speakers at Boma, at the mouth of the Congo
River. Norm Schrag points out that Boma elders believed that the Nsundi, as well
as the Yombe, situated north of the Congo River, were “enemies against whom
they should not to make war but [rather] kidnap through deception.”36 These
“enemies” were then sold into the Atlantic commerce through the dingizi trading
system, a commercial network that allowed certain individuals to travel safely 36 Norm Schrag, “Mboma and the Lower Zaire: a Socioeconomic Study of a Kongo Trading Community, c.1785-1885” (Ph.D., Bloomington: Indiana University, 1985), 62-63.
108

through the interior using special insignias belonging to a corporation of healing
cults called Lemba. Most of these individuals were graduates of the Khimba
schools for youth initiation, organized by chiefs who introduced young free men to
the magical knowledge of their culture. The graduates used a secret language that
was unintelligible to Kikongo speakers and promoted special bonds among the
initiates that transcended lineage, territorial domain, and ethnicity.37 As a result,
Boma traders were able to enslave and sell members of the Nsundi ethnic group
even though both spoke the same language.
The impact of the slave trade on the Kikongo speakers in the nineteenth
century is difficult to determine, but it must have been distributed unevenly
across different regions. John Thornton, for example, measured the demographic
impact of the slave trade on the Kikongo population living within the boundaries
of the old Kingdom of Kongo between 1780 and 1789. He argued that in this
period about 600,000 people lived in the Kingdom of Kongo and that the slave
trade carried an average of 6,180 slaves per year from the kingdom, or
approximately 1 percent of the total population.38 This estimate does not include
Africans who died during the process of enslavement, transport, and sale on the
coast, which if included would increase this percentage significantly.
The majority of the slaves shipped came from the kingdom’s capital,
Mbanza Kongo, which at that time served as the principal stage for the kingdom’s
civil wars. These slaves were supplemented with other Kikongo speakers
captured in different parts of the kingdom, especially Mbrize, Kibangu, and
Mbamba Lubota, all three south of Mbanza Kongo.39 Not all of these slaves were
37 Ibid., 64-65. 38 John K. Thornton, “As Guerras Civis no Congo e o Tráfico de Escravos: A História e a Demografia de 1718 a 1844 Revisitadas,” Estudos Afro-Asiáticos 32 (1997): 67 and Table 1. 39 Ibid., 67.
109

prisoners of war. According to Thornton’s estimates, at least 27 percent of all
slaves shipped from the Kingdom of Kongo were enslaved through raids or
judicial proceedings.40 The impact of the slave trade was particularly destructive
in the capital. In 1780, the population of Mbanza Kongo numbered about 27,600,
but by 1789 it had fallen to 18,950; a decline of 31 percent in just ten years.41
Nevertheless, the overall impact on the kingdom’s population was reduced by the
importation of slaves from neighboring regions.42 In the nineteenth century, the
impact of the slave trade on the Kikongo speaking population likely followed a
similar pattern of geographic concentration, but with the majority of the slaves
coming from Nsundi rather than Mbanza Kongo.
Kimbundu speakers shipped from Angola in the nineteenth century were
also enslaved as a result of internal conflicts stimulated by the trade. In fact, they
were victims of the trade from as early as the sixteenth century, when the
Portuguese established a colony at Luanda.43 Figure 3.3 shows the estimated
number of Kimbundu slaves leaving Angola between 1831 and 1855 by ethnic
group. The majority of them came from decentralized societies organized around
clans or lineages headed by one or more individuals who had a voice in decisions
affecting the entire society. These societies included the Kisama, Libolo, Ndembu,
and Ndongo. However, captives also came from centralized states generally ruled
by a chief or king such as Holo, Hungo, Kasanje, Njinga Shinje, and Songo.
40 Ibid., calculated from Table 1. 41 Ibid., calculated from Table 2. 42 Ibid., 68. 43 Birmingham, Trade and Conflict in Angola, 32-33 and 46-51; Vansina, Kingdoms of the Savanna, 125-130; Miller, Way of Death, 140-146.
110

Figure 3.3 – Estimated Number of Kimbundu Slaves Leaving Angola by Ethnic Groups,
1831-1855
Source: Same as Figure 3.1.
The political impact of the trade on the Kimbundu was particularly
destructive. In the sixteenth century, the Ndongo were on the verge of becoming a
centralized society ruled by a king with of the title of ngola, with the increasing
demand for slaves on the coast, however, the Ndongo fell prey to the Portuguese
and other Kimbundu societies, notably Kasanje, who raided them for slaves.44 As
a result, the Ndongo fragmented into a number of chiefdoms called sobados by the
Portuguese, which established suzerainty over local peoples by building a number
of forts along the Kwanza River, such as Muxima, Cambambe, and Ambaca. These
forts were called presídios, and they are identified on Figure 3.3 by dark
44 Birmingham, Trade and Conflict in Angola, 17-20 and 91-96; David Birmingham, Central Africa to 1870: Zambesia, Zaïre and the South Atlantic (New York: Cambridge University Press, 1981), 75-83.
111
triangles. The Portuguese then collected tributes from the sobados in slaves and
other commodities, stimulating rivalry among competing sobas.45
The slave trade also had a significant demographic impact on the Ndongo.
In 1844, Commander Lopes de Lima traveled to Luanda and consulted the
censuses of Portuguese Angola then available in the colonial archives. These
censuses began in the late eighteenth century and, because the Ndongo were the
largest ethnic group living under Portuguese rule in Angola, they provide
valuable evidence about the size of the Ndongo population. According to Lopes de
Lima, the censuses indicated that the black population of Portuguese Angola “had
grown so little, that it had increased no more than one percent in an interval of
twenty years.”46 Modern research supports this assessment, at least for an earlier
period. John Thornton, for example, notes that the slave trade not only reduced
the rate of growth among the black population of Portuguese Angola, but also
caused a dramatic imbalance between the number of males and females. He
concludes that, in the late eighteenth century, Angola was very much a female
world, since females outnumbered males in different age and social categories by
as much as 60 percent.47 In short, the slave trade had a profound demographic
impact on the Ndongo.
Umbundu speakers of the central plateau of Angola, the third major
linguistic group represented in the registries, exhibited patterns similar to the
Kikongo and Kimbundu populations. The slave trade from their region began in 45 Birmingham, Trade and Conflict in Angola, 32-33, 50, and 78-79; Beatrix Heintze, “Luso-African Feudalism in Angola? The Vassal Treaties of the Sixteenth to the Eighteenth Century,” Revista Portuguesa de História 18 (1980): 123; Beatrix Heintze, “Angola nas Garras do Tráfico de Escravos: As Guerras do Ndongo (1611-1630),” Revista Internacional de Estudos Africanos 1 (1984): 11-15. Carlos Couto, however, asserts that tributes were paid mostly in goods. See Carlos Couto, Os Capitães-Mores em Angola no Século XVIII: Subsídios para o Estudo da sua Actuação (Luanda: Instituto de Investigação Científica de Angola, 1972), 124-133 and 252-256. 46 Lopes de Lima, Ensaios sobre a Statistica das Possessões Portuguezas, vol. 3, 6-7. 47 John K. Thornton, “The Slave Trade in Eighteenth Century Angola: Effects on Demographic Structures,” Canadian Journal of African Studies 14, no. 3 (1980): 421-423.
112

the mid-seventeenth century, after the Portuguese attempts to find copper mines
in the interior of Benguela had failed.48 In the eighteenth century, the slave trade
from the central plateau increased with the opening of Benguela in 1716 to the
direct slave trade with Brazil.49 The majority of Umbundu speaking captives came
from centralized states such as Mbailundu, Viye, Wambu, Kiyaka, Ngalangi,
Kivula, Ndulu, Kingolo, Kalukembe, Sambu, Ekekete, Kakonda, and Kitata. These
kingdoms collected tributes from other Umbundu kingdoms, such as Kasongi,
Ngalangi, Kivanda, Namba, Sanga, Kenge, Kipeyo, Mbongo, and Elende.50
However, many of the slaves also came from decentralized societies, such as the
Mbui, Hanya, and Ndombe. In the nineteenth century, violence and warfare
spread throughout the central plateau as a result of political conflicts,
demographic growth, and resource scarcity.51 Figure 3.4 presents an estimated
ethnic breakdown of Umbundu speaking slaves leaving Angola similar to the
Kimbundu and Kikongo analysis in Figures 3.2 and 3.3. It suggests that the
pattern of widespread violence and warfare continued to ravage the central
plateau of Angola. The Portuguese exploited this situation by channeling
prisoners of war through a series of forts that they had built along the Coporolo
River and on the slopes of the Angolan highland, such as Quilengues, Dombe
Grande, and Caconda. However, they had little control over these conflicts.
48 Birmingham, Trade and Conflict in Angola, 140-141; Maria Emília Madeira Santos, Viagens de Exploração Terrestre dos Portugueses em África (Lisbon: Centro de Estudos de Cartografia Antiga, 1978), 138-141; Ferreira, “Transforming Atlantic Slaving,” 71-80; Cândido, “Enslaving Frontiers,” 22-24. 49 Ferreira, “Transforming Atlantic Slaving,” 112-121; Cândido, “Enslaving Frontiers,” 21-22. 50 Childs, Kinship and Character of the Ovimbundu, 168; Merran McCulloch, The Ovimbundu of Angola (London: International African Institute, 1952), 2. 51 Childs, Kinship and Character of the Ovimbundu, 190-207; Pélissier, História das Campanhas de Angola, vol. 1, 69-72; Linda Heywood and John Thornton, “African Fiscal Systems as Sources for Demographic History: The Case of Central Angola, 1799-1920,” Journal of African History 29, no. 2 (1988): 222-225; Dias, “Angola,” 345-348; Cândido, “Enslaving Frontiers,” 43-50.
113

Umbundu slaves too were victims of internecine conflicts rather than prisoners of
Lunda wars.
Figure 3.4 – Estimated Number of Umbundu Slaves Leaving Angola by Ethnic Groups,
1831-1855
Source: Same as Figure 3.1.
Despite the importance of the Umbundu as a source of slaves, the Atlantic
commerce had little impact on the total number of Umbundu speakers living in
the central plateau of Angola. In the mid-nineteenth century, László Magyar, a
refugee of the Hungarian revolutions of 1848, moved to the Angolan highlands.
He married the daughter of an Umbundu aristocrat and lived in the Kingdom of
Viye for almost ten years, from 1849 to 1858, leaving detailed records of his
114

interactions with the several Umbundu kingdoms on the central plateau. John
Thornton and Linda Heywood accessed Magyar’s accounts and estimated the size
of the Umbundu population based on his knowledge of African systems of tax
collection. They argue that the total Umbundu population in this period numbered
approximately 1,680,150 individuals, living in Kakonda, Kenge, Kisanji, Kiyaka,
Mbailundu, Mbui, Ndulu, Ngalangi, Nganda, Sambu, Sele, Sumbe, Viye, and
Wambu.52 The estimates of slaves shipped from the same ethnic groups between
1831 and 1855 include 116,324 individuals, or an average of 4,652 per year.
This figure suggests that the proportion of Umbundu slaves sold into the trade
each year during the nineteenth century was approximately 0.3 percent of the
entire Umbundu population.
The Umbundu population increased during the nineteenth century thanks
to the incorporation of slaves belonging to other linguistic groups into their own
societies. The Umbundu kingdoms of the central plateau shared borders with a
number of peoples from whom they drew slaves, especially females who could
contribute to high rates of natural population growth. These peoples included the
Nyaneka, Nkhumbi, Ovambo, and notably the Ngangela, a group whose name was
originally derived from a derogatory term that Umbundu speakers gave to the
people living east of the central plateau.53 The Umbundu sold some of these slaves
down to the coast, but they also kept some of them within their kingdoms.
Thornton and Heywood note that despite the continuation of the slave trade from
their area from the late eighteenth to the mid-nineteenth century, the Umbundu
52 These do not include the Massongo, Kubala, Libolo, and Haku, listed in Thornton and Heywood’s Chart 1, since they were actually Kimbundu speakers. See Heywood and Thornton, “African Fiscal Systems as Sources for Demographic History,” 213-219. 53 According to Gladwin Childs, the Ngangela included the Luimbi, Cimbandi, Lucazi, Cyemba, Ngonzelo, Chokwe and other peoples who lived east of the central plateau. See Childs, Kinship and Character of the Ovimbundu, 173, footnote 1.
115

population increased.54 This increase no doubt resulted in part from the
introduction and retention of females coming from other linguistic groups in West
Central Africa. Once more, the pattern of slaves generated by internal conflicts
and political unrest rather than wars of imperial expansion is evident.
In conclusion, the analysis of the lists of liberated Africans from Cuba and
Brazil in addition to the slave registers of Angola challenges current
interpretations of the origins of slaves and the ways they entered the
transatlantic traffic. It shows that slaves leaving Angola in the nineteenth
century came from regions adjacent to the coast, rather than from deep in the
interior of West Central Africa as Lunda prisoners. It also draws attention to an
important aspect of the history of the transatlantic trade. Africans enslaved and
sold one another into the trade for nearly four hundred years. However, it should
be noted that these individuals did not regard themselves as Africans. In fact, the
documentary evidence suggests that they defined themselves on the basis of ties
to localized polities, lineages, or ethnic groups. While they spoke the same
language as their captors, they were neighbors and, in some senses, “outsiders.”
This restricted sense of localized identity had disastrous consequences for some
communities, such as the Nsundi and the Ndongo. Others were able to minimize
the impact of the trade on them by incorporating slaves from other linguistic
groups into their own societies, as did the Umbundu of the central plateau of
Angola. It is clear that these localized forms of identity were an essential
prerequisite for the continuation of the transatlantic slave trade well into the
nineteenth century.
54 Heywood and Thornton, “African Fiscal Systems as Sources for Demographic History,” 223-225; Linda M. Heywood, Contested Power in Angola, 1840s to the Present (Rochester: University of Rochester Press, 2000), 2-3, 10-11, and 17.
116

Chapter Four
Of Men, Women and Children
A Demographic Profile of Slaves Leaving Angola
in the
Nineteenth Century
In the nineteenth century, British efforts to suppress the transatlantic
trade increased the demand for slave women in Brazil and the Spanish Americas.
Planters in these regions feared that if Britain succeeded in abolishing the trade
the captive population on their plantations would decline rapidly. Planters sought
to increase the ratio of women on their properties, in the expectation that the
captive population would soon need to increase by natural means as opposed to
relying on arrivals from Africa. Indeed, until the abolition of the trade, the growth
of the captive population in Brazil and the Caribbean depended largely on the
transatlantic trade. The work conditions on the Brazilian and Cuban sugar
plantations were so demanding that planters often preferred purchasing able
bodied slaves from Africa rather than raising slave children to adulthood.1
Furthermore, mortality rates among slaves working on sugar plantations were
particularly high, inhibiting the natural growth of slave populations in many
1 Carlos Augusto Taunay, Manual do Agricultor Brasileiro, ed. Rafael de Bivar Marquese (São Paulo: Companhia das Letras, 2001), 76-80; Maria Graham, Journal of a Voyage to Brazil and Residence There during Part of the Years 1821, 1822, 1823 (London: Longman, Hurst, Rees, Orme, Brown, and Green, 1824), 289; Alexander Humboldt, The Island of Cuba, trans. J. S. Thrasher (New York: Derby and Jackson, 1856), 187, 213-216 and 227-229.
117

parts of the Americas.2 Finally, the Industrial Revolution in Europe reduced the
cost of commodities used to exchange for slaves in Africa, making it possible for
planters to buy more able bodied individuals.3
However, planter preferences had little impact on the demographic profile
of the slave population leaving Angola in the nineteenth century. Although
planters tried to increase the number of females on their plantations, males
continued to predominate among Angolan departures. Moreover, captives sold
into the Angolan trade during the nineteenth century were on average younger
than those sold in previous centuries. All this suggests that planter preferences
were probably not the most important factor shaping the demographic profile of
the traffic from Angola. African enslavers, traders and owners were also primary
agents determining the sex and age patterns of the export trade. This finding has
profound implications for the history of the transatlantic trade, because it
fundamentally challenges accepted wisdom about who shaped the trade and
decided which individuals were eligible for enslavement and sale across the
Atlantic.
Scholars in the past have generally claimed that planter preferences were
the principal factor shaping the demographic profile of captives embarked from
Africa. They have argued that the majority of slaves embarked were men because
planters believed that males were more able than females to endure the intense
2 B. W. Higman, Slave Populations of the British Caribbean, 1807-1834 (Baltimore: Johns Hopkins University Press, 1984), 314-317 and 374-378; Herbert S. Klein and Francisco Vidal Luna, Slavery in Brazil (New York: Cambridge University Press, 2010), 167-168; Manuel Moreno Fraginals, The Sugarmill: The Socioeconomic Complex of Sugar in Cuba, 1760-1860 (New York: Monthly Review Press, 1976), 55, 142-143 and 148. 3 David Eltis, Economic Growth and the Ending of the Transatlantic Slave Trade (New York: Oxford University Press, 1987), 47-48; Joseph C. Miller, Way of Death: Merchant Capitalism and the Angolan Slave Trade, 1730-1830 (Madison: University of Wisconsin Press, 1988), 496-502 and 635-636.
118

labor routine of cash crop plantations in the Americas.4 Additionally, in most
European societies, men usually performed most of the heavy labor in
agriculture, such as clearing, plowing and harvesting, while women generally
worked on household chores, such as food processing and clothes manufacturing
as well as on the sale of homegrown produces in neighboring markets.5 When
Europeans migrated, they took with them their perceptions of the gender division
of labor, which they sought to replicate on the cash crop plantations of the
Americas. It long seemed obvious to scholars that the proportion of
approximately two males for every female exported in the overall traffic
stemmed from planters demanding more slave men than women.
However, in recent decades a number of studies have challenged this
interpretation. According to this new view, the majority of slaves sold into the
transatlantic trade were men not because planters believed that males could
support the labor regime of plantation agriculture better than females, but
because Africans valued female labor more highly than male labor. Ester Boserup,
for example, called attention to women’s participation in African economic
development. According to her, women played a central role in both agriculture
and trade in Africa.6 Claire Robertson and Martin Klein then noted the
importance of women’s labor in Africa, stressing that most slaves as well as their
owners on the continent were women rather than men.7 Finally, Joseph Miller, in
4 Jacob Gorender, O Escravismo Colonial (São Paulo: Ática, 1978), 321-324; Fernando Ortiz, Los Negros Esclavos (Havana: Editorial de Ciencias Sociales, 1975), 196-199; Eric Williams, Capitalism and Slavery (Chapel Hill: University of North Carolina Press, 1994), 38. 5 Carlo M. Cipolla, Before the Industrial Revolution: European Society and Economy, 1000-1700 (New York: Norton, 1976), 59-60; Louise Tilly and Joan W. Scott, Women, Work, and Family (New York: Holt, Rinehart and Winston, 1978), 32-37 and 44-47; Merry E. Wiesner, Women and Gender in Early Modern Europe, 2nd ed. (New York: Cambridge University Press, 2000), 108-111. 6 Ester Boserup, Woman’s Role in Economic Development (London: Allen & Unwin, 1970), 16-24. 7 Claire C. Robertson and Martin A. Klein, “Women’s Importance in African Slave Systems,” in Women and Slavery in Africa, ed. Claire C. Robertson and Martin A. Klein (Madison: University of Wisconsin Press, 1983), 3-5.
119

a recent publication with Gwyn Campbell and Suzanne Miers, has also
emphasized the importance of women in African economies by showing not only
that they outnumbered men in earlier times but also “that they played crucial
roles in the politics of the men who brought them into their households, and
sometimes also the economies of the women in them.”8
Such findings have prompted new research into the gender component of
the slave trade. Herbert Klein, for example, has examined the sexual distribution
of slaves shipped from Africa by different European carriers and argued that
Africans exercised a direct control over this movement by keeping what for them
were more highly valued women off the market. Klein held that the preferences of
planters in the Americas and Africans were complementary.9 David Eltis and
Stanley Engerman analyzed sex and age data of slaves sold into the trade
between the seventeenth and nineteenth centuries and discovered that men made
up less than half of all slaves embarked from Africa. They noted that the
proportion of women dropped markedly from a relatively high level in the
seventeenth century, while the shares of both boys and girls rose strongly into
the nineteenth century, with the increase in the ratio of girls undergoing the most
dramatic change of any of the four categories. They concluded that men were not
the dominant sex and age category in the trade and that their relative importance
probably declined over time.10 Finally, Ugo Nwokeji analyzed the trade from the
Bight of Biafra and noted that the sexual distribution of slaves embarked from
8 Joseph C. Miller, “Women as Slaves and Owners of Slaves: Experiences from Africa, the Indian Ocean World, and the Early Atlantic,” in Women and Slavery: Africa, the Indian Ocean, and the Medieval North Atlantic, ed. Gwyn Campbell, Suzanne Miers, and Joseph C. Miller, vol. 1 (Athens: Ohio University Press, 2007), 1. 9 Herbert S. Klein, “African Women in the Atlantic Slave Trade,” in Women and Slavery in Africa, ed. Claire C. Robertson and Martin A. Klein (Madison: University of Wisconsin Press, 1983), 34-37. 10 David Eltis and Stanley L. Engerman, “Was the Slave Trade Dominated by Men?,” Journal of Interdisciplinary History 23, no. 2 (1992): 241.
120

this region differed significantly from other regions of embarkation in Africa.
According to him, economic factors alone cannot account for this difference either
in Africa or the Americas. Rather, he argues that in this particular region
“African conceptions of gender shaped the sex and age structure of the overseas
slave trade.”11 All in all, recent studies of the trade have suggested that Africans
may have been the primary agents shaping the demographic profile of slaves
carried across the Atlantic.
What was the situation in nineteenth century Angola? Data on the sex and
age of slaves embarked from the region in this period is fragmentary at best.
However, they indicate that Africans had a major influence on determining the
demography of slave departures. Table 4.1 shows the percentage of males leaving
West Central Africa between 1781 and 1867 by region of disembarkation based
on 316 records of voyages available in the “Voyages Database.” It confirms the
traditional opinion about the sexual distribution of individuals sold into the trade,
with males comprising about 68 percent of all captives embarked. This ratio did
not vary much according to region of disembarkation. About 66 percent of those
embarked to the British and French Caribbean were males, while to Cuba and
Brazil they comprised 67 percent. This proportion was slightly higher to other
regions of disembarkation, 72 percent, but not very far from the average. Overall,
the majority of the captives leaving West Central Africa were males independent
of their final destination in the Americas.
11 G. Ugo Nwokeji, “African Conceptions of Gender and the Slave Traffic,” William and Mary Quarterly 58, no. 1 (2001): 66.
121

Table 4.1 – Percentage of Male Slaves Leaving West Central Africa by Region of
Disembarkation, 1781-1867
Years British and
French Caribbean
Cuba Brazil Other Total
1781-1805 149 (65.0) 24 (70.4) 3 (69.7) 13 (64.3) 189 (65.7)
1806-1830 5 (71.4) 24 (61.2) 1 (50.0) 7 (70.0) 37 (64.0)
1831-1855 7 (81.5) 8 (79.0) 13 (67.1) 43 (74.3) 71 (74.2)
1856-1867 1 (91.1) 1 (42.6) - 17 (74.1) 19 (73.3)
Total 162 (66.1) 57 (67.3) 17 (66.5) 80 (72.3) 316 (67.9)
Note: Numbers in brackets represent percentage of males embarked.
Source: David Eltis et al., "Voyages: The Trans-Atlantic Slave Trade Database," Online database,
2008, www.slavevoyages.org.
The proportion of males embarked increased significantly during the
period of the illegal trade. Table 4.1 shows that between 1781 and 1805 about 66
percent of those shipped were males. This proportion decreased to 64 percent
between 1806 and 1830, probably as a reaction of Cuban and Brazilian planters
to British efforts to abolish the trade. They expected to use the females they had
brought to expand the slave population on their plantations, in case the British
succeeded in their endeavors. However, the ratio of males embarked increased
sharply to 74 percent between 1831 and 1855 and to 73 percent between 1856
and 1867. As a consequence, the captive population embarked from West Central
Africa continued to be predominantly male despite planter demands for more
females.
Planters in general valued males more highly than females but, as we have
seen, in the first decades of the nineteenth century there was an increased
demand for females. This demand narrowed the price differential between males
122

and females at the main slave markets of the Americas. Manolo Florentino, for
example, accessed probate records of slave owners who had lived in rural areas of
Rio de Janeiro between 1790 and 1830, then the principal destination for slaves
leaving West Central Africa.12 These records list the value of each individual by
age, sex and origin, that is, whether the slaves were Africans or Creoles. They
indicate that planter attitudes towards females were shifting as the British
pressed to end the slave trade.
Among African slaves aged 12 to 55 years old, the price differential
between males and females decreased from 25 percent between 1810 and 1812 to
14 percent between 1815 and 1817. In the following years, this figure continued
to decline, from 11 percent between 1820 and 1822 to 9 percent between 1825
and 1827. In 1830, the last year of the legal trade to Brazil, and also the final year
for which price data is available, the price difference for captives brought from
Africa was slightly under 9 percent.13 Among Creoles in the same age group there
was a similar price pattern between males and females, but the difference
increased again in the final years of the legal trade. The price differential between
male and female Creoles decreased sharply from 22 percent between 1815 and
1817 to 11 percent between 1820 and 1822 and then increased again to 14
percent in 1825 to 1827 and to 17 percent in 1830.14 Nevertheless, these
numbers suggest that planters had changed their attitudes toward females,
especially those from Africa.
Pictorial representations of plantation labor in the Americas suggest that
planters had no compunction about working slave women side by side with slave
12 Manolo Florentino, Em Costas Negras: Uma História do Tráfico Atlântico de Escravos entre a África e o Rio de Janeiro, Séculos XVIII e XIX (São Paulo: Companhia das Letras, 1997), 59-60. 13 Ibid., 220. 14 Ibid.
123

men in the most demanding tasks. Jerome Handler and Michael Tuite have
grouped into a single website images of plantations scenes and agriculture labor
published in periodicals, as well as travelers’ accounts from the sixteenth to the
nineteenth century. These images are a rich source for our understanding of the
sexual division of labor in the plantations and cities of the Americas.15 William
Clark’s Ten Views in the Island of Antigua, published in 1823, contains the most
revealing images. It shows clearly women working in every stage of sugar
production, including digging, cutting, fetching, and transporting sugar cane.16
Planters in nineteenth century Brazil were no different. Henry Koster, who
lived in Pernambuco between 1809 and 1815, reported that it was common for
slave women to work alongside men in the Brazilian sugar mills. Figure 4.1 is a
copy of an image published in Koster’s account showing two women working in a
sugar mill; one is carrying cane while the other is feeding it to the sugar mill.
According to Koster, in general “two men and two women are employed in feeding
the mill with cane.”17 Maria Graham also noted the use of women in sugar
production in Brazil. She travelled throughout the interior of Rio de Janeiro
between 1821 and 1823 and saw slave women working in one of the first steam
powered mills then existing in Brazil.18 Steam powered milling of sugar cane was
a key technological innovation on nineteenth century plantations. In 1854, the
Illustrated London News published an article about the application of this new
technology in Brazil, and the image illustrating the article shows three slave
15 Jerome S. Handler and Michael L. Tuite Jr., “The Atlantic Slave Trade and Slave Life in the Americas: A Visual Record,” Online database, 2008, http://hitchcock.itc.virginia.edu/Slavery/. 16 William Clark, Ten Views in the Island of Antigua (London: T. Clay, 1823). Reproduced in Handler and Tuite Jr., The Atlantic Slave Trade and Slave Life in the Americas, image reference NW0051, NW0052, NW 0054 and NW0065. 17 Henry Koster, Travels in Brazil (London: Longman, Hurst, Rees, Orme, and Brown, 1816), 348. 18 Graham, Journal of a Voyage to Brazil, 282-283.
124

women milling sugar cane in one of De Mornay’s steam powered mills on the
Caraúna plantation, Pernambuco.19
Figure 4.1 – A Sugar Mill, Brazil, 1816
Source: Henry Koster, Travels in Brazil (London: Longgam, Hurst Rees, Orme, and Brown, 1816),
336. Reproduced from Jerome Handler and Michael L. Tuite Jr., The Atlantic Slave Trade and Slave
Life in the Americas: A Visual Record (Charlottesville: University of Virginia, 2008), image
reference KOSTER2, http://hitchcock.itc.virginia.edu/Slavery/.
Milling sugar cane may not seem as exacting as toiling in the fields, but it
was in fact hard work. Since the sixteenth century, travelers often described the
19 “Sugar Manufacture in Brazil,” The Illustrated London News 25 (September 9, 1854): 232. A copy of this article’s image is available in Handler and Tuite Jr., The Atlantic Slave Trade and Slave Life in the Americas, image reference pg232.
125

labor routine in Brazilian sugar mills as a hell for blacks.20 Because the juice had
to be extracted from the cane as soon as it was cut, the sugar mill had to operate
almost continually from August to the beginning of May of the following year.21
Moreover, in Brazil the boiling house was commonly located next to the mill. As a
consequence, in addition to the stress of milling cane, workers also had to endure
the heat coming from the caldrons of the boiling house.22
Work at the sugar mills was particularly dangerous because of the risk of
slaves losing a limb while feeding cane between the sugar mill rollers. Henry
Koster witnessed such accidents and reported planters’ precautions to avoid
them. He also noted that some planters began using oxen instead of horses to run
their mills, because the screams of the blacks caught in the rollers sometimes
caused horses to draw the mill with increased velocity. Oxen, by contrast, moved
more slowly and tended to stop rather than speed up when such accidents
occurred.23 The flames heating the caldrons, intense work routine and
horrendous accidents were enough to evoke the image of hell in the minds of
European travelers.24
Slave women’s work was not restricted to planting and milling sugar.
Historians have noted that women were employed in a wide variety of activities
20 André João Antonil, Cultura e Opulência do Brasil (Belo Horizonte: Itatiaia, 1982), 92-93. 21 Stuart B. Schwartz, Sugar Plantations in the Formation of Brazilian Society, Bahia, 1550-1835 (New York: Cambridge University Press, 1985), 99-106. In Cuba, sugar mills could operate up to sixteen hours per day during the peak of the harvest seasons. See Ortiz, Los Negros Esclavos, 189. 22 Schwartz, Sugar Plantations in the Formation of Brazilian Society, 115-118. 23 Koster states that the “negros who thrust the cane in between the rollers have sometimes allowed their hands to go too far, and one or both of them having been caught, in some instances, before assistance could be given, the whole limb and even the body has been crushed to pieces. In the mills belonging to owners who pay attention to the safety of their negroes, and whose wish it is to have every thing in proper order, a bar of iron and a hammer are placed close to the rollers upon the table which supports the cane. The bar is intended to be violently inserted between the rollers in case of an accident, so as to open them, and this set at liberty the unfortunate negro. In some instances I have seen lying by the side of the bar and hammer, a well tempered hatchet, for the purpose of severing the limb from the body if judged necessary,” Koster, Travels in Brazil, 348-349. 24 Ibid., 348.
126

located in the countryside as well as urban centers. They typically worked as
servants, maids, cooks, porters, weavers, sewers, hucksters, washers, midwives
and in many other capacities. Some activities were the strict domain of female
slaves, such as wet nursing and prostitution.25 All the evidence from nineteenth
century Brazil points to female slaves being just as useful to planters as male
slaves. Forces shaping the demographic profile of slaves leaving Angola were thus
more likely to have originated in Africa than in the Americas.
The sex ratio of slaves leaving West Central Africa by port of departure
further supports the idea of African influence. Table 4.2 shows that on average 69
percent of the slaves embarked taken from these ports were males. However, the
proportion of males shipped varied significantly from port to port. In the African
controlled ports located north of Luanda, about 70 percent were males. Most of
them came from the Kimbundu, Kikongo and Vili speaking peoples, who lived in
matrilineal societies where women had a prominent role in relations of
production and reproduction. By contrast, the ratio of males embarked from the
Portuguese ports was considerably lower; only 63 percent of those leaving
Luanda and the ports south of Luanda were males. The populations inhabiting the
interior of these ports also lived in matrilineal societies, such as the Kimbundu
and Umbundu. Since planters in the nineteenth century demanded slaves of both
sexes, the variation in the ratio of males shipped from these ports is clearly a
result of African conceptions of who could be enslaved and who could not. Some
societies were simply more open to selling females into the trade than others.
25 Mary C. Karasch, Slave Life in Rio de Janeiro, 1808-1850 (Princeton: Princeton University Press, 1987), 203-210 and 230-231.
127

Table 4.2 – Percentage of Male Slaves Leaving West Central Africa by Port of Embarkation,
1781-1867
Years Ports North of
Luanda Luanda
Ports South of Luanda
Total
1781-1805 88 (65.7) 2 (68.2) 2 (74.7) 92 (65.9)
1806-1830 19 (68.9) 13 (53.8) - 32 (62.8)
1831-1855 38 (81.0) 9 (75.6) 21 (62.2) 68 (74.5)
1856-1867 19 (73.3) - - 19 (73.3)
Total 164 (70.5) 24 (63.2) 23 (63.3) 211 (68.9)
Note: Numbers in brackets represent percentage of males embarked.
Source: Same as Table 4.
The sexual distribution of slaves embarked from each of these ports also
varied considerably over time. In the ports north of Luanda, the proportion of
males embarked increased continuously between 1781 and 1855, from 66 to 81
percent, declining thereafter to 73 percent between 1856 and 1867. By contrast,
the ratio of males shipped from Luanda declined initially from 68 percent
between 1781 and 1805 to 54 percent between 1806 and 1830. However, it
increased again to 76 percent between 1831 and 1855. Data for the ports south of
Luanda are incomplete, but the evidence available suggests that the proportion of
males shipped declined between the eighteenth and nineteenth centuries, from 75
percent between 1781 and 1805 to 62 percent between 1831 and 1855. This data
indicates that the populations living in the central plateau were inclined to sell
more females into the trade than other populations living in the interior of
Angola.
Angolans in general had several reasons for selling more males than
females into the trade. Many males were trained soldiers who had been captured
128

in wars waged by different polities within West Central Africa. As prisoners of
war, they were expensive to maintain and at the same time potentially rebellious.
Many of these prisoners came from the central plateau of Angola. They were
soldiers of the Nano Wars waged by several Umbundu polities during the first half
of the nineteenth century, especially Viye, Mbailundu and Wambu.26 African
masters, enslavers, and traders in general usually looked to sell these slaves on
the coast as soon as they could. This outlet gave them a convenient way of
reducing maintenance costs, avoiding potential rebellions, and making a profit
from an undesirable “commodity.”
Africans also preferred to sell more males than females into the trade
because, in West Central Africa in particular, women were an integral part of the
work force, especially in food production. Women digging, planting, harvesting
and processing grains with their children strapped on their backs was a common
sight in West Central Africa. Father Giovanni Antonio Cavazzi de Montecuccolo,
for example, travelled throughout the kingdoms of Ndongo, Kongo and Matamba
between 1654 and 1667 and noted that “women performed almost all agricultural
work.”27 One of the images illustrating his writings clearly shows a woman with a
child strapped on her back preparing the soil for cultivation with a hoe. Over two
hundred years later, the Portuguese explorers Hermenegildo Capelo and Roberto
Ivens, travelling overland from Benguela to Yaka, remarked on the food produced
26 Bernardino Freire de Figueiredo Abreu e Castro, “Colonia de Mossamedes,” Annaes do Conselho Ultramarino (Parte Não Oficial) ser. 1 (1855): 152; Joachim John Monteiro, Angola and the River Congo (New York: Macmillan and Co., 1876), 289; René Pélissier, História das Campanhas de Angola: Resistência e Revoltas, 1845-1941 (Lisbon: Editorial Estampa, 1997), vol. 1, 173-175 and 187-192; José Redinha, Distribuição Étnica de Angola (Luanda: Centro de Informação e Turismo de Angola, 1962), 16-17; Catarina Madeira Santos, “Um Governo ‘Polido’ para Angola: Reconfigurar Dispositivos de Domínio (1750-c.1800)” (Doctorate, Lisbon: Universidade Nova de Lisboa, 2005), 299-308. 27 João António Cavazzi de Montecucculo, Descrição Histórica dos Três Reinos de Congo, Matamba e Angola, trans. Graciano Maria Leguzzano (Lisbon: Junta de Investigações do Ultramar, 1965), vol.1, 38-39.
129

in the region and recorded the same scene near the Kwango River, reproduced
here in Figure 4.2.28 Women’s work was essential to the economies of West
Central African societies, so much so that African masters, enslavers, and slave
traders often considered it more important to keep female slaves in the continent
than selling them across the Atlantic.
Figure 4.2 – African Women Working the Fields Near the Kwango River, 1881
Source: Hermenegildo Capello and Roberto Ivens, De Benguella às Terras de Iácca: Descripção de
uma Viagem na Africa Central e Occidental (Lisbona: Imprensa Nacional, 1881), vol. 1, 177.
A further reason why Africans preferred to retain females lies in the
importance of their role in the distribution of wealth and power within West
Central African societies. Although power was usually in the hands of men, most
28 Hermenegildo Capello and Roberto Ivens, De Benguella às Terras de Iácca: Descripção de uma Viagem na Africa Central e Occidental (Lisbon: Imprensa Nacional, 1881), vol. 1, 53-54 and 177.
130

of these societies were matrilineal, in which wealth and power were distributed
according to maternal lines of succession. This practice often led men who wanted
to protect inherited wealth and power to marry kinless women, so that their
inheritance would neither be dispersed among their brothers in law nor among
their own children, who were the legal heirs of their mothers and maternal
uncles. As a consequence, many African men sought to marry slave women to
avoid the dispersal of their wealth and power to the families of their spouses.29
Moreover, in West Central African societies, the number of dependents a man had
commonly served as an important indicator of his status.30 Marrying slave
women ensured that the fruits of this marriage legally belonged to their fathers
instead of their mothers and uncles. All these reasons clearly underscore
Africans’ preference for female over male slaves.
Angolan preferences also influenced the age profile of individuals sold into
the trade. Traditionally, planters and slave owners in the Americas purchased
more adults than children from Africa, because they expected to recover their
investments by employing them as soon as they arrived. However, in the
nineteenth century, slaves leaving Angola were younger than in previous
centuries, suggesting that despite the planter preference for adults the number of
29 Anne Hilton, The Kingdom of Kongo (New York: Clarendon Press, 1985), 85-90; Paul E. Lovejoy, Transformations in Slavery: A History of Slavery in Africa, 2nd ed. (New York: Cambridge University Press, 2000), 12-15; Kristin Mann, Slavery and the Birth of an African City: Lagos, 1760-1900 (Bloomington: Indiana University Press, 2007), 76-79; Patrick Manning, Slavery and African Life: Occidental, Oriental, and African Slave Trades (New York: Cambridge University Press, 1990), 118-122; Joseph C. Miller, “Imbangala Lineage Slavery,” in Slavery in Africa: Historical and Anthropological Perspectives, ed. Suzanne Miers and Igor Kopytoff (Madison: University of Wisconsin Press, 1977), 211-215; Miller, Way of Death, 94-103; Jan Vansina, Kingdoms of the Savanna: A History of Central African States until European Occupation (Madison: University of Wisconsin Press, 1966), 219. 30 Lovejoy, Transformations in Slavery, 12-15; Mann, Slavery and the Birth of an African City, 79-81; Manning, Slavery and African Life, 122-125; Miller, Way of Death, 42-53; Alberto da Costa e Silva, A Manilha e o Libambo: A África e a Escravidão de 1500-1700 (Rio de Janeiro: Nova Fronteira, 2002), 370; John K. Thornton, Africa and Africans in the Making of the Atlantic World, 1400-1800, 2nd ed. (New York: Cambridge University Press, 1998), 91; Vansina, Kingdoms of the Savanna, 194-196.
131

children shipped tended to increase over time. Explanations for such a trend are
more likely to be found either in Africa or in attempts to suppress the slave trade
on the African coast than in Europe.
Comparing age categories of persons sold into the trade is considerably
harder than comparing sexual categories. The age an individual enters adulthood
differs from culture to culture and is subject to many interpretations. Europeans
often recorded the age of slaves purchased in Africa according to their own
perceptions of age. In the eighteenth and nineteenth centuries, Europeans
believed that individuals entered adulthood when they became eligible for
marriage. In southern Europe, females were generally eligible for marriage when
they reached puberty at about twelve years old. Males were commonly eligible for
marriage about the time they could bear arms and serve in the army. As a
consequence, European females usually reached adulthood before males. The
Constitutions of the Archbishopric of Bahia, which guided moral conduct in the
Portuguese empire, ruled that females were eligible for marriage when they
reached twelve years old, while males were eligible for marriage only after they
turned fourteen years old.31 Thus, by our standards many of the individuals that
Europeans recorded as adult slaves were probably teenagers.
Perception of adulthood among West Central Africans during the period of
the trade was not very different from those of Europeans previously described.
However, in Africa both sexes generally had to undergo rituals of initiation before
being considered as adults. Because physical signs of adulthood are less clear in
males than in females, males had to undergo extensive rituals of initiation that
culminated with circumcision. These rituals were frequently carried out in camps
31 Sebastião Monteiro da Vide, Constituições Primeiras do Arcebispado da Bahia (São Paulo: Typographia de António Louzada Antunes, 1853), 109-110, Title 64.
132

outside the home villages, towns and cities from which the initiates came.
Additionally, these rituals introduced young males to techniques of hunting,
warfare, and other responsibilities associated with manhood in their societies. In
some societies, these rituals could be exceedingly cruel. Galdwyn Murray Childs
noted that among the twentieth century Umbundu speakers of the central plateau
of Angola the “hardship and the cruelty of the initiation camps have their parallel
in the trading and slave trading expeditions of the past.”32 In any event,
Portuguese and West Central Africans probably had similar notions of when
individuals reached adulthood.
However, the specifics of carrying slaves across the Atlantic sometimes
influenced the way Europeans distinguished children from adults. From the
sixteenth to the mid-eighteenth century, for example, Portuguese and Spanish
traders identified slave children not by their approximate age but by their height.
They counted slaves in terms of peças da Índia, or in piezas de Índia in Spanish.
This term, literally a piece of Asian cloth, referred to one of the most popular
commodities used to purchase slaves on the African coast. In the seventeenth
century, a peça in Spanish contracts for the slave trade equaled the value of a
healthy adult, male or female, measuring seven or more quarters of a vara.33 The
vara was a medieval form of measurement of length that varied over time from
region to region. The Seville vara was the standard used in the Angolan-Brazilian
maritime trade. In the nineteenth century, the length of a Seville vara was
32 Gladwyn Murray Childs, Kinship and Character of the Ovimbundu: Being a Description of the Social Structure and Individual Development of the Ovimbundu of Angola, with Observations Concerning the Bearing on the Enterprise of Christian Missions of Certain Phases of the Life and Culture Described (London: Reprinted for the International African Institute & for the Witwatersrand U.P. by Dawson, 1969), 116-117. 33 Enriqueta Vila Vilar, Hispanoamerica y el Comercio de Esclavos (Seville: Escuela de Estudios Hispano-Americanos, 1977), 189-190.
133

approximately 83.59 centimeters or 32.9 inches, so the height of a peça da Índia
in the nineteenth century was about 146 centimeters or 57 inches.34
This was rather short for a healthy adult, male or female. David Eltis
showed that, in the nineteenth century, adult males shipped from any part of the
African coast south of the Sahara measured on average between 157 and 166
centimeters, while females measured between 151 and 157 centimeters.35 In any
event, Portuguese slave traders between the sixteenth and the mid-eighteenth
century calculated the carrying capacity of their vessels by adding the heights of
their slaves in peças da Índia and dividing it by a vara craveira, which measured
about 525 centimeters.36 In general, three peças were allowed for each ton, so
that Portuguese and Spanish traders could in fact write contracts for the trade
specifying the volume of the cargo to be shipped across the Atlantic.37
Additionally, this practice allowed customs officials to collect taxes on the basis of
able-bodied equivalencies, rather than on the actual number of captives. The
contract of the Companhia da Guiné, for example, specified that it had to deliver
“ten thousand tons of slaves” from Africa to the Spanish Americas between 1699
and 1705.38 As a consequence, until the eighteenth century, references to
children in documents related to the Portuguese and Spanish trades are rare.
In the eighteenth century, the term peça da Índia was increasingly
replaced by a new term, cabeça, indicating a single adult. Because a cabeça did not
34 Converted according to the “Real Orden del 9 de Diciembre de 1852,” in Cárlos Sanguineti, Diccionario Jurídico-Administrativo (Madrid: Imprensa de la Revista de Legislacion y Jurisprudencia, 1858), 643-655. 35 David Eltis, “Nutritional Trends in Africa and the Americas: Heights of Africans, 1819-1839,” Journal of Interdisciplinary History 12, no. 3 (1982): 459, Table 1. 36 J. Lúcio de Azevedo, Épocas de Portugal Económico, 4th ed. (Lisbon: Livraria Clássica, 1988), 75-76. 37 Ibid. 38 “Assento para a Introdução dos Negros das Índias Espanholas, Feito entre o Conselho Real das Índias e um Sócio da Companhia Real da Guiné, em Madrid a 12 de Julho de 1699,” in António Carreira, As Companhias Pombalinas de Navegação, Comércio e Tráfico de Escravos entre a Costa Africana e o Nordeste Brasileiro (Bissau: Centro de Estudos da Guiné Portuguesa, 1969), 309.
134

necessarily imply the same limit of labor power as a healthy adult, the Portuguese
government began to tax slaves according to different age categories. These
categories, however, were also based on the height of the slaves rather than their
actual age. The trade contract that the Portuguese government awarded to
Manuel Barbosa Torres in 1753 to carry slaves from Angola, for example, stated
that “the duties for cabeças and children who do not fit the established
requirements of peças da Índia will be paid relative to the peças da Índia with the
proviso that the children must not be more than four palmos tall.”39 Palmos was a
measurement of length equivalent approximately to 22 centimeters in the
nineteenth century. Therefore, slaves considered children could not be taller than
88 centimeters, a very short stature compared to 146 centimeters of a peça da
Índia.40
In the eighteenth century, the Portuguese began to separate children
embarked from Angola into two different categories. The first category they called
crias de pé or children able to stand. The second category they called crias de
peito or nursing infants. The distinction between crias de pé and crias de peito
resulted from a conflict over how to tax children put on board Portuguese ships
on the coast of Angola. Until the eighteenth century, the heights of children were
added to those of adults and taxes were then collected in peças da Índia. However,
as traders and customs officials began to count slaves in cabeças, they had to
create a new way of taxing children. Thus, in 1758 the Portuguese government
settled the conflict with a tax reform that levied different taxes on children and
adults embarked. Crias de pé measuring four palmos or less were charged half the
39 Dom José I, “Carta de Sua Mag. sobre a Remataçam do Contrato dos Direitos Novos que a Rematou Manoel Barbosa Torres dos Direitos dos Escravos q’ se Embarcam desta Cid. de Loanda p. os Portos do Brazil,” Arquivos de Angola 2, no. 13-15, 1 (1936): 521. 40 Fortunato José Barreiros, Memória sobre os Pesos e Medidas de Portugal, Espanha, Inglaterra e França (Lisbon: Typographia da Academia Real das Sciencias, 1838), 20.
135

taxes paid on adults, while crias de peito were tax free and, when shipped
together with their mothers, the two counted as only one cabeça.41
After the Portuguese began to count slaves in cabeças, children appeared
in the documentation more frequently. Most of them were probably nursing
infants and toddlers. Since tax procedures at the Portuguese ports of slave
embarkation in Angola stipulated such a short height for children embarked,
there were many individuals classified as adults but would be considered children
by our own standards and, indeed, may have been by the standards of Europeans
and Africans of that time. Nevertheless, tax records of slaves embarked from
Luanda provide us with some idea of their age distribution.
In the eighteenth century, children comprised a significant percentage of
the total number of slaves shipped from Luanda. Horácio Gutiérrez analyzed
records of taxes collected from vessels carrying slaves from Luanda and
estimated the proportion of children shipped for 17 years between 1734 and
1769. These records provide the total number of slaves as well as the number of
crias de pé and crias de peito embarked for the years 1740-1742, 1744, 1747-
1749, 1762-1767, and 1769. Gutiérrez also found records showing only totals
embarked for the years 1734, 1738 and 1754, but he estimated the proportion of
crias de pé and crias de peito embarked in these years using the average
percentage rate of children shipped according to each category in the following
four years for which he had data. In total, Gutiérrez calculated that 143,848
slaves were embarked from Luanda in these 17 years. Approximately 9,220 of
the total were children; 7,003 crias de pé and 2,217 crias de peito. According to
41 Dom José I, “Ley sobre a Arecadação dos Direitos dos Escravos, e Marfim, que Sahirem do Reino de Angola, e Pórtos da sua Dependencia,” Arquivos de Angola 2, no. 13-15, 1 (1936): 538.
136

his estimates, about 6 percent of the slaves embarked from Luanda in those years
were children.42
Although Gutiérrez recognized the different categories of children
embarked, he did not realize that these categories included only individuals
measuring up to four palmos tall. In fact, the proportion of children shipped could
have been much higher according to both European and African perceptions of
age during the period of the trade. A more realistic proportion is probably double
the percentage Gutiérrez estimated. This is important to emphasize because
shipping records with age data available for slaves embarked in West Central
Africa during the nineteenth century were not based on Portuguese tax records.
Rather, they were created by other institutions in different countries that
recorded the age of enslaved individuals according to European and African
perceptions of age during the eighteenth and nineteenth centuries. One example
of these institutions is the mixed commission courts for the adjudication of
vessels accused of illegal trading, which form the basis for much of the age data
available in the “Voyages Database.”
The database contains records of 365 vessels with age data for slaves
shipped from West Central Africa by region of disembarkation between the late
eighteenth and the nineteenth centuries. Table 4.3 shows that about 17 percent of
all individuals carried were children. Further, the proportion of children
embarked varied widely across time. Between 1781 and 1805, about 11 percent
of those shipped were children. This ratio increased to 16 percent between 1806
and 1830. However, during the period of the illegal trade, the proportion of
children sold increased sharply to 53 percent between 1831 and 1855 and 36
42 Horácio Gutiérrez, “O Tráfico de Crianças Escravas para o Brasil durante o Século XVIII,” Revista de História, São Paulo 120 (1989): 60-63.
137

percent between 1856 and 1867. Traders had never shipped such a large
percentage of children before, but the causes for this increase are difficult to
determine. On the one hand, planters in the Americas were not interested in
receiving so many children. On the other, Africans were often reluctant to sell
children across the Atlantic. Given these positions, it appears that the British
efforts to abolish the slave trade created a situation to which both sides had to
adjust.
Table 4.3 – Percentage of Slave Children Leaving West Central Africa by Region of
Disembarkation, 1781-1867
Years British and
French Caribbean
Cuba Brazil Other Total
1781-1805 130 (15.2) 10 (21.4) 111 (3.2) 7 (27.8) 258 (10.6)
1806-1830 3 (33.4) 22 (19.2) 22 (4.0) 7 (39.7) 54 (16.5)
1831-1855 7 (55.4) 7 (53.1) 13 (56.8) 21 (49.6) 48 (52.9)
1856-1867 - - - 5 (42.9) 5 (35.7)
Total 140 (17.5) 39 (25.9) 146 (8.1) 40 (43.2) 365 (17.4)
Note: Numbers in brackets represent percentage of children embarked.
Source: Same as Table 4.1.
Table 4.3 confirms that the ratio of children embarked increased in all
regions of disembarkation, especially during the period of the illegal trade. In the
British and French Caribbean, it increased from 15 percent between 1781 and
1805, to 33 percent between 1806 and 1830, and 55 percent between 1831 and
1855. The proportion of children shipped to Cuba initially decreased from 21
percent between 1781 and 1805 to 19 percent between 1806 and 1830. However,
138

from 1831 to 1855 it increased sharply to 53 percent. The proportion of children
embarked to Brazil also increased significantly during the nineteenth century,
from a range of 3 to 4 percent between 1781 and 1830 to an impressive 57
percent between 1831 and 1855. The ratio of children embarked to other
destinations though always relatively high, also increased during the nineteenth
century, from 28 percent between 1781 and 1805 to 40 percent between 1806
and 1830, culminating at 50 percent between 1831 and 1855. After this period,
the ratio of children shipped to other destinations declined to 43 percent.
The ratio of children shipped varied significantly by port of embarkation.
Table 4.4 shows that the ports north and south of Luanda shipped relatively more
children than Luanda. In total, children comprised about 26 percent of the slaves
leaving the ports north of Luanda, 47 percent from the ports south of Luanda, and
only 6 percent from Luanda itself. However, these numbers may be misleading.
The “Voyages Database” contains too few records of voyages with age data for
slaves leaving Luanda between 1831 and 1855, when the proportion of children
sold into the slave trade is likely to have increased. If the data were more
complete, the ratio of children embarked from Luanda would have been probably
higher and indeed closer to the average of those shipped from the ports north and
south of Luanda.
139

Table 4.4 – Percentage of Slave Children Leaving West Central Africa by Port of Embarkation,
1781-1867
Years Ports North of
Luanda Luanda
Ports South of Luanda
Total
1781-1805 69 (16.0) 110 (3.2) 3 (3.4) 182 (8.0)
1806-1830 17 (28.3) 34 (8.1) - 51 (14.8)
1831-1855 26 (50.5) 6 (53.4) 15 (55.4) 47 (52.5)
1856-1867 6 (35.7) - - 6 (35.7)
Total 118 (26.4) 150 (6.3) 18 (46.8) 286 (17.1)
Note: Numbers in brackets represent percentage of children embarked.
Source: Same as Table 4.1.
Despite the lack of data, the records available do indicate important
variations in the ratio of children exported across time from the various ports of
embarkation. Between 1781 and 1805, for example, the percentage of children
leaving the ports north of Luanda was considerably higher than the percentage of
those leaving Luanda and the southern ports. In that period, about 16 percent of
the slaves leaving the northern ports were children. In contrast, in the same
period, only 3 percent of slaves leaving Luanda and the southern ports were
children. This suggests that the societies living in the hinterland of these ports
were less open to selling children into the trade than the societies located in the
port areas north of Luanda. However, during the period of the illegal trade, the
ratio of children embarked from all ports increased significantly. Between 1831
and 1855, children comprised about 51 percent of the slaves shipped from the
ports north of Luanda, 53 percent from Luanda itself, and 55 percent from the
ports south of Luanda.
140

The increase in the proportion of children embarked from West Central
Africa is surprising in view of the current understanding of who was eligible for
enslavement and sale into the transatlantic slave trade. Scholars generally stress
that African enslavers and traders commonly preferred to sell adults into the
external trade and keep children for sale into the domestic market. This
interpretation implies that the demand for slave children in Africa was higher
than the demand for adult slaves, because African slave owners believed that
purchasing and owning slave children involved fewer risks than those associated
with adults. Children could be easily integrated into their masters’ society
through cultural assimilation. Adults, on the other, were potential escapees,
capable of inciting rebellion, or murdering their masters, sometimes employing
poison and even witchcraft.43 Scholars of African slavery need to take on board
the increasing proportion of children sold from West Central Africa between the
late eighteenth and the mid-nineteenth century. Perhaps our current
understanding of African slavery in this period needs reassessing, particularly
ideas about who was eligible for sale across the Atlantic.
Kikongo speakers living in the interior of the ports north of Luanda were
probably more open to selling children into the trade than Kimbundu or Umbundu
speakers who lived in the interior of Luanda and the ports south of Luanda. Table
4.4 shows that the proportion of children leaving the northern ports was 4 to 5
times higher than at the other ports. This trend may be related to the methods of
enslavement among the Kikongo. As previously noted, kidnapping was one of the
primary forms of enslavement among Kikongo speakers, especially at Boma, and
43 Lovejoy, Transformations in Slavery, 16-17; Suzanne Miers and Igor Kopytoff, “African ‘Slavery’ as an Institution of Marginality,” in Slavery in Africa: Historical and Anthropological Perspectives (Madison: University of Wisconsin Press, 1977), 53.
141
children could easily fall victim to such abductions.44 Kimbundu speakers living
in the interior of Luanda were more conservative in determining who could be
sold into the trade. Many of them had long suffered the demographic impact of
the trade, especially the Ndongo who lived under direct influence of the
Portuguese. Consequently, Kimbundu societies could not afford to sell women and
children into the trade, as these categories were crucial to the very survival of
their societies.45 In the mid-nineteenth century, the ratio of children shipped from
Luanda increased, but it should be noted that at this time the overall numbers
embarked from this port had declined significantly.46 Finally, the Umbundu also
seemed very conservative in their sale of slaves, as the percentage of captives
leaving the southern ports was similar to that leaving Luanda. However, the
Umbundu populations of the central plateau of Angola were expanding between
the late eighteenth and the mid-nineteenth centuries.47 As a consequence, it may
be possible that they shipped more adults during the legal period of the trade not
because they were coping with the demographic impact of the trade, but rather
because they could best supply the demand for adult slaves overseas. The
proportion of children shipped from the southern ports also increased in the mid-
nineteenth century but this was more an adjustment to the period of the illegal
trade than a shift in Umbundu conceptions of who could be sold across the
Atlantic.
44 Norm Schrag, “Mboma and the Lower Zaire: a Socioeconomic Study of a Kongo Trading Community, c.1785-1885” (Ph.D., Bloomington: Indiana University, 1985), 62-63. 45 John K. Thornton, “The Slave Trade in Eighteenth Century Angola: Effects on Demographic Structures,” Canadian Journal of African Studies 14, no. 3 (1980): 421-423. 46 See Chapter One, Figure 1.2. 47 Linda Heywood and John Thornton, “African Fiscal Systems as Sources for Demographic History: The Case of Central Angola, 1799-1920,” Journal of African History 29, no. 2 (1988): 223-225; Linda M. Heywood, Contested Power in Angola, 1840s to the Present (Rochester: University of Rochester Press, 2000), 2-3, 10-11 and 17.
142

Two important factors contributed to the increase in the percentage of
children embarked from West Central Africa during the nineteenth century.
Neither had much to do directly with developments on plantations in the
Americas or within African societies; rather they were a function of efforts to
suppress the trade. First, as British antislave trade activity increased, traders
had to find new outlets through which to sell captives across the Atlantic. These
outlets assumed the form of clandestine ports of slave embarkation spread along
the coast of West Central Africa. British naval cruisers often guarded traditional
ports of embarkation, so slave traders had to move their operations to different
places agreed upon in advance with captains of slave vessels. In most of them,
slaves were maintained not on the coast, but in barracoons located at some
distance from the shoreline, in order to disguise their presence from antislave
trade cruisers patrolling the coast. These barracoons were built for the sole
purpose of housing slaves until the moment of embarkation.48 Since traders had
to constantly change location and run their activities as clandestinely as possible,
they could not afford to face resistance from their slaves. This may have meant
that slave traders began to buy more children than adults.
Second, as the demand for slaves in the Americas declined, the number of
slaves available for sale in the African domestic market increased. This created a
surplus of slave children on the continent, which African owners could not
support to adulthood, so they began to sell them on the coast. Although large
numbers of slaves continued to be shipped from West Central Africa until 1850,
their real price on the coast began to decline from the beginning of the nineteenth
century. Real prices of slaves sold at Luanda, for example, remained constant
48 Roquinaldo Amaral Ferreira, “Dos Sertões ao Atlântico: Tráfico Ilegal de Escravos e Comércio Lícito em Angola, 1830-1860” (M.A., Rio de Janeiro: Universidade Federal do Rio de Janeiro, 1996), 38-42; Miller, Way of Death, 299-308.
143

form the 1800s to the 1810s, varying between 110,395 réis to 110,008 réis. It
declined significantly in the 1820s to approximately 66,901 réis, increasing again
only at the eve of the abolition of the Brazilian slave trade in the 1830s to
149,123 réis.49 These data indicate that, although large numbers continued to be
shipped from Angola until the mid-nineteenth century, the demand for slaves on
the coast was losing momentum. Africans who were previously enslaved and sold
into the external trade were now being sold into the domestic market.
Enslavement in the interior must have declined with time, and the temporary
effect of more slaves on the domestic market probably increased the slave
population in many societies of West Central Africa, perhaps resulting in many
African owners holding a surplus of young captives that they could not afford to
raise to adulthood.
All in all, slaves shipped from Angola included individuals from every sex
and age category but, in the nineteenth century, they tended to be mostly boys.
The demographic profile of slaves transported shows that African conceptions of
gender and age helped shape the trade by determining who was eligible for
enslavement and sale across the Atlantic. In the nineteenth century, planters in
the Americas became more interested in purchasing slave women in response to
the British efforts to abolish the trade. Africans, on the other hand, were often
reluctant to sell women into the trade. Additionally, they preferred to keep
children within the continent, rather than selling them overseas. However, given
the pressures to suppress the trade, Africans adjusted to the new circumstances
and began selling more children into the trade than in previous years. Children
were easier to transport and keep at barracoons situated at remote places along
the coast of Angola. As the slave trade declined, it is also possible that African 49 See Appendix C, Table C.2.
144

traders found themselves with a surplus of captives, including children, that they
were disposed to sell across the Atlantic. African conceptions of gender and age
combined with the impact of attempts to suppress the trade were thus important
factors determining who could be enslaved and sold into the transatlantic slave
trade from Angola.
145

Chapter Five
On Goods and People
African Patterns of Consumption in Angola
in the
Nineteenth Century
Africans exchanged slaves on the coast of Angola for a variety of goods
imported from several regions around the world. In terms of value, the majority
of the slaves embarked were exchanged for Asian textiles, sugar cane rum
produced in the Americas, and weapons brought largely from Europe. Historians
of Angola believe that Africans distributed these goods among their loyal
followers in order to accumulate power, increase their number of dependents, and
raise armies to capture more slaves and expand their influence throughout the
interior of West Central Africa. This interpretation implies that the supply of
captives on the coast was in the hands of just a few rulers, who competed against
one another for power and access to foreign imports. This process generated a
vicious cycle of violence and warfare, which led to the destruction of some
societies and the imperial expansion of others, such as the Lunda Empire. Some
scholars have seen Africans as politically motivated to participate in the trade,
with the economic gains resulting from sales being secondary.1
1 The main supporter of this view is, of course, Joseph C. Miller, Way of Death: Merchant Capitalism and the Angolan Slave Trade, 1730-1830 (Madison: University of Wisconsin Press, 1988), 51-61.
146

However, prices of slaves leaving Luanda between the late eighteenth and
the nineteenth centuries show that Africans did respond to economic incentives.
Philip Curtin devised a model to examine the participation of Africans in the trade
from Senegambia, which measured their political and economic motivations to
sell slaves based on variations in the value and number of captives sold across the
Atlantic. If the number of individuals shipped varied according to the price for
which they were sold, it signified that Africans were economically motivated to
participate in the trade. In contrast, if the number of individuals shipped did not
respond to variations in price, it meant that Africans engaged in the trade for
political reasons, such as wars waged in the interest of establishing a state and
imperial expansion. These are extreme examples, of course. The actual
motivations must have been diverse, but they probably varied within these
parameters, making the analysis of the price and number of slaves embarked a
useful indicator of the primary reason Africans participated in the trade.2
Because the number of slaves shipped from the Senegambia did not vary
according to price, Curtin concluded that in this particular region Africans were
more politically than economically motivated to participate in the trade.3 Since
the publication of his study, many historians have begun collecting data on the
price and number of captives sold from other African regions and subjecting it to
similar analyses but sometimes drawing different conclusions. Philip Le Veen, for
But see also David Birmingham, Trade and Conflict in Angola: The Mbundu and their Neighbours under the Influence of the Portuguese, 1483-1790 (Oxford: Clarendon Press, 1966), 148-149; Jill R. Dias, “Angola,” in Nova História da Expansão Portuguesa: O Império Africano, 1825-1890, ed. Valentim Alexandre and Jill R. Dias, vol. 10 (Lisbon: Editorial Estampa, 98), 335-339; Paul E. Lovejoy, Transformations in Slavery: A History of Slavery in Africa, 2nd ed. (New York: Cambridge University Press, 2000), 149-150; John K. Thornton, “The Chronology and Causes of Lunda Expansion to the West, c.1700-1852,” Zambia Journal of History 1 (1981): 6-7; Achim von Oppen, Terms of Trade and Terms of Trust: The History and Contexts of Pre-Colonial Market Production around the Upper Zambezi and Kasai (Münster: LIT Verlag, 1994), 59-61. 2 Philip D. Curtin, Economic Change in Precolonial Africa: Senegambia in the Era of the Slave Trade (Madison: University of Wisconsin Press, 1975), vol. 1, 156-157. 3 Ibid., vol. 1, 166-168.
147

example, collected price data on slaves sold from all regions and argued that
Africans were motivated more by economic than political gains to sell slaves.
According to him, as the price of captives sold on the coast increased, the number
of slaves shipped increased; when prices declined, the number of captives
embarked declined. Le Veen claimed that, in general, Africans sold other Africans
on the coast not because of their desire to accumulate power, but because of the
economic rewards they derived from the trade.4
The paucity of the price data for slaves embarked from Angola makes
similar analyses difficult. However, the custom records of Luanda provide price
information about captives shipped from there between 1780 and 1830, which
serves as an indicator of the fluctuations in the prices of slaves leaving Angola.
Customs officials reported the prices of slaves embarked from Luanda annually,
but they did not record the value for which each captive was sold. Rather, they
listed the annual average price of adult slaves embarked. Unfortunately, the
custom records are not complete, but the data available do allow us to calculate
the average price by decade and compare it with the number of slaves leaving
Luanda. The prices listed in the records were deflated to reflect real prices and to
allow comparison across time. The original data is reproduced together with the
deflated prices in Appendix C, Tables C.1 and C.2. The comparison between the
price and the number of slaves shipped from Luanda between the 1780s and
1830s is indicated below in Figure 5.1.
4 E. Philip Le Veen, “The African Slave Supply Response,” African Studies Review 18, no. 1 (1975): 18-21.
148

Figure 5.1 – Comparison between Price and Number of Slaves Leaving Luanda by Decades,
1780s-1830s
Sources: Appendix A, Table A.3 and Appendix C, Table C.2.
Figure 5.1 shows that the number of captives embarked varied directly
with the prices for which they were sold in Luanda. The fluctuations in the
number of slaves and the annual average price almost coincide. The only
exception is in the 1820s, when the average price of slaves sold declined
significantly compared to the number of captives embarked. Otherwise, the lines
representing the value and number of slaves transported fluctuated at the same
rhythm. When prices increased, the number of captives shipped also increased,
when prices declined, the number of slaves embarked declined. This variation
shows that traders in the interior were sensitive to changes in demand on the
coast. Since Africans dominated the supply of slaves, the variation in the price
0
25
50
75
100
125
150
175
200
0
25
50
75
100
125
150
175
200
1780s 1790s 1800s 1810s 1820s 1830s
Nu
mb
er of slav
es (in th
ou
san
ds)A
nn
ua
l av
era
ge p
rice
of
slav
es
(in
th
ou
san
ds
of ré
is)
Decades
Prices Slaves
149
and number of captives embarked indicates that they were more economically
than politically motivated to participate in the trade. It also suggests that more
than a handful of despotic rulers were willing to participate in this activity.
Slavery had existed in Angola long before the nineteenth century.
Historians still debate whether or not Africans regarded slavery as a system of
exchange and economic exploitation before the rise of the transatlantic slave
trade. John Thornton, for example, argues that Africans viewed slaves as the only
form of private, revenue-producing property recognized by law. As such, they
were subject to exchange for other slaves as well as for commodities.5 “When
Europeans came to Africa and offered to buy slaves,” Thornton notes, “it is hardly
surprising that they were almost immediately accepted.”6 Joseph Miller, on the
other hand, believes that Africans began to sell slaves as commodities gradually
because of the transatlantic trade. According to him, although Africans had long
exchanged material goods, such as copper, iron, wax and salt, among themselves,
they regarded the exchange of slaves for goods as something qualitatively
different, as gifts among people who had personal obligations to one another.
Miller argues that the transatlantic trade changed this form of exchange by
adding a new variable, people without previous personal obligations meeting at
trading centers with goods to be exchanged exclusively for slaves.7
In the nineteenth century, Africans in Angola were very familiar with the
concept of slavery as a system of exchange and economic exploitation and their
desire to obtain consumer goods was the primary reason they enslaved and sold
other Africans. These goods circulated widely throughout Angola, and they
5 John K. Thornton, Africa and Africans in the Making of the Atlantic World, 1400-1800, 2nd ed. (New York: Cambridge University Press, 1998), 74. 6 Ibid., 94. 7 Miller, Way of Death, 47-58.
150
served as an important medium of exchange, especially when the sum involved
was high. Historians of Africa often claim that rulers somehow monopolized these
goods and used them to raise armies and finance wars.8 However, most of the
goods imported were destined for personal use, including adornment.
Furthermore, they were not a substitute for similar items produced locally.
Moreover, they were introduced in such large quantities, that the net effect was
to reduce their value as luxury items. As a result, the goods brought to Angola
generated large numbers of slaves and were dispersed among the wider public,
who would participate in the trade as long as foreign imports were accessible to
them.
African economic interest in the trade is not difficult to explain. Historians
of the slave trade have long challenged the assumption that Europeans purchased
slaves with gewgaws or trinkets. Scholars have collected lists of goods used to
exchange for captives in several regions and they have noted that Africans had a
sophisticated taste for goods imported from places as far away as Asia and the
Americas.9 As previously mentioned, the majority of the slaves shipped were
8 Joseph E. Inikori, “Introduction,” in Forced Migration: The Impact of the Export Slave Trade on African Societies, ed. Joseph E. Inikori (New York: Africana Publishing Company, 1982), 41-51; Martin A. Klein and Paul E. Lovejoy, “Slavery in West Africa,” in The Uncommon Market: Essays in the Economic History of the Atlantic Slave Trade, ed. Henry A. Gemery and Jan S. Hogendorn (New York: Academic Press, 1979), 201; Martin A. Klein, “The Impact of the Atlantic Slave Trade on the Societies of the Western Sudan,” Social Science History 14, no. 2 (1990): 235-241; Lovejoy, Transformations in Slavery, 110; Claude Meillassoux, “The Role of Slavery in the Economic and Social History of Sahelo-Sudanic Africa,” in Forced Migration: The Impact of the Export Slave Trade on African Societies, ed. Joseph E. Inikori, trans. R. J. Gavin (New York: Africana Publishing Company, 1982), 80-81; Claude Meillassoux, The Anthropology of Slavery: The Womb of Iron and Gold, trans. Alide Dasnois (Chicago: University of Chicago Press, 1991), 44-54; Richard L. Roberts, Warriors, Merchants, and Slaves: The State and the Economy in the Niger Valley, 1700-1914 (Stanford: Stanford University Press, 1987), 18-19. 9 See, for example, Richard Bean, “A Note on the Relative Importance of Slaves and Gold in West African Exports,” Journal of African History 15, no. 3 (1974): 351-356; George Metcalf, “A Microcosm of Why Africans Sold Slaves: Akan Consumption Patterns in the 1770s,” Journal of African History 28, no. 3 (1987): 377-394; Joseph C. Miller, “Imports at Luanda, Angola: 1785-1823,” in Figuring African Trade: Proceedings of the Symposium on the Quantification and Structure of the Import and Export and Long-Distance Trade of Africa in the Nineteenth Century, c.1800-1913 (St. Augustin, 3-6 January 1983), ed. Gerhard Liesegang, Helma Pasch, and Adam Jones (Berlin: Dietrich Reimer Verlag, 1986), 162-244; David Richardson, “West African
151

exchanged for textiles, alcohol and weapons, but these were not the only
merchandise used to purchase captives. Since a successful deal depended largely
on being able to present the right assortment of goods, traders combined these
goods with a wide variety of other items, such as tobacco, beads, and clothing.
Commodities used to purchase slaves can therefore provide us with important
clues to understanding why Africans participated in the trade.
As with data on slave prices, lists of commodities imported into Angola
during the nineteenth century are rare. Only a few records of the merchandise
imported at Benguela, for example, have survived. Moreover, Africans who
controlled the trade in the ports north of Luanda did not keep written records of
the goods imported there, or at least none has ever been located. For this reason,
historians have generally used lists of articles exported from Europe or the
Americas to Africa in order to trace African patterns of consumption.10 After
1807, with the increasing illegality of the slave trade, these lists gradually
became scarce. Brazil and Cuba remained the principal markets, with their
traders purchasing slaves at the ports north of Luanda, but records of the
commodities exported from these countries to those ports are missing.
Customs records from Luanda, by contrast, are more complete, and they
allow us to trace the consumption patterns of the populations living in the interior
of Angola in the nineteenth century. In the late eighteenth century, customs
officials began to report the amount, value and price of all merchandise legally
imported per year, but this information did not reflect the current value of the
goods exchanged for slaves. Rather the figures were estimates that members of
Consumption Patterns and Their Influence on the Eighteenth Century English Slave Trade,” in The Uncommon Market: Essays in the Economic History of the Atlantic Slave Trade, ed. Henry A. Gemery and Jan S. Hogendorn (New York: Academic Press, 1979), 303-330. 10 See, for instance, Richardson, “West African Consumption Patterns,” 305-311.
152

the trading board at Luanda calculated by multiplying the amount of goods
imported by the annual average price of these goods. By 1823, the records
became more accurate, reflecting the value of the merchandise as it entered the
port. Joseph Miller has published summaries of these records for the years 1785-
1799, 1803-1805, 1809-1810, 1812, 1815-1819, and 1823.11 The eighteenth
century lists are no longer extant in the Portuguese colonial archives, but the
nineteenth century lists are. A review of them reveals higher values than those
Miller found in his study. Since these values are more complete, the following
analysis was based on them.
Furthermore, new lists of imports at Luanda are now available for the
years 1837 and 1861-1864, and they allow us to extend our analysis to the
period of the suppression of the trade. Although the Portuguese prohibited the
sale of slaves from their African possessions in 1836, many vessels continued to
visit Luanda after that year. As Roquinaldo Ferreira noted, these vessels arrived
with goods commonly used to purchase slaves, unloaded them at Luanda, from
and then departed in ballast to neighboring ports, where they loaded captives out
of sight of the authorities.12 This strategy enabled captains to continue using
Luanda as a major slaving port, despite the prohibition on selling captives
overseas. The customs house at Luanda therefore continued recording most
commodities used to purchase slaves in the interior close to the end of the trade.
Table 5.1 shows the total value of the merchandise imported at Luanda for
the years available between the late eighteenth and the nineteenth centuries in
thousands of réis distributed across eight different categories. These categories
11 Miller, “Imports at Luanda,” 211-241. 12 Roquinaldo Amaral Ferreira, “Dos Sertões ao Atlântico: Tráfico Ilegal de Escravos e Comércio Lícito em Angola, 1830-1860” (M.A., Rio de Janeiro: Universidade Federal do Rio de Janeiro, 1996), 221-222.
153

are the same ones that Miller used in his study, and they were adopted here to
facilitate a comparison to the eighteenth century data with that of the legal and
illegal period of the slave trade in the nineteenth century. The first category
includes all commodities: namely alcohol, followed by Asian textiles, European
textiles, foodstuffs, ironware and other metals, weapons, and a category
comprising miscellaneous items, such as beads, shells, raw cotton and tobacco.
154
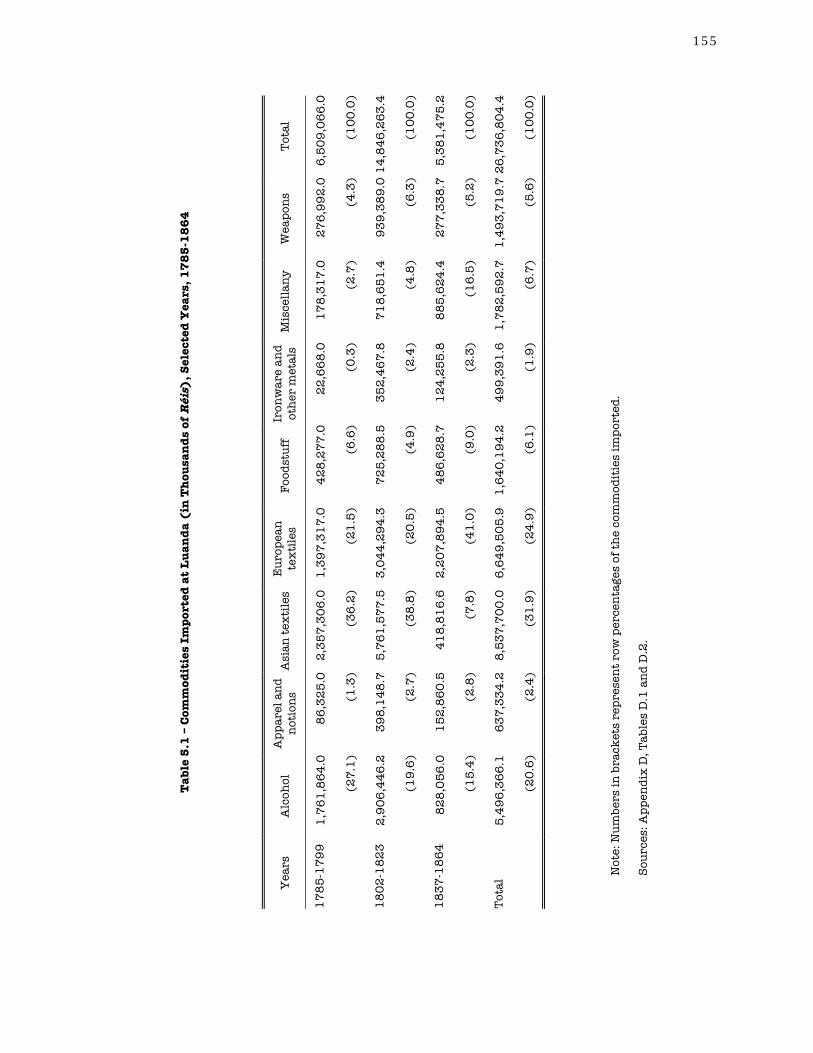
To
tal
6,5
09
,06
6.0
(10
0.0
)
14
,84
6,2
63
.4
(10
0.0
)
5,3
81
,47
5.2
(10
0.0
)
26
,73
6,8
04
.4
(10
0.0
)
We
ap
on
s
27
6,9
92
.0
(4.3
)
93
9,3
89
.0
(6.3
)
27
7,3
38
.7
(5.2
)
1,4
93
,71
9.7
(5.6
)
Mis
cell
an
y
17
8,3
17
.0
(2.7
)
71
8,6
51
.4
(4.8
)
88
5,6
24
.4
(16
.5)
1,7
82
,59
2.7
(6.7
)
Iro
nw
are
an
d
oth
er m
eta
ls
22
,66
8.0
(0.3
)
35
2,4
67
.8
(2.4
)
12
4,2
55
.8
(2.3
)
49
9,3
91
.6
(1.9
)
Fo
od
stu
ff
42
8,2
77
.0
(6.6
)
72
5,2
88
.5
(4.9
)
48
6,6
28
.7
(9.0
)
1,6
40
,19
4.2
(6.1
)
Eu
rop
ea
n
tex
tile
s
1,3
97
,31
7.0
(21
.5)
3,0
44
,29
4.3
(20
.5)
2,2
07
,89
4.5
(41
.0)
6,6
49
,50
5.9
(24
.9)
Asi
an
tex
tile
s
2,3
57
,30
6.0
(36
.2)
5,7
61
,57
7.5
(38
.8)
41
8,8
16
.6
(7.8
)
8,5
37
,70
0.0
(31
.9)
Ap
pa
rel
an
d
no
tio
ns
86
,32
5.0
(1.3
)
39
8,1
48
.7
(2.7
)
15
2,8
60
.5
(2.8
)
63
7,3
34
.2
(2.4
)
Alc
oh
ol
1,7
61
,86
4.0
(27
.1)
2,9
06
,44
6.2
(19
.6)
82
8,0
56
.0
(15
.4)
5,4
96
,36
6.1
(20
.6)
Yea
rs
17
85
-17
99
18
02
-18
23
18
37
-18
64
To
tal
Ta
ble
5.1
– C
omm
odit
ies
Imp
orte
d a
t L
ua
nd
a (
in T
hou
san
ds
of R
éis)
, Sel
ecte
d Y
ears
, 17
85
-18
64
No
te: N
um
ber
s in
bra
cket
s re
pre
sen
t ro
w p
erce
nta
ges
of
the
com
mo
dit
ies
imp
ort
ed.
So
urc
es: A
pp
end
ix D
, Ta
ble
s D
.1 a
nd
D.2
.
155

The most striking feature about the commodities used by Africans for
trading slaves is that the majority of them consisted of articles that did not
address the primary needs of the populations living in the interior of Angola.
John Thornton, for example, noted that Africans had a strong textile
manufacturing industry during the period of the slave trade. Although their
technology was not comparable to that in Europe, Africans wove excellent cloth
from raffia fibers as well as bark and palm trees. Some of these textiles were so
fine and delicate that only nobles could afford to wear them. In fact, European
visitors frequently compared the cloth produced by Kikongo and Vili weavers to
the best produced in Europe.13 Nevertheless, Asian and European textiles
together accounted for approximately 57 percent of Luanda imports between the
late eighteenth and mid-nineteenth centuries.
Asian textiles alone comprised about 32 percent of all goods brought to
Luanda. These fabrics were the most important items used to purchase slaves in
the interior. Materials most in demand included baés, cadeás, carlagalines, chitas,
garrazes, longuins, and zuartes. They were dyed white, red, yellow and blue and
came in different patterns such as stripes or checks.14 The names associated with
some of them give us a hint about their place of origin. Names such as cambaia,
jambuseiro, and surrate can be clearly identified with the ports of Cambay,
Jambusar and Surat, on the western coast of India, also known as the Malabar
Coast. In fact, many of the textiles imported through Luanda were simply called
13 John K. Thornton, “Precolonial African Industry and the Atlantic Trade, 1500-1800,” African Economic History, no. 19 (1990): 10-12. 14 Luís Frederico Dias Antunes, “Têxteis e Metais Peciosos: Novos Vínculos do Comércio Indo-Brasileiro (1808-1820),” in O Antigo Regime nos Trópicos: a Dinâmica Imperial Portuguesa (Séculos XVI-XVIII), ed. João Fragoso, Maria Fernanda Baptista Bicalho, and Maria de Fátima Silva Gouvêa (Rio de Janeiro: Civilização Brasileira, 2001), 410; Pedro Machado, “Cloths of a New Fashion: Indian Ocean Networks of Exchange and Cloth Zones of Contact in Africa and India in the Eighteenth and Nineteenth Centuries,” in How India Clothed the World: The World of South Asian Textiles, 1500-1850, ed. Giorgio Riello and Tirthankar Roy (Leiden: Brill, 2009), 68.
156

panos da costa, that is, “fabrics of the coast,” meaning the Malabar Coast, which
should not be confused with the panos da costa from West Africa, which were
brought from the Bights of Benin and Biafra for sale in Brazil.15
These ports were located near the principal centers of textile production in
India, such as Gujarat, Punjab, and Sindh. Some of the fabrics, termed
coromandéis, came from the Coromandel Coast, on the eastern Indian seaboard,
which was also a major production center, along with Bengal, further north in the
same region. Local Hindi traders known as baneanes transported these cloths
overland from the production centers to the coast, where they embarked them on
small vessels to be taken for sale at the principal Portuguese ports in Asia, such
as Damão, Diu and Goa in India, and Macau in China.16 From there, the textiles
were shipped overseas in larger vessels to Portugal and Brazil.
Traditionally, the Portuguese crown held the monopoly over the
transportation of goods from its Asian possessions. Since the sixteenth century,
all commodities carried from Portuguese Asia had been shipped in a fleet system
made up of royal vessels that sailed once or twice per year. These vessels were
supposed to deliver the merchandise to Portugal, but they often stopped at Bahia
to refurbish before crossing the North Atlantic, selling part of their cargo there
illegally. As a consequence, Bahia became a major center of distribution of Asian
textiles in Brazil.17 The crown tried to suppress this contraband but the practice
became so common that in 1672 it made Bahia an official stop in the famous
Carreira da Índia or the India Route.18 From there, Asian textiles were taken to
15 Antunes, “Têxteis e Metais Peciosos,” 410; Machado, “Cloths of a New Fashion,” 58-59. 16 Antunes, “Têxteis e Metais Peciosos,” 390-391; Machado, “Cloths of a New Fashion,” 58-59. 17 José Roberto do Amaral Lapa, A Bahia e a Carreira da Índia, Estudos Históricos, 42 (São Paulo: Hucitec, Unicamp, 2000), 1-4. 18 Roquinaldo Ferreira, “Dinâmica do Comércio Intracolonial: Geribitas, Panos Asiáticos e Guerra no Tráfico Angolano de Escravos (Século XVIII),” in O Antigo Regime nos Trópicos: a Dinâmica
157

other Brazilian ports, such as Recife and Rio de Janeiro, and traded for slaves in
Angola.
In 1765, the crown abolished the fleet system, allowing private traders to
purchase textiles in Asia. It tried to restrict the agency of these entrepreneurs by
limiting the sale of cloth in certain ports, including Luanda, before it reached
Portugal.19 However, Asian textiles were so crucial for the slave traffic at Angola
that Brazilians dominated this branch of the trade even in Portugal. According to
Ernestina Carreira, in the final years of the fleet system, about 90 percent of all
cloth shipped from Portugal to Brazil was Asian, which traders used to purchase
slaves.20 In the late eighteenth century, Asian textiles comprised approximately
36 percent of the commodities imported at Luanda, and in the nineteenth
century, while the trade was still legal, this figure increased slightly to about 39
percent. The huge amount of Asian textiles imported into Luanda no doubt
widened consumer choice by increasing the variety of cloth available for sale.
During the period of the illegal slave trade, the proportion of Asian textiles
brought to Luanda declined significantly to about 8 percent of the total value as
European textiles replaced them as the major import. Europeans always brought
some cloth produced in their countries to purchase slaves in Angola, but Africans
found this cloth inferior to the Asian variety. The principal European fabrics
introduced in Luanda included baetás, bretanhas, brins, calamanhas, crês, lenços,
panos, and riscadinhos. Despite the European technological advancements in
textile production at the turn of the nineteenth century, these fabrics were still
Imperial Portuguesa (Séculos XVI-XVIII), ed. João Fragoso, Maria Fernanda Baptista Bicalho, and Maria de Fátima Silva Gouvêa (Rio de Janeiro: Civilização Brasileira, 2001), 352. 19 Ibid., 354. 20 Ernestina Carreira, “Os Últimos Anos da Carreira da Índia,” in A Carreira da Índia e as Rotas dos Estreitos: Actas do VIII Seminário Internacional de História Indo-Portuguesa, ed. Artur Teodoro de Matos and Luís Filipe F. Reis Thomaz (Angra do Heroísmo: Barbosa e Xavier, 1998), 826.
158

very rough and had less color variety than the Asian. European textiles were
mostly dark and too thick to be worn in the tropics. Since this cloth was more
appropriate for temperate climates, the principal consumers of European textiles
in Angola were probably the Umbundu, who lived in the central highlands, where
the temperature was cooler than any other region in West Central Africa.
Most of the European cloth imported through Luanda came originally
from England, but the names associated with some fabrics also indicate other
regions of provenance. Names like irlanda, holanda and alemanha, for example,
suggest that Luanda also imported cloth from Ireland, the Netherlands, and
Germany, especially Hamburg. These names also imply that such cloths had
different styles. Europeans sold their textiles in Lisbon or Porto, from where
Portuguese traders loaded them onto transatlantic vessels and resold them to
merchants in Brazil. Merchants then exchanged them in Luanda for slaves.
In 1808, with the transfer of the Portuguese court to Rio de Janeiro,
European traders were allowed to sell their textiles directly to Brazil. This
reduced the costs of using European textiles in the slave trade, as well as shipping
and freight costs for the merchandise carried from Portugal to Brazil. British
textiles, in particular, benefitted significantly from the opening of the Brazilian
ports. Since the British navy had escorted the Portuguese royal family to Brazil,
the king granted tax privileges to all British imports.21 This made British textiles
used in the slave trade far cheaper than most other cloth imported from Europe.
Despite these incentives, during the period of the legal trade in the
nineteenth century, Africans still preferred Asian materials to European textiles.
The percentage of Asian textiles imported at Luanda between 1802 and 1823 was
21 Boris Fausto, Historia do Brasil, 8th ed. (Sao Paulo: Editora da Universidade de São Paulo, 2000), 122-124.
159

almost double that of European cloth. During the illegal period, this percentage
changed dramatically. The value of European fabrics increased to about 41
percent while that of Asian textiles declined to mere 8 percent. In the nineteenth
century, European technology finally caught up with Asian production
techniques. Europeans also had copied the patterns of Asian textiles and were
now producing similar fabrics at much cheaper prices.22 As a consequence, textile
designs that had typically been produced in India, such as cadeás, chitas and
zuartes, began to arrive in Luanda from Europe, especially England.
Brazilian independence in 1822 was another important factor leading to
the expansion of European textiles imported through Luanda. Before
independence, textiles brought to Brazil from Portuguese possessions in Asia
were taxed at the usual domestic import and export rates. However, after
independence, Brazil and Portugal treated each other as foreign countries, whose
merchandise was subject to international tax rates, which were generally higher
than domestic rates. This charge inevitably increased costs for Brazilian traders,
thus making European textiles the principal cloth brought to Luanda.
Alcohol was the third most imported commodity, constituting about 21
percent of the value of all goods brought to Luanda between 1785 and 1864. The
customs records show that Africans were particularly interested in geribita,
aguardente and wine. Geribita was a sugar based rum produced in Brazil, which
accounted for 39 percent of all alcoholic beverages imported at Luanda during the
nineteenth century.23 Aguardente, a distilled by product of sugar or wine
production in Portugal and Brazil, comprised 31 percent, while wine, which came
mostly from the banks of the Douro and Tagus rivers in Portugal, contributed 28
22 Miller, Way of Death, 74. 23 Calculated from Appendix D, Table D.3.
160

percent.24 The remaining imported beverages included beer, brandy, cognac,
liquor, and a highly aromatic bitter gin called genebra or geneva, originally
produced in the Netherlands.
African interest in geribita and arguadente derived in large part from their
high alcoholic content. According to Roquinaldo Ferreira, the alcohol content of
the sugar rum that traders used to purchase slaves in the interior could be as
high as 60 percent.25 Joseph Miller believes that it could reach up to 90 percent,
though it may have been mixed with water before consumption.26 The alcoholic
content of the wine must have been much lower, between 10 and 13 percent.
Although traders also purchased slaves with wine, most of the wine imported at
Luanda was probably sold at the numerous taverns that flourished throughout
the city. The 1850 census return for Luanda, for example, reported that the port
had about 90 taverns, which addressed the needs of both the local population and
the community of sailors, soldiers and visitors from abroad.27
The influx of rum and wine through Luanda offered consumers greater
variety when compared to the locally produced alcoholic beverages. José Curto
claims that Africans living in the hinterland of Luanda produced two types of
fermented beverages: malafu or malavu, a sort of wine made primarily from
raphia or extractions from the palm tree, and another, known as ovallo or walo, a
type of beer made of grains such as millet or sorghum.28 Neither one had a high
alcoholic content so, after they were produced, both had to be drunk within a
24 Calculated from Appendix D, Table D.3. 25 Ferreira, “Dinâmica do Comércio Intracolonial,” 348. 26 Miller, Way of Death, 465. 27 “Estatísticas dos Edifícios, Estabelecimentos e Oficinas da Cidade de Luanda Relativa ao Ano de 1850” reproduced in José de Almeida Santos, Vinte Anos Decisivos de uma Cidade (Luanda: Câmara Municipal de Luanda, 1970), 167-168. 28 José C. Curto, Enslaving Spirits: The Portuguese-Brazilian Alcohol Trade at Luanda and Its Hinterland, c.1550-1830 (Leiden: Brill, 2004), 21-22.
161

short period of time. In contrast, the imported beverages, especially the geribita
and aguardente, could be stored for much longer periods, making them more
suitable for sale in the long distance trade than the local variety.29
Despite this, Africans continued consuming and producing both walo and
malafu. As late as the 1880s, European travelers commented on the local
production and consumption of liquor in the hinterland of Luanda. Hermenegildo
Capello and Roberto Ivens, who traveled extensively throughout Angola between
1877 and 1886, observed the production of palm wine. Near the Kwango River, in
the Kimbundu speaking region, they estimated that the production reached
“thousands of liters per habitation, judging from the quantity that we have seen
consumed in the places we visited.”30 Moreover, the value of imported alcoholic
beverages declined during the period of the suppression of the slave trade, from
an annual average of 242,200 réis between 1802 and 1823 to 165,610 réis
between 1837 and 1864. This decline further encouraged the production and
consumption of local alcoholic beverages.
Let us consider the remaining imports by category and their relative
importance to the trade. Despite all of the debate about the introduction of
firearms to the continent, the customs records of Luanda show that weapons
made up only 6 percent of the value of goods imported. In the seventeenth and
eighteenth centuries, the Portuguese tried to restrict the use of weapons to
purchase slaves because they feared Africans might turn them against their
colonies in Angola. However, in the face of foreign competition at the ports north
29 Ferreira, “Dinâmica do Comércio Intracolonial,” 346. 30 Hermenegildo Capello and Roberto Ivens, De Benguella às Terras de Iácca: Descripção de uma Viagem na Africa Central e Occidental (Lisbon: Imprensa Nacional, 1881), vol. 2, 143-144.
162

of Luanda and pressure from Lisbon’s arms dealers, the government relaxed this
prohibition.31
The customs records do not specify the origins of the firearms introduced
in Angola. Most of them were probably inexpensive flintlock guns known as
“Angola muskets,” produced notably in Birmingham, England. According to
Joseph Inikori, firearms were a key component in the British slave trade, and the
majority of the guns used to purchase slaves were sold in West Central Africa.32
Until 1807, when the British retreated from the business, these guns were
distributed through the ports north of Luanda but, after that year, they were
shipped to Luanda from Brazil, as a result of the opening of the Brazilian ports to
international commerce in 1808.
Portuguese guns were also used to purchase slaves, and they circulated
widely in the interior of Angola. In 1852, David Livingston traveled across West
Central Africa, from Cape Town to Luanda, and noted that Africans living near the
Upper Zambezi River traded Portuguese guns for slave children. He examined one
of these guns and saw the inscription Legítimo de Braga, meaning “Made in
Braga,” Portugal. Livingston observed that Makololo chiefs bought these guns
from the Mambári, traders of Portuguese and African ancestry who lived near the
Kingdom of Viye, in the central plateau of Angola. The Mambári accepted only
boys about fourteen years of age in exchange for their guns. Livingstone further
noted that the children who the Makololo sold to the Mambári were not their own,
but “captives of the black races they had conquered.”33
31 Birmingham, Trade and Conflict in Angola, 146-147; Miller, Way of Death, 607-608. 32 Joseph E. Inikori, “The Import of Firearms into West Africa, 1750-1807: A Quantitative Analysis,” Journal of African History 18, no. 3 (1977): 352. 33 David Livingstone, Missionary Travels and Researches in South Africa: Including a Sketch of Sixteen Years’ Residence in the Interior of Africa (New York: Harper & Bros., 1858), 105-106.
163

Africans no doubt used guns in wars and raids, but firearms never
replaced traditional weapons in military conflicts in Angola. In fact, John
Thornton argues that during the period of the slave trade, weapons such as
swords, knives, spears, clubs, axes, and shields, as well as bows and arrows
figured prominently in most armies across West Central Africa. Firearms served
only as an additional military resource that Africans used in conjunction with
more traditional weapons.34 Joseph Miller claims that only a small percentage of
the guns survived the first few attempts to fire them, and many were unusable
from the start.35 Nevertheless, the potential of these guns to cause death and
destruction was intimidating, and African warlords could easily harness that
potential in raids and military conflicts.
Most of the guns imported through Luanda were probably used for
hunting, a necessary activity in many societies in Angola. Guns had a
revolutionary impact on Cokwe speakers, for example, who lived near the Upper
Kasai River. In the nineteenth century, they began using guns to hunt elephants
and to break into the ivory trade from Angola. Historians believe that this activity
caused a significant decline in the number of elephants in the region, but it also
inaugurated an age of prosperity for the Cokwe, who spread throughout the
interior of West Central Africa.36 In the mid-nineteenth century, Cokwe influence
in the region became so strong that it rivaled that of their more powerful
neighbor, the Lunda Empire. Cokwe art also reflects the central importance of
firearms in their culture, as is well illustrated by the guns decorated with hunter
34 John Kelly Thornton, Warfare in Atlantic Africa, 1500-1800 (New York: University College London Press, 1999), 107-110. 35 Miller, Way of Death, 88. 36 Isabel Castro Henriques, Percursos da Modernidade em Angola: Dinâmicas Comerciais e Transformações Sociais no Século XIX, trans. Alfredo Margarido (Lisbon: Instituto de Investigação Científica Tropical; Instituto da Cooperação Portuguesa, 1997), 448.
164

charms which can be seen in many museums, as well as sculptures of their
famous hunter hero, Chibinda Ilunga, who nineteenth century artists began to
represent as holding a gun instead of a bow and arrow.37
Although Europeans considered the Angolan muskets cheap, Africans had
good reason for preferring them to the more sophisticated firearms. The
construction of these muskets involved less complicated technology, so
blacksmiths in Angola could easily repair them using their own tools and
knowledge. According to Isabel de Castro Henriques, European travelers in
Angola often remarked on the ability of local blacksmiths to repair firearms.38
Similarly, historians have noted that Europeans considered the British and
French gunpowder superior to the Portuguese, because of its higher saltpeter
content, which made it more powerful. Africans, on the other hand, preferred the
Portuguese gunpowder because it caused less damage to their weapons, which in
turn resulted in fewer deaths to users.39
The customs records of Luanda reflected these preferences. While Africans
could repair their muskets, they had to be more selective about the gunpowder
they used, so the value of gunpowder imported at Luanda was far greater than
that of firearms. Gunpowder comprised about 73 percent of the value of all of the
weapons imported at Luanda, while firearms made up only 19 percent.40 The
remaining weapons imported included shot lead and blade weapons, such as
spears, swords, and knives, especially facas flamengas or Flemish knives. 37 See the images available in Marie Louise Bastin, Statuettes Tshokwe du Héros Civilisateur “Tshibinda Ilunga” (Arnouville-les-Gonesse: Arts d’Afrique Noire, 1978), 63-97; Henriques, Percursos da Modernidade, 322. 38 Henriques, Percursos da Modernidade, 320-323. 39 Phyllis M. Martin, The External Trade of the Loango Coast, 1576-1870: The Effects of Changing Commercial Relations on the Vili Kingdom of Loango (Oxford: Clarendon Press, 1972), 111; Miller, Way of Death, 91-92. A similar observation for other African regions see Raymond A. Kea, “Firearms and Warfare on the Gold and Slave Coasts from the Sixteenth to the Nineteenth Centuries,” Journal of African History 12, no. 2 (1971): 204-205. 40 Calculated from Appendix D, Table D.10.
165

Africans also traded slaves for a number of miscellaneous items, which
accounted for approximately 7 percent of the value of all imports. Some of these
goods were important for the slave trade, such as tobacco, which accounted for
about 10 percent of the miscellaneous items.41 Most of the tobacco brought to
Luanda came from Bahia, Sergipe, Pernambuco and Alagoas, in Brazil, which
were also major suppliers of tobacco to Europe and West Africa, especially the
Bight of Benin, where tobacco was used to purchase slaves. Brazilian tobacco
differed from its main competitors because it was covered with molasses, which
rendered a sweet and intense flavor well suited to African taste.42
Although Angolans appreciated Brazilian tobacco, it encountered strong
competition from local production. Capello and Ivens, for example, observed that
tobacco abounded in the lands of the Bondo, Kikongo speakers who lived near the
Kwango River. They once stopped there on the way to Yaka and noted that the
Bondo smoked their own tobacco in pipes that passed from hand to hand among a
group of smokers. After a short period, this pipe was replaced by another type of
pipe made of horn called mutopa, with which they smoked liamba, an herb Capello
and Ivens identified with hemp of the species Cannabis sativa. They observed
that, though the Bondo appreciated their own tobacco, they viewed the liamba as
one of their “greatest delights.”43
Beads, which accounted for about 15 percent of the miscellaneous items
imported through Luanda, were also used to buy slaves.44 It is difficult to tell the
41 Calculated from Appendix D, Table D.9. 42 Dauril Alden, “Late Colonial Brazil, 1750-1808,” in The Cambridge History of Latin America, ed. Leslie Bethell, vol. 2 (New York: Cambridge University Press, 1984), 631-635; Pierre Verger, Fluxo e Refluxo: O Tráfico de Escravos entre o Golfo de Benin e a Bahia de Todos os Santos dos Séculos XVII a XIX (São Paulo: Corrupio, 1987), 20-26. 43 Capello and Ivens, De Benguella às Terras de Iácca: Descripção de uma Viagem na Africa Central e Occidental, vol. 2, 26-27. 44 Calculated from Appendix D, Table D.9.
166

exact provenance of these beads. Most of them appear to have originated in
Portugal. They were made of glass or porcelain and came in different shapes, sizes
and colors. They appear listed in the records as missangas, avelórios, contas,
contarias, granadas and roncalhas. In Angola, Africans used these beads to make
necklaces, bracelets, and earrings. They also used them to decorate their hair,
clothes, and various utensils, including works of art and religious artifacts.45
The customs records include two additional items worth mentioning under
the miscellaneous category. The first is shells, listed in the records as conchas,
búzios and zimbo. In the sixteenth and seventeenth centuries, shells were valued
as medium of exchange at Luanda as well as in other African ports, especially in
West Africa, such as Ouidah, Cape Coast and Lagos.46 In Luanda, shells served as
currency for small exchanges but, with the expansion of the slave trade, the value
of the shells declined sharply, leading traders to barter rather than relying on
commodities as currencies.47 The customs records show that this trend continued
from the late eighteenth to the mid-nineteenth century, with the value of the
shells declining to insignificance.48
The second item worth mentioning is raw cotton, which comprised about
24 percent of all miscellaneous items brought to Luanda, or less than 2 percent of
total imports.49 The reason for such imports is not clear. Perhaps, it was destined
for sale to the population living in the Portuguese colonies, but it may have been
45 Miller, Way of Death, 86. 46 Jan S. Hogendorn and Marion Johnson, The Shell Money of the Slave Trade, African Studies Series (New York: Cambridge University Press, 1986), 109-113; Marion Johnson, “The Cowrie Currencies of West Africa. Part II,” Journal of African History 11, no. 3 (1970): 17-27; Robin Law, The Slave Coast of West Africa, 1550-1750: The Impact of the Atlantic Slave Trade on an African Society (Oxford: Clarendon Press, 1991), 48-50, 57-58 and 176-181. 47 Carlos Couto, O Zimbo na Historiografia Angolana (Luanda: Instituto de Investigação Científica de Angola, 1973), 37-42; Miller, Way of Death, 86. 48 Calculated from Appendix D, Table D.9. 49 Calculated from Appendix D, Table D.9.
167

used to purchase slaves in the interior of Angola. If so, this suggests that Africans
were modifying their textile industry to spin and weave cotton cloth for local
consumption and export, a move that could have had important consequences for
the relationship between Africans and Europeans. The development of a local
cotton cloth industry might have reduced textile importation from Asia and
Europe and, as a result, the export of slaves from Angola.
In 1780, Elias Alexandre da Silva Corrêa noted that a type of wild cotton
grew widely in Angola, especially in Ambaca, Kimbundu land. Africans spun this
cotton into yarn, which they used as currency. They also wove it on double stick
looms placed next to the walls of their habitations and made cloth and mats on
which many people in Angola, including Portuguese colonizers, slept. According
to Corrêa, the fabrics made with this cotton, especially in Kikongo country,
“exceeded in perfection and beauty those produced in India.”50 However, the use
of imported cotton appears to have spread during the nineteenth century.
European travelers believed that the region’s climate favored the cultivation of
imported cotton varieties. David Livingston, for example, travelling across
Kimbundu country saw “cotton growing luxuriantly all around the market places
from seeds dropped accidentally. It is seen also about the native huts, and, so far
as I could learn, it was the American cotton, so influenced by climate as to be
perennial.”51
The remaining commodities imported were not used exclusively in the
slave trade. Foodstuffs, for example, were imported mostly for consumption in
the Portuguese colonies. The principal articles brought included wheat flour,
50 Elias Alexandre da Silva Corrêa, História de Angola, ed. Manuel Múrias (Lisbon: Editorial Ática, 1937), vol. 1, 155-158. 51 Livingstone, Missionary Travels and Researches in South Africa: Including a Sketch of Sixteen Years’ Residence in the Interior of Africa, 433.
168

sugar, rice, olive oil, butter, and salt. None of these items, with the exception of
salt, was part of the African diet. Wheat flour and sugar alone made up 40 percent
of the value of all food imports, and both were essential to the Portuguese diet.52
Wheat flour was used in bread, cakes and other food items, but also in the
eucharistic bread for Catholic mass. Sugar was also a central ingredient in the
various sweets, desserts and pastry for which the Portuguese were and remain
famous throughout the world. The diet of the African population was based
essentially on maize, cassava and beans, which made up an insignificant
percentage of the value of the food imports.53 They were probably brought to help
traders supplement local food supplies for their slaves, because most of the food
consumed in the colonies and exported in slave vessels was produced locally and
stored at the public granary.54 Although food was not used to purchase slaves, it
comprised about 6 percent of all goods imported at Luanda.
Apparel and notions also served a dual purpose: to purchase slaves and for
use in Portuguese Angola. As clothing was used to denote social hierarchy among
Africans, traders often included it in their bundles of European and Brazilian
goods destined for sale in the interior. Traders usually gave these clothes to
Africans as gifts to begin negotiations or seal a deal rather than to purchase
captives. Africans were particularly interested in caps, hats, and jackets, which
they combined with their own attire, creating a unique sense of fashion and
52 Calculated from Appendix D, Table D.7. 53 Calculated from Appendix D, Table D.7. See also José Carlos Venâncio, A Economia de Luanda e Hinterland no Século XVIII: Um Estudo de Sociologia Histórica (Lisbon: Editorial Estampa, 1996), 57-59. 54 Miller, Way of Death, 86; Venâncio, A Economia de Luanda e Hinterland, 63-67.
169

style.55 Early photographs from the mid-nineteenth century have a wealth of
images showing West Central Africans wearing European clothing.56
The apparel and notions, however, were not only employed in the slave
trade. A large part of them was destined for sale at the Portuguese colonies,
especially Luanda and Benguela. These colonies had a significant population of
Europeans or people of European ancestry, who wished to maintain contact with
their culture and traditions. One way of doing so was to wear clothes from their
country of origin and follow the latest trends in European fashion. Apparel and
notions for both uses made up only 2 percent of the total value of the commodities
imported at Luanda between the late eighteenth and nineteenth centuries.
Ironware could also be used to buy slaves, as well as sold to Portuguese
colonists living in Angola. Iron, in particular, was an important commodity used
to purchase slaves in other African regions. Indeed, in places like the Upper
Guinea coast and the Bight of Benin, the value of a slave was measured in terms of
iron bars.57 However, in Angola, iron as well as other metals played a relatively
minor role in the trade. Although Africans had a thriving iron industry, the
domestic supply of iron in Angola was sufficient to satisfy the local demand.58 In
fact, Angola had such rich deposits of iron ore that the Portuguese tried to build
two foundries there during the period of the slave trade; one in Oeiras and
another in Trombeta. The ruins of the former remain, but neither one operated for
55 Miller, Way of Death, 79-83. 56 See, for example, the images available in Beatrix Heintze, Pioneiros Africanos: Caravanas de Carregadores na África Centro-Ocidental entre 1850 e 1890 (Lisbon: Caminho, 2002), between pages 96-97, 128-129, 160-161, 192-193, 225-226, and 288-289; Maria Emília Madeira Santos, Nos Caminhos de África: Serventia e Posse (Angola, Século XIX) (Lisbon: Instituto de Investigação Científica Tropical, 1998), 272. 57 See, for example, Walter Hawthorne, Planting Rice and Harvesting Slaves: Transformations along the Guinea-Bissau Coast, 1400-1900 (Portsmouth: Heinemann, 2003), 96-98; Law, The Slave Coast of West Africa, 50-51. 58 Miller, Way of Death, 85-86.
170

long, because the working conditions the Portuguese imposed were not
compatible with those to which African blacksmiths were accustomed.59
Portuguese colonists in Luanda and Benguela, by contrast, depended
heavily on the ironware imported at Angola. Metals like iron, copper and zinc
were crucial for the construction of houses, maintenance of public buildings and,
of course, the operation of ports and military facilities. They also needed metals to
make tools and a number of other articles essential to every day life, such as cups,
plates, knives, forks, spoons, hooks, etc. Thus, most of the metals imported at
Luanda, which constituted less than 2 percent of the value of all imported goods,
were consumed by Europeans, not Africans.
The customs records of Luanda show that Africans sold other Africans into
the trade for consumer goods, especially textiles, alcohol and weapons imported
from Asia, the Americas and Europe. These goods were not the prime necessities
of African life but could and did add to the variety of similar items produced
locally. Although Africans had clear preferences for some imported commodities,
such as Asian textiles, they continued to produce their own goods, like cloths
made of raffia and palm trees. Even though they used the opportunity to
experiment with new materials, as indicated by the use of imported cotton for
textile production, the local industry remained largely independent of foreign
imports during the period of the slave trade, raising doubts about the latter’s
potential to undermine the local economy.
Additionally, the customs records show that most of the goods imported
were destined for personal use and adornment. They were not primarily intended
to fund raids and wars. Asian and European textiles could indeed have been
59 Ana Madalena Trigo de Sousa, “Uma Tentativa de Fomento Industrial na Angola Setecentista: A ‘Fábrica do Ferro’ de Nova Oeiras (1766-1772),” Africana Studia 10 (2007): 295-305; Venâncio, A Economia de Luanda e Hinterland, 113-123.
171

employed to raise armies. However, they accounted for such a large percentage of
the imported goods that their very abundance in the interior casts doubt on their
exclusive status, which indicates they would not have power to finance raids and
wars. Africans enslaved other Africans in the nineteenth century more from their
material desire than from a thirst for power. Foreign goods would only generate
large numbers of slaves as long as they were spread among the African
population and not concentrated in the hands of rulers. Warfare was far from
being the single method of enslavement. The experiences of enslavement of
captives leaving Angola, subject of the following chapter, will show that Africans
were captured in several ways, violent as well as non-violent.
172

Chapter Six
Embracing Dependants,
Releasing Slaves
Experiences of Enslavement in Angola during the
Nineteenth Century
Although outsiders were the main target group for capture and sale into
the slave trade, a smaller group of insiders were also inadvertently or
purposefully taken for the same purpose. This chapter will examine records and
stories of both groups enslaved in the interior of Angola. By the nineteenth
century, Angolan societies had long been familiar with the institution of slavery,
defined as a system of economic exploitation in which people were regarded as
valuable properties that could be exchanged for cash or its equivalence in goods.
Not all captives were sold into the trade; some remained in bondage on the
continent. As previously noted, such captives were mostly women and children,
who could be easily integrated in the families of their masters as spouses or
dependents. Africans sold into the trade had little to offer in this respect, but they
were valuable as barter. They were enslaved under specific circumstances,
varying from violent conflicts to judicial proceedings. The experiences of these
individuals provide important insights into the question of whom nineteenth
century Angolans considered as eligible for sale into the slave trade.
173

One way that contemporaries learned about the experiences of captives
was to interview them. In 1847, Sigismund Wilhelm Koelle disembarked at
Freetown, Sierra Leone, as an agent of the Church Missionary Society. He became
a linguist at the Fourah Bay Institute where research into African languages was
conducted. In 1854, he published his findings in Polyglotta Africana, a well known
book which is essentially a collection of sample vocabularies of languages spoken
by Africans rescued from ships condemned for illegal trading by the Freetown
courts.1 These vocabularies cover almost all African regions involved in the trade,
and they were collected directly from liberated Africans. The Polyglotta Africana
is more than a collection of words; it also provides information about the people
Koelle interviewed, such as their names, ages, countries of origin, and the number
of their fellow countrymen living in Sierra Leone, as well as about how they were
taken from their original homelands.2
Koelle’s work is especially valuable for our understanding of the
experiences of Angolan captives. In contrast to those from other regions of slave
embarkation, Angolan captives left little information about their lives and
experiences. There are no autobiographies of Africans enslaved in the interior of
Angola.3 Reconstructed stories about Angolan slaves in the Americas likewise
contain little information on how they were captured and sold in Africa.4 Apart
1 Sigismund Wilhelm Koelle, Polyglotta Africana, ed. P. E. H. Hair and David Dalby (Graz: Akademische Druck, U. Verlagsanstalt, 1965); P. E. H. Hair, “Koelle at Freetown: An Historical Introduction,” in Polyglotta Africana, ed. P. E. H. Hair and David Dalby, by Sigismund Wilhelm Koelle (Graz: Akademische Druck, U. Verlagsanstalt, 1965), 7. 2 Philip D. Curtin and Jan Vansina, “Sources of the Nineteenth Century Atlantic Slave Trade,” Journal of African History 5, no. 2 (1964): 186; P. E. H. Hair, “The Enslavement of Koelle’s Informants,” Journal of African History 6, no. 2 (1965): 193. 3 José C. Curto, “Experiences of Enslavement in West Central Africa,” Social History 41, no. 82 (2009): 383-388. 4 Edward Ball, Slaves in the Family (New York: Ballantine Books, 1999), 134-137, 147, 174-176, 184, 228, 250-251; Cheryll Ann Cody, “There was No ‘Absalom’ on the Ball Plantations: Slave-Naming Practices in the South Carolina Low Country, 1720-1865,” American Historical Review 92, no. 3 (1987): 563-596; Melinde Lutz Sanborn, “Angola and Elizabeth: An African Family in the
174

from Koelle’s book, all we have are some fragments reporting the experiences of a
few individuals taken from the interior. These fragments, which are available in
print as well as in archival documents, together with Koelle’s research provide a
valuable record of the experiences of individuals deprived of their freedom in
Angola.5
Koelle interviewed 18 liberated Africans from West Central Africa to build
his inventory of words for this region, which he termed Congo Angola. Although
this is a very small number compared to the thousands of individuals embarked,
it includes representatives from almost every major linguistic group involved in
the Angolan trade. The demographics of Koelle’s informants further support the
use of his data for an assessment of how Africans were enslaved in Angola. All
interviewees were male, with ages ranging from fourteen to twenty-eight. Except
for three men who remained in Africa for several years, those captured had been
sold immediately. When Koelle interviewed these individuals, they were well
established in Sierra Leone, having been there for at least seven years. In fact,
one of them, a Kongo man named Mugádu, also known as Thomas Tob, had been
living in Freetown for about 40 years when Koelle contacted him. Koelle noted
that by the time he interviewed Mugádu, given man’s age, he had held the “office
of Kongo headman,” an institution found around the Atlantic wherever there was
Massachusetts Bay Colony,” New England Quarterly 72, no. 1 (1999): 119-129. Two notable exceptions are John K. Thornton, “The African Experience of the ‘20. and Odd Negroes’ Arriving in Virginia in 1619,” William and Mary Quarterly 55, no. 3 (1998): 421-434; Linda M. Heywood and John K. Thornton, Central Africans, Atlantic Creoles, and the Foundation of the Americas, 1585-1660 (New York: Cambridge University Press, 2007), 1-9. 5 Louis Jadin, “Rapport sur les Recherches aux Archives d’Angola du 4 Juillet au 7 Septembre 1952,” Bulletin des Séances de l’Institut Royal Colonial Belge, no. 24 (1953): 167; Luiz António de Oliveira Mendes, Memória a Respeito dos Escravos e Tráfico da Escravatura entre a Costa da África e o Brasil, ed. José Capela (Porto: Escorpião, 1977), 61-62; Felisberto Caldeira Brant Pontes, “Memória de Brant Pontes sôbre a Comunicação das Duas Costas 9/9/1800,” in Apontamentos sobre a Colonização dos Planaltos e Litoral do Sul de Angola, ed. Alfredo de Albuquerque Felner, vol. 1 (Lisbon: Agência Geral das Colónias, 1940), 248-251.
175

a substantial Kongo population in the nineteenth century.6 Koelle’s informants
provide us with reliable information about the experiences of West Central
Africans sent to the Americas.
They report two broad methods of enslavement; kidnapping and judicial
proceedings. One of the informants said that he was sold by his relatives, but did
not give reasons for the transaction.7 Kidnapping included not only victims of
abduction and trickery but also prisoners of either wars or raids. Given the
emphasis historians have placed on the role of wars in the slave trade, this
method of capture deserves considerable discussion. Scholars generally agree
that the majority of slaves sold into the slave trade were prisoners of wars. The
question is what kind of wars generated these slaves? Were they large-scale wars
that required the mobilization of significant resources and manpower? Or were
they local conflicts more accurately described as raids and skirmishes?
The Angolan Wars of the sixteenth and seventeenth centuries have led
many historians to believe that large-scale conflicts were the primary method of
enslavement in the interior. After the Portuguese founded Luanda in 1575, they
formed an alliance with bands of itinerant warriors known as the Jaga. This
alliance added further instability to a region that was already very politically
fragile because of the independence of Ndongo from Kongo. The Portuguese found
the Ndongo ruler unwilling to conform to their trading terms, so they invaded his
realm with the help of the Jaga, replacing him with a ruler more amenable to
Portuguese interests. This move unleashed a series of military confrontations
between claimants to the throne of Ndongo and their rivals supported by the
6 Koelle, Polyglotta Africana, 13. On the office of Kongo headman see Marina de Mello e Souza, Reis Negros no Brasil Escravista: História da Festa de Coroação de Rei Congo (Belo Horizonte: Editora UFMG, 2002), 159-208. 7 Koelle, Polyglotta Africana, 13-14.
176
Portuguese and the Jaga, who founded a new polity in the region known as the
Imbangala Kingdom of Kasanje.8 These confrontations resulted in a vast number
of prisoners being sent to the Americas during the sixteenth and seventeenth
centuries. The Portuguese governors often provoked these conflicts because their
income depended largely on the traffic from Luanda.9 Many people were sold into
the Atlantic commerce because of this warfare, which in conjunction with the
resulting political instability, contributed to an atmosphere of destruction,
violence and insecurity in the hinterland of Luanda. As a local observer noted, the
Angolans Wars led to “carnage on such a large-scale that rivers became polluted
with numerous corpses and multitudes of innocent people were captured without
cause.”10 Not only soldiers but also many civilians became victims of these
conflicts.
In the eighteenth century, Portuguese participation in large-scale African
wars began to decline. In 1720, administrative reforms established a salary for
high ranking administrators and prohibited them from engaging in private
commercial activities in the colonies.11 As a consequence, Portuguese governors
based on the coast of Angola were in theory no longer able to participate in the
trade. Nevertheless, historians continue to view large-scale wars as the primary
method of enslavement of Angolans sent to the Americas. The difference is that
now they locate these conflicts in the deep interior of West Central Africa, at the
frontiers of the Lunda Empire. Historians have good reasons to trace the origins 8 The traditional account about the Angolan Wars is António de Oliveira de Cadornega, História Geral das Guerras Angolanas, 1680, ed. José Matias Delgado (Lisbon: Agência Geral do Ultramar, 1972). 9 Joseph C. Miller, Way of Death: Merchant Capitalism and the Angolan Slave Trade, 1730-1830 (Madison: University of Wisconsin Press, 1988), 541-542. 10 Bishop of Angola to the King, 7 September 1619 in Alfredo de Albuquerque Felner, Angola: Apontamentos sobre a Ocupação e Início do Estabelecimento dos Portugueses no Congo, Angola e Benguela Extraídos de Documentos Históricos (Coimbra: Imprensa da Universidade, 1933), 452-456. As quoted and translated by Curto, “Experiences of Enslavement in West Central Africa,” 390. 11 Miller, Way of Death, 543.
177

of slaves shipped from Angola in the eighteenth century to the Lunda Empire.
During this period, the Portuguese governors in Luanda informed the Colonial
Office in Lisbon that the Lunda were conducting a number of military activities
deep in the interior of Angola.12 Additionally, slave traders operating inland
reported casualties from the Lunda wars in the interior of West Central Africa.
Manoel Correia Leitão, for example, traveled to the valley of the Kwango River
between 1755 and 1756 and noted that a few years before his arrival the Lunda
had waged a war that resulted in 200,000 casualties. He further remarked that
the Lunda and their neighbors “wage war merely in order to take people for sale,
and as many die, not even a tenth of those who die [sic, survive] come up for
sale.”13
Lunda military activities along the Kwango River may have been highly
destructive, but they did not result in large numbers of captives sold on the coast
as Leitão argued. Moreover, customs records of slaves shipped from Luanda
suggest that large-scale wars inhibited the slave trade rather than stimulated it.
David Birmingham, a major proponent of the Lunda origins of slaves embarked
from Angola, accessed records of slaves shipped from Luanda during the mid-
eighteenth century. He noted that, despite the ongoing conflicts along the Kwango
River, the number of slaves shipped from Luanda declined in comparison to
previous years.14 In contrast to the conventional wisdom, large-scale wars were
not the primary method of enslavement in the interior. This conclusion is not
without parallel in other African regions. David Eltis, for example, has noted that
12 David Birmingham, Trade and Conflict in Angola: The Mbundu and their Neighbours under the Influence of the Portuguese, 1483-1790 (Oxford: Clarendon Press, 1966), 152-154. 13 Manoel Correia Leitão, “Angola’s Eastern Hinterland in the 1750s: A Text Edition and Translation of Manoel Correia Leitão's ‘Voyage’ (1755-1756),” ed. Eva Sebestyen and Jan Vansina, History in Africa 26 (1999): 341-342. 14 Birmingham, Trade and Conflict in Angola, 154.
178

the number of slaves shipped from the Bight of Benin actually declined in the first
half of the eighteenth century as a result of the Dahomean wars, which
culminated with the annexation of Allada and Ouidah, the two principal ports of
slave embarkation on the Bight of Benin.15
Large-scale wars were not the only type of military conflict in the interior.
Minor wars were frequent and widespread in the interior of West Central Africa.
In the eighteenth and nineteenth centuries, there were essentially two types of
small-scale wars, one waged by Portuguese colonial officials, the other conducted
by different African groups and polities. Although Portuguese governors were no
longer allowed to trade slaves, it was part of their duty to launch punitive
expeditions against Africans who they considered disruptive or insufficiently
loyal to the Crown. Portuguese governors could also wage “just wars” against
Africans who attacked, or threatened to attack, the Portuguese settlements in
Angola. José Curto considers these expeditions large-scale wars, but the number
of captives usually reported clearly indicates that they were minor conflicts.
There are many examples of these military operations, but few reported in
printed literature show the size of these conflicts.
In 1736, the Portuguese launched a military expedition from Benguela
against Kakonda in the central plateau of Angola. The expedition records list 77
captives for the royal fifth, a tax equivalent to a fifth part of all goods produced in
the Portuguese colonies, which was due to the government’s treasury. These
records indicate that some 385 individuals were captured overall. In 1744, the
Portuguese mounted another expedition, but this time against the Ndembu in the
interior of Luanda. The expedition resulted in 62 female slaves for the royal fifth.
15 David Eltis, “The Volume and Structure of the Transatlantic Slave Trade: A Reassessment,” William and Mary Quarterly 58, no. 1 (2001): 34.
179

The total number of individuals captured must have numbered five times that or
approximately 310 captives. In 1761, the Portuguese governor dispatched a
small army from Luanda to fight the Hungu, who presumably invaded Portuguese
territory while escaping from a Lunda attack. António de Vasconcelos, Governor
of Angola, estimated that this encounter resulted in 15,000 dead or captured
among the Hungu. Yet, the official figures show that only 803 were allocated to
the royal fifth, from a total of 4,015 individuals seized during this campaign.
These examples were among the largest expeditions launched by the Portuguese
during the eighteenth century, and they include only the successful campaigns.
The Portuguese military expeditions were undermanned, lacked sufficient
weapons and were somewhat intermittent. Clearly, they were not the principal
force behind the 20,000 or so slaves shipped annually from Luanda and Benguela.
Nevertheless, based on these examples José Curto concludes, “warfare remained
far from a trivial mechanism for the production of slaves.”16
During the eighteenth and nineteenth centuries, prisoners taken in small-
scale conflicts between the different African polities frequently became slaves.
Because these conflicts took place in regions outside European influence, we have
little information about their causes, how they unfolded, or what was the number
of prisoners seized in them. However, our current knowledge of military logistics
in West Central Africa suggests that these conflicts were seasonal, marked by
intense action and rapid retreat, and typically involved only a few thousands
combatants. John Thornton notes that the Angolan savannah was the land of
infantry. He argues that horses were unable to survive the region’s climate and,
although its main rivers supported a considerable boat traffic, the local
population never developed a marine culture similar to other African regions, 16 Curto, “Experiences of Enslavement in West Central Africa,” 391-392.
180
such as the West African coast or along the Niger River.17 As a consequence, in
Angola, African warlords typically employed fleet footed soldiers to resolve
military disputes.
The armies were usually made up of a combination of conscript and
professional warriors. The chain of command varied according to the level of
centralization within each society, but soldiers’ loyalty to their commanders was
generally beyond question.18 Battles occurred mostly during the dry seasons,
when men and women were free from farming and armies could move more easily
in the interior. The savannah was sparsely populated, making the distribution of
food supplies problematic. When mobilized, armies were required to report with
rations. They often took food with them in large baggage trains packed by their
wives, who were the principal agricultural workers in most societies of the
savannah. These baggage trains were positioned in the middle of marching
formations, when armies were on the move, and carefully stationed at a secure
place during battles.19 Given the limited food supplies, and the mobilization of
significant productive sectors of the population, these small-scale campaigns
usually involved fierce battles in wars that could last up to three years.20 As
previously mentioned, the variations in the climate and agricultural calendar of
the region resulted in a seasonal variation in the number of slaves embarked.21
The number of people captured in individual conflicts was probably small.
However, given the frequency of such conflicts and their dispersal in the interior,
they generated large numbers of captives for the trade. These prisoners of war 17 John K. Thornton, “The Art of War in Angola, 1575-1680,” Comparative Studies in Society and History 30, no. 2 (1988): 367-368; John Kelly Thornton, Warfare in Atlantic Africa, 1500-1800 (New York: University College London Press, 1999), 99. 18 Thornton, “The Art of War in Angola,” 362-363; Thornton, Warfare in Atlantic Africa, 113. 19 Thornton, “The Art of War in Angola,” 369-371; Thornton, Warfare in Atlantic Africa, 119-120. 20 Thornton, “The Art of War in Angola,” 368-369; Thornton, Warfare in Atlantic Africa, 120-124. 21 See Chapter Two.
181

were taken to the nearest markets in the interior, where traders from the coast
came to purchase them. Sometimes these small-scale conflicts produced so many
captives that they flooded inland markets, and African traders needed to take
them directly to the ports of embarkation for sale. In 1791, for example, Manoel
de Almeida e Vasconcelos, Governor of Angola, noted that Kongo slave traders
brought 120 slaves from the interior in one shipment for sale at Ambriz.22 These
captives were probably prisoners of the civil wars at the old Kingdom of Kongo.
They were sufficient to fill about half the average carrying capacity of a vessel
loading slaves at Ambriz.
Although wars were a common method of enslavement, records of specific
individuals enslaved through wars or raids are surprisingly rare. There are in
fact only three such records. The earliest refers to the involuntary servitude of
Angela who, according to John Thornton and Linda Heywood, was captured
during the wars Portugal waged against the Kingdom of Ndongo or in a civil war
in the old Kingdom of Kongo. They found she sailed in the same vessel as the “20
and odd Negroes” who disembarked in Virginia in 1619, from the São João
Batista. This vessel had departed from Luanda in that year with some 350 slaves
on board. A Dutch privateer, operating in conjunction with an English vessel,
intercepted the São João off the coast of present day Venezuela. The Dutch
privateer seized slaves from the São João and transferred some of them,
including Angela, to the English vessel, the Treasurer. The Dutch privateer then
sailed ahead and delivered the “20 and odd Negroes” to Virginia, while Angela
arrived at the same destination four days later in the Treasurer. Interestingly,
Angela made two more trips in this ship. She went to Bermuda, finally returning
22 Manoel de Almeida e Vasconcelos to Paulo Martins Pinheiro de Lacerda, 29 January 1791, AHU, CU, Angola, cod. 1627, 79-81.
182

to Virginia where she spent the rest of her life working as a servant on the estate
of Captain William Pierce at Jamestown.23
The second record of particular prisoners of war is to be found in the list of
77 captives representing the royal fifth of the military expedition that the
Portuguese launched from Benguela against the Kingdom of Kakonda in 1736.
This list includes the names of the individuals allocated to the royal fifth and the
estimated value of each individual in réis.24 This information was organized into
three categories by age and sex; “Negroes,” “girls,” and “women and children.” Of
the 77 individuals, 14 were males, including two boys, one of whom was listed
separately from his mother; 18 were girls; and 32 were women, including nine
with one child each. Finally, a further small group was made up of one young
child, two girls, and a male captive of unspecified age. The total value of these
slaves at Benguela amounted to 901,000 réis.25 As José Curto noted, excluding
the nine children listed with their mothers and the last group, who were dying
and consequently deemed worthless, the average value of the remaining 64 was
only 14,708 réis, less than half the average price of a prime slave sold at Luanda
23 Heywood and Thornton, Central Africans, Atlantic Creoles, and the Foundation of the Americas,, 1-9. See also Engel Sluiter, “New Light on the ‘20. and Odd Negroes’ Arriving in Virginia, August 1619,” William and Mary Quarterly 54, no. 2, 3 (1997): 397; Thornton, “The African Experience of the ‘20. and Odd Negroes’ Arriving in Virginia in 1619,” 421-434. 24 Isabel Castro Henriques believes that the names available in this document do not belong to the individuals listed but to their African rulers. She claims that the abbreviations “Mle. pelo da terr” and “Ma. pelo da terra” means moleque or moleca proveniente da terra, that is, boy or girl from the land. However, the preposition “pelo” used in both terms implies that the names belonged to the individuals listed, as in the expression moleque or moleca pelo nome da terra, that is, how they were called in their lands, because the Portuguese commonly changed the African names of the individuals that they captured for Christian names in Portuguese form. See Isabel Castro Henriques, “A Organização Afro-Portuguesa do Tráfico de Escravos (Séculos XVII-XIX),” in A Rota dos Escravos: Angola e a Rede do Comércio Negreiro, ed. João Medina and Isabel Castro Henriques (Lisbon: Cegia, 1996), 164, note 1. 25 Avaliação das Cabeças que Chegaram de Benguela em … Abril de 1738, enclosed in João Jacques de Magalhães, 29 April 1738, AHU, CU, Angola, box 30 doc. 90. This documents is reproduced in Ibid., 162-164; Miller, Way of Death, xii-xiii.
183

or Benguela.26 These individuals arrived in Benguela two years after being
captured, but their subsequent fate remains unknown.
Koelle’s Polyglotta Africana provides the third record of individual
Africans who forfeited their freedom through wars or raids in Angola. Two of his
informants said that neighboring populations kidnapped them in their
hometowns. Further, at the time of their enslavement, both were old enough to
bear arms and serve in the armies of their countries. Dsíku, for example, also
known as Isaac Manners, was a Kikongo speaker from Nsundi, a former province
of the Kingdom of Kongo located on the lower Congo River. He said he was born in
the town of Kaimatúba, where the Yombe, who lived across the river, kidnapped
him when he was twenty-three.27 Dsíku was probably captured in a raid that the
Yombe launched from across the Congo River. Nkóngal, or James Mafoi, was a
Ruund speaker from the Lunda Empire. According to Koelle, the “Kásas”
kidnapped him at his hometown when he was the same age as Dsíku. These
“Kásas” were most likely the Kasanje, who lived across the Kwango River and
often engaged in military conflicts with the Lunda.28 Nkóngal may also have been
captured in a raid or war, rather than being simply abducted from his hometown
by members of a foreign ethnolinguistic group.
Although most kidnappings may have occurred during raids and wars,
many Africans were enslaved through abductions, trickery or simply because of
greed. Two of Koelle’s informants seem to have been taken from their hometowns.
Kadióngo or John Morrison, a Kimbundu speaker from Kisama, said he had been
kidnapped in his hometown when he was sixteen. He was sold at Luanda and
26 Curto, “Experiences of Enslavement in West Central Africa,” 392-393. 27 Koelle, Polyglotta Africana, 15. 28 Ibid.
184

remained there for about five years before being sold into the Atlantic.29 Muséwo
or Toki Petro, a Kimbundu speaker from Songo, related that he had been
kidnapped when he was fifteen and sold in Luanda, where he lived for
approximately 21 years working for a Portuguese trader named Henrique
Consale or Gonçalves. This slave trader sometimes purchased slaves at Songo,
and Muséwo was able to maintain contact with his former home by working as a
translator. Nevertheless, he assimilated much of the Portuguese culture, for his
alternate name was a corruption of the Portuguese António Pedro. Although
Muséwo claimed he was kidnapped, there is probably more to his story. He may
have upset his people in some way, because at his master’s death he was freed,
yet he did not return home, as one might expect. Rather, he moved to Brazil,
where another Portuguese trader employed him in the trade. Muséwo crossed the
Atlantic seven times in six years as a free crewmember on a slaving vessel. On the
eighth voyage, an antislave trade cruiser captured his ship and took him to Sierra
Leone, where he lived for the next 28 years. Muséwo was about seventy when
Koelle interviewed him.30
Young men were routinely abducted for sale into the slave trade.
Commander Felisberto Caldeira Brant Pontes, on his voyage from Angola to Bahia
on April 17, 1800, met an African sailor who told him a story similar to those of
Koelle’s informants. According to Brant Pontes, the sailor Domingos was born in a
village called Quissuca Quialaceta near the source of the Zambeze River. Local
countrymen kidnapped him when he was about fifteen. They took him to a place
called Massango Nangumbe, from whence Domingos traveled to the lands of
Quirimbo Quiandua, near the port of Novo Redondo. Domingos was then shipped
29 Ibid. 30 Ibid.
185

from this port to Benguela. He reported that his journey in the interior lasted
three lunar months and that he was sold to a brother of the captain who
commanded the ship in which Brant Pontes was traveling to Bahia. Although the
evidence is not clear, Domingos seems to have been working as a sailor on a vessel
belonging to this captain’s family. On one of his trips to Brazil, he met his former
kidnapper working on the galleys of Rio de Janeiro. This man said that Domingos’
father had captured him along with five of his companions after discovering that
he was to blame for Domingos’ plight. Domingos’ response was that his father’s
actions were legal, because he had acted with the chief’s permission. Two of the
five captives remained enslaved in the interior, while Domingos’ abductor and
three others were taken to Mbailundu, in the central plateau of Angola, where a
trafficker from Benguela purchased them and shipped them to Rio de Janeiro.31
Domingos was about thirty-nine, when he told his story to Brant Pontes, and he
was still working as a sailor.
Trickery was often used to enslave the unsuspecting. Nbena, an Umbundu
speaker from Ndombe, had high status in her community as a freeborn owner of
both goods and slaves. She was related, moreover, to male leaders within her
community and thus linked through them to males of other Ndombe communities
around Benguela.32 Early one morning in May or June 1817, Nbena and her
daughter set out on a journey to Benguela. On the way, they met an old slave
woman who worked on the nearby estate of her owner, Lieutenant Colonel
António Leal do Sacramento, a black man of means in Benguela. This woman 31 Brant Pontes, “Memória de Brant Pontes sôbre a Comunicação das Duas Costas 9/9/1800.” A copy of this documents is also available in Felisberto Caldeira Brant Pontes, “Memoria de Brant Pontes sobre a Comunicação da Costa Oriental com a Ocidental de Africa,” Arquivos de Angola 1, no. 1, 1 (1933): doc. 18. See also Curto, “Experiences of Enslavement in West Central Africa,” 402; Miller, Way of Death, 1-7. 32 José C. Curto, “The Story of Nbena, 1817-20: Unlawful Enslavement and the Concept of ‘Original Freedom’ in Angola,” in Trans-Atlantic Dimensions of Ethnicity in the African Diaspora, ed. Paul E. Lovejoy and David V. Trotman (New York: Continuum, 2003), 44.
186
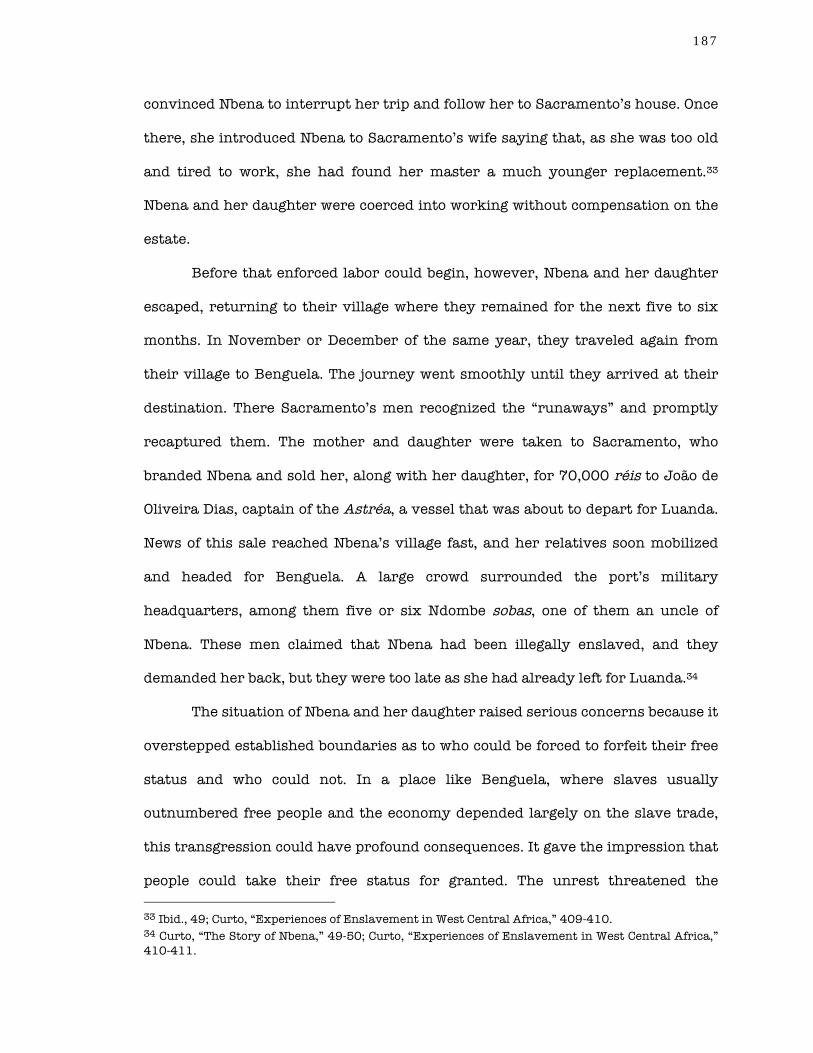
convinced Nbena to interrupt her trip and follow her to Sacramento’s house. Once
there, she introduced Nbena to Sacramento’s wife saying that, as she was too old
and tired to work, she had found her master a much younger replacement.33
Nbena and her daughter were coerced into working without compensation on the
estate.
Before that enforced labor could begin, however, Nbena and her daughter
escaped, returning to their village where they remained for the next five to six
months. In November or December of the same year, they traveled again from
their village to Benguela. The journey went smoothly until they arrived at their
destination. There Sacramento’s men recognized the “runaways” and promptly
recaptured them. The mother and daughter were taken to Sacramento, who
branded Nbena and sold her, along with her daughter, for 70,000 réis to João de
Oliveira Dias, captain of the Astréa, a vessel that was about to depart for Luanda.
News of this sale reached Nbena’s village fast, and her relatives soon mobilized
and headed for Benguela. A large crowd surrounded the port’s military
headquarters, among them five or six Ndombe sobas, one of them an uncle of
Nbena. These men claimed that Nbena had been illegally enslaved, and they
demanded her back, but they were too late as she had already left for Luanda.34
The situation of Nbena and her daughter raised serious concerns because it
overstepped established boundaries as to who could be forced to forfeit their free
status and who could not. In a place like Benguela, where slaves usually
outnumbered free people and the economy depended largely on the slave trade,
this transgression could have profound consequences. It gave the impression that
people could take their free status for granted. The unrest threatened the 33 Ibid., 49; Curto, “Experiences of Enslavement in West Central Africa,” 409-410. 34 Curto, “The Story of Nbena,” 49-50; Curto, “Experiences of Enslavement in West Central Africa,” 410-411.
187

foundations of many societies in Angola, including the Portuguese colonies, which
had a class system based on status – a lower class of slaves, a serving class of
commoners and, at the top of the social pyramid, the nobility. Alarmed by the
crowd, the Governor of Benguela, Manuel de Abreu de Melo e Alvim, decided to
adjudicate the case in court. He summoned the plaintiffs, including Nbena’s
family, the Ndombe sobas, and a number of other witnesses, who were unanimous
in their opinion. Nbena was born free and lived as a free woman until she was
enslaved at Sacramento’s estate. Sacramento, on the other hand, claimed that
Nbena was a slave who had escaped from his estate after being brought there by
an old slave woman as her replacement. In response to such a delicate situation,
the governor decided in favor of Nbena and ordered Sacramento to return her to
Benguela.35
Fortunately, Nbena and her daughter were still in Luanda when the
governor decided the issue. They were taken back to Benguela but could not
return to their village because Sacramento had petitioned for the case to be
reopened. The two women were then placed in the custody of a local merchant,
Manuel Pereira Gonçalves. Sacramento requested the help of the Governor of
Angola at Luanda, Luiz da Mota Feo e Torres, and initiated a judicial challenge
against Melo e Alvim that lasted for three years, during which time Nbena and
her daughter remained in Benguela. As the authorities could not reach an
agreement, Melo e Alvim decided unilaterally to free Nbena and her daughter.
Sacramento again pressed the authorities to have the two women returned to
him, on the grounds that their successful flight from slavery would set a bad
example for the slaves living on his estate. The term of service for both governors
35 Curto, “The Story of Nbena,” 50; Curto, “Experiences of Enslavement in West Central Africa,” 411-412.
188

then ended and subsequent officials showed little interest in supporting
Sacramento’s cause. As a consequence, he unwillingly dropped the case.36 Nbena
and her daughter returned to their home to enjoy freedom surrounded by their
family, friends and, ironically, their own slaves.
These two women retained their freedom thanks to their family, friends
and political connections and local authorities learned a valuable lesson from the
incident. Those who lacked insider status or were subject to speedy sale were not
so fortunate. Catherine Mulgrave Zimmermann survived exportation on the
Heroína, a vessel that left Angola for Cuba in 1833 with 303 slaves on board, but
was shipwrecked off the Jamaican coast.37 Catherine had been captured when
only eight and immediately put on board a slave vessel. In Jamaica, she grew up
as a free woman and married twice. Johannes Zimmermann, her second husband,
says in his letters that Catherine’s African name was Gewe and that she was
descended from a family of chiefs on her father’s side. He claimed that she
belonged to a prominent family of mulattos on her mother’s side. However, the
location of Catherine’s hometown remains unclear. Zimmermann mentions that
she remembered it as a major seaport where several Europeans lived. Luanda fits
this description but since she also referred to snow covered mountaintops, Cape
Town is another possible location. Catherine recalled being on the way to school
with her friends when a group of sailors offered them candies, and enticed them
onto the Heroína, which subsequently set sail across the Atlantic. With the
shipwreck of the Heroína, Catherine escaped what would otherwise have been a
life of harsh work on one of the many sugar plantations of Cuba. She never
36 Curto, “The Story of Nbena,” 51-59; Curto, “Experiences of Enslavement in West Central Africa,” 412-413. 37 David Eltis et al., “Voyages: The Trans-Atlantic Slave Trade Database,” Online database, 2008, voyage id 41890, www.slavevoyages.org/.
189

returned to her hometown, but traveled to Africa with her second husband as a
teacher to conduct missionary work in Ghana.38
Walter Hawthorne, in his recent study about the slave trade between
Brazil and Upper Guinea, argues that Africans enslaved other Africans from
necessity. The Balanta, he argues, participated in the trade from Upper Guinea
because they needed iron to make tools and weapons. The tools they used in rice
production, and the weapons to defend themselves. Rice was an important
component of the Balanta diet, and Upper Guinea was a region with just as many
conflicts as Angola. The Balanta could obtain iron only by participating in the
trade. They imported iron ore from Europeans who, until the mid-nineteenth
century, were interested in only one commodity from Upper Guinea. These factors
clearly support Hawthorne’s thesis, which is further bolstered by the social
structures of the Balanta.39
Hawthorne argues that the Balanta were a decentralized society that
valued ideologies of egalitarianism.40 However, in Angola as well as in Upper
Guinea decentralized societies were not the only suppliers of slaves. Moreover,
decentralized societies were not totally immune from greed, which no doubt
tempted many Africans. An example can be found in the letters of the King of
Kongo, Dom Afonso I. In the sixteenth century, the Kingdom of Kongo was a
centralized society but, in spite of his powers, the king was unable to curtail the
avarice of some of his subjects, who continued their illegal activities. In 1526,
38 Daniel B. Domingues da Silva, “Catherine Zimmermann-Mulgrave: A Slave Odyssey,” in Voyages: The Transatlantic Slave Trade Database, ed. David Eltis et al. (Atlanta: Emory University, 2008), www.slavevoyages.org. 39 Walter Hawthorne, From Africa to Brazil: Culture, Identity, and an Atlantic Slave Trade, 1600-1830 (New York: Cambridge University Press, 2010), 64-80. 40 Ibid., 64 and 77-79; Walter Hawthorne, “Nourishing a Stateless Society during the Slave Trade: The Rise of Balanta Paddy-Rice Production in Guinea-Bissau,” Journal of African History 42, no. 1 (2001): 1-3.
190

Dom Afonso I wrote to the Portuguese king saying that “every day the
[Portuguese] merchants carry away our people, sons of our soil and sons of our
nobles and vassals, and our relatives, whom thieves and people of bad conscience
kidnap and sell to obtain the coveted things and trade goods of the [Portuguese]
Kingdom.”41 A few months later, he wrote again about “thieves and people of bad
conscience.” The king claimed that they were “nossos naturaes,” that is, “our
people who kidnapped and secreted them [e.g. slaves] away at night for sale to
white men.”42
As a centralized society, the Kingdom of Kongo had laws prohibiting the
enslavement and sale of free subjects and vassals. Some more avaricious
inhabitants ignored the laws. By the nineteenth century, the Kingdom of Kongo
was no longer a centralized society. The new kings had little power over their
subjects.43 In this environment, it was easier to capture and sell fellow Africans.
The King of Kongo, Dom Garcia V, annually dispatched an ambassador with three
slaves for sale at Luanda to cover the expenses of the education of his son and
nephew. They were studying Latin at Luanda’s seminary in order to become
priests. The sum available to Prince Pedro and his cousin seems to have been
sufficient, but in 1812 the prince decided to supplement it by selling his father’s
ambassador into the slave trade, along with the usual three slaves.44 Alarmed by
this transaction, the Governor of Angola, João de Oliveira Barbosa, sent Prince
41 Dom Afonso I to Dom João III, 6 July 1526, in António Brásio, ed., Monumenta Missionária Africana, 1 (Lisbon: Agência Geral do Ultramar, 1952), 470–471. As quoted and translated by Curto, “Experiences of Enslavement in West Central Africa,” 389. 42 Dom Afonso I to Dom João III, 18 October 1526, in Brásio, Monumenta Missionária Africana, 489–490. As quoted and translated by Curto, “Experiences of Enslavement in West Central Africa,” 389. 43 Susan Herlin Broadhead, “Trade and Politics on the Congo Coast, 1770-1870” (Ph.D., Boston University, 1971), 17-18 and 26-31; Susan Broadhead, “Beyond Decline: The Kingdom of Kongo in the Eighteenth and Nineteenth Centuries,” International Journal of African Historical Studies 12, no. 4 (1979): 619-620; Jelmer Vos, “The Kingdom of Kongo and Its Borderlands, 1880-1915” (Ph.D., London: School of Oriental and African Studies, 2005), 33-36. 44 Jadin, “Rapport sur les Recherches aux Archives d’Angola,” 167.
191

Pedro and his cousin back to Kongo. Then he set out to search for the ambassador
in Brazil. This was a most difficult task, since official figures show that, in 1812,
10,704 slaves were shipped from Luanda to five different regions in Brazil; Rio de
Janeiro, Bahia, Pernambuco, Maranhão and Pará.45 This search was extremely
important because the ambassador’s sale challenged the accepted norms of
eligibility for enslavement. After all, as an envoy from Dom Garcia V, the
ambassador was a nobleman who belonged to the Kongo diplomatic corps.
Portuguese authorities eventually succeeded in locating the ambassador in Brazil.
They made amends by returning him to Luanda from where he travelled back to
Kongo. There he could enjoy life again as a free man in the company of his
kidnappers.46 Greed does not recognize ideology or political organization. It can
thrive in centralized as well as decentralized societies.
The motives for kidnapping someone and selling him or her into the
infamous trade were not always clear. The last two interviewees in Koelle’s
inventory did not state clearly how they were captured or by whom. They only
mentioned that they were kidnapped and sold on the coast. Tut or Charles
Wilhelm, a Teke speaker from Tsaye, related that at twenty he was kidnapped and
hurried to the sea. Tut had lived in Sierra Leone for 17 years by the time Koelle
interviewed him. He lived in Lomley, near Freetown, with his wife, who had also
45 José C. Curto, “A Quantitative Reassessment of the Legal Portuguese Slave Trade from Luanda, Angola, 1710-1830,” African Economic History, no. 20 (1992): 17 and 24; Joseph C. Miller, “The Political Economy of the Angolan Slave Trade in the Eighteenth Century,” Indian Historical Review 15 (September 1988): 179; Joseph C. Miller, “The Numbers, Origins, and Destinations of Slaves in the Eighteenth-Century Angolan Slave Trade,” Social Science History 13, no. 4 (1989): 396-397; Joseph C. Miller, “The Numbers, Origins, and Destinations of Slaves in the Eighteenth-Century Angolan Slave Trade,” in The Atlantic Slave Trade: Effects on Economics, Societies, and Peoples in Africa, the Americas and Europe, ed. Joseph E. Inikori and Stanley L. Engerman, 2nd ed. (Durham: Duke University Press, 1998), 92-93. 46 Curto, “Experiences of Enslavement in West Central Africa,” 403-404; Jadin, “Rapport sur les Recherches aux Archives d’Angola,” 167.
192

come from the same land.47 Ngónga or John Wilhelm, a Kimbundu speaker from
Kasanje, said that he was abducted at twenty-eight. He spent two years in the
hands of the Portuguese before being sold into the trade, but did not mention who
had originally enslaved him. Ngónga was about forty-three when Koelle contacted
him, and he knew some five other countrymen living in Sierra Leone, but he left
no further details about his life.48
Judicial proceedings also generated captives. As previously noted, in many
African societies slavery was an integral part of prescribed punishments, even for
full members of these societies. It is not surprising to find victims of the slave
trade who were originally enslaved as criminals sentenced to banishment or
perpetual exile. This plight could occur for several reasons. The available records
list misconduct, adultery, debt and witchcraft as warranting involuntary
servitude in the Americas.
Koelle’s linguistic inventory provides three examples of individuals
sentenced to exile because of misconduct or adultery. Mútomp or William Francis,
a Kanyok speaker from the Katanga Plateau, in present day Congo Kinshasa, said
that he grew up at Mámunyikáyint, a day’s journey from the Lualaba River, and
had one child who could not yet walk when he was “sold on account of bad
conduct.” He did not specify the nature of his misconduct, but he mentioned that
he was sold to Mbundu dealers, who took him to Kasanje, where he was resold to
Portuguese traders. Mútomp spent two years and a month enslaved in Angola
before he was transported to the Americas. He had lived in Sierra Leone for 12
years when Koelle interviewed him.49
47 Koelle, Polyglotta Africana, 14. 48 Ibid. 49 Ibid.
193

Okiri or Andrew Park from Mbeti, in present day Congo Brazzaville, said
that he was enslaved at Akuara, when he was about sixteen, because his mother
took him with her after fleeing from his father.50 It is significant that Okiri
suffered the consequences of his mother’s flight from the matrimonial home. West
Central African societies were generally matrilineal, so inheritance and the
distribution of wealth normally followed maternal lines of succession.51 Moreover,
women were the primary agricultural producers in this region.52 Okiri was
neither his father’s heir nor an important addition to the household so his father
used the justice system to exact revenge. Okiri became a victim of the trade.
Family dynamics in West Central Africa have changed overtime, but they could
clearly have contributed to the enslavement process that fed captives to
plantations and mines of the Americas.
Bunsála or Thomas Pratt from Obamba, in present day Gabon, said that he
had been married four years when he was enslaved because of adultery. The
nature of his punishment is significant for our understanding of the role of gender
in the process. Although Bunsála did not say whether the person with whom he
committed adultery received the same punishment, it is clear that he paid a steep
price for violating the rules of marriage in matrilineal societies. This example is
all the more revealing, in view of the incidence of polygyny in West Central Africa.
Bunsála journeyed five months to the coast, where he was taken to a slave vessel.
50 Ibid. 51 Anne Hilton, “Family and Kinship among the Kongo South of the Zaire River from the Sixteenth to the Nineteenth Centuries,” Journal of African History 24, no. 2 (1983): 190; Wyatt MacGaffey, “Lineage Structure, Marriage and the Family amongst the Central Bantu,” Journal of African History 24, no. 2 (1983): 173; A. Richards, “Some Types of Family Structure amongst the Central Bantu,” in African Systems of Kinship and Marriage, ed. A. R. Radcliffe-Brown and Cyril Daryll Forde (London: Oxford University Press, 1964), 208. For a different point of view see Kajsa Ekholm, “External Exchange and the Transformation of Central African Social System,” in The Evolution of Social Systems, ed. Jonathan Friedman and Michael J. Rowlands (Pittsburgh: University of Pittsburgh Press, 1978), 115-118. 52 Hilton, “Family and Kinship among the Kongo South of the Zaire River,” 193; MacGaffey, “Lineage Structure, Marriage and the Family amongst the Central Bantu,” 173-177.
194

He had been living in Sierra Leone for 15 years, with some ten other countrymen,
when Koelle interviewed him.53
Under the legal systems of many West Central African societies, debtors
were liable to be sentenced to slavery and banishment. Dsíngo or James Job,
another of Koelle’s interviewees, was sold into the trade because of unpaid debts.
He was taken from his hometown, Gílibe or Boõõ, near the Congo River when his
eldest son was ten.54 This penalty for debt was so common that even in the
Portuguese colonies freeborns were apt to suffer such consequences. According to
Portuguese law, enslavement for debt was illegal but there is archival evidence to
prove that it fact happened. José Curto tells the story of a militia soldier named
José Manuel, who was in danger of losing his freedom because of some
merchandise he had borrowed to cover debts he had incurred with African
authorities in the interior. The man who had lent him the items was no other than
Lieutenant Colonel António Leal do Sacramento, the very man who had tried to
sell Nbena and her daughter.
In 1816, José Manuel set out from Benguela to purchase slaves in the
central plateau of Angola. Such activity was common among militiamen, who
supplemented their income by engaging in the slave trade, the principal export
activity of Benguela. However, Manuel’s trip did not go well. Somewhere in the
interior, local countrymen stole his merchandise. Additionally, for reasons that
remain obscure, he was arrested and subjected to a fine of 46 panos, or small
pieces of cloth, each valued between 18,000 and 20,000 réis in Benguela. Alone
and imprisoned in the interior, he had no one to turn to, but a soba offered to pay
53 Koelle, Polyglotta Africana, 14. 54 Ibid.
195
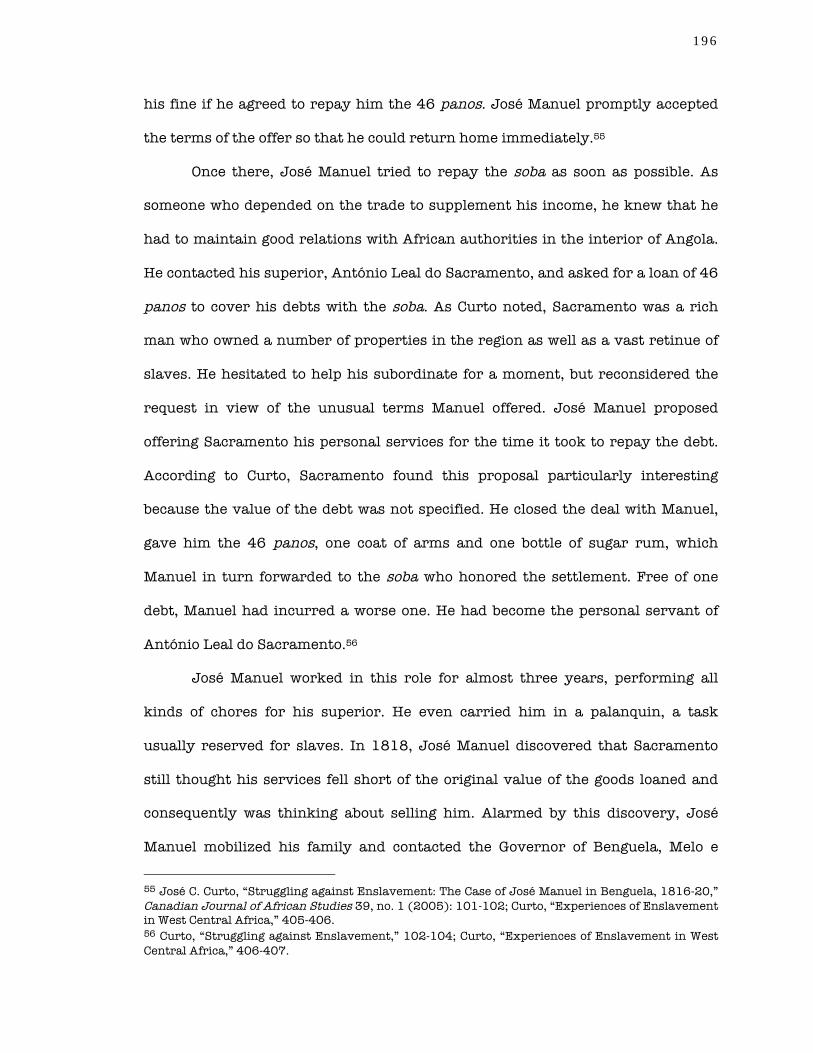
his fine if he agreed to repay him the 46 panos. José Manuel promptly accepted
the terms of the offer so that he could return home immediately.55
Once there, José Manuel tried to repay the soba as soon as possible. As
someone who depended on the trade to supplement his income, he knew that he
had to maintain good relations with African authorities in the interior of Angola.
He contacted his superior, António Leal do Sacramento, and asked for a loan of 46
panos to cover his debts with the soba. As Curto noted, Sacramento was a rich
man who owned a number of properties in the region as well as a vast retinue of
slaves. He hesitated to help his subordinate for a moment, but reconsidered the
request in view of the unusual terms Manuel offered. José Manuel proposed
offering Sacramento his personal services for the time it took to repay the debt.
According to Curto, Sacramento found this proposal particularly interesting
because the value of the debt was not specified. He closed the deal with Manuel,
gave him the 46 panos, one coat of arms and one bottle of sugar rum, which
Manuel in turn forwarded to the soba who honored the settlement. Free of one
debt, Manuel had incurred a worse one. He had become the personal servant of
António Leal do Sacramento.56
José Manuel worked in this role for almost three years, performing all
kinds of chores for his superior. He even carried him in a palanquin, a task
usually reserved for slaves. In 1818, José Manuel discovered that Sacramento
still thought his services fell short of the original value of the goods loaned and
consequently was thinking about selling him. Alarmed by this discovery, José
Manuel mobilized his family and contacted the Governor of Benguela, Melo e
55 José C. Curto, “Struggling against Enslavement: The Case of José Manuel in Benguela, 1816-20,” Canadian Journal of African Studies 39, no. 1 (2005): 101-102; Curto, “Experiences of Enslavement in West Central Africa,” 405-406. 56 Curto, “Struggling against Enslavement,” 102-104; Curto, “Experiences of Enslavement in West Central Africa,” 406-407.
196

Alvim. They argued that José Manuel, in spite of having chosen to become a
servant, was a free man and therefore was ineligible to be forced into slave status
with all the inevitable consequences. Curto claims that José Manuel and his
family petitioned for the privilege of “original freedom,” a right granted to
Africans by the Portuguese Crown early on in the trade, which protected those
unlawfully enslaved from serving a life of bondage. Melo e Alvim decided to
oppose the sale and gave José Manuel and his family more time to arrange the
goods necessary to settle his debt.57
José Manuel and his family began to assemble the required items to give to
Sacramento, who then refused reimbursement of the original debt, demanding
instead a peça da Índia, a prime adult slave valued at about 90,000 réis at that
time in Benguela. José Manuel and his family found yet another official in the
regiment who, willing to help, gave them a young female slave valued at 64,000
réis. Governor Melo e Alvim ordered Sacramento to accept this payment to
resolve the issue. Sacramento took the young woman, and sold her, but he did not
honor the agreement, as he still refused to release Manuel. The governor,
unaware the new owner had paid 70,000 réis for the woman, ordered her to be
returned to Manuel’s family which eventually persuaded Sacramento to take her
in exchange for their kinsman.58 However, Sacramento, not a man to give up
easily, petitioned the Governor of Angola, Feo e Torres, to intervene in his favor,
initiating a judicial battle between the two governors, as in the case of Nbena. This
battle had a similar outcome with one exception. José Manuel remained free but
his advocate, Melo e Alvim, was arrested for insubordination and transported to
57 Curto, “Struggling against Enslavement,” 104-105; Curto, “Experiences of Enslavement in West Central Africa,” 407. 58 Curto, “Struggling against Enslavement,” 106-107; Curto, “Experiences of Enslavement in West Central Africa,” 408-409.
197

answer for his actions before His Majesty.59 This outcome illustrates the strange
twists that justice could and did take.
The use of human pawns to secure goods against the delivery of slaves was
yet another ploy. African slave traders usually borrowed merchandise from
Europeans to purchase slaves in the interior because of the scarcity of credit at
the ports of embarkation. In order to secure these loans, they pledged human
pawns that they redeemed after exchanging the merchandise advanced for slaves
in the interior. These pawns could be slaves, but many were free people with
family ties to those borrowing the goods. When Africans were unable to redeem
their human warranties, Europeans kept them for their own trading purposes.
Paul Lovejoy and David Richardson argue that pawning was present mostly in
West Africa, especially at Old Calabar.60 However, records of Africans enslaved in
the interior of Angola show that the practice was also common in West Central
Africa.
In 1793, Luiz António de Oliveira Mendes presented his memoirs of the
trade to Brazil to the Scientific Academy of Lisbon. He lived in Bahia while writing
the manuscript, which was for the most part based on testimonies collected from
people who had lived in Angola during the eighteenth century. One of these
individuals was Raimundo Jalama, who had worked at Luanda between 1760 and
1770 as an agent of the well known Companhia Geral de Comércio do Grão Pará e
Maranhão and its sister Companhia Geral de Comércio de Pernambuco e Paraíba.
Jalama told Mendes several stories about the Angolan trade, one of which
59 Curto, “Struggling against Enslavement,” 107-112; Curto, “Experiences of Enslavement in West Central Africa,” 409. 60 Paul E. Lovejoy and David Richardson, “Trust, Pawnship, and Atlantic History: The Institutional Foundations of the Old Calabar Slave Trade,” American Historical Review 104, no. 2 (1999): 335-336; Paul E. Lovejoy and David Richardson, “The Business of Slaving: Pawnship in Western Africa, c.1600-1810,” Journal of African History 42, no. 1 (2001): 67-69.
198

concerned two unredeemed pawns who were sold at Luanda, a mother and her
daughter, the latter identified by historians as Lucrécia.61 According to Mendes,
Jalama only discovered the women’s misfortune after he had bought them.
Lucrécia’s mother was suffering from what the Portuguese at that time called
banzo, a psychological condition associated with depression. Jalama initially
thought that she missed home and he tried to help by giving her familiar food, but
that did not work. He then investigated Lucretia’s mother’s situation further and
discovered that her husband had pledged both his wife and daughter for a debt
that he had incurred in the interior. When the husband defaulted on the debt,
both human guarantees were forfeited.62
The suffering that followed being enslaved as a result of debts could be
devastating, and the examples of it in the records available attract attention
precisely because they are extreme. One of Koelle’s informants was sold into the
trade as an unredeemed pawn. Nanga or John Smart, was a Kimbundu speaker, a
member of the Libolo ethnic group who lived south of the Kwanza River.63 Koelle
states that Nanga’s mother pawned her twenty-four year old son to free one of her
brothers, who had been sold because of adultery. Before his mother could redeem
him, he was placed in the hands of the Portuguese at Luanda, who immediately
shipped him to the Americas. However, an antislave trade cruiser intercepted
Nanga’s vessel on the high seas and took him to Sierra Leone, where he lived for
61 Curto, “Experiences of Enslavement in West Central Africa,” 401. 62 Mendes, Memória a Respeito dos Escravos e Tráfico da Escravatura entre a Costa da África e o Brasil, 61-62. 63 Philip Curtin and Jan Vansina believe that Nanga belonged to the Lwena ethnic group, but Koelle’s remarks clearly indicate that he was a Libolo, neighbors of the Kisama. The Libolo lived a week’s journey from the Kwanza River and two weeks from Luanda. The Lwena lived much farther from Luanda, near the central plateau of Angola. See Curtin and Vansina, “Sources of the Nineteenth Century Atlantic Slave Trade,” 204; Koelle, Polyglotta Africana, 15.
199

seven years before Koelle interviewed him.64 The family dynamics in Nanga’s
case are also worthy of note. Although most societies in West Central Africa were
matrilineal, power was usually in the hands of men.65 This reality helps explain
why Nanga’s mother pledged her son as collateral.
In transactions involving pawns, the terms were usually implicit in the
negotiation between the two parties, creditors and debtors. The former advanced
merchandise needed to buy slaves; the latter used relatives as guarantees. The
terms were of part of a moral economy based on traditional rights or customs
supported by the consensus of the community engaged in slaving on the coast.66
As long as both parties abided by the terms, everyone would benefit but, if one or
other violated the agreement, the consequences could be disastrous. The revolt of
Burra Bene, an African chief who lived at Cape Lopez, in present day Gabon,
provides insights into these agreements and the consequences of their violation
for the trade.
In 1810, Luís Joaquim Lisboa, Governor of the islands of São Tomé and
Príncipe, located in the Bight of Biafra, reported to the Portuguese Crown that
António José Corrêa, Captain of the Bergantim Boa Sorte from Pernambuco,
arrived at São Tomé with pawns entrusted to him by Burra Bene. This event
caused great concern among the island’s traders, because those pledged were free
people directly related to the chief of Cape Lopez. Two were women, one of whom
was the chief’s spouse. According to Lisboa, the captain broke a “very ancient
custom” between slave traders from Gabon and São Tomé, because he did not
return the pawns after loading his vessel with slaves and leaving the coast of
64 Koelle, Polyglotta Africana, 15. 65 MacGaffey, “Lineage Structure, Marriage and the Family amongst the Central Bantu,” 173-177. 66 Edward Palmer Thompson, Customs in Common (New York: The New Press, 1991), 187-189.
200

Gabon.67 The island’s traders were very familiar with the institution of pawnship
in this region. They frequently visited Gabon to purchase slaves. Customs records
from São Tomé and Príncipe, for example, indicate that between 1799 and 1811
about 55 percent of the vessels arriving with slaves came from the coast of
Gabon.68 Corrêa was clearly not cognizant of the customs governing the slave
trade in this region, but the island traders understood only too well what was at
stake as a result of his violation.
António José Corrêa’s seizure of Burra Bene’s pawns threatened a
commercial system based on trust. Because of the scarcity of credit available to
purchase slaves, Africans needed to be sure that their human bonds would be safe
until they returned from the interior. Corrêa did not appreciate that important
point, so the island’s traders petitioned the governor to order him to return Burra
Bene’s pawns. Corrêa initially resisted the petition but later a judicial order filed
with the Crown forced him to comply. Corrêa tried to return the individuals, but it
was too late to repair the damage caused to commercial relations between Gabon
and São Tomé. Governor Lisboa reported that three days after the arrival of the
Boa Sorte, Burra Bene retaliated for the loss of his pawns by capturing and
destroying the vessels of traders from São Tomé and Príncipe on the coast of
Gabon.69 Pawning was an important bargaining tool subject to customary laws
governing commercial relations, including the norms that determined who could
be enslaved and taken to the Americas.
Finally, this chapter will consider accusations of witchcraft. In contrast to
the conventional wisdom, Africans in Angola deplored witchcraft as something 67 Daniel B. Domingues da Silva, “O Tráfico de São Tomé e Príncipe, 1799-1811: Para o Estudo de Rotas Negreiras Subsidiárias ao Comércio Transatlântico de Escravos,” Estudos de História, Franca 9 (2002): 47. 68 Ibid., 39-41. 69 Ibid., 48.
201

aimed against the canons of their own religions. Religion played a central role in
African societies during the period of the slave trade. It was essentially one of the
principal means of justifying political power, establishing norms of moral conduct,
and making sense of the world in which they lived. As a consequence, African
authorities usually regarded witchcraft as subject to judicial proceedings.
Individuals found guilty of practicing witchcraft could be sentenced to death or
have their sentence commuted to slavery. Walter Hawthorne, for example, notes
that many slaves sold on the coast of Upper Guinea in the eighteenth and
nineteenth centuries were Africans convicted of practicing witchcraft. Hawthorne
states that the African populations living in that region considered witchcraft one
of the most serious of all transgressions.70
In West Central Africa, witchcraft also led to the enslavement and
transportation of many Africans to the Americas. Two of Koelle’s informants from
this region, for example, claimed that they had been enslaved because members
of their families were accused of practicing witchcraft. Kúmbu or Thomas Parker,
a Kikongo speaker from the Yombe region, situated north of the Congo River, said
that he was enslaved because his sister was accused of practicing witchcraft. He
did not give his age at enslavement, but he was already a married man and the
father of a five-year-old child.71 Kúmbu’s family paid dearly for his sister’s crime,
because the price of adult males sold into the slave trade was higher than that of
adult females.
The case of Bémbe or William Davis provides a further example of
enslavement because of witchcraft. Bémbe was an Umbundu speaker from
Pangéla, a place Koelle insists is different from Benguela. He grew up in
70 Hawthorne, From Africa to Brazil, 81. 71 Koelle, Polyglotta Africana, 14-15.
202

Wodsimbúmba, a day’s journey from the sea. According to Koelle, Bémbe was
enslaved because his family was accused of using witchcraft to kill the king of his
hometown.72 Apparently, he was not directly involved in the king’s murder, but
his family may have decided to let him pay for their crimes, since he would fetch a
high price on the coast. Bémbe was about twenty-eight when he was enslaved.73
As witchcraft was considered a serious offense in Angola, those caught practicing
it endangered their entire families, as the case of Kúmbu and Bembe clearly
demonstrates.
Judicial procedures also allowed members of a society to enslave their own
countrymen. This route to enslavement contrasted widely with that resulting
from wars or raids, because it was aimed at insiders rather than outsiders. It
resulted from internal affairs decided by the community and sanctioned with its
support. The demand for slaves on the coast may have loosened the laws
determining which types of offenses could result in enslavement and sale. How
this process occurred is still not entirely clear. Linda Heywood offers some clues,
pointing out that from the sixteenth century Kongo elites tried to manipulate the
kingdom’s laws in order to increase the number of criminals sentenced to exile.
Elites behaved this way, she argues, because slaves had become the principal
exchange currency in the region. Kongo rulers tried to control such abuse of the
laws by creating offices specifically responsible for determining the legality of the
states of slaves sold on the coast.74 The Portuguese also had similar bureaucratic
positions at Luanda and Benguela. The Governor of Angola, Miguel António de
Melo, for example, reported that such offices still existed in Luanda at the turn of
72 Ibid., 15. 73 Ibid. 74 Linda Heywood, “Slavery and its Transformation in the Kingdom of Kongo,1491-1800,” Journal of African History 50, no. 1 (2009): 9-12.
203

the eighteenth century.75 As the trade increased, African elites felt particularly
tempted to manipulate the laws governing the sale of criminals on the coast of
Angola.
The experiences of Africans embarked from Angola in the nineteenth
century show that, as Robin Law has demonstrated for West Africa, West Central
African societies had specific laws governing who was eligible for sale into the
trade.76 Enslaved Africans were usually people situated at the bottom of the social
hierarchy of most societies in the interior of Angola. They included prisoners of
war, as well as civilians captured in armed conflicts. Although large-scale wars
yielded significant numbers of slaves, most Africans captured in warfare came
from small-scale conflicts. Enslaved Africans shipped from Angola in the
nineteenth century also included victims of abductions, trickery and greed. These
forms of enslavement were primarily aimed at outsiders but, though illegal, they
extended to insiders. As we have seen, insiders could be legally enslaved via
judicial proceedings that ended in their banishment or perpetual exile via the
slave trade. These crimes included, but were not limited to, unpaid debts,
adultery, and witchcraft. In the nineteenth century, Africans were enslaved
through several means; some legal, some not. The fact that both outsiders and, to
a lesser extent, insiders were eligible for enslavement and sale helps explain the
longevity of the slave trade.
75 António Miguel de Mello, “Angola no Fim do Século XVIII - Documentos,” Boletim da Sociedade de Geografia de Lisboa 6, no. 5 (1886): 287-288. 76 Robin Law, “Legal and Illegal Enslavement in West Africa, in the Context of the Trans-Atlantic Slave Trade,” in Ghana in Africa and the World: Essays in Honor of Adu Boahen, ed. Toyin Falola (Trenton: Africa World Press, 2003), 514.
204

Conclusion
Redefining the Frontiers
The origins of slaves leaving Angola in the nineteenth century provide us
with an opportunity to understand whom Africans regarded as eligible for
enslavement and sale across the Atlantic. The data also illuminate the impact of
the slave trade on West Central Africa. Historians have long claimed that the
majority of the slaves embarked were prisoners of wars waged by rulers who
participated in the trade to exchange captives for foreign commodities, which
they then used to cement alliances, raise armies and expand their power
throughout the interior. This process, the argument goes, had a devastating
impact on the region, with rulers seeking captives in places increasingly farther
from the coast. As Joseph Miller writes, “the entire series of local
transformations, viewed over three centuries of the Angolan slave trade
resembled a moving frontier zone of slaving violence.”1
However, lists of liberated Africans from Cuba and Brazil, in addition to
slave registers made by Portuguese colonial officials in Angola, show that slaves
came from regions much closer to the coast than previously thought. In the
nineteenth century, with British efforts to suppress the trade in the North
Atlantic, Angola emerged as the principal source of captives for the Americas. The
majority was brought to work on the plantations of Cuba and Brazil. Historians
believe that the number of slaves leaving Angola in this period increased
1 Joseph C. Miller, Way of Death: Merchant Capitalism and the Angolan Slave Trade, 1730-1830 (Madison: University of Wisconsin Press, 1988), 141.
205

significantly, leading Africans to search for captives in regions more distant from
the coast. The analysis in this dissertation of the estimates of slaves embarked
from West Central Africa, however, shows that the numbers remained stable from
the late eighteenth until the mid-nineteenth century.
Despite the British efforts, traders continued to purchase slaves in regions
situated north of the Equator, such as the Bights of Benin and Biafra. Moreover,
though Portuguese, Brazilian and Spanish traders increased their activities along
the coast of Angola, they were able to do so because British, American, and Dutch
traders had retreated from the business early in the nineteenth century, allowing
the former to buy slaves in ports previously dominated by the latter. Additionally,
traders began to search for other sources of slaves in the South Atlantic, such as
Mozambique, in Southeast Africa. These other sources of slaves helped ensure
that the numbers of those leaving Angola remained stable from the late
eighteenth to the mid-nineteenth century, contradicting the view of historians
who believe that the expansion of the Portuguese, Brazilian and Spanish activity
increased the volume of the trade and the incidence of warfare in the interior of
West Central Africa.
Slaves leaving Angola were transported to the Americas by a complex
network of merchants, brokers and traders. These individuals might specialize in
a specific function or segment of the trade, but they usually took on several roles.
Brokers, for example, could become merchants and finance their own slaving
expeditions after they accumulated sufficient resources. This network of
merchants, brokers and traders was flexible, but it operated within
environmental conditions that helped shape the trade. The gyres of the South
Atlantic, for instance, contributed significantly to the development of a bilateral
slaving system, with voyages beginning in the Americas as opposed to Europe.
206
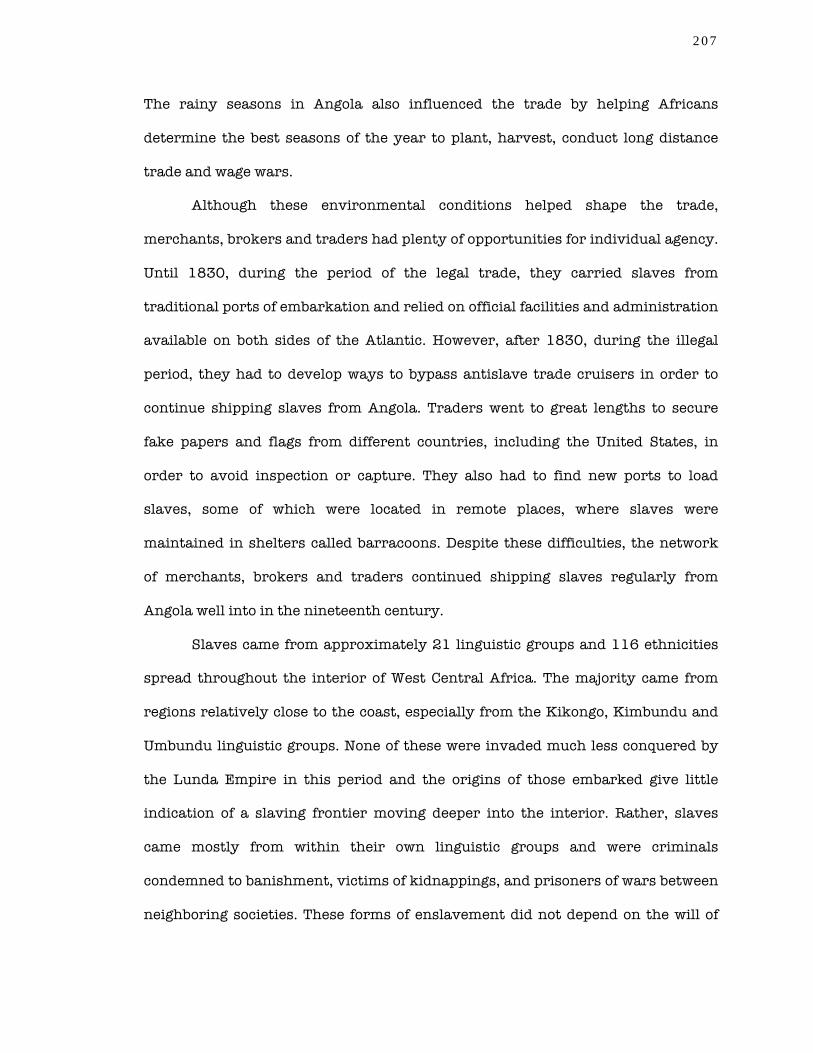
The rainy seasons in Angola also influenced the trade by helping Africans
determine the best seasons of the year to plant, harvest, conduct long distance
trade and wage wars.
Although these environmental conditions helped shape the trade,
merchants, brokers and traders had plenty of opportunities for individual agency.
Until 1830, during the period of the legal trade, they carried slaves from
traditional ports of embarkation and relied on official facilities and administration
available on both sides of the Atlantic. However, after 1830, during the illegal
period, they had to develop ways to bypass antislave trade cruisers in order to
continue shipping slaves from Angola. Traders went to great lengths to secure
fake papers and flags from different countries, including the United States, in
order to avoid inspection or capture. They also had to find new ports to load
slaves, some of which were located in remote places, where slaves were
maintained in shelters called barracoons. Despite these difficulties, the network
of merchants, brokers and traders continued shipping slaves regularly from
Angola well into in the nineteenth century.
Slaves came from approximately 21 linguistic groups and 116 ethnicities
spread throughout the interior of West Central Africa. The majority came from
regions relatively close to the coast, especially from the Kikongo, Kimbundu and
Umbundu linguistic groups. None of these were invaded much less conquered by
the Lunda Empire in this period and the origins of those embarked give little
indication of a slaving frontier moving deeper into the interior. Rather, slaves
came mostly from within their own linguistic groups and were criminals
condemned to banishment, victims of kidnappings, and prisoners of wars between
neighboring societies. These forms of enslavement did not depend on the will of
207

rulers or their thirst for power, and they involved far less violence than large-
scale wars between different linguistic groups.
The origins of slaves leaving Angola also show that the demographic
impact of the trade on the populations living in the interior was unevenly
distributed and that Africans coped with it in different ways. As we have seen, the
trade had a profound effect on the Ndongo, Kimbundu speakers who lived in the
hinterland of Luanda. By the mid-nineteenth century, the Ndongo population had
declined substantially as a result of years of slave trading, and it contained far
fewer males than females. In contrast, Umbundu speakers, who lived in the
central plateau of Angola, had a very different experience. Although they served
as a major source of slaves, the trade’s impact on the Umbundu populations was
less harsh than on the Kimbundu, because the annual average number of
Umbundu speakers sold into the trade comprised a smaller percentage of the total
population. This comparison was made possible by an analysis of the lists of
liberated Africans from Cuba and Brazil in addition to the slave registers of
Angola.
Africans were not only victims of the slave trade but also perpetrators of it.
In fact, the transatlantic trade depended largely on African traders and
enslavers, who captured the majority of the slaves in the interior and sold them
on the coast. However, the use of the term “African” in this context is something
of a misnomer given that Africans did not regarded each other as Africans.
Rather, they identified themselves more with their ethnicity, polity, ruler or
religion than with the fact that they lived in the same continent. As Nathan
208

Huggins posited many years ago, Africans who participated actively in the trade
“saw themselves as selling people other than their own.”2
Africans participated in the trade according to their own conceptions of
who could be enslaved and sold on the coast and who could not. Gender and age
played an important role in this determination. Africans were often reluctant to
sell adult women into the trade. Even when prices of female slaves in the
Americas increased, such as on the eve of the Brazilian abolition in 1830,
Africans continued selling more males than females. They considered women too
important in their own societies to sell them on the coast in the same proportion
as men. Women were regarded as the primary food producers in many Angolan
societies. They were also valued for their reproductive roles. Further, most
societies in Angola were matrilineal and practiced polygyny, so free men often
married slave women in order to avoid dispersing their inheritance to the lineage
of their wives. This stress on the importance of women in society shaped the
demographic profile of the slaves leaving Angola.
Africans enslaved one another more for economic than political gains.
Some historians believe that the number of slaves shipped from Africa bore no
relationship to fluctuations in price, since most captives shipped were prisoners
of wars captured in political conflicts between African rulers. However, prices of
slaves sold from Luanda, the principal port of embarkation in the region, show
that Africans responded positively to the demand for captives in the Americas.
The more prices increased in Luanda, the greater the number of slaves embarked.
This relationship between prices and slaves embarked clearly indicates that the
trade did not depend exclusively on the thirst for power of African rulers. Many
2 Nathan Irvin Huggins, Black Odyssey: The Afro-American Ordeal in Slavery (New York: Pantheon Books, 1977), 20.
209

Africans participated in the trade in order to obtain foreign commodities
imported from Europe, Asia and the Americas.
The principal commodities used to purchase slaves in Angola were textiles,
alcohol and weapons. None of these commodities supplied the primary needs of
the populations living in the interior. They were mostly consumer goods, which
added variety to what was produced locally but did not displace the local
produced manufactures. Africans continued producing their own cloth and
alcohol and fighting with their traditional weapons until late in the nineteenth
century. Foreign imports brought to West Central Africa during the slave trade
era were not among the principal causes of the later underdevelopment of the
region. Additionally, these goods were introduced in such large quantities that
they lost their luxury status.
The experience of those who survived enslavement and sale into the trade
confirms that warfare was not the only way of producing slaves. Although raids
and wars generated large numbers of captives, Africans had many other ways of
enslaving other Africans, such as legal proceedings, pawning, trickery or simply
kidnapping. These forms of enslavement were not exclusive to outsiders. Africans
also enslaved and sold people from their own linguistic and ethnic groups into the
trade, a fact frequently overlooked in the history of slavery. This practice reveals
that Africans were familiar with the notion of slavery as an institution for
economic exploitation and that this institution did not exclude insiders from
being enslaved and sold across the Atlantic.
The origins of slaves leaving Angola cannot be traced on a map as a moving
frontier of violence. The range of interests, people and forms of enslavement
involved in the trade were so diverse that it is impossible to represent the origins
as a single wave moving from the coast to the interior. Causes of enslavement and
210

sources of slaves were clearly multiple and must have overlapped with each
other, but, more important, they depended ultimately on the values, customs and
beliefs of the populations engaged in the trade. Thus, a close study of the origins of
the slaves leaving Angola in the nineteenth century offers new insights into
whom Africans regarded as eligible for enslavement and sale across the Atlantic
as well as the impact of the transatlantic trade on West Central Africa.
211

Appendix A
Volume of the Transatlantic Slave
Trade from West Central Africa,
1781-1867
The tables below were generated based on the estimates available in
“Voyages: The Trans-Atlantic Slave Trade Database,” www.slavevoyages.org/.
These estimates were adjusted to reduce a bias in the data that the website
editors used when creating them. This bias derives from documents related to the
Portuguese and Brazilian slave trades to Bahia between 1816 and 1830. In this
period, Bahian traders were prohibited from loading slaves at their traditional
ports of slave embarkation in the Bight of Benin, located north of the Equator.
They asked Portuguese and Brazilian authorities for passports to load them at
Cabinda and Molembo, on the coast of West Central Africa. However, instead of
sailing to these assigned destinations, they continued to trade slaves at their
traditional ports of embarkation. They used the passports granted to load
captives at Cabinda and Molembo only to conceal the origins of them in the event
antislave trade cruisers intercepted them on the high seas north of the Equator.
Because the website estimates were largely based on these documents, the
estimates below were adjusted to allow for the bias available in this particular
segment of the trade from West Central Africa. Further details about the
212

methodology used to generate the estimates below are available in Chapter One
and in a paper presented at the 124th Annual Meeting of the American Historical
Association.1
1 Daniel B. Domingues da Silva, “The Coastal Origins of Slaves Leaving West Central Africa, c.1780-1867” (Paper presented at the 124th Annual Meeting of the American Historical Association, San Diego, 2010).
213

Tab
le A
.1 –
Est
imat
ed N
umbe
r of
Sla
ves
Lea
vin
g W
est
Cen
tral
Afr
ica
by N
atio
nal
Car
rier
(in
Tho
usan
ds),
178
1-18
67
Yea
rs
Spai
n /
Uru
guay
Po
rtug
al /
Bra
zil
Gre
at B
rita
in
Net
herl
ands
U
.S.A
. Fr
ance
D
enm
ark
/ B
alti
c To
tals
1781
-85
- 90
.2
12.7
2.
5 0.
6 43
.7
- 14
9.7
1786
-90
- 95
.0
4.0
- -
85.1
-
184.
2 17
91-9
5 1.
3 12
1.6
43.5
1.
8 -
32.6
-
200.
6 17
96-0
0 0.
3 97
.9
72.3
-
0.2
0.1
0.5
171.
2 18
01-0
5 0.
2 12
0.9
55.7
0.
6 4.
2 4.
9 1.
8 18
8.3
1806
-10
1.4
112.
3 21
.2
0.3
16.5
-
- 15
1.7
1811
-15
8.3
138.
9 -
- 0.
9 1.
5 -
149.
6 18
16-2
0 58
.5
194.
5 -
- 1.
5 1.
7 -
256.
3 18
21-2
5 -
180.
4 -
- -
0.3
- 18
0.7
1826
-30
2.2
252.
7 -
- -
0.9
- 25
5.8
1831
-35
19.5
80
.1
- -
- -
- 99
.7
1836
-40
15.9
22
7.9
- -
- -
- 24
3.8
1841
-45
12.3
11
4.3
- -
- -
- 12
6.6
1846
-50
13.1
24
7.3
- -
- -
- 26
0.4
1851
-55
32.5
4.
3 -
- -
- -
36.7
18
56-6
0 76
.8
- -
- 0.
4 -
- 77
.2
1861
-65
42.0
-
- -
- -
- 42
.0
1866
-67
0.9
- -
- -
- -
0.9
Tota
l 28
5.4
2,07
8.1
209.
3 5.
2 24
.3
170.
8 2.
3 2,
775.
3
So
urce
s: D
avid
Elt
is e
t al
., “V
oyag
es: T
he T
rans
-Atl
anti
c Sl
ave
Trad
e D
atab
ase,
” On
line
data
base
, 200
8, w
ww
.sla
vevo
yage
s.or
g/; D
anie
l B. D
omin
gues
da
Silv
a, “
The
Coas
tal
Orig
ins
of S
lave
s Le
avin
g W
est
Cent
ral
Afr
ica,
c.1
780-
1867
,” p
rese
nted
at
124t
h A
nnua
l Mee
ting
of
the
Am
eric
an H
isto
rica
l A
ssoc
iati
on, S
an D
iego
, 201
0).
214

Table A.2 – Estimated Number of Slaves Leaving West Central Africa by Region of
Disembarkation (in Thousands), 1781-1867
Brazil Years
Amazonia Bahia Pernambuco SE Brazil Brazil unspecified
1781-85 0.7 21.0 13.1 55.4 - 1786-90 3.8 12.1 15.5 63.6 - 1791-95 2.5 26.5 18.7 69.7 4.2 1796-00 3.7 11.3 20.5 59.4 2.4 1801-05 10.8 15.7 24.7 66.2 3.5 1806-10 3.4 8.3 19.7 75.0 4.2 1811-15 0.4 7.9 26.1 97.2 4.8 1816-20 11.3 35.9 41.2 99.8 4.7 1821-25 4.8 29.1 35.0 106.0 3.1 1826-30 4.9 53.5 34.0 159.0 0.7 1831-35 0.6 4.2 8.9 65.5 - 1836-40 0.7 7.6 32.1 185.4 0.8 1841-45 - 4.1 13.9 88.5 2.8 1846-50 - 5.0 9.0 226.3 2.9 1851-55 - 1.1 - 3.1 - 1856-60 - - - - - 1861-65 - - - - - 1866-67 - - - - - Total 47.6 243.3 312.2 1,420.1 34.1
215

Table A.2 (Cont.)
British Caribbean Years
Jamaica Barbados Antigua St. Kitts Grenada
1781-85 4.2 - 0.4 - 0.4 1786-90 - - - 0.3 0.7 1791-95 25.8 2.3 - 0.6 8.9 1796-00 27.3 7.7 0.3 1.6 1.0 1801-05 12.3 0.7 0.4 1.4 0.6 1806-10 3.7 0.9 - 0.3 - 1811-15 - - 1.7 - - 1816-20 - - - - - 1821-25 - - - - - 1826-30 - - - - - 1831-35 0.3 - - - - 1836-40 - - - - - 1841-45 - - - - - 1846-50 - - - - - 1851-55 - - - - - 1856-60 - - - - - 1861-65 - - - - - 1866-67 - - - - - Total 73.6 11.6 2.8 4.2 11.6
216

Tab
le A
.2 (
Con
t.)
Bri
tish
Car
ibbe
an
Yea
rs
Dom
inic
a B
riti
sh G
uian
a St
. Vin
cent
M
onts
erra
t /
Nev
is
Trin
idad
/ To
bago
Ot
her
Bri
tish
Ca
ribb
ean
1781
-85
1.3
- 0.
3 -
0.4
2.8
1786
-90
1.9
- -
- -
0.2
1791
-95
1.3
- 0.
7 -
- 0.
6 17
96-0
0 1.
3 10
.6
1.4
- 0.
8 1.
8 18
01-0
5 -
4.2
- 0.
1 3.
7 5.
6 18
06-1
0 0.
6 1.
9 -
0.1
0.9
0.8
1811
-15
- -
- -
- 0.
3 18
16-2
0 -
- -
- -
- 18
21-2
5 -
- -
- -
0.3
1826
-30
- -
- -
- -
1831
-35
- -
- -
- 0.
7 18
36-4
0 -
- -
- -
1.2
1841
-45
- 0.
4 -
- -
- 18
46-5
0 -
- -
- -
- 18
51-5
5 -
- -
- -
- 18
56-6
0 -
- -
- -
- 18
61-6
5 -
- -
- -
- 18
66-6
7 -
- -
- -
- To
tal
6.4
17.1
2.
3 0.
2 5.
8 14
.2
217

Tab
le A
.2 (
Con
t.)
Fren
ch C
arib
bean
Yea
rs
Sain
t D
omin
gue
Mar
tini
que
Gua
delo
upe
Fren
ch G
uian
a Fr
ench
Ca
ribb
ean
unsp
ecifi
ed
1781
-85
42.4
0.
4 0.
4 -
- 17
86-9
0 84
.2
- -
- 0.
3 17
91-9
5 20
.3
3.2
5.3
- 0.
5 17
96-0
0 0.
6 7.
0 -
1.7
- 18
01-0
5 -
2.4
2.8
0.3
- 18
06-1
0 -
0.4
0.8
0.3
0.3
1811
-15
0.2
- -
- -
1816
-20
0.4
1.3
- -
- 18
21-2
5 -
- -
- -
1826
-30
- -
- -
- 18
31-3
5 -
- -
- -
1836
-40
- -
- -
- 18
41-4
5 -
- -
- -
1846
-50
- -
- -
- 18
51-5
5 -
- -
- -
1856
-60
- -
- -
- 18
61-6
5 -
- -
- -
1866
-67
- -
- -
- To
tal
148.
1 14
.8
9.3
2.4
1.2
218

Tab
le A
.2 (
Con
t.)
Span
ish
Am
eric
as
Yea
rs
Cuba
Pu
erto
Ric
o Sp
anis
h Ce
ntra
l A
mer
ica
Rio
de
la P
lata
Ot
her
Span
ish
Am
eric
as
1781
-85
1.0
- -
- 0.
8 17
86-9
0 0.
3 -
- -
0.8
1791
-95
5.2
- -
1.3
0.4
1796
-00
1.3
- -
0.9
- 18
01-0
5 9.
6 -
- 3.
0 -
1806
-10
4.5
- -
1.2
- 18
11-1
5 9.
3 0.
6 -
- -
1816
-20
58.8
0.
6 0.
4 -
- 18
21-2
5 1.
7 -
- -
- 18
26-3
0 2.
2 -
- 1.
5 -
1831
-35
17.3
-
- 1.
9 -
1836
-40
14.9
-
- -
- 18
41-4
5 8.
1 -
- -
- 18
46-5
0 6.
0 -
- -
- 18
51-5
5 32
.3
- -
- -
1856
-60
69.9
-
- -
- 18
61-6
5 32
.2
- -
- -
1866
-67
0.9
- -
- -
Tota
l 27
5.6
1.2
0.4
9.7
2.0
219

Tab
le A
.2 (
Con
t.)
Mai
nlan
d N
orth
Am
eric
a D
utch
Am
eric
as
Yea
rs
Caro
linas
/ G
eorg
ia
Gul
f sta
tes
Dut
ch
Cari
bbea
n D
utch
Gui
anas
D
anis
h W
est
Indi
es
Afr
ica
Tota
ls
1781
-85
2.8
0.2
0.4
1.4
- -
149.
7 17
86-9
0 -
- 0.
4 -
- -
184.
2 17
91-9
5 -
0.4
- 2.
1 0.
4 -
200.
6 17
96-0
0 0.
5 -
- 1.
0 6.
9 -
171.
2 18
01-0
5 9.
4 1.
0 -
5.6
4.3
- 18
8.3
1806
-10
22.0
0.
8 -
0.7
0.6
- 15
1.7
1811
-15
- -
- -
- 1.
2 14
9.6
1816
-20
- 1.
5 -
0.4
- -
256.
3 18
21-2
5 -
- -
0.6
- 0.
1 18
0.7
1826
-30
- -
- -
- -
255.
8 18
31-3
5 -
- -
- -
0.4
99.7
18
36-4
0 -
- -
- -
1.3
243.
8 18
41-4
5 -
- -
- -
8.8
126.
6 18
46-5
0 -
- -
- -
11.3
26
0.4
1851
-55
- -
- -
- 0.
1 36
.7
1856
-60
0.4
- -
- -
7.0
77.2
18
61-6
5 -
- -
- -
9.8
42.0
18
66-6
7 -
- -
- -
- 0.
9 To
tal
35.1
3.
9 0.
8 11
.8
12.2
39
.9
2,77
5.3
Sour
ces:
Sam
e as
Tab
le A
.1.
220
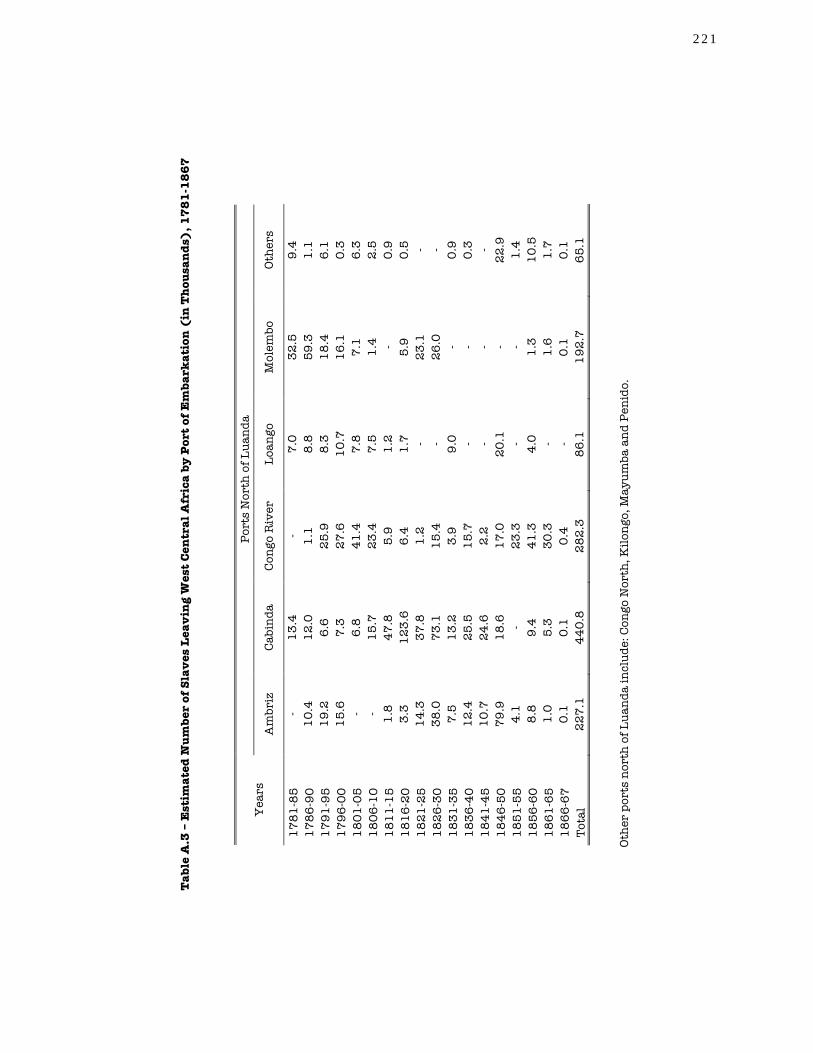
Tab
le A
.3 –
Est
imat
ed N
umbe
r of
Sla
ves
Lea
vin
g W
est
Cen
tral
Afr
ica
by P
ort
of E
mba
rkat
ion
(in
Tho
usan
ds),
178
1-18
67
Port
s N
orth
of L
uand
a Y
ears
A
mbr
iz
Cabi
nda
Cong
o R
iver
Lo
ango
M
olem
bo
Othe
rs
1781
-85
- 13
.4
- 7.
0 32
.5
9.4
1786
-90
10.4
12
.0
1.1
8.8
59.3
1.
1 17
91-9
5 19
.2
6.6
25.9
8.
3 18
.4
6.1
1796
-00
15.6
7.
3 27
.6
10.7
16
.1
0.3
1801
-05
- 6.
8 41
.4
7.8
7.1
6.3
1806
-10
- 15
.7
23.4
7.
5 1.
4 2.
5 18
11-1
5 1.
8 47
.8
5.9
1.2
- 0.
9 18
16-2
0 3.
3 12
3.6
6.4
1.7
5.9
0.5
1821
-25
14.3
37
.8
1.2
- 23
.1
- 18
26-3
0 38
.0
73.1
15
.4
- 26
.0
- 18
31-3
5 7.
5 13
.2
3.9
9.0
- 0.
9 18
36-4
0 12
.4
25.5
15
.7
- -
0.3
1841
-45
10.7
24
.6
2.2
- -
- 18
46-5
0 79
.9
18.6
17
.0
20.1
-
22.9
18
51-5
5 4.
1 -
23.3
-
- 1.
4 18
56-6
0 8.
8 9.
4 41
.3
4.0
1.3
10.5
18
61-6
5 1.
0 5.
3 30
.3
- 1.
6 1.
7 18
66-6
7 0.
1 0.
1 0.
4 -
0.1
0.1
Tota
l 22
7.1
440.
8 28
2.3
86.1
19
2.7
65.1
Othe
r po
rts
nort
h of
Lua
nda
incl
ude:
Con
go N
orth
, Kilo
ngo,
May
umba
and
Pen
ido.
221

Tab
le A
.3. (
Con
t.)
Port
s So
uth
of L
uand
a Y
ears
Lu
anda
B
engu
ela
Nov
o R
edon
do
Othe
rs
Unk
now
n Po
rts
Tota
l
1781
-85
50.3
37
.1
- -
- 14
9.7
1786
-90
56.7
34
.8
- -
- 18
4.2
1791
-95
60.2
54
.9
- -
1.0
200.
6 17
96-0
0 51
.4
36.5
-
- 5.
7 17
1.2
1801
-05
80.6
38
.1
- -
- 18
8.3
1806
-10
71.5
29
.4
- -
0.2
151.
7 18
11-1
5 66
.7
25.5
-
- -
149.
6 18
16-2
0 92
.6
22.4
-
- -
256.
3 18
21-2
5 79
.8
24.5
-
- -
180.
7 18
26-3
0 74
.4
28.3
0.
5 -
- 25
5.8
1831
-35
54.6
10
.5
- -
- 99
.7
1836
-40
137.
9 51
.1
0.8
0.1
- 24
3.8
1841
-45
29.9
54
.3
1.6
3.2
- 12
6.6
1846
-50
44.8
47
.2
4.5
5.2
- 26
0.4
1851
-55
- 8.
0 -
- -
36.7
18
56-6
0 -
2.0
- -
- 77
.2
1861
-65
- 2.
1 -
- -
42.0
18
66-6
7 -
0.1
- -
- 0.
9 To
tal
951.
5 50
6.8
7.5
8.5
7.0
2,77
5.3
Unk
now
n po
rts
incl
ude:
Ale
cuba
, Am
bona
, Bom
ara,
Cap
e M
ole
and
Gre
nada
Poi
nt.
Othe
r po
rts
sout
h of
Lua
nda
incl
ude:
Ben
guel
a V
elha
, Kw
anza
Riv
er, Q
uico
mbo
and
Sal
inas
.
Sour
ces:
Sam
e as
Tab
le A
.1.
222

Appendix B
Origins Data of Slaves and Liberated
Africans from Angola, 1832-1856
The origins of slaves leaving Angola in the nineteenth century were traced
using two sets of documents. The first were the lists of liberated Africans
compiled by the mixed commission courts of Havana and Rio de Janeiro; the
second, the slave registers of Luanda, Benguela and Novo Redondo. Tables B.1 to
B.17 include the designations of origins available in the lists of liberated Africans
compiled for each vessel and distributed by port of embarkation. The ports of
embarkation of the Bergantim Rio da Prata were imputed according to the
designations of origins, because this vessel purchased slaves at two ports of
embarkation, Benguela and Luanda. Slaves whose designation of origin referred
to the central plateau of Angola were considered as embarked in Benguela and
those whose designation of origin referred to places in the hinterland of Luanda
were considered as embarked from that port. Since slaves usually came from
places situated in the hinterland of their port of embarkation, this measure was
adopted to mantain integrity with the data available in the other lists of liberated
Africans.1
1 Philip D. Curtin, The Atlantic Slave Trade: A Census (Madison: University of Wisconsin Press, 1969), 260-261.
223

In the bundle of documents related to the Bergantim Brilhante at the
Arquivo Histórico do Itamaraty, in Rio de Janeiro, there is a list of Africans very
similar to the lists of liberated Africans compiled by the mixed commission courts
for the adjudication of vessels accused of illegal slave trading. It differs from the
Brilhante inventory in that it has 209 Africans registered by their Christian name
in Portuguese, while that of the Brilhante contains 245 individuals listed by their
African names. Both vessels embarked slaves at Ambriz and both lists were
created in 1839. The Rio court records indicate that, in the same year, the mixed
commission condemned four other vessels. All four vessels, the Carolina, the Leal,
the Paquete do Sul, and the César, embarked slaves at Ambriz. Lists of liberated
Africans survive for the first two vessels; that of the Carolina contains 211
individuals and the list of the Leal 315, all of which are Christian names, but the
designations of origin are far more diverse than those of the Brilhante and the
unknown vessel. It is possible that the additional list included in the documents of
the Brilhante belongs either to the Paquete do Sul, which disembarked 444
recaptives, or more likely to the César, which disembarked 207 recaptives.
Unfortunately, the lack of further evidence does not allow us to identify to which
of these ships the unidentified list belongs. Nevertheless, it was used to trace the
origins of slaves leaving Angola.
Tables B.18 to B.20 show the origins of the individuals noted in the slave
registers of Luanda, Benguela and Novo Redondo between 1855 and 1856. The
estimated number of slaves leaving Angola by linguistic and ethnic origins was
calculated based only on the ethnonyms available in these documents. They do
not include other designations of origin, such as places, regions, rivers, etc. Tables
B.21 and B.22 summarize the final results. Further details about the methodology
used to develop these estimates are available in Chapter Three and in a paper
224

presented at the 53rd Annual Meeting of the African Studies Association.2 Readers
who wish to generate their own estimates, or who would like to provide a different
interpretation about the ethnonyms selected, are advised to use the raw data
available in the previous tables.
2 Daniel B. Domingues da Silva, “Inland Diasporas: Tracing the Origins of Slaves Leaving Angola in the Nineteenth Century” (Paper presented at the 53rd Annual Meeting of the African Studies Association, San Francisco, November 18, 2010).
225

Lists of Liberated Africans from Havana, Cuba, 1832-1837
Table B.1 – Designations of Origin Available in the List of Liberated Africans from the
Brigantine Aguila, 1832
Port of embarkation Designations of origin Number of recaptives
Congo Luango 118 Congo Mondongo 355
Congo Mullombe 7 Loango
Congo Musundi 116
Total 596
Sources: BNA, FO 313, vol. 58, ff. 43-102 and David Eltis et al., “Voyages: The
Transatlantic Slave Trade Database,” Online database, 2008,
www.slavevoyages.org/.
Table B.2 - Designations of Origin Available in the List of Liberated Africans from the
Brigantine Marte, 1835
Port of embarkation Designations of origin Number of recaptives
Loango Congo 326
Total 326
Sources: BNA, FO 313, vol. 60, ff. 134-137 and David Eltis et al., “Voyages,”
www.slavevoyages.org/.
226

Table B.3 - Designations of Origin Available in the List of Liberated Africans from the Goleta
Amalia, 1835
Port of embarkation Designations of origin Number of recaptives
Congo Boma 177
Congo Lavinda 1 Congo Luango 6
Congo Mondongo 6 Congo Moyoni 2
Congo Mullombe 1 Congo Musundi 5
Congo River
Congo Real 2 Total 200
Sources: BNA, FO 313, vol. 61, ff. 71-91 and David Eltis et al., “Voyages,”
www.slavevoyages.org/.
Table B.4 - Designations of Origin Available in the List of Liberated Africans from the Goleta
Diligencia, 1835
Port of embarkation Designation of origin Number of recaptives
Congo Boma 1 Congo Borida 1
Congo Lemba 2 Congo Luango 31
Congo Manba 1 Congo Moyombe 2
Congo Mulimba 1 Congo Mullombe 42
Congo Musimba 1 Congo Musundi 11
Mayumba
Congo Muyala 1 Total 94
Sources: BNA, FO 313, vol. 61, ff. 92-141 and David Eltis et al., “Voyages,”
www.slavevoyages.org/.
227

Table B.5 - Designations of Origin Available in the List of Liberated Africans from the Goleta
Empresa, 1836
Port of embarkation Designations of origin Number of recaptives
Luanda Congo 407
Total 407
Sources: BNA, FO 313, vol. 61, ff. 190-230 and David Eltis et al., “Voyages,”
www.slavevoyages.org/.
Table B.6 - Designations of Origin Available in the List of Liberated Africans from the Goleta
Joven Reyna, 1835
Port of embarkation Designations of origin Number of recaptives
Congo Antpaango 1 Congo Ausange 3
Congo Baca 1 Congo Baco 2
Congo Bafo 1 Congo Bamba 2
Congo Bandechendi 1 Congo Bangola 1
Congo Bansa 1 Congo Bencha 1
Congo Biabo 1 Congo Bimba 1
Congo Bimgo 2 Congo Binda 2
Congo Binga 1 Congo Biri 2
Congo Boco 2 Congo Bomgoma 33
Congo Bongo 7 Congo Buchimpe 1
Congo River
Congo Buco 2
228

Table B.6 (Cont.)
Port of embarkation Designations of origin Number of recaptives
Congo Buere 2
Congo Bullonde 2 Congo Cai 1 Congo Camba 3 Congo Canga 1 Congo Cango 3 Congo Cansa 2 Congo Cay 2 Congo Chiongo 1 Congo Chita 1 Congo Chocho 3 Congo Cimchi 1 Congo Cimgo 1 Congo Cocumbe 1 Congo Cola 1 Congo Conche 1 Congo Cuma 1 Congo Cumi 2 Congo Cuno 1 Congo Cusa 1 Congo Cutuide 1 Congo Damba 8 Congo Danval 1 Congo Decolo 1 Congo Densuco 1 Congo Emagebo 1 Congo Enchi 2 Congo Enlasa 1 Congo Ensadi 1 Congo Ensuca 1 Congo Ensumga 1 Congo Ensuso 1 Congo Esombe 1 Congo Febo 1 Congo Femba 1 Congo Fete 1 Congo Fula 2
Congo River
Congo Ganda 1
229

Table B.6 (Cont.)
Port of embarkation Designation of origin Number of recaptives
Congo Ganga 2
Congo Gimse 1 Congo Ginga 3
Congo Gongo 1 Congo Guaguana 1
Congo Guele 1 Congo Guembo 1
Congo Jali 1 Congo Laba 1
Congo Lano 2 Congo Lemba 3
Congo Lenida 1 Congo Leque 1
Congo Llanga 1 Congo Lombo 1
Congo Lonica 1 Congo Lotala 1
Congo Lucuti 2 Congo Lufo 1
Congo Lumbi 2 Congo Lungo 3
Congo Lusanda 1 Congo Lusanga 1
Congo Macara 1 Congo Maganie 1
Congo Mansa 1 Congo Matendi 2
Congo Melele 1 Congo Mesa 1
Congo Mesara 1 Congo Moache 1
Congo Moamba 1 Congo Moboma 4
Congo Mobomesa 1 Congo Mocanda 1
Congo River
Congo Mondongo 1
230
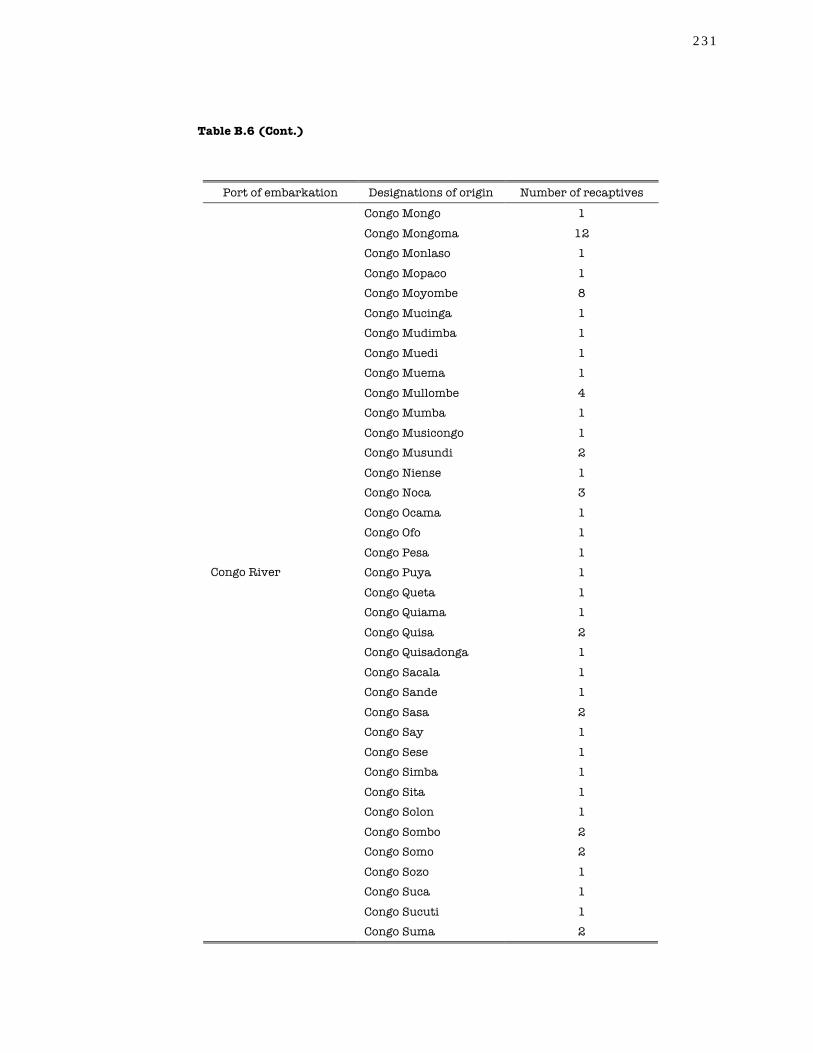
Table B.6 (Cont.)
Port of embarkation Designations of origin Number of recaptives
Congo Mongo 1
Congo Mongoma 12 Congo Monlaso 1
Congo Mopaco 1 Congo Moyombe 8
Congo Mucinga 1 Congo Mudimba 1
Congo Muedi 1 Congo Muema 1
Congo Mullombe 4 Congo Mumba 1
Congo Musicongo 1 Congo Musundi 2
Congo Niense 1 Congo Noca 3
Congo Ocama 1 Congo Ofo 1
Congo Pesa 1 Congo Puya 1
Congo Queta 1 Congo Quiama 1
Congo Quisa 2 Congo Quisadonga 1
Congo Sacala 1 Congo Sande 1
Congo Sasa 2 Congo Say 1
Congo Sese 1 Congo Simba 1
Congo Sita 1 Congo Solon 1
Congo Sombo 2 Congo Somo 2
Congo Sozo 1 Congo Suca 1
Congo Sucuti 1
Congo River
Congo Suma 2
231

Table B.6 (Cont.)
Port of embarkation Designations of origin Number of recaptives
Congo Tamba 2
Congo Tando 3 Congo Tibo 1
Congo Timga 1 Congo Totela 1
Congo Untacala 1
Congo River
Musicongo 3
Total 254
Sources: BNA, FO 313, vol. 60, ff. 84-110 and David Eltis et al., “Voyages,”
www.slavevoyages.org/.
Table B.7 - Designations of Origin Available in the List of Liberated Africans from the Goleta
Matilde, 1837
Port of embarkation Designations of origin Number of recaptives
Ambriz Congo 255
Total 255
Sources: BNA, FO 313, vol. 61, ff. 231-257 and David Eltis et al., “Voyages,”
www.slavevoyages.org/.
232

Lists of Liberated Africans from Rio de Janeiro, Brazil, 1834-1839
Table B.8 - Designations of Origin Available in the List of Liberated Africans from the
Bergantim Brilhante, 1838
Port embarkation Designations of origin Number of recaptives
Angola 11 Biomba 1
Cassanje 9 Coango 1
Congo 161 Meinbo 1
Miombo 6 Moiange 8
Moiomba 2 Moiombe 1
Moiombo 11 Moionbo 1
Monjolo 20 Mosimbo 1
Mossorongo 1 Rebola 2
Ambriz
Rebolo 8 Total 245
Sources: AHI, Coleções Especiais, Brilhante, lata 4, maço 3, pasta 1.
233

Table B.9 - Designations of Origin Available in the List of Liberated Africans from the
Bergantim Carolina, 1839
Port of embarkation Designations of origin Number of recaptives
Ambriz 1
Angola 7 Baca 13
Bacal 1 Bamba 1
Bié 1 Cabinda 5
Cabonda 1 Cacoma 1
Caré 1 Cassange 4
Conda 1 Congo 121
Cuange 1 Cumba 2
Curamba 1 Cusolongo 1
Dange 2 Domba 1
Gomba 1 Gombé 1
Guisamá 1 Lomba 1
Luanda 1 Malanba 1
Malemba 1 Malliava 1
Maolo 1
Ambriz
Mauza 2
234

Table B.9 (Cont.)
Port of embarkation Designations of origin Number of recaptives
Miange 10
Mizi 1
Monjolo 14 Nobamba 1
Oio 1 Quibombo 1
Quiçamá 1 Quisamá 1
Soso 2 Soyo 1
Ambriz
Unspecified 1 Total 211
Sources: ANRJ, Carolina, cod. 184, vol. 3, ff. 90-96v.
Table B.10 - Designations of Origin Available in the List of Liberated Africans from the
Bergantim Órion, 1835
Port of embarkation Designations of origin Number of recaptives
Angola 29
Baca 19 Benguela 49
Cabinda 1 Cabundá 1
Cassange 21 Congo 11
Ladino 4 Loanda 2
Luanda
Monjolo 1
235

Table B.10 (Cont.)
Port of embarkation Designations of origin Number of recaptives
Quisama 3
Quisamá 8
Rebola 5 Rebolo 90
Luanda
Songo 3 Total 247
Sources: ANRJ, Órion, cod. 184, vol. 3, ff. 43v-51v.
Table B.11 - Designations of Origin Available in the List of Liberated Africans from the
Bergantim Paquete de Benguela, 1840
Port of embarkation Designations of origin Number of recaptives
Benguella 266 Benguela
Unspecified 4
Total 270
Sources: ANRJ, Paquete de Benguela, cod. 184, vol. 4, ff. 19v-23v.
Table B.12 - Designations of Origin Available in the List of Liberated Africans from the
Bergantim Rio da Prata, 1834
Port of embarkation Designations of origin Number of recaptives
Benguela 3
Benguella 87 Benguela
Bié 1
Total 91
236

Table B.12 (Cont.)
Port of embarkation Designations of origin Number of recaptives
Angola 56 Baca 6
Cabinda 1 Cassange 13
Congo 42 Monjolo 1
Rebollo 7 Songa 2
Luanda
Songo 1 Total 129
Sources: ANRJ, Rio da Prata, cod. 471, ff. 9v-16v.
Table B.13 - Designations of Origin Available in the List of Liberated Africans from the Brigue
Escuna Feliz, 1838
Port of embarkation Designations of origin Number of recaptives
Abarundo 1 Alonjonba 1
Anbuera 1 Anga 1
Anganba 1 Angola 1
Atunduvele 1 Barundo 1
Benguela 5 Bundo 1
Cababo 1 Cabarundu 1
Cabinda 1 Cabunba 1
Cabunge 1
Benguela
Cachonga 1
237

Table B.13 (Cont.)
Port of embarkation Designations of origin Number of recaptives
Caconda 1
Calenbi 1 Calenda 2
Calunda 3 Camame 1
Camanga 1 Camungo 1
Canano 1 Candonde 1
Candunbo 1 Canhiacuto 1
Canosse 1 Caponga 1
Carangue 1 Caromoxingo 1
Carova 1 Cassamba 1
Cauia 1 Cavinja 1
Caxito 1 Coanha 1
Coca 1 Cochinjomba 2
Cochiurai 1 Cocunha 1
Cogangote 1 Cojoco 1
Colembe 1 Comanga 1
Combaungo 1 Conane 1
Congola 2 Congonga 1
Congongo 1 Congulo 1
Benguela
Cossumbe 1
238

Table B.13 (Cont.)
Port of embarkation Designations of origin Number of recaptives
Cotinde 1
Cuaitele 1 Cuanbo 2
Cubangola 3 Cuchipea 2
Cucoetá 1 Cucuale 1
Cucuando 2 Cucuito 1
Cudelonga 1 Cugulumbo 1
Cussanba 1 Cussanbo 2
Cussanga 1 Cussobe 1
Cuxijaca 1 Cuxipé 3
Engoa 1 Garoseque 1
Gogunga 1 Izua 1
Maguaza 1 Massango 1
Mativangue 1 Mexicongo 2
Monjolo 1 Mossongo 1
Mossuma 1 Muchiengue 1
Mudungo 1 Mutimoma 1
Muvales 1 Nanpinda 1
Ongó 1 Ongonga 1
Benguela
Pulonda 1
239

Table B.13 (Cont.)
Port of embarkation Designations of origin Number of recaptives
Redondo 1
Sungo 1 Tipea 1
Tipeo 1 Uamba 4
Uambo 3 Uanba 4
Uanbo 6 Uango 1
Uanha 3 Uanima 1
Ubarunda 2 Ubarundu 1
Ubia 1 Ubiá 1
Ucandé 1 Ucanganda 1
Ucanjonga 1 Ucarista 1
Uchipea 2 Uculema 1
Udandiba 1 Uembe 1
Ueteca 1 Ufendi 1
Ugamba 1 Uganda 1
Ugaranga 1 Ugarangue 6
Uguambo 1 Ugunha 1
Uiango 1 Uitequé 1
Uitera 1 Uiva 1
Benguela
Ulimba 1
240

Table B.13 (Cont.)
Port of embarkation Designations of origin Number of recaptives
Umama 1
Umanga 2 Unana 1
Unane 23 Unané 2
Unanga 1 Unbarunda 1
Unbarundu 1 Unbonga 1
Unbuim 1 Unbungo 1
Unduim 1 Undunba 1
Unganda 1 Ungarangue 2
Ungarengue 1 Ungoa 1
Ungonga 1 Unhangue 1
Unlungo 1 Unspecified 1
Urebo 1 Uronga 1
Ussamba 1 Ussanba 2
Utanba 1
Benguela
Uttere 1
Total 217
Sources: ANRJ, Feliz, cod. 184, vol. 3, ff. 72-81.
241
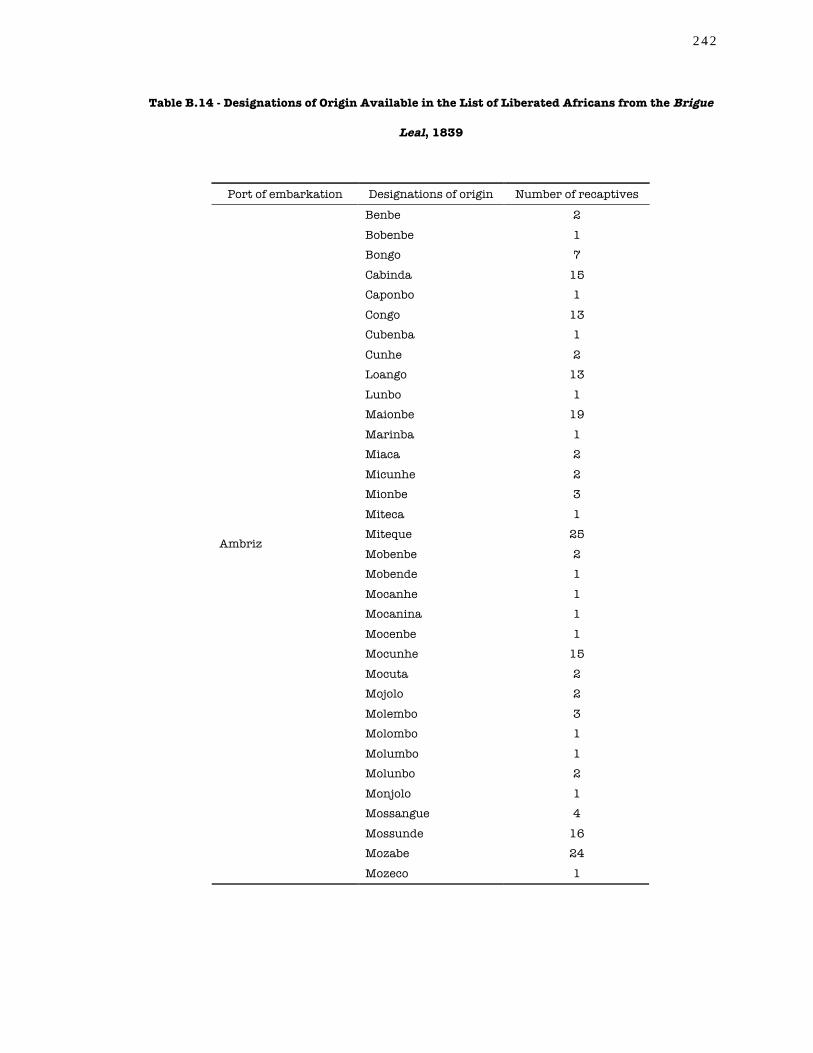
Table B.14 - Designations of Origin Available in the List of Liberated Africans from the Brigue
Leal, 1839
Port of embarkation Designations of origin Number of recaptives
Benbe 2
Bobenbe 1 Bongo 7
Cabinda 15 Caponbo 1
Congo 13 Cubenba 1
Cunhe 2 Loango 13
Lunbo 1 Maionbe 19
Marinba 1 Miaca 2
Micunhe 2 Mionbe 3
Miteca 1 Miteque 25
Mobenbe 2 Mobende 1
Mocanhe 1 Mocanina 1
Mocenbe 1 Mocunhe 15
Mocuta 2 Mojolo 2
Molembo 3 Molombo 1
Molumbo 1 Molunbo 2
Monjolo 1 Mossangue 4
Mossunde 16 Mozabe 24
Ambriz
Mozeco 1
242

Table B.14 (Cont.)
Port of embarkation Designations of origin Number of recaptives
Mozeniga 1
Mucunhe 2 Muiaca 18
Muinda 1 Mussenbe 1
Muteca 52 Muteque 4
Mutiniga 1 Nocoso 1
Ocarango 1 Quilunga 3
Quinteque 4 Quiteque 9
Sunde 25 Tiaca 2
Ambriz
Unspecified 3 Total 315
Sources: ANRJ, Leal, cod. 184, vol. 4, ff. 14-19 and Luciano Raposo,
Marcas de Escravos: Listas de Escravos Emancipados Vindos a Bordo de
Navios Negreiros, 1839-1841 (Rio de Janeiro: Arquivo Nacional, 1990),
facsimile copy.
Table B.15 - Designations of Origin Available in the List of Liberated Africans from the Escuna
Duquesa de Bragança, 1834
Port of embarkation Designations of origin Number of recaptives
Angola 44 Baca 3
Bamba 9 Benguela 6
Benguella 40
Luanda
Bié 3
243

Table B.15 (Cont.)
Port of embarkation Designations of origin Number of recaptives
Cabinda 10
Cabundá 2 Calabar 4
Calunda 3 Camba 1
Camondongo 1 Camundongo 1
Cassange 10 Comba 16
Conga 2 Congo 78
Congoa 1 Dondo 2
Dúlu 1 Inhambane 1
Inhoé 4 Mina 2
Moange 12 Moçambique 2
Monjollo 3 Monjolo 1
Quissama 3 Rebola 2
Rebollo 3 Rebolo 1
Songo 1 Yarra 1
Luanda
Unspecified 3 Total 276
Sources: ANRJ, Duquesa de Bragança, cod. 471, ff. 1-9.
244

Table B.16 - Designations of Origin Available in the List of Liberated Africans from the Patacho
Especulador, 1839
Port of embarkation Designations of origin Number of recaptives
Angola 4
Baca 2 Banba 1
Barando 1 Barangongo 1
Barundo 20 Benguella 20
Bié 18 Bonba 1
Bongo 1 Cabundo 1
Cacunde 1 Caíra 1
Camama 1 Candunbe 2
Candunbo 4 Canduro 1
Carembe 1 Caronbo 1
Caveta 1 Chamaco 1
Cocangange 1 Cocuje 1
Coma 1 Comonguera 1
Congori 1 Coqueto 1
Coquina 1 Cuanbo 1
Cuango 1 Cuanha 1
Cugange 1 Culongo 1
Benguela
Cumba 1
245

Table B.16 (Cont.)
Port of embarkation Designations of origin Number of recaptives
Cumbundo 1
Cunane 1 Cunhanba 1
Cunhema 1 Cunhemba 1
Cuquipera 1 Cussambo 1
Cutepeio 1 Cuxibanba 1
Cuxiundo 1 Damba 1
Danba 1 Donbo 1
Donde 2 Dulo 4
Dunbo 1 Duro 1
Gamguella 1 Ganda 3
Gande 1 Ganguela 2
Ganguella 41 Garanga 3
Garangue 18 Gavanga 1
Hipeio 1 Inhangue 1
Moma 3 Mongo 1
Mungo 2 Muximanga 1
Nema 1 Oanba 17
Oanbo 4 Ogijunba 1
Onana 1
Benguela
Oribindo 1
246

Table B.16 (Cont.)
Port of embarkation Designations of origin Number of recaptives
Peió 1
Pumbo 1 Pungo 1
Quanbe 1 Quequibula 1
Querendé 1 Quibanda 1
Quibura 1 Quicuma 1
Quingoa 1 Quingolo 1
Quiovanda 1 Quirombo 2
Quironbo 2 Quita 1
Quitete 1 Quivanda 1
Samba 2 Sanba 4
Soco 1 Sonbe 1
Songo 3 Tiaca 2
Tiegue 1 Vanda 1
Benguela
Unspecified 3 Total 259
Sources: ANRJ, Especulador, cod. 184, vol. 4, ff. 1-5 and Raposo, Marcas de
Escravos, facsimile copy.
247

Table B.17 - Designations of Origin Available in the List of Liberated Africans from the
Unknown Vessel, c.1840
Port of embarkation Designations of origin Number of recaptives
Angola 18
Benguela 1 Congo 136
Miombe 14 Moange 8
Monjolo 19 Rebola 1
Rebolo 9
Ambriz
Unspecified 3
Total 209
Sources: AHI, Coleções Especiais, enclosed with the list of the Brilhante, lata 4,
maço 3, pasta 1.
Slave Registers of Angola, 1855-1856
Table B.18 – Designations of Origin Available in the Slave Register of Benguela, 1855-1856
Designations of origin Number of slaves
Ambaca 20
Ambriz 5 Ambrizete 1
Andulo 3 Arui ou Lui 1
Bacusso 1 Bailundo 199
Bengo 5
248

Table B.18 (Cont.)
Designations of origin Number of slaves
Benguela 126
Bie 253 Biscuco 1
Blungo 1 Bonge 1
Bongo 2 Bulo 3
Bulu 2 Bumba 1
Bumbo 1 Busaeo 2
Buy 1 Cabinda 1
Cabongo 1 Cabunda 2
Cabundau 1 Cacaquesa 1
Cacate 1 Cacoco 10
Cacombo 1 Caconda 86
Cacondo 2 Cacovo 2
Cadumbo 3 Cagongo 1
Caguingue 2 Cahila 1
Calambe 1 Calemba 1
Calembe 1 Caloeio 1
Caluceque 1 Caluguembe 2
Calumbo 1 Calundula 1
Calundura 1
249

Table B.18 (Cont.)
Designations of origin Number of slaves
Caluquemba 1
Caluquembe 4 Caluquimba 1
Cambunda 1 Cambundo 1
Candala 2 Candumbo 6
Candundo 1 Candungo 1
Canela 1 Cangande 1
Caoumbo 1 Capeia 1
Capira 1 Caquengue 1
Caquinge 1 Caquingua 1
Caquingue 7 Carazando 1
Cassanje 29 Cassendi 1
Cassoco 1 Cassoleca 1
Cassongo 1 Cassongue 3
Cassungo 1 Casumbo 1
Catara 1 Catumbela 54
Caula 1 Caumbiza 1
Cauombe 1 Cazenda 1
Cazengo 1 Cazonda 1
Celes 7 Chindumbula 1
250

Table B.18 (Cont.)
Designations of origin Number of slaves
Co-Bissolela 1
Combule 1 Congo 14
Congoia 2 Corioco ou Cohioco 1
Cuacango 1 Cubala 1
Cucaiba 1 Cumbe 1
Cumbile 2 Cumbira 6
Cunano 2 Cuteia 1
Dande 6 Daquela 1
Demba 1 Dembos 1
Dombe 36 Dombe Grande 22
Dombe Pequeno 6 Dongo 2
Dula 1 Dulo 1
Duro 1 Ecumbiza 2
Egito 14 Embimbi 1
Endulo 1 Galanga 20
Galange 1 Galangue 67
Galangues 45 Galengue 1
Gamba 2 Gambos 4
Ganda 11
251

Table B.18 (Cont.)
Designations of origin Number of slaves
Gandaveia 1
Ganguela 146 Ganguelas 5
Gania 1 Genga 1
Genge 1 Gerolo 1
Ginga 13 Goia 9
Golungo 1 Golungo Alto 12
Gonga 1 Gongo 2
Guaca 1 Guademba 1
Guengere 1 Guilenges 1
Guilengues 11 Guingolo 8
Guiolo 1 Gumbui 1
Gunga 2 Gungia 1
Gungolo 3 Guri 1
Hambe 1 Hambo 147
Hamboim 2 Hambuim 16
Hanha 48 Hanha da Caconda 2
Hanha de Caconda 2 Hanherriba 2
Heles ou Celes 1 Hilunda 1
Hombe 14
252

Table B.18 (Cont.)
Designations of origin Number of slaves
Hongui 1
Huambe 1 Huambo 1
Huande 1 Huila 1
Humbe 5 Humbi 2
Humbo 1 Hungoia 1
Icolo e Bengo 1 Imemba 1
Jamba 1 Lembo 1
Libolo 11 Loboelo 2
Lobolo 1 Luanda 96
Lubar 25 Lubiri 1
Lubolo 7 Lucala 1
Lucegue 1 Luceque 4
Lui 4 Lumbo 1
Lunda 5 Luvemba 1
Luvenda 1 Mango 1
Mangosa 1 Massangano 5
Matiamvo 3 Moçambique 1
Molemo 1 Moma 5
Mongoca 2
253

Table B.18 (Cont.)
Designations of origin Number of slaves
Mongoia 11
Monjolo 1 Mossoquel 1
Mucangula 1 Mucanio 1
Mucele 1 Mucerra 1
Mucuanhama 1 Mucusso 1
Mugaguela 1 Muganguela 5
Mugangula 1 Muhumbe 1
Muimbo 1 Mulua 1
Mulue 1 Muncombe 1
Mungeria 1 Mungo 3
Mungoia 13 Munguese 1
Mussambe 1 Mussumbe 4
Mutende 1 Mutumbe 1
Nalende 1 Nambua 1
Nando 1 Nano 44
Nbala 1 Nbondo 1
Nbui 1 Ndombe 1
Ndonde 1 Ndungo 1
Nete 1
254

Table B.18 (Cont.)
Designations of origin Number of slaves
Ngala 1
Ngambe 1 Ngoia 5
Ngola 22 Nhanha 4
Nhemba 1 Niatianhe 1
Noguengue 1 Nondolo 1
Novo Redondo 31 Numbulo 1
Nutibe 1 Pambagala 1
Pedra de Encoje 1 Pirama 3
Pungo Andongo 11 Quangasi 1
Quanza 3 Quecuombe 1
Quengolo 1 Quengue 1
Quiaca 88 Quiambula 1
Quianhama 1 Quibala 8
Quibanda 69 Quibinda 1
Quibombo 1 Quibula 28
Quibulo 1 Quibumba 1
Quibumbo 1 Quibunda 2
Quica 2 Quicangue 2
Quicombo 2
255

Table B.18 (Cont.)
Designations of origin Number of slaves
Quicuma 3
Quicumba 1 Quicunga 1
Quihumbe 1 Quilenguas 1
Quilengues 52 Quilombo 15
Quiluanje 1 Quiluza 1
Quimbanda 1 Quimbundo 8
Quimoma 1 Quimuma 1
Quincoela 1 Quindumbo 1
Quingolo 26 Quinono 1
Quinza 1 Quioco 1
Quiogo 1 Quipeio 36
Quipeo 1 Quipepa 1
Quipingo 1 Quipipa 3
Quipungo 1 Quirono 1
Quisanje 1 Quiseca 1
Quisesa 1 Quissama 8
Quissamba 1 Quissandala 1
Quissandura 1 Quissanje 11
Quitata 2
256

Table B.18 (Cont.)
Designations of origin Number of slaves
Quitato 1
Quitumba 1 Quitumbo 1
Quiuama 1 Quivava 1
Quizamba 1 Quogoma 1
Qusaca 1 Rebolo 1
Rio 3 Saca 1
Sacabuqueste 1 Samba 1
Sambo 20 Sambos 2
São Tomé 1 Seles 24
Sertão 2 Sertão de Benguela 14
Sertão de Luanda 3 Silamba 1
Songo 7 Soulo 1
Suboelo 1 Sumbe 4
Sumbo 1 Talagoce 1
Tende 1 Tendi 1
Tenguere 1 Ucongae 1
Uhande 1 Uhembo 1
Uhila 2 Umbe 1
Ussoque 1
257

Table B.18 (Cont.)
Designations of origin Number of slaves
Utona 3
Utono 2 Zanzimbar 1
Zenza 1 Zucaca 1
Zuibula 1 Unspecified 35
Total 2588
Sources: AHNA, Registro de Escravos de Benguela, cod. 3160.
Table B.19 – Designations of Origin Available in the Slave Register of Luanda, 1855-1856
Designations of origin Number of slaves
Ambaca 331 Ambris 1
Ambriz 60 Ambrizete 1
Andulo 3 Angola 60
Anguille 1 Bailundo 17
Bambo 1 Bangla 3
Bembe 6 Bengo 80
Benguela 60 Benguela Velha 1
Benguella 24 Bie 99
Bihé 71 Bimba 1
258

Table B.19 (Cont.)
Designations of origin Number of slaves
Bimbe 8
Bimbi 1 Boma 4
Bombe 1 Bondo 21
Bongo 1 Bumbe 1
Bumbo 2 Cabinda 21
Cabocassa 1 Caboco 2
Caboco Cabiri 4 Cabunda 3
Caconda 1 Caconje 2
Cacuaco 2 Caculo 4
Cadumbe 1 Caenda 1
Caginga 3 Calambo 1
Calanaula 1 Calandula 102
Calandule 3 Calandulo 1
Calumbo 38 Calunda 3
Calundo 1 Calundula 30
Cambambe 13 Cambande 3
Cambe 5 Cambua Pungo Andongo 1
Cancuye 1
Candambe 1 Cande 2
259

Table B.19 (Cont.)
Designations of origin Number of slaves
Candumbe 1
Capanga 4 Caquango 1
Caquila 1 Casanga 5
Casongo 1 Cassane 1
Cassange 160 Cassanje 279
Cassongo 1 Catandula 6
Catinda 1 Catumba 1
Catumbo 1 Cauige 1
Caxillo 1 Cazanga 6
Cazengo 286 Cazengue 1
Chinge 2 Chovi 1
Colunda 1 Congo 1641
Corobala 1 Criolo 1
Cuango 4 Cuanza 1
Cubinga 1 Culonde 1
Cuque 1 Cuquim 1
Cuso 1 Dambe 2
Dande 49 Demba 1
Dembos 13
260

Table B.19 (Cont.)
Designations of origin Number of slaves
Dombe 2
Donde 2 Dondo 8
Dongo 2 Dulo 1
Duque 8 Duque de Bragança 2
Encoge 14 Encoje 34
Funda 1 Galenga 1
Gangahé 1 Ganguela 5
Ganguella 1 Geja 1
Ginga 393 Ginge 11
Gola 1 Golungo 8
Golungo Alto 28 Guibala 1
Guilenges 1 Guilengues 5
Gumba 1 Hairy 1
Hambo 1 Hari-Huiga 1
Hojol 2 Holo 1
Huengo 1 Hungo 1
Icollo e Bengo 1 Icolo 30
Icolo e Bengo 4 Ilha 75
Ilha de Cazanga 3
261

Table B.19 (Cont.)
Designations of origin Number of slaves
Ilha de Mussulo 1
Ilha do Cabo 8 Ilha do Desterro 4
Ilhas 3 Ilhas Adjacentes 1
Lacunda 1 Lemba 1
Lembe 1 Libollo 41
Libolo 365 Libongo 9
Loanda 241 Loango 1
Lovar 1 Luanda 421
Luango 1 Lubale 6
Luballe 4 Lucala 4
Lucunda 1 Lucuye 1
Lumbe 1 Lunda 73
Luvalle 1 Luvar 1
Luxime 1 Mabamba 1
Mabuco 2 Mabumbo 14
Macoca 1 Maçongo 1
Macuta 1 Magomba 1
Mahungo 11 Malanje 1
Malumbo 1
262

Table B.19 (Cont.)
Designations of origin Number of slaves
Malunga 1
Mambumbo 1 Manengo 1
Mapuco 1 Massangano 47
Massango 2 Massongo 3
Matemo 2 Matiambo 3
Matiamvo 5 Matianvo 8
Matumbo 2 Maungo 1
Mobumba 1 Mobumbo 5
Moçambique 1 Moçâmedes 2
Moceque 13 Molembo 1
Molua 2 Molue 4
Moluz 12 Monengo 1
Mongolo 2 Monjolo 4
Morro da Cruz 5 Mossamedes 1
Mosseque 1 Motembo 3
Motemo 9 Mubomba 1
Mubumba 1 Mubumbo 17
Mucenie 1 Muenge 1
Mugenga 1
263

Table B.19 (Cont.)
Designations of origin Number of slaves
Mugongo 1
Muhuo 1 Muicanga 1
Mujol 1 Mujolo 4
Mulua 58 Mulue 20
Mulumbo 1 Muluz 1
Mungulo 1 Munjollo 1
Munta-a-Gombe 1 Mussango 1
Musseque 5 Mussonyemo 1
Mussulo 1 Mutamo 3
Mutembo 1 Mutemo 42
Mutumbo 2 Mutumo 2
Muxiconga 3 Muxicongo 24
Muxima 6 Nbumbo 1
Ngala 1 Ngola 316
Ngola Calunga 1 Ngolagumba 1
Ngolla 3 Ngolo 1
Ngonga 1 Novo Redondo 23
Pedra de Encoje 4 Pernambuco 1
Pungo Andongo 27
264

Table B.19 (Cont.)
Designations of origin Number of slaves
Quango 6
Quanza 21 Quiaca 1
Quibala 10 Quibale 3
Quiballa 1 Quibele 1
Quiconda 1 Quiengue 2
Quifangondo 1 Quilamba 1
Quilemba 1 Quilengues 7
Quilunda 2 Quimbe 1
Quinania 1 Quingale 1
Quioco 1 Quisembi 1
Quissama 387 Quissamba 2
Quissengue 2 Quitala 1
Rio de Janeiro 1 Rio Ginga 1
Salvador 1 Samba 9
Sangi 1 São José de Encoge 1
São Tomé 1 Sarra 1
Seiye 3 Selle 1
Senge 1 Senha 1
Seniye 2
265

Table B.19 (Cont.)
Designations of origin Number of slaves
Soco 1
Songa 1 Songo 48
Songue 1 Sosso 2
Subala 1 Sumbo 1
Sunde 1 Sunje 1
Tala Mugongo 2 Talla Maxingo 1
Tambo 1 Tombo 7
Ungo 3 Xinge 5
Zaire 1 Zenco 1
Zenza 14 Zenza do Golungo 7
Zombo 2 Zuaze 1
Zubala 1 Zulunda 1
Zunza 1 Unspecified 740
Total 7522
Sources: AHNA, Registro de Escravos de Luanda, cod. 2467, 2482,
2524, 2845, 2862, 3186, 3254, 3260 and box 135.
266

Table B.20 – Designations of Origin Available in the Slave Register of Novo Redondo, 1855-
1856
Designations of origin Number of slaves
Ambaca 19
Ambriz 2 Ambuim 322
Ambuima 1 Anambo 1
Angola 13 Bailundo 5
Bamangala 1 Benguela 3
Benguela Velha 2 Bié 43
Buto Curinde 1 Cahi 1
Cai 1 Calundula 1
Calungo 1 Caqui 1
Cassambe 1 Cassambo sem Peles 1
Cassanje 34 Cassenda 1
Cassuca 1 Cassucia 1
Catumbe 1 Caucia 1
Ceiro 1 Coango 1
Coanza 1 Columba 1
Congo 13 Copanza 1
Cuso 1 Cuvo 1
Dande 3
267

Table B.20 (Cont.)
Designations of origin Number of slaves
Dembo 1
Dombo 1 Donga 1
Duque de Bragança 1 Egito 1
Encoje 3 Ganguela 5
Ginga 20 Gola 7
Golungo Alto 1 Gonga 1
Gongo 1 Gunza 2
Himba 6 Hombe 125
Humbe 3 Humbe a Hengue 2
Libolo 56 Libongo 2
Luanda 26 Lubar 3
Mahombe 2 Mahungo 1
Maiombe 1 Massangano 1
Mationgo 1 Mohambe 7
Mohumbe 6 Mossambe 10
Mossule 1 Mossumba 1
Mossumbe 28 Moxicongo 1
Muambe 1 Mucambo 1
Mucile 1
268

Table B.20 (Cont.)
Designations of origin Number of slaves
Muhombe 3
Mulua 3 Mulue 2
Mussambo 1 Muxicongo 5
Nano 15 Novo Redondo 28
Poaia 1 Pungo 1
Pungo Andongo 4 Quatar 1
Quibala 3 Quibingula 1
Quibussinta 1 Quicombo 16
Quilengues de Benguela 2 Quilunda 12
Quimbundo 1 Quipala 4
Quissama 20 Quissaquesa 2
Quissaquina 1 Seles 83
Songo 4 Sumbe 5
Tanda 1 Tunda 99
Zenzua 1 Unspecified 21
Total 1154
Sources: AHNA, Registro de Escravos de Novo Redondo, cod.
2830.
269

Esti
mat
es
Tab
le B
.21
– E
stim
ated
Num
ber
of S
lave
s E
mba
rked
from
the
Por
ts N
orth
of L
uan
da b
y L
ingu
isti
c an
d E
thn
ic G
roup
s, 1
831-
1855
Port
of
emba
rkat
ion
Impu
ted
lingu
isti
c gr
oup
Impu
ted
ethn
ic
grou
p E
thno
nym
re
cord
ed
Num
ber
of
indi
vidu
als
liste
d E
stim
ated
nu
mbe
r of
sla
ves
Am
briz
K
imbu
ndu
Hol
o M
aolo
1
262
Am
briz
K
imbu
ndu
Kad
i Ca
ré
1 26
2 A
mbr
iz
Kim
bund
u K
asam
ba
Cura
mba
1
262
Am
briz
K
imbu
ndu
Kas
anje
Ca
ssan
ge
13
3,41
2 A
mbr
iz
Kim
bund
u K
isam
a G
uisa
má
1 26
2 A
mbr
iz
Kim
bund
u K
isam
a Qu
içam
á 1
262
Am
briz
K
imbu
ndu
Kis
ama
Quis
amá
1 26
2 A
mbr
iz
Kim
bund
u Li
bolo
R
ebol
a 3
787
Am
briz
K
imbu
ndu
Libo
lo
Reb
olo
17
4,46
2 A
mbr
iz
Kim
bund
u M
bund
u Ca
bond
a 1
262
Am
briz
K
imbu
ndu
Pend
e M
oben
de
1 26
2 A
mbr
iz
Kik
ongo
D
ange
D
ange
2
525
Am
briz
K
ikon
go
Dan
ge
Mia
nge
10
2,62
5 A
mbr
iz
Kik
ongo
D
ange
M
oang
e 8
2,10
0 A
mbr
iz
Kik
ongo
M
bam
ba
Bam
ba
1 26
2
270

Tab
le B
.21
(Con
t.)
Port
of
emba
rkat
ion
Impu
ted
lingu
isti
c gr
oup
Impu
ted
ethn
ic
grou
p E
thno
nym
re
cord
ed
Num
ber
of
indi
vidu
als
liste
d E
stim
ated
nu
mbe
r of
sla
ves
Am
briz
K
ikon
go
Mba
mba
N
obam
ba
1 26
2
Am
briz
K
ikon
go
Mba
mba
Qu
ibom
bo
1 26
2
Am
briz
K
ikon
go
Mbe
mbe
B
enbe
2
525
Am
briz
K
ikon
go
Mbe
mbe
B
oben
be
1 26
2
Am
briz
K
ikon
go
Mbe
mbe
Cu
benb
a 1
262
Am
briz
K
ikon
go
Mbe
mbe
M
oben
be
2 52
5
Am
briz
K
ikon
go
Ngo
yo
Oio
1 26
2 A
mbr
iz
Kik
ongo
N
sons
o So
so
2 52
5
Am
briz
K
ikon
go
Nsu
ndi
Mos
sund
e 16
4,
199
Am
briz
K
ikon
go
Nsu
ndi
Sund
e 25
6,
561
Am
briz
K
ikon
go
Pum
bu
Capo
nbo
1 26
2 A
mbr
iz
Kik
ongo
So
long
o Cu
solo
ngo
1 26
2
Am
briz
K
ikon
go
Solo
ngo
Mos
soro
ngo
1 26
2 A
mbr
iz
Kik
ongo
So
long
o So
yo
1 26
2
Am
briz
K
ikon
go
Suku
M
ozec
o 1
262
Am
briz
K
ikon
go
Yak
a M
iaca
2
525
Am
briz
K
ikon
go
Yak
a M
uiac
a 18
4,
724
Am
briz
K
ikon
go
Yak
a Ti
aca
2 52
5
Am
briz
K
ota
Okot
a M
ocut
a 2
525
Am
briz
K
unyi
K
unyi
Cu
nhe
2 52
5
Am
briz
K
unyi
K
unyi
M
icun
he
2 52
5 A
mbr
iz
Kun
yi
Kun
yi
Moc
anhe
1
262
Am
briz
K
unyi
K
unyi
M
ocun
he
15
3,93
7
271

Tab
le B
.21
(Con
t.)
Port
of
emba
rkat
ion
Impu
ted
lingu
isti
c gr
oup
Impu
ted
ethn
ic
grou
p E
thno
nym
re
cord
ed
Num
ber
of
indi
vidu
als
liste
d E
stim
ated
nu
mbe
r of
sla
ves
Am
briz
K
unyi
K
unyi
M
ucun
he
2 52
5
Am
briz
Lu
mbu
Lu
mbu
Lo
mba
1
262
Am
briz
Lu
mbu
Lu
mbu
Lu
nbo
1 26
2 A
mbr
iz
Lum
bu
Lum
bu
Mol
ombo
1
262
Am
briz
Lu
mbu
Lu
mbu
M
olum
bo
1 26
2 A
mbr
iz
Lum
bu
Lum
bu
Mol
unbo
2
525
Am
briz
N
dong
a N
kusu
N
ocos
o 1
262
Am
briz
N
jebi
N
zabi
M
ozab
e 24
6,
299
Am
briz
N
khum
bi
Nkh
umbi
Cu
mba
2
525
Am
briz
R
uund
Lu
nda
Mal
liava
1
262
Am
briz
Te
ke
Tio
Mit
eca
1 26
2 A
mbr
iz
Teke
Ti
o M
iteq
ue
25
6,56
1
Am
briz
Te
ke
Tio
Moj
olo
2 52
5 A
mbr
iz
Teke
Ti
o M
onjo
lo
54
14,1
73
Am
briz
Te
ke
Tio
Mut
eca
52
13,6
48
Am
briz
Te
ke
Tio
Mut
eque
4
1,05
0
Am
briz
Te
ke
Tio
Quin
tequ
e 4
1,05
0 A
mbr
iz
Teke
Ti
o Qu
iteq
ue
9 2,
362
Am
briz
Te
ke
Tsin
tseg
e M
ozen
iga
1 26
2 A
mbr
iz
Teke
Ts
ints
ege
Mut
inig
a 1
262
Am
briz
U
mbu
ndu
Kak
onda
Co
nda
1 26
2 A
mbr
iz
Um
bund
u K
ikum
a Ca
com
a 1
262
272

Tab
le B
.21
(Con
t.)
Port
of
emba
rkat
ion
Impu
ted
lingu
isti
c gr
oup
Impu
ted
ethn
ic
grou
p E
thno
nym
re
cord
ed
Num
ber
of
indi
vidu
als
liste
d E
stim
ated
nu
mbe
r of
sla
ves
Am
briz
U
mbu
ndu
Ndo
mbe
D
omba
1
262
Am
briz
U
mbu
ndu
Viy
e B
ié
1 26
2
Am
briz
Y
ansi
M
uyan
ji M
oian
ge
8 2,
100
Am
briz
Y
ombe
Y
ombe
B
iom
ba
1 26
2
Am
briz
Y
ombe
Y
ombe
M
aion
be
19
4,98
7 A
mbr
iz
Yom
be
Yom
be
Mal
anba
1
262
Am
briz
Y
ombe
Y
ombe
M
einb
o 1
262
Am
briz
Y
ombe
Y
ombe
M
iom
be
14
3,67
4
Am
briz
Y
ombe
Y
ombe
M
iom
bo
6 1,
575
Am
briz
Y
ombe
Y
ombe
M
ionb
e 3
787
Am
briz
Y
ombe
Y
ombe
M
oiom
ba
2 52
5 A
mbr
iz
Yom
be
Yom
be
Moi
ombe
1
262
Am
briz
Y
ombe
Y
ombe
M
oiom
bo
11
2,88
7 A
mbr
iz
Yom
be
Yom
be
Moi
onbo
1
262
Cong
o R
iver
B
angi
K
anga
Co
ngo
Cang
a 1
262
Cong
o R
iver
B
angi
N
gele
Co
ngo
Gue
le
1 26
2
Cong
o R
iver
K
imbu
ndu
Ndo
ngo
Cong
o B
ango
la
1 26
2 Co
ngo
Riv
er
Kim
bund
u N
dong
o Co
ngo
Cola
1
262
Cong
o R
iver
K
imbu
ndu
Ndo
ngo
Cong
o M
ondo
ngo
7 1,
837
Cong
o R
iver
K
imbu
ndu
Ndo
ngo
Cong
o Qu
isad
onga
1
262
Cong
o R
iver
K
imbu
ndu
Njin
ga
Cong
o G
inga
3
787
273

Tab
le B
.21
(Con
t.)
Port
of
emba
rkat
ion
Impu
ted
lingu
isti
c gr
oup
Impu
ted
ethn
ic
grou
p E
thno
nym
re
cord
ed
Num
ber
of
indi
vidu
als
liste
d E
stim
ated
nu
mbe
r of
sla
ves
Cong
o R
iver
K
imbu
ndu
Njin
ga
Cong
o M
ucin
ga
1 26
2
Cong
o R
iver
K
ikon
go
Kak
ongo
Co
ngo
Conc
he
1 26
2
Cong
o R
iver
K
ikon
go
Kak
ongo
Co
ngo
Gon
go
1 26
2 Co
ngo
Riv
er
Kik
ongo
K
ongo
Co
ngo
Ban
sa
1 26
2
Cong
o R
iver
K
ikon
go
Kon
go
Cong
o M
usic
ongo
1
262
Cong
o R
iver
K
ikon
go
Kon
go
Cong
o R
eal
2 52
5
Cong
o R
iver
K
ikon
go
Kon
go
Mus
icon
go
3 78
7 Co
ngo
Riv
er
Kik
ongo
Le
mba
Co
ngo
Lem
ba
3 78
7
Cong
o R
iver
K
ikon
go
Mad
imba
Co
ngo
Mud
imba
1
262
Cong
o R
iver
K
ikon
go
Mba
mba
Co
ngo
Bam
ba
2 52
5
Cong
o R
iver
K
ikon
go
Mpa
ngu
Cong
o A
ntpa
ango
1
262
Cong
o R
iver
K
ikon
go
Nla
za
Cong
o E
nlas
a 1
262
Cong
o R
iver
K
ikon
go
Nla
za
Cong
o M
onla
so
1 26
2 Co
ngo
Riv
er
Kik
ongo
N
sons
o Co
ngo
Choc
ho
3 78
7
Cong
o R
iver
K
ikon
go
Nso
nso
Cong
o D
amba
8
2,10
0 Co
ngo
Riv
er
Kik
ongo
N
sons
o Co
ngo
Ens
uso
1 26
2
Cong
o R
iver
K
ikon
go
Nso
nso
Cong
o So
zo
1 26
2 Co
ngo
Riv
er
Kik
ongo
N
sund
i Co
ngo
Mus
undi
7
1,83
7
Cong
o R
iver
K
ikon
go
Okan
go
Cong
o Ca
ngo
3 78
7 Co
ngo
Riv
er
Kik
ongo
Su
ku
Cong
o D
ensu
co
1 26
2
Cong
o R
iver
K
ikon
go
Suku
Co
ngo
Ens
uca
1 26
2 Co
ngo
Riv
er
Kik
ongo
Su
ku
Cong
o E
nsum
ga
1 26
2
Cong
o R
iver
K
ikon
go
Suku
Co
ngo
Suca
1
262
274

Tab
le B
.21
(Con
t.)
Port
of
emba
rkat
ion
Impu
ted
lingu
isti
c gr
oup
Impu
ted
ethn
ic
grou
p E
thno
nym
re
cord
ed
Num
ber
of
indi
vidu
als
liste
d E
stim
ated
nu
mbe
r of
sla
ves
Cong
o R
iver
K
ikon
go
Yak
a Co
ngo
Llan
ga
1 26
2
Cong
o R
iver
K
ikon
go
Zom
bo
Cong
o E
som
be
1 26
2
Cong
o R
iver
Lu
mbu
Lu
mbu
Co
ngo
Lom
bo
1 26
2 Co
ngo
Riv
er
Tote
la
Tote
la
Cong
o To
tela
1
262
Cong
o R
iver
V
ili
Loan
go
Cong
o B
iri
2 52
5 Co
ngo
Riv
er
Vili
Lo
ango
Co
ngo
Luan
go
6 1,
575
Cong
o R
iver
Y
ombe
Y
ombe
Co
ngo
Moy
ombe
8
2,10
0 Co
ngo
Riv
er
Yom
be
Yom
be
Cong
o M
ullo
mbe
5
1,31
2
Loan
go
Kim
bund
u N
dong
o Co
ngo
Mon
dong
o 35
5 93
,173
Lo
ango
K
ikon
go
Nsu
ndi
Cong
o M
usun
di
116
30,4
45
Loan
go
Vili
Lo
ango
Co
ngo
Luan
go
118
30,9
70
Loan
go
Yom
be
Yom
be
Cong
o M
ullo
mbe
7
1,83
7
May
umba
K
ikon
go
Lem
ba
Cong
o Le
mba
2
525
May
umba
K
ikon
go
Nsu
ndi
Cong
o M
usun
di
11
2,88
7
May
umba
V
ili
Loan
go
Cong
o Lu
ango
31
8,
136
May
umba
Y
ombe
Y
ombe
Co
ngo
Moy
ombe
2
525
May
umba
Y
ombe
Y
ombe
Co
ngo
Mul
lom
be
42
11,0
23
Tota
l
1,19
4 31
3,37
5
Not
e: S
ee C
hapt
er T
hree
for
furt
her
deta
ils o
n th
e es
tim
ates
pro
cedu
res.
Sour
ces:
Tab
les
B.1
to B
.20.
275

Tab
le B
.22
– E
stim
ated
Num
ber
of S
lave
s E
mba
rked
from
Lua
nda
by
Lin
guis
tic
and
Eth
nic
Gro
ups,
183
1-18
55
Port
of
emba
rkat
ion
Impu
ted
lingu
isti
c gr
oup
Impu
ted
ethn
ic
grou
p E
thno
nym
re
cord
ed
Num
ber
of
indi
vidu
als
liste
d E
stim
ated
nu
mbe
r of
sla
ves
Luan
da
Cokw
e Co
kwe
Chov
i 1
87
Luan
da
Cokw
e Co
kwe
Quio
co
1 87
Luan
da
Kim
bund
u B
ondo
B
ondo
21
1,
818
Luan
da
Kim
bund
u H
olo
Hol
o 1
87
Luan
da
Kim
bund
u H
ungo
H
ungo
1
87
Luan
da
Kim
bund
u H
ungo
M
ahun
go
11
952
Luan
da
Kim
bund
u H
ungo
M
aung
o 1
87
Luan
da
Kim
bund
u H
ungo
U
ngo
3 26
0
Luan
da
Kim
bund
u K
adi
Hai
ry
1 87
Lu
anda
K
imbu
ndu
Kad
i H
ari-H
uiga
1
87
Luan
da
Kim
bund
u K
alan
dula
Ca
lana
ula
1 87
Lu
anda
K
imbu
ndu
Kal
andu
la
Cala
ndul
a 10
2 8,
830
Luan
da
Kim
bund
u K
alan
dula
Ca
land
ule
3 26
0 Lu
anda
K
imbu
ndu
Kal
andu
la
Cala
ndul
o 1
87
Luan
da
Kim
bund
u K
alan
dula
Ca
lund
ula
30
2,59
7 Lu
anda
K
imbu
ndu
Kal
andu
la
Cata
ndul
a 6
519
Luan
da
Kim
bund
u K
asan
je
Ban
gla
3 26
0 Lu
anda
K
imbu
ndu
Kas
anje
Ca
ssan
e 1
87
Luan
da
Kim
bund
u K
asan
je
Cass
ange
48
3 41
,813
276

Tab
le B
.22
(Con
t.)
Port
of
emba
rkat
ion
Impu
ted
lingu
isti
c gr
oup
Impu
ted
ethn
ic
grou
p E
thno
nym
re
cord
ed
Num
ber
of
indi
vidu
als
liste
d E
stim
ated
nu
mbe
r of
sla
ves
Luan
da
Kim
bund
u K
ipal
a Co
roba
la
1 87
Luan
da
Kim
bund
u K
ipal
a G
uiba
la
1 87
Luan
da
Kim
bund
u K
ipal
a Qu
ibal
a 10
86
6 Lu
anda
K
imbu
ndu
Kip
ala
Quib
ale
3 26
0
Luan
da
Kim
bund
u K
ipal
a Qu
ibal
la
1 87
Lu
anda
K
imbu
ndu
Kip
ala
Suba
la
1 87
Luan
da
Kim
bund
u K
ipal
a Zu
bala
1
87
Luan
da
Kim
bund
u K
isam
a Qu
isam
a 3
260
Luan
da
Kim
bund
u K
isam
a Qu
isam
á 8
693
Luan
da
Kim
bund
u K
isam
a Qu
issa
ma
390
33,7
63
Luan
da
Kim
bund
u Li
bolo
Li
bollo
41
3,
549
Luan
da
Kim
bund
u Li
bolo
Li
bolo
36
5 31
,598
Luan
da
Kim
bund
u Li
bolo
R
ebol
a 7
606
Luan
da
Kim
bund
u Li
bolo
R
ebol
lo
10
866
Luan
da
Kim
bund
u Li
bolo
R
ebol
o 91
7,
878
Luan
da
Kim
bund
u Lu
nga
Mal
unga
1
87
Luan
da
Kim
bund
u M
bund
u Ca
bund
a 3
260
Luan
da
Kim
bund
u M
bund
u Ca
bund
á 3
260
Luan
da
Kim
bund
u N
dem
bu
Cam
ba
1 87
Lu
anda
K
imbu
ndu
Nde
mbu
D
emba
1
87
277

Tab
le B
.22
(Con
t.)
Port
of
emba
rkat
ion
Impu
ted
lingu
isti
c gr
oup
Impu
ted
ethn
ic
grou
p E
thno
nym
re
cord
ed
Num
ber
of
indi
vidu
als
liste
d E
stim
ated
nu
mbe
r of
sla
ves
Luan
da
Kim
bund
u N
dem
bu
Dem
bos
13
1,12
5
Luan
da
Kim
bund
u N
dem
bu
Gum
ba
1 87
Luan
da
Kim
bund
u N
dem
bu
Mab
amba
1
87
Luan
da
Kim
bund
u N
dem
bu
Mag
omba
1
87
Luan
da
Kim
bund
u N
dong
o Ca
mon
dong
o 1
87
Luan
da
Kim
bund
u N
dong
o Ca
mun
dong
o 1
87
Luan
da
Kim
bund
u N
dong
o D
ongo
2
173
Luan
da
Kim
bund
u N
dong
o G
ola
1 87
Luan
da
Kim
bund
u N
dong
o M
ongo
lo
2 17
3 Lu
anda
K
imbu
ndu
Ndo
ngo
Mun
gulo
1
87
Luan
da
Kim
bund
u N
dong
o N
gola
31
6 27
,356
Lu
anda
K
imbu
ndu
Ndo
ngo
Ngo
la C
alun
ga
1 87
Luan
da
Kim
bund
u N
dong
o N
gola
gum
ba
1 87
Lu
anda
K
imbu
ndu
Ndo
ngo
Ngo
lla
3 26
0
Luan
da
Kim
bund
u N
dong
o N
golo
1
87
Luan
da
Kim
bund
u N
jinga
Ca
ging
a 3
260
Luan
da
Kim
bund
u N
jinga
Ca
mba
nde
3 26
0 Lu
anda
K
imbu
ndu
Njin
ga
Gin
ga
393
34,0
22
Luan
da
Kim
bund
u N
jinga
G
inge
11
95
2 Lu
anda
K
imbu
ndu
Njin
ga
Mug
enga
1
87
Luan
da
Kim
bund
u N
tem
o M
atem
o 2
173
Luan
da
Kim
bund
u N
tem
o M
otem
o 9
779
278

Tab
le B
.22
(Con
t.)
Port
of
emba
rkat
ion
Impu
ted
lingu
isti
c gr
oup
Impu
ted
ethn
ic
grou
p E
thno
nym
re
cord
ed
Num
ber
of
indi
vidu
als
liste
d E
stim
ated
nu
mbe
r of
sla
ves
Luan
da
Kim
bund
u N
tem
o M
utam
o 3
260
Luan
da
Kim
bund
u N
tem
o M
utem
o 42
3,
636
Luan
da
Kim
bund
u Sh
inje
Ch
inge
2
173
Luan
da
Kim
bund
u Sh
inje
X
inge
5
433
Luan
da
Kim
bund
u So
ngo
Caso
ngo
1 87
Lu
anda
K
imbu
ndu
Song
o Ca
sson
go
1 87
Luan
da
Kim
bund
u So
ngo
Maç
ongo
1
87
Luan
da
Kim
bund
u So
ngo
Mas
sang
o 2
173
Luan
da
Kim
bund
u So
ngo
Mas
song
o 3
260
Luan
da
Kim
bund
u So
ngo
Mus
sang
o 1
87
Luan
da
Kim
bund
u So
ngo
Song
a 3
260
Luan
da
Kim
bund
u So
ngo
Song
o 53
4,
588
Luan
da
Kim
bund
u So
ngo
Song
ue
1 87
Lu
anda
K
ikon
go
Dan
ge
Moa
nge
12
1,03
9
Luan
da
Kik
ongo
K
akon
go
Mug
ongo
1
87
Luan
da
Kik
ongo
K
ongo
Co
ngoa
1
87
Luan
da
Kik
ongo
K
ongo
M
uxic
onga
3
260
Luan
da
Kik
ongo
K
ongo
M
uxic
ongo
24
2,
078
Luan
da
Kik
ongo
M
bam
ba
Bam
ba
9 77
9 Lu
anda
K
ikon
go
Mba
mba
B
ambo
1
87
279
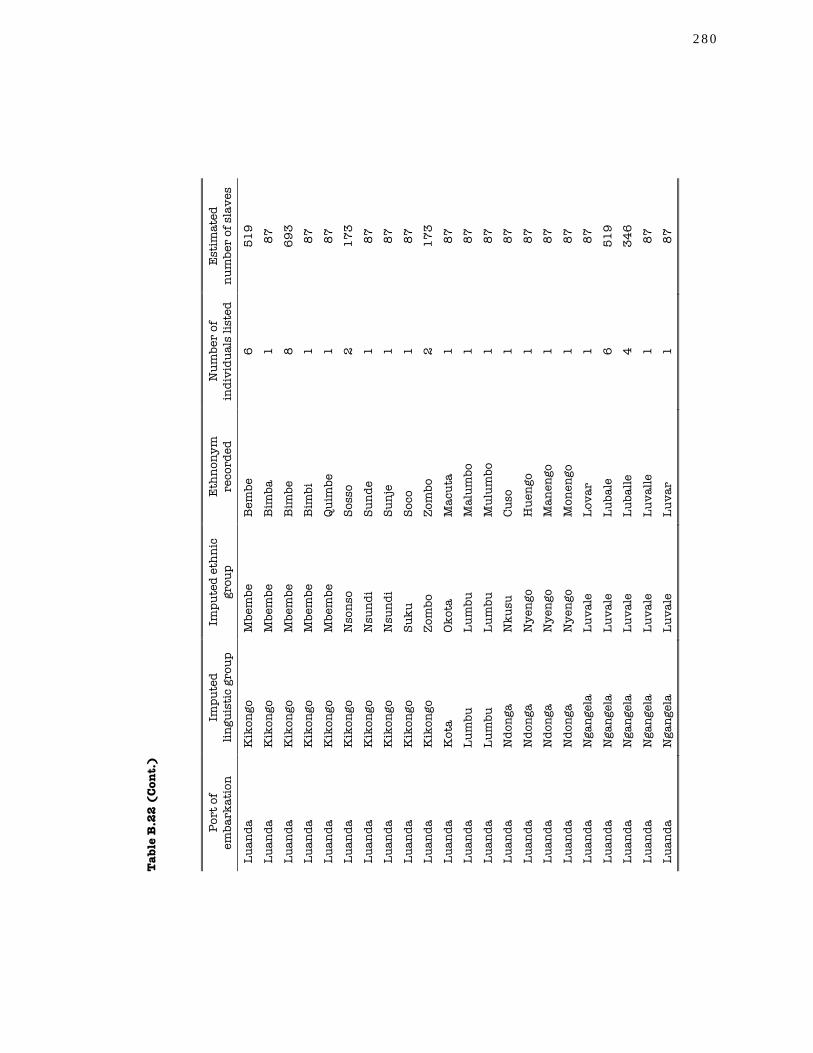
Tab
le B
.22
(Con
t.)
Port
of
emba
rkat
ion
Impu
ted
lingu
isti
c gr
oup
Impu
ted
ethn
ic
grou
p E
thno
nym
re
cord
ed
Num
ber
of
indi
vidu
als
liste
d E
stim
ated
nu
mbe
r of
sla
ves
Luan
da
Kik
ongo
M
bem
be
Bem
be
6 51
9
Luan
da
Kik
ongo
M
bem
be
Bim
ba
1 87
Luan
da
Kik
ongo
M
bem
be
Bim
be
8 69
3 Lu
anda
K
ikon
go
Mbe
mbe
B
imbi
1
87
Luan
da
Kik
ongo
M
bem
be
Quim
be
1 87
Lu
anda
K
ikon
go
Nso
nso
Soss
o 2
173
Luan
da
Kik
ongo
N
sund
i Su
nde
1 87
Lu
anda
K
ikon
go
Nsu
ndi
Sunj
e 1
87
Luan
da
Kik
ongo
Su
ku
Soco
1
87
Luan
da
Kik
ongo
Zo
mbo
Zo
mbo
2
173
Luan
da
Kot
a Ok
ota
Mac
uta
1 87
Lu
anda
Lu
mbu
Lu
mbu
M
alum
bo
1 87
Luan
da
Lum
bu
Lum
bu
Mul
umbo
1
87
Luan
da
Ndo
nga
Nku
su
Cuso
1
87
Luan
da
Ndo
nga
Nye
ngo
Hue
ngo
1 87
Lu
anda
N
dong
a N
yeng
o M
anen
go
1 87
Luan
da
Ndo
nga
Nye
ngo
Mon
engo
1
87
Luan
da
Nga
ngel
a Lu
vale
Lo
var
1 87
Luan
da
Nga
ngel
a Lu
vale
Lu
bale
6
519
Luan
da
Nga
ngel
a Lu
vale
Lu
balle
4
346
Luan
da
Nga
ngel
a Lu
vale
Lu
valle
1
87
Luan
da
Nga
ngel
a Lu
vale
Lu
var
1 87
280

Tab
le B
.22
(Con
t.)
Port
of
emba
rkat
ion
Impu
ted
lingu
isti
c gr
oup
Impu
ted
ethn
ic
grou
p E
thno
nym
re
cord
ed
Num
ber
of
indi
vidu
als
liste
d E
stim
ated
nu
mbe
r of
sla
ves
Luan
da
Nga
ngel
a N
gang
ela
Gan
gahé
1
87
Luan
da
Nga
ngel
a N
gang
ela
Gan
guel
a 5
433
Luan
da
Nga
ngel
a N
gang
ela
Gan
guel
la
1 87
Lu
anda
N
khum
bi
Nkh
umbi
Co
mba
16
1,
385
Luan
da
Nya
neka
K
ileng
e G
uile
nges
1
87
Luan
da
Nya
neka
K
ileng
e G
uile
ngue
s 5
433
Luan
da
Nya
neka
K
ileng
e Qu
ileng
ues
7 60
6 Lu
anda
R
uund
Lu
nda
Calu
nda
6 52
0
Luan
da
Ruu
nd
Lund
a Ca
lund
o 1
87
Luan
da
Ruu
nd
Lund
a Co
lund
a 1
87
Luan
da
Ruu
nd
Lund
a Lu
nda
73
6,32
0 Lu
anda
R
uund
Lu
nda
Mat
iam
bo
3 26
0
Luan
da
Ruu
nd
Lund
a M
atia
mvo
5
433
Luan
da
Ruu
nd
Lund
a M
atia
nvo
8 69
3
Luan
da
Ruu
nd
Lund
a M
olua
2
173
Luan
da
Ruu
nd
Lund
a M
olue
4
346
Luan
da
Ruu
nd
Lund
a M
oluz
12
1,
039
Luan
da
Ruu
nd
Lund
a M
ulua
58
5,
021
Luan
da
Ruu
nd
Lund
a M
ulue
20
1,
731
Luan
da
Ruu
nd
Lund
a M
uluz
1
87
Luan
da
Ruu
nd
Lund
a Qu
ilund
a 2
173
281
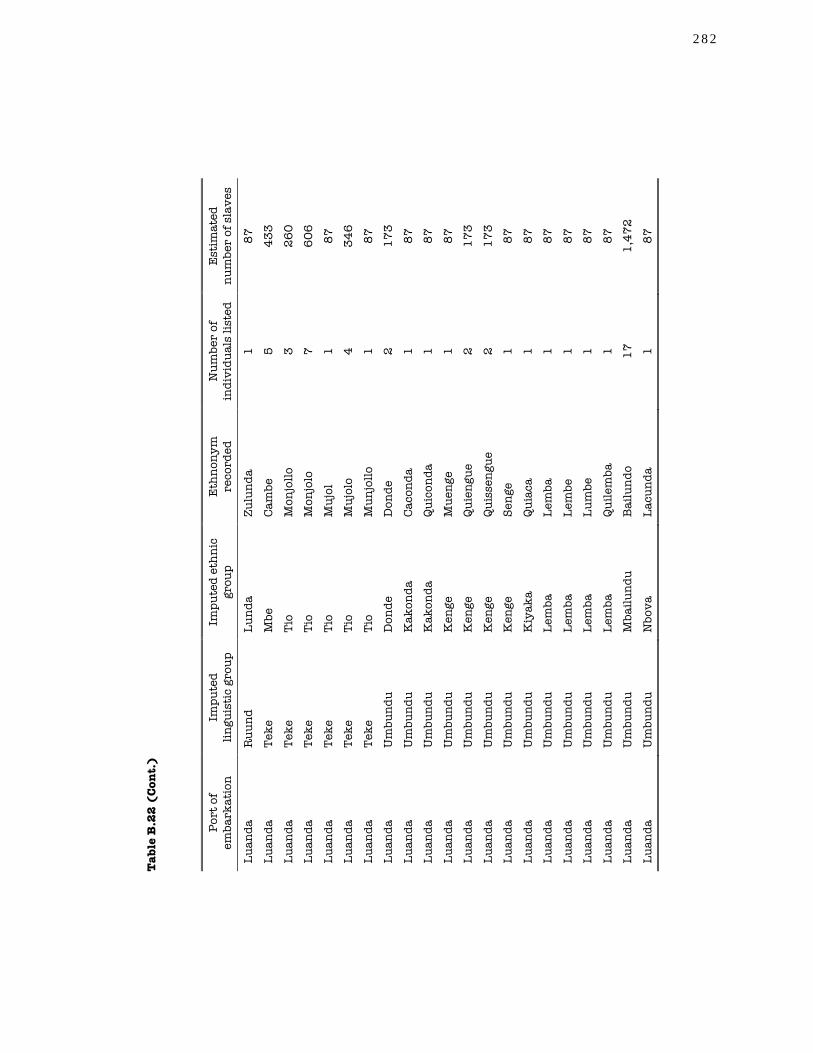
Tab
le B
.22
(Con
t.)
Port
of
emba
rkat
ion
Impu
ted
lingu
isti
c gr
oup
Impu
ted
ethn
ic
grou
p E
thno
nym
re
cord
ed
Num
ber
of
indi
vidu
als
liste
d E
stim
ated
nu
mbe
r of
sla
ves
Luan
da
Ruu
nd
Lund
a Zu
lund
a 1
87
Luan
da
Teke
M
be
Cam
be
5 43
3
Luan
da
Teke
Ti
o M
onjo
llo
3 26
0 Lu
anda
Te
ke
Tio
Mon
jolo
7
606
Luan
da
Teke
Ti
o M
ujol
1
87
Luan
da
Teke
Ti
o M
ujol
o 4
346
Luan
da
Teke
Ti
o M
unjo
llo
1 87
Lu
anda
U
mbu
ndu
Don
de
Don
de
2 17
3
Luan
da
Um
bund
u K
akon
da
Caco
nda
1 87
Lu
anda
U
mbu
ndu
Kak
onda
Qu
icon
da
1 87
Luan
da
Um
bund
u K
enge
M
ueng
e 1
87
Luan
da
Um
bund
u K
enge
Qu
ieng
ue
2 17
3
Luan
da
Um
bund
u K
enge
Qu
isse
ngue
2
173
Luan
da
Um
bund
u K
enge
Se
nge
1 87
Luan
da
Um
bund
u K
iyak
a Qu
iaca
1
87
Luan
da
Um
bund
u Le
mba
Le
mba
1
87
Luan
da
Um
bund
u Le
mba
Le
mbe
1
87
Luan
da
Um
bund
u Le
mba
Lu
mbe
1
87
Luan
da
Um
bund
u Le
mba
Qu
ilem
ba
1 87
Lu
anda
U
mbu
ndu
Mba
ilund
u B
ailu
ndo
17
1,47
2
Luan
da
Um
bund
u N
bova
La
cund
a 1
87
282

Tab
le B
.22
(Con
t.)
Port
of
emba
rkat
ion
Impu
ted
lingu
isti
c gr
oup
Impu
ted
ethn
ic
grou
p E
thno
nym
re
cord
ed
Num
ber
of
indi
vidu
als
liste
d E
stim
ated
nu
mbe
r of
sla
ves
Luan
da
Um
bund
u N
bova
Lu
cund
a 1
87
Luan
da
Um
bund
u N
dom
be
Cadu
mbe
1
87
Luan
da
Um
bund
u N
dom
be
Cand
ambe
1
87
Luan
da
Um
bund
u N
dom
be
Cand
umbe
1
87
Luan
da
Um
bund
u N
dom
be
Dam
be
2 17
3 Lu
anda
U
mbu
ndu
Ndo
mbe
D
ombe
2
173
Luan
da
Um
bund
u N
dulu
A
ndul
o 3
260
Luan
da
Um
bund
u N
dulu
D
ulo
1 87
Luan
da
Um
bund
u N
dulu
D
úlu
1 87
Lu
anda
U
mbu
ndu
Nga
lang
i G
alen
ga
1 87
Luan
da
Um
bund
u Sa
mbu
Qu
issa
mba
2
173
Luan
da
Um
bund
u Sa
mbu
Sa
mba
9
779
Luan
da
Um
bund
u Sa
mbu
Su
mbo
1
87
Luan
da
Um
bund
u Sa
nga
Casa
nga
5 43
3
Luan
da
Um
bund
u Se
le
Selle
1
87
Luan
da
Um
bund
u V
iye
Bie
99
8,
570
Luan
da
Um
bund
u V
iye
Bié
3
260
Luan
da
Um
bund
u V
iye
Bih
é 71
6,
147
Luan
da
Um
bund
u W
ambu
H
ambo
1
87
Tota
l
3,08
8 26
7,33
0
Not
e: S
ee C
hapt
er T
hree
for
deta
ils o
n th
e es
tim
ates
pro
cedu
res.
Sour
ces:
Tab
les
B.1
to B
.20.
283

Tab
le B
.23
– E
stim
ated
Num
ber
of S
lave
s E
mba
rked
from
the
Por
ts S
outh
of L
uan
da b
y L
ingu
isti
c an
d E
thn
ic G
roup
s, 1
831-
1855
Port
of
emba
rkat
ion
Impu
ted
lingu
isti
c gr
oup
Impu
ted
ethn
ic
grou
p E
thno
nym
re
cord
ed
Num
ber
of
indi
vidu
als
liste
d E
stim
ated
nu
mbe
r of
sla
ves
Ben
guel
a Co
kwe
Cokw
e Co
joco
1
56
Ben
guel
a Co
kwe
Cokw
e Co
rioc
o ou
Co
hioc
o 1
56
Ben
guel
a Co
kwe
Cokw
e Qu
ioco
1
56
Ben
guel
a Co
kwe
Cokw
e Qu
iogo
1
56
Ben
guel
a H
erer
o H
imba
M
uim
bo
1 56
B
engu
ela
Kim
bund
u H
ungo
B
lung
o 1
56
Ben
guel
a K
imbu
ndu
Hun
go
Com
baun
go
1 56
B
engu
ela
Kim
bund
u H
ungo
On
gó
1 56
Ben
guel
a K
imbu
ndu
Kad
i Ca
rom
oxin
go
1 56
B
engu
ela
Kim
bund
u K
alan
dula
Ca
lund
ula
1 56
Ben
guel
a K
imbu
ndu
Kal
andu
la
Calu
ndur
a 1
56
Ben
guel
a K
imbu
ndu
Kal
andu
la
Quis
sand
ala
1 56
Ben
guel
a K
imbu
ndu
Kal
andu
la
Quis
sand
ura
1 56
B
engu
ela
Kim
bund
u K
asan
je
Cass
ange
29
1,
624
Ben
guel
a K
imbu
ndu
Kip
ala
Cong
oia
2 11
2 B
engu
ela
Kim
bund
u K
ipal
a Cu
bala
1
56
Ben
guel
a K
imbu
ndu
Kip
ala
Goi
a 9
504
Ben
guel
a K
imbu
ndu
Kip
ala
Hun
goia
1
56
Ben
guel
a K
imbu
ndu
Kip
ala
Mon
goia
11
61
6
284

Tab
le B
.23
(Con
t.)
Port
of
emba
rkat
ion
Impu
ted
lingu
isti
c gr
oup
Impu
ted
ethn
ic
grou
p E
thno
nym
re
cord
ed
Num
ber
of
indi
vidu
als
liste
d E
stim
ated
nu
mbe
r of
sla
ves
Ben
guel
a K
imbu
ndu
Kip
ala
Mun
goia
13
72
8
Ben
guel
a K
imbu
ndu
Kip
ala
Nba
la
1 56
Ben
guel
a K
imbu
ndu
Kip
ala
Ngo
ia
5 28
0 B
engu
ela
Kim
bund
u K
ipal
a Qu
ibal
a 8
448
Ben
guel
a K
imbu
ndu
Kis
ama
Quis
sam
a 8
448
Ben
guel
a K
imbu
ndu
Libo
lo
Caul
a 1
56
Ben
guel
a K
imbu
ndu
Libo
lo
Libo
lo
11
616
Ben
guel
a K
imbu
ndu
Libo
lo
Lobo
lo
1 56
Ben
guel
a K
imbu
ndu
Libo
lo
Lubo
lo
7 39
2 B
engu
ela
Kim
bund
u Li
bolo
R
ebol
o 1
56
Ben
guel
a K
imbu
ndu
Mbu
ndu
Cabu
nda
2 11
2 B
engu
ela
Kim
bund
u M
bund
u Ca
bund
au
1 56
Ben
guel
a K
imbu
ndu
Mbu
ndu
Cam
bund
o 1
56
Ben
guel
a K
imbu
ndu
Mbu
ndu
Nbo
ndo
1 56
Ben
guel
a K
imbu
ndu
Nde
mbu
D
emba
1
56
Ben
guel
a K
imbu
ndu
Nde
mbu
D
embo
s 1
56
Ben
guel
a K
imbu
ndu
Ndo
ngo
Don
go
2 11
2 B
engu
ela
Kim
bund
u N
dong
o N
gola
22
1,
232
Ben
guel
a K
imbu
ndu
Ndo
ngo
Quilu
anje
1
56
Ben
guel
a K
imbu
ndu
Njin
ga
Cong
ola
2 11
2
Ben
guel
a K
imbu
ndu
Njin
ga
Cong
ori
1 56
B
engu
ela
Kim
bund
u N
jinga
Co
ngul
o 1
56
Ben
guel
a K
imbu
ndu
Njin
ga
Gen
ga
1 56
285

Tab
le B
.23
(Con
t.)
Port
of
emba
rkat
ion
Impu
ted
lingu
isti
c gr
oup
Impu
ted
ethn
ic
grou
p E
thno
nym
re
cord
ed
Num
ber
of
indi
vidu
als
liste
d E
stim
ated
nu
mbe
r of
sla
ves
Ben
guel
a K
imbu
ndu
Njin
ga
Gin
ga
13
728
Ben
guel
a K
imbu
ndu
Song
o Ca
sson
go
1 56
Ben
guel
a K
imbu
ndu
Song
o Ca
sson
gue
3 16
8 B
engu
ela
Kim
bund
u So
ngo
Cass
ungo
1
56
Ben
guel
a K
imbu
ndu
Song
o M
osso
ngo
1 56
B
engu
ela
Kim
bund
u So
ngo
Song
o 10
56
0
Ben
guel
a K
imbu
ndu
Song
o Su
ngo
1 56
B
engu
ela
Kik
ongo
K
akon
go
Bar
ango
ngo
1 56
Ben
guel
a K
ikon
go
Kak
ongo
Ca
gong
o 1
56
Ben
guel
a K
ikon
go
Kak
ongo
Co
ngon
ga
1 56
Ben
guel
a K
ikon
go
Kak
ongo
Co
ngon
go
1 56
B
engu
ela
Kik
ongo
K
akon
go
Ongo
nga
1 56
Ben
guel
a K
ikon
go
Kak
ongo
U
ngon
ga
1 56
B
engu
ela
Kik
ongo
K
ongo
M
exic
ongo
2
112
Ben
guel
a K
ikon
go
Mba
mba
B
anba
1
56
Ben
guel
a K
ikon
go
Mba
mba
Cu
xiba
nba
1 56
Ben
guel
a K
ikon
go
Mbe
mbe
E
mbi
mbi
1
56
Ben
guel
a K
ikon
go
Ngo
yo
Caui
a 1
56
Ben
guel
a K
ikon
go
Nso
nso
Dam
ba
1 56
B
engu
ela
Kik
ongo
N
sons
o D
anba
1
56
Ben
guel
a K
ikon
go
Pum
bu
Pum
bo
1 56
286

Tab
le B
.23
(Con
t.)
Port
of
emba
rkat
ion
Impu
ted
lingu
isti
c gr
oup
Impu
ted
ethn
ic
grou
p E
thno
nym
re
cord
ed
Num
ber
of
indi
vidu
als
liste
d E
stim
ated
nu
mbe
r of
sla
ves
Ben
guel
a N
dong
a N
dund
o Ca
ndun
do
1 56
Ben
guel
a N
dong
a N
kusu
B
acus
so
1 56
Ben
guel
a N
dong
a N
kusu
M
ucus
so
1 56
B
engu
ela
Nga
ngel
a K
anga
la
Cabu
nba
1 56
Ben
guel
a N
gang
ela
Luio
A
rui o
u Lu
i 1
56
Ben
guel
a N
gang
ela
Luio
Ca
loei
o 1
56
Ben
guel
a N
gang
ela
Luio
Lu
i 4
224
Ben
guel
a N
gang
ela
Luva
le
Caro
va
1 56
Ben
guel
a N
gang
ela
Luva
le
Cucu
ale
1 56
B
engu
ela
Nga
ngel
a Lu
vale
Lu
bar
25
1,40
0
Ben
guel
a N
gang
ela
Luva
le
Muv
ales
1
56
Ben
guel
a N
gang
ela
Mba
nde
Hua
nde
1 56
Ben
guel
a N
gang
ela
Mba
nde
Uha
nde
1 56
B
engu
ela
Nga
ngel
a M
bund
a Ca
mbu
nda
1 56
Ben
guel
a N
gang
ela
Mbu
nda
Quib
unda
2
112
Ben
guel
a N
gang
ela
Mbw
ela
Anb
uera
1
56
Ben
guel
a N
gang
ela
Mbw
ela
Cum
bile
2
112
Ben
guel
a N
gang
ela
Mbw
ela
Cum
bira
6
336
Ben
guel
a N
gang
ela
Mbw
ela
Subo
elo
1 56
B
engu
ela
Nga
ngel
a N
dung
o Ca
ndun
go
1 56
Ben
guel
a N
gang
ela
Ndu
ngo
Mud
ungo
1
56
Ben
guel
a N
gang
ela
Ndu
ngo
Ndu
ngo
1 56
Ben
guel
a N
gang
ela
Nga
ngel
a G
amgu
ella
1
56
287

Tab
le B
.23
(Con
t.)
Port
of
emba
rkat
ion
Impu
ted
lingu
isti
c gr
oup
Impu
ted
ethn
ic
grou
p E
thno
nym
re
cord
ed
Num
ber
of
indi
vidu
als
liste
d E
stim
ated
nu
mbe
r of
sla
ves
Ben
guel
a N
gang
ela
Nga
ngel
a G
angu
ela
148
8,28
9
Ben
guel
a N
gang
ela
Nga
ngel
a G
angu
elas
5
280
Ben
guel
a N
gang
ela
Nga
ngel
a G
angu
ella
41
2,
296
Ben
guel
a N
gang
ela
Nga
ngel
a M
ugag
uela
1
56
Ben
guel
a N
gang
ela
Nga
ngel
a M
ugan
guel
a 5
280
Ben
guel
a N
gang
ela
Nga
ngel
a M
ugan
gula
1
56
Ben
guel
a N
gang
ela
Nye
mba
Cu
nhan
ba
1 56
B
engu
ela
Nga
ngel
a N
yem
ba
Cunh
emba
1
56
Ben
guel
a N
gang
ela
Nye
mba
Im
emba
1
56
Ben
guel
a N
gang
ela
Nye
mba
Lu
vem
ba
1 56
Ben
guel
a N
gang
ela
Nye
mba
N
hem
ba
1 56
B
engu
ela
Nkh
umbi
N
khum
bi
Cauo
mbe
1
56
Ben
guel
a N
khum
bi
Nkh
umbi
Cu
mba
1
56
Ben
guel
a N
khum
bi
Nkh
umbi
Cu
mbe
1
56
Ben
guel
a N
khum
bi
Nkh
umbi
H
ombe
14
78
4 B
engu
ela
Nkh
umbi
N
khum
bi
Hum
be
5 28
0
Ben
guel
a N
khum
bi
Nkh
umbi
H
umbi
2
112
Ben
guel
a N
khum
bi
Nkh
umbi
M
uhum
be
1 56
Ben
guel
a N
khum
bi
Nkh
umbi
Qu
ecuo
mbe
1
56
Ben
guel
a N
khum
bi
Nkh
umbi
Qu
ihum
be
1 56
Ben
guel
a N
khum
bi
Nkh
umbi
U
hem
bo
1 56
288

Tab
le B
.23
(Con
t.)
Port
of
emba
rkat
ion
Impu
ted
lingu
isti
c gr
oup
Impu
ted
ethn
ic
grou
p E
thno
nym
re
cord
ed
Num
ber
of
indi
vidu
als
liste
d E
stim
ated
nu
mbe
r of
sla
ves
Ben
guel
a N
khum
bi
Nkh
umbi
U
mbe
1
56
Ben
guel
a N
yane
ka
Kile
nge
Gui
leng
es
1 56
Ben
guel
a N
yane
ka
Kile
nge
Gui
leng
ues
11
616
Ben
guel
a N
yane
ka
Kile
nge
Quile
ngua
s 1
56
Ben
guel
a N
yane
ka
Kile
nge
Quile
ngue
s 52
2,
912
Ben
guel
a N
yane
ka
Kip
ungu
Ca
pong
a 1
56
Ben
guel
a N
yane
ka
Kip
ungu
Qu
ipin
go
1 56
B
engu
ela
Nya
neka
K
ipun
gu
Quip
ungo
1
56
Ben
guel
a N
yane
ka
Kw
anku
a Co
cunh
a 1
56
Ben
guel
a N
yane
ka
Lend
a Lu
vend
a 1
56
Ben
guel
a N
yane
ka
Nga
mbo
G
ambo
s 4
224
Ben
guel
a N
yane
ka
Nga
mbo
U
gam
ba
1 56
Ben
guel
a N
yane
ka
Nga
mbo
U
guam
bo
1 56
B
engu
ela
Nya
neka
N
yane
ka
Pung
o 1
56
Ben
guel
a N
yane
ka
Wila
H
uila
1
56
Ben
guel
a N
yane
ka
Wila
U
hila
2
112
Ben
guel
a Ov
ambo
K
wan
yam
a Cu
nhem
a 1
56
Ben
guel
a Ov
ambo
K
wan
yam
a M
ucua
nham
a 1
56
Ben
guel
a Ov
ambo
K
wan
yam
a N
ema
1 56
B
engu
ela
Ovam
bo
Kw
anya
ma
Quia
nham
a 1
56
Ben
guel
a R
uund
Lu
nda
Cale
nda
2 11
2 B
engu
ela
Ruu
nd
Lund
a Ca
lund
a 3
168
289

Tab
le B
.23
(Con
t.)
Port
of
emba
rkat
ion
Impu
ted
lingu
isti
c gr
oup
Impu
ted
ethn
ic
grou
p E
thno
nym
re
cord
ed
Num
ber
of
indi
vidu
als
liste
d E
stim
ated
nu
mbe
r of
sla
ves
Ben
guel
a R
uund
Lu
nda
Cuco
etá
1 56
B
engu
ela
Ruu
nd
Lund
a Cu
xiun
do
1 56
Ben
guel
a R
uund
Lu
nda
Gua
dem
ba
1 56
B
engu
ela
Ruu
nd
Lund
a H
ilund
a 1
56
Ben
guel
a R
uund
Lu
nda
Lund
a 5
280
Ben
guel
a R
uund
Lu
nda
Mat
iam
vo
3 16
8
Ben
guel
a R
uund
Lu
nda
Mat
ivan
gue
1 56
B
engu
ela
Ruu
nd
Lund
a M
ulua
1
56
Ben
guel
a R
uund
Lu
nda
Mul
ue
1 56
B
engu
ela
Ruu
nd
Lund
a Pu
lond
a 1
56
Ben
guel
a R
uund
Lu
nda
Quilu
za
1 56
B
engu
ela
Teke
Te
ke
Utt
ere
1 56
Ben
guel
a Te
ke
Tio
Cuai
tele
1
56
Ben
guel
a Te
ke
Tio
Mon
jolo
2
112
Ben
guel
a Te
ke
Tio
Uet
eca
1 56
B
engu
ela
Teke
Ti
o U
iteq
ué
1 56
Ben
guel
a Te
ke
Tio
Uit
era
1 56
B
engu
ela
Um
bund
u D
onde
D
onde
2
112
Ben
guel
a U
mbu
ndu
Don
de
Ndo
nde
1 56
B
engu
ela
Um
bund
u E
keke
te
Coqu
eto
1 56
Ben
guel
a U
mbu
ndu
Fend
e U
fend
i 1
56
290

Tab
le B
.23
(Con
t.)
Port
of
emba
rkat
ion
Impu
ted
lingu
isti
c gr
oup
Impu
ted
ethn
ic
grou
p E
thno
nym
re
cord
ed
Num
ber
of
indi
vidu
als
liste
d E
stim
ated
nu
mbe
r of
sla
ves
Ben
guel
a U
mbu
ndu
Han
ya
Ang
a 1
56
Ben
guel
a U
mbu
ndu
Han
ya
Atu
nduv
ele
1 56
Ben
guel
a U
mbu
ndu
Han
ya
Cam
anga
1
56
Ben
guel
a U
mbu
ndu
Han
ya
Cave
ta
1 56
Ben
guel
a U
mbu
ndu
Han
ya
Cham
aco
1 56
B
engu
ela
Um
bund
u H
anya
Co
anha
1
56
Ben
guel
a U
mbu
ndu
Han
ya
Coca
1
56
Ben
guel
a U
mbu
ndu
Han
ya
Coca
ngan
ge
1 56
Ben
guel
a U
mbu
ndu
Han
ya
Com
anga
1
56
Ben
guel
a U
mbu
ndu
Han
ya
Com
ongu
era
1 56
Ben
guel
a U
mbu
ndu
Han
ya
Cuan
ha
1 56
B
engu
ela
Um
bund
u H
anya
Cu
gang
e 1
56
Ben
guel
a U
mbu
ndu
Han
ya
Gan
ia
1 56
B
engu
ela
Um
bund
u H
anya
H
anha
48
2,
688
Ben
guel
a U
mbu
ndu
Han
ya
Han
ha d
e Ca
cond
a 4
224
Ben
guel
a U
mbu
ndu
Han
ya
Han
herr
iba
2 11
2
Ben
guel
a U
mbu
ndu
Han
ya
Mux
iman
ga
1 56
B
engu
ela
Um
bund
u H
anya
N
hanh
a 4
224
Ben
guel
a U
mbu
ndu
Han
ya
Uan
ha
3 16
8 B
engu
ela
Um
bund
u H
anya
U
gunh
a 1
56
291

Tab
le B
.23
(Con
t.)
Port
of
emba
rkat
ion
Impu
ted
lingu
isti
c gr
oup
Impu
ted
ethn
ic
grou
p E
thno
nym
re
cord
ed
Num
ber
of
indi
vidu
als
liste
d E
stim
ated
nu
mbe
r of
sla
ves
Ben
guel
a U
mbu
ndu
Kaa
la
Cahi
la
1 56
B
engu
ela
Um
bund
u K
aala
Ca
íra
1 56
Ben
guel
a U
mbu
ndu
Kak
onda
Ca
chon
ga
1 56
B
engu
ela
Um
bund
u K
akon
da
Caco
nda
87
4,87
3
Ben
guel
a U
mbu
ndu
Kak
onda
Ca
cond
o 2
112
Ben
guel
a U
mbu
ndu
Kak
onda
Ca
cund
e 1
56
Ben
guel
a U
mbu
ndu
Kak
onda
Ca
ronb
o 1
56
Ben
guel
a U
mbu
ndu
Kak
onda
Qu
ilom
bo
15
840
Ben
guel
a U
mbu
ndu
Kak
onda
Qu
irom
bo
2 11
2 B
engu
ela
Um
bund
u K
akon
da
Quir
onbo
2
112
Ben
guel
a U
mbu
ndu
Kal
ukem
be
Calu
guem
be
2 11
2 B
engu
ela
Um
bund
u K
aluk
embe
Ca
luqu
emba
1
56
Ben
guel
a U
mbu
ndu
Kal
ukem
be
Calu
quem
be
4 22
4 B
engu
ela
Um
bund
u K
aluk
embe
Ca
luqu
imba
1
56
Ben
guel
a U
mbu
ndu
Kal
ukem
be
Uem
be
1 56
B
engu
ela
Um
bund
u K
enge
Ca
quen
gue
1 56
Ben
guel
a U
mbu
ndu
Ken
ge
Caqu
inge
1
56
Ben
guel
a U
mbu
ndu
Ken
ge
Muc
hien
gue
1 56
Ben
guel
a U
mbu
ndu
Ken
ge
Quen
gue
1 56
B
engu
ela
Um
bund
u K
ikum
a Co
ma
1 56
292

Tab
le B
.23
(Con
t.)
Port
of
emba
rkat
ion
Impu
ted
lingu
isti
c gr
oup
Impu
ted
ethn
ic
grou
p E
thno
nym
re
cord
ed
Num
ber
of
indi
vidu
als
liste
d E
stim
ated
nu
mbe
r of
sla
ves
Ben
guel
a U
mbu
ndu
Kik
uma
Quic
uma
4 22
4 B
engu
ela
Um
bund
u K
ingo
lo
Cuba
ngol
a 3
168
Ben
guel
a U
mbu
ndu
Kin
golo
G
uing
olo
8 44
8 B
engu
ela
Um
bund
u K
ingo
lo
Gui
olo
1 56
Ben
guel
a U
mbu
ndu
Kin
golo
G
ungo
lo
3 16
8 B
engu
ela
Um
bund
u K
ingo
lo
Quen
golo
1
56
Ben
guel
a U
mbu
ndu
Kin
golo
Qu
ingo
lo
27
1,51
2 B
engu
ela
Um
bund
u K
ipey
o Ca
peia
1
56
Ben
guel
a U
mbu
ndu
Kip
eyo
Cuch
ipea
2
112
Ben
guel
a U
mbu
ndu
Kip
eyo
Cuqu
iper
a 1
56
Ben
guel
a U
mbu
ndu
Kip
eyo
Cute
peio
1
56
Ben
guel
a U
mbu
ndu
Kip
eyo
Cuxi
pé
3 16
8
Ben
guel
a U
mbu
ndu
Kip
eyo
Hip
eio
1 56
B
engu
ela
Um
bund
u K
ipey
o Pe
ió
1 56
Ben
guel
a U
mbu
ndu
Kip
eyo
Quip
eio
36
2,01
6 B
engu
ela
Um
bund
u K
ipey
o Qu
ipeo
1
56
Ben
guel
a U
mbu
ndu
Kip
eyo
Quip
epa
1 56
B
engu
ela
Um
bund
u K
ipey
o Ti
pea
1 56
Ben
guel
a U
mbu
ndu
Kip
eyo
Tipe
o 1
56
293

Tab
le B
.23
(Con
t.)
Port
of
emba
rkat
ion
Impu
ted
lingu
isti
c gr
oup
Impu
ted
ethn
ic
grou
p E
thno
nym
re
cord
ed
Num
ber
of
indi
vidu
als
liste
d E
stim
ated
nu
mbe
r of
sla
ves
Ben
guel
a U
mbu
ndu
Kip
eyo
Uch
ipea
2
112
Ben
guel
a U
mbu
ndu
Kis
anji
Quis
anje
1
56
Ben
guel
a U
mbu
ndu
Kis
anji
Quis
sanj
e 11
61
6 B
engu
ela
Um
bund
u K
itat
a Qu
ita
1 56
Ben
guel
a U
mbu
ndu
Kit
ata
Quit
ata
2 11
2 B
engu
ela
Um
bund
u K
itat
a Qu
itat
o 1
56
Ben
guel
a U
mbu
ndu
Kit
ata
Quit
ete
1 56
B
engu
ela
Um
bund
u K
ivan
da
Quib
anda
70
3,
921
Ben
guel
a U
mbu
ndu
Kiv
anda
Qu
imba
nda
1 56
B
engu
ela
Um
bund
u K
ivan
da
Quio
vand
a 1
56
Ben
guel
a U
mbu
ndu
Kiv
anda
Qu
ivan
da
1 56
B
engu
ela
Um
bund
u K
ivan
da
Van
da
1 56
Ben
guel
a U
mbu
ndu
Kiv
ula
Bul
o 3
168
Ben
guel
a U
mbu
ndu
Kiv
ula
Bul
u 2
112
Ben
guel
a U
mbu
ndu
Kiv
ula
Chin
dum
bula
1
56
Ben
guel
a U
mbu
ndu
Kiv
ula
Queq
uibu
la
1 56
Ben
guel
a U
mbu
ndu
Kiv
ula
Quia
mbu
la
1 56
B
engu
ela
Um
bund
u K
ivul
a Qu
ibul
a 28
1,
568
Ben
guel
a U
mbu
ndu
Kiv
ula
Quib
ulo
1 56
B
engu
ela
Um
bund
u K
ivul
a Qu
ibur
a 1
56
294

Tab
le B
.23
(Con
t.)
Port
of
emba
rkat
ion
Impu
ted
lingu
isti
c gr
oup
Impu
ted
ethn
ic
grou
p E
thno
nym
re
cord
ed
Num
ber
of
indi
vidu
als
liste
d E
stim
ated
nu
mbe
r of
sla
ves
Ben
guel
a U
mbu
ndu
Kiv
ula
Zuib
ula
1 56
B
engu
ela
Um
bund
u K
iyak
a Cu
xija
ca
1 56
Ben
guel
a U
mbu
ndu
Kiy
aka
Quia
ca
88
4,92
9 B
engu
ela
Um
bund
u K
iyak
a Ti
aca
2 11
2
Ben
guel
a U
mbu
ndu
Lem
ba
Ang
anba
1
56
Ben
guel
a U
mbu
ndu
Lem
ba
Cala
mbe
1
56
Ben
guel
a U
mbu
ndu
Lem
ba
Cale
mba
1
56
Ben
guel
a U
mbu
ndu
Lem
ba
Cale
mbe
1
56
Ben
guel
a U
mbu
ndu
Lem
ba
Cale
nbi
1 56
B
engu
ela
Um
bund
u Le
mba
Ca
rem
be
1 56
Ben
guel
a U
mbu
ndu
Lem
ba
Cole
mbe
1
56
Ben
guel
a U
mbu
ndu
Lem
ba
Gam
ba
2 11
2
Ben
guel
a U
mbu
ndu
Lem
ba
Lem
bo
1 56
B
engu
ela
Um
bund
u Le
mba
U
limba
1
56
Ben
guel
a U
mbu
ndu
Lum
bo
Lum
bo
1 56
B
engu
ela
Um
bund
u M
bailu
ndu
Aba
rund
o 1
56
Ben
guel
a U
mbu
ndu
Mba
ilund
u B
ailu
ndo
199
11,1
46
Ben
guel
a U
mbu
ndu
Mba
ilund
u B
aran
do
1 56
Ben
guel
a U
mbu
ndu
Mba
ilund
u B
arun
do
21
1,17
6 B
engu
ela
Um
bund
u M
bailu
ndu
Caba
rund
u 1
56
Ben
guel
a U
mbu
ndu
Mba
ilund
u U
baru
nda
2 11
2
295

Tab
le B
.23
(Con
t.)
Port
of
emba
rkat
ion
Impu
ted
lingu
isti
c gr
oup
Impu
ted
ethn
ic
grou
p E
thno
nym
re
cord
ed
Num
ber
of
indi
vidu
als
liste
d E
stim
ated
nu
mbe
r of
sla
ves
Ben
guel
a U
mbu
ndu
Mba
ilund
u U
baru
ndu
1 56
B
engu
ela
Um
bund
u M
bailu
ndu
Unb
arun
da
1 56
Ben
guel
a U
mbu
ndu
Mba
ilund
u U
nbar
undu
1
56
Ben
guel
a U
mbu
ndu
Mbo
ngo
Bon
go
3 16
8
Ben
guel
a U
mbu
ndu
Mbo
ngo
Cabo
ngo
1 56
B
engu
ela
Um
bund
u M
bong
o U
iang
o 1
56
Ben
guel
a U
mbu
ndu
Mbo
ngo
Unb
onga
1
56
Ben
guel
a U
mbu
ndu
Mbo
ngo
Unb
ungo
1
56
Ben
guel
a U
mbu
ndu
Mbo
ngo
Unl
ungo
1
56
Ben
guel
a U
mbu
ndu
Mbu
i B
uy
1 56
Ben
guel
a U
mbu
ndu
Mbu
i G
umbu
i 1
56
Ben
guel
a U
mbu
ndu
Mbu
i H
ambo
im
2 11
2
Ben
guel
a U
mbu
ndu
Mbu
i H
ambu
im
16
896
Ben
guel
a U
mbu
ndu
Mbu
i N
bui
1 56
Ben
guel
a U
mbu
ndu
Mbu
i U
nbui
m
1 56
B
engu
ela
Um
bund
u M
bui
Und
uim
1
56
Ben
guel
a U
mbu
ndu
Mom
a Ca
mam
a 1
56
Ben
guel
a U
mbu
ndu
Mom
a Ca
mam
e 1
56
Ben
guel
a U
mbu
ndu
Mom
a M
oma
8 44
8 B
engu
ela
Um
bund
u M
oma
Mut
imom
a 1
56
296

Tab
le B
.23
(Con
t.)
Port
of
emba
rkat
ion
Impu
ted
lingu
isti
c gr
oup
Impu
ted
ethn
ic
grou
p E
thno
nym
re
cord
ed
Num
ber
of
indi
vidu
als
liste
d E
stim
ated
nu
mbe
r of
sla
ves
Ben
guel
a U
mbu
ndu
Mom
a Qu
imom
a 1
56
Ben
guel
a U
mbu
ndu
Mom
a Qu
imum
a 1
56
Ben
guel
a U
mbu
ndu
Mom
a U
mam
a 1
56
Ben
guel
a U
mbu
ndu
Nam
ba
Uta
nba
1 56
Ben
guel
a U
mbu
ndu
Nan
o Ca
nano
1
56
Ben
guel
a U
mbu
ndu
Nan
o Co
nane
1
56
Ben
guel
a U
mbu
ndu
Nan
o Cu
nane
1
56
Ben
guel
a U
mbu
ndu
Nan
o Cu
nano
2
112
Ben
guel
a U
mbu
ndu
Nan
o N
ano
44
2,46
4 B
engu
ela
Um
bund
u N
ano
Onan
a 1
56
Ben
guel
a U
mbu
ndu
Nan
o Qu
inon
o 1
56
Ben
guel
a U
mbu
ndu
Nan
o U
nana
1
56
Ben
guel
a U
mbu
ndu
Nan
o U
nane
23
1,
288
Ben
guel
a U
mbu
ndu
Nan
o U
nané
2
112
Ben
guel
a U
mbu
ndu
Ndo
mbe
Ca
dum
bo
3 16
8 B
engu
ela
Um
bund
u N
dom
be
Cand
umbo
6
336
Ben
guel
a U
mbu
ndu
Ndo
mbe
Ca
ndun
be
2 11
2 B
engu
ela
Um
bund
u N
dom
be
Cand
unbo
5
280
Ben
guel
a U
mbu
ndu
Ndo
mbe
D
ombe
36
2,
016
Ben
guel
a U
mbu
ndu
Ndo
mbe
D
ombe
Gra
nde
22
1,23
2
Ben
guel
a U
mbu
ndu
Ndo
mbe
D
ombe
Peq
ueno
6
336
297

Tab
le B
.23
(Con
t.)
Port
of
emba
rkat
ion
Impu
ted
lingu
isti
c gr
oup
Impu
ted
ethn
ic
grou
p E
thno
nym
re
cord
ed
Num
ber
of
indi
vidu
als
liste
d E
stim
ated
nu
mbe
r of
sla
ves
Ben
guel
a U
mbu
ndu
Ndo
mbe
D
onbo
1
56
Ben
guel
a U
mbu
ndu
Ndo
mbe
D
unbo
1
56
Ben
guel
a U
mbu
ndu
Ndo
mbe
N
dom
be
1 56
B
engu
ela
Um
bund
u N
dom
be
Und
unba
1
56
Ben
guel
a U
mbu
ndu
Ndu
lu
And
ulo
3 16
8 B
engu
ela
Um
bund
u N
dulu
Ca
ndur
o 1
56
Ben
guel
a U
mbu
ndu
Ndu
lu
Dul
a 1
56
Ben
guel
a U
mbu
ndu
Ndu
lu
Dul
o 5
280
Ben
guel
a U
mbu
ndu
Ndu
lu
Dur
o 2
112
Ben
guel
a U
mbu
ndu
Ndu
lu
End
ulo
1 56
Ben
guel
a U
mbu
ndu
Nga
lang
i Ca
rang
ue
1 56
B
engu
ela
Um
bund
u N
gala
ngi
Gal
anga
20
1,
120
Ben
guel
a U
mbu
ndu
Nga
lang
i G
alan
ge
1 56
B
engu
ela
Um
bund
u N
gala
ngi
Gal
angu
e 67
3,
753
Ben
guel
a U
mbu
ndu
Nga
lang
i G
alan
gues
45
2,
520
Ben
guel
a U
mbu
ndu
Nga
lang
i G
alen
gue
1 56
Ben
guel
a U
mbu
ndu
Nga
lang
i G
aran
ga
3 16
8 B
engu
ela
Um
bund
u N
gala
ngi
Gar
angu
e 18
1,
008
Ben
guel
a U
mbu
ndu
Nga
lang
i G
avan
ga
1 56
298

Tab
le B
.23
(Con
t.)
Port
of
emba
rkat
ion
Impu
ted
lingu
isti
c gr
oup
Impu
ted
ethn
ic
grou
p E
thno
nym
re
cord
ed
Num
ber
of
indi
vidu
als
liste
d E
stim
ated
nu
mbe
r of
sla
ves
Ben
guel
a U
mbu
ndu
Nga
lang
i Qu
ican
gue
2 11
2 B
engu
ela
Um
bund
u N
gala
ngi
Uga
rang
a 1
56
Ben
guel
a U
mbu
ndu
Nga
lang
i U
gara
ngue
6
336
Ben
guel
a U
mbu
ndu
Nga
lang
i U
ngar
angu
e 2
112
Ben
guel
a U
mbu
ndu
Nga
lang
i U
ngar
engu
e 1
56
Ben
guel
a U
mbu
ndu
Nga
nda
Cang
ande
1
56
Ben
guel
a U
mbu
ndu
Nga
nda
Gan
da
14
784
Ben
guel
a U
mbu
ndu
Nga
nda
Gan
dave
ia
1 56
Ben
guel
a U
mbu
ndu
Nga
nda
Gan
de
1 56
B
engu
ela
Um
bund
u N
gand
a U
cand
é 1
56
Ben
guel
a U
mbu
ndu
Nga
nda
Uca
ngan
da
1 56
B
engu
ela
Um
bund
u N
gand
a U
gand
a 1
56
Ben
guel
a U
mbu
ndu
Nga
nda
Ung
anda
1
56
Ben
guel
a U
mbu
ndu
Ovim
bund
u B
undo
1
56
Ben
guel
a U
mbu
ndu
Ovim
bund
u Ca
bund
o 1
56
Ben
guel
a U
mbu
ndu
Ovim
bund
u Ca
ndon
de
1 56
Ben
guel
a U
mbu
ndu
Ovim
bund
u Cu
mbu
ndo
1 56
B
engu
ela
Um
bund
u Ov
imbu
ndu
Quin
dum
bo
9 50
4
Ben
guel
a U
mbu
ndu
Sam
bu
Cass
amba
1
56
299

Tab
le B
.23
(Con
t.)
Port
of
emba
rkat
ion
Impu
ted
lingu
isti
c gr
oup
Impu
ted
ethn
ic
grou
p E
thno
nym
re
cord
ed
Num
ber
of
indi
vidu
als
liste
d E
stim
ated
nu
mbe
r of
sla
ves
Ben
guel
a U
mbu
ndu
Sam
bu
Casu
mbo
1
56
Ben
guel
a U
mbu
ndu
Sam
bu
Cuss
ambo
1
56
Ben
guel
a U
mbu
ndu
Sam
bu
Cuss
anba
1
56
Ben
guel
a U
mbu
ndu
Sam
bu
Cuss
anbo
2
112
Ben
guel
a U
mbu
ndu
Sam
bu
Mus
sam
be
1 56
B
engu
ela
Um
bund
u Sa
mbu
Qu
issa
mba
1
56
Ben
guel
a U
mbu
ndu
Sam
bu
Sam
ba
3 16
8 B
engu
ela
Um
bund
u Sa
mbu
Sa
mbo
20
1,
120
Ben
guel
a U
mbu
ndu
Sam
bu
Sam
bos
2 11
2 B
engu
ela
Um
bund
u Sa
mbu
Sa
nba
4 22
4
Ben
guel
a U
mbu
ndu
Sam
bu
Sum
bo
1 56
B
engu
ela
Um
bund
u Sa
mbu
U
ssam
ba
1 56
Ben
guel
a U
mbu
ndu
Sam
bu
Uss
anba
2
112
Ben
guel
a U
mbu
ndu
Sang
a Cu
ssan
ga
1 56
Ben
guel
a U
mbu
ndu
Sang
a M
assa
ngo
1 56
B
engu
ela
Um
bund
u Sa
nga
Um
anga
2
112
Ben
guel
a U
mbu
ndu
Sang
a U
nang
a 1
56
Ben
guel
a U
mbu
ndu
Sele
Ce
les
7 39
2
Ben
guel
a U
mbu
ndu
Sele
H
eles
ou
Cele
s 1
56
Ben
guel
a U
mbu
ndu
Sele
M
ucel
e 1
56
300

Tab
le B
.23
(Con
t.)
Port
of
emba
rkat
ion
Impu
ted
lingu
isti
c gr
oup
Impu
ted
ethn
ic
grou
p E
thno
nym
re
cord
ed
Num
ber
of
indi
vidu
als
liste
d E
stim
ated
nu
mbe
r of
sla
ves
Ben
guel
a U
mbu
ndu
Sele
M
ucer
ra
1 56
B
engu
ela
Um
bund
u Se
le
Sele
s 24
1,
344
Ben
guel
a U
mbu
ndu
Soke
U
ssoq
ue
1 56
B
engu
ela
Um
bund
u Su
mbe
Co
ssum
be
1 56
Ben
guel
a U
mbu
ndu
Sum
be
Mus
sum
be
4 22
4 B
engu
ela
Um
bund
u Su
mbe
N
anpi
nda
1 56
Ben
guel
a U
mbu
ndu
Sum
be
Sonb
e 1
56
Ben
guel
a U
mbu
ndu
Sum
be
Sum
be
4 22
4
Ben
guel
a U
mbu
ndu
Viy
e B
ie
253
14,1
70
Ben
guel
a U
mbu
ndu
Viy
e B
ié
19
1,06
4
Ben
guel
a U
mbu
ndu
Viy
e U
bia
1 56
B
engu
ela
Um
bund
u V
iye
Ubi
á 1
56
Ben
guel
a U
mbu
ndu
Viy
e U
iva
1 56
B
engu
ela
Um
bund
u W
ambu
Ca
oum
bo
1 56
Ben
guel
a U
mbu
ndu
Wam
bu
Cuan
bo
3 16
8 B
engu
ela
Um
bund
u W
ambu
H
ambe
1
56
Ben
guel
a U
mbu
ndu
Wam
bu
Ham
bo
147
8,23
3 B
engu
ela
Um
bund
u W
ambu
H
uam
be
1 56
Ben
guel
a U
mbu
ndu
Wam
bu
Hua
mbo
1
56
Ben
guel
a U
mbu
ndu
Wam
bu
Hum
bo
1 56
Ben
guel
a U
mbu
ndu
Wam
bu
Oanb
a 17
95
2
301

Tab
le B
.23
(Con
t.)
Port
of
emba
rkat
ion
Impu
ted
lingu
isti
c gr
oup
Impu
ted
ethn
ic
grou
p E
thno
nym
re
cord
ed
Num
ber
of
indi
vidu
als
liste
d E
stim
ated
nu
mbe
r of
sla
ves
Ben
guel
a U
mbu
ndu
Wam
bu
Oanb
o 4
224
Ben
guel
a U
mbu
ndu
Wam
bu
Uam
ba
4 22
4
Ben
guel
a U
mbu
ndu
Wam
bu
Uam
bo
3 16
8 B
engu
ela
Um
bund
u W
ambu
U
anba
4
224
Ben
guel
a U
mbu
ndu
Wam
bu
Uan
bo
6 33
6 B
engu
ela
Um
bund
u W
ambu
U
ango
1
56
Ben
guel
a V
ili
Loan
go
Lubi
ri
1 56
B
engu
ela
Yom
be
Yom
be
Alo
njon
ba
1 56
Ben
guel
a Y
ombe
Y
ombe
Co
chin
jom
ba
2 11
2 N
ovo
Red
ondo
H
erer
o H
imba
H
imba
6
336
Nov
o R
edon
do
Kim
bund
u H
ungo
M
ahun
go
1 56
N
ovo
Red
ondo
K
imbu
ndu
Kal
andu
la
Calu
ndul
a 1
56
Nov
o R
edon
do
Kim
bund
u K
asan
je
Bam
anga
la
1 56
N
ovo
Red
ondo
K
imbu
ndu
Kas
anje
Ca
ssan
ge
34
1,90
4
Nov
o R
edon
do
Kim
bund
u K
ipal
a Qu
ibal
a 3
168
Nov
o R
edon
do
Kim
bund
u K
ipal
a Qu
ipal
a 4
224
Nov
o R
edon
do
Kim
bund
u K
isam
a Qu
issa
ma
20
1,12
0 N
ovo
Red
ondo
K
imbu
ndu
Libo
lo
Libo
lo
56
3,13
7
Nov
o R
edon
do
Kim
bund
u N
dem
bu
Dem
bo
1 56
N
ovo
Red
ondo
K
imbu
ndu
Ndo
ngo
Don
ga
1 56
Nov
o R
edon
do
Kim
bund
u N
dong
o G
ola
7 39
2
302

Tab
le B
.23
(Con
t.)
Port
of
emba
rkat
ion
Impu
ted
lingu
isti
c gr
oup
Impu
ted
ethn
ic
grou
p E
thno
nym
re
cord
ed
Num
ber
of
indi
vidu
als
liste
d E
stim
ated
nu
mbe
r of
sla
ves
Nov
o R
edon
do
Kim
bund
u N
jinga
G
inga
20
1,
120
Nov
o R
edon
do
Kim
bund
u So
ngo
Song
o 4
224
Nov
o R
edon
do
Kik
ongo
K
ongo
M
oxic
ongo
1
56
Nov
o R
edon
do
Kik
ongo
K
ongo
M
uxic
ongo
5
280
Nov
o R
edon
do
Ndo
nga
Nku
su
Cuso
1
56
Nov
o R
edon
do
Nga
ngel
a Lu
vale
Lu
bar
3 16
8
Nov
o R
edon
do
Nga
ngel
a N
gang
ela
Gan
guel
a 5
280
Nov
o R
edon
do
Nkh
umbi
N
khum
bi
Hom
be
125
7,00
1
Nov
o R
edon
do
Nkh
umbi
N
khum
bi
Hum
be
3 16
8 N
ovo
Red
ondo
N
khum
bi
Nkh
umbi
H
umbe
a H
engu
e 2
112
Nov
o R
edon
do
Nkh
umbi
N
khum
bi
Mah
ombe
2
112
Nov
o R
edon
do
Nkh
umbi
N
khum
bi
Moh
ambe
7
392
Nov
o R
edon
do
Nkh
umbi
N
khum
bi
Moh
umbe
6
336
Nov
o R
edon
do
Nkh
umbi
N
khum
bi
Mua
mbe
1
56
Nov
o R
edon
do
Nkh
umbi
N
khum
bi
Muh
ombe
3
168
Nov
o R
edon
do
Nya
neka
K
ileng
e Qu
ileng
ues
de
Ben
guel
a 2
112
Nov
o R
edon
do
Ovam
bo
Dom
bond
ola
Dom
bo
1 56
N
ovo
Red
ondo
Ov
ambo
Ov
ambo
A
nam
bo
1 56
Nov
o R
edon
do
Ruu
nd
Lund
a M
atio
ngo
1 56
N
ovo
Red
ondo
R
uund
Lu
nda
Mul
ua
3 16
8
Nov
o R
edon
do
Ruu
nd
Lund
a M
ulue
2
112
303

Tab
le B
.23
(Con
t.)
Port
of
emba
rkat
ion
Impu
ted
lingu
isti
c gr
oup
Impu
ted
ethn
ic
grou
p E
thno
nym
re
cord
ed
Num
ber
of
indi
vidu
als
liste
d E
stim
ated
nu
mbe
r of
sla
ves
Nov
o R
edon
do
Ruu
nd
Lund
a Qu
ilund
a 12
67
2 N
ovo
Red
ondo
U
mbu
ndu
Kaa
la
Cahi
1
56
Nov
o R
edon
do
Um
bund
u K
aala
Ca
i 1
56
Nov
o R
edon
do
Um
bund
u M
bailu
ndu
Bai
lund
o 5
280
Nov
o R
edon
do
Um
bund
u M
bui
Am
buim
32
2 18
,035
N
ovo
Red
ondo
U
mbu
ndu
Mbu
i A
mbu
ima
1 56
Nov
o R
edon
do
Um
bund
u N
ano
Nan
o 15
84
0 N
ovo
Red
ondo
U
mbu
ndu
Ovim
bund
u Qu
imbu
ndo
1 56
Nov
o R
edon
do
Um
bund
u Sa
mbu
Ca
ssam
be
1 56
Nov
o R
edon
do
Um
bund
u Sa
mbu
Ca
ssam
bo s
em
Pele
s 1
56
Nov
o R
edon
do
Um
bund
u Sa
mbu
M
ossa
mbe
10
56
0
Nov
o R
edon
do
Um
bund
u Sa
mbu
M
ossu
mba
1
56
Nov
o R
edon
do
Um
bund
u Sa
mbu
M
ossu
mbe
28
1,
568
Nov
o R
edon
do
Um
bund
u Sa
mbu
M
ussa
mbo
1
56
Nov
o R
edon
do
Um
bund
u Se
le
Muc
ile
1 56
Nov
o R
edon
do
Um
bund
u Se
le
Sele
s 83
4,
649
Nov
o R
edon
do
Um
bund
u Su
mbe
Su
mbe
5
280
Nov
o R
edon
do
Um
bund
u Tu
nda
Tund
a 99
5,
545
Nov
o R
edon
do
Um
bund
u V
iye
Bié
43
2,
408
Nov
o R
edon
do
Yom
be
Yom
be
Mai
ombe
1
56
Tota
l
3,33
0 18
6,51
0 N
ote:
See
Cha
pter
Thr
ee fo
r de
tails
on
the
esti
mat
es p
roce
dure
s.
Sour
ces:
Tab
les
B.1
to B
.20.
304
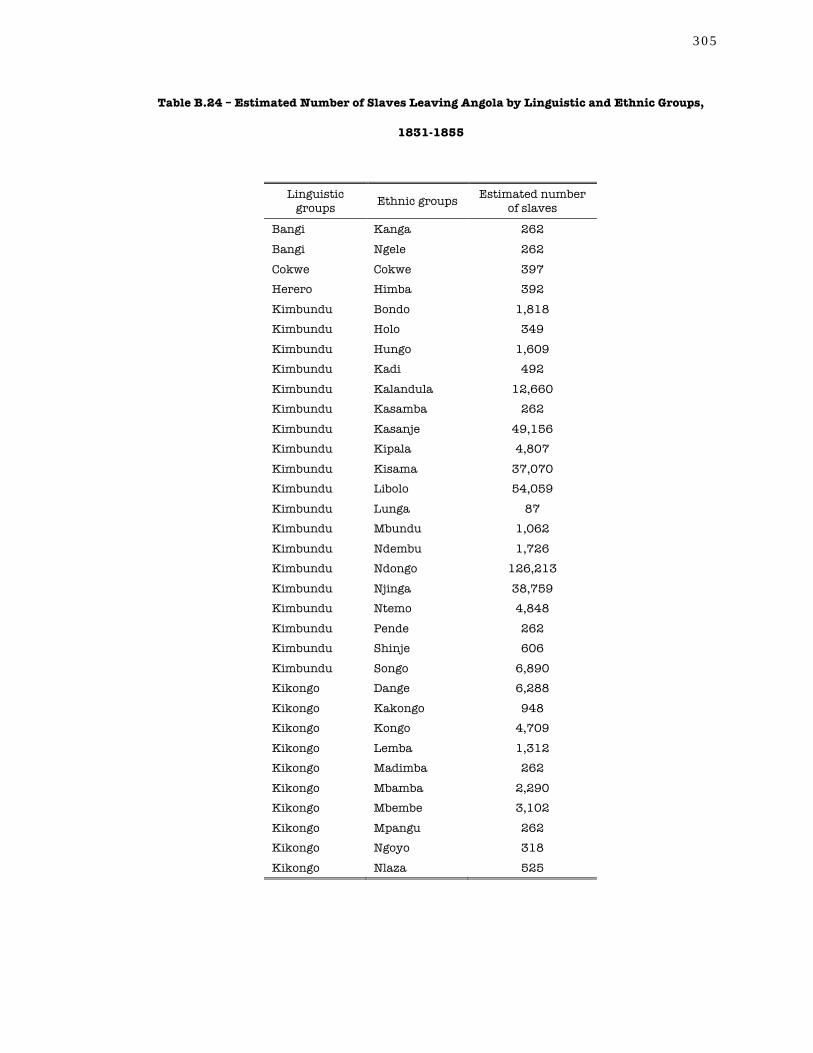
Table B.24 – Estimated Number of Slaves Leaving Angola by Linguistic and Ethnic Groups,
1831-1855
Linguistic groups Ethnic groups Estimated number
of slaves
Bangi Kanga 262
Bangi Ngele 262
Cokwe Cokwe 397 Herero Himba 392
Kimbundu Bondo 1,818 Kimbundu Holo 349
Kimbundu Hungo 1,609 Kimbundu Kadi 492
Kimbundu Kalandula 12,660 Kimbundu Kasamba 262
Kimbundu Kasanje 49,156 Kimbundu Kipala 4,807
Kimbundu Kisama 37,070 Kimbundu Libolo 54,059
Kimbundu Lunga 87 Kimbundu Mbundu 1,062
Kimbundu Ndembu 1,726 Kimbundu Ndongo 126,213
Kimbundu Njinga 38,759 Kimbundu Ntemo 4,848
Kimbundu Pende 262 Kimbundu Shinje 606
Kimbundu Songo 6,890 Kikongo Dange 6,288
Kikongo Kakongo 948 Kikongo Kongo 4,709
Kikongo Lemba 1,312 Kikongo Madimba 262
Kikongo Mbamba 2,290 Kikongo Mbembe 3,102
Kikongo Mpangu 262 Kikongo Ngoyo 318
Kikongo Nlaza 525
305

Table B.24 (Cont.)
Linguistic groups Ethnic groups Estimated number
of slaves
Kikongo Nsonso 4,222
Kikongo Nsundi 46,103
Kikongo Okango 787 Kikongo Pumbu 318
Kikongo Solongo 787 Kikongo Suku 1,399
Kikongo Yaka 6,037 Kikongo Zombo 436
Kota Okota 611 Kunyi Kunyi 5,774
Lumbu Lumbu 2,010 Ndonga Ndundo 56
Ndonga Nkusu 517 Ndonga Nyengo 260
Ngangela Kangala 56 Ngangela Luio 336
Ngangela Luvale 2,862 Ngangela Mbande 112
Ngangela Mbunda 168 Ngangela Mbwela 560
Ngangela Ndungo 168 Ngangela Ngangela 12,200
Ngangela Nyemba 280 Njebi Nzabi 6,299
Nkhumbi Nkhumbi 11,880 Nyaneka Kilenge 4,878
Nyaneka Kipungu 224 Nyaneka Kwankua 56
Nyaneka Lenda 56 Nyaneka Ngambo 336
Nyaneka Wila 168 Ovambo Dombondola 56
Ovambo Kwanyama 224 Ovambo Ovambo 56
Ruund Lunda 19,501 Ruund Ndemba 56
306

Table B.24 (Cont.)
Linguistic groups Ethnic groups Estimated number
of slaves
Teke Mbe 433
Teke Monjolo 16,195
Teke Teke 56 Teke Tio 25,157
Teke Tsintsege 525 Totela Totela 262
Umbundu Donde 341 Umbundu Ekekete 56
Umbundu Fende 56 Umbundu Hanya 4,257
Umbundu Kaala 224 Umbundu Kakonda 6,653
Umbundu Kalukembe 504 Umbundu Kenge 743
Umbundu Kikuma 543 Umbundu Kingolo 2,408
Umbundu Kipeyo 2,912 Umbundu Kisanji 672
Umbundu Kitata 280 Umbundu Kivanda 4,145
Umbundu Kivula 2,184 Umbundu Kiyaka 5,183
Umbundu Lemba 962 Umbundu Lumbo 56
Umbundu Mbailundu 14,522 Umbundu Mbongo 448
Umbundu Mbui 19,379 Umbundu Moma 784
Umbundu Namba 56 Umbundu Nano 5,153
Umbundu Nbova 173 Umbundu Ndombe 5,573
Umbundu Ndulu 1,161 Umbundu Ngalangi 9,552
Umbundu Nganda 1,176 Umbundu Ovimbundu 784
307

Table B.24 (Cont.)
Linguistic groups Ethnic groups Estimated number
of slaves
Umbundu Sambu 5,688
Umbundu Sanga 713
Umbundu Sele 6,696 Umbundu Soke 56
Umbundu Sumbe 896 Umbundu Tunda 5,545
Umbundu Viye 33,050 Umbundu Wambu 10,952
Vili Loango 41,262 Yansi Muyanji 2,100
Yombe Yombe 32,769 Total 767,215
Sources: Tables B.21 to B.23.
308

Appendix C
Prices of Slaves Leaving
Luanda, 1780-1830
Information on prices of slaves leaving Angola in the nineteenth century is
extremely rare. The prices used here were originally collected from reports of
commodities imported and exported from Luanda, the principal port of slave
embarkation on the coast of Angola. Colonial officials began to issue these reports
in the late eighteenth century, following administrative reform in the Portuguese
Empire.1 They dispatched these reports annually to Lisbon and, during the
French occupation of Portugal, to Rio de Janeiro. Unfortunately, only a few of
these reports survive to the present day.2 They give the quantity, price and total
value of all merchandise, including slaves, imported and exported from Luanda.
Colonial officials reported the price of slaves in terms of annual averages
calculated on the number of adult slaves embarked. Although they were generally
purchased with imported commodities, colonial officials communicated the cost of
slaves embarked in réis (sing. real), the Portuguese currency in Angola. Table C.1
1 José C. Curto and Raymond R. Gervais, “The Population History of Luanda during the Late Atlantic Slave Trade, 1781-1844,” African Economic History, no. 29 (2001): 4-12; José C. Curto and Raymond R. Gervais, “A Dinâmica Demográfica de Luanda no Contexto do Tráfico de Escravos do Atlântico Sul, 1781-1844,” Topoi, no. 4 (2002): 86-90. 2 Manolo Florentino, Em Costas Negras: Uma História do Tráfico Atlântico de Escravos entre a África e o Rio de Janeiro, Séculos XVIII e XIX (São Paulo: Companhia das Letras, 1997), 160; Joseph C. Miller, “Slave Prices in the Portuguese Southern Atlantic, 1600-1830,” in Africans in Bondage: Studies in Slavery and the Slave Trade, ed. Paul E. Lovejoy (Madison: University of Wisconsin, 1986), 67. References to surviving reports are listed in the sources of Table C.1.
309

shows the prices of slaves leaving Luanda as they appear in the reports available
between the eighteenth and nineteenth centuries. Because the value of the real
changed significantly with inflation, these prices were deflated using an index
built with prices of 35 domestic and foreign articles traded in pounds in Britain
between 1779 and 1850.3 Table C.2 shows these prices deflated by decade
between 1780 and 1830.
Table C.1 – Prices of Slaves Leaving Luanda as Reported by Colonial Officials, 1780-1830
Years Prices in réis Years Prices in
réis 1780 53,000 1813 75,000
1790 59,000 1815 70,000 1802 67,940 1816 68,000
1803 69,550 1817 75,000
1804 72,500 1818 75,000
1805 75,000 1819 75,000
1808 67,000 1820 75,000
1809 72,000 1823 60,000
1810 70,000 1824 65,000
1811 70,000 1825 70,000
1812 69,000 1830 150,000
Sources: 1808, 1811 and 1820: Manolo Florentino, Em Costas Negras, 160. 1780, 1790 and 1830:
Joseph C. Miller, “Slave Prices in the Portuguese Southern Atlantic,” 67. 1802-1805, 1809-1810,
1812-1819, 1823-1825: AHU, CU, Angola, box 106 doc. 5; box 109 doc. 54, box 112 doc. 47; box
115 doc. 14; box 121 doc. 6; box 121A doc. 35; box 127 doc. 1; box 128 doc. 26; box 131 doc. 11;
box 132 doc. 26; box 133 doc. 3; box 134 doc. 24; box 138 doc. 56; box 144 doc. 92; and box 159
doc. 13.
3 Norman J. Silbering, “British Prices and Business Cycles, 1779-1850,” Review of Economics and Statistics 5 (1923): 232-233.
310

Table C.2 – Prices of Slaves Leaving Luanda Deflated by Decades, 1780-1830
Years Nominal prices in
réis
Silbering indices
Reindex to 1780s
Real prices in
réis 1780s 53,000 102.6 100.0 53,000
1790s 59,000 128.4 125.1 73,836
1800s 70,570 160.5 156.4 110,395
1810s 72,444 155.8 151.9 110,008
1820s 65,000 105.6 102.9 66,901
1830s 150,000 102.0 99.4 149,123
Sources: Table C.1 and Norman J. Silbering, “British Prices and Busyness Cycles,” 232-233.
311

Appendix D
Imports at Luanda, 1785-1864
The following tables were built with data originally compiled from the
customs records of Luanda. They show the value of the commodities imported
through that port in thousands of réis. It should be noted that customs officials
did not record the current value of the merchandise brought there. Rather, the
numbers available are estimates that members of the trading board calculated
multiplying the amount of goods imported by their annual average price. As a
consequence, they should not be regarded as accurate numbers but only as
approximations. Nevertheless, they provide a reliable indication of the principal
commodities used to purchase slaves in the interior of Angola.
Tabled D.1 and D.2 show the total value and percentage of the commodities
imported by categories: alcohol, apparel and notions, Asian textiles, European
textiles, foodstuff, ironware and other metals, miscellany articles, and weapons.
Tables D.3 to D.10 provide the value of the principal articles imported within each
of these categories. They do not include information about the goods introduced
during the late eighteenth century because the data for this period was compiled
from Joseph Miller’s study on the imports at Luanda, which for reasons of space
does not itemize all the articles listed in the original sources.1 Hence, Tables D.3
1 Joseph C. Miller, “Imports at Luanda, Angola: 1785-1823,” in Figuring African Trade: Proceedings of the Symposium on the Quantification and Structure of the Import and Export and Long-Distance Trade of Africa in the Nineteenth Century, c.1800-1913 (St. Augustin, 3-6 January 1983), ed. Gerhard Liesegang, Helma Pasch, and Adam Jones (Berlin: Dietrich Reimer Verlag, 1986), 211-237.
312

to D.10 provide only data available to the nineteenth century, derived directly
from archival sources.
Table D.1 – Commodities Imported at Luanda by Categories (in Thousands of Réis), 1785-1864
Years Alcohol Apparel and notions Asian textiles European
textiles
1785-94 1,043,639.0 70,916.0 1,526,555.0 890,592.0 1795-97 560,298.0 - 468,318.0 326,857.0 1798 72,557.0 8,067.0 130,452.0 68,025.0 1799 85,370.0 7,342.0 231,981.0 111,843.0 Subtotal 1,761,864.0 86,325.0 2,357,306.0 1,397,317.0 1802 192,336.6 22,029.3 300,082.6 233,887.1 1803 175,375.6 32,599.6 275,553.1 251,838.8 1804 206,530.8 54,022.0 205,334.3 248,868.4 1805 255,923.0 20,965.0 547,632.9 183,086.5 1809 165,992.0 9,391.3 197,990.1 128,371.2 1810 155,576.6 20,263.5 349,795.8 245,166.1 1812 167,173.0 22,380.0 385,228.8 158,175.4 1813 195,513.2 9,768.5 371,850.6 194,316.2 1815 173,378.1 22,495.0 413,354.8 172,739.7 1816 172,854.0 30,016.4 419,699.7 219,380.7 1817 271,646.6 45,998.9 588,723.2 355,531.2 1818 294,448.7 31,833.5 621,998.7 216,496.8 1819 223,443.4 49,757.6 900,710.2 320,925.1 1823 256,254.6 26,628.4 183,622.8 115,511.3 Subtotal 2,906,446.2 398,148.7 5,761,577.5 3,044,294.3 1837 150,628.6 66,656.4 129,679.1 798,510.4 1861 212,468.8 34,611.8 157,790.7 625,411.1 1862 202,003.8 20,247.9 68,396.3 332,427.2 1863 158,309.4 16,965.1 26,802.6 247,315.2 1864 104,645.3 14,379.3 36,147.8 204,230.6 Subtotal 828,056.0 152,860.5 418,816.6 2,207,894.5 Total 5,496,366.1 637,334.2 8,537,700.0 6,649,505.9
313

Table D.1 (Cont.)
Years Foodstuffs Ironware and other
metals Miscellany Weapons Total
1785-94 259,087.0 19,690.0 100,623.0 192,901.0 4,104,003.0 1795-97 126,218.0 - 52,058.0 62,247.0 1,595,996.0 1798 15,662.0 1,206.0 9,566.0 3,257.0 308,792.0 1799 27,310.0 1,772.0 16,070.0 18,587.0 500,275.0 Subtotal 428,277.0 22,668.0 178,317.0 276,992.0 6,509,066.0 1802 43,121.2 19,462.8 97,701.8 25,827.9 934,449.4 1803 69,105.4 35,513.9 81,305.1 76,928.2 998,219.7 1804 94,403.9 33,492.3 77,620.4 62,309.9 982,582.0 1805 - - 5,875.8 49,514.0 1,062,997.2 1809 33,591.1 24,927.4 18,921.9 6,500.9 585,685.9 1810 35,720.3 18,370.6 42,068.4 12,994.5 879,955.7 1812 46,498.9 14,704.3 34,356.2 33,484.2 862,000.6 1813 32,551.5 10,700.4 29,687.1 691.4 845,079.0 1815 54,789.6 18,426.0 43,136.2 50,693.2 949,012.6 1816 55,357.2 18,267.1 46,815.1 62,029.4 1,024,419.5 1817 48,038.5 50,993.9 69,642.0 153,903.4 1,584,477.6 1818 56,840.2 34,906.1 60,167.0 233,349.6 1,550,040.6 1819 60,329.0 24,945.2 72,613.7 119,560.4 1,772,284.4 1823 94,941.8 47,757.9 38,740.6 51,602.0 815,059.3 Subtotal 725,288.5 352,467.8 718,651.4 939,389.0 14,846,263.4 1837 55,741.3 28,039.0 95,883.5 182,086.4 1,507,224.9 1861 159,587.8 29,433.9 376,533.7 59,687.3 1,655,525.1 1862 96,340.9 21,207.1 178,347.1 8,279.1 927,249.5 1863 93,085.8 28,857.1 114,282.9 11,784.7 697,402.8 1864 81,872.8 16,718.7 120,577.2 15,501.3 594,072.9 Subtotal 486,628.7 124,255.8 885,624.4 277,338.7 5,381,475.2 Total 1,640,194.2 499,391.6 1,782,592.7 1,493,719.7 26,736,804.5
Sources: 1785-1799: Joseph C. Miller, “Imports at Luanda,” Table VI.1; 1802-1823: AHU, CU,
Angola, box 106 doc. 5; box 109 doc. 54; box 112 doc. 47; box 115 doc. 14; box 121 doc. 6; box 121A
doc. 35; box 127 doc. 1; box 128 doc. 26; box 131 doc. 11; box 132 doc. 26; box 133 doc. 3; box 134
314

doc. 24; box 138 doc. 56; box 144 doc. 94; 1837: AHU, SEMU, Angola, box 593 folder 4; 1861-1864:
AHU, SEMU, Angola, box 629, folder 28 and box 638 folder 37.
Table D.2 – Commodities Imported at Luanda by Categories (in Row Percentages), 1785-1864
Years Alcohol Apparel and notions Asian textiles European
textiles
1785-94 25.4 1.7 37.2 21.7 1795-97 35.1 - 29.3 20.5 1798 23.5 2.6 42.2 22.0 1799 17.1 1.5 46.4 22.4 Subtotal 27.1 1.3 36.2 21.5 1802 20.6 2.4 32.1 25.0 1803 17.6 3.3 27.6 25.2 1804 21.0 5.5 20.9 25.3 1805 24.1 2.0 51.5 17.2 1809 28.3 1.6 33.8 21.9 1810 17.7 2.3 39.8 27.9 1812 19.4 2.6 44.7 18.3 1813 23.1 1.2 44.0 23.0 1815 18.3 2.4 43.6 18.2 1816 16.9 2.9 41.0 21.4 1817 17.1 2.9 37.2 22.4 1818 19.0 2.1 40.1 14.0 1819 12.6 2.8 50.8 18.1 1823 31.4 3.3 22.5 14.2 Subtotal 19.6 2.7 38.8 20.5 1837 10.0 4.4 8.6 53.0 1861 12.8 2.1 9.5 37.8 1862 21.8 2.2 7.4 35.9 1863 22.7 2.4 3.8 35.5 1864 17.6 2.4 6.1 34.4 Subtotal 15.4 2.8 7.8 41.0 Total 20.6 2.4 31.9 24.9
315

Table D.2 (Cont.)
Years Foodstuffs Ironware and other
metals Miscellany Weapons Total
1785-94 6.3 0.5 2.5 4.7 100.0 1795-97 7.9 - 3.3 3.9 100.0 1798 5.1 0.4 3.1 1.1 100.0 1799 5.5 0.4 3.2 3.7 100.0 Subtotal 6.6 0.3 2.7 4.3 100.0 1802 4.6 2.1 10.5 2.8 100.0 1803 6.9 3.6 8.1 7.7 100.0 1804 9.6 3.4 7.9 6.3 100.0 1805 - - 0.6 4.7 100.0 1809 5.7 4.3 3.2 1.1 100.0 1810 4.1 2.1 4.8 1.5 100.0 1812 5.4 1.7 4.0 3.9 100.0 1813 3.9 1.3 3.5 0.1 100.0 1815 5.8 1.9 4.5 5.3 100.0 1816 5.4 1.8 4.6 6.1 100.0 1817 3.0 3.2 4.4 9.7 100.0 1818 3.7 2.3 3.9 15.1 100.0 1819 3.4 1.4 4.1 6.7 100.0 1823 11.6 5.9 4.8 6.3 100.0 Subtotal 4.9 2.4 4.8 6.3 100.0 1837 3.7 1.9 6.4 12.1 100.0 1861 9.6 1.8 22.7 3.6 100.0 1862 10.4 2.3 19.2 0.9 100.0 1863 13.3 4.1 16.4 1.7 100.0 1864 13.8 2.8 20.3 2.6 100.0 Subtotal 9.0 2.3 16.5 5.2 100.0 Total 6.1 1.9 6.7 5.6 100.0
Sources: Same as Table D.1.
316

Table D.3 – Alcohol Imported at Luanda (in Thousands of Réis), 1802-1864
Years Aguardente Geribita Wine Other Total 1802 77,520.0 50,150.0 63,352.6 1,314.0 192,336.6 1803 5,813.0 112,125.0 56,528.3 909.3 175,375.6 1804 8,906.8 134,880.0 61,359.2 1,384.8 206,530.8 1805 179,177.0 - 76,160.0 586.0 255,923.0 1809 155,737.2 - 9,769.2 485.6 165,992.0 1810 1,000.0 102,520.0 51,045.0 1,011.6 155,576.6 1812 - 123,440.0 41,819.4 1,913.6 167,173.0 1813 - 154,594.0 39,838.2 1,081.0 195,513.2 1815 200.0 138,073.6 33,714.5 1,390.0 173,378.1 1816 1,310.0 115,240.0 54,280.0 2,024.0 172,854.0 1817 1,235.0 155,292.0 114,448.0 671.6 271,646.6 1818 600.0 199,033.5 94,352.0 463.2 294,448.7 1819 1,072.1 184,090.0 32,834.0 5,447.3 223,443.4 1823 196,312.0 - 58,929.2 1,013.4 256,254.6 1837 85,788.6 - 57,295.1 7,544.9 150,628.6 1861 111,924.3 - 93,396.0 7,148.5 212,468.8 1862 151,027.5 - 41,038.7 9,937.6 202,003.8 1863 108,141.1 - 37,860.5 12,307.7 158,309.4 1864 60,150.8 - 36,917.7 7,576.8 104,645.3 Total 1,145,915.4 1,469,438.1 1,054,937.8 64,210.9 3,734,502.1
Sources: AHU, CU, Angola, box 106 doc. 5; box 109 doc. 54; box 112 doc. 47; box 115 doc. 14; box
121 doc. 6; box 121A doc. 35; box 127 doc. 1; box 128 doc. 26; box 131 doc. 11; box 132 doc. 26;
box 133 doc. 3; box 134 doc. 24; box 138 doc. 56; box 144 doc. 94; 1837: AHU, SEMU, Angola, box
593 folder 4; 1861-1864: AHU, SEMU, Angola, box 629, folder 28 and box 638 folder 37.
317
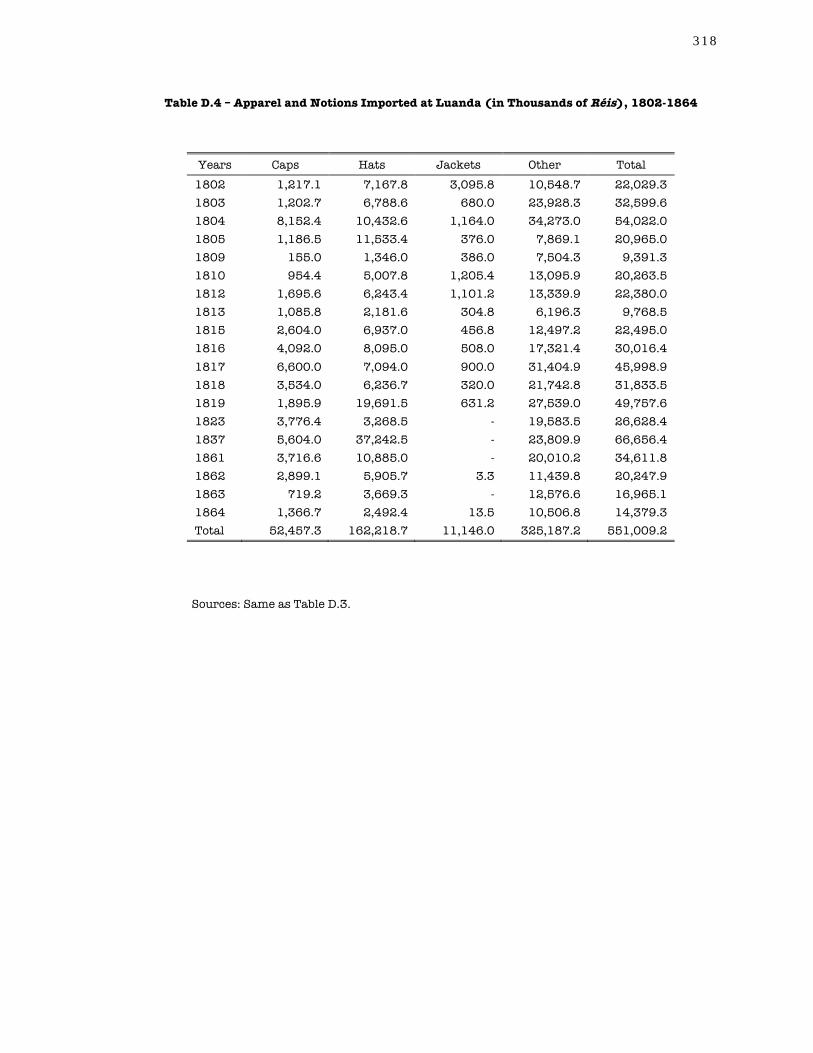
Table D.4 – Apparel and Notions Imported at Luanda (in Thousands of Réis), 1802-1864
Years Caps Hats Jackets Other Total 1802 1,217.1 7,167.8 3,095.8 10,548.7 22,029.3 1803 1,202.7 6,788.6 680.0 23,928.3 32,599.6 1804 8,152.4 10,432.6 1,164.0 34,273.0 54,022.0 1805 1,186.5 11,533.4 376.0 7,869.1 20,965.0 1809 155.0 1,346.0 386.0 7,504.3 9,391.3 1810 954.4 5,007.8 1,205.4 13,095.9 20,263.5 1812 1,695.6 6,243.4 1,101.2 13,339.9 22,380.0 1813 1,085.8 2,181.6 304.8 6,196.3 9,768.5 1815 2,604.0 6,937.0 456.8 12,497.2 22,495.0 1816 4,092.0 8,095.0 508.0 17,321.4 30,016.4 1817 6,600.0 7,094.0 900.0 31,404.9 45,998.9 1818 3,534.0 6,236.7 320.0 21,742.8 31,833.5 1819 1,895.9 19,691.5 631.2 27,539.0 49,757.6 1823 3,776.4 3,268.5 - 19,583.5 26,628.4 1837 5,604.0 37,242.5 - 23,809.9 66,656.4 1861 3,716.6 10,885.0 - 20,010.2 34,611.8 1862 2,899.1 5,905.7 3.3 11,439.8 20,247.9 1863 719.2 3,669.3 - 12,576.6 16,965.1 1864 1,366.7 2,492.4 13.5 10,506.8 14,379.3 Total 52,457.3 162,218.7 11,146.0 325,187.2 551,009.2
Sources: Same as Table D.3.
318

Tab
le D
.5 –
Asi
an T
exti
les
Impo
rted
at
Lua
nda
(in
Tho
usan
ds o
f Réis)
, 180
2-18
64
Yea
rs
Cade
ás
Chit
as
Coro
man
déis
G
arra
zes
Long
uins
Zu
arte
s Ot
her
Tota
l
1802
18
,874
.3
22,4
15.4
39
,721
.0
4,05
8.0
3,32
2.5
65,1
65.7
14
6,52
5.8
300,
082.
6 18
03
49,7
42.4
36
,834
.7
56,9
75.5
1,
836.
8 1,
740.
8 29
,017
.4
99,4
05.5
27
5,55
3.1
1804
36
,990
.0
28,6
55.2
27
,200
.0
1,99
0.0
1,00
2.0
33,9
92.0
75
,505
.1
205,
334.
3 18
05
93,4
06.0
43
,190
.1
67,3
25.0
5,
417.
5 13
,868
.0
155,
504.
0 16
8,92
2.3
547,
632.
9 18
09
35,6
20.0
12
,245
.4
26,5
85.0
6,
180.
0 2,
944.
0 40
,665
.0
73,7
50.7
19
7,99
0.1
1810
28
,009
.0
12,1
01.9
35
,524
.0
17,2
57.5
8,
953.
2 11
5,09
9.3
132,
850.
9 34
9,79
5.8
1812
30
,420
.1
5,61
7.5
53,4
86.4
13
,446
.0
7,29
6.0
113,
469.
0 16
1,49
3.8
385,
228.
8 18
13
39,1
86.6
6,
527.
4 52
,083
.0
23,4
28.0
10
,328
.0
93,9
88.5
14
6,30
9.1
371,
850.
6 18
15
36,8
52.0
6,
425.
5 51
,847
.5
20,7
90.0
6,
070.
0 11
4,40
2.0
176,
967.
8 41
3,35
4.8
1816
46
,035
.0
7,31
7.0
59,4
90.0
12
,600
.0
3,71
5.0
129,
385.
0 16
1,15
7.7
419,
699.
7 18
17
142,
720.
0 27
,224
.0
79,7
50.0
15
,975
.0
1,65
0.0
64,1
95.0
25
7,20
9.2
588,
723.
2 18
18
177,
084.
8 2,
724.
0 22
8,90
4.0
18,2
92.5
-
58,9
82.0
13
6,01
1.4
621,
998.
7 18
19
79,3
43.0
95
,370
.3
105,
088.
0 56
,756
.0
10,7
38.0
19
3,62
6.0
359,
788.
9 90
0,71
0.2
1823
8,
948.
0 22
,842
.0
33,4
68.0
17
,989
.2
6,83
0.0
33,0
16.0
60
,529
.6
183,
622.
8 18
37
- 36
,422
.5
- -
- 62
,313
.1
30,9
43.5
12
9,67
9.1
1861
-
9,92
8.0
- -
- 92
,855
.9
55,0
06.8
15
7,79
0.7
1862
-
- -
168.
0 -
35,2
31.5
32
,996
.8
68,3
96.3
18
63
- -
- -
- 14
,382
.7
12,4
19.9
26
,802
.6
1864
-
- -
105.
0 -
17,5
41.5
18
,501
.3
36,1
47.8
To
tal
823,
231.
2 37
5,84
0.9
917,
447.
4 21
6,28
9.5
78,4
57.5
1,
462,
831.
6 2,
306,
296.
1 6,
180,
394.
0
Sour
ces:
Sam
e as
Tab
le D
.3.
319

Tab
le D
.6 –
Eur
opea
n T
exti
les
Impo
rted
at
Lua
nda
(in
Tho
usan
ds o
f Réis)
, 180
2-18
64
Yea
rs
Bae
tás
Bre
tanh
as
Crês
Le
nços
Pa
nos
Ris
cadi
nhos
Ot
her
Tota
l
1802
40
,457
.3
10,9
59.5
22
,327
.9
4,64
3.6
38,6
84.5
14
,276
.3
102,
538.
1 23
3,88
7.1
1803
38
,066
.0
14,0
55.1
28
,974
.0
7,07
4.4
33,0
72.9
4,
968.
6 12
5,62
7.8
251,
838.
8 18
04
60,1
04.2
21
,876
.6
26,8
20.0
6,
748.
6 26
,131
.3
4,90
0.0
102,
287.
7 24
8,86
8.4
1805
39
,083
.7
7,03
2.5
28,4
82.0
1,
965.
0 28
,147
.2
3,34
4.0
75,0
32.1
18
3,08
6.5
1809
30
,393
.6
4,86
9.0
1,51
5.0
1,19
5.2
14,5
36.2
28
0.0
75,5
82.2
12
8,37
1.2
1810
34
,146
.4
10,0
78.4
1,
975.
5 15
,495
.3
47,3
65.4
1,
901.
5 13
4,20
3.6
245,
166.
1 18
12
23,0
83.7
2,
344.
0 1,
160.
0 12
,880
.8
27,9
37.3
2,
478.
2 88
,291
.4
158,
175.
4 18
13
39,1
76.5
1,
053.
5 16
0.0
20,2
98.6
49
,810
.1
839.
3 82
,978
.3
194,
316.
2 18
15
34,2
89.3
1,
845.
0 1,
072.
0 16
,458
.8
38,6
81.8
2,
044.
0 78
,348
.9
172,
739.
7 18
16
74,0
87.8
1,
490.
0 1,
230.
0 13
,095
.0
35,3
96.0
1,
226.
0 92
,855
.9
219,
380.
7 18
17
92,7
06.4
2,
350.
0 1,
480.
0 29
,774
.0
75,8
44.0
1,
963.
0 15
1,41
3.8
355,
531.
2 18
18
13,5
77.6
1,
218.
0 1,
784.
0 26
,670
.6
49,6
92.2
1,
295.
3 12
2,25
9.2
216,
496.
8 18
19
66,0
17.9
2,
820.
0 84
0.0
18,8
13.9
10
9,35
7.5
6,84
8.7
116,
227.
1 32
0,92
5.1
1823
11
,856
.0
852.
0 -
56,6
65.6
15
,887
.8
7,83
1.0
22,4
18.9
11
5,51
1.3
1837
31
,408
.4
- -
67,3
80.8
73
,068
.0
36,5
97.4
59
0,05
5.9
798,
510.
4 18
61
42,8
00.0
-
- 85
,963
.1
3,99
5.0
257,
421.
7 23
5,23
1.3
625,
411.
1 18
62
4,76
0.8
- -
57,3
30.3
1,
189.
1 14
9,31
8.1
119,
828.
9 33
2,42
7.2
1863
3,
707.
4 -
- 33
,680
.0
2,64
9.5
82,8
07.7
12
4,47
0.6
247,
315.
2 18
64
4,47
6.3
- -
54,0
51.2
41
0.0
74,7
70.5
70
,522
.6
204,
230.
6 To
tal
684,
199.
1 82
,843
.6
117,
820.
4 53
0,18
4.7
671,
855.
6 65
5,11
1.1
2,51
0,17
4.4
5,25
2,18
8.9
Sour
ces:
Sam
e as
Tab
le D
.3.
320

Tab
le D
.7 –
Foo
dstu
ff I
mpo
rted
at
Lua
nda
(in
Tho
usan
ds o
f Réis)
, 180
2-18
64
Yea
rs
But
ter
Oliv
e oi
l R
ice
Suga
r W
heat
flou
r Ot
her
Tota
l 18
02
3,21
1.6
7,21
0.0
5,55
6.0
6,18
8.4
4,59
4.0
16,3
61.2
43
,121
.2
1803
6,
669.
0 6,
265.
0 4,
624.
0 8,
773.
5 24
,572
.4
18,2
01.5
69
,105
.4
1804
7,
680.
0 5,
400.
0 9,
366.
0 19
,172
.5
27,8
91.6
24
,893
.8
94,4
03.9
18
09
6,58
8.9
3,45
0.0
1,75
5.0
2,23
4.0
8,33
5.7
11,2
27.6
33
,591
.1
1810
1,
176.
2 78
2.0
3,31
8.0
5,30
7.7
7,90
2.0
17,2
34.4
35
,720
.3
1812
5,
798.
4 2,
750.
0 5,
400.
0 7,
906.
2 10
,587
.5
14,0
56.8
46
,498
.9
1813
3,
158.
4 1,
250.
0 3,
180.
0 5,
838.
9 11
,089
.8
8,03
4.4
32,5
51.5
18
15
4,30
0.8
3,20
0.0
4,32
0.0
13,9
16.6
13
,875
.0
15,1
77.2
54
,789
.6
1816
4,
224.
0 4,
500.
0 6,
000.
0 15
,402
.0
8,25
0.0
16,9
81.2
55
,357
.2
1817
4,
352.
0 1,
150.
0 96
0.0
20,1
84.0
1,
750.
0 19
,642
.5
48,0
38.5
18
18
3,23
8.4
1,90
0.0
7,20
0.0
31,8
40.4
1,
680.
0 10
,981
.4
56,8
40.2
18
19
5,06
0.0
4,58
8.5
3,06
0.0
10,6
39.2
14
,022
.0
22,9
59.3
60
,329
.0
1823
3,
360.
0 9,
393.
6 7,
125.
0 11
,717
.6
18,3
60.0
44
,985
.6
94,9
41.8
18
37
3,29
3.4
3,07
9.6
3,38
9.3
10,8
89.9
6,
498.
0 28
,591
.2
55,7
41.3
18
61
9,17
5.9
4,41
6.3
7,46
3.9
24,0
31.0
27
,843
.3
86,6
57.4
15
9,58
7.8
1862
5,
136.
4 3,
991.
5 6,
091.
9 24
,361
.8
18,2
56.9
38
,502
.4
96,3
40.9
18
63
8,01
8.6
3,97
8.2
5,28
6.1
16,0
72.1
18
,424
.3
41,3
06.7
93
,085
.8
1864
6,
222.
3 3,
014.
4 4,
169.
2 7,
738.
2 21
,999
.6
38,7
29.2
81
,872
.8
Tota
l 90
,664
.3
70,3
19.0
88
,264
.4
242,
213.
9 24
5,93
2.0
474,
523.
7 1,
211,
917.
2
Sour
ces:
Sam
e as
Tab
le D
.3.
321

Table D.8 – Ironware and Other Metals Imported at Luanda (in Thousands of Réis), 1802-1864
Years Cutlery Ironware Nails Wire Other Total 1802 1,300.1 1,381.6 4,497.3 142.8 12,140.9 19,462.8 1803 1,100.3 2,852.6 15,942.2 105.8 15,513.0 35,513.9 1804 2,362.8 3,366.8 6,265.1 975.0 20,522.7 33,492.3 1809 1,338.8 34.8 22,354.2 44.4 1,155.2 24,927.4 1810 1,830.0 366.2 1,827.3 314.5 14,032.5 18,370.6 1812 5,298.7 1,315.2 3,950.0 34.0 4,106.4 14,704.3 1813 3,497.2 433.6 1,096.5 80.4 5,592.7 10,700.4 1815 8,684.1 1,187.0 3,944.0 70.0 4,540.9 18,426.0 1816 5,763.8 1,521.0 5,688.0 120.0 5,174.3 18,267.1 1817 10,050.2 454.0 30,560.0 300.0 9,629.7 50,993.9 1818 8,170.6 1,885.2 10,806.0 600.0 13,444.3 34,906.1 1819 6,900.5 50.0 2,147.0 7,315.8 8,531.9 24,945.2 1823 5,396.8 - 416.0 24,569.6 17,375.5 47,757.9 1837 100.0 8,356.6 - 12,212.5 7,369.9 28,039.0 1861 4,763.5 12,753.5 140.1 35.2 11,741.7 29,433.9 1862 4,490.4 14,354.1 - 218.6 2,144.0 21,207.1 1863 3,807.9 17,052.7 2,097.0 639.6 5,259.9 28,857.1 1864 2,212.5 10,697.8 423.0 734.4 2,651.0 16,718.7 Total 77,068.3 78,062.7 112,153.7 48,512.5 160,926.3 476,723.6
Sources: Same as Table D.3.
322

Table D.9 – Miscellany Articles Imported at Luanda (in Thousands of Réis), 1802-1864
Years Beads Cotton Tobacco Other Total 1802 54,060.3 - 6,586.4 37,055.2 97,701.8 1803 33,685.2 - 11,708.8 35,911.1 81,305.1 1804 20,082.0 - 16,956.6 40,581.8 77,620.4 1805 - - 3,734.0 2,141.8 5,875.8 1809 180.0 130.0 8,364.5 10,247.4 18,921.9 1810 14,771.2 865.4 879.7 25,552.1 42,068.4 1812 3,322.0 1,474.0 5,984.9 23,575.3 34,356.2 1813 1,779.0 1,504.5 8,119.3 18,284.3 29,687.1 1815 3,039.0 125.0 14,160.2 25,812.1 43,136.2 1816 4,466.0 150.0 8,418.2 33,780.9 46,815.1 1817 8,288.0 250.0 13,170.4 47,933.6 69,642.0 1818 11,907.0 381.3 168.4 47,710.4 60,167.0 1819 26,864.0 72.2 869.8 44,807.7 72,613.7 1823 4,800.0 179.5 9,315.5 24,445.6 38,740.6 1837 11,857.5 7,070.0 8,093.4 68,862.6 95,883.5 1861 19,787.0 252,982.8 9,280.7 94,483.1 376,533.7 1862 9,151.7 68,250.7 20,753.8 80,190.9 178,347.1 1863 8,369.9 30,118.6 11,718.9 64,075.6 114,282.9 1864 9,293.1 29,727.7 11,484.7 70,071.7 120,577.2 Total 245,702.8 393,281.7 169,768.1 795,523.1 1,604,275.7
Sources: Same as Table D.3.
323

Table D.10 – Weapons Imported at Luanda (in Thousands of Réis), 1802-1864
Years Blade weapons Firearms Gunpowder Other Total 1802 14,218.5 4,429.4 7,020.8 159.2 25,827.9 1803 8,657.2 31,391.0 28,304.0 8,576.0 76,928.2 1804 6,009.9 27,800.0 22,500.0 6,000.0 62,309.9 1805 - 7,464.0 42,050.0 - 49,514.0 1809 50.9 200.0 6,250.0 - 6,500.9 1810 834.0 274.0 11,750.0 136.5 12,994.5 1812 1,272.2 639.0 31,400.0 173.0 33,484.2 1813 552.4 75.0 - 64.0 691.4 1815 1,607.2 606.0 48,300.0 180.0 50,693.2 1816 656.4 668.0 60,500.0 205.0 62,029.4 1817 1,481.4 1,540.0 150,500.0 382.0 153,903.4 1818 699.6 3,206.0 228,800.0 644.0 233,349.6 1819 6,839.6 10,972.8 101,560.0 188.0 119,560.4 1823 2,008.0 11,334.0 24,080.0 14,180.0 51,602.0 1837 16,522.5 86,941.0 78,392.4 230.6 182,086.4 1861 240.0 30,902.7 28,544.6 - 59,687.3 1862 - 8,248.1 12.0 19.0 8,279.1 1863 - 3,212.6 8,394.1 178.0 11,784.7 1864 - 2,210.0 13,291.3 - 15,501.3 Total 61,649.8 232,113.5 891,649.2 31,315.3 1,216,727.7
Sources: Same as Table D.3.
324

Bibliography A) Archival Sources A.1) Arquivo Histórico do Itamaraty, Rio de Janeiro, Brazil Coleções Especiais, Brilhante, lata 4, maço 3, pasta 1. A.2) Arquivo Histórico Nacional de Angola, Luanda, Angola Registro de Escravos da Cidade de Luanda, cod. 2862. Registro de Escravos de Benguela, cod. 3160. Registro de Escravos de Luanda, box 135. Registro de Escravos de Luanda, cod. 2845. Registro de Escravos de Luanda, cod.3254. Registro de Escravos de Luanda, cod. 3260. Registro de Escravos de Novo Redondo, cod. 2830. Registro de Escravos do Distrito de Luanda, cod. 2467. Registro de Escravos do Distrito de Luanda, cod. 2482. Registro de Escravos do Distrito de Luanda, cod. 2524. Registro de Escravos do Distrito de Luanda, cod. 3186. A.3) Arquivo Histórico Ultramarino, Lisbon, Portugal Conselho Ultramarino, Angola
Box 30 doc. 90 Box 65 doc. 64 Box 66 doc. 68, 69, 70, 74 Box 68 doc. 29, 54 Box 69 doc. 34 Box 76 doc. 18, 102 Box 77 doc. 31 Box 78 doc. 57 Box 83 doc. 66 Box 85 doc. 28 Box 106 doc. 5 Box 109 doc. 54 Box 110 doc. 33 Box 112 doc. 47 Box 115 doc. 14, 45
Box 121 doc. 6, 32 Box 121A doc. 31, 32, 35, 36 Box 125 doc. 46 Box 127 doc. 1 Box 128 doc. 26 Box 129 doc. 63 Box 131 doc. 11, 45 Box 132 doc. 26 Box 133 doc. 3 Box 134 doc. 24 Box 138 doc. 56 Box 144 doc. 94 Box 147 doc. 34 Cod. 1627 Cod. 1634
Papéis de Sá da Bandeira, sala 12, maço 822 Secretaria de Estado da Marinha e Ultramar, Angola Box 593 folder 4 Box 629 folder 28 Box 638 folder 37 A.4) Arquivo Nacional, Rio de Janeiro, Brazil Registro das Cartas de Alforria, Carolina, cod. 184, vol. 3, ff. 90-96v. Registro das Cartas de Alforria, Duquesa de Bragança, cod. 471, ff. 1-9. Registro das Cartas de Alforria, Escuna Feliz, cod. 184, vol. 3, ff. 72-81. Registro das Cartas de Alforria, Especulador, cod. 184, vol. 4, ff. 1-5. Registro das Cartas de Alforria, Leal, cod. 184, vol. 4, ff. 14-19. Registro das Cartas de Alforria, Órion, cod. 184, vol. 3, ff. 43v-51v. Registro das Cartas de Alforria, Paquete de Benguela, cod. 184, vol. 4, ff. 19v-23v. Registro das Cartas de Alforria, Rio da Prata, cod. 471, ff. 9v-16v.
325

A.5) Arquivo Nacional Torre do Tombo, Lisbon, Portugal Registo Geral de Mercês, Dona Maria I, Book 16. Registo Geral de Mercês, Dona Maria I, Book 29. A.6) British National Archives, Kew, England Foreign Office Series 313, Amalia, vol. 61, ff. 71-91. Foreign Office Series 313, Aguila, vol. 58, ff. 43-102. Foreign Office Series 313, Diligencia, vol. 61, ff. 92-141. Foreign Office Series 313, Empresa, vol. 61, ff. 190-230. Foreign Office Series 313, Joven Reyna, vol. 60, ff. 84-110. Foreign Office Series 313, Marte, vol. 60, ff. 134-137. Foreign Office Series 313, Matilde, vol. 61, ff. 231-257. A.7) Manuscripts, Archives and Rare Books Library, Emory University, U.S.A. Logbook of the Yacht Wanderer, Wanderer (Ship) Records, Mss. 172. B) Published Primary Sources Abreu e Castro, Bernardino Freire de Figueiredo. “Colonia de Mossamedes.” Annaes do Conselho
Ultramarino (Parte Não Oficial) ser. 1 (1855): 151-155. Angola. Almanak Estatístico da Província d’Angola e suas Dependências para o Anno de 1851.
Luanda: Imprensa do Governo, 1852. Antonil, André João. Cultura e Opulência do Brasil. Belo Horizonte: Itatiaia, 1982. Barreiros, Fortunato José. Memória sobre os Pesos e Medidas de Portugal, Espanha, Inglaterra e
França. Lisbon: Typographia da Academia Real das Sciencias, 1838. Bonavides, Paulo, and Roberto Amaral. Textos Políticos da História do Brasil. 10 vols. 3rd ed.
Brasília: Senado Federal, 2002. Brásio, António, ed. Monumenta Missionária Africana. 15 vols. 1. Lisbon: Agência Geral do
Ultramar, 1952. Brant Pontes, Felisberto Caldeira. “Memória de Brant Pontes sôbre a Comunicação das Duas Costas
9/9/1800.” In Apontamentos sobre a Colonização dos Planaltos e Litoral do Sul de Angola, edited by Alfredo de Albuquerque Felner, 1:248-251. Lisbon: Agência Geral das Colónias, 1940.
———. “Memoria de Brant Pontes sobre a Comunicação da Costa Oriental com a Ocidental de Africa.”
Arquivos de Angola 1, no. 1. 1 (1933): doc. 18. Cadornega, António de Oliveira de. História Geral das Guerras Angolanas, 1680. Edited by José
Matias Delgado. Lisbon: Agência Geral do Ultramar, 1972. Capello, Hermenegildo, and Roberto Ivens. De Benguella às Terras de Iácca: Descripção de uma
Viagem na Africa Central e Occidental. Lisbon: Imprensa Nacional, 1881. “Catálogo dos Governadores do Reino de Angola.” Arquivos de Angola 3, no. 34-36. 1 (1937): 459-
549. Cavazzi de Montecucculo, João António. Descrição Histórica dos Três Reinos de Congo, Matamba e
Angola. Translated by Graciano Maria Leguzzano. Lisbon: Junta de Investigações do Ultramar, 1965.
326

Clark, William. Ten Views in the Island of Antigua. London: T. Clay, 1823. Coimbra, Carlos Dias, ed. Livro de Patentes do Tempo do Sr. Salvador Correia de Sá e Benevides. 2
vols. Luanda: Instituto de Investigação Científica de Angola, 1958. Corrêa, Elias Alexandre da Silva. História de Angola. Edited by Manuel Múrias. 2 vols. Lisbon:
Editorial Ática, 1937. Dom José I. “Carta de Sua Mag. sobre a Remataçam do Contrato dos Direitos Novos que a Rematou
Manoel Barbosa Torres dos Direitos dos Escravos q’ se Embarcam desta Cid. de Loanda p. os Portos do Brazil.” Arquivos de Angola 2, no. 13-15. 1 (1936): 515-528.
———. “Ley para Ser Livre, e Franco o Commercio de Angola, e dos Portos, e Sertões Adjacentes.”
Arquivos de Angola 2, no. 13-15. 1 (1936): 531-535. ———. “Ley sobre a Arecadação dos Direitos dos Escravos, e Marfim, que Sahirem do Reino de
Angola, e Pórtos da sua Dependencia.” Arquivos de Angola 2, no. 13-15. 1 (1936): 537-540. Dom Pedro II. “Ley sobre as Arqueações dos Navios que Carregarem Escravos, 28 de Março de
1684.” Arquivos de Angola 2, no. 11-12. 1 (1936): 313-320. Ellison, Thomas. The Cotton Trade of Great Britain. London: Effingham Wilson, 1886. Felner, Alfredo de Albuquerque. Angola: Apontamentos sobre a Ocupação e Início do
Estabelecimento dos Portugueses no Congo, Angola e Benguela Extraídos de Documentos Históricos. Coimbra: Imprensa da Universidade, 1933.
Ferreira Diniz, José de Oliveira. Populações Indígenas de Angola. Coimbra: Imprensa da
Universidade, 1918. Graham, Maria. Journal of a Voyage to Brazil and Residence There during Part of the Years 1821,
1822, 1823. London: Longman, Hurst, Rees, Orme, Brown, and Green, 1824. Great Britain. Irish University Press Series of British Parliamentary Papers: Slave Trade. 95 vols.
Shannon: Irish University Press, 70. Humboldt, Alexander. The Island of Cuba. Translated by J. S. Thrasher. New York: Derby and
Jackson, 1856. Johnson, William Henry. Cotton and Its Production. London: Macmillan, 1926. Koelle, Sigismund Wilhelm. Polyglotta Africana. Edited by P. E. H. Hair and David Dalby. Graz:
Akademische Druck, U. Verlagsanstalt, 1965. Koster, Henry. Travels in Brazil. London: Longman, Hurst, Rees, Orme, and Brown, 1816. Laet, Joannes de. Iaerlijck Verhael van de Verrichtingen der Geoctroyeerde West-Indische
Compagnie in derthien Boecken. Tweede Deel: Boek IV-VII (1627-1630). Edited by S. P. L’Honoré Naber. ’s-Gravenhage: Martinus Nijhoff, 1932.
Leitão, Manoel Correia. “Angola’s Eastern Hinterland in the 1750s: A Text Edition and Translation
of Manoel Correia Leitão's ‘Voyage’ (1755-1756).” Edited by Eva Sebestyen and Jan Vansina. History in Africa 26 (1999): 299-364.
Livingstone, David. Missionary Travels and Researches in South Africa: Including a Sketch of
Sixteen Years’ Residence in the Interior of Africa. New York: Harper & Bros., 1858. Lopes de Lima, José Joaquim. Ensaios sobre a Statistica das Possessões Portuguezas. 5 vols. Lisbon:
Imprensa Nacional, 62. Mello, António Miguel de. “Angola no Fim do Século XVIII - Documentos.” Boletim da Sociedade de
Geografia de Lisboa 6, no. 5 (1886): 284-304.
327

———. “Regimento da Alfandega da Cidade de Saõ Paulo d’Assumpçaõ Capital do Reino de Angola, 21
de Outubro de 1799.” Arquivos de Angola 2, no. 11-12. 1 (1936): 359-447. Mendes, Luiz António de Oliveira. Memória a Respeito dos Escravos e Tráfico da Escravatura entre
a Costa da África e o Brasil. Edited by José Capela. Porto: Escorpião, 1977. Monteiro, Joachim John. Angola and the River Congo. New York: Macmillan and Co., 1876. Neves, António Rodrigues. Memoria da Expedição à Cassange Commandada pelo Major Graduado
Francisco Salles Ferreira em 1850, Escripta pelo Capitão Móvel d’Ambriz António Rodrigues Neves. Lisbon: Imprensa Silviana, 1854.
Sanguineti, Cárlos. Diccionario Jurídico-Administrativo. Madrid: Imprensa de la Revista de
Legislacion y Jurisprudencia, 1858. “Sugar Manufacture in Brazil.” The Illustrated London News 25 (September 9, 1854): 232. Tams, Georg. Visit to the Portuguese Possessions in South-Western Africa. London: T. C. Newby,
1845. Taunay, Carlos Augusto. Manual do Agricultor Brasileiro. Edited by Rafael de Bivar Marquese. São
Paulo: Companhia das Letras, 2001. Torres, João Carlos Feo Cardoso de Castello Branco e. Memórias Contendo a Biographia do Vice
Almirante Luis da Motta Feo e Torres, a História dos Governadores e Capitaens Generaes de Angola desde 1575 até 1825, e a Descripção Geographica e Politica dos Reinos de Angola e Benguella. Paris: Fantin, 1825.
Vide, Sebastião Monteiro da. Constituições Primeiras do Arcebispado da Bahia. São Paulo:
Typographia de António Louzada Antunes, 1853. Visconde d’Athoguia. “Decreto de 14 de Dezembro de 1854.” Diário do Governo. Lisbon, December
28, 1854, 305 edition, sec. Ministério dos Negócios da Marinha e Ultramar, Seção do Ultramar.
———. “Regulamento que Faz Parte do Decreto de 25 de Outubro de 1853, Publicado no Diário do
Governo no. 268, de 14 de Novembro de 1853.” Diário do Governo. Lisbon, November 29, 1853, 281 edition, sec. Ministério dos Negócios da Marinha e Ultramar, Seção do Ultramar.
C) Secondary Sources Alden, Dauril. “Late Colonial Brazil, 1750-1808.” In The Cambridge History of Latin America, edited
by Leslie Bethell, 2:601-660. New York: Cambridge University Press, 1984. Alencastro, Luiz Felipe de. O Trato dos Viventes: Formação do Brasil no Atlântico Sul. São Paulo:
Companhia das Letras, 2000. Alpers, Edward A. “‘Mozambiques’ in Brazil: Another Dimension of the African Diaspora in the
Atlantic World.” In Africa and the Americas: Interconnections during the Slave Trade, edited by José C. Curto and Renée Soulodre-La France, 43-68. Trenton: Africa World Press, 2005.
Anstey, Roger. The Atlantic Slave Trade and British Abolition, 1760-1810. Atlantic Highlands:
Humanities Press, 1975. Antunes, Luís Frederico Dias. “Têxteis e Metais Preciosos: Novos Vínculos do Comércio Indo-
Brasileiro (1808-1820).” In O Antigo Regime nos Trópicos: a Dinâmica Imperial Portuguesa (Séculos XVI-XVIII), edited by João Fragoso, Maria Fernanda Baptista Bicalho, and Maria de Fátima Silva Gouvêa, 379-420. Rio de Janeiro: Civilização Brasileira, 2001.
328

Arruda, José Jobson de A. O Brasil no Comércio Colonial. São Paulo: Editora Ática, 1980. Azevedo, J. Lúcio de. Épocas de Portugal Económico. 4th ed. Lisbon: Livraria Clássica, 1988. Bal, Willy. “Portugais Pombeiro, Commerçant Ambulant du ‘Sertão’.” Annali dell’Istituto
Universitario Orientalis, Naples 7 (1965): 123-161. Ball, Edward. Slaves in the Family. New York: Ballantine Books, 1999. Bastin, Marie Louise. Statuettes Tshokwe du Héros Civilisateur “Tshibinda Ilunga”. Arnouville-les-
Gonesse: Arts d’Afrique Noire, 1978. Bean, Richard. “A Note on the Relative Importance of Slaves and Gold in West African Exports.”
Journal of African History 15, no. 3 (1974): 351-356. Bethell, Leslie. The Abolition of the Brazilian Slave Trade: Britain, Brazil and the Slave Trade
Question, 1807-1869. Cambridge: Cambridge University Press, 1970. ———. “The Mixed Commissions for the Suppression of the Transatlantic Slave Trade in the
Nineteenth Century.” Journal of African History 7, no. 1 (1966): 79-93. Birmingham, David. Central Africa to 1870: Zambesia, Zaïre and the South Atlantic. New York:
Cambridge University Press, 1981. ———. “The Date and Significance of the Imbangala Invasion of Angola.” Journal of African History 6,
no. 2 (1965): 143-152. ———. Trade and Conflict in Angola: The Mbundu and their Neighbours under the Influence of the
Portuguese, 1483-1790. Oxford: Clarendon Press, 1966. Boahen, A. A. “New Trends and Processes in Africa in the Nineteenth Century.” In General History
of Africa, edited by J. F. A. Ajayi. Vol. 6. London: Heinemann, 1989. Boserup, Ester. Woman’s Role in Economic Development. London: Allen & Unwin, 1970. Boxer, C. R. “Salvador Correia de Sá e Benevides and the Reconquest of Angola in 1648.” Hispanic
American Historical Review 28, no. 4 (1948): 483-513. ———. Salvador de Sá and the Struggle for Brazil and Angola, 1602-1686. London: University of
London Press, 1952. ———. The Golden Age of Brazil, 1695-1750: Growing Pains of a Colonial Society. Berkeley:
University of California, 1962. Broadhead, Susan. “Beyond Decline: The Kingdom of Kongo in the Eighteenth and Nineteenth
Centuries.” International Journal of African Historical Studies 12, no. 4 (1979): 615-650. Broadhead, Susan Herlin. “Trade and Politics on the Congo Coast, 1770-1870”. Ph.D., Boston
University, 1971. Cândido, Mariana P. “Enslaving Frontiers: Slavery, Trade and Identity in Benguela, 1780-1850”.
Ph.D., Toronto: York University, 2006. ———. “Merchants and the Business of the Slave Trade in Benguela c. 1750-1850.” African Economic
History 35 (2007): 1-30. Caldeira, Arlindo Manuel. “Os Jesuítas em Angola nos Séculos XVI e XVII: Tráfico de Escravos e
‘Escrúpulos de Consciência’.” Trabalho Forçado Africano: Articulações com o Poder Político, Revista do Centro de Estudos Africanos da Universidade do Porto 3 (2007): 47-82.
329

Calonius, Erik. The Wanderer: The Last American Slave Ship and the Conspiracy that Set Its Sails. New York: St. Martin’s Press, 2006.
Cardoso, Carlos Alberto Lopes, “Dona Ana Joaquina dos Santos Silva: Industrial Angolana da
Segunda Metade do Século XIX,” Boletim Cultural da Câmara Municipal de Luanda 37 (1972): 5-14.
Carreira, António. As Companhias Pombalinas de Navegação, Comércio e Tráfico de Escravos entre
a Costa Africana e o Nordeste Brasileiro. Bissau: Centro de Estudos da Guiné Portuguesa, 1969.
Carreira, Ernestina. “Os Últimos Anos da Carreira da Índia.” In A Carreira da Índia e as Rotas dos
Estreitos: Actas do VIII Seminário Internacional de História Indo-Portuguesa, edited by Artur Teodoro de Matos and Luís Filipe F. Reis Thomaz, 809-834. Angra do Heroísmo: Barbosa e Xavier, 1998.
Carvalho, Marcus J. M. de. Liberdade: Rotinas e Rupturas do Escravismo no Recife, 1822-1850.
Recife: Universidade Federal de Pernambuco, 2002. Chambers, D. B. “Ethnicity in the Diaspora: The Slave-Trade and the Creation of African ‘Nations’ in
the Americas.” Slavery and Abolition 22, no. 3 (2001): 25. Childs, Gladwyn Murray. Kinship and Character of the Ovimbundu: Being a Description of the Social
Structure and Individual Development of the Ovimbundu of Angola, with Observations Concerning the Bearing on the Enterprise of Christian Missions of Certain Phases of the Life and Culture Described. London: Reprinted for the International African Institute & for the Witwatersrand U.P. by Dawson, 1969.
Cipolla, Carlo M. Before the Industrial Revolution: European Society and Economy, 1000-1700. New
York: Norton, 1976. Clarence-Smith, William Gervase. “The Portuguese Contribution to the Cuban Slave and Coolie
Trades in the Nineteenth Century.” Slavery and Abolition 5, no. 1 (1984): 25-33. Cody, Cheryll Ann. “There was No ‘Absalom’ on the Ball Plantations: Slave-Naming Practices in the
South Carolina Low Country, 1720-1865.” American Historical Review 92, no. 3 (1987): 563-596.
Couto, Carlos. O Zimbo na Historiografia Angolana. Luanda: Instituto de Investigação Científica de
Angola, 1973. ———. Os Capitães-Mores em Angola no Século XVIII: Subsídios para o Estudo da sua Actuação.
Luanda: Instituto de Investigação Científica de Angola, 1972. Crosby, Alfred W. Ecological Imperialism: The Biological Expansion of Europe. New York: Cambridge
University Press, 1986. Curtin, Philip D. Economic Change in Precolonial Africa: Senegambia in the Era of the Slave Trade. 2
vols. Madison: University of Wisconsin Press, 1975. ———. The Atlantic Slave Trade: A Census. Madison: University of Wisconsin Press, 1969. Curtin, Philip D., and Jan Vansina. “Sources of the Nineteenth Century Atlantic Slave Trade.”
Journal of African History 5, no. 2 (1964): 185-208. Curto, José C. “A Quantitative Reassessment of the Legal Portuguese Slave Trade from Luanda,
Angola, 1710-1830.” African Economic History, no. 20 (1992): 1-25. ———. Enslaving Spirits: The Portuguese-Brazilian Alcohol Trade at Luanda and Its Hinterland,
c.1550-1830. Leiden: Brill, 2004.
330

———. “Experiences of Enslavement in West Central Africa.” Social History 41, no. 82 (2009): 381-415.
———. “Struggling against Enslavement: The Case of José Manuel in Benguela, 1816-20.” Canadian
Journal of African Studies 39, no. 1 (2005): 96-122. ———. “The Anatomy of a Demographic Explosion: Luanda, 1844-1850.” International Journal of
African Historical Studies 32, no. 2/3 (1999): 381-405. ———. “The Origin of Slaves in Angola: The Case of Runaways, 1850-1876” presented at the Seventh
European Social Science and History Conference, Lisbon, 2008. ———. “The Story of Nbena, 1817-20: Unlawful Enslavement and the Concept of ‘Original Freedom’ in
Angola.” In Trans-Atlantic Dimensions of Ethnicity in the African Diaspora, edited by Paul E. Lovejoy and David V. Trotman, 43-64. New York: Continuum, 2003.
Curto, José C., and Raymond R. Gervais. “A Dinâmica Demográfica de Luanda no Contexto do
Tráfico de Escravos do Atlântico Sul, 1781-1844.” Topoi, no. 4 (2002): 85-138. ———. “The Population History of Luanda during the Late Atlantic Slave Trade, 1781-1844.” African
Economic History, no. 29 (2001): 1-59. Davis, David Brion. Inhuman Bondage: The Rise and Fall of Slavery in the New World. New York:
Oxford University Press, 2006. Delgado, Ralph. História de Angola. 4 vols. Lisbon: Banco de Angola, 1970. Dias, Jill R. “Angola.” In Nova História da Expansão Portuguesa: O Império Africano, 1825-1890,
edited by Valentim Alexandre and Jill R. Dias, 10:317-556. Lisbon: Editorial Estampa, 98. ———. “Famine and Disease in the History of Angola, c.1830-1930.” Journal of African History 22,
no. 3 (1981): 349-378. Dias, Manuel Nunes. Fomento e Mercantilismo: A Companhia Geral do Grão Pará e Maranhão
(1755-1778). 2 vols. Belém: Universidade Federal do Pará, 1970. Domingues da Silva, Daniel B. “Catherine Zimmermann-Mulgrave: A Slave Odyssey.” In Voyages:
The Transatlantic Slave Trade Database, edited by David Eltis, David Richardson, Stephen Behrendt, and Manolo Florentino. Atlanta: Emory University, 2008. www.slavevoyages.org.
———. “O Tráfico de São Tomé e Príncipe, 1799-1811: Para o Estudo de Rotas Negreiras Subsidiárias
ao Comércio Transatlântico de Escravos.” Estudos de História, Franca 9 (2002): 35-51. ———. “The Atlantic Slave Trade to Maranhão, 1680-1846: Volume, Routes and Organisation.”
Slavery and Abolition 29, no. 4 (2008): 461-501. ———. “The Coastal Origins of Slaves Leaving West Central Africa, c.1780-1867”. Paper presented at
the 124th Annual Meeting of the American Historical Association, San Diego, 2010. Drescher, Seymour. The Mighty Experiment: Free Labor versus Slavery in British Emancipation.
New York: Oxford University Press, 2002. Ekholm, Kajsa. “External Exchange and the Transformation of Central African Social System.” In
The Evolution of Social Systems, edited by Jonathan Friedman and Michael J. Rowlands, 115-136. Pittsburgh: University of Pittsburgh Press, 1978.
Eltis, David. Economic Growth and the Ending of the Transatlantic Slave Trade. New York: Oxford
University Press, 1987. ———. “Nutritional Trends in Africa and the Americas: Heights of Africans, 1819-1839.” Journal of
Interdisciplinary History 12, no. 3 (1982): 453-475.
331

———. “Slave Departures from Africa, 1811-1867: An Annual Time Series.” African Economic History, no. 15 (1986): 143-171.
———. “The British Contribution to the Nineteenth Century Trans-Atlantic Slave Trade.” Economic
History Review 32, no. 2 (1979): 211-227. ———. “The British Trans-Atlantic Slave Trade after 1807.” Maritime History 4, no. 1 (1974): 1-11. ———. “The Nineteenth Century Transatlantic Slave Trade: An Annual Time Series of Imports into
the Americas Broken Down by Region.” Hispanic American Historical Review 67, no. 1 (1987): 109-138.
———. The Rise of African Slavery in the Americas. New York: Cambridge University Press, 2000. ———. “The Volume and Structure of the Transatlantic Slave Trade: A Reassessment.” William and
Mary Quarterly 58, no. 1 (2001): 17-46. Eltis, David, and Stanley L. Engerman. “Was the Slave Trade Dominated by Men?” Journal of
Interdisciplinary History 23, no. 2 (1992): 237-257. Eltis, David, and David Richardson. Atlas of the Transatlantic Slave Trade. New Haven: Yale
University Press, 2010. Engerman, Stanley L., Herbert S. Klein, Robin Haines, and Ralph Shlomowitz. “Transoceanic
Mortality: The Slave Trade in Comparative Perspective.” William and Mary Quarterly 58, no. 1 (2001): 93-118.
Fage, J. D. “Slavery and the Slave Trade in the Context of West African History.” Journal of African
History 10, no. 3 (1969): 393-404. Fausto, Boris. Historia do Brasil. 8th ed. Sao Paulo: Editora da Universidade de São Paulo, 2000. Ferreira, Roquinaldo Amaral. “Dos Sertões ao Atlântico: Tráfico Ilegal de Escravos e Comércio Lícito
em Angola, 1830-1860”. M.A., Rio de Janeiro: Universidade Federal do Rio de Janeiro, 1996.
———. “Transforming Atlantic Slaving: Trade, Warfare and Territorial Control in Angola, 1650-
1800”. Ph.D., Los Angeles: University of California, 2003. Ferreira, Roquinaldo. “Dinâmica do Comércio Intracolonial: Geribitas, Panos Asiáticos e Guerra no
Tráfico Angolano de Escravos (Século XVIII).” In O Antigo Regime nos Trópicos: a Dinâmica Imperial Portuguesa (Séculos XVI-XVIII), edited by João Fragoso, Maria Fernanda Baptista Bicalho, and Maria de Fátima Silva Gouvêa, 339-378. Rio de Janeiro: Civilização Brasileira, 2001.
Finkelman, Paul. “Regulating the African Slave Trade.” Civil War History 54, no. 4 (2008): 379-405. Florentino, Manolo. Em Costas Negras: Uma História do Tráfico Atlântico de Escravos entre a África
e o Rio de Janeiro, Séculos XVIII e XIX. São Paulo: Companhia das Letras, 1997. ———. “The Slave Trade, Colonial Markets, and Slave Families in Rio de Janeiro, Brazil, ca.1790-
ca.1830.” In Extending the Frontiers: Essays on the New Transatlantic Slave Trade Database, edited by David Eltis and David Richardson, 275-312. New Haven: Yale University Press, 2008.
Flory, Rae Jean. “Bahian Society in the Mid-Colonial Period: The Sugar Planters, Tobacco Growers,
Merchants and Artisans of Salvador and the Recôncavo, 1680-1725”. Ph.D., Austin: University of Texas, 1978.
Fragoso, João Luís Ribeiro. “A Nobreza da República: Notas sobre a Formação da Primeira Elite
Senhorial do Rio de Janeiro (Séculos XVI e XVII).” Topoi, no. 1 (2000): 43-122.
332

Gomez, Michael Angelo. Exchanging Our Country Marks: The Transformation of African Ties in the Colonial and Antebellum South. Chapel Hill: University of North Carolina Press, 1998.
Gorender, Jacob. O Escravismo Colonial. São Paulo: Ática, 1978. Guedes, Roberto, and João Luís Fragoso. “Alegrias e Artimanhas de uma Fonte Seriada: Os Códices
390, 421, 424 e 425: Despachos de Escravos e Passaportes da Intendência de Polícia da Corte, 1819 – 1833.” In Tráfico Interno de Escravos e Relações Comerciais no Centro-Sul do Brasil, Séculos XVIII e XIX, edited by IPEA. Brasília: Instituto de Pesquisa Econômica Aplicada, 2000.
Gutiérrez, Horácio. “O Tráfico de Crianças Escravas para o Brasil durante o Século XVIII.” Revista
de História, São Paulo 120 (1989): 59-73. Hair, P. E. H. “Ethnolinguistic Continuity on the Guinea Coast.” Journal of African History 8, no. 2
(1967): 247-268. ———. “From Language to Culture: Some Problems in the Systemic Analysis of the Ethnohistorical
Records of the Sierra Leone Region.” In The Population Factor in African Studies, edited by R. P. Moss and R. J. A. R. Rathbone, 71-83. London: University of London Press, 1975.
———. “Koelle at Freetown: An Historical Introduction.” In Polyglotta Africana, edited by P. E. H. Hair
and David Dalby, by Sigismund Wilhelm Koelle, 7-17. Graz: Akademische Druck, U. Verlagsanstalt, 1965.
———. “The Enslavement of Koelle’s Informants.” Journal of African History 6, no. 2 (1965): 193-
203. Hall, Gwendolyn Midlo. “African Ethnicities and the Meanings of ‘Mina’.” In Trans-Atlantic
Dimensions of Ethnicity in the African Diaspora, edited by Paul E. Lovejoy and David V. Trotman, 65-81. New York: Continuum, 2003.
Harms, Robert W. River of Wealth, River of Sorrow: The Central Zaire Basin in the Era of the Slave
and Ivory Trade, 1500-1891. New Haven: Yale University Press, 1981. Hawthorne, Walter. From Africa to Brazil: Culture, Identity, and an Atlantic Slave Trade, 1600-
1830. New York: Cambridge University Press, 2010. ———. “Nourishing a Stateless Society during the Slave Trade: The Rise of Balanta Paddy-Rice
Production in Guinea-Bissau.” Journal of African History 42, no. 1 (2001): 1-24. ———. Planting Rice and Harvesting Slaves: Transformations along the Guinea-Bissau Coast, 1400-
1900. Portsmouth: Heinemann, 2003. ———. “The Production of Slaves where There Was No State: The Guinea-Bissau Region, 1450–1815.”
Slavery and Abolition 20, no. 2 (1999): 97-124. Heintze, Beatrix. “Angola nas Garras do Tráfico de Escravos: As Guerras do Ndongo (1611-1630).”
Revista Internacional de Estudos Africanos 1 (1984): 11-59. ———. “Luso-African Feudalism in Angola? The Vassal Treaties of the Sixteenth to the Eighteenth
Century.” Revista Portuguesa de História 18 (1980): 111-131. ———. Pioneiros Africanos: Caravanas de Carregadores na África Centro-Ocidental entre 1850 e
1890. Translated by Marina Santos. Lisbon: Caminho, 2002. Henriques, Isabel Castro. “A Organização Afro-Portuguesa do Tráfico de Escravos (Séculos XVII-
XIX).” In A Rota dos Escravos: Angola e a Rede do Comércio Negreiro, edited by João Medina and Isabel Castro Henriques, 124-173. Lisbon: Cegia, 1996.
333

———. Percursos da Modernidade em Angola: Dinâmicas Comerciais e Transformações Sociais no Século XIX. Translated by Alfredo Margarido. Lisbon: Instituto de Investigação Científica Tropical; Instituto da Cooperação Portuguesa, 1997.
Heywood, Linda M. Contested Power in Angola, 1840s to the Present. Rochester: University of
Rochester Press, 2000. Heywood, Linda M., and John K. Thornton. Central Africans, Atlantic Creoles, and the Foundation of
the Americas, 1585-1660. New York: Cambridge University Press, 2007. Heywood, Linda. “Slavery and its Transformation in the Kingdom of Kongo,1491-1800.” Journal of
African History 50, no. 1 (2009): 1-22. Heywood, Linda, and John Thornton. “African Fiscal Systems as Sources for Demographic History:
The Case of Central Angola, 1799-1920.” Journal of African History 29, no. 2 (1988): 213-228.
Higman, B. W. Slave Populations of the British Caribbean, 1807-1834. 2 vols. Baltimore: Johns
Hopkins University Press, 1984. Hilton, Anne. “Family and Kinship among the Kongo South of the Zaire River from the Sixteenth to
the Nineteenth Centuries.” Journal of African History 24, no. 2 (1983): 189-206. ———. The Kingdom of Kongo. New York: Clarendon Press, 1985. Hogendorn, Jan S., and Marion Johnson. The Shell Money of the Slave Trade. New York: Cambridge
University Press, 1986. Hoover, Jeffrey J. “The Seduction of Ruweej: Reconstructing Ruund History (The Nuclear Lunda:
Zaire, Angola, Zambia)”. Ph.D., New Haven: Yale University, 1978. Hubbell, Andrew. “A View of the Slave Trade from the Margin: Souroudougou in the Late
Nineteenth-Century Slave Trade of the Niger Bend.” Journal of African History 42, no. 1 (2001): 25-47.
Huggins, Nathan Irvin. Black Odyssey: The Afro-American Ordeal in Slavery. New York: Pantheon
Books, 1977. Inikori, Joseph E. “Introduction.” In Forced Migration: The Impact of the Export Slave Trade on
African Societies, edited by Joseph E. Inikori, 13-59. New York: Africana Publishing Company, 1982.
———. “The Import of Firearms into West Africa, 1750-1807: A Quantitative Analysis.” Journal of
African History 18, no. 3 (1977): 339-368. Jadin, Louis. “Rapport sur les Recherches aux Archives d’Angola du 4 Juillet au 7 Septembre
1952.” Bulletin des Séances de l’Institut Royal Colonial Belge, no. 24 (1953). Johnson, Marion. “The Cowrie Currencies of West Africa. Part II.” Journal of African History 11, no.
3 (1970): 331-353. Karasch, Mary C. Slave Life in Rio de Janeiro, 1808-1850. Princeton: Princeton University Press,
1987. ———. “The Brazilian Slavers and the Illegal Slave Trade, 1836-1851”. M.A., Madison: University of
Wisconsin, 1967. Kea, Raymond A. “Firearms and Warfare on the Gold and Slave Coasts from the Sixteenth to the
Nineteenth Centuries.” Journal of African History 12, no. 2 (1971): 185-213. Kennedy, John Norman. “Bahian Elites, 1750-1822.” Hispanic American Historical Review 53, no. 3
(1973): 415-439.
334

Klein, Herbert S. “African Women in the Atlantic Slave Trade.” In Women and Slavery in Africa,
edited by Claire C. Robertson and Martin A. Klein, 29-38. Madison: University of Wisconsin Press, 1983.
———. The Middle Passage: Comparative Studies in the Atlantic Slave Trade. Princeton: Princeton
University Press, 1978. ———. “The Portuguese Slave Trade From Angola in the Eighteenth Century.” Journal of Economic
History 32, no. 4 (1972): 894-918. Klein, Herbert S., and Francisco Vidal Luna. Slavery in Brazil. New York: Cambridge University
Press, 2010. Klein, Martin A. “The Impact of the Atlantic Slave Trade on the Societies of the Western Sudan.”
Social Science History 14, no. 2 (1990): 231-253. ———. “The Slave Trade and Decentralized Societies.” Journal of African History 42, no. 1 (2001):
49-65. Klein, Martin A., and Paul E. Lovejoy. “Slavery in West Africa.” In The Uncommon Market: Essays in
the Economic History of the Atlantic Slave Trade, edited by Henry A. Gemery and Jan S. Hogendorn, 181-212. New York: Academic Press, 1979.
Lapa, José Roberto do Amaral. A Bahia e a Carreira da Índia. Estudos Históricos, 42. São Paulo:
Hucitec, Unicamp, 2000. Law, Robin. “Ethnicities of Enslaved Africans in the Diaspora: On the Meanings of ‘Mina’ (Again).”
History in Africa 32 (2005): 247-267. ———. “Ethnicity and the Slave Trade: ‘Lucumi’ and ‘Nago’ as Ethnonyms in West Africa.” History in
Africa 24 (1997): 205-219. ———. “Legal and Illegal Enslavement in West Africa, in the Context of the Trans-Atlantic Slave
Trade.” In Ghana in Africa and the World: Essays in Honor of Adu Boahen, edited by Toyin Falola, 513-533. Trenton: Africa World Press, 2003.
———. The Slave Coast of West Africa, 1550-1750: The Impact of the Atlantic Slave Trade on an
African Society. Oxford: Clarendon Press, 1991. Le Veen, E. Philip. “The African Slave Supply Response.” African Studies Review 18, no. 1 (1975): 9-
28. Lopo, Júlio de Castro, “Uma Rica Dona de Luanda,” Portucale 3, no. 16-17, 2 (1948): 129-138. Lovejoy, Paul E. “Ethnic Designations of the Slave Trade and the Reconstruction of the History of
Trans-Atlantic Slavery.” In Trans-Atlantic Dimensions of Ethnicity in the African Diaspora, edited by Paul E. Lovejoy and David V. Trotman, 9-42. New York: Continuum, 2003.
———. “Transatlantic Transformations: The Origins and Identities of Africans in the Americas.” In
Africa, Brazil, and the Construction of Trans-Atlantic Black Identities, edited by Boubacar Barry, Elisée Soumonni, and Livio Sansone, 81-112. Trenton: Africa World Press, 2008.
———. Transformations in Slavery: A History of Slavery in Africa. 2nd ed. New York: Cambridge
University Press, 2000. Lovejoy, Paul E., and David Richardson. “The Business of Slaving: Pawnship in Western Africa,
c.1600-1810.” Journal of African History 42, no. 1 (2001): 67-89. ———. “Trust, Pawnship, and Atlantic History: The Institutional Foundations of the Old Calabar Slave
Trade.” American Historical Review 104, no. 2 (1999): 333-355.
335

MacGaffey, Wyatt. “Lineage Structure, Marriage and the Family amongst the Central Bantu.” Journal of African History 24, no. 2 (1983): 173-187.
Machado, Pedro. “Cloths of a New Fashion: Indian Ocean Networks of Exchange and Cloth Zones of
Contact in Africa and India in the Eighteenth and Nineteenth Centuries.” In How India Clothed the World: The World of South Asian Textiles, 1500-1850, edited by Giorgio Riello and Tirthankar Roy, 53-84. Leiden: Brill, 2009.
Maestri Filho, Mário José. A Agricultura Africana nos Séculos XVI e XVII no Litoral Angolano. Porto
Alegre: Universidade Federal do Rio Grande do Sul, 1978. Mamigonian, Beatriz Gallotti. “To Be a Liberated African in Brazil: Labour and Citizenship in the
Nineteenth Century”. Ph.D., University of Waterloo, 2002. Manchester, Alan K. “The Transfer of the Portuguese Court to Rio de Janeiro.” In Conflict and
Continuity in Brazilian Society, edited by Henry H. Keith and S. F. Edwards, 148-183. Columbia: University of South Carolina Press, 1969.
Mann, Kristin. Slavery and the Birth of an African City: Lagos, 1760-1900. Bloomington: Indiana
University Press, 2007. Manning, Patrick. Slavery and African Life: Occidental, Oriental, and African Slave Trades. New
York: Cambridge University Press, 1990. Marques, João Pedro. Os Sons do Silêncio: O Portugal de Oitocentos e a Abolição do Tráfico de
Escravos. Lisbon: Imprensa de Ciências Sociais, 1999. Martin, Phyllis M. “Family Strategies in Nineteenth Century Cabinda.” Journal of African History
28, no. 1 (1987): 65-86. ———. The External Trade of the Loango Coast, 1576-1870: The Effects of Changing Commercial
Relations on the Vili Kingdom of Loango. Oxford: Clarendon Press, 1972. Martins Filho, Amilcar, and Roberto B. Martins. “Slavey in a Non-Export Economy: Nineteenth
Century Minas Gerais Revisited.” Hispanic American Historical Review 63, no. 3 (1983): 537-568.
McCulloch, Merran. The Ovimbundu of Angola. London: International African Institute, 1952. Meillassoux, Claude. The Anthropology of Slavery: The Womb of Iron and Gold. Translated by Alide
Dasnois. Chicago: University of Chicago Press, 1991. ———. “The Role of Slavery in the Economic and Social History of Sahelo-Sudanic Africa.” In Forced
Migration: The Impact of the Export Slave Trade on African Societies, edited by Joseph E. Inikori, translated by R. J. Gavin, 74-99. New York: Africana Publishing Company, 1982.
Mello, Evaldo Cabral de. A Fronda dos Mazombos: Nobres Contra Mascates, Pernambuco, 1666-
1715. São Paulo: Companhia das Letras, 1995. ———. Olinda Restaurada: Guerra e Açúcar no Nordeste, 1630-1654. Rio de Janeiro: Editora Forense-
Universitária, 1975. Metcalf, George. “A Microcosm of Why Africans Sold Slaves: Akan Consumption Patterns in the
1770s.” Journal of African History 28, no. 3 (1987): 377-394. Miers, Suzanne, and Igor Kopytoff. “African ‘Slavery’ as an Institution of Marginality.” In Slavery in
Africa: Historical and Anthropological Perspectives, 3-81. Madison: University of Wisconsin Press, 1977.
Milheiros, Mário. Notas de Etnografia Angolana. 2nd ed. Luanda: Instituto de Investigação Científica
de Angola, 1967.
336

———. Índice Histórico-Corográfico de Angola. Luanda: Instituto de Investigação Científica de Angola, 1972.
Miller, Joseph C. “Central Africa during the Era of the Slave Trade, c.1490s-1850s.” In Central
Africans and Cultural Transformations in the American Diaspora, edited by Linda M. Heywood, 21-69. New York: Cambridge University Press, 2002.
———. “Imbangala Lineage Slavery.” In Slavery in Africa: Historical and Anthropological
Perspectives, edited by Suzanne Miers and Igor Kopytoff, 205-233. Madison: University of Wisconsin Press, 1977.
———. “Imports at Luanda, Angola: 1785-1823.” In Figuring African Trade: Proceedings of the
Symposium on the Quantification and Structure of the Import and Export and Long-Distance Trade of Africa in the Nineteenth Century, c.1800-1913 (St. Augustin, 3-6 January 1983), edited by Gerhard Liesegang, Helma Pasch, and Adam Jones, 162-244. Berlin: Dietrich Reimer Verlag, 1986.
———. “The Imbangala and the Chronology of Early Central African History.” Journal of African
History 13, no. 4 (1972): 549-574. ———. “The Numbers, Origins, and Destinations of Slaves in the Eighteenth-Century Angolan Slave
Trade.” Social Science History 13, no. 4 (1989): 381-419. ———. “The Numbers, Origins, and Destinations of Slaves in the Eighteenth-Century Angolan Slave
Trade.” In The Atlantic Slave Trade: Effects on Economics, Societies, and Peoples in Africa, the Americas and Europe, edited by Joseph E. Inikori and Stanley L. Engerman, 77-115. 2nd ed. Durham: Duke University Press, 1998.
———. “The Political Economy of the Angolan Slave Trade in the Eighteenth Century.” Indian
Historical Review 15 (September 1988): 152-187. ———. “The Significance of Drought, Disease and Famine in the Agriculturally Marginal Zones of
West-Central Africa.” Journal of African History 23, no. 1 (1982): 17-61. ———. Way of Death: Merchant Capitalism and the Angolan Slave Trade, 1730-1830. Madison:
University of Wisconsin Press, 1988. ———. “Women as Slaves and Owners of Slaves: Experiences from Africa, the Indian Ocean World,
and the Early Atlantic.” In Women and Slavery: Africa, the Indian Ocean, and the Medieval North Atlantic, edited by Gwyn Campbell, Suzanne Miers, and Joseph C. Miller, 1:1-39. Athens: Ohio University Press, 2007.
Moreno Fraginals, Manuel. The Sugarmill: The Socioeconomic Complex of Sugar in Cuba, 1760-
1860. New York: Monthly Review Press, 1976. Murray, David R. Odious Commerce: Britain, Spain, and the Abolition of the Cuban Slave Trade. New
York: Cambridge University Press, 1980. Northrup, David. Trade without Rulers: Pre-Colonial Economic Development in South-Eastern
Nigeria. Oxford: Clarendon Press, 1978. Nwokeji, G. Ugo. “African Conceptions of Gender and the Slave Traffic.” William and Mary Quarterly
58, no. 1 (2001): 47-68. Oppen, Achim von. Terms of Trade and Terms of Trust: The History and Contexts of Pre-Colonial
Market Production around the Upper Zambezi and Kasai. Münster: LIT Verlag, 1994. Ortiz, Fernando. Los Negros Esclavos. Havana: Editorial de Ciencias Sociales, 1975. Pélissier, René. História das Campanhas de Angola: Resistência e Revoltas, 1845-1941. 2 vols.
Lisbon: Editorial Estampa, 1997.
337

Parreira, Adriano. Economia e Sociedade em Angola na Época da Rainha Jinga, Século XVII. Lisbon: Estampa, 1990.
Patterson, Orlando. Slavery and Social Death: A Comparative Study. Cambridge: Harvard University
Press, 1982. Pinto, Virgílio Noya. O Ouro Brasileiro e o Comércio Anglo-Português: Uma Contribuição aos Estudos
da Economia Atlântica no Século XVIII. 2nd ed. São Paulo: Companhia Editora Nacional, 1979.
Queirós, Dario X. Variabilidade das Chuvas em Angola. Luanda: Serviço Meteorológico de Angola,
1955. Redinha, José. Distribuição Étnica de Angola. Luanda: Centro de Informação e Turismo de Angola,
1962. Ribeiro Júnior, José. Colonização e Monopólio no Nordeste Brasileiro: A Companhia Geral de
Pernambuco e Paraíba (1759-1780). São Paulo: HUCITEC, 1976. Ribeiro, Alexandre Vieira. “A Cidade de Salvador: Estrutura Econômica, Comércio de Escravos e
Grupo Mercantil (c.1750-c.1800)”. Doctorate, Rio de Janeiro: Universidade Federal do Rio de Janeiro, 2009.
———. “O Comércio de Escravos e a Elite Baiana no Período Colonial.” In Conquistadores e
Negociantes: Histórias de Elites no Antigo Regime nos Trópicos. América Lusa, Séculos XVI a XVIII, edited by João Luís Ribeiro Fragoso, Carla Maria de Carvalho de Almeida, and Antônio Carlos Jucá de Sampaio, 311-335. Rio de Janeiro: Civilização Brasileira, 2007.
———. “O Tráfico Atlântico de Escravos e a Praça Mercantil de Salvador, c.1680-1830”. M.A., Rio de
Janeiro: Universidade Federal do Rio de Janeiro, 2005. Richards, A. “Some Types of Family Structure amongst the Central Bantu.” In African Systems of
Kinship and Marriage, edited by A. R. Radcliffe-Brown and Cyril Daryll Forde. London: Oxford University Press, 1964.
Richardson, David. “Prices of Slaves in West and West Central Africa: Toward an Annual Series,
1698-1807.” Bulletin of Economic Research 43, no. 1 (1991): 21-56. ———. “West African Consumption Patterns and Their Influence on the Eighteenth Century English
Slave Trade.” In The Uncommon Market: Essays in the Economic History of the Atlantic Slave Trade, edited by Henry A. Gemery and Jan S. Hogendorn, 303-330. New York: Academic Press, 1979.
Roberts, Richard L. Warriors, Merchants, and Slaves: The State and the Economy in the Niger
Valley, 1700-1914. Stanford: Stanford University Press, 1987. Robertson, Claire C., and Martin A. Klein. “Women’s Importance in African Slave Systems.” In
Women and Slavery in Africa, edited by Claire C. Robertson and Martin A. Klein, 3-25. Madison: University of Wisconsin Press, 1983.
Rodrigues, Jaime. De Costa a Costa: Escravos, Marinheiros e Intermediários do Tráfico Negreiro de
Angola ao Rio de Janeiro, 1780-1860. São Paulo: Companhia das Letras, 2005. Russell-Wood, A. J. R. “Colonial Brazil: The Gold Cycle, c.1690-1750.” In The Cambridge History of
Latin America, edited by Leslie Bethell, 2:547-600. New York: Cambridge University Press, 1984.
Sampaio, Antônio Carlos Jucá. “Famílias e Negócios: A Formação da Comunidade Mercantil Carioca
na Primeira Metade do Setecentos.” In Conquistadores e Negociantes: Histórias de Elites no Antigo Regime nos Trópicos. América Lusa, Séculos XVI a XVIII, edited by João Luís Ribeiro Fragoso, Antônio Carlos Jucá de Sampaio, and Carla Maria de Carvalho de Almeida, 225-264. Rio de Janeiro: Civilização Brasileira, 2007.
338

Sanborn, Melinde Lutz. “Angola and Elizabeth: An African Family in the Massachusetts Bay
Colony.” New England Quarterly 72, no. 1 (1999): 119-129. Santos, Catarina Madeira. “Um Governo ‘Polido’ para Angola: Reconfigurar Dispositivos de Domínio
(1750-c.1800)”. Doctorate, Lisbon: Universidade Nova de Lisboa, 2005. Santos, Corcino Medeiro dos. “Relações de Angola com o Rio de Janeiro (1736-1808).” Estudos
Históricos, no. 12 (1973): 7-68. Santos, José de Almeida. Vinte Anos Decisivos de uma Cidade. Luanda: Câmara Municipal de
Luanda, 1970. Santos, Maria Emília Madeira. Nos Caminhos de África: Serventia e Posse (Angola, Século XIX).
Lisbon: Instituto de Investigação Científica Tropical, 1998. ———. Viagens de Exploração Terrestre dos Portugueses em África. Lisbon: Centro de Estudos de
Cartografia Antiga, 1978. Schrag, Norm. “Mboma and the Lower Zaire: a Socioeconomic Study of a Kongo Trading Community,
c.1785-1885”. Ph.D., Bloomington: Indiana University, 1985. Schwartz, Stuart B. Sugar Plantations in the Formation of Brazilian Society, Bahia, 1550-1835. New
York: Cambridge University Press, 1985. Silbering, Norman J. “British Prices and Business Cycles, 1779-1850.” Review of Economics and
Statistics 5 (1923): 223-247. Silva, Alberto da Costa e. A Manilha e o Libambo: A África e a Escravidão de 1500-1700. Rio de
Janeiro: Nova Fronteira, 2002. Slenes, Robert W. “‘Malungu, Ngoma Vem!:’ África Coberta e Descoberta no Brasil.” Revista USP 12
(92): 48-67. Sluiter, Engel. “New Light on the ‘20. and Odd Negroes’ Arriving in Virginia, August 1619.” William
and Mary Quarterly 54, no. 2. 3 (1997): 395-398. Smith, Adam. An Inquiry into the Nature and Causes of the Wealth of Nations. 2 vols. London: W.
Strahan and T. Cadell, 1776. Smith, David Grant. “The Mercantile Class of Portugal and Brazil in the Seventeenth Century: A
Socioeconomic Study of the Merchants of Lisbon and Bahia, 1620-1690”. Ph.D., University of Texas, 1975.
Soares, Mariza de Carvalho. Devotos da Cor: Identidade Étnica, Religiosidade e Escravidão no Rio de
Janeiro, Século XVIII. Rio de Janeiro: Civilização Brasileira, 2000. Sousa, Ana Madalena Trigo de. “Uma Tentativa de Fomento Industrial na Angola Setecentista: A
‘Fábrica do Ferro’ de Nova Oeiras (1766-1772).” Africana Studia 10 (2007): 291-308. Souza, Marina de Mello e. Reis Negros no Brasil Escravista: História da Festa de Coroação de Rei
Congo. Belo Horizonte: Editora UFMG, 2002. Thompson, Edward Palmer. Customs in Common. New York: The New Press, 1991. Thornton, John K. Africa and Africans in the Making of the Atlantic World, 1400-1800. 2nd ed. New
York: Cambridge University Press, 1998. ———. “As Guerras Civis no Congo e o Tráfico de Escravos: A História e a Demografia de 1718 a 1844
Revisitadas.” Estudos Afro-Asiáticos 32 (1997): 55-74.
339

———. “Precolonial African Industry and the Atlantic Trade, 1500-1800.” African Economic History, no. 19 (1990): 1-19.
———. “The African Experience of the ‘20. and Odd Negroes’ Arriving in Virginia in 1619.” William
and Mary Quarterly 55, no. 3 (1998): 421-434. ———. “The Art of War in Angola, 1575-1680.” Comparative Studies in Society and History 30, no. 2
(1988): 360-378. ———. “The Chronology and Causes of Lunda Expansion to the West, c.1700-1852.” Zambia Journal
of History 1 (1981): 1-14. ———. “The Slave Trade in Eighteenth Century Angola: Effects on Demographic Structures.”
Canadian Journal of African Studies 14, no. 3 (1980): 417-427. ———. Warfare in Atlantic Africa, 1500-1800. New York: University College London Press, 1999. Tilly, Louise, and Joan W. Scott. Women, Work, and Family. New York: Holt, Rinehart and Winston,
1978. Vansina, Jan. “Ambaca Society and the Slave Trade c.1760-1845.” Journal of African History 46,
no. 1 (2005): 1-27. ———. “It Never Happened: Kinguri’s Exodus and Its Consequences.” History in Africa 25 (1998):
387-403. ———. Kingdoms of the Savanna: A History of Central African States until European Occupation.
Madison: University of Wisconsin Press, 1966. ———. “More on the Invasions of Kongo and Angola by the Jaga and the Lunda.” Journal of African
History 7, no. 3 (1966): 421-429. ———. “Portuguese vs Kimbundu: Language Use in the Colony of Angola (1575-c.1845).” Bulletin des
Séances de l’Academie Royale des Sciences d'Outre Mer 47 (March 2001): 267-281. ———. “The Foundation of the Kingdom of Kasanje.” Journal of African History 4, no. 3 (1963): 355-
374. Vellut, Jean-Luc. “Notes sur le Lunda et la Frontière Luso-Africaine (1700-1900).” Études d’Histoire
Africaine 3 (1972): 61-166. Venâncio, José Carlos. A Economia de Luanda e Hinterland no Século XVIII: Um Estudo de
Sociologia Histórica. Lisbon: Editorial Estampa, 1996. Verger, Pierre. Fluxo e Refluxo: O Tráfico de Escravos entre o Golfo de Benin e a Bahia de Todos os
Santos dos Séculos XVII a XIX. São Paulo: Corrupio, 1987. Vila Vilar, Enriqueta. Hispanoamerica y el Comercio de Esclavos. Seville: Escuela de Estudios
Hispano-Americanos, 1977. Vos, Jelmer. “The Kingdom of Kongo and Its Borderlands, 1880-1915”. Ph.D., London: School of
Oriental and African Studies, 2005. Wells, Tom Henderson. The Slave Ship Wanderer. Athens: University of Georgia Press, 1967. Wheeler, Douglas L. “The Portuguese in Angola, 1836-1891: A Study in Expansion and
Administration”. Ph.D., Boston: Boston University, 1963. ———. “Angolan Woman of Means: D. Ana Joaquina dos Santos e Silva, Mi-Nineteenth Century Luso
African Merchant-Capitalist of Luanda,” Santa Barbara Portuguese Studies Review 3 (1996): 284-297.
340
Wiesner, Merry E. Women and Gender in Early Modern Europe. 2nd ed. New York: Cambridge University Press, 2000.
Williams, David M. “Abolition and the Re-Deployment of the Slave Fleet, 1807-11.” Journal of
Transport History 11, no. 2 (1973): 103-115. Williams, Eric. Capitalism and Slavery. Chapel Hill: University of North Carolina Press, 1994. Ximenes, Cristina Ferreira Lyrio. “Joaquim Pereira Marinho: Perfil de um Contrabandista de
Escravos na Bahia, 1828-1887”. M.A., Salvador: Universidade Federal da Bahia, 1999. D) Electronic Sources Eltis, David, David Richardson, Manolo Florentino, and Stephen D. Behrendt. “Voyages: The Trans-
Atlantic Slave Trade Database.” Online database, 2008. www.slavevoyages.org/. Handler, Jerome S., and Michael L. Tuite Jr. “The Atlantic Slave Trade and Slave Life in the
Americas: A Visual Record.” Online database, 2008. http://hitchcock.itc.virginia.edu/Slavery/.
Hoare, Robert. “WorldClimate: Weather and Climate Data Worldwide.” Online database, 1996.
www.worldclimate.com/. Paul M. Lewis, ed. “Ethnologue: Languages of the World,” 16th ed. Online databsae, 2009,
http://www.ethnologue.com/. “Merriam-Webster Dictionary Online”, 2011. http://www.merriam-webster.com/.
341