Distinct male reproductive strategies in two closely related oak species
13
Distinct male reproductive strategies in two closely related oak species L ELIA LAGACHE,* † ETIENNE K. KLEIN, ‡ ALEXIS DUCOUSSO* † and R EMY J. PETIT* † *INRA, UMR 1202 Biogeco, F-33610 Cestas, France, †Univ. Bordeaux, UMR1202 Biogeco, F-33400 Talence, France, ‡Biostatistique et Processus Spatiaux (BioSP), INRA, UR546, F-84914 Avignon France Abstract Reproductive strategies of closely related species distributed along successional gradi- ents should differ as a consequence of the trade-off between competition and coloniza- tion abilities. We compared male reproductive strategies of Quercus robur and Q. petraea, two partly interfertile European oak species with different successional sta- tus. In the studied even-aged stand, trees of the late-successional species (Q. petraea) grew faster and suffered less from intertree competition than trees of the early- successional species (Q. robur). A large-scale paternity study and a spatially explicit individual-based mating model were used to estimate parameters of pollen production and dispersal as well as sexual barriers between species. Male fecundity was found to be dependent both on a tree’s circumference and on its environment, particularly so for Q. petraea. Pollen dispersal was greater and more isotropic in Q. robur than in Q. petraea. Premating barriers to hybridization were strong in both species, but more so in Q. petraea than in Q. robur. Hence, predictions based on the competition–coloni- zation trade-off are well supported, whereas the sexual barriers themselves seem to be shaped by colonization dynamics. Keywords: ecological speciation, male fecundity, pollen dispersal, Quercus petraea, Quercus robur, spatially explicit model Received 6 December 2013; revision received 12 March 2014; accepted 8 April 2014 Introduction The coexistence of competing populations or species is often attributed to differing ecological strategies, that is, specific combinations of life history traits evolved in response to multiple selective pressures and under mul- tiple trade-offs (Newell & Tramer 1978; Westoby et al. 2002; Burton et al. 2010). One important trade-off is that between competition and colonization abilities, resulting in two distinct ecological strategies, one in which infe- rior competitors are better colonists and another where superior competitors are poorer dispersers (Levins & Culver 1971; Tilman 1994; Harbison et al. 2008). At the interspecific level, the competition–colonization trade- off has been used to explain the coexistence of species characterized by different life history traits along suc- cessional gradients, including traits related to reproduc- tion (e.g. Ackerly 2003; Kneitel & Chase 2004; Calcagno et al. 2006). According to Pickett (1976), ‘the complex, dynamic pattern of selection pressures in the landscape [should allow] for the assortment of species into different suc- cessional positions’, because succession provides a com- plex gradient of physical and biotic environments to which a single species cannot be uniformly adapted. Hence, comparing reproductive strategies of closely related species with different colonization dynamics and successional status, and sexual barriers between them, could help clarify the emergence of distinct eco- logical strategies. Traditionally, comparative studies of reproductive strategies in plants have focused on the female compo- nent, with fitness estimated by counting the relative numbers of seeds produced (Primack & Kang 1989). Yet the fitness of an individual plant is equally determined by its success as a male parent in fertilizing ovules (Lloyd 1980a; Morgan & Conner 2001). Moreover, while dispersal to new patches of habitat requires seed Correspondence: R emy Petit, Fax: +33557122881; E-mail: [email protected] © 2014 John Wiley & Sons Ltd Molecular Ecology (2014) 23, 4331–4343 doi: 10.1111/mec.12766
Transcript of Distinct male reproductive strategies in two closely related oak species

Distinct male reproductive strategies in two closelyrelated oak species
L �ELIA LAGACHE,*† ETIENNE K. KLEIN,‡ ALEXIS DUCOUSSO*† and R �EMY J. PETIT*†
*INRA, UMR 1202 Biogeco, F-33610 Cestas, France, †Univ. Bordeaux, UMR1202 Biogeco, F-33400 Talence, France,
‡Biostatistique et Processus Spatiaux (BioSP), INRA, UR546, F-84914 Avignon France
Abstract
Reproductive strategies of closely related species distributed along successional gradi-
ents should differ as a consequence of the trade-off between competition and coloniza-
tion abilities. We compared male reproductive strategies of Quercus robur and
Q. petraea, two partly interfertile European oak species with different successional sta-
tus. In the studied even-aged stand, trees of the late-successional species (Q. petraea)grew faster and suffered less from intertree competition than trees of the early-
successional species (Q. robur). A large-scale paternity study and a spatially explicit
individual-based mating model were used to estimate parameters of pollen production
and dispersal as well as sexual barriers between species. Male fecundity was found to
be dependent both on a tree’s circumference and on its environment, particularly so
for Q. petraea. Pollen dispersal was greater and more isotropic in Q. robur than in
Q. petraea. Premating barriers to hybridization were strong in both species, but more
so in Q. petraea than in Q. robur. Hence, predictions based on the competition–coloni-zation trade-off are well supported, whereas the sexual barriers themselves seem to be
shaped by colonization dynamics.
Keywords: ecological speciation, male fecundity, pollen dispersal, Quercus petraea, Quercus
robur, spatially explicit model
Received 6 December 2013; revision received 12 March 2014; accepted 8 April 2014
Introduction
The coexistence of competing populations or species is
often attributed to differing ecological strategies, that is,
specific combinations of life history traits evolved in
response to multiple selective pressures and under mul-
tiple trade-offs (Newell & Tramer 1978; Westoby et al.
2002; Burton et al. 2010). One important trade-off is that
between competition and colonization abilities, resulting
in two distinct ecological strategies, one in which infe-
rior competitors are better colonists and another where
superior competitors are poorer dispersers (Levins &
Culver 1971; Tilman 1994; Harbison et al. 2008). At the
interspecific level, the competition–colonization trade-
off has been used to explain the coexistence of species
characterized by different life history traits along suc-
cessional gradients, including traits related to reproduc-
tion (e.g. Ackerly 2003; Kneitel & Chase 2004; Calcagno
et al. 2006). According to Pickett (1976), ‘the complex,
dynamic pattern of selection pressures in the landscape
[should allow] for the assortment of species into different suc-
cessional positions’, because succession provides a com-
plex gradient of physical and biotic environments to
which a single species cannot be uniformly adapted.
Hence, comparing reproductive strategies of closely
related species with different colonization dynamics
and successional status, and sexual barriers between
them, could help clarify the emergence of distinct eco-
logical strategies.
Traditionally, comparative studies of reproductive
strategies in plants have focused on the female compo-
nent, with fitness estimated by counting the relative
numbers of seeds produced (Primack & Kang 1989). Yet
the fitness of an individual plant is equally determined
by its success as a male parent in fertilizing ovules
(Lloyd 1980a; Morgan & Conner 2001). Moreover, while
dispersal to new patches of habitat requires seedCorrespondence: R�emy Petit, Fax: +33557122881;
E-mail: [email protected]
© 2014 John Wiley & Sons Ltd
Molecular Ecology (2014) 23, 4331–4343 doi: 10.1111/mec.12766

dispersal, subsequent demographic growth depends in
part on pollen immigration as it helps overcome
inbreeding depression (e.g. Hampe et al. 2013; Lesser &
Jackson 2013). For these two reasons, it should be valu-
able to focus on components of male reproductive fit-
ness in species having different successional status.
Comparing male fecundity and pollen dispersal of dif-
ferent species can now be performed using paternity
analysis, taking advantage of methodological develop-
ments in the field (Meagher 1986; Devlin & Ellstrand
1990; Smouse et al. 1999; Burczyk et al. 2002; Oddou-
Muratorio et al. 2005). Theory predicts greater pollen
dispersal, more even pollen production and less strin-
gent mate choice in the pioneer species than in the late-
successional one (e.g. Lloyd 1980b; Richards 1996;
Ronce & Olivieri 1997; Burton et al. 2010). To what
extent this holds for different plant species has not been
explicitly investigated to date.
Here, we compare male reproductive strategies of
two partly interfertile tree species with contrasting colo-
nization dynamics using a large-scale paternity analysis.
Our aim is to evaluate the extent to which their male
reproductive strategies differ in the direction predicted
by theory. The spatially explicit individual-based mat-
ing model introduced by Lagache et al. (2013a) was
used as a starting point for predicting mating events
within and between species. This model was expanded
to control for anisotropic pollen dispersal (Torimaru
et al. 2012) and for variation in male fecundity caused
by tree size (Oddou-Muratorio et al. 2005; Chybicki &
Burczyk 2013), environment (e.g. De Cauwer et al. 2012;
Chybicki & Burczyk 2013) and interplant phenological
overlap (Slavov et al. 2005; Wendt et al. 2011). Using
this expanded mating model, we identify the traits that
affect the mating system of the two species. We then
ask whether differences between species can be inter-
preted in terms of adaptive responses to species coloni-
zation dynamics.
Materials and methods
Study species
We selected the pedunculate (Quercus robur L.) and ses-
sile oaks [Q. petraea (Matt.) Liebl.] as model species pair
for this study. These two long-lived, widespread and
abundant forest tree species are partly interfertile and
have similar geographical distributions in Europe but
contrasting colonization dynamics. Quercus robur is a
pioneer species that can colonize more open environ-
ments, whereas Q. petraea is a more competitive late-
successional species that typically lives in mature
forests (Petit et al. 2003). Quercus robur is therefore
expected to invest a larger share of its energy in female
and male reproduction organs, including attributes
favoring seed and pollen dispersal, than Q. petraea. In
contrast, Q. petraea is expected to invest a larger share
of its energy in growth and competition than Q. robur.
Previous studies have reported greater reserves in the
cotyledons of Q. robur acorns and faster growth of
Q. robur seedlings (Dupouey & Le Bouler 1989; Fried-
man & Barrett 2009; G�erard et al. 2009; Landergott et al.
2012). Furthermore, greater seed dispersal was inferred
in Q. robur than in Q. petraea on the basis of genetic
structure at maternally inherited markers (reviewed in
Petit et al. 2003). Quercus robur and Q. petraea have also
been the target of numerous mating system and parent-
age studies spanning nearly two decades (e.g. Bacilieri
et al. 1996; Streiff et al. 1999; Jensen et al. 2009; Lepais &
Gerber 2011; Chybicki & Burczyk 2013; Lagache et al.
2013a). While these studies suggest greater pollen dis-
persal in the pioneer Q. robur than in the late-succes-
sional Q. petraea, they did not rely on estimated
dispersal kernels (more robust to spatial design, Hardy
2009) and did not investigate male fecundity patterns.
Study site
The study site is a mixed oak stand of 5 ha located in
the Petite Charnie State Forest in western France (lati-
tude: 48.056°N, longitude: 0.168°W). It contains both
Q. petraea and Q. robur adult trees (Fig. 1, Data S1, Sup-
porting Information). We determined the taxonomic sta-
tus of 260 of the 298 trees growing in the stand with
multilocus genetic data using Bayesian assignment
methods (Pritchard et al. 2000). The genetic data
were obtained with a 12-plex microsatellite assay and a
384-plex single-nucleotide polymorphism assay (Guic-
houx et al. 2011, 2013; Lagache et al. 2012, 2013a). For
the 38 remaining trees, for which no tissue was avail-
able for genetic analysis, we relied on previously pub-
lished leaf morphological data (Bacilieri et al. 1995).
Molecular-based and morphologically based taxonomic
approaches have been shown to give largely congruent
results in these oaks (Lagache et al. 2013b). Quercus pet-
raea formed a smaller proportion of the stand than did
Q. robur (40% vs. 55%, the remaining 5% being admixed
trees). In 1995, 3780 seeds were harvested on all adult
trees that had produced a significant acorn crop, that is,
on 22 Q. petraea, 26 Q. robur and three admixed mother
trees. The 51 mother trees were well distributed
throughout the stand (Fig. 1). The resulting seedlings
were grown in a nursery and subsequently planted in a
progeny test located near the adult stand.
The adult stand is situated on a regular slope that
forms an ecological gradient, over humid clay soil in
the lower part up to relatively dry silt and sandy soil in
the upper part. Bacilieri et al. (1995) produced a
© 2014 John Wiley & Sons Ltd
4332 L. LAGACHE ET AL.

fine-scale topographical map of the stand by measuring
terrain elevation every two metres across the stand
(Data S2, Supporting Information). We can thus deduce
the approximate terrain elevation at which each tree
was growing, from the bottom (altitude <135 m) to the
top (altitude >146 m), summarized by a class score
between 1, being the lowest class, and 9.
Phenotypic data
Bacilieri et al. (1995) studied the flowering phenology of
the two oak species in this stand during three years
(1989, 1991 and 1992). They found that on average pol-
len shedding from catkins precedes female flowers’
receptivity by 4–7 days. As phenological ranks are very
stable among years (Bacilieri et al. 1995) and leaf phe-
nology is highly heritable in oaks (Alberto et al. 2011),
flowering phenology data from one year should help
predict compatible mating events in other years. We
used data from 1992 because it included most records.
During two months in that year, two ratings of the phe-
nological stages (one for female flowers and one for
male flowers) were made each week for each of the 298
individuals in the stand. For all pairs of candidate trees,
we computed the number of weeks where male flower-
ing of the candidate father k overlapped female flower-
ing of the mother j: OPjk varied between 1 and 4. In
addition, for all adult trees (i.e. 298 individuals), the
height (H) and the circumference at 1.3 m above ground
level (Cir1.3) were measured in 1998 before clear-cutting
of the stand. We used the circumference as a predictor
of male fecundity and the H/DBH index (where DBH =Cir1.3/p) as a life-long indicator of tree competition
(Becker 1992). Trees with a high H/DBH index are con-
sidered to have suffered more from competition than
other trees. Finally, to determine tree ages, the number
of rings was counted on the stump (approximately
25 cm above the ground) after trees were felled.
Paternity analysis
Details on genotyping methods and on paternity analy-
sis are provided in Lagache et al. (2013a). Briefly, using
12 highly polymorphic microsatellite markers, simple
paternity exclusion tests were performed for the 3046
offspring for which genotypic data were available. They
identified a single father for 51.7% of the offspring (615
Q. petraea and 855 Q. robur) and two or more compati-
ble fathers for 1.8% of the offspring (22 Q. petraea and
31 Q. robur). The remaining individuals (427 Q. petraea
and 885 Q. robur, i.e. 46.5% of all offspring) had no
compatible father among the 260 adult trees genotyped.
Following Lagache et al. (2013a), we decomposed off-
spring whose fathers were not found into two groups:
offspring sired by ‘ghost’ fathers located inside the
stand, for which taxonomic status (species assignment
based on morphological markers), circumference and
terrain elevation were available but for which genotypic
data were missing; and offspring sired by fathers
located outside the stand (i.e. immigration), for which
no information at all was available.
Spatially explicit mating model
We used a spatially explicit individual-based mating
model to investigate intra- and interspecific mating
events with pollen from inside and outside the studied
stand (Data S3, Supporting Information). This allows a
simultaneous estimation of all the parameters influenc-
ing male fecundity and pollen dispersal using a classi-
cal likelihood approach (e.g. Oddou-Muratorio et al.
2003; De Cauwer et al. 2012; DiFazio et al. 2012). In this
approach, the probability that a seed o from mother johas genotype go is:
Pðgo j gjoÞ ¼ sTðgo j gjo ;gjoÞþ ð1� sÞ½migjoPTðgo j gjo ;AFPÞþmigjoRTðgo j gjo ;AFRÞþ
Xk:candidates
pjokTðgo j gjo ;gkÞ�
ðeqn 1Þ
where s is the selfing rate; T(go|.,.) are the Mendelian
probabilities of generating the offspring’s genotype go
Fig. 1 Map of the study stand. Quercus robur trees are repre-
sented by grey diamonds, Q. petraea trees by black squares and
intermediate trees by white triangles. Sampled mother trees
are circled. Ghost trees (for which genotypic data were miss-
ing) are represented in light grey diamonds for Q. robur, light
grey squares for Q. petraea and light grey triangles for interme-
diate trees.
© 2014 John Wiley & Sons Ltd
MALE REPRODUCTIVE STRATEGIES IN OAKS 4333

from the known genotypes of the two parents; AFR and
AFP are the microsatellite allelic frequencies of Q. robur
and Q. petraea; migjR and migjP correspond to the two
apparent migration rates (Q. robur and Q. petraea) on
mother j (‘apparent’ because they include pollen from
ghost trees); and pjk is the relative contribution of the
candidate father k to the pollen pool of mother j
(detailed below). As in Lagache et al. (2013a), we mod-
elled pollen immigration from outside the stand using a
mass-action law (Holsinger 1991). Migration rates can
thus vary across mothers (see details below).
Modelling the relative contributions of the candidatefathers to the pollen pools (pjk)
The relative contribution pjk of the candidate father k to
the pollen pool of mother j results from the competition
with pollen from all other candidate fathers together
with pollen from all ghost trees and with immigrant
pollen. Following Smouse & Sork (2004), we considered
two kinds of factors determining the pollen pool avail-
able to each mother tree j: factors affecting the male
fecundity of each father tree k of the stand (Fk) and fac-
tors affecting the cross-compatibility between each
mother j and father k (Compatjk):
where qP(DEj) and qR(DEj) are the relative amounts of
Q. petraea and Q. robur pollen coming from outside the
stand received by the mother j, at a distance DEj of the
edges of the plot. The measures qP(DEj) and qR(DEj) are
relative to a tree with a male fecundity equal to one
and present at the edge of the plot. hspj,R and hspj,P rep-
resent the postdispersal relative fertilization successes
on mother j of each Q. robur pollen grain (hspj,R) and of
each Q. petraea pollen grain (hspj,P).
The fecundity component (Fk) in eqn. 2 includes the
effects of circumference and terrain elevation following:
Fk ¼exp aCir1:3 ;spk Cir1:3;k � Cir1:3� �� �
expðaspk þ bspkELkÞ1þ expðaspk þ bspkELkÞ
ðeqn 3Þ
where Cir1.3,k and ELk are the circumference and terrain
elevation for tree k, and Cir1:3 is the average circumfer-
ence of trees in the study site. One set of parameters
(a, b, aCir1:3 ) applies to each of the three categories
(Q. petraea, Q. robur and admixed trees). The circumfer-
ence parameter (aCir1:3 ) measures the direction and
strength of the effect of circumference on fecundity (0:
no effect, >0: bigger trees are more fecund; < 0: bigger
trees are less fecund). Elevation parameters (a, b) deter-
mine the inflection point (i.e.�a/b) and the slope (i.e. if
b is small, the slope is weak) of the sigmoidal curve
relating fecundity to elevation. Finally, spk is the species
of tree k.
The compatibility component in eqn. 2 includes
effects of spatial distance between parents, overlapping
phenology and interspecific sexual barriers:
compatjk ¼ cPOjkhspj;spk fEPðdjk; azjk; dspk ; bspk ; jspk ; hspkÞ
ðeqn 4Þwhere POjk, djk and azjk are the distance, phenological
overlap and azimuth between trees j and k, respectively,
and fEP is the anisotropic exponential power dispersal
kernel (detailed below). Different sets of parameters (d, b,j, h) apply to the three groups (Q. petraea, Q. robur and
admixed trees) and must be estimated. Six h parameters
quantify the intensities of sexual barriers for an allospeci-
fic pollen grain relative to a conspecific pollen grain (two
between Q. robur and Q. petraea, one in each direction).
Four c parameters quantify the relative pollination suc-
cess for pairs of trees with different overlapping periods.
Parameters c and h also need to be estimated.
To model pollen dispersal, we took into account not
only the distance but also the azimuth between trees,
following Torimaru et al. (2012). As the pollen dispersal
curves of the two species were known to differ (Lagache
et al. 2013a), we modelled different anisotropic exponen-
tial power pollen dispersal kernels for each species:
fEPðd;az;d;b;j;hÞ/ exp � dCð3=bÞdCð2=bÞ
� �b" #
exp½jcosðaz�hÞ�;
ðeqn 5Þwhere d is the mean dispersal distance, b the shape
parameter, j the intensity of anisotropy and h (in radian
with east as starting point) the main direction of anisot-
ropy.
Modelling apparent and true pollen immigration
As in Lagache et al. (2013a), our model allowed immi-
grant pollen to compete with pollen produced inside the
stand, resulting in immigration rates that can vary across
mother trees following the mass-action law (Holsinger
pjk ¼ Fk � CompatjkPl:candidates Fl � Compatjl þ
Pl:ghosts Fl � Compatjl þ qPðDEjÞhspj;P þ qRðDEjÞhspj;R
ðeqn 2Þ
© 2014 John Wiley & Sons Ltd
4334 L. LAGACHE ET AL.

1991). The model also accounts for the positions of ghost
trees relative to each mother tree. While the offspring
sired by the different ghost trees cannot be distinguished
from each other nor from offspring sired by immigrant
pollen on an individual basis, the explicit inclusion of
ghost trees in the model enabled us to estimate the
amounts of true immigrant pollen after statistically
removing (i.e. partialling out) the pollen from ghost trees
from the set of unassigned seeds. To take into account
possible edge effects (e.g. a mother tree near the edge of
the stand might receive more immigrant pollen than a
mother tree located in the middle), we considered that
the amount of true immigrant pollen from each species
qR and qP decreased with the distance to the edges of the
plot. We therefore computed DEj, the distance of mother
tree j to the closest edge of the stand, and defined:
qPðDEjÞ ¼ qPexpðam;P þ bm;PDEjÞ
1þ expðam;P þ bm;PDEjÞ and
qRðDEjÞ ¼ qRexpðam;R þ bm;RDEjÞ
1þ expðam;R þ bm;RDEjÞðeqn 6Þ
where qP(0) and qR(0) are the amounts of pollen of
Q. petraea and Q. robur at the edge of the plot (i.e.
DEj = 0). The parameters qP and qR correspond to the
amount of pollen from each species received per unit
area relative to the total emission of a tree with a fecun-
dity equal to 1. am,P, bm,P, am,R, bm,R are parameters of
pollen dilution with distance to the edge of the plot.
The Q. robur and Q. petraea apparent immigration
rates on a mother tree j (i.e. migjR and migjP) were then
calculated by summing true immigration with contribu-
tions from ghost trees:
Parameter estimation
The log-likelihood of the full genotypic data set was
computed by summing the logarithm of eqn. 1 for the
3046 genotyped offspring. All computations necessary
to derive the likelihood were conducted with MATHEMATI-
CA 8.1 (Wolfram Research Inc. 2010). We maximized the
log-likelihood using a quasi-Newton algorithm to obtain
maximum-likelihood estimates for all parameters con-
sidered. The maximization was repeated several times
using different initial values in order to be confident
that we had reached a global maximum.
Likelihood ratio tests
Thirteen submodels were fitted to the data to investi-
gate different biological hypotheses by omitting or fix-
ing different parameters of interest. Likelihood ratio
tests were then used to test the hypotheses (i.e. to
investigate the significance of fixed parameters in the
full model), following Oddou-Muratorio et al. (2005).
First, the general effect and species-specific effect of
circumference on male fecundity were studied by con-
trasting the full model with a model without this effect
of circumference on male fecundity and with a model
with the same effect of circumference on the male
fecundity for both species. Second, the full model was
compared with a model without the effect of terrain
elevation on male fecundity and with a model where
the effect of terrain elevation on male fecundity is the
same for both species. Third, we contrasted the full
model with one with no phenological effect on cross-
ing probability. Fourth, we compared the full model
with one where the sexual barriers are symmetric
between Q. robur and Q. petraea (hPR = hRP). Fifth, the
effect of pollen dispersal on mating events was studied
by contrasting the full model with an unlimited dis-
persal model and with a model with the same dis-
persal parameters for both species. Sixth, the full
model was compared with a model where there is no
anisotropic effect on pollen dispersal and with a model
where this anisotropic effect is the same for both spe-
cies. Seventh, we tested whether different amounts of
Q. robur and Q. petraea pollen come from outside the
stand by fitting a model with the same amounts of
immigrant pollen for the two species [qP(0) = qR(0)].
Eighth, we compared the full model with a model
without edge effect on the amount of immigrant pol-
len, assuming that whatever the position of a mother
tree, it receives the same amount of Q. robur or of
Q. petraea immigrant pollen. Ninth, we compared the
full model with a model where the edge effect is the
same for both species.
We also explored two other more complex models by
extending the full model described above. First, we cre-
ated a model where pollen dispersal curves can differ
migjR ¼P
l:robur ghosts Fl � Compatjl þ qRðDEjÞHybjRPl:candidates Fl � Compatjl þ
Pl:ghosts Fl � Compatjl þ qPðDEjÞHybjP þ qRðDEjÞHybjR
ðeqn 7Þ
migjP ¼P
l:petraea ghosts Fl � Compatjl þ qPðDEjÞHybjPPl:candidates Fl � Compatjl þ
Pl:ghosts Fl � Compatjl þ qPðDEjÞHybjP þ qRðDEjÞHybjR
ðeqn 8Þ
© 2014 John Wiley & Sons Ltd
MALE REPRODUCTIVE STRATEGIES IN OAKS 4335
for groups of trees that flower at different times. Sec-
ond, we studied whether relatedness between father
trees and mother trees modifies fertilization success
within each species, as detailed in Appendix S1 (Sup-
porting Information).
Effective male population size
To test whether intertree variation in male fecundity
differs between species, we first estimated the fecundity
of each tree with the complete model. As the absolute
amounts of pollen produced by individual trees are not
known, we present relative fecundities with reference to
a tree of average circumference (1.73 m) growing in ter-
rain elevation class nine. We then computed the coeffi-
cient of variation (CV) of relative male fecundities
within each species and its confidence interval (for
a = 0.05) and compared them. All else being equal, the
species with the more heterogeneous male fecundities
across individuals (i.e. a larger CV) should have a smal-
ler male effective population size.
The effective number of fathers (Ke) provides another
estimate of effective population size. It corresponds to
the number of offspring that need to be examined in a
given maternal progeny to find two offspring sired by
the same father (i.e. the inverse of the probability of
copaternity). We used the unbiased estimate of Ke pro-
posed by Nielsen et al. (2003) to compute the effective
number of fathers in the progeny of a tree:
Ke ¼ ðn� 1Þ2Pnk¼1 p
2kðnþ 1Þðn� 2Þ þ 3� n
ðeqn 9Þ
where pk and n are, respectively, the proportion of off-
spring sired by a given father tree k and the number of
offspring sampled in the progeny of a given mother
tree. A simple paternity exclusion analysis for each
mother tree was used to compute the average Ke for
each species and a Kruskal–Wallis test was used to
evaluate the significance of the difference between spe-
cies. Note that in the computation of Ke, we excluded
fathers located outside the plot. For a full picture of the
diversity in the maternal progeny of each individual,
differences in immigration rates ought to be accounted
for. Here, they were investigated separately through a
comparison of immigration parameters.
Results
Direct comparison of growth and phenology
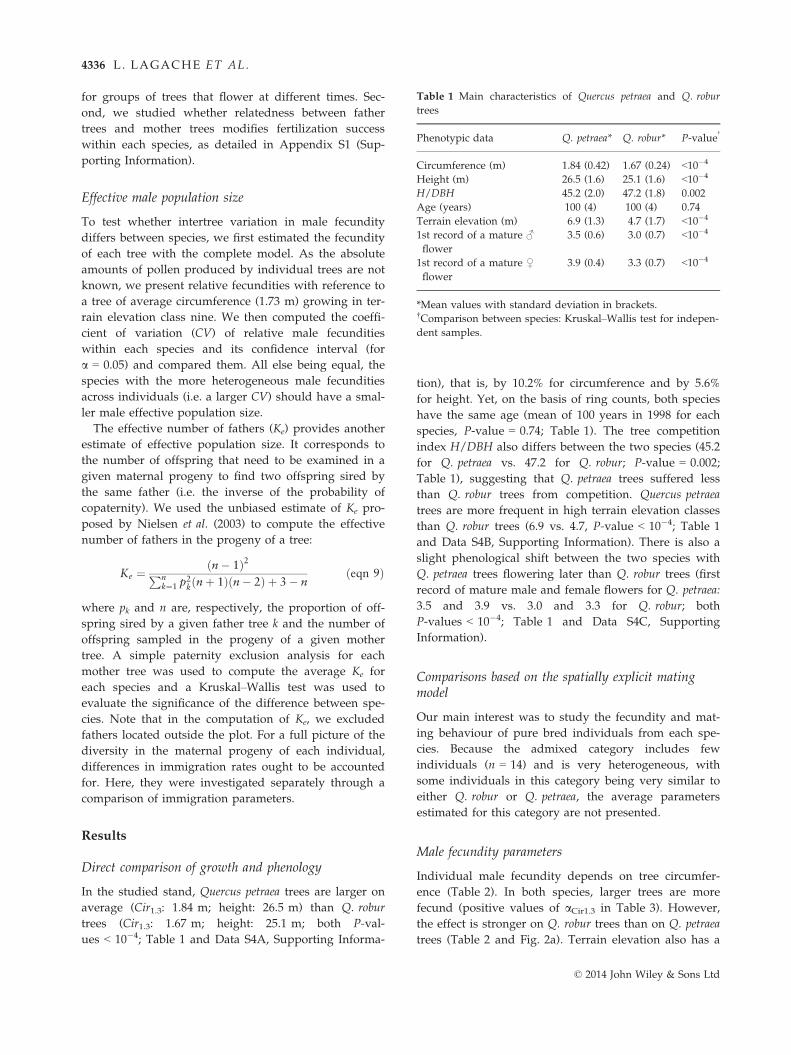
In the studied stand, Quercus petraea trees are larger on
average (Cir1.3: 1.84 m; height: 26.5 m) than Q. robur
trees (Cir1.3: 1.67 m; height: 25.1 m; both P-val-
ues < 10�4; Table 1 and Data S4A, Supporting Informa-
tion), that is, by 10.2% for circumference and by 5.6%
for height. Yet, on the basis of ring counts, both species
have the same age (mean of 100 years in 1998 for each
species, P-value = 0.74; Table 1). The tree competition
index H/DBH also differs between the two species (45.2
for Q. petraea vs. 47.2 for Q. robur; P-value = 0.002;
Table 1), suggesting that Q. petraea trees suffered less
than Q. robur trees from competition. Quercus petraea
trees are more frequent in high terrain elevation classes
than Q. robur trees (6.9 vs. 4.7, P-value < 10�4; Table 1
and Data S4B, Supporting Information). There is also a
slight phenological shift between the two species with
Q. petraea trees flowering later than Q. robur trees (first
record of mature male and female flowers for Q. petraea:
3.5 and 3.9 vs. 3.0 and 3.3 for Q. robur; both
P-values < 10�4; Table 1 and Data S4C, Supporting
Information).
Comparisons based on the spatially explicit matingmodel
Our main interest was to study the fecundity and mat-
ing behaviour of pure bred individuals from each spe-
cies. Because the admixed category includes few
individuals (n = 14) and is very heterogeneous, with
some individuals in this category being very similar to
either Q. robur or Q. petraea, the average parameters
estimated for this category are not presented.
Male fecundity parameters
Individual male fecundity depends on tree circumfer-
ence (Table 2). In both species, larger trees are more
fecund (positive values of aCir1.3 in Table 3). However,
the effect is stronger on Q. robur trees than on Q. petraea
trees (Table 2 and Fig. 2a). Terrain elevation also has a
Table 1 Main characteristics of Quercus petraea and Q. robur
trees
Phenotypic data Q. petraea* Q. robur* P-value†
Circumference (m) 1.84 (0.42) 1.67 (0.24) <10�4
Height (m) 26.5 (1.6) 25.1 (1.6) <10�4
H/DBH 45.2 (2.0) 47.2 (1.8) 0.002
Age (years) 100 (4) 100 (4) 0.74
Terrain elevation (m) 6.9 (1.3) 4.7 (1.7) <10�4
1st record of a mature ♂
flower
3.5 (0.6) 3.0 (0.7) <10�4
1st record of a mature ♀
flower
3.9 (0.4) 3.3 (0.7) <10�4
*Mean values with standard deviation in brackets.†Comparison between species: Kruskal–Wallis test for indepen-
dent samples.
© 2014 John Wiley & Sons Ltd
4336 L. LAGACHE ET AL.

significant effect on male fecundity (Table 2), with trees
located higher on the slope being more fecund
(Table 3). Interestingly, this effect differs for the two
species (Table 2), with male fecundity of Q. petraea trees
being more reduced at low terrain elevation than male
fecundity of Q. robur trees (Fig. 2b).
Mating compatibility between trees
Distance between trees has the greatest influence on
observed mating patterns (Table 2). Moreover, pollen
dispersal curves are not the same for both species
(Table 2). Indeed, we found that Q. petraea trees dis-
persed their pollen over shorter distances within the
study site (mean pollination distance of 97 m, with a
thinner-tailed dispersal kernel: b = 0.48) than Q. robur
trees (137 m, b = 0.25) (Table 3 and Fig. 3a). Pollen dis-
persal is directional in both species (i.e. models without
anisotropy have a lower likelihood than models in which
anisotropy is included, Table 2), but the directionality of
crosses is stronger in Q. petraea than in Q. robur
(jP = 1.21 > jR = 0.66; P-value < 10�4; Table 2). The
preferential direction is from east to west in Q. petraea
(hP = 0.17 rad; Table 2 and Fig. 3b) and from northeast
to southwest in Q. robur (hR = 1.14 rad; Table 2 and
Fig. 3b).
Taking the phenological overlap between mother trees
and father trees into account significantly improves
model fit (Table 2). As expected, the longer the overlap
Table 2 Likelihood ratio test of the significance of each sub-
model
Model* �log DlogL ddl† P-value‡
Full model 61423 – 37 –
Diameter effect on male
fecundity
aCirc1:3;P= aCirc1:3;R= 0 ?
61513 90 3 <10�4
Species-specific diameter effect
on male fecundity
aCirc1:3;P= aCirc1:3;R ?
61432 9 1 0.027
Terrain elevation effect on
male fecundity
bP = bR = 0 ?
61448 25 6 <10�3
Species-specific terrain
elevation effect on male
fecundity
bP = bR ?
61442 19 2 <10�4
Phenology effect on cross-
compatibility
cPOJk=1 = cPOJk=2 = cPOJk=3
= cPOJk=4 = 1 ?
61448 25 3 <10�4
Asymmetric hybridization
hPR = hRP ?
61431 8 1 0.0047
Distance effect on cross-
compatibility
dP = dR = ∞ ?
62565 1142 6 <10�4
Species-specific pollen
dispersal
dP = dR and bP = bR ?
61433 10 2 0.0067
Anisotropic pollen dispersal
jP = jR = 0 ?
61606 183 6 <10�4
Species-specific anisotropy of
pollen dispersal
jP = jR and hP = hR ?
61495 72 2 <10�4
Species-specific pollen
immigration rates
qP(0) = qR(0) ?
61432 9 1 0.0027
Immigration rate with edge
effects
bmP = bmP = 0 ?
61449 26 4 <10�4
Species-specific edge effects
bmP = bmR and amP = amR ?
61432 9 3 0.029
*All models listed are based on the full model modified in one
respect to yield the corresponding submodel.†ddl is the number of estimated parameters for the full model
and for all other cases the number of parameters that are fixed
and not estimated.‡P-values lower than 0.05 indicate that the full model is signifi-
cantly more informative than the tested submodel.
Table 3 Parameters estimated from the spatially explicit
mating model
Parameter* Estimated value
aCirc1:3;P 0.0075
aCirc1:3;R 0.0161
aP �5.7
aR �2.5
bP 0.81
bR 2.17
cPOJk=1 0.57
cPOJk=2 0.69
cPOJk=3 1
cPOJk=4 0.68
hPR 0.00095
hRP 0.035
dP (m) 97
dR (m) 137
bP 0.48
bR 0.25
jP 1.21
jR 0.66
hP 0.17
hR 1.14
qP(0) 0.0010
qR(0) 0.0018
amP �8.3
bmP �0.017
amR �4.1
bmR �0.005
*In total, 37 parameters were estimated, but the 11 parameters
for hybrid/intermediate trees (hIP, hIR, hPI, hRI, dI, bI, jI, hI, aI, bIand aCirc1:3;I ), are not shown in this table.
© 2014 John Wiley & Sons Ltd
MALE REPRODUCTIVE STRATEGIES IN OAKS 4337

between male and female flowering, the greater the likeli-
hood of mating between the trees (except for the fourth
overlap class that was under-represented; Table 3). The
sexual barriers to hybridization are on average 37 times
more porous in Q. robur than in Q. petraea mother trees
(hRP = 0.035 vs. hPR = 0.00095, P-value < 10�4; Tables 2
and 3). In comparison with the study of Lagache et al.
(2013a) based on the same genotypic data but a much
simpler model, the estimates of pollen dispersal parame-
ters and sexual barriers tend to vary in the same direction
(Appendix S2, Supporting Information).
We did not find any effect of trees relatedness on
mating success within species (Appendix S1, Support-
ing Information). In contrast, we found that in Q. robur,
early- and mid-season-flowering trees have their pollen
dispersed at shorter distances than late-flowering trees
(mean pollen dispersal of 95, 114 and 193 m for the
early, intermediate and late periods, P-value < 10�4).
This difference seems to be due to an increase in the
proportion of pollen dispersing to long distances in
late-flowering trees, as suggested by differences in the
parameter b of the dispersal curve (0.60, 0.23 and 0.16
for the early, intermediate and late periods). On the
contrary, the pollen dispersal curve for Q. petraea does
not change significantly during the season (mean pollen
dispersal of 96 and 100 m for mid-season- and late-
flowering trees; P-value = 0.27).
Immigration
In the studied flowering episode, immigrant pollen was
approximately half as abundant in Q. petraea as in
Q. robur (at the edge of the stand: qP(0) = 0.0010 vs.
qR(0) = 0.0018, P-value = 0.003, Tables 2 and 3). As
expected, immigration rates were larger at the edge
than inside the stand for both species (Table 2 and
Fig. 3c). However, the difference is greater in Q. petraea
than in Q. robur (Table 2).
Distribution of male fecundities and effective numberof males
The coefficient of variation of male fecundities is signifi-
cantly lower for Q. robur (CVR = 43% � 2%) than for
Q. petraea (CVP = 57% � 2%; P-value < 0.05; Data S5,
Supporting Information). The greater heterogeneity of
male fecundities in Q. petraea and its lower pollen dis-
persal and immigration rates should result in Q. petraea
being sired by a less diverse cohort of pollen grains
than Q. robur. Accordingly, for the fraction of maternal
progenies sired by fathers from inside the plot, we
found that the effective number of fathers is signifi-
cantly lower in Q. petraea (KeP = 11) than in Q. robur
(KeR = 45) (P-value = 0.004, Kruskal–Wallis test).
Discussion
We compared the male reproductive strategies of two
closely related oak species. The mating model used
relies on individual characteristics of trees and of pairs
of trees (circumference, intertree distance, phenological
overlap, etc.) and an accurate paternity analysis. Con-
sidering several characteristics of the mating system
simultaneously in a spatially explicit mating model and
testing the marginal effects of each characteristic (i.e.
type III tests) avoids possible confusions among effects
of nonindependent environmental variables. This
approach allowed the estimation of important yet rarely
available reproductive parameters that could then be
compared between species. Our goal here is to interpret
the corresponding findings in the light of existing theo-
ries on ecological strategy.
a
b
Fig. 2 Effect of tree circumference and terrain elevation on Quer-
cus robur and Q. petraea predicted male fecundity. Quercus robur
relative fecundity is symbolized by a dotted line and Q. petraea
by a full line. In a, the reference is the fertility of a tree with a
circumference equal to the mean circumference of the population
(1.73 m). In b, the reference is the fertility of a tree growing in
terrain elevation class 9.
© 2014 John Wiley & Sons Ltd
4338 L. LAGACHE ET AL.

Q. robur and Q. petraea: two species with contrastingecological dynamics
We found that Q. petraea trees grow faster than Q. ro-
bur trees. We also found indications that Q. petraea
trees better tolerate competition than Q. robur trees, as
suggested by previous studies (Becker 1992; Jensen
2000; Landergott et al. 2012; L�evy et al. 1992; reviewed
in Petit et al. 2003). Furthermore, we confirmed that
trees of these two species occupy different ecological
niches, as Q. petraea trees are found preferentially at
the top of the slope, whereas Q. robur trees are found
everywhere but are most abundant at the bottom.
Interestingly, the environment was shown to affect
male fecundity: trees of both species growing in the
lower part of the stand, where anoxic conditions pre-
vail, had decreased male fecundities, regardless of
tree size. Moreover, this effect was stronger for Q. pet-
raea than for Q. robur. This is consistent with knowl-
edge on the ecological preferences of these two
species: Q. robur, unlike Q. petraea, is tolerant of root
waterlogging (Ponton et al. 2002; Parelle et al. 2006; Le
Provost et al. 2011). In a recent study of the mating
system of these species in Poland, male reproductive
success was also found to vary spatially within the
studied plantation, with trees located lower in the
plot being characterized by lower male reproductive
success (Chybicki & Burczyk 2013). Such a confirma-
tion in another independent study is important
because inferences from a single site are difficult to
generalize.
Q. robur’s ecological strategy favours dispersal
According to our expanded model, mean pollen dis-
persal distance was 40% greater in Q. robur than in
a
b
c
Fig. 3 Pollen dispersal in Quercus robur
and Q. petraea. (a) Pollen dispersal kernel
of Q. robur (symbolized by a dotted line)
and Q. petraea (symbolized by a full line).
Right panel: along the main direction of
dispersal, left panel: in the direction
opposite to the main direction of dis-
persal. (b) Anisotropic pollen dispersal
modelling for Q. petraea (left) and Q. ro-
bur (right). (c) Amount of immigrant pol-
len as a function of the distance from the
edge to Q. robur (symbolized by a dotted
line) and to Q. petraea (symbolized by a
full line).
© 2014 John Wiley & Sons Ltd
MALE REPRODUCTIVE STRATEGIES IN OAKS 4339

Q. petraea. Furthermore, Q. robur pollen was over-
represented among immigrant pollen and dilution with
distance from the edge of the stand was three times
lower for Q. robur pollen than for Q. petraea pollen, also
suggesting that Q. robur pollen travels greater distances
and is therefore less quickly diluted by locally pro-
duced pollen. These findings support those of Lagache
et al. (2013a) based on the same data but using a sim-
pler model and those of Jensen et al. (2009) based on
realized pollen dispersal distances in another study plot
during two different mating episodes. We also found
that pollen dispersal differs throughout the flowering
season in Q. robur, with late-flowering trees dispersing
their pollen twice as far as early-flowering trees. No
such trend was detected in Q. petraea. Interestingly,
interspecific differences in pollen dispersal are detected
only among late-flowering trees. While differences in
pollen dispersal might in principle be caused by differ-
ences in pollen size between species (Rushton 1976), as
dispersal is known to depend on pollen size (Niklas
1985), they could also be due to interspecific differences
in the timing of pollen release relative to leafing and
canopy closure and to the position of the stigmas borne
by short vs. long and erect peduncles in these decidu-
ous trees (Nathan & Katul 2005; Miller�on et al. 2012).
Regardless of its origin, the difference in pollen dis-
persal between species might explain why we found a
lower effective number of fathers in Q. petraea than in
Q. robur.
In the studied year (1995), pollen dispersal events
inferred from paternity analysis were predominantly
from east to west in Q. petraea and from northeast to
southwest in Q. robur. One hypothesis is that wind is
responsible for this anisotropy (e.g. Shen et al. 1981;
Burczyk & Prat 1997; Pluess et al. 2009; Torimaru et al.
2012). However, this does not explain why the direction
is not the same for both species. Moreover, the prevail-
ing winds in this area blow mainly from west to east in
spring (Meteo France database), that is, in a direction
different from that inferred for the pollen. The finding
that the direction of intraspecific crosses is independent
of the predominant wind direction is not without prece-
dent (e.g. Burczyk et al. 2004; Robledo-Arnuncio & Gil
2005), suggesting that landscape features (e.g. topogra-
phy) could be involved in pollen anisotropic dispersal.
In addition, crosses were more anisotropic in Q. petraea
than in Q. robur. This observation could be caused by
the different locations of the species within the stand.
Whatever the reason for this difference, it has conse-
quences for mating opportunities (i.e. anisotropic dis-
persal should decrease mating opportunities).
Altogether, Q. robur appears to have higher dispersal
ability than Q. petraea, whether through pollen (this
study) or through seed (Petit et al. 2003). While it would
now be important to conduct full parentage studies in
mixed stands to investigate not only pollen but also
acorn dispersal, these findings are consistent with mod-
els of the colonization of disturbed environment in
which Q. robur establishes first at low density, whereas
Q. petraea establishes only after, in areas already colo-
nized by Q. robur (Petit et al. 1997, 2003; Lepais &
Gerber 2011). Note that this scenario requires that
Q. petraea has sufficiently strong sexual barriers against
Q. robur so as not to be swamped out by allospecific
pollen during forest succession while still at low den-
sity, in forests dominated by Q. robur.
Interspecific sexual barriers
The flowering phenologies of the two oak species are
not exactly the same, with flowers of Q. petraea matur-
ing later on average than those of Q. robur (Bacilieri
et al. 1995). This phenological shift should thus help
limit interspecific crosses between these two species. It
is also responsible for part of the observed asymmetry
of interspecific crosses, given that these oaks are protan-
drous, that is, that pollen shedding precedes the peak
of stigmata receptivity (Appendix S2, Supporting Infor-
mation). However, we also identified asymmetric sexual
barriers between species in addition to the isolation
effect conferred by phenology. This interspecific sexual
barrier was 37 times stronger on Q. petraea mother trees
than on Q. robur mother trees, a finding consistent with
results from a previous study (Chybicki & Burczyk
2013) and from interspecific controlled crosses (e.g.
Steinhoff 1993; Lepais et al. 2013), which point to asym-
metric mating compatibility in the same direction. It fits
also with predictions that mating system should be
more relaxed in early-successional than in late-succes-
sional species (e.g. Richards 1996).
In principle, the superior siring ability of Q. petraea
pollen could be caused by its larger pollen grains
(Delph et al. 1997). However, it seems difficult to attri-
bute the marked asymmetry in interspecific mating com-
patibility, confirmed in controlled crosses (e.g. Steinhoff
1993; Lepais et al. 2013), solely to differences in pollen
grain size, as these are quite weak between the studied
species (Rushton 1976). Yet another scenario is that
this asymmetric prezygotic barrier is the consequence of
asymmetric reinforcement, due to differences in inter-
specific mating opportunities resulting from ecological
succession, a directional process. From this perspec-
tive, Q. petraea trees colonizing stands of Q. robur would
initially face conditions conducive to massive hybridiza-
tion while the species is still at low density (Lepais et al.
2009). This should result in a strong and asymmetric
selection against interspecific mating events, as recently
described in Drosophila (Yukilevich 2012).
© 2014 John Wiley & Sons Ltd
4340 L. LAGACHE ET AL.

Conclusions
The differences observed in terms of pollen dispersal
(greater in Q. robur than in Q. petraea) and male fecun-
dity (more stable across environments in Q. robur than in
Q. petraea) fit with the more pioneering character of
Q. robur and the more competitive character of Q. pet-
raea. Differentiation between these two closely related
oak species could additionally be shaped by differing
adaptation to the environment, as shown by differences
in male fitness as a function of terrain elevation. Such
cases of multiple selection pressures (i.e. of ‘multifarious
divergent selection’), caused by interrelated selection
trade-offs, have been shown to be particularly conducive
to ecological speciation (Nosil et al. 2009; Nosil 2012).
Interestingly, the more competitive character of mature
Q. petraea than of Q. robur trees also extends to interspe-
cific mating relationships, as the siring success of Q. pet-
raea appears greater than that of Q. robur. More empirical
and theoretical studies of closely related species with dif-
ferent successional status could help assess whether dif-
fering selection pressures and asymmetric interaction
during succession trigger or reinforce speciation.
Acknowledgements
We are grateful to G�erard Nepveu and Maryline Harrou�e for
sharing tree-ring data. We also thank Jean-Marc Louvet, ONF
office of Le Mans, ONF Research and Development Depart-
ment in Fontainebleau and the ONF manager of La Petite
Charnie (Gabriel Faramin) for construction and maintenance
of the stands. We are particularly grateful to Da-Yong Zhang,
Olivier Lepais, Berthold Heinze and three anonymous referees
for their constructive comments on previous versions of the
manuscript and to Didier Bert and C�eline Meredieu for help
in interpreting tree rings and tree growth. Funding was
provided by the LinkTree project (ANR BIODIVERSA), the
EU Network of Excellence EvolTree and ANR-10-EQPX-16
XYLOFOREST.
References
Ackerly DD (2003) Community assembly, niche conservatism,
and adaptive evolution in changing environments. Interna-
tional Journal of Plant Sciences, 164, S165–S184.Alberto F, Bouffier L, Louvet JM, Lamy JB, Delzon S, Kremer
A (2011) Adaptive responses for seed and leaf phenology in
natural populations of sessile oak along an altitudinal gradi-
ent. Journal of Evolutionary Biology, 24, 1442–1454.Bacilieri R, Ducousso A, Kremer A (1995) Genetic, morphologi-
cal, ecological and phenological differentiation between
Quercus petraea (Matt.) Liebl. and Q. robur L in a mixed stand
of Northwest France. Silvae Genetica, 44, 1–10.Bacilieri R, Ducousso A, Petit RJ, Kremer A (1996) Mating sys-
tem and asymmetric hybridization in a mixed stand of Euro-
pean oaks. Evolution, 50, 900–908.
Becker M (1992) Deux indices de comp�etition pour la compa-
raison de la croissance en hauteur et en diam�etre d’arbres
aux pass�es sylvicoles vari�es et inconnus. Annales des Sciences
Foresti�eres, 49, 25–37.Burczyk J, Prat D (1997) Male reproductive success in Pseudots-
uga menziesii (Mirb.) Franco: the effects of spatial structure
and flowering characteristics. Heredity, 79, 638–647.
Burczyk J, Adams WT, Moran GF, Griffin AR (2002) Complex
patterns of mating revealed in a Eucalyptus regnans seed
orchard using allozyme markers and the neighbourhood
model. Molecular Ecology, 11, 2379–2391.
Burczyk J, Lewandowski A, Chalupka W (2004) Local pollen
dispersal and distant gene flow in Norway spruce (Picea abies
[L.] Karst.). Forest Ecology and Management, 197, 39–48.Burton OJ, Phillips BL, Travis JMJ (2010) Trade-offs and the
evolution of life-histories during range expansion. Ecology
Letters, 13, 1210–1220.
Calcagno V, Mouquet N, Jarne P, David P (2006) Coexistence
in a metacommunity: the competition–colonization trade-off
is not dead. Ecology Letters, 9, 897–907.Chybicki IJ, Burczyk J (2013) Seeing the forest through the
trees: comprehensive inference on individual mating patterns
in a mixed stand of Quercus robur and Q. petraea. Annals of
Botany, 112, 561–574.De Cauwer I, Arnaud JF, Klein EK, DufayM (2012) Disentangling
the causes of heterogeneity in male fecundity in gynodioecious
Beta vulgaris ssp.maritima.New Phytologist, 195, 676–687.
Delph LF, Johannsson MH, Stephenson AG (1997) How envi-
ronmental factors affect pollen performance: ecological and
evolutionary perspectives. Ecology, 78, 1632–1639.
Devlin B, Ellstrand NC (1990) The development and applica-
tion of a refined method for estimating gene flow from
angiosperm paternity analysis. Evolution, 44, 248–259.DiFazio SP, Leonardi S, Slavov GT, Garman SL, Adams WT,
Strauss SH (2012) Gene flow and simulation of transgene
dispersal from hybrid poplar plantations. New Phytologist,
193, 903–915.Dupouey JL, Le Bouler H (1989) Discrimination morphologique
des glands de chenes sessile Quercus petraea Matt. Liebl. et
p�edoncul�e Quercus robur L. Annales des Sciences Foresti�eres, 46,
187–194.Friedman J, Barrett SCH (2009) Wind of change: new
insights on the ecology and evolution of pollination and
mating in wind-pollinated plants. Annals of Botany, 103,
1515–1527.G�erard B, Alaoui-Soss�e B, Badot PM (2009) Flooding effects on
starch partitioning during early growth of two oak species.
Trees, 23, 373–380.
Guichoux E, Lagache L, Wagner S, L�eger P, Petit RJ (2011)
Two highly validated multiplexes (12-plex and 8-plex) for
species delimitation and parentage analysis in oaks (Quercus
spp.). Molecular Ecology Resources, 11, 578–585.
Guichoux E, Garnier-G�er�e P, Lagache L, Lang T, Bourry C,
Petit RJ (2013) Outlier loci highlight the direction of intro-
gression in oaks. Molecular Ecology, 22, 450–462.Hampe A, Pemonge M-H, Petit RJ (2013) Efficient mitigation of
founder effects during the establishment of a leading-edge
oak population. Proceedings of the Royal Society of London B,
280: 20131070; doi:10.1098/rspb.2013.1070.
Harbison CW, Bush SE, Malenke JR, Clayton DH (2008) Com-
parative transmission dynamics of competing parasite spe-
cies. Ecology, 89, 3186–3194.
Hardy OJ (2009) How fat is the tail? Heredity, 103, 437–438.
© 2014 John Wiley & Sons Ltd
MALE REPRODUCTIVE STRATEGIES IN OAKS 4341

Holsinger KE (1991) Mass-action models of plant mating sys-
tems: the evolutionary stability of mixed mating systems.
The American Naturalist, 138, 606–622.
Jensen JS (2000) Provenance variation in phenotypic traits
in Quercus robur and Quercus petraea in Danish prove-
nance trials. Scandinavian Journal of Forest Research, 15, 297–308.
Jensen J, Larsen A, Nielsen LR, Cottrell J (2009) Hybridization
between Quercus robur and Q. petraea in a mixed oak stand
in Denmark. Annals of Forest Science, 66, 706.
Kneitel JM, Chase JM (2004) Trade-offs in community ecology:
linking spatial scales and species coexistence. Ecology Letters,
7, 69–80.
Lagache L, Klein EK, Guichoux E, Petit RJ (2012) Data from:
Fine-scale environmental control of hybridization in oaks.
Dryad Digital Repository, doi:10.5061/dryad.n50b4.
Lagache L, Klein EK, Guichoux E, Petit RJ (2013a) Fine-scale
environmental control of hybridization in oaks. Molecular
Ecology, 22, 423–436.
Lagache L, L�eger JB, Daudin JJ, Petit RJ, Vacher C (2013b) Putt-
ing the biological species concept to the test: using mating
networks to delimit species. PLoS ONE, 8, e68267.
Landergott U, Gugerli F, Hoebee SE, Finkeldey R, Holderegger
R (2012) Effects of seed mass on seedling height and compe-
tition in European white oaks. Flora, 207, 721–725.
Le Provost G, Sulmon C, Frigerio JM, Bod�en�es C, Kremer A,
Plomion C (2011) Role of waterlogging-responsive genes in
shaping interspecific differentiation between two sympatric
oak species. Tree Physiology, 32, 119–134.Lepais O, Gerber S (2011) Reproductive patterns shape intro-
gression dynamics and species succession within the
European white oak species complex. Evolution, 65, 156–
170.
Lepais O, Petit RJ, Guichoux E et al. (2009) Species relative
abundance and direction of introgression in oaks. Molecular
Ecology, 18, 2228–2242.
Lepais O, Roussel G, Hubert F, Kremer A, Gerber S (2013)
Strength and variability of postmating reproductive isolating
barriers between four European white oak species. Tree
Genetics and Genomes, 9, 841–853.
Lesser MR, Jackson ST (2013) Contributions of long-distance
dispersal to population growth in colonising Pinus ponderosa
populations. Ecology Letters, 16, 380–389.Levins R, Culver D (1971) Regional coexistence of species
and competition between rare species. Proceedings of the
National Academy of Science United States of America, 68,
1246–1248.L�evy G, Becker M, Duhamel D (1992) A comparison of the
ecology of pedunculate and sessile oaks: radial growth in the
centre and northwest of France. Forest Ecology and Manage-
ment, 55, 51–63.Lloyd DG (1980a) Sexual strategies in plants. III. A quantitative
method for describing the gender of plants. New Zealand
Journal of Botany, 18, 103–108.
Lloyd DG (1980b) Demographic factors and mating patterns in
angiosperms. In: Demography and Evolution in Plant Popula-
tions (ed. Solbrig OT), pp. 67–88. Blackwell, Oxford.
Meagher TR (1986) Analysis of paternity within a natural pop-
ulation of Chamaelirium luteum. 1. Identification of most-
likely male parents. American Naturalist, 128, 199–215.
Miller�on M, de Heredia UL, Lorenzo Z et al. (2012) Effect of
canopy closure on pollen dispersal in a wind-pollinated spe-
cies Fagus sylvatica L. Plant Ecology, 213, 1715–1728.
Morgan MT, Conner JK (2001) Using genetic markers to
directly estimate male selection gradients. Evolution, 55,
272–281.Nathan R, Katul GG (2005) Foliage shedding in deciduous for-
ests lifts up long-distance seed dispersal by wind. Proceedings
of the National Academy of Sciences of the United States of Amer-
ica, 102, 8251–8256.Newell SJ, Tramer EJ (1978) Reproductive strategies in herba-
ceous plant communities during succession. Ecology, 59, 228–234.
Nielsen R, Tarpy DR, Reeve HK (2003) Estimating effective
paternity number in social insects and the effective number
of alleles in a population. Molecular Ecology, 12, 3157–3164.Niklas K (1985) The aerodynamics of wind pollination. The
Botanical Review, 51, 328–386.Nosil P (2012) Ecological Speciation. Oxford University Press,
Oxford.
Nosil P, Harmon LJ, Seehausen O (2009) Ecological explana-
tions for incomplete speciation. Trends in Ecology and Evolu-
tion, 24, 145–156.
Oddou-Muratorio S, Houot ML, Demesure-Musch B, Austerlitz
F (2003) Pollen flow in the wildservice tree, Sorbus torminalis
L. Crantz. I. Evaluating the paternity analysis procedure in
continuous populations. Molecular Ecology, 12, 3427–3439.
Oddou-Muratorio S, Klein EK, Austerlitz F (2005) Pollen flow
in the wildservice tree, Sorbus torminalis L. Crantz. II. Pollen
dispersal and heterogeneity in mating success inferred from
parent–offspring analysis. Molecular Ecology, 14, 4441–4452.Parelle J, Brendel O, Bod�en�es C et al. (2006) Differences in mor-
phological and physiological responses to water-logging
between two sympatric oak species Quercus petraea [Matt.]
Liebl, Quercus robur L. Annals of Forest Science, 63, 849–859.Petit RJ, Pineau E, Demesure B, Bacilieri R, Ducousso A,
Kremer A (1997) Chloroplast DNA footprints of postglacial
recolonization by oaks. Proceedings of the National Academy of
Sciences United States of America, 94, 9996–10001.Petit RJ, Bod�en�es C, Ducousso A, Roussel G, Kremer A (2003)
Hybridization as a mechanism of invasion in oaks. New Phy-
tologist, 161, 151–164.
Pickett STA (1976) Succession: an evolutionary interpretation.
The American Naturalist, 110, 107–119.
Pluess AR, Sork VL, Dolan B et al. (2009) Short distance pollen
movement in a wind-pollinated tree, Quercus lobata (Fagaceae).
Forest Ecology and Management, 258, 735–744.Ponton S, Dupouey JL, Br�eda N, Dreyer E (2002) Comparison
of water-use efficiency of seedlings from two sympatric oak
species: genotype 9 environment interactions. Tree Physiol-
ogy, 22, 413–422.Primack RB, Kang H (1989) Measuring fitness and natural
selection in wild plant populations. Annual Review of Ecology
and Systematics, 20, 367–396.
Pritchard JK, Stephens M, Donnelly P (2000) Inference of popu-
lation structure using multilocus genotype data. Genetics,
155, 945–959.Richards AJ (1996) Breeding systems in flowering plants and
the control of variability. Folia Geobotanica and Phytotaxonomi-
ca, 31, 283–293.
© 2014 John Wiley & Sons Ltd
4342 L. LAGACHE ET AL.

Robledo-Arnuncio JJ, Gil L (2005) Patterns of pollen dispersal
in a small population of Pinus sylvestris L. revealed by total-
exclusion paternity analysis. Heredity, 94, 13–22.
Ronce O, Olivieri I (1997) Evolution of reproductive effort in a
metapopulation with local extinctions and ecological succes-
sion. The American Naturalist, 150, 220–249.Rushton BS (1976) Pollen grain size in Quercus robur L. and
Quercus petraea Matt. Liebl. Watsonia, 11, 137–140.Shen H, Rudin D, Lindgren D (1981) Study of the pollination
pattern in a Scots pine seed orchard by means of isozyme
analysis. Silvae Genetica, 30, 7–15.
Slavov GT, Howe GT, Adams WT (2005) Pollen contamination
and mating patterns in a Douglas-fir seed orchard as mea-
sured by simple sequence repeat markers. Canadian Journal of
Forest Research, 35, 1592–1603.
Smouse PE, Sork VL (2004) Measuring pollen flow in forest
trees: an exposition of alternative approaches. Forest Ecology
and Management, 197, 21–38.Smouse PE, Meagher TR, Kobak CJ (1999) Parentage analysis
in Chamaelirium luteum (L.) Gray (Liliaceae): why do some
males have higher reproductive contributions? Journal of Evo-
lutionary Biology, 12, 1069–1077.Steinhoff S (1993) Results of species hybridization with Quercus
robur L. and Quercus petraea Matt. Liebl. Annals of Forest Sci-
ence, 50, 137s–143s.
Streiff R, Ducousso A, Lexer C, Steinkellner H, Gloessl J,
Kremer A (1999) Pollen dispersal inferred from paternity
analysis in a mixed oak stand of Quercus robur L. and Q. pet-
raea Matt. Liebl. Molecular Ecology, 8, 831–841.Tilman D (1994) Competition and biodiversity in spatially
structured habitats. Ecology, 75, 2–16.Torimaru T, Wennstrom U, Lindgren D, Wang XR (2012)
Effects of male fecundity, interindividual distance and aniso-
tropic pollen dispersal on mating success in a Scots pine (Pi-
nus sylvestris) seed orchard. Heredity, 108, 312–321.Wendt T, da Cruz DD, Demuner VG, Guilherme FAG, Boudet-
Fernandes H (2011) An evaluation of the species boundaries
of two putative taxonomic entities of Euterpe (Arecaceae)
based on reproductive and morphological features. Flora,
206, 144–150.
Westoby M, Falster DS, Moles AT, Vesk PA, Wright IJ (2002)
Plant ecological strategies: some leading dimensions of varia-
tion between species. Annual Review of Ecology and Systemat-
ics, 33, 125–159.
Wolfram Research Inc. 2010. Mathematica Edition: Version 8.0.
Wolfram Research, Inc., Champaign, Illinois.
Yukilevich R (2012) Asymmetrical patterns of speciation
uniquely support reinforcement in Drosophila. Evolution, 66,
1430–1446.
A.D. established the progeny test and shared informa-
tion about tree characteristics. R.J.P. initially conceived
the study, which evolved significantly with the help of
all authors. L.L. gathered and analysed the data. E.K.
performed the modelling. L.L. and R.J.P. wrote the
paper; E.K. wrote part of the methods. All four authors
reviewed the complete manuscript.
Data accessibility
Microsatellite data can be found in the Dryad data
repository at http://datadryad.org, doi:10.5061/dryad.
n50b4 (Lagache et al. 2012).
Morphological data can be found in the TreePop data-
base at http://bioinfo.orleans.inra.fr/TreePop/tmp/
export_20121002141319506ada5f6da21.txt.
Supporting information
Additional supporting information may be found in the online ver-
sion of this article.
Data S1 Spatial coordinates of the trees in the stand.
Data S2 Topographic map of the stand and definition of ter-
rain elevation classes.
Data S3 Mathematica Notebook.
Data S4 Distribution of individual circumferences (A), terrain
elevation class (B) and first record of male and female mature
flowers (C) for each species.
Data S5 Model prediction of individual male fecundities by
species.
Appendix S1 Model including a relatedness effect
between father and mother trees on male fecundity.
Appendix S2 Dependence of parameter estimation on
the model used.
© 2014 John Wiley & Sons Ltd
MALE REPRODUCTIVE STRATEGIES IN OAKS 4343