ABSTRACT Title of Dissertation - UMD DRUM - University of ...
Upload
khangminh22Category
view
0download
0
COPYRIGHT AND CITATION CONSIDERATIONS FOR THIS THESIS/ DISSERTATION
o Attribution — You must give appropriate credit, provide a link to the license, and indicate if changes were made. You may do so in any reasonable manner, but not in any way that suggests the licensor endorses you or your use.
o NonCommercial — You may not use the material for commercial purposes.
o ShareAlike — If you remix, transform, or build upon the material, you must distribute your contributions under the same license as the original.
How to cite this thesis
Surname, Initial(s). (2012) Title of the thesis or dissertation. PhD. (Chemistry)/ M.Sc. (Physics)/ M.A. (Philosophy)/M.Com. (Finance) etc. [Unpublished]: University of Johannesburg. Retrieved from: https://ujdigispace.uj.ac.za (Accessed: Date).

THE INFLUENCE OF INTERNAL MARKETING ON INTERNAL CUSTOMER
SATISFACTION WITHIN RETAIL BANKING
LEIGH REYNOLDS-DE BRUIN
STUDENT NUMBER: 909340297
FULL DISSERTATION
Submitted in fulfilment of the requirements
for the degree
MCom
in Marketing Management
in the Faculty of Management
at the
University of Johannesburg
Johannesburg Supervisor: Prof M Roberts-Lombard
October 2013 Co-supervisor: Dr C De Meyer

i
DECLARATION
I, Leigh Reynolds-DeBruin, declare that this dissertation is my own, unaided work. Any
assistance that I have received has been duly acknowledged in the dissertation. It is
submitted in fulfilment of the requirements for the degree of Master of Commerce at the
University of Johannesburg. It has not been submitted before for any degree or
examination at this or at any other university.
Leigh Reynolds-De Bruin October, 2013

ii
ACKNOWLEDGEMENTS
A sincere thankyou to all the people who in one way or another contributed to the completion
of this study. My special appreciation is extended to:
My brilliant supervisors, Doc De Meyer and Prof Roberts-Lombard, thank you so much for
your guidance, advice and motivation throughout my MCom journey – I couldn’t have done
this without you. I thoroughly enjoyed my visits to UJ and our times together. You really made
me feel a part of the UJ family.
Mom and dad, thank you so much for all your love, guidance and support over the years and
for the opportunities you gave me to make all of this possible. I love you both with all my heart
and feel so blessed to have you as my parents.
Riaan De Bruin, my special Tigger, my best friend and IT support. Thank you so much for all
your love and support during this period, this wouldn’t have been possible without you – thank
you for stepping in to take care of the boys when I had to study or travel to SA – you are an
amazing father and husband and l love you with all my heart, now and forever. My document
would not look as good as it does without your brilliant input.
Christiaan and Alex De Bruin my most precious, amazing boys – this has all been for you! I
realise that this hasn’t always been easy on you and there were times I seriously thought
about holding off on completing this but we always teach you to never to give up – in the
words of Yoda “Do or do not, there is no try” so this is me doing and never giving up. You
have always been my inspiration and everything I do in life since the day you were both born
is for you – this is to encourage you to pursue each and every dream and so that I can
provide you with the opportunities you need to make your dreams come true. I love you to
infinity and back again.
Petro De Bruin - Moeka, I know you would have been so proud of me. I often feel your
presence with me pushing me on. You touched my life in such special way and helped mould
the person I am today and I am so grateful for the time I had with you.
Meraatjie, thank you so much for all your support and for all your help in taking care of the
boys especially during the crazy 2 months towards the end of my study. I still have the straw
behind my ear calling in to Maverick and Goose.

iii
Diane Schneider, thank you so much for you support and input over the last couple of years,
it is deeply appreciated.
Alison Clarke, thank you so much for support over the last decade, for keeping me sane (well
almost) and for all your input into my study. You are such a special friend and I don’t think I
would have survived all of this without you. It has been a difficult path but knowing I could call
on you at any point has always been reassuring for me.
Lee Wright, thank you so much for the coffee sessions and for the welcome breaks and
chats. You have been such a core part of this process and my strongest source of emotional
support on this side. Thank you for helping me out with the boys and for all your support, not
sure I could have endured without you.
Team Costa: Dr Mustafa, Ian, Zoe, Mark and Patrick – thank you for the wacky chats, laughs
and coffees. You became a welcome part of my work environment and I’d feel lost if none of
you were around. I’ll always look back on this period with fond memories and am so grateful
that my study led me to all of you.
David Fisk, thank you so much for your friendship and support over the years and for your
input into my study.
Jurgen Becker, I feel so grateful that my study led me to meet you. You have been a
wonderful source of motivation and inspiration during this time and I would not have managed
without your brilliant mind and guidance. Thank you so much for all your support and for
always being available when I needed to chat. Thank you for your assistance with the
processing and analysis of the data and for mentoring me in the ‘language of statistics’.
The GDP participants from Standard Bank, FNB and Nedbank, thank you for participating in
this study and for making all of this possible. I’d especially like to thank Sharon Douglas-
Henry, Luan McArthur-Grill and Joanna Preston for their help in pulling everything together. I
trust that the results will add some value to your organisations.
Elsabeth Marnitz, thank you for time and effort in conducting the language editing.
God, thank you for all that I am, all that I have and for all that I have become.

iv
DEDICATION
This study is dedicated to my Mom and Dad, Moeka, my husband Riaan and my two beautiful
boys, Christiaan and Alex.
“The journey with the people we love is all that really matters. Such a simple truth so easily
forgotten” - Unknown

v
EXECUTIVE SUMMARY
Despite the extensive research undertaken in the subject area of services marketing, not
much research has been conducted in the internal marketing area, specifically in the South
African context. This study attempted to address this subject and focused on seven internal
marketing mix elements (internal product, internal price, internal promotion, internal
distribution, internal people, internal process and internal physical evidence) and their
influence on the satisfaction of graduate development employees within retail banks in South
Africa. Further to this, the link between employee satisfaction and affective commitment was
explored due to its impact on employee productivity.
The growth of the service sector worldwide has led to services being considered as one of the
most important sectors in the world. The contribution of the South African service sector to
GDP was 68.1% in 2012, where the financial services sector in South Africa has already
overtaken the manufacturing sector as the largest contributor to GDP. The financial service
sector contributed 22% in 2008. Given the homogeneity within the retail banking industry,
there is very little differentiating the banks, and imitation of any innovation is inevitable. For
this reason a market-driven strategy that enables retail banks to deliver superior quality is
essential as service quality is the only real differentiator and key to building a competitive
advantage. Given its employees who create the service experience, the employee as the
internal customer becomes the organisation’s most valuable asset. For this reason, retail
banks in South Africa have been placing an increased focus on recruiting at the graduate
level leading to the establishment of Graduate Development Programmes (GDPs). These
banking GDPs are specifically designed to help graduates succeed in complex environments
and to build the talent pipeline by providing an in-depth training programme. However one of
the biggest challenges faced by banks is the satisfaction and retention of their GDP
employees. Banks generally experience high attrition rates amongst this group of employees
mainly due to job dissatisfaction which impacts service quality provided to external
customers, and which increases the organisation’s costs. An internal marketing programme
aimed at employees could enhance employee satisfaction which in turn could enhance
employee levels of affective commitment resulting in higher retention rates. Satisfied
employees will go the extra mile to serve external customers and in this manner service
quality can be improved.
In order to investigate the influence of the internal marketing mix on employee satisfaction
and test the relationship between employee satisfaction and affective commitment, an
empirical investigation was conducted. The primary research objective of the study was to

vi
investigate the influence of the internal marketing mix on employee satisfaction from GDP
employees’ perspective in order to enhance their satisfaction at retail banks with graduate
development programmes in South Africa. In addition to this, the relationship between
satisfaction and affective commitment was explored.
A census approach was applied to the study using a person administered and an electronic
survey method. All retail banks with graduate development programmes were invited to
participate in the study of which three agreed to participate. Of the 360 graduates, 64
employees agreed to participate in the study. Regression analysis was used to test the
relationships proposed in the study. The internal promotion and internal physical evidence
scales were discarded due to poor construct validity, internal distribution emerged as a two-
factor solution and was split into collaborative culture and organisational structure, and the
internal price element was not regarded as statistically significant. From the study, the internal
marketing mix elements that influenced employee satisfaction to come to fore included
internal product, collaborative culture, organisational structure, internal people and internal
process.
The outcome of the regression analysis showed that employee satisfaction is influenced by
internal product, collaborative culture, organisational structure, internal people and internal
process. In addition to this, it was concluded that employee satisfaction influences affective
commitment. Based on these outcomes, recommendations were made to retail banks for the
implementation of a formal internal marketing mix through for example the implementation of
the internal people element. Retail banks would be able to ensure that supervisors are easily
accessible and providing constant ongoing feedback, a benefit which was identified as the
most important contributor to GDP job satisfaction.

vii
TABLE OF CONTENTS
DECLARATION ...................................................................................................................... i
ACKNOWLEDGEMENTS...................................................................................................... ii
DEDICATION ....................................................................................................................... iv
EXECUTIVE SUMMARY ....................................................................................................... v
CHAPTER 1 .......................................................................................................................... 1
INTRODUCTION AND BACKGOUND .................................................................................. 1
1.1 INTRODUCTION ................................................................................................... 1
1.2 BACKGROUND TO THE STUDY .......................................................................... 1
1.3 PROBLEM STATEMENT ...................................................................................... 6
1.4 RESEARCH OBJECTIVES ................................................................................... 8
1.4.1 Primary objective of the study ................................................................................ 8
1.4.2 The secondary objectives ...................................................................................... 8
1.4.3 Hypotheses ............................................................................................................ 9
1.5 SIGNIFICANCE OF THE STUDY ........................................................................ 11
1.6 LITERATURE REVIEW ....................................................................................... 12
1.6.1 The interaction between the marketing function, the external and internal market 12
1.6.2 Internal market ..................................................................................................... 13
1.6.3 Internal marketing ................................................................................................ 14
1.6.4 Internal marketing mix .......................................................................................... 16
1.6.4.1 Internal product .................................................................................................... 17
1.6.4.2 Internal price ........................................................................................................ 18
1.6.4.3 Internal promotion ................................................................................................ 19
1.6.4.4 Internal distribution ............................................................................................... 20
1.6.4.5 Internal people ..................................................................................................... 21
1.6.4.6 Internal process ................................................................................................... 22
1.6.4.7 Internal physical evidence .................................................................................... 22

viii
1.7 EMPLOYEE SATISFACTION .............................................................................. 23
1.7.1 Internal marketing and employee satisfaction ...................................................... 24
1.7.2 The link between employee satisfaction and affective commitment ...................... 25
1.8 RESEARCH METHODOLOGY ............................................................................ 27
1.8.1 Research design and plan ................................................................................... 27
1.8.2 Population and sample ........................................................................................ 28
1.8.3 Data collection, instruments, sources and procedure ........................................... 29
1.8.4 Data analysis procedures ..................................................................................... 31
1.9 DIVISION OF THE STUDY .................................................................................. 32
1.10 DISCUSSION OF TERMINOLOGY ..................................................................... 33
1.11 CONCLUSION ..................................................................................................... 33
CHAPTER 2 ........................................................................................................................ 35
AN INTRODUCTORY PERSPECTIVE ON INTERNAL MARKETING ................................. 35
2.1 INTRODUCTION ................................................................................................. 35
2.2 THE SERVICE CONCEPT ................................................................................... 36
2.2.1 Characteristics of services ................................................................................... 38
2.2.1.1 Intangibility ........................................................................................................... 38
2.2.1.2 Inseparability ........................................................................................................ 38
2.2.1.3 Perishability ......................................................................................................... 39
2.2.1.4 Heterogeneity ...................................................................................................... 39
2.3 SERVICES MARKETING TRIANGLE ................................................................. 40
2.3.1 External marketing as part of the services marketing triangle .............................. 41
2.3.2 Interactive marketing as part of the services marketing triangle ........................... 42
2.3.3 Internal marketing as part of the services triangle ................................................ 43
2.4 AN INTRODUCTORY PERSPECTIVE TO INTERNAL MARKETING ................. 44
2.4.1 Defining internal marketing .................................................................................. 45
2.4.2 Internal market orientation ................................................................................... 49
2.4.3 Internal customer orientation ................................................................................ 52
2.4.4 Internal marketing strategies ................................................................................ 53
2.4.4.1 Internal marketing as an internal branding strategy .............................................. 54
2.4.4.2 Internal marketing as an employer branding strategy ........................................... 55
2.4.4.3 Internal marketing as a change management strategy ......................................... 56
2.4.4.4 Internal marketing as an internal communication strategy .................................... 56
2.4.4.5 The extended services marketing mix strategy .................................................... 57
2.4.5 Internal marketing strategies pursued by the retail banks in South Africa ............. 57
2.4.5.1 Internal marketing as an internal branding strategy for South African retail banks 57

ix
2.4.5.2 Internal marketing as an employer branding strategy for South African retail
banks ................................................................................................................... 58
2.4.5.3 Internal marketing as a change management strategy for South African retail
banks ................................................................................................................... 58
2.4.5.4 Internal marketing as an internal communication strategy for South African retail
banks ................................................................................................................... 58
2.4.5.5 The extended services marketing mix for South African retail banks .................... 59
2.5 INTERNAL RELATIONSHIPS ............................................................................. 60
2.5.1 The purpose of internal marketing in the creation of internal relationships ........... 60
2.5.2 The internal environment ..................................................................................... 61
2.5.2.1 Trust and commitment ......................................................................................... 63
2.5.2.2 The role of cross-functional coordination in creating relationships in the internal
environment ......................................................................................................... 63
2.6 EMPLOYEE SATISFACTION AND AFFECTIVE COMMITMENT ....................... 64
2.6.1 Role of employee satisfaction and affective commitment in creating internal and
external customer satisfaction, loyalty and retention ............................................ 65
2.7 CONCLUSION ..................................................................................................... 67
CHAPTER 3 ........................................................................................................................ 69
THE INTERNAL MARKETING MIX ..................................................................................... 69
3.1 INTRODUCTION ................................................................................................. 69
3.2 INTERNAL MARKETING MIX ELEMENTS ......................................................... 70
3.2.1 Internal product .................................................................................................... 72
3.2.1.1 Employee training and development .................................................................... 74
3.2.1.2 Employee Empowerment ..................................................................................... 75
3.2.1.3 Role fit and role clarity ......................................................................................... 76
3.2.1.4 Career advancement ........................................................................................... 77
3.2.2 Internal price ........................................................................................................ 79
3.2.2.1 Opportunity costs ................................................................................................. 79
3.2.2.2 Psychological costs .............................................................................................. 80
3.2.2.3 Emotional cost and labour .................................................................................... 80
3.2.3 Internal promotion ................................................................................................ 82
3.2.3.1 Internal advertising ............................................................................................... 83
3.2.3.2 Internal personal selling ....................................................................................... 84
3.2.3.3 Internal sales promotion ....................................................................................... 85
3.2.3.4 Social media ........................................................................................................ 87
3.2.4 Internal distribution ............................................................................................... 90
3.2.4.1 Organisational culture .......................................................................................... 91

x
3.2.4.2 Organisational structure ....................................................................................... 94
3.2.5 Internal people ..................................................................................................... 96
3.2.5.1 Senior leadership and leadership style ................................................................. 97
3.2.5.2 Employee relationships with supervisors .............................................................. 99
3.2.5.3 Employee relationships with co-workers ............................................................ 100
3.2.6 Internal process ................................................................................................. 100
3.2.6.1 Internal process design ...................................................................................... 101
3.2.6.2 Internal process delivery and improvement ........................................................ 102
3.2.7 Internal physical evidence .................................................................................. 103
3.2.7.1 Essential evidence ............................................................................................. 103
3.2.7.2 Peripheral evidence ........................................................................................... 104
3.3 CONCLUSION ................................................................................................... 105
CHAPTER 4 ...................................................................................................................... 107
EMPLOYEE SATISFACTION ............................................................................................ 107
4.1 INTRODUCTION ............................................................................................... 107
4.2 THE IMPORTANCE OF EMPLOYEE SATISFACTION AND INTERNAL
MARKETING IN THE SERVICE PROFIT CHAIN .............................................. 108
4.2.1 Link between internal service quality and employee satisfaction ........................ 109
4.2.2 Link between employee satisfaction and employee productivity ......................... 109
4.2.3 Link between employee satisfaction and employee retention ............................. 110
4.2.4 Link between employee productivity and employee retention and external
service quality .................................................................................................... 110
4.2.5 Link between external service quality and customer satisfaction ........................ 110
4.2.6 Link between customer satisfaction and customer loyalty .................................. 111
4.2.7 Link between customer loyalty and increased organisational revenue and
profitability.......................................................................................................... 111
4.2.8 Increased profitability and growth improves internal service quality ................... 111
4.3 EMPLOYEE SATISFACTION ............................................................................ 112
4.3.1 Employee satisfaction defined............................................................................ 112
4.3.1.1 Employee feelings, attitudes and emotional state............................................... 113
4.3.1.2 Appraisal of one’s job ......................................................................................... 114
4.3.2 Predictors of employee satisfaction .................................................................... 114
4.3.2.1 Reward and recognition ..................................................................................... 115
4.3.2.2 Empowerment .................................................................................................... 115
4.3.2.3 Training .............................................................................................................. 115
4.3.2.4 Stress and pressure ........................................................................................... 115
4.3.2.5 Decentralised decision making........................................................................... 115

xi
4.3.2.6 Organisational culture ........................................................................................ 116
4.3.2.7 Career advancement ......................................................................................... 116
4.3.2.8 Physical environment ......................................................................................... 116
4.3.2.9 Feedback ........................................................................................................... 116
4.3.2.10 Role fit and clarity .............................................................................................. 116
4.3.2.11 Relationship with co-workers ............................................................................. 117
4.3.2.12 Relationship with supervisors/managers ............................................................ 117
4.3.2.13 Leadership and leadership style ......................................................................... 117
4.3.2.14 Sharing of information and knowledge ............................................................... 117
4.3.2.15 Operating processes and policies ...................................................................... 118
4.4 THE RELATIONSHIP BETWEEN EMPLOYEE SATISFACTION AND THE
INTERNAL MARKETING MIX ........................................................................... 118
4.4.1 The relationship between employee satisfaction and internal product ................ 119
4.4.1.1 Employee satisfaction through training and development as a factor of internal
product ............................................................................................................... 120
4.4.1.2 Employee satisfaction through empowerment as a factor of internal product ..... 121
4.4.1.3 Employee satisfaction through role fit and role clarity as a factor of internal
product ............................................................................................................... 121
4.4.1.4 Employee satisfaction through career advancement as a factor of internal
product ............................................................................................................... 122
4.4.2 Relationship between internal price and employee satisfaction .......................... 123
4.4.3 Relationship between internal promotion and employee satisfaction .................. 123
4.4.3.1 Employee satisfaction through internal communication (advertising, personal
selling and social media) as a factor of internal promotion ................................. 124
4.4.3.2 Employee satisfaction through reward and recognition (sales promotion) as a
factor of internal promotion ................................................................................ 125
4.4.4 Relationship between internal distribution and employee satisfaction ................ 126
4.4.4.1 Employee satisfaction through organisational culture as a factor of internal
distribution ......................................................................................................... 126
4.4.4.2 Employee satisfaction through organisational structure as a factor of internal
distribution ......................................................................................................... 127
4.4.5 Relationship between internal people and employee satisfaction ....................... 128
4.4.5.1 Employee satisfaction through relationships with co-workers as a factor of
internal people ................................................................................................... 128
4.4.5.2 Employee satisfaction through leadership style as a factor of internal people .... 129
4.4.5.3 Employee satisfaction through relationship with managers/supervisors as a
factor of internal people...................................................................................... 130

xii
4.4.6 Relationship between internal process and employee satisfaction ..................... 130
4.4.7 The relationship between physical evidence and employee satisfaction ............ 131
4.4.7.1 Employee satisfaction through the physical work environment (essential
evidence) as a factor of internal physical evidence ............................................ 131
4.4.7.2 Employee satisfaction through performance feedback (peripheral evidence) as a
factor of internal physical evidence .................................................................... 132
4.5 RELATIONSHIP BETWEEN EMPLOYEE SATISFACTION, AFFECTIVE
COMMITMENT AND EMPLOYEE RETENTION ................................................ 133
4.5.1 Affective commitment ......................................................................................... 134
4.5.2 Relationship between employee satisfaction, internal marketing and affective
commitment ....................................................................................................... 135
4.6 CONCLUSION ................................................................................................... 136
CHAPTER 5 ...................................................................................................................... 137
RESEARCH METHODOLOGY ......................................................................................... 137
5.1 INTRODUCTION ............................................................................................... 137
5.2 THE RESEARCH PROCESS ............................................................................ 137
5.2.1 Step 1: identify and formulate the research problem .......................................... 138
5.2.2 Step 2: Determine the research objectives ......................................................... 139
5.2.2.1 The primary research objective .......................................................................... 140
5.2.2.2 The secondary objectives .................................................................................. 140
5.2.2.3 Hypotheses ........................................................................................................ 141
5.2.3 Step 3: Research design .................................................................................... 142
5.2.3.1 Descriptive research design ............................................................................... 143
5.2.4 Step 4: Conduct secondary research ................................................................. 144
5.2.5 Step 5: Select a primary research method ......................................................... 144
5.2.5.1 Data collection methods ..................................................................................... 145
5.2.5.2 Questionnaire design ......................................................................................... 145
5.2.5.3 Scale choice ...................................................................................................... 149
5.2.5.4 Pre-test of the questionnaire .............................................................................. 151
5.2.5.5 Validity of the questionnaire ............................................................................... 151
5.2.5.6 Reliability of the questionnaire ........................................................................... 153
5.2.6 Step 6: Determine the research frame ............................................................... 154
5.2.6.1 Target population ............................................................................................... 154
5.2.6.2 The sampling frame and sampling unit ............................................................... 155
5.2.6.3 The sampling method ........................................................................................ 156
5.2.6.4 Realisation rate .................................................................................................. 156

xiii
5.2.7 Step 7: Data gathering ....................................................................................... 157
5.2.7.1 Distribution of the questionnaire ......................................................................... 157
5.2.8 Data processing and analysis ............................................................................ 159
5.2.8.1 Statistical analysis .............................................................................................. 160
5.2.9 Step 9: Reporting and recommendations ........................................................... 167
5.3 CONCLUSION ................................................................................................... 167
CHAPTER 6 ...................................................................................................................... 168
DATA ANALYSIS AND INTERPRETATION ..................................................................... 168
6.1 INTRODUCTION ............................................................................................... 168
6.2 DISCUSSION OF PRIMARY RESEARCH OBJECTIVES AND HYPOTHESES 168
6.2.1 The secondary objectives .................................................................................. 168
6.2.2 Hypotheses ........................................................................................................ 169
6.3 REALISATION RATE ........................................................................................ 170
6.4 DEMOGRAPHIC PROFILE ............................................................................... 170
6.5 AWARENESS OF INTERNAL MARKETING MIX, INTERNAL MARKETING
MIX ELEMENTS, EMPLOYEE SATISFACTION AND AFFECTIVE
COMMITMENT DESCRIPTIVE STATISTICS .................................................... 171
6.5.1 GDP employee awareness of the internal marketing mix ................................... 171
6.5.2 Internal marketing mix ........................................................................................ 173
6.5.3 Employee satisfaction ........................................................................................ 182
6.5.4 Affective commitment ......................................................................................... 184
6.6 FACTOR ANALYSIS ......................................................................................... 185
6.6.1 Exploratory factor analysis ................................................................................. 186
6.6.1.1 The internal marketing mix ................................................................................. 186
6.6.1.2 Employee satisfaction ........................................................................................ 193
6.6.1.3 Affective commitment ......................................................................................... 194
6.7 RELIABILITY OF THE MEASUREMENT INSTRUMENT .................................. 195
6.8 ASSUMPTIONS OF REGRESSION ANALYSIS ............................................... 197
6.8.1 Outliers .............................................................................................................. 197
6.8.1.1 The internal marketing mix ................................................................................. 197
6.8.1.2 Employee satisfaction ........................................................................................ 198
6.8.1.3 Affective commitment ......................................................................................... 199

xiv
6.8.2 Normality ........................................................................................................... 199
6.8.3 Linearity ............................................................................................................. 201
6.8.4 Homoscedacity .................................................................................................. 201
6.9 REGRESSION ANALYSIS AND HYPOTHESES TESTING .............................. 202
6.9.1 Regression of the employee satisfaction on the internal marketing mix elements202
6.9.1.1 H1: There is a significant positive relationship between the internal product and
GDP employee satisfaction ................................................................................ 203
6.9.1.2 H2: There is a significant positive relationship between the internal price and
GDP employee satisfaction ................................................................................ 203
6.9.1.3 H3: There is a significant positive relationship between internal promotion and
GDP employee satisfaction ................................................................................ 204
6.9.1.4 H4: There is a significant positive relationship between internal distribution and
GDP employee satisfaction ................................................................................ 204
6.9.1.5 H5: There is a significant positive relationship between internal people and GDP
employee satisfaction ........................................................................................ 205
6.9.1.6 H6: There is a significant positive relationship between internal process and
GDP employee satisfaction ................................................................................ 205
6.9.1.7 H7: There is a significant positive relationship between internal physical
evidence and GDP employee satisfaction .......................................................... 206
6.9.2 The relationship between employee satisfaction and affective commitment ....... 207
6.9.2.1 H8: There is a significant positive relationship between employee satisfaction
and affective commitment .................................................................................. 208

xv
6.10 FINAL SUMMARY OF RESEARCH OBJECTIVES, HYPOTHESES AND
RESULTS .......................................................................................................... 209
6.11 CONCLUSION ................................................................................................... 211
CHAPTER 7 ...................................................................................................................... 213
CONCLUSIONS, IMPLICATIONS AND RECOMMENDATIONS FOR FUTURE
RESEARCH ....................................................................................................... 213
7.1 INTRODUCTION ............................................................................................... 213
7.2 OVERVIEW OF STUDY ..................................................................................... 213
7.3 CONCLUSIONS AND RECOMMENDATIONS FOR SECONDARY
OBJECTIVES .................................................................................................... 214
7.3.1 Secondary objective 1 ........................................................................................ 214
7.3.2 Secondary objective 2 ........................................................................................ 215
7.3.3 Secondary objective 3 ........................................................................................ 217
7.3.4 Secondary objective 4 ........................................................................................ 218
7.3.5 Secondary objective 5 ........................................................................................ 222
7.3.6 Secondary objective 6 ........................................................................................ 223
7.3.7 Secondary objective 7 ........................................................................................ 224
7.3.7.1 Collaborative culture .......................................................................................... 225
7.3.7.2 Organisational structure ..................................................................................... 226
7.3.8 Secondary objective 8 ........................................................................................ 228
7.3.9 Secondary objective 9 ........................................................................................ 232
7.3.10 Secondary objective 10 ...................................................................................... 235
7.3.11 Secondary objective 11 ...................................................................................... 235
7.4 LIMITATIONS OF THE STUDY ......................................................................... 238
7.5 FUTURE RESEARCH OPPORTUNITIES .......................................................... 238
7.6 CONCLUSION ................................................................................................... 238
LIST OF REFERENCES .................................................................................................... 240
APPENDICES ................................................................................................................... 291
Appendix 1: GDP cover email and questionnaire ...................................................... 291
Appendix 2: Histograms for the internal marketing mix, employee satisfaction
and affective commitment ...................................................................... 302
Appendix 3: Scatter plots for internal marketing mix elements, employee
satisfaction and affective commitment ................................................. 304
Appendix 4: Box-and-whisker plots for the internal marketing mix, employee
satisfaction and affective commitment ................................................. 307
LIST OF TABLES

xvi
Table 1.1. Various definitions of internal marketing ................................................ 15
Table 1.2. Realisation rate ......................................................................................... 29
Table 2.1. Definitions of the service concept ........................................................... 35
Table 2.2. Definition of internal marketing ............................................................... 45
Table 4.1. Definitions of employee satisfaction ..................................................... 113
Table 5.1 Link between secondary objectives and sections in the
questionnaire .......................................................................................... 148
Table 5.2. Development of scales ........................................................................... 150
Table 5.3. Realisation rate ....................................................................................... 157
Table 6.1. Demographic information for GDP retail bank employees .................. 170
Table 6.2. Descriptive statistics for awareness of the internal marketing mix .... 172
Table 6.3. Descriptive statistics for the internal marketing mix ........................... 173
Table 6.4. Overall mean and standard deviation scores for the internal
marketing mix ......................................................................................... 182
Table 6.5. Descriptive statistics for employee satisfaction .................................. 183
Table 6.6. Descriptive statistics for affective commitment ................................... 184
Table 6.7. KMO measure of sampling adequacy and Bartlett’s test of
sphericity results .................................................................................... 185
Table 6.8. Unrestricted Eigenvalues, commonality values, factor or pattern
matrix and cumulative percentage for the internal marketing mix ...... 187
Table 6.9. Unrestricted Eigenvalues, commonality values and common
variance for employee satisfaction ....................................................... 193
Table 6.10. Unrestricted Eigenvalues, commonality values and common
variance for affective commitment ........................................................ 194
Table 6.11. Results of the Cronbach alpha test ....................................................... 196
Table 6.12. Summary of skewness and kurtosis statistics ..................................... 199
Table 6.13. Summary of Shapiro-Wilks p- values .................................................... 200
Table 6.14. Regression of the internal marketing mix elements on employee
satisfaction .............................................................................................. 203
Table 6.15. Regression of affective commitment onto employee satisfaction ...... 207
Table 6.16. Summary of secondary research objectives and hypotheses............. 209
LIST OF FIGURES
Figure 1.1. The influence of the internal marketing mix elements on employee
satisfaction and the link between employee satisfaction and
affective commitment ................................................................................. 7

xvii
Figure 1.2. A presentation of the hypotheses for the study ..................................... 10
Figure 1.3. An illustration of the interaction between the marketing function
and the internal and external markets of the business. ......................... 13
Figure 2.1. Services marketing triangle ..................................................................... 41
Figure 2.2. Proposed conceptualisation of internal market orientation .................. 49
Figure 3.1. The internal marketing mix elements framework ................................... 72
Figure 3.2. Competing Values Model of organisational culture ............................... 92
Figure 4.1. The service profit chain .......................................................................... 108
Figure 4.2. Relationship between employee satisfaction and the internal
marketing mix ......................................................................................... 119
Figure 5.1. The Research process ............................................................................ 138
Figure 5.2. A presentation of the hypotheses for the study ................................... 142
Figure 5.3. Target population, sampling units and sampling size ......................... 154
Figure 6.1. Regression results for the relationship between the internal
marketing mix elements and employee satisfaction ............................ 207
Figure 6.2. Regression results for the relationship between employee
satisfaction and affective commitment ................................................. 208
Figure 6.3. Refined theoretical model and regression results for research
objectives ................................................................................................ 209
Figure 7.1. A summary of the primary objective, the secondary objectives, the
sections in the questionnaire, the main findings and the
recommendations of the study .............................................................. 237

1
CHAPTER 1
INTRODUCTION AND BACKGOUND
1.1 INTRODUCTION
This chapter starts off with a discussion on the background of the study which provides
insight into retail banking, graduate development programmes, internal marketing,
employee satisfaction and the link between employee satisfaction and affective
commitment. This is followed by a discussion of the problem statement and the research
objectives and hypotheses which form the basis of the study. A brief literature review is
provided and the chapter concludes with a discussion on the research methodology, the
data analysis procedure and a summary of the chapters to follow.
1.2 BACKGROUND TO THE STUDY
The growth of the service sector worldwide has led to services being considered as one of
the most important sectors in the world (Mishra, 2010:186). The contribution of the South
African service sector to GDP was 68.1% in 2012(CIA, 2012) where the financial services
sector in South Africa has already overtaken the manufacturing sector as the largest
contributor to GDP. The financial service sector contributed 22% in 2008 followed by the
manufacturing industry with 19%. Between 2000 and 2010, the financial sector had grown
at an annual rate of 9.1% (National Treasury Policy Document, 2011:13). This growth in
the service sector in South Africa implies that that the country is becoming a mature
economy, with increasing levels of competition (Global Entrepreneurship Monitor, 2011)
The only way to secure new customers is to lure them from competitors which have major
implications for the banking sector.
The South African banking sector remains highly concentrated as a result of the years of
economic isolation during the 1980s. There are currently 17 registered banks, 2 mutual
banks and 12 local foreign banks operating in South Africa. In addition to this 41 foreign
banks have been given approval to open and run local representative offices in South
Africa. The four largest retail banks namely, Amalgamated Banks of South Africa (ABSA),
First National Bank (FNB), The Standard Bank of South Africa (SBSA) and Nedbank hold
86% of the South African banking assets thereby owning the bulk of the retail banking
system. The remaining banks tend to focus on specific activities, regions or communities
(The Banking Association of South Africa, 2012; PricewaterhouseCoopers, 2007).

2
Given the homogeneity within the retail banking industry, there is very little differentiating
the banks and imitation of any innovation is inevitable. For this reason a market-driven
strategy that enables retail banks to deliver superior quality is essential as service quality
is the only real differentiator and key to building a competitive advantage (Culiberg &
Rojsek, 2010:152, Kotler et al., 2010:19). Service quality is regarded as a driver of
corporate marketing and financial performance and has been recognised as a key
strategic issue for organisations operating in service sectors. Banks believe customers will
be loyal if they receive greater value than from competitors and should therefore focus on
improving service quality as a core competitive strategy (Ouyang, 2010:77).
Service organisations need to ensure that they can deliver on promises made to
customers in all service encounters, labelled in marketing literature as ‘moments of truth’.
Contact employees have one of the most challenging yet rewarding tasks as the way they
behave directly affects the service encounter (Slatten, 2011:21). However, it is not these
individuals alone who ‘wow’ the customer, behind the scenes are a myriad of players all
working together in a coordinated fashion to create the ultimate service experience
(French, La Berge & Magill, 2011). The study is focused on the internal banking customer
specifically and for the purpose of this study, the internal banking customer is referred to
as the employee.
Since human interaction is required to deliver the service, it is necessary to have quality
employees in place to do so (Angelova & Zekiri, 2011:247). King and Grace (2013)
suggest that the employee is pivotal in creating and sustaining quality as the quality of the
service rendered, is inseparable from the quality of the service provider. Irrespective of
where technology leads, quality comes from people. For this reason, many service
organisations, banks in particular, have resorted to placing increased focus on the
attraction, retention and satisfaction of quality employees in order to create a sustainable
competitive advantage (King & Grace, 2013, Vural, Akinci & Coskun, 2011:75). However,
attracting top calibre employees is a challenge for banks and even though the labour pool
may be large, finding the right quality of employees can prove to be an expensive and
time consuming process (Branine, 2008:498). Given these challenges, banks in South
Africa have been placing an increased focus on recruiting at graduate level leading to the
establishment of Graduate Development Programmes (GDPs).
GDPs were started by the Big 4 banks with the view of offering graduates dynamic, fast-
paced environments in which to learn new skills, participate in a range of projects, and
make an important contribution to the bank (Standard Bank, 2011). Each year a number

3
of top calibre graduates are selected across numerous fields of study to enter their one-
year development programmes. They are recruited with a specific position and business
unit in mind, but spend a number of months rotating through different areas in order to
obtain a better understanding of how the bank operates. These banking GDPs are
specifically designed to help graduates succeed in complex environments and to build the
talent pipeline by providing an in-depth training programme inclusive of coaching (FNB &
ABSA, 2011). However, one of the biggest challenges faced by banks is the satisfaction
and retention of their GDP employees. Banks generally experience high attrition rates
amongst this group of employees mainly due to job dissatisfaction (McDermott, Mangan &
O’Connor, 2006:457). This results in significant costs for the banks as high attrition rates
drive up training and recruiting costs. They also increase the potential for customer
service complaints or quality problems, and create massive continuity problems for long-
term projects. Because of high turnover, organisations are required to hire more
aggressively, resulting in a steady loss of cost efficiencies (Budhwar et al., 2009:354).
Since banks invest a substantial amount of money into the GDPs, a healthy return on
investment looks dim. Employee satisfaction therefore becomes a key factor to business
success (Heaton, McCracken & Harrison, 2008:279). Mishra (2010:185) suggests that
employees are the backbone of any business success, specifically in the service sector,
and therefore they need to be developed, motivated and retained in the organisation at all
costs to support the organisation to be globally competitive. Given that employees are key
to ensuring that customers are satisfied, which can lead to increased profits, achieving a
competitive business advantage depends on understanding and acting on what it takes to
maximise employee satisfaction (Leonard & Murphy, 2013).
Employee satisfaction is defined as the way an employee feels about his or her job.
Employees who are more satisfied tend to be more effective and productive in the
organisation (Appelbaum et al., 2009:240). Gu and Siu (2008:564) found that satisfied
employees believe that their organisation provide customer service that is reliable,
responsive, and empathetic, and that employees are knowledgeable and able to instil
confidence in customers. Bai (2006:40) also found employee satisfaction and internal
service quality to have positive relationships with organisational commitment, specifically
affective commitment. Pertaining to studies that have been conducted with respect to the
impact of satisfaction on employee turnover intention (such as Kabungaidze, Mahlatshan
& Ngirande, 2013; Berry, 2010; Choi, 2006; Kim, 1998), it can be concluded that highly
satisfied employees are less likely to seek new employment. Given the importance of
employee satisfaction for service quality and employee retention, it is essential for
organisations to understand the drivers behind employee satisfaction. The following have

4
been identified as the main drivers of satisfaction. These drivers are role fit and clarity,
reward and recognition, career advancement, training and development, performance
feedback, interaction between other employees and management, satisfaction with
leaders (supervisors and senior management), empowerment, assessing the level of
stress and pressure in the work environment, the appearance and layout of the internal
environment, the level of decentralised decision-making and the organisational culture
(Halepota & Shah, 2011:281; Turkyilmaz et al., 2011:678; Gu & Siu, 2009:565; Schon,
2007: 17-18; Rad & Yarmohammadian, 2006:xii; Roos, 2005:48).
Should any of these factors not meet with the individual’s expectations, job dissatisfaction
is likely to ensue (Turkyilmaz et al., 2011: 678). Organisations should therefore start
asking themselves how they can manage their recruits more effectively and how they can
address the issues of job dissatisfaction experienced by these GDP employees. A way of
addressing these issues and improving satisfaction levels is through a well designed
internal marketing programme (Illiopoulos & Priporas, 2011:2-3).
Chu and Yeh (2013) describes internal marketing as a “planned effort using a marketing-
like approach to internal customers in an organisation to deliver customer satisfaction
through a process of creating customer oriented employees”. The aim of internal
marketing is to ensure that employees feel valued by the organisation. This in turn
translates into positive employee attitudes towards their work including organisational
commitment, job involvement, work motivation and satisfaction which ultimately leads to
customer satisfaction (refer to Chapter 2, section 2.4.1). Illiopoulos and Priporas (2011:2)
state that internal marketing is focused on treating employees as internal customers. The
internal customer in the case of this study is the GDP employee.
There is much confusion in marketing literature as to a clear definition of internal
marketing and, there has also been much debate over what constitutes the elements of
internal marketing that can be used to influence and motivate employees (de Farias,
2010:100). Since the focus of the study is on internal customers within retail banking the
extended services internal marketing mix will be used as the internal marketing elements
as proposed by Burin (2011:89). The extended service marketing mix elements are:
internal product (addressing the satisfaction drivers of role fit and role clarity, training and
development, career advancement and empowerment), internal price (addressing the
level of stress and pressure in the work environment), internal promotion (addressing the
satisfaction drivers of sharing of information and knowledge through internal
communication and reward and recognition) internal distribution (addressing the

5
satisfaction drivers of decentralised decision-making (organisational structure) and
organisational culture, internal people (addressing the satisfaction drivers of relationships
with leaders, supervisors/managers and co-workers), internal process (addressing internal
organisational processes) and internal physical evidence (addressing the satisfaction
drivers of performance feedback and the appearance and layout of the physical
environment)(refer to Chapter 3, section 3.2). Each of these elements addresses the
drivers of employee satisfaction as discussed above and will be discussed in more detail
in the literature review. This study proposes that each of the internal marketing elements
could influence and potentially improve the satisfaction level of GDP employees.
By developing a clearer internal marketing orientation, banks could better understand the
needs of their graduate level employees and develop more effective ways of addressing
their needs by placing a greater focus on the development and implementation of the
internal marketing mix elements to create value for these internal customers
(Papasolomou, 2006:196). In this way the banks could satisfy and retain the graduate
level talent pool, benefiting from their creativity, innovation and technical savvy as well as
their contribution to organisational success, whilst maximising their return on investment
given the substantial financial commitment which accompanies the recruitment and
development of graduates (Shaw & Fairhurst, 2008:368, McDermot et al., 2006:460). If
organisations were to use mechanisms such as internal marketing, it could contribute to
higher levels of employee motivation, commitment and satisfaction resulting in happier
employees and increased productivity and affective commitment resulting in improved
employee retention rates (Nittala & Kameswari, 2009:208).
Zaman, Javaid, Arshad and Bibi (2012:77-78) suggest that from a GDP employee
satisfaction perspective as well as from an affective commitment perspective, there is a
need for a well structured internal marketing programme that can significantly enhance
overall organisational competitiveness and performance. A well structured internal
marketing programme utilising the internal marketing mix as discussed, has the potential
for reaching out to today’s graduates with a proactive, conscious process geared to
increase satisfaction and new talent retention (Schneider, 2013). As these employees
complete their jobs effectively, they become motivated and fulfilled to provide a high
quality service which results in higher levels of customer satisfaction and loyalty
(Hammond, 2011).
In addition to the above discussion, Appelbaum et al. (2013:226) state that a strong
relationship exists between employee satisfaction and affective commitment which is

6
viewed as the most common measure of loyalty and retention (Calisir, Gumussoy & Iskin,
2011:516). If organisations are able to increase employee levels of satisfaction, this in turn
will result in higher levels of affective commitment. This study therefore further proposes
that a relationship exists between employee satisfaction and affective commitment.
1.3 PROBLEM STATEMENT
Internal marketing is aimed at “attracting, developing, motivating and retaining employees
through job products that satisfy their needs (Kale, 2008:3). Internal marketing could serve
as an enabling tool to improve satisfaction among retail banking GDP employees within
South Africa. By satisfying these internal customers’ needs, the banks should be in a
better position to deliver the quality service desired to satisfy the external customer
(Aburoub, Hersh & Aladwan, 2011:110). The reason for this is that fulfilling the employees’
needs enhances employee motivation and as a consequence, the higher the degree of
employee satisfaction, the higher the possibility of generating external satisfaction and
commitment and loyalty (Zampetakis & Moustakis, 2007:417–418). Boles et al. (2007:313)
state that increased employee satisfaction results in higher levels of affective commitment
and thus retention. This argument is supported by Pushpakumari (2011) who argues that
employee satisfaction results in higher levels of affective commitment and better retention
rates.
Previous internal marketing studies within the banking industry have focused on employee
understanding of corporate values, market orientation, employee commitment, service
quality, customer satisfaction and loyalty (Sahi, Gupta & Seli, 2013; Kameswari &
Rajyalakshmi, 2012; Aburoub,et al.; 2011, Abzari & Ghujali, 2011; Awwad & Agti, 2011).
Pelitier, Pointer and Schibrowsky (2008) have conducted a number of studies exploring
the link between internal marketing and satisfaction in the nursing industry. However no
studies, either locally or internationally could be found exploring the influence of internal
marketing as a means of achieving satisfaction amongst retail banking GDP employees.
In addition, no studies could be found linking the elements of the internal marketing mix
(internal product, internal price, internal promotion, internal distribution, internal people,
internal process and internal physical evidence) to employee satisfaction.
This raises the question as to whether internal marketing does in fact have a positive
influence on the satisfaction levels of retail banking GDP employees in South Africa.
Further to this, various studies by Appelbaum et al. (2013:226), Lumley et al. (2011:107)
and Boles et al. (2007:313) link employee satisfaction to affective commitment, and the

7
researcher was interested in exploring the link between employee satisfaction and
affective commitment due to its influence in retaining graduate employees. Taking the
above into consideration, the problem statement and aim of this study can be formulated
as follows:
To determine the influence that the internal marketing mix elements have on
employee (graduate) satisfaction within the retail banking industry in South Africa.
Further to this, the study also aims to identify whether a link between employee
satisfaction and affective commitment in this context can be observed.
Taking the above into consideration, a theoretical framework has been developed by the
researcher. Figure 1.1 presents a schematic representation of the link between the
internal marketing mix elements and employee satisfaction, and the link between
employee satisfaction and affective commitment that will be examined in this study.
Figure 1.1. The influence of the internal marketing mix elements on employee
satisfaction and the link between employee satisfaction and affective commitment
Source: Researchers own construct.
Figure 1.1 shows that the controllable elements inside the organisation are identified as
the internal marketing mix which consists of: the internal product, internal price, internal

8
promotion, internal distribution, internal people, internal process and internal physical
environment. The controllable elements (i.e. the internal marketing mix) are used to
influence the key target groups that have been identified as GDP employees (or internal
customers) equivalent to key customer segments in external marketing. The term internal
marketing mix implies that it consists of elements that are controllable and need to be
used appropriately to get the desired results (Mudie & Pirrie, 2006:5). The desired result in
this framework is employee satisfaction. The premise of this study as depicted in Figure
1.1 is that the internal marketing mix variables are positively related to employee
satisfaction. A further observation is that employee satisfaction is positively related to
affective commitment (Appelbaum et al., 2013:226). By illustrating the influence of internal
marketing on employee satisfaction, and the link between employee satisfaction and
affective commitment, the researcher hopes to provide a basis for banks to design their
internal marketing programmes in order for them to better satisfy and retain their GDP
employees. Further to this, it will also help managers realise the importance of having
internal marketing competencies which could be essential for retail banks to improve their
performance and benefit both the employee and the organisation in the long term.
1.4 RESEARCH OBJECTIVES
The following objectives will clearly outline the objectives the study, as suggested by the
problem statement.
1.4.1 Primary objective of the study
The primary objective of the study is:
To investigate the influence of the internal marketing mix on employee satisfaction from
GDP employees’ perspective in order to enhance their satisfaction at retail banks with
graduate development programmes in South Africa. In addition to this, the relationship
between employee satisfaction and affective commitment is also explored. The secondary
objectives and hypotheses are summarised next.
1.4.2 The secondary objectives
The secondary objectives of the study are stated as:

9
To examine the theory relating to the seven elements of the internal marketing mix,
employee satisfaction and affective commitment
To determine whether GDP employees are aware of the internal marketing mix
elements at their bank
To determine GDP employees’ level of satisfaction with their bank as an employer
To determine whether a significant positive relationship exists between internal
product and GDP employee satisfaction
To establish whether a significant positive relationship exists between internal price
and GDP employee satisfaction
To explore whether a significant positive relationship exists between internal
promotion and GDP employee satisfaction
To determine whether a significant positive relationship exists between internal
distribution and GDP employee satisfaction
To establish whether a significant positive relationship exists between internal people
and GDP employee satisfaction
To explore whether a significant positive relationship exists between internal process
and GDP employee satisfaction
To determine whether a significant positive relationship exists between internal
physical evidence and GDP employee satisfaction
To determine whether a significant positive relationship exists between employee
satisfaction and affective commitment
1.4.3 Hypotheses
Based on the above objectives, the following hypotheses have been put forward to test
the relationship between the internal marketing mix elements and employee satisfaction
and the relationship between employee satisfaction and affective commitment:
H1: There is a significant positive relationship between the internal product and GDP
employee satisfaction
H2: There is a significant positive relationship between the internal price and GDP
employee satisfaction
H3: There is a significant positive relationship between the internal promotion and GDP
employee satisfaction
H4: There is a significant positive relationship between the internal distribution and GDP
employee satisfaction

10
H5: There is a significant positive relationship between the internal people and GDP
employee satisfaction
H6: There is a significant positive relationship between the internal process and GDP
employee satisfaction
H7: There is a significant positive relationship between the internal physical evidence and
GDP employee satisfaction
H8: There is a significant positive relationship between GDP employee satisfaction and
affective commitment
Figure 1.2. A presentation of the hypotheses for the study
Source: Researchers own construct.
11
1.5 SIGNIFICANCE OF THE STUDY
The growing complexity of the business environment such as an open world economy has
led to a much fiercer competitive environment due to an increasingly diverse and
demanding customer base that is more connected as a result of the internet (Doole &
Lowe, 2008:3). McDermott et al. (2006:456) specify that organisations are devoting
considerable amounts of time, effort and resources to the recruitment process in ensuring
that they recruit top quality graduates into their organisations. For this reason, banks are
realising that the development and retention of young talent is crucial for survival, yet one
of the biggest challenges faced by organisations is how to develop, satisfy and retain
these young employees. Keeping these individuals satisfied is a challenge for banks and it
has become essential that these graduates are retained in order for banks to realise a
return on their investments (Kalman, Narayan, Oehler, Schuler & Walker, 2013). Given
that organisations spend considerable financial resources on GDPs, they should be
assured that they are getting just return for their investment (Heaton et al., 2008:279).
Papasolomou (2006:196) suggests that internal marketing has been identified as a
mechanism which could achieve the required results. A strong internal marketing strategy
can be critical to achieving and sustaining a competitive advantage, as well as driving
organisational change and enhanced organisational performance. The successful
implementation of internal marketing can lead to various advantages such as the fulfilment
of business obligations, internal competitiveness, an improvement in quality of employees
and an improvement in overall profitability (Done & Domazet, 2012).
Most research conducted in the field of internal marketing has looked at employees
ranging from non-managerial to senior management, but very little research has been
conducted focusing on the entry level and more specifically, the GDP group of employees.
Given that these individuals are the future leaders of the organisation, it may be beneficial
for organisations to develop, motivate, satisfy and retain them. Through this study deeper
insights will be obtained which could motivate the need for a formal internal marketing
programme. It will also provide valuable input into the design of internal marketing
programmes. This could further enrich the satisfaction of GDP employees and enhance
affective commitment (Davoudi & Kaur, 2012:63).

12
1.6 LITERATURE REVIEW
Organisations serve two types of markets and customers referred to as the internal
market and the external market. Success in today’s world is a function of the
organisation’s ability to effectively manage the interrelationships that exist between them
(Gounaris, 2008b:72).
1.6.1 The interaction between the marketing function, the external and internal
market
The external market is concerned with the provision of products and services to the
external customer delivered via the marketing function. The scope of marketing has
traditionally focused on matching and aligning the organisation’s output with the
customer’s needs (Aburoub et al., 2011). Today however, the effectiveness of the
marketing strategy is not only a function of the organisation’s responsiveness to its
external market, but also its ability to align its internal market with its objectives (Avlonitis
& Giannopouls, 2012:567-568).
The internal market refers to the employee market and internal market orientation
demonstrates management commitment to them (Kyriazopoulos et al., 2007).
Management should show a commitment to understand what employees value and
become responsive to their individual needs, while ensuring they have been equipped
with all the resources necessary to perform their jobs well. In this way employees are able
to deliver on the promises made through the organisation’s external marketing strategy
(Lamb, Hair & McDaniel, 2010:19; Gounaris, 2008b:72). Internal marketing becomes a
powerful tool in the influencing and motivating of these internal customers to deliver value
to the external market. If employees are aligned and motivated to deliver the marketing
plan objectives, it could have a major impact on the achievement of the broader
organisational strategy and objectives.

13
Figure 1.3. An illustration of the interaction between the marketing function and the
internal and external markets of the business.
Source: Lamb et al. (2010:191).
As shown in Figure 1.3 the response and behaviour of the external market influence both
front-line and back-office staff (4), as well as the success of the external strategy
emphasised through the marketing function (1). This then influences the response and
behaviour of the internal market (3), and the internal strategy endorsed by the marketing
function (6). The marketing strategy therefore influences the response and behaviour of
both the internal (5) and external (2) markets (Gounaris, Vassilikipoulou &
Chatzipanagiotou, 2010: 1669-1670; Lamb et al., 2010:191). Whilst the importance of
external marketing is well documented and understood, in today’s knowledge era,
significant emphasis also needs to be placed on the internal market. The internal market
refers to the employees and involves all the internal activities required to encourage
employees to respond and adapt to the external market. By developing an internal market
in which employees feel satisfied and appreciated, employees are motivated to improve
business performance and generate a sustainable competitive advantage for
organisations (Varnai & Fojtik, 2008:162).
1.6.2 Internal market
The internal market refers to the employees working for the organisation (Naidoo,
2009:40). Chu and Yeh (2013:150) suggests that employees, both front-line and back-

14
office staff form part of the internal customer – supplier value chain, meaning that the
employees can be viewed as both the customer and the supplier and must work together
in a coordinated manner in order to deliver value for customers. Therefore, the motivation
and retention of these employees over the long term become important to the success of
the organisation (Gupta, McDaniel & Herath, 2005:398). In order to achieve this, an
internal market orientation is required. This has been defined by Avlonitis & Giannopouls
(2012:567-568) as an ongoing marketing focus within an organisation aimed at the
organisation’s employees. The objective of internal market orientation is to align and
motivate employees towards the achievement of the organisation’s market objectives and
to encourage employees to perform better. When employees perform well, they provide
superior quality service to customers which ultimately improves customer retention and
enhances the success of the organisation (Gounaris, Vassilikipoulou & Chatzipanagiotou,
2010: 1669-1670).
Internal market orientation encourages organisations to build effective relationships with
its employees, based on a commitment to provide superior value for employees (i.e. the
internal market) by understanding and meeting their needs in much the same way as
commitment is required to produce value for the organisation’s external customers
(Gounaris, 2006:436). Sahi et al. (2013:387) stipulate that information about the internal
market needs to be gathered. Once gathered, this information then needs to be
disseminated and responses to this information need to be implemented. Gurung
(2012:12) suggests that by satisfying the needs of internal customers, the organisation is
in a better position to deliver quality services to the external customer. The assumption
being if the employees’ needs are met, they are more motivated, which enhances
employee satisfaction and retention.
1.6.3 Internal marketing
There is no clear and agreed upon definition of internal marketing in the marketing
literature and a plethora of definitions exist. Table 1.1 provides a few internal marketing
definitions:

15
Table 1.1. Various definitions of internal marketing
Author Definition
Al –Hawary et al.
(2013:813)
Internal marketing can be defined as a planned effort using a
marketing-like approach to overcome organisational resistance,
to change and to align, motivate, and interfunctionally co-
ordinate and integrate employees towards the effective
implementation of corporate and functional strategies in order to
deliver customer satisfaction through the process of creating
motivated and customer-orientated employees
Qayum and Sahaf
(2013:50)
Internal marketing is concerned with viewing employees as
internal customers, and jobs as internal products that satisfy the
needs and wants of these internal customers while addressing
the objectives of the organisation
Guven and Sadaklioglu
(2012:109)
Internal marketing is a comprehensive programme concerned
with employee recruitment, training, motivation, communication
and retention efforts which results in positive attitudes towards
work
Kameswari and
Rajyalakshmi (2012:47)
Internal marketing is the application of marketing inside an
organization to enhance customer focused and customer
oriented employees
Grönroos (2007:389) Internal marketing is involved with the establishment,
maintenance and growth of internal relationships between
employees despite their position within the business. Through
this process employees must be motivated to deliver a quality
service to both internal and external customers of the business
Kotler and Armstrong
(2006:300)
Marketing by a service organisation to train and effectively
motivate its customer-contact employees and all the supporting
service people to work as a team to provide customer
satisfaction
16
Internal marketing for the purpose of this study can thus be defined as:
A philosophy for the management of large service organisations where the employees, in
this case GDP employees, are viewed as an internal customer market. Internal marketing
includes marketing tactics geared towards the attraction, development, retention and inter-
functional coordination of employees with the overall objective of enhancing service
quality to the customer, whilst creating value and satisfaction for the employee.
Guven & Sadaklioglu (2012:109) is of the opinion that the successful application of an
internal marketing programme translates into positive attitudes towards work such as
increased commitment and increased levels of employee satisfaction. For internal
marketing to succeed, the following internal market orientation objectives need to be in
place. Firstly, the organisation needs to derive an understanding of the GDP employees’
needs and wants and establish an understanding between the employees and managers.
Secondly, the organisation’s vision and strategic objectives need to be communicated to
all GDP employees mainly through internal mass media communications. Finally, actions
need to be taken in response to the GDP employees’ needs through the implementation
of the internal marketing mix (Gounaris, 2008b:73). If internal marketing is implemented
successfully and the objectives are met, it can lead to the following benefits: effective
overall communications, stronger individual performance and productivity, better
teamwork and improved employee retention resulting in increased profits (Mieres,
Sanchez & Vijande, 2012:408-409).
In order to create value for both internal and external customers, a strong focus on the
internal marketing mix is required as each of the elements has the potential to influence
employee behaviour and satisfaction.
1.6.4 Internal marketing mix
Many different elements have been identified in internal marketing literature with little
agreement as to which elements should be included in the internal marketing mix. The
unique characteristics of services drive customers to search for evidence of service in
each of their interactions with the organisation. The 7 P’s of the extended services
marketing mix provide internal customers with evidence that the service has been
delivered and allows them to formulate their own judgement regarding the quality of
service received (Mudie & Pirrie, 2006:6). Given that the study is focused on the service
sector, the extended services internal marketing mix (7 P’s), namely: internal product,

17
internal price, internal promotion, internal distribution, internal people, internal process and
internal physical evidence will be used as the internal marketing mix for the purpose of the
study as suggested by Burin (2011:89). Each of these elements will be discussed next:
1.6.4.1 Internal product
Yang (2012) defines internal product as the employee’s job accompanied with the basic
operational skills of the training programme. A successful service organisation must first
sell the job to employees before it can sell its services to customers. The following
elements, namely training and development, empowerment, career advancement and
role fit and clarity are identified as the components of internal product for the purpose of
the study (Yang, 2012; Grayson & Sanchez-Hernandez, 2010:9; Gounaris, 2008b:72).
Internal product is discussed in more detail in Chapter 3, section 3.2.1).
Training and development
Employee training and development is defined as a strategic investment by an
organisation in training its employees. If employees are expected to perform their tasks
well, they must be provided with the necessary skills and knowledge that are required of
them (Che Ha, Abu Bakar & Izzaddin Syed Jaafar, 2007:138). Training and development
programmes play a pivotal role in the satisfaction and retention of employees (Emerson,
2007:14) (refer to Chapter 3, section 3.2.1.1).
Empowerment
In order for employees to fully appreciate their job (i.e. the internal product), they must
also be provided with more autonomy in dispensing their duties. Empowerment should be
an essential aspect of internal marketing. Empowerment refers to the practice of enabling
an individual to think, behave, take action, control work and make decisions in
autonomous ways (El Samen & Alshurideh :2012:86). Through empowerment, employees
can make faster decisions which in turn increase productivity, enhance the service
experience and improve overall performance (Ueno,2010:78). Further to this Akhbar,
Yousaf, Ul Haq and Hunjra (2011:683) proved there is a significant positive relationship
between empowerment and employee satisfaction. Empowerment is discussed further in
Chapter 3 (section 3.2.1.2).

18
Role fit and clarity
Role fit theory states that employees select jobs based on their personalities, their
interests and their abilities to perform the job well (Gounaris, 2008b:72). When a good
degree of job and personality fit exists between the employee and the organisation,
employees are able to thrive at work resulting in higher levels of satisfaction (Edwards &
Cable, 2009: 655). Role clarity relates to the responsibilities and expectations of the role
which need to be clearly communicated to employees. When employees understand what
is expected, uncertainty can be reduced and employees experience higher levels of
satisfaction (Ingram, 2013:377). Role fit and clarity are discussed in greater detail in
Chapter 3 (section 3.2.1.3).
Career advancement
Career advancement is defined as the “evolving sequence of a person’s work over time”
(Maniam & Uli, 2011:271). Career advancement and a clearly defined career progression
plan play a pivotal role in the attraction, satisfaction and retention of quality employees
(Cedefop, 2008; Branham, 2005:105) (refer to Chapter 3, section 3.2.1.4).
The underlying view of internal marketing is based on the concept that in order for a
service organisation to have satisfied customers, it must first have satisfied employees, as
satisfied employees are more capable of providing maximum effort which aids in satisfying
the needs and wants of external customers (Guven & Sadaklioglu, 2012:109). It is
imperative therefore that employees are able to relate positively to all aspects of their jobs
and are satisfied users of the internal product (Che Ha et al., 2007:137). Internal price is
discussed next.
1.6.4.2 Internal price
Internal price relates to the costs the employee incurs to work for the organisation. These
costs include the opportunity costs, psychological costs and the emotional labour costs
employees take on to work for organisations (Strydom, 2004:164). Internal price is
discussed thoroughly in Chapter 3 (section 3.2.2).
Opportunity costs
Opportunity costs relate to the external opportunities the employee gives up to work for
his/her current organisation. Opportunity costs also relate to the sacrifices employees

19
make to adjust to changes within their organisation (Zeithamel et al., 2012:358; Strydom,
2004:164). Opportunity costs are discussed in Chapter 3 (section 3.2.2.1).
Psychological costs
Psychological costs refer to the employee’s psychological reaction to their environment
and is generally related to employee burnout (Hu & Schaufeli, 2011:9). Psychological
costs are discussed in greater detail in Chapter 3 (section 3.2.2.2).
Emotional costs
Emotional costs also known as emotional labour relates to the control employees are
required to have over their emotions when serving customers. Having to remain calm
when dealing with irate customers may be emotionally demanding for employees which
can result in emotional strain (Karatepe, 2011:45). Emotional costs are discussed further
in Chapter 3 (section 3.2.2.3).
When employees feel the costs are of working for the organisation are too high, they may
experience high levels of stress and withdraw either physically or psychologically resulting
in adverse affects for the organisation (Mansoor et al., 2011:51).
1.6.4.3 Internal promotion
This element in the internal marketing mix refers to the use of advertising, personal selling
(face to face presentations), sales promotions and new /social media in order to inform
and influence employee’s attitudes towards the organisation and their job (Gummesson,
Lusch & Vargo, 2010:12; Baldauf et al., 2009:441). From an internal marketing mix
perspective, promotion directly deals with the internal communication efforts of the
organisation. Internal communication is an important element of internal marketing as it is
the key factor in creating understanding among employees (Akroush et al., 2013:312).
Internal promotion consists of internal advertising, internal personal selling, sales
promotion and social media which are discussed next. Internal promotion is covered more
extensively in chapter 3 (section 3.2.3).
Internal advertising
Internal advertising as an extension of external advertising relates to the mass
communication used to attract attention, inform, persuade and remind employees about
the internal product (job) (Yurchisin & Damhorst, 2009:458). Further to this basic

20
information about the organisation or information about employees jobs can be
communicated through formal communication such as internal advertising
(Steingrimsdottir, 2011:24) (refer to Chapter 3, section 3.2.3.1).
Internal personal selling
Internal personal selling entails the direct communication which takes place between the
organisation and the employees (Bubnjevic, 2011:371; Koekemoer, 2004:13). In this case
it is between managers and employees. Direct or face-to-face communication is still the
most effective way to communicate within the organisation due to the speed and control
the sender has over the message (Steingrimsdottir, 2011:25) (refer to Chapter 3, section
3.3.3.2)
Sales promotion
Sales promotion refers to the incentives used to excite and motivate employees. For the
purpose of the study, sales promotion relates to the reward and recognition systems used
by organisations to communicate to employees that they are cared for (Tag-Eldeen & El-
Said, 2011:156; Javadein, Rayei, Estiri & Ghorbani, 2010, 368-369) (refer to Chapter 3,
section 3.2.3.3)
New or social media
New or social media refers to the open community-based online platforms used to
connect employees and encourage collaboration (Bulmer & DiMauro, 2009:4; Berman et
al., 2007:23-24) (refer to chapter 3, section 3.2.3.4).
1.6.4.4 Internal distribution
This refers to the place and the channels that are used to get internal products (jobs) to
the internal customers (employees) (Kasper, van Helsdingen & Gabbott, 2006:400). For
the purpose of the study, internal distribution comprises of organisational structure and
organisational culture and the role these concepts play in the satisfaction of employees
(refer to Chapter 3, section 3.2.4). Each of these are discussed next.
Organisational culture
Organisational culture is defined as a combination of artefacts, values, beliefs and the
underlying assumptions that employees hold about suitable behaviour (Economides,

21
2008:244). Organisations that adopt an internally market-orientated organisational culture
such as a clan type culture, are able to encourage collaboration and teamwork resulting in
higher levels of employee satisfaction and commitment (Braunscheidl et al., 2010:887;
Rodrigues & Pinho, 2010:176) (refer to Chapter 3, section 3.2.4.1).
Organisational structure
Organisational structure is defined as the pattern of relationships between roles and their
different parts within the organisation. Organisational structure governs the allocation of
work and responsibilities within the organisation so that various activities can be carried
out successfully to achieve the organisational objectives (McMillan, 2011). This study
focuses on decentralised organisational structures as these structures support
decentralised decision-making and empowerment, which results in increased levels of
employee motivation and satisfaction (Miri et al., 2011:56-57) (refer to Chapter 3, section
3.2.4.2).
1.6.4.5 Internal people
This refers to the people involved in delivering the internal product (job) and those
receiving the internal product (job) who may influence the internal customer’s
(employee’s) perception (Peters & Mazdarani, 2008:33, Ahmed & Rafiq, 2002:35).
Organisations with a high degree of internal marketing orientation have ongoing
processes in place for producing value for their employees through the effective
management of the relationships between employees, supervisors and management
(Gounaris, 2006:436). From an internal marketing mix perspective ‘internal people’
include: leadership and leadership style, relationship with supervisors/direct managers
and relationship with co-workers (refer to Chapter 3, section 3.2.5).
Leadership and leadership style
Senior leadership is seen as the most important determinant of employees’ attitudes and
behaviours and is viewed as the moral and intellectual ability of the upper-echelon
management to move the organisation and its employees in the right direction. The
leadership style of senior management will therefore impact how leaders behave and act
(Che Ha et al., 2007:139). Gharibvand (2012:295) suggests that there is a strong positive
relationship between a participative management style and employee satisfaction. In
addition to this, transformational leadership has been linked to employee satisfaction as
well (Eyal & Roth, 2011:257/259) (refer to Chapter 3, section 3.2.5.1).

22
Relationship with supervisors or direct managers
Supervisors are essential in the satisfaction and retention of employees. This implies that
supervisors must make all efforts necessary in order to know their employees and their
needs, value them and acknowledge their differences, as well as ensure that the
employees’ training is adequate (Taylor & Poyner, 2008:597). The quality of the
supervisor/management-employee relationship has an impact on employees’ levels of
satisfaction (Brooke, 2007) (refer to Chapter 3, section 3.2.5.2).
Relationship with co-workers
This refers to the GDP employees peer group and other employees with whom the GDP
employee would interact, but who do not have any managerial authority over the GDP
employees (Gu & Siu, 2008:565). Support, encouragement, guidance and help from
colleagues are likely to promote a harmonious working environment in which employee
satisfaction is likely to be sustained (Lumley et al., 2011:104) (refer to section 3.5.3).
1.6.4.6 Internal process
The process aspect of the internal marketing mix refers to how the internal customer
receives the internal product and includes work processes. If the employee knows what to
do and how to do it, it promotes competency and improved employee satisfaction (Uzzi,
2010; Ahmed & Rafiq, 2002:34).
Che Ha et al. (2007:136) state that the organisation’s internal resources must be
coordinated in order to achieve superior value for customers. No operation’s area can
function in isolation, and employees across functional areas must work together in order
to deliver value for customers. Chang and Chang (2008:93) suggest that every employee
in the customer–supplier chain must be committed to the delivery of quality (French et al.,
2011). Internal process is covered more extensively in Chapter 3 (section 3.2.6).
1.6.4.7 Internal physical evidence
This can either be categorised as ‘essential’ or ‘peripheral’ evidence (Ahmed & Rafiq,
2002:34). Each of these concepts is discussed below. Internal physical evidence is
discussed further in chapter 3, section 3.2.7.

23
Essential evidence
Essential evidence refers to the environment in which the internal product (job) is
delivered, usually the normal work environment (Ahmed & Rafiq, 2002:34). The layout of
office space and the appearance of the internal environment all have an impact on
employee satisfaction and employee performance (Pitt & Bennett, 2008:301). Essential
evidence is discussed in more detail in Chapter 3 (section 3.2.7.1).
Peripheral evidence
Peripheral evidence refers to tangible cues that the internal product (job) has been
delivered for. It relates to the ‘proof’ that employees can keep, such as training manuals
and performance feedback reports. In this case ‘peripheral’ refers to performance
feedback delivered through the performance feedback report (Ahmed & Rafiq, 2002:34).
From an organisational perspective, performance feedback keeps its employees’
behaviour directed towards the desired goals and stimulates and maintains high levels of
effort (Govaerts et al., 2013:106). Bai (2006:40) suggests that turnover decisions and
employee satisfaction are influenced by a number of characteristics, one being employee
performance feedback. Peripheral evidence is covered in more detail in Chapter 3
(section 3.2.7.2).
1.7 EMPLOYEE SATISFACTION
Employee satisfaction is an important issue in organisations as it could have a drastic
effect on employees as well as organisational performance. Employee satisfaction is
commonly defined as a “pleasurable or positive emotional state resulting from the
appraisal of one’s job or job experiences” (Ahmad, Ahmad & Shah, 2010:257). It refers to
the extent to which people feel satisfied or dissatisfied with their jobs. Employee
satisfaction plays an important role in the service industry since the industry is
characterised by highly demanding customers. Employee satisfaction has been
recognised as a predictor of how much stress and pressure someone can handle while on
the job. If employees are enjoying their job, they are more likely to be more effective in the
handling of daily stressors they will encounter (Zeffane, Ibrahim & Mehairi, 2008:238).
Employee satisfaction directly impacts the mood and manner in which the service is
performed, and it therefore affects the service quality experienced by the customer (Gu &
Siu, 2008:536).

24
Extensive studies suggest that employee satisfaction plays a crucial role in improving the
performance of service employees in the workplace, therefore the service quality provided
to customers (Bontis et al., 2011; Naseem , Sheikh & Malik., 2011; Ahmad et al., 2010;
Bai, 2006; Karl & Peluchette, 2006; Lee et al., 2006). Employee satisfaction not only
ensures customer service quality, but also contributes to employee retention and
commitment, hence elevating the organisation’s competitiveness in the market (Gu & Siu,
2008:564). More satisfied employees tend to be less absent, more committed, and less
likely to leave the organisation (Zeffane et al., 2008:238).
1.7.1 Internal marketing and employee satisfaction
Gounaris, Vassilikipoulou & Chatzipanagiotou (2010: 1669-1670) stipulate that the
underlying objective of internal marketing is the development of a marketing programme
which is directed at the internal market of the organisation with the aim of considering and
meeting employee needs in order to bring about higher levels of employee satisfaction. In
this way, customer value can be created and the external market objectives achieved
(Davoudi & Kaur, 2012:61). Through an internal marketing programme the predictors of
employee satisfaction, namely: reward and recognition (including salary and benefits),
career advancement (promotional opportunities), work environment (including personal
safety), leadership, relationship with supervisors/managers, relationship with co-workers,
stress and pressure, role clarity and fit, empowerment, training and development,
feedback, decentralised decision-making, sharing of knowledge and information and
organisational culture (Ahmad Wasay & Malik, 2012:532; Halepota & Shah, 2011:281;
Turkyilmaz et al., 2011:676-677/678; Gu & Siu, 2009:565; Schon, 2007:17-18/20; Rad &
Yarmohammadian, 2006:xii; Roos, 2005:48), can be addressed. Each of these predictors
are discussed in more detail in Chapter 4 (section 4.3.2).
If successfully implemented, these internal marketing activities would ensure the following
outcomes: better job design would ensure better role fit and role clarity (internal product)
ensuring that jobs match the individual’s abilities and competencies. Weiten et al.
(2008:404) suggest that people select jobs that match their abilities, interests and
personalities, which then enhances their level of employee satisfaction. Through training
and development (internal product), the right processes (internal process) and
empowerment (internal product), these GDP employees could be equipped with the
required skills, knowledge and authority to perform their jobs competently (Gu & Siu,
2009:565; Che Ha et al., 2007:137). This in conjunction with integration and coordination
(internal distribution) across functions and more participative leadership styles (internal

25
people), would reduce service failures since operations and functions would be better
coordinated and aligned with customers’ needs and behaviours during the encounter. As
a result conflicts with customers as well as friction between back office and front office
staff will reduce, improving relations with co-workers (internal people) which results in
higher levels of employee satisfaction. This would help reduce stress and emotional
labour costs (internal price) (Grayson & Sanchez-Hernandez, 2010:9; Gounaris,
2008b:75). Communication (internal promotion) would be more effective, and performance
feedback (internal physical evidence) as well as the timely exchange of information would
improve employee perception of communication quality which would also lead to
increased satisfaction. The communication and adherence to a corporate vision (internal
promotion) that binds the employee emotionally to the organisation can also lead to
greater commitment, productivity, job satisfaction and employee retention (Appelbaum et
al., 2009:243). Further to this, a pleasing internal physical environment (internal physical
evidence) which facilitates the development of personal relationships and teamwork is
conducive for a satisfying internal customer (employee) experience (Yilmaz & Ergun,
2008:292).
Delivering on the organisation’s brand promise is the responsibility of all employees within
the organisation (Foster, Punjaisri & Cheng, 2010:402). Internal marketing is responsible
for the attraction and satisfaction of customer-conscious employees who are supported to
fulfil their role as part-time marketers within the organisation (Grönroos, 2007:389). In this
way internal marketing aims to create value for both the employee and the organisation,
allowing for the external strategic and marketing objectives to be met (Sincic & Vokic,
2007:5-6).
1.7.2 The link between employee satisfaction and affective commitment
If employees are unhappy in their internal environment, they are likely to feel disengaged,
underpowered and highly unappreciated which would drive employees to recede from the
organisation and seek employment elsewhere (Turkyilmaz et al., 2011:9-10; Peltier &
Dahl, 2009). Peltier and Dahl (2009) suggest that the internal environment affects the
service capability of employees which influences employee satisfaction which, in turn,
affects the commitment and retention of employees. In other words, if organisations such
as retail banks are able to create the appropriate internal environment in which strong
relationships are fostered, this would result in more satisfied employees (Emerson,
2007:59).

26
Employee satisfaction is regarded as a prerequisite for commitment and loyalty, meaning
that commitment and loyalty develop from satisfaction and mediate the effects of
satisfaction on turnover variables. Therefore, when employee satisfaction is high,
employee commitment and loyalty will be higher too (Gibbs & Ashill, 2013:310).
Turkyilmaz et al. (2011:9) describe loyalty as the psychological state which characterises
the relationship between the employee and the organisation and the employee’s
identification and involvement with the organisation which impacts the decision to remain
with the organisation. Employees who are loyal exhibit more committed behaviour, and
less intent to leave (Farzad, Nahavandi & Caruana, 2008:1481).
Organisational commitment, specifically affective commitment, is synonymous with loyalty
and has been identified as the strongest predictor of employee intention to remain with
organisations (Calisir et al., 2011:516). Affective commitment has been described as the
employee’s state of emotional commitment to the organisation and is influenced by factors
such as organisational support (Awwad & Agti, 2011:311). Normative commitment refers
to the employee’s belief that he or she should remain within the organisation and develop
as a result of social pressures (family, cultural and organisational) (Jonsson & Jeppesen,
2013:6). Continuance commitment is either based on the degree of personal sacrifice
associated with leaving the organisation or it is based on the availability of alternatives
should the employee leave the organisation (Jha, 2011:266).
The focus of the study is on affective commitment, since it has been demonstrated to
have a strong positive relationship with job satisfaction and organisational outcomes such
as turnover intentions and financial performance (Dimitriades & Papalexandris, 2011:146).
Appelbaum et al. (2013:226) suggest that there is a strong relationship between employee
satisfaction and affective commitment. This is because affective commitment is influenced
by the exchange process. If an employee evaluates the costs and benefits of working for
the organisation and feels that his/her needs or desires have been met, the employee will
experience satisfaction. The results of this is an affectively committed state to the
organisation or work environment. Therefore, there is a positive correlation between
employee satisfaction and affective commitment resulting in retention (Boles, Madupalli,
Rutherford & Wood, 2007:313).

27
1.8 RESEARCH METHODOLOGY
The research methodology for the study takes into account, the research design, the
study population and sample, the data collection process and the analysis thereof. All of
which are discussed next.
1.8.1 Research design and plan
The research design is considered to be the blue print or master plan used to achieve the
research objectives of the study (Zikmund et al., 2010:66). Research designs may be
classified as exploratory, descriptive, or causal. Exploratory research focuses on finding
ideas and patterns and is concerned with gaining background information and familiarity
on a subject area. Descriptive research focuses on the relationship between variables,
measures existing characterises or phenomena at a particular point in time. Causal
research focuses on the need to determine causality in relationships between marketing
factors (Hair, Bush & Ortinau, 2010:210; Churchill & Iacobucci, 2005:74). Descriptive
research has been used in this study since a clear statement of the problem exists
together with the information requirements and hypotheses (Zikmund et al., 2010). In
addition to this, descriptive research has been used for the purpose of the study as it is
best suited to quantitative research (refer to Chapter 5, section 5.2.3). Zikmund and Babin
(2007:83) describe quantitative research as research that focuses on the research
objectives through empirical observations that involve statistical evaluation and analysis.
Data for the study was collected using a survey method. A survey is described as a
technique in which respondents are surveyed of questioned and their responses recorded
for analysis. The main advantages of conducting a survey is its versatility, its speed, it is
inexpensive, efficient and an accurate means of assessing information about a population
(Gaiser & Schreiner, 2009:47).
For the study at hand secondary and primary data was collected. Secondary data refers
to repositories of literature and statistics originally collected for a purpose other than the
study at hand. Secondary research contributes to the effectiveness of research as this is a
prerequisite to the collection of primary data. Further to this, secondary data is quick,
inexpensive and simple to access (Zikmund & Babin, 2007:160; Malhotra & Birks,
2006:85,87; Malhotra & Peterson, 2006:106). Secondary sources of data have been
included in this study in order to establish a theoretical background to the study. Books,
websites, academic journals, internal company information, theses and dissertations were
consulted in this study. Primary data is first-hand raw data structures, which have to

28
receive any type of meaningful interpretation (Hair et al., 2010:60). Primary data for this
study was extracted in the form of responses obtained through a structured questionnaire
from the sample population.
1.8.2 Population and sample
The target population is defined as the total number of cases that conform to
predetermined specifications (Iacobucci & Churchill, 2010:283). The important element of
the group is that it shares a common set of characteristics (Hair et al., 2010:131). For the
purpose of the study, the population is represented as the employees in Graduate
Development Programmes in retail banks in South Africa.
The sampling frame is similar to the target population and relates to the list of elements
from which the sample is drawn (Conradie, 2012:279). Sampling is described as the
selection of a small number of participants from a larger defined target population of
elements with the expectation that the information collected from the small group will
provide inferences concerning the larger group (Hair et al., 2006:308; Solomon, Marshall
& Stuart, 2006:119). Given that the GDP group of employees is small population,
employees could be contacted with ease at a low cost. A census approach was used. All
GDP employees from the South African retail banks offering GDP programs were
approached to participate in the study. Only three of these banks agreed to participate in
the study. These banks are First National Bank, Nedbank and Standard Bank of South
Africa. ABSA was undergoing a major restructure at the time of the study so morale was
low and their focus was elsewhere, as a result they declined to participate. Capitech had
been through a series of surveys at the graduate level and did not want to subject their
employees to any further surveys. The remaining retail banks did not have formal
graduate development programmes in place at the time of the study.
Therefore the sampling frame was made up of GDP employees from First National Bank,
Nedbank and Standard Bank. These three retail banks were seen to be representative of
the retail banking population given their size, market share, income and sustainability.
First National Bank owns 18.8% share of the market, Nedbank owns 17.8% share of the
market and Standard Bank owns 25.5 % of the market. Collectively, these three banks
hold 62.1% of the South African market share (The Banking Association South Africa ,
2011).

29
A census approach was used to survey the sample frame, given that the GDP employee
population is small and each of these employees could be contacted with ease at a low
cost. A census is defined as a research method that includes data from each and every
member of the defined population (Hair et al., 2010:351). A fixed amount of graduates are
taken into the graduate development programme each year and each bank contains a
defined list of these individuals. First National Bank has one hundred and twenty (120)
GDP employees in their programme, as do Nedbank and Standard Bank. The banks were
unable to make these lists available to external parties given the Access to Information
Act 2 of 2000. The researcher however worked through the head of the GDP programme
with each of the participating banks. The heads of the GDP programmes sent the cover
email to every GDP employee on the programme asking for their participation in the study.
Interested employees could then contact the researcher directly and arrangements were
made for survey completion. All three hundred and sixty GDP employees in the sample
frame were contacted to participate in the study. Table 1.2 provides a summary of the
realisation rate.
Table 1.2. Realisation rate
Bank Total GDP employees
in GDP programme GDP employees
participating in study Total percentage
participation
First National Bank 120 20 5.56%
Nedbank 120 22 6.11%
Standard Bank 120 22 6.11%
Total 360 64 17.78%
As determined from Table 1.2, a total of 20 participants agreed to participate from First
National Bank, 22 participants agreed to participate from Nedbank, and 22 agreed to
participate from Standard Bank. Thus a realisation rate of 17.78% was obtained.
1.8.3 Data collection, instruments, sources and procedure
A number of survey methods are available to researchers such as electronic surveys,
person-administered surveys, telephone and self-administered surveys (Aaker et al.,
2007:246-270). In accordance with the participating banks’ needs, it was determined that
a combination of person-administered and electronic survey methods would best facilitate
the objectives of this study. Since the study is focusing on a specialised group of
employees, the population is relatively small and validity and reliability issues could result

30
in challenges further reducing the sample size. Since all GDP employees employed with
First National Bank and Standard Bank are situated in their head office, a person-
administered survey was selected. This would allow the researcher to conduct the survey
personally with First National Bank and Standard Bank GDP employees to ensure that all
questions and instructions were clearly understood and answered in full.
Nedbank however requested an electronic survey given that their GDP employees are
scattered across the region and obtaining access to this group would have been difficult.
The same questionnaire was utilised in both the person-administered and electronic
surveys. Electronic survey methods allow for high quality data to be collected at rapid
rates and at low costs. In addition to this, interviewer bias can be kept to a minimum and
respondents are able to complete the survey during their own time whilst remaining
completely anonymous, allowing for more truthful answers (Churchill & Brown, 2007:114;
Malhotra & Birks, 2006:234; Solomon et al., 2006:116).
A structured questionnaire was designed relevant to the problem statement and research
objectives. The questionnaire opened with a demographic section in order to classify the
type of employee responding. The first section of the questionnaire measured the
participant’s awareness of the internal marketing mix as depicted in the conceptual model
(see Figure 1.1). The second section measured the importance of the internal marketing
mix to job satisfaction, the third section measured perceptions of employee satisfaction,
and the fourth section focused on employees’ perception of affective commitment.
In-depth literature was investigated to aid in the development of the measurement
constructs and previous studies were used where possible (Burin, 2011; Petzer & De
Meyer, 2011; Awwad & Agti, 2011). Data was collected in these four sections using a five-
point interval Likert scale, ranging from ‘strongly agree’ to ‘strongly disagree’. Likert
scales are generally used to measure attitudes and perceptions and since this study aims
to measure the attitudes and perceptions of GDP employees within the retail banks, the
main part of the questionnaire consisted of Likert scales (Cooper & Schindler, 2007:234).
The questionnaire was pre-tested with six GDP employees from two of the banks. The
person-administered approach was used with three GDP employees from Standard Bank
and an email approach was used the three GDP employees from First National Bank.
Once the pre-test had been conducted and relevant changes made, an email was sent out
to the First National Bank, Nedbank and Standard Bank GDP employees requesting their
participation in the study. Given the restrictions of the Access to Information Act 2 of 2000,
31
the banks were unable to present the researcher with a list of the GDP employees or their
contact details. An email was sent out to these GDP employees through a bank
representative and interested parties were asked to contact the researcher directly should
they wish to participate in the study. Once responses had been received from the First
National Bank and Standard Bank group of employees, the researcher made
arrangements to meet with each of these individuals in order to conduct the personal
interviews.
Once responses had been received from Nedbank, an electronic link containing the
survey was sent through to these individuals via email. The electronic survey conducted
with Nedbank was hosted by the Statistical Consultation Service of the University of
Johannesburg (STATKON). This allowed the online survey to be accessed through a
website for the sample group to read and complete. Given that responses to the survey
went straight through to STATKON, response bias was reduced as participants may have
felt safer to answer questions honestly.
1.8.4 Data analysis procedures
Statistical procedures to test the research hypotheses and achieve the primary and
secondary objectives include descriptive statistics, factor analysis and
correlation/regression analysis. Descriptive statistics were used to describe the
demographics of the sample as well as to gauge participants’ awareness of the internal
mix, the perceived importance of the internal marketing mix elements, employee
satisfaction and affective commitment. In addition to this the frequency distribution of
sample responses could be observed (refer to Chapter 6, section 6.5). The validity and
reliability of the measurement instrument were assessed through the KMO sampling
measure of adequacy, Bartlett’s test of sphericity and the Cronbach alpha measure (refer
to Chapter 5, section 5.2.5.5 & 5.2.5.6 and Chapter 6, section 6.6 & 6.7 ).Exploratory
factor analysis was used to determine how many factors to retain and to help determine
the validity of the measurement instrument. Simple linear regression analysis was used to
test the relationship between the internal marketing mix elements and employee
satisfaction, and to test the relationship between employee satisfaction and affective
commitment. STATKON assisted in the data analysis.

32
1.9 DIVISION OF THE STUDY
The proposed study will include seven chapters. The following provides a description of
the contents of each chapter.
Chapter 1: Provides the introduction and background to the study. The formulation of the
research problem, the objectives and the hypotheses of the study are outlined
in this chapter. Similarly, the purpose and significance of the study, a review
of the literature and the scope and limitations of the study are presented in
this chapter.
Chapter 2: Concentrates on the services marketing concept and the role of internal
marketing within this sphere. The discussion focuses specifically on the
definition of internal marketing and the importance of strong internal
relationships within the internal environment of the organisation.
Chapter 3: Focuses on the internal marketing mix. Special attention is given to the
internal marketing mix elements of internal product, internal price, internal
promotion, internal distribution, internal people, internal process and internal
physical evidence.
Chapter 4: Focuses on employee satisfaction and the link between internal marketing
and satisfaction. In addition to this, retention through affective commitment is
discussed as well as the link between employee satisfaction and affective
commitment.
Chapter 5: Is centred on the research methodology and design followed to achieve the
research objectives. In this chapter emphasis is placed on the research
method, research format, research technique, population and sampling
methodology which include sample size, sampling type, sampling technique
and data analysis.
Chapter 6: Focuses on the analysis and interpretation of data. The research findings and
interpretation of the data are presented in this chapter through the
measurement of the different stated hypotheses.
Chapter 7: The conclusions and recommendations drawn from the results are described.
Further to this, the chapter discusses how the primary and secondary
research objectives as stated in the first chapter were achieved.

33
1.10 DISCUSSION OF TERMINOLOGY
Retail Banking Industry: This relates to banking services that are offered to individual
customers through local branches of the bank. Examples of retail banking services include
checking and savings accounts, credit cards, personal lines of credit and mortgages and
so forth (Financial Dictionary, 2011).
Internal Marketing: Internal marketing can be defined as a planned effort using a
marketing like approach to overcome organisational resistance, to change and to align,
motivate, and interfunctionally co-ordinate and integrate employees towards the effective
implementation of corporate and functional strategies in order to deliver customer
satisfaction through the process of creating motivated and customer-orientated employees
(Ferrel & Hartline, 2008:324).
Graduate Development Programme: These are programmes designed to attract and
retain graduates. These programmes enable graduates to quickly realise their potential
and achieve fast career advancement (McDermott et al., 2006:460).
Employee satisfaction: This relates to an individual’s sense of satisfaction not only with
the work, but also with the larger organisational context within which work exists (Schon,
2007:16).
Affective commitment: This is described as an employee’s state of emotional
commitment to the organisation and as a result employees continue their association with
that organisation (Awwad & Agti, 2011:311).
1.11 CONCLUSION
In service environments where customers are highly demanding of employees, coupled
with employees who in turn hold high expectations from their jobs as sources of self-
actualisation and self-development, the internal marketing programme of the organisation
can assist in creating more satisfied employees (Ajang, 2013; Voon, 2011:46; Kameswari
& Rajyalakshmi, 2012:48). Increased satisfaction levels will result in higher levels of
affective commitment and higher employee retention rates (Gibbs & Ashill, 2013:310).
Chapter 1 provided a background to the research problem and research objectives of the
study. An industry background, the problem statement, research objectives and

34
hypotheses and a short literature review were discussed. This was followed by a
discussion on the research methodology as well as the data analysis used for the
purposes of this study. The next chapter focuses on the service industry and the
importance of internal marketing to service organisations.

35
CHAPTER 2
AN INTRODUCTORY PERSPECTIVE ON INTERNAL MARKETING
2.1 INTRODUCTION
In order to survive in today’s turbulent and complex organisational environment it is vital
that service organisations are able to attract and retain loyal customers in order to
generate profit (de Farias, 2010:102; Dayan, Al-Tamimi & Elhadji, 2008:321). Specifically
in the retailing of financial services where competition has intensified and markets have
become saturated, the importance and awareness of customer loyalty and retention is
increasing (Atkinson, 2012; Anani, 2010:3). This requires service organisations to place
increased focus on service quality and customer satisfaction in order to retain customers
and create a competitive advantage. Given the fact that service quality is dependent on
the interaction between the service employee and the customer, employees become an
important component in the service delivery process and value creation chain (Hoffman &
Bateson, 2006:270-272). This has lead to the development of the internal marketing
concept whereby organisations realise the importance of building internal partnerships,
communicating better with employees, and selling jobs to employees which needs to
precede selling services to customers. Competent customer-orientated employees who
are well trained and fairly compensated are more productive, require less supervision and
are more likely to remain with the organisation (Parry, 2012:24, Mishra, 2010:185).
This chapter focuses on internal marketing as a philosophy for the management of large
service organisations (in this case retail banks) where employees are viewed as an
internal market. For this internal market, marketing tactics need to be geared towards the
attraction, development, empowerment and engagement, motivation, satisfaction and
retention of employees in order to help the organisation develop a competitive advantage
(El Samen & Alshurideh, 2012:85; Zampetakis & Moustakis, 2007:417). The purpose of
the chapter is to highlight the role that internal marketing plays from a services and
services marketing perspective. The premise being that a well thought out internal
marketing plan will help create strong internal relationships, which in turn will increase
employee satisfaction and retention and thereby enhance customer satisfaction and
retention (Qayum & Sahaf, 2013:51). The relationship between internal marketing and
external marketing will be elaborated on in the discussion on the service marketing
triangle (refer to section 2.2.3). As internal marketing forms the focus of this study,
Chapter 2 will concentrate primarily on the internal marketing component as opposed to

36
the external marketing arm of services marketing. This is because internal marketing
contributes to employee satisfaction and when employees feel satisfied and appreciated
they are motivated to improve business performance and generate a sustainable
competitive advantage for organisations (Varnai & Fojtik, 2008:162).
The following section considers the service concept and services marketing triangle in
more detail.
2.2 THE SERVICE CONCEPT
The concept of ‘services’ has been described as an action which involves transferring
value, performed by one party on behalf of, or for another (Molapo, 2010:9). A service is
generated by a process or series of activities generally intangible in nature that take place
between the customer and service employee, with value being created as the outcome
(Edvardsson, Gustafsson & Roos, 2005:110). In the case of a service, as opposed to a
product, the consumption of the service takes place where the service is produced (for
example in the banking branch) and the customer is present which affects the results in
terms of added value and quality. Services are usually regarded as performances (such
as medical services) or efforts and experiences (such as spectator sports) which may be
mechanically based (such as telecommunications, radio, TV) or human based (such as
banking) (Lamb et al., 2010:334). This indicates that services can be viewed from various
perspectives, with authors defining the concept of services in different ways. Table 2.1
provides an overview of the various definitions of the services market concept.
Table 2.1. Definitions of the service concept
Reference Definition
Godlevskaja, Van Iwaarden and Van
der Wiele (2011:72)
Service is defined as a perspective on value
creation where value is seen through the lens of
the customer and where the customer has the role
of co–producer
Moeller ( 2010:361) Service is something that can be bought and sold,
but which is intangible

37
Reference Definition
Cant, Strydom and Jooste (2009:282) A service is any act or performance that one party
can offer to another that is essentially intangible
and does not result in ownership of anything. Its
production may or may not be linked to a physical
product
Lamb et al. (2010:334) Service is a deed, a performance, an effort that
cannot be physically possessed
Zeithaml, Bitner and Gremler (2012:4-5) Service is defined as all economic activities whose
output is not a physical product or construction, is
generally consumed at the time it is produced, and
provides added value in forms such as
convenience, amusement and experience, which
are essentially concerns of its first purchaser
Edwardsson et al. (2005:110) A service is an activity or series of activities of
more or less intangible nature that normally, but
not necessarily, take place in interactions between
the customer and the service employee and/or
physical resources or goods and/or systems of the
service provider, which are provided as solutions
to customer problems
From the definitions provided in Table 2.1, it can be noted that services encompass
creating value for the customer. Grönroos and Ravald (2011:8) suggest that value
creation, and particularly the value-in-use concept, are important issues for understanding
service and the quality of the service encounter. Customers are not predominately
interested in what they buy and consume as such. They are more interested in the
positive consequences derived from their possessions or in the service activities they
utilise than the actual product they buy and consume. The possession of a gold credit
card for someone newly employed out of university is a symbol of success which enables
the owner to feel good and uplifted about him/herself. Value is not created from the use of
the card, but is rather created from the good feeling or from admiration shown by the
owner’s friends (Grönroos, 2008:303).

38
Furthermore, from Table 2.1, the main characteristics of services can be identified,
namely intangibility, heterogeneity, inseparability and perishability (Moeller, 2010:359).
These are recognised as the unique characteristics that differentiate goods from services
(Lamb et al., 2010:276).
2.2.1 Characteristics of services
Each of the service characteristics as identified from Table 2.1, namely intangibility,
inseparability, perishability and heterogeneity leads to challenges for marketers in
financial services, as each of these differs from the traditional product functions and
requires special strategies for dealing with them (Jan, 2012: 37). It is important therefore
that these are understood as part of the services marketing concept. Each of these is
discussed in more detail next.
2.2.1.1 Intangibility
The most recognised characteristic of a service is intangibility which emphasises that
service is not an object and does not have a physical dimension, meaning that there is no
tangible asset which can be touched, smelled or tested prior to the purchase (Yao, 2006).
The intangible nature of services can thus create problems for marketers attempting to
market the service as well as for the customer (Jan, 2012:37). As customers cannot
physically see or hold the service, they are generally required to rely on the reputation of
the service organisation when assessing the service (Hellen & Gummerus, 2013:132).
Furthermore, services as intangibles are often combined with tangible elements making it
difficult to define what is really offered to the customer (Moeller, 2010:361-362). When
making a payment over the Internet, there is no physical exchange of money taking place
between the sender and receiver making this transfer intangible. There are however
physical dimensions to the service in terms of the computer used to make the transaction
and the proof of payment which can be printed out. Due to the level of uncertainty in the
purchase decision and the overall perception of services, intangibility is often considered
the most fundamental service characteristic (Moeller, 2010:361-362).
2.2.1.2 Inseparability
Jan (2012:38) stipulates that this characteristic of services relates to the fact that the
production and consumption of a service take place at the same time, in real time, with the
provider and the customer co-operating in the process together. The customer needs to

39
participate in the service process and for this reason service cannot be centralised. (Rust
& Chung, 2006:563). Customers also play a role in the service delivery process which
influences their level of satisfaction. The quality of the service delivery is however
dependent on the exchange which takes place between the service employee and the
customer. Service organisations must acknowledge the influential role that service
employees play in delivering the service (Jan, 2012:38). Given that services cannot be
mass produced, inseparability does provide an advantage in terms of customising the
service offering for customers, which can influence the customer’s perception of service
quality (Grobbelaar, 2008:6). An example of inseparability in the retail banking context
would be when conducting a cash withdrawal from a bank teller, or for the collection of a
credit card, the customer physically needs to be present in the branch and rely on the
employees help.
2.2.1.3 Perishability
Perishability relates to the concept that services, unlike tangible products, cannot be
stocked or stored, they perish when the delivery of service takes place (Jan, 2012:37).
Once the time of the service passes the opportunity to sell the service perishes. (Moeller,
2010:364; Rust & Chung, 2006:563). Moeller (2010:364) opines that in service marketing
literature perishability is not only connected with the outcome of service, but also with the
service provider’s capacity. Whereas producers of products are able to carry inventories
of their products in order to guard against fluctuations in demand, managing capacity in
services is dependent on the demand of customers. Because customers need to
participate in the service delivery process as co-producers of service, the organisation
becomes dependent on these customer resources (Shaw, Bailey & Williams, 2011:4-5).
Katzan (2008:5) states that capacity represented in the organisation’s physical facilities is
perishable, meaning that if there are no customer resources available, the capacity to
perform the service experience so to speak perishes. For example, an ATM is a store of
cash withdrawal. The potential to be of value, however, perishes if there is no customer
demand for cash. So the potential capacity to provide service perishes.
2.2.1.4 Heterogeneity
Service involves the use of human resources and heterogeneity comes about as a result
of this human labour which is more variable as a result of different employees performing
services differently (Correa et al., 2013). Moeller (2010:363) proposes that these
variations occur as its human resources performing the service for other human

40
resources, meaning that no two service encounters will ever be the same. Different
employees following the same process will provide different customer outcomes and
employees themselves will perform differently on a day to day basis, depending on
elements such as personal circumstances. There are some elements of the service which
can be standardised in order to create greater efficiencies such as the use of machine
intensive operations such as ATMs for the withdrawal of money (Edvardsson et al.,
2005:114). An example of heterogeneity in the retail banking context would relate to the
service encounter experienced at a branch which could be very different from a service
encounter experienced at another branch due to different employees. Likewise, the
encounter experienced on one day in the same banking branch could differ on another
day (Fisk, 2013).
In light of the above discussion, it is important to note that each service encounter is
unique and often highly customised, and all of these characteristics impact the service
offering and the manner in which the service is delivered. It also becomes evident that
employees play a vital role in service delivery (Hoffman & Bateson, 2006:270). For an
employee to be motivated to provide customers with quality services, it is necessary for
the organisation to satisfy its employees as satisfied and committed employees, will
provide a much higher level of service quality to the external customer thereby influencing
the performance of the organisation (Hoang, Hill & Lu, 2011). This results in the
organisation needing to be aware of the relationship between itself, the employee and the
customer.
The services marketing triangle visually represents and explains the relationship between
the organisation, the customer and the employee and how they work together to develop,
promote and deliver exceptional service (Peters & Mazdarani, 2008:35). The services
marketing triangle is based on the three pillars of services marketing namely external
marketing, interactive marketing and internal marketing. Since the study is concerned with
internal marketing-specific focus will be placed on the role that the employee plays within
the broader services marketing arena (Aburoub et al., 2011:110). The services marketing
triangle is discussed next.
2.3 SERVICES MARKETING TRIANGLE
A strategic framework known as the services marketing triangle visually reinforces the
importance of employees in the organisation in terms of their ability to deliver high quality
services and to keep the promises made to customers (Aburoub et al., 2011:110). The

41
framework assists marketers in addressing marketing challenges which revolve around
issues such as understanding customers’ needs and expectations of services; making
services tangible to customers, and keeping promises made to the customers (Zeithaml et
al., 2012:355).
Zeithaml et al. (2012:356) posit that the three points of the service triangle represent the
organisation’s management, external customers and employees as illustrated in Figure
2.1. Between each of the three points of the triangle different marketing activities such as
external marketing (the activity of making promises), interactive marketing (the activity of
fulfilling a promise) and internal marketing (the activity of striving to keep a promise) have
to be carried out successfully for service processes to succeed and for internal and
external market alignment to occur (Kurniatun & Heriyati, 2012:43).
Figure 2.1. Services marketing triangle
Source: Zeithaml, Bitner and Gremler (2012:356).
2.3.1 External marketing as part of the services marketing triangle
Zeithaml et al. (2012:355-356) opine that external marketing represents the promises
which organisations make to their customers with reference to the services that they offer
and how these promises will be fulfilled through the delivery of their offerings. The
marketing process involves more than just making promises. Organisations also need to
honour the promises that have been made. Marketing activities and processes, such as
communicating and pricing, are aimed at making promises, whilst activities and processes
such as applications, recovery of problems and mistakes are aimed at keeping promises

42
(Grönroos, 2009:355). An example of external marketing in the retail banking context
could relate to the TV and print advertisements utilised by retail banks to call customers to
action (Fisk, 2013).
2.3.2 Interactive marketing as part of the services marketing triangle
Grönroos (2009:356) stipulates that interactive marketing relates to the interaction
between the employee and customer. During this interaction, the promises made though
external marketing should be kept. Customer expectations created through external
marketing are met by providing assistance to customers’ value creation. This is done by
providing resources, processes, information, people, systems, infrastructures and
interactions between the customer and these elements. Customers themselves need to
be mobilised as a resource in the service delivery process and as a result must be able to
use products, services and information, as well as handle systems and infrastructure in a
value-creating way. Value creation therefore becomes the responsibility of several
functions in the organisation, meaning that marketing is no longer a separate business
function. Marketing in this respect helps organisations co create value propositions with all
stakeholders in order to enhance total value for the organisation (Lusch & Webster,
2010:4). All employees in the organisation therefore need to become more customer
orientated and take on the role as part-time marketers in order to positively affect
marketing strategy success (Fotiadis et al., 2011).
Work activities can no longer be arranged as separate functions as no function is effective
if it operates in isolation. Organisations need to ensure that employees in all parts of the
organisation serve as part-time marketers. For this reason all employees must be involved
in the delivery of quality, have understanding of the operations of service, and be provided
with the tools and facilities to do so (Kowalkowski, 2011:485). For example, retail banks
make use of call centres to assist customers with service queries or complaints. In order
for the call centre to function effectively and deliver service to the external customer, a
high level of internal integration is needed to achieve external integration (Zhao et al.,
2011:19). (Zhao et al., 2011:19) suggest that three aspects are required for internal
integration to influence external integration namely, information sharing, strategic
cooperation and working together. The degree to which organisations collaborate within
the value chain and manage their internal processes to deliver the efficient and effective
flow of services will determine the level of value provided to both internal and external
customers (Zhao et al., 2008). Further to this, technology and systems relating to the
hardware and software required to deliver services and internal integration (such as a

43
telephone, computer and corresponding software programmes allowing employees to
access customer information) must be in place. With these internal systems and a high
level of internal integration, information can be shared in real time and the data can be
fully utilised resulting in higher levels of external customer satisfaction (Zhoa et al.,
2011:19). Given the importance of the internal integration and the internal environment,
internal marketing as a leg of the services triangle is discussed next.
2.3.3 Internal marketing as part of the services triangle
Grönroos (2009:355) posits that promises cannot be successfully kept at all times by the
organisation unless employees are willing and motivated to do so, as employees of the
organisation are the brand representing the organisation and have the ability to create
value and directly influence customer satisfaction through the service encounter. For this
reason the ‘right’ employees whose values fit with the organisation’s brand values should
be recruited into and retained within the organisation (Anosike & Ahmed, 2006:6).
Internal marketing aimed at attracting employees and improving employee satisfaction
therefore becomes critical for external marketing success (Qayum & Sahaf, 2013:51).
Sincic and Vokic (2007:5-6) state that internal marketing involves the efforts of an
organisation to recruit, train, motivate and reward its employees towards more satisfying
marketing behaviour. Internal marketing aims to develop and motivate the internal market
(employees) to create value for customers and in that way achieve the external strategic
and marketing objectives.
Kale (2008:3) mentions that internal marketing refers to two kinds of interrelated activities
namely the ‘customer-focused’ and ‘employee-focused’ activity. Customer-focused
internal marketing is based on the belief that all employees of the organisation are part-
time marketers (Kimura, 2011:77). The objective of customer-focused internal marketing
is to get the most out of customer encounters in order to encourage repeat business from
existing customers and generate new business opportunities (Kale, 2008:3). Internal
marketing as an employee-focused activity is based on the philosophy of treating
employees as internal customers with the intention of shaping jobs and the internal
environment to meet employee needs (Muhammad & Yazdani, 2009:84). Kale (2008:3)
furthermore divides the employee-focused activity into two domains, namely substantive
and symbolic internal marketing. The substantive approach involves the use of externally
proven marketing techniques such as market research, marketing communication,
positioning, and segmentation to employees making up the internal market (Yang,

44
2008:30). The symbolic approach acknowledges that all internal management practices
(such as recruitment, induction, training, and employee reward systems) have an
embedded marketing dimension to them in that they convey the message to employees
that they are trusted and valued (Muhammad & Yazdani, 2009:84, Kale, 2008:3).
Javadein et al. (2010:367) suppose that internal marketing also hinges on the assumption
that everyone in the organisation is an internal supplier and customer in the value chain
and in order to satisfy external customers, organisations must first satisfy their internal
customers’ (employees) needs. Panigyrakis and Theodoridis (2009:606) continue that
internal marketing focuses on the exchanges that take place between employees and the
various business units as they progress through the value chain which eventually links to
the external customer. The focus of internal marketing in this instance is to ensure that
employees’ needs are satisfied by providing value to the employee-organisation
relationship. Further to this, internal marketing is essential in creating an environment
focused on providing quality to the next internal customer (Abzari & Ghujali, 2011:96).
Therefore, the provision of a superior quality service to the external customer is influenced
directly by the quality of the internal service and the organisations internal environment
(Benea, 2011). As this study focuses on internal marketing, the following section will delve
deeper into this concept.
2.4 AN INTRODUCTORY PERSPECTIVE TO INTERNAL MARKETING
Employees are critical to the success of organisation’s. Organisations that select, develop,
manage and motivate their employees towards outstanding performance have a unique
competitive advantage that others cannot copy (Papasolomou, 2006:195). Internal
marketing as an ‘employee-focused’ strategy is focused on marketing the organisation
inwardly to the employees through their jobs as internal products. In this way employees
become more customer orientated and strive for higher levels of service excellence
(Akroush et al., 2013:310). Papasolomou (2006:195) specifies that the overall goal of
internal marketing in this regard is to create a stable workforce of part-time marketers or
organisational fanatics with higher levels of employee motivation, commitment and
satisfaction resulting in more satisfied customers, increased productivity and improved
employee retention rates. This ensures enhanced organisational performance and
increased profits for the organisation (Zaman et al., 2012: 79, Nittala & Kameswari,
2009:208).

45
In light of the above, an effective internal marketing programme aims at understanding
and satisfying employees’ needs and expectations so that they in turn will go above and
beyond to deliver value to the customer (Al-Hawary et al., 2013:813). Through an
integrated and coordinated approach, employees should be able to function better as a
team of internal customer and internal suppliers and add value through every step of the
value chain, thereby creating satisfied and loyal customers who will in turn drive the
profitability of the organisation (Panigyrakis & Theodoridis, 2009:605-606). Before
discussing internal marketing in more detail, it is necessary to provide an understanding
into the internal marketing concept.
2.4.1 Defining internal marketing
Table 2.2 provides a summary of the various definitions of internal marketing and what
internal marketing means for the purpose of this study.
Table 2.2. Definition of internal marketing
Author Definition
Al –Hawary et al.
(2013:813)
Internal marketing can be defined as a planned effort using a
marketing like approach to overcome organisational resistance,
to change and to align, motivate, and interfunctionally co-
ordinate and integrate employees towards the effective
implementation of corporate and functional strategies in order to
deliver customer satisfaction through the process of creating
motivated and customer-orientated employees
Qayum and Sahaf
(2013:50)
Internal marketing is concerned with viewing employees as
internal customers, and jobs as internal products that satisfy the
needs and wants of these internal customers while addressing
the objectives of the organisation
Guven and Sadaklioglu
(2012:109)
Internal marketing is a comprehensive programme concerned
with employee recruitment, training, motivation, communication
and retention efforts which results in positive attitudes towards
work
Kameswari and
Rajyalakshmi (2012:47)
Internal marketing is the application of marketing inside an
organization to enhance customer focused and customer

46
Author Definition
oriented employees
Grönroos (2007:389) Internal marketing is involved with the establishment,
maintenance and growth of internal relationships between
employees despite their position within the business. Through
this process employees must be motivated to deliver a quality
service to both internal and external customers of the business
Kotler and Armstrong
(2006:300)
Internal marketing is defined as: marketing by a service
organisation to train and effectively motivate its customer-
contact employees and all the supporting service people to work
as a team to provide customer satisfaction
From the different definitions provided, various elements such as a marketing like
approach, establishment of internal relationships, jobs as internal products, satisfaction of
employees as internal customers, training and development of employees, motivation and
empowerment of employees, interfunctional integration and internal communication
encompassing the concept of internal marketing can be identified, and are subsequently
discussed.
“Marketing-like” approach
Marketing-like approach is defined as a management philosophy based on the need for
customer orientation, profit orientation, and recognition of the role of marketing to
communicate the needs of the market to all major organisational departments (Che Ha et
al., 2007:136-137). A marketing-like approach implies that internal marketing is a
marketing approach within the organisation, meaning that in order to achieve the external
marketing objectives, internal marketing is essential to motivate employees to become
more customer conscious by using marketing tools and techniques internally. These
marketing techniques are applied internally by focusing on internal customers and
suppliers with the aim of improving internal relationships, quality and customer service
(Naidoo, 2009:47).
Establishment and maintenance of internal relationships
Dodd (2011) believes that the goal of internal relationship marketing is to plan and build,
close and flexible relationships with internal parties. Internal relationship marketing is

47
required where secondary relationships with employees referring to relationships between
managers, co–workers and other departments influence the customer. Internal marketing
is based on the understanding that in order to create value for customers, all functions,
operations and employees have to work together (de Farias, 2010:101-102, Kowalkowski,
2011:485). Internal marketing therefore supports internal relationship marketing by
building and changing relationships across the organisation so that employees are
motivated to deliver quality service to customers (Sirenne, 2013:17).
Jobs as internal products
Illiopoulos and Priporas (2011:2) state that organisations should use jobs as products in
order to attract and retain employees much the same way as products and services are
used to attract and retain customers. Given that employees are an organisation’s most
important asset, they should receive the most attractive job product package in order to
satisfy their needs. Organisations should offer enjoyable job experiences in exchange for
employee loyalty and commitment which will then result in improved organisational
performance and customer satisfaction and loyalty. In this way both the organisation and
employees’ needs can be fulfilled in a proficient manner (Vasconcelos, 2008:1255). The
aim of internal marketing in this context is to focus on the design of jobs as products in
order to provide higher levels of satisfaction for employees (Yaghoubi, Salehi & Moloudi,
2011:80-81). Treating jobs as products goes beyond the tasks that need to be performed;
it needs to take into account reward systems, training requirements, involvement in
decision-making and career opportunities. For this reason, organisations need to create
jobs that engage employees in the organisation’s philosophy and sustainability (Grayson
& Sanchez-Hernandez, 2010:9).
Satisfaction of employees as internal customers
Internal marketing starts with the premise that the employees of the organisation are the
first members of the internal market. Organisations need to be committed to
understanding employees’ needs and expectations and know how to respond to these in
value adding ways to deliver the level of service the strategy dictates (Sirenne, 2013:24).
If employees’ needs are met, they feel cared for by the organisation which results in more
positive attitudes towards their work including motivation, satisfaction and commitment
(Davoudi & Kaur, 2010:188). The internal marketing strategy of an organisation must
focus on building relationships with employees in order to research and understand
employees’ needs and develop ways to meet these needs and expectations. In this way

48
the organisation demonstrates its commitment to employees by creating value for them in
the same way that they create value for their customers (Lings & Greenley, 2010:324).
Inter-functional coordination and integration
Various business units and employees with different skill sets must become actively
involved in creating value for both internal and external customers (Chang & Chang,
2008:92-93). These cross-functional activities all have an impact on the final outcome and
for this reason employees in all parts of the organisation must become involved in the
delivery of service quality throughout the value chain (Esfahani et al., 2013:2). Panigyrakis
and Theodoridis (2008:605-606) state that the internal value chain is made up of
employees seen as both internal customers and internal suppliers. Internal marketing is
focused on the notion that employees need to provide service to each other first in order
to deliver service to the external customer.
Training and development of employees
van Dyk et al. (2013:61) define employee training and development as a strategic
investment by an organisation in developing its internal market. If employees are required
to perform their tasks well, they must be provided with the necessary skills and knowledge
that are required of them (Joung et al., 2010:2). Gibbs and Ashill (2010:308) states that
employees need to be equipped with the means and know-how to develop the skills and
capabilities to deliver the level of service prescribed by the organisation’s strategy. In
order for internal marketing to be effectively employed within an organisation, employees
must be trained and properly developed to fulfil their service role. This will allow the
organisation to utilise the full potential of their employees, thus improving organisational
performance (Davoudi & Kaur, 2012:67, Ueno, 2010,:78).
Motivation and empowerment of employees
Organisations need to create an internal environment in which employees are empowered
and motivated to create and improve the organisation. Every interaction that takes place
between employees and the organisation should be focused on the delivery of service
quality and the satisfaction of both internal and external customer needs (Kuar, Sharma &
Seli, 2009:597). Hoffman and Bateson (2006:270-271) state that service employees are
happiest when they are empowered to make customers happy. This adds value to their
jobs, leading to the satisfaction of both the employee and the customer. Through the
empowerment of employees, greater depth can be added to their job, keeping them
motivated and interested in the challenge of their job for longer (Moodley, 2008:67).
49
Internal marketing plays a role in ensuring that employees are satisfied with their internal
environment and the organisation as a whole which results in higher levels of commitment
and productivity and less intent to leave the organisation (Farzad, Nahavandi & Caruana,
2008:1481).
Internal Communication
Stoyanova (2011:31-32) identifies internal communication as the dissemination of
information within the organisation in order to provide employees with a greater sense of
ownership, accountability and responsibility. When employees have been informed about
the expectations of their internal and external customers as well as the health of the
organisation, they are more willing to perform their jobs effectively which in turn improves
organisational performance. Internal communication is a key aspect of internal marketing
as it is a major factor in creating understanding amongst employees so that they are able
to perform their role as part-time marketers (White, Vanc & Stafford, 2011; King, 2010) .
The next section concentrates on internal market orientation and internal customer
orientation as part of the understanding of the internal marketing concept.
2.4.2 Internal market orientation
Internal market orientation refers to the manager-employee relations which occur within
the internal market of the organisation (Tortosa-Edo, Sanchez-Garcia & Moliner-Tena,
2010:1285). Internal market orientation emphasises the organisation’s commitment to
their employees, by firstly generating information in order to obtain a better understanding
of their needs and expectations and secondly disseminating the information and then
responding to these needs and expectations by ensuring that employees have all the
resources necessary to perform their jobs (Kuar et al., 2009:597). Through this approach,
employees feel cared for and demonstrate greater commitment to the organisation which
translates into greater customer satisfaction and loyalty (Shekary et al., 2012:20-21).
Internal market orientation is therefore based on the need to build effective relationships
between employees and management based on a commitment to providing superior value
for employees. Managers need to understand and satisfy employee needs in much the
same way as the organisation is committed to understanding and satisfying external
customer needs (Sahi et al., 2013:387). Gounaris (2008a:406) states that the internal
market orientation is made up of three sub dimensions as displayed in Figure 2.2 namely,
the effort to collect internal market-related intelligence or internal market knowledge; the

50
internal communication between supervisors and subordinates; and the organisation’s
response to internal-market intelligence with the aim of developing employee satisfaction.
Figure 2.2. Proposed conceptualisation of internal market orientation
Source: Gounaris (2008a:406).
In light of the above model (Figure 2.2), the generation of internal market intelligence
relates to internal market knowledge creation and consists of segmenting the internal
market into various internal customer groups. The purpose of this particular factor is to
identify the different employee groups and their needs within the organisation, and to
determine how these different employee groups can be communicated with (Gounaris,
2008b:73). Tsiotsou and Vlachopoulou (2011:142) emphasise the importance of
understanding customer needs; in this case employees’ needs now and over time in order
to create value for them. Once the information and data have been collected pertaining to
employee needs this information should be disseminated throughout the organisation.
The dissemination of internal intelligence refers to internal market communication and
relates to how managers and employees communicate with each other and how
managers communicate with other managers from different business units and at different

51
levels within the organisation (Steingrimsdottir, 2011:22). This factor serves two purposes.
The first purpose is that it allows marketing strategies, corporate values and knowledge to
circulate amongst employees, and secondly it provides managers with an understanding
of employee needs and desires (Gounaris, 2008b:73).
Response to market intelligence relates to how an organisation responds to the needs
of its employees by designing job products to fit their needs, as well as training and
motivating employees to perform well in their jobs (Chu & Yeh, 2013). The function of
internal market orientation is to help facilitate the relationship between the employee and
the organisation, so that external customer satisfaction can be achieved (Sanchez-
Hernandez & Miranda, 2011:209).
If managers are able to create a strong internal market orientation, it has many benefits
for the organisation. Lings and Greenley (2010:324) stipulate the following benefits with
which internal market orientation provides the organisation:
Organisations that have developed an internal market orientation are interested in the
views of their employees. Information obtained about employees’ wants and needs are
likely to be communicated to the right decision-makers so that responses to these
needs can be actioned. In this way organisations that focus on their employees’ needs
become more effective than organisations purely focused on their external markets
(Sanchez-Hernandez & Miranda, 2011:209; Lings & Greenley, 2010:324).
The adoption of an internal market orientation leads to a greater level of customer
consciousness and external market orientation (Sahi et al., 2013:388).
Successful implementation of a market orientation requires that all employees in the
organisation generate information about customers, communicate this information to
the appropriate people and respond in an appropriate manner. Employees therefore
become an important source of market research information (Lings & Greenley,
2010:325).
Internal market orientation could also have important consequences for customer
evaluations of their interactions with employees. Customers make judgements about
organisations based on the functional quality of their interactions with the employee
seeing that it is the employee who links the customer to the organisation. Having the
right employees in place to deliver on the promises made through the external
marketing strategies is a key determinant of customer satisfaction (Lin & Lin,
2011:195; Lings & Greenley, 2010:324).

52
An internal market orientation therefore represents a marketing strategy applied internally
and focusing on the satisfaction of employee needs, which leads to higher levels of job-
satisfaction. As a result, employees become more customer-orientated, enabling the
organisation to meet its service objectives and the expectations of its customers
(Gounaris et al., 2010:1670).
2.4.3 Internal customer orientation
Internal customer orientation builds on the internal market orientation whereby internal
market orientation is focused on treating employees as internal customers and
understanding their needs and expectations. The internal customer orientation supports
the notion that everyone in the organisation is an internal supplier and customer in the
value chain (Chu & Yeh, 2013). Li (2010:17-18) describes internal customer orientation as
a mindset in which internal suppliers of services treat consumers of their services as
customers. Kilburn (2008) states that the transactional and relational exchange which
takes place between these parties is supported and maintained through the display of the
right attitudes and behaviours which are grounded in marketing philosophy, theory and
practice. Internal customer orientation is considered part of the organisational culture that
guides the attitudes and behaviours of organisational members to deliver quality to other
employees who then deliver quality to the end customer (Conduit & Quigg, 2013).
Li (2010:15) stipulates that the concept of internal customer orientation evolved from the
belief that quality is a function of continuous improvement occurring in the internal value
chain of the organisation. Better internal service quality between internal customer-
supplier exchanges lead to the provision of superior quality to the external customer. The
overarching goal of internal customer orientation is therefore the creation of value in all
steps of the value chain (Sirenne, 2013:24; Panigyrakis &Theodoridis, 2008:605-606).
To achieve the above objectives interfunctional coordination and integration are required
to utilise the organisation’s resources in creating superior value for customers. However,
different business units or functional areas in an organisation often have conflicting
perspectives, choosing to focus on the interests of their respective areas (Eng, 2011:256).
This leads to a misalignment of goals and work processes which results in functions
moving away from each other and this may also be related to turf barriers. Functions often
feel compelled to control and defend their power which adversely affects interfunctional
relationships (Malshe, 2009:46).

53
According to Eng (2011:256), all employees need to identify their role in the organisation,
implicating that business units should work together through a coordinated approach
putting their functional interests aside. For this reason, creating and aligning internal
relationships between business units, functions and employees is essential for creating
customer value and improving organisational performance. An internal customer
orientation has many benefits to offer organisations should they view the employee as
both a customer and supplier in the value chain and integrate and coordinate, employees,
business units and functions across the organisation in order to create value for
customers (Li, 2010:10). When the marketing department is able to form connections and
relationships with other business units in the organisation, it has many benefits for the
organisation such as enhanced business unit and employee productivity, enhanced
learning capabilities, greater customer value and overall organisational performance
(Malshe, 2009:46).
To capitalise on the above-mentioned benefits, organisations should concentrate their
efforts on developing and sustaining an internal environment that emphasises internal
customer orientation and employee well-being in order to achieve external customer
patronage. To this end the formulation and implementation of an internal marketing
strategy becomes essential (de Farias, 2010:101). There is no single clearly defined
strategy in internal marketing literature and a number of possible strategies could be
utilised (Aburoub et al., 2011:109). The following section focuses on some of the internal
marketing strategies which could be utilised by organisations.
2.4.4 Internal marketing strategies
Aburoub et al. (2011:109) state that there is no agreement in academic literature as to the
internal marketing conceptual framework or even the correct usage of the term, which
results in confusion about internal marketing content and applications. The authors
believe that internal marketing strategy refers to any activities that organisations should
apply in order to attract and win the hearts and minds of its employees in order to achieve
service excellence. For this reason internal marketing strategies, specifically the internal
marketing mix, may vary across organisations according to their resources, market
conditions and changing customer needs (Goi, 2009:4). Vrontis, Thrassou and Zin,
(2010:35) suggest that internal marketing may be used as a change management
strategy in that it shifts the marketing targets area from the internal customers
(employees) environment to the internal customers’ (employees) mind with increased

54
focus on the management of perceptions. Through this approach, resistance to change
can be managed effectively.
Sincic and Vokic (2007:8-9) state that internal communication may be used as an internal
marketing strategy, as internal marketing covers contact and communications with all
organisational stakeholders. For this reason internal communications must be developed
strategically to ensure that employees establish a ‘value-adding attitude’. Further to this,
internal communication builds healthy, favourable relationships between managers and
employees which results in employee satisfaction and increased productivity. When
employees are satisfied with how they receive information, they perform their roles as
brand ambassadors well, resulting in enhanced organisational reputation and credibility
with external stakeholders (White, Vanc & Stafford, 2011).
Internal marketing may also be considered as an internal branding and employer branding
strategy given its positive effect on both internal and external customer perceptions of the
organisational brand (Patla & Pandit, 2012:118). From an internal perspective through
improved internal service, internal customers develop a more positive image of the
organisational identity and the culture conveyed by internal suppliers. This results in the
increased ability of employees to positively influence external customer perceptions of the
organisation’s brand, thus achieving the external marketing objectives (Vrontis et al.,
2010:35, White et al., 2011). Given the complexity of service marketing, a more
comprehensive internal marketing strategy may be required focusing on the extended
services marketing mix. The extended services mix is considered to be more
comprehensive and provides a broader perspective on internal marketing than the
traditional 4 Ps mix (Goi, 2009:15). Internal marketing as change management strategy,
an internal branding strategy, an employer branding strategy, an internal communication
strategy and as the extended services marketing mix strategy will be discussed in more
detail next with a final discussion on the strategies used by banks in South Africa (Foster
et al., 2010:402; Vrontis et al., 2010:35; White et al., 2011; Goi, 2009:15; Sincic & Vokic,
2007:8-9).
2.4.4.1 Internal marketing as an internal branding strategy
Internal branding is the process of enabling the internal market to deliver on promises
made through external marketing (Devasagayam, Buff, Aurand & Judson, 2010:211). It
involves aligning business processes, job designs, rewards and recognition, and engaging
all employees in the brand process (Punjaisri, 2009:210). Delivering on the brand promise

55
is dependent on employees, both frontline and back-office employees, meaning that each
service encounter could be experienced differently by customers at different times
affecting the overall service and brand experience (Patla & Pandit, 2012:116).
All employees are both customers and suppliers so each employee must ensure that
he/she provides excellent service to each of their internal customers so that excellent
service can be received by the external customer (Panigyrakis & Theodoridis, 2009:605-
606; Bellou & Andronikidis, 2008:945). This reflects the notion of effective internal
branding, which suggests that both frontline and back-office employees play an important
role in the consistent delivery of the brand promise. For this reason, every employee
across the organisation needs to understand the corporate brand values (Foster et al.,
2010:402). Punjaisri and Wilson (2009:210-211) state that internal branding activities
involve communicating and educating employees about the brand values in order to
improve their intellectual and emotional commitment to the brand. Matanda & Ndubisi,
2013:1032-1034) state that this clear understanding of the brand promise allows
employees to perform well during the service encounter, enabling them to deliver on the
brand promise. Employees are more likely to display emotional commitment to the brand if
they accept and align themselves to the brand values. Internal marketing can therefore be
employed as an internal branding strategy by organisations in order to communicate their
brand values to the internal market to ensure the alignment of employees’ behaviour to
these values (Punjaisri & Wilson, 2009:210-211). Through the achievement of the internal
branding objectives, employees are able to deliver on the promises made to external
customers (Khan & Naeem, 2013:56).
2.4.4.2 Internal marketing as an employer branding strategy
Sehgal and Malati (2013:53-54) state that this relates to the importance of recruiting
employees whose values fit with the organisation, and is achieved through developing an
‘employer brand’ which creates a perception of the organisation as an attractive place to
work within the external labour market. Employer branding allows organisations to
distinguish themselves from their competitors in an attempt to attract talented applicants
who share values similar to those of the organisation and provides the organisation with
the benefit of recruiting customer-orientated employees to better serve their customers
(Dawn & Biswas, 2010:23). Devasagayam et al. (2010:211) suggest that a psychological
contract is created between the organisation and its employees which encompasses the
employees’ expectations from the time of recruitment throughout their employment with
the organisation. Internal marketing concepts in this regard encompass employee
56
recruitment and retention efforts aimed at attracting customer-conscious employees who
are supported to fulfil their role as part-time marketers for the organisation (Grönroos,
2007:389).
2.4.4.3 Internal marketing as a change management strategy
The need for organisational change is continuous as organisations constantly have to
adapt to changing economic conditions, customer expectations and a shifting workforce
(Hallencreutz & Turner, 2011:60). Internal marketing is often used by organisations as a
change management strategy in order to assist communication and help overcome
organisational resistance to change (Finney & Scherrebeck-Hansen, 2010:326). It informs
and involves all employees about new initiatives and strategies. It can be used to market
one business unit to other areas of the organisation or to obtain buy-in on projects, new
procedures, processes, systems or strategy implementation (Anosike & Ahmed, 2006:11-
12).
The National Learning Consortium (2013:2) states that change management strategies
create a vision of what the future state should look like, and engage all employees in
terms of the change agenda and actions required to achieve the desired state. This
involves communicating the vision widely and consistently through all levels of the
organisation and empowering employees to act and think differently, adopt the new ways
of working, and overcome barriers to learning whilst embedding the change to make it
‘stick’. As new knowledge is produced, employees and the organisation as a whole
develop new ways of thinking and behaving (Smith, 2011:119).
2.4.4.4 Internal marketing as an internal communication strategy
Ndubisi (2007:100) refers to internal communication as “the ability to provide timely and
trustworthy information” to internal users. Internal communication plays a vital role in the
success of internal marketing as its function lies in reconciling the required skills and
information needs of the organisation with the purpose of enabling and energising
employees to carry out its strategic objectives (Stoyanova, 2011:32-33). If an
organisation’s strategy and objectives are not communicated to all employees sufficiently,
employees will not be able to carry out their strategic intentions effectively. Internal
communication is essential to ensuring that employees understand their purpose and ‘buy
in’ to how they contribute to the success of the organisation (Mokgoatlheng, 2010:37). In
order to create better cohesion within the internal environment, interdepartmental

57
communication is required to enhance the transfer of knowledge. This in turn allows for
mutual learning, interdepartmental coopertion and the stimulation and generation of ideas
and innovations, which result in better organisational performance (Yang, Alejandro &
Boles, 2011:155).
2.4.4.5 The extended services marketing mix strategy
Burin (2011:89) proposes the extended services marketing mix as an internal marketing
strategy. Through the use of the 7 Ps (product, price, place, promotion, people, process
and physical evidence) from an internal marketing perspective, organisations are better
able to align internal market activities with the external marketing objectives (Farzad et al.,
2008:1481). This type of strategy forms the basis of the study at hand and each of these
elements will be discussed in further detail in Chapter 3.
2.4.5 Internal marketing strategies pursued by the retail banks in South Africa
Al – Hawary (2013:812) states that given the growth in the service sector and knowledge-
based economy in which retail banks operate, internal marketing is becoming increasingly
significant. Retail banks need to have a much better understanding of the role of
employees in the delivery of service, which leads to the adoption of internal marketing
practices necessitating the need to treat their employees as internal customers (Shekary
et al., 2012:8). The justification for the adoption of internal marketing is that this leads to
employee satisfaction and the development of more customer-orientated employees who
are more willing to create value for customers (Papasolomou, 2006:196). The following
section provides examples of the above-mentioned internal marketing strategies within the
South African retail banking industry.
2.4.5.1 Internal marketing as an internal branding strategy for South African retail
banks
Retail banks make use of internal branding activities to engage employees in their
branding process. In this way employees are then able to better represent the bank’s
brand to the external market (Devasagayam et al., 2010:211). This is achieved through
the open communication of the bank’s brand values, their vision and mission and
objectives on a regular basis. This is achieved through yearly road shows conducted by
the executive management teams, through monthly circulars and multimedia messaging.
Banks also utilise induction programmes to communicate the values, vision and objectives

58
in order to ensure the alignment of new employees with the bank’s brand and external
marketing strategy (Clarke, 2012).
2.4.5.2 Internal marketing as an employer branding strategy for South African retail
banks
Banks place a large emphasis on their Graduate Development Programmes in order to
attract the most skilled and educated individuals for vacant positions. They make use of
current employees to market the banking brand to universities with the intention of
creating a desirable perception of the bank (Clarke, 2012). It is through these internal
marketing activities that the banks are able to attract the calibre of employees needed to
improve performance, serve as brand ambassadors, enhance service quality and deliver
on the external brand promise (Yaghoubi et al., 2011:80; Punjaisri et al., 2009:210).
2.4.5.3 Internal marketing as a change management strategy for South African retail
banks
A retail bank implementing a service improvement programme across the bank will require
all employees to buy into the programme The programme may require that the employees
are expected to adopt new ways of behaving and training, and development may be
required in order to teach employees the new skills so that they are able to perform as
required. Unless employees understand exactly what is expected of them and understand
the “What’s in it for me?”, the change will be met with resistance (Fisk, 2013). Banks in
this instance use change management techniques to communicate through various
channels in order to create an awareness of the service improvements needed and obtain
buy-in to the impending change (Edmonds, 2011:352).
2.4.5.4 Internal marketing as an internal communication strategy for South African
retail banks
Most banks have formal communication channels in place. Monthly magazines
highlighting past performances, celebrating performances and creating hype about things
still to come are frequently utilised by banks. Most banks also make use of a TV channel,
predominately in the branch network, to educate and inform staff on all pertinent issues
(Fisk, 2013). Interdepartmental communication is also vital for cross-functional alignment
between business units (Li, 2010:10). For example, the branch network has regional
monthly meetings where various managers from operations, sales, service and other

59
business units come together to discuss issues and generate possible solutions (Clarke,
2012). Internal communication is a very broad area of research. For the sake of the
internal communication discussion in this section, a very-high level view has been
provided, and internal communication will be elaborated on in more detail in Chapter 3
(section 3.2.3).
2.4.5.5 The extended services marketing mix for South African retail banks
Retail banks make use of many channels to serve their customers, an example of the 7
Ps in practice is considered from a banking branch perspective which is the channel
utilised to serve their walk-in customers. In order to create value using the 7 Ps, the
following elements would have to be in place. All employees, both frontline and back office
staff, need to have clear job descriptions informing them of their roles and responsibilities.
Processes (such as the account opening process) need to be clearly understood, visible
and effectively aligned (Clarke, 2012). Effective communication is required between all the
internal functions like the branch and operations, the branch and marketing. Given it is the
employees who will be serving the customers it is vital that they are properly inducted into
the bank, understand the banks vision and objectives, are trained and developed, and
sufficiently rewarded and incentivised for excellent service delivery (Fisk, 2013).
Employees would also need to be empowered to serve customers better and the right
kind of physical environment in terms of branch layout, air conditioning and lighting is
necessary for increased employee satisfaction which will drive customer satisfaction
(Schneider, 2013; Mansoor et al., 2011:52).
An internal focus on marketing and the successful implementation of internal marketing
strategies is important as it addresses the internal environment of an organisation,
promotes the organisation and its services to employees, and enables a better adaptation
of employees to the organisation and their internal environment. In this way, employees
are better equipped to deal with external marketing challenges, thus increasing a bank’s
chance for success (Rodrigues & Pinho, 2010:174). In order to achieve this, it is important
that strong relationships are created internally between management and employees, and
between employees across functions and business units (Ali & Haider, 2012:38). The
following section focuses on the importance of internal relationships in detail with specific
emphasis on the role of internal marketing in the creating of strong internal relationships.

60
2.5 INTERNAL RELATIONSHIPS
If the function of marketing is to create and deliver value for external markets it is essential
that collaborative relationships are established within the internal environment between
internal customers and internal suppliers in order to eliminate silo effects which will
prevent the flow and transfer of knowledge (Yang et al., 2011:154-155). This implies that
marketing will need to work in collaboration with non-marketing areas and employees to
exchange information and share the same vision, goals and resources in order to
generate value for customers (Guenzi & Troilo, 2006:975-976). In this way, a knowledge-
generating environment can be established in which knowledge is effectively coordinated
and shared (Kotlarsky, van Fenema & Willcocks, 2008:98-99).
Dodd (2011) suggests that organisations should plan and build close and flexible
relationships within and between their internal functions as internal relational exchanges
need to be successful before external relationship requirements can be met. The internal
marketing concept emphasises the importance of internal relationships and teamwork for
strategy success. Thomas and Pretat (2009:14) suggest that teamwork is required for the
effective transfer of knowledge which then generates new ideas and ensures that the
organisation’s culture can be maintained or improved. Collaborative relationships can also
be viewed as a source of social and organisational support to the internal market. It is this
support that enhances commitment and teamwork by giving employees a sense of pride
in belonging to the organisation. Employees feel they are part of a successful team and
believe they are making an important contribution, which is expected to lead to higher
levels of commitment and high levels of employee satisfaction which in turn translate into
service excellence, increased customer loyalty and higher profits to the organisation
(Esfahani et al., 2013:2-3). If employees as internal customers and internal suppliers do
not function as a team, service errors are more likely to occur, meaning that any errors or
inefficiencies experienced during the service delivery process will affect the customer’s
perception of value, causing friction in the relationship between the customer and the
organisation and between employees across functions. Such friction can only be reduced
through the development of strong internal relationships conditioned and nurtured in
commitment and trust (Herington, Johnson & Scott, 2006:373).
2.5.1 The purpose of internal marketing in the creation of internal relationships
Abzari and Ghujali (2011:96) suggest that the purpose of internal marketing is to engage
employees in order to overcome organisational resistance to environmental and business

61
change. Employee engagement has been defined as “an individual employee’s cognitive,
emotional and behavioural state directed toward desired organisational outcomes” (Shuck
& Wollard, 2010:103). According to Bhatnager (2007:646-647), engagement is described
as “a positive, fulfilling, work-related state of mind that is characterised by vigour,
dedication and absorption.” Engagement is composed of two vital components: attention
and absorption. Attention relates to the level of the employees’ cognitive accessibility and
the amount of time spent thinking about their function, whilst absorption refers to the
intensity of the employees’ focus on their function (Saks, 2006:601). Employees who feel
safe in their environment are far more accessible and highly absorbed in their work as
they feel part of something bigger (Shuck, Rocco & Albornoz, 2011:313). As a result,
employees who are fully engaged are involved and passionate about their work and the
services they provide to customers (Luna-Arocas & Camps, 2008:27). Grayson and
Sanchez-Hernandez (2010:6) believe that internal marketing should be considered as a
method for enhancing employee engagement. These authors suppose that the role of
internal marketing involves far more than the attraction and motivation of employees, it
highlights the need for cross-functional coordination across employees and business units
in order to achieve customer satisfaction (Sincic & Vokic, 2007:10-11). The fundamental
nature of internal marketing is to improve internal communications and customer
consciousness among employees in an effort to improve external market performance
and customer satisfaction. Broadly speaking, the purpose of internal marketing is to
involve employees in the organisation’s mission and strategy direction and help them
understand the organisation’s objectives and their role in achieving these objectives in
order to create value for customers (Mahmood, 2013).
From the above discussion, it can be concluded that the purpose of internal marketing is
to concentrate on the internal relationship between employees and the organisation in
order to ensure that employees are motivated and engaged and effectively managed to
ensure a customer and service orientation (Sanchez-Hernandez & Miranda, 2011:208).
This will therefore ensure that customers receive higher levels of service quality resulting
in increased customer satisfaction and retention (Hoffman & Bateson, 2006:271-272).The
next section looks at the internal environment and the role of internal marketing in creating
an internal environment in which strong internal relationships are cultivated.
2.5.2 The internal environment
The internal marketing environment of organisations consists of two characteristics,
namely tangible and intangible characteristics. Tangible characteristics include

62
organisational resources, functional departments, systems and processes, while
intangible characteristics would be human capital, culture, mission and objectives,
leadership, alignment and teamwork (Klopper, et al. 2006:27; Kaplan & Norton, 2004:12).
When both the tangible and intangible aspects are aligned with the external marketing
objectives, the organisation has a higher degree of actioning its strategy (Murby & Gould,
2005:15).
Employees are at the heart of organisations. It is the employees who pull everything
together, so it is essential that their needs are taken into consideration when designing
and developing the organisational strategy (Conradie, 2012:101). It is also essential that
employees are included in the development of the organisational strategy and are
informed about the organisation’s customer needs, expectations, products, services,
concepts and business initiatives. Through this approach, shared goals can be created
which results in a common understanding of tasks and outcomes resulting in employees
working together as a unit to achieve the organisational objectives (Yang et al., 2011:154).
For this reason, internal marketing aims at creating an appropriate internal environment
where strong internal relationships are created in which employees are engaged and
encouraged to work together in a coordinated fashion in order to transfer knowledge and
generate ideas and innovations that create value for customers (Peltier & Dahl, 2009).
In this way organisations can ensure that a continuous flow of knowledge takes place
between employees, as well as between the various business units. It is widely
recognised that the successful management of tacit knowledge transfer can make a
significant contribution to an organisation’s success. Tacit knowledge is defined as
knowledge which is derived from personal experience, it is subjective and difficult to
formalise, and is generally transferred from one person to another through an
apprenticeship. It is tacit knowledge that the organisation needs to nurture and manage in
order to develop individual skills and expertise (Paton & Karunaratne, 2009:282-283).
Paton and Karunaratne (2009:282-283) propose that “knowledge and intellect grow
exponentially when shared. If two people exchange knowledge with each other, both gain
information and experience resulting in a linear growth. However, if both of them share
their new knowledge with others, the benefits are exponential”. Naidoo (2009:38) specifies
that if organisational knowledge is shared, it becomes entrenched in the organisation’s
processes, products and services which makes these unique to the organisation and
therefore difficult to copy, giving the organisation a unique competitive advantage. The
development of an appropriate internal environment characterised by strong internal

63
relationships provides the motivation and ability for employees to transfer tacit knowledge
within the organisation (Yang et al., 2011:154).
Section 2.5.2.1 and 2.5.2.2. consider how trust and commitment and cross-functional
integration help create the required internal environment in which strong internal
relationships are fostered, allowing for the transfer of knowledge between employees and
the achievement of the internal marketing objectives.
2.5.2.1 Trust and commitment
Trust and commitment have been identified as key virtues which underpin relationships
(Ndubisi, 2007:99). Ndubisi (2007:100) defines trust as “a willingness to rely on an
exchange partner in whom one has confidence”, and commitment as “an enduring desire
to maintain a valued relationship”. Trust, commitment and understanding are fundamental
to internal marketing and the creation of the internal environment. The main reason being
that these factors create psychological safety for the employee which is referred to as a
state in which people feel safe to be honest about what they think and feel. It is through
this psychological safety that relationships can be successfully developed as employees
are more likely to act transparently and with integrity when they feel psychologically safe
in their environment (Eggers; 2013, Williams; 2013, ). In addition, this psychological safety
ensures that employees are fully engaged allowing them to perform their roles more
competently and deliver service excellence to customers (Slatten & Mehmetoglu, 2011:90;
Brown et al., 2009: 6-7). It is important therefore that all internal marketing processes are
conditioned in trust, referring to trust in leadership, processes and systems. To build trust
and commitment an organisation needs to know and understand its employees and itself
thoroughly. Internal marketing helps in the development and growth of trust and
commitment among parties. By looking after the needs of the employees, internal
marketing provides a clear message to the internal market that the organisation values its
employees. If employees feel valued and psychologically safe they will be more willing to
share knowledge and generate ideas (Eggers, 2013; Williams, 2013; Ahmed & Rafiq,
2003:1181-1182).
2.5.2.2 The role of cross-functional coordination in creating relationships in the
internal environment
Throughout the value chain, each employee is responsible for generating customer value,
either directly or through internal cross-functional relationships and teamwork with the aim

64
of creating value in all steps of the value chain (Panigyrakis & Theodoridis, 2009:605-
606). Cross-functional coordination brings employees from all parts of the organisation
together in order to achieve the organisational objectives. Through the internal customer-
supply chain (value chain) a network of relationships is created and through internal
marketing practices, all employees understand their role and their impact on the next
customer in the value chain (Matanda & Ndubisi, 2013:1036; Guenzi & Troilo, 2006:976).
Cross-functional coordination is therefore essential in creating and aligning relationships
within the internal environment and assisting in the transfer of knowledge. Personal
relationship theory suggests that mutual interdependence is also created between parties
in the value chain which reduces the risk of one party acting in their own interests as this
adversely affects the partnerships. Relationships between internal customers and
suppliers are crucial as the outcome of these alliances depends not only on what each
party does individually, but also on the joint decisions and actions (Sambasivan, Siew-
Phaik, Mohamed & Leong, 2011:552). It is therefore important for organisations to build
relationships with their employees on all levels from top management level right down to
shop-floor level (Grönroos, 2007:387). This helps to establish an internal environment
which is based on trust, where employees feel psychologically safe, are fully engaged,
motivated and committed to the transfer of knowledge and improved collaboration
(Willams, 2013; Wang & Noe, 2010:121). The management of internal relationships and
the creation of an appropriate internal environment are essential for the satisfaction of
employees and their loyalty and retention in the long run (Ali & Haider, 2012:40). The
following section provides the backdrop for the discussion of employee satisfaction,
retention and the role of affective commitment.
2.6 EMPLOYEE SATISFACTION AND AFFECTIVE COMMITMENT
If employees are unhappy in their internal environment, they are likely to feel disengaged,
underpowered and highly unappreciated, which would drive employees to recede from the
organisation and seek employment elsewhere (Barnes & Collier, 2013:490-491). Peltier
and Dahl (2009) suggest that the internal environment affects the service capability of
employees which influences employee satisfaction. This in turn, affects the retention of
employees. In other words, if organisations such as retail banks are able to create the
appropriate internal environment in which strong relationships are fostered and employees
are fully engaged, this would improve the service capability of employees through more
empowered decision-making which would allow them to create value throughout the entire
internal customer-supply chain. This would result in more satisfied employees, higher

65
levels and more consistent levels of service quality resulting in higher levels of customer
satisfaction (Emerson, 2007:59).
Inadequate retention of employees generates high employee turnover costs for the
organisations such as hiring costs, training costs and productivity loss which continue to
cause concern for organisations. Replacement costs are usually two-and–a-half times the
salary of the individual. The costs associated with turnover may also include lost
customers, lost sales, high error rates, longer customer wait times and damaged morale
resulting in lower service quality (Hausknecht & Trevor, 2011:360; Workforce Planning
Wisconsin State Government, 2005). Furthermore, employees who have left an
organisation also increase the likelihood of customer service issues and complaints and
create challenges over the long term (Zheng, 2009:497-498). Employee satisfaction
therefore becomes a key issue for organisational success and has been recognised as
the ultimate motive of internal marketing as it serves to improve loyalty, reduce turnover
and therefore improve retention rates (Nittala & Kameswari, 2009:211).
Given that internal marketing efforts have been proven to develop better relationships
between employees and their organisations with increasing satisfaction and retention,
many organisations are turning to internal marketing practices in order to better motivate,
satisfy and retain employees by developing healthy relationships with these employees
(Peltier & Dahl, 2009; Sim, 2008:34). As it is understood, healthy, well functioning internal
relationships are a prerequisite for healthy, well functioning external relationships
(Mitrega, 2012:488). Further to this, satisfied, happy employees develop a stronger level
of affective commitment to organisations which results in employees remaining with
organisations for longer (Boles et al., 2007:311).
The following discussion focuses on the link between employee satisfaction and affective
commitment in creating both employee and customer loyalty and retention.
2.6.1 Role of employee satisfaction and affective commitment in creating internal
and external customer satisfaction, loyalty and retention
Naseem et al., (2011:42) believe that employee satisfaction is in fact job satisfaction.
Bontis, Richards and Serenko (2011:242) suggest that employees who experience job
satisfaction are more likely to contribute more to the organisational objectives, possess a
positive self concept about work, and demonstrate greater self-determination which
results in greater effectiveness and higher levels of service. Employee satisfaction also

66
increases enthusiasm and engagement in all service encounters which results in
increased customer satisfaction and greater customer orientation, meaning that customer
needs are better understood so that value can be created on an ongoing basis (Che Ha et
al., 2007:137). Satisfied employees are also more effective at transferring knowledge,
specifically in an environment built on trust (Wang & Noe, 2010:118).
Employee satisfaction is regarded as a prerequisite for loyalty, meaning that loyalty
develops from satisfaction and mediates the effects of satisfaction on turnover variables.
Therefore, when employee satisfaction is high, employee loyalty will be higher too. (Gibbs
& Ashill, 2013:310). Turkyilmaz et al. (2011:9) describe loyalty as the psychological state
which characterises the relationship between the employee and the organisation, and the
employee’s identification and involvement with the organisation which impacts his/her
decision to remain with the organisation. Employees who are loyal and committed exhibit
higher job performance, less job dissatisfaction, more ethical behaviour, diminished intent
to leave, less stress, and organisational citizenship. In addition to this, their personal goals
and objectives such as growth and development are aligned with those of the
organisation, resulting in happier employees (Farzad et al., 2008:1481).
Calisir et al. (2011:516) state that the strongest predictor of loyalty and employee
intention to remain with organisations is organisational commitment. Research conducted
by Lumley et al. (2011:107) states that satisfied employees are more committed to
organisations and employees who are more committed stay with organisations for longer.
In addition to this, they arrive on time, perform well and go the extra mile to serve both
internal and external customers.
Organisational commitment can be defined as affective, normative or continuance.
Affective commitment is considered to be the most effective measure of organisational
commitment and loyalty due to the feelings of belongingness and attachment employees
develop towards the organisation. Affective commitment has been described as the
employee’s state of emotional commitment to the organisation and is influenced by factors
such as organisational support. Employees link their identity to that of the organisation
and form an emotional commitment with the organisation which goes beyond the
organisation’s instrumental worth. As a result, employees desire to continue their
association with the organisation (Awwad & Agti, 2011:311). Ugboro (2006:236) and
Baptiste (2008:292) posit that employees with a strong affective commitment remain with
organisations because they want to as opposed to having to, and are willing to exert extra

67
effort on behalf of the organisation in pursuit of the organisation’s objectives (refer to
Chapter 4, section 4.5.1).
The focus of the study is on affective commitment since it has been demonstrated to have
a strong positive relationship with job satisfaction (Dimitriades & Papalexandris,
2011:146). Boles et al. (2007:311) state that satisfied employees tend to be more
affectively commitment and affectively committed employees stay with organisations for
longer, which contributes to better service, stronger financial performance and profitability
(Moodley, 2008:67; Hoffman & Bateson, 2006: 271). This is due to the fact that
organisations benefit from affective commitment and employee loyalty in the form of
reduced attrition costs and in the form of stronger employee-customer relationships
resulting in increased sales volumes, increased cross-sell opportunities, better operating
efficiencies, positive word-of-mouth publicity, improved customer feedback and decreased
marketing expenses (Izquierdo, Chillan & Gutierrez, 2005:233). One of the major
elements contributing to organisational success and profitability is customer satisfaction.
The more satisfied the customer, the more durable the relationship meaning that
customers are more effectively retained (Ibhar Technologies, 2011).
Datta (2010:1-2) posits that customer retention is a prime issue for organisations looking
to improve profitability and build a sustainable competitive advantage. For retail banks in
particular, the longer customers are retained, the better the benefits in terms of a
sustained income stream. This is due to more effective cross selling of banking products
which relates to the number of products held by one customer leading to higher net
present value of customers (Datta, 2010:1-2; Farquhar, 2004:88). In addition to this,
satisfied, loyal customers become advocates of the organisation and are more likely to
make recommendations which lead to better revenues, profit and cash flow which all
influence the organisation’s stock price and market valuation (Williams & Naumann,
2011:10-20). Given that satisfied employees make satisfied customers, the satisfaction
and retention of talented employees create a stable and experienced labour force that
delivers higher service quality to customers at a lower cost, leading to greater customer
satisfaction, retention and profitability (Ibhar Technologies, 2011).
2.7 CONCLUSION
Given the dynamic nature of the banking environment, complex work environments and
high levels of stress, retaining employees remains a challenge for the banking industry,
specifically GDP employees. This poses a challenge which has serious cost implications

68
for banks given the substantial level of investment put into these employees (Anani,
2010:2; McDermott et al., 2006:457). In order to achieve a sustainable competitive
advantage created through these customer-orientated employees, retail banks have to
look at a variety of solutions aimed at satisfying this internal group and retaining them over
the long run in order to create value for customers. One solution to the challenge at hand
is the implementation of an internal marketing programme (Illiopoulos & Priporas, 2011:2-
3).
This chapter provided a background into the characteristics of services and how internal
marketing plays a role in the services industry. The chapter focuses on the role of internal
marketing in enhancing internal relationships (a prerequisite for external relationship
success) and in the development of the internal environment. Organisational structure and
culture were also discussed as necessary components to support internal relationships.
The chapter concluded with a discussion on enhanced customer satisfaction through
enhanced employee satisfaction, loyalty and retention.
The following chapter delves deeper into the internal marketing concept by considering
the internal marketing mix elements and the role they play in creating and supporting an
appropriate internal environment which enhances internal relationships and drives greater
levels of employee satisfaction, loyalty and retention.

69
CHAPTER 3
THE INTERNAL MARKETING MIX
3.1 INTRODUCTION
The purpose of internal marketing is to apply the concepts of external marketing within the
organisation’s internal market. For this reason, in order to utilise external marketing
principles it is essential that an internal marketing mix be developed and implemented
(Abzari & Ghujali, 2011:96). Dhiman and Sharma (2009: 456) define the marketing mix as
an important component of the marketing function as it relates to the strategy used to
perform marketing activities and the package of elements used to achieve the
organisational objectives. The internal marketing mix applies the same definition, but
purely from an internal perspective with focus on the internal package of elements
required to achieve both the internal and external organisational objectives.
Initially, 12 Ps were put forward as the marketing mix, these elements consisted of:
product planning, pricing, branding, channels of distribution, personal selling, advertising,
promotions, packaging, display, servicing, physical handling, fact finding and analysis
(Singh, Chakraborty & Raju, 2011:49). The marketing mix was refined further and viewed
as a combination of all the factors at the marketing manager’s disposal to satisfy the
target market. The 12 marketing mix elements were thus regrouped to four elements,
namely product, price, promotion and place (distribution) (Goi, 2009:3).
The concept of the internal marketing mix proposed that the four Ps of the external
marketing mix discussed in the previous paragraph be applied internally. The internal
product, internal price, internal promotion and internal distribution could be used to
facilitate the process of organisational change as each of these influence the techniques,
systems, the structure of power, and the culture of the organisation’s internal environment
(Abzari & Ghujali, 2011:96; Javadein et al., 2010:366-367). The initial 4 P marketing mix
however was based on a world characterised by stability, economic growth and much less
competition rendering it inadequate in the modern world (Afridi, 2011:139). In the 1990’s a
new perspective of internal marketing emerged known as the processional perspective
whereby the focus shifted to the development of relationships between organisational
members with the concept of the internal customer and internal supplier being
emphasised. A stronger relational approach to internal marketing is necessary, as both
internal and external customer behaviour have evolved due to the shifting of mass

70
marketing to a more customised relationship building approach (Kotler & Armstrong,
2006:67).Technological advancements have provided customers with easy access to
information which has resulted in the increased sophistication of customers (Kimmel,
2005:135). Organisations are having to constantly evolve and improve communication
with customers in order to meet their changing needs. In addition to this, organisations
need to respond quickly to competitive actions and for this reason, organisations must
have strong relationships with the internal and external market (Constantinides,
2006:413).
Academics therefore propose that if the four Ps are accepted as the marketing mix, in this
case the internal marketing mix, modified versions and new elements would need to be
added to these factors. Additions would need to be made in the service sector specifically
where the four Ps as an internal marketing mix is considered insufficient, given the
intangible nature of the ‘product’ being marketed in the internal marketing context and the
simultaneous production and consumption of internal services (Afridi, 2011:139;
Constantinides, 2006:409). In addition to this, internal marketing stresses the need for
integrated effort and strong internal relationships which requires additional elements to be
added to the traditional four Ps marketing mix (Ali, 2012: 244; Ahmed & Rafiq, 2002:27).
The internal marketing mix was developed even further to include an additional three Ps
of services marketing namely people, process and physical evidence into the mix. The
unique characteristics of services drive customers to search for evidence of service in
each of their interactions with the organisation. These additional elements provide internal
customers with evidence that the service has been delivered and allows them to formulate
their own judgement regarding the quality of service received (Mudie & Pirrie, 2006:6).
Given that the study is focused on the service sector, Ahmed and Rafiq’s (2002) extended
services internal marketing mix will be used as the internal marketing mix for the purpose
of the study as suggested by Burin (2011:89). Each of these elements will be discussed in
detail next.
3.2 INTERNAL MARKETING MIX ELEMENTS
Mudie and Pirrie (2006:5) state that the marketing mix, or in this case the internal
marketing mix, is composed of the controllable elements inside the organisation to satisfy
or communicate with internal customers. For the purpose of this study, the internal
marketing mix elements refer to the extended services marketing mix elements
comprising: internal product, internal price, internal promotion, internal distribution, internal

71
people, internal process and internal physical evidence. These controllable internal
marketing elements are used to influence employee attitudes and behaviours and if used
correctly, are able to obtain the desired organisational results.
For the purpose of the study, internal product is referred to as the employee’s job and the
additional factors which go beyond the tasks such as training and development,
empowerment, role fit and clarity and career advancement opportunities (Yang, 2012;
Grayson & Sanchez-Hernandez, 2010:9). Internal price is referred to as the price that
employees pay to work for the organisation, in other words the sacrifices that they make
(Ziethaml et al., 2012:517). Internal price will thus include opportunity costs, psychological
costs and emotional labour costs. Internal promotion refers to activities (internal
communication) and incentives (reward and recognition) geared towards getting employee
attitudes in line with the organisational objectives and values (Javadein et al., 2010:369).
Internal distribution refers to the channels needed to get the job to the internal customer
and for the purpose of the study includes organisational culture and organisational
structure (Kasper et al., 2006:400). Internal people refers to the human factor involved in
the service delivery process and for the purpose of the study includes, relationship with
supervisor/direct manager, relationship with co-workers and leadership style (Peters &
Mazdarani, 2008:33). Internal process refers to the processes and procedures in which
the internal product and the service are delivered (Zeithaml et al., 2012:27). Finally,
internal physical evidence is referred to as essential or peripheral. Essential evidence
relates to the actual physical environment in which the internal job is delivered and
peripheral evidence relates to the proof that the product has been delivered, specifically
relating to the things employees can keep such as performance feedback reports (Ahmed
& Rafiq, 2002:34). Figure 3.1 provides a framework of the internal marketing mix elements
and the relevant discussion points (developed from the literature).

72
Figure 3.1. The internal marketing mix elements framework
Source: Researcher’s own construct.
These internal mix elements and each of the factors making up the elements are
discussed in detail below.
3.2.1 Internal product
From an external marketing perspective, product is described as anything that
organisations offer to their customers in order to satisfy needs. For service organisations
the product represents the service provided to customers by the organisation’s employees
(Yang, 2012). From an internal perspective, product generally relates to the employee’s
job. Approaching jobs as products goes beyond the tasks which need to be fulfilled on a
daily basis; it also takes into consideration factors such as training, level of responsibility,
involvement in decision-making (empowerment) and career opportunities as the
components of internal product. Without well designed internal products the organisation
has limited hope of engaging employees and achieving the organisational objectives
(Yang, 2012; Grayson & Sanchez-Hernandez, 2010:9).
Conradie (2012:118) suggests that an internal product can be presented at three levels,
namely the strategic level, tactical level and fundamental level. The strategic levels refer
to the organisation’s marketing strategies. Kotler and Keller (2009:43) state that marketing

73
strategy and marketing plans should be incorporated into internal products, the marketing
strategy that should be entrenched into employees includes values, thoughts and
behaviours, whilst the marketing plan is the tool used for directing and coordinating all
marketing efforts in order to create value for customers. The tactical level refers to the
services and training offered to employees by Human Resources. Fair HR policies and
practice result in employees feeling respected and treated fairly, which leads to increasing
trust in internal relationships and the internal environment (Conradie, 2012:118;
Vasconcelos, 2008:1256). At the fundamental level, internal product refers to the job itself.
The employee’s job plays a key role in the exchange process which takes place between
the employee and the organisation (Cano & Sams, 2009:286; Anosike & Ahmed, 2006:6).
This implies that organisations use marketing tools to sell jobs (internal products) to
employees and employees buy and assess these internal products much the same way
as customers buy and assess a product or service (Vasconcelos, 2008:1255).
In a nutshell, organisations need to provide satisfying job experiences in return for
employees’ expertise and commitment. In addition to this, organisations must concentrate
on role fit and role clarity to ensure that employees have clarity about performance
expectations which will result in heightened feelings of satisfaction (Halepota & Shah,
2011:285). Organisations therefore need to offer jobs as products that are designed to
offer features employees value rather than just describing the task requirements. In this
way jobs can be used to attract and retain customer orientated employees in the
organisation (Conradie, 2012:118; Vasconcelos, 2008:1255-1256).
Esfahani et al. (2013:2-3) and Vasconcelos (2008:1256) suppose that in order to create
jobs as internal products which create value for employees, it is important that
organisations understand employee needs and conduct research internally in order to
better understand their job aspirations, dreams and goals. In this way internal products
can be designed for different employee segments based on their needs and core
competencies. In addition to this, factors which are important to employees need to be
incorporated into internal products which will then create value for employees and
increase their levels of satisfaction. If employees are satisfied they are less likely to leave
the organisation, meaning that talented customer-orientated employees can be retained
within the organisation (Bowers & Martin, 2007:91). This has many benefits from a cost-
reduction perspective, but additionally it ensures that quality customer-oriented employees
are in place to serve as part-time marketers, therefore delivering on the external promises
made (Bhatnager, 2007:641; Kale, 2008:5).

74
Based on the previous discussion, training, empowerment, role fit and clarity, and career
opportunities for advancement have been selected as the components of internal product
(Yang, 2012; Grayson & Sanchez-Hernandez, 2010:9; Gounaris, 2008b:72).The following
section considers each of these factors in more detail below.
3.2.1.1 Employee training and development
Oyitso and Olomukoro (2012:70-71) describes training as the acquirement of knowledge
and skills that enable employees to perform their jobs more effectively. Pynes (2009:216)
claim that employees need to understand their purpose within the organisation and they
need to feel competent and valued. Markos and Sridevi (2010:93) recommend that
organisations contribute to these needs through informing and educating employees
about what needs to be done and by providing the resources to complete their work
effectively. This makes training a powerful marketing tool and an essential ingredient in
enhancing employee engagement. Shuck et al. (2011:319) also suggest that learning and
development programmes closely aligned with the organisation’s vision, mission and
values and strongly grounded in the organisational culture, should be available at all
levels of the organisation. These learning and development programmes can take place
through many channels. One of the most effective is through a supervisor or mentor who
coaches employees based on feedback from compliments or complaints, in this way they
learn skills as and when they are needed (Burin, 2011:91).
Training as a component of the internal product also helps build self esteem, allowing
employees to feel more professional and more respected by customers and more
dedicated to handling difficult customers and situations which can reduce both person and
role stress (Lovelock, Writz & Chew, 2009:291). Further to this, given that employees are
such an important part of the internal product or service delivered, they need to be trained
as part-time marketers with customer retention skills. This would allow employees to build
and maintain relationships with customers on an ongoing basis (Illiopoulos & Priporas,
2011:2). However, employees cannot contribute to customer satisfaction or organisational
performance if they do not have the necessary information, skills or training and coaching
to do so (Brown et al., 2009).
Training contributes to the internal marketing objectives as the sharing of knowledge and
information is vital for the creation of an internal environment based on trust (Wang &
Noe, 2010:118).Training as a component of internal product is essential as this is viewed
as the leading factor for professional growth (GRReporter, 2011). Retail banks send their

75
employees to seminars and various internal and external training programmes in order to
increase their knowledge and skills in their field. Retail banks invest a substantial amount
into their Graduate Recruitment Programmes whereby selected graduates undergo
extensive training across various organisational functions with the intention of fast tracking
these talented employees into key managerial positions (McDermott et al., 2006:460;
SBSA, 2011). Training increases promotional prospects for employees and helps increase
awareness of new trends and procedures which is crucial for professional development
(GRReporter, 2011). Oyitso and Olomukoro (2012:75) believe that training improves
employees’ skills and abilities enabling them to perform tasks better, which results in an
increase in job satisfaction and commitment hence improving employee and
organisational performance.
3.2.1.2 Employee Empowerment
Kim (2013:6) put forward that empowerment can be seen as an important element for
employee satisfaction as it fulfils basic human needs in a job situation such as personal
development and feelings of meaning and worth. It also links to the heterogeneity
characteristic of service in that no two customers are the same. Each customer has
his/her own unique needs and demands which means that employees need to understand
these various needs and adapt their behaviour accordingly (Slatten & Mehmetoglu,
2011:92).
Organisations should also apply a similar approach internally and recognise that each
employee in the internal customer value chain has their own unique needs and demands
which need to be taken into consideration. This can be a very challenging task for
employees, but empowerment allows the constraints of the service blue print to be
removed, giving the employees more power to act when serving different external and
internal customers (Gounaris, 2008a:409). For employees to experience satisfaction, they
should be given more authority in dispensing their duties which makes empowerment an
important aspect of internal marketing (Gupta, 2012:176).
Empowerment provides greater autonomy to employees in terms of how they think,
behave, control work and make decisions. Employees tend to feel more confident and
appreciated if they see the meaning in what they do. This allows them to respond to
customers faster, increasing productivity, and improving the service experience ( El
Samen & Alshurideh :2012:86) Empowerment is an important part of internal marketing

76
given it can have a major impact on employee satisfaction when implemented correctly
(Kim, 2013:1; Sahi et al.2013:387 ).
Sim (2008: 26) states that in a retail banking setting, employees fill a myriad of different
roles ranging from frontline customer contact employees to back office, process
administration employees, to employees in various management and support functions
such as HR and marketing. Employees in frontline positions need to match the
organisation’s products and services with customer needs. They collect and disseminate
customer intelligence and act as part-time marketers in terms of promoting the bank’s
image to the external market (Kyriazopulos et al., 2007:2). Employees in back office,
management and support functions, although not in direct contact with customers, need to
respond to customer requests in a timely manner in order to ensure that quality services
are provided (Sim, 2008:26). For this reason, in order to deliver value to internal
customers in the internal value chain, it is essential that employees throughout the
organisation are empowered to act and are provided with the discretion to fulfil their job
roles successfully (Palmer, 2011:445).
3.2.1.3 Role fit and role clarity
(Saeed & Asghar, 2012:12180) posit that it is essential to ensure that the job fit between
the employee and the role is right, meaning that there needs to be a sufficient level of
comfort between the employees, their role and the internal environment. If employees
adapt well to an organisation, they are less likely to leave (Matanda & Ndubisi,
2013:1032). Important to note here is the employees’ value orientation. A bank employee
may have a higher preference for the technical aspect of their job, such as an IT specialist
looking after a core banking system (task orientated), or they may have more interest in
the social aspect of the job like a private banker interacting with high networth customers
on a daily basis (people orientated). Organisations that are aware of their employees
value orientation and take this into consideration when designing jobs are more likely to
retain their workforce (Matanda & Ndubisi, 2013:1032; Holtom & O’Neill, 2004:5-6).
Gounaris (2008b:83) states that through an internal marketing programme, organisations
are required to understand the value employees look for in their jobs and ensure that
there is a good fit between employee needs and specific tasks.
Although employees look for challenges, their knowledge, skills and abilities must match
their jobs, otherwise they are likely to experience stress which will impact negatively on
their job performance (Towers Watson, 2012:12; Saeed & Asghar, 2012:12180).

77
Employees who experience a good degree of job fit, are able to use different skills and
develop personally and professionally and are more likely to be engaged with their work
and are overall, more productive employees (Shuck et al., 2011:319; Martensen &
Gronholdt, 2006:98). This makes role fit an important component of internal product.
Holtom and O’Neill (2004:4) suggest that role fit can also contribute to the internal
marketing objectives specifically from an employer branding and ‘employer of choice’
perspective, as talented customer-orientated employees can be obtained and retained in
retail banks through better role fit. When organisations focus on elements such as salary
and bonuses, short-term victories may be achieved, but over the long run if factors such
as role fit are ignored, these employees will leave the organisation. One of the most
important factors therefore in employee performance and retention is a good fit between
the employees and their job (June & Mahmood, 2011:97). Additionally, Halepota and
Shah (2011:285) suggest that role clarity is essential for improved employee productivity
and performance. Role clarity relates to the responsibilities and expectations of the role
which must be made clear to employees to enhance their performance (Ryan, 2012:20).
When employees are clear about role and job expectations, uncertainty can be reduced
as employees adjust to their jobs more comfortably (Halepota & Shah, 2011:285).
From a retail bank’s internal marketing perspective it becomes essential that employees
are provided with information pertaining to the external marketing strategy and external
promises made to customers. When banking employees understand the organisation’s
internal and external brand or marketing strategy, they are better able to understand the
role they play in delivering the strategy and the rationale behind management decisions
(Melcrum Connecting Communications, 2013). This in turn enables the delivery of service
quality through the desired organisational behaviours. From a retail bank perspective the
right employees should be recruited into the organisation and provided with clear job
descriptions and KPIs (Key Performance Indicators) which clearly specify performance
deliverables. Further to this, employees should understand how their individual
performance criteria tie into the broader banking objectives (King, 2010).
3.2.1.4 Career advancement
Organisations could also market jobs to employees as a source of status enhancement
which can be achieved through career development programmes. If employees perceive
that they are gaining benefits in terms of status enhancement, they are more likely to be

78
fully engaged and adopt more innovative approaches to customer service (Slatten &
Mehmetoglu, 2011:101).
Salvato, Minichilli and Piccarreta (2008:2) define career development as “the evolving
sequence of a person’s work experience over time”. This is assisted through a career
progression plan which is a clearly defined plan of action which prepares the employee for
the future by showing the different steps in the career development path and how the
employee progresses along these steps (Merchant, 2013). Regular competency
assessments need to be conducted to ensure that employees posses the adequate skills
to achieve their career aspiration. If employees are lacking skills required to obtain their
goals and the benefits of status enhancement, mentoring and coaching should be
provided by management to assist employees in this regard (Slatten & Mehmetoglu,
2011:101; Branham, 2005:101).
Danske Bank, the largest financial services provider in Denmark provides employees with
IT tools to access information about the skills and capabilities needed for particular jobs
throughout the bank. Further to this, employees have access to e-learning tools to
develop their skills and experience to move into the jobs that interest them. In this way
Danske Bank empowers their employees to take control of their careers (The Economist,
2007:10).
Internal product can therefore be considered as an important element of the internal
marketing mix given that the provision of service quality to customers is dependent on the
level of dedication and motivation of the service employees (Ahmad, Wasay & Malik,
2012:532). Since employees purchase jobs (internal products) from organisations,
organisations need to ensure that they create internal products that attract, develop and
inspire the right kind of employees. In this way organisations are able to develop strong
employer brands and become the employer of choice, enabling employees to deliver on
promises made through the marketing strategy (Brown et al., 2009; Kale, 2008:5).
Similar to external marketing principles, employees pay a price for internal products which
relates to the sacrifices made by employees to work for the organisation (Yang, 2012).
Yang (2012) and Burin (2011:97) refer to internal price as the opportunity costs, the
psychological costs and the emotional costs employees pay to engage in their jobs. The
next section discusses internal price and the components thereof in further detail.

79
3.2.2 Internal price
Zeithaml et al. (2012:517) suggest that monetary price is not the only price customers pay
for products or services. In terms of internal price, there are many costs borne by the
employee which are not monetary based, but more intrinsic in nature. These intrinsic
costs relate to the price employees pay to work for the organisation, in other words the
sacrifices they make. Job demands have been defined as demands that relate to the
physical or psychological aspects of the job that require continual physical or
psychological effort on behalf of the employee and in this way contribute to the
psychological and emotional costs paid by the employee (Karatepe, 2011:48; Bakker &
Demerouti, 2007:312). The following section considers opportunity costs, psychological
costs and emotional costs as the components of internal price as each of these represent
the intrinsic costs employees pay to work for organisations (Strydom, 2004:164). Each of
these will be discussed in more detail.
3.2.2.1 Opportunity costs
Strydom (2004:164) and Zeithamel et al. (2012:358) believe that there are two kinds of
opportunity costs borne by employees working for organisations. The first refers to
external career advancement opportunities which the employee does not consider since
he/she decides to remain with the organisation. The second refers to the costs incurred as
a result of adapting to organisational change in terms of loss of freedom, teamwork and
sharing of information. An example of this is when a system change may require
employees having to learn how to operate the new system and adapt themselves to new
ways of working. This requires additional time and effort on behalf of the employees which
distracts them from achieving other deliverables (Grayson & Sanchez-Hernandez,
2010:3).
These costs are not always negative though, as new systems may provide employees
with the opportunity to improve their employability or create an opportunity in which they
feel better by doing the right things or doing things more efficiently (Conradie, 2012:122).
Furthermore, the employees’ perception of value will determine their level of involvement
with the organisation (Grayson & Hernandez-Sanchez, 2010:15). If employees experience
stress or distress it may cost them their success due to their natural resistance leading to
a lost opportunity from a professional growth perspective (Vakola & Nikolaou, 2005:161).
Value can be added through internal relationships which enhance the employment
relationship between the employee and the organisation so that the employee has the

80
opportunity to experience satisfying interactions, relationships and opportunities which will
lead to increasing levels of employee satisfaction within the organisation. (Grayson &
Hernandez-Sanchez, 2010:15; Kuo & Kuo, 2010:629).
3.2.2.2 Psychological costs
Psychological costs such as stress relate to the psychological reactions arising from the
comparisons between the demands of the job and the employee’s ability to cope with
these demands (Leung, Chan & Dongyu, 2011:313). Psychological costs incurred by
employees relate to dissatisfaction, distress and burnout (Hu & Schaufeli, 2011:9).
Distress is covered in the next section on emotional labour and this section focuses on
employee burnout as a psychological cost. Burnout refers to employees’ psychological
reactions to their environment (Hu & Schaufeli, 2011:9). Egan (2006:5) describes burnout
as the combination of three interacting factors namely exhaustion, depersonalisation
(disengagement) and reduced personal accomplishment. Karatepe (2011:49) states that
exhaustion is the result of intensive physical or cognitive strain experienced over a long
time period leaving employees feeling tired and strained and unable to meet customer
demands. Depersonalisation refers to a detachment to work with employees developing
negative attitudes towards work or customers. Employees distance themselves from work
and may even experience feelings of dehumanisation. Reduced personal accomplishment
relates to the employees’ negative self image and reduced satisfaction with their
professional development (Egan, 2006:4). Each of these factors result in increased levels
of employee dissatisfaction and disengagement. Further to this, if an employee’s task
performance is affected and he/she are not able to perform their job effectively, this will
result in conflict with co-workers, supervisors and senior management. If the psychological
costs can be controlled, employees are able to perform their jobs well which will positively
impact interpersonal relationships with others. This in turn leads to a more integrated
internal environment and stronger organisational performance (Leung et al., 2011:315-
316).
3.2.2.3 Emotional cost and labour
Karatepe (2011:45) believes that service employees need to deal with customers on an
emotional level. They are often required to be empathetic to customers’ needs and have
to remain calm when dealing with irate customers, all of which can be emotionally
demanding for the employee and result in emotional strain. This has been referred to as
81
emotional labour which is defined as the planning, effort and control needed to express
the emotions required by the customer and the organisation during the service encounter.
This implies that employees are often expected to behave in ways which are in conflict
with how they feel emotionally at a given point in time. This may also result in the
exploitation of employees as they are expected to fake their true feelings and express
false emotions which result in depression, exhaustion, isolation and loss of identity (Walsh
& Bartikowski, 2013:1215-1216/1218). Lin and Lin (2011:17-18) state that as customers
perceive the employees’ emotional interaction as part of the service itself, employees’
positive inner emotions become key to the emotions they display to the customer. Service
delivery is at its best when employees genuinely feel the positive emotions they display;
this has been referred to as deep acting and results in increased feelings of personal
achievement.
The issues of internal price can be addressed through the internal product component of
the mix specifically through the training and role-fit factors. Schermuly, Schermuly and
Meyer (2011:254,259) suggest that if employees are provided with training to meet the
requirements of the jobs, they will display more confidence in their skills and abilities
thereby reducing stress. To perform emotional labour, employees are encouraged to
develop deep-acting strategies as an approach to reduce the psychological costs and
emotional costs discussed previously (Motaghi-Pisheh & Harianto, 2011:167). For this
reason organisations such as retail banks should put frontline employees through rigorous
training on how to control their inner emotions and act in accordance with the
‘emotions/feelings’ guidelines. This encompasses role playing situations and training
employees to imagine customers in certain scenarios such as pretending they are children
in order to reduce negative inner emotion (Lin & Lin, 2011:193).
Further to this, if the fit between the employee and the job is right, greater alignment will
exist between the beliefs, values and behaviours of the employee and the job, thereby
psychologically empowering employees and reducing stress (Schermuly et al., 2011:254).
Emphasis should also be placed on the recruitment of customer-orientated employees
and ensuring that the correct fit between the employee and the organisation takes place.
Frontline employees in a bank should display friendly, accommodating, cheerful and
extroverted personalities which will help regulate inner emotions and create more positive
service encounter. It is important to note however, that continuous customer service
training is essential for reinforcing desirable employee behaviours (Lin & Lin, 2011:193;
Emerson, 2007:111).

82
Internal price can also be addressed through the internal people component of the mix,
specifically through management commitment and support. Karatepe (2011:45, 49)
proposes that management commitment and support are also required to create the
perception that employees are cared for. If organisations and management are supportive
of employees, employees are more likely to feel that the organisation is backing them and
providing them with the help needed to complete their tasks and cope with the stressful
demands placed upon them (Markos & Sridevi, 2010:93). This in turn reduces role
conflict, role ambiguity and burnout resulting in happier, more productive, more satisfied
employees (Karatepe, 2011:45, 49).
In addition, Huang (2010:3-4) suggests that work- family balance is a major contributor to
internal price from a stress and burnout perspective and needs to be taken into
consideration. If work-family life is not balanced in an effective manner, employees are
likely to seek employment elsewhere. Retail banks could create flexible work hours in
which employees have the freedom to arrange their own work hours in accordance with
their needs (Schneider, 2013).
To create a supportive internal environment in which employees feel supported, it is
important that trust is built internally. For this reason organisations must openly share
information with employees in order to strengthen internal relationships and increase
service excellence (de Farias, 2010:108). Knowledge sharing and internal communication
is discussed next as part of the internal promotion element of the internal marketing mix.
3.2.3 Internal promotion
Promotion has been described as the activities used to create an awareness of the
organisation and any new or existing products or services (Pride & Ferrell, 2010:8). The
main objective of promotion is to inform, influence and remind customers about the
organisation’s product or service offering and to position the product or service in the
marketplace (Hoffman et al., 2005:18).
White, Vanc and Stafford (2011) suggest that from an internal marketing perspective,
promotion relates to the internal communication which takes place within the organisation
to ensure that employees are sufficiently informed about the organisation’s vision, mission
and objectives and the role they play in contributing to these. Chen and Huang (2007:105)
believe that the main purpose of internal promotion is to create knowledge and skills
within the organisation so that employees understand exactly what is expected of them to

83
perform their jobs well. Well informed employees who understand the organisation’s
vision, objectives and brand and how this relates to their jobs, become the organisation’s
best brand ambassadors. This in turn allows employees to deliver on the brand promise,
and enhance the organisation’s reputation and brand image (King, 2010).
Communication is only effective when a shared understanding is obtained amongst
employees and when a top-down approach combined with two-way interaction is
employed as managers are required to listen to employees so that they can understand
and address their needs and frustrations in order to increase satisfaction levels and
reduce employee turnover (Kale, 2008:9; Kalla, 2005:303-304). To communicate
effectively with employees, different communication channels and media are required to
ensure the delivery of the message to the selected target audience (Steingrimsdottir,
2011:22). Employees have access to many channels of communication and choosing the
most appropriate medium or media is an important issue in communication success (Ali &
Haider, 2012:39; Steingrimsdottir, 2011:22). The media is often referred to as the
message itself as each medium engages employees in different ways and determines the
scale, pace and acceptance of the communication which ultimately influences employees’
level of participation in organisational activities (Berger, 2008).
For this reason an internal promotional mix similar to the external promotional mix is
required. This internal promotional mix consists of media such as advertising, personal
selling, sales promotion, and social media (Gummesson et al., 2010:12; Baldauf, Cravens,
Daimantopoulous & Zeugner-Roth, 2009:441).
3.2.3.1 Internal advertising
Advertising has been described as the paid for mass, non-personal presentation and
promotion of goods and services by a sponsor. This is usually the first point of contact
between the organisation and the customer or employee, making advertising a powerful
communication tool (Müller, Alt & Michelis, 2013). The main objectives of advertising are
to attract attention, to inform, to persuade, and to remind customers of a product or
service, in much the same way as the objective of internal advertising is to attract
attention and inform employees about the internal product and services (Yurchisin &
Damhorst, 2009:458).
Christensen (2011) suggests that service organisations make extensive use of adverts to
communicate with their employees as well as their customers, with the understanding that

84
employees constitute an important audience for these adverts, especially given the fact
that they are expected to deliver on the promises made through these communications.
To this end advertising supports internal marketing as it makes employees aware of the
organisation’s strategies and goals and helps to create clarity for employees. In addition to
this, internal advertising helps create an internal environment focused on understanding
employee needs and communicating what the organisation is doing to fulfil these needs. If
employees believe that the organisation is doing everything it can to aid in their well-
being, they feel more motivated and higher levels of satisfaction are experienced (Hedrick,
Beverland & Minahan, 2007:64).
Retail banks make extensive use of internal advertising in the form of posters and
billboards situated in prominent areas within the bank’s offices and branches. The banks
make use of monthly magazines such as SBSA’s “The Standard” to communicate with
employees in terms of new initiatives and to celebrate successes (Clarke, 2012). They
can also ensure that the vision and values are clearly communicated to employees
ensuring that the strategic objectives are met (Christensen, 2011). The intranet is an
additional internal advertising tool used to advertise and sell job products internally with
the intention of motivating and retaining employees within the organisation (Clarke, 2012).
Internal advertising creates an environment that caters for the needs of employees and
lets them know what the organisation is doing to fulfil their needs. This in turn results in
higher levels of employee motivation and satisfaction (Hedrick et al., 2007:64).
3.2.3.2 Internal personal selling
Personal selling refers to the direct personal communication that takes place between the
customer and the employee whereby the employee learns about the customer needs and
seeks to satisfy them by offering suitable products and services (Bubnjevic, 2011:371).
From an internal perspective this would relate to the face-to-face interactions that occur
between managers and employees whereby managers seek to understand employee
needs with the intention of selling job products and ideas to employees. In this way
managers are able to customise the message delivered to internal customers based on
the feedback obtained from these customers (Kotler & Keller, 2009:536; Kasper et al.,
2006:416).
Ahmed et al. (2003:1226) suggest that personal selling is linked to internal marketing as it
aids in understanding the individual needs of each employee and allows for customised
job-products to be created. This results in greater levels of satisfaction and loyalty as

85
employees feel that the organisation cares about them. This is vital from an internal
marketing perspective because if quality employees are retained, they have higher levels
of organisational knowledge and a greater understanding of their roles within the
organisation, allowing them to offer quality service to customers. (Schmitt, 2011:54,58-59;
Ahmed et al., 2003:1226).
In the retail banking setting, personal selling takes place between managers and
employees generally in group meetings or in a one-on-one context. The managers will sell
the organisation’s vision, mission and objectives to their subordinates and explain exactly
what is required of employees to achieve these aims. It also encourages feedback and
two-way communication in order to achieve a better understanding of employee needs
(Fisk, 2013). Personal selling is a powerful internal marketing tool as it allows managers to
interact face–to-face with employees. This supports managers by enabling them to
understand employees’ aspirations, goals, dreams and expectations with regard to job
products and the organisation, and how to respond to these needs which results in better
internal relationships (Vasconcelos, 2008:1256).
3.2.3.3 Internal sales promotion
A sales promotion is used to stimulate customer demand through the use of
communication tools generally involving some kind of incentive (Omotayo, 2011:68). The
aim is to encourage customers to use the product or service more frequently and
generally within a specific time period where it may be offered at a discounted price
(Tung, Kuo & Kuo, 2011:32, Linholm, 2008:31). Promotion generally takes on several
forms such as: price discounts, store displays, or advertising features and are used most
effectively when services have a low perceived risk, are purchased frequently, and
compete on the basis of price (Lindholm, 2008:31-32).
Clarke (2012) states that from an internal perspective, sales promotion could be used to
sell internal training programmes or market the services of various business units. HR
may offer business coaching services to managers as part of their service offering to the
organisation. Sales promotion could also be used to encourage and motivate employees
through incentives such as financial bonuses, awards, recognition and competitions. Fisk
(2013) states that retail banks make use of sales and service incentive programmes to
reward frontline employees, annual bonuses, star awards for recognising outstanding
individual performance, and competitions in order to encourage employees to adopt
changes and new ways of doing things.
86
If employees are not learning new skills, transferring knowledge and working together in a
coordinated fashion, the banks will not be able to survive and prosper in the long run.
Promotions therefore act as an incentive to encourage employee development,
knowledge transfer and promote interfunctional coordination (Tag-eldeen & El-Said,
2011:156). For this reason sales promotion for the purpose of the study refers to reward
and recognition systems as these communicate to employees that they are cared for.
Further to this, when employees are sufficiently rewarded and recognised, desired
behaviours and actions are repeated on an ongoing basis (Danish & Usman, 2010:160).
Rewards and recognition are discussed in more detail next.
Employee recognition and rewards
Reward and recognition is an important component of internal promotion specifically when
it comes to motivating employees and influencing employee behaviour (Javadein et al.,
2010). Further to this, Danish & Usman (2010:160) propose that employee satisfaction
and commitment are closely linked to reward and recognition systems.
If organisations want to retain their best performers, they must reward and promote these
employees (Palmer, 2011:460). Employees also need to understand how their
performance will be measured and must believe and experience the reward system to be
fair and consistent (Kale, 2008:9). Palmer (2011:460) believes that the main objective of a
reward system is to improve employee performance by rewarding them with something
they value once the organisational objectives have been achieved. Sawar & Abugre
(2013:24) state that rewards can either be monetary or non-monetary in nature, both will
be discussed in more detail next.
i) Monetary reward
Monetary reward serves as an enticement for attracting the right calibre of people into the
organisation, motivating them, satisfying them, and retaining them over the long term
(Carraher, 2011:25-26). Monetary reward for the purpose of the study relates to the
employees’ compensation (salary), bonuses (financial incentives) and benefits such as
medical aid and pension fund contributions. Organisations can use these monetary
rewards to create the perception that employees are valued (Gough & Arkani, 2011:175).
Gough and Arkani (2011:175) suggest that through the provision of benefits such as
pension funds, employees believe that the organisation is providing for their future
financial security which creates the perception that they are valued and cared for by the
organisation. Employees are willing to accept greater risks and take on greater workloads
and put in extra time if they are compensated for their efforts through a salary and/or

87
additional benefits as a fair trade-off. Monetary reward is regarded as a job resource as it
fulfils basic human needs such as food and clothing and indirectly promotes growth and
development too (Hu & Schaufeli, 2011:9). Kilburn (2008) and states from an internal
marketing perspective, that in order to create a strong internal customer orientation, the
incentives must outweigh the costs, otherwise employees will resist.
ii) Non monetary reward
Non-monetary reward relates to the recognition and appreciation of employees which
enhances the employees’ pride in their job and results in positive behaviour basis (Danish
& Usman, 2010:160). Ongoing, public appreciation in front of peers and colleagues can
offset the costs employees pay to work for organisations (internal price), as employees
feel a greater sense of self worth as their efforts are noticed and appreciated. (Bowers &
Martin, 2007:92). Retail banks use non-monetary rewards in the form of certificates for the
completion of training programmes, public recognition of performance in the banks
monthly magazine, special dinners and events or parties to celebrate both individual and
team success, and managers congratulating employees in public forums (Clarke, 2012).
Given that rewards and recognition contribute to the attraction, satisfaction and retention
of talented employees, it can therefore be concluded that the rewarding and recognising
of employees contribute to the internal marketing strategy of retail banks (Palmer,
2011:460).
3.2.3.4 Social media
Singh (2011) suggests that technology and the Internet have changed the business
environment significantly with the market place now often referred to as the market space
given the electronic exchange of information and communication. Technology and
electronic communications have changed the physical environment substantially, and
provides more opportunity for value creation given that the constraints of time, place and
geographic boundaries are eliminated. New or social media is now the new buzzword
referring to open community-based online platforms that allow for user-generated content
and information to be present and to circulate to employees across the organisation
(Berman et al., 2007:23-24). Social media forms a key part of the social dynamics and
internal communication within an organisation, since it connects employees and promotes
collaboration through online communities (Bulmer & DiMauro, 2009:4). The objective of
these online communities is to distribute information to employees within the organisation
and they can also be used for promotional purposes (Berman et al., 2007:24; Kasper et
al., 2006:417; Finin et al., 2005:418). From a retail bank perspective, through access to
this information employees are able to collaborate, participate and interact (Bonson &

88
Flores, 2011:34). By adapting their internal communication strategies, banks are able to
encourage the involvement and participation of employees and provide a seamless flow of
relevant information and feedback through honest communication enabling employees to
complete their jobs more effectively (Lalic, Marjanovic & Lalic, 2012:546).
Electronic communications have evolved with the development of the Internet and a
number of new media tools are used frequently both internally and externally by modern-
day organisations. These new media electronic communications include: intranet, social
networking, wiki’s and blogs (Burin, 2011:104; Finin et al., 2005:418). Each of these is
discussed next.
Internet and intranet
Organisations make use of the Internet in order to provide detailed information to
employees and allow employees to participate more effectively through the use of new
platforms. The idea is to encourage multidirectional flows of information between
employees and management, in that way making communication more interactive
(Bonson & Flores, 2011:35). For example, retail banks are able to engage in Internet
conferences whereby employees situated in regional offices across the country can
participate in these virtual meeting (Banerji & Dutta, 2009:606). Banks also make use of
the Internet for broadcasting news such as their periodic results by means of real-time
web video or audio programmes. This kind of material can be downloaded once the event
has taken place and re-used in other devices such as cell phones and I-pods at a much
lower cost than print material (Bonson & Flores, 2011:35; Rowe, 2007:602).
Organisations also make use of intranets to share information and encourage open
communication and integration within the organisation, contributing significantly to the
internal marketing objectives (Lehmuskallio, 2008:96). Retail banks make use of intranets
to advertise jobs available within the organisation, to provide functional support and to
market various business units within the bank in this way satisfying employees’ needs
through informing and connecting them (Fisk, 2013).
Social networking
Social networking refers to platforms which allow for the exchange of personal and
professional information in a special marketplace (Bonson & Flores, 2011:36). Social
networking enhances the communication tools and communication channels within the
organisation (Willem & Buelens, 2009:152). In addition to this, social networking sites give
employees the ability to maintain strong relationships with colleagues through a consistent

89
identity which goes beyond time and space. Through these relationships, collaboration
amongst employees can be enhanced as deeper social bonds develop. These friendship
ties across groups enable employees to collaborate and coordinate in times of crisis
(Baltatzis, Ormrod & Grainger, 2008:77-78).
The most commonly used social network sites include Facebook and Linkedin (Topper,
2007:378). Topper (2007:378) and Finin et al. (2005:418) explain that retail banks make
use of Facebook to produce an internal social network, specifically for the GDP group of
employees. These employees are able to create a profile and connect with other
graduates throughout the bank, allowing these employees to share information via online
conversations.
Wikis
Bonson and Flores (2011:36) state that wikis constitute a specific kind of website set up to
support entries from numerous users. It refers to a website that encourages information
sharing by allowing individuals to add content, make changes to content and provide
opinions in a controlled manner (Gorman, 2005:225). Wikis contribute to the internal
marketing objectives by integrating knowledge and information across all levels of the
organisation with the intention of improving external customer understanding, employee
empowerment, internal communication and knowledge sharing, efficiency and productivity
(Long, 2006:158). Wikis have also been considered helpful for improving an organisation’s
relationship with its employees, under certain conditions (Bonson & Flores, 2011:45).
Organisational blogs
Organisational blogs are described as a means of communication between the
organisation and its public. From an internal perspective, organisational blogs refer to the
communication between the organisation and its employees forming the intersection
between personal and professional communications (Kelleher & Miller, 2006). Baxter,
Connolly and Stansfield (2010:518) state that blogs are defined as publishing tools for the
purpose of modifying web pages in which entries are documented in reverse chronological
order.
It is the conversational nature of blogs that makes them appealing and encourages the
exchange of views and opinions between employees. In the case of sensitive information,
employees may be more reluctant to share information with each other and will weigh the
benefits against the costs before making comments. Blogs also allow for limited
exchanges as the author controls the ownership of the content. They are however useful

90
in providing information, problem-solving and in the provision of mutual support
(Savolainen, 2011:863,866-867).
The CEOs of retail banks could use these internally to communicate the bank’s vision and
various initiatives as well as deal with issues relating to the bank. Blogs could also be a
valuable tool for detecting credit problems and for obtaining ideas for new financial
products and services (Bonson & Flores, 2011:44). Other web-based media sharing
systems should also be mentioned in terms of video sharing through YouTube,
photographs through Flickr, documents through Docstoc and presentations through
SlideShare which could also enhance internal promotion and contribute to the broader
goals of internal marketing (Bonson & Flores, 2011:36).
Given that communication can have a significant impact on employees, Christensen
(2011) suggests that organisations should design their marketing communication
messages in accordance with employee needs. The author argues that the values of
employees, their hopes and their vision for the future need to be taken into consideration.
Given the focus on employees and employee needs in internal marketing, the next section
discusses the element of internal people in more detail.
3.2.4 Internal distribution
Kasper et al. (2006:400) describe distribution as the strategic and operational activities
that take place in making products or services available to target customers. It involves
the channels, outlets and methods of transportation needed to ensure that the product or
service is delivered to the right customers at the right time and place in the right condition
(Owomoyela, Ola & Oyeniyi, 2013:488; Kasper et al., 2006:400). From an internal
perspective, distribution includes both the physical and non-physical aspects of the work
environment in which exchanges take place between the organisation and employees.
Physical distribution relates to the visible and tangible aspects which will be discussed
under the internal physical evidence (discussed in section, 3.7), whilst non-physical
relates to the invisible and intangible aspects such as the cultural and symbolic aspects of
the organisation (Abzari & Ghujali, 2011:97). An important element in creating the culture
and paradigm of the internal environment is the organisational structure (Grayson &
Sanchez-Hernandez, 2010:17). Organisational structure is discussed as a component of
internal distribution as it has been described as the ‘invisible hand’ which brings the
organisation to life (McMillan, 2011). The non physical aspects relating to the culture and

91
structure and how these aspects ensure the delivery of the internal product will be
discussed next.
3.2.4.1 Organisational culture
Mehr et al. (2012:1030) describe organisational culture as the core beliefs, values, norms
and social customs that dominate the way individuals act and behave in an organisation.
Culture represents the agreement within the organisation in terms of how activities should
be conducted and can be viewed as the outcome of the group’s shared experience and
knowledge (Melewar & Karaosmanoglu, 2006:854). Employees form psychological
contracts with their organisation. Psychological contracts refer to expectations and
obligations that employees share with their organisation. These psychological factors are
part of the organisation‘s culture and ultimately affect the attitudes and behaviours of
employees within the organisation (Lucas & Kline, 2008:281).
Ubius and Alas, (2009:92) identified four archetypes of culture, namely adhocracy, clan,
hierarchy and market respectively, which have been selected for the study. Gounaris
(2008a:407) believes that the organisation’s cultural archetype will influence the adoption
of internal market orientation within the organisation. The author proposed that
organisational culture be considered from the Competing Values Model perspective as
shown in Figure 3.2.

92
Figure 3.2. Competing Values Model of organisational culture
Source: Adapted from Prajogo and McDermott (2011:715) and Trivellas and Dargenidou
(2009:386).
The model presented in Figure 3.2 suggests that two key dimensions define the four
archetypes. The first of these dimensions refers to the emphasis organisations place on
flexibility, spontaneity and individuality as opposed to control, stability and order. The
second dimension relates to the focus placed on integrating and coordinating functions as
opposed to emphasis on competition and environmental factors (Prajogo & McDermott,
2011:714-715). The combination of these two dimensions results in an archetype of
culture characteristics reflected in each of the four quadrants, namely: adhocracy culture,
clan culture, market culture and hierarchy culture (Ubius & Alas, 2009:92). Each of these
is discussed next.
Adhocracy culture
Adhocracy culture emphasises entrepreneurship, creativity, proactiveness, and
innovativeness in discovering new markets and opportunities for growth (Trivellas &
Dargenidou, 2009:386). Open system or adhocracy culture values adaptability, capacity to
change and customer orientation in terms of flexibility in meeting customer needs. In this
kind of culture, management encourages employee creativity and initiative and values
their commitment to the organisation (Saame, Reino & Vadi, 2011:532).

93
Clan culture
Clan culture values employee commitment, loyalty, empowerment, openness, morale,
participation, teamwork, personal involvement and cohesiveness by stressing the need for
flexibility and internal focus (Braunscheidl et al., 2010:887). Organisations adopting these
human relations or clan type of cultural values place emphasis on building trust and close
internal relationships between employees, whilst containing conflict and resistance to
change (Saame et al., 2011:531; Trivellas & Dargendiou, 2009:386).
Market culture
Market culture is focused on external orientation and stability and control. Market culture
emphasises goal achievement, productivity, task accomplishment, profitability, planning
and setting objectives and efficiency (Braunscheidl et al., 2010:887). In this type of
rational goal or market, culture emphasis is placed on external positioning and the
objective is about winning and focusing on results (Saame et al., 2011:532).
Hierarchy culture
Hierarchy culture emphasises inward orientation and formalised structures with specific
focus on order, uniformity, certainty, stability, and control. Braunscheidl et al., 2010:887).
Rules and regulations, definitions of responsibilities, centralisation of decision-making,
and standardisation of procedures, measurement, dependability and reliability are
principles promoted by hierarchy cultures (Trivellas & Dargenidou, 2009:386). The aim of
an internal process of hierarchy culture is to create stability and control and continuity
through formulised communication and a centralised approach. They are often
characterised by detailed job descriptions and a strict reporting system (Saame et al.,
2011:532).
It is important for organisations and leaders to understand the dimensions and different
types of organisational culture in order to assess which cultural values they wish to
promote in order to drive the desired employee behaviours. When organisations are clear
about which organisational culture and organisational values they are promoting, they are
able to articulate this definition of culture to all managers and employees throughout the
organisation (Shaw & Ivens, 2005:119). When the culture and the cultural values have
been clearly communicated, employees understand how to act and behave (Madu, 2013).
A culture supportive of internal marketing is one that highly values collaboration and
cross-functional integration, as this allows for the transfer and distribution of skills and
knowledge. This kind of culture encourages employees to come together and interact,

94
exchange ideas, create, share and apply knowledge, thereby empowering them to
perform their jobs better (Wong, 2005:269).
In order to provide support to internal marketing programmes, Trivellas and Dargenidou
(2009:386) assume that the corporate culture will become a certain combination of all four
cultural types. Simberova (2009:517) argues that the market orientation culture should
become the dominant culture pulling the organisation together. Market-orientated or
customer-orientated organisations tend to deliver higher levels of service quality. In
addition to this, organisations need to have a clan culture in order to focus on the transfer
of knowledge as well as creating internal cohesion, trust and loyalty aiding the distribution
of the internal product. Further to this clan, cultures could contribute to collaborative
intelligence (Simberova, 2009:517; Trivellas & Dargenidou 2009:386). Leonardo (2008)
stipulates that collaborative intelligence is defined as the ability to generate, contribute
and harness the power within networks of people which allows employees to synchronise
their activities. Collaborative intelligence aids in attracting and retaining talented customer-
orientated employees, creating a sense of community amongst employees, and helps
create a sense of purpose which is necessary for engagement.
In order to facilitate the distribution of skills, information and the flow of communication
within the organisation, the structure of an organisation forms an important component of
internal distribution. The design of the organisational structure is the invisible hand which
weaves all aspects of the organisation together so that activities are able to function as a
complete unit (McMillan, 2011). Organisational structure is now discussed in more detail.
3.2.4.2 Organisational structure
Due to the need for organisations to develop internal environments characterised by
highly engaged teams of employees and the flow of knowledge it is important that the
internal organisation structure and communication paths are analysed (Chang & Chang,
2008:92-93). This is essential to ensure that the organisation is structured for cross-
functional communication purposes and in this way allows for the free flow of information
and the learning of new skills which enhance the delivery of service both within the
internal and external environment. In order to achieve these objectives a certain level of
trust is required between managers and employees (Esfahani, 2013:1-2, Chang & Chang,
2008:92-93). Managers need to create an internal environment in which employees are
engaged, empowered to make decisions and are motivated to work, discover and
connect. The more involved and connected employees feel in their job, the more job
95
satisfaction they will experience (Kale, 2008:8). In order to develop an internal market
orientation, organisations are required to move away from beaurocratic vertical structures
(centralised structures) to more flat, decentralised structures that allow for open
communication and participation of all functions (Boshoff & Du Plessis, 2009:200).
Leviatan (2013:150) states that hierarchical structures are based on strict principles of
hierarchy. Control, centralised decision-making and management, long term planning and
clearer representation of the organisation to the outside world embody these hierarchical
structured organisations. The challenge with this kind of centralised structure is that it
restricts communication, decision-making and innovation and intensifies rivalry which is
not conducive from a relationship development perspective (Meehan, 2011). From a
service organisation perspective, such a formal structure may result in employees feeling
that demands from management are impossible to meet and subsequently negative
effects are visible in their attitudes during the delivery of the service (Grönroos, 2007:422).
In order to improve service and in order for internal marketing to be effective,
decentralised organisational structures are required. These structures follow a more
decentralised approach with business units having far more autonomy and fewer
centralised features (McMillan, 2011). Decentralised structures will be discussed in a little
more detail next.
Decentralised structures
Employee communication, interfunctional integration and involved decision-making
become critical within decentralised structures (Kilburn, 2008). Organisations that practise
internal marketing require team-based organisations that value employee engagement
and give priority to decentralised structures making these organisations more successful
(Avital, Boland & Cooperrider, 2008). Organisations characterised by decentralised
structures allow for high levels of internal communication and flow of information, better
integration between departments and the formation of teams, and greater autonomy to
execute work functions (Egzibo, 2012:125-126). This kind of decentralised structure
implies that frontline employees often assume more responsibility, work more
independently and are empowered to make decisions in all service encounters (Boshoff &
Du Plessis, 2009:200). Furthermore, a decentralised organisational structure supports
learning in organisations and enables the seamless flow of tacit knowledge which
encourages and empowers employees to make their own decisions in performing their job
functions and service customers more effectively (El Emary, Bader & Arif, 2012:358-359;
Spreitzer, 2007; Gilmore, 2003:162).

96
Given that internal marketing involves the building and sustaining of relationships over
time, internal suppliers need to feel that they have some control over decisions impacting
their internal and external customers (Kilburn, 2008). In addition to this, through a
decentralised structure a more informal bond develops between management and
employees allowing for knowledge sharing and the prompt recognition and
implementation of ideas (Huang & Chen, 2009:12137). From an internal marketing
perspective and specifically from an internal customer-orientation perspective, success is
dependent on the internal supplier’s ability to freely exchange information across
managerial levels and departments in order to better serve internal customers. If that is
limited due to the structure of the organisation, suppliers are less likely to have an internal
customer orientation, making the achievement of the internal marketing objectives and
value creation difficult (Huang & Chen, 2009:12137; Kilburn, 2008).
The objective of internal distribution therefore is to create an internal environment that is
supportive of the accomplishment of specific goals and objectives in order to achieve
higher levels of satisfaction. This may be achieved by examining where changes are
required, what resources are required and employee empowerment through cultural and
structural adjustments to achieve higher levels of satisfaction resulting in enhanced
service delivery and a positive brand image (Baldauf, Cravens, Diamantopoulos &
Zeugner-Roth, 2009:437-438). The internal people element is discussed next.
3.2.5 Internal people
Peters and Mazdarani (2008:33) state that ‘people’ relates to the human factor and all the
people involved in the service delivery process that have an impact on customer
perceptions. These role players include employees, customers and other customers in the
service environment. Whilst consuming the service, the customer comes into contact with
the physical facilities of the organisation, employees, other customers and other visible
elements which all provide clues to the customer regarding the quality of the service
(Avlonitis et al., 2012:568). In these cases, the customer’s perception of the service
encounter could be affected by the physical environment, other customers or more
importantly, by the employee. From an internal marketing perspective, the employee is the
internal customer whose perception of the service encounter is affected by internal
suppliers and other employees in the environment (Guzman, Rodriguez & Manautou,
2013).

97
Turkyilmaz et al. (2011:678) suggest that from an employee satisfaction perspective, the
relationship with leaders, supervisors/direct managers and co-workers all have an impact
on the employee as employee behaviour depends on their interaction with others in the
internal environment. Leaders, managers and supervisors have a powerful influence over
employees and their work behaviours. Leadership aims to produce change, whilst
management seeks to create predictability and order (De Jong & Den Hartog, 2007:42,
45).
Co-workers or colleagues are defined as “a fellow worker or member of a staff” (Collins
English Dictionary, 2012). The following section considers the role of senior leaders and
the leadership style adopted, supervisors/direct managers and co- workers in the building
of strong internal relationships, and how they facilitate the transfer of knowledge and the
development of a highly engaged internal environment.
3.2.5.1 Senior leadership and leadership style
Leadership is defined as “The process of influencing others towards achieving some kind
of desired outcome” (De Jong & Den Hartog, 2007:44). The role of senior leadership
encompasses the selling of ideas to employees and convincing other business units or
subordinates to take on difficult tasks. It is the role of senior leadership to ensure that
employees experience healthy quality relationships within the organisation (Sim, 2008:28).
Quality and the values organisations wish to embed within the culture begin with top
management and are then disseminated throughout the rest of the organisation. Senior
leadership must establish the vision and objectives for the organisation and ensure that
these are clearly communicated to all employees, so that a shared vision can be created
and all employees throughout the organisation know exactly where the organisation is
heading. This results in higher levels of employee commitment, satisfaction and loyalty
(Tsai, 2011:2).
Direct access to senior leadership can be very advantageous for organisations as it helps
create an environment of trust and commitment within the organisation. The creation of
the internal environment and an organisational culture that supports the generation of new
ideas and effective internal market orientation, is one of the major responsibilities of senior
leadership (Martensen & Gronholdt, 2006:95). From an internal marketing perspective,
employees should be enabled to learn and improve their skills and abilities and they
should be empowered ensuring that knowledge generation is a natural part of the
organisation’s culture and value system. In this way senior leadership influences an

98
employee’s level of satisfaction and loyalty (Kuo, Lai & Lee, 2011:1124-1125; Tsai,
2011:2).
Against the background provided above, leadership is essential to providing direction,
building relationships and anticipating future trends (Lings & Greenley, 2009:49). By using
appropriate leadership styles, managers are able to influence employee satisfaction,
commitment and productivity (Gharibvand, 2012:289-290). There are two styles of
leadership namely transformational and participative. De Jong and Den Hartog (2007:44-
45) and Conradie (2012:142) suggest that a combination of a participative and
transformational leadership style creates employees who are team-oriented, knowledge
sharing and engaged. This in turn contributes to the organisation‘s performance through
the generation of ideas which result in higher quality services.
Participative or empowering leadership is aimed at the self-development of employees
encouraging behaviours such as self-leadership, participative goal-setting and teamwork
which is necessary for knowledge sharing and the generation of ideas specifically in
decision-making. Increased emphasis on employee empowerment has also lead to
greater focus on empowering leadership concepts such as participative management
(Dewettinck & van Ameijde, 2011:285 & 287). It is through this kind of leadership style that
an environment supportive of internal marketing can be created in which knowledge can
be shared, employees empowered, and work activities co-ordinated (Kuo et al.,
2011:1122).
Transformational leadership involves the charismatic communication of the vision which
leads to the emotional commitment of the employees. This style of leadership involves
behaviours such as providing a sense of vision, engaging of idealism, and providing
stimulation and inspiration. These leaders are able to motivate employees to look at
problems in creative ways thus helping them to go above and beyond their personal
development prospects (Dewettinck & van Ameijde, 2011:287; De Jong & Den Hartog,
2007:44). By using appropriate leadership styles such as participative and
transformational leadership, managers are able to influence the quality of the relationship
between leaders and subordinates thereby influencing employee satisfaction, commitment
and productivity (Hamidifar, 2013).

99
3.2.5.2 Employee relationships with supervisors
Supervisor or direct manager support is defined by Hsu (2011:235) as “the degree to
which an employee feels that they are supported by their supervisor”. Given that
supervisors/direct managers are responsible for maintaining the psychological contract of
employees, the level of consideration and support they give to employees has an impact
on the employees’ level of motivation, their well-being and their commitment to service
excellence (Hsu, 2011:235; Heish, 2012:251).
Sim (2008:28-29) states that internal marketing is concerned with relationship and
knowledge management and focus should be given to building close relationships
between supervisors and subordinates. When employees are encouraged by supervisors
and when supervisors model the desired behaviours, employees feel more comfortable in
their roles and as a result display higher levels of commitment to the organisation (Wong,
2005:267). Supervisory support takes on the form of peer cohesion, fair treatment of
employees and performance feedback (which will be discussed in greater detail under
section 3.2.7.2 of this chapter) (Rad & Yarmohammadian, 2006:xiii).
Given that the sharing of knowledge is key to internal marketing, open communication
between supervisors and employees is vital to building strong teamwork (Sim, 2008:28-
29). Porter, Wrench & Hoskinson (2007:13) state that employees often feel that
supervisors can be approached through informal discussions which make them more real
to employees. Through this approach, employees feel cared for and are encouraged to
communicate more freely allowing for the healthy exchange of knowledge, skills and
services (Clarke, 2012). Employees may experience stress when overloaded with work
which will increase the internal price paid by employees. When supervisors help manage
these workloads, assign meaningful tasks, include employees in decision-making and
reward them for their efforts, employees feel that they have been treated fairly and
become more motivated and satisfied (Hsu, 2011:235). In addition to this, it is the
responsibility of supervisors and managers to create an internal environment of
engagement through the creation of a safe area (both physically and psychologically) for
employees to work and provide them with the necessary resources to complete their jobs,
thus achieving the internal marketing objectives as the sharing of knowledge, open
communication, joint problem-solving and engagement are the essence of the supervisor-
subordinate relationship (Shuck et al., 2011:306; Kular et al., 2008:16). Through
supervisor support, work stress and turnover intention can be reduced and greater levels
of satisfaction achieved (Hsu, 2011:235).
100
3.2.5.3 Employee relationships with co-workers
Ladebo, Awotunde and Salaam-Saghir (2008:207) state that relationships with co-workers
have a significant impact on employee satisfaction. Lenka, Suar & Mohapatra (2010:1318)
state that when employees feel comfortable at work and feel that the people they work
with care for them, the emotions they express are positive, having a positive impact on the
internal environment and the way in which they serve both internal and external
customers. For this reason it is important that co-workers treat each other with respect.
When employees treat each other with respect and refrain from making negative
comments to or about their co-workers and when employees feel as though they are a
valued member of the team, they feel respected by others. These positive interactions that
reflect the importance of co-worker relationships in motivating employee engagement and
performance (Shuck et al. 2011:306; Peltier & Dahl, 2009). Stronger relationships with co-
workers aid in the creation of an environment conditioned in trust and for this reason,
employees feel safe to share information and ideas enhancing the flow of knowledge
throughout the organisation (Lau & Cobb:2010, 901,906).
Further to this, employees’ perception of co-worker satisfaction has an impact on
engagement levels and employee satisfaction. Social studies confirm that people change
their attitudes and behaviours to conform to social expectations and norms within a
collective environment. Positive employees send positive cues to their co-workers which
results in a more productive environment. When employees demonstrate satisfaction with
their job and the organisation and are intent on staying with the organisation, they send
positive messages and cues to their co-workers to do the same (Liu et al., 2011). The next
section looks at internal process and how this contributes to the achievement of the
internal marketing objectives.
3.2.6 Internal process
Kumar et al.(2008:176-177) state that in an era of increased competition and little
differentiation between banking products, the importance of achieving high levels of
customer satisfaction has been receiving increased focus. Many organisations,
particularly banks are focusing on service quality improvement issues in order to drive
high levels of customer satisfaction and therefore compete more effectively. In order to
ensure that both external customers and employees are satisfied during the service
encounter, the design, management, improvement and implementation of effective

101
processes (Business Process Management) become important to the delivery of service
excellence. Zeithaml et al. (2012:27) define process as the procedures, methods and
manner in which the service is delivered. Process therefore refers to the service delivery
and operating systems of the organisation. From an internal perspective, internal
processes that are streamlined and effective lead to better service delivery and
organisations that succeed in the delivery of service excellence and faster turnaround
times will have more satisfied customers (Gebre, Hallman, Minukas & O’Brien, 2012).
Ahmed and Rafiq (2002:34) state that from an internal marketing perspective, internal
process relates to how the employee receives the job product. HR processes for instance
become important in terms of recruitment, induction, training and day-to-day processes
required for delivering internal service quality.
The design and delivery of internal processes in terms of efforts of employees and the
reliability of the process becomes essential to organisational success and the delivery of
the internal product (Kasper et al., 2006:382). The importance of process design and
delivery is discussed next.
3.2.6.1 Internal process design
Process design involves the design of products or services from the very beginning of
their lifecycle through the use of process design tools and methodologies to ensure that
these processes meet customer expectations. The purpose is to design effective internal
processes from the start in order to ensure that both internal and external service quality
is delivered (Chang, 2010:3). Lu and Wood (2006:1125) propose that process design
involves understanding the characteristics of products or services well in order to translate
the product or service design into knowledge, organisational capabilities and operating
processes needed to deliver the service.
Technology and the various system designs should also be considered during the design
of processes, given that technology allows for processes to be automated and greater
efficiencies can be achieved from a monetary, employee energy, and time perspective
(Burin, 2011:122; Hasgall & Shoham, 2008:52). Retail bank employees may be required
to use a technologically based performance management system as part of the
performance management process. The system needs to be available to all employees
(all employees have computers with the performance management application installed),
and employees need to be trained on how to use the system increasing their comfort level

102
with this technology. This technology provides access to performance data and the ability
to track performance against objectives, compare ratings, and it provides information to
support decision-making (MacMillan, 2006:10).
3.2.6.2 Internal process delivery and improvement
An important component in satisfying both external and internal customers in the context
of services is not only the design of the service and the internal service process, but also
the delivery thereof. This is specifically important given the high level of variability and
customisation experienced during the service encounter (Rust & Chung, 2006:568).
Bellou and Andronikidis (2008:944-945) specify that employees play a vital role in the
delivery of processes. High levels of customer service arise from high levels of internal
service between frontline employees and other employees within an organisation.
Employees expect the internal service experience to be reliable, meaning that the service
experience is consistent and dependable and that integrity is applied throughout the
process (Khanji, 280:580; Kasper et al., 2006:387). If the customer, in this case the
internal customer, feels that the service delivery from the service provider, in this case
internal suppliers is consistent and reliable, it results in greater levels of satisfaction (Vella
Gountas & Walker, 2009:41; Khanji, 2008:580).
In addition to the design and delivery of internal processes, internal processes need to be
constantly improved. Internal business process improvements reduce errors and improve
decision-making ability resulting in greater levels of internal quality and employee
satisfaction (Holtzman, 2011:50). Further to this, cost and time reductions can be
achieved. Time reductions relate to the productivity of employees being internal suppliers
and how efficiently they perform their jobs within a period of time. Business process
improvements assist in eliminating waits, streamlining processes and through knowledge
retention efforts, allow for more effective coordination between internal customers and
suppliers (Holtzman, 2011:50; Makhfi, 2009). Better coordination between internal
customers and suppliers results in a strong network of internal relationships focused on
the generation of value through internal cross-functional relationships and teamwork
(Panigyrakis & Theodoridis, 2008:605-606). Internal physical evidence is discussed next.

103
3.2.7 Internal physical evidence
Holder and Berndt (2011:390-393) define the physical environment or servicescape as the
physical facility or actual working environment where the service is provided; it refers to
the non-living features of the service environment. Organisations rely heavily on physical
evidence to create perceptions of service quality for customers (Lenka et al., 2010
:1318).The physical environment also helps to create positive word-of-mouth as
customers recommend pleasing environments, and physical evidence also improves
employee satisfaction, as well designed areas improve employee satisfaction, create a
positive work ethic and reduce employee turnover (Newsham et al., 2009:4; Lee,
2006:343).
Physical evidence is categorised as either essential or peripheral evidence. Essential
evidence relates to the actual environment in which the service is delivered, such as the
working environment of the employees. Peripheral evidence relates to the things which
employees can keep such as training manuals, performance feedback reports, memos
and guidelines. This is the proof that the service has been delivered (Conradie, 2012:150).
Considering that memo’s, guidelines and training manuals form part of other sections of
this chapter (such as internal product and internal promotion), the section of peripheral
evidence will focus on performance feedback as this is seen as crucial for employee
satisfaction (Gu & Siu, 2009:565). The next section looks at the role of essential evidence
and performance feedback specifically from an internal marketing perspective.
3.2.7.1 Essential evidence
Essential evidence relates to the physical environment being the tangible aspects used to
improve service quality, influence employee productivity and satisfaction (Kasper et al.,
2006:389). These tangible aspects include elements such as the office layout, lighting,
music, air quality and work space density, all of which enhance positive employee
behaviour and the strengthening of internal relationships (Lin & Lin, 2011:189). Parkin et
al., 2011:31, 33) and McGuire and McLaren (2009:35-39) posit that internal environments
should be designed so as to facilitate the distribution of knowledge and information
between employees. These authors suggest that employees should be placed with other
employees who excite and stimulate them as co-workers play a significant role in the
sharing of knowledge. An employee’s social and physical environment can also have an
impact on his/her level of motivation to complete certain activities and therefore impact
their performance (Guven & Sadaklioglu, 2012:108). For this reason, the environment

104
needs to be appropriately designed. The physical work environment and the design
thereof therefore impacts collaboration, interaction and social bonds (Zagenczyk, Murrell
& Gibney, 2007:124-125). Employees whose work stations are in close proximity of their
colleagues are more likely to interact with each other, given the ease of accessibility and
visibility of these work stations allowing for the seamless flow of communication and
knowledge sharing (McGuire & McLaren, 2009:35-39).The physical environment therefore
influences employee performance and their communication with each other and external
customers (Holder & Berndt, 2011:390-391).
In the retail banking environment, internal physical evidence would refer to the head office
buildings, branches and websites. The look and feel of the branches and head office or
regional offices should encourage both employee and customer interaction and create a
positive experience with the bank (Lenka et al., 2010:1321). The physical environment
and the interactions amongst employees and between employees and customers should
be designed in such a way that employees and customers develop a perception of
superior service quality. In this way both internal and external customers will continue to
purchase the organisation’s offerings (Lings & Greenley, 2009:44). The exterior
environment includes aspects such as the branch buildings, exterior signage, parking and
landscaping. The internal physical environment or servicescape is essential in creating
value and enhancing perceptions, and the interior environment would include the branch
or office layout, the internal decor, waiting areas, equipment used, and dress code of
employees (Lenka et al., 2010:1322). It would also relate to the product brochures and
internal marketing/promotional material used in the branches and offices in order to create
a sense of comfort and security for employees and create a satisfying experience for
customers (Yilmaz & Ergun, 2008:292). Further to this, the organisation’s website
should be designed for ease of use and convenient navigation (Fisk, 2013).
3.2.7.2 Peripheral evidence
Peripheral evidence refers to performance feedback. The tangible evidence that feedback
has been provided usually takes the form of a performance feedback report or an
appraisal form. Jawahar (2006: 213-214) believes that from an individual perspective,
feedback relates to the need for information in terms of how well personal goals are being
met, as well as the need for social comparisons about how employees are performing
relative to their colleagues. Kuvaas (2011:124) states that goal setting forms an important
part of the process with the objective of providing feedback to improve performance.
Performance feedback also enlightens employees in terms of how their behaviour

105
contributes to the organisational goals and this can in turn increase their commitment
levels. MacMillan (2006:9) suggests that organisations should provide performance
feedback more frequently. If feedback, recognition and support are built into the day-to-
day interactions and combined with increased visibility into goals, the environment will
encourage development and performance improvement. Bai (2006:40) suggests that
turnover decisions and employee satisfaction are influenced by a number of
characteristics, one being employee performance feedback.
For employees in the retail banking environment, monthly one-on-one meetings should
take place between managers and employees in order to determine personal goals and
development plans and discuss key performance areas, whilst ensuring the alignment of
day-to-day actions with strategic business objectives (Clarke, 2012). Individual
performance to support compensation and career planning should be well documented
and should provide a focus for skill development and learning activity. At the end of each
year, a final appraisal should be held summarising job expectations, key areas of
contribution, and previously discussed goals and evaluation methods (Schneider, 2013).
Three hundred and sixty degree performance appraisals allowing for professional
feedback from colleagues as well as management can also have a positive impact and
provide valuable feedback to employees (MacMillan, 2006:2,8). When managers clearly
communicate expectations and how these expectations tie into compensation and when
employees understand how they add value, they feel more satisfied and become more
engaged as a result thereof (The Economist, 2007:7).
3.3 CONCLUSION
Through using the elements of the internal marketing mix discussed in the previous
section, retail banks are able to improve internal relationships and internal service quality
resulting in satisfied employees who are engaged, more productive, more knowledgeable
and empowered to serve internal customers well. These employees are then more
motivated to improve external service quality resulting in delighted customers (Fisk, 2013).
According to Vella et al. (2009:408), successful internal marketing should produce positive
relationships between employee attitudes and actions and therefore result in higher levels
of customer satisfaction and service quality. By satisfying the needs of employees,
organisations are able to enhance their ability to satisfy the needs of the external
customers (Kimpakorn & Tocquer, 2010:381). The next chapter focuses on the link
between employee satisfaction and internal marketing. Chapter 4 discusses the service

106
profit chain and the importance of employee satisfaction and loyalty in the delivery of
customer satisfaction and loyalty. A discussion on the link between the internal marketing
mix elements and the predictors of employee satisfaction is provided. Finally, employee
retention through affective commitment is discussed.

107
CHAPTER 4
EMPLOYEE SATISFACTION
4.1 INTRODUCTION
The implementation of the internal marketing mix and internal marketing principles is
essential to employee satisfaction. Internal marketing is regarded as the mechanism
needed to balance the relationship between employee satisfaction and customer
satisfaction through improved service quality (Tortosa-Edo et al., 2011:1281). The focus
on employee satisfaction in internal marketing is attributable to the fact that customers rely
on human acts of performance to establish an image of the organisation (Nittala &
Kameswari, 2009:208). Thus, the attitude and behaviour of employees exhibited during
the service encounter determines the quality of the relationship and the quality of service
provided to customers, in this case internal customers (Tortosa-Edo et al., 2011:1281;
Nittala & Kameswari, 2009:208, Martensen & Gronholdt, 2006:92).
Employee satisfaction has received increased attention from service organisations since
its importance in terms of organisational effectiveness has been better understood (Roos,
2005:37). Employee satisfaction is associated with increased productivity, commitment,
engagement, lower levels of absenteeism and employee turnover, all of which increase
organisational effectiveness (Abdullah, Djebarni & Mallahi, 2011:127; Roos, 2005:37).
This is because satisfied employees are more productive and motivated in delivering
higher levels of service quality to their internal and external customers (Aburoub et al.,
2011:108; Roos, 2005:37).
For this reason, Chapter four focuses on the definition of employee satisfaction, the link
between internal marketing and employee satisfaction, and how this impacts on employee
productivity and retention. To place the relationship between internal marketing, employee
satisfaction, employee productivity and retention into context, a brief discussion of the
service profit chain concept is discussed.

108
4.2 THE IMPORTANCE OF EMPLOYEE SATISFACTION AND INTERNAL
MARKETING IN THE SERVICE PROFIT CHAIN
The service profit chain illustrated in Figure 4.1, identifies the direct strong relationships
that exist between profit, growth, customer loyalty and satisfaction, the value of services,
employee capability, employee satisfaction, employee productivity and retention
(Moodley, 2008:67-68). Simply put, satisfied employees result in satisfied customers and
satisfied customers purchase more resulting in increased revenue and profit (Gelade &
Young, 2005:2).
Figure 4.1. The service profit chain
Source: Palmer (2011:291).
Ratanjee (2007:53) states that the service profit chain is a powerful model that
emphasises the importance of people, both employees and customers. This study is

109
specifically focused on the employee dimension. The following section discusses the
service profit chain and the various links in more detail, with specific emphasis on the
employees’ role.
4.2.1 Link between internal service quality and employee satisfaction
In an attempt to address global competition, many organisations are focusing their efforts
on the enhancement of customer service through increased levels of service quality. In
order for organisations to improve their external service levels, they must first improve the
quality of their internal service delivery (Sirenne, 2013:5). Internal services are defined as
the services provided by business units or the employees within these business units to
other business units within the organisation (Dimitriades & Papalexandris, 2011:144). The
provision of quality internal services to employees and their levels of satisfaction with the
internal service are crucial to the success of the organisation. Further to this employee
satisfaction is impacted by the quality of the internal environment and the strength of the
relationships therein (El Samen & Alshurideh, 2013:85). For this reason, internal
marketing aims at creating an appropriate internal environment where strong internal
relationships are created in which employees are engaged and encouraged to work
together in a coordinated fashion in order to create value for both internal and external
customers (Dimitriades & Papalexandris, 2011:144; Peltier & Dahl, 2009).The internal
service quality dimensions are similar to the internal marketing mix elements and
elements such as training and development opportunities, relationship with managers
and co-workers, and empowerment of employees become pertinent issues from an
internal perspective (Moodley, 2008:68). If employees are well trained and have positive
attitudes towards their jobs, they are able to complete their jobs more effectively which
increases employee satisfaction (Heskett, Jones, Loveman, Sasser & Schlesinger,
2008:123).
4.2.2 Link between employee satisfaction and employee productivity
When new employees are recruited into organisations they are not as knowledgeable as
their peers and are often experiencing customer interactions and internal processes for
the first time. In these instances, specifically where a new recruit has replaced a
knowledgeable employee, a certain level of customer dissatisfaction is expected (Hurley &
Estelami, 2007:188). Experienced and skilled employees are generally more productive
than newly recruited employees who still require a fair amount of training (Boshoff & du
Plessis, 2009:13). Therefore organisations that focus on understanding employee needs

110
and delivering on these needs to create employee satisfaction are more likely to retain
their employees resulting in higher levels of service quality, customer satisfaction and
reduced costs (Zheng,2009 :488-489).
4.2.3 Link between employee satisfaction and employee retention
There are steep costs associated with employee turnover, not only in the cost of
recruiting, hiring and training employees, but also in the loss of productivity and reduced
customer satisfaction (Heskett et al., 2008:122). To this end, employee satisfaction
becomes essential as satisfied employees are more likely to remain within the
organisation. If employees are well trained and empowered, are well paid and have well
designed jobs and internal environments, they will experience higher levels of satisfaction
which results in higher levels of loyalty and commitment towards the organisation,
resulting in higher levels of retention (Liu, Petruzzi & Sudharshan, 2007:25; Hoffman &
Bateson, 2006:272).
4.2.4 Link between employee productivity and employee retention and external
service quality
Customer orientated employees tend to be more productive and these higher levels of
productivity and improvement are reflected in the quality of service delivered to external
customers (Moodley, 2008:68). In addition to this, employees who are satisfied with their
jobs treat customers better which also results in greater levels of external service quality
(Ahmad et al., 2012: 532).
4.2.5 Link between external service quality and customer satisfaction
Patla and Pandit (2012:116-117) state that the quality of the service experienced by
external customers is highly correlated to the quality of the internal service and relates to
how employees are treated within the organisation. For this reason, a healthy internal
environment comprising of collaborative internal relationships is required for external
service quality and market success (Pantouvakis, 2011:14). Higher levels of external
service quality result in customer satisfaction, loyalty and retention which are cited as the
only reasons as to why organisations exist. It is further argued that external service
quality, customer satisfaction and profits in turn drive employee satisfaction, and higher
levels of employee satisfaction drive higher levels of internal service quality which in turn

111
improves employee satisfaction and retention (Jeon & Choi, 2012:333; Hoffman &
Bateson, 2006:272).
4.2.6 Link between customer satisfaction and customer loyalty
Loyalty is a direct result of customer satisfaction. If customers are satisfied they are more
likely to repatronise the organisation at some point in the future. Satisfied customers are
also more likely to recommend the organisation to others thereby creating future profits for
the organisation (Boshoff & du Plessis, 2009:14-15; Heskett et al., 2008:120). In the retail
banking market, higher levels of customer satisfaction lead to increased cross selling of
products at a branch level. To this end customer satisfaction is a predictor of revenue and
growth in customers and bank branches (Gelade & Young, 2005:5).
4.2.7 Link between customer loyalty and increased organisational revenue and
profitability
Profit and growth are stimulated primarily by customer loyalty (Heskett et al., 2008:120).
Burin (2011:137-138) suggests that satisfied customers remain loyal to organisations and
as a result the transaction and marketing costs associated with acquiring new customers
can be reduced. Profits and growth can be increased as organisations develop a better
understanding of their customers’ needs and offer products and services aligned with
these needs. Efficiency can be improved through reduced cycle or turnaround times as
new information does not need to be gathered from customers to cross-sell other products
and services to them (Burin, 2011:137).
4.2.8 Increased profitability and growth improves internal service quality
The study is focused on the upper portion of the service profit chain model concentrating
on the enhancement of the internal environment through internal marketing principles and
the impact of this on employee satisfaction and employee retention. Considering the
significance of employee satisfaction in the attainment of customer satisfaction and
organisational profitability, the following section focuses on employee satisfaction and the
motivators and drivers behind this concept.

112
4.3 EMPLOYEE SATISFACTION
The service profit chain highlights the importance of employee satisfaction as the
precursor of external customer satisfaction, growth and profitability. To fully understand
the impact of employee satisfaction within the organisation it is fundamental to reiterate
the importance of employees in service organisations (Yavas, Babakus & Ashill,
2010:369-370). Zeithaml et al. (2006:349) believe that employees in service organisations
are comparable to the service itself, both from an external and from an internal service
perspective. This is because employees represent the most tangible clue to both internal
and external customers. Employees are the service, employees are the organisation in
the customer’s eyes, employees are the brand, and employees are the marketers. This
implies that employees personify the organisation and the customers perception of the
brand is influenced by their interactions with the service organisation’s employees (Peters
& Mazdarani, 2008:33-34). Given the intangibility, production and simultaneous
consumption of services, it is the attitudes and behaviours of service employees that
influence customer satisfaction (Sirenne, 2013:20).
The relationship between the service employee and the customer is paramount and a
healthy balance between employee satisfaction and customer satisfaction is necessary
(Maritz & Nieman, 2008:14). To this end, satisfied employees make for satisfied internal
and external customers. This is attributable to the demonstration of employee satisfaction
in the service delivery process. Employee satisfaction impacts the mood and manner in
which the service is performed and therefore affects internal and external service quality
and ultimately internal and external customer satisfaction (Sirenne, 2013:13, Gu & Siu,
2009:563). Mohammad, Al-Zeaud and Batayneh (2011:38) posit that employee
satisfaction is a means to attract and retain quality employees. Employee satisfaction is
therefore key to organisational success and for this reason the next section deliberates
employee satisfaction in further detail.
4.3.1 Employee satisfaction defined
There is a plethora of definitions, explanations and characterisations of what constitutes
employee satisfaction, but no agreed upon definition which sums up employee satisfaction
in its entirety. Table 4.1 highlights some of the most prominent definitions of employee
satisfaction.
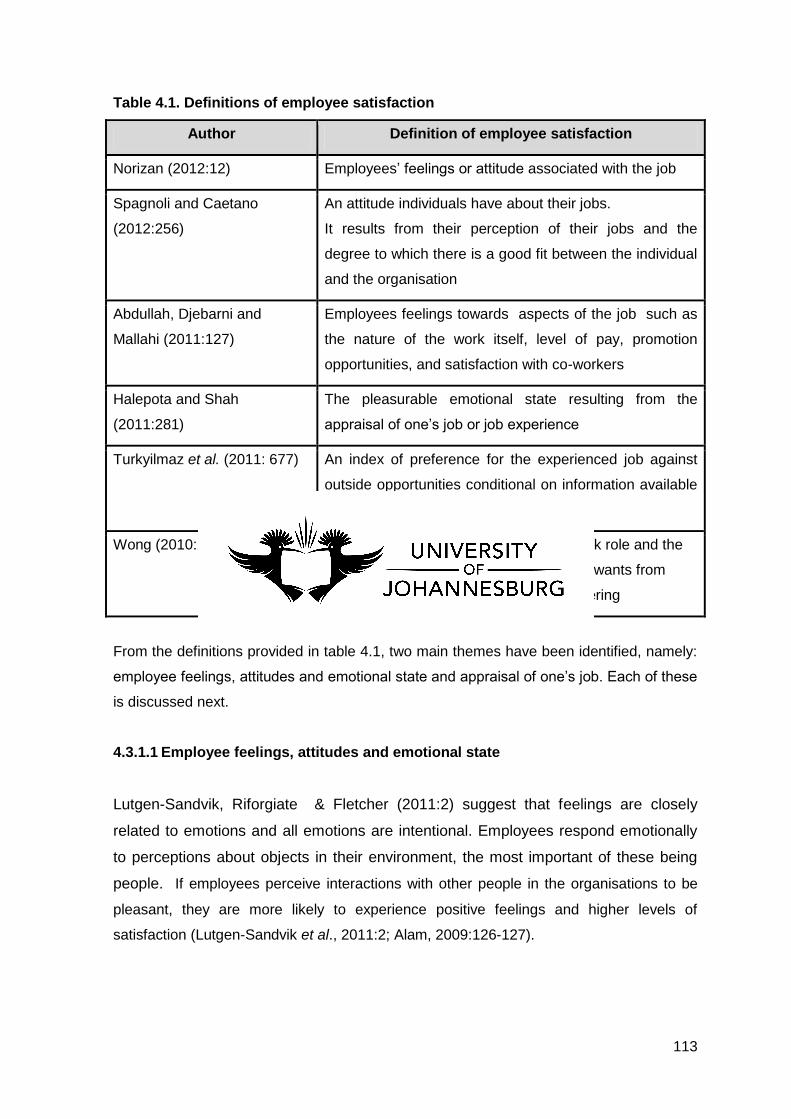
113
Table 4.1. Definitions of employee satisfaction
Author Definition of employee satisfaction
Norizan (2012:12) Employees’ feelings or attitude associated with the job
Spagnoli and Caetano
(2012:256)
An attitude individuals have about their jobs.
It results from their perception of their jobs and the
degree to which there is a good fit between the individual
and the organisation
Abdullah, Djebarni and
Mallahi (2011:127)
Employees feelings towards aspects of the job such as
the nature of the work itself, level of pay, promotion
opportunities, and satisfaction with co-workers
Halepota and Shah
(2011:281)
The pleasurable emotional state resulting from the
appraisal of one’s job or job experience
Turkyilmaz et al. (2011: 677) An index of preference for the experienced job against
outside opportunities conditional on information available
at the time
Wong (2010:24) Employees' affective relations to their work role and the
perceived relationship between what one wants from
one's job and what one perceives it is offering
From the definitions provided in table 4.1, two main themes have been identified, namely:
employee feelings, attitudes and emotional state and appraisal of one’s job. Each of these
is discussed next.
4.3.1.1 Employee feelings, attitudes and emotional state
Lutgen-Sandvik, Riforgiate & Fletcher (2011:2) suggest that feelings are closely
related to emotions and all emotions are intentional. Employees respond emotionally
to perceptions about objects in their environment, the most important of these being
people. If employees perceive interactions with other people in the organisations to be
pleasant, they are more likely to experience positive feelings and higher levels of
satisfaction (Lutgen-Sandvik et al., 2011:2; Alam, 2009:126-127).

114
4.3.1.2 Appraisal of one’s job
Employee satisfaction is closely related to employees work needs and expectations.
Employees positively assess the extent to which their needs and expectations are met by
various episodes and events. When employee needs and expectations have been met,
feeling of satisfaction increase (Martins & Coetzee, 2007:21). Employees value close co-
worker relationships for example, because they enhance collaboration and friendships
and support networks can be established as a result thereof. This would result in a
positive assessment about what is good about working for the organisation (Lutgen-
Sandvik et al., 2011:3).
Feelings of satisfaction may be determined by a variety of factors relating to the person,
the job or the organisation as whole (Roos, 2005:48). Employee satisfaction in the context
of this study is defined as an employee’s sense of satisfaction not only with the work, but
also with the broader organisational context within which the work exists (Schon, 2007:1).
Various authors have identified the predictors of satisfaction. The following dimensions
have been put forward and have been defined as the generic predictors of employee
satisfaction, namely: reward and recognition (including salary and benefits), career
advancement, work environment, leadership, relationship with supervisors/managers,
relationship with co-workers, stress and pressure, role clarity and fit, empowerment,
training and development, feedback, decentralised decision-making, operating process
and policies, sharing of knowledge and information and organisational culture (Ahmad et
al., 2012:532; Halepota & Shah, 2011:281; Lumley et al., 2011:103; Turkyilmaz et al.,
2011:676,677-678; Gu & Siu, 2009:565; Schon, 2007:17-18,20; Rad & Yarmohammadian,
2006:xii; Roos, 2005:48).
Turkyilmaz et al. (2011:678) state that employee satisfaction involves an evaluation of the
various predictors related to the employee’s job. Therefore it is important that the
predictors identified earlier are comprehended in more detail.
4.3.2 Predictors of employee satisfaction
The following section delves into the employee satisfaction predictors as identified in
section 4.3.1.

115
4.3.2.1 Reward and recognition
Reward and recognition refer to the pay, intrinsic and extrinsic fringe benefits that attract
an employee’s attention and result in higher levels of productivity and commitment to the
organisation (Danish & Usman, 2010:160). Reward and recognition are recognised as two
of the most important predictors of employee satisfaction (Van Dyk, Coetzee & Takawira,
2013:60).
4.3.2.2 Empowerment
Empowerment involves the creation of values for employees so that they are able to
perform their jobs independently (Kazlauskaite, Buciuniene & Turauskas, 2102:141).
When employees are able to perform their jobs independently without the intervention
from management, they experience higher levels of satisfaction (Kim, 2013:15).
4.3.2.3 Training
Joung et al. (2010:2) state that training provides employees with opportunities for learning
which in turn helps their career and personal development. In this way training results in
positive employee feelings and attitudes and is therefore an important predicator of
employee satisfaction (Halepota and Shah (2011:283).
4.3.2.4 Stress and pressure
Stress relates to the negative reactions (mental, physical or behavioural) that employees’
exhibit towards excessive pressure and job demands (Moodley, 2008:51). The loss of
work-life balance and too much change cause stress for employees and result in lower
productivity. Stress and pressure in turn cause both psychological and emotional
problems for employees and result in burnout. Burnout is a major predictor of job
dissatisfaction (Schon, 2007:19-20).
4.3.2.5 Decentralised decision making
In decentralised organisations, top management delegates most of the decision-making to
the lower echelons of the organisations. This approach results in less rigid policies, a
wider span of control and flatter, decentralised organisational structures which result in
self-managed, cross-functional work teams and greater employee empowerment (Ezigbo,

116
2012:125-126,128). In this way, a decentralised organisational structure creates
empowerment which results in positive feelings and attitudes and increased employee
satisfaction (Miri et al., 2011:56-57; Yang, 2012).
4.3.2.6 Organisational culture
Employees’ feelings and attitudes towards their job (such as satisfaction) are influenced
by the way in which they perceive the organisational culture (Roos, 2005:48). For this
reason, there is a strong link between organisational culture and employee satisfaction,
making culture a predictor of employee satisfaction (Mehr et al., 2012:1030).
4.3.2.7 Career advancement
Career advancement refers to promotional opportunities within the organisation (van Dyk
et al., 2013:61). In addition to increased social status, career advancement provides
opportunities for personal growth and more responsibility which results in positive
emotional states and greater levels of employee satisfaction (Loong, 2011:346-347).
4.3.2.8 Physical environment
The physical environment refers to the employees’ working conditions and includes
factors such as the look and feel of the workplace (Pitt & Bennett, 2008:301). Physical
environment is a predictor of employee satisfaction since employees want a comfortable,
safe, physical environment to work in (Pantouvakis, 2011:13).
4.3.2.9 Feedback
Lenka et al. (2010:13191) states that feedback relates to clear performance feedback
provided to employees generally through a formal performance appraisal. Performance
feedback is important for employees to assess how they are performing and regular
feedback influences employee attitudes and behaviours such as their level of job
satisfaction (Jawahar, 2006:213).
4.3.2.10 Role fit and clarity
Cedefop (2010:7-8) posit that it is important that the employees’ skills and knowledge
match the job they have been assigned to, otherwise the employees may experience
117
feelings of inadequacy resulting in dissatisfaction. Secondly, role clarity needs to be
enforced in which employees are clear about their deliverables and what values and
behaviours are expected from them within the internal environment. When employees
have clarity about what is expected, they experience stronger emotional states and higher
levels of satisfaction (Ingram, 2013:377).
4.3.2.11 Relationship with co-workers
When co-workers are friendly and supportive they serve as a source of support and
comfort to each other, which strengthens the internal bonds (Kehinde, 2011:34). Given
that relationships with co-workers create a harmonious internal working environment, this
factor is recognised as a predictor of employee satisfaction (Gu & Siu, 2009:565).
4.3.2.12 Relationship with supervisors/managers
Sahi et al. (2013:388) state that employee satisfaction increases when supervisors/direct
managers are understanding and supportive, provide feedback and praise, and adopt
open lines of communication with employees. This is because supportive supervisors are
perceived as caring which enhances the relationship between supervisors and
subordinates (van Dyk et al., 2013:61).
4.3.2.13 Leadership and leadership style
Leadership relates to the function of managing employees and social interaction as well
as the influencing of employees to achieve the organisational objectives (Rad &
Yarmohammadian, 2006:xii-xiii). The leadership style chosen by an organisation is viewed
as one of the most important predictors of employee satisfaction (Hamidifar, 2013:48).
4.3.2.14 Sharing of information and knowledge
The sharing of information and knowledge refers to the provision of information and know-
how to help employees perform their jobs. Further to this, the flow of knowledge and
information facilitates the creation of a healthy internal environment through collaboration,
problem-solving and sharing of ideas (Wang & Noe, 2010:117). A high level of knowledge
sharing and effective communication has been associated with increased levels of
satisfaction (Almahamid, McAdams & Kalaldeh.,2010:332).

118
4.3.2.15 Operating processes and policies
Process is described as the activities and tasks necessary to perform work consistently
(Allen, Curtis & Gates, 2011:1). It is important that employees are provided with processes
so that they are able to perform their jobs, understand their internal and external customer
needs, and build relationships both within and outside of the organisation (Eichorn,
2004:156). Lumley et al. (2011:103) state that process and operating procedures increase
levels of employee satisfaction.
Viewing these employee satisfaction predictors in isolation may not be very effective and
could be counterproductive. For instance, increasing employees’ training and
development opportunities will not accomplish much unless employees are empowered to
use and share their knowledge (Schon, 2007:18). Collaboration and knowledge sharing
will not be effective if an organisation’s leadership style is not aligned and adapted to meet
these requirements (Almahamid et al., 2010:331).
Internal marketing is therefore essential in bringing these elements together in a formal
internal marketing programme where each of these predictors of employee satisfaction
can be addressed through the elements of the internal mix discussed in Chapter 3. The
relationship between the internal marketing mix elements and employee satisfaction is
discussed next.
4.4 THE RELATIONSHIP BETWEEN EMPLOYEE SATISFACTION AND THE
INTERNAL MARKETING MIX
Through the implementation of an internal marketing mix, internal marketing focuses on
treating employees with the same level of importance as customers in order to achieve
both the internal and external marketing objectives (Farzad et al., 2008:1481). In this way
employees feel cared for by organisations, which results in increased levels of employee
satisfaction and more positive attitudes towards their work such as increased
organisational commitment and loyalty (Sahi et al., 2013:388).
Chapter 3, section 3.2 identified the internal marketing mix (internal product, internal
price, internal promotion, internal distribution, internal people, internal process and internal
physical evidence) for the purpose of this study. The previous section identified the
generic predictors of employee satisfaction. Each of the internal marketing mix elements
contains factors which are very similar or are closely aligned to the predictors of employee

119
satisfaction. By implementing the internal marketing mix proposed in the study, each of
these employee satisfaction predictors would be addressed through a formal programme,
in that way contributing to higher levels of employee satisfaction. Figure 4.2 provides a
conceptual framework (developed from the literature) to explain the relationship between
the internal marketing mix elements and the predictors of employee satisfaction.
Figure 4.2. Conceptual framework of the relationship between employee
satisfaction and the internal marketing mix
Source: Researcher’s own construct.
The following section focuses on the link between the internal marketing mix elements
and the predictors of employee satisfaction in greater detail.
4.4.1 The relationship between employee satisfaction and internal product
Zampetakis and Moustakis (2007:417) postulate that internal marketing is concerned with
the creation of attractive job products to satisfy employee needs through the development
and motivation of best qualified employees. Satisfied employees are more responsive to
internal and external customers’ needs and build stronger relationships with both internal

120
and external customers as they are able to draw on previous experience and knowledge
(Luna-Arocas & Camps, 2008:40; Lee, 2006:343). For this reason, organisations should
focus on the development of attractive internal products (in this case the employee’s job)
and aspects pertaining to the performance of their jobs (Cano & Sams, 2009:286).
Kehinde (2011:33) supposes that employees prefer jobs that allow them to apply their
skills and abilities, jobs that empower them to make their own decisions, and that provide
them with constant feedback on how they are performing. Hence it is imperative that
organisations make employees’ jobs more interesting in order to increase levels of
employee satisfaction. If employees are satisfied with their jobs, they are more likely to
deliver better quality work. The following components of internal product positioned in
Chapter 3 (section 3.2.1), namely training and development, empowerment, role fit and
clarity, and career advancement, are discussed next in terms of how they align to and
influence the predicators of employee satisfaction and therefore contribute to overall
employee satisfaction.
4.4.1.1 Employee satisfaction through training and development as a factor of
internal product
From an internal product perspective, training and development provide employees with
opportunities to improve their knowledge and abilities and develop themselves as
individuals thus permitting employees to perform their jobs more effectively (Joung et al.,
2010:2). Employees who undergo such training and development programmes develop
stronger self-confidence and believe that their organisations are making an investment in
them (Halepota & Shah, 2011:283). This is because training and development practices
communicate to employees that they are cared for, resulting in higher levels of employee
satisfaction (Rehman et al., 2011:19-20). From an internal market orientation perspective,
training and development are considered to be a response behaviour to employee needs,
and when these needs have been met, employees feel increased satisfaction with their
jobs (internal product). In this way the training and empowerment as a predictor of
employee satisfaction (Panigyrakis & Theodoridos, 2009:607).
Satisfied employees who are well trained and better informed than their counterparts in
competing organisations, are able to play their role in business activities and in team
efforts more effectively, thus positively impacting productivity (Vet Consulting Group,
2012). For retail banks, it is essential that customer-facing employees are provided with
the required knowledge and skills to understand customer needs and address these
needs in a courteous manner. Satisfied employees achieve better results with customers

121
contributing to customer satisfaction with the service and enhanced organisational
performance. (Ahmad et al., 2012:532).
4.4.1.2 Employee satisfaction through empowerment as a factor of internal product
From an internal marketing perspective, in order to deliver value to internal customers in
the internal value chain, it is essential that employees throughout the organisation are
empowered to act and are provided with the discretion to fulfil their job roles successfully
(Palmer, 2011:445). Empowerment involves the process of providing employees with the
power and autonomy to make job related decisions without a high level of management
involvement (Gupta, 2012:176). By reducing the standardisation in frontdesk operation
facilities and providing employees with more discretion to make decisions and to serve
internal and external customers well, employee satisfaction can be enhanced (Gounaris,
2008b:69,74). This is because employees are allowed to think about their jobs and solve
their own problems which results in more positive employee attitudes and higher levels of
employee satisfaction. Thus empowerment as a predictor of employee satisfaction is
influenced through the internal product element (Turkyilmaz et al., 2011:681).
Peters and Mazdarani (2008:51) found in a study focused on retail banking that if
employees are empowered to make decisions affecting customer service, they are more
satisfied. It was established in the study that if employees were not able to handle a given
situation or did not have the knowledge, they would consult fellow employees for advice. It
was important however that the employees had the autonomy to do so.
4.4.1.3 Employee satisfaction through role fit and role clarity as a factor of internal
product
Role fit theory suggests that employees choose jobs based on the fit between their own
personalities and the job. When employees select jobs that best match their abilities and
interests, they are more likely to thrive at work resulting in the enhancement of employee
satisfaction (Gounaris, 2008b:72,75; Martensen & Gronholdt, 2006:98). Markets change
however, as do organisational objectives which require jobs to change too. This may
result in situations where employees find themselves in miss-fit positions. In retail banking
the salesforce may initially have been office bound, but in order to capture additional
market share the banks resorted to mobile banking. For a bank employee who has does
not enjoy being ‘on the road’ this would pose a problem resulting in feelings of
dissatisfaction (Atkinson, 2012).

122
Through the development of an internal market orientation and through the internal
product element, employees’ need can be monitored and organisations can respond to
these changing needs ensuring that employee satisfaction is maintained (Gounaris,
2008b:75). Further to this, role clarity as a factor of internal product reduces uncertainty
amongst employees. When employees are clear about their deliverables and have been
provided with the information needed to perform their job well, they experience higher
levels of satisfaction (Ingram, 2013:377). Peppers and Rogers (2010) suggest that retail
banks should also match employee skills with customer segments so that each internal or
external customer receives the level of experience and service required to meet their
needs. Through correct role fit and clarity, employees feel that their jobs are significant
and meaningful, and as a result experience higher levels of satisfaction resulting in
increased performance. Both role fit and role clarity as satisfaction predictors are
addressed through the internal product element (Peppers & Rogers, 2010; Halepota &
Shah, 2011:285).
4.4.1.4 Employee satisfaction through career advancement as a factor of internal
product
From an internal product perspective, career advancement and a clearly defined career
progression path are recognised as significant tools in the attraction, satisfaction and
retention of quality employees (Cedefop, 2008; Branham, 2005:105). Career
advancement or development equips employees with the opportunity to build skills and
capabilities and put these to optimal use resulting in increased satisfaction and employee
performance (Scales, 2013).
Loong (2011:346-347) believes that career advancement as an extrinsic reward is one of
the most significant predictors of employee satisfaction. Traditional rewards can only
motivate employees to a point. One approach to keep employees motivated and satisfied
is to help them take charge of their careers. This can be achieved by helping employees
assess their skills, determine what they like or dislike about their jobs, and identify areas
they would like to develop in or change. This approach assists employees in identifying
what motivates them so that they are able to make their work more satisfying. Through the
internal product element, by recognising and responding to the job needs of individual
employees such as their career needs, organisations are able to satisfy employees and
get the best out of them (Cedefop, 2008). Career advancement in retail banks is
performance based, meaning that employees are able to advance at a faster pace. As

123
long as employees perceive promotional decisions to be fair and just, they are likely to
experience satisfaction with their jobs. Career advancement as a satisfaction predictor
can thus be dealt with through the internal product element (Shrivastava & Purang,
2009:75).
4.4.2 Relationship between internal price and employee satisfaction
The internal price paid by employees as discussed in Chapter 3 (refer to section 3.2.2)
can contribute to both the employee satisfaction and dissatisfaction (Mansoor et al.,
2011:51). Mansoor et al. (2011:5) offer that employees may gain new knowledge and
skills, but in order to learn these skills and acquire the new knowledge, sacrifices have to
be made which may result in stress and lower levels of satisfaction or even dissatisfaction.
When employees feel high levels of stress, the cost of working for the organisation
becomes too high and employees will try to avoid the stress and ‘increased costs’ by
withdrawing either psychologically or physically. In extreme circumstances they may leave
the organisation altogether.
It is imperative that organisations understand the costs employees pay to work for them
and find ways to reduce these costs. By understanding the predictors of satisfaction and
responding to these in meaningful ways, employees feel supported and cared for. When
employees feel cared for and supported, their stress levels are reduced and the costs or
internal price of working for organisations may be diminished resulting in higher levels of
employee satisfaction (Karatepe, 2011:45, 49).
4.4.3 Relationship between internal promotion and employee satisfaction
The main objective of promotion is to inform, influence and remind customers about the
organisation’s product or service offering and to position the product or service in the
marketplace (Hoffman et al., 2005:18). From an internal perspective, the role of internal
promotion is to inform, influence and remind employees about the organisation’s internal
products, internal service offerings and how these fit into the internal environment. The
next section contemplates the relationship between employee satisfaction and internal
communication, and reward and recognition as factors of internal promotion (refer to
Chapter 3, section 3.2.3).

124
4.4.3.1 Employee satisfaction through internal communication (advertising,
personal selling and social media) as a factor of internal promotion
From an internal promotion perspective, the need for information about employee needs
and the communication of this information are essential aspects in creating an internally-
market orientated culture (Panigyrakis & Theodoridos, 2009:606). Communication of
information and knowledge sharing ensures the adherence to shared goals and a
harmonious working relationship between employees, which enables value to be created
throughout the internal value chain (Stoyanova, 2011:31). This is because an internal
environment based on honesty and openness is created in which everyone is for
everyone and no secrets are kept (Mitrega, 2012:488/491). Further to this, knowledge
sharing increases employees’ flexibility and adaptability which enhances their level of
satisfaction. This is mainly because of employees being exposed to information about
what has and has not worked previously in the organisation (Almahamid et al., 2010:330).
The level of employee adaptability and flexibility to perform their jobs more competently
comes from employees being better informed about the organisation’s vision and
objectives, and through the learning that transpires when knowledge is transferred
effectively (Almahamid et al.,2010:332,334). Increased flexibility results in greater internal
customer responsiveness as the free flow of knowledge allows for better integration and
cross-functional coordination across teams and business units. In addition to this, through
increased competence, greater creativity and innovation, stress levels can be reduced
and higher levels of job satisfaction achieved (Almahamid et al.,2010:332,334; Niehaves
& Plattfaut, 2011: 2-3). Thus, a high level of knowledge sharing and effective
communication lead to increased employee satisfaction (Niehaves & Plattfaut, 2011: 2-3).
Peppers and Rogers (2010) state that within a retail banking context, integrated
communication is important for employees. These authors suggest that retail banks
should not only listen to their internal and external customers, they should also respond to
these customers through social networking tools such as facebook and organisational
blogs. In this way banks communicate that internal and external customers are cared for,
which increases satisfaction and customer enthusiasm. In this way sharing of information
(communication) as a predictor of satisfaction is attended to through the internal
promotion element.

125
4.4.3.2 Employee satisfaction through reward and recognition (sales promotion) as
a factor of internal promotion
From an internal marketing perspective, organisations use reward and recognition
programmes to attract qualified employees into the organisation, retain them in the
organisation, and motivate them to achieve higher levels of performance (Pushpakumari,
2008:91). Reward and recognition support internal marketing objectives in that they serve
as an incentive to facilitate knowledge sharing and the creation of strong internal
relationships (Wang & Noe, 2011: 118).
Reward and recognition systems communicate to employees that they are valued by the
organisation which increases the occurrence of positive work behaviours such as
organisation citizenship behaviour (Wilches-Alzate, 2009:24). Martin and Martin (2005)
state that regardless of the type of compensation, it is necessary that reward and
recognition are closely tied to the specific internal market-orientated behaviours that
organisations are trying to elicit from their employees. Reward and recognition systems
are thus important determinants of employee behaviour and determine the level of work
improvement and service quality to internal customers, thus supporting internal marketing
objectives (Danish & Usman:160). Employees assess the rewards provided, and if the
rewards are perceived to be adequate and equitable, employees experience satisfaction.
Reward and recognition are viewed as some of the most important factors related to
employee satisfaction (Sarwar & Abugre, 2013:30). Improved levels of employee
satisfaction will affect the employees’ work effort, thereby improving their performance and
productivity (Pushpakumari, 2008:91). If employees have not been sufficiently rewarded
and recognised for their work, they will not promote the organisation’s services or serve
customers well thus affecting both internal and external marketing success (Panigyrakis &
Theodoridos, 2009:603,605). Thus reward and recognition (sales promotion) as a factor of
internal promotion influence employee satisfaction (Wilches-Alzate, 2009:24,29). Bowers
and Martin (2007:92) espouse that service organisations such as retail banks should
celebrate exemplary performance, and offer praise in a formal ceremony. In this way
employees feel recognised, which heightens their levels of satisfaction and service
consciousness. Bowers and Martin (2007:92) also suggest that from a reward
perspective, retail banks should tie compensation to performance, in this way, rewarding
customer and quality conscious employees whilst motivating other employees to improve
performance.

126
4.4.4 Relationship between internal distribution and employee satisfaction
From an internal perspective, internal distribution is concerned with the operational
activities that take place in making the internal product available to internal customers
(Kasper et al., 2006:400) (refer to Chapter 3, section 3.2.3). Service excellence is
dependent on various business units working together to create quality throughout the
value chain (Sirenne, 2013:21-122). To achieve the desired levels of quality, a network of
internal relationships is required with a strong focus on collaboration and interfunctional
coordination (Conduit & Quigg, 2013). For this reason, the organisation’s culture is
important as it represents how the internal environment functions (Popescu & Grigore,
2007:175). An essential element in creating the organisational culture and internal
environment is the organisational structure (Grayson & Sanchez-Hernandez, 2010:17).
The following section focuses on how employee satisfaction can be enhanced through
organisational culture and organisational structure as factors of internal distribution.
4.4.4.1 Employee satisfaction through organisational culture as a factor of internal
distribution
Culture represents the organisation’s internal environment; it represents how employees
treat each other and how decisions are made (Popescu & Grigore 2007:175).
Understanding culture is important as it provides an understanding of employee behaviour
(Mehr et al., 2012:1030). Organisations that emphasise an internal environment built on
trust facilitate behaviours such as collaboration and the sharing of knowledge between
employees and across departments (Wang & Noe, 2011:118).
From an internal distribution perspective, organisations must adopt a collaborative or clan
style of culture to enhance collaborative intelligence and lay the way for an integrated
organisation (Chang et al., 2010:52, Leonardo, 2008). Johnson (2013) believes that for a
retail bank to succeed, a collaborative networked culture of trust is required to increase
organisational performance. Beer (2012) suggests that organisations must become more
organisationally orientated rather than individually orientated in order to contribute to
internal-market orientation behaviours and objectives. In this way employees work
together to achieve organisational success. Further to this, the organisation’s cultural
environment is vital in keeping the organisation and employees focused, yet flexible in the
way they approach work (George et al., 2012:38). Popescu and Grigore (2007:175)
believe that organisations bring people together and in order to obtain the best from
employees, employees’ needs must first be satisfied. Employee-centred or a clan-type

127
organisational culture characterised by higher levels of employee support and
collaboration, are associated with meeting employee needs and therefore higher levels of
employee satisfaction (George et al., 2012:38; Beer, 2012; Ahmadi, 2010:464-465;
Newsham et al., 2009).
Emerson (2007:222) states that the predictors of employee satisfaction such as training
and development, strong relationships with co-workers and reward and recognition would
not be able to exist within the organisation without a culture that nurtures and cultivates
these elements. Organisations must constantly seek to ensure that a culture supportive of
employee satisfaction is harnessed. If through the element of internal distribution such a
culture can be developed and maintained, it will result in maximum employee satisfaction
and subsequent organisational profitability. Mehr et al. (2012:1030) found that there is a
strong link between organisational culture and employee satisfaction, thus organisational
culture is a driver of employee satisfaction.
4.4.4.2 Employee satisfaction through organisational structure as a factor of
internal distribution
From an internal distribution perspective, it is essential that the organisational structure is
a good fit for the internal environment. For an internally market-orientated environment
focused on engaged teams, strong internal communication and interfunctional co-
ordination as well as a decentralised organisational structure allowing for decentralised
decision-making, would make the best fit (Kilburn, 2008). These decentralised
organisational structures which permit decentralised decision-making allow internal
suppliers to better serve internal customers resulting in increased employee productivity
and performance. To this end, organisations are able to respond to their internal market
needs more effectively and efficiently, thus supporting the internal marketing objectives
(Beer, 2012; Tata, Prasad & Thorn, 2011). Further to this, a more decentralised/horizontal
organisational structure supports internal marketing objectives as it helps to create an
internal environment in which internal relationships can be harnessed (Wang & Noe,
2010:119).
Decentralised structures are the embodiment of decentralised decision-making and are
thus essential for responding to needs such as empowerment, flexibility, freedom and
action (Miri, Rangriz & Sabzikaran, 2011:56-57).
Peters and Mazdarani (2008:52) believe that the organisational structure of a retail bank
should be flat in order to remove barriers and create relationships both within the

128
organisation and with customers. This provides employees with access to top
management and with employees from other areas of the bank, which results in the better
flow of information. When the organisational structure supports the flow of information,
empowerment and freedom of employees to make decisions, employees experience
higher levels of satisfaction. Decentralised decision making as a satisfaction predictor is
therefore influenced by the internal distribution element of the internal marketing mix
(Yang, 2011:274; Miri et al., 2011: 56-57).
4.4.5 Relationship between internal people and employee satisfaction
Internal people are focused on the employees themselves (refer to section 3.2.5).
Employees define the customer’s perception of service quality and for this reason it is
important that the customer has a positive encounter with the organisation’s employees
(Gummesson, 2007).
Employees are therefore critical to a service organisations success as employees are
viewed as the service itself and play an essential role as part-time marketers (Zeithaml et
al., 2012:349). Gummesson (2007) suggests that organisations such as retail banks
realise that it is imperative that all employees influence customer relationships. Those who
don’t influence the customer relationship are redundant. For this reason, service
organisations must develop strong internal relationships through interfunctional integration
and collaboration with other employees (Mitrega, 2012:488). In this way, all employees
understand the mechanisms involved in the service delivery process and are able to
influence the customer experience as a result thereof (Gummesson, 2007). Through
strong internal relationships with leaders, supervisors/managers and co-workers,
employees are able to fulfil their affiliation needs and work together as a team which
results in greater feelings of satisfaction (SHRM, 2012:15-16).
4.4.5.1 Employee satisfaction through relationships with co-workers as a factor of
internal people
From an internal people perspective, it is the relationship with co-workers that provides
the notion of ‘teamwork’ and the feelings of a team spirit. Team spirit is based on how
employees feel about their co-workers as this group collectively depend upon one another
as they work together to achieve common objectives. If positive relationships exist
between co-workers, these employees will bond better as a team resulting in greater
levels of employee satisfaction (Halepota & Shah, 2011:284; Bateman, 2009:6).

129
Employee satisfaction is increased when co-workers are friendly, competent and
supportive, as these employees serve as a source of support, comfort and advice to each
other (Parvin & Kabir, 2011:115). Employees observe the satisfaction levels of other
employees in the organisation and then model these behaviours. If older employees
speak positively about the organisation and work hard, new employees will model this
behaviour too, resulting in higher levels of employee satisfaction. In this way relationships
with co-workers as a satisfaction predictor is influenced through the internal prople
element of the mix. (Kehinde, 2011:34).
4.4.5.2 Employee satisfaction through leadership style as a factor of internal people
Gharibvand (2012:289) opines that organisational success in obtaining its goals and
objectives depends on managers and their leadership style. From an internal people
perspective, leadership style encompasses the extent to which managers operate with
honesty and integrity, promote efficiency, treat employees with respect, and adopt open
lines of communication resulting in higher levels of employee satisfaction (Rad &
Yarmohammadian, 2006:xiii). Organisations with a strong internal marketing orientation
should adopt a combination of both participative and transformational leadership styles, as
these create employees who are team orientated and committed to knowledge sharing,
resulting in higher levels of internal service quality (De Jong & Den Hartog, 2007:41).
From an internal marketing perspective, both participative and transformational leadership
styles bring about higher levels of employee satisfaction. Newsham et al. (2009) found
that participative management styles have the strongest relationship with employee
satisfaction. Alkahtani et al. ( 2011:77) believe that in retail banking a participative
management style has benefits for both managers and employees. Through this kind of
management style employees become part of the team and managers are able to make
better decisions resulting in satisfaction for both parties. Mohammed, Al-Zeaud and
Batayneh (2011:39) espouse that transformational leadership styles reduce employee
work pressure and stress and increase employee morale, thereby resulting in increased
levels of employee satisfaction.
The correct application of leadership style as an element of internal people is important as
it influences the relationship between managers and their subordinates which results in
higher levels of employee satisfaction. In this way, leadership style as a satisfaction
predictor is influenced by the internal people element of the mix (Hamidifar, 2013).

130
4.4.5.3 Employee satisfaction through relationship with managers/supervisors as a
factor of internal people
The supervisor is the first link between the employee and the organisation and a positive
approach by supervisors towards employees could generate more positive attitudes and
behaviours such as job satisfaction from employees resulting in increased internal market
orientation (Panigyrakis & Theodoridos, 2009:607).
The relationship with the employee’s immediate supervisor/manager has been determined
as a major factor in an employee’s level of satisfaction and loyalty to the organisation.
When supervisors or managers as an element of internal people provide support and
resources necessary for employees to perform their jobs, treat employees with respect,
and adopt open lines of communication, employees feel more engaged, more satisfied
with their job and they become more loyal and committed as a result thereof (SHRM,
2012:15-16; Heish, 2012:251). This helps promote interfunctional integration in which all
banking employees understand the operations behind the service process, enabling them
to perform their role as part-time marketers (Gummesson, 2007). In addition to this, if
employees feel that they matter to supervisors/managers, their level of satisfaction is
further enhanced (Kehinde, 2011:34). From retail banking perspective the relationship
with supervisors supports the internal marketing objectives in that if supervisors and direct
managers create a supportive internal environment and open channels of communication,
employees experience satisfaction and are more willing to share information and develop
internal relationships. In this way, relationships with supervisors as a satisfaction predictor
is addressed through the internal people elment (Wang & Noe, 2010:118).
4.4.6 Relationship between internal process and employee satisfaction
Gupta, McDaniel and Herath (2005:391) believe that if the internal processes that are put
in place are practised often and enforced, they will ensure that a consistent level of
service quality is delivered (refer to section 3.2.6). From an internal process perspective,
consistent processes contribute to confidence levels as employees understand exactly
what is expected from them, allowing them to perform their jobs more effectively. Effective
and efficient processes allow employees to create value throughout all steps in the value
chain. In retail banking the delivery of operational excellence requires a consistent service
experience across channels under both normal and abnormal circumstances. Processes
need to be constantly examined for improvement opportunities, contingency plans must
be developed for disruptive events, and internal and external customer loops must be

131
closed following customer problems to ensure both internal and external customer
satisfaction (Peppers & Rogers, 2010). Processes should be automated as much as
possible by providing employees with self service systems such as an HR administration
system. Costs can be reduced and employee satisfaction increased as employees feel a
greater sense of control over their work life (The Economist, 2007:7).
Internal customers will assess the service and service-delivery process they receive from
internal suppliers. If the service process is perceived to be consistent and reliable, these
internal customers will experience higher levels of satisfaction (Lovelock et al., 2009:23-
24; Vella et al., 2009:411; Kasper et al., 2006:387). Bellou and Andronikidis (2008:944-
945) further support this notion by stating that employee satisfaction is dependent on the
quality of the internal service process.
4.4.7 The relationship between physical evidence and employee satisfaction
The physical environment refers to physical facility in which the service is provided
(Holder & Berndt, 2011:390-393). Organisations rely on internal physical evidence to
create perceptions of service quality for employees. The happier the employee is with the
physical evidence, the higher the level of satisfaction (Holder & Berndt, 2011:390-393;
Newsham et al., 2009:3). The internal physical evidence for the purpose of this study
relates to both peripheral (performance feedback) and essential evidence (physical
environment) as discussed in Chapter 3 (refer to section 3.2.7). The next section focuses
on the achievement of employee satisfaction through the physical environment and
performance feedback as factors of internal physical evidence.
4.4.7.1 Employee satisfaction through the physical work environment (essential
evidence) as a factor of internal physical evidence
From an internal perspective, physical working conditions relate to factors such as a
comfortable working environment, ventilation, lighting, temperature, safety, better and
cleaner office space. These factors have a strong influence on the employees’ feelings of
physical comfort and safety within their internal environment (Mansoor, et al., 2011:52).
Changing or improving the physical environment of employees is one of the most effective
tools for changing individual behaviour, as it allows for improved outcomes such as
increased productivity and internal market-orientated behaviours (Martin & Martin, 2005).
Better work environments which are considered to be more physically pleasing mean
more satisfied employees and more satisfied employees make for a more productive work

132
environment. This is because well designed work environments signal the values and
objectives of the organisation, which in turn has a significant impact on employee
satisfaction. How well the organisation satisfies and engages employees impacts their
level to perform, which in turn influences the employees error rate, level of innovation and
level of collaboration with other employees, their level of absenteeism, and ultimately how
long they remain with the organisation. The physical environment as a satisfaction
predictor is therefore addressed through the internal physical evidence element of the
internal marketing mix (Mansoor et al., 2011:52; Al-Anzi, 2009:10,13; Newsham et al.,
2009).
According to a retail banking study conducted by Peters and Mazdarani (2008: 49), it was
found that the employees’ work environment influenced the level of service provided to
customers. Given that employees have direct access to banking customers, if employees
are satisfied with their work environment, this impacts the level of individual service
provided to both internal and external customers.
4.4.7.2 Employee satisfaction through performance feedback (peripheral evidence)
as a factor of internal physical evidence
Organisations focused on providing ongoing feedback in terms of how employees are
performing their tasks relative to expectations, are able to reduce uncertainty amongst
employees and achieve higher levels of employee satisfaction (Halepota & Shah,
2011:285). Further to this, feedback as a factor of internal physical evidence is recognised
as self-rewarding and provides the opportunities for improved performance through trial
and error learning which in turn leads to enhanced satisfaction. In this way, internal
physical evidence influences performance feedback as a satisfaction predictor (Sage
Publications, 2011).
In summary, the primary objective of the study is to determine the influence of the internal
marketing mix on employee satisfaction. Should the internal marketing mix elements have
a positive impact on employee satisfaction as assumed in the above discussion, a
comprehensive internal marketing programme should be implemented in order to achieve
the objectives of employee satisfaction. Achieving increased employee satisfaction should
be a major goal of all service organisations as increased employee satisfaction results in
increased employee productivity, quality output and retention (Antoncic & Antoncic,
2011:593). The next section focuses on employee retention and the role of employee
satisfaction and internal marketing in the retention of quality employees.

133
4.5 RELATIONSHIP BETWEEN EMPLOYEE SATISFACTION, AFFECTIVE
COMMITMENT AND EMPLOYEE RETENTION
“The challenge today is not just retaining talented people, but fully engaging them,
capturing their minds and hearts at each stage of their work lives” (Lockwood, 2007: 2).
To achieve these objectives, service organisations are placing increased importance on
understanding employee satisfaction as this has been associated with improved employee
productivity and increased employee retention, which results in increased organisational
effectiveness (Abdullah, Djebarni & Mallahi, 2011:127). Employee retention is defined as
a commitment to continuously exchange with a specific organisation over a period of time
(Alkandari & Hammad, 2009:7). From a service profit chain perspective, employee
satisfaction is directly linked to employee retention. Many organisations fail to recognise
the loss of productivity and decrease of both internal and external customer satisfaction
that result from poor employee satisfaction and increased employee turnover (Emerson,
2007:3).
Berry and Morris (2008) state that healthy employee turnover in an organisation can be
positive as new ideas and techniques and fresh ways of thinking are introduced into the
organisation, which can result in greater levels of success. Turnover among highly
productive, quality employees however is a very costly and destructive exercise for
organisations. Research by Ongori (2007:51-52) indicates that the replacement cost for a
lost employee is approximately 50% of the employee’s annual salary. Apart from the direct
costs related to turnover, these organisations are subject to high indirect costs such as the
induction, training and development costs of employees. Additional costs involve lost
productivity, lack of commitment, inconsistency in the provision of service to customers,
reduced customer satisfaction and customer defection when a productive employee quits.
High turnover is detrimental to organisational profitability and performance as
organisations are losing these valuable employees to direct competitors (Chiboiwa,
Chipunza & Samuel, 2011:2911; Ongori, 2007:51-52; Heskett et al., 2008:122; Chartered
Institute of Personnel Development, 2008).
There is no agreed upon framework for understanding the employee turnover process as
a whole, but a there are several factors which have been identified as drivers of retention
such as culture, salary and career development to name a few (in this case the employee
satisfaction predictors) (Nujjoo & Meyer, 2012:2; Alkandari & Hammad, 2009:7). When
employees are satisfied they are less likely to leave organisations. This is because highly

134
satisfied employees demonstrate high levels of organisational commitment and committed
employees stay with organisations (Pepe & College, 2010:42). Farzad et al. (2008:1481)
recognise that creating a sustainable competitive advantage in service organisation starts
with stronger focus on the internal market and the conversion of employees into
organisational supporters, part-time marketers and exceptional customer service
providers which requires organisational commitment, specifically affective commitment
(Benjamin, 2012:54-56; Farzad et al., 2008:1481).The next section discusses affective
commitment in more detail.
4.5.1 Affective commitment
Affective commitment synonymous with loyalty has been identified as the strongest
predictor of employee intention to remain with organisations (Calisir, Gumussoy & Iskin,
2011:516). Organisational commitment can be best understood through the three
component model which proposes three types of organisational commitment namely,
affective commitment, normative commitment and continuance commitment (Jha,
2011:266). Normative commitment refers to the employee’s belief that he or she should
remain within the organisation and develop as a result of social pressures (family, cultural
and organisational) (Warsi, Fatima & Sahibzada, 2009:402). Continuance commitment is
either based on the degree of personal sacrifice associated with leaving the organisation,
or it is based on the availability of alternatives should the employee leave the organisation
(Gonzalez & Guillen, 2007:404). Affective commitment is described as the employee’s
state of emotional commitment to the organisation and is influenced by factors such as
organisational support. Employees link their identity to that of the organisation and form
an emotional commitment with the organisation which goes beyond the organisation’s
instrumental worth. As a result, employees desire to continue their association with the
organisation (Jha, 2011:266). Baptiste (2008:292) believes that affective commitment
relates to the employees positive attachment to the organisation. Affectively committed
employees are willing to exert extra effort on behalf of the organisation in pursuit of the
organisation’s objectives.
The focus of the study is on affective commitment since it has been demonstrated to have
a strong positive relationship with job satisfaction and organisational outcomes such as
turnover intentions, retention and financial performance (Dimitriades & Papalexandris,
2011:146).

135
4.5.2 Relationship between employee satisfaction, internal marketing and affective
commitment
Employees demonstrate affective commitment to organisations in return for certain
rewards which can either be extrinsic, such as reward and recognition, or intrinsic such as
belonging and employee satisfaction (Baptiste, 2008:292). When employees feel that
they are able to develop with organisations and are satisfied with employee satisfaction
predictors such as relationship with co-workers, pay and supervision, their level of
commitment to those organisations is greater (Warsi et al., 2009:402).
Appelbaum et al. (2013:226) suggest that there is a strong relationship between employee
satisfaction and affective commitment. This is because affective commitment is influenced
by the exchange process. If an employee evaluates the costs and benefits of working for
the organisation and feels that his/her needs or desires have been met, the employee will
experience satisfaction. The results of this is an affectively committed state towards the
organisation or work environment. There is a positive correlation between employee
satisfaction and affective commitment and thus retention (Boles et al., 2007:313). Chang
and Chang (2008:163) suggest that one way of improving employee satisfaction is
through the implementation of an internal marketing programme.
Given that internal marketing efforts have been proven to develop better relationships
between employees and their organisations whilst increasing satisfaction and retention,
many organisations are turning to internal marketing practices in order to better motivate,
satisfy and retain employees by developing healthy relationships with these employees
(Peltier & Dahl, 2009; Sim, 2008:34). Boshoff and Du Plessis (2009:13) advocate that
organisations that focus on understanding employee needs and deliver on these needs as
per internal marketing principles, are more likely to retain their employees in the long run.
Through the implementation of an internal marketing, internal marketing focuses on
treating employees with the same level of importance as customers in order to achieve
both the internal and external marketing objectives. In this way employees feel cared for
by organisations, which results in increased levels of employee satisfaction and more
positive attitudes towards their work, such as increased affective commitment and loyalty
(Farzad et al., 2008:1481). Committed employees demonstrate high levels of
performance, less dissatisfaction and less intent to leave organisations (Appelbaum et al.,
2013:224). Thus internal marketing is the driver of employee satisfaction and employee
satisfaction is the precursor for affective commitment and employee retention (Lee &
Chen, 2013:199; Guven & Sadaklioglu, 2012:109).

136
4.6 CONCLUSION
Organisations, in particular retail banks that are characterised by high levels of employee
turnover specifically within the GDP employee group, must attract, engage and retain
talented employees in order to survive and compete effectively. The satisfaction of
employee needs therefore becomes of pivotal importance for retail banks and these
organisations must ensure that the predictors behind employee satisfaction are well
understood. If the drivers behind employee satisfaction have been identified and clearly
understood, programmes can be developed to better satisfy employee needs. Internal
marketing has been viewed as a potential programme for the satisfaction of employee
needs as the internal marketing mix elements are able to effectively address the factors of
employee satisfaction.
Chapter 4 explored the theory of employee satisfaction with specific focus on the
discussion of the factors of employee satisfaction and the theoretical relationship between
internal marketing and employee satisfaction. Chapter 4 also considered the link between
internal marketing, employee satisfaction, productivity and retention. Literature throughout
this study purports the notion that internal marketing impacts employee satisfaction which
in turn impacts employee productivity and retention ultimately effecting customer
satisfaction and organisational profitability.
The following chapter will explain the research design and methodology utilised to prove
the hypotheses stated in Chapter one. Chapter five will focus on the research design,
survey techniques and the sampling process in detail. In addition to this, the questionnaire
design and data analysis methods considered for the study will be discussed in depth.

137
CHAPTER 5
RESEARCH METHODOLOGY
5.1 INTRODUCTION
Research involves the activities that increase the sum of human knowledge, and for this
reason the research process begins with recognising the need for information. Once the
need for this information has been identified, the plan to meet and resolve these
information needs must be designed (Moodley, 2008:76).
A research design serves as a blueprint of the methods used to gather and evaluate data.
Determining the most suitable research design is based on the research objectives and
the precise information requirements of the study. The choice of research design is
determined by the nature of the data necessary for collection and by the sampling
methods and procedures (Hair et al., 2006:63).
This chapter focuses on the various steps in the research process with specific focus on
the sampling method and research method and design. Further to this, data collection
methods and questionnaire design with particular focus on measurement scales will be
explained, followed by a section on data processing and analysis. The following section
will open with a discussion on the research process.
5.2 THE RESEARCH PROCESS
The research process consists of a number of steps, some with a high level of
interdependency. The purpose of the research process is to provide a holistic
understanding of the different steps to be followed when conducting research (Cant,
Gerber-Nel, Nel & Kotze, 2005:39). Different authors have different steps in their research
processes. This study makes use of research process steps as proposed by Iacobucci
and Churchill (2010:31) in Figure 5.1. The different steps in the research process are
discussed next.

138
Figure 5.1. The Research process
Source: Adapted from Iacobucci and Churchill (2010:31).
Figure 5.1 will be discussed in detail in this chapter. Steps one and two focus on the
formulation of the research problem and the research objectives as discussed in Chapter
1. Steps three and four will be discussed in order to determine what type of research
design is required based on the research problem, objectives and hypotheses discussed
in Chapter 1. Steps five, six, seven and eight will consider the sampling strategy,
statistical procedures and empirical validation of the research objectives. Steps nine and
ten will be discussed in Chapter 7.
5.2.1 Step 1: identify and formulate the research problem
Chapter 1 (section 1.3) emphasised that internal marketing is aimed at “attracting,
developing, motivating and retaining employees through job products that satisfy their
needs’ (Kale, 2008:3). Internal marketing could serve as an enabling tool to improve
satisfaction among retail banking GDP employees within South Africa. By satisfying these
internal customers’ needs, the banks should be in a better position to deliver the quality
service desired to satisfy the external customer. The reason for this is that fulfilling the
employees’ needs, enhances employee motivation and as a consequence the higher the
degree of employee satisfaction, the higher the possibility of generating external

139
satisfaction and loyalty (Zampetakis & Moustakis, 2007:417–418). Pushpakumari (2011)
and Boles et al. (2007:313) state that increased employee satisfaction results in higher
levels of affective commitment and thus retention.
Previous internal marketing studies within the banking industry have focused on employee
understanding of corporate values, employee commitment, service quality, customer
satisfaction and loyalty (Sahi et al., 2013; Kameswari & Rajyalakshmi, 2012; Aburoub,et
al.; 2011, Abzari & Ghujali, 2011; Awwad & Agti, 2011). Pelitier et al. (2008) have
conducted a number of studies exploring the link between internal marketing and
employee satisfaction in the nursing industry. However, no studies either locally or
internationally could be found exploring the influence of internal marketing as a means to
achieving employee satisfaction amongst retail banking GDP employees. In addition, no
studies could be found linking the elements of the internal marketing mix (product, price,
promotion, place, people, process, physical evidence and interfunctional coordination) to
employee satisfaction.
This raises the question as to whether internal marketing does in fact have a positive
influence on the satisfaction levels of retail banking GDP employees in South Africa.
Various studies (Appelbaum et al., 2013:226; Boles et al., 2007:313) link employee
satisfaction to affective commitment and the researcher was interested in exploring the
link between employee satisfaction and affective commitment. Taking the above into
consideration, the problem statement and aim of this study can be formulated as follows:
To determine the influence that the internal marketing mix elements have on
employee (graduate) satisfaction within the retail banking industry in South Africa.
The study also aims to identify whether a link between employee satisfaction and
affective commitment can be observed in this context (refer to Chapter 1, section
1.3).
5.2.2 Step 2: Determine the research objectives
Once the research problem and purpose have been identified, research objectives can be
developed. The research objectives are based on the research problem definition
identified in Step 1 and provide the guidelines for the remainder of the steps in the
marketing research process (Hair et al., 2010:35). The primary and secondary research
objectives have been developed from the research problem (refer to section 1.3 in
Chapter 1).
140
5.2.2.1 The primary research objective
To investigate the influence of the internal marketing mix on employee satisfaction from
GDP employees’ perspective in order to enhance their satisfaction at retail banks with
graduate development programmes in South Africa. In addition to this, the relationship
between employee satisfaction and affective commitment is also explored.
5.2.2.2 The secondary objectives
This section will provide insights into the secondary objectives set for the study in order to
achieve the primary objective. The secondary objectives that the researcher aims to
investigate include:
To examine the theory relating to the seven elements of the internal marketing mix,
employee satisfaction and affective commitment
To determine whether GDP employees are aware of the internal marketing mix
elements at their bank
To determine GDP employees’ level of satisfaction with their bank as an employer
To determine whether a significant positive relationship exists between internal
product and GDP employee satisfaction
To establish whether a significant positive relationship exists between internal price
and GDP employee satisfaction
To explore whether a significant positive relationship exists between internal
promotion and GDP employee satisfaction
To determine whether a significant positive relationship exists between internal
distribution and GDP employee satisfaction
To establish whether a significant positive relationship exists between internal people
and GDP employee satisfaction
To explore whether a significant positive relationship exists between internal process
and GDP employee satisfaction
To determine whether a significant positive relationship exists between internal
physical evidence and GDP employee satisfaction
To determine whether a significant positive relationship exists between employee
satisfaction and affective commitment

141
5.2.2.3 Hypotheses
Based on the objectives identified, the following hypotheses have been put forward:
H1: There is a significant positive relationship between the internal product and GDP
employee satisfaction
H2: There is a significant positive relationship between the internal price and GDP
employee satisfaction
H3: There is a significant positive relationship between the internal promotion and GDP
employee satisfaction
H4: There is a significant positive relationship between the internal distribution and GDP
employee satisfaction
H5: There is a significant positive relationship between the internal people and GDP
employee satisfaction
H6: There is a significant positive relationship between the internal process and GDP
employee satisfaction
H7: There is a significant positive relationship between the internal physical evidence and
GDP employee satisfaction
H8: There is a significant positive relationship between GDP employee satisfaction and
affective commitment

142
Figure 5.2. A presentation of the hypotheses for the study
Source: Researchers own construct.
5.2.3 Step 3: Research design
Solomon et al. (2006:109) describe research design as a framework that specifies what
information will be gathered and what kind of study the researcher will be conducting.
Research designs may be classified as exploratory, descriptive, or causal (Solomon et al.,
2006:109). Exploratory research focuses on finding ideas and patterns, and is concerned
with gaining background information and familiarity on a subject area. Descriptive
research refers to the collection of data in order to describe and measure existing
characterises or phenomena at a particular point in time (Zikmund & Babin, 2010:45).
Causal research focuses on the need to determine causality in relationships between
marketing factors (Hair et al., 2010:77).
To meet the research objective of determining the influence of internal marketing on
employee satisfaction and to determine the link between employee satisfaction and
affective commitment, a descriptive research design has been selected since descriptive

143
research is best suited to quantitative research (Zikmund & Babin, 2007:83).The following
section focuses on descriptive research designs and the importance of quantitative
research. Quantitative research is defined as research that makes use of structured
closed-ended questions which have predetermined response possibilities in
questionnaires or surveys that are distributed to a large number of participants (Hair et al.,
2010:78). Quantitative research has been selected for the purpose of this study as it
allows for larger sample sizes (Hair et al., 2010:78). It also provides quick, inexpensive
and efficient data which can be generalised and statistically calculated, and the
researcher is able to apply simple statistical tools to analyse the data (Zikmund et al.,
2010:136,147).
Through the quantitative method a direct link between the concepts of internal marketing
and employee satisfaction can be determined, as well as the link between employee
satisfaction and affective commitment as it allows the researcher to determine the extent
to which the participants of the study agreed or disagreed with each element of the study,
thereby allowing for the measurement of these elements. For this reason a descriptive
research design was used and is discussed next.
5.2.3.1 Descriptive research design
A descriptive research design can be defined as a mechanism that describes the
characteristics of a given research problem (Zikmund & Babin, 2010:45).These research
designs are quantitative in nature and allow for research that defines the characteristics of
certain groups, determine the proportion of people behaving in a specific manner and
make predications in relation to this (Iacobucci & Churchill, 2010:84; Churchill & Brown,
2007:105).
Descriptive research has been used in this study as it makes use of formal survey and
questionnaire techniques in order to gather data pertaining to the study (Kent, 2007: 182;
Solomon et al., 2006:113). Descriptive research allows the researcher to determine
certain demographic variables of the participants, as well as how many participants
shared similar attitudes or opinions to questionnaire statements leading to more precise
results. Descriptive studies furthermore aid in the determination of relationships between
marketing elements and dimensions such as those involved in internal marketing and
employee satisfaction (Churchill & Brown, 2007:105).

144
5.2.4 Step 4: Conduct secondary research
Secondary data are comprises repositories of literature and statistics originally collected
for a purpose other than the study at hand (Malhotra, 2007:106). Secondary research
contributes to the effectiveness of research as this is a prerequisite to the collection of
primary data. Further to this, secondary data is quick, inexpensive and simple to access
(Zikmund & Babin, 2010:123; Malhotra & Peterson, 2006:106). In this study, secondary
research was conducted in order to formulate the theoretical background. Extensive
literature on services marketing, internal marketing, employee satisfaction and affective
commitment (retention) in particular, was collected as part of secondary data.
Furthermore, previous studies conducted on the topic were researched. This information
was gathered from numerous academic journals, theses and dissertations, books,
websites and industry studies prior to considering any primary research methods. This
information is presented in Chapters 2, 3 and 4.
Although secondary data can be valuable in explaining similar situations, it is not able to
explain the current existing situation and thus it is necessary to select a primary research
method in order to collect primary data (Malhotra, 2007:106). This is discussed in the next
section.
5.2.5 Step 5: Select a primary research method
Primary data refers to data that has been initiated by the researcher for the purpose of the
current study (Churchill & Brown, 2007:146). From the collection of primary data,
meaningful insights can be gathered. For the purpose of the study, insights can be gained
into GDP employees’ awareness levels of the internal marketing mix, the importance of
the internal marketing mix elements, their satisfaction levels and levels of affective
commitment.
This step includes a discussion of the following subsections: the data collection methods,
questionnaire design, the choice of scales selected, the pretesting of the questionnaire,
the validity of the questionnaire, and, lastly, the reliability of the questionnaire in gathering
the data.

145
5.2.5.1 Data collection methods
Descriptive research designs utilise surveys as the data collection method. A survey is
described as a technique in which participants are surveyed or questioned and their
responses recorded for analysis. The main advantages of conducting a survey is its
versatility, its speed, its inexpensive, efficient and accurate means of assessing
information about a population (Gaiser & Schreiner, 2009:47). Various survey data
collection methods were considered for the study (refer to Chapter 1, section 1.8.3). In
order to best facilitate the participating bank’s needs and meet the study objectives, it was
decided that a combination of person-administered and electronic survey methods would
be used.
Since the study is focusing on a specialised group of employees the population size is
relatively small.. Since all GDP employees employed with First National Bank and
Standard Bank are situated in their head office, a person-administered survey was
selected. This would allow the researcher to conduct the survey personally with First
National Bank and Standard Bank GDP employees to ensure that all questions and
instructions were clearly understood and answered in full. Nedbank however requested an
electronic survey, given that their GDP employees are scattered across the region and
obtaining access to this group would have been difficult. The same survey questionnaire
was utilised in both the person-administered and electronic survey. Once the survey
method had been decided, a well designed questionnaire needs to be developed to
extrapolate the desired information from participants. The next section focuses on the
importance of questionnaire design.
5.2.5.2 Questionnaire design
The objective of questionnaire design is to increase the participation of target participants,
to improve the relevance and accuracy of the data collected, and to assist in the collection
and analysis of the data (Gaiser & Schreiner, 2009:46-48).
The questionnaire developed for the study made use of closed–ended structured
statements in the form of a predetermined collection of responses or scale options (Hair et
al., 2010:430; Iacobucci & Churchill, 2010:188). The questionnaire was made up of four
sections according to the concepts developed in the theoretical framework (refer to
Appendix 1).

146
Demographic section
The objective of this section was to gather information about the respondent. Statements
regarding the participant’s age, gender and race were included. In addition to this, the
participants were asked with which bank they were employed, and two additional
questions were included in terms of which department they were working in and whether
they had had any previous work experience and if so, with which organisation.
Section 1: Awareness of the internal marketing mix
This section tested the participants’ awareness of the internal marketing mix within their
bank. This section made use of an awareness scale which was developed for the study
based on constructs developed from the literature (Javadein et al., 2010:366-367; Yang,
2012; Grayson & Sanchez-Hernandez, 2010:9) (refer to Table 5.2, in section 5.2.5.3 for a
summary of the scale sources) . A five-point Likert scale was used with response
categories ranging from 1= strongly agree to 5= strongly disagree. An interval scale was
used and the response categories were unlabelled. The section included seven
statements relating to the awareness of each of the internal marketing mix elements.
Section 2: Internal marketing
This section included all aspects pertaining to the internal marketing theory explored in
Chapter 3. Existing internal marketing mix scales from previous studies were adapted for
use in this section for the internal product, internal price and internal promotion scales
(Burin, 2011). The rest of the constructs were developed from literature in Chapter 3
(refer to Table 5.2, section 5.2.5.3 for a summary of the scale sources) This section made
use of a five-point interval Likert scale ranging from 1= strongly agree to 5=strongly
disagree (discussed in more detail in section 5.2.5.3 ) to measure the internal marketing
mix of product, price, promotion, distribution, people, process and physical evidence. An
interval scale was used and response categories were unlabelled. Section 2 of the
questionnaire consisted of seven subcategories totalling 46 statements pertaining to the
internal marketing mix.
i) The internal product subscale contained six statements concerning employee training
development, career advancement opportunities, empowerment, if the employees’
skills matched their work (role fit) and how passionate the employees are about their
work. The internal product scale is an adapted scale from a previous study by Burin
(2011).

147
ii) The internal price subscale consisted of six statements relating to the degree of
distress felt by the employee, psychological costs and emotional labour. Internal price
is an adapted scale based on previous study conducted by Burin (2011).
iii) The internal promotion subscale was made up of ten statements regarding
communication and the modes of communication and reward and recognition. The
internal promotion scale was adapted from a study conducted by Burin (2011).
iv) The internal distribution subscale included seven statements about the organisational
culture and structure. The internal distribution scale was developed from the literature
in Chapter 3 (El Emary et al., 2012:358-359; Spreitzer, 2007; Melewar &
Karaosmanoglu, 2006:854; Wong 2005:269; Huang & Chen, 2009:12137; Lovelock &
Wirtz, 2008:313; Kilburn, 2008) (refer to Table 5.2, section 5.2.5.3).
v) The internal people subscale was made up of eight statements relating to leadership,
and the relationship with supervisors and co-workers. The internal people scale was
developed from the literature in Chapter 3 (Sim, 2008:25; Martensen & Gronholdt,
2006:94; Dewettinck & van Ameijde, 2011:285,287; Rad & Yarmohammadian,
2006:13; Wong, 2005:267; Shuck et al., 2011:306; Peltier & Dahl, 2009; Liu et al.,
2011) (refer to Table 5.2, section 5.2.5.3).
vi) The internal process subscale consisted of four statements relating to the significance
of existing and improved process. The internal process scale was developed from the
literature in Chapter 3 (Lu & Wood, 2006:1125; Burin, 2011:122; Lovelock et al.,
2009:23-24; Vella et al., 2009:411; Holtzman, 2011:50) (refer to Table 5.2, section
5.2.5.3).
vii) The internal physical subscale evidence consisted of five statements concerning the
attractiveness of the internal environment and the significance of performance
feedback. The internal physical evidence scale was developed from the literature in
Chapter 3 (Parkin et al., 2011:31/33; Jawahar, 2006: 213-214; Kuvaas, 2011:124;
MacMillan, 2006:9) (refer to Table 5.2, section 5.2.5.3).

148
Section 3: Employee satisfaction
This section contained aspects relating to employee satisfaction theory. A five-point Likert
scale ranging from 1= strongly agree to 5=strongly disagree was used to measure the four
various elements. An interval scale was used and the response categories were
unlabelled. An existing satisfaction scale was adopted from the study of Petzer and De
Meyer (2011) for the purpose of this study.
Section 4: Affective commitment
This section addressed the affective commitment as perceived by employees. An existing
affective commitment scale from the study of Awwad and Agti (2011) was adopted for the
study. This section made use of a five-point Likert scale ranging from 1= strongly agree to
5=strongly disagree to measure the seven statements of the construct. An interval scale
was used and the response categories were unlabelled.
Linking the secondary objectives to the sections in the questionnaire
Table 5.1 provides the links between the secondary objectives identified for the study, the
sections in the questionnaire aiming to achieve the objectives, and the literature
pertaining to the scale development.
Table 5.1 Link between secondary objectives and sections in the questionnaire
No Secondary objective Items in questionnaire
1
To examine the theory relating the seven elements of the
internal marketing mix, employee satisfaction and affective
commitment
N/A
2 To determine whether GDP employees are aware of the internal
marketing mix elements at their bank
Section 1
Q1.1 - Q1.6
3 To determine GDP employees’ level of satisfaction with their
bank as an employer
Section 3
Q9.1- Q9.4
4 To determine whether a significant positive relationship exists
between internal product and GDP employee satisfaction
Section 2
Q2.1 - Q2.6
5 To determine whether a significant positive relationship exists
between internal price and GDP employee satisfaction
Section 2
Q3.1 - Q2.6

149
No Secondary objective Items in questionnaire
6 To determine whether a significant positive relationship exists
between internal promotion and GDP employee satisfaction
Section 2
Q4.1- Q4.10
7 To determine whether a significant positive relationship exists
between internal distribution and GDP employee satisfaction
Section 2
Q5.1 - Q5.7
8 To determine whether a significant positive relationship exists
between internal people and GDP employee satisfaction
Section 2
Q6.1 - Q6.8
9 To determine whether a significant positive relationship exists
between internal process and GDP employee satisfaction
Section 2
Q7.1 - Q7.4
10
To determine whether a significant positive relationship exists
between internal physical evidence and GDP employee
satisfaction
Section 2
Q8.1 - Q8.5
11 To determine whether a relationship exists between employee
satisfaction and affective commitment
Section 4
Q10.1 - Q10.7
5.2.5.3 Scale choice
Likert scales are generally used to measure attitudes and perceptions and since this study
aims to measure the attitudes and perceptions of GDP employees within the retail banks,
the main part of the questionnaire consisted of unlabelled interval Likert scales (Cooper &
Schindler, 2007:234). Likert scales require participants to indicate the degree to which
they agree or disagree with a series of statements about the constructs. Each scale
consists of five response categories ranging from 1= ‘strongly agree’ to 5= ‘strongly
disagree’ (Antonucci & Goeke, 2011:133; Hair et al., 2009:287). As stated in section
5.2.5.2, scales were both adopted and adapted from previous studies and the researcher
developed five of the scales based on the literature provided in the study. Table 5.2
provides a summary of how the scales were developed.

150
Table 5.2. Development of scales
Construct Origin Literature
Awareness of internal marketing mix
Developed from literature
Javadein et al. (2010:366-367); Yang
(2012); Grayson & Sanchez-
Hernandez (2010:9)
Internal product Adapted Burin (2011)
Internal price Adapted Burin (2011)
Internal promotion Adapted Burin (2011)
Internal distribution Developed from literature presented in Chapter 3 section 3.2.4
El Emary et al. (2012:358-359);
Spreitzer, (2007); Melewar &
Karaosmanoglu ( 2006:854); Wong
(2005:269); Huang & Chen
(2009:12137); Lovelock & Wirtz
(2008:313); Kilburn (2008)
Internal people Developed from literature presented in Chapter 3 section 3.2.5
Sim (2008:25); Martensen and
Gronholdt (2006:94), Dewettinck and
van Ameijde (2011:285 & 287); Rad
and Yarmohammadian, (2006:13),
Wong, (2005:267); Shuck et al.
(2011:306); Peltier and Dahl (2009),
Liu et al. (2011)
Internal process Developed from literature presented in Chapter 3 section 3.2.6
Lu and Wood (2006:1125) Burin
(2011:122); Lovelock et al. (2009:23-
24); Vella et al. ( 2009:411); Holtzman
(2011:50).
Internal physical evidence
Developed from literature presented in Chapter 3 section 3.2.7
Parkin et al. (2011:31/33); Jawahar
(2006: 213-214); Kuvaas (2011:124);
MacMillan (2006:9)
Satisfaction Adopted Petzer and De Meyer (2011)
Affective commitment
Adopted Awwad and Agti (2011)

151
When administering a survey, a certain degree of error is expected due to fluctuations in
data (Hair et al., 2010:227). Errors were reduced by designing a questionnaire which was
easy to understand and respond to, and by constructing Likert-type statements on the
questionnaire from related literature and pre-testing the questionnaire with participants in
the population (Conradie, 2012:273). The next section discusses questionnaire pre-test in
more detail.
5.2.5.4 Pre-test of the questionnaire
A pre-test of the questionnaire is necessary to determine if any weaknesses exist in the
research design and questionnaire itself (Russel & Purcell, 2009:130). The objective is to
determine if participants have any problems in understanding the questionnaire, whether
the wording and instructions are clear and easily understood. Through this approach
weaknesses in the questionnaire can be identified and improved upon in order to ensure
that an accurate questionnaire is produced (Steyn, 2008:178; Zikmund & Babin,
2007:377).
The pre-test was conducted with six GDP employees from two of the participating banks.
The person-administered approach was used with three GDP employees from Standard
Bank and an email approach was used for the three GDP employees from First National
Bank. The three participants in the person-administered group had no problem with the
initial questionnaire, as the researcher was present to provide clear instructions on how to
answer section two in particular, but the participants in the email group failed to read and
understand the instructions correctly and instead of rating the importance of each item,
rated the degree to which they agreed or disagreed with each statement. For this reason
the statements were changed to ensure participants understood the questions clearly.
5.2.5.5 Validity of the questionnaire
Validity is defined as the precision of a measure or the degree to which a research
instrument measures what it is supposed to measure (Zikmund & Babin, 2010:250).
Validity is an essential measure since a lack of validity will result in incorrect conclusions
(Zikmund & Babin, 2010:250; Solomon et al., 2006:118). Content validity and construct
validity were used to test for validity and are discussed in more detail next.

152
Content validity Content validity refers to the subjective concurrence among professionals that a research
instrument reflects the theory being measured (Malhotra, 2007:286). Iacobucci and
Churchill (2010:256) define content validity as the adequacy of the area in which
characteristics are captured by the measure. When professionals are convinced that the
items match the definition, it is said to have content validity (Zikmund & Babin, 2010:250).
In determining content validity the researcher adopted scales and scale items from
previous studies where possible (refer to Table 5.2, section 5.2.5.3). The rest of the items
were developed by the researcher, based on the theory developed in the literature review
(refer to Table 5.2, section 5.2.5.3) of the study and assessed and discussed for
applicability to the study by two mentor researchers. Together with the pre-test of the
questionnaire, this ensured that the questionnaire was altered and corrected so that it was
relevant and applicable to the objectives of the study.
Construct validity
Iacobucci and Churchill (2010:257) and Malhotra (2007:287) define construct validity as
the ability or the degree to which the instrument measures what it is supposed to
measure. In addition to this, construct validity is the degree to which elements being
assessed are identified before hypothesising any functional relationships. In setting up the
questionnaire, the researcher made use of previous studies that have all proven reliable,
where possible. The rest of the items were defined as cautiously as possible using
multiple sources of publications to ensure accurate statements.
Exploratory factor analysis is frequently used to validate a measurement instrument
(Treiblmaier & Filzmoser, 2009:11). For this reason, the researcher made use of the
Kaiser-Meyer-Olkin (KMO) statistic and Barlett‘s test of sphericity discussed in section 6.6
of Chapter 6 to observe and determine the construct validity of the questionnaire. The
KMO method indicates that factor analysis is conducted by correlating items in the
questionnaire against each other. Groups of large correlations signify that variables may
be measuring parts of the same essential dimension known as factors (Field, 2009:647).
To verify that the data set is suitable for factor analysis, the KMO measure of sampling
adequacy must indicate a value of 0.6 or above. Bartlett’s test of sphericity observes
whether a variance-covariance matrix is proportional to an identity matrix and should be
significant (p<0.05) for factor analysis to be considered suitable (Field, 2009:781).

153
Both the KMO measure of sampling adequacy and Bartlett’s test of sphericity are
discussed in Chapter 6 (section 6.6) as a means of determining the validity of the
questionnaire and the suitability of data for factor analysis.
Determining measurement validity is a critical prerequisite for the unambiguous
interpretation of relationships between variables and a necessary measure for the
achievement of the research objectives. The structural relationship between the internal
marketing mix and employee satisfaction and the relationship between employee
satisfaction and affective commitment will be ambiguous in the absence of evidence
confirming the measurement integrity of scales.
5.2.5.6 Reliability of the questionnaire
Reliability is defined as the extent to which a scale is able to obtain consistent results
across time, different evaluators or different items (Churchill & Brown, 2007:271).
Reliability is a measure of constancy and an indication of the measurement instrument’s
internal consistency (Zikmund & Babin, 2010:321; Malhorta, 2007:284). Internal
consistency can be assessed using two different approaches: The split half test and the
Cronbach alpha measurement technique.
Split half tests involve dividing items in the scale into two halves and correlating the
scores against one another. High correlations between the halves indicate good internal
consistency and low correlations indicate poor internal consistency (Hair et al.,
2010:157).The second technique, Cronbach alpha takes the average of all possible split
half measures that result from the various ways of splitting the scale items. In determining
the degree to which these individual items correlate collectively with the scale, the internal
consistency or reliability of the scale can be established (Malhotra, 2007:285). Cronbach
alpha was used for the purpose of the study. Reliability was assessed by using Cronbach
alpha (α) coefficients to establish the extent to which all items in the measuring instrument
were measuring the same characteristic and therefore a single unidimensional latent
construct. Cronbach alpha also ensured that the set of variables was consistent in
measuring what they were supposed to measure (Al-Dujaili, 2011: 11; Iacobucci &
Churchill, 2010:259). Cronbach alpha values vary in value from 0, meaning no
consistency, to 1, meaning complete consistency. Cronbach alpha values of 0.8 or higher
are considered as high reliability; those between 0.70 and 0.80 are regarded as having
good reliability; values between 0.60 and 0.70 are fair; and coefficients lower than 0.60

154
are questionable (Hair et al., 2010:708). Reliability of the questionnaire is discussed in
Chapter 6 (see section 6.7). The next section will include an in-depth discussion on the
research frame that was used in gathering data.
5.2.6 Step 6: Determine the research frame
The research frame is also referred to as the sampling plan and relates to the process of
collecting participants or objects to be surveyed (Churchill & Brown, 2007:350). Hair et al.
(2006:308) state that sampling refers to the selection of a small number of participants
from a larger defined target population with the intention of gathering information from this
group so that judgements can be made about the larger population. Figure 5.3 explains
the sampling process followed in the study.
Figure 5.3. Target population, sampling units and sampling size
Source: Adapted from Conradie (2012:279).
5.2.6.1 Target population
The target population is defined as the total number of cases that conform to
predetermined specifications (Iacobucci & Churchill, 2010:283). The important element of
the group is that it shares a common set of characteristics (Hair et al., 2010:131) For the
purpose of the study the population is represented as the Graduate Development
Programme employees in retail banks in South Africa.

155
5.2.6.2 The sampling frame and sampling unit
The sampling frame is similar to the target population and relates to the list of elements
from which the sample is drawn (Zikmund et al., 2010:391). Sampling is described as the
selection of a small number of participants from a larger defined target population of
elements with the expectation that the information collected from the small group will
provide inferences concerning the larger group (Hair et al., 2006:308; Solomon et al.,
2006:119). Given that the GDP group of employees is a small population, employees
could be contacted with ease at a low cost and for this reason a census approach was
used. All GDP employees from the South African retail banks offering GDP programmes
were approached to participate in the study. Only three banks agreed to participate in the
study. These banks are First National Bank, Nedbank and Standard Bank of South Africa.
ABSA was undergoing a major restructure at the time of the study so morale was low
and their focus was elsewhere, as a result they declined to participate. Capitech had been
through a series of surveys at the graduate level and did not want to subject their
employees to any further surveys. The remaining retail banks did not have formal
graduate development programmes in place at the time of the study.
Therefore the sampling frame was made up of GDP employees from First National Bank,
Nedbank and Standard Bank. These three retail banks were seen to be representative of
the retail banking population given their size, market share, income and sustainability.
First National Bank owns 18.8% share of the market, Nedbank owns 17.8% share of the
market and Standard Bank owns 25.5 % of the market. Collectively, these three banks
hold 62.1% of the South African market share (The Banking Association South Africa,
2011).
The sampling unit is a single element or group of elements subject to selection in the
sample (Zikmund & Babin, 2007:409). The unit of analysis relates to the person or object
from which the researcher collects data (Conradie, 2012:280). Data collected can only
describe the specific unit from which the data was collected, but when compared with
other related data collected from similar units, provides an accurate picture of the group to
which that unit belongs (Kent, 2007:229). The sampling unit and the sampling frame are
the same in the case of the study at hand. Therefore, both the sampling frame and
sampling unit represent GDP employees from First National Bank, Nedbank and Standard
Bank.

156
5.2.6.3 The sampling method
A census approach was used to survey the sample frame, given that the GDP employee
population is small and each of these employees could be contacted with ease at a low
cost. A census is defined as a research method that includes data from each and every
member of the defined population (Hair et al., 2010:351).
A fixed number of graduates are taken into the Graduate Development Programme each
year and each bank contains a defined list of these individuals. First National Bank has
120 GDP employees in their programme, as does Nedbank and Standard Bank. The
banks are unable to make these lists available to external parties given the Access to
Information Act 2 of 2000. The researcher however worked through the head of the GDP
programme with each of the participating banks. The heads of the GDP programmes sent
the cover email to every GDP employee on the programme asking for their participation
in the study. Interested employees could then contact the researcher directly and
arrangements were made for survey completion. All three hundred and sixty GDP
employees in the sample frame were contacted to participate in the study.
5.2.6.4 Realisation rate
The size of the sample determines the statistical precision (Russel & Purcell, 2009:174).
Larger sample sizes generally result in greater statistical precision, however, if the sample
size is too large unnecessary time and money may have been spent and the results may
not be more accurate than those obtained from a smaller sample (Burns & Burns,
2008:181; Schmidt & Hollensen, 2006:168). On the other hand, if the sample size is too
small the study may not achieve a valid and reliable conclusion (Schmidt & Hollensen,
2006:168). The GDP group of employees is a small population given the nature of the
programme and as a result the researcher was limited to a finite population.
Three major South African retail banks agreed to participate in the study forming the
sampling frame and each of these banks had 120 GDP employees in their GDP
programmes providing a sample of 360 GDP employees in total. A total of 20 participants
agreed to participate from First National Bank, 22 participants agreed to participate from
Nedbank and 22 agreed to participate from Standard Bank. Thus a realisation rate of
17.78% was obtained. Table 5.3 summaries the realisation rate.

157
Table 5.3. Realisation rate
Bank Total GDP employees
in GDP programme
GDP employees participating in
study
% of total participants from each
bank
First National Bank 120 20 5.56%
Nedbank 120 22 6.11%
Standard Bank 120 22 6.11%
Total 360 64 17.78%
5.2.7 Step 7: Data gathering
Once the sampling plan has been determined, the data gathering can commence. Data
gathering refers to the collection of information from participants (Zikmund et al., 2010:69).
As discussed in section 5.2.5.1 a person administered survey was performed with
participants from First National Bank and from Standard bank. An electronic survey was
conducted with Nedbank and hosted by the Statistical Consulting Services of the
University of Johannesburg (STATCON).
5.2.7.1 Distribution of the questionnaire
Given the restrictions of the Access to Information Act 2 of 2000, the banks were unable
to present the researcher with a list of the GDP employees or their contact details. The
researcher however met with the heads of the GDP programmes from each of the
participating banks who agreed to assist by communicating the purpose of the study to
their GDP employees and encouraging their participation in the study. If GDP employees
volunteered to participate in the study, the study could proceed. GDP employees
interested in participating in the study could then contact the researcher directly via email.
For this reason, an email cover letter was developed by the researcher and distributed to
the Heads of the GDP programmes at the participating banks. The heads of the GDP
programs then forwarded the email to their GDP employees. The objective of the email
was to request and motivate GDP employees to participate in the study.

158
Email cover letter
The purpose of the email, and in this case the cover letter, was to outline the study
purpose and objectives and convince GDP employees to participate in the study and
complete the survey (Zikmund & Babin, 2007:221). For the sake of anonymity and
protection in terms of the Access to Information Act 2 of 2000, the participant’s name was
not used, but the letter or in this case the email was addressed to “Dear valued GDP
employee” and the tone and language of the letter spoke to these participants as
individuals.
Because the target population would not have time to read a lengthy email, the most
important information was placed in the beginning of the email. The research study was
introduced, the purpose of the study was explained, how the information was going to be
used and the mail motivated why the participant’s participation was necessary. The
researcher’s contact details were provided and the participants were urged to contact the
researcher directly after receiving the email if they were interested in participating in the
study.
Person administered survey
Once the researcher had received responses from the targeted group of employees, a list
of participants was compiled. Given the anonymous nature of the study the list was
deemed confidential and only the researcher had access to the participating GDP
employees’ details. A further email was then sent out to these participants thanking them
for their participation and an arrangement was made to meet with each of these
participants on a one-to-one basis to obtain their input. The participants were assured
that their personal details would remain anonymous with no personal details being
provided on the questionnaire, and they were assured that they could pull out of the study
at any time.
The person administered surveys carried out with Standard Bank and First National Bank
were conducted by the researcher at the employees’ place of work. The researcher
presented each employee with a questionnaire and clearly defined the objectives of the
study. The researcher was present to clarify any areas of ambiguity and to check that the
questionnaire had been completed correctly in full. Twenty one GDP employees from
Standard Bank and twenty GDP employees from FNB agreed to participate in the person-

159
administered survey. All forty four of these participants were surveyed personally by the
researcher.
Electronic survey
Once the researcher had received responses from the targeted group of employees at
Nedbank, a list of participants was compiled. A further email was then sent out to this
group thanking them for their participation and reinforcing their importance to the study.
The mail contained the link to the questionnaire and a specified closing date was
incorporated to ensure the timely return of the questionnaire.
The electronic survey conducted with Nedbank contained exactly the same questionnaire
used in the person-administered surveys. The electronic version of the survey was hosted
by the Statistical Consultation Service of the University of Johannesburg (STATCON) and
distributed to participants via a link through email. This allowed the online survey to be
accessed through a website for the sample group to read and complete. Given that
responses to the survey went straight through to STATCON, response bias was reduced
as participants may have felt safer to answer questions honestly. Additionally, participants
did not provide any names or identifying details during the survey, so that it would remain
anonymous.
In the case of the electronic survey conducted with Nedbank, twenty six participants
agreed to participate in the study and the link was sent to all twenty six. However only
eighteen responses were received online and an additional four were captured through
email due to the Nedbank system blocking the link in these instances. In total, twenty two
responses were received from Nedbank. Non –response error occurred with the electronic
survey. This error results when participants may not wish to complete the survey due to
time or interest constraints (Churchill & Brown, 2007:397). In addition, non-response error
occurred because the Nedbank system blocked the email containing the online link in
some instances. An email containing the questionnaire was sent to those participants who
contacted the researcher in this regard. These emails were then sent through to
STATCON for manual capturing.
5.2.8 Data processing and analysis
Data analysis refers to the interpretation of the data that has been collected. Data analysis
involves the determination of constant patterns and the summarisation of significant

160
information obtained in the study (Zikmund & Babin, 2007:68). Once the data has been
collected, the focus then moves to the analysis of the data. SPSS was the software
programme used for the purpose of the analysis. The analysis itself was conducted by the
Statistical Consultancy Service of University of Johannesburg (STATCON). A combination
of descriptive and inferential statistical procedures was utilised to analyse the data and
empirically validate the main research questions.
5.2.8.1 Statistical analysis
A number of approaches were used to statistically analyse the data. The following section
discusses descriptive statistics, factor analysis and regression analysis.
Descriptive statistics
Descriptive statistics are used to describe characteristics of the data set (Kerr, Hall &
Kozub, 2009:6). Descriptive statistics were used to describe the demographics of the
sample as well as to gauge participants’ awareness of the internal mix, the perceived
importance of the internal marketing mix elements, employee satisfaction and affective
commitment. In addition to this the frequency distribution of sample responses could be
observed (Hair et al., 2010:160). Frequency distributions were used with the objective of
obtaining a count of the number of responses linked with different values of the variable
within a particular data set (Malhotra, 2009:504). Furthermore, the mean and standard
deviations were used as these are recognised as the most commonly used descriptives
(Churchill & Brown, 2007:455). A mean refers to the arithmetic average and can be
considered as the most common measure of central tendency (Zikmund et al., 2010:415).
The standard deviation is defined as the average distance of the distribution values from
the mean (Hair et al., 2010:264).
Descriptive statistics were important to understand central tendency and distributions in
the sample responses as well as the demographic make-up of the sample. To meet the
primary objective of the study, inferential statistics were needed to answer the research
hypotheses. The next section discusses factor analysis.
Factor analysis
Before factor analysis could be conducted, the data needed to be tested for factor
analysis suitability. This was completed when testing the validity of the measuring
instrument through the KMO measure of sampling adequacy and Bartlett’s test of

161
sphericity (refer to section 5.2.5.5 of this chapter). The KMO measure of sampling
adequacy was above 0.6 for all the constructs, but internal physical evidence (refer to
Chapter 6, section 6.6 for the KMO measure of sampling adequacy results). Internal
physical evidence had a value of 0.51, but seeing that it was not too low and due to a
small population size, it was considered acceptable for further EFA analysis (Becker,
2013). All constructs were considered significant and thus factor analysis could be
performed.
Factor analysis is the statistical technique of identifying a condensed number of factors
from a larger number of measured variables (Zikmund & Babin, 2007:608). Factor
analysis has three main purposes, namely: to understand the structure of a set of
variables, to develop a questionnaire to measure the main variable, and to reduce the
data set to a more manageable size whilst still ensuring its feasibility (Field, 2009:628).
Kahn (2006) defines Exploratory Factor Analysis (EFA) as a set of statistical techniques
used to determine the number of underlying variables that explain variation and co-
variation within a set of measured variables. Field (2009:628-629) states that the
presence of groups of correlation coefficients between subsets of variables implies that
those variables could be measuring parts of the same fundamental element. These
elements are known as factors. Exploratory Factor analysis (EFA) was used in the study
as a data reduction tool. In order to determine the validity of the measurement instrument
used. It made sense to utilise EFA because some of the measures are newly developed
and their dimensionality is largely unknown (Khan, 2006).
To test whether the data set is suitable for factor analysis, the sample size and
relationship among variables need to be observed. According to Pallant (2010:183),
factors obtained from a small sample size do not generalise as well as those from larger
samples, however, smaller samples are acceptable if solutions have several high loading
marker variables (above .80). Pallant (2010:183) further postulates that it is not the overall
sample size that is important but rather the ratio of participants to items, five cases per
item is deemed adequate in most cases. Given the criteria mentioned, the population size
was not considered adequate for EFA but given that the retail banks take a limited number
of employees into their graduate recruitment programmes, this was the maximum number
of employees that the researcher had access to. It was therefore considered appropriate
for an EFA to be conducted.
By minimising the data set from a large cluster of interconnected variables to a smaller set
of factors, the researcher was able to explain the highest sum of common variance (the

162
cumulative variance) between factors (Field, 2009:628-629). Unidimensional
measurement indicates that each item loads onto a single factor and that error terms are
independent (Kline, 2011).
Various tools such as scree plot, Kaiser-Guttman criteria and reproduced residuals were
used to assess the unidimensionality of the subscales. Restricted EFA specifies the
extraction of a number of specified factors based on theoretical deliberations, whereas
unrestricted EFA entails no restriction with regard to the number of factors extracted. This
study utilised both unrestricted and restricted EFA (Kline, 2011). An unrestricted EFA was
applied to each subscale and each of the constructs was assessed individually, meaning
that not all the items measuring the internal marketing mix constructs were entered into
the EFA at once. Each construct was assessed on its own in a sequence of EFA
analyses. An unrestricted and a restricted EFA were applied in the case of the internal
price construct where items were forced onto a single factor (discussed in Chapter 6,
section 6.6.1.1). To assess the strength of intercorrelations between items and determine
whether a scale is considered to be unidimensional or multidimensional as well as
determining how to retain factors, the Kaiser-Guttman criterion was applied (Matsunaga,
2010:102).
The Kaiser-Guttman criterion makes use of Eigenvalues, specifying that factors with an
Eigenvalue of greater than 1.0 account for variance. If only one factor has an Eigenvalue
of greater than 1.0, the scale is considered to be unidimensional and measuring only one
factor. However, if more than one factor in a sub-scale has Eigenvalues of greater than
1.0, they account for just as much variance as a single measurable indicator. This is
considered to be a multidimensional scale and a decision needs to be reached as to how
many factors should to be retained (Matsunaga, 2010:102). Screeplots examine a graph
of Eigenvalues. These were used in the study to identify the breakpoint in the data. The
number of breakpoints above the break indicates the number of factors to retain (Costello
& Osborne, 2005:3). Furthermore, the amount of common factor variance explained by
each factor needs to be considered. The variance is indicative of the strength of the
connection between the observed variables and underlying factors. Robust factors
normally describe large proportions of common variance (Kahn, 2006). Kahn (2006)
states that commonality shows the extent of common variance between items, meaning
the higher the value the higher the degree of commonality. A third criterion that can be
used to assess the dimensionality of scale factors is the strength and pattern of factor
loadings. Items that display strong salient factor loadings that correspond to theoretical
conceptualisations of the construct provide strong support for the particular factor. For the
purpose of the study, standardised factor loadings with values smaller than 0.50 were
163
identified for deletion as these loadings suggest that the items were unable to account for
at least 25% of the overlapping variance (Becker, 2013).
In the case of multidimensional scales, oblique rotations utilising Promax was used to
produce the pattern matrix. Oblique rotations allow for the estimation of factor correlations.
If factors are unrelated the rotation is regarded as orthogonal, however, if factors are
related, the rotation is regarded as oblique (Costello & Osborne, 2005:3). In the current
study factor structure with clear multiple factors was rotated with the aim of examining
patterns in the loadings of the oblique rotated factor solutions. Oblique rotations were
applied to the internal price, internal promotion, internal distribution, internal process and
the internal physical evidence scales due to items loading on more than one factor as
discussed in more detail in Chapter 6 (section 6.6.1.1).
Regression analysis
An assessment of the measurement instruments validity and reliability was conducted
prior to the regression analysis to confirm the measurement integrity of the newly
developed measures. Construct validity remains a necessary yet insufficient prerequisite
for predictive validity (McGrath, 2005). Thus, although the research objectives are
achieved via the regression analysis, validity measures, an EFA and internal consistency
had to be conducted prior to the regression analysis. Regression analysis is used to
measure the linear relationship between the independent and dependent variables.
According to Pallant (2010:128) regression is based on correlations used to describe
variables under a number of different conditions. Given that regression analysis is used
for prediction, the researcher was able to evaluate the relationship between the
independent variables and dependent variable. In this way the researcher was able to
establish the link between the internal marketing mix and employee satisfaction as well as
establish the link between employee satisfaction and affective commitment (retention).
Before regression could be applied to the study, the assumptions of regression analysis
had to be tested. If the assumptions of regression analysis were to be severely violated, it
would not be permissible to utilise regression analysis. Regression analysis requires that
the data be tested for outliers, normality, linearity and homoscedaticity. These
assumptions were evaluated by means of scatterplots, box-and-whisker plots, as well as
histograms as suggested by Pallant (2010:131).

164
i) Test for outliers
An outlier is defined as an observation that deviates so much from other observations that
it arouses suspicion that it may have been produced by another instrument (Azmandian
et al., 2012:51). Outliers are the data points which are either very high or very low in
nature and appear to be isolated from the main cluster of points. Outliers create problems
for regression analysis and for this reason extreme outliers can either be removed entirely
from the data set or manipulated down to a value which is less extreme (Pallant,
2010:131). Histograms were used initially to test for outliers, any data points lying out at
the extremes are considered outliers. Since outliers were identified, box-and-whisker plots
were used to investigate the impact of these. SPSS considers circles with a number
attached to be outliers. This means that these points extend 1.5 box lengths from the
edge of the box. Extreme points indicated by an asterisk are those that extend more than
3 box lengths from the edge of the box (Pallant, 2010:131). Although outliers were
identified for all constructs, they were not removed due to the limited nature of the
population size and because they were not considered a threat to the study (Becker,
2013) (refer to Chapter 6, section 6.8.1).
ii) Test for normality
A normal distribution is depicted by the bell-shaped curve and is represented by the
presence of a few characteristics, namely: the curve is symmetrical in relation to the
mean, the mean equates to the highest point on the normal curve (the mode), the curve
represents an unlimited number or cases, and the portion below the curve has a
probability equal to 1. Finally, a normal distribution has a mean of 0 and a standard
deviation of 1. It is necessary to determine the normality of the data in order to generate
accurate and valid results. Should the dependent variable be skewed to the left or right,
the mean becomes an inaccurate assessment of the data, implying that the data has low
levels of normality. In this instance the data would require transforming to make it more
accurate and normal (Grimm & Yarnold, 2000:328-329). To achieve the objectives of the
study, the assessment of normality started with an evaluation of the skewness and
kurtosis values of the internal marketing mix elements employee satisfaction and affective
commitment. Gamst, Meyers & Guarino (2008:56,66) state skewness and kurtosis values
that are zero or close to zero indicate a normal distribution. Values greater than or less
than 1 and -1 are regarded as abnormally distributed. In addition to this, the Shapiro-Wilks
test was used to test normality. The Shapiro-Wilks test rejects the hypothesis of normality
when the p-value is less than or equal to 0.05. Apart from internal price all the constructs
violated the assumptions of normality. However, given the sample size and specialised

165
nature of the group, normality was not expected and it was considered appropriate to
continue with regression analysis (refer to Chapter 6, section 6.8.2).
iii) Test for linearity in the data
A linear relationship represents a link between variables. A straight line relationship
indicates a strong relationship between two variables which remain unchanged over a
range of both variables (Hair et al., 2010:546). Scatter plots were used to investigate the
linearity of the data. An upward trend in the scatter plot indicates a positive relationship
between the dependent and independent variables and downward trend indicates a
negative relationship between the variables (Pallant, 2010:131). To achieve the research
objectives, a strong positive relationship was needed between the internal marketing mix
elements and employee satisfaction, and between employee satisfaction and affective
commitment in order to accurately assess the hypotheses of the study. All constructs met
the assumptions of linearity as discussed in Chapter 6 (section 6.8.3).
iv) Test for homoscedasticity
Homoscedasticity refers to the assumption that the variance of residuals about the
dependent variable should be similar for all predicted scores, meaning that the variability
in scores for variable X should be similar at all values of variable Y (Pallant, 2010:151).
Scatter plots were used to assess for homoscedasticity. The assumptions of
homoscedasticity were met (refer to Chapter 6, section 6.8.4).
If the data meets the requirements from an outlier, normality, linearity and
homoscedasticity perspective then regression analysis can be performed. The study
violated the assumptions of normality and outliers were identified, but since the violations
were not deemed serious, regression analysis could be performed.
Simple linear regression
Initially the researcher wanted to apply multiple regression analysis to the study; through
this approach the internal marketing mix scales could be applied as a group to determine
the influence of the elements on employee satisfaction. Moreover, multivariate regression
analyses would allow the researcher to determine which of the marketing mix elements
emerged as the strongest predictor of employee satisfaction. However, during the analysis
phase no single element emerged as the most influential or strongest and for this reason
each element was regressed individually against satisfaction in order to assess the
strength of each relationship individually. Due to reasons provided, a simple linear

166
regression was applied to the study. Simple linear regression explains the amount of
variance accounted for by the independent variable in predicting the dependent variable
(MIT, 2013). Simple linear regression analysis was used to determine the bivariate
relationship between each of the internal marketing mix elements and employee
satisfaction, simple linear regression was also used to determine the relationship between
employee satisfaction and affective commitment. To perform simple regression analysis,
each independent variable is placed into a regression equation in order to observe its
relationship with the dependent variable (Hair et al., 2006:561). Employee satisfaction
was regressed against each of the internal marketing mix elements individually . Further
to this, affective commitment (retention) was regressed against employee satisfaction in
order to understand the relationship between employee satisfaction and affective
commitment.
When interpreting the results of regression analysis, a number of indices need to be
examined, namely the R-square, standardised beta coefficients and their significance (p-
value) (Field, 2009:239). Typically standardised regression coefficients and
accommodating p-values, R2-values and adjusted R2-values were utilised to corroborate
or refute substantive research hypotheses. Standardised beta coefficients represent the
extent to which a change in one variable matches significantly to changes in another
variable (Zikmund & Babin, 2007:577). The R-square explains how much of the variance
in the dependent variable is explained by the independent variables. For smaller samples
the R-square value may provide an overoptimistic estimation of the total population in
which case the adjusted R-square can be used (Pallant, 2010:160).
The beta coefficient is regarded as an anticipated regression coefficient that has been
recalculated to display a mean of 0 and a standard deviation of 1. This allows for the
direct comparison of independent variables with different forms of measurement against
the dependent variable (Hair et al., 2006:567). Betas indicate the number of standard
deviations that the outcome will change as a result of one standard deviation change in
the predictor and therefore provides insight into the importance of a predictor in the
regression equation (Field, 2009:239). Beta coefficients are classified as either
standardised or unstandardised. Standardised beta coefficients are used in the current
study meaning that the values for each of the different variables have been converted to
the same scale to allow for meaningful comparisons (Pallant, 2010:161). Beta coefficients
and the adjusted R-squared values were used to determine which of the internal
marketing mix elements are the strongest predictors of employee satisfaction when

167
entered into the regression equation individually, or when step-wise regression analysis
was performed.
For each of these values it is necessary to observe the associated statistical significance
(i.e. p-value). The significance value explains whether the variable is making a significant
unique contribution to the study. If the p-value is smaller or equal to 0.05, the variable is
considered to be making a significant unique contribution to the prediction of the
dependent variable. If greater than 0.05, the variable is not making a statistically
significant unique contribution to the dependent variable (Pallant, 2010:161).
From a primary research objective perspective, regression analysis allowed the
researcher to observe the influence of each of the refined independent variables (internal
product, internal price, collaborative culture, organisational structure, internal process,
internal people and internal physical evidence) on the dependent variable (employee
satisfaction). From a secondary research objective, regression analysis was used to
investigate the relationship between employee satisfaction and affective commitment
(retention).
5.2.9 Step 9: Reporting and recommendations
This step is concerned with the reporting of the results and making recommendations to
retail banks based on the research findings. Chapter 6 reports the results of the study and
Chapter 7 provides the conclusions and recommendations made to retail banks.
5.3 CONCLUSION
Chapter 5 presented the research design selected for the study, the sampling procedures
and how the data was to be collected and analysed. The data analysis specified the use
of various statistical methods specifically validity and reliability measures, descriptive
statistics and exploratory factor analysis. A section on simple regression analysis was
provided to explain how the relationships between the internal marketing mix and
employee satisfaction (the primary objective) would be tested and simple regression was
used to test the relationship between employee satisfaction and affective commitment (the
secondary objective). The empirical research findings will be discussed in detail in
Chapter 6 where each hypothesis set for the study will be tested.

168
CHAPTER 6
DATA ANALYSIS AND INTERPRETATION
6.1 INTRODUCTION
Following on from the research design discussed in chapter five, chapter six is
predominately concerned with the empirical evidence collected and the interpretation of the
findings. The chapter commences with a discussion of the various research objectives,
hypotheses of the study and followed by a discussion on the realisation rate. This is
followed up with a discussion on the analysis of the SPSS data to explain the demographic
characteristics, the descriptive statistics of the various constructs as well as the
measurement instruments validity and reliability through a discussion of the Factor analysis
performed. The chapter continues with an explanation of the statistical measures of simple
linear regression analysis that were used to explain the relationships between the key
constructs in the study. These relationships refer to the relationships between the internal
marketing mix elements and employee satisfaction and the relationship between employee
satisfaction and affective commitment discussed under the secondary objectives in chapter
5 (section 5.2.2.2).
6.2 DISCUSSION OF PRIMARY RESEARCH OBJECTIVES AND HYPOTHESES
As established in chapter 1 (section 1.3.1), the primary objective of the study is: To
investigate the influence of the internal marketing mix on employee satisfaction
from GDP employees’ perspective in order to enhance their satisfaction at retail
banks with graduate development programs in South Africa. In addition to this the
relationship between satisfaction and affective commitment is also explored. The
secondary objectives and hypotheses are summarised below:
6.2.1 The secondary objectives
To examine the theory relating to the seven elements of the internal marketing mix,
employee satisfaction and affective commitment

169
To determine whether GDP employees are aware of the internal marketing mix
elements at their bank
To determine GDP employees level of satisfaction with their bank as an employer
To determine whether a significant positive relationship exists between internal
product and GDP employee satisfaction
To determine whether a significant positive relationship exists between internal price
and GDP employee satisfaction
To determine whether a significant positive relationship exists between internal
promotion and GDP employee satisfaction
To determine whether a significant positive relationship exists between internal
distribution and GDP employee satisfaction
To determine whether a significant positive relationship exists between internal
people and GDP employee satisfaction
To determine whether a significant positive relationship exists between internal
process and GDP employee satisfaction
To determine whether a significant positive relationship exists between internal
physical evidence and GDP employee satisfaction
To determine whether a significant positive relationship exists between employee
satisfaction and affective commitment
6.2.2 Hypotheses
Based on the above objectives, the following hypotheses have been put forward:
H1: There is a significant positive relationship between the internal product and GDP
employee satisfaction
H2: There is a significant positive relationship between the internal price and GDP
employee satisfaction
H3: There is a significant positive relationship between the internal promotion and GDP
employee satisfaction
H4: There is a significant positive relationship between the internal distribution and GDP
employee satisfaction
H5: There is a significant positive relationship between the internal people and GDP
employee satisfaction
H6: There is a significant positive relationship between the internal process and GDP
employee satisfaction

170
H7: There is a significant positive relationship between the internal physical evidence and
GDP employee satisfaction
H8: There is a significant positive relationship between GDP employee satisfaction and
affective commitment
It was previously stated in Chapter 1 (section 1.3.3) and Chapter 5 (section 5.2.2.3) that
the identified hypotheses would be tested and the results are provided in the following
sections below.
6.3 REALISATION RATE
As discussed in Chapter 5 (section 5.2.6.4), a census approach was applied to the study
and all retail banks offering graduate development programmes were approached to
participate in the study. Three of the largest retail banks agreed to participate providing a
population of 360 GDP employees. Of the 360 GDP employees approached, 64 agreed to
participate in the study. Thus the realisation rate for the study was 17.78%. Descriptive
statistics were used to describe the demographic profile of the participants as discussed
next.
6.4 DEMOGRAPHIC PROFILE
The demographic composition of the participants is summarised in Table 6.1. In particular
the age, gender, race and previous work experience of the participants are reported.
Table 6.1. Demographic information for GDP retail bank employees
Items Description Frequency Percentage
Age
18-25 56 88.90%
26-30 5 7.90%
31-35 2 3.20%
Total: 63 100%
Gender
Male 26 40.60%
Female 38 59.40%
Total: 64 100%
Race
Indian/Asian 16 25.00%
Black 36 56.30%
White 12 18.80%

171
Items Description Frequency Percentage
Total: 64 100%
Previous work experience
Yes 13 21.70%
No 47 78.30%
Total: 60 100%
It is evident from the Table provided that the majority of GDP employees are between the
ages of 18-25 (88.9%, n= 63) which makes sense given that these individuals are
participating in a graduate programme and the majority have been recruited straight from
university. The majority of participants were female (59.4%, n=64), whilst approximately
40.6% (n=64) of the participants were males. The largest number of participants were
black (56.3%, n=64), followed by the Indian/Asian community (25%, n=64). Whites made
up the smallest race contingent of the participants (18.8%, n=64). Most of the participants
had no prior work experience (78.3%, n=60) with only 21.7% (n=60) having had some
form of experience with another organisation. In summary, the majority of participants
were black female within the age group 18-25 having predominately had no prior work
experience.
6.5 AWARENESS OF INTERNAL MARKETING MIX, INTERNAL MARKETING MIX
ELEMENTS, EMPLOYEE SATISFACTION AND AFFECTIVE COMMITMENT
DESCRIPTIVE STATISTICS
The following sections provide a descriptive exposition of the awareness levels of the
internal marketing mix, the importance of the internal marketing mix elements to employee
job satisfaction, general satisfaction levels and affective commitment. This section aims to
provide results pertaining to secondary objectives 2 and 3 as discussed in section 6.2.1.
6.5.1 GDP employee awareness of the internal marketing mix
Section 1 of the questionnaire tested the internal marketing mix awareness levels among
the GDP employees. A series of seven statements were presented to participants and
participants were asked to rate their level of agreement with each statement. A five-point
interval Likert scale was used where 1 signalled ‘strongly agree’ and 5 signalled
‘strongly disagree’. Table 6.2 indicates the mean and standard deviation for each item.
Table 6.2. Descriptive statistics for awareness of the internal marketing mix

172
Section 1 - Awareness of internal marketing mix Mean Standard Deviation
Q1.1 I am aware of my job description 1.72 1.046
Q1.2 I am aware of my cost to company 1.55 0.975
Q1.3 I am aware of whom I need to report to 1.14 0.710
Q1.4 The bank communicates with me through internal measures such as the intranets
1.23 0.771
Q1.5 I am aware of the processes involved in order to complete my work
1.78 0.941
Q1.6 I am aware of the different departments within my bank
2.02 0.900
Q1.7 I am aware that my physical working environment influences the way I perform
1.36 0.804
Overall awareness of the internal marketing mix 1.54 0.878
The means for the awareness construct ranged between 1.14 and 2.02 (1= strongly agree
and 5= strongly disagree) and the standard deviations for the awareness construct ranged
between 0.710 to 1.046 which show some level of variance. The overall mean for the
awareness of the internal marketing mix is 1.54, indicating that the majority of participants
agreed with the statements specified in the study and are therefore aware of the internal
marketing mix in their bank. The statement which participants agreed with most was Q1.3
“I am aware of whom I report to” (mean= 1.14 and standard deviation = 0.710). The
statement indicating the least level of agreement was Q 1.6 “I am aware of the different
departments within my bank” (mean= 2.02 and standard deviation =0.900), reflecting that
GDP employees are not familiar with the various departments and business units within
their bank.
Main finding 1: Overall GDP employees are aware on the internal marketing mix at
the bank (mean = 1.54).
Main finding 2: GDP employees indicated their highest levels of agreement pertaining
to the following item: “I am aware of whom I report to” (mean= 1.14 and standard
deviation = 0.710).
Main finding 3: GDP employees indicated their lowest level of agreement pertaining
to the following item: “I am aware of the different departments within my bank” (mean=
2.02 and standard deviation =0.900).

173
6.5.2 Internal marketing mix
Section 2 of the questionnaire tested the importance of each of the internal marketing mix
elements in influencing job satisfaction levels. The section was broken down in sub-
sections for internal product (6 items), internal price (6 items), internal promotion (10
items), internal distribution (7 items), internal people (8 items), internal process (4 items)
and internal physical evidence (5 items). In total, section 2 presented participants with 46
statements and they were asked to rate their agreement or disagreement with each
statement. A five point interval Likert scale was used in which 1 signalled ‘strongly
agree’ and 5 signalled ‘strongly disagree’. Table 6.3 indicates the mean and standard
deviation for each item.
Table 6.3. Descriptive statistics for the internal marketing mix
Section 2 – Internal marketing mix
Internal product Mean Standard Deviation
Q2.1 It is important that the bank I work for provide me with training opportunities
1.22 0.678
Q2.2 It is important that I have opportunities to advance my career in the bank I work for
1.13 0.549
Q2.3 It is important that I understand what I am expected to deliver in my job
1.25 0.642
Q2.4 It is important that I am provided with the opportunity to make my own decisions
1.41 0.635
Q2.5 It is important that my skills match the job I am doing
1.89 0.961
Q2.6 It is important to me to feel passionate about the work I do
1.22 0.629
Overall importance of internal product to employee satisfaction
1.35 0.682
Internal price Mean Standard Deviation
Q3.1 It is important that I put in extra time to learn new processes in my bank
1.45 0.711
Q3.2 It is important that I do not have too much to do in my job and too little time
2.41 1.342
Q3.3 It is important that the sacrifices I make are worth it for me
1.78 1.105

174
Q3.4 It is important to me to feel that by working for my bank I have not missed out on opportunities elsewhere
2.68 1.502
Q3.5 It is important that I don’t find it stressful to put on a ‘happy face’ at work when I am not in a happy mood
2.59 1.303
Q3.6 It is important that I feel responsive towards my bank
2.56 1.344
Overall importance of internal price to employee satisfaction
2.24 1.217
Internal promotion Mean Standard Deviation
Q4.1 It is important that bank’s vision is frequently communicated to me
1.59 1.035
Q4.2 It is important that print materials (such as posters and newsletters) are frequently used by my bank to communicate with me
1.84 1.087
Q4.3 It is important that events (such as roadshows) are frequently used by my bank to communicate with me
2.02 0.984
Q4.4 It is important that my manager has one-on-one meetings to communicate with me
1.18 0.587
Q4.5 It is important that my bank communicates to me through online mechanisms (i.e. intranet, Internet, email and social networking)
1.30 0.634
Q4.6 It is important for me to receive verbal recognition for the job I do
1.97 0.992
Q4.7 It is important for me to receive public appreciation (so that my colleagues know that I am good performer and valued team member) when I achieve my performance goals
1.70 0.971
Q4.8 It is important that the pay I receive is high compared with what others get for similar work at their organisations
1.68 1.090
Q4.9 It is important for me to receive an award on a monthly/annual basis when I perform my duties well
1.44 0.871
Q4.10 It is important that financial rewards (bonuses, increases, security of employment) are used to acknowledge me when I achieve the goals set out for me by my job description
1.22 0.552
Overall importance of internal promotion to employee satisfaction
1.60 0.880

175
Internal distribution Mean Standard Deviation
Q5.1 It is important that everyone in my bank works together to provide high quality service to customers
1.63 0.766
Q5.2 It is important for me to share the same values as my colleagues
2.13 1.106
Q5.3 It is important for me to frequently share information with my colleagues
1.70 0.816
Q5.4 It is important for me to frequently share information with managers I do not report to
2.05 1.061
Q5.5 It is important that I am easily able to implement plans set up within the boundaries of my job description
1.32 0.591
Q5.6 It is important that my manager allows me to communicate with supporting departments without his/her permission
1.38 0.787
Q5.7 It is important for me to able to communicate with upper management when necessary
1.31 0.664
Overall importance of internal distribution to employee satisfaction
1.64 0.827
Internal people Mean Standard Deviation
Q6.1 It is important that senior leaders in the bank communicate a clear vision
1.48 1.090
Q6.2 It is important that senior leaders consider the suggestions of employees while making a decision
1.31 0.639
Q6.3 It is important that senior leaders share information about the bank with employees
1.48 0.908
Q6.4 It is important that senior leaders in the bank encourage teamwork
1.44 0.833
Q6.5 It is important that my manager/supervisor supports me by treating me fairly
1.09 0.526
Q6.6 It is important that my manager/supervisor communicates openly with me
1.08 0.517
Q6.7 It is important that my co-workers treat me with respect
1.22 0.683
Q6.8 It is important to me that my co-workers are satisfied with their jobs
2.41 1.003
Overall importance of internal people to employee satisfaction
1.44 0.774

176
Internal process Mean Standard Deviation
Q7.1 It is important that the bank I work for has well designed processes
1.95 0.999
Q7.2 It is important that the support activities offered by other departments are reliable
1.89 1.041
Q7.3 It is important that improved ways of doing tasks at work are found allowing me to give better service to my internal customers
1.80 0.858
Q7.4 It is important to have automated processes that allow me to save time
1.55 0.711
Overall importance of internal process to employee satisfaction
1.80 0.902
Internal physical evidence Mean Standard Deviation
Q8.1 It is important for me to work in a physically appealing environment
1.70 1.455
Q8.2 It is important that the layout of my office is easy to work in
1.42 0.752
Q8.3 It is important that my colleagues are grouped around me in a pleasant manner
1.98 0.984
Q8.4 It is important that my manager/supervisor helps me to set both personal and work-related goals
1.61 0.884
Q8.5 It is important that my manager/supervisor frequently provides feedback relating to my work performance
1.25 0.690
Overall importance of internal physical evidence to employee satisfaction
1.60 0.953

177
The mean scores for internal product varied between 1.13 and 1.89 (1=strongly agree
and 5= strongly disagree). The overall mean score of 1.35 showed that most of the GDP
employees strongly agreed with the statements pertaining to internal product. The highest
level of agreement and least variance was with the statement Q2.2, “It is important that I
have opportunities to advance my career in the bank I work for” (mean = 1.13, standard
deviation 0.549). This was followed by Q2.1, “It is important that the bank I work for
provides me with training opportunities” (mean=1.22, standard deviation=0.678) and Q2.6,
“It is important to me to feel passionate about the work I do” (mean=1.22, standard
deviation=.629). The least level of agreement and most variance was with Q2.5, “It is
important that my skills match the job I am doing (mean = 1.89, standard deviation =
0.961). The standard deviation scores ranged between 0.549 and 0.961, indicating
minimal variance between responses to the statements.
Main finding 4: The overall mean of the statements measuring internal product
indicates that GDP employees agree that internal product is important to their job
satisfaction (mean =1.35).
Main finding 5: GDP employees indicated their highest levels of agreement pertaining
to the following item: “It is important that I have opportunities to advance my career in
the bank I work for” (mean = 1.13, standard deviation 0.549).
Main finding 6: GDP employees indicated their lowest level of agreement pertaining
to the following item: “It is important that my skills match the job I am doing” (mean =
1.89, standard deviation = 0.961).
The mean scores for the internal price construct ranged between 1.45 and 2.68
(1=strongly agree and 5=strongly disagree). The overall mean score was 2.24 showing
agreement with statements pertaining to the internal price construct. The highest level of
agreement and least level of variance was with statement Q3.1, “It is important that I put
in extra time to learn new processes in my bank” (mean=1.45, standard deviation 0.711).
This was followed by Q3.3, “It is important that the sacrifices I make are worth it for me”
(mean =1.78, standard deviation=1.105). The third lowest mean was Q3.2, “It is important
that I do not have too much to do in my job and too little time” (mean=2.41, standard
deviation=1.342). The lowest level of agreement and most variance was with the
statement Q3.4, “It is important to me to feel that by working for my bank I have not
missed out on opportunities elsewhere” (mean=2.68, standard deviation=1.502). The
standard deviation ranged between 0.711 and 1.502, indicating a level of variance
between responses to statements.

178
Main finding 7: The overall mean of the statements measuring internal price indicates
that GDP employees agree that internal price is important to their job satisfaction
(mean=2.24).
Main finding 8: GDP employees indicated their highest levels of agreement pertaining
to the following item: “It is important that I put in extra time to learn new processes in
my bank” (mean=1.45, standard deviation 0.711).
Main finding 9: GDP employees indicated their lowest level of agreement pertaining
to the following item: “It is important to me to feel that by working for my bank I have
not missed out on opportunities elsewhere’’ (mean=2.68, standard deviation=1.502).
The mean scores for the internal promotion construct ranged between 1.18 and 2.02
(1=strongly agree and 5=strongly disagree). The overall mean score is 1.60 indicating a
high level of agreement with statements relating to the internal promotion construct.
Question 4.4, “It is important that my manager has one-on-one meetings to communicate
with me” (mean=1.18, standard deviation=0.587) signified the highest level of agreement.
Question 4.10, “It is important that financial rewards (bonuses, increases, security of
employment) are used to acknowledge me when I achieve the goals set out for me by my
job description”, had the second highest level of agreement and lowest level of variance
(mean=1.22, standard deviation=0.552). This was followed by Q4.5, “It is important that
my bank communicates to me through online mechanisms (i.e. intranet, Internet, email
and social networking)” (mean=1.30, standard deviation=0.634). The least level of
agreement was with statement Q 4.3 (2.02), “It is important that events (such as
roadshows) are frequently used by my bank to communicate with me” (mean=2.02,
standard deviation=0.984). Standard deviations ranged between 0.552 and 1.090,
showing that the most variance from a response perspective was around Q 4.8 (1.090) “It
is important that the pay I receive is high compared with what others get for similar work at
their organisations”(standard deviation=1.090).
Main finding 10: The overall mean of the statements measuring internal promotion
indicates that GDP employees agree that internal promotion is important to their job
satisfaction (mean =1.60).
Main finding 11: GDP employees indicated their highest levels of agreement
pertaining to the following item: “It is important that my manager has one-on-one
meetings to communicate with me ” (mean=1.18, standard deviation=0.587).

179
Main finding 12: GDP employees indicated their lowest level of agreement pertaining
to the following item: “It is important that events (such as roadshows) are frequently
used by my bank to communicate with me” (mean=2.02, standard deviation = 0.984).
The mean scores for internal distribution ranged between 1.31 and 2.13. The overall
mean for internal distribution is 1.64, showing agreement with statements made pertaining
to this construct. The least level of agreement was reflected in Q5.7, “It is important for me
to be able to communicate with upper management when necessary (mean=1.31,
standard deviation=0.664)”. This was followed by Q5.5, “It is important that I am easily
able to implement plans set up within the boundaries of my job description” (mean=1.32,
standard deviation=0.591) and Q5.6, “It is important that my manager allows me to
communicate with supporting departments without his/her permission” (mean=1.38,
standard deviation=0.787). The least level of agreement and highest level of variance was
with Q5.2, “It is important for me to share the same values as my colleagues” (mean=2.13,
standard deviation=1.106). The standard deviation scores ranged between 0.549 and
1.106, indicating a fair level of variance between responses to statements. Q5.5, “It is
important that I am easily able to implement plans set up within the boundaries of my job
description” had the lowest score (standard deviation=0.549), indicating that the
responses were least varied for this particular item.
Main finding 13: The overall mean of the statements measuring internal distribution
indicates that GDP employees agree that internal distribution is important to their job
satisfaction (mean =1.64).
Main finding 14 : GDP employees indicated their highest levels of agreement
pertaining to the following item: “It is important for me to able to communicate with
upper management when necessary” (mean=1.31, standard deviation=0.664).
Main finding 15: GDP employees indicated their lowest level of agreement pertaining
to the following item: “It is important for me to share the same values as my
colleagues” (mean=2.13, standard deviation=1.106).
The mean scores for the internal people construct varied between 1.08 and 2.41
(1=strongly agree and 5=strongly disagree). The overall mean score of 1.44 reflects
agreement with statements made relating to the internal people construct. Question 6.6,
“It is important that my manager/supervisor communicates openly with me” (mean=1.08,
standard deviation=0.517) had the highest level of agreement and least level of variance.
The next highest level of agreement was with Q6.5, “It is important that my

180
manager/supervisor supports me by treating me fairly” (mean=1.09, standard
deviation=0.526). This was followed by Q6.7, “It is important that my co-workers treat me
with respect” (mean=1.22, standard deviation=0.683) . The lowest level of agreement was
with Q6.8, “It is important to me that my co-workers are satisfied with their jobs”
(mean=2.41, standard deviation=1.003). The standard deviation ranged between 0.517
and 1.090. Q 6.1 “It is important that senior leaders in the bank communicate a clear
vision” had the highest level of variance from responses (standard deviation=1.090).
Main finding 16: The overall mean of the statements measuring internal people
indicates that GDP employees agree that internal people is important to their job
satisfaction (mean =1.44).
Main finding 17 : GDP employees indicated their highest levels of agreement
pertaining to the following item: “It is important that my manager/supervisor
communicates openly with me” (mean=1.08).
Main finding 18: GDP employees indicated their lowest level of agreement pertaining
to the following item: “It is important to me that my co-workers are satisfied with their
jobs” (mean=2.41).
The mean scores for internal process varied between 1.55 and 1.95 (1=strongly agree
and 5=strongly disagree). The overall mean score of 1.80 represents agreement with
statements made pertaining to the internal process construct. The strongest level of
agreement and lowest level of variance was with Q7.4, “It is important to have automated
processes that allow me to save time” (mean=1.55, standard deviation=0.711). The
second strongest level of agreement was with Q7.3, “It is important that improved ways of
doing tasks at work are found allowing me to give better service to my internal customers”
(mean=1.80, standard deviation=0.858). Question Q7.1, “It is important that the bank I
work for has well designed processes” (mean= 1.95, standard deviation=0.999) indicated
the least level of agreement. Standard deviations ranged between 0.711 and 1.041
showing a low level of variance. The strongest level of variance was with Q7.2, “It is
important that the support activities offered by other departments are reliable” (standard
deviation=1.041).
Main finding 19: The overall mean of the statements measuring internal process
indicates that GDP employees agree that internal process is important to their job
satisfaction (mean =1.80).

181
Main finding 20 : GDP employees indicated their highest levels of agreement
pertaining to the following item: “It is important to have automated processes that allow
me to save time” (mean=1.55, standard deviation=0.711).
Main finding 21: GDP employees indicated their lowest level of agreement pertaining
to the following item: “It is important that the bank I work for has well designed
processes” (mean= 1.95, standard deviation=0.999).
The mean scores in the internal physical evidence scale varied between 1.25 and 1.98
(1=strongly agree and 5=strongly disagree). The overall mean score of 1.60 showed
agreement made with statements pertaining to internal physical evidence. The strongest
level of agreement was with Q8.5, “It is important that my manager/supervisor frequently
provides feedback relating to my work performance” (mean=1.25, standard
deviation=0.690). GDP employees also indicated a strong level of agreement with the
statement Q8.2, “It is important that the layout of my office is easy to work in” (mean=1.42,
standard deviation=0.752). The item representing the least level of agreement was Q8.3,
“It is important that my colleagues are grouped around me in a pleasant manner”
(mean=1.98, standard deviation=0.984).The standard deviation ranged between 0.690
and 1.455 indicating that there was a high level of variance between responses made on
statements. Question 8.5, “It is important that my manager/supervisor frequently provides
feedback relating to my work performance” accounted for the lowest score (standard
deviation=0.690), indicating a low variance of responses for this item. Question 8.1, “It is
important for me to work in a physically appealing environment” had the highest level of
variance from responses (standard deviation=1.455).
Main finding 22: The overall mean of the statements measuring internal physical
evidence indicates that GDP employees agree that internal physical evidence is
important to their job satisfaction (mean =1.60).
Main finding 23: GDP employees indicated their highest levels of agreement
pertaining to the following item: “It is important that my manager/supervisor frequently
provides feedback relating to my work performance” (mean=1.25, standard
deviation=0.690).
Main finding 24: GDP employees indicated their lowest level of agreement pertaining
to the following item: “It is important that my colleagues are grouped around me in a
pleasant manner” (mean=1.98, standard deviation=0.984).

182
The overall means of all items in the internal marketing mix construct were considered to
be important for GDP employee job satisfaction. As per Table 6.4, internal product
represented the lowest overall mean score (mean = 1.35), meaning that the GDP
employees agreed the most with statements relating the internal product construct
(1=strongly agree and 5= strongly disagree). Internal people followed with overall mean
score of 1.44. This was followed by internal promotion (mean=1.60) and internal physical
evidence (mean=1.60), then by internal distribution (mean=1.64) and internal process
(mean=1.80). The lowest level of agreement was with the internal price construct (mean=
2.24).
Table 6.4. Overall mean and standard deviation scores for the internal marketing
mix
Construct Mean score Standard deviation
Internal product 1.35 0.682
Internal price 2.24 1.217
Internal promotion 1.60 0.880
Internal distribution 1.64 0.827
Internal people 1.44 0.774
Internal process 1.80 0.902
Internal physical evidence 1.60 0.953
Main finding 25: GDP employees agreed most that the statements measuring internal
product were important to their job satisfaction (mean =1.35).
Main finding 26: GDP employees agreed least that the statements measuring internal
price were important to their job satisfaction (mean=2.24).
6.5.3 Employee satisfaction
Section 3 of the questionnaire tested the general satisfaction levels among the GDP
employees. A series of four statements were presented to participants and participants
were asked to rate their level of agreement with each statement. A five-point interval Likert
scale was used where 1 signalled ‘strongly agree’ and 5 signalled ‘strongly
disagree’. Table 6.5 indicates the mean and standard deviation for each item.

183
Table 6.5. Descriptive statistics for employee satisfaction
Section 3 - Employee satisfaction Mean Standard Deviation
Q9.1 I am positive about my job 1.52 0.992
Q9.2 I have positive feelings towards the bank I work for
1.38 0.745
Q9.3 I feel satisfied with the job I am doing for my bank
1.89 1.261
Q9.4 I will recommend working for this bank to others
1.33 0.818
Overall employee satisfaction level 1.53 0.954
The mean scores for employee satisfaction ranged between 1.33 and 1.89 (1=strongly
agree and 5= strongly disagree) and the standard deviation ranged between 0.992 and
1.261, indicating variance between responses. The overall mean score of the employee
satisfaction construct was 1.53 reflecting that GDP employees agreed with the statements
measuring employee satisfaction. The item accounting for the strongest level of
agreement (1= strongly agree) was Q9.4, “I will recommend working for this bank to
others” (mean = 1.33, standard deviation = 0.818) implying that GDP employees are
satisfied with the bank with which they are employed are are willing to recommend their
bank to others. The item reflecting the least level of agreement was Q9.3, “I feel satisfied
with the job I am doing for my bank” (mean=1.89, standard deviation= 1.261). This implies
that GDP employees are not necessarily satisfied with their current job. Question 9.1
(standard deviation=0.992) accounted for the lowest score indicating a lower variance of
responses for this item, and Q 9.3 (standard deviation 1.261) had the highest level of
variance from responses.
Main finding 27: The overall mean score of employee satisfaction indicates that GDP
employees agree with the statements measuring employee satisfaction (mean=1.53).
Main finding 28: GDP employees indicated their highest levels of agreement
pertaining to the following item: “I will recommend working for this bank to others”
(mean = 1.33, standard deviation = 0.818).
Main finding 29: GDP employees indicated their lowest level of agreement pertaining
to the following item: “I feel satisfied with the job I am doing for my bank” (mean=1.89,
standard deviation= 1.261).

184
6.5.4 Affective commitment
Section 4 of the questionnaire tested levels of affective commitment among the GDP
employees. A series of seven statements were presented to participants and participants
were asked to rate their level of agreement with each statement. A five-point interval Likert
scale was used where 1 signalled ‘strongly agree’ and 5 signalled ‘strongly
disagree’. Table 6.6 indicates the mean and standard deviation for each item.
Table 6.6. Descriptive statistics for affective commitment
Section 4 - Affective commitment Mean Standard Deviation
Q10.1 I would be happy to spend the rest of my career with my bank
2.18 1.235
Q10.2 I feel a strong sense of ‘belonging’ to my bank
1.87 1.100
Q10.3 I feel ‘emotionally attached’ to my bank 1.32 1.075
Q10.4 I feel like a ‘part of the family’ at my bank 1.87 0.992
Q10.5 The relationship between my bank (as an employer) and myself is mutually beneficial
1.92 0.921
Q10.6 My bank is the first company that comes to mind when I make future career decisions
1.81 1.060
Q10.7 I intend to stay in a committed relationship with my bank (as my employer)
1.87 1.123
Overall affective commitment level 1.83 1.07
The mean scores for the affective commitment construct ranged between 1.32 and 2.18
(1=strongly agree and 5=strongly disagree). The strongest level of agreement was with
Q10.3, “I feel ‘emotionally attached’ to my bank” (mean = 1.32, standard deviation 1.075),
followed by “My bank is the first company that comes to mind when I make future career
decisions” (Mean=1.81, standard deviation=1.060). This was followed by Q10.4, “I feel like
a ‘part of the family’ at my bank” (mean = 1.87, standard deviation= 0.992) and Q10.7, “I
intend to stay in a committed relationship with my bank as an employer” (mean=1.87,
standard deviation=1.123).The item with the weakest level of agreement (mean:2.18,
standard deviation=1.235) swaying towards disagreement with the statement was Q10.1,
“I would be happy to spend the rest of my career with my bank”. The standard deviation
ranged between 0.921 and 1.235, showing variance amongst responses.
Main finding 30: The overall mean score of affective commitment indicates that GDP
employees agree with the statements measuring affective commitment (mean=1.83)

185
Main finding 31: GDP employees indicated their highest levels of agreement
pertaining to the following item: “I feel emotionally attached to my bank” (mean=1.32).
Main finding 32: GDP employees indicated their lowest level of agreement pertaining
to the following item: “I would be happy to spend the rest of my career with my bank”
(mean=2.18).
In order to test the relationships between the internal marketing mix elements and
employee satisfaction, and between employee satisfaction and affective commitment
inferential statistics were needed. The first step was to determine the extraction of factors
for analysis. The next section discusses factor analysis in detail.
6.6 FACTOR ANALYSIS
As discussed in Chapter 5 (section 5.2.8.1), factor analysis was conducted in order to
assess the internal validity and reliability of the questionnaire. The following discussion
provides a detailed account of how factors were determined for the internal marketing mix,
employee satisfaction and affective commitment scales. These results are presented and
discussed in the sections to follow.
Before the factor analysis was performed, the data was verified for factor analysis
suitability using the KMO measure of sampling adequacy and Bartlett’s test of sphericity.
Bartlett’s test of sphericity should be p < 0.05 and the KMO should be greater than 0.6.
Table 6.7 provides a summary of the results.
Table 6.7. KMO measure of sampling adequacy and Bartlett’s test of sphericity
results
Construct KMO
Bartlett’s test of sphericity
Internal marketing mix
Internal product (6 items) 0.864 0.000
Internal price (6 items) 0.676 0.000
Internal promotion (10 items) 0.644 0.000
Internal distribution (7 items) 0.644 0.000
Internal people (8 items) 0.836 0.000
Internal process (4 items) 0.726 0.000
Internal physical evidence (5 items) 0.510 0.000
Employee satisfaction (4 items) 0.751 0.000

186
Affective commitment (7 items) 0.882 0.000
It can be observed from Table 6.7 that the KMO scores for the internal marketing mix
varied between barely acceptable (0.510) and great (0.864), and although the internal
physical evidence score was below 0.6, it was considered acceptable given the limited
size of the population (Becker, 2013). The data met the requirements for Bartlett’s test of
sphericity indicating that factor analysis for all constructs was possible. The data for
employee satisfaction (0.751) and affective commitment (0.882) met the requirements of
the KMO measure of sampling adequacy and Bartlett’s test of sphericity indicating that
factor analysis for these constructs was possible.
6.6.1 Exploratory factor analysis
Once factor analysis suitability had been assessed, an EFA could then be conducted. The
following discussion provides a detailed account of how factors were determined for each
scale. In order to determine which factors to extract from each scale, only components
with an Eigenvalue of greater than 1 were considered. The internal marketing mix is
discussed first, followed by a discussion on the employee satisfaction and affective
commitment sections. These results are presented and discussed in the sections to
follow.
6.6.1.1 The internal marketing mix
The following section provides a detailed discussion of the EFA conducted for the internal
marketing mix section. Table 6.8 contains the unrestricted Eigenvalues, commonality
values and common variance.

187
Table 6.8. Unrestricted Eigenvalues, commonality values, factor or pattern matrix
and cumulative percentage for the internal marketing mix
Constructs and Items
Commonality Eigenvalue
Factor/Pattern matrix**
Cumulative percentage
F1 F2 F3 F1 F2 F3
Internal product
Q2.1 0.695
F1: 4.063
0.834
67.72%
Q2.2 0.714 0 .845
Q2.3 0.835 0.914
Q2.4 0.406 0.637
Q2.5 0.381 0.617
Q2.6 0.682 0.826
Internal price
Q3.1 0.151
F1: 2.928
F2: 1.251
0.029 0.375
48.80% 20.85%
Q3.2 0.785 -0.148 0.938
Q3.3 0.544 0.406 0.469
Q3.4 0.494 0.616 0.167
Q3.5 0.689 0.909 -0.289
Q3.6 0.787 0.795 0.183
Internal promotion
Q4.1 0.999
F1: 3.744
F2: 1.732
F3: 1.545
-0.030 -0.131 1.038
37.44% 17.32% 15.45%
Q4.2 0.234 -0.274 0.348 0.385
Q4.3 0.426 0.086 -0.039 0 .619
Q4.4 0.847 0.927 -0.037 0.014
Q4.5 0.812 0 .777 0.032 0.202
Q4.6 0.144 0 .448 -0.125 -0.149
Q4.7 0.351 0 .015 0.424 0.307
Q4.8 0.421 0.252 0.564 -0.277
Q4.9 0.999 -0.194 1.059 -0.010
Q4.10 0.699 0 .572 0.360 0.103
Internal distribution

188
Q5.1 0.743
F1: 2.921
F2: 1.969
-0.220 0.879
41.72% 28.13%
Q5.2 0.422
0.653
Q5.3 0.504 0.218 0 .634
Q5.4 0.675 0.690 0.327
Q5.5 0.609 0.749
Q5.6 0.508 0.727
Q5.7 0.642 0.816 -0.222
Internal people
Q6.1 0.797
F1: 5.125
F2: 1.220
0.952
64.06% 15.25%
Q6.2 0.803 0.522 0.470
Q6.3 0.886
0.927
Q6.4 0.706
0.751
Q6.5 0.999 1.100
Q6.6 0.947
Q6.7 0.670
Q6.8 0.185
Internal process
Q7.1 0.472
F1: 2.888
0.687
72.21%
Q7.2 0.640 0.800
Q7.3 0.977 0.989
Q7.4 0.469 0.685
Internal physical evidence
Q8.1 0.176
F1: 2.265
F2: 1.032
F3: 1.008
45.29% 20.65% 20.17%
Q8.2 0.358
Q8.3 0.231
Q8.4 0.635
Q8.5 0667
** Factor matrix was used in the instance of one factor and the pattern matrix was used in
the instance of multiple factors.

189
For internal product, the commonality values ranged between 0.381 and 0.835. Question
2.5 (0.381) was the weakest indicator of internal product and Q2.3 (0.835) was the
strongest indicator (0.835) of the internal product construct. Only one Eigenvalue with an
absolute value of greater than 1.0 (4.063) was identified, which explained 67.72% of the
variance. This scale was considered to be unidimensional and no further rotation of factor
scores was required. One factor was retained and labelled internal product. It was
therefore possible to investigate the internal reliability of the construct using the Cronbach
alpha coefficient. This would allow for the computation of a single factor score for use in
the regression analysis.
Main finding 33: The Internal product subscale is considered valid.
The commonality values for internal price ranged between 0.151 and 0.787. Question
3.6 (0.787) was the strongest indicator of the internal price construct, whilst Q3.1 (0.151)
was the weakest indicator of the construct. Item Q3.1 (0.151) displayed a weak
commonality value and was marked and considered for deletion. An unrestricted EFA was
run and two Eigenvalues with an absolute value of greater than 1.0 were identified. F1
(2.928) accounted for a 48.8% variance and F2 (1.251) accounted for a 20.85% variance.
The screeplot also indicated the existence of multiple factors suggesting that the scale
may be multidimensional. Results from the screeplot and Eigenvalues Table suggest that
multiple factors may underlay the internal price subscale. As a first step, item Q3.1. was
deleted since the item did not adhere to the minimum acceptable criteria of at least 0.25
with regard to the factor loading. After the deletion of the items from the subscale, the EFA
results were regenerated.
The refined scale showed the existence of two Eigenvalues, Factor 1 (2.796) and Factor 2
(1.111). Factor 2 accounted for 22% of the common variance. The Eigenvalue for the
second factor was only marginally bigger than 1.00 and only two items loaded saliently on
the second factor based on the pattern matrix results. For this reason, it was decided to
force all the items onto a single factor and see if the commonality and factor loading
values would significantly deteriorate. The final restricted EFA solution was satisfactory
and seemed to present a fairly unidimensional account of the inter-item correlations. No
further items were deleted from the subscale. Therefore one factor was retained, labelled
internal price. It was therefore deemed permissible to calculate the internal reliability score
for internal price via the Cronbach alpha coefficient and compute a single factor score for
use in the regression analysis.

190
Main finding 34: After refinement the internal price subscale was considered valid
The commonality values for internal promotion ranged between 0.144 and 0.999.
Question 4.1 and 4.9 (0.999) were the strongest indicators of the internal promotion
construct, whilst Q4.6 (0.144) was the weakest indicator of the construct. Item Q4.6
displayed a weak commonality value and was marked and considered for deletion.
Several items in the internal promotion subscale reported aberrantly high communality
values, including item 4.1 (0.999) and 4.9 (0.999). Based on the very high communality
values, it was decided to delete these two items from the original scale.
Three Eigenvalues exceeding 1.0 were detected, F1 (3.744) explained 37.44% of the total
variance, F2 (1.732) explained 17.32% of the total variance, and F3 (1.545) accounted for
15.45% of the variance. Results from the screeplot illustrating multiple nodes above the
elbow and the presence of three Eigenvalues greater than 1.0 suggested that the inter-
correlations between scale items were the workings of multiple latent factors and not a
single construct.
After the deletion of Q4.1 (0.999), Q4.9 (0.999) due to high commonality values, and the
deletion of Q4.6 due to low commonality values, the EFA solution for the scale still proved
to be problematic with Q4.3 (0.999) now reporting a high factor loading. Furthermore, a
three-factor solution emerged. The analyses suggested that at least three factors were
responsible for the intercorrelations between the items constituting internal promotion
[Factor 1 (2.508: 36%), Factor 2 (1.363:19%) and Factor 3 (1.109:15.8%)]. No
theoretically meaningful patterns were detected in the pattern matrix. In addition, items
Q4.6, Q 4.3 and 4.5 now reported high communality values. These items were removed
from the revised scaled, but then even more items became problematic. The factor
structure of the subscale seemed unstable and the researcher faced three options with
regard to the internal promotion subscale. Firstly, the researcher could disregard the EFA
and use all items to create or compute a factor score. However, the researcher was aware
that no valid rationale would be applied to this solution, secondly the researcher could use
the remaining four items in the scale to create a factor score, however, this would not be
representative of the construct. Thirdly, the researcher could remove the scale completely
as it did not have enough construct validity to contribute to the conclusion of the study.
Option three was selected from an integrity point of view and as a result the internal
promotion scale was discarded from the study and no longer subject to any further

191
measurement. Conceptually the construct of internal promotion seems quite important in
the prediction of employee satisfaction; however the measurement of this construct
remains problematic. For this reason, any deductions made in the regression analyses
using this measure would be contentious.
Main finding 35: The internal promotion subscale was discarded due to poor
construct validity.
The commonality values for internal distribution ranged between 0.422 and 0.743.
Question 5.1 (0.743) was the strongest indicator of the construct, whilst Q5.2 (0.422)
represented the weakest indicator of internal distribution construct. An unrestricted EFA
was run and two Eigenvalues with a value of greater 1.0 were reported. The first factor
(2.921) explained 41.72% of the common variance and the second factor (1.969)
explained 28.13% of the common variance. In addition, the screeplots were also indicative
of additional factors. Further analysis of the scale was therefore deemed necessary. The
pattern matrix revealed that Q5.1, Q5.2 and Q5.3 cluster onto one factor (Factor 2) and
Q5.4, Q5.5, Q5.6 and Q5.7 cluster onto the other factor (Factor 1) in the same direction.
There is enough evidence and items in the scale to support a two-factor solution and the
independent ideas coming through. For this reason internal distribution was split into two
distinct themes namely: collaborative culture (F2: Q5.1, Q5.2 and Q5.3) and
organisational structure (F1:Q5.4, Q5.5, Q5.6 and Q5.7). The factors were therefore
labelled as collaborative culture (F2) and organisational structure (F1).These scales
were considered to be unidimensional and therefore no additional rotation of factor scores
was necessary. Against this background, it was also permissible to calculate the internal
reliability consistency score via Cronbach’s alpha coefficient alpha and to compute a
single factor score which will be used in the regression analysis.
Main finding 36: The Internal distribution subscale evolved as a two-factor solution
and was split into two factors labelled as collaborative culture and organisational
structure. The hypothesis has therefore been split into two H4a (There is a positive
significant relationship between collaborative culture and GDP employee satisfaction)
and H4b (There is a significant positive relationship between organisational structure
and GDP employee satisfaction).
The commonality values for the internal people construct ranged between 0.185 and
0.999. Question 6.5 (0.999) contributed the most to internal people element and Q6.8

192
(0.185) contributed the least to internal people. However Q6.5 was marked for deletion
due to the excessively high communality value, Q6.6 was also approaching a high value
and potentially problematic. In addition, two Eigenvalues with a value of greater 1.0 were
detected. F1 (5.125) accounted for 64.06% of the common variance and F2 (1.220)
accounted for 15.25% of the common variance. The second factor’s Eigenvalue was
substantially less than the first, however this may have suggested that the scale was
multidimensional. The screeplot results however did not display a clear break point for
Factor two (1.220), suggesting that only one or two items tap into the second dimension.
Further to this the pattern matrix showed Q6.5 (1.100) and Q6.6 (1.038) as problematic.
For this reason the scale required refinement, Q6.5 was removed due to high
commonality values and the EFA was regenerated. The scale automatically converged to
a one-factor solution. The scale was considered to be unidimensional and therefore no
additional rotation of factor scores was necessary. One factor was retained and labelled
internal people. It was therefore possible to investigate the internal reliability of the
construct using the Cronbach alpha coefficient. This would allow for the computation of a
single factor score for use in the regression analysis.
Main finding 37: After refinement, the internal people subscale was considered to be
valid.
The commonality values for internal process ranged between 0.469 and 0.977. Question
7.3 (0.977) was the strongest indicator of the construct and Q7.4 (0.469) represented the
weakest indicator of the internal process construct. Only one Eigenvalue with an absolute
value of greater than 1.0 (2.888) was identified which explained 72.21% of the variance.
Q7.3 (0.977) however posed a problem and was rejected as result of a high commonality
value indicating that Q7.3 did not adequately explain the variance. Although already a
uniimensional scale, Q7.3 was removed and the EFA regenerated. Only one Eigenvalue
(2.076) with a value exceeding 1.0 was present. The scale was considered to be
unidimensional and therefore no additional rotation of factor scores was required. One
factor was retained labelled internal process. Against this background, it was also
permissible to calculate the internal reliability consistency via Cronbach’s alpha
coefficient. This would allow for the computation of a single factor score for use in the
regression analysis.
Main finding 38: After refining, the internal process subscale was considered to be
valid.

193
The commonality values for internal physical evidence ranged between 0.176 and
0.667. Question Q8.5 (0.667) represented the strongest indicator of internal physical
evidence and Q8.1 (0.176) represented the weakest indicator to the internal physical
evidence construct. Q8.3 (0.176) displayed weak commonality values and a result was
marked and considered for deletion. Three Eigenvalues were indentified with values
exceeding 1.0. Factor 1 (2.265) explained 45.29 % of the common variance, Factor 2
(1.032) explained 20.65% and Factor 3 (1.008) accounted for 20.17% of the common
variance. The screeplot also indicated the existence of multiple factors suggesting that the
scale may be multidimensional. Results from the screeplot and Eigenvalues Table
suggest that multiple factors may underlay internal physical evidence. However, no
refinement could be made to the scale as the scale did not converge, meaning that the
items did not represent the scale denouncing any construct validity. For this reason the
internal distribution scale was removed from the study and from any further investigation
and measurement.
Main finding 39: The internal physical evidence scale was discarded due to poor
construct validity.
6.6.1.2 Employee satisfaction
The following section provides a detailed discussion of the EFA conducted for the
employee satisfaction section. Table 6.9 contains the unrestricted Eigenvalues,
commonality values and common variance.
Table 6.9. Unrestricted Eigenvalues, commonality values and common variance for
employee satisfaction
Constructs and Items
Commonality Eigenvalue
Factor/Pattern matrix**
Cumulative Percentage
F1 F1
Employee satisfaction
Q9.1 0.605
3.140
0.778
78.49% Q9.2 0.816 0.903
Q9.3 0.523 0.723
Q9.4 0.872 0.934
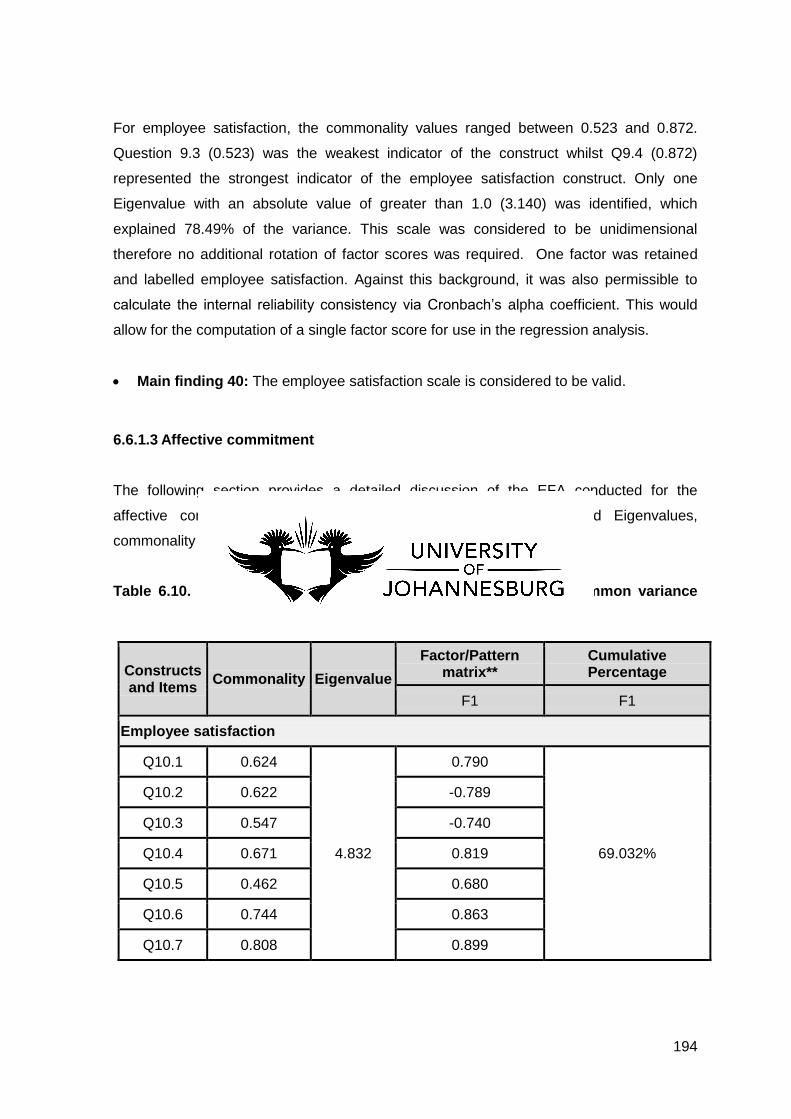
194
For employee satisfaction, the commonality values ranged between 0.523 and 0.872.
Question 9.3 (0.523) was the weakest indicator of the construct whilst Q9.4 (0.872)
represented the strongest indicator of the employee satisfaction construct. Only one
Eigenvalue with an absolute value of greater than 1.0 (3.140) was identified, which
explained 78.49% of the variance. This scale was considered to be unidimensional
therefore no additional rotation of factor scores was required. One factor was retained
and labelled employee satisfaction. Against this background, it was also permissible to
calculate the internal reliability consistency via Cronbach’s alpha coefficient. This would
allow for the computation of a single factor score for use in the regression analysis.
Main finding 40: The employee satisfaction scale is considered to be valid.
6.6.1.3 Affective commitment
The following section provides a detailed discussion of the EFA conducted for the
affective commitment section. Table 6.10 contains the unrestricted Eigenvalues,
commonality values and common variance.
Table 6.10. Unrestricted Eigenvalues, commonality values and common variance
for affective commitment.
Constructs and Items
Commonality Eigenvalue
Factor/Pattern matrix**
Cumulative Percentage
F1 F1
Employee satisfaction
Q10.1 0.624
4.832
0.790
69.032%
Q10.2 0.622 -0.789
Q10.3 0.547 -0.740
Q10.4 0.671 0.819
Q10.5 0.462 0.680
Q10.6 0.744 0.863
Q10.7 0.808 0.899

195
For affective commitment, the commonality values ranged between 0.462 and 0.808.
Question 10.5 represented the weakest indicator of the construct (0.462), whilst Q10.7
(0.808) represented the strongest indicator of the affective commitment construct. Once
the unrestricted EFA had been applied, only one Eigenvalue with an absolute value of
greater than 1.0 (4.832) was identified which explained 69.03% of the variance. This scale
was considered to be unidimensional and no additional rotation of factor scores was
required. One factor was retained and labelled affective commitment. It was therefore
deemed possible to determine the internal reliability consistency using the Cronbach
alpha coefficient. In this way a single factor score could be generated for use in the
regression analysis.
Main finding 41: The affective commitment scale is considered to be valid.
Once the internal promotion and internal physical evidence scales were removed from the
study due to poor construct validity, only the remaining internal marketing mix scales
namely: internal product, internal price, collaborative culture, organisational structure,
internal people and internal process were investigated further to determine their reliability.
In addition to this, the employee satisfaction scale and affective scales were assessed for
construct reliability as discussed in the following section.
6.7 RELIABILITY OF THE MEASUREMENT INSTRUMENT
Although some of internal marketing mix (internal product, internal price and internal
promotion) was adapted from previous literature and the employee satisfaction and
affective commitment constructs were adopted from previous literature, it was still
important to determine the reliability of the measuring scales for this study after the EFA
was conducted. Chapter Five (section 5.2.5.6) specified that Cronbach alpha would be
used to test the reliability of the questionnaire. Cronbach alpha values of .8 or higher are
considered as high reliability; those between 0.70 and 0.80 are regarded as having good
reliability; values between 0.60 and 0.70 are fair; and coefficients lower than .60 are
questionable (Hair et al., 2010:708). Table 6.11 summarises the results of the Cronbach
alpha test.

196
Table 6.11. Results of the Cronbach alpha test
Construct Cronbach Alpha
Internal marketing
mix
Internal product (Q2.1, Q2.2, Q2.3, Q2.4, Q2.5 & Q2.6) 0.887
Internal price (Q3.2, Q3.3, Q3.4, Q3.5 & Q3.6) 0.789
Collaborative culture (Q5.1, Q5.2 & Q5.3) 0.758
Organisational structure (Q5.4, Q5.5, 5.6 & Q5.7) 0.796
Internal people (Q6.1, Q6.2, Q6.3, Q6.4, Q6.6, 6.7 & Q6,8) 0.884
Internal process (Q7.1, Q7.2 &Q7.4) 0.766
Employee satisfaction (Q9.1, Q9.2, Q9.3 & 9.4) 0.890
Affective commitment (Q10.1, Q10.2, Q10.3, Q10.4, Q10.6 & Q10.7) 0.923
The Cronbach alpha scores for the internal marketing mix varied between 0.766 and
0.887. The internal promotion scale and internal physical evidence scale had been
removed due to poor construct validity and as a result were not included in the reliability
assessment. In addition to this item, Q3.1, Q6.5 and Q7.3 were removed from their
designated scales due to low communality values. As can be inferred from Table 6.11, all
the subscales reported good internal consistency reliability. Internal product (α=0.887) and
internal people (α=0.884) had the highest levels of reliability. Although somewhat lower
than internal people and internal product, all the remaining subscales reported sufficient
levels of reliability [Internal price (α=0.789), collaborative culture (α=.0758), organisational
structure (α=0.796) and internal process (α=.0766)].
The Cronbach alpha score for employee satisfaction (α=0.890) indicated a high level of
reliability, as did the Cronbach alpha score for affective commitment (α=0.923). Thus,
considered collectively, all the measurement scales reported good levels of internal
consistency reliability as measured by Cronbach’s alpha coefficient.
Main finding 42: All refined constructs tested were considered reliable.
Since the reliability and validity of the measures included in the study were found to be
satisfactory, it was permissible to continue to the hypotheses testing phase of the study.
However, regression analysis presumes that the data adheres to a number of
assumptions. Before the regression analysis was conducted, the following assumptions
were evaluated:
Impact of outliers are assessed.

197
Whether the aggregated factor scores are distributed relatively normal.
Linearity between independent and dependent factors.
Homoscedasticity of residuals.
6.8 ASSUMPTIONS OF REGRESSION ANALYSIS
The assumptions of regression analysis are discussed next.
6.8.1 Outliers
Initially, histograms were utilised to observe the presence of outliers in the data set. If
outliers were identified in the histogram, box plots were used to examine the presence of
outliers further. The circles above and below the whiskers of the box-and-whisker plots
are the outliers (Field, 2009:101-102). Circles represent points that extend 1.5 box lengths
from the edge of the box. An asterix represents extreme points more than 3 box lengths
from the edge of the box (refer to appendix 4) (Pallant, 2010:131).
6.8.1.1 The internal marketing mix
The results for the internal marketing mix are provided next, (refer to appendix 2 and 4).
Internal product
The initial observation of the histogram showed the presence of outliers in the data set.
Box plots were used to examine the data further. It was identified that case number 22
and 27 were identified as outliers and case number 56 was identified as an extreme
outlier. Ordinarily, outliers would be removed from the data set but since the population is
small and since none of the outliers posed a threat to the study, they were retained and
regression analysis was considered appropriate (Becker, 2013).
Internal price
The initial observation of the histogram showed the presence of outliers in the data set.
Box-and-whisker plots were used to examine the data further. It was identified that case
number 56 was identified as an outlier. Ordinarily, outliers would be removed from the
data set but since the population is small and since none of the outliers posed a threat to
the study, they were retained and regression analysis was considered appropriate
(Becker, 2013).

198
Collaborative culture
The initial observation of the histogram showed the presence of outliers in the data set.
Box-and-whisker plots were used to examine the data. Case number 27 and 56 were
identified as outliers. Ordinarily, outliers would be removed from the data set but since the
population is small and since none of the outliers posed a threat to the study, they were
retained and regression analysis was considered appropriate (Becker, 2013).
Organisational structure
The initial observation of the histogram showed the presence of outliers in the data set.
Box-and-whisker plots were used to examine the data. Case number 27 and 62 were
identified as outliers. Ordinarily, outliers would be removed from the data set but since the
population is small and since none of the outliers posed a threat to the study, they were
retained and regression analysis was considered appropriate (Becker, 2013).
Internal people
The initial observation of the histogram showed the presence of outliers in the data set.
Box-and-whisker plots were used to examine the data. Case number 22 and 28 were
identified as outliers. Case numbers 27, 39 and 56 were identified as extreme outliers.
Ordinarily, outliers would be removed from the data set but since the population is small
and since none of the outliers posed a threat to the study, they were retained and
regression analysis was considered appropriate (Becker, 2013).
Internal process
The initial observation of the histogram showed the presence of outliers in the data set.
Box-and-whisker plots were used to examine the data. Case number 56 was identified as
an outlier. Ordinarily, outliers would be removed from the data set but since the population
is small and since none of the outliers posed a threat to the study, they were retained and
regression analysis was considered appropriate (Becker, 2013).
6.8.1.2 Employee satisfaction
The initial observation of the histogram showed the presence of outliers in the data set.
Box-and-whisker plots were used to examine the data (refer to appendix 2 and 4). Case
numbers 28, 53 and 58 were identified as an outlier. Case numbers 48 and 56 were
identified as extreme outliers. Ordinarily, outliers would be removed from the data set but

199
since the population is small and since none of the outliers posed a threat to the study,
they were retained and regression analysis was considered appropriate (Becker, 2013).
6.8.1.3 Affective commitment
The initial observation of the histogram showed the presence of outliers in the data set.
Box-and-whisker plots were used to examine the data further (refer to appendix 2 and 4).
It was identified that case numbers 22, 28, 53 and 55 were identified as outliers and case
numbers 27, 48 and 56 were identified as extreme outliers. Ordinarily, outliers would be
removed from the data set but since the population is small and since none of the outliers
posed a threat to the study, they were retained and regression analysis was considered
appropriate (Becker, 2013).
6.8.2 Normality
The evaluation of normality in the data analysis began with exploring the skewness and
kurtosis values of the elements of internal marketing mix, employee satisfaction and
affective commitment. Skewness and kurtosis values that are zero or close to zero
indicate a normally distributed variable, while values greater than or less than 1 and -1 are
considered to be abnormally distributed (Gamst et al., 2008:56, 66). Table 6.12
summarises the skewness and kurtosis values of the constructs.
Table 6.12. Summary of skewness and kurtosis statistics
Constructs Skewness statistic Kurtosis statistic
Internal marketing mix
Internal product 4.271 24.429
Internal price 0.635 0.532
Collaborative culture 1.094 1.627
Organisational structure 1.378 1.048
Internal people 2.904 10.833
Internal process 1.394 3.594
Employee satisfaction 2.115 4.851
Affective commitment 1.625 2.620
The skewness and kurtosis values for the internal marketing mix elements, namely
internal product, collaborative culture, organisational structure, internal people and internal

200
process were all above 1, indicating that the data is not normally distributed for these
elements. Internal price however displayed a skewness value of 0.635 and a kurtosis
value of 0.532, both these values are less than 1, indicating that the data for internal price
is normally distributed. The employee satisfaction construct showed skewness and
kurtosis values of greater than 1, and is therefore non-normally distributed. The skewness
and kurtosis values for the affective commitment construct showed skewness and kurtosis
values of greater than 1 and are therefore not normally distributed.
Because the population was small, an additional test for normality was included making
use of the Shapiro – Wilks test. The Shapiro-Wilks test rejects the hypothesis of normality
when the p-value is less than or equal to 0.05. Based on this, Table 6.13 was used to
summarise the p-values of the constructs to determine if they met the requirement of
normality.
Table 6.13. Summary of Shapiro-Wilks p- values
Constructs Shapiro-Wilks p – value
Internal Marketing mix
Internal product 0.000
Internal price 0.021
Collaborative culture 0.000
Organisational structure 0.000
Internal people 0.000
Internal process 0.000
Employee satisfaction 0.000
Affective commitment 0.000
The Shapiro-Wilks (p < 0.05) test confirmed that none of the constructs followed a normal
distribution, since all the values were lower than 0.05. The data for the internal marketing
mix elements, namely internal product, collaborative culture, organisational structure,
internal people and internal process was considered to be non-normally distributed.
Employee satisfaction and affective commitment were also considered to be non-
normally distributed. The Shapiro - Wilks test however is limited. A significance test does
not automatically determine whether the deviation from normality is sufficient to bias any
statistical methods applied to the data (Field, 2009:144).

201
Based on the skewness and kurtosis values and the Shapiro – Wilks test, the dimensions
of internal product, internal price, collaborative culture, organisational structure, internal
people, internal process, employee satisfaction and affective commitment did not meet the
requirements of normality. Since the population was small and limited to a specialised
group of employees, normality was not expected and it was considered appropriate to
continue with regression analysis (Becker, 2013).
Main finding 43: None of the internal marketing elements, employee satisfaction or
affective commitment met the assumptions of normality.
6.8.3 Linearity
Chapter 5 section 5.2.8.1 mentioned that scatter plots would be used to test for linearity
as scatter plots are useful in plotting a line which summarises the relationship between
variables (Field, 2009:119). Scatter plots were used to examine the data for all the internal
marketing mix elements (refer to appendix 3). The scatter plots indicated that linear
relationships existed between the internal marketing mix elements and employee
satisfaction. In addition to this, the scatter plots indicated that a linear relationship exists
between employee satisfaction and affective commitment. The basic assumptions of
linearity were thus met for the purpose of regression analysis.
Main finding 44: The assumptions of linearity were met.
6.8.4 Homoscedacity
Testing for homoscedacity took place, the data was considered to be random, meaning
that no structure was observed. The assumptions of homoscedasticity have therefore
been met and regression analysis could be performed.
Main finding 45: The assumptions of homoscedascity were met.
Based on the results discussed the assumptions for linearity and homoscedascity were
met. The results for normality of the internal marketing mix, employee satisfaction and
affective commitment however violate the assumptions of normality. Normality was not
however expected and given the size and specialised nature of the population, it was
considered appropriate to continue with regression analysis. Outliers were not considered

202
to be a threat and as a result regression analysis could therefore be performed and the
results are discussed next.
6.9 REGRESSION ANALYSIS AND HYPOTHESES TESTING
Since the assumptions had been tested and the violations were not deemed to be serious,
regression analysis could be performed. Factor scores used in the regression analysis
were computed-based on the refined measures and not the original scales. Internal
promotion and internal physical evidence were not included in the regression analysis as
these scales were considered unfit from a validity perspective and discarded as a result of
the EFA (discussed in section 6.6.1.1).
Initially, the researcher wanted to apply multiple regression analysis to the study, through
this approach the internal marketing mix scales could be applied as a group to determine
the influence of the elements on employee satisfaction. Moreover, multivariate regression
analyses would allow the researcher to determine which of the internal marketing mix
elements emerged as the strongest predictor of employee satisfaction. However, during
the analysis phase no single element emerged as the most influential or strongest and for
this reason each element was regressed individually against satisfaction in order to
assess the strength of each relationship individually. Due to the reasons discussed, a
simple linear regression was applied to the study (refer to Chapter 5, section 5.2.8.1).
Simple linear regression was used to test the hypotheses and determine whether to
accept or reject the hypotheses. The next section provides the results pertaining to each
hypothesis set for the study as discussed in Chapter 1 (section 1.3.3) and Chapter 5
(section 5.2.2.3). The hypotheses aim to provide results for the secondary objectives 4- 11
set out in section 6.2.2. The first section focuses on the relationship between the internal
marketing mix and employee satisfaction which will aim to achieve the secondary
objectives 4-10 and the second section focuses on the relationship between employee
satisfaction and affective commitment which aims to achieve secondary objective 11.
6.9.1 Regression of the employee satisfaction on the internal marketing mix
elements
The secondary research objectives 4-10 will be empirically validated by means of a series
of bivariate regression models (step-wise regression), regressing employee satisfaction

203
onto the internal marketing mix elements. The regression findings are presented in Table
6.14 below.
Table 6.14. Regression of the internal marketing mix elements on employee
satisfaction
Dependent variable
Independent variables P-value Beta value R-square value
Adjusted R-square value
Employee satisfaction
Internal product 0.000 0.548 0.300 0.289
Internal price 0.086 0.216 0.470 0.031
Collaborative culture 0.006 0.338 0.338 0.114
Organisational structure 0.000 0.431 0.431 0.185
Internal people 0.000 0.571 0.571 0.326
Internal process 0.001 0.399 0.399 0.159
6.9.1.1 H1: There is a significant positive relationship between the internal product
and GDP employee satisfaction
A positive relationship was predicted between internal product and employee satisfaction.
The results from the regression results support the hypothesis (β = 0.548, p < 0.05). The
direction of the relationship was congruent with a priori theorising since a moderately
positive relationship was predicted between internal product and employee satisfaction.
Thus, the null hypothesis can be rejected in favour of the alternative hypothesis. The
adjusted R2 –value of 0.289 indicates that approximately 28% of the variance in employee
satisfaction is predicted by internal product.
Main finding 46: There is a significant positive relationship between internal product
and employee satisfaction indicating that H1 can be accepted.
6.9.1.2 H2: There is a significant positive relationship between the internal price and
GDP employee satisfaction
A positive relationship was predicted between internal price and employee satisfaction.
The β results from the regression results support the hypothesis (β = 0.216). However, the
p value is greater than 0.05 (p=0.86) and therefore not statistically significant. The
hypothesis is therefore rejected in favour of the null hypothesis.

204
Main finding 47: Internal price is not statistically significant and therefore H2 is
rejected.
6.9.1.3 H3: There is a significant positive relationship between internal promotion
and GDP employee satisfaction
The relationship between internal promotion and employee satisfaction could not be
tested as the internal promotion subscale was discarded due to poor construct validity and
no further testing was conducted for this construct (refer to section 6.6.1.1.).
6.9.1.4 H4: There is a significant positive relationship between internal distribution
and GDP employee satisfaction
The internal distribution subscale emerged as a two-factor solution during the EFA and as
a result was split into two factors labelled as collaborative culture and organisational
structure. For this reason the hypothesis was split into H4a (there is a significant positive
relationship between collaborative culture and GDP employee satisfaction) and H4b
(There is a significant positive relationship between organisational structure and GDP
employee satisfaction)(refer to section 6.6.1.1.). Each of these will be discussed next.
H4a: There is a significant positive relationship between collaborative culture and GDP
employee satisfaction.
A positive relationship was predicted between collaborative culture and employee
satisfaction. The results from the regression results support the hypothesis (β = 0.338, p <
0.05). The direction of the relationship was congruent with a priori theorising since a
moderately positive relationship was found between collaborative culture and employee
satisfaction. Thus, the null hypothesis can be rejected in favour of the alternative
hypothesis. The adjusted R2 –value of 0.114 indicates that approximately 11.4% of the
variance in employee satisfaction is predicted by collaborative culture.
Main finding 48: There is a significant positive relationship between collaborative
culture and employee satisfaction indicating that H4a can be accepted.

205
H4b: There is a significant positive relationship between organisational structure and
GDP employee satisfaction.
A positive relationship was predicted between organisational structure and employee
satisfaction. The results from the regression results support the hypothesis (β = 0.431, p <
0.05). The direction of the relationship was congruent with a priori theorising since a
moderately positive relationship was found between organisational structure and
employee satisfaction. Thus, the null hypothesis can be rejected in favour of the
alternative hypothesis. The adjusted R2 –value of 0.185 indicates that approximately
18.5% of the variance in employee satisfaction is predicted by organisational structure.
Main finding 49: There is a significant positive relationship between organisational
structure and employee satisfaction indicating that H4b can be accepted. As H4a and
H4b were both accepted, H4 can also therefore be accepted.
6.9.1.5 H5: There is a significant positive relationship between internal people and
GDP employee satisfaction
A positive relationship was predicted between internal people and employee satisfaction.
The results from the regression results support the hypothesis (β =0.571, p< 0.05). The
direction of the relationship was congruent with a priori theorising since a moderately
positive relationship was found between internal people and employee satisfaction. Thus,
the null hypothesis can be rejected in favour of the alternative hypothesis. The adjusted R2
–value of 0.326 indicates that approximately 32.6% of the variance in employee
satisfaction is predicted by internal people.
Main finding 50: There is a significant positive relationship between internal people
and employee satisfaction indicating that H5 can be accepted.
6.9.1.6 H6: There is a significant positive relationship between internal process and
GDP employee satisfaction
A positive relationship was predicted between internal process and employee satisfaction.
The results from the regression results support the hypothesis (β = 0.399, p < 0.05). The
direction of the relationship was congruent with a priori theorising since a moderately
positive relationship was found between internal process and employee satisfaction. Thus,

206
the null hypothesis can be rejected in favour of the alternative hypothesis. The adjusted
R2-value of 0.159 indicates that approximately 15.9% of the variance in employee
satisfaction is predicted by internal process.
Main finding 51: There is a significant positive relationship between internal process
and employee satisfaction indicating that H6 can be accepted.
6.9.1.7 H7: There is a significant positive relationship between internal physical
evidence and GDP employee satisfaction
The relationship between internal physical evidence and employee satisfaction could not
be tested as the internal physical subscale was discarded due to poor construct validity
and no further testing was conducted for this construct (refer to section 6.6.1.1.).
When entered into the regression equation individually through step-wise regression, the
highest level of variance in employee satisfaction is predicted by the internal people
element (β=0.571, R² = 0.326). The next highest level of variance in employee satisfaction
was predicted by internal product (β=0548, R² = 0.289). This was followed by organisation
structure (β=0.431, R² = 0.185), then by internal process (β=0.399, R² = 0.159), and finally
by collaborative culture (β=0.338, R² = 0.114). Internal price was not regarded as
statistically significant and is therefore not regarded as a predictor of employee
satisfaction.
Main finding 52: Employee satisfaction is influenced by internal marketing through
internal product, collaborative culture, organisational structure, internal people and
internal process. Therefore there is a significantly positive relationship between these
internal marketing mix elements and employee satisfaction. Figure 6.1 shows the
refined theoretical model and statistical results for the relationship between the internal
marketing mix elements and employee satisfaction.

207
Figure 6.1. Regression results for the relationship between the internal marketing
mix elements and employee satisfaction
Source: Researcher’s own construct.
6.9.2 The relationship between employee satisfaction and affective commitment
The secondary research objective 11 will be empirically validated by means of a bivariate
regression model regressing affective commitment on employee satisfaction. The
regression findings are presented in Table 6.15 below.
Table 6.15. Regression of affective commitment onto employee satisfaction
Dependent variable
Independent variable P-value Beta R-square value
Adjusted R-square value
Affective commitment
Employee satisfaction 0.000 0.835 0.698 0.693

208
6.9.2.1 H8: There is a significant positive relationship between employee
satisfaction and affective commitment
A positive relationship was predicted between employee satisfaction and affective
commitment. The results from the regression results support the hypothesis (β = 0.835, p
< 0.05). The direction of the relationship was congruent with a priori theorising since a
strong positive relationship was found between employee satisfaction and affective
commitment. Thus, the null hypothesis can be rejected in favour of the alternative
hypothesis. The adjusted R2 –value of 0.693 indicates that approximately 69.3% of the
variance in affective commitment is predicted by employee satisfaction.
Main finding 53: There is a significant positive relationship between employee
satisfaction and affective commitment indicating that H8 can be accepted.
Figure 6.2. Regression results for the relationship between employee satisfaction
and affective commitment
Source: Researcher’s own construct.
Figure 6.3 provides the final refined theoretical model for the study based on the overall
regression results for the research objectives.

209
Figure 6.3. Refined theoretical model and regression results for research objectives
Source: Researcher’s own construct.
6.10 FINAL SUMMARY OF RESEARCH OBJECTIVES, HYPOTHESES AND
RESULTS
The final section provides a summary of the secondary research objectives, the results of
which are presented in Table 6.16.
Table 6.16. Summary of secondary research objectives and hypotheses
Objective Nr Hypotheses Main
Findings Results
To examine the theory relating to the seven elements of the internal marketing mix, employee satisfaction and affective commitment
1 N/A N/A N/A
To determine whether GDP employees are aware of the internal marketing mix elements at their bank
2 N/A 1 GDP employees are aware of the internal marketing mix (mean=1.54)
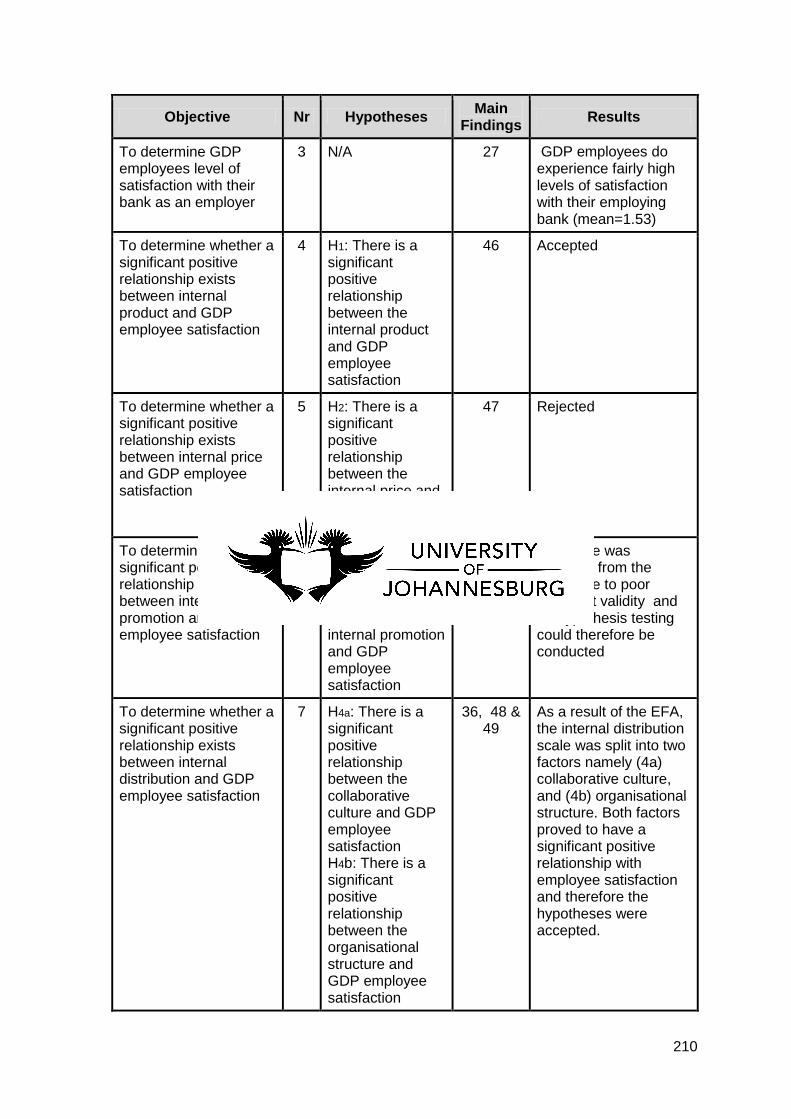
210
Objective Nr Hypotheses Main
Findings Results
To determine GDP employees level of satisfaction with their bank as an employer
3 N/A 27 GDP employees do experience fairly high levels of satisfaction with their employing bank (mean=1.53)
To determine whether a significant positive relationship exists between internal product and GDP employee satisfaction
4 H1: There is a significant positive relationship between the internal product and GDP employee satisfaction
46 Accepted
To determine whether a significant positive relationship exists between internal price and GDP employee satisfaction
5 H2: There is a significant positive relationship between the internal price and GDP employee satisfaction
47 Rejected
To determine whether a significant positive relationship exists between internal promotion and GDP employee satisfaction
6 H3: There is a significant positive relationship between the internal promotion and GDP employee satisfaction
35 The scale was removed from the study due to poor construct validity and no hypothesis testing could therefore be conducted
To determine whether a significant positive relationship exists between internal distribution and GDP employee satisfaction
7 H4a: There is a significant positive relationship between the collaborative culture and GDP employee satisfaction H4b: There is a significant positive relationship between the organisational structure and GDP employee satisfaction
36, 48 & 49
As a result of the EFA, the internal distribution scale was split into two factors namely (4a) collaborative culture, and (4b) organisational structure. Both factors proved to have a significant positive relationship with employee satisfaction and therefore the hypotheses were accepted.

211
Objective Nr Hypotheses Main
Findings Results
To determine whether a significant positive relationship exists between internal people and GDP employee satisfaction
8 H5: There is a significant positive relationship between the internal people and GDP employee satisfaction
50 Accepted
To determine whether a significant positive relationship exists between internal process and GDP employee satisfaction
9 H6: There is a significant positive relationship between the internal process and GDP employee satisfaction
51 Accepted
To determine whether a significant positive relationship exists between internal physical evidence and GDP employee satisfaction
10 H7: There is a significant positive relationship between the internal physical evidence and GDP employee satisfaction
39 The scale was removed from the study due to poor construct validity and no hypothesis testing could therefore be conducted
To determine whether a significant positive relationship exists between employee satisfaction and affective commitment
11 H8: There is a significant positive relationship between the employee satisfaction and affective commitment
53
Accepted
6.11 CONCLUSION
Chapter 6 covered the empirical results of the study. This section commenced with a
discussion on descriptive statistics which allowed the researcher to identify the
demographics of the sample and interpret them in a meaningful way. In addition to this,
the frequency distribution of sample responses could be observed for the awareness of
internal marketing, the internal marketing mix, employee satisfaction and affective
commitment. This was followed by the validity testing of the measurement instrument

212
through exploratory factor analysis (EFA) and the testing of the measurement instruments
reliability through Cronbach alpha. The assumptions of regression were also tested.
Finally, the relationships and hypotheses linking the refined internal marketing mix to
employee satisfaction were tested through simple regression analysis, as was the
relationship between employee satisfaction and affective commitment. The hypotheses
H1, H4a, H4b, H5, H6, H7 and H8 were accepted as laid out in Table 6.22. H2 was rejected
as internal price was not regarded as statistically significant. Further to this, H3 and H6
could not be tested as the subscales for internal promotion (pertaining to H3) and internal
physical evidence (pertaining to H6) were discarded as a result of the EFA due to poor
construct validity.
When employee satisfaction was regressed onto each of the refined internal marketing
mix elements in a step-wise regression, it was found that all the internal marketing mix
elements influence GDP employee satisfaction within retail banks (refer to Figure 6.3).
When affective commitment was regressed onto employee satisfaction, it was found that
there is a positive relationship between employee satisfaction and affective commitment.
The strongest relationship observed in the step-wise regression analysis was between the
internal people construct and employee satisfaction. The second strongest relationship
being between internal product and employee satisfaction.
Chapter 7 is presented next. This chapter covers the summary, conclusions and
recommendations based on the empirical findings in Chapter 6. Recommendations are
made to retail banks in terms of how to improve internal marketing programmes and
increase satisfaction and affective commitment amongst existing and potential GDP
employees. Limitations of the study as well as possible future research are also
discussed.

213
CHAPTER 7
CONCLUSIONS, IMPLICATIONS AND RECOMMENDATIONS FOR FUTURE
RESEARCH
7.1 INTRODUCTION
Chapter 7 provides a summary of the research undertaken in the study. The realisation of
the primary and secondary research objectives will be discussed. A general explanation of
the findings will be discussed in this chapter and recommendations drawn from the
conclusions of the research will be provided to retail banks to improve GDP employee
satisfaction through the design or improvement of internal marketing programmes.
7.2 OVERVIEW OF STUDY
Chapter 1 provided an outline of the study. Brief discussions were provided on the internal
marketing concept, the elements of the internal marketing mix (internal product, internal
price, internal promotion, internal distribution, internal people, internal process and internal
distribution), employee satisfaction and affective commitment. The conceptual framework
of the study is based on the premise that the internal marketing mix elements are able to
aid in the development of employee satisfaction. In this way the internal marketing mix
elements are able to play a role in increasing employee satisfaction within retail banks. It
is important therefore that the relationship between the internal marketing mix elements
and employee satisfaction is understood (refer to regression results in Chapter 6, section
6.9.1) so that these relationships can be strengthened. It is also important for retail banks
to understand the relationship between employee satisfaction and affective commitment
so that this relationship may be enhanced. When employees are satisfied they experience
higher levels of affective commitment and remain with organisations for longer (refer to
regression results Chapter 6, section 6.9.2) Recommendations and guidelines are
provided to retail banks in this chapter. These are linked to the secondary objectives of
the study (refer to Chapter 1, section 1.3.2).
A theoretical framework was provided (Chapter 1, section 1.2 Figure 1.2) which
represented the relationship between the internal marketing mix (internal product, internal
price, internal promotion, internal distribution, internal people, internal process and internal
physical evidence) and employee satisfaction. In addition to this, the relationship between
employee satisfaction and affective commitment was also represented.

214
The study consisted of literature which discussed services marketing, internal marketing,
employee satisfaction and affective commitment. These concepts were identified and
explained in detail in Chapter 2, 3 and 4. The research methodology used in the study
was also provided in Chapter 5. Chapter 6 discussed the results obtained from the
empirical research. The following section of the chapter provides conclusions and
recommendations for each secondary objective set for the study in the aim of reaching the
primary objective of: To investigate the influence of the internal marketing mix on
employee satisfaction from GDP employees’ perspective in order to enhance their
satisfaction at retail banks with graduate development programmes in South Africa. In
addition to this, the relationship between employee satisfaction and affective commitment
is also explored. The secondary objectives and hypotheses are summarised next.
7.3 CONCLUSIONS AND RECOMMENDATIONS FOR SECONDARY OBJECTIVES
In today’s highly competitive market, retail banks have come to realise that employee
satisfaction and the retention of talented employees through increased levels of affective
commitment could provide the competitive edge needed to succeed in the market (Lumley
et al., 2011:107). The following section summarises the conclusions drawn for the
research objectives of the study and provides recommendations to retail banks to improve
the relationship between internal marketing and employee satisfaction, and the
relationship between employee satisfaction and affective commitment. If higher levels of
employee satisfaction are achieved, higher levels of affective commitment would follow
and thus better retention rates.
7.3.1 Secondary objective 1
To examine the theory relating to internal marketing, the seven elements of the
internal marketing mix, employee satisfaction and affective commitment
Chapter 2 highlighted the services marketing constituent of marketing and the
characteristics of services as opposed to products. In this chapter internal marketing was
defined as a main component of the services triangle and an essential element in the
delivery of services. Internal marketing was defined as A philosophy for the management
of large service organisations where the employees, in this case GDP employees, are
viewed as an internal customer market. Internal marketing includes marketing tactics
geared towards the attraction, development and retention of employees with the overall

215
objective of enhancing service quality to the customer whilst creating value and
satisfaction for the employee (refer to Chapter 1, section 1.6.3).
It was highlighted in the literature through the service profit chain that employees play a
vital role in the satisfaction of customer needs (Chapter 4, section 4.2). Internal marketing
aids in attracting, satisfying and retaining the most talented employees in the market, in
this case GDP employees to ensure the delivery of service excellence to external
customers. It is pertinent therefore that these employees understand the organisation’s
offerings, vision and processes. In addition to this, employees need to be provided with
the knowledge and skill to manage internal relationships well (Gummesson, 2007). The
significance of internal relationships and cross-functional coordination was elaborated on,
as well as the need for an effective internal environment in which employees are
encouraged to work together in a coordinated fashion in order to transfer knowledge and
produce new ideas that create value for customers. To achieve these goals, an effective
internal marketing mix is required (Yang et al.,2011:154-155; Kotlarsky et al., 2008:98-
99).
Chapter 3 focused on the internal marketing mix. The internal services marketing mix,
namely: internal product, internal price, internal distribution, internal promotion, internal
people, internal process and internal physical evidence was chosen to leverage
organisational performance.
Chapter 4 discussed employee satisfaction as an essential element for service success.
The employee is considered key to the service encounter and in view of the service profit
chain, employee satisfaction results in customer satisfaction and overall profitability.
Employee satisfaction was defined as an employee’s sense of satisfaction not only with
the work, but also with the broader organisational context within which the work exists.
Chapter 4 discussed the link between the internal marketing mix and employee
satisfaction. The link between employee satisfaction and affective commitment was also
discussed.
7.3.2 Secondary objective 2
GDP employees are aware of the internal marketing mix in their bank

216
The study assumed that GDP employees are aware of the internal marketing mix
elements in their bank. Chapter 6 section 6.5.1 showed that the overall mean for the
awareness of the internal marketing mix is 1.54 (1=strongly agree and 5=strongly
disagree), indicating that the majority of participants agreed with the statements specified
in the study and are therefore aware of the internal marketing mix in their bank (main
finding 1). The statement which participants agreed with most was Q1.3, “I am aware of
whom I report to” (mean= 1.14 and standard deviation = 0.710) as highlighted with main
finding 2 (Chapter 6, section 6.5.1). This item relates to the internal people element of the
internal marketing mix and suggests that GDP employees are most aware of the internal
people element in the bank. The statement indicating the least level of agreement was Q
1.6, “I am aware of the different departments within my bank” (mean= 2.02) (main finding
3). This item relates to the internal distribution element of the internal marketing mix. This
result suggests that GDP employees are not overly familiar with the various departments
and business units within their bank. Since GDP employees are new to the bank, they
may not have had exposure to the various business units or understand the specific
functioning of these business units within the broader banking context. However, since
internal marketing requires cross-functional integration between departments specifically
for the flow of knowledge and information, it is important that this level of awareness
increases.
It can therefore be concluded that GDP employees are aware of the internal marketing
mix elements within their employing bank. The internal marketing mix elements however
did exist independently and the GDP sample were aware of these. The internal people
element had the highest level of awareness amongst the retail bank GDP employees and
internal distribution accounted for the lowest level of awareness as per the discussion
above.
The implications of the results indicate that these internal marketing elements can be
enhanced to bring about increased levels of awareness and can be integrated into a
formal internal marketing programme in order to enhance employee satisfaction. Through
the implementation of a formal programme in which each of the internal marketing mix
elements are understood and communicated to employees, it sends a message that the
organisation cares about their employees’ needs. Furthermore, just like the external
customer, internal customers have become more knowledgeable about internal products
and services. If employees are aware of the internal mix, they are able to determine their
own level of satisfaction with each of these elements and provide feedback when specific
items are not meeting their needs. The internal marketing mix provides an internal

217
strategy which provides insight into how everything pulls together to deliver value for the
external customer. In this way it helps employees understand the corporate objective and
their purpose in this regard (Sanchez-Hernandez & Grayson, 2012:282-283). By
increasing awareness levels of certain elements, such collaborative culture employees
understand the importance of cross-functional integration, teamwork, the role they play in
this regard, and how this relates to the service quality provided to external customers.
Recommendation 1: Retail banks should develop and communicate a formal internal
marketing programme incorporating the internal marketing mix elements discussed in
Chapter 6 in order to increase the awareness levels amongst staff. In this way the
internal marketing mix elements will not exist independently of each other and through
a formal approach, employees will be aware of the internal marketing mix within their
bank. Through this kind of integrated approach greater levels of employee satisfaction
could be achieved which will in turn result in higher levels of affective commitment and
employee retention.
7.3.3 Secondary objective 3
To determine GDP employees level of satisfaction with their bank as an employer
As discussed in Chapter 6 (section 6.5.3), the overall mean score of the employee
satisfaction construct was 1.53, reflecting that GDP employees are satisfied with their
bank as an employer (main finding 27). The item accounting for the strongest level of
agreement (1= strongly agree) was Q9.4, “I will recommend working for this bank to
others” (mean = 1.33) (main finding 28), implying that GDP employees are satisfied with
the bank they are employed with and are willing to recommend their bank to others. The
item reflecting the least level of agreement was Q9.3, “I feel satisfied with the job I am
doing for my bank” (mean=1.89) (main finding 29). Graduates generally start in entry level
positions and have to work themselves up to more challenging positions and this may be
frustrating for some of these individuals eager to get ahead.
It can be concluded that GDP employees are generally satisfied with their employing
bank. GDP employees would recommend their bank as an employer to others. Their least
level of satisfaction was with the job they are currently doing as discussed. It is important
for retail banks to ensure that their employees are satisfied since this can lead to
increased productivity, commitment, engagement, lower levels of absenteeism and staff

218
turnover, all of which increase organisational effectiveness. This is because satisfied
employees are more productive and motivated in delivering higher levels of service quality
to both internal and external customers. The following recommendations have been put
forward.
Recommendation 2: In order to continue to provide high levels of employee
satisfaction, retail banks could look at each item developed for the internal marketing
mix and determine how improvements can be made to each of these. For example,
retail banks could work on improving the supervisor-employee relationship and help
ensure that supervisors/direct managers have regular feedback sessions with
employees whereby they communicate openly and honestly, since this item had the
lowest mean (mean=1.08) indicating the highest level of agreement (1=strongly agree
and 5 =strongly disagree).
Recommendation 3: “Voice of internal customer” sessions could be held on a
quarterly basis in order to stay in touch with GDP employee needs. The sessions
would focus on things that are going well and those things which are not going well. In
this way evolving employee needs are catered for and effective solutions can be
developed. A comprehensive internal marketing programme needs to be put in place
to address issues of dissatisfaction.
7.3.4 Secondary objective 4
To determine whether a positive relationship exists between internal product and
GDP employee satisfaction
The findings measuring Hypothesis 1, which links to secondary objective 4, suggest that a
significant positive relationship exists between internal product and employee satisfaction.
The outcome of the regression supports the hypothesis (β = 0.548, p < 0.05). The
adjusted R2 –value of 0.289 indicates that approximately 28% of the variance in employee
satisfaction is predicted by internal product (main finding 46) (Chapter 6, section 6.9.1.1).
By providing internal products that meet employee needs, organisations are able to
increase employee satisfaction and their commitment within the organisation. The GDP
participants agreed that internal product is important to their job satisfaction (mean=1.35)
(main finding 4).

219
Chapter 3 section 3.2.1.1 highlighted that by providing training as part of the internal
product, it serves as both a tool for attracting talented employees and as a way of
improving employees skills and abilities so that they are able to perform their jobs well.
When employees are able to perform their jobs effectively and serve customers well, they
experience higher levels of satisfaction. GDP employees agreed that the internal training
is an important component of internal product (mean= 1.22) (Chapter 6, section 6.5.2).
Chapter 3 section 3.2.1.2 also identified empowerment as a component of internal
product. By empowering employees and giving them the discretion to solve both internal
and external customer problems, they are able to perform better resulting in greater
feelings of satisfaction. In this way empowerment allows employees to feel better about
their jobs. In addition to this, empowerment contributes to the building of trust,
collaboration and loyalty amongst employees, all of which enhance employee satisfaction.
GDP participants agreed that empowerment is an important component of the internal
product (mean= 1.41) (Chapter 6, section 6.5.2).
Role fit and role clarity were discussed in Chapter 3 section 3.2.1.3 as further parts of
internal product. When the fit between the employee and the job is right, employees are
able to perform their jobs better resulting in increased satisfaction. To perform their jobs
well, employees need to be clear about what they are expected to deliver. When clear
performance goals are put in place and employees are provided with the relevant
knowledge and information to achieve their goals, they feel more satisfied. GDP
participants agreed with the statement and found role fit to be an important component of
internal product (mean=1.89).
Finally, Chapter 3, section 3.2.1.4 discussed career advancement as an essential part of
internal product emphasising that when a clear career progression plan is put in place,
employees feel valued by the organisation and become more engaged with the
organisation and more motivated to perform well. Clearly defined career paths aid in
attracting talented employees, their satisfaction and their retention within the organisation.
GDP employees found career advancement to be the most important element in the
internal product scale (mean= 1.13) (Chapter 6, section 6.5.2). The overall mean of the
statements measuring internal product indicated that GDP employees agree that internal
product is important to their job satisfaction (mean =1.35)(main finding 4, refer to Chapter
6, section 6.5.2). The highest level of agreement was with Q2.2, “It is important that I have
opportunities to advance my career in the bank I work for” (mean = 1.13) (main finding 5,
Chapter 6, section 6.5.2). The least level of agreement was with Q2.5, “It is important that

220
my skills match the job I am doing (mean = 1.89) (main finding 6, Chapter 6, section
6.5.2).
Chapter 6 (section 6.9.1.1) confirmed that there is a significant positive relationship
between internal product and GDP employee satisfaction. The main conclusion drawn is
that the internal product and the components thereof, namely training and development,
empowerment, role fit and clarity and career advancement are influencers of GDP
satisfaction. Of these components, career advancement opportunities is the most
important to GDP employees as discussed. The implication is that retail banks must
ensure that the components of internal product, namely training and development,
empowerment, role fit and clarity and career advancement opportunities are taken into
account, improved and incorporated as part of the internal product offering.
The empirical results identified internal product to be a significant influencer of GDP
employee satisfaction (main finding 46, Chapter 6, section 6.9.1.1). This provides an
opportunity for retail banks to improve or enhance the internal product element of the
internal marketing mix which will form the basis for the recommendations. Therefore, in
order to attract the right kind of employees into the organisation the internal product needs
to be reviewed and the following elements, namely career advancement opportunities,
training and development, empowerment and role fit and clarity ought to be included as
part of the internal product offering. These components will help the employee to engage
and connect with the organisation. When employees feel connected to the organisation
and cared for, they experience high levels of satisfaction and loyalty leading to higher
levels of retention. The following recommendations have been put forward:
Recommendation 4: Retail banks must provide comprehensive career plans for the
GDP group of employees. This should include a clear career path of what positions
they should be able to move into from a promotional perspective, and which positions
they would be able to move into from a lateral move perspective. Retail banks need to
focus on providing careers that allow GDP employees to grow and develop their skills
and competencies. In addition to this employees should be empowered to take charge
of their own careers. Employees want to know that they have a future in the bank and
that they are an important part of the “cause”. If a career plan is provided, employees
feel valued and cared for (refer to Chapter 3, section 3.2.1).
Recommendation 5: Coupled with the career plan is a need for a personal
development plan in terms of what training and development and what specific

221
competencies are required for GDPs to move into the more senior positions specified
in the career plan.
Recommendation 6: Before GDPs are promoted into more senior roles, retail banks
could conduct competency assessments to assess whether GDP employees do in fact
possess the desired competencies required for upward or lateral promotions and
positions (Schneider, 2013). In this way retail banks are also able to assist employees
to assess their skills and competencies so that they are able to change these areas or
develop themselves to manage the challenging parts.
Recommendation 7: Chapter 3 and 4 discussed how training and development
comprise a key part of internal product. When employees have been sufficiently
trained about the product or service they offer, they feel more confident, professional
and more respected by customers. In addition to product and job related training,
employees need to receive soft skills training such as emotional intelligence.
Recommendation 8: A coaching and mentoring programme must be established for
the GDP group of employees whereby senior managers provide coaching and
guidance to these employees. Group coaching sessions could be put in place to help
GDP employees with developmental areas such as desirable leadership
competencies. Mentoring and coaching is an essential method of transferring
knowledge and providing support to GDP employees. On-the-job coaching is essential
in ensuring that skills are entrenched and utilised and that employee performance is
enhanced (Jabbour, 2013).
Recommendation 9: Chapter 3 and 4 highlighted that GDP employees’ need to be
empowered to perform their jobs and make decisions necessary for the delivery of
service excellence. Given that each customer has their own unique set of needs and
requirements, employees need to understand these needs and have the power to
meet these needs (within the boundaries of associated business risk). Empowerment
provides employees with greater autonomy in terms of how they think, behave and
make decisions as well as how they are managed. Employees who are provided with
the discretion to perform their jobs well and can see meaning in what they do, tend to
be more satisfied and stay with organisations for longer. Retail banks must empower
the GDP employees as much as possible. Daily production meetings could be held
whereby employees have input in what is going well and not going well, and need to

222
develop their own solutions to these challenges (within a safe and supportive
environment).
Recommendation 10: It is important to note however that not all employees feel
comfortable in a collaborative environment or in positions of high autonomy. For this
reason, organisations need to ensure that the job fit between the employee and the
role they are recruited for is right and organisations must also ensure that the fit
between the employee’s values and career goals and the organisational culture are
correct to ensure employee satisfaction, productivity and retention over the long run. It
is important therefore that the right employees are recruited into the organisation. GDP
employees should be carefully screened through competency assessments and other
employees in the employing department could participate in the interview process to
ensure that the right kind of person is brought into the organisation to ensure a good fit
with the existing team.
Recommendation 11: Employees need to know exactly what it is that they are
expected to do and deliver. Employees should understand the bank’s external
marketing strategy and what role they play in delivering on promises made to both
internal and external customers (refer to Chapter 3, section 3.2.1). For this reason,
GDP employees need clear job descriptions specifying the functional responsibilities
of the job, the competencies required for the job and what a graduate is expected to
do over and above this such as being part of an innovation committee of a community
of practice. The job description needs to be linked to the employees KPIs and it is
essential that regular feedback is provided regarding their performance and the
meeting of these objectives. This would in turn facilitate open communication between
managers and subordinates. In addition to this, employees should be aware of how
their deliverables contribute to the bank’s overall performance as this can enhance
satisfaction levels. Satisfied employees tend to feel more passionate about their jobs
and as a result put more effort into serving internal and external customers (refer to
Chapter 3, section 3.2.1 and Chapter 4, section 4.4.1).
7.3.5 Secondary objective 5
To establish whether a significant positive relationship exists between internal
price and GDP employee satisfaction

223
The findings measuring Hypothesis 2, which links to secondary objective 5, suggested
that a significant positive relationship exists between internal price and employee
satisfaction. The outcome of the regression did not support this as internal price was not
found to be statistically significant (p=0.086). As a result the hypothesis was rejected.
Too much work and unrealistic time pressures may result in feelings of stress and
burnout, leading to feelings of dissatisfaction resulting in high employee turnover.
Employees expected to engage in emotional labour and act empathetically to customers’
needs, experience higher levels of emotional exhaustion and dissatisfaction. In addition to
this, if employees feel that they have missed out on opportunities with other organisations
as a result of working for the bank or have missed out on opportunities as a result of
having to learn new processes, their feelings of stress and dissatisfaction are likely to
increase. A psychological contract exists between the employee and the organisation and
when this contract is breached employees are likely to become less responsiveness to the
organisation and dissatisfied with their work. As a result their productivity will decrease
resulting in poor levels of service and these employees are more likely to leave the
organisation and seek employment elsewhere. Since the GDP employees are new to the
organisation and are part of a programme in which they are cared for and looked after, the
psychological contract is still firmly in place and it is unlikely that they would experience
high levels of stress and burnout. For this reason it makes sense that the GDP
participants did not find internal price to be statistically significant.
Internal price was excluded as an element of the internal marketing mix for the purpose of
this study (main finding 47, section 6.9.1.2).
7.3.6 Secondary objective 6
To explore whether a significant positive relationship exists between internal
promotion and GDP employee satisfaction
The findings measuring Hypothesis 3, which links to secondary objective 6, suggested
that a significant positive relationship exists between internal promotion and employee
satisfaction.
No hypothesis testing could be performed for internal promotion since the internal
promotion subscale was removed from the study during the EFA due to poor construct

224
validity (main finding 35, refer to Chapter 6, section 6.6.1.1.). Three factors with
Eigenvalues exceeding 1 were initially detected [F1(3.744:37.44%, F2(1.732:17.32% and
F3(1.545:15.45%)] and for this reason the scale required refinement. High commonality
scores were deleted and factor scores were rotated a couple of times, however
throughout the refinement process no meaningful patterns were detected in the pattern
matrix. The factor structure of the subscale seemed unstable and the researcher faced
three options with regard to the internal promotion subscale. Firstly, the researcher could
disregard the EFA and use all items to create or compute a factor score; however the
researcher was aware that no valid rationale would be applied to this solution. Secondly,
the researcher could use the remaining four items in the scale to create a factor score;
however this would not be representative of the construct. Thirdly, the researcher could
remove the scale completely as it did not have enough construct validity to contribute to
the conclusion of the study. Option three was selected from an integrity point of view and
as a result the internal promotion scale was discarded from the study and no longer
subject to any further measurement. Conceptually, the construct of internal promotion
seems quite important in the prediction of employee satisfaction; however the
measurement of this construct remained problematic. For this reason, any deductions
made in the regression analyses using this measure would have been contentious.
7.3.7 Secondary objective 7
To determine whether a significant positive relationship exists between internal
distribution and GDP employee satisfaction
The findings measuring Hypothesis 4, which links to secondary objective 7, suggested
that a significant positive relationship exists between internal distribution and employee
satisfaction. During the EFA internal distribution emerged as a two-factor solution (main
finding 36, Chapter 6, section 6.6.1.1). Initially two factors emerged, the first factor
labelled collaborative culture (2.921) explained 41.72% of the common variance, and the
second factor labelled organisational culture (1.969) explained 28.13% of the common
variance. Each of these is discussed next.

225
7.3.7.1 Collaborative culture
H4a: There is a significant positive relationship between collaborative culture and
GDP employees’ level of satisfaction
A positive relationship was predicted between collaborative culture and employee
satisfaction. The results from the regression results support the hypothesis (β =0.388, p<
0.05). The adjusted R2 –value of 0.114 indicates that approximately 11.4% of the variance
in employee satisfaction is predicted by collaborative culture (main finding 48, Chapter 6,
section 6.9.1.3).
Chapter 3, section 3.2.4.1 specified the importance of organisational culture for the
purpose of collaboration and the transfer and sharing of skills and knowledge. The culture
of the organisation defines the values and norms required to support an internally market
orientated environment. When employees are recruited into the organisation, it is
important that their personal values match those of the organisation and the employees
working there. This helps create an environment of synergy and teamwork. Teamwork is
essential for allowing knowledge to be shared across the organisation. Delivering service
quality requires a team effort and synergy across a number of departments and co-
workers. A culture that supports interfunctional coordination encourages employees to
come together and share ideas and knowledge which allows for better job performance
resulting in enhanced feelings of satisfaction. The GDP participants agreed with the
literature and found collaborative culture to be a predictor of employee satisfaction. In
addition to this, the GDP participants agreed with the concepts presented in the literature
(pertaining to Q5.1, Q5.2 & Q5.3) and found Q5.1, “it is important that everyone in my
bank works together to provide high quality service to customers” to be the most important
component in the collaborative culture construct (mean=1.63)(refer to Chapter 6, section
6.5.2).
The main conclusion is that collaborative culture is an influencer of GDP employee
satisfaction. Employees working together to provide a high quality service to both internal
and external customers were considered to be the most important element in the
collaborative culture construct as per the previous discussion.
The implication is that retail banks must encourage a culture of teamwork and
collaboration. Retail banks must become cross-functional and integrated so that

226
information can flow seamlessly and all functions work together to create value within the
value chain.
Recommendation 12: Retail banks must focus more on cross-functional integration
by encouraging business units to work together. Retail banks could include different
talents and different points of view by forming a cross-functional value proposition area
for example whereby employees from the sales area, marketing area, product area
and customer strategy area come together to understand the external customers’
needs and how to develop meaningful solutions to meet these needs. In this way,
knowledge can be shared and employees work together to provide higher levels of
service quality to customers. To this end, retail banks are able to increase their
collaborative intelligence by harnessing the power within networks of people which
allows employees to synchronise their activities and create value within the value
chain (refer to Chapter 3, section 3.2.3.1).
Recommendation 13: Retail banks need to adopt a clan-type culture which values
employee commitment, loyalty, empowerment, openness, morale, participation,
teamwork, personal involvement and cohesiveness, by stressing the need for flexibility
and internal focus (refer to Chapter 3, section 3.2.4.1).This kind of organisational
culture will govern employee behaviour and attitudes within the organisation. In
addition to this, this type of culture will help establish trust and the formation of close
internal relationships between employees which will in turn aid with the sharing of
knowledge and information.
7.3.7.2 Organisational structure
H4b: There is a significant positive relationship between organisational structure
and GDP employees’ level of satisfaction
A positive relationship was predicted between organisational structure and employee
satisfaction. The results from the regression results support the hypothesis (β =0.431, p<
0.05). The adjusted R2 –value of 0.185 indicates that approximately 18.5% of the variance
in employee satisfaction is predicted by organisational structure.
Chapter 3, section 3.2.4.2 explained the importance of organisational structure in creating
organisational culture and specified that the organisation needs to be structured for inter-

227
functional purposes allowing for the free flow of information and the sharing of ideas. It is
the responsibility of managers to create an internal environment where employees can
build positive relationships with co-workers and management and feel more engaged and
connected. When employees are more involved and connected to the organisation, they
experience higher levels of satisfaction. Decentralised structures are the embodiment of
decentralised decision-making and are thus essential for responding to needs such as
empowerment, flexibility, freedom and action. Managers who implement decentralised or
more horizontal type structures encourage the free exchange of information and support
high levels of communication across departments and across all levels of the
organisation. Managers therefore need to ensure that the right channels or structures are
in place for information to be shared and for the empowerment of employees to make
decisions. When employees are empowered through decentralised decision-making
supported by a decentralised structure, they are able to perform their jobs well which
results in increased satisfaction. The GDP sample agreed with the literature and found
organisational structure to be a predictor of employee satisfaction. In addition to this, the
GDP participants agreed with the concepts presented in the literature. The GDP
participants found Q5.7, “It is important for me to able to communicate with upper
management when necessary” (mean=1.31) to be the strongest item in the scale (main
finding 14, refer to Chapter 6, section 6.5.2). The least level of agreement and highest
level of variance was with Q5.2, “It is important for me to share the same values as my
colleagues” (mean=2.13)(main finding 15, refer to Chapter 6, section 6.5.2).
The main conclusion is that organisational structure is an influencer of GDP employee
satisfaction. Communication with upper management was viewed as the most important
characteristic of the internal organisational construct as discussed. The implication is that
retail banks need to be structured for cross-functional purposes and allow for the free flow
of information across departments and specifically across different levels of management.
It is important that employees have access to and are able to communicate with senior
level management.
The empirical results identified organisational structure as an influencer of GDP employee
satisfaction. This provides an opportunity for retail banks to improve or enhance the
organisational structure element of the internal marketing mix which will form the basis for
the recommendations.
Recommendation 14: Retail banks must adopt flatter and more decentralised
organisational structures that allow for better integration between departments and

228
higher levels of internal communication across all levels of management and
departments. Matrix structures could make for the best fit in which employees from
different areas come together to work on projects. For example, in the development of
a new banking product, a matrix structure would bring employees together from areas
such as marketing, product, sales and finance. These kind of structures encourage
open employee communication, interfunctional integration and involved decision-
making (refer to Chapter 3, section 3.2.3.2). A decentralised organisational structure
will allow employees to communicate freely with all levels of management and across
departments, resulting in higher levels of satisfaction. In this way employees are better
able to serve their internal customers. Decentralised structures also bring about more
empowerment which supports the internal product from an empowerment perspective.
When employees are empowered to serve customers well they experience higher
levels of satisfaction.
7.3.8 Secondary objective 8
To explore whether a significant positive relationship exists between internal
people and GDP employees’ level of satisfaction
The findings measuring Hypothesis 5, which links to secondary objective 8, suggest that a
significant positive relationship exists between internal people and employee satisfaction.
The outcome of the regression supports the hypothesis (β =0.571, p< 0.05). The adjusted
R2 –value of 0.326 indicates that approximately 32.6% of the variance in employee
satisfaction is predicted by internal people (main finding 50, Chapter 6, section 6.9.1.5)
Chapter 3, section 3.2.5 reiterated that retail banks are people-based organisations.
Therefore people form the most important asset required for producing services. Through
strong internal relationships with leaders, supervisors/managers and co-workers,
employees are able to fulfil their affiliation needs and as a result feel more satisfied with
their work and their organisation.
From an employee satisfaction perspective, the relationships with leaders,
supervisors/direct managers and co-workers all have an impact on the employee as
employee behaviour depends on the interaction with others in the internal environment. It
is the responsibility of senior leadership to establish a clearly communicated shared vision
for employees in the organisation. In addition to this, leaders encourage the development
of new ideas, teamwork and the sharing of information with employees across all areas of

229
the organisation. Leaders need to be accessible and are required to listen to the
suggestions their employees make, thereby creating an environment of trust and
commitment within the organisation.
Chapter 3, section 3.2.5 also stressed the importance of supervisors/direct managers. The
supervisor/direct manager is the employee’s source of reference when he/she is facing
challenges. For this reason supervisors need to be approachable and encourage informal
discussion as this allows for more open communication between supervisors and
subordinates. SHRM (2012:15) states that when there are open lines of communication,
supervisors/direct managers are able to respond more effectively to employees’ problems
and concerns. Further to this supervisors are required to assign meaningful work, help
manage workloads and employee stress, involve employees in decision-making and
reward employees for a job well done. In this way supervisors/direct managers support
employees and employees feel that they been treated fairly resulting in feelings of
satisfaction.
Chapter 3, section 3.2.5 also mentioned the role of co-workers as part of internal people.
Co-workers are the employees’ second family; it is the relationship with co-workers that
provides the notion of ‘teamwork’ and the feelings of a team spirit. Team spirit is based on
how employees feel about their co-workers as this group collectively depends upon one
another as they work together to achieve common objectives. If positive relationships exist
between co-workers, these employees will bond better as a team resulting in greater
levels of employee satisfaction. Employee satisfaction is increased when co-workers are
friendly, competent and supportive as these employees serve as a source of support,
comfort and advice to each other. It is also essential that co-workers treat each other with
respect. When employees feel respected, they feel satisfied. In addition to this, when co-
workers are positive and satisfied with their work they send out positive cues to others to
model their behaviour.
The GDP participants agreed with the literature and found the most important item, “It is
important that my manager/supervisor communicates openly with me” (mean=1.08) (main
finding 17, Chapter 6, section 6.5.2). If employees feel they are supported by their
supervisors and are able to communicate openly and honestly, they tend to experience
higher levels of satisfaction. Employees often feel that supervisors can be approached
through informal discussions which make them more real to employees and employees
are encouraged to communicate more freely allowing for the healthy exchange of
knowledge, skills and services (Hsu, 2011:235). Their least level of agreement was with “It

230
is important to me that my co-workers are satisfied with their jobs” (mean=2.41) (main
finding 18, Chapter 6, section 6.5.2). This suggests that GDP employees do not believe
strongly that their satisfaction is linked to their colleagues’ feelings of satisfaction.
The main conclusion therefore is that internal people is the strongest influencer of
employee satisfaction given that the strongest relationship observed in the step-wise
regression analysis was between the internal people construct and employee satisfaction.
The research findings showed the relationship with supervisors in terms of open
communication with subordinates to be the most important component of the internal
people construct as per previous discussions.
The implication is that internal people is recognised as the strongest influencer of
employee satisfaction. Therefore, retail banks need to ensure that the components of
internal people, namely leadership style, relationship with supervisors/direct managers
and relationship with co-workers are firmly entrenched within the bank in a way that
creates employee satisfaction and stronger levels of affective commitment. In particular it
is necessary to ensure that open channels of communication are established between
management and subordinates.
When employees are satisfied, affective commitment is higher and employees remain with
organisations thereby increasing retention rates and ultimately profitability. The empirical
results identified internal people to be the most important influencer of GDP employee
satisfaction. This provides an opportunity for retail banks to improve or enhance the
internal people element of the internal marketing mix which will form the basis for the
recommendations.
Recommendation 15: Retail banks must ensure that supervisors/direct managers are
accessible and constantly communicating with GDP employees. A weekly progress
meeting could be put in place to discuss performance and development plans and
progress. This is also a great opportunity for employees to raise concerns and ask for
support which enhances open communication between employees and
supervisors/direct managers. Further to this, it is essential that supervisors and direct
managers provide positive reinforcement to this particular group of employees. Shaw
and Fairhurst (2008:368) state that although GDP employees are independent, they
are emotionally needy and as a result require constant feedback and seek approval
and praise from their superiors (Shaw & Fairhurst, 2008:368). It makes sense
therefore that these employees require constant open communication with direct

231
managers/supervisors. When positive feedback and guidance are given, these
employees feel that they are adding value to the organisation and are therefore more
satisfied.
Recommendation 16: Retail banks should develop a combination of a participative
and transformational leadership style within the organisation. Chapter 3 and 4
highlighted how, in order to create an internal environment in which direct
managers/supervisors treat employees with respect and develop open channels of
communication; the right kind of leadership style is required. A combination of a
participative and transformational leadership style resembles the best fit in this regard.
Through a combination of a participative and transformational leadership style
organisations are able to shape employees into team orientated individuals committed
to sharing knowledge and improving service quality. A participative leadership style is
focused on the self-development of employees; it focuses strongly on the development
of behaviours such as self-leadership, goal setting and working in teams, which aid in
the sharing of information and the generation of ideas. In this way a participative
leadership style supports employee empowerment, relationships between employees
and supervisors/direct managers and an internally market-orientated environment
further supporting the internal product and collaborative culture objectives.
Transformational leadership on the other hand refers to how leaders are able to
communicate the vision in a charismatic way and inspire an emotional connection
within the organisation. Transformational leaders are able to motivate employees to go
above and beyond their perceived personal limitations and to pull out all the stops for
both internal and external customers. Mohammed, Al–Zeaud and Batayneh (2011:39)
espouse that transformational leadership styles also reduce employee work pressure
and stress and increase employee morale thereby resulting in increased levels of
employee satisfaction. From a transformational leadership perspective, leaders should
focus on being inspirational, positive about the future, articulating a vision for the
future and displaying a confident behaviour. Leaders need to find ways to become
more intellectually stimulating, seek different perspectives when problem solving and
instil a sense of pride in employees (Mohammad et al., 2011: 43).
Recommendation 17: Retail banks should provide training and support programmes
to help managers develop a participative style of leading. This would help leaders to
consult employees more often and ensure that they have sufficient autonomy when
executing their work. This would also help leaders to create a safe environment that
fosters openness, risk-taking and idea generation (De Jong & Den Hartog, 2007:58).

232
Recommendation 18: Executive coaching could be provided to help develop the
transformational leadership style of leading. This would help leaders to become more
inspirational and enhance their communication skills (Schneider, 2013).
Recommendation 19: Create opportunities whereby GDP employees can work
together as a team to solve problems and develop solutions for example through daily
production meetings mentioned under Recommendation 9. GDP employees are most
satisfied when working in areas characterised by high levels of collaboration and
empowerment. To provide service excellence to internal customers, strong internal
relationships are required. For this reason relationship with co-workers becomes
paramount for organisational success. Co-workers are regarded as the employees’
‘work family’, so when employees identify with, share the same values, and can relate
to their co-workers, they bond as a team which heightens feelings of satisfaction. GDP
employees as part of the Generation Y group have high levels of social consciousness
and look to peers for mutual support. This group of employees would prefer to work
collaboratively with others than operate in isolation on their own (Shaw & Fairhurst,
2008: 373).
Recommendation 20: Retail banks must create an environment that supports and
encourages social interactions amongst employees in order to develop trust and
deeper relationships. For this reason, social activities and team-building interventions
are a necessity for this group in order to strengthen the social bonds. Higher levels of
social capital result in more informed and engaged employees which results in higher
levels of satisfaction and loyalty towards the organisation (Ali & Haider, 2010:40).
7.3.9 Secondary objective 9
To explore whether a significant positive relationship exists between internal
process and GDP employees’ level of satisfaction
The findings measuring Hypothesis 6, which links to secondary objective 9, suggest that a
significant positive relationship exists between internal process and employee satisfaction.
The outcome of the regression supports the hypothesis (β =0.399, p< 0.05). The adjusted
R2--value of 0.159 indicates that approximately 15.9% of the variance in employee
satisfaction is explained by the internal process element (main finding 51, Chapter 6,
section 6.9.1.6).
233
Chapter 4 discussed how internal processes that are practised often and enforced will
ensure a consistent level of service quality. From an internal process perspective,
consistent processes contribute to confidence levels as employees understand exactly
what is expected from them, allowing them to perform their jobs more effectively. It is the
internal processes that help coordinate internal resources. In this way business operations
and employees across different business units function together in order to create value
through all steps in the value chain. When well designed processes are implemented
within organisations, employees understand what to do resulting in better service delivery
through faster turnaround times and a more consistent service experiences which results
in satisfied internal and external customers.
When designing internal processes, organisations need to consider technology and
various system designs which allow for the automation of internal processes to take place.
Automated processes allow for greater efficiencies to be achieved from a cost, time and
employee energy perspective, resulting in increased feelings of satisfaction. Through the
delivery of well designed processes, better internal coordination can be achieved between
internal customers and suppliers allowing for better interfunctional relationships and
teamwork. In this way internal process contributes to the collaborative culture objectives.
In addition to the design and delivery of internal processes, organisations should be
continuously improving their existing processes. Internal process improvements allow
organisations to reduce errors and improve their decision-making ability which leads to
increased internal quality and employee satisfaction. Thus internal process enhances
employee empowerment and in turn the internal product.
The GDP participants agreed with the internal process literature and found the most
important item in the scale to be, “It is important to have automated processes that allow
me to save time” (mean=1.55)(main finding 20, Chapter 6, section 6.5.2). Automated
processes avail time and energy so that employees are able to focus on more pertinent
issues such as managing people or serving customers better. The GDP participants
agreed least with the item, “It is important that the bank I work for has well designed
processes” (mean= 1.95)(main finding 21, Chapter 6, section 6.5.2), implying that GDP
employees do consider well designed processes to be as important as other items in the
scale.
The main conclusion is that internal process is an influencer of employee satisfaction.
Automated processing that allows for time saving was considered to be the most
important component of the internal process element as per the discussed.

234
The implication is that internal process is important to GDP satisfaction. Therefore retail
banks need to design, implement and improve internal processes in a manner that
enhances employee satisfaction
Recommendation 21: All processes should be documented, scripted and visible so
that every employee understands exactly what is expected and what needs to be
done. This will ensure a more consistent service experience for both internal and
external customers. In addition to this, internal processes will increase employee
accessibility to information and the internal product.
Recommendation 22: Well designed automated processes such as e-procurement
and e-learning which are consistent, should be implemented and coordinated across
the organisation. This will ensure that employees are able to obtain and share
information in a meaningful way which is critical for service improvement (Schneider,
2013).
Recommendation 23: New technology should be reviewed and implemented to
enhance self-service as this aids in reducing employee energy and time costs, whilst
increasing the speed and effectiveness of service delivery. In terms of delivering both
internal and external service, processes must be effective in terms of reducing waiting
lines and ensuring high levels of reliability throughout the process.
Recommendation 24: Employees work with processes every day and for this reason
the employee should have input into how process improvements can be made. Basic
process training could be provided to employees in order to empower employees and
enhance their ability to understand processes and how to make relevant changes to
non-value adding processes (Weir, 2011).
Recommendation 25: Employees must be informed of any process changes.
Employees who understand the processes feel more confident to perform their jobs
and have more trust in the organisation. If any process change takes place, this must
be clearly communicated to all employees who are affected, and may require a
change management or training intervention.
Recommendation 26: Internal processes must be reviewed on a regular basis in
order to assess whether all steps in the process are adding value to internal and

235
external customers. If certain activities are not adding value, these activities should be
reviewed and removed if necessary (Weir, 2011).
7.3.10 Secondary objective 10
To determine whether a significant positive relationship exists between internal
physical evidence and GDP employees’ level of satisfaction
The findings measuring Hypothesis 7, which links to secondary objective 10, suggested
that a significant positive relationship exists between internal physical evidence and
employee satisfaction.
No hypothesis testing was however performed for the internal physical evidence subscale,
since the scale was removed from the study during the EFA due to poor construct validity
(main finding 39, refer to Chapter 6, section 6.6.1.1.). Three Eigenvalues were identified
with values exceeding 1.0. Factor 1 (2.265) explained 45.29 % of the common variance,
Factor 2 (1.032) explained 20.65% and Factor 3 (1.008) accounted for 20.17% of the
common variance. However no refinement could be made to the subscale as the scale did
not converge, meaning that the items did not represent the scale denouncing any
construct validity. For this reason the internal physical evidence scale was removed from
the study and from any further investigation and measurement.
7.3.11 Secondary objective 11
To determine whether a relationship exists between employee satisfaction and
affective commitment
The findings measuring Hypothesis 8, which links to secondary objective 11, suggest that
a significant positive relationship exists between employee satisfaction and affective
commitment. The outcome of the regression supports the hypothesis (β =0.835, p< 0.05).
The adjusted R2- value of 0.693 indicates that approximately 69.3% of the variance in
affective commitment is predicted by employee satisfaction.
The literature in Chapter 4 covered how organisational commitment was identified as the
strongest predictor of employee intention to remain with organisations. Organisational
commitment was discussed through the three-component model which proposes three

236
types of organisational commitment namely, affective commitment, normative commitment
and continuance commitment. The focus of the study is on affective commitment since it
has been demonstrated to have a strong positive relationship with employee satisfaction.
Affective commitment has been described as the employees’ state of emotional
commitment to the organisation and is influenced by factors such as organisational
support. Employees link their identity with that of the organisation and form an emotional
commitment with the organisation which goes beyond the organisation’s instrumental
worth. As a result, employees desire to continue their association with the organisation
(Awwad & Agti, 2011:311).
Chapter 4 explained how employees demonstrate affective commitment to organisations
in return for certain rewards which can either be extrinsic such as reward and recognition,
or intrinsic such as belonging and job satisfaction. When employees feel that they are able
to develop with organisations and are satisfied with the employee satisfaction predictors
such as relationship with co-workers, pay and supervision, their level of affective
commitment to their organisations is greater. In order to ensure greater levels of affective
commitment, it is necessary that employees feel satisfied with their jobs. Thus a strong
relationship exists between affective commitment and employee satisfaction. The overall
mean score of affective commitment indicates that GDP employees agree with the
statements measuring affective commitment (mean=1.83) (main finding 30, Chapter 6,
section 6.5.2).GDP participants had the strongest level of agreement with the statement, “I
feel emotionally attached to my bank” (mean=1.32)(main finding 31, Chapter 6, section
6.5.2). Their highest level of disagreement was with “I would be happy to spend the rest of
my career with my bank” (mean=2.18) (main finding 32, Chapter 6, section 6.5.2).
The conclusion can therefore be made that employee satisfaction influences affective
commitment. The implication is that employee satisfaction influences affective
commitment. Therefore, retail banks need to develop strategies and put procedures in
place to enhance employee satisfaction in order to create a higher level of affective
commitment and retention. The following recommendations have been put forward.
Recommendation 27: Retail banks need to develop a comprehensive internal
marketing programme as discussed in the findings. Through the implementation of an
internal marketing mix, internal marketing focuses on treating employees with the
same level of importance as customers in order to achieve both the internal and
external marketing objectives. In this way employees feel cared for by organisations,

237
which results in increased levels of employee satisfaction and more positive attitudes
towards their work, such as increased affective commitment and loyalty.
Figure 7.1. A summary of the primary objective, the secondary objectives, the
sections in the questionnaire, the main findings and the recommendations of the
study
The primary objective and secondary objectives were met by proving the relationships
suggested in the refined theoretical framework (Chapter 6, section 6.9.2.1, Figure 6.3)
based on the perceptions of the GDP employee group. Main finding 52 (chapter 6, section
6.9.1) confirmed that employee satisfaction is influenced by internal marketing through
internal product, collaborative culture, organisational structure, internal people and internal
process. Therefore, internal marketing does influence employee satisfaction among
graduate development employees in South African retail banks. Main finding 53 (Chapter
6, section 6.9.2.1) confirmed that there is a positive relationship between employee
satisfaction and affective commitment. Thus the primary research objective was
achieved.

238
7.4 LIMITATIONS OF THE STUDY
The main limitation of this study is that the study was only conducted among GDP
employees. Findings could have been significantly different had the study been conducted
among other populations within the retail banking community such as with middle and
senior level management. In addition to this only three retail banks were included in the
study. It is possible therefore that the information provided may not be representative of
the entire industry. The results of the EFA found the factor validity for the internal
promotion scale and the internal physical evidence scale to be weak. These scales were
removed and therefore not used in the statistical analysis in the study. Both these factors
are considered to be important elements of internal marketing. Reward and recognition
formed part of the internal promotion scale and this item in particular is often considered
to be the most important element of employee satisfaction. Due to the removal of the
internal promotion scale, this item was not included in the statistical analysis of study.
Multiple regression was not possible for this study and as a result the researcher could not
establish through multivariate analysis which internal marketing element was the strongest
predictor of employee satisfaction.
7.5 FUTURE RESEARCH OPPORTUNITIES
Further research could be extended to include other segments within the retail banking
community, other geographical regions, and other banking structures such as Islamic
banking or other service organisations. Various demographic focuses could be
investigated such as the influence of age, gender and race within retail banking. Further to
this, additional questions could be developed for the internal promotion and internal
physical evidence scales to ensure factor validity. These elements could then be included
in the study to extend the statistical analysis. Lastly, through further refinement,
multivariate analysis could be performed to determine which of the internal marketing mix
elements is the strongest predictor of employee satisfaction.
7.6 CONCLUSION
Retail banks are known to have a high turnover rate amongst GDP employees which
indicates that GDP programmes are not as effective as they could be (Clarke, 2012). The
use of the internal marketing mix is not being used as tool to improve satisfaction and
increase retention. Employees provide the differentiating advantage for service
organisations and employee satisfaction is therefore pivotal for organisational success.

239
For this reason, retail banks must consider the importance of a comprehensive internal
marketing programme which is integrated into the bank’s overall marketing strategy. This
will ensure that retail banks hire and train employees to deliver on the promises made
through the external marketing strategy. A retail bank’s strategic advantage often exists in
its capacity to streamline and connect the organisation’s capabilities in order to create
service practices that are superior to competitors. Through aligning processes and
employees with the external marketing strategy and external customer needs, retail banks
are able to create a strategic advantage that is difficult to replicate, ensuring a sustainable
competitive advantage. With the aid of internal marketing, retail banks are able to
enhance GDP employee satisfaction which results in higher levels of affective
commitment and GDP employees remaining with the organisation for longer, thereby
contributing to better service, stronger financial performance and profitability.
Chapter 7 provided insights into the major findings of the study and provided retail banks
with recommendations for the implementation of a formal internal marketing mix utilising
the five internal marketing mix elements identified in this study. In this way increased
levels of employee satisfaction and affective commitment can be brought about. A
summary of the primary and secondary objectives, the hypotheses, relevant sections in
the questionnaire, main findings and recommendations were also provided in this chapter.
The study aimed to investigate the influence of the internal marketing mix on GDP
employee satisfaction and to establish whether a relationship exists between employee
satisfaction and affective commitment. The five internal marketing mix elements that came
to the fore were: the internal product, collaborative culture, organisational structure,
internal people and internal process. The study showed that GDP employee satisfaction is
influenced by the internal product, collaborative culture, organisational structure, internal
people and internal process. In addition to this, the study showed that affective
commitment is influenced by employee satisfaction. The primary objective of the study
was therefore achieved.

240
LIST OF REFERENCES
Aaker, D.A., Kumar, V. & Day, G.S. (2007). Marketing Research. 9th ed. New York: John
Wiley & Sons.
Aaker, D.A., Kumar, V., Day, G.S. & Leone, R.P. (2011). Marketing Research. 10th ed.
New York: John Wiley & Sons.
Abdullah, J., Djebarni, R. & Mellahi, K. (2011). Determinants of job satisfaction in the
UAE: A case study of the Dubai police . Personnel Review, 40(1):126-146.
Aburoub, A.S., Hersh, A.M. & Aladwan, K. (2011). Relationship between internal
marketing and service quality with customer’s satisfaction. International Journal of
Marketing Studies, 3(2):107-118.
Abzari, M. & Ghujali, T. (2011). Examining the impact of internal marketing on
organisational citizenship behaviour. International Journal of Marketing Studies, 3(4):95-
104.
Afridi, F.K. (2011): Extended services marketing mix and emergence of additional
marketing Ps. Available from:
http://www.qurtuba.edu.pk/jms/default_files/JMS/3_1/09_fahd.pdf (Accessed 5 March
2012).
Ahmad, H., Ahmad, K. & Shah, I.A. (2010). Relationship between job satisfaction, job
performance attitude towards work and organisational commitment. European Journal of
Social Sciences, 18(2):257-267.
Ahmad, M.B., Wasay, E. & Malik, S.U. (2012). Impact of employee motivation on
customer satisfaction: study of airline industry in Pakistan. Interdisciplinary Journal of
Contemporary Research in Business, 4(6):531-539.
Ahmed, P.K. & Rafiq, M. (2002). Internal Marketing: Tools and Concepts for Customer
Focused Management. London: Butterworth-Heinemann.
Ahmed, P.K. & Rafiq, M. (2003). Internal marketing issues and challenges. European
Journal of Marketing, 37(9):1177-1186.

241
Ahmed, P.K., Rafiq, M. & Saad, N.M. (2003). Internal marketing and the mediating role of
organisational competencies. European Journal of Marketing , 37(9):1221-1241.
Ajang, P.E. (2013). Assessing the role of work motivation on employee performance.
Available from: http://www.diva-portal.org/smash/get/diva2:140549/FULLTEXT01.
(Accessed 20 July 2013).
Akhbar, S.W., Yousaf, M., Ul Haq, N. & Hunjra, A.I. (2011). Impact of employee
empowerment on job satisfaction: An empirical analysis of Pakistani service industry.
Interdisciplinary Journal of Contemporary Research in Business, 2(11):680-685.
Akroush, M.N.; El Samen, A.A.A.; Samawi, G.A.; Odetallah, A.L. (2013). Internal
marketing and service quality in restaurants. Marketing Intelligence & Planning, 3(4):304-
336.
Alam, M.M. (2009). The relationships between the emotional Intelligence and
job satisfaction: Emprical findings from higher education Institution in Malaysia. Journal of
Management and Social Sciences, 5(2):124-139.
Al-Anzi, N.M. (2009). Workplace environment and its impact on employee performance.
Masters Degree of Business Administration. Open University of Malaysia.
Al-Dujaili, M.A.A ( 2011). Knowledge systems: A catalyst for innovation and organisational
learning support in decision making for efficiency improvement. International Journal of
Human Resource Studies, 1(1):1-11.
Al-Hawary, S. I., Al-Qudah, K.A.M., Abutayeh P.M., Abutayeh, S.M. & Al-Zyadat, D.Y.
(2013). Impact of internal marketing on employee’s job satisfaction of commercial banks in
Jordan. Interdisciplinary Journal of Contemporary Research in Business, 4(9):811-826.
Allen, J.H.; Curtis, P.D. & Gates, L.P. (2011). Using defined processes as a context for
resilience measures. Software engineering group:1-46.
Ali, N. (2012). An exploratory study into the implementation of internal marketing in small
insurance brokers in the United Kingdom. Journal of Financial Services Marketing,
17:242-254.

242
Ali, A. & Haider, J. (2012). Impact of internal organisational communications on
employee job satisfaction- Case of some Pakistani Banks. Global Advanced Research
Journal of Management and Business Studies, 1:38-44.
Alkahtani, A.H., Abu-Jarad, I., Sulaiman, M. & Nikbin, D. (2011). The impact of personality
and leadership styles on leading change capability of Malaysian Managers. Australian
Journal of Business and Management Research 1(2):70-99.
Alkandari, Q. & Hammad, A.A. (2009). Employees retention in private sector: An
exploratory study in the State of Kuwait. Masters Degree of Business Administration.
Open University of Malaysia.
Allen, J.H., Curtis, P.D. & Gates, L.P. (2011). Using defined processes as a context for
resilience measures. Software Engineering Institute:1-10.
Almahamid, S., McAdams, A.C. & Kalaldeh, T. (2010). The relationships among
Organisational knowledge sharing practices, employees’ learning commitments,
employees’ adaptability and employees’ job satisfaction: An empirical investigation of the
listed manufacturing companies in Jordan. Interdisciplinary Journal of Information,
Knowledge, and Management 5:327-356.
Amalgamated Banks of Southern Africa (ABSA). (2011). Graduate Programme. Available
from: http://www.absa.co.za/absacoza/content.jsp?/Home/Personal/Our-
Customers/Students/Graduate-Programme. (Accessed 3 June 2011).
Anani, A.O. (2010). Attracting and retaining customers in South Africa’s banking sector.
MBA. Faculty of Business Management. Nelson Mandela Metropolitan University.
Angelova, B. & Zekiri, J (2011). Measuring customer satisfaction with service quality using
American Customer Satisfaction Model (ACSI Model). International Journal of Academic
Research in Business and Social Sciences, 1(3):232-258.
Antoncic, J.A. & Antoncic, B. (2011). Employee satisfaction, intrapreneurship and firm
growth: a model. Industrial Management and Data Systems, 111(4):589-607.

243
Antonucci, Y.L. & Goeke, R.J. (2011). Identification of appropriate responsibilities and
positions for business process management success: Seeking a valid and reliable
framework. Business Process Management, 17(1):127-146.
Anosike, P.U. & Ahmed, P. (2006). Internal marketing: perceptions from theory and
practice. Working paper series WP005/06, University of Wolverhampton:2-21.
Appelbaum, S., Carriere, D., Abi Chaker, M., Benmoussa, K., Elghawanmeh, B. & Shash,
S. (2009). Rx for excessive turnover: Lessons in communicating a vision (part 1).
Industrial and Commercial Training, 41(5):238-247.
Appelbaum, S.H., Louis,D., Makarenko, D., Saluja, J., Meleshko, O. & Kulbashian, S. (
2013). Participation in decision making: a case study of job satisfaction and commitment
(part one). Industrial and Commercial Training,45(4):222-229.
Atkinson, B. (2012). Head of Private Banking, Gulf Bank, Kuwait. Discussion : Front line
employees and the internal product (Job). Interviewed on 27 September 2012.
Avital, M., Boland, R.J. & Cooperrider, D.L. (2008). Designing information and
organisations with a positive lens. Available from:
http://www.avital.net/DC/AAI_vol2_intro.pdf (Accessed 17 February 2011).
Avlonitis, G.J. & Giannopoulos, A.A (2012). Balanced market orientation: qualitative
findings on a fragile equilibrium. Managing Service Quality, 22(6):565-579.
Awad, E.M. & Ghaziri, H.M. (2004). Knowledge management. Upper Saddle River, New
Jersey: Pearson Education.
Awwad, M.S. & Agti, D.A.M. (2011). The impact of internal marketing on commercial
banks’ market orientation. International Journal of Bank Marketing, 29(4):308-332.
Azmandian, F., Dy, J.G., Aslam, J.A. & Kaeli, D.R. (2012). Local kernel density ratio-
based feature selection for outlier detection. JMLR: Workshop and Conference
Proceedings, 25:49-64.

244
Bai, B. (2006). Job satisfaction, organisational commitment, and internal service quality: a
case study of Las Vegas hotel/casino industry. Journal of Human Resources in Hospitality
Tourism, 5(2):37-54.
Bakker, A.B. & Demerouti, E. (2007). The job demands-resources model: State of the art.
Journal of Managerial Psychology, 22:309-328.
Baldauf, A., Cravens, K.S., Diamantopoulos, A. & Zeugner-Roth, K.P. (2009). The impact
of product-country image and marketing efforts on retailer-perceived brand equity: An
empirical analysis. Journal of Retailing, 85(4):437-452.
Baltatzis, G., Ormrod, D.G. & Grainger, N. (2008). Social networking tools for internal
communication in large organisations: benefits and barriers. Social Networking tools in
organisations. Australian conference on information systems.
Banerji, A. & Dutta,B. (2009). Local network externalities and market segmentation.
International Journal of Industrial Organisation, 27(5):605-614.
Baptiste, N. R. (2008). Tightening the link between employee wellbeing at work and
performance: A new dimension for HRM. Management Decision, 46(2):284-309.
Barnes, D.C. & Collier, J.E. (2013) Investigating work engagement in the service
environment. Journal of Services Marketing, 27(6):485-499.
Baxter, G.J., Connolly, T.M. & Stansfield, M.H. (2010). Organisational blogs: benefits and
challenges of implementation. Learning Organisation,17(6):515-528.
Becker, J. (2013). Consultant with STATCON (Statistical Consutling Services of the
University of Johannesburg). Discussion: Statistical analysis. Interviewed 10 January, 16
April and 5 July, 2013.
Beer, M. (2012). Organisational behaviour and development. Available from:
http://www.hbs.edu/research/facpubs/workingpapers/papers2/9798/98-115.pdf (Accessed
3 April, 2012).

245
Bellou, V. & Andronikidis, A. (2008). The impact of internal service quality on customer
service behaviour: Evidence from the banking sector. International Journal of Quality and
Reliability Management, 25(9):943-945.
Benea, M.C. (2011). Internal marketing and performance in service organisations.
Available from: http://acta.fih.upt.ro/pdf/2008/ACTA-2008-1-02.pdf (Accessed 12 June
2012).
Benjamin, A. (2012). The influence of affective commitment on citizenship behavior and
intention to quit among commercial banks’ employees in Nigeria. Journal of Management
and Sustainability, 2(2):54-68.
Berger, B.K. (2008). Employee/Organisational communications. Available from:
http://www.instituteforpr.org/topics/employee-Organisational-communications/ (Accessed
2 March 2012).
Beri, G.C. (2007). Market Research. New Dehli: McGraw- Hill.
Berman, S.J., Abraham, S., Battino, B., Shipnuck, L., Neus, A. (2007). New business
models for the new media world. Strategy & Leadership, 35(4):23-30.
Berry,M.L. (2010). Predicting turnover intent: Examining the effects
of employee engagement, compensation, fairness, job satisfaction and age. Doctoral
thesis. University of Tennessee.
Berry, M.L. & Morris, M.L. (2008). To leave or not to leave: The impact of
best practices to optimize performance reviews and goal management. HR.com
Whitepaper:1-12.
Bhatnagar, J. (2007). Talent management strategy of employee engagement in Indian
ITES employees: Key to retention. Employee Relations, 29(6):640-663.
Boles, J., Madupalli, R., Rutherford, B. & Wood, J.A. (2007). The relationship of facets of
salesperson job satisfaction with affective organisational commitment. Journal of Business
& Industrial Marketing, 22(5):311-321.

246
Bonson, E. & Flores, F. (2011). Social media and corporate dialogue: the response of
global financial institutions. Online Information Review, 35(1):34-49.
Bontis, N., Richards, D. & Serenko, A. (2011). Improving service delivery: Investigating
the role of information sharing, job characteristics, and employee satisfaction. The
Learning Organisation, 18(3):239-250.
Boshoff, C. & du Plessis, F. (2009). Services Marketing: A Contemporary Approach. Cape
Town: Juta.
Bowers, M.R. & Martin, C.L. (2007). Trading places redux: employees as customers,
customers as employees. Journal of Services Marketing, 21(2):88-98.
Branham, L. (2005). Seven hidden reasons employees leave. New York, USA: AMACOM
Branine, M. (2008). Graduate recruitment and selection in the UK: A study of the recent
changes in methods and expectations. Career Development International, 13(6): 497-513.
Braunscheidel, M.J.; Suresh, N.C.; Boisnier, A.D. (2010). Investigating the impact of
organisational culture on supply chain integration. Human Resource Management,
49(5):883-911.
Brooke, S. (2007). Leadership and job satisfaction. Available from:
http://www.academicleadership.org/new/publish/authors/Stephanie_L_Brooke_PhD.shtml.
(Accessed 17 July 2011).
Brown, J., Elliott, S., Christensen-Hughes,J., Lyons, S., Mann, S. & Zdaniuk, A. (2009).
Using HRM practice to improve productivity in the Canadian Tourism industry. Department
of Business, University of Guelph.
Budhwar, P.S., Varma, A., Malhotra, N. & Mukherjee, A. (2009). Insights into the Indian
call centre industry: can internal marketing help tackle high employee turnover? Journal of
Services Marketing, 23(5):351-362.
Bull, I. (2005). The relationship between job satisfaction and organisational commitment
amongst high school teachers in the disadvantaged areas in Western Cape. Master’s
dissertation, Department of Industrial Psychology, University of the Western Cape .

247
Bulmer, D. & DiMauro, V. (2009). The new symbiosis of professional networks: Social
media's impact on business and decision-making. Jounal of New Communcations
Research, 94:93-99.
Burin, C. (2011). The perceived influence of the elements of internal marketing on the
brand image of staffing agencies in South Africa. Master’s dissertation, Department of
Business Management, University of Johannesburg.
Burns, R.B. & Burns, R.A. (2008). Business Research Methods and Statistics using
SPSS. London: Sage Publications
Burns, A.C. & Bush, R.F. (2006). Marketing Research. 5th ed. Upper Saddle River, New
Jersey: Pearson Education.
Calisir, F., Gumussoy, C.A. & Iskin, I. (2011). Factors affecting intention to quit among IT
professionals in Turkey. Personnel Review, 40(4):514-533.
Cano, C.R. & Sams, D. (2009). The importance of an internal marketing orientation in
social services. International Journal of Nonprofit and Voluntary Sector Marketing, 14:
285-295.
Cant, M., Gerber-Nel, C., Nel, D. & Kotze, T. (2005). Marketing Research. 2nd ed.
Claremont: New Africa Books.
Cant, M.C., Strydom, J.W. & Jooste, C.J. (2009). Marketing management. 5th ed. Cape
Town: Juta.
Carraher, S.M. (2011). Turnover prediction using attitudes towards benefits, pay, and pay
satisfaction among employees and entrepreneurs in Estonia, Latvia, and Lithuania. Baltic
Journal of Management, 6(1):25-52.
Cedefop. (2008) : Career development at work:A review of career guidance
to support people in employment. Available from:
http://www.cedefop.europa.eu/en/Files/5183_EN.pdf (Accessed 6 May 2012).
Cedefop. (2010). The skill matching challenge analysing skill mismatch

248
and policy implications. Available from:
http://www.cedefop.europa.eu/EN/Files/3056_en.pdf. (Accessed 17th June 2013).
Chang, C. (2010). Software development process design by using an integrated design
for lean Six Sigma approach. Department of Business Administration, Minghsin University
of Science of Technology:1-22.
Chang, C.P. & Chang, W.C. (2008). Internal marketing practices and employees’ turnover
intentions in Tourism and Leisure Hotels. The Journal of Human Resource and Adult
Learning, 4(2):161-172.
Chartered Institute of Personnel Development. (2008). Understanding employee turnover
and retention. Available from: http://syntonium.wordpress.com/2008/08/29/understanding-
employee-turnover-and-retention-cipd (Accessed 18 January 2012).
Che Ha, N., Abu Bakar, R. & Izzaddin Syed Jaafar, S. (2007). Internal marketing issues in
service organisations in Malaysia. International Review of Business Research Papers,
3(5)134-145.
Chen, C.J. & Huang, J.W. (2007). How organisational climate and structure affect
knowledge management: The social interaction perspective. International Journal of
Information Management, 27:104-118.
Chiboiwa, M.W., Chipunza, C. & Samuel, M.O. (2011). Evaluation of job satisfaction and
organisational citizenship behaviour: Case study of selected organisations in Zimbabwe.
African Journal of Business Management, 5(7):2910-2918.
Choi, K. (2006). A structural relationship analysis of hotel employees’ turnover intention.
Asia Pacific Journal of Tourism Research, 11(4):321-337.
Chiu, K.K., Lin, R., Hsu, M.K. & Huang, L. (2010). Power of branding on internet service
providers. Journal of Computer Information Systems:112-120.
Christensen, L.T. (2011). The Organisation as sender and receiver: Carrying the
marketing communication process full circle. Available from:
http://www.cerog.org/lalondeCB/CB/1999_lalonde_seminar/christensen.pdf (Accessed 10
October 2011).

249
Chu, P.Y & Yeh, S.C. (2013). Municipal government business process reengineering: A
case study of kaohsiung citizen electronic complaints System. Available from:
http://wspg.nccu.edu.tw/download/topics/Panel_4.pdf. (Accessed 12 August 2013).
Churchill, G.A. & Brown, T.J. (2007). Basic Marketing Research. 6th ed. Mason, Ohio:
Thomson South-Western.
Churchill, G.A. & Iacobucci, D. (2005). Marketing research. Methodological foundations.
9th ed. Mason, Ohio: South Western Cengage Learning.
CIA. (2012). The world fact book. Available from:
https://www.cia.gov/library/publications/the-world-factbook/geos/sf.html. (Accessed 2
February, 2012).
Clarke, A.J. (2012). Senior manager, Customer Strategy, Standard Bank. Discussion: The
role of GDP’s (Graduate Development Programs) and customer satisfaction. Interviewed
on 14 August 2012.
Colins English Dictionary. (2012). Available
from:http://www.collinsdictionary.com/dictionary/english. (Accessed 6 February 2012).
Conduit, J. & Quigg, J. (2013). Influencing internal customers through market orientation:
How it leads to exceptional service quality and satisfied customers. Available from:
http://citeseerx.ist.psu.edu/viewdoc/download?doi=10.1.1.196.2092&rep=rep1&type=pdf.
(Accessed 4 July 2013).
Conradie, E.S. (2012). The influence of internal marketing elements on the brand
awareness of car rental customers in South Africa. Doctoral thesis, Department of
Business Management, University of Johannesburg.
Constantinides, E. (2006). The marketing mix revisited: Towards the 21st century
marketing. Journal of Marketing Management, 22 (3/4):407-438.
Cooper, D.R .& Schindler, P.S. (2006). Marketing Research. New York: McGraw-Hill.
Correa, H.L., Ellram, L.M., Scavarda, A.J. & Cooper, M.C. (2013). An operations
management view of the services and goods offering mix. Available from:

250
http://www.pomsmeetings.org/confproceedings/007/cdprogram/topics/full_length_papers_
files/007-0008.pdf. (Accessed 2 July 2013).
Costello, A.B. & Osborne, J.W. (2005). Best practices in exploratory factor analysis: Four
recommendations for getting the most from your analysis. Practical Assessment Research
and Evaluation, 10(7):1-9.
Culiberg, B. & Rojsek, I. (2010). Indentifying service quality dimensions as antecedents to
customer satisfaction in retail banking. Economic and Business Review, 12(3):151-166.
Danish, R.Q. & Usman, A. (2010). Impact of reward and recognition on job satisfaction
and motivation: An empirical study from Pakistan. International Journal of Brand
Management, 5(2):159-167.
Datta, P.R. (2010). An examination into customer relationship marketing and customer
retention in grocery food retaining in Bangladesh: Proposed research agenda.
International Trade & Academic Research Conference (ITARC):1-19.
Davoudi, S.M.M. & Kaur, R. (2012). The link between internal marketing and human
resource management. Arth Prabhand: A Journal of Economics and Management,
1(2):59-72.
Dawn, S.K. & Biswas, S. (2010). Employer branding: A new strategic dimension of Indian
corporations. Asian Journal of Management Research, 2229-3795:21-23.
Dayan, M., Al-Tamimi, H. & Elhadji, A. (2008). Perceived justice and customer loyalty in
the retail banking sector in the UAE. Journal of Financial Services Marketing, 12(4):320-
330.
de Farias, S.A. (2010). Internal Marketing (IM): a literature review and research
propositions for service excellence. BBR - Brazilian Business Review, 7(2):99-115.
De Jong, J. & Hartog, D.D. (2010). Measuring innovative work behaviour. Creativity
and Innovation Management, 19(1):23-36.

251
Devasagayam, P.R., Buff, C.L., Aurand, T.W. & Judson, K.M. (2010). Building brand
community membership within Organisations: a viable internal branding alternative?
Journal of Product & Brand Management, 19(3):210-217.
Dewettinck, K. & van Ameijde, M. (2011). Linking leadership empowerment behaviour to
employee attitudes and behavioural intentions: Testing the mediating role of psychological
empowerment. Personnel Review, 40(3):284-305.
Dhiman, A.K. & Sharma, H. (2009). Services marketing mix in library and information
centres. ICAL- Advocacy and Marketing:456-460.
Dimitriades, Z.S. & Papalexandris, N. (2011). Test of a service profit chain model in the
Greek banking sector. EuroMed Journal of Business, 6(2):142-154.
Dodd, C. (2011). Sustaining customer relationships through internal relationship
marketing. Available from
http://conferences.anzmac.org/ANZMAC2007/papers/CDodd_1.pdf (Accessed 6th June
2011).
Doole, I. & Lowe, R. (2008). International marketing strategy: Analysis, development and
implementation. 5th ed. London: South Western Cengage learning.
Done, I. & Domazet, I. (2012). Improving the quality of human resources by
implementation of internal marketing. Available from: http://mpra.ub.uni-
muenchen.de/35363/1/Chapter_3_draft_Improving_the_Quality_of_Human_Resources_b
y_Implementation_of_Internal_Marketing.pdf. (Accessed 8 August 2012).
Economides, A.A. (2008). Culture-aware collaborative learning. Multicultural Education
&Technology Journal, 2(4):243-267.
Edmonds, J. (2011). Managing successful change. Industrial and Commercial Training.
43(6):349-353.
Edvardsson, B., Gustafsson, A. & Roos, I. (2005). Service portraits in service research: a
critical review. International Journal of Service Industry Management, 16(1):107-121.
Edwards, J.R. & Cable, D.M. (2009).The value of value congruence. Journal of Applied

252
Psychology, 94(3):654-677.
Egan, J.B. (2006). Burnout in female counsellor/therapists of the NCS. Doctoral thesis.
Department of Psychology. University of Hull.
Eggers, J.T. (2013). Psychological safety influences relationship behavior. Available from:
https://www.aca.org/research/pdf/ResearchNotes_Feb2011.pdf. (Accessed 23 July 2013).
Eichorn, F.L. (2004). Internal customer relationship management (IntCRM): A framework
for achieving customer relationship management from the inside out. Problems and
Perspectives in Management, 1:154-177.
El Emary, I.M.M., Bader, A.A. & Arif, M.J. (2012). Toward investigating the requirements
of Knowledge Management in the Arab Cities: Case study of the Dubai City. Middle-East
Journal of Scientific Research, 12(3):357-364.
El Samen, A.A. & Alshurideh, M. (2012). The impact of internal marketing on internal
service quality: A Case study in a Jordanian pharmaceutical company. International
Journal of Business and Management, 7(19):84-96.
Emerson, A.L. (2007). The effects of employee satisfaction and customer retention on
corporate profitability: An analysis of the service profit chain. Doctoral dissertation,
International School of Management.
Eng, T.J. (2011). Six Sigma: insights from organisational innovativeness
and market orientation. International Journal of Quality and Reliability Management,
28(3):252-262.
Esfahani, A.N., Amirosadat, S.N., Rahimi, H.R. & Marandi, M.H. (2013). Investigating
relationship between internal marketing and job satisfaction with using structural equation
modeling. International Journal of Academic Research in Economics and Management
Sciences, 2(3):1-11.
Eyal, O. & Roth, G. (2011). Principals' leadership and teachers' motivation: Self-
determination theory analysis. Journal of Educational Administration, 49(3):256-275.

253
Ezigbo, C.A. (2012). Assessing enforcement of ethical principles in the work place.
International Journal of Business and Social Science, 3(22):231-241.
Farquhar, J.D. (2004). Customer retention in retail financial services: an employee
perspective. The International Journal of Bank Marketing, 22(2):86-99.
Farzad, A., Nahavandi, N. & Caruana, A. (2008). The effect of internal marketing on
organisational commitment in Iranian banks. American journal of applied sciences,
11(5):1480-1486.
Ferrel, O.C. & Hartline, M.D. (2008). Marketing strategy. 4th ed. Mason, Ohio: Thomson
South-Western.
Financial Dictionary. (2011). Retail banking. Available from: http://financial-
dictionary.thefreedictionary.com/Retail+Banking (Accessed 31 August 2011).
Field, A. (2009). Discovering Statistics Using SPSS. 3rd ed. London: Sage Publications.
Finin, T., Ding, L., Zhou, L. & Joshi, A. (2005). Social Networking on the Semantic Web.
The Learning Organisation, 12(5):418-435.
Finney, S. & Sherrebeck-Hansen, M. (2010:) Internal marketing as a change management
tool: A case study in re-branding. Journal of Marketing Communications, 16(5):325-344.
First National Bank (FNB).(2011). Graduate Programme. Available from:
https://www.fnb.co.za/careers/graduates/main/fnb-graduate-development-
programme.html. (Accessed 3 June 2011).
Fisk, D. (2013). Head of internal communication, HSBC, Oman. Discussion on internal
communications and knowledge sharing. Interviewed on 18 of February 2013.
Foster, C., Punjaisri, K. & Cheng, R. (2010). Exploring the relationship between corporate,
internal and employer branding. Journal of Product & Brand Management, 19(6):401-409.
Fotiadis, T.H., Vassiliadis, C.H., Hatzithomas, L. & Gkotzamanis, E.(2011). An IT
approach against brand positioning confusion on hospitality enterprises: The case of

254
Greek hotels. Available from: http://www.ifitt.org/admin/public/uploads/Fotiadis54.pdf
(Accessed 17 May 2011).
French, T., La Berge, L. & Magill, P. (2011). We’re all marketers now. Mckinsey and
Company insights and publications. Available from:
http://www.mckinsey.com/insights/marketing_sales/were_all_marketers_now (Accessed
18 April 2012).
Gaiser, T.J. & Schreiner, A.E. (2009). A Guide to Conduction Online Research. London:
Sage Publications.
Gamst, G.; Meyers, L.S. & Guarino, A.J. (2008). Analysis of Variance Designs: A
Conceptual and Computational Approach with SPSS and SAS. New York, Cambridge
University Press.
Gebre, B., Hallman, P., Minukas, M. & O’Brien, B. (2012). Transforming government
performance through lean management. Mckinsey and Company:4-13.
Gelade, G.A & Young, S. (2005).Test of a service profit chain model in the retail banking
sector. Journal of Occupational and Organisational Psychology 78(2005):1–22.
George, O.J., Owoyemi, O. & Onakala, U. (2012). Theorising the concept of
organisational artefacts: How it enhances the development of corporate/organisational
identity. International Journal of Business Administration, 3(4):37-44.
Gharibvand, S. (2012). The relationship between Malaysian organisational culture,
participative leadership style, and employee job satisfaction among Malaysian employees
from semiconductor industry. International Journal of Business and Social Science,
3(16):289-299.
Gibbs.T. & Ashill, N.J. (2013). The effects of high performance work practices on job
outcomes: Evidence from frontline employees in Russia. International Journal of Bank,
31(4):305-326.
Gilmore, A. (2003). Services, marketing and management. London: Sage Publications.

255
Global Entrepreneurship Monitor. (2011). The UCT centre for innovation and
entrepreneurship. Available from: http://www.gemconsortium.org/docs/download/2313.
(Accessed 4 August 2013).
Godlevskaja, O., Van Iwaarden, J. & van der Wiele, T. (2011). Moving from product-based
to service-based business strategies: Services categorisation schemes for the automotive
industry. International Journal of Quality and Reliability Management, 28(1):62-94.
Goi, C.L. (2009). Marketing mix: a review of ‘P’. Available from:
http://www.arraydev.com/commerce/JIBC/2005-08/goi.htm (Accessed 3 March 2011).
Gonzalez, T.F. & Guillen, M. (2007). Organisational commitment: A proposal for a wider
ethical conceptualization of ‘Normative Commitment’. Journal of Business Ethics, 78:401-
414.
Govaerts, M.J.B.; van de Wiel, M.W.J. & van der Vleuten, C.P.M. (2013). Quality of
feedback following performance assessments: does assessor expertise matter? European
Journal of Training and Development, 37(1):105-125.
Gorman, G.E. (2005). Editorial: Is the wiki concept really so wonderful? Online Information
Review, 29(3):225-226.
Gough, O. & Arkani, S. (2011). The impact of the shifting pensions landscape on the
psychological contract. Personnel Review, 40(2):173-184.
Gounaris, S. (2006). Measuring internal marketing orientation in services: Some financial
evidence. Journal of Business Research, 59:432-448.
Gounaris, S. (2008a). Antecedents of internal marketing practice: some preliminary
empirical evidence. International Journal of Service Industry Management, 19(3):400-434.
Gounaris, S. (2008b). Internal market orientation and job satisfaction. Journal of Services
Marketing, 22(1):68-90.
Gounaris, S., Vassilikipoulou, A. & Chatzipanagiotou, K.C. (2010). Internal-market
orientation: A misconceived aspect of marketing theory. European Journal of Marketing,
44(11/12):1667-1699.

256
Grayson, D. & Sanchez-Hernandez, I.M. (2010). Using internal marketing to engage
employees in corporate responsibility. Cranefield University Working Paper Series:1-31.
Grimm, L.G. & Yarnold, P.R. (2000). Reading and understanding more multivariate
statistics. Washington, DC: American Psychological Association.
Grobbelaar, S.F. (2008). Measuring the impact of perceived service quality and price
amongst restaurant customers in Johannesburg. Masters dissertation, Department of
Business Management, University of Johannesburg.
Grönroos, C. (2007). Service management and marketing: Customer management in
service competition. 3rd ed. London: John Wiley and Sons Inc.
Grönroos, C. (2008). Service logic revisited: Who creates value? And who co-creates?
European Business Review, 20(4):298-314.
Grönroos, C. (2009). Marketing as promise management: Regaining customer
management for marketing. Journal of Business and Industrial Marketing, 25(5/6):351-
359.
Grönroos, C. & Ravald, A. (2011). Service as business logic:implications for value
creation and marketing. Journal of Service Management, 22(1):5-22.
GRReporter. (2011). Job stability most sought after in times of crisis. Available from:
http://www.grreporter.info/en/job_stability_most_soughtafter_time_crisis/4665 (Accessed
18 February 2012).
Gu, Z. & Siu, R.C.S. (2009). Drivers of job satisfaction as related to work performance in
Macao casino hotels. International Journal of Contemporary Hospitality Management,
21(5):561:578.
Guenzi, P. & Troilo, G. (2006). Developing marketing capabilities for customer value
creation through Marketing–Sales integration. Industrial Marketing Management, 35:974-
998.

257
Gummesson, E. (2007). Exit Services Marketing: Enter Service Marketing. Available from:
http://www2.ifm.eng.cam.ac.uk/ssme/references/Gummesson_ref_cambridgessme07.pdf.
(Accessed 29 Oct 2011).
Gummesson, E., Lusch, R.F. & Vargo, S.L. (2010). Transitioning from service
management to service-dominant logic. Observations and recommendations. International
Journal of Quality and Service Sciences, 2(1):8-22.
Gupta, S. (2012). Interdependence between experience marketing and business strategy.
Journal of Indian Business Research, 4(3):170-193.
Gupta, A., McDaniel, J.C. & Herath, S.K. (2005). Quality management in service firms:
sustaining structures of total quality management. Managing Service Quality, 15(4):389-
402.
Gurung, B. (2012). Constructing an internal communication plan. Bachelors thesis, Kemi-
Tornino University of Applied Sciences.
Guven, A. & Sadaklioglu, H. (2012). Internal marketing approach in human resources
management: A case study on state establishment. International Research Journal of
Finance & Economics, 98:106-118.
Guzman, M., Rodriquez, B. & Manautou, P. (2013). The link between customer
satisfaction and employee satisfaction in the restaurant industry: An analysis of full service
restaurants in Tampico, Mexico. Available from:
http://www.tam.itesm.mx/documentos/ANEXO%20004%20JUAN%20DI.pdf. (Accessed
14 May 2013).
Hair, J., Bush, R. & Ortinau, D. ( 2006). Marketing research: Within a changing
environment. 3rd ed. New York: McGraw-Hill.
Hair, J.F., Wolfinbarger, M.F., Ortinau, D.J. & Bush, R.P. (2010). Essentials of marketing
research. 2nd ed. New York: McGraw-Hill.
Halepota, J.A. & Shah, N. (2011). An empirical investigation of organisational
antecedents on employee job satisfaction in a developing country. Transforming
Government: People, Process and Policy, 5(3):280-294.

258
Hallencreutz, J. & Dawn-Marie Turner, D.C. (2011). Exploring organisational change best
practice: Are there any clear-cut models and definitions? International Journal of Quality
and Service Sciences, 3(1):60-68.
Hamidifar, F. (2013). A Study of the relationship between leadership styles and employee
job satisfaction at Islamic Azad University branches in Tehran, Iran. Available from:
http://gsbejournal.au.edu/4V/Journals/4.pdf. (Accessed 10 August 2013).
Hammond, R. (2011). Internal customer satisfaction and the link to customer loyalty.
Available from: http://www.ecustomerserviceworld.com/pdf/internalcustomerservice.pdf.
(Accessed 3 August 2011).
Hasgall, A. & Shoham, S. (2008). Knowledge processes: from managing people to
managing processes. Journal of Knowledge Management, 12(1):52.
Hausknecht, J.P. & Trevor, C.O. (2011). Collective turnover at the group, unit, and
organisational levels: Evidence, issues, and implications. Journal of Management, 37:352-
388.
Heaton, N., McCracken,M. & Harrison, J. (2008). Graduate recruitment and development:
Sector influence on a local market/regional economy. Education and Training, 50(4):276-
288.
Hedrick, N., Beverland, M. & Minahan, S. (2007). An exploration of relational customers‘
response to service failure. Journal of Services Marketing, 21(1):64-65.
Heish, H.L. (2012). Building employees’ organisational commitment with LMX: the
mediating role of supervisor support. Global Journal of Engineering Education, 14(3):250-
255.
Hellen, K. & Gummerus, J. (2013). Re-investigating the nature of tangibility/intangibility
and its influence on consumer experiences. Journal of Service Management, 24(2):130-
150.
Herington, C., Johnson, L.W. & Scott, D. (2006). Internal relationships: Linking practitioner
literature and relationship marketing theory. European Business Review, 18(5):364-381.

259
Heskett, J.L., Jones, T.O., Loveman, G.W., Sasser, E.R. & Schlesinger, L.A. (2008).
Putting the Service-Profit Chain to Work. Harvard Business Review (July-August):120-
122.
Hoang, H.T., Hill, S.R. & Lu, V.N. (2011). The influence of service culture on customer
service quality: Local vs. foreign service firms in emerging markets. Available from:
http://anzmac2010.org/proceedings/pdf/anzmac10Final00502.pdf (Accessed 10 June
2011).
Hoffman, K.D. & Bateson, J.E.G. (2006). Services Marketing: Concepts, Strategies and
Cases. 3rd ed. Mason, Ohio: Thomson South-Western.
Hoffman, K.D., Czinkota, M.R., Dickson, P.R., Dunne, P., Griffin, A., Hutt, M.D., Krishnan,
B.C., Lusch, R.F., Ronkainen, I.A., Rosenbloom, B., Sheth, J.N., Shimp, T.A., Siguaw,
J.A., Simpson, P.M., Speh, T.W. & Urbany, J.E. (2005). Marketing principles and best
practices. 3rd ed. Mason, Ohio: Thomson South-Western.
Holder, M. & Berndt, A. (2011). The effect of changes in servicescape and service quality
perceptions in a maternity unit. International Journal of Health Care Quality Assurance,
24(5):389-405.
Holtom, B. & O’Neill, B.S. (2004). A theoretical foundation for developing a
comprehensive nurse retention plan. Marquette University, Management Faculty
Research and Publications:1-24.
Holtzhausen, L. & Fourie, L. (2009). Employees’ perceptions of company values and
objectives and employer-employee relationships: A theoretical model. Corporate
Communications: An International Journal, 14(3):333-344.
Holtzman, Y. (2011). Business process improvement and the tax department. Journal of
Management Development, 30(1):49-60.
Houy, C., Fettke, P. & Loos, P. (2010). Empirical research in business process
management: Analysis of an emerging field of research. Business Process Management
Journal, 16(4):619-661.

260
Hsu, Y.R. (2011). Work-family conflict and job satisfaction in stressful working
environments: The moderating roles of perceived supervisor support and internal locus of
control. International Journal of Manpower, 32(2):233-248.
Hu, Q. & Schaufeli, W.B. (2011). Job insecurity and remuneration in Chinese family-
owned business workers. Career Development International, 16(1):6-19.
Hundley, K. (2006). Strategic marketing of ABC consulting services. MBA dissertation,
University of Kwa-Zulu Natal, Pietermaritzburg.
Huang, P. (2010). Exploring the relationship between work-life and stress. Work Life Law.
Issue brief, US Hastings College of Law:1-16.
Hurley, R.F. & Estelami, H. (2007). An exploratory study of employee turnover indicators
as predictors of customer satisfaction. Journal of Services Marketing, 21(3):188.
Iacobucci, D. & Churchill, G.A. (2010). Marketing Research Methodological Foundations.
10th ed. Sydney: South-Western Cengage Learning.
Ibhar Technologies (2011). Employee satisfaction lead to better customer management.
Ibhar Business Partner Program. Available from:
http://www.scribd.com/doc/86641065/Retention. (Accessed 6 November 2011).
Iles, P. & Jiang, T. (2011). Employer brand equity,Organisational attractiveness and talent
management in the Zhejiang private sector. Journal of Chinese Entrepreneurship, 3(1):24-
35.
Illiopoulos, E. & Priporas, C.V. (2011). The effect of internal marketing on job satisfaction
in health services: a pilot study in public hospitals in Northern Greece. BMC Health
Services Research :1-8.
Ingram, J.R. (2013). Supervisor-officer fit and role ambiguity Re-assessing the nature of
the sergeant-officer attitudinal relationship. Policing: An International Journal of Police
Strategies & Management, 36(2):375-398.
Iriana, I. & Buttle, F. & Ang, L. (2013). Does organisational culture influence CRM's
financial outcomes? Journal of Marketing Management, 29 (3/4):467-493.

261
Izquierdo, C.C., Cillán, J.G. & Gutiérrez, S.S.M. (2005). The impact of customer
relationship marketing on the firm performance: a Spanish case. Journal of Services
Marketing, 19(4):234-244.
Jabbour, M. (2013). Managing Director, Privilege Management Solutions. Discussion: The
importance of coaching in employee satisfaction. Interviewed 24 June 2013.
Jan, A. (2012). Services marketing theory revisited: An empirical investigation into
financial services marketing. Journal of Business and Management, 4(4):36-45.
Javadein,S.S.R., Rayej, H., Estiri, M. & Ghorbani, H. (2010). The role of internal marketing
in creation of a sustainable competitive advantages: Trends in Applied Science Research,
6(4):364-374.
Jawahar, M. (2006). Correlates of satisfaction with performance appraisal feedback.
Journal of Labour Research, 27(2):213-236.
Jeon, H. & Choi, B. (2012). The relationship between employee satisfaction and customer
satisfaction . Journal of Services Marketing, 26(5):332-341.
Jeston, J. & J. Nelis. (2007). Business process management. London: Butterworth-
Heinemann.
Jha, S. (2011). Influence of psychological empowerment on affective,normative and
continuance commitment: A study in the Indian IT industry. Journal of Indian Business
Research, 3(4):263-282.
Joung, H.W.; Choi, E.K. & Goh, B.K. (2010). Training motivational factors as predictors of
employees' training satisfaction in foodservice operation. International CHRIE
Conference-Refereed Track, Event 6:1-8.
Johnson, I. (2013). Delivering ad choice of distinctive client centered banking experiences.
Available from: http://www.nedbankgroup.co.za/divisionNedbankRetailBusiness.asp
(Accessed 4 January 2013).

262
Jonsson, T. & Jeppesen, H.J. (2013). A closer look into the employee influence,
organisational commitment relationship by distinguishing between commitment forms and
influence sources. Employee Relations, 35(1):4-19.
June, S. & Mahmood, R. (2011). The relationship between person fit and job performance:
A study among employees of the service sector SME’s in Malaysia. International Journal
of Business, Humanities and Technology, 1(2):95-105.
Kabungaidze, T., Mahlatshan, N. & Ngirande, H. (2013). The impact of job satisfaction
and some demographic variables on employee turnover intentions. International Journal
of Business Administration, 4(1):53-65.
Kahn, J.H. (2006). Factor analysis in counseling Psychology research, training, and
practice: Principles, advances and applications. The Counselling Psychologist, 2006:34-
684.
Kale, S.H. (2008). Internal marketing: An antidote for Macau’s labour shortage. UNLV
Gaming Research and Review Journal, 11(1):1-11.
Kalla, H.K. (2005). Integrated internal communications: a multidisciplinary perspective.
Corporate Communications: An International Journal, 10 (4):302-314.
Kalman, D., Narayan, K.A., Oehler, K.H., Schuler, R. & Walker, M. (2013). The global
talent index report. The outlook to 2015. Economist Intelligence Unit. Available from:
http://www.managementthinking.eiu.com/sites/default/files/downloads/GTI%20FINAL%20
REPORT%205.4.11.pdf (Accessed 12 April 2013).
Kameswari, A.V. & Rajyalakshmi, N. (2012). Role of internal marketing in job satisfaction
of employees in State Bank of India. AIMS International Conference on Management: 47-
56.
Kanji, G.K. (2008). Reality check of Six Sigma for business excellence. Total Quality
Management, 19(6):575-582.
Kaplan, R.S. & Norton, D.P. (2004). The strategy map: guide to aligning intangible assets.
Strategy and Leadership, 32(5):10-17.

263
Karatepe, O.M. (2011). Do job resources moderate the effect of emotional dissonance on
burnout. International Journal of Contemporary Hospitality Management, 23(1):44-65.
Karl, K. & Peluchette, J. (2006). How does workplace fun impact employee perceptions of
customer service quality? Journal of Leadership and Organisational Studies, 13(2):2-13.
Kasper, H., van Helsdingen, P. & Gabbott, M. (2006). Services marketing management: A
strategic perspective. 2nd ed. Chichester: John Wiley & Sons.
Katzan, H. (2008). Foundations of service science concepts and facilities. Journal of
service science, 1(1):1-22.
Kazlauskaite, R.; Buciuniene, I. & Turauskas, L. (2012). Organisational and psychological
empowerment in the HRM-performance linkage. Employee Relations, 34(2):138-158.
Kehinde, A.O. (2011). The impact of job satisfaction on absenteeism: A correlative study.
European Journal of Humanities and Social Sciences, 1(1):25-49.
Kelleher, T. & Miller, B.M. (2006). Organisational blogs and the human voice:
relational strategies and relational outcomes. Available from:
http://jcmc.indiana.edu/vol11/issue2/kelleher.html (Accessed 17 February 2012).
Keller, S.B. (2006). The impact of internal marketing efforts in distribution service
operations. Available from: http://www.allbusiness.com/marketing-advertising/4088747-
1.html (Accessed 7 February 2011).
Kent, R. (2007). Marketing research: Approaches, methods and applications in Europe.
London: Thomson.
Kerr, A.W., Hall, H.K. & Kozub, S.A. (2009). Doing Statistics with SPSS. Los Angeles,
California: Sage.
Khan, F.N. & Naeem, H. (2013). The anatomy of employee involvement and internal
branding and their impact on the emotional intelligence of employees: Evidence from the
nursing staff hospital sector of Pakistan. Journal of Business and Management, 8(2):56-
61.

264
Kilburn, A. (2008). Building quality internal exchanges: The role of the organisation and
the individual in internal customer orientation. Available from:
http://www.freepatentsonline.com/article/Academy-Marketing-Studies-
Journal/219063768.html. (Accessed 17 May 2012).
Kim, I.C. (1998). Effects of the job performance on the turnover intention of hotel
employees in Korea. Journal of Tourism Sciences, 21(2):142-156.
Kim, S.Y. (2013). Exploring the relationships among leader-member exchange,
employee empowerment and job satisfaction in public organisations. 12th Public
Management Research Conference, Madison, Wisconsin:1-31.
Kimmel, A.J. (2005). Marketing communication: New approaches, technologies and
styles. Oxford: University Press.
Kimpakorn, N. & Tocquer, G. (2010). Service brand equity and employee brand
commitment. Journal of Services Marketing, 24(5):378–388.
Kimura, T. (2011). An empirical study into the current state and structure of internal
marketing in Japanese companies. 2nd International Conference on Economics, Business
and Management, Singapore:77-81.
King, C. (2010). Building and Measuring Employee Based Brand Equity. Available from:
http://www98.griffith.edu.au/dspace/bitstream/handle/10072/33650/64027_1.pdf?sequenc
e=1 (Accessed 5 February 2012).
King, C. & Grace, D. (2013). Employee is pivotal in creating and sustaining quality as the
quality of the service rendered is inseparable from the quality of the service provider.
Available from:
http://www98.griffith.edu.au/dspace/bitstream/handle/10072/28364/55762_1.pdf?sequenc
e=1 (Accessed 20 July 2013).
Klenke, K. (2006). Keeping control in nonhierarchical organisations. Available from:
http://www.aom-iaom.org/article_kk.pdf (Accessed 16 February 2012).
Kline, R.B. (2011). Principles and practice of Structural equation modeling. 3rd ed. New
York: The Guilford Press.

265
Klopper, H.B., Berndt, A., Chipp, K., Ismail, Z., Roberts-Lombard, M., Subramani, D.,
Wakeham, M., Petzer, D., Hern, L., Saunders, S. & Myers-Smith, P. (2006). Marketing:
Fresh perspectives. Cape Town: Pearson Education South Africa.
Koekemoer, L. (2004). Marketing communications. Cape Town: Juta.
Kotlarsky, J., van Fenema, P.C. & Willcocks, L.P. (2008). Developing a knowledge-based
perspective on coordination. Information & Management, 45:96-108.
Kotler, P. & Armstrong, G. (2006). Principles of marketing. 11th ed. Upper Saddle River,
New Jersey: Prentice Hall.
Kotler, P. & Keller, K. (2009). Marketing management. 13th ed. Upper Saddle River, New
Jersey; Prentice Hall.
Kotler, P., Armstrong, G., Tait, M., Beneke, J., Bhowan, K., Blake, S., Botha, E., Cassim,
S., de Jager, J,. Frey, N., George, R., Golestaneh, M., Human, D., Rammile, N., Roberts-
Lombard, M., Rootman, C., Rugimbana, R., van Zyl, J., Vigar-Ellis, D. & Wait, M. (2010).
Principles of marketing. Cape Town: Pearson Education.
Kowalkowski, C. (2011). The service function as a holistic management
concept. Journal of Business & Industrial Marketing, 26(7):484–492.
Kuar, G., Sharma, R.D. & Seli, N. (2009). Internal market orientation in Indian banking: an
empirical analysis. Managing Service Quality, 19(5):595-627.
Kular,S., Gatenby, M., Rees,C., Soane, E. & Truss, T. (2008). Employee engagement: A
literature review. Working paper series 19, Kingston University 19:2-28.
Kumar, V., Smart, P.A., Maddern, H. & Maull, R.S. (2008). Alternative perspectives
on service quality and customer satisfaction: the role of BPM. International Journal of
Service, 19(2):176-187.
Kuo, T.H. & Kuo, Y.L. (2010). The effect of corporate culture and total quality
management on construction project performance in Taiwan. Total Quality
Management, 21(6):617-632

266
Kuo, R.Z., Lai, M.F. & Lee, G.G. (2011). The impact of empowering leadership for KMS
adoption. Management Decision, 49(7):1120-1140.
Kurniatun, T.C. & Heriyati, P. (2012). The ethics of the promise in the service marketing
triangle and its effect on value and customer intentions for education services. Acta. Univ.
Bohem, 15(1):43-53.
Kuvaas, B. (2011). The interactive role of performance appraisal reactions and
regular feedback. Journal of Managerial Psychology, 26(2):123-137.
Kyriazopoulos, P., Yannacopoulos,D., Spyridakos, A., Siskos, Y. & Grigoroudis, E.
(2007). Implementing internal marketing through employee motivation. Available
from:
http://www.poms.org/conferences/poms2007/cdprogram/topics/full_length_papers_fil
es/007-0124.pdf (Accessed 20 July 2013).
Ladebo, O., Awotunde, J.M. & Salaam-Saghir, P. (2008). Coworkers' and supervisor
interactional justice: Correlates of extension personnel's job satisfaction, distress, and
aggressive behaviour. Institute of Behavioral and Applied Management:206-225.
Laice, N. (2013). The relationship approach to internal marketing and why it has become
so important in service business. Available from:
http://www.academia.edu/205233/The_relationship_approach_to_internal_marketing_and
_why_it_has_become_so_important_in_service_business (Accessed 23 February 2013).
Lalic, D., Marjanovic, U. & Lalic, B. (2012). The Influence of Social Networks on
Communication Satisfaction within the Organisations. Handbook of Research on Business
Social Networking: Organisational, Managerial, and Technological Dimensions. IGI global,
volume 1.
Lamb, C.W., Hair, J.F. & McDaniel, C. (2010). Marketing. 11th ed. Mason, Ohio: South
Western College.
Lau, R.S. & Cobb, A.T. (2010). Understanding the relationship between relationship
conflict and performance: the intervening roles of trust and exchange. Journal of
Organisational Behaviour, 31:898-917.

267
Lee, S.Y. (2006). Expectations of employees toward the workplace and environmental
satisfactions. Facilities, 24(9/10):343.
Lee, C.C & Chen, J.C. (2013). The Relationship between employee commitment and job
attitude and its effect on service quality in the tourism industry. American Journal of
Industrial and Business Management, 3:196-208.
Lee, Y.K., Nam, F.H., Park, D.H. & Lee, K.A. (2006). What factors influence customer-
oriented prosocial behaviour of customer-contact employees? Journal of Services
Marketing, 20(4):251-264.
Lehmuskallio, S. (2008). Intranet editors as corporate gatekeepers and agenda setters.
Corporate Communications: An International Journal, 13(1):95-111.
Lenke, U., Suar, D. & Mohapatra, P.K.J. (2010). Customer satisfaction in Indian
commercial banks through total quality management approach. Total Quality
Management, 21(12):1315-1341.
Leonard, D. & Murphy, W. (2013). A wake-up call: Achieving customer satisfaction
through your employees. Available from: http://williamhmurphy.com/wp-
content/themes/WillMurphy/files/publications/a_wakeup_call.pdf (Accessed 30 July 2013).
Leonardo, C. (2008). The age of participation is about getting clever – together. Gibs
Review. Available from:
http://www.gibsreview.co.za/home.asp?PID=11&ToolID=2&revieis=323&itemid=325
(Accessed 10 October 2011).
Leung, M.Y., Chan, Y.S.I. & Dongyu, C. (2011). Structural linear relationships between job
stress, burnout, physiological stress, and performance of construction project managers.
Engineering, Construction and Architectural Management, 18(3):312-328.
Leviatan, U. (2013). Overcoming drawbacks of hierarchy: examples from Kibbutz
communities. Journal of Community Positive Practices, XIII(1):147-164.
Li, L. (2010). Internal quality management in service organisations: a theoretical
approach. Masters thesis. Karlstad Business School.

268
Lin, J.S. & Lin, C.Y. (2011). What makes service employees and customers smile:
Antecedents and consequences of the employees' affective delivery in the service
encounter. Journal of Service Management, 22( 2):183-201.
Lindholm, O. (2008). The influence of sales promotion on consumer behavior in financial
services. Masters dissertation, Department of Marketing and Management, Helsinki
School of Economics.
Lings, I.N. & Greenley, G.E. (2010). Internal marketing orientation and market orientated
behaviours. Journal of Service Management, 21(3):321-343.
Liu, B.S.C, Petruzzi, N.C. & Sudharshan, D. (2007). A service effort allocation model for
assessing customer lifetime value in service marketing. Journal of Services Marketing,
21(1):25.
Liu, D., Mitchell, T.R., Lee,T.W., Holtom, B.C. & Hinton,T. (2011). Job satisfaction growth
and voluntary turnover: A dynamic multilevel investigation. Available from:
http://www.roa.unimaas.nl/seminars/pdf2011/Tom%20Lee%20Paper.pdf (Accessed 5
February 2011).
Lockwood, N.R. (2007). Leveraging employee engagement for competitive
advantage: HR’s strategic role. SHRM Research Quarterley:1-11.
Long, S.A. (2006). Exploring the wiki world: the new face of collaboration. New Library
World, 107(1222/1223):157-159.
Loong, K.L. (2011). The impact of organisational commitment among executives in retail
industry, Klang Valley (Malaysia). The 2nd International Research Symposium in Service
Management Yogyakarta, Indonesia:345-353.
Lovelock, C. & Wirtz, J. (2008). Services Marketing: People, Technology, Strategy. 6th ed.
Upper Saddle River, New Jersey: Pearson Prentice Hall.
Lovelock, C.H., Wirtz, J. & Chew, P. (2009). Essentials of Services Marketing. Upper
Saddle River, Pearson Prentice Hall.

269
Lu, Q. & Wood, L. (2006). The refinement of design for manufacture: inclusion of process
design. International Journal of Operations & Production Management, 26(10):1123-1145.
Lucas, C. & Kline, T. (2008). Understanding the influence of organisational culture and
group dynamics on organisational change and learning. The Learning Organisation,
15(3):277-281.
Lumley, E.J., Coetzee, M., Tladinyane, R. & Ferreira, N. (2011). Exploring the job
satisfaction and organisational commitment of employees in the information
technology environment. Southern African Business Review , 15(1):100-118.
Luna-Arocas, R. & Camps, J. (2008). A model of high performance work practices and
turnover intentions. Personnel Review, 37:26-46.
Lusch, R.F. & Webster, F.E. (2010). Marketing responsibility for the value of the
enterprise. Marketing Science Institute Working Paper Series, 10(111):1-48.
Lutgen-Sandvik, P., Riforgiate, S.E. & Fletcher, C.V. (2011). Work as a source of positive
emotional experiences and the discourses informing positive assessment. Western
Journal of Communication, 75(1):1-23.
MacMillan, A. (2006). Raising the bar on performance management- best practices to
optimize performance reviews and goal management. White paper. HR.com:1-12.
Madu, B.C. (2013). Organisation culture as driver of competitive advantage. Available
from: http://www.aabri.com/manuscripts/11791.pdf. (Accessed 20 July 2013).
Mahmood, Z. (2013). Internal marketing provides a systematic framework to develop
corporate culture and improve the internal organisational communication towards the
implementation of quality management programs. Available from:
http://faculty.kfupm.edu.sa/coe/sadiq/proceedings/SCAC2004/03.ASC018.EN.Mahmood.I
nternal%20Marketing%20Provides%20A%20Syste%20_1_.pdf (Accessed 24 July 2013).
Makhfi, P. (2009).To BPM or not BPM: Consideration, approach and benefit analysis
of process-enabled business solutions. Available from:
http://www.progress.com/docs/whitepapers/2bpm_not2bpm-wp.pdf (Accessed 13 October
2011).
270
Malhotra, N.K. (2007). Marketing Research. 5th ed. Upper Saddle River, New Jersey:
Pearson Prentice Hall.
Malhotra, N.K. & Birks, D.F. (2006). Marketing Research. An applied approach. 3rd ed.
Upper Saddle River, New Jersey: Prentice Hall.
Malhorta, N.K. & Peterson, M. (2006). Basic Marketing Research: A decision-making
approach. London: Pearson Prentice Hall.
Malhotra, N.K. (2009). Basic Marketing Research: A decision-making approach. 3rd ed.
London: Pearson Prentice Hall.
Malshe, A. (2009). An exploration of key connections within sales marketing interface.
Journal of Business and Industrial Marketing, 26(1):45-57.
Maniam, V.A. & Uli, J. (2011). Exploring career success perceptions among managers.
International Conference on Advancements in Information Technology:271-276.
Mansoor, M., Fida, S., Nasir, S. & Ahmad, Z. (2011). The Impact of job stress on
employee job satisfaction: A study on telecommunication sector of Pakistan. Journal of
Business Studies Quarterly, 2(3):50-56.
Maritz, A. & Nieman, G. (2008). Implementation of service profit chain initiatives in a
franchise system. Journal of Services Marketing, 22(1):13-23.
Markos, S. & Sridevi, M.S. (2010). Employee engagement: The key to improving
performance. International Journal of Business and Management, 5(12):89-96.
Martensen, A. & Gronholdt, L. (2006). Internal Marketing: A study of employee loyalty, its
determinants and consequences. Innovative Marketing, 2(4):92-116.
Martins, N. & Coetzee, M. (2007). Organisational culture, employee satisfaction,
perceived leader emotional competency and personality type: An exploratory study in a
South African engineering company. SA Journal of Human Resource Management,
5(2):20-32.

271
Martin, B.A. & Martin, J.H. (2005). Building a market orientated organisational
environment: an implementation framework for small organisations. American Journal of
Business, 20(2):45-58.
Massa, M. & Zhang, L. (2012). The role of organisational structure between hierarchy and
specialisation. Available from: http://www.apjfs.org/conference/2010/cafm2010/6-3.pdf
(Accessed 16 August 2012).
Matanda, M.J. & Ndubisi, N.O. (2013). Internal marketing, internal branding, and
organisational outcomes: The moderating role of perceived goal congruence. Journal of
Marketing Management, 29(9-10):1030-1055.
Matsunaga, M. (2010). How to factor analyze your data right: the do’s, dont’s and how
to’s. International Journal of Psychological Research, 3(1):97-110.
McDermott, E., Mangan, J. & O’Connor, M. (2006). Graduate development programmes
and satisfaction levels. Journal of European Industrial Training, 30(6):456-471.
McGuire, D. & McLaren, L. (2009). The impact of physical environment on employee
commitment in call centres: The mediating role of employee well-being. Team
Performance Management, 15(1/2):35-48.
McGrath, R.E. ( 2005) Conceptual complexity and construct validity. Journal of Personality
Assessment, 85(2):112-124.
McMillan, E. (2011). Considering organisation structure and design from a complexity
paradigm perspective. Available from:
http://www2.ifm.eng.cam.ac.uk/mcn/pdf_files/part5_5.pdf (Accessed 4 May 2012).
Meehan, C. (2011). Advantages and disadvantages of the vertical functional organisation
structure. Available from: http://smallbusiness.Meehan.com/advantages-disadvantages-
vertical-functional-Organisational-structure-1268.html (Accessed 2 October 2011).
Mehr, S.K., Emadi, S., Cheraghian, H., Roshani.F. & Behzadi, F. (2012). Relationship
between job satisfaction and Organisational culture in staff and experts of physical

272
education offices of Mazandaran Province. European Journal of Experimental Biology, 2
(4):1029-1033.
Melewar,T.C. & Karaosmanoglu, E. (2006). Seven dimensions of corporate identity: A
categorization from practitioners‘ perspectives. European Journal of Marketing,
40(7/8):846-849.
Melcrum Connecting Communications (2013). Creating a coherent strategic narrative.
Available from: https://www.melcrum.com/research/strengthen-leader-
communication/creating-coherent-strategic-narrative (Accessed 21 May 2013).
Merchant, R. (2013). The role of career development in improving organisational
effectiveness and employee development. Available from:
http://www.fdle.state.fl.us/Content/getdoc/f486fb86-6af0-4f0f-8c5b-
0efc1bac4bc3/Merchant.aspx (Accessed 3 August 2013).
Mieres, C.G.; Sanchez, J.A.L.A. & Vijande, M.L.S. (2012). Internal marketing, innovation
and performance in business service firms: The role of organisational unlearning.
International Journal of Management, 29(4):403-429.
Miri, A., Rangriz, H. & Sabzikaran, E. (2011). The relationship between organisational
structure and employee empowerment in National Iranian Oil Products Distribution
Company. Kuwait Chapter of Arabian Journal of Business and Management Review,
1(1):51-68.
Mishra, S. (2010). Internal marketing: A tool to harness employees’ power in service
Organisations in India. International Journal of Business and Management, 5(1):185-190.
Mitrega, M. (2012). Network partner knowledge and internal relationships influencing
customer relationship quality and company performance. Journal of Business & Industrial
Marketing, 27(6):486-496.
Moeller, S. (2010). Characteristics of services: A new approach uncovers their value.
Journal of Services Marketing, 24(5):359-368.

273
Mohammad, S.I.S., Al-Zeaud, H.A. & Batayneh, A.M.E. (2011). The relationship between
transformational leadership and employees’ satisfaction at Jordanian private hospitals.
BEH - Business and Economic Horizons, 5(2):35-46.
Mokgoatlheng, J.E. (2010). The role of internal marketing in building corporate reputation
in South African retail banking, specifically ABSA. MCom dissertation, Department of
Business Management, University ofJohannesburg
Molapo, M.N. (2010). An assessment of internet banking service quality. MCom
dissertation. Department of Business Management, University of Johannesburg.
Moodley, C. (2008). The impact employee satisfaction levels have on the quality of
customer service in the service utility: Telkom SA. MCom dissertation. Department of
Business Management, University of Johannesburg.
Motaghi-Pisheh, M.H. & Harianto, L. (2011). Investigating the occurrence of workplace
aggression of front-line staff of hotel industries in Penang Island by assigning emotional
labor as predictor. International Bulletin of Business Administration,10:166-188.
Mudie, P. & Pirrie, A. (2006). Services Marketing Management. 3rd ed. Oxford: Elsevier.
Muhammad, D. & Yazdani, N.A. (2009). Internal marketing and a conceptual model for
development of employees as brand. ASA University Review, 3(2):83-99.
Mulhern, F. (2010). How to make the shift to a PPMM strategy. Available from:
http://www.incentivecentral.org/pdf/shift_to_ppm_strategy_wp.pdf (Accessed 25 October
2011).
Müller, J.; Alt, F. & Michelis, D. (2013). Pervasive advertising. Available from:
http://www.hcilab.org/wp-content/uploads/mueller-perad-intro-book.pdf (Accessed 15 June
2013).
Murby, L. & Gould, S. (2005). Effective performance management with the Balanced
Scorecard. CIMA:1-41.
Naidoo, L.P. (2009). Internal marketing in a customer service centre. Master’s
dissertation. Department of Business Management, University of Johannesburg.

274
Naseem, A., Sheikh, E.S. & Malik, K.P. (2011). Impact of employee satisfaction on
success on organisation: relationship between customer satisfaction and employee
satisfaction. International Journal of Mulitdisciplinary Sciences and Engineering, 2(5):41-
46.
National Treasury. (2011). National Treasury Policy Document. Available from:
http://www.treasury.gov.za/documents/national%20budget/2011/A%20safer%20financial
%20sector%20to%20serve%20South%20Africa%20better.pdf (Accessed: 22 February
2011).
Ndubisi, N.O. (2007). Relationship marketing and customer loyalty. Marketing Intelligence
and Planning, 25(1):98-106.
Nedbank. (2011). Nedbank Graduate Development Programme. Available from:
http://www.nedbankgroup.co.za/graduate_site/about.html. (Accessed 3 June 2011).
Newsham, G.R., Brand, J., Donnelly, C.L., Veitch, J.A., Aries, M. & Charles, K.E. (2009).
Linking indoor environment conditions to job satisfaction: A field study. Available from:
http://www.nrc-cnrc.gc.ca/obj/irc/doc/pubs/nrcc49714/nrcc49714.pdf (Accessed 5 May
2012).
Niehaves, B. & Plattfaut, R. (2011). Collaborative business process management: Status
quo and quo vadis. Business Process Management, 17(3):1-16.
Nittala, R. & Kameswari, A.V. (2009). Internal marketing for customer satisfaction in retail
sector. Aims International Journal of Management, 3(3):207-220.
Nittala, R. & Kameswari, A.V. (2012). Role of internal marketing in job satisfaction of
employees in State Bank of India. AIMS International Conference on Management:47-56.
Norizan, I. (2012). Organisational commitment and job satisfaction among staff of higher
learning education institutions in Kelantan. Master’s dissertation, Department of Human
Resource Management. University of Malaysia.

275
Nujjoo, A. & Meyer, I. (2012). The relative importance of different types of rewards for
employee motivation and commitment in South Africa. SA Journal of Human Resource
Management, 10(2):1-10.
Omotayo, O. (2011). Sales promotion and consumer loyalty: A study of Nigerian
tecommunication industry. Journal of Competitiveness, 4:66-77.
O’Neill, M. (2005). Employee care, a vital antecedent to customer care in the health care
industry. An exploratory investigation of the employee satisfaction construct at North East
Alabama Regional Medical Center. International Journal Of Health Care Quality
Assurance, 15(2):131-151.
Ongori, H. (2007). A review of the literature on employee turnover. African Journal of
Business Management, 1993-8233:49-54.
Ouyang, Y. (2010). A relationship between the financial consultants service quality and
customer trust after Financial Tsunami. International Research Journal of Finance and
Economics, 36:75-84.
Owomoyela, S.K., Ola, O.S. & Oyeniyi, K.O. (2013). Investigating the impact of marketing
mix elements on consumer loyalty: An empirical study on Nigerian Breweries PLC.
Interdisciplinary Business Research, 4(11):485-486.
Oyitso, M. & Olomukoro, C.O. (2012). Training and retaining Nigerian workers to enhance
work performance. Interdisciplinary Journal of Contemporary Research in Business,
4(1):69-78.
Pallant, J. (2010). SPSS Survival Manual. 4th ed. London: Mc-Graw Hill.
Palmer, A. (2005). Principles of Service Marketing. 4th ed. London: Mc-Graw Hil.
Palmer, A. (2011). Principles of Service Marketing. 6th ed. London: Mc-Graw Hill.
Panigyrakis, G.G. & Theodoridis, P.K. (2009). Internal marketing impact on business
performance in a retail context. International Journal of Retail and Distribution
Management, 37(7):600-628.

276
Pantouvakis, A. (2011). Internal service quality and job satisfaction synergies for
performance improvement: Some evidence from a B2B environment. Journal of Targeting,
Measurement and Analysis for Marketing 19(1):11–22.
Papasolomou, I. (2006). Can internal marketing be implemented within bureaucratic
organisations? Internal Journal of Bank Marketing, 24(3):194:212.
Parkin, J.K., Austin, S.A., Pinder, J.A., Baguley, T.S. & Allenby, S.N. (2011). Balancing
collaboration and privacy in academic workspaces. Facilities, 29(1/2):31-49.
Parry, E. (2012). The role of internal marketing in ensuring the delivery of excellent
customer Service. The New Researcher, 5:23-28.
Parvin, M. & Kabir, M.M. (2011). Factors affecting employee job satisfaction of
pharmaceutical sector. Australian Journal of Business and Management Research,
1(9):113-123.
Pasebani, F., Mohammid, S. & Yektatyar, M. (2012). The relationship between
Organisational learning culture and job satisfaction and internal service quality in sport
organisations in Iran. Archives of Applied Science Research, 4(4):1901-1905.
Patla, S. & Pandit, D. (2012). Internal branding in an Indian bank: An initial exploration.
Vilakshan, XIMB Journal of Management:115-125.
Paton, R. & Karunaratne, N. (2009). Engagement and innovation: the Honda case. VINE,
39(4):280-297.
Peltier, J.W., Pointer, L. & Schibrowsky, J.A. (2008). Nurse loyalty and the relational
marketing continuum. Health Marketing Quarterly, 23(4):109-129.
Peltier, J. & Dahl, A. (2009). Relationship between employee satisfaction and hospital
patient experience. Available from: http://www.info-
now.com/typo3conf/ext/p2wlib/pi1/press2web/html/userimg/FORUM/Hospital%20Study%2
0Relationship%20Btwn%20Emp.%20Satisfaction%20and%20Pt.%20Experiences.pdf
(Accessed 18 October 2011).

277
Pepe, M. & College, S. (2010). The impact of extrinsic motivational dissatisfiers on
employee level of job satisfaction and commitment resulting in the intent to turnover.
EABR & ETLC Conference:41-49.
Peppers & Rogers Group. (2010). Customer experience in retail banking: Understanding
the drivers of growth. Available from:
http://www.teletech.com/media/2739337/peppers_rogers_customer_experience_in_retail_
banking_article.pdf (Accessed 13 March 2012).
Peters, S.C. & Mazdarani, E. (2008). The impact of employee empowerment on service
quality and customer satisfaction in service organisations. Bachelor thesis in Business
Administation. School of Sustainable Development of Society and Technology, University
of Mälardalen.
Petzer, D.J. & De Meyer, C.F. (2011). The perceived quality, satisfaction and behavioural
intent towards cellphone network providers: A generational perspective.
African Journal of Business Management, 5(17):7461-7473.
Pitt, M. & Bennett, J. (2008). Workforce ownership of space in a space sharing
environment. Journal of Facilities Management, 6(4):290-302.
Ployhart, R.E. & Bliese, P.D. (2006). Indvidual Adaptability (I-ADAPT) Theory:
Conceptualizing the antecedents, consequences, and measurement of individual
Differences in adaptability, in C. Shawn Burke, Linda G. Pierce, Eduardo Salas (ed.)
Understanding adaptability: A prerequisite for effective performance within complex
environments. Advances in Human Performance and Cognitive Engineering Research
6:3-39.
Popescu, A. & Grigore, L. (2007). The relationship between organisational culture and
employees satisfaction. International Conference on Business Excellence:173-177.
Porter, H., Wrench, J.S. & Hoskinson, C. (2007).The influence of supervisor
temperament on subordinate job satisfaction and perceptions of supervisor
sociocommunicative orientation and approachability. Communication Quarterly,
55(1):129-153.
278
Prajogo, D.I. & McDermott, C.M. (2011). The relationship between multidimensional
organisational culture and performance. International Journal of Operations and
Production Management, 31(7):712-735.
PricewaterhouseCoopers. (2007). Strategic and emerging issues in SA banking. 2007 ed.
PricewaterhouseCoopers.
Pride, W.M. & Ferrell, O.C. (2010). Marketing. 15th ed. Ontario:South-Western.
Punjaisri, K., Evanschitzky, H. & Wilson, A. (2009). Internal branding: an enabler of
employees’ brand-supporting behaviours. Journal of Service Management, 20(2):209-226.
Pushpakumari, M.D. (2008). The impact of job satisfaction on job performance : An
empirical analysis. Available from:
http://202.11.2.113/SEBM/ronso/no9_1/08_PUSHPAKUMARI.pdf (Accessed 18 February
2012).
Pynes, J.E. (2009). Human resource management for public and nonprofit organisations:
A strategic approach. 3rd ed. San Francisco: Jossey-Bass.
Qayum, M.N. & Sahaf, M.A. (2013). Internal marketing: A pre-requisite for employee
satisfaction in universities. International Journal of Business and Management Invention,
2(5):50-55.
Rad, A.M.M. & Yarmohammadian, M.H. (2006). A study of relationship between
managers’ leadership style and employees’ job satisfaction. Leadership in Health
Services, 19(2):xi-xxviii.
Ratanjee, N.J. (2007). Investigating the factors that influence client satisfaction: A case
study, Barat Carbide. Masters dissertation, Department of Business Management.
University of Johannesburg.
Rehman, O., Mansoor, A., Rafiq, M. & Rashid, M. (2011). Training and development,
leadership style and empowerment practices as determinants of organisation citizenship
behavior in the corporate sector of developing country Pakistan. Far East Journal of
Psychology and Business, 4(2):16-26.

279
Rodrigues, A.P. & Pinho, J.C.M.R. (2010). Market orientation, job satisfaction,
commitment and organisational performance. Transforming Government: People, Process
and Policy, 14(2):172-192.
Tata, J., Prasad, S. & Thorn, R. (2011). The influence of organisational structure on the
effectiveness or TQM programs. Available from
http://www.allbusiness.com/management/benchmarking-quality-improvement/370247-
1.html#ixzz1iT7kvQPU (Accessed 4 May 2012).
Roos, W. (2005). The relationship between employee motivation, job satisfaction and
corporate culture. Department of Psychology. Master of Science. University of South
Africa.
Rowe, J. (2007). Cybernetics of culture. Kybernetes, 36(5/6):602.
Russell, B. & Purcell, J. (2009). Online research essentials: Designing and implementing
research studies. San Francisco: Jossey-Bass.
Rust, R.T. & Chung, T.S. (2006). Marketing models of service and relationships.
Marketing Science, 25(6):560-580.
Ryan, S. (2012). The relationship between shared vision, cohesion, role clarity, mutual
trust and transformational leadership in a team setting. Master’s dissertation, Department
of Psychology, University of Stellenbosch.
Saame, I., Reino, A. & Vadi, M. (2011).Organisational culture based on the example of an
Estonian hospital. Journal of Health Organisation and Management, 25(5): 526-548.
Saeed, M.M. & Asghar, M.A. (2012). Examining the relationship between training,
motivation and employees job performance :The moderating role of person job fit. Journal
of Basic and Applied Scientific Research, 2(12):12177-12183.
Sage Publications. (2011). Impact of leadership and work environments of organisation
citizenship behaviour: Available from: http://www.sagepub.com/upm-
data/5862_Chapter_5__Organ_I_Proof_3.pdf (Accessed 10 April 2012).

280
Sahi, G.K.; Lonial, S.; Gupta, M. & Seli, N. (2013). Revisiting internal market orientation: a
note. Journal of Services Marketing, 27(5):385-403.
Saks, M.A. (2006). Antecedents and consequences of employee engagement. Journal of
Managerial Psychology, 21(7):600-619.
Salvato, C., Minichilli, A. & Piccarreta, R. (2008). Career dynamics in family and non-
family firms: An optimal matching analysis. Frontiers of Entrepreneurship Research,
28(14):1-18.
Sambasivan, M., Siew-Phaik, L., Mohamed, Z.A. & Leong Y.C. (2011). Impact of
interdependence between supply chain partners on strategic alliance outcomes: Role of
relational capital as a mediating construct. Management Decision, 49(4):548-569.
Sanchez-Hernandez, I.M. & Grayson, D. (2012). Internal marketing for engaging
employees on the corporate responsibility journey. Intangible capital, 8(2):275-307.
Sanchez-Hernandez, I.M. & Miranda, F.J. (2011). Linking internal market orientation and
new service performance. European Journal of Innovation and Management, 14(2):207-
226.
Sarwar, S. & Abugre, J. (2013). The influence of rewards and job satisfaction on
employees in the service industry. The Business & Management Review, 3(2):22-32.
Savolainen, R. (2011). Requesting and providing information in blogs and internet
discussion forums, Journal of Documentation, 67(5):863-886.
Scales, M. (2013). Developing talent: How career opportunities drive business
performance. Available from: http://www.right.com/thought-leadership/e-
newsletter/developing-talent-how-career-opportunities-drive-business-performance.pdf
(Accessed 19 March 2013).
Schermuly, C.C., Schermuly, R.A. & Meyer, B. (2011). Effects of vice-principals'
psychological empowerment on job satisfaction and burnout. International Journal of
Educational Management, 25(3):252-264.

281
Schmidt, M.J. & Hollensen, S. (2006). Marketing Research: An International Approach.
London: Prentice Hall.
Schmitt, A. (2011). Don’t let knowledge walk away: Knowledge retention during employee
downsizing. Management Learning, 43(1):53-74.
Schneider, D. (2013). Group HR Director, Deloitte, Africa. Discussion: Internal marketing,
Graduate Development Programmes and employee satisfaction. Interviewed 29 June
2013.
Schon, K. (2007). Job satisfaction, Six Sigma work improvement and the interconnection
between the two. Department of Business Admistration and Social Sciences. Doctoral
Thesis. Lulea University of Technology.
Sehgal, K. & Malati, N. (2013). Employer branding: A potent Organisational tool for
enhancing competitive advantage. UIP Journal of Brand Management, (1):52-65.
Sharma, R.D. & Seli, N. (2009). Internal market orientation in Indian banking: an empirical
analysis. Managing Service Quality, 19(5):595-627.
Shaw, C. & Ivens, J. (2005). Building great customer experiences. Hampshire: Palgrave
Macmillan.
Shaw, S. & Fairhurst, D. (2008). Engaging in a new generation of graduates. Education
and Training, 50(5):366-378.
Shaw, G., Bailey, A. & Williams, A.M. (2011). Service dominant logic and its implications
for tourism management: the co-production of innovation in the hotel industry.Tourism
Management, 32(2):207-214.
Shekary, G.A., Moghadam, S.K., Adaryany, N.R. & Moghadam, I.M. (2012). The impact of
internal marketing on Organisational commitment in banking industry through structural
equation modelling. Interdisciplinary Journal of Contemporary Research in Business,
3(9):18-28.
Shrivastava, A. & Purong, P. (2009). Employee perceptions of job satisfaction:
Comparative study of Indian banks. Asian Academy of Management Journal, 14(2):65-78.

282
SHRM (Society for Human Resource Management). (2013). 2012 Employee job
satisfaction and engagement: How employees are dealing with uncertainty. SHRM.
Shuck, B. & Wollard, K.K. (2010). Employee engagement and HRD: A seminal review of
the foundations. Human Resource Development Review, 9(1):89-110.
Shuck, M.B., Rocco, T.S. & Albornoz, C.A. (2011). Exploring employee engagement from
the employee perspective: implications for HRD. Journal of European Industrial Training,
35(4):300-325.
Sim, C.M. (2008). Internal marketing: a study of management support and employees’
commitment to customer service in banking industry of Malaysia. MBA dissertation.
University of Malaysia.
Simberova, I. (2009). Corporate culture as a barrier or market orientation implementation.
Economics and Management, 14:513-521.
Simpson,T., Speh, T.W. & Urbany, J.E. (2005). Marketing principles and best practices.
3rd ed. Mason, Ohio: Thomson South-Western.
Sincic, D. & Vokic, N.P. (2007). Integrating internal communications, human resource
management and marketing concepts into the new internal marketing philosophy. Working
paper. Faculty of Economics and Business, Zagreb University:1-13.
Singh , M.A. (2011). A primer on developing an E-business strategy. Available from:
http://www.commerce.state.il.us/NR/rdonlyres/3608158F-181F-44A8-BC66-
353CA27088ED/0/eCommerce.pdf (Accessed 12 October 2011).
Singh, M.P., Chakraborty, A. & Raju, G. (2011). Contemporary issues in marketing of life
insurance services in India. International Journal of Multidisciplinary Research, 1(7):47-61.
Sirenne,M.J. (2013). Creating customer focused service descriptions. Masters dissertation
in service, innovation and design, Laurea University of Applied Sciences.
Slatten, T. (2011). Emotions in service encounters from the perspectives of employees

283
and customers. Master’s dissertation, Department of Business Studies, Karlstad
University.
Slatten, T. (2011). Antecedents and effects of employees’ feelings of joy on
employees’innovative behaviour. International Journal of Quality and Service Science,
3(1):93-109.
Slatten, T. & Mehmetoglu, M. (2011). Antecedents and effects of engaged frontline
employees: A study from the hospitality industry. Managing Service Quality, 21(1):88-10.
Smith, I. (2011). Organisational quality and organisational change:
Interconnecting paths to effectiveness. Library Management, 32(1/2):111-128.
Solomon, M.R., Marshall, G.W. & Stuart, E.W. (2006). Marketing: Real people, real
choices. Upper Saddle River, New Jersey: Pearson Prentice Hall.
Spagnoli, P. & Caetano, P. (2012). Personality and organisational commitment: The
mediating role of job satisfaction during socialisation. Career Development International,
17(3): 255-275.
Spreitzer, G. (2007). Taking Stock: A review of more than twenty years of research on
empowerment at work. Available from:
http://webuser.bus.umich.edu/spreitze/empowermentandself-management.pdf. (Accessed
22 July 2013).
Standard Bank (SBSA). (2011). Retail bank graduate development programme. Available
from:
http://www.standardbank.co.ls/SBIC/Frontdoor_02_02/0,2454,15064326_17890430_0,00.
html (Accessed 3 June 2011).
Steingrimsdottir, H. (2011). The relationship between internal communication
and job satisfaction. Master’s dissertation. Copenhagen Business School.
Steyn, M. (2008). Promoting safety in the work environment: the role of internal marketing.
Master‘s dissertation. Johannesburg: University of Johannesburg.

284
Stoyanova, T. (2011). Strategic change management and the use of internal
communication:The case of HP. Masters dissertation in corporate communication.
University of Aarhus.
Strydom, L. (2004). Internal marketing in a service organisation. Master’s dissertation,
Department of Business Management. University of Johannesburg.
Tag-Eldeen, A. & El-Said, O. (2011). Implementation of internal marketing on a sample of
Egyptian five-star hotels. Faculty of Tourism and Hotels, Alexandria University, Egypt,
22(2):153-167.
Taylor, L.J., & Poyner, I. (2008). Goldratt’s thinking process applied to problems
associated with trained employee retention in highly competitive labour market. Journal of
European Industrial Training, 32(7):594-608.
The Economist. (2007). Building an integrated talent management strategy. The
Economist Intelligence Unit. Available from:
https://www.eoeleadership.nhs.uk/downloadFile.php (Accessed 17 February 2012).
The Banking Association South Africa. (2011). South African Banking Sector Overview for
2011. Available at: http://www.banking.org.za/getdoc/getdoc.aspx?docid=1130 (Accessed
25 July 2011).
The banking Association of South Africa. (2013). The South African Banking Sector
Overivew for 2012. Available at: http://www.banking.org.za/index.php/our-industry/2012-
south-african-banking-sector-overview/ (Accessed 19 December 2013).
Thomas, T. & Pretat, C. (2009). The process of knowledge transfer. Masters dissertation,
Leadership and Management. Baltic Business School.
Topper, E.F. (2007). Social networking in libraries. New World Library, 108(7/8):378-380.
Tortosa-Edo, V., Sanchez-Garcia, J. & Moliner-Tena, M.A. (2010). Internal market
orientation and its influence on the satisfaction of contact personnel. The Services
Industry Journal, 30(8):1279-1297.

285
Towers Watson. (2012) Engagement at risk: Driving strong performance in global volatile
environment. Available from: http://www.towerswatson.com/Insights/IC-Types/Survey-
Research-Results/2012/07/2012-Towers-Watson-Global-Workforce-Study (Accessed 23
January 2013).
Treiblmaier, H. & Filzmoser, P. (2009). Exploratory factor analysis revisited: How robust
methods support the detection of hidden multivariate data structures in IS research. White
paper. Vienna University of Technology:1-43.
Trivellas, P. & Dargenidou, D. (2009). Organisational culture, job satisfaction and higher
education service quality: The case of Technological Educational Institute of Larissa. The
TQM Journal, 21(4):382-399.
Tsai, Y. (2011). Relationship between organisational culture, leadership behavior and job
satisfaction. BMC Health Services Research, 11(98):1-9.
Tsiotsou, R.H. & Vlachopoulou, M. (2011). Understanding the effects of market orientation
and e-marketing on service performance. Marketing Intelligence and Planning, 29(2):141-
155.
Tung, G.S., Kuo, C.J. & Kuo, Y.T. (2011). Promotion, switching barriers and loyalty.
Australian Journal of Business and Management, 1(2):30-44.
Turkyilmaz, A., Akman, G., Ozkan, C. & Pastuszak, Z. (2011). Empirical study of public
sector employee loyalty and satisfaction. Industrial Management & Data Systems,
111(5):675-696.
Tyilana, X.E. (2005). Impact of motivation on job satisfaction amoungst employees of a
national broadcaster. Masters dissertation, Department of Business Management.
University of Johannesburg.
Ubius, U. & Alas, R. (2009). Organisational culture types as predictors of corporate social
responsibility. Engineering Econimics, 1(61):90-99.
Ueno, A. (2010). What are the fundamental features supporting service quality? Journal of
Services Marketing, 24(1):74-86.

286
Ugboro, I. (2006). Organisational commitment, job redesign, employee empowerment and
intent to quit among survivors of restructuring and downsizing. Institute of Behavioral and
Applied Management: 232-257.
Uzzi, J. (2010). Work design and Six Sigma: Improve jobs and processes. Available from:
http://www.isixsigma.com/index.php?option=com_k2&view=item&id=968:work-design-
and-six-sigma-improve-jobs-and-processes&Itemid=182&tmpl=component&print=1.html
(Accessed 3 August 2011).
Vakola, M. & Nikolaou, I. (2005). Attitudes towards organisational change: what is the role
of employees‘ stress and commitment. Employee Relations, 27(2):160-161.
van Dyk, J., Coetzee, M. & Takawira, N. (2013). Satisfaction with retention factors as
predictors of the job embeddedness of medical and information technology services staff.
South African Business Review, 17(1):57-75.
Varnai, S. & Fojtik, J. (2008). Internal marketing orientation in cultural
change management for organisation development. MEB 2008 – 6th International
Conference on Management, Enterprise and Benchmarking:161-166.
Vasconcelos, A.F. (2008). Broadening even more the internal marketing concept.
European Journal of Marketing, 42(11/12):1246-1264.
Vella, P.J., Gountas, J. & Walker, R. (2009). Employee perspectives of service quality in
the supermarket sector. Journal of Services Marketing, 23(6):407-411.
Vet Consulting Group. (2012). The layers of vetenary financial success. Available from:
http://vethelpconsulting.com/staff.pdf (Accessed 5 February 2012).
Voon, B.H. (2011). Service environment of restaurants: Findings from the youth
customers. Journal of Asian Behavioural Studies, 1(2):45-56.
Vrontis, D., Thrassou, A. & Zin, R.M. (2010). Internal marketing as an agent of change -
implementing a new human resource information system for Malaysian Airlines. Journal of
General Management, 36(1):21-41.
Vural, Z., Akinci B. & Coşkun G. (2011). Corporate social responsibility and ethics.

287
Gumuşhane University Electronic Journal of Communications Faculty, 1:75.
Walsh, G. & Bartikowski, B. (2013). Employee emotional labour and quitting intentions:
Moderating effects of gender and age. European Journal of Marketing, 47(8):1213-1237
Wang, S. & Noe, R.A. (2010). Knowledge sharing: A review and directions for future
research. Human Resource Management Review 20:115-131.
Warsi, S., Fatima, N. & Sahibzada, S. A. (2009). Study on relationship between
organisational commitment and its determinants among private sector employees of
Pakistan. International Review of Business Research Papers, 5(3):399-410.
Weir, I. (2011). Director, business process management. Standard Bank of South Africa.
Discussion: Business Process Management. Interviewed 17 August 2011.
Weiten, W., Lloyd, M., Dunn, D.S. & Hammer, E.Y. (2008). Psychology applied to modern
life: adjustment in the 21st century. 9th ed. Belmont, California: Cengage Learning.
White, C., Vanc, A. & Stafford, G. (2011). Internal communication, information satisfaction,
and sense of community: The effect of personal influence. Available from:
http://www.instituteforpr.org/wp-content/uploads/White_Vanc_Stafford.pdf (Accessed 10
October 2011).
Wilches-Alzate, G. (2009). The relationship between rewards and recognition, service-
oriented organisational citizenship behaviour, and customer satisfaction. Doctoral Thesis,
Department of Management, Univerisity of Waterloo.
Willem, A. & Buelens, M. (2009). Knowledge sharing in inter-unit cooperative episodes:
The impact of organisational structure dimensions. International Journal of Information
Management, 29:151-160.
Williams, K.C. (2013). Core qualities of successful marketing relationships. Available from:
http://www.aabri.com/manuscripts/111023.pdf (Accessed 23 July 2013).
Williams, P. & Naumann, E. (2011). Customer satisfaction and business performance: A
firm-level analysis. Journal of Services Marketing, 25(1):20-32.

288
Wong, K.Y. (2005). Critical success factors for implementing knowledge management in
small and medium enterprises. Industrial Management and Data Systems, 105(3):261-
279.
Wong, S.L. (2010). The relationship between job characteristics and job satisfaction
toward affective commitment:The case of engineers in Spakat Setia Perunding SDN BHD.
MBA, University Sains Malaysia
Workforce Planning Wisconsin State Government. (2005). Employee retention. Available
from:
http://www.cs.state.ny.us/successionplanning/workgroups/Retention/employeeretentionre
port.pdf (Accessed 3 December 2010).
Yaghoubi, N.M., Salehi, M. & Moloudi, J. (2011). Improving service quality by using
organisational citizenship behaviour: Iranian evidence. Iranian Journal of Management
Studies, 4(2):79-97.
Yang, F. (2011). Work, motivation and personal characteristics: an in-depth study
of six organisations in Ningbo. Chinese Management Studies, 5(3):272-297.
Yang, H. (2008). An Internal marketing study of service encounters between managers
and caddies in the Chinese golf industry. Doctoral thesis. Newcastle Business School.
Yang, J.T. (2012). The development and emergence of the internal marketing concept.
Available from: http://www.hicbusiness.org/biz2003proceedings/Jen-Te%20Yang.pdf
(Accessed 16 February 2012).
Yang, J., Alejandro, T.G.B. & Boles, J.S. (2011). The role of social capital and knowledge
transfer in selling center performance. Journal of Business & Industrial Marketing,
26(3):152-161.
Yao, J. (2006) . Customer service at a chain store in the greater Durban area. Master’s in
Technology degree, Faculty of Commerce, Durban University of Technology.
Yavas, U., Babakus, E. & Ashill, N.J. (2010). Testing a branch performance model in a
New Zealand bank. Journal of Services Marketing, 24(4):369-377.

289
Yilmaz, C. & Ergun, E. (2008). Organisational culture and firm effectiveness: An
examination of relative effects of culture traits and the balanced culture hypothesis in an
emerging economy. Journal of World Business, 48:290-306.
Yurchisin, J. & Damhorst, M.L. (2009). An investigation of salesperson appearance and
organisational identity. Journal of Fashion Marketing and Management, 13(3):458-470.
Zagenczyk, T.J., Murrell, A.J. & Gibney, R. (2007). Effects of the physical work
environment on the creation of individual and group-level social capital. International
Journal of Organisational Analysis, 15(2):124-125.
Zaman, K., Javaid, N., Arshad, A & Bibi, S. (2012). Impact of internal marketing on market
orientation and business performance. International Journal of Business and Social
Science, 3(12):76-87.
Zampetakis, L.A. & Moustakis, V. (2007). Fostering corporate entrepreneurship through
internal marketing. Journal of Innovation Management, 10(4):413-433.
Zeffane, R., Ibrahim, M. & Mehairi, R. (2008). Exploring the differential impact of job
satisfaction on employee attendance and conduct: The case of a utility company in the
United Arab Emirates. Employee Relations, 30(3):237-250.
Zeithaml, V.A., Bitner, M.J. & Gremler, D.D. (2006). Services marketing: Integrating
customer focus across the firm. New York: McGraw-Hill.
Zeithaml, V.A., Bitner, M. J., Gremler, D.D. (2012). Services marketing: Integrating
customer focus across the firm. 2nd ed. New York, McGraw-Hill.
Zhao, X., Huo, B., Flynn, B.B. & Yeung, J.H.Y. (2008). The impact of power and
relationship commitment on the integration between manufacturers and customers in a
supply chain. Available from: http://business.illinois.edu/ba/seminars/2010/flynn_paper.pdf
(Accessed 15 February 2012).
Zhao, X., Huo, B., Selen, W. & Yeung, J.H.Y. (2011): The impact of internal integration
and relationship commitment on external integration. Journal of Operations Management
29(1-2):17-32.

290
Zheng, C. (2009). Keeping talent for advancing service firms in Asia. Journal of Service
Management, 20(5):482-502.
Zikmund, W.G. & Babin, B.J. (2007). Exploring marketing research. 9th ed. Upper Saddle
River, New Jersey: Thomson South-Western.
Zikmund, W.G. & Babin, B.J. (2010). Essentials of marketing research. 4th ed. Mason,
Ohio: South Western, Cengage Learning.
Zikmund, W.G., Babin. B.J., Carr, J.C. & Griffin, M. (2010). Business research methods.
8th ed. Mason, Ohio: South Western, Cengage Learning.

291
APPENDICES
Appendix 1: GDP cover email and questionnaire
Dear Valued GDP Employee
Please make a difference and assist me in obtaining my Masters of Commerce degree, while
simultaneously contributing to a significant study that will add value to the business and academic
community at large.
This study is on how internal marketing influences employee job satisfaction (specifically Graduate
Development Employees) within the retail banking industry.
Brief background to the study
Service organisations have begun to place large emphasis on internal marketing in order to attract,
satisfy and retain employees within the organisation. The objective being that satisfied employees
are more able to deliver on the brand promises made to external customers. The purpose of this
study is to understand how the different elements of the internal marketing mix, namely internal
product, internal price, internal promotion, internal distribution, internal people, internal process and
internal physical evidence influence employee job satisfaction and the retention of talented
employees within the organisation specifically the retention of GDP employees.
You have been identified as a current GDP employee and therefore your opinion is held in high
regard to this study.
Information about the survey
I will be conducting the survey during the month of August and the questionnaire will take
approximately 15 minutes to complete. Should you choose to participate in this study an email
containing an electronic link hosted by the University of Johannesburg will be sent through to you.
Once you have completed the survey the information will be sent directly to the statistical
department of the University of Johannesburg for collation.
Any information obtained from this study will in no way reflect the identities of the people
participating in the study (it will be entirely anonymous). Your cooperation, opinions and attitudes
will be kept completely confidential.
If you would like to participate please email me on [email protected]. Please also cc
me on [email protected] to ensure that I receive the mail
Your opinion matters so please share it and add value to this study!
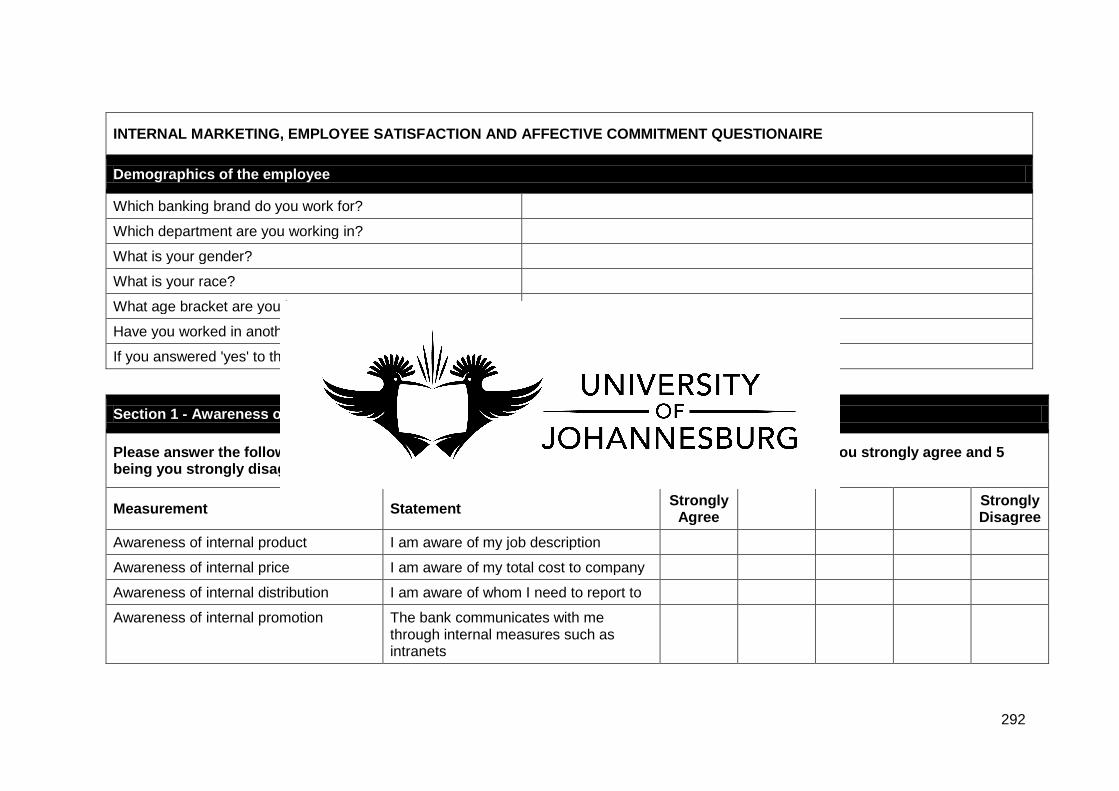
292
INTERNAL MARKETING, EMPLOYEE SATISFACTION AND AFFECTIVE COMMITMENT QUESTIONAIRE
Demographics of the employee
Which banking brand do you work for?
Which department are you working in?
What is your gender?
What is your race?
What age bracket are you in?
Have you worked in another organisation previously?
If you answered 'yes' to the previous question, please specify
Section 1 - Awareness of Internal Marketing Mix
Please answer the following questions in terms of how much you agree with the statement (i.e. 1 being you strongly agree and 5 being you strongly disagree)
Measurement Statement Strongly
Agree
Strongly Disagree
Awareness of internal product I am aware of my job description
Awareness of internal price I am aware of my total cost to company
Awareness of internal distribution I am aware of whom I need to report to
Awareness of internal promotion The bank communicates with me through internal measures such as intranets

293
Section 1 - Awareness of Internal Marketing Mix
Please answer the following questions in terms of how much you agree with the statement (i.e. 1 being you strongly agree and 5 being you strongly disagree)
Measurement Statement Strongly
Agree
Strongly Disagree
Awareness of internal processes I am aware of the processes involved in order to complete my work
Awareness of internal people I am aware of the different departments within the bank
Awareness of internal physical evidence I am aware that my physical working environment influences the way I perform my job
Section 2 - Internal Marketing
Please answer the following questions in terms of how much you agree with the statement (i.e. 1 being you strongly agree and 5 being you strongly disagree)
Measurement Statement Strongly
Agree
Strongly Disagree
Internal Product
Training and development It is important that the bank I work for provides me with training opportunities
Career advancement It is important that I have opportunities to advance my career in the bank I work for

294
Section 2 - Internal Marketing
Please answer the following questions in terms of how much you agree with the statement (i.e. 1 being you strongly agree and 5 being you strongly disagree)
Measurement Statement Strongly
Agree
Strongly Disagree
Role clarity It is important that I understand what I am expected to deliver in my job
Empowerment It is important that I am provided with the opportunity to make my own decisions
Role fit It is important that my skills match the job that I am doing
Degree of passion It is important to me to feel passionate about the work that I do
Training and development It is important that the bank I work for provides me with training opportunities
Internal Price
Willingness to go the extra mile It is important that I put in extra time to learn new processes in my bank
Burn out - exhaustion (psychological cost)
It is important that I do not have too much to do and too little time in my job
Stress (psychological cost) It is important that the sacrifices I make at work are worth it for me
Opportunity cost It is important to me to feel that by working for my bank I have not missed out on opportunities elsewhere

295
Section 2 - Internal Marketing
Please answer the following questions in terms of how much you agree with the statement (i.e. 1 being you strongly agree and 5 being you strongly disagree)
Measurement Statement Strongly
Agree
Strongly Disagree
Emotional labour It is important that I don't find it stressful to put on a 'happy face' at work when I am not in a happy mood
Depersonalisation (psychological cost) It is important that I feel responsive towards my bank
Internal Promotion
Communication It is important the bank’s vision is frequently communicated to me
Communication It is important that print materials (such as posters and newsletters) are frequently used by my bank to communicate to me
Communication It is important that events (such as roadshows) are frequently used by my bank to communicate to me
Communication It is important that my manager has one-on-one meetings to communicate to me
Communication It is important that my bank communicates to me through online mechanisms (i.e. intranet, Internet, email or social networking )
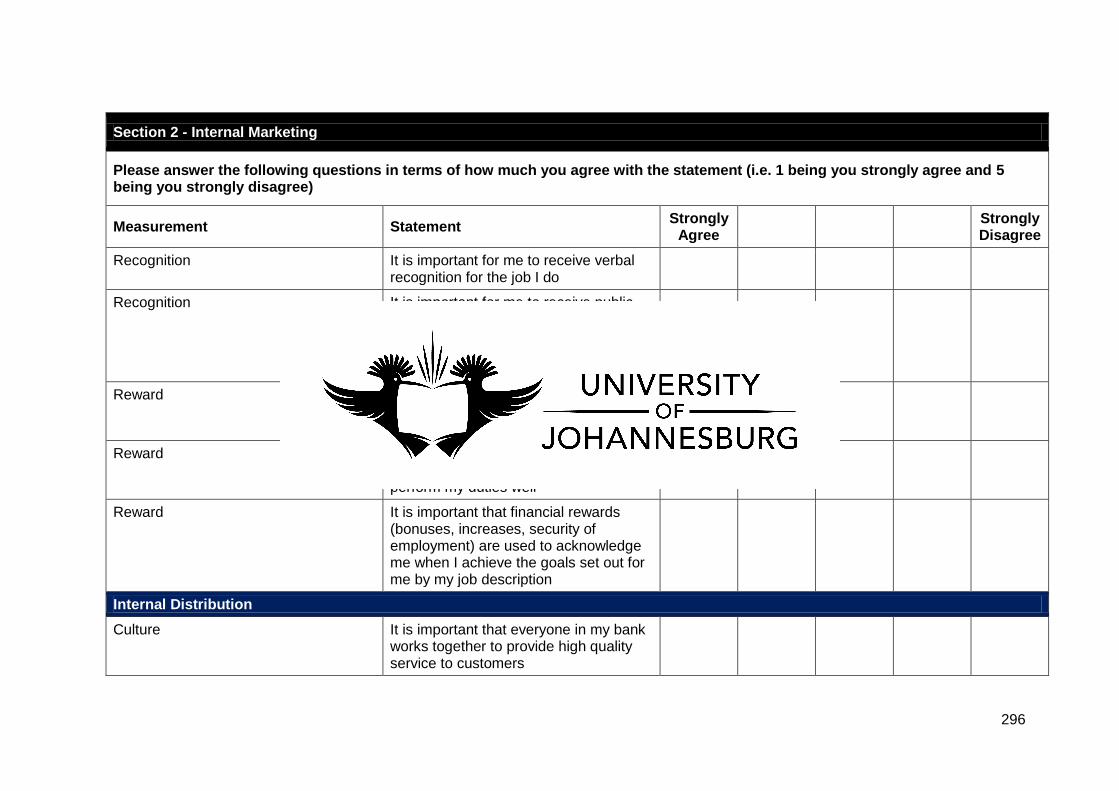
296
Section 2 - Internal Marketing
Please answer the following questions in terms of how much you agree with the statement (i.e. 1 being you strongly agree and 5 being you strongly disagree)
Measurement Statement Strongly
Agree
Strongly Disagree
Recognition It is important for me to receive verbal recognition for the job I do
Recognition It is important for me to receive public appreciation (so that my colleagues know I am a good performer and valued team member) when I achieve my performance goals
Reward It is important that the pay I receive is high compared with what others get for similar work at their organisations
Reward It is important for me to receive an award on a monthly/annual basis when I perform my duties well
Reward It is important that financial rewards (bonuses, increases, security of employment) are used to acknowledge me when I achieve the goals set out for me by my job description
Internal Distribution
Culture It is important that everyone in my bank works together to provide high quality service to customers

297
Section 2 - Internal Marketing
Please answer the following questions in terms of how much you agree with the statement (i.e. 1 being you strongly agree and 5 being you strongly disagree)
Measurement Statement Strongly
Agree
Strongly Disagree
Culture It is important for me to share the same values as my work colleagues
Culture It is important for me to frequently share information with my colleagues
Culture It is important for me to frequently share information with managers I do not report to
Structure It is important that I am easily able to implement plans set up within the boundaries of my job description
Structure It is important that my manager allows me to communicate with supporting departments without his/her permission
Structure It is important for me to be able to communicate with upper management when necessary
Internal People
Leadership (transformational) It is important that senior leaders in the bank communicate a clear vision
Leadership (transformational) It is important that senior leaders consider the suggestions of employees while making a decision

298
Section 2 - Internal Marketing
Please answer the following questions in terms of how much you agree with the statement (i.e. 1 being you strongly agree and 5 being you strongly disagree)
Measurement Statement Strongly
Agree
Strongly Disagree
Leadership (Participative) It is important that senior leaders in the bank share information about the bank with employees
Leadership (Participative) It is important that senior leaders in the bank encourage teamwork
Supervisor It is important that my manager/supervisor supports me by treating me fairly
Supervisor It is important that my manager/supervisor communicates openly with me
Co-workers It is important that my co-workers treat me with respect
Co-workers It is important to me that my co-workers are satisfied with their jobs
Internal Processes
Process design It is important that the bank I work for has well designed processes
Process delivery It is important that the support activities offered by other departments are reliable

299
Section 2 - Internal Marketing
Please answer the following questions in terms of how much you agree with the statement (i.e. 1 being you strongly agree and 5 being you strongly disagree)
Measurement Statement Strongly
Agree
Strongly Disagree
Process improvement It is important that improved ways of doing tasks at work are found allowing me to give better service to my internal customers
Process design It is important to have automated processes that allow me to save time
Internal Physical Evidence
Physical evidence It is important for me to work in a physically appealing environment
Physical evidence It is important that the layout of my office is easy to work in
Physical evidence It is important that my colleagues are grouped around me in a pleasant manner
Essential evidence It is important that my manager/supervisor helps me set both personal and work-related goals
Essential evidence It is important that my manager/supervisor frequently provides feedback relating to my work performance

300
Section 3 - Employee Job Satisfaction
Please answer the following questions in terms of how much you agree with the statement (i.e. 1 being you strongly agree and 5 being you strongly disagree)
Measurement Statement Strongly
Agree
Strongly Disagree
Satisfaction I am positive about my job
Satisfaction I have positive feelings towards the bank I work for
Satisfaction I feel satisfied with the job I am doing for my bank
Satisfaction I will recommend working for this bank to others
Section 4 - Affective Commitment (Retention)
Please answer the following questions in terms of how much you agree with the statement (i.e. 1 being you strongly agree and 5 being you strongly disagree)
Measurement Statement Strongly
Agree
Strongly Disagree
Affective commitment I would be happy to spend the rest of my career with my bank
Affective commitment I do not feel a strong sense of 'belonging' to my bank
Affective commitment I feel 'emotionally attached' to my bank

301
Section 4 - Affective Commitment (Retention)
Please answer the following questions in terms of how much you agree with the statement (i.e. 1 being you strongly agree and 5 being you strongly disagree)
Measurement Statement Strongly
Agree
Strongly Disagree
Affective commitment I feel like a 'part of the family' at my bank
Affective commitment The relationship between my bank (as an employer) and myself is mutually beneficial
Affective commitment My bank is the first company that comes to mind when I make future career decisions
Affective commitment I intend to stay in a committed relationship with my bank (as my employer)

302
Appendix 2: Histograms for the internal marketing mix, employee satisfaction and
affective commitment
Internal product Internal price
Collaborative culture Organisational structure

303
Internal people Internal process
Employee satisfaction Affective commitment

304
Appendix 3: Scatter plots for internal marketing mix elements, employee
satisfaction and affective commitment
Internal product and employee satisfaction
Internal price and employee satisfaction

305
Organisational structure and employee satisfaction
Collaborative culture and employee satisfaction
Internal people and employee satisfaction

306
Internal process and employee satisfaction
Employee satisfaction and affective commitment

307
Appendix 4: Box-and-whisker plots for the internal marketing mix, employee
satisfaction and affective commitment
Internal Product Internal Price
Internal promotion Organisational structure

308
Collaborative culture Internal people
Internal process
Employee satisfaction Affective commitment
Copyright © 2022 FDOKUMEN