Dissecting Motivation: Translational Approaches and Clinical ...
176
Dissecting Motivation: Translational Approaches and Clinical Implications Billur Avlar Submitted in partial fulfillment of the requirements for the degree of Doctor of Philosophy in the Graduate School of Arts and Sciences COLUMBIA UNIVERSITY 2016
-
Upload
khangminh22 -
Category
Documents
-
view
4 -
download
0
Transcript of Dissecting Motivation: Translational Approaches and Clinical ...

Dissecting Motivation: TranslationalApproaches and Clinical Implications
Billur Avlar
Submitted in partial fulfillment of the
requirements for the degree
of Doctor of Philosophy
in the Graduate School of Arts and Sciences
COLUMBIA UNIVERSITY
2016

c©2016
Billur Avlar
All Rights Reserved

ABSTRACT
Dissecting Motivation: TranslationalApproaches and Clinical Implications
Billur Avlar
The question of how motivation affects our behavior is a long debated issue. Be-
yond pleasure and pain, motivation is closely related to cognitive functions and a key
player in the self-regulation. The relationship between cognition and motivation was
investigated from several angles, but a parsimonious explanation still awaits.
In order to create a framework to understand the interaction between cognition
and motivation, I chose two aspects of this relationship. Executive functions are one
of the most studied psychological concepts and their components closely resemble
the units of motivational processes. Secondly, a specific neural signature, dopamine,
was selected due to its involvement in both executive functions and motivational
processes. To enable dissection of motivation, in this thesis, we used a translational
and a multilevel approach.
In the first part, we focused on schizophrenia, which has a clinical presentation
of cognitive (especially executive functions) and motivational deficits. Using a trans-
genic animal model mimicking the dopaminergic dysfunction related to schizophrenia,
we manipulated motivation genetically, behaviorally, and pharmacologically and pre-
sented the changes in interval timing function.
Part 2 of this thesis consists of 3 studies performed in humans to delineate the
role of motivational orientations as measured by regulatory focus and regulatory mode
surveys. A probabilistic reversal task and an n-back task were used to explore different
components of executive functions; namely maintenance and monitoring, updating

the representations, switching, and behavioral inhibition. The results of these studies
showed that specific motivational orientations and their interactions could predict
cognitive performance.

Table of Contents
List of Figures v
List of Tables x
1 General Introduction 1
1.1 What is Motivation? . . . . . . . . . . . . . . . . . . . . . . . . . . . 1
1.2 Motivation and cognition in normal and disease states: dopamine as a
neuronal signature . . . . . . . . . . . . . . . . . . . . . . . . . . . . 5
1.3 Approach . . . . . . . . . . . . . . . . . . . . . . . . . . . . . . . . . 8
1.4 Outline of the studies . . . . . . . . . . . . . . . . . . . . . . . . . . . 9
I Animal Studies: Dopamine 2R Receptor Overexpression
Model of Negative Symptoms of Schizophrenia 13
2 Improving Temporal Cognition by Enhancing Motivation 14
2.1 Introduction . . . . . . . . . . . . . . . . . . . . . . . . . . . . . . . . 15
2.2 Methods . . . . . . . . . . . . . . . . . . . . . . . . . . . . . . . . . . 17
2.2.1 Subjects . . . . . . . . . . . . . . . . . . . . . . . . . . . . . . 17
2.2.2 Apparatus . . . . . . . . . . . . . . . . . . . . . . . . . . . . . 18
2.2.3 Operant Lever Press Training . . . . . . . . . . . . . . . . . . 18
2.2.4 Temporal Discrimination Training . . . . . . . . . . . . . . . . 19
2.2.5 Normalizing D2R expression in D2R-OE mice . . . . . . . . . 20
i

2.2.6 Reward magnitude manipulation . . . . . . . . . . . . . . . . 20
2.2.7 Pharmacological manipulation . . . . . . . . . . . . . . . . . . 21
2.2.8 Data Analysis . . . . . . . . . . . . . . . . . . . . . . . . . . . 21
2.3 Results . . . . . . . . . . . . . . . . . . . . . . . . . . . . . . . . . . . 23
2.3.1 Study 1: Normalizing D2 Receptor Overexpression Improves
Temporal Discrimination . . . . . . . . . . . . . . . . . . . . . 23
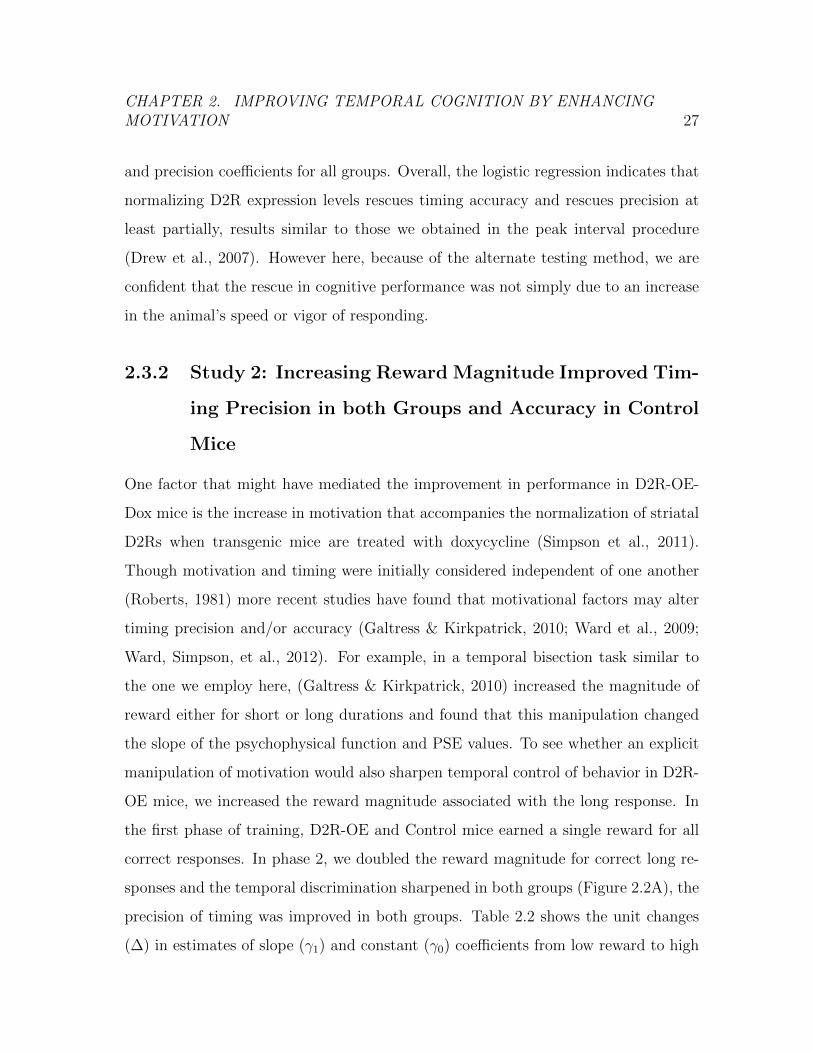
2.3.2 Study 2: Increasing Reward Magnitude Improved Timing Pre-
cision in both Groups and Accuracy in Control Mice . . . . . 27
2.3.3 A Downshift in Reward Magnitude Reduced Timing Accuracy
in both Groups and Reduced Timing Precision in D2R-OE mice 28
2.3.4 Study 3: Interval Timing Performance is Improved by Modula-
tion of the 5-HT2C Receptor in both Groups . . . . . . . . . . 31
2.3.5 Discussion . . . . . . . . . . . . . . . . . . . . . . . . . . . . . 34
2.4 Acknowledgements . . . . . . . . . . . . . . . . . . . . . . . . . . . . 40
2.5 Abbreviations . . . . . . . . . . . . . . . . . . . . . . . . . . . . . . . 40
II Human Studies: Motivational Orientations and Execu-
tive Functions 41
3 Introduction 42
4 Probabilistic Reversal Learning 45
4.1 Study 4 . . . . . . . . . . . . . . . . . . . . . . . . . . . . . . . . . . 45
4.2 Introduction . . . . . . . . . . . . . . . . . . . . . . . . . . . . . . . . 45
4.3 What is New in This Task? . . . . . . . . . . . . . . . . . . . . . . . 51
4.4 Composition of a Decision in a Probabilistic Reversal Task . . . . . . 52
4.5 Selection of the Appropriate Sample Space: Simplex . . . . . . . . . . 53
4.6 Instantaneous Rate Estimates for Sensitivity and Preference . . . . . 56
4.7 Methods . . . . . . . . . . . . . . . . . . . . . . . . . . . . . . . . . . 58
ii

4.7.1 Subjects . . . . . . . . . . . . . . . . . . . . . . . . . . . . . . 58
4.7.2 Tasks and Procedure . . . . . . . . . . . . . . . . . . . . . . . 59
4.7.3 Questionnaires . . . . . . . . . . . . . . . . . . . . . . . . . . 60
4.8 Results . . . . . . . . . . . . . . . . . . . . . . . . . . . . . . . . . . . 62
4.8.1 Sensitivity results . . . . . . . . . . . . . . . . . . . . . . . . . 62
4.8.2 Preference results . . . . . . . . . . . . . . . . . . . . . . . . . 66
4.8.3 Preferences of Fractal A . . . . . . . . . . . . . . . . . . . . . 68
4.8.4 Preferences of Fractal B . . . . . . . . . . . . . . . . . . . . . 72
4.8.5 Preferences of Fractal C . . . . . . . . . . . . . . . . . . . . . 78
4.9 Discussion . . . . . . . . . . . . . . . . . . . . . . . . . . . . . . . . . 84
5 Working Memory and Motivation 92
5.1 Introduction . . . . . . . . . . . . . . . . . . . . . . . . . . . . . . . . 92
5.2 Study 5: Working Memory . . . . . . . . . . . . . . . . . . . . . . . . 97
5.3 Methods . . . . . . . . . . . . . . . . . . . . . . . . . . . . . . . . . . 97
5.3.1 Subjects . . . . . . . . . . . . . . . . . . . . . . . . . . . . . . 97
5.3.2 Tasks and procedure . . . . . . . . . . . . . . . . . . . . . . . 97
5.3.3 Single n-back task with varying difficulty . . . . . . . . . . . . 97
5.3.4 Questionnaires . . . . . . . . . . . . . . . . . . . . . . . . . . 98
5.4 Results . . . . . . . . . . . . . . . . . . . . . . . . . . . . . . . . . . . 99
5.4.1 Hits . . . . . . . . . . . . . . . . . . . . . . . . . . . . . . . . 99
5.4.2 False alarms . . . . . . . . . . . . . . . . . . . . . . . . . . . . 100
5.4.3 Total Score . . . . . . . . . . . . . . . . . . . . . . . . . . . . 101
5.5 Study 6: Working Memory with framing . . . . . . . . . . . . . . . . 101
5.6 Methods . . . . . . . . . . . . . . . . . . . . . . . . . . . . . . . . . . 101
5.6.1 Subjects . . . . . . . . . . . . . . . . . . . . . . . . . . . . . . 101
5.6.2 Tasks and procedure . . . . . . . . . . . . . . . . . . . . . . . 101
5.6.3 Single n-back task with success and failure framing . . . . . . 101
5.6.4 Questionnaires . . . . . . . . . . . . . . . . . . . . . . . . . . 102
iii

5.7 Results . . . . . . . . . . . . . . . . . . . . . . . . . . . . . . . . . . . 102
5.7.1 Hits . . . . . . . . . . . . . . . . . . . . . . . . . . . . . . . . 103
5.7.2 False alarms . . . . . . . . . . . . . . . . . . . . . . . . . . . . 103
5.7.3 Total Score . . . . . . . . . . . . . . . . . . . . . . . . . . . . 104
5.8 Discussion . . . . . . . . . . . . . . . . . . . . . . . . . . . . . . . . . 105
III Conclusions 110
6 General Discussion 111
IV Bibliography 122
Bibliography 123
V Appendices 140
A Questionnaires 141
A.1 RFQ . . . . . . . . . . . . . . . . . . . . . . . . . . . . . . . . . . . . 141
A.2 RMODE . . . . . . . . . . . . . . . . . . . . . . . . . . . . . . . . . . 143
B Tables of Results 146
iv

List of Figures
2.1 Performance of Control, D2R-OE and D2R-OE-Dox Mice in the Tem-
poral Bisection Task. A) Mean proportion of responses to the lever
associated with the ‘long’ sample duration as a function of sample du-
ration (seconds) in control mice (black circles and lines), D2R-OE mice
(light gray diamonds and lines) and D2R-OE mice fed with doxycy-
cline , D2R-OE-DOX (dark gray squares lines). B) Data fit by bi-
nomial logistic regression is superimposed with the mean proportion
of long responses per sample duration for Control (black circles and
lines), D2R-OE (light gray diamonds and lines) and D2R-OE-DOX
(dark gray squares and lines) mice. Lower row of graphs show model
coefficients for each group after addition of fixed effect estimates: C)
the accuracy coefficient (β0 ± SE), D) the slope coefficient (β1 ± SE). 25
v

2.2 Performance of Control and D2R-OE Mice in the Temporal Bisection
Task with Changes in Reward Magnitude. The upper row of graphs
show mean proportion of responses to the lever associated with the
‘long’ sample duration as a function of sample duration (seconds) in
3 phases (phase1-low reward = black circles and lines, phase2-high re-
ward = dark gray squares and lines, and phase3-low reward = light gray
diamonds and lines). A) Control mice, B) D2R-OE mice. The lower
row of graphs show data fit by binomial logistic regression superim-
posed with the mean proportion of long responses per sample duration
for C) Control mice and D) D2R-OE mice in each phase (Same phase
symbols as A and B). . . . . . . . . . . . . . . . . . . . . . . . . . . 29
2.3 Model coefficients for each group after addition of fixed effect estimates:
E) the accuracy coefficient (β0±SE), F) the slope coefficient (β1±SE).
Control = black circles, D2R-OE = gray diamonds. . . . . . . . . . . 31
2.4 The Effect of SB242084 on the Performance of Control and D2R-OE
Mice in the Temporal Bisection Task. The upper row of graphs show
mean proportion of responses to the lever associated with the ‘long’
sample duration as a function of sample duration (seconds) in saline
(black circles and lines) and drug (gray squares and lines) phases for
A) control mice and B) D2R-OE mice. The lower row of graphs show
data fit by binomial logistic regression superimposed with the mean
proportion of long responses per log sample duration for C) Control
mice and D) D2R-OE mice in each phase (saline = black circles and
lines, drug = gray squares and lines). . . . . . . . . . . . . . . . . . 33
2.5 Model coefficients for each group after addition of fixed effect estimates:
E) the accuracy coefficient (β0±SE), F) the slope coefficient (β1±SE).
Control = black circles, D2R-OE = gray diamonds. . . . . . . . . . . 34
4.1 Fractal images and corresponding probabilities in all three phases. . 60
vi

4.2 Mean sensitivity scores across participants in 3 phases for every trial.
Loess smoothing is applied and gray boundary lines show the standard
error. . . . . . . . . . . . . . . . . . . . . . . . . . . . . . . . . . . . 61
4.3 Sensitivity scores across phases for every participant. Phase 1 = blue,
Phase 2 = pink, and Phase 3 = green curves. . . . . . . . . . . . . . 63
4.4 Quadratic-Polynomial Model Predictions. Model predictions for sensi-
tivity (black circles) and the mean sensitivity scores superimposed (red
circles) for three phases. . . . . . . . . . . . . . . . . . . . . . . . . . 64
4.5 Quadratic-Polynomial Model Predictions for Promotion. Model pre-
dictions of sensitivity in three phases for low (black) and high (red)
levels of promotion orientation. . . . . . . . . . . . . . . . . . . . . . 65
4.6 Quadratic-Polynomial Model Predictions for Prevention. Model pre-
dictions of sensitivity in three phases for low (black) and high (blue)
levels of prevention orientation. . . . . . . . . . . . . . . . . . . . . . 67
4.7 Mean Preference of Fractal A in three phases. Loess smoothing is
applied. Note that three phases are not continuous, every phase shows
the last 50 trials of participant’s whole phase. . . . . . . . . . . . . . 68
4.8 Data points and linear fit superimposed for Fractal A preferences for
Promotion. Linear model fit for each phase is shown over the mean
preference data points (smoothing is applied). . . . . . . . . . . . . . 69
4.9 Data points with linear fit superimposed for Fractal A preferences for
Prevention. Linear model fit for each phase is shown over the mean
preference data points (smoothing is applied). . . . . . . . . . . . . . 71
4.10 Data points with linear fit superimposed for Fractal A preferences.
Linear model fit for each phase is shown over the mean preference data
points (smoothing is applied). . . . . . . . . . . . . . . . . . . . . . . 72
4.11 Effect plot of trialphase*phase*promotiongroup interaction from linear
model fit for each phase is shown. . . . . . . . . . . . . . . . . . . . . 73
vii
4.12 Mean Preference for Fractal B. Mean preference for three phases, Loess
smoothing is applied. Note that three phases are not continuous, every
phase shows the last 50 trials of participant’s whole phase. . . . . . . 74
4.13 Data points with linear fit superimposed for Fractal B preferences for
Promotion Linear model fit for each phase is shown over the mean
preference data points (smoothing is applied). . . . . . . . . . . . . . 75
4.14 Data points with linear fit superimposed for Fractal B preferences for
Prevention Linear model fit for each phase is shown over the mean
preference data points smoothing is applied. . . . . . . . . . . . . . . 77
4.15 Data points with linear fit superimposed for Fractal B preferences Lin-
ear model fit for each phase is shown over the mean preference data
points smoothing is applied. . . . . . . . . . . . . . . . . . . . . . . 78
4.16 Effect plot of trialphase*phase*promotiongroup interaction from linear
model fit for each phase is shown. . . . . . . . . . . . . . . . . . . . . 79
4.17 Mean Preference for Fractal C. Mean preference for three phases, loess
smoothing is applied. Note that three phases are not continuous, every
phase shows the last 50 trials of participant’s whole phase. . . . . . . 80
4.18 Data points with linear fit superimposed for Fractal C preferences for
Promotion. Linear model fit for each phase is shown over the mean
preference data points (smoothing is applied). . . . . . . . . . . . . . 81
4.19 Data points with linear fit superimposed for Fractal C preferences for
Prevention. Linear model fit for each phase is shown over the mean
preference data points (smoothing is applied). . . . . . . . . . . . . . 82
4.20 Data points with linear fit superimposed for Fractal C preferences.
Linear model fit for each phase is shown over the mean preference data
points (smoothing is applied). . . . . . . . . . . . . . . . . . . . . . . 83
4.21 Effect plot of trialphase*phase*promotiongroup interaction from linear
model fit for each phase is shown. . . . . . . . . . . . . . . . . . . . . 84
viii

4.22 Mean preferences for high vs low promotion vs prevention groups for
three fractal images. Green= Fractal C, Red= Fractal B, Blue=Fractal
A . . . . . . . . . . . . . . . . . . . . . . . . . . . . . . . . . . . . . 89
5.1 Effect plot of assessment*promotion interaction from linear model fit
is shown. . . . . . . . . . . . . . . . . . . . . . . . . . . . . . . . . . 100
5.2 Effect plot of assessment*framing interaction from linear model fit is
shown. Success Frame =0, Failure Frame=1 . . . . . . . . . . . . . . 104
5.3 Effect plot of locomotion effect on total score for loss framing condition
from linear model fit is shown. . . . . . . . . . . . . . . . . . . . . . . 105
5.4 Effect plot of locomotion and assessment interaction on total score for
failure framing condition from linear model fit is shown. . . . . . . . . 106
ix

List of Tables
2.1 Characterization of Performance on the Temporal Bisection Task using
Multilevel Logistic Regression. ∆γ-estimates, standard error (S.E.), z-
values and p-values for fixed effects of groups. ∆γ-estimate indicates
the unit change for either the constant coefficient (γ0) or the slope
coefficient (γ1) in log-odds units. The model specifies the control group
as the baseline condition and values for D2R-OE and D2R-OE-Dox
correspond to the contribution of those group variables to the baseline
coefficients. For details of the model see the data analysis section in
the Methods. n.s. = not significant. . . . . . . . . . . . . . . . . . . . 26
2.2 Characterization of the Effect of Changing Reward Magnitude in the
Temporal Bisection Task using Multilevel Logistic Regression. ∆γ-
estimates, standard error (S.E.), z-values and p-values for fixed effects
of reward magnitude and the interaction between genotype and reward
magnitude. Low–High Reward indicates the shift from phase 1 to phase
2, High–Low Reward indicates the shift from phase 2 to phase 3. The
genotype variable is centered at zero. ∆γ-estimate indicates the unit
change for either the constant coefficient (γ0) or the slope coefficient
(γ1) in log-odds units. n.s. = not significant. . . . . . . . . . . . . . . 30
x

2.3 Characterization of the Effect of SB242084 on Performance in the
Temporal Bisection Task using Multilevel Logistic Regression. ∆γ-
estimates, standard error (S.E.), z-values and p-values for fixed effects
of drug condition and the interaction between genotype and drug con-
dition. ∆γ-estimate indicates the unit change for either the constant
coefficient (γ0) or the slope coefficient (γ1) in log-odds units. n.s. =
not significant. . . . . . . . . . . . . . . . . . . . . . . . . . . . . . . 32
4.1 Estimates, SE, t-value and and p-value for the difference between high
promotion-low promotion for coefficients of the polynomial-quadratic
model. ND= no difference . . . . . . . . . . . . . . . . . . . . . . . . 66
4.2 Estimates, SE, t-value and and p-value for the difference between high
prevention-low prevention for coefficients of the polynomial-quadratic
model. ND= no difference . . . . . . . . . . . . . . . . . . . . . . . . 66
5.1 Estimates, SE, t-value and and p-value from main effects model for
predicting the false alarms . . . . . . . . . . . . . . . . . . . . . . . . 100
B.1 Results of the analysis of regulatory mode (4) X regulatory focus (4)X
TrialphaseX phase (3) model for Fractal A. Residual standard error:
0.4542 on 8904 degrees of freedom, Adjusted R-squared: 0.4433 F-
statistic: 76.44 on 95 and 8904 DF, p-value: less than 2.2e-16 . . . . 146
B.2 Results of the analysis of regulatory mode (4) X regulatory focus (4)X
TrialphaseX phase (3) model for Fractal B. Residual standard error:
0.4626 on 8904 degrees of freedom, Adjusted R-squared: 0.3433 F-
statistic: 50.51 on 95 and 8904 DF, p-value: less than 2.2e-16 . . . . 151
B.3 Results of the analysis of regulatory mode (4) X regulatory focus (4)X
TrialphaseX phase (3) model for Fractal C. Residual standard error:
0.3866 on 8904 degrees of freedom, Adjusted R-squared: 0.3182 F-
statistic: 45.22 on 95 and 8904 DF, p-value: less than 2.2e-16 . . . . 155
xi

Acknowledgments
Life during graduate years can present unexpected and though circumstances. In
my case, I was lucky to have many people support me when things did not work the
way they were planned. I would like to acknowledge Ed Smith first in this regard,
him leaving us too early was a huge loss. I cherish the time I spent with him during
the time he was my advisor and I am indebted to him for his efforts to accept me as
a graduate student in this program.
Being part of Higgins lab was transformative in my scientific thinking. I thank
Tory Higgins; you always made me feel as part of the family, thank you for your
unconditional support and for being so open-minded. Now, I see that if there is
something that proves that I am your protege, it is that the breadth of the studies I
presented in this thesis, and you are an expert in seeing the big picture! My trajectory
during my graduate studies was led to a better end by the efforts of Niall Bolger. I
can not thank him enough for his valuable advices on both academic and personal
matters dealing with the troubles of graduate life. I also would like to acknowledge
my former advisor Peter Balsam and collaborator Eleanor Simpson for their guidance
and help in animal studies. Appreciation is further due to Daphna Shohamy who
was a great role model. I appreciate all the support, encouragement, and kindness
by Eric Lang who has a tremendous role in helping me becoming a better scientist. I
also thank you all for agreeing to be in my committee.
I would also like to thank my friends who were always there for me in good
and bad times, Svetlana Komissarouk, Ljubica Chatman, Caroline Marvin, Christine
Webb, and many other graduate fellows whom I unfortunately can’t list here all. I
xii

was surrounded with valuable colleagues in both labs I worked. I thank Greg Jensen
and Matt Bailey for sharing the experience. Specially, Greg was influential as a big
brother and always available in gchat to answer my never-ending questions. The
current members of Higgins family; Svetlana, Marta, Maya, Katherine, Mark, and
Mirei, it was a pleasure to share the office with you. I would also like to acknowledge
the hard work of all my RAs and lab technicians who made the work I presented
in this thesis possible. I feel privileged to be a part of Graduate Student Advisory
Council (GSAC) as the culture chair. This position brought me a lot of wisdom and
valuable discussions with members of GSAC and our deans as advisors.
My graduate study in Columbia University brought to my life an exceptional
person, Renee Marton, you are an inspiration to me. This thesis could not have been
as impeccable as it is now without the help of Ozan Erdogan. In addition to bearing
all my emotional volatility with me, he was an excellent colleague and editor. Finally,
I would like to express my deep gratitude for my parents and my sister. Without the
tenacity of my mother and selfless hard work of my father, I would not have been
able to achieve this level of training. They have never doubted I will succeed, and I
am grateful for their continuous support forever.
xiii

To my parents
xiv

CHAPTER 1. GENERAL INTRODUCTION 1
Chapter 1
General Introduction
1.1 What is Motivation?
The concept of motivation is a burning inquiry dating back to ancient Greek phi-
losophy. The same question has appeared over and over in different disciplines and
approaches: what would make a person/organism act in a certain way that will max-
imize the well-being, what do motivate us?
One of the predominant ideas is hedonism; the act of maximizing the pleasure
and minimizing the pain, is the main route to the happiness and therefore organisms
strive for hedonic outcomes. Indeed, the concept of hedonism attracted a lot of at-
tention throughout the history of thought. As the first philosopher who raised the
question of pleasure as an identity question, Plato would say pleasure is a replen-
ishment or restoration to the natural state, which will create an intrinsically good
state (Wolsdorf, 2013). Jumping to experimental psychology era, while behaviorists,
ignored the motivation concept altogether, neobehaviorists reduced the problem of
motivation simply to a drive or a need state, and saw it just as an intervening variable
for decades. Hull (1943) would explain his case as follows: stimulus response relations
can provide the direction. There must be a deficit state, unsatisfied need that will
produce the drive and this will in turn create an action. The level of drive is the

CHAPTER 1. GENERAL INTRODUCTION 2
sum of all drives, even if they seem not relevant. Each drive combines with all others
to create an undifferentiated amount to be used for the goal related activity-pooled
energy source. But he lacks a specific explanation for the energy required for the
action. All purpose pooled energy concept is later challenged by cognitive and social
psychologists. As many others, Maslow (1943) opposed to reductionist view of the
behavior and motivation:
“Motivation theory is not synonymous with behavior theory. The moti-
vations are only one class of determinants of behavior. While behavior is
almost always motivated, it is also almost always biologically, culturally
and situationally determined as well.”
Maslow (1943) outlined a hierarchy of needs that will relate to motivation to un-
derstand the process to maximize satisfaction of needs. This hierarchy also allows
for the differentiation of needs to levels that require elaborate allocation of energy
or cognitive and physiological capacity. Examples for these needs are physiological,
safety, love, esteem ands self-actualization needs. White (1959) introduced compe-
tence as a motivator, his theory added beyond hedonistic value and biological need
theories. He defined the competence as an organism’s capacity to interact effectively
with environment and came up with the effectance motivation concept. For a re-
view of theories explaining motivational beliefs and their relation to goals and values,
please see Eccles and Wiggfield (2002).
In addition to describing what is motivation, Carver and Scheier (2012) were
also interested in explaining the mechanism of motivation and how we construct and
update goals in a cybernetic model (1981). With this kind of a feedback mechanism,
they predicted the approach and avoidance processes through discrepancy reducing
and enlarging loops. Another seminal motivation theory that describe the behavior
through discrepancies is the self-discrepancy theory. Higgins (1987) describes the self
in three basic domains: a) the actual self, representation of the attributes someone
believes herself possesses; b) the ideal self, representation of the attributes someone

CHAPTER 1. GENERAL INTRODUCTION 3
will ideally possess (hopes and aspirations); c) the ought self, representation of the
attributes someone will ought to possess (duties, responsibilities). Ideal and ought
self-states are used as self-guides in comparison to own self states and people differ
in their motivation to reach a condition that self-concept will match the relevant
self-guides. As a result of this process, chronic discrepancies are formed between
the self-concept and self-guides, and these discrepancies are related to approach and
avoidance behavior (Higgins, Roney, Crowe, Hymes, 1994) and different motivational
orientations. In line with the self-discrepancy theory, ideal and ought self-regulation
can be seen as components of regulatory focus (Higgins, 1996).
With Regulatory Focus Theory (RFT), Higgins approached motivation in a dif-
ferent way. Instead of treating pain and pleasure unidimensionally, this theory is an
attempt to classify promotion (approaches to gains) and prevention (approaches to
nonlosses) traits and states in individuals (Higgins, 1998). In self-discrepancy terms,
a promotion focus is related to ideal self-regulatory goals while ought self-regulatory
goals has a prevention focus. Hence, the theory asserts that the fit between the in-
dividual’s motivational traits and the conditional states would create a incentive for
actions and decisions (Cesario, Grant and Higgins, 2004).
In addition to regulatory focus theory of motivation, regulatory mode theory de-
scribes the truth, and control motivations working together. Instead of creating a uni-
dimensional regulatory function system, Kruglanski et al. (2000; Higgins, Kruglanski
and Pierro, 2003) proposed a system consisted of locomotion (progress) and assess-
ment (get things right) modes, which are orthogonal to each other. The independence
of locomotion and assessment enables scenarios where an individual could be high or
low on both assessment and locomotion. Assessment mode mainly is related to mak-
ing comparisons between target and standard (what is real, truth motivation). Doing
things right is one of the goals and to be able ensure this, an individual with high
assessment would be good at assessing the end state and comparing it to other al-
ternative end states. Locomotion mode, however, is all about movement and change

CHAPTER 1. GENERAL INTRODUCTION 4
from the current state. Main concern of the locomotion mode is to initiate movement
and to sustain it smoothly, and could be summarized with the motto: just do it.
We can track these concepts from philosophical readings, Democritus describes
the contented man in his work On Contentment.
“The contented man (euthymos) who undertakes right and lawful deeds
rejoices in sleeping and walking and is strong and free from care. But
he who takes no heed of what is right and does not do what he should
is distressed by all these things, whenever he remembers them, and is
frightened and reproaches himself. (B174, translation by Wolsdord, 2013)
Here Democritus explains how contented man will behave with an oughts self-
regulation and seek pleasure from preventing and probably assessing the right out-
comes determined by the norms and law.
While all of these theories provide valuable insight to motivation, the need for
objectively understanding the mechanism how motivation related to cognition re-
quires elaborate testing. As an example from neuroscience, Berridge (Smith, Tindell,
Aldridge and Berridge, 2009; Berridge, Robinson and Aldridge, 2009) performed a se-
ries of experiments with rats where he demonstrated how liking and wanting could be
dissociated in the nucleus accumbens shell. This type of dissociation further provides
evidence for the role of motivation beyond hedonistic value, and this information can
readily be translated to clinical disorders where motivational disturbance is observed.
This line of research has already been extended to clinical populations, where in
schizophrenia patients, a deficit in wanting but not liking occurs, patients would like
to consume the rewarding food, however they would not want to spend any effort to
retrieve the rewarding food (Strauss et al., 2011).
As it is outlined above, behavioral analysis of behavior can provide quantitative
understanding of reward motivation whereas social psychology studies the individual
in the motivational processes. There is a need for a synthesis of two kinds of analyses,
in which a more precise quantitative understanding of individual motivational orien-

CHAPTER 1. GENERAL INTRODUCTION 5
tations could be obtained. The relationship between motivation and cognition could
be understood better by establishing a synthesis of approaches from different disci-
plines. Therefore, in human studies, we used regulatory focus and regulatory mode
theories to measure individual motivational orientations and used them as predictors
in trial by trial evaluation of sensitivity, preference and working memory function.
1.2 Motivation and cognition in normal and dis-
ease states: dopamine as a neuronal signature
In this section, I will give an outline of the relationship between motivation and cog-
nition, and give evidence of their mutual involvement in dopamine related disorders.
However, it must be noted that in some of the studies below, motivation for rewards
and punishment is used to describe the relation or impact of motivation to cogni-
tion. We limit our investigation on cognition and motivation specifically to executive
functions.
Motivation and cognition are historically defined as distinct psychological con-
structs, due to the usefulness of such a classification. However, the neural systems that
are responsible for active maintenance and manipulation of information, the internal
representation of goals and the motivated behaviors, and the motivational states ac-
tually coincide (Braver et al, 2014). The resemblance of self-regulatory mechanisms
with executive functions were also reported by Hofmann, Schmeichel, and Baddeley
(2012), where they paired working memory operations to active representation of self-
regulatory goals and standards; behavioral inhibition to active inhibition of prepotent
impulses and habitual, ‘mindless’ behaviors and task switching to switching between
multiple goals (‘goal-shifting/balancing’). Therefore, motivation and cognition inter-
action should not be understood in mechanistic discrete terms and should not be
thought of an intersection point of different neural systems.
Executive functions require focused and sustained attention, anticipation, plan-

CHAPTER 1. GENERAL INTRODUCTION 6
ning, goal selection, monitoring, flexible set shifting, maintenance, manipulation and
retrieval of the information, and use of feedback to guide the behavior. Previous
research demonstrated one of the most important brain region involved in these func-
tions is the frontal cortex, in addition to other cortical and subcortical regions (Smith
and Jonides, 1998). In corroboration with this, patients with frontal lobe lesions had
difficulties in components of executive functions depending on the lesion location and
severity (Almarez and Emory, 2006).
Evidence that the mesocortical and nigrostriatal DA systems have a common role
in cognitive and reward-related processes corroborates the similarities of functions of
motivation and executive functions. An inverted U function of D1 receptors in the
prefrontal cortex is observed; either excessive or insufficient amounts of dopamine
impaired working memory (Takahashi et al., 2008). In addition, working memory
training furthermore increased the activity of the D1 receptors in the prefrontal and
parietal cortices (Mcnab et al., 2009) and lowered the activity of the D2 receptors in
the caudate nucleus (Backman et al., 2011).
Another demonstration of this relationship comes from diseases that are linked to
dopamine. Parkinson’s disease (PD) is one of the disorders that is primarily linked
to a dopaminergic dysfunction. Depletion of dopamine in putamen is greater than
the caudate nucleus in patients with the PD during early stages in the disease course.
The depletion of dopamine in the putamen is involved in motor deficits, however the
loss of dopamine in the caudate nucleus has a role in cognitive functioning. It is
hypothesized that the dopaminergic medications restore the levels of dopamine in the
more depleted caudate nucleus and putamen (dorsal striatum) region but overdose the
nucleus accumbens (ventral striatum) (Cools, 2006). The over-dopamine hypothesis
is used to explain the different patterns of cognitive improvement and impairments
after initiation of dopaminergic drugs (Swainson et al., 2000).
Impairments observed in patients with PD resemble the deficits found in frontal
cortex dysfunction. PD patients who had severe clinical symptoms were significantly

CHAPTER 1. GENERAL INTRODUCTION 7
impaired in a spatial working memory task (Owen et al., 1992). In addition, the
dopaminergic treatment in PD improved the process of manipulation in the working
memory, however medication did not improve the deficits seen in extra-dimensional
attentional set shifting, which requires transfer of previously irrelevant information to
the new rule (Lewis et al., 2005). In another dopamine related disorder, schizophrenia,
disturbances in executive functions including working memory and reversal learning
(Waltz and Gold, 2007), and updating the representation of reward are observed
(Gold et al., 2008). These impairments are thought to have originated from a pre-
frontal cortex hypofunction (Barch, 2005; Glahn et al., 2005), which is related to a
hyperfunction of striatal dopamine. In schizophrenia, the motivation to initiate or
persist in goal-directed behavior is also reduced. Barch and Dowd (2010) suggested
that this deficit has originated from a difficulty in using the internal representations
of rewards or emotional information. Therefore, patients may have a problem in
creating motivational goals for current and future behavior.
Cools et al. (2001) hypothesized that the over-dose of DA in the ventral stria-
tum in patients with PD would result in impairment in the medicated patients in
a probabilistic reversal-learning paradigm. The ventral striatum is implicated in re-
sponse inhibition and cognitive control. The patients ON medication showed larger
deficits in this task as compared to patients OFF medication and controls. In addi-
tion, the patients ON medication showed more impulsive behavior in a probabilistic
learning task as compared to patients OFF medication and control group, however
the accuracy of the decision making was not affected (Cools et al., 2005).
The relationship between dopamine the incentive motivation was also shown in
both PD and schizophrenia patients. Patients with PD and controls showed a signifi-
cant change in the grip force with the increase in the reward magnitude as compared
to basal ganglia damaged subjects. However, skin conductance responses were simi-
larly reduced in PD patients and patients with basal ganglia lesions as compared to
the controls. The results of the skin conductance response and incentive grip force

CHAPTER 1. GENERAL INTRODUCTION 8
responses provided evidence for flattening of the affective and motor responses in PD
(Schmidt et al., 2008). Furthermore, in a recent study, the asymmetric dopamine loss
in the subcortical-frontal circuits in patients with PD predicted the deficits observed
the gain and losses contingent on the effort expenditure (Porat et al., 2013). In a rare
study that looked at how the regulatory states change in a disorder state, Foerde et al.
(2015) showed that PD patients have differences in regulatory mode in comparison to
controls, and the learning performance in a probabilistic learning task was mediated
by an increase in the assessment mode of the patients.
1.3 Approach
I will present broad implications for the role of motivation in cognition in different
parts of this thesis. First of all, a translational approach is taken, the impairment in
the cognitive and motivational processes in disease states is used to further manipulate
the mechanism underlying the processes. In Part 1, I will explain the studies that
were performed using a transgenic animal model. This model was put forward by
Kellendonk and colleagues (Kellendonk et al., 2006 ). It was designed to mimic
the negative symptoms of schizophrenia by targeting the striatum and resulting in a
overexpression of dopamine 2 receptor, creating a similar amount of hyperfunction as
in the humans. Three studies in Part I aim to characterize the motivational (reward
motivation) and cognitive (executive functions: timing) profile in this animal model.
Despite the fact that animal models provide strong evidence on causal relationship on
dopamine on motivation and executive functions with methods enable quantification
of the behavior, there is still a need to better characterize the executive functions and
their relation to motivational states.
Braver et al. (2014) summarized how different disciplines of research use different
terminology and methods to explain motivation and related constructs. Conflicts in
these accounts are few. However the gaps in animal behavior research and social

CHAPTER 1. GENERAL INTRODUCTION 9
psychology seem to be rather complementary. While social psychology is focused
on the efficacy and expectation of the individual, animal literature emphasizes the
quantification of the behavior that energizes action. There is a need for synthesis of
the information from these two different disciplines and levels to better characterize
the role of motivation in cognition. In an attempt to enable this kind of a synthesis,
in Part 2 we used rather higher level survey measures that measure regulatory focus
and regulatory mode orientations (social psychology approach). We used them as
predictors in cognitive tasks, which have a trial by trial construction and also work
on the implicit levels (quantitative analysis of behavior). This is a unique approach to
understand the role of motivational states in cognitive processes by using a multilevel
analysis. This way, we aim to better quantify the role of motivational orientations in
executive functions and cognition in general.
Overall, the implications of Part 1 could be applied to clinical populations to
better understand the deficits in motivation and provide potential intervention to
rescue motivational and/or cognitive deficits in schizophrenia patients. In addition to
this, at the end of this thesis we aim to provide preliminary evidence for the hypothesis
where we can situate the motivation (and individual differences within motivational
orientations) as a domain of adaptive self-regulation and/or executive function.
1.4 Outline of the studies
Despite the fact that different disciplines focus on specific domains of motivation
research, there has not been a parsimonious explanation to understand how moti-
vational states could affect our cognitive capacity, personality, and overall behavior.
Nevertheless, there has been a surge of interest in motivation research in the recent
years, where interdisciplinary and translational approaches have been undertaken. In
this thesis, I will try to make a case for motivation as being an essential process for
our existence (from basic drives to complex needs) and execution of goal-directed
CHAPTER 1. GENERAL INTRODUCTION 10
behaviors: it is irreplaceably ingrained into our selves. At the end of the thesis, I will
have presented an array of studies that may potentially explain how motivation can
be tracked in many psychological processes across humans and animals and clinical
conditions.
To indicate that, I will present six studies in three experiments. The first experi-
ment is performed to show how changing motivational states in an animal model of
negative symptoms of schizophrenia could positively impact cognitive performance.
The relationship between motivation and dopamine is well documented (Drew et al.,
2007; Nowend, Arizzi, Carlson, & Salamone, 2001). One of the methods to inves-
tigate the role of the regions that are implicated in the dopaminergic modulation
of motivation are genetically engineered animal models of disease. Specifically, the
involvement of D2 receptors in the striatum in the motivational phenotype of the
schizophrenia patients is demonstrated (Abi-Dargham et al., 2000). Following this
hypothesis, Kellendonk & Simpson (2006) created a mouse line that overexpresses
D2 receptors in the striatum with a similar rate that is commonly observed in the
schizophrenia patients. The previous research in this animal model provides extensive
evidence of motivational and cognitive deficits in the D2R-OE mice, proving its use
as a useful animal model to understand how motivation is affected by D2 receptor
overexpresssion in the striatum (Ward et al., 2009; Drew et al., 2007). In Chapter 2,
I will present 3 studies. In all of these studies, we employed a cognitive timing task
that allows us to detect changes in cognitive performance that are not influenced by
general activity or arousal factors such as the speed or persistence of responding. We
used a timing task because, D2R-OE mice showed a specific impairment in timing
previously, and it is also speculated that this deficit is connected to a wider executive
function impairment. Accuracy and sensitivity in interval timing tasks requires main-
tenance of the passage of time, comparison to a referent value and updating of the
working memory for the interval. These processes require intact executive function-
ing and were shown to be affected by manipulations that target motivational states

CHAPTER 1. GENERAL INTRODUCTION 11
(Ward and Odum, 2007; Galtress and Kirkpatrick, 2010). Dopamine is shown as
one of the strongest modulators of the timing function. In corroboration with this,
deficits of timing were observed in diseases with a dopaminergic dysfunction (Jones et
al., 2008; Frank, Posada, Pichon, & Haggard, 2005; Turgeon et al., 2012). D2R-OE
mice showed deficits in working memory tasks, interval timing, and incentive moti-
vation (Simpson et al., 2011; Drew et al., 2007; Ward et al., 2009). We manipulated
motivation using three different methods; molecular/genetic, behavioral and phar-
macological. Increased striatal D2Rs resulted in deficits in temporal discrimination.
To manipulate motivation behaviorally, in Study 2, we altered reward magnitude
and found that increasing reward magnitude improved timing in control mice and
partially rescued timing in the transgenic mice. Lastly, we manipulated motivation
pharmacologically using a functionally selective 5-HT2C receptor ligand, SB242084,
which we previously found to increase incentive motivation. SB242084 improved tem-
poral discrimination in both control and transgenic mice. In summary, these studies
demonstrated that increasing motivation can enhance cognitive performance. In these
3 studies, the observed necessity of motivational processes in cognitive performance
could be an indication of the interdependency between cognition and motivation.
The next 2 chapters aim to better characterize the impact of different motivational
states on cognition, focusing on the executive functioning. The interaction between
motivation and executive functioning was demonstrated previously (Bengtsson, Lau
and Passingham, 2009) mostly focusing on the motivation to gain rewards (Pochon
et al., 2002, Taylor et al., 2004).
In connection to reward modulation of executive functioning, individual differ-
ences in approach and avoidance were found as mediators of working memory (Gray
and Braver, 2002). However, there are no studies that characterize the role of moti-
vational modes and regulatory focus on executive function beyond the reinforcement,
in other words, pain and pleasure. Specifically, Study 4 provided evidence for differ-
ences in reward sensitivity between individuals who have different regulatory mode

CHAPTER 1. GENERAL INTRODUCTION 12
and regulatory focus in a probabilistic reversal task. We focused on the regulatory
focus theory in this study and explained the effects of promotion and prevention
orientations on preference of good and bad options. The feedback is constructed as
“good” or “bad” choice in this study and aims to create an assignment of positive
or negative values to stimuli shown in different phases. The involvement of regula-
tory focus states on value construction and operation is reported earlier. Therefore,
I present the results from individuals who have high and low degrees of promotion
and prevention orientations and track their choice behavior in a trial by trial fash-
ion. However, we can not ignore the fact that different use of probabilities in this
task may also manipulate the information seeking behavior and the regulatory mode
systems. Therefore, we present the results of regulatory mode orientations and their
interactions with regulatory focus states and how they affect the choice behavior in
Appendix B.
Despite the fact that working memory deficits are implicated in many disorders
that involve a motivational impairment as stated above, and the working memory
performance shows a huge variability between individuals, there are only a handful of
studies that directly investigated the role of motivational states on working memory
(Pochon et al., 2002, Taylor et al., 2004). Studies 5 and 6 investigate how working
memory performance in an n-back test is affected depending on the regulatory mode
and focus of the individual. In Study 5, neither monetary incentive nor feedback was
given after the trials, so that the performance has no explicit reward component. The
overall test performance depends on how well participants maintained the information
over a delay and compare it against the new set of numbers. it is predicted that
successful performance would depend on maximizing the correct answers (promotion)
at the same time by comparing it against the previously shown letters (assessment
motivation). Therefore, I present the interactions between regulatory focus and mode
in studies 5 and 6. In Study 6, I also manipulated the accuracy in n-back test by
using a success or failure framing.

13
Part I
Animal Studies: Dopamine 2R
Receptor Overexpression Model of
Negative Symptoms of
Schizophrenia

CHAPTER 2. IMPROVING TEMPORAL COGNITION BY ENHANCINGMOTIVATION 14
Chapter 2
Improving Temporal Cognition by
Enhancing Motivation
Originally published as
Avlar, Kahn, Jensen, Simpson, Kandel & Balsam (2015). Improving Temporal Cog-
nition by Enhancing Motivation. Behavioral Neuroscience, 129(5): 576-588
CHAPTER 2. IMPROVING TEMPORAL COGNITION BY ENHANCINGMOTIVATION 15
2.1 Introduction
Deficits in incentive motivation, the energizing of behavior in pursuit of a goal, occur
in several psychiatric disorders including schizophrenia and some affective disorders.
Such deficits in motivation significantly impact functional outcome (Barch, Tread-
way, & Schoen, 2014; Green, Hellemann, Horan, Lee, & Wynn, 2012) and in the
case of schizophrenia, interacts with cognitive deficits (Fervaha et al., 2014; Mann,
Footer, Chung, Driscoll, & Barch, 2013). Therefore, developing methods to enhance
motivation could result in improvements in cognitive function and quality of life for
psychiatric patients. Studying the potential for enhancements in motivation to in-
crease cognitive performance requires using an assay for cognition that is not directly
influenced by general activity or arousal factors such as the speed or persistence of
responding. In addition, the cognitive domain tested should be relevant to a cognitive
deficit that occurs in psychiatric patients.
Symptoms of schizophrenia include impairments in working memory and atten-
tion, as well as executive functions (Kerns, Nuechterlein, Braver, & Barch, 2008).
Aspects of these impairments may result from the disruption of a capacity common
to all these cognitive functions (Andreasen, 1999). Several lines of evidence suggest
that such a core capacity may involve timing. Thus, schizophrenia patients show
impairments in motor timing (Bolbecker et al., 2009), sequencing (Exner, Weniger,
Schmidt-Samoa, & Irle, 2006; Picard, Amado, Mouchet-Mages, Olie, & Krebs, 2008)
as well as in order and time perception (Carroll, Boggs, O’Donnell, Shekhar, & Het-
rick, 2008; Davalos, Kisley, & Ross, 2003; Elvevag, Brown, McCormack, Vousden,
& Goldberg, 2004). In addition, there is overlap between neural circuits involved in
timing and those implicated in schizophrenia. Cortical-cerebellar and cortical-striatal
circuits that are directly involved in encoding and representation of temporal informa-
tion (Buhusi & Meck, 2005; Rao, Mayer, & Harrington, 2001) are functionally altered
in schizophrenia (Siegel et al., 1993). Dopamine modulates timing within cortical-
striatal circuits (Coull, Hwang, Leyton, & Dagher, 2012; Maricq, Roberts, & Church,

CHAPTER 2. IMPROVING TEMPORAL COGNITION BY ENHANCINGMOTIVATION 16
1981). Dopamine D2 receptors (D2Rs) specifically are importantly responsible for
the dopaminergic modulation of timing (Drew, Fairhurst, Malapani, Horvitz, & Bal-
sam, 2003; Maricq & Church, 1983; Meck, 1986) and people with schizophrenia have
an increased occupancy of D2Rs (Abi-Dargham et al., 2000; Kuepper, Skinbjerg, &
Abi-Dargham, 2012; Weinberger & Laruelle, 2001). In addition to the role that D2R
play in timing it is well known that D2R also play an important role in motivation
(Drew et al., 2007; Nowend, Arizzi, Carlson, & Salamone, 2001). Thus the altered
D2R function in patients likely gives rise to both cognitive and motivational problems.
It is within this context that we explored the interaction of motivation and cogni-
tion. We manipulated motivation using three different methods; molecular/genetic,
behavioral and pharmacological. For the molecular manipulation we used a trans-
genic line of mice that we previously generated to model the increase in occupancy of
D2Rs observed in patients with schizophrenia (Kellendonk et al., 2006). These mice
selectively and reversibly overexpress D2Rs in post-synaptic medium spiny neurons
in the striatum (D2R-OE mice). D2R-OE mice display cognitive phenotypes similar
to those observed in patients including deficits in timing (Drew et al., 2007; Ward
et al., 2009). In addition, as with patients (Heerey & Gold, 2007), D2R-OE mice
display a deficit in motivation. In D2R-OE mice this motivational deficit is rescued
in adulthood by switching the transgene off (Drew et al., 2007; Ward, Simpson, et al.,
2012). Switching off the transgene also alleviated some aspects of the timing deficit
(Drew et al., 2007; Ward et al., 2009) raising the possibility that the improvement in
timing might be mediated by the change in motivation.
We found that normalizing D2R expression, increasing the reward magnitude,
and administering a motivationally enhancing drug all improved timing. Therefore,
while the idea that increasing motivation can have a positive impact on cognitive
processes has been discussed in the literature based on clinical intuition, we here
provide a concrete demonstration that enhancing motivation is an effective strategy
for enhancing cognition.

CHAPTER 2. IMPROVING TEMPORAL COGNITION BY ENHANCINGMOTIVATION 17
2.2 Methods
2.2.1 Subjects
A detailed explanation of the generation of the transgenic model can be found in pre-
vious publications (Kellendonk et al., 2006). Mice expressing the human D2 receptor
under control of the tet operator (tetO hD2R mice) were maintained on a congenic
C57BL/6(J) background and mice expressing the tetracycline transactivator trans-
gene under the calcium/calmodulin- dependent kinase IIα promoter (tTA-CaMKIIα
mice) (Mayford et al., 1996) were maintained on 129SveV(Tac) congenic background.
F1 animals obtained from intercrossing these two lines were used for all experiments.
To specifically test the effect of transgenic D2R overexpression, double transgenic
mice (D2R-OE) were compared to control mice that included single-transgenic and
wild type littermates
Mice were genotyped at weaning by triplex polymerase chain reaction (PCR) us-
ing primers specific for tTA, tet-O and a fragment of an unrelated endogenous gene
(Sim1), to provide a positive control for the PCR. All genotypes were re-confirmed
using the same method after the termination of all experiments. To regulate tet-
O-driven gene expression, mice were fed doxycycline-supplemented chow (40 mg/kg;
Mutual Pharmaceutical, Philadelphia, PA) beginning approximately 16-20 weeks of
age. Two weeks after commencing doxycycline feeding, behavioral testing was started.
Experimental protocols were approved by the Institutional Animal Care and Use
Committees of Both the New York State Psychiatric Institute and Columbia Univer-
sity. Mice were maintained and bred under standard conditions, consistent with NIH
guidelines.
The following groups of female mice were used in the first experiment described:
Double transgenic mice fed a regular diet (Isopro RMH 3000 complete mouse diet)
which overexpress the D2R transgene (D2R-OE) (n = 12), Double transgenic mice
fed a doxycycline supplemented diet (doxycycline-supplemented chow), to switched

CHAPTER 2. IMPROVING TEMPORAL COGNITION BY ENHANCINGMOTIVATION 18
off the transgene in adulthood, (D2R-OE-Dox) (n=13), control mice fed a regular diet
(Control) (n=13) and control mice fed a doxycycline supplemented diet (Control-Dox)
(n =13). The control and D2R-OE mice served as subjects in all experiments. In
the second experiment, 2 mice in both the D2R-OE and Control groups were exposed
to the wrong test procedure and were excluded from further testing. Mice used in
this study had a restricted daily access to food (1 hour and 30 minutes) in order to
motivate them to earn rewards during behavioral testing. Water was available ad
libitum.
2.2.2 Apparatus
In the present experiments, eight matching experimental chambers (model env-307w;
Med- Associates, St. Albans, VT) equipped with liquid dippers were used. Each
chamber was located in a light- and sound-attenuating cabinet equipped with an
exhaust fan. The internal dimensions of the experimental chamber were 22x18x13
cm, and the floor consisted of metal rods placed 0.87cm apart. A feeder trough was
centered on one wall of the chamber. An infrared photocell detector 4 mm from
the trough opening was used to record head entries. Raising the dipper located
inside the feeder trough, provided one drop of evaporated milk as a reward. Two
retractable levers located 5 cm on either side of the feeder trough could be inserted
into the chamber. A house light (model 1820; Med Associates) located at the top
of the chamber provided illumination throughout all sessions. An audio speaker was
positioned 8.5 cm above the floor on the wall opposite the feeder trough. This speaker
delivered a brief tone (90 db, 2500 Hz, 250 ms) to signal that the liquid dipper was
raised.
2.2.3 Operant Lever Press Training
During dipper training, mice were trained to consume the liquid reward from the
dipper. Initially, mice were placed inside the experimental chamber while the dipper

CHAPTER 2. IMPROVING TEMPORAL COGNITION BY ENHANCINGMOTIVATION 19
was in the raised position. The dipper was retracted 10 s after a head entry into
the feeder trough was detected. Subsequent dipper presentations were separated by
variable intertrial intervals. The session ended after 30 min or 20 dipper presentations.
On the following day, mice received another session similar to the first, except that
the dipper remained up for 8 s and then lowered whether or not mice had made a
head entry. Dipper training continued until a mouse made head entries at least 20 of
30 dipper presentations in a session. During all behavioral testing of this experiment,
sessions occurred once per day, 7 d per week.
During lever press training, mice were required to press a lever to earn the liquid
reward. For the first lever press training session, mice were put in the experimental
chamber for 8 h. At the beginning of the session, both levers were extended into the
chamber, and lever presses were reinforced on a continuous reinforcement schedule. In
this and all subsequent sessions (except the reward magnitude manipulation phase),
the reward consisted of raising the dipper for 5 s. After 20 reinforcements, the lever
was retracted to familiarize mice with the retraction and extension of the lever. The
lever was extended again following a variable delay and the cycle was repeated. Mice
had to earn 100 reinforcements in a session. If they did not, the procedure was
repeated the next day. Two days after the first successful lever press training session,
mice received a session which began with the lever extended. The lever was retracted
after every two reinforcements and then re-extended after a variable intertrial interval.
The session ended when the mouse earned 40 reinforcements or 1 h elapsed. Mice
continued receiving sessions like this until they earned 40 rewards in one session.
2.2.4 Temporal Discrimination Training
A detailed explanation of temporal discrimination training can be found in (Ward et
al., 2009) (see temporal bisection procedure). Briefly, a tone was presented either for
a short or long duration. Once the sample terminated, two levers were inserted into
the chamber. A single response to one of the two levers was rewarded conditional

CHAPTER 2. IMPROVING TEMPORAL COGNITION BY ENHANCINGMOTIVATION 20
on the duration of the preceding sample. For half of the mice, the left lever was
designated as the correct following a 6-s (short) duration tone and the right lever was
designated as the correct following a 24-s (long) duration tone. This rule was reversed
for the remaining mice. Following lever training, 5 logarithmically spaced (7.6-s, 9.5-
s, 12-s, 15.1-s, 19-s) intermediate sample durations were presented on half of the
trials. Correct responses to the anchor durations were continued to be reinforced but
responses on the trials of intermediate duration were never reinforced. Each daily
session was consisted of 60 trials.
2.2.5 Normalizing D2R expression in D2R-OE mice
Control, D2R-OE and D2R-OE-Dox mice served as subjects. Mice earned a single
reward for correct responses on both short (6 s) and long (24 s) sample trials. Each
subject received 12 days of test sessions and the final 5 days were used in the data
analysis for this part of the study.
2.2.6 Reward magnitude manipulation
Control and D2R-OE mice were used. In the first phase (low reward) of the reward
magnitude manipulation, subjects earned a single reward for correct responses on
both short (6 s) and long (24 s) sample trials for 12 daily test sessions. In phase 2
(high reward) we doubled the reward magnitude on long trials and tested mice for an
additional 12 sessions. During these sessions when a reward was earned the dipper
was raised for 5s and then lowered back into the liquid well and an additional milk
reward was immediately presented by raising the dipper for another 5s. In the third
phase (low reward), which lasted for 9 sessions, mice again received a single dipper
presentation for correct responses to both the 6 and 24-s samples. Again, data from
the final five sessions of each phase were analyzed.

CHAPTER 2. IMPROVING TEMPORAL COGNITION BY ENHANCINGMOTIVATION 21
2.2.7 Pharmacological manipulation
Control and D2R-OE mice were used. A functionally selective ligand at the 5-HT2C
receptor, SB242084 (Sigma Aldrich, St. Louis, Missouri) was dissolved in .9 % saline
and injected intraperitoneally for four days, 20 minutes before behavioral testing.
Based on a previous study (Simpson et al., 2012) demonstrating motivationally en-
hancing effects of this drug, a dose of 0.75 mg/kg was administered. Before adminis-
tration of the SB242084, baseline performance was assessed through 4 days of saline
injections of the same volume as the drug. Data from all days of drug and saline
injections were included in the analysis.
2.2.8 Data Analysis
The basic datum of these experiments is the psychometric functions obtained by
plotting the proportion of long lever choices as a function of sample duration. Multi-
level binomial logistic regressions were conducted using the R (R Development Core
Team) statistical software with the lme4 mixed model package to obtain fits of the
psychometric data.
The point of subjective equality (PSE) is the duration that subjects are equally
likely to classify as long or short. Past research has shown that the PSE for time
is usually at the geometric mean of the anchor durations (Church & Deluty, 1977;
Wearden & Ferrara, 1995). Consequently, for all experiments, the regressions were
conducted on the logarithms of sample durations centered with respect to the log-
arithm of the geometric mean of the anchor durations. The goodness of fit was
determined by comparing the change in the deviance from the null model (intercept
only) to the full model (with all fixed effects) (Nelder & Wedderburn, 1972). The
Bayesian Information Criterion was used to take model complexity into account when
comparing models (Schwartz, 1978). The Bayesian Information Criterion values and
residual deviance were significantly lower in the full model than in the null model for
all of the experiments (p < .000) in the present study, therefore the full model was

CHAPTER 2. IMPROVING TEMPORAL COGNITION BY ENHANCINGMOTIVATION 22
utilized.
The multilevel logistic model for estimating the probability of choosing the long
lever, P(long) is based on the standard logistic function that relates a sample duration
X to P(long) and is given by
P (long) =1
1 + e−(β0+β1X), (2.1)
where the beta coefficients, β0 and β1 are the constant and slope parameters of
the model, and here represent indexes of the accuracy and the precision of timing,
respectively. The point of subjective equality (PSE) can be obtained from these two
parameters (−β0/β1). These coefficients derive from model estimates at each level of
the multilevel analysis. In different experiments the model estimates represent the
fixed effects of different experimental groups, reward magnitudes, and drug manip-
ulations. We specified the model to allow slope and intercept to vary randomly by
individual mouse (Bolger & Laurenceau, 2013). For each experiment, fixed effects
estimates are calculated by
P (F )(long) =1
1 + e−η(F ), (2.2)
η(F ) = β(F )0 + β
(F )1 Xij , (2.3)
β(F )0 = γ00 + γ01Fij + u0j , (2.4)
β(F )1 Xij = γ10Xij + γ11Xij + u1j , (2.5)
where F denotes each of the fixed effects used in the three experiments, the index
j represents an individual mouse, the index i stands for trials, and Xij represents log
durations for each trial and individual mouse. Finally, u0j and u1j represent the error
terms for the constant and the slope parameters in the model.
Estimates of γ0 and γ1 in the model correspond to the unit change (in log-odds
units) for different fixed effects on the constant and the slope, respectively. β0 and

CHAPTER 2. IMPROVING TEMPORAL COGNITION BY ENHANCINGMOTIVATION 23
β1 were estimated by summing the contribution of each fixed effect to produce the
composite constant (β0) and slope parameters (β1) for each group. Negative and
positive values of the β0 indicate response bias for short and long lever choices at the
geometric mean of the sample durations. A β0 value that is closer to zero indicates
better timing accuracy and a higher value of the β1 corresponds to more precise
temporal discriminations.
In the first experiment normalizing D2R expression in D2R-OE mice, relationships
of the predictor variables; group (control, D2R-OE, and D2R-OE-Dox) and sample
duration, to the probability of choosing the long lever were assessed. We analyzed
trial-by-trial choices for each animal over the last five days of training. Control and
Control-Dox groups were not different in any of the dependent measures (p > .05),
so they were pooled into a single control group.
For the other manipulations, predictor variables of reward magnitude, drug and
sample duration were analyzed to model the change in the probability of choosing
the long lever. In both these experiments, we centered the genotype variable to zero
to be able to observe the main effects of the manipulations. If an interaction with
genotype was found in this initial analysis, we performed separate post-hoc analyses
for each genotype.
2.3 Results
2.3.1 Study 1: Normalizing D2 Receptor Overexpression Im-
proves Temporal Discrimination
We previously reported an interval timing deficit in the D2R-OE mice using a peak
interval procedure in which animals are reinforced for pressing after a specific target
time has elapsed since the presentation of a cue (Drew et al., 2007). We also reported
that turning off the transgene resulted in a partial rescue of timing deficits. In a peak
interval procedure, accuracy and precision of timing is evidenced by increased rate of

CHAPTER 2. IMPROVING TEMPORAL COGNITION BY ENHANCINGMOTIVATION 24
responding close to the target duration and followed by a decline in rate after the ex-
pected time of reinforcement on long duration test trials (called peak trials) in which
no reward is presented. While D2R-OE mice displayed a reduced rate of respond-
ing and relatively flat response gradients, D2R-OE mice in which the transgene was
switched off by treatment with doxycycline (D2R-OE-Dox mice) had higher response
rates and timing accuracy, but only partially improved timing precision (Drew et al.,
2007). A limitation of the peak interval procedure, however is that the measure of
timing depends on the animals response rate. Consequently it is difficult to separate
timing deficits from motivational factors. To overcome this problem in the current
experiments, we used a temporal bisection task, which only requires a single response
on each trial and is thus independent of the subjects response vigor. In a temporal
bisection task a subject is reinforced for successfully discriminating between two sam-
ple stimuli, which differ only in duration. In our experiments mice were presented
with either a long (24s) or short (6s) tone, followed by the presentation of two choice
levers. A single response on one of the two levers was rewarded conditional on the
duration of the tone presented (e.g. after a short tone a left lever press was reinforced
and after a long tone a right lever press was reinforced). Following this discrimination
training, 5 logarithmically spaced intermediate sample durations (7.6-s, 9.5-s, 12-s,
15.1-s, 19-s) were presented on half of the trials. As detailed in the methods section,
psychometric functions of the animals’ responses to these intermediate durations was
used to determine accuracy (how close the animal is to normatively perceiving and
responding to the exact duration of the cues) as well as precision (each subject’s in-
trinsic variability in making temporal judgments). We tested D2R-OE and D2R-OE
mice that were fed with doxycycline as well as control mice (half fed doxycycline, half
not).
D2R-OE mice had flatter timing functions than control mice, generally performing
at chance when cue durations were longer than the geometric mean of the anchor
durations (Figure 2.1A). D2R-OE-Dox displayed a sharper temporal discrimination

CHAPTER 2. IMPROVING TEMPORAL COGNITION BY ENHANCINGMOTIVATION 25
æ
æ
æ
æ
æ
æ
æ
à
à
à
à
à
à
à
ì
ì
ì
ì
ìì
ì
æ Control
à D2R-OE-DOX
ì D2R-OE
-1 0 1
0.25
0.5
0.75
1
sample duration
PHlo
ng
L
A
æ
æ
æ
æ
æ
æ
æ
à
à
à
à
à
à
à
ì
ì
ì
ì
ìì
ì
-1 0 1
0.25
0.5
0.75
1
sample duration
PHlo
ng
L
B
ææ àà
ìì
Control D2R-OE-DOX D2R-OE-0.6
-0.5
-0.4
-0.3
-0.2
-0.1
0
0.1
0.2
Acc
ura
cyC
oef
fici
ent
HΒ0
L
C
ææ
àà
ìì
Control D2R-OE-DOX D2R-OE0
0.5
1
1.5
2
Pre
cisi
on
Coef
fici
ent
HΒ1
L
D
Figure 2.1: Performance of Control, D2R-OE and D2R-OE-Dox Mice in the TemporalBisection Task. A) Mean proportion of responses to the lever associated with the‘long’ sample duration as a function of sample duration (seconds) in control mice(black circles and lines), D2R-OE mice (light gray diamonds and lines) and D2R-OE mice fed with doxycycline , D2R-OE-DOX (dark gray squares lines). B) Datafit by binomial logistic regression is superimposed with the mean proportion of longresponses per sample duration for Control (black circles and lines), D2R-OE (lightgray diamonds and lines) and D2R-OE-DOX (dark gray squares and lines) mice.Lower row of graphs show model coefficients for each group after addition of fixedeffect estimates: C) the accuracy coefficient (β0±SE), D) the slope coefficient (β1±SE).

CHAPTER 2. IMPROVING TEMPORAL COGNITION BY ENHANCINGMOTIVATION 26
Coefficient Group ∆γ-estimate S.E. z-value p-value
Constant (γ0) D2R-OE -0.23 0.17 -1.34 n.s.
(Timing Accuracy) D2R-OE-Dox 0.01 0.16 -0.08 n.s.
Slope (γ1) D2R-OE -0.76 0.28 -2.7 < 0.01
(Timing Precision) D2R-OE-Dox -0.40 0.27 -1.45 n.s.
Table 2.1: Characterization of Performance on the Temporal Bisection Task usingMultilevel Logistic Regression. ∆γ-estimates, standard error (S.E.), z-values and p-values for fixed effects of groups. ∆γ-estimate indicates the unit change for eitherthe constant coefficient (γ0) or the slope coefficient (γ1) in log-odds units. The modelspecifies the control group as the baseline condition and values for D2R-OE andD2R-OE-Dox correspond to the contribution of those group variables to the baselinecoefficients. For details of the model see the data analysis section in the Methods.n.s. = not significant.
compared to D2R-OE mice but did not completely recover the level of discrimination
observed in the control mice (Figure 2.1A). To characterize the timing performance
of individual mice in more detail, we fit a multilevel binomial logistic function to the
data. Unit changes (∆) in estimates of slope (γ1) and constant (γ0) coefficients from
Control (baseline) values to D2R-OE and D2R-OE-Dox values (in log-odds) are given
in Table 2.1 and model fits for each group are presented in Figure 2.1B. There was no
significant difference between groups in timing accuracy (γ0-estimate) but the timing
precision was significantly altered: the slope parameter (γ1) of the logistic function
was -0.76 log-odds units (p < .01) lower in D2R-OE group in comparison to Control
group. There was no significant difference between the Control and the D2R-OE-Dox
mice (−0.40, p > .05), suggesting that switching off the transgene with doxycycline
reduced or eliminated the source of impairment.
In a separate analysis comparing D2R-OE and D2R-OE-Dox groups, the timing
precision was not significantly different between these two groups either (γ1 = 0.37,
SE = 0.32, z-value = 1.13, p > .05). Figure 2.1C shows the composite accuracy
CHAPTER 2. IMPROVING TEMPORAL COGNITION BY ENHANCINGMOTIVATION 27
and precision coefficients for all groups. Overall, the logistic regression indicates that
normalizing D2R expression levels rescues timing accuracy and rescues precision at
least partially, results similar to those we obtained in the peak interval procedure
(Drew et al., 2007). However here, because of the alternate testing method, we are
confident that the rescue in cognitive performance was not simply due to an increase
in the animal’s speed or vigor of responding.
2.3.2 Study 2: Increasing Reward Magnitude Improved Tim-
ing Precision in both Groups and Accuracy in Control
Mice
One factor that might have mediated the improvement in performance in D2R-OE-
Dox mice is the increase in motivation that accompanies the normalization of striatal
D2Rs when transgenic mice are treated with doxycycline (Simpson et al., 2011).
Though motivation and timing were initially considered independent of one another
(Roberts, 1981) more recent studies have found that motivational factors may alter
timing precision and/or accuracy (Galtress & Kirkpatrick, 2010; Ward et al., 2009;
Ward, Simpson, et al., 2012). For example, in a temporal bisection task similar to
the one we employ here, (Galtress & Kirkpatrick, 2010) increased the magnitude of
reward either for short or long durations and found that this manipulation changed
the slope of the psychophysical function and PSE values. To see whether an explicit
manipulation of motivation would also sharpen temporal control of behavior in D2R-
OE mice, we increased the reward magnitude associated with the long response. In
the first phase of training, D2R-OE and Control mice earned a single reward for all
correct responses. In phase 2, we doubled the reward magnitude for correct long re-
sponses and the temporal discrimination sharpened in both groups (Figure 2.2A), the
precision of timing was improved in both groups. Table 2.2 shows the unit changes
(∆) in estimates of slope (γ1) and constant (γ0) coefficients from low reward to high

CHAPTER 2. IMPROVING TEMPORAL COGNITION BY ENHANCINGMOTIVATION 28
reward magnitude (in log-odds) and model fits for each group are presented in Fig-
ure 2.2B. There was a significant main effect of increasing the reward magnitude on
the slope of the logistic curve (p < .05). There was no main effect of increasing the
reward magnitude on the timing accuracy; however, the interaction between reward
magnitude and genotype for this parameter of the logistic regression was significant
(p < .01; Table 2.2 and Figure 2.2B). In two separate post-hoc analyses, increasing re-
ward magnitude was found to improve timing accuracy in Control mice (γ0 = 0.20, SE
= 0.05, z-value = 3.6, p < .001); accuracy of D2R-OE was not improved (γ0 = −0.06,
SE = 0.06, z-value = -1.05, p > .05; Figure 2.2C).
2.3.3 A Downshift in Reward Magnitude Reduced Timing
Accuracy in both Groups and Reduced Timing Preci-
sion in D2R-OE mice
To further understand the effect of altering the reward value on timing performance,
mice were returned to the lower and equal payoffs for each anchor cue in the final
phase of this experiment. Multilevel logistic regression contrasting phase 2 and phase
3 (see Table 2.2) indicated a significant main effect of returning to the lower reward
condition on timing accuracy (p < .01), without any significant interaction between
genotype and phase on the accuracy parameter (p > .05) (Figure 2.2A). In the analysis
of timing precision, there was no main effect of repeating the lower reward condition
on the slope parameter (p > .05) but, there was a significant genotype X phase
interaction (p < .05). The slope of the D2R-OE group was significantly lower than
the Control group (γ1 = −.31, SE = 0.16, z-value = -1.98, p < .05) following the
reward downshift.
In summary, increasing the reward magnitude improved the timing precision in
both Control and D2R-OE mice, but accuracy of timing was only improved in the
Control mice.

CHAPTER 2. IMPROVING TEMPORAL COGNITION BY ENHANCINGMOTIVATION 29
Ê
Ê Ê
Ê
Ê
Ê
Ê
‡
‡
‡
‡
‡
‡
‡
Ï
Ï
Ï
Ï
Ï
Ï
Ï
Ê Low reward HP1L‡ High reward HP2LÏ Low reward HP3L
-1 0 1
0.25
0.5
0.75
1
sample duration
PHlongL
Control
A
ÊÊ
Ê
Ê Ê
ÊÊ
‡
‡
‡
‡
‡
‡‡
Ï
Ï Ï
Ï
Ï
Ï
Ï
-1 0 1
0.25
0.5
0.75
1
sample duration
PHlongL
D2R-OE
B
Ê
Ê Ê
Ê
Ê
ÊÊ
‡
‡
‡
‡
‡
‡
‡
ÏÏ
Ï
Ï
Ï
ÏÏ
-1 0 1
0.25
0.5
0.75
1
sample duration
PHlongL
Control
C
ÊÊ
Ê
Ê ÊÊ
Ê
‡
‡‡
‡
‡
‡‡
Ï
Ï Ï
ÏÏ
ÏÏ
-1 0 1
0.25
0.5
0.75
1
sample duration
PHlongL
D2R-OE
D
Ê
Ê
Ê
ÏÏ
Ï
Ê Control
Ï D2R-OE
Low reward HP1L High reward HP2L Low reward HP3L-1.0
-0.5
0.0
0.5
1.0
AccuracyCoefficientHb 0L
E
Ê
Ê
Ê
Ï
ÏÏ
Low reward HP1L High reward HP2L Low reward HP3L0.0
0.5
1.0
1.5
2.0
2.5
PrecisionCoefficientHb 1L
F
Figure 2.2: Performance of Control and D2R-OE Mice in the Temporal BisectionTask with Changes in Reward Magnitude. The upper row of graphs show meanproportion of responses to the lever associated with the ‘long’ sample duration as afunction of sample duration (seconds) in 3 phases (phase1-low reward = black circlesand lines, phase2-high reward = dark gray squares and lines, and phase3-low reward= light gray diamonds and lines). A) Control mice, B) D2R-OE mice. The lowerrow of graphs show data fit by binomial logistic regression superimposed with themean proportion of long responses per sample duration for C) Control mice and D)D2R-OE mice in each phase (Same phase symbols as A and B).

CHAPTER 2. IMPROVING TEMPORAL COGNITION BY ENHANCINGMOTIVATION 30
Coefficient Reward Change ∆γ S.E. z-value p-value
Low → High Reward 0.06 0.04 1.64 n.s.
Constant (γ0)Genotype X Low → High -0.26 0.08 -3.20 < 0.01
(Timing Accuracy)High → Low Reward -0.26 0.04 -6.30 < 0.001
Genotype X High → Low -0.07 0.08 -0.89 n.s.
Low → High Reward 0.40 0.08 5.24 < 0.001
Slope (γ1)Genotype X Low → High 0.02 0.16 0.15 n.s.
(Timing Precision)High → Low Reward 0.02 0.08 0.21 n.s.
Genotype X High → Low -0.31 0.16 -1.98 < 0.05
Table 2.2: Characterization of the Effect of Changing Reward Magnitude in theTemporal Bisection Task using Multilevel Logistic Regression. ∆γ-estimates, stan-dard error (S.E.), z-values and p-values for fixed effects of reward magnitude and theinteraction between genotype and reward magnitude. Low–High Reward indicatesthe shift from phase 1 to phase 2, High–Low Reward indicates the shift from phase 2to phase 3. The genotype variable is centered at zero. ∆γ-estimate indicates the unitchange for either the constant coefficient (γ0) or the slope coefficient (γ1) in log-oddsunits. n.s. = not significant.

CHAPTER 2. IMPROVING TEMPORAL COGNITION BY ENHANCINGMOTIVATION 31
Ê
Ê Ê
Ê
Ê
Ê
Ê
‡
‡
‡
‡
‡
‡
‡
Ï
Ï
Ï
Ï
Ï
Ï
Ï
Ê Low reward HP1L‡ High reward HP2LÏ Low reward HP3L
-1 0 1
0.25
0.5
0.75
1
sample duration
PHlongL
Control
A
ÊÊ
Ê
Ê Ê
ÊÊ
‡
‡
‡
‡
‡
‡‡
Ï
Ï Ï
Ï
Ï
Ï
Ï
-1 0 1
0.25
0.5
0.75
1
sample duration
PHlongL
D2R-OE
B
Ê
Ê Ê
Ê
Ê
ÊÊ
‡
‡
‡
‡
‡
‡
‡
ÏÏ
Ï
Ï
Ï
ÏÏ
-1 0 1
0.25
0.5
0.75
1
sample duration
PHlongL
Control
C
ÊÊ
Ê
Ê ÊÊ
Ê
‡
‡‡
‡
‡
‡‡
Ï
Ï Ï
ÏÏ
ÏÏ
-1 0 1
0.25
0.5
0.75
1
sample duration
PHlongL
D2R-OE
D
Ê Ê Ê
ÏÏ
Ï
Ê Control
Ï D2R-OE
Low reward HP1L High reward HP2L Low reward HP3L-1.0
-0.5
0.0
0.5
1.0
AccuracyCoefficientHb 0L
E
Ê
Ê
Ê
Ï
ÏÏ
Low reward HP1L High reward HP2L Low reward HP3L0.0
0.5
1.0
1.5
2.0
2.5
PrecisionCoefficientHb 1L
F
Figure 2.3: Model coefficients for each group after addition of fixed effect estimates:E) the accuracy coefficient (β0 ± SE), F) the slope coefficient (β1 ± SE). Control =black circles, D2R-OE = gray diamonds.
The results show that the downshift in reward magnitude during phase 3 lowered
the timing accuracy in both groups and that the downshift resulted in a significantly
lower timing precision in the D2R-OE group relative to the controls.
In summary, in Control mice increasing reward magnitude increased accuracy,
and decreasing reward magnitude (returning to equal payoffs) decreased accuracy,
demonstrating that cognitive performance can be bi-directionally affected by the value
of the rewards available. Furthermore, in control mice precision of timing increased
with each phase. In contrast, the timing accuracy of D2R-OE mice was not improved
when the reward magnitude was increased, yet it still worsened after the reward
magnitude downshift in phase 3. This suggests that overexpression of the D2R may
create an asymmetry in motivation: lower sensitivity to positive changes in reward
value than to negative shifts in reward value.
2.3.4 Study 3: Interval Timing Performance is Improved by
Modulation of the 5-HT2C Receptor in both Groups
Increasing the payoff selectively for correct responses to the long anchor duration
generally improved timing in control mice but in D2R-OE mice timing accuracy did

CHAPTER 2. IMPROVING TEMPORAL COGNITION BY ENHANCINGMOTIVATION 32
Coefficient Drug Condition ∆γ S.E. z-value p-value
Constant (γ0) Saline–Drug 0.38 0.05 7.89 < 0.001
(Timing Accuracy) Genotype X Saline-Drug -0.30 0.10 -3.1 < 0.01
Slope (γ1) Saline–Drug 0.22 0.09 2.43 < 0.05
(Timing Precision) Genotype X Saline-Drug 0.27 0.18 1.50 n.s.
Table 2.3: Characterization of the Effect of SB242084 on Performance in the TemporalBisection Task using Multilevel Logistic Regression. ∆γ-estimates, standard error(S.E.), z-values and p-values for fixed effects of drug condition and the interactionbetween genotype and drug condition. ∆γ-estimate indicates the unit change foreither the constant coefficient (γ0) or the slope coefficient (γ1) in log-odds units. n.s.= not significant.
not improve. In the current experiment we used a pharmacological manipulation to
produce a more global change in motivation. Previously, Simpson et al. (2011) found
that administration of SB242084, a functionally selective ligand at the 5-HT2C recep-
tor, increased the motivation to work for rewards. Additionally, the drug alleviated
the motivational deficits of D2R-OE mice. Specifically, a dose of 0.75 mg/kg was suf-
ficient to restore the D2R-OE mice’s willingness to work to earn rewards to the level
of control subjects when tested on a progressive ratio schedule in which the number
of responses required to earn each successive was doubled. To determine if SB242084
treatment would also alleviate the timing deficits observed in D2R-OE mice, four days
of saline were followed by four days of SB242084 injections. All injections occurred
20 minutes before each behavioral test session.
Administration of SB 242084 resulted in improvement of temporal discrimination
performance in both Control and D2R-OE mice. (See Table 2.3; Figure 2.4A). There
was a main effect of the drug on both timing accuracy and precision. For both Control
and D2R-OE groups, SB242084 had an enhancing effect on timing performance. For
accuracy, there was also a significant interaction between drug and genotype. Separate

CHAPTER 2. IMPROVING TEMPORAL COGNITION BY ENHANCINGMOTIVATION 33
ÊÊ
Ê
Ê
Ê
Ê
Ê
‡
‡
‡
‡
‡‡
‡
Ê Saline
‡ Drug
-1 0 1
0.25
0.5
0.75
1
sample duration
PHlongL
Control
A
Ê
Ê
Ê
Ê
Ê Ê
Ê
‡
‡
‡
‡
‡ ‡
‡
-1 0 1
0.25
0.5
0.75
1
sample duration
PHlongL
D2R-OE
B
ÊÊ
Ê
Ê
Ê
Ê
Ê
‡
‡‡
‡
‡‡
‡
-1 0 1
0.25
0.5
0.75
1
sample duration
PHlongL
Control
C
ÊÊ
ÊÊ
Ê ÊÊ
‡
‡‡
‡
‡ ‡‡
-1 0 1
0.25
0.5
0.75
1
sample duration
PHlongL
D2R-OE
D
Ê
Ê
Ï
Ï
Ê Control
Ï D2R-OE
Saline Drug-1.0
-0.5
0.0
0.5
1.0
AccuracyCoefficientHb 0L
E
ÊÊ
Ï
Ï
Saline Drug0.0
0.5
1.0
1.5
2.0
2.5
PrecisionCoefficientHb 1L
F
Figure 2.4: The Effect of SB242084 on the Performance of Control and D2R-OEMice in the Temporal Bisection Task. The upper row of graphs show mean proportionof responses to the lever associated with the ‘long’ sample duration as a function ofsample duration (seconds) in saline (black circles and lines) and drug (gray squaresand lines) phases for A) control mice and B) D2R-OE mice. The lower row of graphsshow data fit by binomial logistic regression superimposed with the mean proportionof long responses per log sample duration for C) Control mice and D) D2R-OE micein each phase (saline = black circles and lines, drug = gray squares and lines).

CHAPTER 2. IMPROVING TEMPORAL COGNITION BY ENHANCINGMOTIVATION 34
ÊÊ
Ê
Ê
Ê
Ê
Ê
‡
‡
‡
‡
‡‡
‡
Ê Saline
‡ Drug
-1 0 1
0.25
0.5
0.75
1
sample duration
PHlongL
Control
A
Ê
Ê
Ê
Ê
Ê Ê
Ê
‡
‡
‡
‡
‡ ‡
‡
-1 0 1
0.25
0.5
0.75
1
sample duration
PHlongL
D2R-OE
B
ÊÊ
Ê
Ê
Ê
Ê
Ê
‡
‡‡
‡
‡‡
‡
-1 0 1
0.25
0.5
0.75
1
sample duration
PHlongL
Control
C
ÊÊ
ÊÊ
Ê ÊÊ
‡
‡‡
‡
‡ ‡‡
-1 0 1
0.25
0.5
0.75
1
sample duration
PHlongL
D2R-OE
D
Ê
Ê
Ï
Ï
Ê Control
Ï D2R-OE
Saline Drug-1.0
-0.5
0.0
0.5
1.0
AccuracyCoefficientHb 0L
E
ÊÊ
Ï
Ï
Saline Drug0.0
0.5
1.0
1.5
2.0
2.5
PrecisionCoefficientHb 1L
F
Figure 2.5: Model coefficients for each group after addition of fixed effect estimates:E) the accuracy coefficient (β0 ± SE), F) the slope coefficient (β1 ± SE). Control =black circles, D2R-OE = gray diamonds.
post-hoc analyses showed that the drug improved accuracy in both Control (γ0 = 0.53,
SE = 0.06, z-value = 8.14,p < .001) and D2R-OE groups (γ0 = 0.23, SE = 0.07, z-
value = 3.25, p < .01). Composite accuracy and precision coefficients for all groups
in saline and drug phases are shown in Figure 2.4C. Overall, SB242084 improved
the timing accuracy and precision in both groups showing that a global increase in
motivation can produce quite general improvements in cognition.
In summary, increasing the reward magnitude improved the timing precision in
both Control and D2R-OE mice, but accuracy of timing was only improved in the
Control mice.
2.3.5 Discussion
Increasing the payoff selectively for correct responses to the long anchor duration
generally improved timing in control mice but in D2R-OE mice timing accuracy did
not improve. In the current experiment we used a pharmacological manipulation to
produce a more global change in motivation. Previously, Simpson et al. (2011) found
that administration of SB242084, a functionally selective ligand at the 5-HT2C recep-
tor, increased the motivation to work for rewards. Additionally, the drug alleviated

CHAPTER 2. IMPROVING TEMPORAL COGNITION BY ENHANCINGMOTIVATION 35
the motivational deficits of D2R-OE mice. Specifically, a dose of 0.75 mg/kg was suf-
ficient to restore the D2R-OE mice’s willingness to work to earn rewards to the level
of control subjects when tested on a progressive ratio schedule in which the number
of responses required to earn each successive was doubled. To determine if SB242084
treatment would also alleviate the timing deficits observed in D2R-OE mice, four days
of saline were followed by four days of SB242084 injections. All injections occurred
20 minutes before each behavioral test session.
Administration of SB 242084 resulted in improvement of temporal discrimination
performance in both Control and D2R-OE mice. (See Table 2.3; Figure 2.4A). There
was a main effect of the drug on both timing accuracy and precision. For both Control
and D2R-OE groups, SB242084 had an enhancing effect on timing performance. For
accuracy, there was also a significant interaction between drug and genotype. Separate
post-hoc analyses showed that the drug improved accuracy in both Control (γ0 =
0.53, SE = 0.06, z − value = 8.14, p < .001) and D2R-OE groups (γ0 = 0.23, SE =
0.07, z − value = 3.25, p < .01). Composite accuracy and precision coefficients for
all groups in saline and drug phases are shown in Figure 2.4C. Overall, SB242084
improved the timing accuracy and precision in both groups showing that a global
increase in motivation can produce quite general improvements in cognition.
We demonstrated that increasing motivation can enhance cognitive performance
using several different methods of altering motivation. We show that in control mice,
accuracy and precision of timing were modulated by reward magnitude as well as by a
global increase in motivation produced by a 5-HT2C selective ligand (SB242084) pre-
viously shown to increase motivation (Simpson et al., 2011). Additionally, we showed
that mice that overexpress D2 receptors in the striatum have a deficit in temporal
discrimination in addition to a deficit in incentive motivation (Simpson et al., 2011).
In these mice, we found that cognitive performance could be improved by using three
methods to increase motivation. First, we normalized receptor levels by switching off
the transgene with doxycycline and produced a partial rescue of the timing deficit.

CHAPTER 2. IMPROVING TEMPORAL COGNITION BY ENHANCINGMOTIVATION 36
As in our previous study that employed a different assay of timing behavior (Drew et
al., 2007), normalizing the D2R overexpression, resulted in a recovery of accuracy and
partial rescue of precision of timing. To explore the effect of reward magnitude, we
altered the levels of motivation by first increasing the reward magnitude selectively
for the longer anchor cue duration. This improved timing precision but not accuracy
in D2R-OE mice. Finally, we used the 5-HT2C selective ligand to increase motivation
and found that this drug improved both the precision and the accuracy of timing.
Taken together, these results demonstrate that increasing motivation improves the
discrimination and use of time to guide actions.
Good temporal discrimination depends on both attention to and perception of
time, updating of working memory as time elapses, long-term recall of which partic-
ular actions are rewarded after different amounts of time and the proper selection
of the rewarded actions (Ward, Avlar, & Balsam, 2014; Ward, Kellendonk, Kandel,
& Balsam, 2012). Consideration of what we have previously learned about D2R-OE
mice gives us some clues as to which processes might have been modulated by moti-
vation in the current studies. We previously found no deficit in sustained attention
in D2R-OE mice, as well as intact maintenance of working memory stimuli (Ward,
Winiger, Higa, Kahn, Kandel, Balsam, and Simpson, submitted). D2R-OE mice also
show normal accuracy as well as normal precision in timing on a temporal bisection
task with shorter anchor durations (2s and 8s) than the ones we used here (6s and
24s) (Ward et al., 2009). Thus, the deficit in D2R-OE mice does not appear to be the
result of impaired attention, maintenance of working memory or timing perception,
per se. Good performance with short duration cues also indicates that the D2R-OE
mice have intact long-term memory about which actions are rewarded after different
amounts of time. Thus we are left with the hypothesis that the deficit involves the
updating of working memory with new information. Either a compromised facility
with updating memories or a lowered working memory capacity might limit the abil-
ity of D2R-OE mice to accurately accumulate information about elapsing time during

CHAPTER 2. IMPROVING TEMPORAL COGNITION BY ENHANCINGMOTIVATION 37
longer intervals. Patients with schizophrenia also show intact maintenance of working
memory stimuli (Gold et al., 2010) and instead have deficits in the aspects of working
memory that involve the updating and manipulation of information (Kim, Glahn,
Nuechterlein, & Cannon, 2004) as well as in the capacity of working memory (Gold
et al., 2010). Consequently, our results suggest that these alterations in cognitive
function may arise from altered D2R signaling found in many patients (Kuepper et
al., 2012) and may, at least in part, be caused by the impact of altered D2R signaling
on motivation. Consequently, our results suggest that motivation can modulate the
updating and/or capacity of working memory and imply that enhancing motivation
to use this specific aspect of cognitive function might be of considerable value to
patients. Our results further suggest that the changed motivation probably arises
from a change in processing of positive rewards. Our previous work indicates that
the D2R-OE mice have a deficit in representing the value of positive outcomes as well
as a deficit in assessing the tradeoff between the costs and benefits of their actions
(Simpson et al., 2011; Ward, Simpson, et al., 2012). The reward magnitude manipu-
lation we used in the current study revealed another interesting aspect of how reward
processing may be changed by D2R overexpression. As in the previous study (Ward,
Simpson, et al., 2012), the D2R-OE mice were less sensitive to an increase in reward
value. However, D2R-OE mice were not less sensitive to a decrease in reward value
because when the magnitude of reward was shifted back to the smaller reward, the
accuracy of timing in D2R-OE mice declined, as it did for controls. Thus, the pattern
of results implies that the 5-HT2C ligand is enhancing motivation by improving the
processing of positive rewards.
The pattern of a greater sensitivity to a reduction or loss in reward value and
a lowered sensitivity to increases in reward value of the D2R-OE mice is similar
to the deficits in reward processing that has been described in patients (Gold et
al., 2012; Waltz, Frank, Robinson, & Gold, 2007; Waltz, Frank, Wiecki, & Gold,
2011). As previously suggested (Simpson, Waltz, Kellendonk, & Balsam, 2012), this

CHAPTER 2. IMPROVING TEMPORAL COGNITION BY ENHANCINGMOTIVATION 38
asymmetry may arise from a general deficit in the capacity to represent the value of
future positive rewards in D2R-OE mice (Ward, Simpson, et al., 2012) and in patients
with schizophrenia (Barch & Dowd, 2010; Strauss, Wilbur, Warren, August, & Gold,
2011; Ziauddeen & Murray, 2010). The results of the current study along with the
similar characterization of reward processing deficits in patients suggests that the 5-
HT2C receptor might be a novel therapeutic target to consider for meliorating specific
deficits in processing positive rewards.
Moreover, our study suggests that modulation of the 5-HT2C receptor may be
a useful therapeutic target for generally improving both motivation and cognition.
Our earlier work demonstrates that SB242084 increases motivation as reflected in the
willingness to expend effort to obtain rewards (Simpson et al., 2011). Our current re-
sults provide the first demonstration that 5-HT2C receptor modulation increases both
timing precision and accuracy. Previously, modulation of the 5-HT2C receptor with
SB242084 has been found to improve cognitive function in a rodent assay of cognitive
flexibility when delivered systemically, (Boulougouris, Glennon, & Robbins, 2008) or
selectively to the orbitofrontal cortex (Boulougouris & Robbins, 2010). SB242084 has
also been found to have antidepressant related effects in rodent models with a faster
onset than traditional serotonergic antidepressant drugs (Opal et al., 2013). These
studies suggest that targeting the 5-HT2C receptor may have very general effects on
motivation and cognition and thus might be efficacious for a number of psychiatric
disorders. It is therefore important to consider the mechanisms by which SB242084
enhances motivated behavior and cognition.
SB242084 is one of several compounds known to display functional selectivity
at the 5-HT2C receptor, acting as an inverse agonist on some signal transduction
pathways, and an agonist on others (De Deurwaerdere, Navailles, Berg, Clarke, &
Spampinato, 2004). Several studies suggest that this compound exerts its behavioral
effect through an interaction with the mesolimbic dopamine system. In the anes-
thetized rat, systemic injection of SB242084 at 0.64 - 1.0mg/kg (i.e. similar to the

CHAPTER 2. IMPROVING TEMPORAL COGNITION BY ENHANCINGMOTIVATION 39
dose used in our studies) increases the rate of firing of VTA DA neurons (Di Mat-
teo, Di Giovanni, Di Mascio, & Esposito, 1999) and also augments pharmacologically
stimulated dopamine release (Hutson et al., 2000; Navailles, De Deurwaerdere, Porras,
& Spampinato, 2004). The enhanced increase in extracellular dopamine (DAex) was
observed in the nucleus accumbens (NAc), an area of the mesolimbic DA projection
from the VTA that is involved in the dopaminergic regulation of motivated behaviors.
Thus at least some of the behavioral impact of 5-HT2C receptor modulation may be
mediated by DA in the NAc.
It seems plausible that altered dopamine signaling would be central to the general
interaction of motivation and cognition. First, dopamine plays a pivotal role in re-
ward processing (Liu, Hairston, Schrier, & Fan, 2011; Markou et al., 2013; Salamone &
Correa, 2012) through a network that computes a cost and benefit calculations when
expected reward magnitude and effort are manipulated (Croxson, Walton, O’Reilly,
Behrens, & Rushworth, 2009). Second, altering dopamine related circuitry and base-
line DA levels in frontal cortices and striatum is a determinant of cognitive processes
such as working memory (Abi-Dargham et al., 2002), attention (Boulougouris &
Tsaltas, 2008; Nieoullon, 2002) and timing (Coull, Cheng, & Meck, 2011). Inter-
estingly this relation is bidirectional. Not only does cognition depend on dopamine
signaling but cognitive training also alters dopamine function. In fact, working mem-
ory training for 5 weeks altered the D1R binding potential in prefrontal and parietal
cortices (McNab et al., 2009) and D2R binding potential in the striatum (Backman
et al., 2011).
In conclusion, cognition and motivation are inseparable mental operations that
are required for everyday functioning. We demonstrate here that the accuracy and
precision of timing is altered by changes in motivation. These alterations in tim-
ing likely depend on the impact of motivation on working memory updating and/or
capacity. Since timing and working memory are such an integral part of so many
functional behaviors, an altered interaction between motivation and these processes

CHAPTER 2. IMPROVING TEMPORAL COGNITION BY ENHANCINGMOTIVATION 40
in patients may contribute significantly to functional deficits in a very broad range of
activities including academic pursuits, maintaining a job and relationship, and even
in the basic activities of daily living. Our results suggest that patients have two dif-
ficulties to overcome to improve their daily functioning; motivational and cognitive
impairments. Whatever deficits exist in cognition may be exacerbated by a low level
of motivation and conversely, whatever deficits exist in motivation may be aggra-
vated by cognitive deficits. Our experiments demonstrate that altering motivation
can improve temporal cognition. Similarly, it has been found that increasing intrinsic
motivation in patients enhances arithmetic skills (Choi & Medalia, 2010). Therefore,
using behavioral and pharmacological strategies to increase motivation in patients
may not only improve motivationally relevant symptoms but may also significantly
improve cognitive functions.
2.4 Acknowledgements
This work was supported by NIH grants R01MH068073 (PDB) and P50MH086404
(EHS and ERK), the Lieber Institute for Brain Development (EHS and ERK), and the
Howard Hughes Medical Institute (ERK). We are grateful to Iram Haq for maintain-
ing and genotyping the transgenic mouse colony. Conflict of interests: The authors
declare no competing financial interests.
2.5 Abbreviations
D2R Dopamine D2 receptor D2R-OE mice Dopamine D2 receptor over-expressing
mice PSE Point of Subjective Equality SB242084 (Chemical Name) 6-Chloro-2,3-
dihydro-5-methyl-N-[6-[(2-methyl-3-pyridinyl)oxy]-3-pyridinyl]-1H-indole-1-carboxyamide
dihydrochloride.

41
Part II
Human Studies: Motivational
Orientations and Executive
Functions

CHAPTER 3. INTRODUCTION 42
Chapter 3
Introduction
Executive functions can be explained as the final stage of information processing
where external sensory information and internal signals are integrated to produce
an action pattern. Visual, auditory and tactile stimulation is initially analyzed at
temporal, parietal and occipital lobes and this pattern of information is mapped onto
past experience. Depending on the goodness of fit of both, strategic planning and goal
monitoring costs are determined. When faced with a novel problem, salient sensory
input should be selected, and then input needs to be sequenced and maintained.
Finally, performance should be updated against the original problem. Therefore,
intact executive functioning requires focused and sustained attention, anticipation,
planning, goal selection, monitoring, flexible set shifting, maintenance, manipulation
and retrieval of the information, use of feedback to guide the behavior (Baddeley,
2007).
Patients with frontal lobe lesions had difficulties in components of executive func-
tions depending on the lesion location and severity (Almarez and Emory, 2006). The
deficits of executive function observed in patients with Parkinson’s Disease resemble
the deficits found patients with frontal cortex dysfunction. Non-medicated patients
with mild symptoms showed no deficit in spatial working memory. In contrast to
this, the medicated and particularly patients with severe symptoms were impaired.
CHAPTER 3. INTRODUCTION 43
In a spatial memory task, subjects were required to remember sequences of color
changing boxes with the number boxes increasing throughout the trials. There was
no impairment in non-medicated and medicated patients with mild symptoms while
patients who were medicated and had severe clinical symptoms were significantly
impaired (Owen et al., 1992). Similarly, in a task that was designed to test the spa-
tial working memory with demands on the active reorganization and manipulation of
information within working memory and development of an efficient and organized
searching strategy, medicated PD patients at either mild and severe phase made more
errors than matching controls. Although patients with extremely mild symptoms were
not significantly impaired, they had a trend for impairment. Generally, L-dopa was
shown to improve these components of the working memory (Owen et al., 1997),
the absence of difference between medication status proves that the contribution of
the dopaminergic medication to this impairment is unlikely. Therefore, these studies
provide evidence that executive impairment observed in patients with PD could be
used as a discriminant variable. Effects of dopamine agonist on working memory and
reversal learning was shown in a study by Mehta et al. (2001) where a dopamine (D2)
receptor agonist bromocriptine improved the visuospatial short term memory, while
at the same time disrupting the probabilistic reversal learning.
The involvement of motivation on executive function is demonstrated in different
studies, with manipulations on the reinforcement magnitudes and values (Pochon et
al. 2002). Furthermore, there are studies demonstrating the role of individual differ-
ences (Studer-Luethi et al., 2011) with a focus on impact of approach and avoidance
dimensions on working memory performance (Gray and Braver, 2002). The stark
resemblance of the components of executive functions and motivational processes is
already noted by researchers (Hofmann, Schmeichel and Baddeley, 2010; Braver et
al., 2014).
Hofmann, Schmeichel, and Baddeley (2012) reviewed the connections between
executive functions and self- regulatory mechanisms and argued that executive func-

CHAPTER 3. INTRODUCTION 44
tions is in service of broader self-regulatory processes. The overlap between the brain
regions implicated in representation of goals, on-line maintenance and manipulation
of information in working memory and behaviors involved in motivational functions
is remarkable (Braver et al., 2014). Such a striking similarity demands a careful
analysis of the relationship between motivation and executive functions. This could
pose a potential problem especially when the relationship between two functions is
characterized as an interaction of two distinct neural systems.
Despite the speculated common mechanisms shared by executive functions and
self-regulatory functions, and in particular motivation, they are studied separately by
cognitive and social personality psychology respectively. Therefore, there is an urgent
need for a synthesis of these mechanisms and characterization of their relationships
in behavioral terms.
To understand the involvement of individual motivational orientations in executive
functioning, in the following 3 studies, I will focus on different components of the
executive functions. Specifically, I will utilize a probabilistic reversal learning an n-
back task (with success/failure framing in study 6). The aim is to demonstrate the
relationship between motivational orientations together with their mutual interactions
and the components of executive functions.
CHAPTER 4. PROBABILISTIC REVERSAL LEARNING 45
Chapter 4
Probabilistic Reversal Learning
4.1 Study 4
4.2 Introduction
How do we make a choice? What is a good choice? These questions grabbed attention
of researchers from multiple disciplines, such as psychology, economics, and neuro-
science to name a few. Behaviorists were among the first to study choice behavior in
animals: the matching law was an attempt to demonstrate the quantitative relation-
ship between the response rate and the reinforcement rate (Herrnstein, 1961,1970;
Baum, 1974). Moving to economics, maximizing the utility of decisions became the
focus of the research and the concept of human rationality was challenged with fur-
ther investigation of decision-making patterns under risky situations. Some of the
very important theories in behavioral economics are prospect theory (Kahneman and
Tversky, 1979) and expected utility theory (Bernoulli, 1738; Von Neumann, 1944).
In the last decades, decision-making research gained further momentum with the ad-
vancements in neuroscience, as well as introduction of disciplines as neuroeconomics
and social cognitive affective neuroscience. Research on risky behavior and decision-
making also gained traction in social psychology research. Ajzen (1996, Higgins,

CHAPTER 4. PROBABILISTIC REVERSAL LEARNING 46
2012) gives a detailed survey of the decision-making research in social psychology,
touching upon the effects of attitudes, biases and intention on decision-making and
also discusses how framing and heuristics could affect our choices. Despite the in-
terest in social psychology in decision-making research, there seems to be no unified
research theme or a formal model that explains social psychological underpinnings of
decision-making.
Neuroscience at the other hand has taken a reductionist approach to understand
human decision-making. A lot of studies focused on how we react to gains or losses
(or rewards and punishments) and delineated brain regions and their underlying net-
works (Doherty et al., 2003, Jimura, Locke and Braver, 2010). Before delving into
more research on decision-making in neuroscience, we need to talk about the case of
Phineas Gage. Briefly, a railroad worker Phineas Gage had a terrible accident where
a rod damaged his brain, but leaving him alive. The famous story had anecdotal
evidence, his acquaintances mentioned his personality was drastically changed, and
became more impulsive and irreverent. In addition, he had trouble in adapting the
social conventions without obvious impairments in speech or memory. Interestingly,
he was able to keep a basic job and managed to live a regular life, showing that he
was not challenged intellectually. Damasio et al. (1994) reconstructed the location
of the damage in the brain of Phineas Cage, and proposed it to be predominantly in
the ventromedial prefrontal (or orbitofrontal) cortex. This case gave rise to a lot of
studies that involved cognitive tasks that are tailored to measure prefrontal cortex
related functions. Despite the fact that the changes in personality and disruption in
socially adaptive behaviors are frequently reported after prefrontal cortex damage,
as also implicated in the case of Phineas Cage, the role of the chronic motivational
orientations on reversal learning has not been studied extensively. Nonetheless, there
are studies that provided evidence for the proposed role of the orbitofrontal cortex in
decision-making. For instance, Hornak et al. (2004) used individuals with bilateral le-
sions of orbitofrontal as participants and tested them in a reversal task. As expected,

CHAPTER 4. PROBABILISTIC REVERSAL LEARNING 47
bilateral lesions, but not unilateral lesions of orbitofrontal cortex disrupted the rever-
sal learning. The deficit occurred specifically in the phases following the first phase
(where learning of contingencies happens), which indicates that the deficit is rather
in updating the associations and as a consequence participants were not able to adapt
to changes in contingencies. The probabilistic nature of the reversal task was also
replicated in an animal study, where the nucleus accumbens deactivations disrupted
the learning from feedback and reversal learning when the reward is probabilistically
delivered and not available 100% of the time (Dalton, Phillips and Floresco, 2014).
Also firing of orbitofrontal cortex neurons that code odor changed after a reversal
where the reward contingencies were altered (Rolls et al. 1996). This type of research
has also extended to populations with mental or neurological disorders that include
impairments in decision-making and reinforcement learning in an effort to show how
our perception of rewards and punishment and overall value changes in a disease
state. Parkinson’s disease, which primarily affects the dopaminergic system in the
striatum, is one of the disorders which has been extensively studied. Using a proba-
bilistic reversal learning task, Parkinson’s disease (PD) patients made higher number
of errors during reversal phases, which required adapting to the changes in stimulus
feedback contingencies (Cools et al. 2001). Interestingly, this effect is observed in
both L-Dopa medicated and unmedicated patients. In addition to this finding, in
a probabilistic learning task, dopaminergic medication was related to impaired ac-
curacy to choose a stimulus that was associated with higher loss potential, whereas
in absence of dopaminergic medication learning from gains were impaired in PD pa-
tients (Frank, Seeberger and Reilly, 2004). In another dopamine related disorder,
schizophrenia, patients also demonstrated impaired performance in a probabilistic
reversal task as shown by higher number of errors and less number of overall reversal
phases completed (Waltz & Gold, 2007).
In summary, probabilistic reversal learning tasks are designed to target psycholog-
ical functions that require cognitive flexibility and adaptation to changes in stimulus-

CHAPTER 4. PROBABILISTIC REVERSAL LEARNING 48
reward contingencies. In addition, a reversal task also requires suppression of non-
adaptive responses and inhibitory control over previously relevant but now irrelevant
contingencies (Clark et al.,2004).
When is a good decision to switch? What really does determine the efficiency,
faster adaptation? The idea of finding a prescription for better decision-making may
be useful when used as a diagnostic tool for disorders (Ernst and Paulus, 2005).
However, individual differences in decision-making can still be observed in “normal”
states. Therefore, implicit studies of reversal learning when not studied in a moti-
vational framework could easily fell into a trap of a deficit hypothesis (Davis et al.,
2007). A theoretical idea that can surpass such problems is to study the individual
in her own adaptive system. In this framework, the definition of value depends on
the fit; “people experience a regulatory fit when the manner of their engagement in
an activity sustains (rather than disrupts) their current motivational orientation or
interests” (Higgins, 2005).
A different approach is to focus on self-regulatory states which can provide infor-
mation about distinct patterns of sensitivity and decision-making. Regulatory focus
theory (RFQ, Higgins, 1998) identifies two regulatory systems that are related to
goal attainment and desired outcomes; promotion and prevention states. In a promo-
tion focus orientation, goals are seen as hopes and aspirations (ideals) and the main
concerns to achieve these goals are described as nurturance, accomplishment, and
advancement. In sensitivity terms, promotion concerns can be translated as gains
and non-gains; difference between a neutral state and a positive change from zero is
desired (Idson, Liberman and Higgins,1999). In a promotion state, eagerness is the
main strategy in achieving a goal and the success is defined as obtaining the maxi-
mal goal. In a probabilistic reversal task, a participant with a high promotion focus
would be expected to be eager to switch to a new contingency when the likelihood of
being correct is manipulated. In addition to this, since the ultimate aim is to achieve
the maximal goal, a promotion state would drive the individual to make choices that

CHAPTER 4. PROBABILISTIC REVERSAL LEARNING 49
match contingencies in each reversal phase, creating a higher sensitivity to changes
in stimulus-feedback relationship overall. There is neural evidence that shows promo-
tion goals are associated with activity in medial PFC (including orbitofrontal cortex),
which is shown to be involved in calculating the future value, and could be related
to predictive processing and overall maximal gains as compared to prevention goals
which requires stability (Packer and Cunningham, 2009).
In contrast to promotion, goals are seen as duties and obligations (oughts) in a
prevention focus orientation and the main concern for achieving a goal is maintaining
the safety and security. Prevention concerns are related to non-losses and losses;
individuals with high prevention focus orientation are sensitive to keep the status quo
and not lose their position in the neutral (zero) state (Liberman et al., 1999). This
type of a vigilant strategy protect a prevention focus individual from making mistakes
and ensure there is a minimal gain, but no loss towards the goal. Therefore, a higher
prevention focus would result in resistance to change and lower likelihood of switching
behavior when presented with a new contingency. In the current task, prevention
focus individuals are predicted to show a persistence in the first presented stimulus-
feedback contingency and stick with it and show a lower sensitivity to changes in the
contingencies.
The role of orbitofrontal cortex in integration of outcomes of different values in the
quest of higher order goals (Schoenbaum, Roesch, Stalnaker, and Takahashi, 2011)
were demonstrated in several studies. Eddington et al. (2007), used a promotion and
prevention prime (in an event-related design with blocks including four promotion
goal primes, four prevention goal primes, and eight control primes randomly pre-
sented in blocks) to induce promotion or prevention goals and measured the neural
activity in the brain. They also measured chronic regulatory focus of the partici-
pants. As expected, in comparison to prevention priming, promotion goal priming
was related to a significantly greater activation in the bilateral orbitofrontal cortex.
The left orbitofrontal cortex activation was greater than the right hemisphere, and

CHAPTER 4. PROBABILISTIC REVERSAL LEARNING 50
activation on the left orbitofrontal cortex was significantly correlated with regulatory
focus promotion success scores. The promotion goal prime would activate the ad-
vancement and achievement of goal-related desired outcomes, and in line with the
promotion prime, OFC activation is related to reward processing (Elliot, Agnew and
Deakin, 2010; Kringelbach, 2005) and goal-directed behavior (Hollerman, Tremblay
and Schultz 2000). The correlation between the activation of OFC in promotion goal
prime and chronic promotion focus further solidifies the role of OFC in self-regulation.
Prevention goal priming was related to activation in the anterior cingulate cortex
(ACC). This finding is also quite consistent with the literature where ACC activa-
tion frequently observed when comparing the threatening vs. safe conditions (Bishop,
Duncan, Brett and Lawrence, 2004). ACC is crucial in integration of multiple inputs
about motivation and works together with OFC and anterior insula (Rushworth et al.,
2007). In addition, research provided evidence for ACC’s role in conflict detection and
error monitoring (Bush, Luu and Posner, 2000). Indeed, a prevention goal priming
would put participant into a more vigilant strategy where error monitoring is crucial.
Eddington et al. (2007) further stresses the absence of activation in more traditional
reward or fear related areas such as amygdala and also the lack of correlations with
BIS and BAS measures.
How does regulatory modes and regulatory focus affect our way of adapting to
changes in the value of an object? Social psychology research on decision making
and self-regulation was rather stayed separated from all cognitive and neuroscientific
research unfortunately and as a result there are very few studies also investigated
the motivational constructs that are directly involved in self-regulation in strictly
cognitive type of tasks (Linke et al, 2000, Locke and Braver, 2008). To our knowledge,
there are no studies tracking this type of a dynamic change in value in respect to
motivational orientations. Therefore, the aim of this study is to continuously track
the sensitivity to changes in contingencies and relate it to chronic motivational states.

CHAPTER 4. PROBABILISTIC REVERSAL LEARNING 51
4.3 What is New in This Task?
Current research on reversal learning utilizes task designs to measure probabilistic
reversal learning which closely resembles the task we use in this study. However, in
the current study the probabilities of being a correct choice do not add up to 1 in
every trial, this is in contrast with many other studies that used a similar probabilistic
reversal design (Frank et al., 2004; Pessiglione et al., 2006). We have attempted to use
probabilities that are not complementary in every trial. In this way, we have devised a
more naturalistic decision-making set up, as we don’t always make decisions between
complementary options. In line with this, the task is not designed to create a strict
reversal between complementary pairs, but rather to track changes in the contingen-
cies (for example, from 0.3 to 0.5), while in some of the reversal blocks contingencies
are fully reversed (for example, from 0.7 to 0.3). For the sake of consistency with the
literature, the current task is still named as a reversal task.
In addition to this, we chose not to use any explicit reward information during the
trials. After choosing a fractal image, participants were shown either “Good Choice”
or “Bad Choice” without any monetary incentive after each trial. Other than these
points, the design of the task closely matches its counterparts in the literature, which
are collectively classified as implicit decision making tasks.
Another new side of this study is to use the information about the motivational
mode and the focus of the individual to understand how implicit value acquisition and
switching behavior occur. While we are not interested in how this kind of an implicit
process unfolds, our aim is to provide evidence for the hypothesis that higher levels
of motivational indices could inform cognitively structured, more implicit processes.
Ultimately, the aim of this study is to show that motivation and decision-making are
integrated in a larger system that can create self-consistent behavior.
Lastly, we attempt to use a fairly new analysis in this task, a compositional
analysis. While the compositional analysis is not quite new, and has been used in
geology and other disciplines in previous years, its application in psychology is quite

CHAPTER 4. PROBABILISTIC REVERSAL LEARNING 52
novel (Jensen 2014; 2015). In addition to a compositional analysis, we also used a
kernel smoothing rate estimation procedure to characterize the instantaneous changes
in choices across different trials and phases.
4.4 Composition of a Decision in a Probabilistic
Reversal Task
Compositions are observed in many psychological processes in terms of proportions,
probabilities or percentages. In a decision making task such as we utilized here,
different probabilities of stimuli (fractal images in our case below) may affect our
choice. The values computed as probabilities are regarded as a composition and
different kinds of compositions give rise to different types of decisions. Examples
of other type of compositional data are as follows; mineral compositions of rocks in
geology or blood compositions in medicine. In the current study, the choice behavior is
dependent on a 3 alternative (3 probabilities: .3, .5, .7) composition. The alternatives
in these examples have a meaning only when thought as relative to each other, or in
other words as a composition.
Probability of being a correct choice for every stimulus (gray scale fractal image) is
preset for this task. In addition to this, individual fractals carry no informative value
for the choice behavior. Participants infer the likelihood for each fractal image as
they go through trials and choose the one with the higher chance of being correct. In
three blocks, the contingencies were changed for every fractal in a way that at the end
of the study each fractal would have been assigned to all possible three probability
contingencies. Therefore, assuming that the individual acquired the task throughout
the trials, and could detect the changes in the contingencies, each fractal does not
carry any overall bias accordingly.
As it can be seen already, the task performance depends on the estimation of
correctness of a fractal in comparison to others (good or bad choice) throughout

CHAPTER 4. PROBABILISTIC REVERSAL LEARNING 53
the trials. In other words, since the fractals themselves have no absolute value,
their correctness is rather constructed through the comparison of contingencies of all
fractal images. Thus, we can say that the decision to choose one of the fractal over
the other is composed of three probabilities. Data consisted of parts that belong to a
common denominator, such as proportions or probabilities, are compositional data,
from which the ratios of the frequencies or magnitudes are the main information that
can be obtained. Compositional data can only provide information about the relative
magnitudes, without giving information about the absolute values. Compositional
data includes vectors with elements, which are the proportions or probabilities that
add up to a constant sum.
4.5 Selection of the Appropriate Sample Space:
Simplex
In order to analyze compositional data appropriately, we need to first understand the
geometry of sample space of compositional data. As compositional data consist of
only relative information but not the absolute values of its elements, when realized in
geometric terms, its sample space should respect this property. Relative information
consists of ratios, hence does not depend on scales of its elements. Therefore, sample
space of compositional data can not be directly realized as points in a vector space
(for instance, in Rn), where each point can have arbitrary length scales.
The geometrical form, simplex is put forward as the appropriate sample space to
better characterize and analyze compositional data (Aitchison 1986, Egozcue et al.,
2011, Pawlovksy Glahn and Buccianti, 2011). Simplex is a generalization of a triangle
to arbitrary dimensions. It is an n-dimensional polytope whose number of vertices is
n+ 1. Basic examples of simplices are a 1-simplex that is a line segment, a 2-simplex
that is a triangle, and a 3-simplex that is a tetrahedron, where n = 1, 2, 3 refers to
the dimension of the simplex. In the following, a simplex denoted by Sn refers to an

CHAPTER 4. PROBABILISTIC REVERSAL LEARNING 54
n-part simplex that is an n− 1-dimensional polytope with n vertices.
A standard n-simplex Sn is a subset of Rn and is given by
Sn ={
x = (x1, x2, . . . , xn)∣∣∣xi > 0, i = 1, 2, . . . , n,
n∑i=1
xi = κ > 0}, (4.1)
where x is a point in Rn and whose components are parts of the simplex. An element
of the simplex, x ∈ Sn, is a composition. The parts of compositions are positive
numbers since they correspond to proportions or probabilities.
As compositions are strictly required to contain relative information only, their
parts can be scaled by any factor, which does not change their ratios. They are
independent of any scale, and in essence do not even depend on the sum of their parts.
The closure operation C on a composition x extracts the pure relative information of
its parts, and is defined by
C(x) =
(κx1∑nj=1 xj
, . . . ,κ xn∑nj=1 xj
), (4.2)
where κ is an arbitrary constant. For instance, it can be set to 1 for probabilities, or
100 for percentages. This closure operation also allows us to define subcompositions,
which is very important, since we cannot always know all the elements that take part
in the composition, and/or are involved in the phenomenon we investigate.
The scale equivalence of compositions reflected by the closure operation, however,
prevents us from using basic operations of addition and multiplication in simplicial
geometry. There are two other operations for simplexes, which are defined using
the closure operation, and are analogous to addition and multiplication. The first
operation is called perturbation, and is defined for two compositions x, y ∈ Sn as
x⊕ y = C(x1y1 , x2y2 , . . . , xnyn
). (4.3)
The second operation is powering, which is a power transformation of a composition

CHAPTER 4. PROBABILISTIC REVERSAL LEARNING 55
x by a real number α,
α� x = C(xα1 , x
α2 , . . . , x
αn
). (4.4)
Similarly, the anti-perturbation of x by a composition y is given by
x y = x⊕((−1)� y
). (4.5)
The opposite element of x is given by x = (−1) � x = C(1/x1, . . . , 1/xn), while
the neutral element is n = x x = C(1, . . . , 1) for any x. For instance, for a 3-
part simplex, the neutral element is (1/3, 1/3, 1/3), which is (the coordinates of) the
barycenter of an equilateral triangle. The two operations, perturbation and powering,
give the simplex a vector space structure, which enables us to define an inner product,
thus “length” of a composition, via transformations to real vector spaces, Rn. By
transforming a composition into a real vector, the notions of norm and distance in
the simplex can be introduced.
One such transformation is the centered log-ratio (clr) transformation, which is
given by
u = clr(x) = log
(x1
gm(x), . . . ,
xngm(x)
), (4.6)
where gm(x) is the geometric mean of the parts of the composition x,
gm(x) =
(n∏i=1
xi
)1/n
. (4.7)
Note that the resulting object is not a simplex, because the sum of its components,∑ni=1 ui = 0, does not satisfy the definition of simplices given in Eq. (4.1). The result
of the clr transformation is a real vector in a (n− 1)-dimensional subspace of Rn.
The Aitchison inner product between two compositions x and y is defined in terms

CHAPTER 4. PROBABILISTIC REVERSAL LEARNING 56
of their centered-log-ratio (clr-) transforms
〈x , y〉a =n∑i=1
logxi
gm(x)log
yigm(y)
= 〈clr(x) , clr(y)〉 . (4.8)
The Aitchison norm is given by the square-root of the Aitchison inner product as
usual,
||x||a = 〈x,x〉1/2a = ||clr(x)|| , (4.9)
while the Aitchison distance between two compositions x and y is given by
da(x,y) = ||x y|| . (4.10)
Thus, by the Aitchison inner product, the norm and distance for compositions in Sn
are defined by the standard inner product of their clr-transforms that are vectors in
Rn.
Many elements of the simplicial geometry and algebra are explained by Aitchison
(sometimes referred as Aitchison Geometry), and there has been further research to
expand the use and rules of simplicial geometry as well. Please refer to Pawlowsky-
Glahn and Buccianti (2011) and Aitchison (1986) and Egozcue et al. (2011) for more
information on perturbation and powering operations alongside with clr and other
relevant transformations.
4.6 Instantaneous Rate Estimates for Sensitivity
and Preference
When working with discrete type of data, such as binomial responses of yes or no
(indicating correct/incorrect in the current data), detecting the fluctuations in sensi-
tivity and preference when contingencies of stimuli change is challenging. One of the
solutions to address this kind of a problem is to use a kernel function such as Gaussian
CHAPTER 4. PROBABILISTIC REVERSAL LEARNING 57
density function to convolute or smooth the sequence of choices. In a kernel-based
smoothing, each of the binomial observation is replaced with a kernel (here a Gaus-
sian function) and the summation of these kernels results in a smooth estimate. It
must be noted that, since, we are interested in drawing instantaneous estimates (a
time series) in the current analysis, a kernel rate estimation is applied rather than
a kernel density estimation. To be able to apply a kernel rate estimation procedure,
we need to know the dispersion which is operated by a single parameter named as
bandwidth should be known (standard deviation in a Gaussian distribution). Band-
width selection is established following the MISE optimization with a cost function
for a fixed bandwidth (Shimazaki and Shinomoto, 2010). A detailed explanation of
the application of kernel rate estimation to choice data is given by Jensen (2015).
The relationship between schedules of contingencies (3 sets of probabilities for
each phase block, which are set previously) and the response pattern of participants
(subjective preferences) is measured by calculating a trial-based sensitivity measure.
A centered log transformation is applied to the schedule of contingencies for every
phase and used to predict subjective preferences. First, pairwise subjective prefer-
ences are constructed by calculating the pairwise probabilities for each time point
with a kernel rate estimation procedure. Following this, we applied a clr transfor-
mation to pairwise probability time series. We then calculated the pairwise bias by
taking the difference between the mean preference for stimulus pairs irrespective of
the contingency and the schedule probabilities. Pairwise probabilities are corrected
for bias, by subtracting the bias for each pairwise probability and estimated the in-
dividual subjective preference estimates for each fractal image. In other words, we
identified how mean preference differs from the schedule globally, creating a central
tendency or bias of preference. Then, we remove this bias. Sensitivity is calculated
by a linear regression predicting the relationship between schedule and the behavior.
We excluded the intercept term, because bias is corrected in this model already. The
slope measure from the regression is used as the sensitivity index, and calculated for

CHAPTER 4. PROBABILISTIC REVERSAL LEARNING 58
every time point.
Sensitivity measure depicts the current willingness to respond to one item more
than others, in concordance with the schedule. The sensitivity of zero may have
2 meanings; first, it may be an indication of your sampling from each option or
exploration, and change in the behavior accordingly. The sensitivity ramps up when
the participant starts to identify the contingency. Secondly, if the sensitivity of zero
persists throughout the trial with no decrease or increase, it may point to a neglect
of the schedule. Decrease in the sensitivity below zero means that the richer schedule
do not get enough attention, in contrast, higher sensitivity points to an increased
attention to the richer schedule. Overall, sensitivity measure shows how you react
to the response contingency. In simple terms, getting close to 1 indicates better
matching to the schedule, and sensitivity scores over 1 means overmatching to the
richer schedule. Sensitivity lower than 0 shows that participant is undermatching the
schedule.
4.7 Methods
4.7.1 Subjects
A total of 75 subjects is tested (female=45, male=24, not disclosed=6). Participants
age ranged from 20 to 57, with a mean age of 26.16 (SD = 5.99). The participants
were recruited through Columbia Business School, Behavioral Research Lab (BRL)
subject pool at Columbia University. The participants were paid 5 dollars as a com-
pensation. Informed written consent was obtained from all participants in accordance
with procedures approved by the institutional review board at Columbia University.

CHAPTER 4. PROBABILISTIC REVERSAL LEARNING 59
4.7.2 Tasks and Procedure
Three gray-scaled fractals used in this probabilistic reversal task are shown in Fig. 4.1.
In every trial a pair of fractals were presented, all of the possible pairs were AB, AC,
BC. The position of the stimulus (right vs. left) was counterbalanced. Participants
were required to choose one of the fractals presented and they received feedback
(correct/incorrect) after making a choice. At the beginning of the study, participants
were given the instruction:
“Please read through these instructions carefully. It is important that
you understand them before beginning the task. Two fractals will appear
simultaneously on the computer screen. Sometimes a symbol will be a
GOOD CHOICE and sometimes it will be a BAD CHOICE, but you
won’t know which is which. Try to guess the best choice as quickly and
accurately as possible. There is no ABSOLUTE right answer, but some
choices will have better odds of being correct than others. Try to pick the
fractal you find to have the best odds of being correct. During the course
of the study, the odds of a fractal being a good choice may change. Press
the right arrow key to select the right fractal and the left arrow key to
select the left fractal. Press any key to start.”
A sliding window approach used to enforce the criterion; contingency was reversed
twice. Probability of getting a correct feedback was set as 30% (A), 50% (B) or
70%(C) at the beginning of the study. After achieving a criterion of 60% correct
on the trials, the contingency was changed to 50% (A), 70% (B) or 30%(C). The
contingency reversed again to 70% (A), 30% (B) or 50%(C) after achieving the same
criterion. Schedule of the contingencies are presented in Fig. 4.1. At the end of the
last reversal, participants were asked to assign monetary values to each fractal, they
were asked to allocate 10 dollars to among these fractals.
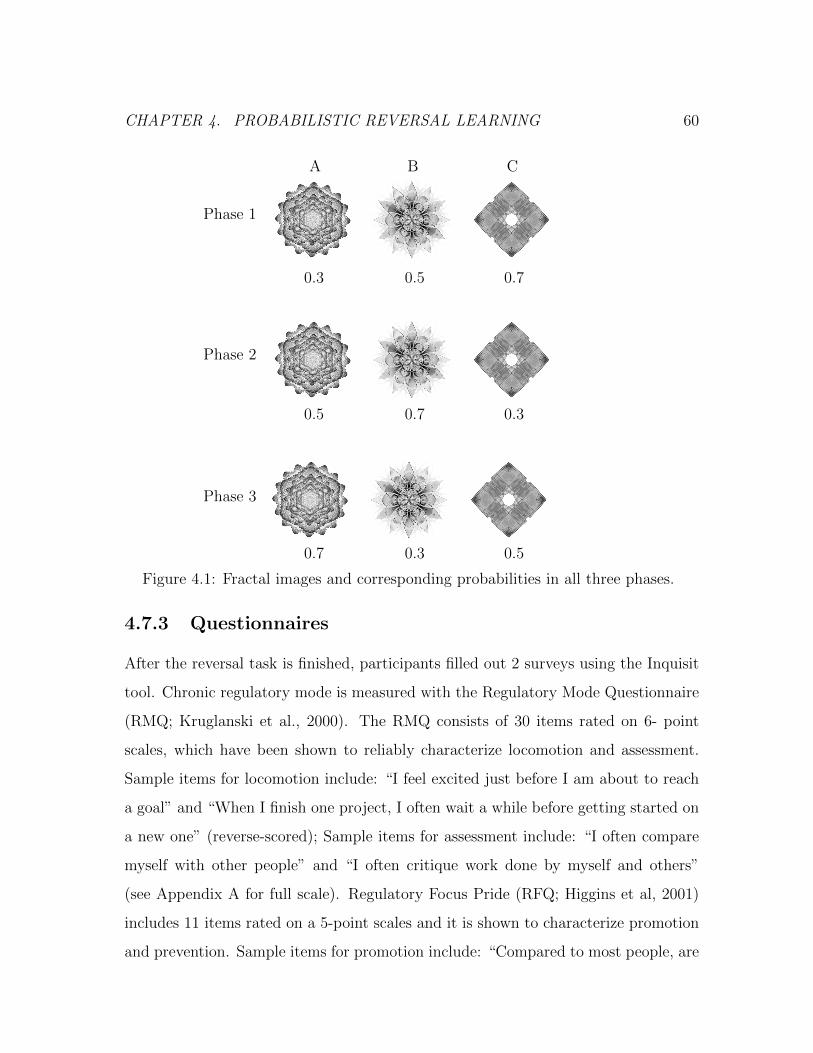
CHAPTER 4. PROBABILISTIC REVERSAL LEARNING 60
CHAPTER 3. MOTIVATIONAL ORIENTATIONS AND COGNITION:EXECUTIVE FUNCTIONS 61
A sliding window approach used to enforce the criterion; contingency was reversed
twice. Probability of getting a correct feedback was set as 30% (A), 50% (B) or
70%(C) at the beginning of the experiment. After achieving a criterion of 60% correct
on the trials, the contingency was changed to 50% (A), 70% (B) or 30%(C). The
contingency reversed again to 70% (A), 30% (B) or 50%(C) after achieving the same
criterion. Schedule of the contingencies are presented in Fig. 3.1. At the end of the
last reversal, participants were asked to assign monetary values to each fractals, they
were asked to allocate 10 dollars to each of these fractals.
Figure 3.1: Fractal images and corresponding probabilities in all three phases.
CBA
Phase 1
Phase 2
Phase 3
0.70.50.3
0.30.70.5
0.50.30.7
Figure 4.1: Fractal images and corresponding probabilities in all three phases.
4.7.3 Questionnaires
After the reversal task is finished, participants filled out 2 surveys using the Inquisit
tool. Chronic regulatory mode is measured with the Regulatory Mode Questionnaire
(RMQ; Kruglanski et al., 2000). The RMQ consists of 30 items rated on 6- point
scales, which have been shown to reliably characterize locomotion and assessment.
Sample items for locomotion include: “I feel excited just before I am about to reach
a goal” and “When I finish one project, I often wait a while before getting started on
a new one” (reverse-scored); Sample items for assessment include: “I often compare
myself with other people” and “I often critique work done by myself and others”
(see Appendix A for full scale). Regulatory Focus Pride (RFQ; Higgins et al, 2001)
includes 11 items rated on a 5-point scales and it is shown to characterize promotion
and prevention. Sample items for promotion include: “Compared to most people, are

CHAPTER 4. PROBABILISTIC REVERSAL LEARNING 61
1 2 3
−1
0
1
2
3
0 10 20 30 40 50 0 10 20 30 40 50 0 10 20 30 40 50trials by phase
Mea
n S
ensi
tivity
Sco
res
Figure 4.2: Mean sensitivity scores across participants in 3 phases for every trial.Loess smoothing is applied and gray boundary lines show the standard error.
you typically unable to get what you want out of life?” (reverse-scored )and “How
often have you accomplished things that got you psyched to work even harder?”;
sample items for prevention include: “Growing up, would you ever cross the line
by doing things that your parents would not tolerate?” (reverse-scored) and “How
often did you obey rules and regulations that were established by your parents?” (see
Appendix A for full scale).

CHAPTER 4. PROBABILISTIC REVERSAL LEARNING 62
4.8 Results
The last 50 trials of each phase are selected for every participant and used in the
following analyses. The number of trials in each phase varied across individuals due to
the sliding windows approach. The shortest phase was comprised of 52 trials. Changes
in the sensitivity, and log-odds of preference for each fractal image are analyzed across
phases. The effects of two regulatory focus orientations, promotion and prevention, on
the sensitivity and preference is shown in two sections. The predictions for regulatory
mode measures, locomotion and assessment and their interactions with regulatory
focus measures are included as tables in the Appendix b. Please note that, in the
following analyses, with the term ”beginning of the phases” we mean the beginning
of the last 50 trials of each phase. Therefore, the preference at the beginning of the
phase is indicative of the prior preference patterns during respective phase.
4.8.1 Sensitivity results
Mean sensitivity scores across individuals for each phase is presented in Fig. 4.2. Poly-
nomial regressions are used in the following analyses due to the non-linear nature of
the mean sensitivity scores distribution in addition to linear effects. Panel Figure 4.3
shows each participant’s sensitivity scores in different phases.
Quadratic-polynomial function is adopted for prediction of the sensitivity in differ-
ent phases and in different groups. The first quadratic-polynomial model addressed
the characterization of the change in sensitivity by comparing the three different
phases irrespective of the regulatory focus condition and is given by
y(E)(sens) = a(E)X2j + b(E)Xj + c
(E)j , (4.11)
where E denotes a particular effect (phase or group), the index j stands for individ-
uals, and the variable Xj represents trials of individual j.
To calculate the differences between phases and groups, quadratic and linear fits

CHAPTER 4. PROBABILISTIC REVERSAL LEARNING 63S
ensi
tivity
ove
r tim
e
tria
ls
sensitivity
−4
−2024
050
100
150
4661
278
133
050
100
150
5410
364
444
050
100
150
7551
472
040
050
100
150
8736
787
013
050
100
150
7496
8
8046
482
588
7878
177
761
8589
474
233
5310
777
866
−4
−2
02456
971
−4
−2024
8297
284
631
8626
480
791
8743
674
482
8200
985
855
4893
4
5843
882
024
7432
049
540
7268
278
031
7967
873
639
−4
−2
02460
439
−4
−2024
8049
475
211
7222
377
791
7129
082
714
7966
086
479
6215
2
5820
484
337
5698
971
476
7493
262
095
7281
172
886
−4
−2
02469
361
−4
−2024
8216
5
050
100
150
8729
279
366
050
100
150
8734
987
178
050
100
150
8579
2
Figure 4.3: Sensitivity scores across phases for every participant. Phase 1 = blue,Phase 2 = pink, and Phase 3 = green curves.

CHAPTER 4. PROBABILISTIC REVERSAL LEARNING 64
0 50 100 150
−1.
0−
0.5
0.0
0.5
1.0
1.5
2.0
Overall Quadratic−Polynomial Model Predictions
Trials
Pre
dict
ed S
ensi
tivity
Figure 4.4: Quadratic-Polynomial Model Predictions. Model predictions for sensitiv-ity (black circles) and the mean sensitivity scores superimposed (red circles) for threephases.
are compared. In addition, parameters of the quadratic-polynomial function is used.
Looking at the polynomial function, c term is the intercept and indicates the sensitiv-
ity score at the beginning of every phase. In addition to this, b is the coefficient of the
linear term and a is the coefficient of the quadratic term. Together, they determine
the shape of the parabola, where the curve turns from decrease to increase, i.e. where
the minimum point is.
Model predictions for each phase are shown in Fig. 4.4. In the first phase the
sensitivity scores fluctuates around zero and after the first reversal, a dip and a
consequent rise in the sensitivity is observed. At the end of the second phase, the
estimate of sensitivity rises just above 1.5 (overmatching) and makes a smaller dip and
return back to 1 (matching) over the third phase. The quadratic model is significant
different from zero in both phase 1 (estimate=0.0006, SE: 0.0003, t-value= −2.5,

CHAPTER 4. PROBABILISTIC REVERSAL LEARNING 65
1 2 3
−2
0
2
0 10 20 30 40 50 0 10 20 30 40 50 0 10 20 30 40 50
Trials
Mod
el P
redi
ctio
ns
Promotion GroupLowHigh
Figure 4.5: Quadratic-Polynomial Model Predictions for Promotion. Model predic-tions of sensitivity in three phases for low (black) and high (red) levels of promotionorientation.
p < 0.05) and phase 2 (estimate=0.001, SE: 0.0004, t-value= 3.25, p < 0.01)
Two groups for each regulatory focus orientation are constructed by choosing in-
dividuals with highest and lowest percentiles of promotion and prevention scores.
Separate analyses are carried for showing the effects of promotion and prevention
orientations on sensitivity. The quadratic-polynomial models for predicting the ef-
fects of promotion and prevention strength are given by Eq. (4.11) Using general
linear hypothesis testing, the differences between high promotion and low promotion
groups for three coefficient estimates are presented in Table 4.1 for each phase. Model
predictions for promotion groups over 3 phases can be seen in Fig. 4.5.
Another quadratic-polynomial model was built to show the difference between
two prevention groups. Figure 4.6 shows how these two groups’ sensitivity changed
throughout the phases. The differences between high prevention and low prevention

CHAPTER 4. PROBABILISTIC REVERSAL LEARNING 66
Estimate Std. Error t value Pr(>|t|)Phase 1-C 1.11 0.34 3.27 .004Phase 2-C 0.88 0.49 1.80 0.08Phase 3-C NDPhase 1-B NDPhase 2-B -1.1 0.04 -2.38 .028Phase 3-B NDPhase 1-A NDPhase 2-A 0.002 0.0008 2.22 .038Phase 3-A -0.002 0.0008 -2.02 0.06
Table 4.1: Estimates, SE, t-value and and p-value for the difference between highpromotion-low promotion for coefficients of the polynomial-quadratic model. ND=no difference
groups for three coefficient estimates are presented in Table 4.2 for each phase.
Estimate Std. Error t value Pr(>|t|)Phase 1-C 1.31 0.37 3.52 .002Phase 2-C NDPhase 3-C 0.03 .001 2.87 .01Phase 1-B NDPhase 2-B NDPhase 3-B -0.12 .05 -2.49 .02Phase 1-A NDPhase 2-A -0.002 0.001 -2.05 0.055Phase 3-A 0.003 0.001 2.82 0.01
Table 4.2: Estimates, SE, t-value and and p-value for the difference between highprevention-low prevention for coefficients of the polynomial-quadratic model. ND=no difference
4.8.2 Preference results
To look at response patterns closely, we have also analyzed how preference for three
fractal images changed in response to different combinations of contingencies. In
the following analyses, we present separate analyses for 3 fractal images; and for
each fractal image the role of promotion and prevention orientations on preference
are shown. Refer to Sec. 4.6 for the explanation on how the preference measure

CHAPTER 4. PROBABILISTIC REVERSAL LEARNING 67
1 2 3
−2
0
2
0 10 20 30 40 50 0 10 20 30 40 50 0 10 20 30 40 50
Trials
Mod
el P
redi
ctio
ns
Prevention GroupLowHigh
Figure 4.6: Quadratic-Polynomial Model Predictions for Prevention. Model predic-tions of sensitivity in three phases for low (black) and high (blue) levels of preventionorientation.
is calculated. Briefly, preference to choose a fractal image is calculated for each
trial of every participant. We use a series of linear models to track the changes of
preference observed in 3 phases and 2 reversals (change in contingency). As in the
sensitivity analyses explained above, we selected the participants who were in the top
and bottom quartiles of promotion and prevention scores and used them as groups in
the analyses. In the following sections, linear models are shown with respect to group
(low promotion, high promotion, low prevention and high prevention), and phase
as explanatory variables with preference for each fractal as the outcome variables.
General Linear Hypothesis testing is used to compare different groups to each other.

CHAPTER 4. PROBABILISTIC REVERSAL LEARNING 68
−0.2
0.0
0.2
0.4
0 50 100 150Trials
Mea
n P
refe
renc
e of
Fra
ctal
A
Figure 4.7: Mean Preference of Fractal A in three phases. Loess smoothing is applied.Note that three phases are not continuous, every phase shows the last 50 trials ofparticipant’s whole phase.
4.8.3 Preferences of Fractal A
The probability of being correct for fractal A was .3 in the first phase, .5 in the second
phase, and finally .7 in the first phase. The mean preferences for fractal A over three
phases is shown in Fig. 4.7. As it can be observed, the overall preference to choose
fractal A decreased in the first phase and increased in the second and third phases.
However, this pattern was differentially affected by the regulatory states.
Firstly, we looked at the difference between individuals with low promotion and
high promotion scores. In Figure 4.8, the mean preferences and the standard errors
are shown with a linear fit superimposed on the data points. The decrease in the
preference in the first phase was sharper for individuals with a higher promotion
score (estimate=−0.006, SE: 0.002, t-value= −2.94, p < 0.01). In addition, in the

CHAPTER 4. PROBABILISTIC REVERSAL LEARNING 69
1 2 3
−0.6
−0.3
0.0
0.3
0 10 20 30 40 50 0 10 20 30 40 50 0 10 20 30 40 50
Trials
Mea
n P
refe
renc
e of
Fra
ctal
A
Promotion GroupLowHigh
Figure 4.8: Data points and linear fit superimposed for Fractal A preferences forPromotion. Linear model fit for each phase is shown over the mean preference datapoints (smoothing is applied).
second phase, while the high promotion group showed a significant increase in their
preference for fractal A (estimate=0.016, SE: 0.003, t-value= 5.76, p < 0.001), there
was no change in the low promotion group . As compared to phase 2, an increase
in the preference was observed for low promotion group (0.009, SE: 0.002, t-value=
4.68, p < 0.001), while high promotion group preserved their already high preference
for fractal A. In the third phase, preference increased 0.046 log-odds units for low
locomotion group (SE: 0.05, t-value= 8.175, p < 0.001) in comparison to first phase,
and the high locomotion group also reached to the same level of preference with no
difference from low promotion group.

CHAPTER 4. PROBABILISTIC REVERSAL LEARNING 70
Moving to the comparison between low promotion and low prevention groups,
groups were not different in the first phase in both intercept and slope terms. However,
low prevention had higher preference for the fractal A in the second phase as compared
to low promotion group (estimate=0.011, SE: 0.002, t-value= 4.434, p < 0.001). In
the third phase again, there were no difference between groups.
In comparison to low promotion, high prevention group had a sharper slope in
the first phase (estimate== .008, SE: 0.002, t-value= −3.84, p < 0.001), indicating
high prevention had a lower preference for the fractal A at the end of the first phase.
When the contingency increased to .5, high prevention group increased preference
for fractal A significantly as compared to the low promotion group throughout phase
2 (estimate=0.022, SE: 0.003, t-value= 7.614, p < 0.001). In the third phase this
pattern is observed again, while low promotion group increased their preference for
fractal A this time, preference increase in the high prevention group was steeper
(estimate=0.011, SE: 0.002, t-value= 3.9, p < 0.001).
Low prevention and high prevention groups were compared in Fig. 4.9. Similar
to comparison between high prevention to high promotion, low prevention group also
demonstrated a lower preference at the beginning of the first phase (estimate=−0.22,
SE: 0.06, t-value=−3.79, p < 0.001) with a less sharper decrease in preference
throughout phase 2 (estimate=0.005, SE: 0.002, t-value=2.82, p < 0.01). In the sec-
ond phase, low prevention group had a higher preference at the beginning, (similarly
to high promotion, estimate=0.34, SE: 0.08, t-value=4.16, p < 0.001), but the in-
crease in the preference was higher for high prevention individuals (estimate=−0.001,
SE: 0.002, t-value=−3.71, p < 0.001). In the third phase, low prevention group had
a flatter slope in comparison to high prevention group (estimate=−0.01, SE: 0.002,
t-value=−3.66, p < 0.001).
Next, we looked at the high promotion and high prevention contrast. In the
first phase, participants with high prevention scores had higher preference for the
fractal A at the beginning of the phase (estimate=0.016, SE: 0.06, t-value= 2.74,

CHAPTER 4. PROBABILISTIC REVERSAL LEARNING 71
1 2 3
−0.4
0.0
0.4
0 10 20 30 40 50 0 10 20 30 40 50 0 10 20 30 40 50
Trials
Mea
n P
refe
renc
e of
Fra
ctal
A
Prevention GroupLowHigh
Figure 4.9: Data points with linear fit superimposed for Fractal A preferences forPrevention. Linear model fit for each phase is shown over the mean preference datapoints (smoothing is applied).
p < 0.01). In addition, there was no difference in the slopes between high prevention
and high promotion groups. However, in the second phase, high promotion partici-
pants reached to higher preferences at the beginning of phase 2 as compared to high
prevention (estimate=0.346, SE: 0.002, t-value=4.02, p < 0.001). High prevention
group had a sharper increase in preference (estimate=0.006, SE: 0.002, t-value=2.03,
p < 0.05). In the third phase, a similar pattern was seen for high promotion group:
higher preference at the beginning, but a flatter increase of preference during phase
3 (estimate=−0.006, SE: 0.003, t-value=2.16, p < 0.05).
Finally, preference of fractal A for high promotion and low prevention groups were

CHAPTER 4. PROBABILISTIC REVERSAL LEARNING 72
−0.4
0.0
0.4
0 50 100 150
Trials
Mea
n P
refe
renc
e of
Fra
ctal
A
groupsPrevention HighPrevention LowPromotion HighPromotion Low
Figure 4.10: Data points with linear fit superimposed for Fractal A preferences. Linearmodel fit for each phase is shown over the mean preference data points (smoothing isapplied).
compared. There was no difference between groups in three phases for both intercept
and slope terms. In Figure 4.10, mean preferences (with SE, and a linear smoothing)
of all groups in 3 phases are shown. Moreover, all model predictions are plotted in
an effect plot in Fig. 4.11.
4.8.4 Preferences of Fractal B
The contingency for Fractal B was set up such that probability of being correct was
.5 in the first phase, .7 in the second phase and finally .3 in the first phase. The
mean preferences for fractal B over three phases is shown in Fig. 4.12. As it can

CHAPTER 4. PROBABILISTIC REVERSAL LEARNING 73
Model Predictions for Group and Phase Interaction
Trials
Pre
fere
nce
for
Fra
ctal
A
−0.6−0.4−0.2 0.0 0.2 0.4 0.6
10 15 20 25 30 35 40 45 50
: phase 1 : group 1
: phase 2 : group 1
10 15 20 25 30 35 40 45 50
: phase 3 : group 1
: phase 1 : group 2
: phase 2 : group 2
−0.6−0.4−0.2 0.0 0.2 0.4 0.6
: phase 3 : group 2
−0.6−0.4−0.2 0.0 0.2 0.4 0.6
: phase 1 : group 3
: phase 2 : group 3
: phase 3 : group 3
: phase 1 : group 4
10 15 20 25 30 35 40 45 50
: phase 2 : group 4
−0.6−0.4−0.2 0.0 0.2 0.4 0.6
: phase 3 : group 4
Figure 4.11: Effect plot of trialphase*phase*promotiongroup interaction from linearmodel fit for each phase is shown.
be observed, the overall preference to choose fractal B increased in the first phase
and kept increasing until towards the end of the second and decreased sharply in the
third phase. There were also differences in preference changes between promotion
and prevention groups.
The difference between low promotion and high promotion groups were investi-
gated first. In Figure 4.13, the mean preferences and the standard errors are shown
with a linear fit superimposed on the data points. The increase in the preference in the
first phase was greater for individuals with a higher promotion score (estimate=0.005,
SE: 0.002, t-value= 2.82, p < 0.01). In the second phase, low promotion individuals
showed a greater increase in their preference of fractal B (estimate=0.01, SE: 0.003,

CHAPTER 4. PROBABILISTIC REVERSAL LEARNING 74
−0.4
−0.2
0.0
0.2
0 50 100 150Trials
Mea
n P
refe
renc
e of
Fra
ctal
B
Figure 4.12: Mean Preference for Fractal B. Mean preference for three phases, Loesssmoothing is applied. Note that three phases are not continuous, every phase showsthe last 50 trials of participant’s whole phase.
t-value= 5.76, p < 0.001) during phase 2 in comparison to the high promotion group.
Groups showed no difference in intercept and slope terms in phase 3.
The comparison between low promotion and low prevention groups, yielded results
such that in the first phase, groups were different at the beginning of the phase 1, low
prevention group showed greater preference for fractal B (estimate=0.165, SE: 0.05,
t-value= 3.26, p < 0.01), but two groups were not different and slope terms. However,
low prevention had lower preference for the fractal B in the second phase as compared
to low promotion group (estimate=−0.019, SE: 0.07, t-value= −2.65, p < 0.01) and
their preference kept decreasing in contrast to low promotion (estimate=−0.008, SE:
0.002, t-value= −3.36, p < 0.001). In the third phase again, both groups decreased
their preferences, however it was sharper for low promotion group (estimate=0.005,
SE: 0.002, t-value= 2.39, p < 0.05).

CHAPTER 4. PROBABILISTIC REVERSAL LEARNING 75
1 2 3
−0.8
−0.4
0.0
0.4
0 10 20 30 40 50 0 10 20 30 40 50 0 10 20 30 40 50
Trials
Mea
n P
refe
renc
e of
Fra
ctal
B
Promotion GroupLowHigh
Figure 4.13: Data points with linear fit superimposed for Fractal B preferences forPromotion Linear model fit for each phase is shown over the mean preference datapoints (smoothing is applied).
High prevention group had lower preference at the beginning of the phase 1 as
compared to participants with low promotion scores (estimate=−0.15, SE: 0.05, t-
value= −2.74, p < 0.01). Additionally, in comparison to low promotion, high
prevention group had a greater increase in their preference during the first phase
(estimate= 0.005, SE: 0.002, t-value= 2.734, p < 0.01). When the contingency in-
creased to .7, at the beginning of the phase 2, high prevention individuals chose fractal
B more than low promotion group (estimate=0.19, SE: 0.08, t-value= 2.46, p < 0.05).
During the phase 2, low promotion group showed an increase in their preference while
high prevention group decreased their preference for fractal B significantly as com-

CHAPTER 4. PROBABILISTIC REVERSAL LEARNING 76
pared to the low promotion group (estimate=−0.015, SE: 0.003, t-value= −5.71,
p < 0.001). At the beginning of the third phase, the same pattern is observed again,
high prevention group persisted on choosing fractal B even though the contingency
switched to .3 (estimate=0.34, SE: 0.008, t-value= 4.32, p < 0.001). Two groups
equally decreased their preference for fractal B during the phase 3.
Next, we looked at the high promotion and high prevention contrast. In the first
phase, groups were not different for both intercept and slope terms. In the second
phase, groups differ in their preferences at the beginning of the phase, participants
with high promotion scores had lower preference for the fractal B (estimate=−0.19,
SE: 0.08, t-value= −2.40, p < 0.05). In addition, there were no difference in the
slopes between high prevention and high promotion groups. In the third phase, high
promotion participants had lower preferences at the beginning of the phase than high
prevention (estimate=−0.25, SE: 0.08, t-value=−3.12, p < 0.01). However, both
groups decreased their preference without showing a difference in the slope.
As depicted in Fig. 4.14, low prevention group chose the fractal B more than the
high prevention groups at the beginning of the phase 1(estimate=0.32, SE: 0.05, t-
value=5.87, p < 0.001). In addition, low prevention group had a sharper decrease
in preference throughout the phase 2 (estimate=−0.007, SE: 0.002, t-value=−3.61,
p < 0.001). In the second phase, low prevention group had lower preference at the
beginning, (estimate=−0.38, SE: 0.07, t-value=−5.05, p < 0.001), but the decrease in
the preference was higher for low prevention individuals (estimate=0.007, SE: 0.002,
t-value=2.71, p < 0.01). In the third phase, high prevention group had a greater
decrease in the slope in comparison to low prevention group (estimate=0.01, SE:
0.002, t-value=3.73, p < 0.001).
Lastly, the preferences of fractal B were compared in the low prevention and
high promotion groups. In the first phase, high promotion individuals chose fractal
B significantly more than low prevention individuals (estimate=0.25, SE: 0.005, t-
value=4.92, p < 0.001) and the increase in their preference throughout the phase was

CHAPTER 4. PROBABILISTIC REVERSAL LEARNING 77
1 2 3
−0.8
−0.4
0.0
0.4
0 10 20 30 40 50 0 10 20 30 40 50 0 10 20 30 40 50
Trials
Mea
n P
refe
renc
e of
Fra
ctal
B
Prevention GroupLowHigh
Figure 4.14: Data points with linear fit superimposed for Fractal B preferences forPrevention Linear model fit for each phase is shown over the mean preference datapoints smoothing is applied.
greater (estimate=0.007, SE: 0.002, t-value=3.74, p < 0.001). While both groups
showed no change in their preference during phase 2, in phase 3 high promotion
group had a sharper decrease in their preference (estimate=−0.008, SE: 0.002, t-
value=−3.53, p < 0.001). In Figure 4.15, mean preferences (with SE, and a linear
smoothing) all groups in 3 phases are shown. In addition, all model predictions is
plotted in an effect plot in Fig. 4.16.
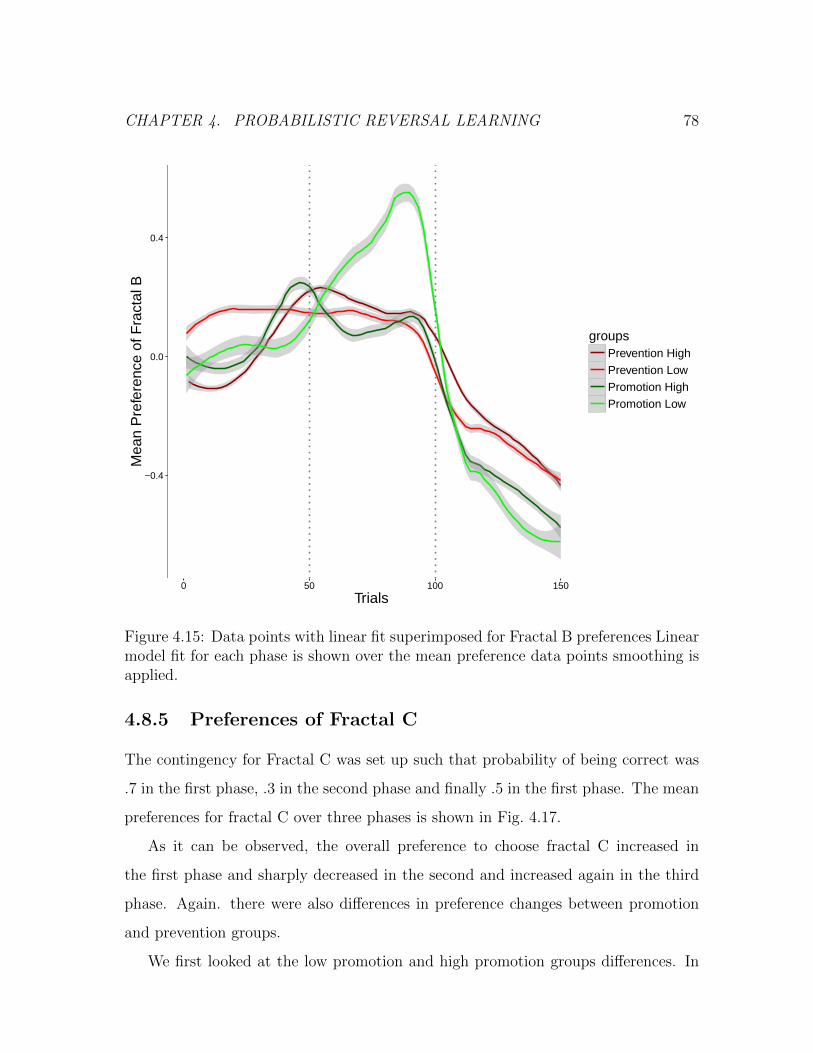
CHAPTER 4. PROBABILISTIC REVERSAL LEARNING 78
−0.4
0.0
0.4
0 50 100 150
Trials
Mea
n P
refe
renc
e of
Fra
ctal
B
groupsPrevention HighPrevention LowPromotion HighPromotion Low
Figure 4.15: Data points with linear fit superimposed for Fractal B preferences Linearmodel fit for each phase is shown over the mean preference data points smoothing isapplied.
4.8.5 Preferences of Fractal C
The contingency for Fractal C was set up such that probability of being correct was
.7 in the first phase, .3 in the second phase and finally .5 in the first phase. The mean
preferences for fractal C over three phases is shown in Fig. 4.17.
As it can be observed, the overall preference to choose fractal C increased in
the first phase and sharply decreased in the second and increased again in the third
phase. Again. there were also differences in preference changes between promotion
and prevention groups.
We first looked at the low promotion and high promotion groups differences. In

CHAPTER 4. PROBABILISTIC REVERSAL LEARNING 79
Model Predictions for Group and Phase Interaction
Trials
Pre
fere
nce
for
Fra
ctal
B
−0.6−0.4−0.2 0.0 0.2 0.4 0.6
10 15 20 25 30 35 40 45 50
: phase 1 : group 1
: phase 2 : group 1
10 15 20 25 30 35 40 45 50
: phase 3 : group 1
: phase 1 : group 2
: phase 2 : group 2
−0.6−0.4−0.2 0.0 0.2 0.4 0.6
: phase 3 : group 2
−0.6−0.4−0.2 0.0 0.2 0.4 0.6
: phase 1 : group 3
: phase 2 : group 3
: phase 3 : group 3
: phase 1 : group 4
10 15 20 25 30 35 40 45 50
: phase 2 : group 4
−0.6−0.4−0.2 0.0 0.2 0.4 0.6
: phase 3 : group 4
Figure 4.16: Effect plot of trialphase*phase*promotiongroup interaction from linearmodel fit for each phase is shown.
Figure 4.18, the mean preferences and the standard errors are shown with a linear fit
superimposed on the data points. Low promotion and high promotion groups showed
no difference in intercept and slope terms in all three phases.
Low promotion and low prevention groups were compared to each other next. In
the first phase, groups were different at the beginning of the phase, low promotion
group showed greater preference for fractal C (estimate=0.182, SE: 0.04, t-value=4.32,
p < 0.001), however during phase 1, low prevention group increased their preferences
greater than low promotion group (estimate=0.003, SE: 0.001, t-value=2.57, p <
0.01). In addition, low prevention group had a lower preference for the fractal C in
the second phase as compared to low promotion group (estimate=0.013, SE: 0.05,

CHAPTER 4. PROBABILISTIC REVERSAL LEARNING 80
−0.2
−0.1
0.0
0.1
0.2
0 50 100 150Trials
Mea
n P
refe
renc
e of
Fra
ctal
C
Figure 4.17: Mean Preference for Fractal C. Mean preference for three phases, loesssmoothing is applied. Note that three phases are not continuous, every phase showsthe last 50 trials of participant’s whole phase.
t-value=2.3, p < 0.05) and their preference kept decreasing similarly throughout the
phase 2. In the third phase again, both groups increased their preferences, however
it was sharper for low promotion group (estimate=0.007, SE: 0.002, t-value=3.41,
p < 0.001).
In phase 1 high prevention and low promotion groups were not different in their
preference. In addition, they chose the fractal C similarly in the beginning of the
phase 2, but low prevention group showed a greater decrease throughout the phase
(estimate = −0.006, SE: 0.002, t−value = −2.9, p < 0.01). Similarly, low promotion
and high prevention groups had similar preferences at the beginning of phase 3,
however low promotion group had a greater increase in their preference as compared
to high prevention at the end of phase 3 (estimate=0.007, SE: 0.002, t-value=3.36,
p < 0.001).

CHAPTER 4. PROBABILISTIC REVERSAL LEARNING 81
1 2 3
−0.6
−0.3
0.0
0.3
0.6
0 10 20 30 40 50 0 10 20 30 40 50 0 10 20 30 40 50
Trials
Mea
n P
refe
renc
e of
Fra
ctal
C
Promotion GroupLowHigh
Figure 4.18: Data points with linear fit superimposed for Fractal C preferences forPromotion. Linear model fit for each phase is shown over the mean preference datapoints (smoothing is applied).
Next, we looked at the high promotion and high prevention contrast. In the first
phase, groups were not different at the beginning, but high promotion group increased
their preference to choose fractal C higher than high prevention group (estimate=0.10,
SE: 0.05, t − value = 2.24, p < 0.05). In the second phase, groups differ in their
preferences at the beginning of the phase, participants with high promotion scores
had lower preference for the fractal C (estimate=−0.15, SE: 0.07, t− value = −2.3,
p < 0.05). In addition, there were no difference in the slopes between high prevention
and high promotion groups. In the third phase, high promotion and high prevention
participants had similar preferences at the beginning of the phase, but high promotion

CHAPTER 4. PROBABILISTIC REVERSAL LEARNING 82
1 2 3
−0.6
−0.3
0.0
0.3
0.6
0 10 20 30 40 50 0 10 20 30 40 50 0 10 20 30 40 50
Trials
Mea
n P
refe
renc
e of
Fra
ctal
C
Prevention GroupLowHigh
Figure 4.19: Data points with linear fit superimposed for Fractal C preferences forPrevention. Linear model fit for each phase is shown over the mean preference datapoints (smoothing is applied).
individuals had a sharper increase in their preference (estimate=0.005, SE: 0.002, t-
value=2.41, p < 0.05).
As depicted in Fig. 4.19, low prevention group chose the fractal C less than the
high prevention groups at the beginning of the phase 1 (estimate=−0.10, SE: 0.04, t-
value=−2.18, p < 0.05). In the phase 2, there were no difference between groups, both
groups decreased their preference for the fractal C. Low prevention group Low pre-
vention group had higher preference at the beginning of the phase 3, (estimate=0.33,
SE: 0.06, t-value=5.21, p < 0.001), but the slope of the increase through the phase
was similar between groups.

CHAPTER 4. PROBABILISTIC REVERSAL LEARNING 83
−0.2
0.0
0.2
0 50 100 150
Trials
Mea
n P
refe
renc
e of
Fra
ctal
C
GroupsPrevention HighPrevention LowPromotion HighPromotion Low
Figure 4.20: Data points with linear fit superimposed for Fractal C preferences. Linearmodel fit for each phase is shown over the mean preference data points (smoothing isapplied).
Lastly, the preferences of fractal C were compared in the low prevention and
high promotion groups. In the first phase, high promotion individuals chose fractal
C significantly more than low prevention individuals (estimate=0.20, SE: 0.04, t-
value=4.73, p < 0.001), but the increase in the preference throughout the phase was
greater for the low prevention group (estimate=0.003, SE: 0.001, t-value=2.1, p <
0.01). In the phase 2, low prevention group chose the fractal C more in the beginning
of the phase (estimate=0.20, SE: 0.06, t-value=3.26, p < 0.01), but the decrease in
the preference afterwards were similar between groups. In phase 3 high promotion
group had a higher preference at the beginning of the phase (estimate=0.32, SE:

CHAPTER 4. PROBABILISTIC REVERSAL LEARNING 84
Model Predictions for Group and Phase Interaction
Trials
Pre
fere
nce
for
Fra
ctal
C
−0.4
−0.2
0.0
0.2
0.4
10 15 20 25 30 35 40 45 50
: phase 1 : group 1
: phase 2 : group 1
10 15 20 25 30 35 40 45 50
: phase 3 : group 1
: phase 1 : group 2
: phase 2 : group 2
−0.4
−0.2
0.0
0.2
0.4 : phase 3 : group 2
−0.4
−0.2
0.0
0.2
0.4 : phase 1 : group 3
: phase 2 : group 3
: phase 3 : group 3
: phase 1 : group 4
10 15 20 25 30 35 40 45 50
: phase 2 : group 4
−0.4
−0.2
0.0
0.2
0.4 : phase 3 : group 4
Figure 4.21: Effect plot of trialphase*phase*promotiongroup interaction from linearmodel fit for each phase is shown.
0.06, t-value=5.27, p < 0.001), but high promotion group showed a sharper increase
in their preference (estimate=0.05, SE: 0.002, t-value=2.4, p < 0.05). In Figure 4.20,
mean preferences (with SE, and a linear smoothing) all groups in 3 phases are shown.
In addition, all model predictions is plotted in an effect plot in Fig. 4.21.
4.9 Discussion
The results of Study 4 showed that both sensitivity to changes in contingencies and
preference to choose the richer schedule were affected by regulatory focus orienta-
tions. The sensitivity measure provides a composite measure of choice made for the

CHAPTER 4. PROBABILISTIC REVERSAL LEARNING 85
richest schedule. Looking at Fig. 4.4, in the first phase sensitivity score fluctuated
around zero, which indicates exploration behavior. In the second phase, after the
first reversal, a decrease in the sensitivity scores was observed, which is in line with
learning the new contingency. Towards the end of the phase, sensitivity scores go
above 1.5, which indicates an overmatching to the richest schedule. In the third
phase a dip in the sensitivity scores were observed, however not as sharp as the sec-
ond phase. This can be seen as learning to adapt to changing contingencies, which
results in less volatility in sensitivity. Then, we selected participants who scored at
the top and bottom quartiles of the promotion and prevention scores. In Figure 4.5,
a similar kind of exploration behavior is demonstrated in phase 1, low promotion
participants started in a low sensitivity and kept exploring, their sensitivity scores
stayed around 0. High promotion individuals started off with a higher sensitivity,
however the earlier part of the phase 1 indicates actually the beginning of the last 50
trials of the phase, thus the results need to be examined more carefully. During phase
1 high promotion individuals keep exploration behavior after the higher sensitivity
patterns, perhaps due to their higher tendency to switch and try different options.
In the phase 2, after the reversal high promotion individuals demonstrated a sharper
decline than low promotion, even though sensitivity of both groups were declined.
In the third phase, high promotion individuals showed a small decrease in the sen-
sitivity and during phase 3, their sensitivity was close to 1 overall, which indicates
matching to the richer schedule. In contrast, low promotion group had a further
decrease in sensitivity, which can be interpreted as a slower learning or adaptation to
the reversals. Prevention groups also showed a exploration behavior in the first phase
with increasing sensitivity towards the end of the phase. In phase 2, a decrease in
sensitivity in both prevention groups is observed and decrease in sensitivity for high
prevention was not as great as it was for low prevention. This could be the result of
high prevention individuals being more persistent with their choice while exploring
other options (Figure 4.6). In addition, the increase in the sensitivity approximately

CHAPTER 4. PROBABILISTIC REVERSAL LEARNING 86
in the middle of the phase, occurred earlier for the low prevention group. Finally, in
the third phase, low prevention showed better adaptation from the beginning of the
trial and has sensitivity scores around 1 mostly. High prevention group had shown a
further decrease in the sensitivity after the reversal.
Sensitivity analysis provided a composite measure to define how well the subjects
matched to contingencies presented in phases. We, then looked at the preferences for
specific fractals and how combination of contingencies affected the behavior. Overall,
the best adaptation occurred with the .3, .5, and .7 contingency (fractal A). The
model explained 24 percent of the variance in comparison to other contingencies that
explained 12 percent (B) and 10 percent (C).
In the first phase, all groups showed a decrease in preference in line with the
contingency (.3 was the least favorable in first phase for fractal A). However, both
high promotion and high prevention groups similarly demonstrated a sharper decrease
as compared to both low promotion and low prevention groups. This finding is in
accordance with the predictions, where high prevention will be vigilant to avoid the
worse option, while high promotion will be eager to find the better option. As a
result of both tendencies, there was a decrease in preference in the first phase for high
promotion and high prevention groups. However this effect was less pronounced for
low promotion and low prevention groups. When the contingency switched from .3
to .5, low promotion group were not able to increase their preference for fractal A,
whereas an increase in the preference was observed for high promotion group. This
difference is meaningful, because promotion orientation strives for maximal gain, and
it is sensitive to changes. However, in comparison to high promotion, high prevention
group showed an even greater increase in preference. This is again in line with the
vigilance tendency of prevention individuals, where they were more sensitive to a
positive changes in the amount of good choices, especially if they were presented with
a bad option previously. In accordance with this idea, increase in the preference was
not as high in the low prevention group as it was for high prevention group. When
CHAPTER 4. PROBABILISTIC REVERSAL LEARNING 87
we look at phase 3, there was no difference between low and high promotion groups,
however, high prevention group kept increasing their preference for fractal A and this
increase was greater than all other groups. This increase can be seen as a continuation
of status quo, where high prevention group found a good choice that kept increasing
from a previously bad choice. It must be noted that the first probability presented
in a contingency also had a role on future construction of preference. Fractal A
with the contingency of .3, .5, .7 could be translated to values such that, in the first
phase with .3 can be seen as -1 in comparison to .5 (0) in phase 2 and .7 as +1 in
phase 3. Therefore, the preference got even greater at the end of the phase 3. In
addition, individuals with promotion orientation could modulate their preference and
increasingly chose fractal A overall at the end of the phase 3.
The preference for fractal B is investigated next. This fractal was presented with
.5 probability in the first phase, .7 in the second and .3 in the third phase. Overall, an
increase in the preference from phase 1 to phase 2 and a decrease in the phase 3 was
occurred, however this contingency created interesting patterns of preference groups.
We noted in the previous paragraph that the order of the probabilities presented may
have an effect. When presented with .5 probability at the beginning of the study, the
value construction in the future phases may differ. The reason is that .5 probability
does not have any informative value in comparison to both .3 and .7 ( .3 and .7 can
guide the participant to approach or avoid the fractal presented, respectively). In
the first phase, low promotion and low prevention groups showed a flatter slope in
comparison to both high prevention an high promotion groups. In high promotion
and high prevention gro”ups, the increasing trend in the preference towards the end of
phase 1 did not continue in phase 2. This finding can be seen as unexpected, because
promotion orientation is expected to be sensitive to changes and the probability of
being a good choice is increased to .7 in phase 2. However, if the previous value of the
fractal B in phase 1 was not well established, the switch from .5 to .7 could be ignored.
Indeed, in all groups except low promotion, the preference for fractal B in phase 2

CHAPTER 4. PROBABILISTIC REVERSAL LEARNING 88
was not changed and was rather flat. It is possible that at the end of the phase 1,
for high promotion group, increasing the preference for fractal B did not yield any
benefit or information about the stimulus and in phase 2, which would be opposite of
a promotion goal of improvement and gain. As a result of this calculation, they might
have ignored this fractal and switched to others. In contrast, low promotion group
had a greater increase in phase 2 in comparison to all other groups. Remembering
that for fractal A, phase 1 low promotion group did not show an increase from .3
to .5, but rather stayed with lower preferences. In addition it can be seen that low
promotion groups preference for fractal C in phase 2 was also off, they chose fractal
C more than the other groups even though on that phase, fractal C only had .3
probability. This pattern also suggest that low promotion group had a less effective
performance in matching their preferences to contingencies (see Fig. 4.22) to see how
each group changed their preferences for each fractal). In addition, low prevention
group had a flat slope in both phase 1 and phase 2 and was not good at distinguishing
between .5 and .7 probabilities. In this task design, we did not have a contrast from
.5 to .3. Therefore the role of non-informative .5 probability when administered on
the first phase on the 1) increase in the preference for low promotion group, 2) null
effect for low prevention, and 3) decrease for the rest of the groups can not be fully
understood. In phase 3, all groups decreased their preference in phase 3.
Lastly, the fractal C was presented as the best choice in the first phase (.7), and
in phase 2 it became the worst option (.3) and in phase 3 it had a .5 probability
of being a good choice. Overall, the participants’ preference of fractal C followed
this contingency, with the highest preference in the first phase and a sharp decrease
in the second and leveling back to a mid preference in the third phase. In the first
phase, both promotion groups increased their preference similarly and better than
the both prevention groups (no difference between prevention groups as well). Higher
promotion orientation seek for the maximal gain and fractal C (.7 ) had the highest
probability in the first phase. In accordance with this prediction, high promotion

CHAPTER 4. PROBABILISTIC REVERSAL LEARNING 89
−0.
75
−0.
50
−0.
25
0.00
0.25
0.50
0.75
050
100
150
Tria
ls
Mean Preference
All
Fra
ctal
s H
igh
Pro
mot
ion
−0.
75
−0.
50
−0.
25
0.00
0.25
0.50
0.75
050
100
150
Tria
ls
Mean Preference
All
Fra
ctal
s Lo
w P
rom
otio
n
−0.
75
−0.
50
−0.
25
0.00
0.25
0.50
0.75
050
100
150
Tria
ls
Mean Preference
All
Fra
ctal
s H
igh
Pre
vent
ion
−0.
75
−0.
50
−0.
25
0.00
0.25
0.50
0.75
050
100
150
Tria
ls
Mean Preference
All
Fra
ctal
s Lo
w P
reve
ntio
n
Figure 4.22: Mean preferences for high vs low promotion vs prevention groups forthree fractal images. Green= Fractal C, Red= Fractal B, Blue=Fractal A

CHAPTER 4. PROBABILISTIC REVERSAL LEARNING 90
individuals chose fractal C more than high prevention group. In the second phase,
a very sharp decrease in preference was observed for both high prevention and high
promotion groups, and this decrease was more pronounced than low promotion and
low prevention groups. Both low groups had less tendency to switch from the first
contingency, however the high promotion group was very sensitive to changes. This
decrease in the preference for fractal C could be suggestive of that high promotion
group increased their preference for another fractal and hence increasing the overall
maximal gain. High prevention group also decreased their preference sharply, in this
case, high prevention individuals had a greater sensitivity to decreases in the proba-
bility of a good choice and adapted easily. However, in phase 3, their vigilant strategy
resulted in the least effective strategy, and they persisted in the lower preference for
fractal C even though it increased to .5 in the last phase. All other groups showed
an increase in the preference in comparison to phase 2.
These results provide strong evidence of modulation of reversal learning by reg-
ulatory focus states. Here, we are not presenting how regulatory modes could also
affect choices in response to different probability schedules, but their involvement in
reversal learning and overall executive functions can not be neglected (see Appendix
B, for regulatory mode related results).
Finally, we need to talk about the drawback of this design. We didn’t use fixed
number of trials in every phase, but rather utilized a sliding windows approach where
each individual had to achieve a criterion to move to the next phase. Thus, each
participant had different numbers of trials in every phase, which was governed by
their learning rate and sensitivity. The reason for not using fixed number of trials per
phase is to get a good estimation of the full preference pattern for each individual
rather than having a part of the preference construction process. As a result of design,
we chose the last 50 trials for each phase and analyzed the sensitivity and preference.
However, this poses a problem, while for some of the participants the sensitivity scores
are originating from the last 50 trials, but for some other it could represent the whole

CHAPTER 4. PROBABILISTIC REVERSAL LEARNING 91
phase worth of trials. In addition, the kernel rate estimation procedure is dependent
on the smoothing over neighbor trials, and in cases of participants with less number
of trials in a phase, the trials close to the end and the beginning of the consequent
phase could be sharing information for sensitivity.

CHAPTER 5. WORKING MEMORY AND MOTIVATION 92
Chapter 5
Working Memory and Motivation
5.1 Introduction
In study 5, a probabilistic reversal learning paradigm is used and the role of motiva-
tional orientations were demonstrated with distinct patterns of fluctuations of sensi-
tivity over reversal phases. Reversal learning depends on two crucial components of
executive functions: 1) behavioral inhibition of the previously relevant contingencies
and 2) flexibly switching to the new goals, mental set-shifting or task switching. An-
other element of executive functions is working memory. The concept of a temporary
storage or memory as opposed to a primary memory is not new and dates back to
William James (1890). For a historical review of theories and models of working
memory, please refer to Baddeley (2007). Working memory is responsible for tem-
porary storage and manipulation of remembered material and it is under attentional
control (Baddeley, 2007). A quality of this type of memory is that, it is only relevant
for a short duration (Fuster, 1995; Goldman-Rakic, 1995), which is held “on-line”
with no external cue or prompt (Goldman-Rakic, 1996; Smith and Jonides, 1999). In
general terms, working memory handles an overall updating function under executive
functions (Hofmann, Schmeichel and Baddeley, 2012).
A good deal of research is done to show how working memory components are

CHAPTER 5. WORKING MEMORY AND MOTIVATION 93
represented in the brain. Walsh and Phillips (2010) used a working memory task
that involves maintenance and retrieval components, and found activations dorsolat-
eral prefrontal cortex (DLPFC), cerebellum, inferior temporal gyrus and thalamus
with increasing load (task difficulty). The involvement of DLPFC in working mem-
ory tasks were frequently demonstrated (Smith and Jonides, 1998), especially after
rehearsal related components are filtered out, in a n-back task DLPFC activation re-
mained strong (Smith and Jonides, 1999). N-back task is tailored to assess the on-line
monitoring, updating and manipulation of information, each component that have a
paramount role in working memory. Hence, it is used widely among researchers.
DLPFC is mostly indicated in maintenance, monitoring and manipulation functions,
organization and response selection (see Owen et al., 2005 for a meta-analysis of n-
back functional imaging studies). In addition to DLPFC, mid-ventrolateral frontal
cortex, parietal cortex and anterior cingulate cortex (conflict detection, error moni-
toring (Owen et al. 2005, Wager and Smith, 2003) are also described as important
players of n-back related functions. N-back performance is affected in many disorders
as well. The performance in an n-back task was not different between depressive and
control subjects, however brain activation patterns were distinguishable. Patients
with depression showed higher activations as compared to controls in the areas of left
middle frontal gyrus (DLPFC), anterior cingulate cortex and left inferior frontal gyrus
(Haney et al., 2005) with increasing difficulty, indicating the task brings higher cog-
nitive burden to depressive subjects. Accuracy in an n-back test was impaired in PD
patients, in both L-Dopa ON and OFF conditions irrespective of load (Beato et al.,
2008). Last by not the least, in schizophrenia impairments in executive functions are
reported frequently (Glahn et al., 2005 for a meta-analysis of executive functions and
working memory deficits in schizophrenia) and moderately correlated with the nega-
tive symptoms (characterized by avolition, amotivation and anhedonia; Nieuwenstein,
Aleman & de Haan, 2001). In line with hypofrontality hypothesis, negative symptoms
were negatively correlated to DLPFC glucose metabolism rate (Wolkin et al., 1992)

CHAPTER 5. WORKING MEMORY AND MOTIVATION 94
in patients with schizophrenia.
In addition to functional imaging results, cortical dopamine 1 receptor (D1R)
binding were also altered after working memory training (McNab et al., 2009).This
finding along other studies (Klinberg et al., 2002; Olesen, Westerberg and Klingberg,
2004) further strengthens the view of adaptiveness or flexibility of working memory.
The idea of manipulating the working memory function is taken as an opportunity
to show the influence of incentives (mostly incorrectly described as motivational in-
fluences) and motivational states on working memory. Pochon et al. (2002) used an
incentivized n-back task to dissociate the representation of value and load (n-back
difficulty) in the brain. Findings implicated deactivation in the ventral striatum and
activation in DLPFC when n-back trials were incentivized by monetary gain. How-
ever, it needs to be specified that, the value is defined simply as the reaction to
monetary incentives in this study, and necessarily does not point to a subjective or
motivational value in self-regulatory terms. Despite different activation patterns were
observed in the brain, this study among others (Belayachi et al. 2015, Taylor et al.,
2004) could not consistently show the effect of monetary rewards or punishments on
working memory behaviorally (for an example of significant effect of incentives on
working memory, see Szatkowska et al., 2011). However, this null finding does not
mean incentives do not affect working memory necessarily. On the contrary, it ap-
prises the role of individual differences and fit between motivational orientations and
incentive type. Baddeley (2001) concurred that the individual differences on work-
ing memory span and function are “the most prominent feature in research on the
topic in North America”. In support of this claim, Brose et al. (2011) found daily
variations in working memory, and separated within and between subject variability.
The variations in working memory performance was explained by global motivation,
followed by attention and negative affect. There are also studies using behavioral ac-
tivation scale (BAS) indicating better working memory accuracy (Gray and Braver,
2002; also null results, Gray et al., 2005).

CHAPTER 5. WORKING MEMORY AND MOTIVATION 95
A key issue arises from studies, the fit between the task and measured personality
index is crucial. Studer-Luethi et al. (2012) used two different cognitive interven-
tion to assess the improvement in the fluid intelligence; a dual n-back task and a
single n-back task (standard). A dual n-back task involves two sensory modalities
and it is cognitively more demanding. The gains on fluid intelligence on these two
tasks were differed depending on the levels of neuroticism of the participant. In sin-
gle n-back task training intervention, participants who had high neuroticism scores
gained significantly more than the low neuroticism. This picture is reversed in dual
n-back training group, people who were low in neuroticism benefited from dual n-back
training (also refer to Kane & Engle, (2002) for a review of individual differences in
working memory and general fluid intelligence).
The evidence presented above indicates that working memory and self-regulation
is rather intertwined, they are dependent or convoluted processes. Importance of
working memory function in self-regulation is shown by its involvement in most of
the major disorders, large individual differences in capacity and function and per-
sonality indices. To provide an evidence of such convoluted relationship, a classic
working memory task n-back task with different variations is used in studies 5 and
6. Study 5 aims to demonstrate the involvement of motivational orientations in a
working memory traditionally perceived as a classic cognitive task with no incentives
or feedback throughout the task. Using an incentivized version of n-back, study 6
aims to present evidence for effects of success/failure framing is modulated by the
motivational orientations.
In the following studies, the relationship between two self regulatory mechanisms;
regulatory focus and regulatory mode orientations and working memory is investi-
gated. Promotion goals proposed to be more projective and mostly involve distant
time frames (Freitas, Liberman, Salovey, & Higgins, 2002; Packer and Cunnigham,
2009) in contrast prevention goals are about keeping the status quo (Liberman et
al., 1999) and deal with the close frames. When promotion goals were framed as dis-

CHAPTER 5. WORKING MEMORY AND MOTIVATION 96
tant and prevention goals were framed closer, dorsolateral prefrontal cortex activation
(implicated in working memory; selection, monitoring and control of the information)
was observed. In corroboration with this finding, in a working memory task, a pro-
motion focus oriented individual would try to keep track of correct options across
trials, ensuring the advancement (Crowe and Higgins, 1997) even when there is delay
between options. The effects of promotion focus may depend on the feedback. Pro-
motion motivation is essential when there is a need to evaluate the success or value
of the goal, especially when there is no explicit feedback is administered. Meanwhile,
the prevention focus would be vigilant to detect errors and preventing false alarms
in every trial. Therefore, in an n-back test with no feedback, promotion state would
predict higher hits while prevention state would ensure lower number of false alarms.
Regulatory mode theory describes strategic differences in how reality is estab-
lished. These individual differences may determine how people seek information when
making choices (Kruglanski et el., 2000; Higgins, Kruglanski and Pierro, 2003). One
of the regulatory modes is the assessment mode mainly concerns with making com-
parisons between target and standard (what is real, truth motivation). It is interested
in doing things right and to be able ensure this, an individual with high assessment
would assess the end state and compare it to other alternative end states. In other
words, assessment orientation is related to comparison of alternative options to each
other while maintaining the information about the options. The assessment orienta-
tion was associated with lower delay discounting rates (Guo and Feng, 2015), showing
that assessment is related to maintaining the correct information about the stimulus
over delays, and comparing it to other alternatives, which is desired in a working mem-
ory task. We predict that, higher assessment orientation is expected to be associated
with better performance in n-back test with and without feedback.
Locomotion mode, however is all about movement and change from current state.
Main concern of the locomotion mode is to initiate movement and sustaining it
smoothly. In the current task, accuracy depends on choosing to click when it is

CHAPTER 5. WORKING MEMORY AND MOTIVATION 97
the target letter and not to click when it is not. Locomotion orientation itself is not
predicted to be beneficial, however if aided by assessment, it may be beneficial for
task performance in an n-back test.
In study 6, we used a success and failure framing in an n-back task to investigate
how regulatory mode and regulatory focus orientations respond to explicit success
and failure feedback. Since, explicit feedback would inform the participants their
overall success in the task, we predicted assessment would predict better performance
when they are primed to be successful.
5.2 Study 5: Working Memory
5.3 Methods
5.3.1 Subjects
A total of 83 subjects are tested (female= 52, male=28, not disclosed=3). Partici-
pants age range was 20 to 57, with a mean age of 26.76 (SD= 7.61). The participants
were recruited through Columbia Business School, Behavioral Research Lab (BRL)
subject pool at Columbia University. The participants were paid 5 dollars as a com-
pensation. Informed written consent was obtained from all participants in accordance
with procedures approved by the institutional review board at Columbia University.
5.3.2 Tasks and procedure
5.3.3 Single n-back task with varying difficulty
Inquisit psychometric testing tool, millisecond software is used to administer the n-
back task. Before the actual n-back task, participants performed a practice test where
they got accustomed to the task structure. During the practice task, they received 9
trial per n-back block and they received feedback (correct/error) for their responses.

CHAPTER 5. WORKING MEMORY AND MOTIVATION 98
Their performance in percentage is shown after every practice block. No feedback is
given during test trials. During practice and test trials, a sequence of letter stimuli is
shown to participants. Participants were required to respond when the current letter
stimulus is the same to the one presented n trials back in this sequence. N-back blocks
varied from 0 to 3 and randomly introduced throughout the task. The letters were all
shown in white on the center, with a black background for 500 ms each, followed by
a 2500 ms interstimulus interval. When they see a target, participants were required
to press “A” in the keyboard and the stimulus would stay in the screen until the
presentation of the next stimulus (3000 ms). There was no response required for
non-targets. A block consisted of 15 + n stimuli and contained 5 targets and 10 + n
non-targets each. The dependent measures were hits, false alarms and the proportion
of hits minus false alarms averaged over all n-back levels.
5.3.4 Questionnaires
After the n-back task is finished, participants filled out 2 surveys using the Inquisit
tool. Chronic regulatory mode is measured with the Regulatory Mode Questionnaire
(RMQ; Kruglanski et al., 2000). The RMQ consists of 30 items rated on 6- point
scales, which have been shown to reliably characterize locomotion and assessment.
Sample items for locomotion include: “I feel excited just before I am about to reach
a goal” and “When I finish one project, I often wait a while before getting started on
a new one” (reverse-scored); Sample items for assessment include: “I often compare
myself with other people” and’ I often critique work done by myself and others”
(see Appendix A for full scale). Regulatory Focus Pride (RFQ; Higgins et al, 2001)
includes 11 items rated on a 5-point scales and it is shown to characterize promotion
and prevention. Sample items for promotion include: “Compared to most people, are
you typically unable to get what you want out of life?” (reverse-scored )and “How
often have you accomplished things that got you psyched to work even harder?”;
sample items for prevention include: “Growing up, would you ever cross the line

CHAPTER 5. WORKING MEMORY AND MOTIVATION 99
by doing things that your parents would not tolerate?” (reverse-scored) and “How
often did you obey rules and regulations that were established by your parents?” (see
Appendix A for full scale).
5.4 Results
Linear models with the predictor variables, promotion, prevention, locomotion and
assessment scores and 2-way interactions and outcome variables, hits, false alarms
and the total score are performed. Total score was calculated by proportion of hits
minus false alarms over trial number. Predictor variables are z-transformed.
5.4.1 Hits
Interaction model explained more variance for prediction of hits. The significant term
from this model was promotion X assessment interaction. The linear model predicted
the individuals having a higher promotion and assessment score per unit (1 SD unit)
had a higher hits score (estimate= 3.72, SE= 1.34, t-value= 2.78, p-value < 0.01, see
Fig. 5.1).

CHAPTER 5. WORKING MEMORY AND MOTIVATION 100
Model Predictions for Assessment and Promotion Interaction
Assessment_zscored
Hits
10
20
30
40
50
60
70
80
90
−3 −2 −1 0 1 2
zpromo
−3 −2 −1 0 1 2
zpromo
−3 −2 −1 0 1 2
zpromo
−3 −2 −1 0 1 2
zpromo
−3 −2 −1 0 1 2
zpromo
Figure 5.1: Effect plot of assessment*promotion interaction from linear model fit is
shown.
5.4.2 False alarms
Interaction model was compared against the main effects model, and it did not ex-
plained more variance. Therefore, interaction model was excluded from the results.
The results of the main effect model showed a significant effect for prevention scores.
Individuals having a higher prevention score per unit had lower number of false alarms
(estimate= 1.27, SE= 0.5049, t-value=−2.489 ) (see Table 5.1).
Estimate Std. Error t value Pr(>|t|)(Intercept) 5.22 0.48 10.78 0.00
zpromo 0.20 0.61 0.32 0.75zprevent -1.26 0.50 -2.49 0.015
zLoco 0.49 0.6022 0.81 0.42zasses 0.67 0.5220 1.28 0.20
Table 5.1: Estimates, SE, t-value and and p-value from main effects model for pre-dicting the false alarms

CHAPTER 5. WORKING MEMORY AND MOTIVATION 101
5.4.3 Total Score
Main effects model was not better than interaction model for explaining the variance,
so interaction model is selected. The same pattern of promotion X assessment in-
teraction predicting higher total score emerged ( estimate: 0.292662, SE: 0.134564,
t− value : 2.175, p− value < 0.033).
5.5 Study 6: Working Memory with framing
5.6 Methods
5.6.1 Subjects
A total of 147 subjects is tested. The participants were recruited through Columbia
Business School, Behavioral Research Lab (BRL) subject pool at Columbia Univer-
sity. Subjects assigned to gain (69, female= 42, male=19, not disclosed=8) or loss
(76, female=51, male=22) framing conditions. Participants age range was 19-34,
with a mean age of 24.65 (SD= 4.7) in the gain group and 19-57, with a mean age of
25.18 (SD= 5.82). The participants were paid 5 dollars as a compensation. Informed
written consent was obtained from all participants in accordance with procedures
approved by the institutional review board at Columbia University.
5.6.2 Tasks and procedure
5.6.3 Single n-back task with success and failure framing
The single n-back with varying difficulty is used (see Study 1 above). Subjects ran-
domly divided into either success or failure framing conditions.
For success framing, subjects were presented with this instruction:
CHAPTER 5. WORKING MEMORY AND MOTIVATION 102
“The actual n-back testing is about to begin. In every block, you can earn
1 point contingent on your performance. If you dont perform well, your
score will not change. Your total score will be shown after each block.
Try hard to keep as many points as possible. The maximum score you
can achieve at the end of the experiment is 12.”
For failure framing,subjects were presented with this instruction:
“The actual n-back testing is about to begin. You will start the experiment
with 12 points. In every block, you can lose 1 point if you dont perform
well. Your total score will be shown after each block. Try hard to keep as
many points as possible.”
Feedback is given at the end of each block as earned or lost points. Participant
could earn or lose 1 point every block. The maximum points that could be collected
was 12. The dependent measures were hits, false alarms, the proportion of hits minus
false alarms averaged over all n-back levels and points collected at the end of the task.
5.6.4 Questionnaires
RFQ and RMQ surveys were given at the end of the n-back task.
5.7 Results
Linear models with the predictor variables, framing condition, promotion, prevention,
locomotion and assessment scores, and outcome variables, hits, false alarms, the total
score and the points earned are performed. Total score was calculated by proportion
of hits minus false alarms over trial number. Predictor variables are z-transformed.
We compared models including only main effects and the partial interaction models

CHAPTER 5. WORKING MEMORY AND MOTIVATION 103
with and without specifying the framing conditions. There were no difference between
these models in terms of variance explained.
5.7.1 Hits
We first run a model without controlling for framing effects, including two way in-
teractions between regulatory focus and mode. A significant interaction between
promotion and prevention was observed (estimate: 2.37, SE: 0.99, t-value: 2.38,
p < 0.05).
After this analysis, interaction model that included 2-way interactions of regu-
latory focus and mode orientations, and their interactions with framing conditions
is used. This model included three way interactions (regulatory focus X regulatory
mode X framing). For individuals who received a success framing, model predicted
that the individuals with higher assessment score per unit had a higher hits score
(estimate: 2.85, SE: 1.29, t-value: 2.2, p < 0.05). This beneficial effect is reversed
in individuals who had a failure framing (estimate: −4.2, SE: 1.81, t-value: −2.31,
p < 0.05). For failure framing, locomotion orientation marginally predicted lower
number of hits (estimate: −2.63, SE: 1.41, t-value: −1.9, p = 0.065). In addition,
locomotion X assessment interaction was trending to be significant, and predicted
higher number of hits (estimate: 2.60, SE: 1.40, t-value: 1.85, p = 0.066).
5.7.2 False alarms
First, a model excluding the framing showed that people with higher assessment
scores had lower number of false alarms overall (estimate: −0.75, SE: 0.36, t-value:
−2.08, p < .05). The interaction model showed that for the individuals who had a
success framing, assessment orientation predicted less false alarms (estimate: −1.09,
SE: 0.56, t-value: −1.94, p = 0.054). Failure framing did not effect the number of
false alarms.

CHAPTER 5. WORKING MEMORY AND MOTIVATION 104
Model Predictions for Assessment Gain and Loss Framing
Assessment_zscored
Tota
l Sco
re
2.0
2.5
3.0
3.5
4.0
4.5
5.0
−3 −2 −1 0 1 2
: framing 0
−3 −2 −1 0 1 2
: framing 1
Figure 5.2: Effect plot of assessment*framing interaction from linear model fit isshown. Success Frame =0, Failure Frame=1
5.7.3 Total Score
In the first model excluding the framing while controlling for focus and mode variables,
a significant interaction between promotion and prevention is observed (estimate:
0.25, SE: 0.12, t-value: 2.68, p = 0.01).
For success framing, interaction model predicted that the individuals with higher
assessment score per unit had a higher total score (estimate: 0.32, SE: 0.12, tvalue :
2.69, p < 0.01, see Fig. 5.2). With failure framing, this effect reversed, a higher as-
sessment score predicted a lower total score (estimate:−0.41, SE: 0.17, t value:−2.42,
p < 0.05) in comparison to success framing. In addition to this, locomotion pre-

CHAPTER 5. WORKING MEMORY AND MOTIVATION 105
Model Predictions for Locomotion effect in Loss Framing
Locomotion_zscored
Tota
l Sco
re
3.0
3.5
4.0
4.5
−2 −1 0 1 2
Figure 5.3: Effect plot of locomotion effect on total score for loss framing conditionfrom linear model fit is shown.
dicted lower total score when there is a failure frame (estimate:−0.28, SE: 0.13, t
value:−2.15, p < 0.05, see Fig. 5.3). Furthermore, in failure framing condition, loco-
motion and assessment interaction yielded better total score (estimate:0.28, SE: 0.13,
t value:2.13, p < 0.05, see Fig. 5.4).
5.8 Discussion
The results of Studies 5 and 6 provide some evidence of modulation of working mem-
ory function in an n-back task by regulatory focus and regulatory mode states. In
Study 5, we administered a classic n-back task using letter stimuli and measured

CHAPTER 5. WORKING MEMORY AND MOTIVATION 106
Model Predictions for Locomotion and Assessment Interaction in Loss Framing
Assessment_zscored
Tota
l Sco
re
1
2
3
4
5
6
−3 −2 −1 0 1 2
zLoco
−3 −2 −1 0 1 2
zLoco
−3 −2 −1 0 1 2
zLoco
−3 −2 −1 0 1 2
zLoco
−3 −2 −1 0 1 2
zLoco
Figure 5.4: Effect plot of locomotion and assessment interaction on total score forfailure framing condition from linear model fit is shown.
the accuracy by calculating the hits, false alarms and the total score. As predicted,
working memory performance was associated with both assessment and promotion
orientations. Individuals who had high assessment and high promotion scores scored
a higher number of hits and overall achieved a higher total score. For our knowledge
the involvement of assessment motivation in working memory tasks that involve active
maintenance and updating of information was never shown. Assessment orientation
is driven by truth and control motivations where the ultimate aim is to make a com-
parison of the options and to find the true solution (Higgins, 2012). In an n-back test,
high performance depends on keeping the last ’n’ worth letters in mind and actively
comparing it to the target letter. In this sense, the task has a backwards tendency,

CHAPTER 5. WORKING MEMORY AND MOTIVATION 107
where to be able to move efficiently through the task, thinking the past occurrences
is crucial. In line with this, assessment motivation is also very effective at revising
and updating the previous information. In addition to modulation by assessment
mode, n-back performance was improved by promotion orientation concomitant with
assessment orientation. The promotion goal in the Study 5 is to finish the task, and
get the payment. Furthermore, we did not give feedback or incentive after each trial
or block. The main goal is then to get the monetary incentive at the end and also to
finish the task sooner (at least some of the participants are also motivated for that).
Therefore, the overall promotion goal in Study 5 had a longer time frame. Promotion
orientation is shown to be effective in dealing with conditions which had longer time
frames (Crowe and Higgins, 1997).
Higher prevention score was associated with less number of false alarms in the
current n-back test. This finding is supported by previous reports, which show that
people with prevention orientation are more vigilant not to make mistakes (Freitas,
Liberman, Salovey, & Higgins, 2002). Being vigilant requires a strategy to be consis-
tently checking if a choice will yield a bad outcome. In line with this idea, prevention
goals have shorter time frames. In an n-back task, prevention goal will require to
keep attention high in every trial and not make mistakes.
In the next study, we added a success or failure framing manipulation to the
n-back task and investigated how the overall task performance has changed among
individuals with different levels of regulatory focus and mode orientations. Previ-
ous research demonstrated an advantage of promotion orientation in gain settings,
whereas prevention orientation better adapts to loss conditions (Higgins, 2000; 2005).
Collapsing across the framing conditions, a significant effect of promotion and preven-
tion is observed for predicting higher number of hits and higher total score. However,
the effect of success and failure as distinct forms gain and loss dimensions on working
memory performance was not investigated previously.
There were potential explanations of why promotion and prevention focus indi-

CHAPTER 5. WORKING MEMORY AND MOTIVATION 108
viduals did not benefit further from gaining and losing points for each block. First
of all, the success or failure condition did not involve any change in the monetary
incentive they get at the end of the experiment. The participants were told that they
will be earning a fixed amount of money for participation, so they knew that their
performance will not result in additional reward or punishment at the end of the ex-
periment. Moreover, the feedback for performance was given at the end of each block
and presented in terms of points accumulated/kept so far. In a way, the gain and
loss information also required a comparison against the performance in the previous
block. The effects of success or failure framing would be potentially different if they
were presented after each target trial, and probably present more information about
the value rather than the success.
In study 6, promotion system is not needed when the information on success and
failure of performance were provided. In line with this kind of a substitution, the effect
of assessment on hits and total score differed between framing conditions. In success
framing, while high assessment orientation predicted better hits and total score, in
the failure framing condition individuals with high assessment had lower number of
hits and a lower total score. In addition to this, assessment orientation also predicted
less false alarms in both framing groups, but more so under gain framing. In failure
framing, higher locomotion orientation predicted lower total score. This decrease was
rescued in case of a locomotion and assessment interaction in the failure condition.
On a success framing, the points you accumulate in every block gets meaningful when
compared to the previous block, assessment motivation will be helpful in this type
of comparison. However, when the aim is not to lose points, the assessment of the
value in previous blocks is also needed. To be able to keep the performance and
movement through trials, locomotion will be an effective strategy when combined
with an assessment orientation. Overall, study 6 replicated the study 5 and showed
that assessment is needed with promotion (success) goals.
These results suggest that truth, control, and value motivations all together play

CHAPTER 5. WORKING MEMORY AND MOTIVATION 109
a role in the current task with the addition of framing manipulation. Findings also
suggest that in a task where the maintenance and comparison of information across
multiple stimuli is required, assessment and locomotion could participate in the value
related calculations. Avnet and Higgins (2002) previously reported that the decision
of “right” can be transferred as value to the decision outcome. Furthermore, Studies
5 and 6 are valuable in providing an account of different motivations working together
and affect cognitive processes. This kind of an interaction approach is not a new idea,
nevertheless, it is not used extensively in motivation research.
Before we conclude this chapter, it should be noted that the models used to
explain behavior in these tasks are rather delicate in nature and generally quite poor
in explaining the overall behavior. Hence, replications are needed to validate these
results.

110
Part III
Conclusions

CHAPTER 6. GENERAL DISCUSSION 111
Chapter 6
General Discussion
Everyone has a view on how motivation affects them. They easily prescribe values to
various objects and events around them, use this information to make comparisons
between their options, and ultimately make a choice. However, as psychologists, our
ability to explain how we use motivation to guide our decision is quite limited.
One of the approaches to improve our understanding how motivation affects
decision-making, more executive functions more generally, is identifying common neu-
ral mechanisms and psychological processes of interest. In this thesis, dopamine was
chosen as a candidate for a neural signature to help us reveal how motivation and
executive functions relate to each other. In order to achieve this, we demonstrated
the role of motivation (and reward) in cognition in two different species, mouse and
human.
In Part 1, we focused on the dopaminergic dysfunction that is observed in schizophre-
nia patients. Despite its devastating consequences, schizophrenia disorder also pro-
vides a valuable medium to investigate how motivation and cognition interact. Schizophre-
nia includes three sets of symptoms, positive (hallucinations, delusions), cognitive
(deficits in executive functions, attention, timing, Kerns et al., 2008) and negative
(motivation deficits, avolition, anhedonia) symptoms (Barch and Dowd, 2010). While
the current medications provide satisfactory solutions to positive symptoms, they are

CHAPTER 6. GENERAL DISCUSSION 112
rather ineffective to alleviate cognitive and motivational impairment. Furthermore,
negative and cognitive symptoms are shown to be related to each other (Nieuwen-
stein, Aleman and de Haan, 2001; Foussias and Remington, 2010; Harvey et al., 2006).
The poor performance in Wisconsin Card Sorting Task (which is measure of execu-
tive function, perseverance) was positively correlated with negative symptom severity.
Therefore, illuminating the relation between motivation and executive function will
also help improve the functional outcomes of the disorder. Moreover, the findings are
valuable when they are translated back to normal processes and can provide clues
how motivation and executive functions work together.
A possible primary phenotype in schizophrenia is cognitive dysmetria, which is
the disruption in the coordination of mental activity (Andreason et al. 1999). This
dysfunction may contribute to deficits in cognition as well as motivation. Temporal
processing deficit deficits may be a common class of processes that can lead to a
cognitive dysmetria (Andreason et al. 1999). Consistent with this idea, patients show
timing deficits (Penney et al., 2005). Dopamine D2 receptors (D2Rs) in the striatum
are also involved in timing (Drew, Fairhurst, Malapani, Horvitz, & Balsam, 2003;
Maricq & Church, 1983; Meck, 1986). In schizophrenia, an increase in the occupancy
of dopamine D2 receptors (D2Rs) in the striatum is observed (Abi-Dargham et al.,
2000; Kuepper, Skinbjerg, & Abi-Dargham, 2012; Weinberger & Laruelle, 2001).
Furthermore, D2Rs also implicated in reward motivation (Drew et al., 2007; Nowend,
Arizzi, Carlson, & Salamone, 2001). In order to study the interaction between reward
motivation and timing, we used a D2R overexpressing (D2R-OE) mice to model the
increase in the occupancy of D2Rs in the striatum.
As expected, D2R-OE mice also showed deficits in motivation and timing. In three
studies, we manipulated the motivation by normalizing the D2R overexpression, alter-
ing the reward magnitude and finally administered a motivationally enhancing drug.
In control group, all of these manipulations altered the timing precision and accuracy,
however in D2R-OE mice only the pharmacological manipulation resulted in better

CHAPTER 6. GENERAL DISCUSSION 113
timing accuracy and precision. The results of this study showed that altering moti-
vation (here to earn rewards) is beneficial for improving the cognitive impairments in
schizophrenia. It must be noted though, the definition of the accuracy of timing still
can not be taken absolutely since the subjective perception of timing can be different
between subjects. However, in this study we applied a multilevel analysis where the
random variations in individuals were also analyzed, and therefore we believe the
accuracy of timing in these studies are good depictions of timing function overall.
The results clearly indicate an interdependent relationship between motivation and
temporal cognition.
Despite the fact that motivational impairment on various disorders such as Parkin-
son’s Disease (PD) is observed frequently, there are very few studies that characterized
the impact of the changes in motivational traits in the disease. Foerde et al. (2015)
showed that the PD patients were indeed different in their regulatory mode scores;
they had lower assessment scores as compared to aged matched controls and the lower
assessment scores mediated the poorer performance in a feedback based probabilistic
learning task. The observed differences or changes in the regulatory states in disorders
could also have an important value when thought as behavioral markers in diseases
that involve a core deficit of motivation. The results of Foerde et al.’s (2015) study
provides further support for the need to understand how motivation could affect the
cognition and functional outcome of disease.
The comorbidity of motivation and executive functions in disorders raises the
possibility of a potential common mechanism underlying these functions. Other re-
searchers also pointed to the importance of individual states of motivation on execu-
tive functions.
“Different individuals, under apparently the same conditions, show differ-
ences in degree of attention. The individual, himself, that is, is one of the
most important conditions. Of course, for the ’individual,’ we may some
day be able to substitute a more definite condition or list of conditions.

CHAPTER 6. GENERAL DISCUSSION 114
What this list would include is at present not known, but merely as a sug-
gestion of the meaning of these general, individual conditions, we might
surmise such things as the general cortical structure or certain features
thereof; the number of association fibers; the frontal lobes or some func-
tion thereof; ’mental constitution’ or organization; or ’intellective energy.”
(Woodrow, 1916, p. 285)
This kind of an ’intellective energy’ is very similar to conceptualization of moti-
vation, as energy that moves us to goals, which depends on the self. Kane and Engle
(2002) pointed to the importance of individual differences in executive functions as
well and suggested that the source of the individual differences in working memory
should be neuronally a shared structure or location, namely the dorsal prefrontal
cortex. Interestingly, neural structures implicated in both executive functions and
motivation are very similar, if not the same (Braver et al. 2014; Locke and Braver,
2008). In light of this, we propose that individual differences in executive functions
may indeed be a result of differences in motivational orientations (also see Sorrentino
and Higgins, 1996, more on synergism between motivation and cognition).
To make this inference however, these regulatory states need to be better un-
derstood as core players in cognitive operations. To provide further experimental
evidence for this claim, Part 2 specifically focused on understanding the relationship
between executive functions and motivational states by using a probabilistic learning
(Study 4) and working memory task (Studies 5 and 6). In these tasks, the compo-
nents of behavioral inhibition, task switching, maintenance, updating and monitoring
were investigated. The approach of these studies were unique: current research on
the motivation and cognition are either focus solely on the reinforcement aspect of
the motivational behavior and delineating the related brain structures, instead have
experimental constructions that prevents the dissection of the components of motiva-
tion and cognition quantitatively. A synthesis between these two approaches is needed
to better characterize the relation between motivation and executive functions. We

CHAPTER 6. GENERAL DISCUSSION 115
believe that unique motivational orientations could be informative even in the more
mechanistic (implicit), trial-based cognitive tasks. This approach could garner more
evidence for the view that motivation as a domain of executive functions and overall
both executive functions and motivational states are involved in the process of self-
regulation. Results of Chapters 4 and 5 demonstrate experimental evidence for this
prediction.
In recent years, a surge of interest in decision making research in neuroscience
and neuroeconomics has arisen, and produced valuable information to characterize
how we learn the value of a stimulus and update it throughout experimental trials.
While there is abundant computational and neuroscience research present (Hampton
and Doherty (2007), Dayan and Balleine, 2002; Dayan, 2012), there are few studies
that also focused on the role of motivational infrastructure of the individual gov-
erning these computations (Linke et al. 2010, characterized extrinsic vs. intrinsic
motivation in a probabilistic reversal task). The ones that are focused on individual
differences, however, most often take a deficit approach, where individual differences
and the differences in personality are portrayed to create a deficit in decision-making,
and their core role in the process is neglected. As an example, people with higher im-
pulsivity were investigated in risky contexts or monetary loss conditions. Individuals
with higher impulsivity were reported as performing poorer in decision-making tasks
(Iowa Gambling Task and a probabilistic reversal task) (Franken et al., 2008). To
give an example from behavioral economics, motivation is still perceived as a variable
distorting the results of the effects such as diminishing marginal utility. Hence, indi-
vidual differences are portrayed as nuisance variables and potential causes of deficits
that are involved less in rational behavior.
Another approach is to take the observed individual differences as indispensables in
the process of executive functioning. To explain this kind of a convoluted relationship,
we used regulatory focus orientations as potential players. The effect of promotion
and prevention as motivational orientations on various indices of performance were

CHAPTER 6. GENERAL DISCUSSION 116
shown previously (Higgins, 2006; Idson, Liberman and Higgins, 2000). Promotion
focus is about advancement and the goals related with the promotion orientation is
about achieving the maximal outcome. In other words, promotion focus will strive
for increasing the outcome and won’t be satisfied with the status quo. In contrast, a
prevention focus is about sustaining the mediocre but a safe choice. This tendency
brings higher vigilance and increases the safety concerns. Therefore, an individual
with high prevention focus will be fine with the status quo of non-loss. Prevention
focus individuals were shown to persist in their decisions even when it is not ethical
(Zhang, Cornwell and Higgins, 2014), this prevention-repetition effect emerged for
decisions in multiple ethical domains.
In Study 4, we tracked bias and sensitivity in a continuous manner for 3 frac-
tal images that had no informative value other than the experimentally programmed
schedules of reward. The changes in the contingencies resulted in fluctuations of over-
all sensitivity for choosing the correct fractal, from phase 1 to phase 3, a pattern of
adaptation to changes is observed. In the third phase, the decrease in the sensitivity
after reversal was not as sharp as the previous phases and the subsequent increase
in the sensitivity occurred faster. Overall, high promotion individuals were best in
adapting to differences in the changes in the reward schedule. However, high pre-
vention group was better than both of the other low promotion and low prevention
groups. The detailed explanation of the contrasts between groups are provided in
Sec. 4.9. This analysis enabled us to show how the magnitude and the direction of
changes in probabilities (for example, from .3 to .5 or .7 to .3) and the order of the
overall contingency could inform us about differential choice patterns depending on
the motivational orientation. It must be noted that these preference and sensitivity
differences may be adaptive in conditions that match the regulatory focus state and
should not be taken as impairments in preference formation. Furthermore, the prefer-
ence changes were not absolute when a change in contingencies was observed: a change
from .3 to .5 was perceived differently depending on how individuals constructed the

CHAPTER 6. GENERAL DISCUSSION 117
value of stimuli at the beginning of the task. This dynamic construction continued
throughout the task and consistent with the selection of sample space simplex as an
analytic tool for compositional data. The changes in the preference observed in this
experiment were not dependent on the absolute values of the probabilities, but on
how they were compared against each other in a composition. In other words, not
all status quos were equal in this task. While this study provides useful information
on how regulatory focus states could determine our preferences and overall sensitiv-
ity to changes in value, further studies that would systematically investigate these
differences in preference in different probability schedules are required. This kind of
a more granular approach will be eventually helpful to understand how individuals
construct preference.
In Studies 5 and 6, we provided further evidence that motivational orientations
could have an impact on working memory tasks. The task we used was a classic work-
ing memory task that is dependent on maintenance and monitoring of the information
and comparison to a reference. These functions resembled a specific regulatory mode
orientation, assessment. Assessment mode mainly concerns with making comparisons
between target and standard (what is real, truth motivation). Individuals with higher
assessment mode is interested in doing things right and to be able ensure this, she
would assess the end state and compare it to other alternative end states. Locomo-
tion mode is not concerned with the value of the outcome and individuals with high
locomotion mode are interested in changing from state to state. In addition to regula-
tory modes, the role of promotion and prevention orientations were also investigated.
Promotion goals are more effective when the outcome is distal. In this task, we did
not give any feedback after trials (and only after each phase block in Study 6), there-
fore promotion orientation would be beneficial to keep the advancement through the
trials. Prevention goals, on the other hand, are more effective in closer time frames
and the individuals with higher prevention is vigilant about avoiding making mistakes
in every trial. Because we predict both regulatory mode and focus are involved in

CHAPTER 6. GENERAL DISCUSSION 118
working memory, we also calculated the 2-way interactions between focus and mode
orientations. In Study 5, assessment and promotion interaction predicted higher hits
and total score; prevention orientation predicted smaller number of false alarms. This
finding is in concordance with the previous research showing prevention is better in
detecting errors (Crowe and Higgins, 1997). Together with higher promotion orien-
tation, higher assessment mode is related to better performance, probably because
assessment is an expert in comparison of options and updating the rightfulness, which
is needed in a working memory task.
Lastly, in study 6, we used a success/failure framing in an n-back task and repli-
cated the results of study 5. Assessment motivation predicted better performance
when an explicit feedback of success was provided. These results are similar to study
5, where promotion state was needed to finish the task successfully when there were
no explicit success or failure feedback is provided. The success priming made the pro-
motion state unnecessary as an effective strategy, because in the study 6 an explicit
feedback of either success (earning a point every block) or failure (losing a point every
block) was provided. Therefore, assessment mode itself predicted better performance
in success framing, but not in the failure framing. The findings of this study is dif-
ferent from more traditional gain and loss framing studies, where traditionally either
a priming is used before the task or a feedback is provided after each trial. Instead,
we used a feedback that shows how much their performance is improved or declined
(in points) after each block of n-back condition. Therefore, the feedback itself be-
came a mean of comparison of performance. The results of this study suggest that
assessment orientation could potentially take a role in value motivation when success
and failure is used to determine the goal. Studies 5 and 6 are among the pioneers
of studies which investigated the interactions between different types of motivational
orientations. More evidence is needed to understand how value, control, and truth
motivations interact in cognitive processes.
Furthermore, replication studies are required due to the fact that the models

CHAPTER 6. GENERAL DISCUSSION 119
explaining these effects are not very good in explaining the overall behavior.
Another future direction for interaction studies is how each regulatory state plays
a role during the cognitive process. The temporal profile of this interaction has never
been investigated. In other words, if working memory performance can be predicted
by assessment and promotion interaction, is it possible to detect when each of these
orientations affect the performance during the cognitive task? The answer to this
question could further improve the dissection of motivational orientations and draw
parallels to the components of executive functions.
Despite the fact that results from the studies above provide evidence of the role of
motivation as an integral part in executive functions, the direction of the causal rela-
tionship is still vague. Hofmann et al (2012) listed the potential models how executive
functions and self-regulation could be related by depicting these roles as either pre-
dictor or outcome variables. We believe that executive functions and motivation are
intertwined. They are interdependent or convoluted processes. There are potential
explanations to explain how this relation occurs: 1) differences in the motivational ori-
entations modulate our executive function, 2) effectiveness of executive function (for
example, working memory capacity or operations) is one of the determinants of how
we react to world and choose to self-regulate, 3) there is a bidirectional relationship
between motivation and cognition, 4) motivation is another domain in the executive
functions and its ultimate aim is self-regulation, 5) motivation and cognition may be
separable components of a common mechanism.
Testing these arguments especially requires use of developmental studies to see if
either of these processes are more stable at the beginning of life. Developmental tra-
jectories of motivational orientations and executive functions could inform us about
the character of these processes; are they trait like and stable throughout the develop-
ment; or do they both approximately start at a similar baseline, and the interactions
with the nature and nurture changes them? An evidence of a dynamic profile of
working memory function in participants aged between 8–22 years of age was shown

CHAPTER 6. GENERAL DISCUSSION 120
in Satterthwaite et al.’s (2012) study. The discrimination (equivalent to total score
in our studies) improved by age in an n-back test, and ventral striatum activation
in response to correct-incorrect response showed a quadratic function, which peaked
at the adolescence. The peak observed during adolescence may have implications on
self-regulation strategies and their relation to personality. Adolescence and young
adulthood is shown as a period where more stable patterns of self-regulation strate-
gies emerge (Erdogan et al., 2008; Conway and Pleydell-Pearce, 2000). In addition
to developmental studies more research on disorders that show comorbidity of both
motivational deficits and executive function impairment is required.
There are many unanswered questions in this thesis. Firstly, the experimental
designs in this thesis are either asymmetrical (only manipulating the motivational
domain) or correlational. In the first 3 studies, we manipulated the motivation but
not specifically looked at how the differences in timing function could affect the re-
sponses to motivational manipulations. Similarly, in the remaining studies, we looked
at the chronic individual differences in motivation, but not focused on the effects of
individual differences in decision-making and working memory on motivational orien-
tations. Further investigation is needed to see how individual differences in cognitive
functions could affect our motivational orientations. This kind of an approach will
help us understand the relationship between motivation and cognition more precisely.
Secondly, in this thesis the relationship between motivation and cognition is presented
by focusing on executive functions. However, the implications of the studies presented
in this thesis should initiate more research on interdependency of different cognitive
functions and motivation. I believe, the results presented for executive functions can
be generalized to all cognitive functions and point to a synergism between cognition
and motivation. However, there is a need for additional experimental evidence to
demonstrate this kind of a synergism.
There is a need of a perspective change in motivation and cognition research.
The large individual differences observed in these classic cognitive tasks challenge the

CHAPTER 6. GENERAL DISCUSSION 121
idea that these processes are not as mechanical and standard as they were thought
to be. The existence of these differences are also pointing to a obvious fact, that
these differences are essentially what creates the unique self. This viewpoint could be
beneficial to understand how the self is constructed with a developmental motivational
system, which ultimately guides our decisions and overall cognitive operations.

122
Part IV
Bibliography

123
References
Abi-Dargham, A., Mawlawi, O., Lombardo, I., Gil, R., Martinez, D., Huang, Y.,
. . . , Laruelle, M. (2002). Prefrontal dopamine D1 receptors and working memory in
schizophrenia. Journal of Neuroscience, 22(9), 3708-3719.
Abi-Dargham, A., Rodenhiser, J., Printz, D., Zea-Ponce, Y., Gil, R., Kegeles,
L. S., . . . , Laruelle, M. (2000). Increased baseline occupancy of D2 receptors by
dopamine in schizophrenia. Proceedings of the National Academy of Sciences of the
United States of America, 97(14), 8104-8109.
Aitchison, J. (1986). The statistical analysis of compositional data. Chapman &
Hall. Reprinted in 2003 with additional material by The Blackburn Press.
Ajzen, I. (1996). The social psychology of decision making. In E. T. Higgins & A.
W. Kruglanski (Eds.), Social psychology: Handbook of basic principles (pp. 297-325).
New York: Guilford Press.
Andreasen, N. C. (1999). A unitary model of schizophrenia: Bleuler’s “fragmented
phrene” as schizencephaly. Arch Gen Psychiatry, 56(9), 781-787.
Avnet, T., & Higgins, E. T. (2003). Locomotion, assessment, and regulatory fit:
Value transfer from “how” to “what”. Journal of Experimental Social Psychology, 39,
525-530.
Backman, L., Nyberg, L., Soveri, A., Johansson, J., Andersson, M., Dahlin, E.,
. . . , Rinne, J. O. (2011). Effects of working-memory training on striatal dopamine
release. Science, 333(6043), 718.
Baddeley, A. D. (2001). Is working memory still working? American Psychologist,
56: 11, 864-878.
Baddeley, A. D. (2007). Working memory, thought and action. Oxford, GB:
Oxford University Press.
Barch, D. M., & Dowd, E. C. (2010). Goal representations and motivational drive
in schizophrenia: the role of prefrontal-striatal interactions. Schizophr Bull, 36(5),
919-934.

124
Barch, D. M., Treadway, M. T., & Schoen, N. (2014). Effort, anhedonia, and func-
tion in schizophrenia: reduced effort allocation predicts amotivation and functional
impairment. J Abnorm Psychol, 123(2), 387-397.
Baum, W.M. (1974). On two types of deviation from the matching law: Bias and
undermatching. Journal of the Experimental Analysis of Behavior, 22, 231-242.
Belayachi, S., Majerus, S., Gendolla, G., Salmon, E., Peters, F., & Van der Linden,
M. (2015). Are the carrot and the stick the two sides of same coin? A neural exami-
nation of approach/avoidance motivation during cognitive performance. Behavioural
Brain Research, 293:217-226.
Bernoulli, Daniel. Originally published in 1738; translated by Dr. Louise Sommer.
(1954). Exposition of a New Theory on the Measurement of Risk. Econometrica, 22:
1, 23-36.
Berridge, K. (1996). Food Reward : Brain Substrates of Wanting and Liking.
Neuroscience and Biobehavioral Reviews, 20(1), 1-25.
Berridge, K. C., Robinson, T. E., & Aldridge, J. W. (2009). Dissecting compo-
nents of reward : “liking”, “wanting”, and learning. Current Opinion in Pharmacol-
ogy, 9:65-73.
Bishop, S., Duncan, J., Brett, M., & Lawrence, A. D. (2004). Prefrontal cor-
tical function and anxiety : controlling attention to threat-related stimuli. Nature
Neuroscience, 7:2, 184-188.
Bolbecker, A. R., Mehta, C. S., Edwards, C. R., Steinmetz, J. E., O’Donnell,
B. F., & Hetrick, W. P. (2009). Eye-blink conditioning deficits indicate temporal
processing abnormalities in schizophrenia. Schizophr Res, 111(1-3), 182-191.
Bolger, N., & Laurenceau, J. P. (2013). Modelling categorical outcomes. In N.
Bolger & J. P. Laurenceau (Eds.), Intensive Longitudinal Methods: An Introduction
to Diary and Experience Sampling Research (pp. 105-1025). New York Guilford
Press
Boulougouris, V., Glennon, J. C., & Robbins, T. W. (2008). Dissociable effects of

125
selective 5-HT2A and 5-HT2C receptor antagonists on serial spatial reversal learning
in rats. Neuropsychopharmacology, 33(8), 2007-2019.
Boulougouris, V., & Robbins, T. W. (2010). Enhancement of spatial reversal
learning by 5-HT2C receptor antagonism is neuroanatomically specific. J Neurosci,
30(3), 930-938.
Boulougouris, V., & Tsaltas, E. (2008). Serotonergic and dopaminergic modula-
tion of attentional processes. Prog Brain Res, 172, 517-542.
Braver, T. S., Krug, M. K., Chiew, K. S., Kool, W., Westbrook, J. A., Clement,
N. J., . . . , Somerville, L. H. (2014). Mechanisms of motivation–cognition interaction:
challenges and opportunities. Cogn Affect Behav Neurosci, 14:443-472.
Brose, A., Schmiedek, F., Lovden, M., & Lindenberger, U. (2011). Daily Vari-
ability in Working Memory is Coupled With Negative Affect: The Role of Attention
and Motivation, Emotion, 12(3):605-17.
Buhusi, C. V., & Meck, W. H. (2005). What makes us tick? Functional and
neural mechanisms of interval timing. Nat Rev Neurosci, 6(10), 755-765.
Bush, G., Luu P., Posner M.I. (2000) Cognitive and emotional influences in ante-
rior cingulate cortex. Trends Cogn. Sci. 4, 215-222.
Carroll, C. A., Boggs, J., O’Donnell, B. F., Shekhar, A., & Hetrick, W. P. (2008).
Temporal processing dysfunction in schizophrenia. Brain Cogn, 67(2), 150-161.
Carver, C. S. & Scheier, M. F. (1981). Attention and Self-regulation: A Control-
theory approach to human behavior. New York: Springer Verlag.
Carver, C. S. & Scheier, M. F. (2012). In Ryan, R. M.( Editor), The Oxford
Handbook of Motivation. New York: Oxford University Press.
Cesario, J., Grant, H., & Higgins, E. T. (2004). Regulatory Fit and Persuasion :
Transfer From “Feeling Right”. Journal of Personality and Social Psychology, 86(3),
388-404.
Choi, J., & Medalia, A. (2010). Intrinsic motivation and learning in a schizophre-
nia spectrum sample. Schizophr Res, 118(1-3), 12-19.

126
Church, R. M., & Deluty, M. Z. (1977). Bisection of temporal intervals. J Exp
Psychol Anim Behav Process, 3(3), 216-228.
Clark, L., Cools, R., & Robbins, T. W. (2004). The neuropsychology of ven-
tral prefrontal cortex: Decision-making and reversal learning. Brain and Cognition,
55(1):41-53.
Conway, M. A. & Pleydell-Pearce, C. W. (2000). The constrcution of autobio-
graphical memories in the self memory system. Psychological Review, 107:2, 261-288.
Cools. R. (2006). Dopaminergic modulation of cognitive function-implications for
L-DOPA treatment in Parkinson’s disease. Neuroscience and Biobehavioral Reviews.
30, 1-23.
Cools, R., Clark, L., Owen, A. M., & Robbins, T. W. (2002). Defining the Neu-
ral Mechanisms of Probabilistic Reversal Learning Using Event-Related Functional
Magnetic Resonance Imaging. Journal of Neuroscience, 22:11, 4563-4567.
Cools, R., & Esposito, M. (2011). Inverted-U-shaped dopamine actions on human
working memory and cognitive control. Biological Psychiatry. 69:12, 113-125.
Cools, R., Frank, M. J., Gibbs, S. E., Miyakawa, A., Jagust, W., & D’esposito,
M. (2009). Striatal Dopamine Predicts Outcome-Specific Reversal Learning and Its
Sensitivity to Dopaminergic Drug Administration. Journal of Neuroscience, 29(5):
1538-1543
Coull, J. T., Cheng, R. K., & Meck, W. H. (2011). Neuroanatomical and neuro-
chemical substrates of timing. Neuropsychopharmacology, 36(1), 3-25.
Coull, J. T., Hwang, H. J., Leyton, M., & Dagher, A. (2012). Dopamine precursor
depletion impairs timing in healthy volunteers by attenuating activity in putamen and
supplementary motor area. Journal of Neuroscience, 32(47), 16704-16715.
Crowe, E., & Higgins, E. T. (1997). Regulatory Focus and Strategic Inclinations:
Promotion and Prevention in Decision-Making. Organizational Behavior and Human
Decision Processes, 69(2), 117-132.
Croxson, P. L., Walton, M. E., O’Reilly, J. X., Behrens, T. E., & Rushworth,

127
M. F. (2009). Effort-based cost-benefit valuation and the human brain. Journal of
Neuroscience, 29(14), 4531-4541.
Dalton, G. L., Phillips, A. G., & Floresco, S. B. (2014). Preferential involvement
by nucleus accumbens shell in mediating probabilistic learning and reversal shifts.
Journal of Neuroscience, 34(13):4618-4626.
Davalos, D. B., Kisley, M. A., & Ross, R. G. (2003). Effects of interval duration
on temporal processing in schizophrenia. Brain Cogn, 52(3), 295-301.
Davis, C., Patte, K. Tweed, S. & Curtis, C. (2016). Personality traits associated
with decision- making deficits. Personality and Individual Differences, 42:2, 279-290.
Dayan, P. & Ballein, B. W. (2002). Reward, motivation and reinforcement learn-
ing. Neuron, 36:285-298.
De Deurwaerdere, P., Navailles, S., Berg, K. A., Clarke, W. P., & Spampinato, U.
(2004). Constitutive activity of the serotonin2C receptor inhibits in vivo dopamine
release in the rat striatum and nucleus accumbens. J Neurosci, 24(13), 3235-3241.
Di Matteo, V., Di Giovanni, G., Di Mascio, M., & Esposito, E. (1999). SB 242084,
a selective serotonin2C receptor antagonist, increases dopaminergic transmission in
the mesolimbic system. Neuropharmacology, 38(8), 1195-1205.
Drew, M. R., Fairhurst, S., Malapani, C., Horvitz, J. C., & Balsam, P. D. (2003).
Effects of dopamine antagonists on the timing of two intervals. Pharmacol Biochem
Behav, 75(1), 9-15.
Drew, M. R., Simpson, E. H., Kellendonk, C., Herzberg, W. G., Lipatova, O.,
Fairhurst, S., . . . , Balsam, P. D. (2007). Transient overexpression of striatal D2
receptors impairs operant motivation and interval timing. J Neurosci, 27(29), 7731-
7739.
Eccles, J. S. & Wigfield, A (2002). Motivational beliefs, values and goals. Annu.
Rev. Psychol., 53: 109-132.
Eddington, K. M., Dolcos, F., Cabeza, R., Krishnan, K. R. R., & Strauman, T.
J. (2007). Neural Correlates of Promotion and Prevention Goal Activation : An

128
fMRI Study using an Idiographic Approach. Journal of Cognitive Neuroscience, 19:7,
1152-1162.
Egozcue J. J., Barcelo-Vidal, C. 2 , Martin-Fernandez, J.A. , Jarauta-Bragulat,
E., Diaz-Barrero, J. L. & Mateu-Figueras, G. (2011). Elements of simplicial linear
algebra and geometry. In Pawlowsky-Glahn, V., Buccianti, A. (Eds.) Compositional
Data Analysis : Theory and Applications (1). Hoboken, GB: Wiley.
Elliott, R., Agnew, Z., & Deakin, J. F. W. (2010). Hedonic and informational
functions of the human orbitofrontal cortex. Cerebral Cortex, 20:198-204
Elvevag, B., Brown, G. D., McCormack, T., Vousden, J. I., & Goldberg, T. E.
(2004). Identification of tone duration, line length, and letter position: an experi-
mental approach to timing and working memory deficits in schizophrenia. J Abnorm
Psychol., 113(4), 509-521.
Engle, R. W., Kane, M. J. & Tuholski, S. W. (1999). In Miyake, A. & Shah,
P.(Eds.). Models of Working Memory. Cambridge University Press.
Erdogan, A., Baran, B., Avlar, B., Tas, C., & Tekcan, A. I. (2008). On the
persistence of positive events in life scripts. Applied Cognitive Psychology, 22:95-111.
Ernst, M., & Paulus, M. P. (2005). Neurobiology of decision making: A selective
review from a neurocognitive and clinical perspective. Biological Psychiatry, 58:597-
604
Exner, C., Weniger, G., Schmidt-Samoa, C., & Irle, E. (2006). Reduced size of
the pre-supplementary motor cortex and impaired motor sequence learning in first-
episode schizophrenia. Schizophr Res, 84(2-3), 386-396.
Fervaha, G., Zakzanis, K. K., Foussias, G., Graff-Guerrero, A., Agid, O., & Rem-
ington, G. (2014). Motivational deficits and cognitive test performance in schizophre-
nia. JAMA Psychiatry, 71(9), 1058-1065.
Foerde, K., Braun, E. K., Higgins, E. T. & Shohamy, D. (2015). Motivational
modes and learning in Parkinson’s disease. Social cognitive and affective neuroscience,
10 (8): 1066-1073

129
Frank, M. J., Seeberger, L. C., & O’Reilly, R. C. (2004). By carrot or by stick:
cognitive reinforcement learning in parkinsonism. Science, 306(5703):1940-1943.
Franken, I. H. A., van Strien, J. W., Nijs, I., & Muris, P. (2008). Impulsivity is
associated with behavioral decision-making deficits. Psychiatry Research. 158:155-
163.
Freitas, A. L., Liberman, N., Salovey, P., & Higgins, E. T. (2002). When to be-
gin? Regulatory focus and initiating goal pursuit. Personality and Social Psychology
Bulletin, 28, 121-130.
Foussias, G., & Remington, G. (2010). Negative symptoms in schizophrenia:
Avolition and occam’s razor. Schizophrenia Bulletin, 36(2): 359-369.
Galtress, T., & Kirkpatrick, K. (2010). The role of the nucleus accumbens core in
impulsive choice, timing, and reward processing. Behav Neurosci, 124(1), 26-43.
Galtress, T., & Kirkpatrick, K. (2010). Reward magnitude effects on temporal
discrimination. Learning and Motivation, 41(2), 108-124.
Glahn, D. C., Ragland, J. D., Abramoff, A., Barrett, J., Laird, A. R., Bearden, C.
E., & Velligan, D. I. (2005). Beyond hypofrontality: A quantitative meta-analysis of
functional neuroimaging studies of working memory in schizophrenia. Human Brain
Mapping, 25:60-69.
Gold, J. M., Hahn, B., Zhang, W. W., Robinson, B. M., Kappenman, E. S., Beck,
V. M., & Luck, S. J. (2010). Reduced capacity but spared precision and maintenance
of working memory representations in schizophrenia. Arch Gen Psychiatry, 67(6),
570-577.
Gold, J. M., Waltz, J. A., Prentice, J., Morris, S. E., & Heerey, E. A. (2008). Re-
ward Processing in Schizophrenia: A Deficit in the Representation of Value. Schizophre-
nia Bulletin, 34(5), 835-847.
Gold, J. M., Waltz, J. A., Matveeva, T. M., Kasanova, Z., Strauss, G. P., Herbener,
E. S., . . . , Frank, M. J. (2012). Negative symptoms and the failure to represent the
expected reward value of actions: behavioral and computational modeling evidence.
130
Arch Gen Psychiatry, 69(2), 129-138.
Goldman-Rakic, P. S. (1995). Architecture of the prefrontal cortex and the central
executive. Annals of the New York Academy of Sciences, 15(769):71-83.
Guo, Y., & Feng, T. (2015). The mediating role of LPFC -vmPFC functional con-
nectivity in the relation between regulatory mode and delay discounting. Behavioural
Brain Research, 292, 252-258.
Green, M. F., Hellemann, G., Horan, W. P., Lee, J., & Wynn, J. K. (2012). From
perception to functional outcome in schizophrenia: modeling the role of ability and
motivation. Arch Gen Psychiatry, 69(12), 1216-1224.
Hampton, A. N., & O’Doherty, J. P. (2007.). Decoding the neural substrates of
reward-related decision making with functional MRI. PNAS, 104:4, 1377-1382.
Harvey P.D., Koren D., Reichenberg A., Bowie C.R. Negative symptoms and cog-
nitive deficits: what is the nature of their relationship? Schizophr Bull. 2006;32:250–
258.
Heerey, E. A., & Gold, J. M. (2007). Patients with schizophrenia demonstrate
dissociation between affective experience and motivated behavior. J Abnorm Psychol,
116(2), 268-278.
Herrnstein, R.J. (1961). Relative and absolute strength of responses as a function
of frequency of reinforcement. Journal of the Experimental Analysis of Behaviour, 4,
267-272.
Herrnstein, R.J. (1970). On the law of effect. Journal of the Experimental Analysis
of Behavior, 13, 243-266.
Heatherton, T. F., & Wagner, D. D. (2011). Cognitive neuroscience of self-
regulation failure. Trends in Cognitive Sciences, 15:3, 132-139
Higgins, E. T . (1987). Self-discrepancy: A theory relating self and affect. Psy-
chological Review, 94, 319-340.
Higgins, E. T. (1996). Value From Hedonic Experience and Engagement. Psycho-
logical Review,113: 3, 439-460

131
Higgins, E. T. (1997). Beyond Pleasure and Pain, American Psychologist, 52(12),
1280-1300.
Higgins, E. T. (1998). Promotion and Prevention: Regulatory focus as a motiva-
tional principle. Advances in Experimental Social Psychology, 30:1-46.
Higgins, E. T. (2000). Making a good decision: value from fit. American Psychol-
ogist, 55:11, 1230-1245.
Higgins, E. T. (2005). Value From Regulatory Fit. Current Directions in Psycho-
logical Science, 14:4, 209-213.
Higgins, E.T. (2012). Beyond pleasure and pain. New York: Oxford University
Press.
Higgins, E. T., Friedman, R. S., Harlow, R. E., Idson, L. C., Ayduk, O. N., Taylor,
A. (2001). Achievement orientations from subjective histories of success: Promotion
pride versus prevention pride. European Journal of Social Psychology, 31, 3-23.
Higgins, E. T., Kruglanski, A. W., & Pierro, A. (2003). Regulatory Mode: Loco-
motion and Assessment as Distinct Orientations. In M. P. Zanna (Ed.), Advances in
Experimental Social Psychology (Vol. 35, pp. 293-344). New York: Academic Press.
Higgins, E. T., Roney, C. J. R., Crowe, E., & Hymes, C. (1994). Ideal Versus
Ought Predilections for Approach and Avoidance : Distinct Self-Regulatory Systems.
Journal of Personality and Social Psychology, 66(2), 276-286.
Higgins, E. T., Shah, J., & Friedman, R. (1997). Emotional responses to goal
attainment: Strength of regulatory focus as moderator. Journal of Personality and
Social Psychology, 72(3): 515-525.
Hofmann, W., Schmeichel, B. J., & Baddeley, A. D. (2012). Executive functions
and self-regulation. Trends in Cognitive Sciences, 16(3): 174-180.
Hornak, J., O’Doherty, J., Bramham, J., Rolls, E. T., Morris, R. G., Bullock, P.
R., & Polkey, C. E. (2004). Reward-related Reversal Learning after Surgical Excisions
in Orbito-frontal or Dorsolateral Prefrontal Cortex in Humans. Journal of Cognitive
Neuroscience, 16(3):463-78
132
Hull, C. L. (1943). Principles of behavior, an introduction to behavior theory.
New York: Appleton-Century-Crofts.
Hutson, P. H., Barton, C. L., Jay, M., Blurton, P., Burkamp, F., Clarkson, R., &
Bristow, L. J. (2000). Activation of mesolimbic dopamine function by phencyclidine
is enhanced by 5-HT(2C/2B) receptor antagonists: neurochemical and behavioural
studies.Neuropharmacology, 39(12), 2318-2328.
Idson, L. C., Liberman, N., & Higgins, E. T. (2000). Distinguishing Gains from
Nonlosses and Losses from Nongains: A Regulatory Focus Perspective on Hedonic
Intensity. Journal of Experimental Social Psychology, (13), 370-396
Jensen, G. (2014). Compositions and their application to the analysis of choice.
Journal of the Experimental Analysis of Behavior, 102(1):1-25.
Jensen, G. (2014). Kernel Probability Estimation For Binomial And Multinomial
Data. PeerJ PrePrints
Jimura, K., Locke, H. S., & Braver, T. S. (2010). Prefrontal cortex mediation of
cognitive enhancement in rewarding motivational contexts. PNAS, 107:19, 8871-8876
Kahneman, D., & Tversky, A. (1979). Prospect Theory: An Analysis of Decision
under Risk. Econometrica, 47(2), 263-291.
Kane, M. J. & Engle, R. W. (2002). The role of prefrontal cortex in working
memory capacity, executive attention and general fluid intelligence: An individual-
differences perspective. Psychonomic Bulletin, 9(4), 637-671.
Kellendonk, C., Simpson, E. H., Polan, H. J., Malleret, G., Vronskaya, S., Winiger,
V., . . . , Kandel, E. R. (2006). Transient and selective overexpression of dopamine D2
receptors in the striatum causes persistent abnormalities in prefrontal cortex func-
tioning. Neuron, 49(4), 603-615.
Kerns, J. G., Nuechterlein, K. H., Braver, T. S., & Barch, D. M. (2008). Executive
functioning component mechanisms and schizophrenia. Biol Psychiatry, 64(1), 26-33.
Kim, J., Glahn, D. C., Nuechterlein, K. H., & Cannon, T. D. (2004). Maintenance
and manipulation of information in schizophrenia: further evidence for impairment in

133
the central executive component of working memory. Schizophr Res, 68(2-3), 173-187.
Kruglanski, A. W., Thompson, E. P., Higgins, E. T., Atash, M. N., Pierro, A.,
Shah, J. Y., Spiegel, S. (2000). To “do the right thing” or to “just do it”: Loco-
motion and assessment as distinct self-regulatory imperatives.Journal of Personality
and Social Psychology, 79, 793-815.
Kuepper, R., Skinbjerg, M., & Abi-Dargham, A. (2012). The dopamine dysfunc-
tion in schizophrenia revisited: new insights into topography and course. Handb Exp
Pharmacol, (212), 1-26.
Liberman, N., Idson, L. C., Camacho, C. J., & Higgins, E. T. (1999). Promotion
and Prevention Choices Between Stability and Change, Journal of Personality and
Social Psychology, 77(6), 1135-1145.
Linke, J., Kirsch, P., King, A. V., Gass, A., Hennerici, M. G., Bongers, A., &
Wessa, M. (2010). Motivational orientation modulates the neural response to reward.
NeuroImage.49:2618-2625.
Liu, X., Hairston, J., Schrier, M., & Fan, J. (2011). Common and distinct net-
works underlying reward valence and processing stages: a meta-analysis of functional
neuroimaging studies. Neurosci Biobehav Rev, 35(5), 1219-1236.
Mann, C. L., Footer, O., Chung, Y. S., Driscoll, L. L., & Barch, D. M. (2013).
Spared and impaired aspects of motivated cognitive control in schizophrenia. J Ab-
norm Psychol, 122(3), 745-755.
Maricq, A. V., & Church, R. M. (1983). The differential effects of haloperidol and
methamphetamine on time estimation in the rat. Psychopharmacology, 79(1), 10-15.
Maricq, A. V., Roberts, S., & Church, R. M. (1981). Methamphetamine and time
estimation.J Exp Psychol Anim Behav Process, 7(1), 18-30.
Markou, A., Salamone, J. D., Bussey, T. J., Mar, A. C., Brunner, D., Gilmour, G.,
& Balsam, P. (2013). Measuring reinforcement learning and motivation constructs in
experimental animals: relevance to the negative symptoms of schizophrenia. Neurosci
Biobehav Rev, 37(9), 2149-2165.

134
Maslow, A. H. (1943). A theory of human motivation. Psychological Review, 50:4,
370-396 .
Mayford, M., Bach, M. E., Huang, Y. Y., Wang, L., Hawkins, R. D., & Kandel, E.
R. (1996). Control of memory formation through regulated expression of a CaMKII
transgene. Science, 274(5293), 1678-1683.
McNab, F., Varrone, A., Farde, L., Jucaite, A., Bystritsky, P., Forssberg, H., &
Klingberg, T. (2009). Changes in cortical dopamine D1 receptor binding associated
with cognitive training. Science, 323(5915), 800-802.
Meck, W. H. (1986). Affinity for the dopamine D2 receptor predicts neuroleptic
potency in decreasing the speed of an internal clock. Pharmacol Biochem Behav,
25(6), 1185-1189.
Mehta, M. A., Swainson, R., Ogilvie, A. D., Sahakian, B., & Robbins, T. W.
(2002). Improved short-term spatial memory but impaired reversal learning following
the dopamine D2 agonist bromocriptine in human volunteers. Psychopharmacology,
159(1):10-20.
Navailles, S., De Deurwaerdere, P., Porras, G., & Spampinato, U. (2004). In vivo
evidence that 5-HT2C receptor antagonist but not agonist modulates cocaine-induced
dopamine outflow in the rat nucleus accumbens and striatum. Neuropsychopharma-
cology, 29(2), 319-326.
Nelder, J. A., & Wedderburn, R. W. M. (1972). Generalized Linear Models.
Journal of the Royal Statistical Society, 135(3), 370-384.
Nieoullon, A. (2002). Dopamine and the regulation of cognition and attention.
Prog Neurobiol, 67(1), 53-83.
Nieuwenstein, M. R., & de Haan, E. H. (2001). Relationship between symptom di-
mensions and neurocognitive functioning in schizophrenia: a meta-analysis of WCST
and CPT studies. Journal of Psychiatric Research, 35:119-125
Nowend, K. L., Arizzi, M., Carlson, B. B., & Salamone, J. D. (2001). D1 or D2
antagonism in nucleus accumbens core or dorsomedial shell suppresses lever press-

135
ing for food but leads to compensatory increases in chow consumption. Pharmacol
Biochem Behav, 69(3-4), 373-382.
Olesen, P., Westerberg, H., Klingberg, T.(2004. Increased prefrontal and parietal
activity after training of working memory. Nat. Neurosci. 7, 75-79.
Opal, M. D., Klenotich, S. C., Morais, M., Bessa, J., Winkle, J., Doukas, D., . . . ,
Dulawa, S. M. (2013). Serotonin 2C receptor antagonists induce fast-onset antide-
pressant effects. Mol Psychiatry, 19, 1106-1114.
Owen, A. M., Iddon, J. L., Hodges, J. R., Summers, B. A., & Robbins, T. W.
(1997). Spatial and non spatial working memory at different stages of Parkinson’s
disease. Neurospsychologia, 35:4, 519-532
Owen, A. M., Leigh, P. N., Summers, B. A., Marsden, C. D., Quinn, N. P., Lange,
K. W., & Robbins, T. W. (1992). Fronto-striatal cognitive deficits at different stages
of parkinson’s disease. Brain, 115: 1727-1751.
Owen, A. M., McMillan, K. M., Laird, A. R., & Bullmore, E. (2005). N-back
working memory paradigm: A meta-analysis of normative functional neuroimaging
studies. Human Brain Mapping, 25(1):46-59.
Packer, D. J., Cunningham, W. A., Packer, D. J., & Cunningham, W. A. (2009).
Neural correlates of reflection on goal states: The role of regulatory focus and tem-
poral distance. Social Neuroscience, 4:5, 412-425.
Panno, A., Pierro, A., & Lauriola, M. (2014). Self-regulation predicts risk-taking
through people’s time horizon. International Journal of Psychology, 49(3), 211-215.
Pawlowsky-Glahn, V., & Buccianti, A. (Eds.). (2011). Compositional data anal-
ysis: Theory and applications. Wiley.
Penney, T. B., Meck, W. H., Roberts, S.A. Gibbon, J.R. & Erlenmeyer-Kimling,
L. (2005). Interval timing deficits in individuals at high risk for schizophrenia. Brain
Cognition, 58:109-18.
Pessiglione, M., Seymour, B., Flandin, G., Dolan, R. J., & Frith, C. D. (2006.).
Dopamine-dependent prediction errors underpin reward-seeking behaviour in humans.

136
Nature, 442:31, 1042-1045.
Picard, H., Amado, I., Mouchet-Mages, S., Olie, J. P., & Krebs, M. O. (2008).
The role of the cerebellum in schizophrenia: an update of clinical, cognitive, and
functional evidences. Schizophr Bull, 34(1), 155-172.
Pochon, J. B., Levy, R., Fossati, P., Lehericy, S., Poline, J. B., Pillon, B., . . . ,
Dubois, B. (2002). The neural system that bridges reward and cognition in humans:
An fMRI study. PNAS, 99(8):5669-5674.
Rao, S. M., Mayer, A. R., & Harrington, D. L. (2001). The evolution of brain
activation during temporal processing. Nat Neurosci, 4(3), 317-323.
Roberts, S. (1981). Isolation of an internal clock. J Exp Psychol Anim Behav
Process, 7(3), 242-268.
Rolls, E. T., Critchley, H. D., Mason, R., & Wakeman, E. A. (1996). Orbitofrontal
Cortex Neurons: Role in Olfactory and Visual Association Learning. Journal of
Neurophysiology, 75(5).
Rushworth, M.F., Buckley, M.J., Behrens, T. E. J., Walton, M. E. & Bannerman,
D. M. (2007). Functional organization of the medial frontal cortex. Curr. Opin.
Neurobiol. 17, 220-227
Salamone, J. D., & Correa, M. (2012). The mysterious motivational functions of
mesolimbic dopamine. Neuron, 76(3), 470-485.
Satterthwaite, T. D., Ruparel, K., Loughead, J., Elliott, M. A., Gerraty, R. T.,
Calkins, M. E., & Wolf, D. H. (2012). Being right is its own reward: Load and
performance related ventral striatum activation to correct responses during a working
memory task in youth. NeuroImage, 61:723-729.
Schoenbaum, G., Roesch, M. R., Stalnaker, T.A. & Takahashi, Y. K. (2011).
Orbitofrontal Cortex and Outcome Expectancies: Optimizing Behavior and Sensory
Perception. In (Ed). Neurobiology of Sensation and Reward. Boca Raton (FL): CRC
Press/Taylor & Francis
Schwartz, G. E. (1978). Estimating the dimension of a model. Annals of Statistics,

137
6(2), 461-464.
Schmidt, L., d’Arc, B. F., Lafargue, G. Galanaud, D., Czernecki, V., Grabli, D.,
Schupbach, M., . . . , Pessiglione, M. Disconnecting force from money: effects of basal
ganglia damage on incentive motivation. Brain, 131: 1303-1310.
Shimazaki, H., & Shinomoto, S. (2010). Kernel bandwidth optimization in spike
rate estimation. Journal of Computational Neuroscience, 29(1-2): 171-182.
Siegel, B. V., Jr., Buchsbaum, M. S., Bunney, W. E., Jr., Gottschalk, L. A.,
Haier, R. J., Lohr, J. B., . . . , et al. (1993). Cortical-striatal-thalamic circuits and
brain glucose metabolic activity in 70 unmedicated male schizophrenic patients. Am
J Psychiatry, 150(9), 1325-1336.
Simpson, E. H., Kellendonk, C., Ward, R. D., Richards, V., Lipatova, O., Fairhurst,
S., . . . , Balsam, P. D. (2011). Pharmacologic Rescue of Motivational Deficit in an
Animal Model of the Negative Symptoms of Schizophrenia. Biological Psychiatry,
69(10):928-35.
Simpson, E. H., Waltz, J. A., Kellendonk, C., & Balsam, P. D. (2012). Schizophre-
nia in translation: dissecting motivation in schizophrenia and rodents. Schizophr Bull,
38(6), 1111-1117.
Smith, E. E., & Jonides, J. (1998). Neuroimaging analyses of human working
memory. Psychology Neurobiology, 95, 12061–12068.
Smith, E. E., & Jonides, J. (1999). Storage and Executive Processes in the Frontal
Lobes. Science, 283: 1657-1661.
Sorrentino, R. M., Higgins, E. T. (1996). Handbook of Motivation & Cognition.
The Guilford Press
Strauss, G. P., Wilbur, R. C., Warren, K. R., August, S. M., & Gold, J. M. (2011).
Anticipatory vs. consummatory pleasure: what is the nature of hedonic deficits in
schizophrenia? Psychiatry Res, 187(1-2), 36-41.
Studer-Luethi, B., Jaeggi, S. M., Buschkuehl, M., & Perrig, W. J. (2012). In-
fluence of neuroticism and conscientiousness on working memory training outcome.

138
Personality and Individual Differences, 53(1):44-49.
Swainson, R., Rogers, R. D., Sahakian, B. J., Summers, B. A., Polkey, C. E., &
Robbins, T. W. (2000). Probabilistic learning and reversal deficits in patients with
Parkinson’s disease or frontal or temporal lobe lesions: possible adverse effects of
dopaminergic medication. Neuropsychologia, 38(5):596-612.
Szatkowska, I., Szymaska, O., Marchewka, A., Soluch, P., & Rymarczyk, K.
(2011). Dissociable contributions of the left and right posterior medial orbitofrontal
cortex in motivational control of goal-directed behavior. Neurobiology of Learning
and Memory, 96(2):385-391.
Taylor, S. F., Welsh, R. C., Wager, T. D., Phan, K. L., Fitzgerald, K. D., &
Gehring, W. J. (2004). A functional neuroimaging study of motivation and executive
function. NeuroImage, 21(3):1045-1054.
Wager TD, Feldman-Barrett L. From affect to control: functional specialization of
the insula in motivation and regulation. 2004. Published Online at PsycExtra. [cited
2011 Dec 15]. Available from: URL http://www.apa.org/pubs/databases/psycextra/
Walsh, N. D., & Phillips, M. L. (2010). Interacting outcome retrieval, anticipation,
and feedback processes in the human brain. Cerebral Cortex, 20(2): 271-281.
Waltz, J. A., Frank, M. J., Robinson, B. M., & Gold, J. M. (2007). Selective rein-
forcement learning deficits in schizophrenia support predictions from computational
models of striatal-cortical dysfunction. Biol Psychiatry, 62(7), 756-764.
Waltz, J. A., Frank, M. J., Wiecki, T. V., & Gold, J. M. (2011). Altered proba-
bilistic learning and response biases in schizophrenia: behavioral evidence and neu-
rocomputational modeling. Neuropsychology, 25(1), 86-97.
Ward, R. D., Avlar, B., & Balsam, P. D. (2014). Interactions of timing and
motivational impairments in schizophrenia. In A. Vatakis & M. J. Allman (Eds.),
Time distortions in mind: Temporal processing in clinical populations. Boston, MA:
Brill Academic Publishers
Ward, R. D., Kellendonk, C., Kandel, E. R., & Balsam, P. D. (2012). Timing as

139
a window on cognition in schizophrenia. Neuropharmacology, 62(3), 1175-1181.
Ward, R. D., Kellendonk, C., Simpson, E. H., Lipatova, O., Drew, M. R., Fairhurst,
S., . . . , Balsam, P. D. (2009). Impaired timing precision produced by striatal D2
receptor overexpression is mediated by cognitive and motivational deficits. Behav
Neurosci, 123(4), 720-730.
Ward, R. D., Simpson, E. H., Richards, V. L., Deo, G., Taylor, K., Glendinning,
J. I., . . . , Balsam, P. D. (2012). Dissociation of hedonic reaction to reward and
incentive motivation in an animal model of the negative symptoms of schizophrenia.
Neuropsychopharmacology, 37(7), 1699-1707.
White, R. W. (1959). Motivation reconsidered: The concept of competence. Psy-
chological Review, 66, 297-333.
Wearden, J. H., & Ferrara, A. (1995). Stimulus spacing effects in temporal bisec-
tion by humans. Q J Exp Psychol B, 48(4), 289-310.
Weinberger, D. R., & Laruelle, M. (2001). Neurochemical and neuropharmaco-
logical imaging in schizophrenia. In K. L. Davis, D. S. Charney, J. T. Coyle & C.
Nemeroff (Eds.) Neuropharmacology- the Fifth generation of progress (pp. 833-856).
Philadelpia: Lippincott Williams and Wilkins
Wolsdorf, D. (2013). Pleasure in Ancient Greek Philosophy. New York: Cam-
bridge University Press.
Woodrow, H. (1916). The faculty of attention. Journal of Experimental Psychol-
ogy, 1, 285-318.
Zhang, S. Cornwell, J. F. M., Higgins, E. T. (2014). Repeating the Past: Preven-
tion Focus Motivates Repetition, Even for Unethical Decisions, Psychological Science,
25(1): 179-187.
Ziauddeen, H., & Murray, G. K. (2010). The relevance of reward pathways for
schizophrenia. Curr Opin Psychiatry, 23(2), 91-96.

140
Part V
Appendices

APPENDIX A. QUESTIONNAIRES 141
Appendix A
Questionnaires
A.1 RFQ
This set of questions asks you HOW FREQUENTLY specific events actually occur
or have occurred in your life. Please indicate your answer to each question by circling
the appropriate number below it.
1. Compared to most people, are you typically unable to get what you want out
of life?
1 2 3 4 5
never or seldom sometimes very often
2. Growing up, would you ever “cross the line” by doing things that your parents
would not tolerate?
1 2 3 4 5
never or seldom sometimes very often
3. How often have you accomplished things that got you “psyched” to work even
harder?
1 2 3 4 5
never or seldom sometimes very often

APPENDIX A. QUESTIONNAIRES 142
4. Did you get on your parents’ nerves often when you were growing up?
1 2 3 4 5
never or seldom sometimes very often
5. How often did you obey rules and regulations that were established by your
parents?
1 2 3 4 5
never or seldom sometimes very often
6. Growing up, did you ever act in ways that your parents thought were objec-
tionable?
1 2 3 4 5
never or seldom sometimes very often
7. Do you often do well at different things that you try?
1 2 3 4 5
never or seldom sometimes very often
8. Not being careful enough has gotten me into trouble at times.
1 2 3 4 5
never or seldom sometimes very often
9. When it comes to achieving things that are important to me, I find that I don’t
perform as well as I ideally would like to do.
1 2 3 4 5
never true sometimes true very often true
10. I feel like I have made progress toward being successful in my life.
1 2 3 4 5
certainly false certainly true

APPENDIX A. QUESTIONNAIRES 143
11. I have found very few hobbies or activities in my life that capture my interest
or motivate me to put effort into them.
1 2 3 4 5
certainly false certainly true
A.2 RMODE
Read each of the following statements and decide how much you agree with each
according to your beliefs and experiences. Please respond according to the following
scale:
1 = strongly disagree 4 = slightly agree
2 = moderately disagree 5 = moderately agree
3 = slightly disagree 6 = slightly disagree
1. I don’t mind doing things even if they involve extra effort.
2. I never evaluate my social interactions with others after they occur.
3. I am a “workaholic.”
4. I feel excited just before I am about to reach a goal.
5. I enjoy actively doing things, more than just watching and observing.
6. I spend a great deal of time taking inventory of my positive and negative char-
acteristics.
7. I like evaluating other people’s plans.
8. I am a “doer.”
9. I often compare myself with other people.
10. I don’t spend much time thinking about ways others could improve themselves.

APPENDIX A. QUESTIONNAIRES 144
11. I often critique work done by myself and others.
12. I believe one should never engage in leisure activities.
13. When I finish one project, I often wait awhile before getting started on a new
one.
14. I have never been late for work or for an appointment.
15. I often feel that I am being evaluated by others.
16. When I decide to do something, I can’t wait to get started.
17. I always make the right decision.
18. I never find faults with someone I like.
19. I am a critical person.
20. I am very self-critical and self-conscious about what I am saying.
21. By the time I accomplish a task, I already have the next one in mind.
22. I often think that other people’s choices and decisions are wrong.
23. I have never hurt another person’s feelings.
24. I am a “low energy” person.
25. Most of the time my thoughts are occupied with the task that I wish to accom-
plish.
26. I feel that there is no such thing as an honest mistake.
27. I rarely analyze the conversations I have had with others after they occur.
28. When I get started on something, I usually persevere until I finish.

APPENDIX A. QUESTIONNAIRES 145
29. I am a “go-getter.”
30. When I meet a new person I usually evaluate how well he or she is doing on
various dimensions (e.g., looks, achievements, social status, clothes).

APPENDIX B. TABLES OF RESULTS 146
Appendix B
Tables of Results
Table B.1: Results of the analysis of regulatory mode (4)
X regulatory focus (4)X TrialphaseX phase (3) model for
Fractal A. Residual standard error: 0.4542 on 8904 de-
grees of freedom, Adjusted R-squared: 0.4433 F-statistic:
76.44 on 95 and 8904 DF, p-value: less than 2.2e-16
Estimate Std. Error t value Pr(>|t|)
(Intercept) 0.1501 0.0229 6.55 0.0000
trialphase -0.0138 0.0008 -17.71 0.0000
phase2 -0.2954 0.0324 -9.12 0.0000
phase3 0.1271 0.0324 3.92 0.0001
zprom -0.3591 0.0288 -12.46 0.0000
zprev 0.2572 0.0238 10.79 0.0000
zasses 0.0797 0.0234 3.41 0.0007
zloco 0.2509 0.0271 9.26 0.0000
trialphase:phase2 0.0208 0.0011 18.85 0.0000
trialphase:phase3 0.0133 0.0011 12.07 0.0000
trialphase:zprom 0.0036 0.0010 3.67 0.0002

APPENDIX B. TABLES OF RESULTS 147
phase2:zprom 0.3333 0.0408 8.17 0.0000
phase3:zprom 0.3924 0.0408 9.62 0.0000
trialphase:zprev -0.0060 0.0008 -7.42 0.0000
phase2:zprev -0.3220 0.0337 -9.55 0.0000
phase3:zprev -0.1663 0.0337 -4.93 0.0000
zprom:zprev -0.2247 0.0252 -8.93 0.0000
trialphase:zasses -0.0015 0.0008 -1.93 0.0542
phase2:zasses -0.0839 0.0330 -2.54 0.0112
phase3:zasses -0.1283 0.0330 -3.88 0.0001
zprom:zasses 0.0764 0.0347 2.20 0.0276
zprev:zasses 0.0998 0.0282 3.54 0.0004
trialphase:zloco -0.0050 0.0009 -5.43 0.0000
phase2:zloco -0.3346 0.0383 -8.73 0.0000
phase3:zloco -0.4645 0.0383 -12.13 0.0000
zprom:zloco -0.0653 0.0279 -2.34 0.0192
zprev:zloco 0.3852 0.0367 10.49 0.0000
zasses:zloco -0.1047 0.0259 -4.04 0.0001
trialphase:phase2:zprom 0.0072 0.0014 5.17 0.0000
trialphase:phase3:zprom -0.0063 0.0014 -4.51 0.0000
trialphase:phase2:zprev 0.0065 0.0012 5.68 0.0000
trialphase:phase3:zprev 0.0062 0.0012 5.42 0.0000
trialphase:zprom:zprev 0.0016 0.0009 1.92 0.0551
phase2:zprom:zprev 0.1255 0.0356 3.53 0.0004
phase3:zprom:zprev 0.2030 0.0356 5.70 0.0000
trialphase:phase2:zasses -0.0035 0.0011 -3.09 0.0020
trialphase:phase3:zasses 0.0028 0.0011 2.52 0.0116
trialphase:zprom:zasses 0.0051 0.0012 4.28 0.0000
phase2:zprom:zasses 0.0662 0.0491 1.35 0.1776

APPENDIX B. TABLES OF RESULTS 148
phase3:zprom:zasses -0.2693 0.0491 -5.49 0.0000
trialphase:zprev:zasses -0.0031 0.0010 -3.19 0.0014
phase2:zprev:zasses -0.1330 0.0399 -3.33 0.0009
phase3:zprev:zasses -0.1373 0.0399 -3.44 0.0006
zprom:zprev:zasses -0.1386 0.0364 -3.81 0.0001
trialphase:phase2:zloco 0.0039 0.0013 3.02 0.0025
trialphase:phase3:zloco 0.0111 0.0013 8.47 0.0000
trialphase:zprom:zloco 0.0059 0.0010 6.20 0.0000
phase2:zprom:zloco 0.1515 0.0394 3.84 0.0001
phase3:zprom:zloco 0.2353 0.0394 5.96 0.0000
trialphase:zprev:zloco -0.0098 0.0013 -7.81 0.0000
phase2:zprev:zloco -0.4382 0.0519 -8.44 0.0000
phase3:zprev:zloco -0.5437 0.0519 -10.47 0.0000
zprom:zprev:zloco -0.1827 0.0403 -4.53 0.0000
trialphase:zasses:zloco -0.0013 0.0009 -1.47 0.1413
phase2:zasses:zloco 0.2604 0.0367 7.10 0.0000
phase3:zasses:zloco 0.2056 0.0367 5.61 0.0000
zprom:zasses:zloco -0.0734 0.0218 -3.37 0.0008
zprev:zasses:zloco 0.3055 0.0411 7.43 0.0000
trialphase:phase2:zprom:zprev -0.0007 0.0012 -0.61 0.5430
trialphase:phase3:zprom:zprev 0.0020 0.0012 1.63 0.1032
trialphase:phase2:zprom:zasses -0.0050 0.0017 -2.96 0.0031
trialphase:phase3:zprom:zasses -0.0048 0.0017 -2.84 0.0045
trialphase:phase2:zprev:zasses 0.0007 0.0014 0.54 0.5873
trialphase:phase3:zprev:zasses 0.0042 0.0014 3.06 0.0022
trialphase:zprom:zprev:zasses 0.0020 0.0012 1.61 0.1071
phase2:zprom:zprev:zasses 0.1894 0.0515 3.68 0.0002
phase3:zprom:zprev:zasses 0.4372 0.0515 8.49 0.0000

APPENDIX B. TABLES OF RESULTS 149
trialphase:phase2:zprom:zloco -0.0157 0.0013 -11.67 0.0000
trialphase:phase3:zprom:zloco -0.0066 0.0013 -4.91 0.0000
trialphase:phase2:zprev:zloco 0.0050 0.0018 2.82 0.0048
trialphase:phase3:zprev:zloco 0.0107 0.0018 6.05 0.0000
trialphase:zprom:zprev:zloco 0.0046 0.0014 3.35 0.0008
phase2:zprom:zprev:zloco 0.4955 0.0570 8.69 0.0000
phase3:zprom:zprev:zloco 0.3099 0.0570 5.43 0.0000
trialphase:phase2:zasses:zloco 0.0031 0.0013 2.49 0.0127
trialphase:phase3:zasses:zloco 0.0011 0.0013 0.89 0.3759
trialphase:zprom:zasses:zloco 0.0034 0.0007 4.61 0.0000
phase2:zprom:zasses:zloco 0.0379 0.0308 1.23 0.2183
phase3:zprom:zasses:zloco 0.0496 0.0308 1.61 0.1070
trialphase:zprev:zasses:zloco -0.0068 0.0014 -4.83 0.0000
phase2:zprev:zasses:zloco -0.1587 0.0581 -2.73 0.0063
phase3:zprev:zasses:zloco -0.2364 0.0581 -4.07 0.0000
zprom:zprev:zasses:zloco -0.1543 0.0285 -5.40 0.0000
trialphase:phase2:zprom:zprev:zasses -0.0022 0.0018 -1.23 0.2176
trialphase:phase3:zprom:zprev:zasses -0.0054 0.0018 -3.06 0.0022
trialphase:phase2:zprom:zprev:zloco -0.0003 0.0019 -0.13 0.8963
trialphase:phase3:zprom:zprev:zloco -0.0070 0.0019 -3.62 0.0003
trialphase:phase2:zprom:zasses:zloco -0.0058 0.0011 -5.47 0.0000
trialphase:phase3:zprom:zasses:zloco -0.0029 0.0011 -2.72 0.0066
trialphase:phase2:zprev:zasses:zloco -0.0009 0.0020 -0.43 0.6663
trialphase:phase3:zprev:zasses:zloco 0.0050 0.0020 2.50 0.0125
trialphase:zprom:zprev:zasses:zloco 0.0001 0.0010 0.14 0.8923
phase2:zprom:zprev:zasses:zloco 0.0098 0.0404 0.24 0.8089
phase3:zprom:zprev:zasses:zloco 0.0013 0.0404 0.03 0.9742
trialphase:phase2:zprom:zprev:zasses:zloco 0.0103 0.0014 7.48 0.0000

APPENDIX B. TABLES OF RESULTS 150
trialphase:phase3:zprom:zprev:zasses:zloco 0.0018 0.0014 1.28 0.1989

APPENDIX B. TABLES OF RESULTS 151
Table B.2: Results of the analysis of regulatory mode (4)
X regulatory focus (4)X TrialphaseX phase (3) model for
Fractal B. Residual standard error: 0.4626 on 8904 de-
grees of freedom, Adjusted R-squared: 0.3433 F-statistic:
50.51 on 95 and 8904 DF, p-value: less than 2.2e-16
Estimate Std. Error t value Pr(>|t|)
(Intercept) -0.0968 0.0233 -4.15 0.0000
phase2 0.2757 0.0330 8.35 0.0000
phase3 0.0346 0.0330 1.05 0.2940
trialphase 0.0077 0.0008 9.61 0.0000
zloco -0.1855 0.0276 -6.73 0.0000
zasses -0.0877 0.0238 -3.68 0.0002
zprom 0.2519 0.0294 8.58 0.0000
zprev -0.2055 0.0243 -8.46 0.0000
phase2:trialphase -0.0089 0.0011 -7.92 0.0000
phase3:trialphase -0.0145 0.0011 -12.91 0.0000
phase2:zloco 0.2280 0.0390 5.84 0.0000
phase3:zloco 0.3299 0.0390 8.46 0.0000
trialphase:zloco 0.0025 0.0009 2.65 0.0081
phase2:zasses 0.1231 0.0337 3.66 0.0003
phase3:zasses 0.0365 0.0337 1.08 0.2781
trialphase:zasses 0.0036 0.0008 4.43 0.0000
zloco:zasses 0.1070 0.0264 4.05 0.0001
phase2:zprom -0.2600 0.0415 -6.26 0.0000
phase3:zprom -0.4099 0.0415 -9.87 0.0000
trialphase:zprom -0.0023 0.0010 -2.29 0.0220
zloco:zprom 0.0274 0.0284 0.97 0.3342

APPENDIX B. TABLES OF RESULTS 152
zasses:zprom -0.0475 0.0353 -1.35 0.1785
phase2:zprev 0.2755 0.0343 8.02 0.0000
phase3:zprev 0.2652 0.0343 7.72 0.0000
trialphase:zprev 0.0059 0.0008 7.10 0.0000
zloco:zprev -0.4128 0.0374 -11.03 0.0000
zasses:zprev -0.1181 0.0287 -4.11 0.0000
zprom:zprev 0.1009 0.0256 3.94 0.0001
phase2:trialphase:zloco -0.0042 0.0013 -3.18 0.0015
phase3:trialphase:zloco -0.0059 0.0013 -4.44 0.0000
phase2:trialphase:zasses -0.0033 0.0011 -2.88 0.0039
phase3:trialphase:zasses -0.0037 0.0011 -3.22 0.0013
phase2:zloco:zasses -0.1470 0.0374 -3.93 0.0001
phase3:zloco:zasses -0.1555 0.0374 -4.16 0.0000
trialphase:zloco:zasses 0.0002 0.0009 0.22 0.8280
phase2:trialphase:zprom -0.0053 0.0014 -3.71 0.0002
phase3:trialphase:zprom 0.0094 0.0014 6.66 0.0000
phase2:zloco:zprom -0.1556 0.0402 -3.87 0.0001
phase3:zloco:zprom -0.0656 0.0402 -1.63 0.1024
trialphase:zloco:zprom -0.0064 0.0010 -6.56 0.0000
phase2:zasses:zprom -0.0847 0.0500 -1.69 0.0902
phase3:zasses:zprom 0.1995 0.0500 3.99 0.0001
trialphase:zasses:zprom -0.0051 0.0012 -4.21 0.0000
zloco:zasses:zprom -0.0173 0.0222 -0.78 0.4353
phase2:trialphase:zprev -0.0055 0.0012 -4.72 0.0000
phase3:trialphase:zprev -0.0088 0.0012 -7.55 0.0000
phase2:zloco:zprev 0.6102 0.0529 11.53 0.0000
phase3:zloco:zprev 0.5134 0.0529 9.71 0.0000
trialphase:zloco:zprev 0.0119 0.0013 9.33 0.0000
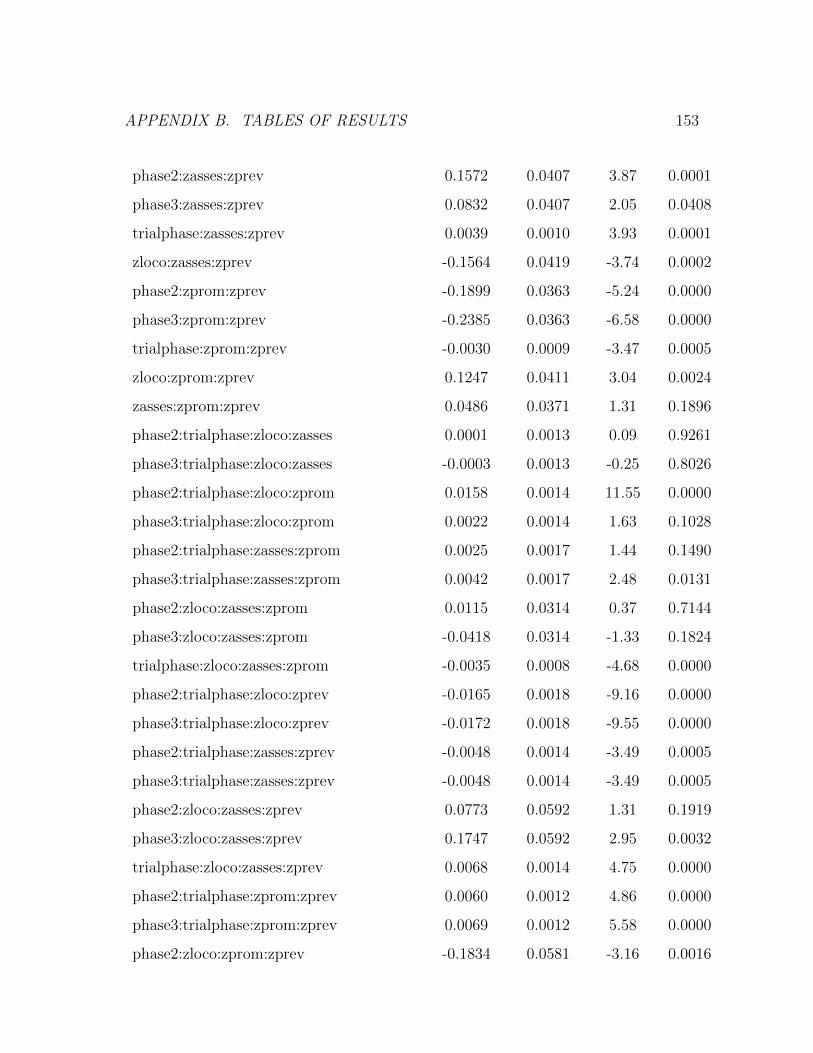
APPENDIX B. TABLES OF RESULTS 153
phase2:zasses:zprev 0.1572 0.0407 3.87 0.0001
phase3:zasses:zprev 0.0832 0.0407 2.05 0.0408
trialphase:zasses:zprev 0.0039 0.0010 3.93 0.0001
zloco:zasses:zprev -0.1564 0.0419 -3.74 0.0002
phase2:zprom:zprev -0.1899 0.0363 -5.24 0.0000
phase3:zprom:zprev -0.2385 0.0363 -6.58 0.0000
trialphase:zprom:zprev -0.0030 0.0009 -3.47 0.0005
zloco:zprom:zprev 0.1247 0.0411 3.04 0.0024
zasses:zprom:zprev 0.0486 0.0371 1.31 0.1896
phase2:trialphase:zloco:zasses 0.0001 0.0013 0.09 0.9261
phase3:trialphase:zloco:zasses -0.0003 0.0013 -0.25 0.8026
phase2:trialphase:zloco:zprom 0.0158 0.0014 11.55 0.0000
phase3:trialphase:zloco:zprom 0.0022 0.0014 1.63 0.1028
phase2:trialphase:zasses:zprom 0.0025 0.0017 1.44 0.1490
phase3:trialphase:zasses:zprom 0.0042 0.0017 2.48 0.0131
phase2:zloco:zasses:zprom 0.0115 0.0314 0.37 0.7144
phase3:zloco:zasses:zprom -0.0418 0.0314 -1.33 0.1824
trialphase:zloco:zasses:zprom -0.0035 0.0008 -4.68 0.0000
phase2:trialphase:zloco:zprev -0.0165 0.0018 -9.16 0.0000
phase3:trialphase:zloco:zprev -0.0172 0.0018 -9.55 0.0000
phase2:trialphase:zasses:zprev -0.0048 0.0014 -3.49 0.0005
phase3:trialphase:zasses:zprev -0.0048 0.0014 -3.49 0.0005
phase2:zloco:zasses:zprev 0.0773 0.0592 1.31 0.1919
phase3:zloco:zasses:zprev 0.1747 0.0592 2.95 0.0032
trialphase:zloco:zasses:zprev 0.0068 0.0014 4.75 0.0000
phase2:trialphase:zprom:zprev 0.0060 0.0012 4.86 0.0000
phase3:trialphase:zprom:zprev 0.0069 0.0012 5.58 0.0000
phase2:zloco:zprom:zprev -0.1834 0.0581 -3.16 0.0016

APPENDIX B. TABLES OF RESULTS 154
phase3:zloco:zprom:zprev 0.1572 0.0581 2.71 0.0068
trialphase:zloco:zprom:zprev -0.0038 0.0014 -2.73 0.0064
phase2:zasses:zprom:zprev -0.0577 0.0524 -1.10 0.2707
phase3:zasses:zprom:zprev 0.0137 0.0524 0.26 0.7932
trialphase:zasses:zprom:zprev -0.0025 0.0013 -1.94 0.0522
zloco:zasses:zprom:zprev 0.1339 0.0291 4.61 0.0000
phase2:trialphase:zloco:zasses:zprom 0.0056 0.0011 5.26 0.0000
phase3:trialphase:zloco:zasses:zprom 0.0044 0.0011 4.10 0.0000
phase2:trialphase:zloco:zasses:zprev -0.0025 0.0020 -1.22 0.2240
phase3:trialphase:zloco:zasses:zprev -0.0150 0.0020 -7.42 0.0000
phase2:trialphase:zloco:zprom:zprev 0.0012 0.0020 0.63 0.5302
phase3:trialphase:zloco:zprom:zprev -0.0026 0.0020 -1.29 0.1979
phase2:trialphase:zasses:zprom:zprev 0.0076 0.0018 4.22 0.0000
phase3:trialphase:zasses:zprom:zprev 0.0018 0.0018 1.02 0.3088
phase2:zloco:zasses:zprom:zprev -0.0434 0.0411 -1.05 0.2918
phase3:zloco:zasses:zprom:zprev -0.0880 0.0411 -2.14 0.0323
trialphase:zloco:zasses:zprom:zprev -0.0002 0.0010 -0.25 0.8056
phase2:trialphase:zloco:zasses:zprom:zprev -0.0085 0.0014 -6.05 0.0000
phase3:trialphase:zloco:zasses:zprom:zprev 0.0025 0.0014 1.77 0.0775

APPENDIX B. TABLES OF RESULTS 155
Table B.3: Results of the analysis of regulatory mode (4)
X regulatory focus (4)X TrialphaseX phase (3) model for
Fractal C. Residual standard error: 0.3866 on 8904 de-
grees of freedom, Adjusted R-squared: 0.3182 F-statistic:
45.22 on 95 and 8904 DF, p-value: less than 2.2e-16
Estimate Std. Error t value Pr(>|t|)
(Intercept) -0.0533 0.0195 -2.73 0.0063
phase2 0.0197 0.0276 0.72 0.4745
phase3 -0.1617 0.0276 -5.86 0.0000
trialphase 0.0062 0.0007 9.30 0.0000
zloco -0.0654 0.0231 -2.83 0.0046
zasses 0.0080 0.0199 0.40 0.6868
zprom 0.1072 0.0245 4.37 0.0000
zprev -0.0516 0.0203 -2.54 0.0109
phase2:trialphase -0.0119 0.0009 -12.67 0.0000
phase3:trialphase 0.0012 0.0009 1.27 0.2025
phase2:zloco 0.1066 0.0326 3.27 0.0011
phase3:zloco 0.1346 0.0326 4.13 0.0000
trialphase:zloco 0.0025 0.0008 3.21 0.0013
phase2:zasses -0.0392 0.0281 -1.39 0.1631
phase3:zasses 0.0918 0.0281 3.26 0.0011
trialphase:zasses -0.0021 0.0007 -3.04 0.0024
zloco:zasses -0.0023 0.0221 -0.10 0.9174
phase2:zprom -0.0733 0.0347 -2.11 0.0347
phase3:zprom 0.0175 0.0347 0.51 0.6133
trialphase:zprom -0.0013 0.0008 -1.57 0.1165
zloco:zprom 0.0379 0.0237 1.60 0.1107

APPENDIX B. TABLES OF RESULTS 156
zasses:zprom -0.0289 0.0295 -0.98 0.3278
phase2:zprev 0.0465 0.0287 1.62 0.1052
phase3:zprev -0.0989 0.0287 -3.45 0.0006
trialphase:zprev 0.0002 0.0007 0.22 0.8279
zloco:zprev 0.0275 0.0313 0.88 0.3784
zasses:zprev 0.0182 0.0240 0.76 0.4478
zprom:zprev 0.1238 0.0214 5.78 0.0000
phase2:trialphase:zloco 0.0003 0.0011 0.25 0.8003
phase3:trialphase:zloco -0.0052 0.0011 -4.64 0.0000
phase2:trialphase:zasses 0.0068 0.0010 7.08 0.0000
phase3:trialphase:zasses 0.0009 0.0010 0.89 0.3737
phase2:zloco:zasses -0.1134 0.0312 -3.63 0.0003
phase3:zloco:zasses -0.0502 0.0312 -1.61 0.1082
trialphase:zloco:zasses 0.0011 0.0008 1.47 0.1421
phase2:trialphase:zprom -0.0019 0.0012 -1.63 0.1023
phase3:trialphase:zprom -0.0032 0.0012 -2.67 0.0076
phase2:zloco:zprom 0.0041 0.0336 0.12 0.9018
phase3:zloco:zprom -0.1696 0.0336 -5.05 0.0000
trialphase:zloco:zprom 0.0005 0.0008 0.57 0.5656
phase2:zasses:zprom 0.0185 0.0418 0.44 0.6573
phase3:zasses:zprom 0.0699 0.0418 1.67 0.0944
trialphase:zasses:zprom 0.0000 0.0010 0.01 0.9918
zloco:zasses:zprom 0.0907 0.0185 4.89 0.0000
phase2:trialphase:zprev -0.0010 0.0010 -1.02 0.3059
phase3:trialphase:zprev 0.0026 0.0010 2.67 0.0076
phase2:zloco:zprev -0.1720 0.0442 -3.89 0.0001
phase3:zloco:zprev 0.0303 0.0442 0.68 0.4938
trialphase:zloco:zprev -0.0021 0.0011 -1.99 0.0467

APPENDIX B. TABLES OF RESULTS 157
phase2:zasses:zprev -0.0242 0.0340 -0.71 0.4761
phase3:zasses:zprev 0.0541 0.0340 1.59 0.1110
trialphase:zasses:zprev -0.0008 0.0008 -0.96 0.3396
zloco:zasses:zprev -0.1491 0.0350 -4.26 0.0000
phase2:zprom:zprev 0.0645 0.0303 2.13 0.0333
phase3:zprom:zprev 0.0355 0.0303 1.17 0.2415
trialphase:zprom:zprev 0.0014 0.0007 1.90 0.0573
zloco:zprom:zprev 0.0581 0.0343 1.69 0.0907
zasses:zprom:zprev 0.0900 0.0310 2.90 0.0037
phase2:trialphase:zloco:zasses -0.0032 0.0011 -3.04 0.0024
phase3:trialphase:zloco:zasses -0.0008 0.0011 -0.74 0.4586
phase2:trialphase:zloco:zprom -0.0001 0.0011 -0.12 0.9044
phase3:trialphase:zloco:zprom 0.0044 0.0011 3.81 0.0001
phase2:trialphase:zasses:zprom 0.0025 0.0014 1.75 0.0794
phase3:trialphase:zasses:zprom 0.0005 0.0014 0.37 0.7109
phase2:zloco:zasses:zprom -0.0494 0.0262 -1.88 0.0596
phase3:zloco:zasses:zprom -0.0078 0.0262 -0.30 0.7657
trialphase:zloco:zasses:zprom 0.0001 0.0006 0.17 0.8629
phase2:trialphase:zloco:zprev 0.0115 0.0015 7.65 0.0000
phase3:trialphase:zloco:zprev 0.0065 0.0015 4.31 0.0000
phase2:trialphase:zasses:zprev 0.0041 0.0012 3.54 0.0004
phase3:trialphase:zasses:zprev 0.0007 0.0012 0.58 0.5634
phase2:zloco:zasses:zprev 0.0814 0.0495 1.65 0.0998
phase3:zloco:zasses:zprev 0.0617 0.0495 1.25 0.2125
trialphase:zloco:zasses:zprev -0.0000 0.0012 -0.00 0.9987
phase2:trialphase:zprom:zprev -0.0053 0.0010 -5.10 0.0000
phase3:trialphase:zprom:zprev -0.0089 0.0010 -8.59 0.0000
phase2:zloco:zprom:zprev -0.3121 0.0485 -6.43 0.0000

APPENDIX B. TABLES OF RESULTS 158
phase3:zloco:zprom:zprev -0.4671 0.0485 -9.62 0.0000
trialphase:zloco:zprom:zprev -0.0008 0.0012 -0.68 0.4981
phase2:zasses:zprom:zprev -0.1316 0.0438 -3.00 0.0027
phase3:zasses:zprom:zprev -0.4509 0.0438 -10.29 0.0000
trialphase:zasses:zprom:zprev 0.0005 0.0011 0.43 0.6670
zloco:zasses:zprom:zprev 0.0204 0.0243 0.84 0.4020
phase2:trialphase:zloco:zasses:zprom 0.0001 0.0009 0.14 0.8919
phase3:trialphase:zloco:zasses:zprom -0.0015 0.0009 -1.72 0.0862
phase2:trialphase:zloco:zasses:zprev 0.0033 0.0017 1.96 0.0498
phase3:trialphase:zloco:zasses:zprev 0.0100 0.0017 5.94 0.0000
phase2:trialphase:zloco:zprom:zprev -0.0010 0.0017 -0.60 0.5499
phase3:trialphase:zloco:zprom:zprev 0.0096 0.0017 5.79 0.0000
phase2:trialphase:zasses:zprom:zprev -0.0054 0.0015 -3.61 0.0003
phase3:trialphase:zasses:zprom:zprev 0.0036 0.0015 2.38 0.0173
phase2:zloco:zasses:zprom:zprev 0.0336 0.0344 0.98 0.3284
phase3:zloco:zasses:zprom:zprev 0.0867 0.0344 2.52 0.0116
trialphase:zloco:zasses:zprom:zprev 0.0001 0.0008 0.14 0.8924
phase2:trialphase:zloco:zasses:zprom:zprev -0.0018 0.0012 -1.55 0.1216
phase3:trialphase:zloco:zasses:zprom:zprev -0.0042 0.0012 -3.62 0.0003