Motivation in Business Survey Response Behavior. Influencing motivation to improve survey outcome
185
MOTIVATION IN BUSINESS SURVEY RESPONSE BEHAVIOR Influencing motivation to improve survey outcome MOTIVATION IN BUSINESS SURVEY RESPONSE BEHAVIOR : Influencing motivation to improve survey outcome Vanesa Torres van Grinsven Vanesa Torres van Grinsven
Transcript of Motivation in Business Survey Response Behavior. Influencing motivation to improve survey outcome
MOTIVATION IN BUSINESS SURVEY RESPONSE BEHAVIORIn�uencing motivation to improve survey outcome
MOTIVATION IN BUSINESS SURVEY RESPONSE BEHAVIOR : In�uencing m
otivation to improve survey outcom
e
Vanesa Torres van GrinsvenVanesa Torres van Grinsven

M o t i v at i o n i n B u s i n e s s s u r v e y r e s p o n s e B e h a v i o ri n f l u e n c i n g m o t i v a t i o n t o i m p r o v e s u r v e y o u t c o m e
Va n e s a To r r e s v a n G r i n s v e n

ISBN: 978-94-6182-576-6
Layout and printing: Off Page (www.offpage.nl)
© Vanesa Torres van Grinsven.
All rights reserved. No part of this publication may be reproduced, stored, or transmitted, in any form or by any means, without the prior written permission of the author.
M o t i v at i o n i n B u s i n e s s s u r v e y r e s p o n s e B e h a v i o ri n f l u e n c i n g m o t i v a t i o n t o i m p r o v e s u r v e y o u t c o m e
M o T i V aT i e i n r e s p o n s G e d r a G b i j b e d r i j f s e n q u ê T e sb e ï n v l o e d i n g v a n m o t i v a t i e t e r v e r b e t e r i n g v a n e n q u ê t e u i t k o m s t e n
(met een samenvatting in het Nederlands)
PROEFSCHRIFT
ter verkrijging van de graad van doctor aan de Universiteit Utrecht,
op gezag van rector magnificus, Prof. dr. G.J. van der Zwaan,
volgens besluit van het college van promoties in het openbaar te verdedigen
op maandag 24 augustus 2015 des middags te 2.30 uur
door
Vanesa Torres van Grinsven
geboren op 22 februari 1977
te Ibiza, Spanje

Promotoren: Prof. dr. J.J. Hox Prof. dr. G.J.M.E. Snijkers

B e o o r d e l i n g s c o m m i s s i e :Prof. dr. S. Biffignandi (University of Bergamo)
Prof. dr. P.P.M. Leseman (Utrecht University)
Prof. dr. H. Schmeets (Maastricht University)
Prof. dr. S. van Buuren (Utrecht University)
Prof. dr. P.G.M. van der Heijden (Utrecht University)


T A B L E O F C O N T E N T S
Chapter 1 Introduction 13 Torres van Grinsven, V.
Chapter 2 In Search of Motivation for the Business Survey Response Task 25 Torres van Grinsven, V., Bolko, I., and Bavdaž, M.
2.1. Introduction 27
2.2. Data and Methods 29
2.2.1. Sample Selection 30
2.2.2. Sample Recruitment 31
2.2.3. Data Collection 32
2.2.4. Data Analysis 33
2.3. Results 34
2.3.1. Extrinsic Motivation 34
2.3.1.1. Externally Regulated Motivation 35
2.3.1.2. Introjected Extrinsic Motivation 36
2.3.1.3. Identified Extrinsic Motivation 37
2.3.1.4. Integrated Extrinsic Motivation 38
2.3.2. Intrinsic Motivation 39
2.3.3. Beyond the SDT Framework 41
2.3.4. Dynamics Between Extrinsic 43 and Intrinsic Motivation
2.4. Discussion and Suggestions for Improving 44 Business Survey Response Behavior
2.4.1. Suggestions for enhancing motivation 46
2.5. Further Research 49
Chapter 3 Enhancing use of official statistical figures for business decisions 53 Lorenc, B., Giesen, D., Torres van Grinsven, V., Seljak, R., and Bavdaž, M.
3.1. Introduction 55
3.2. Methods and Data 56
3.2.1. Businesses’ Perspective 57
3.2.1.1. Sample Selection 57

3.2.1.2. Sample Recruitment 57
3.2.1.3. Data Collection 58
3.2.1.4. Data Analysis 58
3.2.2 NSI Perspective 59
3.2.2.1. Data on Customer Support 59 to Businesses
3.2.2.2. NSI Experts on Businesses’ Use of NSI Statistics 60
3.2.3. External Experts’ Perspective 61
3.2.4. Integration of Results 61
3.3. Results 62
3.3.1. How Can Businesses Access Official Statistics? 62
3.3.2. How Do Official Statistics Relate to Internal and Other External Data That Businesses Use? 63
3.3.3. What Kinds of Official Statistics Do Businesses 65 Use and For What Purpose?
3.3.4. What Prevents Businesses from Using Official 67 Statistics More Often?
3.3.4.1. Lack of Awareness of NSI Statistics 67
3.3.4.2. Problems with Finding NSI Statistics 67
3.3.4.3. Shortcomings of NSI Statistics 68
3.4. Summary and Suggested Action 69
3.4.1. Opportunities for Businesses 69
3.4.2. Action Points 69
3.4.2.1. Disseminate Official Statistical Figures Better 70
3.4.2.2. Support Bringing Official Statistics 70 Closer to Fulfilling Businesses’ Needs
3.4.2.3. Broader Action Points 70
Chapter 4 A Meta-Analysis of Experiments on the Effectiveness 73 of the Use of Incentives in Organizational Surveys Torres van Grinsven, V., and Hox, J.
4.1. Introduction 75
4.2. Method 78
4.2.1.Selection of studies 78

4.2.1.1. Search strategy 78
4.2.1.2. Eligibility criteria 78
4.2.1. Coding of study characteristics 80
4.3. Data analysis 81
4.4. Results 82
4.4.1. Characteristics of the studies 82
4.4.2. Publication bias 83
4.4.3. Mean effect size of the use of incentives 84 in organizational surveys
4.4.4. Variability in results and moderating study features 84
4.4.4.1. Research organization 84
4.4.4.2. Year of publication 86
4.4.4.3. Value of the incentive 86
4.4.4. Summary 88
4.5. Discussion 88
Chapter 5 Sentiments and Perceptions of Business Respondents 95 on Social Media: An Exploratory Analysis Torres van Grinsven, V., and Snijkers, G.
5.1. Introduction 97
5.2. Data and Method 99
5.2.1. Data 99
5.2.2. Methods of analysis 100
5.3. Results 102
5.3.1. Exploring the social media 102
5.3.2. Results of the lexical analysis 103
5.3.3. Thematic analysis: sentiments and themes 106
5.3.3.1. Themes in negative posts 106
5.3.3.2. Themes in neutral posts 109
5.3.3.3. Themes in positive posts 110
5.4. Conclusion and discussion 111
5.4.1. Exploring and analyzing social media data 111
5.4.2. Summary and discussion of the analysis results 112

5.4.3. Recommendations for survey 114 and communication design
Chapter 6 A critical review of motivation theories and propositions 117 for organizational survey methodology research Torres van Grinsven, V., Bolko, I., and Bavdaž, M.
6.1. Introduction 119
6.2. Motivation theory: what is motivation? 121
6.3. Motivation in survey methodology research 122
6.3.1. Individual surveys 122
6.3.2. Organizational surveys 124
6.4. Discussion: motivation in the organizational survey task 125
6.4.1. Implicit and explicit motives 125
6.4.1.1. Implicit versus explicit motives 125 in the organizational survey task
6.4.2. Self-determination theory 126
6.4.2.1. Intrinsic versus extrinsic motivation 127 in an organizational setting
6.4.3. Goal-setting theory 130
6.4.3.1. Goal-setting and motivation 131 for organizational survey response
6.5. Sources of motivation 131
6.5.1. Sources of motivation in the literature 131
6.5.2. Sources of motivation in the organizational 132 survey setting
6.6. Conclusion 134
Chapter 7 Summary and Conclusion 137 Torres van Grinsven, V.
7.1. Summary of the results and conclusions 139
7.2. Practical recommendations for organizational 140 survey design
7.3. Further research 142
References 145

Appendices 157
Appendix A 157
Appendix B 166
Appendix C 168
Appendix D 171
Nederlandse samenvatting 175
About the author 181
Acknowledgements 183


i n t r o d u C t i o n
C h a p t e r 1


I n t r o d u c t I o n
This dissertation presents a number of studies that directly or indirectly concern motivation of business and organizational respondents: motivation to respond to business or organizational surveys, and to respond accurately, completely, and timely (Snijkers et al., 2013); and ways to enhance this motivation with survey design and communication. Today’s survey organizations and researchers face many challenges to collect information from their studied populations. In official statistics in particular, although debates in this field have been focused on actual response burden, since the start of the new millennium the attention has shifted towards perceived response burden as this may be more relevant for accurate and timely reporting (Willeboordse, 1997; Snijkers et al., 2013). As the expression “burden” bears a negative connotation and gives attention to only one aspect of the survey task, suggestions have been made to emphasize the positive counterpart of the burden, namely to focus on motivation in official business surveys (official business surveys can be defined as surveys sent out by official national statistical organizations). In this dissertation, the scope is broadened to encompass also other organizational surveys in addition to official business surveys, though Chapters 2, 3 and 5 specifically treat official business surveys. The reason for this is that there are other organizations and researchers, like commercial organizations (e.g. market research companies) or academic researchers that may have an important interest in enhancing response rates, accuracy, completeness and timeliness. For reason of readability, hereinafter I will thus use the term organizational surveys (except in Chapters 2, 3 and 5 or when discussing these chapters) to denote both business and organizational surveys. It must be noted though and born in mind when reading the remainder of this dissertation that business surveys can also include smaller businesses that are not organizations.
The problems of declining or low response rates in organizational surveys, high reminder rates to establish high enough response rates, poor data quality (due to measurement and non-response errors) and burden complaints suggest that a driving force, namely the motivation for the organizational survey task, is insufficient or lacking. Research in psychology has shown that behavioral outcomes reflect, among other factors, the level of motivation to participate in a task and perform it well (see for example Ryan and Deci, 2000). This is discussed more in detail in Chapters 2 and 6. However, knowledge about motivation had not consistently and in-depth been applied to organizational surveys yet. The research in this dissertation has been started to reduce the gap between what is known in other disciplines about motivation (like psychology and its various sub-disciplines) and organizational survey methodology. The results of the different studies carried out and presented in this dissertation have led to new empirical and theoretical insights and to a number of recommendations on how to improve organizational survey and communication designs to enhance motivation and herewith improve response rates and data quality and diminish burden complaints.
In the remainder, I will first shortly introduce the concept of motivation. Then I will give a description of each chapter of the thesis. I finish with a short overview of this thesis.
The term motivation was introduced in the beginning of the 1900s in the work context (see for example Steers, Mowday, and Shapiro, 2004) where the Hawthorne studies acknowledged
15

C h a p t e r 1
the workers’ motivation as a crucial factor contributing to productivity (Roethlisberger and Dickson, 1939). As Pittman (1998) explains, after a period of declining interest in motivation studies in the 1970s and 1980s in social psychology, motivation was back on the research agenda since the 1990s. A basic characteristic of motivational analyses, and in line with this also of the present analysis, are the assumptions that motivation is one salient feature of behavior, and that the person is an active participant: an originating striving source with needs, desires, hopes, and fears. Motivation, Pittman explains, is the activation of internal desires, needs and concerns. Though different scholars give different importance to motivation, in social psychology, motivation is directly linked to behavior as a determinant of the intensity, direction and persistence of the behavior and the focus is generally put on social human behavior as the actions people take in response to other persons (Berkowitz, 1985). In this sense, response behavior occurs in response to the survey request; regarding organizational surveys it would concern organizational response behavior in response to a survey request by an organization or an individual researcher. The motivational approach can be applied both to overt actions as well as to not directly observable actions, like the development of cognitive structures and the processing of information (Pittman, 1985). Several studies suggest a connection between motivational orientations and information processing effects (Webster, 1993; Webster and Kruglanski, 1994). Kruglanski and Freund (1983) introduce a theory of lay epistemology in which epistemic motivation, affected by several needs, plays an important role, next to capacity, in the cognition-generating process. As epistemic motivation is related to cognitive processes, it can be assumed to affect the outcome of the response process (e.g., accuracy of the response). Hence the importance of motivation to understand organizational survey response behavior.
Different kind of motivational subsystems can underlie behavior according to one of the main motivation theories, namely Self-determination theory (SDT) (Deci and Ryan, 1980). According to Ryan and Deci (2000), to be motivated means to be moved to do something; a person who feels no impetus or inspiration to act is thus characterized as unmotivated, whereas someone who is energized or activated toward an end is considered motivated. Deci and Ryan (1985) also distinguish between different types of motivation based on the different reasons or goals that give rise to an action. Self-determination Theory (SDT) posits motivation as a continuum between amotivation, that is, lack of motivation, at one extreme, and intrinsic motivation, that is, completely self-determined, internally rewarding motivation, at the other extreme. Extrinsic motivation, which is, originating from outside the individual, is in between (Deci and Ryan, 1985; Gagné and Deci, 2005). When a person adopts an intrinsic motivational orientation, the activity is approached as an end in itself. The actions are “performed in the absence of any apparent external contingency” (Deci and Ryan, 1980, p. 42). Activities that stem from an intrinsic motivational orientation are inherently satisfying. Activities stemming from an extrinsic motivational orientation are activities engaged with the focus on more distant goals, and current actions are treated as steps along the way to those ends. The primary focus is on rewards that are mediated by but not part of the activity itself. A switch to an extrinsic orientation shifts the person’s focus to value the outcomes contingent on engagement in the activity rather than characteristics of the activity itself.
16

I n t r o d u c t I o n
It is posited that these two different motivational subsystems are mediated by different kind of factors. Therefore, an exploration of the extent to which organizational survey response behavior is organized and governed by the intrinsic or the extrinsic motivational subsystem would be of great importance to be able to design effective motivational strategies. In Chapter 2, after first shortly discussing SDT and one of the main applications of SDT to survey methodology (Wenemark et al., 2010; Wenemark et al., 2011), we continue with the presentation of a thematic analysis of qualitative interview data. The purpose of the analysis presented in this chapter was to assess the fit of the data to psychological theories, and in particular SDT. The sources of motivation that remained unassigned to the themes of the SDT framework were considered with respect to other relevant psychological theories.
In the fields of, for example, social psychology or education in the last decades a major concern has been that rewards (such as an incentive) would decrease intrinsic motivation, with pervasive negative effects on performance. Research suggests that the quality of experience and performance is higher when intrinsic motivation is stimulated (Ryan and Deci, 2000), and that incentives undermine intrinsic motivation (see e.g. Deci, Koestner and Ryan, 1999). Recently, the discussed findings of SDT about intrinsic motivation were applied to the field of household surveys (see Wenemark et al., 2010; Wenemark et al., 2011). Wenemark et al. (2011) use SDT as an inspiration to redesign data collection procedures and the questionnaire of a self-administered voluntary health-related survey of individuals. This redesign focused on promoting competence, autonomy and relatedness, which are regarded as innate psychological needs that facilitate intrinsic motivation according to the Cognitive Evaluation Theory (CET), another sub theory of SDT (Deci and Ryan, 1980, 1985). Based on an experiment, they concluded that survey researchers should aim to enhance intrinsic motivation to achieve respondents’ superior commitment to the task.
Nevertheless, as we will discuss in Chapter 2 and Chapter 6 (paragraph 4.2.), other research proposes that extrinsic rewards do not have pervasive negative effects on intrinsic motivation, and that this may apply especially to the organizational or business context (see for example Fang and Gerhart, 2011) and thus to the context of organizational or business response behavior. This is more extensively discussed in Chapter 6.
In Chapter 2 (Torres van Grinsven, Bolko and Bavdaž, 2014), we endeavor to understand motivation in the business survey response task empirically investigating which types of motivation might be important in the business survey response task and assess the fit of the data to existing theories on motivation. Based on the thematic analysis of qualitative interview data, we find that SDT theory can’t explain all sources of motivation in the business survey response task as identified in our data. These qualitative interview data were, first, primary data collected in the frame of the international BLUE-ETS research project (BLUE Enterprise and Trade Statistics, http://www.blue-ets.eu). Second, secondary data collected as part of the doctoral research of one of the authors. As opposed to previous findings and firmly grounded in the empirical data we discuss that in the business setting extrinsic motivation calls for at least as much attention as intrinsic motivation and that other sources
17

C h a p t e r 1
of motivation may be relevant besides those influencing intrinsic motivation, which are those stemming from the three fundamental needs in the Cognitive Evaluation Theory, namely competence, autonomy and relatedness. We also propose that other approaches may have the potential to better explain some aspects of motivation in business surveys than the SDT framework alone, for instance McClelland’s (e.g. McClelland 1985) dual system approach to motivation that treats implicit motives. In McClelland’s dual system approach to motivation (1985) there are two types of motives. Implicit motives refer to unconscious determinants and may be paralleled to the aroused motive as in Hull’s original sense (1943) that represents a more primitive motivational system derived from affective experiences (McClelland, 1985; Woike, 1995). Other, cognitive, variables such as the probability of success and the incentive value, i.e. conscious expectancies and values, are then the base for explicit or self-attributed motives (these explicit motives conceptually have a parallel with extrinsic motivation). A more comprehensive overview of motivation theories and especially as potentially applicable to the organizational context is given in Chapter 6. Chapter 2 concludes with suggestions for improvement of motivation in business surveys and ideas for further research.
In the context of response burden, survey motivation is often associated with a respondent’s perception of the usefulness of the statistics to the business and/or society. Very few studies, however, have established an empirical link between motivation, perceived burden, response behavior, and response quality (e.g., Kennedy and Phipps, 1995; Hedlin et al., 2005; Hedlin et al., 2008; Giesen, 2012; Snijkers et al., 2013). These studies provide some evidence that higher motivation (i.e., higher perceived usefulness of the survey or greater interest in survey participation) may be related to lower perceived burden and/or better response behavior. In this context, Chapter 3 (Lorenc et al., in review) shows how to improve the use and perception of official statistics by businesses. This perception can in turn be a factor to achieve a higher (extrinsic) motivation. Evidence from national statistical institutes indicates that businesses may perceive official statistics as of little use for their business. On the other hand, businesses may potentially find official statistical figures useful, for instance, to guide their market and investment decisions, regulate contractual obligations, or benchmark own performance. This type of data source may be valuable to businesses because access is free and the data are methodologically sound. However, deeper insights into businesses’ use of official statistics and possibilities of enhancing this use are lacking. To address this issue, in Chapter 3 we present a multifaceted study that investigated business practices in using official statistics in four countries, and which was based on work done in the frame of the BLUE-ETS project. The article showcases uses of official statistics, identifies barriers to their use, and suggests areas of improvement, with the dual goal of enhancing the ability of national statistical institutes to produce and communicate high-quality statistics relevant to businesses and of raising businesses’ awareness of the potential uses of official statistics. This knowledge on the usage of official statistics can be used to design motivational tools, i.e. apply the respective sources of motivation to the survey and communication design so that the motivation to respond to an organizational survey is enhanced.
18
I n t r o d u c t I o n
Chapter 4 (Torres van Grinsven and Hox, in review) describes the results of a meta-analysis of 34 experimental studies that implemented a monetary or non-monetary incentive in order to increase response rates in an organizational survey. Based on the results of the research carried out in the frame of the BLUE-ETS project and Chapter 2 and 3 of this dissertation, which are to a large extent based on data collected in this BLUE-ETS project, we expected that an extrinsic motivator such as an incentive, would be effective as a technique to increase motivation and consequently response rates in an organizational survey.
The use of monetary and non-monetary incentives for increasing response rates is an established and widely used method in surveys of individuals or households. Incentives are used in mail, but also in face-to-face and telephone surveys, not only to increase unit response rates but also to improve response completeness, response speed and even attitude towards the survey sponsor, without negative influence on bias (see e.g. Medway, 2012). The 34 studies that were identified during the literature search and were analyzed comprise a variety of incentives used, survey modes, sample frames, survey topics, research organizations, population types, industries, respondent types, countries, data types, and both voluntary and mandatory surveys. These study features were coded for the moderator analysis which we did because we were interested in finding out whether any of these study features had a significant effect on the effect size of the use of incentives in organizational surveys.
We found that sending or promising an incentive does have a small but highly significant effect on the response rate. The mean effect size is d = 0.25 (p < .0001). In terms of Cohen’s (1988) effect size definitions this is a small effect. This finding corroborates our findings in Chapter 2 that extrinsic motivation is relevant for the organizational survey task, and that extrinsic sources of motivation are effective in increasing response rates in organizational surveys.
The analysis of variance of the study features showed that only ‘research organization’ has a significant effect on the effect size (p=.04). Surveys carried out by commercial organizations show the largest effect: d = 0.36, while universities (d = 0.26) and government organizations (d = 0.10) show much smaller effects. Our interpretation is that research organizations that are already obtaining relatively high response rates, find it more difficult to increase them further. This interpretation is supported by the finding that, if we include the response rate in the control group as a predictor, the significant differences between organization types disappear completely, while the regression coefficient for the response rate in the control group is negative and highly significant. No significant effects were found for year of publication, population type, sample frame, country where the survey was implemented, survey topic, survey method, data type, industry, characteristics of the respondents, or type or value of the incentive. It doesn’t seem to matter either if a survey is mandatory or voluntary.
Despite the conceptual doubts that have been surrounding the application of incentives to organizational surveys, we conclude that incentives can be used as a general tool to enhance response in organizational surveys with different survey features. The largest effect can be expected in cases where the expected response rate for a survey without addition
19

C h a p t e r 1
of an incentive is relatively low. Furthermore, what is important in the use of incentives in organizational surveys seems to be not the factual value (as in an economic exchange), but the psychological value as a symbolic gift or benefit that needs to be reciprocated. One possible explanation for the effectiveness of incentives thus lies within the tenets of reciprocity theory (Gouldner, 1960; see also Cialdini, 2001). This is one of the central rules of social exchange (Homans, 1958; Dillman, 2014). Another possible explanation lies in its being a symbolic benefit that counteracts the perceived costs (e.g. perceived burden) of completing and returning a questionnaire (as in the theory of a cost/benefit analysis (Tullar, Pressley and Gentry, 1979; Singer, 2011).
Following up on the discussion about intrinsic versus extrinsic sources of motivation, as also discussed in Chapter 2 and later on in Chapter 6, especially concerning motivation in a work environment, some researchers (Cameron, Banko and Pierce, 2001) show that in general extrinsic rewards are not harmful for motivation to perform a task. Negative effects are found on high-interest tasks when the rewards are tangible, expected and loosely tied to level of performance. Rewards given for low-interest tasks do even enhance intrinsic motivation. Consequently, when responding to an organizational survey is perceived as a low-interest task by the respondent, offering a tangible incentive can be expected to increase intrinsic motivation and thus survey participation but also level of performance. When it concerns the use of incentives (that is, extrinsic tangible rewards) to surveys, some researchers have achieved results consistent with this assumption towards the level of performance. In the field of individual surveys, a study showed that a prepaid cash incentive reduces respondent bias and item non-response (Tzamourani and Lynn, 1999). Also McDaniel and Rao (1980) show that a monetary inducement is found to decrease item omission and response error significantly in a survey of individuals. Medway (2012) shows that a 5 $ incentive decreases with significance item nonresponse in a telephone individual survey, though this reduction is of only 3 to 2 %. Further research is thus necessary to investigate the effects of the use of incentives on measurement error, (item) non-response, and response speed in organizational surveys. As opposed to the propositions made on base of SDT which were discussed before that extrinsic rewards such as an incentive have pervasive negative effects on performance, it may well be that also extrinsic rewards may have a positive effect on performance in an organizational or business setting and thus organizational survey outcome. Further research should also be necessary to investigate the cost-effectiveness of the use of incentives and the optimization regarding the trade-off between survey quality and survey costs.
Chapter 5 (Torres van Grinsven and Snijkers, 2015) presents a study into the perceptions and sentiments of business respondents of official surveys issued by the Dutch national statistical institute (Statistics Netherlands), and it’s relation to survey design facets and communication instances by Statistics Netherlands. Moreover it presents a novel way of obtaining data and analyzing perceptions and sentiments as expressed in these data: in this study social media (like Twitter and Facebook) are used as data source. Perceptions and sentiments are related to motivation and behavior and therefore relevant for the response;
20

I n t r o d u c t I o n
but they are also important for the relationship with the surveying organization. As we will see in Chapter 2, feelings of relatedness are an important source of intrinsic motivation. Furthermore Chapter 2 also shows that sentiments such as for example a respondent’s mood, and perceptions such as the perceived value of the survey or the surveying organization, are empirically identified as important sources of motivation in business surveys.
Researching expressions in social media hence gives insights into the sentiments and perceptions of those business respondents that are active on social media and that lay at the base of their actions. Analyses of expressions on social media can thus be used as a way to get insights into business respondents’ feelings and perceptions towards the NSI and their survey response behavior. This knowledge can in turn be used to adapt communication and survey designs to influence these perceptions and sentiments and hence achieve a better motivation for survey participation. In this chapter we conclude with recommendations of how organizational survey design but also the communication strategies can be improved as to ameliorate the perception business respondents have of Statistics Netherlands and their sentiments towards Statistics Netherlands to positively influence motivation to achieve improved survey outcomes.
In Chapter 6, to conclude this thesis, we revisit motivation theories. Chapter 6 critically reviews motivation research and theories from different fields of research and concludes with recommendations for the application of these findings from other fields regarding motivation and behavior on organizational survey design. It offers a new perspective on understanding the drives underlying the organizational response behavior, and the functioning of incentives in the organizational settings. In particular, as opposed to some the most important previous research that gives priority to intrinsic motivation and the three underlying sources competence, autonomy and relatedness, we expose the relevance of extrinsic motivation and the related explicit goals and motives and its potential impact on intrinsic motivation. Besides these cognitive and conscious determinants, we also acknowledge the impact of implicit motives. Research indicates that implicit motives seem very relevant in the work context (see Chapter 6, paragraph 4.1.) and should be taken into consideration when developing and survey and communication design for an organizational survey. We also point to the prominent role of goal setting, which is typical of work environments and much more explicitly present there compared to person surveys. One of the most prominent theories in motivation research in the work-setting is the goal-setting theory (see for example Locke and Latham, 1990). Goal-setting directs action by activating cognitively-based motivational processes (explicit motives). We further discuss this in paragraph 4.3 of chapter 6.
Furthermore, extant theories on survey participation and response process in organizational surveys offer only a limited insight into motivation; we call for a more in-depth treatment.
Chapter 6 also gives an overview of possible sources of motivation for the organizational survey response task as found in the literature.
21

C h a p t e r 1
To sum up, we conclude, first, regarding types of motivation, from Chapter 2, that extrinsic motivation calls for attention with regards to organizational survey response behavior and that thus extrinsic sources of motivation may be relevant besides those influencing intrinsic motivation. We also propose that other approaches may have the potential to better explain some aspects of motivation in organizational surveys than the SDT framework alone, for instance McClelland’s (see for example McClelland 1985) dual system approach to motivation that treats implicit motives, as opposed to previous survey research that has given attention only to intrinsic motivation (Wenemark et al, 2011). Possible ways to enhance extrinsic motivation for the organizational survey response task are, for example, the use of incentives (Chapter 4); or the enhancement of the usefulness of the surveys as perceived by businesses by, for example, the feedback of statistical figures (Chapter 3). Chapter 3 explores more in depth businesses’ use of official statistics and possibilities of enhancing this. This knowledge can be used to enhance motivation through a survey and communication design. Nevertheless intrinsic motivation seems to remain with potential in the organizational setting. In the context of intrinsic motivation especially important seems to be the relationship between a survey organization such as Statistics Netherlands and a responding organization (for example a business) or an organizational respondent. The effect of survey design and communication instances and strategies on perception and sentiments is explored in Chapter 5. Chapter 5 indicates which kind of actions and communication strategies influence a positive or negative sentiment and perception and herewith also points towards knowledge on how to enhance motivation through a survey and communication design. This chapter makes it especially evident that communication instances are very important in influencing perception and sentiments and should receive due attention when designing a survey.
Except the introduction and the conclusion, all chapters in this thesis were written as independent publications either published in or under review at international journals. For this reason, a certain redundancy is present across these chapters as regards to the problem statement and rationale for the research. There may also be an overlap in the conclusion and discussion sections – in the description of the implications of the findings and discussion and recommendations for further research. Nevertheless each one of these chapters presents different research and research results. Chapters 2 and 3 are partially based on the same qualitative research interviews with businesses conducted in the framework of the international research project BLUE-ETS. Therefore some overlap in the description of this project is present. However, the advantage is that all chapters can be read and understood independently from each other.
22


i n s e a r C h o F M o t i v at i o n F o r t h e B u s i n e s s s u r v e y r e s p o n s e t a s k
Torres van Grinsven, V., Bolko, I., and Bavdaž, M. Journal of Official Statistics. Volume 30, Issue 4, Pages 579–606,
ISSN (Online) 2001-7367, DOI: 10.2478/jos-2014-0039, December 2014
C h a p t e r 2

C h a p t e r 2
a B s t r a C tIncreasing reluctance of businesses to participate in surveys often leads to declining or low response rates, poor data quality and burden complaints, and suggests that a driving force, that is, the motivation for participation and accurate and timely response, is insufficient or lacking. Inspiration for ways to remedy this situation has already been sought in the psychological theory of self-determination; previous research has favored enhancement of intrinsic motivation compared to extrinsic motivation. Traditionally however, enhancing extrinsic motivation has been pervasive in business surveys. We therefore review this theory in the context of business surveys using empirical data from the Netherlands and Slovenia, and suggest that extrinsic motivation calls for at least as much attention as intrinsic motivation, that other sources of motivation may be relevant besides those stemming from the three fundamental psychological needs (competence, autonomy and relatedness), and that other approaches may have the potential to better explain some aspects of motivation in business surveys (e.g., implicit motives). We conclude with suggestions that survey organizations can consider when attempting to improve business survey response behavior.
k e y w o r d sData quality; incentive; organization; respondent; survey participation
26

I n S e a r c h o f M o t I v at I o n f o r t h e B u S I n e S S S u r v e y r e S p o n S e t a S k
2 . 1 . i n t r o d u C t i o nIt is a real challenge for today’s survey organizations and researchers to collect information from their studied populations. This challenge is most visible in declining response rates (De Leeuw and De Heer, 2002; Baruch, 1999) that have stabilized at a low level in research on organizations (Baruch and Holtom, 2008) but only because of response-enhancing techniques (Anseel et al., 2010). Less visible, though far from marginal, is the issue of the poor quality of reported data, which is the main (though not the only) reason for the high cost of data editing in governmental surveys of business organizations, which may represent as much as 30 % (e.g. Adolfsson et al., 2010) of the total survey cost. Businesses describe statistical reporting as burdensome even if it only represents a tiny proportion of all administrative burdens (Haraldsen et al., 2013). The problems of declining or low response rates, poor data quality and burden complaints suggest that a driving force, namely the motivation for the business survey task, is insufficient or lacking.
Most commonly the term motivation is used to describe “why a person in a given situation selects one response over another or makes a given response with great energization or frequency” (Bargh et al., 2010, 268). Behavioral outcomes reflect, among other factors, the level of motivation to participate in a task and perform it well. The role of motivation has been acknowledged and indirectly tested in academic and commercial business surveys through research on incentives or survey design, for example (for an overview of research on response enhancing techniques see, for example, Cycyota and Harrison, 2006, or Jobber et al., 2004). More recently, a paradigm shift from a burden-centered to a motivation-centered approach seems to be occurring in governmental business surveys as increasing attention is given to improving the overall survey experience, especially through better communication and relationships with businesses and efforts to understand the business response environment (for a recent overview, see Snijkers et al., 2013). In the context of response burden, survey motivation is often associated with a respondent’s perception of the usefulness of the statistics to the business and/or society; it has been considered an important factor for perception of response burden and through that for data quality and response rates (Dale and Haraldsen, 2007). Very few studies, however, have established an empirical link between motivation, perceived burden and response behavior (e.g. Kennedy and Phipps, 1995; Hedlin et al., 2005; Hedlin et al., 2008; Giesen, 2012). These studies provide some evidence that higher motivation (i.e. higher perceived usefulness of the survey or greater interest in survey participation) may be related to lower perceived burden and/or better response behavior.
Several studies have given an account of factors that affect participation or data quality in business surveys (e.g. Davis and Pihama, 2009; Giesen and Burger, 2013; Janik and Kohaut, 2009; Porter, 2004; Seiler, 2010). Theoretically, these accounts are largely based on one or a combination of the frameworks provided by Groves, Cialdini and Couper (1992), Tomaskovic-Devey, Leiter and Thompson. (1994, 1995), and Willimack, Nichols and Sudman (2002). Some of these studies explicitly suggest that the identified factors (e.g. survey design, time spent on a previous questionnaire’s completion, business situation) affect
27

C h a p t e r 2
participation through the motivation to respond; however, both the empirical accounts and the theoretical frameworks lack a detailed explanation about the precise role of motivation and how the factors affect response behavior or motivation for this behavior. These studies investigate neither the mechanisms about how motivation works nor the role of perceived response burden (for an exception addressing the latter, see Giesen and Burger, 2013).
Recently, a psychological motivation theory, namely Self-Determination Theory (hereinafter SDT), has been applied to the field of household surveys (see Wenemark et al., 2010; Wenemark et al., 2011). As illustrated in Figure 1, SDT posits motivation as a continuum between amotivation, that is lack of motivation, at one extreme, and intrinsic motivation, that is, completely self-determined, internally rewarding motivation, at the other extreme; extrinsic motivation, that is, originating from outside the individual, is in between (Deci and Ryan, 1985; Gagné and Deci, 2005). As Kruglanski (1975) puts it, with intrinsic motivation the task is an end in itself, whereas with extrinsic motivation the task is a means to an end. People may thus be completing business surveys because they find this kind of work interesting, or because some externally imposed reasons or incentives make them do it, for example, avoiding reminders or a superior’s dissatisfaction, fulfilling duties to society, and so on. Given the importance of extrinsic motivation in the work environment where a business survey task usually takes place, a subtheory of SDT, Organismic Integration Theory, is used to detail the different variants of extrinsic motivation (Deci and Ryan, 1985). As indicated in Figure 1, transitions from the least self-determined (i.e. external) to the most self-determined (i.e. integrated) extrinsic motivation are a matter of degree and may also change over time through processes of internalization and integration. Respondents can turn extrinsically motivating aspects of the business survey task into (more) internalized elements by making them more personal. Externally initiated motivation may become introjected if respondents accept an imposed regulation (though not as their own), or identified if respondents value certain behaviors for their congruence with their personal goals and identities, or even integrated if respondents completely identify specific behaviors with themselves.
Applying this theory allows survey participation theories to be broadened to also include task commitment and performance. Wenemark et al. (2011) use SDT as an inspiration to redesign data collection procedures and the questionnaire of a self-administered voluntary health-related survey of individuals. This redesign focused on promoting competence, autonomy and
Figure 1. A model of motivation according to Self-Determination Theory and its subtheory Organismic Integration Theory (based on Deci and Ryan, 1985).
28

I n S e a r c h o f M o t I v at I o n f o r t h e B u S I n e S S S u r v e y r e S p o n S e t a S k
relatedness, which are regarded as innate psychological needs that facilitate intrinsic motivation according to Cognitive Evaluation Theory, another subtheory of SDT (Deci and Ryan, 1980, 1985). Based on an experiment, they conclude that survey researchers should aim to enhance intrinsic motivation to achieve respondents’ superior commitment to the task, as research suggests that the quality of experience and performance are higher when intrinsic motivation is stimulated (Ryan and Deci, 2000), and that incentives undermine intrinsic motivation (see e.g. Deci et al., 1999). At the same time, they acknowledge that the topic studied may have been inherently interesting to respondents and that the possibilities of intrinsically motivating respondents may vary across different surveys and different populations.
Business surveys and businesses have many specific features (see e.g. Rivière, 2002), which casts doubts on the applicability of Wenemark et al.’s (2011) conclusions for business surveys. The business participation decision and the survey response task occur in a business setting, where the response occupies participants’ work time; respondents provide answers on behalf of their organization, and the task’s rejection, inaccurate and late completion may have consequences for the participants and their organization (e.g. superiors’ reprimands, or survey reminders, follow-up calls or even fines). To better understand survey response motivation in such a setting, we use a combination of primary and secondary data sources from qualitative research interviews conducted in businesses in two countries, the Netherlands and Slovenia. We use thematic analysis to identify sources of motivation according to theoretically defined types of motivation in the SDT and its subtheories. We define sources of motivation as “those conditions that elicit, sustain, and enhance this special type of motivation” (Ryan and Deci, 2000, p. 57). The data and methods are presented in the next section, followed by the presentation of results. In light of these exploratory data and specifics of the setting, we review and discuss the applicability of the SDT to business surveys. We propose that in the business setting: (a) extrinsic motivation calls for at least as much attention as intrinsic motivation, that (b) other sources of motivation may be relevant besides those stemming from the three fundamental needs in the Cognitive Evaluation Theory (competence, autonomy and relatedness), and that (c) other approaches may have the potential to better explain some aspects of motivation in business surveys than the SDT framework alone, for instance McClelland’s (1985) dual system approach to motivation that treats implicit motives (for simplicity, these approaches are presented together with relevant quotes in Subsections 3.3 and 3.4). The article concludes with suggestions for improvement of motivation in business surveys and ideas for further research.
2 . 2 . d at a a n d M e t h o d sThe presented study is based on data collated from primary and secondary data sources, using the different sources of evidence to support validity of findings. The primary data were collected as part of the international research project BLUE-ETS (BLUE Establishment and Trade Statistics; see www.blue-ets.eu) that sought, among other things (e.g. use of internal
29

C h a p t e r 2
and external data), to understand what motivates businesses to participate in and report accurately and on time to national statistical institutes’ (NSI) surveys1. Our study analyzed data collected in the Netherlands and Slovenia. The secondary data were collected as part of doctoral research that studied the actual response process to a specific business survey from start to finish (i.e. from the moment the survey instrument entered the business to the moment it left the business) in real business environments (see Bavdaž, 2010). The survey studied, the Quarterly Survey on Trade, was a mandatory self-administered survey conducted in Slovenia by the Statistical Office of the Republic of Slovenia on a sample of units performing trade activities.
The two studies differed in many ways that might have an impact on the reported sources of motivation. One study addressed surveys in general so it collected general perceptions, while the other focused on a single survey at a time when the experience of responding to that survey was still fresh and memories vivid (special attention was paid to minimizing the time that elapsed between the completion and the interview) so that it collected immediate perceptions about the situation as they arose. One study included units from different economic sectors that might have completely different attitudes towards data and surveys; the other included only units from the trade services that might be more homogeneous in this respect. One study addressed the motivation together with data use, thus extending the context to potential benefits of data reporting, while the other addressed motivation together with the response process, thus mainly focusing on the cost aspect of data reporting. One was conducted during the most recent economic downturn that might reduce motivation for survey response; the other was carried out in much better economic conditions. The secondary data source thus complements the primary data source well. More details about both data sources are given below.
2 . 2 . 1 . s a m p l e s e l e c t i o nTo ensure that the businesses had had some experience with business surveys, the sampling frame for primary data collection in the Netherlands was the sample of a large survey conducted by Statistics Netherlands. In Slovenia, the sampling frame for primary data collection consisted of all corporations as listed in the Slovenian commercial database GVIN. The sampling frame for secondary data collection was the sample of the studied trade survey.
In the case of both primary and secondary data sources, the selection of businesses aimed to gather as many different insights as possible in accordance with purposeful maximum variation sampling (Cutcliffe, 2000). As suggested by Sandelowski et al. (1992) and Coyne (1997), this purposeful sampling was partially superseded by theoretical sampling: We targeted businesses of different size and economic activity because these two variables are generally hypothesized to influence survey response behavior the most and in multiple ways.
1 See Appendix A for the interview guide for the field study.
30
I n S e a r c h o f M o t I v at I o n f o r t h e B u S I n e S S S u r v e y r e S p o n S e t a S k
Businesses for the primary data collection were thus chosen from different size classes (small – less than 50 employees; medium – 50 to 250 employees; and large – 250+ employees) and diverse manufacturing, commercial and service activities. Three criteria guided our selection of the two-digit NACE activities from which we chose businesses: Activities had to have many businesses, because a high number of similar businesses increases the relevance of our findings; they had to be important for the national economy, because activities that have a significant contribution to national economic indicators typically receive considerable attention from survey organizations (they are surveyed more often and/or in more detail, which adds to a high response burden and increases the importance of motivation); or they had to have a large share of small businesses that deserve special attention, because they have a relatively high response burden given their modest resources (see Seens, 2010) and are assumed to have problematic survey response behavior (such as nonresponse, item nonresponse or measurement errors). We selected businesses from activities that preferably satisfied more than one criterion. The selected businesses had to have different two-digit NACE codes. We also sought to ensure as much variability as possible with respect to other criteria that were not explicitly defined as inclusion criteria. We can say that we covered both services and industry, internationally oriented and locally oriented business, foreign and domestically owned business, and different locations. The secondary data source, on the other hand, was already limited to a single economic activity. Its sample was selected systematically across all business sizes, but businesses that were the largest in size in a particular trade activity and/or in trade as a whole were oversampled.
2 . 2 . 2 . s a m p l e r e c r u i t m e n tIn the case of the primary data source, initial contacts were established by phone. The recruiting strategy was to start with one interview per business agreed in advance (with either a business survey respondent or a data user; the latter sometimes being in the managing position), and then ask for another interview on the spot using the “foot in the door” technique. In some businesses, we first targeted business survey respondents, while in others we targeted data users (e.g. accounting, economic, analytical and (quality) control departments). As can be seen from Table 1, the strategy was especially successful in Slovenia, where most on-site visits resulted in more than one interview. In the Netherlands, gift vouchers that can be used in many Dutch shops were given before or after the interview as a token of appreciation.
The recruiting approach was different in the case of the secondary data source. An advance letter was first sent to respondents of the Quarterly Survey on Trade. Then a telephone contact was established to obtain information about the timing of the questionnaire’s completion. This information was later communicated to them in written form (mail and/or email). Subsequent telephone calls served as final confirmation of the date of the on-site visit, which had to coincide with or follow the completion of the questionnaire. As can be seen from Table 1, a group interview was conducted in three cases because respondents were working together very closely (e.g. a novice and the preceding respondent). After the
31
C h a p t e r 2
interviews with respondents, an attempt was made to contact other mentioned key people involved in the survey response process besides the respondents (mainly providers of data to respondents, but also some authorities), but these contacts were sometimes short, structured telephone interviews. Altogether the study included 28 different-sized businesses covering various combinations of trade activities and various kinds of merchandise.
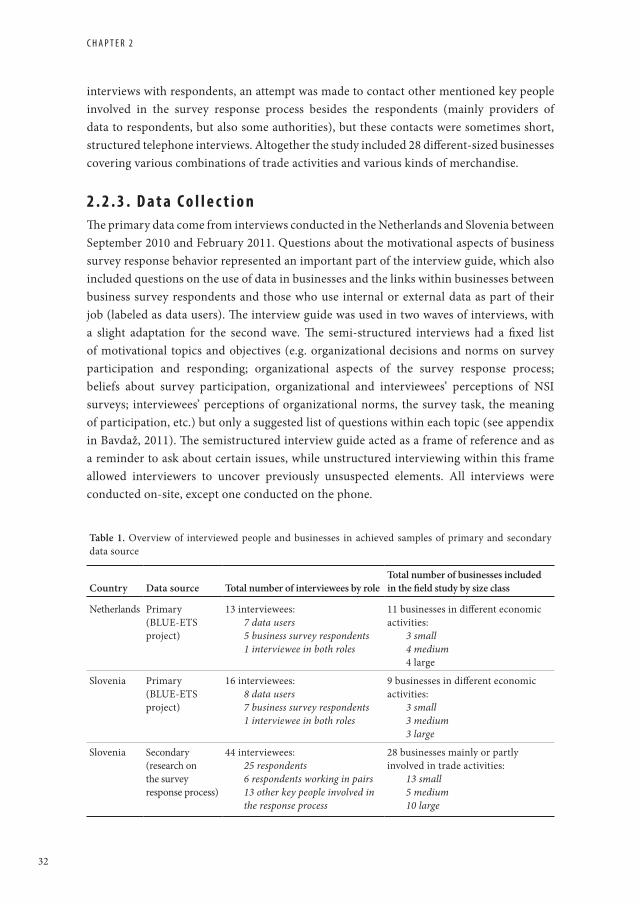
2 . 2 . 3 . d a t a C o l l e c t i o nThe primary data come from interviews conducted in the Netherlands and Slovenia between September 2010 and February 2011. Questions about the motivational aspects of business survey response behavior represented an important part of the interview guide, which also included questions on the use of data in businesses and the links within businesses between business survey respondents and those who use internal or external data as part of their job (labeled as data users). The interview guide was used in two waves of interviews, with a slight adaptation for the second wave. The semi-structured interviews had a fixed list of motivational topics and objectives (e.g. organizational decisions and norms on survey participation and responding; organizational aspects of the survey response process; beliefs about survey participation, organizational and interviewees’ perceptions of NSI surveys; interviewees’ perceptions of organizational norms, the survey task, the meaning of participation, etc.) but only a suggested list of questions within each topic (see appendix in Bavdaž, 2011). The semistructured interview guide acted as a frame of reference and as a reminder to ask about certain issues, while unstructured interviewing within this frame allowed interviewers to uncover previously unsuspected elements. All interviews were conducted on-site, except one conducted on the phone.
Table 1. Overview of interviewed people and businesses in achieved samples of primary and secondary data source
Country Data source Total number of interviewees by roleTotal number of businesses included in the field study by size class
Netherlands Primary (BLUE-ETS project)
13 interviewees:7 data users5 business survey respondents1 interviewee in both roles
11 businesses in different economic activities:
3 small 4 medium 4 large
Slovenia Primary (BLUE-ETS project)
16 interviewees:8 data users7 business survey respondents1 interviewee in both roles
9 businesses in different economic activities:
3 small3 medium3 large
Slovenia Secondary (research on the survey response process)
44 interviewees:25 respondents6 respondents working in pairs13 other key people involved in the response process
28 businesses mainly or partly involved in trade activities:
13 small5 medium10 large
32

I n S e a r c h o f M o t I v at I o n f o r t h e B u S I n e S S S u r v e y r e S p o n S e t a S k
The secondary data come from on-site visits to businesses in Slovenia arranged around two consecutive deadlines for the completion of the Quarterly Survey on Trade in 2005. The qualitative research interview was the primary method of investigation in businesses. It largely relied on retrospective probing (Willis, 2005) and ethnographic interviewing (Gerber, 1999) of the principal respondent to the survey on-site. Other people with a minor role in the response process (e.g. a respondent that only answered a single survey question or a data provider that prepared some data input for the respondent) were sometimes reached over the phone. Although the focus of the interviews was on the survey response process, attention was also paid to contextual topics such as the role of authorities and other organizational issues as well as attitudes towards the NSI and (official) statistics. This often produced insights into the motivational aspects, which made the data source useful for the present analysis.
2 . 2 . 4 . d a t a a n a l y s i sInterviews from both primary and secondary data sources were recorded and transcribed so that a verbatim account of interviewees’ verbal utterances would be available (an exception was made for some shorter interactions over the phone that were noted down immediately). From the primary data source, all interviews with respondents, and those interviews with data users that contributed any insight relevant to surveys (e.g. interviews with superiors deciding on survey participation) were included in the analysis. From the secondary data source, segments of transcripts and notes bearing information on motivation were identified and included in the analysis.
The purpose of the analysis presented in this article was to assess the fit of the data to psychological theories. It has to be noted, however, that the analysis meant a re-examination of the previously coded data from the primary data source, that is, the second round of analysis of these data. The first round of analysis mainly relied on an inductive, “bottom-up” approach with no specific framework in mind, even though some preconceptions and background knowledge of potentially relevant or related theories may have contributed to topics and questions in the interview guide (see Coffey and Atkinson, 1996; Dey, 1993). This mainly data-driven process of coding resulted in the identification of several motivational themes that were then classified as either organizational motivation (corporate social responsibility, attention, prioritizing and statistical hub) or individual motivation (emotional aspects, habits and routines, worth attached to survey task and obligations) (see Torres van Grinsven et al., 2011).
The immersion in the data helped to achieve a deeper understanding of motivation in business surveys. As suggested by Stern (1980) and Strauss and Corbin (1994), we then systematically reviewed the literature, selected relevant psychological theories and brought in theoretically suggested themes. We also added the secondary data source. The second round of analysis that followed and is presented in this article relied on a deductive approach, in which the themes followed the SDT framework, namely the SDT and its subtheories Cognitive Evaluation Theory and Organismic Integration Theory (Deci and
33

C h a p t e r 2
Ryan, 1980; 1985). The sources of motivation that remained unassigned to the themes of the SDT framework were considered with respect to other relevant psychological theories.
Thematic analysis was applied in both rounds of data analysis. Thematic analysis can be defined as “a method for identifying, analyzing and reporting patterns (themes) within data” (Braun and Clarke, 2006, p. 79). A theme is manifested through “expressions”, that is, particular instances in data (Ryan and Bernard, 2003) that are attributed to codes within that theme. We searched for expressions of motivation for business survey response behavior of the interviewees at the semantic or explicit level (as opposed to the latent level) within the realist/essentialist paradigm, which means that we reported the meaning, experiences and reality of interviewees without constructing or deriving other meanings from their words (see Braun and Clarke, 2006). Codes sometimes applied to a longer passage of the interview, while at other times several themes applied to an interviewee’s turn of speech. Codes were developed by the three authors using a standard iterative process (see MacQueen et al., 1998). Each coded passage was assessed individually in several rounds of discussions for agreement between authors on the codes and attribution of codes to themes.
2 . 3 . r e s u Lt sIn this section we give an account of sources of motivation for business survey participation and accurate and timely response as expressed in our data. The sources of motivation were structured around the two main types of motivation they trigger or influence according to the SDT, that is, intrinsic and extrinsic motivation (see Table 2); amotivation is not included as it lacks a drive, an intention to act, while we were interested in the positive counterpart. The particular sources of extrinsic motivation found in our data were further attributed to the subthemes derived from the Organismic Integration Theory. The essential source of intrinsic motivation is “the fun or challenge entailed” that moves a person to act (Ryan and Deci, 2000, p. 56). Three other sources of intrinsic motivation, that is, perceived competence, relatedness and autonomy, were derived from the Cognitive Evaluation Theory. Some sources of motivation remained unassigned to the themes derived from the SDT framework after the data analysis; these sources are presented at the end of the results section together with a possible theoretical explanation and are debated further in the discussion section.
All quotes are accompanied by information about the interviewees. It is indicated in parentheses if the interviewee was a respondent to business surveys [Respondent], a superior to business survey respondent(s) [Superior], or if the role was more specific, for example self-employed, a user of official statistics, and so on.
2 . 3 . 1 . e x t r i n s i c M o t i v a t i o nSources of motivation in our data could be assigned to all four subtypes of extrinsic motivation as defined by the SDT and its subtheory, Organismic Integration Theory (see Table 2). Several verbal accounts expressing extrinsic motivation were identified in each interview.
34

I n S e a r c h o f M o t I v at I o n f o r t h e B u S I n e S S S u r v e y r e S p o n S e t a S k
2 . 3 . 1 . 1 . e x t e r n a l l y r e g u l a t e d M o t i v a t i o nL e g a l m a n d a t eIn the case of “pure” external regulation, the task was executed with the sole purpose of satisfying an external demand. In business surveys this demand often comes from legislation and represents a legal obligation for the business. External regulation seemed to be the most common source of motivation in governmental business surveys. While some interviewees stressed the importance of participation, others also express concern with accuracy and timeliness.
“The only reason to participate is the legal mandate.” [Self-employed outsourcing reporting]
“We have to report, we are legally obliged to do it.” [Respondent]
“It is something that has to be delivered in time. And it also concerns correctness. It has to be correct.” [Respondent]
The obligation itself could be explicitly known or just assumed.
“I haven’t checked, but I assume it’s obligatory to report. If you are chosen and you agree on something, than you have to do it no matter what.” [Respondent]
Table 2. Themes, subthemes and codes for sources of motivation for the business survey task
Themes Subthemes Codes for sources of motivation
Extrinsic motivation Externally regulated motivation Legal mandate
Introjected extrinsic motivation Work tasks (explicitly assigned)Social responsibility:• Value for society in general• Value for specific purposes• Value for specific groups• Principle of reciprocity
Identified extrinsic motivation Value for own business or self
Integrated extrinsic motivation Work tasks (adopted)
Intrinsic motivation Enjoyment and challenge Perceived competenceAutonomyRelatedness
MoodHuman curiosity disposition Disposition for accuracy and precisionRoutinesTask characteristics
Note: Terms in italics are taken from the SDT and its subtheories Cognitive Evaluation Theory and Organismic Integration Theory
35

C h a p t e r 2
Response-enhancing practices based on legal mandates seemed to be highly effective in the minds of the interviewees. In the occasional event that a business was late with the response to the survey request, reminder phone calls and letters, and threats of fines would lead the business to respond. Reacting to letters threatening fines represented a form of externally regulated behavior while reminders represented a softer form of extrinsic regulation (i.e. introjected), mainly relying on feelings of guilt for not respecting the deadline.
“Preferably we want to prevent that we receive letters [with fines].” [Respondent]
“That one was also postponed for a while, and then there came serious letters with the possible fines. And that became rather nasty. […] So I caught up on that.” [Respondent]
Some other interviewees explained that the point at which they would finally respond was when the threats were communicated in a letter.
2 . 3 . 1 . 2 . i n t r o j e c t e d e x t r i n s i c M o t i v a t i o nWo r k t a s k s ( e x p l i c i t l y a s s i g n e d )Obligations stemming from the organization and imposed on the respondent were an important source of motivation not only to participate in a survey, but also to respond in a timely and accurate manner. Introjected extrinsic motivation refers to behaviors performed under external pressure to avoid guilt and anxiety or to build self-esteem (Ryan and Deci, 2000).
“The top management requests us to participate in as many surveys as possible in order to be more transparent.” [User of official statistics]
“The agreement in this company is that we neatly comply with the request and send it [the questionnaire] back in time.” [Respondent]
This obligation to comply was implicitly communicated by certain actions or explicitly part of one’s work tasks and remuneration basis.
“When a survey comes in, he [the superior] lays it down at my desk and just presupposes I will get it answered.” [Respondent]
“It’s a part of my job tasks.” [Respondent]
“It’s in my work description.” [Respondent]
These data showed that avoiding upsetting a superior was a reason to comply with the survey request, which would be an introjected type of motivation. From the point of view of the superior, though, this could be categorized as externally regulated extrinsic motivation, because from that perspective the avoidance of external punishments was salient.
36

I n S e a r c h o f M o t I v at I o n f o r t h e B u S I n e S S S u r v e y r e S p o n S e t a S k
“He instructs me to comply and to send those things back in time so that we don’t get any reminders or anything. Because if we get a reminder by post he will come to my desk asking if I forgot or what’s happening.” [Respondent]
It has to be noted, however, that in some cases people exhibited a higher degree of internalization or self-determination of their work tasks. In such cases, motivation for these tasks could be part of the identified or even integrated extrinsic motivation.
s o c i a l r e s p o n s i b i l i t y : v a l u e f o r s o c i e t y i n g e n e r a l , v a l u e f o r s p e c i f i c p u r p o s e s , v a l u e f o r s p e c i f i c g r o u p s ; p r i n c i p l e o f r e c i p r o c i t yVerbal accounts of value for society as a source of introjected external motivation were also found. Businesses seemed to acknowledge the importance of their data for society and other businesses.
“The government needs data to function properly.” [Self-employed]
“I think everybody has to just contribute their part, because the whole picture has to be right, because it will be used by politics, the national economic planning institution or any other institution.” [Respondent]
“If I’m not selfish, then I have to say that as I need some specific data, others might need some other data that I might find useless, thus we should report them.” [Superior]
“Data we are producing need to be accurate, that’s the most important thing. We are informing the public, so we must provide accurate data.” [Superior]
2 . 3 . 1 . 3 . i d e n t i f i e d e x t r i n s i c M o t i v a t i o nVa l u e f o r o w n b u s i n e s s o r s e l fIdentified extrinsic motivation refers to behaviors with which a person has identified so that he or she consciously values them (Ryan and Deci, 2000). Our data showed that getting something back for the effort and time spent on responding to a business survey was an important source of this motivation. Value could be expressed with tangible benefits or rewards, or merely perceived as such.
[Referring to the gift voucher given for the interview] “This is a good start. We, Dutch people, always want to have something. Get something.” [Self-employed outsourcing reporting]
“I think it is useful to send a thank-you note. Just to let them know you had the response and you appreciate it.” [Self-employed outsourcing reporting]
“It gets a little on your nerves when you have to prepare it, and I say, ‘oh, why’, then you moan a little [about it] but if you know, that if you want to find, get something, you have to do something for it, then you do it.” [Respondent]
37

C h a p t e r 2
[Referring to the value of (official) statistics] “Having no statistical data is like driving a car by night without lights on – you have no idea where are you going.” [Superior]
“Look, everybody wants to receive data in return. And every company is very selfish in this.” [Superior]
“One good deserves another.” [Superior]
In fact, a commonly mentioned reason to participate in a voluntary survey was receiving results in return because they were relevant for the company’s operations management.
“We pay to participate in surveys from which we get data back.” [Superior]
“We participate in surveys if it’s interesting for us to get data back.” [Respondent]
When there were no perceived benefits, responding to the questionnaire was experienced merely as a cost.
“Replying to business surveys seems an extra job that doesn’t give any benefit.” [Respondent]
2 . 3 . 1 . 4 . i n t e g r a t e d e x t r i n s i c M o t i v a t i o nWo r k t a s k s ( a d o p t e d )Integrated extrinsic motivation refers to behaviors that are externally motivated but completely internalized (Ryan and Deci, 2000). In the business context this can be interpreted as executing the tasks not because of an external requirement and control but because it is congruent with one’s work-related values. So although some interviewees said that they took part in official surveys because they had to, this obligation was in some cases integrated to the extent that it was neither checked nor questioned but simply accepted as part of the job.
“Actually the CBS [the Dutch NSI] surveys are all just answered.” [Superior]
“It’s just something you have to do.” [Respondent]
“This is not debated. It’s just something that has to happen.” [Respondent]
It is important to note that this integration affected not only participation, but also accuracy and timeliness.
“We just presuppose we will fill it in in good faith and accurately.” [Respondent]
Business motivation to respond seemed also to be guided to some extent by the concern for the public image. An interviewee thus reported that their company carefully followed the media news on their company, and that the company would treat any survey request carefully so as to maintain its positive image and avoid any negative publicity.
38

I n S e a r c h o f M o t I v at I o n f o r t h e B u S I n e S S S u r v e y r e S p o n S e t a S k
“Sometimes qualitative information could ruin our image, reputation, although our quantitative data is showing a positive direction. We have to be aware of that.” [User of official statistics]
2 . 3 . 2 . i n t r i n s i c M o t i v a t i o nThe sources of intrinsic motivation that are suggested by the SDT and its subtheory, Cognitive Evaluation Theory (see Table 2), were also all expressed in our data, as can be seen from the quotes below. Verbal accounts of intrinsic motivation were, however, fewer than those of extrinsic motivation. Still, as our data are qualitative, this does not necessarily mean that intrinsic motivation is less present or less important for the business survey response task than extrinsic motivation.
e n j o y m e n t a n d c h a l l e n g eThematic analysis of the interview transcripts identified that some respondents enjoyed surveys and found them challenging, which is the essence of intrinsically motivating activities. They liked the survey task simply because they took pleasure in it, which showed their inherent motivation.
“I always found that the survey on finances and enterprises was a very enjoyable form. Yes, I like that. […] That’s the kind of work I like to do.” [Respondent]
It also seems important that respondents enjoyed preparing data for surveys.
[Showing data in Excel files for reporting purposes] “One has to be quite creative. If you enjoy it, then it’s not a problem…” [Respondent]
p e r c e i v e d c o m p e t e n c eIntrinsic motivation is triggered only if the person feels capable with respect to the task (Ryan and Deci, 2000). Many respondents claimed that survey requests were intelligible and the questionnaires were clear and easy to them, which suggests that they perceived themselves as competent to perform the task.
“Questions seem to be clear enough, at least the majority of them.” [Respondent]
“Well, I think that the surveys that arrive are clear and understandable.” [Respondent]
Some respondents felt their capacity for successfully completing the task was low. In the first quote below, the survey task was outsourced and the respondent never completed the task alone. In the second quote, the respondent provided estimates because of inadequate information support, which made her feel frustrated.
“If I had to complete it [the questionnaire] myself, well then I think you would not understand anything. Then it would be riddled with inaccuracies because
39

C h a p t e r 2
I just don’t know, you know. There is, there will be specific questions that are technical on accounting. Yes, for me it’s counting up and deducting and the rest is up to the accountant” [Self-employed outsourcing reporting]
“This [question about sales broken down by types of buyers] is a problematic one, yes. It’s done according to a feel, and percentages. Now, in the beginning, 15 years ago, we already had something similar. [...] It could be done at that time. Now we have 15 thousand buyers so it is very difficult to get data. [The respondent explained that they contacted the NSI and got their permission to provide estimates but for her such a solution still represented a frustration:] We are used to accurate numbers.” [Respondent]
r e l a t e d n e s sIntrinsic motivation can also arise from connectedness to others in the business and the survey organization. In the data, there were several expressions of appreciation of a good personal relationship with the NSI. Respondents described how their personal relationship with the designated NSI staff had advantages and made them feel obliged to maintain a good relationship. If respondents received help from the NSI staff, then that could make them want to do something in return.
“The advantage is that you’ve seen each other a couple of times. When I’m talking to somebody on the phone now, then I think, I know his face.” [Respondent]
“I think I have a good relationship. Yes, with X.” [Respondent]
[About the interview] “My colleagues asked why I should do this interview. Then I replied: I find this is important now, because I’m the one having the contact [with the NSI], therefore I want to do this. Because I want to maintain the contact in good shape, so I want to do this now.” [Respondent]
A friendly tone and language as an expression of a correct relationship seemed to be expected in communication that was addressed to businesses; they might have even been indispensable for survey requests to be considered.
[Discussing a polite tone and language] “I think that’s the way to cooperate. If you attack from one of both sides, then somebody might get blocked and that’s worse.” [Respondent]
Some of the interviewed respondents also stated that they appreciated receiving a reaction when reported data seemed to be wrong or just an acknowledgment of receipt of the data. The awareness that the reported data were used made them feel that the time and effort they put into the questionnaire mattered, which enhanced a good relationship, contributed to positive feelings associated with the task, and influenced the perceived value of the performed task.
40

I n S e a r c h o f M o t I v at I o n f o r t h e B u S I n e S S S u r v e y r e S p o n S e t a S k
“But they do look at that, and yes, I like that, because if you get an answer then at least you know they do look at it. So that’s pleasant.” [Respondent]
a u t o n o m ySome respondents found it important that consultations and negotiations with the survey organization took place so that their working processes were considered and some autonomy about the deadline was granted.
“We don’t have all the data available at the deadline and as we are a large company that represents a great share of aggregated data, we made an agreement with the NSI that we report with a few days of delay in order to assure accurate and reliable data.” [Respondent]
2 . 3 . 3 . B e y o n d t h e s d t F r a m e w o r kSources of motivation presented in Subsections 3.1 and 3.2 could be categorized under one of the (sub)themes derived from the SDT framework. However, some remaining sources of motivation that were identified in the first round of inductive coding did not seem to fit easily in the SDT framework. They are presented in this section along with possible theoretical explanations.
M o o dSome verbal accounts suggested that a person’s mood affected motivation at least temporarily. Here we show an account pointing to the relevance of mood for the decision on survey participation.
“When I’m in a good mood then I usually participate in all those surveys, but if I’m in a bad mood then I probably reject.” [Respondent]
“If they irritate me I just throw them away.” [Self-employed]
Mood is shown to be an important factor for motivation in Seo, Feldman and Bartunek (2004), who provide a framework in which emotion is theorized to be the central construct affecting both the processes and outcomes of work motivation. Mood also affects information processing and task performance; people in a good mood are less easily distracted from the task than people in a bad mood (Bless et al., 1990).
d i s p o s i t i o nOur data showed the presence of two kinds of disposition that might be relevant for the business survey response task. One concerns a disposition for precision and accuracy that seems to be typically inherent in the accounting profession. This disposition stems from the accounting work methods that require precise balancing of accounts and from the accounting principles that require an accurate picture of business reality. Evidently, an accuracy-motivated
41

C h a p t e r 2
disposition can also be present in other respondents regardless of profession. This disposition together with the explicit goal to respond to a survey promises to lead to an accurate response.
“If I do something, I do it well, that’s in a bookkeeper.” [Respondent]
“We do our best, we don’t just put any random data thinking it’s good enough for statistics.” [Respondent]
The other type of disposition concerns human curiosity, which is visible in the attraction to performing new, demanding tasks (e.g. searching for new data and solutions, optimizing processes etc.) or learning new things. This disposition is likely to lead to enhanced intrinsic motivation when applied to the survey task.
“I’m a searcher in my soul. It’s a challenge for me to search for new ways of obtaining and using data.” [Superior]
“Next year we are facing an exciting event as two different branches of our company have to be merged. That’s a challenge again, so I like to do that, yes.” [Respondent]
These dispositions seem to be congruent with dispositions based on implicit motives. Implicit motives provide a general orientation toward certain types of goals such as a general trend to do things well (McClelland, Koestner and Weinberger, 1989). They thus generally sustain behavioral trends over time, such as an accuracy-motivated disposition.
r o u t i n eOur data also suggested that reporting ran smoothly on a routine basis after the first completion or introduction of changes. Once integrated into the usual work routine, the business survey response task became easier and less time consuming.
“So at least I personally have a structure that I fill in the questionnaires in a certain way and that I maintain this structure over the years.” [Respondent]
“Well, yes, then you have a certain way of getting out of things. And if something changes, yes, then I have extra work but, ehem, you then finally figure out how to fill it in and then it runs again smoothly.” [Respondent]
The consistency entailed by routine might even be considered more important than reporting accurately.
“We keep the method the same over the years to maintain comparable figures. Ehm, a mistake, if you make a mistake in 2008, then you have to do the same in 2009 because then at least the trend is visible.” [Respondent]
Behaviors that were initially based on conscious (explicit) decisions may become habitualized and routinized through frequent execution and then be carried out independent of the implications
42

I n S e a r c h o f M o t I v at I o n f o r t h e B u S I n e S S S u r v e y r e S p o n S e t a S k
of the original conscious judgment (Aarts and Dijksterhuis, 2000; Ouelette and Wood ,1998). According to recent research, due to characteristics of modern work life, a large proportion of daily cognitive and other processing is unconscious, occurring outside employees’ awareness and control (Uhlmann et al., 2012; Johnson and Steinman, 2009), which calls for attention to implicit processes within organizations (e.g. Bing et al. 2007; Haines and Sumner, 2006).
Ta s k c h a r a c t e r i s t i c sInterviewees mentioned some characteristics of the business survey task that seemed generally to support motivation for the successful completion of the task. One such characteristic was simplicity or simplification of the task. The most radical and preferred way, especially for mandatory surveys, was “to make fewer surveys”. Other ideas mentioned were that “the NSI should look for a junction with the tax declaration”, that the questionnaire should be adapted to the internal administration of companies, and other ways of simplifying response and “automating things as much as possible” in order “to be as efficient as possible”.
Moreover, our data showed that it was important to maintain the same questionnaire items and item order over time in recurring surveys, and give prior notification of changes. Respondents often had a routinized approach to the questionnaire’s completion in these surveys, especially if repeated frequently, which made it more difficult to adapt to changes. It thus seems important to make the survey task predictable.
“I mean, don’t be too specific and once you have such a survey and you have figured things out […] then let it be the same next year, and don’t change too much.” [Respondent]
“When there are changes then I have to change my models and that costs extra time.” [Respondent]
“I find it important to get notifications on changes. […] I do things automatically, thus it is important for me to know if there are any changes to the deadline or questionnaire. Then I check what is different.” [Respondent]
The task’s simplicity, easiness, and predictability have previously been identified as factors affecting extrinsic motivation (Kruglanski, 1975; Pittman, Boggiano and Ruble, 1983; McClelland, Koestner and Weinberger 1989).
2 . 3 . 4 . d y n a m i c s B e t w e e n e x t r i n s i c a n d i n t r i n s i c M o t i v a t i o nSeveral sources of extrinsic motivation reflect the importance of authorities for the business survey response task: Authorities determine work tasks and expectations; they speak through companies’ values, policies and routines. Although extrinsic motivation might become more integrated through the process of internalization, it does not mean that extrinsic motives are transformed into intrinsic ones (Ryan and Deci, 2000). However, extrinsic motives could be replaced by intrinsic motives. In business surveys this could
43

C h a p t e r 2
happen if a person started the business survey response task only to answer an external demand for obligatory reporting (and avoid fines), but experienced the activity as interesting, challenging and enjoyable, presumably also because the recurrent completion reduces burden. Such cases are consistent with Kehr (2004), who proposes that externally imposed goals fueling extrinsic motivation can become intrinsically motivating, provided they are congruent with the person’s implicit motives.
“Well, I start enjoying it much more every time. (…) In the beginning because you’re still looking for your way it’s never pleasant.” [Respondent]
On the other hand, the negative side is that the same task might get boring over time, thus reducing the level of intrinsic motivation over time.
“If you do the same thing every year, then it gets boring.” [Respondent]
As mentioned above, sources of extrinsic motivation were expressed in all our interviews. At the same time some respondents showed that they experienced the business survey response task as intrinsically motivating, which suggests that both types of motivation coexisted and drove the respondents towards desirable outcomes. However, most respondents reported not liking or particularly enjoying the business survey response task, which seems to indicate a lack of intrinsic motivation. In spite of this, the task was still carried out, indicating that another (extrinsic) motivation should be at play. Some of these respondents even reported executing the task on time and as accurately as possible. The first two of the following quotes explicitly express an extrinsic motive, namely the legal mandate, and at the same time an absence of intrinsic motivation. The same combination was also seen in a superior’s quote.
“You take it as a necessary evil, you complete it. You complete everything that you have to complete. I don’t think [about it].” [Respondent]
“Well, it’s not the greatest challenge to fill in those questionnaires. Yes, the obligation and, ehm, yes, of course, as accurate as possible. And on time.” [Respondent]
“Well we have nicer and less nice tasks, that everybody has in his job. And this is one of the standards. The tasks that are not always that enjoyable.” [Respondent]
“I think we fill in in good faith, but it’s seen as a necessary evil.” [Superior]
2 . 4 . d i s C u s s i o n a n d s u g g e s t i o n s F o r i M p r o v i n g B u s i n e s s s u r v e y r e s p o n s e B e h a v i o r
In this article we have shown specific sources of motivation for the business survey response task based on interview data from the Netherlands and Slovenia from two sources. Our empirical data have provided support for the existence of all different (sub)types of motivation suggested by SDT and its subtheories, Cognitive Evaluation Theory and
44

I n S e a r c h o f M o t I v at I o n f o r t h e B u S I n e S S S u r v e y r e S p o n S e t a S k
Organismic Integration Theory. Although the quantity of verbal accounts of extrinsic motivation compared to those of intrinsic motivation is by no means indicative of their prevalence, it is impossible to ignore their presence and relevance in the business setting. On the other hand, it seems that influencing intrinsic motivation also has some potential even if intrinsic motivation for the business survey response task seems relatively weak. Research findings suggest that intrinsic motivation can positively influence commitment (Ryan and Deci, 2000), albeit in different kinds of settings. We therefore suggest not overlooking any of these types of motivation in the business setting.
Moreover, the results suggest that SDT cannot explain all sources of motivation expressed in our data. A large group of such sources might be considered implicit motives that are part of implicit, automatic processes, which seem to be pervasive in organizational life (Johnson and Steinman 2009). Some dispositions (e.g. for precision and accuracy) seem to have been built over the years through multiple repetition and some routinized behaviors have lost connection with their original intent. It thus seems reasonable to expect that implicit motives and implicit processes also play a role in business survey response behavior. Kehr (2004) proposes that the presence (or absence) of an individual’s implicit motives seems to determine if a task is experienced as intrinsically motivating (or not). Still, arousal of implicit motives does not necessarily lead to intrinsic motivation. It does not lead to intrinsic motivation if incompatible cognitive preferences exist at the same time (Kehr, 2004). The influence of implicit motives may also disappear in the presence of powerful explicit motives, such as social constraints (Kehr, 2004; McClelland, Atkinson and Lowell, 1953). Some authors therefore propose a dual model of explicit and implicit processes, in which the two types function in parallel and in interaction with one another (Fazion and Olson, 2003; Strack and Deutsch, 2004).
The concealed nature of implicit motives and processes, however, makes it difficult to recognize them and turn them to the benefit of the business survey response task. It might be easier to accomplish a mood change or simplify and predict the survey task, both of which also seem to influence the response behavior. The psychological literature also points to some other sources of motivation that have not been expressed in our data but might be relevant for the business survey response task. For instance, positive emotions are suggested to be essential elements of optimal functioning (Fredrickson, 2001); accountability is shown to act as a source of motivation for more analytical cognitive processing (Tetlock, 1985) and so forth.
Our study followed qualitative research in organizational psychology that studies how people “think, feel and behave in work and organizational contexts”, including their motivation (Silvester, 2008, p. 489). Some other sources of motivation may still be identified using other methodological approaches than qualitative research interviews, which mainly relied on reported sources of motivation. Especially for specific unconscious, concealed or otherwise latent sources of motivation, it might be necessary to use an experimental and/or laboratory setting to provide evidence of their existence and relevance in the business survey setting. Moreover, focusing on business surveys with specific design features (e.g.
45

C h a p t e r 2
voluntary or interviewer-administered business surveys) or conducting research in other institutional environments might bring new insights, and using larger samples can further support the external validity of findings. According to respondents in several interviews, it was normal that the survey questionnaires “came” to them; any deviation from such a routine calls for more attention to be given to other people involved in the business survey response task (e.g. gatekeepers and authorities). Although our study involved some data users that were not simultaneously respondents to business surveys, involving people with other tasks could open up new perspectives. We only touched upon motivation of survey nonrespondents marginally, as some of our interviewees claimed not to respond to all survey requests. Still, people refusing to participate in our study might have some (other types of) motivation for the business survey response task which remain to be identified. Nevertheless, the presented study provided some indication of the drives underlying business survey response behavior.
2 . 4 . 1 . S u g g e s t i o n s f o r e n h a n c i n g m o t i v a t i o nUnfortunately, awareness of the sources of motivation is just a starting point for thinking of how to effectively and efficiently increase the motivation for the business survey response task. Still, the knowledge of sources of motivation identified thus far can be valuable in designing and testing actions and strategies for enhancing response and response quality in business surveys. We provide several suggestions below. Some of them are not new, but we iterate them here for the sake of completeness. The suggestions are focused both on intrinsic and on extrinsic motivation. They are presented as specific actions and strategies that can be applied to enhance motivation, which is in turn expected to positively affect the outcomes related to the survey response task. Although the identified sources of motivation are theoretically founded, further (preferably experimental) research is necessary to determine how specific interventions targeting these sources affect motivation and the resulting response behavior. Nevertheless, it seems reasonable to expect that interventions triggering both intrinsic and extrinsic motivation produce a larger effect than just triggering a single motivation type, and that interventions triggering intrinsic motivation produce a larger effect because they directly involve the person unless there are negative consequences for the business. Respondents that already have some motivation might be more affected than those without or with a very low level of motivation. The effects on outcomes thus seem likely to be dependent on the initial level of motivation and respondents’ perception of additional effort to improve behavior.
Before presenting suggestions for enhancing extrinsic motivation, it has to be noted that some previous research in behavioral psychology and the field of social surveys advises against using incentives as extrinsic rewards because they seem to undermine intrinsic motivation, which is considered better for performance than extrinsic methods (see e.g. Deci, Koestner and Ryan, 1999; Wenemark et al., 2011). However, some studies suggest that such a conclusion is far from straightforward. A positive effect on intrinsic motivation is expected for praise (being delivered immediately, often and without clear stimuli) while
46

I n S e a r c h o f M o t I v at I o n f o r t h e B u S I n e S S S u r v e y r e S p o n S e t a S k
a negative effect is limited to tangible rewards (Carton, 1996). Rewards seem to enhance intrinsic motivation for low-interest tasks and also for high-interest tasks if they are linked to level of performance (Cameron, Banko and Pierce, 2001). These findings have been taken into account when designing suggestions that focus mainly on enhancing respondents’ extrinsic motivation, also taking note of limitations and cautions mentioned above:
• Current response-enhancing practices, that is, reminders and (threats of) fines in the case of nonresponse, seem to achieve their aim of assuring response though they typically represent negative, not positive reinforcers.
• Value of the survey, the survey organization and the survey outcomes should be improved and communicated. The value may be expressed with tangible benefits or rewards or merely perceived as such. Several ‘stakeholders’ should perceive this value, namely society, the economy, the business and the individual respondent. Influencing the value in real terms could be done by giving the businesses an appropriate incentive for the time and effort they have spent to fill in the questionnaire, though this might be costly or even have negative consequences if not tied to good performance. The perceived value can be increased by a communication strategy, for instance, by showing businesses in more concrete terms (e.g. with case studies and testimonials) what the data are used for and what the specific purpose of the requested data is.
Suggestions that focus mainly on enhancing respondents’ intrinsic motivation are:
• Survey participation should be made as enjoyable as possible. Given that the task of answering survey questions is not attractive to most respondents, it might be necessary to think of other aspects of survey participation and make them enjoyable. The possibilities are greater or at least more convenient for electronic reporting and include, for instance, accessing an online questionnaire, printing the questionnaire, receiving a confirmation of receipt by email, and so on. These activities might become more enjoyable if accompanied by interesting figures, famous or wise thoughts, quiz-like questions, other challenges and so forth. A respectful and friendly tone should be present in all communication.
• Respondents’ perceived competence (or perceived abilities) should be enhanced, as it seems that perceived competence influences response behavior and, vice versa, having positive experiences with questionnaires influences perceived competence towards future questionnaires. This can be improved by using an appropriate communication strategy that stresses the easiness and the simplicity of the response task. This should of course be accompanied by a questionnaire that is both as easy and simplified as possible as well as user-friendly to make a good first impression.
• A good relationship with the business and the respondent should be built up to enhance relatedness. A good example of this is using dedicated staff (account managers) for businesses that are important for the aggregate statistics. However, such an approach
47

C h a p t e r 2
is typically granted to only a handful of large businesses, so it is necessary to think of efficient ways of establishing and maintaining relationships with all businesses. Possible strategies are to target only new respondents, respondents involved in more surveys, respondents completing questionnaires for several businesses (e.g. in accounting firms), and so on. The relationship could be established through a live contact, with some tokens of appreciation, and so forth. It also seems important that nameless and faceless survey staff reveal their identity. Providing contact names is just the minimum; showing their picture and adding a few words about themselves could greatly deepen the feeling of relatedness. Given that a good relationship is typically based on reciprocity, giving different forms of feedback (from thank-you notes to statistical results) should also be useful in this regard, as explained below.
• Respondents should feel that they have some autonomy with regard to the business survey task. Two situations where more autonomy typically is or could be granted concern the deadline for reporting and the provision of estimates instead of precise figures, although some conditions could be set to avoid attributing less importance to deadlines and precise figures.
A different approach to enhancing motivation is to attempt to improve respondents’ mood. As mood is a temporary state, it is important to focus on activities that immediately precede a questionnaire’s completion. Given the impact of humor on people’s mood, ideas for improving the mood could be sought, for instance, in humorous thoughts or instructive anecdotes of famous statisticians and so on. However, these ideas have to be applied with great delicacy to the business setting, which might exhibit certain expectations about professional behavior (Romero and Cruthirds, 2006).
The business survey response task could also result in better outcomes if respondents were selected from those people that have desirable dispositions. As the disposition for precision and accuracy seems to be present in the accounting profession, we suggest treating them with special care, for example by targeting them through their professional organizations, events, publications, and so on. Better outcomes can also be expected if responding to a questionnaire is made as easy, simple and predictable as possible, which calls for the implicit processes in companies to be taken into account. This would include, for example, adapting the survey items as much as possible to the businesses’ administration; avoiding changes as much as possible, and if changes are made, communicating them early on and clearly to the business; using as much as possible a standardized format, for example in concordance with other data-requesting organizations such as the tax office, and so on.
It seems extremely important to reduce actual survey burden, defined as the time it takes to respond to the survey (Dale and Haraldsen, 2007), because of its correlation with perceived response burden and data quality (see e.g. Berglund , Haraldsen and Kleven, 2012). The reductions of actual burden, however, may have a limit as some data have to be collected from businesses. The only way of improving survey outcomes thus seems to
48

I n S e a r c h o f M o t I v at I o n f o r t h e B u S I n e S S S u r v e y r e S p o n S e t a S k
be through raising motivation. Whether raising motivation also affects perceived response burden or not might depend on the type of motivation invoked; intrinsic motivation and more internalized forms of extrinsic motivation presumably have more potential to further alleviate perceived response burden.
Some suggestions promise to affect intrinsic and extrinsic motivation, depending also on the exact form of implementation. This, for instance, holds for the provision of feedback that should be given to respondents because it can invoke motivation from several sources. For instance, a message confirming a questionnaire’s receipt, thanking the respondent for a timely delivery and acknowledging their contribution to the timely release of official indicators should influence both intrinsic motivation (by enhancing a good relationship and perceived competence, thus making (the next) survey participation more pleasant) and extrinsic motivation (by influencing the perceived value of the task). Some kinds of feedback are already used on a regular or ad hoc basis, such as statistical results and thank-you notes. However, there is still a lot of potential for improving and diversifying even these two kinds of feedback. Immediate feedback should work better than delayed feedback. Statistical results can be customized and more tailored to the needs of a specific business, presented in a way to offer information (not only data) to the business or simply made more attractive, but survey organizations are not always aware of business data needs.
Acknowledging respondents’ efforts can be supported with further-reaching marketing activities, such as rewarding the most deserved respondents once a year. Another strategy might be to send positive evaluations about good respondents to their superiors as well as requests for improvement of reporting, but a positive tone would have to be used to convey such messages so they can be clearly distinguished from reprimands and fines. Acknowledging organizational efforts, on the other hand, can be implemented with the cooperation of a reputable company that also excels in reporting and thus nourishes its social responsibility, or by publically naming companies that excel in reporting overall. These approaches, however, require NSIs to be able to determine the overall quality of reporting for every business (consisting of timeliness that is easy to measure and accuracy that is difficult to measure).
Many of these suggestions thus require good information about each business and each respondent. NSIs are typically in possession of such information, but not in a format that would allow further managing. It seems that without such support and a more customer-oriented focus, NSIs might have to relinquish more sophisticated and/or tailored forms of improving motivation.
2 . 5 . F u r t h e r r e s e a r C hResearch presented in this article is in line with the call for more research on motivation in business survey response behavior (Rogelberg and Stanton, 2007; Rose, Sidle and Griffith, 2007). Application of motivation theories to business surveys promises to inspire new approaches to motivate business survey respondents to better response to and performance of the survey task. As our empirical data are limited, additional and somewhat different
49

C h a p t e r 2
approaches might be recommended, especially if they are more focused on voluntary surveys, nonrespondents and reluctant respondents or other people involved in the response process. Nevertheless, our results should help with the development of actions and strategies enhancing motivation in the meantime.
Business surveys often embrace methodological advances from household surveys. A different perspective seems to be necessary to explain motivation for business survey response tasks which are done during work time, often require expert knowledge and rarely rely on monetary incentives. The theoretical framework should be expanded beyond the SDT framework, which seems to be insufficient to cover all specifics of the business setting. It seems necessary to bring in more research conducted in the work environment to understand the functioning of people involved in the response process.
More research is also necessary to conclude whether or not motivation to participate in business surveys and provide an accurate and timely response can be treated as a single and integral concept, what the relationship between motivation and perceived response burden is and whether it is appropriate to focus on respondents’ motivation while acknowledging organizational motives as an important source of the individual motivation. An important step should be to implement and experimentally test interventions as a means to evaluate the proposed suggestions. Research is necessary to evaluate the specific impact of each one of the different sources of motivation that appear to be of importance in the business survey response task, and also to evaluate in which cases each one of the sources or a combination of the sources is most effective.
50


E n h a n c i n g u s E o f o f f i c i a l s t at i s t i c a l f i g u r E s f o r b u s i n E s s d E c i s i o n s
This chapter is under review as: Lorenc, B., Giesen, D., Torres van Grinsven, V., Seljak, R., and Bavdaž, M.
Enhancing use of official statistical figures for business decisions.
c h a p t E r 3

C h a p t e r 3
a B s t r a C tEvidence from national statistical institutes indicates that businesses may perceive official statistics as of little use for their business. However, businesses may find official statistical figures useful, for instance, to guide their market and investment decisions, regulate contractual obligations or benchmark own performance with official statistical figures. This type of data source may be valuable to businesses because access is free and the data are methodologically sound. However, deeper insights into businesses’ use of official statistics and possibilities of enhancing this use are lacking. To address this, a multifaceted study investigated business practices in using official statistics in four countries. The article showcases uses of official statistics, identifies barriers to their use, and suggests areas of improvement, with the dual goal of enhancing the ability of national statistical institutes to produce and communicate high-quality statistics relevant to businesses and of raising businesses’ awareness of the potential uses of official statistics.
k e y w o r d sBusiness information; data source; decision making; evidence-based management; national statistical institute
54

E n h a n c i n g u s E o f o f f i c i a l s t at i s t i c a l f i g u r E s f o r b u s i n E s s d E c i s i o n s
3 . 1 . i n t r o d u C t i o nBusinesses may have numerous data sources available to inform their decisions. The abundance and variety of data sources and the differences in their content, cost, access, and prerequisites for use may, however, impede businesses’ selection of the best sources for a particular purpose. This study investigates the current status and potential use of official statistical figures as one such data source for business decision making. Official statistics are those statistics disseminated by a national statistical institute or body, except for those that are explicitly stated as not official (Organisation for Economic Co-operation and Development, 2004). These statistics include vital economic and societal indicators, such as consumer price index, gross domestic product (GDP), and unemployment rates. Because national statistical institutes (NSIs) usually have a central or coordinating role in national statistical systems, we use the term NSI statistics as synonymous with the term official statistics.
Official statistics have the potential to be an appreciated data source because they generally are methodologically sound and cost-effective. Businesses also contribute to official statistics by responding to NSI surveys, but they seem to exploit the results much less often. Swedish and Dutch research has investigated how respondents to one of the largest official business surveys—the structural business statistics survey—perceived the usefulness of the resulting statistics; the majority of these respondents (ranging from 64% to 74%) reported that the statistics were not useful for their business (Giesen, 2012; Hedlin et al., 2008). Although the number and variety of users of official statistics has increased significantly in several European countries after governments granted access to these data free of charge (Snorrason and Gylfadóttir, 2001), our research shows that awareness of the potential use of official statistics among businesses is still modest.
The literature suggests some specific uses of official statistics, for example in marketing (Houston, 2004), strategic analysis (Türkay, Solmaz and Şengül, 2011), and new product development (Chang and Cho, 2008). Despite such fragmentary insights, research has not systematically addressed the potential of official statistics for businesses. Official statistics may be appropriate for start-up businesses, which typically lack both internal data (e.g., historical data on own performance) and financial resources to acquire customized external data. Official statistics may also be relevant for established businesses, which can use them to complement their existing internal and external data. Smaller businesses may appreciate the cost-effectiveness of this source, and larger businesses may appreciate the statistics’ broad coverage, international comparability, methodological soundness, and reliability.
To help reveal the potential that official statistics may offer to businesses, our research addresses four research questions:
1. How can businesses access official statistics?
2. How do official statistics relate to internal and other external data that businesses use?
3. What kinds of official statistics do businesses use and for what purposes?
4. What prevents businesses from using official statistics more often?
55

C h a p t e r 3
Research shows that many business decisions are based on intuition, heuristics, and impressions (see, e.g., Mousavi and Gigerenzer, 2014; Persson and Ryals, 2014). Patterns of decision making of this kind include, for instance, doing what appears to be successful for others, repeating what seems to have worked in the past, and trusting what others think to be true (Pfeffer and Sutton, 2006; for a review of well-studied heuristics, see also Mousavi and Gigerenzer, 2014). Managerial heuristics have been applied in decisions that, for instance, needed to balance numerous requirements (Rusetski, 2014); in the case of information asymmetry (Monti et al., 2014); and even in the presence of sophisticated analytical tools that could deal with such complexity (Persson and Ryals, 2014). Despite this, rational, fact-based decisions do have their place in businesses. Research shows that data-driven decision making may improve a business’s development and performance. For instance, data-driven competitive prediction has more predictive accuracy than competitive prediction based on informal intelligence (Lim, 2013). Moreover, the use of information systems and analyses for decision making is related to high levels of business performance (Morgan and Strong, 2003).
A conceptual distinction exists between internal data, generated by the business itself in the course of carrying out its main and support activities (e.g., data on production, sales, or wages), and external data (e.g., data on inflation, average wages, or economic growth in a country) (see also McGee and Sawyerr, 2003; Sawyerr, McGee and Peterson, 2003). Businesses are obliged to report some of the internal data to various governmental agencies (e.g., for the purpose of taxation, social insurance, or employment statistics). As governmental agencies, NSIs also claim their portion of the internal data and aggregate them into official statistics, at which point they become external data.
Businesses’ current and potential use of official statistics is a complex phenomenon: official statistics data can reach businesses through various channels; also, various people in a business use such data for various purposes, in a structured or improvised manner, most likely in combination with other data available to the business. Several approaches were therefore necessary to get insights into businesses’ use of official statistics.
In Section 2 we provide details about the methodologies for collection and analyses of our data. Section 3 presents the results according to each of the four research questions listed previously. Section 4 summarizes the findings, points out the opportunities for businesses, and proposes some action points through which NSIs are likely to respond better to business needs, thus leading businesses to appreciate, and use, official statistics more.
3 . 2 . M e t h o d s a n d d at aData for this study came from an international research project (BLUE Enterprise and Trade Statistics, http://www.blue-ets.eu), that aims, among other things, to better understand businesses’ uses of official statistics and their participation in surveys for official statistics purposes. Data reported in this study come from the Netherlands, Norway, Slovenia, and Sweden.
56
E n h a n c i n g u s E o f o f f i c i a l s t at i s t i c a l f i g u r E s f o r b u s i n E s s d E c i s i o n s
To address and find answers to the research questions, we approached each one from the perspective of (1) businesses; (2) NSIs as producers of official statistics; and (3) external experts, or experts affiliated with institutional representatives of businesses, such as industrial and other associations, which act as catalysts for business interests. The following subsections provide further details about these three perspectives.
3 . 2 . 1 . B u s i n e s s e s ’ p e r s p e c t i v eA multinational field study investigated businesses’ perspective in the four countries by seeking information from people in two kinds of roles within a business: people who complete NSI surveys (i.e., survey respondents) and people who use internal and external data as part of their job (i.e., statistics users), for instance, to perform business analyses, make decisions, or manage the business in analysis, accounting, finance, and control or quality-control departments (see Appendix A for the interview guide for the field study). Both types of roles are likely to come in contact with official statistics data, although in different ways. The data collected through this approach address research questions 2–4.
3 . 2 . 1 . 1 . s a m p l e s e l e c t i o nFollowing the idea of purposeful maximum variation sampling to achieve insights that are as varied as possible (Cutcliffe, 2000), our sample included businesses of different size classes and kinds of economic activity, as these two variables are believed to have a strong relationship to business behavior (for a definition of size classes, see Table 1). The aim was to get an approximately equal number of businesses per size class in each country (see Table 1).
To ensure that businesses came from a variety of manufacturing, trade, and other service activities, the national samples in each wave of the study implemented procedures to avoid more than one business sampled from any specific sector (on the two-digit classification level of economic activities).
3 . 2 . 1 . 2 . s a m p l e r e c r u i t m e n tInterviewers initially contacted sampled businesses by telephone. To cover both relevant roles, they first identified and approached either a survey respondent or a potential statistics user. After completing this agreed-to interview, the interviewers proposed on the spot interviewing a representative in the opposite role. This procedure did not always lead to a second interview. For instance, in a large business in Norway, the interviewed statistics user could not identify any survey respondent even though the business participated in several NSI surveys. This situation probably reflects the complexity of the organizational structure and might call for a different method of identifying a second interviewee within a business. In the Netherlands, interviewees received gift vouchers for use in many Dutch shops before or after the interview as a token of appreciation.
57

C h a p t e r 3
3 . 2 . 1 . 3 . d a t a C o l l e c t i o nData collection took place between September 2010 and February 2011 in two waves of semistructured interviews. The interview guide contained several specific questions and probes for each item, to engage interviewees in providing details about three broad areas:
1. Use of data in the business, including use and quality of internal data; sources, use, quality of, and further need for external data, as well as proficiency for their use; and the NSI as a source of external data
2. Motivational aspects in the business’s survey response behavior, including decision to participate, details about the response process, and attitudes toward NSI surveys and suggestions for improvement
3. Links within businesses between survey respondents and potential statistics users
This article reports on use of data in businesses, the first of the three broad studied areas (for the other two broad areas, see Bavdaž et al., 2011; Torres van Grinsven, Bolko and Bavdaž, 2014).
3 . 2 . 1 . 4 . d a t a a n a l y s i sInterviewers recorded the interviews. In the Netherlands, Slovenia, and Sweden, transcription of interviews provided a verbatim account of the interviews. In Norway summaries containing key quotes from interviews served as input for analysis. Thereafter,
Table 1. Overview of businesses that took part in the study, with a breakdown by business size class, and interviewee roles within them (survey respondents or statistics users)
CountryTotal number of businesses included in the field study by size classa Total number of interviewees by role
Netherlands 11 businesses, of which:3 small 4 medium 4 large
13 interviewees, of which:7 statistics users5 survey respondents1 interviewee in both roles
Norway 10 businesses, of which:2 small 3 medium 5 large
18 interviewees, of which:10 statistics users6 survey respondents2 interviewees in both roles
Slovenia 9 businesses, of which:3 small3 medium3 large
16 interviewees, of which:8 statistics users7 survey respondents1 interviewee in both roles
Sweden 5 businesses, of which:2 small2 medium1 large
7 interviewees, of which:2 statistics users2 survey respondents3 interviewees in both roles
a Size classes refer to the following number of employees: small (fewer than 50), medium (at least 50 but fewer than 250), and large (at least 250).
58

E n h a n c i n g u s E o f o f f i c i a l s t at i s t i c a l f i g u r E s f o r b u s i n E s s d E c i s i o n s
each country’s interviewing material, kept in the original language, was analyzed by researchers in the project using thematic analysis. Output from this analysis—summaries in English for each country—then served as the input for integrating findings across countries, also using thematic analysis. The researchers then discussed initial findings to provide the generalizations that we present here as results.
3 . 2 . 2 . n s i p e r s p e c t i v eAnalyses of available data and dissemination channels, as well as interviews with staff, provided insights into the perspective of four NSIs in participating countries—Statistical Office of the Republic of Slovenia (SORS), Statistics Netherlands, Statistics Norway, and Statistics Sweden—on businesses’ use of official statistics. In operationalizing this approach, important issues we addressed included which NSI departments and staff do businesses turn to for NSI statistics, which kinds of businesses and employees seek out NSI statistics, and what are businesses’ intended uses of NSI statistics. Availability of data for addressing some of the research questions was quite limited. For instance, very little data exist on which kinds of employees within businesses approach NSIs to request statistics or support. The collected data come from three sources:
1. Data on customer support that the NSIs provide to businesses (Table 2), and other internal data from the NSIs
2. Opinions of NSI experts on businesses’ uses of NSI statistics
3. Information available at the NSIs’ websites, which served as an input for analysis of dissemination channels of the four NSIs
We used these data to address research questions 1, 3, and 4.
3 . 2 . 2 . 1 . d a t a o n C u s t o m e r s u p p o r t t o b u s i n e s s e sCustomers—both business and other—occasionally ask NSIs for assistance in identifying or using statistics. NSIs support these statistics users through various channels, most commonly telephone and Internet (web forms and email). A dedicated central unit typically serves as an NSI’s single point of entry and thus is the first to receive support requests. However, only one of the participating NSIs recorded requests through all channels that users had at their disposal, which indicates that data available for our study were fragmented. Further, practices regarding keeping records of requests varied considerably across the four NSIs, which frustrated attempts to generalize from these data and prevented us from getting a complete overview of business users’ support requests for any of the NSIs. The shortcomings in these data concerned the following:
• Lack of identifying businesses as a separate user group; for example, the NSIs did not differentiate businesses from other types of support seekers in some sources
• Different definitions of businesses at the four NSIs: for instance, some included media organizations as businesses, whereas others did not
59

C h a p t e r 3
• Variations in kind and quantity of collected data about received support requests
• Variations in record formats (e.g., paper, email, spreadsheets, databases)
• Variations in documentation practices
• Access issues (e.g., data found only in personal folders of a particular employee, complicated data extraction)
In the analysis we also used additional data that existed in two participating NSIs: Statistics Sweden’s invoices to businesses for commissioned statistics for the period January–May 2010 and Statistics Netherlands’ satisfaction survey of respondents and nonrespondents to business surveys in 2009, the 2009 satisfaction survey of Infoservice users (users of the customer support service), questions about the use of statistical data in 97 interview reports from field visits conducted in the course of 12 different questionnaire tests between 2003 and 2010, and five visits to large businesses in 2010 about their needs for statistics.
3 . 2 . 2 . 2 . n s i e x p e r t s o n b u s i n e s s e s ’ u s e o f n s i s t a t i s t i c sThree approaches helped us identify NSI experts who could provide us with information about business requests for NSI statistics. First, we approached staff in the central support units of the NSIs, as they would have information about support requests from businesses. Second, when central support units cannot respond to a request themselves, they tend to forward the request to a subject-matter unit, which produces the statistics in question. Thus, central support units have a good overview of subject-matter experts who offer support. Finally, people in managerial positions at the NSIs (e.g., process owners of data collection from businesses, directors of business statistics) have an overview of staff members who have good insight into business requests. From these approaches, 27 staff members provided data in the four participating NSIs (Table 3).
Table 2. Overview of collected data on customer support to businesses by NSIs’ central support units.
NSI Source Estimated total number of requests from businesses, annually
Analyzed channel and period
Number of analyzed requests
Statistics Netherlands
Infoservice About 14,000 answered requests (plus some that could not be answered)
All channels (2009)
13,131
Statistics Norway
Library and Information Center
About 10,000 requests (2/3 from web form, 1/3 by email and phone)
All channels (June 2010 –May 2011)
939 requests mentioning business
Statistical Office of the Republic of Slovenia
Information Center
About 640 written requests (plus many unrecorded telephone requests)
Email and web (2010)
Sample of 249 email requests
Statistics Sweden
Customer Service
About 6,000 requests (plus unrecorded written requests)
Phone (January–May 2010)
2,652 (all registered calls)
Note: Data on customer support to businesses by subject-matter units were not available.
60

E n h a n c i n g u s E o f o f f i c i a l s t at i s t i c a l f i g u r E s f o r b u s i n E s s d E c i s i o n s
3 . 2 . 3 . e x t e r n a l e x p e r t s ’ p e r s p e c t i v eAssuming that certain experts outside of the NSIs would be able to provide information about actual or potential business uses of NSI statistics, we approached business associations, general and specialized chambers of commerce, consultancy firms, and agencies supporting small and medium-size enterprises. Insights of these experts, into businesses in various economic sectors and of different sizes, complement findings from the field study of businesses (Section 2.1) and the NSIs (Section 2.2). The interview data collected from 21 external experts (Table 4) addressed research questions 2, 3, and 4.
Table 3. Overview of interviewed NSI experts
NSI Data collection methods Interviewees by role in the NSI
Statistics Netherlands 3 focus groups 14 interviewees, of which:8 staff conducting on-site visits2 staff of support center4 staff of the unit dedicated to large businesses
Statistics Norway 4 individual interviews 4 interviewees, of which:3 subject-matter experts 1 staff of support center
Statistical Office of the Republic of Slovenia
3 individual interviews 3 interviewees, of which:1 staff of support center1 staff of the unit dedicated to dissemination1 subject-matter expert
Statistics Sweden 6 individual interviews 6 interviewees, of which:4 subject-matter experts 2 staff of support center
Table 4. Overview of interviewed external experts
Country Type of organizations Total number of interviewees
Netherlands Business associations 4 interviewees
Norway Business associations 1 interviewee
Slovenia Business associationsCouncil on competitiveness
8 interviewees
Sweden Business associationsConsultancies
3 interviewees
3 . 2 . 4 . i n t e g r a t i o n o f r e s u l t sIntegration of data from different sources and countries proceeded along with the data collection. The first analyses included data that shed light on the NSIs’ perspective within each country and then compared the findings across the four countries. Further, data on the perspective of external experts and those on the business perspective followed the same procedure. The final step concerned the preparation of summaries by country and by theme.
61

C h a p t e r 3
Although this study used multiple sources of evidence in each of the four analyzed countries, the sources were qualitative (i.e., based on opinions, even if expert ones) or offered only fragmentary insights (e.g., a result of limitations in registering businesses’ requests for NSI statistics). Caution is thus required when interpreting these generalized findings within and across the analyzed countries.
3 . 3 . r e s u Lt sThe exposition in this section follows the research questions set out in the introduction to this article.
3 . 3 . 1 . h o w C a n B u s i n e s s e s a c c e s s o f f i c i a l s t a t i s t i c s ?Fulfilling their mission to provide relevant statistics for fact-based policy and decision making, the four NSIs have put in place multiple channels for disseminating the statistics they produce to their users, of which their websites are the most important channel.
The websites of the four NSIs have a similar organization. Statistics and data are available in the following ways:
• On the entry page to the website (i.e., the home page), which features key indicators of the current status of society (e.g., population, unemployment, inflation, GDP).
• Under the heading of press releases or news, with summaries of recently published statistics, mainly for journalists.
• By browsing through dozens of subject-matter areas (e.g., population, living conditions, education, prices, labor market, trade, construction, housing), which are further divided into more specific topics. Within each topic, the level of presentation further varies, from descriptions and shorter analyses for nonexpert users to more detailed tables and figures, as well as reports with deeper analyses that usually require both some subject-matter knowledge and an understanding of methods for producing statistics. Many of these reports can be downloaded, and some are available as print publications.
• In statistical databases that provide access to additional and more detailed data in subject-matter areas, with options to browse, view, and download data.
The content of the website thus offers several layers of increasing complexity: from a few central statistics to increasingly more developed analytical and methodological expositions in narrower areas of official statistics that are aimed at different kinds of users, to low-level aggregate data that businesses may use to perform own computations or analyses.
The increase in the level of detail of the data seems to imply that users need greater competence in interpreting statistics or analyzing data. However, more detail may raise confidentiality issues, as some micro-level data that businesses provide to NSIs are
62

E n h a n c i n g u s E o f o f f i c i a l s t at i s t i c a l f i g u r E s f o r b u s i n E s s d E c i s i o n s
confidential rather than open data. As one of businesses’ uses of official statistics is to study their competitors (see Section 3.3), NSIs emphasize that they are under a legal obligation to protect individual businesses’ identification in the statistics they publish. NSIs put much effort into preserving the confidentiality of reporting businesses.
The importance of print publications as a medium for disseminating official statistics has apparently diminished with the rise of the Internet, although such publications still do exist. Users, though, seem to give priority to downloading an electronic version of the publication immediately and without cost.
Businesses can get help finding official statistics of interest to them or correctly using statistics by turning to an NSI’s customer support service. At the studied NSIs, this service was accessible through multiple channels, including web, email, and telephone.
Some of the NSIs produce a customer magazine that promulgates using official statistics. Statistics Sweden additionally produces an annual customer magazine geared specifically toward businesses that aims to cover both data provision and data use, and to present different uses of official business statistics for political and societal decision making. Only one of the four studied NSIs had a separate website dedicated solely to businesses (CBS, n.d.). This website targets businesses as both users of official statistics and respondents to NSI surveys.
Apart from these two examples of a magazine and a website, NSIs generally do not treat businesses as a separate customer group with distinct, recognized, and addressed needs. The general conclusion that NSIs do not make sufficient efforts to distinguish businesses from other users applies to both dissemination and support.
3 . 3 . 2 . h o w d o o f f i c i a l s t a t i s t i c s r e l a t e t o i n t e r n a l a n d o t h e r e x t e r n a l d a t a t h a t B u s i n e s s e s u s e ?
Interviewed businesses generated internal data in the course of carrying out their activities. In addition to legally mandated internal data, the businesses chose to record other kinds of internal data. Business size and industry seem to have an effect on the amount and complexity of internal data recorded in the interviewed businesses and on their approach to using those data. Large businesses tended to indicate that they had rich internal data and used them in decision making, whereas small businesses tended to consider the legally required internal data sufficient. Businesses in some industries (e.g., logistics, retail) collected sizable quantities of detailed data. For example, a statistics user from a medium-size Swedish transportation business reported:
If we compare us with our competitors, [the business support system that we have recently built] is one of our big advantages. We have moved from, as you said, intuition to in fact trusting the data, as our business is relatively complex. In two years we have worked on the system, which lets us see profit [or] loss per specific customer group, in fact per single customer, so that we can see how
63

C h a p t e r 3
profitable a specific customer is. . . . Based on that, we can . . . attempt to do something in that specific transport flow more effectively. . . . [The system] is the basis for our decisions now, as we are striving for a profitable business.
Intuition and experience, as the other basis for decision making, was also notable, in particular in some smaller businesses. A statistics user from a medium-size Dutch construction business commented:
Look, you have to start somewhere. Call it intuition or call it a gut feeling or, yes, intuition. It doesn’t matter. Or clairvoyance with a crystal ball, yes, you have a gut feeling, you have a gut feeling. Eh, at the end it is the reality that shows you if your direction is good or not. And that is the information or data that you receive at a certain moment.
Interviewed businesses generally considered internal data to be of high quality—that is, accurate and timely—although they acknowledged some concerns when it came to survey data (e.g., data on opinions, such as employee satisfaction survey data) rather than countable or quantitative data (e.g., production or sales data).
In specifying the meaning of the term external data, interviewees in businesses gave several examples. According to one statistics user from a large Slovenian retail business:
Here we use the statistical office, Slovenian and European, then the Bank of Slovenia. Given that we are a company that has [X] affiliated companies in [X] countries around the world, we use . . . various NSIs, central banks, websites of commercial banks. Then AJPES [Agency of the Republic of Slovenia for Public Legal Records and Related Services], Chamber of Commerce and Industry of Slovenia, also various websites of competing companies, partner companies, for comparison purposes and similar. And websites of newspapers, news portals.
Other interviewees added other sources, including services like Bloomberg and Reuters, different notification services, credit rating agencies, and other trade or industrial organizations, but they seldom spontaneously mentioned official statistics as a source of external data. In the few cases where they did, they mentioned the consumer price index and employment figures. However, further interviewing found that sometimes interviewees used NSI statistics without realizing that such data came from an NSI (on the lack of awareness of NSI statistics, see Section 3.4).
When asked about quality of external data, interviewees took into account relevance (e.g., validity, fitness for purpose), accuracy (reliability), and timeliness as primary factors. A rather strong demand seemed to exist for more timely data, something that some non-NSI services were presumably far better at providing than NSIs. At the same time, an acknowledgment emerged that these data, however timely, might be inaccurate or otherwise of poor quality (e.g., partial) and thus misleading. Related to this, NSIs seemed
64
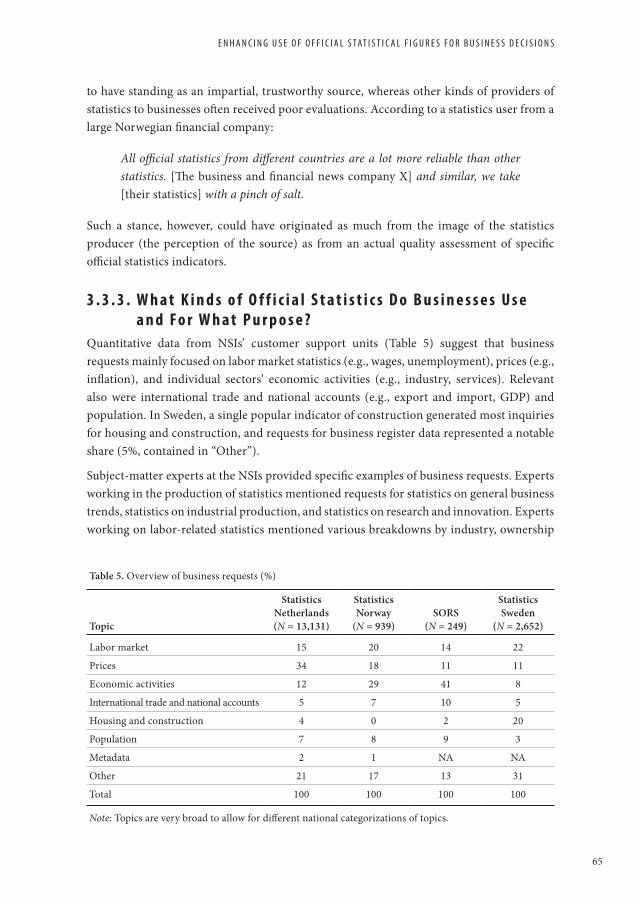
E n h a n c i n g u s E o f o f f i c i a l s t at i s t i c a l f i g u r E s f o r b u s i n E s s d E c i s i o n s
to have standing as an impartial, trustworthy source, whereas other kinds of providers of statistics to businesses often received poor evaluations. According to a statistics user from a large Norwegian financial company:
All official statistics from different countries are a lot more reliable than other statistics. [The business and financial news company X] and similar, we take [their statistics] with a pinch of salt.
Such a stance, however, could have originated as much from the image of the statistics producer (the perception of the source) as from an actual quality assessment of specific official statistics indicators.
3 . 3 . 3 . W h a t k i n d s o f o f f i c i a l s t a t i s t i c s d o B u s i n e s s e s u s e a n d F o r W h a t p u r p o s e ?
Quantitative data from NSIs’ customer support units (Table 5) suggest that business requests mainly focused on labor market statistics (e.g., wages, unemployment), prices (e.g., inflation), and individual sectors’ economic activities (e.g., industry, services). Relevant also were international trade and national accounts (e.g., export and import, GDP) and population. In Sweden, a single popular indicator of construction generated most inquiries for housing and construction, and requests for business register data represented a notable share (5%, contained in “Other”).
Subject-matter experts at the NSIs provided specific examples of business requests. Experts working in the production of statistics mentioned requests for statistics on general business trends, statistics on industrial production, and statistics on research and innovation. Experts working on labor-related statistics mentioned various breakdowns by industry, ownership
Table 5. Overview of business requests (%)
Topic
Statistics Netherlands (N = 13,131)
Statistics Norway
(N = 939)SORS
(N = 249)
Statistics Sweden
(N = 2,652)
Labor market 15 20 14 22
Prices 34 18 11 11
Economic activities 12 29 41 8
International trade and national accounts 5 7 10 5
Housing and construction 4 0 2 20
Population 7 8 9 3
Metadata 2 1 NA NA
Other 21 17 13 31
Total 100 100 100 100
Note: Topics are very broad to allow for different national categorizations of topics.
65

C h a p t e r 3
(foreign versus domestic), and education. Other examples include requests for labor cost indexes, wages, statistics on sick-leaves, commuting statistics, consumer price indexes, expenditures, sales figures, import and export, regional figures, statistics for a market a business wants to enter, market analyses reflecting the number of businesses engaged in an activity, and so on. NSI experts who communicate with respondents to business surveys mentioned demographic, macroeconomic and industry statistics, and various indexes.
The external experts in general corroborated these findings. External experts indicated various official statistics indicators used by businesses, such as general economic indicators, industry-specific data, prices, and wages. They pointed out indicators that contribute to a complete overview of an industry or a region. They also brought up data about businesses, especially if these data were region- and industry-specific, demographic and employment figures, indicators of international trade, business cycle statistics, and so on. Some experts also mentioned these data at the international level. When speaking about the use of NSI statistics in general, one expert commented that although the institution received fewer requests for official statistics, the use of NSI statistics among businesses was in fact increasing, as the data were widely available for free through the Internet and various other media.
Businesses’ use of the official statistics mainly concerned the following:
• Reporting: Businesses include NSI statistics in annual and other interim reports required by management on a regular or ad hoc basis (e.g., to make a specific decision). Such reports often include analysis of the current economic and market situation, benchmarking (comparison with the best competitors, the industry, the national economy, or an international region), and so on.
• Planning; Use of NSI statistics for planning was often in close relation to reporting for business plans, strategic planning, general forecasts and trends, own forecasts, and controlling. NSI statistics seem to provide evidence of opportunities for starting up a new business, projects, expanding economic activity, entering new markets, making decisions about relocating production or the business, and so on.
• Tenders and applications: Businesses often include official statistics in various applications and proposals. When they are applying for funding, especially if starting a new business, official statistical figures may be useful as evidence of viability of the business plans.
• Contracts and agreements: Businesses use NSI statistics (typically various indexes expressing price changes) in negotiations; they included them in contracts and agreements for cost or wage adjustments.
External experts indicated the importance of the periodicity of data use: businesses can use data to either systematically analyze the market on a continuous or short-term basis (with the help of various indexes and other indicators), or they can take a long-term perspective, generally while preparing annual reports and strategic plans (with the help of macroeconomic data). These uses can tentatively describe operational and strategic
66

E n h a n c i n g u s E o f o f f i c i a l s t at i s t i c a l f i g u r E s f o r b u s i n E s s d E c i s i o n s
perspectives. Operational data use would be on a daily, weekly, and monthly basis, when businesses check financial data, liquidity of business partners, and so on, whereas strategic data use would occur toward the end of the fiscal year and go along with preparation of annual report and strategic planning.
Some experts pointed out that businesses have a need for lists of contacts for direct marketing. Businesses could obtain such data from those NSIs that also maintain a business register and update their databases with new or changed data, then approach potential customers.
3 . 3 . 4 . W h a t p r e v e n t s B u s i n e s s e s f r o m u s i n g o f f i c i a l s t a t i s t i c s M o r e o f t e n ?
Our research identified three groups of issues that businesses face regarding use of NSI statistics: lack of awareness of NSI statistics, problems with finding NSI statistics, and shortcomings of NSI statistics.
3 . 3 . 4 . 1 . L a c k o f a w a r e n e s s o f n s i s t a t i s t i c sInterviews within businesses indicated that businesses knew neither that potentially relevant official statistics existed at the NSIs nor how such data could be useful to the business. One interviewee, a statistics user from a medium-size Slovenian engineering business, commented that he “had not been aware of NSI statistics as potential information source and thus had never considered it applicable in their business,” and this comment was quite typical of our interviews.
Another way insufficient awareness of NSI statistics showed up in our data were situations in which interviewees claimed they were not using NSI statistics, but through the content of their utterances it became apparent that they did but were unaware of doing so. For instance, two interviewees reported on use of price indexes for calculation of investment values and for contracts but attributed the source of the indexes to the chamber of commerce because that is where they received the indexes.
3 . 3 . 4 . 2 . p r o b l e m s w i t h f i n d i n g n s i s t a t i s t i c sAnalysis of customer support data in those NSIs that recorded outcomes showed that between one-third and one-half of requests to customer support services ended by the service pointing the user to a piece of information already openly accessible on the NSI’s website. External experts suggested that search skills in businesses varied significantly, resulting in potential difficulties in searching the NSI website or querying its databases. However, one expert mentioned that the sheer volume of data offered on NSI websites may make it difficult to find a specific piece of information. Some experts indicated that the NSI website organization was not intuitive, and that the NSI database was difficult to use and not adapted to entrepreneurs. Businesses similarly commented that the content and structure of the data available at an NSI (i.e., through the website) were hard to comprehend.
67

C h a p t e r 3
3 . 3 . 4 . 3 . s h o r t c o m i n g s o f n s i s t a t i s t i c sA repeated objection to NSI statistics—predominantly from advanced statistics users—concerned an insufficient level of detail of the data. A greater level of detail increases the risk of revealing individual businesses’ confidential information, which restrains the NSIs in making such low-level data publicly available. Especially in smaller countries, the confidentiality of data in small domains is an acknowledged issue.
Apart from being too aggregated or too general to fit a specific business use, NSI statistics were sometimes considered to be disaggregated in a way that failed to match a business’s internal data. Another common remark concerned the lack of timeliness. For example, a statistics user of a large Slovenian manufacturing business said:
The average wage in [our] company is known . . . [by] around the tenth [of the month]. . . . If I want to give the director or supervisory board the data [on] how much higher or lower than the average wage in [the business’s branch] is the average wage in [the business], I have to wait two and a half months to give him this data. . . . The government cannot release the average wage in the economy before we all from the economy tell how much our wages were.
Moreover, businesses of different size seemed to appreciate different formats and levels of analysis of NSI statistics. External experts pointed out that large companies often accessed NSI statistics directly, whereas small and medium-size businesses mainly relied on tertiary sources, including public media, business associations, and banks. Correspondingly, larger businesses appreciated raw data, whereas smaller businesses preferred analyzed and graphically presented data. A statistics user in a large Slovenian retailer explained: “We nearly always need only data because we’re doing the analysis ourselves, in our own way. So I wouldn’t care much if there are graphs, [textual] contents included, I’m only interested in numbers.”
Another issue arises with the national focus of an NSI. Internationally active businesses have data needs beyond national borders. In Europe, Eurostat or the UN Economic Commission for Europe (and in other areas, other supranational statistical agencies) might be of more use in meeting the needs of businesses active on multinational markets.
Some businesses also expressed the need for more time-series data. One suggestion from Norway also concerned time-series data on what the businesses themselves have reported to the NSI, to use in benchmarking within the industry. Such functionality has already been implemented at Statistics Netherlands for some industries to promote reporting for short-term statistics.
Both external experts and interviewees in businesses also noted that some NSI statistics, such as base indices, seasonally adjusted indices, and derived indicators, were difficult to comprehend. Metadata documentation that should support interpretation seemed often to be too lengthy and complex for nonexperts to understand. Some experts and interviewees also pointed out the discrepancy between the amount of data NSIs request of businesses on stringent deadlines and NSIs’ modest and late release of these statistics.
68

E n h a n c i n g u s E o f o f f i c i a l s t at i s t i c a l f i g u r E s f o r b u s i n E s s d E c i s i o n s
3 . 4 . s u M M a r y a n d s u g g e s t e d a C t i o nOur findings show that NSIs currently provide statistics to businesses mainly by posting official statistical figures on their websites. The content is structured in a hierarchy, from a few prominent numbers representing development in a country to more detailed summaries—usually containing graphic and/or tabular elements in addition to a written presentation—on a wide range of topics in a society, to low-level aggregated data accessible through dedicated database interfaces. NSIs’ obligations to protect confidentiality limit access to microdata. NSIs provide dissemination and support to users through their customer service but seldom consider businesses’ needs as a separate, recognized concern. Some changes may, however, be on the way at the time of this writing in at least the four participating NSIs.
3 . 4 . 1 . o p p o r t u n i t i e s f o r B u s i n e s s e sBusinesses put official statistics to purposes such as reporting, planning, prospecting, and contracting, and these examples indicate where the business may gainfully use official statistics. Some of these purposes are operational; others, strategic. Potential use of official statistics in businesses might depend on the relationship of the businesses to their internal and external data environments. A continuum seems to exist from businesses with little or no reliance on data in decision making (in these cases external accountants commonly managing internal data) to businesses with strong reliance on data—both internal and external—in management and decision making. Businesses were generally aware in a limited way of the NSI as a source of external data, independent of the level of data reliance within the business.
Three issues seem to hinder further use of official statistics in businesses: unawareness that some useful statistics might exist at an NSI (which involves an awareness component and a competency component), difficulty in accessing the statistics, and shortcomings of the statistics. The shortcomings were multifaceted, including mismatch between internal and external data, insufficient level of detail, insufficient timeliness, unmet need for multinational statistics, and low comprehensibility of the statistics.
3 . 4 . 2 . a c t i o n p o i n t sProposals for action that follow are first aimed at NSIs as the institutions that, with established principles of producing official statistics, are expected to actively work to further the use of their produced statistics (e.g., the European Statistics Code of Practice, in particular its principle 11). Recently, NSIs have become more aware that it is important to better communicate their value proposition (Brouwer, 2014). Our research nevertheless shows that NSIs do not sufficiently recognize businesses as a distinct and important user group.
Following the service sector regarding customer relationship management, NSIs can improve their own practices of recording communications from their business users (including in-house communication between customer service and those subject-matter units that field a large proportion of requests from customer support). In this way, they
69

C h a p t e r 3
would improve their ability both to aid businesses and other support seekers and to utilize their own resources better.
3 . 4 . 2 . 1 . d i s s e m i n a t e o f f i c i a l s t a t i s t i c a l f i g u r e s b e t t e r Current dissemination of NSI statistics offers a poor user experience for novice and infrequent users. For instance, the organization of the websites of the four NSIs is according to statistical production and the NSIs’ organizational divisions. Such organization does not seem to be intuitive to business users, who would appreciate a more accessible, clearly structured according to business needs and generally more appealing website that also caters to variability in business users’ statistical and methodological competence.
3 . 4 . 2 . 2 . s u p p o r t b r i n g i n g o f f i c i a l s t a t i s t i c s C l o s e r t o f u l f i l l i n g b u s i n e s s e s ’ n e e d s
Some concrete proposals for bringing official statistics more in line with what businesses actually need include the following:
• Providing more tips on how businesses of different types and sizes can make the best use of the NSI statistics, ranging from different levels of analyses to macro-level reports and low-level aggregated data.
• Providing cases of incorrectly using or misinterpreting NSI statistics to help businesses understand the role and importance of metadata documentation.
• Allowing for the possibility of accessing and analyzing own data that the business has reported to the NSI in relation to official statistical figures (e.g., by creating an account with the NSI).
In doing so, it might prove useful to distinguish simplified use of statistics (e.g., microbusiness entrepreneurs) and high-level use of statistics (e.g., analysts in government, financial institutions, and large companies; researchers; specialized consultants). A potentially useful related concept is that of the maturity of data-driven decision making within a business (Lorenc and Persson, 2011).
The example of Statistics Netherlands’ site dedicated to businesses (CBS, n.d.) leads the way but can surely be evaluated and further developed. Some other NSIs also have partial sites dedicated specifically to businesses (see, e.g., ABS, n.d.) or links to a special site for businesses (New Zealand, n.d.). Further research is necessary to better understand how businesses appreciate such efforts.
3 . 4 . 2 . 3 . b r o a d e r a c t i o n p o i n t sTwo broader action points also bear potential. First, more cooperation with intermediaries (e.g., media, trade organizations) that distribute official statistics might raise awareness of the statistics’ origin and inform businesses of other relevant NSI statistics. Second, activities for aligning
70

E n h a n c i n g u s E o f o f f i c i a l s t at i s t i c a l f i g u r E s f o r b u s i n E s s d E c i s i o n s
formats and breakdowns of internal and external data would benefit both businesses and NSIs. Mismatches can originate from different standards in the different branches of government (e.g., accounting, statistics, customs). Efforts to eliminate such differences include, for instance, single entry points for businesses to provide data for administrative purposes (e.g., Yancheva and Iskrova, 2011; Pereira, 2011) and unifying data formats (e.g. Van Hilvoorde, 2011).
71


C h a p t e r 4 a M e t a - a n a Ly s i s o F e x p e r i M e n t s o n t h e e F F e C t i v e n e s s o F t h e u s e
o F i n C e n t i v e s i n o r g a n i z at i o n a L s u r v e y sA version of this chapter has been conditionally accepted as:
Torres van Grinsven, V., and Hox, J. A Meta-Analysis of Experiments on the Effectiveness of the Use of Incentives
in Organizational Surveys.

C h a p t e r 4
a B s t r a C tThe use of monetary and non-monetary incentives for increasing response is an established and widely used method in surveys of individuals or households. This applies not only to mail, but also to face-to-face and telephone surveys. Experimental research shows that the technique is also effectively used in organizational surveys, not only to increase unit response rates but also to improve response completeness, response speed and even attitude towards the survey sponsor, without negative influence on bias. We report a meta-analysis of 34 experimental studies that implemented a monetary or non-monetary incentive in order to increase response rates in an organizational survey. The included studies comprise a variety of survey modes, sample frames, survey topics, research organizations, population types, industries, respondent types, countries, data types, and both voluntary and mandatory surveys. Using the meta-analytical technique of inverse variance weighted regression, we find a small but significant mean effect size for the use of incentives in these organizational surveys. Of the coded study features, only research organization had a significant mediating effect on the effect of incentives: it seems that research organizations that are already obtaining relatively high response rates, find it more difficult to increase them further.
k e y w o r d sIncentives, response rate, organizational survey, meta-analysis, effect size
74

A M e tA - A n A ly s i s o f e x p e r i M e n t s o n t h e e f f e c t i v e n e s s o f t h e U s e o f i n c e n t i v e s i n o r g A n i z At i o n A l s U r v e y s
4 . 1 . i n t r o d u C t i o nHistorically, establishment or organizational surveys have brought in low response rates, lower than surveys of individual participants (Armstrong and Lusk, 1987; Baruch, 1999). Exceptions to this are surveys by governmental organizations, where businesses are mandated to participate. In these so called mandatory official establishment (or business) surveys, response rates have been traditionally high. Nevertheless, in general response rates have been declining notably (see Baruch (1999), for an analysis of response rates in academic surveys). In some fields this decline seems to have stabilized at a low level (Baruch and Holtom, 2008). This can be ascribed to the use of response enhancing techniques (Anseel et al., 2010). To what extent response enhancing techniques that have been used in person or household surveys apply to organizational surveys remains largely an open question. Some authors propose that, despite the differences in the populations for organizational and person or household surveys, there are similarities in the effects of most response inducement techniques (Greer et al., 2000). Others propose a differential functioning of response enhancing techniques across respondent types (Anseel et al., 2010). In general, there have been doubts whether the findings in the field of person surveys can be applied to organizational surveys. For example, Paxson (1995, p.68) posits that “Monetary incentives may not be appropriate with business surveys, however, because the person who opens the envelope and pockets the cash may not be the person you’d like to complete the survey.” Comparing person and organizational respondents, there are conceptual differences between the two populations which are posited to be a factor in a differential reaction to response enhancing techniques, as the situation where the questionnaire is likely to be completed is different. For an organizational respondent, the context of the survey will most probably be at work; or for those individuals who work at home at least during work hours. This means that the questionnaire will probably be completed during company time. Furthermore, an organizational respondent may be much more sensitive to the length of the questionnaire and the time it takes to complete it because of competing job tasks and the information requested will usually not be about the respondent himself but about the organization. Questionnaires asking about topics like management practices, planning procedures and systems or financial information are asking for information that is the organization’s property, and not the respondents’ own (Jobber, 1986). Thus, because of factors such as a preoccupation with work, confidentiality of information, or organizational rules and policies it is assumed that organizational populations are in general less likely to respond to survey questionnaires than persons or households (Greer, Chuchinprakarn and Seshadri, 2000).
One of the response enhancing techniques about which there is no consensus regarding its effectiveness in organizational surveys is the use of incentives. In person and household surveys, incentives have extensively and since long been used as a way to motivate sample members to participate (Singer, Van Hoewyk and Maher, 2000; Kulka, Eyerman and McNeeley, 2005; Cantor, O’Hare and O’Connor, 2008). Extensive research shows that incentives do increase response rates (e.g., Heberlein and Baumgartner, 1978; Yammarino, Skinner and Childers,
75

C h a p t e r 4
1991; Church, 1993; Singer et al., 1999). This research into the use of incentives goes back to the beginnings of survey methodology research (see for example Armstrong, 1975). Already then the difference was made between the “general public” and “business executives” (Robin and Walters 1976, p. 50), “management” was targeted as a special target population (Watson, 1965, p. 49), and experiments were carried out on establishment surveys (Kimball, 1961; Pressley and Tullar, 1977). However, the use of incentives in establishment or organizational surveys is not consistently applied in all fields or organizational survey research. Especially in the field of official business surveys, incentives are typically not used to (see Snijkers et al., 2013).
It has been proposed that organizational respondents require higher incentives to affect the same change in response due to the competing demands placed on a respondents’ working day, the value placed on the respondent’s time, and the perception of the value of the information to the survey sponsor (Jobber, Birro and Sanderson, 2004). Consistent with that view, Anseel et al., (2010), in a meta-analytic review of academic non-experimental research, find differential functioning of response incentives across respondent types, as mean response rates are lowest for executive respondents, just like the effectiveness of incentives. The higher respondents are situated in the organizational hierarchy, the harder it appears to be to persuade them to respond to surveys. Executives might be a special target group in survey research: there are differences between executives and other groups in response rates (Baruch, 1999) and respondent characteristics (Gupta, Shaw and Delery, 2000). However, taking all respondent types together, the results of Anseel et al. (2010) are inconclusive as they find a non-significant zero-order relationship between incentives and response rates. Other empirical, though not experimental, research (Luo and White, 2005; Biemer et al., 2007) does not find evidence for an increase in response rates due to the use of incentives. Cycyota and Harrison (2006) conducted a meta-analysis of organizational research that surveys executives, in which several hypotheses are tested. Among these is the hypothesis that inclusion of an incentive will increase the likelihood of executive response to mail surveys. Of the various methods suggested to increase response rates in other populations, none were found to be effective for executives. However, only one of the studies they reviewed mentioned providing an incentive, because of which this variable was taken out of the analyses.
In their meta-analysis of the effectiveness of the use of monetary incentives in organizational mail surveys, Jobber, Saunders and Mitchell (2004) do not find support for the hypothesis of differential effects of the use of incentives in survey research for organizational and individual respondents. Their analysis confirms the efficacy of using monetary incentives to increase response to mail organizational surveys. In addition, they report that response rates increase as the value of the prepaid monetary incentive increases. Other studies have also found that response increases significantly with larger incentives (e.g. James and Bolstein, 1990). However, it should be noted that in this meta-analysis by Jobber, Saunders and Mitchell (2004), other meta-analytic procedures are used than suggested by Lipsey and Wilson (2001) and Hox and De Leeuw (1994). To be precise, response rates are not transformed and no weighting is applied.
76

A M e tA - A n A ly s i s o f e x p e r i M e n t s o n t h e e f f e c t i v e n e s s o f t h e U s e o f i n c e n t i v e s i n o r g A n i z At i o n A l s U r v e y s
To explain the effect of incentives on survey response, it has been argued that it is the giving of an incentive and not its value that increases response rates (e.g. Armstrong, 1975; Moser and Kalton, 1997). Important would be the psychological impact of receiving an incentive (as opposed to the general value itself). In individual surveys, it is posed that whether a specific behaviour occurs is a function of the perceived costs of engaging in an activity and the expected rewards (Poon, Albaum and Evangelista, 1999). Social exchange theory (Homans, 1958), when applied to survey behaviour, asserts that the actions of respondents in answering a questionnaire are motivated by the personal benefit these actions are expected to bring, or usually do bring. This has been extensively applied to improve survey participation in the field of household or person surveys, for a discussion we refer to the classic work by Dillman (1978). In an early meta-analysis, Heberlein and Baumgartner (1978) show that high response rates are achievable by manipulating the costs of responding and the perceived importance of both the research and the individual response. Also utility theory (Groves and Couper, 1998) suggests that individuals weigh the costs and benefits of completing a task and will take action when the benefits of doing so exceed the costs. Singer (2012) revives these frameworks in the context of person surveys, proposing the benefit-cost theory, in which the argument is that people choose to act when in their subjective calculus the benefits of doing so outweigh the costs. Tullar, Pressley and Gentry (1979) have pointed out that the perceived benefits are derived from the properties of the stimulus material. One of these potential perceived benefits of filling out a questionnaire can be heightened self-esteem. Incentives could work to heighten self-esteem, as the incentive is perceived as a symbol of how important a respondent’s contribution is held to be, though it is not used to compensate the respondents fully for their time.
Tullar, Pressley and Gentry (1979) seem to be the first to propose a theoretical framework for organizational survey populations, which states that in order to induce participants to take the time and trouble to fill out and return a mail questionnaire, the properties of the “stimulus material” (envelope, cover letter, subject of the questionnaire, etc.) must provide sufficient “justification” (Tullar, Pressley and Gentry 1979, p. 243) as they call it: the cognitive cost-benefit analysis of a respondent. If the perceived benefits of filling out and returning a questionnaire are equal to or greater than the perceived costs, the respondent will complete the form. However, this will not be the case if the perceived costs are less than the perceived benefits. Thus, in their view, social exchange principles do apply to organizational surveys.
A systematic synthesis of the experimental research on the effectiveness of incentives in organizational surveys is still lacking. A meta-analysis of experimental research has the potential to assess whether an overall effect exists, and a moderator analysis can detect which variables moderate the overall effect, which contributes to our theoretical understanding of survey response to organizational surveys.
77
C h a p t e r 4
4 . 2 . M e t h o d4 . 2 . 1 . s e l e c t i o n o f s t u d i e s4 . 2 . 1 . 1 . s e a r c h s t r a t e g yThe literature search took place between June and August 2013, and included multiple databases such as Web of Science, WorldCat, EBSCO, Picarta, PsycInfo, SIAM, ESOMAR (the research papers database), AAPOR (Survey Practice database). We also searched into the Proceedings of the Survey Research Methods Section of the American Statistical Association, and in the database of the Industrial Management Marketing journal. Google and Google Scholar were also used. We searched with a combination of the keywords incentive, survey and experiment. In the Proceedings of the Survey Research Methods Section of the ASA we searched with the keyword incentive only. In many cases, the different databases led us to the same articles.
Once an article was found, cited references were checked for additional studies; also the reference lists of review articles or previous meta-analyses were scrutinized. This resulted in a snowball sample by which a large number of additional articles were found. It should be noted that we searched for studies in English only. We thus possibly overlooked relevant publications in other languages. However, a study of the effect of excluding non-English publications from medical meta-analysis by Jüni et al. (2002) showed that excluding non-English publications had little effect on the overall results of the meta-analyses.
4 . 2 . 1 . 2 . e l i g i b i l i t y c r i t e r i aA study was included in the meta-analysis if it met all six criteria below:
• The study was an experimental study with a split ballot, longitudinal studies were excluded. To include a treatment in the meta-analysis, an appropriate control group had to be present;
• The sample units were randomly assigned to the control and experimental conditions; moreover the sample was a random sample from an explicit sample frame;
• The response rates (RR1 of the AAPOR, 20061) of the treatments (among which the control group) are reported or it was possible to calculate these based on the information given in the article;
• The sample size and the sizes of the treatments and control groups are reported;
• It was an experiment done with an organizational survey, defined as a survey on a commercial population: “Commercial populations are defined as those composed of commercial, industrial, administrative and/or business respondents who receive a questionnaire at their
1 AAPOR (2006) standard definitions: RR1 is the minimum response rate: the number of completed interviews divided by the number of interviews (complete plus partial) plus the number of non-interviews (refusals and break-off plus noncontacts plus others) plus all cases of unknown eligibility. RR1 = I/(I + P) + (R + NC) +(UH + UO).
78

A M e tA - A n A ly s i s o f e x p e r i M e n t s o n t h e e f f e c t i v e n e s s o f t h e U s e o f i n c e n t i v e s i n o r g A n i z At i o n A l s U r v e y s
place of employment” (Pressley and Tullar, 1977, p.108), with the addition of non-profit-organizations (1 study) and other professionals as well (physicians and teachers –each with one study) who received the questionnaire at their place of employment and about job-related issues (e.g. job attitudes, influenza immunization in the case of the physicians). In the teachers’ case (one of the studies) some received it at home; it was a follow-up study of a survey that was at first carried out at the teacher’s school;
• The experiment was an experiment on the effects of incentives, defined as a prepaid or promised monetary or non-monetary incentive.
In this study we use the response rate (RR1) defined as the number of completed interviews or questionnaires divided by the total sample and not the cooperation rate (COOP1, AAPOR 20062) which is the number of completed questionnaires divided by the effective sample (the total sample minus ineligibles etc.). However, for reasons of the analysis it would have been more practical to use the cooperation rate as this would have indicated better the effectiveness of the use of the incentives. Reason for using the response rate RR1 instead is that this was available for the larger part of the studies (either reported in the article or calculated by us using the available information). One of the reports identified in the search (Jobber, Mirza and Wee, 1991) had to be left out of the analysis because it reported only the cooperation rate, and it was impossible to transform that to a response rate.
The studies that detailed how the response rate was calculated most often reported the response rate as RR1. Therefore, for the studies that did just report the response rates without specifically explaining how this was calculated, we assumed this to be the response rate (RR1) (15 studies).
One article was additionally excluded though it met the eligibility criteria (one of the two studies in Keown, 1985). Reason for this was that a statistical analysis showed the study results to be an extreme outlier. Further examination also showed that this was the result of a response rate of zero response in the treatment group versus twelve per cent response in the control group. After transformation (described below), this results in a transformed response rate approaching minus infinity, which creates the extreme outlier. The excluded study concerned a mail survey of Hong Kong business executives. In the treatment group, a 1 $ bill was added to the envelope of the questionnaire. Also a postscript was added to the cover letter which said “Please accept this money to help pay for the postage and your time” (Keown, 1985, p. 151).
Studies presented in more than one publication were used only once. For this reason Beckler and Ott (2006) was left out, and Ollinger and Moore (2007) who presented the same results as Moore and Ollinger (2007). Two publications reported several independent studies in the same publication. These were treated as separated cases. London and Dommeyer (1990) reported two independent experiments. Moore and Ollinger (2007) reported 13 cases of which 6 were
2 COOP1 is the minimum cooperation rate: the number of completed interviews divided by the number of interviews (complete and partial) plus the number of noninterviews that involve the identification of and contact with an eligible respondent (refusal and break-off plus other). COOP1 = I/(I + P) + R + 0.
79

C h a p t e r 4
deemed appropriate according to the eligibility criteria and thus added to the analysis. Rosen et al. (2003) reported two experiments of which only one was applicable to the meta-analysis as only that one complied with the eligibility criteria. Two articles had to be discarded after the coding work established that they did not comply with the eligibility criteria (Watson, 1965; Robin and Walters, 1976). Though they were an experiment with incentives performed on “men in industry” (Watson 1965, p. 49) and “business executives” (Robin and Walters, 1976, p. 50) they could not be characterized as an organizational survey but were in fact a person survey. The net result was 34 independent experimental studies on the influence of the use of incentives on the response rate that were available for the meta-analysis. The 34 studies from 28 articles are listed in Appendix B with a short description of the survey. Appendix C presents a bibliography of all publications.
The majority of these studies (19) had more than one experimental condition, as these combined several treatments in the form of different kinds of monetary or non-monetary incentives, or incentives of different value. These are all features that were taken into account in the meta-analysis through the coding and analysis of study characteristics. Treatments were only taken into the analysis if they met the eligibility criterion of the application of a prepaid or promised monetary or non-monetary incentive with an appropriate control group and no confounding factors were present. E.g. if a treatment concerned the application of an incentive and at the same time another type of strategy like a different kind of postal service; and there was no appropriate control group to measure the effect of only the incentive, it was not used for the analysis.
In sum, the 34 independent studies incorporated 68 experimental conditions with a combined sample size of 343,500 respondents including the control groups. All of the studies reported the sample sizes we needed for the meta-analysis, except two. In these two cases we contacted the authors asking them for the sample sizes. In both cases we thankfully received the information we asked for.
Of the 28 articles, 22 are journal articles (23 studies), 5 are published in conference proceedings (10 studies) and 1 can be characterized as grey literature (Burnside et al. 2005). The oldest publication was published in 1961 and the most recent in 2008, with the mean at 1995. Country of implementation and research organization were part of the experiment in some cases. Therefore we report these in numbers of experimental condition. The gross of the experimental conditions (47) were implemented in the USA; other countries were the UK (8), Canada (4), Sweden (3), Australia and India (2), Germany and Japan (1). The majority of the studies were done by universities or research organizations (41 experimental conditions), 14 were by commercial parties, and 13 by governmental agencies, including national statistical institutes. Other features of the studies will be discussed below.
4 . 2 . 1 . C o d i n g o f s t u d y c h a r a c t e r i s t i c sTo understand if study characteristics had a mediating effect on the effect size of the use of incentives, we coded several of these study features, as reported in Appendix D. The coding scheme was based on a combination of open coding by the authors and the coding schedules
80
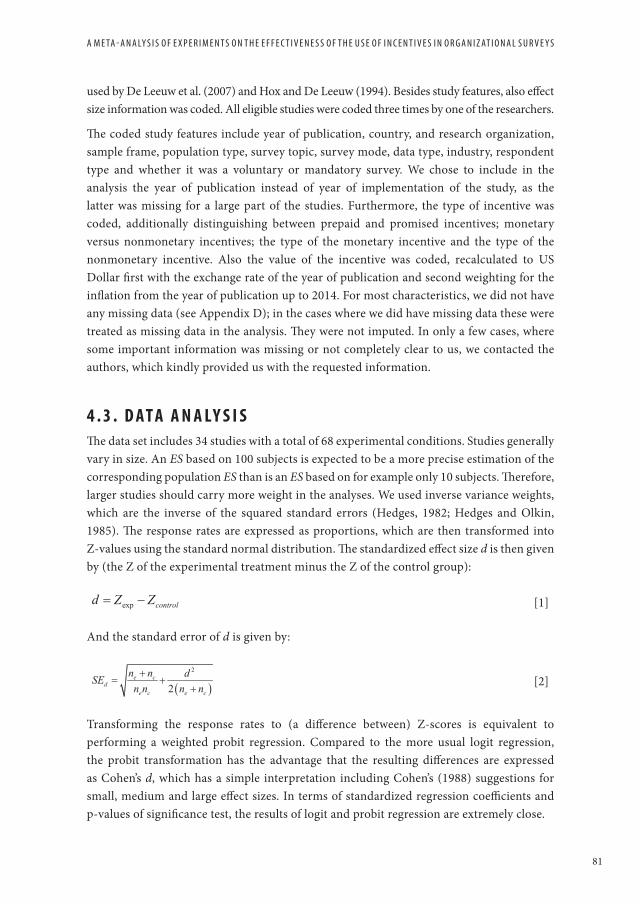
A M e tA - A n A ly s i s o f e x p e r i M e n t s o n t h e e f f e c t i v e n e s s o f t h e U s e o f i n c e n t i v e s i n o r g A n i z At i o n A l s U r v e y s
used by De Leeuw et al. (2007) and Hox and De Leeuw (1994). Besides study features, also effect size information was coded. All eligible studies were coded three times by one of the researchers.
The coded study features include year of publication, country, and research organization, sample frame, population type, survey topic, survey mode, data type, industry, respondent type and whether it was a voluntary or mandatory survey. We chose to include in the analysis the year of publication instead of year of implementation of the study, as the latter was missing for a large part of the studies. Furthermore, the type of incentive was coded, additionally distinguishing between prepaid and promised incentives; monetary versus nonmonetary incentives; the type of the monetary incentive and the type of the nonmonetary incentive. Also the value of the incentive was coded, recalculated to US Dollar first with the exchange rate of the year of publication and second weighting for the inflation from the year of publication up to 2014. For most characteristics, we did not have any missing data (see Appendix D); in the cases where we did have missing data these were treated as missing data in the analysis. They were not imputed. In only a few cases, where some important information was missing or not completely clear to us, we contacted the authors, which kindly provided us with the requested information.
4 . 3 . d at a a n a Ly s i sThe data set includes 34 studies with a total of 68 experimental conditions. Studies generally vary in size. An ES based on 100 subjects is expected to be a more precise estimation of the corresponding population ES than is an ES based on for example only 10 subjects. Therefore, larger studies should carry more weight in the analyses. We used inverse variance weights, which are the inverse of the squared standard errors (Hedges, 1982; Hedges and Olkin, 1985). The response rates are expressed as proportions, which are then transformed into Z-values using the standard normal distribution. The standardized effect size d is then given by (the Z of the experimental treatment minus the Z of the control group):
[1]
And the standard error of d is given by:
[2]
Transforming the response rates to (a difference between) Z-scores is equivalent to performing a weighted probit regression. Compared to the more usual logit regression, the probit transformation has the advantage that the resulting differences are expressed as Cohen’s d, which has a simple interpretation including Cohen’s (1988) suggestions for small, medium and large effect sizes. In terms of standardized regression coefficients and p-values of significance test, the results of logit and probit regression are extremely close.
81

C h a p t e r 4
Some studies report results on more than one experimental condition. This can be dealt with by using a multilevel meta-regression, with experimental conditions nested within studies. In our case, however, the average number of conditions within studies was too low to permit this. Therefore we included each experimental condition as a separate case. To avoid inflation of the control group sample size, in such studies the control group sample size was divided by the number of experimental conditions it was compared to.
A relevant issue in meta-analysis is the publication bias, also called the file-drawer problem. This refers to the possibility that relevant studies might not have been published, but disappeared in the investigator’s file drawer. Publication bias was assessed by inspecting a funnel plot and by calculating the fail-safe N. A funnel plot is a scatterplot of effect size by sample size; the name derives from the expected shape if there is no publication bias against null-results. The fail-safe N is an estimate of the number of studies reporting null results that must exist but are unpublished, hidden away in file drawers, to render the combined p-value of the studies that were located insignificant at the 5 per cent level (Rothstein, Sutton and Borenstein, 2005).
Before calculating the mean effect size and the moderator analyses, a homogeneity analysis (Q analysis) was used to test whether the assumption that all of the effect sizes are estimating the same population mean is a reasonable assumption. For details we refer to Lipsey and Wilson (2001).
The data were further analysed using inverse variance weighted meta-analysis techniques (Lipsey and Wilson, 2001) employing a random effects model with restricted maximum likelihood (REML) estimation. Random effects models assume that the distribution of effect sizes is heterogeneous; the variability between effect sizes is not only due to sampling error but also due to systematic variability in the population of effects (study-level differences in the set of true population effect sizes), which was the case in our data. Meta-regression and the meta-analytic analogue of Anova were used for the moderator analysis. All analyses were done in SPSS using Wilson’s meta-analysis macros.3 The fail-safe N was calculated with a macro developed by Hox (available upon request).
4 . 4 . r e s u Lt s4 . 4 . 1 . C h a r a c t e r i s t i c s o f t h e s t u d i e sThe 34 studies that were located through the literature search were coded for study features for the moderator analysis. We were interested in finding out whether any of these study features had a significant effect on the effect size of the use of incentives in organizational surveys. Appendix D shows the breakdown in characteristics of these experiments in detail. Country of implementation, research organization and survey mode were part
3 Described in Lipsey and Wilson (2001) and available on Wilson’s homepage at http://mason.gmu.edu/~dwilsonb
82

A M e tA - A n A ly s i s o f e x p e r i M e n t s o n t h e e f f e c t i v e n e s s o f t h e U s e o f i n c e n t i v e s i n o r g A n i z At i o n A l s U r v e y s
of the experiment in some cases. Therefore we report these in numbers of experimental conditions. The other characteristics will be reported in numbers by studies.
Of the 28 articles, 22 are journal articles (23 studies), 5 are published in conference proceedings (10 studies) and 1 can be characterized as grey literature (Burnside, Bishop and Guiver, 2005). The oldest publication was published in 1961 and the most recent in 2008. The gross of the experimental conditions (47) were implemented in the USA; other countries were the UK (8), Canada (4), Sweden (3), Australia and India (2), Germany and Japan (1). The majority of the studies included in the meta-analysis were done by universities or research organizations (41 experimental conditions), followed by survey carried out by commercial parties (e.g. marketing firms) (14 experimental conditions) and 13 experimental conditions by governmental institutes, including national statistical institutes. Almost all surveys were a mail survey (53 experimental conditions), with only 6 mixed web/mail, 4 telephone surveys an 5 implemented other kinds of mixed methods.
The majority of the surveys were voluntary (32), whilst the mandatory surveys are in a minority. There is a great variability in type of respondent, though the largest part are managers or executives (13) and owners (3) followed by the cases where the respondent is not specified (9). There’s also a great variability in industry and sample frame with the largest group (8 studies) being a survey of no specifically determined industry. In most cases the population is a special population (27 studies), as opposed to surveys of the general population, for example the list of customers of a firm. Most occurring survey topics are business practices or management issues (9) and financial topics (7). The kind of data surveyed were categorical data (10), figures (9), or a combination (1) with a missing of 58.8 %. Many different kind of incentives are used, both prepaid as promised and both monetary as non-monetary. These include cash, a check, an ATM card or a gift card in the case of monetary incentives; and a stamp, a small gift (other than a stamp), an article (in general) or a publication or leaflet about the survey, or a charitable donation in the case of non-monetary incentives. The value of the (monetary) incentives ranges between 0.10 $ (in 1961, worth 0.78 $ nowadays) and 50 $ (in 1981, worth 135.01 $ now). The year of publication ranges between 1961 and 2008, with a mean at 1995.
4 . 4 . 2 . p u b l i c a t i o n b i a sWe addressed the file-drawer and publication bias problems by calculating the fail-safe N. In our case, the significant effect of the incentive on the response rate would be swiped away if we assume the existence of 426 unpublished studies all reporting no effect. This is highly implausible, so the file-drawer problem is not likely to seriously bias our results.
A boxplot of the correlation between effect size (d, Z of the treatment minus Z of the control group) and sample size (the inverse variance weight) revealed one extreme outlier, due to the fact that in one of the two studies from Keown (1985) the experimental group had a response rate of zero. Since an outlier can strongly bias results (see e.g. Tabachnick
83

C h a p t e r 4
and Fidell, 2001), we decided to exclude this outlier from the analysis. After removal of this outlier we found a virtually perfect funnel plot (see figure 1) which is again an indication of no publication bias.
Figure 1. Funnel plot of the correlation between effect size and sample size.
4.4.3. Mean effec t s ize of the use of incentives in organizational sur veys
Sending or promising an incentive does have a small but significant effect on the response rate. The mean effect size is d = 0.25 (p < .0001). In terms of Cohen’s (1988) effect size definitions this is a small effect.
The homogeneity test is inconclusive: the chi-square test is not significant (chi-square = 69.44, df=67, p=.40). However, using REML estimation, the study level variance is estimated as 0.08, with a standard error of 0.016, which renders this variance significant at p<.0001. Since the differences between the results of a fixed effect and a random effects analysis proved to be small, we decided to continue with the more general random effects model. Figure 2 two shows the d of each one of the included studies, with the standard error.
4 . 4 . 4 . v a r i a b i l i t y i n r e s u l t s a n d m o d e r a t i n g s t u d y f e a t u r e s 4 . 4 . 4 . 1 . r e s e a r c h o r g a n i z a t i o nThe meta-analytic procedure analogous to the analysis of variance is a technique that groups effect sizes into mutually exclusive categories on the basis of a categorical independent
84

A M e tA - A n A ly s i s o f e x p e r i M e n t s o n t h e e f f e c t i v e n e s s o f t h e U s e o f i n c e n t i v e s i n o r g A n i z At i o n A l s U r v e y s
Figure 2. Boxplot of the d of each one of the included studies.
variable, and tests the differences between the categories. If the between category variability is significant, the mean effect sizes across groups differ by more than sampling error (macro MetaF, Lipson and Wilson, 2001). The analysis of variance of the study features coded as categorical variables showed that only research organization has a significant effect on the effect size (p=.04). Surveys carried out by commercial organizations show the largest effect: d = 0.36, while universities (d = 0.26) and government (d = 0.10) show much smaller effects.
Following tables present the increase in response rates both in d (Ztreatment - Zcontrol) (Table 1a) and in original response rate figures (Table 1b) of the total sample (based on each treatment) and for the three different research organizations represented in the studies we analyzed: commercial organizations (e.g. a marketing bureau), universities or other independent research organization, and governmental institutions. These figures aid in the interpretation and comparison. For instance, we see that for the total sample, the mean increase
85

C h a p t e r 4
Table 1a: Total effect sizes by research organization in d
Research Organization N Mean Std. Dev.
Std. Error
Lower bound
Upper bound Min Max Range
Commercial 14 .37 .35 .09 .17 .57 -.34 .94 1.28
University 41 .28 .38 .06 .17 .40 -.74 1.44 2.18
Government 13 .10 .07 .02 .06 .14 .03 .22 .19
Total 68 .27 .34 .04 .18 .35 -.74 1.44 2.18
ES d (Ztreatment – Z control)
Table 1b: Total effect sizes by research organization in percentages
Research Organization N Mean Std. Dev.
Std. Error
Lower bound
Upper bound Min Max Range
Commercial 14 8.93 9.60 2.57 3.38 14.47 -12.2 23.95 36.15
University 41 9.51 13.18 2.06 5.35 13.67 -25.3 50 75.33
Government 13 3.71 2.62 .73 2.13 5.30 1 7.70 6.7
Total 68 8.28 11.3 1.37 5.55 11.01 -25.3 50 75.33
ES (RRtreatment- RRcontro) (percentages)
in response rate is 8.28 %. The highest mean d for commercial organizations as opposed to a higher mean difference in response rates for universities (9.51 %) is caused by the inverse variance weight meta-analysis techniques we used. The d can therefore be considered a more valid indicator for the effectiveness of the incentive than the difference in response rates.
4 . 4 . 4 . 2 . Ye a r o f p u b l i c a t i o nWhen looking at the development over the years, we first see a small decline in the effect size statistic. Further scrutiny revealed that this small decline was due to the overabundance of survey experiments by governmental institutes in the years after 2000 in our dataset, as we saw that the effect of incentives on the overall response rate is smaller when the survey is carried out by a governmental institute. Therefore we corrected for survey organization. When doing this (Figure 3), we see a small increase in the effect size over the years. However visually there is a small increase, a statistical analysis revealed no significant effect of year of publication of the effect size.
4 . 4 . 4 . 3 . Va l u e o f t h e i n c e n t i v eFor the cases where the value of the incentive was mentioned in the study report, the effect of the value of the incentive on the d was analysed. The inverse variance weighted regression showed that the value of the incentive does not appear to make any difference in the effect size (see also Figure 4). For this analysis, the value of the incentive was calculated, first, by
86

A M e tA - A n A ly s i s o f e x p e r i M e n t s o n t h e e f f e c t i v e n e s s o f t h e U s e o f i n c e n t i v e s i n o r g A n i z At i o n A l s U r v e y s
Figure 3. Effect size (d) over the years.
Figure 4. Effect size (d) related to the value of the incentive.
87

C h a p t e r 4
calculating the value in dollars for the cases with other currencies with the exchange rate of the year of publication of the study. Second, we calculated what would be the current value from this original value in dollars. Like in the analysis of the year of publication, the d was corrected for research organization, as we saw that this moderator had a significant effect on the d. The result of this regression corroborates previous research conclusions that propose that it is the giving of an incentive and not its value that increases response rates (e.g. Moser and Kalton, 1976; Armstrong, 1975). We will further discuss this in section 5 (Discussion).
4 . 4 . 4 . s u m m a r y To conclude the results section, it should be noticed that no significant effects were found for year of publication, population type, sample frame, country were the survey was implemented, survey topic, survey mode, data type, industry, characteristics of the respondents, or type or value of incentive. It doesn’t matter either if a survey is mandatory or voluntary.
This means that incentives can be used as a general tool to enhance response in organizational surveys with different survey features, and that an effect, though in some cases small, can be expected from the use of an incentive. The largest effect can be expected in commercial surveys of industrial populations because they seem to have the lowest response rates; the lowest effect can be expected from (official) establishment surveys implemented by governmental institutions because they already have high response rates. Though only a low effect can be expected in the case of already high response rates, it seems a stable factor. The value of the (monetary) incentive doesn’t seem to matter either. Concerning the year of publication, what we can expect from our results is that, though the year of publication in itself has no significant relationship with the effect size of the application of an incentive in a survey, as the response rates seem to be decreasing in organizational surveys overall, the effect size of the use of incentives can be expected to increase.
4 . 5 . d i s C u s s i o nIn the introduction we discussed extensive research that shows that incentives work to increase response rates in individual surveys (e.g., Heberlein and Baumgartner, 1978; Yammarino, Skinner and Childers, 1991; Church 1993; Singer et al. 1999). Our results about the effect of incentives in organizational surveys are in line with this research, with the combined effect size somewhat smaller but close to the values reported for individual surveys. However, our results do not compare to the results of another meta-analysis on the use of incentives in organizational surveys (Anseel et al. 2010). Nevertheless, their results are inconclusive as the zero-order relationship Anseel et al. (2010) find between incentives and response rates is non-significant. Our analysis is based on experimental studies where treatment groups are compared to control groups, and provides therefore a more solid base for conclusions.
It is important to note that the effect size used in this meta-analysis is calculated on the response rate (AAPOR RR1). This response rate is an overall index that includes the
88

A M e tA - A n A ly s i s o f e x p e r i M e n t s o n t h e e f f e c t i v e n e s s o f t h e U s e o f i n c e n t i v e s i n o r g A n i z At i o n A l s U r v e y s
ineligible cases and noncontacts in the denominator. It reflects therefore also the success in, for example, contacting persons, or achieving an appropriate sample frame with correct addresses, which cannot be influenced by the inclusion or the promise of an incentive. If we had been able to analyse the effect of the incentives on the cooperation rate (AAPOR COOP1), then this might have resulted in a higher effect size. Unfortunately, most of the study reports did not contain sufficient information to calculate the cooperation rate.
Some previous research suggests that response rates increase as the value of the prepaid monetary incentive increases. Studies have shown response to increase with larger incentives (e.g. James and Bolstein,1990, for individual surveys; Trussel and Lavrakas, 2004; Jobber, Saunders and Mitchel,l 2004, for organizational surveys). In the field of individual or household surveys, it is often proposed that respondents may see an incentive as a payment for their time and effort (Biner and Kidd, 1994), thus conceptualizing an incentive as an economic exchange (see also Medway 2012). Opposed to this, our findings suggest that the value of the monetary incentive doesn’t have a significant effect on the effect size. In line with our results, already Moser and Kalton (1976) and Armstrong (1975) argued that it is the giving of an incentive and not its value that increases response rates, both for individual and organizational surveys. The psychological impact of receiving money (as opposed to the financial value itself) seems to be important (Pressley and Tullar, 1977, p. 108).
One possible explanation for the potential effectiveness of incentives lies thus within the tenets of reciprocity theory (Gouldner, 1960). This is one of the central rules of social exchange (Blau, 1964; Homans, 1968), which has been extensively applied to person surveys (Dillman, 1978). The norm of reciprocity states that people help those who provide favours for them and therefore the act of giving builds up an obligation on the part of the recipient to reciprocate. In the context of mail survey response behaviour, a recipient may feel obligated to reciprocate by completing and returning the questionnaire after having received a gift (the incentive), or being promised one, independent of the value of that gift. Another theory that has been invoked to explain why incentives can work both in individual and organizational surveys to enhance response even when it is a token incentive is dissonance theory (Festinger, 1957). According to this theory, once respondents have received a prepaid incentive, the idea of keeping it without completing the survey creates a feeling of dissonance (Furse and Stewart, 1982).
Tullar, Pressley and Gentry (1979) seemed to be the first to propose a theoretical framework for commercial survey populations based on the cognitive cost-benefit analysis of a respondent. Important to note is that this analysis is about the perceived costs and perceived benefits. One of these potential perceived benefits of filling out a questionnaire might be heightened self-esteem. Incentives might also work to heighten self-esteem, as the incentive is proposed to be a symbol of how important a respondent’s contribution is held to be, though it is not possible to compensate the respondent fully for his time. In this context, the study we had to remove of the analysis because of being an outlier (Keown, 1985) is of interest. This study was a mail survey of Hong Kong business executives. In the
89

C h a p t e r 4
treatment group, a HKD one dollar bill was added to the envelope of the questionnaire. A postscript was added to the cover letter which said “Please accept this money to help pay for the postage and your time” (Keown, 1985, p. 151). It would seem that this postscript, which describes the incentive as payment for their time and thus defines it as an economic exchange, was not efficient, as the treatment resulted in a response rate of 0 %. In contrast, in other studies included in our analysis, the payment of the incentive was not described as an economic exchange but as a small token or symbolic gift, for example:
“However, we would like for you to use this token of our appreciation to help pay for a coke or cup of coffee while filling out this brief questionnaire”, Pressley and Tullar (1977), p. 109.
“Also, please accept the enclosed new $1 bill as a small token “thank you” for participating in the study and, if you wish, pass it along to a young child in your life.” Schneider and Johnson (1995), p.267.
“a token of appreciation”, Chawla, Balakrishnan and Smith (1992) p. 308.
“Please accept the enclosed dollar bill as our special thanks to you” London and Dommeyer (1990), p.239.
Only one of the experiments in which the incentive had a positive effect on the response rates, indicated the incentive as an economic exchange: “Please accept this money to help pay for the postage and your time.” Angur and Nataraajan (1995, p. 354) (effect size = 0.62).
Some of the studies included in our meta-analysis used non-monetary incentives, such as small gifts or even other kind of incentives such as access to the research organization’s own published statistics (Burnside et al. 2005), access to an article (Kalafatis and Tsogas, 1994), feedback of the results (Tyagi, 1989; Kalafatis and Tsogas, 1994; Hedlin et al., 2008), or information about the survey (Jobber et al. 1988; Hedlin et al. 2008). This conforms to principles that incentives should be token. Besides, the latter ones that give information or data also conform to the principle that the saliency (perceived importance) of the survey topic to the recipient is significantly related to response (Heberlein and Baumgartner, 1978; Eichner and Habermehl, 1981; Goyder, 1982) and this may thus hold also for organizational surveys (Jobber, Birro and Sanderson, 1988).
Also the fact that neither the type nor the value of the incentive has a statistically significant effect on the effect size is consistent with the principle that effectiveness of an incentive lies within its symbolic meaning and not its “real” economic value.
Another important finding of our analysis is that of the coded study features only research organization has a significant mediating effect on the effectiveness of the use of incentives
90

A M e tA - A n A ly s i s o f e x p e r i M e n t s o n t h e e f f e c t i v e n e s s o f t h e U s e o f i n c e n t i v e s i n o r g A n i z At i o n A l s U r v e y s
in organizational surveys. This could have several reasons which could be sought both in the decision to participate and in the response process. The commonly ascribed unique characteristics of organizational surveys and organizational populations previously led to the enhancement of the basic cognitive response model (Tourangeau ,1984), adding several steps to the process (Edwards and Cantor, 1991; Eisenhower, Mathiowetz and Morganstein, 1991; Willimack and Nichols, 2010). The enhanced model explicitly recognizes and adds organizational behavioural steps that affect the survey response process, and herewith add possible causes for response error to the process. Bavdaž (2010), based on an empirical study with a focus from the business perspective, proposes the MIBSR (Multidimensional Integral Business Survey Response) model as tool for investigating and explaining the outcomes of the response process in organizations. The MIBSR model explicitly distinguishes between processes occurring at the individual level and others taking place at the organizational level. Evidently, as steps and complexity have been added to the response process, also possible factors for nonresponse are added. Even if initially the decision to participate was positive, difficulties during the response process can eventually still lead to nonresponse. This can be a reason why there are no other mediating factors, as it seems that the (non)response is less influenced by external factors than by the internal response processes in an organization. Besides the response process, of importance for possible mediating factors is the decision to participate in a survey. Also in this aspect, more complexity can be expected in an organizational setting than is the case in an individual survey. For example, Groves, Cialdini and Couper, (1992) theorize that cooperation of members of organizations reporting to surveys on behalf of these organizations will be likely influenced by formal rules and legal guidance. Tomaskovic-Devey, Leiter and Thompson, (1994) provide a framework to explain the organizational nonresponse to survey requests with the individual and organizational authority, capacity, and motive. Thus, besides the motivation that can be influenced by incentives (see Torres van Grinsven, Bolko and Bavdaž, 2014), other factors within the organization such as the capacity and authority might be at stake that can mediate the effectiveness of the incentives. However, we found very few studies that were based on en explicit model for organizational survey response behaviour, so it was not possible to include more theoretically oriented explanatory variables in our meta-analysis.
Thus, to sum up, the results of our meta-analysis show a small but significant effect of the use of incentives in organizational surveys. The value of the monetary incentive does not seem to matter. The type of the incentive (prepaid versus promised, monetary versus non-monetary, et cetera) does neither have a statistically significant effect on the effect size. The largest effect can be expected in commercial surveys of industrial populations; the lowest effect can be expected from (official) establishment surveys implemented by governmental institutions. Our interpretation is that research organizations that are already obtaining relatively high response rates, find it more difficult to increase them further. This interpretation is supported by the finding that, if we include the response rate in the control group as a predictor, the significant differences between organization types disappear completely, while the regression coefficient for the response rate in the control group is
91

C h a p t e r 4
negative and highly significant. We conclude that incentives can be used as a general tool to increase response in organizational surveys with different survey features. Furthermore, what is important in the use of incentives in organizational surveys seems to be not the factual value (as in an economic exchange), but the psychological value as a symbolic gift or benefit that needs to be reciprocated (as in reciprocity theory); or –when taking a different theoretical standpoint, in its being a symbolic benefit that counteracts the perceived costs of completing and returning a questionnaire (as in the theory of a cost/benefit analysis). This means that it is useful to use an incentive in a business survey design, especially when response rates are low. Further research is necessary to find out the cost-effectiveness of the use of incentives with different initial response rates. This incentive can be a small symbolic gift and does not need to have a high economic value.
92


Torres van Grinsven, V. and Snijkers, G. Sentiments and Perceptions of Business Respondents on Social Media: An Exploratory Analysis, Journal of Official Statistics. Volume 31, Issue 2, Pages 1-22, DOI: 10.1515/JOS-2015-0018, 2015
s e n t i M e n t s a n d p e r C e p t i o n s o F B u s i n e s s r e s p o n d e n t s o n s o C i a L
M e d i a : a n e x p L o r at o r y a n a Ly s i s
C h a p t e r 5

C h a p t e r 5
a B s t r a C tPerceptions and sentiments of business respondents are considered important for statistical bureaus. As perceptions and sentiments are related to the behavior of the people expressing them, gaining insights into the perceptions and sentiments of business respondents is of interest to understand business survey response. In this paper we present an exploratory analysis of expressions in the social media regarding Statistics Netherlands. In recent years, social media have become an important infrastructure for communication flows and thus an essential network in our social structure. Within that network participants are actively involved in expressing sentiments and perceptions. The results give insights into the perceptions and sentiments business respondents have of this national statistical institute and specifically its business surveys. They point towards specific causes that led to a positive or a negative sentiment. Based on these results, recommendations aimed at influencing the perceptions and sentiments will be discussed, with the ultimate goal to stimulate survey participation. We also suggest recommendations regarding social media studies on sentiments and perceptions of survey respondents.
k e y w o r d sBusiness survey communication, survey participation, response motivation, expressions, social media
96

S e n t i m e n t S a n d P e r c e P t i o n S o f B u S i n e S S r e S P o n d e n t S o n S o c i a l m e d i a : a n e x P l o r at o r y a n a ly S i S
5 . 1 . i n t r o d u C t i o n In the Netherlands, Statistics Netherlands (hereinafter SN) is responsible for publishing official statistics to be used in practice, by policymakers and for scientific research. For the production of statistics, data on a large variety of topics are collected and processed. To get its data, a decade ago SN has established a policy on data collection (rewritten in 2011 by Snijkers et al.). Although surveys are still an important way to collect data, firstly secondary data need to be used, before a survey is considered. Secondary data include the use of administrative data, and in the future very likely big data (Groves, 2011; Daas et al. 2013). This data collection strategy holds for both social and business statistics. A major driver for the implementation of this strategy was and still is the reduction of response burden, i.e. the compliance costs for businesses. Over the last two decades SN has reduced its actual response burden by about 70% (Snijkers, 2008). In addition to its responsibility for official national statistics, SN also has the task of producing European (community) statistics.
Some of the official business surveys request financial data, like the annual Structural Business Survey (SBS), but others request other kind of data, e.g. movements (the Traffic and Transport Surveys), ICT use within the company (the ICT survey), international trade (International Trade Survey). Some businesses are sampled for multiple surveys, and for recurring surveys they receive a questionnaire for a number of waves, because of their importance for the statistics. On a yearly basis, about a million questionnaires are sent to businesses.
We know that some businesses are not fond of these surveys, but most of them comply. An important reason for compliance is the fact that most of these surveys are mandatory (Torres van Grinsven, Bolko and Bavdaž, 2014; Snijkers et al. 2013). In the Netherlands, sentiments about official business surveys sent out by SN have been expressed in traditional media, for instance in newspapers, and in publications by business organizations, among others. For example, in a 2006 publication of the Dutch Employers’ Union in the provinces of Brabant and Zeeland (Brabants Zeeuwse Werkgeversvereniging) it is stated for example that for surveys ‘the costs outweigh the added value’ (Vroenhoven, 2006, p. 23). Some businesses express their views on surveys by sending letters and e-mails to Statistics Netherlands, or contacting its Help desk by phone. In the past, politicians have also expressed their sentiments on official business surveys.
Research on the sentiments of business respondents towards official business surveys is not new. At SN, Customer Satisfaction Surveys amongst respondents have been conducted to study these views (for an analysis of these data see Giesen, 2012). An overview of (data on) these sentiments that concern the official business surveys conducted by Statistics Netherlands has been presented by Snijkers, Berkenbosch and Luppes, (2007). These studies will be discussed in the concluding section.
Collecting and analyzing these sentiments has been cumbersome because the data needed to be collected from various sources. For each source, the gathering of the appropriate data that measured these sentiments was not self-evident. With the expanding usage of social media, data on perceptions and sentiments have become more readily available. Recent research estimates
97

C h a p t e r 5
that around 70% of the Dutch population actively posts messages on social media (Daas and Puts, 2014). The huge amount of Dutch messages (Coosto, 2014) may thus be an interesting data source for the analysis of perceptions and sentiments of business survey respondents in the Netherlands, which might be an appropriate replacement for formerly used data.
In this paper we present the results of an analysis of expressions in social media by business respondents about SN, its business surveys and questionnaires. This analysis can be characterized as exploratory, as it is not used for testing of hypotheses, but exploring how many expressions have been posted in social media and their content. For this study, all available data (expressions in social media), within a specific period of time, have been used, as we will discuss in section 2.1. As such, this study can be characterized as an analysis of “organic” data, as opposed to “design” data created by survey research (Groves, 2011). Researching perceptions and sentiments through, for example, a survey is inherently different than the analysis we have done on social media data. The expressions in social media data can be genuinely defined as ‘texts’: they are “words and images that have become recorded without the intervention of a researcher” (Silverman, 2000, p. 825). In a survey or an interview, the researchers’ preconceptions always strongly influence the categories of topics that are revealed. When the data analyzed are ‘texts’ as defined by Silverman one is much more likely to discover original participants’ categories.
This analysis indicates sentiments and perceptions respondents have of SN, or, said in another way, meanings these respondents attribute to SN and its actions. In addition, it also gives insights into sources that cause these perceptions and sentiments. Analyzing these expressions in-depth unveils major irritations but also positive attitudes and this knowledge can in turn be used to better design communication strategies and surveys such that the perception businesses and business respondents have of a national statistical institute (hereinafter NSI) will be influenced in a positive way.
The sentiments and perceptions of business respondents are relevant to business surveys because it is proposed that these are related to survey participation, as well as the respondent’s behaviour when completing a questionnaire, via perceived response burden and the motivation to respond (as is discussed by Giesen, 2012; Torres van Grinsven, Bolko and Bavdaž, 2014; Snijkers and Jones, 2013; Willimack and Snijkers, 2013; Haraldsen et al. 2013). Consequently this affects the quality of the resulting survey data (see e.g. Wenemark et al. 2011; Haraldsen, 2013) as well as cost-efficiency of survey data collection (Snijkers and Jones, 2013). Blumer (1973) noted that human behaviour results from a vast interpretive process in which people, both individually and collectively, guide themselves by defining and evaluating objects, events and situations they encounter. This is another way of saying that business survey response behaviour is affected by the interpretation business respondents give to the NSI and the survey request – or perception they have of the NSI and the survey request. The social media are used more and more to express these perceptions and sentiments. The internet and social media have developed into a new and vast communicative infrastructure and cultural forum (Jensen and Helles, 2011), in which social
98

S e n t i m e n t S a n d P e r c e P t i o n S o f B u S i n e S S r e S P o n d e n t S o n S o c i a l m e d i a : a n e x P l o r at o r y a n a ly S i S
actors themselves as communicators become sources of information (Jensen, 2012), and are actively involved in expressing perceptions and images. Also business survey respondents might be active in the social media, which makes the social media an interesting data source to explore when researching perceptions and sentiments of business survey respondents; and if one is interested in a better understanding of the behaviour of these respondents.
This study has two explorative research questions. The first question is: what can we find in the social media; and is the study of messages on social media useful for SN to understand business respondents’ views on SN and its surveys? Second, we aimed at getting insights into the content of these expressions: the perceptions or images they reflect, the sentiments expressed and the causes for both positive and negative sentiments.
That is, first, we explored the social media as a new kind of data source to find out if researching social media messages can lead to useful results; and second, we explored these expressions on social media to find out what sentiments and perceptions they reflect; and what the causes are for these sentiments and perceptions.
Based on the first research question, the following research objectives are discussed in this paper: What is the number of expressions about SN and its surveys and questionnaires on social media and on webfora? Are there fluctuations in these numbers over time? That is, to see if there is a connection with the dispatch of questionnaires or other events. The second research question led to the following research objectives: What are the sentiments, are they negative or positive in nature? Which perceptions (ideas or images) do business respondents have of SN, its surveys and questionnaires as shown by these expressions? What aspects of the survey do these expressions relate to, and about which aspects do people complain, or write positively?
5 . 2 . d at a a n d M e t h o d5 . 2 . 1 . d a t aThe data source used for this study is a database named Coosto: a social media monitor operating in the Netherlands. In this database, virtually all public posts in the Dutch language on Dutch social media, web fora and weblogs are structurally collected and stored since January 2009 (Coosto, 2014). Since August 2010 this includes all posts on Twitter: “tweets”. Currently, this database contains more than a billion entries, and each day about 3.2 million entries are added. At the time of data extraction (August 2012), more than 390.000 different social media channels were used, among which the most important are Twitter, Facebook, Hyves, and Google+. Studies of the content of Dutch Twitter messages –the dominant social medium in the Netherlands– revealed that nearly 50% of the messages were composed of ‘pointless babble’ (Daas et al. 2012). This makes the main problem in social media research discriminating the informative from the non-informative messages. The large share of the non-informative ‘babble’ messages negatively affects the use of the more serious informative messages (Daas et al. 2013).
99

C h a p t e r 5
We addressed this problem by devising a restrictive search in the Coosto database, which resulted in a selection of posts to be analyzed. The selection was based on posts for the period January 2009 – August 2012. Keywords for the search included a combination of different denotations of the NSI, and a set of survey-related keywords, like “survey”, “questionnaire”, “letter”, “response”, “fine”, “obligation”, “mandatory”, “administrative burden”, the name of major surveys, and so on. The resulting data set, though, still included a lot of ‘noise’, irrelevant records (see Daas and Puts, 2014, p.26). We then restricted the posts to those strictly relevant to business respondents and business surveys. Double entries that resulted from the overlapping original sets of queries were taken care of. Entries from large news sites and Twitter and Facebook news accounts were left out, as our interest went out to more personal sentiments and dialogues, stemming from business respondents themselves. The few posts or tweets by SN or the Dutch Ministry of Economic affairs were left out as well. Posts that clearly referred to household surveys (114 posts) and posts that did not clearly speak about business surveys (50 posts) were left out as well, as we were only interested in sentiments and perceptions of business respondents towards business surveys in particular. This resulted in 477 posts that were clearly about business surveys and written by business respondents; these posts were analyzed in this study. These procedures can be characterized as the selection of posts based on the relevance to our research objectives. The resulting data set of 477 posts can be defined as the population of public posts with regard to our research questions for the period January 2009 – August 2012; furthermore, in our study no sample was drawn from this population, instead, we analyzed the whole population.
5 . 2 . 2 . M e t h o d s o f a n a l y s i sThe selected posts were analyzed using a sequential two-step mixed-method design. First, a word count or “lexical analysis” was carried out, followed by a qualitative thematic analysis. In a lexical analysis (also called “word counts” or “concordance analyses”) a word list is created which can be seen as concentrated or distilled data (Tesch, 1990, p. 138-139). This enables the exploration and objective identification of central themes in large bodies of text. The words from the word list are therefore clustered into meaningful categories of words with shared semantic fields in a process analogous to the development of a coding scheme for the interpretative qualitative analysis of text. Interpretive researcher input is thus to a certain extent required in certain steps of the analysis, as the “lemma’s” or categories in the classification of words with a similar meaning are to be constructed by the researcher. Still, using this technique makes the analysis to be of a more inductive approach than a purely qualitative analysis as the researchers constructs the categories after the identification of the word and production of the word list.
Lexical analysis is based on an innovative approach to using software originally designed for “corpus linguistics analysis” (CL) (see e.g. Adolphs et al. 2004; Seale, Ziebland and Charteris-Black, 2006). Corpus linguistics is the analysis of large collections of stored, naturally occurring texts, and is typically used to examine discourses, that is, to examine texts as a representation of a certain world view or perception. This type of analysis has
100

S e n t i m e n t S a n d P e r c e P t i o n S o f B u S i n e S S r e S P o n d e n t S o n S o c i a l m e d i a : a n e x P l o r at o r y a n a ly S i S
been used as an effective approach for quantitative analyses of large volumes of texts in the traditional media (see Tesch, 1990; Leech, 1992; Gabrielatos and Baker, 2008), but also postings from social media like Twitter and web fora (see e.g. Seale et al. 2006). Lexical analysis has also been proposed as a suitable method for analyzing qualitative textual data (e.g. Ryan and Weisner, 1996; Jehn and Doucet, 1996, 1997), as it is of a more inductive nature than conventional qualitative approaches. It seems, though, to be especially suited to the conjoint qualitative (thematic) and quantitative analysis of large bodies of texts (e.g. Seale, Ziebland and Charteris-Black, 2006; Gabrielatos and Baker, 2008).
A key concept in lexical analysis is the notion of collocates, which we will introduce here. Collocates are two or more words that regularly co-occur. In this study we focus on the collocates of the NSI, which we define as all words appearing in the selected posts (as all selected and analyzed posts contain a reference to the NSI). All the words examined and the resulting word lists are thus collocates of the NSI. Many of those are an evaluative expression. In the context of lexical analysis, the examination of collocates can not only provide a “semantic analysis of a word” (Sinclair, 1991, pp. 1156-116) but also contributes to reveal its attributed meaning (e.g. Nattinger and DeCarrico, 1992).
An analysis of collocates reveals the attitude or perception expressed (Gabrielatos and Baker, 2008), in this case about the NSI. These attitudes and perceptions are subjective in nature. The aspect of subjectivity is taken into account in lexical analysis by making explicit that the frequent use of particular collocates may result in particular meaning attributes being associated with the NSI that may be subjective and not necessarily be elements of the nature of the NSI (Gabrielatos and Baker, 2008). Moreover, words that at a first glance may seem descriptive, can also be used in an evaluative way (be it positive or negative). This is an important notion, because in this study we are not interested in objective descriptions of the NSI, its surveys, the survey questionnaires and the official statistics, but in the subjective perceptions and sentiments the “speakers” have of these. Collocates thus give information about the most frequent ideas associated with an entity of phenomenon, for example, our lexical analysis shows that the NSI is associated with, among other things, technical issues and “having to”.
For the lexical analysis the software programme Concordance was used (see www.concordancesoftware.co.uk/). The Concordance tool allows researchers, among others, to count words, cluster words into categories, and view and sort collocates. This software tool allows for a more inductive approach to the formulation of coding categories than some other text analysis programs (e.g. Pennebaker, Francis and Booth, 2001) that rely on pre-specified categories. In this project, the Concordance software was preferred over another frequently used tool, i.e. the WordSmith Tool, as this tool is primarily used to calculate keywords in texts on the basis of comparing the corpus with a reference corpus, which we did not have in this study.
In a second step, following the lexical analysis, we carried out a thematic (discourse) analysis. In this step the sentiment of the posts (positive/negative/neutral), as well as the themes or topics present in the posts were coded (see e.g. Ryan and Bernard, 2003; Braun and Clarke,
101

C h a p t e r 5
2006). In line with Silverman’s (2000) definition of a ‘text’, discourse analysis focuses on how different versions of the world are produced through the use of a discourse. Accordingly, we were interested in the representations of SN as displayed in the postings we analyzed.
We made the decision to make our interpretation and coding scheme as objective as possible. Concerning the sentiment of the posts, the requirement to code a post as negative was that the post should contain a clear and objectively definable word or sentence as indicator of a negative evaluation of SN or a survey or something else ‘sent out’ by SN (e.g. a survey, a reminder, a telephone call). E.g. “failure”, “bad”, “”, “Aargh”, and so on, are indicators for negative sentiments. The same holds for the positive sentiment, and includes indicators like “”, “good news”.
The complete set of posts was coded three times by one of the researchers. Between the second and the third coding round, the second researcher coded a subsample of the set, after which differences were discussed and the coding adapted. Like the collocates, themes might be descriptive as well as have evaluative meanings.
In the next section we describe the results of the analysis.
5 . 3 . r e s u Lt s5 . 3 . 1 . e x p l o r i n g t h e s o c i a l m e d i aBy looking at the number of posts in the 3½ year period and the number of different authors, the size of the communication related to the NSI and business surveys on social media is not big (table 1). Relative to the total numbers, there are very little posts about official business surveys to be found in social media and on web forums: 477 posts are relevant. Furthermore, of these eligible posts a large number was “re-tweeted” or otherwise re-sent: 19 % of the total number of posts is a “re-post” of a former post by someone else, or of a news item. A vast majority of these posts are posted by different authors: on average an author posted 1.3 posts.
When looking at these posts over time, at first sight no clear structural annual fluctuations are visible nor a relationship with survey contacts (figure 1), e.g. there is no relation as to when advance letters were sent out. There is one peak that especially stands out and which we could find an explanation for, namely in January 2012. This peak was caused by a press
Table 1. Number of posts, words and authors in the analyzed dataset
Number
Posts 477
(of which re-tweet or other kind of “re-post”) 91 (19%)
Words 19 257
Without stopwords* 3 513
Authors 378
*Stopwords are usually frequent words like “the” that are not meaningful.
102

S e n t i m e n t S a n d P e r c e P t i o n S o f B u S i n e S S r e S P o n d e n t S o n S o c i a l m e d i a : a n e x P l o r at o r y a n a ly S i S
release including a social media post by a Dutch ministry, stating that the administrative burden imposed on entrepreneurs by the NSI had decreased; which was neutral in its presentation. This press release resulted in a large number of posts, including a large amount of re-posts by many different authors. Figure 1 also shows the sentiments of posts in time. The peak in January 2012 mainly consisted of neutral posts (43), followed by 26 negative posts, and only 2 positive posts. Most of these posts were coded as neutral as they were a straight re-post of the original social media post by the Dutch ministry, without adding any positive or negative evaluations.
The largest amount of posts that were in our selection were placed on Twitter (383), followed by Facebook (22 posts). It is important to mark that possibly many posts on Facebook are not public, while we did only have access to public posts. Contrary, tweets are all public by default.
Figure 1. Number of posts over time.
5 . 3 . 2 . r e s u l t s o f t h e l e x i c a l a n a l y s i s The results of the word count or “lexical analysis” are shown in tables 2 and 3. Table 2 shows the prevalence of words that were one of the query words in the Coosto database search. Table 3 shows most occurring meaningful words that were not query words. From this table we get a picture of evaluative meanings that are associated with the NSI in the posts under study, i.e. the collocates, and thus of the perceptions the authors of the posts have of the NSI. It is not surprising
103

C h a p t e r 5
that in these posts the NSI is associated with “entrepreneurs”, “filling in” questionnaires, “data”, “statistics”, and so on, as these are aspects that are part of the objective, factual role of the NSI in society. These thus can be seen as descriptive aspects that are not the core of our interest.
We also see, though, the NSI being associated with other aspects that aren’t necessarily part of the NSI’s factual definition. These are thus evaluative meanings attributed to the NSI, which are indicators of the perception and sentiments of the authors. It is these perceptions and sentiments we are interested in. In the following, we list these, clustered for a number of themes, giving examples only for the cases that complement the results of the thematic analysis (as will be discussed in the next subsection):
Table 2. Most occurring words from the query words in the analyzed dataset
Item Number
NSI 607
Questionnaire 347
Obligation 229
Letter 85
Fine 56
SBS 50
Threatening letter 18
Table 3. Most occurring meaningful words or categories of words in the analyzed dataset
Item Number Item Number
Fill in, supply, provide 335 “Again” 58
Negation 329 Annual report 50
Software or hardware tools 215 Research 49
Time period 152 Receive (a request) 48
Entrepreneurs 146 Failure 47
Data, information, figures 137 Statistics 34
Must, have to 136 “Time” 31
Sanctions 136 Threat, coercion 30
(of which “fine”*) 56) Report 29
Internet, internet tools 103 Netherlands 28
Government 86 Accountancy 24
Decrease, less 66 Economics 22
Question 66 “Cost”, “costs” 20
Administration 20
*Quotation marks indicate a precise word as opposed to a category of words with similar meaning.
104

S e n t i m e n t S a n d P e r c e P t i o n S o f B u S i n e S S r e S P o n d e n t S o n S o c i a l m e d i a : a n e x P l o r at o r y a n a ly S i S
Technological issues (“software and hardware tools”) and “failure” (in the two first examples together in one post):
“What a #failure. The mandatory survey that you have to fill in as an entrepreneur doesn’t function with that browser.”
“Grrrr…. Obliged to share information with the NSI but have been trying for already 2 months just to open the corresponding programme. #fail”
“It is possible to file a complaint but the term to receive an answer is 6 weeks. What do you mean, I’m an organization that is busy only with herself. #NSI#fail.”
“Right. You receive an NSI survey that is obligatory, and then it does not function. Big #fail.”
Coercion (“threat and coercion”, “sanctions”) is highly represented in the data.
We as well see that negations are overabundant in the posts, especially as opposed to “yes” or variations of that word (91 occurences). Detailed scrutiny reveals that they concern a variety of issues of which we give two examples here. In the next section we will more deeply explore the issues related to negative feelings.
“This is sick. If you do not return your data in time to the NSI you’re fined to up to X €! Nutcase” (negation in relation with sanctions.)
“You cannot fill in surveys of the NSI with browser X. What a fuss.” (negation in relation with technological issues.)
“Time” and denotations of time periods, such as “month”, “year” or “week” are frequently used by business respondents on social media in combination with the NSI. This gives an impression on how important time is for businesses. Among the time periods we see the months January, March, April and July appear. These coincide with the dispatching of survey requests. The references to “time” are two sided: we find posts that talk about a decrease in time spent on the NSI’s surveys, but others express experiencing filling in the questionnaires as a waste of time.
Costs are referred to as costs in time but also as money spent on completing the NSI’s questionnaires.
The word “again” shows us that the NSI is associated with reiteration. After a detailed scrutiny of these posts, it turns out that the authors of these posts experience the contacts with the NSI as too frequent. They refer not only to the advance letter and many survey requests, but also to the reminders.
“Pffff again the obligatory exercise for the NSI.”
“Every time again these *** NSI questionnaires…”
105
C h a p t e r 5
Lastly, there are many references to “decrease” or “less”. These concern posts that talk about a decrease in the administrative burden caused by the NSI.
5 . 3 . 3 . t h e m a t i c a n a l y s i s : s e n t i m e n t s a n d t h e m e s Next, we were interested in the themes present in the posts from a qualitative thematic perspective, and the sentiments expressed: positive, negative or neutral. The majority of the posts express a negative sentiment (362 or 76 %), followed by the neutral posts (92 or 19 %). Posts that express a positive sentiment are a minority with only 23 (5 %). The fact that there are more negative than neutral or positive posts can be due to the fact that people might be more prone to post something on the web when they have negative feelings than when they have neutral or positive feelings. These percentages are thus not representative for the feelings of the whole population of Dutch business respondents. But by carefully examining the content of the posts we can infer causes for these feelings and perceptions. In this section we present the themes found in the posts by sentiment. As tables 4, 5 and 6 show, the content of the posts clearly diverges for the three kinds of sentiments. This divergence indicates that the respective themes show causes of positive, negative or neutral feelings. The tables show which themes are related to these sentiments.
In tables 4, 5 and 6, the percentages indicate what percentages of posts contain the respective theme. Several themes can be present in one post at the same time. Themes not printed in italics are considered to be less important. Reason for this is that these themes contain search words and are present in the posts with all three sentiments. It is obvious that, when you look for a certain theme, this theme will be present in your search results. But, on the other hand, if these search words are clearly differentially represented in the postings with different sentiments, then they can be an indicator of what influences the sentiment. The theme “failure of the NSI” is also present in the posts, but is not presented in this section as it was already well discussed above in the results of the lexical analysis.
5 . 3 . 3 . 1 . T h e m e s i n n e g a t i v e p o s t sTable 4 shows the major topics that are identified in posts with a negative sentiment. Below we sum up the main causes of negative sentiments that are revealed and quote some exemplar posts. As these examples show, most posts contain several themes at once.
An important part of the posts that express a negative sentiment refers to technical problems, namely problems with software and/or hardware (e.g. the questionnaires can’t be completed with certain internet browsers). Especially, the combination of these technical problems with the fact that responding is mandatory appears to have resulted in negative sentiments.
“How tragic: the site of the survey of the NSI – which I’m legally obliged to fill in – only works with internet browser X. #bunglers # government”
“I received a survey from the NSI which I’m legally obliged to complete, but can’t be downloaded on X [hardware]. #inwhatyeararetheylivingin?”
106

S e n t i m e n t S a n d P e r c e P t i o n S o f B u S i n e S S r e S P o n d e n t S o n S o c i a l m e d i a : a n e x P l o r at o r y a n a ly S i S
A lot of negative posts show that respondents are unfamiliar with the NSI, its role in society, the legal obligation to comply and the reasons of receiving the questionnaire. This unfamiliarity seems to make respondents insecure about their position. This seems to especially cause negative sentiments in combination with the receipt of a letter in which one is “threatened” with a fine.
“Oops, the NSI! What a nasty threatening letter. Since when am I legally obliged to hand in statistical data? #sanctions (civil servants open until 17h).”
“Why am I LEGALLY MANDATED to supply company data to the NSI and otherwise the fine will be up to xxx €? #daretoask”
As the posts also show, the letters that mention the possibility of fines are experienced as compelling. Moreover, the coercive tone is expressed not to have a positive influence on the motivation and response behavior.
“@X1 @X2 Last month I also had such a letter. Badly formulated and compelling, while they don’t even explain why #nsi”
“Another of those coercive letters by the NSI about obligatorily filling in the survey on X. Legal sanctions, fine, hell and damnation”
Table 4. Major themes in negative posts
Theme Number Percentage*
Questionnaires** 285 79
Statutory obligation 186 51,4
Technical problems 102 28
Unfamiliarity 101 28
Letter 81 22
Fine, sanctions 74 20
Coercive tone 51 14
Waste of time, costs in time 42 11
Difficult questionnaire 35 10
Many questionnaires 29 8
Unnecessary regulation 28 8
Tenacity 24 7
Long questionnaire 25 7
Lack of communication 17 5
*Number of occurrences of the theme and percentage of occurrence of the theme as compared to the complete amount of posts. As the table shows, most posts contain several themes. **The themes not printed in italics are themes in which search words are blended ánd are present in the posts with all three sentiments. These are therefore considered to be less significant.
107
C h a p t e r 5
“Just filled in an NSI survey about my company. A task to seriously procrastinate. Probably the threatening letter has a role in that. . #dig my heels in.”
Also the lack of communication with the NSI may additionally cause negative sentiments, when the help desk is hard to reach for business respondents who have a question.
“#NSI survey, how much time would that cost? Could that be 2 days being unreachable by phone and more than 10 minutes waiting time? And then I still have to fill it in…. ;(“
“But the online NSI questionnaire doesn’t function. Telephone waiting time 15 minutes! A shame!”
“Ooooh yes, I am obliged to return the questionnaire by the 11th, but questions by email are only answered after 10 working days because of busyness !!! #fail#NSI”
Taken all the above together, the combination of the fine, the coercive tone, the tenacity, the deadline, the lack of communication, and the technical problems seem to additionally cause negative sentiments, and reinforce these.
“Great. The NSI OBLIGES me to fill in a questionnaire, or else… fine. When I want to do this, I get an error message. So then, tell me how I should do this?”
“The NSI is stalking me with some survey and is threatening with sanctions, but in the meanwhile their own online survey questionnaire isn’t functioning: #notdoingwell.”
Completing official statistics’ questionnaires is expressed to be experienced as a waste of time. Presumably the reason for this is that entrepreneurs prefer to spend their time on profit-oriented activities, and that they are unaware of the backgrounds of the NSI and its surveys.
“What a f** survey from the #NSI, costs so much time to fill in, like if I have nothing better to do.”
“NOOOOOO, #NSI has made up a new survey and we have to fill that in. #Redtape. Want to work instead of filling in NSI surveys.”
“Obliged to complete that survey!....... WASTE OF MY TIME!!!!!!!!!!!!!!!!!! With your vague letters!”
In addition, characteristics of the questionnaires, like questionnaires that are hard to complete, long questionnaires, and the fact that businesses receive many questionnaires (for various surveys or as part of a recurring survey) are also found as a cause of negative sentiments.
“Filled in an NSI survey on the internet. Jesus, what a user-unfriendly survey was that pffff *completely irritated*”
108

S e n t i m e n t S a n d P e r c e P t i o n S o f B u S i n e S S r e S P o n d e n t S o n S o c i a l m e d i a : a n e x P l o r at o r y a n a ly S i S
“@x. It also cost me a full afternoon and a pot of diazepam to fill in that #NSI bunch of misery. I ate the threatening letter ”
“#NSI is giving me the itches. On an average I receive 10 surveys a month…”
Some negative posts refer to the large number of legal requirements entrepreneurs have to respect. The legal obligation to respond to the NSI’s business surveys is seen as one of these, and experienced as an “unnecessary control mechanism”.
“Filling in the obligatory NSI questionnaire costs hours with those technical problems. Nonsense rules; #NSI #government #wasted tax money # fail.”
“I’ve had my own company for 22 years now and have wasted at least 60% of my time complying with rules of the municipality, province, state and some more of these scumbags. And don’t forget filling in surveys of the NSI among others. I’ll become a communist as well very soon. I don’t think it will make a huge difference in this country.”
5 . 3 . 3 . 2 . T h e m e s i n n e u t r a l p o s t sEven though the neutral posts do not clearly express a positive or negative sentiment, they identify themes that denote concern or interest of business respondents. Besides, they also reflect the perceptions of the authors of the posts. Most of these posts are reposts or re-tweets, indicating that at least the authors somehow find it worthwhile to do so, and make others aware of the message. The main themes in neutral posts, apart from the search words as shown in table 5, refer to administrative burden (39), and unfamiliarity with the NSI (31), indicating that these issues have the attention of business respondents.
Table 5. Major themes in neutral posts
Theme Number Percentage*
Questionnaires** 45 49
Administrative burden (decrease) 39 42
Statutory obligation 38 41
Unfamiliarity 31 34
Less costs in time 9 10
Letter 9 10
Fine, sanctions 7 8
Less costs in money 6 7
*Number of occurrences of the theme and percentage of occurrence of the theme as compared to the complete amount of posts. As the table shows, most posts contain several themes. **The themes not printed in italics are themes in which search words are blended ánd are present in the posts with all three sentiments. These are therefore considered to be less significant.
109

C h a p t e r 5
The posts below are examples of neutral posts. We decided to code these as neutral as no clear and objectively definable word(s), symbol(s) or sentence as indicator of a negative evaluation of Statistics Netherlands or its surveys are present in these posts, like “#fail”, “bad”, “”, “Aargh”, etc.
Administrative burden:
“Administrative burden on entrepreneurs by the NSI decreases.”
Unfamiliarity:
“Ooops I didn’t know that as a company you’re legally obliged to supply data if the NSI asks for that, so just decided to do that…”
“If I don’t cooperate with a survey, there will be consequences?? Since when is it compulsory to fill in a survey?”
“Today I received a letter by the NSI. I must COMPULSORILY cooperate in a study into the business environment. Is that really possible just like that?”
Less costs in time:
“NSI surveys are costing entrepreneurs less time: the administrative burden for entrepreneurs…”
Letter:
“Letter from the NSI: the government considers the providing of data that important that they have made it legally obligatory”
5 . 3 . 3 . 3 . T h e m e s i n p o s i t i v e p o s t sThemes in positive posts are shown in Table 6. These include the simplification of the questionnaires, the acknowledgement of the value of statistics produced by the NSI, the decrease of the administrative burden, and the observation that the number of questionnaires is being reduced. Examples of these posts are:
Simplification:
“Then there’s good news. The NSI reduces and simplifies the surveys for one-man companies and SMEs.”
Positive value of statistics:
“Just completely filled in a long questionnaire on request by the NSI. That’s good for the accuracy of the statistics. #you’rewelcome.”
Decrease administrative burden:
“#goodnews: Administrative burden for entrepreneurs by the NSI decreases.”
Decrease in amount of questionnaires:
“Good news for one-man companies, less surveys by the NSI to one-man companies.”
110

S e n t i m e n t S a n d P e r c e P t i o n S o f B u S i n e S S r e S P o n d e n t S o n S o c i a l m e d i a : a n e x P l o r at o r y a n a ly S i S
5 . 4 . C o n C L u s i o n a n d d i s C u s s i o n5 . 4 . 1 . e x p l o r i n g a n d a n a l y z i n g s o c i a l m e d i a d a t a The exploratory study presented in this paper is – to the best of our knowledge – one of the first into the use of social media data aimed at exploring the perception and sentiments of business survey respondents. Based on our findings and experience we can suggest the following recommendations toward conducting social media studies on survey respondents:
As discussed in the introduction, the large share of the non-informative ‘babble’ messages in the social media negatively affects the use of the more serious informative messages (Daas et al., 2013). It is thus very important to make an appropriate selection and to define the relevant keywords and synonyms (as used by the target population) to use for the query. When the target population is not well defined, posts from units that are out of scope may be selected, resulting in over coverage of the posts. This is important as the number of data records will be vast. On the other hand, when keywords are missed, the data set may not cover all eligible posts, resulting in under coverage of posts. As Stieglitz and Dang-Xuan (2012, p. 1283) state: “to attain a high level of data completeness, relevant keywords representing the topic of interest have to be carefully and systematically chosen in advance”.
The characteristics of social media data also have implications for the analysis methods that should be used. As discussed in section 2.2 we applied a two-step mixed-method design, including both a word count and a thematic analysis. As for the thematic analysis posts were coded several times by one of the authors and a sample was coded by both authors. This is done to achieve intra and inter-coding reliability.
The two methods used in this two-step mixed-methods approach can help triangulate the findings of each other (see for example also Baker et al. 2008, p. 295). Triangulation is a method used by qualitative or mixed-methods researchers to check and establish validity in their studies by analyzing a research question from multiple perspectives (Guion, Diehl and McDonald, 2011). However they are also complementary to each other: with the lexical
Table 6. Major themes in positive posts
Theme Number Percentage*
Questionnaires** 18 78
Statutory obligation 8 35
Simplification questionnaires 6 26
Positive value of statistics 4 17
Administrative burden (decrease) 3 13
Decrease in amount of questionnaires 3 13
*Number of occurrences of the theme and percentage of occurrence of the theme as compared to the complete amount of posts. As the table shows, most posts contain several themes. **The themes not printed in italics are themes in which search words are blended ánd are present in the posts with all three sentiments. These are therefore considered to be less significant.
111

C h a p t e r 5
analysis we were able to identify themes we would not have found with the thematic analysis and vice versa. The lexical analysis in the first step aided in identifying themes and coding the posts, as it showed quantitative evidence of words and patterns being repeatedly used (see also e.g. Hardt-Mautner, 1995; Baker et al., 2008), and identifying areas of interest (see e.g. Mautner, 2007). In this way it helps to guard for over- or under interpretation. The thematic analysis in the second step has the advantage that one can look beyond the semantic level, and themes can be coded at the latent level, as well as identifying so called wider themes (Gabrielatos and Baker, 2008) or meta themes (Ryan and Bernard, 2003). Subtle, implicit meanings can’t be easily analyzed through lexical analysis (Wodak, 2007), but can be identified with qualitative thematic coding. An example in the case of this study would be the unfamiliarity with the NSI, frequently referred to in the postings. We were only able to identify this theme when we did the thematic coding. If we had only done the lexical analysis we would have not identified this theme.
Representativeness of social media data is still an issue but recent findings are positive. Daas et al. (2013) discuss opportunities and challenges associated with using social media data form the Coosto data base for official statistics based on a case study conducted at Statistics Netherlands. They found that the monthly sentiment for the period June 2010 to August 2012 derived from Dutch social media messages taken from the Coosto data base correlated very strongly (0.83) with the officially determined monthly Dutch consumer confidence. In addition it correlated also with the sentiment for the sub indicator of the attitude towards the economic climate (0.88). This high correlation is remarkable, as the populations from which the data are obtained are different: both official indicators are based on a sample survey in which 1500 people are interviewed each month.
5 . 4 . 2 . s u m m a r y a n d d i s c u s s i o n o f t h e a n a l y s i s r e s u l t sWe found that the discussions on social media with regard to the NSI, its surveys and questionnaires are very small in number. The number is small both relative to the total number of public posts, and relative to the total number of questionnaires dispatched every year. Furthermore, we did not find important annually reoccurring increases in communication activities related to the dispatching of questionnaires.
The topics discussed show a variety of themes, varying over the associated sentiments: negative, positive, and neutral. In negative posts the main themes are: technical failures; unfamiliarity with the NSI and its role; letters that are perceived as too coercive; the idea that filling in a questionnaire is a waste of time and that these surveys are “unnecessary mandatory regulations”; characteristics of the questionnaire and the inaccessibility of the NSI for business respondents with questions, both by telephone and email. In a number of posts more than one theme was mentioned, indicating that a combination of these aspects may especially lead to negative feelings. The combination of the technical problems with the waiting time to contact the NSI, the legal obligation to comply and the strict deadlines to return the completed questionnaire, is not helpful in establishing a positive perception of the NSI.
112

S e n t i m e n t S a n d P e r c e P t i o n S o f B u S i n e S S r e S P o n d e n t S o n S o c i a l m e d i a : a n e x P l o r at o r y a n a ly S i S
A positive image is associated with the simplification of questionnaires, the positive value of official statistics and the (perception of) a decrease of the response burden.
Neutral posts indicate that entrepreneurs somehow show interest in the reduction of response burden, simply by re-tweeting these messages. The neutral posts also show, like the negative posts, that some business respondents are unfamiliar with the NSI, from which we can conclude that this is an important topic to address.
Considering the attention that is given to the imposed response burden by SN, by politicians and in various publications by e.g. business organizations, commercial banks, as well as the government, we had expected that in the social media this topic would also be discussed quite often. However, this assumption is not corroborated in our exploratory analysis. This may have several reasons. It might indicate that a vast majority of the entrepreneurs is not as much interested in posting on this topic in the social media as we thought. Possibly they are too busy running their businesses to spend much time communicating on social media about these issues. It is also possible that the topic in itself is not that important to them as we thought. This might also be a reason why we did not find important annually reoccurring increases in communication activities related to the dispatching of questionnaires. However, we still need to put some critical remarks with these data and the analyses. We only had access to public posts; private posts are not included in our database. This may lead to an underestimation of the number of messages in our source.
Nevertheless, we can validate our conclusions. We can conclude that in the overall picture the findings (as to the expressed sentiments) are in line with findings from previous qualitative and quantitative studies into sentiments of business respondents towards SN and its surveys. Giesen (2012) analyzed the results of the Customer Satisfaction Survey conducted by SN in 2006. In this survey, a sample of respondents of the Dutch Structural Business Survey (SBS) was contacted for a short CATI interview asking questions about the completion of the SBS questionnaire and the respondents’ opinion about SN. As an indicator for the overall attitude towards SN a question is used which asks respondents to rate their overall satisfaction with SN with a grade between 1 and 10. On average respondents grade SN with a 6.5. According to the Dutch system of rating school grades this would be a bit above satisfactory. 13% of the respondents give a grade below 6, an unsatisfactory grade. In Snijkers, Berkenbosch and Luppes (2007), qualitative data show that negative sentiments are related to costs; the statutory obligation; the fines; threats and tone of the letters; and lack of knowledge of survey procedures (especially the importance of random sampling). Interest in and usefulness of the survey topic is another important topic: businesses generally did not rate surveys as useful for society or themselves. Also unfamiliarity is found. Customer-friendliness, on the other hand, is associated with positive sentiments.
In addition to these studies, with this analysis, we have gained some quantitative information about perceptions of business respondents of official surveys. More importantly, we have gained information about causes for a positive or negative perception, and aspects that are related to positive or negative sentiments. This analysis is an inductive and empirical observation
113

C h a p t e r 5
of existing perceptions and sentiments about the NSI and its surveys and causes for these perceptions and sentiments. Even though the breakdown in percentages of the sentiments may not be representative for the breakdown in percentages of the whole population of business respondents in the Netherlands, that is not the main and most important finding of the analysis.
The analysis shows which actions taken by the NSI and features of the communication and survey design are related to the expressed perceptions and sentiments. Therefore, the results give an empirical indication of how the communication and survey design could be adapted to positively influence survey response (see figure 2) .
Figure 2. Communication strategy and sentiments of respondents.
5 . 4 . 3 . r e c o m m e n d at i o n s f o r s u r ve y a n d c o m m u n i c at i o n d e s i g nBased on the results, we can formulate a set of recommendations that should eliminate the causes of negative sentiments, enhance a positive perception of the NSI and its surveys, and therefore enhance motivation to comply and increase response rates and the quality of the response. These recommendations follow up on and corroborate the recommendations of previous studies (see for example Snijkers et al., 2007; Torres van Grinsven et al. 2011, Torres van Grinsven, Bolko and Bavdaž, 2014). They also are in line with internationally identified factors affecting the business survey response process (Snijkers et al., 2013).
As costs in time and money are important for entrepreneurs, it is important to reduce participation costs but also to increase the (perceived) value, or the (perceived) benefit, of the surveys for the businesses. This is in line with social exchange theory (Homans, 1958), which when applied to survey behavior asserts that the actions of respondents in answering a questionnaire are motivated by the personal benefit these actions are expected to bring, or usually do bring. Whether a given behavior occurs is a function of the perceived costs of engaging in that activity and the expected rewards (Poon, Albaum and Evangelista, 1999). Social exchange theory has been extensively applied to improve survey participation in the
114

S e n t i m e n t S a n d P e r c e P t i o n S o f B u S i n e S S r e S P o n d e n t S o n S o c i a l m e d i a : a n e x P l o r at o r y a n a ly S i S
field of household surveys (e.g. Dillman, 1978). Singer (2012) proposes a variant of this theory – the benefit-cost theory, in which the argument is that people choose to act when in their subjective calculus the benefits of doing so outweigh the costs.
In the same line, it is very important to facilitate and simplify the response tasks, to reduce (perceived) costs. Initial perceptions of high costs, and negative experiences cause a negative perception and therefore a higher perceived burden (see Giesen, 2012), especially in combination with a coercive tone, the strict response deadline and response chasing. The NSI should also make clear to business respondents that it has made efforts to facilitate the response process. Furthermore, our analysis shows that simplification of questionnaires enforces positive sentiments, which may lift the public image of an NSI.
Besides, the unfamiliarity with the NSI, its role as surveyor of data and producer and publisher of statistics needs to be marketed by developing a sound and coherent survey communication strategy (see also Snijkers, 2009).
A final set of recommendations is related to the use of social media as a communication channel to be used by NSIs. Social media can be used to disseminate statistics, but can also be used to communicate with respondents and as a channel in a communication strategy to enhance a positive perception (see figure 2).
Current theories within linguistics claim that people are unconsciously primed to infer meanings due to the cumulative effect of all of their previous encounters with a word, i.e. the collocates of that word (e.g. Hoey, 2005). This means that if people in the media consistently come across the NSI in combination with burden, they are primed to associate the NSI with burden. Therefore it is important for statistical bureaus to consciously engage in well-considered communicative practices to influence the perception people and business respondents have of the statistical bureau, and evaluate the effectiveness of these. The social media, together with traditional media, can be used to actively and pervasively inform the public and businesses about the NSI, its role and importance in the modern information society, and consequently influence the perception and image business respondents and the public in general have of an NSI. The social media can also be used to monitor the effectiveness of these communication activities.
115


C h a p t e r 6 a C r i t i C a L r e v i e W o F M o t i v at i o n t h e o r i e s
a n d p r o p o s i t i o n s F o r o r g a n i z at i o n a L s u r v e y M e t h o d o L o g y r e s e a r C h
Torres van Grinsven, V., Bolko, I., and Bavdaž, M.

C h a p t e r 6
a B s t r a C tHistorically most organizational surveys have brought in low response rates. Assumedly the driving force behind behavior – motivation – is insufficient or lacking in these cases. Motivation in organizational surveys has been tested implicitly through specific actions and incentives, but an explanatory framework is still missing. This paper seeks to start filling up this gap by giving a selective overview of motivation research and theories from different fields and critically integrating findings in these fields into propositions to apply motivation theory to organizational survey design. Understanding motivation for the survey task in organizations promises to enhance the capacity of researchers to influence the behavior of respondents in an organizational setting, and, consequently, achieve higher response rates and more valid survey results.
k e y w o r d sMotivation, goal setting, organization, response behavior, survey error, work motivation
118

A crit ic Al re vie w of motivAtion theories And propositions for orgAniz AtionAl surve y methodology reseArch
6 . 1 . i n t r o d u C t i o nIn survey-based research declining response rates have been a problem since years (de Leeuw and de Heer, 2002; Baruch, 1999). However they have stabilized at a low level in organization research (Baruch and Holtom, 2008) but only because of response enhancing techniques (Anseel, Lievens, Schollaert, and Choragwicka, 2010). However historically most organizational surveys have brought in low response rates (Armstrong and Lusk, 1987; Baruch 1999), the reasons for these negative developments may be sought in societal changes and changing perceptions of time and privacy. Younger generations of workers hold stronger values for leisure time and place more value on work that provides extrinsic rewards. Moreover, they value intrinsic and social rewards less than older generations of workers (Twenge et al., 2010).
If person or household surveys take participants’ free time, the situation is different in the organizational or business setting where surveys occupy participants’ work time (as discussed by Willimack and Snijkers, Chapter 2 in Snijkers et al., 2013). Questionnaires asking about topics like management practices, planning procedures and systems or financial information are asking for information that is the organization’s property, and not the respondents’ own (Jobber, 1986). Thus, because of factors such as a preoccupation with work, confidentiality of information, or organizational rules and policies it is assumed that organizational populations are in general less likely to respond to survey questionnaires than persons or households (Greer, Chuchinprakarn and Seshadri, 2000).
Even when an establishment or organization does participate, the attention to the survey task might not be sufficient, which leads to a more covert problem of poor quality of reported data. The extent of this measurement error might be most easily evaluated in governmental surveys where recent studies suggest that as much as 30 % (e.g. Adolfsson et al., 2010) of the total survey cost is spent on data editing.
In social psychology and behavioral economics, motivation has long been acknowledged as a driving force behind behavior. Especially in work-related behavior, motivation is shown to be relevant (e.g. Pinder, 2008; Rainey and Steinbauer, 1999). As an example of behavior relevant for the organizational survey task, previous research suggests that motivation is linked to information processing (Pittman and D’Agostino, 1985; Webster and Kruglanski, 1994). Better information processing was shown to be induced by several sources of motivation such as accountability (Tetlock, 1985), perceived importance of the task (Kruglanski and Freund, 1983; Locke and Latham, 2002), positive emotions (Fredrickson, 2001), and mood (Bless et al., 1990). In this line, Groves, Cialdini and Couper (1992) also theorized that social psychological factors like respondents’ current mood, feelings of obligation, deference, and liking toward the survey sponsor should be considered, among others, in addition to cost/benefit issues, when trying to understand survey participation. Currently, there is some empirical evidence for agricultural surveys that differences in the respondents’ feelings about the survey sponsor and the perceived effect of survey statistics are related to survey participation (McCarthy, Beckler and Qualey, 2006).
119

C h a p t e r 6
Based on behavioral theories from psychology and behavioral economics, we propose that the problem of declining response rates and poor data quality indicates that the drive behind behavior – the motivation for the organizational survey task –is insufficient or lacking. Though other factors might be at stake, such as the authority and the capacity to respond (see e.g. Tomaskovic-Devey, Leiter and Thompson, 1994; Snijkers et al., 2013) motivation seems to play a crucial role and should not be omitted when trying to achieve higher response rates and more valid survey results. Motivation has been explicitly mentioned or implicitly included in several theories on survey participation and the response process, and indirectly tested in empirical studies on incentives. For instance, Snijkers and Jones (chapter 9 in Snijkers et al., 2013) explicitly state that the role of a communication strategy aimed at obtaining high survey response rates, is to motivate respondents to comply with the survey request. However, more in-depth treatment of motivation has been rare (e.g. Krosnick, 1991; Rogelberg et al., 2001; Wenemark et al., 2011), though in line with the call to bring into survey research more findings from social and behavioral sciences to help explain survey behavior (Krosnick, 1991, Groves and Lyberg, 2010). Motivation was shown to contribute to respondents’ better item completion rates and greater effort and care of responding to the survey (Rogelberg et al., 2001) as well as increased response rates, respondent satisfaction and data quality (Wenemark et al, 2011). Still, more research is necessary to understand motivation in organizational survey response behavior (Rogelberg and Stanton, 2007; Rose, Sidle and Griffith, 2007) because this promises to enhance the capacity of researchers to influence this motivation and thus achieve better survey outcomes: not only response rates, but also quality of response (measurement error) and timing.
Continuing this path of research the aim of this review is to gain theoretical insights into the motivational processes that lead to participation in organizational surveys and provision of an accurate and timely response. Reviewing and critically synthesizing former theories and empirical research in the areas of psychology, behavioral economics and survey methodology and guided by the most recent empirical research that investigated motivation in official business surveys (Torres van Grinsven Bolko and Bavdaž, 2014; Chapter 2 in this thesis) and the use of incentives in organizational surveys (Torres van Grinsven and Hox, in review; Chapter 4), we propose which types of motivation appear to be important for the organizational survey task. Torres van Grinsven, Bolko and Bavdaž (2014) show that for the business survey task, there appears to be a certain variety of sources of motivation and types of motivation functioning in the organizational survey task. Not all sources identified in their qualitative interview data can be accommodated to the Self-determination theory, which seems to be the most applied theory in motivation research and has also been applied to household surveys (see Wenemark et al., 2011). Furthermore we bring special attention to the specifics of organizational surveys. The specifics arising from the organizational setting and the employment relationship in a business or another organization may have consequences for relevant types of motivation and the way the motivation leads to desired behavioral and survey outcomes. Organizational surveys and organizations have many specifics which may ask for caution as to the straightforward applicability of Wenemark et al.’s (2011) conclusion to the organizational survey response task.
120

A crit ic Al re vie w of motivAtion theories And propositions for orgAniz AtionAl surve y methodology reseArch
We begin with a short introduction of the concept of motivation and we then explore the uses of the concept in survey methodology. Then we critically discuss and synthesize findings from different fields and formulate a set of critical propositions concerning the importance of the different types of motivation and sources of motivation on organizational survey outcome and the process leading to this outcome. Finally, in paragraph 5 we review sources of motivation as found in the literature and conclude with thoughts about possible sources for the organizational survey task.
6 . 2 . M o t i v at i o n t h e o r y : W h at i s M o t i v at i o n ?The term motivation was introduced in the beginning of the 1900s in the work context (Steers, Mowday and Shapiro, 2004) where the Hawthorne studies acknowledged the workers’ motivation as a crucial factor contributing to productivity (Roethlisberger and Dickson, 1939). In the following decades, the study of motivation as a driving force behind behavior entered many areas of psychology. The primary assumption of the behavioral theory was that behavior is basically carried out in an effort to reduce internal tension or stimulation that rested on a limited set of primary drives arising from physical necessities (Hull, 1943). Cessation of the internal stimulation would lead to a decrease or even disappearance of the activity – a phenomenon which is called homeostasis (see Berkowitz, 1969). Later studies revealed that organisms also show attempts to increase arousal. Motivation independent of the primary drives, or motives not associated with some form of deprivation were suggested (see for example Maslow, 1954; Hunt, 1965; Berlyne, 1966). Hunt (1965) referred to this type of motivation as of “intrinsic motivation,” an expression which was taken up by many scholars, and is now firmly grounded in motivation research.
Currently, there seems to be no consensual definition of motivation despite attempts to find one (e.g. Kleinginna and Kleinginna, 1981). Most commonly, though, the term ‘motivation’ is used to describe “why a person in a given situation selects one response over another or makes a given response with great energization or frequency” (Bargh, Gollwitzer and Oettingen, 2010, p. 268). The idea of choosing a certain response is also expressed as a direction (Berkowitz, 1969) or an orientation (Ryan and Deci, 2000) of the behavior. In organizational surveys, this direction would initially determine (the decision for) survey (non) participation. The energization is also described as vigor (Berkowitz, 1969) or strength (Ryan and Deci, 2000), which means that motivated respondents would invest more energy and effort in the survey task. Persistence (or maintenance or duration of the initially chosen action) is another aspect of action that motivation can affect (Locke and Latham, 2004; Seo et al., 2004). In organizational surveys this implies that respondents would persist with the survey task even if some obstacles appear. They would thus perform better and provide a more accurate and complete response. On the other hand, lack of persistence results in less than optimal survey outcome, such as measurement error or even unit nonresponse if the obstacles result too high to overcome without or with modest persistence. Survey outcome thus reflects the amount of motivation to perform a task through the three dimensions direction, intensity
121

C h a p t e r 6
and persistency of the behavior. The higher the motivation: (a) the more favorable initial choices related to the task (direction), (b) the higher the amount of effort invested in the task (intensity), and (c) the more persistence for the task in the presence of obstacles (persistence). It depends on these three dimensions whether or not the survey outcome is the desired one: survey response providing timely and accurate data, though we acknowledge the importance of other factors in organizational surveys, such as capacity and authority.
Several theories from different fields try to define types of motivation, explain their functioning and determine their sources. Without being exhaustive, in paragraph 4 of this Chapter we critically review those identified as potentially most relevant for organizational survey research and discuss propositions for organizational survey design. But first we shortly review the uses of the concept of motivation in survey methodology research up to now.
6 . 3 . M o t i v at i o n i n s u r v e y M e t h o d o L o g y r e s e a r C hIn survey methodology research, motivation has been explicitly mentioned or implicitly included in several theories on survey participation and the response process, most of them concerning person or household surveys. In this section we review this research and discuss its application to organizational surveys.
6 . 3 . 1 . i n d i v i d u a l s u r v e y sTheory of planned behavior. In individual surveys, important research (Hox, de Leeuw and Vorst, 1996; Rogelberg et al., 2001; Loosveldt and Storms, 2008) is founded on the theory of planned behavior (Ajzen, 1991) that was derived from Bandura’s self-efficacy theory (Bandura and Cervone, 1983) and proved efficient as a predictor of intentions and behavior (see a meta-analysis in Armitage and Conner, 2001). According to this theory intentions are assumed to capture the motivational factors; are posed as the precursors of behavior; and are used as proximal measures of behavior. Predictions about whether a person intends to do something are based on the analysis of this person’s attitudes (whether the person is in favor of doing it), subjective norms (how much the person feels social pressure to do it) and perceived behavioral control (whether the person feels in control of the action in question).
In the survey context, this theory provides one of the rationales for the hypothesis that an individual with positive opinions about and positive attitudes towards surveys will be more eager to participate in a survey and provide better data quality compared to those with negative attitudes who are more likely to act as non-respondents (Rogelberg et al., 2001). Effortful responding has been theoretically linked to respondent motivation, which in turn has been theoretically linked to a variety of individual difference variables (Krosnick, 1991). These individual difference variables have some conceptual similarity to attitudes toward surveys (e.g., need for cognition, interest in the survey topic) (Rogelberg et al., 2001, p. 6). In this line, Loosveldt and Storms (2008) introduce five dimensions that shape the survey response behavior, namely: survey enjoyment, survey value, survey cost, survey reliability,
122

A crit ic Al re vie w of motivAtion theories And propositions for orgAniz AtionAl surve y methodology reseArch
and survey privacy. Rogelberg et al. (2001) and Loosveldt and Storms (2008) asked for attitudes towards surveys in general whereas Hox et al. (1996) were also interested in attitudes towards the specific survey actually used to measure the response. The latter is more consistent with Ajzen’s argument that the indicators must be assessed in relation to the particular behavior of interest and in the specific context.
Although the theory of planned behavior is one of the most studied and implemented approaches in scientific prediction its applicability for explaining motivation and behavior in the organizational survey response process seems less evident. It does share some aspects with the Self-Determination theory (e.g. perceived behavioral control compared to competence, see below) but it focuses on intentions that are similar though not the same as motivation given that intentions capture more than just motivation. In addition, factors influencing intentions seem insufficient to cover all business or organizational situations (e.g. an explicit instruction from a superior can hardly be labeled a subjective norm).
Cost-benefit theory. Whereas intentions are posed as the precursors of behavior in the theory of planned behavior, the willingness to participate represents the core idea of the benefit-cost theory of survey participation by Singer (2012). Singer provides a model, based on expectancy-value theory, in which the decision to participate represents a subjective estimation of costs and benefits and leads to participation if benefits outweigh the costs, similar as in rational choice theory (see e.g. Schnell, 1997). Included in this analysis, but not further elaborated, is motivation to respond as an essential part of behavior; this motivation seems to occur after estimation and weighing. Singer (2012) sees the benefit-cost theory as a synthesis of principles derived from social exchange theory (e.g. Dillman, 1978) and leverage-saliency theory (e.g. Groves, Singer and Corning, 2000). In Singer’s theory the process of decision making is almost completely rationally based. As opposed to this rational process of decision making, the heuristic decision making is stressed in the leverage-saliency theory of survey participation (Groves et al., 2000). Achieved influence of a particular survey design attribute depends upon how important it is to the potential respondent (leverage), and how salient it becomes during the presentation of the survey request. These attributes seem to be sources of motivation. We will further discuss the issue of rationality versus heuristics in paragraph 4.1.1.
Self-determination theory applied to a person survey. Recently Self-Determination theory has been applied to the field of person or household surveys (see Wenemark et al., 2010; Wenemark et al., 2011). Applying this theory allows for a broadening of survey participation theories to also include task commitment and performance. Wenemark et al. (2011) use the Self-Determination theory as an inspiration to redesign data collection procedures and the questionnaire of a self-administered voluntary health-related survey of individuals. The redesign is focused on promoting competence, autonomy and relatedness that facilitate intrinsic motivation. Based on an experiment, Wenemark et al. (2011) conclude that survey researchers should aim to enhance intrinsic motivation to achieve respondents’ superior commitment to the task, having in mind that research suggests that the quality of experience
123

C h a p t e r 6
and performance is higher when intrinsic motivation is stimulated (Ryan and Deci 2000). The experiment shows increased response rates, respondent satisfaction and a slightly higher data quality with the SDT design. We will further discuss these issues in paragraph 4.2.
6 . 3 . 2 . o r g a n i z a t i o n a l s u r v e y sIn the context of organizational surveys, it is important to note that motivation can be studied for different units of observation (see Tomaskovic-Devey, Leiter and Thompson, 1994; Lorenc, 2006; Bavdaž, 2010). The individual’s motivation is influenced by the respondents’ specific organizational setting. Groves et al. (1992), for example, propose that cooperation of members of organizations reporting to surveys on behalf of these organizations will be likely influenced by formal rules and legal guidance.
Tomaskovic-Devey et al. (1994) aim to explain the organizational nonresponse to survey requests with the individual and organizational authority, capacity, and motive. Their model takes into account that organizational complexity importantly influences these three factors, but the motivational aspect is much less elaborated than the authority and the capacity. The authors suggest that in organizational surveys the individual motive to cooperate is an important determinant of response rates as in surveys of individuals and conclude that organizational goals influence individual behavior through collective motives for survey response. They conceptualize the organizational motive to respond to reflect whether or not it is in the organization’s interest to disclose information; the organizational motive is seen as a reflection of the interaction between the organization’s relationships with the environment, the attributes of the designated respondent for the organization, and the salience of a particular survey instrument. However, Tomaskovic-Devey et al. (1994) perceive a specific collective motive as the only influence on the individual motivation and they do not elaborate on the motivation at the individual level. Furthermore, they do not study the impact of motivation on the quality of the response and there is no reflection on the level of commitment, as is possible with SDT.
Willimack, Nichols, and Sudman (2002) investigate factors that affect non-response in official business surveys. They divide them in factors out of researcher’s control, and factors under researcher’s control. Motivation of the respondent is allocated among the factors out of researcher’s control but at the same time they call for more research on these factors. Based on this framework and the one proposed by Groves and Couper (1998), Snijkers (2008) provides a response model for understanding organizational response behavior and includes organizational motivation as a factor of the decision to respond together with response burden (for a recent discussion, see Snijkers et al. 2013). Yet, how motivation and response burden lead to the decision, and how the decision leads to the behavior is not elaborated.
Numerous research shows that influencing motivation is an effective way to influence behavior and induce behavioral change. Still, quite surprisingly, this knowledge has up to now not consistently or in-depth been applied to behavioral change and influence for
124

A crit ic Al re vie w of motivAtion theories And propositions for orgAniz AtionAl surve y methodology reseArch
achieving better organizational survey outcomes. Motivation figures in several theories on survey participation and response process but none of them provides its in-depth treatment in organizational surveys. Survey methodologists attribute different roles and attention to motivation in their models, and expose different combinations of often similar sources of motivation. Having these previous frameworks in mind, it seems necessary to investigate the concept of motivation more in depth, and specifically relating it to the setting of the organizational survey response process. In chapter 4 we critically discuss several frameworks on motivation from different fields of research and formulate a set of critical propositions concerning the importance of the different types of motivation on organizational survey outcome and the process leading to this outcome.
6 . 4 . d i s C u s s i o n : M o t i v at i o n i n t h e o r g a n i z at i o n a L s u r v e y t a s k
6 . 4 . 1 . i m p l i c i t a n d e x p l i c i t m o t i v e sIn McClelland’s dual system approach to motivation (1985) there are two types of motives. Implicit motives refer to unconscious determinants and may be paralleled to the aroused motive as in Hull’s original sense (1943) that represents a more primitive motivational system derived from affective experiences (McClelland, 1985; Woike, 1995). Other, cognitive variables such as the probability of success and the incentive value, i.e. conscious expectancies and values, are then the base for explicit or self-attributed motives (these explicit motives conceptually have a parallel with extrinsic motivation). Implicit motives are posited to better predict behavioral trends over time because they provide a general orientation toward certain types of goals like a general trend to do things well, whereas self-attributed motives better predict immediate responses to specific situations or choice behavior because they help define more narrowly the area in which those goals are to be accomplished and are associated with explicit goals. Implicit motives in the form of specific personality traits for example may thus guide a respondent to generally do things accurately (McClelland, Koestner and Weinberger, 1989), and this disposition would lead to accurate fulfillment of survey requests if an explicit goal is set to fulfill a survey request.
6 . 4 . 1 . 1 . i m p l i c i t v e r s u s e x p l i c i t m o t i v e s i n t h e o r g a n i z a t i o n a l s u r v e y t a s k
Psychological theories of motivation have mainly focused on explicit motives and conscious goals, and paid less attention to unconscious determinants except for research based on the attribution theory (Weiner, 1985) – which we will shortly mention in paragraph 5, and McClelland’s dual system motivation theory. This is particularly true for organizational theories of work motivation (see paragraph 4.3.). Trying to fill this gap, Seo et al. (2004), for example, provide a framework in which emotion is theorized to be the central construct affecting both the processes and outcomes of work motivation. They propose that mood affects information
125

C h a p t e r 6
processing and task performance; people in a good mood are less easily distracted from the task than people in a bad mood (Bless et al., 1990). The effect of unconscious determinants on motivation and ensuing behavior was also stressed by others (e.g. McClelland et al., 1953; Bargh et al., 2001). Research by social psychologists has challenged standard (economic) models of decision making that assume rational outcome maximization (Frank, Gilovich, and Regan, 1993; Kahneman and Tvresky (e.g. 1979, 1984); Mikulincer et al., 2005; Schwartz, 1994; Vohs, Mead and Goode, 2006). In this line, a great deal of empirical research relies on heuristics and judgmental short cuts in most every day decision-making tasks. Also in survey research heuristics is discussed in relation to respondent behavior (Krosnick, 1991; Groves, Cialdini, and Couper (1992) McCarthy, Beckler, and Qualey, 2006). Recently, researchers have called to pay more attention to implicit processes within organizations (e.g. Bing et al., 2007; Haines and Sumner, 2006). Due to characteristics of modern work life, a large proportion of daily processing occurs outside employee’s awareness and control (Uhlmann et al., 2012). This puts doubts on the full-fledged applicability of a cost/benefit theory that is almost completely based on a rational process of decision-making on the survey process and the organizational survey process in particular.
Many of these unconscious determinants are well captured with implicit motives as suggested in McClelland’s dual system approach (1985). Moreover, in the literature, implicit motives are associated with intrinsic and extrinsic motivation. Kehr (2004) poses that not just fulfillment of certain fundamental implicit motives or needs but fulfillment of any implicit motive is associated with task enjoyment so an individual’s implicit motives determine whether or not he or she experiences the tasks as intrinsically motivating. This would mean that implicit motives are an important influence to behavior; implicit motives influence both intrinsic and extrinsic motivation and should thus have an important place in organizational survey design when trying to positively influence organizational survey response. Consistently, Torres van Grinsven et al. (2014; Chapter 2), find that a large group of sources as found in their qualitative interview data might be considered implicit motives that are part of implicit, automatic processes and which seem to be pervasive in organizational life (Johnson and Steinman 2009). From here we derive that implicit motives influence survey outcome by influencing intrinsic and extrinsic motivation for the organizational survey task (proposition 1).
In section 4.3. we will further discuss the relevance of explicit motives and goals for the organizational survey response task.
6 . 4 . 2 . s e l f - d e t e r m i n a t i o n t h e o r yTwo types of motivation are also at the core of the Self-Determination theory, namely intrinsic and extrinsic motivation (Deci and Ryan, 1985). This theory explains the motivation as a continuum between intrinsic motivation, i.e. completely self-determined motivation at one extreme and amotivation, i.e. lack of motivation, at the other extreme, with extrinsic motivation in between (Gagné and Deci, 2005). For organizational surveys, this means that respondents would find the survey task interesting and derive spontaneous satisfaction from it if they
126

A crit ic Al re vie w of motivAtion theories And propositions for orgAniz AtionAl surve y methodology reseArch
are intrinsically motivated, i.e. anticipated rewards are inherent in engaging in the activity. If, on the other hand, respondents are extrinsically motivated, they need an instrumentality between the task and some separable consequences (e.g. tangible or intangible rewards); those consequences are then the source of satisfaction, not the task itself. In Kruglanski’s words (1975), with intrinsic motivation the task is an end in itself whereas with extrinsic motivation the task is a means to an end. There is a conceptual parallel between this distinction and the distinction between implicit and explicit motives (McClelland, 1985; McClelland et al., 1989).
Intrinsic motivation is facilitated by three factors, i.e. competence, autonomy, and relatedness, which could be regarded as innate psychological needs that guide behavior (see Cognitive Evaluation Theory, a sub-theory of self-determination theory, Ryan and Deci, 2000). This would mean that respondents who feel more competent to successfully complete a questionnaire, more in control of the whole task, and more connected to others in the organization they belong to (if the organization asks them to respond) or the surveying organization, are also more intrinsically motivated to perform this task. Another important aspect is that extrinsic motivation spans along the continuum that ranges from externally induced to internalized (see Organismic Integration Theory, a sub-theory of self-determination theory, Deci and Ryan, 1985). Through the process of internalization respondents can turn extrinsically motivating aspects of the organizational survey task into intrinsically stimulating elements by making them more personal. Besides “purely” externally regulated motivation, there are three types of extrinsic motivation depending on the extent of their internalization: introjected, identified, and integrated. With introjected regulation, respondents accept regulation, but not as their own; with identified regulation, respondents value certain behaviors for their congruence with their personal goals and identities; and with integrated regulation, respondents completely identify specific behaviors with themselves.
Two types of motivation are also distinguished in Herzberg’s two-factor theory (1968), a classic theory of organizational behavior, proposing hygiene factors that are extrinsic to the work, and motivators that are intrinsic to the work. This theory, however, focuses primarily on how behavior is energized, whereas we are also interested in how it is directed.
6 . 4 . 2 . 1 . i n t r i n s i c v e r s u s e x t r i n s i c m o t i v a t i o n i n a n o r g a n i z a t i o n a l s e t t i n g
Where one motivation theory, i.e. SDT has been applied in depth to the improvement of survey outcome in a household survey (Wenemark et al., 2010; Wenemark et al. 2011), only the effects of intrinsic motivation with the underlying three fundamental needs competence, autonomy and relatedness have been studied, while still ignoring the possible importance of other types of motivation. In this previously discussed study, Wenemark et al. (2011) acknowledge that the studied topic may have been inherently interesting to respondents and that the possibilities of intrinsically motivating respondents may vary across different surveys and different populations. In the case of an organizational survey, responding to a survey might not be perceived as that interesting, neither for the organization nor for the respondent.
127

C h a p t e r 6
Therefore, it is not straightforward that the same results would have been achieved when doing such an experiment with an organizational survey. Empirical research shows that for the organizational survey task, there appears to be a large variety of sources of motivation and types of motivation functioning in the organizational survey task, not only intrinsic motivation (Torres van Grinsven, Bolko and Bavdaž, 2014; Chapter 2). They conclude that although the high quantity of verbal accounts of extrinsic motivation identified in their analysis compared to those of intrinsic motivation is by no means indicative of their prevalence, it is impossible to ignore their presence and relevance in the business setting. Research also shows that an extrinsic reward such as an incentive improves response rates in organizational surveys (Torres van Grinsven and Hox, in review), from which it can be concluded that the motivation for the survey task is enhanced by the incentive and thus extrinsic motivation is more important for the organizational survey task than would be concluded based on SDT alone. Even Ryan and Deci (2000, p.2) state: “Frankly speaking, because many of the tasks that educators want their students to perform are not inherently interesting or enjoyable, knowing how to promote more active and volitional (versus passive and controlling) forms of extrinsic motivation becomes an essential strategy for successful teaching.” The same could hold for promoting motivation in organizational survey response: probably not all tasks in an organizational survey can be made inherently interesting or enjoyable. In these cases it is important to know how to promote extrinsic motivation the right way. Some research on motivation in the fields of psychology and behavioral economics supports these suggestions, which we will discuss now.
SDT suggests that the quality of experience and performance can be very different when one is behaving for intrinsic versus extrinsic reasons. Ryan and Deci (2000) posed that intrinsic reasons lead to higher quality than extrinsic ones and that incentives undermine intrinsic motivation while enhancing extrinsic motivation. This conclusion is based on experimental research that is mostly based on the “free choice measure” as a measure for intrinsic motivation, or in some cases measures by self-reports of interest and enjoyment. This is also the central argument in the “crowding out” theory (Frey, 1997), stating that extrinsic motivators such as incentives crowd out intrinsic motivation, if they are perceived as controlling. A meta-analysis of the literature by Deci, Koestner and Ryan (1999) shows pervasive negative effects of financial incentives as extrinsic rewards on intrinsic motivation. However, some studies suggest that such conclusion is far from straightforward. Carton (1996) points to confounding methodological effects in these experiments, because some aspects were not controlled for; namely the timing of reward delivery, the number of reward administrations, and the perception of reward availability. These aspects can explain why tangible rewards have a negative impact on intrinsic motivation while praise (being delivered immediately, often and without clear stimuli) has a positive impact. Fehr and Falk (2002) also question the negative impact of rewards on intrinsic motivation because neither the costs nor the full returns of the subjects’ performance were taken into account in the respective psychology studies, because of which it was not possible to examine the impact on the efficiency of changing from an intrinsic motivational orientation to an extrinsic one. Cameron, Banko and Pierce (2001) conducted a meta-analysis of more than a hundred
128

A crit ic Al re vie w of motivAtion theories And propositions for orgAniz AtionAl surve y methodology reseArch
experimental studies on the role of rewards. Their results show that rewards enhance intrinsic motivation for low-interest tasks while different kinds of rewards have different effects on high-interest tasks. Negative effects are found on high-interest tasks when the rewards are tangible, expected (offered beforehand), and loosely tied to level of performance. When rewards are linked to level of performance, measures of intrinsic motivation increase or do not differ from a non-rewarded control group. Overall, the pattern of these results indicates that reward contingencies do not have pervasive negative effects on intrinsic motivation. Also other research contends that incentives in general promote effort and performance (see e.g. Gibbons, 1997; Lazear, 2000). In other words, contingent rewards are shown to serve as “positive” reinforcers for the desired behavior (Bénabou and Tirole, 2003).
Furthermore, it is not clear whether crowding out of task-specific intrinsic orientation prevails in contexts usually associated with monetary compensation, like in an employment relationship (Fang and Gerhart, 2012; Fehr and Falk, 2002; Staw et al., 1980), which is typically the case in the organizational survey response task. Fang and Gerhart (2012) show that pay for performance, i.e. an extrinsic reward, was associated with higher (not lower) levels of perceived autonomy, perceived competence, and intrinsic interest in a workplace setting. On the other hand, empirical studies have indicated that payments perceived as controlling can reduce work effort and performance, whereas payments perceived as supportive have the opposite effect of improving work effort and performance (Andersen and Pallessen, 2008; Bertelli, 2006; Frey and Jegen, 2001). A negative association between a controlling perception of an external intervention and all types of motivation is shown. But when the perception of the external intervention is perceived as supportive rather than controlling, then motivation is not negatively influenced. The mechanisms between “crowding out” effects would thus appear to be depending on how an external intervention is perceived and how it makes an individual feel (Jacobsen et al., 2013).
Moreover, it has not been studied a lot whether “crowding out” occurs for other types of autonomous motivation than intrinsic motivation (Delfgaauw and Dur, 2008; Georgellis et al., 2011). Only a few studies consider the crowding out effects of command systems (Andersen et al., 2011). According to these authors, it appears that command systems (such as in a work environment) can in certain cases provoke a “crowding in” instead of a “crowding out”. In the case of intrinsic motivation, it would depend on whether the external intervention either reinforces self-determination or not.
In this line, Kehr (2004), in a theoretical framework, proposes that extrinsic rewards only undermine intrinsic motivation if they are incongruent with the person’s initial motives. This means that extrinsic motivation to participate in a survey and provide a timely and accurate response reduces a respondent’s intrinsic drives only if it contradicts the initial (implicit) motives that lay on the base of this intrinsic motivation. Externally imposed goals fueling extrinsic motivation can be intrinsically motivating, provided they are congruent with the person’s initially aroused implicit motives (Kehr, 2004). In fact, this does not contradict Organismic Integration Theory (Deci and Ryan, 1985), as this theory also states that initially
129

C h a p t e r 6
extrinsically motivating aspects can be turned into intrinsically stimulating elements. By means of the process of internalization respondents can turn extrinsically motivating aspects of the organizational survey task into intrinsically stimulating elements by making them more personal. Based on this discussion, we propose (Proposition 2a) that extrinsic rewards given to respondents can in certain conditions (as discussed above) increase performance for the survey task, and (Proposition 2b) that these can even increase the respondents’ intrinsic motivation in the case they are compatible with their original implicit motives.
6 . 4 . 3 . g o a l - s e t t i n g t h e o r yGoals are defined as cognitive representations of desired states, and represent a frequently studied motivational construct (Austin and Vancouver, 1996). They direct action by activating cognitively-based motivational processes (explicit motives). When people establish a goal, they devote a portion of their total available resources to goal accomplishment.
One of the most prominent theories in motivation research is the goal-setting theory (see Locke and Latham, 1990). According to this theory, setting goals actually helps attaining these goals and thus leads to enhanced performance (Locke, 1997). Performance is maximized when goals set have high valence, are specific, difficult, people understand what behaviors will lead to the goals and feel competent to do so (Locke and Latham, 1990).
Setting specific goals often requires dividing a large goal into sub goals. The parsing of situations affects decision making (see Rachlin, 2000; Steel and König, 2006). This means, for example, that when respondents divide the whole task of completing a questionnaire into partial tasks (e.g. retrieving data from records, collecting data from colleagues) they more easily estimate how much time is needed to accomplish each of the partial tasks. This way the working process is more realistically planned; running late and completing the questionnaire carelessly becomes less likely. According to this theory, the most difficult goals trigger the highest levels of effort and performance (Locke and Latham, 2002). Furthermore, actions toward a goal occur only if its drive or utility exceeds that of other pursuits (Raschlin, 2000). This is important for organizational surveys because there are typically many competing options in the form of other tasks that depend on the respondent’s work description (e.g. completing tax forms, preparing internal reports, etc.). Several factors also influence the actual impact of goal setting on effort and performance, namely ability, feedback, task complexity, goal commitment and situational constraints (see e.g. Seijts and Crim, 2009). This means, for example, that a respondent has to be able and feel competent to attain a specific goal (e.g. computing a certain datum based on data from the business information system), otherwise the motivation is likely to be missing. Research findings also suggest that the desire to pursue a goal increases as goal attainment draws nearer (Freeman and Muravem, 2010) so that respondents who see that a (sub)goal (e.g. computing a required datum) is nearly reached are less likely to stop striving to reach this goal. On the other hand, if respondents are confronted with a very complex task (e.g. a long questionnaire with unclear navigation) they are more likely to completely lose motivation.
130
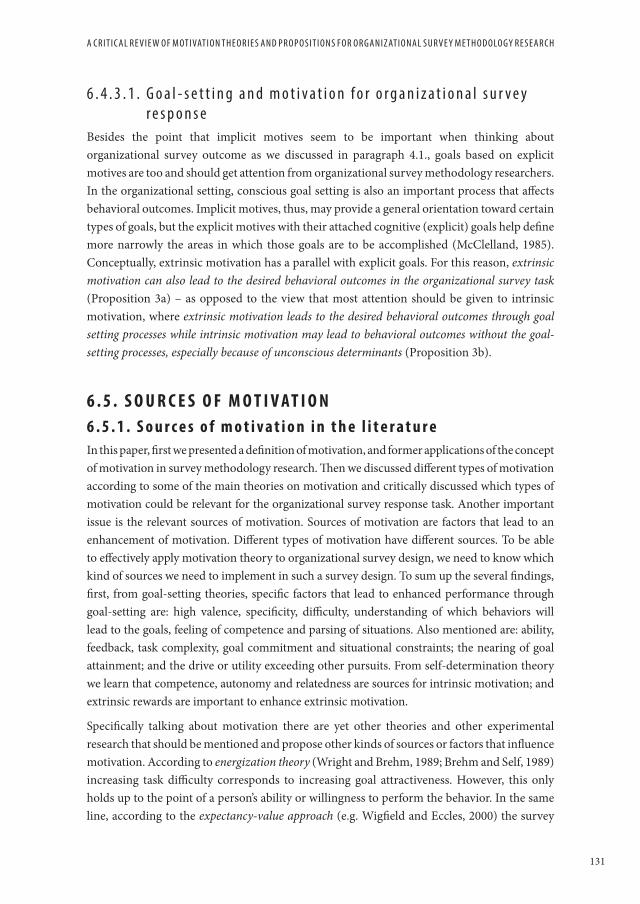
A crit ic Al re vie w of motivAtion theories And propositions for orgAniz AtionAl surve y methodology reseArch
6 . 4 . 3 . 1 . G o a l - s e t t i n g a n d m o t i v a t i o n f o r o r g a n i z a t i o n a l s u r v e y r e s p o n s e
Besides the point that implicit motives seem to be important when thinking about organizational survey outcome as we discussed in paragraph 4.1., goals based on explicit motives are too and should get attention from organizational survey methodology researchers. In the organizational setting, conscious goal setting is also an important process that affects behavioral outcomes. Implicit motives, thus, may provide a general orientation toward certain types of goals, but the explicit motives with their attached cognitive (explicit) goals help define more narrowly the areas in which those goals are to be accomplished (McClelland, 1985). Conceptually, extrinsic motivation has a parallel with explicit goals. For this reason, extrinsic motivation can also lead to the desired behavioral outcomes in the organizational survey task (Proposition 3a) – as opposed to the view that most attention should be given to intrinsic motivation, where extrinsic motivation leads to the desired behavioral outcomes through goal setting processes while intrinsic motivation may lead to behavioral outcomes without the goal-setting processes, especially because of unconscious determinants (Proposition 3b).
6 . 5 . s o u r C e s o F M o t i v at i o n6 . 5 . 1 . s o u r c e s o f m o t i v a t i o n i n t h e l i t e r a t u r eIn this paper, first we presented a definition of motivation, and former applications of the concept of motivation in survey methodology research. Then we discussed different types of motivation according to some of the main theories on motivation and critically discussed which types of motivation could be relevant for the organizational survey response task. Another important issue is the relevant sources of motivation. Sources of motivation are factors that lead to an enhancement of motivation. Different types of motivation have different sources. To be able to effectively apply motivation theory to organizational survey design, we need to know which kind of sources we need to implement in such a survey design. To sum up the several findings, first, from goal-setting theories, specific factors that lead to enhanced performance through goal-setting are: high valence, specificity, difficulty, understanding of which behaviors will lead to the goals, feeling of competence and parsing of situations. Also mentioned are: ability, feedback, task complexity, goal commitment and situational constraints; the nearing of goal attainment; and the drive or utility exceeding other pursuits. From self-determination theory we learn that competence, autonomy and relatedness are sources for intrinsic motivation; and extrinsic rewards are important to enhance extrinsic motivation.
Specifically talking about motivation there are yet other theories and other experimental research that should be mentioned and propose other kinds of sources or factors that influence motivation. According to energization theory (Wright and Brehm, 1989; Brehm and Self, 1989) increasing task difficulty corresponds to increasing goal attractiveness. However, this only holds up to the point of a person’s ability or willingness to perform the behavior. In the same line, according to the expectancy-value approach (e.g. Wigfield and Eccles, 2000) the survey
131

C h a p t e r 6
response behavior can be explained by respondents’ beliefs about how able they are to do the survey task and their appraisal of the task outcomes. The attribution theory of motivation suggests that motivation depends on how people attribute causes to consequences depending on their expectancies and related emotional experiences (Weiner, 1985). In this theory, the perceived causes of success and failure share three common properties: locus, controllability, and stability. For the organizational survey task this means that respondents’ motivation would be strengthened when they attribute successful questionnaire’s completion to their engagement; when they feel in control of the response process and are able to influence it (e.g. by setting a more appropriate deadline); and when their questionnaire’s completion follows the same routine. Similarly, Morsella et al. (2011) imply that negative valence associations may underlie avoidance motivation, and have practical implications for workplace environment in which effort and positive affect are conducive to success.
To sum up, proposed sources are thus: increasing task difficulty up to the people’s willingness or ability to perform the behavior; respondents’ beliefs about how able they are to do the survey task and their appraisal of the task outcomes; and locus, controllability and stability. Negative valence associations are proposed as sources of motivation directed in the opposite direction: namely avoidance of the task.
We see valence (utility), task difficulty / complexity and ability as especially clearly recurring elements, though this doesn’t mean the other elements are less relevant.
Table 1 provides a wider though non-exhaustive overview of different sources or factors for motivation as found in the literature. Part of the literature presented in this table has been discussed in this paper.
6 . 5 . 2 . s o u r c e s o f m o t i v a t i o n i n t h e o r g a n i z a t i o n a l s u r v e y s e t t i n g
In paragraph 5.1., we gave a sample overview of sources of motivation as found in the literature and that theoretically could be relevant for the organizational business survey response task. In this paragraph, we discuss some empirical research into sources of motivation specifically for the organizational survey response task. It awaits further research to test the precise effects of these sources on behavioral and survey response process and outcomes; and to determine how to exactly apply these sources into a survey and communication design.
As discussed in paragraph 4.2.1., recent empirical research into sources of motivation shows that for the organizational survey task, there appears to be a large variety of sources of motivation and types of motivation (Torres van Grinsven, Bolko and Bavdaž, 2014; Chapter 2 in this dissertation). Table 2, adapted from Chapter 2 shows the sources of motivation as coded in their thematic analysis of qualitative interview data. As we can see, not all identified sources can be accommodated to the Self-determination theory, which seems to be the most applied theory in motivation research. Further on, these empirical data corroborate the four propositions presented in this Chapter 6 as they draw attention towards the
132

A crit ic Al re vie w of motivAtion theories And propositions for orgAniz AtionAl surve y methodology reseArch
Tabl
e 1.
Sam
ple
over
view
of s
ourc
es o
r fac
tors
for m
otiv
atio
n as
foun
d in
the
liter
atur
e
Intr
insi
c m
otiv
atio
nEx
trin
sic m
otiv
atio
n, ex
plic
it m
otiv
esN
on-d
efine
d
Kru
glan
ski (
1975
); Pi
ttman
, Bo
ggia
no a
nd R
uble
(198
3)Pr
edic
tabi
lity,
sim
plic
ity, e
ase
of
mas
teri
ng ta
sk
Zuck
erm
ann,
Por
ac, L
athi
n,
Sm
ith a
nd D
eci (
1978
)Pe
rcei
ved
choi
ce
Wei
ner (
1985
) Lo
cus,
cont
rolla
bilit
y, st
abili
ty
McC
lella
nd, K
oestn
er an
d W
einb
erge
r (19
89)
Cha
lleng
eEa
sine
ss o
f tas
k
Wri
ght a
nd B
rehm
(198
9);
Breh
m a
nd S
elf (
1989
)Ta
sk d
ifficu
lty (u
p to
the
poin
t of a
per
son’s
ab
ility
or w
illin
gnes
s)
Mal
one
and
Lepp
er (1
987)
Cha
lleng
e, co
ntro
l, cu
riosit
y, fa
ntas
y
Ajz
en (1
991)
1A
ttitu
des,
subj
ectiv
e no
rms a
nd p
erce
ived
be
havi
oral
con
trol
Epste
in an
d H
arak
iew
itz (1
992)
Com
pete
nce
valu
atio
n
Ryan
and
Dec
i (20
00)
Com
pete
nce,
aut
onom
y, re
late
dnes
sEx
trin
sic
rew
ards
, avo
idan
ce
of n
egat
ive
feed
back
, val
ue
Wig
field
and
Ecc
les (
2000
)Be
liefs
abou
t abi
lity
and
appr
aisa
l of t
ask
outc
omes
Cam
eron
, Ban
ko a
nd P
ierc
e (2
001)
Extr
insi
c re
war
ds
Wor
k mot
ivat
ion
Staw
, Cal
der a
nd H
ess (
1980
) Ex
trin
sic
rew
ards
Fehr
and
Fal
k (2
002)
; Bé
nabo
u an
d Ti
role
(200
3)Ex
trin
sic
rew
ards
Extr
insi
c re
war
ds
Lock
e an
d La
tham
(200
2)C
onsc
ious
per
form
ance
goa
ls
Seo,
Fel
dman
Bar
ret a
nd B
artu
nek
(200
4)A
ffect
ive
expe
rien
ce
Mor
sella
, Fei
nber
g, C
igar
hci,
N
ewto
n an
d W
illia
ms (
2011
)Po
sitiv
e va
lenc
e as
soci
atio
ns
Fang
and
Ger
hart
(201
2)PF
IP (p
ay fo
r ind
ivid
ual p
erfo
rman
ce)
1 In th
e th
eory
of p
lann
ed b
ehav
ior,
thes
e fa
ctor
s are
pro
pose
d as
affe
ctin
g in
tent
ions
, whi
ch a
re a
ssum
ed to
cap
ture
the
mot
ivat
iona
l ele
men
ts.
133

C h a p t e r 6
relevance of extrinsic motivation and explicit goals and motives; implicit motives; and the prominent role of goal setting, e.g. in the form of work tasks. In Chapter 2 we also suggest that in the organizational setting extrinsic motivation calls for at least as much attention as intrinsic motivation and that other sources of motivation may be relevant than only those stemming from the three fundamental needs in Cognitive Evaluation Theory, and that other approaches may have the potential to better explain some aspects of motivation in business surveys than the SDT framework alone, for instance McClelland’s (1985) dual system approach to motivation that treats implicit motives.
Research also shows that an extrinsic reward such as in the form of an incentive improves response rates in organizational surveys (Torres van Grinsven and Hox, in review; Chapter 4 in this dissertation), from which it can be concluded that the motivation for the survey task is enhanced by the incentive.
6 . 6 . C o n C L u s i o nTo sum up, in this chapter we critically reviewed motivation research and theories from different fields of research and integrated findings in these fields into critical propositions for applying motivation theory to organizational survey design to improve response rates, data quality and timeliness. It offers a new perspective on understanding the drives underlying
Table 2. Sources of motivation for the business survey task (from: Torres van Grinsven, Bolko and Bavdaž, 2014; Chapter 2)
Type of motivation Subtypes Sources of motivation
Extrinsic motivation Externally regulated motivation Legal mandate
Introjected extrinsic motivation Work tasks (explicitly assigned)Social responsibility:Value for society in generalValue for specific purposesValue for specific groupsPrinciple of reciprocity
Identified extrinsic motivation Value for own business or self
Integrated extrinsic motivation Work tasks (adopted)
Intrinsic motivation Enjoyment and challenge Perceived competenceAutonomyRelatedness
MoodHuman curiosity disposition Disposition for accuracy and precisionRoutinesTask characteristics
Note: Terms in italics are taken from the SDT and its sub theories Cognitive Evaluation Theory and Organismic Integration Theory
134

A crit ic Al re vie w of motivAtion theories And propositions for orgAniz AtionAl surve y methodology reseArch
the organizational response behavior and the functioning of incentives in the organizational settings. In particular, as opposed to the most important previous research that gives priority to intrinsic motivation and the three underlying sources competence, autonomy and relatedness, we expose the relevance of extrinsic motivation and the related explicit goals and motives and its potential impact on intrinsic motivation. Besides these cognitive and conscious determinants, we also acknowledge the impact of implicit motives. Moreover, we point to the prominent role of goal setting, which is typical of work environments and much more explicitly present there compared to person surveys. Furthermore, extant theories on survey participation and response process in organizational surveys offer only a limited insight into motivation; we call for a more in-depth treatment.
Based on this review, we also challenge the perspective encountered in previous research (e.g. Willimack, Nichols and Sudman, 2002) that motivation is out of researcher’s control. We suggest that some types of motivation can and should be influenced. Motivation might even be the easiest to change compared to authority that is completely in an organization’s domain, and capacity that can merely be influenced through education or training (cf. Tomaskovic-Devey, Thompson and Leiter, 1994). This paper studied motivation at the level of the individual respondent but it would also be interesting to further examine specific organizational characteristics and their impact on motivation both at the organizational and individual levels.
Given that several types of motivation appear relevant in organizational surveys, the list of possible specific sources of motivation is expected to be long and diverse. This chapter can thus be considered as a reminder about the variety of possible stimuli to be utilized to enhance motivation for the organizational survey task and as an inducement for generating ideas for new ones. We appeal to researchers to be open to innovative sources of motivation and especially to think of the survey questionnaire not so much as a data gathering device but as a medium that establishes a relationship. This should be equally or even more important for survey agencies that continuously turn to businesses or other organizations with requests for data. Last but not least, it awaits future research to design tools and strategies for utilizing the discussed types of motivation and the respective sources that stimulate these types of motivation, and test their precise effects on behavioral and survey response process and outcomes.
135


C h a p t e r 7 s u M M a r y a n d C o n C L u s i o n


S u m m a r y a n d C o n C l u S i o n
7 . 1 . s u M M a r y o F t h e r e s u Lt s a n d C o n C L u s i o n sIn this dissertation we have gained theoretical and empirical insights into the concept of motivation in relationship to the business and organizational survey task. The research has led to a number of recommendations on how to improve organizational survey and communication design to enhance motivation and herewith improve response rates and data quality and diminish burden complaints by businesses and other types of organizations. With this knowledge, now we can not only start improving motivation of organizations and respondents in organizational surveys, but we have also laid the base upon which to continue further research on motivation in organizational surveys, continuing to fill the gap between what is known in other disciplines about motivation and how this can be applied to organizational survey research. Both qualitative and quantitative analysis techniques were used, as well as different types of data. By using different data types and analysis methods complementarity and validation of the results of the different chapters is achieved. Literature research was also part of the endeavor of bringing in more knowledge on motivation into the field of business and organizational survey methodology.
In the remainder, I will first discuss the conclusion of each chapter, continuing with a summary of practical recommendations based on each of the chapters. I finish with ideas for further research, directed towards continuing on the base that has been laid in this dissertation with regard to motivation in organizational surveys.
In Chapter 2, we present a thematic analysis of both primary and secondary qualitative interview data. We discuss that in the business setting extrinsic motivation calls for at least as much attention as intrinsic motivation and that other sources of motivation may be relevant besides those stemming from the three fundamental needs in the Cognitive Evaluation Theory (competence, autonomy and relatedness) as opposed to previous research that gives attention mainly to intrinsic motivation and its related three fundamental needs. We also discuss that other approaches may have the potential to better explain some aspects of motivation in business surveys than the SDT framework alone, for instance McClelland’s (e.g. McClelland, 1985) dual system approach to motivation that treats implicit motives. The chapter concludes with suggestions for improvement of motivation in business surveys and ideas for further research.
Chapter 3 explores more in depth businesses’ use of official statistics and possibilities for enhancing this use. The article showcases uses of official statistics, identifies barriers to their use, and suggests areas of improvement, with the dual goal of enhancing the ability of national statistical institutes to produce and communicate high-quality statistics relevant to businesses and of raising businesses’ awareness of the potential uses of official statistics. This knowledge can be used to enhance motivation through a survey and communication design.
Chapter 4 describes the results of a meta-analysis of 34 experimental studies that implemented a monetary or non-monetary incentive in order to increase response rates in an organizational survey. In this chapter we showed that an extrinsic reward such as an incentive is effective in increasing organizational survey response rates. We were, however,
139

C h a p t e r 7
not able to analyze timeliness and quality of the response. Neither were we able to directly test motivation and see which types of motivation were increased with the incentive. It awaits future research to test the use of an incentive, measuring not only response rates, quality of the response (item non-response and measurement error) and timeliness but also directly measuring the impact of the incentive on motivation.
As we saw in Chapter 2, sentiments – like for example a respondent’s mood, and perceptions (for example the perceived value of the survey or the surveying organization) – are empirically identified as important sources of motivation in business surveys. Chapter 5 indicates which kind of actions and communication strategies influence a positive or negative sentiment and perception and herewith also aids in gaining knowledge on how to enhance motivation through a survey and communication design. This chapter makes it especially evident that communication instances are very important in influencing perception and sentiments and should receive due attention when designing a survey.
Finally, Chapter 6 offers a critical review of motivation research and theories from different fields and integrates findings in these fields into critical propositions to apply motivation theory to organizational survey design, guided by previous findings from the research that is presented in this dissertation, especially from Chapter 2 and 4. It offers a new perspective on understanding the drives underlying the organizational response behavior and the functioning of incentives in the organizational settings. In particular, as opposed to the most important previous research that gives attention to intrinsic motivation and the three underlying sources competence, autonomy and relatedness, we expose the relevance of extrinsic motivation and the related explicit goals and motives and its potential impact on intrinsic motivation. Besides these cognitive and conscious determinants, we also acknowledge the impact of implicit motives. Moreover, we point to the prominent role of goal setting, which is typical of work environments and much more explicitly present there compared to person surveys.
7 . 2 . p r a C t i C a L r e C o M M e n d at i o n s F o r o r g a n i z at i o n a L s u r v e y d e s i g n
More concretely speaking, this dissertation gives practical recommendations on how to adapt a survey and communication design for a business or organizational survey as to enhance motivation in such a way that response rates, timeliness, accuracy and completeness are improved.
First, in Chapter 2, we recommend several survey design and communication strategies as to enhance motivation: current response-enhancing practices, that is, reminders and (threats of) fines in the case of nonresponse seem to achieve their aim of assuring response though they typically represent negative, not positive reinforcers; value of the survey, the survey organization and the survey outcomes should be improved and communicated. This applies both to the perceived and the actual value. Second, suggestions that focus mainly
140

S u m m a r y a n d C o n C l u S i o n
on enhancing respondents’ intrinsic motivation are: survey participation should be made as enjoyable as possible; respondents’ perceived competence (or perceived abilities) should be enhanced; a good relationship with the business and the respondent should be built up to enhance relatedness; and respondents should feel that they have some autonomy with regard to the business survey task. A different approach to enhancing motivation is to attempt to improve respondents’ mood. The business survey response task could also result in better outcomes if respondents were selected from those people that have desirable dispositions. It awaits further research to exactly determine how this would best be done. For example, it seems that people in certain jobs are more prone to have certain dispositions (see Chapter 2, paragraph 3.3.), so an approach could be to select people with a certain job description for the survey request.
Chapter 3 shows that national statistical institutes (NSIs) do not sufficiently recognize businesses as a distinct and important user group. Because of this reason NSIs seldom consider businesses’ needs as a separate, recognized concern. Businesses were generally aware in a limited way of the NSI as a source of external data, independent of the level of data reliance within the business. Three issues seem to hinder further use of official statistics in businesses: unawareness that some useful statistics might exist at an NSI (which involves an awareness component and a competency component), difficulty in accessing the statistics, and shortcomings of the statistics. The shortcomings were multifaceted, including mismatch between internal and external data, insufficient level of detail, insufficient timeliness, unmet need for multinational statistics, and low comprehensibility of the statistics. These shortcomings relate to quality dimensions of official statistics as presented by Eurostat, the European Statistical Office (Eurostat, 2011), which include among others: relevance, timeless, clarity, comparability, and coherence. NSIs are encouraged to improve their own practices of managing communications from their business users. In this way, they would improve their ability both to aid businesses and other support seekers and to utilize their own resources better. This is expected to lead to increased perceived importance and usefulness of the surveys in businesses which, as in Chapter 2 identified sources of extrinsic motivation, are assumed to lead to better survey outcomes. Concrete proposals include dissemination of official statistics figures more adapted to businesses’ needs and experience (see paragraph 4.2.1 of chapter 3) and support to businesses to bring official statistics closer to fulfilling their needs (4.2.2.).
We also propose two broader action points. First, more cooperation with intermediaries (e.g., media, trade organizations) that distribute official statistics might raise awareness of the statistics’ origin and inform businesses of other relevant NSI statistics. Second, activities for aligning formats and breakdowns of internal and external data would benefit both businesses and NSIs. Mismatches can originate from different standards in the different branches of government (e.g., accounting, statistics, customs). Efforts to eliminate such differences include, for instance, single entry points for businesses to provide data for administrative purposes (e.g., Yancheva and Iskrova, 2011; Pereira, 2011) and unifying data formats (e.g. Van Hilvoorde, 2011).
141

C h a p t e r 7
From Chapter 4 we learn that the use of an extrinsic motivator, in particular an incentive, can lead to better response rates in an organizational survey, especially when response rates are normally low. The results of the meta-analysis corroborate findings from Chapter 2 which show the importance of extrinsic motivation in the business survey response task. It is recommended to use incentives in organizational surveys, depending on the initial response rates and a previous analysis of the cost-effectiveness and other specific interests in each particular case.
Based on the results of Chapter 5, we can as well formulate a set of recommendations that are expected to eliminate the causes of negative sentiments, enhance a positive perception of the NSI and its surveys, and therefore enhance motivation to comply and increase response rates and the quality and timeliness of the response. Some of these recommendations repeat and thus corroborate findings from other chapters. As costs in time and money are important for entrepreneurs, it is important to reduce participation costs but also to increase the (perceived) value, or the (perceived) benefit, of the surveys for the businesses. In the same line, it is very important to facilitate and simplify the response tasks, to reduce (perceived) costs. Besides, looking at the unfamiliarity with the NSI, its role as surveyor of data and producer and publisher of statistics, this needs to be marketed by developing a sound and coherent survey communication strategy (see also Snijkers 2009; Snijkers et al., 2013: chapter 9). A final set of recommendations is related to the use of social media as a communication channel to be used by NSIs. Social media can be used to disseminate statistics, but can also be used to communicate with respondents and as a channel in a communication strategy to enhance a positive perception.
7 . 3 . F u r t h e r r e s e a r C hIt awaits future research to design tools and strategies for utilizing the discussed types of motivation and the respective sources that stimulate these types of motivation to their full extent, and test their precise effects on behavioral and survey response process and outcomes. For example, the effectiveness of an incentive (Chapter 4) as a source of extrinsic motivation and even its potential impact on intrinsic motivation could be experimentally tested. In the same way it awaits further research to test the use of other sources of extrinsic and intrinsic motivation, such as the promotion of the use of official statistics by organizations that are requested to participate in an organizational survey (Chapter 3) or other sources as concluded from Chapter 2. Ideally these should be tested in a survey and communication design to enhance response rates, timeliness and quality of the response and explicitly measure the effect of these strategies on the different types of motivation.
A possible way to measure intrinsic and extrinsic motivation and thus to measure the precise effect on motivation of using the different specific sources in a survey and communication design as discussed in this dissertation, is applying one of the several motivation scales that have been developed. See for example: SIMS, Situational Motivation Scale (Guay, Vallerand and Blanchard, 2000); PLOCQ, Perceived Locus of Causality scale (Goudas,
142

S u m m a r y a n d C o n C l u S i o n
Biddle and Fox, 1994); the scale for Work Motivation used by Wright (2004); and several other motivation scales developed in the context of Self-determination theory, among which the IMI (Intrinsic Motivation Inventory, not dated). It would seem very interesting to carry out experiments on survey design applying the strategies we have discussed in this dissertation, and measuring the exact effects on response rate, data quality, timeliness and also the different types of motivation.
143


R e f e R e n c e s
R e f e R e n c e s1 Aarts, H. and Dijksterhuis, A. (2000). “Habits as Knowledge Structures: Automaticity in Goal-Directed
Behaviour.” Journal of Personality and Social Psychology, 78, 53–63. 2 ABS (Australian Bureau of Statistics). (n.d.). Planning for Business. Retrieved from http://www.abs.gov.
au/AUSSTATS/[email protected]/Lookup/1391.0.55.001Main+Features22010 3 Adolfsson, C., Arvidson, G.,Gidlund, P., Norberg, A. and Nordberg, L. (2010). “Development and
Implementation of Selective Data Editing at Statistics Sweden.” European Conference on Quality in Official Statistics, Helsinki, Finland. Available at: http://q2010.stat.fi/media//presentations/Norberg_et_all__Statistics_Sweden_slutversion.pdf
4 Adolphs, S., Brown, B., Carter, R., Crawford, P and Sahota, O. (2004). “Applying corpus linguistics in a health care context”. Journal of Applied Linguistics, 1 (1), 9-28.
5 Aguinis, H., Pierce, C. A., Bosco, F. A., and Muslin, I. S. (2009). “First Decade of Organizational Research Methods: Trends in Design, Measurement, and Data-Analysis Topics”. Organizational Research Methods, 12 (1), 69-112.
6 Ajzen, I. (1991). “The Theory of Planned Behavior”. Organizational Behavior and Human Decision Processes, 50(2), 179–211.
7 Andersen, L.B. and Pallesen, T. (2008). “ ‘Not Just for the Money?’ How Financial Incentives Affect the Number of Publications at Danish Research Institutions”, International Public Management Journal, 11(1), 28–47.
8 Andersen, L.B., Kristensen, N. and Pedersen, L.H. (2011). “Do Documentation Requirements Reduce Intrinsic Motivation and Increase Worker Absence?” Paper presented at the 11th Public Management Research Association Conference, The Maxwell School of Citizenship and Public Affairs, Syracuse University, USA.
9 Angur, M.G., and Nataraajan, R. (1995), “Do Source of Mailing and Monetary Incentives Matter in International Industrial Mail Surveys?” Industrial Marketing Management, 24, 351-357.
10 Anseel, F., Lievens, F. Schollaert, E. and Choragwicka, B. (2010). “Response Rates in Organizational Science, 1995–2008: A Meta-Analytic Review and Guidelines for Survey Researchers.” Journal of Business Psychology, 25, 335–349.
11 Armitage, C. J. and Conner, M. (2001). “Efficacy of the Theory of Planned Behaviour. A Meta-analytic Review”. British Journal of Social Psychology, 40(4), 471–499.
12 Armstrong, J.S. (1975). “Monetary incentives in mail surveys”, Public Opinion Quarterly, 39, 111-116.13 Armstrong, J.S., and Lusk, E.J. (1987). “Return postage in mail surveys: A meta-analysis”, Public Opinion
Quarterly, 51, 233-248.14 Austin, J. T. and Vancouver, J. B. (1996). “Goal constructs in psychology: Structure, process, and content”.
Psychological Bulletin, 120(3), 338–375. 15 Baker, P., Gabrielatos, C., Khosravinik, M., Krzyzanowski, M, McEnery, T., and Wodak, R. (2008). “A
useful methodologic synergy? Combining critical discourse analysis and corpus linguistics to examine discourses of refugees and asylum seekers in the UK press”. Discourse and Society, 19, 273-306.
16 Bandura, A. and Cervone, D. (1983). “Self-evaluative and Self-efficacy Mechanisms Governing the Motivational Effects of Goal Systems”. Journal of Personality and Social Psychology, 45(5), 1017–1028.
17 Bargh, J. A., Gollwitzer, P. M., Lee-Chai, A., Barndollar, K., and Troetschel, R. (2001). “The Automated Will: Nonconscious Activation and Pursuit of Behavioral Goals”. Journal of Personality and Social Psychology, 81(6), 1014–1027.
18 Bargh, J. A., Gollwitzer, P.M. and Oettingen, G. (2010). “Motivation.” In Handbook of Social Psychology, edited by S. T. Fiske, D. T. Gilbert, and G. Lindzey, 5th ed., 268–316. New York: Wiley.
19 Baruch, Y. (1999). “Response Rate in Academic Studies — A Comparative Analysis.” Human Relations, 52, 421–438.
20 Baruch, Y. and Holtom, B.C. (2008). “Survey Response Rate Levels and Trends in Organizational Research.” Human Relations, 61, 1139–1160.
21 Bavdaž, M. (2010). “The Multidimensional Integral Business Survey Response Model.” Survey Methodology, 36, 81–93.
145

R e f e R e n c e s
22 Bavdaž, M. (Ed.) (2011). Final Report Integrating Findings on Business Perspectives Related to NSIs’ Statistics. Deliverable 3.2 of the BLUE-ETS Project. Available at: http://www.blue-ets.istat.it/fileadmin/deliverables/Deliverable3.2.pdf
23 Beckler, D.G. and Ott, K. (2006), “Indirect monetary incentives with a complex agricultural establishment survey”, Proceedings of the Survey Research Methods Section of the ASA. Available at: https://www.amstat.org/sections/srms/Proceedings/
24 Bénabou, R. and Tirole, J. (2003). “Intrinsic and Extrinsic Motivation”. Review of Economic Studies, 70(3), 489–520.
25 Berglund, F., Haraldsen, G., and Kleven, Ø. (2013). “Causes and Consequences of Actual and Perceived Response Burden Based on Norwegian Data.” In Comparative Report on Integration of Case Study Results Related to Reduction of Response Burden and Motivation of Businesses for Accurate Reporting, edited by D. Giesen, M. Bavdaž, and I. Bolko. Deliverable 8.1 of the BLUE-ETS Project. Available at: http://www.blue-ets.istat.it/fileadmin/deliverables/Deliverable8.1.pdf
26 Berkowitz, L. (1985). “Social Motivation”. In: Lindzey, G., and Aronson, E., The Handbook of Social Psychology, 2nd edition, pp. 55-135. Addison Wesley Publishing Company.
27 Berlyne, D. E. (1966). “Exploration and Curiosity”. Science, 153(3731), 25–33.28 Bertelli, A.M. (2006). “Motivation Crowding and the Federal Civil Servant: Evidence from the US
Internal Revenue Service”, International Public Management Journal, 9(1), 3–23.29 Biemer, P.B., Ellis, C., Pitts, A. and Aspinwall, K. (2007), “Do Monetary Incentives Increase Business
Survey Response Rates? Results from a Large Scale Experiment”, Proceedings of the Third International Conference on Establishment Surveys, ICES III, June 18-21, Montréal, Quebec, Canada. Available at: http://www.amstat.org/meetings/ices/2007/proceedings/ICES2007-000211.PDF
30 Biner, P. M., and Kidd, H. J. (1994), “The interactive effects of monetary incentive justification and questionnaire length on mail survey response rates”, Psychology and Marketing, 11, 483-492.
31 Bing, M. N., LeBreton, J.M., Davison, H.K., Migetz, D.Z. and James, L.R. (2007). “Integrating Implicit and Explicit Social Cognitions for Enhanced Personality Assessment: A General Framework for Choosing Measurement and Statistical Methods.” Organizational Research Methods, 10, 346–389.
32 Blau, P. M. (1964). Exchange and power in social life. New York: Wiley. 33 Bless, H., Bohner, G., Schwarz, N., and F. Strack, F. (1990). “Mood and Persuasion: A Cognitive Response
Analysis.” Personality and Social Psychology Bulletin, 16, 331–345. 34 Blumer, H. (1973). Symbolic Interactionism: Perspectives and Method. Prentice-Hall, Englewood Cliffs,
New Jersey.35 Braun, V. and Clarke, V. (2006). “Using Thematic Analysis in Psychology.” Qualitative Research in
Psychology, 3, 77–101. 36 Brehm, J. W. and Self, E. A. (1989). “The Intensity of Motivation”. Annual Review of Psychology, 40(1), 109–131.37 Brouwer, C. (2014, June 18–20). Communicating the NSO value proposition—Ensuring that official
statistics is a well recognized brand. Work Session on the Communication of Statistics, UN Economic Commission for Europe, Geneva, Switzerland. Retrieved from http://www.unece.org/fileadmin/DAM/stats/documents/ece/ces/ge.45/2014/papers/Corien_Brouwer.pdf
38 Burnside, R., Bishop, G and Guiver, T. (2005), “The Effect of an Incentive on Response Rates and Timing in an Economic Survey”, OECD Statistics Directorate 2005. Available at: http://www.oecd.org/std/34976200.pdf
39 Cameron, J., K. M. Banko, and W. D. Pierce. (2001). “Pervasive Negative Effects of Rewards on Intrinsic Motivation: The Myth Continues.” The Behavior Analyst, 24, 1–44.
40 Cantor, D., O’Hare, B. C., and O’Connor, K. S. (2008), “The use of monetary incentives to reduce nonresponse in random digit dial telephone surveys”, In J. M. Lepkowski, C. Tucker, J. M. Brick, E. de Leeuw, L. Japec, P. Lavrakas, M. W. Link, and R. L. Sangster. (Eds.), Advances in telephone survey methodology, pp. 471–498. New York: Wiley.
41 Carton, J. S. 1996. “The Differential Effects of Tangible Rewards and Praise on Intrinsic Motivation: A Comparison of Cognitive Evaluation Theory and Operant Theory.” The Behavior Analyst, 19, 237–255.
42 CBS (Centraal Bureau voor de Statistiek). (n.d.). CBS for your business [translated]. Retrieved from http://www.cbsvooruwbedrijf.nl
146

R e f e R e n c e s
43 Chang, D. R., and Cho, H. (2008). Organizational memory influences new product success. Journal of Business Research, 61(1), 13–23.
44 Chawla, S.K., Balakrishnan, P.V., and Smith, M.F. (1992). “Mail Response Rates from Distributors”, Industrial Marketing Management, 21, 307-310.
45 Church, A. H. (1993). “Estimating the effect of incentives on mail survey response rates: A meta-analysis”, Public Opinion Quarterly, 57, 62-79.
46 Cialdini, R.B. (2001). Influence. Science and Practice. Boston: Allyn and Bacon.47 Coffey, A. and Atkinson, P. (1996). Making Sense of Qualitative Data: Complementary Research Strategies.
Thousand Oaks, CA: Sage.48 Cohen, J. (1988). Statistical power analysis for the behavioral sciences. Hillsdale, NJ: Erlbaum.49 Coosto (2014). The facts webpage. Available at: http://www.coosto.nl/home/about/feiten and in English
at http://www.coosto.co.uk/home/about/facts 50 Coyne, I. T. (1997). “Sampling in Qualitative Research: Purposeful and Theoretical Sampling; Merging or
Clear Boundaries?” Journal of Advanced Nursing, 26, 623–630. 51 Cutcliffe, J. R. (2000). “Methodological Issues in Grounded Theory.” Journal of Advanced Nursing, 31,
1476–1484. DOI: http://dx.doi.org/ 10.1046/j.1365-2648.2000.01430.x52 Cycyota, C. S. and Harrison, D.A. (2006). “What (Not) to Expect When Surveying Executives: A Meta-Analysis
of Top Manager Response Rates and Technique over Time.” Organizational Research Methods, 9, 133 – 160. 53 Daas, P.J.H., Roos, M., van de Ven, M., and Neroni, J. (2012). Twitter as a potential data source for
statistics. Discussion paper 201221, The Hague/Heerlen: Statistics Netherlands. Available at: http://www.cbs.nl/NR/rdonlyres/04B7DD23-5443-4F98-B466-1C67AAA19527/0/201221x10pub.pdf
54 Daas P.J.H., Puts M.J., Buelens B. and van den Hurk P.A.M. (2013). Big Data and Official Statistics, Proceedings of the NTTS (New Techniques and Technologies for Statistics) 2013, March 5 - 7, Brussels, Belgium, available at: http://www.cros-portal.eu/sites/default/files/NTTS2013fullPaper_76.pdf
55 Daas P.J.H., and Puts, M.J. (2014). New and Emerging Methods: Big Data as a Source of Statistical Information, The Survey Statistician, 69, 22-31. Available at: http://isi.cbs.nl/iass/N69.pdf
56 Daas, P.J.H. and Puts, M.J.H., (2014). Social Media Sentiment and Consumer Confidence. Statistics Paper Series, No.5, European Central Bank. Available at: https://www.ecb.europa.eu/pub/pdf/scpsps/ecbsp5.pdf
57 Dale, T. and Haraldsen, G. (Eds.) (2007). Handbook for Monitoring and Evaluating Business Survey Response Burdens. Eurostat. Available at: http://epp.eurostat.ec.europa.eu/portal/page/portal/research_methodology/documents/HANDBOOK_FOR_MONITORING.pdf
58 Davis, W. R. and Pihama, N. (2009). “Survey Response as Organizational Behavior: An Analysis of the Annual Enterprise Survey, 2003–2007.” New Zealand Association of Economists conference 2009, 1–16. New Zealand: New Zealand Association of Economists. Available at: http://ro.uow.edu.au/cgi/viewcontent.cgi?article=1832andcontext=eispapers
59 Deci, E. L., Koestner, R. and Ryan, M.R. (1999). “A Meta-Analytic Review of Experiments Examining the Effect of Extrinsic Rewards on Intrinsic Motivation.” Psychological Bulletin, 125, 627–668.
60 Deci, E. L., and Ryan, R.M. (1980). “The Empirical Exploration of Intrinsic Motivational Processes.” In Advances in Experimental Social Psychology, Vol. 13, edited by L. Berkowitz, pp. 40–80. New York/London: Academic Press Inc.
61 Deci, E. L., and Ryan, R.M. (1985). Intrinsic Motivation and Self-Determination in Human Behavior. New York: Plenum.
62 De Leeuw, E. and W. De Heer, W. (2002). “Trends in Household Survey Nonresponse: A Longitudinal and International Comparison.” In Survey Nonresponse, edited by R. M. Groves, D. A. Dillman, J. L. Eltinge, and R. J. A. Little, pp. 41–54. New York: Wiley.
63 De Leeuw, E., Callegaro, M., Hox, J., Korendijk, E. and Lensveldt-Mulders G. (2007), “The Influence of Advance Letters on Response in Telephone Surveys: A Meta-Analysis”, Public Opinion Quarterly, 71(3), 413-443.
64 Delfgaauw, J. and Dur, R. (2008). “Incentives and Workers’ Motivation in the Public Sector”, Economic Journal, 118, 171-191.
65 Dey, I. (1993). Qualitative Data Analysis: A User-Friendly Guide for Social Scientists. London: Routledge Kegan Paul.
147

R e f e R e n c e s
66 Dillman, D. (2014), Mail and Telephone Surveys: The Total Design Method. New York: John Wiley and sons. 67 Edwards, W.S. and Cantor, D. (1991). “Toward a Response Model in Establishment Surveys”, In P.P. Biemer,
R.M. Groves and L.E. Lyberg, Measurement Error in Surveys, pp. 127-144. New York: John Wiley and Sons.68 Eichner, K., and Habermehl, W. (1981). “Predicting response rates to mailed surveys: A comment”,
American Sociological Review, 46, 361-363.69 Eisenhower, D., Mathiowetz, N.A. and Morganstein, D. (1991), “Recall Error: Sources and Bias Reduction
Techniques”, In P.P. Biemer, R.M. Groves and L.E.Lyberg, Measurement Error in Surveys, pp. 127-144. New York: John Wiley and Sons.
70 Epstein, J.A. and Harakiewicz, J.M. (1992). “Winning is not enough: The effects of competition and achievement orientation on intrinsic interest”. Personality and Social Psychology Bulletin, 4, 595-599.
71 European Comission High Level Group of Independent Stakeholders on Administrative Burdens. (2009, July 7). Opinion of the High Level Group. Brussels: High Level Group of Independent Stakeholders on Administrative Burdens. Retrieved from http://ec.europa.eu/enterprise/policies/smart-regulation/administrative-burdens/high-level-group/index_en.htm
72 Eurostat (2011), European Statistical Code of Practice, Eurostat, Luxembourg, http://ec.europa.eu/eurostat/web/products-manuals-and-guidelines/-/KS-32-11-955
73 Fang, M. and Gerhart, B. (2012). “Does pay for performance diminish intrinsic interest?” The International Journal of Human Resource Management, 23, 1176-1196.
74 Fazio, R. H., and Olson, M.A. (2003). “Implicit Measures in Social Cognition: Their Meaning and Use.” Annual Review of Psychology, 54, 297–327.
75 Fehr, E. and Falk, A. (2002). “Psychological Foundations of Incentives”. (Joseph Schumpeter Lecture, Annual Conference of the European Economic Association 2001). European Economic Review, 46, 687–724.
76 Festinger, L. (1957). A theory of cognitive dissonance. Evanston, IL: Row, Peterson.77 Frank, R.H., Gilovich, T., and Regan, D.T. (1993). “Does studying economics inhibit cooperation?”
Journal of Economic Perspectives, 7, 159-171.78 Fredrickson, B. L. (2001). “The Role of Positive Emotions in Positive Psychology. The Broaden-and-Build
Theory of Positive Emotions.” American Psychologist, 56, 218–226. 79 Freeman, N. and Muravem, M. (2010). “Don’t Interrupt Me! Task Interruption Depletes the Self ’s Limited
Resources”. Motivation and Emotion, 34(3), 230–241.80 Frey, B. S. (1997). Not Just for The Money. An Economic Theory of Personal Motivation.81 Cheltenham, UK and Brookfield, USA: Edward Elgar.82 Frey, B.S. and Jegen, R. (2001). “Motivation Crowding Theory”. Journal of Economic Surveys, 15, 589–611.83 Fricker, S. and Tourangeau, R. (2010). “Examining the Relationship between Nonresponse Propensity
and Data Quality in Two National Household Surveys”. Public Opinion Quarterly, 74(5), 934–955.84 Furse, D. H., and Stewart, D. W. (1982), “Monetary incentives versus promised contribution to charity:
New evidence on mail survey response”, Journal of Marketing Research, 19, 375-380.85 Gabrielatos, C., and Baker, P. (2008). “Fleeing, Sneeking, Flooding: A Corpus Analysis of Discursive Constructions
of Refugees and Asylum Seekers in the UK Press 1996-2005”. Journal of English Linguistics, 36, 5 – 38.86 Gagné, M. and Deci, E.L. (2005). “Self-Determination Theory and Work Motivation.” Journal of
Organizational Behavior, 26, 331–362.87 Georgellis, Y., Iossa, E. and Tabvuma, V. (2011). “Crowding Out Intrinsic Motivation in the Public
Sector”, Journal of Public Administration Research and Theory, 21, 473–493.88 Gerber, E. R. (1999). “The View from Anthropology: Ethnography and the Cognitive Interview.” In
Cognition and Survey Research, edited by M. G. Sirken, D. J. Herrmann, S. Schlechter, N. Schwarz, J. M. Tanur, and R. Tourangeau, pp. 214–237. New York: Wiley-Interscience.
89 Gibbons, R. (1997). “Incentives and Careers in Organizations”. In R. Blundell, W.K. Newey, and T. Persson (Eds.), Advances in Economic Theory and Econometrics: Theory and Applications, Vol. II, pp. 1-37. Cambridge UK: Cambridge University Press.
90 Giesen, D. (Ed.) (2011, October 3). Response Burden in Official Business Surveys: Measurement and Reduction Practices of National Statistical Institutes. BLUE-ETS Project Report. Retrieved from http://www.blue-ets.istat.it/fileadmin/deliverables/Deliverable2.2.pdf.
148

R e f e R e n c e s
91 Giesen, D. 2012. “Exploring Causes and Effects of Perceived Response Burden.” In Proceedings of the Fourth International Conference on Establishment Surveys (ICES IV), Montreal, Canada, 11–14 June 2012. Available at: http://www.amstat.org/meetings/ices/2012/papers/302171.pdf
92 Giesen, D., and J. Burger. 2013. “Measuring and Understanding Response Quality in the Structural Business Survey Questionnaires.” Paper prepared for the European Establishment Statistics Workshop, Nuremberg, Germany, 9–11 September 2013. Available at: http://enbes.wikispaces.com/file/view/Giesen%20Burger%202013.pdf/456104004/Giesen%20Burger%202013.pdf
93 Goudas, M., Biddle, S., and Fox, K. (1994). “Perceived locus of causality, goal orientations, and perceived competence in school physical education classes”. British Journal of Educational Psychology, 64, 453-463.
94 Gouldner, A. W. (1960). “The norm of reciprocity: A preliminary statement”, American Sociological Review, 25, 161-178.
95 Goyder, J.C. (1982). “Further evidence on factors affecting response rates to mailed questionnaires”, American Sociological Review, 47, 550-553.
96 Greer, T.V., Chuchinprakarn, N. and Seshadri, S. (2000). “Likelihood of Participating in Mail Survey Research”. Industrial Marketing Management, 29, 97-109.
97 Groves, R.M. (2011). “Three Eras of Survey Research”. Public Opinion Quarterly, 75, 861-871.98 Groves, R. M., Cialdini, R.B. and Couper, M.P. (1992). “Understanding The Decision to Participate in a
Survey.” The Public Opinion Quarterly, 56, 475–495. DOI: http://dx.doi.org/ 10.1086/269338 99 Groves, R. M., and Couper, M. P. (1998), Nonresponse in household interview surveys. New York: Wiley.100 Groves, R. M., Singer, E., and Corning, A. (2000). “Leverage-Saliency Theory of Survey Participation:
Description and Illustration”. Public Opinion Quarterly, 64(3), 299–308.101 Groves, R, M. and Lyberg, L. (2010). “Total Survey Error: Past, Present, and Future”. Public Opinion
Quarterly, 74(5), 849–879.102 Guay, F., Vallerand, R.J. and Blanchard, C (2000). “On the Assessment of Situational Intrinsic and
Extrinsic Motivation: The Situational Motivation Scale (SIMS)”, Motivation and Emotion, 24, 175-213.103 Guion, L.A., Diehl, D.C. and McDonald, D. (2011). Triangulation: Establishing the Validity of Qualitative
Studies. Available at: http://edis.ifas.ufl.edu/fy394 104 Gupta, N., Shaw, J. D. and Delery, J. E. (2000). “Correlates of response outcomes among organizational
key informants”, Organizational Research Methods, 3, 323-347.105 Fang, M. and Gerhart, B. (2012). “Does pay for performance diminish intrinsic interest?”
The International Journal of Human Resource Management, 23, 1176-1196. 106 Haines, E. L. and Sumner, K. (2006). “Implicit Measurement of Attitudes, Stereotypes, and Self-Concepts
in Organizations: Teaching Old Dogmas New Tricks.” Organizational Research Methods, 9, 536–553. 107 Haraldsen, G. (2013). Quality Issues in Business Surveys. In Designing and Conducting Business Surveys,
G. Snijkers, G. Haraldsen, J. Jones, and D. Willimack, c, pp. 83-125. Hoboken: Wiley.108 Haraldsen, G., J. Jones, D. Giesen, and L. C. Zhang. 2013. “Understanding and Coping with Response
Burden.” In Designing and Conducting Business Surveys, G. Snijkers, G. Haraldsen, J. Jones, and D. Willimack, pp. 219–252. Hoboken: John Wiley and Sons.
109 Hardt-Mautner, G. (1995). “Only Connect”. Critical Discourse Analysis and Corpus Linguistics. UCREL Technical Paper 6. Lancaster, UK: Lancaster University. Available at: http://ucrel.lancs.ac.uk/papers/techpaper/vol6.pdf
110 Heberlein, T.A., and Baumgartner, R. (1978). “Factors affecting response rates to mailed questionnaires: A quantitative analysis of the published literature”. American Sociological Review, 43, 447-462.
111 Hedges, L.V. (1982). “Estimating effect size form a series of independent experiments”. Psychological Bulletin, 92, 490-499.
112 Hedges, L.V. and Olkin, I. (1985). Statistical methods for meta-analysis. Orlando, Florida: Academic Press.113 Hedlin, D., Dale, T., Haraldsen, G. and Jones, J. (Eds.) (2005). Developing Methods for Assessing Perceived
Response Burden. A Joint Report of Statistics Sweden, Statistics Norway and the UK Office for National Statistics. Available at: epp.eurostat.ec.europa.eu/pls/portal/url/ITEM/1CA1E9AC26242D43E0440003BA9322F9
114 Hedlin, D., Lindkvist, H., Bäckström,H. and J. Erikson, J. (2008). “An Experiment on Perceived Survey Response Burden Among Businesses.” Journal of Official Statistics, 24, 301–318.
149

R e f e R e n c e s
115 Herzberg, F. (1968). “One More Time: How to Motivate Employees?” Harvard Business Review, 46(1), 53–62.116 Hoey, M. (2005). Lexical Priming: A New Theory of Words and Language. London: Routledge. 117 Homans, G.C. (1958). “Social Behavior as Exchange”. American Journal of Sociology, 63(6), 597-606.118 Houston, M. B. (2004). “Assessing the validity of secondary data proxies for marketing constructs”.
Journal of Business Research, 57(2), 154–161.119 Hox, J.J., and De Leeuw, E.D. (1994). “A comparison of nonresponse in mail, telephone, and face-to-face
surveys. Applying multilevel modeling to meta-analysis”. Quality and Quantity, 28, 329-344. 120 Hox, J., de Leeuw, E., and Vorst, H. (1996). “A Reasoned Action Explanation for Survey Nonresponse”. In
S. Laaksonen (Ed.), International Perspectives on Nonresponse, pp. 101-110. Helsinki: Statistics Finland. 121 Hull, C. L. (1943). Principles of Behavior. New York: Appleton.122 Hunt J.M., (1965). “Intrinsic Motivation and its Role in Psychological Development”. In D. Levine (Ed.),
Nebraska Symposium on Motivation, vol. 13, pp. 189-282. Lincoln: University of Nebraska Press.123 IMI, Intrinsic Motivation Inventory, http://www.selfdeterminationtheory.org/intrinsic-motivation-inventory/ 124 Jacobsen, C.B., Hvitved, J. and Andersen, L.B. (2014). “Command and motivation: how the perception
of external interventions relates to intrinsic motivation and public service motivation”. Public Administration, 92, 790-806.
125 James, J.M., and Bolstein, R. (1992). “Large Monetary Incentives and Their Effects on Mail Survey Response Rates”, Public Opinion Quarterly, 56(4), 442-453.
126 Janik, F. and Kohaut, S. (2009). “Why Don’t They Answer? – Unit Non-Response in the IAB Establishment Panel.” FDZ Methodenreport, Nr. 7/2009, Bundesagentur für Arbeit. Available at: http//doku.iab.de/fdz/reporte/2009/MR_07-09.pdf
127 Jehn, K.A. and Doucet, L. (1996). “Developing Categories from Interview Data: Text Analysis and Multidimensional Scaling, Part 1”. Field Methods, 8, 15-16.
128 Jehn, K.A. and Doucet, L. (1997). “Developing Categories for Interview Data: Consequences of Different Coding and Analysis Strategies in Understanding”. Field Methods, 9, 1-7.
129 Jensen, K.B. and Helles, R. (2011). “The internet as a cultural forum: Implications for research”. New Media and Society, 13, 517-533.
130 Jensen, K.B. (2012). A Handbook of Media and Communication Research. Qualitative and Quantitative Methodologies, 2nd edition. New York: Routledge.
131 Jobber, D. (1986). “Improving Response Rates in Industrial Mail Surveys”. Industrial Marketing Management, 15, 183-195.
132 Jobber, D., Birro, K. and Sanderson, S.M. (1988). “A factorial investigation of methods of stimulating response to a mail survey”. European Journal of Operational Research, 37, 158-164.
133 Jobber, D., Mirza, H. and Wee, K.H. (1991). “Incentives and Response Rates to Cross-National Business Surveys: A Logit Model Analysis”. Journal of International Business Studies, 22(4), 711-721.
134 Jobber, D., Saunders, J. and Mitchell, V.W. (2004). “Prepaid Monetary Incentive Effects on Mail Survey Response.” Journal of Business Research, 57, 347–350.
135 Johnson, R. E. and Steinman, L. (2009). “The Use of Implicit Measures for Organizational Research: An Empirical Example.” Canadian Journal of Behavioural Science, 41, 202–212.
136 Jüni, P., Holenstein, F., Sterne, J., Bartlett, C. and Egger, M. (2002). “Direction and impact of language bias in meta-analyses of controlled trials: empirical study”. International Journal of Epidemiology, 31 (1), 115-123.
137 Kalafatis, S.P. and Tsogas, M.H. (1994), “Impact of the Inclusion of an Article as an Incentive in Industrial Mail Surveys”, Industrial Marketing Management, 23, 137-143.
138 Kanfer, R. (1990). “Motivation and Individual Differences in Learning: An Integration of Developmental, Differential and Cognitive Perspectives”. Learning and Individual Differences, 2(2), 221–239.
139 Kehr, H. M. (2004). “Integrating Implicit Motives, Explicit Motives and Perceived Abilities: The Compensatory Model of Work Motivation and Volition.” Academy of Management Review, 29, 479–499.
140 Kennedy, J. and Phipps, P. (1995). “Respondent Motivation, Response Burden, and Data Quality in the Survey of Employer-provided training.” Annual Meeting of the American Association for Public Opinion Research, May 1995, Ft. Lauderdale, FL. Available at: http://www.bls.gov/osmr/pdf/st950250.pdf
150

R e f e R e n c e s
141 Keown, C.F. (1985). “Foreign Mail Surveys: Response Rates Using Monetary Incentives”, Journal of International Business Studies, 16 (3), 151-153.
142 Kimball, A.E. (1961). “Increasing the Rate of Return in Mail Surveys”, Journal of Marketing, 25(6), 63-64.143 Kleinginna, P. R. and Kleinginna, A. M. (1981). “A Categorized List of Emotion Definitions, with
Suggestions for a Consensual Definition”. Motivation and Emotion, 5(4), 345–379.144 Krosnick, J. A. (1991). “Response Strategies for Coping with the Cognitive Demands of Attitude Measures
in Surveys”. Applied Cognitive Psychology, 5(3), 213–236.145 Kruglanski, A. W. (1975). “The Endogenous-Exogenous Partition in Attribution Theory”. Psychological
Review, 82(6), 387–406.146 Kruglanski, A. W. and Freund, T. (1983). “The Freezing and Unfreezing of Lay-Inferences: Effects on
Impressional Primacy, Ethnic Stereotyping, and Numerical Anchoring”. Journal of Experimental Social Psychology, 19(5), 448–468.
147 Kulka, R. A., Eyerman, J. and McNeeley, M. E. (2005). “The use of monetary incentives in federal surveys on substance use and abuse”. Journal of Economic and Social Measurement, 30, 233-249.
148 Lazear, E. P. (2000). “Performance, Pay and Productivity”. American Economic Review, 90(5), 1346–1361.149 Leech, G. (1992). Corpora and Theories of Linguistic Performance. In Directions in Corpus Linguistics:
Proceedings of the Nobel Symposium 82, Stockholm, 4–8 August 1991, J. Svartvik (Ed.), pp. 105–22. Berlin: Mouton de Gruyter.
150 Lim, L. K. S. (2013). “Mapping competitive prediction capability: Construct conceptualization and performance payoffs”. Journal of Business Research, 66(9), 1576–1586.
151 Lipsey, M.W. and Wilson, D.B. (2001). Practical Meta-Analysis. Sage Publications.152 Locke, E. A. (1997). “The Motivation to Work: What We Know”. In M. Maehr and P. Pintrich (Eds.),
Advances in Motivation and Achievement, vol. 10, pp. 375-412. Greenwich, CT: JAI Press.153 Locke, E. A. and Latham, G. P. (1990). A Theory of Goal Setting and Task Performance. Englewood Cliffs,
NJ: Prentice-Hall.154 Locke, E. A. and Latham, G.P. (2002). “Building a Practically Useful Theory of Goal Setting and Task
Motivation. A 35 Year Odyssey”. American Psychologist, 57(9), 705–717.155 Locke, E. A. and Latham, G. P. (2004). “What Should We Do about Motivation Theory? Six
Recommendations for the Twenty-First Century”. Academy of Management Review, 29(3), 388–403.156 London, S.J. and Dommeyer, C.J. (1990). “Increasing Response to Industrial Mail Surveys”. Industrial
Marketing Management, 19, 235-241.157 Lorenc, B. (2006). Two Topics in Survey Methodology: Modelling the Response Process in Establishment
Surveys; Inference from Nonprobability Samples Using the Double Samples Setup. Unpublished doctoral dissertation, Stockholm University.
158 Lorenc, B., and Persson, A. (2011). Perspectives on business use of NSI statistics in Sweden. In M. Bavdaž (Ed.), Final report integrating findings on business perspectives related to NSIs’ statistics (pp. 54–65). Deliverable 3.2 of the project BLUE-Enterprise and Trade Statistics. Retrieved from http://www.blue-ets.istat.it/fileadmin/deliverables/Deliverable3.2.pdf
159 Lorenc, B., Giesen, D., Torres van Grinsven, V., Seljak, R. and Bavdaž, M. (in review) Enhancing use of official statistical figures for business decisions, Chapter 3 in this dissertation.
160 Luo, A.C. and White, G.D. (2005). “Exploring a New Establishment Survey Incentive To Improve Response Rates”. Joint Statistical Meetings 2005, Proceedings of the Survey Research Methods Section of the ASA. Available at: https://www.amstat.org/sections/srms/proceedings/y2005/Files/JSM2005-000908.pdf
161 MacQueen, K. M., McLellan, E., Kay, K. and B. Milstein, B. (1998). “Codebook Development for Team-Based Qualitative Analysis.” Cultural Anthropology Methods Journal, 10, 31–36.
162 McCarthy, J. S., Beckler, D. G. and Qualey, M. S. (2006). “An Analysis of the Relationship Between Survey Burden and Nonresponse: If We Bother Them More, Are They Less Cooperative?” Journal of Official Statistics, 22(1), 97–112.
163 McClelland, D. C. 1985. “How Motives, Skills and Values Determine What People Do.” American Psychologist, 40, 812–825.
151

R e f e R e n c e s
164 McClelland, D. C., Atkinson, J.W., Clark, R. and Lowell, E.L. (1953). The Achievement Motive. New York: Free Press.
165 McClelland, D. C., Koestner, R. and Weinberger, J. (1989). “How Do Self-Attributed and Implicit Motives Differ?” Psychological Review, 96, 690–702.
166 McDaniel, S.W. and Rao, C.P. (1980). “The Effect of Monetary Inducement on Mailed Questionnaire Response Quality”. Journal of Marketing Research, 17, 265-268.
167 McGee, J. E. and Sawyerr, O. O. (2003). “Uncertainty and information search activities: A study of owner-managers of small high-technology manufacturing firms”. Journal of Small Business Management, 41(4), 385–401.
168 Malone, T. W. and Lepper, M.R. (1987). “Making learning fun: A taxonomy of intrinsic motivations for learning”. Aptitude, learning, and instruction, 3, 223-253.
169 Maslow, A. H. (1954). Motivation and Personality. New York: Harper.170 Mautner, G. (2007). “Mining Large Corpora for Social Information: The Case of Elderly”, Language in
Society, 36 (1), 51–72.171 Medway, R. (2012), Beyond Response Rates: The Effect of Prepaid Incentives on Measurement Error.
Available at: http://drum.lib.umd.edu/bitstream/1903/13646/1/Medway_umd_0117E_13833.pdf 172 Mikulincer, M., Shaver, P.R., Gillath, O. and Nitzberg, R.A. (2005). “Attachment, caregiving, and
altruism: Boosting attachment security increases compassion and helping”. Journal of Personality and Social Psychology, 89, 817-839.
173 Monti, M., Pelligra, V., Martignon, L. and Berg, N. (2014). “Retail investors and financial advisors: New evidence on trust and advice taking heuristics”. Journal of Business Research, 67, 1749–1757.
174 Moore, D.L. and Ollinger, M. (2007). “Effectiveness of Monetary Incentives and Other Stimuli Experimentally Carried Out Across Industry Populations for Establishment Surveys”. Proceedings of the Third International Conference on Establishment Surveys, ICES III, June 18-21, 2007, Montréal, Quebec, Canada. Available at: http://www.amstat.org/meetings/ices/2007/proceedings/ICES2007-000146.PDF
175 Moser, C. and Kalton G. (1976). Survey methods in social investigation. London: Heineman.176 Morgan, R. E. and Strong, C. A. (2003). “Business performance and dimensions of strategic orientation”.
Journal of Business Research, 56, 163–176. 177 Morsella, E., Feinberg. G. H., Cigarchi, S., Newton, J. W., and Williams, L. E. (2011). “Sources of Avoidance
Motivation: Valence Effects from Physical Effort and Mental Rotation”. Motivation and Emotion, 35(3), 296–305.
178 Mousavi, S., and Gigerenzer, G. (2014). “Risk, uncertainty, and heuristics”. Journal of Business Research, 67, 1671–1678.
179 Nattinger, J.R. and DeCarrico, J.S. (1992). Lexical Phrases and Language Teaching. Oxford: Oxford University Press.
180 New Zealand (n.d.). Business.govt.nz. Retrieved from http://www.business.govt.nz 181 Organisation for Economic Co-operation and Development. (2004). Official statistics. Glossary of
Statistical Terms. Retrieved from http://stats.oecd.org/glossary/detail.asp?ID=4350182 Ollinger, M. and Moore, D. (2007) “Food Safety Approaches to Examining HACCP Costs and
Performance and Technologies”. Agribusiness, 23(2), 193-210.183 Ouellette, J. A. and Wood, W. (1998). “Habit and Intention in Everyday Life: The Multiple Process by
Which Past Behavior Predicts Future Behavior.” Psychological Bulletin, 124, 54–74. 184 Paxson, M.C. (1995). “Increasing Survey Response Rates: Practical Instructions from the Total-Design
Method”. Hotel and Restaurant Administration Quarterly, 36(4), 66-73. 185 Pennebaker, J.W., Francis, M.E., Booth, R.J. (2001). Linguistic inquiry and word count (LWIC): A
computerized text analysis program. Mahwah NJ: Erlbaum Publishers.186 Pereira, H. J. (2011). Simplified business information (IES): Is coordination between public entities really
possible? In D. Giesen and M. Bavdaž (Eds.), Proceedings of the BLUE-ETS conference on Burden and Motivation in Official Business Surveys, Statistics Netherlands, Heerlen, Netherlands. Retrieved from http://www.cbs.nl/NR/rdonlyres/23FD3DF5-6696-4A04-B8EF-1FAACEAD995C/0/2011proceedingsblueets.pdf
187 Pinder, C.C. (2008). Work motivation in Organizational Behavior. Psychology Press.
152

R e f e R e n c e s
188 Pittman, T. S., Boggiano, A.K. and Ruble, N. (1983). “Intrinsic and Extrinsic Motivational Orientations: Limiting Conditions on the Undermining and Enhancing Effects of Reward on Intrinsic Motivation.” In Teacher and student perceptions: implications for learning, J.M. Levine (Ed.), 319–340. Hillsdale: Lawrence Erlbaum Associates.
189 Pittman, T.S. and D’Agostino, P.R. (1985). “Motivation and attribution: The effects of control deprivation on subsequent information processing”. In J.Harvey and G.Weary (Eds.), Current perspectives on attribution research (Vol. 1). New York: Academic Press.
190 Pittman, T.S. (1998). “Motivation”. In: Gilbert, D., Fiske, S. and Lindzey, G., The Handbook of Social Psychology, 4th edition, New York: Oxford University Press Inc.
191 Pfeffer, J., and Sutton, R.I. (2006). “Profiting from evidence-based management”. Strategy and Leadership, 34(2), 35–42.
192 Poon, P, Albaum, G. and Evangelista, F. (1999), “An Empirical Test of Alternative Theories of Survey Response Behaviour”, International Journal of Market Research, 41(2), 1-18.
193 Porter, S. R. (2004). “Raising Response Rates: What Works?” In New Directions for Institutional Research, 2004, 5–21.
194 Pressley, M.M. and Tullar, W.L. (1977). “A Factor Interactive Investigation of Mail Survey Response Rates from a Commercial Population”. Journal of Marketing Research, 14(1), 108-111.
195 Rachlin, H. C. (2000). The Science of Self-Control. Cambridge, MA: Harvard University Press.196 Rainey, H.G. and Steinbauer, P. (1999). “Galloping Elephants: Developing Elements of a Theory of
Effective Government Organizations”, Journal of Public Administration Research and Theory, 9, 1-32.197 Rivière, P. (2002). “What Makes Business Statistics Special?” International Statistical Review, 70, 145–159. 198 Robin, D.P. and Walters, G.C. (1976). “The Effect on Return Rate of Messages Explaining Monetary
Incentives in Mail Questionnaire Studies”. Journal of Business Communication, 13(3), 49-54. 199 Roethlisberger, F. J. and Dickson, W. J. (1939). Management and the Worker. Cambridge, MA: Harvard
University Press.200 Rogelberg, S. G., Fisher, G. G., Maynard, D., Hakel, M. D. and Horvath, M. (2001). “Attitudes Toward
Surveys: Development of a Measure and its Relationship to Respondent Behavior”. Organizational Research Methods, 4(1), 3-25.
201 Rogelberg, S. G. and Stanton, J.M. (2007). “Introduction: Understanding and Dealing With Organizational Survey Nonresponse”. Organizational Research Methods, 10, 195–209.
202 Romero, E. J. and Cruthirds, K.W. (2006). “The Use of Humor in the Workplace.” Academy of Management Perspectives, 20, 58–69.
203 Rose, D. S., Sidle, S.D. and Griffith, K.H. (2007). “A Penny for Your Thoughts: Monetary Incentives Improve Response Rates for Company-Sponsored Employee Surveys.” Organizational Research Methods, 10, 225–240.
204 Rosen, R., Harrell, L, Hertwig, R. and Gomes, T. (2003). “Efforts to Improve Response Rates in the Current Employment Statistics Program: Results from two Experiments”. 2003 Joint Statistical Meetings, Proceedings of the Survey Research Methods Section of the ASA., available at: https://www.amstat.org/sections/srms/Proceedings/y2003/Files/JSM2003-000449.pdf
205 Rosenthal, R. (1994). “Statistically describing and combining studies”. In H.Cooper and L.V. Hedges (Eds.), The handbook of research synthesis, pp. 231-244. New York: Russell Sage Foundation.
206 Rothstein, H.R., Sutton, A.J. and Borenstein, M. (2005). Publication bias in meta-analysis. New York: Wiley.207 Rusetski, A. (2014). Pricing by intuition: Managerial choices with limited information. Journal of Business
Research, 67, 1733–1743. 208 Ryan, G.R. and Weisner, T. (1996). “Analyzing Words in Brief Descriptions: Fathers and Mothers Describe
Their Children”. Field Methods, 8, 13 – 16209 Ryan, G. W. and Bernard, H.R. (2003). “Techniques to Identify Themes.” Field Methods, 15, 85–109. 210 Ryan, R. M. and Deci, E.L. (2000). “Intrinsic and Extrinsic Motivations: Classic Definitions and New
Directions.” Contemporary Educational Psychology, 25, 54–67. 211 Sandelowski, M., Holditch-Davis, D. and Harris, B.G. (1992). “Using Qualitative and Quantitative
Methods: the Transition to Parenthood of Infertile Couples.” In Qualitative Methods in Family Research, J. F. Gilgum, K. Daly, and G. Handel (Eds.), pp. 301–322. London: Sage.
153
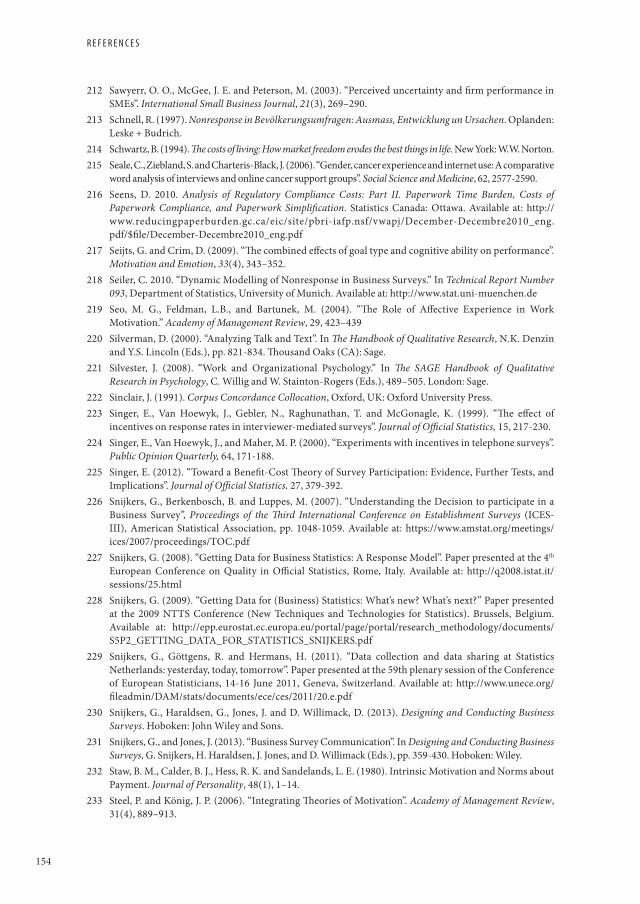
R e f e R e n c e s
212 Sawyerr, O. O., McGee, J. E. and Peterson, M. (2003). “Perceived uncertainty and firm performance in SMEs”. International Small Business Journal, 21(3), 269–290.
213 Schnell, R. (1997). Nonresponse in Bevölkerungsumfragen: Ausmass, Entwicklung un Ursachen. Oplanden: Leske + Budrich.
214 Schwartz, B. (1994). The costs of living: How market freedom erodes the best things in life. New York: W.W. Norton. 215 Seale, C., Ziebland, S. and Charteris-Black, J. (2006). “Gender, cancer experience and internet use: A comparative
word analysis of interviews and online cancer support groups”. Social Science and Medicine, 62, 2577-2590.216 Seens, D. 2010. Analysis of Regulatory Compliance Costs: Part II. Paperwork Time Burden, Costs of
Paperwork Compliance, and Paperwork Simplification. Statistics Canada: Ottawa. Available at: http://www.reducingpaperburden.gc.ca/eic/site/pbri-iafp.nsf/vwapj/December-Decembre2010_eng.pdf/$file/December-Decembre2010_eng.pdf
217 Seijts, G. and Crim, D. (2009). “The combined effects of goal type and cognitive ability on performance”. Motivation and Emotion, 33(4), 343–352.
218 Seiler, C. 2010. “Dynamic Modelling of Nonresponse in Business Surveys.” In Technical Report Number 093, Department of Statistics, University of Munich. Available at: http://www.stat.uni-muenchen.de
219 Seo, M. G., Feldman, L.B., and Bartunek, M. (2004). “The Role of Affective Experience in Work Motivation.” Academy of Management Review, 29, 423–439
220 Silverman, D. (2000). “Analyzing Talk and Text”. In The Handbook of Qualitative Research, N.K. Denzin and Y.S. Lincoln (Eds.), pp. 821-834. Thousand Oaks (CA): Sage.
221 Silvester, J. (2008). “Work and Organizational Psychology.” In The SAGE Handbook of Qualitative Research in Psychology, C. Willig and W. Stainton-Rogers (Eds.), 489–505. London: Sage.
222 Sinclair, J. (1991). Corpus Concordance Collocation, Oxford, UK: Oxford University Press.223 Singer, E., Van Hoewyk, J., Gebler, N., Raghunathan, T. and McGonagle, K. (1999). “The effect of
incentives on response rates in interviewer-mediated surveys”. Journal of Official Statistics, 15, 217-230.224 Singer, E., Van Hoewyk, J., and Maher, M. P. (2000). “Experiments with incentives in telephone surveys”.
Public Opinion Quarterly, 64, 171-188.225 Singer, E. (2012). “Toward a Benefit-Cost Theory of Survey Participation: Evidence, Further Tests, and
Implications”. Journal of Official Statistics, 27, 379-392.226 Snijkers, G., Berkenbosch, B. and Luppes, M. (2007). “Understanding the Decision to participate in a
Business Survey”, Proceedings of the Third International Conference on Establishment Surveys (ICES-III), American Statistical Association, pp. 1048-1059. Available at: https://www.amstat.org/meetings/ices/2007/proceedings/TOC.pdf
227 Snijkers, G. (2008). “Getting Data for Business Statistics: A Response Model”. Paper presented at the 4th European Conference on Quality in Official Statistics, Rome, Italy. Available at: http://q2008.istat.it/sessions/25.html
228 Snijkers, G. (2009). “Getting Data for (Business) Statistics: What’s new? What’s next?” Paper presented at the 2009 NTTS Conference (New Techniques and Technologies for Statistics). Brussels, Belgium. Available at: http://epp.eurostat.ec.europa.eu/portal/page/portal/research_methodology/documents/S5P2_GETTING_DATA_FOR_STATISTICS_SNIJKERS.pdf
229 Snijkers, G., Göttgens, R. and Hermans, H. (2011). “Data collection and data sharing at Statistics Netherlands: yesterday, today, tomorrow”. Paper presented at the 59th plenary session of the Conference of European Statisticians, 14-16 June 2011, Geneva, Switzerland. Available at: http://www.unece.org/fileadmin/DAM/stats/documents/ece/ces/2011/20.e.pdf
230 Snijkers, G., Haraldsen, G., Jones, J. and D. Willimack, D. (2013). Designing and Conducting Business Surveys. Hoboken: John Wiley and Sons.
231 Snijkers, G., and Jones, J. (2013). “Business Survey Communication”. In Designing and Conducting Business Surveys, G. Snijkers, H. Haraldsen, J. Jones, and D. Willimack (Eds.), pp. 359-430. Hoboken: Wiley.
232 Staw, B. M., Calder, B. J., Hess, R. K. and Sandelands, L. E. (1980). Intrinsic Motivation and Norms about Payment. Journal of Personality, 48(1), 1–14.
233 Steel, P. and König, J. P. (2006). “Integrating Theories of Motivation”. Academy of Management Review, 31(4), 889–913.
154

R e f e R e n c e s
234 Steers, R.M., Mowday, R. T. and Shapiro, D. L. (2004). “The Future of Work Motivation Theory”. Academy of Management Review, 29(3), 379–387.
235 Stern, P. (1980). “Grounded Theory Methodology its Uses and Applications.” Image, 12, 20–23.236 Stieglitz, S. and Dang-Xuan, L. (2012). “Social media and political communication: a social media
analytics framework”. Social Network Analysis and Mining, 3, 1277-1291.237 Strack, F. and Deutsch, R. (2004). “Reflective and Impulsive Determinants of Social Behaviour.”
Personality and Social Psychology Review, 8, 220–247. 238 Strauss, A. and J. Corbin. (1994). “Grounded Theory Methodology: an Overview.” In Handbook of
Qualitative Research, N. K. Denzin and Y.S. Lincoln (Eds.), pp. 273–285. London: Sage.239 Tabachnick, B.G. and Fidell L.S. (2001). Using Multivariate Statistics, 4th edition. Boston: Allyn and Bacon.240 Tesch, R. (1990). Qualitative Research: Analysis Types and Software Tools. New York, Falmar Press.241 Tetlock, P.E. (1983). “Accountability and complexity of thought”. Journal of Personality and Social
Psychology, 45, 74-83. 242 Tetlock, P. E. (1985). “Accountability: A Social Check on the Fundamental Attribution Error.” Social
Psychology Quarterly, 48, 227–236.243 Tomaskovic-Devey, D., Leiter, J. and Thompson, S. (1994). “Organizational Survey Nonresponse.”
Administrative Science Quarterly, 39, 439–457.244 Tomaskovic-Devey, D., Leiter, J. and Thompson, S. (1995). “Item Nonresponse in Organizational
Surveys.” Sociological Methodology, 25, 77–110. 245 Torres van Grinsven, V., Bolko, I.., Bavdaž, M. and Biffignandi, S. (2011). “Motivation in Business
Surveys.” In Proceedings of the BLUE-ETS Conference on Business Burden and Motivation, D. Giesen and M. Bavdaž (Eds.), Statistics Netherlands, Heerlen, 22-23 March 2011. Available at: http://www.cbs.nl/NR/rdonlyres/23FD3DF5-6696-4A04-B8EF-1FAACEAD995C/0/2011proceedingsblueets.pdf
246 Torres van Grinsven, V., Bolko, I. and Bavdaž, M. (2014). “In Search of Motivation for the Business Survey Response Task”. Journal of Official Statistics, 30, 579–606.
247 Torres van Grinsven, V. and Hox, J. (in review), “A Meta-Analysis of Experiments on the Effectiveness of the Use of Incentives in Organizational Surveys”, Chapter 4 in this dissertation.
248 Torres van Grinsven, V. and Snijkers, G. (2015), “Sentiments and Perceptions of Business Respondents on Social Media: An Exploratory Analysis”, Journal of Official Statistics, 31, Issue 2, 1-22.
249 Tourangeau, R. (1984), “Cognitive Sciences and Survey Methods”, In T.B. Jabine, M.L. Straf, J.M Tanur, and R. Tourangeau (Eds.), Cognitive Aspects of Survey Methodology: Building a Bridge Between Disciplines, pp. 73-100. Washington D.C.: National Academy of Science.
250 Tullar, W., Pressley, M. and Gentry, D. (1979), “Toward a theoretical framework for mail survey response”, Proceedings of the Third Annual Conference of the Academy of Marketing Science, pp. 243-247. Available upon request at Academy of Marketing Science, [email protected].
251 Türkay, O., Solmaz, S. A., and Şengül, S. (2011). “Strategic analysis of the external environment and the importance of the information: Research on perceptions of hotel managers”. Procedia: Social and Behavioral Sciences, 24, 1060–1069.
252 Trussell, N., and Lavrakas, P. J. (2004). “The influence of incremental increases in token cash incentives on mail survey response: Is there an optimal amount?”. Public Opinion Quarterly, 68, 349-367.
253 Twenge, J.M., Campbell, S.M., Hoffman, B.J. and Lance, C.E. (2010). “Generational Differences in Work Values: Leisure and Extrinsic Values Increasing, Social and Intrinsic Values Decreasing”, Journal of Management, 36, 1117-1142.
254 Tyagi, P.K. (1989). “The Effects of Appeals, Anonymity, and Feedback on Mail Survey Response Patterns from Salespeople”. Journal of the Academy of Marketing Science, 17(3), 235 – 241.
255 Tzamourani P. and Lynn P (1999). “The effect of monetary incentives on data quality – Results from the British Social Attitudes Survey 1998 experiment”. Center for Research Into Elections and Social Trends, Working Paper Number 73, September 1999. Available at: http://www.crest.ox.ac.uk/papers/p73.pdf
256 Uhlmann, E. L., Leavitt, K., Menges, J.I.,. Koopman, J., Howe, M. and Johnson, R.E. (2012). “Getting Explicit About the Implicit: A Taxonomy of Implicit Measures and Guide for Their Use in Organizational Research.” Organizational Research Methods, 15, 553–601.
155

R e f e R e n c e s
257 Van Hilvoorde, M. (2011). “Standard business reporting programme: A Netherlands government initiative”. In Proceedings of the BLUE-ETS Conference on Business Burden and Motivation, D. Giesen and M. Bavdaž (Eds.), Statistics Netherlands, Heerlen, 22-23 March 2011. Available at: http://www.cbs.nl/NR/rdonlyres/23FD3DF5-6696-4A04-B8EF-1FAACEAD995C/0/2011proceedingsblueets.pdf
258 Van Vroenhoven, J. (2006), “Irritating!” (in Dutch: Storend!). In Humor om te huilen: Zwartboek doorgeslagen regelgeving, pp. 22-23. Tilburg: Brabants-Zeeuwse Werkgeversvereniging (BZW).
259 Vohs, K.D., Mead, N.L. and Goode, M.R. (2006). “The psychological consequences of money”. Science, 314, 1154-1156.
260 Watson, J.J. (1965), “Improving the Response Rate in Mail Research”, Journal of Advertising Research, 5, 48-50. 261 Webster, D.M. (1993). “Motivated augmentation and reduction of the overattribution bias”. Journal of
Personality and Social Psychology, 65(2), 261-271. 262 Webster, D. M. and Kruglanski, A. W. (1994). “Individual Differences in Need for Cognitive Closure”.
Journal of Personality and Social Psychology, 67(6), 1049-1062.263 Weiner, B. (1985). “An Attributional Theory of Achievement Motivation and Emotion”. Psychological
Review, 92(4), 548–573.264 Wenemark, M., Hollman Frisman, G., Svensson, T. and Kristenson, M. (2010). “Respondent Satisfaction
and Respondent Burden among Differently Motivated Participants in a Health-Related Survey.” Field Methods, 22, 378–390.
265 Wenemark, M., Persson, A., Noorlind Brage, H., Svensson, T. and Kristenson, M. (2011). “Applying Motivation Theory to Achieve Increased Response Rates, Respondent Satisfaction and Data Quality.” Journal of Official Statistics, 27, 393–414.
266 Willeboordse, A. (Ed) (1997). Handbook on the design and implementation of business surveys. Eurostat, Luxembourg.
267 Willimack, D. K., Nichols, E. and Sudman, S. (2002). “Understanding Unit and Item Nonresponse in Business Surveys.” In Survey Nonresponse, R. M. Groves, D. A. Dillman, J. L. Eltinge, and R. J. A. Little (Eds.), pp. 213–228. New York: Wiley.
268 Willimack, D.K. and Nichols, E. (2010). “A Hybrid Response Process Model for Business Surveys”. Journal of Official Statistics, 26, 3-24.
269 Willimack, D., and Snijkers G. (2013). “The Business Context and Its Implications for the Survey Response Process”. In Designing and Conducting Business Surveys, G. Snijkers, H. Haraldsen, J. Jones, and D. Willimack (Eds.), pp. 39-82. Hoboken: Wiley.
270 Willis, G. D. (2005). Cognitive Interviewing: A Tool for Improving Questionnaire Design. Thousand Oaks, CA: Sage Publications.
271 Wigfield, A. and Eccles, J. S. (2000). “Expectancy Value Theory of Achievement Motivation”. Contemporary Educational Psychology, 25(1), 68-81.
272 Wodak, R. (2007). “Pragmatics and Critical Discourse Analysis: A Cross-Disciplinary Inquiry”. Journal of Pragmatics and Cognition, 15 (1), 203-227.
273 Woike, B.S. (1995). “Most-Memorable Experiences: Evidence for a Link Between Implicit and Explicit Motives and Social Cognitive Processes in Everyday Life”. Journal of Personality and Social Psychology, 68(6), 1081–1091.
274 Wright, R. A. and Brehm, J. W. (1989). “Energization and goal attractiveness”. In L.A. Pervin (Ed.), Goal Concepts in Personality and Social Psychology, pp. 169–210. Hillsdale, NJ: Erlbaum.
275 Wright, B.E. (2004): “The Role of Work Context in Work Motivation: A Public Sector Application of Goal and Social Cognitive Theories”, Journal of Public Administration Research and Theory, 14, 59-78.
276 Yammarino, F. J., Skinner, S. J. and Childers, T. L. (1991), “Understanding mail survey response behaviour”, Public Opinion Quarterly, 55, 613-629.
277 Yancheva, D. and Iskrova, K. (2011). Reducing the administrative burden for the business in Bulgaria: Single Entry Point for Reporting Fiscal and Statistical Information. In Proceedings of the BLUE-ETS Conference on Business Burden and Motivation, D. Giesen and M. Bavdaž (Eds.), Statistics Netherlands, Heerlen, 22-23 March 2011. Available at: http://www.cbs.nl/NR/rdonlyres/23FD3DF5-6696-4A04-B8EF-1FAACEAD995C/0/2011proceedingsblueets.pdf
278 Zuckerman, M., Porac, J., Lathin, D., Smith, R. and Deci, E. L. (1978). “On the importance of self-determination for intrinsically motivated behavior”. Personality and Social Psychology Bulletin, 4, 443–446.
156

A p p e n d i c e s
a p p e n d i C e sa p p e n d i x aAppendix for Chapters 2 and 3: Interview guide for the field study
Legend:
• DP = data provider
• DU = data user
• [...] = potentially problematic terminology; depending on the meaning the interviewee assigns to the terms, choose an appropriate term
• (text text text) = explanations and instructions for interviewer
• Regular text for key questions.
• Text in bold for powerful/key words or phrases that need attention.
• Gray background for optional questions.
i . u s e o f s t a t i s t i c s / d a t a i n b u s i n e s s e s ( l i n k t o “f a c t - b a s e d d e c i s i o n m a k i n g” )
1. The concept of [internal data] and [external data] (interviewee’s perspective)
Purpose:
- to get familiar with terminology used in business with the help of CARDs and EXAMPLES
- to identify relations between similar concepts (data, statistics and information)
- to identify the concept of internal and external data from interviewee’s perspective
a. I would like you to take a look at these two cards. On these cards, you find two terms. Do you use any of them in your business?
Data Information
b. Do you use other terms that are roughly synonymous or related to these terms? Can you give me some examples for each of these terms?
c. How would you place them in relation to one another? Is there something different or equivalent between these terms? So, how would you define each of them? (The last question is posed only if interviewees are comfortable with the terms to avoid their embarrassment)
d. What do you mean by term [internal data]? Can you give me some examples? Relation to the two cards?
157

A p p e n d i c e s
e. What do you mean by term [external data]? Can you give me some examples? Relation to the two cards?
2. Use of [internal data]
Purpose:
- to get a better insight into the use of data in the business, in particular for key business aspects (goods/services and processes)
- to identify any frameworks relevant for use of internal data
a. For what purposes do you use [internal data]? (First focus on personal use, then probe wider. Treat the following three questions as mandatory probes if these purposes do not come up spontaneously)
b. Do you use [internal data] for decision making in your business? How? Examples?
c. Do you use [internal data] that measure product quality? (quality of goods produced or services offered) How? Examples?
d. Do you use [internal data] that monitor effectiveness of your working processes? How? Examples?
e. Do you have any standards or rules that dictate the use of [internal data]? (e.g. ISO 9000 – quality management)
f. What considerations guide your decisions on which [internal data] to produce and keep? Do you have any standards or rules that dictate the production of [internal data]? (e.g. legal obligations, obligations from mother companies, monitoring of costs, revenues and profits)
g. Does the business further process, analyse [internal data]? Which departments are doing that? Where do results appear? Who uses these results (departments/offices, positions, levels)?
h. Are [data] processed differently for different activities? Do you ever use the term “business intelligence” in your company? (If yes, check what it means, where it is used, by whom...)
i. How important are the [internal data] compared with intuition and experience?
3. Quality of [internal data] (interviewee’s perspective)
Purpose:
- to identify the concept of data quality from interviewee’s perspective
- to identify quality dimensions (attributes/characteristics/properties) of internal data and relations between them
158

A p p e n d i c e s
j. Do you trust some [internal data] more than others? Why? Examples?
a. If [internal data] were described as having high quality, what [properties] would you expect them to have? (Let them define quality dimensions first.)
b. What do you think of the [quality] of your [internal data]? Which of previously mentioned [properties] do these [data] have? Can you order them by importance? Examples?
4. Sources of [external data]
Purpose:
- to identify sources of external data and compare them
We are now turning attention to [external data].
a. Are [external data] used in your business or not? If yes, what sources do you use? What channels do you use to get them?
b. Can you tell me more about each of these sources? How and how often you access these sources and what you get from them? (Get more insights into the sources: what they are (institutions, publications, websites etc.); try to understand whether they include the NSI’s data here or not, and whether they are aware of that; whether they access these sources directly or through an intermediary and how this affects awareness and perception of the source)
c. In which aspects are these sources similar/different? (cost, accuracy, timeliness etc.) Do you prefer specific sources? Why? What properties of these sources are most/least important?
d. Do other firms (in your industry) use the same sources?
5. Use of [external data]
Purpose:
- get an in-depth insight into the role of (specific) external data, and in particular official statistics, for business and its decision making
- to discuss importance of external data
- to identify links between external and internal data
a. For what purposes do you use [external data]? (when, how often; for internal and/or external reports; for comparison with competitors; for specific business decisions, e.g. investments in new technologies, international expansions, new products introduction)
b. How are [external data] kept/organised within the business? (in a central system/application or separately, e.g. in Excel files on individual computers or within specific
159
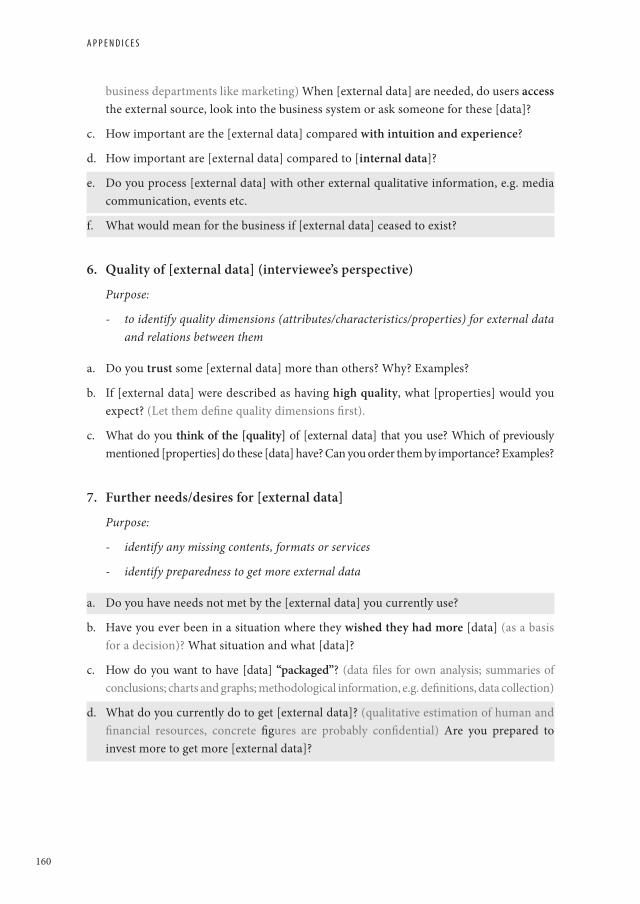
A p p e n d i c e s
business departments like marketing) When [external data] are needed, do users access the external source, look into the business system or ask someone for these [data]?
c. How important are the [external data] compared with intuition and experience?
d. How important are [external data] compared to [internal data]?
e. Do you process [external data] with other external qualitative information, e.g. media communication, events etc.
f. What would mean for the business if [external data] ceased to exist?
6. Quality of [external data] (interviewee’s perspective)
Purpose:
- to identify quality dimensions (attributes/characteristics/properties) for external data and relations between them
a. Do you trust some [external data] more than others? Why? Examples?
b. If [external data] were described as having high quality, what [properties] would you expect? (Let them define quality dimensions first).
c. What do you think of the [quality] of [external data] that you use? Which of previously mentioned [properties] do these [data] have? Can you order them by importance? Examples?
7. Further needs/desires for [external data]
Purpose:
- identify any missing contents, formats or services
- identify preparedness to get more external data
a. Do you have needs not met by the [external data] you currently use?
b. Have you ever been in a situation where they wished they had more [data] (as a basis for a decision)? What situation and what [data]?
c. How do you want to have [data] “packaged”? (data files for own analysis; summaries of conclusions; charts and graphs; methodological information, e.g. definitions, data collection)
d. What do you currently do to get [external data]? (qualitative estimation of human and financial resources, concrete figures are probably confidential) Are you prepared to invest more to get more [external data]?
160

A p p e n d i c e s
8. Proficiency in use of [external data]
Purpose:
- to check knowledge on availability and methodological aspects of external data sources
- to identify beliefs on external data and related methodological aspects
- to get perception of official statistics source with respect to other external data sources
a. Do you know any other sources of [external data] relevant for your business? (if some sources haven’t been mentioned, probe here)
b. What is the role of [NSI statistics] among other [external data]? How do you rate the [quality] of [NSI statistics]? Any strengths and weaknesses of these [data]? Examples? (Be sure interviewee shows understanding what NSI statistics are; ask for examples of NSI statistics; otherwise rephrase, e.g. through examples of indicators)
c. Are you interested in statistical methodology (e.g. about classifications, codes etc.) behind the figures? Do you know anything about it? Or, are you only interested in getting figures?
d. Do you agree with the statement that “only completely accurate data allow taking good fact-based decisions”? Why (not)? Is there an acceptable level of inaccuracy of [data]?
i i . M o t i v a t i o n a l a s p e c t sIn this section our attention turns to surveys.
1. Participation decision (organisational perspective)
Purpose:
- to get insight into organisational decision on survey participation
- to assess organisational norms on survey participation and interviewee’s extrinsic motivation
- to assess beliefs about survey participation
a. From whom the company gets requests for survey participation? (NSI mentioned or not?)
b. How do these requests (and questionnaires) reach the company? (mail, email)
c. How the company decides whether they will participate in a survey or not? (by chance, as time permits; fixed rules; just do the minimum required)
d. What are the reasons for (non-)participation? Why does (not) the company participate? (mandatory vs. voluntary; any specifics for NSI surveys; ask for some examples of NSI survey they participate in to be sure they really have NSI surveys in mind)
e. Are there policies/rules/expectations governing participation in surveys? (try to understand what are explicit policies and what implicit norms; start with explicit and proceed to implicit; any specifics for NSI surveys)
161

A p p e n d i c e s
f. Would you say that the behaviour of your company regarding survey participation is similar or different with respect to other companies? In which way similar/different? (identify beliefs)
g. Has the current economic climate had an impact on your decision regarding participation in research?
2. Response process (organisational perspective)
Purpose:
- to get insight into organisational aspects of survey response process
- to assess organisational norms on survey responding and interviewee’s extrinsic motivation
a. If you decide to fulfil the request, what happens next? Who receives the questionnaire? Who gets involved in the process of responding to questions? (departments/offices, positions, levels) Any specifics for NSI surveys?
b. How does the co-operation of several people look like? (One coordinator that collects others’ data or not; the form going around in the business or not; meetings; email communication, etc, etc, etc.)
From here on, I would like to focus exclusively on NSI surveys.
c. Do you have any internal support or procedures that ease your reporting to NSI, for instance, working documents explaining how you get a certain item for the questionnaire or spreadsheets that help you compute requested items from your company’s data?
d. DP/ How do you prioritise among competing tasks? How do you determine how much time you can spend on the form?
e. DP/ What determines when you actually send back the data? (probe on internal factors (time, data, workload, etc.) and external factors (e.g. reminders))
f. DP/ What do you think of reminders sent by NSI? What about fines used by (some) NSIs?
g. DP/ Has it happened that you received feedback from NSI after participating? What did it mean? How was it received? Was it useful? What type of feedback would you like to have etc?
h. DP/ Do you keep records in your company for various surveys that you responded to?
i. Do you sometimes use data gathered for NSI reporting also for other purposes in the business (e.g. internal reporting, business decisions)?
162

A p p e n d i c e s
3 NSI surveys (organisational perspective)
Purpose:
- to assess organisational perceptions of NSI surveys (by combining answers from more interviewees at the same business)
- to assess interviewee’s perception of organisational norms (questions f) – i) try to tap interviewee’s perceptions, not necessarily truth)
a. DP/ What is your superior’s view on NSI surveys (and your participation in NSI surveys)?
b. DP/ How and when does the superior express that view? Examples. (Are NSI surveys mentioned only at specific occasions, e.g. when work has to be done; how do they refer to NSI surveys, any specific terms?)
c. DP/ Does the superior give any rewards/incentives/critiques for reporting task? Any attention (at all) to the task?
d. DP/ Does the superior or anyone else within the company check the figures before they are reported to NSI?
e. What is the view of your superior’s superiors (and higher management levels) of NSI surveys and reporting tasks?
f. What is the view of your (closest/departmental) colleagues on the NSI surveys? And on the reporting task?
g. What about the view of these people (superior, higher management, colleagues) on the NSI? (Tap the general attitude and image)
h. What about the view of these people (superior, higher management, colleagues) on statistics in general?
4. NSI surveys (interviewee’s perspective)
Purpose:
- to assess interviewee’s perceived behavioural control (i.e. perceived ease or difficulty of performing a behaviour; abilities and obstacles)
- to assess interviewee’s perception of data quality in NSI surveys
- to assess interviewee’s attitudes and intrinsic motivation
a. What are your experiences with NSI surveys? (length of participation; positive and negative sides)
b. What do you personally think of NSIs surveys? (get interviewee’s spontaneous impressions)
163

A p p e n d i c e s
c. DP/ What does it mean for you to participate in NSI surveys? Do you like this work or not? Why?
d. Do you think this work is valuable or not? Why, how? (to whom – business, society?) Do you think this work offers challenges or not? Why? What do you think is the contribution of (your) reporting?
e. DP/ How do NSI surveys differ from other surveys that you are asked to participate in?
f. DP/ Are the NSI questionnaires you receive simple or difficult to understand? Simple or difficult to respond to? What makes a questionnaire easy or difficult?
g. How do you feel about the way the NSI communicates with you?
h. DP/ How much effort do you have to invest in questionnaire completion? (stay alert for willingness to perform, initiative, commitment, perseverance, persistence they use to fulfil their tasks)
i. DP/ Do changes in questionnaire content (e.g. modification of questions) or administration (e.g. introduction of web surveys) impact the effort invested in questionnaire completion? (positive, negative sides)
j. DP/ To what extent are the questions applicable to your company (both clarity of questions and availability/structure of data requested)?
k. DP/ What do you think of the [quality] of data provided to NSI? Why? When do approximate data suffice compared to exact figures (rather than extensive searches for data)? (verify meaning of quality or refer to Part I definitions)
l. DP/ Would you say that the [quality] of your reporting to NSI is similar or different with respect to other companies? In which way similar/different? (identify beliefs)
5. Possible improvements
Purpose:
- to get interviewee’s perspectives and ideas on possible improvements of the data collection
- to get interviewee’s opinion on NSI feedback
a. In an ideal world, what would need to change in order to facilitate good reporting? (check also how timing of the surveys works for them)
b. DP/ How can the NSI’s data collection process be improved? How can we make it easier for you to report? Any reflection on positive and negative sides?
- New data collection tools (e.g. web questionnaires, XBRL - automatic transfer of data from their systems to the NSI)
- Pre-print of any previous response?
164

A p p e n d i c e s
- Proposals for improving NSI questionnaires?
c. What do you think of the idea that NSI gives some data in return for company’s participation in surveys?
i i i . L i n k s b e t w e e n d a t a u s e a n d d a t a p r o v i s i o n
d. DP/ Do you know what happens to the data after you have submitted them/handed them out? How are they used? (For which results/indicators? How do they become results/indicators?)
e. DP/ Does anyone in your company use these results? Who? In your industry (other companies, your association)? Examples. In the wider society?
f. DU/If I go back to the [external data] that are used by your company... Does your company provides data for them? Examples. Do you know who provides data for the [external data] that the company uses?
i V. b a c k g r o u n d
g. Job description.
h. Department/Division/Office (if applicable).
i. Role in the business.
j. Years of service.
k. Educational level.
l. Gender.
m. Do you ever participate in any survey privately (other than NSI’s, e.g. different web surveys)?
165

A p p e n d i c e s
Appendices Chapter 4a p p e n d i x B
Table B1. Studies included in the Meta-Analysis with Brief Summaries
Study SummarySample size (N)
Effect size*
Angur and Nataraajan (1995)
International industrial mail survey experiment with highest ranking marketing officers
450 .621*
Beckler and Ott (2007) Agricultural Resource Management Survey, ARMS Phase III 9722 .186*
Burnside, Bishop and Guiver (2005)
Official economic survey of the ABS (Australian Bureau of Statistics.
813 .09
Chawla, Balakrishnan and Smit (1992)
Questionnaire assessing consumer demand and acceptance for a new product among medical equipment dealers.
400 .94
Cycyota and Harrison (2002)
Opinion survey on area’s “business outlook” among firm-level executives (CEOs).
1200 .04
Dawson and Dickinson (1988)
International survey on previous and planned purchases in several electronic testing product categories.
1297 .359*
Faria and Dickinson (1992) Two-page questionnaire with 8 questions of a dichotomous and multiple-choice nature among a random sample of a customer list of a major manufacturer.
750 .26*
Gillpatrick, Harmon, and Tseng (1994)
Survey to measure product attribute preferences and market perceptions of design engineers and engineering managers regarding CAD work-stations.
619 .516*
Gunn and Rhodes (1981) Telephone survey on attitudes and practices of physicians concerning influenza immunization and the impact of a federal program on their practices.
600 .348*
Hager, Wilson, Pollak and Rooney (2003)
Survey project on fund-raising and administrative costs among non-profit organizations.
120 .094*
Hansen (1980) Survey in name of Market Search Associates: product evaluation; desired change; classification information on company among industrial safety engineers employed by firms that require employees to wear safety hardhats.
2496 .55*
Hedlin, Lindkvist, Bäckström, and Erikson (2008)
Annual SBS (Structural Business Survey) and questionnaire on perceptions of survey, by Statistics Sweden (SCB).
3677 .028
James and Bolstein (1992) Survey on owners of small construction companies to determine competitiveness of a certain health insurance program compared to other programs.
1200 .418*
Jobber, Birro and Sanderson (1988)
Survey among chief executives of building societies to ascertain management practices and contextual and structural characteristics of these societies.
159 .110*
Kalafatis and Tsogas (1994) Survey of purchasing managers dealing with issues of topical interest on environmental issues.
600 -.173*
Keown (1985) Attitudes of business executives towards business risks. 100 .72
Kimball (1961) Survey among technical personnel of electronic manufacturers.
2000 -.044*
166

A p p e n d i c e s
Table B1. Continued
Study SummarySample size (N)
Effect size*
London and Dommeyer (1990) I
Survey of electronic design engineers on a firm’s usage and sources for transformers and inductors; Company demograhics
1500 .406*
London and Dommeyer (1990) II
Survey of electronic design engineers concerning power supply requirements of the military power supply market.
1000 .93
Moore and Ollinger (2007) I USDA Poultry Manufacturers Pilot (UPMPS): nationwide food safety technology and HACCP (Hazard Analysis and Critical Control Points) Cost
90 .40
Moore and Ollinger (2007) II USDA Redmeat Manuf. Pilot Survey (URMPS): nationwide food safety technology and HACCP (Hazard Analysis and Critical Control Points) Cost
472 .25
Moore and Ollinger (2007) III Oregon Business Environment Management Survey(OBES): Oregon Environmental Waste Management
982 .63
Moore and Ollinger (2007) IV Columbia /Snake River Grain Company Survey (CRGCS): Washington Transportation Alternatives – Companies
52 .42
Moore and Ollinger (2007) V Columbia/Snake River Post Shipper Survey (CRPS): Washington Transportation Alternatives and Cost
21 1.44
Moore and Ollinger (2007) VI Columbia /Snake River Grain Company Survey (CRGCS): Washington Transportation Alternatives - for Elevators
276 -.28
Newby, Watson and Woodliff (2003)
SME (Small and Medium Entreprises) : “Attitudes and Expectations of the Self-Employed”.
1487 .41
Paolillo and Lorenzi (1984) Experiment on the use of incentives in a mails survey of high-level executives.
400 .263*
Pickreign and Whitmore (2007)
California Employer Health Benefits Survey: experiment on telephone survey with smallest non-panel firms.
1024 -.123*
Pressley and Tullar (1977) Mail survey of marketing research directors in large manufacturers of 4 different industrial classes.
280 .29
Rosen, Harrell, Hertwig, and Gomes (2003) I
CES (Current Employment Statistics) among business establishments .
300000 .065*
Schneider and Johnson (1995) Logistics and transportation managers’ opinions concerning the 1980 Motor Carrier Act.
540 .131*
Tourkin, Parmer, Cox, and Zukerberg (2005)
TFS (Teacher Follow-up Survey) of SASS Teacher questionnaire (Schools and Staffing Survey) (53 for teachers /40 questions for former teachers).
7738 .134*
Tyagi (1989) Job attitude survey within a medium size life insurance company employing 610 salespeople.
600 -.04
Wu, Petroshius, Crocker and West (1992)
Mail survey of medium and large-sized businesses in a major midwestern city and randomly selected businesses from a list of vendors of a local hospital on corporate donation behaviour.
835 .22
*For the studies with only one treatment, this is d = Ztreat – Zcont; for the studies with more than one treatment, this is the Mean ES for all the treatments, calculated with d and the inverse variance weight using RE.
167

A p p e n d i c e s
a p p e n d i x Cb i b l i o g r a p h y o f s t u d i e s i n c o r p o r a t e d i n t h e m e t a - a n a l y s i sAngur, M.G., and Nataraajan, R. (1995), “Do Source of Mailing and Monetary Incentives Matter in International Industrial Mail Surveys?”, Industrial Marketing Management, 24, 351-357.
Beckler, D.G., and Ott, K. (2007), “Indirect Monetary Incentives With A Complex Agricultural Establishment Survey”, Proceedings of the International Conference on Establishment Surveys, ICES III , June 18-21, 2007, Montréal, Canada, available at: http://www.amstat.org/meetings/ices/2007/proceedings/ICES2007-000157.PDF (accessed May 2014).
Burnside, R., Bishop, G and Guiver, T. (2005), “The Effect of an Incentive on Response Rates and Timing in an Economic Survey”, OECD Statistics Directorate 2005. Available at: http://www.oecd.org/std/34976200.pdf (accessed May 2014).
Chawla, S.K., Balakrishnan, P.V., and Smith, M.F. (1992), “Mail Response Rates from Distributors”, Industrial Marketing Management, 21, 307-310.
Cycyota, C. S. and Harrison, D.A. (2002), “Enhancing Survey Response Rates at the Executive Level: Are Employee- or Consumer-Level Techniques Effective?”, Journal of Management, 28, 151-176 .
Dawson, S., and Dickinson, D. (1988), “Conducting International Mail Surveys: The Effect of Incentives on Response Rates with an Industry Population”, Journal of International Business Studies, 19(3), 491-496.
Faria, A.J. and Dickinson, J.R. (1992), “Mail Survey Response, Speed, and Cost”, Industrial Marketing Management, 21, 51-60.
Gillpatrick, T.R., Harmon, R.R., and Tseng, L.P.D. (1994), “The Effect of a Nominal Monetary Gift and Different Contacting Approaches on Mail Survey Response Among Engineers”, IEEE Transactions Engineering Management, 41(3), 285-290.
Gunn, W.J., and Rhodes, I.N. (1981), “Physician Response Rates to a Telephone Survey: Effects of Monetary Incentive Level”, Public Opinion Quarterly, 45(1), 109-115.
Hager, M.A., Wilson, S., Pollak, T.H. and Rooney, P.M. (2003), “Response Rates for Mail Surveys of Nonprofit Organizations: A Review and Empirical Test”, Nonprofit and Voluntary Sector Quarterly, 32, 252-267.
Hansen, R.A. (1980), “A Self-Perception Interpretation of the Effect of Monetary and Nonmonetary Incentives on Mail Survey Respondent Behavior”, Journal of Marketing Research, 17(1), 77-83
Hedlin, D., Lindkvist, H., Bäckström, H., and Erikson, J. (2008), “An Experiment on Perceived Survey Response Burden Among Businesses”, Journal of Official Statistics, 24(2), 301-318.
James, J.M., and Bolstein, R. (1992), “Large Monetary Incentives and Their Effects on Mail Survey Response Rates”, Public Opinion Quarterly, 56(4), 442-453.
168

A p p e n d i c e s
Jobber, D., Birro, K., and Sanderson, S.M. (1988), “A factorial investigation of methods of stimulating response to a mail survey”, European Journal of Operational Research, 37, 158-164.
Kalafatis, S.P., and Tsogas, M.H. (1994), “Impact of the Inclusion of an Article as an Incentive in Industrial Mail Surveys”, Industrial Marketing Management, 23, 137-143.
Keown, C.F. (1985), “Foreign Mail Surveys: Response Rates Using Monetary Incentives”, Journal of International Business Studies, 16(3), 151-153.
Kimball, A.E. (1961), “Increasing the Rate of Return in Mail Surveys”, Journal of Marketing, 25(6), 63-64.
London, S.J., and Dommeyer, C.J. (1990), “Increasing Response to Industrial Mail Surveys”, Industrial Marketing Management, 19, 235-241.
Moore, D.L., and Ollinger, M. (2007), “Effectiveness of Monetary Incentives and Other Stimuli Experimentally Carried Out Across Industry Populations for Establishment Surveys”, Proceedings of the International Conference on Establishment Surveys, ICES III, June 18-21, 2007, Montréal, Quebec, Canada. Available at: http://www.amstat.org/meetings/ices/2007/proceedings/ICES2007-000146.PDF (accessed May 2014).
Newby, R., Watson, J., and Woodliff, D. (2003), “SME Survey Methodology: Response Rates, Data Quality, and Cost Effectiveness”, ETandP Entrepreneurship Theory and Practice, 28(2), 163-172.
Paolillo, J.G.P., and Lorenzi, P (1984), “Monetary Incentives and Mail Questionnaire Response Rates”, Journal of Advertising, 13(1), 46-48.
Pickreign, J., and Whitmore, H. (2012), “Evaluating the Effectiveness of Two Strategies to Improve Telephone Survey Response Rates of Employers”, Proceedings of the International Conference on Establishment Surveys, ICES IV, June 11-14, 2012, Montréal, Quebec, Canada. Available at: http://www.amstat.org/meetings/ices/2012/papers/301963.pdf (accessed May 2014).
Pressley, M.M., and Tullar, W.L. (1977), “A Factor Interactive Investigation of Mail Survey Response Rates from a Commercial Population”, Journal of Marketing Research, 14(1), 108-111.
Rosen, R., Harrell, L., Hertwig, R., and Gomes, T. (2003), “Efforts to Improve Response Rates in the Current Employment Statistics Program: Results from two Experiments”, 2003 Joint Statistical Meetings, Proceedings of the Survey Research Methods Section of the ASA., available at: https://www.amstat.org/sections/srms/Proceedings/y2003/Files/JSM2003-000449.pdf (accessed May 2014).
Schneider, K.C., and Johnson, J.C. (1995), “Stimulating Response to Market Surveys of Business Professionals”, Industrial Marketing Management, 24, 265-276.
Tourkin, S., Parmer, R., Shawna Cox, S., and Zuckerberg, A. (2005), “(Inter) Net Gain? Experiments to Increase Response”, Joint Statistical Meetings 2005, Proceedings of the Survey Research Methods Section of the ASA. Available at: http://www.amstat.org/sections/srms/proceedings/y2005/Files/JSM2005-000582.pdf (accessed May 2014).
169

A p p e n d i c e s
Tyagi, P.K. (1989), “The Effects of Appeals, Anonymity, and Feedback on Mail Survey Response Patterns from Salespeople”, Journal of the Academy of Marketing Science, 17(3), 235-241.
Wu, B.T., Petroshius, S.M., Crocker, K.E., and West, J.S. (1994), “Response form a Corporate Mail Survey: Effects of Charitable Contributions and Personalization”, American Journal of Business, 9(1), 55-62.
170

A p p e n d i c e s
a p p e n d i x d
Table D1. Coded Categorical Characteristics of Studies or Experimental Groups* Included in the Meta-Analysis
Characteristic Ntot (percent) N (percent)
Population 31 (91.2)
General 4 (11.8)
Special 27 (79.4)
Sample Frame 30 (88.2)
National general list 9 (26.5)
Regional general list 6 (17.6)
List of contacts (e.g. from marketing firm) 5 (14.7)
List of vendors or customers of firm 3 (8.8)
List of contacts of non-profit organization 4 (11.8)
Combination 3 (8.8)
Research Organization* 68 (100)
Commercial 14 (20.6)
University or adhered research institute 41 (60.3)
Government 13 (19.1)
Country / region* 68 (100)
US 47 (69.1)
UK 8(11.8)
Germany 1 (1.5)
Australia 2 (2.9)
Canada 4 (5.9)
Japan 1 (1.5)
Sweden 3 (4.4)
India 2 (2.9)
Survey Topic 29 (85.3)
Financial data 7 (20.6)
Business outlook 1 (2.9)
Business managerial practices 9 (26.5)
Opinions / evaluation 4 (11.8)
Attitudes 5 (14.7)
Assessment consumer demand 3 (8.8)
171

A p p e n d i c e s
Table D1. Continued
Characteristic Ntot (percent) N (percent)
Survey Mode* 68 (100)
Mail 53 (77.9)
Telephone 4 (5.9)
Mixed web/mail 6 (8.8)
Other mixed methods 5 (7.4)
Data Type 20 (58.8)
Figures 9 (26.5)
Categorical data 10 (29.4)
Combination 1 (2.9)
Industry 32 (94.1)
Manufacture except farms 2 (5.9)
Construction 3 (8.8)
Farms (cattle and agriculture) 4 (11.8)
Transport 3 (8.8)
Non-profit 2 (5.9)
Retail 1 (2.9)
Power supply 1 (2.9)
Life insurances 1 (2.9)
Military defence systems 1 (2.9)
Chemical, electrical and electronics sectors 2 (5.9)
Medical care 4 (11.8)
Diverse 8 (23.5)
Respondent 25 (73.5)
Managers, executives non-owners 13 (38.2)
Owners 3 (8.8)
Employees, not otherwise specified 1 (2.9)
Physician 1 (2.9)
Teacher 1 (2.9)
Salespeople 2 (5.9)
Engineers and other technical personnel 4 (11.8)
Mandatory 34 (100)
Yes 2 (5.9)
No 32 (94.1)
172

A p p e n d i c e s
Table D1. Continued
Characteristic Ntot (percent) N (percent)
Treatments* 68 (100)
Prepaid monetary incentive 35 (51.5)
Promised monetary incentive 7 (10.3)
Nonmonetary incentive 15 (22.1)
Promised charitable donation 5 (7.4)
Promised lottery participation 3 (4.4)
Combination 3 (4.4)
Prepaid vs Promised 66 (97.1)
Prepaid 50 (73.5)
Promised 16 (23.5)
Monetary vs Nonmonetary 68 (100)
Monetary 43(63.2)
Nonmonetary 25 (36.8)
Type Monetary Incentive 43 (100)**
Cash (coin or bill) 33 (76.7)
Check 4 (9.3)
ATM card 3 (7)
Gift card 3 (7)
Type Nonmonetary Incentive 25 (100)**
Small gift (other than a stamp) 3 (12)
Stamp 2 (8)
Publication from contributed data 5 (20)
Enclosure about survey 2 (8)
Article (general) 4 (16)
Charitable donation 5 (20)
Lottery 4 (16)
* Country of implementation, research organization, survey method, treatments and types of incentives were part of the experiment in some cases. Therefore we report these in numbers of experimental conditions. The other characteristics are reported in numbers by studies.** 43 of the 43 total cases of a monetary incentive and 25 of the 25 total cases of a nonmonetary incentive (those 3 coded as combination in the Treatment variable were coded here as their primary treatment, a monetary incentive).
Table D2. Coded Continuous Characteristics of Studies or Experimental Groups Included in the Meta-Analysis
Characteristic Ntot (percent) Min Max Mean
Year of publication 34 (100) 1961 2008 1995
Value Incentive ($) 51 (75)* .40 135.01 15.39
* In 51 experimental treatments the value of the monetary or the nonmonetary incentive was exposed
173


n e d e r L a n d s e s a M e n V aT T i n G
n e d e r L a n d s e s a M e n v at t i n g1 . s a m e n v a t t i n g v a n d e r e s u l t a t e n e n c o n c l u s i eHet onderzoek dat wordt besproken in dit proefschrift geeft theoretische en empirische inzichten in het concept van motivatie in verband met organisatie- en bedrijfsenquêtes. Het uitgevoerde onderzoek heeft geleid tot een aantal aanbevelingen over het ontwerp van organisatie-enquêtes, waaronder ook de communicatieaspecten, met het oog op het verbeteren van responsaantallen en data kwaliteit maar ook om klachten over lastendruk door bedrijven en andere soorten organisaties te verminderen. Met deze kennis kunnen de motivatie van organisaties en respondenten voor organisatie- en bedrijfsenquêtes verbeterd worden. Ook is er een basis gelegd op welke voortgebouwd kan worden met verder onderzoek naar motivatie bij organisatie-enquêtes, en om zo het gat te dichten tussen wat bekend is in andere disciplines over motivatie en hoe deze kennis toegepast kan worden op organisatie-enquêteonderzoek. Er zijn zowel kwalitatieve als kwantitatieve analyse technieken gebruikt, net als verschillende soorten data. Door verschillende soorten data en analysetechnieken te gebruiken, worden complementariteit en validatie van de resultaten van de verschillende hoofdstukken bereikt. Literatuuronderzoek was ook een deel van deze onderneming om meer kennis over motivatie in het gebied van organisatie- en bedrijfsenquêtemethodologie in te brengen.
In het vervolg van deze samenvatting, zal ik eerst de conclusie van elk hoofdstuk bespreken, gevolgd door een samenvatting van praktische aanbevelingen gebaseerd op elk hoofdstuk. Op het einde bespreek ik ideeën voor verder onderzoek. Deze zijn gericht op een vervolg van dit proefschrift voor wat betreft onderzoek naar motivatie in organisatie-enquêtes.
In hoofdstuk 2 presenteren we een thematische analyse van zowel primaire als secundaire data. We bespreken dat, binnen een bedrijf en voor het invullen bedrijfsenquêtes, extrinsieke motivatie evenveel aandacht verdient als intrinsieke motivatie. Ook bespreken we dat andere bronnen van motivatie, naast de drie bronnen die afkomstig zijn van de fundamentele behoeften in de Cognitieve Evaluatie theorie (competentie, autonomie en verbondendheid) relevant kunnen zijn, in tegenstelling tot eerder onderzoek dat voornamelijk aandacht gaf aan intrinsieke motivatie en deze gerelateerde drie fundamentele behoeftes. Verder bespreken we dat andere benaderingen het potentieel hebben sommige aspecten van motivatie in bedrijfsenquêtes beter uit te leggen dan alleen het kader van de SDT theorie (self-determinatie theorie), die in voorgaand onderzoek veelvuldig gebruikt is om motivatie bij het invullen van enquêtes te benaderen. Een bijvoorbeeld is de benadering van McClelland (bv. McClelland, 1985), een duaal systeem dat impliciete motieven behandeld naast expliciete motieven. Hoofdstuk 2 eindigt met suggesties ter verbetering van motivatie in bedrijfsenquêtes en met ideeën voor vervolgonderzoek.
Hoofdstuk 3 onderzoekt in detail het gebruik van officiële statistieken door bedrijven en mogelijkheden om dit gebruik te verbeteren. In dit hoofdstuk laten wij het gebruik zien van officiële statistieken door bedrijven en identificeren wij hindernissen voor dit gebruik. Ook maken wij voorstellen voor verbetering, met het dubbele doel om de capaciteit van
175

n e d e r L a n d s e s a M e n V aT T i n G
nationale statistiekbureaus om hoge kwaliteit statistieken, relevant voor bedrijven, te produceren en te communiceren; en het bewustzijn van bedrijven over de mogelijkheden van officiële statistiek voor het gebruik door deze bedrijven te verbeteren. De opgedane kennis en de aanbevelingen kunnen gebruikt worden om motivatie te verbeteren via het ontwerp van de enquêtes en de communicatieaspecten hiervan.
Hoofdstuk 4 beschrijft de resultaten van een meta-analyse van 34 studies die een stimulans (extrinsieke beloning) in de vorm van geld of een andere soort van beloning aanboden om responsaantallen te vergroten bij een organisatie-enquête. In dit hoofdstuk tonen we aan dat een extrinsieke beloning, zoals in de vorm van een extrinsieke stimulans, effectief is in het verhogen van de responsaantallen bij organisatie-enquêtes. Aan de andere kant waren we helaas niet in staat de tijdigheid en de kwaliteit van de respons te analyseren. Ook waren we niet in staat rechtstreeks de motivatie te meten om te zien welke vormen van motivatie door de extrinsieke beloning werden verhoogd. Er is vervolgonderzoek nodig om na te gaan of een extrinsieke beloning effect heeft op de kwaliteit van de respons (non-respons van enquêteonderdelen en meetfouten) en tijdigheid , naast de responsaantallen die wij al onderzocht hebben. Maar ook is er vervolgonderzoek nodig om rechtstreeks te meten welke precieze invloed de extrinsieke beloning heeft op de verschillende soorten van motivatie.
Zoals wij in Hoofdstuk 2 beschreven, hebben wij in ons onderzoek sentimenten (zoals bijvoorbeeld de stemming van een respondent) maar ook percepties (zoals bijvoorbeeld de gepercipieerde waarde van een enquête of van de organisatie die de enquête heeft uitgestuurd) empirisch geïdentificeerd als belangrijke bronnen van motivatie in bedrijfsenquêtes. Hoofdstuk 5 geeft aan welke acties en communicatiestrategieën van het Centraal Bureau voor de Statistiek een positief of een negatief sentiment tot gevolg hebben. Hiermee hebben wij kennis opgedaan over hoe motivatie te verbeteren door middel van een enquêteontwerp en bijbehorend communicatieontwerp. Dit hoofdstuk maakt het in het bijzonder duidelijk dat communicatie heel belangrijk is in het beïnvloeden van percepties en sentimenten. Bij het ontwerpen van een enquête is het dus heel belangrijk ook gepaste aandacht te besteden aan het communicatieontwerp.
Ten slotte biedt hoofdstuk 6 een kritische revisie van motivatie onderzoek en theorieën uit verschillende onderzoeksgebieden. Bevindingen uit deze onderzoeksgebieden worden geïntegreerd in kritische proposities voor wat betreft het toepassen van motivatie theorieën op het ontwerp van organisatie-enquêtes. Naast de literatuur, zijn deze proposities mede gebaseerd op de onderzoeksresultaten die worden gepresenteerd in dit proefschrift, in het bijzonder in H. 2 en H. 4. Deze revisie in H. 6 biedt nieuw perspectief op de drijfveren achter organisatie-enquête responsgedrag en het functioneren van extrinsieke beloningen binnen de omlijsting van een organisatie. In het bijzonder laten we het belang zien van extrinsieke motivatie en de aanverwante expliciete doelen en motieven en hun potentiële invloed op impliciete motieven. Dit in tegenstelling tot enkele van de meest belangrijke voorgaande onderzoeken, waarin vooral aandacht wordt besteed aan intrinsieke motivatie en de drie onderliggende bronnen competentie, autonomie en verbondenheid. Naast de cognitieve en bewuste determinanten (de extrinsieke motivatie en expliciete doelen), bespreken we ook
176

n e d e r L a n d s e s a M e n V aT T i n G
de invloed van impliciete motieven. Ook wijzen we naar de prominente rol van het stellen van doelen, iets wat typisch is in werkomgevingen en veel meer expliciet aanwezig is bij organisatie-enquêtes dan bij persoonsenquêtes.
2 . p r a k t i s c h e a a n b e v e l i n g e n v o o r h e t o n t w e r p v a n o r g a n i s a t i e - e n q u ê t e s
Op basis van het gedane onderzoek, kunnen wij praktische aanbevelingen doen over hoe een ontwerp voor een organisatie- of bedrijfsenquête inclusief de communicatie zo aangepast kan worden dat de motivatie verhoogd kan worden. De verwachting is dat deze hogere motivatie dan weer zal leiden tot hogere responsaantallen, betere tijdigheid, nauwkeurigheid en volledigheid van de respons.
In Hoofdstuk 2 doen we enkele aanbevelingen over enquêteontwerp en communicatiestrategieën om de motivatie te verhogen. De huidige algemeen toegepaste praktijken om responsaantallen te verhogen, namelijk herinneringen en (de dreiging van) boetes in het geval van non-respons lijken hun doel te behalen, hoewel zij negatieve en niet positieve versterkingen zijn. De waarde van een enquête, de enquêterende organisatie en de uitkomsten van de enquête voor de respondenten zouden daarnaast moeten worden verhoogd en beter gecommuniceerd moeten worden. Dit geldt voor zowel de gepercipieerde als de feitelijke waarde.
Verder worden er suggesties genoemd over hoe de intrinsieke motivatie van de respondenten te verbeteren: het meedoen aan een enquête zou zo plezierig mogelijk gemaakt moeten worden; de gepercipieerde competentie (of gepercipieerde bekwaamheden) van de respondenten zou versterkt moeten worden; er zou een goede relatie tussen de bedrijven en de respondenten en de enquêterende organisatie opgebouwd moeten worden ter versterking van de verbondenheid; en respondenten zouden het gevoel moeten krijgen een zekere autonomie te hebben met relatie tot het invullen van de bedrijfsenquêtes.
Een andere mogelijke aanpak om de motivatie te verhogen zou kunnen zijn om de stemming van de respondent te beïnvloeden. Ook zouden de uitkomsten van de bedrijfsenquête verbeterd kunnen worden als die respondenten geselecteerd zouden worden die de gewenste karaktereigenschappen hebben. Er is vervolgonderzoek nodig om te kunnen bepalen hoe dit het beste gedaan zou kunnen worden. Het lijkt bijvoorbeeld zo (zie H.2, paragraaf 3.3.), dat mensen met bepaalde functies in organisaties meer geneigd zijn bepaalde karaktereigenschappen te hebben, die het nauwkeurig invullen van bedrijfsenquêtes positief beïnvloeden.
Hoofdstuk 3 toont aan dat nationale statistiekbureaus bedrijven niet genoeg identificeren als een aparte belangrijke doelgroep. Hierdoor nemen deze instellingen de behoeftes van bedrijven zelden in overweging als een afzonderlijk en erkend belang. De onderzochte bedrijven waren in het algemeen slechts beperkt bewust van de nationale statistiekinstellingen als een bron van externe data, onafhankelijk van het niveau van afhankelijkheid van data binnen het bedrijf. Er zijn drie zaken die verder gebruik van officiële statistieken binnen bedrijven lijken te hinderen: gebrek aan kennis over het feit dat sommige nuttige statistieken
177

n e d e r L a n d s e s a M e n V aT T i n G
te vinden zijn bij een nationaal statistiekbureau (waarbij zowel bewustzijn als bekwaamheid een rol spelen), moeilijkheden met de toegankelijkheid van de statistieken, en tekortkomingen van de statistieken. De geïdentificeerde tekortkomingen waren van verschillende aard en met verschillende aspecten, inclusief het niet op elkaar aansluiten van interne en externe data, het niet hebben van genoeg detail van de officiële statistieken, onvoldoende tijdigheid, behoeftes aan multinationale statistieken waar niet in voorzien werd, en onvoldoende begrip van de statistieken (van de kant van de bedrijven). Deze tekortkomingen houden verband met kwaliteitsdimensies van de officiële statistiek zoals die beschreven zijn door Eurostat, het Europese statistiekbureau (Eurostat, 2011). Deze kwaliteitsdimensies houden onder andere in: relevantie, tijdigheid, duidelijkheid, vergelijkbaarheid en coherentie. Op basis van deze resultaten worden nationale statistiekbureaus dus aangespoord om hun eigen praktijken voor wat betreft de communicatie met hun gebruikers afkomstig van de bedrijfswereld te verbeteren. Op deze manier kunnen de statistiekbureaus zowel hun capaciteit om bedrijven en andere doelgroepen te helpen verbeteren, alsook de statistiekproductie. Wat wij verwachten is dat zo het gepercipieerde belang en nut van de enquêtes voor bedrijven wordt verhoogd. In H.2 worden deze aspecten ook geïdentificeerd als bronnen voor extrinsieke motivatie en wordt verondersteld dat deze zullen leiden tot betere enquête-uitkomsten. Concrete voorstellen omvatten het verspreiden van officiële statistieken op een manier die meer aangepast is aan de behoeftes en ervaringen van bedrijven (zie paragraaf 4.2.1 van H. 3) en ondersteuning van bedrijven om officiële statistieken beter te kunnen gebruiken (4.2.2.).
In dit hoofdstuk stellen we ook twee bredere actiepunten voor voor de nationale statistiekbureaus. Ten eerste, meer samenwerking met tussenpersonen (bv. de media of brancheorganisaties) die officiële statistieken verspreiden. Dit kan het bewustzijn van de bron van de statistieken verbeteren en zo kunnen ook meer bedrijven geïnformeerd worden over relevante statistieken van nationale statistiekbureaus. Ten tweede, inspanningen om de interne data van bedrijven en externe data van nationale statistiekbureaus meer in formaat en specificaties op elkaar te laten lijken zouden zowel voor bedrijven als nationale statistiekbureaus voordelig zijn. Het niet aansluiten van interne en externe data kan veroorzaakt zijn door verschillende standaarden in de verschillende overheidstakken (b.v. boekhouding, statistieken, douane). Pogingen om zulke verschillen te elimineren zijn bijvoorbeeld het gebruik van “single entry points” voor bedrijven om hun data voor administratieve doeleinden via deze “single entry points” te kunnen verstrekken aan overheidsinstellingen (bv. Yancheva en Iskrova, 2011; Pereira, 2011), en unificerende data formats (bv. Van Hilvoorde, 2011).
Van Hoofdstuk 4 leiden we af dat het gebruik van extrinsieke beloningen tot betere responsaantallen kan leiden in organisatie-enquêtes, en dan vooral als de responsaantallen normaal gesproken laag zijn. De resultaten van deze meta-analyse ondersteunen de bevindingen van H. 2 die laten zien dat extrinsieke motivatie belangrijk is bij het invullen en beantwoorden van bedrijfsenquêtes. Op basis hiervan kunnen wij adviseren extrinsieke beloningen te gebruiken in organisatie-enquêtes, afhankelijk van de gebruikelijke responsaantallen en een vooranalyse van de kost-effectiviteit en andere specifieke interesses in elk afzonderlijk geval.
178

n e d e r L a n d s e s a M e n V aT T i n G
Gebaseerd op de resultaten van Hoofdstuk 5, kunnen wij ook een aantal aanbevelingen doen om de oorzaken van negatieve sentimenten weg te nemen, een positieve perceptie van het nationale statistiekbureau en de enquêtes te versterken, en daarmee motivatie om mee te doen aan de enquêtes te verhogen en zo responsaantallen en de kwaliteit en tijdigheid van de respons te verhogen. Sommige van deze aanbevelingen zijn een herhaling van de bevindingen van andere hoofdstukken, waarmee deze dan ook weer worden bevestigd.
Gezien kosten in tijd en geld belangrijk zijn voor ondernemers, is het belangrijk de kosten van de deelname aan een enquête te verlagen, maar tegelijkertijd ook de (gepercipieerde) waarde, of het (gepercipieerde) nut, van de enquêtes te verhogen voor de bedrijven. In dezelfde lijn, is het erg belangrijk de responstaak te vergemakkelijken en simplificeren, om zo de (gepercipieerde) kosten te verlagen. Daarnaast, gelet op de onbekendheid met het Nederlandse nationale statistiekbureau, het Centraal Bureau voor de Statistiek (CBS), en haar rol als enquêteur van data, en producent en publicist van statistieken, is het belangrijk dat deze aspecten bekender worden gemaakt door middel van een geschikte en coherente communicatiestrategie (zie ook Snijkers 2009; Snijkers et al., 2013). Een laatste set van aanbevelingen gaat over het gebruik van de sociale media die door nationale statistiekbureaus gebruikt kunnen worden als communicatiekanaal. De sociale media kunnen worden gebruikt om statistieken te publiceren, maar ze kunnen ook gebruikt worden om met respondenten te communiceren en als een communicatiekanaal om een positieve perceptie van het statistiekbureau te stimuleren.
3 . v e r v o l g o n d e r z o e kEr is vervolgonderzoek nodig om meer in detail kennis op te doen over instrumenten en strategieën om de in dit proefschrift besproken types van motivatie en de bijbehorende bronnen van motivatie zo goed mogelijk te kunnen gebruiken in een enquête- en communicatieontwerp. In zo’n vervolgonderzoek kunnen dan ook de precieze effecten van deze bronnen en types van motivatie op het bedrijfsenquête responsgedrag en de uitkomsten van bedrijfsenquêtes worden getest. Zo zou bijvoorbeeld de effectiviteit van een extrinsieke beloning (H. 4) als bron van extrinsieke motivatie experimenteel kunnen worden getest en ook de potentiële invloed van een extrinsieke beloning op intrinsieke motivatie. Ook het gebruik van andere bronnen van extrinsieke en intrinsieke motivatie die worden besproken in dit proefschrift kunnen experimenteel worden getest, zoals bijvoorbeeld het promoten van het gebruik van officiële statistieken door de organisaties die gevraagd worden deel te nemen in organisatie-enquêtes (Hoofdstuk 3) of andere bronnen zoals beschreven in Hoofdstuk 2. Idealiter zouden deze getest worden in een enquête- en communicatieontwerp om responsaantallen, tijdigheid en kwaliteit van de respons te verhogen, en om dan naast het meten van deze aspecten expliciet ook het effect van deze strategieën op de verschillende types motivatie te meten. Het zou dus heel interessant zijn experimenten uit te voeren op het enquête- en communicatieontwerp van bedrijfsenquêtes waarbij de strategieën toegepast kunnen worden die wij in dit proefschrift besproken hebben (en die dienen als bron van
179

n e d e r L a n d s e s a M e n V aT T i n G
motivatie), om dan de precieze effecten op responsaantallen, data kwaliteit, tijdigheid maar ook de verschillende types motivatie te meten.
Een mogelijke manier om intrinsieke en extrinsieke motivatie te meten, en zo dus het precieze effect op de motivatie te meten van de verschillende soorten bronnen van motivatie in een enquête en communicatieontwerp, is het toepassen van een van de verschillende motivatieschalen die zijn ontwikkeld in eerder onderzoek. Zie bijvoorbeeld: SIMS, Situational Motivation Scale (Guay, Vallerand and Blanchard, 2000); PLOCQ, Perceived Locus of Causality scale (Goudas, Biddle and Fox, 1994); de schaal voor Werk Motivatie gebruikt door Wright (2004); en verscheidene andere motivatieschalen die zijn ontwikkeld in de context van de self-determinatie theorie, waaronder de IMI (Intrinsic Motivation Inventory).
180

a b o u T T h e a u T h o r
a B o u t t h e a u t h o rVanessa Torres van Grinsven (1977) was born in Ibiza, Spain, of a Spanish father and a Dutch mother. She studied Philosophy and Social and Cultural Anthropology at the Universidad de Barcelona, where she obtained her master’s diploma in Social and Cultural Anthropology in 1999. She started working at Statistics Netherlands at the Department of Methodology and Quality in 2010, where she contributed in projects to improve data collection methodology for household and business surveys, shortly after which she started the dissertation project “Motivation of respondents in business surveys”. She has experience with both qualitative and quantitative research methods and a number of publications based on her research. Between 2010 and 2012 she contributed to the European project BLUE-ETS and she is currently active in several international scientific committees.
181


a C k n o W L e d G e M e n T s
a C k n o W L e d g e M e n t sI would like to dedicate this dissertation, first, to my grandparents, José and Eulalia and Robert and Anna Jeanne. I am a combination of the four of you and I would like to think that you would be proud of me now if you could have witnessed me defending my dissertation. I would also like to dedicate this dissertation to my parents, José and Leonie, my stepfather Jan and Rosa (who doesn’t want to be called stepmother though she has been in that role for most of my life), and my brother Roberto and sister Sara. Thank you all for being there and for all the support. Writing this dissertation and carrying out the research including all its facets would not have been possible without the help at home from friends and family.
Last but not least, I dedicate this dissertation to my three children, my one and only “A-team”: Anene, Amelia and Alba. I thank you for being so good and supportive, being proud of me and for being so patient with me as your mom.
I would also like to thank all my other family members, friends, neighbours, other parents from the schoolyard and anybody else I might have forgotten to mention. With either practical support, a casual small talk or just a listening ear you have been in our lives in a positive way. I realize I am so lucky to be surrounded by you all. Especially I would like to mention my friend Sarina. Thanks for all the support and for always being there at the right moment for a pep-talk. To all my friends I left behind somewhere along the path of life: though many of you I will never see again, I love you forever.
I’d like to thank my promotors Joop Hox and Ger Snijkers and my co-authors Deirdre Giesen and Mojca Bavdaz not only for making my dissertation project possible, but also for believing in me and giving me the opportunity to fulfill the project. Joop: I look up to you immensely and I am grateful I had the honor to be your PhD candidate. It was a great pleasure to work with you. Ger: thanks for bringing in inspiring ideas and always reminding me to keep in mind the practical applicability of the research results. A special thanks to Deirdre and Mojca who were not only my day-to-day supervisors during the first part of my research but also gave me personal support at the right times.
I conducted my research as a collaborative project of Utrecht University with Statistics Netherlands and a part of it was conducted within the frame of the BLUE-ETS project. I would like to thank all project colleagues that cooperated in the research at various stages, and especially all my co-authors of the dissertation chapters that resulted from this research: Irena, Mojca, Boris, Deirdre, and Rudi. I enjoyed working together with you all. It was an honor and a pleasure to be your partner in research and your co-author. You all made doing the research a very pleasant activity. Even though we were most of the time physically far apart from each other, that never posed a problem. I enjoyed our many meetings, among which our often very long phone calls. Thanks to Miroslav Hudec who has been a good friend in the past years and brought in many inspiring ideas for future research.
183

a C k n o W L e d G e M e n T s
Especially I’d like to mention Irena and Mojca, as you are the ones I worked with most intensely. Irena, I will never forget that day we spent more than 4 hours discussing our analysis results on the phone. You both are the best!
I have enjoyed the friendly and supportive sphere both at the Methodology and Statistics department at Utrecht University, and at Statistics Netherlands. I am grateful to have been able to be part of such an inspiring setting with all these very skilled and expert researchers. I wasn’t able to be around the Department of Methodology and Statistics in Utrecht a lot. Still, though not plenty, I cherish and appreciate all the moments I shared with you.
Visiting international conferences, workshops and courses was always pleasant, reuniting with colleagues or friends and making new friends and professional contacts. The warm-heartedness of the many people I met has been very appreciated.
184