Disciplined. Sustainable. Growth.
66
ABERDEEN SHOPPING CENTRE AMHERST CENTRE COUNTY FAIR MALL DOWNSVIEW MALL DOWNSVIEW PLAZA EVANGELINE MALL FORT EDWARD MALL HIGHLAND SQUARE MALL NEW MINAS PLAZA PARK LANE PRINCE STREET PLAZA SYDNEY SHOPPING CENTRE RIVER CITY CENTRE BARRINGTON PLACE BARRINGTON TOWER BRUNSWICK PLACE CIBC BUILDING COGSWELL TOWER DUKE TOWER SCOTIA SQUARE MALL SCOTIA SQUARE PARKADE 318 ONTARIO STREET NIAGARA PLAZA PORT COLBORNE MALL QUEENSLAND PLAZA ROSE CITY PLAZA RYMAL ROAD PLAZA SOUTH PELHAM MARKET PLAZA UPPER JAMES SQUARE VILLAGE SQUARE MALL CARLETON MALL CHARLOTTE MALL ELMWOOD PLAZA FREDERICTON MALL LOCH LOMOND PLACE PROSPECT STREET PLAZA RIVERVIEW MALL TERMINAL CENTRES AVALON MALL HAMLYN ROAD PLAZA RANDOM SQUARE VALLEY MALL COUNTY FAIR MALL GREENFIELD PARK CENTRE BRAMPTON PLAZA TAUNTON AND WILSON PLAZA 3250 FAIRVIEW STREET THE MEWS OF CARLETON PLACE, LANSDOWNE AVENUE, CARLETON PLACE 80 DUFFERIN STREET, PERTH MEWS SHOPPING MALL INTERNATIONAL GATEWAY CENTRE, 450 GARRISON ROAD, 8200 BOULEVARD, TASCHEREAU IGA STORE 5840 AND 5844 MALDEN ROAD, TOWN CENTRE PLAZA 385 SPRINGBANK AVENUE 43 484 NORFOLK STREET SOUTH, WHITE HORSE PLAZA 115 BOULEVARD GERARD D. LEVESQUE OUEST, PASPEBIAC PLAZA 94 969 AVE. NORDIQUE 5005 BOULEVARD DE L’ORMIERE 2458 KING GEORGE HIGHWAY, BRIDGEVIEW PLAZA 142 HAMPTON ROAD, ROTHESAY, FAIRVALE PLAZA, 426 RUE DE MOULEN 580 VICTORIA STREET, TRACADIE 68 ROBIE STREET, TRURO, FUNDY TRAIL CENTRE 580 VICTORIA STREET, EDMUNDSTON GEORGE STREET, NEW GLASGOW WEST SIDE PLAZA 109 1020, QUEEN STREET PLAZA 136 EAST VICTORIA STREET, AMHERST PLAZA 961 BEDFORD HIGHWAY, MILL COVE PLAZA 45 WEAVER ROAD, BLINK BONNIE SHOPPING MALL 4 WESTWOOD BOULEVARD, UPPER TANTALLON, TANTALLON PLAZA BELNAN ROAD, ELMSDALE, ELMSDALE SHOPPING CENTRE 128 MAIN STREET, TATAMAGOUCHE, NORTH SHORE CENTRE 35 356 CONCEPTION BAY HIGHWAY, CONCEPTION BAY PLAZA 470 TOPSAIL ROAD, ST. JOHN’S TOPSAIL ROAD PLAZA 272 TORBAY ROAD, ST. JOHN’S, TORBAY ROAD PLAZA 977 GOLF LINKS ROAD, ANCASTER 409 BAYFIELD STREET, BARRIE 215 PARK AVENUE WEST, CHATHAM 34 LIVINGSTONE AVENUE, GRIMSBY 254 HOTEL DE VILLE, RIVIÈRE DU LOUP 1500 RUE DE BRETAGNE, BAIE COMEAU 645 THIBEAU STREET, CAP DE LA MADELEINE 5555 BOUL DES GRADINS, CHARLESBOURG 8 90 BOUL D’ANJOU, CHATEAUGUAY 3950 RUE KING OUEST, SHERBROOKE 8980 BOULEVARD LACROIX, ST. GEORGES DE BEAUCE PLACE, DIEPPE 26 MICHAUD STREET, EDMUNDSTON 535 RIVERVIEW 463 BROOKSIDE, FREDERICTON 273 PLEASANT 1380 MOUNTAIN ROAD, MONCTON 46 PAUL ST. 501 REGIS STREET, DIEPPE 293 FOORD STREET, STELLARTON, 133 CHURCH STREET, ANTIGONISH 2 FOREST HILLS PARKWAY, DARTMOUTH 25 BROOKSIDE STREET, GLACE BAY 75 EMERALD STREET, NEW WATERFORD NORTH AND WINDSOR ST., HALIFAX 287 LACEWOOD DRIVE, LACEWOOD AND DUNBRACK 39 PITT STREET, SYDNEY MINES 634 REEVES STREET, PORT HAWKESBURY 22579 HIGHWAY #7, SHEET HARBOUR 279 HERRINGCOVE ROAD, SPRYFIELD 95 KELTIC DRIVE, SYDNEY RIVER 531 NORTH MAIN STREET, MONTAGUE 201 BUCHANAN DRIVE, WEST ROYALTY 2 COMMERCE STREET, DEER LAKE 10 ELIZABETH AVENUE, ST. JOHN’S, HOWLEY ESTATES 71 GRAND VIEW BLVD, GRAND BANK 21 CROMER AVENUE, GRAND FALLS 69 BLOCKHOUSE ROAD, PLACENTIA 45 ROPEWALK LANE, ST. JOHN’S Disciplined. Sustainable. Growth. Second Quarter Report Six Months Ended June 30, 2009 ROAD, COVERDALE STREET, NEWCASTLE
-
Upload
khangminh22 -
Category
Documents
-
view
0 -
download
0
Transcript of Disciplined. Sustainable. Growth.
A B E RD E E N S HO P P I N G C E N T R E AMH E R S T C E N T R E COUN T Y FA I R MA L L DOWN S V I EW MA L L DOWN S V I EW P L A Z A
E VANGE L I N E MAL L FOR T EDWARD MAL L H I GH LAND SQUAR E MAL L N EW M INA S P LAZA PARK LANE P R I NC E S T R E E T
P L A Z A S YDN E Y S HO P P I N G C E N T R E R I V E R C I T Y C E N T R E B A R R I N G TON P L AC E B A R R I N G TON TOWE R B R UN SW I C K
P L AC E C I B C B U I L D I N G COG SW E L L TOWE R DU K E TOWE R S COT I A S QUA R E MA L L S COT I A S QUA R E PA R K AD E
318 ONTAR I O S T R E E T N I AGARA P LAZA POR T COL BORNE MAL L QUE EN S LAND P LAZA ROS E C I T Y P LAZA RYMAL ROAD
P L A Z A SOU TH P E L H AM MAR K E T P L A Z A U P P E R J AM E S SQUA R E V I L L AG E SQUA R E MA L L C A R L E TON MA L L
CHA R LOT T E MA L L E LMWOOD P L A Z A F R E D E R I C TON MA L L LO CH
LOMOND P LAC E P ROS P E C T S T R E E T P LAZA R I V E R V I EW MAL L T E RM INA L
C E N T R E S AVA LON MA L L H AM LYN ROAD P L A Z A R ANDOM SQUA R E VA L L E Y MA L L COUN T Y FA I R MA L L
GR E EN F I E LD PARK C EN T R E B RAMPTON P LAZA TAUNTON AND W I L SON P LAZA 3250 FA I R V I EW S T R E E T TH E MEWS OF
C A R L E TON P L AC E , L A N SDOWN E AV E NU E , C A R L E TON P L AC E 8 0 DU F F E R I N S T R E E T , P E R T H M EWS SHO P P I N G MA L L
I N T E R NAT I ONA L GAT EWAY C E N T R E , 4 5 0 G A R R I S ON ROAD , 8 2 0 0 BOU L E VA RD , TA S C H E R E AU I G A S TO R E 5 8 4 0 AND
58 4 4 MA LD EN ROAD , TOWN C EN T R E P L A Z A 3 8 5 S P R I N G B AN K AV E NU E 4 3 4 8 4 NO R FO L K S T R E E T S OU TH , WH I T E
HO R S E P L A Z A 1 1 5 BOU L E VA RD G E R A RD D . L E V E S QU E OU E S T , PA S P E B I A C P L A Z A 9 4 9 6 9 AV E . NO RD I QU E
5 0 0 5 BOU L E VA RD D E L’O RM I E R E 2 4 5 8 K I N G G EO RG E H I G HWAY, B R I D G E V I EW P L A Z A 1 4 2 HAMP TON ROAD , R OTH E S AY,
FA I R VA L E P L A Z A , 4 2 6 R U E D E MOU L E N 5 8 0 V I C TO R I A S T R E E T , T R AC AD I E 6 8 R O B I E S T R E E T , T R U RO , F UNDY T R A I L
C E N T R E 5 8 0 V I C TO R I A S T R E E T , E DMUND S TON G EO RG E S T R E E T , N EW
G L A S GOW WE S T S I D E P L A Z A 1 0 9 1 0 2 0 , Q U E E N S T R E E T P L A Z A
136 EA S T V I C TOR I A S T R E E T, AMHER S T P LAZA 961 B EDFORD H IGHWAY, M I L L COV E P LAZA 45 WEAV ER ROAD , B L I N K BONN I E
S HO P P I N G MA L L 4 W E S T WOOD BOU L E VA RD , U P P E R TAN TA L LON , TA N TA L LON P L A Z A B E L N AN ROAD , E LM SDA L E ,
E LM SDA L E S HO P P I N G C E N T R E 1 2 8 MA I N S T R E E T , TATAMAGOUCH E , NO R T H SHO R E C E N T R E 3 5 3 5 6 CONC E P T I O N
B AY H I G HWAY, CONC E P T I O N B AY P L A Z A 4 7 0 TO P S A I L R OAD , S T . J O HN ’ S TO P S A I L R OAD P L A Z A 2 7 2 TO R B AY ROAD ,
S T . J OHN ’ S , TO R BAY ROAD P LA ZA 977 GO L F L I N K S ROAD , ANCA S T E R 409 BAY F I E L D S T R E E T , B A R R I E 2 15 PA R K AV ENU E
WE S T, C HATHAM 34 L I V I NG S TON E AV ENU E , G R IM S BY 254 HOT E L D E V I L L E , R I V I È R E DU LOUP 1500 RU E D E B R E TAGN E ,
B A I E COM EAU 64 5 T H I B E AU S T R E E T , C A P D E L A MAD E L E I N E 5 5 5 5 BOU L D E S G R AD I N S , C H A R L E S BOU RG 8 9 0 BOU L
D ’A N J OU , C H AT E AUGUAY 3 9 5 0 R U E K I N G OU E S T , S H E R B ROO K E 8 9 8 0 BOU L E VA RD L AC RO I X , S T . G E O R G E S D E B E AU C E
P L AC E , D I E P P E 2 6 M I C H AUD S T R E E T , E DMUND S TON 53 5
R I V E R V I E W 46 3 B ROOK S I D E , F R E D E R I C TON 27 3 P L E A S AN T
1 3 8 0 MOUN TA I N ROAD , MONC TON 46 PAU L S T . 5 0 1 R E G I S S T R E E T , D I E P P E 2 9 3 F OO RD S T R E E T , S T E L L A R TON , 1 3 3
CHURCH S T R E E T, AN T I GON I SH 2 FOR E S T H I L L S PARKWAY, DAR TMOUTH 25 B ROOKS I D E S T R E E T, G LAC E BAY 75 EMERA LD
S T R E E T , N EW WAT E R FO RD NOR TH AND W I ND SO R S T . , H A L I FA X 2 8 7 L AC EWOOD DR I V E , L A C EWOOD AND DUN B R AC K
3 9 P I T T S T R E E T , S Y DN E Y M I N E S 6 3 4 R E E V E S S T R E E T , P O R T HAWK E S B U R Y 2 2 5 7 9 H I G HWAY # 7 , S H E E T H A R BOU R 2 7 9
HERR INGCOVE ROAD, SPRYF I E LD 95 KELT I C DR I VE , SYDNEY R I V ER 531 NORTH MA IN STREE T, MONTAGUE 201 BUCHANAN
DR IVE , WEST ROYALT Y 2 COMMERCE STREE T, DEER LAKE 10 EL I ZABE TH AVENUE , S T. JOHN ’S , HOWLEY ESTATES 71 GRAND
VIEW BLVD, GRAND BANK 21 CROMER AVENUE, GRAND FALLS 69 BLOCKHOUSE ROAD, PLACENTIA 45 ROPEWALK LANE, ST. JOHN’S
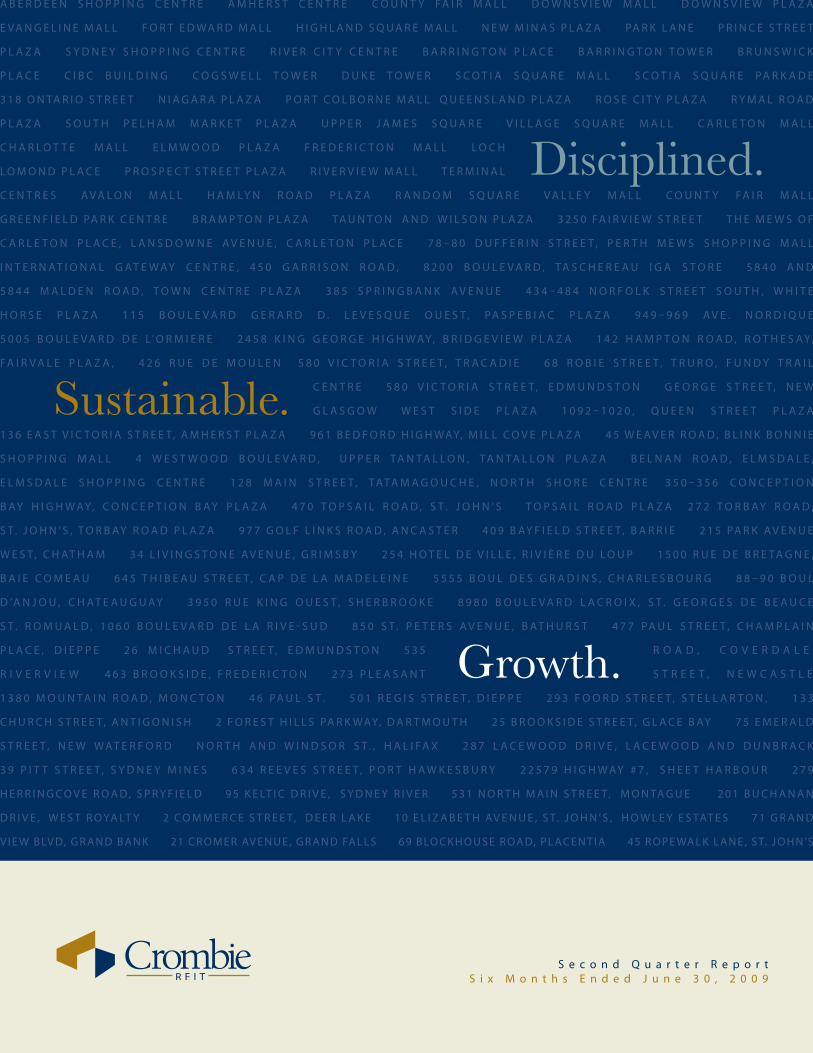
Disciplined.
Sustainable.
Growth.
S e c o n d Q u a r t e r R e p o r tS i x M o n t h s E n d e d J u n e 3 0 , 2 0 0 9
R O A D , C O V E R D A L E
S T R E E T , N E W C A S T L E

Quarterly Report to Unitholders
Crombie Real Estate Investment Trust (“Crombie") is an open-ended real estate investment trust established under, and
governed by, the laws of the Province of Ontario. The trust invests in income-producing retail, office and mixed-use properties
in Canada, with a future growth strategy focused primarily on the acquisition of retail properties. Crombie currently owns a
portfolio of 113 commercial properties in seven provinces, comprising approximately 11.2 million square feet of rentable
space.
Contents Page • Letters to Unitholders.......................................................................................................................................................................................................2
• Management’s Discussion and Analysis ...................................................................................................................................................................4
• Consolidated Financial Statement
• Consolidated Balance Sheet.................................................................................................................................................................................. 38
• Consolidated Statements of Income ................................................................................................................................................................. 39
• Consolidated Statements of Comprehensive Income................................................................................................................................ 40
• Consolidated Statements of Unitholders’ Equity.......................................................................................................................................... 41
• Consolidated Statements of Cash Flows.......................................................................................................................................................... 42
• Notes to the Consolidated Financial Statements ......................................................................................................................................... 43
• Corporate and Unitholders Information ............................................................................................................................................................... 64
Copies of this report are available on the REIT’s website www.crombiereit.com or by contacting the Investor Relations at (902) 755- 8100. A copy has also been filed on SEDAR. The REIT provided additional details concerning its second quarter results on a conference call held Thursday, August 7, 2009. Replay of the call is available on Crombie’s website www.crombiereit.com. Forward-looking Statements
This quarterly report contains forward looking statements that reflect the current expectations of management of Crombie about
Crombie's future results, performance, achievements, prospects and opportunities. Wherever possible, words such as "may", "will",
"estimate", "anticipate", "believe", "expect", "intend" and similar expressions have been used to identify these forward looking
statements. These statements reflect current beliefs and are based on information currently available to management of Crombie.
Forward looking statements necessarily involve known and unknown risks and uncertainties. A number of factors, including those
discussed in the annual Management Discussion and Analysis under "Risk Management” in the 2008 Annual Report, could cause
actual results, performance, achievements, prospects or opportunities to differ materially from the results discussed or implied in the
forward looking statements. These factors should be considered carefully and a reader should not place undue reliance on the
forward looking statements. There can be no assurance that the expectations of management of Crombie will prove to be correct.
Readers are cautioned that such forward-looking statements are subject to certain risks and uncertainties that could cause actual
results to differ materially from these statements. Crombie can give no assurance that actual results will be consistent with these
forward-looking statements.

2
Letter to Unitholders Crombie Real Estate Investment Trust (“Crombie”) (TSX: CRR.UN) is pleased to report its results for the second quarter ended
June 30, 2009.
Three months ended June 30,
Variance
(In millions of dollars, except per unit amounts) 2009 2008 $ % FFO $18.717 $18.812 $(0.095) (0.5)% Per Unit $0.35 $0.38 $(0.03) (7.9)% FFO Payout ratio 65.7% 63.1% (2.6)% AFFO $14.069 $11.916 $2.153 18.1% Per Unit $0.27 $0.24 $0.03 12.5% AFFO Payout ratio 87.4% 99.7% 12.3%
Six months ended June 30, Variance
(In millions of dollars, except per unit amounts) 2009 2008 $ % FFO $39.456 $32.651 $6.805 20.8% Per Unit $0.75 $0.71 $0.04 5.6% FFO Payout ratio 60.7% 63.5% 2.8% AFFO $30.095 $20.012 $10.083 50.4% Per Unit $0.57 $0.44 $0.13 29.5% AFFO Payout ratio 79.6% 103.7% 24.1%
Funds from Operations (FFO) for the second quarter of 2009 decreased slightly to $18.7 million ($0.35 per unit) from $18.8 million ($0.38 per unit) in the second quarter of 2008. The decrease was due to increased general and administrative expenses in the second quarter of 2009, offset by the portfolio acquisition of 61 retail properties from subsidiaries of Empire Company Limited (the “Portfolio Acquisition”) in April 2008 and the addition of the Saskatoon property acquisition in June 2008. FFO for the six months ended June 30, 2009 increased to $39.5 million ($0.75 per unit) from $32.7 million ($0.71 per unit) for the same period in 2008. The improvement was due to the aforementioned acquisitions partially offset by higher general and administrative expenses. Adjusted Funds from Operations (AFFO) for the second quarter of 2009 was $14.1 million ($0.27 per unit) compared to $11.9 million ($0.24 per unit) for the second quarter of 2008. AFFO for the six months ended June 30, 2009 was $30.1 million ($0.57 per unit) compared to $20.0 million ($0.44 per unit) for the same period in 2008. Growth in AFFO during the second quarter ended June 30, 2009 was primarily due to lower maintenance capital and leasing costs, while AFFO growth for the six months ended June 30, 2009 was influenced by the lower maintenance capital and leasing costs as well as the improved FFO results. The six months ended June 30, 2009 AFFO payout ratio was 79.6% which is favourable to the annual target payout ratio of 95% and the payout ratio of 103.7% for the same period in 2008.
2009 Second Quarter Highlights
• Crombie completed the syndication and extension of the 18-month Term Facility to May 2011.
• Crombie completed a public offering of units for gross proceeds of $36.9 million and a private placement of Class B LP units for gross proceeds of $30 million on June 25, 2009.
• Crombie completed leasing activity on approximately 67% of its 2009 expiring leases as at June 30, 2009.
• Occupancy for the properties was 94.1% at June 30, 2009 compared with 94.2% at March 31, 2009.
• Property revenue for the quarter ended June 30, 2009 increased by $3.6 million, or 7.6%, to $50.9 million compared to $47.3 million for the quarter ended June 30, 2008.
• Same-asset NOI for the second quarter of 2009 of $22.2 million decreased by $0.4 million or 1.7%, compared to $22.6 million for the quarter ended June 30, 2008.
• The FFO payout ratio for the six months ended June 30, 2009 was 60.7% which was favourable to the target annual payout ratio of 70% and favourable to the payout ratio of 63.5% for the same period in 2008.
• The AFFO payout ratio for the six months ended June 30, 2009 was 79.6% which was favourable to the target annual AFFO payout ratio of 95% and was favourable to the payout ratio of 103.7% for the same period in 2008.

3
• Debt to gross book value decreased to 50.9% at June 30, 2009 compared to 54.8% at March 31, 2009.
• Crombie’s interest service coverage ratio for the first six months of 2009 was 2.79 times EBITDA and debt service coverage ratio was 1.96 times EBITDA, compared to 2.94 times EBITDA and 2.04 times EBITDA, respectively, for the same period in 2008.
Financial Overview
Same-asset property revenue of $36.2 million in the second quarter of 2009 was 2.7% lower than the second quarter in 2008 due primarily to decreased revenue from lower recoverable common area expenses and a one-time head lease adjustment upon final release of the obligation governing the agreement between ECL and Crombie for County Fair Mall in Summerside, Prince Edward Island and Uptown Center in Fredericton, New Brunswick, partially offset by the increased average rent per square foot. Same-asset property revenue for the six months ended June 30, 2009 of $74.3 million was 0.3% lower than the same period in 2008 due to the reduction in head lease revenue. Same-asset property expenses of $13.9 million in the second quarter of 2009 were 4.3% lower than the $14.6 million for the second quarter of 2008. The decreased property expenses were due to decreased recoverable common area expenses primarily from decreased snow removal costs. Same-asset property expenses of $30.1 million for the six months ended June 30, 2009 were 0.6% higher than the same period in 2008. The increased property expenses were due to increased recoverable common area expenses primarily from increased utility costs and property taxes. Closing Remarks
“I am pleased to see Crombie’s stable operating performance during what continues to be a challenging recession” stated Donald E. Clow, FCA, Crombie’s President and Chief Executive Officer. “Our strategy to focus on primarily grocery anchored retail properties, a defensive asset class, has worked in our favour.” Donald Clow continued, “The recent equity offering combined with the syndication and extension of our term facility has strengthened our balance sheet and provides Crombie with the capacity to consider acquisition opportunities, should they arise.” “On a personal note, I would like to recognize Stuart Blair on his retirement and thank him for his successful career at Crombie REIT and its predecessor companies. I look forward to the council and advice of our board of trustees and leading our outstanding team of employees in the future.”
Donald E. Clow, FCA President & Chief Executive Officer August 6, 2009

4
Management Discussion and Analysis
Forward-looking Information ................................................................................................................. 5 Non-GAAP Financial Measures ............................................................................................................... 6 Introduction ........................................................................................................................................... 6
Financial and Operational Summary ...........................................................................................................................................................................................6
Overview of the Business and Recent Developments ..........................................................................................................................................................6
Business Strategy and Outlook ......................................................................................................................................................................................................7
Business Environment .......................................................................................................................................................................................................................8
2009 Second Quarter Highlights .......................................................................................................................8 Overview of the Property Portfolio...................................................................................................................9
Property Profile.....................................................................................................................................................................................................................................9
Largest Tenants ................................................................................................................................................................................................................................. 10
Lease Maturities................................................................................................................................................................................................................................. 10
2009 Portfolio Lease Expiries and Leasing Activity ............................................................................................................................................................. 10
Sector Information ........................................................................................................................................................................................................................... 11
2009 Results of Operations ..............................................................................................................................12 Acquisitions......................................................................................................................................................................................................................................... 12
Comparison to Previous Year....................................................................................................................................................................................................... 12
Sector Information ........................................................................................................................................................................................................................... 15
Other 2009 Performance Measures ......................................................................................................16 Funds from Operations .................................................................................................................................................................................................................. 17
Adjusted Funds from Operations............................................................................................................................................................................................... 17
Liquidity and Capital Resources ......................................................................................................18 Sources and Uses of Funds ........................................................................................................................................................................................................... 18
Capital Structure ............................................................................................................................................................................................................................... 20
Bank Credit Facilities and Commercial Property Debt....................................................................................................................................................... 20
Taxation of Distributions ............................................................................................................................................................................................................... 21
Borrowing Capacity and Debt Covenants .............................................................................................................................................................................. 22
Debt to Gross Book Value Ratio .................................................................................................................................................................................................. 22
Debt and Interest Service Coverage Ratios............................................................................................................................................................................ 23
Distributions and Distribution Payout Ratios........................................................................................................................................................................ 24
Second Quarter Results.....................................................................................................................25 Comparison to Previous Year....................................................................................................................................................................................................... 25
Sector Information ........................................................................................................................................................................................................................... 27
Other Second Quarter Performance Measures ..............................................................................29 Funds from Operations .................................................................................................................................................................................................................. 29
Adjusted Funds from Operations............................................................................................................................................................................................... 29
Cash Flow............................................................................................................................................................................................................................................. 30
Changes in Accounting Policies .......................................................................................................31 Effect of New Accounting Policies Not Yet Implemented ............................................................31 Related Party Transactions...............................................................................................................32 Critical Accounting Estimates ..........................................................................................................33 Commitments and Contingencies ...................................................................................................33 Risk Management ..............................................................................................................................33 Subsequent Event..............................................................................................................................36 Internal Control Over Financial Reporting .....................................................................................36 Disclosure Controls and Procedures ...............................................................................................36 Quarterly Information.......................................................................................................................37

5
Management Discussion and Analysis
(In thousands of dollars, except per unit amounts)
The following is Management’s Discussion and Analysis (“MD&A”) of the consolidated financial condition and results of
operations of Crombie Real Estate Investment Trust (“Crombie”) for the quarter and year-to-date ended June 30, 2009, with a
comparison to the financial condition and results of operations for the comparable period in 2008.
This MD&A should be read in conjunction with Crombie’s interim consolidated financial statements and accompanying notes
for the period ended June 30, 2009, and the audited consolidated financial statements and accompanying notes for the year
ended December 31, 2008 and the related MD&A. Information about Crombie can be found on SEDAR at www.sedar.com.
FORWARD-LOOKING INFORMATION
This MD&A contains forward-looking statements that reflect the current expectations of management of Crombie about
Crombie's future results, performance, achievements, prospects and opportunities. Wherever possible, words such as "may",
"will", "estimate", "anticipate", "believe", "expect", "intend" and similar expressions have been used to identify these forward-
looking statements. These statements reflect current beliefs and are based on information currently available to management
of Crombie. Forward-looking statements necessarily involve known and unknown risks and uncertainties. A number of
factors, including those discussed under "Risk Management" could cause actual results, performance, achievements,
prospects or opportunities to differ materially from the results discussed or implied in the forward-looking statements. These
factors should be considered carefully and a reader should not place undue reliance on the forward-looking statements.
There can be no assurance that the expectations of management of Crombie will prove to be correct.
In particular, certain statements in this document discuss Crombie’s anticipated outlook of future events. These statements
include, but are not limited to:
(i) the development of new properties under a development agreement, which development activities are undertaken by a
related party and thus are not under the direct control of Crombie and whose activities could be impacted by real estate
market cycles, the availability of labour and general economic conditions;
(ii) the acquisition of accretive properties and the anticipated extent of the accretion of any acquisitions, which could be
impacted by demand for properties and the effect that demand has on acquisition capitalization rates and changes in interest
rates;
(iii) reinvesting to make improvements to existing properties, which could be impacted by the availability of labour and
capital resource allocation decisions;
(iv) generating improved rental income and occupancy levels, which could be impacted by changes in demand for Crombie’s
properties, tenant bankruptcies, the effects of general economic conditions and supply of competitive locations in proximity
to Crombie locations;
(v) overall indebtedness levels, which could be impacted by the level of acquisition activity Crombie is able to achieve and
future financing opportunities;
(vi) tax exempt status, which can be impacted by regulatory changes enacted by governmental authorities;
(vii) anticipated subsidy payments from ECL Developments Limited (“ECL”), which are dependent on tenant leasing and
construction activity;
(viii) anticipated distributions and payout ratios, which could be impacted by seasonality of capital expenditures, results of
operations and capital resource allocation decisions;
(ix) the effect that any contingencies would have on Crombie’s financial statements;
(x) the continued investment in training and resources throughout the international financial reporting standards transition;
(xi) the assumed estimated impact per unit upon future settlement of the interest rate swap agreements which may be
impacted by changes in Canadian bond yields and swap spreads, as well as the timing and type of financing available and the
related amortization period thereon; and
(xii) estimated losses on derivatives that will be reclassified to interest expenses during the remaining two quarters of 2009.
Readers are cautioned that such forward-looking statements are subject to certain risks and uncertainties that could cause
actual results to differ materially from these statements. Crombie can give no assurance that actual results will be consistent
with these forward-looking statements.

6
NON-GAAP FINANCIAL MEASURES
There are financial measures included in this MD&A that do not have a standardized meaning under Canadian generally
accepted accounting principles (“GAAP”) as prescribed by the Canadian Institute of Chartered Accountants. These measures
are property net operating income (“NOI”), adjusted funds from operations (“AFFO”), debt to gross book value, funds from
operations (“FFO”) and earnings before interest, taxes, depreciation and amortization (“EBITDA”). Management includes these
measures because it believes certain investors use these measures as a means of assessing relative financial performance.
INTRODUCTION
Financial and Operational Summary
(in thousands of dollars, except per unit amounts
and as otherwise noted)
Quarter
Ended June
30, 2009
Quarter
Ended June
30, 2008
Six Months Ended
June 30, 2009
Six Months
Ended
June 30, 2008
Property revenue $50,893 $47,314 $103,885 $84,576
Net income $4,128 $3,839 $8,320 $6,622
Basic and diluted net income per unit $0.15 $0.15 $0.30 $0.28
FFO $18,717 $18,812 $39,456 $32,651
FFO per unit(1) $0.35 $0.38 $0.75 $0.71
FFO payout ratio (%) 65.7% 63.1% 60.7% 63.5%
AFFO $14,069 $11,916 $30,095 $20,012
AFFO per unit(1) $0.27 $0.24 $0.57 $0.44
AFFO payout ratio (%) 87.4% 99.7% 79.6% 103.7%
June 30, 2009 June 30, 2008
Debt to gross book value(2) 50.9% 55.0%
Total assets $1,470,474 $1,501,754
Total commercial property debt and convertible debentures $788,313 $828,259
(1) FFO and AFFO per unit are calculated by FFO or AFFO, as the case may be, divided by the diluted weighted average of the total Units and Special Voting Units outstanding of 52,959,049 for the quarter ended June 30, 2009 and 49,954,256 for the quarter ended June 30, 2008, 52,656,935 for the six months ended June 30, 2009 and 45,841,408 for the six months ended June 30, 2008.
(2) See ”Borrowing Capacity and Debt Covenants” for detailed calculation.
Overview of the Business and Recent Developments
Crombie is an unincorporated, open-ended real estate investment trust established pursuant to a Declaration of Trust dated
January 1, 2006, as amended and restated (the “Declaration of Trust”) under, and governed by, the laws of the Province of
Ontario. The units of Crombie trade on the Toronto Stock Exchange under the symbol CRR.UN.
Crombie invests in income-producing retail, office and mixed-use properties in Canada, with a future growth strategy focused
primarily on the acquisition of retail properties. At June 30, 2009, Crombie owned a portfolio of 113 commercial properties in
seven provinces, comprising approximately 11.2 million square feet of gross leaseable area (“GLA”).
On April 22, 2008, Crombie closed an acquisition of a 61 retail property portfolio representing approximately 3.3 million
square feet of GLA (the “Portfolio Acquisition”) from certain affiliates of Empire Company Limited (“Empire Subsidiaries”). The
cost of the Portfolio Acquisition to Crombie was $428,500, excluding closing and transaction costs. The portfolio consists of
40 single-use freestanding Sobeys grocery stores of various Sobeys banners, 20 Sobeys anchored retail strip centres and one
Sobeys anchored partially enclosed centre. The GLA of the portfolio is as follows: Atlantic Canada – 78%; Quebec – 7%; and
Ontario – 15%.
In order to partially finance the Portfolio Acquisition, on March 20, 2008, Crombie completed a public offering of 5,727,750
subscription receipts, including the over-allotment option, at a price of $11.00 per subscription receipt (each subscription
receipt converted into one Unit of Crombie upon closing) and $30,000 of convertible extendible unsecured subordinated
debentures (the “Debentures”) for aggregate gross proceeds of $93,005.
Empire Subsidiaries took $55,000 of the purchase price in Class B LP Units of Crombie Limited Partnership at the $11.00
offering price.

7
The remainder of the purchase price was satisfied with a $280,000, 18 month floating rate term financing (“Term Facility”) and
a draw on Crombie’s revolving credit facility. On September 30, 2008, Crombie completed a refinancing of $100,000 of the
Term Facility with fixed rate mortgages. On February 12, 2009, Crombie completed mortgage refinancing on an additional
$39,000 of the Term Facility (see “Commercial Property Debt”). On June 4, 2009, Crombie extended the Term Facility with a
syndicate of seven Canadian chartered banks. The maturity date of the Term Facility was extended to May 2011 and is
secured by 30 properties purchased as part of the Portfolio Acquisition.
On October 24, 2008, Crombie completed the sale of West End Mall in Halifax, Nova Scotia. Under GAAP, the financial position
and operating results have been reclassified on the financial statements for Crombie as assets and liabilities related to
discontinued operations on a retroactive basis. The operating results tables in this MD&A also reflect the sale of the property
on Crombie’s results.
On June 25, 2009, Crombie closed a public offering of 4,725,000 Units, including the underwriters’ over-allotment option
Units, at a price of $7.80 per Unit for gross proceeds of $36,855. Concurrent with the public offering, in satisfaction of its pre-
emptive right, ECL purchased $30,000 of Class B LP Units and the attached Special Voting Units, on a private-placement basis,
at the $7.80 offering price. Empire Company Limited (“Empire”), through ECL, holds a 47.4% economic and voting interest in
Crombie as of June 30, 2009.
Business Strategy and Outlook
The objectives of Crombie are threefold:
1. Generate reliable and growing cash distributions;
2. Enhance the value of Crombie’s assets and maximize long-term unit value through active management; and
3. Expand the asset base of Crombie and increase its cash available for distribution through accretive acquisitions.
Generate reliable and growing cash distributions: Management focuses on improving both the same-asset results while
expanding the asset base with accretive acquisitions to grow the cash distributions to unitholders. As at June 30, 2009, after
just over three years of operations, Crombie has increased its distributions by 11.25% while achieving its annual AFFO payout
ratio targets.
Enhance value of Crombie’s assets: Crombie anticipates reinvesting approximately 3% to 5% of its property revenue each
year into its properties to maintain their productive capacity and thus overall value.
Crombie's internal growth strategy focuses on generating greater rental income from its existing properties. Crombie plans to
achieve this by strengthening its asset base through judicious expansion and improvement of existing properties, leasing
vacant space at competitive market rates with the lowest possible transaction costs, and maintaining good relations with
tenants. Management will continue to conduct regular reviews of properties and, based on its experience and market
knowledge, will assess ongoing opportunities within the portfolio.
Expand asset base with accretive acquisitions: Crombie's external growth strategy focuses primarily on acquisitions of
income-producing retail properties. Crombie pursues two sources of acquisitions which are third party acquisitions and the
relationship with ECL. All acquisitions completed to date have been purchased at costs which ensure they will be
immediately accretive to cash available for distribution. The relationship with ECL includes currently owned and future
development properties, as well as opportunities through the rights of first refusal that one of Empire’s subsidiaries has
negotiated in many of their leases. Crombie will seek to identify future property acquisitions using investment criteria that
focus on the strength of anchor tenancies, market demographics, terms of tenancies, proportion of revenue from national
tenants, opportunities for expansion, security of cash flow, potential for capital appreciation and potential for increasing
value through more efficient management of the assets being acquired, including expansion and repositioning.
Crombie plans to work closely with ECL to identify development opportunities that further Crombie's external growth
strategy. The relationship is governed by a development agreement described in the Material Contracts section of Crombie’s
Annual Information Form for the year ended December 31, 2008. Through this relationship, Crombie expects to have the
benefits associated with development while limiting its exposure to the inherent risks of development, such as real estate
market cycles, cost overruns, labour disputes, construction delays and unpredictable general economic conditions. The
development agreement will also enable Crombie to avoid the uncertainties associated with property development,
including paying the carrying costs of land, securing construction financing, obtaining development approvals, managing

8
construction projects, marketing in advance of and during construction and earning no return during the construction
period.
The development agreement provides Crombie with a preferential right to acquire retail properties developed by ECL,
subject to approval by the independent trustees. The history of the relationship between Crombie and ECL continues to
provide promising opportunities for growth through future development opportunities on both new and existing sites in
Crombie’s portfolio.
ECL currently owns approximately 1.7 million square feet in 18 development properties that can be offered to Crombie on a
preferential right through the development agreement when the properties are sufficiently developed to meet Crombie’s
acquisition criteria. The properties are primarily retail plazas and approximately 50% of the GLA of the 18 properties is located
outside of Atlantic Canada. These properties are anticipated to be made available to Crombie over the next five years.
Business Environment
The global economic recession has included credit markets experiencing a dramatic reduction in liquidity. As the credit crisis
deepened during the second half of 2008, both the ability and willingness of financial institutions to lend money was greatly
reduced as financial institutions became increasingly risk adverse. This reduced credit availability continues to be a major risk
to the capital intensive real estate investment trust (“REIT”) business environment. Due to the economic and credit markets
situation, Crombie has taken a cautious approach with respect to liquidity and capital resources during the first six months of
2009.
The turmoil in the financial markets also caused bond yields to materially decline and dramatically reduced interest rate swap
spreads during the fourth quarter of 2008 and continuing through the first six months of 2009. While the swap spreads
turned positive in the second quarter of 2009, they still remain below historical average levels. This has resulted in a
significant deterioration of the mark-to-market values for the interest rate swap agreements Crombie has entered into to
hedge its exposure to potential increases in Canadian bond yields associated with future debt issuances. The impact is more
fully explained under the “Borrowing Capacity and Debt Covenants” and “Risk Management” sections of this MD&A.
In light of the widening credit spreads and a limited liquidity credit environment, capitalization rates have begun to expand.
While higher capitalization rates normally make acquisition opportunities more affordable, the higher cost of capital caused
by the tightening credit markets and the higher yield on Crombie’s equity makes it very challenging to source accretive
acquisitions. Crombie only intends to pursue acquisitions that provide an acceptable return, including any acquisitions that
may result from the relationship between Crombie and ECL.
In terms of occupancy rates, while both the retail and office markets where Crombie has a prominent presence remain
relatively stable, the business environment outlook remains pessimistic, influenced by the continuing recession in the U.S.
and Canadian economies. One offsetting factor to the economic slowdown is that many of Crombie's retail locations are
anchored by food stores, which typically are less affected by swings in consumer spending.
2009 SECOND QUARTER HIGHLIGHTS
• Crombie completed the syndication and extension of the Term Facility to May 2011.
• Crombie completed a public offering of Units for gross proceeds of $36,855 and a private placement of Class B LP Units for gross proceeds of $30,000 on June 25, 2009.
• Crombie completed leasing activity on approximately 67% of its 2009 expiring leases as at June 30, 2009.
• Occupancy for the properties was 94.1% at June 30, 2009 compared with 94.2% at March 31, 2009.
• Property revenue for the quarter ended June 30, 2009 increased by $3,579, or 7.6%, to $50,893 compared to
$47,314 for the quarter ended June 30, 2008.
• Same-asset NOI for the second quarter of 2009 of $22,239 decreased by $389 or 1.7%, compared to $22,628 for the
quarter ended June 30, 2008.
• The FFO payout ratio for the six months ended June 30, 2009 was 60.7% which was favourable to the target annual
payout ratio of 70% and favourable to the payout ratio of 63.5% for the same period in 2008.
• The AFFO payout ratio for the six months ended June 30, 2009 was 79.6% which was favourable to the target
annual AFFO payout ratio of 95% and was favourable to the payout ratio of 103.7% for the same period in 2008.
• Debt to gross book value decreased to 50.9% at June 30, 2009 compared to 54.8% at March 31, 2009.

9
• Crombie’s interest service coverage ratio for the first six months of 2009 was 2.79 times EBITDA and debt service
coverage ratio was 1.96 times EBITDA, compared to 2.94 times EBITDA and 2.04 times EBITDA, respectively, for the
same period in 2008.
OVERVIEW OF THE PROPERTY PORTFOLIO
Property Profile
At June 30, 2009 the property portfolio consisted of 113 commercial properties that contain approximately 11.2 million
square feet of GLA. The properties are located in seven provinces: Nova Scotia, New Brunswick, Newfoundland and Labrador,
Prince Edward Island, Ontario, Quebec and Saskatchewan.
As at June 30, 2009, the portfolio distribution of the GLA by province was as follows:
Province
Number of
Properties
GLA
(sq. ft.) % of GLA
% of Annual
Minimum Rent Occupancy(1)
Nova Scotia 41 5,065,000 45.3% 41.2% 94.6%
Ontario 22 1,646,000 14.7% 16.9% 95.3%
New Brunswick 20 1,647,000 14.7% 12.4% 88.6%
Newfoundland and Labrador 13 1,468,000 13.1% 17.0% 94.2%
Quebec 13 825,000 7.4% 7.9% 99.6%
Prince Edward Island 3 385,000 3.4% 3.1% 91.3%
Saskatchewan 1 160,000 1.4% 1.5% 97.8%
Total 113 11,196,000 100.0% 100.0% 94.1% (1) For purposes of calculating occupancy percentage, Crombie considers GLA covered by the head lease agreement in favour of ECL as occupied as there is
head lease revenue being earned on the GLA
Overall occupancy has marginally reduced from 94.2% at March 31, 2009 to 94.1% at June 30, 2009 primarily due the head
lease agreement being satisfied in County Fair Mall in Summerside, Prince Edward Island and Uptown Centre in Fredericton,
New Brunswick. Of the total of 228,000 square feet in GLA of new tenancies, as shown in the “2009 Portfolio Lease Expiries
and Leasing Activity”, approximately 66,000 square feet is related to GLA to be occupied in future quarters of 2009 and 2010.
This additional new leasing represents approximately 0.6% of Crombie’s GLA
Crombie looks to diversify its geographic composition through growth opportunities, as indicated by the seven acquisitions
in Ontario, one acquisition in Quebec and one acquisition in Saskatchewan, plus the Portfolio Acquisition since Crombie’s
initial public offering (the “IPO”). As well, the properties are located in rural and urban locations, which Crombie believes adds
stability to the portfolio, while reducing vulnerability to economic fluctuations that may affect any particular region.
From time to time, Crombie will commence redevelopment work on a property to enhance the economic viability of a
location when the environment in which it operates warrants. Crombie currently has two properties that are under
redevelopment. Fort Edward Mall in Windsor, Nova Scotia is in the process of conversion from a retail enclosed property to a
retail plaza. The property is being reconfigured to replace the previous SAAN location and several small tenants with a new
Hart location. Valley Mall in Corner Brook, Newfoundland and Labrador is being reconfigured to replace an existing food
court with a new Hart store. Costs for properties under redevelopment are classified as productive capacity enhancements to
the extent that Crombie determines they are financeable costs by virtue of increasing a property’s NOI and appraised value
by a minimum threshold (see “Tenant Improvements and Capital Expenditures”).

10
Largest Tenants
The following table illustrates the ten largest tenants in Crombie’s portfolio of income-producing properties as measured by
their percentage contribution to total annual minimum base rent as at June 30, 2009.
Tenant % of Annual Minimum Rent Average Remaining Lease Term
Sobeys (1) 33.0% 16.6 years
Empire Theatres 2.2% 8.7 years
Zellers 2.2% 8.5 years
Shoppers Drug Mart 2.0% 6.8 years
Nova Scotia Power Inc 1.9% 1.8 years
Province of Nova Scotia 1.7% 5.9 years
CIBC 1.6% 17.7 years
Bell (Aliant) 1.4% 9.1 years
Public Works Canada 1.3% 2.2 years
Sears Canada Inc. 1.2% 15.5 years
Total 48.5% (1) Excludes Lawtons and Fast Fuel locations.
Crombie’s portfolio is leased to a wide variety of tenants. Other than Sobeys, that accounts for 33.0% of the annual minimum
rent, no other tenant accounts for more than 2.2% of Crombie’s minimum rent.
Lease Maturities
The following table sets out as of June 30, 2009 the number of leases relating to the properties subject to lease maturities
during the periods indicated (assuming tenants do not holdover on a month-to-month basis or exercise renewal options or
termination rights), the renewal area, the percentage of the total GLA of the properties represented by such maturities and
the estimated average net rent per square foot at the time of expiry. The weighted average remaining term of all leases is
approximately 10.5 years.
Year
Number of
Leases Renewal Area (sq. ft.) % of Total GLA
Average Net Rent per
Sq. Ft. at Expiry ($)
Remaining 2009 139 367,000 3.3% $15.09
2010 198 645,000 5.8% $13.11
2011 217 1,046,000 9.3% $14.42
2012 161 853,000 7.6% $11.79
2013 155 876,000 7.8% $12.02
Thereafter 434 6,747,000 60.3% $12.84
Total 1,304 10,534,000 94.1% $12.94
2009 Portfolio Lease Expiries and Leasing Activity
As at June 30, 2009, portfolio lease expiries and leasing activity for the year ending December 31, 2009 were as follows:
Retail -
Freestanding
Retail -
Plazas
Retail -
Enclosed Office Mixed-use Total
Expiries (sq. ft.) -- 160,000 220,000 103,000 220,000 703,000
Average net rent per sq. ft. $-- $16.28 $13.97 $12.66 $11.64 $13.58
Committed renewals (sq. ft.) -- 54,000 81,000 30,000 76,000 241,000
Average net rent per sq. ft. $-- $15.52 $13.21 $14.54 $9.04 $12.58
New leasing (sq. ft.) 4,000 41,000 122,000 32,000 29,000 228,000
Average net rent per sq. ft. $23.00 $16.71 $8.38 $17.07 $14.84 $12.21
Total renewals/new leasing (sq. ft.) 4,000 95,000 203,000 62,000 105,000 469,000
Total average net rent per sq. ft. $23.00 $16.04 $10.30 $15.86 $10.64 $12.40
During the quarter ended June 30, 2009, Crombie had renewals or entered into new leases in respect of approximately
469,000 square feet at an average net rent of $12.40 per square foot, compared with expiries for 2009 of approximately
703,000 square feet at an average net rent of $13.58 per square foot. Of the 703,000 square feet of expiries, approximately
132,000 square feet involve tenants that are still paying property revenues on a holdover basis. Rent per square foot for the
completed new leasing activity in the retail enclosed properties is below the average net rent per square foot of total expiries
11
in 2009 due primarily to one relatively large lease in a small rural location to replace the last vacant SAAN store location that
went into bankruptcy in 2008 plus two new anchor leases to complete the Highland Square renovation in New Glasgow. Rent
per square foot for the renewals in the retail enclosed properties and in the mixed-use properties was lower than the average
expiry rate due to the renewal of three long term tenants at previously negotiated terms favourable to the tenants. Excluding
the impact of these six new/renewal deals, average net rent per square foot for all remaining leases of approximately 326,000
square feet was $15.25, an increase of 12.3% over the average net rent per square foot for the 2009 expiring rents.
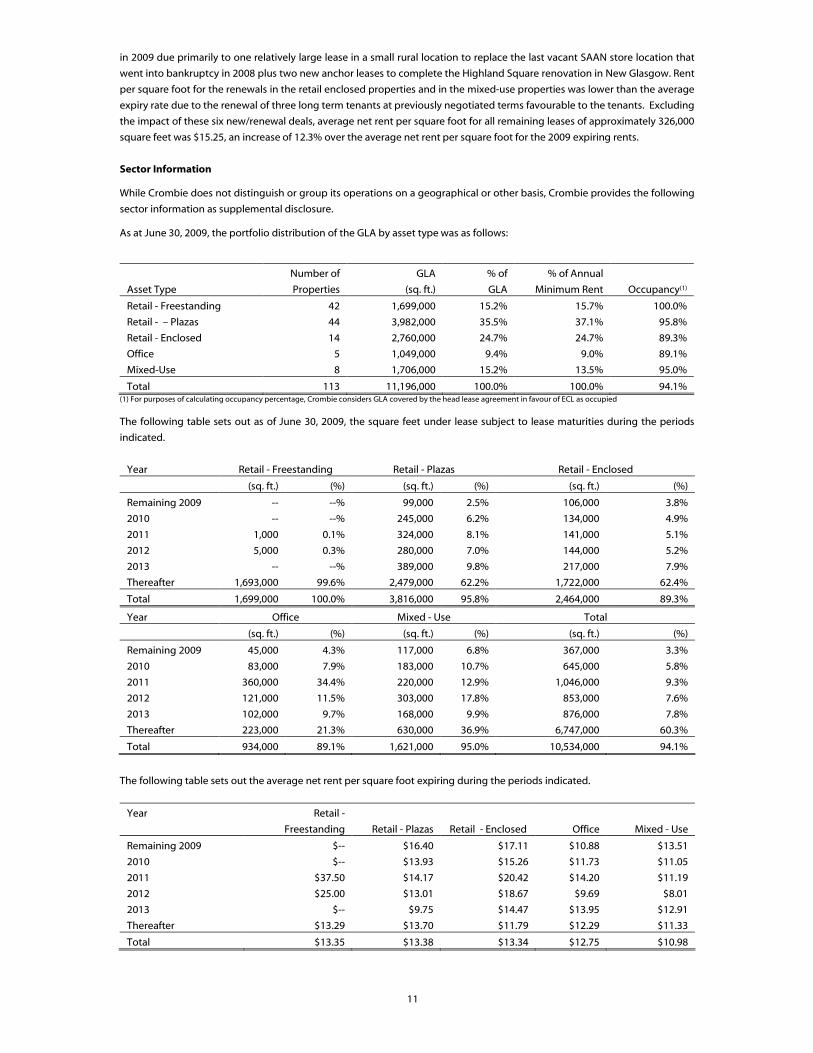
Sector Information
While Crombie does not distinguish or group its operations on a geographical or other basis, Crombie provides the following
sector information as supplemental disclosure.
As at June 30, 2009, the portfolio distribution of the GLA by asset type was as follows:
Asset Type
Number of
Properties
GLA
(sq. ft.)
% of
GLA
% of Annual
Minimum Rent Occupancy(1)
Retail - Freestanding 42 1,699,000 15.2% 15.7% 100.0%
Retail - – Plazas 44 3,982,000 35.5% 37.1% 95.8%
Retail - Enclosed 14 2,760,000 24.7% 24.7% 89.3%
Office 5 1,049,000 9.4% 9.0% 89.1%
Mixed-Use 8 1,706,000 15.2% 13.5% 95.0%
Total 113 11,196,000 100.0% 100.0% 94.1% (1) For purposes of calculating occupancy percentage, Crombie considers GLA covered by the head lease agreement in favour of ECL as occupied
The following table sets out as of June 30, 2009, the square feet under lease subject to lease maturities during the periods
indicated.
Year Retail - Freestanding Retail - Plazas Retail - Enclosed
(sq. ft.) (%) (sq. ft.) (%) (sq. ft.) (%)
Remaining 2009 -- --% 99,000 2.5% 106,000 3.8%
2010 -- --% 245,000 6.2% 134,000 4.9%
2011 1,000 0.1% 324,000 8.1% 141,000 5.1%
2012 5,000 0.3% 280,000 7.0% 144,000 5.2%
2013 -- --% 389,000 9.8% 217,000 7.9%
Thereafter 1,693,000 99.6% 2,479,000 62.2% 1,722,000 62.4%
Total 1,699,000 100.0% 3,816,000 95.8% 2,464,000 89.3%
Year Office Mixed - Use Total
(sq. ft.) (%) (sq. ft.) (%) (sq. ft.) (%)
Remaining 2009 45,000 4.3% 117,000 6.8% 367,000 3.3%
2010 83,000 7.9% 183,000 10.7% 645,000 5.8%
2011 360,000 34.4% 220,000 12.9% 1,046,000 9.3%
2012 121,000 11.5% 303,000 17.8% 853,000 7.6%
2013 102,000 9.7% 168,000 9.9% 876,000 7.8%
Thereafter 223,000 21.3% 630,000 36.9% 6,747,000 60.3%
Total 934,000 89.1% 1,621,000 95.0% 10,534,000 94.1%
The following table sets out the average net rent per square foot expiring during the periods indicated.
Year Retail -
Freestanding Retail - Plazas Retail - Enclosed Office Mixed - Use
Remaining 2009 $-- $16.40 $17.11 $10.88 $13.51
2010 $-- $13.93 $15.26 $11.73 $11.05
2011 $37.50 $14.17 $20.42 $14.20 $11.19
2012 $25.00 $13.01 $18.67 $9.69 $8.01
2013 $-- $9.75 $14.47 $13.95 $12.91
Thereafter $13.29 $13.70 $11.79 $12.29 $11.33
Total $13.35 $13.38 $13.34 $12.75 $10.98

12
2009 RESULTS OF OPERATIONS
Acquisitions
The following table outlines the acquisitions made which affected the results of operations when compared to the previous
year’s results. The following acquisitions took place between January 2008 and June 2009.
Property Date Acquired Property Type GLA (sq. ft.) Acquisition Cost(1)
Portfolio Acquisition April 22, 2008 Retail - Freestanding 1,589,000 $428,500
Retail – Plaza 1,571,000
Retail – Enclosed 128,000
River City Centre, Saskatoon,
Saskatchewan June 12, 2008 Retail – Plaza 160,000 $27,200
Total 3,448,000 $455,700 (1) Excluding closing and transaction costs.
Comparison to Previous Year
Six Months Ended
(In thousands of dollars, except where otherwise noted) June 30, 2009 June 30, 2008 Variance
Property revenue $103,885 $84,576 $19,309
Property expenses 37,229 32,087 (5,142)
Property NOI 66,656 52,489 14,167
NOI margin percentage 64.2% 62.1% 2.1%
Expenses:
General and administrative 5,290 3,931 (1,359)
Interest 22,002 16,465 (5,537)
Depreciation and amortization 23,294 18,752 (4,542)
50,586 39,148 (11,438)
Income from continuing operations before other items, income
taxes and non-controlling interest 16,070 13,341 2,729
Other items 92 97 (5)
Income from continuing operations before income taxes and
non-controlling interest 16,162 13,438 2,724
Income taxes expense – Future 200 1,101 901
Income from continuing operations before non-controlling
interest 15,962 12,337 3,625
Income from discontinued operations -- 399 (399)
Income before non-controlling interest 15,962 12,736 3,226
Non-controlling interest 7,642 6,114 (1,528)
Net income $8,320 $6,622 $1,698
Basic and diluted net income per Unit $0.30 $0.28 $0.02
Basic weighted average Units outstanding (in 000’s) 27,307,174 23,726,866
Diluted weighted average Units outstanding (in 000’s) 27,449,862 23,838,755
Net income for the six months ended June 30, 2009 of $8,320 increased by $1,698 from $6,622 for the six months ended June
30, 2008. The increase was primarily due to:
• higher property NOI from the individual property acquisition and the Portfolio Acquisition; offset in part by
• higher interest and depreciation charges, due primarily to the individual property acquisition and the Portfolio
Acquisition, and higher general and administrative expenses.

13
Property Revenue and Property Expenses
Six Months Ended
(In thousands of dollars) June 30, 2009 June 30, 2008 Variance
Same-asset property revenue $74,254 $74,483 $(229)
Acquisition property revenue 29,631 10,093 19,538
Property revenue $103,885 $84,576 $19,309
Same-asset property revenue of $74,254 for the six months ended June 30, 2009 was 0.3% lower than the six months ended
June 30, 2008 due primarily to a one-time head lease adjustment upon final release of the obligation governing the
agreement between ECL and Crombie for County Fair Mall in Summerside, Prince Edward Island and Uptown Centre in
Fredericton, New Brunswick, partially offset by the increased average rent per square foot ($12.49 in 2009 and $12.31 in 2008)
and increased recoverable common area expenses. The adjustment was paid to ECL to reflect their overachievement in the
leasing results for these two locations which will benefit Crombie in higher rental income on an ongoing basis.
Six Months Ended
(In thousands of dollars) June 30, 2009 June 30, 2008 Variance
Same-asset property expenses $30,096 $29,905 $191
Acquisition property expenses 7,133 2,182 4,951
Property expenses $37,229 $32,087 $5,142
Same-asset property expenses of $30,096 for the six months ended June 30, 2009 were 0.6% higher than the six months
ended June 30, 2008 due to increased recoverable common area expenses primarily from increased property taxes and utility
costs.
Six Months Ended
(In thousands of dollars) June 30, 2009 June 30, 2008 Variance
Same-asset property NOI $44,158 $44,578 $(420)
Acquisition property NOI 22,498 7,911 14,587
Property NOI $66,656 $52,489 $14,167
Same-asset NOI for the six months ended June 30, 2009 decreased by 0.9% from the six months ended June 30, 2008.
Property NOI for the six months ended June 30, 2009 by region was as follows:
2009 2008
(In thousands of dollars)
Property
Revenue
Property
Expenses
Property
NOI
NOI % of
revenue
NOI % of
revenue
Variance
Nova Scotia $46,997 $18,696 $28,301 60.2% 59.3% 0.9%
Newfoundland and Labrador 16,420 4,659 11,761 71.6% 68.2% 3.4%
New Brunswick 12,520 5,365 7,155 57.1% 53.0% 4.1%
Ontario 16,661 5,368 11,293 67.8% 64.7% 3.1%
Prince Edward Island 2,318 661 1,657 71.5% 74.8% (3.3)%
Quebec 7,575 2,097 5,478 72.3% 76.6% (4.3)%
Saskatchewan 1,394 383 1,011 72.5% 82.8% (10.3)%
Total $103,885 $37,229 $66,656 64.2% 62.1% 2.1%
The overall 2.1% increase in NOI as a % of revenue, as well as specific provincial increases in Nova Scotia, Newfoundland and
Labrador, New Brunswick and Ontario was primarily due to the Portfolio Acquisition. Prince Edward Island’s decrease in NOI
% of revenue is attributable to the finalization of the head lease obligation under the terms of the agreement with ECL
combined the relatively smaller number of properties in the province and the timing and nature of expenses. Quebec’s
decrease in NOI % of revenue is attributable to higher recoverable common area expenses. The decrease in NOI % of revenue
in Saskatchewan is due to River City Centre being owned by Crombie for only 19 days in the 2008 results.

14
General and Administrative Expenses
The following table outlines the major categories of general and administrative expenses.
Six Months Ended
(In thousands of dollars) June 30, 2009 June 30, 2008 Variance
Salaries and benefits $3,110 $1,859 $1,251
Professional fees 848 793 55
Public company costs 576 520 56
Rent and occupancy 377 350 27
Other 379 409 (30)
General and administrative costs $5,290 $3,931 $1,359
As a percentage of revenue 5.1% 4.6% 0.5%
General and administrative expenses increased by 34.6% for the six months ended June 30, 2009 to $5,290 compared to
$3,931 for the six months ended June 30, 2008. The increase in expenses was primarily due to one time retirement costs
associated with the retirement of Crombie’s Chief Executive Officer on August 5, 2009, increased salaries and increased legal
and information technology professional fees partially offset by reduced incentive payments.
Interest Expense
Six Months Ended
(In thousands of dollars) June 30, 2009 June 30, 2008 Variance
Same-asset interest expense $13,354 $12,803 $551
Acquisition interest expense 8,648 3,662 4,986
Interest expense $22,002 $16,465 $5,537
Same-asset interest expense of $13,354 for the six months ended June 30, 2009 increased by 4.3% when compared to the six
months ended June 30, 2008 due to the amortization of payments made on the settlement of interest rate swap agreements
of $662 and slightly higher average interest rates on mortgages entered into during 2008 for properties held since the IPO,
offset in part by a decrease in the floating interest rate on the revolving credit facility.
There is an agreement between ECL and Crombie whereby ECL provides a monthly interest rate subsidy to Crombie to
reduce the effective interest rates to 5.54% on certain mortgages that were assumed at Crombie’s IPO for their remaining
term. Over the term of this agreement, management expects this subsidy to aggregate to the amount of approximately
$20,564. The amount of the interest rate subsidy received during the six months ended June 30, 2009 was $1,562 (six months
ended June 30, 2008 - $1,718). The interest rate subsidy is received by Crombie through monthly repayments by ECL of
amounts due under one of the demand notes issued by ECL to Crombie Developments Limited (“CDL”).
Depreciation and Amortization
Six Months Ended
(In thousands of dollars) June 30, 2009 June 30, 2008 Variance
Same-asset depreciation and amortization $14,816 $15,790 $(974)
Acquisition depreciation and amortization 8,478 2,962 5,516
Depreciation and amortization $23,294 $18,752 $4,542
Same-asset depreciation and amortization of $14,816 for the six months ended June 30, 2009 was 6.2% lower than the six
months ended June 30, 2008 due primarily to the intangible assets related to the origination costs and the in-place leases
associated with the properties purchased at the date of the IPO being fully amortized, offset in part by depreciation on fixed
asset additions and amortization on tenant improvement and lease costs incurred since June 30, 2008, combined with the
expenses resulting from the reallocation of $3,946 of costs to commercial properties from other assets due to the retroactive
implementation of accounting guidelines as discussed in “Changes in Accounting Policies and Estimates”. Depreciation and
amortization consists of:

15
Six Months Ended
(In thousands of dollars) June 30, 2009 June 30, 2008 Variance
Depreciation of commercial properties $9,827 $7,821 $2,006
Amortization of tenant improvements/lease costs 2,023 1,468 555
Amortization of intangible assets 11,444 9,463 1,981
Depreciation and amortization $23,294 $18,752 $4,542
Future Income Taxes
A trust that satisfies the criteria of a REIT throughout its taxation year will not be subject to income tax in respect of
distributions to its unitholders or be subject to the restrictions on its growth that would otherwise apply to trusts classified as
specified investment flow-through entities (“SIFTs”).
Crombie’s management and their advisors have completed an extensive review of Crombie’s organizational structure and
operations to support Crombie’s assertion that it currently satisfies the technical tests contained in the Income Tax Act
(Canada) in regard to the definition of a REIT (and thus is not a SIFT). However, the relevant tests apply throughout the
taxation year of Crombie and, as such, the actual status of Crombie for any particular taxation year can only be ascertained at
the end of the year.
The future income tax expenses represent the future tax provision of the wholly-owned corporate subsidiary which is subject
to income taxes.
Sector Information
While Crombie does not distinguish or group its operations on a geographical or other basis, Crombie provides the following
sector information as supplemental disclosure.
Retail Freestanding Properties Six Months Ended June 30, 2009 Six Months Ended June 30, 2008 (In thousands of dollars,
except as otherwise noted) Same-Asset Acquisitions Total Same-Asset Acquisitions Total
Property revenue $862 $13,395 $14,257 $713 $5,040 $5,753
Property expenses 218 2,720 2,938 115 1,078 1,193
Property NOI $644 $10,675 $11,319 $598 $3,962 $4,560
NOI Margin % 74.7% 79.7% 79.4% 83.9% 78.6% 79.2%
Occupancy % 100.0% 100.0% 100.0% 100.0% 100.0% 100.0%
The improvement in the retail freestanding property NOI was caused by the Portfolio Acquisition. The same-asset NOI %
margin is lower as a result of the fluctuations that can occur in a single property’s results.
Retail Plaza Properties Six Months Ended June 30, 2009 Six Months Ended June 30, 2008 (In thousands of dollars,
except as otherwise noted) Same-Asset Acquisitions Total Same-Asset Acquisitions Total
Property revenue $20,510 $15,320 $35,830 $21,304 $4,764 $26,068
Property expenses 6,714 4,124 10,838 6,822 1,047 7,869
Property NOI $13,796 $11,196 $24,992 $14,482 $3,717 $18,199
NOI Margin % 67.3% 73.1% 69.8% 68.0% 78.0% 69.8%
Occupancy % 94.3% 97.8% 95.8% 95.3% 97.4% 96.4%
The improvement in the retail plaza property NOI was primarily caused by the Portfolio Acquisition, partially offset by
increased non-recoverable maintenance costs in same-asset properties. Occupancy in the same-assets at June 30, 2009 is
slightly lower than June 30, 2008, which combined with slightly lower average net rent per square foot results has led to
decreased revenue overall compared to the prior year.

16
Retail Enclosed Properties Six Months Ended June 30, 2009 Six Months Ended June 30, 2008 (In thousands of dollars,
except as otherwise noted) Same-Asset Acquisitions Total Same-Asset Acquisitions Total
Property revenue $23,847 $916 $24,763 $23,456 $283 $23,739
Property expenses 8,645 289 8,934 8,716 57 8,773
Property NOI $15,202 $627 $15,829 $14,740 $226 $14,966
NOI Margin % 63.7% 68.5% 63.9% 62.8% 79.9% 63.0%
Occupancy % 89.4% 87.0% 89.3% 91.3% 92.6% 91.4%
The improvement in NOI was primarily caused by the improved results at Avalon Mall in St. John’s, Newfoundland and
Labrador and the Portfolio Acquisition. Same-asset NOI margin % is higher than 2008 due to the lower common area
expenses in 2009 and higher average net rent per square foot. Occupancy is lower in 2009 compared to 2008 due to
redevelopment work ongoing at two properties as previously discussed.
Office Properties
Six Months Ended June 30, 2009 Six Months Ended June 30, 2008 (In thousands of dollars,
except as otherwise noted) Same-Asset Acquisitions Total Same-Asset Acquisitions Total
Property revenue $11,486 $-- $11,486 $11,365 $-- $11,365
Property expenses 6,135 -- 6,135 5,869 -- 5,869
Property NOI $5,351 $-- $5,351 $5,496 $-- $5,496
NOI Margin % 46.6% --% 46.6% 48.4% --% 48.4%
Occupancy % 89.1% --% 89.1% 90.9% --% 90.9%
Occupancy levels have decreased slightly at the Halifax Developments Properties and Terminal Centres in Moncton, New
Brunswick when compared to the prior year. Higher net rent per square foot at the Halifax Developments Properties were
offset by higher common area expenses, resulting in the higher revenue but lower property NOI and NOI margin % for the
office properties in 2009 compared to 2008.
Mixed-Use Properties
Six Months Ended June 30, 2009 Six Months Ended June 30, 2008 (In thousands of dollars,
except as otherwise noted) Same-Asset Acquisitions Total Same-Asset Acquisitions Total
Property revenue $17,549 $-- $17,549 $17,651 $-- $17,651
Property expenses 8,384 -- 8,384 8,383 -- 8,383
Property NOI $9,165 $-- $9,165 $9,268 $-- $9,268
NOI Margin % 52.2% --% 52.2% 52.5% --% 52.5%
Occupancy % 95.0% --% 95.0% 94.7% --% 94.7%
The increase in mixed-use occupancy levels from 94.7% in 2008 to 95.0% in 2009 was offset by higher non-recoverable
operating expenses, resulting in the slightly lower NOI results for the six months ended June 30, 2009 when compared to the
six months ended June 30, 2008.
OTHER 2009 PERFORMANCE MEASURES
FFO and AFFO are not measures recognized under GAAP and do not have standardized meanings prescribed by GAAP. As
such, these non-GAAP financial measures should not be considered as an alternative to net income, cash flow from
operations or any other measure prescribed under GAAP. FFO represents a supplemental non-GAAP industry-wide financial
measure of a real estate organization’s operating performance. AFFO is presented in this MD&A because management
believes this non-GAAP measure is relevant to the ability of Crombie to earn and distribute returns to unitholders. Due to the
accounting changes related to the capitalization of items previously classified as deferred tenant charges, FFO and AFFO for
prior periods have been restated. FFO and AFFO as computed by Crombie may differ from similar computations as reported
by other REIT’s and, accordingly, may not be comparable to other such issuers.

17
Funds from Operations
FFO represents a supplemental non-GAAP industry-wide financial measure of a real estate organization’s operating
performance. Crombie has calculated FFO in accordance with the recommendations of the Real Property Association of
Canada (“RealPAC”) which defines FFO as net income (computed in accordance with GAAP), excluding gains (or losses) from
sales of depreciable real estate and extraordinary items, plus depreciation and amortization expense, plus future income
taxes, and after adjustments for equity-accounted entities and non-controlling interests. Crombie’s method of calculating
FFO may differ from other issuers’ methods and accordingly may not be directly comparable to FFO reported by other issuers.
A calculation of FFO for the six months ended June 30, 2009 and 2008 is as follows:
(In thousands of dollars)
Six Months Ended
June 30, 2009
Six Months Ended
June 30, 2008
Variance
Net income $8,320 $6,622 $1,698
Add:
Non-controlling interest 7,642 6,114 1,528
Depreciation and amortization 23,294 18,752 4,542
Depreciation and amortization on discontinued
operations -- 139 (139)
Future income taxes 200 1,101 (901)
Gain (loss) on disposal of assets -- (77) 77
FFO $39,456 $32,651 $6,805
The improvement in FFO for the six months ended June 30, 2009 was primarily due to higher property NOI as a result of the
individual acquisition and the Portfolio Acquisition, offset in part by the increased interest expense related to the individual
and Portfolio acquisitions and higher general and administrative expenses.
Adjusted Funds from Operations
Crombie considers AFFO to be a measure of its distribution-generating ability. AFFO reflects cash available for distribution
after the provision for non-cash adjustments to revenue, maintenance capital expenditures and maintenance tenant
improvements (“TI”) and leasing costs. The calculation of AFFO for the six months ended June 30, 2009 and 2008 is as follows:
(In thousands of dollars)
Six Months Ended
June 30, 2009
Six Months Ended
June 30, 2008
Variance
FFO $39,456 $32,651 $6,805
Add:
Above-market lease amortization 1,543 1,515 28
Non-cash revenue impacts on discontinued operations -- 22 (22)
Less:
Below-market lease amortization (4,290) (3,000) (1,290)
Straight-line rent adjustment (2,126) (1,018) (1,108)
Maintenance capital expenditures (2,134) (3,665) 1,531
Maintenance TI and leasing costs (2,354) (6,493) 4,139
AFFO $30,095 $20,012 $10,083
The AFFO result for the six months ended June 30, 2009 was affected by the increase in FFO for the period and lower
maintenance TI and leasing expenditures. Details of the maintenance TI and capital expenditures are outlined in the “Tenant
Improvement and Capital Expenditures” section of the MD&A.
Pursuant to CSA Staff Notice 52-306 “(Revised) Non-GAAP Financial Measures”, non-GAAP measures such as AFFO should be
reconciled to the most directly comparable GAAP measure, which is interpreted to be the cash flow from operating activities
rather than net income. The reconciliation is as follows:

18
(In thousands of dollars)
Six Months Ended
June 30, 2009
Six Months Ended
June 30, 2008
Variance
Cash provided by operating activities $17,076 $22,115 $(5,039)
Add back (deduct):
Recoverable/productive capacity enhancing TIs 190 1,835 (1,645)
Change in non-cash operating items 16,645 224 16,421
Unit-based compensation expense (23) (20) (3)
Amortization of deferred financing charges (997) (477) (520)
Amortization of swap settlements (662) -- (662)
Maintenance capital expenditures (2,134) (3,665) 1,531
AFFO $30,095 $20,012 $10,083
LIQUIDITY AND CAPITAL RESOURCES
Sources and Uses of Funds
Cash flow generated from operating the property portfolio represents the primary source of liquidity used to service the
interest on debt, fund general and administrative expenses, reinvest into the portfolio through capital expenditures, as well
as fund TI costs and distributions. In addition, Crombie has the following sources of financing available to finance future
growth: secured short-term financing through an authorized revolving credit facility of up to $150,000, of which $62,812 was
drawn at June 30, 2009, a demand facility with Empire of $13,800, of which $Nil was drawn at June 30, 2009, and the issue of
new equity and mortgage debt, pursuant to the Declaration of Trust.
(In thousands of dollars)
Six Months Ended
June 30, 2009
Six Months Ended
June 30, 2008
Variance
Cash provided by (used in):
Operating activities $17,076 $22,115 $(5,039)
Financing activities $(15,868) $372,635 $(388,503)
Investing activities $(5,236) $(397,458) $392,222
Operating Activities
(In thousands of dollars)
Six Months Ended
June 30, 2009
Six Months Ended
June 30, 2008
Variance
Cash provided by (used in):
Net income and non-cash items $36,265 $30,667 $5,598
TI and leasing costs (2,544) (8,328) 5,784
Non-cash working capital (16,645) (224) (16,421)
Cash provided by operating activities $17,076 $22,115 $(5,039)
Fluctuations in cash provided by operating activities are largely influenced by the change in non-cash working capital which
can be affected by the timing of receipts and payments. The details of the TI and leasing costs during the six months of 2009
are outlined in the “Tenant Improvements and Capital Expenditures” section of the MD&A.
Financing Activities
(In thousands of dollars)
Six Months Ended
June 30, 2009
Six Months Ended
June 30, 2008
Variance
Cash provided by (used in):
Net issue of convertible debentures $-- $28,786 $(28,786)
Net issue of units 64,574 59,215 5,359
Settlement of interest rate swap agreement (4,535) -- (4,535)
Net issue (repayment) of commercial property debt (54,150) 301,248 (355,398)
Payment of distributions (23,304) (19,819) (3,485)
Other items (net) 1,547 3,205 (1,658)
Cash provided by (used in) financing activities $(15,868) $372,635 $(388,503)
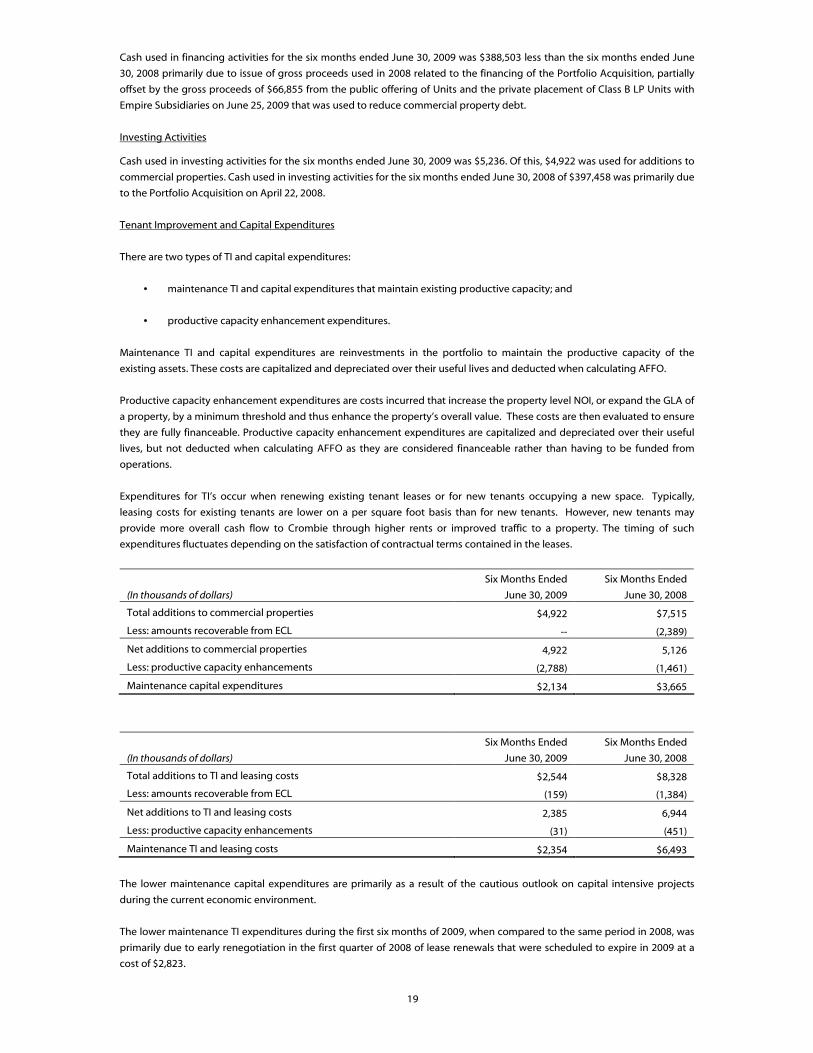
19
Cash used in financing activities for the six months ended June 30, 2009 was $388,503 less than the six months ended June
30, 2008 primarily due to issue of gross proceeds used in 2008 related to the financing of the Portfolio Acquisition, partially
offset by the gross proceeds of $66,855 from the public offering of Units and the private placement of Class B LP Units with
Empire Subsidiaries on June 25, 2009 that was used to reduce commercial property debt.
Investing Activities
Cash used in investing activities for the six months ended June 30, 2009 was $5,236. Of this, $4,922 was used for additions to
commercial properties. Cash used in investing activities for the six months ended June 30, 2008 of $397,458 was primarily due
to the Portfolio Acquisition on April 22, 2008.
Tenant Improvement and Capital Expenditures
There are two types of TI and capital expenditures:
• maintenance TI and capital expenditures that maintain existing productive capacity; and
• productive capacity enhancement expenditures.
Maintenance TI and capital expenditures are reinvestments in the portfolio to maintain the productive capacity of the
existing assets. These costs are capitalized and depreciated over their useful lives and deducted when calculating AFFO.
Productive capacity enhancement expenditures are costs incurred that increase the property level NOI, or expand the GLA of
a property, by a minimum threshold and thus enhance the property’s overall value. These costs are then evaluated to ensure
they are fully financeable. Productive capacity enhancement expenditures are capitalized and depreciated over their useful
lives, but not deducted when calculating AFFO as they are considered financeable rather than having to be funded from
operations.
Expenditures for TI’s occur when renewing existing tenant leases or for new tenants occupying a new space. Typically,
leasing costs for existing tenants are lower on a per square foot basis than for new tenants. However, new tenants may
provide more overall cash flow to Crombie through higher rents or improved traffic to a property. The timing of such
expenditures fluctuates depending on the satisfaction of contractual terms contained in the leases.
(In thousands of dollars)
Six Months Ended
June 30, 2009
Six Months Ended
June 30, 2008
Total additions to commercial properties $4,922 $7,515
Less: amounts recoverable from ECL -- (2,389)
Net additions to commercial properties 4,922 5,126
Less: productive capacity enhancements (2,788) (1,461)
Maintenance capital expenditures $2,134 $3,665
(In thousands of dollars)
Six Months Ended
June 30, 2009
Six Months Ended
June 30, 2008
Total additions to TI and leasing costs $2,544 $8,328
Less: amounts recoverable from ECL (159) (1,384)
Net additions to TI and leasing costs 2,385 6,944
Less: productive capacity enhancements (31) (451)
Maintenance TI and leasing costs $2,354 $6,493
The lower maintenance capital expenditures are primarily as a result of the cautious outlook on capital intensive projects
during the current economic environment.
The lower maintenance TI expenditures during the first six months of 2009, when compared to the same period in 2008, was
primarily due to early renegotiation in the first quarter of 2008 of lease renewals that were scheduled to expire in 2009 at a
cost of $2,823.

20
Productive capacity enhancements during the quarter consisted of the redevelopment of Valley Mall in Corner Brook,
Newfoundland and Labrador and the conversion of Fort Edward Mall in Windsor, Nova Scotia from a retail enclosed property
to a retail plaza.
Capital Structure
(In thousands of dollars) Jun. 30, 2009 Mar. 31, 2009 Dec. 31, 2008 Sep. 30, 2008 Jun. 30, 2008
Commercial property debt $759,223 $812,342 $808,971 $820,634 $812,016
Convertible debentures $29,090 $29,029 $28,968 $28,907 $28,847
Non-controlling interest $233,292 $197,115 $199,163 $218,205 $224,871
Unitholders’ equity $255,475 $213,351 $215,558 $236,241 $243,472
Bank Credit Facilities and Commercial Property Debt
Crombie has in place an authorized floating rate revolving credit facility of up to $150,000 (the “Revolving Credit Facility”),
$62,812 of which was drawn as at June 30, 2009. The Revolving Credit Facility is secured by a pool of first and second
mortgages and negative pledges on certain properties. The floating interest rate is based on specified margins over prime
rate or bankers acceptance rates. The specified margin increases as Crombie’s overall debt leverage increases. Funds
available for drawdown pursuant to the Revolving Credit Facility are determined with reference to the value of the Borrowing
Base (as defined under “Borrowing Capacity and Debt Covenants”) relative to certain financial covenants of Crombie. As at
June 30, 2009, Crombie had sufficient Borrowing Base to permit $150,000 of funds to be drawn down pursuant to the
Revolving Credit Facility, subject to certain other financial covenants. See “Borrowing Capacity and Debt Covenants”.
As of June 30, 2009, Crombie had fixed rate mortgages outstanding of $564,101 ($554,745 after including the marked-to-
market adjustment of $9,356), carrying a weighted average interest rate of 5.48% (after giving effect to the interest rate
subsidy from ECL under an omnibus subsidy agreement) and a weighted average term to maturity of 5.8 years.
In April of 2008, Crombie entered into an 18 month floating rate Term Facility of $280,000 to partially finance the Portfolio
Acquisition. On September 30, 2008, Crombie completed a mortgage financing on certain of the properties acquired in order
to refinance $100,000 of the Term Facility. On February 12, 2009, Crombie completed $39,000 of additional fixed rate
mortgage financings for eight of the properties acquired pursuant to the Portfolio Acquisition in order to refinance the Term
Facility. A third party provided $32,800 of fixed rate first mortgage financing, while $6,200 of fixed rate second mortgage
financing was provided by Empire. In June of 2009, Crombie completed the extension of the remaining Term Facility for two
years with a syndicate of Canadian chartered banks. The floating interest rate is based on a specified margin over prime rate
or bankers acceptance rate. As security for the Term Facility, Crombie has granted a charge on the secured properties
together with an assignment of leases. The Term Facility contains financial and non-financial covenants that are customary
for a credit facility of this nature and which mirror the covenants set forth in the Revolving Credit Facility.
Crombie has secured a $13,800 floating rate demand credit facility with Empire (the “Empire Demand Facility”) on
substantially the same terms and conditions that govern the Revolving Credit Facility. This Empire Demand Facility was put
in place to ensure that Crombie maintains adequate liquidity in order to fund its daily operating activities while volatility in
the financial markets continues while also mitigating the risk of Crombie not being in compliance with certain covenants
under the Revolving Credit Facility. Crombie had $Nil drawn against the Empire Demand Facility as at June 30, 2009.
From time to time, Crombie has entered into interest rate swap agreements to manage the interest rate profile of its current
or future debts without an exchange of the underlying principal amount (see “Risk Management”).
Principal repayments of the debt are scheduled as follows:
Year
Payments of
Principal
Fixed Rate Debt
Maturing during Year
Floating
Rate Debt
Total
Maturity
% of
Total
Remaining 2009 $9,513 $-- $-- $9,513 1.3%
2010 15,489 106,079 -- 121,568 16.1%
2011 15,394 26,786 201,812 243,992 32.2%
2012 15,956 -- -- 15,956 2.1%
2013 16,757 30,041 -- 46,798 6.2%
Thereafter 61,973 256,757 -- 318,730 42.1%
Total (1) $135,082 $419,663 $201,812 $756,557 100.0% (1) Excludes fair value debt adjustment of $9,356 and the deferred financing costs of $6,690

21
Convertible debentures
On March 20, 2008, Crombie issued $30,000 in Debentures related to the Portfolio Acquisition.
Each Debenture will be convertible into units of Crombie at the option of the Debenture holder up to the maturity date of
March 20, 2013 at a conversion price of $13 per unit.
The Debentures bear interest at an annual fixed rate of 7%, payable semi-annually, on June 30 and December 31 in each year.
The Debentures are not redeemable prior to March 20, 2011. From March 20, 2011 to March 20, 2012, the Debentures may be
redeemed, in whole or in part, on not more than 60 days’ and not less than 30 days’ prior notice, at a redemption price equal
to the principal amount thereof plus accrued and unpaid interest, provided that the volume-weighted average trading price
of the Units on the Toronto Stock Exchange for the 20 consecutive trading days ending on the fifth trading day preceding the
date on which notice on redemption is given exceeds 125% of the conversion price. After March 20, 2012, and prior to March
20, 2013, the Debentures may be redeemed, in whole or in part, at anytime at the redemption price equal to the principal
amount thereof plus accrued and unpaid interest. Provided that there is not a current event of default, Crombie will have the
option to satisfy its obligation to pay the principal amount of the Debentures at maturity or upon redemption, in whole or in
part, by issuing the number of units equal to the principal amount of the Debentures then outstanding divided by 95% of the
volume-weighted average trading price of the units for a stipulated period prior to the date of redemption or maturity, as
applicable. Upon change of control of Crombie, Debenture holders have the right to put the Debentures to Crombie at a
price equal to 101% of the principal amount plus accrued and unpaid interest.
Crombie will also have an option to pay interest on any interest payment date by selling units and applying the proceeds to
satisfy its interest obligation.
Transaction costs related to the Debentures have been deferred and are being amortized into interest expense over the term
of the Debentures using the effective interest rate method.
Unitholders’ Equity
In April 2009 there were 43,408 Units awarded as part of the Employee Unit Purchase Plan (April 2008 – 34,053). On June 25,
2009 there were 4,725,000 Units issued, including the underwriters’ over-allotment Units, through a public offering.
Concurrent with the public offering of Units, in satisfaction of its pre-emptive right, ECL purchased 3,846,154 Class B LP Units
and the attached Special Voting Units on a private placement basis. Total units outstanding at August 6, 2009 were as
follows:
Units 32,040,296
Special Voting Units (1) 28,925,730 (1) Crombie Limited Partnership, a subsidiary of Crombie, has also issued 28,925,730 Class B LP Units. These Class B LP units accompany the Special Voting Units,
are the economic equivalent of a Unit, and are convertible into Units on a one-for-one basis.
Taxation of Distributions
Crombie, through its subsidiaries, has a large asset base that is depreciable for Canadian income tax purposes. Consequently,
certain of the distributions from Crombie are treated as returns of capital and are not taxable to Canadian resident
unitholders for Canadian income tax purposes. The composition for tax purposes of distributions from Crombie may change
from year to year, thus affecting the after-tax return to unitholders.
The following table summarizes the history of the taxation of distributions from Crombie:
Taxation Year Return of Capital Investment Income Capital Gains
2006 per $ of distribution 40.0% 60.0% --
2007 per $ of distribution 25.5% 74.4% 0.1%
2008 per $ of distribution 27.2% 72.7% 0.1%

22
Borrowing Capacity and Debt Covenants
Under the amended terms governing the Revolving Credit Facility, Crombie is entitled to borrow a maximum of 70% of the
fair market value of assets subject to a first security position and 60% of the excess of fair market value over first mortgage
financing of assets subject to a second security position or a negative pledge (the “Borrowing Base”). The Revolving Credit
Facility provides Crombie with flexibility to add or remove properties from the Borrowing Base, subject to compliance with
certain conditions. The terms of the Revolving Credit Facility also require that Crombie must maintain certain coverage ratios
above prescribed levels:
• annualized NOI for the prescribed properties must be a minimum of 1.4 times the coverage of the related
annualized debt service requirements; and
• annualized NOI on all properties must be a minimum of 1.4 times the coverage of all annualized debt service
requirements.
The Revolving Credit Facility also contains a covenant of Crombie that ECL must maintain a minimum 40% voting interest in
Crombie. If ECL reduces its voting interest below this level, Crombie will be required to renegotiate the Revolving Credit
Facility or obtain alternative financing. Pursuant to an exchange agreement and while such covenant remains in place, ECL
will be required to give Crombie at least six months’ prior written notice of its intention to reduce its voting interest below
40%.
The Revolving Credit Facility also contains a covenant limiting the amount which may be utilized under the Revolving Credit
Facility at any time. This covenant provides that the aggregate of amounts drawn under the Revolving Credit Facility plus any
negative mark-to-market position on any interest rate swap agreements or other hedging instruments may not exceed the
“Aggregate Coverage Amount”, which is based on a modified calculation of the Borrowing Base, as defined in the Revolving
Credit Facility. In order to hedge its interest rate risk on various debt commitments maturing through 2011, Crombie has
entered into a series of interest rate swap agreements on notional principal amounts totalling approximately $288,334 at
June 30, 2009 that have settlement dates between August 1, 2009 and July 4, 2011. The unprecedented volatility in the
capital markets has caused the mark-to-market adjustment on these interest rate swap agreements to reach an out-of-the-
money position of approximately $31,831 at June 30, 2009. There is no immediate cash impact from this mark-to-market
adjustment. The unfavourable difference in the mark-to-market amount of these interest rate swap agreements is reflected in
other comprehensive income (loss) rather than net income as the swaps are all designated and effective hedges. However,
the deterioration in the mark-to-market position may have the impact of reducing Crombie’s available credit pursuant to the
Revolving Credit Facility.
At June 30, 2009, the amount available under the Revolving Credit Facility was $79,284 after calculation of the Aggregate
Coverage Amount.
At June 30, 2009, Crombie remained in compliance with all debt covenants.
As previously discussed, Crombie has secured a $13,800 floating rate Empire Demand Facility. The Empire Demand Facility
ensures that Crombie maintains adequate liquidity in order to fund its daily operating activities as the volatility in the
financial markets continues while also mitigating the risk of Crombie not being in compliance with certain covenants under
the Revolving Credit Facility.
Debt to Gross Book Value Ratio
When calculating debt to gross book value, debt is defined under the terms of the Declaration of Trust as bank loans plus
commercial property debt. Gross book value means, at any time, the book value of the assets of Crombie and its
consolidated subsidiaries plus deferred financing charges, accumulated depreciation and amortization in respect of
Crombie's properties (and related intangible assets) less (i) the amount of any receivable reflecting interest rate subsidies on
any debt assumed by Crombie and (ii) the amount of future income tax liability arising out of the fair value adjustment in
respect of the indirect acquisitions of certain properties. If approved by a majority of the independent trustees, the appraised
value of the assets of Crombie and its consolidated subsidiaries may be used instead of book value.

23
The debt to gross book value ratio was 50.9% at June 30, 2009 compared to 54.8% at March 31, 2009. The reduction was due
to the proceeds of the June 25, 2009 public offering of Units and concurrent private placement of Class B LP Units being
applied to reduce borrowings under the Revolving Credit Facility. This leverage ratio is below the maximum 60%, or 65%
including convertible debentures, as outlined by Crombie’s Declaration of Trust. On a long-term basis, Crombie intends to
maintain overall indebtedness in the range of 50% to 55% of gross book value, depending upon Crombie’s future
acquisitions and financing opportunities.
(1) Maximum permitted by the Declaration of Trust
Debt and Interest Service Coverage Ratios
Crombie’s interest and debt service coverage ratios for the six months ended June 30, 2009 were 2.79 times EBITDA and 1.96
times EBITDA. This compares to 2.94 times EBITDA and 2.04 times EBITDA respectively for the six months ended June 30,
2008. EBITDA should not be considered an alternative to net income, cash flow from operations or any other measure of
operations or liquidity as prescribed by Canadian GAAP. EBITDA is not a GAAP financial measure; however Crombie believes
it is an indicative measure of its ability to service debt requirements, fund capital projects and acquire properties. EBITDA
may not be calculated in a comparable measure reported by other entities.
(In thousands of dollars, except as otherwise noted)
As at Jun. 30, 2009
As at Mar. 31, 2009
As at Dec. 31, 2008
As at Sep. 30, 2008
As at Jun. 30, 2008
Mortgages payable $564,101 $565,980 $531,970 $524,307 $425,945
Convertible debentures 30,000 30,000 30,000 30,000 30,000
Term financing 139,000 140,323 178,824 180,000 280,000
Revolving credit facility payable 62,812 111,400 93,400 121,585 111,475
Demand credit facility payable -- -- 10,000 -- --
Total debt outstanding 795,913 847,703 844,194 855,892 847,420
Less: Applicable fair value debt
adjustment (9,256) (10,032) (10,818) (11,615) (12,433)
Debt $786,657 $837,671 $833,376 $844,277 $834,987
Total assets $1,470,474 $1,466,045 $1,483,219 $1,501,186 $1,501,754
Add:
Deferred financing charges 7,600 6,332 6,255 6,351 6,728
Accumulated depreciation of
commercial properties 57,715 51,796 45,865 40,105 34,339
Accumulated amortization of
intangible assets 66,492 60,836 53,505 45,995 38,454
Less:
Assets related to discontinued
operations (7,054) (7,162) (7,184) (9,673) (10,951)
Interest rate subsidy (9,256) (10,032) (10,818) (11,615) (12,433)
Fair value adjustment to future taxes (39,245) (39,245) (39,245) (39,245) (39,245)
Gross book value $1,546,726 $1,528,570 $1,531,597 $1,533,104 $1,518,646
Debt to gross book value 50.9% 54.8% 54.4% 55.1% 55.0%
Maximum borrowing capacity(1) 65% 65% 65% 65% 65%

24
(In thousands of dollars)
Six Months Ended June 30, 2009
Six Months Ended June 30, 2008
Property revenue $103,885 $84,576
Amortization of above-market leases 1,543 1,515
Amortization of below-market leases (4,290) (3,000)
Adjusted property revenue 101,138 83,091
Property expenses (37,229) (32,087)
General and administrative expenses (5,290) (3,931)
EBITDA (1) $58,619 $47,073
Interest expense $22,002 $16,465
Amortization of deferred financing charges (997) (477)
Adjusted interest expense (2) $21,005 $15,988
Debt repayments $110,120 $45,735
Amortization of fair value debt premium (2) (20)
Payments relating to interest rate subsidy (1,562) (1,718)
Payments relating to Term Facility (39,824) --
Payments relating to revolving credit facility (49,900) (30,000)
Payments relating to demand credit facility (10,000) --
Balloon payments on mortgages -- (6,922)
Adjusted debt repayments (3) $8,832 $7,075
Interest service coverage ratio {(1)/(2)} 2.79 2.94
Debt service coverage ratio {(1)/((2)+(3))} 1.96 2.04
Distributions and Distribution Payout Ratios
Distribution Policy
Pursuant to Crombie’s Declaration of Trust, it is required, at a minimum, to make distributions to Unitholders equal to the
amount of net income and net realized capital gains of Crombie as is necessary to ensure that Crombie will not be liable for
income taxes. Within these guidelines, Crombie intends to make annual cash distributions to Unitholders equal to
approximately 70% of its FFO and 95% of its AFFO on an annual basis.
Details of distributions to Unitholders are as follows:
(Distribution amounts represented in thousands of dollars) Six Months Ended
June 30, 2009 Six Months Ended
June 30, 2008
Distributions to Unitholders $12,497 $10,983
Distributions to Special Voting Unitholders 11,446 9,763
Total distributions $23,943 $20,746
Number of diluted Units 27,449,862 23,838,755
Number of diluted Special Voting Units 25,207,073 22,002,653
Total diluted weighted average Units 52,656,935 45,841,408
Distributions per unit $0.45 $0.45
FFO payout ratio (target ratio = 70%) 60.7% 63.5%
AFFO payout ratio (target ratio = 95%) 79.6% 103.7%
The FFO payout ratio of 60.7% was favourable to the target ratio as the improved FFO reflected the net results from the
individual property acquisition and the Portfolio Acquisition. The AFFO payout ratio of 79.6% was favourable to the target
ratio as a result of the higher FFO and lower overall TI and maintenance capital expenditures as previously discussed.
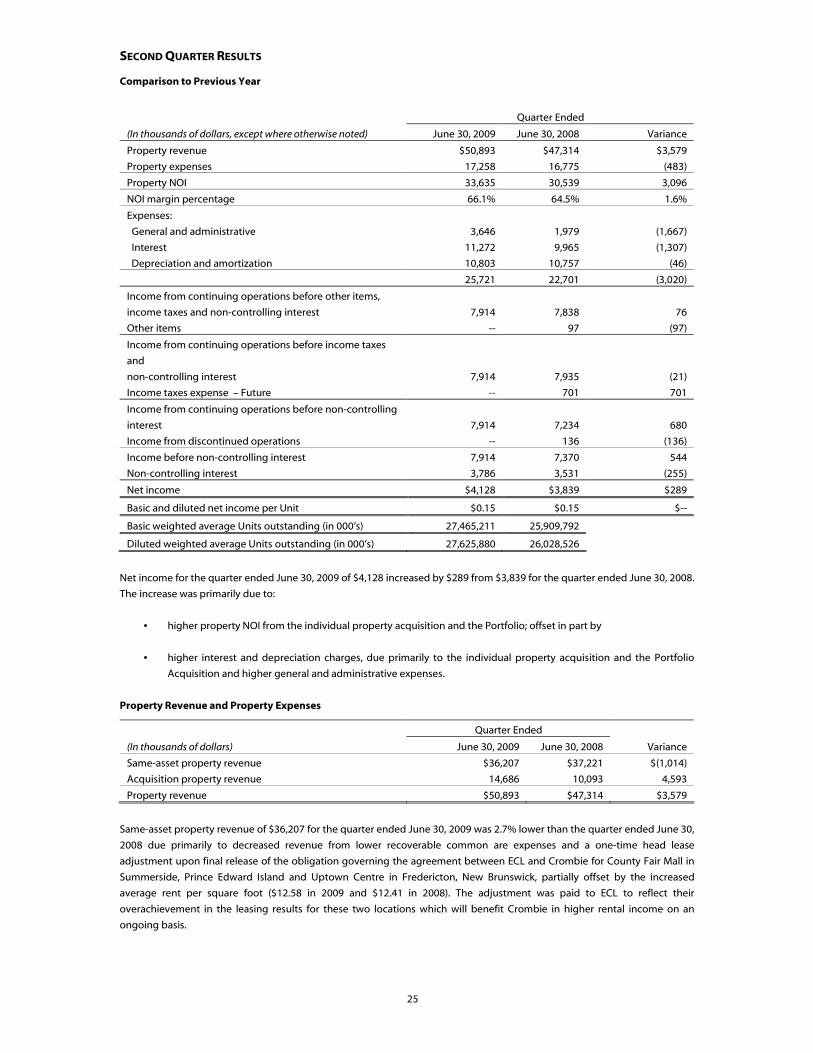
25
SECOND QUARTER RESULTS
Comparison to Previous Year
Quarter Ended
(In thousands of dollars, except where otherwise noted) June 30, 2009 June 30, 2008 Variance
Property revenue $50,893 $47,314 $3,579
Property expenses 17,258 16,775 (483)
Property NOI 33,635 30,539 3,096
NOI margin percentage 66.1% 64.5% 1.6%
Expenses:
General and administrative 3,646 1,979 (1,667)
Interest 11,272 9,965 (1,307)
Depreciation and amortization 10,803 10,757 (46)
25,721 22,701 (3,020)
Income from continuing operations before other items,
income taxes and non-controlling interest 7,914 7,838 76
Other items -- 97 (97)
Income from continuing operations before income taxes
and
non-controlling interest 7,914 7,935 (21)
Income taxes expense – Future -- 701 701
Income from continuing operations before non-controlling
interest 7,914 7,234 680
Income from discontinued operations -- 136 (136)
Income before non-controlling interest 7,914 7,370 544
Non-controlling interest 3,786 3,531 (255)
Net income $4,128 $3,839 $289
Basic and diluted net income per Unit $0.15 $0.15 $--
Basic weighted average Units outstanding (in 000’s) 27,465,211 25,909,792
Diluted weighted average Units outstanding (in 000’s) 27,625,880 26,028,526
Net income for the quarter ended June 30, 2009 of $4,128 increased by $289 from $3,839 for the quarter ended June 30, 2008.
The increase was primarily due to:
• higher property NOI from the individual property acquisition and the Portfolio; offset in part by
• higher interest and depreciation charges, due primarily to the individual property acquisition and the Portfolio
Acquisition and higher general and administrative expenses.
Property Revenue and Property Expenses
Quarter Ended
(In thousands of dollars) June 30, 2009 June 30, 2008 Variance
Same-asset property revenue $36,207 $37,221 $(1,014)
Acquisition property revenue 14,686 10,093 4,593
Property revenue $50,893 $47,314 $3,579
Same-asset property revenue of $36,207 for the quarter ended June 30, 2009 was 2.7% lower than the quarter ended June 30,
2008 due primarily to decreased revenue from lower recoverable common are expenses and a one-time head lease
adjustment upon final release of the obligation governing the agreement between ECL and Crombie for County Fair Mall in
Summerside, Prince Edward Island and Uptown Centre in Fredericton, New Brunswick, partially offset by the increased
average rent per square foot ($12.58 in 2009 and $12.41 in 2008). The adjustment was paid to ECL to reflect their
overachievement in the leasing results for these two locations which will benefit Crombie in higher rental income on an
ongoing basis.
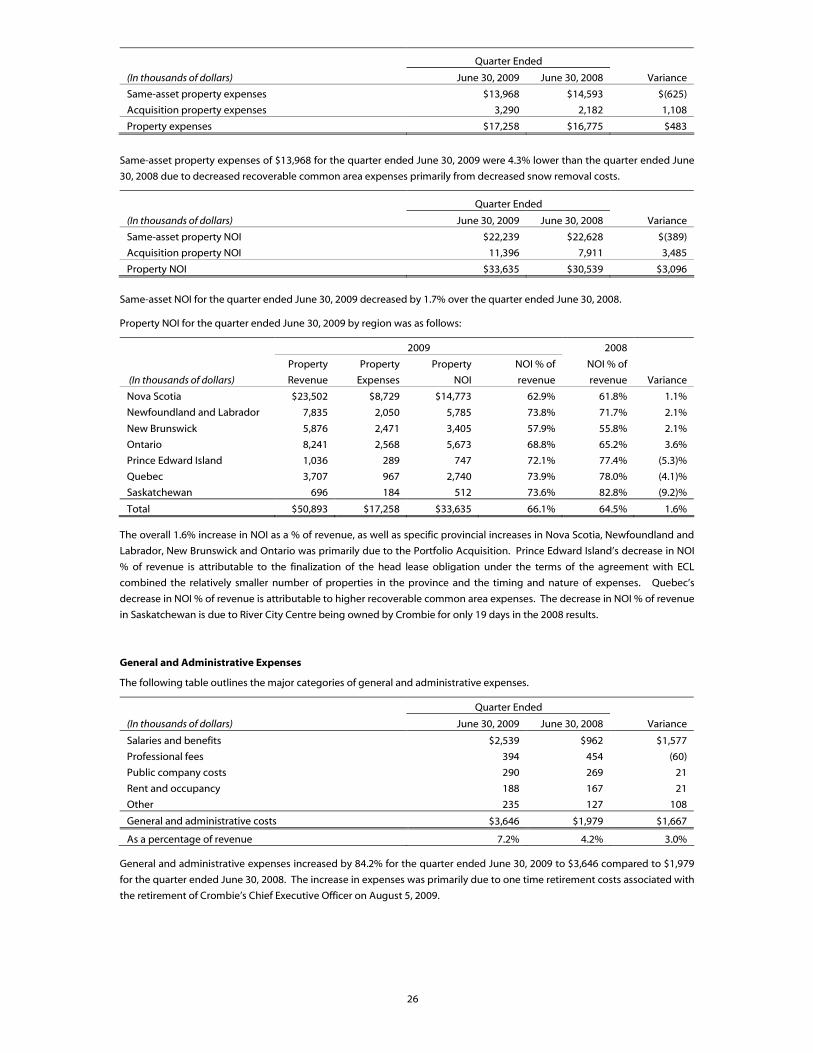
26
Quarter Ended
(In thousands of dollars) June 30, 2009 June 30, 2008 Variance
Same-asset property expenses $13,968 $14,593 $(625)
Acquisition property expenses 3,290 2,182 1,108
Property expenses $17,258 $16,775 $483
Same-asset property expenses of $13,968 for the quarter ended June 30, 2009 were 4.3% lower than the quarter ended June
30, 2008 due to decreased recoverable common area expenses primarily from decreased snow removal costs.
Quarter Ended
(In thousands of dollars) June 30, 2009 June 30, 2008 Variance
Same-asset property NOI $22,239 $22,628 $(389)
Acquisition property NOI 11,396 7,911 3,485
Property NOI $33,635 $30,539 $3,096
Same-asset NOI for the quarter ended June 30, 2009 decreased by 1.7% over the quarter ended June 30, 2008.
Property NOI for the quarter ended June 30, 2009 by region was as follows:
2009 2008
(In thousands of dollars)
Property
Revenue
Property
Expenses
Property
NOI
NOI % of
revenue
NOI % of
revenue
Variance
Nova Scotia $23,502 $8,729 $14,773 62.9% 61.8% 1.1%
Newfoundland and Labrador 7,835 2,050 5,785 73.8% 71.7% 2.1%
New Brunswick 5,876 2,471 3,405 57.9% 55.8% 2.1%
Ontario 8,241 2,568 5,673 68.8% 65.2% 3.6%
Prince Edward Island 1,036 289 747 72.1% 77.4% (5.3)%
Quebec 3,707 967 2,740 73.9% 78.0% (4.1)%
Saskatchewan 696 184 512 73.6% 82.8% (9.2)%
Total $50,893 $17,258 $33,635 66.1% 64.5% 1.6%
The overall 1.6% increase in NOI as a % of revenue, as well as specific provincial increases in Nova Scotia, Newfoundland and
Labrador, New Brunswick and Ontario was primarily due to the Portfolio Acquisition. Prince Edward Island’s decrease in NOI
% of revenue is attributable to the finalization of the head lease obligation under the terms of the agreement with ECL
combined the relatively smaller number of properties in the province and the timing and nature of expenses. Quebec’s
decrease in NOI % of revenue is attributable to higher recoverable common area expenses. The decrease in NOI % of revenue
in Saskatchewan is due to River City Centre being owned by Crombie for only 19 days in the 2008 results.
General and Administrative Expenses
The following table outlines the major categories of general and administrative expenses.
Quarter Ended
(In thousands of dollars) June 30, 2009 June 30, 2008 Variance
Salaries and benefits $2,539 $962 $1,577
Professional fees 394 454 (60)
Public company costs 290 269 21
Rent and occupancy 188 167 21
Other 235 127 108
General and administrative costs $3,646 $1,979 $1,667
As a percentage of revenue 7.2% 4.2% 3.0%
General and administrative expenses increased by 84.2% for the quarter ended June 30, 2009 to $3,646 compared to $1,979
for the quarter ended June 30, 2008. The increase in expenses was primarily due to one time retirement costs associated with
the retirement of Crombie’s Chief Executive Officer on August 5, 2009.

27
Interest Expense
Quarter Ended
(In thousands of dollars) June 30, 2009 June 30, 2008 Variance
Same-asset interest expense $6,592 $6,303 $289
Acquisition interest expense 4,680 3,662 1,018
Interest expense $11,272 $9,965 $1,307
Same-asset interest expense of $6,592 for the quarter ended June 30, 2009 increased by 4.6% when compared to the quarter
ended June 30, 2008 due to the amortization of payments made on the settlement of interest rate swap agreements of $455
and slightly higher average interest rates on mortgages entered into during 2008 for properties held since the IPO, offset in
part by a decrease in the floating interest rate on the revolving credit facility.
There is an agreement between ECL and Crombie whereby ECL provides a monthly interest rate subsidy to Crombie to
reduce the effective interest rates to 5.54% on certain mortgages that were assumed at Crombie’s IPO for their remaining
term. Over the term of this agreement, management expects this subsidy to aggregate to the amount of approximately
$20,564. The amount of the interest rate subsidy received during the quarter ended June 30, 2009 was $776 (quarter ended
June 30, 2008 - $852). The interest rate subsidy is received by Crombie through monthly repayments by ECL of amounts due
under one of the demand notes issued by ECL to CDL.
Depreciation and Amortization
Quarter Ended
(In thousands of dollars) June 30, 2009 June 30, 2008 Variance
Same-asset depreciation and amortization $6,551 $7,795 $(1,244)
Acquisition depreciation and amortization 4,252 2,962 1,290
Depreciation and amortization $10,803 $10,757 $46
Same-asset depreciation and amortization of $6,551 for the quarter ended June 30, 2009 was 16.0% lower than the quarter
ended June 30, 2008 due primarily to the intangible assets related to the origination costs and the in-place leases associated
with the properties purchased at the date of the IPO being fully amortized, offset in part by depreciation on fixed asset
additions and amortization on tenant improvement and lease costs incurred since June 30, 2008, combined with the
expenses resulting from the reallocation of $3,946 of costs to commercial properties from other assets due to the retroactive
implementation of accounting guidelines as discussed in “Changes in Accounting Policies and Estimates”. Depreciation and
amortization consists of:
Quarter Ended
(In thousands of dollars) June 30, 2009 June 30, 2008 Variance
Depreciation of commercial properties $5,027 $4,418 $609
Amortization of tenant improvements/lease costs 892 700 192
Amortization of intangible assets 4,884 5,639 (755)
Depreciation and amortization $10,803 $10,757 $46
Sector Information
While Crombie does not distinguish or group its operations on a geographical or other basis, Crombie provides the following
sector information as supplemental disclosure.
Retail Freestanding Properties Quarter ended June 30, 2009 Quarter ended June 30, 2008 (In thousands of dollars,
except as otherwise noted) Same-Asset Acquisitions Total Same-Asset Acquisitions Total
Property revenue $453 $6,832 $7,285 $351 $5,042 $5,393
Property expenses 125 1,263 1,388 52 1,078 1,130
Property NOI $328 $5,569 $5,897 $299 $3,964 $4,263
NOI Margin % 72.4% 81.5% 80.9% 85.2% 78.6% 79.0%
Occupancy % 100.0% 100.0% 100.0% 100.0% 100.0% 100.0%
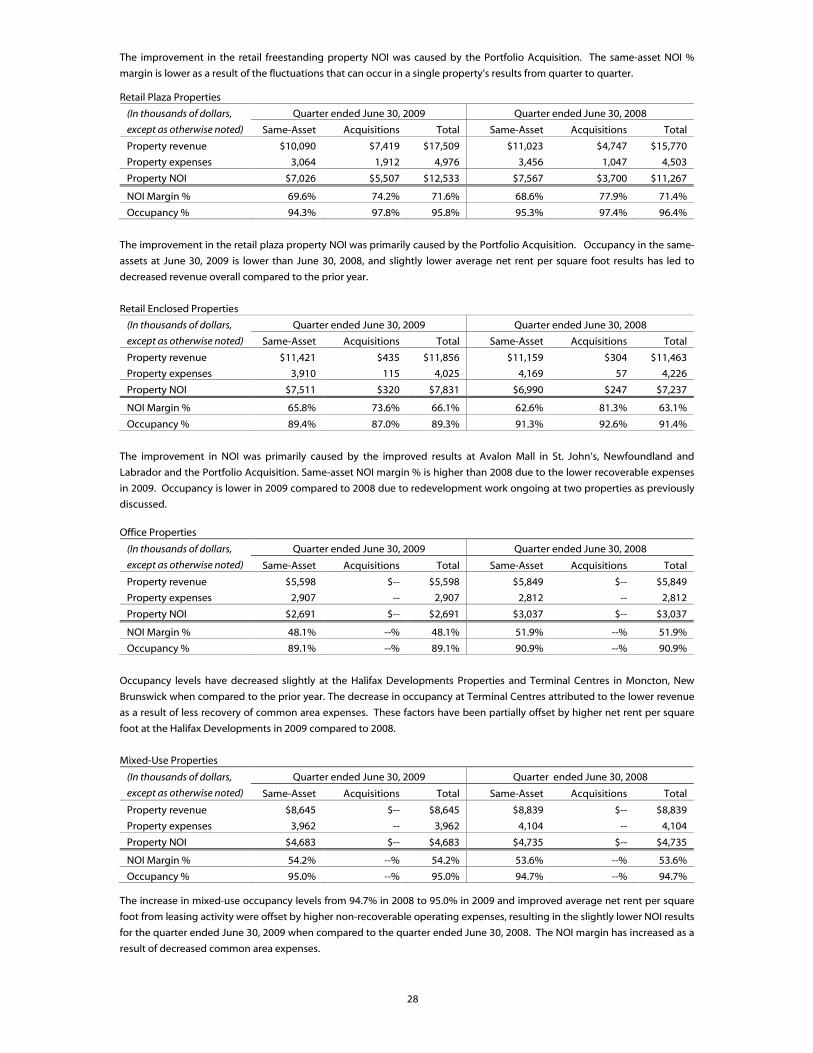
28
The improvement in the retail freestanding property NOI was caused by the Portfolio Acquisition. The same-asset NOI %
margin is lower as a result of the fluctuations that can occur in a single property’s results from quarter to quarter.
Retail Plaza Properties Quarter ended June 30, 2009 Quarter ended June 30, 2008 (In thousands of dollars,
except as otherwise noted) Same-Asset Acquisitions Total Same-Asset Acquisitions Total
Property revenue $10,090 $7,419 $17,509 $11,023 $4,747 $15,770
Property expenses 3,064 1,912 4,976 3,456 1,047 4,503
Property NOI $7,026 $5,507 $12,533 $7,567 $3,700 $11,267
NOI Margin % 69.6% 74.2% 71.6% 68.6% 77.9% 71.4%
Occupancy % 94.3% 97.8% 95.8% 95.3% 97.4% 96.4%
The improvement in the retail plaza property NOI was primarily caused by the Portfolio Acquisition. Occupancy in the same-
assets at June 30, 2009 is lower than June 30, 2008, and slightly lower average net rent per square foot results has led to
decreased revenue overall compared to the prior year.
Retail Enclosed Properties Quarter ended June 30, 2009 Quarter ended June 30, 2008 (In thousands of dollars,
except as otherwise noted) Same-Asset Acquisitions Total Same-Asset Acquisitions Total
Property revenue $11,421 $435 $11,856 $11,159 $304 $11,463
Property expenses 3,910 115 4,025 4,169 57 4,226
Property NOI $7,511 $320 $7,831 $6,990 $247 $7,237
NOI Margin % 65.8% 73.6% 66.1% 62.6% 81.3% 63.1%
Occupancy % 89.4% 87.0% 89.3% 91.3% 92.6% 91.4%
The improvement in NOI was primarily caused by the improved results at Avalon Mall in St. John’s, Newfoundland and
Labrador and the Portfolio Acquisition. Same-asset NOI margin % is higher than 2008 due to the lower recoverable expenses
in 2009. Occupancy is lower in 2009 compared to 2008 due to redevelopment work ongoing at two properties as previously
discussed.
Office Properties
Quarter ended June 30, 2009 Quarter ended June 30, 2008 (In thousands of dollars,
except as otherwise noted) Same-Asset Acquisitions Total Same-Asset Acquisitions Total
Property revenue $5,598 $-- $5,598 $5,849 $-- $5,849
Property expenses 2,907 -- 2,907 2,812 -- 2,812
Property NOI $2,691 $-- $2,691 $3,037 $-- $3,037
NOI Margin % 48.1% --% 48.1% 51.9% --% 51.9%
Occupancy % 89.1% --% 89.1% 90.9% --% 90.9%
Occupancy levels have decreased slightly at the Halifax Developments Properties and Terminal Centres in Moncton, New
Brunswick when compared to the prior year. The decrease in occupancy at Terminal Centres attributed to the lower revenue
as a result of less recovery of common area expenses. These factors have been partially offset by higher net rent per square
foot at the Halifax Developments in 2009 compared to 2008.
Mixed-Use Properties
Quarter ended June 30, 2009 Quarter ended June 30, 2008 (In thousands of dollars,
except as otherwise noted) Same-Asset Acquisitions Total Same-Asset Acquisitions Total
Property revenue $8,645 $-- $8,645 $8,839 $-- $8,839
Property expenses 3,962 -- 3,962 4,104 -- 4,104
Property NOI $4,683 $-- $4,683 $4,735 $-- $4,735
NOI Margin % 54.2% --% 54.2% 53.6% --% 53.6%
Occupancy % 95.0% --% 95.0% 94.7% --% 94.7%
The increase in mixed-use occupancy levels from 94.7% in 2008 to 95.0% in 2009 and improved average net rent per square
foot from leasing activity were offset by higher non-recoverable operating expenses, resulting in the slightly lower NOI results
for the quarter ended June 30, 2009 when compared to the quarter ended June 30, 2008. The NOI margin has increased as a
result of decreased common area expenses.
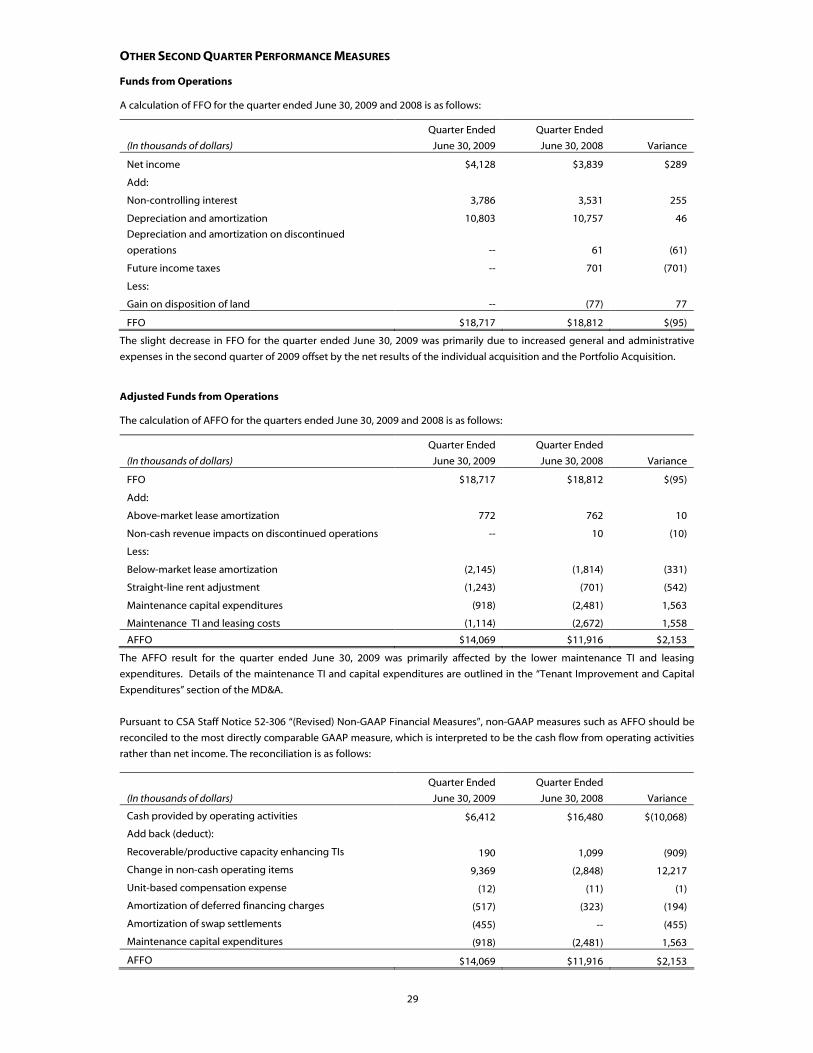
29
OTHER SECOND QUARTER PERFORMANCE MEASURES
Funds from Operations
A calculation of FFO for the quarter ended June 30, 2009 and 2008 is as follows:
(In thousands of dollars)
Quarter Ended
June 30, 2009
Quarter Ended
June 30, 2008
Variance
Net income $4,128 $3,839 $289
Add:
Non-controlling interest 3,786 3,531 255
Depreciation and amortization 10,803 10,757 46
Depreciation and amortization on discontinued
operations -- 61 (61)
Future income taxes -- 701 (701)
Less:
Gain on disposition of land -- (77) 77
FFO $18,717 $18,812 $(95)
The slight decrease in FFO for the quarter ended June 30, 2009 was primarily due to increased general and administrative
expenses in the second quarter of 2009 offset by the net results of the individual acquisition and the Portfolio Acquisition.
Adjusted Funds from Operations
The calculation of AFFO for the quarters ended June 30, 2009 and 2008 is as follows:
(In thousands of dollars)
Quarter Ended
June 30, 2009
Quarter Ended
June 30, 2008
Variance
FFO $18,717 $18,812 $(95)
Add:
Above-market lease amortization 772 762 10
Non-cash revenue impacts on discontinued operations -- 10 (10)
Less:
Below-market lease amortization (2,145) (1,814) (331)
Straight-line rent adjustment (1,243) (701) (542)
Maintenance capital expenditures (918) (2,481) 1,563
Maintenance TI and leasing costs (1,114) (2,672) 1,558
AFFO $14,069 $11,916 $2,153
The AFFO result for the quarter ended June 30, 2009 was primarily affected by the lower maintenance TI and leasing
expenditures. Details of the maintenance TI and capital expenditures are outlined in the “Tenant Improvement and Capital
Expenditures” section of the MD&A.
Pursuant to CSA Staff Notice 52-306 “(Revised) Non-GAAP Financial Measures”, non-GAAP measures such as AFFO should be
reconciled to the most directly comparable GAAP measure, which is interpreted to be the cash flow from operating activities
rather than net income. The reconciliation is as follows:
(In thousands of dollars)
Quarter Ended
June 30, 2009
Quarter Ended
June 30, 2008
Variance
Cash provided by operating activities $6,412 $16,480 $(10,068)
Add back (deduct):
Recoverable/productive capacity enhancing TIs 190 1,099 (909)
Change in non-cash operating items 9,369 (2,848) 12,217
Unit-based compensation expense (12) (11) (1)
Amortization of deferred financing charges (517) (323) (194)
Amortization of swap settlements (455) -- (455)
Maintenance capital expenditures (918) (2,481) 1,563
AFFO $14,069 $11,916 $2,153

30
Cash Flow
(In thousands of dollars)
Quarter Ended
June 30, 2009
Quarter Ended
June 30, 2008
Variance
Cash provided by (used in):
Operating activities $6,412 $16,480 $(10,068)
Financing activities $(3,364) $378,614 $(381,978)
Investing activities $(3,216) $(395,094) $391,878
Operating Activities
(In thousands of dollars)
Quarter Ended
June 30, 2009
Quarter Ended
June 30, 2008
Variance
Cash provided by (used in):
Net income and non-cash items $17,085 $17,403 $(318)
TI and leasing costs (1,304) (3,771) 2,467
Non-cash working capital (9,369) 2,848 (12,217)
Cash provided by operating activities $6,412 $16,480 $(10,068)
Fluctuations in cash provided by operating activities are largely influenced by the change in non-cash working capital which
can be affected by the timing of receipts and payments. The details of the TI and leasing costs during the second quarter of
2009 are outlined in the “Tenant Improvements and Capital Expenditures” section of the MD&A.
Financing Activities
(In thousands of dollars)
Quarter Ended
June 30, 2009
Quarter Ended
June 30, 2008
Variance
Cash provided by (used in):
Net issue of units $64,574 $59,215 $5,359
Net issue (repayment) of commercial property debt (57,102) 328,567 (385,669)
Payment of distributions (11,655) (10,952) (703)
Other items (net) 819 1,784 (965)
Cash provided by (used in) financing activities $(3,364) $378,614 $(381,978)
Cash used in financing activities for the quarter ended June 30, 2009 was $381,978 lower than the quarter ended June 30,
2008 primarily due to the issue of the Term Facility and the public issue of Units related to the Portfolio Acquisition in the
quarter ended June 30, 2008 , partially offset by the gross proceeds of $66,855 from the public offering of Units and the
private placement of Class B LP Units with Empire Subsidiaries on June 25, 2009 that was used to reduce commercial property
debt.
Investing Activities
Cash used in investing activities for the quarter ended June 30, 2009 was $3,216. Of this, $3,192 was used for additions to
commercial properties. Cash used in investing activities for the quarter ended June 30, 2008 of $395,094 was primarily due to
the Portfolio Acquisition.
Tenant Improvement and Capital Expenditures
(In thousands of dollars)
Quarter Ended
June 30, 2009
Quarter Ended
June 30, 2008
Total additions to commercial properties $3,192 $5,803
Less: amounts recoverable from ECL -- (2,084)
Net additions to commercial properties 3,192 3,719
Less: productive capacity enhancements (2,274) (1,238)
Maintenance capital expenditures $918 $2,481
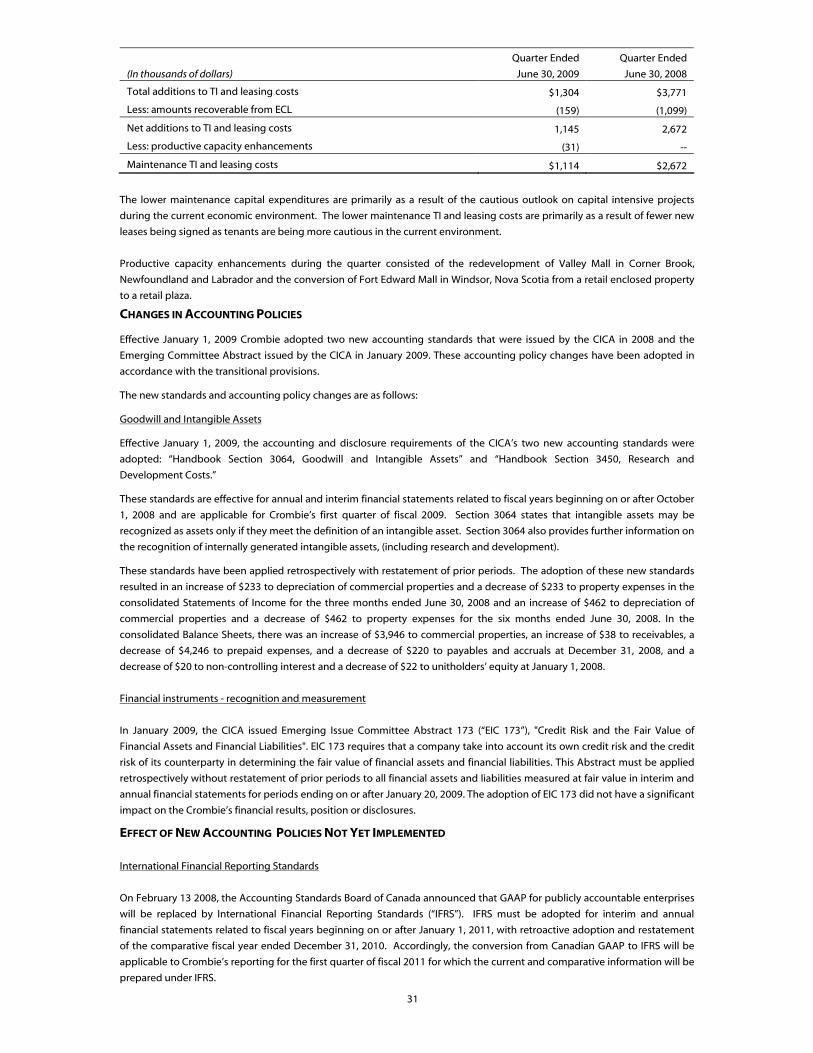
31
(In thousands of dollars)
Quarter Ended
June 30, 2009
Quarter Ended
June 30, 2008
Total additions to TI and leasing costs $1,304 $3,771
Less: amounts recoverable from ECL (159) (1,099)
Net additions to TI and leasing costs 1,145 2,672
Less: productive capacity enhancements (31) --
Maintenance TI and leasing costs $1,114 $2,672
The lower maintenance capital expenditures are primarily as a result of the cautious outlook on capital intensive projects
during the current economic environment. The lower maintenance TI and leasing costs are primarily as a result of fewer new
leases being signed as tenants are being more cautious in the current environment.
Productive capacity enhancements during the quarter consisted of the redevelopment of Valley Mall in Corner Brook,
Newfoundland and Labrador and the conversion of Fort Edward Mall in Windsor, Nova Scotia from a retail enclosed property
to a retail plaza.
CHANGES IN ACCOUNTING POLICIES
Effective January 1, 2009 Crombie adopted two new accounting standards that were issued by the CICA in 2008 and the
Emerging Committee Abstract issued by the CICA in January 2009. These accounting policy changes have been adopted in
accordance with the transitional provisions.
The new standards and accounting policy changes are as follows:
Goodwill and Intangible Assets
Effective January 1, 2009, the accounting and disclosure requirements of the CICA’s two new accounting standards were
adopted: “Handbook Section 3064, Goodwill and Intangible Assets” and “Handbook Section 3450, Research and
Development Costs.”
These standards are effective for annual and interim financial statements related to fiscal years beginning on or after October
1, 2008 and are applicable for Crombie’s first quarter of fiscal 2009. Section 3064 states that intangible assets may be
recognized as assets only if they meet the definition of an intangible asset. Section 3064 also provides further information on
the recognition of internally generated intangible assets, (including research and development).
These standards have been applied retrospectively with restatement of prior periods. The adoption of these new standards
resulted in an increase of $233 to depreciation of commercial properties and a decrease of $233 to property expenses in the
consolidated Statements of Income for the three months ended June 30, 2008 and an increase of $462 to depreciation of
commercial properties and a decrease of $462 to property expenses for the six months ended June 30, 2008. In the
consolidated Balance Sheets, there was an increase of $3,946 to commercial properties, an increase of $38 to receivables, a
decrease of $4,246 to prepaid expenses, and a decrease of $220 to payables and accruals at December 31, 2008, and a
decrease of $20 to non-controlling interest and a decrease of $22 to unitholders’ equity at January 1, 2008.
Financial instruments - recognition and measurement
In January 2009, the CICA issued Emerging Issue Committee Abstract 173 (“EIC 173”), "Credit Risk and the Fair Value of
Financial Assets and Financial Liabilities". EIC 173 requires that a company take into account its own credit risk and the credit
risk of its counterparty in determining the fair value of financial assets and financial liabilities. This Abstract must be applied
retrospectively without restatement of prior periods to all financial assets and liabilities measured at fair value in interim and
annual financial statements for periods ending on or after January 20, 2009. The adoption of EIC 173 did not have a significant
impact on the Crombie’s financial results, position or disclosures.
EFFECT OF NEW ACCOUNTING POLICIES NOT YET IMPLEMENTED
International Financial Reporting Standards
On February 13 2008, the Accounting Standards Board of Canada announced that GAAP for publicly accountable enterprises
will be replaced by International Financial Reporting Standards (“IFRS”). IFRS must be adopted for interim and annual
financial statements related to fiscal years beginning on or after January 1, 2011, with retroactive adoption and restatement
of the comparative fiscal year ended December 31, 2010. Accordingly, the conversion from Canadian GAAP to IFRS will be
applicable to Crombie’s reporting for the first quarter of fiscal 2011 for which the current and comparative information will be
prepared under IFRS.

32
Crombie, with the assistance of its external advisors, have launched an internal initiative to govern the conversion process
and is currently evaluating the potential impact of the conversion to IFRS on its financial statements. At this time, the impact
on Crombie’s future financial position and results of operations is not reasonably determinable or estimatable. Crombie
expects the transition to IFRS to impact accounting, financial reporting, internal control over financial reporting, information
systems and business processes.
Crombie has developed a formal project governance structure, and is providing regular progress reports to senior
management and the audit committee. Crombie has also completed a diagnostic impact assessment, which involved a high
level review of the major differences between current GAAP and IFRS, as well as establishing an implementation guideline. In
accordance with this guideline Crombie has established a staff training program and is in the process of completing analysis
of the key decision areas and making recommendations on the same.
Crombie will continue to assess the impact of the transition to IFRS and to review all of the proposed and ongoing projects of
the International Accounting Standards Board to determine their impact on Crombie. Additionally, Crombie will continue to
invest in training and resources throughout the transition period to facilitate a timely conversion.
In order to assist Crombie with its transition to IFRS the Unitholders approved amendments to Crombie’s Declaration of Trust,
at Crombie’s Annual General and Special Meeting held on May 7, 2009, to allow the Trustees to make future amendments to
the Declaration of Trust without the requirement to obtain Unitholder approval. These changes are in the same manner as
the Declaration of Trust currently permits Trustees to act as it relates to the changes in taxation laws.
An example of a potential change to the Declaration of Trust in order to comply with IFRS standards as they are currently
drafted include the fact that Crombie’s units may be regarded under IFRS as a “liability” rather than “equity” (as they are
currently recognized under Canadian GAAP). This interpretation is influenced principally by the requirement in the
Declaration of Trust that Crombie “shall” distribute in each year an amount at least equal to its taxable income. Under IFRS,
the units would be classified as a liability if they contain “a contractual obligation to deliver cash or another financial asset to
another entity”.
The amendments will not result in any material change to the Unitholders, but rather were contemplated in order to assist
Crombie to implement changes that will assist in its transition to IFRS. Trustees will be obligated to determine whether any
such change is necessary or desirable in the circumstances, and all other matters that are currently required to be approved
by Unitholders pursuant to the Declaration of Trust will remain unchanged.
RELATED PARTY TRANSACTIONS
As at June 30, 2009, Empire, through its wholly-owned subsidiary ECL, holds a 47.4% indirect interest in Crombie. Crombie
uses the exchange amount as the measurement basis for the related party transactions.
For a period of five years commencing March 23, 2006, certain executive management individuals and other employees of
Crombie will provide general management, financial, leasing, administrative, and other administration support services to
certain real estate subsidiaries of Empire on a cost sharing basis. The costs assumed by Empire pursuant to the agreement
during the three months ended and six months ended June 30, 2009 were $278 and $575 (three months ended and six
months ended June 30, 2008 - $386 and $841 respectively) and were netted against general and administrative expenses
owing by Crombie to Empire.
For a period of five years, commencing March 23, 2006, certain on-site maintenance and management employees of Crombie
will provide property management services to certain real estate subsidiaries of Empire on a cost sharing basis. In addition,
for various periods, ECL has an obligation to provide rental income and interest rate subsidies. The costs assumed by Empire
pursuant to the agreement during the three months ended and six months ended June 30, 2009 were $273 and $649 (three
months ended and six months ended June 30, 2008 - $484 and $1,173 respectively) and was netted against property
expenses owing by Crombie to Empire. The head lease subsidy during the three months ended and six months ended June
30, 2009 were $154 and $404 (three months ended and six months ended June 30, 2008 - $231 and $629 respectively).
Crombie also earned rental revenue of $18,650 for the three months ended June 30, 2009 and $33,210 for the six months
ended June 30, 2009 (three months ended and six months ended June 30, 2008 - $13,135 and $19,497 respectively) from
Sobeys Inc., Empire Theatres and ASC Commercial Leasing Limited (“ASC”). These companies were all subsidiaries of Empire
until September 8, 2008 when ASC was sold. Property revenue from ASC is included in this note disclosure until the sale date.
33
Empire has provided Crombie with a $13,800 floating rate demand credit facility on substantially the same terms and
conditions that govern the floating rate revolving credit facility. During the first quarter of 2009, $10,000 outstanding at
December 31, 2008 was repaid to the demand credit facility.
On June 1, 2009, Crombie acquired 1.1 acres of land adjacent to the Avalon Mall, Newfoundland and Labrador, for $3,527 plus
additional closing costs from ECL General Partner Limited, an affiliate of Empire. ECL General Partner Limited provided debt
of $3,527 at a fixed rate of 8.00% and a term of 20 years.
On June 25, 2009, concurrent with the public offering, in satisfaction of its pre-emptive right, ECL purchased $30,000 of Class
B LP Units and the attached Special Voting Units, on a private-placement basis.
CRITICAL ACCOUNTING ESTIMATES
Critical accounting estimates are discussed under the section “Critical Accounting Estimates” in the 2008 Annual Report.
COMMITMENTS AND CONTINGENCIES
There are various claims and litigation, which Crombie is involved with, arising out of the ordinary course of business
operations. In the opinion of management, any liability that would arise from such contingencies would not have a
significant adverse effect on these financial statements.
Crombie has agreed to indemnify its trustees and officers, and particular employees, in accordance with Crombie’s policies.
Crombie maintains insurance policies that may provide coverage against certain claims.
Crombie has entered into a management cost sharing agreement with a subsidiary of Empire.
Crombie has land leases on certain properties. These leases have annual payments of $969 per year over the next five years.
The land leases have terms of between 15.8 and 76.2 years remaining, including renewal options.
Crombie obtains letters of credit to support our obligations with respect to construction work on our commercial properties
and defeasing commercial property debt. In connection with the defeasance of the discontinued operations commercial
property debt, Crombie has issued a standby letter of credit in the amount of $1,715 in favour of the mortgage lender. In
addition, Crombie has $145 in standby letters of credit for construction work that is being performed on its commercial
properties. Crombie does not believe that any of these standby letters of credit are likely to be drawn upon.
RISK MANAGEMENT
In the normal course of business, Crombie is exposed to a number of financial risks that can affect its operating performance.
These risks, and the action taken to manage them, are as follows:
Credit risk
Credit risk arises from the possibility that tenants may experience financial difficulty and be unable to fulfill their lease
commitments. Crombie’s credit risk is limited to the recorded amount of tenant receivables. An allowance for doubtful
accounts is taken for all anticipated problem accounts.
Crombie mitigates credit risk by geographical diversification, utilizing staggered lease maturities, diversifying both its tenant
mix and asset mix and conducting credit assessments for new and renewing tenants. As at June 30, 2009;
• Excluding Sobeys (which accounts for 33.0% of Crombie’s minimum rent), no other tenant accounts for more than
2.2% of Crombie’s minimum rent, and
• Over the next five years, no more than 9.3% of the gross leaseable area of Crombie will expire in any one year.
Crombie earned rental revenue of $18,650 for the three months ended June 30, 2009 and $33,210 for the six months ended
June 30, 2009 (three months ended and six months ended June 30, 2008 - $13,135 and $19,497 respectively) from
subsidiaries of Empire.
34
Interest rate risk
Interest rate risk is the potential for financial loss arising from increases in interest rates. Crombie mitigates interest rate risk
by utilizing staggered debt maturities, limiting the use of permanent floating rate debt and utilizing interest rate swap
agreements. As at June 30, 2009:
• Crombie’s weighted average term to maturity of the fixed rate mortgages was 5.8 years, and
• Crombie’s exposure to floating rate debt, including the impact of the fixed rate swap agreements discussed below,
was 20.0% of the total commercial property debt. Excluding the floating rate term facility, which is to be replaced with
permanent fixed rate financing during the next seven months, the exposure to floating rate debt is 2.1%
From time to time, Crombie has entered into interest rate swap agreements to manage the interest rate profile of its current
or future debts without an exchange of the underlying principal amount. Recent turmoil in the financial markets has
materially affected interest swap rates. This effect was especially pronounced during the fourth quarter of 2008 and the first
quarter of 2009. The interest swap rates are based on Canadian bond yields, plus a premium, called the swap spread, which
reflects the risk of trading with a private counterparty as opposed to the Canadian government. During the fourth quarter
2008, the swap spread turned negative and remained negative throughout the first quarter of 2009. While the swap spreads
turned positive during the second quarter of 2009, they still remain below historical average values. The effect of the
abnormally low swap spreads, combined with the decline in the Canadian bond yields has resulted in a significant
deterioration of the mark-to-market values for the interest rate swap agreements. At June 30, 2009, the mark-to-market
exposure on the interest rate swap agreements was approximately $31,831. There is no immediate cash impact from the
mark-to-market adjustment. The unfavourable difference in the mark-to-market amount of these interest rate swap
agreements is reflected in other comprehensive income (loss) rather than net income as the swaps are all designated and
effective hedges. The breakdown of the swaps in place as part of the interest rate management program, and their
associated mark-to-market amounts are as follows:
• Crombie has entered into a fixed interest rate swap to fix the amount of interest to be paid on $50,000 of the
revolving credit facility. The fair value of the fixed interest rate swap at June 30, 2009, had an unfavourable
mark-to-market exposure of $3,674 (June 30, 2008 – unfavourable $957) compared to its face value. The change
in this amount has been recognized in other comprehensive income (loss). The mark-to-market amount of fixed
interest rate swaps reduce to $Nil upon maturity of the swaps.
• Crombie has entered into a number of delayed interest rate swap agreements of a notional amount of $100,334
(June 30, 2008 - $118,689) with settlement dates between February 1, 2010 and July 2, 2011, maturing between
February 1, 2019 and July 2, 2021 to mitigate exposure to interest rate increases for mortgages maturing in 2010
and 2011. The fair value of these delayed interest rate swap agreements had an unfavourable mark-to-market
exposure of $12,774 compared to the face value June 30, 2009 (June 30, 2008 – unfavourable $8,468). The
change in these amounts has been recognized in other comprehensive income (loss).
• In relation to the acquisition of a portfolio of 61 retail properties from subsidiaries of Empire, Crombie has
entered into a number of delayed interest rate swap agreements of a notional amount of $138,000 (June 30,
2008 - $280,000) with a settlement date of August 1, 2009 to mitigate exposure to interest rate increases prior to
replacing the floating rate term facility with long-term financing. The fair value of these agreements had an
unfavourable mark-to-market exposure of $15,383 compared to their face value on June 30, 2009 (June 30, 2008
– $1,782). The change in these amounts has been recognized in other comprehensive income (loss).
During the first quarter of 2009, Crombie settled an interest rate swap agreement related to a notional amount of $42,000 for
a settlement amount of $4,535. This settlement amount has been recognized in other comprehensive income (loss) since the
inception of the interest rate swap agreements. This loss will be reclassified to interest expense using the effective interest
rate method.
Crombie estimates that $897 of other comprehensive income (loss) will be reclassified to interest expense during the
remaining two quarters of 2009 based on interest rate swap agreements settled to June 30, 2009.
A fluctuation in interest rates would have an impact on Crombie’s net earnings and other comprehensive income (loss) items.
Based on the previous year’s rate changes, a 0.5% interest rate change would reasonably be considered possible. The
changes would have had the following impact:

35
Quarter ended June 30, 2009 Quarter ended June 30, 2008
0.5% increase 0.5% decrease 0.5% increase 0.5% decrease
Impact on net income of interest rate changes the floating rate revolving credit facility
$(244) $244 $(340) $340
Six months ended June 30, 2008 Six months ended June 30, 2008
0.5% increase 0.5% decrease 0.5% increase 0.5% decrease
Impact on net income of interest rate changes the floating rate revolving credit facility
$(514) $514 $(365) $365
June 30, 2009 June 30, 2008
0.5% increase 0.5% decrease 0.5% increase 0.5% decrease
Impact on other comprehensive income and non-controlling interest items due to changes in fair value of derivatives designated as a cash flow hedge
$8,764 $(9,151) $13,129 $(13,735)
Crombie does not enter into these interest rate swap transactions on a speculative basis. Crombie is prohibited by its
Declaration of Trust in purchasing, selling or trading in interest rate future contracts other than for hedging purposes.
Liquidity risk
The real estate industry is highly capital intensive. Liquidity risk is the risk that Crombie may not have access to sufficient debt
and equity capital to fund the growth program and/or refinance the debt obligations as they mature.
Cash flow generated from operating the property portfolio represents the primary source of liquidity used to service the
interest on debt, fund general and administrative expenses, reinvest into the portfolio through capital expenditures, as well
as fund tenant improvement costs and make distributions to Unitholders. Debt repayment requirements are primarily funded
from refinancing Crombie’s maturing debt obligations. Property acquisition funding requirements are funded through a
combination of accessing the debt and equity capital markets.
There is a risk that the debt capital markets may not refinance maturing debt on terms and conditions acceptable to Crombie
or at any terms at all. Crombie seeks to mitigate this risk by staggering the debt maturity dates. There is also a risk that the
equity capital markets may not be receptive to an equity issue from Crombie with financial terms acceptable to Crombie.
Crombie mitigates its exposure to liquidity risk utilizing a conservative approach to capital management.
Access to the Revolving Credit Facility is also limited to the amount utilized under the facility, plus any negative mark-to-
market position on the interest rate swap agreements, not exceeding the security provided by Crombie. The mark-to-market
adjustment on the interest rate swap agreements reached an out-of-the-money position of approximately $31,831 at June 30,
2009. The deterioration in the mark-to-market position may have the impact of reducing Crombie’s available credit in the
Revolving Credit Facility.
Crombie has secured a $13,800 floating rate Empire Demand Facility under essentially the same terms and conditions that
govern the Revolving Credit Facility. This demand facility has been put in place to ensure Crombie maintains adequate
liquidity in order to fund its daily operating activities while the volatility in the financial markets continues, while also
mitigating the risk of Crombie not being in compliance with covenants under the Revolving Credit Facility.
Crombie has no mortgages maturing in fiscal 2009 and during the second quarter of 2009 completed the extension of the
Term Facility from the original maturity date of October 2009 to May 2011.

36
SUBSEQUENT EVENT
On July 22, 2009, Crombie declared distributions of 7.417 cents per unit for the period from July 1, 2009, to and including, July
31, 2009. The distribution will be payable on August 17, 2009 to Unitholders of record as at July 31, 2009.
INTERNAL CONTROL OVER FINANCIAL REPORTING
Management is responsible for establishing and maintaining adequate control over financial reporting (“ICFR”) to provide
reasonable assurance regarding the reliability of financial reporting and the preparation of financial statements for external
purposes in accordance with GAAP. The control framework Management used to design ICFR is COSO, which is the
Committee of Sponsoring Organizations of the Treadway Commission. The Chief Executive Officer and Chief Financial Officer
have evaluated the effectiveness of Crombie’s ICFR and have concluded as at June 30, 2009 that Crombie’s ICFR were
designed and operated effectively, and that there are no material weaknesses relating to the design or operation of
Crombie’s ICFR. There were no changes to Crombie’s ICFR for the quarter ended June 30, 2009 that have materially affected,
or are reasonably likely to materially affect Crombie’s ICFR.
DISCLOSURE CONTROLS AND PROCEDURES
Management is responsible for establishing and maintaining disclosure controls and procedures (“DC&P”) to provide
reasonable assurance that material information relating to Crombie is made known to Management by others, particularly
during the period in which the annual filings are being prepared, and that information required to be disclosed by Crombie in
its annual filings, interim filings or other reports filed or submitted by it under securities legislation is recorded, processed,
summarized and reported with the time periods specified in securities legislation. The Chief Executive Officer and Chief
Financial Officer have evaluated the effectiveness of Crombie’s DC&P and have concluded as at June 30, 2009 that these
DC&P were designed and operated effectively, and that there are no material weaknesses relating to the design or operation
of Crombie’s DC&P.

37
QUARTERLY INFORMATION
The following table shows information for revenues, net income, AFFO, FFO, distributions and per unit amounts for the eight
most recently completed quarters.
Quarter Ended
(In thousands of dollars, except per
unit amounts)
Jun. 30,
2009
Mar. 31,
2009
Dec. 31,
2008
Sep. 30,
2008
Jun. 30,
2008
Mar. 31,
2008
Dec. 31,
2007
Sep. 30,
2007
Property revenue $50,893 $52,992 $52,522 $51,044 $47,315 $37,262 $36,455 $35,068
Property expenses 17,258 19,971 19,649 18,634 16,776 15,312 14,336 14,682
Property net operating income 33,635 33,021 32,873 32,410 30,539 21,950 22,119 20,386
Expenses:
General and administrative 3,646 1,644 2,701 2,004 1,979 1,952 2,492 1,843
Interest 11,272 10,730 11,318 11,449 9,965 6,500 6,577 6,413
Depreciation and amortization 10,803 12,491 12,499 12,535 10,757 7,995 8,352 7,575
25,721 24,865 26,518 25,988 22,701 16,447 17,421 15,831
Income from continuing
operations before other items,
income taxes and non-controlling
interest 7,914 8,156 6,355
6,422
7,838
5,503 4,698 4,555
Other items -- 92 55 27 97 -- -- --
Income from continuing
operations before income taxes
and non-controlling interest 7,914 8,248 6,410
6,449
7,935
5,503
4,698 4,555
Income taxes expense - Future -- 200 (3,450) 859 701 400 (2,994) 718
Income from continuing
operations before non-controlling
interest 7,914 8,048 9,860
5,590 7,234 5,103 7,692 3,837
Gain/(loss) on sale of discontinued
operations -- -- 487 (895) -- -- -- --
Income from discontinued
operations -- -- 24 226 136 263 132 108
Income before non-controlling
interest 7,914 8,048 10,371 4,921 7,370 5,366 7,824 3,945
Non-controlling interest 3,786 3,856 4,968 2,358 3,531 2,583 3,766 1,899
Net income $4,128 $4,192 $5,403 $2,563 $3,839 $2,783 $4,058 $2,046
Basic and diluted net income per
unit $0.15 $0.15 $0.20 $0.09 $0.15 $0.13 $0.19 $0.10
Quarter Ended
(In thousands of dollars, except per
unit amounts)
Jun. 30,
2009
Mar. 31,
2009
Dec. 31,
2008
Sep. 30,
2008
Jun. 30,
2008
Mar. 31,
2008
Dec. 31,
2007
Sep. 30,
2007
AFFO $14,069 $16,026 $14,681 $12,457 $11,916 $8,096 $7,761 $6,273
FFO $18,717 $20,739 $18,933 $19,200 $18,812 $13,839 $13,257 $12,310
Distributions $12,294 $11,649 $11,649 $11,649 $11,879 $8,867 $8,867 $8,867
AFFO per unit(1) $0.27 $0.31 $0.28 $0.24 $0.24 $0.19 $0.19 $0.15
FFO per unit(1) $0.35 $0.40 $0.36 $0.37 $0.38 $0.33 $0.32 $0.30
Distributions per unit(1) $0.23 $0.22 $0.22 $0.22 $0.23 $0.21 $0.21 $0.21
(1) AFFO, FFO and distributions per unit are calculated by AFFO, FFO or distributions, as the case maybe, divided by the diluted weighted average of the total Units and Special Voting Units outstanding of 52,959,049 for the quarter ended June 30, 2009, 52,351,464 for the quarter ended March 31, 2009, 52,351,464 for the quarter ended December 31, 2008, 52,351,464 for the quarter ended September 30, 2008, 49,954,256 for the quarter ended June 30, 2008, 41,728,561 for the quarter ended March 31, 2008, 41,728,561 for the quarter ended December 31, 2007, 41,728,561 for the quarter ended September 30, 2007. The quarterly results of these calculations may not add to the annual calculations due to rounding.
Additional information relating to Crombie, including its latest Annual Information Form, can be found on the SEDAR web site
for Canadian regulatory filings at www.sedar.com.
Dated: August 6, 2009 Stellarton, Nova Scotia, Canada

38
CROMBIE REAL ESTATE INVESTMENT TRUST Consolidated Balance Sheets
(In thousands of dollars) (Unaudited)
June 30, 2009 December 31, 2008
Restated
Assets (Note 3)
Commercial properties (Note 4) $1,307,934 $1,308,347
Intangible assets (Note 5) 118,416 131,403
Notes receivable (Note 6) 9,760 11,323
Other assets (Note 7) 27,310 20,934
Cash and cash equivalents - 4,028
Assets related to discontinued operations (Note 21) 7,054 7,184 $1,470,474 $1,483,219
Liabilities and Unitholders’ Equity
Commercial property debt (Note 8) $759,223 $808,971
Convertible debentures (Note 9) 29,090 28,968
Payables and accruals (Note 10) 59,525 94,462
Intangible liabilities (Note 11) 36,771 41,061
Employee future benefits obligation 6,165 4,836
Distributions payable 4,522 3,883
Future income tax liability (Note 16) 80,000 79,800
Liabilities related to discontinued operations (Note 21) 6,411 6,517
981,707 1,068,498
Non-controlling interest (Note 12) 233,292 199,163
Unitholders' equity 255,475 215,558
$1,470,474 $1,483,219
Commitments and contingencies (Note 18) Subsequent event (Note 24)
See accompanying notes to the interim consolidated financial statements.

39
CROMBIE REAL ESTATE INVESTMENT TRUST Consolidated Statements of Income
(In thousands of dollars, except per unit amounts) (Unaudited)
Three Months
Ended
June 30, 2009
Three Months
Ended
June 30, 2008
Six Months
Ended
June 30, 2009
Six Months
Ended
June 30, 2008
Restated Restated
Revenues (Note 3) (Note 3)
Property revenue (Note 14) $50,893 $47,314 $103,885 $84,576
Lease terminations - 20 92 20
50,893 47,334 103,977 84,596 Expenses
Property expenses 17,258 16,775 37,229 32,087
General and administrative expenses 3,646 1,979 5,290 3,931
Interest expense (Note 15) 11,272 9,965 22,002 16,465
Depreciation of commercial properties 5,027 4,418 9,827 7,821
Amortization of tenant improvements/lease costs 892 700 2,023 1,468
Amortization of intangible assets 4,884 5,639 11,444 9,463 42,979 39,476 87,815 71,235
Income from continuing operations before other items 7,914 7,858 16,162 13,361
Gain on disposal of land - 77 - 77
Income from continuing operations before income taxes and non-
controlling interest 7,914 7,935 16,162 13,438
Income tax expense - Future (Note 16) - 701 200 1,101 Income from continuing operations before non-controlling interest 7,914 7,234 15,962 12,337
Income from discontinued operations (Note 21) - 136 - 399
Income before non-controlling interest 7,914 7,370 15,962 12,736
Non-controlling interest 3,786 3,531 7,642 6,114 Net income $4,128 $3,839 $8,320 $6,622 Basic and diluted net income per unit
Continuing operations $0.15 $0.14 $0.30 $0.26
Discontinued operations $0.00 $0.01 $0.00 $0.02
Net income $0.15 $0.15 $0.30 $0.28
Weighted average number of units outstanding
Basic 27,465,211 25,909,792 27,307,174 23,726,866
Diluted 27,625,880 26,028,526 27,449,862 23,838,755
See accompanying notes to the interim consolidated financial statements.

40
CROMBIE REAL ESTATE INVESTMENT TRUST Consolidated Statements of Comprehensive Income
(In thousands of dollars) (Unaudited)
Three Months
Ended
June 30, 2009
Three Months
Ended
June 30, 2008
Six Months
Ended
June 30, 2009
Six Months
Ended
June 30, 2008
Net income $4,128 $3,839 $8,320 $6,622
Losses on derivatives designated as cash flow hedges
transferred to net income in the current year 237 - 345 -
Net change in derivatives designated as cash flow hedges 9,159 1,487 8,700 (2,807)
Other comprehensive income (loss) 9,396 1,487 9,045 (2,807)
Comprehensive income $13,524 $5,326 $17,365 $3,815
See accompanying notes to the interim consolidated financial statements.

41
CROMBIE REAL ESTATE INVESTMENT TRUST Consolidated Statements of Unitholders’ Equity
(In thousands of dollars) (Unaudited)
See accompanying notes to the interim consolidated financial statements.
REIT
Units
Net
Income
Contributed
Surplus
Accumulated
Other
Comprehensive
Income (Loss) Distributions Total
(Note 13)
Unitholders’ equity, January 1, 2009 $265,096 $34,652 $34 $(29,567) $(54,635) $215,580
Adjustment due to change in accounting policy
(Note 3) - (22) - - - (22)
Unitholders’ equity, January 1, 2009 as restated 265,096 34,630 34 (29,567) (54,635) 215,558
Units released under EUPP 8 - (8) - - -
Units issued under EUPP 304 - - - - 304
Loans receivable under EUPP (304) - - - - (304)
EUPP compensation - - 23 - - 23
Repayment of EUPP loans receivable 90 - - - - 90
Net income - 8,320 - - - 8,320
Distributions - - - - (12,497) (12,497)
Other comprehensive income - - - 9,045 - 9,045
Unit issue proceeds, net of costs of $1,919 34,936 - - - - 34,936
Unitholders’ equity, June 30, 2009 $300,130 $42,950 $49 $(20,522) $(67,132) $255,475
Unitholders’ equity, January 1, 2008 $205,273 $20,064 $12 $(3,000) $(31,515) $190,834
Adjustment due to change in accounting policy
(Note 3) - (22) - - - (22)
Unitholders’ equity, January 1, 2008 as restated $205,273 $20,042 $12 $(3,000) $(31,515) $190,812
Units released under EUPP 20 - (20) - - -
Units issued under EUPP 386 - - - - 386
Loans receivable under EUPP (386) - - - - (386)
EUPP compensation - - 20 - - 20
Repayment of EUPP loans receivable 164 - - - - 164
Net income - 6,622 - - - 6,622
Distributions - - - - (10,983) (10,983)
Other comprehensive loss - - - (2,807) - (2,807)
Unit issue proceeds, net of costs of $2,008 60,997 - - - - 60,997
Unit redemption (1,375) - - - - (1,375)
Unitholders’ equity, June 30, 2008 as restated $265,079 $26,664 $12 $(5,807) $(42,498) $243,450

42
CROMBIE REAL ESTATE INVESTMENT TRUST Consolidated Statements of Cash Flows
(In thousands of dollars) (Unaudited)
Three Months
Ended
June 30, 2009
Three Months
Ended
June 30, 2008
Six Months
Ended
June 30, 2009
Six Months
Ended
June 30, 2008
Restated Restated
Cash flows provided by (used in) (Note 3) (Note 3)
Operating Activities
Net income $4,128 $3,839 $8,320 $6,622
Items not affecting cash:
Non-controlling interest 3,786 3,531 7,642 6,114
Depreciation of commercial properties 5,027 4,441 9,827 7,879
Amortization of tenant improvements/lease costs 892 709 2,023 1,491
Amortization of deferred financing costs 517 323 997 477
Amortization of swap settlements 455 - 662 -
Amortization of intangible assets 4,884 5,668 11,444 9,521
Amortization of above-market leases 772 779 1,543 1,549
Amortization of below-market leases (2,145) (1,819) (4,290) (3,009)
Gain on sale of land - (77) - (77)
Accrued rental revenue (1,243) (703) (2,126) (1,021)
Unit based compensation 12 11 23 20
Future income tax expense - 701 200 1,101
17,085 17,403 36,265 30,667 Additions to tenant improvements and lease costs (1,304) (3,771) (2,544) (8,328)
Change in other non-cash operating items (Note 17) (9,369) 2,848 (16,645) (224)
Cash provided by operating activities 6,412 16,480 17,076 22,115
Financing Activities
Issue of commercial property debt 1,312 350,575 58,312 350,575
Increase in deferred financing charges (1,785) (3,653) (2,342) (3,592)
Issue of convertible debentures - - - 30,000
Issue costs of convertible debentures - - - (1,214)
Units issued 66,855 63,005 66,855 63,005
Units and Class B LP Units issue costs (2,281) (3,790) (2,281) (3,790)
Settlement of interest rate swap agreements - - (4,535) -
Repayment of commercial property debt (56,629) (18,355) (110,120) (45,735)
Decrease in liabilities related to discontinued operations (39) - (106) -
Collection of notes receivable 777 3,002 1,563 4,416
Repayment of EUPP loan receivable 81 157 90 164
Unit redemption - (1,375) - (1,375)
Payment of distributions (11,655) (10,952) (23,304) (19,819)
Cash provided by (used in) financing activities (3,364) 378,614 (15,868) 372,635
Investing Activities
Additions to commercial properties (3,192) (5,803) (4,922) (7,515)
Additions to recoverable capital expenditures (96) (73) (408) (725)
Decrease in assets related to discontinued operations 108 - 130 -
Proceeds on disposal of land, net of closing costs (Note 4) - 187 - 187
Acquisition of commercial properties (Note 4) (36) (389,405) (36) (389,405)
Cash used in investing activities (3,216) (395,094) (5,236) (397,458) Decrease in cash and cash equivalents during the pe riod (168) Nil (4,028) (2,708)
Cash and cash equivalents, beginning of period 168 Nil 4,028 2,708 Cash and cash equivalents, end of period $Nil $Nil $Nil $Nil
See accompanying notes to the interim consolidated financial statements.

43
CROMBIE REAL ESTATE INVESTMENT TRUST Notes to the Interim Consolidated Financial Stateme nts
(In thousands of dollars, except per unit amounts) Unaudited
June 30, 2009
1) CROMBIE REAL ESTATE INVESTMENT TRUST
Crombie Real Estate Investment Trust (“Crombie”) is an unincorporated “open-ended” real estate investment trust created
pursuant to the Declaration of Trust dated January 1, 2006, as amended. The units of Crombie are traded on the Toronto
Stock Exchange (“TSX”) under the symbol “CRR.UN”.
2) SUMMARY OF SIGNIFICANT ACCOUNTING POLICIES
(a) Basis of presentation
These interim consolidated financial statements are prepared in accordance with Canadian generally accepted accounting
principles (“GAAP”) as prescribed by the Canadian Institute of Chartered Accountants (“CICA”). These interim consolidated
financial statements do not include all of the disclosures included in Crombie’s annual consolidated financial statements.
Accordingly, these interim consolidated financial statements should be read in conjunction with the consolidated financial
statements for the year ended December 31, 2008 as set out in the 2008 Annual Report.
The accounting policies used in preparation of these interim consolidated financial statements conform with those used in the
2008 annual consolidated financial statements, except as described in Note 3.
(b) Property acquisitions
Upon acquisition of commercial properties, Crombie performs an assessment of the fair value of the properties’ related tangible
and intangible assets and liabilities (including land, buildings, origination costs, in-place leases, above- and below-market
leases, and any other assumed assets and liabilities), and allocates the purchase price to the acquired assets and liabilities.
Crombie assesses and considers fair value based on cash flow projections that take into account relevant discount and
capitalization rates and any other relevant sources of market information available. Estimates of future cash flow are based on
factors that include historical operating results, if available, and anticipated trends, local markets and underlying economic
conditions.
Crombie allocates the purchase price based on the following:
Land - The amount allocated to land is based on an appraisal estimate of its fair value.
Buildings - Buildings are recorded at the fair value of the building on an “as-if-vacant” basis, which is based on the present
value of the anticipated net cash flow of the building from vacant start up to full occupancy.
Origination costs for existing leases - Origination costs are determined based on estimates of the costs that would be
incurred to put the existing leases in place under the same terms and conditions. These costs include leasing commissions
as well as foregone rent and operating cost recoveries during an assumed lease-up period.
In-place leases - In-place lease values are determined based on estimated costs required for each lease that represents the
net operating income lost during an estimated lease-up period that would be required to replace the existing leases at the
time of purchase.
Tenant relationships - Tenant relationship values are determined based on costs avoided if the respective tenants were to
renew their leases at the end of the existing term, adjusted for the estimated probability that the tenants will renew.
Above- and below-market existing leases - Values ascribed to above- and below-market existing leases are determined
based on the present value of the difference between the rents payable under the terms of the respective leases and
estimated future market rents.
Fair value of debt - Values ascribed to fair value of debt are determined based on the differential between contractual and
market interest rates on long term liabilities assumed at acquisition.
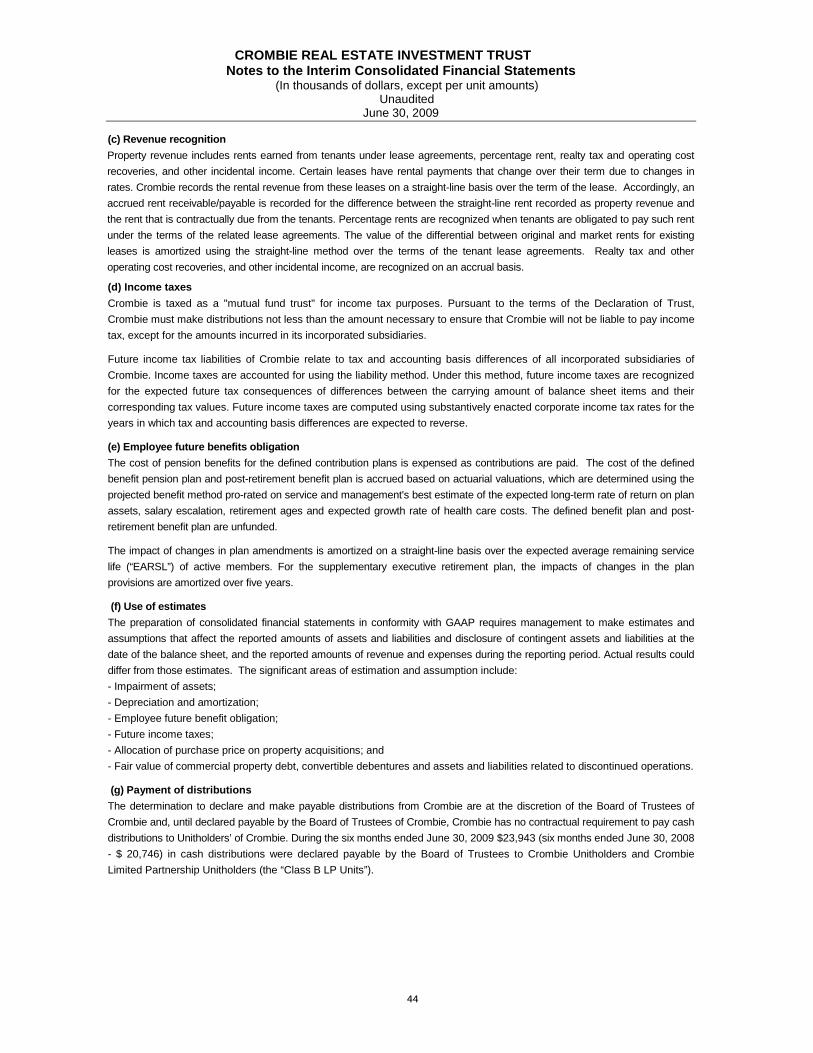
44
CROMBIE REAL ESTATE INVESTMENT TRUST Notes to the Interim Consolidated Financial Stateme nts
(In thousands of dollars, except per unit amounts) Unaudited
June 30, 2009
(c) Revenue recognition
Property revenue includes rents earned from tenants under lease agreements, percentage rent, realty tax and operating cost
recoveries, and other incidental income. Certain leases have rental payments that change over their term due to changes in
rates. Crombie records the rental revenue from these leases on a straight-line basis over the term of the lease. Accordingly, an
accrued rent receivable/payable is recorded for the difference between the straight-line rent recorded as property revenue and
the rent that is contractually due from the tenants. Percentage rents are recognized when tenants are obligated to pay such rent
under the terms of the related lease agreements. The value of the differential between original and market rents for existing
leases is amortized using the straight-line method over the terms of the tenant lease agreements. Realty tax and other
operating cost recoveries, and other incidental income, are recognized on an accrual basis.
(d) Income taxes
Crombie is taxed as a "mutual fund trust" for income tax purposes. Pursuant to the terms of the Declaration of Trust,
Crombie must make distributions not less than the amount necessary to ensure that Crombie will not be liable to pay income
tax, except for the amounts incurred in its incorporated subsidiaries.
Future income tax liabilities of Crombie relate to tax and accounting basis differences of all incorporated subsidiaries of
Crombie. Income taxes are accounted for using the liability method. Under this method, future income taxes are recognized
for the expected future tax consequences of differences between the carrying amount of balance sheet items and their
corresponding tax values. Future income taxes are computed using substantively enacted corporate income tax rates for the
years in which tax and accounting basis differences are expected to reverse.
(e) Employee future benefits obligation
The cost of pension benefits for the defined contribution plans is expensed as contributions are paid. The cost of the defined
benefit pension plan and post-retirement benefit plan is accrued based on actuarial valuations, which are determined using the
projected benefit method pro-rated on service and management's best estimate of the expected long-term rate of return on plan
assets, salary escalation, retirement ages and expected growth rate of health care costs. The defined benefit plan and post-
retirement benefit plan are unfunded.
The impact of changes in plan amendments is amortized on a straight-line basis over the expected average remaining service
life (“EARSL”) of active members. For the supplementary executive retirement plan, the impacts of changes in the plan
provisions are amortized over five years.
(f) Use of estimates
The preparation of consolidated financial statements in conformity with GAAP requires management to make estimates and
assumptions that affect the reported amounts of assets and liabilities and disclosure of contingent assets and liabilities at the
date of the balance sheet, and the reported amounts of revenue and expenses during the reporting period. Actual results could
differ from those estimates. The significant areas of estimation and assumption include:
- Impairment of assets;
- Depreciation and amortization;
- Employee future benefit obligation;
- Future income taxes;
- Allocation of purchase price on property acquisitions; and
- Fair value of commercial property debt, convertible debentures and assets and liabilities related to discontinued operations.
(g) Payment of distributions
The determination to declare and make payable distributions from Crombie are at the discretion of the Board of Trustees of
Crombie and, until declared payable by the Board of Trustees of Crombie, Crombie has no contractual requirement to pay cash
distributions to Unitholders’ of Crombie. During the six months ended June 30, 2009 $23,943 (six months ended June 30, 2008
- $ 20,746) in cash distributions were declared payable by the Board of Trustees to Crombie Unitholders and Crombie
Limited Partnership Unitholders (the “Class B LP Units”).

45
CROMBIE REAL ESTATE INVESTMENT TRUST Notes to the Interim Consolidated Financial Stateme nts
(In thousands of dollars, except per unit amounts) Unaudited
June 30, 2009
(h) Convertible debentures
Debentures with conversion features are assessed at inception as to the value of both their equity component and their debt
component. Based on the assessment, Crombie has determined to date that no amount should be attributed to equity and
thus its convertible debentures have been classified as liabilities. Distributions to debenture holders are presented as interest
expense. Issue costs on convertible debentures are netted against the convertible debentures and amortized over the
original life of the convertible debentures using the effective interest rate method.
(i) Hedges
Crombie has cash flow hedges which are used to manage exposures to increases in variable interest rates. Cash flow hedges
are recognized on the balance sheet at fair value with the effective portion of the hedging relationship recognized in other
comprehensive income (loss). Any ineffective portion of the cash flow hedge is recognized in net income. Amounts recognized
in accumulated other comprehensive income (loss) are reclassified to net income in the same periods in which the hedged item
is recognized in net income. Fair value hedges and the related hedge items are recognized on the balance sheet at fair value
with any changes in fair value recognized in net income. To the extent the fair value hedge is effective, the changes in the fair
value of the hedge and the hedged item will offset each other.
Crombie has fixed interest rate swap agreements and a number of delayed interest rate swap agreements designated as cash
flow hedges. Crombie has identified these hedges against increases in benchmark interest rates and has formally documented
all relationships between these derivative financial instruments and hedged items, as well as the risk management strategy and
objectives. Crombie assesses on an ongoing basis whether the derivative financial instrument continues to be effective in
offsetting changes in interest rates on the hedged items.
(j) Comprehensive income
Comprehensive income is the change in Unitholders’ equity during a period from transactions and other events and
circumstances from non-owner sources. Crombie reports a consolidated statement of comprehensive income, comprising net
income and other comprehensive income (loss) for the period. Accumulated other comprehensive income (loss), has been
added to the consolidated statements of Unitholders’ equity.
(k) Discontinued operations Crombie classifies properties that meet certain criteria as held for sale and separately discloses any net income and gain
(loss) on disposal for current and prior periods as discontinued operations. A property is classified as held for sale at the
point in time when it is available for immediate sale, management has committed to a plan to sell the property and is actively
locating a purchaser for the property at a sales price that is reasonable in relation to the current estimated fair market value
of the property, and the sale is expected to be completed within a one year period. Properties held for sale are carried at the
lower of their carrying values and estimated fair value less costs to sell. In addition, assets held for sale are no longer
depreciated. A property that is subsequently reclassified as held in use is measured at the lower of its carrying value
amount before it was classed as held for sale, adjusted for an amortization expense that would have been recognized had it
been continuously classified as held and in use, and its estimated fair value at the date of the subsequent decision not to
sell.
(l) Impairment of long-lived assets
Long-lived assets are reviewed for impairment annually or whenever events or changes in circumstances indicate the carrying
value of an asset may not be recoverable.
If it is determined that the net recoverable value of a long-lived asset is less than its carrying value, the long-lived asset is written
down to its fair value. Net recoverable amount represents the undiscounted estimated future cash flow expected to be received
from the long-lived asset. Assets reviewed under this policy include commercial properties and intangible assets.
3) CHANGES IN ACCOUNTING POLICIES
Effective January 1, 2009 Crombie adopted two new accounting standards that were issued by the CICA in 2008 and one
Emerging Committee Abstract issued by the CICA in January 2009. These accounting policy changes have been adopted in
accordance with the transitional provisions.
The new standards and accounting policy changes are as follows:

46
CROMBIE REAL ESTATE INVESTMENT TRUST Notes to the Interim Consolidated Financial Stateme nts
(In thousands of dollars, except per unit amounts) Unaudited
June 30, 2009
Goodwill and Intangible Assets
Effective January 1, 2009, the accounting and disclosure requirements of the CICA’s two new accounting standards were
adopted: “Handbook Section 3064, Goodwill and Intangible Assets” and “Handbook Section 3450, Research and
Development Costs.”
These standards are effective for annual and interim financial statements related to fiscal years beginning on or after
October 1, 2008 and are applicable for Crombie’s first quarter of fiscal 2009. Section 3064 states that intangible assets may
be recognized as assets only if they meet the definition of an intangible asset. Section 3064 also provides further
information on the recognition of internally generated intangible assets, (including research and development).
These standards have been applied retrospectively with restatement of prior periods. The adoption of these new standards
resulted in an increase of $233 to depreciation of commercial properties and a decrease of $233 to property expenses in the
consolidated Statements of Income for the three months ended June 30, 2008 and an increase of $462 to depreciation of
commercial properties and a decrease of $462 to property expenses for the six months ended June 30, 2008. In the
consolidated Balance Sheets, there was an increase of $3,946 to commercial properties, an increase of $38 to receivables,
a decrease of $4,246 to prepaid expenses, and a decrease of $220 to payables and accruals at December 31, 2008, and a
decrease of $20 to non-controlling interest and a decrease of $22 to unitholders’ equity at January 1, 2008.
Financial instruments - recognition and measurement
In January 2009, the CICA issued Emerging Issue Committee Abstract 173 (“EIC 173”), "Credit Risk and the Fair Value of
Financial Assets and Financial Liabilities". EIC 173 requires that a company take into account its own credit risk and the
credit risk of its counterparty in determining the fair value of financial assets and financial liabilities. This Abstract must be
applied retrospectively without restatement of prior periods to all financial assets and liabilities measured at fair value in
interim and annual financial statements for periods ending on or after January 20, 2009. The adoption of EIC 173 did not
have a significant impact on Crombie’s financial results, position or disclosures.
Effect of new accounting standards not yet Implemen ted
International Financial Reporting Standards
On February 13 2008, the Accounting Standards Board of Canada announced that GAAP for publicly accountable
enterprises will be replaced by International Financial Reporting Standards (“IFRS”). IFRS must be adopted for interim and
annual financial statements related to fiscal years beginning on or after January 1, 2011, with retroactive adoption and
restatement of the comparative fiscal year ended December 31, 2010. Accordingly, the conversion from Canadian GAAP to
IFRS will be applicable to Crombie’s reporting for the first quarter of fiscal 2011 for which the current and comparative
information will be prepared under IFRS.
Crombie, with the assistance of its external advisors, have launched an internal initiative to govern the conversion process
and is currently evaluating the potential impact of the conversion to IFRS on its financial statements. At this time, the impact
on Crombie’s future financial position and results of operations is not reasonably determinable or estimatable. Crombie
expects the transition to IFRS to impact accounting, financial reporting, internal control over financial reporting, information
systems and business processes.
Crombie has developed a formal project governance structure, and is providing regular progress reports to senior
management and the audit committee. Crombie has also completed a diagnostic impact assessment, which involved a high
level review of the major differences between current GAAP and IFRS, as well as establishing an implementation guideline.
In accordance with this guideline Crombie has established a staff training program and is in the process of completing
analysis of the key decision areas and making recommendations on the same.
Crombie will continue to assess the impact of the transition to IFRS and to review all of the proposed and ongoing projects of
the International Accounting Standards Board to determine their impact on Crombie. Additionally, Crombie will continue to
invest in training and resources throughout the transition period to facilitate a timely conversion.
In order to assist Crombie with its transition to IFRS the Unitholders approved amendments to Crombie’s Declaration of
Trust, at Crombie’s Annual General and Special Meeting held on May 7, 2009, to allow the Trustees to make future
amendments to the Declaration of Trust without the requirement to obtain Unitholder approval. These changes are in the
same manner as the Declaration of Trust currently permits Trustees to act as it relates to the changes in taxation laws.
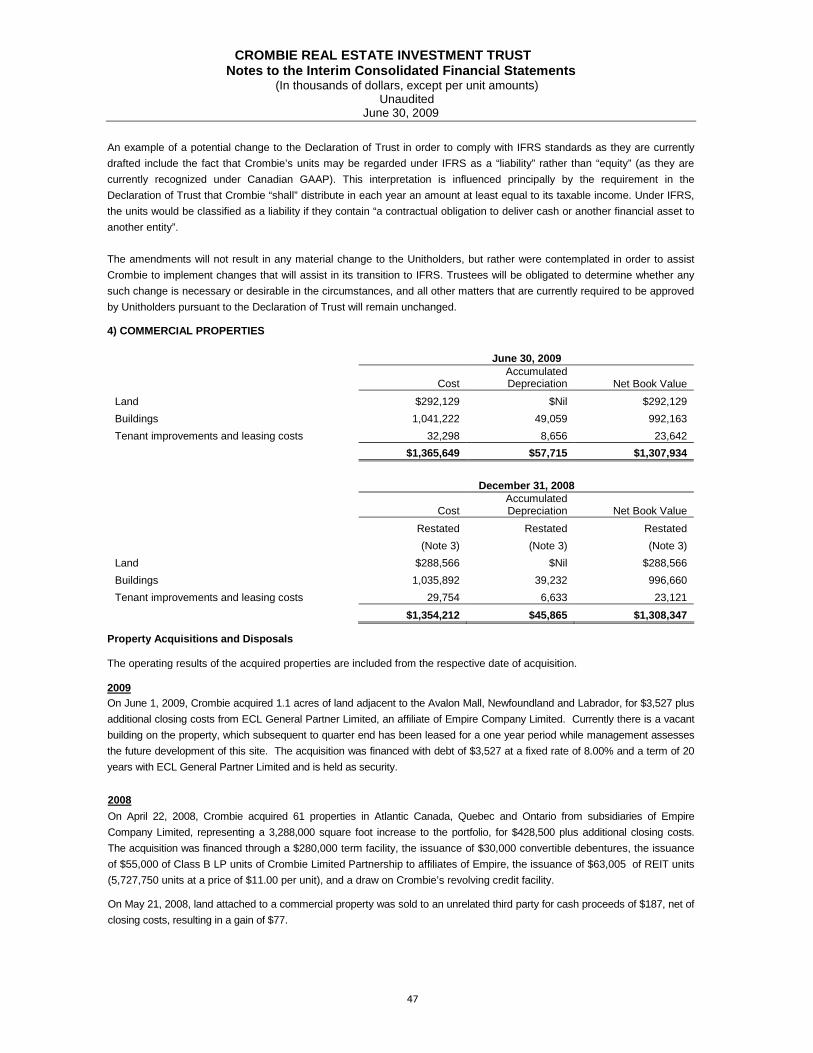
47
CROMBIE REAL ESTATE INVESTMENT TRUST Notes to the Interim Consolidated Financial Stateme nts
(In thousands of dollars, except per unit amounts) Unaudited
June 30, 2009
An example of a potential change to the Declaration of Trust in order to comply with IFRS standards as they are currently
drafted include the fact that Crombie’s units may be regarded under IFRS as a “liability” rather than “equity” (as they are
currently recognized under Canadian GAAP). This interpretation is influenced principally by the requirement in the
Declaration of Trust that Crombie “shall” distribute in each year an amount at least equal to its taxable income. Under IFRS,
the units would be classified as a liability if they contain “a contractual obligation to deliver cash or another financial asset to
another entity”.
The amendments will not result in any material change to the Unitholders, but rather were contemplated in order to assist
Crombie to implement changes that will assist in its transition to IFRS. Trustees will be obligated to determine whether any
such change is necessary or desirable in the circumstances, and all other matters that are currently required to be approved
by Unitholders pursuant to the Declaration of Trust will remain unchanged.
4) COMMERCIAL PROPERTIES
June 30, 2009
Cost
Accumulated Depreciation Net Book Value
Land $292,129 $Nil $292,129
Buildings 1,041,222 49,059 992,163
Tenant improvements and leasing costs 32,298 8,656 23,642
$1,365,649 $57,715 $1,307,934
December 31, 2008
Cost
Accumulated Depreciation Net Book Value
Restated Restated Restated
(Note 3) (Note 3) (Note 3)
Land $288,566 $Nil $288,566
Buildings 1,035,892 39,232 996,660
Tenant improvements and leasing costs 29,754 6,633 23,121
$1,354,212 $45,865 $1,308,347 Property Acquisitions and Disposals The operating results of the acquired properties are included from the respective date of acquisition. 2009 On June 1, 2009, Crombie acquired 1.1 acres of land adjacent to the Avalon Mall, Newfoundland and Labrador, for $3,527 plus
additional closing costs from ECL General Partner Limited, an affiliate of Empire Company Limited. Currently there is a vacant
building on the property, which subsequent to quarter end has been leased for a one year period while management assesses
the future development of this site. The acquisition was financed with debt of $3,527 at a fixed rate of 8.00% and a term of 20
years with ECL General Partner Limited and is held as security.
2008
On April 22, 2008, Crombie acquired 61 properties in Atlantic Canada, Quebec and Ontario from subsidiaries of Empire
Company Limited, representing a 3,288,000 square foot increase to the portfolio, for $428,500 plus additional closing costs.
The acquisition was financed through a $280,000 term facility, the issuance of $30,000 convertible debentures, the issuance
of $55,000 of Class B LP units of Crombie Limited Partnership to affiliates of Empire, the issuance of $63,005 of REIT units
(5,727,750 units at a price of $11.00 per unit), and a draw on Crombie’s revolving credit facility.
On May 21, 2008, land attached to a commercial property was sold to an unrelated third party for cash proceeds of $187, net of
closing costs, resulting in a gain of $77.

48
CROMBIE REAL ESTATE INVESTMENT TRUST Notes to the Interim Consolidated Financial Stateme nts
(In thousands of dollars, except per unit amounts) Unaudited
June 30, 2009
On June 12, 2008, Crombie acquired a property in Saskatoon, Saskatchewan, representing a 160,000 square foot increase to
the portfolio, for $27,200 plus additional closing costs, from an unrelated third party. The acquisition was financed through an
assumption of an existing mortgage of $16,517 at a fixed rate of 5.35% and a term of three years with the balance of the
purchase price paid using funds from the revolving credit facility.
The allocation of the total cost of the acquisitions is as follows:
Commercial property acquired, net:
Three Months
Ended
June 30 , 2009
Three Months
Ended
June 30 , 2008
Six Months
Ended
June 30 , 2009
Six Months
Ended
June 30 , 2008 Land $3,563 $107,826 $3,563 $107,826
Buildings - 287,154 - 287,154
Intangible assets:
Lease origination costs - 40,233 - 40,233
Tenant relationships - 21,622 - 21,622
Above-market leases - 370 - 370
In-place leases - 35,384 - 35,384
Intangible liabilities:
Below-market leases - (31,848) - (31,848)
Net purchase price 3,563 460,741 3,563 460,741
Assumed mortgages (3,527) (16,517) (3,527) (16,517)
Fair value debt adjustment on assumed mortgages - 181 - 181
$36 $444,405 $36 $444,405
Consideration funded by:
Revolving credit facility $36 $16,000 $36 $16,000
Term facility - 280,000 - 280,000
Units - 63,005 - 63,005
Convertible debentures - 30,000 - 30,000 Application of deposit - 400 - 400
Cash paid 36 389,405 36 389,405
Class B LP Units (non-controlling interest) paid - 55,000 - 55,000
Total consideration paid $36 $444,405 $36 $444,405

49
CROMBIE REAL ESTATE INVESTMENT TRUST Notes to the Interim Consolidated Financial Stateme nts
(In thousands of dollars, except per unit amounts) Unaudited
June 30, 2009
5) INTANGIBLE ASSETS
June 30, 2009
Cost
Accumulated Amortization
Net Book Value
Origination costs for existing leases $54,419 $14,706 $39,713
In-place leases 57,376 23,268 34,108
Tenant relationships 57,098 18,968 38,130
Above-market existing leases 16,015 9,550 6,465 $184,908 $66,492 $118,416
December 31, 2008
Cost
Accumulated Amortization Net Book Value
Origination costs for existing leases $54,419 $11,680 $42,739
In-place leases 57,376 19,072 38,304
Tenant relationships 57,098 14,746 42,352
Above-market existing leases 16,015 8,007 8,008
$184,908 $53,505 $131,403
6) NOTES RECEIVABLE
On March 23, 2006, Crombie acquired 44 properties from Empire Company Limited’s subsidiary, ECL Properties Limited
(“ECL”) and certain affiliates, resulting in ECL Developments Limited issuing two demand non-interest bearing promissory
notes in the amounts of $39,600 and $20,564. Payments on the first note of $39,600 are being received as funding is
required for a capital expenditure program relating to eight commercial properties over the period from 2006 to 2010.
Payments on the second note of $20,564 are being received on a monthly basis to reduce the effective interest rate to
5.54% on certain assumed mortgages with an average term to maturity of approximately 2.75 years.
The balance of each note is as follows:
June 30, 2009 December 31, 2008
Capital expenditure program $504 $505
Interest rate subsidy 9,256 10,818
$9,760 $11,323
7) OTHER ASSETS
June 30, 2009 December 31, 2008
Restated
(Note 3)
Gross accounts receivable $7,644 $7,286
Provision for doubtful accounts (269) (250)
Net accounts receivable 7,375 7,036
Accrued straight-line rent receivable 9,912 7,786
Prepaid expenses 9,276 5,174
Restricted cash 747 938
$27,310 $20,934
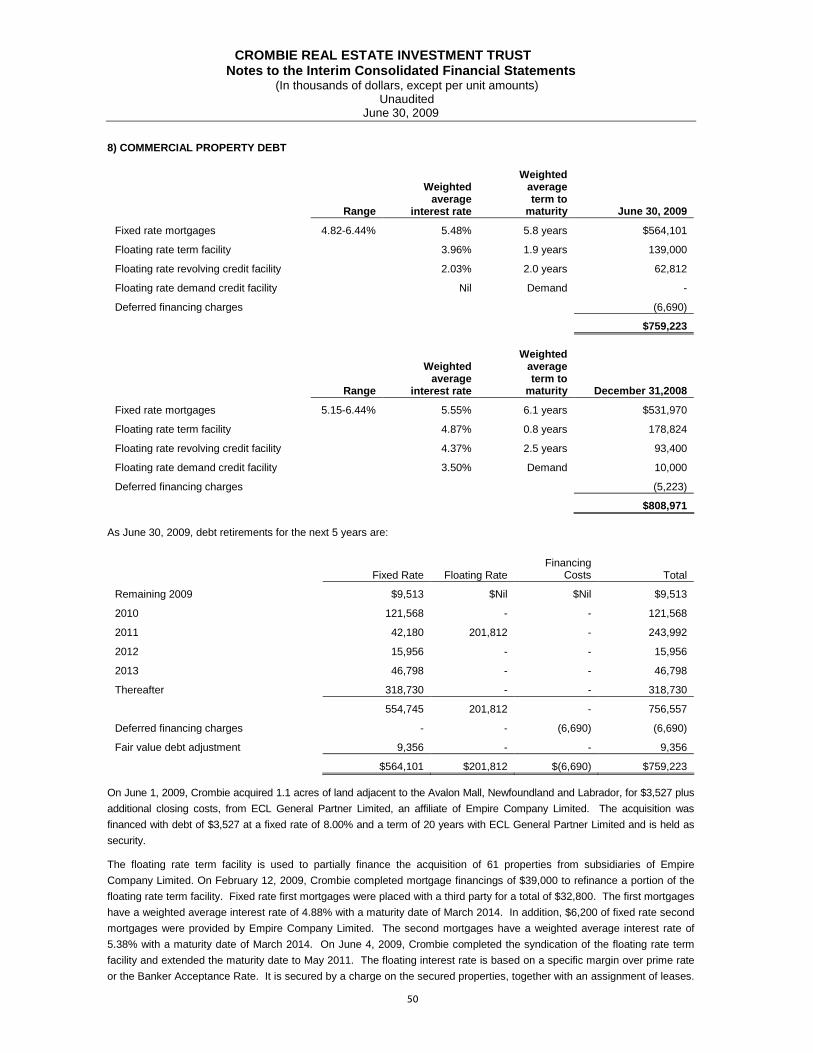
50
CROMBIE REAL ESTATE INVESTMENT TRUST Notes to the Interim Consolidated Financial Stateme nts
(In thousands of dollars, except per unit amounts) Unaudited
June 30, 2009
8) COMMERCIAL PROPERTY DEBT
Range
Weighted average
interest rate
Weighted average term to
maturity June 30, 2009
Fixed rate mortgages 4.82-6.44% 5.48% 5.8 years $564,101
Floating rate term facility 3.96% 1.9 years 139,000
Floating rate revolving credit facility 2.03% 2.0 years 62,812
Floating rate demand credit facility Nil Demand -
Deferred financing charges (6,690)
$759,223
Range
Weighted average
interest rate
Weighted average term to
maturity December 31,2008
Fixed rate mortgages 5.15-6.44% 5.55% 6.1 years $531,970
Floating rate term facility 4.87% 0.8 years 178,824
Floating rate revolving credit facility 4.37% 2.5 years 93,400
Floating rate demand credit facility 3.50% Demand 10,000
Deferred financing charges (5,223)
$808,971 As June 30, 2009, debt retirements for the next 5 years are:
Fixed Rate Floating Rate
Financing Costs Total
Remaining 2009 $9,513 $Nil $Nil $9,513
2010 121,568 - - 121,568
2011 42,180 201,812 - 243,992
2012 15,956 - - 15,956
2013 46,798 - - 46,798
Thereafter 318,730 - - 318,730
554,745 201,812 - 756,557
Deferred financing charges - - (6,690) (6,690)
Fair value debt adjustment 9,356 - - 9,356
$564,101 $201,812 $(6,690) $759,223
On June 1, 2009, Crombie acquired 1.1 acres of land adjacent to the Avalon Mall, Newfoundland and Labrador, for $3,527 plus
additional closing costs, from ECL General Partner Limited, an affiliate of Empire Company Limited. The acquisition was
financed with debt of $3,527 at a fixed rate of 8.00% and a term of 20 years with ECL General Partner Limited and is held as
security.
The floating rate term facility is used to partially finance the acquisition of 61 properties from subsidiaries of Empire
Company Limited. On February 12, 2009, Crombie completed mortgage financings of $39,000 to refinance a portion of the
floating rate term facility. Fixed rate first mortgages were placed with a third party for a total of $32,800. The first mortgages
have a weighted average interest rate of 4.88% with a maturity date of March 2014. In addition, $6,200 of fixed rate second
mortgages were provided by Empire Company Limited. The second mortgages have a weighted average interest rate of
5.38% with a maturity date of March 2014. On June 4, 2009, Crombie completed the syndication of the floating rate term
facility and extended the maturity date to May 2011. The floating interest rate is based on a specific margin over prime rate
or the Banker Acceptance Rate. It is secured by a charge on the secured properties, together with an assignment of leases.

51
The floating rate term facility contains financial and non-financial covenants that are customary for a credit facility of this
nature and which mirror the covenants set forth in the floating rate revolving credit facility.
The floating rate revolving credit facility has a maximum principal amount of $150,000 and is used by Crombie for working
capital purposes. It is secured by a pool of first and second mortgages and negative pledges on certain properties. The
floating interest rate is based on specific margins over prime rate or bankers acceptance rates. The specified margin
increases as Crombie’s overall debt leverage increases.
The floating rate demand credit facility is a $13,800 credit facility with Empire Company Limited on substantially the same
terms and conditions that govern the floating rate revolving credit facility. As at June 30, 2009, Crombie had $Nil drawn
against the floating rate revolving credit facility (December 31, 2008 - $10,000).
9) CONVERTIBLE DEBENTURES
Maturity date Interest rate June 30, 2009 December 31, 2008
Series A March 20, 2013 7.0% $30,000 $30,000
Transaction costs (910) (1,032)
$29,090 $28,968 10) PAYABLES AND ACCRUALS
June 30, 2009 December 31, 2008
Restated
(Note 3)
Tenant improvements and capital expenditures $11,612 $13,384
Property operating costs 11,456 20,166
Advance rents 2,035 5,364
Interest on commercial property debt and debentures 2,591 2,504
Fair value of interest rate swap agreements 31,831 53,044 $59,525 $94,462
11) INTANGIBLE LIABILITIES
June 30, 2009
Cost Accumulated Amortization
Net Book Value
Below-market existing leases $55,703 $18,932 $36,771
December 31, 2008
Cost
Accumulated Amortization
Net Book Value
Below-market existing leases $55,703 $14,642 $41,061

52
CROMBIE REAL ESTATE INVESTMENT TRUST Notes to the Interim Consolidated Financial Stateme nts
(In thousands of dollars, except per unit amounts) Unaudited
June 30, 2009 12) NON-CONTROLLING INTEREST
13) UNITS OUTSTANDING
Crombie REIT Units
Crombie REIT Special Voting Units and Class
B LP Units Total Number of
Units Amount Number of
Units Amount Number of
Units Amount
Balance, January 1, 2009 27,271,888 $265,096 25,079,576 $244,520 52,351,464 $509,616
Unit issue proceeds, net of costs 4,725,000 34,936 3,846,154 29,638 8,571,154 64,574
Units issued under EUPP 43,408 304 - - 43,408 304
Units released under EUPP - 8 - - - 8
Net change in EUPP loans receivable - (214) - - - (214)
Balance, June 30, 2009 32,040,296 $300,130 28,925,730 $274,158 60,966,026 $574,288
Class B LP Units
Net Income
Contributed Surplus
Accumulated Other
Comprehensive Income (Loss) Distributions Total
Balance, January 1, 2009 $244,520 $32,118 $Nil $(27,254) $(50,201) $199,183
Adjustment due to change in accounting
policy (Note 3) - (20) - - - (20)
Balance, January 1, 2009 as restated 244,520 32,098 Nil (27,254) (50,201) 199,163
Net income - 7,642 - - - 7,642
Distributions - - - - (11,446) (11,446)
Other comprehensive income - - - 8,295 - 8,295
Class B LP Unit issue proceeds, net of
costs of $362 29,638 - - - - 29,638
Balance, June 30, 2009 $274,158 $39,740 $Nil $(18,959) $(61,647) $233,292
Class B LP Units
Net Income
Contributed Surplus
Accumulated Other
Comprehensive Income (Loss) Distributions Total
Balance, January 1, 2008 $191,302 $18,678 $Nil $(2,784) $(29,277) $177,919
Adjustment due to change in accounting
policy (Note 3) - (20) - - - (20)
Balance, January 1, 2008 as restated 191,302 18,658 Nil (2,784) (29,277) 177,899
Net income - 6,114 - - - 6,114
Distributions - - - - (9,763) (9,763)
Other comprehensive income (loss) - - - (2,617) - (2,617)
Class B LP Unit issue proceeds, net of
costs of $1,782 53,218 - - - - 53,218
Balance, June 30, 2008 as restated $244,520 $24,772 $Nil $(5,401) $(39,040) $224,851

53
CROMBIE REAL ESTATE INVESTMENT TRUST Notes to the Interim Consolidated Financial Stateme nts
(In thousands of dollars, except per unit amounts) Unaudited
June 30, 2009
Crombie REIT Units
Crombie REIT Special Voting Units and Class
B LP Units Total Number of
Units Amount Number of
Units Amount Number of
Units Amount
Balance, January 1, 2008 21,648,985 $205,273 20,079,576 $191,302 41,728,561 $396,575
Unit issue proceeds, net of costs 5,727,750 60,997 5,000,000 53,218 10,727,750 114,215
Units issued under EUPP 34,053 386 - - 34,053 386
Units released under EUPP - 20 - - - 20
Net change in EUPP loans receivable - (222) - - - (222)
Unit redemption (138,900) (1,375) - - (138,900) (1,375)
Balance, June 30, 2008 27,271,888 $265,079 25,079,576 $244,520 52,351,464 $509,599 Crombie REIT Units
On June 25, 2009, Crombie closed a public offering, on a bought deal basis, of 4,725,000 Units, after full exercise of the
underwriters’ over-allotment option, to the public at a price of $7.80 per Unit for proceeds of $34,936 net of issue costs.
Crombie is authorized to issue an unlimited number of units (“Units”) and an unlimited number of Special Voting Units. Issued
and outstanding Units may be subdivided or consolidated from time to time by the Trustees without the approval of the
Unitholders. Units are redeemable at any time on demand by the holders at a price per Unit equal to the lesser of: (i) 90% of
the weighted average price per Crombie Unit during the period of the last ten days during which Crombie’s Units traded; and
(ii) an amount equal to the price of Crombie’s Units on the date of redemption, as defined in the Declaration of Trust.
The aggregate redemption price payable by Crombie in respect of any Units surrendered for redemption during any calendar
month will be satisfied by way of a cash payment in Canadian dollars within 30 days after the end of the calendar month in
which the Units were tendered for redemption, provided that the entitlement of Unitholders to receive cash upon the
redemption of their Units is subject to the limitation that:
i. the total amount payable by Crombie in respect of such Units and all other Units tendered for redemption, in the
same calendar month must not exceed $50 (provided that such limitation may be waived at the discretion of the
Trustees);
ii. at the time such Units are tendered for redemption, the outstanding Units must be listed for trading on the TSX
or traded or quoted on any other stock exchange or market which the Trustees consider, in their sole discretion,
provides representative fair market value prices for the Units;
iii. the normal trading of Units is not suspended or halted on any stock exchange on which the Units are listed (or if
not listed on a stock exchange, in any market where the Units are quoted for trading) on the Redemption Date
or for more than five trading days during the ten-day trading period commencing immediately after the
Redemption Date.
Crombie REIT Special Voting Units and Class B LP Un its
On June 25, 2009, concurrently with the issuance of the Units, in satisfaction of its pre-emptive right, ECL Developments
Limited purchased 3,846,154 Class B LP Units and the attached Special Voting Units at a price of $7.80 per Class B LP Unit
for proceeds of $29,638 net of issue costs, on a private placement basis.
The Declaration of Trust and the Exchange Agreement provide for the issuance of voting non-participating Units (the
“Special Voting Units”) to the holders of Class B LP Units used solely for providing voting rights proportionate to the votes of
Crombie’s Units. The Special Voting Units are not transferable separately from the Class B LP Units to which they are
attached and will be automatically transferred upon the transfer of such Class B LP Unit. If the Class B LP Units are
exchanged in accordance with the Exchange Agreement, a like number of Special Voting Units will be redeemed and
cancelled for no consideration by Crombie.

54
CROMBIE REAL ESTATE INVESTMENT TRUST Notes to the Interim Consolidated Financial Stateme nts
(In thousands of dollars, except per unit amounts) Unaudited
June 30, 2009
The Class B LP Units issued by a subsidiary of Crombie to ECL Developments Limited have economic and voting rights
equivalent, in all material aspects, to Crombie’s Units. They are indirectly exchangeable on a one-for-one basis for
Crombie’s Units at the option of the holder, under the terms of the Exchange Agreement.
Each Class B LP Unit entitles the holder to receive distributions from Crombie, pro rata with distributions made by Crombie
on Units.
The Class B LP Units are accounted for as non-controlling interest.
Employee Unit Purchase Plan (“EUPP”)
Crombie provides for unit purchase entitlements under the EUPP for certain senior executives. Awards made under the
EUPP will allow executives to purchase units from treasury at the average daily high and low board lot trading prices per unit
on the TSX for the five trading days preceding the issuance. Executives are provided non-recourse loans at 3% annual
interest by Crombie for the purpose of acquiring Units from treasury and the Units purchased are held as collateral for the
loan. The loan is repaid through the application of the after-tax amounts of all distributions received on the Units, as well as
the after-tax portion of any Long-Term Incentive Plan (“LTIP”) cash awards received, as payments on interest and principal.
As at June 30, 2009, there are loans receivable from executives of $1,505 under Crombie’s EUPP, representing 161,482
Units, which are classified as a reduction of Unitholders’ Equity. Loan repayments will result in a corresponding increase in
Unitholders’ Equity. Market value of the Units at June 30, 2009 was $1,316.
Earnings per Unit Computations
Basic net earnings per Unit is computed by dividing net earnings by the weighted average number of Units outstanding
during the period. Diluted earnings per Unit is calculated on the assumption that all EUPP loans were repaid at the
beginning of the period. For all periods, the assumed exchange of all Class B LP Units would not be dilutive. The
convertible debentures are anti-dilutive and have not been included in diluted net earnings per unit or diluted weighted
average number of units outstanding. As at June 30, 2009, there are no other dilutive items.
14) PROPERTY REVENUE
Three Months
Ended
June 30, 2009
Three Months
Ended
June 30, 2008
Six Months
Ended
June 30, 2009
Six Months
Ended
June 30, 2008
Rental revenue contractually due from tenants $48,277 $45,561 $99,012 $82,073
Straight-line rent recognition 1,243 701 2,126 1,018
Below-market lease amortization 2,145 1,814 4,290 3,000
Above-market lease amortization (772) (762) (1,543) (1,515)
$50,893 $47,314 $103,885 $84,576
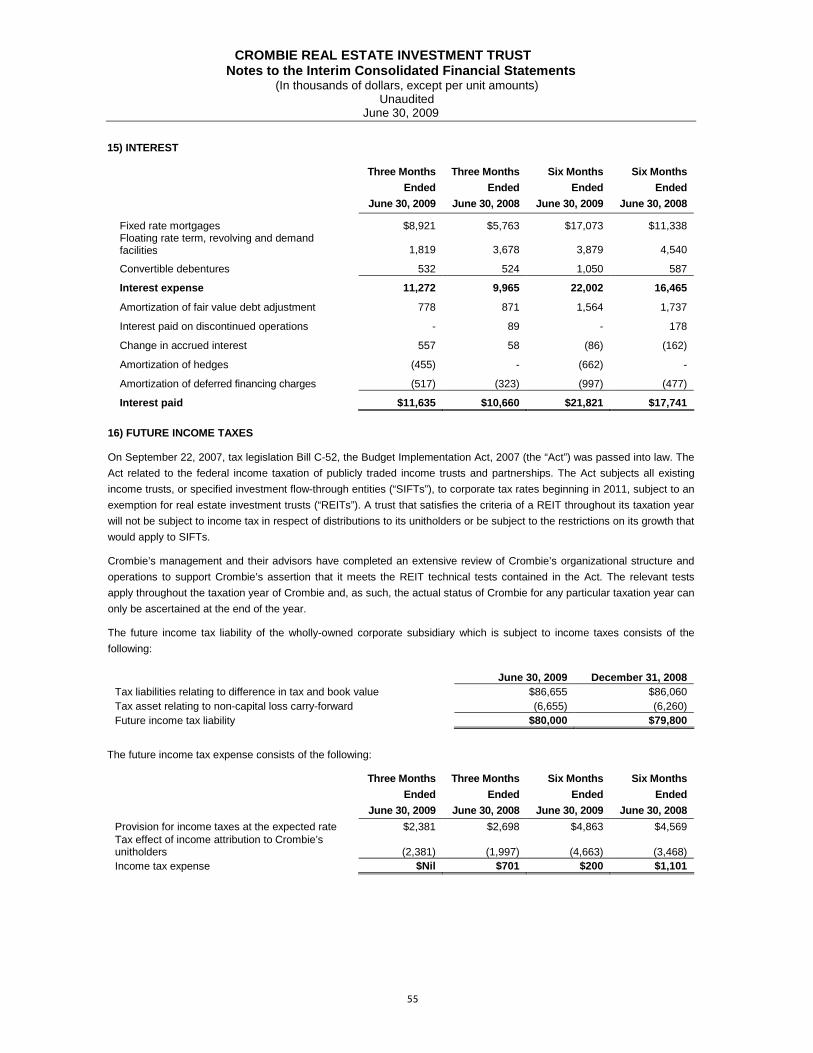
55
CROMBIE REAL ESTATE INVESTMENT TRUST Notes to the Interim Consolidated Financial Stateme nts
(In thousands of dollars, except per unit amounts) Unaudited
June 30, 2009
15) INTEREST
Three Months
Ended
June 30, 2009
Three Months
Ended
June 30, 2008
Six Months
Ended
June 30, 2009
Six Months
Ended
June 30, 2008
Fixed rate mortgages $8,921 $5,763 $17,073 $11,338 Floating rate term, revolving and demand facilities 1,819 3,678 3,879 4,540
Convertible debentures 532 524 1,050 587
Interest expense 11,272 9,965 22,002 16,465
Amortization of fair value debt adjustment 778 871 1,564 1,737
Interest paid on discontinued operations - 89 - 178
Change in accrued interest 557 58 (86) (162)
Amortization of hedges (455) - (662) -
Amortization of deferred financing charges (517) (323) (997) (477)
Interest paid $11,635 $10,660 $21,821 $17,741
16) FUTURE INCOME TAXES
On September 22, 2007, tax legislation Bill C-52, the Budget Implementation Act, 2007 (the “Act”) was passed into law. The
Act related to the federal income taxation of publicly traded income trusts and partnerships. The Act subjects all existing
income trusts, or specified investment flow-through entities (“SIFTs”), to corporate tax rates beginning in 2011, subject to an
exemption for real estate investment trusts (“REITs”). A trust that satisfies the criteria of a REIT throughout its taxation year
will not be subject to income tax in respect of distributions to its unitholders or be subject to the restrictions on its growth that
would apply to SIFTs.
Crombie’s management and their advisors have completed an extensive review of Crombie’s organizational structure and
operations to support Crombie’s assertion that it meets the REIT technical tests contained in the Act. The relevant tests
apply throughout the taxation year of Crombie and, as such, the actual status of Crombie for any particular taxation year can
only be ascertained at the end of the year.
The future income tax liability of the wholly-owned corporate subsidiary which is subject to income taxes consists of the
following:
June 30, 2009 December 31, 2008 Tax liabilities relating to difference in tax and book value $86,655 $86,060 Tax asset relating to non-capital loss carry-forward (6,655) (6,260) Future income tax liability $80,000 $79,800
The future income tax expense consists of the following:
Three Months
Ended
June 30, 2009
Three Months
Ended
June 30, 2008
Six Months
Ended
June 30, 2009
Six Months
Ended
June 30, 2008
Provision for income taxes at the expected rate $2,381 $2,698 $4,863 $4,569 Tax effect of income attribution to Crombie’s unitholders (2,381) (1,997) (4,663) (3,468) Income tax expense $Nil $701 $200 $1,101

56
CROMBIE REAL ESTATE INVESTMENT TRUST Notes to the Interim Consolidated Financial Stateme nts
(In thousands of dollars, except per unit amounts) Unaudited
June 30, 2009
17) CHANGE IN OTHER NON-CASH OPERATING ITEMS
Three Months
Ended
June 30, 2009
Three Months
Ended
June 30, 2008
Six Months
Ended
June 30, 2009
Six Months
Ended
June 30, 2008
Restated Restated Cash provided by (used in): (Note 3) (Note 3) Receivables $(1,116) $(1,247) $(339) $(920) Prepaid expenses and other assets (6,544) (5,378) (3,911) (4,272) Payables and other liabilities (1,709) 9,473 (12,395) 4,968 $ (9,369) $2,848 $ (16,645) $(224)
18) COMMITMENTS AND CONTINGENCIES
There are various claims and litigation, which Crombie is involved with, arising out of the ordinary course of business
operations. In the opinion of management, any liability that would arise from such contingencies would not have a significant
adverse effect on these financial statements.
Crombie has agreed to indemnify its trustees and officers, and particular employees in accordance with Crombie’s policies.
Crombie maintains insurance policies that may provide coverage against certain claims.
Crombie has entered into a management cost sharing agreement with a subsidiary of Empire Company Limited. Details of
this agreement are described in Note 19.
Crombie has land leases on certain properties. These leases have annual payments of $969 per year over the next five
years. The land leases have terms of between 15.8 and 76.2 years remaining, including renewal options.
Crombie obtains letters of credit to support our obligations with respect to construction work on our commercial properties
and defeasing commercial property debt. In connection with the defeasance of the discontinued operations commercial
property debt, Crombie has issued a standby letter of credit in the amount of $1,715 in favour of the mortgage lender. In
addition, Crombie has $145 in standby letters of credit for construction work that is being performed on its commercial
properties. Crombie does not believe that any of these standby letters of credit are likely to be drawn upon.
19) RELATED PARTY TRANSACTIONS
As at June 30, 2009, Empire Company Limited, through its wholly-owned subsidiary ECL, holds a 47.4% indirect interest in
Crombie. Crombie uses the exchange amount as the measurement basis for the related party transactions.
For a period of five years commencing March 23, 2006, certain executive management individuals and other employees of
Crombie will provide general management, financial, leasing, administrative, and other administration support services to
certain real estate subsidiaries of Empire Company Limited on a cost sharing basis. The costs assumed by Empire
Company Limited pursuant to the agreement during the three months ended and six months ended June 30, 2009 were $278
and $575 (three months ended and six months ended June 30, 2008 - $386 and $841 respectively) and were netted against
general and administrative expenses owing by Crombie to Empire Company Limited.
For a period of five years, commencing March 23, 2006, certain on-site maintenance and management employees of
Crombie will provide property management services to certain real estate subsidiaries of Empire Company Limited on a cost
sharing basis. In addition, for various periods, ECL has an obligation to provide rental income and interest rate subsidies.
The costs assumed by Empire Company Limited pursuant to the agreement during the three months ended and six months
ended June 30, 2009 were $273 and $649 (three months ended and six months ended June 30, 2008 - $484 and $1,173
respectively) and was netted against property expenses owing by Crombie to Empire Company Limited. The head lease
subsidy during the three months ended and six months ended June 30, 2009 were $154 and $404 (three months ended and six
months ended June 30, 2008 - $231 and $629 respectively).
Crombie also earned rental revenue of $18,650 for the three months ended June 30, 2009 and $33,210 for the six months
ended June 30, 2009 (three months ended and six months ended June 30, 2008 - $13,135 and $19,497 respectively) from
Sobeys Inc., Empire Theatres and ASC Commercial Leasing Limited (“ASC”). These companies were all subsidiaries of

57
CROMBIE REAL ESTATE INVESTMENT TRUST Notes to the Interim Consolidated Financial Stateme nts
(In thousands of dollars, except per unit amounts) Unaudited
June 30, 2009
Empire Company Limited until September 8, 2008 when ASC was sold. Property revenue from ASC is included in this note
disclosure until the sale date.
Empire Company Limited has provided Crombie with a $13,800 floating rate demand credit facility on substantially the same
terms and conditions that govern the floating rate revolving credit facility. During the first quarter of 2009, $10,000
outstanding at December 31, 2008 was repaid to the demand credit facility. As at June 30, 2009, Crombie had $Nil drawn
against the floating rate revolving credit facility (December 31, 2008 - $10,000).
On June 1, 2009, Crombie acquired 1.1 acres of land adjacent to the Avalon Mall, Newfoundland and Labrador, for $3,527 plus
additional closing costs from ECL General Partner Limited, an affiliate of Empire Company Limited. ECL General Partner
Limited provided debt of $3,527 at a fixed rate of 8.00% and a term of 20 years.
On June 25, 2009, concurrent with the public offering, in satisfaction of its pre-emptive rights, ECL Developments Limited
purchased $30,000 of Class B LP Units and the attached Special Voting Units, on a private-placement basis.
20) FINANCIAL INSTRUMENTS
a) Fair value of financial instruments
The fair value of a financial instrument is the estimated amount that Crombie would receive or pay to settle the financial
assets and financial liabilities as at the reporting date.
Crombie has classified its financial instruments in the following categories:
i. Held for trading - Restricted cash and cash and cash equivalents
ii. Held to maturity investments – Assets related to discontinued operations
iii. Loans and receivables - Notes receivable and accounts receivable
iv. Other financial liabilities - Commercial property debt, liabilities related to discontinued operations, convertible
debentures, tenant improvements and capital expenditures payable, property operating costs payable and
interest payable
The book value of cash and cash equivalents, restricted cash, receivables, payables and accruals approximate fair values at
the balance sheet date.
The fair value of other financial instruments is based upon discounted future cash flows using discount rates that reflect
current market conditions for instruments with similar terms and risks. Such fair value estimates are not necessarily
indicative of the amounts Crombie might pay or receive in actual market transactions.
The following table summarizes the carrying value (excluding deferred financing charges) and fair value of those financial
instruments which have a fair value different from their book value at the balance sheet date.
June 30, 2009 December 31, 2008
Carrying Value Fair Value Carrying Value Fair Value
Assets related to discontinued operations $7,054 $7,192 $7,184 $7,477
Commercial property debt $765,913 $755,367 $814,194 $812,488
Convertible debentures $30,000 $30,075 $30,000 $25,950
Liabilities related to discontinued operations $6,411 $6,370 $6,487 $6,599
The following summarizes the significant methods and assumptions used in estimating the fair values of the financial
instruments reflected in the above table:

58
CROMBIE REAL ESTATE INVESTMENT TRUST Notes to the Interim Consolidated Financial Stateme nts
(In thousands of dollars, except per unit amounts) Unaudited
June 30, 2009
Assets related to discontinued operations: The fair value of the bonds and treasury bills are based on market trading prices
at the reporting date.
Commercial property debt and liabilities related to discontinued operations: The fair value of Crombie’s commercial property
debt and liabilities related to discontinued operations is estimated based on the present value of future payments,
discounted at the yield on a Government of Canada bond with the nearest maturity date to the underlying debt, plus an
estimated credit spread at the reporting date.
Convertible debentures: The fair value of the convertible debentures is estimated based on the market trading prices, at the
reporting date, of the convertible debentures.
b) Risk management
In the normal course of business, Crombie is exposed to a number of financial risks that can affect its operating
performance. These risks, and the action taken to manage them, are as follows:
Credit risk
Credit risk arises from the possibility that tenants may experience financial difficulty and be unable to fulfill their lease
commitments. Crombie’s credit risk is limited to the recorded amount of tenant receivables. An allowance for doubtful
accounts is taken for all anticipated problem accounts (see Note 7).
Crombie mitigates credit risk by geographical diversification, utilizing staggered lease maturities, diversifying both its tenant
mix and asset mix and conducting credit assessments for new and renewing tenants. As at June 30, 2009;
• Excluding Sobeys (which accounts for 33.0% of Crombie’s minimum rent), no other tenant accounts for more than
2.2% of Crombie’s minimum rent, and
• Over the next five years, no more than 9.3% of the gross leaseable area of Crombie will expire in any one year.
As outlined in Note 19, Crombie earned rental revenue of $18,650 for the three months ended June 30, 2009 and $33,210
for the six months ended June 30, 2009 (three months ended and six months ended June 30, 2008 - $13,135 and $19,497
respectively) from subsidiaries of Empire Company Limited.
Interest rate risk
Interest rate risk is the potential for financial loss arising from increases in interest rates. Crombie mitigates interest rate risk by
utilizing staggered debt maturities, limiting the use of permanent floating rate debt and utilizing interest rate swap agreements.
As at June 30, 2009:
• Crombie’s weighted average term to maturity of the fixed rate mortgages was 5.8 years, and
• Crombie’s exposure to floating rate debt, including the impact of the fixed rate swap agreements discussed below,
was 20.0% of the total commercial property debt. Excluding the floating rate term facility, which is to be replaced with
permanent fixed rate financing during the next two years, the exposure to floating rate debt is 2.1%.
From time to time, Crombie has entered into interest rate swap agreements to manage the interest rate profile of its current or
future debts without an exchange of the underlying principal amount. Recent turmoil in the financial markets has materially
affected interest swap rates. This effect was especially pronounced during the fourth quarter of 2008 and the first quarter of
2009. The interest swap rates are based on Canadian bond yields, plus a premium, called the swap spread, which reflects
the risk of trading with a private counterparty as opposed to the Canadian government. During the fourth quarter 2008, the
swap spread turned negative and remained negative throughout the first quarter of 2009. While the swap spreads turned
positive during the second quarter of 2009, they still remain below historical average values. The effect of the abnormally
low swap spreads, combined with the decline in the Canadian bond yields has resulted in a significant deterioration of the
mark-to-market values for the interest rate swap agreements. At June 30, 2009, the mark-to-market exposure on the
interest rate swap agreements was approximately $31,831. There is no immediate cash impact from the mark-to-market
adjustment. The unfavourable difference in the mark-to-market amount of these interest rate swap agreements is reflected
in other comprehensive income (loss) rather than net income as the swaps are all designated and effective hedges. The

59
CROMBIE REAL ESTATE INVESTMENT TRUST Notes to the Interim Consolidated Financial Stateme nts
(In thousands of dollars, except per unit amounts) Unaudited
June 30, 2009
breakdown of the swaps in place as part of the interest rate management program, and their associated mark-to-market
amounts are as follows:
• Crombie has entered into a fixed interest rate swap to fix the amount of interest to be paid on $50,000 of the
revolving credit facility. The fair value of the fixed interest rate swap at June 30, 2009, had an unfavourable mark-
to-market exposure of $3,674 (June 30, 2008 – unfavourable $957) compared to its face value. The change in
this amount has been recognized in other comprehensive income (loss). The mark-to-market amount of fixed
interest rate swaps reduce to $Nil upon maturity of the swaps.
• Crombie has entered into a number of delayed interest rate swap agreements of a notional amount of $100,334
(June 30, 2008 - $118,689) with settlement dates between February 1, 2010 and July 2, 2011, maturing between
February 1, 2019 and July 2, 2021 to mitigate exposure to interest rate increases for mortgages maturing in 2010
and 2011. The fair value of these delayed interest rate swap agreements had an unfavourable mark-to-market
exposure of $12,774 compared to the face value June 30, 2009 (June 30, 2008 – unfavourable $8,468). The
change in these amounts has been recognized in other comprehensive income (loss).
• In relation to the acquisition of a portfolio of 61 retail properties from subsidiaries of Empire Company Limited,
Crombie has entered into a number of delayed interest rate swap agreements of a notional amount of $138,000
(June 30, 2008 - $280,000) with a settlement date of August 1, 2009 to mitigate exposure to interest rate
increases prior to replacing the floating rate term facility with long-term financing. The fair value of these
agreements had an unfavourable mark-to-market exposure of $15,383 compared to their face value on June 30,
2009 (June 30, 2008 – $1,782). The change in these amounts has been recognized in other comprehensive
income (loss).
During the first quarter of 2009, Crombie settled an interest rate swap agreement related to a notional amount of $42,000 for
a settlement amount of $4,535. This settlement amount has been recognized in other comprehensive income (loss) since
the inception of the interest rate swap agreements. This loss will be reclassified to interest expense using the effective
interest rate method.
Crombie estimates that $897 of other comprehensive income (loss) will be reclassified to interest expense during the
remaining two quarters of 2009 based on interest rate swap agreements settled to June 30, 2009.
A fluctuation in interest rates would have an impact on Crombie’s net earnings and other comprehensive income (loss)
items. Based on the previous year’s rate changes, a 0.5% interest rate change would reasonably be considered possible.
The changes would have had the following impact:
Three months ended June 30, 2009 Three months ended June 30, 2008 0.5% increase 0.5% decrease 0.5% increase 0.5% decr ease
Impact on net income of interest rate changes on the floating rate revolving credit facility $(244) $244 $(340) $340
Six months ended June 30, 2009 Six months ended Jun e 30, 2008 0.5% increase 0.5% decrease 0.5% increase 0.5% decr ease
Impact on net income of interest rate changes on the floating rate revolving credit facility $(514) $514 $(365) $365

60
CROMBIE REAL ESTATE INVESTMENT TRUST Notes to the Interim Consolidated Financial Stateme nts
(In thousands of dollars, except per unit amounts) Unaudited
June 30, 2009
June 30, 2009 June 30, 2008 0.5% increase 0.5% decrease 0.5% increase 0.5% decr ease Impact on other comprehensive income and non-controlling interest items due to changes in fair value of derivatives designated as a cash flow hedge $8,764 $(9,151) $13,129 $(13,735)
Crombie does not enter into these interest rate swap transactions on a speculative basis. Crombie is prohibited by its
Declaration of Trust in purchasing, selling or trading in interest rate future contracts other than for hedging purposes.
Liquidity risk
The real estate industry is highly capital intensive. Liquidity risk is the risk that Crombie may not have access to sufficient debt
and equity capital to fund the growth program and/or refinance the debt obligations as they mature.
Cash flow generated from operating the property portfolio represents the primary source of liquidity used to service the interest
on debt, fund general and administrative expenses, reinvest into the portfolio through capital expenditures, as well as fund
tenant improvement costs and make distributions to Unitholders. Debt repayment requirements are primarily funded from
refinancing Crombie’s maturing debt obligations. Property acquisition funding requirements are funded through a combination of
accessing the debt and equity capital markets.
There is a risk that the debt capital markets may not refinance maturing debt on terms and conditions acceptable to Crombie or
at any terms at all. Crombie seeks to mitigate this risk by staggering the debt maturity dates (see Note 8). There is also a risk
that the equity capital markets may not be receptive to an equity issue from Crombie with financial terms acceptable to Crombie.
As discussed in Note 22, Crombie mitigates its exposure to liquidity risk utilizing a conservative approach to capital
management.
Access to the revolving credit facility is also limited to the amount utilized under the facility, plus any negative mark-to-market
position on the interest rate swap agreements, not exceeding the security provided by Crombie. The mark-to-market
adjustment on the interest rate swap agreements reached an out-of-the-money position of approximately $31,831 at June
30, 2009. The deterioration in the mark-to-market position may have the impact of reducing Crombie’s available credit in the
revolving credit facility.
Crombie has secured a $13,800 floating rate demand credit facility with Empire Company Limited under essentially the same
terms and conditions that govern the revolving credit facility. This demand facility has been put in place to ensure Crombie
maintains adequate liquidity in order to fund its daily operating activities while the volatility in the financial markets continues,
while also mitigating the risk of Crombie not being in compliance with covenants under the revolving credit facility.
Crombie has no mortgages maturing in fiscal 2009 and during the second quarter of 2009 completed the extension of the
floating rate term facility the original maturity date of October 2009 to May 2011.
21) ASSET HELD FOR SALE AND DISCONTINUED OPERATIONS
(a) During the second quarter of 2008, Crombie and a potential purchaser signed a purchase and sale agreement for a
commercial property. The purchase and sale agreement closed on October 24, 2008.
(b) During the fourth quarter of 2008, Crombie defeased the mortgage associated with the discontinued operations. The
transaction did not qualify for defeasance accounting, therefore the defeased loan and related asset have not been removed
from the balance sheet. The defeased loan is payable in monthly payments of $42 and bears interest at 5.46%, was
originally amortized over 25 years and is due April 1, 2014. Crombie purchased Government of Canada bonds and treasury
bills and Canada mortgage bonds and pledged them as security to the mortgage company. The bonds mature between
January 22, 2009 and September 15, 2013, have a weighted average interest rate of 3.65% and have been placed in
escrow. The assets and liabilities related to discontinued operations are measured at amortized cost using the effective
interest rate method, until April 1, 2014 at which time the debt will be extinguished.

61
CROMBIE REAL ESTATE INVESTMENT TRUST Notes to the Interim Consolidated Financial Stateme nts
(In thousands of dollars, except per unit amounts) Unaudited
June 30, 2009
The following tables set forth the balance sheets associated with the income property classified as held for sale as at June
30, 2009 and December 31, 2008 and the statements of income for the property held for sale for the three months ended
and six months ended June 30, 2009 and June 30, 2008.
Balance Sheets
June 30, 2009 December 31, 2008
Assets
Assets related to discontinued operations $7,054 $7,184
Liabilities
Accounts payable and accrued liabilities - 30
Liabilities related to discontinued operations 6,411 6,487
6,411 6,517
Net investment in asset held for sale $643 $667
Statements of Income
Three Months
Ended
June 30, 2009
Three Months
Ended
June 30, 2008
Six Months
Ended
June 30, 2009
Six Months
Ended
June 30, 2008
Property revenue
Rental revenue contractually due from tenants $- $608 $- $1,417
Straight-line rent recognition - 2 - 3
Below-market lease amortization - 5 - 9
Above-market lease amortization - (17) - (34)
- 598 - 1,395
Expenses
Property expenses - 312 - 679
Interest - 89 - 178
Depreciation of commercial properties - 23 - 58
Amortization of tenant improvements/lease costs - 9 - 23
Amortization of intangible assets - 29 - 58
- 462 - 996
Income from discontinued operations $- $136 $- $399
22) CAPITAL MANAGEMENT
Crombie’s objective when managing capital on a long-term basis is to maintain overall indebtedness in the range of 50% to
55% of gross book value (as defined in the credit facility agreement), utilize staggered debt maturities, minimize long-term
exposure to floating rate debt and maintain conservative payout ratios. Crombie’s capital structure consists of the following:
June 30, 2009 December 31, 2008
Restated
(Note 3)
Commercial property debt $759,223 $808,971
Convertible debentures 29,090 28,968
Non-controlling interest 233,292 199,163
Unitholders’ equity 255,475 215,558
$1,277,080 $1,252,660

62
CROMBIE REAL ESTATE INVESTMENT TRUST Notes to the Interim Consolidated Financial Stateme nts
(In thousands of dollars, except per unit amounts) Unaudited
June 30, 2009
At a minimum, Crombie’s capital structure is managed to ensure that it complies with the restrictions pursuant to Crombie’s
Declaration of Trust, the criteria contained in the Income Tax Act (Canada) in regard to the definition of a REIT and existing
debt covenants. Some of the restrictions pursuant to Crombie’s Declaration of Trust would include, among other items:
• A restriction that Crombie shall not incur indebtedness (other than by the assumption of existing indebtedness)
where the indebtedness would exceed 75% of the market value of the individual property; and
• A restriction that Crombie shall not incur indebtedness of more than 60% of gross book value (65% including any
convertible debentures)
Crombie’s debt to gross book ratio as defined in Crombie’s Declaration of Trust is as follows:
June 30, 2009 December 31, 2008
Restated
(Note 3)
Mortgages payable $564,101 $531,970
Convertible debentures 30,000 30,000
Term facility 139,000 178,824
Revolving credit facility 62,812 93,400
Demand credit facility - 10,000
Total debt outstanding 795,913 844,194
Less: Applicable fair value debt adjustment (9,256) (10,818)
Debt $786,657 $833,376
Total assets $1,470,474 $1,483,219
Add:
Deferred financing charges 7,600 6,255
Accumulated depreciation of commercial properties 57,715 45,865
Accumulated amortization of intangible assets 66,492 53,505
Less:
Assets held related to discontinued operations (7,054) (7,184)
Interest rate subsidy (9,256) (10,818)
Fair value adjustment to future taxes (39,245) (39,245)
Gross book value $1,546,726 $1,531,597
Debt to gross book value 50.9% 54.4%
Under the amended terms governing the revolving credit facility Crombie is entitled to borrow a maximum of 70% of the fair
market value of assets subject to a first security position and 60% of the excess fair market value over first mortgage
financing of assets subject to a second security position or a negative pledge. The terms of the revolving credit facility also
require that Crombie must maintain certain covenants:
• annualized net operating income for the prescribed properties must be a minimum of 1.4 times the coverage of the
related annualized debt service requirements;
• annualized net operating income on all properties must be a minimum of 1.4 times the coverage of all annualized
debt service requirements;
• access to the revolving credit facility is limited by the amount utilized under the facility, and any negative mark-to-
market position on the interest rate swap agreements, not to exceed the security provided by Crombie; and
• distributions to Unitholders are limited to 100% of Distributable Income as defined in the revolving credit facility.
The revolving credit facility also contains a covenant that ECL Developments Limited must maintain a minimum 40% voting
interest in Crombie. If ECL Developments Limited reduces its voting interest below this level, Crombie will be required to
renegotiate the revolving credit facility or obtain alternative financing. Pursuant to an exchange agreement and while such

63
CROMBIE REAL ESTATE INVESTMENT TRUST Notes to the Interim Consolidated Financial Stateme nts
(In thousands of dollars, except per unit amounts) Unaudited
June 30, 2009
covenant remains in place, ECL Developments Limited will be required to give Crombie at least six months’ prior written
notice of its intention to reduce its voting interest below 40%.
As at June 30, 2009, Crombie is in compliance with all externally imposed capital requirements and all covenants relating to
its debt facilities.
23) EMPLOYEE FUTURE BENEFITS
Crombie has a number of defined benefit and defined contribution plans providing pension and other retirement benefits to
most of its employees.
Defined contribution pension plans
The contributions required by the employee and the employer are specified. The employee’s pension depends on what level
of retirement income (for example, annuity purchase) that can be achieved with the combined total of employee and
employer contributions and investment income over the period of plan membership, and the annuity purchase rates at the
time of the employee’s retirement. During the second quarter of 2009, Crombie announced the retirement of its Chief
Executive Officer. As a result of this announcement, an adjustment of $1,180 was made to the employee future benefit
obligation to recognize service costs and interest costs.
Defined benefit pension plans
The ultimate retirement benefit is defined by a formula that provides a unit of benefit for each year of service. Employee
contributions, if required, pay for part of the cost of the benefit, and the employer contributions fund the balance. The
employer contributions are not specified or defined within the plan text. They are based on the result of actuarial valuations
which determine the level of funding required to meet the total obligation as estimated at the time of the valuation. The
defined benefit plans are unfunded.
The total defined benefit cost related to pension plans and post retirement benefit plans for the three months ended and six
months ended June 30, 2009 were $70 and $145 (three months ended and six months ended June 30, 2008 - $95 and $191
respectively).
The compensation expense related to the EUPP during the three months ended and six months ended June 30, 2009 were
$12 and $23 (three months ended and six months ended June 30, 2008 - $11 and $20 respectively).
24) SUBSEQUENT EVENT
On July 22, 2009, Crombie declared distributions of 7.417 cents per unit for the period from July 1, 2009 to and including,
July 31, 2009. The distribution will be payable on August 17, 2009 to Unitholders of record as at July 31, 2009.
25) SEGMENT DISCLOSURE
Crombie owns and operates primarily retail real estate assets located in Canada. Management, in measuring Crombie’s
performance or making operating decisions, does not distinguish or group its operations on a geographical or other basis.
Accordingly, Crombie has a single reportable segment for disclosure purposes in accordance with GAAP.
26) COMPARATIVE FIGURES
Comparative figures have been reclassified, where necessary, to reflect the current period’s presentation.

64
CORPORATE AND UNITHODLER INFORMATION BOARD OF TRUSTEES OFFICERS Donald E. Clow John Eby Donald E. Clow Trustee, President and Chief Executive Officer Independent Trustee President and Chief Executive Officer
Frank C. Sobey Elizabeth Stroback Scott M. Ball Trustee and Chairman Independent Trustee Vice President, Chief Financial Officer
and Secretary
Paul D. Sobey David Leslie Scott R. MacLean Trustee Independent Trustee Vice President Operations
David G. Graham Paul Beesley Patrick G. Martin Independent Trustee Trustee Vice President Leasing
David J. Hennigar Kent R. Sobey Gary Finkelstein Independent Trustee and Lead Trustee Independent Trustee Vice President Ontario & Quebec
John E. Latimer Brian A. Johnson Independent Trustee Independent Trustee
CROMBIE REIT UNIT SYMBOL COUNSEL Head Office: REIT Trust Units – CRR.UN Stewart McKelvey
115 King St. Halifax, Nova Scotia
Stellarton, Nova Scotia, B0K 1S0 DISTRIBUTION RECORD Telephone: (902) 755-8100 AND PAYMENT DATES FOR AUDITORS Fax (902) 755-6477 FISCAL 2009 Grant Thornton, LLP
Record Date Payment Date
Jan. 31, 2009 Feb. 16, 2009 Feb. 28, 2009 Mar. 16, 2009 Mar. 31, 2009 Apr. 15, 2009 Apr. 30, 2009 May 15, 2009 May 31, 2009 Jun. 15, 2009 Jun. 30, 2009 Jul .15, 2009 Jul. 31, 2009 Aug. 17, 2009
Internet: www.crombiereit.com
INVESTOR RELATIONS AND INQUIRIES
Unitholders, analysts, and investors should direct their financial inquiries or request to: Scott M. Ball, C.A. Vice President, Chief Financial Officer and Secretary Email: [email protected]
New Glasgow, Nova Scotia
MULTIPLE MAILINGS If you have more than one account, you may receive a separate mailing for each. If this occurs, please contact CIBC Mellon Trust Company at (800) 387-0825 to eliminate multiple mailings.
Communications regarding investor records including changes of address or ownership, lost certificates or tax forms, should be directed to the Company’s transfer agent and registrar, CIBC
TRANSFER AGENT CIBC Mellon Trust Company Investor Correspondence P.O. Box 7010 Adelaide Street Postal Station
Mellon Trust Company. STOCK EXCHANGE LISTING Toronto Stock Exchange
Toronto, Ontario, M5C 2W9 Telephone: (800) 387-0825 Email: [email protected]

Province Retail – Plaza Retail – Enclosed Retail – Freestanding Mixed-Use O�ce
New Brunswick 7 2 8 2 1
Newfoundland and Labrador 4 3 6 – –
Nova Scotia 12 7 12 6 4
Ontario 16 1 5 – –
Prince Edward Island – 1 2 – –
Quebec 4 – 9 – –
Saskatchewan 1 – – – –
Total Properties 44 14 42 8 5
Crombie REIT’s Portfolio