Provincial Strategy for Inclusive and Sustainable Urban Growth
359
Technical Assistance Consultant’s Report This consultant’s report does not necessarily reflect the views of ADB or the Government concerned, and ADB and the Government cannot be held liable for its contents. (For project preparatory technical assistance: All the views expressed herein may not be incorporated into the proposed project’s design. Project Number: 49050-001 December 2020 Islamic Republic of Pakistan: Provincial Strategy for Inclusive and Sustainable Urban Growth (Cofinanced by the Japan Fund for Poverty Reduction) Prepared by Saaf Consult (SC), Netherlands in association with dev-consult (DC), Pakistan For Planning and Development Department, Government of Khyber Pakhtunkhwa, Pakistan
-
Upload
khangminh22 -
Category
Documents
-
view
0 -
download
0
Transcript of Provincial Strategy for Inclusive and Sustainable Urban Growth
Technical Assistance Consultant’s Report
This consultant’s report does not necessarily reflect the views of ADB or the Government concerned, and ADB and the Government cannot be held liable for its contents. (For project preparatory technical assistance: All the views expressed herein may not be incorporated into the proposed project’s design.
Project Number: 49050-001 December 2020
Islamic Republic of Pakistan: Provincial Strategy for
Inclusive and Sustainable Urban Growth (Cofinanced by the Japan Fund for Poverty Reduction)
Prepared by Saaf Consult (SC), Netherlands
in association with dev-consult (DC), Pakistan
For Planning and Development Department, Government of Khyber Pakhtunkhwa, Pakistan
KP-SISUG Swat Regional Development Plan
i
CURRENCY EQUIVALENTS
(as of 01 December 2020)
Currency unit – Pakistan Rupee (PKR)
PKR1.00 = $0.0063
$1.00 = PKRs 159.4166
ABBREVIATIONS
ADB - Asian Development Bank
ADP - annual development program
APTMA - All Pakistan Textile Mills Association
CDG - City District Government
CDIA - Cities Development Initiative for Asia
CIU - city implementation unit
CLG - City Local Government
CNG - compressed natural gas
CPEC - China-Pakistan Economic Corridor
CRVA - climate resilience and vulnerability assessment
DDAC - District Development Advisory Committee
DFID - Department for International Development (UK)
DM - disaster management
DRR - disaster risk reduction
EA - executing agency
EIA - environmental impact assessment
EMP - environmental management plan
EPA - Environmental Protection Agency [of Khyber Pakhtunkhwa]
EPO - Environmental Protection Order
EPZ - export processing zone
ESMS - environmental and social management system
FATA - Federally Administered Tribal Area
GDA - Galiyat Development Authority
GIS - geographic information system
GIZ - Deutsche Gesellschaft für Internationale Zusammenarbeit (gmbh) [German international development agency]
GoKP - Government of Khyber Pakhtunkhwa
GoP - Government of Pakistan
ha - Hectare
KP-SISUG Swat Regional Development Plan
ii
HR - human resource
IA - implementing agency
ICT - information and communication technologies
IEE - initial environmental examination
IT - information technology
KP - Khyber Pakhtunkhwa
KPCIP - Khyber Pakhtunkhwa Cities Improvement Project
KPEC - Khyber Pass Economic Corridor
KPEZDMC - Khyber Pakhtunkhwa Economic Zones Development and Management Company
KPHA - Khyber Pass Highways Authority
KPPRA - Khyber Pakhtunkhwa Public Procurement Regulatory Authority
KPUMA - Khyber Pakhtunkhwa Urban Mobility Authority
LGA - local government act
LGE&RDD - Local Government, Elections and Rural Development Department [of Khyber Pakhtunkhwa]
lpd - liters per day
MDTF - Multi Donor Trust Fund
MIS - management information system
NCs - neighborhood councils
NDMA - National Disaster Management Authority
NER - net enrolment rate
NIM - National Institute of Management
NIUIP - National Institute of Urban Infrastructure Planning
NOC - no objection certificate
NUA - New Urban Agenda
NVQF - national vocational qualification framework
O&M - operation and maintenance
OHR - overhead reservoir
P&DD - Planning and Development Department [of Khyber Pakhtunkhwa]
PARD - Pakistan Academy for Rural Development
PCNA - post crisis needs assessment
PDMA - Provincial Disaster Management Authority [of KP]
PEFA - public expenditure and financial accountability
PER - public expenditure review
PFM - public financial management
PHED - Public Health Department [of Khyber Pakhtunkhwa]
PMU - project management unit
PPP - public-private partnership
PSISUG - provincial strategy for inclusive and sustainable urban growth
RDP - regional development plan
SAMA - services and assets management agreement
SDC - Swiss Agency for Development Cooperation
SDG - sustainable development goals

KP-SISUG Swat Regional Development Plan
iii
SPS - safeguards policy statement [of ADB, 2009]
STP - sewage treatment plant
TFR - total fertility rate
TLG - Tehsil Local Government
TMA - Tehsil Municipal Administration
TMO - Tehsil Municipal Officer
TVET - technical and vocational education and training
UN - United Nations
UNDP - United Nations Development Program
UPU - [Khyber Pakhtunkhwa] Urban Policy and Planning Unit
USAID - United States Agency for International Development
VCs - village councils
WB - The World Bank
WSSCM-S - Water and Sanitation Services Company Mingora-Swat
NOTES
(i) The fiscal year (FY) of the Government of the Islamic Republic of Pakistan and
its agencies ends on 30 June. “FY” before a calendar year denotes the year in
which the fiscal year ends, e.g., FY2020 ends on 30 June 2020.
(ii) In this report, “$” refers to US dollars.
KP-SISUG Swat Regional Development Plan
iv
Contents
A. Background to the Regional Development Plan 2
A.1. KP Strategy for Integrated and Sustainable Urban Growth (KP-SISUG) 2
A.2. Objectives of the RDP 4
A.2.1. Vision 4
A.2.2. Objectives of the RDP 4
A.3. RDP’s Structure and Outline 4
B. Sustainable Planning Approach 6
B.1. Planning Principles – General 7
B.2. Planning Principles – Rural and Regional Development 8
B.2.1. Rural Development Objectives 8
B.2.2. Rural Planning Principles 9
B.2.3. Regional planning 10
B.3. The City-Region 11
B.4. Urban Planning Principles 12
B.5. Guidance to Applying the Principles 16
C. The Region 18
C.1. Geophysical Definition of the Region 18
C.2. Geostrategic Significance of the Region 18
C.2.1. China-Pakistan Economic Corridor 19
C.3. Land Use: Provincial and Regional 23
C.3.1. Khyber Pakhtunkhwa Land Uses 23
C.4. Environmental Conditions 26
C.5. Climate Change 28
C.5.1. Key Factors and Drivers and Potential Impacts of Climate Change – Mingora 28
C.5.2. Risk and Vulnerability Assessment 29
C.5.3. Disaster and Climate Risk Management 33
D. Governance and Stakeholders 36
D.1. Legal and Regulatory Framework 36
D.1.1. Statutory Framework 36
D.1.2. Overview of Laws 36
D.1.3. Various Regimes and Inter-institutional jurisdiction 52
D.2. Development Strategies and Plans 57
D.3. Institutional Setup – Structure, Roles and Responsibilities 59
D.3.1. Province Governance and Decentralization 59
D.3.2. Local Governance 61
D.3.3. Sector Governance: Urban Water and Sanitation 66
D.4. Governance and Stakeholders: The Way Forward 72
D.4.1. Legal and Regulatory Framework 72
D.4.2. Institutional Reforms 76
E. Socio-Economic Setting 77
KP-SISUG Swat Regional Development Plan
v
E.1. Demographics 77
E.1.1. Population Distribution 77
E.1.2. Urban Population Distribution – Swat Region 81
E.1.3. Population growth patterns, migration, and driving factors 86
E.1.4. Population Growth Trends 89
E.2. Housing, Water and Sanitation 93
E.3. Energy and Household Use 97
E.4. Education 98
E.4.1. Policy Framework 98
E.4.2. Context 98
E.4.3. Issues 100
E.4.4. Implications for Regional Planning 106
E.5. Health 107
E.5.1. Health and Nutrition Outcomes 107
E.5.2. Services 110
E.5.3. Policy Framework and Key Health Reforms 112
E.5.4. Health Infrastructure and Human Resources 114
E.5.5. Health Protection 116
E.5.6. Implications for Regional Planning 117
E.6. Employment 118
E.7. Poverty and Land Issues 121
E.8. Social Protection 124
E.9. Gender and Inclusiveness 125
E.9.1. Cultural Values 125
E.9.2. Reforms 126
E.9.3. Women’s Empowerment 126
E.10. Socio-Economic Setting: the Way Forward 128
E.10.1. Policy Recommendations 128
F. Urban Expansion and Development 131
F.1. Urban Growth Processes 131
F.2. Existing Land Uses – District and Urban 133
F.2.1. Swat Region Land Uses – Existing 133
F.2.2. Mingora City Urban Land Use – Existing 137
F.2.3. Urban-Rural Land Use Conflicts 137
F.3. Current Urban Forms and Settlement Patterns 138
F.3.1. Swat Region Settlement Patterns 138
F.3.2. Existing Urban Area Forms and Settlement Patterns 138
F.3.3. Urban Densities 146
F.3.4. District Hierarchy 147
F.3.5. Settlement Hierarchy 148
F.3.6. Development Corridors 150
F.3.7. New Towns and Satellite Towns 151
F.3.8. Industrial Estates, Dry Ports and Export Processing 152
F.3.9. Growth Zones and Centers 152
KP-SISUG Swat Regional Development Plan
vi
F.3.10. Green Belts 152
F.3.11. Existing Planning and Challenges 152
F.4. Key Drivers for Regional Urban Development: Challenges and Opportunities 159
F.4.1. Regional Economic Development: Industrial Estates and SEZs 160
F.5. Sustainable Urban Growth: the Way Forward 161
F.5.1. Regional Growth Strategies 161
F.5.2. Rural-Urban Linkages 163
F.5.3. Regional Land Use Zoning – Recommendations 164
F.5.4. Undevelopable Lands – District/Regional Level 165
F.5.5. Proposed Hierarchy of Settlements 168
F.5.6. Urban Clustering 169
F.5.7. Urban Growth Strategies – Recommendations 169
F.5.8. Urban Land Use Planning – Sustainability Recommendations 171
F.5.9. Integrated Urban Development – Recommendations 174
F.5.10. Urban Densification – Recommendations 176
F.5.11. Competitiveness 181
G. Regional Physical Connectivity 182
G.1. Regional Connectivity 182
G.1.1. Road Network Resources 183
G.1.2. Connectivity through Railways and Air Travel 188
G.1.3. Interregional Connectivity 189
G.1.4. Registered Motor vehicles in the Region 191
G.1.5. Region’s Mobility Challenges and Drivers of Change 192
G.2. Urban Mobility 199
G.2.1. Mingora City Mobility 199
G.3. Regional Connectivity: the Way Forward 203
G.3.1. Regional Mobility Sub-Sector Priority Projects 203
G.3.2. Urban Mobility Priority Sub-Sector Projects. 204
H. Urban Economy 206
H.1. Comparative Advantage of the Region 206
H.2. Productive Sectors 208
H.2.1. Agriculture 208
H.2.2. Mineral Extraction 212
H.2.3. Oil, gas and energy 213
H.2.4. Industry 214
H.3. Inter-regional Linkages 216
H.4. Regional Economic Development 217
H.5. Trade and Enterprises 218
H.6. Industrial Estates/Special Economic Zones 219
H.7. Services Sector 222
H.8. Communication 223
H.8.1. FM Channels 224
H.8.2. Newspapers 225
H.8.3. Press Clubs 225
KP-SISUG Swat Regional Development Plan
vii
H.8.4. Digital Communication 225
H.8.5. Public Relations 227
H.9. Economic Impetus for Urban Growth: the Way Forward 227
H.9.1. Agriculture 227
H.9.2. Energy, Mining, and Industry 230
H.9.3. Services 231
H.9.4. Communication 232
I. Municipal Services 235
I.1. Water Supply 235
I.1.1. Current Status 235
I.2. Sanitation and Drainage 239
I.2.1. Current Status 239
I.3. Solid Waste Management 241
I.3.1. Current Status 241
I.4. Effective and Efficient Urban Services: the Way Forward 244
I.4.1. Key infrastructure Investments and Priorities 244
I.4.2. Water Supply 245
I.4.3. Sanitation and Drainage 251
I.4.4. Solid Waste Management 255
J. Tourism 260
J.1. Khyber Pakhtunkhwa Tourism Policy, 2015 260
J.2. Tourism Assets 261
J.3. Gaps in the Promotion of Tourism in KP 264
J.3.1. Province Level Issues 264
J.3.2. Region Level Issues 266
J.4. Tourism Promotion: The Way Forward 267
J.4.1. Province Level Recommendations 267
J.4.2. Region Level Recommendations 269
K. Innovations 272
K.1. Circular Economy 272
K.1.1. Biogas Production out of Organic Waste, Wastewater and Sewage Sludge 274
K.1.2. Production of Reusable Water out of Wastewater 274
K.1.3. Relevance for the Swat Region 275
K.2. Climate Resilience 278
K.2.1. Insurance for Natural Hazards 278
K.2.2. Sponge City 278
L. Institutional Reforms 280
L.1. Legal and Institutional Framework 280
L.2. Revenue generation and Financial Management 281
L.2.1. Structure of Public Budgeting 281
L.2.2. Public Financial Management Reforms 282
L.2.3. Public Budget and Climate Change 283
L.2.4. Institutional Arrangements for Municipal Services 284
KP-SISUG Swat Regional Development Plan
viii
L.3. Capacity Development 287
L.3.1. Results of Needs Assessments 287
L.3.2. Human Resources Management 288
L.3.3. Strategic Partnerships 290
M. Implementation Arrangements 292
M.1. Financing the Development 292
M.1.1. Public Fiscal Trends 292
M.1.2. Foreign and National Private Investment 294
M.1.3. Donor Funding 295
M.1.4. Oil Windfall 298
M.1.5. Financing Conclusions 299
M.2. Procurement 300
M.3. Public-Private Partnership 301
M.3.1. PPP Legal and Institutional Framework 301
M.3.2. PPP Process 302
M.3.3. PPP for Urban Sector 302
M.3.4. Government Procedures in Urban Construction 303
M.3.5. Public Participation/ Transparency 303
TABLES
Table 1: Principles for sustainable and integrated urban planning 15
Table 2: Land use: Khyber Pakhtunkhwa; including ex-FATA (2016) 23
Table 3: Climate data for Mingora 27
Table 4: Summary of future climate indices of Balakot/Abbottabad 28
Table 5: Union Council wise risk indexing in the district 32
Table 6: Legislation related to urban development 36
Table 7: Functions devolved to Tehsil Local Governments (TLGs) 64
Table 8: Functions of Tehsil Local Government 65
Table 9: Functions of City Local Government 66
Table 10. Water and sanitation service providers in Swat district 67
Table 11: Pakistan’s population 77
Table 12: Pakistan urbanization levels 78
Table 13: Pakistan urban-rural growth rates 79
Table 14: Urban Population Distribution (2020) - Swat Region 81
Table 15: Overview of key demographic data 82
Table 16: Fertility and child marriage in the region 86
Table 17: Contraceptive use by province and district 87
Table 18: Average household sizes in Swat Region, 1998–2045 92
Table 19: Average housing for the population in the region 93
Table 20: Primary source of domestic energy for cooking by district 97
Table 21: Survival and Transition rates in government schools 103
Table 22: Comparison of young childhood mortality 107
Table 23: Prevalence thresholds and corresponding labels for wasting, overweight and stunting in children under 5 years 108
KP-SISUG Swat Regional Development Plan
ix
Table 24: Unemployment rates in Pakistan and KP, 2017-18 118
Table 25: Average monthly income per sector (PKR) 2015-16 120
Table 26: Poverty data 122
Table 27: Recommended land use distribution 133
Table 28: Land use – Swat Region (km2) 134
Table 29: Settlement Hierarchy – Typical Roles 150
Table 30: Urban planning policies, legislation and guidelines 153
Table 31: Planning component performance 157
Table 32: Spatial development principles, objectives and strategies 162
Table 33: Settlement Hierarchy – Roles 168
Table 34: Mingora population, land and density scenarios 178
Table 35: Inter-regional Highways of Swat Region 184
Table 36: Other regional roads 187
Table 37: Registered motor vehicles in Swat district (2017) 191
Table 38: Mineral production in Swat 213
Table 39: Approximations of the Gini coefficient 218
Table 40: List of FM stations in Swat Region 225
Table 41: List of newspapers and magazines publishing from the Swat Region 225
Table 42: Groundwater supplied municipal water supply system under WSSCM-S responsibility 236
Table 43: Current operational collection and street cleansing fleet, WSSC Mingora[1] 241
Table 44: Estimated waste generation of urban centers in the region 242
Table 45: Proposed target service levels for municipal water supply in urban areas 245
Table 46: Projected potable water demand in served areas for urban centers in the region[1] 246
Table 47: Projected water production requirement to serve Mingora City[1] 247
Table 48: Indicative levels of population served by municipal sewerage systems assuming progressive installation and development of served areas 252
Table 49: Indicative levels of required treatment capacity for urban populations 253
Table 50: Sewage treatment capacity and projected flows, Mingora City 254
Table 51: Projected waste generation in urban centers (tons per day) 256
Table 52: Treatment and disposal requirements for municipal solid waste – regional landfill 259
Table 53: Tourism sites in Swat Region 264
Table 54: Possible circular technologies 275
Table 55: Capacity issues specific to Swat district 288
Table 56: Annual Development Programmed, Khyber Pakhtunkhwa (in million PKR) 292
Table 57: Development budget, Khyber Pakhtunkhwa (in million PKR) 293
Table 58: Monthly salary ranges in the sector 322
Table 59: Areas proposed for capacity building 323
Table 60: Training needs of different tiers of staff at water and sanitation services companies 324
Table 61: Key performance indicators used in the sector by TLGs 325
Table 62: Educational institutions in Swat district 329
Table 63: Girls educational institutes as per location in Swat district 329
KP-SISUG Swat Regional Development Plan
x
Table 64: Comparison of GER at Primary level from 2013-14 to 2018-19 329
Table 65: Comparison of NER at Primary level from 2013-14 to 2018-19 329
Table 66: Comparison of GER at Secondary level from 2013-14 to 2018-19 330
Table 67: Comparison of NER at Secondary level from 2013-14 to 2018-19 330
Table 68: Children of secondary school age attending secondary school or higher 330
Table 69: Percentage of girls in the total out-of-school population 330
Table 70: Youth literacy rate (age 15–24 years) 330
Table 71: Percentage of children of secondary school age attending secondary school or higher (adjusted net attendance ratio), percentage attending primary school, and percentage out of school 331
Table 72: Health outcome and service indicators 333
Table 73: Maternal and child health services: coverage and use, Khyber Pakhtunkhwa and Swat district 333
Table 74: Malnutrition prevalence among children under five years of age (%) 334
Table 75: Malnutrition prevalence among children under five years of age 334
Table 76: District wise number of medical & paramedical staff actually posted in Khyber Pakhtunkhwa (2018) 335
Table 77: District wise number of registered private medical practitioners in Khyber Pakhtunkhwa 335
FIGURES
Figure 1: Sustainable cities 7
Figure 2: Sustainable development goals 8
Figure 3: Sustainable development 8
Figure 4: Sustainable planning hierarchy 10
Figure 5: Integrated urban and regional planning 11
Figure 6: NUA and Sustainable Development Goals 14
Figure 7: Land use summary: Khyber Pakhtunkhwa 26
Figure 8: Disaster risk management cycle 34
Figure 9: Flood management: salient features 35
Figure 10: District level administration departments in Khyber Pakhtunkhwa 65
Figure 11: Cities’ population in Khyber Pakhtunkhwa (2017) 80
Figure 12: Urban-rural population distribution, and density of Swat District (2020) 81
Figure 13: Pakistan: population projections by the UN Population Division 90
Figure 14: Pakistan actual growth rates and projections by the United Nations 90
Figure 15: Khyber Pakhtunkhwa population growth projections 91
Figure 16: Mingora city: population projections to 2045 91
Figure 17: Urban centers of Swat district: combined population projections to 2045, medium variant 92
Figure 18: Sources of household water in Khyber Pakhtunkhwa and Swat District 95
Figure 19: Household access to sanitation: Khyber Pakhtunkhwa and Swat district 96
Figure 20: Gross enrolment ratios for public and private schools, and deeni madaris by district 101
Figure 21: Net enrolment ratios in Swat and Khyber Pakhtunkhwa, public and private schools and deeni madaris 101
KP-SISUG Swat Regional Development Plan
xi
Figure 22. Children of secondary school age in Swat and Khyber Pakhtunkhwa 102
Figure 23: Student-teacher ratio in public schools 103
Figure 24: Gender Parity Indices, calculated with gross and net enrolment rates 104
Figure 25: Share of girls’ schools in total 105
Figure 26: Youth literacy rates (age 15-24 years) 106
Figure 27: Early childhood mortality (per 1,000 live births): Swat district and Khyber Pakhtunkhwa 107
Figure 28: Malnutrition prevalence among children under 5 years of age 108
Figure 29: Malnutrition in selected districts of Khyber Pakhtunkhwa 109
Figure 30: Health services coverage and use: Khyber Pakhtunkhwa and Swat district 111
Figure 31: Health services coverage and use — comparison with national level 112
Figure 32: Public and private hospital beds (2018) 115
Figure 33: Public and private hospital bed density per 10,000 population (2017-18) 115
Figure 34: Public and private sector physicians and paramedics per 10,000 population; KP 2018 and selected countries (2017–2018) 116
Figure 35: Sector share in employment per district (1998) 119
Figure 36: Share of income for consumption per income group (2015-16) 120
Figure 37: Ownership of agricultural farmland in Swat district (2010) 123
Figure 38: Urban growth processes 131
Figure 39: Urban forms 132
Figure 40: Land use summary – Swat Region 136
Figure 41: Mingora’s compact urban core 141
Figure 42: Mingora – ribbon development 141
Figure 43: Mingora – slope and ribbon development 142
Figure 44: Mingora – agriculture and potential urban infill 142
Figure 45: Barikot settlement form 143
Figure 46: Behrain settlement form 144
Figure 47: Khwaza Khela settlement form 145
Figure 48: Matta settlement form 145
Figure 49: Settlement hierarchy – radial distance structure 149
Figure 50: Settlement hierarchy – networking structure 149
Figure 51: Status of urban planning in Pakistan 155
Figure 52: Planning component performance 156
Figure 53: Population growth and municipal services gap 159
Figure 54: Four Main Categories of Land Use 165
Figure 55: Unmanaged street space 172
Figure 56: Re-planned and managed urban street 173
Figure 57: Integrated urban development 175
Figure 58: Conceptual framework for integrated urban sector development 176
Figure 59: Example of urban densification and infill 180
Figure 60: Example of urban densification and TOD 181
Figure 61: Top-10 exports to China (2018) 207
Figure 62: Top-10 exports to Afghanistan (2018) 207
Figure 63: Share of KP production and relative yield – wheat 209
Figure 64: Share of KP production and relative yield – rice 209
KP-SISUG Swat Regional Development Plan
xii
Figure 65: Share of KP production and relative yield – rabi vegetables 210
Figure 66: Share of KP production and relative yield – rabi fruit 210
Figure 67: Marble production 212
Figure 68: Industrial units per province (2017-18) 214
Figure 69: KP Industries with highest value-added (2005-06) 215
Figure 70: Running industrial units per sector 215
Figure 71: Income inequality in KP 217
Figure 72: HR productivity ratio for WSSCM-S 289
Figure 73: Net private FDI in Pakistan 294
Figure 74: Top ten donors of gross ODA for Pakistan, 2017-2018 average (in million USD) 295
Figure 75: Net ODA received by Pakistan (as percent of GNI) 295
Figure 76: ODA for Pakistan 2017 by sectors 296
Figure 77: Foreign donors' contribution to Khyber Pakhtunkhwa’s ADPs 297
Figure 78: Khyber Pakhtunkhwa Provincial Government Departments 320
Figure 79: Organogram of Tehsil Local Government structure for providing water and sanitation services 327
Figure 80: Organogram of Water and Sanitation Services Company, Mingora-Swat 328
MAPS
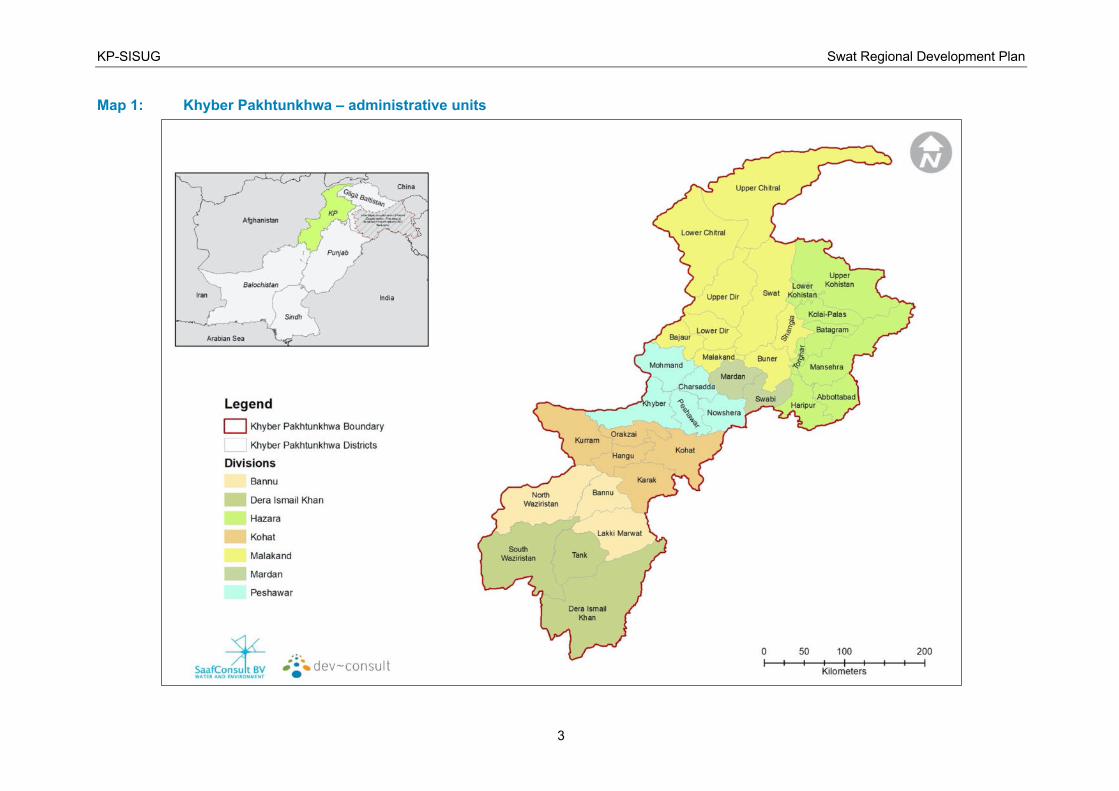
Map 1: Khyber Pakhtunkhwa – administrative units 3
Map 2: Highway network of CPEC 19
Map 3: Swat Region: tehsils 21
Map 4: Swat Region: urban areas 22
Map 5: Land Use: Khyber Pakhtunkhwa; excluding ex-FATA (2016) 24
Map 6: Land Use: ex-FATA; excluding Khyber Pakhtunkhwa (2016) 25
Map 7: Flood inundation in Swat District (2010) 30
Map 8: Union Council-wise hazard zone in District Swat 32
Map 9: Khyber Pakhtunkhwa Population Distribution 84
Map 10: Swat urban population distribution 85
Map 11: Land uses – Swat Region 135
Map 12: Topography: Mingora in the Swat River Valley 136
Map 13: Mingora metropolitan area 137
Map 14: Mingora built-up areas 140
Map 15: Swat flood-prone areas 166
Map 16: Swat District river flood risk 167
Map 17: Swat undevelopable lands due to slopes 168
Map 18: Swat region road network 186
Map 19: Inter-regional surface and air connectivity 190
Map 20: Mingora road network 201
Map 21: Swat regional connectivity improvement program 205
Map 22: Tourism assets in Swat district 263

KP-SISUG Swat Regional Development Plan
xiii
APPENDICES
Appendix 1: Demography of Swat Region 305
Appendix 2: Urban Sector Stakeholders in Khyber Pakhtunkhwa 315
Appendix 3: Devolution of Some Key Functions in Political and Fiscal Decentralization, Khyber Pakhtunkhwa 316
Appendix 4: Governance at Province level: roles and responsibilities 320
Appendix 5: Human Resources and Performance in the Urban Water and Sanitation Sector 322
Appendix 6: Social Statistics 329
Appendix 7: Excerpts from Services and Asset Management Agreement (SAMA) 336
KP-SISUG Swat Regional Development Plan
xiv
Executive Summary
Þ This Regional Development Plan (RDP) identifies the key challenges that must be
addressed to uplift the development of the region and to provide long-term sustainable
and focused development. The RDP provides a 25-year strategic planning framework that
aims to:
o Promote sustainable urban and regional development through integrated and
coordinated planning in order to regularize the region’s future physical
development.
o Identify sustainable economic growth and development opportunities.
o Ensure adequate and improved levels of connectivity and municipal services
through necessary and essential investments in infrastructure.
Swat is a mountainous region, located among the foothills of the Hindukush mountain
range. The Swat District has lush green valleys, snow-covered glaciers, forests, meadows
and plains. The topography of the District is varied but is dominated by the Swat valley;
development in the region is severely constrained by the local topography and is confined,
in the main, to the Swat valley (Map 11).
All main urban centers located in the Swat valley and its tributaries. Mingora City is the
main urban center in the region and is the third most populated city in Khyber Pakhtunkhwa
(KP), with an estimated population of 366,500 in 2020. Mingora City is home to 14.4% of
the total population in the District (approximately 2.542 million, 2020); together with Kabal
City across the Swat river from Mingora City, this urban agglomeration houses just under
half a million people or 19.5% of the District population. The population of urban centers
represent only the official urban population1and not the actual ‘urbanized’ population on
the margins of the urban centers beyond the official city limits (Map 4). Such areas add
significantly to the population living in urbanizing conditions and drawing on the official
urban area services.
The population of the Swat District accounts for 7% and 12% respectively of the province’s
total and urban population. 70% of the population in Swat District is classified as rural,
whilst 30% is urban; the proportion of the population classified as urban is almost double
the proportion for KP as a whole, as a consequence of the constraints imposed by the
topography.
The Swat Region differs considerably from KP’s overall land use averages for both
agriculture (KP: 24%; Swat 17%)) and built-up areas (KP: 2%; Swat 1%). Swat has 80%
of its land covered by forest (23%), rangeland and grasses (46%) with snow and glaciers
covering an additional 11%. This reflects the mountainous nature of the area and whilst
this translates into a considerable eco-tourism economic potential, in the alternative, the
density of development is comparatively high in the locations where development is
feasible but because it is low-rise and sprawling, population densities are comparatively
low.
1 Within the officially-designated municipal or city limits of the urban centers.
KP-SISUG Swat Regional Development Plan
xv
Settlements are clustered and squeezed into the narrow Swat valley between the
mountains, with extensive ribbon development along all main highways. Settlements are
also located on the floodplain of the Swat river leaving them vulnerable to periodic and
extensive flooding (from monsoon rains, high intensity storms and/or glacial lake outburst
floods).
As a result of constrained land availability and lack of development control, the most
challenging issue is uncontrolled urban sprawl which can be seen around all significant
urban centers. In Mingora city, for example, there is as much settlement outside of the
official boundary as there is within, while there remains a substantial amount of
undeveloped, under-developed and/or agricultural land within the official city boundaries.
In the urban centers the lack of integrated planning and development control are manifest
in:
o Inadequate and insufficient provision of basic services (water supply, sanitation,
waste management).
o Uneconomical and poorly-maintained infrastructure.
o Encroachment on surrounding agricultural/natural land (unconstrained sprawl).
o Congestion and increased transport needs with related costs and inefficiencies.
o Environmental degradation and pollution to ground, air, surface water and
groundwater.
o Lack of tax base to support services being accessed.
Swat is at its heart an agrarian community and agriculture is the main source of income
for much of the rural population. The main crops of Swat include wheat, maize, vegetables,
tobacco, fruits, soya bean and sunflower. However, most landowners have small tracts of
land suitable only for subsistence farming. Key challenges faced in the agricultural sector
are low yields, poor soil quality exacerbated by over-fertilization, and, more fundamentally,
lack of local processing capacity and marketing of products.
The industrial base in Swat is limited in size compared to industrial activity in the Peshawar
region. The main industries in Swat are marble and rubber and plastics, followed by
cement and rice. This industrial diversity gives the Swat District some resilience against
sectoral business cycles but manufacturing overall is struggling. Moreover, the export
value of Swat-based industrial production is neither high nor showing positive trends.
Swat has served as a major trading hub for the Malakand Division and a historical trade
route for China. The local markets provide a large variety of Chinese products. However,
the Swat district is somewhat often the main track of the economic and infrastructure
developments proposed under CPEC and CAREC and, accordingly, because of its relative
remoteness is not anticipated to benefit significantly from investments under these
programs.
Significant population growth is projected in the region over the planning horizon to 2045.
The population of urban centers is expected to more than double by 2045, including the
population of Mingora City. The total District population is anticipated to reach just over 5
million by 2045, of which 30.6% will be in the main urban centers (up from 30.2% in 2020).

KP-SISUG Swat Regional Development Plan
xvi
This increase in population will place significant additional burdens and stress on available
land resources, existing infrastructure and the provision of basic services, all with potential
for significant impacts on the natural resources and beauty of the region.
The region has substantial domestic, regional and international tourism potential due to its
dramatic scenery and eco-tourism potential of the Karakorum and Himalaya Mountains.
Tourism was an economic mainstay until 2001 when insecurity in the region virtually ended
visitation. The situation is stabilizing, and tourism is seeing a resurgence.
Approximately 0.5 million tourists visit Mingora and Swat Valley annually. However,
unregulated touristic development has placed hotels and tourism structures within the river
basin and the flood plains, increasing flood risks during times of higher flow rates. The
region offers something for every type of tourist. Popular tourist attractions are Kalam,
Bahrain, Miandam, Madyan, Fizagut, and the skiing resort at Malam Jabba. Swat also
offers historical places like Butkara, Shingardar stupa, and Saidu stupa.
Promotion and development of the tourism sector is perceived to be a high priority and
offers significant growth potential throughout the region, ranging from historical and
cultural sites in the south to scenic attractions and eco-tourism in the northern parts of the
region. Key recommendations for the tourism sector are made in the RDP at both
Provincial level and also at regional level.
Provincial-level Recommendations
• Implement in full the KP Tourism Policy (2015)
• Establish the Tourism Development Committee
• Improve the working and accountability of the KP Tourism Department
• Strengthen the role of the Directorate of Tourist Services
• Adopt specific regulations to improve the standard of tourism facilities throughout the
Province
• Encourage the role of PPP to increase investment in the sector and to meet resource
gaps
• Promote conservation of the natural environment and cultural heritage
• Invoke environmental considerations in all future developments
• Focus on developing indigenized and harmonized quality tourism facilities and support
infrastructure (roads, rest and roadside facilities, range of types and standards of
accommodation and eating places, information centers, first aid/medical facilities etc.)
• Improve supplies and standards of basic services (power, water and sanitation, etc.)
• Focus development on new tourist sites
• Develop and implement hiking trails, footpaths, eco-tourism facilities, safe parking
areas, etc.
• Prepare and implement an overall tourism development plan based on the principles
and goals of sustainable development and underpinned by a detailed market
assessment
• Invest in capacity building for all areas of touristic services – tour operators, hotel
operators, restaurants
• Maximize the involvement and participation of the local communities in order to provide
job creation and economic development
KP-SISUG Swat Regional Development Plan
xvii
Þ However, to realize the true potential of the tourism sector requires careful and integrated
planning since it must be supported at all levels by significant changes in the way
development has proceeded to date in the Swat Valley. This will require specific
interventions in the following:
o Constraints on the physical growth of urban centers, particularly Mingora City and
Kabal City. The priority should be to densify the existing settlements to increase
urban density rather than allowing continued uncontrolled urban sprawl.
o Provision of green buffers between urban centers to preserve the ecological and
environmental quality of the region, particularly in the Swat valley. Prohibit and
control ribbon development along the main highways in the region.
o Improve road transportation and connectivity – for example, improvement in road
quality and width, decongestion of constrained access (for example, development
of by-pass roads or clearance of obstructions on rights of way), traffic control and
restrictions for tourism-related traffic, arrangements should be made to keep Kalam
and Malam Jabba road open during snow fall season to attract winter tourism to
these areas.
o Improve basic water supply and sanitation services throughout the region. In
particular, implement water supply schemes for the main urban centers (where
most of the current tourist facilities are located) and provide sewage collection and
treatment facilities to avoid the discharge of untreated wastewater to surface water
Regional-level Recommendations
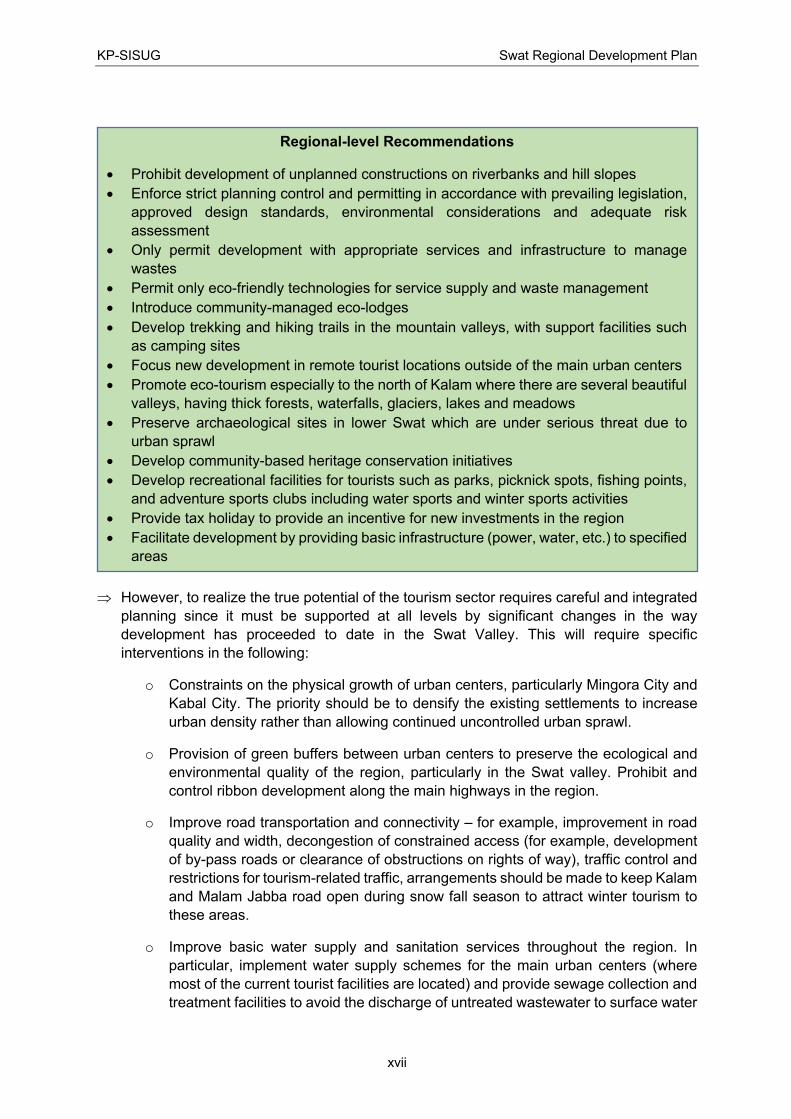
• Prohibit development of unplanned constructions on riverbanks and hill slopes
• Enforce strict planning control and permitting in accordance with prevailing legislation,
approved design standards, environmental considerations and adequate risk
assessment
• Only permit development with appropriate services and infrastructure to manage
wastes
• Permit only eco-friendly technologies for service supply and waste management
• Introduce community-managed eco-lodges
• Develop trekking and hiking trails in the mountain valleys, with support facilities such
as camping sites
• Focus new development in remote tourist locations outside of the main urban centers
• Promote eco-tourism especially to the north of Kalam where there are several beautiful
valleys, having thick forests, waterfalls, glaciers, lakes and meadows
• Preserve archaeological sites in lower Swat which are under serious threat due to
urban sprawl
• Develop community-based heritage conservation initiatives
• Develop recreational facilities for tourists such as parks, picknick spots, fishing points,
and adventure sports clubs including water sports and winter sports activities
• Provide tax holiday to provide an incentive for new investments in the region
• Facilitate development by providing basic infrastructure (power, water, etc.) to specified
areas
KP-SISUG Swat Regional Development Plan
xviii
courses. Similarly, enhance solid waste management systems and implement
policies and facilities to manage solid waste in an environmentally-secure manner.
This is a fundamental requirement since as the population increases the potential
exists for increasingly severe degradation of the environment without adequate
interventions in providing basic municipal services.
o Improve and expand health facilities throughout the region for both locals and
visitors.
o Invest in facilities to bring more local agricultural produce to markets in the district
as well as developing processing facilities to export local products to other areas
of Pakistan and internationally.
o Develop local markets and production facilities for tourism-related products.

KP-SISUG Swat Regional Development Plan
1
PART I:
INTRODUCTION
KP-SISUG Swat Regional Development Plan
2
A. BACKGROUND TO THE REGIONAL DEVELOPMENT
PLAN
1. Pakistan is the most rapidly urbanizing country in the South Asia. In 2017, 36.4 percent
of the Pakistani population was living in urban areas as compared to 32.5 percent in 1998.2 It
is estimated that by 2025 nearly half the country's population will be living in cities.3
Notwithstanding that economic activities in urban areas produce more than 75 percent of
national gross domestic product (GDP), more than 15 percent of the urban population lives in
poverty. Overall, the urban infrastructure is inadequate and is aging, with insufficient
investments to maintain basic services or stimulate economic growth and create jobs.4 A lack
of strategic planning combined with inappropriate regulation, weak planning standards, and
inefficient resource allocation, has resulted in major urban problems across Pakistan. As the
government’s ability to address these challenges is limited, these conditions have contributed
to high levels of socio-economic deprivation and constrained productivity and economic
growth in urban areas.5 This necessitates proactive development planning for these cities to
provide sustainable urban services to their populace.
A.1. KP Strategy for Integrated and Sustainable Urban Growth (KP-
SISUG)
2. The Asian Development Bank’s (ADB’s) country partnership strategy for Pakistan
(2015–2019) stated that ADB will support the government’s priorities for urban renewal, with
improved infrastructure and institutions for municipal services at national, provincial, and city-
level. In November 2016, ADB approved the policy and advisory technical assistance on
Provincial Strategy for Inclusive and Sustainable Urban Growth (PSISUG) in Khyber
Pakhtunkhwa (KP) Province6 with the following four primary outputs:
i. Development of a new road map document for the urban sector.
ii. Preparation of regional development plans (RDPs).
iii. Capacity building program for relevant stakeholders.
iv. Mainstreaming innovations in the urban sector.
3. The Regional Development Plan for the Swat Region provides a broad-brushed
strategic framework for urban and regional development in the Swat District, identifying the
key drivers of urban development, exploring potential for economic dividends thereof, and
estimating demand for urban services in the region.
2 Many demographers believe that urban population in Pakistan is underreported as currently only people residing in metropolitan and municipal corporations, municipal committees (MCs) and cantonments are considered urbanized and these demarcations have not been updated for years. All the ‘residual’ are rural population.
3 UNDP. 2019. Sustainable Urbanization. Development Advocate Pakistan. 5 (4). 4 ADB. 2015. Country Partnership Strategy: Pakistan, 2015–2019. Mandaluyong City: Asian Development
Bank. 5 International Growth Centre. 2015. Reclaiming Prosperity in Khyber Pakhtunkhwa: A Medium-Term Strategy
for Inclusive Growth. London: IGC. F-37109-PAK-1. 6 TA 9223-PAK: Provincial Strategy for Inclusive and Sustainable Urban Growth.
KP-SISUG Swat Regional Development Plan
3
Map 1: Khyber Pakhtunkhwa – administrative units
KP-SISUG Swat Regional Development Plan
4
A.2. Objectives of the RDP
A.2.1. Vision
4. The Regional Development Plan (RDP) for the Swat Region aims to promote
sustainable urban and regional development through integrated and coordinated planning in
order to regularize the region’s future physical development, promote sustainable economic
growth and opportunities and ensure adequate and improved levels of connectivity and
municipal services through necessary and essential investments in infrastructure.
A.2.2. Objectives of the RDP
5. The RDP aims to achieve the following objectives:
• Provide a strategic multisectoral plan that identifies the comparative advantages of the
region and a 25 year investment plan for the selected cities in the region.
• Prioritize key subsectors including water supply, environmental sanitation, solid waste
management, tourism, cultural heritage, smart city, urban green spaces and amenities,
other municipal services, and regional connectivity.
• Explore interventions that will benefit from economies of scale or interconnectivity.
• Prioritize crosscutting areas such as corporate or business planning, data and
indicators, human resources, procurement, safeguards and budget planning and
management.
• Pay special attention to the urban poor, women's participation, and measures to
address income and gender inequity.
• Based on spatial and demographic land use, identify investments for urban areas
within the region.
• Identify the appropriate financing modality and the nature of investments under the
loan.
A.3. RDP’s Structure and Outline
6. The Regional Development Plan for Swat addresses the key urban development
challenges taking into consideration the regional influences and interactions of Swat in
alignment with international urban planning principles. The RDP provides a 25-year planning
framework to deliver a better balance between social, economic, environmental and
infrastructure physical development, integrating cross-cutting issues (such as climate change
and community resilience, urban-rural planning, regional connectivity, poverty, gender and
social issues) with spatial planning.
7. This RDP is set out as follows:
• Part I: Introduction introduces the region in the backdrop of the strategic interventions
being undertaken and explains the sustainable planning approach for sustainable
urban development in terms of planning principles and guidance. It also defined the
region in geographic and physical terms and summarizes the climate change
vulnerabilities of the region. This part sets the stage for the RDP through presenting
KP-SISUG Swat Regional Development Plan
5
current state of governance and stakeholders and the socio-economic settings
(including demographics, energy, education and health sectors, employment, poverty,
and gender and inclusiveness).
• Part II: Urban Development: Status and the Way Forward covers the key sectors
for RDP’s interventions including urban expansion, regional physical connectivity,
urban economy, municipal services and tourism. The individual chapters cover the
current status, service demand and recommendations with investment plans for the
next 25 years.
• Part III: Implementing the Urban Agenda includes some innovative approaches for
circular economy, smart cities and climate resilience. There is a separate chapter on
institutional and legal reforms, financial management, service delivery and capacity
development. The last chapter discusses various options and modalities for financing
the urban development.
KP-SISUG Swat Regional Development Plan
6
B. SUSTAINABLE PLANNING APPROACH
8. This RDP is based on a series of cross-cutting sustainable planning principles aimed
at ensuring that both plans, and their supporting development investments remain relevant,
effective and efficient for their full anticipated lifespan. To support the application of these
principles in on-the-ground investment applications a series of guidance actions are also
presented. Sustainable actions are discussed at the Regional, Urban and Community levels
including their linkages both above to national and international levels, and below to the street
and household.
9. Sustainability has two closely connected components: (1) institutional, and (2)
physical. Institutional starts with the political will to prioritize long-term benefits over short-term
political agendas in order to prepare, implement and institutionalize locally appropriate
policies, plans, legislation, regulations along with consistent implementation and operational
procedures all supported by comprehensive and inclusive stakeholder participation. Political,
institutional and financial capacities must be committed to long-term operations and
maintenance programs. The physical component of sustainability is simply ensuring that
capital investments secure fit-for-purpose designs, materials and technologies on the basis of
life-cycle costing as opposed to only short-term initial capital costs. To manage the full
planning and implementation of Plan-Implement-Manage, a robust program of on-going
monitoring and evaluation with related course adjustments becomes a critical part of ensuring
that investments remain appropriate and sustainable.
10. Further sustainability can be achieved by incorporating a “circular economy” approach
to all development components promoting the re-use, repair, recycling of all products and
resources through the design, manufacturing, distribution, retailing and consumer phases of
the circle.
11. Achieving sustainability also means ensuring resilience, the ability to successfully
manage unexpected shocks to the system be they environmental, economic or social. Specific
resilience actions are discussed below. As a Regional Development Plan, sustainability of
both rural and urban contexts is essential. Key planning principles for both are presented in
Section B.1.
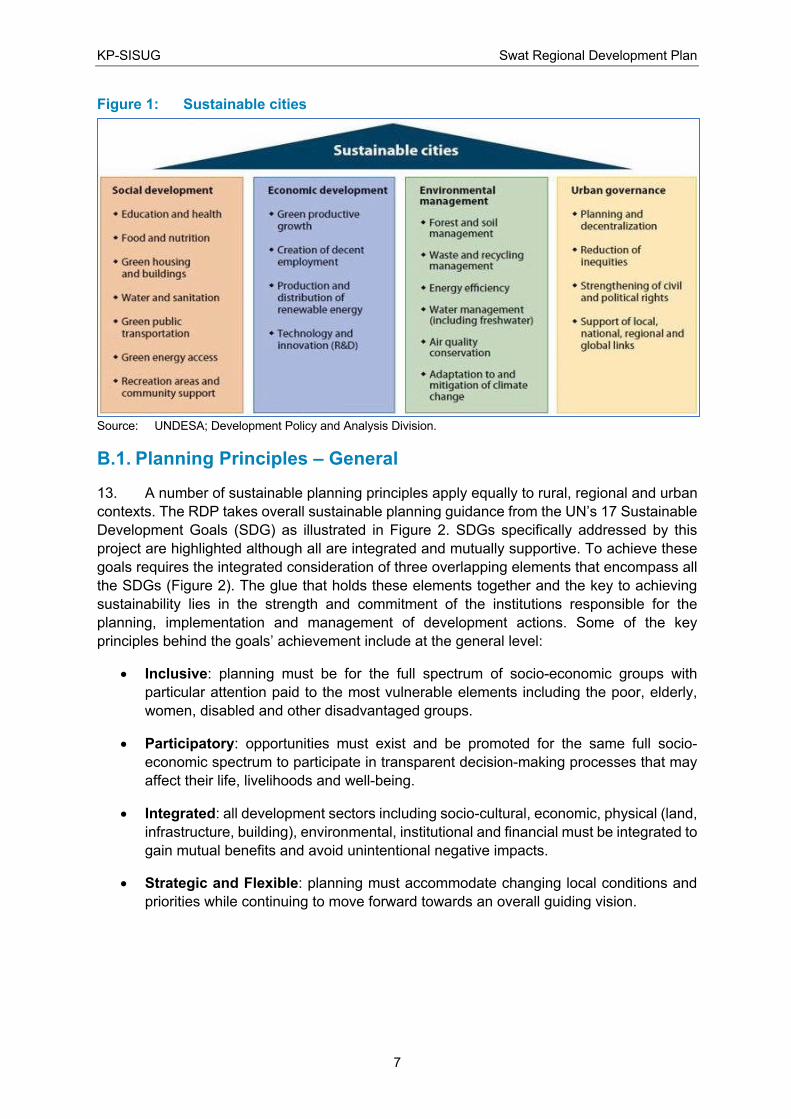
12. The UN identifies four key pillars of sustainable urban development as illustrated in
Figure 1.
KP-SISUG Swat Regional Development Plan
7
Figure 1: Sustainable cities
Source: UNDESA; Development Policy and Analysis Division.
B.1. Planning Principles – General
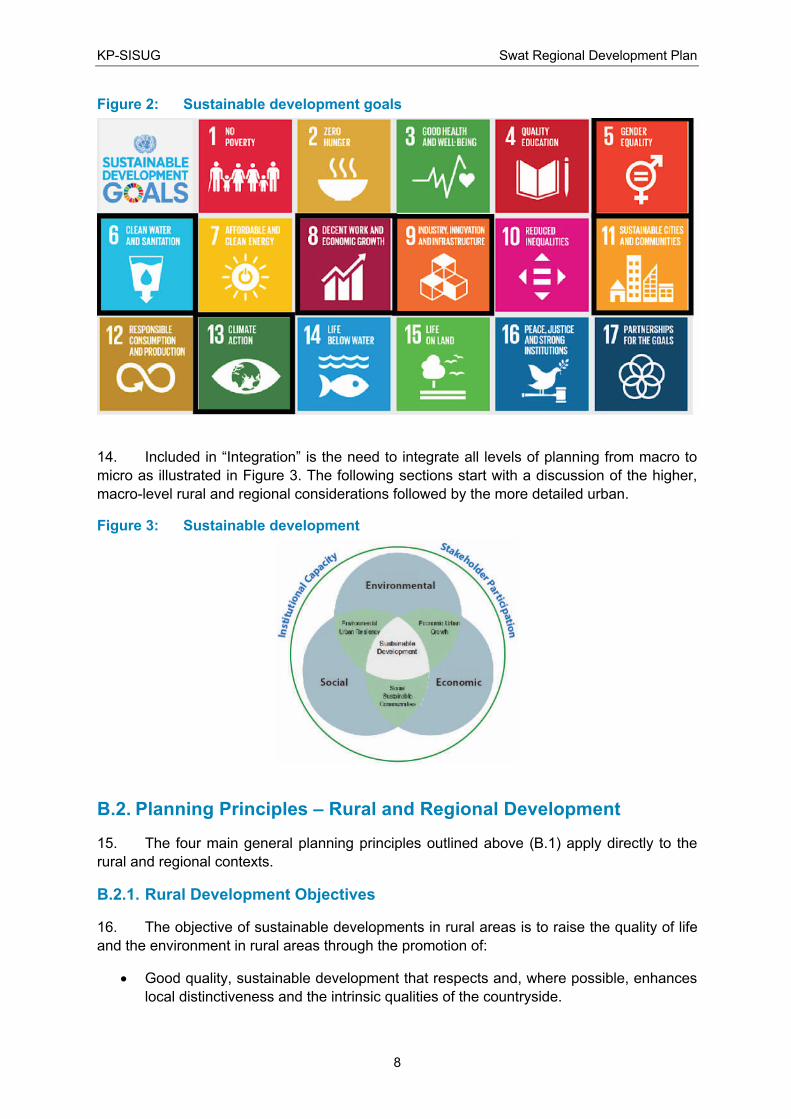
13. A number of sustainable planning principles apply equally to rural, regional and urban
contexts. The RDP takes overall sustainable planning guidance from the UN’s 17 Sustainable
Development Goals (SDG) as illustrated in Figure 2. SDGs specifically addressed by this
project are highlighted although all are integrated and mutually supportive. To achieve these
goals requires the integrated consideration of three overlapping elements that encompass all
the SDGs (Figure 2). The glue that holds these elements together and the key to achieving
sustainability lies in the strength and commitment of the institutions responsible for the
planning, implementation and management of development actions. Some of the key
principles behind the goals’ achievement include at the general level:
• Inclusive: planning must be for the full spectrum of socio-economic groups with
particular attention paid to the most vulnerable elements including the poor, elderly,
women, disabled and other disadvantaged groups.
• Participatory: opportunities must exist and be promoted for the same full socio-
economic spectrum to participate in transparent decision-making processes that may
affect their life, livelihoods and well-being.
• Integrated: all development sectors including socio-cultural, economic, physical (land,
infrastructure, building), environmental, institutional and financial must be integrated to
gain mutual benefits and avoid unintentional negative impacts.
• Strategic and Flexible: planning must accommodate changing local conditions and
priorities while continuing to move forward towards an overall guiding vision.
KP-SISUG Swat Regional Development Plan
8
Figure 2: Sustainable development goals
14. Included in “Integration” is the need to integrate all levels of planning from macro to
micro as illustrated in Figure 3. The following sections start with a discussion of the higher,
macro-level rural and regional considerations followed by the more detailed urban.
Figure 3: Sustainable development
B.2. Planning Principles – Rural and Regional Development
15. The four main general planning principles outlined above (B.1) apply directly to the
rural and regional contexts.
B.2.1. Rural Development Objectives
16. The objective of sustainable developments in rural areas is to raise the quality of life
and the environment in rural areas through the promotion of:
• Good quality, sustainable development that respects and, where possible, enhances
local distinctiveness and the intrinsic qualities of the countryside.
KP-SISUG Swat Regional Development Plan
9
• Continued protection of the open countryside for the benefit of all, with the highest level
of protection for our most valued landscapes and environmental resources.
17. To promote more sustainable patterns of development planning should:
• Focusing most development in, or next to, existing towns and villages.
• Preventing urban sprawl.
• Promote a range of uses to maximize the potential benefits of the countryside fringing
urban areas.
• Providing appropriate leisure opportunities to enable urban and rural dwellers to enjoy
the wider countryside.
• Promote sustainable, diverse and adaptable agriculture sectors where farming
achieves high environmental standards, minimizing impact on natural resources, and
manages valued landscapes and biodiversity; contributes both directly and indirectly
to rural economic diversity; is itself competitive and profitable. provides high quality
products that the public wants.7
B.2.2. Rural Planning Principles
18. Rural planning should be guided by the following principles:
i. Sustainable development is the core principle and foundation of good land use
planning and requires:
a. Social inclusion, recognizing the needs of everyone.
b. Effective protection and enhancement of the environment.
c. Prudent use of natural resources.
d. Maintaining high and stable levels of economic growth and employment.
ii. Good quality, carefully sited, accessible development within existing towns and
villages should be allowed where it benefits the local economy and/or community (e.g.,
affordable housing for identified local needs); maintains or enhances the local
environment. does not conflict with other planning policies.
iii. Accessibility should be a key consideration in all development decisions. Most
developments which are likely to generate large numbers of trips should be located in
or next to towns or other service centers that are accessible by public transport,
walking and cycling. Decisions on the location of other developments in rural areas
should, where possible, give people the greatest opportunity to access them by public
transport, walking and cycling, consistent with achieving the primary purpose of the
development.
iv. New building development in the open countryside away from existing settlements, or
outside areas allocated for development in development plans, should be strictly
7 GoKP. 2020. Abbottabad Land Use Plan (Draft). Peshawar: Urban Policy Unit, P&D Department,
Government of Khyber Pakhtunkhwa.
KP-SISUG Swat Regional Development Plan
10
controlled; the overall aim is to protect the countryside for the sake of its intrinsic
character and beauty, the diversity of its landscapes, heritage and wildlife, the wealth
of its natural resources and so it may be enjoyed by all.
v. Priority should be given to the re-use of previously-developed (‘brownfield’) sites in
preference to the development of greenfield sites, except in cases where there are no
brownfield sites available, or these brownfield sites perform so poorly in terms of
sustainability considerations (for example, in their remoteness from settlements and
services) in comparison with greenfield sites.
vi. All development in rural areas should be well designed and inclusive, in keeping and
scale with its location, and sensitive to the character of the countryside and local
distinctiveness.8
B.2.3. Regional planning
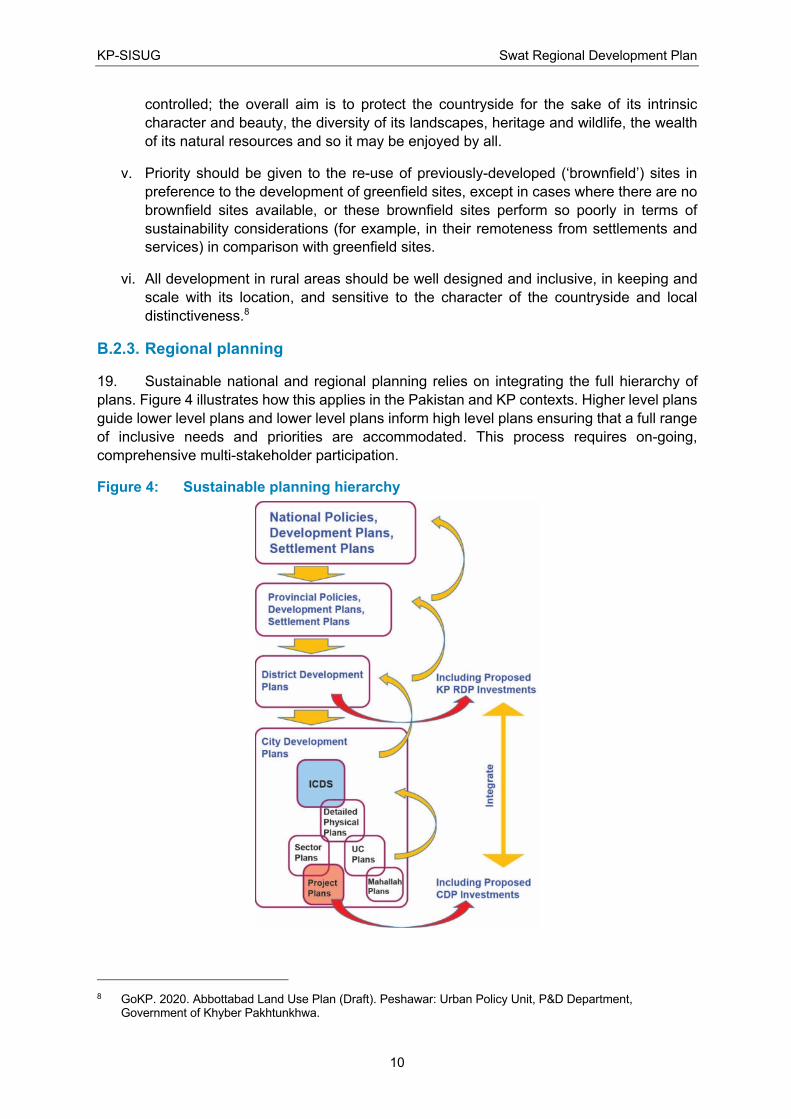
19. Sustainable national and regional planning relies on integrating the full hierarchy of
plans. Figure 4 illustrates how this applies in the Pakistan and KP contexts. Higher level plans
guide lower level plans and lower level plans inform high level plans ensuring that a full range
of inclusive needs and priorities are accommodated. This process requires on-going,
comprehensive multi-stakeholder participation.
Figure 4: Sustainable planning hierarchy
8 GoKP. 2020. Abbottabad Land Use Plan (Draft). Peshawar: Urban Policy Unit, P&D Department,
Government of Khyber Pakhtunkhwa.
KP-SISUG Swat Regional Development Plan
11
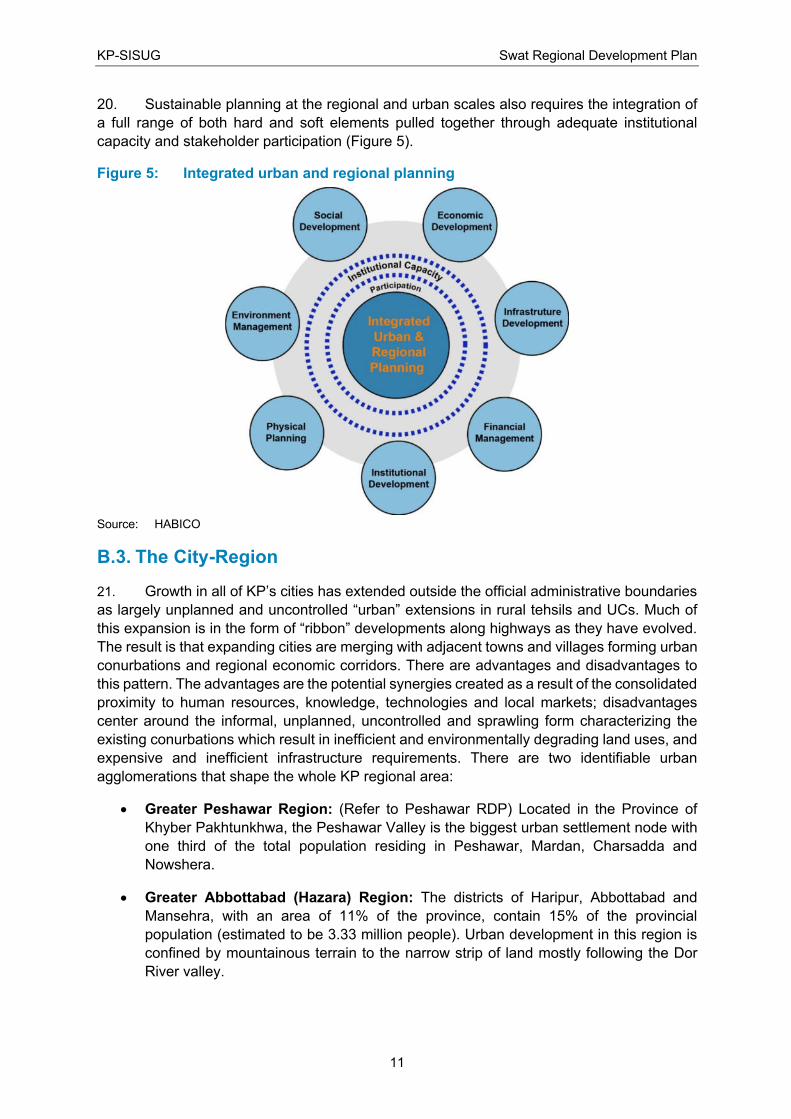
20. Sustainable planning at the regional and urban scales also requires the integration of
a full range of both hard and soft elements pulled together through adequate institutional
capacity and stakeholder participation (Figure 5).
Figure 5: Integrated urban and regional planning
Source: HABICO
B.3. The City-Region
21. Growth in all of KP’s cities has extended outside the official administrative boundaries
as largely unplanned and uncontrolled “urban” extensions in rural tehsils and UCs. Much of
this expansion is in the form of “ribbon” developments along highways as they have evolved.
The result is that expanding cities are merging with adjacent towns and villages forming urban
conurbations and regional economic corridors. There are advantages and disadvantages to
this pattern. The advantages are the potential synergies created as a result of the consolidated
proximity to human resources, knowledge, technologies and local markets; disadvantages
center around the informal, unplanned, uncontrolled and sprawling form characterizing the
existing conurbations which result in inefficient and environmentally degrading land uses, and
expensive and inefficient infrastructure requirements. There are two identifiable urban
agglomerations that shape the whole KP regional area:
• Greater Peshawar Region: (Refer to Peshawar RDP) Located in the Province of
Khyber Pakhtunkhwa, the Peshawar Valley is the biggest urban settlement node with
one third of the total population residing in Peshawar, Mardan, Charsadda and
Nowshera.
• Greater Abbottabad (Hazara) Region: The districts of Haripur, Abbottabad and
Mansehra, with an area of 11% of the province, contain 15% of the provincial
population (estimated to be 3.33 million people). Urban development in this region is
confined by mountainous terrain to the narrow strip of land mostly following the Dor
River valley.
KP-SISUG Swat Regional Development Plan
12
22. The Islamabad-Rawalpindi area can be considered a third conurbation. The Khyber
Pakhtunkhwa’s growth strategy suggests that future planning should focus on the
improvement of regional economic corridors and their capacity to improve linkages to
surrounding service zones.
23. The Swat Region lies outside of these two major urban and economic corridors and
will also be by-passed by the proposed China-Pakistan Economic Corridor. Government’s
current main spatial planning strategy for the province includes the development of new towns,
special economic zone (SEZ) industrial estates, and transportation infrastructure. These
options, and other recommendations, are discussed in Section F.3.8. As illustrated in Map 2,
the Peshawar and Abbottabad development corridors, including their link to Islamabad,
intersect to form the major urban and economic conglomeration in KP. The Swat Region, and
Mingora, the major urban center in the Swat Region, lies in its own valley separated from the
major N-35 highway to the east going north to China and the N-45 to the west going north
from Peshawar to northern Pakistan. Mingora’s connection to the major transport networks is
by Highway N-95 to and from the Mardan-Peshawar conurbation. N-95 follows the Swat River
north and terminates in northern Swat at Kalam. Just north of Mingora, N-90 connects
eastward to the major N-35 which connects Pakistan via Abbottabad to China in the north.
B.4. Urban Planning Principles
24. The same over-arching principles of integration and inclusiveness apply equally to all
levels of planning. Figure 5 illustrates the importance of cross-sector integration supported by
the essential elements of institutional capacity and on-going stakeholder participation.
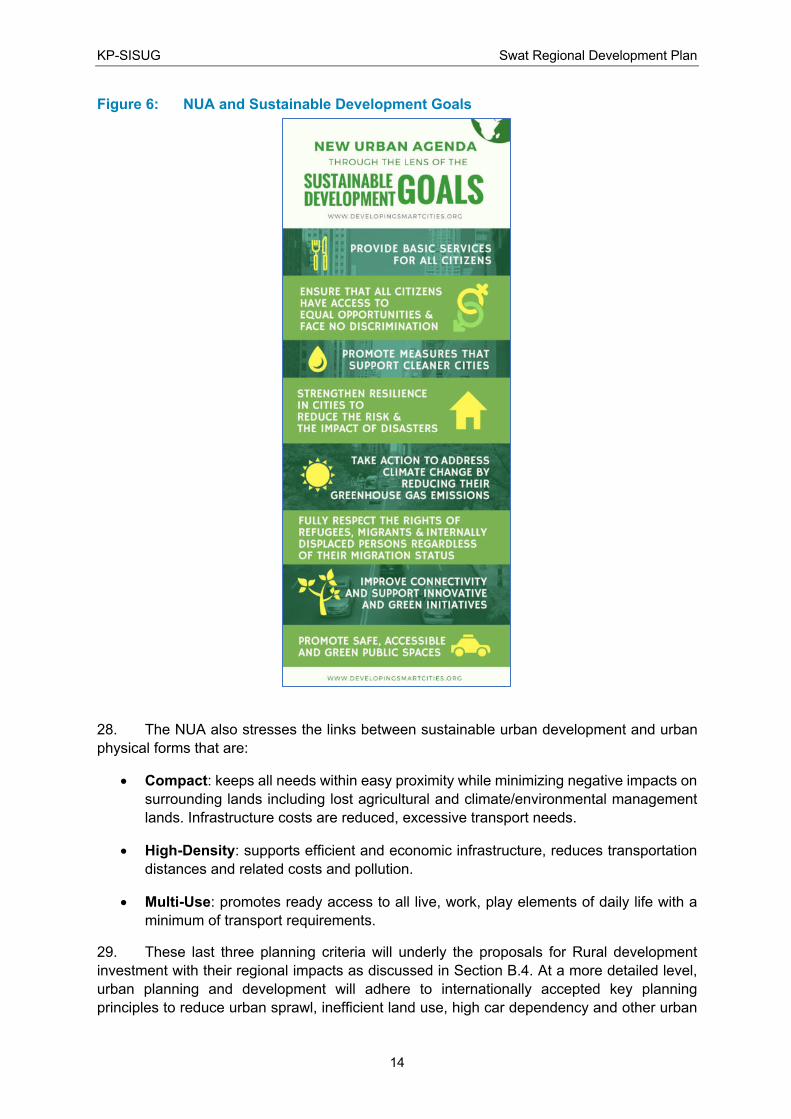
25. To focus on the city level, the United Nations New Urban Agenda (NUA)9 asserts that
city system and urban planning play a crucial role in managing and achieving the 17
Sustainable Development Goals (SDG) – these focus mainly on setting global city planning
standards, and spatial urban planning and design tools. Hence, the NUA stresses the
importance of adopting a Sustainable Planning Approach to deliver sustainable development
(Figure 6). A Sustainable Planning Approach is a planning process whereby the development
of long-term integrated urban and territorial planning and design strategies and spatial
frameworks produce positive outcomes for economic development, infrastructure efficiency
and the environment.
26. The Government of Pakistan adopted policy initiatives and measures with the National
report of Pakistan for Habitat III10 and the Pakistan 2025 – One Nation One Vision – on
implementing the NUA. The key issues identified included land and urban planning reform,
economic growth, smart design and planning, development of integrated planning, urban
resiliency, and urban governance reform. The Government of Khyber Pakhtunkhwa’s
Comprehensive Development Strategy 2010-2017 emphasizes urban public services,
including water, sanitation, drainage, streets, and the public infrastructure required to
accommodate private services in transport, agriculture, and trade.
27. Key elements of the Sustainable Planning Approach as outlined in the NUA include:
9 United Nations, 2017. New Urban Agenda: United Nations Conference on Housing and Sustainable Urban
Development (Habitat III) in Quito, Ecuador. New York: United Nations. 10 Government of Pakistan, 2015. National Report of Pakistan for Habitat III. Islamabad: Ministry of Climate
Change.
KP-SISUG Swat Regional Development Plan
13
• Public Participation – Providing safe, equal access for all to physical and social
infrastructure, basic services, service delivery and decision-making.
• Urban Economies – Ensuring sustainable and inclusive urban economies by
leveraging the clustering and agglomeration of well-planned urbanization, including
competitiveness, innovation and secure land of tenure.
• Urban Sustainability – Promoting clean energy, sustainable use of land and
resources, protecting the ecosystem, managing urban sprawl, and building city
resiliency by reducing disaster risks and mitigating climate change.
• Urban Governance – Strengthening institutions and financial mechanism in cities that
include stakeholders, as well as providing coherence in urban development plans to
enable social inclusion, sustainable economic growth and environment protection.
• Financing Framework – Promoting effective, innovative, and sustainable financing
frameworks and instruments that will enable strengthened municipal finance and local
fiscal systems in order to create, sustain, and share the value generated by sustainable
urban development in an inclusive manner.
KP-SISUG Swat Regional Development Plan
14
Figure 6: NUA and Sustainable Development Goals
28. The NUA also stresses the links between sustainable urban development and urban
physical forms that are:
• Compact: keeps all needs within easy proximity while minimizing negative impacts on
surrounding lands including lost agricultural and climate/environmental management
lands. Infrastructure costs are reduced, excessive transport needs.
• High-Density: supports efficient and economic infrastructure, reduces transportation
distances and related costs and pollution.
• Multi-Use: promotes ready access to all live, work, play elements of daily life with a
minimum of transport requirements.
29. These last three planning criteria will underly the proposals for Rural development
investment with their regional impacts as discussed in Section B.4. At a more detailed level,
urban planning and development will adhere to internationally accepted key planning
principles to reduce urban sprawl, inefficient land use, high car dependency and other urban
KP-SISUG Swat Regional Development Plan
15
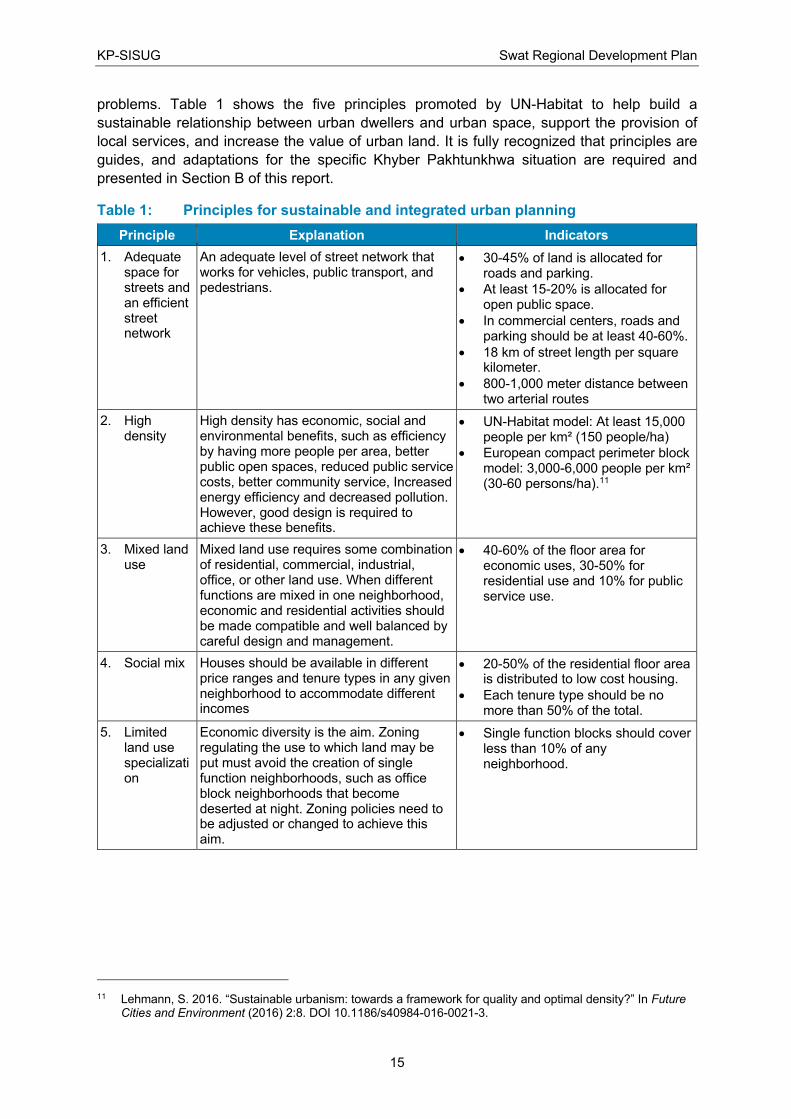
problems. Table 1 shows the five principles promoted by UN-Habitat to help build a
sustainable relationship between urban dwellers and urban space, support the provision of
local services, and increase the value of urban land. It is fully recognized that principles are
guides, and adaptations for the specific Khyber Pakhtunkhwa situation are required and
presented in Section B of this report.
Table 1: Principles for sustainable and integrated urban planning
Principle Explanation Indicators
1. Adequate space for streets and an efficient street network
An adequate level of street network that works for vehicles, public transport, and pedestrians.
• 30-45% of land is allocated for roads and parking.
• At least 15-20% is allocated for open public space.
• In commercial centers, roads and parking should be at least 40-60%.
• 18 km of street length per square kilometer.
• 800-1,000 meter distance between two arterial routes
2. High density
High density has economic, social and environmental benefits, such as efficiency by having more people per area, better public open spaces, reduced public service costs, better community service, Increased energy efficiency and decreased pollution. However, good design is required to achieve these benefits.
• UN-Habitat model: At least 15,000 people per km² (150 people/ha)
• European compact perimeter block model: 3,000-6,000 people per km² (30-60 persons/ha).11
3. Mixed land use
Mixed land use requires some combination of residential, commercial, industrial, office, or other land use. When different functions are mixed in one neighborhood, economic and residential activities should be made compatible and well balanced by careful design and management.
• 40-60% of the floor area for economic uses, 30-50% for residential use and 10% for public service use.
4. Social mix Houses should be available in different price ranges and tenure types in any given neighborhood to accommodate different incomes
• 20-50% of the residential floor area is distributed to low cost housing.
• Each tenure type should be no more than 50% of the total.
5. Limited land use specialization
Economic diversity is the aim. Zoning regulating the use to which land may be put must avoid the creation of single function neighborhoods, such as office block neighborhoods that become deserted at night. Zoning policies need to be adjusted or changed to achieve this aim.
• Single function blocks should cover less than 10% of any neighborhood.
11 Lehmann, S. 2016. “Sustainable urbanism: towards a framework for quality and optimal density?” In Future
Cities and Environment (2016) 2:8. DOI 10.1186/s40984-016-0021-3.
KP-SISUG Swat Regional Development Plan
16
B.5. Guidance to Applying the Principles
30. To achieve the desired sustainability there are numerous micro and macro actions to
be taken in the planning and development process. Some of the macro-level guiding steps
include:
i. Strategic planning rather than master planning: planning has historically been
based on preparing future image master plans. These are typically fixed images of an
ideal future vision, but lack the implementation strategies to achieve them and
seldom acknowledge the social and economic processes, formal and otherwise, that
are inherent in every city’s development. They are not flexible to accommodate
changing local conditions, available resources or investment priorities over time. The
result is that globally very few master plans are ever implemented, and cities move
ahead in an ad hoc, unsustainable manner. Strategic planning, on the other hand, is
based on a series of guiding principles, goals, objectives and iterative processes that
create cities. These may be aiming to achieve the same vision, but have the built-in
flexibility to respond to changes through on-going participation, robust monitoring and
evaluation and regular reviews. It is achieving the results that are paramount, not
filling in all the lines on a master plan.
ii. Incremental development: no region or city can implement all of its desired
development initiatives at one time. Consequently, a planned incremental approach
is essential guided by available resources and demand-driven priorities. Planning
achieves through the preparation of a series of prioritized and integrated Action Plans
all based on the overall Strategic Plan. Action Plans include capital and operating
budgets and implementation timelines that are sustainably achievable through
analysis of the city’s or region’s revenue streams and implementation capacities.
iii. Resilience actions: as discussed above, urban/regional resilience includes
environmental resilience, economic resilience and social resilience: the ability to
weather unforeseen shocks to the systems.
a. Environmental resilience is achieved through both managing the land and
resources and developing adequate basic environmental infrastructure.
Managing land and resources includes proactive land use planning that
identifies, and safeguards valued environmental assets including natural
drainage courses, wetlands, water resources, ground cover and biodiversity
habitats. Environmental infrastructure in urbanizing locations includes
provision basic water and sanitation along with solid waste management and
drainage to ensure human health and well-being. Environmental resilience
also requires natural disaster risk reduction and climate change adaptation
actions as discussed in detail elsewhere in this report. Infrastructure
resilience is partly achieved through building redundancy. There should be
back-up systems to all infrastructure networks such as looped water supply
networks and more than one way in and out of all communities.
b. Economic resilience is best achieved through diversity. Reliance on a single
industry or resource places communities in a vulnerable position if that single
entity is threatened through an environmental disaster, depletion of key
resources or shifting market demands. Economic resilience also requires a
KP-SISUG Swat Regional Development Plan
17
secure, appropriate, consistent and transparent enabling environment
including reliable physical infrastructure and legal and regulatory regimes.
c. Social resilience is directly connected to environmental and economic
resilience (employment), but also requires the existence of health, income
and security safety nets beyond just what a family can provide.
iv. Institutional capacity and self-determination: Adequate and appropriate
institutional structures and capacities including human, technical and financial
resources is the foundation for any form of sustainable development. This must be
the starting point for any planned investment initiatives. To help secure those
institutions - urban and regional governments in the case of this project - maximum
efforts can be made to ensure self-determination by maximizing own source
revenues thus reducing reliance on higher-level or external funding sources. At the
same time, self-determination does not eliminate the need to fully coordinate efforts
with institutions both above and below.
KP-SISUG Swat Regional Development Plan
18
C. THE REGION
C.1. Geophysical Definition of the Region
31. The Swat Region (Map 3) include whole of Swat District, which lies at 72°513’, 35°901’
(North); 72°208’, 35°618’ (West); 72°156’, 34°576’ (South) and 72°787’, 35°375’ (East).
32. It is important to note that focus of RDP, being an urban development plan, remains
on the Mingora city factoring in the demographic and economic influences the adjacent towns
and districts may have on Mingora, and vice versa.
C.2. Geostrategic Significance of the Region
33. The Khyber Pakhtunkhwa Province as a whole, has both the advantage of being at a
major trading cross-roads and the disadvantage of being a land-locked province lacking fully
developed connectivity. Pakistan’s main north-south and east-west trade corridors both pass
through Khyber Pakhtunkhwa with Peshawar being at the cross-roads. However, the main
north-south route linking Pakistan’s ports to China by-passes Swat travelling to the east
through Abbottabad (Map 2). Pakistan is looking forward to economic growth benefits if and
when the China-Pakistan Economic Corridor (CPEC), part of China’s “One Road One Belt”
initiative, is completed. Although the Swat Region and the major city of Mingora are not directly
on the CPEC route, they may also benefit from a general increase in economic opportunities
in the adjacent Abbottabad and Peshawar Regions and can also take advantage of better
regional transportation connections.
34. The region has substantial domestic, regional and international tourism potential due
to its dramatic scenery and eco-tourism potential of the Karakorum and Himalaya Mountains.
Tourism was an economic mainstay until 2001 when insecurity in the region virtually ended
visitation. The situation is stabilizing, and tourism is seeing a resurgence.
35. Mingora is the largest urban center in the Swat District, although Saidu Sharif is the
District capital. Over 2.3 million people live in Swat, of which over 330,00 reside in Mingora,
making Mingora the 3rd largest city in Khyber Pakhtunkhwa after Peshawar and Mardan.12
36. Swat has served as a major trading hub for the Malakand Division and a historical
trade route for China. The local markets provide a large variety of Chinese products. The
economy revolves mostly around agriculture and tourism. The manufacturing units that are
currently present are small and struggling.
37. Swat is a mountainous region, located among the foothills of the Hindukush mountain
range. This range runs in the general direction of North and South and has a varied elevation
within the Swat area. The average elevation is 980 m, resulting in a considerably cooler and
wetter climate compared to most of Pakistan.
38. The District has lush green valleys, snow-covered glaciers, forests, meadows and
plains and offers something for every type of tourist. Popular tourist attractions are Kalam,
Bahrain, Miandam, Madyan, Fizagut, and the skiing resort at Malam Jabba. Swat also offers
historical places like Butkara, Shingardar stupa, and Saidu stupa.
12
Government of Pakistan. 2017. Provisional Summary Results of 6th Population and Housing Census-2017. Islamabad: Pakistan Bureau of Statistics, GoP.
KP-SISUG Swat Regional Development Plan
19
C.2.1. China-Pakistan Economic Corridor
39. CPEC is a USD 54 ban package of investments in road rail, fiber-optic cables, and oil
and gas pipelines linking the ports of Gwadar and Karachi to Xinjiang Province in China. Of
the total, USD 11 ban is intended for improvements to transport infrastructure.13
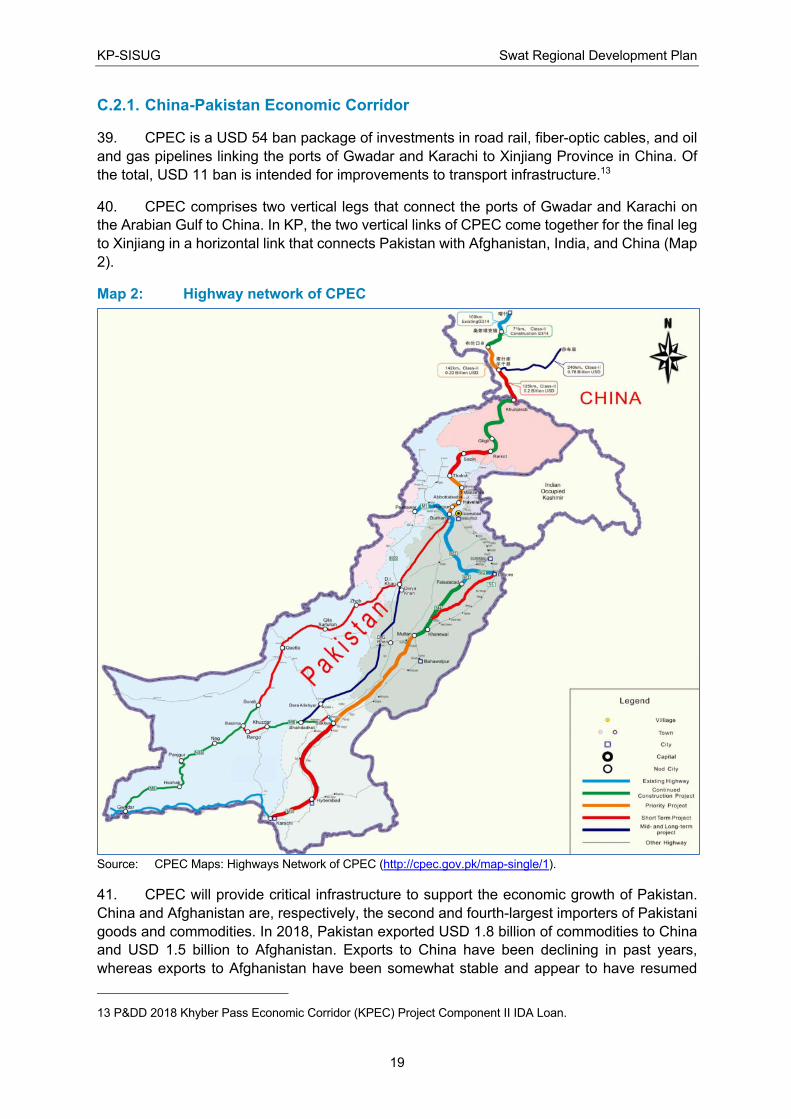
40. CPEC comprises two vertical legs that connect the ports of Gwadar and Karachi on
the Arabian Gulf to China. In KP, the two vertical links of CPEC come together for the final leg
to Xinjiang in a horizontal link that connects Pakistan with Afghanistan, India, and China (Map
2).
Map 2: Highway network of CPEC
Source: CPEC Maps: Highways Network of CPEC (http://cpec.gov.pk/map-single/1).
41. CPEC will provide critical infrastructure to support the economic growth of Pakistan.
China and Afghanistan are, respectively, the second and fourth-largest importers of Pakistani
goods and commodities. In 2018, Pakistan exported USD 1.8 billion of commodities to China
and USD 1.5 billion to Afghanistan. Exports to China have been declining in past years,
whereas exports to Afghanistan have been somewhat stable and appear to have resumed
13 P&DD 2018 Khyber Pass Economic Corridor (KPEC) Project Component II IDA Loan.
KP-SISUG Swat Regional Development Plan
20
growing in recent years. What impact CPEC may have on the Swat Region is not yet
determined, but a further opening up of northern Pakistan in general may well have positive
developmental impacts.
42. The urban center along the final leg of CPEC into Xianjing that is nearest to Mingora
is Thakot, 3.5 hours east of Mingora. This distance implies there are meaningful transport
costs getting to a market connected to CPEC and that benefiting from the CPEC project is
likely to be challenging for the Swat District.
43. The Constructions of the Express way of the project is also a significant step towards
the achievement of the goals fixed by the provincial government in providing roads
communication facility which will lead to enhancement of the Govt; revenue through tourism,
easy access of products of Swat District to different areas of the country as well as to develop
the marble industry.
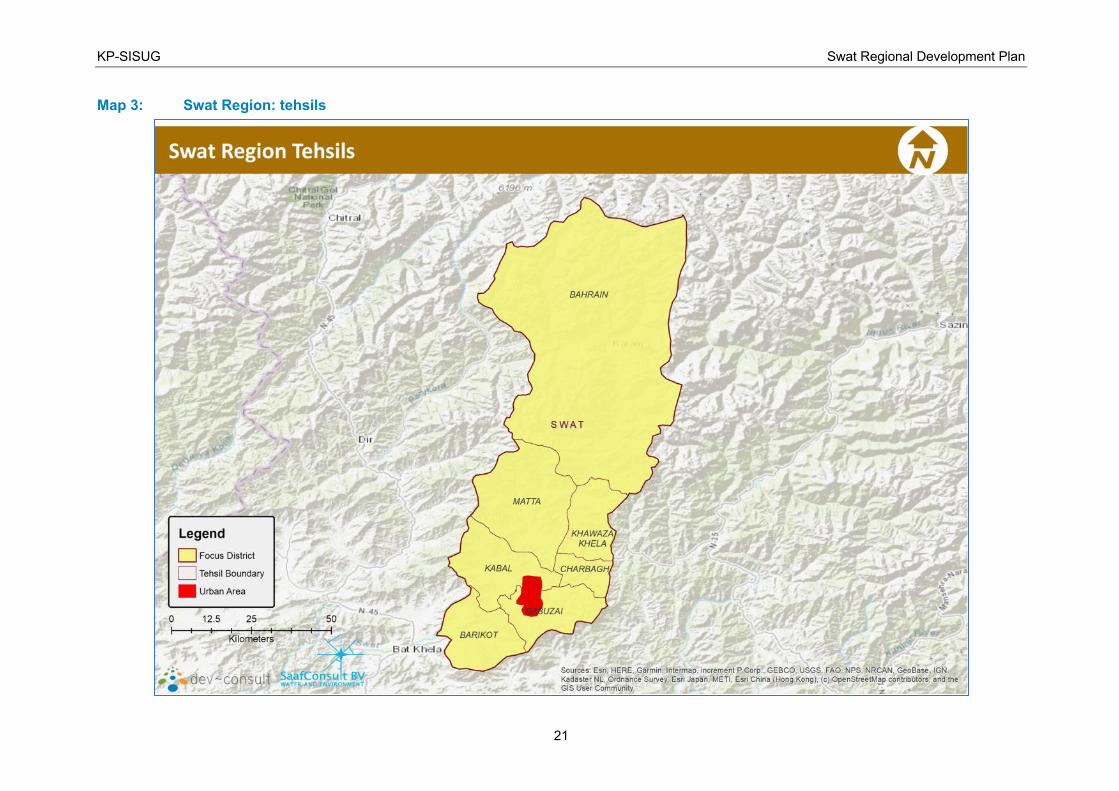
KP-SISUG Swat Regional Development Plan
21
Map 3: Swat Region: tehsils
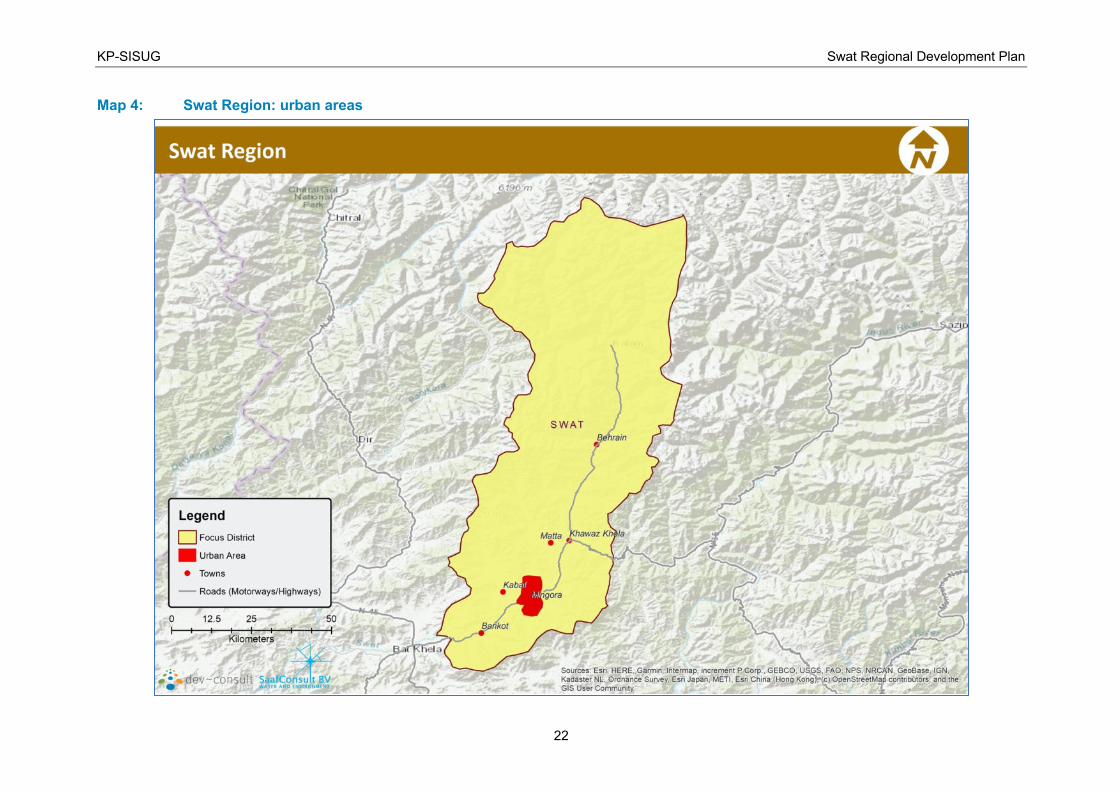
KP-SISUG Swat Regional Development Plan
22
Map 4: Swat Region: urban areas
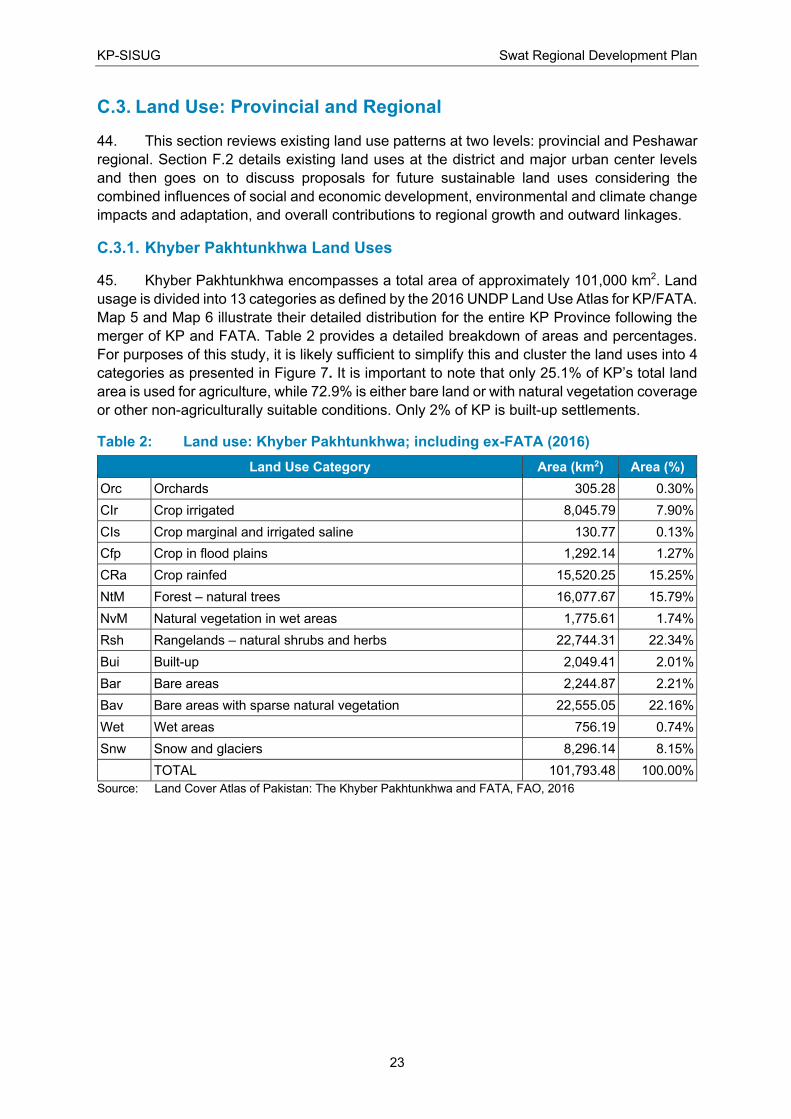
KP-SISUG Swat Regional Development Plan
23
C.3. Land Use: Provincial and Regional
44. This section reviews existing land use patterns at two levels: provincial and Peshawar
regional. Section F.2 details existing land uses at the district and major urban center levels
and then goes on to discuss proposals for future sustainable land uses considering the
combined influences of social and economic development, environmental and climate change
impacts and adaptation, and overall contributions to regional growth and outward linkages.
C.3.1. Khyber Pakhtunkhwa Land Uses
45. Khyber Pakhtunkhwa encompasses a total area of approximately 101,000 km2. Land
usage is divided into 13 categories as defined by the 2016 UNDP Land Use Atlas for KP/FATA.
Map 5 and Map 6 illustrate their detailed distribution for the entire KP Province following the
merger of KP and FATA. Table 2 provides a detailed breakdown of areas and percentages.
For purposes of this study, it is likely sufficient to simplify this and cluster the land uses into 4
categories as presented in Figure 7. It is important to note that only 25.1% of KP’s total land
area is used for agriculture, while 72.9% is either bare land or with natural vegetation coverage
or other non-agriculturally suitable conditions. Only 2% of KP is built-up settlements.
Table 2: Land use: Khyber Pakhtunkhwa; including ex-FATA (2016)
Land Use Category Area (km2) Area (%)
Orc Orchards 305.28 0.30%
CIr Crop irrigated 8,045.79 7.90%
CIs Crop marginal and irrigated saline 130.77 0.13%
Cfp Crop in flood plains 1,292.14 1.27%
CRa Crop rainfed 15,520.25 15.25%
NtM Forest – natural trees 16,077.67 15.79%
NvM Natural vegetation in wet areas 1,775.61 1.74%
Rsh Rangelands – natural shrubs and herbs 22,744.31 22.34%
Bui Built-up 2,049.41 2.01%
Bar Bare areas 2,244.87 2.21%
Bav Bare areas with sparse natural vegetation 22,555.05 22.16%
Wet Wet areas 756.19 0.74%
Snw Snow and glaciers 8,296.14 8.15%
TOTAL 101,793.48 100.00%
Source: Land Cover Atlas of Pakistan: The Khyber Pakhtunkhwa and FATA, FAO, 2016
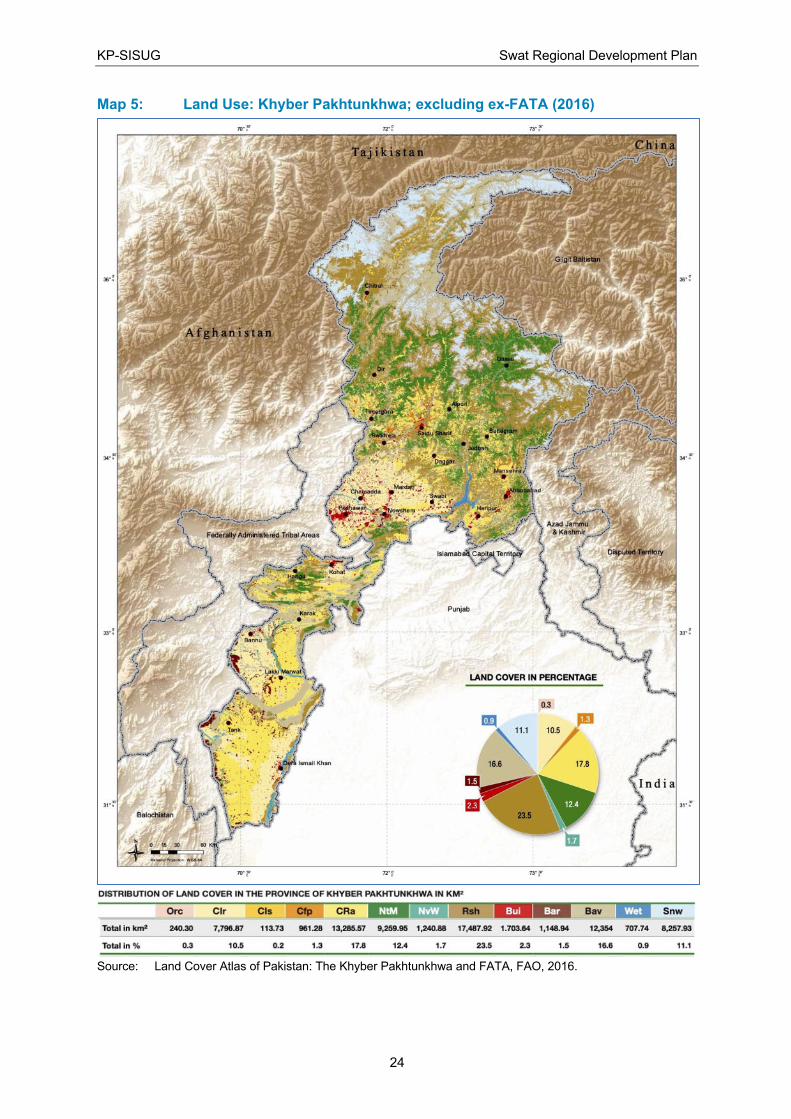
KP-SISUG Swat Regional Development Plan
24
Map 5: Land Use: Khyber Pakhtunkhwa; excluding ex-FATA (2016)
Source: Land Cover Atlas of Pakistan: The Khyber Pakhtunkhwa and FATA, FAO, 2016.
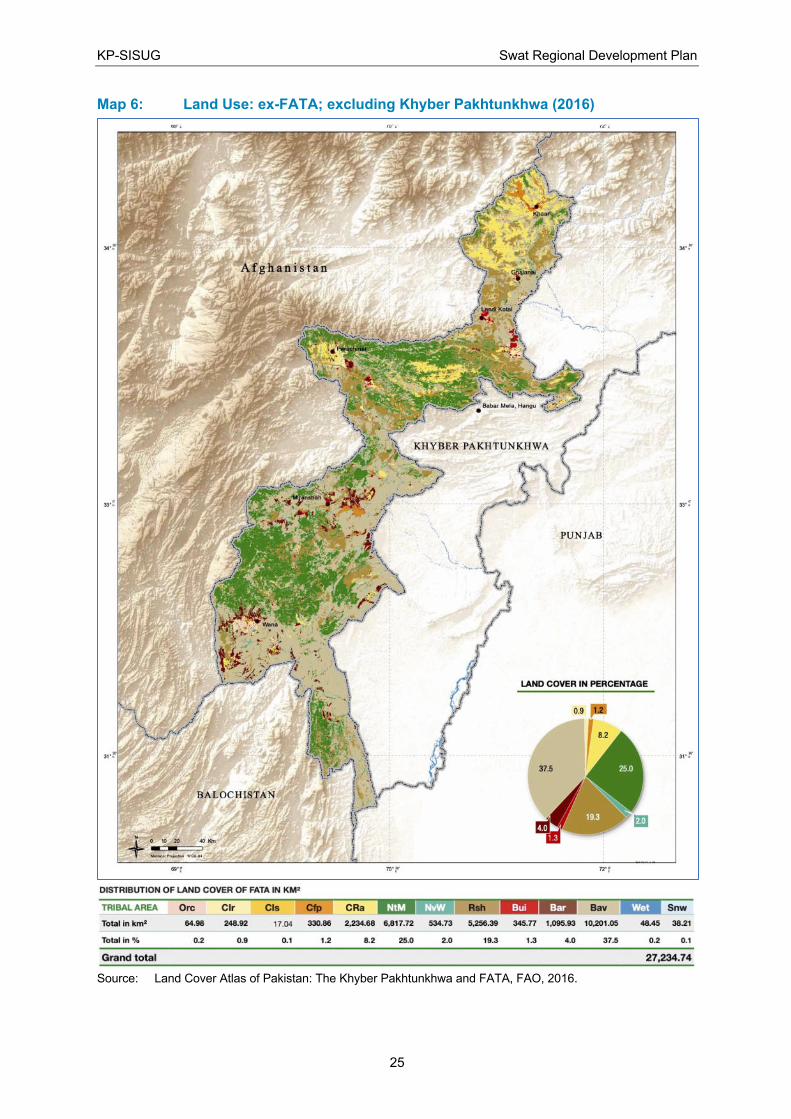
KP-SISUG Swat Regional Development Plan
25
Map 6: Land Use: ex-FATA; excluding Khyber Pakhtunkhwa (2016)
Source: Land Cover Atlas of Pakistan: The Khyber Pakhtunkhwa and FATA, FAO, 2016.
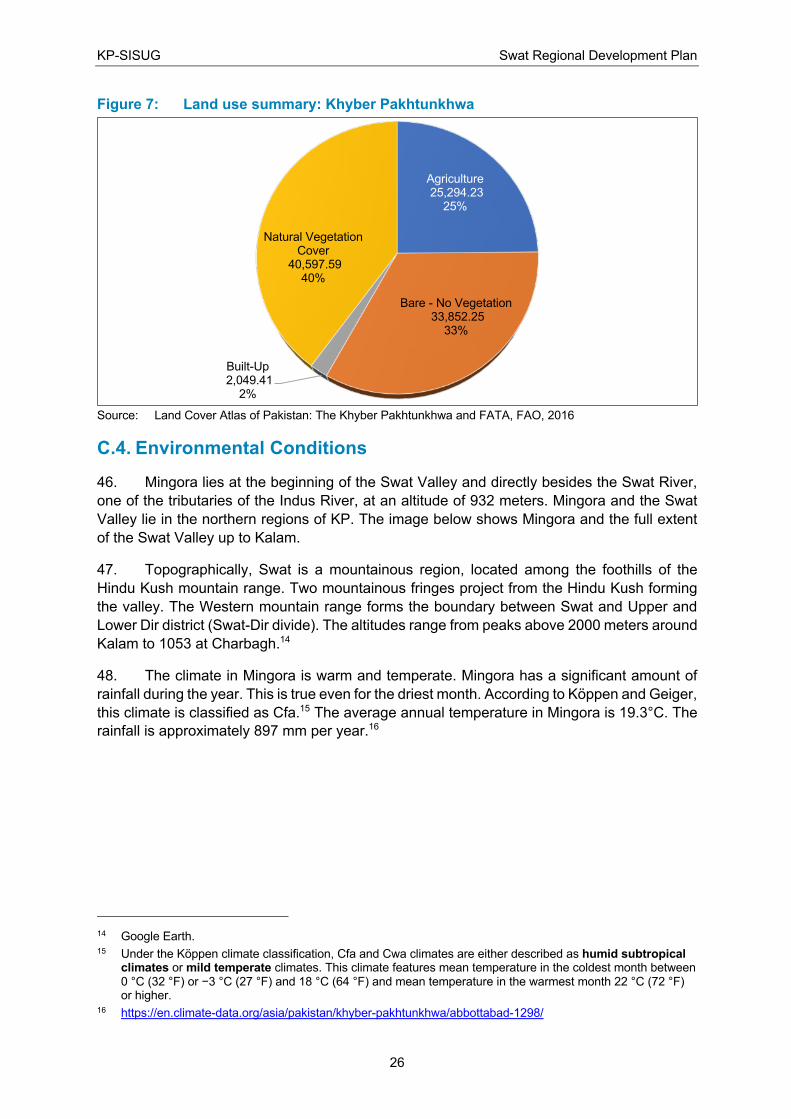
KP-SISUG Swat Regional Development Plan
26
Figure 7: Land use summary: Khyber Pakhtunkhwa
Source: Land Cover Atlas of Pakistan: The Khyber Pakhtunkhwa and FATA, FAO, 2016
C.4. Environmental Conditions
46. Mingora lies at the beginning of the Swat Valley and directly besides the Swat River,
one of the tributaries of the Indus River, at an altitude of 932 meters. Mingora and the Swat
Valley lie in the northern regions of KP. The image below shows Mingora and the full extent
of the Swat Valley up to Kalam.
47. Topographically, Swat is a mountainous region, located among the foothills of the
Hindu Kush mountain range. Two mountainous fringes project from the Hindu Kush forming
the valley. The Western mountain range forms the boundary between Swat and Upper and
Lower Dir district (Swat-Dir divide). The altitudes range from peaks above 2000 meters around
Kalam to 1053 at Charbagh.14
48. The climate in Mingora is warm and temperate. Mingora has a significant amount of
rainfall during the year. This is true even for the driest month. According to Köppen and Geiger,
this climate is classified as Cfa.15 The average annual temperature in Mingora is 19.3°C. The
rainfall is approximately 897 mm per year.16
14 Google Earth. 15 Under the Köppen climate classification, Cfa and Cwa climates are either described as humid subtropical
climates or mild temperate climates. This climate features mean temperature in the coldest month between 0 °C (32 °F) or −3 °C (27 °F) and 18 °C (64 °F) and mean temperature in the warmest month 22 °C (72 °F) or higher.
16 https://en.climate-data.org/asia/pakistan/khyber-pakhtunkhwa/abbottabad-1298/
Agriculture25,294.23
25%
Bare - No Vegetation33,852.25
33%
Built-Up2,049.41
2%
Natural Vegetation Cover
40,597.59 40%
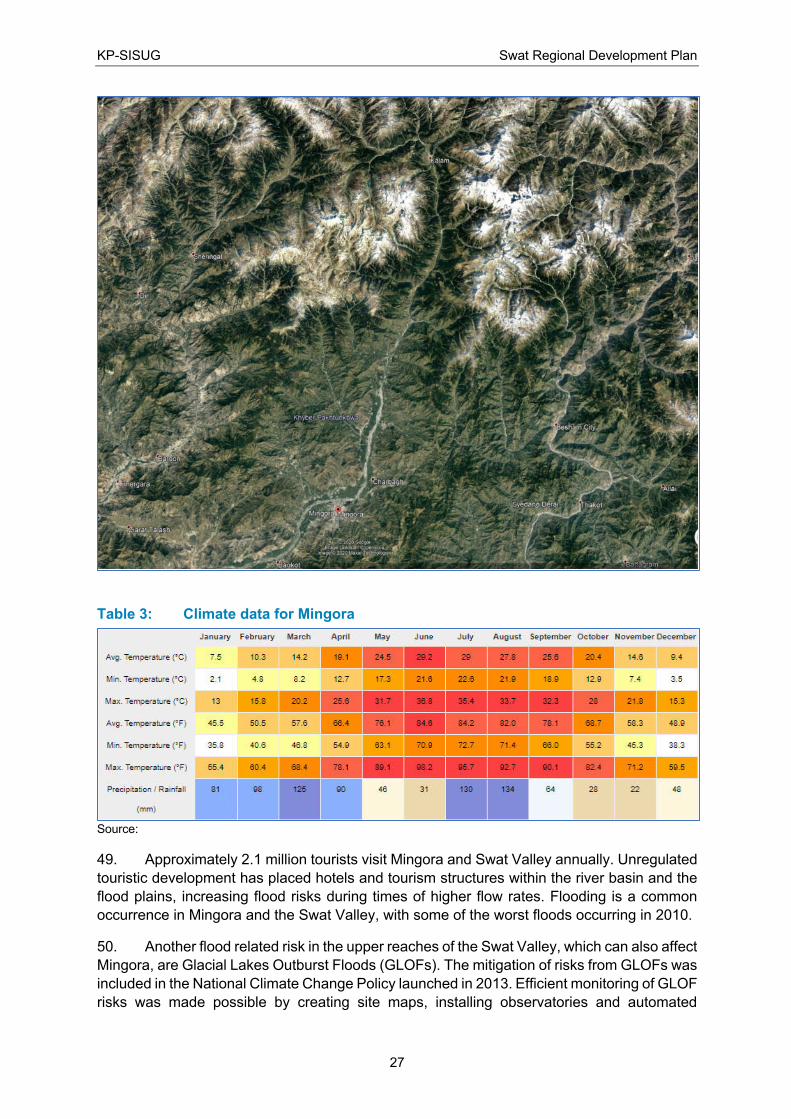
KP-SISUG Swat Regional Development Plan
27
Table 3: Climate data for Mingora
Source:
49. Approximately 2.1 million tourists visit Mingora and Swat Valley annually. Unregulated
touristic development has placed hotels and tourism structures within the river basin and the
flood plains, increasing flood risks during times of higher flow rates. Flooding is a common
occurrence in Mingora and the Swat Valley, with some of the worst floods occurring in 2010.
50. Another flood related risk in the upper reaches of the Swat Valley, which can also affect
Mingora, are Glacial Lakes Outburst Floods (GLOFs). The mitigation of risks from GLOFs was
included in the National Climate Change Policy launched in 2013. Efficient monitoring of GLOF
risks was made possible by creating site maps, installing observatories and automated
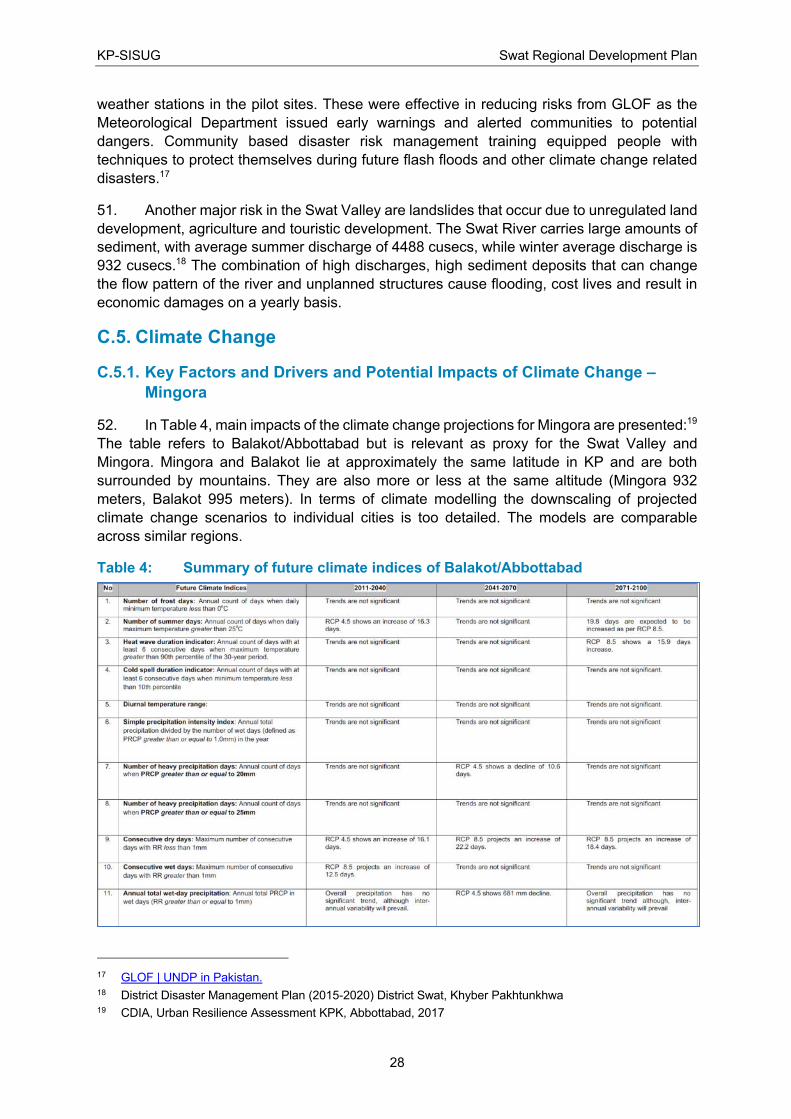
KP-SISUG Swat Regional Development Plan
28
weather stations in the pilot sites. These were effective in reducing risks from GLOF as the
Meteorological Department issued early warnings and alerted communities to potential
dangers. Community based disaster risk management training equipped people with
techniques to protect themselves during future flash floods and other climate change related
disasters.17
51. Another major risk in the Swat Valley are landslides that occur due to unregulated land
development, agriculture and touristic development. The Swat River carries large amounts of
sediment, with average summer discharge of 4488 cusecs, while winter average discharge is
932 cusecs.18 The combination of high discharges, high sediment deposits that can change
the flow pattern of the river and unplanned structures cause flooding, cost lives and result in
economic damages on a yearly basis.
C.5. Climate Change
C.5.1. Key Factors and Drivers and Potential Impacts of Climate Change –
Mingora
52. In Table 4, main impacts of the climate change projections for Mingora are presented:19
The table refers to Balakot/Abbottabad but is relevant as proxy for the Swat Valley and
Mingora. Mingora and Balakot lie at approximately the same latitude in KP and are both
surrounded by mountains. They are also more or less at the same altitude (Mingora 932
meters, Balakot 995 meters). In terms of climate modelling the downscaling of projected
climate change scenarios to individual cities is too detailed. The models are comparable
across similar regions.
Table 4: Summary of future climate indices of Balakot/Abbottabad
17 GLOF | UNDP in Pakistan. 18 District Disaster Management Plan (2015-2020) District Swat, Khyber Pakhtunkhwa 19 CDIA, Urban Resilience Assessment KPK, Abbottabad, 2017
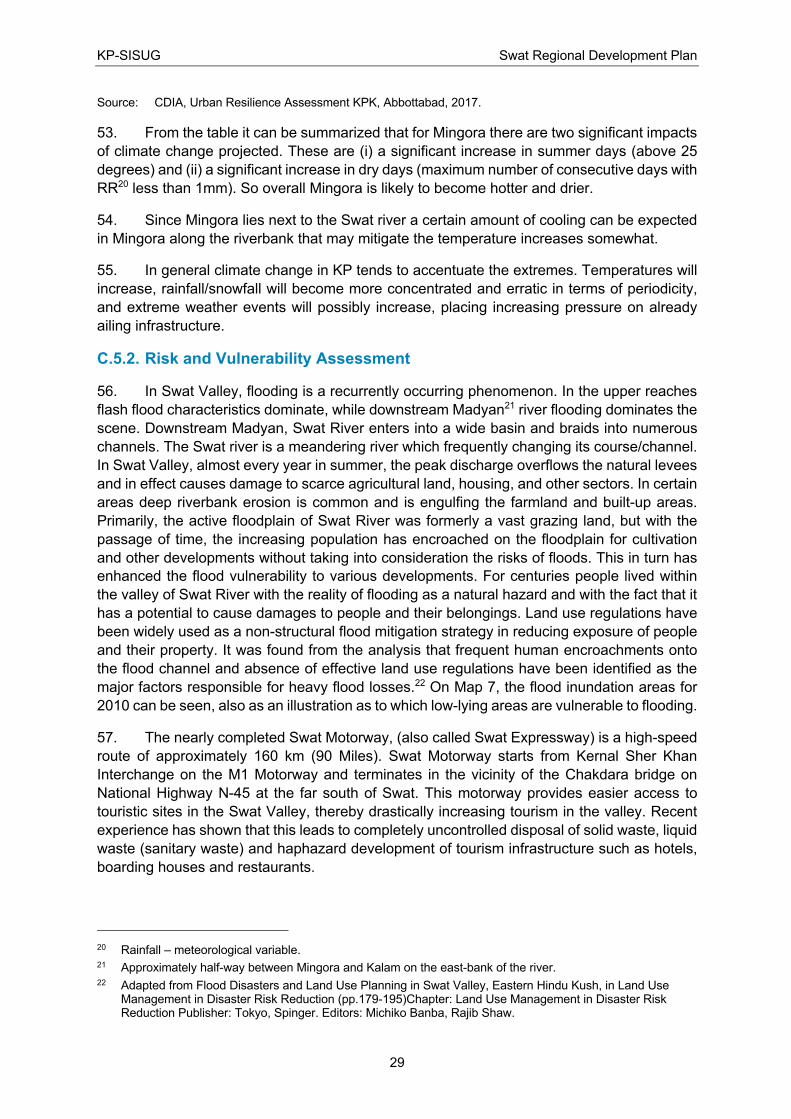
KP-SISUG Swat Regional Development Plan
29
Source: CDIA, Urban Resilience Assessment KPK, Abbottabad, 2017.
53. From the table it can be summarized that for Mingora there are two significant impacts
of climate change projected. These are (i) a significant increase in summer days (above 25
degrees) and (ii) a significant increase in dry days (maximum number of consecutive days with
RR20 less than 1mm). So overall Mingora is likely to become hotter and drier.
54. Since Mingora lies next to the Swat river a certain amount of cooling can be expected
in Mingora along the riverbank that may mitigate the temperature increases somewhat.
55. In general climate change in KP tends to accentuate the extremes. Temperatures will
increase, rainfall/snowfall will become more concentrated and erratic in terms of periodicity,
and extreme weather events will possibly increase, placing increasing pressure on already
ailing infrastructure.
C.5.2. Risk and Vulnerability Assessment
56. In Swat Valley, flooding is a recurrently occurring phenomenon. In the upper reaches
flash flood characteristics dominate, while downstream Madyan21 river flooding dominates the
scene. Downstream Madyan, Swat River enters into a wide basin and braids into numerous
channels. The Swat river is a meandering river which frequently changing its course/channel.
In Swat Valley, almost every year in summer, the peak discharge overflows the natural levees
and in effect causes damage to scarce agricultural land, housing, and other sectors. In certain
areas deep riverbank erosion is common and is engulfing the farmland and built-up areas.
Primarily, the active floodplain of Swat River was formerly a vast grazing land, but with the
passage of time, the increasing population has encroached on the floodplain for cultivation
and other developments without taking into consideration the risks of floods. This in turn has
enhanced the flood vulnerability to various developments. For centuries people lived within
the valley of Swat River with the reality of flooding as a natural hazard and with the fact that it
has a potential to cause damages to people and their belongings. Land use regulations have
been widely used as a non-structural flood mitigation strategy in reducing exposure of people
and their property. It was found from the analysis that frequent human encroachments onto
the flood channel and absence of effective land use regulations have been identified as the
major factors responsible for heavy flood losses.22 On Map 7, the flood inundation areas for
2010 can be seen, also as an illustration as to which low-lying areas are vulnerable to flooding.
57. The nearly completed Swat Motorway, (also called Swat Expressway) is a high-speed
route of approximately 160 km (90 Miles). Swat Motorway starts from Kernal Sher Khan
Interchange on the M1 Motorway and terminates in the vicinity of the Chakdara bridge on
National Highway N-45 at the far south of Swat. This motorway provides easier access to
touristic sites in the Swat Valley, thereby drastically increasing tourism in the valley. Recent
experience has shown that this leads to completely uncontrolled disposal of solid waste, liquid
waste (sanitary waste) and haphazard development of tourism infrastructure such as hotels,
boarding houses and restaurants.
20 Rainfall – meteorological variable. 21 Approximately half-way between Mingora and Kalam on the east-bank of the river. 22 Adapted from Flood Disasters and Land Use Planning in Swat Valley, Eastern Hindu Kush, in Land Use
Management in Disaster Risk Reduction (pp.179-195)Chapter: Land Use Management in Disaster Risk Reduction Publisher: Tokyo, Spinger. Editors: Michiko Banba, Rajib Shaw.
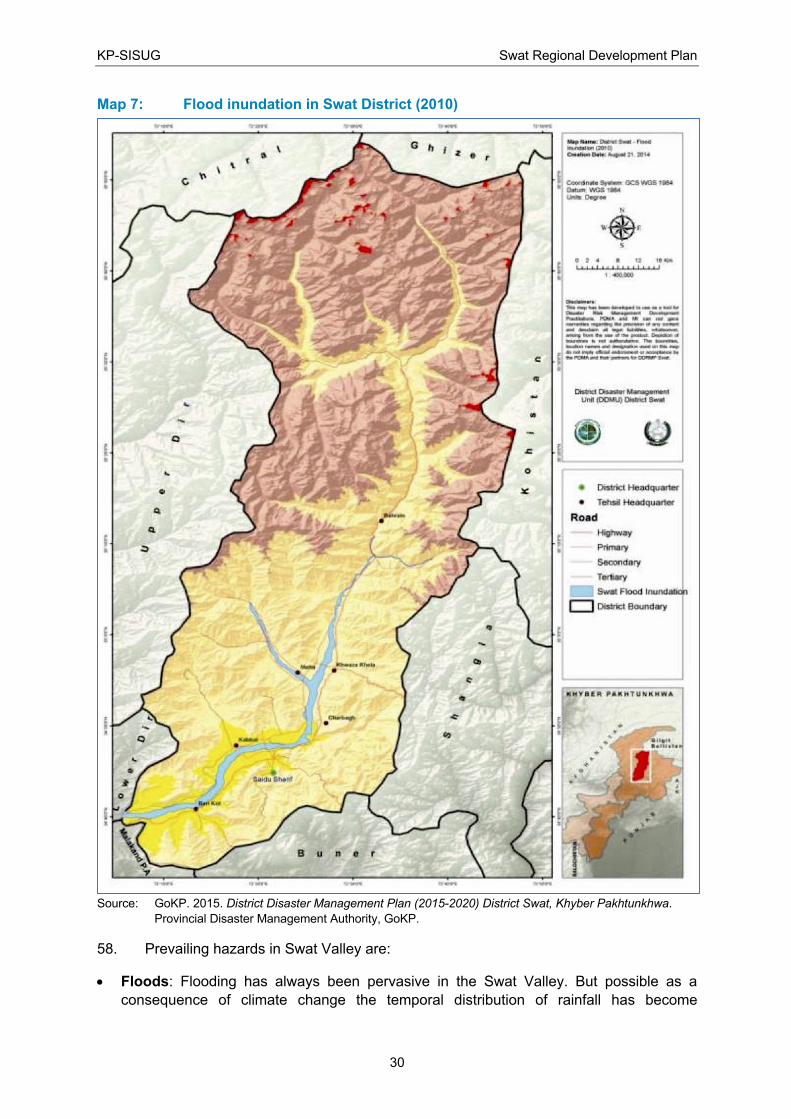
KP-SISUG Swat Regional Development Plan
30
Map 7: Flood inundation in Swat District (2010)
Source: GoKP. 2015. District Disaster Management Plan (2015-2020) District Swat, Khyber Pakhtunkhwa.
Provincial Disaster Management Authority, GoKP.
58. Prevailing hazards in Swat Valley are:
• Floods: Flooding has always been pervasive in the Swat Valley. But possible as a
consequence of climate change the temporal distribution of rainfall has become
KP-SISUG Swat Regional Development Plan
31
condensed into cloud bursts of heavy rainfall which contribute to increased flash floods
and erosion of soils.
• Hailstorms: During the months of June, July and August heavy thunderstorms
increasingly bring hail, which destroys fruit, vegetable and cereal crops, for which the Swat
District is renown.
• Snow Fall: During the winter months the upper reaches of Swat District receive
considerable amounts of snow. These snow periods slow down public life, and access to
markets and services are severely limited.
• Earthquakes: Whereas climate change does not affect the frequency or intensity of
earthquakes, it is important to note that in terms of natural hazards, Swat District has been
at the receiving end of major earthquakes, the most recent one in 2005.
• Landslides: Mountain slopes in the Karakoram Hindukush mountain range are known for
their steep incline, between 40% and 60%. These steep slopes enable landslides. This is
compounded by soil erosion and unregulated (touristic) development, resulting in frequent
landslides that block roads, destroy infrastructure and endanger lives.
• Conflict: Internal conflict in the KP and FATA areas, the remoteness of its upper reaches
and the recent conflict between the Taliban and the Pakistan Army has made life in the
Swat District insecure.
• Dengue: In 2013 a dengue epidemic in Swat District brought the virus to the District and
has added to the hazards of living in Swat.23
59. In Map 8, the hazardous zones of the district are visualized, while Table 5 provides
risk index for all union councils in Swat District.
23 Adapted from District Disaster Management Plan (2015-2020) District Swat, Khyber Pakhtunkhwa
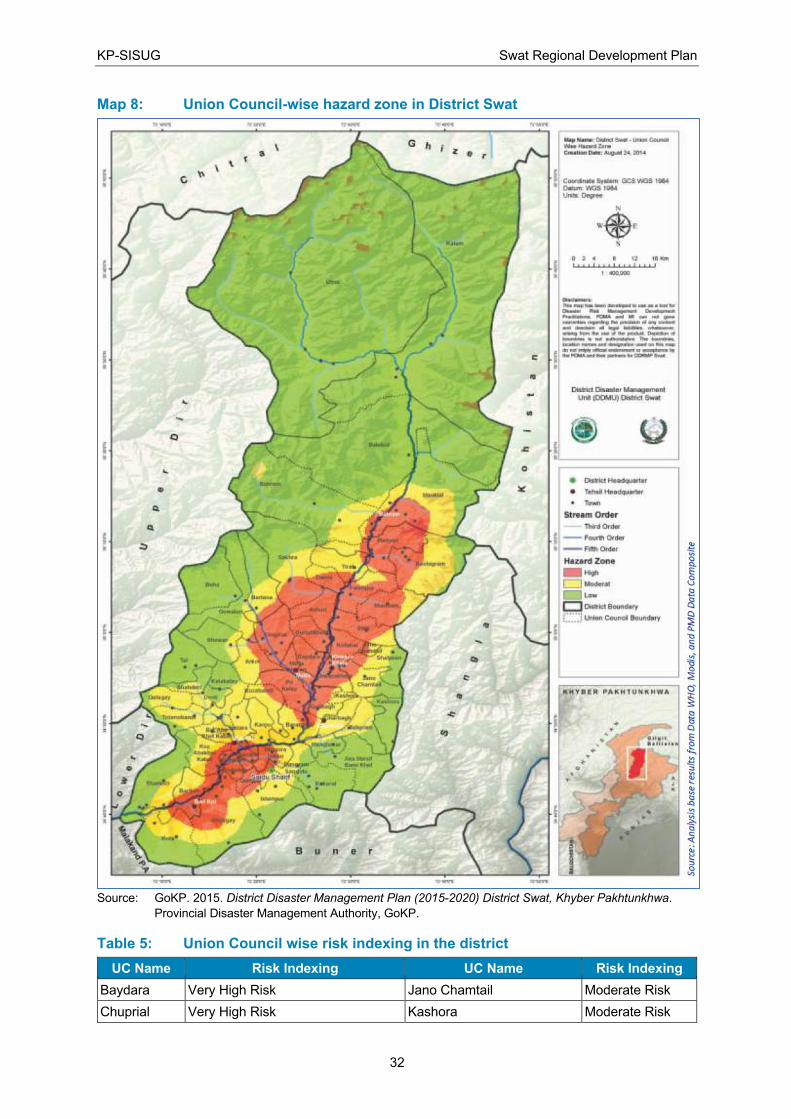
KP-SISUG Swat Regional Development Plan
32
Map 8: Union Council-wise hazard zone in District Swat
Source: GoKP. 2015. District Disaster Management Plan (2015-2020) District Swat, Khyber Pakhtunkhwa.
Provincial Disaster Management Authority, GoKP.
Table 5: Union Council wise risk indexing in the district
UC Name Risk Indexing UC Name Risk Indexing
Baydara Very High Risk Jano Chamtail Moderate Risk
Chuprial Very High Risk Kashora Moderate Risk
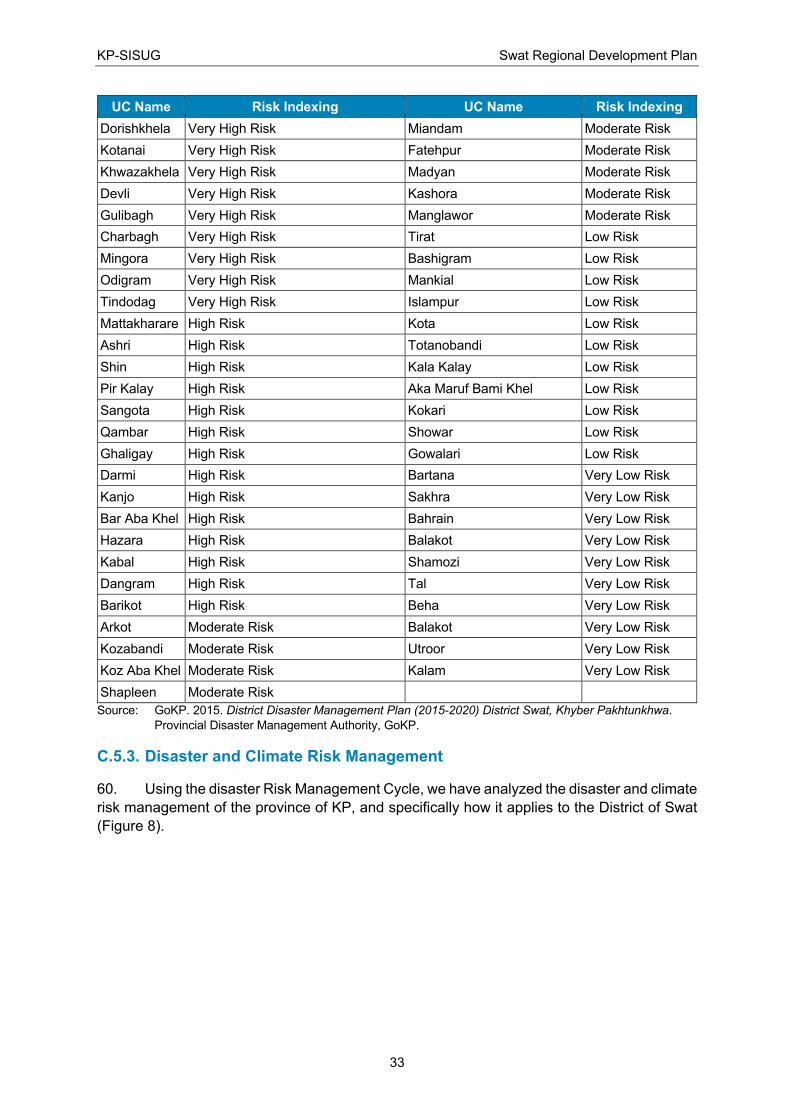
KP-SISUG Swat Regional Development Plan
33
UC Name Risk Indexing UC Name Risk Indexing
Dorishkhela Very High Risk Miandam Moderate Risk
Kotanai Very High Risk Fatehpur Moderate Risk
Khwazakhela Very High Risk Madyan Moderate Risk
Devli Very High Risk Kashora Moderate Risk
Gulibagh Very High Risk Manglawor Moderate Risk
Charbagh Very High Risk Tirat Low Risk
Mingora Very High Risk Bashigram Low Risk
Odigram Very High Risk Mankial Low Risk
Tindodag Very High Risk Islampur Low Risk
Mattakharare High Risk Kota Low Risk
Ashri High Risk Totanobandi Low Risk
Shin High Risk Kala Kalay Low Risk
Pir Kalay High Risk Aka Maruf Bami Khel Low Risk
Sangota High Risk Kokari Low Risk
Qambar High Risk Showar Low Risk
Ghaligay High Risk Gowalari Low Risk
Darmi High Risk Bartana Very Low Risk
Kanjo High Risk Sakhra Very Low Risk
Bar Aba Khel High Risk Bahrain Very Low Risk
Hazara High Risk Balakot Very Low Risk
Kabal High Risk Shamozi Very Low Risk
Dangram High Risk Tal Very Low Risk
Barikot High Risk Beha Very Low Risk
Arkot Moderate Risk Balakot Very Low Risk
Kozabandi Moderate Risk Utroor Very Low Risk
Koz Aba Khel Moderate Risk Kalam Very Low Risk
Shapleen Moderate Risk
Source: GoKP. 2015. District Disaster Management Plan (2015-2020) District Swat, Khyber Pakhtunkhwa.
Provincial Disaster Management Authority, GoKP.
C.5.3. Disaster and Climate Risk Management
60. Using the disaster Risk Management Cycle, we have analyzed the disaster and climate
risk management of the province of KP, and specifically how it applies to the District of Swat
(Figure 8).
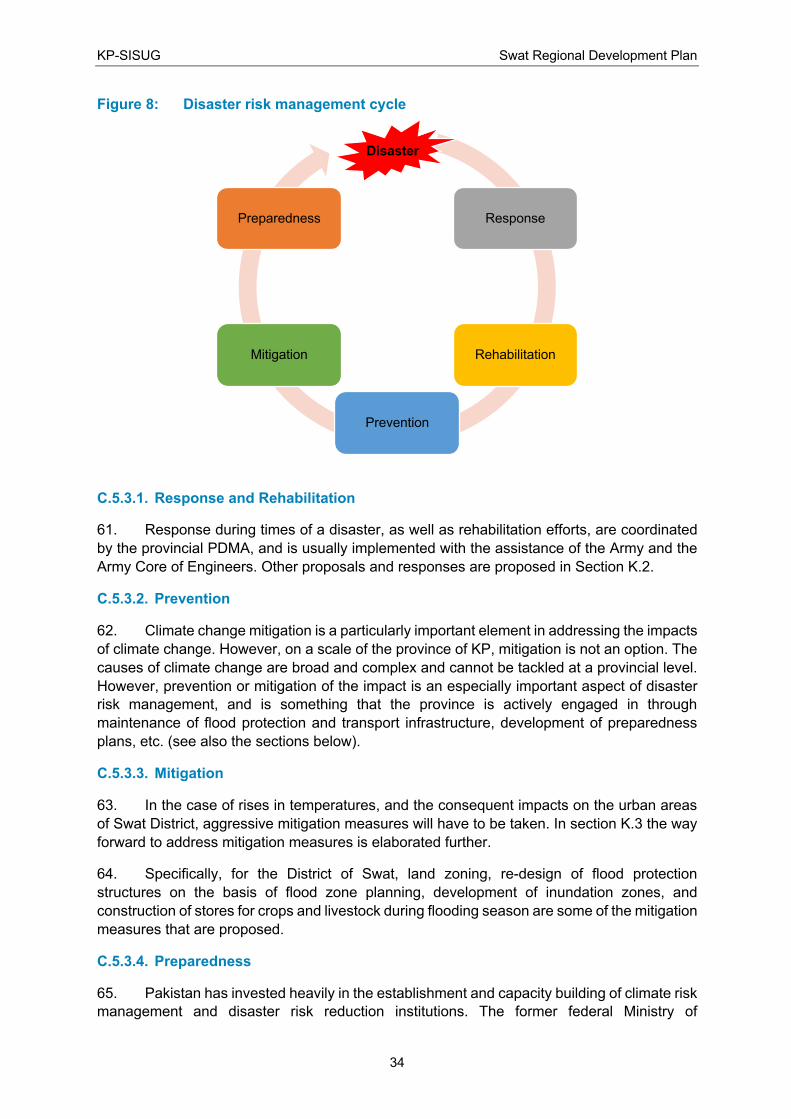
KP-SISUG Swat Regional Development Plan
34
Figure 8: Disaster risk management cycle
C.5.3.1. Response and Rehabilitation
61. Response during times of a disaster, as well as rehabilitation efforts, are coordinated
by the provincial PDMA, and is usually implemented with the assistance of the Army and the
Army Core of Engineers. Other proposals and responses are proposed in Section K.2.
C.5.3.2. Prevention
62. Climate change mitigation is a particularly important element in addressing the impacts
of climate change. However, on a scale of the province of KP, mitigation is not an option. The
causes of climate change are broad and complex and cannot be tackled at a provincial level.
However, prevention or mitigation of the impact is an especially important aspect of disaster
risk management, and is something that the province is actively engaged in through
maintenance of flood protection and transport infrastructure, development of preparedness
plans, etc. (see also the sections below).
C.5.3.3. Mitigation
63. In the case of rises in temperatures, and the consequent impacts on the urban areas
of Swat District, aggressive mitigation measures will have to be taken. In section K.3 the way
forward to address mitigation measures is elaborated further.
64. Specifically, for the District of Swat, land zoning, re-design of flood protection
structures on the basis of flood zone planning, development of inundation zones, and
construction of stores for crops and livestock during flooding season are some of the mitigation
measures that are proposed.
C.5.3.4. Preparedness
65. Pakistan has invested heavily in the establishment and capacity building of climate risk
management and disaster risk reduction institutions. The former federal Ministry of
Disaster
Response
Rehabilitation
Prevention
Mitigation
Preparedness
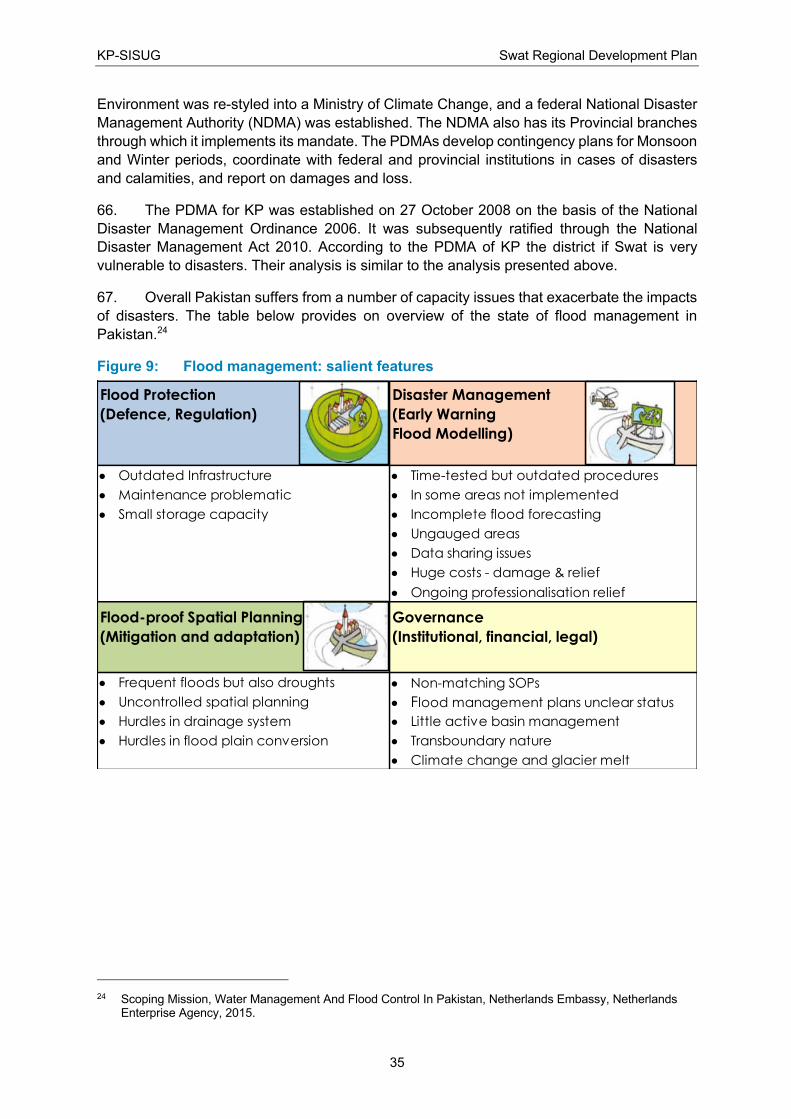
KP-SISUG Swat Regional Development Plan
35
Environment was re-styled into a Ministry of Climate Change, and a federal National Disaster
Management Authority (NDMA) was established. The NDMA also has its Provincial branches
through which it implements its mandate. The PDMAs develop contingency plans for Monsoon
and Winter periods, coordinate with federal and provincial institutions in cases of disasters
and calamities, and report on damages and loss.
66. The PDMA for KP was established on 27 October 2008 on the basis of the National
Disaster Management Ordinance 2006. It was subsequently ratified through the National
Disaster Management Act 2010. According to the PDMA of KP the district if Swat is very
vulnerable to disasters. Their analysis is similar to the analysis presented above.
67. Overall Pakistan suffers from a number of capacity issues that exacerbate the impacts
of disasters. The table below provides on overview of the state of flood management in
Pakistan.24
Figure 9: Flood management: salient features
24 Scoping Mission, Water Management And Flood Control In Pakistan, Netherlands Embassy, Netherlands
Enterprise Agency, 2015.
Flood Protection Disaster Management
(Defence, Regulation) (Early Warning
Flood Modelling)
• Outdated Infrastructure • Time-tested but outdated procedures
• Maintenance problematic • In some areas not implemented
• Small storage capacity • Incomplete flood forecasting
• Ungauged areas
• Data sharing issues
• Huge costs - damage & relief
• Ongoing professionalisation relief
Flood-proof Spatial Planning Governance
(Mitigation and adaptation) (Institutional, financial, legal)
• Frequent floods but also droughts • Non-matching SOPs
• Uncontrolled spatial planning • Flood management plans unclear status
• Hurdles in drainage system • Little active basin management
• Hurdles in flood plain conversion • Transboundary nature
• Climate change and glacier melt
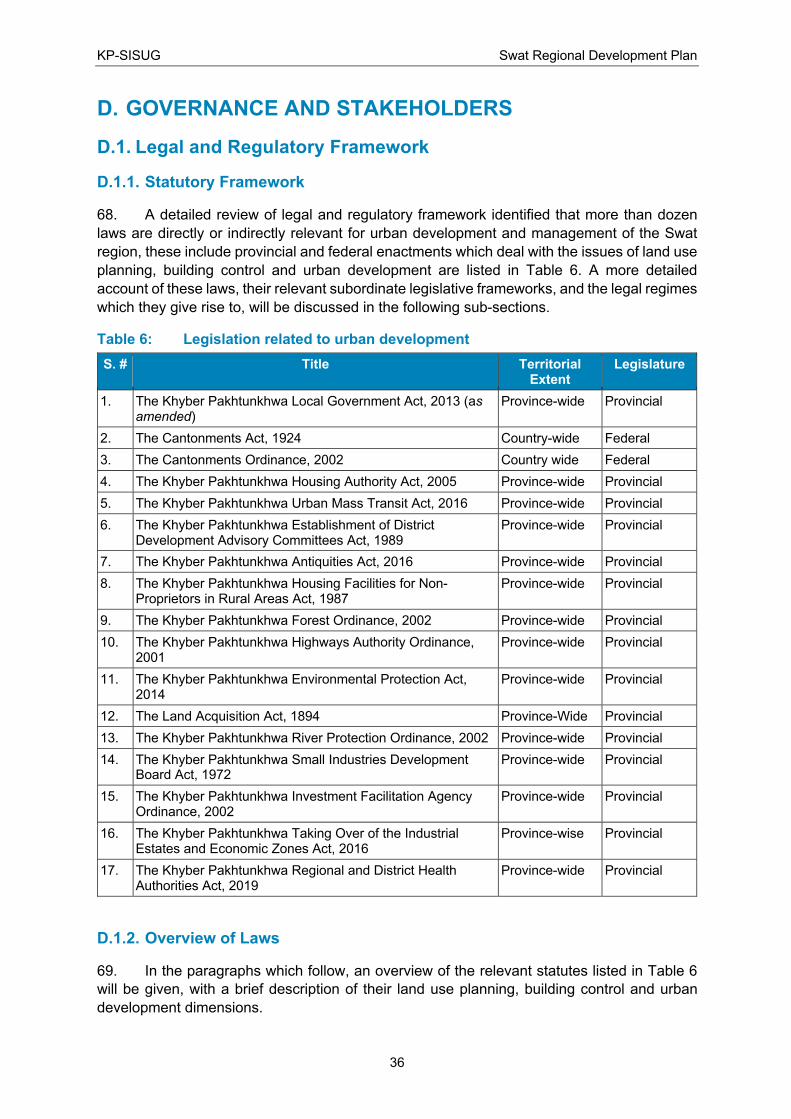
KP-SISUG Swat Regional Development Plan
36
D. GOVERNANCE AND STAKEHOLDERS
D.1. Legal and Regulatory Framework
D.1.1. Statutory Framework
68. A detailed review of legal and regulatory framework identified that more than dozen
laws are directly or indirectly relevant for urban development and management of the Swat
region, these include provincial and federal enactments which deal with the issues of land use
planning, building control and urban development are listed in Table 6. A more detailed
account of these laws, their relevant subordinate legislative frameworks, and the legal regimes
which they give rise to, will be discussed in the following sub-sections.
Table 6: Legislation related to urban development
S. # Title Territorial Extent
Legislature
1. The Khyber Pakhtunkhwa Local Government Act, 2013 (as
amended) Province-wide Provincial
2. The Cantonments Act, 1924 Country-wide Federal
3. The Cantonments Ordinance, 2002 Country wide Federal
4. The Khyber Pakhtunkhwa Housing Authority Act, 2005 Province-wide Provincial
5. The Khyber Pakhtunkhwa Urban Mass Transit Act, 2016 Province-wide Provincial
6. The Khyber Pakhtunkhwa Establishment of District Development Advisory Committees Act, 1989
Province-wide Provincial
7. The Khyber Pakhtunkhwa Antiquities Act, 2016 Province-wide Provincial
8. The Khyber Pakhtunkhwa Housing Facilities for Non-Proprietors in Rural Areas Act, 1987
Province-wide Provincial
9. The Khyber Pakhtunkhwa Forest Ordinance, 2002 Province-wide Provincial
10. The Khyber Pakhtunkhwa Highways Authority Ordinance, 2001
Province-wide Provincial
11. The Khyber Pakhtunkhwa Environmental Protection Act, 2014
Province-wide Provincial
12. The Land Acquisition Act, 1894 Province-Wide Provincial
13. The Khyber Pakhtunkhwa River Protection Ordinance, 2002 Province-wide Provincial
14. The Khyber Pakhtunkhwa Small Industries Development Board Act, 1972
Province-wide Provincial
15. The Khyber Pakhtunkhwa Investment Facilitation Agency Ordinance, 2002
Province-wide Provincial
16. The Khyber Pakhtunkhwa Taking Over of the Industrial Estates and Economic Zones Act, 2016
Province-wise Provincial
17. The Khyber Pakhtunkhwa Regional and District Health Authorities Act, 2019
Province-wide Provincial
D.1.2. Overview of Laws
69. In the paragraphs which follow, an overview of the relevant statutes listed in Table 6
will be given, with a brief description of their land use planning, building control and urban
development dimensions.
KP-SISUG Swat Regional Development Plan
37
D.1.2.1. The KP Local Government Act, 2013
70. The Khyber Pakhtunkhwa Local Government Act, 2013 (the “LGA”) is the enactment
through which the local government system in the province has been re-organized and
consolidated, in furtherance of the constitutional mandate contained in Article 140A of the
Constitution of the Islamic Republic of Pakistan, 1973 (the “Constitution”) which calls for the
establishment of a local government system (in all provinces) and devolution of political,
administrative and financial responsibility authority to the elected representatives of such local
governments.
D.1.2.1.1 Scope and application
71. The LGA applies to the whole of the province except cantonment areas, or any other
area excluded by the provincial Government through notification.25 The Government by
notification may also exempt any area or areas from all or any of the provisions of the Act.26
The local governments established under the LGA function within the Provincial framework
and are obligated to faithfully observe federal and provincial laws, and not impede or prejudice
the exercise of executive authority by the Government.27 As per the newly inserted Section
3(3) of the LGA, the Government is to provide a policy framework for functions devolved to
the local governments which the said governments are obligated to follow, for the purposes of
uniformity. Furthermore, the Government is to prescribe rules of business for local
governments, notifying inter alia the “structure and working of local government
administration”, “allocation of business”, and “coordination of local council business.”28
72. The LGA has undergone multiple amendments since it was first enacted, the most
recent and comprehensive one of which was brought about by the Khyber Pakhtunkhwa Local
Government (Amendment) Act, 2019 (the “2019 Amendment”).
D.1.2.1.2 Tiers of local government
73. Section 5 of the LGA stipulates the tiers of local government, which after the 2019
Amendment have been reduced from three (3) to two (2), with the abolishment of the previous
highest tier, i.e., the district level local governments. The highest tier of local government after
the 2019 Amendment is the Tehsil Local Government (TLG)29 for tehsils, and the equivalent
City Local Government (CLG)30 for Urban Centers. The lower tier comprises of Village
Councils (VC) for a Village31 in rural areas, and Neighborhood Councils (NC) for a
25 Section 1(2). 26 Section 1A. 27 Section 3. 28 Section 5(4). 29 Section 5(1)(c). As per its definition in section 2(gg-ii), the Tehsil Local Government consists of the directly
elected Chairman (previously referred to in the LGA as Nazim) and the Tehsil Local Administration, which in turn is comprised of the Assistant Commissioners, Tehsil Municipal officers and heads of devolved offices. (section 2(gg-i)).
30 Section 5(1)(a). Though the term “Urban Center(s)” is not defined in the LGA; the Government is to notify City Local Governments for Urban Centers of the district, which are to be established at each Divisional Headquarters. There are seven (7) Divisional Headquarters in the province. The Government may also notify any other contiguous group of Neighborhoods as a City Local Government (section 21(5)), or any contiguous village and neighborhood councils in any other district to be a City Local Government (section 6(6)).
31 The basic rural unit in the LGA is the “Village”, defined in section 2(ii) as “an integrated and contiguous human habitation commonly identified by a name and includes a Dhok, Chak, Kalay, Goth, Gaown, Basti or any other comparable habitation.”
KP-SISUG Swat Regional Development Plan
38
Neighborhood32 in areas with urban characteristics. Both VCs and NCs are to be notified by
the Government after a delimitation exercise to be carried out by the Election Commission of
Pakistan.33
74. At the tehsil level, there also exist tehsil councils, which function as a
supervisory/legislative body, working in tandem with the TLG.34 The functions of a tehsil
council include approving taxes, fines and penalties, bye-laws, annual budgets, long and short
term development plans.35
75. As per Section 8 of the LGA, the provisions relating to TLGs and tehsil councils shall
mutatis mutandis apply to the CLGs, unless otherwise provided in the LGA,36 and references
in the LGA to tehsil councils are to be read as referring to City Local Councils.
D.1.2.1.3 Authority of governments
76. The executive authority of the TLG vests in its Chairman who is responsible for its
business being carried out in accordance with the Act and other laws.37 The Chairman is
directly elected through party-based elections, with the whole tehsil acting as a single
constituency.38 In performance of his functions, the Chairman is to be assisted by the Tehsil
Local Administration as given in Tenth Schedule.39
77. The VCs and NCs comprise of the members as provided in Part-II of the Eleventh
Schedule,40 who are directly elected on a non-party basis.41 The candidate securing the most
votes in election to the general seats of the VC or NC shall be its Chairman,42 in whom the
executive authority of the VC or NC vests.43
D.1.2.1.4 Devolution and transfer from predecessor governments
78. On commencement of the 2019 Amendment, the administrative and financial authority
for management of the offices of Government specified in First Schedule in a tehsil stand
devolved to the TLG of that tehsil.44 On such commencement, the organization, functions,
administration and financial management of local councils in the province were also to come
under the administrative and financial control of the “successor local governments” as
32 The basic urban unit in the LGA is the “Neighbourhood”, defined in section 2(s) as: “a mohallah, a group of
streets, lanes or roads, in areas with urban characteristics, designated as Neighbourhood by Department.” 33 Section 26. 34 Section 24. 35 Section 25. 36 For the purposes of City Local Governments, Chairmen are referred to as Mayors, whereas the Tehsil Local
Administration is the City Local Administration. 37 Section 21(3). 38 Section 21(2). 39 Section 21(4). The Tenth Schedule lists inter alia the government machinery corresponding to the devolved
offices in Schedule 1. 40 Section 27(1). 41 Section 27(2). 42 Section 27(3). 43 Section 27(4). 44 Section 22. Through successive amendments to the LGA, the number of devolved offices has been reduced
from the original 24, and now stand at 8.
KP-SISUG Swat Regional Development Plan
39
provided in Section 121.45 As per Section 121(2), the Local Government Elections and Rural
Development Department, Government of KP (the “Department”) shall retain and continue to
exercise control over Local Area Development Authorities in the province.46
79. As per the newly inserted Section 121A of the LGA, on commencement of the 2019
Amendment, the new local governments to be established thereunder are to succeed the
“functions, rights, assets and liabilities of the local councils established before the
commencement of the” 2019 Amendment, in the following manner:
(a) City District Government to City Local Government (CLG)
(b) District Government (other than City District Govt) to respective Tehsil Local
Government (TLG)
(c) Tehsil Municipal Administration or Town Municipal Administration, shall stand
integrated with respective Tehsil Local Government (TLG)
(d) village councils in rural areas with respective village councils.
(e) neighborhood councils with respective neighborhood councils.
80. In light of the above amendments, it can be seen that the 2019 Amendment has done
away with the district-level tier of local government, and has mandated the transfer of its
functions to the tehsil/city level, and the division and distribution of its rights, assets etc.
amongst the various TLGs and CLGs.
81. As per Section 121A(2), the Department shall, as soon as possible, designate an
officer to divide the rights, assets and liabilities of the district governments as well as City
District Government Peshawar, including adjustment of staff, amongst the local governments.
The decision of the designated officer is to be final.
D.1.2.1.5 Land use planning, building control and urban development functions
82. Land-use planning, building control and urban and rural development would all fall
under the definition of “municipal services” provided in Section 2(r), which include:
“intra-city network of water supply, sanitation, conservancy, removal and
disposal of sullage, refuse, garbage, sewer or storm water, solid or liquid waste,
drainage, public toilets, express ways bridges, flyovers, public roads, streets,
foot paths, traffic signals, pavements and lighting thereof, public parks,
gardens, arboriculture, landscaping, bill boards, hoardings, firefighting, land
use control, zoning, master planning, classification, declassification or
reclassification of commercial or residential areas, markets, housing, urban or
rural infrastructure, environment and construction, maintenance or
development thereof and enforcement of any law or rule relating thereto”
[emphasis supplied]
45 Section 22(2); the reference to section 121 seems to be an error, and probably ought to refer to section 121A
instead. 46 It is unclear as to which Development Authorities this is in reference to, as the term is not defined in the LGA.
However, through the KP Local Government (Second Amendment) Act, 2019, it has been clarified that the Galiyat Development Authority and Kaghan Development Authority are excepted from this section.
KP-SISUG Swat Regional Development Plan
40
83. Municipal services (including water and sanitation) is one of the offices devolved to
local governments under the LGA.47
84. The primary responsibility for land use planning and building control under the LGA
has been given to the Chairmen, TLG,48 and Mayors, CLG.49 Whereas, the tehsil councils
have the power to approve long and short term development plans proposed by the Chairman,
TLG.50 In addition to this power which is available to all tehsil councils, City Local Councils
have the function and power to “approve master plans, zoning, land use plans, including
classification and reclassification of land, environmental control, urban design, urban renewal
and ecological balances”51 and “approve development schemes for beautification of areas
along rivers, canals, streams”.52
85. At the lower tier, VCs and NCs have been assigned the responsibility to report to the
District Administration and TLG in respect inter alia of “violation of land use plans, building
codes, rules and bye-laws”.53
D.1.2.2. The Cantonments Act, 1924 and the Cantonments Ordinance, 2002
86. Presently, both the Cantonments Act, 1924 and the Cantonments Ordinance, 2002 are
functional to certain extents. The election provisions of the Cantonment Ordinance are
operative since 200354 while other provisions are still to be operationalized till such time the
Cantonments Act, 1924 remains operative.
87. The Cantonments Act, 1924 provides that the Federal Government may by notification
declare any place it requires for service of it forces55 to be a cantonment. It may include within
a cantonment any local area.56 Hence, cantonments can extend and develop as per the
notifications of the Federal Government. Under the Act, cantonments may be classified into
three categories, Class I cantonments in which one hundred thousand or more civil population
reside; Class II, where between one hundred thousand to fifty thousand reside., Class III,
where less than fifty thousand civil population resides.57
88. The institutional structure provided under the Cantonments Act, 1924, consists of
various Cantonment Boards.58 Constitution of the Board varies according to the Class of the
47 Serial No. (vi) of the First Schedule. 48
Who under section 23A(f) have the power to “prepare spatial plans for the tehsil including plans for land use and zoning and disseminate these plans for public enquiry.” It is unclear how and by whom these public enquiries are to be carried out. Furthermore, under section 23A(l), they have been given functions pertaining to “urban and housing development, including urban improvement and upgrading, and urban renewal and redevelopment, with care being taken to preserve historical and cultural monuments.”
49 Who have the additional function under section 25A(a) of reviewing implementation of “rules and bye-laws governing land use, housing, markets, zoning, roads, traffic, tax, infrastructure, under passes, and inter-town streets”.
50 Section 25(d). 51 Section 25A(2)(a). 52 Section 25A(2)(b). 53 Section 28(1)(d). 54 By SRO 686 (I)/2003, dated 3rd July 2003, published in gazette on 9th July 2003. 55 Section 3. 56 Section 4. 57 Section 13. 58 Section 10.
KP-SISUG Swat Regional Development Plan
41
Cantonment.59 The Boards are responsible for handling all development issues including
provision of sufficient water, sanitation, disposal of solid waste, safety of buildings,
maintenance of roads and pavements etc.60 All development and expansion within the
Cantonment area is done by the Cantonment Boards under the Act, even the extension of
cantonments is done by the Federal Government and the provincial or city governments have
no power to check or control the expansion.
89. Whilst the Cantonments Ordinance, 2002 provides for spatial planning, land-use, land
sub-division, land development and zoning by the Cantonment Administration,61 this provision
and other related provisions are not yet operative.
90. The construction, reconstruction, alteration or extension of any building62 is to be
approved and monitored by the relevant Board under the Cantonments Act, 1924.
D.1.2.3. The KP Housing Authority Act, 2005
91. The KP Housing Authority Act, 2005 was promulgated to establish a comprehensive
system of town planning at different levels in the province to ensure systematic integrated
growth of urban and rural areas and to achieve the object of “Housing for All”, including
housing for shelter-less Government servants, and to that end to create an Authority for proper
achievement of the aforesaid objects.
92. The Act applies throughout the province, and the Authority created thereunder is
comprised of the Minister for Housing, or the Advisor or Special Assistant to the Chief Minister
on Housing; the Secretary Housing Department; representatives of Planning and
Development Department, the Finance Department, and the Local Government and Rural
Development Department; Member Board of Revenue; three representatives of
Builders/Construction Industry and Architects and Consultants; any two persons to be
nominated by the Government from retired Engineers. the DG of the Authority.63
93. The powers and functions of the Authority include,64 to: (i) implement the national
housing policy, coordinate and liaise with the Federal Government, District Governments,
Tehsil and Town Municipal Administrations, concerned departments and Government
Agencies; (ii) identify state and other lands for developing low income and low cost housing
schemes; (iii) facilitate construction of multi-story flats (low cost housing) in collaboration with
the District Governments and Tehsil and Town Municipal Administrations; (iv) facilitate land
availability and develop comprehensive land information for planning & development
requirements for 5-10 years; (v) to prescribe mechanism for acquisition of land, on land
sharing basis; (vi) deal with the issues relating to rehabilitation and settlement of landless
owners in the prescribed manner; (vii) develop packages in which prime state land occupied
by katchi abadi, shall be offered to the private developers for commercial use; provided they
arrange finance or relocation of katchi abadi; (viii) formulate provincial land use policy, plan
and prepare regional development plans (Inter District Spatial Planning-Master Plans) for an
integrated, coordinated and systematic planning to ensure orderly growth and development of
59 Section 13A. 60 Chapter VIII, IX and X. 61 Section 16. 62 Section 178 A & 179. 63 Section 3(3). 64 All powers and functions listed in Section 4(2).
KP-SISUG Swat Regional Development Plan
42
physical infrastructure such as highways, railways, industrial zones, conservation of forest
reserves and provision of electricity, telephone, sui gas, etc.; (ix) plan a comprehensive
program for the development of satellite, intermediate, secondary and industrial towns to
reduce migration and drift to big settlements; (x) develop Geographic Information System for
efficient land documentation and information related to housing and town planning. (xi) provide
technical assistance to the District Governments and Tehsil and Town Municipal
Administrations towards capacity building in all matters related to housing and town planning.
94. The Act has conferred upon the Authority the following powers in relation to the
preparation of schemes:
(a) The Authority, in consultation with the Government Agency65 concerned shall prepare
and execute schemes for the purposes of this Act in various urban and rural areas,
subject to Government’s approval;66
(b) The Authority may modify a scheme so prepared in consultation with Government
Agency concerned;67 and
(c) The Authority may give directions to the Government Agency concerned to execute
work, take over and maintain works and services, and provide amenities in relation to
land falling under any scheme.68
95. Where the Authority is satisfied that any direction given by it under section 18 with
regard to any scheme has not been carried out by the Government Agency concerned, it has
the power under section 19 to itself undertake any work for the execution of that scheme, the
cost of which shall be borne between the Authority and concerned Government Agency as
agreed, or on the failure to so agree, by the Government.
96. The Authority, in the discharge of its functions, is obligated to act and be guided by
directions given by the Government from time to time.69
97. The Authority also possesses the power under section 21 to declare, by notification in
the official Gazette, “any locality to be a Controlled Area”, for the purposes of the Act and to
issue in respect of such locality “such directions as it considers fit and appropriate and do all
such things as may be necessary for the prevention of haphazard growth, encroachments and
unauthorized construction in such area.”
D.1.2.4. The KP Urban Mass Transit Act, 2016
98. Though primarily concerned with planning, establishing, coordinating and regulating
mass transit system and supporting systems in the province, the KP Urban Mobility Authority
created thereunder has certain land use and planning functions as well. Pursuant to Section
4(2)((i) it has the power to “examine the plans for all land use master plans, schemes and
projects primarily related to infrastructure and land use but not limited to that initiated by any
65 As per section 2(d), “Government Agency” includes- (i) a division, department, bureau, section, commission,
board, office or unit of Government. (ii) District Government, Tehsil and Town Municipal Administration, a Development Authority or any other body, company or corporation (whether autonomous or semi-autonomous) owned or controlled by Government;”.
66 Section 16. 67 Section 17. 68 Section 18. 69 Section 20.
KP-SISUG Swat Regional Development Plan
43
Department or authority of Government, as to ensure their compatibility, suitability and
sustainability with present and future mass transit systems, schemes and projects. In this
respect, the Authority shall assist the relevant Departments of Government to the extent of
mass transit systems, planning and infrastructure and issue no objection certificates for the
master plans in accordance with long term plans, strategies, roadmaps and projects pertaining
to mass transit systems.”
D.1.2.5. The KP Establishment of District Development Advisory Committees Act,
1989
99. The KP Establishment of District Development Advisory Committees Act, 1989 and
was set up to provide for proper planning and supervision of local level development activities
in the province, with each district to have its own District Development Advisory Committee.
100. The Committees consist of all the members of the Provincial Assembly from that
District; such other elected representatives as the Government may notify as co-opted
members; such heads of Attached Departments at the district level as may be co-opted by the
Committee; as well as the District Nazim, City District Nazim, Tehsil Nazim/Town Nazim,70 as
the case may be, as co-opted members.71 Co-opted members have no right to vote.72
101. The Committees are to formulate and recommend:73
(a) proposals for Annual Development Program (ADP) of the District and communicate it
to the P&D Department.
(b) the list of schemes to be implemented under the Rural Development Program, other
than those of the Union Councils.
(c) locations or sites for such development projects as may be included in the local
program of the ADP.
102. Additionally, the Committees may even determine the location and select sites for
development schemes in primary, middle and high school education, rural health and public
health engineering.
103. The Committees are also empowered to formulate and recommend location and sites
for such development projects in such other sectors as may be including the ADP of any local
area which may even include policies for electrification of villages in any part of a district.
D.1.2.6. The KP Antiquities Act, 2016
104. The Act repeals the KP Antiquities Act, 1997 and provides for the protection,
preservation, development and maintenance of antiquities in the Province of the Khyber
Pakhtunkhwa.
105. In terms of land use and building control, the Act states inter alia that:
70 Note that the 2019 Amendment to the LGA has now done away with the posts of District Nazim and City
District Nazim, whereas the Tehsil Nazim and Town Nazim are now referred to as the Chairman TLG, and the Mayor CLG, respectively.
71 Section 3(1). 72 Section 3(2). 73 Under Section 4.

KP-SISUG Swat Regional Development Plan
44
(a) The Director of the Directorate of Archaeology and Museum, KP may cause land
containing antiquities to be acquired by the Revenue Department under the Land
Acquisition Act, 1894.74
(b) The Government may declare any immovable property as protected antiquity,75 and
notwithstanding anything contained in any other law, no development plan or scheme,
or new construction may be undertaken or executed within two hundred feet of a
protected immovable antiquity without the approval of the Director.76
(c) No mega development project for residential, commercial, industrial, dams, irrigation
system, drainage system or any other activity in either the public of private sector is
permissible without first obtaining clearance from the Director.77 The Government in
consultation with the Advisory Committee is to decide whether to issue a NOC in this
regard.78
(d) The District Governments are to take all possible measures to protect, preserve and
promote the culture heritage of the Province. The District Government shall be
facilitated by Sports, Culture, Tourism, Archaeology, Museums & Youth Affairs
Departments to undertake the management, conservation and promotion of the
cultural heritage located within their jurisdiction. The District Government shall allocate
sufficient funds for protection, conservation, restoration, rehabilitation and promotion
of such antiquities.79
D.1.2.7. KP Housing Facilities for Non-Proprietors in Rural Areas Act, 1987
106. The Act was promulgated to provide for housing facilities to non-proprietors in rural
areas of the province. The relevant authorities thereunder are the Government and Allotment
Committees to be constituted under Section 5 of the Act, in each District for which a scheme
has been prepared. The Committees are to consist of the Members of the Provincial Assembly
from that District and such other members as may be prescribed. The Chairman of the District
Planning and Development Advisory Committee shall be Ex-officio Chairman of the Allotment
Committee.80
107. Under Section 3 of the Act, subject to the availability of funds, the Government may
prepare schemes in rural areas for developing housing colonies for free of cost grant to non-
proprietors. The Government may reserve a percentage of plots for allotment to Mustahqeen-
e-Zakat.81 Plots not exceeding seven marlas may be allotted free of cost to non-proprietors in
such schemes, subject to terms and conditions, solely for the construction of houses thereon
for their residence.
74 Section 12. 75 Section 15. 76 Section 55. 77 Section 56(1). 78 Section 56(3). 79 Section 71. 80 Section 5(2). 81 Defined in section 2(f) as: “a person who is entitled to receive money from the Zakat Funds established
under the Zakat and Ushr Ordinance, 1980 (Ord. No. XVIII of 1980)”.
KP-SISUG Swat Regional Development Plan
45
D.1.2.8. The KP Forest Ordinance, 2002
108. The law relating to protection, conservation, management and sustainable
development of forests and natural resources. The Ordinance provides for four categories of
forest areas, Reserved Forest,82 Village Forest, Protected Forest and Guzara Forest and
wastelands. The government by notification may constitute any land as reserved forest and a
forest settlement board would determine and deal with all rights of persons within the said
area,83 and the government may revise after five years any arrangements made with the
community regarding right to pasture or forest produce etc.84 The Government may de-notify
any reserved forest85 and it may also assign to a village community the rights of the
Government; such assignment and all such land would be called village forest.86 The
Government may declare any forest or wasteland which is not reserved forest to be protected
forest.87
109. The Conservator of Forests may, for certain purposes specified in Section 36 prohibit
(i) encroachment by breaking up or clearing of land for cultivation or construction of sheds,
building, road, enclosure or any other infrastructure, or its occupation as sites for sheds,
buildings or enclosures; (ii) pasturing of cattle; (iii) burning or clearing of vegetation; (iv) cutting
of particular types of trees listed in Schedule-I or removal of forest produce; (v) quarrying of
stones, mining of minerals, burning of lime or charcoal; (vi) hunting, shooting, poisoning of
water, or setting of traps and snares; or (vii) polluting of soil or water by sewerage, sewage,
domestic or industrial waste or any other pollutants, or means.
110. Guzara forest is protected wasteland of the villages set aside in the areas comprising
the Districts of Haripur, Abbottabad, Mansehra, Kohistan and Batagram and elsewhere in the
Province.88 While the control of Guzara forests and wasteland shall be with the Conservator
of the forests, for conservation and sustainable development,89 management shall vest in the
Department.
111. The Ordinance provides for a Forest Force for enforcement of the provisions of the
Ordinance. Forest officers have wide powers including the power to arrest, seize timber and
other forest produce etc. The law provides for penalty and punishment for violations of the law.
112. The Department will approve provincial forest policy, strategic management plans,
forest management plans, operational plans and village plans shall be managed by authorized
forest officer. For adequate and timely availability of funds for implementation of forest
management plan there shall be a forest development fund.
D.1.2.9. The KP Highways Authority Ordinance, 2001
113. The Ordinance was promulgated in 2001 to establish a Highways Authority in KP for
the purposes of planning, promoting, organizing and implementing programs for construction,
82 In which, as per Section 26, there can inter alia be no encroachments, construction, trespass or grazing, fire
or damage to trees, quarrying, polluting, hunting or shooting. 83 Section 5. 84 Sections 15-16. 85 Section 27. 86 Section 28. 87 Section 29. 88 Section 2(23). 89 Section 35.
KP-SISUG Swat Regional Development Plan
46
development, operations, repairs and maintenance of Provincial Highways and other roads
specially entrusted to it by the Government.
114. The Ordinance set up the KP Highways Authority (KPHA) and the KP Highways
Council, which is comprised of the Chief Minister KP, the Ministers of Works, Finance, and
Environment, the ASC P&D, Secretary Finance, Secretary Works & Services, and the
Managing Director of the Authority.
115. The KP Highways Council has been empowered90 to review and recommend
perspective plans, five years plans for highways and roads in the province, lay down policies
and guidelines to be followed by the Authority, appraise review and approve projects and to
recommend the annual budget of the Authority to Government for approval.
116. The KP Highway Authority has wide ranging powers over the roads and highways
approved by the KP Cabinet.91 Not only does the Authority advise the Government on matters
related to provincial highways and other roads, it may also levy and collect tolls on highways
and such other roads and bridges entrusted to it.
117. The Authority, inter alia, is also required to prepare a master plan for the development,
construction operation and maintenance of highways and roads in KP for the approval of the
Cabinet, and may even notify the right of way around highways, roads, and bridges around
which it would be illegal to make any changes to the land use without the consent of the
Authority.
D.1.2.10. The KP Environmental Protection Act, 2014
118. After devolution of the subject of environment to the Provinces post the 18th
Amendment to the Constitution, in 2014, the KP Legislature passed the KP Environmental
Protection Act, 2014, repealing the application of the Pakistan Environmental Protection Act,
1997 to the Province.
119. The Act provides for the protection, conservation, rehabilitation and improvement of
the environment, for the prevention and control of pollution, and promotion of sustainable
development.
120. The Act establishes the Environmental Protection Agency for KP as well as the
Environmental Protection Council comprising relevant government officials for the purposes
of setting the policy direction of the Authority.
121. The Act under Section 12 thereof empowers the Government to seek a strategic
environmental assessment, of socio-economic development, industrial and agricultural
development, urban and rural development, land use and water use management; economic
zones or industrial parks and estates; transport and infrastructure; solid, municipal and
industrial waste; tourism; or any other plan or policy likely to have an adverse impact on
environment; Additionally, the Government may also require a strategic environmental
assessment for the prevention of water pollution through improper sanitation and control flow
of sanitation water into the rivers. specifying separate zones for poultry and cattle farming and
slaughtering houses.
90 Section 6. 91 Section 10.
KP-SISUG Swat Regional Development Plan
47
122. The Government may also advise and require development authorities and local
governments to include such measures and take such steps, as it deems necessary, to modify
the policy or development plan according to environmental objectives.
123. The Environmental Protection Council on the other hand is, inter alia, empowered92 to
approve comprehensive environmental93 policies, action plans and ensure their
implementation; approve the Khyber Pakhtunkhwa Environmental Quality Standards; provide
guidelines for the conservation of, renewable and non-renewable resources, solid waste
management and water sanitation; co-ordinate integration of the principles and concerns of
sustainable development into development plans and policies at the provincial, district and
local levels by formulating/prepared district and provincial strategies; develop a
comprehensive Land Zonation strategy to save the agriculture and forest land., crucially, to
facilitate establishment of district level environmental councils in a prescribed manner where
the District Nazim94 of Local Government is also member in addition to the concerned
government departments/ stakeholders.
124. The Environmental Protection Authority, along with the usual powers of issuing EPOs,
setting the relevant standards and implementing the same, is also empowered to prepare, in
co-ordination with the appropriate Government Agency or local council95 and in consultation
with the concerned sectoral Advisory Committees where established, environmental policies
for the approval of the Council;96 establish standards for the quality of the ambient air, water
and land, establish different standards for discharge or emission from different sources and
for different areas and conditions as may be necessary, establish a list of areas, with the
approval of the Council, in which any class of activities or projects97 shall not be carried out or
shall only be carried out subject to certain specified safeguards, assist Government Agencies,
local councils, local authorities and other persons to implement schemes for the proper
disposal of wastes so as to ensure compliance with the Khyber Pakhtunkhwa Environmental
Quality Standards, impose ban through an official notification, on commencement or operation
of any activity or work or mobility or transport in a particular area or premises, by declaring it
as environmentally sensitive or protected or prohibited, for a particular time period as and
when required to safeguard the natural environment, prevent and control pollution with prior
approval of the Government, and conduct IEEs & EIAs of projects likely to have adverse
environmental impacts and suggesting mitigation measures for the same.
125. The EPA has sufficient powers to enforce the provisions of the Act and any rules,
regulations or standards that may be framed thereunder. Environmental Tribunals have also
been set-up in the Province to specifically deal with matters arising under the Act.
92 Section 4. 93 Environment, inter alia, includes land and buildings (Section 2(r)). 94 Note that the 2019 Amendment to the LGA has now done away with the post of District Nazim. 95 Local council means a body constituted under a law regulating local governments (Section 2(ii)). 96 Section 6. 97 As per Section 2(ss), “Project” includes change in land use, urban development, alteration, expansion,
repair, decommissioning, etc. of buildings and works.
KP-SISUG Swat Regional Development Plan
48
D.1.2.11. The Land Acquisition Act, 1894
126. The Land Acquisition Act 1894 (LAA) provides for acquisition of land and empowers
the provincial government to acquire land for public purpose98 or for a Company.99 LAA
provides a complete process how public notices and hearings to be conducted before land
may be acquired.
127. Under the LAA whenever Collector of a District considers certain land in a locality is
required for public purpose or for a company a notification100 shall be published along with a
public notice identifying certain area for proposed for acquisition. All persons interested in the
land who would be entitled to compensation may object to the public purpose, area of land or
compensation.101 After hearing of objection the Commissioner my declare specific area for
acquisition for public purpose or company.
128. After finalizing the specific area, the Collector after hearing the interested person
determine the final compensation102 and announce the Award.103 Before taking possession of
the land the Government shall pay compensation as been determined.104 There is an absence
of settlement provisions under the law.
129. However, in cases of urgency after determining public purpose, but before determining
compensation land may be acquired within fifteen days of giving notices under section 9.105
For most large scale urban and even rural public project over the years, urgency provisions
were most prevalent without really determining the urgency.
D.1.2.12. The KP River Protection Ordinance, 2002
130. The Ordinance was promulgated in 2002 to “provide for the protection of the aquatic
ecology, water quality, economic and environmental value of the rivers and their tributaries in
KP” and extends to such length of rivers or their tributaries, or any particular river or stream or
any part of a river or its tributary, as the Government may, from time to time, by notification in
the Official Gazette, specify.
131. The Ordinance prohibits106 construction, or any related physical works of any
commercial building or non-commercial building, or any other developmental work, within two
hundred feet to be measured along the slope (lay off land) beyond high water limit on either
side of the rivers or their tributaries or on a space within the limits between the banks of a river
as well as the deposit or release, directly or indirectly, of any substance into the river or their
tributaries, in excess of the environmental quality standards notified from time to time and the
disposal, directly or indirectly, of any solid waste or hazardous waste or other additional
substances specified and notified by Government into rivers or their tributaries.
98 Section 3 (f) Public purpose has not been adequately defined, the definition merely includes a few things 99 According to the courts even though the law does not specifically state that Companies have to be have a
public purpose but that is assumed. 100 Section 4 101 Section 5A (the law requires all persons interested may object to the acquisition and may be heard in person
or through written objections.) 102 Section 9 103 Section 11 104 Section 16 105 Section 17 106 Section 3.
KP-SISUG Swat Regional Development Plan
49
132. Additionally, and specifically in the context of land use and zoning, the Government
may prepare land use and zoning plans for the catchment area or a part thereof for a specific
river or for all the rivers and their tributaries to which this Ordinance applies and require
mandatory compliance with such plans. The area up to fifteen hundred feet starting from two
hundred feet to be measured along the slope (lay off land) beyond the high water limits on
either side of the rivers or their tributaries has been designated as the Provincial Control Area,
wherein construction or other developmental activities shall be undertaken in accordance with
the land use and zoning plans prepared under this Ordinance.
133. The Government may even make regulations, or apply any of the existing building
control regulations, under any other law for the time being in force, to control construction of
buildings in the catchment areas of any river or a part thereof and any organization or
individual, who intends to construct bridge, culverts, crossing structure and flood protection
works on rivers, streams, nullahs, drains and water channels has to obtain an NOC, before
the commencement of works.
134. The law also specifically deals with the issue of sanitation107 and requires owners,
proprietors or managers of all existing hotel or other building, within 200 feet of both side of
the river to ensure construction of proper septic tanks and a soaking pit or an alternate
arrangement acceptable to the Authorized Officer, and of new buildings, houses, hotels, etc.,
within the Provincial Control Area to make similar arrangements. No new building, house,
structure, or hotel used for commercial or non-commercial purposes, within the Provincial
Control Area is allowed to be made unless the above arrangements are followed, however, a
kacha house built by a local inhabitant for his agriculture purposes is exempted from the
above.
D.1.2.13. The Khyber Pakhtunkhwa Small Industries Development Board Act,
1972
135. This Act establishes a Small Industries Development Board for the Province of Khyber
Pakhtunkhwa for promoting development of industries in the Province with particular reference
to small and cottage industries.
136. The General Manager of the Board is to be its Chief Executive and manage the day to
day affairs of the Board in light of the instructions given by the Government and the Directors
of the Board. There are to be at least four directors on the Board to be headed by its Chairman.
137. The Board is to render assistance in the establishment and development of cottage,
small and other industries in the province and, inter alia, prepare and submit schemes to
Government for the development of cottage, small and other Industries as well as to lay down
policy for the promotion of small industries in the Province.
138. The Board may also establish small industrial estates and sponsor industries for that
estate. The Board may also in special cases with the approve of the Government establish
small industrial estates in less developed areas as well as establishing artisan colonies, design
centers, workshops, institutes for promotion and development of handicrafts.
107 Section 7.
KP-SISUG Swat Regional Development Plan
50
D.1.2.14. The Khyber Pakhtunkhwa Investment Facilitation Agency Ordinance,
2002
139. The Ordinance establishes an Investment Facilitation Agency for the Province as well
as an Investment Facilitation Council comprising the CM KP, Minister Industries, ASC P&D,
Secretary Industries, Secretary Finance, Chairman & MD Bank of Khyber, a representative of
KP Chamber of Commerce, /APTMA etc. and the MD of the Agency.
140. The Investment Facilitation Council is responsible for the general direction and
administration of the Agency and is to be guided by concerned Government Policy. The
Council is to advise the Board of the Authority on industrial priorities and preferences being
pursued by the Federal Government.
141. The Agency is empowered to manage existing industrial estates/EPZ, establish more
industrial estates where required, provide one-window investment facilities for private, public-
private and foreign joint-venture investment; manage the affairs of Provincial Committee of
Investment (PCOI) and to coordinate with the Federal Board of Investment (BOI); apprise the
Ministry of Industries, Government of Pakistan, on impediments and problems being faced by
the industrial sector in the KP; identify new investments and industries and to prepare
opportunity studies and feasibility studies in various sectors. explore new markets, goods and
services and to identify viable small, medium and large scale enterprises based upon
indigenous raw material, cost effective with good market prospects within the country and
abroad.
142. However, some of the industrial estates falling under the jurisdiction of the Ordinance
have been transferred to the Khyber Pakhtunkhwa Economic Zones Development and
Management Company.
D.1.2.15. The Khyber Pakhtunkhwa Taking Over of Industrial Estates or Economic
Zones Act, 2016
143. The Act provides for the taking over of the Industrial Estates or Economic Zones of the
Khyber Pakhtunkhwa Development Authority by the Khyber Pakhtunkhwa Economic Zones
Development and Management Company and to transfer all its assets and liabilities including
employees to the said Company.
144. The KPEZDMC, being a corporate entity, may be used as a vehicle by the KP
Government to execute projects which may otherwise be in the competence of the KP
Government under some other law to carry out, or to implement policies or carry out such
other functions as the KP Government may nominate it for under any law for the time being in
force.
145. Under the Act, the Industrial Estates or Economic Zones mentioned in the Schedule
thereto, along with all assets, liabilities, records, matters ancillary thereto and employees of
the KP Development Authority established under the KP Development Authority Act, 1972,
have been transferred to this non-statutory corporate entity, i.e., the KPEZDMC.
146. The following economic zones have been transferred to the KPEZDMC: Hattar
Industrial Estate Phase VII, Rashakai/M-1 Industrial Estate, Jalozai Industrial Estate, Ghazi
Industrial Estate, Dera Ismail Khan Industrial Estate, Bannu Industrial Estate, Hattar Industrial
Estate, Gadoon Industrial Estate, Hayatabad Industrial Estate, Nowshera Industrial Estate,
Industrial Estate Mansehra and Industrial Estate/Marble City in Chitral.
KP-SISUG Swat Regional Development Plan
51
D.1.2.16. The Khyber Pakhtunkhwa Regional and District Health Authorities Act,
2019
147. The Act aims to provide for a comprehensive and efficient healthcare system in the
province of the Khyber Pakhtunkhwa and to devolve authority and accountability at the
regional and district level by re-organizing the health facilities in the province of the Khyber
Pakhtunkhwa. The law overrides all other laws on the subject (which includes the Local
Government laws).
148. It extends to the whole of KP and applies to all existing health facilities in the public
sector and such other facilities as may be established.
149. The Act establishes a Policy Board consisting Minister Health KP, Secretary Health
KP and Chairpersons of all Regional Health Authorities. The Policy Board is empowered to,
in consultation with the Government, set standards and policies for Regional Health
Authorities; recommend and approve model regulations and policies to be framed by the
Regional Health Authorities; plan and implement specialized training programs; establish
minimum qualifications for posts in the Regional Health Authorities; provide guidance and
advice on any matter referred to by the Regional Health Authority or the Government.,
safeguard farmers rights & interests, review annual reports of each Regional Health Authority
and give recommendations thereon and assist, aid or advise the Government on any matter
relating to health facilities.
150. On the other hand, Regional Health Authorities are to be notified at each divisional
level comprising two doctors, a senior nurse and two eminent persons from any of the fields
of law, finance, economics or management, or retired government servants, educationalists,
civil society, businessmen or renowned philanthropists. The Regional Health Authority is
responsible for overseeing the effective management of, and providing strategic directions to,
the health facilities in an assigned region, allocate funds to health facilities under its
supervision, overseeing health service delivery within the policy framework given by the
Government, implement policies and directions of Government, achieving KMIs set for
healthcare programs, create, re-designate or abolish posts; framing of regulations for
employees and overseeing process of appointment; approve programs and services to ensure
that health facilities fulfil legal, regulatory, and accreditation requirements; ensure coordination
of health related emergency response during any nature calamity or emergency and ensuring
liaison with Government for technical and logistical support; establish or upgrade health
facilities in the district either on its own or on the recommendation of a District Health Authority.
151. The law also mandates that District Health Authorities are to be notified at each district
level and to act as the implementing arm of the concerned Regional Health Authority to be
headed by a Chief Executive Officer and a doctor, a nurse, and three eminent professionals
from any of the fields of law, finance, economics or management, or retired government
servants, educationalists, civil society, businessmen or renowned philanthropists. It is to be
headed by a Chief Executive.
152. The District Health Authority is responsible for all public health facilities for better
healthcare delivery in the district; management and supervision of health facilities in the
district; making plans, strategies and recommendations for the Regional Health Authority for
allocation of necessary funds; developing referral and technical support linkages between
health facilities and tertiary level health facilities & medical educational institutions; develop
linkages between private and public health sectors; ensure timely and adequate reporting of
KP-SISUG Swat Regional Development Plan
52
progress on health indicators and issues relating to disease surveillance, epidemic control and
disaster management to the Regional Health Authority; implement policies and direction of the
Regional Health Authority including achievement of KMIs set; ensure health service delivery
standards, infrastructure standards, patient safety and hygiene standards. procurement of
medications for health facilities under its control.
153. The Chief Executive of a District Health Authority is to exercise powers as executive
head of the District Health Authority and implement standards and policies fixed by the
Regional Health Authority and the District Health Authority; as well as to manage human
resources of the District Health Authority; ensure health outcomes and enrolment in the
district; ensure high quality healthcare services; rationalize existing healthcare facilities and
employees; be accountable for maintaining financial discipline and transparency in the District
Health Authority; monitor, implement and execute development projects of the Regional
Health Authority; ensure achievement of targets against performance indicators laid down by
the Regional Health Authority. manage Waste and disposal standards
D.1.3. Various Regimes and Inter-institutional jurisdiction
154. In the paragraphs which follow, the patchwork of land use, building control and urban
development regimes applicable across the province (with a focus on the Greater Peshawar
area) will be discussed in further detail. The institutions possessed with the legal authority to
implement and manage these regimes will be listed. If there are overlaps or gaps between the
regimes, these will be also be highlighted. This section will base itself and build upon the
analysis of the statutes listed in the previous section.
D.1.3.1. Local Government Act, 2013
155. The most widespread provincial land use and building control regime is that which is
contained in the LGA, 2013108. As highlighted above, the LGA is applicable throughout the
province (aside from the cantonment areas and areas excluded from its remit, as notified by
the Government).109
156. As noted above, under the recently amended LGA, the district level of local
government has been abolished. One of the bigger challenges which may now be faced is the
removal of the district tier of elected government whilst retaining the district as an
administrative unit. It seems that planning (including land use planning) will have to be more
localized as the planning and operational unit has been brought down to the tehsil level. There
is a lack of clarity on how different tehsils within a district will interact. Earlier, the District Nazim
was responsible for this intra-district coordination; which now seems to be the responsibility of
the District Administration.110
157. There appears to be a blurring of lines and boundaries between the CLGs/TLGs and
the District Administration in the newly amended law; which may throw up operational
challenges. Whereas ostensibly under the LGA the authority of the TLGs comprises the
“operation, management and control of offices of the departments which are devolved to it”,111
the Tehsil Local Administration assists the Chairmen TLGs,112 whilst continuing to report to
108 See Section D.1.2.1 above. 109 See Section D.1.2.1.1 above. 110 In this regard, see section 23A(1)(c), section 57(2)(b) and (d), and section 57(3). 111 Section 23(1). 112 Section 21(4).
KP-SISUG Swat Regional Development Plan
53
the District Administration, which is also the relevant authority with respect to disciplinary
action and performance evaluation of government functionaries.113
158. Under the LGA 2013 (prior to the 2019 Amendment) the District Commissioner was
part of the elected district government (and answerable as such), and Tehsil/ Town Nazims
were Chief Executives of the Tehsil Municipal Administration, with wide-ranging powers to
monitor and supervise all offices and their officials, to plan the utilization of land and ensure
the implementation of developmental projects and municipal laws. It is possible that with the
2019 Amendment, the elected TLGs and CLGs may practically operate under the District
Commissioners.
D.1.3.1.1 Land use planning, building control and urban development
159. As stated above,114 land use planning, building control and urban development in
general, all fall within the definition of “municipal services” under the LGA, which office has
been devolved to local governments. Under Section 112 of the LGA, the Government has the
power to make rules, including for those matters stipulated in Part I of the Seventh Schedule,
which include “Planning, Development, Budget and Accounts”,115 “Works and Services”,116
“Development Authorities”,117 “Regulation of Site Development Schemes”,118 “Forests and
plantations”119 and “Property Management”.120
160. Pursuant to this section, the Government has inter alia issued the “KP Tehsil and Town
Municipal Administration Rules of Business, 2015”121 (the “TMA Rules of Business”) which
will now govern the workings of the TLGs122 and CLGs,123 including for matters relating to land
use planning, building control and urban development. In the field of building control, the
Government has also issued the “KP Model Building Bye-Laws, 2017”124 (the “Model Building
Bye-Laws”).
161. The Government also possesses the power under Section 117(2) to “specify general
powers and standard procedures to guide local governments in the performance of their
functions”.125 Pursuant to this section, the Government issued a comprehensive document on
113 In this regard, see Sections 23A(1)(i) and 23A(1)(o). 114 Paragraphs 2.2.13 – 2.2.14. 115 Sr. No. 4. 116 Sr. No. 6. 117 Sr. No. 7. 118 Sr. No. 8. 119 Sr. No. 21. 120 Sr. No. 22. 121 Vide Notification No. SO(Dir)ROB/LGE&RDD/2015, dated 3 November 2015. 122 As the Tehsil Municipal Administrations and Town Municipal Administrations stand integrated with the
respective TLGs under the newly inserted Section 121A. 123 Though this is not clear as CLGs are meant to succeed the erstwhile City District Governments (under
Section 121A(1)(a), and yet they are governed by the same provisions as TLGs (as per Section 8), with the distinction being that they function in areas with urban characteristics (as per Section 21(5)).
124 Vide Notification No. SOG/LG/8-133/Advertisement/2017, dated 24 May 2017. 125 Such procedures would in effect be binding on local governments as by way Section 3(2) they are “not to
impede or prejudice the exercise of the executive authority of Government”, and they are now obligated under Section 3(3) to follow the policy framework for devolved functions stipulated by the Government, for the purposes of uniformity amongst local governments.
KP-SISUG Swat Regional Development Plan
54
21 December 2015 (the “Guidance Notification”)126 which tackles a host of matters, including
land use, building control, and multiple other fields which have urban planning dimensions.
162. The TMA Rules of Business, Model Building Bye-Laws, and the Guidance Notification
will be discussed in detail below.
D.1.3.1.2 Non-Urban areas
163. In non-urban areas,127 the primary responsibility for laying down land use planning and
building control policies vests with the Chairmen, TLG, who as per Section 23A(f) “prepare
spatial plans for the tehsil including plans for land use and zoning and disseminate these plans
for public enquiry”, and under Section 23A(l) carry out functions pertaining to “urban and
housing development, including urban improvement and upgrading, and urban renewal and
redevelopment, with care being taken to preserve historical and cultural monuments.”
164. In such areas, tehsil councils have the power to approve bye-laws for delivery of
services,128 and long and short term development plans proposed by the Chairmen, TLG,129
but no specific powers with respect to land use and building control have been assigned to
them.
165. As far as enforcement and implementation functions are concerned, these have per
se not been given to TLGs under the LGA,130 but they do exist at the Village Council (VC)
level, with VCs being assigned the responsibility to report to the District Administration131 and
TLG in respect inter alia of “violation of land use plans, building codes, rules and bye-laws”.132
D.1.3.1.3 Urban areas
166. Mayors of CLGs (a position analogous to that of Chairmen, TLGs, but with respect to
urban areas) have been assigned the following additional functions under section 25A:
(a) review implementation of rules and bye-laws governing land use, housing, markets,
zoning, roads, traffic, tax, infrastructure, under passes, and inter-town streets.
(b) approve proposals for public transport and mass transit systems, construction of
express ways, fly-overs, bridges, roads, under passes, and inter-town streets.
(c) sewerage tertiary and secondary network, treatment plants, and disposal.
(d) storm water drainage network and disposal.
(e) flood control protection and rapid response contingency plans.
126 Vide Notification No. SO(Dir)/LGRDD/G.Powers. 127 Though a strict demarcation between non-urban (rural) and urban cannot easily be made under the LGA as
TLGs may exist even for urban areas. The Government has the power to notify a contiguous group of Neighborhoods as a City Local Government (under the proviso to section 21(5)), but if it does not do so, such neighborhoods may still be governed by a TLG. It is, however, clear that the “Urban Centers” which are Divisional Headquarters’ are urban, and hence, will have a CLG (section 21(5)).
128 Section 25(b). 129 Section 25(d). 130 Through they do find mention in subordinate legislation. See: Section D.1.3.1.4. 131 The District Administration means the Deputy Commissioner and district heads of provincial departments.
Maintenance and development of parks, playgrounds, open spaces and arboriculture. 132 Section 28(1)(d).
KP-SISUG Swat Regional Development Plan
55
(f) industrial and hospital hazardous and toxic waste treatment and disposal.
(g) urban and housing development, including urban improvement and upgrading, and
urban renewal and redevelopment, with care being taken to preserve historical and
cultural monuments.
167. Similarly, additional powers are given (and understandably so) to City Local Councils
in areas with urban characteristics, under Section 25A(2)(b). They have the function and
power to “approve master plans, zoning, land use plans, including classification and
reclassification of land, environmental control, urban design, urban renewal and ecological
balances”133 and “approve development schemes for beautification of areas along rivers,
canals, streams”.
D.1.3.1.4 Subordinate Legislation
168. The TMA Rules of Business (which apply to both rural and urban areas) contain in
Schedule-I, a list of sub-offices within the TMAs (TLGs), and a detailed distribution of business
amongst them. As per this list, the ‘Municipal Regulation’ sub-office handles inter alia (i)
enforcement of municipal laws, (ii) prevention of encroachments on public lands, (iii)
prosecuting and proceeding against violators of municipal laws before courts, and (iv)
regularization of tenure of katchi abadis, land including rights of way, and drains. Whereas,
the ‘Planning, Infrastructure and Services’ sub-office handles all matters pertaining to
provision, management, operation, maintenance and improvement of Services of the
municipal infrastructure and services.134 The same office: (i) executes and manages
development plans, (ii) prepares spatial plans for tehsil and town in collaboration with District
Councils, VCs and NCs, including plans for land use, and zoning, (iii) formulates strategies for
infrastructure development, improvement of service delivery and implementation of laws, (iv)
exercises control over land use, land sub-division, land development and zoning by public and
private sectors for any purpose,135 (v) handles building control, (vi) develops and manages
schemes including site development in collaboration with District Government, NCs and VCs,
national and international development partners.
169. The TMA Rules of Business make it clear that functions assigned to a City District
Government shall stand deleted from the business allocated to the TMA falling within the area
of that City District Government.136 However, given that the City Local Governments are now
to succeed the City District Governments (with the district tier being abolished), it remains to
be seen how the functions of the latter are to be distributed amongst the CLGs.
170. The Model Building Bye-Laws contain detailed rules and prescriptions with respect to
building control, but it is unclear whether they have been adopted by Tehsil Councils and City
Local Councils across the length and breadth of the province. It is these councils which have
been vested with powers to make bye-laws within their ambit of responsibilities,137 in particular
133 Section 25A(2)(a). 134 Which includes water supply and resources, sanitation and solid waste management, roads and streets,
traffic planning, street lighting, disaster and emergency management. It is clarified in Section 3(3)(i) that water and sanitation services of TMA at Divisional Districts shall lie with the concerned Water and Sanitation Services Company (WSSC), as per Government directives.
135 Including agriculture, industry, commerce, markets, shopping and other employment centers, residential, recreation, parks, entertainment, passenger and transport freight and transit stations.
136 Rule 3(2). 137 Section 113(1).
KP-SISUG Swat Regional Development Plan
56
for the matters specified in Part-II of the Seventh Schedule,138 which include “zoning, master
planning, and buildings.”139
171. The Guidance Notification stipulates detailed powers and standard procedures to be
followed by local governments in various fields, including entire Parts of the guidance
dedicated to Building and Land Use Control, Drainage and Sewerage, Encroachments,
Planning, Public Health and Sanitation, Public Safety, Social Welfare and Community
Development, Streets and Streets Lighting, Transport and Traffic, Water Supply, and
Development Planning.
D.1.3.2. Cantonments
172. As discussed in Section D.1.2.2 above, the Cantonment Boards are responsible for
handling all development issues in Cantonments, including those for provision of water,
sanitation, disposal of waste, safety of buildings, maintenance of roads and pavements. All
development and expansion within the Cantonment areas is done by the Cantonment Boards
under the Act.
D.1.3.3. Other Stakeholders
173. As highlighted above, there are multiple institutional stakeholders – whose functions
and responsibilities have aspects of land use planning, building control and urban
development – which must be taken on board by local governments, building authorities and
the like whilst carrying out their own planning and development roles. These include the
following:
(a) The KP Housing Authority has a major role to play in land use policy.140 It has been
tasked with the formulation of provincial land use policy, and the planning and
preparation of regional development plans for an integrated, coordinated and
systematic planning to ensure orderly growth and development of physical
infrastructure such as highways, railways, industrial zones, conservation of
forest reserves, etc. It also has a defined role to play in the development of satellite,
intermediate, secondary and industrial towns to reduce migration and drift to big
settlements (which would help in addressing the issue of urban sprawl). The Authority
has been tasked with developing a Geographic Information System for efficient land
documentation and information related to housing and town planning. with assisting
local governments with capacity building in matters relating to housing and
town planning.
(b) The KP Urban Mobility Authority also has a role to play in reviewing land use master
plans, schemes and projects as to ensure their compatibility, suitability and
sustainability with present and future mass transit systems, schemes and projects.141
In this respect, the Authority assists the relevant Departments of Government to the
extent of mass transit systems, planning and infrastructure and issue no objection
138 Section 113(2). 139 Sr. No. 2. And also includes inter alia, “prevention of encroachments” (Sr. No. 4), “regulation of traffic” (Sr.
No. 10), “parks and open places” (Sr. No. 16), “encroachment of any public road, public street, or public place.” (Sr. No. 18), and “tampering with any main pipe, or any apparatus or appliance for the supply of water.” (Sr. No. 22).
140 See Section Error! Reference source not found.. 141 See Section D.1.2.4.
KP-SISUG Swat Regional Development Plan
57
certificates for the master plans in accordance with long term plans, strategies,
roadmaps and projects pertaining to mass transit systems.
(c) The KP Highway Authority, inter alia, is required to prepare a master plan for the
development, construction operation and maintenance of highways and roads
in KP, and may even notify the right of way around highways, roads, and bridges
around which it would be illegal to make any changes to land use, without the consent
of the Authority.
(d) Under the Environmental Protection Act, 2014, the Government, the Environmental
Protection Agency, and the Environmental Protection Council all have meaningful
functions to inter alia, carry out strategic environmental assessment of all sorts of
industrial, agricultural, urban and rural development projects and land use
management plans; approve comprehensive environmental policies and ensure
their implementation; co-ordinate the integration of the principles and concerns
of sustainable development into development plans and policies at the
provincial, district and local levels. prepare environmental policies for the approval
of the Council, in consultation with the appropriate Government Agency or local
council.
(e) The Land Acquisition Act, 1894 is a law which has been used frequently for mega
projects and with no settlement plan for all people who are dislocated which serious
impediment in any urban planning and management.
(f) Under the Antiquities Act, 2016, no development plan or scheme, or new construction
may be undertaken or executed within two hundred feet of a protected immovable
antiquity, notwithstanding anything contained in any other law, without the approval of
the Director of the Directorate of Archaeology and Museum, KP.
D.2. Development Strategies and Plans
174. Khyber Pakhtunkhwa has been at the forefront of developing strategies and plans for
its development—it was the first province in Pakistan to develop a provincial conservation
strategy; Sarhad Province Conservation Strategy.142 Some of the most recent and relevant
strategies and plans are discussed in the following paragraphs.
175. Consolidating three key policy documents, Post Crisis Needs Assessment (2010),143
Comprehensive Development Strategy 2010-2017144 and the Economic Growth Strategy
(2011),145 the Integrated Development Strategy (IDS)146 was developed in 2014 with a
timeframe of four years (2014-2018). The IDS consolidated the common themes identified in
earlier assessments to remove overlaps and contradictions and rebalanced the priorities by
142 GoNWFP and IUCN. 1996. Sarhad Provincial Conservation Strategy. Karachi: IUCN & Planning,
Environment & Development Department, Government of NWFP. 143 GoP. 2010. Post Crisis Needs Assessment: Khyber Pakhtunkhwa & Federally Administered Tribal Areas.
Islamabad: Government of Pakistan, Government of Khyber Pakhtunkhwa, FATA Secretariat, ADB, EU, UN and WB.
144 GoKP. 2010. Khyber Pakhtunkhwa Comprehensive Development Strategy 2010-2017. Peshawar: P&D Department, Government of Khyber Pakhtunkhwa.
145 GoKP. 2011. Economic Growth Strategy. Peshawar: P&D Department, Government of Khyber Pakhtunkhwa.
146 GoKP. 2014. Integrated Development Strategy 2014-2018. Peshawar: P&D Department, Government of Khyber Pakhtunkhwa.
KP-SISUG Swat Regional Development Plan
58
the provincial government. It reflected an emphasis toward social services, justice and
security, accountability, and the participation of communities. Growth was included as a gear
through which to provide livelihoods and jobs for the poor. The Strategy identified three pillars
of pro-poor growth: urbanization, regional trade and connectivity, and remittances. It
considered access to safe drinking water and safe sanitation as most effective means of
improving public health and saving lives.147
176. In October 2019, the provincial cabinet approved the Sustainable Development
Strategy (SDS) as a Medium Term Development Framework 2019-23 for Khyber
Pakhtunkhwa.148 The SDS notes that despite the fact that over 3/4th of province’s population
still lives in rural areas but almost 2/3rd of this population lives within a travel time of one hour
from a city, whereas 90% of the population of the province lives within two hours distance from
an urban center.149 Another key aspect of urbanization it points to is the emergence of urban
agglomeration in (i) Central Khyber Pakhtunkhwa where districts of Peshawar, Charsadda,
Mardan, Swabi and Nowshera cover almost 10% of the area of the province and contain 37%
of the population concentrated in and around four cities; (ii) Hazara Region including districts
of Haripur, Abbottabad and Mansehra with 11% of the provincial area containing 15% of the
provincial population, and (iii) other conglomerates including Swat, Dera Ismail Khan and
Kohat.150 These ground realities, coupled with higher incidence of poverty in KP’s urban areas
and rural-urban migration, the SDS places greater focus on important components of urban
development. It outlines the following key objectives of urban development in KP:
i. Enhanced quality, accessibility and affordability of better municipal services through
improved infrastructure, secured urban centers and efficient service delivery.
ii. Balanced economic growth for jobs creation and mainstreaming services sector.
iii. Streamlined physical and spatial planning along with effective land use regulation and
enforcement.
iv. Role of private sector and civil society.
177. It also puts emphasis on urban connectivity through:
i. Efficient mobility and improved mass transit, public transport, non-vehicular transport
(bicycle lanes) and pedestrian facilitation.
ii. Improved regulation and enforcement regime for governing transport sector in the best
interest of commuters and pedestrians.
iii. Improved transport planning and research regime for complimenting urban
development reform agenda of the government.
147 GoKP. 2017. Khyber Pakhtunkhwa Province, Pakistan: Public Financial Management Assessment Report.
Peshawar: Finance Department, Government of Khyber Pakhtunkhwa. 148 GoKP. 2019. Sustainable Development Strategy: A Medium Term Development Framework 2019-23 for
Khyber Pakhtunkhwa. Peshawar: P&D Department, Government of Khyber Pakhtunkhwa. 149 ICG. 2015. Reclaiming Prosperity in Khyber Pakhtunkhwa. 150 GoP. 2018. State of Pakistan Cities’ Report. Government of Pakistan
KP-SISUG Swat Regional Development Plan
59
178. In order the implement the above reform objectives, the Strategy proposes a portfolio
of PKR 80,909 million to be spent in four years (2019-23) for local governance, urban and
rural development, housing and transport.
179. The provincial Chief Minister has launched an Economic Recovery Plan 2020-23
announcing government’s measures to cope with the economic impact of COVID-19
pandemic. With an intended outcome of “enabling environmentally sustainable urban planning
and development,” the Plan provides for formulating a new “Building Code” in line with global
best practice in climate change adaptation and environment-friendly urban development.151
180. Additionally, the Tribal Decade Strategy 2020-2030, formulated in 2019 for the newly
merged districts (erstwhile FATA) underpins the need for transforming the tribal society from
rural to urban areas as engines of growth. However, it emphasizes the sustainability of urban
hubs and services through appropriate planning for revenue generation. The Strategy lays a
portfolio of PKR 93,775 million for providing municipal services and urban development in the
newly merged districts over the next 10 years.152
181. It is important to note that so far only a few efforts have been made in KP, and even
Pakistan, to formulate long-term plans. Most of the strategies and plans focus on investments
to be made and intended result to be achieved during the ongoing regime’s timeframe. There
is need for policy continuity and holistic planning for a long-term sustainable future. The RDPs
are one step towards this direction.
D.3. Institutional Setup – Structure, Roles and Responsibilities
D.3.1. Province Governance and Decentralization
182. The Government of Khyber Pakhtunkhwa has devolved political, fiscal and
administrative authority to local governments. The 2013 Local Government Act (LGA) enables
the elected representatives of local governments to approve and manage their own budget
while making provisions for fiscal transfers and own-source revenue. Subsequently, the
Khyber Pakhtunkhwa Local Government (Amendment) Act, 2019 (the "2019 Amendment")
has abolished the district-level local government, reducing the tiers of government from three
to two. The highest tier of local government after the 2019 Amendment is the Tehsil Local
Government (TLG) for tehsils, and the equivalent City Local Government (CLG) for urban
centers. The lower tier comprises Village Councils (VC) for a Village153 in rural areas, and
Neighborhood Councils (NC) for a Neighborhood154 in areas with urban characteristics.155 On
the other hand, the new rules under the 2019 Amendment are not yet implemented and it
remains to be seen when and how implementation will take place.
151 GoKP. 2020. Azm-e-Nau – The Spirit of Khyber Pakhtunkhwa: Economic Recovery Plan 2020-2023.
Peshawar: P&D Department, Government of Khyber Pakhtunkhwa. 152 GoKP. 2019. Tribal Decade Strategy 2020-2030. Peshawar: P&D Department, Government of Khyber
Pakhtunkhwa. 153 The basic rural unit in the LGA is the “Village”, defined in section 2(ii) as “an integrated and contiguous
human habitation commonly identified by a name and includes a Dhok, Chak, Kalay, Goth, Gaown, Basti or any other comparable habitation.”
154 The basic urban unit in the LGA is the “Neighbourhood”, defined in section 2(s) as: “a mohallah, a group of streets, lanes or roads, in areas with urban characteristics, designated as Neighbourhood by Department.”
155 To date, population data from the 2017 census is available only by Union Council (UC), which were the precursors of VC and NC.
KP-SISUG Swat Regional Development Plan
60
183. The Local Government, Elections and Rural Development (LGE&RD) Department at
provincial level retains and continues to exercise control over Local Area Development
Authorities in the province. The Secretary of LGE&RD reports to the Chief Secretary of Khyber
Pakhtunkhwa province.
184. The decentralization of Khyber Pakhtunkhwa incorporates in its design a number of
checks and balances to promote accountability:
i. The Minister for LGE&RD heads the Local Government Commission (LGC),156 the role
of which is to support the coherent functioning of local governments. The LGC has the
mandate of (i) conducting annual inspections of local governments and submitting
reports in this regard to the Provincial Government; (iii) commissioning third party
performance and financial audits of any or all local government bodies, where deemed
necessary in the public interest; (iii) conducting inquiries into any matter concerning
local governments, (iv) resolving disputes between local governments, (v) submitting
annual reports on the overall performance of local governments to the Chief Minister,
and (vi) taking cognizance of violations of laws and rules by a local government. On
the other hand, the lack of secretarial support for the LGC makes it difficult for it to
perform satisfactorily.
ii. Accountability and transparency are ensured through audit functions. Audit reports are
reviewed by the Public Accounts Committee of the Provincial Assembly. Furthermore,
every CLG and TLG is required to publish an annual audit report for the public.157
iii. The decentralization sought to empower public representatives at the bottom tiers of
governance. In principle, decentralization extends down to the village and
neighborhood level, where the local councils (VCs and NCs) enjoy considerable
powers. The political process that laid the foundation for decentralization with elections
in 2015 was an additional strength, since it led to the increased awareness and
involvement of political parties in planning, development, and decisions regarding
service delivery priorities. This made the political process more responsive and
representative.
iv. The 2019 Amendment of the 2013 LGA has retained the mandatory allocation to local
governments of not less than 30 percent of the total provincial development portfolio
(the Annual Development Program (ADP)).158 On the other hand, there is also a
provision for the provincial government to withhold any amount of funds in the name
of the public fund to be spent by designated government officials. The record shows
that overall, withheld funds have not been significant. Notwithstanding this, the clause
goes against the principle of equity and could affect some communities.
156 The Local Government Commission comprises two provincial assembly members (one nominated by the
Chief Minister, and the other by the Leader of the Opposition, two qualified individuals selected by the government experienced technocrats, and two Government Secretaries (one Secretary from the Law, Parliamentary Affairs, and Human Rights Department, and the other from the Local Government, Elections and Rural Development (LGE&RD) Department), as well as a representative from the Finance department for matters related to budget of local governments. The Director-General, LGE&RD, provides secretariat support.
157 Buzdar, F., 2016. Local Governments in Khyber Pakhtunkhwa and Punjab: Framework, Current Status, and Challenges. Islamabad: AAWAZ.
158 2013 LGA paragraph 53a states, ‘… the development grants for local governments shall be so determined that it is not less than thirty percent of the total development budget of the province in the respective year.’
KP-SISUG Swat Regional Development Plan
61
v. Additionally, a new provision allows 2% of the funds of local governments’ share to be
retained by the provincial government to spend on third party audits of local
governments and their human resource development.159
vi. Nonetheless, local governments still receive a significant share of the development
budget. In FY 2017—2018, some PKR 28 billion was earmarked for local governments’
annual development plans amounting to 22.2% of the provincial ADP (without the
foreign assistance of PKR 82 billion for that year).160 Of the funds earmarked for local
governments, district, tehsil, and village/neighborhood councils accounted respectively
for 29, 26 and 45 percent of this amount.
185. Many challenges remain before the potential of fiscal and administrative
decentralization can be fully realized in Khyber Pakhtunkhwa:
i. Mismatch between some devolved functions and actual practice, and overlaps
between levels create inefficiencies. The provincial portfolio in practice still includes
functions and projects that have been devolved in principle to local governments,
based on the principles of subsidiarity. Overlap of roles is seen, such as in
development planning, infrastructure and land use.
ii. Political friction and increased litigation over contested development schemes are a
threat. The potential for friction is high if local governments are in the party in opposition
to the provincial government, and if debates over development schemes take place.
Such friction diverts focus from service delivery and improved governance. Litigation
has reportedly increased concerning decisions made at the local level.161
186. Limited capacities are the biggest challenge to realizing the full potential and benefits
of decentralization. The increased decision-making powers conferred by decentralization
require a different set of competencies, especially in monitoring the use of funds, conducting
needs assessments systematically to identify gaps in service quality and access and to
address such gaps. Transfers — based on an equalization formula — comprise most of the
resource base at each level. Local governments will need to mobilize more resources locally,
using innovative means of financing, developing new public-private partnerships, and using
the decentralization rules that empower them to levy local taxes or undertake ventures that
generate funds. Project planning, costing, and resource allocation need strengthening.
D.3.2. Local Governance
187. The LGA 2013 ensured considerable autonomy in governance and financial
management at local government level. The 2019 Amendment has implemented three marked
changes, among others, which will affect the delivery of services:162
i. The re-devolution of the Public Health Engineering (Water and Sanitation) Department
(PHED), from provincial government back to the local level (Table 7). PHED is
responsible for setting up and maintaining the water supply schemes in rural areas, a
159 Syed Ata Ur Rehman. 2019. The Khyber Pakhtunkhwa Local Government (Amendment) Act, 2019: An
overview of Amendments and their Implications. Berlin: Democracy Reporting International. 160 Source: provincial government budget provided to project team. 161 (i) Buzdar, F., 2016 (Footnote 3). (ii) Dawn, 2018. ‘Policy devised to reduce govt’s litigation workload’. 11
March 2018. Available from: https://www.dawn.com/news/1394469 Accessed 1 July 2020. 162 Syed Ata Ur Rehman. 2019. The Khyber Pakhtunkhwa Local Government (Amendment) Act, 2019: An
overview of Amendments and their Implications. Berlin: Democracy Reporting International.
KP-SISUG Swat Regional Development Plan
62
function that can be performed better by local governments collaborating closely with
local communities.
ii. The reversal of the health department’s devolution. While the local level still retains
responsibility for primary and secondary education, health has been removed, the
explanation being that separate health legislation was introduced (293 on health).
iii. The abolition of the District Government tier from the elected local government
structure. While this has been removed, the district remains as an administrative unit.
Under this new arrangement, the elected TLGs and CLGs will maintain control over
their bureaucracies which will continue to report to the district administration. In
practical terms, the city/tehsil elected governments will operate under the Deputy
Commissioner at district level.
D.3.2.1. District Level Governance
188. One of the bigger challenges facing local governance is the removal of the district tier
of elected government while retaining the district as an administrative unit. It seems that
planning (including land use planning) will have to be more localized as the planning and
operational unit has been brought down to the tehsil level. There is a lack of clarity on how
different tehsils within a district will interact. Earlier, the District Nazim was responsible for this
intra-district coordination; which now seems to be the responsibility of the District
Administration.
189. The 2019 Amendment introduces a new entity by the name of District Administration.
This represents the provincial government in the district and has a coordinating and conflict
resolution role vis-à-vis the local governments. District Administration is headed by the Deputy
Commissioner who, under orders from the Chief Minister, exercises special powers and
carries out functions that would otherwise fall under the ambit of the Tehsil Chairpersons. It is
possible that with the 2019 Amendment, the elected TLGs and CLGs may operate under the
District Deputy Commissioner.
190. The District Development Advisory Committee (DDAC)163 in each district plays a
determinant role in certain district development programs. The DDAC comprises members of
the Provincial Assembly from the concerned district and other elected representatives, and
the heads of attached Departments at the District level co-opted by the Committee for their
expert opinion. The DDAC formulates and recommends (i) proposals for the annual
development plan in the district, (ii) the list of schemes to be implemented under the Rural
Development Plan, (iii) the location and selection of sites for schools, rural health, and public
health engineering (rural drinking water and sanitation) schemes, (iv) locations or sites for
other development projects as may be included in the ADP of a district including electrification
of villages, and (v) allocation of Ration Depots. The DDAC is also responsible for ensuring
timely implementation of the programs it approves. The Assistant Director LGE&RD has
overall responsibility for implementation, monitoring, and evaluation of the activities concerned
with the local government. The District Officer Finance and Planning translates province plans
into district development schemes, reviews and recommends the schemes identified by
different stakeholders to the respective authorities. The provincial finance department directly
transfers funds to each District Government for the schemes.
163 District Development Advisory Committees (Amendment) Act, 2015
KP-SISUG Swat Regional Development Plan
63
D.3.2.2. Tehsil/City Level Governance
191. The 2019 Amendment vests executive authority in the Chairperson of the Tehsil LG
(to be elected directly on party-based elections) over the devolved departments. The Tehsil
LG itself comprises the Chairperson, Tehsil Local Government and the Tehsil Local
Administration.164
192. The Provincial Government may also notify City Local Governments for urban centers
of the district to be established at each Divisional Headquarters. Such City Local
Governments, if so notified, would have the same powers and functions as the Tehsil Local
Governments. City Local Governments would be headed by a Mayor and comprise the Mayor
and City Local Administration. The Mayor will be elected through direct elections, similar to
those by which a Chairperson Tehsil Local Government is elected.
193. There appears to be a blurring of lines and boundaries between the CLGs/TLGs and
the District Administration in the newly amended law; which may throw up operational
challenges. Whereas ostensibly under the LGA, the authority of the TLGs covers the
"operation, management and control of offices of the departments which are devolved to it",
in reality, the Tehsil Local Administration assists the Chairpersons TLGs , whilst continuing to
report to the District Administration, which is also the relevant authority with respect to
disciplinary action and performance evaluation of government functionaries. While the
Chairperson and Mayor can recommend disciplinary action against tehsil and city employees,
they cannot take direct action. Thus, administrative staff working under the Chairperson of
local government are predominantly under the supervision of and with reporting lines to
officials under the Deputy Commissioner, who represents the province. This has the potential
for confusion and tension.165
194. The tehsil and city councils are composed of all Chairpersons of neighborhood and
village councils in the tehsil and city. There are also reserved seats for women, peasants,
workers and religious minorities that are indirectly elected from among the members of village
councils who secure the largest number of votes.
D.3.2.3. Village/Neighborhood Governance
195. Village and neighborhood councils each have seven members, all being directly
elected on a non-party basis from a single constituency. As before the Amendment, those with
the highest number of votes become Chairpersons.
D.3.2.4. Roles and Functions
196. The Tehsil Local Government, or a City Local Government, as the case may be, shall
be assisted in its functions by the Tehsil Local Council, or the City Local Council,166 which are
responsible for approving the actions to be taken by the Tehsil Local Government. These
actions and plans include the imposition of taxes, fines & penalties; bylaws for the delivery of
devolved services; the enforcement of municipal laws; the preparation of the annual budget,
164 That is, the Assistant Commissioners (the administrative head at Tehsil level), Tehsil Municipal Officers, and
heads of the devolved offices. 165 Syed Ata Ur Rehman. 2019. The Khyber Pakhtunkhwa Local Government (Amendment) Act, 2019: An
overview of Amendments and their Implications. Berlin: Democracy Reporting International. 166 The tehsil and city councils are composed of all Chairmen of neighborhood and village councils in the tehsil
and city.
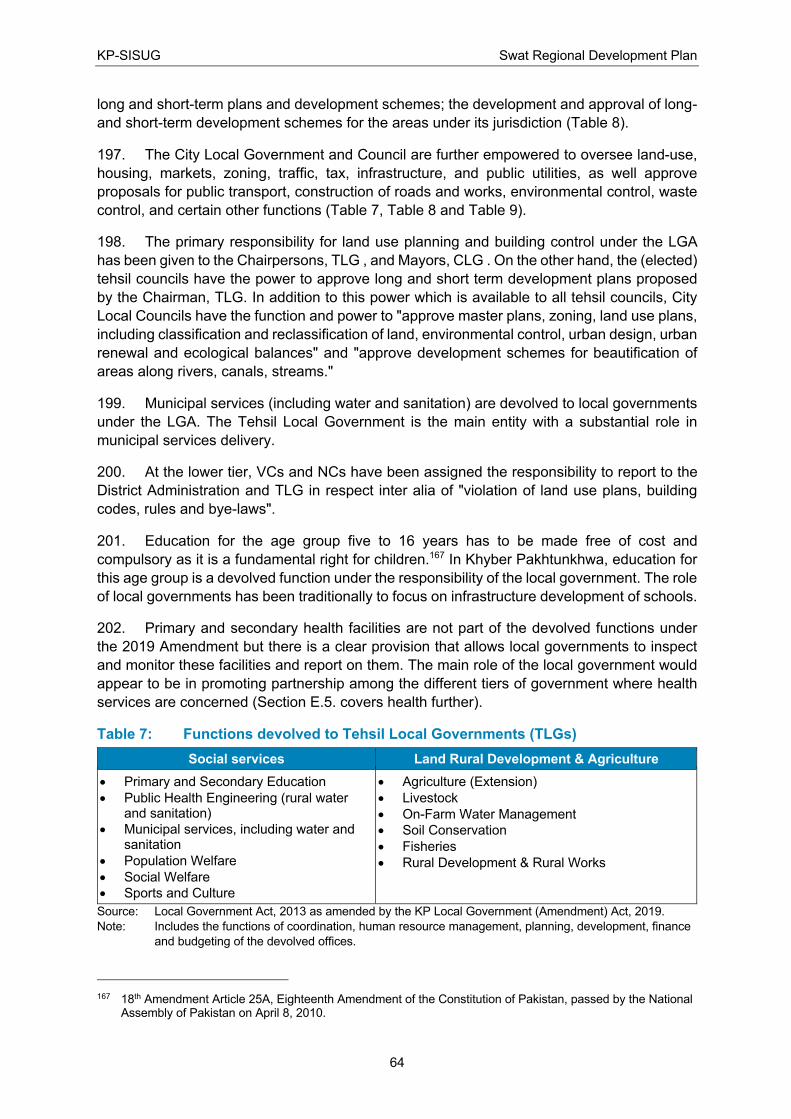
KP-SISUG Swat Regional Development Plan
64
long and short-term plans and development schemes; the development and approval of long-
and short-term development schemes for the areas under its jurisdiction (Table 8).
197. The City Local Government and Council are further empowered to oversee land-use,
housing, markets, zoning, traffic, tax, infrastructure, and public utilities, as well approve
proposals for public transport, construction of roads and works, environmental control, waste
control, and certain other functions (Table 7, Table 8 and Table 9).
198. The primary responsibility for land use planning and building control under the LGA
has been given to the Chairpersons, TLG , and Mayors, CLG . On the other hand, the (elected)
tehsil councils have the power to approve long and short term development plans proposed
by the Chairman, TLG. In addition to this power which is available to all tehsil councils, City
Local Councils have the function and power to "approve master plans, zoning, land use plans,
including classification and reclassification of land, environmental control, urban design, urban
renewal and ecological balances" and "approve development schemes for beautification of
areas along rivers, canals, streams."
199. Municipal services (including water and sanitation) are devolved to local governments
under the LGA. The Tehsil Local Government is the main entity with a substantial role in
municipal services delivery.
200. At the lower tier, VCs and NCs have been assigned the responsibility to report to the
District Administration and TLG in respect inter alia of "violation of land use plans, building
codes, rules and bye-laws".
201. Education for the age group five to 16 years has to be made free of cost and
compulsory as it is a fundamental right for children.167 In Khyber Pakhtunkhwa, education for
this age group is a devolved function under the responsibility of the local government. The role
of local governments has been traditionally to focus on infrastructure development of schools.
202. Primary and secondary health facilities are not part of the devolved functions under
the 2019 Amendment but there is a clear provision that allows local governments to inspect
and monitor these facilities and report on them. The main role of the local government would
appear to be in promoting partnership among the different tiers of government where health
services are concerned (Section E.5. covers health further).
Table 7: Functions devolved to Tehsil Local Governments (TLGs)
Social services Land Rural Development & Agriculture
• Primary and Secondary Education
• Public Health Engineering (rural water and sanitation)
• Municipal services, including water and sanitation
• Population Welfare
• Social Welfare
• Sports and Culture
• Agriculture (Extension)
• Livestock
• On-Farm Water Management
• Soil Conservation
• Fisheries
• Rural Development & Rural Works
Source: Local Government Act, 2013 as amended by the KP Local Government (Amendment) Act, 2019.
Note: Includes the functions of coordination, human resource management, planning, development, finance
and budgeting of the devolved offices.
167 18th Amendment Article 25A, Eighteenth Amendment of the Constitution of Pakistan, passed by the National
Assembly of Pakistan on April 8, 2010.
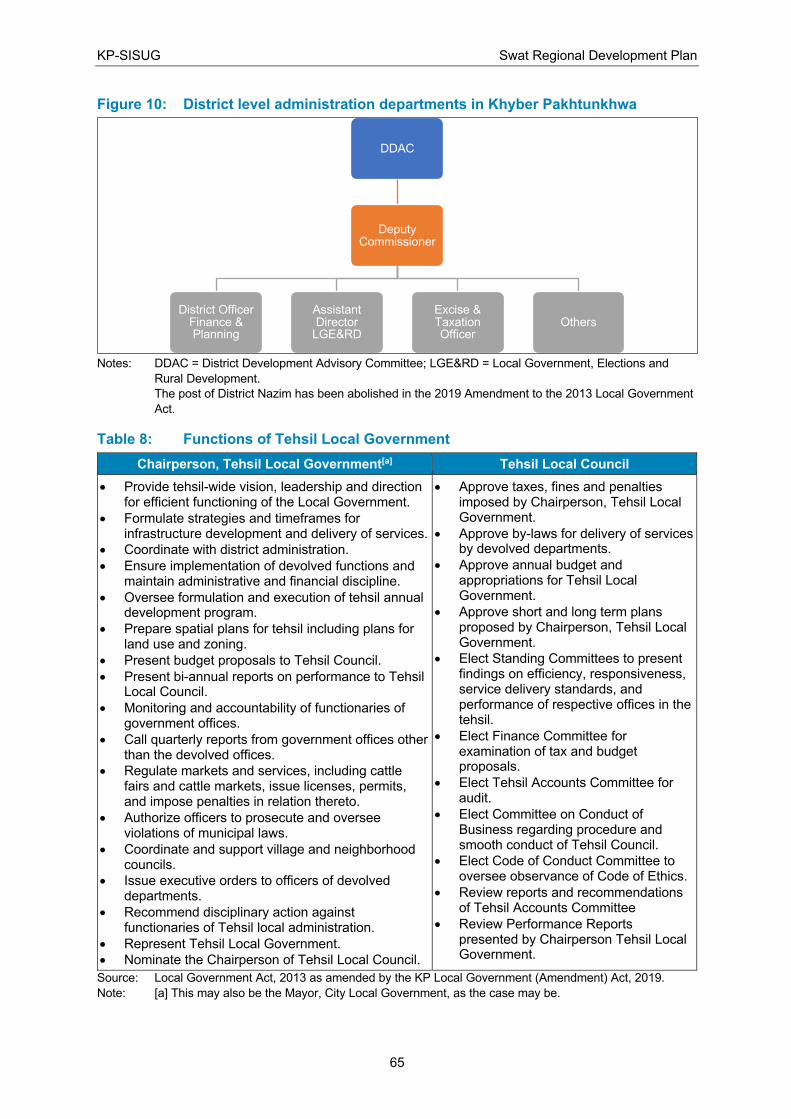
KP-SISUG Swat Regional Development Plan
65
Figure 10: District level administration departments in Khyber Pakhtunkhwa
Notes: DDAC = District Development Advisory Committee; LGE&RD = Local Government, Elections and
Rural Development.
The post of District Nazim has been abolished in the 2019 Amendment to the 2013 Local Government
Act.
Table 8: Functions of Tehsil Local Government
Chairperson, Tehsil Local Government[a] Tehsil Local Council
• Provide tehsil-wide vision, leadership and direction for efficient functioning of the Local Government.
• Formulate strategies and timeframes for infrastructure development and delivery of services.
• Coordinate with district administration.
• Ensure implementation of devolved functions and maintain administrative and financial discipline.
• Oversee formulation and execution of tehsil annual development program.
• Prepare spatial plans for tehsil including plans for land use and zoning.
• Present budget proposals to Tehsil Council.
• Present bi-annual reports on performance to Tehsil Local Council.
• Monitoring and accountability of functionaries of government offices.
• Call quarterly reports from government offices other than the devolved offices.
• Regulate markets and services, including cattle fairs and cattle markets, issue licenses, permits, and impose penalties in relation thereto.
• Authorize officers to prosecute and oversee violations of municipal laws.
• Coordinate and support village and neighborhood councils.
• Issue executive orders to officers of devolved departments.
• Recommend disciplinary action against functionaries of Tehsil local administration.
• Represent Tehsil Local Government.
• Nominate the Chairperson of Tehsil Local Council.
• Approve taxes, fines and penalties imposed by Chairperson, Tehsil Local Government.
• Approve by-laws for delivery of services by devolved departments.
• Approve annual budget and appropriations for Tehsil Local Government.
• Approve short and long term plans proposed by Chairperson, Tehsil Local Government.
• Elect Standing Committees to present findings on efficiency, responsiveness, service delivery standards, and performance of respective offices in the tehsil.
• Elect Finance Committee for examination of tax and budget proposals.
• Elect Tehsil Accounts Committee for audit.
• Elect Committee on Conduct of Business regarding procedure and smooth conduct of Tehsil Council.
• Elect Code of Conduct Committee to oversee observance of Code of Ethics.
• Review reports and recommendations of Tehsil Accounts Committee
• Review Performance Reports presented by Chairperson Tehsil Local Government.
Source: Local Government Act, 2013 as amended by the KP Local Government (Amendment) Act, 2019.
Note: [a] This may also be the Mayor, City Local Government, as the case may be.
DDAC
Deputy Commissioner
District Officer Finance & Planning
Assistant Director
LGE&RD
Excise & Taxation Officer
Others
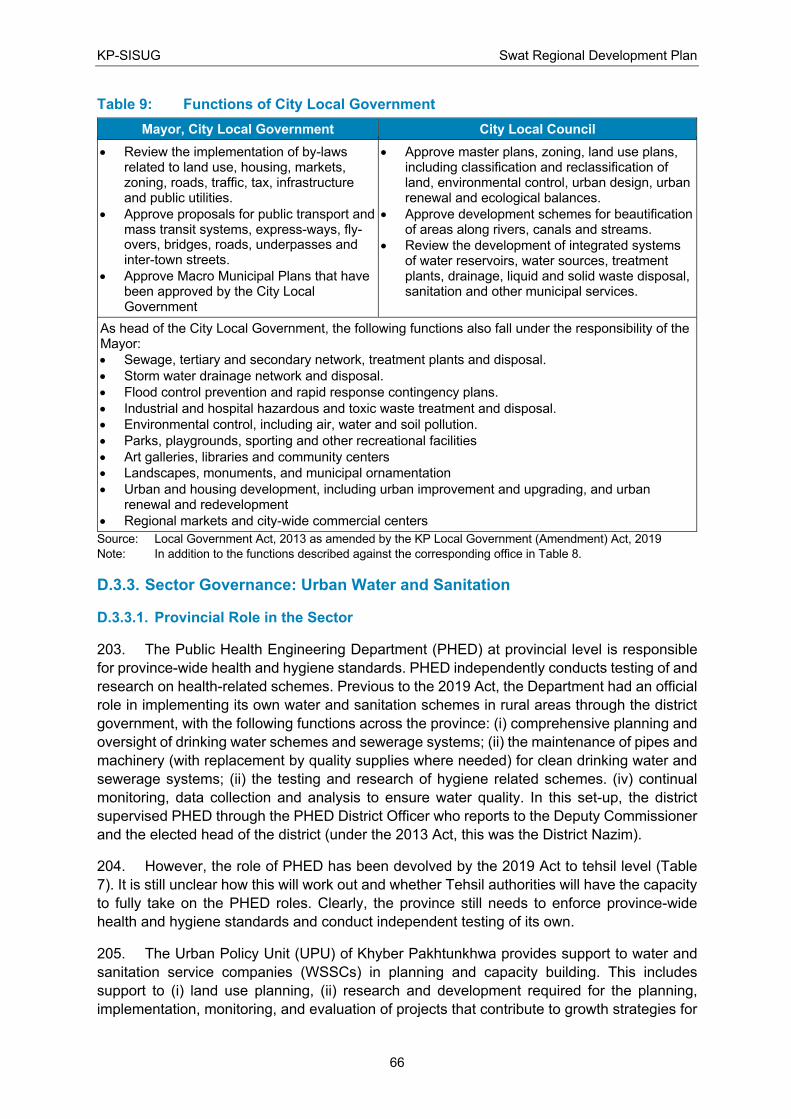
KP-SISUG Swat Regional Development Plan
66
Table 9: Functions of City Local Government
Mayor, City Local Government City Local Council
• Review the implementation of by-laws related to land use, housing, markets, zoning, roads, traffic, tax, infrastructure and public utilities.
• Approve proposals for public transport and mass transit systems, express-ways, fly-overs, bridges, roads, underpasses and inter-town streets.
• Approve Macro Municipal Plans that have been approved by the City Local Government
• Approve master plans, zoning, land use plans, including classification and reclassification of land, environmental control, urban design, urban renewal and ecological balances.
• Approve development schemes for beautification of areas along rivers, canals and streams.
• Review the development of integrated systems of water reservoirs, water sources, treatment plants, drainage, liquid and solid waste disposal, sanitation and other municipal services.
As head of the City Local Government, the following functions also fall under the responsibility of the Mayor:
• Sewage, tertiary and secondary network, treatment plants and disposal.
• Storm water drainage network and disposal.
• Flood control prevention and rapid response contingency plans.
• Industrial and hospital hazardous and toxic waste treatment and disposal.
• Environmental control, including air, water and soil pollution.
• Parks, playgrounds, sporting and other recreational facilities
• Art galleries, libraries and community centers
• Landscapes, monuments, and municipal ornamentation
• Urban and housing development, including urban improvement and upgrading, and urban renewal and redevelopment
• Regional markets and city-wide commercial centers
Source: Local Government Act, 2013 as amended by the KP Local Government (Amendment) Act, 2019
Note: In addition to the functions described against the corresponding office in Table 8.
D.3.3. Sector Governance: Urban Water and Sanitation
D.3.3.1. Provincial Role in the Sector
203. The Public Health Engineering Department (PHED) at provincial level is responsible
for province-wide health and hygiene standards. PHED independently conducts testing of and
research on health-related schemes. Previous to the 2019 Act, the Department had an official
role in implementing its own water and sanitation schemes in rural areas through the district
government, with the following functions across the province: (i) comprehensive planning and
oversight of drinking water schemes and sewerage systems; (ii) the maintenance of pipes and
machinery (with replacement by quality supplies where needed) for clean drinking water and
sewerage systems; (ii) the testing and research of hygiene related schemes. (iv) continual
monitoring, data collection and analysis to ensure water quality. In this set-up, the district
supervised PHED through the PHED District Officer who reports to the Deputy Commissioner
and the elected head of the district (under the 2013 Act, this was the District Nazim).
204. However, the role of PHED has been devolved by the 2019 Act to tehsil level (Table
7). It is still unclear how this will work out and whether Tehsil authorities will have the capacity
to fully take on the PHED roles. Clearly, the province still needs to enforce province-wide
health and hygiene standards and conduct independent testing of its own.
205. The Urban Policy Unit (UPU) of Khyber Pakhtunkhwa provides support to water and
sanitation service companies (WSSCs) in planning and capacity building. This includes
support to (i) land use planning, (ii) research and development required for the planning,
implementation, monitoring, and evaluation of projects that contribute to growth strategies for
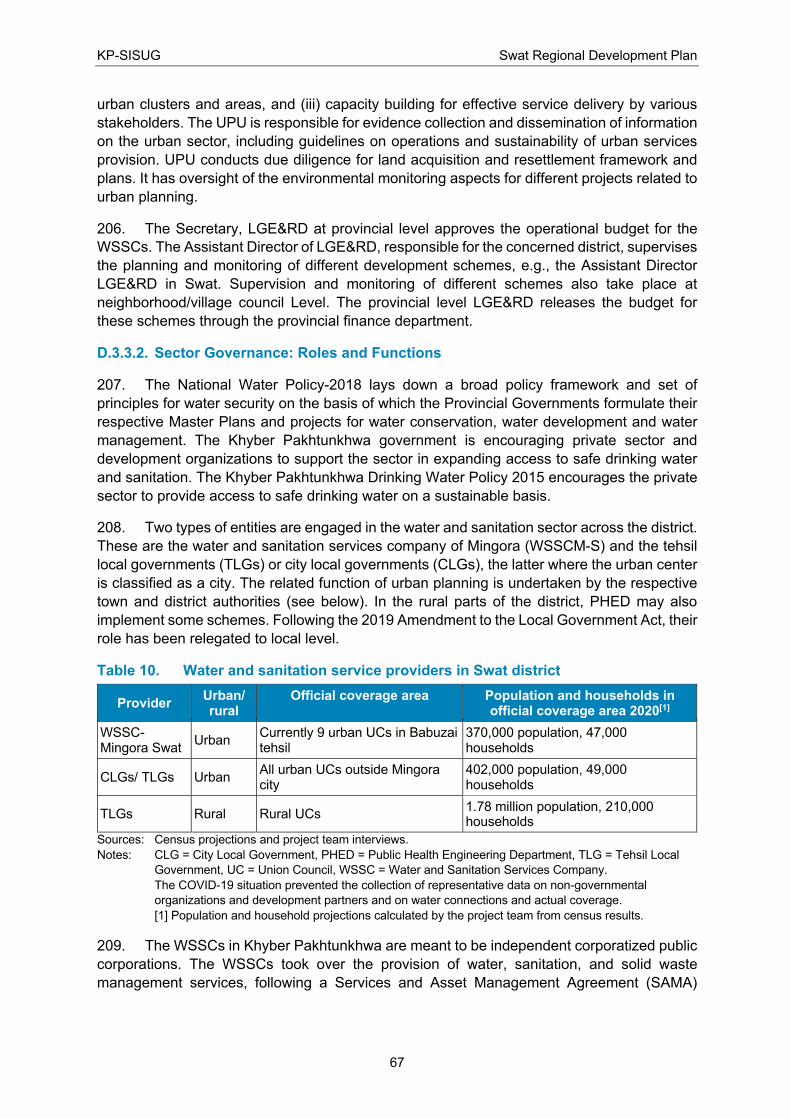
KP-SISUG Swat Regional Development Plan
67
urban clusters and areas, and (iii) capacity building for effective service delivery by various
stakeholders. The UPU is responsible for evidence collection and dissemination of information
on the urban sector, including guidelines on operations and sustainability of urban services
provision. UPU conducts due diligence for land acquisition and resettlement framework and
plans. It has oversight of the environmental monitoring aspects for different projects related to
urban planning.
206. The Secretary, LGE&RD at provincial level approves the operational budget for the
WSSCs. The Assistant Director of LGE&RD, responsible for the concerned district, supervises
the planning and monitoring of different development schemes, e.g., the Assistant Director
LGE&RD in Swat. Supervision and monitoring of different schemes also take place at
neighborhood/village council Level. The provincial level LGE&RD releases the budget for
these schemes through the provincial finance department.
D.3.3.2. Sector Governance: Roles and Functions
207. The National Water Policy-2018 lays down a broad policy framework and set of
principles for water security on the basis of which the Provincial Governments formulate their
respective Master Plans and projects for water conservation, water development and water
management. The Khyber Pakhtunkhwa government is encouraging private sector and
development organizations to support the sector in expanding access to safe drinking water
and sanitation. The Khyber Pakhtunkhwa Drinking Water Policy 2015 encourages the private
sector to provide access to safe drinking water on a sustainable basis.
208. Two types of entities are engaged in the water and sanitation sector across the district.
These are the water and sanitation services company of Mingora (WSSCM-S) and the tehsil
local governments (TLGs) or city local governments (CLGs), the latter where the urban center
is classified as a city. The related function of urban planning is undertaken by the respective
town and district authorities (see below). In the rural parts of the district, PHED may also
implement some schemes. Following the 2019 Amendment to the Local Government Act, their
role has been relegated to local level.
Table 10. Water and sanitation service providers in Swat district
Provider Urban/ rural
Official coverage area
Population and households in official coverage area 2020[1]
WSSC-Mingora Swat
Urban Currently 9 urban UCs in Babuzai tehsil
370,000 population, 47,000 households
CLGs/ TLGs Urban All urban UCs outside Mingora city
402,000 population, 49,000 households
TLGs Rural Rural UCs 1.78 million population, 210,000 households
Sources: Census projections and project team interviews.
Notes: CLG = City Local Government, PHED = Public Health Engineering Department, TLG = Tehsil Local
Government, UC = Union Council, WSSC = Water and Sanitation Services Company.
The COVID-19 situation prevented the collection of representative data on non-governmental
organizations and development partners and on water connections and actual coverage.
[1] Population and household projections calculated by the project team from census results.
209. The WSSCs in Khyber Pakhtunkhwa are meant to be independent corporatized public
corporations. The WSSCs took over the provision of water, sanitation, and solid waste
management services, following a Services and Asset Management Agreement (SAMA)
KP-SISUG Swat Regional Development Plan
68
signed between the province, the City or town administration and the WSSC concerned.
Peshawar came first, in 2014.
210. As with other WSSCs, the WSSCM-S is registered with the Securities and Exchange
Commission of Pakistan and is fully owned by the Government of Khyber Pakhtunkhwa, under
Section 42 of the Companies Ordinance, 1984. It is meant to be a ring-fenced, fully
autonomous, professionally managed and corporate governed utility. Following the SAMA
signed between the province's Public Health Engineering, Swat Tehsil Municipal Authority and
WSSCM-S, the WSSCM-S took over the water, sanitation, and solid waste management
sectors from the Tehsil government in January 2017. The geographical area of WSSCM-S
services covers 24 Neighborhood Councils (9 urban Union Councils168) of tehsil Babuzai
serving some 0.3 million population (Table 10).
211. The respective functions and responsibilities of the provincial government, the TLG,
and the WSSCM-S are set out in the SAMA (Appendix 7 provides excerpts from SAMA).
SAMA transfers the responsibility for management and operation of drinking water,
wastewater, and solid waste management to WSSCM-S. This transfer includes all relevant
assets, facilities, and control over staff so transferred. The TLG retains part of its staff for the
remaining municipal services. SAMA stipulates other requirements for WSSCs, including
benchmarking of services, developing key performance indicators and producing a business
plan and a budget.169 SAMA provided for an assigned budget from the TLG, together with
provincial contributions. Following this, a decision was made in the interests of greater
efficiency, whereby the province now transfers the budget directly to all WSSCs, cutting the
tehsil budget by a commensurate amount. Therefore, while WSSCM-S coordinates closely
with the city government, it is now independent of the city/tehsil authorities.
212. The WSSCM-S has the mandate to provide quality water and sanitation services to
the urban Union Councils of Tehsil Babuzai in Swat. The Company aims to be a consumer-
oriented organization, responsible for production, transmission and distribution of potable
water to citizens of the urban area, managing sewerage systems to ensure hygienic
environment, development of schemes to cover short falls in services, and generation of
revenues for sustained economic viability. More specifically, the WSSCM-S is responsible for:
• Planning, designing, construction, operation and maintenance of water supply,
sanitation, sewerage, drainage, fluid and solid waste systems and allied services,
including their enhancement and improvement.
• Management of all activities, facilities, programs, resources and spaces associated
with these services previously under the control of the TLG, including machinery, tools
and vehicles.
• Management and supervision of personnel who had previously been delivering such
services under the auspices of the TLG.
168 The union councils have now been changed to neighborhood councils (urban) and village councils (rural),
and administrative boundaries have changed as well. 169 Government of Khyber Pakhtunkhwa. 2017. Pakistan – Khyber Pakhtunkhwa Inclusive Urban Growth
Program: Final Report. Peshawar: Urban Policy Unit, Planning & Development Department, GoKP and Cities Development Initiative for Asia, ADB.
KP-SISUG Swat Regional Development Plan
69
• Promotion of public awareness on the importance of water conservation, waste
reduction, resource recovery and the protection of the environment.
• Development of cost recovery measures such as fees and user charges, which it is
responsible for implementing on its own.
213. Establishment of and compliance with performance standards. The WSSCM-S draws
on various sources for its budget. For schemes, the WSSCM-S uses the budget earmarked
for those schemes, such as the schemes included in the provincial ADP, or those included in
the budget of the provincial Public Health Engineering Department for urban areas, or the
funds for the schemes adopted by provincial and national assemblies. The operational budget
of WSSCM-S is provided by the provincial Government through the provincial finance
department under approval from Secretary LGE&RDD. It also collects money through
consumer billing, service provision and projects from INGOs. The provincial government
covers WSSCM-S’ capital expenditure. The original intent was for the company to improve
revenue collection, make efficiency gains, gradually legalize all illegal connections, and levy a
fee for solid waste management in tandem with the improvement in services.
214. The TLGs in urban centers (or CLGs as the case may be) are responsible for the
planning and provision of municipal services, except in Mingora, where WSSCM-S now has
responsibility for water, sanitation, and solid waste management services. The TLG is
responsible for the development of different zones and plans, and the management of
municipal properties, assets, and funds. Therefore, outside Mingora city limits, in union council
areas that are not under the WSSCM-S, the relevant TLG provides water, sanitation, and solid
waste management services.
215. Following the 2019 amendment of the 2013 Local Government Act, the roles are
shifting. It is still too early to tell how these new arrangements will work out. The COVID-19
crisis has prevented a full assessment of the governance of TLGs in the region.
216. The Swat District Development Authority (SDDA) is tasked with urban development
projects. It is supervised by the Provincial Urban Development Board (PUDB). The basic
concept of the Authority was to provide housing facilities at suitable locations in Malakand
Division to overcome the shortage of housing in the vicinity of the city centers and to develop
adjoining areas. The mandate of SDDA includes: (i) provision of housing facilities in urban
areas of District Swat; (ii) execution of developmental schemes in urban areas duly financed
by the provincial/Federal Government. (iii) any other objectives/functions assigned by
Provincial/Federal Government.170 Being a mountainous and scenic area, infrastructure and
housing plans in Mingora require well-planned schemes.
217. An assessment by the project team found the following constraints affecting the work
of WSSCM-S: (i) the need for better knowledge and awareness among communities regarding
waste management, water wastage and other behavioral issues; (ii) the overlap of work with
PHED; (iii) the need for WSSCM-S to have legal means of enforcing regulations with regard
to their mandate and work; (iv) capacity building needs among staff. (v) inadequate
coordination and cooperation with district authorities. To overcome these challenges, the
WSSCM-S identified the following: organizational strengthening and systems development,
capacity building of staff at all levels, a review and identification of mechanisms to strengthen
170 Swat District Development Authority. Available from: https://sdda.gkp.pk/index.php/cms/content/4 . Accessed
15 August 2020.
KP-SISUG Swat Regional Development Plan
70
the enforcement of laws, rules and regulations, and the promulgation of specific laws where
needed.
218. Additionally, for the WSSCM-S to fulfil its mandate of being a corporate-governed utility
with high performance standards, the following barriers have to be addressed.
• Under SAMA, government staff were assigned on deputation from the TLG to
WSSCM-S. The selection of such staff was not necessarily based on criteria such as
performance. This meant that from the start, with the handover in 2017, there are
issues with staff capacity and underperformance. Many field workers coming from the
TLG lack basic skills necessary for operations and maintenance of water and sanitation
services, as well as basic safety precautions when working.
• A number of field workers had reportedly been `ghost employees' when working at the
TLG, drawing salaries and not attending work. This is a common issue with civil
servants in many developing countries. In many cases, this is linked to the need for
better income. Consequently, employees may be working at another job to supplement
their income. This calls for better supervision and other forms of attendance
verification, which adds to the workload of supervisors and detracts from the
effectiveness of the workforce.
• As the staff in WSSCM-S are government employees, sanctions against non-
performing staff are difficult. Under the rules of the Securities and Exchange
Commission of Pakistan, the Board of Directors of WSSCM-S and the Chief Executive
Officer can exercise disciplinary action against WSSCM-S staff. However, under civil
services rules, the punitive actions have to follow lengthy disciplinary procedures.
Implementing sanctions against underperforming government employees is not easily
undertaken.171 The emerging trend of taking the matter to courts and obtaining stay
orders has made it more difficult.
• Low compensation levels for key management posts is another barrier. WSSCM-S is
constrained in hiring well-qualified executives and managers for vacant senior
positions, since its pay scales are on average about half of those for similar
establishments. Such pay scales are not competitive. A previous study on WSSC-
Abbottabad172 showed that for the top six senior positions, the total compensation
package for Abbottabad amounted to roughly half the median figure (50th percentile)
for these six positions drawn from 11 similar companies,173 primarily public sector
municipal service or utility companies.174
171 The Federal Government in 2010 repealed the Removal from Service (Special Powers) Ordinance of 2000,
which had provided for the dismissal, removal, compulsory retirement, or demotion of government staff for inefficiency, misconduct, corruption, and other traits
172 Asian Development Bank. Cities Development Initiative for Asia (CDIA). https://cdia.asia/who-we-are/what-is-cdia/.
173 The companies selected for comparison with WSSCA and WSSCM were TransPeshawar (The Urban Mobility Company), Urban Unit Punjab, Lahore Waste Management Company (LWMC), Gujranwala Waste Management Company (GWMC), WWF Pakistan, Pakistan Poverty Alleviation Fund (PPAF), Private Power Infrastructure Board (PPIB), and Punjab Power Development Company (PPDC).
174 Government of Khyber Pakhtunkhwa. 2017. Pakistan – Khyber Pakhtunkhwa Inclusive Urban Growth Program: Final Report. Peshawar: Urban Policy Unit, Planning & Development Department, GoKP and Cities Development Initiative for Asia, ADB.
KP-SISUG Swat Regional Development Plan
71
219. For TLGs, limited capacities are the biggest challenge. The increased decision-making
powers conferred by decentralization require a different set of competencies. The sheer
numbers of jurisdictions make it difficult to adequately monitor the use of funds and the
implementation at Village and neighborhood council Level.175 Budgeting and the development
of plans at the district level are affected by inadequate capacities from provincial level down
to district and local council levels. Local governments also need to have sufficient capacity for
implementing needs assessments systematically to identify gaps in service quality and
access. Sound planning is then required to address such gaps and meet community needs,
especially in far-flung and rural districts.
220. Local resource mobilization is still unfamiliar ground for local governments. Local
governments will need to mobilize resources locally, using innovative means of financing,
developing new public-private partnerships, and using the decentralization rules that empower
them to levy local taxes or undertake ventures that generate funds.
221. Focus group discussions held with TLGs in other districts and interviews in Swat
showed that the strength of TLGs lay in (i) being able to provide a range of comprehensive
services such as water, sanitation, waste management, addressing encroachment and
settlement issues, and tree plantation; (ii) regularity of service provision; (iii) having the
potential of increased resources and voice with the implementation of the 2019 Amendment
to the 2013 Local Government Act, whereby the chairpersons of village/neighborhood councils
will also be members of the Tehsil Council (iv) being equipped with staff who are more
acceptable to the concerned communities,, as well as staff who have longer institutional
memory, compared to other entities and government departments such as PHED, local
development authorities and irrigation, and (v) having flexibility in adjusting different projects
to the situation and changing needs on the ground.
222. Constraints faced by the TLGs include the following points. Roles and responsibilities
need review: the staff at village or neighborhood council level were not answerable to the TLG
for planning and other matters, and this inevitably led to duplication and inefficiencies. TLGs
also underscored that coordination was not optimal and that they were not kept informed of
relevant work or issues by the different government departments. There was no regulation for
information sharing by other departments. For example, PHED was working on roads and
drains but without coordinating with TLGs. Other constraints include a shortage of vehicles,
the inadequate annual budget allocations for development work, the difficulty to collect fees
from households (less than 10% of households paid water services fees), the lack of control
on leakages, the many illegal water connections, water contamination and leakage from
deteriorating pipes, lack of awareness among communities on water wastage, and the lack of
focus on performance indicators and lack of staff dedicated to monitoring.
223. As a government body, the TLG has no proper performance monitoring at individual
or entity level. Staff appraisal is done through the annual confidential report by the supervisors.
The annual confidential report reportedly does not rely on objective performance indicators
and is perceived as being subject to the personal opinion of the supervisor. Such a system
would discourage employees from taking initiative to improve performance.
175 Buzdar, F. 2016. Local Governments in Khyber Pakhtunkhwa and Punjab: Framework, Current Status, and
Challenges. Islamabad: AAWAZ.
KP-SISUG Swat Regional Development Plan
72
224. Performance indicators cited by TLGs are presented in Appendix 5. It is unknown to
what extent data is regularly collected on these indicators.176 Appendix 5 also provides an
overview of staffing structures, salary ranges, and organigrams of the WSSCs and TLGs in
the region.
D.4. Governance and Stakeholders: The Way Forward
D.4.1. Legal and Regulatory Framework
225. As the analysis given in the Legal and Regulatory Framework Review shows, there
are several overlaps of jurisdiction between the various provincial and local institutions
established in KP. The widest institutional regime is given in the LGA, 2013, which applies all
over KP except for cantonment areas and areas specifically excluded from its ambit by the
Provincial Government. The powers vested with local governments under the LGA, 2013,
before the 2019 Amendments thereto, were wide and covered a vast array of urban and rural
sector subjects including land use and building control, urban planning and design, works and
services, including sanitation and water use, and several others. Regulation under the local
government system was divided into district level governance and tehsil level governance.
However, subsequent to the 2019 Amendments, the LGA 2013 has been significantly watered
down and only a handful of municipal functions have been left within the jurisdiction of local
governments.
226. It may be noted that, for Swat in particular, the local government regime was not in
place. The Swat District Development Authority as a provincial entity overwhelmingly
coordinates the municipal functions in the Swat region. However, ever since the repeal of the
Provincial Urban Development Board, where under the Swat District Development Authority
had been notified, there is a potential legal lacuna regarding the urban regime in the Swat
region. There is a dire need for an independent development authority for the region.
227. Before moving on to any particular recommendations, it is necessary to highlight the
constitutional regime in vogue in Pakistan. Subsequent to the 18th Amendment to the
Constitution of Pakistan, 1973, the constitutional dispensation has shifted from a centralized
federalist system to a devolved provincial and local tier governance system (commonly
referred to as “devolution”). Article 140-A(1) to the Constitution added vide the 18th
Amendment reads:
Each Province shall, by law, establish a local government system and
devolve political, administrative and financial responsibility and authority to
the elected representatives of the local governments.
[Emphasis Supplied]
228. A bare perusal of the above reflects that post devolution, the constitutional regime in
vogue in Pakistan requires that local governments not only be empowered, but, inter alia,
devolved administrative and financial authorities and responsibilities as well. It appears that
the LGA 2013, as originally enacted, was done to meet the requirements of Article 140-A.
However, as a consequence of the 2019 Amendments, the powers of the local governments
as given under LGA 2013, in line with constitutional requirements, were watered down. The
2019 Amendments have still not come into force since no elections thereunder have yet been
176 The COVID-19 situation has constrained a proper assessment of performance indicators and management
information systems used by WSSCs and TLGs.
KP-SISUG Swat Regional Development Plan
73
conducted. Regardless of the above, any recommendations for institutional and regulatory
reforms in the KP region will have to factor in the constitutional dispensation post devolution,
meaning thereby that the local governments, having authority and responsibility over
administrative and financial matters, have to be given a central role.
229. Based on the above, our recommendations are as follows:
• Disassociating planning, coordination and monitoring from implementation and
development:
o The current legal and regulatory framework, in Swat is inadequate. Under the
LGA 2013, one entity creates master plans, strategizes, coordinates, trains,
builds capacity, implements, executes and conducts any manner of affairs,
including land use planning and water & sanitation. This leads to a situation
where the same entity which is carrying on planning and coordination functions
(such as master plans, regional policy and strategy, training etc.) is also
responsible for then implementing, monitoring and certifying the same.
o Under such a regime, monitoring and effective enforcement is compromised
due to a conflict of interest within the entity. Therefore, the first key
recommendations which stands out from a review of the current legal and
regulatory framework is that planning, coordination and capacity building have
to be disassociated from implementation and development. This would mean
that there is a two-tier set up with a “Planning, Coordination and Monitoring”
entity on the one hand and an “Implementation and Development” entity on the
other.
o Under such a set-up, the Planning, Coordination and Monitoring entity would
be responsible for:
§ Formulating master-plans and development strategies for the Swat
region in consultation with all stakeholders.
§ Liaison and coordination between the various provincial entities
operating in KP, such as the KPHA, the Housing Authority and the
Environmental Protection Authority. Such a responsibility to liaise would
enable this entity to factor the concerns of these provincial stakeholders
into any master-plan or strategy that is to be proposed by this entity, as
well as share any concerns of such provincial level authorities with the
Implementation and Development entity.
§ Ensure that the plans and strategies that have been
proposed/formulated are effectively, efficiently, and correctly
implemented and provide any assistance that may be required by the
Implementation and Development entity during this process.
o The second entity which would exist under this set-up is the Implementation
and Development entity which would be responsible for practically carrying out
the development or organizational or administrative work required to be
conducted in light of a plan or strategy formulated or proposed by the Planning,
Coordination and Monitoring entity, either itself, or through special purpose

KP-SISUG Swat Regional Development Plan
74
vehicles or through third party arrangements such as PPP, outsourcing or
tendering.
• Empowering local governments administratively and financially:
o Post devolution, it is inevitable for the Provincial Government in KP to empower
its local governments to assume administrative and financial authority and
responsibility. Since this would require that the funds to actually carry out any
proposed work would be available primarily with the local governments, the
local governments will take up the role of the Implementation and Development
entity.
o Not only would the local governments thus retain their constitutional authority
and responsibility over administrative and financial matters, they would also be
better placed to ensure that there are no political hurdles or
reservations/objections raised from local residents of any particular region
since the elected representatives of the local governments are well placed to
address any concerns that the local population would have against any planned
work. The local governments would also be better placed to receive the fees
and charges for any works that are undertaken in their jurisdiction.
o Most of the implementation and development work being carried out by the
local governments would be on advice of a second entity which is coordinating
with: regional and provincial stakeholders. other local governments operating
in the province; this model will ensure coherent development throughout the
KP, factoring in macro level concerns as well.
o This model would leave discretion to the local government of Swat to decide,
whether at a district or tehsil level, to implement the recommendations, plans
and suggestions of the Planning, Coordination and Monitoring entity, either
itself, or through special purpose vehicles set up for implementing sectoral or
technical plans and strategies, or through public-private partnership projects.
Any institutional capacity building, or technical training required by the local
governments to achieve these objectives may also be provided to it by the
Planning, Coordination and Monitoring entity.
• Provincial and executive authorities to be planning, coordination and monitoring
entities:
o Under the proposed two-tier set up, provincial and executive authorities would
assume the role of planning, coordination and monitoring.
o For the Swat region, there is a dire need for a development authority. Such an
authority will require sufficient powers to direct local governments in whose
jurisdictions its schemes may fall, to execute schemes on its behalf, take over
and maintain works and services, provide amenities, and enforce regulations.
o Such a development authority for Swat can also take on board the KP Housing
Authority and factor in its input regarding preparation of regional development
plans for an integrated, coordinated and systematic planning to ensure orderly
growth and development of physical infrastructure such as highways, railways,
industrial zones, conservation of forest reserves, etc. as well as make their
KP-SISUG Swat Regional Development Plan
75
plans for development of satellite, intermediate, secondary and industrial towns
to reduce migration and drift to big settlements (which would help in addressing
the issue of urban sprawl) as part of the overall master plan it would propose
to the local government of Swat. Any mass transit plans to be undertaken by
the local government may also be proposed in light of the suggestions of the
KP Urban Mobility Authority. Any urban or rural plans to be proposed by such
a development authority would also account for the master plans to be
developed by the KP Highways Authority.
• Provincial level Advisory bodies
o Additionally, certain provincial level authorities have an overarching
responsibility over the state of affairs in the province. The Environmental
Protection Agency is a prime example of one such agency which is tasked with
ensuring that the province as whole proceeds in a manner which provides for
the protection, conservation, rehabilitation and improvement of the
environment, for the prevention and control of pollution, and promotion of
sustainable development.
o The EPA may also provide strategic environmental assessment, of socio-
economic development, industrial and agricultural development, urban and
rural development, land use and water use management; economic zones or
industrial parks and estates; transport and infrastructure; solid, municipal and
industrial waste; tourism; or any other plan or policy likely to have an adverse
impact on environment. Additionally, the Government may also require a
strategic environmental assessment for the prevention of water pollution
through improper sanitation and control flow of sanitation water into the rivers.
specifying separate zones for poultry and cattle farming and slaughtering
houses.
o The Government could also then require the Planning, Coordinating and
Monitoring entity to seek advice of the EPA and to include such measures and
take such steps, as it deems necessary, to modify the policy or development
plan according to environmental objectives.
o However, to enable the EPA to effectively contribute to the development matrix,
significant capacity building has to take place in the EPA to ensure its efficacy.
KP is perhaps the most environmentally sensitive province in Pakistan and any
planning and development related activity that is to be conducted in the
province has to meet the requirements of sustainability. Therefore, significant
budgetary allocation has to be made to empower the EPA and build it to a
capacity which can handle its responsibilities.
o Furthermore, the policing powers of the EPA have to be upgraded to ensure
that it can prevent any activity causing any loss to the environment by the
Implementation and Development entities as well as any plans being
formulated by the Planning, Coordination and Monitoring wing.
o Additionally, a provincial level transport authority is required as a coordinating
and consulting arm between the KP Highways Authority and the Khyber
Pakhtunkhwa Urban Mobility Authority (KPUMA). The KPUMA is legally
empowered to examine the plans for all land use master plans, schemes and
KP-SISUG Swat Regional Development Plan
76
projects primarily related to infrastructure and land use but not limited to that
initiated by any Department or authority of Government, as to ensure their
compatibility, suitability and sustainability with present and future mass transit
systems, schemes and projects, and to this end, an assistive role is assigned
to it under the Urban Mass Transit Authority Act. However, greater role has to
be ascribed to KPUMA to ensure that it has a say in any road network
development projects being undertaken anywhere in the KP province and
liaison with the KPHA to create a holistic transport and road network in KP.
D.4.2. Institutional Reforms
D.4.2.1. Policy Recommendations
230. Policy decisions are required for a sustainable solution to address the inadequate
human resource capacity and non-performance of WSSCM-S staff. This is a basic condition
for all WSSCs to become autonomous, corporate-governed utilities providing high quality
services. The policy measures could include components such as financial and non-financial
incentives for performance, contract employment, release of non-performing government staff,
and capacity development for staff with potential. Policy measures should also require: (i)
effective management information systems for WSSCs, including periodic household surveys
to back up the administrative data (ii) staff performance feedback systems; (ii) transparent
complaint response mechanisms for the public.
231. Greater financial predictability and efficiency need to be assured for the WSSCM-S. A
combination of efficiency measures needs to be employed with measures to protect the poor.
Policies should identify funding sources and financing strategies to assure adequate,
predictable and timely funds for the WSSCM-S each year.
232. Following the 2019 Amendment of the 2013 LGA, and the abolition of district-level
government, there is now a lack of clarity on reporting, functions and roles in a number of
sectors. To avoid potential tension in relationships between the government bureaucracy and
elected representatives, policies for each sector and subsector need to be reviewed and
regulations issued to clearly define the role of each official.
D.4.2.2. Institutional Recommendations
233. The respective mandates and envisaged roles of WSSCM-S, Swat district
development authorities, and tehsil/city local governments should be further reviewed, clarified
and defined. The normative role of the province — especially that of the Public Health
Engineering Department — also needs to be defined, especially following the 2019 revision to
the 2013 Local Government Act. The province needs to lead this exercise with the participation
of policy- and decision makers.
234. Capacity strengthening of the institutions responsible for planning, delivering, and
management of urban services is a top priority. Training and professional development could
be used as incentives for good performance. Efforts need to be made to broaden the scope
of training beyond a narrow specific area in order to develop an agile adaptable workforce with
transferable skills, such as planning and management.
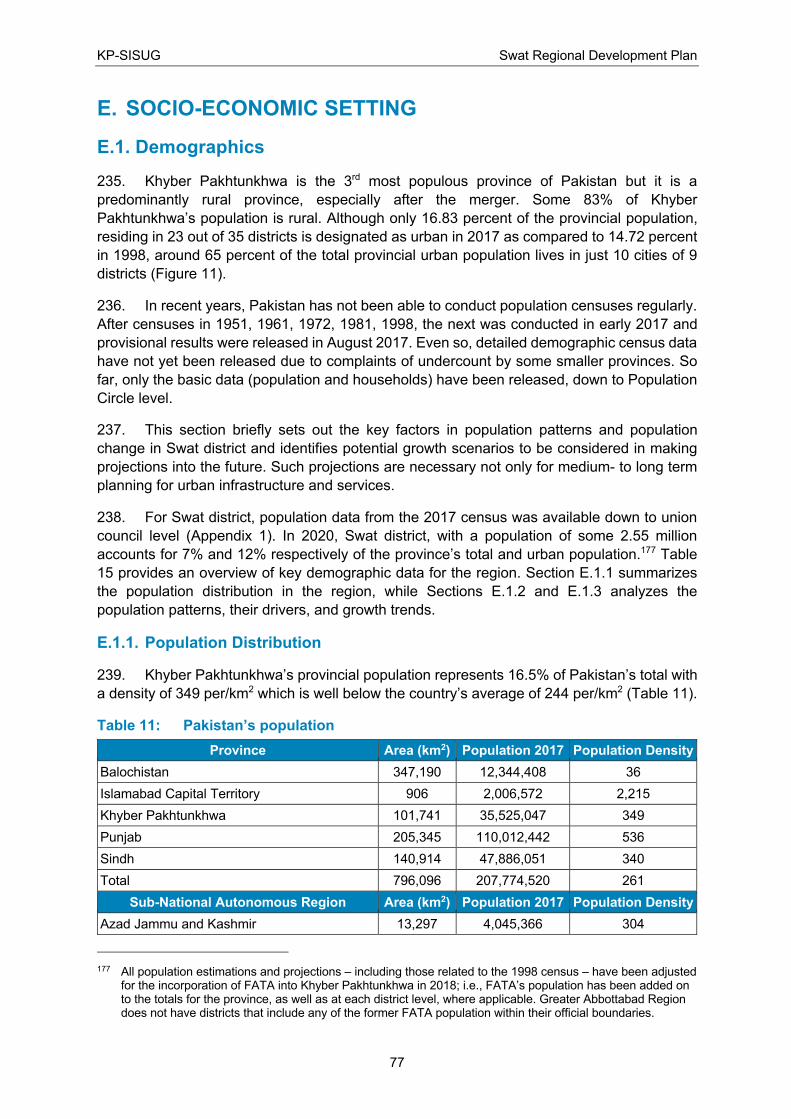
KP-SISUG Swat Regional Development Plan
77
E. SOCIO-ECONOMIC SETTING
E.1. Demographics
235. Khyber Pakhtunkhwa is the 3rd most populous province of Pakistan but it is a
predominantly rural province, especially after the merger. Some 83% of Khyber
Pakhtunkhwa’s population is rural. Although only 16.83 percent of the provincial population,
residing in 23 out of 35 districts is designated as urban in 2017 as compared to 14.72 percent
in 1998, around 65 percent of the total provincial urban population lives in just 10 cities of 9
districts (Figure 11).
236. In recent years, Pakistan has not been able to conduct population censuses regularly.
After censuses in 1951, 1961, 1972, 1981, 1998, the next was conducted in early 2017 and
provisional results were released in August 2017. Even so, detailed demographic census data
have not yet been released due to complaints of undercount by some smaller provinces. So
far, only the basic data (population and households) have been released, down to Population
Circle level.
237. This section briefly sets out the key factors in population patterns and population
change in Swat district and identifies potential growth scenarios to be considered in making
projections into the future. Such projections are necessary not only for medium- to long term
planning for urban infrastructure and services.
238. For Swat district, population data from the 2017 census was available down to union
council level (Appendix 1). In 2020, Swat district, with a population of some 2.55 million
accounts for 7% and 12% respectively of the province’s total and urban population.177 Table
15 provides an overview of key demographic data for the region. Section E.1.1 summarizes
the population distribution in the region, while Sections E.1.2 and E.1.3 analyzes the
population patterns, their drivers, and growth trends.
E.1.1. Population Distribution
239. Khyber Pakhtunkhwa’s provincial population represents 16.5% of Pakistan’s total with
a density of 349 per/km2 which is well below the country’s average of 244 per/km2 (Table 11).
Table 11: Pakistan’s population
Province Area (km2) Population 2017 Population Density
Balochistan 347,190 12,344,408 36
Islamabad Capital Territory 906 2,006,572 2,215
Khyber Pakhtunkhwa 101,741 35,525,047 349
Punjab 205,345 110,012,442 536
Sindh 140,914 47,886,051 340
Total 796,096 207,774,520 261
Sub-National Autonomous Region Area (km2) Population 2017 Population Density
Azad Jammu and Kashmir 13,297 4,045,366 304
177 All population estimations and projections – including those related to the 1998 census – have been adjusted
for the incorporation of FATA into Khyber Pakhtunkhwa in 2018; i.e., FATA’s population has been added on to the totals for the province, as well as at each district level, where applicable. Greater Abbottabad Region does not have districts that include any of the former FATA population within their official boundaries.
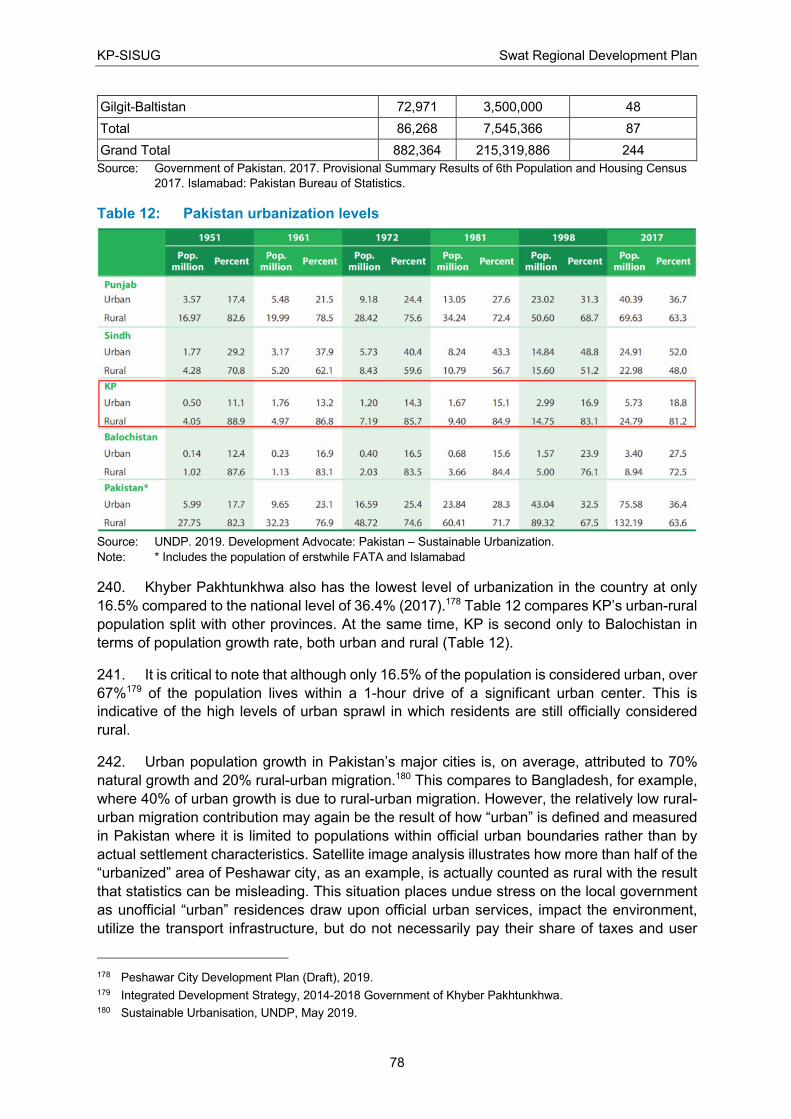
KP-SISUG Swat Regional Development Plan
78
Gilgit-Baltistan 72,971 3,500,000 48
Total 86,268 7,545,366 87
Grand Total 882,364 215,319,886 244
Source: Government of Pakistan. 2017. Provisional Summary Results of 6th Population and Housing Census
2017. Islamabad: Pakistan Bureau of Statistics.
Table 12: Pakistan urbanization levels
Source: UNDP. 2019. Development Advocate: Pakistan – Sustainable Urbanization.
Note: * Includes the population of erstwhile FATA and Islamabad
240. Khyber Pakhtunkhwa also has the lowest level of urbanization in the country at only
16.5% compared to the national level of 36.4% (2017).178 Table 12 compares KP’s urban-rural
population split with other provinces. At the same time, KP is second only to Balochistan in
terms of population growth rate, both urban and rural (Table 12).
241. It is critical to note that although only 16.5% of the population is considered urban, over
67%179 of the population lives within a 1-hour drive of a significant urban center. This is
indicative of the high levels of urban sprawl in which residents are still officially considered
rural.
242. Urban population growth in Pakistan’s major cities is, on average, attributed to 70%
natural growth and 20% rural-urban migration.180 This compares to Bangladesh, for example,
where 40% of urban growth is due to rural-urban migration. However, the relatively low rural-
urban migration contribution may again be the result of how “urban” is defined and measured
in Pakistan where it is limited to populations within official urban boundaries rather than by
actual settlement characteristics. Satellite image analysis illustrates how more than half of the
“urbanized” area of Peshawar city, as an example, is actually counted as rural with the result
that statistics can be misleading. This situation places undue stress on the local government
as unofficial “urban” residences draw upon official urban services, impact the environment,
utilize the transport infrastructure, but do not necessarily pay their share of taxes and user
178 Peshawar City Development Plan (Draft), 2019. 179 Integrated Development Strategy, 2014-2018 Government of Khyber Pakhtunkhwa. 180 Sustainable Urbanisation, UNDP, May 2019.

KP-SISUG Swat Regional Development Plan
79
fees. At the same time provincial and national government transfer payments are often per
capita based in which case receive far less funding allocations than they are actually providing
services for.
Table 13: Pakistan urban-rural growth rates
Source: UNDP. 2019. Development Advocate: Pakistan – Sustainable Urbanization.
243. The reason for the low overall rate of urbanization in KP as a whole is illustrated in
Table 15 and Map 9 which shows that KP’s population is concentrated in the Peshawar Region
and 3 or 4 adjacent Districts. By contrast, the Swat Region/District has an estimated total
population of 2,548,862 (2020) which is almost 6.6% of KP’s total 38,623,451.181 The Region
averages 70% rural population and almost 30% urban compared to the KP overall urban level
of only 16.5%. The average population density in the district is 473 persons/km2.
181 Population Census Organisation, Pakistan.
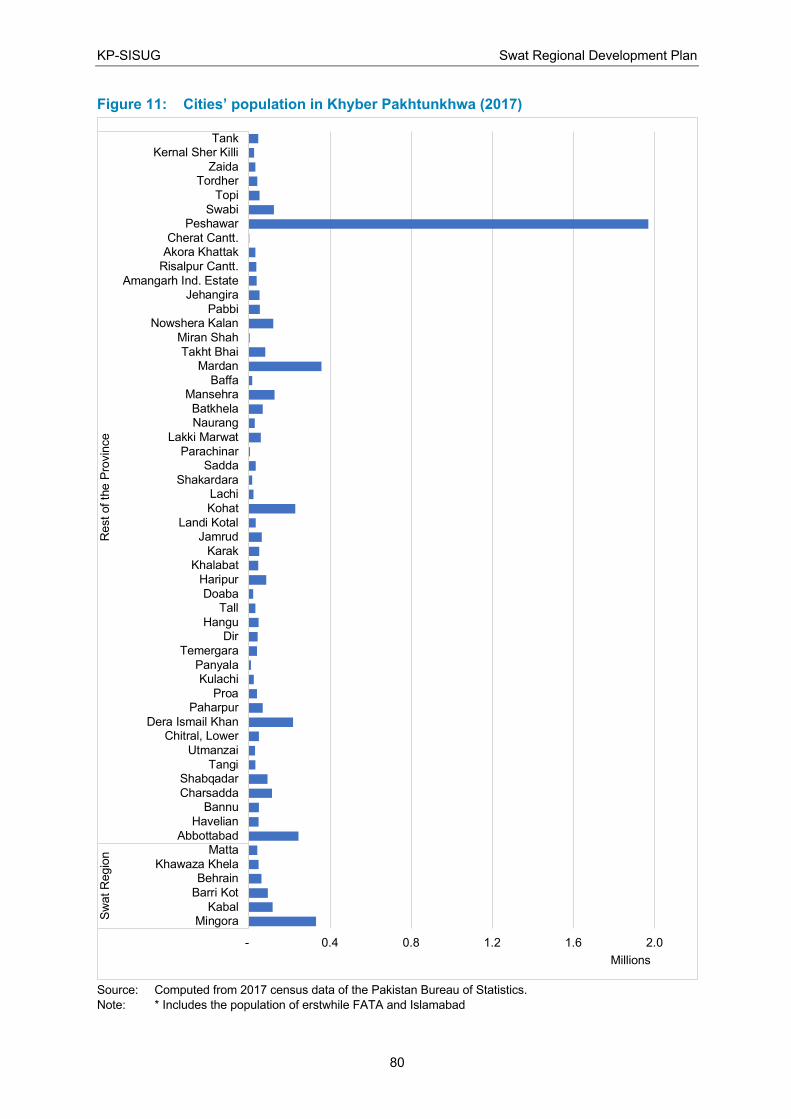
KP-SISUG Swat Regional Development Plan
80
Figure 11: Cities’ population in Khyber Pakhtunkhwa (2017)
Source: Computed from 2017 census data of the Pakistan Bureau of Statistics.
Note: * Includes the population of erstwhile FATA and Islamabad
- 0.4 0.8 1.2 1.6 2.0
MingoraKabal
Barri Kot
BehrainKhawaza Khela
MattaAbbottabad
Havelian
BannuCharsadda
ShabqadarTangi
Utmanzai
Chitral, LowerDera Ismail Khan
PaharpurProa
KulachiPanyala
Temergara
DirHangu
TallDoaba
Haripur
KhalabatKarak
JamrudLandi Kotal
Kohat
LachiShakardara
SaddaParachinar
Lakki Marwat
NaurangBatkhela
MansehraBaffa
MardanTakht Bhai
Miran Shah
Nowshera KalanPabbi
JehangiraAmangarh Ind. Estate
Risalpur Cantt.
Akora KhattakCherat Cantt.
PeshawarSwabi
Topi
TordherZaida
Kernal Sher KilliTank
Sw
at R
egio
nR
est of th
e P
rovin
ce
Millions
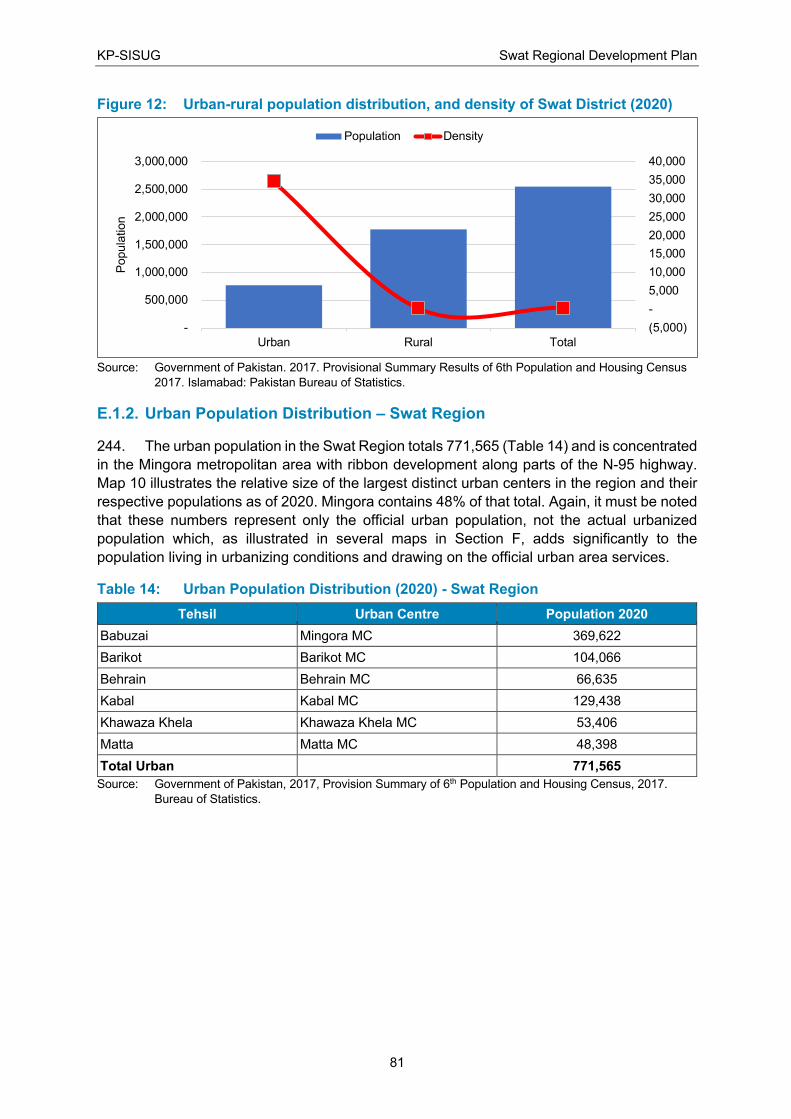
KP-SISUG Swat Regional Development Plan
81
Figure 12: Urban-rural population distribution, and density of Swat District (2020)
Source: Government of Pakistan. 2017. Provisional Summary Results of 6th Population and Housing Census
2017. Islamabad: Pakistan Bureau of Statistics.
E.1.2. Urban Population Distribution – Swat Region
244. The urban population in the Swat Region totals 771,565 (Table 14) and is concentrated
in the Mingora metropolitan area with ribbon development along parts of the N-95 highway.
Map 10 illustrates the relative size of the largest distinct urban centers in the region and their
respective populations as of 2020. Mingora contains 48% of that total. Again, it must be noted
that these numbers represent only the official urban population, not the actual urbanized
population which, as illustrated in several maps in Section F, adds significantly to the
population living in urbanizing conditions and drawing on the official urban area services.
Table 14: Urban Population Distribution (2020) - Swat Region
Tehsil Urban Centre Population 2020
Babuzai Mingora MC 369,622
Barikot Barikot MC 104,066
Behrain Behrain MC 66,635
Kabal Kabal MC 129,438
Khawaza Khela Khawaza Khela MC 53,406
Matta Matta MC 48,398
Total Urban 771,565
Source: Government of Pakistan, 2017, Provision Summary of 6th Population and Housing Census, 2017.
Bureau of Statistics.
(5,000)
-
5,000
10,000
15,000
20,000
25,000
30,000
35,000
40,000
-
500,000
1,000,000
1,500,000
2,000,000
2,500,000
3,000,000
Urban Rural Total
Popula
tion
Population Density
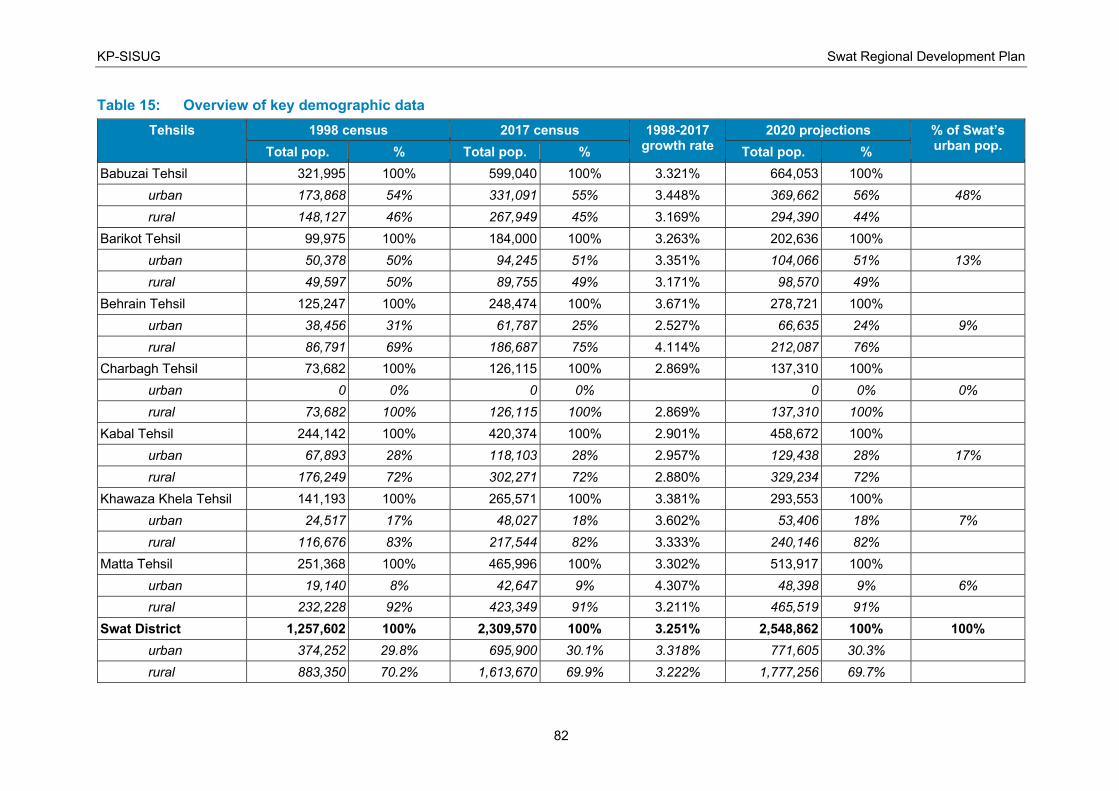
KP-SISUG Swat Regional Development Plan
82
Table 15: Overview of key demographic data
Tehsils 1998 census 2017 census 1998-2017 growth rate
2020 projections % of Swat’s urban pop.
Total pop. % Total pop. % Total pop. %
Babuzai Tehsil 321,995 100% 599,040 100% 3.321% 664,053 100%
urban 173,868 54% 331,091 55% 3.448% 369,662 56% 48%
rural 148,127 46% 267,949 45% 3.169% 294,390 44%
Barikot Tehsil 99,975 100% 184,000 100% 3.263% 202,636 100%
urban 50,378 50% 94,245 51% 3.351% 104,066 51% 13%
rural 49,597 50% 89,755 49% 3.171% 98,570 49%
Behrain Tehsil 125,247 100% 248,474 100% 3.671% 278,721 100%
urban 38,456 31% 61,787 25% 2.527% 66,635 24% 9%
rural 86,791 69% 186,687 75% 4.114% 212,087 76%
Charbagh Tehsil 73,682 100% 126,115 100% 2.869% 137,310 100%
urban 0 0% 0 0% 0 0% 0%
rural 73,682 100% 126,115 100% 2.869% 137,310 100%
Kabal Tehsil 244,142 100% 420,374 100% 2.901% 458,672 100%
urban 67,893 28% 118,103 28% 2.957% 129,438 28% 17%
rural 176,249 72% 302,271 72% 2.880% 329,234 72%
Khawaza Khela Tehsil 141,193 100% 265,571 100% 3.381% 293,553 100%
urban 24,517 17% 48,027 18% 3.602% 53,406 18% 7%
rural 116,676 83% 217,544 82% 3.333% 240,146 82%
Matta Tehsil 251,368 100% 465,996 100% 3.302% 513,917 100%
urban 19,140 8% 42,647 9% 4.307% 48,398 9% 6%
rural 232,228 92% 423,349 91% 3.211% 465,519 91%
Swat District 1,257,602 100% 2,309,570 100% 3.251% 2,548,862 100% 100%
urban 374,252 29.8% 695,900 30.1% 3.318% 771,605 30.3%
rural 883,350 70.2% 1,613,670 69.9% 3.222% 1,777,256 69.7%
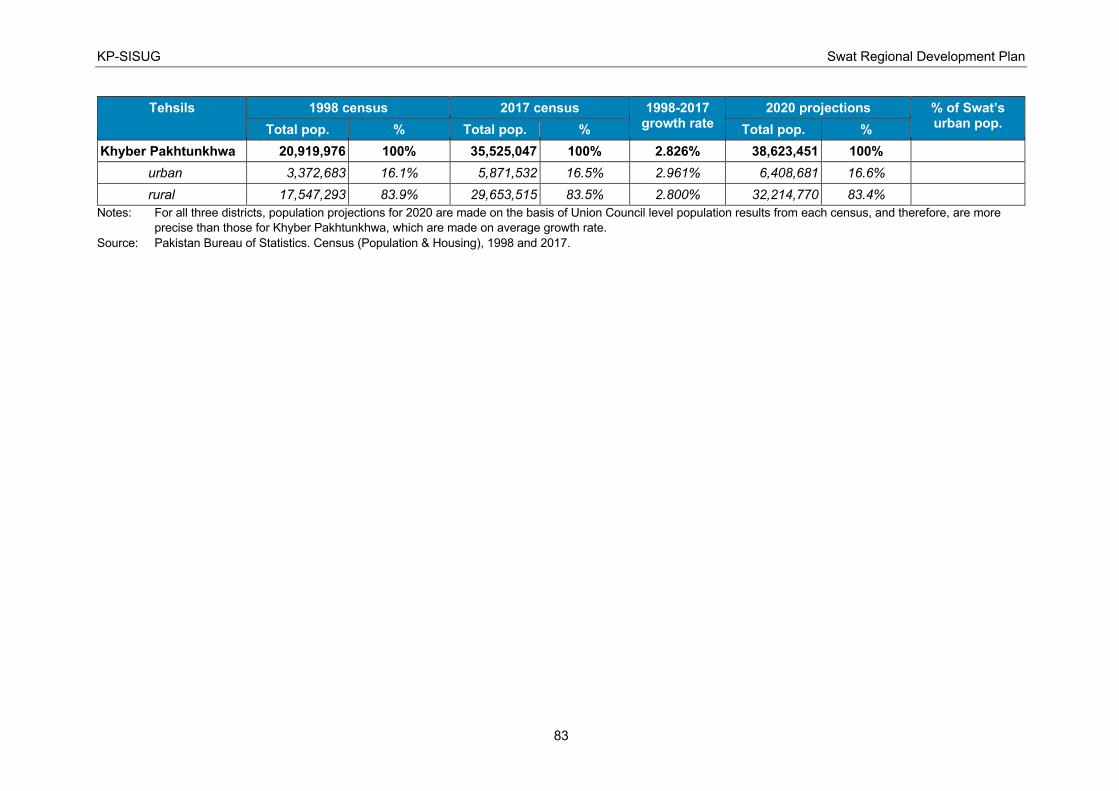
KP-SISUG Swat Regional Development Plan
83
Tehsils 1998 census 2017 census 1998-2017 growth rate
2020 projections % of Swat’s urban pop.
Total pop. % Total pop. % Total pop. %
Khyber Pakhtunkhwa 20,919,976 100% 35,525,047 100% 2.826% 38,623,451 100%
urban 3,372,683 16.1% 5,871,532 16.5% 2.961% 6,408,681 16.6%
rural 17,547,293 83.9% 29,653,515 83.5% 2.800% 32,214,770 83.4%
Notes: For all three districts, population projections for 2020 are made on the basis of Union Council level population results from each census, and therefore, are more
precise than those for Khyber Pakhtunkhwa, which are made on average growth rate.
Source: Pakistan Bureau of Statistics. Census (Population & Housing), 1998 and 2017.
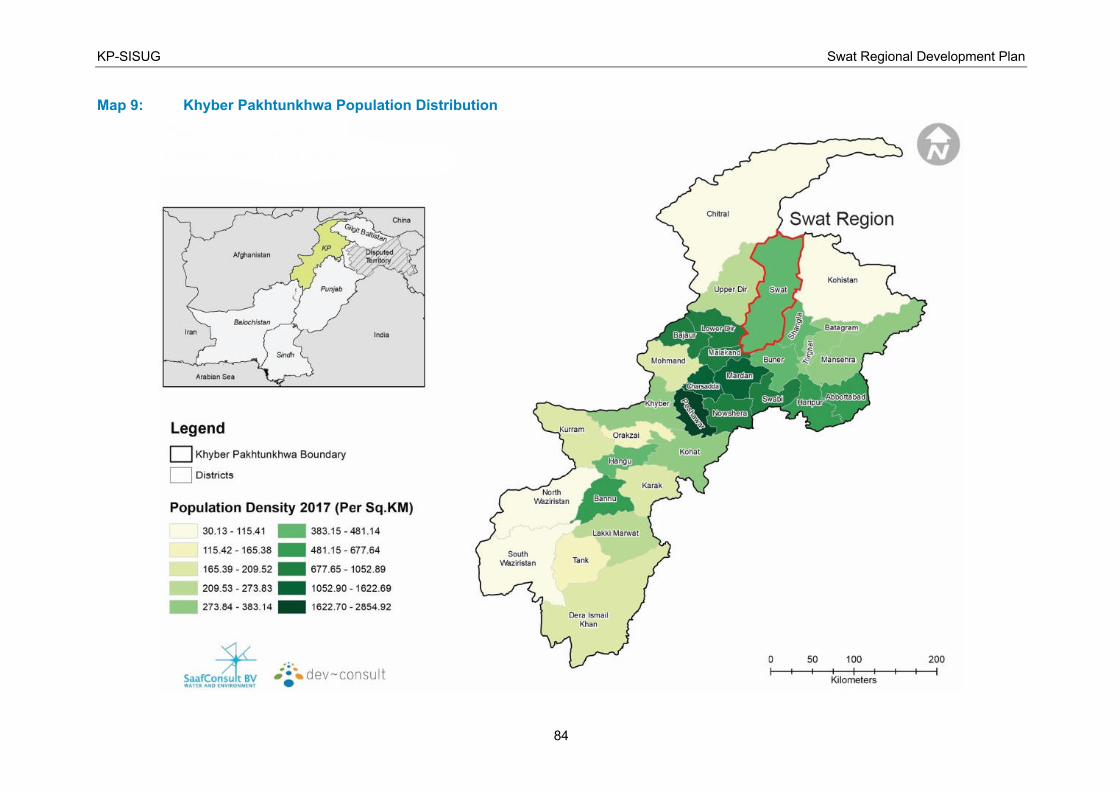
KP-SISUG Swat Regional Development Plan
84
Map 9: Khyber Pakhtunkhwa Population Distribution
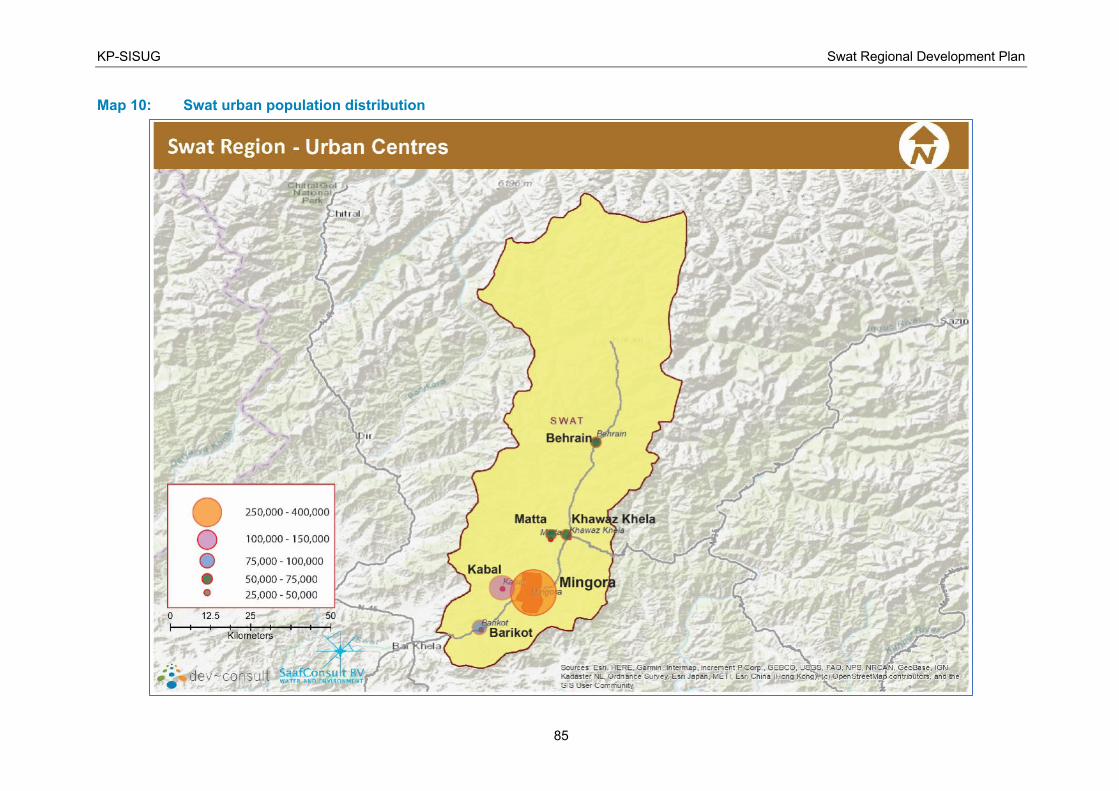
KP-SISUG Swat Regional Development Plan
85
Map 10: Swat urban population distribution
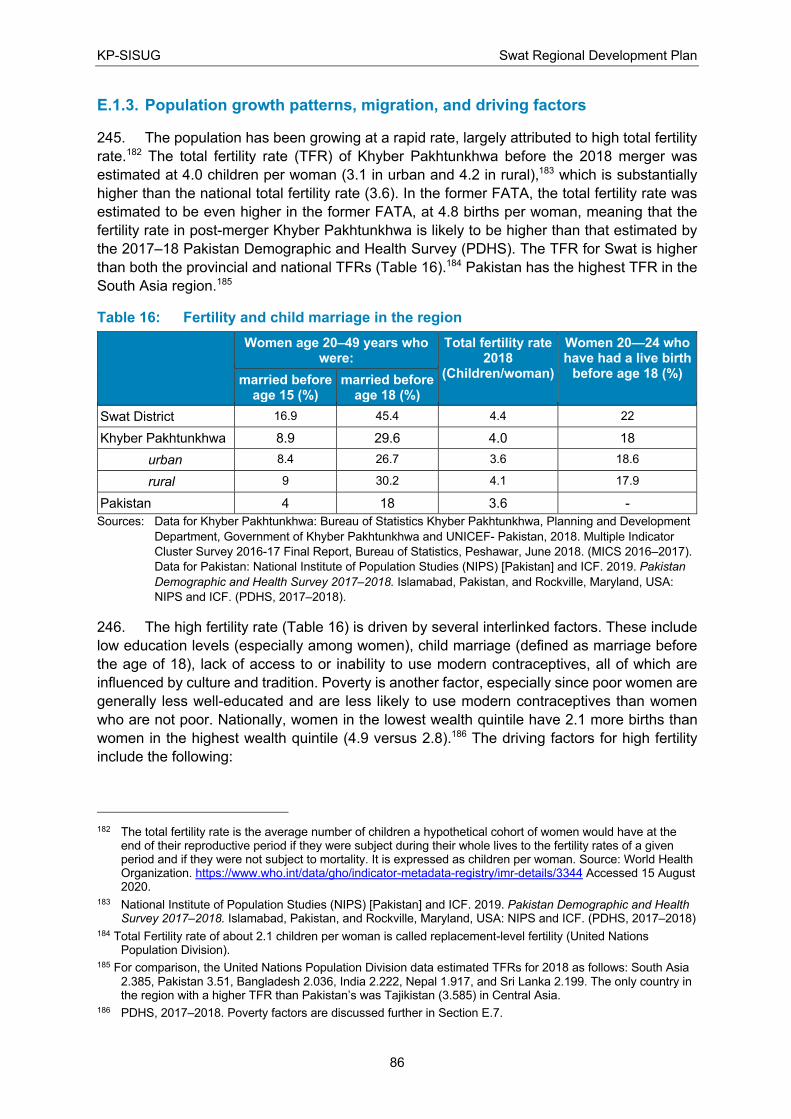
KP-SISUG Swat Regional Development Plan
86
E.1.3. Population growth patterns, migration, and driving factors
245. The population has been growing at a rapid rate, largely attributed to high total fertility
rate.182 The total fertility rate (TFR) of Khyber Pakhtunkhwa before the 2018 merger was
estimated at 4.0 children per woman (3.1 in urban and 4.2 in rural),183 which is substantially
higher than the national total fertility rate (3.6). In the former FATA, the total fertility rate was
estimated to be even higher in the former FATA, at 4.8 births per woman, meaning that the
fertility rate in post-merger Khyber Pakhtunkhwa is likely to be higher than that estimated by
the 2017–18 Pakistan Demographic and Health Survey (PDHS). The TFR for Swat is higher
than both the provincial and national TFRs (Table 16).184 Pakistan has the highest TFR in the
South Asia region.185
Table 16: Fertility and child marriage in the region
Women age 20–49 years who were:
Total fertility rate 2018
(Children/woman)
Women 20—24 who have had a live birth
before age 18 (%) married before
age 15 (%) married before
age 18 (%)
Swat District 16.9 45.4 4.4 22
Khyber Pakhtunkhwa 8.9 29.6 4.0 18
urban 8.4 26.7 3.6 18.6
rural 9 30.2 4.1 17.9
Pakistan 4 18 3.6 -
Sources: Data for Khyber Pakhtunkhwa: Bureau of Statistics Khyber Pakhtunkhwa, Planning and Development
Department, Government of Khyber Pakhtunkhwa and UNICEF- Pakistan, 2018. Multiple Indicator
Cluster Survey 2016-17 Final Report, Bureau of Statistics, Peshawar, June 2018. (MICS 2016–2017).
Data for Pakistan: National Institute of Population Studies (NIPS) [Pakistan] and ICF. 2019. Pakistan
Demographic and Health Survey 2017–2018. Islamabad, Pakistan, and Rockville, Maryland, USA:
NIPS and ICF. (PDHS, 2017–2018).
246. The high fertility rate (Table 16) is driven by several interlinked factors. These include
low education levels (especially among women), child marriage (defined as marriage before
the age of 18), lack of access to or inability to use modern contraceptives, all of which are
influenced by culture and tradition. Poverty is another factor, especially since poor women are
generally less well-educated and are less likely to use modern contraceptives than women
who are not poor. Nationally, women in the lowest wealth quintile have 2.1 more births than
women in the highest wealth quintile (4.9 versus 2.8).186 The driving factors for high fertility
include the following:
182 The total fertility rate is the average number of children a hypothetical cohort of women would have at the
end of their reproductive period if they were subject during their whole lives to the fertility rates of a given period and if they were not subject to mortality. It is expressed as children per woman. Source: World Health Organization. https://www.who.int/data/gho/indicator-metadata-registry/imr-details/3344 Accessed 15 August 2020.
183 National Institute of Population Studies (NIPS) [Pakistan] and ICF. 2019. Pakistan Demographic and Health Survey 2017–2018. Islamabad, Pakistan, and Rockville, Maryland, USA: NIPS and ICF. (PDHS, 2017–2018)
184 Total Fertility rate of about 2.1 children per woman is called replacement-level fertility (United Nations Population Division).
185 For comparison, the United Nations Population Division data estimated TFRs for 2018 as follows: South Asia 2.385, Pakistan 3.51, Bangladesh 2.036, India 2.222, Nepal 1.917, and Sri Lanka 2.199. The only country in the region with a higher TFR than Pakistan’s was Tajikistan (3.585) in Central Asia.
186 PDHS, 2017–2018. Poverty factors are discussed further in Section E.7.
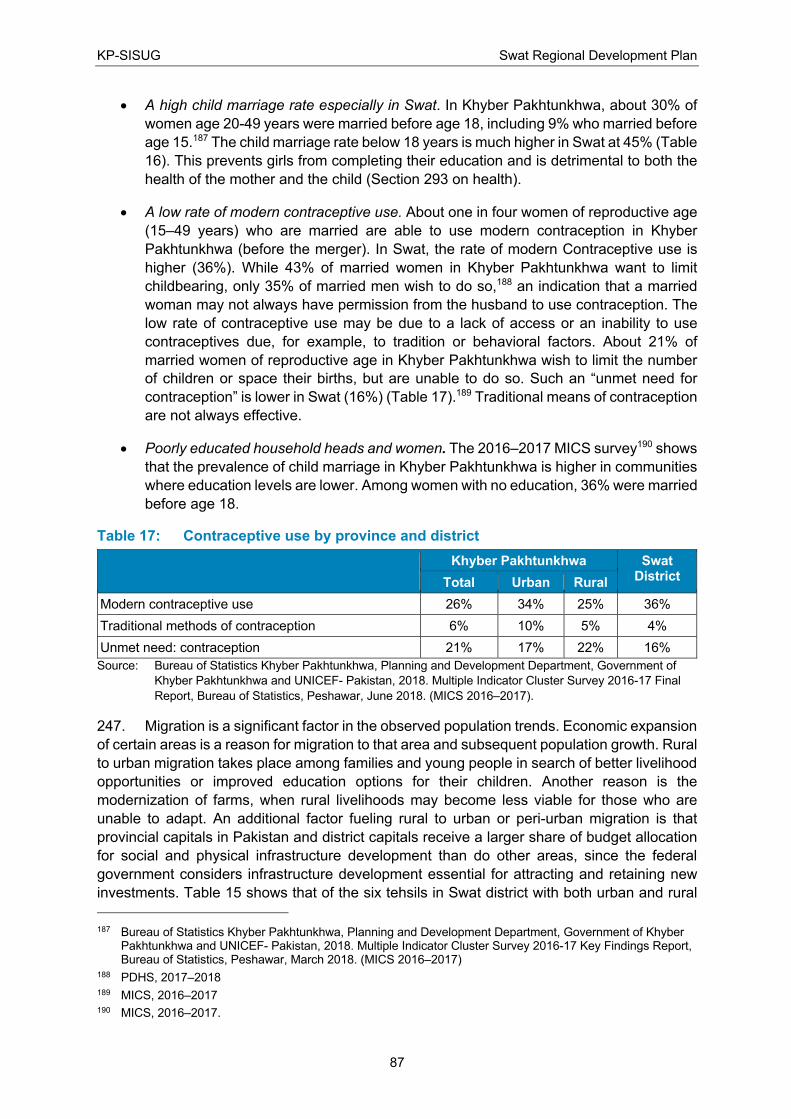
KP-SISUG Swat Regional Development Plan
87
• A high child marriage rate especially in Swat. In Khyber Pakhtunkhwa, about 30% of
women age 20-49 years were married before age 18, including 9% who married before
age 15.187 The child marriage rate below 18 years is much higher in Swat at 45% (Table
16). This prevents girls from completing their education and is detrimental to both the
health of the mother and the child (Section 293 on health).
• A low rate of modern contraceptive use. About one in four women of reproductive age
(15–49 years) who are married are able to use modern contraception in Khyber
Pakhtunkhwa (before the merger). In Swat, the rate of modern Contraceptive use is
higher (36%). While 43% of married women in Khyber Pakhtunkhwa want to limit
childbearing, only 35% of married men wish to do so,188 an indication that a married
woman may not always have permission from the husband to use contraception. The
low rate of contraceptive use may be due to a lack of access or an inability to use
contraceptives due, for example, to tradition or behavioral factors. About 21% of
married women of reproductive age in Khyber Pakhtunkhwa wish to limit the number
of children or space their births, but are unable to do so. Such an “unmet need for
contraception” is lower in Swat (16%) (Table 17).189 Traditional means of contraception
are not always effective.
• Poorly educated household heads and women. The 2016–2017 MICS survey190 shows
that the prevalence of child marriage in Khyber Pakhtunkhwa is higher in communities
where education levels are lower. Among women with no education, 36% were married
before age 18.
Table 17: Contraceptive use by province and district
Khyber Pakhtunkhwa Swat District
Total Urban Rural
Modern contraceptive use 26% 34% 25% 36%
Traditional methods of contraception 6% 10% 5% 4%
Unmet need: contraception 21% 17% 22% 16%
Source: Bureau of Statistics Khyber Pakhtunkhwa, Planning and Development Department, Government of
Khyber Pakhtunkhwa and UNICEF- Pakistan, 2018. Multiple Indicator Cluster Survey 2016-17 Final
Report, Bureau of Statistics, Peshawar, June 2018. (MICS 2016–2017).
247. Migration is a significant factor in the observed population trends. Economic expansion
of certain areas is a reason for migration to that area and subsequent population growth. Rural
to urban migration takes place among families and young people in search of better livelihood
opportunities or improved education options for their children. Another reason is the
modernization of farms, when rural livelihoods may become less viable for those who are
unable to adapt. An additional factor fueling rural to urban or peri-urban migration is that
provincial capitals in Pakistan and district capitals receive a larger share of budget allocation
for social and physical infrastructure development than do other areas, since the federal
government considers infrastructure development essential for attracting and retaining new
investments. Table 15 shows that of the six tehsils in Swat district with both urban and rural
187 Bureau of Statistics Khyber Pakhtunkhwa, Planning and Development Department, Government of Khyber
Pakhtunkhwa and UNICEF- Pakistan, 2018. Multiple Indicator Cluster Survey 2016-17 Key Findings Report, Bureau of Statistics, Peshawar, March 2018. (MICS 2016–2017)
188 PDHS, 2017–2018 189 MICS, 2016–2017 190 MICS, 2016–2017.
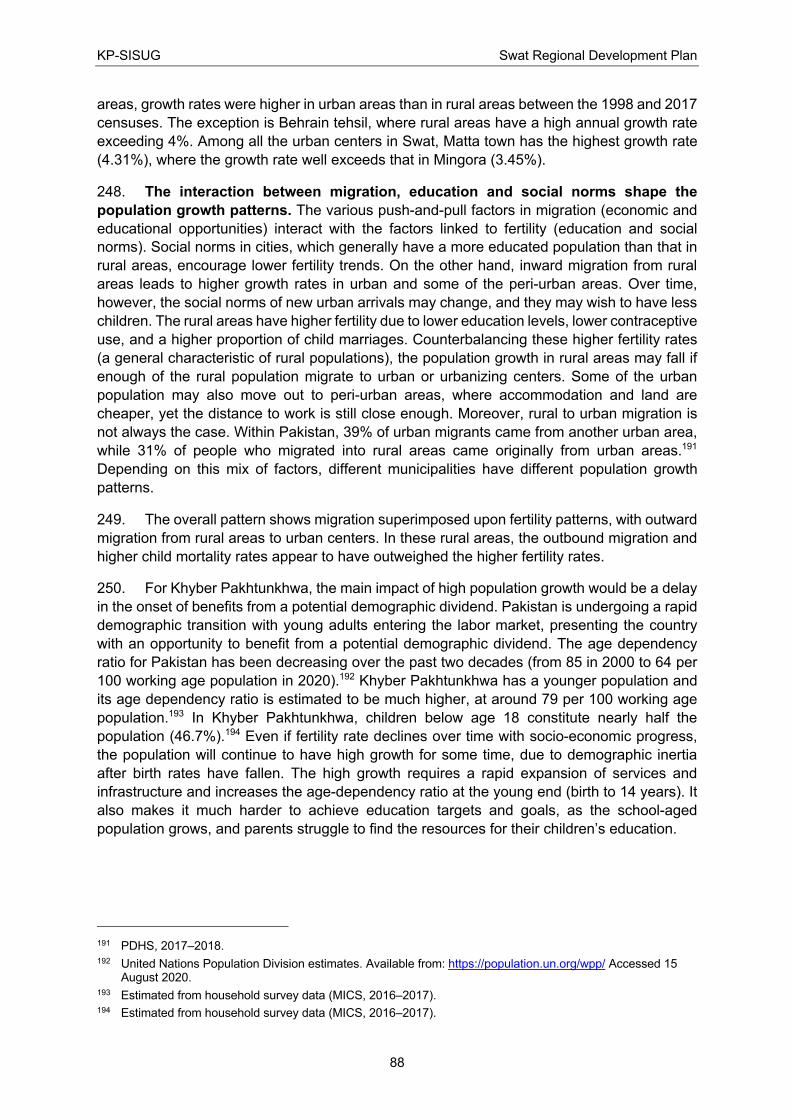
KP-SISUG Swat Regional Development Plan
88
areas, growth rates were higher in urban areas than in rural areas between the 1998 and 2017
censuses. The exception is Behrain tehsil, where rural areas have a high annual growth rate
exceeding 4%. Among all the urban centers in Swat, Matta town has the highest growth rate
(4.31%), where the growth rate well exceeds that in Mingora (3.45%).
248. The interaction between migration, education and social norms shape the
population growth patterns. The various push-and-pull factors in migration (economic and
educational opportunities) interact with the factors linked to fertility (education and social
norms). Social norms in cities, which generally have a more educated population than that in
rural areas, encourage lower fertility trends. On the other hand, inward migration from rural
areas leads to higher growth rates in urban and some of the peri-urban areas. Over time,
however, the social norms of new urban arrivals may change, and they may wish to have less
children. The rural areas have higher fertility due to lower education levels, lower contraceptive
use, and a higher proportion of child marriages. Counterbalancing these higher fertility rates
(a general characteristic of rural populations), the population growth in rural areas may fall if
enough of the rural population migrate to urban or urbanizing centers. Some of the urban
population may also move out to peri-urban areas, where accommodation and land are
cheaper, yet the distance to work is still close enough. Moreover, rural to urban migration is
not always the case. Within Pakistan, 39% of urban migrants came from another urban area,
while 31% of people who migrated into rural areas came originally from urban areas.191
Depending on this mix of factors, different municipalities have different population growth
patterns.
249. The overall pattern shows migration superimposed upon fertility patterns, with outward
migration from rural areas to urban centers. In these rural areas, the outbound migration and
higher child mortality rates appear to have outweighed the higher fertility rates.
250. For Khyber Pakhtunkhwa, the main impact of high population growth would be a delay
in the onset of benefits from a potential demographic dividend. Pakistan is undergoing a rapid
demographic transition with young adults entering the labor market, presenting the country
with an opportunity to benefit from a potential demographic dividend. The age dependency
ratio for Pakistan has been decreasing over the past two decades (from 85 in 2000 to 64 per
100 working age population in 2020).192 Khyber Pakhtunkhwa has a younger population and
its age dependency ratio is estimated to be much higher, at around 79 per 100 working age
population.193 In Khyber Pakhtunkhwa, children below age 18 constitute nearly half the
population (46.7%).194 Even if fertility rate declines over time with socio-economic progress,
the population will continue to have high growth for some time, due to demographic inertia
after birth rates have fallen. The high growth requires a rapid expansion of services and
infrastructure and increases the age-dependency ratio at the young end (birth to 14 years). It
also makes it much harder to achieve education targets and goals, as the school-aged
population grows, and parents struggle to find the resources for their children’s education.
191 PDHS, 2017–2018. 192 United Nations Population Division estimates. Available from: https://population.un.org/wpp/ Accessed 15
August 2020. 193 Estimated from household survey data (MICS, 2016–2017). 194 Estimated from household survey data (MICS, 2016–2017).
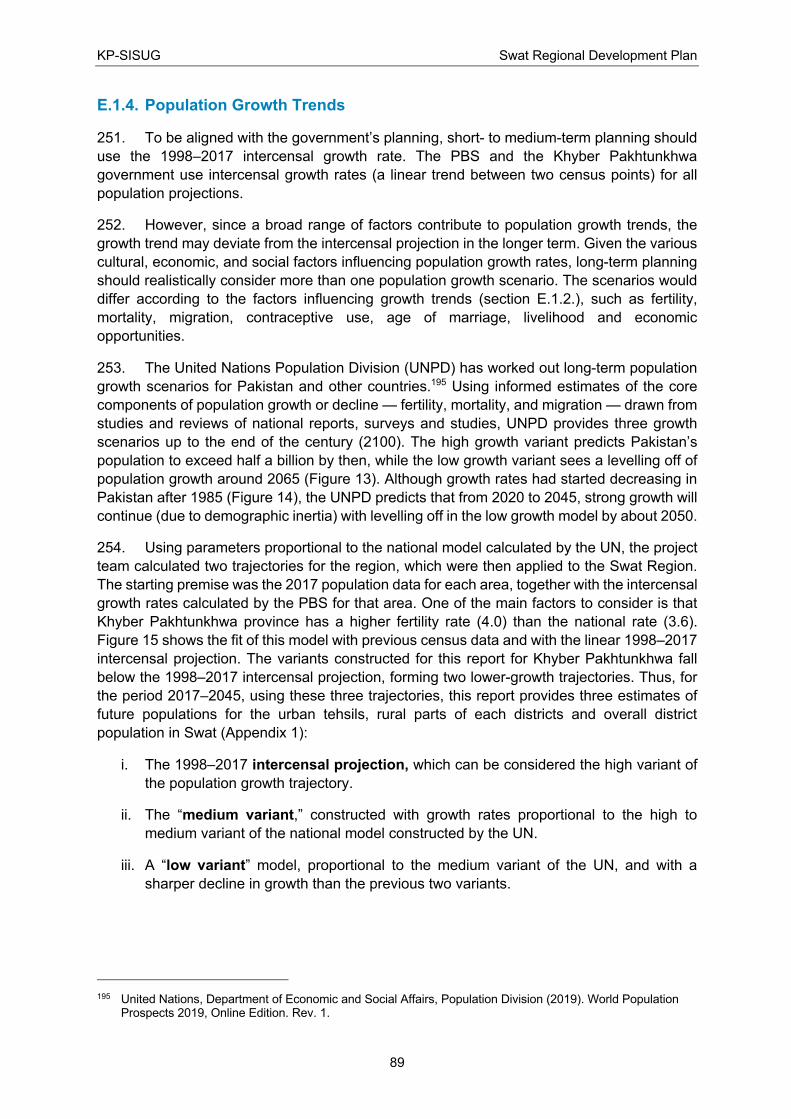
KP-SISUG Swat Regional Development Plan
89
E.1.4. Population Growth Trends
251. To be aligned with the government’s planning, short- to medium-term planning should
use the 1998–2017 intercensal growth rate. The PBS and the Khyber Pakhtunkhwa
government use intercensal growth rates (a linear trend between two census points) for all
population projections.
252. However, since a broad range of factors contribute to population growth trends, the
growth trend may deviate from the intercensal projection in the longer term. Given the various
cultural, economic, and social factors influencing population growth rates, long-term planning
should realistically consider more than one population growth scenario. The scenarios would
differ according to the factors influencing growth trends (section E.1.2.), such as fertility,
mortality, migration, contraceptive use, age of marriage, livelihood and economic
opportunities.
253. The United Nations Population Division (UNPD) has worked out long-term population
growth scenarios for Pakistan and other countries.195 Using informed estimates of the core
components of population growth or decline — fertility, mortality, and migration — drawn from
studies and reviews of national reports, surveys and studies, UNPD provides three growth
scenarios up to the end of the century (2100). The high growth variant predicts Pakistan’s
population to exceed half a billion by then, while the low growth variant sees a levelling off of
population growth around 2065 (Figure 13). Although growth rates had started decreasing in
Pakistan after 1985 (Figure 14), the UNPD predicts that from 2020 to 2045, strong growth will
continue (due to demographic inertia) with levelling off in the low growth model by about 2050.
254. Using parameters proportional to the national model calculated by the UN, the project
team calculated two trajectories for the region, which were then applied to the Swat Region.
The starting premise was the 2017 population data for each area, together with the intercensal
growth rates calculated by the PBS for that area. One of the main factors to consider is that
Khyber Pakhtunkhwa province has a higher fertility rate (4.0) than the national rate (3.6).
Figure 15 shows the fit of this model with previous census data and with the linear 1998–2017
intercensal projection. The variants constructed for this report for Khyber Pakhtunkhwa fall
below the 1998–2017 intercensal projection, forming two lower-growth trajectories. Thus, for
the period 2017–2045, using these three trajectories, this report provides three estimates of
future populations for the urban tehsils, rural parts of each districts and overall district
population in Swat (Appendix 1):
i. The 1998–2017 intercensal projection, which can be considered the high variant of
the population growth trajectory.
ii. The “medium variant,” constructed with growth rates proportional to the high to
medium variant of the national model constructed by the UN.
iii. A “low variant” model, proportional to the medium variant of the UN, and with a
sharper decline in growth than the previous two variants.
195 United Nations, Department of Economic and Social Affairs, Population Division (2019). World Population
Prospects 2019, Online Edition. Rev. 1.
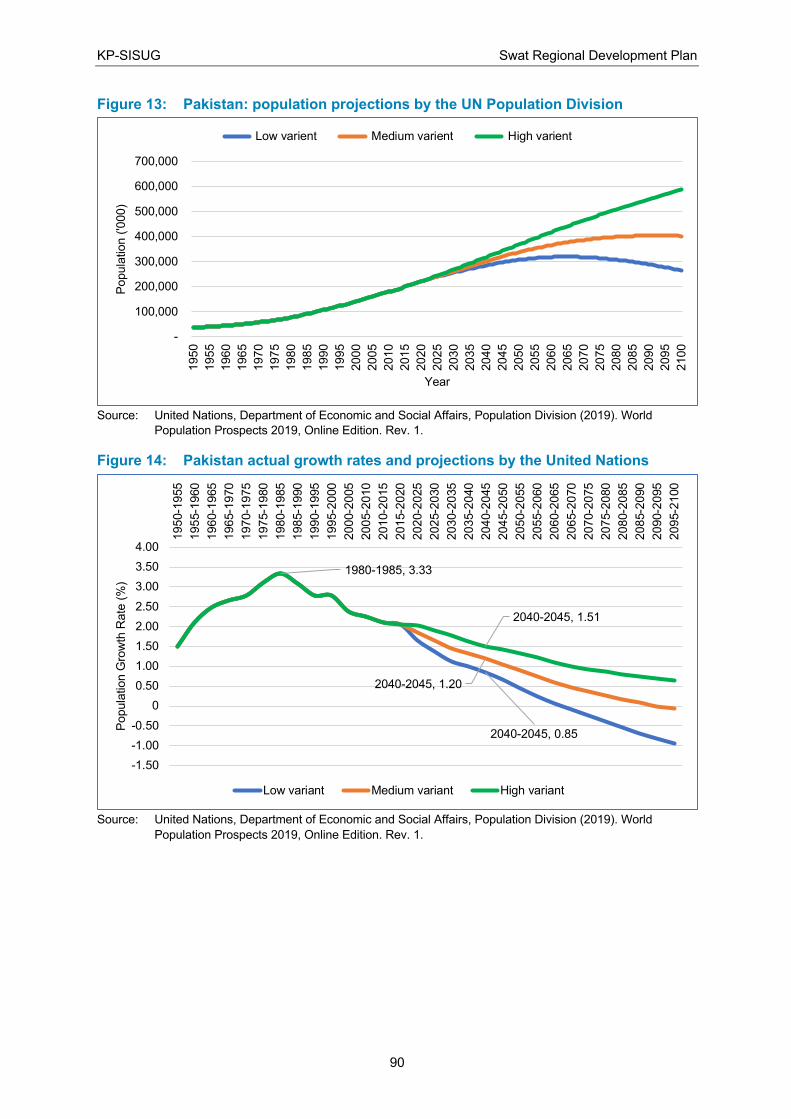
KP-SISUG Swat Regional Development Plan
90
Figure 13: Pakistan: population projections by the UN Population Division
Source: United Nations, Department of Economic and Social Affairs, Population Division (2019). World
Population Prospects 2019, Online Edition. Rev. 1.
Figure 14: Pakistan actual growth rates and projections by the United Nations
Source: United Nations, Department of Economic and Social Affairs, Population Division (2019). World
Population Prospects 2019, Online Edition. Rev. 1.
-
100,000
200,000
300,000
400,000
500,000
600,000
700,000
1950
1955
1960
1965
1970
1975
1980
1985
1990
1995
2000
2005
2010
2015
2020
2025
2030
2035
2040
2045
2050
2055
2060
2065
2070
2075
2080
2085
2090
2095
2100
Popula
tion (
'000)
Year
Low varient Medium varient High varient
2040-2045, 0.85
2040-2045, 1.20
1980-1985, 3.33
2040-2045, 1.51
-1.50
-1.00
-0.50
0
0.50
1.00
1.50
2.00
2.50
3.00
3.50
4.00
1950-1
955
1955-1
960
1960-1
965
1965-1
970
1970-1
975
1975-1
980
1980-1
985
1985-1
990
1990-1
995
1995-2
000
2000-2
005
2005-2
010
2010-2
015
2015-2
020
2020-2
025
2025-2
030
2030-2
035
2035-2
040
2040-2
045
2045-2
050
2050-2
055
2055-2
060
2060-2
065
2065-2
070
2070-2
075
2075-2
080
2080-2
085
2085-2
090
2090-2
095
2095-2
100
Popula
tion G
row
th R
ate
(%
)
Low variant Medium variant High variant
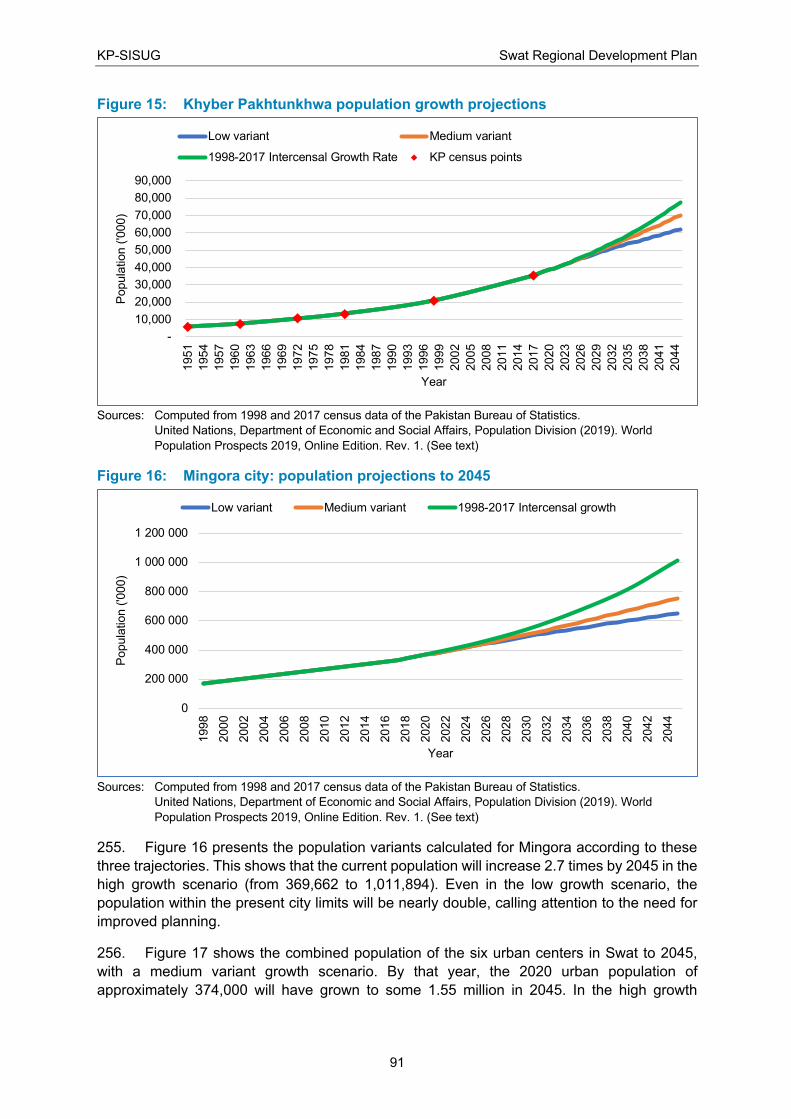
KP-SISUG Swat Regional Development Plan
91
Figure 15: Khyber Pakhtunkhwa population growth projections
Sources: Computed from 1998 and 2017 census data of the Pakistan Bureau of Statistics.
United Nations, Department of Economic and Social Affairs, Population Division (2019). World
Population Prospects 2019, Online Edition. Rev. 1. (See text)
Figure 16: Mingora city: population projections to 2045
Sources: Computed from 1998 and 2017 census data of the Pakistan Bureau of Statistics.
United Nations, Department of Economic and Social Affairs, Population Division (2019). World
Population Prospects 2019, Online Edition. Rev. 1. (See text)
255. Figure 16 presents the population variants calculated for Mingora according to these
three trajectories. This shows that the current population will increase 2.7 times by 2045 in the
high growth scenario (from 369,662 to 1,011,894). Even in the low growth scenario, the
population within the present city limits will be nearly double, calling attention to the need for
improved planning.
256. Figure 17 shows the combined population of the six urban centers in Swat to 2045,
with a medium variant growth scenario. By that year, the 2020 urban population of
approximately 374,000 will have grown to some 1.55 million in 2045. In the high growth
-
10,000
20,000
30,000
40,000
50,000
60,000
70,000
80,000
90,0001951
1954
1957
1960
1963
1966
1969
1972
1975
1978
1981
1984
1987
1990
1993
1996
1999
2002
2005
2008
2011
2014
2017
2020
2023
2026
2029
2032
2035
2038
2041
2044
Popula
tion (
'000)
Year
Low variant Medium variant
1998-2017 Intercensal Growth Rate KP census points
0
200 000
400 000
600 000
800 000
1 000 000
1 200 000
1998
2000
2002
2004
2006
2008
2010
2012
2014
2016
2018
2020
2022
2024
2026
2028
2030
2032
2034
2036
2038
2040
2042
2044
Popula
tion (
'000)
Year
Low variant Medium variant 1998-2017 Intercensal growth
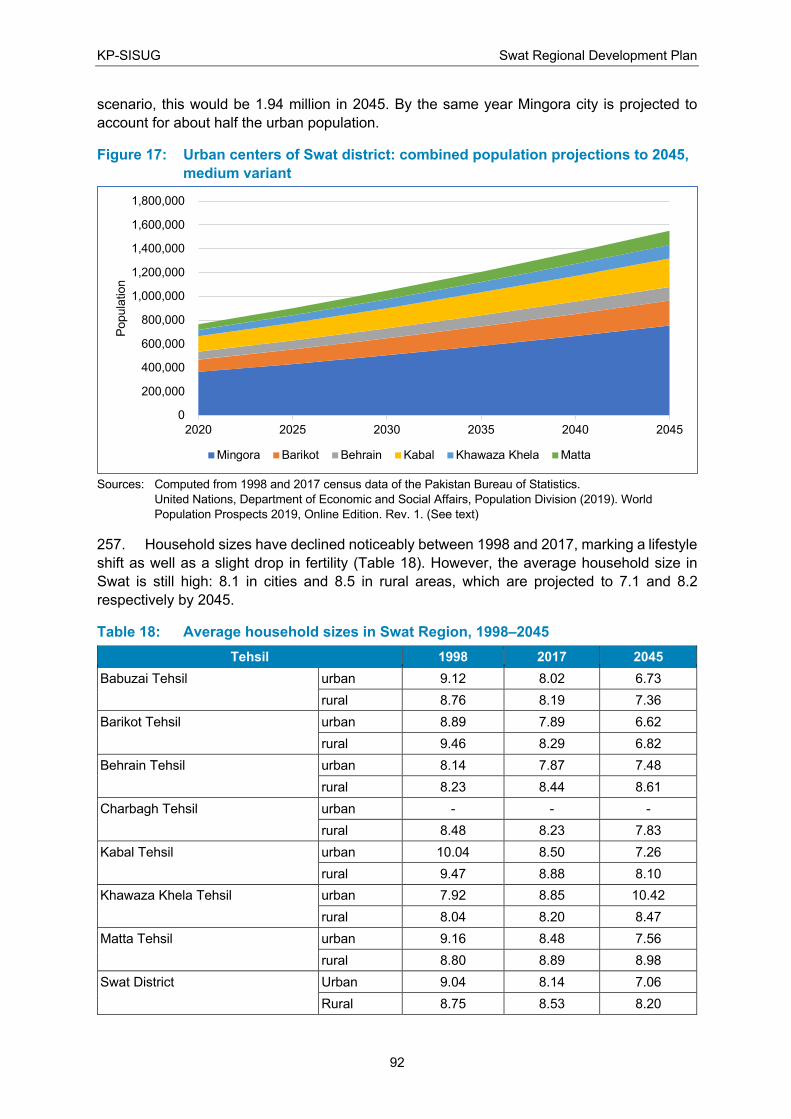
KP-SISUG Swat Regional Development Plan
92
scenario, this would be 1.94 million in 2045. By the same year Mingora city is projected to
account for about half the urban population.
Figure 17: Urban centers of Swat district: combined population projections to 2045,
medium variant
Sources: Computed from 1998 and 2017 census data of the Pakistan Bureau of Statistics.
United Nations, Department of Economic and Social Affairs, Population Division (2019). World
Population Prospects 2019, Online Edition. Rev. 1. (See text)
257. Household sizes have declined noticeably between 1998 and 2017, marking a lifestyle
shift as well as a slight drop in fertility (Table 18). However, the average household size in
Swat is still high: 8.1 in cities and 8.5 in rural areas, which are projected to 7.1 and 8.2
respectively by 2045.
Table 18: Average household sizes in Swat Region, 1998–2045
Tehsil 1998 2017 2045
Babuzai Tehsil urban 9.12 8.02 6.73
rural 8.76 8.19 7.36
Barikot Tehsil urban 8.89 7.89 6.62
rural 9.46 8.29 6.82
Behrain Tehsil urban 8.14 7.87 7.48
rural 8.23 8.44 8.61
Charbagh Tehsil urban - - -
rural 8.48 8.23 7.83
Kabal Tehsil urban 10.04 8.50 7.26
rural 9.47 8.88 8.10
Khawaza Khela Tehsil urban 7.92 8.85 10.42
rural 8.04 8.20 8.47
Matta Tehsil urban 9.16 8.48 7.56
rural 8.80 8.89 8.98
Swat District Urban 9.04 8.14 7.06
Rural 8.75 8.53 8.20
0
200,000
400,000
600,000
800,000
1,000,000
1,200,000
1,400,000
1,600,000
1,800,000
2020 2025 2030 2035 2040 2045
Popula
tion
Mingora Barikot Behrain Kabal Khawaza Khela Matta
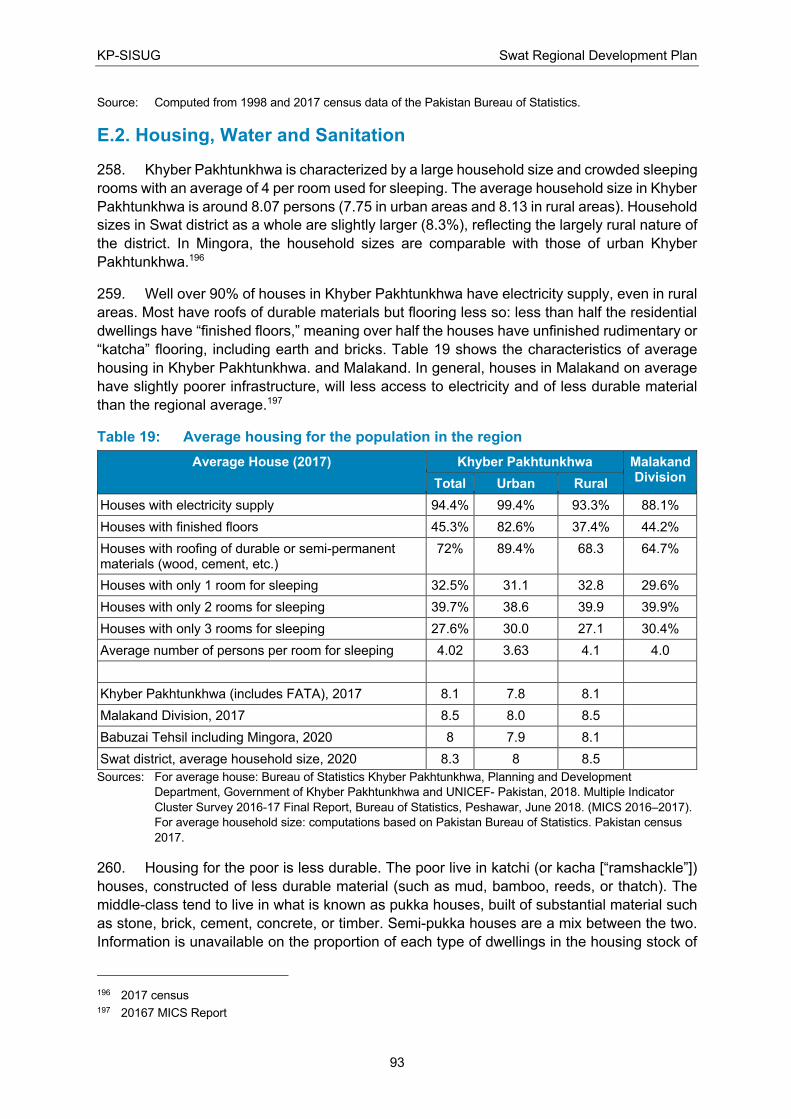
KP-SISUG Swat Regional Development Plan
93
Source: Computed from 1998 and 2017 census data of the Pakistan Bureau of Statistics.
E.2. Housing, Water and Sanitation
258. Khyber Pakhtunkhwa is characterized by a large household size and crowded sleeping
rooms with an average of 4 per room used for sleeping. The average household size in Khyber
Pakhtunkhwa is around 8.07 persons (7.75 in urban areas and 8.13 in rural areas). Household
sizes in Swat district as a whole are slightly larger (8.3%), reflecting the largely rural nature of
the district. In Mingora, the household sizes are comparable with those of urban Khyber
Pakhtunkhwa.196
259. Well over 90% of houses in Khyber Pakhtunkhwa have electricity supply, even in rural
areas. Most have roofs of durable materials but flooring less so: less than half the residential
dwellings have “finished floors,” meaning over half the houses have unfinished rudimentary or
“katcha” flooring, including earth and bricks. Table 19 shows the characteristics of average
housing in Khyber Pakhtunkhwa. and Malakand. In general, houses in Malakand on average
have slightly poorer infrastructure, will less access to electricity and of less durable material
than the regional average.197
Table 19: Average housing for the population in the region
Average House (2017) Khyber Pakhtunkhwa Malakand Division
Total Urban Rural
Houses with electricity supply 94.4% 99.4% 93.3% 88.1%
Houses with finished floors 45.3% 82.6% 37.4% 44.2%
Houses with roofing of durable or semi-permanent materials (wood, cement, etc.)
72% 89.4% 68.3 64.7%
Houses with only 1 room for sleeping 32.5% 31.1 32.8 29.6%
Houses with only 2 rooms for sleeping 39.7% 38.6 39.9 39.9%
Houses with only 3 rooms for sleeping 27.6% 30.0 27.1 30.4%
Average number of persons per room for sleeping 4.02 3.63 4.1 4.0
Average Household Size (2017 and 2020) Total Urban Rural
Khyber Pakhtunkhwa (includes FATA), 2017 8.1 7.8 8.1
Malakand Division, 2017 8.5 8.0 8.5
Babuzai Tehsil including Mingora, 2020 8 7.9 8.1
Swat district, average household size, 2020 8.3 8 8.5
Sources: For average house: Bureau of Statistics Khyber Pakhtunkhwa, Planning and Development
Department, Government of Khyber Pakhtunkhwa and UNICEF- Pakistan, 2018. Multiple Indicator
Cluster Survey 2016-17 Final Report, Bureau of Statistics, Peshawar, June 2018. (MICS 2016–2017).
For average household size: computations based on Pakistan Bureau of Statistics. Pakistan census
2017.
260. Housing for the poor is less durable. The poor live in katchi (or kacha [“ramshackle”])
houses, constructed of less durable material (such as mud, bamboo, reeds, or thatch). The
middle-class tend to live in what is known as pukka houses, built of substantial material such
as stone, brick, cement, concrete, or timber. Semi-pukka houses are a mix between the two.
Information is unavailable on the proportion of each type of dwellings in the housing stock of
196 2017 census 197 20167 MICS Report
KP-SISUG Swat Regional Development Plan
94
the Swat Region. Some 22% of the provincial population do not have improved sanitation
facilities, meaning that these poor households do not have sanitary toilets, toilets may be
shared, and excreta is not disposed of safely.198
261. Household assets are prioritized by the poor. Nearly all (96%) households have a
mobile phone, although 11% of households in the province do not have soap or other
cleansing agents to maintain their hygiene, meaning that there are some households who do
not think hygiene is sufficiently important, although they can afford mobile phones. Some 41%
of households in Khyber Pakhtunkhwa own television, 56% own a refrigerator, 35% own
agricultural land and 54% own livestock or farm animals. Some 10% have a vehicle (car, van,
jeep) and 29% have a bank account.199
262. In Pakistan, unplanned settlements are known as katchi abadis (non-permanent
settlements). Such settlements are poorly built and building codes are often not enforced.
Mingora has its share of poorly built areas that highly vulnerable to seismic shocks. This was
seen in the 7.5-magnitude earthquake that affected Pakistan in October 2015.200 While the
area had already been through the devastating experience of the earthquake in 2005, the
poorer residents still lived in housing still vulnerable to earthquake.
263. For Khyber Pakhtunkhwa as a whole, household survey data show that piped water
and underground water are the most common sources. One third of rural households and
nearly half the urban households use piped water. Pumped water from shallow to artesian
wells is also widely used (42.9% of urban households). These are mainly handpumps or
motorized pumps. Pumped water from tube wells account for only 4.9% of sources in urban
and 2.4% in rural areas. Less than 10% of the population use sources defined as “unsafe” by
WHO and UNICEF, which mean surface water, unprotected springs or wells, and water
purchased from tanker trucks201 (Figure 18).202
264. In Swat district, 46% of the households have access to piped water, although about
70% of the district is rural. This is a relatively high coverage by piped water, and close to the
provincial average for urban areas (48%). On the other hand, a 2014 assessment showed that
old water schemes have rusted pipelines, some of those more than 50 years old and
connections may be illegally made from others’ pipelines or from water points in the street,
and therefore, prone to leaking and contamination. The same assessment reports that a new
water supply scheme is usually approved on the basis of population expansion, but by the
time a new scheme is approved and funds are released, the drains and septic tanks have
been constructed in the area, making it difficult to maintain distance between water supply and
sewage conveyance systems.203 The second most used source is protected wells or springs.
One tenth of the population uses unsafe sources (Figure 18). Around 21% of households do
198 20167 MICS Report 199 20167 MICS Report 200 The Express Tribune. 2015. ‘Massive quake hits Pakistan.’ October 26, 2015. Available from:
https://r.tribune.com.pk/story/979739/horror-in-october-massive-quake-hits-pakistan/ Accessed 15 September 2020.
201 These are defined as unsafe because the primary source is unknown. 202 20167 MICS Report 203 Imran S., L. N. Bukhari. and Gul S. 2018. Water Quality Assessment Report: Mingora City, District Swat,
Khyber Pakhtunkhwa. March 2018. Pakistan Council of Research in Water Resources, pp. 40.
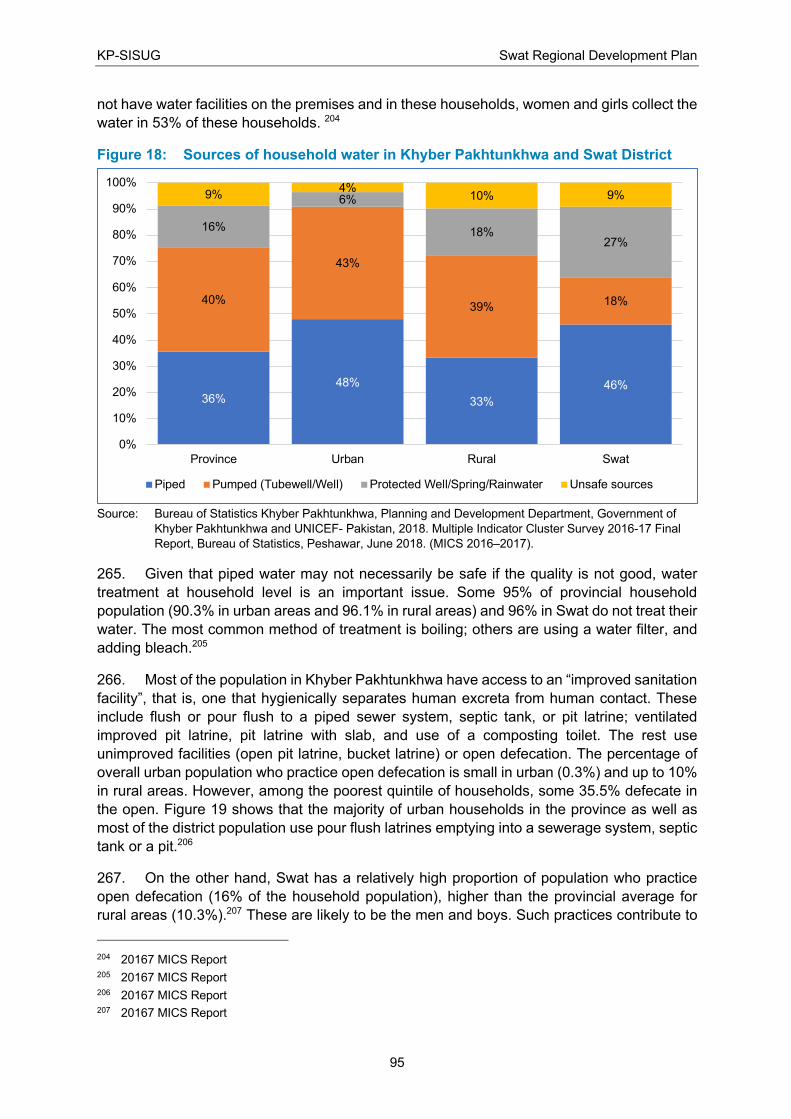
KP-SISUG Swat Regional Development Plan
95
not have water facilities on the premises and in these households, women and girls collect the
water in 53% of these households. 204
Figure 18: Sources of household water in Khyber Pakhtunkhwa and Swat District
Source: Bureau of Statistics Khyber Pakhtunkhwa, Planning and Development Department, Government of
Khyber Pakhtunkhwa and UNICEF- Pakistan, 2018. Multiple Indicator Cluster Survey 2016-17 Final
Report, Bureau of Statistics, Peshawar, June 2018. (MICS 2016–2017).
265. Given that piped water may not necessarily be safe if the quality is not good, water
treatment at household level is an important issue. Some 95% of provincial household
population (90.3% in urban areas and 96.1% in rural areas) and 96% in Swat do not treat their
water. The most common method of treatment is boiling; others are using a water filter, and
adding bleach.205
266. Most of the population in Khyber Pakhtunkhwa have access to an “improved sanitation
facility”, that is, one that hygienically separates human excreta from human contact. These
include flush or pour flush to a piped sewer system, septic tank, or pit latrine; ventilated
improved pit latrine, pit latrine with slab, and use of a composting toilet. The rest use
unimproved facilities (open pit latrine, bucket latrine) or open defecation. The percentage of
overall urban population who practice open defecation is small in urban (0.3%) and up to 10%
in rural areas. However, among the poorest quintile of households, some 35.5% defecate in
the open. Figure 19 shows that the majority of urban households in the province as well as
most of the district population use pour flush latrines emptying into a sewerage system, septic
tank or a pit.206
267. On the other hand, Swat has a relatively high proportion of population who practice
open defecation (16% of the household population), higher than the provincial average for
rural areas (10.3%).207 These are likely to be the men and boys. Such practices contribute to
204 20167 MICS Report 205 20167 MICS Report 206 20167 MICS Report 207 20167 MICS Report
36%
48%
33%
46%
40%
43%
39%18%
16%
6%
18%27%
9%4%
10% 9%
0%
10%
20%
30%
40%
50%
60%
70%
80%
90%
100%
Province Urban Rural Swat
Piped Pumped (Tubewell/Well) Protected Well/Spring/Rainwater Unsafe sources
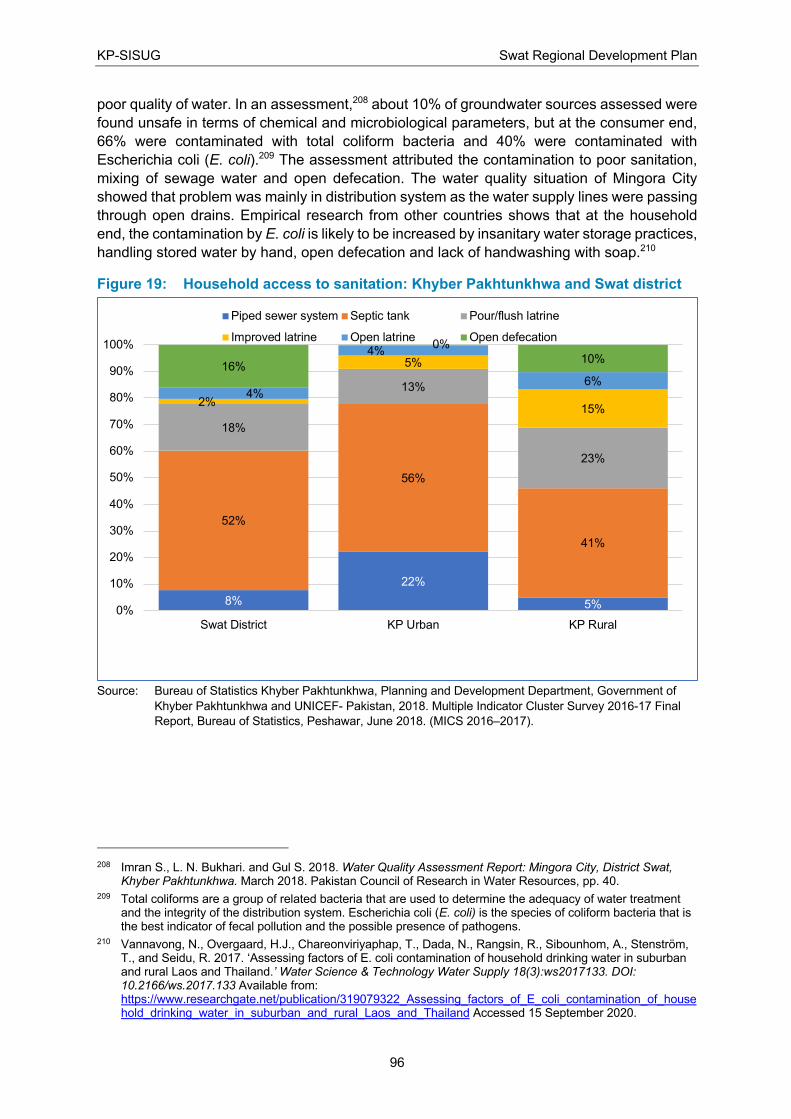
KP-SISUG Swat Regional Development Plan
96
poor quality of water. In an assessment,208 about 10% of groundwater sources assessed were
found unsafe in terms of chemical and microbiological parameters, but at the consumer end,
66% were contaminated with total coliform bacteria and 40% were contaminated with
Escherichia coli (E. coli).209 The assessment attributed the contamination to poor sanitation,
mixing of sewage water and open defecation. The water quality situation of Mingora City
showed that problem was mainly in distribution system as the water supply lines were passing
through open drains. Empirical research from other countries shows that at the household
end, the contamination by E. coli is likely to be increased by insanitary water storage practices,
handling stored water by hand, open defecation and lack of handwashing with soap.210
Figure 19: Household access to sanitation: Khyber Pakhtunkhwa and Swat district
Source: Bureau of Statistics Khyber Pakhtunkhwa, Planning and Development Department, Government of
Khyber Pakhtunkhwa and UNICEF- Pakistan, 2018. Multiple Indicator Cluster Survey 2016-17 Final
Report, Bureau of Statistics, Peshawar, June 2018. (MICS 2016–2017).
208 Imran S., L. N. Bukhari. and Gul S. 2018. Water Quality Assessment Report: Mingora City, District Swat,
Khyber Pakhtunkhwa. March 2018. Pakistan Council of Research in Water Resources, pp. 40. 209 Total coliforms are a group of related bacteria that are used to determine the adequacy of water treatment
and the integrity of the distribution system. Escherichia coli (E. coli) is the species of coliform bacteria that is the best indicator of fecal pollution and the possible presence of pathogens.
210 Vannavong, N., Overgaard, H.J., Chareonviriyaphap, T., Dada, N., Rangsin, R., Sibounhom, A., Stenström, T., and Seidu, R. 2017. ‘Assessing factors of E. coli contamination of household drinking water in suburban and rural Laos and Thailand.’ Water Science & Technology Water Supply 18(3):ws2017133. DOI: 10.2166/ws.2017.133 Available from: https://www.researchgate.net/publication/319079322_Assessing_factors_of_E_coli_contamination_of_household_drinking_water_in_suburban_and_rural_Laos_and_Thailand Accessed 15 September 2020.
8%
22%
5%
52%
56%
41%
18%
13%
23%
2%
5%
15%
4%
4%
6%
16%
0%
10%
0%
10%
20%
30%
40%
50%
60%
70%
80%
90%
100%
Swat District KP Urban KP Rural
Piped sewer system Septic tank Pour/flush latrine
Improved latrine Open latrine Open defecation
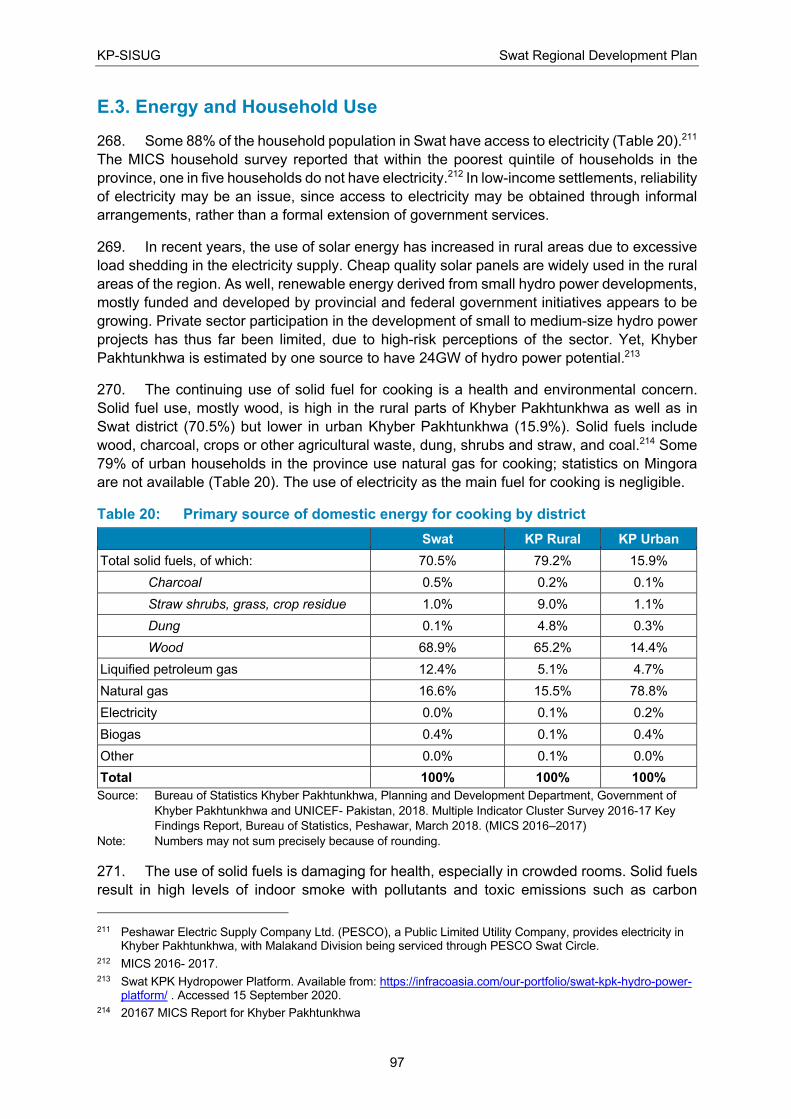
KP-SISUG Swat Regional Development Plan
97
E.3. Energy and Household Use
268. Some 88% of the household population in Swat have access to electricity (Table 20).211
The MICS household survey reported that within the poorest quintile of households in the
province, one in five households do not have electricity.212 In low-income settlements, reliability
of electricity may be an issue, since access to electricity may be obtained through informal
arrangements, rather than a formal extension of government services.
269. In recent years, the use of solar energy has increased in rural areas due to excessive
load shedding in the electricity supply. Cheap quality solar panels are widely used in the rural
areas of the region. As well, renewable energy derived from small hydro power developments,
mostly funded and developed by provincial and federal government initiatives appears to be
growing. Private sector participation in the development of small to medium-size hydro power
projects has thus far been limited, due to high-risk perceptions of the sector. Yet, Khyber
Pakhtunkhwa is estimated by one source to have 24GW of hydro power potential.213
270. The continuing use of solid fuel for cooking is a health and environmental concern.
Solid fuel use, mostly wood, is high in the rural parts of Khyber Pakhtunkhwa as well as in
Swat district (70.5%) but lower in urban Khyber Pakhtunkhwa (15.9%). Solid fuels include
wood, charcoal, crops or other agricultural waste, dung, shrubs and straw, and coal.214 Some
79% of urban households in the province use natural gas for cooking; statistics on Mingora
are not available (Table 20). The use of electricity as the main fuel for cooking is negligible.
Table 20: Primary source of domestic energy for cooking by district
Swat KP Rural KP Urban
Total solid fuels, of which: 70.5% 79.2% 15.9%
Charcoal 0.5% 0.2% 0.1%
Straw shrubs, grass, crop residue 1.0% 9.0% 1.1%
Dung 0.1% 4.8% 0.3%
Wood 68.9% 65.2% 14.4%
Liquified petroleum gas 12.4% 5.1% 4.7%
Natural gas 16.6% 15.5% 78.8%
Electricity 0.0% 0.1% 0.2%
Biogas 0.4% 0.1% 0.4%
Other 0.0% 0.1% 0.0%
Total 100% 100% 100%
Source: Bureau of Statistics Khyber Pakhtunkhwa, Planning and Development Department, Government of
Khyber Pakhtunkhwa and UNICEF- Pakistan, 2018. Multiple Indicator Cluster Survey 2016-17 Key
Findings Report, Bureau of Statistics, Peshawar, March 2018. (MICS 2016–2017)
Note: Numbers may not sum precisely because of rounding.
271. The use of solid fuels is damaging for health, especially in crowded rooms. Solid fuels
result in high levels of indoor smoke with pollutants and toxic emissions such as carbon
211 Peshawar Electric Supply Company Ltd. (PESCO), a Public Limited Utility Company, provides electricity in
Khyber Pakhtunkhwa, with Malakand Division being serviced through PESCO Swat Circle. 212 MICS 2016- 2017. 213 Swat KPK Hydropower Platform. Available from: https://infracoasia.com/our-portfolio/swat-kpk-hydro-power-
platform/ . Accessed 15 September 2020. 214 20167 MICS Report for Khyber Pakhtunkhwa
KP-SISUG Swat Regional Development Plan
98
monoxide, polyaromatic hydrocarbons, and Sulphur dioxide (SO2), among others. Such
emissions are especially damaging to the health of pregnant women and their newborns.
Household air pollution causes non-communicable diseases such as stroke, ischemic heart
disease, chronic obstructive pulmonary disease, and lung cancer. Close to half of deaths due
to pneumonia among children under 5 years of age are caused by particulate matter (soot)
inhaled from household air pollution.215 In Khyber Pakhtunkhwa, some 92% of households
using solid fuel in the richest quintile cook in a kitchen separate from the rest of the house, but
on average, 37% of households using solid fuel do not have a separate room to cook in. In
Swat, 71.5% of households using solid fuel do have a separate kitchen to cook in.216
E.4. Education
E.4.1. Policy Framework
272. Education was devolved to provincial level by the 18th amendment to the Constitution
of Pakistan. Article 25-A in the amendment reads: ‘The State shall provide free and
compulsory education to all children of the age of five to sixteen years in such manner as may
be determined by law.’ However, the provincial assembly of Khyber Pakhtunkhwa has not
passed any legislation to translate Article 25-A (free and compulsory education) into practice.
In 2011, the Khyber Pakhtunkhwa government developed and approved the Education Sector
Plan with three key objectives: (i) universal primary education, (ii) gender equality at all levels
of education, and (iii) improved educational attainment by strengthening teaching-learning
quality. Several reform measures have been adopted over the years in this regard with support
from various development partners. In 2018, the government issued its Education Blueprint
2018-23,217 mainly focusing on improving access to and quality of education.
273. Co-education is provided in government schools from primary to secondary level
educational institutes in the district, expanding the opportunities for girls’ education.
E.4.2. Context
274. In the first decade of the 21st century, Swat suffered from its largest turmoil, created by
a mullah who gained extreme popularity because of his traditional rhetoric against the
education of girls and against women who went out shopping. He recruited militia and
eventually took over control of Swat in 2007. This militia committed extreme atrocities killing
men, women and children with impunity. They wanted to enforce Pashtun cultural Islam and
its main planks were eradication of girls' education and confinement of women to their home.
The majority of girls' schools were targeted, with many destroyed, and children going to school
were attacked. A military operation was launched against the extremist militants in 2007, but
this was stopped by the government which wanted a negotiated settlement with the militants.
The settlement failed and the level of militia atrocities intensified, which forced another military
operation in 2009 when the entire population of Swat was evacuated. The Pakistan Army
demolished the militia but by then, the militia had destroyed the city, plundered commercial,
industrial and mining establishments, and destroyed government buildings.
215 World Health Organization “Household air pollution and health”. Available from: https://www.who.int/news-
room/fact-sheets/detail/household-air-pollution-and-health. Accessed 15 August 2020. 216 MICS 2016- 2017 217 Government of KP, Education Blueprint 2018-23, Elementary and Secondary Education Department.
KP-SISUG Swat Regional Development Plan
99
275. The population which had become internally displaced then returned to their homes in
late 2009, and rebuilding was started. The targeting by militants of girls’ education dealt a
severe blow to educational advancement in the district. Parents and children suffered from
trauma and insecurity for a prolonged period, not least because the people of Swat had initially
supported the mullah with a huge collection of funds at every fund-raising event. After the
restoration of peace in the district, schools were re-opened and enrolment started and
gradually increased in the district.
276. Pakistan’s education system is composed of at least four stages before tertiary, with
two nationwide examinations: (a) primary (grades I to V, age 5–9 years old); (b) “middle
school” or lower secondary (grades VI to VIII, age 10–12 years old),218 (c) “high school” or
upper secondary (grades IX–X, age 13–14 years old) at the end of which students sit exams
for the Secondary School Certificate (SSC), and (d) ”intermediate” or higher secondary
(grades XI–XII, age 15–16 years old).219 At the end of grade XII, students sit the Higher
Secondary School Certificate (HSSC) examination. An HSSC is required for students to
continue on to tertiary education and for some vocational pathways. For vocational training,
SSC is required as a minimum.220
277. The private sector is increasing its share in the market for education services, although
the government is still the largest provider. All government schools are sex-segregated, while
the majority of the private schools have co-education. Private schools are perceived to provide
education of slightly better quality, and have minimal drop-out rates. Student performance and
learning competencies are better in private schools, as shown by a survey.221 Primary and
secondary education is free of cost in government schools, while private schools of different
categories charge tuition fees, with some for the elite class charging exorbitant fees.
278. Data availability is not optimal for planning and analysis. Basic data on primary and
secondary education are published regularly by the Department of Elementary and Secondary
Education in its Annual Statistical Report (ASR), However, the ASR Report 2012-13 on non-
government schools was published in 2013 and not updated since then. There are no recent
statistics on private schools. The statistics on higher education institutions in the public sector
are published by the Bureau of Statistics in its Annual Development Statistics. Overall,
statistics need to be treated with caution. The ASR provides statistics on primary and
secondary schools gross and net enrolment ratio, but these statistics are based on population
projections by provincial Bureau of Statistics, and not on school censuses as in some other
countries. The enrolment reported on private schools is not based on actual enrolment data,
but on estimations that 6.5% enrolment is in private schools. Data on deeni madaris (Islamic
seminaries), where enrolment is estimated at 2.5%, are not always reliable. A large number
of deeni madaris are only teaching children to recite and memorize the text of Holy Quran in
Arabic, but without teaching its meaning, and therefore do not impart reading and writing skills
in Arabic, Urdu or English languages. Furthermore, large numbers of deeni madaris are
unregistered. For example, in 2015, some 3,136 seminaries were registered in Khyber
Pakhtunkhwa; however, 4,135 were not registered, according to officials from the ministries of
218 Elementary education is composed of primary and middle (Grades 1 to 8). 219 In UNESCO terms, both intermediate and high school are classed as “upper secondary” education. 220 UNESCO: ISCED mapping by country. Available from: http://uis.unesco.org/en/isced-mappings. Accessed
10 July 2020. 221 ASER, 2019. Annual Status of Education Report: ASER Pakistan 2018. National (Rural). Islamabad: ASER
Pakistan Secretariat.
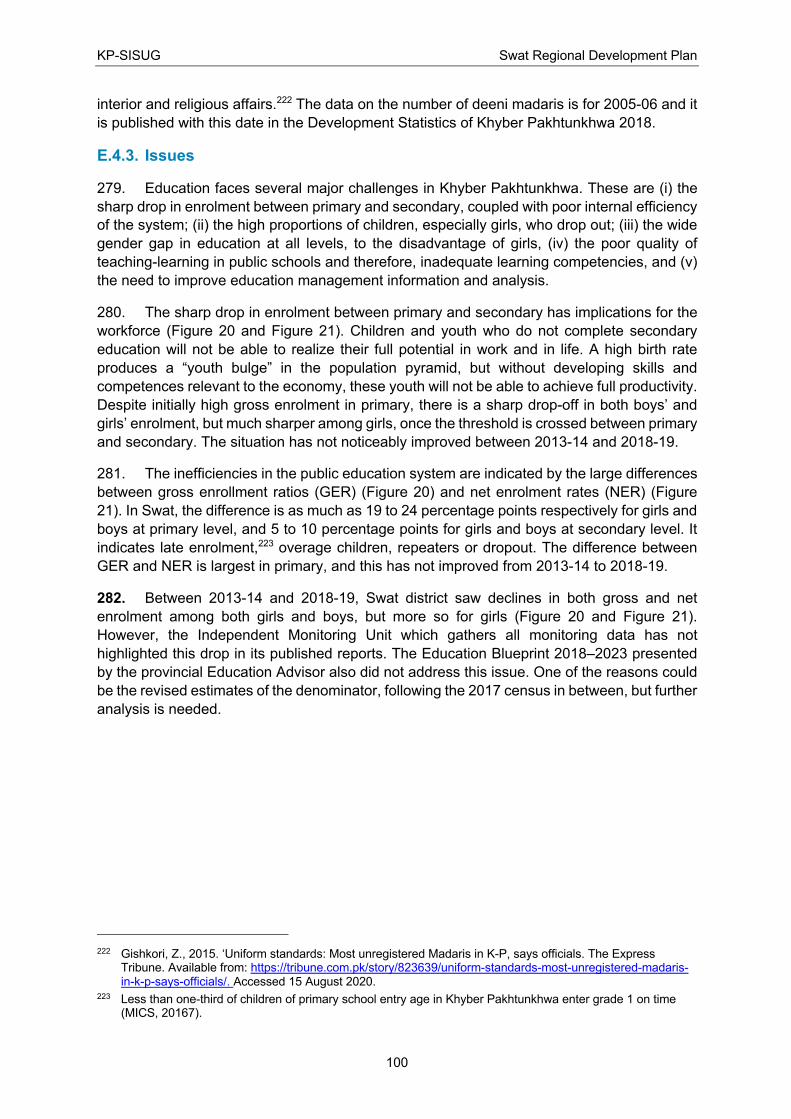
KP-SISUG Swat Regional Development Plan
100
interior and religious affairs.222 The data on the number of deeni madaris is for 2005-06 and it
is published with this date in the Development Statistics of Khyber Pakhtunkhwa 2018.
E.4.3. Issues
279. Education faces several major challenges in Khyber Pakhtunkhwa. These are (i) the
sharp drop in enrolment between primary and secondary, coupled with poor internal efficiency
of the system; (ii) the high proportions of children, especially girls, who drop out; (iii) the wide
gender gap in education at all levels, to the disadvantage of girls, (iv) the poor quality of
teaching-learning in public schools and therefore, inadequate learning competencies, and (v)
the need to improve education management information and analysis.
280. The sharp drop in enrolment between primary and secondary has implications for the
workforce (Figure 20 and Figure 21). Children and youth who do not complete secondary
education will not be able to realize their full potential in work and in life. A high birth rate
produces a “youth bulge” in the population pyramid, but without developing skills and
competences relevant to the economy, these youth will not be able to achieve full productivity.
Despite initially high gross enrolment in primary, there is a sharp drop-off in both boys’ and
girls’ enrolment, but much sharper among girls, once the threshold is crossed between primary
and secondary. The situation has not noticeably improved between 2013-14 and 2018-19.
281. The inefficiencies in the public education system are indicated by the large differences
between gross enrollment ratios (GER) (Figure 20) and net enrolment rates (NER) (Figure
21). In Swat, the difference is as much as 19 to 24 percentage points respectively for girls and
boys at primary level, and 5 to 10 percentage points for girls and boys at secondary level. It
indicates late enrolment,223 overage children, repeaters or dropout. The difference between
GER and NER is largest in primary, and this has not improved from 2013-14 to 2018-19.
282. Between 2013-14 and 2018-19, Swat district saw declines in both gross and net
enrolment among both girls and boys, but more so for girls (Figure 20 and Figure 21).
However, the Independent Monitoring Unit which gathers all monitoring data has not
highlighted this drop in its published reports. The Education Blueprint 2018–2023 presented
by the provincial Education Advisor also did not address this issue. One of the reasons could
be the revised estimates of the denominator, following the 2017 census in between, but further
analysis is needed.
222 Gishkori, Z., 2015. ‘Uniform standards: Most unregistered Madaris in K-P, says officials. The Express
Tribune. Available from: https://tribune.com.pk/story/823639/uniform-standards-most-unregistered-madaris-in-k-p-says-officials/. Accessed 15 August 2020.
223 Less than one-third of children of primary school entry age in Khyber Pakhtunkhwa enter grade 1 on time (MICS, 20167).
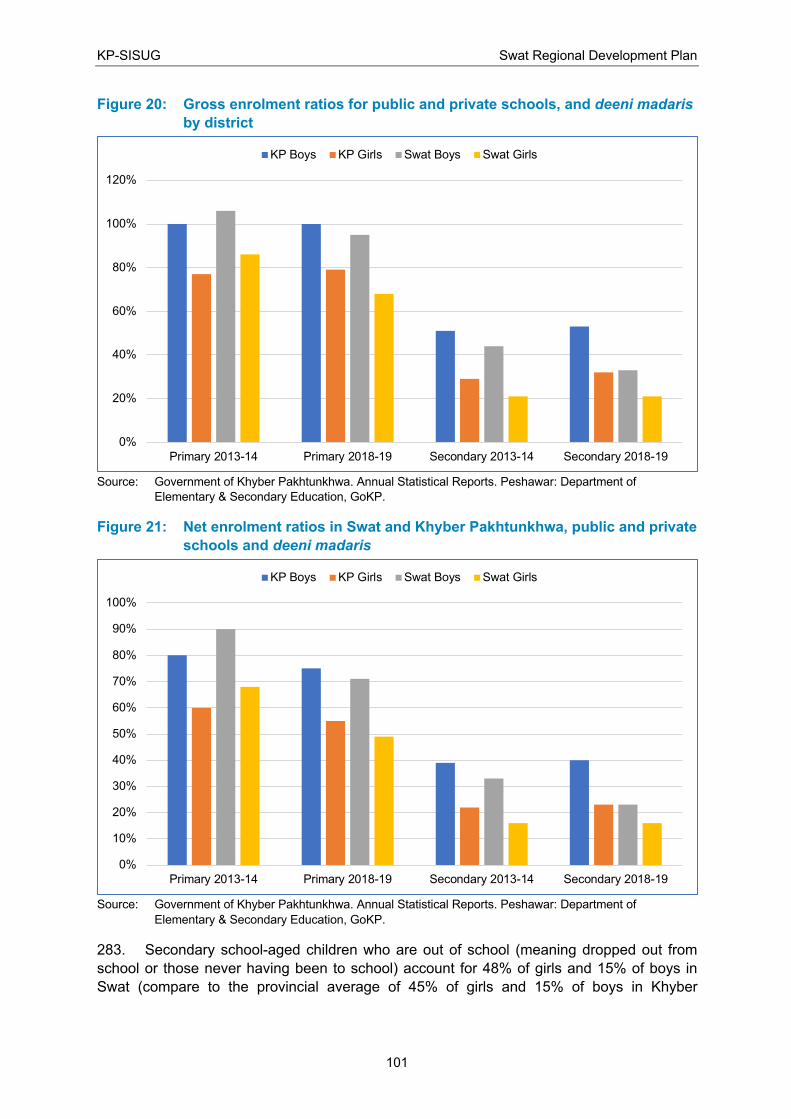
KP-SISUG Swat Regional Development Plan
101
Figure 20: Gross enrolment ratios for public and private schools, and deeni madaris
by district
Source: Government of Khyber Pakhtunkhwa. Annual Statistical Reports. Peshawar: Department of
Elementary & Secondary Education, GoKP.
Figure 21: Net enrolment ratios in Swat and Khyber Pakhtunkhwa, public and private
schools and deeni madaris
Source: Government of Khyber Pakhtunkhwa. Annual Statistical Reports. Peshawar: Department of
Elementary & Secondary Education, GoKP.
283. Secondary school-aged children who are out of school (meaning dropped out from
school or those never having been to school) account for 48% of girls and 15% of boys in
Swat (compare to the provincial average of 45% of girls and 15% of boys in Khyber
0%
20%
40%
60%
80%
100%
120%
Primary 2013-14 Primary 2018-19 Secondary 2013-14 Secondary 2018-19
KP Boys KP Girls Swat Boys Swat Girls
0%
10%
20%
30%
40%
50%
60%
70%
80%
90%
100%
Primary 2013-14 Primary 2018-19 Secondary 2013-14 Secondary 2018-19
KP Boys KP Girls Swat Boys Swat Girls
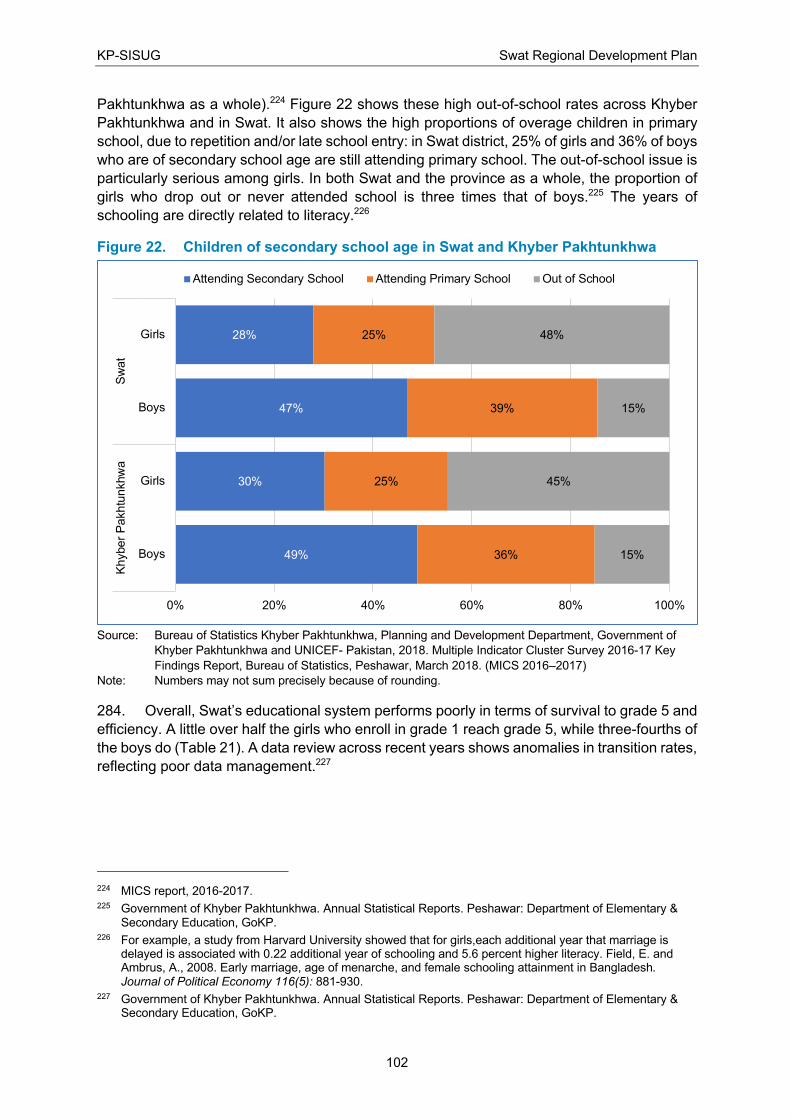
KP-SISUG Swat Regional Development Plan
102
Pakhtunkhwa as a whole).224 Figure 22 shows these high out-of-school rates across Khyber
Pakhtunkhwa and in Swat. It also shows the high proportions of overage children in primary
school, due to repetition and/or late school entry: in Swat district, 25% of girls and 36% of boys
who are of secondary school age are still attending primary school. The out-of-school issue is
particularly serious among girls. In both Swat and the province as a whole, the proportion of
girls who drop out or never attended school is three times that of boys.225 The years of
schooling are directly related to literacy.226
Figure 22. Children of secondary school age in Swat and Khyber Pakhtunkhwa
Source: Bureau of Statistics Khyber Pakhtunkhwa, Planning and Development Department, Government of
Khyber Pakhtunkhwa and UNICEF- Pakistan, 2018. Multiple Indicator Cluster Survey 2016-17 Key
Findings Report, Bureau of Statistics, Peshawar, March 2018. (MICS 2016–2017)
Note: Numbers may not sum precisely because of rounding.
284. Overall, Swat’s educational system performs poorly in terms of survival to grade 5 and
efficiency. A little over half the girls who enroll in grade 1 reach grade 5, while three-fourths of
the boys do (Table 21). A data review across recent years shows anomalies in transition rates,
reflecting poor data management.227
224 MICS report, 2016-2017. 225 Government of Khyber Pakhtunkhwa. Annual Statistical Reports. Peshawar: Department of Elementary &
Secondary Education, GoKP. 226 For example, a study from Harvard University showed that for girls,each additional year that marriage is
delayed is associated with 0.22 additional year of schooling and 5.6 percent higher literacy. Field, E. and Ambrus, A., 2008. Early marriage, age of menarche, and female schooling attainment in Bangladesh. Journal of Political Economy 116(5): 881-930.
227 Government of Khyber Pakhtunkhwa. Annual Statistical Reports. Peshawar: Department of Elementary & Secondary Education, GoKP.
49%
30%
47%
28%
36%
25%
39%
25%
15%
45%
15%
48%
0% 20% 40% 60% 80% 100%
Boys
Girls
Boys
Girls
Khyber
Pakhtu
nkhw
aS
wat
Attending Secondary School Attending Primary School Out of School
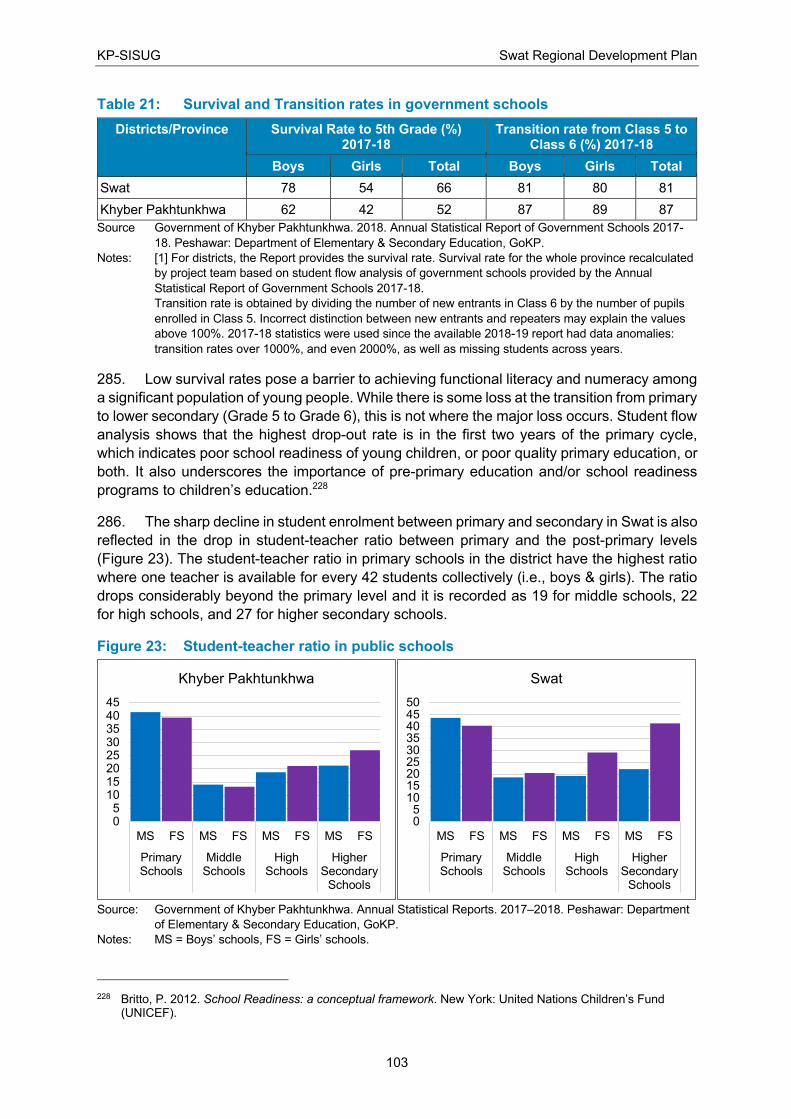
KP-SISUG Swat Regional Development Plan
103
Table 21: Survival and Transition rates in government schools
Districts/Province Survival Rate to 5th Grade (%) 2017-18
Transition rate from Class 5 to Class 6 (%) 2017-18
Boys Girls Total Boys Girls Total
Swat 78 54 66 81 80 81
Khyber Pakhtunkhwa 62 42 52 87 89 87
Source Government of Khyber Pakhtunkhwa. 2018. Annual Statistical Report of Government Schools 2017-
18. Peshawar: Department of Elementary & Secondary Education, GoKP.
Notes: [1] For districts, the Report provides the survival rate. Survival rate for the whole province recalculated
by project team based on student flow analysis of government schools provided by the Annual
Statistical Report of Government Schools 2017-18.
Transition rate is obtained by dividing the number of new entrants in Class 6 by the number of pupils
enrolled in Class 5. Incorrect distinction between new entrants and repeaters may explain the values
above 100%. 2017-18 statistics were used since the available 2018-19 report had data anomalies:
transition rates over 1000%, and even 2000%, as well as missing students across years.
285. Low survival rates pose a barrier to achieving functional literacy and numeracy among
a significant population of young people. While there is some loss at the transition from primary
to lower secondary (Grade 5 to Grade 6), this is not where the major loss occurs. Student flow
analysis shows that the highest drop-out rate is in the first two years of the primary cycle,
which indicates poor school readiness of young children, or poor quality primary education, or
both. It also underscores the importance of pre-primary education and/or school readiness
programs to children’s education.228
286. The sharp decline in student enrolment between primary and secondary in Swat is also
reflected in the drop in student-teacher ratio between primary and the post-primary levels
(Figure 23). The student-teacher ratio in primary schools in the district have the highest ratio
where one teacher is available for every 42 students collectively (i.e., boys & girls). The ratio
drops considerably beyond the primary level and it is recorded as 19 for middle schools, 22
for high schools, and 27 for higher secondary schools.
Figure 23: Student-teacher ratio in public schools
Source: Government of Khyber Pakhtunkhwa. Annual Statistical Reports. 2017–2018. Peshawar: Department
of Elementary & Secondary Education, GoKP.
Notes: MS = Boys’ schools, FS = Girls’ schools.
228 Britto, P. 2012. School Readiness: a conceptual framework. New York: United Nations Children’s Fund
(UNICEF).
05
1015202530354045
MS FS MS FS MS FS MS FS
PrimarySchools
MiddleSchools
HighSchools
HigherSecondary
Schools
Khyber Pakhtunkhwa
05
101520253035404550
MS FS MS FS MS FS MS FS
PrimarySchools
MiddleSchools
HighSchools
HigherSecondary
Schools
Swat
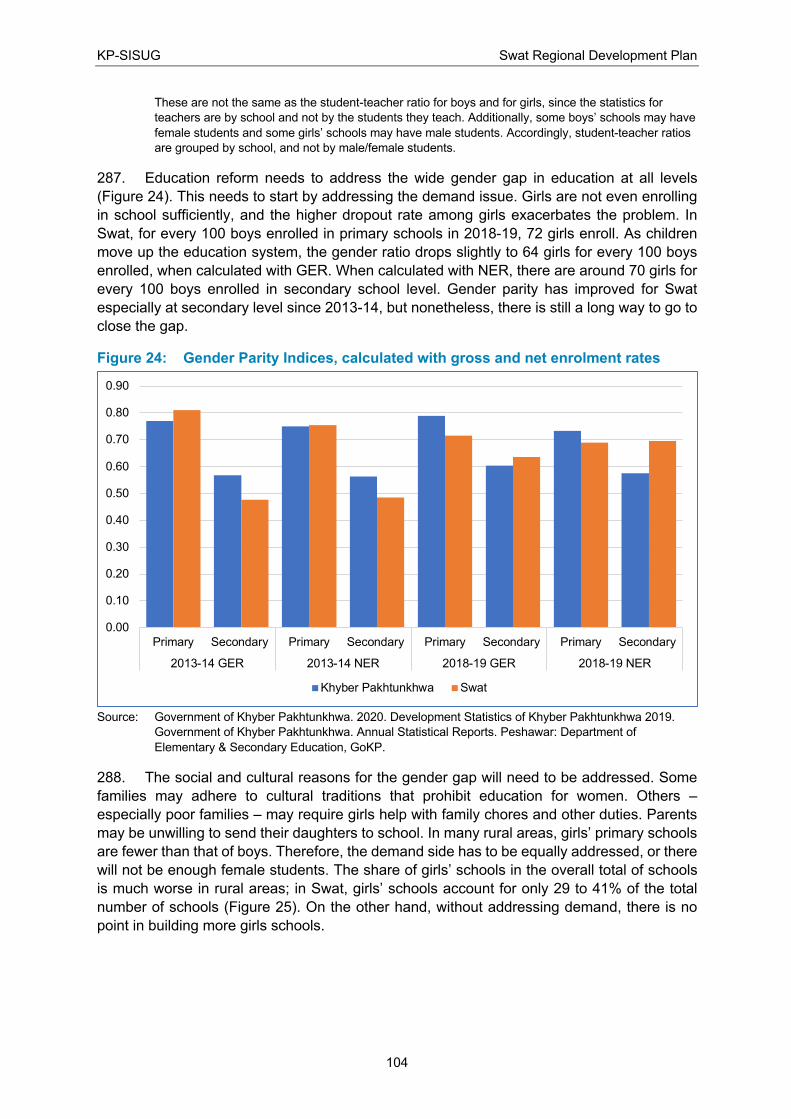
KP-SISUG Swat Regional Development Plan
104
These are not the same as the student-teacher ratio for boys and for girls, since the statistics for
teachers are by school and not by the students they teach. Additionally, some boys’ schools may have
female students and some girls’ schools may have male students. Accordingly, student-teacher ratios
are grouped by school, and not by male/female students.
287. Education reform needs to address the wide gender gap in education at all levels
(Figure 24). This needs to start by addressing the demand issue. Girls are not even enrolling
in school sufficiently, and the higher dropout rate among girls exacerbates the problem. In
Swat, for every 100 boys enrolled in primary schools in 2018-19, 72 girls enroll. As children
move up the education system, the gender ratio drops slightly to 64 girls for every 100 boys
enrolled, when calculated with GER. When calculated with NER, there are around 70 girls for
every 100 boys enrolled in secondary school level. Gender parity has improved for Swat
especially at secondary level since 2013-14, but nonetheless, there is still a long way to go to
close the gap.
Figure 24: Gender Parity Indices, calculated with gross and net enrolment rates
Source: Government of Khyber Pakhtunkhwa. 2020. Development Statistics of Khyber Pakhtunkhwa 2019.
Government of Khyber Pakhtunkhwa. Annual Statistical Reports. Peshawar: Department of
Elementary & Secondary Education, GoKP.
288. The social and cultural reasons for the gender gap will need to be addressed. Some
families may adhere to cultural traditions that prohibit education for women. Others –
especially poor families – may require girls help with family chores and other duties. Parents
may be unwilling to send their daughters to school. In many rural areas, girls’ primary schools
are fewer than that of boys. Therefore, the demand side has to be equally addressed, or there
will not be enough female students. The share of girls’ schools in the overall total of schools
is much worse in rural areas; in Swat, girls’ schools account for only 29 to 41% of the total
number of schools (Figure 25). On the other hand, without addressing demand, there is no
point in building more girls schools.
0.00
0.10
0.20
0.30
0.40
0.50
0.60
0.70
0.80
0.90
Primary Secondary Primary Secondary Primary Secondary Primary Secondary
2013-14 GER 2013-14 NER 2018-19 GER 2018-19 NER
Khyber Pakhtunkhwa Swat
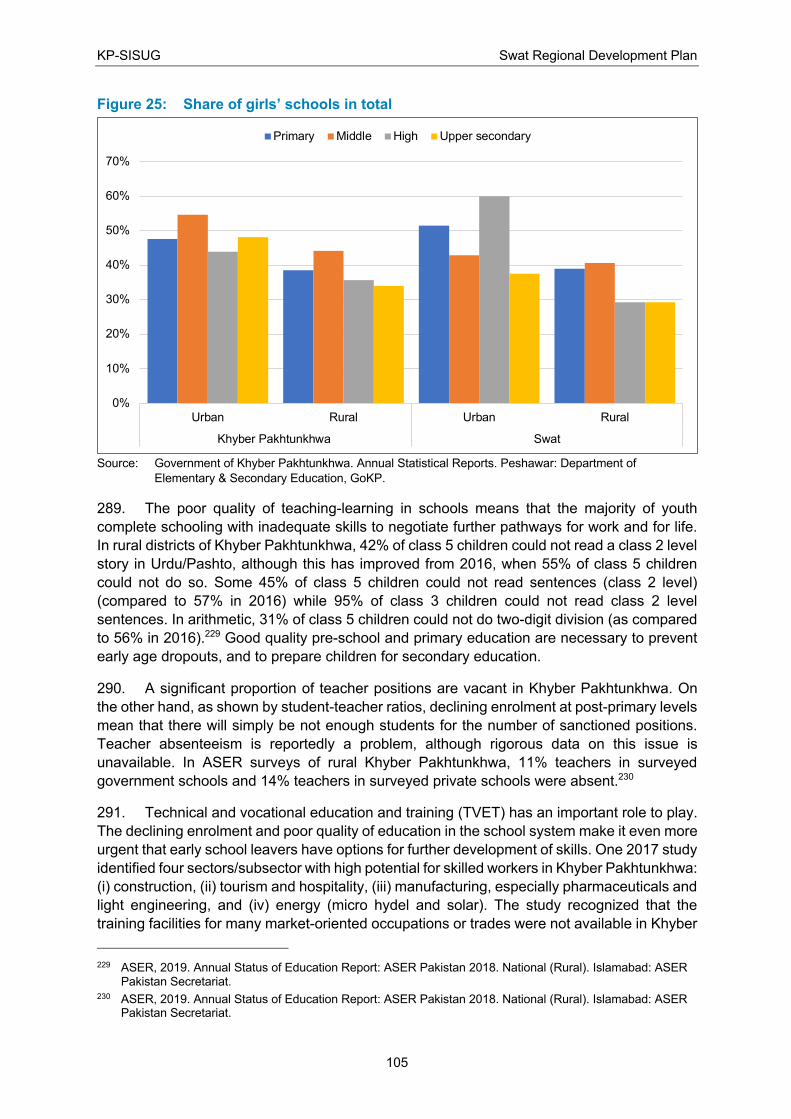
KP-SISUG Swat Regional Development Plan
105
Figure 25: Share of girls’ schools in total
Source: Government of Khyber Pakhtunkhwa. Annual Statistical Reports. Peshawar: Department of
Elementary & Secondary Education, GoKP.
289. The poor quality of teaching-learning in schools means that the majority of youth
complete schooling with inadequate skills to negotiate further pathways for work and for life.
In rural districts of Khyber Pakhtunkhwa, 42% of class 5 children could not read a class 2 level
story in Urdu/Pashto, although this has improved from 2016, when 55% of class 5 children
could not do so. Some 45% of class 5 children could not read sentences (class 2 level)
(compared to 57% in 2016) while 95% of class 3 children could not read class 2 level
sentences. In arithmetic, 31% of class 5 children could not do two-digit division (as compared
to 56% in 2016).229 Good quality pre-school and primary education are necessary to prevent
early age dropouts, and to prepare children for secondary education.
290. A significant proportion of teacher positions are vacant in Khyber Pakhtunkhwa. On
the other hand, as shown by student-teacher ratios, declining enrolment at post-primary levels
mean that there will simply be not enough students for the number of sanctioned positions.
Teacher absenteeism is reportedly a problem, although rigorous data on this issue is
unavailable. In ASER surveys of rural Khyber Pakhtunkhwa, 11% teachers in surveyed
government schools and 14% teachers in surveyed private schools were absent.230
291. Technical and vocational education and training (TVET) has an important role to play.
The declining enrolment and poor quality of education in the school system make it even more
urgent that early school leavers have options for further development of skills. One 2017 study
identified four sectors/subsector with high potential for skilled workers in Khyber Pakhtunkhwa:
(i) construction, (ii) tourism and hospitality, (iii) manufacturing, especially pharmaceuticals and
light engineering, and (iv) energy (micro hydel and solar). The study recognized that the
training facilities for many market-oriented occupations or trades were not available in Khyber
229 ASER, 2019. Annual Status of Education Report: ASER Pakistan 2018. National (Rural). Islamabad: ASER
Pakistan Secretariat. 230 ASER, 2019. Annual Status of Education Report: ASER Pakistan 2018. National (Rural). Islamabad: ASER
Pakistan Secretariat.
0%
10%
20%
30%
40%
50%
60%
70%
Urban Rural Urban Rural
Khyber Pakhtunkhwa Swat
Primary Middle High Upper secondary
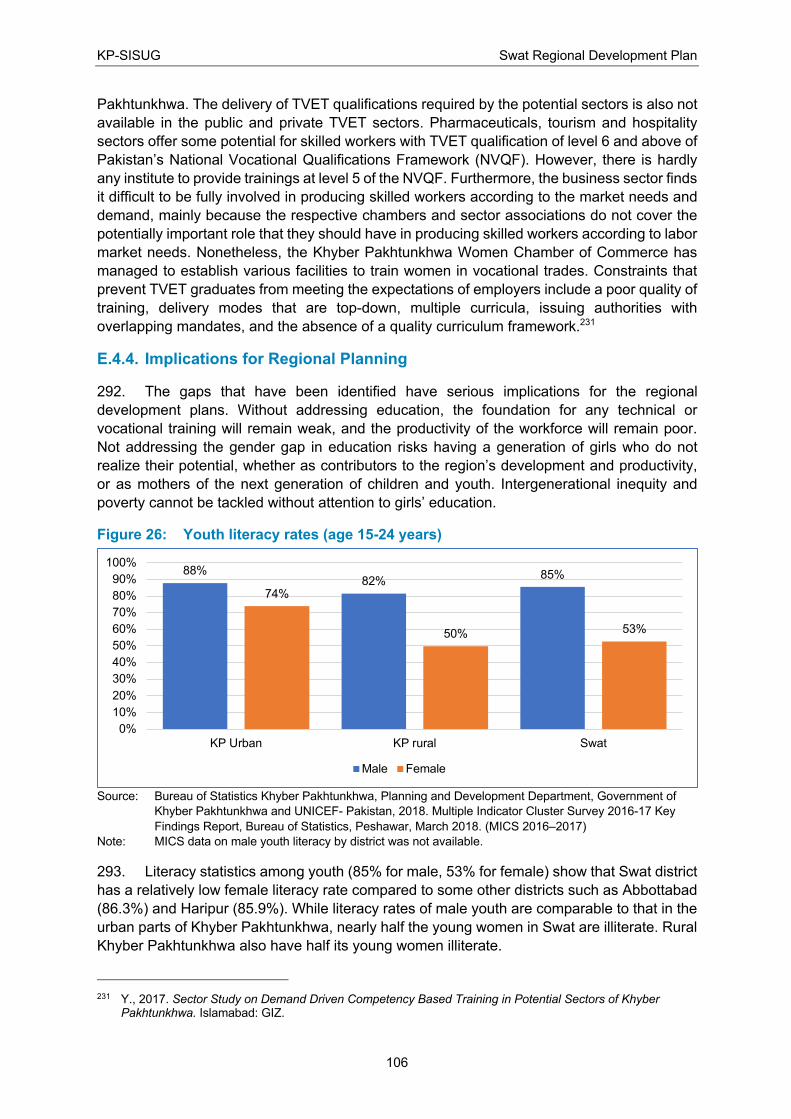
KP-SISUG Swat Regional Development Plan
106
Pakhtunkhwa. The delivery of TVET qualifications required by the potential sectors is also not
available in the public and private TVET sectors. Pharmaceuticals, tourism and hospitality
sectors offer some potential for skilled workers with TVET qualification of level 6 and above of
Pakistan’s National Vocational Qualifications Framework (NVQF). However, there is hardly
any institute to provide trainings at level 5 of the NVQF. Furthermore, the business sector finds
it difficult to be fully involved in producing skilled workers according to the market needs and
demand, mainly because the respective chambers and sector associations do not cover the
potentially important role that they should have in producing skilled workers according to labor
market needs. Nonetheless, the Khyber Pakhtunkhwa Women Chamber of Commerce has
managed to establish various facilities to train women in vocational trades. Constraints that
prevent TVET graduates from meeting the expectations of employers include a poor quality of
training, delivery modes that are top-down, multiple curricula, issuing authorities with
overlapping mandates, and the absence of a quality curriculum framework.231
E.4.4. Implications for Regional Planning
292. The gaps that have been identified have serious implications for the regional
development plans. Without addressing education, the foundation for any technical or
vocational training will remain weak, and the productivity of the workforce will remain poor.
Not addressing the gender gap in education risks having a generation of girls who do not
realize their potential, whether as contributors to the region’s development and productivity,
or as mothers of the next generation of children and youth. Intergenerational inequity and
poverty cannot be tackled without attention to girls’ education.
Figure 26: Youth literacy rates (age 15-24 years)
Source: Bureau of Statistics Khyber Pakhtunkhwa, Planning and Development Department, Government of
Khyber Pakhtunkhwa and UNICEF- Pakistan, 2018. Multiple Indicator Cluster Survey 2016-17 Key
Findings Report, Bureau of Statistics, Peshawar, March 2018. (MICS 2016–2017)
Note: MICS data on male youth literacy by district was not available.
293. Literacy statistics among youth (85% for male, 53% for female) show that Swat district
has a relatively low female literacy rate compared to some other districts such as Abbottabad
(86.3%) and Haripur (85.9%). While literacy rates of male youth are comparable to that in the
urban parts of Khyber Pakhtunkhwa, nearly half the young women in Swat are illiterate. Rural
Khyber Pakhtunkhwa also have half its young women illiterate.
231 Y., 2017. Sector Study on Demand Driven Competency Based Training in Potential Sectors of Khyber
Pakhtunkhwa. Islamabad: GIZ.
88%82%
85%
74%
50% 53%
0%
10%
20%
30%
40%
50%
60%
70%
80%
90%
100%
KP Urban KP rural Swat
Male Female

KP-SISUG Swat Regional Development Plan
107
E.5. Health
E.5.1. Health and Nutrition Outcomes
294. High young child mortality rates reflect a combination of poor maternal health, poor
childcare practices, inadequate health services coverage, and poor hygiene. Poor maternal
health and poor antenatal delivery and delivery care play major roles in high neonatal mortality
or infant death first month within birth). Table 22 compares young child mortality rates in
Khyber Pakhtunkhwa, while Figure 27 shows that child mortality in Swat district is significantly
higher than the provincial average. In the two surveys (Multiple Indicator Cluster Survey 2016-
17 and Pakistan Demographic & Health Survey 2017-18) infant mortality rates account for
similar proportions (82% and 81%) of the deaths among under-five children in pre-merger
Khyber Pakhtunkhwa. This indicates the need to prioritize neonatal causes as well as vaccine
preventable diseases. Four out of five infant deaths in the first year of life in both urban and
rural Khyber Pakhtunkhwa take place in the first month of life, indicating the need for better
maternal and delivery care services (Table 23).
Table 22: Comparison of young childhood mortality
FATA Khyber Pakhtunkhwa Swat
Overall Urban Rural
MICS 2016-2017
Under-five mortality, per 1000 live births 74 67 75 94
Infant mortality, per 1000 live births 60 55 61 75
Pakistan DHS, 2017-2018
Under-five mortality, per 1000 live births 33 64 41 69
Infant mortality, per 1000 live births 29 53 36 57
Neonatal mortality rate, per 1000 live births 18 42 29 45
Sources: Government of Khyber Pakhtunkhwa & UNICEF. 2018. Multiple Indicator Cluster Survey 2016-17.
Government of Pakistan. 2019. Pakistan Demographic & Health Survey 2017-18. Islamabad: National
Institute of Population Studies and ICF, GoP.
Figure 27: Early childhood mortality (per 1,000 live births): Swat district and Khyber
Pakhtunkhwa
Source: Government of Khyber Pakhtunkhwa & UNICEF. 2018. Multiple Indicator Cluster Survey 2016-17.
0 10 20 30 40 50 60 70 80 90 100
Under-five mortality
Infant mortality
KP Rural KP Urban KP Total Swat
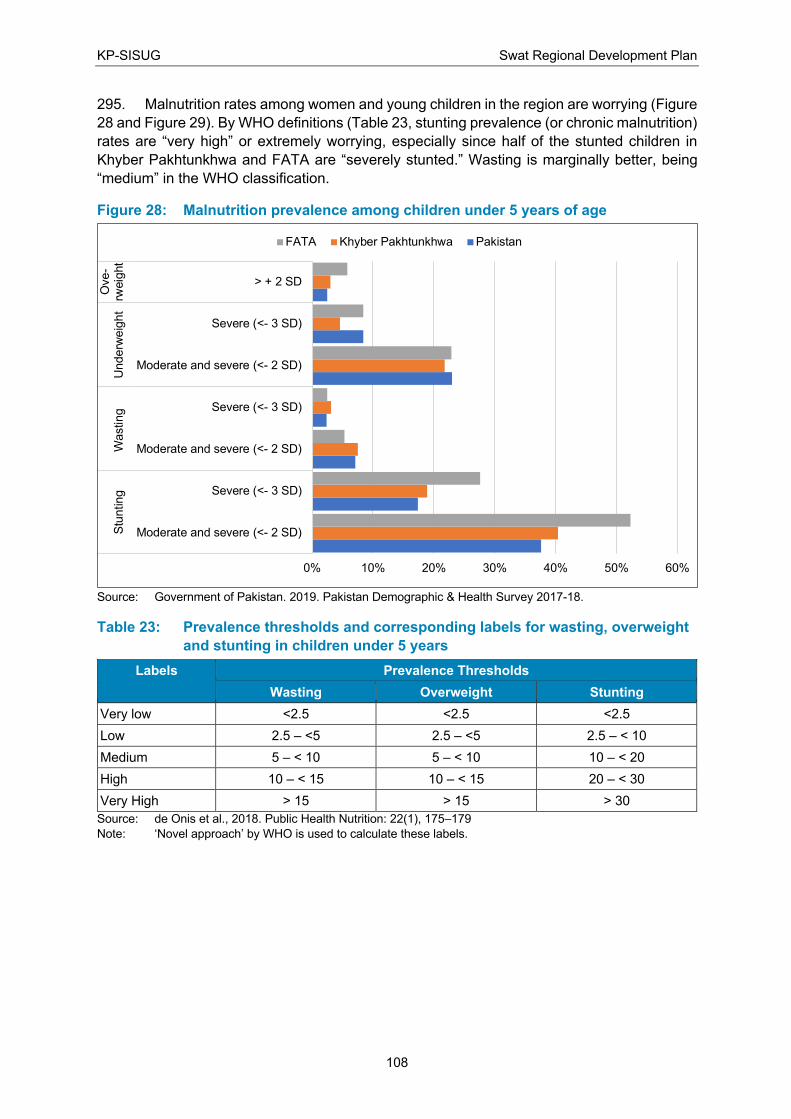
KP-SISUG Swat Regional Development Plan
108
295. Malnutrition rates among women and young children in the region are worrying (Figure
28 and Figure 29). By WHO definitions (Table 23, stunting prevalence (or chronic malnutrition)
rates are “very high” or extremely worrying, especially since half of the stunted children in
Khyber Pakhtunkhwa and FATA are “severely stunted.” Wasting is marginally better, being
“medium” in the WHO classification.
Figure 28: Malnutrition prevalence among children under 5 years of age
Source: Government of Pakistan. 2019. Pakistan Demographic & Health Survey 2017-18.
Table 23: Prevalence thresholds and corresponding labels for wasting, overweight
and stunting in children under 5 years
Labels Prevalence Thresholds
Wasting Overweight Stunting
Very low <2.5 <2.5 <2.5
Low 2.5 – <5 2.5 – <5 2.5 – < 10
Medium 5 – < 10 5 – < 10 10 – < 20
High 10 – < 15 10 – < 15 20 – < 30
Very High > 15 > 15 > 30
Source: de Onis et al., 2018. Public Health Nutrition: 22(1), 175–179
Note: ‘Novel approach’ by WHO is used to calculate these labels.
0% 10% 20% 30% 40% 50% 60%
Moderate and severe (<- 2 SD)
Severe (<- 3 SD)
Moderate and severe (<- 2 SD)
Severe (<- 3 SD)
Moderate and severe (<- 2 SD)
Severe (<- 3 SD)
> + 2 SD
Stu
nting
Wasting
Underw
eig
ht
Ove-
rweig
ht
FATA Khyber Pakhtunkhwa Pakistan
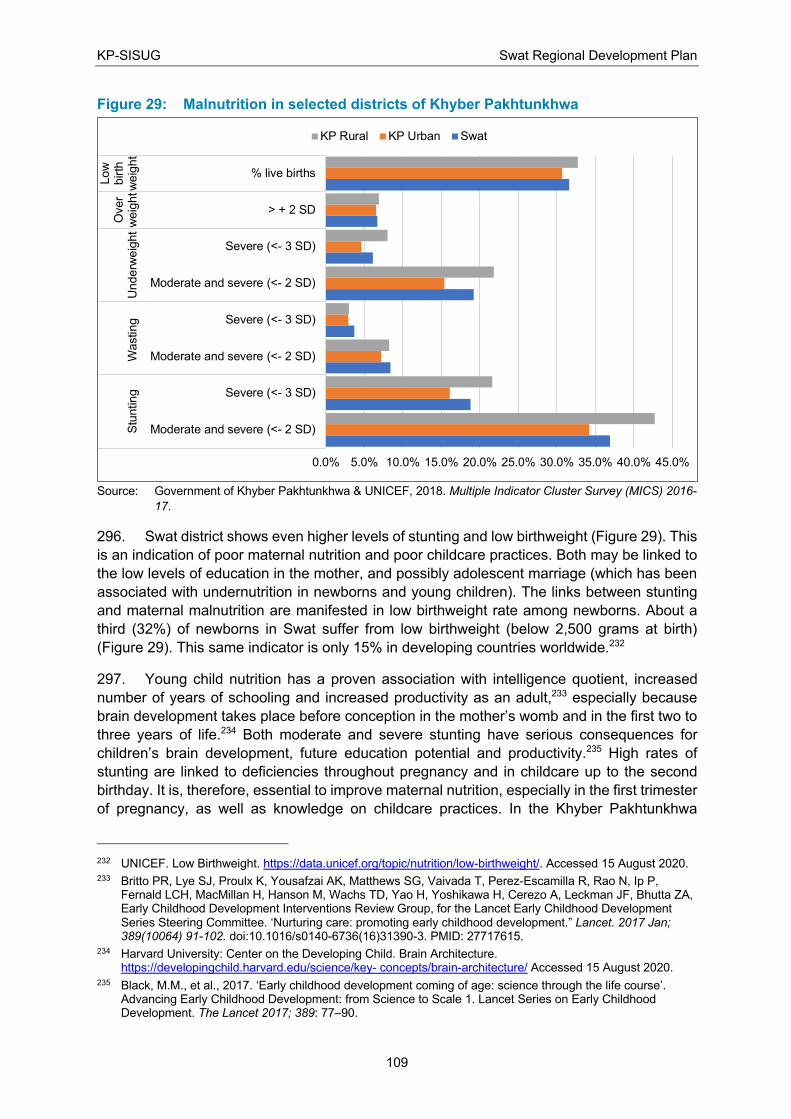
KP-SISUG Swat Regional Development Plan
109
Figure 29: Malnutrition in selected districts of Khyber Pakhtunkhwa
Source: Government of Khyber Pakhtunkhwa & UNICEF, 2018. Multiple Indicator Cluster Survey (MICS) 2016-
17.
296. Swat district shows even higher levels of stunting and low birthweight (Figure 29). This
is an indication of poor maternal nutrition and poor childcare practices. Both may be linked to
the low levels of education in the mother, and possibly adolescent marriage (which has been
associated with undernutrition in newborns and young children). The links between stunting
and maternal malnutrition are manifested in low birthweight rate among newborns. About a
third (32%) of newborns in Swat suffer from low birthweight (below 2,500 grams at birth)
(Figure 29). This same indicator is only 15% in developing countries worldwide.232
297. Young child nutrition has a proven association with intelligence quotient, increased
number of years of schooling and increased productivity as an adult,233 especially because
brain development takes place before conception in the mother’s womb and in the first two to
three years of life.234 Both moderate and severe stunting have serious consequences for
children’s brain development, future education potential and productivity.235 High rates of
stunting are linked to deficiencies throughout pregnancy and in childcare up to the second
birthday. It is, therefore, essential to improve maternal nutrition, especially in the first trimester
of pregnancy, as well as knowledge on childcare practices. In the Khyber Pakhtunkhwa
232 UNICEF. Low Birthweight. https://data.unicef.org/topic/nutrition/low-birthweight/. Accessed 15 August 2020. 233 Britto PR, Lye SJ, Proulx K, Yousafzai AK, Matthews SG, Vaivada T, Perez-Escamilla R, Rao N, Ip P,
Fernald LCH, MacMillan H, Hanson M, Wachs TD, Yao H, Yoshikawa H, Cerezo A, Leckman JF, Bhutta ZA, Early Childhood Development Interventions Review Group, for the Lancet Early Childhood Development Series Steering Committee. ‘Nurturing care: promoting early childhood development.” Lancet. 2017 Jan; 389(10064) 91-102. doi:10.1016/s0140-6736(16)31390-3. PMID: 27717615.
234 Harvard University: Center on the Developing Child. Brain Architecture. https://developingchild.harvard.edu/science/key- concepts/brain-architecture/ Accessed 15 August 2020.
235 Black, M.M., et al., 2017. ‘Early childhood development coming of age: science through the life course’. Advancing Early Childhood Development: from Science to Scale 1. Lancet Series on Early Childhood Development. The Lancet 2017; 389: 77–90.
0.0% 5.0% 10.0% 15.0% 20.0% 25.0% 30.0% 35.0% 40.0% 45.0%
Moderate and severe (<- 2 SD)
Severe (<- 3 SD)
Moderate and severe (<- 2 SD)
Severe (<- 3 SD)
Moderate and severe (<- 2 SD)
Severe (<- 3 SD)
> + 2 SD
% live births
Stu
nting
Wasting
Underw
eig
ht
Over
weig
ht
Low
birth
weig
ht
KP Rural KP Urban Swat
KP-SISUG Swat Regional Development Plan
110
context, this means improving women’s nutrition and health prior to conception since most
pregnant women in poor regions do not use health services until the pregnancy begins to
show, usually in the second trimester. Women from poor rural communities enter pregnancy
more undernourished and less healthy than their counterparts from better-off urban
communities. Wasting, on the other hand, indicates acute weight loss, the result of insufficient
food intake or repeated infectious diseases, especially diarrhea. Wasting impairs the
functioning of the immune system and can lead to an increased risk for death.236
E.5.2. Services
298. The poor health and nutrition outcomes in Swat and the province may be attributed to
a combination of low service coverage, poor quality of health care, and low use of health
services among the population. The last is linked to the education levels of household heads
and mothers. These are shown in the following indicators (Figure 30 and Figure 31):
i. At the time of childbirth, health service coverage is able to reach about four-fifths of
pregnant women in Khyber Pakhtunkhwa. This is shown by the coverage of the BCG
vaccination against tuberculosis, which is relatively high (72% in the 2016-17 survey
and 81% in the 2017-18 survey).
ii. Families do not consider subsequent vaccinations to be such a priority, and need to
be educated on the different timings and characteristics of childhood vaccines. The
drop between BCG and the third dose of DPT3-HepB-HiB vaccine shows a falling off
in coverage.
iii. Overall, Swat has a higher coverage by some health interventions such as
vaccination compared to the provincial average. However, it has worse nutrition
outcomes, likely due to poor maternal nutrition and low level of education in the
mother.
299. There is a need for better education of pregnant women by health workers on the
importance of having at least four visits and of delivery in a health facility. Antenatal care
coverage (ANC) indicates not only the reach of maternal health services, but also to what
extent the woman is educated and able to make the decision for herself. The first visit indicates
a reasonably high coverage of pregnant women (83% in Swat). However, the visits drop as
the pregnancy continues.
300. The quality of maternal health care is inadequate. This is shown by the proportion of
pregnant women who received antenatal services of acceptable quality (71% in Swat, 56% in
Khyber Pakhtunkhwa). These pregnant women had their blood pressure measured, and urine
and blood sample taken. These tests are recommended by WHO for ANC of acceptable
quality.237 The proportion is more in urban areas (76%) but nonetheless it still means that one
of four pregnant women are not receiving the tests that they should.238
236 World Health Organization. Stunting, wasting, overweight and underweight. Available from:
https://apps.who.int/nutrition/landscape/help.aspx?menu=0&helpid=391&lang=EN Accessed 15 August 2020. 237 WHO guidelines are specific on the content on antenatal care visits, which include: (i) blood pressure
measurement; (ii) urine testing for bacteriuria and proteinuria; (iii) blood testing to detect syphilis and severe anaemia. (iv) weight and height measurement (optional).
238 Government of Khyber Pakhtunkhwa & UNICEF. 2018. Multiple Indicator Cluster Survey 2016-17.
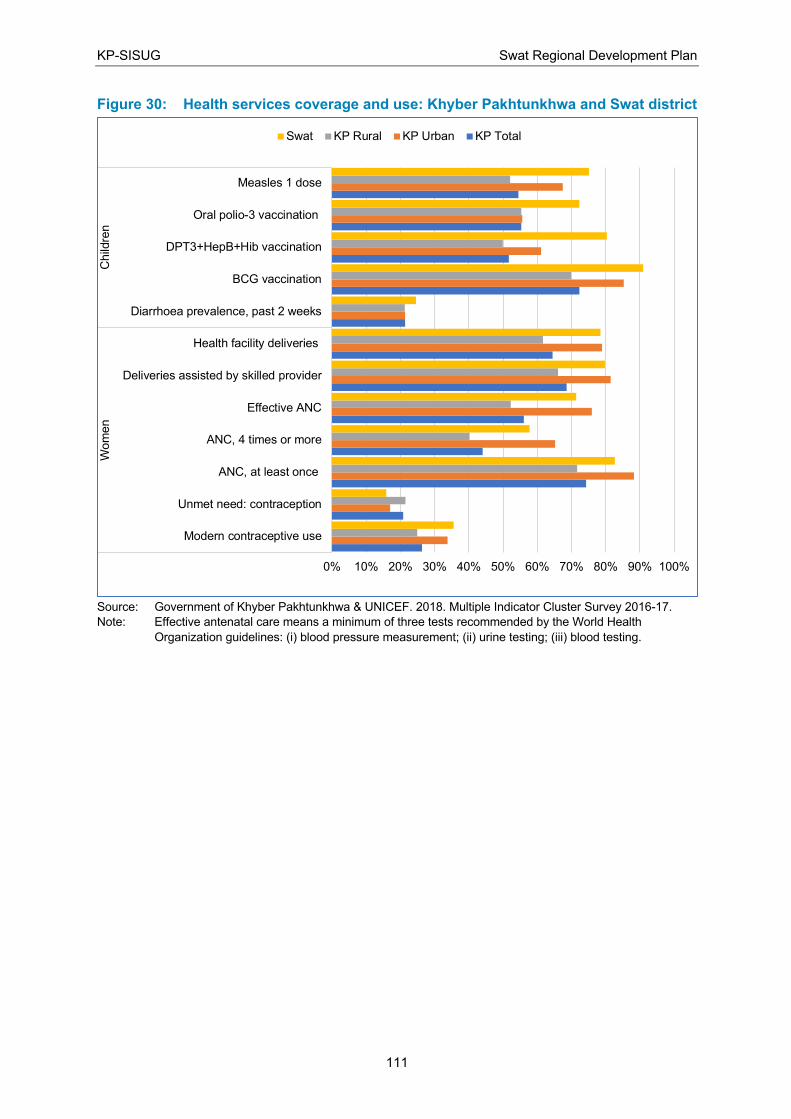
KP-SISUG Swat Regional Development Plan
111
Figure 30: Health services coverage and use: Khyber Pakhtunkhwa and Swat district
Source: Government of Khyber Pakhtunkhwa & UNICEF. 2018. Multiple Indicator Cluster Survey 2016-17.
Note: Effective antenatal care means a minimum of three tests recommended by the World Health
Organization guidelines: (i) blood pressure measurement; (ii) urine testing; (iii) blood testing.
0% 10% 20% 30% 40% 50% 60% 70% 80% 90% 100%
Modern contraceptive use
Unmet need: contraception
ANC, at least once
ANC, 4 times or more
Effective ANC
Deliveries assisted by skilled provider
Health facility deliveries
Diarrhoea prevalence, past 2 weeks
BCG vaccination
DPT3+HepB+Hib vaccination
Oral polio-3 vaccination
Measles 1 dose
Wom
en
Child
ren
Swat KP Rural KP Urban KP Total
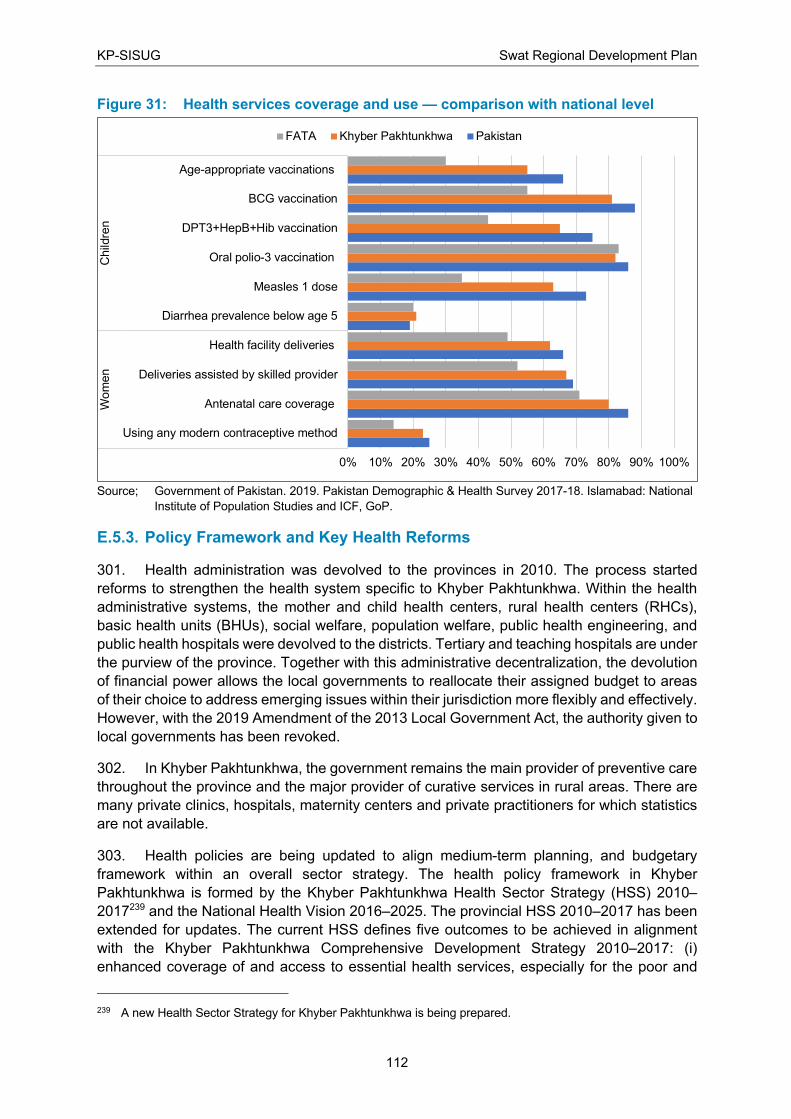
KP-SISUG Swat Regional Development Plan
112
Figure 31: Health services coverage and use — comparison with national level
Source; Government of Pakistan. 2019. Pakistan Demographic & Health Survey 2017-18. Islamabad: National
Institute of Population Studies and ICF, GoP.
E.5.3. Policy Framework and Key Health Reforms
301. Health administration was devolved to the provinces in 2010. The process started
reforms to strengthen the health system specific to Khyber Pakhtunkhwa. Within the health
administrative systems, the mother and child health centers, rural health centers (RHCs),
basic health units (BHUs), social welfare, population welfare, public health engineering, and
public health hospitals were devolved to the districts. Tertiary and teaching hospitals are under
the purview of the province. Together with this administrative decentralization, the devolution
of financial power allows the local governments to reallocate their assigned budget to areas
of their choice to address emerging issues within their jurisdiction more flexibly and effectively.
However, with the 2019 Amendment of the 2013 Local Government Act, the authority given to
local governments has been revoked.
302. In Khyber Pakhtunkhwa, the government remains the main provider of preventive care
throughout the province and the major provider of curative services in rural areas. There are
many private clinics, hospitals, maternity centers and private practitioners for which statistics
are not available.
303. Health policies are being updated to align medium-term planning, and budgetary
framework within an overall sector strategy. The health policy framework in Khyber
Pakhtunkhwa is formed by the Khyber Pakhtunkhwa Health Sector Strategy (HSS) 2010–
2017239 and the National Health Vision 2016–2025. The provincial HSS 2010–2017 has been
extended for updates. The current HSS defines five outcomes to be achieved in alignment
with the Khyber Pakhtunkhwa Comprehensive Development Strategy 2010–2017: (i)
enhanced coverage of and access to essential health services, especially for the poor and
239 A new Health Sector Strategy for Khyber Pakhtunkhwa is being prepared.
0% 10% 20% 30% 40% 50% 60% 70% 80% 90% 100%
Using any modern contraceptive method
Antenatal care coverage
Deliveries assisted by skilled provider
Health facility deliveries
Diarrhea prevalence below age 5
Measles 1 dose
Oral polio-3 vaccination
DPT3+HepB+Hib vaccination
BCG vaccination
Age-appropriate vaccinations
Wom
en
Child
ren
FATA Khyber Pakhtunkhwa Pakistan
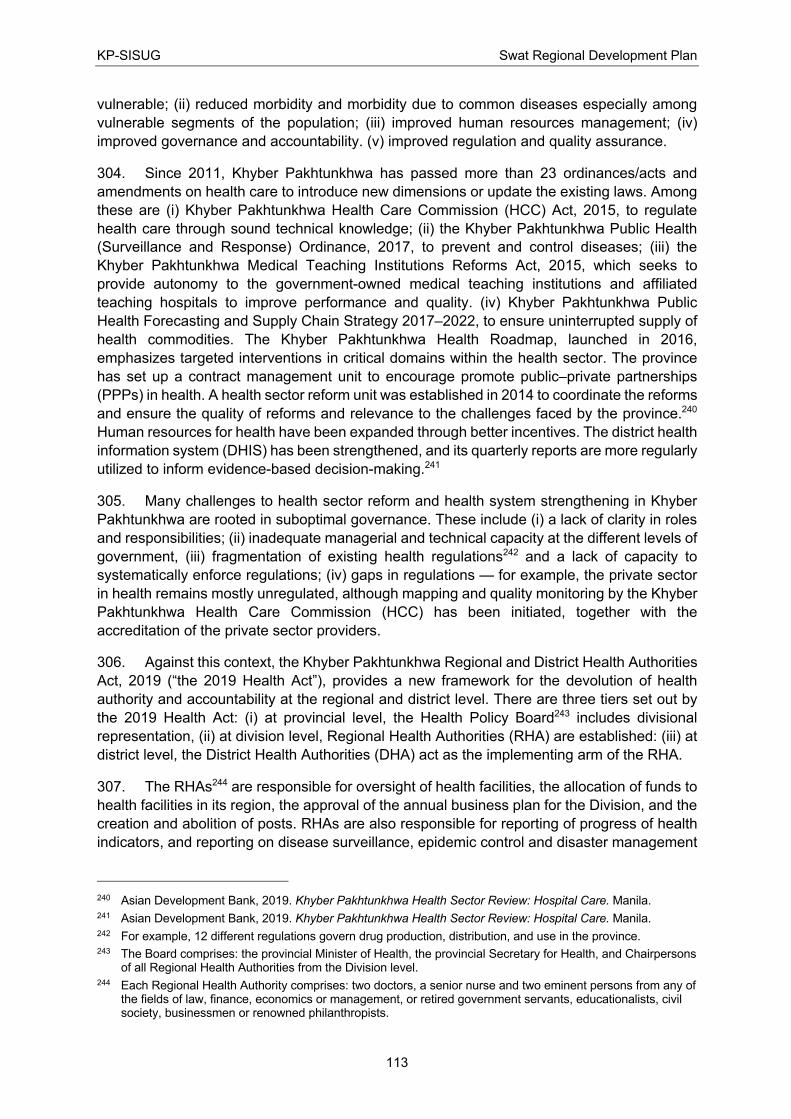
KP-SISUG Swat Regional Development Plan
113
vulnerable; (ii) reduced morbidity and morbidity due to common diseases especially among
vulnerable segments of the population; (iii) improved human resources management; (iv)
improved governance and accountability. (v) improved regulation and quality assurance.
304. Since 2011, Khyber Pakhtunkhwa has passed more than 23 ordinances/acts and
amendments on health care to introduce new dimensions or update the existing laws. Among
these are (i) Khyber Pakhtunkhwa Health Care Commission (HCC) Act, 2015, to regulate
health care through sound technical knowledge; (ii) the Khyber Pakhtunkhwa Public Health
(Surveillance and Response) Ordinance, 2017, to prevent and control diseases; (iii) the
Khyber Pakhtunkhwa Medical Teaching Institutions Reforms Act, 2015, which seeks to
provide autonomy to the government-owned medical teaching institutions and affiliated
teaching hospitals to improve performance and quality. (iv) Khyber Pakhtunkhwa Public
Health Forecasting and Supply Chain Strategy 2017–2022, to ensure uninterrupted supply of
health commodities. The Khyber Pakhtunkhwa Health Roadmap, launched in 2016,
emphasizes targeted interventions in critical domains within the health sector. The province
has set up a contract management unit to encourage promote public–private partnerships
(PPPs) in health. A health sector reform unit was established in 2014 to coordinate the reforms
and ensure the quality of reforms and relevance to the challenges faced by the province.240
Human resources for health have been expanded through better incentives. The district health
information system (DHIS) has been strengthened, and its quarterly reports are more regularly
utilized to inform evidence-based decision-making.241
305. Many challenges to health sector reform and health system strengthening in Khyber
Pakhtunkhwa are rooted in suboptimal governance. These include (i) a lack of clarity in roles
and responsibilities; (ii) inadequate managerial and technical capacity at the different levels of
government, (iii) fragmentation of existing health regulations242 and a lack of capacity to
systematically enforce regulations; (iv) gaps in regulations — for example, the private sector
in health remains mostly unregulated, although mapping and quality monitoring by the Khyber
Pakhtunkhwa Health Care Commission (HCC) has been initiated, together with the
accreditation of the private sector providers.
306. Against this context, the Khyber Pakhtunkhwa Regional and District Health Authorities
Act, 2019 (“the 2019 Health Act”), provides a new framework for the devolution of health
authority and accountability at the regional and district level. There are three tiers set out by
the 2019 Health Act: (i) at provincial level, the Health Policy Board243 includes divisional
representation, (ii) at division level, Regional Health Authorities (RHA) are established: (iii) at
district level, the District Health Authorities (DHA) act as the implementing arm of the RHA.
307. The RHAs244 are responsible for oversight of health facilities, the allocation of funds to
health facilities in its region, the approval of the annual business plan for the Division, and the
creation and abolition of posts. RHAs are also responsible for reporting of progress of health
indicators, and reporting on disease surveillance, epidemic control and disaster management
240 Asian Development Bank, 2019. Khyber Pakhtunkhwa Health Sector Review: Hospital Care. Manila. 241 Asian Development Bank, 2019. Khyber Pakhtunkhwa Health Sector Review: Hospital Care. Manila. 242 For example, 12 different regulations govern drug production, distribution, and use in the province. 243 The Board comprises: the provincial Minister of Health, the provincial Secretary for Health, and Chairpersons
of all Regional Health Authorities from the Division level. 244 Each Regional Health Authority comprises: two doctors, a senior nurse and two eminent persons from any of
the fields of law, finance, economics or management, or retired government servants, educationalists, civil society, businessmen or renowned philanthropists.
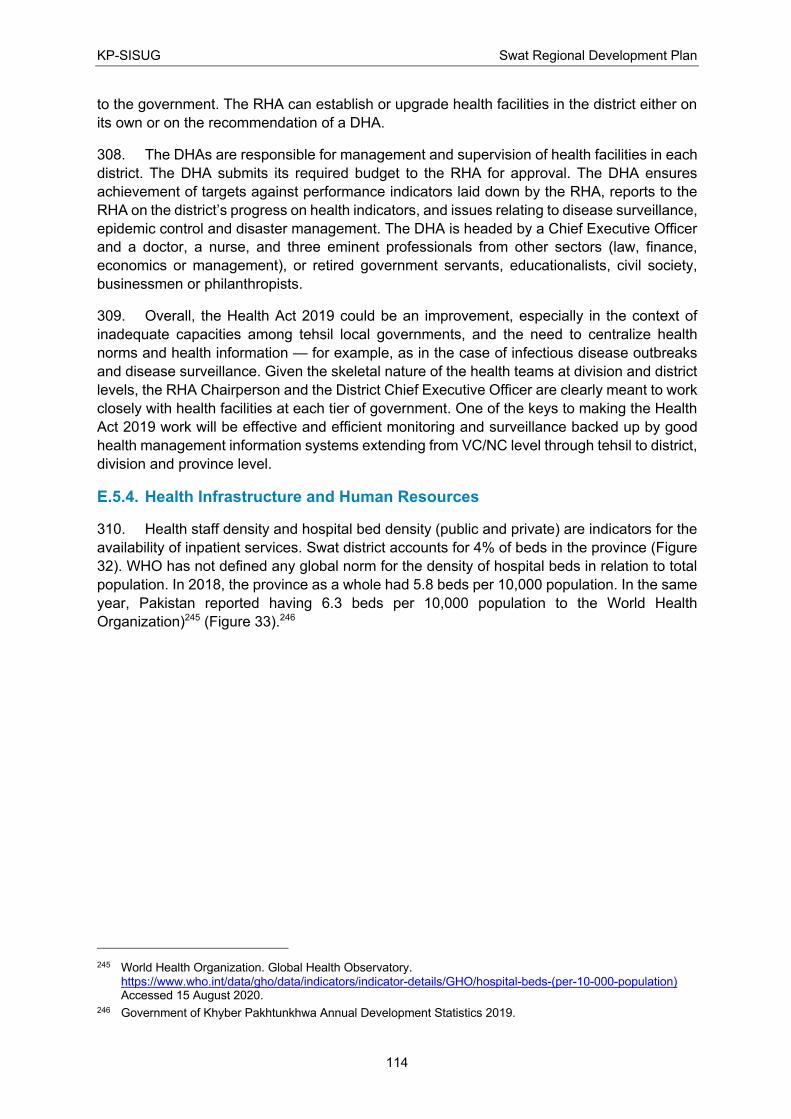
KP-SISUG Swat Regional Development Plan
114
to the government. The RHA can establish or upgrade health facilities in the district either on
its own or on the recommendation of a DHA.
308. The DHAs are responsible for management and supervision of health facilities in each
district. The DHA submits its required budget to the RHA for approval. The DHA ensures
achievement of targets against performance indicators laid down by the RHA, reports to the
RHA on the district’s progress on health indicators, and issues relating to disease surveillance,
epidemic control and disaster management. The DHA is headed by a Chief Executive Officer
and a doctor, a nurse, and three eminent professionals from other sectors (law, finance,
economics or management), or retired government servants, educationalists, civil society,
businessmen or philanthropists.
309. Overall, the Health Act 2019 could be an improvement, especially in the context of
inadequate capacities among tehsil local governments, and the need to centralize health
norms and health information — for example, as in the case of infectious disease outbreaks
and disease surveillance. Given the skeletal nature of the health teams at division and district
levels, the RHA Chairperson and the District Chief Executive Officer are clearly meant to work
closely with health facilities at each tier of government. One of the keys to making the Health
Act 2019 work will be effective and efficient monitoring and surveillance backed up by good
health management information systems extending from VC/NC level through tehsil to district,
division and province level.
E.5.4. Health Infrastructure and Human Resources
310. Health staff density and hospital bed density (public and private) are indicators for the
availability of inpatient services. Swat district accounts for 4% of beds in the province (Figure
32). WHO has not defined any global norm for the density of hospital beds in relation to total
population. In 2018, the province as a whole had 5.8 beds per 10,000 population. In the same
year, Pakistan reported having 6.3 beds per 10,000 population to the World Health
Organization)245 (Figure 33).246
245 World Health Organization. Global Health Observatory.
https://www.who.int/data/gho/data/indicators/indicator-details/GHO/hospital-beds-(per-10-000-population) Accessed 15 August 2020.
246 Government of Khyber Pakhtunkhwa Annual Development Statistics 2019.
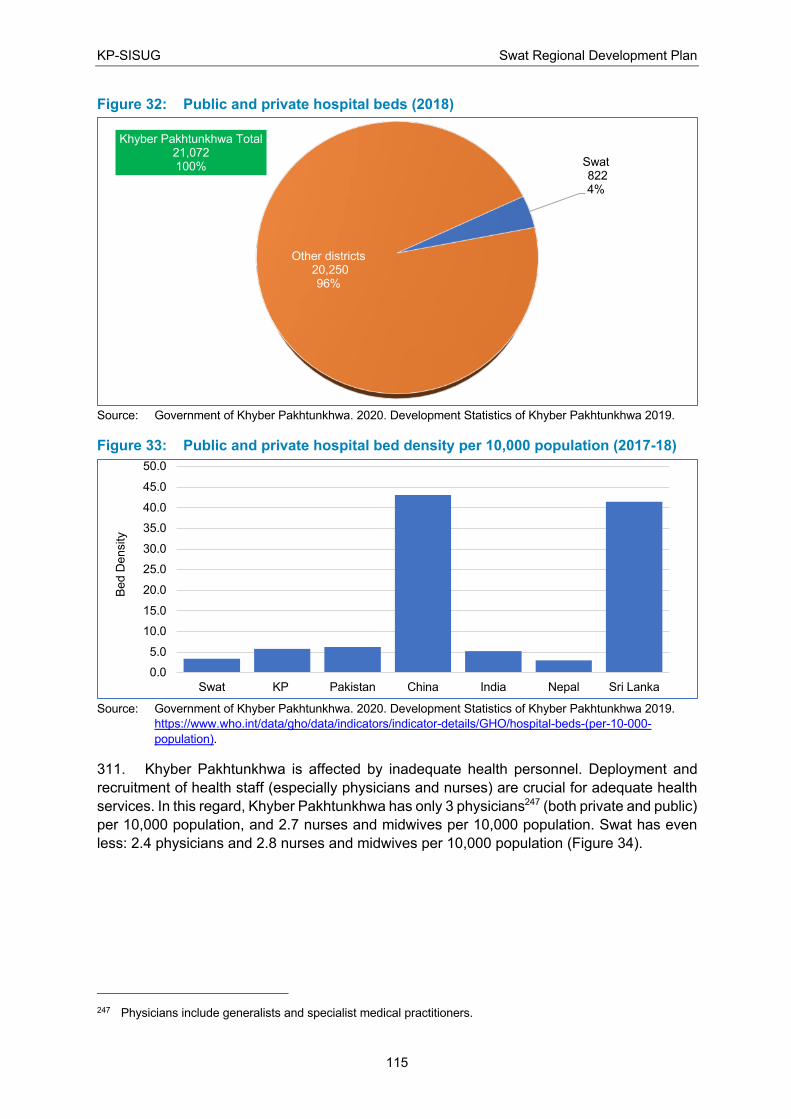
KP-SISUG Swat Regional Development Plan
115
Figure 32: Public and private hospital beds (2018)
Source: Government of Khyber Pakhtunkhwa. 2020. Development Statistics of Khyber Pakhtunkhwa 2019.
Figure 33: Public and private hospital bed density per 10,000 population (2017-18)
Source: Government of Khyber Pakhtunkhwa. 2020. Development Statistics of Khyber Pakhtunkhwa 2019.
https://www.who.int/data/gho/data/indicators/indicator-details/GHO/hospital-beds-(per-10-000-
population).
311. Khyber Pakhtunkhwa is affected by inadequate health personnel. Deployment and
recruitment of health staff (especially physicians and nurses) are crucial for adequate health
services. In this regard, Khyber Pakhtunkhwa has only 3 physicians247 (both private and public)
per 10,000 population, and 2.7 nurses and midwives per 10,000 population. Swat has even
less: 2.4 physicians and 2.8 nurses and midwives per 10,000 population (Figure 34).
247 Physicians include generalists and specialist medical practitioners.
Swat822 4%
Other districts20,250 96%
Khyber Pakhtunkhwa Total21,072100%
0.0
5.0
10.0
15.0
20.0
25.0
30.0
35.0
40.0
45.0
50.0
Swat KP Pakistan China India Nepal Sri Lanka
Bed D
ensity
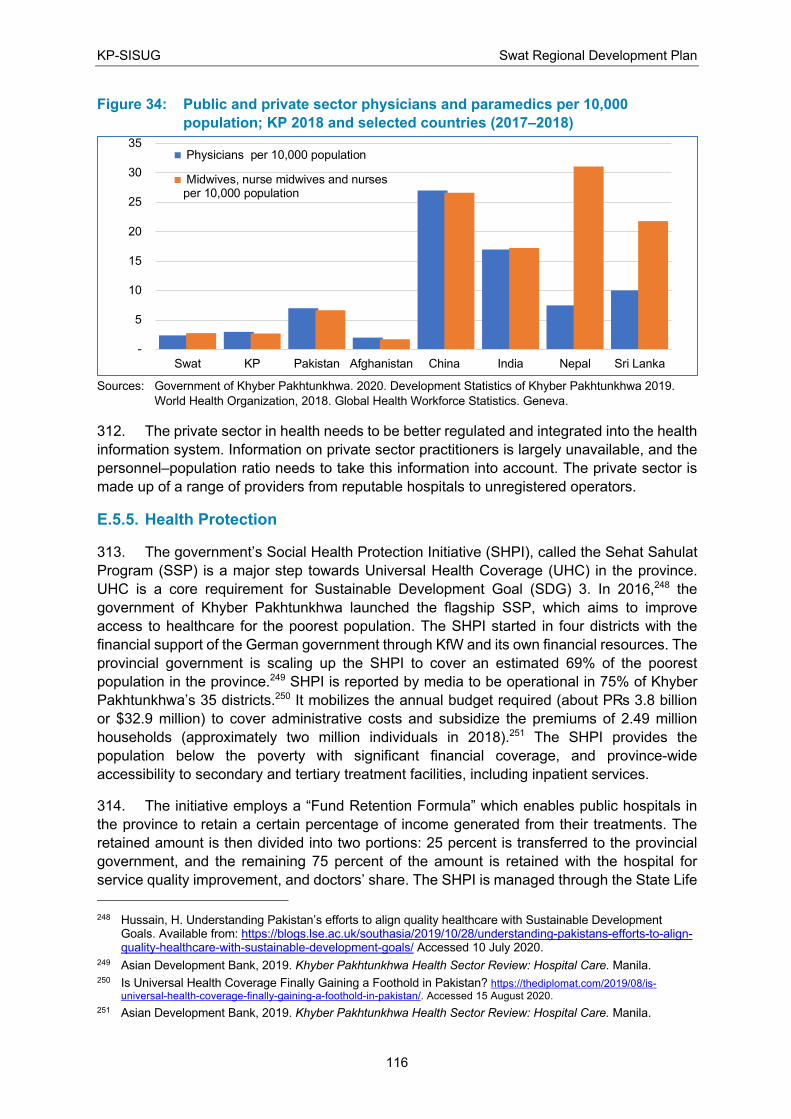
KP-SISUG Swat Regional Development Plan
116
Figure 34: Public and private sector physicians and paramedics per 10,000
population; KP 2018 and selected countries (2017–2018)
Sources: Government of Khyber Pakhtunkhwa. 2020. Development Statistics of Khyber Pakhtunkhwa 2019.
World Health Organization, 2018. Global Health Workforce Statistics. Geneva.
312. The private sector in health needs to be better regulated and integrated into the health
information system. Information on private sector practitioners is largely unavailable, and the
personnel–population ratio needs to take this information into account. The private sector is
made up of a range of providers from reputable hospitals to unregistered operators.
E.5.5. Health Protection
313. The government’s Social Health Protection Initiative (SHPI), called the Sehat Sahulat
Program (SSP) is a major step towards Universal Health Coverage (UHC) in the province.
UHC is a core requirement for Sustainable Development Goal (SDG) 3. In 2016,248 the
government of Khyber Pakhtunkhwa launched the flagship SSP, which aims to improve
access to healthcare for the poorest population. The SHPI started in four districts with the
financial support of the German government through KfW and its own financial resources. The
provincial government is scaling up the SHPI to cover an estimated 69% of the poorest
population in the province.249 SHPI is reported by media to be operational in 75% of Khyber
Pakhtunkhwa’s 35 districts.250 It mobilizes the annual budget required (about P₨ 3.8 billion
or $32.9 million) to cover administrative costs and subsidize the premiums of 2.49 million
households (approximately two million individuals in 2018).251 The SHPI provides the
population below the poverty with significant financial coverage, and province-wide
accessibility to secondary and tertiary treatment facilities, including inpatient services.
314. The initiative employs a “Fund Retention Formula” which enables public hospitals in
the province to retain a certain percentage of income generated from their treatments. The
retained amount is then divided into two portions: 25 percent is transferred to the provincial
government, and the remaining 75 percent of the amount is retained with the hospital for
service quality improvement, and doctors’ share. The SHPI is managed through the State Life
248 Hussain, H. Understanding Pakistan’s efforts to align quality healthcare with Sustainable Development
Goals. Available from: https://blogs.lse.ac.uk/southasia/2019/10/28/understanding-pakistans-efforts-to-align-quality-healthcare-with-sustainable-development-goals/ Accessed 10 July 2020.
249 Asian Development Bank, 2019. Khyber Pakhtunkhwa Health Sector Review: Hospital Care. Manila. 250 Is Universal Health Coverage Finally Gaining a Foothold in Pakistan? https://thediplomat.com/2019/08/is-
universal-health-coverage-finally-gaining-a-foothold-in-pakistan/. Accessed 15 August 2020.
251 Asian Development Bank, 2019. Khyber Pakhtunkhwa Health Sector Review: Hospital Care. Manila.
-
5
10
15
20
25
30
35
Swat KP Pakistan Afghanistan China India Nepal Sri Lanka
Physicians per 10,000 population
Midwives, nurse midwives and nursesper 10,000 population
KP-SISUG Swat Regional Development Plan
117
insurance Corporation of Pakistan. With expansion of the SHPI, both public and private
providers are being enrolled into the program through contracts.
E.5.6. Implications for Regional Planning
315. Much more effort is needed to expand coverage and quality of basic health services in
Khyber Pakhtunkhwa (including the areas merged from FATA). The following components
need to be prioritized:
i. Health infrastructure: Quantitative targets in terms of infrastructure, beds and human
resources should be set in relation to the growing population. An actuarial analysis by
the ADB252 has shown that the Government of Khyber Pakhtunkhwa and the private
sector need to invest in the health care infrastructure to assure continuous supply-side
readiness, especially with the expansion of SHPI, which will increase demand.
ii. The quality of health services also needs to improve through development of quality
assurance systems and enforcement of appropriate regulations. Standard operating
procedures need to be developed where there are gaps, such as in secondary and
tertiary health care.253
iii. Human resources for health reform: Continuous professional development of the
knowledge and skills of all medical, paramedical, technical, and administrative staff
needs to take place through training and other capacity-building measures. Such
professional development could be offered as an additional incentive for retaining and
attracting health staff for remote or rural locations.
iv. Health sector devolution and governance, as set out in the Health Act 2019 will
need to be supported by an effective health management information system and
strengthened coordination at local government level, including through joint planning,
budgeting, identification of bottlenecks, and establishment of appropriate supervision
structures and processes.
v. Consolidating social protection schemes254 and other schemes into the SHPI will
increase revenues, reduce fragmentation and strengthen the purchasing power of
SHPI. The Khyber Pakhtunkhwa government needs to improve the capacity of both
government and private health care providers, in order to work with health insurers.
316. At the same time, health authorities need to intensify preventive health education
efforts, to address behavioral- and cultural issues. Maternal and child malnutrition are not
necessarily linked to the lack of food – rather, malnutrition is linked to insufficient nutrient value
in food intake and/or infectious disease episodes, which are linked to poor hygiene. This
means that improving health, nutrition and hygiene knowledge of families — especially
mothers — remains a priority.
252 Asian Development Bank, 2019. Khyber Pakhtunkhwa Health Sector Review: Hospital Care. Manila. 253 Asian Development Bank, 2019. Khyber Pakhtunkhwa Health Sector Review: Hospital Care. Manila. 254 Social protection schemes include, for Khyber Pakhtunkhwa, the Employees Social Security Institution,
Zakat, Bait-ul-Mal, etc.
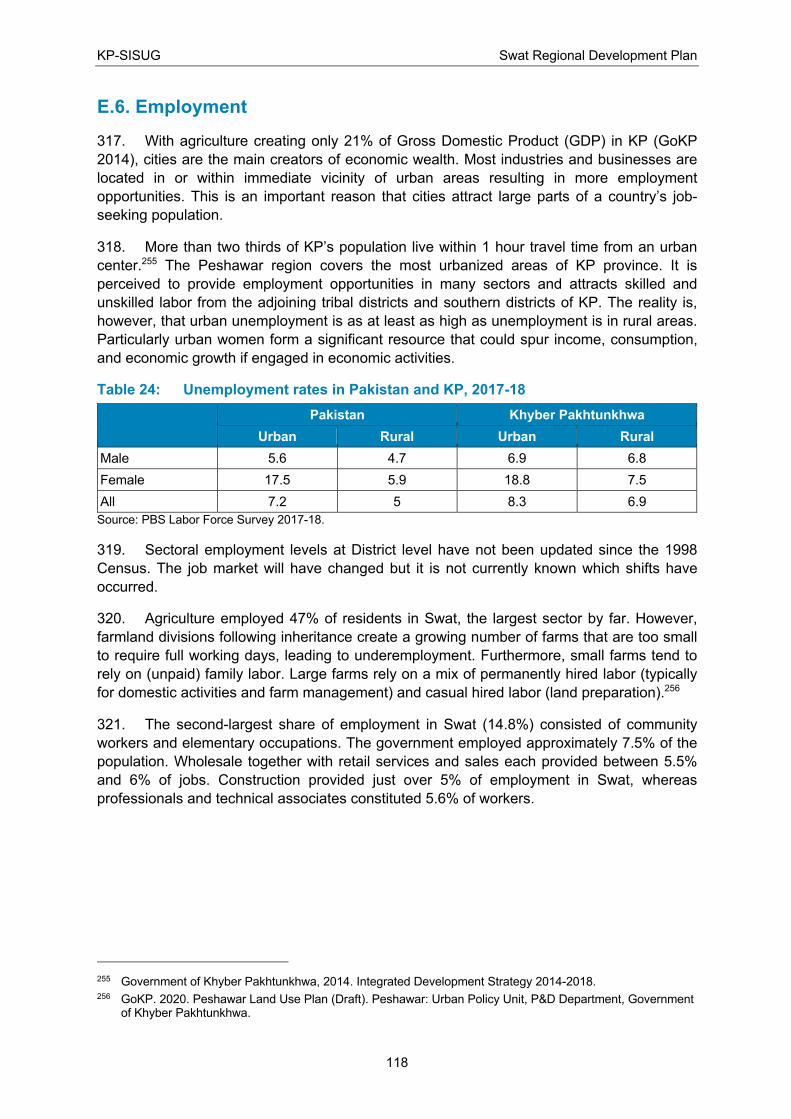
KP-SISUG Swat Regional Development Plan
118
E.6. Employment
317. With agriculture creating only 21% of Gross Domestic Product (GDP) in KP (GoKP
2014), cities are the main creators of economic wealth. Most industries and businesses are
located in or within immediate vicinity of urban areas resulting in more employment
opportunities. This is an important reason that cities attract large parts of a country’s job-
seeking population.
318. More than two thirds of KP’s population live within 1 hour travel time from an urban
center.255 The Peshawar region covers the most urbanized areas of KP province. It is
perceived to provide employment opportunities in many sectors and attracts skilled and
unskilled labor from the adjoining tribal districts and southern districts of KP. The reality is,
however, that urban unemployment is as at least as high as unemployment is in rural areas.
Particularly urban women form a significant resource that could spur income, consumption,
and economic growth if engaged in economic activities.
Table 24: Unemployment rates in Pakistan and KP, 2017-18
Pakistan Khyber Pakhtunkhwa
Urban Rural Urban Rural
Male 5.6 4.7 6.9 6.8
Female 17.5 5.9 18.8 7.5
All 7.2 5 8.3 6.9
Source: PBS Labor Force Survey 2017-18.
319. Sectoral employment levels at District level have not been updated since the 1998
Census. The job market will have changed but it is not currently known which shifts have
occurred.
320. Agriculture employed 47% of residents in Swat, the largest sector by far. However,
farmland divisions following inheritance create a growing number of farms that are too small
to require full working days, leading to underemployment. Furthermore, small farms tend to
rely on (unpaid) family labor. Large farms rely on a mix of permanently hired labor (typically
for domestic activities and farm management) and casual hired labor (land preparation).256
321. The second-largest share of employment in Swat (14.8%) consisted of community
workers and elementary occupations. The government employed approximately 7.5% of the
population. Wholesale together with retail services and sales each provided between 5.5%
and 6% of jobs. Construction provided just over 5% of employment in Swat, whereas
professionals and technical associates constituted 5.6% of workers.
255 Government of Khyber Pakhtunkhwa, 2014. Integrated Development Strategy 2014-2018. 256 GoKP. 2020. Peshawar Land Use Plan (Draft). Peshawar: Urban Policy Unit, P&D Department, Government
of Khyber Pakhtunkhwa.
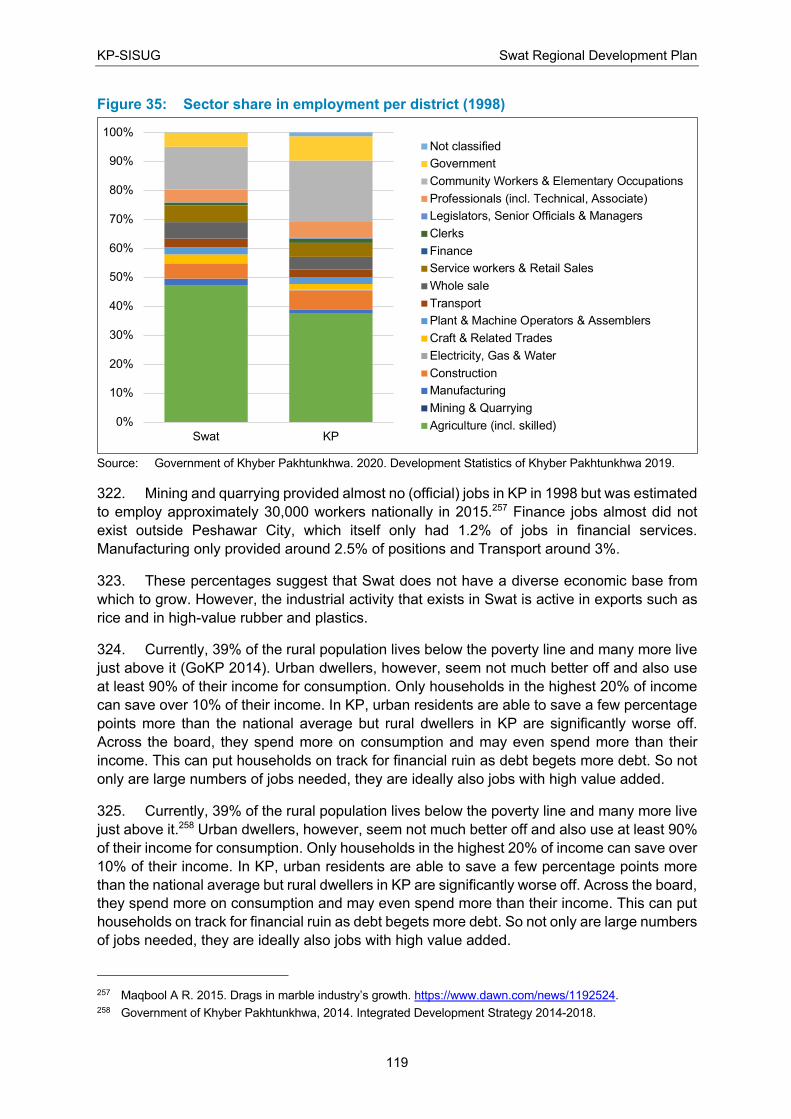
KP-SISUG Swat Regional Development Plan
119
Figure 35: Sector share in employment per district (1998)
Source: Government of Khyber Pakhtunkhwa. 2020. Development Statistics of Khyber Pakhtunkhwa 2019.
322. Mining and quarrying provided almost no (official) jobs in KP in 1998 but was estimated
to employ approximately 30,000 workers nationally in 2015.257 Finance jobs almost did not
exist outside Peshawar City, which itself only had 1.2% of jobs in financial services.
Manufacturing only provided around 2.5% of positions and Transport around 3%.
323. These percentages suggest that Swat does not have a diverse economic base from
which to grow. However, the industrial activity that exists in Swat is active in exports such as
rice and in high-value rubber and plastics.
324. Currently, 39% of the rural population lives below the poverty line and many more live
just above it (GoKP 2014). Urban dwellers, however, seem not much better off and also use
at least 90% of their income for consumption. Only households in the highest 20% of income
can save over 10% of their income. In KP, urban residents are able to save a few percentage
points more than the national average but rural dwellers in KP are significantly worse off.
Across the board, they spend more on consumption and may even spend more than their
income. This can put households on track for financial ruin as debt begets more debt. So not
only are large numbers of jobs needed, they are ideally also jobs with high value added.
325. Currently, 39% of the rural population lives below the poverty line and many more live
just above it.258 Urban dwellers, however, seem not much better off and also use at least 90%
of their income for consumption. Only households in the highest 20% of income can save over
10% of their income. In KP, urban residents are able to save a few percentage points more
than the national average but rural dwellers in KP are significantly worse off. Across the board,
they spend more on consumption and may even spend more than their income. This can put
households on track for financial ruin as debt begets more debt. So not only are large numbers
of jobs needed, they are ideally also jobs with high value added.
257 Maqbool A R. 2015. Drags in marble industry’s growth. https://www.dawn.com/news/1192524. 258 Government of Khyber Pakhtunkhwa, 2014. Integrated Development Strategy 2014-2018.
0%
10%
20%
30%
40%
50%
60%
70%
80%
90%
100%
Swat KP
Not classified
Government
Community Workers & Elementary Occupations
Professionals (incl. Technical, Associate)
Legislators, Senior Officials & Managers
Clerks
Finance
Service workers & Retail Sales
Whole sale
Transport
Plant & Machine Operators & Assemblers
Craft & Related Trades
Electricity, Gas & Water
Construction
Manufacturing
Mining & Quarrying
Agriculture (incl. skilled)
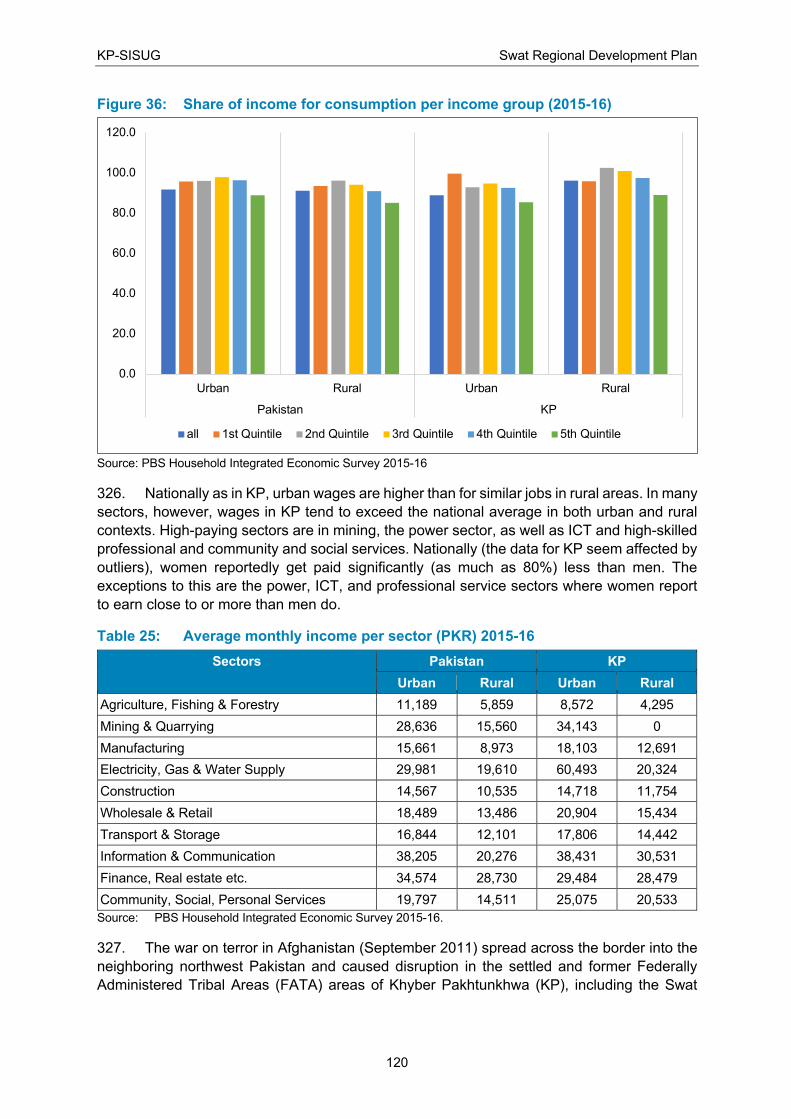
KP-SISUG Swat Regional Development Plan
120
Figure 36: Share of income for consumption per income group (2015-16)
Source: PBS Household Integrated Economic Survey 2015-16
326. Nationally as in KP, urban wages are higher than for similar jobs in rural areas. In many
sectors, however, wages in KP tend to exceed the national average in both urban and rural
contexts. High-paying sectors are in mining, the power sector, as well as ICT and high-skilled
professional and community and social services. Nationally (the data for KP seem affected by
outliers), women reportedly get paid significantly (as much as 80%) less than men. The
exceptions to this are the power, ICT, and professional service sectors where women report
to earn close to or more than men do.
Table 25: Average monthly income per sector (PKR) 2015-16
Sectors Pakistan KP
Urban Rural Urban Rural
Agriculture, Fishing & Forestry 11,189 5,859 8,572 4,295
Mining & Quarrying 28,636 15,560 34,143 0
Manufacturing 15,661 8,973 18,103 12,691
Electricity, Gas & Water Supply 29,981 19,610 60,493 20,324
Construction 14,567 10,535 14,718 11,754
Wholesale & Retail 18,489 13,486 20,904 15,434
Transport & Storage 16,844 12,101 17,806 14,442
Information & Communication 38,205 20,276 38,431 30,531
Finance, Real estate etc. 34,574 28,730 29,484 28,479
Community, Social, Personal Services 19,797 14,511 25,075 20,533
Source: PBS Household Integrated Economic Survey 2015-16.
327. The war on terror in Afghanistan (September 2011) spread across the border into the
neighboring northwest Pakistan and caused disruption in the settled and former Federally
Administered Tribal Areas (FATA) areas of Khyber Pakhtunkhwa (KP), including the Swat
0.0
20.0
40.0
60.0
80.0
100.0
120.0
Urban Rural Urban Rural
Pakistan KP
all 1st Quintile 2nd Quintile 3rd Quintile 4th Quintile 5th Quintile
KP-SISUG Swat Regional Development Plan
121
district. The militant insurgency took hold because of similarities in geography, language and
culture.259
328. The Pakistani government tried to prevent militant activities through dialogue with the
Taliban, but this proved to be unsuccessful, and a military operation, Rah-e-Rast, was
launched in early 2009 against Tehrik-i-Taliban Pakistan (TTP). Though the operation was
seen as well-intentioned, it caused massive internal migration from embattled areas, with an
estimated 2 million people becoming internally displaced and considerable damage was done
to the physical and social infrastructure. After combating the Taliban, the army regained
control of Swat district and it was handed over to the local district administration.260
329. This population influx has altered the demographic character of the entire city and also
placed further pressure on an already stretched social and economic infrastructure, the city's
environment, as well as the security condition of its inhabitants.
330. Economic activities of the men in slum areas include all types of professions. The
largest percentage 33% comprised unskilled daily wage earners, followed by 27% service
providers (dyers, mechanics, etc.), 9% were artisans (carpenter, furniture maker, polish work,
etc.). About 9% were construction workers (masons, electricians, etc.). About 15% were
shopkeepers or vendors and 5% were highly skilled salaried persons including doctors and
teachers. About 4% of boys and 3% of girls under 15 years of age were working for wages in
these areas.
331. The employment status of the slum household was very low as 1.71 persons per
household were employed though the wages were low. The average household income was
PRs 18,718. The household size was large in range of 8 to 11 persons per household. The
study found that 35% of the households were extremely poor and 31% of the households were
poor. Only 40% of the population in slum areas comprised non-poor.
332. In addition, a large cohort of youngsters is about to enter the work force: 44% of the
population in KP is under 15.261 To bring down the relatively high unemployment in KP’s cities,
the number of employment opportunities needs to grow to avoid widespread poverty and its
associated social problems.
E.7. Poverty and Land Issues
333. There are no recent data on poverty for the region or province, as defined by household
consumption and expenditure. Pakistan’s national poverty line was defined on the food energy
intake of 2,300 calories per adult equivalent per day. The cost of basic needs in this regard
was calculated as Rs. 3,030.32 per adult per month in 2013-14. According to this (monetary)
poverty line, some 29.5% of the population were below the national poverty line in Pakistan
(35.6% in rural areas and 18.2% in urban areas) in 2013-14.262 The Pakistan Economic Survey
2017-18 indicated that 24.3% of the population were below the national poverty line in 2015-
16; however, this figure was based on committee estimates instead of any statistical data.263
No estimated cost of basic needs was given and there were no provincial and district level
259 District Swat: Socioeconomic Baseline and Displacement Impact, Center for Public Research. 260 Preliminary Damage and Needs Assessment , World Bank and the Asian Development Bank 5 Interview with
Police Official Swat. 261 PBS Household Integrated Economic Survey 2015-16. 262 UNDP, Multidimensional Poverty in Pakistan. 263 Government of Pakistan, Pakistan Economic Survey 2017-18. Finance Division, Islamabad, Page 245.
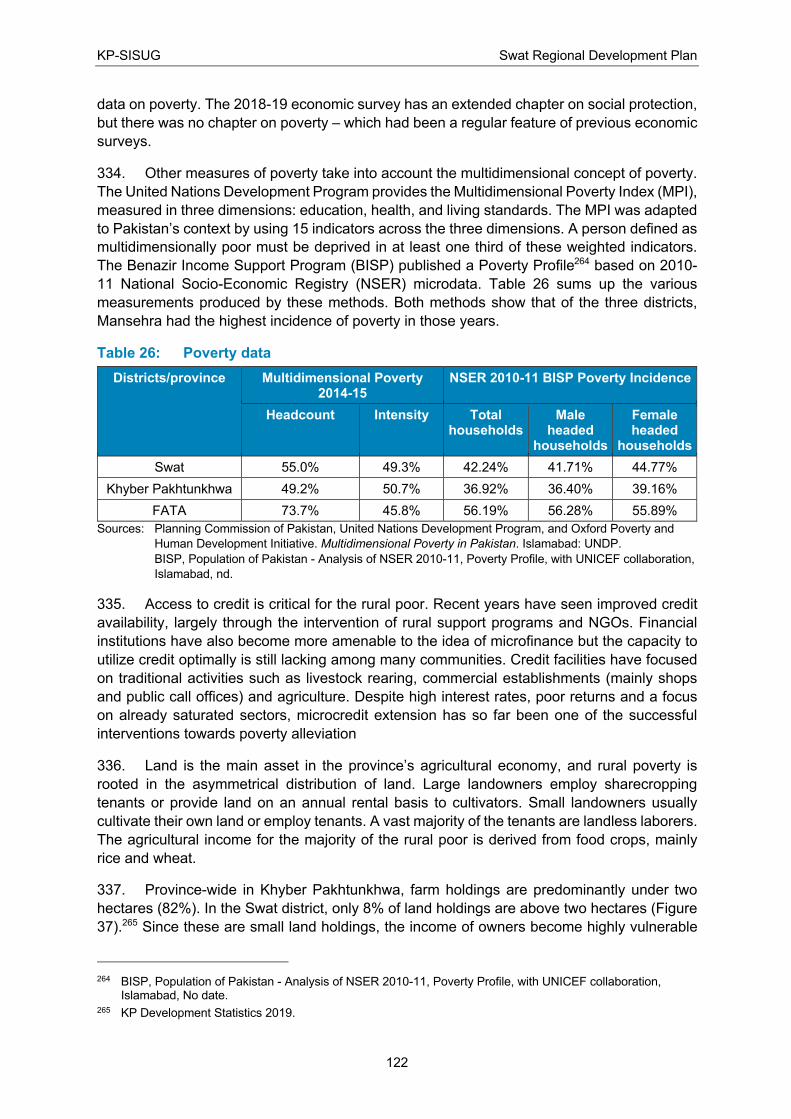
KP-SISUG Swat Regional Development Plan
122
data on poverty. The 2018-19 economic survey has an extended chapter on social protection,
but there was no chapter on poverty – which had been a regular feature of previous economic
surveys.
334. Other measures of poverty take into account the multidimensional concept of poverty.
The United Nations Development Program provides the Multidimensional Poverty Index (MPI),
measured in three dimensions: education, health, and living standards. The MPI was adapted
to Pakistan’s context by using 15 indicators across the three dimensions. A person defined as
multidimensionally poor must be deprived in at least one third of these weighted indicators.
The Benazir Income Support Program (BISP) published a Poverty Profile264 based on 2010-
11 National Socio-Economic Registry (NSER) microdata. Table 26 sums up the various
measurements produced by these methods. Both methods show that of the three districts,
Mansehra had the highest incidence of poverty in those years.
Table 26: Poverty data
Districts/province Multidimensional Poverty 2014-15
NSER 2010-11 BISP Poverty Incidence
Headcount Intensity Total households
Male headed
households
Female headed
households
Swat 55.0% 49.3% 42.24% 41.71% 44.77%
Khyber Pakhtunkhwa 49.2% 50.7% 36.92% 36.40% 39.16%
FATA 73.7% 45.8% 56.19% 56.28% 55.89%
Sources: Planning Commission of Pakistan, United Nations Development Program, and Oxford Poverty and
Human Development Initiative. Multidimensional Poverty in Pakistan. Islamabad: UNDP.
BISP, Population of Pakistan - Analysis of NSER 2010-11, Poverty Profile, with UNICEF collaboration,
Islamabad, nd.
335. Access to credit is critical for the rural poor. Recent years have seen improved credit
availability, largely through the intervention of rural support programs and NGOs. Financial
institutions have also become more amenable to the idea of microfinance but the capacity to
utilize credit optimally is still lacking among many communities. Credit facilities have focused
on traditional activities such as livestock rearing, commercial establishments (mainly shops
and public call offices) and agriculture. Despite high interest rates, poor returns and a focus
on already saturated sectors, microcredit extension has so far been one of the successful
interventions towards poverty alleviation
336. Land is the main asset in the province’s agricultural economy, and rural poverty is
rooted in the asymmetrical distribution of land. Large landowners employ sharecropping
tenants or provide land on an annual rental basis to cultivators. Small landowners usually
cultivate their own land or employ tenants. A vast majority of the tenants are landless laborers.
The agricultural income for the majority of the rural poor is derived from food crops, mainly
rice and wheat.
337. Province-wide in Khyber Pakhtunkhwa, farm holdings are predominantly under two
hectares (82%). In the Swat district, only 8% of land holdings are above two hectares (Figure
37).265 Since these are small land holdings, the income of owners become highly vulnerable
264 BISP, Population of Pakistan - Analysis of NSER 2010-11, Poverty Profile, with UNICEF collaboration,
Islamabad, No date. 265 KP Development Statistics 2019.
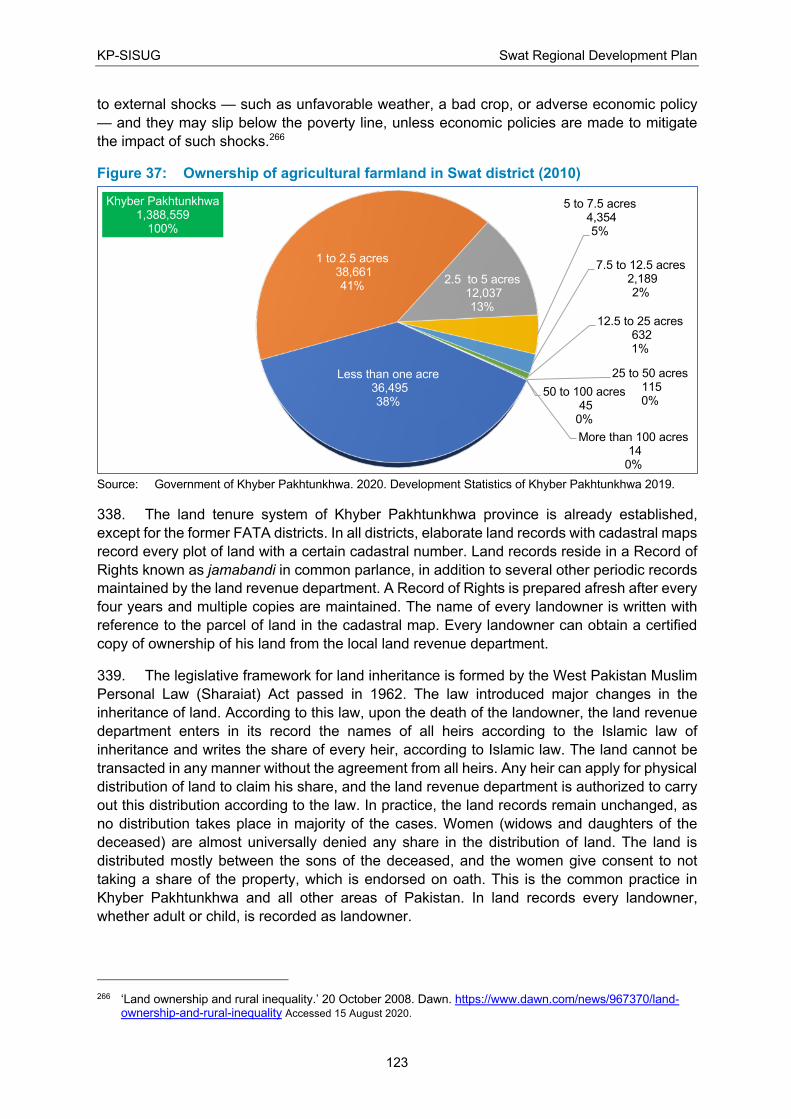
KP-SISUG Swat Regional Development Plan
123
to external shocks — such as unfavorable weather, a bad crop, or adverse economic policy
— and they may slip below the poverty line, unless economic policies are made to mitigate
the impact of such shocks.266
Figure 37: Ownership of agricultural farmland in Swat district (2010)
Source: Government of Khyber Pakhtunkhwa. 2020. Development Statistics of Khyber Pakhtunkhwa 2019.
338. The land tenure system of Khyber Pakhtunkhwa province is already established,
except for the former FATA districts. In all districts, elaborate land records with cadastral maps
record every plot of land with a certain cadastral number. Land records reside in a Record of
Rights known as jamabandi in common parlance, in addition to several other periodic records
maintained by the land revenue department. A Record of Rights is prepared afresh after every
four years and multiple copies are maintained. The name of every landowner is written with
reference to the parcel of land in the cadastral map. Every landowner can obtain a certified
copy of ownership of his land from the local land revenue department.
339. The legislative framework for land inheritance is formed by the West Pakistan Muslim
Personal Law (Sharaiat) Act passed in 1962. The law introduced major changes in the
inheritance of land. According to this law, upon the death of the landowner, the land revenue
department enters in its record the names of all heirs according to the Islamic law of
inheritance and writes the share of every heir, according to Islamic law. The land cannot be
transacted in any manner without the agreement from all heirs. Any heir can apply for physical
distribution of land to claim his share, and the land revenue department is authorized to carry
out this distribution according to the law. In practice, the land records remain unchanged, as
no distribution takes place in majority of the cases. Women (widows and daughters of the
deceased) are almost universally denied any share in the distribution of land. The land is
distributed mostly between the sons of the deceased, and the women give consent to not
taking a share of the property, which is endorsed on oath. This is the common practice in
Khyber Pakhtunkhwa and all other areas of Pakistan. In land records every landowner,
whether adult or child, is recorded as landowner.
266 ‘Land ownership and rural inequality.’ 20 October 2008. Dawn. https://www.dawn.com/news/967370/land-
ownership-and-rural-inequality Accessed 15 August 2020.
Less than one acre36,495 38%
1 to 2.5 acres38,661 41%
2.5 to 5 acres12,037 13%
5 to 7.5 acres4,354 5%
7.5 to 12.5 acres2,189 2%
12.5 to 25 acres632 1%
25 to 50 acres115 0%
50 to 100 acres45
0%
More than 100 acres14
0%
Khyber Pakhtunkhwa1,388,559
100%
KP-SISUG Swat Regional Development Plan
124
E.8. Social Protection
340. Around 5.1% of the population in Khyber Pakhtunkhwa and 4.6% of that in the former
FATA are covered under social protection programs.267 Most of these are covered under
several federal government social protection programs with nationwide coverage. In addition,
the Government of Khyber Pakhtunkhwa’s provincial social health protection initiative (SHPI)
called the Sehat Sahulat Program (Section 293) provides 100% coverage for maternity care
and cancer in the outpatient department, as well as all illnesses requiring hospitalization in
secondary care hospitals, with limited tertiary coverage. The other social protection programs
are as follows:268
• Ehsaas Kafaalat Program: In 2019 government initiated the Ehsaas Kafaalat
program linked with the national database, reaching out to seven million poor women
in the country. This program provided Rs. 2,000 per month to women through biometric
verification with designated bank branches and ATMs. The total number of
beneficiaries in Khyber Pakhtunkhwa or in different districts is not available. The overall
objective of Ehsaas is to reduce inequality, invest in people, and lift lagging districts.
• Ehsaas Emergency Cash: Under the Ehsaas umbrella, the Ehsaas Emergency
Cash program was launched by the Prime Minister on April 1, 2020 to help alleviate
the impact of the ongoing crisis caused by COVID-19. The program covers 12 million
families; at Rs. 12,000 per family, to mitigate income losses incurred from lock-down
measures. Distribution by district and province is not available.269
• Zakat programs: The federal government collects zakat (Islamic dues to donate to
the poor) and distributes to provinces. Khyber Pakhtunkhwa received Rs. 948.22
million in the 2018-19 zakat budget.270
• Pakistan Bai-ul-Mal (PBM) provides financial assistance to the poor under several
programs (medical, education and others). District-wise breakdown is not available.
• Employees Old Age Benefits Institutions (EOBI) EOBI provides pension to
registered workers in non-government establishments. Provincial and district
distribution is not available.271
341. The Department of Social Welfare, Special Education and Women’s Empowerment
implements programs for ‘marginalized segments of population such as destitute women,
orphans, victims of violence, drug addicts.272
267 Ministry of National Health Services and UNICEF, 2018. National Nutrition Survey 2018. Islamabad:
UNICEF. 268 The previous Benazir Income Support Programme (BISP) provided Rs. 5,000 quarterly to about five million
poor women in all districts of the country. Massive fraud was unearthed in 2018-19 in the program where more than 800,000 people were benefitting from this programme.
269 According to press reports Rs. 19.85 billion were distributed to 1.61 million families of Khyber Pakhtunkhwa province by May 19, 2020. https://nation.com.pk/19-May-2020/rs-104-917b-disbursed-among-8-619-142-beneficiaries-under-ehsaas-emergency-cash-programme. Accessed 15 August 2020.
270 Pakistan Economic Survey 2018-19. 271 In 2018-19 July to March the number of beneficiaries were 401,940 and total payment made was Rs. 23,296
billion. 272 Government of KP, Annual Statistical Report 2016-17, Department of Social Welfare, special education and
women Empowerment.
KP-SISUG Swat Regional Development Plan
125
• Vocational Training Centers for Women: There were total of 204 functional centers
in the province, including two in Swat.
• Darul Aman (Shelter for Distressed Women): There are five shelters in KP, including
one in Swat.
• Rehabilitation centers for drug addicts: The province has a total of six functional
centers but none in Swat district.
• Working Women Hostels: These hostels are located in Peshawar, Mardan, Kohat,
and Abbottabad, but none in Swat district.
• Welfare homes for orphans are located in Peshawar (two homes), Abbottabad,
Nowshera, Charsadda and Kohat, but none in Swat district.
• Special Education Centers: There are total of 44 such centers in the province, 11
for sight impaired, 18 for hearing and speech impaired, and 15 for those with mental
and/or physical disabilities. Two of these are in Swat district.
E.9. Gender and Inclusiveness
342. The Government of Pakistan is signatory to international conventions and committed
to gender equality in its public policy and legislation. The provincial government of Khyber
Pakhtunkhwa has also issued policy statements and legislation in this regard. Gender
discrimination cannot be addressed by public policy and legislation alone, since it requires
socio-cultural changes in the value system, and in the cultural interpretation of Islam prevalent
in Pakistan. The basic element is recognition of the equality of sexes despite gender roles.
Equality of access and opportunity for both male and female children in family is the major
issue where decisions are based on traditionally-cast gender roles, reinforced by cultural
religious interpretations.
E.9.1. Cultural Values
343. The Pashtun social organization is tribal, based on a patriarchal kinship system. Five
districts in the Greater Peshawar Region have almost ethnic uniformity, being Pashtun with
presence of small segments of non-Pashtun ethnicities mainly in the urban localities and
cantonments. Cantonments are mainly military garrisons with wide ethnic variations. Tribe
(qoum) is divided into clan (khel) and further, lineages (tappa), which section into (bajar or
palarina) and finally into extended family (kor). Pashtunwali or the code of honor is the set of
traditional values that are ingrained in the tribal culture. These values are hospitality, truce,
revenge, deputation, agnatic rivalry, honor and forgiveness. Pashtun claim that Islam, as
deliberated in their traditions through centuries, is amalgamated in their culture. In Pathan
culture, the family is the most important unit, women are the center of the family honor and
segregation of sexes is an important social value. The male members of the family are
protectors of the family honor and custodians of women’s behavior and movement. They are
the decision-makers about what women can do and cannot do, where they can go and cannot
go. Women cannot go unaccompanied outside their neighborhood. This value system places
women in a weak position, where they need protection of male family member in all matters,
and imposes strict male domination on women in all walks of life.
344. Because of the segregation of sexes, the social role of women is traditionally limited to
within the household, dominated by childbearing and housekeeping. Because of family honor
KP-SISUG Swat Regional Development Plan
126
associated with women, it was considered disgraceful to take sick women for treatment to a
male doctor. The religious functionaries – mulla - strongly opposed education of girls and their
interpretations were accepted. The interpretation of religious beliefs and practices by the mulla
is considered sacrosanct and final in Khyber Pakhtunkhwa. Religion is intertwined into the
Pashtun culture and the mulla is the authority on this cultural-religion complex. Segregation is
declared a religious edict and women must observe purdah (wearing of veil) while going out.
Their main responsibility is defined as being within the household therefore, it is deemed that
the education of girls is against religion, apart from many other demerits which are viewed as
impinging upon family honor. Women are confined to the household, denied health and
education facilities under strict male domination. This culture was reinforced by the popularity
and prominence of mullah throughout the region.
E.9.2. Reforms
345. Since the 1980s, the government has made efforts to increase education, health, water
supply and sanitation facilities, ushering in social changes at a slow pace. Civil society played
an important role in helping to bring about this change. People brought their women for
treatment to the nearest health facilities and very few also enrolled their daughters in primary
school. This trend increased with the passage of time when health and education programs
were expanded to rural areas. The enrolment of girls in school and the gradual mobility and
employment of women enraged the mulla. Initially, girls’ schools were attacked and destroyed
in many rural areas. The reaction shifted from rhetoric to warfare at the turn of the 20th century
with different intensities in different areas. Countless number of men, women and children lost
their lives at the hand of such insurgents. After decade-long battles, intervention by the
Pakistan Army became the major turning point that brought about the beginning of the change
in traditional religious-cultural values determining the status of women in Pashtun society. The
first major indication of this change was the rebuilding and opening of girls’ schools in rural
areas of the province.
346. There is still a long way to go in terms of improving gender equality in education and
health, but progress is visible. In the census of 1972, the literacy rate in Peshawar district was
26.8% for men and 8.4% for women while in rural areas it was 19.7% for men and 2.7% for
women273. The various education and literacy development programs since the 1980s and
later the national drive in support of the Millennium Development Goals (MDGs) have brought
about significant change in access to education for women in the region and other parts of the
country. The fact that the gross enrolment ratio of girls in primary education was above 70%
and net enrolment rate was above 50% in all districts of the region except Khyber clearly
indicates a change in traditional values where men have at least realized the importance of
education for girls. Yet, a large number of girls are still out of school, mostly in rural areas.
Stronger campaigns are required to bring about change in the socio-cultural milieu that
restricts access to education for girls. Access to health facilities for women has increased to
some extent as indicated by the percentages of women visiting health facilities for antenatal
care, tetanus toxoid vaccination and deliveries in public health facilities. This indicates
fundamental changes are taking place though at a slow pace.
E.9.3. Women’s Empowerment
347. The Government has increased the number of women in public representation. All
women in national and provincial legislature come up through nomination by the party leaders.
273 Government of Pakistan, District Census Report Peshawar 1972, Ministry of Interior, Islamabad, 1975.
KP-SISUG Swat Regional Development Plan
127
This representation has further been extended to local government institutions. However, the
value system has not changed at a commensurate pace. Women do not own property and are
dependent on men for their all needs. All decisions about their wellbeing are taken by male
family members: the father (in the case of unmarried girls) and husbands (in case of married
women). Their social life is confined to attending family and community ceremonies at the rites
of passage. The participation of women in exercising their franchise in elections is restricted,
particularly in rural areas.
348. Women are economically dependent on the male head of the household. Employment
of women is minimal — mostly limited to the education and health sectors, and to a very small
extent in bureaucracy and private sector. About 54.4% of women who earn income in urban
Khyber Pakhtunkhwa are able to decide on how to spend their income, compared to 31.8% in
rural areas. The respondents in this case were drawn from a small number, only 129. About
1.8% of urban and 2.3% rural women are able decide on the spending of the husband’s
income in KP province.274
349. In land ownership the West Pakistan Muslim Personal Law (Sharaia) Act of 1962
provides for the distribution of inheritance according to Islamic law (Section D.1). The land
revenue department distributes the land of the deceased according to Islamic law in the record
of rights updated every four year. The name of women – wife and daughters – of the deceased
and their share in the property are recorded in the record of rights. However, this is just
ownership in the record of rights without any physical transfer of the property to the women.
Property can be transferred from one heir to another heir after a solemn declaration of
surrender on oath by the heir. This kind of declaration is used to deny landed property rights
to women throughout Pakistan and in Khyber Pakhtunkhwa. About 98.1% of women in Khyber
Pakhtunkhwa did not receive their inheritance of agricultural land, residential plots, house and
non-agricultural land, although this is a gross violation of the Muslim Family Laws (Sharaia)
Act of 1962. With the representation of women in public representative offices, this Law needs
to be better enforced.
350. For some women, the most important asset that they own is gold jewelry or consumer
durables they received from parents and husband when they marry. Since poor families
cannot afford these items, these women have no assets. In Khyber Pakhtunkhwa, 2.1% pf
urban and 1.7% of rural women have their own assets. About 53% of women in Khyber
Pakhtunkhwa own their mobile phone in urban areas and 33% in rural areas.275
351. Women are rarely consulted by their parents on the selection of a husband for them,
although this may arguably be the most important decision in life for them. The decision to
marry off their daughter is taken by the father, or in some cases jointly by both parents. The
consent of the young woman, which is the basic condition of marriage contract in Islam, is
generally denied in Khyber Pakhtunkhwa. The cultural religious interpretation of Islam has
given this right to the wali (father or another male custodian of the girl). While there are laws
against forced marriage, and against giving women in exchange for settlement of conflicts
through jirga (assembly of tribal elders), these laws are only in statute books. Khyber
Pakhtunkhwa is not immune to violence against women and girls, which is now recognized as
274 Government of Pakistan, Pakistan Demographic and Health Survey 2017-18, National Institute of Population
Studies, Islamabad, 2019. All the following data are from this report. 275 Government of Pakistan, Pakistan Demographic and Health Survey 2017-18, National Institute of Population
Studies, Islamabad, 2019.
KP-SISUG Swat Regional Development Plan
128
a global phenomenon affecting 1 in 3 women in their lifetime.276 In Khyber Pakhtunkhwa, 29%
urban and 46% rural women have experienced physical violence since they were 15 years of
age.277
352. Changes in education are taking place, albeit slowly for girls in rural areas. According
to Pakistan Education Statistics of 2016-17 in Khyber Pakhtunkhwa, some 2,384 million
children were out of school, comprising 1.637 million girls and 0.747 million boys.278 The
evidence of declining trends in GER and NER of the Swat district are a sobering reminder of
the difficulties. Education is the gateway to change that can pave the way for inclusiveness in
due course. Education provides access to Islam to counter the cultural religious interpretation
that relegated the status of women to the back. Education brings employment for women and
provides for their economic wellbeing and control over their income. Education provides the
tools by which women can take recourse to law to ensure their rights where needed.
E.10. Socio-Economic Setting: the Way Forward
E.10.1. Policy Recommendations
353. Population and city planning: The mismatch between the official municipal limits of
each city and the reality on the ground needs to be addressed at policy level. The development
of this policy needs to go hand-in-hand with a redefinition of urban and rural areas, as well as
a review of capacities and mandates of each entity providing services within the city limits, the
peri-urban and rural areas. The 2019 amendment to the 2013 Local Government Act provides
the opportunity to initiate this undertaking.
354. Human capital investment: Khyber Pakhtunkhwa needs to develop and implement
policies on prioritizing investment in human capital. Such policies will focus on maximizing the
potential of children and adolescents in Khyber Pakhtunkhwa through three investment
components, all of which have high benefit-cost ratios.
• First, investments in services for young child development and education have a
proven association with increased number of years of schooling and increased
productivity as an adult.279 These also have a benefit/cost ratio of 7.3; that is, a benefit
of 7.3 dollars for every dollar spent.280
• Second, investments to improve the quality and labor-market relevance of secondary
education, which have been proven to have a mean benefit–cost ratio of 11:8.281
276 https://www.worldbank.org/en/topic/socialdevelopment/brief/violence-against-women-and-girls. Accessed 15
August 2020. 277 PDHS, 2017–2018 278 Government of Pakistan, Pakistan Education Statistics 2016-17, Ministry of Federal Education and
Professional Training, Islamabad, 2018. 279 Britto PR, Lye SJ, Proulx K, Yousafzai AK, Matthews SG, Vaivada T, Perez-Escamilla R, Rao N, Ip P,
Fernald LCH, MacMillan H, Hanson M, Wachs TD, Yao H, Yoshikawa H, Cerezo A, Leckman JF, Bhutta ZA, Early Childhood Development Interventions Review Group, for the Lancet Early Childhood Development Series Steering Committee. ‘Nurturing care: promoting early childhood development.” Lancet. 2017 Jan; 389(10064) 91-102. doi:10.1016/s0140-6736(16)31390-3. PMID: 27717615.
280 García, J., Heckman, J., Leaf,D., and Prados, M.J., 2016. ’The Life-cycle Benefits of an Influential Early Childhood Program’, NBER Working Paper No. 22993 December 2016, Available from: https://www.nber.org/papers/w22993.pdf.
281 Sheehan, P., Sweeny, K., Rasmussen, B., Wils, A., Friedman, H, Mahon, J., Patton, G., Sawyer, S., Howard, E., Symons, J., Stenberg, K., Chalasani, S., Maharaj, N., Reavley, N., Hui Shi, Fridman, M., Welsh, A.,
KP-SISUG Swat Regional Development Plan
129
• Third, investments in female education are required as these have multiplier effects in
terms of the next generation of children and young people.282
355. Health: Khyber Pakhtunkhwa requires an enhanced health policy framework for the
medium to long term, backed by adequate financing. The framework should guide the
improvements in the coverage and quality of basic health services and lay out the investments
required in health care infrastructure, human resources, and social health protection. Health
sector governance needs more attention, especially the planning and coordination, and the
information management at district and local government level. Preventive health education
efforts need to be intensified to address behavioral- and cultural issues.
Nsofor, E., and Laski, L., 2017. ‘Building the foundations for sustainable development: a case for global investment in the capabilities of adolescents.’ The Lancet. 2017, 390: 1792–1806
282 Schäferhoff M, Evans D, Burnett N, et al. Estimating the costs and benefits of education from a health perspective. Background paper for the Oslo Summit on Education for Development. Berlin: SEEK Development, 2015.
KP-SISUG Swat Regional Development Plan
130
PART II:
URBAN DEVELOPMENT:
STATUS AND THE WAY FORWARD
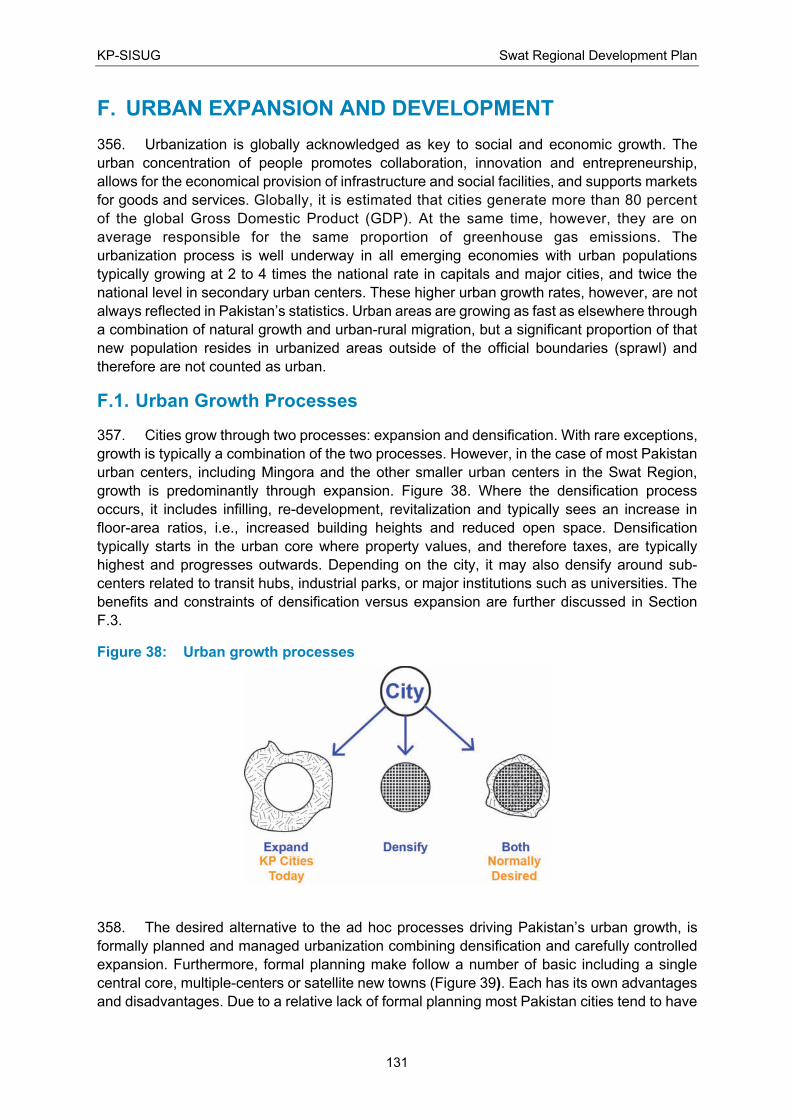
KP-SISUG Swat Regional Development Plan
131
F. URBAN EXPANSION AND DEVELOPMENT
356. Urbanization is globally acknowledged as key to social and economic growth. The
urban concentration of people promotes collaboration, innovation and entrepreneurship,
allows for the economical provision of infrastructure and social facilities, and supports markets
for goods and services. Globally, it is estimated that cities generate more than 80 percent
of the global Gross Domestic Product (GDP). At the same time, however, they are on
average responsible for the same proportion of greenhouse gas emissions. The
urbanization process is well underway in all emerging economies with urban populations
typically growing at 2 to 4 times the national rate in capitals and major cities, and twice the
national level in secondary urban centers. These higher urban growth rates, however, are not
always reflected in Pakistan’s statistics. Urban areas are growing as fast as elsewhere through
a combination of natural growth and urban-rural migration, but a significant proportion of that
new population resides in urbanized areas outside of the official boundaries (sprawl) and
therefore are not counted as urban.
F.1. Urban Growth Processes
357. Cities grow through two processes: expansion and densification. With rare exceptions,
growth is typically a combination of the two processes. However, in the case of most Pakistan
urban centers, including Mingora and the other smaller urban centers in the Swat Region,
growth is predominantly through expansion. Figure 38. Where the densification process
occurs, it includes infilling, re-development, revitalization and typically sees an increase in
floor-area ratios, i.e., increased building heights and reduced open space. Densification
typically starts in the urban core where property values, and therefore taxes, are typically
highest and progresses outwards. Depending on the city, it may also densify around sub-
centers related to transit hubs, industrial parks, or major institutions such as universities. The
benefits and constraints of densification versus expansion are further discussed in Section
F.3.
Figure 38: Urban growth processes
358. The desired alternative to the ad hoc processes driving Pakistan’s urban growth, is
formally planned and managed urbanization combining densification and carefully controlled
expansion. Furthermore, formal planning make follow a number of basic including a single
central core, multiple-centers or satellite new towns (Figure 39). Each has its own advantages
and disadvantages. Due to a relative lack of formal planning most Pakistan cities tend to have
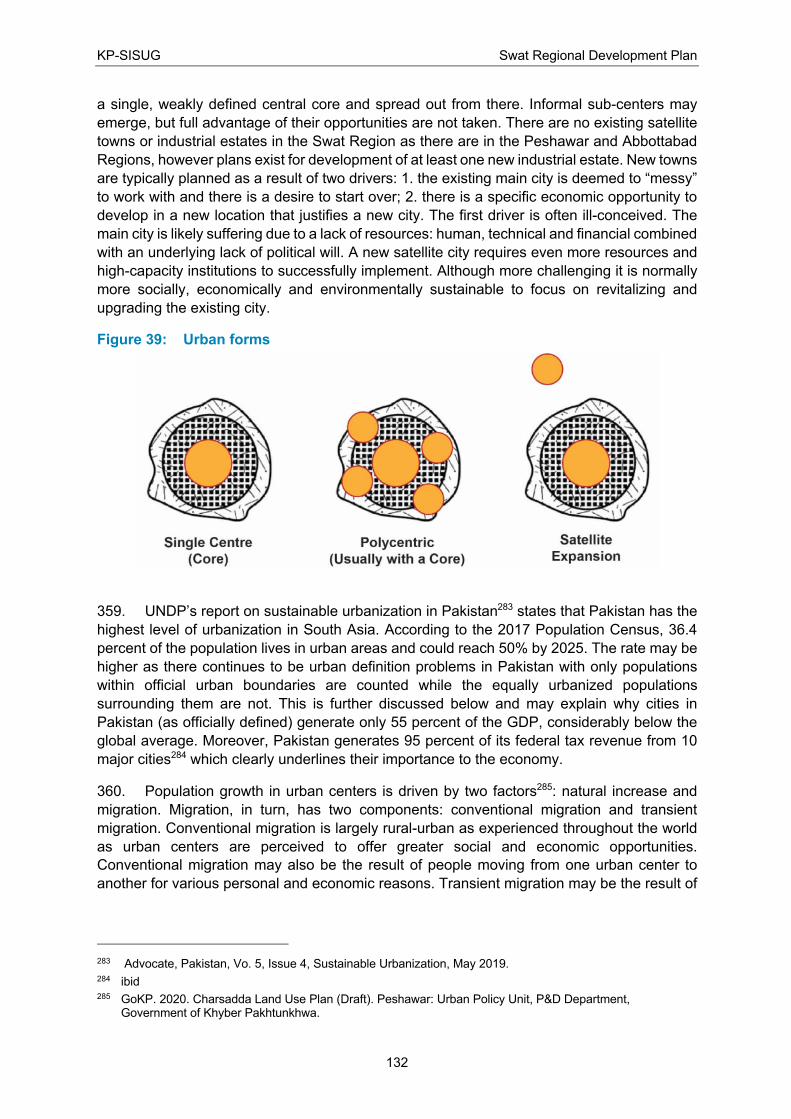
KP-SISUG Swat Regional Development Plan
132
a single, weakly defined central core and spread out from there. Informal sub-centers may
emerge, but full advantage of their opportunities are not taken. There are no existing satellite
towns or industrial estates in the Swat Region as there are in the Peshawar and Abbottabad
Regions, however plans exist for development of at least one new industrial estate. New towns
are typically planned as a result of two drivers: 1. the existing main city is deemed to “messy”
to work with and there is a desire to start over; 2. there is a specific economic opportunity to
develop in a new location that justifies a new city. The first driver is often ill-conceived. The
main city is likely suffering due to a lack of resources: human, technical and financial combined
with an underlying lack of political will. A new satellite city requires even more resources and
high-capacity institutions to successfully implement. Although more challenging it is normally
more socially, economically and environmentally sustainable to focus on revitalizing and
upgrading the existing city.
Figure 39: Urban forms
359. UNDP’s report on sustainable urbanization in Pakistan283 states that Pakistan has the
highest level of urbanization in South Asia. According to the 2017 Population Census, 36.4
percent of the population lives in urban areas and could reach 50% by 2025. The rate may be
higher as there continues to be urban definition problems in Pakistan with only populations
within official urban boundaries are counted while the equally urbanized populations
surrounding them are not. This is further discussed below and may explain why cities in
Pakistan (as officially defined) generate only 55 percent of the GDP, considerably below the
global average. Moreover, Pakistan generates 95 percent of its federal tax revenue from 10
major cities284 which clearly underlines their importance to the economy.
360. Population growth in urban centers is driven by two factors285: natural increase and
migration. Migration, in turn, has two components: conventional migration and transient
migration. Conventional migration is largely rural-urban as experienced throughout the world
as urban centers are perceived to offer greater social and economic opportunities.
Conventional migration may also be the result of people moving from one urban center to
another for various personal and economic reasons. Transient migration may be the result of
283 Advocate, Pakistan, Vo. 5, Issue 4, Sustainable Urbanization, May 2019. 284 ibid 285 GoKP. 2020. Charsadda Land Use Plan (Draft). Peshawar: Urban Policy Unit, P&D Department,
Government of Khyber Pakhtunkhwa.
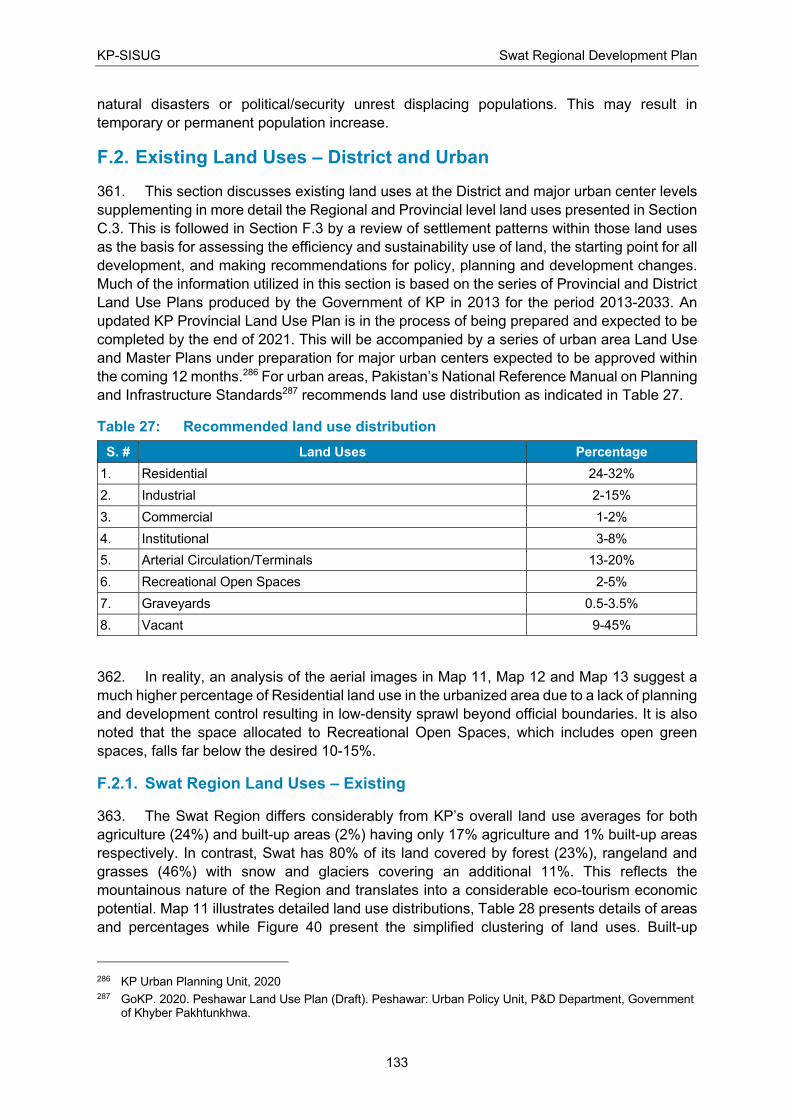
KP-SISUG Swat Regional Development Plan
133
natural disasters or political/security unrest displacing populations. This may result in
temporary or permanent population increase.
F.2. Existing Land Uses – District and Urban
361. This section discusses existing land uses at the District and major urban center levels
supplementing in more detail the Regional and Provincial level land uses presented in Section
C.3. This is followed in Section F.3 by a review of settlement patterns within those land uses
as the basis for assessing the efficiency and sustainability use of land, the starting point for all
development, and making recommendations for policy, planning and development changes.
Much of the information utilized in this section is based on the series of Provincial and District
Land Use Plans produced by the Government of KP in 2013 for the period 2013-2033. An
updated KP Provincial Land Use Plan is in the process of being prepared and expected to be
completed by the end of 2021. This will be accompanied by a series of urban area Land Use
and Master Plans under preparation for major urban centers expected to be approved within
the coming 12 months.286 For urban areas, Pakistan’s National Reference Manual on Planning
and Infrastructure Standards287 recommends land use distribution as indicated in Table 27.
Table 27: Recommended land use distribution
S. # Land Uses Percentage
1. Residential 24-32%
2. Industrial 2-15%
3. Commercial 1-2%
4. Institutional 3-8%
5. Arterial Circulation/Terminals 13-20%
6. Recreational Open Spaces 2-5%
7. Graveyards 0.5-3.5%
8. Vacant 9-45%
362. In reality, an analysis of the aerial images in Map 11, Map 12 and Map 13 suggest a
much higher percentage of Residential land use in the urbanized area due to a lack of planning
and development control resulting in low-density sprawl beyond official boundaries. It is also
noted that the space allocated to Recreational Open Spaces, which includes open green
spaces, falls far below the desired 10-15%.
F.2.1. Swat Region Land Uses – Existing
363. The Swat Region differs considerably from KP’s overall land use averages for both
agriculture (24%) and built-up areas (2%) having only 17% agriculture and 1% built-up areas
respectively. In contrast, Swat has 80% of its land covered by forest (23%), rangeland and
grasses (46%) with snow and glaciers covering an additional 11%. This reflects the
mountainous nature of the Region and translates into a considerable eco-tourism economic
potential. Map 11 illustrates detailed land use distributions, Table 28 presents details of areas
and percentages while Figure 40 present the simplified clustering of land uses. Built-up
286 KP Urban Planning Unit, 2020 287 GoKP. 2020. Peshawar Land Use Plan (Draft). Peshawar: Urban Policy Unit, P&D Department, Government
of Khyber Pakhtunkhwa.
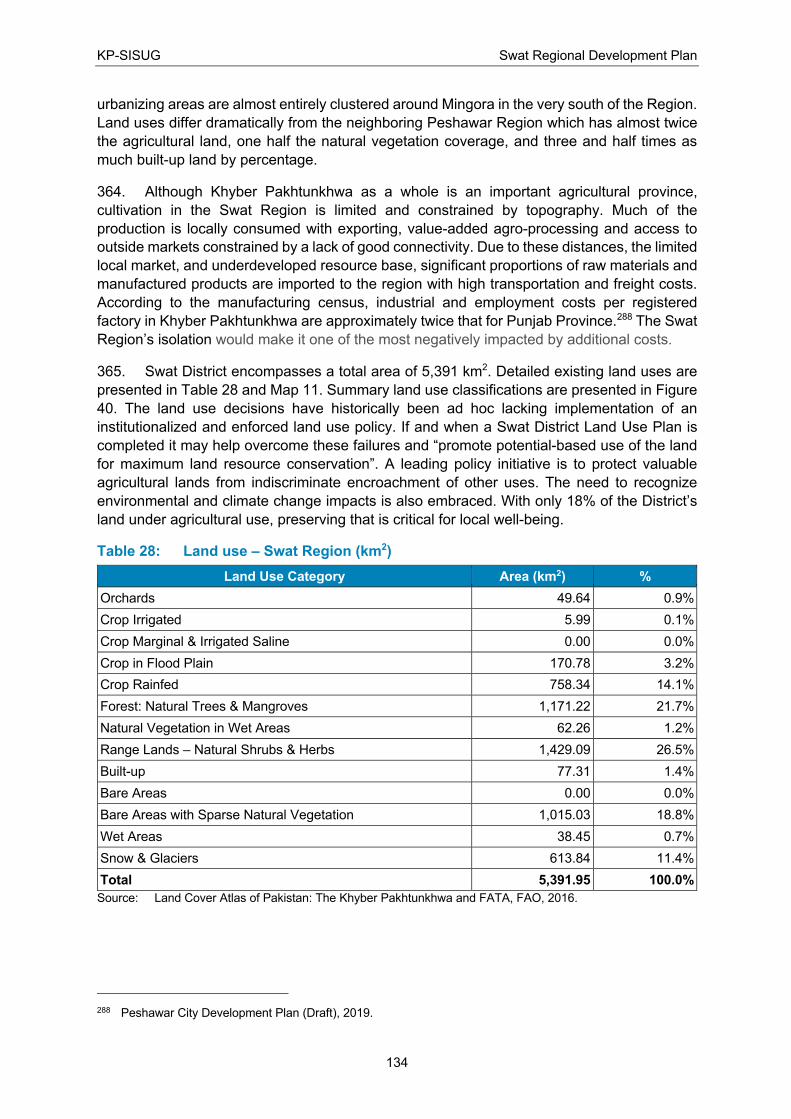
KP-SISUG Swat Regional Development Plan
134
urbanizing areas are almost entirely clustered around Mingora in the very south of the Region.
Land uses differ dramatically from the neighboring Peshawar Region which has almost twice
the agricultural land, one half the natural vegetation coverage, and three and half times as
much built-up land by percentage.
364. Although Khyber Pakhtunkhwa as a whole is an important agricultural province,
cultivation in the Swat Region is limited and constrained by topography. Much of the
production is locally consumed with exporting, value-added agro-processing and access to
outside markets constrained by a lack of good connectivity. Due to these distances, the limited
local market, and underdeveloped resource base, significant proportions of raw materials and
manufactured products are imported to the region with high transportation and freight costs.
According to the manufacturing census, industrial and employment costs per registered
factory in Khyber Pakhtunkhwa are approximately twice that for Punjab Province.288 The Swat
Region’s isolation would make it one of the most negatively impacted by additional costs.
365. Swat District encompasses a total area of 5,391 km2. Detailed existing land uses are
presented in Table 28 and Map 11. Summary land use classifications are presented in Figure
40. The land use decisions have historically been ad hoc lacking implementation of an
institutionalized and enforced land use policy. If and when a Swat District Land Use Plan is
completed it may help overcome these failures and “promote potential-based use of the land
for maximum land resource conservation”. A leading policy initiative is to protect valuable
agricultural lands from indiscriminate encroachment of other uses. The need to recognize
environmental and climate change impacts is also embraced. With only 18% of the District’s
land under agricultural use, preserving that is critical for local well-being.
Table 28: Land use – Swat Region (km2)
Land Use Category Area (km2) %
Orchards 49.64 0.9%
Crop Irrigated 5.99 0.1%
Crop Marginal & Irrigated Saline 0.00 0.0%
Crop in Flood Plain 170.78 3.2%
Crop Rainfed 758.34 14.1%
Forest: Natural Trees & Mangroves 1,171.22 21.7%
Natural Vegetation in Wet Areas 62.26 1.2%
Range Lands – Natural Shrubs & Herbs 1,429.09 26.5%
Built-up 77.31 1.4%
Bare Areas 0.00 0.0%
Bare Areas with Sparse Natural Vegetation 1,015.03 18.8%
Wet Areas 38.45 0.7%
Snow & Glaciers 613.84 11.4%
Total 5,391.95 100.0%
Source: Land Cover Atlas of Pakistan: The Khyber Pakhtunkhwa and FATA, FAO, 2016.
288 Peshawar City Development Plan (Draft), 2019.

KP-SISUG Swat Regional Development Plan
135
Map 11: Land uses – Swat Region
Source: Land Cover Atlas of Pakistan: The Khyber Pakhtunkhwa and FATA, FAO, 2016.
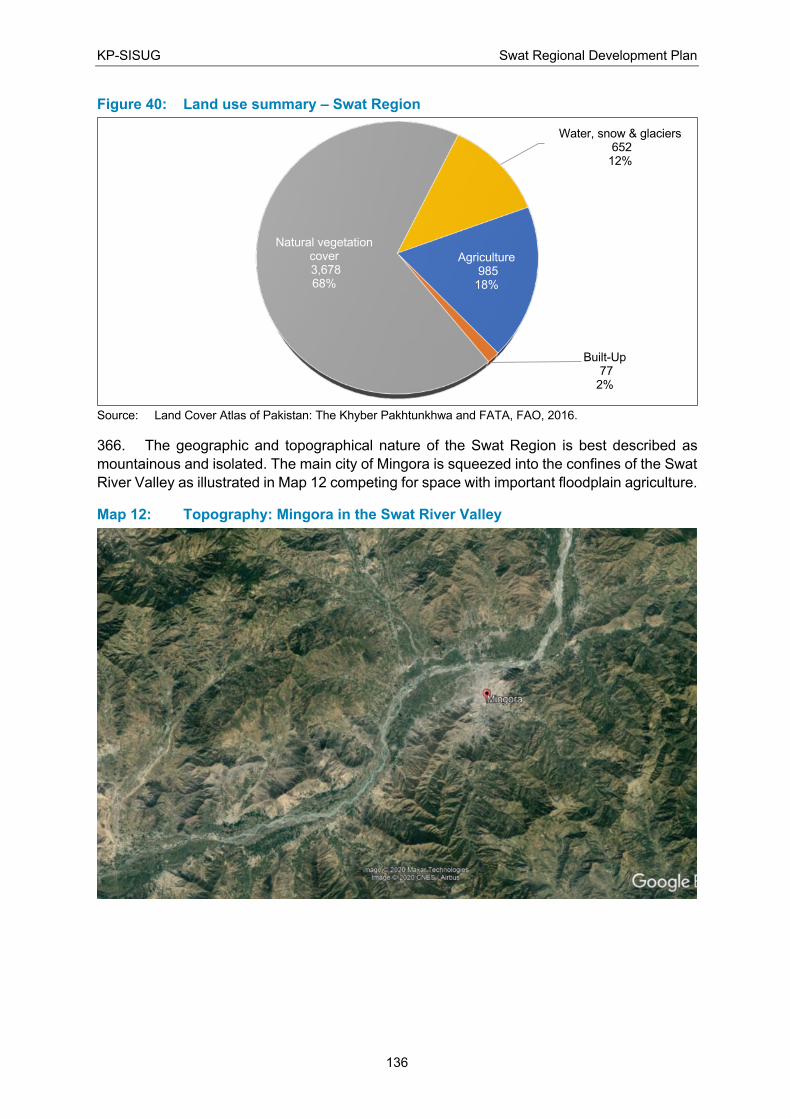
KP-SISUG Swat Regional Development Plan
136
Figure 40: Land use summary – Swat Region
Source: Land Cover Atlas of Pakistan: The Khyber Pakhtunkhwa and FATA, FAO, 2016.
366. The geographic and topographical nature of the Swat Region is best described as
mountainous and isolated. The main city of Mingora is squeezed into the confines of the Swat
River Valley as illustrated in Map 12 competing for space with important floodplain agriculture.
Map 12: Topography: Mingora in the Swat River Valley
Agriculture985
18%
Built-Up77
2%
Natural vegetation cover3,678 68%
Water, snow & glaciers652
12%
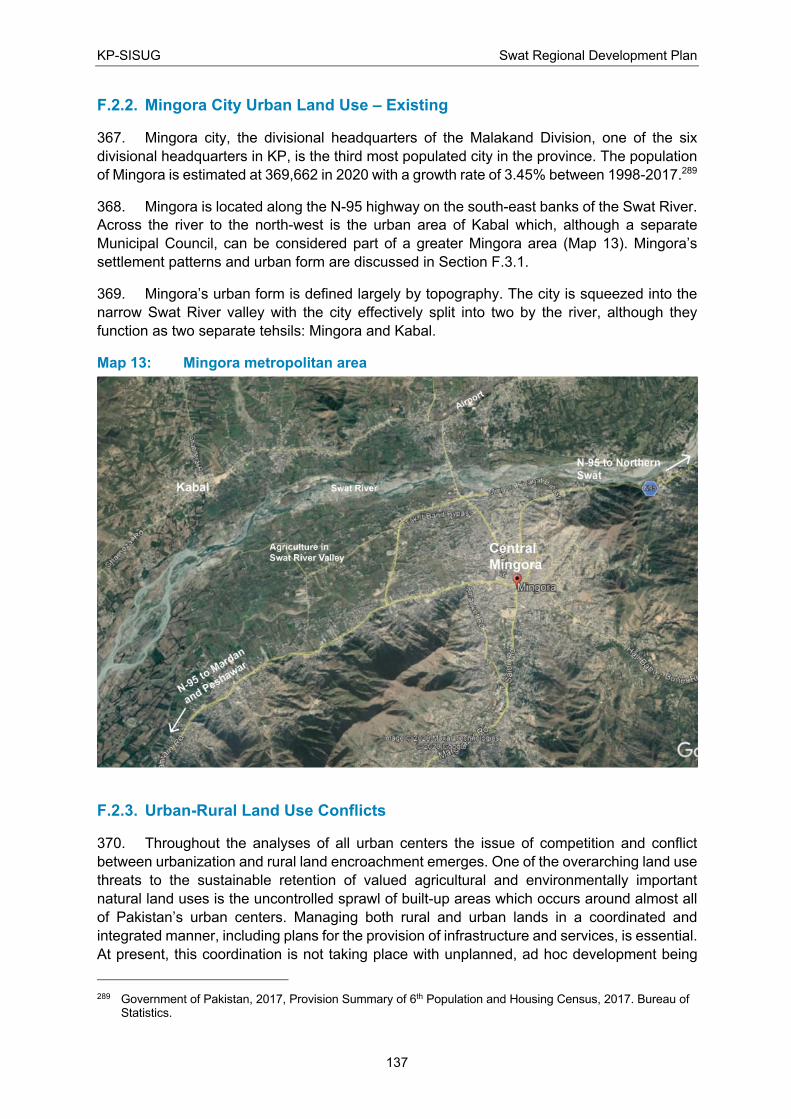
KP-SISUG Swat Regional Development Plan
137
F.2.2. Mingora City Urban Land Use – Existing
367. Mingora city, the divisional headquarters of the Malakand Division, one of the six
divisional headquarters in KP, is the third most populated city in the province. The population
of Mingora is estimated at 369,662 in 2020 with a growth rate of 3.45% between 1998-2017.289
368. Mingora is located along the N-95 highway on the south-east banks of the Swat River.
Across the river to the north-west is the urban area of Kabal which, although a separate
Municipal Council, can be considered part of a greater Mingora area (Map 13). Mingora’s
settlement patterns and urban form are discussed in Section F.3.1.
369. Mingora’s urban form is defined largely by topography. The city is squeezed into the
narrow Swat River valley with the city effectively split into two by the river, although they
function as two separate tehsils: Mingora and Kabal.
Map 13: Mingora metropolitan area
F.2.3. Urban-Rural Land Use Conflicts
370. Throughout the analyses of all urban centers the issue of competition and conflict
between urbanization and rural land encroachment emerges. One of the overarching land use
threats to the sustainable retention of valued agricultural and environmentally important
natural land uses is the uncontrolled sprawl of built-up areas which occurs around almost all
of Pakistan’s urban centers. Managing both rural and urban lands in a coordinated and
integrated manner, including plans for the provision of infrastructure and services, is essential.
At present, this coordination is not taking place with unplanned, ad hoc development being
289 Government of Pakistan, 2017, Provision Summary of 6th Population and Housing Census, 2017. Bureau of
Statistics.
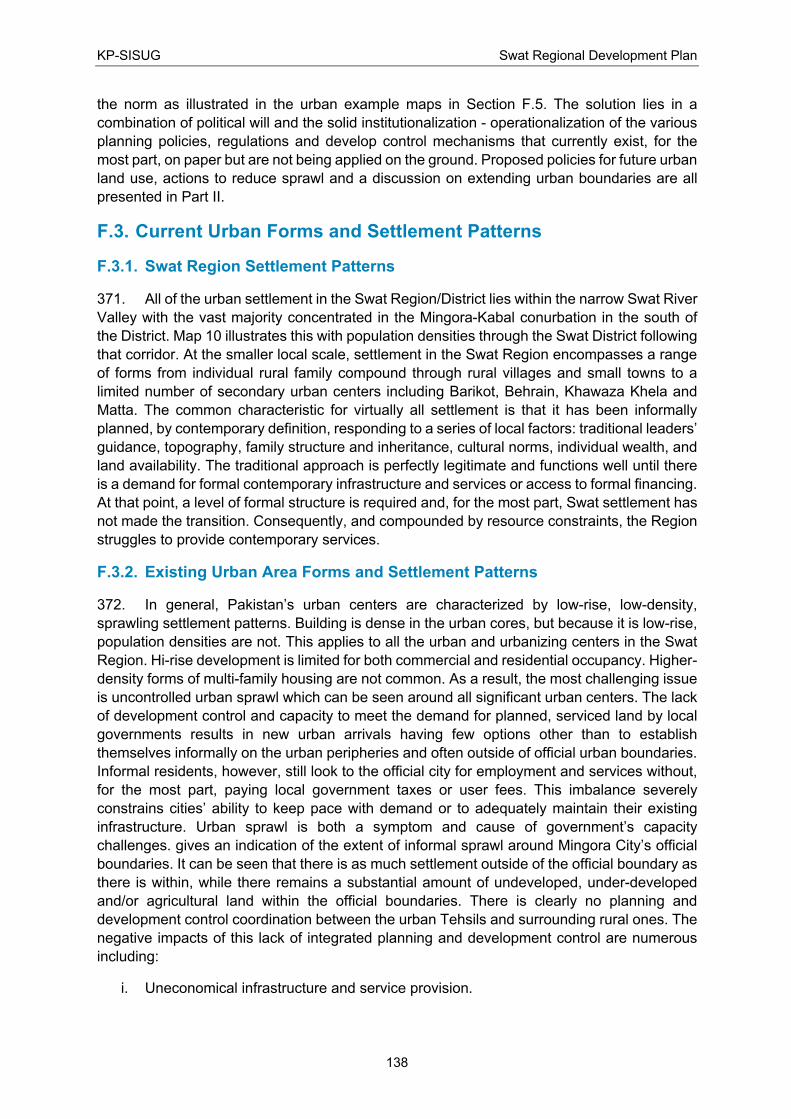
KP-SISUG Swat Regional Development Plan
138
the norm as illustrated in the urban example maps in Section F.5. The solution lies in a
combination of political will and the solid institutionalization - operationalization of the various
planning policies, regulations and develop control mechanisms that currently exist, for the
most part, on paper but are not being applied on the ground. Proposed policies for future urban
land use, actions to reduce sprawl and a discussion on extending urban boundaries are all
presented in Part II.
F.3. Current Urban Forms and Settlement Patterns
F.3.1. Swat Region Settlement Patterns
371. All of the urban settlement in the Swat Region/District lies within the narrow Swat River
Valley with the vast majority concentrated in the Mingora-Kabal conurbation in the south of
the District. Map 10 illustrates this with population densities through the Swat District following
that corridor. At the smaller local scale, settlement in the Swat Region encompasses a range
of forms from individual rural family compound through rural villages and small towns to a
limited number of secondary urban centers including Barikot, Behrain, Khawaza Khela and
Matta. The common characteristic for virtually all settlement is that it has been informally
planned, by contemporary definition, responding to a series of local factors: traditional leaders’
guidance, topography, family structure and inheritance, cultural norms, individual wealth, and
land availability. The traditional approach is perfectly legitimate and functions well until there
is a demand for formal contemporary infrastructure and services or access to formal financing.
At that point, a level of formal structure is required and, for the most part, Swat settlement has
not made the transition. Consequently, and compounded by resource constraints, the Region
struggles to provide contemporary services.
F.3.2. Existing Urban Area Forms and Settlement Patterns
372. In general, Pakistan’s urban centers are characterized by low-rise, low-density,
sprawling settlement patterns. Building is dense in the urban cores, but because it is low-rise,
population densities are not. This applies to all the urban and urbanizing centers in the Swat
Region. Hi-rise development is limited for both commercial and residential occupancy. Higher-
density forms of multi-family housing are not common. As a result, the most challenging issue
is uncontrolled urban sprawl which can be seen around all significant urban centers. The lack
of development control and capacity to meet the demand for planned, serviced land by local
governments results in new urban arrivals having few options other than to establish
themselves informally on the urban peripheries and often outside of official urban boundaries.
Informal residents, however, still look to the official city for employment and services without,
for the most part, paying local government taxes or user fees. This imbalance severely
constrains cities’ ability to keep pace with demand or to adequately maintain their existing
infrastructure. Urban sprawl is both a symptom and cause of government’s capacity
challenges. gives an indication of the extent of informal sprawl around Mingora City’s official
boundaries. It can be seen that there is as much settlement outside of the official boundary as
there is within, while there remains a substantial amount of undeveloped, under-developed
and/or agricultural land within the official boundaries. There is clearly no planning and
development control coordination between the urban Tehsils and surrounding rural ones. The
negative impacts of this lack of integrated planning and development control are numerous
including:
i. Uneconomical infrastructure and service provision.
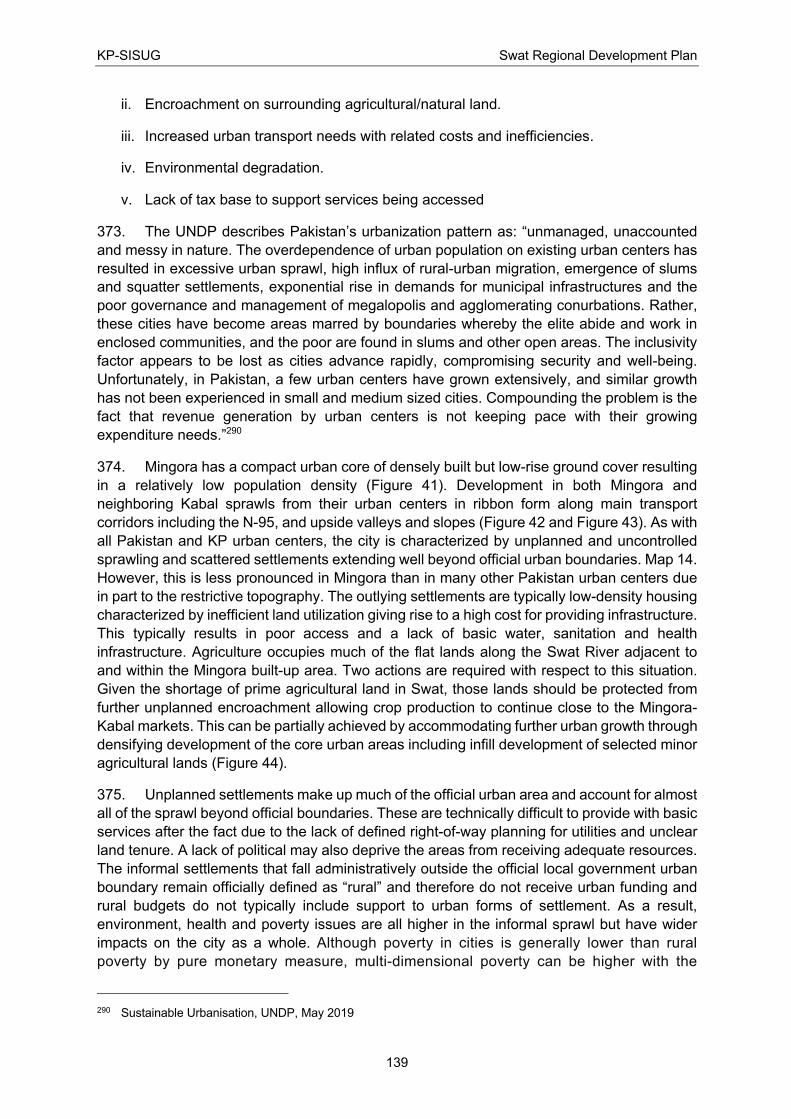
KP-SISUG Swat Regional Development Plan
139
ii. Encroachment on surrounding agricultural/natural land.
iii. Increased urban transport needs with related costs and inefficiencies.
iv. Environmental degradation.
v. Lack of tax base to support services being accessed
373. The UNDP describes Pakistan’s urbanization pattern as: “unmanaged, unaccounted
and messy in nature. The overdependence of urban population on existing urban centers has
resulted in excessive urban sprawl, high influx of rural-urban migration, emergence of slums
and squatter settlements, exponential rise in demands for municipal infrastructures and the
poor governance and management of megalopolis and agglomerating conurbations. Rather,
these cities have become areas marred by boundaries whereby the elite abide and work in
enclosed communities, and the poor are found in slums and other open areas. The inclusivity
factor appears to be lost as cities advance rapidly, compromising security and well-being.
Unfortunately, in Pakistan, a few urban centers have grown extensively, and similar growth
has not been experienced in small and medium sized cities. Compounding the problem is the
fact that revenue generation by urban centers is not keeping pace with their growing
expenditure needs.”290
374. Mingora has a compact urban core of densely built but low-rise ground cover resulting
in a relatively low population density (Figure 41). Development in both Mingora and
neighboring Kabal sprawls from their urban centers in ribbon form along main transport
corridors including the N-95, and upside valleys and slopes (Figure 42 and Figure 43). As with
all Pakistan and KP urban centers, the city is characterized by unplanned and uncontrolled
sprawling and scattered settlements extending well beyond official urban boundaries. Map 14.
However, this is less pronounced in Mingora than in many other Pakistan urban centers due
in part to the restrictive topography. The outlying settlements are typically low-density housing
characterized by inefficient land utilization giving rise to a high cost for providing infrastructure.
This typically results in poor access and a lack of basic water, sanitation and health
infrastructure. Agriculture occupies much of the flat lands along the Swat River adjacent to
and within the Mingora built-up area. Two actions are required with respect to this situation.
Given the shortage of prime agricultural land in Swat, those lands should be protected from
further unplanned encroachment allowing crop production to continue close to the Mingora-
Kabal markets. This can be partially achieved by accommodating further urban growth through
densifying development of the core urban areas including infill development of selected minor
agricultural lands (Figure 44).
375. Unplanned settlements make up much of the official urban area and account for almost
all of the sprawl beyond official boundaries. These are technically difficult to provide with basic
services after the fact due to the lack of defined right-of-way planning for utilities and unclear
land tenure. A lack of political may also deprive the areas from receiving adequate resources.
The informal settlements that fall administratively outside the official local government urban
boundary remain officially defined as “rural” and therefore do not receive urban funding and
rural budgets do not typically include support to urban forms of settlement. As a result,
environment, health and poverty issues are all higher in the informal sprawl but have wider
impacts on the city as a whole. Although poverty in cities is generally lower than rural
poverty by pure monetary measure, multi-dimensional poverty can be higher with the
290 Sustainable Urbanisation, UNDP, May 2019
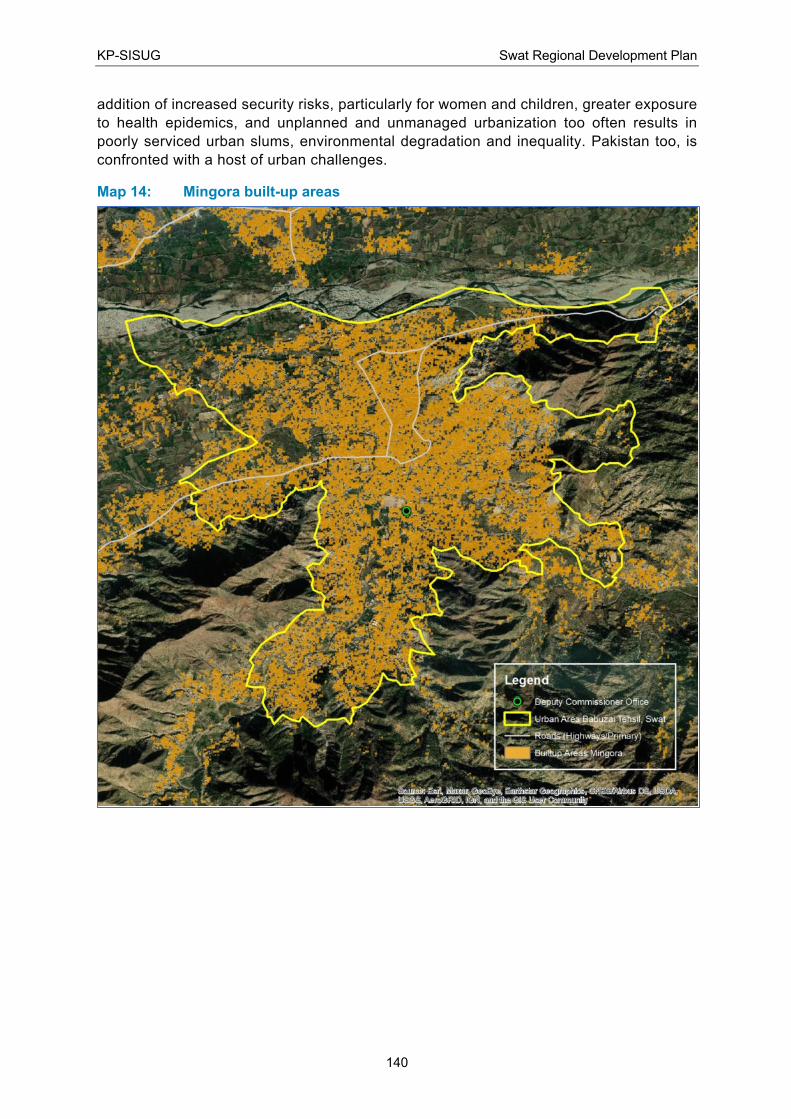
KP-SISUG Swat Regional Development Plan
140
addition of increased security risks, particularly for women and children, greater exposure
to health epidemics, and unplanned and unmanaged urbanization too often results in
poorly serviced urban slums, environmental degradation and inequality. Pakistan too, is
confronted with a host of urban challenges.
Map 14: Mingora built-up areas
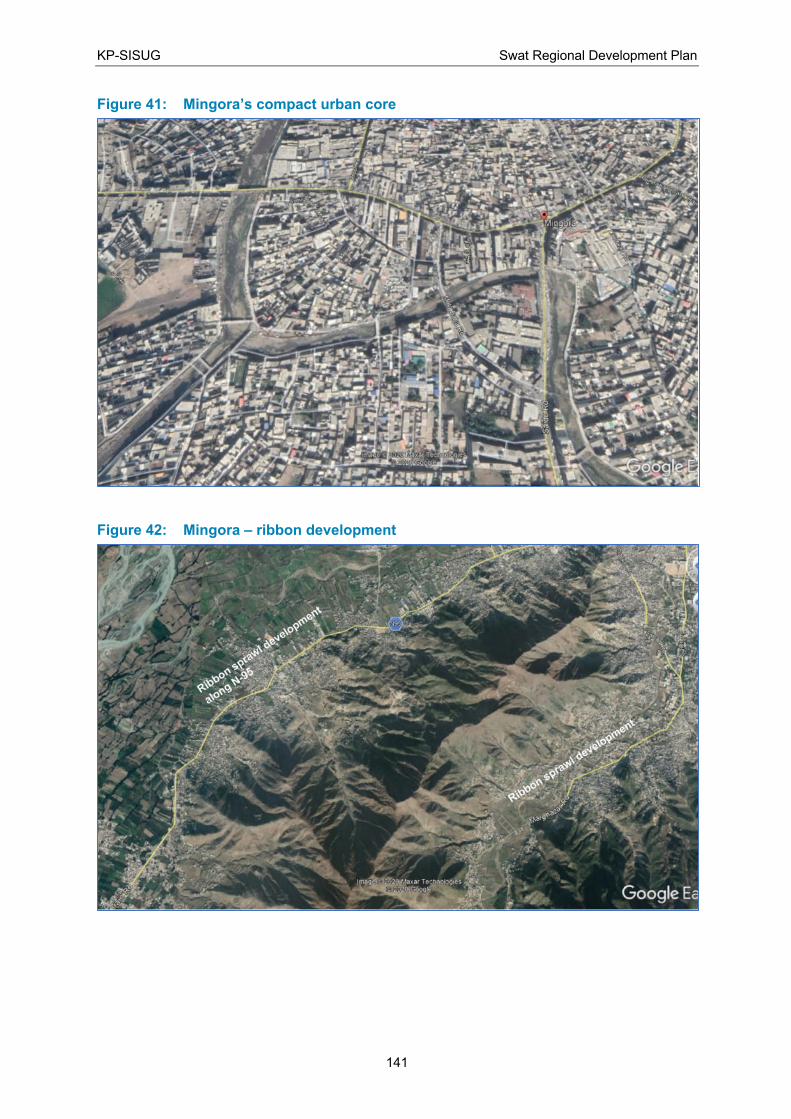
KP-SISUG Swat Regional Development Plan
141
Figure 41: Mingora’s compact urban core
Figure 42: Mingora – ribbon development
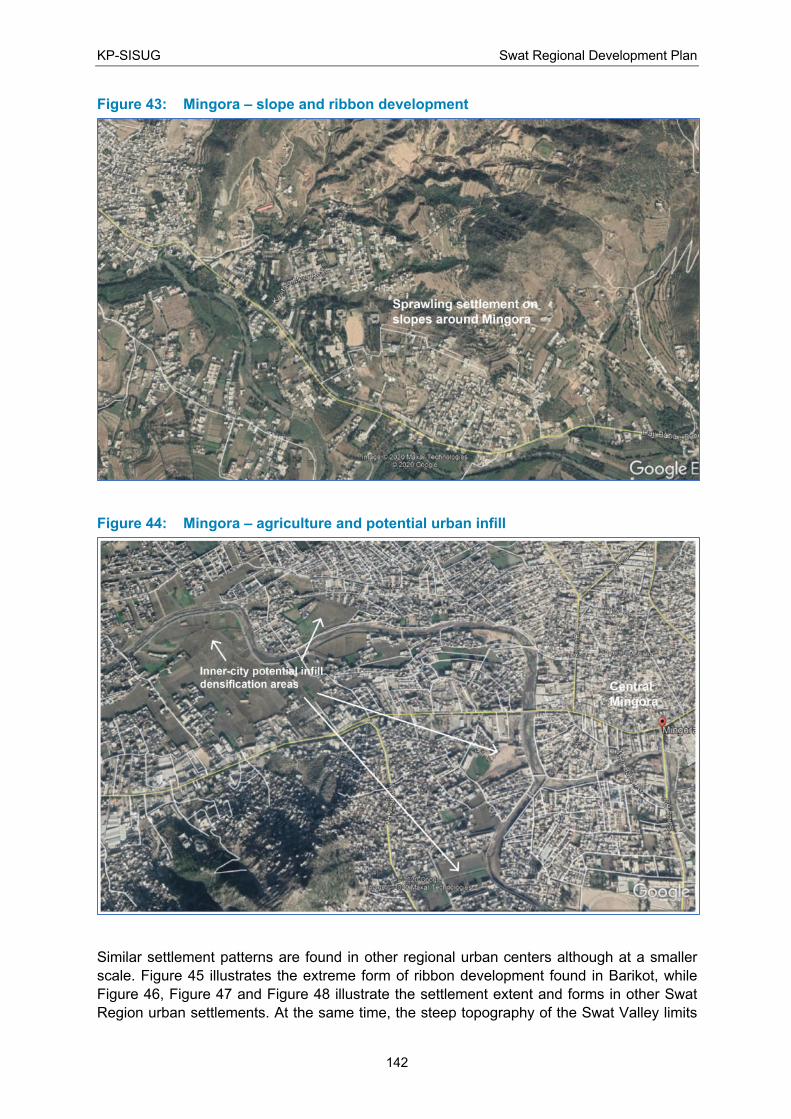
KP-SISUG Swat Regional Development Plan
142
Figure 43: Mingora – slope and ribbon development
Figure 44: Mingora – agriculture and potential urban infill
Similar settlement patterns are found in other regional urban centers although at a smaller
scale. Figure 45 illustrates the extreme form of ribbon development found in Barikot, while
Figure 46, Figure 47 and Figure 48 illustrate the settlement extent and forms in other Swat
Region urban settlements. At the same time, the steep topography of the Swat Valley limits

KP-SISUG Swat Regional Development Plan
143
urban expansion, with the limited exception of Khwaza Khela and Matta, to ribbons following
drainage courses and some developable ridges. The resulting sprawl is the common concern
and opportunities and processes to reduce sprawl are discussed in Section F.3.3. Throughout,
urban expansion is in direct competition with the Region’s very limited agricultural lands that
require the same level topography. The actions suggested above for preserving prime
agricultural land adjacent to Mingora apply equally to all other Swat urban centers.
Figure 45: Barikot settlement form
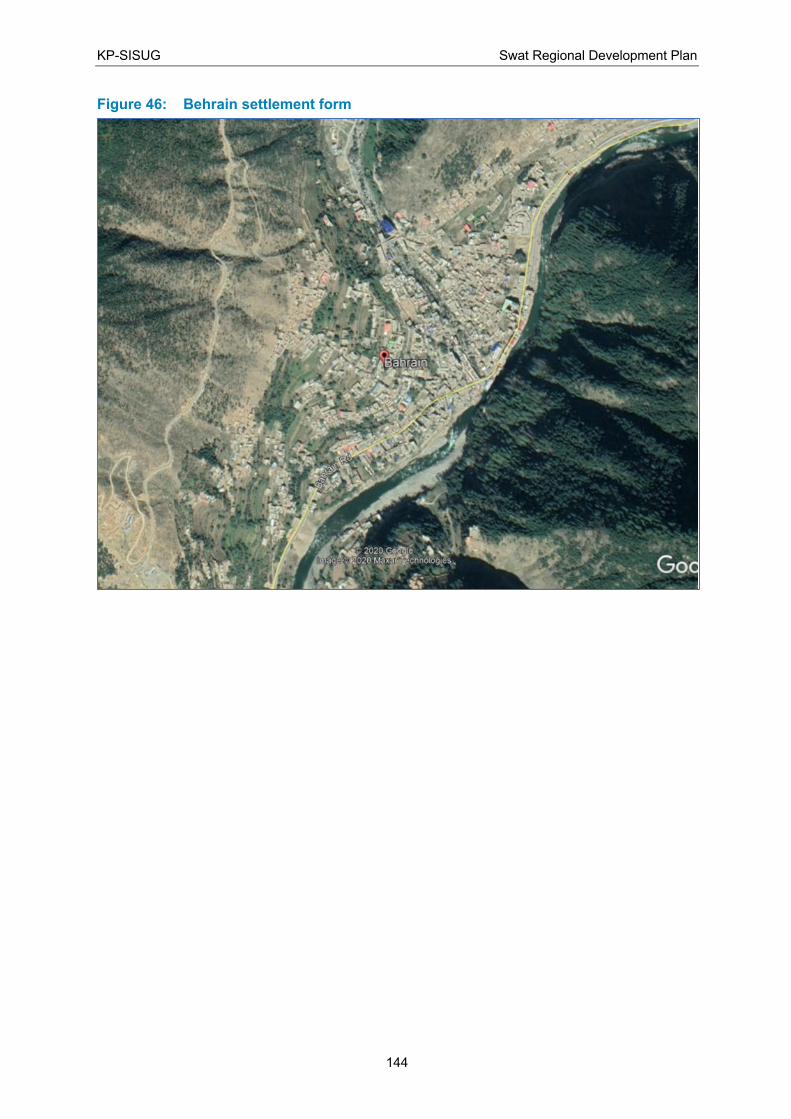
KP-SISUG Swat Regional Development Plan
144
Figure 46: Behrain settlement form
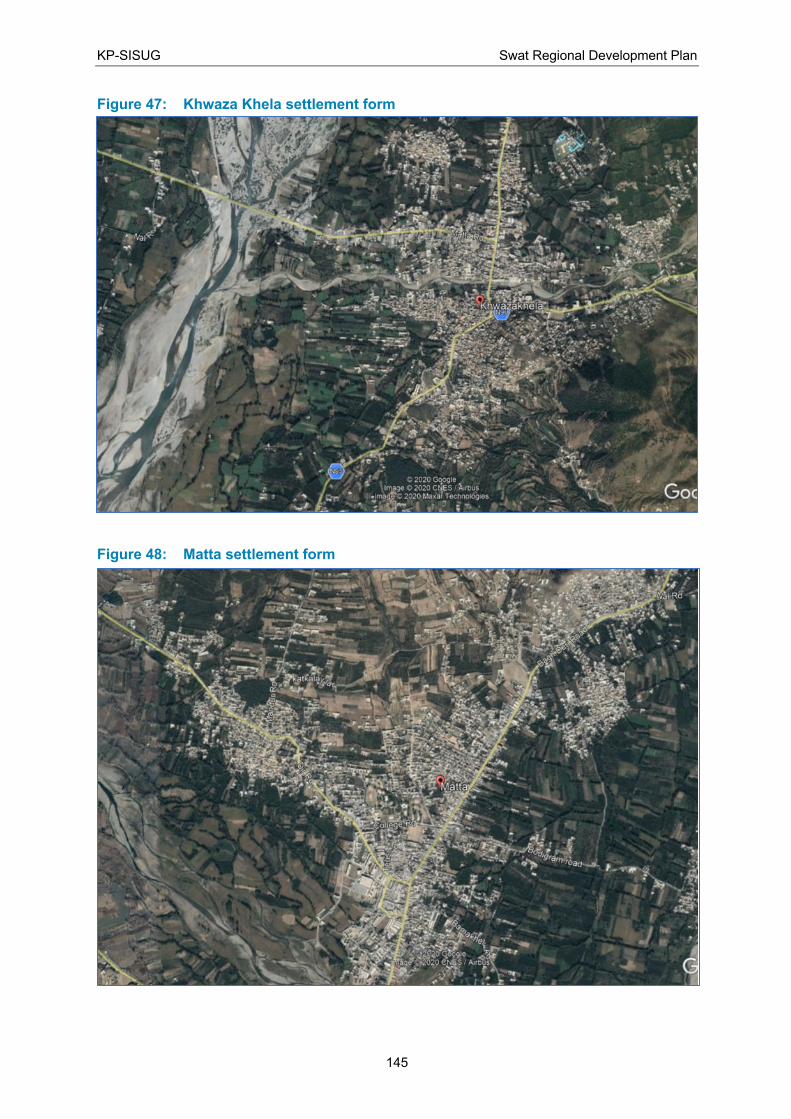
KP-SISUG Swat Regional Development Plan
145
Figure 47: Khwaza Khela settlement form
Figure 48: Matta settlement form
KP-SISUG Swat Regional Development Plan
146
376. All official urban areas and unofficial expansions include significant portions of
agricultural land. It is always prudent to plan for future urban expansion, but the danger with
incorporating too much agricultural land while the existing built-up urban areas remain
relatively low-density is the tendency to simply continue expanding unsustainably at low
density rather than promoting densification of the existing built-up areas. Agricultural lands are
unnecessarily lost, and provision of infrastructure and services becomes too expensive.
F.3.3. Urban Densities
377. Urban population density is one of the key criteria affecting both urban sustainable and
that of their surrounding regions. As introduced above, population density is directly
proportional to infrastructure per capita costs. The higher the density, the lower the per capita
infrastructure cost. Higher density also means less travel time, cost and GHG emissions
between live, work, play and shop destinations. At the same time, higher urban density,
reduces the need to expand into adjacent agricultural or environmentally valued surrounding
lands. By global standards, Pakistan’s cities are generally low-density. Settlement culture
historically favors low-rise living and when combined with weak institutional development
control capacities, the result is extensive uncontrolled urban sprawl around most major and
secondary urban centers. A primary recommendation in the United Nations New Urban
Agenda is the promotion of compact, dense urban centers as a key to sustainability. Other
causes of urban sprawl include:
• Poor coordination and land use management among different institutions and agencies
in Swat. Urban infrastructure and services are planned and implemented based on
compartmentalized jurisdictional areas among the City District Government, Town
Management Administrations (TMAs), Development Authorities, Cantonment Boards
and Defense Housing Authorities. This leads to a significant degree of fragmentation
in planning and development and wastage of resources.
• Inconsistent application of policies and planning schemes in implementing city
expansion.
• Inadequate technical and organizational capacities to keep pace with and respond to
population pressures and the consequent demand for new housing and services.
378. Urban cores in KP’s cities are particularly low-density by global norms and remain with
significant potential for rejuvenation, redevelopment and densification thereby reducing the
need to continually expand outwards while theoretically increasing tax revenues from the most
valuable inner-city lands.
379. Urban sprawl increases per capita road and utility line (water, sewage, power, etc.),
and the travel distances required for live-work commuting and to provide public services
(garbage collection, policing and emergency response). These all increase the cost of
infrastructure, road network and greenhouse gas emissions from additional travel. Cities with
less than 5,000 persons/km2 have nearly three times the roadway area per capita compared
to denser cities with more than 10,000 persons/km2.
380. Insufficient integration between investment plans and a long-term planning vision
based on institutional realities and service delivery mapping. A primary recommendation in
the United Nations New Urban Agenda is the promotion of compact, dense urban centers as
a key to sustainability.
KP-SISUG Swat Regional Development Plan
147
381. Mingora Urban Density: Based on an estimated 2020 population of 369,662291 and
an official urban area of 22.2 km2, Mingora’s urban UC’s have an average density of 16,651
per/km2. This is slightly above the UN’s recommendation for a sustainable density of 15,000
per/km2 with a more desirable core density of 25-50,000 per/km2 or higher. This compares to
Abbottabad’s urban density of only 6,465 per/km2 and Peshawar’s urban density of 14,000
per/km2. The higher density in Mingora is likely the result of expansion constraints imposed by
the topography. By comparison it is only one half of Karachi’s urban density. Comparisons to
other cities are difficult given the wide range of urban boundary definitions between cities, but
some comparative urban core examples are Mumbai at 121,000 per/km2, and Shanghai and
Istanbul at about 76,000 per/km2. Cultural and perceived land-availability differences also, of
course, contribute to how cities develop. What is clear is that there is considerable scope to
double or triple the current density of urban Mingora thereby contributing significantly to more
sustainable land use, both within and surrounding the city, reduced urban sprawl, more
economically viable infrastructure, including transportation, and significant contributions to
climate change mitigation and adaptation, and other environmental sustainability actions. How
to achieve sustainable densification within the KP context is discussed in Section F.5.
F.3.4. District Hierarchy
382. District Hierarchy: The Government of KP has established a methodology and
structure for determining settlement hierarchies as a basis for assessing development
priorities, opportunities and potential clustering and linkages. This can be applied at the District
or urban center levels. To date, an analysis of the Swat District has not been completed, but
factors that are considered include:
• Number of universities.
• Number of hospitals.
• Area under major commercial centers.
• Length of roads per sq. km of district area.
• Number of hotels.
• District population.
• Availability of:
o Airport
o Dry Port
o Export Processing Zone
291 Source: Government of Pakistan, 2017, Provision Summary of 6th Population and Housing Census, 2017.
Bureau of Statistics.
KP-SISUG Swat Regional Development Plan
148
F.3.5. Settlement Hierarchy
383. The Government of KP in its various draft Land Use Plans of 2020 identifies a number
of objectives in officially recognizing and supporting settlement hierarchies with their social,
economic and physical linkages. Objectives include:
• Improving Accessibility – locating development where everyone can access services
or facilities on foot, bicycle or public transport rather than having to rely on access by
car. It is recognized that this may present challenges in rural areas.
• Delivering Sustainable Patterns of Development – focusing development on locations
which offer a range of community facilities, services, jobs, and infrastructure. This will
direct development to towns and smaller centers within rural areas.
• Ensuring Continued Service Viability – Directing development to areas where services
are economically viable to deliver.
• Accounting for Economic Change – Defining a hierarchy that is resilient to anticipated
future economic changes and able to meet the needs of their catchments.
• Promoting Vibrant Communities – Raising the quality of life of residents and the
environment by promoting thriving, inclusive and locally distinctive communities.
• Tackling Climate Change – Reducing the need to travel by creating self-sustaining
settlements where the needs of the community for jobs, housing, facilities and services
are provided for.
384. The typical radiating, distance-based settlement hierarchy structure is illustrated in
Figure 49. As a region develops more sophisticated ICT networks, the hierarchical structure
may adjust by skipping some levels resulting in a network structure as illustrated in Figure 50.
The Swat settlement hierarchy remains largely a distance-based structure although very much
linear rather than radial given the Region’s topography.

KP-SISUG Swat Regional Development Plan
149
Figure 49: Settlement hierarchy – radial distance structure
Figure 50: Settlement hierarchy – networking structure
Source: GoKP. 2020. Abbottabad Land Use Plan (Draft). Peshawar: Urban Policy Unit, P&D Department,
Government of Khyber Pakhtunkhwa.
385. Mingora is by far the dominant urban center in the Swat Region with the District’s major
governance, educational and health facilities, and the core of regional goods and services
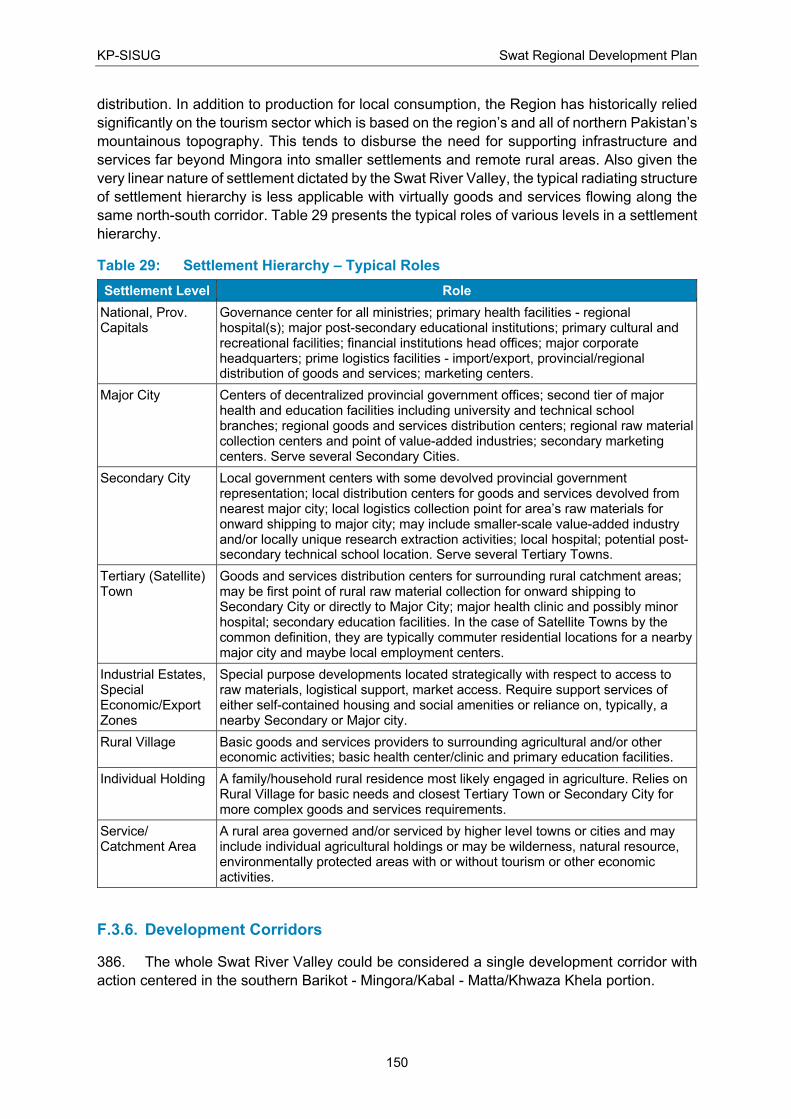
KP-SISUG Swat Regional Development Plan
150
distribution. In addition to production for local consumption, the Region has historically relied
significantly on the tourism sector which is based on the region’s and all of northern Pakistan’s
mountainous topography. This tends to disburse the need for supporting infrastructure and
services far beyond Mingora into smaller settlements and remote rural areas. Also given the
very linear nature of settlement dictated by the Swat River Valley, the typical radiating structure
of settlement hierarchy is less applicable with virtually goods and services flowing along the
same north-south corridor. Table 29 presents the typical roles of various levels in a settlement
hierarchy.
Table 29: Settlement Hierarchy – Typical Roles
Settlement Level Role
National, Prov. Capitals
Governance center for all ministries; primary health facilities - regional hospital(s); major post-secondary educational institutions; primary cultural and recreational facilities; financial institutions head offices; major corporate headquarters; prime logistics facilities - import/export, provincial/regional distribution of goods and services; marketing centers.
Major City Centers of decentralized provincial government offices; second tier of major health and education facilities including university and technical school branches; regional goods and services distribution centers; regional raw material collection centers and point of value-added industries; secondary marketing centers. Serve several Secondary Cities.
Secondary City Local government centers with some devolved provincial government representation; local distribution centers for goods and services devolved from nearest major city; local logistics collection point for area’s raw materials for onward shipping to major city; may include smaller-scale value-added industry and/or locally unique research extraction activities; local hospital; potential post-secondary technical school location. Serve several Tertiary Towns.
Tertiary (Satellite) Town
Goods and services distribution centers for surrounding rural catchment areas; may be first point of rural raw material collection for onward shipping to Secondary City or directly to Major City; major health clinic and possibly minor hospital; secondary education facilities. In the case of Satellite Towns by the common definition, they are typically commuter residential locations for a nearby major city and maybe local employment centers.
Industrial Estates, Special Economic/Export Zones
Special purpose developments located strategically with respect to access to raw materials, logistical support, market access. Require support services of either self-contained housing and social amenities or reliance on, typically, a nearby Secondary or Major city.
Rural Village Basic goods and services providers to surrounding agricultural and/or other economic activities; basic health center/clinic and primary education facilities.
Individual Holding A family/household rural residence most likely engaged in agriculture. Relies on Rural Village for basic needs and closest Tertiary Town or Secondary City for more complex goods and services requirements.
Service/ Catchment Area
A rural area governed and/or serviced by higher level towns or cities and may include individual agricultural holdings or may be wilderness, natural resource, environmentally protected areas with or without tourism or other economic activities.
F.3.6. Development Corridors
386. The whole Swat River Valley could be considered a single development corridor with
action centered in the southern Barikot - Mingora/Kabal - Matta/Khwaza Khela portion.
KP-SISUG Swat Regional Development Plan
151
387. The growth pattern throughout Khyber Pakhtunkhwa suggests that future planning
should focus on the more holistic improvement of existing development corridors rather than
isolated settlements in order to build on the synergies and opportunities of different centers
through infrastructure development.292
388. Because of existing and potential economic activity, the corridors are particularly
attractive to inward migration, but in the absence of comprehensive planning, unplanned and
sprawling ribbon development occurs along these corridors extending urban centers and
generating smaller-scale, patchy development. Integrated planning and development control
is required in these areas to ensure the economic potential is realized and not undermined by
the inefficiencies of attempting to service ad hoc development and environmental degradation.
F.3.7. New Towns and Satellite Towns
389. Based on global experience, caution is urged prior to embarking upon the development
of new or satellite towns. As Regional cities expand, and congestion increases there is often
a call for new towns or satellite towns as a perceived solution to the problems facing the
existing cities. New towns can serve as positive development actions if there is sufficient
economic justification to warrant the large development expenses required in a specific new
location. However, committing to a new town should be done with caution. Several reasons
are given by governments for considering this route including wider distribution of development
initiatives, housing, employment and infrastructure. However, if the primary rationale is to
decongest existing cities and help limit continued unplanned urban sprawl around these larger
centers, caution is required. The first question to ask is the proposed new town development
supply-driven or demand-driven? Supply-driven is typically the result of political aspiration, an
expert’s concept and/or vested interests in the land ownership and development. Supply-
driven initiatives are typically relatively narrow in perspective not capturing the full complex
range of hard and soft factors that build a community. If it is supply-driven, it will likely fail. If is
truly a demand-driven opportunity such as to support an identified major resource extraction
with related processing and manufacturing, then it can be given further consideration. The
next caution is that if government does not have the resources to manage an existing town, it
is even less likely to have the resources required to build and manage an entirely new town
with all of the required land acquisition, new infrastructure, social and recreational amenities,
employment generators and incentives to attract the wide variety of micro, small and medium
private sector commercial investments to make the new town a vibrant, livable, competitive
and sustainable place. The congestion that is being escaped from is simply the result of a lack
of political will and resources: human, technical, financial. Cities do not function on physical
development alone; they need the social and economic vibrancy that only develops over time
as a result of real demand-supply processes.
390. Attempting to resettle the urban poor from inner-city to a remote new location can be
problematic and may well lead to a higher level of multi-dimensional poverty. People have
chosen to live where they do as they perceive it to be their best access to social and economic
opportunities. Communities develop complex social and economic networks and informal
safety nets over time upon which all rely. Disrupting this through resettlement significantly
increases vulnerability. Resources will not be available to replicate their well-being in a new
location. Relocation also deprives the remaining city of a substantial part of its workforce.
There is, however, strong rationale for redeveloping, densifying and revitalizing existing urban
292 GoKP. 2020. Peshawar Land Use Plan (Draft). Peshawar: Urban Policy Unit, P&D Department, Government
of Khyber Pakhtunkhwa.
KP-SISUG Swat Regional Development Plan
152
centers as discussed in several places in this report. That should be done but done with the
full participation and collaboration of the existing residents. Approaches for undertaking this
type of redevelopment are discussed in Section F.5. Cities must be inclusive and not
developed as exclusive enclaves for the wealthier.
391. Numerous regional and global examples exist of enthusiastic starts to new towns that
result only in an initial phase of infrastructure investment and a largely vacant housing estate
remote from social and economic amenities. The demand and required resources failed to
emerge.
392. In summary, the development of “New Towns” or “Satellite Towns” is not
recommended as they tend to be only single purpose housing estates developed for private
sector or political self-interest, promote urban sprawl into valued agricultural and/or
environmental lands and divert resources from the much more sustainable development,
redevelopment and densification of existing urban areas.
F.3.8. Industrial Estates, Dry Ports and Export Processing
393. There are none currently active, government-supported Industrial Estates (IE) in the
Swat Region. Numerous ones existed in the past but have closed with a loss of tax
advantages. Both SIDB and KPEZDMC have plans for new IEs in Swat. A new Special
Industrial Estate exists in Dargai in the adjacent Malakand District.
F.3.9. Growth Zones and Centers
394. The Swat Region has no known officially designated growth points although the urban
centers of Mingora and Kabal as primary growth points, along with Barikot, Khwaza Khela and
Behrain as secondary centers would be logical choices.
F.3.10. Green Belts
395. The Swat Region nor its urban centers have not designated any known official Green
Belts, although these can be recommended to limit sprawl, preserve agriculture and contribute
to the Region’s climate change adaptation and mitigation efforts.
F.3.11. Existing Planning and Challenges
396. At provincial level, the Planning & Development (P&D) Department has the mandate
for providing policy input for the Provincial and Sectoral Development Policies. It appraises all
development projects, coordinates, and adds value to the project proposals of all provincial
departments. The development of the Provincial Annual Development Program is one of the
key functions of this Department. Interaction with international partners is another focus of
P&D activities. Monitoring and evaluation of projects, interaction with Federal Level institutions
and long-term planning are all areas that are part of the Department’s duties. Preparation of
provincial statistics and planning for districts also lie within P&D mandate. The Department
also oversees the Government’s reform initiatives. P&D Department has undertaken the
strategic level planning, including the development of an Integrated Development Strategy, a
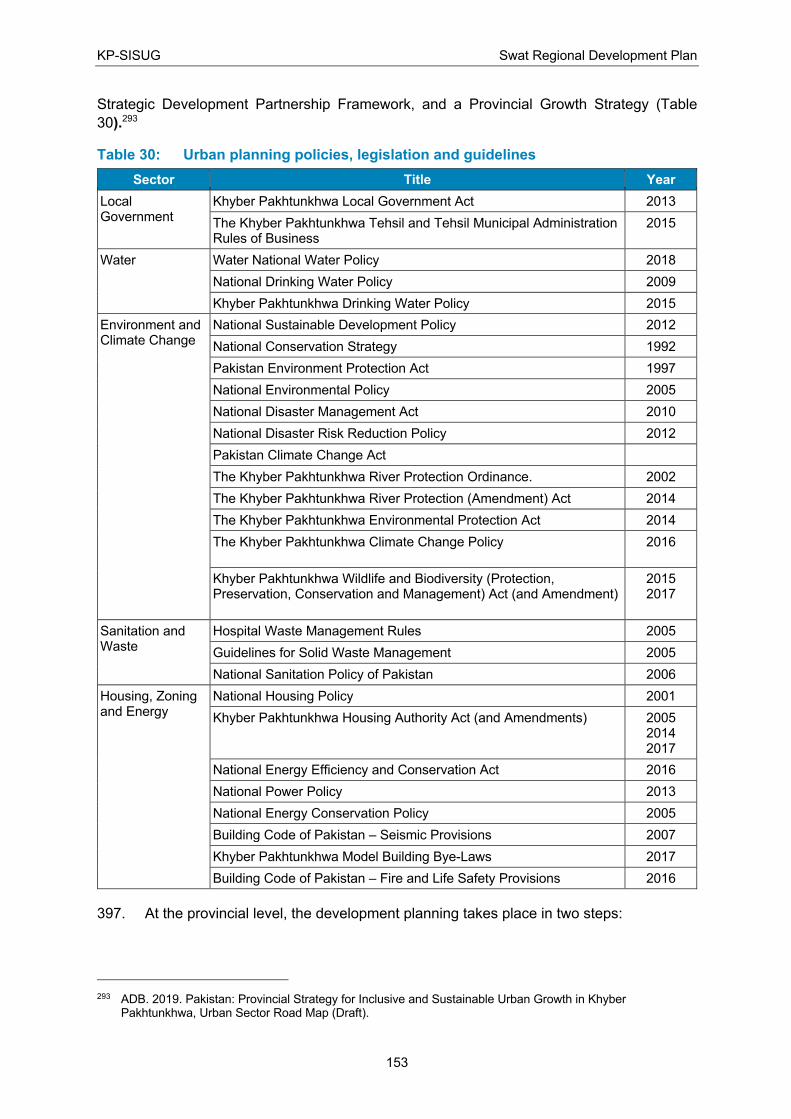
KP-SISUG Swat Regional Development Plan
153
Strategic Development Partnership Framework, and a Provincial Growth Strategy (Table
30).293
Table 30: Urban planning policies, legislation and guidelines
Sector Title Year
Local Government
Khyber Pakhtunkhwa Local Government Act 2013
The Khyber Pakhtunkhwa Tehsil and Tehsil Municipal Administration Rules of Business
2015
Water Water National Water Policy 2018
National Drinking Water Policy 2009
Khyber Pakhtunkhwa Drinking Water Policy 2015
Environment and Climate Change
National Sustainable Development Policy 2012
National Conservation Strategy 1992
Pakistan Environment Protection Act 1997
National Environmental Policy 2005
National Disaster Management Act 2010
National Disaster Risk Reduction Policy 2012
Pakistan Climate Change Act
The Khyber Pakhtunkhwa River Protection Ordinance. 2002
The Khyber Pakhtunkhwa River Protection (Amendment) Act 2014
The Khyber Pakhtunkhwa Environmental Protection Act 2014
The Khyber Pakhtunkhwa Climate Change Policy
2016
Khyber Pakhtunkhwa Wildlife and Biodiversity (Protection, Preservation, Conservation and Management) Act (and Amendment)
2015 2017
Sanitation and Waste
Hospital Waste Management Rules 2005
Guidelines for Solid Waste Management 2005
National Sanitation Policy of Pakistan 2006
Housing, Zoning and Energy
National Housing Policy 2001
Khyber Pakhtunkhwa Housing Authority Act (and Amendments) 2005 2014 2017
National Energy Efficiency and Conservation Act 2016
National Power Policy 2013
National Energy Conservation Policy 2005
Building Code of Pakistan – Seismic Provisions 2007
Khyber Pakhtunkhwa Model Building Bye-Laws 2017
Building Code of Pakistan – Fire and Life Safety Provisions 2016
397. At the provincial level, the development planning takes place in two steps:
293 ADB. 2019. Pakistan: Provincial Strategy for Inclusive and Sustainable Urban Growth in Khyber
Pakhtunkhwa, Urban Sector Road Map (Draft).
KP-SISUG Swat Regional Development Plan
154
i. Annual Development Program: The ADP procedure is competing for a limited
amount of funds available for development. The preparation of the ADP is coordinated
by the Programming Section of the Planning and Development Department. The
procedure is laid down in detail in an ADP call letter sent annually to all provincial
departments and their affiliated agencies and authorities, and Chiefs/Heads of
technical sections of the Planning & Development Department.
ii. Departmental Development Projects: The provincial departments, and their affiliated
agencies and authorities have to submit a list of projects with cost estimates to P&D
for inclusion in the Annual Development Plan (ADP). The projects are prioritized
according to the following criteria:
a. On-going projects at a fairly advanced stage of implementation.
b. Foreign-aided projects with high priority.
c. Projects dealing with emergencies, such as flood relief, etc..
d. Newly approved projects.
iii. Special Projects: Projects are also identified as a result of special policy directives of
the Government. These projects initiated under such directives should be taken up on
priority, even by postponing/ superseding other projects, if availability of funds is the
constraint.
398. What is missing in the above project selection criteria is reference to their consistency
with, and support for, higher-level visions, growth strategies and integrated development
plans. There is a tendency for these higher-level planning frameworks that should be guiding
the selection for all investments to be ignored in the face of politically motivated “special
projects” or an agenda driven by external funding sources. This highlights the need for plans,
policies and their implementation methodologies to be fully “institutionalized” securing them
beyond the whims of short-cutting interference.
399. A recent assessment of urban planning issues in Pakistan identified a series of
constraints.294 The study notes that 83% of urban settlements in Pakistan are growing without
a spatial plan (Figure 51).
294 “Shaping up the Future Spatial Plans for Urban Areas in Pakistan, MDPI, Waheed, May 2020.
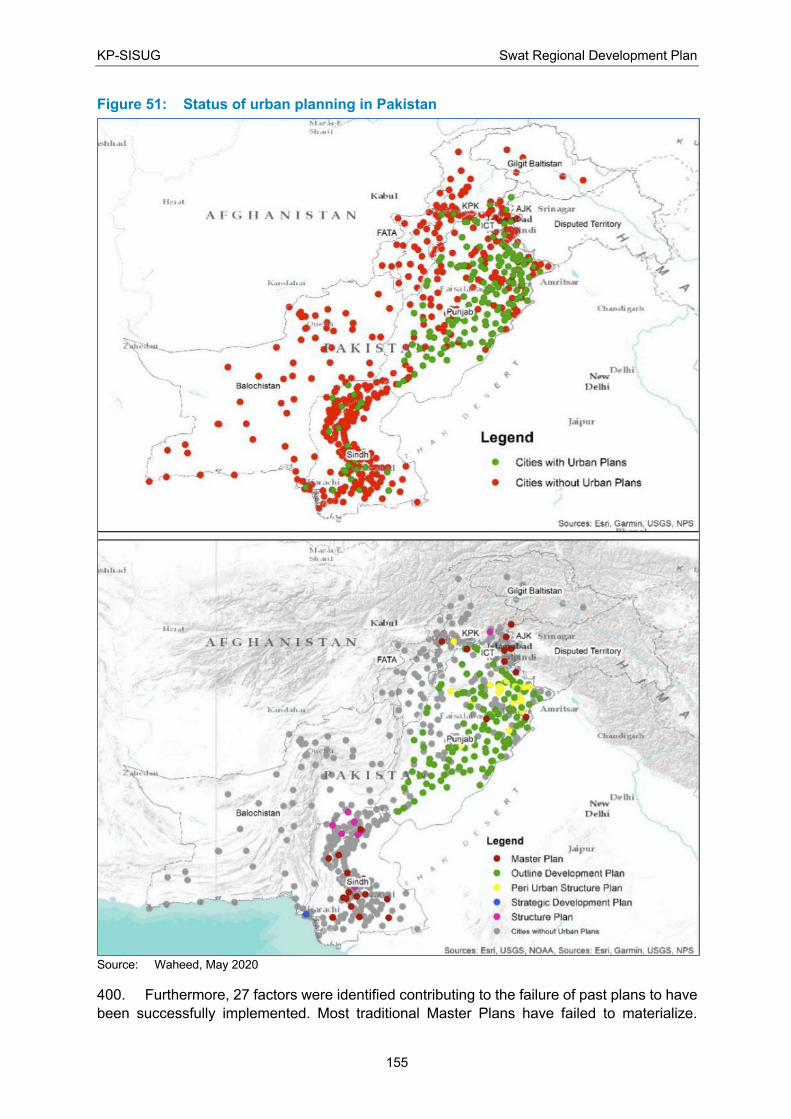
KP-SISUG Swat Regional Development Plan
155
Figure 51: Status of urban planning in Pakistan
Source: Waheed, May 2020
400. Furthermore, 27 factors were identified contributing to the failure of past plans to have
been successfully implemented. Most traditional Master Plans have failed to materialize.
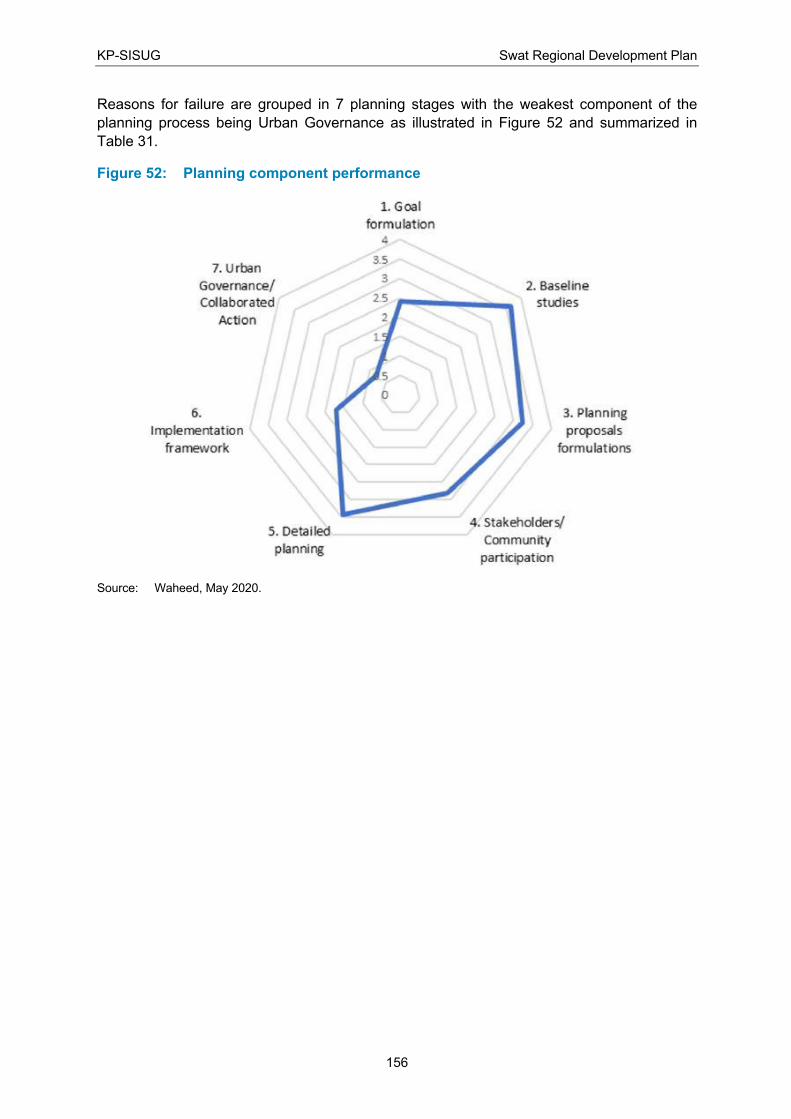
KP-SISUG Swat Regional Development Plan
156
Reasons for failure are grouped in 7 planning stages with the weakest component of the
planning process being Urban Governance as illustrated in Figure 52 and summarized in
Table 31.
Figure 52: Planning component performance
Source: Waheed, May 2020.
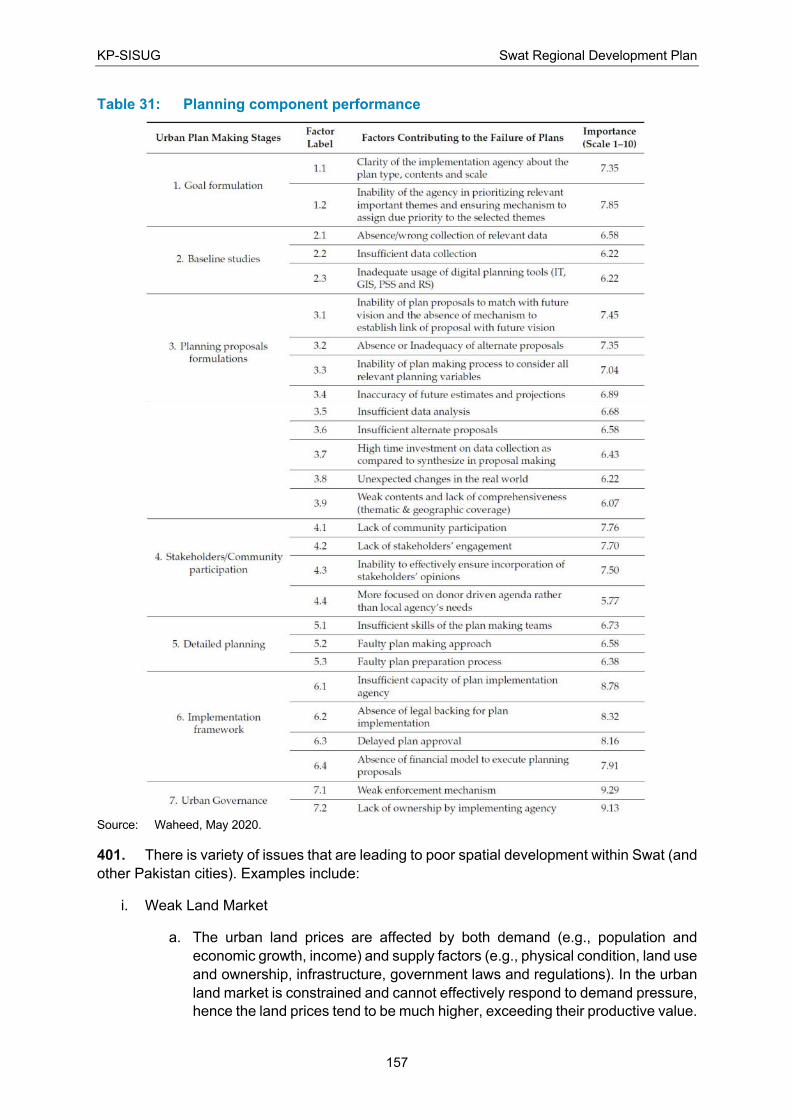
KP-SISUG Swat Regional Development Plan
157
Table 31: Planning component performance
Source: Waheed, May 2020.
401. There is variety of issues that are leading to poor spatial development within Swat (and
other Pakistan cities). Examples include:
i. Weak Land Market
a. The urban land prices are affected by both demand (e.g., population and
economic growth, income) and supply factors (e.g., physical condition, land use
and ownership, infrastructure, government laws and regulations). In the urban
land market is constrained and cannot effectively respond to demand pressure,
hence the land prices tend to be much higher, exceeding their productive value.
KP-SISUG Swat Regional Development Plan
158
b. The illegal land market, land speculation, leads to the creation of informal
settlements and slums, inefficient service provision and land administration,
which increases the cost for infrastructure.
c. The lack of resources and technical capacity to tackle the issue of land for
development (plans and planning instruments).
ii. Urban Infrastructure Gap
a. The growing urban infrastructure deficits in roads, water, electricity, sewerage,
etc. and the poor services are increasing the cost and risk of real estate
development.
b. The inadequate finance resource flows from higher levels of government and
the poorly administered local tax base to support the development of
infrastructure.
c. The lack of technical capacity from the Water and Sanitation Agency (WSCC)
has limited information on the situation analysis for the current infrastructure.
d. The mismatch between administrative and municipal service jurisdiction
boundaries and the lack of transparent processes and coordinated planning
between different local jurisdictions are other obstacles to coherent
infrastructure development.
iii. Out-of-date Planning
a. Extensive urban sprawl that has become a regular feature of KP Cities.
b. The absence of a settlement hierarchy that has led to the inadequate
sometimes inappropriate provision of community facilities and infrastructure
and the lack of ‘place-making’.
c. The prevailing “Linear project approach”, rather than adopting a multi-sectoral
integrated approach, is weak and nowhere ready to address the country’s
urbanization.
d. Lack of an organized implementation system and effective monitoring and
enforcement process to provide long-term strategic planning.
e. The current procedures for obtaining planning and building approval are
unclear. Pakistan is ranked 98 out of 183 economies globally for the ease of
dealing with construction permits.
f. The current issue of food ‘insecurity’ and the lack of a robust agricultural sector
in the peri-urban area.
g. The lack of economic diversification in recent times and the need for the private
sector to be more involved.
402. In addition, orderly planning and development suffers from lack of enforcement of
existing regulations, such as they exist, corruption, and different taxation regimes between
urban and rural.
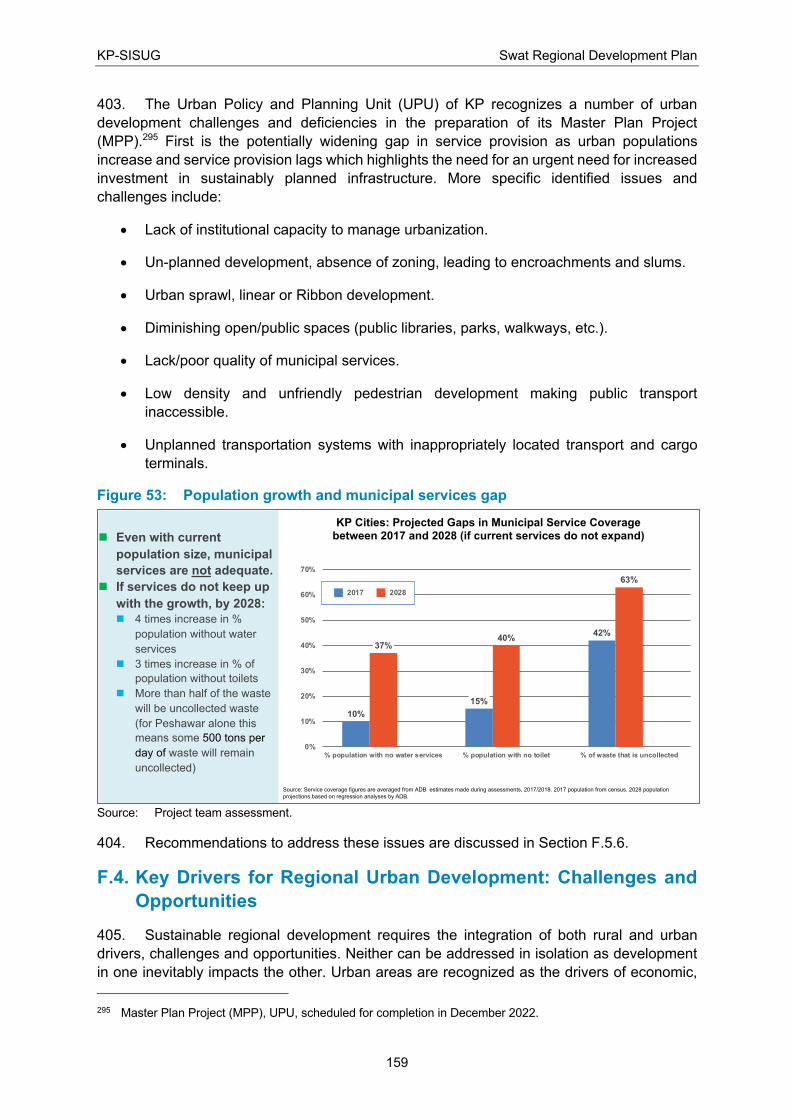
KP-SISUG Swat Regional Development Plan
159
403. The Urban Policy and Planning Unit (UPU) of KP recognizes a number of urban
development challenges and deficiencies in the preparation of its Master Plan Project
(MPP).295 First is the potentially widening gap in service provision as urban populations
increase and service provision lags which highlights the need for an urgent need for increased
investment in sustainably planned infrastructure. More specific identified issues and
challenges include:
• Lack of institutional capacity to manage urbanization.
• Un-planned development, absence of zoning, leading to encroachments and slums.
• Urban sprawl, linear or Ribbon development.
• Diminishing open/public spaces (public libraries, parks, walkways, etc.).
• Lack/poor quality of municipal services.
• Low density and unfriendly pedestrian development making public transport
inaccessible.
• Unplanned transportation systems with inappropriately located transport and cargo
terminals.
Figure 53: Population growth and municipal services gap
Source: Project team assessment.
404. Recommendations to address these issues are discussed in Section F.5.6.
F.4. Key Drivers for Regional Urban Development: Challenges and
Opportunities
405. Sustainable regional development requires the integration of both rural and urban
drivers, challenges and opportunities. Neither can be addressed in isolation as development
in one inevitably impacts the other. Urban areas are recognized as the drivers of economic,
295 Master Plan Project (MPP), UPU, scheduled for completion in December 2022.
n Even with current
population size, municipal
services are not adequate.
n If services do not keep up
with the growth, by 2028:
n 4 times increase in %
population without water
services
n 3 times increase in % of
population without toilets
n More than half of the waste
will be uncollected waste
(for Peshawar alone this
means some 500 tons per
day of waste will remain
uncollected)
10%
15%
42%
37%40%
63%
0%
10%
20%
30%
40%
50%
60%
70%
% population with no water services % population with no toilet % of waste that is uncollected
2017 2028
Source: Service coverage figures are averaged from ADB estimates made during assessments, 2017/2018. 2017 population from census. 2028 population
projections based on regression analyses by ADB.
KP Cities: Projected Gaps in Municipal Service Coverage
between 2017 and 2028 (if current services do not expand)
KP-SISUG Swat Regional Development Plan
160
and therefore social, growth and are consequently discussed here first followed by
accompanying regional considerations. Proposals to address these challenges and
opportunities are presented in the subsequent Section F.5.
F.4.1. Regional Economic Development: Industrial Estates and SEZs
406. Industrial Estates and related Special Economic Zones (SEZ), Export Processing
Zones (EPZ) and Prioritized Special Economic Zones (PSEZ) may all have roles in promoting
economic development. Potential industrial investors are interested in three main conditions
that Industrial Estates can provide:
407. Access to suitable land situated in convenient relationship to raw materials, market
connectivity and labor while ensuring environmental sustainability including no negative
impacts on adjacent land uses.
408. Fully functional, reliable and affordable infrastructure and services including water
supply, sanitation, power, communications (high-speed internet) and transport. Industrial
developments have particular solid waste disposal requirements that need specialized
treatment, not easily provided within the typical urban environment and often benefiting from
the economies of scale where a number of industries can utilize one treatment facility.
409. Attractive and livable host community in order to attract and retain essential human
resources at all skill levels. This means a community with affordable housing, accessible
health, education and recreational facilities, and a wide variety of consumer goods and
services.
410. An established Industrial Estate ready for potential investors seeking a development
opportunity can put that city at a competitive advantage.
411. Governments at all levels can play a significant role in promoting the development of
Industrial Estates by ensuring comprehensive, transparent and consistent planning, approval
and development control processes; partnering with the private sector to market, develop and
ensure adequate on-going management and maintenance. provide other incentives such as
tax relief of various sorts, keeping in mind that municipalities rely on taxation to keep them
running, so there are realistic limits to tax breaks.
412. As with all other developments, Industrial Estates should be developed on the basis of
demand, not supply. The “build-it-and-they-will-come” philosophy is not reliable. Demand may
come from several sources including:
• An identified sufficient local market gap to justify investing in locally-produced import
replacement articles.
• A sustainably exploitable natural resource with potential for value-added processing
prior to exporting either regionally or beyond.
413. In response to unsustainable environmental or climate change impacts that require
existing industries to relocate from long-established inner-city locations to more sustainable
and acceptable outer locations.
KP-SISUG Swat Regional Development Plan
161
F.5. Sustainable Urban Growth: the Way Forward
414. In spite of no national or provincial urban policy in Pakistan and with unmanaged
urbanization patterns being the norm, Pakistan is still the most urbanized country in South
Asia. However, its general characteristics of low density, sprawling and for the most part
single-use zoning are the exact opposite of what the UN’s New Urban Agenda considers the
ideal sustainable urban form: compact, high density and mixed-use. A brief discussion of the
each of these qualities:
• Compact: makes maximum use of disturbed land and limits sprawl into adjacent and
valued agricultural, environmentally protected and/or otherwise valued natural assets.
Compact cities require less infrastructure and provide closer proximity to social and
economic amenities with reduced transportation needs.
• High Density: as with compact cities, high density accommodates more population
and related social and economic activities in a smaller land base thereby reducing
impacts on surrounding lands. Municipal infrastructure economics are also based on
connecting the maximum number of users to the minimal length of pipe or road thereby
generating sufficient revenue to protect capital investments with sustainable
operations and maintenance programs. Commercial entities obviously benefit from
higher populations within their market catchment area.
• Mixed-Use: promotes close and convenient access to daily live, work, shop and play
activities with minimal transportation costs. Also allows for greater use of healthier and
environmentally beneficial non-motorized transport. Mixed-use development if well-
managed, contributes to a more livable city.
415. However, while policies can be and should be put in place to accomplish these goals,
the transformation takes time and requires in many cases, a shift in traditional cultural thinking.
Specific approaches to achieving more sustainable cities are discussed in Section F.5.8
below.
416. The following are some proposals for managing and tackling urbanization in the
future:296
F.5.1. Regional Growth Strategies
417. The Khyber Pakhtunkhwa Provincial Government recognizes the importance of
integrating rural and urban development in order to develop a sustainable regional growth
strategy. This is clear in its discussion of the negative impact of urban sprawl on agriculture
when it states that due to rapid urbanization, cultivated land around major urban centers is
rapidly being used for housing purposes by various new settlements and housing societies in
KP. The government may frame a land zoning policy to regulate this practice and to preserve
agricultural base, to ensure the continued production of agricultural commodities. Such a
policy should limit the density of development, restrict non-farm use of land in selected areas
and limit construction of buildings and structures unrelated to agricultural land uses and
activities in these areas.297
296 Sustainable Urbanisation, UNDP, 2019 297 “Reclaiming Prosperity in Khyber Pakhtunkhwa, Growing Opportunity”, Planning and Development
Department Government of Khyber Pakhtunkhwa.
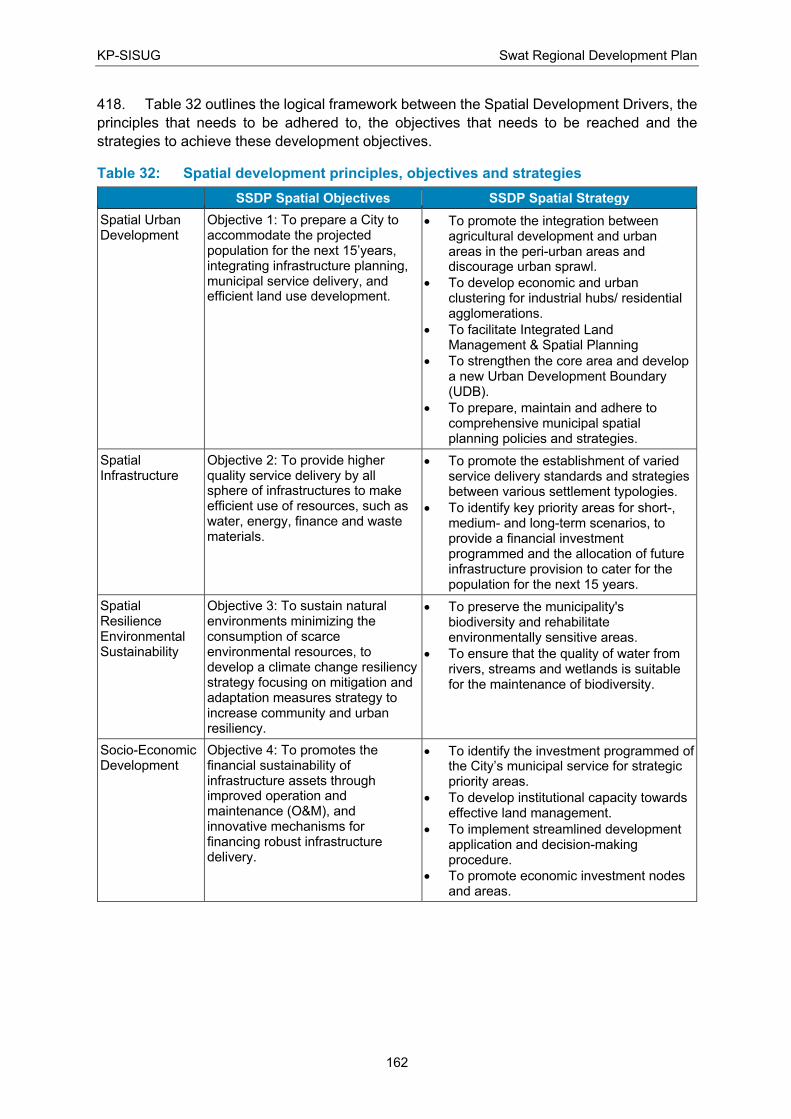
KP-SISUG Swat Regional Development Plan
162
418. Table 32 outlines the logical framework between the Spatial Development Drivers, the
principles that needs to be adhered to, the objectives that needs to be reached and the
strategies to achieve these development objectives.
Table 32: Spatial development principles, objectives and strategies
SSDP Spatial Objectives SSDP Spatial Strategy
Spatial Urban Development
Objective 1: To prepare a City to accommodate the projected population for the next 15’years, integrating infrastructure planning, municipal service delivery, and efficient land use development.
• To promote the integration between agricultural development and urban areas in the peri-urban areas and discourage urban sprawl.
• To develop economic and urban clustering for industrial hubs/ residential agglomerations.
• To facilitate Integrated Land Management & Spatial Planning
• To strengthen the core area and develop a new Urban Development Boundary (UDB).
• To prepare, maintain and adhere to comprehensive municipal spatial planning policies and strategies.
Spatial Infrastructure
Objective 2: To provide higher quality service delivery by all sphere of infrastructures to make efficient use of resources, such as water, energy, finance and waste materials.
• To promote the establishment of varied service delivery standards and strategies between various settlement typologies.
• To identify key priority areas for short-, medium- and long-term scenarios, to provide a financial investment programmed and the allocation of future infrastructure provision to cater for the population for the next 15 years.
Spatial Resilience Environmental Sustainability
Objective 3: To sustain natural environments minimizing the consumption of scarce environmental resources, to develop a climate change resiliency strategy focusing on mitigation and adaptation measures strategy to increase community and urban resiliency.
• To preserve the municipality's biodiversity and rehabilitate environmentally sensitive areas.
• To ensure that the quality of water from rivers, streams and wetlands is suitable for the maintenance of biodiversity.
Socio-Economic Development
Objective 4: To promotes the financial sustainability of infrastructure assets through improved operation and maintenance (O&M), and innovative mechanisms for financing robust infrastructure delivery.
• To identify the investment programmed of the City’s municipal service for strategic priority areas.
• To develop institutional capacity towards effective land management.
• To implement streamlined development application and decision-making procedure.
• To promote economic investment nodes and areas.
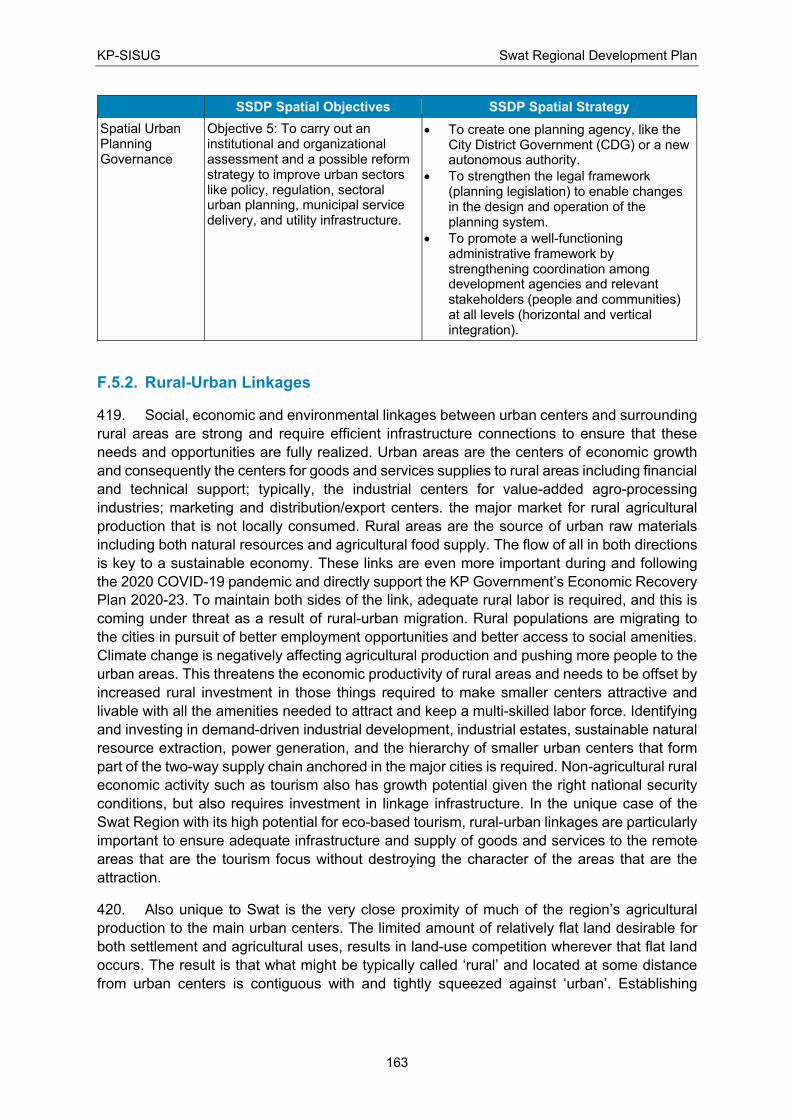
KP-SISUG Swat Regional Development Plan
163
SSDP Spatial Objectives SSDP Spatial Strategy
Spatial Urban Planning Governance
Objective 5: To carry out an institutional and organizational assessment and a possible reform strategy to improve urban sectors like policy, regulation, sectoral urban planning, municipal service delivery, and utility infrastructure.
• To create one planning agency, like the City District Government (CDG) or a new autonomous authority.
• To strengthen the legal framework (planning legislation) to enable changes in the design and operation of the planning system.
• To promote a well-functioning administrative framework by strengthening coordination among development agencies and relevant stakeholders (people and communities) at all levels (horizontal and vertical integration).
F.5.2. Rural-Urban Linkages
419. Social, economic and environmental linkages between urban centers and surrounding
rural areas are strong and require efficient infrastructure connections to ensure that these
needs and opportunities are fully realized. Urban areas are the centers of economic growth
and consequently the centers for goods and services supplies to rural areas including financial
and technical support; typically, the industrial centers for value-added agro-processing
industries; marketing and distribution/export centers. the major market for rural agricultural
production that is not locally consumed. Rural areas are the source of urban raw materials
including both natural resources and agricultural food supply. The flow of all in both directions
is key to a sustainable economy. These links are even more important during and following
the 2020 COVID-19 pandemic and directly support the KP Government’s Economic Recovery
Plan 2020-23. To maintain both sides of the link, adequate rural labor is required, and this is
coming under threat as a result of rural-urban migration. Rural populations are migrating to
the cities in pursuit of better employment opportunities and better access to social amenities.
Climate change is negatively affecting agricultural production and pushing more people to the
urban areas. This threatens the economic productivity of rural areas and needs to be offset by
increased rural investment in those things required to make smaller centers attractive and
livable with all the amenities needed to attract and keep a multi-skilled labor force. Identifying
and investing in demand-driven industrial development, industrial estates, sustainable natural
resource extraction, power generation, and the hierarchy of smaller urban centers that form
part of the two-way supply chain anchored in the major cities is required. Non-agricultural rural
economic activity such as tourism also has growth potential given the right national security
conditions, but also requires investment in linkage infrastructure. In the unique case of the
Swat Region with its high potential for eco-based tourism, rural-urban linkages are particularly
important to ensure adequate infrastructure and supply of goods and services to the remote
areas that are the tourism focus without destroying the character of the areas that are the
attraction.
420. Also unique to Swat is the very close proximity of much of the region’s agricultural
production to the main urban centers. The limited amount of relatively flat land desirable for
both settlement and agricultural uses, results in land-use competition wherever that flat land
occurs. The result is that what might be typically called ‘rural’ and located at some distance
from urban centers is contiguous with and tightly squeezed against ‘urban’. Establishing
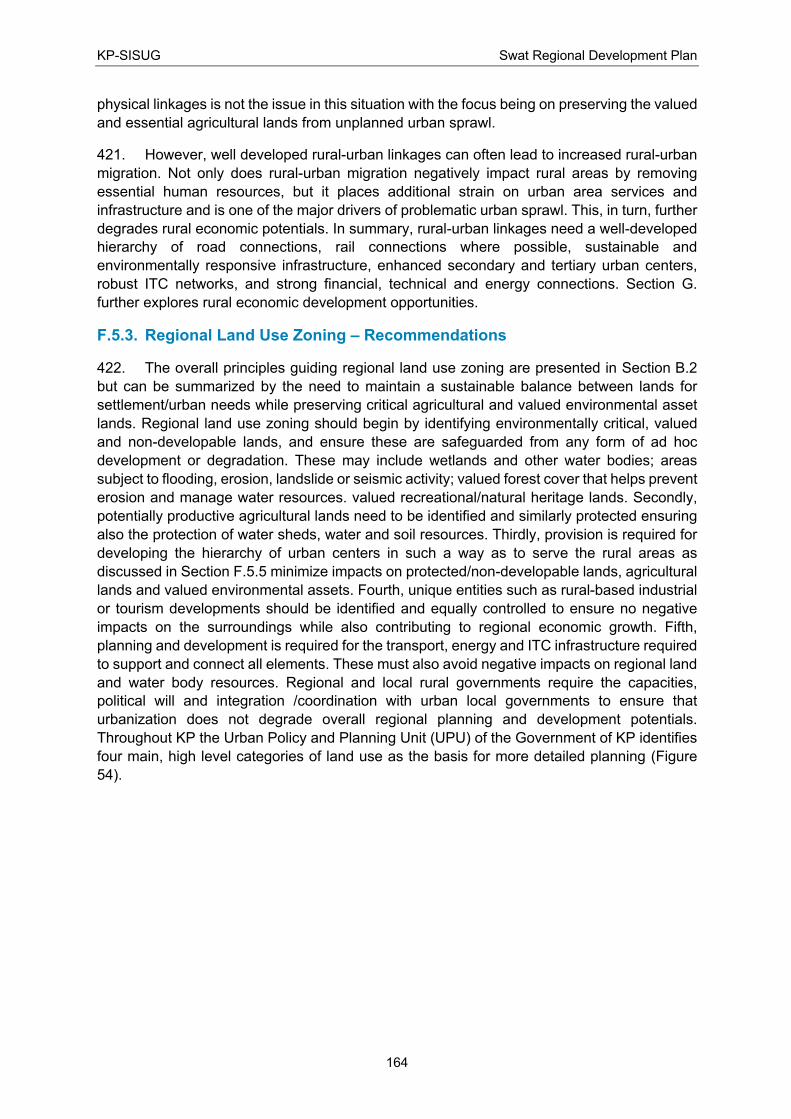
KP-SISUG Swat Regional Development Plan
164
physical linkages is not the issue in this situation with the focus being on preserving the valued
and essential agricultural lands from unplanned urban sprawl.
421. However, well developed rural-urban linkages can often lead to increased rural-urban
migration. Not only does rural-urban migration negatively impact rural areas by removing
essential human resources, but it places additional strain on urban area services and
infrastructure and is one of the major drivers of problematic urban sprawl. This, in turn, further
degrades rural economic potentials. In summary, rural-urban linkages need a well-developed
hierarchy of road connections, rail connections where possible, sustainable and
environmentally responsive infrastructure, enhanced secondary and tertiary urban centers,
robust ITC networks, and strong financial, technical and energy connections. Section G.
further explores rural economic development opportunities.
F.5.3. Regional Land Use Zoning – Recommendations
422. The overall principles guiding regional land use zoning are presented in Section B.2
but can be summarized by the need to maintain a sustainable balance between lands for
settlement/urban needs while preserving critical agricultural and valued environmental asset
lands. Regional land use zoning should begin by identifying environmentally critical, valued
and non-developable lands, and ensure these are safeguarded from any form of ad hoc
development or degradation. These may include wetlands and other water bodies; areas
subject to flooding, erosion, landslide or seismic activity; valued forest cover that helps prevent
erosion and manage water resources. valued recreational/natural heritage lands. Secondly,
potentially productive agricultural lands need to be identified and similarly protected ensuring
also the protection of water sheds, water and soil resources. Thirdly, provision is required for
developing the hierarchy of urban centers in such a way as to serve the rural areas as
discussed in Section F.5.5 minimize impacts on protected/non-developable lands, agricultural
lands and valued environmental assets. Fourth, unique entities such as rural-based industrial
or tourism developments should be identified and equally controlled to ensure no negative
impacts on the surroundings while also contributing to regional economic growth. Fifth,
planning and development is required for the transport, energy and ITC infrastructure required
to support and connect all elements. These must also avoid negative impacts on regional land
and water body resources. Regional and local rural governments require the capacities,
political will and integration /coordination with urban local governments to ensure that
urbanization does not degrade overall regional planning and development potentials.
Throughout KP the Urban Policy and Planning Unit (UPU) of the Government of KP identifies
four main, high level categories of land use as the basis for more detailed planning (Figure
54).
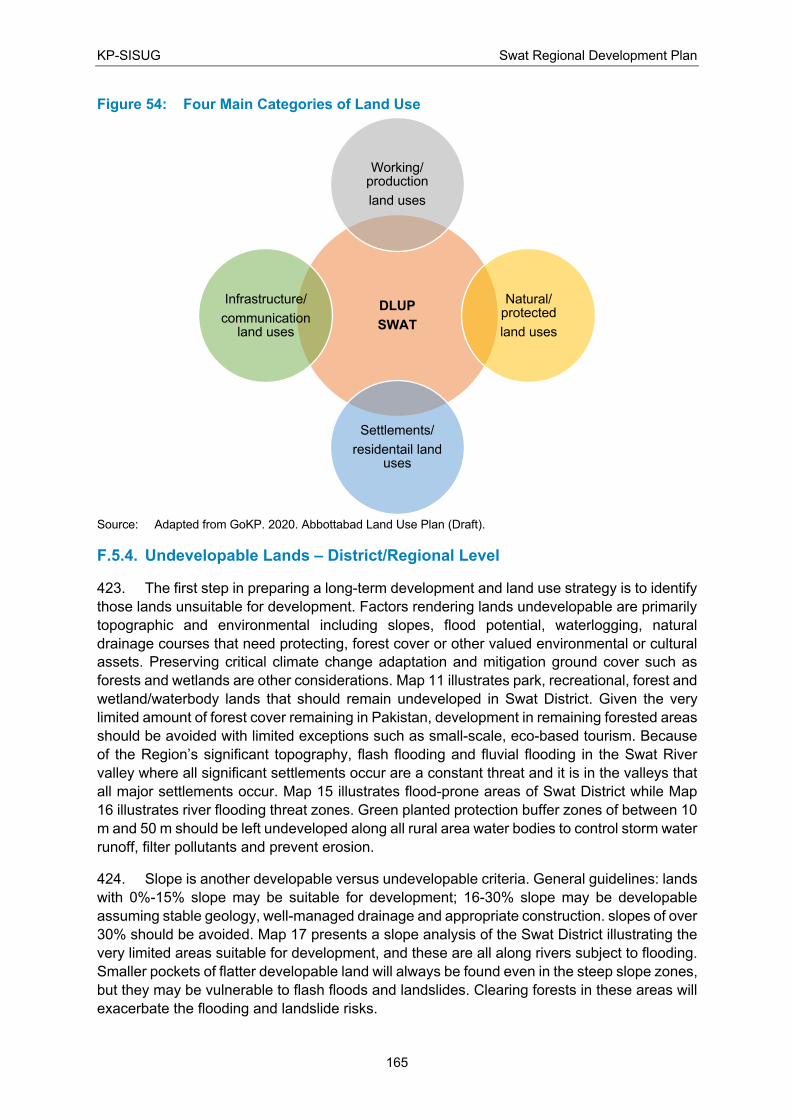
KP-SISUG Swat Regional Development Plan
165
Figure 54: Four Main Categories of Land Use
Source: Adapted from GoKP. 2020. Abbottabad Land Use Plan (Draft).
F.5.4. Undevelopable Lands – District/Regional Level
423. The first step in preparing a long-term development and land use strategy is to identify
those lands unsuitable for development. Factors rendering lands undevelopable are primarily
topographic and environmental including slopes, flood potential, waterlogging, natural
drainage courses that need protecting, forest cover or other valued environmental or cultural
assets. Preserving critical climate change adaptation and mitigation ground cover such as
forests and wetlands are other considerations. Map 11 illustrates park, recreational, forest and
wetland/waterbody lands that should remain undeveloped in Swat District. Given the very
limited amount of forest cover remaining in Pakistan, development in remaining forested areas
should be avoided with limited exceptions such as small-scale, eco-based tourism. Because
of the Region’s significant topography, flash flooding and fluvial flooding in the Swat River
valley where all significant settlements occur are a constant threat and it is in the valleys that
all major settlements occur. Map 15 illustrates flood-prone areas of Swat District while Map
16 illustrates river flooding threat zones. Green planted protection buffer zones of between 10
m and 50 m should be left undeveloped along all rural area water bodies to control storm water
runoff, filter pollutants and prevent erosion.
424. Slope is another developable versus undevelopable criteria. General guidelines: lands
with 0%-15% slope may be suitable for development; 16-30% slope may be developable
assuming stable geology, well-managed drainage and appropriate construction. slopes of over
30% should be avoided. Map 17 presents a slope analysis of the Swat District illustrating the
very limited areas suitable for development, and these are all along rivers subject to flooding.
Smaller pockets of flatter developable land will always be found even in the steep slope zones,
but they may be vulnerable to flash floods and landslides. Clearing forests in these areas will
exacerbate the flooding and landslide risks.
DLUP
SWAT
Working/ production
land uses
Natural/ protected
land uses
Settlements/
residentail land uses
Infrastructure/
communication land uses
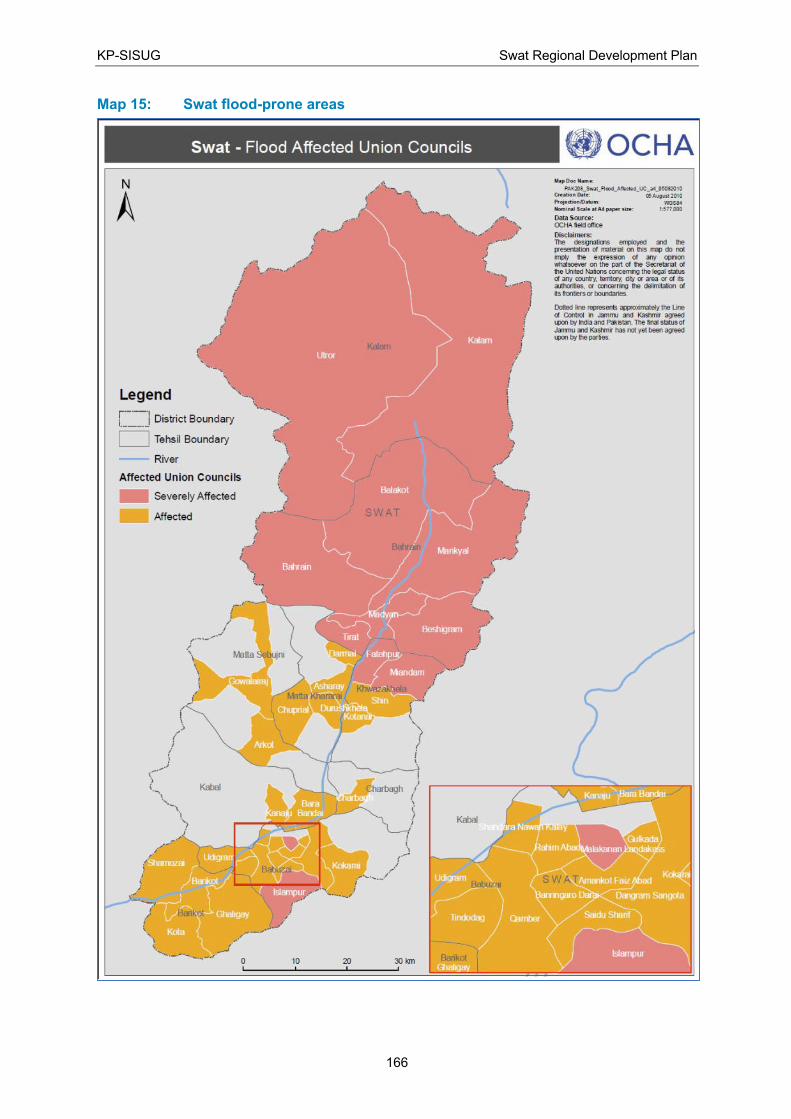
KP-SISUG Swat Regional Development Plan
166
Map 15: Swat flood-prone areas
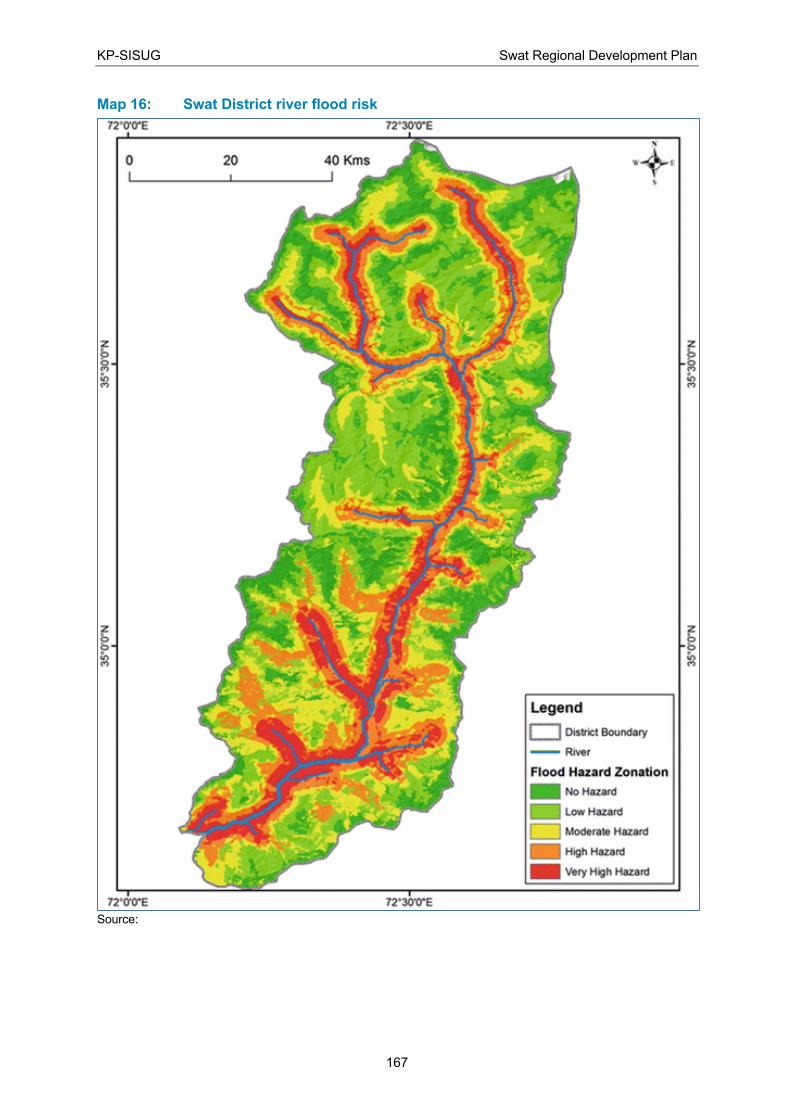
KP-SISUG Swat Regional Development Plan
167
Map 16: Swat District river flood risk
Source:
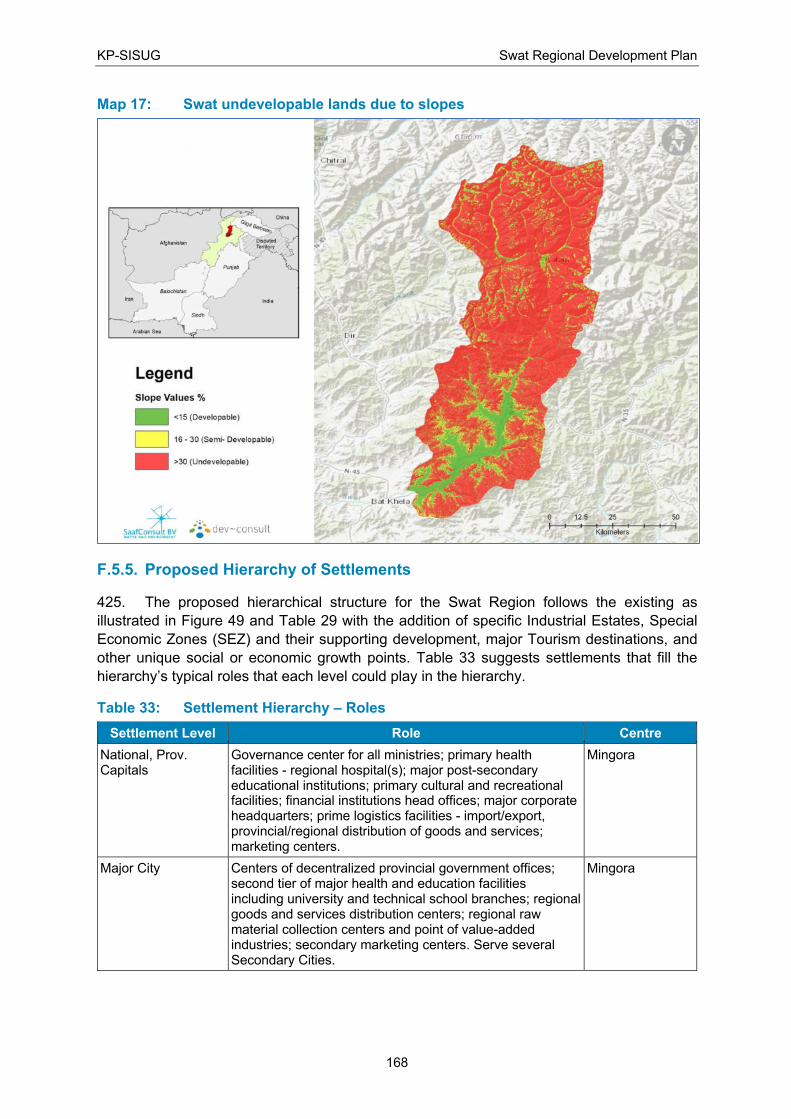
KP-SISUG Swat Regional Development Plan
168
Map 17: Swat undevelopable lands due to slopes
F.5.5. Proposed Hierarchy of Settlements
425. The proposed hierarchical structure for the Swat Region follows the existing as
illustrated in Figure 49 and Table 29 with the addition of specific Industrial Estates, Special
Economic Zones (SEZ) and their supporting development, major Tourism destinations, and
other unique social or economic growth points. Table 33 suggests settlements that fill the
hierarchy’s typical roles that each level could play in the hierarchy.
Table 33: Settlement Hierarchy – Roles
Settlement Level Role Centre
National, Prov. Capitals
Governance center for all ministries; primary health facilities - regional hospital(s); major post-secondary educational institutions; primary cultural and recreational facilities; financial institutions head offices; major corporate headquarters; prime logistics facilities - import/export, provincial/regional distribution of goods and services; marketing centers.
Mingora
Major City Centers of decentralized provincial government offices; second tier of major health and education facilities including university and technical school branches; regional goods and services distribution centers; regional raw material collection centers and point of value-added industries; secondary marketing centers. Serve several Secondary Cities.
Mingora
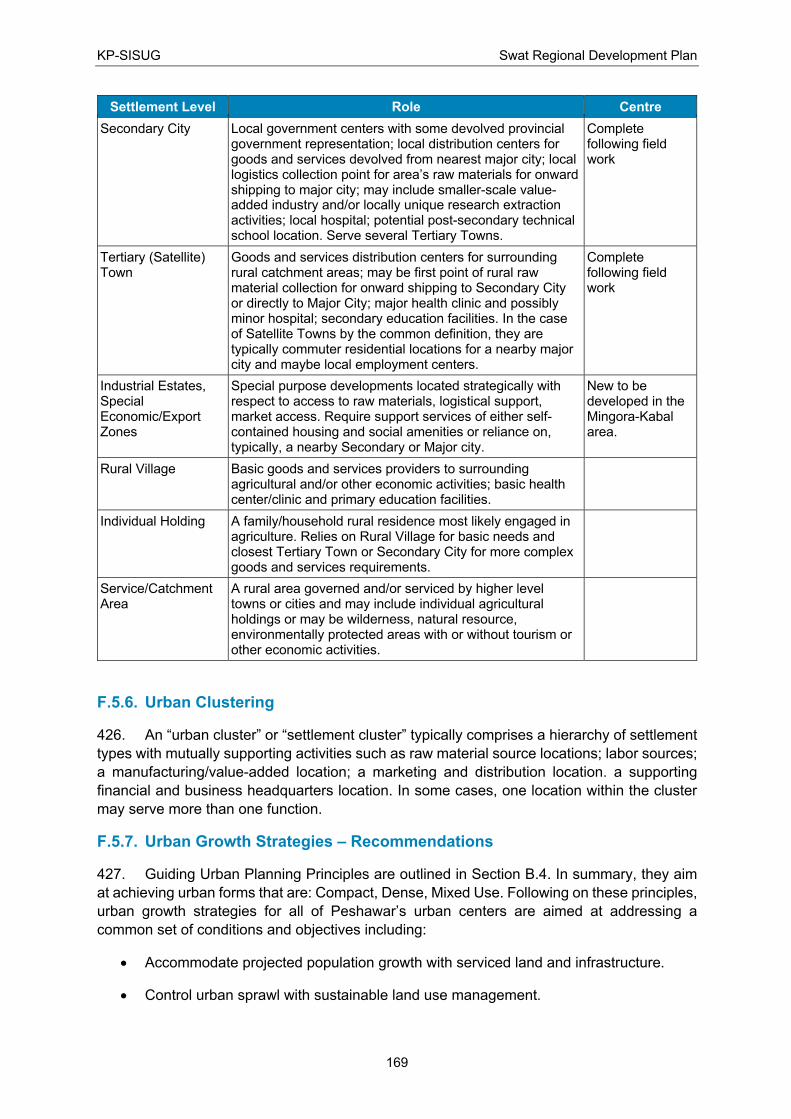
KP-SISUG Swat Regional Development Plan
169
Settlement Level Role Centre
Secondary City Local government centers with some devolved provincial government representation; local distribution centers for goods and services devolved from nearest major city; local logistics collection point for area’s raw materials for onward shipping to major city; may include smaller-scale value-added industry and/or locally unique research extraction activities; local hospital; potential post-secondary technical school location. Serve several Tertiary Towns.
Complete following field work
Tertiary (Satellite) Town
Goods and services distribution centers for surrounding rural catchment areas; may be first point of rural raw material collection for onward shipping to Secondary City or directly to Major City; major health clinic and possibly minor hospital; secondary education facilities. In the case of Satellite Towns by the common definition, they are typically commuter residential locations for a nearby major city and maybe local employment centers.
Complete following field work
Industrial Estates, Special Economic/Export Zones
Special purpose developments located strategically with respect to access to raw materials, logistical support, market access. Require support services of either self-contained housing and social amenities or reliance on, typically, a nearby Secondary or Major city.
New to be developed in the Mingora-Kabal area.
Rural Village Basic goods and services providers to surrounding agricultural and/or other economic activities; basic health center/clinic and primary education facilities.
Individual Holding A family/household rural residence most likely engaged in agriculture. Relies on Rural Village for basic needs and closest Tertiary Town or Secondary City for more complex goods and services requirements.
Service/Catchment Area
A rural area governed and/or serviced by higher level towns or cities and may include individual agricultural holdings or may be wilderness, natural resource, environmentally protected areas with or without tourism or other economic activities.
F.5.6. Urban Clustering
426. An “urban cluster” or “settlement cluster” typically comprises a hierarchy of settlement
types with mutually supporting activities such as raw material source locations; labor sources;
a manufacturing/value-added location; a marketing and distribution location. a supporting
financial and business headquarters location. In some cases, one location within the cluster
may serve more than one function.
F.5.7. Urban Growth Strategies – Recommendations
427. Guiding Urban Planning Principles are outlined in Section B.4. In summary, they aim
at achieving urban forms that are: Compact, Dense, Mixed Use. Following on these principles,
urban growth strategies for all of Peshawar’s urban centers are aimed at addressing a
common set of conditions and objectives including:
• Accommodate projected population growth with serviced land and infrastructure.
• Control urban sprawl with sustainable land use management.
KP-SISUG Swat Regional Development Plan
170
• Ensure the elements for a conducive investment environment are in place to promote
diversified economic development and competitiveness.
• Integrate the urban center into the Regional hierarchy of urban centers, growth points
and rural activities.
• Ensure climate and environmental sustainability.
428. To achieve this, all of Swat’s urban centers will need to implement the following set of
common actions:
• Urgently control and reduce urban sprawl, and implement increased densification and
infill development within the current city limits.
• Reduce single function blocks (including housing developments) through zoning
regulations, and increase the floor area for economic uses, recreational and urban
green spaces, and public use.
• Avoid expanding on to productive agricultural land, land that is vulnerable to flooding
and land that would affect drainage.
• Re-define the city limits to accommodate all these concerns and manage the direction
of growth.
• Review and revise zoning regulations as needed, using international urban planning
principles as a guide, and enforce the regulations.
429. In practice, this means that city planning authorities in Mingora City, as an example,
will need to:
• Discourage the conversion of productive agricultural land in the north to urban
occupancy.
• Discourage expansion into flood-prone areas north and north-east of the city, with a
preferred axis of development to the south and south-east of the present urban area.
• Encourage development towards the west, east and southern margins of the city to
take advantage of opportunities such as regional development corridors, SEZs and
transportation infrastructure.
• Consolidate the role of the city center, increasing density in line with planning
standards and norms.
• Change the demarcation of city boundaries to incorporate appropriate peri-urban
nodes. In this strategy, a dense urban core would be linked by efficient public transport
networks to dense, mixed use, complementary sub-centers.
• Increase the proportion of publicly spaces to at least 15 to 20 per cent in line with the
planning norms (see Section F.5.9).
• Designated green buffer zones in strategic locations around the existing margins of
the city to focus development to selected peri-urban and sub-urban nodes, to preserve
KP-SISUG Swat Regional Development Plan
171
sensitive ecological and hydrogeological resources (for example, groundwater aquifer
recharge zones) and to prohibit development in areas prone to flooding.
430. The need to control urban sprawl underlies many of these actions and objectives. The
first challenge to limiting urban sprawl is having the political will to enforce - “institutionalize” -
approved plans and regulations. This will begin to provide local governments with the
resources necessary to fully operationalize planning and development control policies and
must apply to both urban local governments and the surrounding rural local governments. The
two must act in coordination. One common response is to simply extend the official urban
boundaries to incorporate surrounding urban sprawl. Without well entrenched development
control, this will not solve the problem as new arrivals will continue to settle in the less
regulated surrounding areas and the sprawl continues with its negative impacts and
developmental challenges. Taxation levels, where these are implemented and operational,
tend to be higher on urbanized land than rural lands. This becomes an incentive for rural local
government to permit sprawling development into their jurisdiction even though they may lack
to capacity for sustainable planning and development. Provincial level regulation is required
to control this and enforce a cooperation protocol between rural and urban entities.
F.5.8. Urban Land Use Planning – Sustainability Recommendations
431. Urban Form: Three typical urban forms are discussed in Section F.3. Swat’s urban
centers tend to be an unclear blend of all three. For most effective and efficient future
investment, a clear, informed decision should be made on a city’s chosen form as the basis of
a comprehensive Integrated City Development Plan. Rather than linear development along
the highways or a business as usual scenario, there are numerous social, economic and
environmental benefits to the “polycentric” form with a series of well-linked development nodes
surrounding a primary core. This creates a series of development nodes each containing all
that is required to live, work and play on a daily basis: housing, employment, retail, schools,
health facilities, parks and recreational facilities. The benefits include reduced travel distances,
reduced urban core traffic congestion, and the ability to incrementally add new nodes in a
controlled manner as the city grows with incrementally developed servicing and infrastructure.
The core remains the heart of the city and the focal point for governance, the main social,
cultural and recreational facilities, major bank and corporate headquarters, and maybe key
historical assets that give the city a sense of place. The core will also continue to develop as
the city grows, but it does not have to absorb the full needs of the expanding city as these are
dispersed to the nodes.
432. Transport and TOD Development: Transportation, public transport in particular, is
the physical framework of a city and should form the nuclei of multi-centric nodes linking each
other to the core through a series of transit-oriented-developments (TOD). Although Mingora
is still a relatively small city, it is not too early to begin introducing the approach. Transit hubs
- bus, train or multi-model - attract development, increase property and taxation levels and
provide accessible employment and services for surrounding residents. Secondary mobility
networks for both non-motorized and motorized transport are required to link all parts of the
node to the center. Land use planning should encourage high-density and mixed-use
development in TODs. Refer to Figure 59 and Figure 60 for conceptual examples.
433. Mixed-Use Neighborhoods: Whether cities develop with a single core or multi-
centric, a fine fabric of mixed land uses should be encouraged throughout. All neighborhoods
should strive to become self-contained areas that meet the diverse needs of local communities
in housing, employment and leisure. To this end, a greater proportion of the land use plan
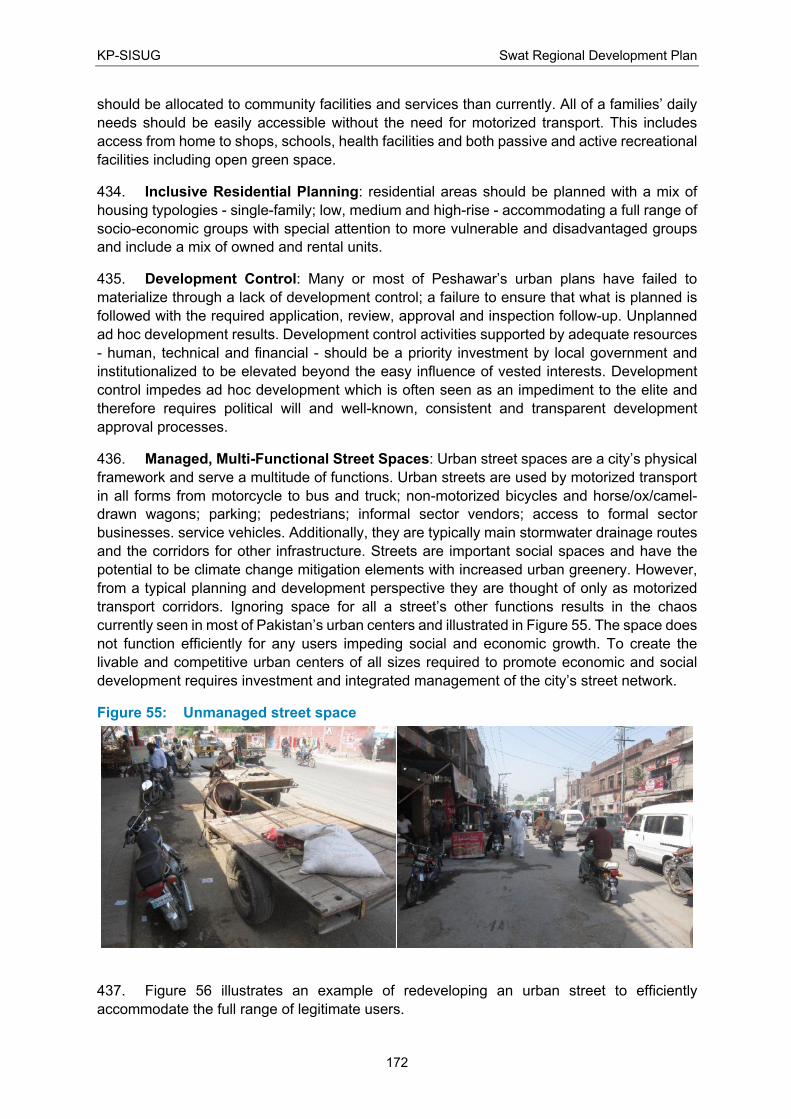
KP-SISUG Swat Regional Development Plan
172
should be allocated to community facilities and services than currently. All of a families’ daily
needs should be easily accessible without the need for motorized transport. This includes
access from home to shops, schools, health facilities and both passive and active recreational
facilities including open green space.
434. Inclusive Residential Planning: residential areas should be planned with a mix of
housing typologies - single-family; low, medium and high-rise - accommodating a full range of
socio-economic groups with special attention to more vulnerable and disadvantaged groups
and include a mix of owned and rental units.
435. Development Control: Many or most of Peshawar’s urban plans have failed to
materialize through a lack of development control; a failure to ensure that what is planned is
followed with the required application, review, approval and inspection follow-up. Unplanned
ad hoc development results. Development control activities supported by adequate resources
- human, technical and financial - should be a priority investment by local government and
institutionalized to be elevated beyond the easy influence of vested interests. Development
control impedes ad hoc development which is often seen as an impediment to the elite and
therefore requires political will and well-known, consistent and transparent development
approval processes.
436. Managed, Multi-Functional Street Spaces: Urban street spaces are a city’s physical
framework and serve a multitude of functions. Urban streets are used by motorized transport
in all forms from motorcycle to bus and truck; non-motorized bicycles and horse/ox/camel-
drawn wagons; parking; pedestrians; informal sector vendors; access to formal sector
businesses. service vehicles. Additionally, they are typically main stormwater drainage routes
and the corridors for other infrastructure. Streets are important social spaces and have the
potential to be climate change mitigation elements with increased urban greenery. However,
from a typical planning and development perspective they are thought of only as motorized
transport corridors. Ignoring space for all a street’s other functions results in the chaos
currently seen in most of Pakistan’s urban centers and illustrated in Figure 55. The space does
not function efficiently for any users impeding social and economic growth. To create the
livable and competitive urban centers of all sizes required to promote economic and social
development requires investment and integrated management of the city’s street network.
Figure 55: Unmanaged street space
437. Figure 56 illustrates an example of redeveloping an urban street to efficiently
accommodate the full range of legitimate users.
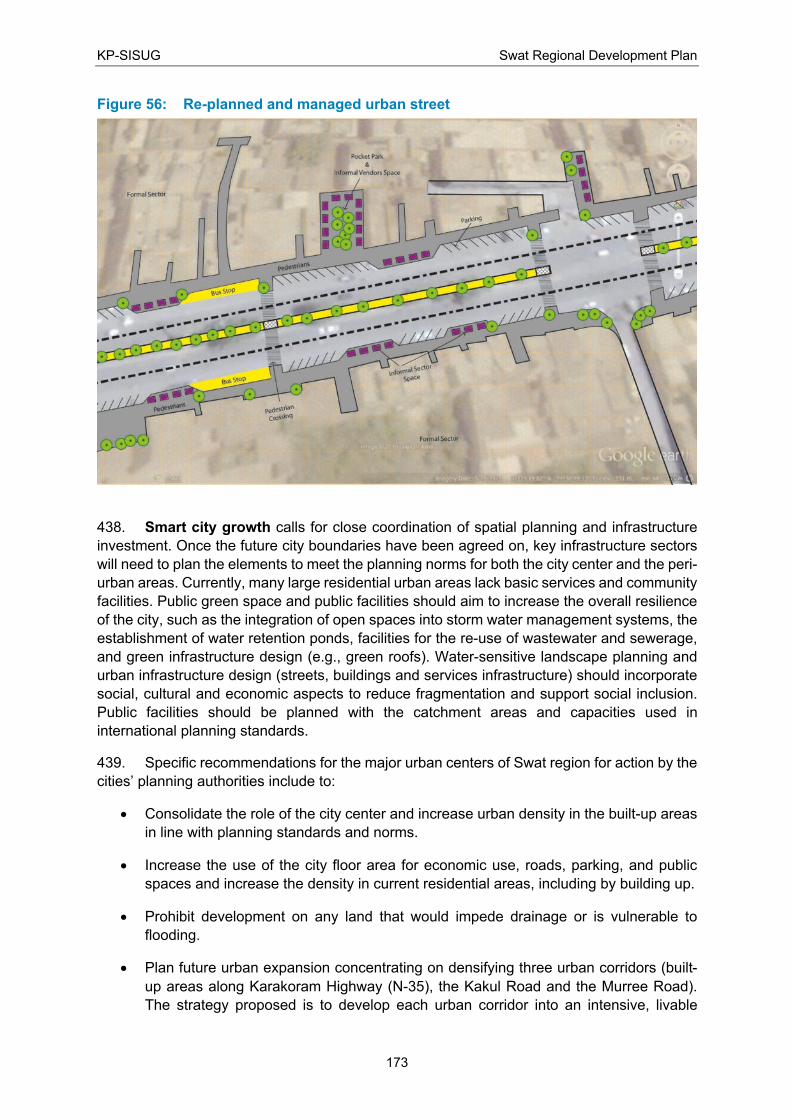
KP-SISUG Swat Regional Development Plan
173
Figure 56: Re-planned and managed urban street
438. Smart city growth calls for close coordination of spatial planning and infrastructure
investment. Once the future city boundaries have been agreed on, key infrastructure sectors
will need to plan the elements to meet the planning norms for both the city center and the peri-
urban areas. Currently, many large residential urban areas lack basic services and community
facilities. Public green space and public facilities should aim to increase the overall resilience
of the city, such as the integration of open spaces into storm water management systems, the
establishment of water retention ponds, facilities for the re-use of wastewater and sewerage,
and green infrastructure design (e.g., green roofs). Water-sensitive landscape planning and
urban infrastructure design (streets, buildings and services infrastructure) should incorporate
social, cultural and economic aspects to reduce fragmentation and support social inclusion.
Public facilities should be planned with the catchment areas and capacities used in
international planning standards.
439. Specific recommendations for the major urban centers of Swat region for action by the
cities’ planning authorities include to:
• Consolidate the role of the city center and increase urban density in the built-up areas
in line with planning standards and norms.
• Increase the use of the city floor area for economic use, roads, parking, and public
spaces and increase the density in current residential areas, including by building up.
• Prohibit development on any land that would impede drainage or is vulnerable to
flooding.
• Plan future urban expansion concentrating on densifying three urban corridors (built-
up areas along Karakoram Highway (N-35), the Kakul Road and the Murree Road).
The strategy proposed is to develop each urban corridor into an intensive, livable
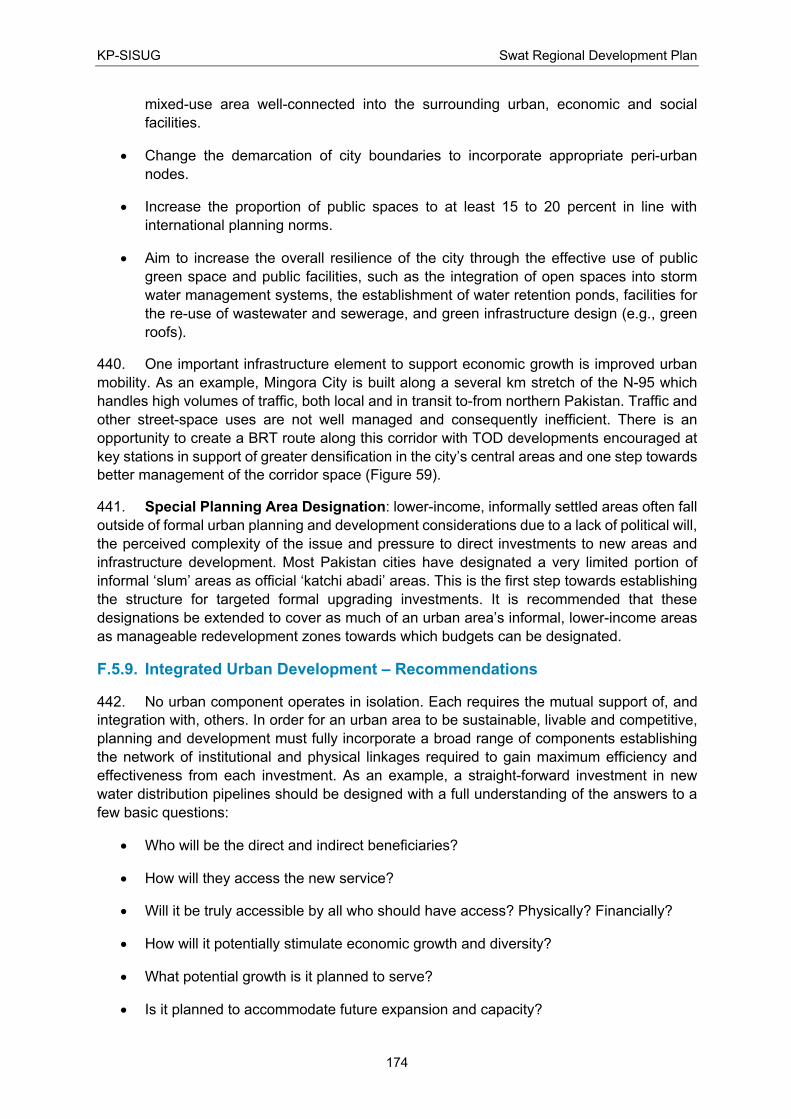
KP-SISUG Swat Regional Development Plan
174
mixed-use area well-connected into the surrounding urban, economic and social
facilities.
• Change the demarcation of city boundaries to incorporate appropriate peri-urban
nodes.
• Increase the proportion of public spaces to at least 15 to 20 percent in line with
international planning norms.
• Aim to increase the overall resilience of the city through the effective use of public
green space and public facilities, such as the integration of open spaces into storm
water management systems, the establishment of water retention ponds, facilities for
the re-use of wastewater and sewerage, and green infrastructure design (e.g., green
roofs).
440. One important infrastructure element to support economic growth is improved urban
mobility. As an example, Mingora City is built along a several km stretch of the N-95 which
handles high volumes of traffic, both local and in transit to-from northern Pakistan. Traffic and
other street-space uses are not well managed and consequently inefficient. There is an
opportunity to create a BRT route along this corridor with TOD developments encouraged at
key stations in support of greater densification in the city’s central areas and one step towards
better management of the corridor space (Figure 59).
441. Special Planning Area Designation: lower-income, informally settled areas often fall
outside of formal urban planning and development considerations due to a lack of political will,
the perceived complexity of the issue and pressure to direct investments to new areas and
infrastructure development. Most Pakistan cities have designated a very limited portion of
informal ‘slum’ areas as official ‘katchi abadi’ areas. This is the first step towards establishing
the structure for targeted formal upgrading investments. It is recommended that these
designations be extended to cover as much of an urban area’s informal, lower-income areas
as manageable redevelopment zones towards which budgets can be designated.
F.5.9. Integrated Urban Development – Recommendations
442. No urban component operates in isolation. Each requires the mutual support of, and
integration with, others. In order for an urban area to be sustainable, livable and competitive,
planning and development must fully incorporate a broad range of components establishing
the network of institutional and physical linkages required to gain maximum efficiency and
effectiveness from each investment. As an example, a straight-forward investment in new
water distribution pipelines should be designed with a full understanding of the answers to a
few basic questions:
• Who will be the direct and indirect beneficiaries?
• How will they access the new service?
• Will it be truly accessible by all who should have access? Physically? Financially?
• How will it potentially stimulate economic growth and diversity?
• What potential growth is it planned to serve?
• Is it planned to accommodate future expansion and capacity?
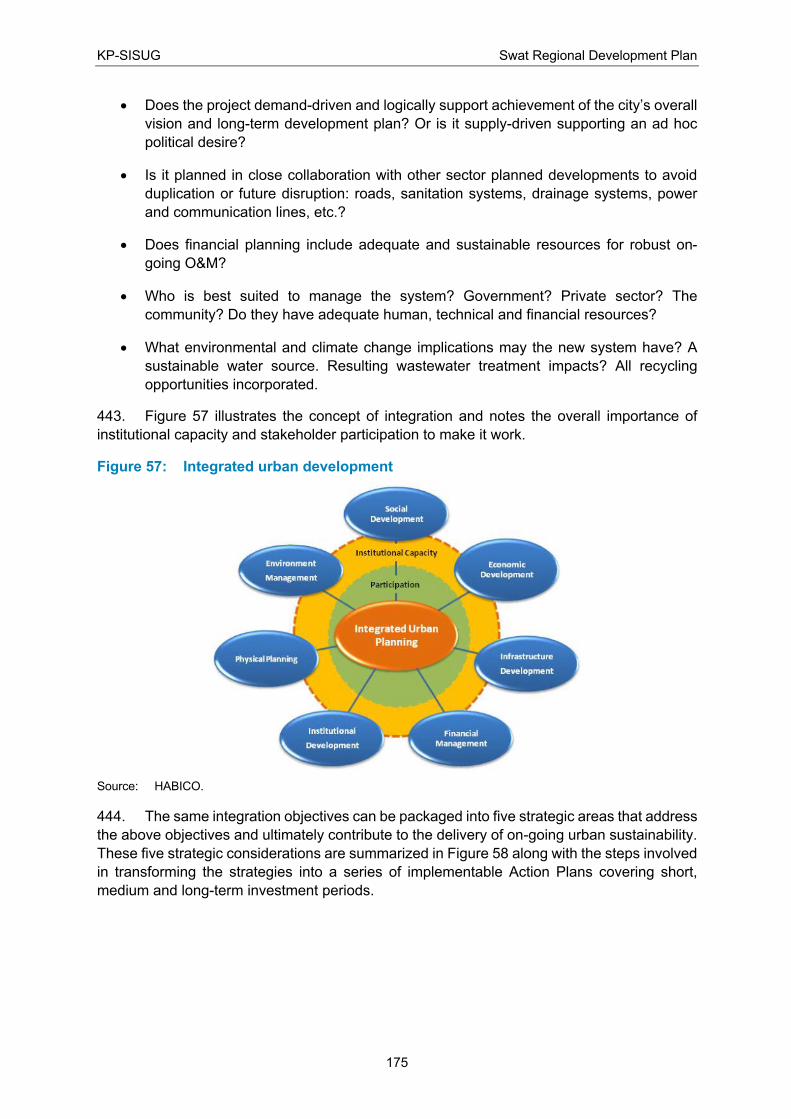
KP-SISUG Swat Regional Development Plan
175
• Does the project demand-driven and logically support achievement of the city’s overall
vision and long-term development plan? Or is it supply-driven supporting an ad hoc
political desire?
• Is it planned in close collaboration with other sector planned developments to avoid
duplication or future disruption: roads, sanitation systems, drainage systems, power
and communication lines, etc.?
• Does financial planning include adequate and sustainable resources for robust on-
going O&M?
• Who is best suited to manage the system? Government? Private sector? The
community? Do they have adequate human, technical and financial resources?
• What environmental and climate change implications may the new system have? A
sustainable water source. Resulting wastewater treatment impacts? All recycling
opportunities incorporated.
443. Figure 57 illustrates the concept of integration and notes the overall importance of
institutional capacity and stakeholder participation to make it work.
Figure 57: Integrated urban development
Source: HABICO.
444. The same integration objectives can be packaged into five strategic areas that address
the above objectives and ultimately contribute to the delivery of on-going urban sustainability.
These five strategic considerations are summarized in Figure 58 along with the steps involved
in transforming the strategies into a series of implementable Action Plans covering short,
medium and long-term investment periods.
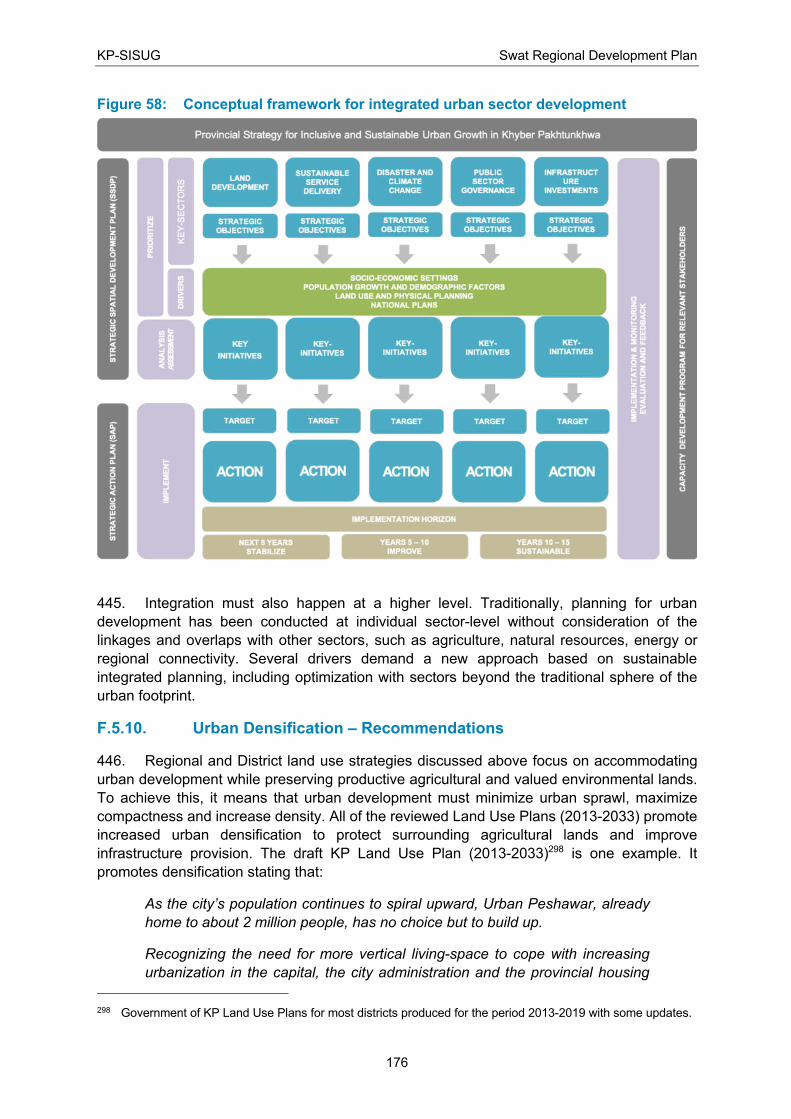
KP-SISUG Swat Regional Development Plan
176
Figure 58: Conceptual framework for integrated urban sector development
445. Integration must also happen at a higher level. Traditionally, planning for urban
development has been conducted at individual sector-level without consideration of the
linkages and overlaps with other sectors, such as agriculture, natural resources, energy or
regional connectivity. Several drivers demand a new approach based on sustainable
integrated planning, including optimization with sectors beyond the traditional sphere of the
urban footprint.
F.5.10. Urban Densification – Recommendations
446. Regional and District land use strategies discussed above focus on accommodating
urban development while preserving productive agricultural and valued environmental lands.
To achieve this, it means that urban development must minimize urban sprawl, maximize
compactness and increase density. All of the reviewed Land Use Plans (2013-2033) promote
increased urban densification to protect surrounding agricultural lands and improve
infrastructure provision. The draft KP Land Use Plan (2013-2033)298 is one example. It
promotes densification stating that:
As the city’s population continues to spiral upward, Urban Peshawar, already
home to about 2 million people, has no choice but to build up.
Recognizing the need for more vertical living-space to cope with increasing
urbanization in the capital, the city administration and the provincial housing
298 Government of KP Land Use Plans for most districts produced for the period 2013-2019 with some updates.
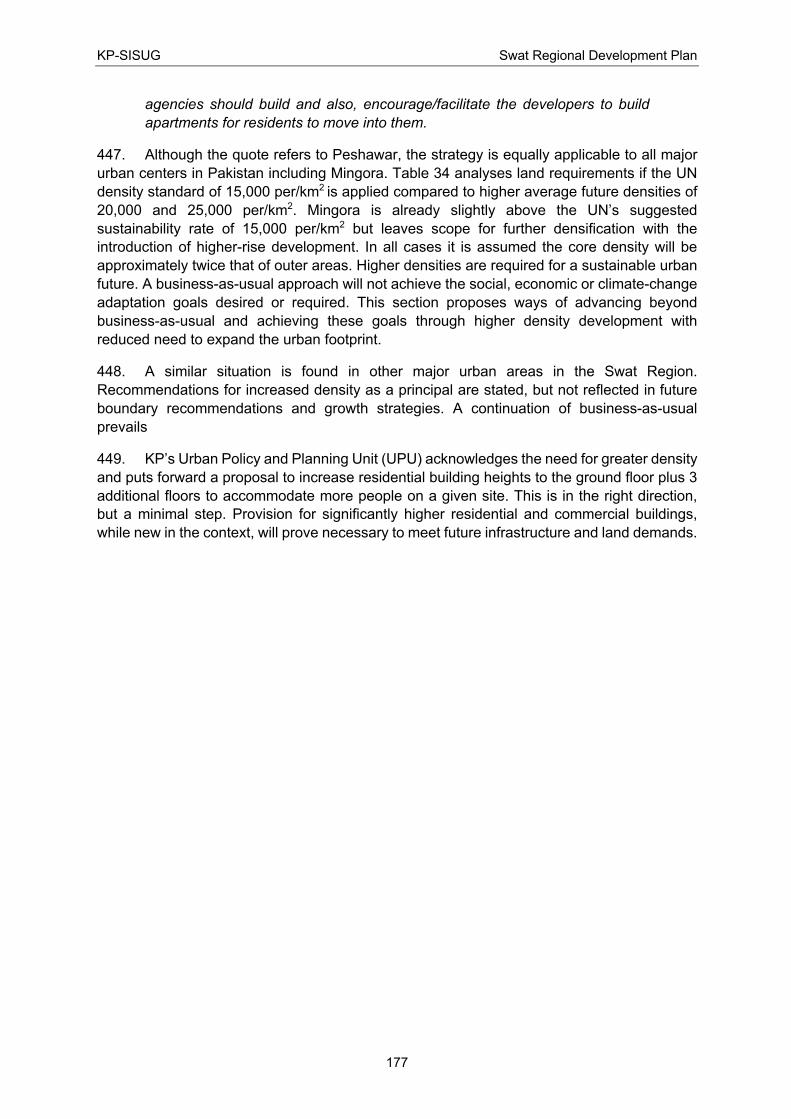
KP-SISUG Swat Regional Development Plan
177
agencies should build and also, encourage/facilitate the developers to build
apartments for residents to move into them.
447. Although the quote refers to Peshawar, the strategy is equally applicable to all major
urban centers in Pakistan including Mingora. Table 34 analyses land requirements if the UN
density standard of 15,000 per/km2 is applied compared to higher average future densities of
20,000 and 25,000 per/km2. Mingora is already slightly above the UN’s suggested
sustainability rate of 15,000 per/km2 but leaves scope for further densification with the
introduction of higher-rise development. In all cases it is assumed the core density will be
approximately twice that of outer areas. Higher densities are required for a sustainable urban
future. A business-as-usual approach will not achieve the social, economic or climate-change
adaptation goals desired or required. This section proposes ways of advancing beyond
business-as-usual and achieving these goals through higher density development with
reduced need to expand the urban footprint.
448. A similar situation is found in other major urban areas in the Swat Region.
Recommendations for increased density as a principal are stated, but not reflected in future
boundary recommendations and growth strategies. A continuation of business-as-usual
prevails
449. KP’s Urban Policy and Planning Unit (UPU) acknowledges the need for greater density
and puts forward a proposal to increase residential building heights to the ground floor plus 3
additional floors to accommodate more people on a given site. This is in the right direction,
but a minimal step. Provision for significantly higher residential and commercial buildings,
while new in the context, will prove necessary to meet future infrastructure and land demands.
KP-SISUG Swat Regional Development Plan
178
Table 34: Mingora population, land and density scenarios
450. Table 34 shows that if the UN’s target density of 15,000 per/km2 is accepted, it will be
necessary to continue expanding Mingora’s urban area from the present day onwards.
However, given the unique situation of Mingora’s surrounding topography and immediate land
use competition with the very limited amount of prime agricultural land in the Region, the case
Projected PopulationDensity Target
Options per/km2
Land Required
km2Notes
2017 Population
331,091 14,914 22 Existing in 2017
2020 Population
369,662 11,000 34 See Notes 1 and 2
15,000 25 See Note 3
20,000 18 (less than existing)
30,000 12 (less than existing)
2025 Population
446,479 11,000 41 See Notes 1 and 2
15,000 30 See Note 3
20,000 22 (existing)
30,000 15 (less than existing)
2030 Population
542,715 11,000 49 See Notes 1 and 2
15,000 36 See Note 3
20,000 27
30,000 18 (less than existing)
2035 Population
663,871 11,000 60 See Notes 1 and 2
15,000 44 See Note 3
20,000 33
30,000 22
2040 Population
817,129 11,000 74 See Notes 1 and 2
15,000 54 See Note 3
20,000 41
30,000 27
2045 Population
1,011,894 11,000 92 See Notes 1 and 2
15,000 67 See Note 3
20,000 51
30,000 34
Note 1: Population Refer to Table __
Note 2: Projected target by KP to 2033
Note 3: UN urban target
Pop. data source: Population and Housing Census, 2017, GOM, BOS.
KP-SISUG Swat Regional Development Plan
179
can made for promoting significantly increased densification. It is acknowledged that the
current situation of unplanned sprawl beyond existing boundaries may require some
adjustment to incorporate selected sprawl areas in order to provide urban services and collect
necessary taxes and user fees. At the same time, a significant cultural mind-set shift is
required to accept a rapid transition from existing urban form to a more hi-rise oriented one.
Moves towards higher-density and restrained urban sprawl are essential. Increased density
can be achieved through urban redevelopment, including high-density TOD developments,
infill, land-pooling or land sharing. Each is discussed below but all require the political will and
institutional capacities and commitment to implement. These also all represent changes to the
historic “business-as-usual” approach and therefore must be accompanied by robust public
communication and participation programs to manage a mind-set shift. Taxation regimes and
accompanying investment incentives are also useful tools to achieve the objectives.
Underlying all innovations must be a demand-driven market to encourage new development.
A government mandated supply-driven approach attempting to change the face of the city
without an actual social and economic demand will fail. To support private sector investment
in any of these densification approaches requires accompanying government investments in
upgraded infrastructure to ensure the extra capacities are available. An efficient and
transparent land market is also required so that property transactions and registrations can
happen smoothly. Equally efficient, consistent and transparent development approval
processes are also essential to not discourage investment.
451. Redevelopment: this simply refers to redeveloping poor condition or under-developed
properties. Assuming there is a market demand, redevelopment can be encouraged through
a robust property tax system. Lands are taxed at their development potential according to the
applicable land use bylaws, not according to the actually existing improvements on the
property. Therefore, a low-density, poor quality and low-revenue property will have difficulty
paying the tax and must either redevelop or sell to someone who can. This increases density,
increases taxation to the local government and lowers per-capita infrastructure costs.
Redevelopment and infill as discussed below should both be aimed at increasing urban
density for the reasons discussed above. With this comes the opportunity for compact mixed-
use developments with a combination of residential, commercial, recreation, cultural, public
green space and a finer network of motorized and non-motorized mobility options.
452. Lower-income, informally developed areas can be redeveloped through establishment
of special interest zones as discussed above. Expanding Pakistan’s designation of ‘katchi
abadi’ zones with formally allocated annual budgets for upgrading and redevelopment would
lay the groundwork for further private sector investment in these areas. Successful global
examples exist of similar initiatives including Brazil’s “PRECEIS” program piloted in a number
of cities which did exactly this with 2% of annual urban budgets dedicated to infrastructure,
social and economic amenities, and environmental improvement.
453. Infill Development: refers to developing undeveloped lots within a built-up area. This
can be undertaken as a private sector investment in residential, commercial or other revenue-
generating development, or by the public sector as an open green space to enhance
neighborhood livability while contributing to climate change adaptation efforts. In the case of
private sector development, this can again be encouraged through a robust property tax
system which essentially penalizes people for allowing serviced land to remain undeveloped.
Figure 59 illustrates infill densification converting some inner-city agricultural parcels to high-
density development thereby helping conserve more valuable out-lying agricultural lands.
Transit-Oriented Development (TOD) is one approach supported by the Government of KP for
densification and transport improvements in all of its draft Land Use Plans (2013-2033). Figure
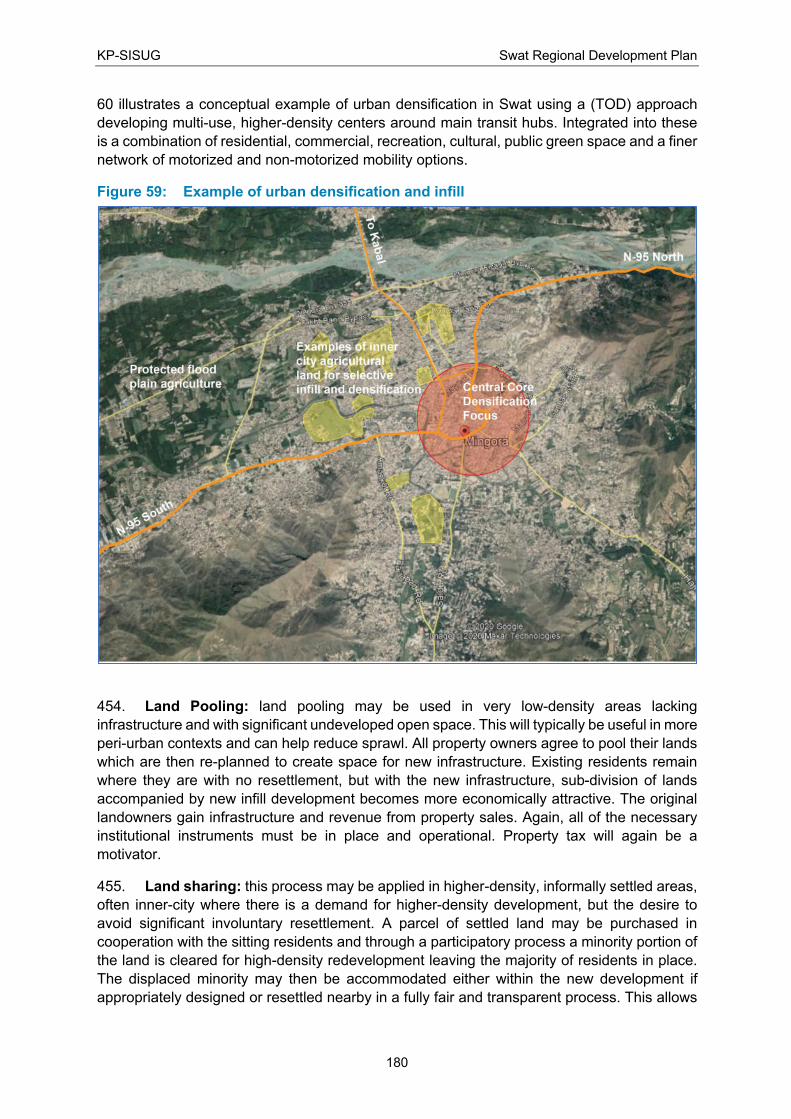
KP-SISUG Swat Regional Development Plan
180
60 illustrates a conceptual example of urban densification in Swat using a (TOD) approach
developing multi-use, higher-density centers around main transit hubs. Integrated into these
is a combination of residential, commercial, recreation, cultural, public green space and a finer
network of motorized and non-motorized mobility options.
Figure 59: Example of urban densification and infill
454. Land Pooling: land pooling may be used in very low-density areas lacking
infrastructure and with significant undeveloped open space. This will typically be useful in more
peri-urban contexts and can help reduce sprawl. All property owners agree to pool their lands
which are then re-planned to create space for new infrastructure. Existing residents remain
where they are with no resettlement, but with the new infrastructure, sub-division of lands
accompanied by new infill development becomes more economically attractive. The original
landowners gain infrastructure and revenue from property sales. Again, all of the necessary
institutional instruments must be in place and operational. Property tax will again be a
motivator.
455. Land sharing: this process may be applied in higher-density, informally settled areas,
often inner-city where there is a demand for higher-density development, but the desire to
avoid significant involuntary resettlement. A parcel of settled land may be purchased in
cooperation with the sitting residents and through a participatory process a minority portion of
the land is cleared for high-density redevelopment leaving the majority of residents in place.
The displaced minority may then be accommodated either within the new development if
appropriately designed or resettled nearby in a fully fair and transparent process. This allows
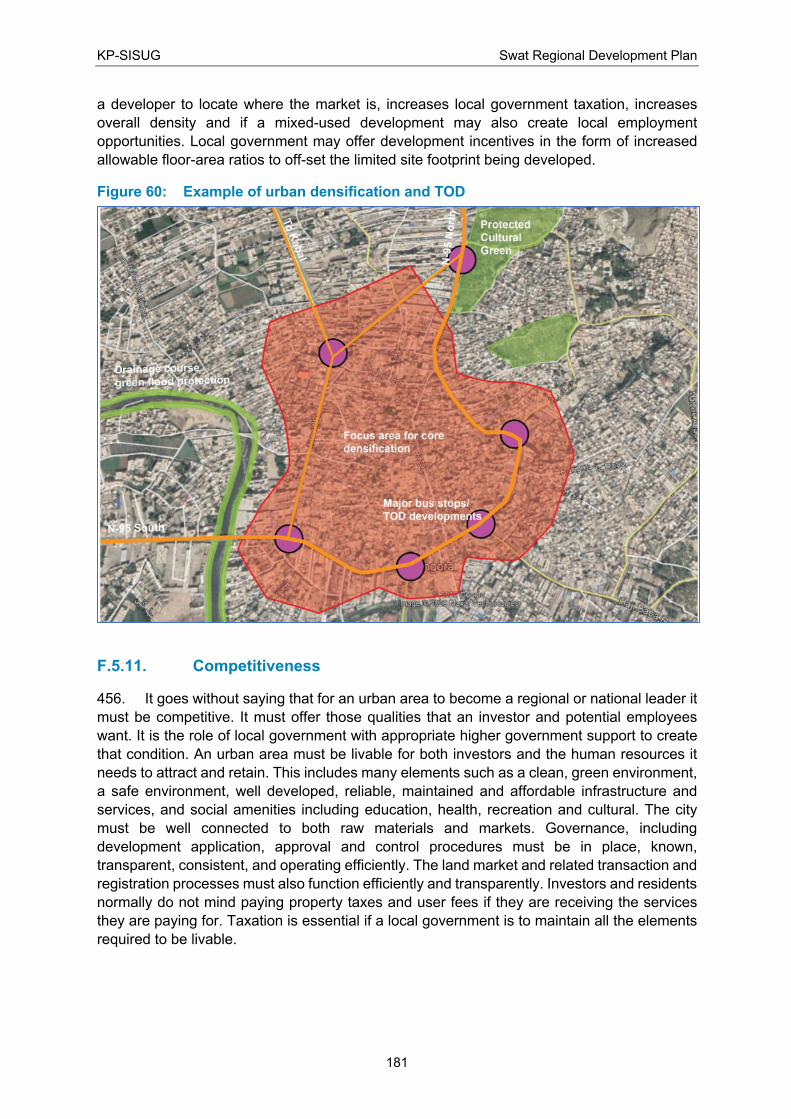
KP-SISUG Swat Regional Development Plan
181
a developer to locate where the market is, increases local government taxation, increases
overall density and if a mixed-used development may also create local employment
opportunities. Local government may offer development incentives in the form of increased
allowable floor-area ratios to off-set the limited site footprint being developed.
Figure 60: Example of urban densification and TOD
F.5.11. Competitiveness
456. It goes without saying that for an urban area to become a regional or national leader it
must be competitive. It must offer those qualities that an investor and potential employees
want. It is the role of local government with appropriate higher government support to create
that condition. An urban area must be livable for both investors and the human resources it
needs to attract and retain. This includes many elements such as a clean, green environment,
a safe environment, well developed, reliable, maintained and affordable infrastructure and
services, and social amenities including education, health, recreation and cultural. The city
must be well connected to both raw materials and markets. Governance, including
development application, approval and control procedures must be in place, known,
transparent, consistent, and operating efficiently. The land market and related transaction and
registration processes must also function efficiently and transparently. Investors and residents
normally do not mind paying property taxes and user fees if they are receiving the services
they are paying for. Taxation is essential if a local government is to maintain all the elements
required to be livable.
KP-SISUG Swat Regional Development Plan
182
G. REGIONAL PHYSICAL CONNECTIVITY
G.1. Regional Connectivity
457. Swat is a distinguished northern region of the Khyber Pakhtunkhwa province located
on north side of Peshawar Valley and lying on Northwestern corner of Pakistan. It is accessible
through M-1 from Karnal Sher Khan Interchange in Nowshera District of KP and also from GT
Road at Nowshera city through N- 45 leading to Mardan City followed by Chakdara for
connection to Swat through -95 (Chakdara-Mingora - Kalam Road). Swat is also accessible
through famed silk route of Karakoram Highway from Behsham to Khwazakhela via Shangla
Top. A few more routes are available from Dir and Bunner sides as well.
458. The region comprises of narrow winding valleys within enclave of high-rise hills and
mountains of Swat. Mingora, the capital of the region, placed closer to south end of region and
closely sited ribbon shaped series of settlements along Swat River are emerging as a complex
urban agglomeration. With some exceptions of high-level hill/mountain stations like, Tall,
Shahdrai, Fazal Banda, Shangla Top, Top Seen, Malam Jabba, Chinar Bagh, Pareena and
Kalaid Kandro most of settlements are located along the banks of River Swat and its tributaries
deep in the valley. Along Swat river, settlements of Barikot, Mingora, Mangalore, Chahar
Bagh, Khwazakhela, Matta, Chakdara, Baidar, Bazkhela, Kala Kot, Bagh Dheri, Bacha Abad,
Dama Lai, Madyan, Behrain, Mankyal Kalan, Matlitan and so many others are located on both
sides along mainstream of Swat River. Whereas Chamtali, Behr, Shakand, Azim Abad, Seer,
Shinkand, Jukhtai, Khair Abad, Utrar, Shangwati, Shakh Dara, Chuperyal, Aghand, Koz,
Shansar, Carsamai, and Kal kaley are located along various tributaries of Swat River.
459. Having limited space around for urban extensions current settlements within the valley
has witnessed abnormal growth and congestion of mass scale on account of high potential of
tourism industry and partially due to migration; as a consequential impact of disturbance on
western borders of the country. Resultantly abnormal urban/rural sprawl has taken place all
along roads running along river streams and sub-valleys. As such the settlements developed
so, are experiencing growing pressure on utilities and transport infrastructure and services.
Irregular population growth of closely located settlements is causing long conurbation along
the available road corridors linking neighboring regions and rest of the country in the south.
460. Further on account of recently developed Phase-1 of Swat Expressway up to
Chakdara; outside the limit of Swat Region, and its further planned extension to Fatehpur
within Swat Area would no doubt facilitate quick access to Swat but it is likely to cause massive
congestion on existing road network in the valley. Speedy delivery of mass volume of traffic
on already congested network would further complicate the travel distribution and
management issue. Therefore, there are two main challenges of urban and rural settlements
control mechanism and road congestion as a result of greater emphasis on Tourism industry
and likely growth of congestion thereof. Swat is likely to experience massive agglomeration
during coming decades. Growing tourism industry and huge potential for its expansion is far
beyond the capacity of available infrastructure and organizational capacity to handle the
challenges. The development initiatives; no doubt shall bring expanded business activities,
but resultant urbanization process, growing congestion and consequential environmental
degradation shall remain challenge for times to come.
KP-SISUG Swat Regional Development Plan
183
G.1.1. Road Network Resources
461. Having population of 2.55 million, Swat region is linked through metaled road network
of 974.351 km. It constitutes route length of 127 km of N-95, and 30 km of N- 90, 58.20 km of
provincial highways and 346.90 km of rural access roads. Area of region being 5,337 Sq.km,
Road density of Swat is 0.1825. Swat road density is low as compared to Provincial figure of
0.300 and 0.320 for Pakistan, simply because Swat being a mountainous region, population
mostly remain concentrated within narrow valleys resulting limited number of roads that could
be developed and consequential road congestion on available network. Road network
coverage, through standard width of rural access roads is significantly low.
G.1.1.1. Road Network Connectivity
462. Mingora city together with neighboring settlements of Kabal, Saidu Sharif, Derai, Bara
Banda, Manglor, Chaharbagh, Shakdara, and Mingola and large-scale growing conurbation
along N-95 and surrounding links, together with sparsely populated rural settlements in the
surroundings would ultimately form Greater Mingora. To ensure economic growth and
equitable access to region resources and social services, sustainable physical connectivity is
essential amongst above stated settlement entities within and beyond regional boundaries.
Quality of physical connectivity focuses precisely on the physical network of corridors through
which the mobility of resources flows every day. The main components that reflect the
effectiveness of this road network is the coverage required to support the daily traffic
generated by the needs of the inhabitants, as well as the quality offered through infrastructure
to accomplish safer and more efficient service connections.
463. N-95 and N-90 are two primary corridors that link the region with surrounding regions
and the countryside beyond. N-95 originates from Chakdara town; located in Malakand district,
just outside Swat Region, for its destination to Kalam through the region is considered the
backbone of both regional and inter-regional connectivity to middle and southern parts of
Khyber Pakhtunkhwa province. From Chakdara; connectivity to central regions of KP is
consolidated through N-45 for its connection with N-5 (historic Gt Road) and Phase-1 of Swat
Expressway that links with M-1 through Kernal Sher Khan Interchange. Connectivity with
western region of upper Dir is facilitated through Kalam Utrar Road falling in the highlands of
the region in the north. N-90 originating from Khwazakhela for Behsham located on KKH
provides inter regional connectivity from middle of Swat region with Shangla, Kohistan,
Batagram and Abbottabad regions of KP. N-95 through N-45 and N-5 provide connectivity with
international border crossing point (BCP) of Torkham for Afghanistan on west side and
Islamabad, Lahore and BCR Wagha for India. Whereas; N-90 links KKH at Behsham for
connectivity to BCP at Khunjerab for China in the North and M-1 and N-5 for connection to
Islamabad and Karachi/Gwadar ports in the south.
464. Madyan Matta Chakdara Highway also controlled by Provincial Highway Department,
runs parallel to N-95 on right side of Swat River. It is an important inter regional route providing
connectivity of freight and travelers through less congested route to Swat Valley. Kalam Dir
Highway provide connectivity of upper areas of Swat Region with upper Dir and Chitral
accessible to border crossing point of Arundu to Afghanistan. Apart Barikot Sowari Road,
Mingora-Sultanwas Sowari Road, Kabal Gulabad Road, and Tatano Toormang Road are
inter-regional routes as all provide inter-regional connectivity of Swat with Malakand and lower
Dir Region. But, in spite of the physical connectivity all these four roads pass through hilly and
mountainous ranges traversing high altitudes, therefore, their character is more or less of rural
access roads and therefor least traffic is observed for inter- regional mobility.
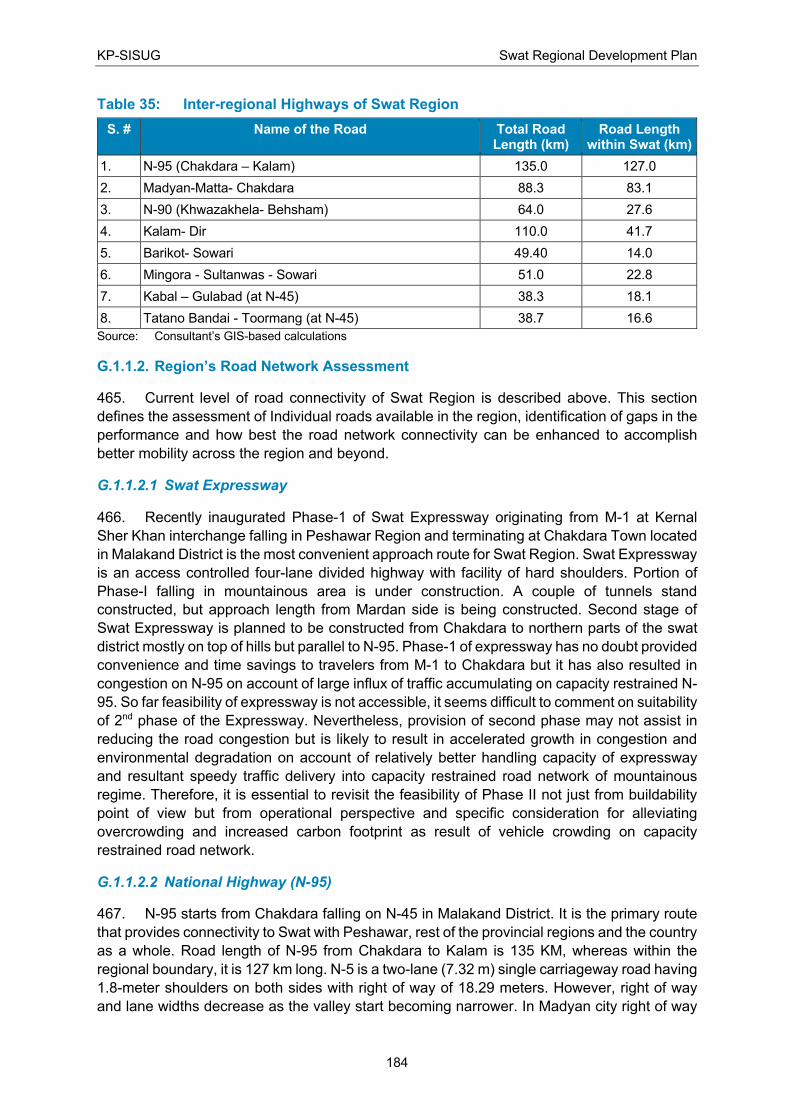
KP-SISUG Swat Regional Development Plan
184
Table 35: Inter-regional Highways of Swat Region
S. # Name of the Road Total Road Length (km)
Road Length within Swat (km)
1. N-95 (Chakdara – Kalam) 135.0 127.0
2. Madyan-Matta- Chakdara 88.3 83.1
3. N-90 (Khwazakhela- Behsham) 64.0 27.6
4. Kalam- Dir 110.0 41.7
5. Barikot- Sowari 49.40 14.0
6. Mingora - Sultanwas - Sowari 51.0 22.8
7. Kabal – Gulabad (at N-45) 38.3 18.1
8. Tatano Bandai - Toormang (at N-45) 38.7 16.6
Source: Consultant’s GIS-based calculations
G.1.1.2. Region’s Road Network Assessment
465. Current level of road connectivity of Swat Region is described above. This section
defines the assessment of Individual roads available in the region, identification of gaps in the
performance and how best the road network connectivity can be enhanced to accomplish
better mobility across the region and beyond.
G.1.1.2.1 Swat Expressway
466. Recently inaugurated Phase-1 of Swat Expressway originating from M-1 at Kernal
Sher Khan interchange falling in Peshawar Region and terminating at Chakdara Town located
in Malakand District is the most convenient approach route for Swat Region. Swat Expressway
is an access controlled four-lane divided highway with facility of hard shoulders. Portion of
Phase-I falling in mountainous area is under construction. A couple of tunnels stand
constructed, but approach length from Mardan side is being constructed. Second stage of
Swat Expressway is planned to be constructed from Chakdara to northern parts of the swat
district mostly on top of hills but parallel to N-95. Phase-1 of expressway has no doubt provided
convenience and time savings to travelers from M-1 to Chakdara but it has also resulted in
congestion on N-95 on account of large influx of traffic accumulating on capacity restrained N-
95. So far feasibility of expressway is not accessible, it seems difficult to comment on suitability
of 2nd phase of the Expressway. Nevertheless, provision of second phase may not assist in
reducing the road congestion but is likely to result in accelerated growth in congestion and
environmental degradation on account of relatively better handling capacity of expressway
and resultant speedy traffic delivery into capacity restrained road network of mountainous
regime. Therefore, it is essential to revisit the feasibility of Phase II not just from buildability
point of view but from operational perspective and specific consideration for alleviating
overcrowding and increased carbon footprint as result of vehicle crowding on capacity
restrained road network.
G.1.1.2.2 National Highway (N-95)
467. N-95 starts from Chakdara falling on N-45 in Malakand District. It is the primary route
that provides connectivity to Swat with Peshawar, rest of the provincial regions and the country
as a whole. Road length of N-95 from Chakdara to Kalam is 135 KM, whereas within the
regional boundary, it is 127 km long. N-5 is a two-lane (7.32 m) single carriageway road having
1.8-meter shoulders on both sides with right of way of 18.29 meters. However, right of way
and lane widths decrease as the valley start becoming narrower. In Madyan city right of way
KP-SISUG Swat Regional Development Plan
185
is 10.67 meter. Highway from Madyan to Kalam have average right of way of 10.67 meters
and travel way of 6.10 meters. Surface quality of the road is quite good, however, sign
postings, and road markings are lacking. At many places narrow bridges still exist that create
road bottlenecks and need to replace with widened bridge structures. At some other places,
temporary equipment bridges are installed, where old bridge structures stand eroded during
recent floods. Same needs to be replaced with new bridge structures to enable free flow of
traffic on damaged road section. In the last reaches between Madyan to Kalam, road
pavement is recently built and lot of bridge sites are under construction process. As soon as
the road enters the Swat region, it is flanked with uncontrolled commercial development and
remains usually blocked on account of linear conurbation and commercial activity all along the
road right up to Khwazakhela town. It looks as if; with exception of a few green patches, almost
half the road length is urban in character and liable to blockades and congestion. National
Highways and Motorways Police is operating on motorways and other important National
Highways but not operating on this important route. Local police is well placed and mostly
visible in Mingora city only but least posted on regular basis on any section of the highway.
Therefore, traffic enforcement within the capital city of the Mingora is quite visible but remains
totally absent on highways and rural access roads.
G.1.1.2.3 National Highway (N-90)
468. N-90 starts from settlement of Khwazakhela situated at a distance of 30 Km from
Mingora on its north. Passing through the picturesque mountains of Shangla top and Alpuri,
the road connects with Behsham city at a distance of 64 km, later falling on KKH in Shangla
District. It is a two lanes single carriageway without the provision of hard shoulders with right
of way of 18 meters. It experiences congestion within city limits of Khwazakhela on account of
uncontrolled roadside retail commercial activity. Since the road connects scenic mountainous
places and important CPEC route, it remains fairly busy. However, safety conditions on the
road are poor on account of frequent sharp turns; least equipped with guard rails, requisite
signage/ road surface markings and treatments against the roadway departures. No bus
service is observed operating on this road, however specifically hired mini -bus coaches are
witnessed. Local freight traffic is operating on this route. Concrete safety barriers, installed on
river sides are far below any standard, therefore, need to be replaced with standardized guard
rails or kerb barriers as part of counter measures program against rural roadway departures.
An important inter-regional route needs upgradation through realigning some of its critical
sections and improvement of road safety conditions instead of replacing through proposed E-
90 Expressway, as planned by National Highway Authority.
G.1.1.2.4 Madyan Chakdara Road via Matta and Kabal
469. Route length of 88.3 km long Chakdara Madyan through Matta is an inter -regional
provincial highway running on right side of Swat River. Section of this highway is also known
as Airport Road in the suburbs of Mingora. It is two lanes single carriageway asphalted road,
flanked with 1.22-meter concrete shoulders. Its carriageway width is 7.32 meters and its right
of way varying between 13.72m to 20.12m. The road remains busy within the urban settlement
accommodating Saidu Sharif Airport and within limits of other main settlements like Matta,
Kabal and others. N-95 being too busy Madyan Chakdara is the preferred route for freight
traffic. Its road surface/ pavement condition within exception of few patches is excellent. Being
less trafficked road, it is preferred route for commuters. However, like other roads it does not
accommodate any pedestrian facility as it passes through urbanized settlements.
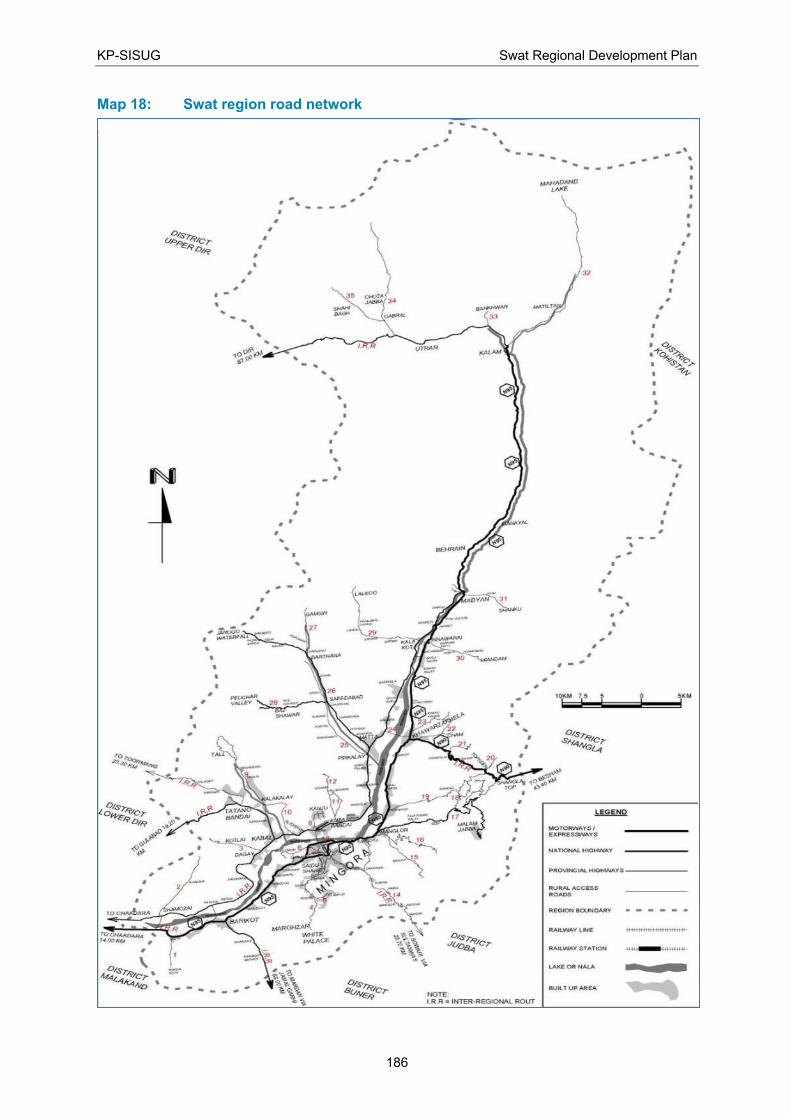
KP-SISUG Swat Regional Development Plan
186
Map 18: Swat region road network

KP-SISUG Swat Regional Development Plan
187
G.1.1.2.5 Malam Jabba Road
470. The road leading to skying resort of Malam Jabba located on mountain top originates
from Manglore, a suburb of Mingora falling on N-95 at a distance of 9 Km from the city center.
It is newly built two lanes road flanked with paved shoulders and right of way of 14.5 meters.
It is well marked and provided with sign postings on important road turns. Most of bridge sites
are under construction process; however, road is in operation through installing temporary
bridge structures. Being a mountainous road, concrete kerb installed on outer valley side are
bellow standard and unsafe. Being an important and busy route during skying season, entire
road length needs to be reviewed through a conduct of safety assessment, identification of
likely roadway departure sites and preparation of a comprehensive mass action program of
countermeasures against the roadway departures.
G.1.1.2.6 Kalam Dir Highway
471. Kalam Dir Highway provides connectivity of Swat to famous tourist destination of
Kumrat Valley, Upper Dir, Chitral Regions up to BCP of Arundu for Afghanistan. The road is
in poor condition and closed for light traffic as taken up by KPHA for its upgrading and
reconstruction. It is being built as two lanes single carriageway width of 6.10 meters and
additional width of 1.22 meter on both sides for concrete paved shoulders. As discussed with
Subdivisional Officer of the Department, the road shall provide for all required road safety
appliances but not standardized roadside barriers and concrete kerb, on the identifiable spots
of roadway departures. Being an important route, it is suggested to carry out the road safety
audit of the proposed road design and improve upon the road safety provisions accordingly.
G.1.1.2.7 Kabal-Tatano Bandai-Gulabad Road
472. Technically Kabal-Tatano-Bandai road is an inter-regional road connecting Kabal area;
a suburb of Mingora lying on Madyan-Matta- Chakdara Road, with Chakdara on N-45 in
Malakand District. Passing through hill tops, practically it is a rural access road by all means.
The road’s ROW varies between 9.14 to 16.76 meters Its carriageway width varying between
4.27m to 6.10m. Its two lanes wide road with varying width of 2.13m to 3.05m and paved
shoulder width of 1.20m on both sides. Pavement condition is good between Kabal to Tatano
Bandai, road improvement is in process between Tatano Bandai to District Dir boundary
between Swat and Dir on hilltop. The old sections of the road are devoid of superelevation,
signage, guardrails and /or roadside kerb barriers for safety of vehicles at sharp curved road
sections.
G.1.1.2.8 Other Regional Roads
473. Apart from interregional routes as explained above, and host of rural link roads and
tracks, following are some important road links that serve the region.
Table 36: Other regional roads
S. # Road Name Connecting Destinations Route Length (km)
1 Thalang-Chorkhai Road Kota(N-95), Manzai Kota 8.10
2 Shamozai-Khazana Road Shamozai, Khazana 11.30
3 Dagay-Kotlai Dagay (Shamozai Road)-Kotlai 9.00
4 Saidu sharif-Marghazar Road Saidu sharif, Marghazar 14.20
5 Islampur Road Kokrai (Marghazar Road), Islampur 2.70
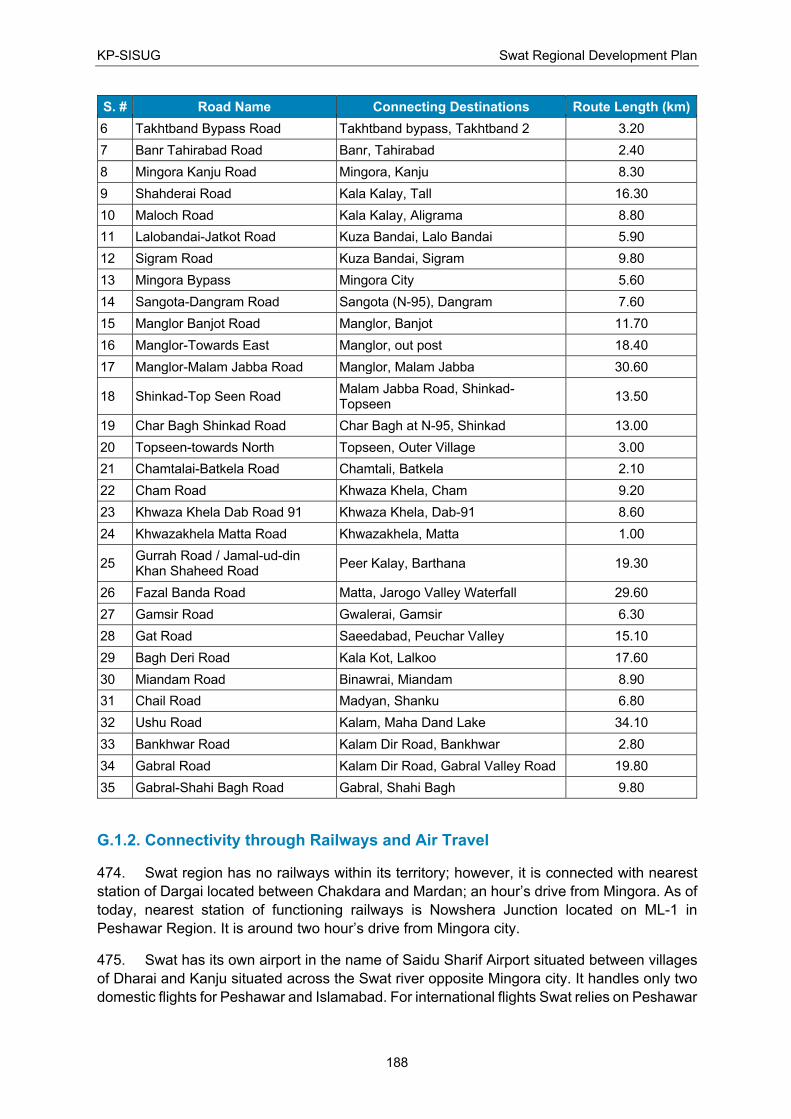
KP-SISUG Swat Regional Development Plan
188
S. # Road Name Connecting Destinations Route Length (km)
6 Takhtband Bypass Road Takhtband bypass, Takhtband 2 3.20
7 Banr Tahirabad Road Banr, Tahirabad 2.40
8 Mingora Kanju Road Mingora, Kanju 8.30
9 Shahderai Road Kala Kalay, Tall 16.30
10 Maloch Road Kala Kalay, Aligrama 8.80
11 Lalobandai-Jatkot Road Kuza Bandai, Lalo Bandai 5.90
12 Sigram Road Kuza Bandai, Sigram 9.80
13 Mingora Bypass Mingora City 5.60
14 Sangota-Dangram Road Sangota (N-95), Dangram 7.60
15 Manglor Banjot Road Manglor, Banjot 11.70
16 Manglor-Towards East Manglor, out post 18.40
17 Manglor-Malam Jabba Road Manglor, Malam Jabba 30.60
18 Shinkad-Top Seen Road Malam Jabba Road, Shinkad-Topseen
13.50
19 Char Bagh Shinkad Road Char Bagh at N-95, Shinkad 13.00
20 Topseen-towards North Topseen, Outer Village 3.00
21 Chamtalai-Batkela Road Chamtali, Batkela 2.10
22 Cham Road Khwaza Khela, Cham 9.20
23 Khwaza Khela Dab Road 91 Khwaza Khela, Dab-91 8.60
24 Khwazakhela Matta Road Khwazakhela, Matta 1.00
25 Gurrah Road / Jamal-ud-din Khan Shaheed Road
Peer Kalay, Barthana 19.30
26 Fazal Banda Road Matta, Jarogo Valley Waterfall 29.60
27 Gamsir Road Gwalerai, Gamsir 6.30
28 Gat Road Saeedabad, Peuchar Valley 15.10
29 Bagh Deri Road Kala Kot, Lalkoo 17.60
30 Miandam Road Binawrai, Miandam 8.90
31 Chail Road Madyan, Shanku 6.80
32 Ushu Road Kalam, Maha Dand Lake 34.10
33 Bankhwar Road Kalam Dir Road, Bankhwar 2.80
34 Gabral Road Kalam Dir Road, Gabral Valley Road 19.80
35 Gabral-Shahi Bagh Road Gabral, Shahi Bagh 9.80
G.1.2. Connectivity through Railways and Air Travel
474. Swat region has no railways within its territory; however, it is connected with nearest
station of Dargai located between Chakdara and Mardan; an hour’s drive from Mingora. As of
today, nearest station of functioning railways is Nowshera Junction located on ML-1 in
Peshawar Region. It is around two hour’s drive from Mingora city.
475. Swat has its own airport in the name of Saidu Sharif Airport situated between villages
of Dharai and Kanju situated across the Swat river opposite Mingora city. It handles only two
domestic flights for Peshawar and Islamabad. For international flights Swat relies on Peshawar
KP-SISUG Swat Regional Development Plan
189
and Islamabad international airports which stand connected through N-95, through N-45 and
N-5 and Swat Expressway and M-1.
G.1.3. Interregional Connectivity
476. Swat Region is connected with surrounding regions, provinces and territories through
following road links:
National Highway N-95, running close, and mostly along left side of Swat River from
Chakdara town of Malakand District connects all major settlements of the region including
Mingora, Khwaza Khela, Madyan, Behrain and Kalam. Between Madyan and Behrain N-
95 remains on east side of the river. On the south, N-95 connects with N-45 at Chakdara
that further links with Dir and Chitral regions in the north-western direction. From Mirkhani
on way to Chitral, N-45 is connected; through Chitral Jalalabad Road to a border crossing
point at Arundu for Afghanistan. On south-east side, N-45 links to cities of Mardan and
later to Nowshera on N-5. N-5 provides connectivity to Peshawar and further to border
crossing point with Afghanistan at Torkham. On eastern side N-5 leads to Islamabad; the
capital city and Lahore for Border Crossing point at Wagha for India and Karachi in the
south-west for port facility. At Chakdara’ N-95 is also linked to M-1; through Swat
Expressway providing connectivity through all parts of the country.
Parallel to N-95 on west side of Swat River runs a provincial Highway complementing,
north -south regional connectivity through Madyan Matta Chakdara Road. Compared to
N-95 road is lightly trafficked hence favorite route of freight traffic.
National Highway N-90 initiating from Khwazakhela facilitates Swat connectivity to KKH(N-
35) at Behsham for further connectivity to border crossing point with China at Khunjerab
Pass in the north and Abbottabad and rest of the country towards south.
Road from Kalam to Utrar leading to Sheringal in Upper Dir Region connects with N-45 at
Dir for connection to Chitral in the north-west and Chakdara in South East.
Apart from above there are a few other routes to provide inter regional connectivity. Since
all such routes pass through mountain passes at significant heights, role of such roads
remains more of rural access roads. Such category of roads includes Mingora Sowari
Mardan Road connecting district Judba, Bunner and Mardan, Barikot Jamal Ghari Mardan
Road connecting Swat with Bunner and Mardan Districts, Kabal Gulabad Road for
connectivity with N-45 in Lower Dir, and Kabal Tatano Bandhai Toormang Road
connecting N-45 in Lower Dir.
An additional Expressway is planned to be developed by National Highway Authority to
connect Khwazakhela with Behsham as an alternate route to N-90.
There is another planned proposal from KP Provincial Government to construct 4 lanes
divided expressway from Chakdara to Mingora via Shamozai (right side of the river).
Proposed 40 km expressway shall supplement N-95 and Chakdara Shamozai Kabal
Mingora section of Chakdara Matta Madyan Highway.
G.1.3.1. Connectivity with CPEC and CAREC
477. N-90 originating from Khwaza Khela town of central area of Swat is connected with
CPEC at Behsham on KKH and CAREC financed part of E-35. Whereas N-95 is connected
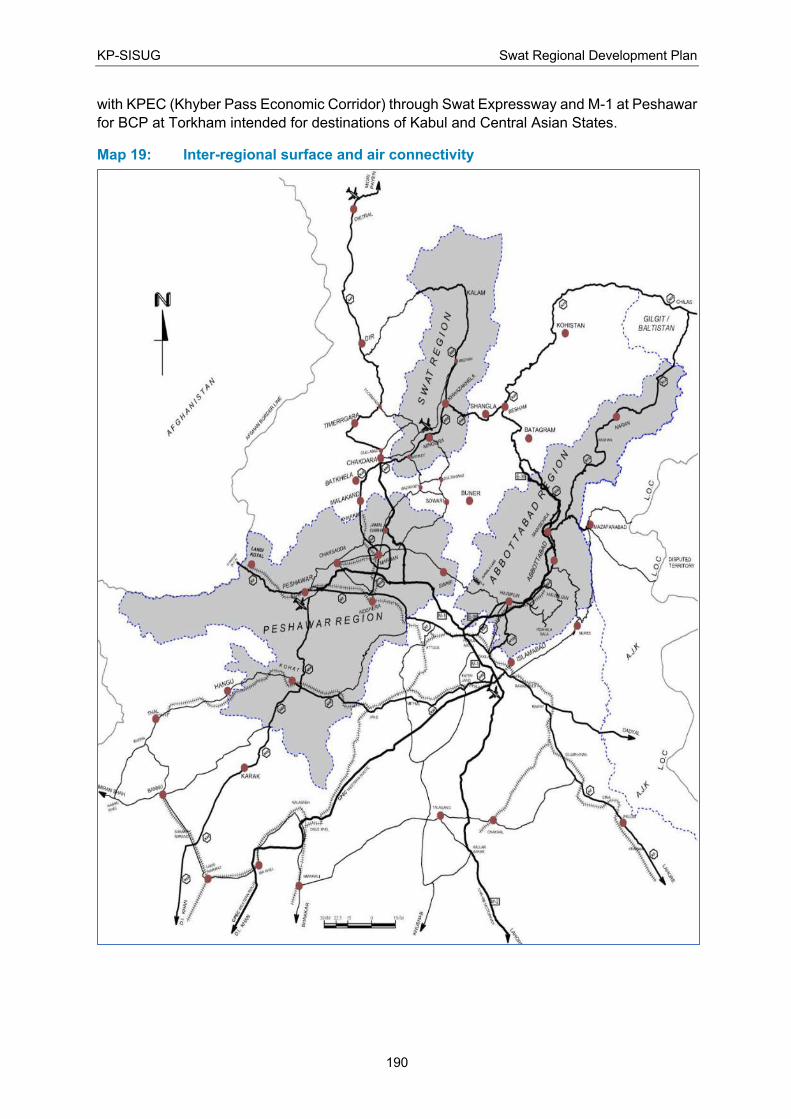
KP-SISUG Swat Regional Development Plan
190
with KPEC (Khyber Pass Economic Corridor) through Swat Expressway and M-1 at Peshawar
for BCP at Torkham intended for destinations of Kabul and Central Asian States.
Map 19: Inter-regional surface and air connectivity
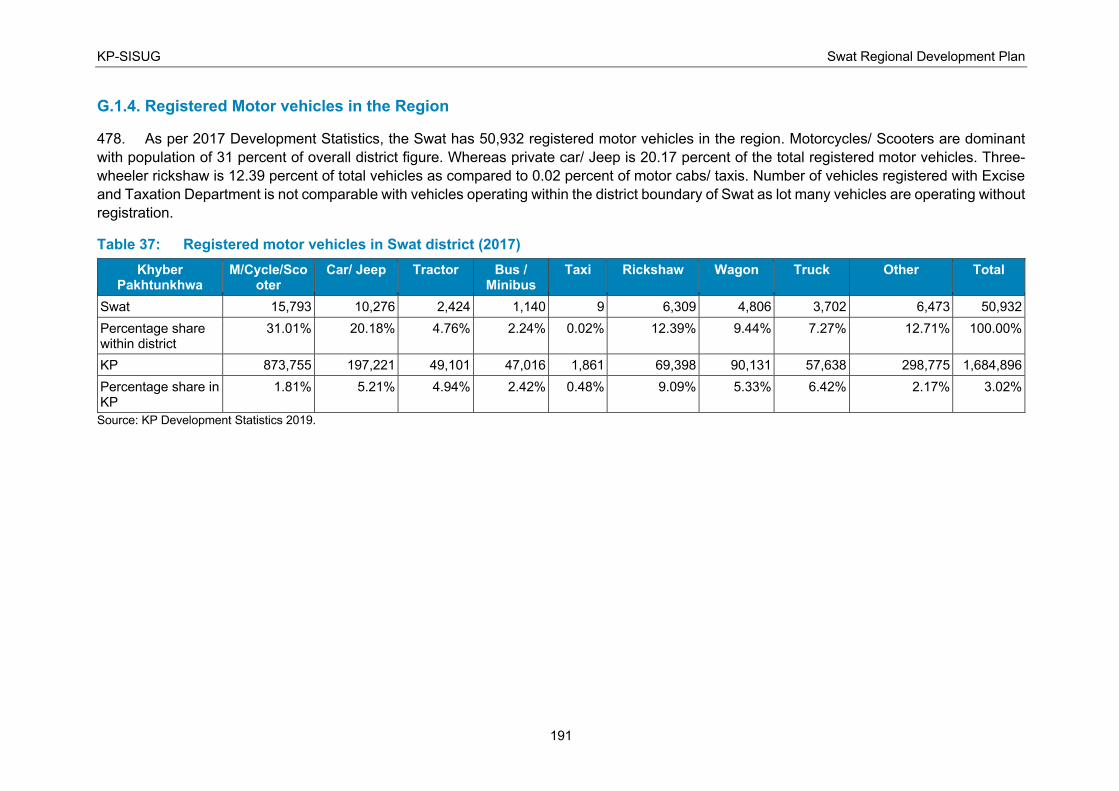
KP-SISUG Swat Regional Development Plan
191
G.1.4. Registered Motor vehicles in the Region
478. As per 2017 Development Statistics, the Swat has 50,932 registered motor vehicles in the region. Motorcycles/ Scooters are dominant
with population of 31 percent of overall district figure. Whereas private car/ Jeep is 20.17 percent of the total registered motor vehicles. Three-
wheeler rickshaw is 12.39 percent of total vehicles as compared to 0.02 percent of motor cabs/ taxis. Number of vehicles registered with Excise
and Taxation Department is not comparable with vehicles operating within the district boundary of Swat as lot many vehicles are operating without
registration.
Table 37: Registered motor vehicles in Swat district (2017)
Khyber Pakhtunkhwa
M/Cycle/Scooter
Car/ Jeep Tractor Bus / Minibus
Taxi Rickshaw Wagon Truck Other Total
Swat 15,793 10,276 2,424 1,140 9 6,309 4,806 3,702 6,473 50,932
Percentage share within district
31.01% 20.18% 4.76% 2.24% 0.02% 12.39% 9.44% 7.27% 12.71% 100.00%
KP 873,755 197,221 49,101 47,016 1,861 69,398 90,131 57,638 298,775 1,684,896
Percentage share in KP
1.81% 5.21% 4.94% 2.42% 0.48% 9.09% 5.33% 6.42% 2.17% 3.02%
Source: KP Development Statistics 2019.
KP-SISUG Swat Regional Development Plan
192
G.1.5. Region’s Mobility Challenges and Drivers of Change
479. Most important challenges of Swat region are its enormous potential for tourism, its
location, topography and its formation, consequential settlement’s growth in valleys and
limited capacity road links experiencing growing road congestion within and around the urban
settlements and region’s network during peak tourist seasons. Both N-95, together with
parallel route of Chakdara Madyan(S-3B) and to lesser extent N-90 highways are the
backbone of regional mobility. Since the region lies in neighborhood of CPEC route linking
northern areas of Pakistan and Khunjerab Pass border crossing to China, it is expected for N-
90 to start experiencing congestion through the year around, but more severely during
summers when tourists visit the valley in masses. As the CPEC gets operational, road
congestion is likely to become more alarming.
480. Recently inaugurated Swat Expressway has no doubt resulted in travel time savings
and convenient accessibility to the region but on the other hand it has multiplied the road
congestion on already problematic N-95 on account of process of swift delivery of traffic from
the Expressway at Chakdara. Resultantly it, keeps it extremely busy form its start at Chakdara
to the settlement of Khwazakhela situated in the middle of the region. Roads to Malam Jabba
and link to upper Dir from Kalam are also experiencing congestion partly because of road
capacity issue and more importantly there is absolutely no control on private vehicles
ownership. Road from Kalam to Dir is under construction whereas link from Kalam to Maha
Dando Lake is yet to be paved. Fastly growing vehicle ownership coupled with rising tourists’
traffic is contributing towards road congestion, mounting vehicle emissions, escalating carbon
footprint and consequential environmental degradation are key issues associated with Swat
region.
481. KP government has also planned to construct Phase II of 79 Km long Swat
Expressway from Chakdara to the north to terminate at Fatehpur. Proposed alignment is
proposed to be running on higher altitudes on mountain tops as compared to N-95 and S.3B
running down through the valley. Proposed Phase II shall no doubt spread the traffic and result
in lowering the road congestion from the main access to the Swat, but congestion issue is
likely to be simply transferred from access road (Swat Expressway phase ii) to the regional
distributors. Problem is likely to continue acerbating unless usage of public transport as a
major means of access to swat is not adopted and usage of private cars is not controlled.
Construction of Phase II of the Expressway and growing car ownership in the region and lack
of any sustainable policy on tourism traffic would result in high degree of road congestion and
environmental degradation at the expense of natural beauty of the region.
482. Higher degree of individual car ownership is on account of non-application of custom
duty on all imported vehicles for Swat residents. Therefore, all types of vehicle brands from
abroad are available at much cheaper rates as compared to any other district of KP or any
other part of the country. Any move to discourage the use of private car would require an
appropriate strategy other than the levy of custom/ import duty. That may include road pricing,
strict controls; through declaring areas banned for parking and heavily charged parking
wherever deemed feasible.
483. Answer to the above-mentioned issue lies in discouraging the use of private cars,
diesel operated vehicles, and encouraging usage of electric operated, public transport buses
and individual vehicles on main routes and shared services journeys to higher altitudes and
remote valleys. Such a policy decision has to be part of the Region’s Mobility Strategy and
Tourism Policy. For local population private vehicle usage need to be gradually replaced
KP-SISUG Swat Regional Development Plan
193
through electric operated fleets. Regular bus operations are suggested on Chakdara-Kalam,
Kalam – Dir and Khwazakhela routes with connected shared mobility services to rural
destinations. Government in collaboration of private concerns need to invest in alternate
energy sources; preferably hydro, wind and solar and provision of frequent charging points all
along highways and adequately placed tourism spots and rural communities.
484. Roadside linear conurbations on highways need to be strictly controlled through
exercise of development control mechanisms and roadside parking within urban limits to be
checked and heavily charged to avoid road congestion. On Highways access management
need to be exercised on all major urban settlements through capacity enhancement of local
authorities and administrative reforms to improve urban governance.
485. Swat region is largely mountainous and most of region’s road network follows the rout
alignments along streams and mountain sides with winding configurations facing roadway
departures and high speeds on newly built roads. Any counter measures to overcome this
issue and relevant road safety applications are generally lacking throughout the road network.
In nutshell road network and system as a whole is safety deficient requiring serious efforts to
make it safe through safe system approach.
G.1.5.1. Articulating Regional Mobility Strategy (RMS)
486. Recognizing the opportunity and responsibility to improve movement of people and
goods and in particular mobility enhancement during tourism seasons within the Swat Region,
the office of the Deputy Commissioner, Swat is proposed to be initiating the Regional Mobility
Strategy (RMS), essentially required to understand the opportunities and implications
associated with future major transportation and community investments, and to prioritize those
investments. Changing views, needs, and expectations for greater neighborhood and regional
connectivity and livability are motivating communities to re-examine traditional and innovative
transportation solutions. Since the Deputy Commissioner office is least staffed to deal with
technical matters, it is more appropriate for the provincial Transport Department to post the
representative of Directorate of Transport called Secretary District Regional Transport
Authority (DRTA) as per law, under the direct supervision of the Deputy Commissioner office
for coordinating all transport related activities at regional level.
G.1.5.1.1 Purpose of the Strategy
487. Provincial Department of Transport funded and stakeholder driven, RMS is suggested
to focus on improving project design with multimodal solutions that contribute to both
transportation mobility and economic vitality for the residents of the Swat Region. RMS will
identify opportunities that provide a path forward for decision making, design and funding
prioritization for projects that will promote economic development in the region. It will evaluate
infrastructure, policy, and technology opportunities at the regional level. It shall also address
the road congestion during peak periods of tourism industry.
G.1.5.1.2 Expected Outcomes
488. RMS is suggested to evaluate infrastructure, policy, and technology opportunities at
the regional level that would:
• Decrease travel times
• Increase connectivity
KP-SISUG Swat Regional Development Plan
194
• Decrease road congestion
• Improve level of service
• Increase network reliability and job opportunities
• Provide additional modal opportunities
• Decrease emission levels and carbon footprint
• Preserve community character, cohesion and quality of life
• Identify projects for funding and implementation
• Promote economic development opportunities.
G.1.5.2. Establishing Transit Route from Chakdara to Kalam
489. Apart from controlling urban sprawl happening all along N-95 and parallel route of
Chakdara Matta Madyan Road, it is high time for capacity enhancement of the corridor.
Addition of Swat Expressway has no doubt provided a relief, however, sever congestion is
noticeable on N-95; from its entry point in Swat to Khwazakhela town; current limit of urban
conurbation along the highway. To serve the area more effectively for towns of Kota, Barikot,
Ghalegay, Timadagh, Dahdra, Kabal, Mingora, Saidu Sharif Airport Area, Manglor, Charbagh,
and all settlement on both sides of Swat River up to village Konia and Drushkhela on N-95,it
is suggested to be connected through independent transit route to be developed along both
banks of Swat River up to Drushkhela in the first phase and to extendable to Kalam in Second
stage. New alignment on both sides of river is suggested for transit, because all above said
settlements have emerged all along the alignment of N-95 utilizing it for commercial activities
and leaving least space for road widening for exclusive use of buses. Proposed 2-lanes transit
route is suggested to be flanked with cycle tracks and footways close and within the limits of
urban settlements only.
490. So apart from developing quite a few linkages in these settlements to transit line
required to for access to the transit route, situation requires a shift in the strategy to improve
the capacity of N-95 and S-3B. As the travel requirement would increase, it is appropriate to
service the demand through shared mobility. Entire corridor needs to be investigated for a
transit initially between Chakdara to Drushkhela and future extension to Madyan and
connecting shared services for traversing and feeder routes. Shared mobility services could
be pedal cycles for short trip lengths and long distance travelling through bus or minibus
operation and/or variety of other types of services.
G.1.5.3. Capacity Enhancement of the Inter regional Road Network
491. Apart from improving the capacity of urban road network; covered in G-2 section, it is
important to improve the capacity of key interregional access routes entering the swat region
from different directions. KP Government is keen to build Swat Expressway Phase II, instead
priority should be to consolidate the three gateways to the region: N-95,including Chakdara
,Matta Madyan Road, N-90 and Kalam – Dir Road, through provision of hard shoulders for
separating the movement of two wheelers, roadside drainage, footways within areas of
roadside human settlements and dedicated bus bays for public transport stoppages. Proposed
improvements must also include counter measures against spots of roadway departures; as
explained hereafter, and conventional road safety measures to make road journeys safe.
KP-SISUG Swat Regional Development Plan
195
492. Some of other inter regional routes are under improvement by CWD, all these route
improvement proposals need to be re-examined through road safety assessment and road
safety audit requirements to improve accessibility to touristic resorts and safety assured
journeys and to diminish congestion on main inter regional routes.
G.1.5.4. Road Safety
493. Safety deficient road network, hostile traffic mix, poor operating environment, unsafe
driving behavior has given rise to exceptionally high number of road crashes on Pakistan
roads. Punjab Emergency Medical Services reports a road crash in everyone and half minute
interval on Punjab roads. Swat region is not an exception. In KP the EMS is newly introduced,
it has established branch in Swat but same is too new to show some effectiveness. Safety
conditions on the part of driver / vehicle licensing, road engineering, and risk led road behavior
are critically alarming. Most of regions main road network is generally in shape as far as road
surface and pavement quality are concerned but lack facilities for vulnerable road users i.e.,
pedestrians and two wheelers. Most of National and Provincial Highways lack hard shoulders.
In hilly terrains sharp road bends are devoid of roadside guard rails and protective kerb remain
altogether missing. Curved portions are seldom accompanied with requisite warning signage
and other counter measures to protect roadway departures (RWD). Driving Licensing system
is faulty and enforcement laws are poorly applied. Most of the drivers on the road don’t
possess driver license. All these issues contribute towards a bigger problem of exceptionally
high level of road crashes requiring a comprehensive approach to ensure safe travelling.
494. A comprehensive proposal to introduce road safety at provincial level is already
suggested as part of the Peshawar Regional Plan. Two most relevant interventions at the level
of swat regions pertain to (i) improving driver licensing standard on the part of Driver Licensing
Authority (DLA) at district level and (ii) ensuring safer roads in line with the 2018 National Road
Safety Strategy and National Road Safety Engineering Guidelines. Provincial and districts
road authorities are required to carry out road safety assessment of the road network under
their jurisdiction, identify probable sites of roadway departures (RwD) and road cashes
happening on almost all hilly roads in the region. A program Focusing Rural Roadway
Departures (FRWWD) must be suggested, to introduce counter measures against roadway
departures for implementing through region-based mass action program. NHA to be
approached and coordinated for similar actions on National Highways in the region.
G.1.5.5. Focusing Roadway Departures
495. Emergency Medical Services (EMS) of KP, Gilgit Baltistan and Azad Jammu and
Kashmir (AJ&K) claim roadway departures and vehicle tumbling into roadside ravines / river
streams, as a significant cause of road crashes in hilly terrains. Absence of adequate
countermeasures for such problematic road sections was recently observed during site visits
to some of intercity and regional roads in hilly sections of the region.
496. It is not a unique phenomenon for Pakistan, it happens everywhere having similar
roadway and roadside configuration. Each year, USA reports about 12,000 fatal crashes when
vehicles veer out of their travel lanes in rural areas. Road authorities in the developed world
target this deadly problem through a program ‘focus on rural roadway departures
(FoRRRwD)’. With a similar mission, KP government needs to reduce the potential for
roadway departure crashes on all rural roads by increasing the systemic deployment of proven
countermeasures.
KP-SISUG Swat Regional Development Plan
196
497. A roadway departure (RwD) crash happens when a vehicle leaves the traveled way
(crossing an edge line or a centerline). These crashes, comprising run-off-road (ROR) and
cross-median head on collisions, tend to be more severe than other crash types. Inattention
or fatigue, an avoidance maneuver, or traveling too fast, are the common reasons a driver
may leave the travel lane. Roadway and roadside geometric design features (e.g., lane and
widths, horizontal curvatures, side slope, and clear zones) play a significant role in whether or
not human error results in a crash. To achieve Toward Zero Deaths Vision, the Federal
Highway Administration’s (FHWA’s) in States and road authorities in Europe, are
implementing countermeasures to mitigate RwD crashes.
498. Several strategies to reduce the number of ROR crashes have been identified by the
American Association of State Highway and Transportation Officials (AASHTO) including:
• Pavement edge line installation
• Centerline and shoulder rumble strip installation
• Pavement marking enhancement
• Shoulder drop-offs elimination
• Safer slopes design
• Object removal/relocation within the clear zone
• Object delineation using retro reflective tape
• Barrier design improvement
• Horizontal curve geometric improvement
• Skid-resistant roadway surface provision
G.1.5.6. Road Assets Management
499. As per regions topography, its basic road infrastructure stand developed. With a few
exceptions, it hardly requires new alignment or construction of new roads. However, it is
essential to consolidate the current network, and manage its maintenance for better operation.
ADB has extended assistance for capacity building on part the of KP road authorities in Road
Assets Management System (RAMS). Therefore, CWD and KPHA instead of spending
maximum of their allocated budget on new road construction, need to consolidate and roll out
road assets management program as per Ministry of Communications (MoC) recently
endorsed guidelines on RAMS and improve upon the quality of operation and management of
the available road assets. Same needs to be demonstrated in Swat Region.
G.1.5.7. Improving Rural-Urban Connectivity through Eco- Mobility
500. Majority of region’s population lives in rural areas. As per 2020 estimates Swat district
has population of 2,548,862, whereas its urban areas have population of 731,965 while rural
area accommodates 1,816,897 which is 71.283 percent of district population. In this sense,
both rural and urban areas deserve clean, affordable, accessible and safe mobility.
Sustainable mobility is vital for maintaining the environmental and economic well-being of both
rural and urban areas and to ensure access to services for both inhabitants and visitors.
KP-SISUG Swat Regional Development Plan
197
Despite this, policies and efforts for sustainable mobility are usually focused on the urban
areas, overlooking mobility between urban and rural areas and also mobility within rural areas.
Eco Mobility can support connectivity between rural areas and cities.
501. For the last few decades, in Pakistan, urban – rural links are increasingly growing,
nevertheless, rural connectivity is an ongoing challenge. Furthermore, a particular challenge
concerning rural-urban connectivity is the first and last mile travelled. This challenge is more
severe in case of rural hilly and mountainous terrains because these distances are usually
much larger.
502. ‘Eco Mobility offers the possibility for rural-urban connectivity through integrated,
socially inclusive, and environmentally friendly transport options.’ These might include
integrating walking, cycling, public transport and other climate and people friendly innovative
modes of transport for these areas. Especially relevant, intermodal passenger transport offers
a solution to rural-urban mobility possibly combining road, rail, waterborne or cycling mobility
options. Regions rural areas offer a significant potential for electromobility in these areas in
combination with renewable energy sources. Small scale hydro and solar energy are
evidenced in similar neighboring regions.
503. In addition, rural areas could become more eco-mobile allowing a series of strategies
such as providing car share stations, Minibus/ taxi ramps and electric charging points in a
strategic location with the appropriate capacity for the area. It would also allow for other forms
of ride sharing including paratransit to discourage use of personal transport. Rural- urban
connectivity could also be improved with the provision of cycle paths; wherever feasible, that
join to the next urban or rural communities and important service points such as schools.
Transit stations of the proposed transit lines of N-90 and N-95 for Swat may house shared
mobility services like pedal cycle or electric scooter for rural destinations.
504. To conclude, Eco Mobility for the Region’s rural- urban areas can allow a better access
to education, health and leisure services, offer new job opportunities and encourage the
development of economic activities, including tourism. Most of all, it works as an enabler for
people and communities to be part of the global marketplace connecting rural areas with towns
and cities.
505. Combining Prime Minister’s ‘Tree Plantation Program along cycle tracks to villages can
bring positive change in eco-mobility and green cover of the region at large.
G.1.5.8. Sustainable Regional Mobility Plan (SRMP) for Touristic Region of Swat
506. The SRMP is proposed to contribute to tourists and residents using more sustainable
transport modes for their leisure and everyday trips. The main objective is to collect mobility
and tourism information in one place and to share resources and data between different
regional actors as well as tourism stakeholders.
507. The measure also addresses mobility during high tourism season events to solve sever
road congestion witnessed on N-95, N-90, Malam Jabba Road, various rural access roads
and other tourists’ spots during tourism seasons.
G.1.5.8.1 Implementing Sustainable Mobility
508. Proposed framework to implement sustainable mobility is outlined as follows:

KP-SISUG Swat Regional Development Plan
198
G.1.5.8.1.1 Strategic Transport Network Design Study
• The regional government (Deputy Commissioner’s office) to own and present the
Strategic Regional Integrated Transport Plan through representative of provincial
transport department; a ‘Directorate of Regional Transport’(DRT). The plan to include
air, and land transport to Swat Region and further travel details to touristic destinations.
• Designation of a central terminal place within or outside the region ‘Tourism Centre’
and Region’s ‘Mobility Hub’, for parking of individual vehicles of tourists, being the last
station for individual vehicle journeys. It must be a well-placed commercial complex;
housing hotels, parking and offices of DRT and organizations dealing with mobility and
tourism industry. It must deal with all information on tourism and mobility and to act as
a control center for both.
• Perform the conduct of detailed analyses of public transport supply and demand and
to present a proposal to increase the efficiency of public transport service. It needs to
form the backbone of the bidding process for interurban or inter regional public
transport services in the region. As of today, for Swat there are three most suitable
places for developing ‘mobility hubs’, outside the regional boundaries which include
Chakdara in Malakand for main Swat areas, Dir for Kumrat valley and tourism
destinations in northern parts of Swat and Behsham from KKH side for central Swat
destinations.
G.1.5.8.1.2 Sustainable Regional Mobility Plan (SRMP)
• An Action Plan for Sustainable Mobility in Swat Region is required to seek the approval
of competent forum. It must provide the regional government with an instrument that
links the short-, medium- and long-term action strategy for infrastructure and transport
development within the Region, improving accessibility throughout its territory and
providing more sustainable mobility and transport to residents and visitors.
• During the development of SRMP, the Regional Government must study population
needs and the network layout, and conclude any significant obstacle to accessing
public transport.
G.1.5.8.1.3 Traffic Plans for Annual Tourist Events
• These include but not limited to:
o Tourist traffic plans to be prepared as an outcome of the SRMP. – these must
be prepared and finalized by March every year. In parallel DRT Centre should
start implementing commercial strategies to promote public transport use
during big events.
o Launch of a web-based platform for better involvement of citizens and tourists
o The DRT start preparing the tender process for this measure. The objective is
to have a single platform that contains all vital mobility-related information for
tourists and residents.
G.1.5.8.1.4 Tourist/Mobility Info Point and Web Application
• As stated above the Tourism Center shall be the central mobility point, which shall be
improved overtime. It shall be handling all information and activities from one point.
KP-SISUG Swat Regional Development Plan
199
The Centre would develop its own mobile application to be officially launched and
notified.
• This app will contain information related to tourism, road works, the public transport
network, and other services. It will be geared at tourists and residents and constantly
updated. It will be further expanded for inclusion of other modules related to mobility
and transport, such as recharging points for EV, mobility sharing services, and more.
• Tourism Center shall perform activities for promotion for big events and arrange for
publicity material and complete information on services at the center and region at
large i.e., hoteling, parking of individual transport, public transport services to tourism
destinations, shared mobility services for last mile, weather etc.
G.1.5.8.1.5 The outcomes of the measure:
• Increase the share of tourists that use more sustainable transport modes.
• Better cost-effectiveness of transport services.
• Better satisfaction with transport services.
• Info tourist/mobility info point in Abbottabad Region.
• Congestion management through enhanced utility of public transport and shared
services
• Emission free environment for tourism spots.
• Employment and economic growth.
G.2. Urban Mobility
G.2.1. Mingora City Mobility
509. Mingora city, the regional headquarters of Swat with population of 369,662 (2020
estimates) people, is located at a distance of 41 Km from Chakdara town; situated on N-45.
Mingora is the only major urban settlement of the region. It is developed in the wider section
of the valley along Swat River. Its official boundary is quite small. But least controlled
recurrently growing roadside development has resulted in long narrow urban strip all along N-
95. Within the confines of its municipal boundaries the city itself seems fairly laid out. Same is
the case of its adjacent urban settlements of Saidu Sharif, Union Councils (UCs) of Rahimabad
and Amankot. Its main road network is adequately provided and successfully maintained with
a few exceptions. N-95 passes through the city center and rest of the road network is laid out
as per topographical features of meandering sub valleys. Most of its suburbs; are located
outside its official municipal limits but well connected through radiating out road links to
suburban valleys. Almost all main urban roads are 2 lanes single carriageways with ample
side spaces for paved shoulders mostly used for roadside parking. A bypass to city is provided
and is well functioning providing relief for through traffic. City connection to the Regional
Airport situated on right bank of Swat River is well maintained through Airport Road and Bridge
across the river. Public bus terminal is ideally located close to city center, whereas number of
privately owned and operated long and short distance coaches and minibus terminals are
scattered around, mostly abutting on N-95.
KP-SISUG Swat Regional Development Plan
200
510. City road network usually remains busy, traffic conditions are usually reported to be
congested on account of comparatively high degree of vehicle ownership and their
concentration at the region’s capital on account of, quality shopping and commercial activities,
fairly decent education and health facilities and acceptable level of hoteling and tourism. Traffic
Police is fairly active and delivers but overall city mobility suffers in the absence of, any traffic
management plan, and custom-made public transport service. City mobility suffers on account
of poor configured road infrastructure, wide-ranging absence of pedestrian facilities, poor road
junction layouts, ill-defined parking and deficient traffic control and management mechanism,
contributing heavily towards poor city functioning. Responsibility for road infrastructure lies
with engineering department of the municipality with least understanding of traffic engineering,
control and management issues.
511. Apart, poorly trained and risky drivers behavior, rare helmet wearing and seat belt
usage, most of drivers operating without any driving license, underdeveloped EMS for timely
post- crash response, all contribute significantly towards unsafe mobility conditions.
512. Capacity deficient organizations, lacking planning and building control mechanism,
and overall absence of Traffic Engineering & Management organizational support for city
functionality and mobility management and host of other related causes has resulted towards
low quality and safety deficient mobility services.
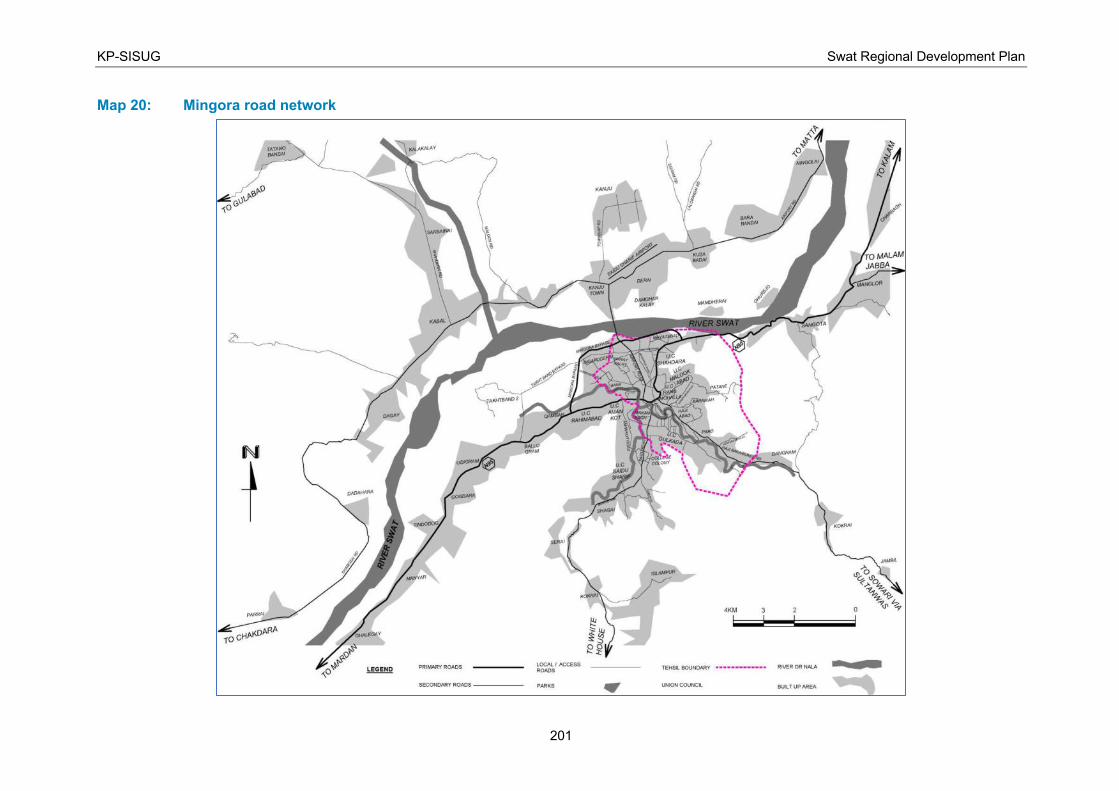
KP-SISUG Swat Regional Development Plan
201
Map 20: Mingora road network
KP-SISUG Swat Regional Development Plan
202
G.2.1.1. Public Transport Operation
513. City public transport mostly relies on shared car service used as a taxi, three wheelers
and small size Suzuki’s operating on short distance routes. Limited seater Mazda buses and
Toyota Vans are operating for close by region’s towns of Chakdara, Khwazakhela, Matta,
Madyan, Behrain, Kalam, Behsham and Shangla. Long distance intercity routes buses and
quality bus operations are available from Mingora to all main destinations like Peshawar,
Islamabad, Lahore, Multan and Karachi. All buses, coaches and vans operate from main bus
terminal in the city center and privately operated terminals along N-95. There are no formal
Taxi/Three wheelers ramps as waiting spots on the city road network. Arbitrary and Ill
organized stoppages and halting points on N-95 and other intercity links create traffic
bottlenecks and generate mobility and road safety issues. Absence of road recessed bus bays
and bus halting stations cause road blockages and disturbance to smooth travelling and urban
mobility.
514. City public transport is suggested to be reorganized through introduction of city bus
service at the level of Greater Mingora covering both city areas and suburban growth all
around. City bus service could further be rationalized through shared facility of pedal cycles/
electric scooters linked through well connected pedestrian ways and cycle tracks on cross
routes. Introduction of formal bus scheme need to be supported through parking management
throughout central areas to discourage the usage of private cars during busy hours.
G.2.1.2. Key proposals to improve city mobility
515. City mobility is suggested to be improved through targeting road congestion
abatement, bringing functional improvements in transport infrastructure, services, and
organizational capacity to charge qualitative city governance for achieving healthy urban living
and economic growth.
516. City mobility improvement measures include ‘Implementation of traffic management
and safe road system program’ to advance city mobility through:
• Improving links, and junctions’ layouts and traffic control systems, on all primary and
secondary roads of the city through small scale configuration enhancements.
• Provision and improvement of footways, and suitably placed pedestrian at-grade
crossing facilities appropriately linked throughout the city along all primary and
secondary roads, commercial streets and road links to parks and city spaces.
Transform Mingora city and its suburbs as walkable city.
• Reorganize and improve City/ Intercity Bus Terminal for its improved functioning.
• Provide designated spaces for placing ramps for shared transport. Encourage shared
mobility and taxi service. Bring transformational change for better usage of shared
services through strict control & formidable parking charges for individual vehicles.
• Instituting parking management scheme for the city through declaring road lengths
banned for parking and suitably designated spaces for charged parking and
areas/roadsides for free parking.
• Facilitate and improve hard shoulders along all primary and secondary roads for usage
of two wheelers/ roadside parking as per site specific requirements.
KP-SISUG Swat Regional Development Plan
203
• Ensure provisioning of city-wide safe road system through conduct of comprehensive
road safety assessment and execution of relevant mass action program covering road
delineation/ lane marking, signage and roadside guard rails as deemed essential.
• Implement and ensure road safety on streets of Mingora through:
o Implementing 2018 National Road Safety Strategy and recently initiated
National Road Safety Action Plan to adopt safe system approach to reduce
fatalities and injuries on city roads.
o Adopt Ministry of Communications endorsed Road Safety Guidelines on ‘road
safety management, driver licensing, vehicle testing, road safety engineering,
improving post- crash response, controlling high risk road- user behavior i.e.,
non-wearing of helmet and seat belt, and adoption of updated road safety law
by the provincial government.’
• Build and strengthen organizational capacity in area of ‘urban development’ through
revamping and training in areas of ‘urban planning and building control’, ‘road building,
and traffic engineering / management’, to keep the city infrastructure functional through
Assets Managements Approach.
G.3. Regional Connectivity: the Way Forward
G.3.1. Regional Mobility Sub-Sector Priority Projects
517. Following sub-sector projects, in order of priority, are identified as most suitable for
investment, to help improve regional mobility in Swat Region.
i. Swat Region’s Mobility Study. The foremost activity required to be carried out for
bringing improvement and transformational change towards regional mobility is to
launch a comprehensive regional mobility study aimed at improving mobility
infrastructure and services for growing mobility demand as a consequence of CPEC
routing passing close by the region, tourism industry and regions growth potential.
Study shall help assessing the level of service of the available infrastructure and
services, to understand the opportunities and implications associated with future major
transportation and community investments, and to prioritize those investments.
ii. Study outcome shall result the production of Regional Mobility Strategy incorporating
greater role for public transit, shared mobility and innovations in micro-mobility,
Sustainable Regional Mobility Plan and Tourism specific Mobility Development
Framework, initiative of Eco-Mobility for Urban Rural Connectivity, priority projects to
improve inter regional connectivity, and Strengthening Road Assets Management and
capacity building of road agencies. Study is expected to cost around USD 0.50 million.
iii. Regional Transit Study. Second most significant study requirement is the conduct of
transit study at the regional level and to introduce prioritized regional transit operation
aimed at mobility improvements for the region and urban centers alike. It is proposed
to made part of Region mobility Study.
iv. Road Network Safety Assessment Study. Being a serious most issue of poor road
safety situation, where speeds are uncontrollable and roadway departures are
common on account of topography of the region, it is most imperative to initiate safety
KP-SISUG Swat Regional Development Plan
204
assessment of the road network and potential sites of roadway departures. All types
of rural roads are proposed to be assessed and a program for implementing counter
measure sites are to be identified for improvement. Study is expected to cost
USD.48,000.
v. Inter-Regional Connectivity Priority Projects. Some of the mobility corridors are
vital to improve inter regional connectivity on priority basis. These include N-90 and
Kalam Dir Highway. N-90 is required to be upgraded through addition of paved
shoulders, footways for sections falling within existing human settlements and
application of road safety measures all along the road. Kalam Dir Highway is being
improved. Proposed design of the road needs to be reviewed through Road Safety
Audit and implementing the consequential improvements. Other routes improvements
including 39 km of Jatano Bandai-Toormang Road (Dir area), 54 km of Mingora-Sowari
Road (district Bunner) and 74 km of Barikot- Bazar Gai Road (district Bunner) are also
important for enhancement of regional connectivity (Map 21). Approximate cost of
these projects is USD 80 million.
G.3.2. Urban Mobility Priority Sub-Sector Projects.
518. Following Sub-Sector Projects for Urban Mobility improvements are considered for
Swat.
i. Urban Transport Planning Study for agglomeration of Great Mingora comprising of
existing Mingora, Saidu Sharif, and Rahimabad, Balogram, Doigram, Tindodog,
Manyar, Sangota and Manglore on N-95, Dagay, Kabal, Kanju town, Kuza Bandi, Bara
Bandi, and Mangolai, on Chakdara Madyan Highway. Proposed transport study would
be an important contribution towards transforming this agglomeration into high density
development and prioritized walking and cycling city. One of the important outcomes
of the study would be Urban Mobility Management Plan. Implementing the urban
mobility management plan would largely contribute towards improvements in
organized city circulation, improved environmental conditions and healthy urban living
so important for growth of tourism, trade and urban and regional economy.
ii. Implementation of Urban Mobility Management Plan. This shall include but not
limited to, small scale improvement of city road links, improvement of junction
configurations, appropriate road signage, reorganizing street flows in most suitable
patterns, parking management, traffic signaling and control, taxi/other shared mobility
ramps, large scale improvements towards building/upgrading of footways and cycle
tracks through city and establishing /training of Mobility Management Units staff.
Proposed program (study and works) would cost around USD. 12 million.
iii. Improvement Plan for Mingora Intercity Bus Terminal. Another important outcome
of the Urban Transport Planning Study would be comprehensive review of current
practice of variety of intercity bus terminals and project plan for reorganizing the main
terminal. Project for improvement of the bus terminal shall cost around USD 0.50
million.
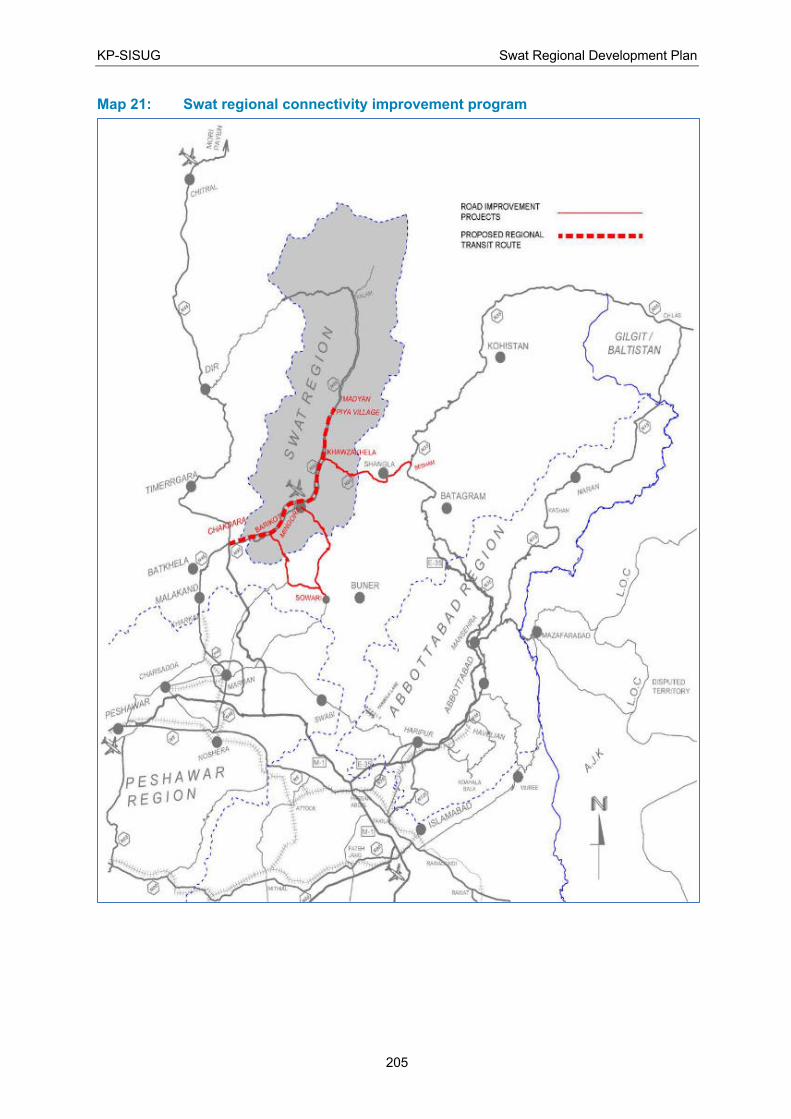
KP-SISUG Swat Regional Development Plan
205
Map 21: Swat regional connectivity improvement program
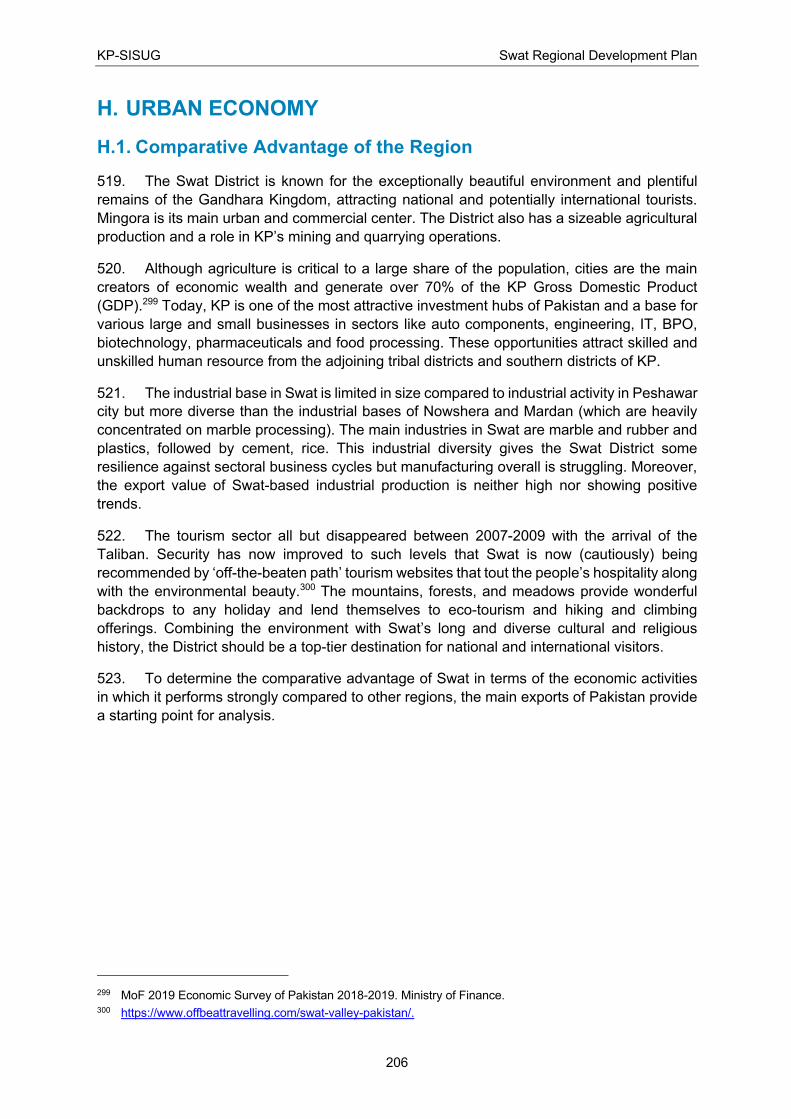
KP-SISUG Swat Regional Development Plan
206
H. URBAN ECONOMY
H.1. Comparative Advantage of the Region
519. The Swat District is known for the exceptionally beautiful environment and plentiful
remains of the Gandhara Kingdom, attracting national and potentially international tourists.
Mingora is its main urban and commercial center. The District also has a sizeable agricultural
production and a role in KP’s mining and quarrying operations.
520. Although agriculture is critical to a large share of the population, cities are the main
creators of economic wealth and generate over 70% of the KP Gross Domestic Product
(GDP).299 Today, KP is one of the most attractive investment hubs of Pakistan and a base for
various large and small businesses in sectors like auto components, engineering, IT, BPO,
biotechnology, pharmaceuticals and food processing. These opportunities attract skilled and
unskilled human resource from the adjoining tribal districts and southern districts of KP.
521. The industrial base in Swat is limited in size compared to industrial activity in Peshawar
city but more diverse than the industrial bases of Nowshera and Mardan (which are heavily
concentrated on marble processing). The main industries in Swat are marble and rubber and
plastics, followed by cement, rice. This industrial diversity gives the Swat District some
resilience against sectoral business cycles but manufacturing overall is struggling. Moreover,
the export value of Swat-based industrial production is neither high nor showing positive
trends.
522. The tourism sector all but disappeared between 2007-2009 with the arrival of the
Taliban. Security has now improved to such levels that Swat is now (cautiously) being
recommended by ‘off-the-beaten path’ tourism websites that tout the people’s hospitality along
with the environmental beauty.300 The mountains, forests, and meadows provide wonderful
backdrops to any holiday and lend themselves to eco-tourism and hiking and climbing
offerings. Combining the environment with Swat’s long and diverse cultural and religious
history, the District should be a top-tier destination for national and international visitors.
523. To determine the comparative advantage of Swat in terms of the economic activities
in which it performs strongly compared to other regions, the main exports of Pakistan provide
a starting point for analysis.
299 MoF 2019 Economic Survey of Pakistan 2018-2019. Ministry of Finance. 300 https://www.offbeattravelling.com/swat-valley-pakistan/.
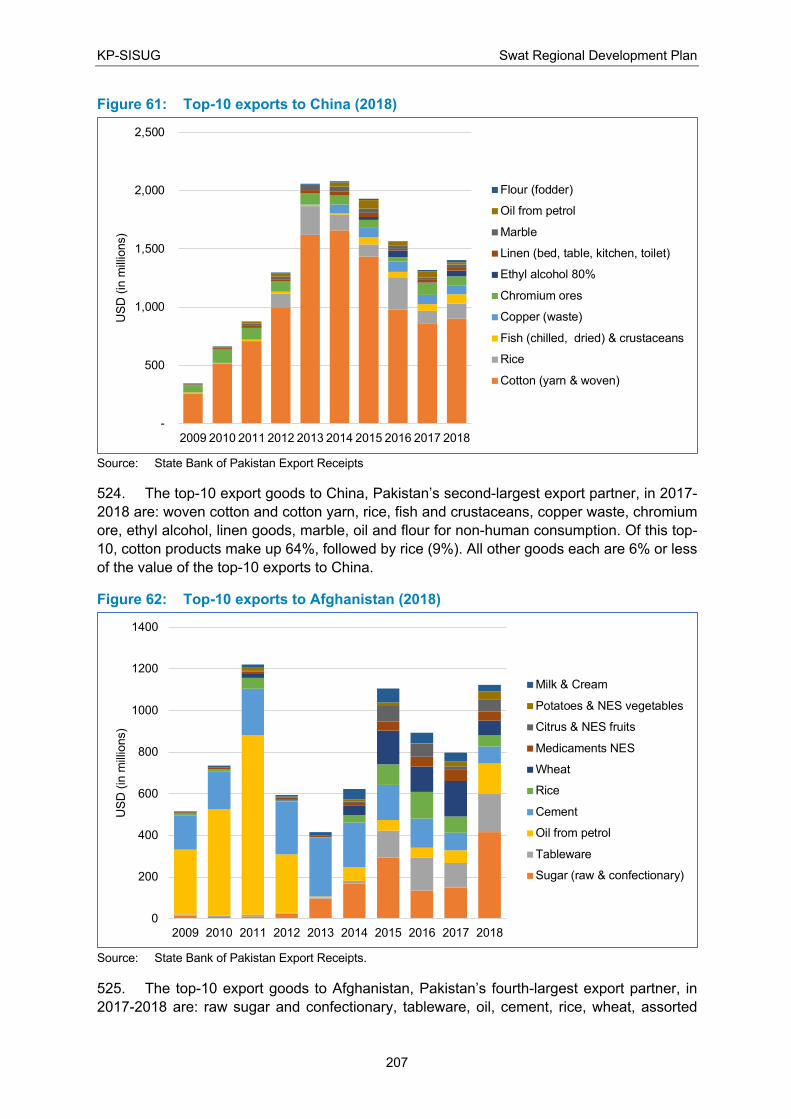
KP-SISUG Swat Regional Development Plan
207
Figure 61: Top-10 exports to China (2018)
Source: State Bank of Pakistan Export Receipts
524. The top-10 export goods to China, Pakistan’s second-largest export partner, in 2017-
2018 are: woven cotton and cotton yarn, rice, fish and crustaceans, copper waste, chromium
ore, ethyl alcohol, linen goods, marble, oil and flour for non-human consumption. Of this top-
10, cotton products make up 64%, followed by rice (9%). All other goods each are 6% or less
of the value of the top-10 exports to China.
Figure 62: Top-10 exports to Afghanistan (2018)
Source: State Bank of Pakistan Export Receipts.
525. The top-10 export goods to Afghanistan, Pakistan’s fourth-largest export partner, in
2017-2018 are: raw sugar and confectionary, tableware, oil, cement, rice, wheat, assorted
-
500
1,000
1,500
2,000
2,500
2009 2010 2011 2012 2013 2014 2015 2016 2017 2018
US
D (
in m
illio
ns)
Flour (fodder)
Oil from petrol
Marble
Linen (bed, table, kitchen, toilet)
Ethyl alcohol 80%
Chromium ores
Copper (waste)
Fish (chilled, dried) & crustaceans
Rice
Cotton (yarn & woven)
0
200
400
600
800
1000
1200
1400
2009 2010 2011 2012 2013 2014 2015 2016 2017 2018
US
D (
in m
illio
ns)
Milk & Cream
Potatoes & NES vegetables
Citrus & NES fruits
Medicaments NES
Wheat
Rice
Cement
Oil from petrol
Tableware
Sugar (raw & confectionary)
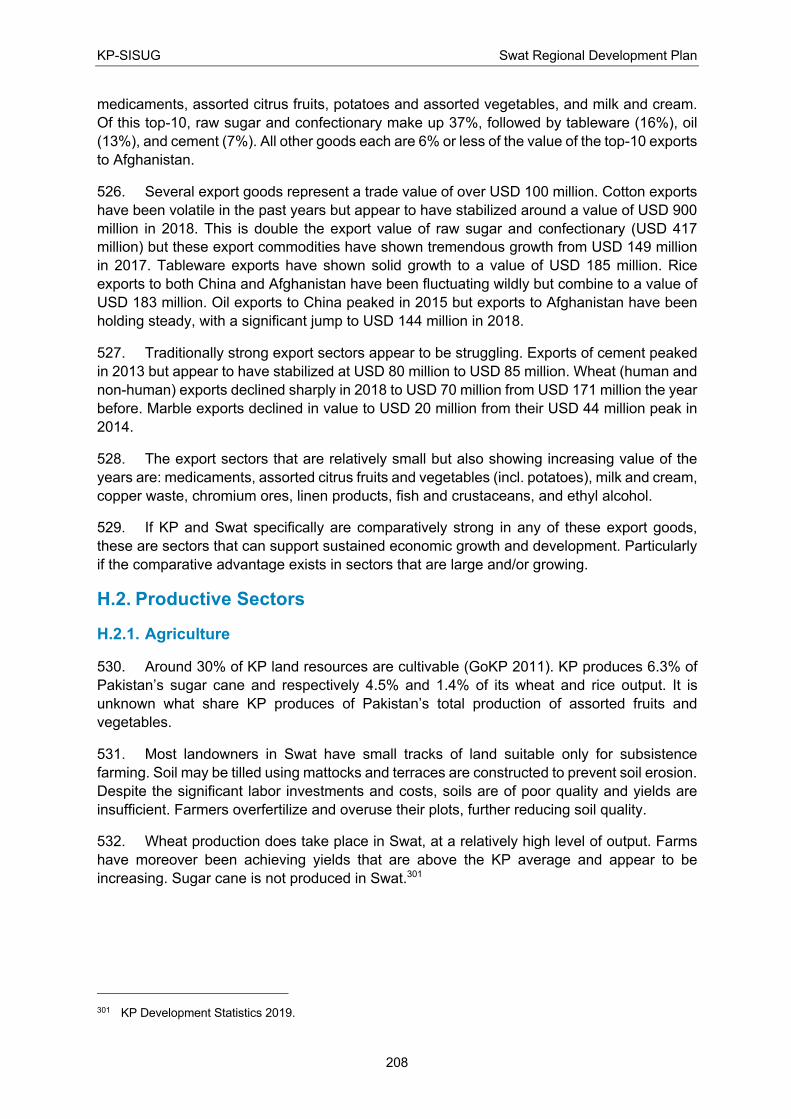
KP-SISUG Swat Regional Development Plan
208
medicaments, assorted citrus fruits, potatoes and assorted vegetables, and milk and cream.
Of this top-10, raw sugar and confectionary make up 37%, followed by tableware (16%), oil
(13%), and cement (7%). All other goods each are 6% or less of the value of the top-10 exports
to Afghanistan.
526. Several export goods represent a trade value of over USD 100 million. Cotton exports
have been volatile in the past years but appear to have stabilized around a value of USD 900
million in 2018. This is double the export value of raw sugar and confectionary (USD 417
million) but these export commodities have shown tremendous growth from USD 149 million
in 2017. Tableware exports have shown solid growth to a value of USD 185 million. Rice
exports to both China and Afghanistan have been fluctuating wildly but combine to a value of
USD 183 million. Oil exports to China peaked in 2015 but exports to Afghanistan have been
holding steady, with a significant jump to USD 144 million in 2018.
527. Traditionally strong export sectors appear to be struggling. Exports of cement peaked
in 2013 but appear to have stabilized at USD 80 million to USD 85 million. Wheat (human and
non-human) exports declined sharply in 2018 to USD 70 million from USD 171 million the year
before. Marble exports declined in value to USD 20 million from their USD 44 million peak in
2014.
528. The export sectors that are relatively small but also showing increasing value of the
years are: medicaments, assorted citrus fruits and vegetables (incl. potatoes), milk and cream,
copper waste, chromium ores, linen products, fish and crustaceans, and ethyl alcohol.
529. If KP and Swat specifically are comparatively strong in any of these export goods,
these are sectors that can support sustained economic growth and development. Particularly
if the comparative advantage exists in sectors that are large and/or growing.
H.2. Productive Sectors
H.2.1. Agriculture
530. Around 30% of KP land resources are cultivable (GoKP 2011). KP produces 6.3% of
Pakistan’s sugar cane and respectively 4.5% and 1.4% of its wheat and rice output. It is
unknown what share KP produces of Pakistan’s total production of assorted fruits and
vegetables.
531. Most landowners in Swat have small tracks of land suitable only for subsistence
farming. Soil may be tilled using mattocks and terraces are constructed to prevent soil erosion.
Despite the significant labor investments and costs, soils are of poor quality and yields are
insufficient. Farmers overfertilize and overuse their plots, further reducing soil quality.
532. Wheat production does take place in Swat, at a relatively high level of output. Farms
have moreover been achieving yields that are above the KP average and appear to be
increasing. Sugar cane is not produced in Swat.301
301 KP Development Statistics 2019.
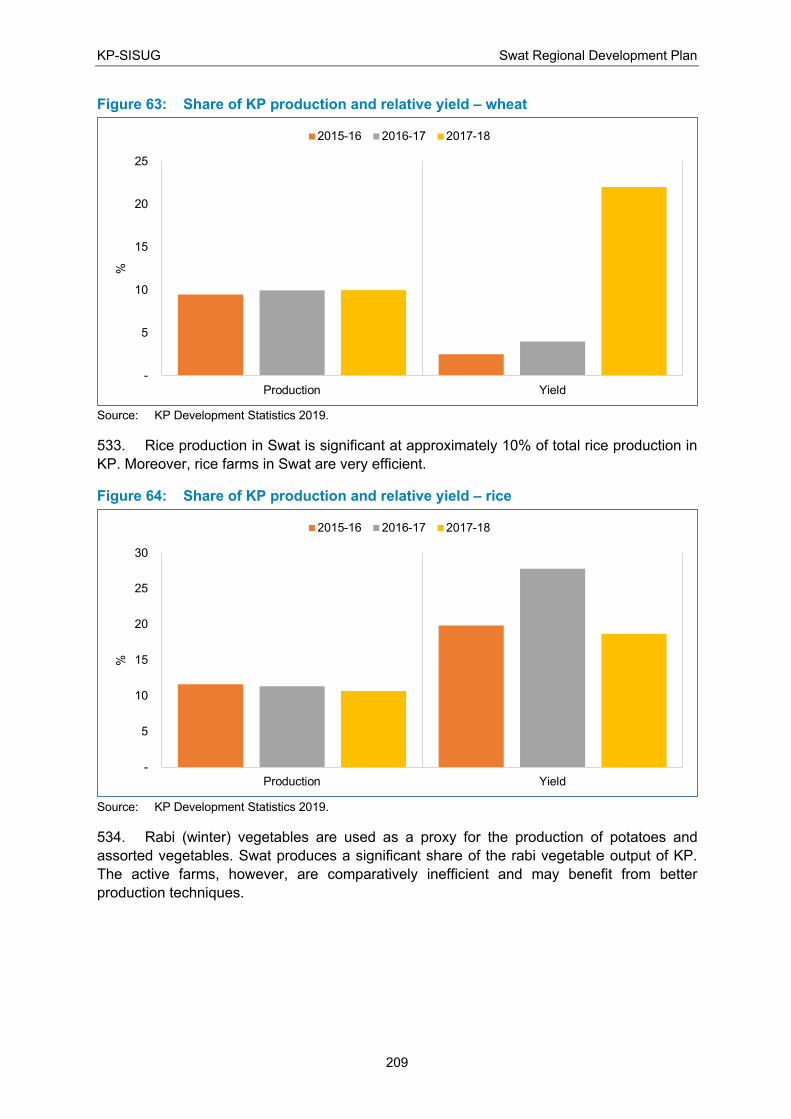
KP-SISUG Swat Regional Development Plan
209
Figure 63: Share of KP production and relative yield – wheat
Source: KP Development Statistics 2019.
533. Rice production in Swat is significant at approximately 10% of total rice production in
KP. Moreover, rice farms in Swat are very efficient.
Figure 64: Share of KP production and relative yield – rice
Source: KP Development Statistics 2019.
534. Rabi (winter) vegetables are used as a proxy for the production of potatoes and
assorted vegetables. Swat produces a significant share of the rabi vegetable output of KP.
The active farms, however, are comparatively inefficient and may benefit from better
production techniques.
-
5
10
15
20
25
Production Yield
%
2015-16 2016-17 2017-18
-
5
10
15
20
25
30
Production Yield
%
2015-16 2016-17 2017-18
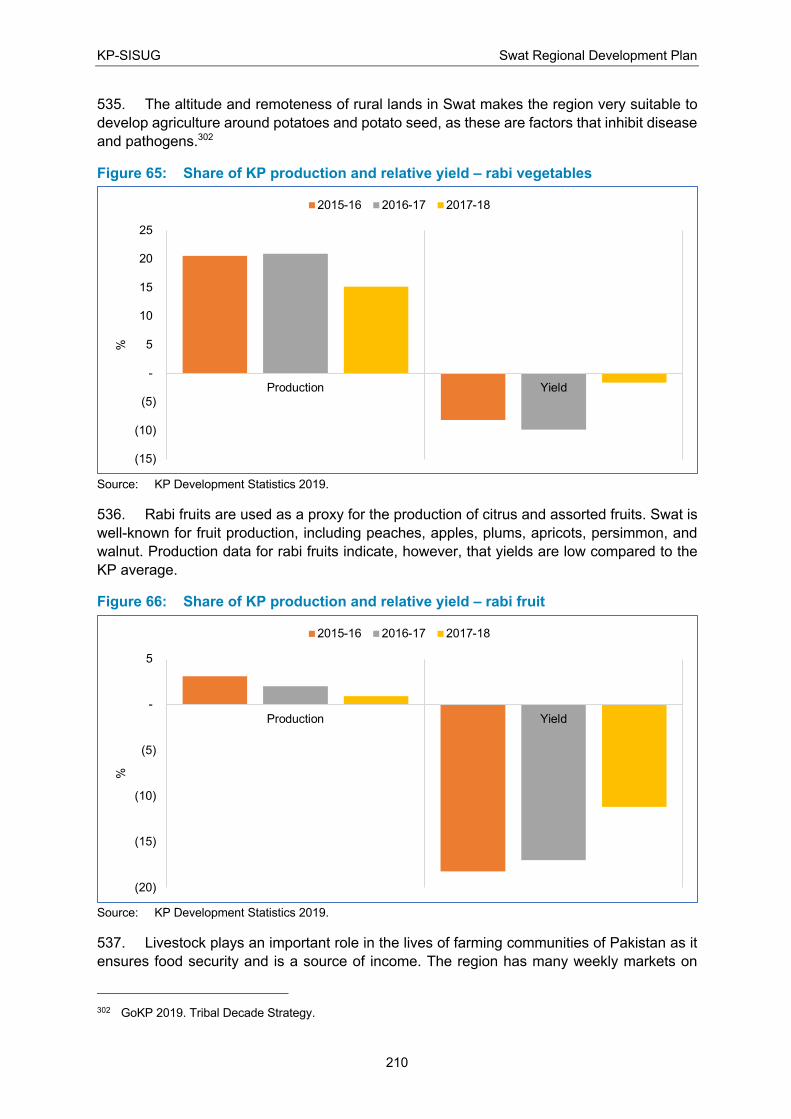
KP-SISUG Swat Regional Development Plan
210
535. The altitude and remoteness of rural lands in Swat makes the region very suitable to
develop agriculture around potatoes and potato seed, as these are factors that inhibit disease
and pathogens.302
Figure 65: Share of KP production and relative yield – rabi vegetables
Source: KP Development Statistics 2019.
536. Rabi fruits are used as a proxy for the production of citrus and assorted fruits. Swat is
well-known for fruit production, including peaches, apples, plums, apricots, persimmon, and
walnut. Production data for rabi fruits indicate, however, that yields are low compared to the
KP average.
Figure 66: Share of KP production and relative yield – rabi fruit
Source: KP Development Statistics 2019.
537. Livestock plays an important role in the lives of farming communities of Pakistan as it
ensures food security and is a source of income. The region has many weekly markets on
302 GoKP 2019. Tribal Decade Strategy.
(15)
(10)
(5)
-
5
10
15
20
25
Production Yield
%
2015-16 2016-17 2017-18
(20)
(15)
(10)
(5)
-
5
Production Yield
%
2015-16 2016-17 2017-18
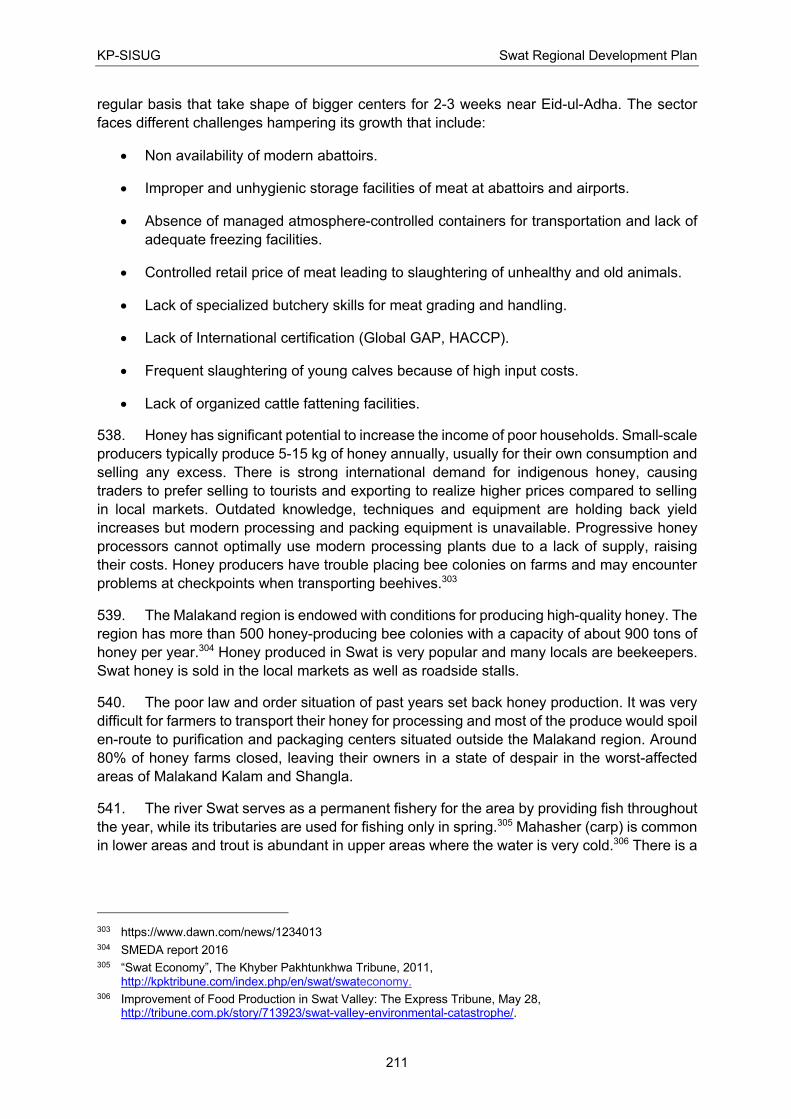
KP-SISUG Swat Regional Development Plan
211
regular basis that take shape of bigger centers for 2-3 weeks near Eid-ul-Adha. The sector
faces different challenges hampering its growth that include:
• Non availability of modern abattoirs.
• Improper and unhygienic storage facilities of meat at abattoirs and airports.
• Absence of managed atmosphere-controlled containers for transportation and lack of
adequate freezing facilities.
• Controlled retail price of meat leading to slaughtering of unhealthy and old animals.
• Lack of specialized butchery skills for meat grading and handling.
• Lack of International certification (Global GAP, HACCP).
• Frequent slaughtering of young calves because of high input costs.
• Lack of organized cattle fattening facilities.
538. Honey has significant potential to increase the income of poor households. Small-scale
producers typically produce 5-15 kg of honey annually, usually for their own consumption and
selling any excess. There is strong international demand for indigenous honey, causing
traders to prefer selling to tourists and exporting to realize higher prices compared to selling
in local markets. Outdated knowledge, techniques and equipment are holding back yield
increases but modern processing and packing equipment is unavailable. Progressive honey
processors cannot optimally use modern processing plants due to a lack of supply, raising
their costs. Honey producers have trouble placing bee colonies on farms and may encounter
problems at checkpoints when transporting beehives.303
539. The Malakand region is endowed with conditions for producing high-quality honey. The
region has more than 500 honey-producing bee colonies with a capacity of about 900 tons of
honey per year.304 Honey produced in Swat is very popular and many locals are beekeepers.
Swat honey is sold in the local markets as well as roadside stalls.
540. The poor law and order situation of past years set back honey production. It was very
difficult for farmers to transport their honey for processing and most of the produce would spoil
en-route to purification and packaging centers situated outside the Malakand region. Around
80% of honey farms closed, leaving their owners in a state of despair in the worst-affected
areas of Malakand Kalam and Shangla.
541. The river Swat serves as a permanent fishery for the area by providing fish throughout
the year, while its tributaries are used for fishing only in spring.305 Mahasher (carp) is common
in lower areas and trout is abundant in upper areas where the water is very cold.306 There is a
303 https://www.dawn.com/news/1234013 304 SMEDA report 2016 305 “Swat Economy”, The Khyber Pakhtunkhwa Tribune, 2011,
http://kpktribune.com/index.php/en/swat/swateconomy. 306 Improvement of Food Production in Swat Valley: The Express Tribune, May 28,
http://tribune.com.pk/story/713923/swat-valley-environmental-catastrophe/.
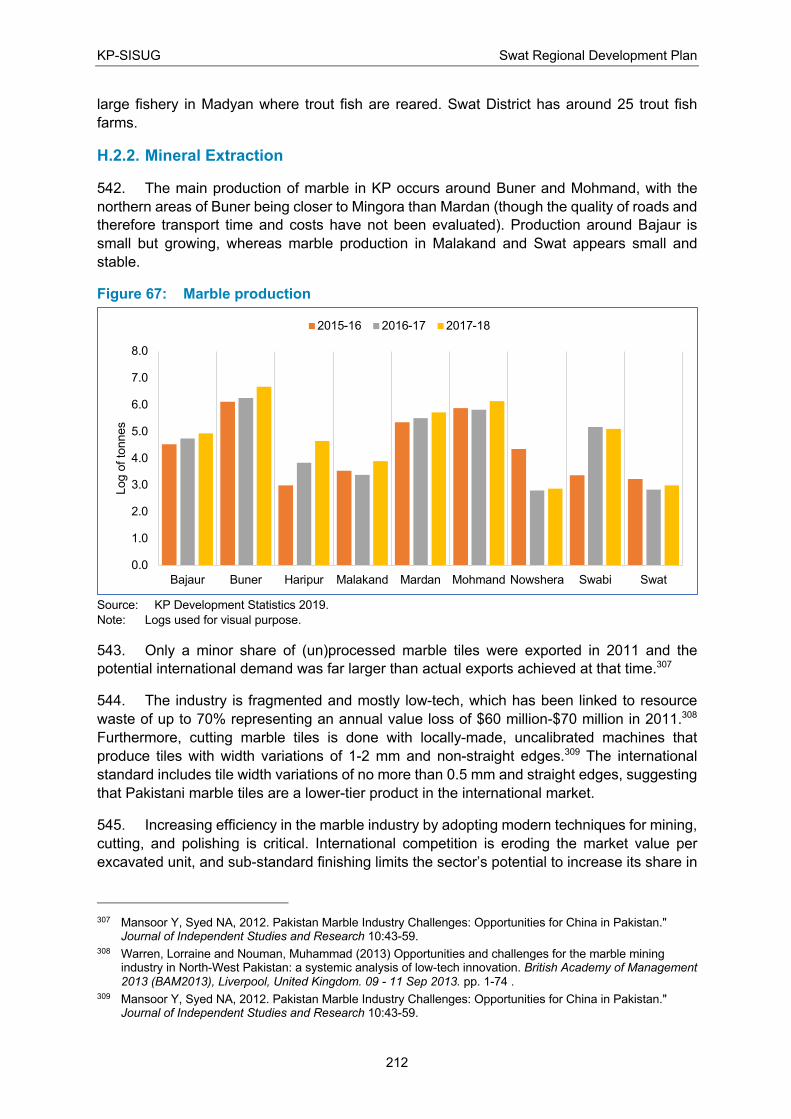
KP-SISUG Swat Regional Development Plan
212
large fishery in Madyan where trout fish are reared. Swat District has around 25 trout fish
farms.
H.2.2. Mineral Extraction
542. The main production of marble in KP occurs around Buner and Mohmand, with the
northern areas of Buner being closer to Mingora than Mardan (though the quality of roads and
therefore transport time and costs have not been evaluated). Production around Bajaur is
small but growing, whereas marble production in Malakand and Swat appears small and
stable.
Figure 67: Marble production
Source: KP Development Statistics 2019.
Note: Logs used for visual purpose.
543. Only a minor share of (un)processed marble tiles were exported in 2011 and the
potential international demand was far larger than actual exports achieved at that time.307
544. The industry is fragmented and mostly low-tech, which has been linked to resource
waste of up to 70% representing an annual value loss of $60 million-$70 million in 2011.308
Furthermore, cutting marble tiles is done with locally-made, uncalibrated machines that
produce tiles with width variations of 1-2 mm and non-straight edges.309 The international
standard includes tile width variations of no more than 0.5 mm and straight edges, suggesting
that Pakistani marble tiles are a lower-tier product in the international market.
545. Increasing efficiency in the marble industry by adopting modern techniques for mining,
cutting, and polishing is critical. International competition is eroding the market value per
excavated unit, and sub-standard finishing limits the sector’s potential to increase its share in
307 Mansoor Y, Syed NA, 2012. Pakistan Marble Industry Challenges: Opportunities for China in Pakistan."
Journal of Independent Studies and Research 10:43-59. 308 Warren, Lorraine and Nouman, Muhammad (2013) Opportunities and challenges for the marble mining
industry in North-West Pakistan: a systemic analysis of low-tech innovation. British Academy of Management 2013 (BAM2013), Liverpool, United Kingdom. 09 - 11 Sep 2013. pp. 1-74 .
309 Mansoor Y, Syed NA, 2012. Pakistan Marble Industry Challenges: Opportunities for China in Pakistan." Journal of Independent Studies and Research 10:43-59.
0.0
1.0
2.0
3.0
4.0
5.0
6.0
7.0
8.0
Bajaur Buner Haripur Malakand Mardan Mohmand Nowshera Swabi Swat
Log o
f to
nnes
2015-16 2016-17 2017-18
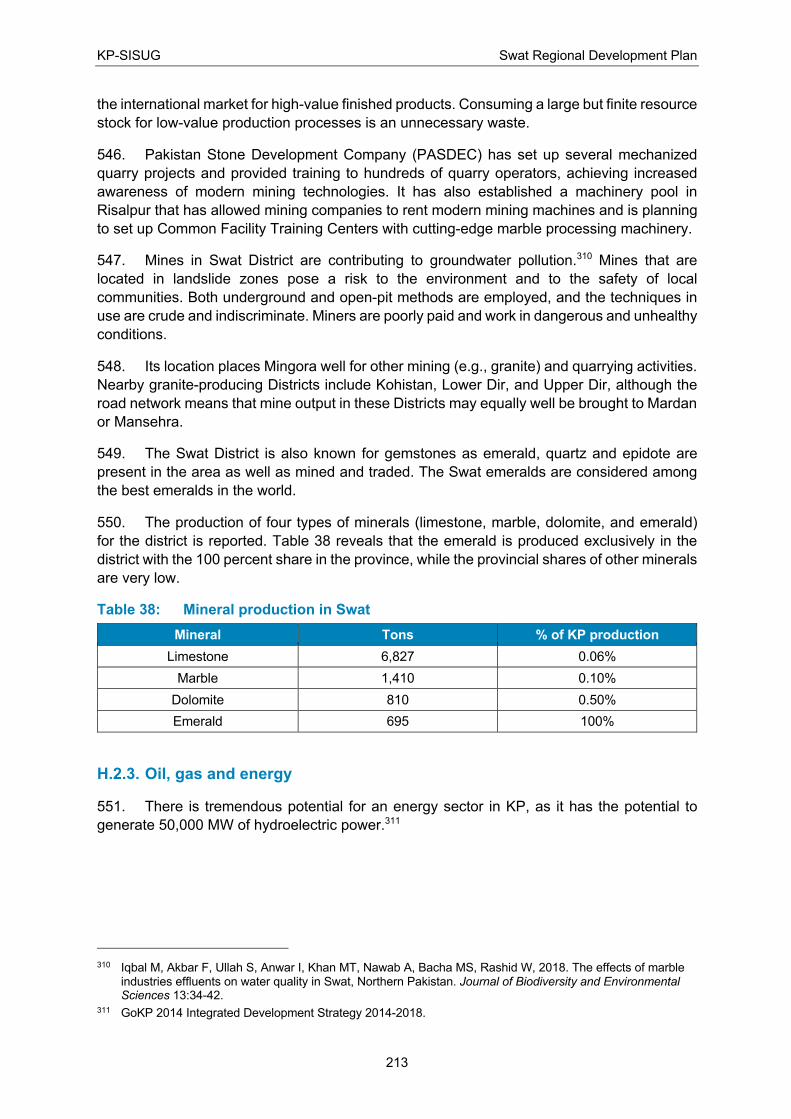
KP-SISUG Swat Regional Development Plan
213
the international market for high-value finished products. Consuming a large but finite resource
stock for low-value production processes is an unnecessary waste.
546. Pakistan Stone Development Company (PASDEC) has set up several mechanized
quarry projects and provided training to hundreds of quarry operators, achieving increased
awareness of modern mining technologies. It has also established a machinery pool in
Risalpur that has allowed mining companies to rent modern mining machines and is planning
to set up Common Facility Training Centers with cutting-edge marble processing machinery.
547. Mines in Swat District are contributing to groundwater pollution.310 Mines that are
located in landslide zones pose a risk to the environment and to the safety of local
communities. Both underground and open-pit methods are employed, and the techniques in
use are crude and indiscriminate. Miners are poorly paid and work in dangerous and unhealthy
conditions.
548. Its location places Mingora well for other mining (e.g., granite) and quarrying activities.
Nearby granite-producing Districts include Kohistan, Lower Dir, and Upper Dir, although the
road network means that mine output in these Districts may equally well be brought to Mardan
or Mansehra.
549. The Swat District is also known for gemstones as emerald, quartz and epidote are
present in the area as well as mined and traded. The Swat emeralds are considered among
the best emeralds in the world.
550. The production of four types of minerals (limestone, marble, dolomite, and emerald)
for the district is reported. Table 38 reveals that the emerald is produced exclusively in the
district with the 100 percent share in the province, while the provincial shares of other minerals
are very low.
Table 38: Mineral production in Swat
Mineral Tons % of KP production
Limestone 6,827 0.06%
Marble 1,410 0.10%
Dolomite 810 0.50%
Emerald 695 100%
H.2.3. Oil, gas and energy
551. There is tremendous potential for an energy sector in KP, as it has the potential to
generate 50,000 MW of hydroelectric power.311
310 Iqbal M, Akbar F, Ullah S, Anwar I, Khan MT, Nawab A, Bacha MS, Rashid W, 2018. The effects of marble
industries effluents on water quality in Swat, Northern Pakistan. Journal of Biodiversity and Environmental Sciences 13:34-42.
311 GoKP 2014 Integrated Development Strategy 2014-2018.
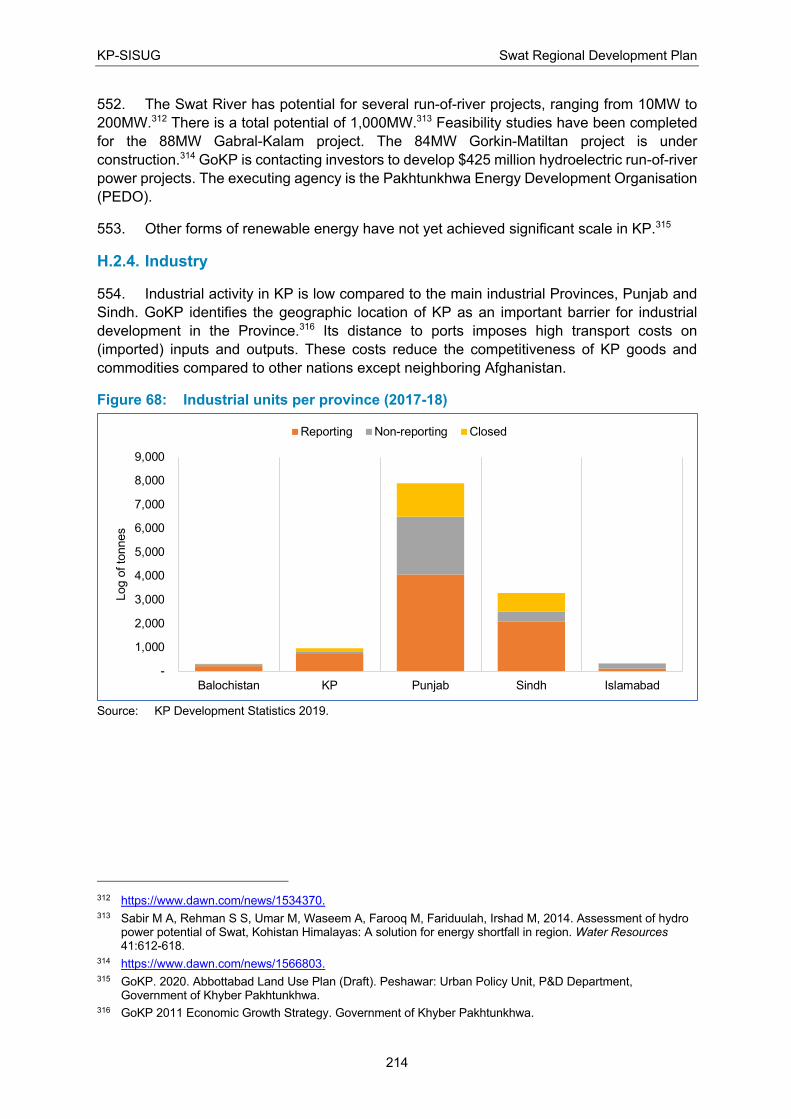
KP-SISUG Swat Regional Development Plan
214
552. The Swat River has potential for several run-of-river projects, ranging from 10MW to
200MW.312 There is a total potential of 1,000MW.313 Feasibility studies have been completed
for the 88MW Gabral-Kalam project. The 84MW Gorkin-Matiltan project is under
construction.314 GoKP is contacting investors to develop $425 million hydroelectric run-of-river
power projects. The executing agency is the Pakhtunkhwa Energy Development Organisation
(PEDO).
553. Other forms of renewable energy have not yet achieved significant scale in KP.315
H.2.4. Industry
554. Industrial activity in KP is low compared to the main industrial Provinces, Punjab and
Sindh. GoKP identifies the geographic location of KP as an important barrier for industrial
development in the Province.316 Its distance to ports imposes high transport costs on
(imported) inputs and outputs. These costs reduce the competitiveness of KP goods and
commodities compared to other nations except neighboring Afghanistan.
Figure 68: Industrial units per province (2017-18)
Source: KP Development Statistics 2019.
312 https://www.dawn.com/news/1534370. 313 Sabir M A, Rehman S S, Umar M, Waseem A, Farooq M, Fariduulah, Irshad M, 2014. Assessment of hydro
power potential of Swat, Kohistan Himalayas: A solution for energy shortfall in region. Water Resources 41:612-618.
314 https://www.dawn.com/news/1566803. 315 GoKP. 2020. Abbottabad Land Use Plan (Draft). Peshawar: Urban Policy Unit, P&D Department,
Government of Khyber Pakhtunkhwa. 316 GoKP 2011 Economic Growth Strategy. Government of Khyber Pakhtunkhwa.
-
1,000
2,000
3,000
4,000
5,000
6,000
7,000
8,000
9,000
Balochistan KP Punjab Sindh Islamabad
Log o
f to
nnes
Reporting Non-reporting Closed
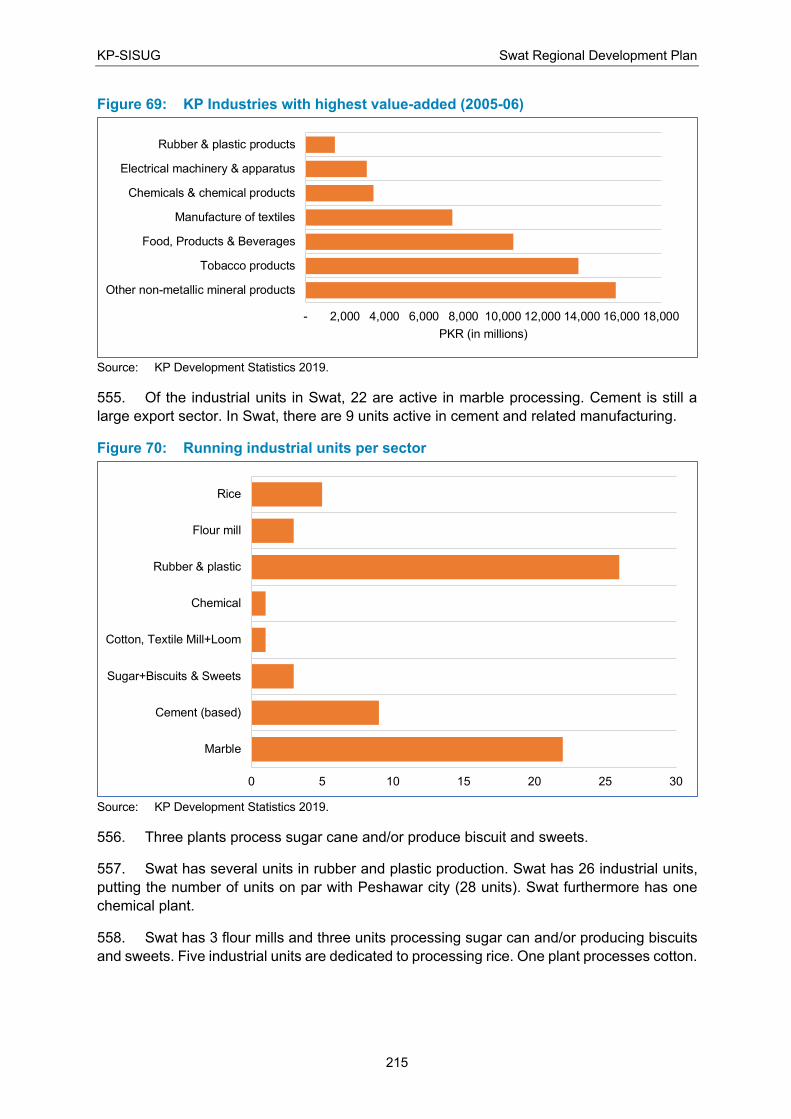
KP-SISUG Swat Regional Development Plan
215
Figure 69: KP Industries with highest value-added (2005-06)
Source: KP Development Statistics 2019.
555. Of the industrial units in Swat, 22 are active in marble processing. Cement is still a
large export sector. In Swat, there are 9 units active in cement and related manufacturing.
Figure 70: Running industrial units per sector
Source: KP Development Statistics 2019.
556. Three plants process sugar cane and/or produce biscuit and sweets.
557. Swat has several units in rubber and plastic production. Swat has 26 industrial units,
putting the number of units on par with Peshawar city (28 units). Swat furthermore has one
chemical plant.
558. Swat has 3 flour mills and three units processing sugar can and/or producing biscuits
and sweets. Five industrial units are dedicated to processing rice. One plant processes cotton.
- 2,000 4,000 6,000 8,000 10,000 12,000 14,000 16,000 18,000
Other non-metallic mineral products
Tobacco products
Food, Products & Beverages
Manufacture of textiles
Chemicals & chemical products
Electrical machinery & apparatus
Rubber & plastic products
PKR (in millions)
0 5 10 15 20 25 30
Marble
Cement (based)
Sugar+Biscuits & Sweets
Cotton, Textile Mill+Loom
Chemical
Rubber & plastic
Flour mill
Rice
KP-SISUG Swat Regional Development Plan
216
559. Swat has a tradition in the silk industry, but it suffered during the insurgency. Only 75
out of about 350 silk units that were closed due to military operations have started working
again.
560. Swat is aiming to develop a silk cluster with common facilities do dyeing, washing, and
pressing silk. The Silk Centre has the capacity to process 3,000 meters of fabric in 24 hours,
enough to meet the demands of the existing silk industry in Swat.317
561. Although these industrial data appear promising, there is an important caveat: by and
large, the industries in Swat are struggling. This is discussed further in section H.6.
H.3. Inter-regional Linkages
562. For regions and cities in KP, economic development is particularly important since the
only alternative for many residents is subsistence agriculture. With only a small base of
manufacturing and services, the region and cities suffers from widespread poverty.
Demographic trends, such as population growth, urbanization, and the youthful age profile of
the population, point to the fact that poverty alleviation is likely to be an even more serious
task in the years to come.
563. To make KP competitive for investment and development, cities are going to play a
vital role. Cities offer virtuous cycles of growth, where residents demand goods and services,
which tempts businesses to provide goods services and thus jobs. In turn, the prospect of jobs
causes people to move to cities, further stimulating demand and offering a wider labor pool for
businesses.
564. For further rural-urban migration and urbanization to be successful in terms of
employment and income growth, manufacturing and services need to grow fast enough to
absorb the increasing supply of labor. KP will have to invest in multiple cities to ensure a
geographically balanced rate of urbanization and the creation of a “system of cities” that have
sufficiently large economies to start a virtuous growth cycle. In a system of cities, each urban
agglomeration can take on a specialized role in the network that can lead to faster job creation
and higher productivity growth for the region.318
565. In the adoption of a strategy for the achievement of any meaningful development, a
well-planned physical infrastructure is of great significance. To bring about progress and to
increase economic activity, it is necessary to have a well-laid system of roads. The density of
roads in regions are not too far below the national average but the overall road availability is
inadequate because of rugged terrain. This makes the road network one of the main obstacles
to economic growth.
566. Although these industrial data appear promising, there is an important caveat: by and
large, the industries in Swat are struggling. The existing industries established in Swat are
either closed or on the verge of closure. This is discussed further in section H.6.
317 SMEDA report 2016 318 World Bank (2014), “Pakistan Urban Sector Assessment: Leveraging the Growth Dividend from the
Urbanization Process”. A background paper for the World Bank’s South Asia Urbanization Flagship Report.
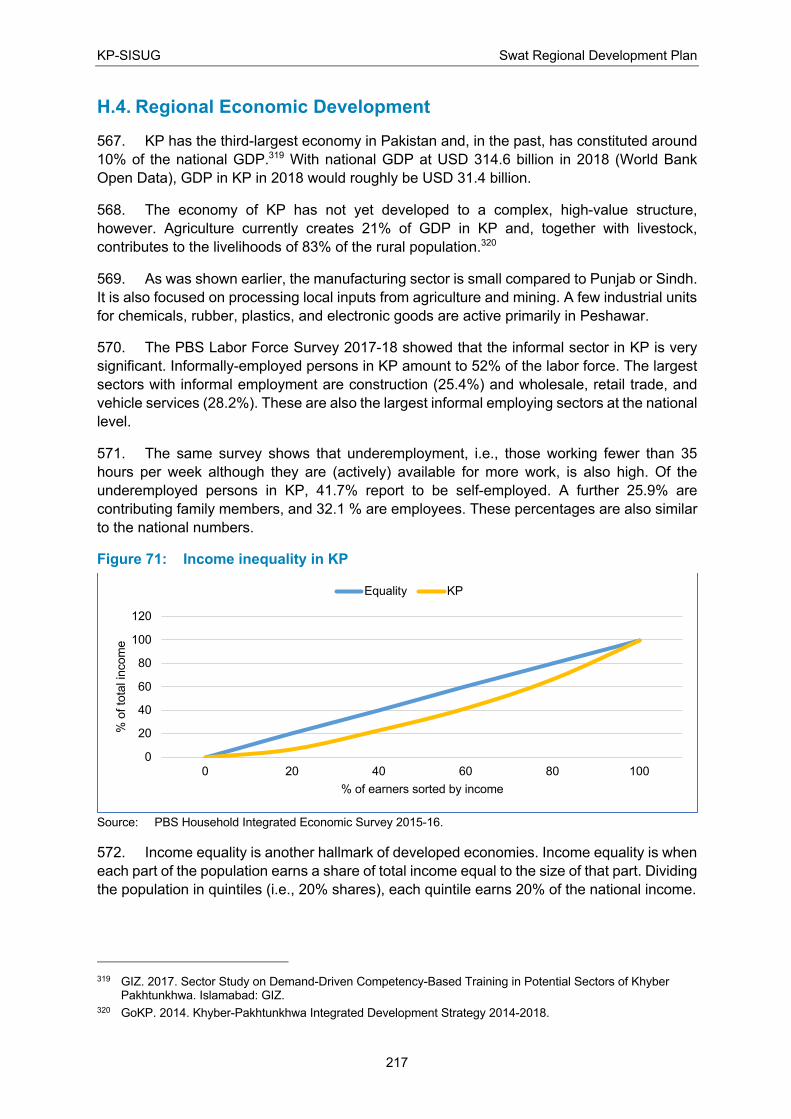
KP-SISUG Swat Regional Development Plan
217
H.4. Regional Economic Development
567. KP has the third-largest economy in Pakistan and, in the past, has constituted around
10% of the national GDP.319 With national GDP at USD 314.6 billion in 2018 (World Bank
Open Data), GDP in KP in 2018 would roughly be USD 31.4 billion.
568. The economy of KP has not yet developed to a complex, high-value structure,
however. Agriculture currently creates 21% of GDP in KP and, together with livestock,
contributes to the livelihoods of 83% of the rural population.320
569. As was shown earlier, the manufacturing sector is small compared to Punjab or Sindh.
It is also focused on processing local inputs from agriculture and mining. A few industrial units
for chemicals, rubber, plastics, and electronic goods are active primarily in Peshawar.
570. The PBS Labor Force Survey 2017-18 showed that the informal sector in KP is very
significant. Informally-employed persons in KP amount to 52% of the labor force. The largest
sectors with informal employment are construction (25.4%) and wholesale, retail trade, and
vehicle services (28.2%). These are also the largest informal employing sectors at the national
level.
571. The same survey shows that underemployment, i.e., those working fewer than 35
hours per week although they are (actively) available for more work, is also high. Of the
underemployed persons in KP, 41.7% report to be self-employed. A further 25.9% are
contributing family members, and 32.1 % are employees. These percentages are also similar
to the national numbers.
Figure 71: Income inequality in KP
Source: PBS Household Integrated Economic Survey 2015-16.
572. Income equality is another hallmark of developed economies. Income equality is when
each part of the population earns a share of total income equal to the size of that part. Dividing
the population in quintiles (i.e., 20% shares), each quintile earns 20% of the national income.
319 GIZ. 2017. Sector Study on Demand-Driven Competency-Based Training in Potential Sectors of Khyber
Pakhtunkhwa. Islamabad: GIZ. 320 GoKP. 2014. Khyber-Pakhtunkhwa Integrated Development Strategy 2014-2018.
0
20
40
60
80
100
120
0 20 40 60 80 100
% o
f to
tal in
com
e
% of earners sorted by income
Equality KP
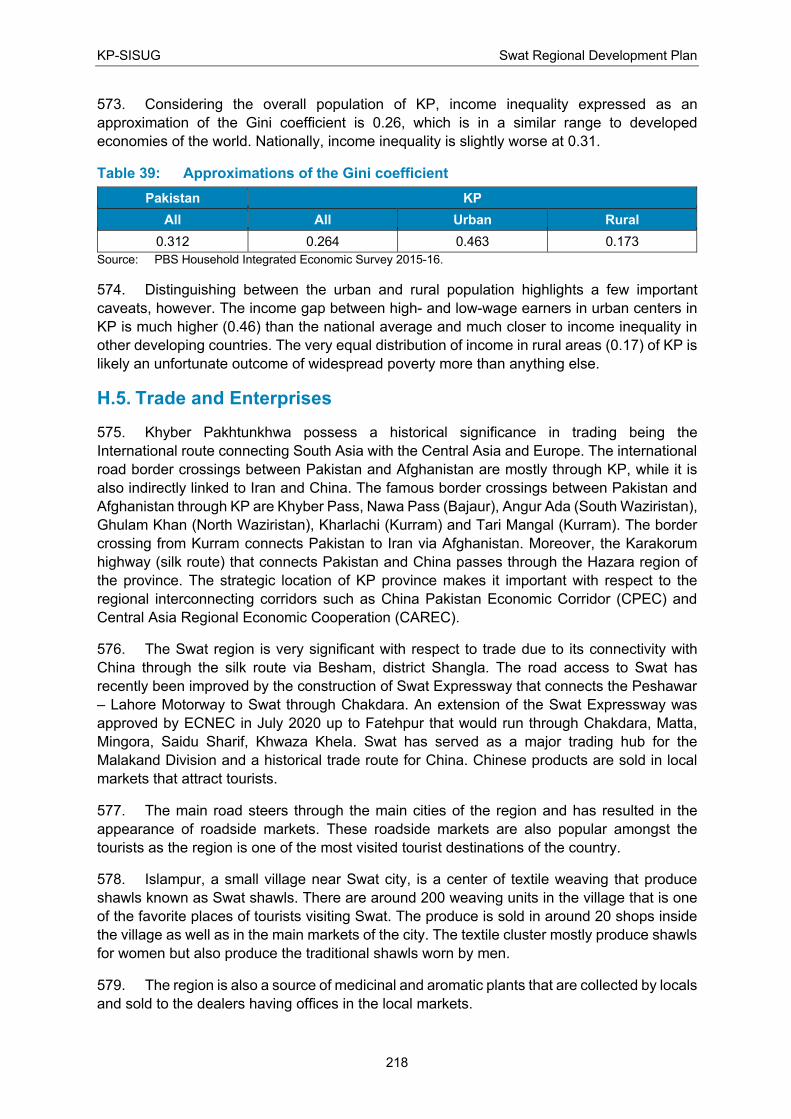
KP-SISUG Swat Regional Development Plan
218
573. Considering the overall population of KP, income inequality expressed as an
approximation of the Gini coefficient is 0.26, which is in a similar range to developed
economies of the world. Nationally, income inequality is slightly worse at 0.31.
Table 39: Approximations of the Gini coefficient
Pakistan KP
All All Urban Rural
0.312 0.264 0.463 0.173
Source: PBS Household Integrated Economic Survey 2015-16.
574. Distinguishing between the urban and rural population highlights a few important
caveats, however. The income gap between high- and low-wage earners in urban centers in
KP is much higher (0.46) than the national average and much closer to income inequality in
other developing countries. The very equal distribution of income in rural areas (0.17) of KP is
likely an unfortunate outcome of widespread poverty more than anything else.
H.5. Trade and Enterprises
575. Khyber Pakhtunkhwa possess a historical significance in trading being the
International route connecting South Asia with the Central Asia and Europe. The international
road border crossings between Pakistan and Afghanistan are mostly through KP, while it is
also indirectly linked to Iran and China. The famous border crossings between Pakistan and
Afghanistan through KP are Khyber Pass, Nawa Pass (Bajaur), Angur Ada (South Waziristan),
Ghulam Khan (North Waziristan), Kharlachi (Kurram) and Tari Mangal (Kurram). The border
crossing from Kurram connects Pakistan to Iran via Afghanistan. Moreover, the Karakorum
highway (silk route) that connects Pakistan and China passes through the Hazara region of
the province. The strategic location of KP province makes it important with respect to the
regional interconnecting corridors such as China Pakistan Economic Corridor (CPEC) and
Central Asia Regional Economic Cooperation (CAREC).
576. The Swat region is very significant with respect to trade due to its connectivity with
China through the silk route via Besham, district Shangla. The road access to Swat has
recently been improved by the construction of Swat Expressway that connects the Peshawar
– Lahore Motorway to Swat through Chakdara. An extension of the Swat Expressway was
approved by ECNEC in July 2020 up to Fatehpur that would run through Chakdara, Matta,
Mingora, Saidu Sharif, Khwaza Khela. Swat has served as a major trading hub for the
Malakand Division and a historical trade route for China. Chinese products are sold in local
markets that attract tourists.
577. The main road steers through the main cities of the region and has resulted in the
appearance of roadside markets. These roadside markets are also popular amongst the
tourists as the region is one of the most visited tourist destinations of the country.
578. Islampur, a small village near Swat city, is a center of textile weaving that produce
shawls known as Swat shawls. There are around 200 weaving units in the village that is one
of the favorite places of tourists visiting Swat. The produce is sold in around 20 shops inside
the village as well as in the main markets of the city. The textile cluster mostly produce shawls
for women but also produce the traditional shawls worn by men.
579. The region is also a source of medicinal and aromatic plants that are collected by locals
and sold to the dealers having offices in the local markets.
KP-SISUG Swat Regional Development Plan
219
580. The trading enterprises are spread in different parts of the region with some major
markets that are listed below:
i. Main bazar, Mingora
ii. Fruit & Vegetable market, Madyan road
iii. People Chowk, Mingora
iv. Naway Kalay Shahdara Mingora
v. Besham Road Khwaza Khela
vi. Muhammad Khan Bazar Matta
vii. Madyan Bazar
viii. Kabal Bazar
ix. Swat shopping center Qambar Mingora
x. Islampur textile weaving cluster
H.6. Industrial Estates/Special Economic Zones
581. The organized industrial establishments of Khyber Pakhtunkhwa comprise of industrial
estates, export processing zones, and special economic zones (SEZs). The industries
established are mainly developed and managed by the Khyber Pakhtunkhwa Economic Zones
Development & Management Company (KPEZDMC) while there are some industrial estates
under the control of Small Industries Development Board (SIDB).
582. Special Economic Zone (SEZ) is a blanket term for various types of specialized zones
with specific types of enterprises operating in a well-defined geographic area where certain
economic activities are promoted by a set of policy measures that are not generally applicable
to the rest of the country. The concept of SEZs may be old but the first modern zone is said to
have been established in Brooklyn, New York’s Navy Yard in 1937.321 China formally started
it in 1970s and established around 2000 SEZ till date. The experience of SEZ is considered
highly successful and it provided attractive incentives to FDI.
583. The Government of Pakistan introduced SEZs through the SEZ Act promulgated on
13 September 2012 though some may argue that the Gadoon Industrial Estate established in
1987-88 was the first informal SEZ in the country as the investors were offered unprecedented
incentives for establishment of industrial units that lasted for a couple of years. The SEZ Act
2012 provides a well-designed framework to establish and manage the industrial zones. The
law provides SEZs to be set up by the Federal or Provincial Governments themselves or in
collaboration with the private sector under different modes of public-private partnership or
exclusively through the private sector.
584. The Khyber Pakhtunkhwa Economic Zones Development and Management Company
(KPEZDMC) was established in 2015 as a section 42 company that is wholly owned by
government of Khyber Pakhtunkhwa. The company aims to develop and manage world class
321 World Bank report on Special Economic Zones ‘An operational review of their Impacts’
KP-SISUG Swat Regional Development Plan
220
industrial estates in the Khyber Pakhtunkhwa to help organizing and establishing planned and
rapid industrialization in Khyber Pakhtunkhwa. Rehabilitation of the existing industrial estates
is also part of the objectives of this company. The company took over the industrial estates
developed and owned by the Sarhad Development Authority (SDA) on abolition of the later
that was established in 1973 as well as the sole Export Processing Zones (EPZ) in the
province located at Risalpur, Nowshera that was developed and managed by the EPZ
Authority. The SEZ offers fiscal benefits including a one-time exemption from custom duties
and taxes for all capital goods imported into Pakistan for the development, operations and
maintenance of a SEZ and exemption from all taxes on income for a period of ten years.
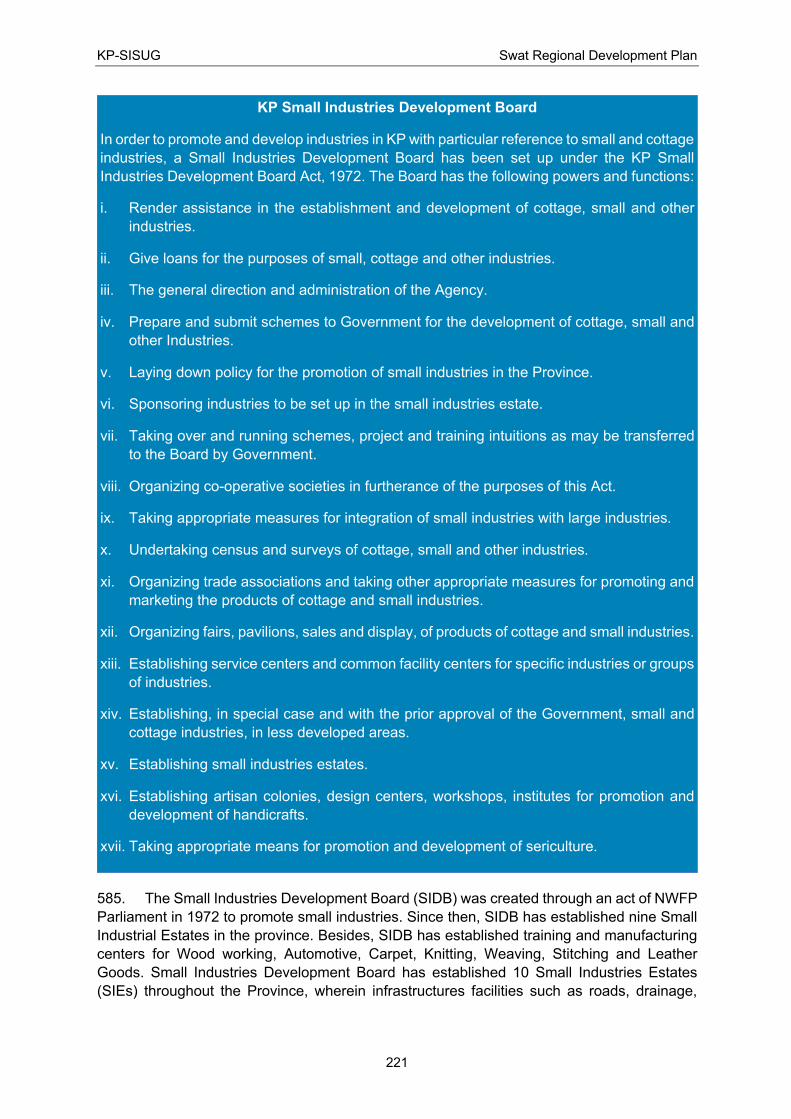
KP-SISUG Swat Regional Development Plan
221
585. The Small Industries Development Board (SIDB) was created through an act of NWFP
Parliament in 1972 to promote small industries. Since then, SIDB has established nine Small
Industrial Estates in the province. Besides, SIDB has established training and manufacturing
centers for Wood working, Automotive, Carpet, Knitting, Weaving, Stitching and Leather
Goods. Small Industries Development Board has established 10 Small Industries Estates
(SIEs) throughout the Province, wherein infrastructures facilities such as roads, drainage,
KP Small Industries Development Board
In order to promote and develop industries in KP with particular reference to small and cottage
industries, a Small Industries Development Board has been set up under the KP Small
Industries Development Board Act, 1972. The Board has the following powers and functions:
i. Render assistance in the establishment and development of cottage, small and other
industries.
ii. Give loans for the purposes of small, cottage and other industries.
iii. The general direction and administration of the Agency.
iv. Prepare and submit schemes to Government for the development of cottage, small and
other Industries.
v. Laying down policy for the promotion of small industries in the Province.
vi. Sponsoring industries to be set up in the small industries estate.
vii. Taking over and running schemes, project and training intuitions as may be transferred
to the Board by Government.
viii. Organizing co-operative societies in furtherance of the purposes of this Act.
ix. Taking appropriate measures for integration of small industries with large industries.
x. Undertaking census and surveys of cottage, small and other industries.
xi. Organizing trade associations and taking other appropriate measures for promoting and
marketing the products of cottage and small industries.
xii. Organizing fairs, pavilions, sales and display, of products of cottage and small industries.
xiii. Establishing service centers and common facility centers for specific industries or groups
of industries.
xiv. Establishing, in special case and with the prior approval of the Government, small and
cottage industries, in less developed areas.
xv. Establishing small industries estates.
xvi. Establishing artisan colonies, design centers, workshops, institutes for promotion and
development of handicrafts.
xvii. Taking appropriate means for promotion and development of sericulture.
KP-SISUG Swat Regional Development Plan
222
water supply, sewerage system, electricity, Sui gas and telephone etc., have been provided
for the establishment of industrial.
586. Currently there is no IE or SIE in Swat even though the area has seen industrial activity
due to tax benefits awarded when it was declared a tax-free zone during the merger with
Pakistan in 1969. Industries were established on private lands adjacent to residential areas.
These industries mainly comprised on textile units followed by cosmetics and plastic
manufacturing units.
587. The conflict in 2009-2014 contributed to the closure of many manufacturing facilities in
Swat, along with a general lack of competitiveness. A KPEZDMC plan to establish a SEZ at
Swat and SIDB is in the process of land acquisition for the small industrial estate that is
expected to be launched in 2-5 years. This SEZ will need to be accompanied by an analysis
of the (non)competitiveness of local manufacturers as well as a strategy and plan to avoid
future closures.
H.7. Services Sector
588. The capacities of existing and incoming workers in manufacturing need to be
strengthened to realize the potential profitability of additive manufacturing and other frontier
technologies. Skilled trainers, regardless of nationality, must be available and accessible to
ensure that the labor force is able to adapt to current and emerging trends in the sector.
589. The construction of Mingora till Nangolai Expressway Phase II has been proposed
by the Provincial Government of KP, to provide best communication facilities to District Swat
and Shangla and to attract more tourists to the area. Regionally district Swat is also known
as mini Switzerland’s of the world due to its worth seen sceneries and natural waterfalls. It
is in the North West of the country. The Constructions of the Express way from Phase II of
the project is also a significant step towards the achievement of the goals fixed by the
provincial government in providing roads communication facility which will lead to
enhancement of the Government revenue through tourism, easy access of products of Swat
District to different areas of the country as well as to develop the marble industry.
590. The tourist destinations in Swat districts are jampacked especially during summer
season but in winter as well. The main destinations include Kalam, Bahrain, Miandam,
Madyan, Fizagut, and Malam Jabba. In winter tourists come to enjoy snowfall and visit Malam
Jabba, which has a skiing resort.
591. The development of the Malam Jabba Ski Resort was a joint effort of Pakistani
government and its Austrian counterpart. The resort was leased out by Government of KP to
a private entity Samsons Group in 2014 for a period of 33 years. The private company
rehabilitated the ski resort as well as the hotel. The hotel is being managed by PC Hotels and
Malam Jabba has resulted into a favorite tourist resort of domestic as well as foreign tourists.
It has a ski slope of about 800m with the highest point of the slope 2804m (9200 feet) above
sea level.
592. Modern facilities including roller/ice-skating rinks, chair lifts, skiing platforms,
telephones and snow clearing equipment are available at the resort. These are one of the
tourist attractions of the area.
593. Two stations at Malam Jabba provide the facility of chair lift for tourists and couples for
their enjoyment. This chair lift can elevate approximately 56 passengers at a time to the height
KP-SISUG Swat Regional Development Plan
223
of 10500 feet. Inside the Malam Jabba resort, the facility of indoor games and other ice games
are available. In winters, six to eight feet snow falls around the resort.
594. The internet services started in early 1990s in Pakistan that has developed at a rapid
pace and currently close to 30 percent of the population is broadband internet users. This
translates into 62 million citizens of the country having access to high speed internet. The e-
commerce market has also witnessed phenomenal growth recently in Pakistan where local
and International e-commerce companies have captured a sizable market share. There are
hundreds of retailers; ranging from clothing outlets to electronic equipment stores; fresh fruit
and vegetables to cooked and baked items are now using websites to sell goods to customers.
595. The emergence of several online marketplaces, such as Daraz.pk and OLX Pakistan,
has made it easier for retailers to sell goods on the web. Simultaneously, a number of new
online businesses have also propped up with different marketing approach including Zameen,
Pak Wheels, Food Panda, etc. This development of e-commerce industry has resulted into a
major shift in penetrating market and an opportunity for new entrepreneurs to start business
through minimum investment in marketplace. At the same time, it opens up new avenues of
enterprise creation for women as a solution to the conservative culture and higher level of
barriers for them to do business or shop. E-commerce not only brings ease of business but
also to shop comfortably through online markets.
H.8. Communication
596. Located in Himalayas, Swat district is a major tourist attraction in Pakistan much
celebrated for its scenic beauty. Unfortunately, it got notoriety in world media during the height
of terrorism in Pakistan, particularly from 2007 to 2010 when it became a Taliban stronghold.
Fortunately, peace has been fully restored to the area and tourists have made a steady
comeback. Teeming with tourists during the summer season, Swat's valley has regained its
status as a tourist hub.
597. Though the district does not generate much negative news any longer, the media
interest in the region has not waned completely. Residents in the region take keen interest in
national affairs, watch almost all major television networks and read all major newspapers.
Like other parts of the country, state owned broadcasters as well as privately owned radio and
television stations command a large audience in the region.
598. Television is the dominant media platform in Pakistan, with more than three-fourths of
adults (76.2%) watching weekly. Though this figure is higher in urban (89.3%) than rural
(69.3%) areas. Television use also increases substantially with Pakistanis’ education level.322
599. Cable is the most common form of TV service in urban areas of Sindh, Punjab, and
Baluchistan (in urban KPK, it is about as common as use of terrestrial antennas). However, in
most of rural Pakistan satellite services and/or use of terrestrial antennas remain more
common.
600. About one in six Pakistanis (16.5%) listen to the radio at least weekly. Notably, young
Pakistani adults are most likely to listen to the radio weekly or more – 21.2% of those age 15
to 24 do so, with weekly listening trending downward by age group to just 10.4% among those
55 and older. More than two-thirds of weekly radio listeners (71.2%) say they tune in via the
322 Contemporary Media Use in Pakistan, Pakistan Research Brief, Gallup, 2014
KP-SISUG Swat Regional Development Plan
224
FM waveband, though AM use is also relatively common at 29.7%. About one in eight weekly
listeners (13.3%) report using shortwave radio.323
601. Where television is available, people rely on it as the major source of news and
information. However, rural population continues to rely heavily on radio for information and
entertainment. This is particularly true for the mountain villages where cable networks are
unavailable. Young urbanites also listen to the radio, often on their mobile phone. But they
usually tune in for music and entertainment, rather than news and information.
602. The government-run Pakistan Television Corporation (PTV) retains a monopoly on
free-to-air terrestrial broadcasting. As a result, only PTV can be watched without any cable or
satellite service; accordingly the channel attracts a good part of the overall TV audience.
Private TV channels are only allowed to broadcast on cable, satellite and the internet. Many
privately owned television stations broadcast news and current affairs programming.
603. There is no regional television channel located in the district. Most private news
channels have their teams, comprising journalists and cameramen, in Swat. Most television
channels distribute their programming through private cable networks. These cable services
include Swat Cable, Haji Cable, Naveed Cable and Ali Cable.
604. Popular Pashtu channel Khyber TV has a regional set up for Malakand based in
Mingora. The channel produces live programs from Swat, mainly covering politics and current
affairs. Cable channels also produce local programs.
H.8.1. FM Channels
605. Despite wider access of television sets and mushrooming of television channels, radio
has not lost its significance. In fact, it has been able to win a newfound appeal thanks to FM
channels that air programmes locally in high quality audio signals. Unlike television, FM
channels give listeners flexibility to tune in to their favourite programs while doing other work.
606. Radio remained a medium of choice for many areas of KP and erstwhile FATA during
decades of conflict and terrorism and this appeal was not limited to news only. Radio soap
operas enjoyed a wide audience and, according to some studies influenced attitudes among
their listeners. Radio also provides entertainment through music, drama, talk shows and live
sports commentaries. Unfortunately, illegal FM stations run by terrorists played a major role
in disrupting law and order during the Taliban insurgency in Swat.324
607. Apart from news and entertainment, the FM channels also cover social issues including
health, education and sanitation. Because of this wider appeal and low cost, these channels
have become important source of public service messaging. The government departments
often use FM channels for announcements and public service messaging on health and
development issues.
608. There are three FM channels in Swat including one managed by Pakistan
Broadcasting Corporation (PBC). Other two include Radio Swat and campus Radio managed
by the University of Swat.
323 Contemporary Media Use in Pakistan, Pakistan Research Brief, Gallup, 2014 324 Role of FM Radios in News and Information: A study of FM Radios in Peshawar, Khyber Pakhtunkhwa,
Rahman Ullah, New media technologies, Volume 8 • Issue 2, April / June 2018
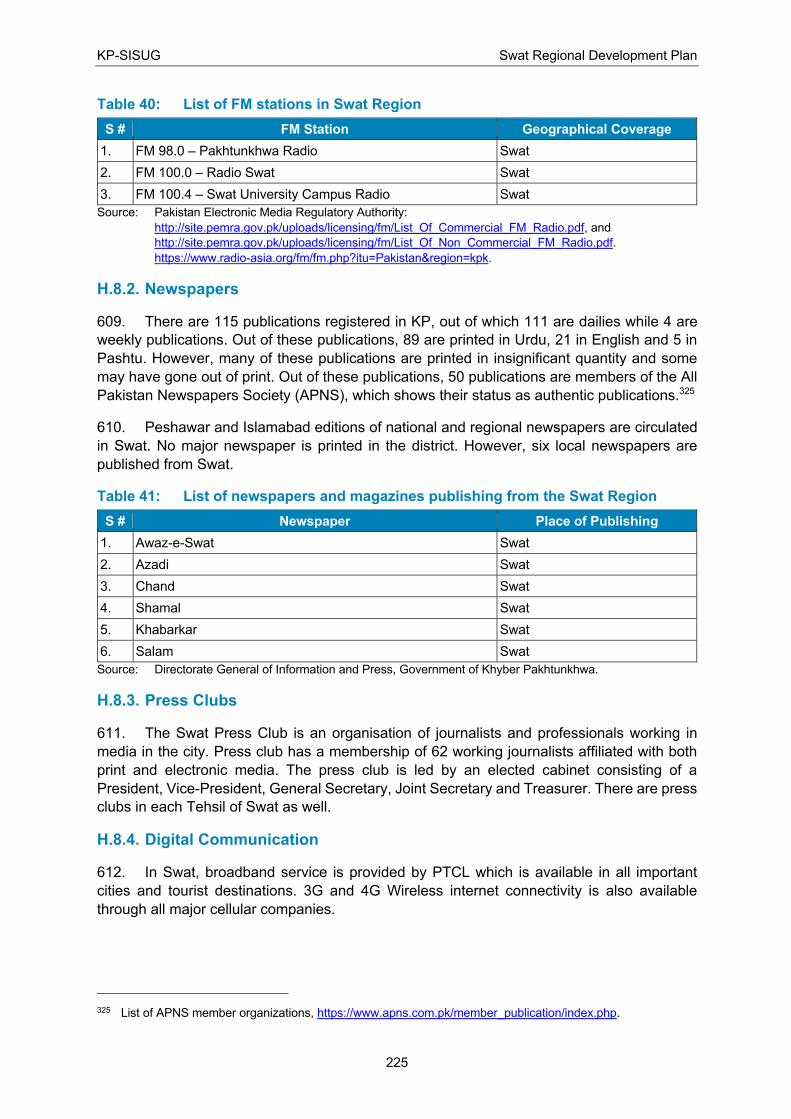
KP-SISUG Swat Regional Development Plan
225
Table 40: List of FM stations in Swat Region
S # FM Station Geographical Coverage
1. FM 98.0 – Pakhtunkhwa Radio Swat
2. FM 100.0 – Radio Swat Swat
3. FM 100.4 – Swat University Campus Radio Swat
Source: Pakistan Electronic Media Regulatory Authority:
http://site.pemra.gov.pk/uploads/licensing/fm/List_Of_Commercial_FM_Radio.pdf, and
http://site.pemra.gov.pk/uploads/licensing/fm/List_Of_Non_Commercial_FM_Radio.pdf.
https://www.radio-asia.org/fm/fm.php?itu=Pakistan®ion=kpk.
H.8.2. Newspapers
609. There are 115 publications registered in KP, out of which 111 are dailies while 4 are
weekly publications. Out of these publications, 89 are printed in Urdu, 21 in English and 5 in
Pashtu. However, many of these publications are printed in insignificant quantity and some
may have gone out of print. Out of these publications, 50 publications are members of the All
Pakistan Newspapers Society (APNS), which shows their status as authentic publications.325
610. Peshawar and Islamabad editions of national and regional newspapers are circulated
in Swat. No major newspaper is printed in the district. However, six local newspapers are
published from Swat.
Table 41: List of newspapers and magazines publishing from the Swat Region
S # Newspaper Place of Publishing
1. Awaz-e-Swat Swat
2. Azadi Swat
3. Chand Swat
4. Shamal Swat
5. Khabarkar Swat
6. Salam Swat
Source: Directorate General of Information and Press, Government of Khyber Pakhtunkhwa.
H.8.3. Press Clubs
611. The Swat Press Club is an organisation of journalists and professionals working in
media in the city. Press club has a membership of 62 working journalists affiliated with both
print and electronic media. The press club is led by an elected cabinet consisting of a
President, Vice-President, General Secretary, Joint Secretary and Treasurer. There are press
clubs in each Tehsil of Swat as well.
H.8.4. Digital Communication
612. In Swat, broadband service is provided by PTCL which is available in all important
cities and tourist destinations. 3G and 4G Wireless internet connectivity is also available
through all major cellular companies.
325 List of APNS member organizations, https://www.apns.com.pk/member_publication/index.php.
KP-SISUG Swat Regional Development Plan
226
613. All large hotels in Swat make extensive use of internet to do get reservations. Some
tour operating companies also offer package tours online. However, many small businesses
are lagging behind and vacation rental online marketplace has not picked up yet.
614. Pakistan's tele-density is 78.84% where the main contribution is by the mobile sector
with penetration crossing 76.4%. Growth in broadband has been rapid in both subscription
and usage. The country has a total broadband subscriber base of 76.3 million, i.e., 39.25%
and 3G/4G penetration is 38.25%.326
615. However, many gaps still exist. According to The Inclusive Internet Index 2020,
Pakistan fell into the last quartile of countries, overall ranking 76th out of 100 countries (24th
out of 26 Asian countries). Besides a low level of digital literacy and poor quality networks, the
country also scored poorly in the affordability indicators.
616. Digital marketing is fast gaining popularity in KP. Development of this sector is
important because markets of many goods and services produced in KP are located outside
the province. For example, KP is a major tourist hub for the whole country and attracts
international tourists as well. Apart from the regular businesses, a number of major firms and
start-ups use various digital platforms to market their goods and services. Though many
businesses market their products and services online, internet remains underutilized. For
example, Peshawar is a regional hub of gems and precious stones. These precious stones
have an international market. However, this sector hardly makes use of the internet because
market still follows old ways of marketing.
617. With regard to international marketing by small businesses and individual
entrepreneurs and service providers also face problems due to unavailability of online
payment solutions like PayPal that does not offer its services in Pakistan.
618. A number of college and the university of Swat, like other parts of KP, both in the
government and the private sector, offer certificates and degree courses in various
specializations in information technologies. The Department of Computer Science at
University of Swat aims to provide education and training at all levels to contribute to the
national pool of computer scientists who can meet the demands of the industry and the
academia. These institutions cater to the needs of students from Swat and Malakand division.
619. Online degree courses are offered by two state sector universities i.e. Allama Iqbal
Open University and the Virtual University. Due to COVID-19, all major universities have also
turned to online education. This experience may prove a turning point for the way education
is imparted in KP and Pakistan. In many rural areas, students were not able to make use of
this facility and students organized protests in parts of KP, demanding better internet access.
620. In 2011, KP Assembly enacted the Khyber Pakhtunkhwa Establishment of Information
Technology Board Act 2011. Under this act, a board of the same name has been established.
The board has adopted a Digital Policy for Khyber Pakhtunkhwa that looks at the regulatory,
operational and financial challenges to the growth of IT Sector in the province and presents a
set of comprehensive recommendations from a provincial perspective to uplift this sector.
326 Telecom Indicators, Pakistan Telecommunication Authority, August 2020,
https://www.pta.gov.pk/en/telecom-indicators.
KP-SISUG Swat Regional Development Plan
227
621. Information Technology has a cross cutting role and its development requires cross-
sectoral coordination. In order to make effective use of information technology for development
in the region, these links must be fully explored and made use of.
H.8.5. Public Relations
622. The Directorate of Information and Public Relation is the sole and main publicity organ
of Government of Khyber Pakhtunkhwa. The department is mandated with the publicity of the
provincial government through print and electronic media with the aim to educate and inform
the general public about government policies and initiatives undertaken for the public welfare
in addition to promoting a soft image of the provincial government and the province. The
mandate of the directorate includes: publicity of the government; acting as a bridge between
the government & public; issuance of advertisements to the newspapers and magazines;
managing media affairs on behalf of the government; management of newspapers, books,
magazines, printing presses etc.; regulating motion pictures under the law; production and
distribution of films and documentaries of general interests with the consultation of the
departments concerned as well as broadcasting and telecasting.
H.9. Economic Impetus for Urban Growth: the Way Forward
623. The Swat District with Mingora as the major urban agglomeration. Mingora contains
just over 14% of the provincial population.327 Unfortunately, job opportunities are relatively
limited.
H.9.1. Agriculture
624. With the important role that agriculture has in Swat District, developing the sector
provides opportunities for rural residents.
625. Swat is at its heart an agrarian community and agriculture is the main source of income
for much of the rural population. The main crops of Swat include wheat, maize, vegetables,
tobacco, fruits, soya bean and sunflower. An area of 1180,586 hectares is normally brought
under cultivation in Swat including 130,369 hectares in cereal crops, like wheat, maize and
rice, 12,218 hectares for fruit orchards and 11,143 hectares for vegetables.
H.9.1.1. Policy recommendations
626. To stimulate household income from farming, two approaches are available. The first
is to invest in the technology and knowledge to raise yields for selected crops. The second is
to support farmers in transitioning towards higher-value crops with export potential.
627. Yields for wheat and rice in the Swat District are high compared to the average yield
in KP. These crops are candidates for expansion, particularly considering the export potential
of these crops, though institutional reforms are needed for wheat to become a cash crop for
small farmers.
628. The Swat District is famous for producing quality fruits. A variety of fruits like peaches,
apple, pear, apricot, plum, persimmon, walnut, etc. are produced and marketed all over the
327 Development Statistics of Khyber Pakhtunkhwa – 2017, Government of KP.
KP-SISUG Swat Regional Development Plan
228
country.328 The yields for the traditional fruit production are comparatively low, however,
indicating a need for extension services and facilitating investment in modern equipment by
small farmers.
629. The altitude and remoteness of rural lands in Swat makes the region very suitable to
develop agriculture around potatoes and potato seed for national and international markets,
which may provide another avenue for income generation for rural households.
630. Developing the production and market for medicinal and aromatic plants is another
way to potentially raise the income of poor households.329, 330
631. The livestock and poultry sectors need modern slaughterhouses and atmosphere-
controlled storage facilities to grow the local and exports markets. Similarly, the processing
and marketing chain of milk needs to be raised to a higher standard. Infrastructure
development must be combined with capacity building of farmers and butchers and oversight.
632. Exports of fish are currently small but have growth potential, suggesting this is a
sector that, with proper support, can raise the regional economy.
633. Stimulating the number of beekeepers and bee colonies improves pollination and the
size and appearance of fruits and nuts.331 This would further support agricultural yields and
enable farmers to realize higher prices.
634. Overall, extension services need to be strengthened. Farmers need to be introduced
to modern techniques that reduce waste (e.g., drip irrigation) and improve yields (e.g.,
commercial seed stock, tunnel farming). Proven technologies suitable to geological,
meteorological conditions can be demonstrated in pilot farms and taught to farmers. In the
long run, advanced farming technologies (e.g., hydroponic farms) may be explored.332
635. Farmers may also not be fully aware of the (inter-) national value chain of agricultural
products.333 Strong extension services raise such awareness, while government or sector
agencies should develop the value chain and provide marketing.
636. Considering the tourism potential of Swat, a strategy for tying agriculture into tourism
may provide supplemental income and access to foreign currency for farm households. For
instance, bee conservation provides an ecotourism narrative and beekeeping itself is even
becoming a tourism experience.334
328 Improvement of Food Production in Swat Valley. The Express Tribune, 27 may 2014
(https://tribune.com.pk/story/713923/swat-valley-environmental-catastrophe). 329 Best Practices: Conservation and Sustainable Management of Biodiversity in Khyber Pakhtunkhwa,
Pakistan, GIZ, 2016. 330 Agricultural Policy Khyber Pakhtunkhwa. A ten year perspective, FAO, 2015. 331 Klatt BK, Holzschuh A, Westphal C, Clough Y, Smit I, Pawelzik E, Tscharntke T 2014. Bee Pollination
Improves Crop Quality, Shelf Life and Commercial Value. Proceedings of the Royal Society B 281: https://doi.org/10.1098/rspb.2013.2440
332 GoKP 2019. Tribal Decade Strategy. 333 GoKP 2019. Tribal Decade Strategy. 334 https://www.positive.news/environment/conservation/bee-tourism/
KP-SISUG Swat Regional Development Plan
229
H.9.1.2. Institutional reforms
637. The government currently acts as a buyer for agricultural crops such as wheat. Small
farmers currently struggle to sell in this way. The hurdles they face should be identified and
eliminated to level the playing field for all market participants.
638. Regulating supply, demand, and prices diminishes the efficiency of production and
markets in general. Deregulating agricultural markets can incentivize farmers to become more
efficient, respond to market changes, and achieve economies of scale through industry
consolidation.
639. Digital dissemination of market information (expected production, demand, realized
prices) is needed to support the income of small farms in particular. If this information
asymmetry is eliminated, small farms have a better bargaining position and can reduce profit-
taking by middlemen. Apps such as TruTrade and PixFruit have been used successfully by
African farmers.
640. Honey producers can encounter problems at checkpoints when transporting beehives.
They need support in eliminating such events.
641.
H.9.1.3. Operational recommendations
642. The main fruit and vegetable markets are the most congested areas where farmers,
middle-men, dealers, wholesalers, sale agents, retailers, and consumers meet. The markets
in all parts of the region lack proper storage capacity, auction sheds, and roads. The existing
fruit and vegetable markets need to be upgraded to modern standards and new markets need
to be constructed to meet the growing demand:
• Feasibility studies with different investment models for upgradation of fruit and
vegetable markets to be prepared for Mingora in year 1 to be executed in in 2-5 years.
• Conduct a survey to identify suitable locations for establishment of fruit and vegetable
markets in Swat region in year 1-2.
• Capacity building of market committees and local Government to improve regulatory
regime and better implementation.
• Investment generation activities such as road shows and seminars.
643. Currently, there is only one food processing unit ‘Master Foods’ but its capacity is
insufficient to service Swat District, let alone surrounding Districts. Warehousing, processing,
packaging, and sales services need to be developed further.
644. The livestock and poultry sectors suffer from constraints that must be addressed to
raise incomes: chronic shortages of feed/fodder, lack of supporting services (consulting,
veterinary, finishing), lack of modern processing facilities, (cold chain) storage and transport,
and marketing. Bottlenecks in modern infrastructure must be identified. Solutions must
account for the local and regional structure of the production and value chains, which will
require detailed studies.
645. Oversight and training for workers need to accompany these infrastructural
investments. A public-private partnership model where the government provides suitable land
and regulatory support may be productive.
KP-SISUG Swat Regional Development Plan
230
646. Honey producers do not have access to facility for extracting honey, cleaning, bottling,
and packaging it. Developing this infrastructure enables a constant and high quality of honey,
which improves access to international markets and raises incomes.
647.
H.9.2. Energy, Mining, and Industry
H.9.2.1. Policy recommendations
648. Manufacturing in the Swat District is small, struggling, and hamstrung by its geographic
location. It may be unrealistic to expect Mingora to become a manufacturing powerhouse in
the medium term. Nonetheless, there is a need to come up with new schemes to attract
investment and increase indigenous manufacturing base of the region.
649. Where existing manufacturing companies are suffering because of a lack of
competitiveness, further investments should be made only after solid business cases show
the decline can be reversed. Overly generous financial support for non-viable activities creates
so-called ‘zombie firms’ that may become reliant on regular infusions of financial support.
650. Similar to the agricultural sector, the industrial sector of Swat may be best served by
providing any needed support for its traditional crafts:
• A tradition of woodcarving is borne out by the huge statues of Buddha in Bamiyan,
Afghanistan and the elaborately designed statues of Buddha in Swat.
• The goldsmiths of Swat valley have made beautiful jewelry and ornaments that are
original and typical of the region.
• Swati embroidery for dresses, shawls, blankets, bed sheets, pillow covers, tablecloths,
veils, head scarves, handkerchiefs, etc., has a great significance and has an innovative
and creative underpinning. The silver and golden lace embroidery of Swat is famous
throughout the country.
• Silk is a regional product that with improved quality can help the community enter new
markets and raise incomes.
• The sought-after emeralds from Swat could find another target audience in tourists.
651. While there is mining, small mining operations appear to dominate, which are known
to be associated with higher environmental damage.335 Such negative impacts need to be
regulated and reduced.
652. Reviving and strengthening traditional small-scale manufacturing so that there is room
for tourists to safely experience unfamiliar production processes, they may open to buying
mementos of their holiday. This would help the industry meet competitive pressure from other
producers from, e.g., India.336
653. GoKP promises to develop local coal resources to generate power.337 In light of the
global climate change debate and the untapped potential of hydroelectric dams in KP,
335 Hentschel T, Hruschka F, Priester M 2002. Global Report on Artisanal & Small-Scale Mining. International
Institute for Environment and Development & World Busiiness Council for Sustainable Development. 336 https://www.dawn.com/news/1151164 337 GoKP 2019. Sustainable Development Strategy. A medium-term development framework 2019-23 for
Khyber Pakhtunkhwa.
KP-SISUG Swat Regional Development Plan
231
development of renewable resources promises a more future-resistant path to reliable energy
provision. Currently, renewable energy sources are underdeveloped.338, 339
654. At the same time, stimulating energy efficiency can both reduce energy demand and
power outages and create a new economic sector and employment. Of course, the business
case for becoming energy-efficient requires that energy use is metered and paid for.
H.9.2.2. Institutional reform
655. Currently, SIDB is responsible for developing and managing small industrial estates
and technical training. It is recommended that the small industrial estates shall be transferred
to KPEZDMC in order to have one public entity developing and managing industrial
estates/zones.
656. The technical training component of SIDB may be transferred to Technical &
Vocational Education Training Authority (TEVTA) that has a training mandate.
657. In general, easy and transparent regulation for new businesses will facilitate economic
growth led by the private sector that builds on market opportunities.
H.9.2.3. Operational recommendations
658. An SEZ at Swat can be established within the next 3-5 years in order to support
industrialization in the area. The SEZ is suggested to be focused on food processing in order
to utilize the local produce.
659. Developing small industrial estates in different parts of the region that require lesser
investment and are smaller units brings manufacturing within reach of smaller investors. It is
recommended to develop small industrial estate in Swat region that focus on traditional
products, including units for marble, furniture, emeralds and jewelry, silk, honey etc.
660. Support can take the form of soft loans and grants to upgrade facilities relevant to each
traditional product and supporting infrastructure such as roads, warehouses, uninterrupted
supply of utilities, sewerage, waste management, environmental protection, labor
accommodation, transport facilities, etc.
H.9.3. Services
H.9.3.1. Policy recommendations
661. Trading enterprises are mostly situated on the roadside along the main road/ Highway
in an unorganized manner that makes future expansion a problem. A trend of constructing
bigger shopping plazas along the roadside has increased in the past decade. Future trading
plazas need better planning and the existing markets need to be improved to modern
standards.
662. Shopping centers have been constructed Mingora and Saidu Sharif but more modern
shopping centers/malls are needed with efficient land use through more floors, proper parking
338 GoKP 2020. Proposed Land Use Plan for the District Peshawar 339 GoKP 2020. Final Land Use Plan of District Mardan
KP-SISUG Swat Regional Development Plan
232
spaces, security arrangements, central air-conditioning, access for women and the disabled,
children’s play areas, restaurants, banks, health clinics, etc.
663. It is recommended to promote establishing of modern shopping centers in Mingora and
Saidu Sharif in the next three years and in Khwaza Khela, Matta and Kabal in five to ten years.
Government support may be in the shape of including commercial plots specified for shopping
centers in the master plan. The investment is going to be made by private sector but it needs
transparent building regulation to encourage investment.
664. The IT industry has shown promising growth for Pakistan in the last five years. The
software export has become a billion-dollar industry in a few years and freelancer are earning
an equal amount of income. The Government needs to support this sector and establish a
software park replicating the model of Pakistan Software Export Board that was established
at Peshawar.
665. Such initiatives should be supported in other parts of the region as well, in collaboration
with educational institutions and private companies. Small businesses and entrepreneurs
often struggle to adopt to digital marketing. They need training opportunities as well as digital
platforms and portals where they could market their goods and services. Availability of training
opportunities and facilitation in creation of such platforms can go a long way in promoting
business activities and creating new employment opportunities.
666. Promotion of online business is not possible without ensuring availability of reliable,
safe and easy to use online payment solutions. Provincial authorities should work closely with
the State Bank of Pakistan and private companies to ensure availability and promotion of such
solutions among the business community.
H.9.4. Communication
H.9.4.1. Effective Use of Media
667. Like other communication efforts, working with the news media is done best when it is
based on a strategy and follows a systematic process. As in other communication initiatives,
assessing the needs of the audience—journalists—is important to reaching them effectively.
The most important task of media relations is to find newsworthy information and to present it
to journalists accurately and in ways that they can use. Some of the proven techniques,
methods, and materials include:
• Providing accurate, timely, and interesting information.
• Collecting and analyzing information about the news media's interests and needs.
• Producing news releases, feature stories, opinion pieces, newsletters, and other
readily usable material.
• Preparing press kits, fact sheets, experts lists, and other aids for journalists.
• Presenting story ideas to journalists, and responding to their requests for information
and assistance.
• Arranging and assisting with news conferences, site visits, and other events that
interest the news media.
KP-SISUG Swat Regional Development Plan
233
• Helping journalists make contact with program staff, including arranging interviews.
• Dealing with opposition and public controversies when they arise, and countering false
rumors.
H.9.4.2. Building Capacity of Media
668. Media is focused on reporting events. Most journalists lack the capacity to dig deep
and report processes. Therefore, development reporting remains underdeveloped in the
province as well as the country As a result, government's development programmes often get
ill-informed criticism. It is the right of the media to work as a watch dog and point out mistakes
of the government and state institutions. However, criticism can be counterproductive if such
criticism is ill informed.
669. The KP government should build bridges with media and organise trainings for media
persons on development journalism as well as speciality reporting including education
reporting, health reporting and municipal reporting.
H.9.4.3. Make Effective Use of Social Media
670. Social media are revolutionizing the basic rules of engagement. Where traditional
media messaging was one-way, controlled, and relevant primarily to the organization, social
media are networked, free-flowing and relevant to the participants. The principles of social
media are sometimes referred to as ‘democracy in communications’.
671. The social media can play a major role in information sharing, social mobilization and
public relations. Departments can use social media to build awareness, create a network of
supporters and empower its supporters to spread their message. Departments should make
an active use of Facebook, Twitter, Instagram and YouTube as social media tools. Social
media should also be used to encourage interaction and participation in city programs. Social
media tools can also be used to increase engagement efforts to involve the public in the
development of a strategic plan and annual budgets.
H.9.4.4. Implement Digital Policy
672. KP's digital policy outlines an excellent framework for development of the IT sector. If
implemented well, province can make major strides to overcome its challenges and achieve
its ambitions.340
673. In order to achieve ambitious goals outlined by the digital policy, fast and affordable
internet connectivity must be made available to most citizens in the province. Though the
PTCL telephone exchanges in most cities are linked through optical fibre lines, exchange to
home optical fibre services are very limited. Enhancement of optical fibre infrastructure can
ensure availability of economical and high speed broadband to businesses and citizens.
674. Unavailability of reliable internet service may also discourage national and
international tourists from visiting popular tourist destinations in KP. Ensuring availability of
internet in such areas can help in promotion of tourism in the province.
340 Khyber Pakhtunkhwa Digital Policy 2018-2023, Khyber Pakhtunkhwa Information Technology Board,
Government of Khyber Pakhtunkhwa.
KP-SISUG Swat Regional Development Plan
234
675. Small businesses and entrepreneurs often struggle to adopt to digital marketing. They
need training opportunities as well as digital platforms and portals where they could market
their goods and services. Availability of training opportunities and facilitation in creation of such
platforms can go a long way in promoting business activities and creating new employment
opportunities.
676. Creation of Economic Zones under CPEC and Economic Corridors can be a game
changer for the province. It can bring back the past glory of a trading hub to Peshawar- a city
that linked Central Asia with South Asia and beyond. Realization of this dream is not possible
without harnessing the potential of digital technology and ensuring availability of fast internet
access to businesses and citizens.
677. Promotion of online business is not possible without ensuring availability of reliable,
safe and easy to use online payment solutions. Provincial authorities should work closely with
the State Bank of Pakistan and private companies to ensure availability and promotion of such
solutions among the business community.
KP-SISUG Swat Regional Development Plan
235
I. MUNICIPAL SERVICES
678. Responsibility for the provision of basic municipal services is shared between a
number of organizations, as discussed in Section D.3.3 above. In the main urban center of
Mingora, the Water and Sanitation Services Company Mingora (WSSCM-S) has the sole
responsibility for providing water supply, sanitation (drainage and sewerage), and municipal
solid waste services throughout all of the city.
679. The geographical area of WSSCM-S services covers nine (9) urban UCs: Amankot,
Banringaro Darai, Gulkada, Malkanan Landakass, Malok Abad, Rahim Abad, Rang Muhallah,
Saidu Sharif and Shahdara Nawan Killi. As per 2020 population estimates, 369,662 people
resided in Mingora (census 2017: 331,091 people, 41,301 households). The city’s growth is
comparatively rapid, with a projected increase of population in the service area of more than
eleven and a half per cent (actual: 11.65%) in the last three (3) years since the 2017census.
680. WSSCM-S took over operation of the water, sanitation, and solid waste management
sectors from the TMA with effect from January 2018. Elsewhere in the region, the TMAs
(TLGs) retain responsibility for providing municipal services in all other urban centers aside
from Mingora.
681. In the absence of any data to the contrary it is assumed that the TMAs in the other
urban centers in the region provide services to the population within all of their respective
urban limits. The estimated populations in 2020 for the main urban centers in the region, other
than Mingora, are (Appendix 1):
• Barikot City, 104,066.
• Behrain City, 66,635.
• Kabal City, 129,438.
• Khawaza Khela City, 53,406.
• Matta City, 48,398.
682. In total the population in the urban centers in the region is estimated in 2020 to be
771,605, based on intercensal growth rates, with Mingora accounting for approximately forty-
eight per cent (48%) of the region’s urban population. The urban population, within the official
urban boundaries, represents approximately thirty per cent (30%) of the total estimated
population of Swat District in 2020.
I.1. Water Supply
I.1.1. Current Status
683. Virtually all of the potable water supply throughout the region is met from groundwater
sources. The review below is focused on Mingora City in the absence of data from other urban
centers in the region.
684. In practice, the abstraction of groundwater is not controlled or regulated. Any individual
or company or institution may sink its own well to abstract groundwater. There are no limits,
other than the actual recharge capacity of the well, to restrict the amount of water that may be
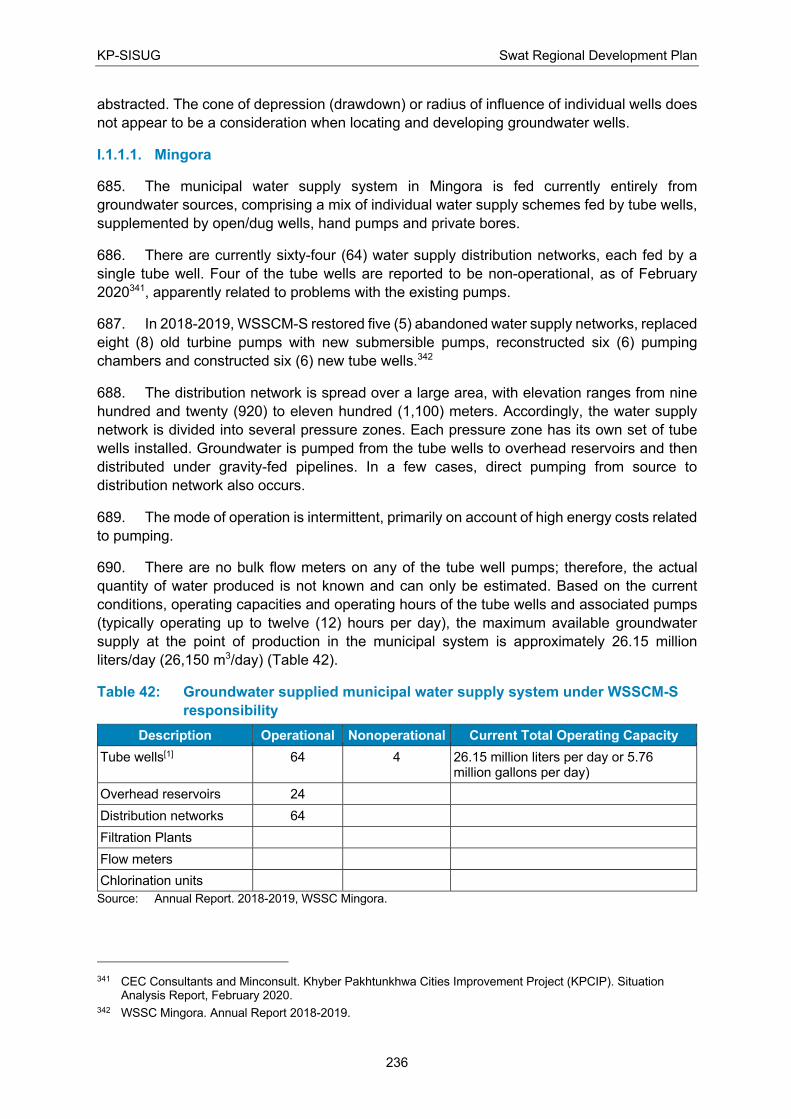
KP-SISUG Swat Regional Development Plan
236
abstracted. The cone of depression (drawdown) or radius of influence of individual wells does
not appear to be a consideration when locating and developing groundwater wells.
I.1.1.1. Mingora
685. The municipal water supply system in Mingora is fed currently entirely from
groundwater sources, comprising a mix of individual water supply schemes fed by tube wells,
supplemented by open/dug wells, hand pumps and private bores.
686. There are currently sixty-four (64) water supply distribution networks, each fed by a
single tube well. Four of the tube wells are reported to be non-operational, as of February
2020341, apparently related to problems with the existing pumps.
687. In 2018-2019, WSSCM-S restored five (5) abandoned water supply networks, replaced
eight (8) old turbine pumps with new submersible pumps, reconstructed six (6) pumping
chambers and constructed six (6) new tube wells.342
688. The distribution network is spread over a large area, with elevation ranges from nine
hundred and twenty (920) to eleven hundred (1,100) meters. Accordingly, the water supply
network is divided into several pressure zones. Each pressure zone has its own set of tube
wells installed. Groundwater is pumped from the tube wells to overhead reservoirs and then
distributed under gravity-fed pipelines. In a few cases, direct pumping from source to
distribution network also occurs.
689. The mode of operation is intermittent, primarily on account of high energy costs related
to pumping.
690. There are no bulk flow meters on any of the tube well pumps; therefore, the actual
quantity of water produced is not known and can only be estimated. Based on the current
conditions, operating capacities and operating hours of the tube wells and associated pumps
(typically operating up to twelve (12) hours per day), the maximum available groundwater
supply at the point of production in the municipal system is approximately 26.15 million
liters/day (26,150 m3/day) (Table 42).
Table 42: Groundwater supplied municipal water supply system under WSSCM-S
responsibility
Description Operational Nonoperational Current Total Operating Capacity
Tube wells[1] 64 4 26.15 million liters per day or 5.76 million gallons per day)
Overhead reservoirs 24
Distribution networks 64
Filtration Plants
Flow meters
Chlorination units
Source: Annual Report. 2018-2019, WSSC Mingora.
341 CEC Consultants and Minconsult. Khyber Pakhtunkhwa Cities Improvement Project (KPCIP). Situation
Analysis Report, February 2020. 342 WSSC Mingora. Annual Report 2018-2019.
KP-SISUG Swat Regional Development Plan
237
Note: In the absence of flowmeters on the tube well pumps, the estimated operating capacity has been
derived assuming an average of 12 hours pumping per day and a pump capacity of approximately 10
liters/second (8,000 gallons per hour).
691. The distribution network, mostly comprising galvanized iron, asbestos cement and
HDPE pipes, is almost thirty (30) years old and in need of replacement and/or repair. In places
the distribution network passes through sanitation drains; leaking pipes are prone to cross-
contamination. As is common in many urban centers, WSSCM-S have reported the presence
of significant leakage from old and rusted pipes, the need to replace such pipes to reduce high
levels of non-revenue water (NRW) and the extensive use of asbestos cement pipes, the latter
giving rise to potential health concerns from ingestion of asbestos fibers.
692. The total length of the distribution network under WSSCM-S’ jurisdiction is
approximately 110 km. Not all streets have distribution networks laid out for water supply. In
some streets, the residents have constructed private pipelines connected to nearby rising
mains for water supply.343
693. In the UCs under WSSCM-S’ jurisdiction (2020, estimated population 369,662), the
potential available water is calculated to be approximately 70 liters per capita per day (lcpd),
before losses, based on the maximum produced water per day.
694. WSSC Mingora estimate that Non-Revenue water (NRW) and unaccounted for water
in Mingora is at least sixty per cent (60%) of the produced groundwater and possibly much
higher. Based on this level of losses the available water at consumer level is calculated to be
around 28 lpcd. This is well below the service level assumed to be the minimum (50 lcpd) to
cater for basic consumption needs and maintain adequate levels of personal and food
hygiene.344
695. Due to an insufficient and inadequate distribution system, certain areas even within
the served UCs are not supplied with water from the municipal system. On average, a typical
consumer has access to one (1) hour’s water supply on a daily basis. The supply is intermittent
and often very irregular. This ensures that pressure is not maintained in the system, thereby
allowing the potential ingress of contaminants into the pipelines giving rise to downstream
deterioration of water quality.
696. The potential demand for potable water is estimated to be approximately 49,905
m3/day, on the basis of a demand of one hundred and thirty-five (135) lpcd. The maximum
available production, before losses, is calculated to be approximately fifty-two per cent (52%)
of the projected potential demand. Taking into account losses of up to sixty per cent (60%),
the available production is sufficient to cater for only around twenty-one per cent (21%) of the
estimated potential demand.
697. WSSCM-S reported that, in 2019, several additional water supply schemes were in
progress and there were plans under the USAID funds and Provincial annual funds to
construct an additional twenty-one (21) schemes in 2019-2020. Even with completion of these
schemes the available supply would be insufficient to cater for the projected demand.
343 CEC Consultants and Minconsult. Khyber Pakhtunkhwa Cities Improvement Project (KPCIP). Situation
Analysis Report, February 2020 344 WHO. 2003. Domestic Water Quantity, Service Level and Health. Geneva: World Health Organization.
KP-SISUG Swat Regional Development Plan
238
698. The number of registered water connections in the served area was 23,564, as of
February 2020.345 No breakdown of the registered users by UC has been seen to date. The
number of recorded active connections represents around half of the households in the area
served by WSSCM-S at this time. Correspondingly, the number of illegal connections is high,
in excess of thirty per cent (30%) impacting the ability of WSSCM-S to recover the costs of
operations.
699. Pakistan Council of Research in Water Resources (PCRWR) published a water quality
assessment report for Mingora in 2018.346 Over five hundred (500) samples of water were
tested, obtained from a variety of sources including tube wells, hand pumps, dug wells, bores,
storage tanks, springs, taps and supply lines, covering both sources and components of the
distribution system up to the point of consumption.
700. Overall, fifty-five per cent (55%) of the samples tested were found to be contaminated,
primarily by coliforms.
701. Ninety per cent (90%) of the samples obtained from tube wells were found to be safe
in accordance with National Drinking Water Standards. Ten per cent (10%) were found to be
contaminated by coliforms. It is noted that there are currently no disinfection (chlorination)
units installed on any of the tube wells.
702. Other sources, from which groundwater was obtained from shallow depth, contained
higher levels of contamination with coliforms, typically in excess of thirty-five per cent (35%)
and as high as fifty-five per cent (55%) for open wells.
703. Households unserved by the municipal water system rely on shallow tube wells, and
motor pumps and hand pumps. Because of the shallowness of the water table, it is prone to
contamination from poor household sanitation practices.
704. Water in the distribution system – supply lines and storage tanks – and at the point of
consumption demonstrated persistent contamination with greater than sixty-five per cent
(65%) of the samples considered to be unsafe, as per National Drinking Water standards.
Subsequently, WSSCM-S have begun to chlorinate the water in the storage tanks and have
provided individual households with aqua tabs in order to improve water quality at consumer
level.
705. In summary, the present municipal water supply for Mingora City:
• Relies solely on groundwater sources.
• Has insufficient infrastructure to meet the estimated demand from the urban area.
• Cannot operate for significant parts of the day because of high energy costs for
pumping, thus limiting the pumping and distribution capacity of the system to meet the
estimated demand for potable water.
345 CEC Consultants and Minconsult. Khyber Pakhtunkhwa Cities Improvement Project (KPCIP). Situation
Analysis Report, February 2020 346 Imran S., L. N. Bukhari. and Gul S. (2018). Water Quality Assessment Report: Mingora City District Swat
Khyber Pakhtunkhwa 2018. Pakistan Council of Research in Water Resources (PCRWR), pp. 40.
KP-SISUG Swat Regional Development Plan
239
• Meets only about one quarter of the estimated demand and provides only an
intermittent supply.
• Has high water losses in parts of the distribution system, the magnitude of which has
yet to be quantified accurately.
• Only about fifty per cent of the households are legally registered users.
• Suffers from poor quality water at the consumer level, often unfit for human
consumption, because of cross-contamination from other sources of pollution.
706. There are a number of significant issues associated with the current water supply.
Aside from the lack of capacity to satisfy the demand, the current reliance on groundwater has
resulted in significant drawdown of the groundwater table in the Swat valley around Mingora.
In last year alone, it is reported that thirteen (13) meters of drawdown has been observed in
some areas.347
707. Even though the current tube wells are insufficient to cater for the demand, it is evident
that the amount of pumping currently exceeds the recharge of the groundwater system. In
addition, as the water table declines, this leads to a reduction in well yields and increasing
costs for pump operation. According to WSSCM-S around sixty-five per cent (65%) of their
total annual operational expenditure is accounted for by energy costs alone.348
708. Another significant factor is the unplanned sprawl of the city into elevated, previously
low-density, areas outside of the valley. The distribution network in these areas was not
planned to cater for the increase in housing density now being witnessed, nor has it the
capacity to serve these areas. In some areas there is no distribution network in place.
I.2. Sanitation and Drainage
I.2.1. Current Status
709. There is no comprehensive sewerage network installed in Mingora. Similarly, there are
no sewerage lines/networks in any other urban center in the region.
710. In Mingora over ninety per cent (90%) of the population is reported to have access to
flushing latrines; waste is discharged either to septic tanks or directly to open drains or natural
water ways near their homes. The situation is the same for all other urban centers in the
region.
711. The existing sewerage/storm water systems serving urban areas are, typically,
combined systems that convey domestic, commercial and industrial wastewater. The same
systems also carry the surface runoff (storm water) during rain events. The combined flows
are mostly conveyed by open or covered drains.
712. The majority of Mingora city still lacks any basic sewerage system, including drains
and sewage pipes. Available drains are open and discharge into existing water bodies without
any form of treatment.
347 CEC Consultants and Minconsult. Khyber Pakhtunkhwa Cities Improvement Project (KPCIP). Situation
Analysis Report, February 2020 348 Ibid.
KP-SISUG Swat Regional Development Plan
240
713. Existing drains, mostly rectangular secondary and tertiary drains, collect and convey
raw sewage into primary drains which transition into natural Nallahs or Khurr before discharge
into the Swat river.
714. Surface water drains are often encroached or clogged resulting in parts of the urban
areas being susceptible to flooding during rain.
715. Currently there is no wastewater treatment plant for Mingora. There are no STPs
anywhere in the region.
716. In all urban centers, water supply pipelines are often co-located in, or cross, open
sewers and drainage channels which convey untreated wastewater. Significant potential
exists, therefore, for poorly maintained and leaking drinking water networks to be
contaminated by untreated sewage and wastewater.
717. In summary, the present sewerage and drainage systems for Mingora City and other
urban centers in the region:
• Are combined systems for drainage and sewerage.
• Are highly polluted since they receive untreated sewage and wastewater from all
sources.
• Impact the quality of the potable water distribution system.
• Provide no treatment capacity for sewage and wastewater in the absence of any
sewage network and wastewater treatment plants.
• Convey all raw sewage eventually to natural streams and watercourses which
discharge ultimately to the Swat river.
718. Based on the 2020 population estimates, the urban centers in the region are estimated
to generate of the order of 69,450 m3 of sewage and wastewater per day, assuming a water
supply of one hundred (100) liters per capita per day, of which ninety per cent (90%) translates
into wastewater:
• Mingora City – approximately 33,270 m3 per day.
• Barikot City – approximately 9,370 m3 per day.
• Behrain City – approximately 6,000 m3 per day.
• Kabal City – approximately 11,650 m3 per day.
• Khawaza Khela City – approximately 4,800 m3 per day.
• Matta City – approximately 4,360 m3 per day.
719. Given that Behrain City, Khawaza Khela City and Matta City all lie upstream of Mingora
City the wastewater from these cities (estimate of 15,160 m3 per day) will contribute to the flow
of the Swat river passing through Mingora City.
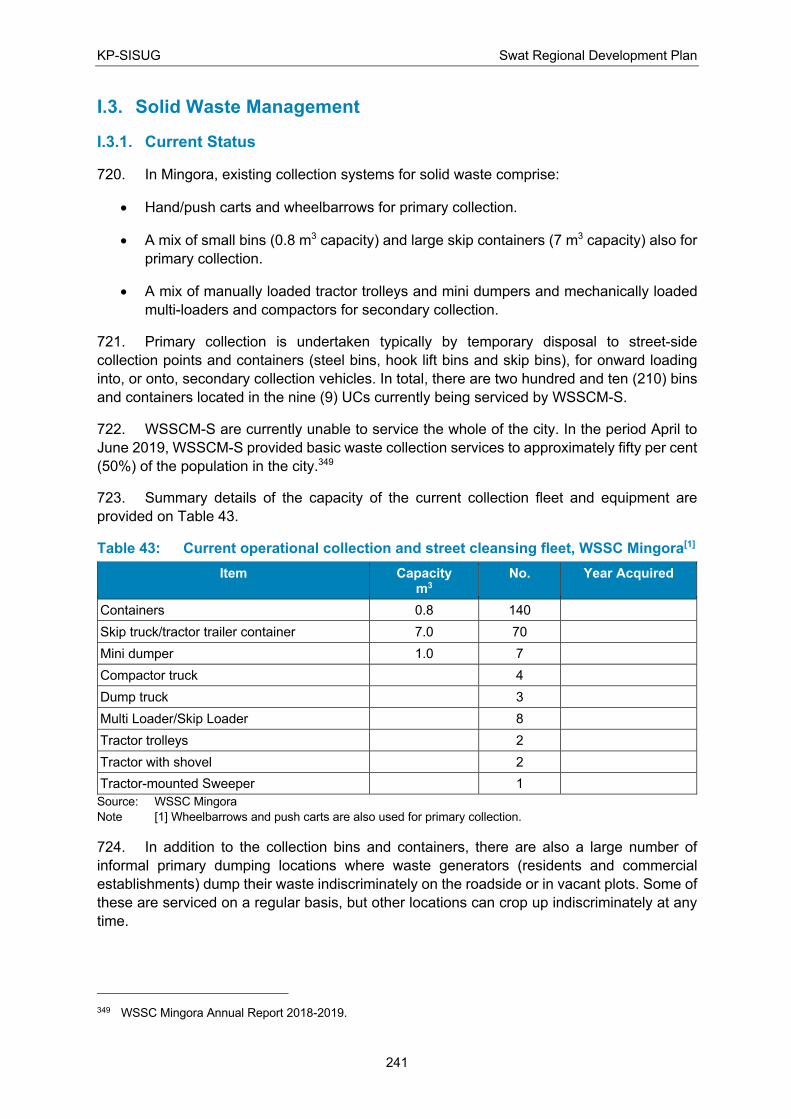
KP-SISUG Swat Regional Development Plan
241
I.3. Solid Waste Management
I.3.1. Current Status
720. In Mingora, existing collection systems for solid waste comprise:
• Hand/push carts and wheelbarrows for primary collection.
• A mix of small bins (0.8 m3 capacity) and large skip containers (7 m3 capacity) also for
primary collection.
• A mix of manually loaded tractor trolleys and mini dumpers and mechanically loaded
multi-loaders and compactors for secondary collection.
721. Primary collection is undertaken typically by temporary disposal to street-side
collection points and containers (steel bins, hook lift bins and skip bins), for onward loading
into, or onto, secondary collection vehicles. In total, there are two hundred and ten (210) bins
and containers located in the nine (9) UCs currently being serviced by WSSCM-S.
722. WSSCM-S are currently unable to service the whole of the city. In the period April to
June 2019, WSSCM-S provided basic waste collection services to approximately fifty per cent
(50%) of the population in the city.349
723. Summary details of the capacity of the current collection fleet and equipment are
provided on Table 43.
Table 43: Current operational collection and street cleansing fleet, WSSC Mingora[1]
Item Capacity m3
No. Year Acquired
Containers 0.8 140
Skip truck/tractor trailer container 7.0 70
Mini dumper 1.0 7
Compactor truck 4
Dump truck 3
Multi Loader/Skip Loader 8
Tractor trolleys 2
Tractor with shovel 2
Tractor-mounted Sweeper 1
Source: WSSC Mingora
Note [1] Wheelbarrows and push carts are also used for primary collection.
724. In addition to the collection bins and containers, there are also a large number of
informal primary dumping locations where waste generators (residents and commercial
establishments) dump their waste indiscriminately on the roadside or in vacant plots. Some of
these are serviced on a regular basis, but other locations can crop up indiscriminately at any
time.
349 WSSC Mingora Annual Report 2018-2019.
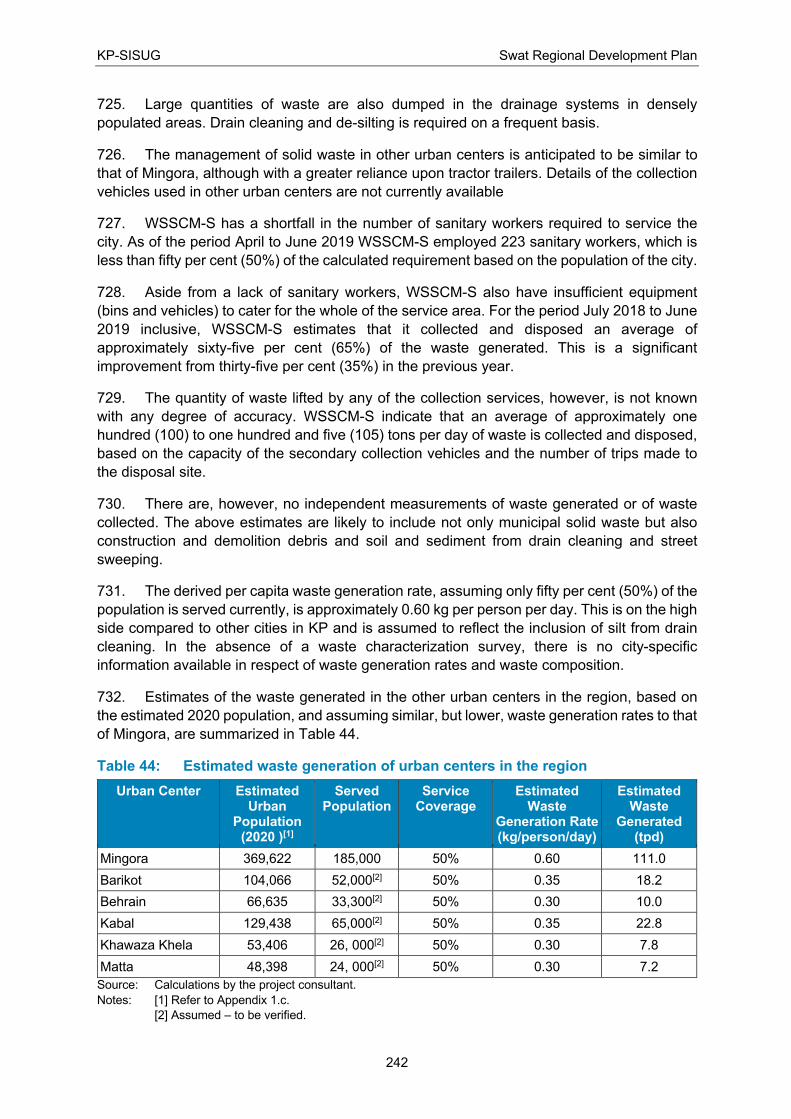
KP-SISUG Swat Regional Development Plan
242
725. Large quantities of waste are also dumped in the drainage systems in densely
populated areas. Drain cleaning and de-silting is required on a frequent basis.
726. The management of solid waste in other urban centers is anticipated to be similar to
that of Mingora, although with a greater reliance upon tractor trailers. Details of the collection
vehicles used in other urban centers are not currently available
727. WSSCM-S has a shortfall in the number of sanitary workers required to service the
city. As of the period April to June 2019 WSSCM-S employed 223 sanitary workers, which is
less than fifty per cent (50%) of the calculated requirement based on the population of the city.
728. Aside from a lack of sanitary workers, WSSCM-S also have insufficient equipment
(bins and vehicles) to cater for the whole of the service area. For the period July 2018 to June
2019 inclusive, WSSCM-S estimates that it collected and disposed an average of
approximately sixty-five per cent (65%) of the waste generated. This is a significant
improvement from thirty-five per cent (35%) in the previous year.
729. The quantity of waste lifted by any of the collection services, however, is not known
with any degree of accuracy. WSSCM-S indicate that an average of approximately one
hundred (100) to one hundred and five (105) tons per day of waste is collected and disposed,
based on the capacity of the secondary collection vehicles and the number of trips made to
the disposal site.
730. There are, however, no independent measurements of waste generated or of waste
collected. The above estimates are likely to include not only municipal solid waste but also
construction and demolition debris and soil and sediment from drain cleaning and street
sweeping.
731. The derived per capita waste generation rate, assuming only fifty per cent (50%) of the
population is served currently, is approximately 0.60 kg per person per day. This is on the high
side compared to other cities in KP and is assumed to reflect the inclusion of silt from drain
cleaning. In the absence of a waste characterization survey, there is no city-specific
information available in respect of waste generation rates and waste composition.
732. Estimates of the waste generated in the other urban centers in the region, based on
the estimated 2020 population, and assuming similar, but lower, waste generation rates to that
of Mingora, are summarized in Table 44.
Table 44: Estimated waste generation of urban centers in the region
Urban Center Estimated Urban
Population (2020 )[1]
Served Population
Service Coverage
Estimated Waste
Generation Rate (kg/person/day)
Estimated Waste
Generated (tpd)
Mingora 369,622 185,000 50% 0.60 111.0
Barikot 104,066 52,000[2] 50% 0.35 18.2
Behrain 66,635 33,300[2] 50% 0.30 10.0
Kabal 129,438 65,000[2] 50% 0.35 22.8
Khawaza Khela 53,406 26, 000[2] 50% 0.30 7.8
Matta 48,398 24, 000[2] 50% 0.30 7.2
Source: Calculations by the project consultant.
Notes: [1] Refer to Appendix 1.c.
[2] Assumed – to be verified.
KP-SISUG Swat Regional Development Plan
243
[3] Excludes cantonments
733. Based on Table 44, it is estimated that approximately one hundred and seventy-seven
(177) tons per day of municipal solid waste is generated by the served population and, overall,
approximately three hundred and fifty-five (355) tons per day in the main urban centers in the
District.
734. Uncollected waste is burnt, re-used or recycled or disposed into drains and canals.
Hospitals and medical clinics will also generate relatively large amounts of hazardous clinical
waste that is not separated from municipal waste.
735. Overall, the methods employed for waste collection are labor intensive, slow, inefficient
and unhygienic, exposing personnel to unnecessary risks. The transfer of uncovered and
unconfined waste by tractor trolley and open dump trucks results in increased littering during
waste collection and transportation. Significant odors are also associated with this method of
transportation, affecting urban populations since tractor trolleys and dump trucks travel on
main roads through populated areas. The slow speed of collection and travel also increases
congestion on the main collection routes.
736. The payload of tractor trolleys is low compared to the use of compactor trucks. In-
vehicle densities of waste are typically 1.5-2.5 times higher in compactor trucks than in open,
uncompacted trolleys. Allied with the greater capacity of medium to large-sized compactor
trucks (for example, 8m3 or 13m3 as against 4-5 m3 for trolleys) the waste load carried by
compactor trucks is significantly higher than achieved by tractor trolleys. As a result, the use
of tractor trolleys is known to be the least cost-effective method of collecting and transferring
waste. Tractor trolleys have the highest cost for waste transportation on a per ton basis.
737. WSSCM-S are also responsible for cleaning of drains and street sweeping.
Approximately 185.4 km of drains were cleaned on a quarterly basis in the year 2018-2019,
with each sanitary worker responsible for cleaning 15-25 m of drain daily.350 Without regular
cleaning of the drains they become clogged with waste resulting in flooding of the streets.
738. There are approximately 52.5 km of roads within the jurisdiction of WSSCM-S, of which
an average of 21.1% were swept on a daily basis in the period July to September 2018,
increasing progressively to 31.1% in the period April to June 2019.351
739. There is a single transfer station in Mingora, although the available area is small (0.3
ha). There are no transfer stations in any of the other cities in the region. Generally, waste
transportation is undertaken solely by waste collection vehicles, thus restricting their
availability to collect waste.
740. Currently, there are no sanitary or controlled landfills for the disposal of waste
anywhere in the region. Disposal is to unhygienic and unsanitary open dumps.
741. The current disposal site for Mingora is located at Kawtharo Maria approximately 6
(six) km east of the city center. The site extends to approximately three (3) hectares; WSSCM-
S has commenced waste disposal at the site recently.
742. There are no formal facilities or systems for the recovery and treatment of solid wastes.
Materials that are diverted from the waste stream are limited to those extracted through
350 WSSC Mingora Annual Report 2018-2019 351 Ibid.
KP-SISUG Swat Regional Development Plan
244
informal materials recovery at household level and via waste pickers at disposal sites. Burning
of waste at the dump sites is common, typically used to make it easier for waste pickers to
recover recyclable material like metal and glass from the waste mass.
743. In summary, the present solid waste management system for Mingora and other urban
centers in the region:
• Is limited in Mingora City to primary and secondary collection to approximately fifty per
cent (50%) of the population within the service area of WSSCM-S.
• Have insufficient equipment to be able to collect all of the MSW generated daily
throughout the city or even within the served areas.
• Have no facilities to treat waste in order to reduce the waste disposed to land.
• Rely on unsanitary open dumping of municipal solid waste outside of the current city
limits but often in populated areas along the main access road to the city.
I.4. Effective and Efficient Urban Services: the Way Forward
I.4.1. Key infrastructure Investments and Priorities
744. The major obstacles to well-managed, prosperous, safe and healthy cities is perceived
to be the weak institutional capacity of the municipal authorities, which manifests itself through:
• Lack of planning and transparent development in accordance with approved plans.
• Lack of enforcement of existing regulations pertaining to planning and building control.
• Unregulated slum developments.
• Unregulated and unchecked urban sprawl.
• Inadequate and reliable provision of water supply of good/acceptable quality.
• Inadequate provision of basic sanitation services.
• Inadequate provision of services for the management of solid wastes.
• Unreliable power supply.
• Highly congested and poorly maintained urban roads.
• Lack of public transportation facilities and integrated transportation systems.
• Pollution of waterways, groundwater and the general urban environment.
• Lack of employment opportunities and economic development.
745. The aspiration should be to provide basic municipal services (water supply, sanitation
and solid waste management) to all of the population, households and commercial and
institutional properties within the service area. For example, one Sustainable Development
Goal adopted by the Government of Khyber Pakhtunkhwa is to achieve universal and
equitable access to safe and affordable drinking water for all by 2030. The speed at which
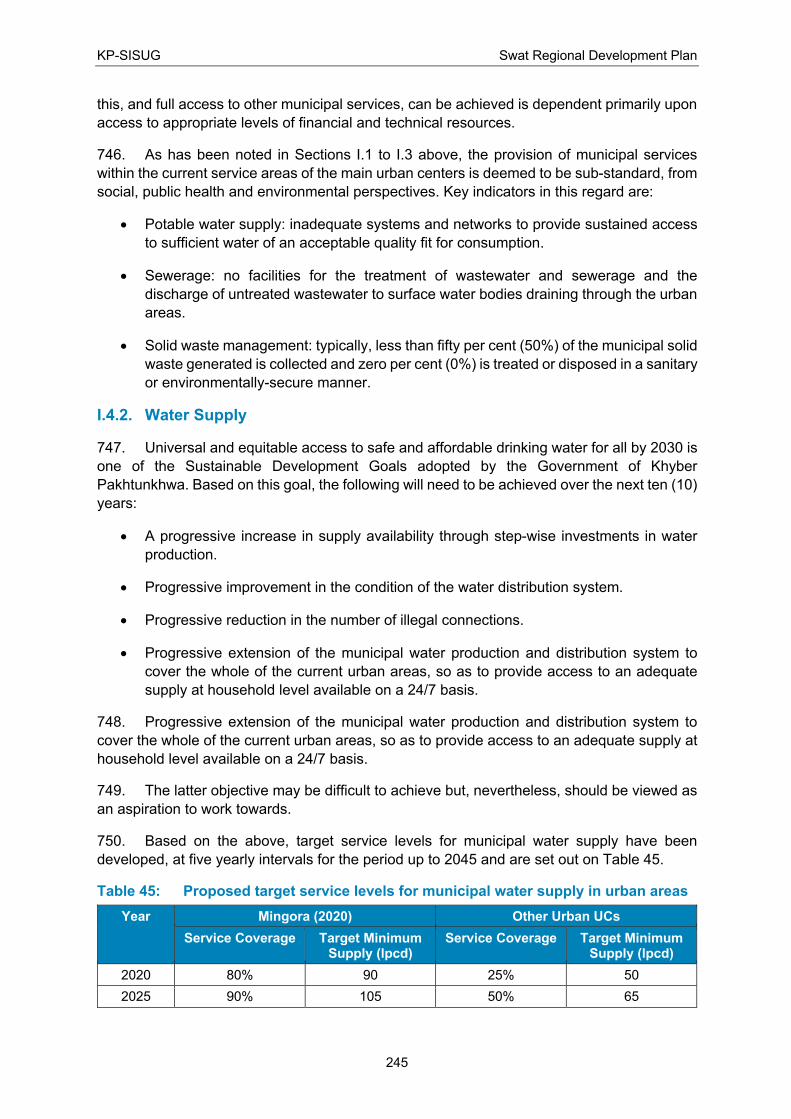
KP-SISUG Swat Regional Development Plan
245
this, and full access to other municipal services, can be achieved is dependent primarily upon
access to appropriate levels of financial and technical resources.
746. As has been noted in Sections I.1 to I.3 above, the provision of municipal services
within the current service areas of the main urban centers is deemed to be sub-standard, from
social, public health and environmental perspectives. Key indicators in this regard are:
• Potable water supply: inadequate systems and networks to provide sustained access
to sufficient water of an acceptable quality fit for consumption.
• Sewerage: no facilities for the treatment of wastewater and sewerage and the
discharge of untreated wastewater to surface water bodies draining through the urban
areas.
• Solid waste management: typically, less than fifty per cent (50%) of the municipal solid
waste generated is collected and zero per cent (0%) is treated or disposed in a sanitary
or environmentally-secure manner.
I.4.2. Water Supply
747. Universal and equitable access to safe and affordable drinking water for all by 2030 is
one of the Sustainable Development Goals adopted by the Government of Khyber
Pakhtunkhwa. Based on this goal, the following will need to be achieved over the next ten (10)
years:
• A progressive increase in supply availability through step-wise investments in water
production.
• Progressive improvement in the condition of the water distribution system.
• Progressive reduction in the number of illegal connections.
• Progressive extension of the municipal water production and distribution system to
cover the whole of the current urban areas, so as to provide access to an adequate
supply at household level available on a 24/7 basis.
748. Progressive extension of the municipal water production and distribution system to
cover the whole of the current urban areas, so as to provide access to an adequate supply at
household level available on a 24/7 basis.
749. The latter objective may be difficult to achieve but, nevertheless, should be viewed as
an aspiration to work towards.
750. Based on the above, target service levels for municipal water supply have been
developed, at five yearly intervals for the period up to 2045 and are set out on Table 45.
Table 45: Proposed target service levels for municipal water supply in urban areas
Year Mingora (2020) Other Urban UCs
Service Coverage Target Minimum Supply (lpcd)
Service Coverage Target Minimum Supply (lpcd)
2020 80% 90 25% 50
2025 90% 105 50% 65
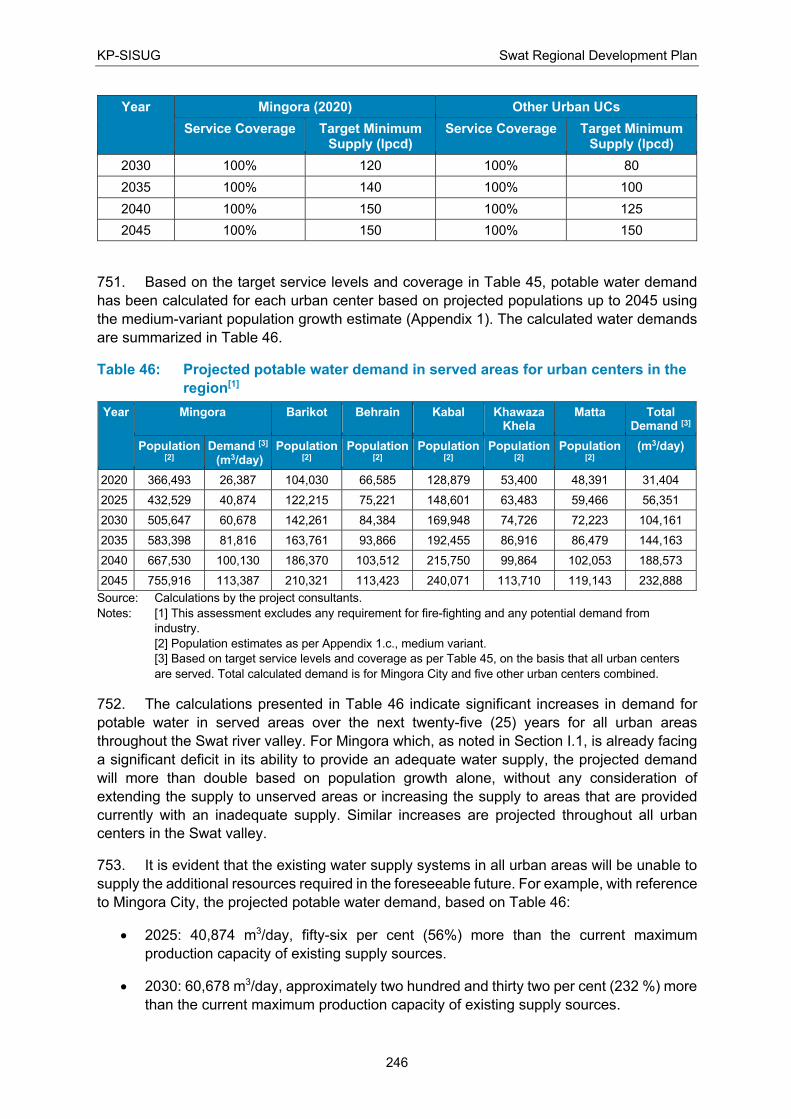
KP-SISUG Swat Regional Development Plan
246
Year Mingora (2020) Other Urban UCs
Service Coverage Target Minimum Supply (lpcd)
Service Coverage Target Minimum Supply (lpcd)
2030 100% 120 100% 80
2035 100% 140 100% 100
2040 100% 150 100% 125
2045 100% 150 100% 150
751. Based on the target service levels and coverage in Table 45, potable water demand
has been calculated for each urban center based on projected populations up to 2045 using
the medium-variant population growth estimate (Appendix 1). The calculated water demands
are summarized in Table 46.
Table 46: Projected potable water demand in served areas for urban centers in the
region[1]
Year Mingora Barikot Behrain Kabal Khawaza Khela
Matta Total Demand [3]
Population [2]
Demand [3] (m3/day)
Population [2]
Population [2]
Population [2]
Population [2]
Population [2]
(m3/day)
2020 366,493 26,387 104,030 66,585 128,879 53,400 48,391 31,404
2025 432,529 40,874 122,215 75,221 148,601 63,483 59,466 56,351
2030 505,647 60,678 142,261 84,384 169,948 74,726 72,223 104,161
2035 583,398 81,816 163,761 93,866 192,455 86,916 86,479 144,163
2040 667,530 100,130 186,370 103,512 215,750 99,864 102,053 188,573
2045 755,916 113,387 210,321 113,423 240,071 113,710 119,143 232,888
Source: Calculations by the project consultants.
Notes: [1] This assessment excludes any requirement for fire-fighting and any potential demand from
industry.
[2] Population estimates as per Appendix 1.c., medium variant.
[3] Based on target service levels and coverage as per Table 45, on the basis that all urban centers
are served. Total calculated demand is for Mingora City and five other urban centers combined.
752. The calculations presented in Table 46 indicate significant increases in demand for
potable water in served areas over the next twenty-five (25) years for all urban areas
throughout the Swat river valley. For Mingora which, as noted in Section I.1, is already facing
a significant deficit in its ability to provide an adequate water supply, the projected demand
will more than double based on population growth alone, without any consideration of
extending the supply to unserved areas or increasing the supply to areas that are provided
currently with an inadequate supply. Similar increases are projected throughout all urban
centers in the Swat valley.
753. It is evident that the existing water supply systems in all urban areas will be unable to
supply the additional resources required in the foreseeable future. For example, with reference
to Mingora City, the projected potable water demand, based on Table 46:
• 2025: 40,874 m3/day, fifty-six per cent (56%) more than the current maximum
production capacity of existing supply sources.
• 2030: 60,678 m3/day, approximately two hundred and thirty two per cent (232 %) more
than the current maximum production capacity of existing supply sources.
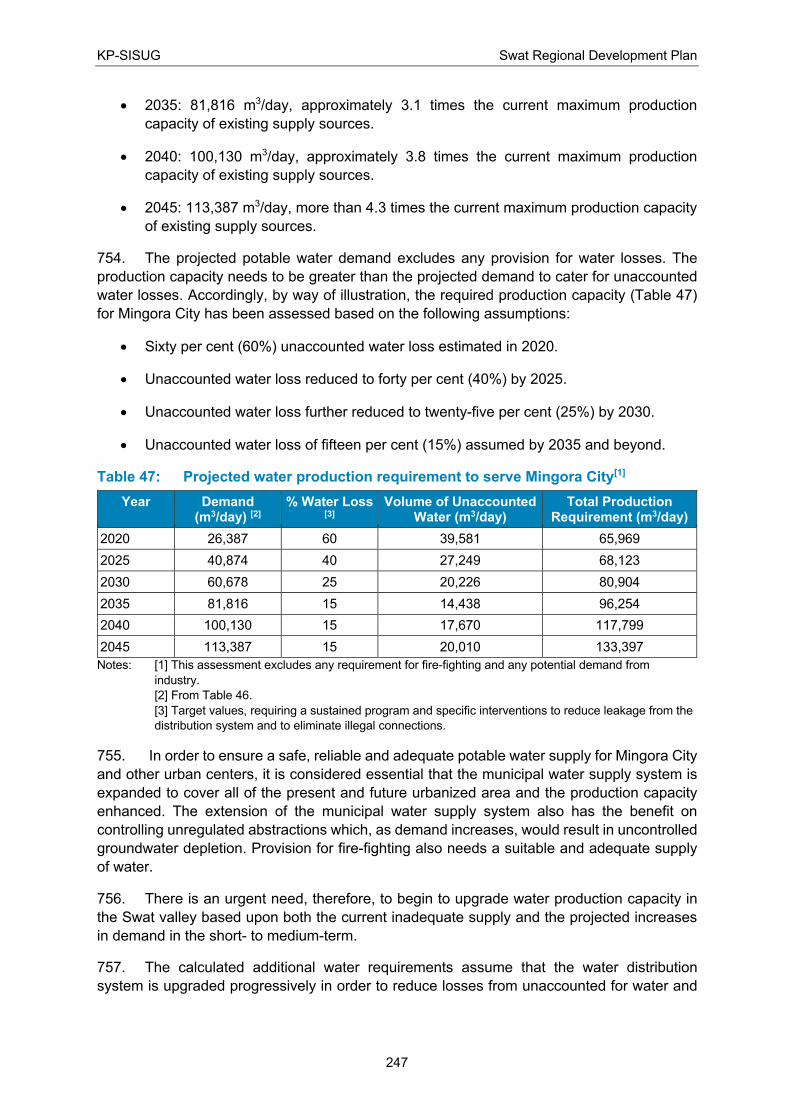
KP-SISUG Swat Regional Development Plan
247
• 2035: 81,816 m3/day, approximately 3.1 times the current maximum production
capacity of existing supply sources.
• 2040: 100,130 m3/day, approximately 3.8 times the current maximum production
capacity of existing supply sources.
• 2045: 113,387 m3/day, more than 4.3 times the current maximum production capacity
of existing supply sources.
754. The projected potable water demand excludes any provision for water losses. The
production capacity needs to be greater than the projected demand to cater for unaccounted
water losses. Accordingly, by way of illustration, the required production capacity (Table 47)
for Mingora City has been assessed based on the following assumptions:
• Sixty per cent (60%) unaccounted water loss estimated in 2020.
• Unaccounted water loss reduced to forty per cent (40%) by 2025.
• Unaccounted water loss further reduced to twenty-five per cent (25%) by 2030.
• Unaccounted water loss of fifteen per cent (15%) assumed by 2035 and beyond.
Table 47: Projected water production requirement to serve Mingora City[1]
Year Demand (m3/day) [2]
% Water Loss [3]
Volume of Unaccounted Water (m3/day)
Total Production Requirement (m3/day)
2020 26,387 60 39,581 65,969
2025 40,874 40 27,249 68,123
2030 60,678 25 20,226 80,904
2035 81,816 15 14,438 96,254
2040 100,130 15 17,670 117,799
2045 113,387 15 20,010 133,397
Notes: [1] This assessment excludes any requirement for fire-fighting and any potential demand from
industry.
[2] From Table 46.
[3] Target values, requiring a sustained program and specific interventions to reduce leakage from the
distribution system and to eliminate illegal connections.
755. In order to ensure a safe, reliable and adequate potable water supply for Mingora City
and other urban centers, it is considered essential that the municipal water supply system is
expanded to cover all of the present and future urbanized area and the production capacity
enhanced. The extension of the municipal water supply system also has the benefit on
controlling unregulated abstractions which, as demand increases, would result in uncontrolled
groundwater depletion. Provision for fire-fighting also needs a suitable and adequate supply
of water.
756. There is an urgent need, therefore, to begin to upgrade water production capacity in
the Swat valley based upon both the current inadequate supply and the projected increases
in demand in the short- to medium-term.
757. The calculated additional water requirements assume that the water distribution
system is upgraded progressively in order to reduce losses from unaccounted for water and
KP-SISUG Swat Regional Development Plan
248
to mitigate the potential for cross-contamination from other water sources so as to ensure
water quality is fit for consumption at the point of delivery.
758. Aside from reducing water losses to make more efficient use of available production
capacity, there are two main ways to upgrade production capacity and water availability:
• Abstraction from surface water sources, including springs, allied with additional
storage capacity./or
• Provision of additional tube wells to abstract from the groundwater aquifer, allied with
enhanced pumping and storage capacity.
759. Rainwater harvesting could also be adopted, in order to reduce the use of potable
water for non-potable uses (for example, laundry, car washing, irrigation/watering of green
spaces). However, this will not be a suitable source to cater for potable water demand.
760. Given the rapid drawdown in the groundwater table noted in and around Mingora City
(Section I.1 above) it is apparent that the shallow groundwater aquifer is currently being over
exploited. Continued reliance, or even increased reliance, on groundwater abstracted from the
valley aquifer will have two consequences:
• Reduction in yield as the groundwater table becomes deeper and deeper, requiring
tube wells to be upgraded, replaced or deepened simply to maintain current pumping
capacity. The installation of additional (new) tube wells beyond the current number will
increase the rate of drawdown.
• Pumping costs, which are already a significant drain on the resources of WSSCM-S,
will increase substantially.
761. Given the above, the following recommendations can be made:
• Significant efforts should be made and put in place to enhance the conservation of
water, in order to constrain projected increases in demand.
• Re-use of water (circularity) should be promoted as far as practicable.
• Significant effort and investment should be made into reducing water losses from the
distribution system as quickly as possible, since a significant proportion of the water
abstracted currently is lost to consumers. Reduction in water losses will offset partially
the projected increase in demand.
• Illegal connections should be eliminated as quickly as possible, and the number of
legally registered consumers maximized, in order to enhance the revenue of WSSCM-
S and to increase the sustainability of the water supply system, since significant
investments will be required to provide the additional capacity necessary to meet
projected demands.
• An alternative supply of water is required to service the demands of Mingora City and
other urban centers in the Swat valley.
762. There is a current initiative under KPCIP to develop a surface water source to supply
potable water to Mingora City from an abstraction on the Swat River, originally proposed to be
KP-SISUG Swat Regional Development Plan
249
at Bagh Dehri approximately thirty-four (34) km north-north-east of Mingora (‘Mingora Greater
Water Supply Scheme’).
763. The objective of the scheme is to ensure a sustainable supply of water to the existing
and future population of Mingora City under the jurisdiction of WSSCM0S and to some of the
surrounding areas.
764. Although details are yet to be finalized, the following is proposed currently:
• The scheme is a gravity-based abstraction and distribution system (option 1) or a
combined gravity and pumping scheme (option 2).
• An intake point at Bagh Dehri (option 1) or, alternatively, downstream of Khwaza Khela
City (option 2).
• A water treatment plant.
• Transmission main from the water treatment plant to Mingora City.
• Receiving storage tanks in Mingora City.
• Supply mains within Mingora City.
• Distribution network within Mingora City, from storage tanks to end users.
• Water meters at customer connections.
765. The proposed abstraction point at Bagh Dehri (option 1) is upstream of Matta City and
Khawaza Khela City, but downstream of Behrain City, whilst the second option for the
abstraction point is downstream of Khwaza Khela.
766. The scheme is being designed to provide a total supply of up to 135,000 m3/day of
treated water, which, based on the calculations in Table 46, would be sufficient to cater for the
projected demand in Mingora City up to 2045 from surface water alone or Mingora and Kabal
(across the Swat river from Mingora) up to 2040 from surface water alone. Including
groundwater sources to supplement surface water supplies would be sufficient to cater for
Mingora and Kabal up to 2045 based on the projected populations.
767. It should be noted that under option 2, the transmission main would be able to serve
population residing up to an elevation of 1,030 m which would cater for approximately eight-
five per cent (85%) of the current population of Mingora. Option 1 would serve a population
residing up to an elevation of 1,100 m which would cater for ninety-five per cent (95%) of the
current population.
768. Once the scheme is operational, then abstraction from tube wells could be reduced
significantly, thereby allowing the groundwater table to recover.
769. Existing tube wells would need to be retained and maintained to provide a back-up in
the event of reduced river flow during the winter season and to supplement the supply system
as and when required.
770. The actual production rate and efficiency of the existing tube wells will need to be
verified on an individual basis. Where feasible and economic, any existing dysfunctional tube
wells or inefficient tube wells should be rehabilitated and upgraded.
KP-SISUG Swat Regional Development Plan
250
771. All functional tube wells and pumps (existing and new) should be instrumented,
including installation of flow meters. Supervisory Control and Data Acquisition (SCADA)
systems and equipment for centralized management, monitoring and control should also be
provided.
772. The existing production capacity of the tube wells in the municipal system in Mingora
City is assessed to be 26,150 m3/day (Section I.1.1). Given the drawdown noted in the
groundwater table, it is recommended, subject to a hydrogeological assessment, that
production capacity be reduced substantially to around 10,000 m3/day or less once the surface
water supply scheme is operational.
773. In conjunction with investment in increased production capacity, it is recommended
that a community-education program is implemented, targeted on the efficient use of water
and the adoption of water conservation measures.
774. In order to ensure appropriate water quality, all production and storage facilities
(production wells and OHRs) should also be fitted with disinfection facilities where not already
installed.
775. The new primary transmission main from the proposed water treatment plant will
branch out into multiple supply mains to existing and new water storage tanks and, thereafter,
be conveyed to customers through existing or new distribution system pipelines and
household connections. Based on option 2, all tanks having an elevation equal to or less than
1,030 m will be fed by gravity, whilst tanks above this elevation will be fed through a pumping
system.
776. The storage tanks are proposed to provide a minimum storage equivalent to one-day’s
demand. Accordingly, there is a need to provide additional storage to increase the available
storage capacity. The Greater Mingora Water Supply Scheme envisages a requirement for
nine (9) surface tanks and eight (8) overhead reservoirs at locations throughout the city. These
tanks are in addition to twelve (12) new overhead reservoirs currently under design/co-
execution under the USAID Municipal Services program (MSP).
777. In addition to the above, all of the existing distribution network will need to be replaced
and/or upgraded progressively throughout the currently served area and the distribution
network expanded to cover all presently unserved areas within the expanded city limit.
778. The upgraded distribution network should be sized based on hydraulic analyses in
order to deliver an adequate volume of water to the most hydraulically remote fixture during
minimum pressure and maximum flow conditions.
779. A preliminary estimate of the new distribution network required in 325 km.352
780. Meters should be installed progressively for every consumer as part of the distribution
system rehabilitation and upgrade. This will require the number of registered metered
connections in Mingora to be increased from 23,564 to approximately 150,450 by 2045 (Table
45).
352 Minconsult and CEC Consultants. 2000. Khyber Pakhtunkhwa Cities Improvement Project (KPCIP). Concept
Design Note, Mingora Greater Water Supply Scheme. Volume 1 – Transmission Mains and Water Distribution Network. May 2020.
KP-SISUG Swat Regional Development Plan
251
I.4.3. Sanitation and Drainage
781. As discussed in Section I.2.1 above, the sewage network in all urban areas is not
existent, nor is any treatment provided prior to discharge of sewage and wastewater to land
or to surface water courses. Rectification of this situation, at least for urbanized areas, must
be a high priority in line with the sustainable development objectives of the KP government.353
782. In addition, and as discussed in Section �, there is a current initiative under KPCIP to
develop a surface water source to supply potable water to Mingora City from an abstraction at
Bagh Dehri (option 1) or downstream of Khawaza Khela (option 2) on the Swat River.
783. The abstraction point at Bagh Dehri (option 1) is upstream of Matta City and Khawaza
Khela City, but downstream of Behrain City. In addition, there is significant linear development
of housing along the N-95 and a series of smaller towns and villages, such as Fatehpur,
upstream of the proposed intake point. The second option lies downstream of the urban
centers of Matta City and Khawaza Khela.
784. Given the lack of treatment facilities and the practice of discharging untreated sewage
and wastewater to surface drains, which eventually discharge into the Swat River, it is
inevitable that contamination of the proposed surface water source, whichever option is
selected for the intake point, will continue unabated until such time as wholesale
improvements can be made to sanitation and drainage even in small rural communities. The
extent of contamination at the second intake point, however, is anticipated to be significantly
higher than for option 1.
785. In the main urban centers, there are two priority areas for improvement:
• Install a functioning sewage system within the limits of all urbanized areas that is
separate from the drainage system.
• Develop appropriate treatment facilities, both in terms of process and capacity,
786. The overall objective of any investments in sanitation and drainage shall be to reduce,
and ultimately eliminate, the discharge of untreated sewage and wastewater to the
environment.
787. This objective can be achieved by collecting and conveying sewerage and wastewater
hygienically away from all residential and commercial areas though the following interventions:
• Installing new primary (trunk) sewers.
• Developing secondary and tertiary sewer lines and installing connections to individual
properties.
• Connecting the trunk sewers to newly developed treatment facilities.
• Over time extending the sewer network across all currently unserved urban areas.
788. In addition, any industrial wastewater should be collected separately and treated at
purpose-designed treatment facilities, preferably on site (site-specific effluent treatment plant)
353 Government of Kyber Pakhtunkhwa. Integrated Development Strategy 2014-2018.
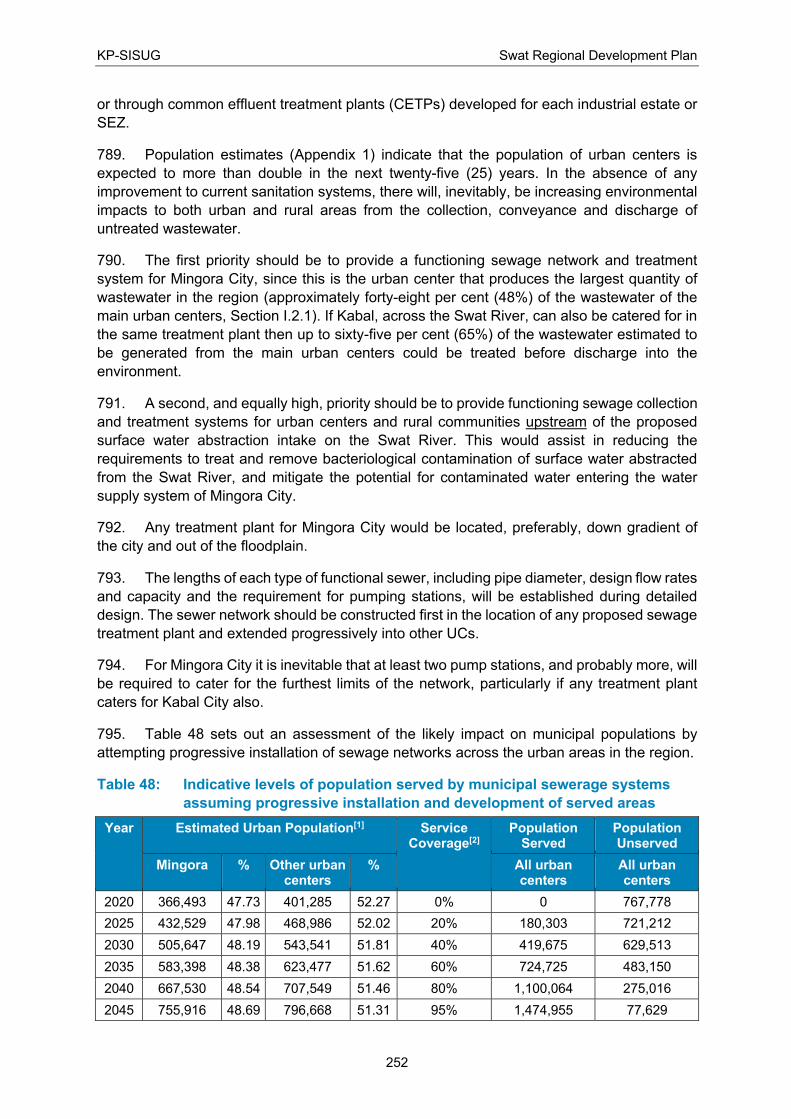
KP-SISUG Swat Regional Development Plan
252
or through common effluent treatment plants (CETPs) developed for each industrial estate or
SEZ.
789. Population estimates (Appendix 1) indicate that the population of urban centers is
expected to more than double in the next twenty-five (25) years. In the absence of any
improvement to current sanitation systems, there will, inevitably, be increasing environmental
impacts to both urban and rural areas from the collection, conveyance and discharge of
untreated wastewater.
790. The first priority should be to provide a functioning sewage network and treatment
system for Mingora City, since this is the urban center that produces the largest quantity of
wastewater in the region (approximately forty-eight per cent (48%) of the wastewater of the
main urban centers, Section I.2.1). If Kabal, across the Swat River, can also be catered for in
the same treatment plant then up to sixty-five per cent (65%) of the wastewater estimated to
be generated from the main urban centers could be treated before discharge into the
environment.
791. A second, and equally high, priority should be to provide functioning sewage collection
and treatment systems for urban centers and rural communities upstream of the proposed
surface water abstraction intake on the Swat River. This would assist in reducing the
requirements to treat and remove bacteriological contamination of surface water abstracted
from the Swat River, and mitigate the potential for contaminated water entering the water
supply system of Mingora City.
792. Any treatment plant for Mingora City would be located, preferably, down gradient of
the city and out of the floodplain.
793. The lengths of each type of functional sewer, including pipe diameter, design flow rates
and capacity and the requirement for pumping stations, will be established during detailed
design. The sewer network should be constructed first in the location of any proposed sewage
treatment plant and extended progressively into other UCs.
794. For Mingora City it is inevitable that at least two pump stations, and probably more, will
be required to cater for the furthest limits of the network, particularly if any treatment plant
caters for Kabal City also.
795. Table 48 sets out an assessment of the likely impact on municipal populations by
attempting progressive installation of sewage networks across the urban areas in the region.
Table 48: Indicative levels of population served by municipal sewerage systems
assuming progressive installation and development of served areas
Year Estimated Urban Population[1] Service Coverage[2]
Population Served
Population Unserved
Mingora % Other urban centers
% All urban centers
All urban centers
2020 366,493 47.73 401,285 52.27 0% 0 767,778
2025 432,529 47.98 468,986 52.02 20% 180,303 721,212
2030 505,647 48.19 543,541 51.81 40% 419,675 629,513
2035 583,398 48.38 623,477 51.62 60% 724,725 483,150
2040 667,530 48.54 707,549 51.46 80% 1,100,064 275,016
2045 755,916 48.69 796,668 51.31 95% 1,474,955 77,629
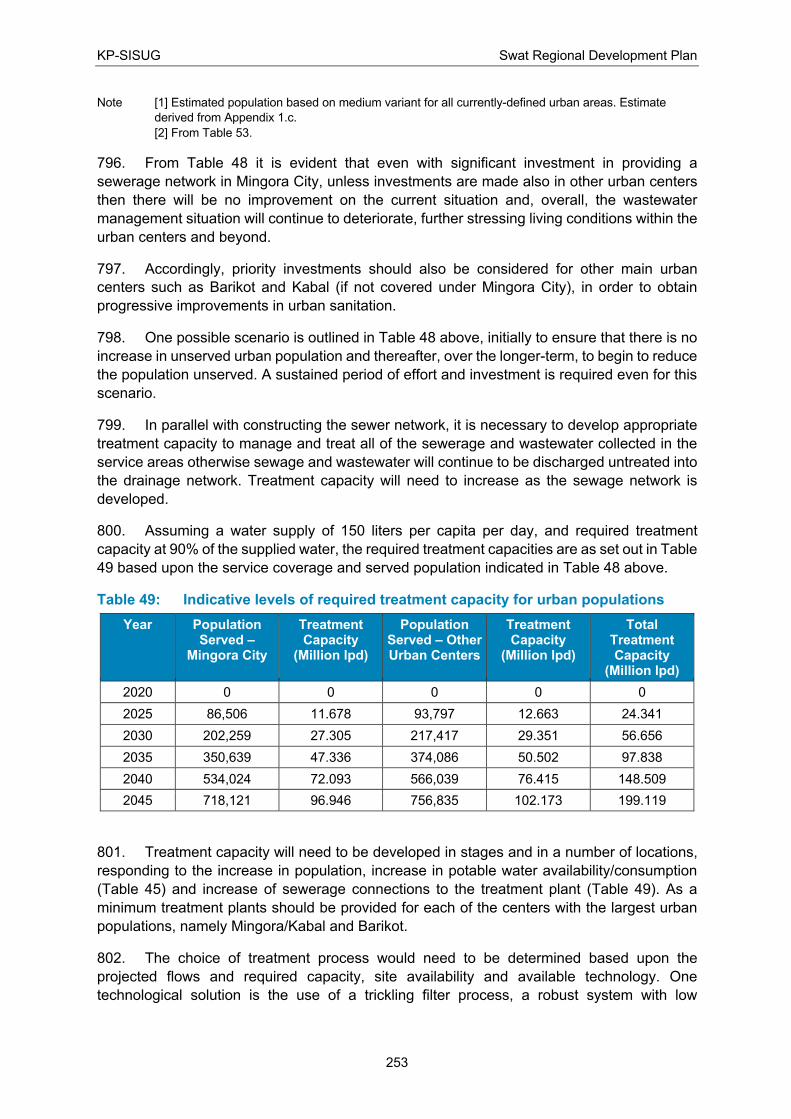
KP-SISUG Swat Regional Development Plan
253
Note [1] Estimated population based on medium variant for all currently-defined urban areas. Estimate
derived from Appendix 1.c.
[2] From Table 53.
796. From Table 48 it is evident that even with significant investment in providing a
sewerage network in Mingora City, unless investments are made also in other urban centers
then there will be no improvement on the current situation and, overall, the wastewater
management situation will continue to deteriorate, further stressing living conditions within the
urban centers and beyond.
797. Accordingly, priority investments should also be considered for other main urban
centers such as Barikot and Kabal (if not covered under Mingora City), in order to obtain
progressive improvements in urban sanitation.
798. One possible scenario is outlined in Table 48 above, initially to ensure that there is no
increase in unserved urban population and thereafter, over the longer-term, to begin to reduce
the population unserved. A sustained period of effort and investment is required even for this
scenario.
799. In parallel with constructing the sewer network, it is necessary to develop appropriate
treatment capacity to manage and treat all of the sewerage and wastewater collected in the
service areas otherwise sewage and wastewater will continue to be discharged untreated into
the drainage network. Treatment capacity will need to increase as the sewage network is
developed.
800. Assuming a water supply of 150 liters per capita per day, and required treatment
capacity at 90% of the supplied water, the required treatment capacities are as set out in Table
49 based upon the service coverage and served population indicated in Table 48 above.
Table 49: Indicative levels of required treatment capacity for urban populations
Year Population Served –
Mingora City
Treatment Capacity
(Million lpd)
Population Served – Other Urban Centers
Treatment Capacity
(Million lpd)
Total Treatment Capacity
(Million lpd)
2020 0 0 0 0 0
2025 86,506 11.678 93,797 12.663 24.341
2030 202,259 27.305 217,417 29.351 56.656
2035 350,639 47.336 374,086 50.502 97.838
2040 534,024 72.093 566,039 76.415 148.509
2045 718,121 96.946 756,835 102.173 199.119
801. Treatment capacity will need to be developed in stages and in a number of locations,
responding to the increase in population, increase in potable water availability/consumption
(Table 45) and increase of sewerage connections to the treatment plant (Table 49). As a
minimum treatment plants should be provided for each of the centers with the largest urban
populations, namely Mingora/Kabal and Barikot.
802. The choice of treatment process would need to be determined based upon the
projected flows and required capacity, site availability and available technology. One
technological solution is the use of a trickling filter process, a robust system with low
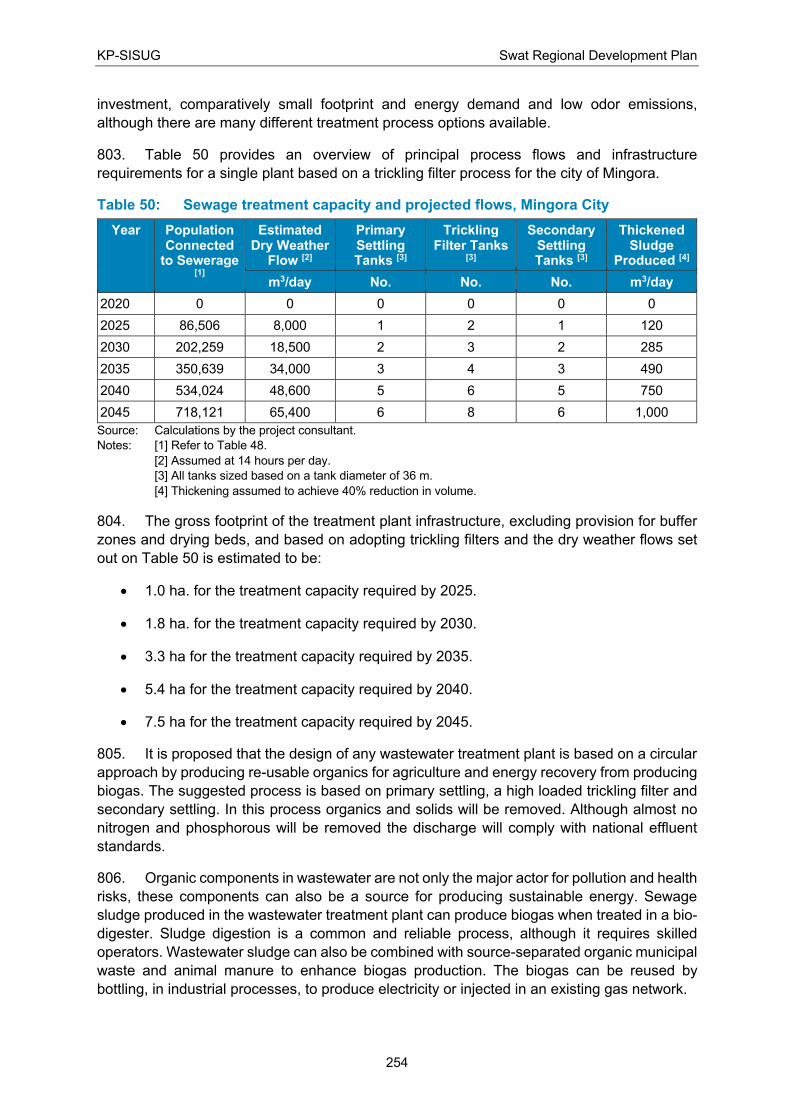
KP-SISUG Swat Regional Development Plan
254
investment, comparatively small footprint and energy demand and low odor emissions,
although there are many different treatment process options available.
803. Table 50 provides an overview of principal process flows and infrastructure
requirements for a single plant based on a trickling filter process for the city of Mingora.
Table 50: Sewage treatment capacity and projected flows, Mingora City
Year Population Connected
to Sewerage [1]
Estimated Dry Weather
Flow [2]
Primary Settling Tanks [3]
Trickling Filter Tanks
[3]
Secondary Settling Tanks [3]
Thickened Sludge
Produced [4]
m3/day No. No. No. m3/day
2020 0 0 0 0 0 0
2025 86,506 8,000 1 2 1 120
2030 202,259 18,500 2 3 2 285
2035 350,639 34,000 3 4 3 490
2040 534,024 48,600 5 6 5 750
2045 718,121 65,400 6 8 6 1,000
Source: Calculations by the project consultant.
Notes: [1] Refer to Table 48.
[2] Assumed at 14 hours per day.
[3] All tanks sized based on a tank diameter of 36 m.
[4] Thickening assumed to achieve 40% reduction in volume.
804. The gross footprint of the treatment plant infrastructure, excluding provision for buffer
zones and drying beds, and based on adopting trickling filters and the dry weather flows set
out on Table 50 is estimated to be:
• 1.0 ha. for the treatment capacity required by 2025.
• 1.8 ha. for the treatment capacity required by 2030.
• 3.3 ha for the treatment capacity required by 2035.
• 5.4 ha for the treatment capacity required by 2040.
• 7.5 ha for the treatment capacity required by 2045.
805. It is proposed that the design of any wastewater treatment plant is based on a circular
approach by producing re-usable organics for agriculture and energy recovery from producing
biogas. The suggested process is based on primary settling, a high loaded trickling filter and
secondary settling. In this process organics and solids will be removed. Although almost no
nitrogen and phosphorous will be removed the discharge will comply with national effluent
standards.
806. Organic components in wastewater are not only the major actor for pollution and health
risks, these components can also be a source for producing sustainable energy. Sewage
sludge produced in the wastewater treatment plant can produce biogas when treated in a bio-
digester. Sludge digestion is a common and reliable process, although it requires skilled
operators. Wastewater sludge can also be combined with source-separated organic municipal
waste and animal manure to enhance biogas production. The biogas can be reused by
bottling, in industrial processes, to produce electricity or injected in an existing gas network.
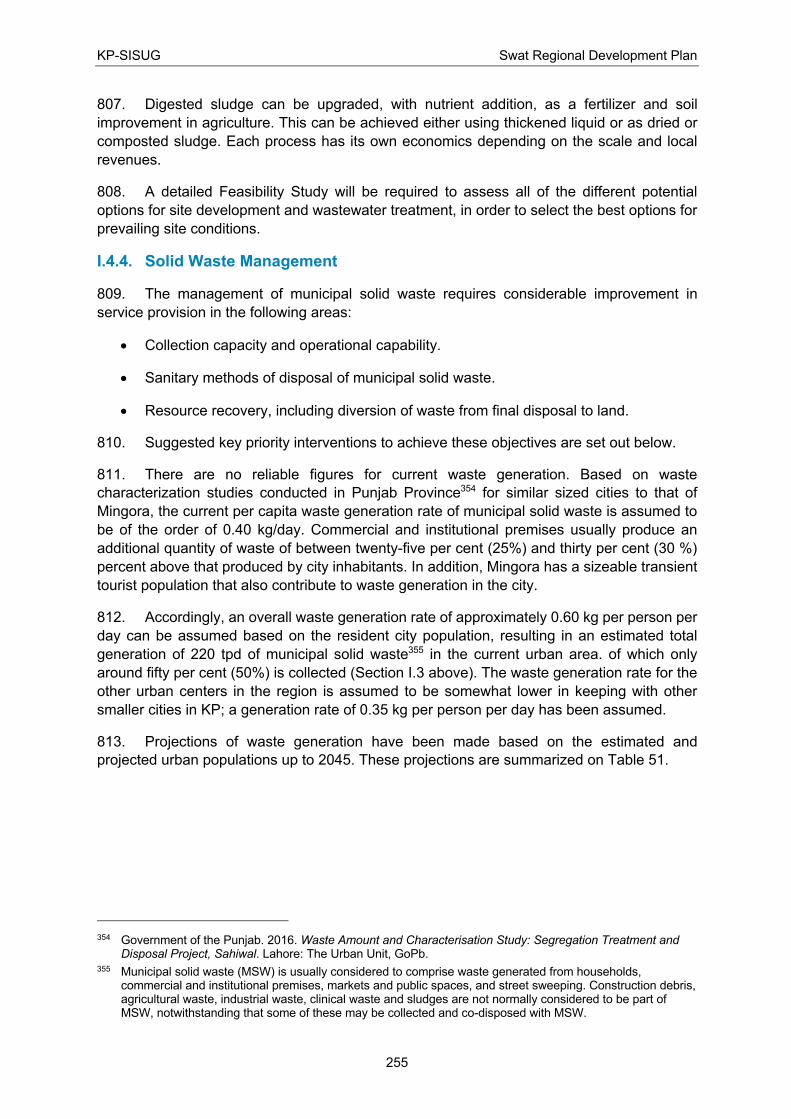
KP-SISUG Swat Regional Development Plan
255
807. Digested sludge can be upgraded, with nutrient addition, as a fertilizer and soil
improvement in agriculture. This can be achieved either using thickened liquid or as dried or
composted sludge. Each process has its own economics depending on the scale and local
revenues.
808. A detailed Feasibility Study will be required to assess all of the different potential
options for site development and wastewater treatment, in order to select the best options for
prevailing site conditions.
I.4.4. Solid Waste Management
809. The management of municipal solid waste requires considerable improvement in
service provision in the following areas:
• Collection capacity and operational capability.
• Sanitary methods of disposal of municipal solid waste.
• Resource recovery, including diversion of waste from final disposal to land.
810. Suggested key priority interventions to achieve these objectives are set out below.
811. There are no reliable figures for current waste generation. Based on waste
characterization studies conducted in Punjab Province354 for similar sized cities to that of
Mingora, the current per capita waste generation rate of municipal solid waste is assumed to
be of the order of 0.40 kg/day. Commercial and institutional premises usually produce an
additional quantity of waste of between twenty-five per cent (25%) and thirty per cent (30 %)
percent above that produced by city inhabitants. In addition, Mingora has a sizeable transient
tourist population that also contribute to waste generation in the city.
812. Accordingly, an overall waste generation rate of approximately 0.60 kg per person per
day can be assumed based on the resident city population, resulting in an estimated total
generation of 220 tpd of municipal solid waste355 in the current urban area. of which only
around fifty per cent (50%) is collected (Section I.3 above). The waste generation rate for the
other urban centers in the region is assumed to be somewhat lower in keeping with other
smaller cities in KP; a generation rate of 0.35 kg per person per day has been assumed.
813. Projections of waste generation have been made based on the estimated and
projected urban populations up to 2045. These projections are summarized on Table 51.
354 Government of the Punjab. 2016. Waste Amount and Characterisation Study: Segregation Treatment and
Disposal Project, Sahiwal. Lahore: The Urban Unit, GoPb. 355 Municipal solid waste (MSW) is usually considered to comprise waste generated from households,
commercial and institutional premises, markets and public spaces, and street sweeping. Construction debris, agricultural waste, industrial waste, clinical waste and sludges are not normally considered to be part of MSW, notwithstanding that some of these may be collected and co-disposed with MSW.
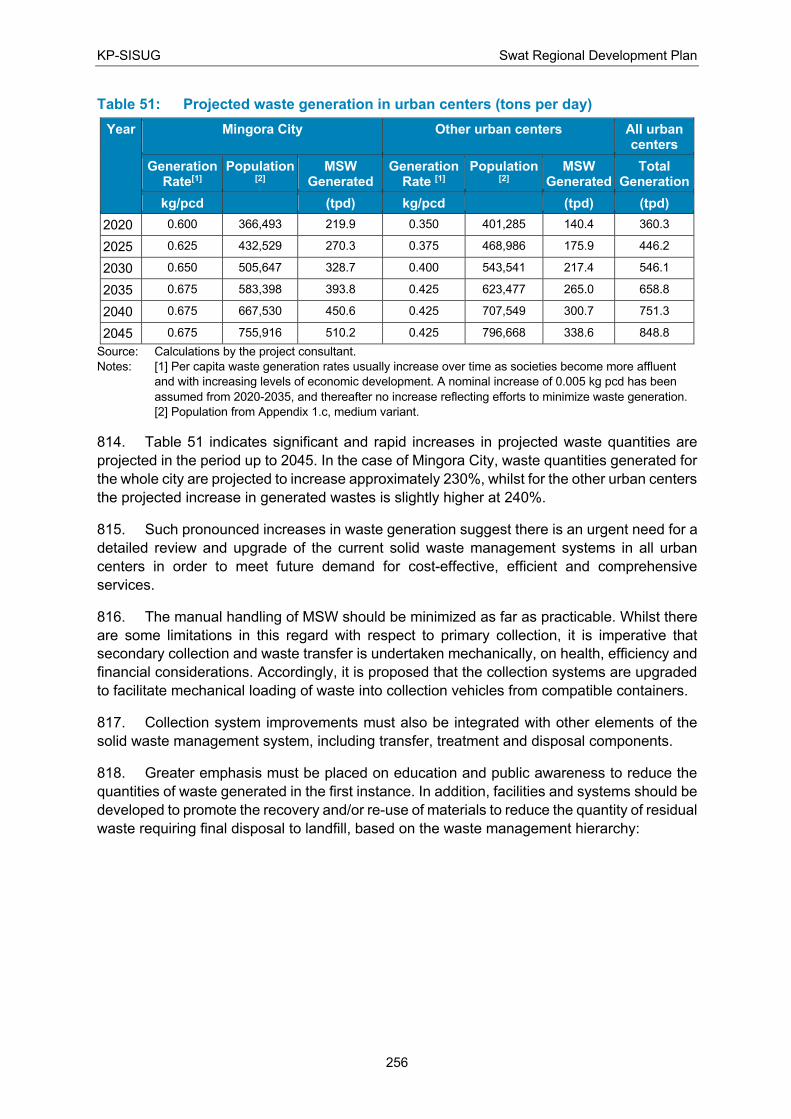
KP-SISUG Swat Regional Development Plan
256
Table 51: Projected waste generation in urban centers (tons per day)
Year Mingora City Other urban centers All urban centers
Generation Rate[1]
Population [2]
MSW Generated
Generation Rate [1]
Population [2]
MSW Generated
Total Generation
kg/pcd (tpd) kg/pcd (tpd) (tpd)
2020 0.600 366,493 219.9 0.350 401,285 140.4 360.3
2025 0.625 432,529 270.3 0.375 468,986 175.9 446.2
2030 0.650 505,647 328.7 0.400 543,541 217.4 546.1
2035 0.675 583,398 393.8 0.425 623,477 265.0 658.8
2040 0.675 667,530 450.6 0.425 707,549 300.7 751.3
2045 0.675 755,916 510.2 0.425 796,668 338.6 848.8
Source: Calculations by the project consultant.
Notes: [1] Per capita waste generation rates usually increase over time as societies become more affluent
and with increasing levels of economic development. A nominal increase of 0.005 kg pcd has been
assumed from 2020-2035, and thereafter no increase reflecting efforts to minimize waste generation.
[2] Population from Appendix 1.c, medium variant.
814. Table 51 indicates significant and rapid increases in projected waste quantities are
projected in the period up to 2045. In the case of Mingora City, waste quantities generated for
the whole city are projected to increase approximately 230%, whilst for the other urban centers
the projected increase in generated wastes is slightly higher at 240%.
815. Such pronounced increases in waste generation suggest there is an urgent need for a
detailed review and upgrade of the current solid waste management systems in all urban
centers in order to meet future demand for cost-effective, efficient and comprehensive
services.
816. The manual handling of MSW should be minimized as far as practicable. Whilst there
are some limitations in this regard with respect to primary collection, it is imperative that
secondary collection and waste transfer is undertaken mechanically, on health, efficiency and
financial considerations. Accordingly, it is proposed that the collection systems are upgraded
to facilitate mechanical loading of waste into collection vehicles from compatible containers.
817. Collection system improvements must also be integrated with other elements of the
solid waste management system, including transfer, treatment and disposal components.
818. Greater emphasis must be placed on education and public awareness to reduce the
quantities of waste generated in the first instance. In addition, facilities and systems should be
developed to promote the recovery and/or re-use of materials to reduce the quantity of residual
waste requiring final disposal to landfill, based on the waste management hierarchy:
KP-SISUG Swat Regional Development Plan
257
819. Current recycling efforts are based on informal systems, undertaken primarily by waste
pickers, hawkers and collection personnel who sell on recovered materials to wholesale
buyers. Few details are currently available on the quantities and types of materials recovered
in the region.
820. The introduction of segregation of waste at source is a practicable means of
enhancing the recovery of useful materials from the waste stream. Such a system can
supplement the existing informal recovery system rather than attempting to replace it. The
objective of such a system would be to ‘pre-sort’ specified materials from the waste stream
and, in so doing, to avoid potential cross-contamination that might impair the ability to recycle
such materials successfully.
821. If implemented, it is recommended that segregation should initially be limited to two
categories only – dry, recyclable materials (paper, cardboard, glass, metals, plastic, etc.) and
wet, general waste. Adoption of source segregation must be accompanied by an extensive
information and education campaign over a sustained period of time, including monitoring of
the effectiveness of the campaign and the success of source separation.
822. The implementation of segregation at source would require changes to the collection
system (collection method and vehicle types) and the associated development of processing
facilities and markets to absorb any source separated materials. In the absence of markets for
the recovered materials there is no merit in segregating these, since they will ultimately need
to be disposed. Accordingly, any decision to implement segregation at source must be
founded on a comprehensive assessment of the demand for different recovered materials and
detailed plans to develop the capacity to handle and absorb these materials and transform
them into useful products.
823. Existing open dump sites are not considered sustainable for continued use on a long-
term basis from social, environmental and aesthetic perspectives. Whilst landfills are a
KP-SISUG Swat Regional Development Plan
258
fundamental component of any waste management system, the development of sanitary
landfills that are engineered to mitigate the impact on the surrounding environment and host
community is often deemed to be very expensive. Negative perceptions of landfilling as a
waste disposal method are also prevalent, since such perceptions are often based on the
negative environmental impacts of open dumping of waste.
824. Given the cost of developing environmentally-secure disposal systems, it is often the
case that individual municipalities are often not in a position to afford to upgrade the standards
of waste disposal systems. Hence, two approaches can be advocated:
• First, the development of materials recovery facilities (MRFs) that aim to recovery the
maximum useable materials from the waste stream. Clean MRFs are the most
successful form of intervention in this regard, relying on the final sorting of clean
source-segregated waste to maximize material recovery. Clean MRFs can be
instigated as small individual facilities within local communities or can be integrated
into a transfer station to intercept waste prior to onward conveyance to the disposal
facility./or
• Second, as an alternative to an individual disposal facility for each municipality, then a
cluster of municipalities can contribute to, and make use, of a regional landfill, thereby
sharing in the costs of its development and operation. By sharing costs, the standard
of waste disposal can be improved significantly by adopting sanitary methods of landfill
engineering and operation.
825. The current waste disposal site at Kawtharo Maria is used by WSSCM-S but is under
the ownership of the TMA. WSSCM-S has identified a site for the landfill; however, the
available is small (< 3 hectares). Few details of the site, the proposed facility, or the proposed
capacity of the facility, are currently available.
826. The need for transfer stations will be dictated by the selected location of the site to be
developed as a sanitary landfill. Typically, transfer stations are justified economically where
the haul distance of collected waste exceeds 15 km to 20 km. The distance at which transfer
stations become economic depends to a large extent on the types of collection vehicles
employed (for example, volumetric/load capacity and fuel economy) and the road conditions
(for example, level of congestion) which influence travel times between the collection zone
and disposal site.
827. It is recommended that a location for a waste management facility be selected outside
of the limits of the city in an area that is accessible by road, but which is currently unproductive.
Based on waste quantities (Table 51) one transfer station, if required, would be sufficient to
serve the current urbanized areas of Mingora City, including the city center and the peri-urban
margins of the city. If required, the transfer station should be located so as to avoid travel for
transfer vehicles on the congested roads through the city center.
828. Waste quantities generated and collected in Mingora City alone, currently and even up
to 2045, are marginal for the development of a waste-to-energy plant. However, combining
waste from the other urban centers, particularly those located close to Mingora City might
provide sufficient mass to justify a waste-to-energy plant, assuming that the waste has
sufficient calorific value to permit self-sustained combustion and without the need for extensive
pre-treatment and sorting to produce refuse-derived fuel with the required characteristics.
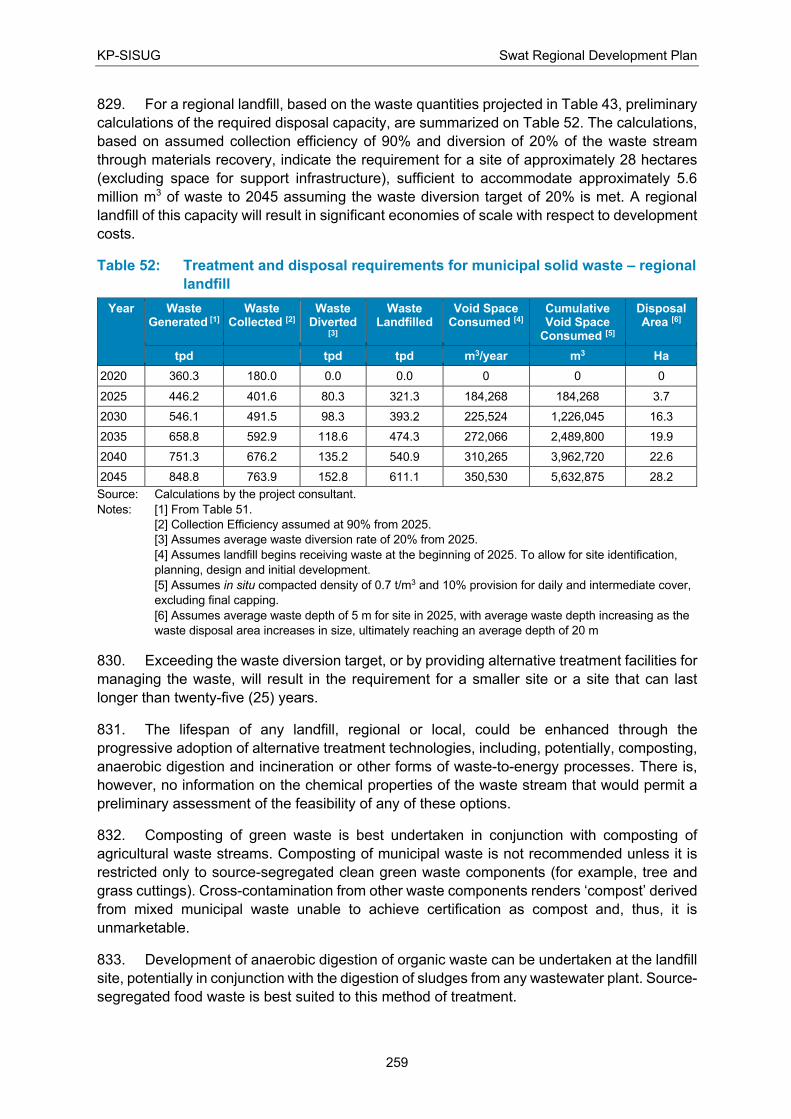
KP-SISUG Swat Regional Development Plan
259
829. For a regional landfill, based on the waste quantities projected in Table 43, preliminary
calculations of the required disposal capacity, are summarized on Table 52. The calculations,
based on assumed collection efficiency of 90% and diversion of 20% of the waste stream
through materials recovery, indicate the requirement for a site of approximately 28 hectares
(excluding space for support infrastructure), sufficient to accommodate approximately 5.6
million m3 of waste to 2045 assuming the waste diversion target of 20% is met. A regional
landfill of this capacity will result in significant economies of scale with respect to development
costs.
Table 52: Treatment and disposal requirements for municipal solid waste – regional
landfill
Year Waste Generated [1]
Waste Collected [2]
Waste Diverted
[3]
Waste Landfilled
Void Space Consumed [4]
Cumulative Void Space
Consumed [5]
Disposal Area [6]
tpd tpd tpd m3/year m3 Ha
2020 360.3 180.0 0.0 0.0 0 0 0
2025 446.2 401.6 80.3 321.3 184,268 184,268 3.7
2030 546.1 491.5 98.3 393.2 225,524 1,226,045 16.3
2035 658.8 592.9 118.6 474.3 272,066 2,489,800 19.9
2040 751.3 676.2 135.2 540.9 310,265 3,962,720 22.6
2045 848.8 763.9 152.8 611.1 350,530 5,632,875 28.2
Source: Calculations by the project consultant.
Notes: [1] From Table 51.
[2] Collection Efficiency assumed at 90% from 2025.
[3] Assumes average waste diversion rate of 20% from 2025.
[4] Assumes landfill begins receiving waste at the beginning of 2025. To allow for site identification,
planning, design and initial development.
[5] Assumes in situ compacted density of 0.7 t/m3 and 10% provision for daily and intermediate cover,
excluding final capping.
[6] Assumes average waste depth of 5 m for site in 2025, with average waste depth increasing as the
waste disposal area increases in size, ultimately reaching an average depth of 20 m
830. Exceeding the waste diversion target, or by providing alternative treatment facilities for
managing the waste, will result in the requirement for a smaller site or a site that can last
longer than twenty-five (25) years.
831. The lifespan of any landfill, regional or local, could be enhanced through the
progressive adoption of alternative treatment technologies, including, potentially, composting,
anaerobic digestion and incineration or other forms of waste-to-energy processes. There is,
however, no information on the chemical properties of the waste stream that would permit a
preliminary assessment of the feasibility of any of these options.
832. Composting of green waste is best undertaken in conjunction with composting of
agricultural waste streams. Composting of municipal waste is not recommended unless it is
restricted only to source-segregated clean green waste components (for example, tree and
grass cuttings). Cross-contamination from other waste components renders ‘compost’ derived
from mixed municipal waste unable to achieve certification as compost and, thus, it is
unmarketable.
833. Development of anaerobic digestion of organic waste can be undertaken at the landfill
site, potentially in conjunction with the digestion of sludges from any wastewater plant. Source-
segregated food waste is best suited to this method of treatment.
KP-SISUG Swat Regional Development Plan
260
J. TOURISM
834. The tourism sector has gained significant importance over the past few decades all
over the world. Pakistan in general and Khyber Pakhtunkhwa (KP) Province in particular is
blessed with immense tourism potential. The province of Khyber Pakhtunkhwa (KP) is a
unique province of Pakistan where all types of tourism attractions exist. These include tourism
sites with natural and scenic beauty, sites with unique historical and archeological importance,
sites of religious significance, sites for ecotourism and nature tourism, winter tourism,
shopping, cuisines, sports and festivals. No other province of Pakistan can claim to have such
diversity of Tourism assets.
835. As per Pakistan Tourism Growth Report of 2009,356 the total number of domestic
tourists visiting Khyber Pakhtunkhwa in a year was about 8.8 million which account for about
19% share of the total national domestic tourist traffic. A higher share of Khyber Pakhtunkhwa
in domestic tourism compared to its share in population is a clear indicator of the competitive
edge the province possesses over other provinces of the country. On the other hand, total
number of foreign tourists arriving in Khyber Pakhtunkhwa in 2009 was 47,900 which
translated into 5.6% share of the national foreign tourist traffic.
836. The most popular tourist locations in Khyber Pakhtunkhwa include Swat Valley,
Kaghan Valley, Chitral Valley, Kumrat Valley, Abbottabad and Gallia region of Hazara,
Mardan, Swabi, D.I. Khan, Khyber Pass, Peshawar and its surrounding areas.
J.1. Khyber Pakhtunkhwa Tourism Policy, 2015
837. KP is the first province in Pakistan which launched its provincial tourism policy in 2015.
The KP Tourism Policy 2015 visualizes developing an internationally competitive tourism
sector to fully realize its diverse potential, making tourism a leading economic sector for the
province. Improved institutional capacity and regulatory reforms, investment promotion
through public-private partnership, creating an enabling business environment for private
sector, quality assurance in tourism and hospitality services, marketing and image building
and improving the workforce for quality assurance are mentioned as key strategic thrust areas
with sort to mid-terms targets in this policy. The policy also focuses on the sustainable
development of tourism as a cross-cutting theme by acknowledging the importance of long
term benefits of sustainable development of tourism in the province which heavily depends on
the natural endearments and cultural heritage for its tourism products.
838. In order to improve coordination mechanism among the key public sector departments
and private sector stakeholders, the policy has also proposed a framework to establish a high
level Tourism Development Committee (TDC) to effectively implement the policy
recommendations. A detailed action plan along with monitoring & evaluation plan is also part
of the overall implementation framework with clearly defined role of different partner
organizations and timeframe to achieve the given goals.
839. On the institutional side, the government also promised to rationalize the institutional
setup, by clarifying responsibilities for DoT, TCKP, DTS and other government entities and to
356 These are the figures as per the annual Tourism Growth Report of 2009 as no latest data is available after
this period. The federal ministry of tourism used to publish this report annually but after the devolution under the 18th Amendment in the constitution of Pakistan, the subject of tourism has been assigned to the province and the federal tourism ministry has been dissolved hence no department is now producing such report at present.
KP-SISUG Swat Regional Development Plan
261
provide adequate resources to these entities. The policy also emphasized the roles of the
public versus private sectors for the tourism sector development, with the former strengthening
its regulatory and planning capacity, monitoring capability, information provision, as well as
the capacity to manage private sector transactions, whereas taking charge of project
development and management for tourist infrastructure development and services provision.
While the private sector grew tremendously in the past few years, the policy had little role to
play in that. One notable initiative by the KP government, however, was to lease out
government rest houses, increasing the private sector participation in the sector.
840. On the regulatory side, the policy proposed development of robust regulatory regime
to ensure better quality of tourism services by upgrading the existing tourism and hospitality
related laws. It also highly speaks about the high standard of enforcement of Environment
protection Act, the local government act, wildlife etc., but when we look on the action side, we
see that the new Tourism Act 2019 is totally against what is mentioned in the KP Tourism
Policy 2015 as the new law makes way to repel all the above laws.
841. As a whole, the KP tourism policy document is quite a comprehensive covering all the
important dimensions of tourism development and promotion in the province. Moreover, it
presents a very detailed implementation framework with clearly defined list of activities and
their timelines till 2021. But apparently it looks like that the suggested interventions has not
been seriously taken care by the Tourism Department itself. No effort even has been made to
follow the proposed implementation plan by the concerned department. As a result, after
passing of five years we have no clean idea about the level of achievement of targets set in
this policy document.
J.2. Tourism Assets
842. Swat is a mountainous region, located among the foothills of the Hindukush mountain
range. This range runs in the general direction of North and South and has a varied elevation
within the Swat area, beginning from 600 meters above sea level in the South and rising
rapidly up towards the North, to around 6,000 meters above sea level. The Swat region,
containing the meandering Swat River, is also home to lush green valleys, snow-covered
peaks, glaciers, forests, meadows and alpine pastures. Along with its natural and scenic
beauty, Swat valley also possesses a historical significance. It has been a destination for
Alexander the Great in 327 BC. In ancient times, it was also famous as a center of Buddhism;
still having its prominent marks in the valley in shape of countless archaeological sites in lower
part of Swat Valley. Mingora, Saidu Sharif, Madyan, Baharin, Kalam, Miandam and Malam
Jabba are the main tourist destinations in the Swat Region.
843. A brief description of tourism assets in the Swat Region is given below. A list of tourism
assets in the region is given in Table 53. the same are also shown on Map 22.
• Mingora is the main town and the center of economic activities of Swat Valley. The
bazars of Mingora are famous among domestic and foreign tourist to enjoy shopping
of various handicrafts and other locally produced items. Traditional jewelry made of
silver and semi-precious stones, embroidered dresses, hand woven woolen shawls,
waistcoats, caps and woodwork products are available in the shops of Mingora
markets. The town large number of hotels and restaurants to provide boarding and
lodging facility to the visitors.
KP-SISUG Swat Regional Development Plan
262
• The other important urban area is Saidu Sharif which is the seat of administration for
managing government affairs. There is an airport in Saidu Sharif which used to have
flights from Islamabad when the situation was normal.
• The area of lower Swat is very important tourist destination because of the presence
of large number of archaeological sites of Buddhist heritage. Buddhist sites, such as
stupas, monasteries, settlements, caves, rock carvings and inscriptions are scattered
all over the lower Swat Valley. Some important Buddhist locations include Butkara
Stupa, Saidu Sharif Stupa, Shingardar Stupa, Nimogram Stupa, Elephant Pass in
Shahkot Pass, Tokar Dara Stupa and Monastery, Gumbutana Stupa, Amlukdara
Stupa, Udegram, Jehanabad Buddha, Bazira and Ram Takht (Ram’s throne on mount
Elum).
• Swat Museum is located in Saidu Sharif which has a huge collection of artifacts, coins
and other assets of Gandhara civilization.
• Maraghzar is a small serene town located about 13 km from Saidu Sharif at the base
of Mount Elum. Key attraction of the area is the White Palace which was the residence
of the ruler of Swat. The palace now exists in the shape of a high grade hotel and
restaurant.
• Islampur is a small village famous because of in handloom weaving. Handmade Swati
woolen shawls and blankets produced at Islampur are famous all over Pakistan.
• Malam Jabba is a hill resort about 44 km from Mingora. The area is surrounded by
beautiful mountains and has chairlift, ski run and a mini golf course. Presently, the
place is in the process of rebuilding; after being destroyed during conflict situation in
the area.
• Bahrain and Madyan are two beautiful small towns in Upper Swat, situated along Swat
River. They are the most frequently visited place; by being on the road leading to other
tourist destinations.
• Kalam is a small town in Upper Swat. By virtue of its beautiful panoramic natural
beauty, it is one of the most popular places for the tourists coming to Swat Valley.
Ushu, Matiltan, Gabral and Utror are beautiful side valleys above Kalam which are
accessible by jeep roads.
• Other tourist places in Swat which are famous for their natural scenic beauty include
Miandam, valleys of Bashigram and Mankial.
• There are many beautiful lakes in upper Swat which feed the emerald green Swat
River. These lakes provide ideal camping sites for adventurers and nature lovers. Most
of these lakes are accessible only through foot treks. Some popular lakes include
Bashigram Dand, Daral Dand, Mahodand, Saidgai Dand, Kundal Dand, Pari/Khapiro
and Neelsar.
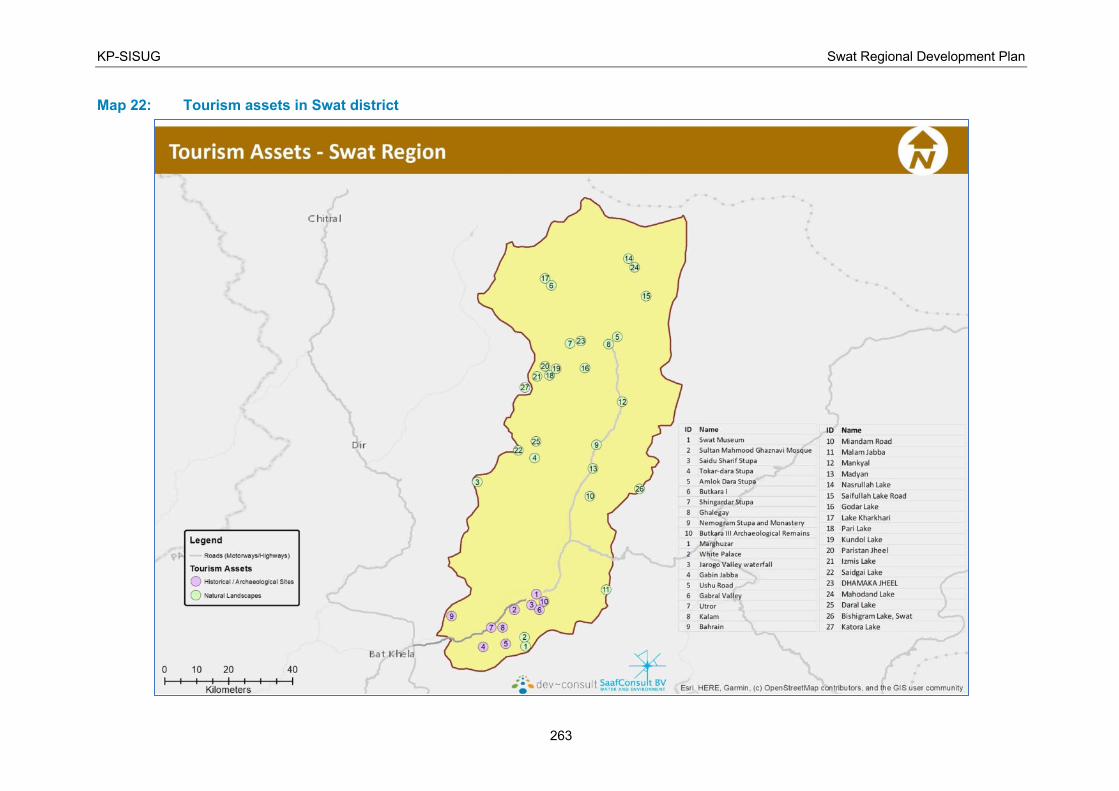
KP-SISUG Swat Regional Development Plan
263
Map 22: Tourism assets in Swat district

KP-SISUG Swat Regional Development Plan
264
Table 53: Tourism sites in Swat Region
Geographic / Natural Landscapes Historical / Archaeological Sites Cultural Sites
• Beautiful Mountainous landscape
• Fruit orchards
• River Swat and its tributaries
• Miandam Valley
• Madyan
• Bahrain
• Kalam
• Ushu
• Matiltan
• Gibral
• Atrot
• Mahudand Lake
• Condol Lake
• Mount Flackser
• Mount Mankial
• Beshigram valley
• Bishigram Lake
• Gabina Jaba
• Gumbt Stupa
• Remains of Bazira
• Amluk Dara Stupa
• Udegram remains
• Ghalighay
• Butkara Stupa
• Saidu Stupa
• Jahanabad Buddha
• Thokardara Stupa
• Shingardar Stupa
• Nemogram Stupa
• Gogidra
• Mount Ilum
• Muraghzar
• Prehistoric rock paintings in Kandak valley of lower Swat
• Mingora Main Bazars
• Swat Museum
• Saidu Baba tomb
• Islampur (village of shawls weavers)
• Madyan Bazar (traditional Woodcarving)
• Old Bahrain
J.3. Gaps in the Promotion of Tourism in KP
J.3.1. Province Level Issues
844. Based on the literature review, following are the sector specific key issues and gaps in
the KP Tourism sector.
J.3.1.1. Institutional and Coordination Issues
845. In spite of the very evident importance of Tourism sector for KP, the sector has not
obtained its due attention from provincial government. Moreover, tourism is a cross cutting
theme and is related to number of other departments and ministries; such as environment,
wildlife, forestry, culture, archaeology, local government, Communication and Works etc.
However, all these ministries and departments keep working in isolation without taking into
account the synergies which may be developed with Tourism. This results in missing out on
many opportunities through which tourism development can take place without incurring much
cost.
846. The management of Tourism in the province is carried out by Tourism Corporation of
Khyber Pakhtunkhwa (TCKP). During the past two years, TCKP has been very active and has
taken number of good initiatives for the promotion of tourism in KP. With the devolution of
Tourism, TCKP has an expanded role to play for the development of tourism as well. The
current organizational structure of TCKP is not geared to take on the additional responsibilities.
There is lack of capacity in TCKP in the functions of marketing, research, infrastructure
planning and development, investment promotion and development of other segments of
tourism more effectively.
J.3.1.2. Limited Availability of Information
847. The planning and management of any sector and its activities depend upon effective
evidence-based decision-making, backed by flow of data and meaningful information.
KP-SISUG Swat Regional Development Plan
265
Presently, there is no mechanism in place to collect and analysis data of tourism at provincial
level.
J.3.1.3. Low Quality of Workforce
848. Availability of quality human resource has been a significant challenge for the tourism
sector in the province. There are few universities offering degree courses on tourism but their
overall standard need lot of improvement. Furthermore, Pakistan Austrian Institute of Tourism
and Hotel Management (PAITHOM) in Swat - the only notable training institute in the province
for tourism and hospitality related training - has been non-operational since the conflict in Swat
and is still in use by Pakistan Army.
J.3.1.4. Insufficient Private and Public Investments
849. Development of tourism infrastructure requires influx of substantial funds; the provision
of which is difficult for the government. The flow of private investments in the tourism sector
of KP has also been limited. In order to promote private investments in the province, a
regulatory framework is required to empower government officials and also to provide
opportunities for secure investments to private sector investors. Presently, in KP, there is no
such framework; which limits the execution of this option
J.3.1.5. Absence of Efficient Regulatory Mechanism and Poor Quality Standards
850. The enforcement of any quality standards is virtually absent in the tourism sector. The
responsibility of managing the laws and standards of hotels, tourist guides and travel agencies
lies with Directorate of Tourist Services (DTS). Before 18th Amendment, DTS used to work
under the federal Ministry of Tourism. As per the mandate decided for DTS, it is responsible
to ensure the quality of tourist services through implementation of various enactments
including: The Pakistan Hotels and Restaurants Act 1976; The Pakistan Tourist Guides Act
1976. The Travel Agencies Act 1976. This absence of an efficient regulatory mechanism and
standards regime has implications for services offered by hotels and restaurants; licenses for
tourist guides; fitness certification system vehicles used by tourists; transportation rates, etc.
J.3.1.6. Poor Infrastructure
851. Due to a recent history of armed conflict in Swat and natural disasters in different
mountainous regions, the tourism sector in KP has suffered major losses, including physical
damages to buildings and equipment and lost businesses. This in turn has taken its toll on
availability of tourist facilities in the province. Firstly, damage caused to access roads,
unreliable supply of electricity, poor sanitation at tourists spots and closure of Saidu Sharif
airport have further worsened the situation. The crisis damaged roads and bridges in Swat
valley, Dir, Kohistan and Kaghan valley. In addition, new link roads should also be developed
to reach scenic places in Swat, Dir, Chitral and Kaghan valley and other areas. Secondly,
provision of electricity, water supply, sewerage and solid waste management are the key areas
which need immediate attention of government.
J.3.1.7. Weak Marketing Activities
852. While the poor law and order situation has played its role in discouraging tourism in
KP, some responsibility also has to be placed on lack of an effective and well-coordinated
image building and marketing strategy to promote in KP as a preferred tourism destination.
KP has been bestowed with valuable tourism assets and unharnessed tourism potential in
areas of natural, historic, archaeological, religious and cultural tourism, however, the tourism
KP-SISUG Swat Regional Development Plan
266
officials, especially at the federal level, have so far been unsuccessful in conveying this
potential to the relevant audience across the globe. So far, the government’s efforts to attract
domestic tourists have been mostly cantered around activities within the province, however,
there is a need to extend these activities to tourist feeding areas in the country, including major
cosmopolitan cities, to further promote domestic tourism. There is also need to focus of special
interest foreign tourist markets to attract sufficient number of foreign tourists interested in
adventure, nature, archaeological and cultural tourism.
J.3.1.8. Insufficient Funding for Tourism Sector and Low Investment by Private
Sector
853. In spite of the great business potential of Tourism, the sector has not been a priority
for the financial institutions. There has never been a preferential treatment given to this sector
either by the government or by the banks. Unlike many other sectors, there has been no
concessional financial support for tourism and hospitality sectors; although dynamics of the
sector are very different from industrial, agriculture or micro sectors. As a result, the private
sector in tourism sector is unable to get its due share of the commercial funding. There are no
special funds allocated and no program lending schemes launched for tourism. Moreover, the
provincial government so far has also not been able to offer any good incentive schemes to
attract investment in tourism from private sector.
J.3.2. Region Level Issues
854. Swat Valley is a popular tourist destination because of its pleasant summer climate
and number of scenic tourist spots. It has large number of hotels and most of the tourist areas
are also easily accessible. Most of the tourists visits Swat valley during summer holidays are
domestic tourist from down country. Although there is no official data available on the number
of tourist arrival in Swat district but as per careful estimates more than 500,000 domestic and
around 2000 foreign tourists annually visit different places in Swat. Main tourist season is from
May to August but small numbers of tourists also come during rest of the year.
855. In the past, there has been a reasonable flow of foreign tourists vising Swat for its
historical sites and enjoy natural landscape of Swat. Trips to visit archaeological sites of
Gandhara in Lower Swat and trekking trips to Chitral via Kachikani pass and to Ghizer Valley
of Gilgit-Baltistan via Dadrali Pass were popular tour products among foreign tourists, but
nowadays due to security concerns, the movement of foreign tourists in upper Swat is almost
insignificant.
856. In the recent years, a significant growth has been observed in the domestic tourist
arrival in Swat district. This is mainly attributed due to the influence of social media and
mushroom growth of unlicensed tour operators who offer cheaper package tours to domestic
tourists groups. Most of these domestic tourists are family groups and young people who visit
this area during summer holidays. These domestic tourists come on four to five days excursion
trips and some of them also come with specific purpose of trekking in the areas of Swat
Kohistan which has number of high mountains passes and beautiful alpine lakes.
857. As far as key issues in tourism sector are concern, there is general lack of basic tourism
infrastructure such as good restaurants, public toilets and rest areas along the roads, direction
signage, poor hygiene conditions and cleanliness of boarding and lodging facilities. Untrained
staff in hotels/guest houses, issue of road safety, degradation of natural environment due to
deforestation and unplanned construction and mushroom growth of hotels at tourist resorts
are some other key issues. KP Tourism Department has not played an active role for the

KP-SISUG Swat Regional Development Plan
267
development and promotion of tourism in the past but now they are working on preparing area
specific tourism developmental plans and it is hoped that some new tourism specific projects
will be initiated in near future.
858. Regardless its specific form, tourism has emerged as a major factor for regional
economic development. Popular tourist destinations in Swat are jam-packed during summer
season and now also have started receiving tourists in winter as well.
859. There are good possibilities to develop various tourism products using the beautiful
natural landscape and rich cultural aspects. KP government is the first province which has
approved its tourism policy and the political leadership is now also very keen to promote
tourism in the province. There is also interest of national and international development
agencies, NGOs and donor agencies on creating new livelihood opportunities for the people
of Swat which will be helpful in initiating projects to make tourism an integral part of local
economic development in this area. On the other hand, there is now an increase in the arrival
of tourists after the opening of Swat Expressway from Swabi to Chakdara. Moreover, the
facility of e-visa and visa on arrival for foreign tourists of many countries will also positively
impact to increase the number of foreign tourist arrivals in Swat.
860. There is now need to harness the existing recreational tourism potential to make it
more eco-friendly and culture friendly by adopting the best practices of responsible and
sustainable tourism. The motivation behind developing tourism in this area should not be just
to attract more tourists but to ensure that local communities must get good share of economic
benefits accrue from tourism business activities. At the same time, the negative impacts of
irresponsible tourism development need to be avoided, such as damaging effects on the local
natural, cultural and historical resources due to mushroom growth of unattractive hotels and
commercial buildings. Therefore, tourism should be developed strictly based on the concept
of sustainable development of tourism.
J.4. Tourism Promotion: The Way Forward
J.4.1. Province Level Recommendations
861. Developing Tourism sector in Khyber Pakhtunkhwa requires a structured and phased
approach. The recommendations for the promotion of tourism as a whole in the province and
specifically in the Swat Region are made in the following paragraphs.
862. The first and foremost step for promoting Tourism in KP is assigning Tourism the high
priority by the Government of Khyber Pakhtunkhwa. Tourism should be officially declared as
an industry and it must be backed by the appropriate funding for the development of proper
infrastructure for the development of tourism in the province.
863. The KP Tourism Policy is very comprehensive document and effort should be made to
establish a mechanism for its proper implementation. This policy document should be
reviewed and updated to meet the requirements for the next phase of five years.
864. On governance side, there is need to improve the working of KP Tourism Department
and its associate directorates and agencies. TCKP need to adopt an outlook of effective
corporate body playing its due role in the development and promotion of tourism in the
province. The role of Directorate of Tourist Services (DTS) should be strengthened through its
capacity building and upgradation of tourism related laws and its implementation mechanism.
KP-SISUG Swat Regional Development Plan
268
865. Public-private partnerships should be encouraged for Tourism Projects in KP to meet
the resource gap and create fiscal space for the government to divert scarce resources to
other projects. This will also take care of the government’s implementation capacity constraints
by bringing in the private sector’s efficient management skills.
866. Conservation of natural environment and cultural heritage should be part and parcel of
the development strategies. Environmental considerations should be kept in view while
designing and implementing any Tourism project. TCKP should coordinate with Environmental
Protection Agency (EPA) to conduct Initial Environment Examination (IEE) and Environmental
Impact Assessment (EIA) for the hotels and ensure adherence to environmental standards.
867. Having quality tourism infrastructure is a prerequisite for attracting tourists. Important
components of infrastructure include access roads, roadside facilities, transport facilities,
accommodation facilities (hotels, motels, youth hostels, camping sites etc.), restaurants,
tourist resorts and activity sites, tourist shops, tourist information centers, medical/first aid
facilities etc. An important consideration in developing infrastructure is that the developed
facilities should be indigenized and harmonized with surrounding environment and should not
lose the local cultural touch since the tourists come to experience the local specialties.
868. There is serious lack of basic facilities such as electricity, water supply, sewerage and
solid waste management, safe parking areas, walking paths and information sing posting at
all the site in project areas. Special attention need to be given develop these basic facilities to
improve the delivery of better tourist services and help to provide a pleasant touristic
experience to the visitors.
869. As the tourist traffic is increasing in most of the project areas so there is need to identify
and develop new tourist sites; including scenic locations, historical sites, museums, parks,
adventure tourism facilities and theme parks, etc. Development of these new sites should be
the part of an overall tourism development plan based on the principles of sustainable
development so that there is no compromise on the quality of natural environment and cultural
heritage. The target market for each new site should be identified and detailed feasibility
studies should be developed to ascertain the commercial viability of the projects. Effort should
be made that local community could gain maximum socio-economic of such new develop
projects.
870. To improve and strengthen the implementation of standards and certification for the
hotels, restaurants and tour operation services. Hotels, restaurants tour guides and tour
operators should be issued license to do business once they are evaluated and awarded a
rating certificate by a qualified certification body. It should be mandatory for the hotels,
restaurants and tourism businesses that the certificates are displayed at prominent positions
at their reception desks to inform the tourists about the quality of services. DTS should take
the lead in this regard.
871. Development strategies for different areas should only be designed with the
participation of local community for ensuring its ownership and support. Opinion makers of the
society like religious leaders, community heads, teachers, social workers, etc. should be
mobilized for improving affinity of local communities for Tourism in KP. It will be useful to
highlight potential job creation opportunities and economic benefits in these mobilization
campaigns. The importance of civic responsibilities, cleanliness and waste management
should also be promoted through religious leaders. Along with creating religious tolerance, it
is equally important that the Tourism strategy should not violate local culture and traditions.
KP-SISUG Swat Regional Development Plan
269
J.4.2. Region Level Recommendations
872. In order to make tourism in Swat a key engine of socio-economic development there
is need to focus on the following interventions.
873. The unplanned construction and mushroom growth of hotels at popular tourist sites
such as Fizagat near Mingora, Baharin, Madyan, Miandam and Kalam etc. has created a lot
of problem related to the environment, health and sanitation. Ironically, many of small and
large hotels have been built on the banks of the rivers on the reclaimed land or on mountain
slops where trees have been cut to clear land. In the absence of proper land use planning,
sewage water from such hotels is directly polluting the rivers ultimately damaging its aquatic
fauna and creating health related issues for local population and visitors of these areas. As a
first propriety there is need to incorporate the eco-friendly appropriate technologies such as
wastewater water treatment, solid waste disposal, use of energy efficient lights, solar water
heating etc. to minimize their negative impacts on the natural environment.
874. There is need to have strict control on the undesirable and unplanned development of
concrete structures and no new hotel should be construction without the prior approval from
the concerned department. For new investors in hoteling business there is need to provide
them proper guidelines by the tourism department so that the new hotels and guest houses
are properly designed and built to meet the acceptable service standards of tourist
accommodation, their overall outlook is in harmony with surrounding natural environment and
their operational system is not damaging the natural environment in any case.
875. In Swat, tourism is a seasonal business activity and to meet the increasing demand of
tourist accommodation in coming future there is possibility to develop good tourist resorts at
different locations of Swat valley by involving local entrepreneurs. Depending on the
acceptability by the local community, in some selected areas concept of community managed
eco-lodges can also be introduced.
876. The domestic tourist traffic is increasing to Swat and there is need to harness the
potential of this existing tourism to make it more eco-friendly and culture friendly by creating
awareness and adopting the best practices of responsible and sustainable tourism.
877. There is also need to develop standards on appropriate behavior to make tourists as
well local community members eco-conscious and culture friendly. This can be achieved by
developing code of conducts for tourists and tourism service providers. A community based
system should also be established to enforce this code of conduct and those how don’t respect
this code should be penalized through a fine system.
878. Many areas in upper Swat at still intact in terms of its natural beauty and biodiversity.
To the north of Kalam there are several beautiful valleys, having thick forests, waterfalls,
glaciers, lakes and meadows. Most of these places are still intact and has excellent potential
for ecotourism. Ecotourism should be encouraged in such areas through adequate awareness
and consciousness about the conservation and protection of natural resources for the
enjoyment and benefit of both locals and visitors.
879. In the area of lower Swat there are number of important archaeological sites which are
under serious thereat due to present mushroom growth. There is also urgent need to preserve
most of these sites by developing some community-based heritage conservation initiatives. In
the recent past Italian Archaeological Mission’s ACT Project has done some remarkable work
in building the capacity of local communities at four archaeological sites in this area. There is

KP-SISUG Swat Regional Development Plan
270
possibility to further replicate this project at some more sites to make this area a hub of
sustainable archaeological tourism in Pakistan.
880. As a whole the hotel industry in Swat district is quite developed and perhaps the largest
in Khyber Pakhtunkhwa. There are more than 450 hotels and guest houses of different
categories located at Mingora, Saidu Sharif, Malam Jabba, Madyan, Miandam, Bahrain and
Kalam. There are many good hotels but generally the standard of services of these hotels and
their overall ambiance and hygienic conditions are not up to the mark. There is a particular
need to improve the hygienic conditions of these hotels and built the skills of their management
staff through training, grooming and exposure visits. Moreover, all the hotels must be
registered with Department of Tourist Services (DTS) to ensure that they follow some
minimum service standards and their rates are properly regulated through a price control
mechanism.
881. There is good potential to develop more recreational facilities for tourists such as parks,
pick spots, fishing points, adventure sports clubs. Water sports and winter sports activities
should be developed in collaboration with private sector with proper safety and environmental
SOPs should be developed and implemented to ensure safety of the visitors.
882. Many areas of Swat have excellent opportunists of the trekking and hiking in the
mountain valleys. Selected trekking routes should be developed with proper walking trails and
halting camping sites to promote the segment of trekking and hiking in Swat region.
883. In order to promote private sector investment in tourism related projects government
should introduce incentive package for new investors in tourism. This could be based on tax
holiday for tourism project for first 5 years, provision of government land on low rates, provision
of utility services to tourism projects on priority basis and development of basic infrastructure.
884. The good road access plays key role in tourism promotion. Most of the roads linking
tourist sites in Swat are not up to the mark. There is need to develop good road network with
proper safety and signage. Moreover, arrangements should be made to keep Kalam and
Malam Jabba road open during snow fall season to attract winter tourism to these areas.
885. The local government role at the level of destination is very important. It should ensure
that there is proper coordination among the key support department to provide a safe and eco-
friendly environment for tourism to grow in a sustainable manner. The issues of water supply,
electricity provision, road clearance, solid waste management, sewerage treatment and
disposal, provision of health facilities to the locals and visitors, safe transport are the key areas
where local government should play its due role in an effective manner At present there is no
local level institutional setup to oversee the development and promotion of tourism in Swat
district. There is need to establish district level Destination Management Organizations (DMO)
to bridge this gap.
KP-SISUG Swat Regional Development Plan
271
PART III:
IMPLEMENTING THE URBAN AGENDA
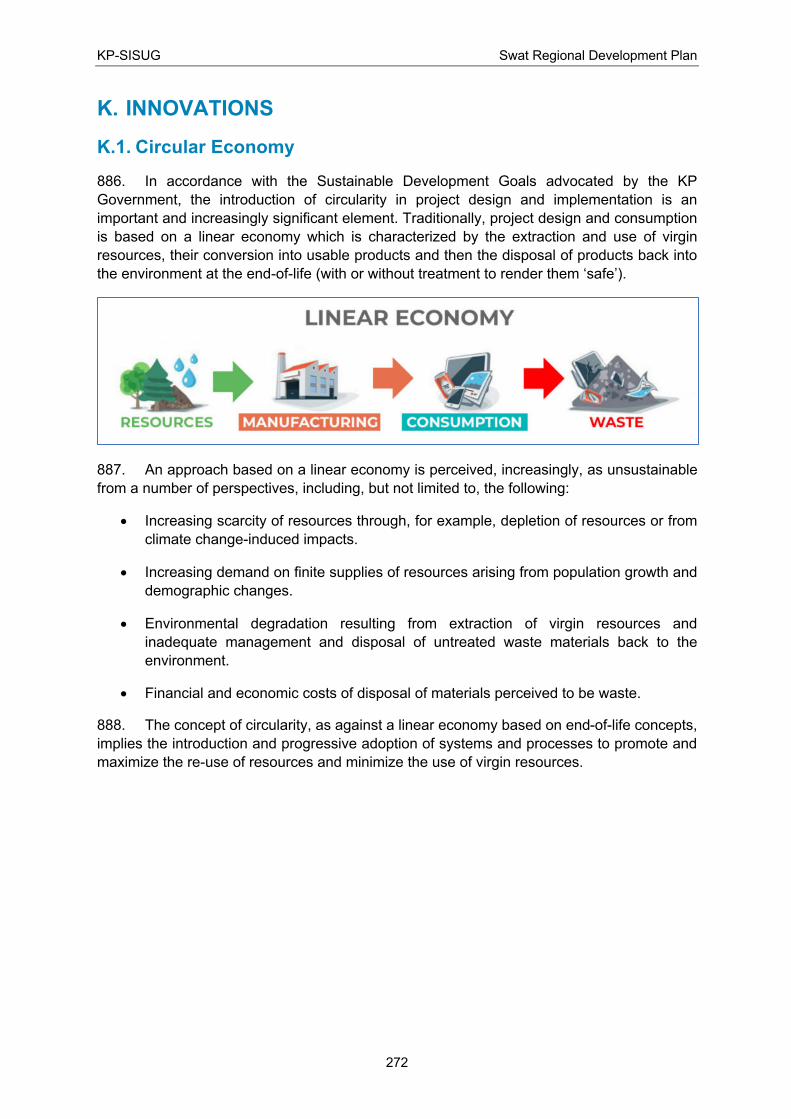
KP-SISUG Swat Regional Development Plan
272
K. INNOVATIONS
K.1. Circular Economy
886. In accordance with the Sustainable Development Goals advocated by the KP
Government, the introduction of circularity in project design and implementation is an
important and increasingly significant element. Traditionally, project design and consumption
is based on a linear economy which is characterized by the extraction and use of virgin
resources, their conversion into usable products and then the disposal of products back into
the environment at the end-of-life (with or without treatment to render them ‘safe’).
887. An approach based on a linear economy is perceived, increasingly, as unsustainable
from a number of perspectives, including, but not limited to, the following:
• Increasing scarcity of resources through, for example, depletion of resources or from
climate change-induced impacts.
• Increasing demand on finite supplies of resources arising from population growth and
demographic changes.
• Environmental degradation resulting from extraction of virgin resources and
inadequate management and disposal of untreated waste materials back to the
environment.
• Financial and economic costs of disposal of materials perceived to be waste.
888. The concept of circularity, as against a linear economy based on end-of-life concepts,
implies the introduction and progressive adoption of systems and processes to promote and
maximize the re-use of resources and minimize the use of virgin resources.
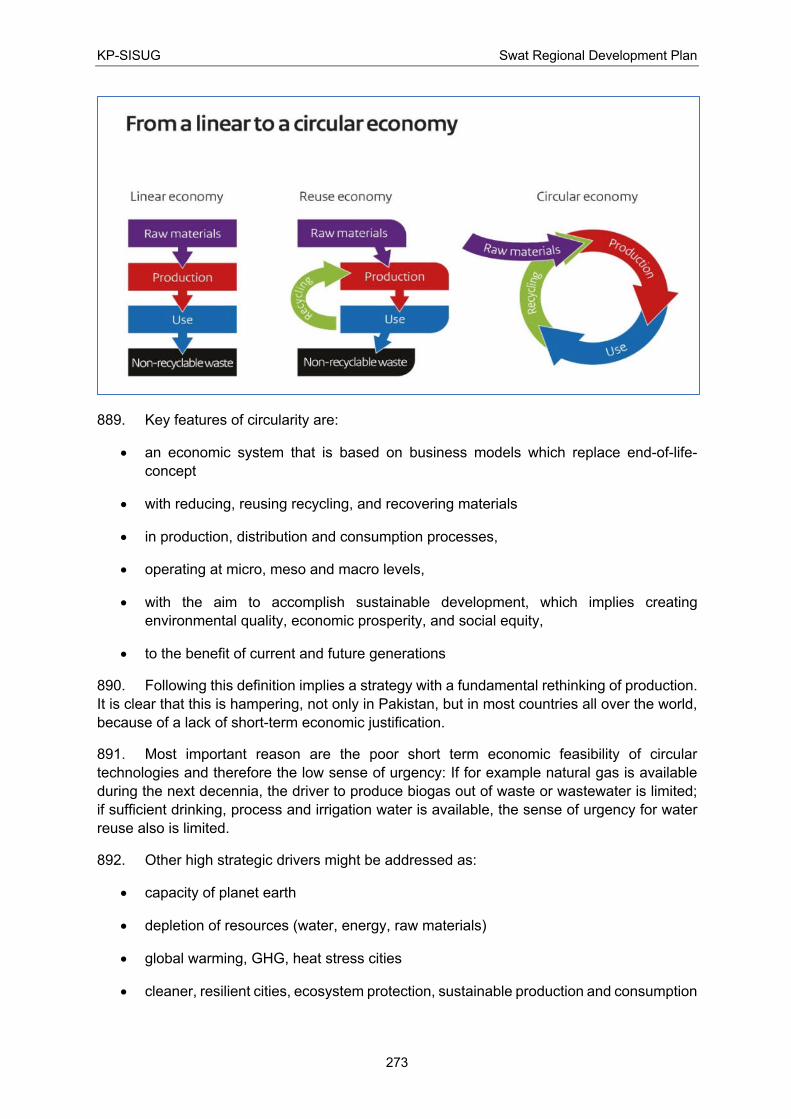
KP-SISUG Swat Regional Development Plan
273
889. Key features of circularity are:
• an economic system that is based on business models which replace end-of-life-
concept
• with reducing, reusing recycling, and recovering materials
• in production, distribution and consumption processes,
• operating at micro, meso and macro levels,
• with the aim to accomplish sustainable development, which implies creating
environmental quality, economic prosperity, and social equity,
• to the benefit of current and future generations
890. Following this definition implies a strategy with a fundamental rethinking of production.
It is clear that this is hampering, not only in Pakistan, but in most countries all over the world,
because of a lack of short-term economic justification.
891. Most important reason are the poor short term economic feasibility of circular
technologies and therefore the low sense of urgency: If for example natural gas is available
during the next decennia, the driver to produce biogas out of waste or wastewater is limited;
if sufficient drinking, process and irrigation water is available, the sense of urgency for water
reuse also is limited.
892. Other high strategic drivers might be addressed as:
• capacity of planet earth
• depletion of resources (water, energy, raw materials)
• global warming, GHG, heat stress cities
• cleaner, resilient cities, ecosystem protection, sustainable production and consumption
KP-SISUG Swat Regional Development Plan
274
• reducing import dependency
893. Although commonly accepted also as drivers in circularity, these drivers are in a
situation with limited financial resources unfortunately lower in ranking than the economic
feasibility especially in developing countries. Therefore, these drivers are seldom enough to
introduce and stimulate circularity in a situation with a limited economic feasibility.
894. Two situations can be identified to create a breakthrough:
• Although no actual depletion of water, energy or raw materials yet, it is expected this
might occur within a short time frame. Public and private organizations require these
time frame to prepare themselves.
• Circularity might be stimulated by financial institutions in providing loans under
conditions to apply circular technology and applying life-cycle considerations during
project design. The driver for the banks might be that circularity at the long term
provides the best conditions for repayment of the loan.
895. Introducing circularity at RDP level, the following technologies might be relevant:
• producing reusable water from wastewater
• producing biogas/energy from organic waste, sewage sludge or wastewater
• recovery raw materials from waste of wastewater
K.1.1. Biogas Production out of Organic Waste, Wastewater and Sewage
Sludge
896. Municipal wastewater and specific industrial wastewater (e.g., food processing
industry) have high organic concentrations. Currently no municipal nor industrial wastewater
treatment plants are operational in Swat region. When discharged these organics cause
bacteriological pollution of groundwater and surface water and may result in serious health
risks. In common STP processes wastewater is treated by precipitation and biological
treatment. Both processes produce organic sludge, which can be digested. The digestion
process results in bacteriological stabilization and biogas production. The biogas produced
contains 50-65% methane (natural gas = approx. 85% methane). From a circularity
perspective the biogas may be captured and re-used in industrial processes (for example,
local brick production) or as a source of domestic fuel, thus substituting for fossil fuels. The
sewage sludge might be co-digested with organic waste. Digested sludge and organic waste
are well known fertilizers and from soil improvement.
897. The Swat region has a high fruit and vegetable production with links to food processing
industries. The wastewater from these industries is high concentrated and easy
biodegradable. Individual industrial wastewater treatment might be considered for specific fruit
processing industries wherein the produced biogas is used in their processes.
K.1.2. Production of Reusable Water out of Wastewater
898. Currently the wastewater in the Swat region isn't treated yet; untreated wastewater is
discharged to the rivers. The Swat region is well known for its high fruit and vegetable
production. This production is much depending on sufficient (irrigation) water of acceptable
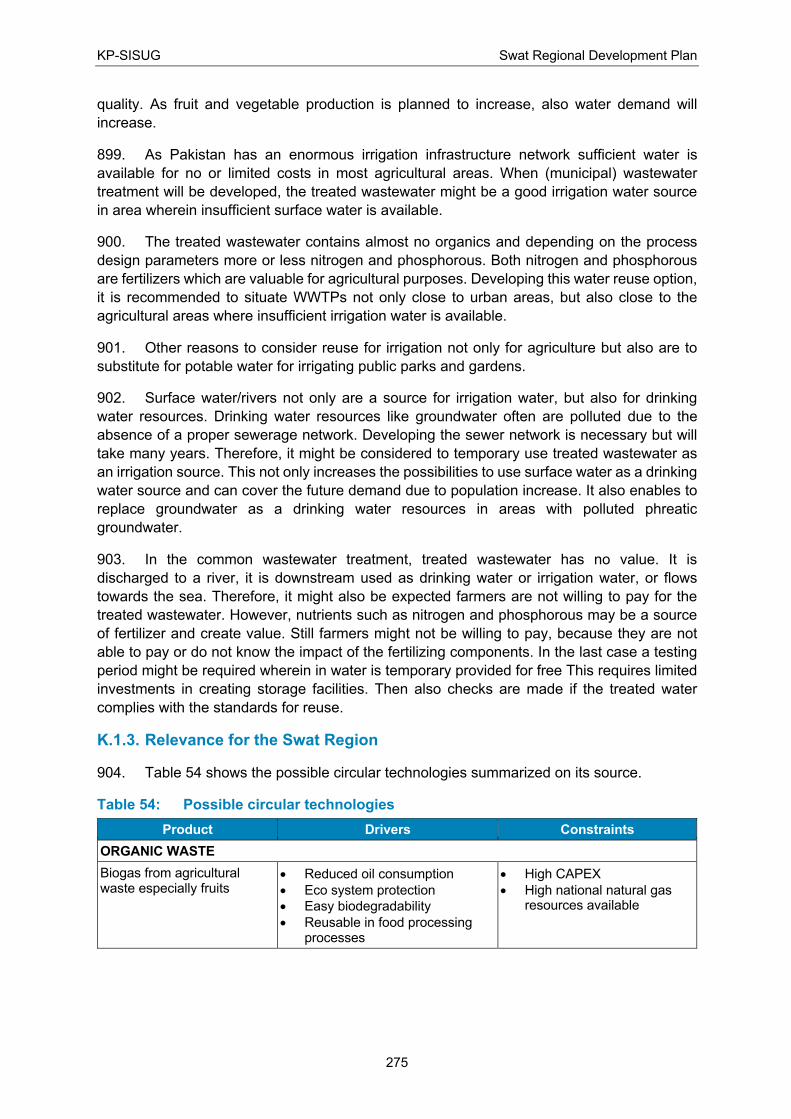
KP-SISUG Swat Regional Development Plan
275
quality. As fruit and vegetable production is planned to increase, also water demand will
increase.
899. As Pakistan has an enormous irrigation infrastructure network sufficient water is
available for no or limited costs in most agricultural areas. When (municipal) wastewater
treatment will be developed, the treated wastewater might be a good irrigation water source
in area wherein insufficient surface water is available.
900. The treated wastewater contains almost no organics and depending on the process
design parameters more or less nitrogen and phosphorous. Both nitrogen and phosphorous
are fertilizers which are valuable for agricultural purposes. Developing this water reuse option,
it is recommended to situate WWTPs not only close to urban areas, but also close to the
agricultural areas where insufficient irrigation water is available.
901. Other reasons to consider reuse for irrigation not only for agriculture but also are to
substitute for potable water for irrigating public parks and gardens.
902. Surface water/rivers not only are a source for irrigation water, but also for drinking
water resources. Drinking water resources like groundwater often are polluted due to the
absence of a proper sewerage network. Developing the sewer network is necessary but will
take many years. Therefore, it might be considered to temporary use treated wastewater as
an irrigation source. This not only increases the possibilities to use surface water as a drinking
water source and can cover the future demand due to population increase. It also enables to
replace groundwater as a drinking water resources in areas with polluted phreatic
groundwater.
903. In the common wastewater treatment, treated wastewater has no value. It is
discharged to a river, it is downstream used as drinking water or irrigation water, or flows
towards the sea. Therefore, it might also be expected farmers are not willing to pay for the
treated wastewater. However, nutrients such as nitrogen and phosphorous may be a source
of fertilizer and create value. Still farmers might not be willing to pay, because they are not
able to pay or do not know the impact of the fertilizing components. In the last case a testing
period might be required wherein in water is temporary provided for free This requires limited
investments in creating storage facilities. Then also checks are made if the treated water
complies with the standards for reuse.
K.1.3. Relevance for the Swat Region
904. Table 54 shows the possible circular technologies summarized on its source.
Table 54: Possible circular technologies
Product Drivers Constraints
ORGANIC WASTE
Biogas from agricultural waste especially fruits
• Reduced oil consumption
• Eco system protection
• Easy biodegradability
• Reusable in food processing processes
• High CAPEX
• High national natural gas resources available
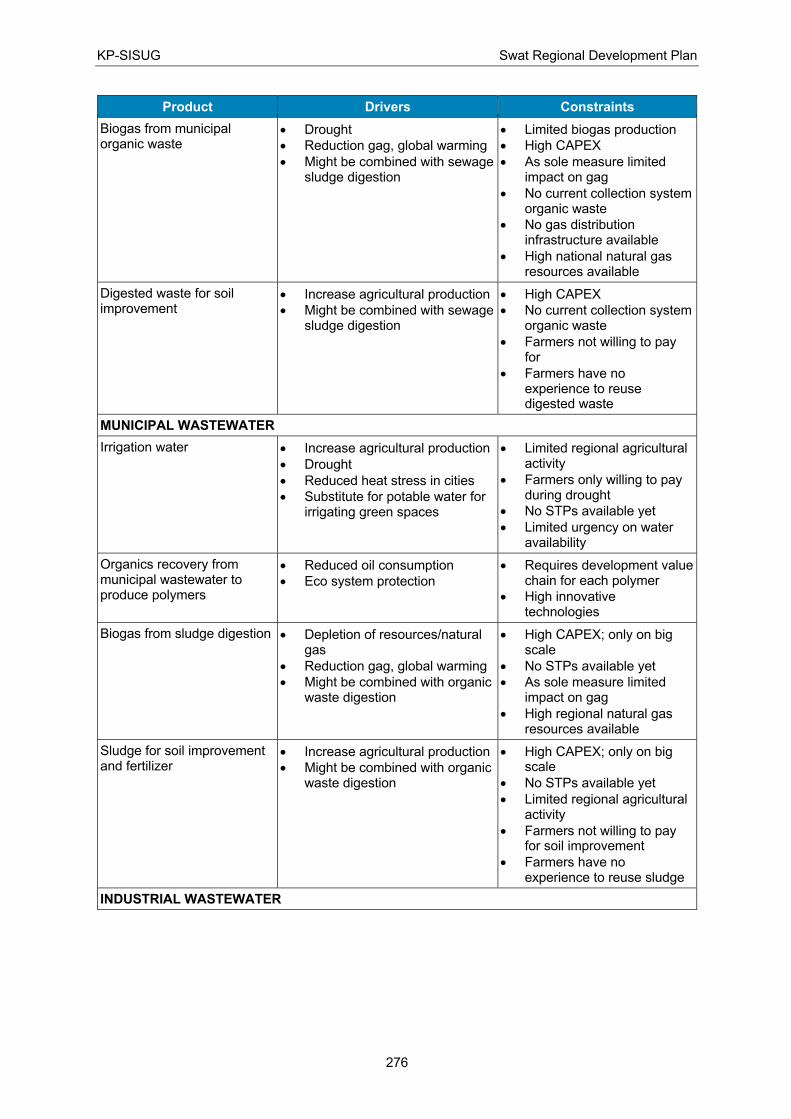
KP-SISUG Swat Regional Development Plan
276
Product Drivers Constraints
Biogas from municipal organic waste
• Drought
• Reduction gag, global warming
• Might be combined with sewage sludge digestion
• Limited biogas production
• High CAPEX
• As sole measure limited impact on gag
• No current collection system organic waste
• No gas distribution infrastructure available
• High national natural gas resources available
Digested waste for soil improvement
• Increase agricultural production
• Might be combined with sewage sludge digestion
• High CAPEX
• No current collection system organic waste
• Farmers not willing to pay for
• Farmers have no experience to reuse digested waste
MUNICIPAL WASTEWATER
Irrigation water • Increase agricultural production
• Drought
• Reduced heat stress in cities
• Substitute for potable water for irrigating green spaces
• Limited regional agricultural activity
• Farmers only willing to pay during drought
• No STPs available yet
• Limited urgency on water availability
Organics recovery from municipal wastewater to produce polymers
• Reduced oil consumption
• Eco system protection
• Requires development value chain for each polymer
• High innovative technologies
Biogas from sludge digestion • Depletion of resources/natural gas
• Reduction gag, global warming
• Might be combined with organic waste digestion
• High CAPEX; only on big scale
• No STPs available yet
• As sole measure limited impact on gag
• High regional natural gas resources available
Sludge for soil improvement and fertilizer
• Increase agricultural production
• Might be combined with organic waste digestion
• High CAPEX; only on big scale
• No STPs available yet
• Limited regional agricultural activity
• Farmers not willing to pay for soil improvement
• Farmers have no experience to reuse sludge
INDUSTRIAL WASTEWATER
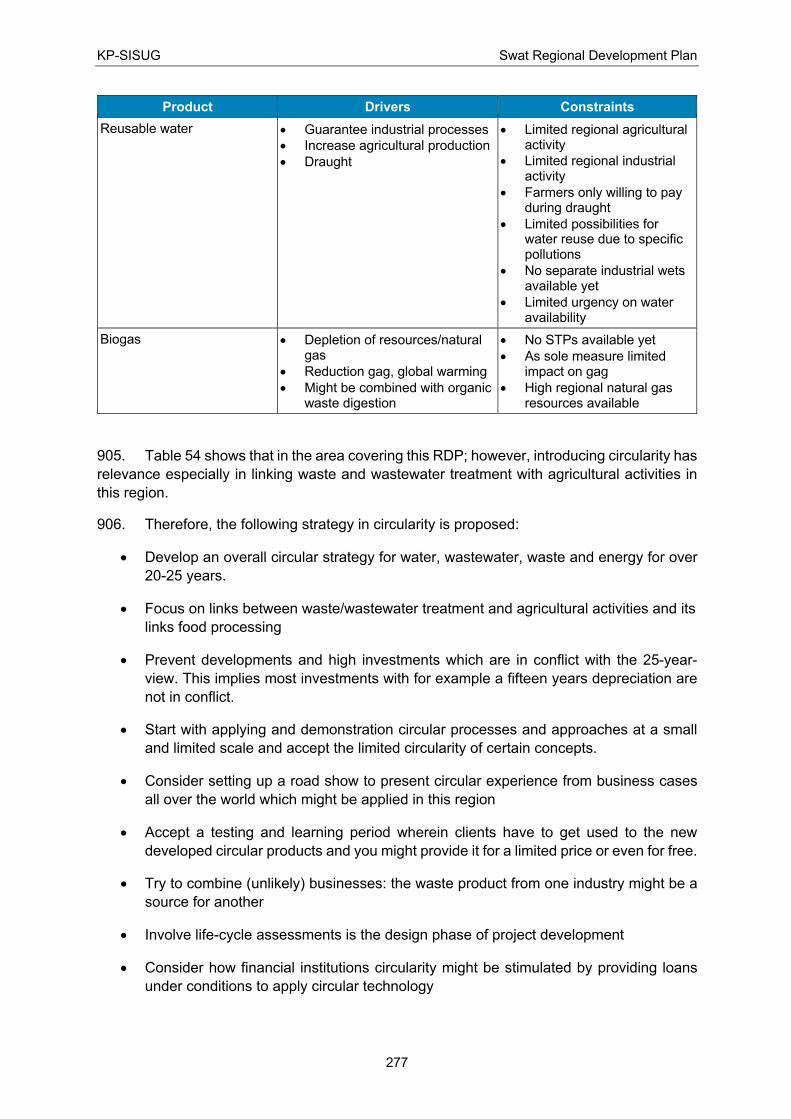
KP-SISUG Swat Regional Development Plan
277
Product Drivers Constraints
Reusable water • Guarantee industrial processes
• Increase agricultural production
• Draught
• Limited regional agricultural activity
• Limited regional industrial activity
• Farmers only willing to pay during draught
• Limited possibilities for water reuse due to specific pollutions
• No separate industrial wets available yet
• Limited urgency on water availability
Biogas • Depletion of resources/natural gas
• Reduction gag, global warming
• Might be combined with organic waste digestion
• No STPs available yet
• As sole measure limited impact on gag
• High regional natural gas resources available
905. Table 54 shows that in the area covering this RDP; however, introducing circularity has
relevance especially in linking waste and wastewater treatment with agricultural activities in
this region.
906. Therefore, the following strategy in circularity is proposed:
• Develop an overall circular strategy for water, wastewater, waste and energy for over
20-25 years.
• Focus on links between waste/wastewater treatment and agricultural activities and its
links food processing
• Prevent developments and high investments which are in conflict with the 25-year-
view. This implies most investments with for example a fifteen years depreciation are
not in conflict.
• Start with applying and demonstration circular processes and approaches at a small
and limited scale and accept the limited circularity of certain concepts.
• Consider setting up a road show to present circular experience from business cases
all over the world which might be applied in this region
• Accept a testing and learning period wherein clients have to get used to the new
developed circular products and you might provide it for a limited price or even for free.
• Try to combine (unlikely) businesses: the waste product from one industry might be a
source for another
• Involve life-cycle assessments is the design phase of project development
• Consider how financial institutions circularity might be stimulated by providing loans
under conditions to apply circular technology
KP-SISUG Swat Regional Development Plan
278
• Focus on circular concepts using proven technology, financial economic feasibility and
a well-developed governance. Understand that the governance is most difficult as
industries and public organizations have to cooperate, which till now might have never
been cooperating with each other.
907. The following tables show the optional circular technologies summarized on its source.
K.2. Climate Resilience
908. In terms of innovative approaches to tackling climate resilience we would like to
propose two approaches.
K.2.1. Insurance for Natural Hazards
909. Insurance for natural hazards are a protection against natural hazards by offering those
that suffer losses compensation via an insurance scheme. This type of insurance reduces the
catastrophic impact of disasters, enables a timely recovery, and can be coupled with other
disaster Risk management to soften the impacts of catastrophic events on vulnerable
communities. Insurance can and should also be linked to Risk reduction and preventive
activities. Prudently employing a combination of insurance measures with risk reduction,
including, early warning, education, infrastructure strengthening, and land-use regulations,
can greatly reduce the immediate losses and long-term development setbacks from disasters.
In addition, by creating a secure investment environment, insurance instruments can enable
productive risk taking on the part of individuals and governments, and in this way reduce
disaster-induced poverty traps. However, insurance for natural hazards is not affordable or
even available to many in the most vulnerable communities in Pakistan. This has led the
Government of Pakistan to work with the Munich Climate Insurance Initiative (MCII) and
supported by the Climate Development and Knowledge Network (CDKN) in a project to design
a viable national fund designed to help the most vulnerable communities better manage
natural hazards.357
910. In 2019 the World Bank, in cooperation with UK Aid, developed detailed proposals to
develop more effective key priorities for the first national Disaster Risk Financing Strategy of
Pakistan. The identified options were presented for consideration of the GoP during the
National Consultation on Disaster Risk Finance in July 2019. The Disaster Risk Financing
Strategy and implementation plan will be developed by the National Disaster Risk
Management Fund (NDRMF) in coordination with the GoP.358
911. As part of this Regional Development Plan the consultants would like to propose to
ADB and the Government of KP to engage with these initiatives, and to ensure that an enabling
environment is created to make headway with these initiatives, as they are crucial to improve
resilience from climate impacts.
K.2.2. Sponge City
912. For the urban development of Pakistan, and also very applicable to KP and Mingora,
is the concept of a Sponge City. In light of the natural hazards that Mingora has to deal with
357 Adapted from: https://climate-insurance.org/projects/designing-a-disaster-risk-insurance-framework-for-
pakistan/ 358 Options to Strengthen Disaster Risk Financing in Pakistan, World Bank, UK Aid, 2019
KP-SISUG Swat Regional Development Plan
279
and that are identified above, a Sponge City approach is proposed to become part of the urban
design of the city and for other urban areas in the region.
913. The concept of Sponge City envisages a particular type of urban development that
does not act like an impermeable system, thereby precluding water from filtering through to
the ground, but, more like a sponge, actually absorbing rainwater, which then percolates to
the (urban) aquifers. Amongst other benefits, this allows for the extraction of water from the
ground through (urban or peri-urban) wells. This water can be readily used for irrigation of
urban green spaces, thereby replacing the use of potable water, or easily treated and used to
supplement the city’s potable water supply.
914. Sponge cities need to have abundant spaces that allow water to seep into the
underlying ground. Instead of only impermeable concrete and asphalt, the city needs more:
• Contiguous open green spaces, interconnected waterways, channels and ponds
across neighborhoods that can naturally detain and filter water as well as foster
urban ecosystems, boost biodiversity and create cultural and recreational
opportunities.
• Green roofs that can retain rainwater and naturally filter it before it is recycled/re-
used or released into the ground (rainwater catchment).
• Porous design interventions across the city, including construction of bio-swales and
bio-retention systems to detain run-off and allow for groundwater infiltration; porous
roads and pavements that can safely accommodate car and pedestrian traffic while
allowing water to be absorbed, permeate and recharge groundwater; drainage
systems that allow trickling of water into the ground or that direct storm water run-off
into green spaces for natural absorption
• Water savings and recycling, including extending water recycling particularly of grey
water at the building block level, incentivizing consumers to save water through
increased tariffs for increase in consumption, raising awareness campaigns, and
improved smart monitoring systems to identify leakages and inefficient use of
water.359
915. These are ambitious proposals for Swat district, but worth considering in light of the
environment and the climate change impacts expected, and in some cases already
manifesting.
359 Adapted from: https://www.worldfuturecouncil.org/sponge-cities-what-is-it-all-about/.
KP-SISUG Swat Regional Development Plan
280
L. INSTITUTIONAL REFORMS
L.1. Legal and Institutional Framework
916. Addressing governance and institutional challenges in urban services provision
requires decisions based on a review of mandates and capacities. Participation from provincial
policy makers will be essential, in order to lead to political and technical decisions. The review
and decision-making process needs to consider the following points as a minimum.
917. A reaffirmation of the mandates of WSSC, and those of the respective city
development authorities and TLGs needs to be the first step in the review process. The review
should confirm the mandate and come to an agreement on the bottlenecks that impede the
achievement of this mandate. Human resources issues (Chapter D4) need to be underscored.
918. The Review needs to confirm that staff capacities are a main barrier, and agree on
solutions to resolve this. No single solution can address the inadequate human resource
capacities and non-performance of staff in WSSC and TLGs. Instead, the Review should
debate, consider and decide on the best mix of solutions, including (a) legislation that makes
it possible to offer performance-based career advancements for government staff, and golden
handshakes for non-performers; b) contract employment, especially of lower echelon staff, as
many banks have done, c) natural attrition of non-performing government staff, and d) capacity
development for staff with potential.
919. The Review also needs to explore approaches to move towards greater financial
predictability and efficiency. While it is unrealistic to expect WSSC (and TLGs) to become
financially sustainable in the short to medium term, it is possible to have more predictable,
better-planned financing strategies and greater efficiency than those in the current
arrangement. The consultations need to explore a range of measures and develop a tailored
approach including the following:
i. For greater efficiency in reaching the poor: (a) stratified tariffs for water services for
different classes of customers, with cross-subsidization, (b) connection rather than
consumption subsidies, (c) pre-paid meters (possibly at subsidized tariffs for the poor)
which allow households to control their total expense on the service, and (d) a voucher
system or targeted cash transfers for the poor, based on means testing.
ii. For greater financial predictability and efficiency: (a) the establishment of an
endowment fund by the provincial government, (b) the provision of a single line grant
through an annual transfer from the provincial government to the WSSCs, and (c)
increased use of technology to improve efficiency, reduce unmetered water and illegal
connections.
920. To garner political and public support for the decisions that ensue, the Review will
require robust data and transparency on losses, revenue and poverty. Targeting of poor
households could be done through existing social welfare information systems.360 Calculating
the transfers needed from the provincial government (whether through annual grant or
endowment fund) will require robust data on the losses made by each WSSC, the losses that
360 These include (but are not necessarily limited to) the National Socioeconomic Registry (NSER) of the
Government’s Benazir Income Support Programme, an approach that uses poverty scorecard surveys to identify eligible households through proxy means. Available from: https://www.pitb.gov.pk/bisp Accessed 1 July 2020.
KP-SISUG Swat Regional Development Plan
281
could be avoided, households’ willingness-to-pay, and the projection of revenue following new
tariff structures and greater efficiency in operations.
921. An additional policy measure is required if WSSCs are to receive annual grants from
the provincial government. Receipt of such public funds will require audits of WSSC by the
Auditor General of Pakistan. However, WSSCs are subject to audits by third-party chartered
accountants, in line with their registration under the Section 42 of the Companies Act, 2017.
To avoid audits by two different bodies at different times, with accompanying disruption of
work, a provincial level policy would be required to exempt WSSCs from audits by the Auditor
General of Pakistan.
922. Effective management information systems need to be established and strengthened.
The administrative systems need to produce data robust enough for annual planning. Local
surveys and censuses are periodically required, to produce disaggregated data. In addition,
efficient and transparent complaint response mechanisms are required.
923. Capacity strengthening of the institutions responsible for planning, delivering, and
management of urban services is a top priority. Many government staff consider training and
professional development as opportunities. Hence, such training should be used as incentives
for performing staff. L.3 covers capacity development strategies.
L.2. Revenue generation and Financial Management
L.2.1. Structure of Public Budgeting
924. The Constitution of Pakistan contains broader provisions for management of public
finance. The 18th Constitutional Amendment has redefined the structural contours of the State
through a paradigm shift from a heavily centralized to a predominantly decentralized
federation.
925. It reinforces a multi-level governance system by extending greater autonomy to the
Provinces and laying down fundamentals of substantive decentralization at the lower tiers of
local government.
926. The KP Local Government Act, 2013 provides the framework for establishment of local
governments at District, Tehsil and Village/Neighborhood Councils, and institutional
framework for local government finance and distribution of resources.
927. The Department of Finance is (DoF) responsible for the supervision and control of
provincial finances, preparation of the budget, formulation, execution and interpretation of
financial rules related to employees, management of public funds and debt, banking,
coordination of the National and Provincial Finance Commissions and administration of Local
Fund Audit.
928. The Planning and Development Department (P&DD) is the custodian of the
development budget of the province and is therefore another important institution directly
involved in Public Financial Management (PFM). The P&DD is responsible for implementing
development plans and plays a critical role in policy making (provincial and sectoral policies,
setting priorities of projects against resource availability, and appraising and processing
development projects) and implementation (monitoring releases and inter-sectoral re-
appropriation), and in monitoring and evaluation of the development projects.
KP-SISUG Swat Regional Development Plan
282
929. The Accountant General (AG) of the province is responsible for maintaining accounting
records, pre-auditing of financial transactions of centralized accounting entities in the province,
and for preparing periodic financial reports for the Provincial Government. The AG also
prepares the financial statements for district governments.
L.2.2. Public Financial Management Reforms
930. The Public Expenditure and Financial Accountability (PEFA) assessment (2007) and
Fiduciary Risk Assessment (2010) by the UK Department for International Development
(DFID) created a stimulus for the first PFM reforms strategy adopted in 2010 to improve budget
formulation, execution, and fiscal disclosures. The Public Financial Management Reforms
Strategy builds on the following objectives:
(i) Making budget strategic by linking policy, planning and budgeting.
(ii) Making budget result oriented by introducing output based budgeting.
(iii) Enhancing the capacity of line departments to prepare, execute and monitor their
budget.
(iv) Improving budget execution and reporting.
(v) Improving monitoring and evaluation.
931. Cognizant of the growth challenges ahead and acting upon Post Crisis Needs
Assessment (PCNA) for Khyber Pakhtunkhwa/FATA carried out by the Government of
Pakistan (GoP) in October 2010, a harmonized donor approach was agreed upon to meet the
short- and medium-term social and economic needs of the province, one of which was the
establishment of the Multi Donor Trust Fund (MDTF). As one of the important outcomes of
PCNA, the Public Expenditure Review (PER) 2012 of Khyber Pakhtunkhwa province was
funded by MDTF and undertaken in partnership with the World Bank and Government of
Khyber Pakhtunkhwa.
932. The PER 2012 report recommended that Khyber Pakhtunkhwa should assign more of
its budget to operational and maintenance costs for existing physical infrastructure. It should
also ensure predictability of funds by releasing funds in a timely fashion. Furthermore, PER
2012 recommended that not to spread resources across to a large number of projects and to
prioritize project completion over new projects.
933. The Government of Khyber Pakhtunkhwa partnered with the World Bank for a PFM in
2015 (published in 2017) to assess the effects of its reforms since PER 2012. While noting
areas of progress, the 2015 PFM assessment highlighted ongoing unrealistic projections for
public expenditures and revenue. Consequently, frequent budget adjustments are necessary
during a fiscal year and complicate PFM and strategic budgeting. Fluctuations in federal
transfers are additional challenges for PFM.
934. These challenges are aggravated by the lack of systems and capacity for legislative
oversight. The 2015 PEFA, confirming repeated findings by the Public Accounts Committee’s
(PAC), noted weak internal controls at the line departments and a lack of interest in the
executive branch to comply with PFM directions. Internal audits only address matters of
(technical) financial compliance rather than looking for opportunities to strengthen processes,
evaluations, and quality assurance.
KP-SISUG Swat Regional Development Plan
283
935. Incremental increases in the Annual Development Program (ADP) are slowly eroding
the power of devolved and output-based budgeting. The provincial development portfolio
includes projects that, if analyzed on the matter of importance, should have been under the
decision authority of the local governments. Devolved budgeting may be further diminished by
funding as-yet unapproved projects and by approving projects that currently have no funding
(‘throw forward’). Redirecting the ADP’s focus to investments that strategically strengthen the
province provincial creates room for devolved budgeting and likely improve resource
allocation.
936. Achieving the potential of medium-term and strategic budgeting frameworks requires
balancing operational expenditures (e.g., maintenance of infrastructure) and strategic
development investments. This should be a multi-level political process that follows the proper
regulatory mechanisms and processes that enable informed and transparent budgeting. The
Finance Department has been leading financial management reforms in the province. It has
also started an ambitious program to introduce the Medium Term Budgeting Framework
(MTBF).
L.2.3. Public Budget and Climate Change
937. The Government of KP has been pursuing a citizen-centered model for socioeconomic
development, focusing on reducing poverty and achieving peace through an integrated and
holistic approach. It has also been investing in tackling climate change through initiatives such
as the Billion Tree Tsunami, Peshawar Metro, and efforts to combat deforestation. According
to the 2017 Climate Public Expenditure and Institutional Review (CPEIR), between 2010 and
2016 the KP government has been making climate change expenditures to the tune of 5.3%
to 8.9% of total expenditures each year.
938. One specific recommendation of the CPEIR endorsed and launched in 2017 included
the development of a Climate Change Financing Framework (CCFF). The CPEIR was a critical
step for establishing a baseline of climate change related expenditures (both development and
non-development) and to identify patterns. It looked at climate change expenditures of the
province, also in relation to expenditures incurred by federal government, Azad Jammu and
Kashmir (AJK) and Gilgit-Baltistan. A system for climate expenditure monitoring and tracking
under the CCFF can generate more sustainable and reliable information for policy formulation.
939. The CCFF outlined an action plan to integrate climate change into KP’s Public
Financial Management system after stakeholder consultations and consensus building:
• Integrating a climate change lens in the MTBF is a critical CCFF component. To
ensure line departments consider climate change when identifying and proposing
budgets for new projects, and developing MTBFs, the Finance Department (FD) will
amend the Budget Call Circular (BCC). The amendment would ensure a climate
change focus is incorporated into the MTBF for climate-relevant departments.
• Budget/financial reports including information on climate spending can assist
policymakers in making resource allocation decisions and tracking progress against
policy targets/KPIs. The quality and timeliness of climate change expenditure
reporting depends on generating and managing information on allocation and
spending.
• Development of the provincial adaptation plan and sector action policies will be the
logical next step after systemic and process changes for climate change integration.
KP-SISUG Swat Regional Development Plan
284
A provincial-level strategic approach to climate policy and planning will require line
departments to prepare sectoral policies and plans in accordance with larger goals
and objectives, while accounting for sector and department level financing.
• The FD and the P&DD will establish a robust coordination mechanism to provide
strategic guidance to line departments. The KP Government will consider a climate
change legislative gap analysis, including a review of relevant existing laws, such as
the Environment Act. The review could support the strengthening of the legal basis
for inclusion of climate change in planning and budget systems.
940. The members of the KP Provincial Assembly will have a pivotal role in steering climate
budgeting and function as a platform for strengthening accountability of climate change
expenditures.
L.2.4. Institutional Arrangements for Municipal Services
941. A number of government entities are involved in the governance and management of
the urban areas of Swat. There is no dedicated authority to lead city-wide urban planning and
development. The range of entities active in the urban sector fall under the authority of different
ministries and offices at the provincial and regional levels, with differing mandates, interests
and accountability requirements. This complicates the ability to coordinate urban planning
processes and to develop unity of purpose.
942. The main entities involved in Swat District’s urban development and administration are:
• City Local Government
• Tehsil Local Government (TLG)
• Swat District Development Authority (SDDA)
L.2.4.1. Swat District Development Authority
943. Solutions were needed to address the growing housing problems in the large urban
centers of Swat, created by rapid population growth, urbanization, scarcity of government
resources, and socio-economic imbalances between urban and rural areas. To face this
challenge, the (now defunct) Provincial Urban Development Board (PUDB) established the
Malakand Division Development Authority (MDDA) via Notification on 29/11/1989. After the
promulgation of LGA 2013, the PUDB was dissolved and the MDDA was re-named to SDDA.
944. The main functions of the SDDA are:
• To provide housing facilities in the urban areas of District Swat.
• To execute all kinds of developmental schemes in the urban areas duly financed by
the Provincial/Federal Govt.
• Any other objectives/functions assigned by Provincial/Federal Govt.
945. The SDDA is now working under the Administrative control of Secretary Local
Government, Elections and Rural Development Department, Government of Khyber
Pakhtunkhwa.
946. It is worth noting that, despite the tasks and powers outlined above, responsibility for
city-wide urban planning is not clearly owned or demonstrated by any of the above-named
KP-SISUG Swat Regional Development Plan
285
agencies. Similarly, the responsibility for municipal service delivery has been inconsistent,
resting first with the PHED, then the TLG, and now residing with Water and Sanitation Services
Company Mingora Swat (WSSCM-S).
L.2.4.2. Tehsil Local Government, Mingora Babuzai
947. The budget of TLG Mingora for 2018-19 has been projected using average growth rate
based on average growth rate forecasts under the KP budget strategy paper II 2018-19 and
has been further applied to projections from 2019-20 onwards.
948. Considering first the budget of TLG Mingora for the FY 2019-20, the total revenue is
PKR 600.31 million. This compares to PKR 470.26 million budgeted for FY 2018-19, showing
a revenue increase of PKR 130.05 million.
949. The total budgeted expenditure is PKR 695.71 million in 2019-20 as compared to PKR
595.89 million budgeted in 2018-19. This represents a net expenditure increase of PKR 99.82
million over the 2018-19 year, which ended with a deficit of PKR 95.41 million that was met
from actual budget savings from the previous financial year.
950. If we analyze the TLG budget of Mingora Babuzai for the FY 2018-19, the total revenue
was PKR 470.26 million as compared to PKR 355.73 million estimated for FY 2017-18, a net
increase of PKR 114.53 million which was mainly due to increase in PFC share and share of
local taxes collected at provincial level in 2018-19. The revenue budget increased on average
at the rate of 68 percent from 2017-18 to 2018-19 with extreme increase of 119 percent in
provincial transfers over the same period mainly due to increase in 30 percent PFC share
allotted to TLGs in the Provincial budget and a 32% increase in share of local taxes collected
at provincial level. The increase in the budgeted expenditures from PKR 377.95 million in
2017-18 to PKR 595.89 million in 2018-19 was mainly due to New Development Expenditures
in ADP 2018-19 and an increase in the TLG’s share of Water and Sanitation Services
Company Mingora (WSSC Mingora) operational expenses.
L.2.4.3. Water and Sanitation Services Company Mingora
951. The WSSC Mingora is a new addition to the institutional architecture for managing
essential municipal services like water supply, wastewater, and solid waste management in
KP. WSSC Mingora was established by GoKP under s42 of the Companies Ordinance 1984
in May 2015. WSSC Mingora started operations in October 2016 to provide integrated
improved drinking water, sanitation, and solid waste management services in the Mingora
Babuzai tehsil of Swat District. WSSC Mingora is an integration of PHED and TLG and is
operating in the UCs of tehsil Mingora Babuzai for the provision of municipal services to the
population of urban towns and cities under the (current and future) jurisdiction of WSSC
Mingora.
952. The Services and Assets Management Agreement (SAMA) was signed on 26 July
2017 between the provincial government, TMA and the WSSC Mingora. The SAMA sets out
the functions and responsibilities of the provincial government, the TMA, and the WSSC. The
SAMA transfers the responsibility for management and operation of drinking water,
wastewater, and solid waste management to WSSC. This transfer includes all relevant assets,
facilities, and control over staff transferred to the WSSC. The SAMA stipulates other
requirements for WSSC, including benchmarking of services, developing key performance
indicators, and producing a business plan and a budget.
KP-SISUG Swat Regional Development Plan
286
953. The WSSC Mingora uses the budget earmarked for development schemes included
in the provincial ADP for urban areas of Mingora. The operational budget of WSSC is provided
by the provincial finance department under approval from the Secretary, LGE&RD. The
provincial government has undertaken to finance all existing and future activities, operations
and meeting obligations of WSSC directly or indirectly relating to the services in Mingora Swat
in addition to providing grant for development projects of Mingora Swat as stipulated under
the SAMA.
954. The revenue and expenditure summary prepared by the WSSC Mingora for financial
years 2017-18 and 2018-19 shows annual own source revenue from water and conservancy
charges of PKR 36.96 million for 2018-19 from PKR 9.68 million in 2017-18. The increase is
mainly due to the fact that WSSC took over assets under SAMA effective July 2017 and took
full control of consumer billing and collection from the tehsil administration.
955. According to the summary of revenue and expenditure prepared by WSSC Mingora,
the total revenue budgeted for 2018-19 is PKR 545.82 million, including transfers from TLG
and provincial government, and expenditure of PKR 406.92 million. The result is a budgeted
resource gap (surplus) of PKR 138.90 million in financial year 2018-19.
956. The WSSC draws on various revenue sources for its budget. For schemes, the WSSC
use the budget earmarked for those schemes. These schemes can be included in the
provincial ADP or in the budget of the TLG for urban centers, or the funds for the schemes
adopted by provincial and national assemblies. The Provincial government transfers all funds
budgeted for development and non-development expenditure of TLG relating to the municipal
services to the WSSC Mingora. This makes up more than 90% of total revenue of WSSC
Mingora in 2018-19.
957. The operational budget of WSSC is provided by the Provincial finance department
under approval from the Secretary, LGE&RD. A small part of the budget derives from tariffs
from households deposited in the WSSC Mingora’s account. The Provincial government
covers WSSC Mingora’s capital expenditure.
958. The original intent was for the company to improve revenue collection, make efficiency
gains, gradually legalize all illegal connections, and levy a fee for solid waste management in
tandem with the improvement in services. However, for the foreseeable future WSSC Mingora
is expected to need grants from provincial government to fill budget gaps in order to deliver
the expected volume of services.
959. Water supply tariffs are low in the province to ensure affordability. The present
domestic water supply rate in the urban UCs of Mingora is PKR 200 per month with
conservancy charges of PKR 50 per month for domestic connections which is proposed to be
retained at PKR 200 for water supply but increased to PKR 70 on account of conservancy
charges for the year 2020-21. Similarly, presently water supply rates ranging from PKR 400
to PKR 1000 per month and conservancy charges ranging from PKR 1000 to PKR 10,000 per
month for commercial connections are being charged by the WSSC which is proposed to be
revised to PKR 500 to PKR 600 per month for water supply and PKR 100 to PKR 1,000 per
month for the year 2020-21. The WSSC also charges Aquifer charges of PKR 500 for domestic
KP-SISUG Swat Regional Development Plan
287
and PKR 2,000 for commercial connection which is also proposed to be revised to PKR 200
per month for domestic but retained at PKR 2,000 per month for commercial connections.361
960. As a result of low water rates and administrative inefficiencies, the financial position of
water supply organizations in KP is extremely fragile. The people in KP contribute in kind by
providing free labor to construct schemes beneficial to them but maintenance is often deferred
in budgeting and water supply schemes stop functioning.
961. An affordable tariff is needed for water supply connections provided at the user’s
premises. The coverage of water charge can be expanded gradually, improving the revenue
base for operational requirements. However, collection mechanisms for such services are
costly. Moreover, water supply connections cannot be disconnected for non-payment as water
is a basic human need. New schemes must therefore be financially analyzed in light of these
challenges.
L.3. Capacity Development
L.3.1. Results of Needs Assessments
962. The technical and organizational capacities of public entities involved in urban planning
and services were assessed. The aim was to develop long-term capacity building programs
to equip and re-tool mid-level professionals in urban management and services. The
assessment covered Abbottabad, Charsadda, Haripur, Manesar, Mardan, Nowshera,
Peshawar, Swabi, and also the private sector.362 Appendix 5 provides further details from
these assessments. A separate assessment was conducted of WSSCs, including WSSC-
Swat. The following organizations were assessed:
i. The local government institutions (District, Tehsil, Union Council, Village Council and
Neighborhood Councils),
ii. The Water and Sanitation Services Companies (WSSCs),
iii. The City Development Authorities, and
iv. The Cantonment Boards, which are responsible for services in Cantonment areas.
963. Two types of capacity strengthening are required among elected officials and
government staff at district and tehsil levels. The first is managerial training, strategic planning,
audit, accounts, tendering and procedural issues, especially for City and Tehsil Local
governments. The engineering staff within the TLGs need to be trained in preparing Bill of
Quantities, tender documents, tendering and tender security, and soil testing. The other type
of capacity strengthening required is technical training related to drinking water, sanitation,
solid waste management, and building control. Such technical training is crucial for TLGs in
areas where there are no WSSCs operating. TLGs/CLGs need to be strengthened all the more
since now the role of the provincial Public Health Engineering Department (PHED) has now
been devolved to tehsil level; it is unclear whether TLGs/CLGs will have the capacity to take
over the former PHED role.
361 Water and Sanitation Services Company Mingora proposed rates 2020-21. 362 Assessments have not yet been conducted in Kohat at the time of this draft report due to the COVID-19
outbreak.
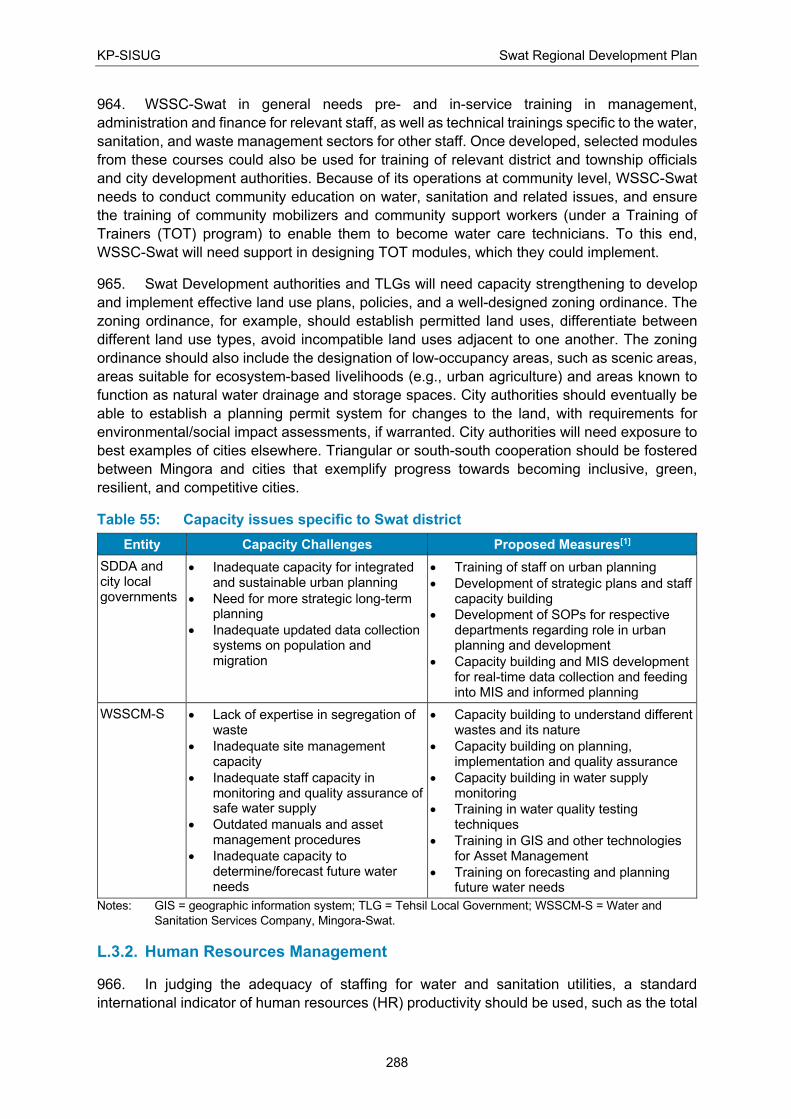
KP-SISUG Swat Regional Development Plan
288
964. WSSC-Swat in general needs pre- and in-service training in management,
administration and finance for relevant staff, as well as technical trainings specific to the water,
sanitation, and waste management sectors for other staff. Once developed, selected modules
from these courses could also be used for training of relevant district and township officials
and city development authorities. Because of its operations at community level, WSSC-Swat
needs to conduct community education on water, sanitation and related issues, and ensure
the training of community mobilizers and community support workers (under a Training of
Trainers (TOT) program) to enable them to become water care technicians. To this end,
WSSC-Swat will need support in designing TOT modules, which they could implement.
965. Swat Development authorities and TLGs will need capacity strengthening to develop
and implement effective land use plans, policies, and a well-designed zoning ordinance. The
zoning ordinance, for example, should establish permitted land uses, differentiate between
different land use types, avoid incompatible land uses adjacent to one another. The zoning
ordinance should also include the designation of low-occupancy areas, such as scenic areas,
areas suitable for ecosystem-based livelihoods (e.g., urban agriculture) and areas known to
function as natural water drainage and storage spaces. City authorities should eventually be
able to establish a planning permit system for changes to the land, with requirements for
environmental/social impact assessments, if warranted. City authorities will need exposure to
best examples of cities elsewhere. Triangular or south-south cooperation should be fostered
between Mingora and cities that exemplify progress towards becoming inclusive, green,
resilient, and competitive cities.
Table 55: Capacity issues specific to Swat district
Entity Capacity Challenges Proposed Measures[1]
SDDA and city local governments
• Inadequate capacity for integrated and sustainable urban planning
• Need for more strategic long-term planning
• Inadequate updated data collection systems on population and migration
• Training of staff on urban planning
• Development of strategic plans and staff capacity building
• Development of SOPs for respective departments regarding role in urban planning and development
• Capacity building and MIS development for real-time data collection and feeding into MIS and informed planning
WSSCM-S • Lack of expertise in segregation of waste
• Inadequate site management capacity
• Inadequate staff capacity in monitoring and quality assurance of safe water supply
• Outdated manuals and asset management procedures
• Inadequate capacity to determine/forecast future water needs
• Capacity building to understand different wastes and its nature
• Capacity building on planning, implementation and quality assurance
• Capacity building in water supply monitoring
• Training in water quality testing techniques
• Training in GIS and other technologies for Asset Management
• Training on forecasting and planning future water needs
Notes: GIS = geographic information system; TLG = Tehsil Local Government; WSSCM-S = Water and
Sanitation Services Company, Mingora-Swat.
L.3.2. Human Resources Management
966. In judging the adequacy of staffing for water and sanitation utilities, a standard
international indicator of human resources (HR) productivity should be used, such as the total
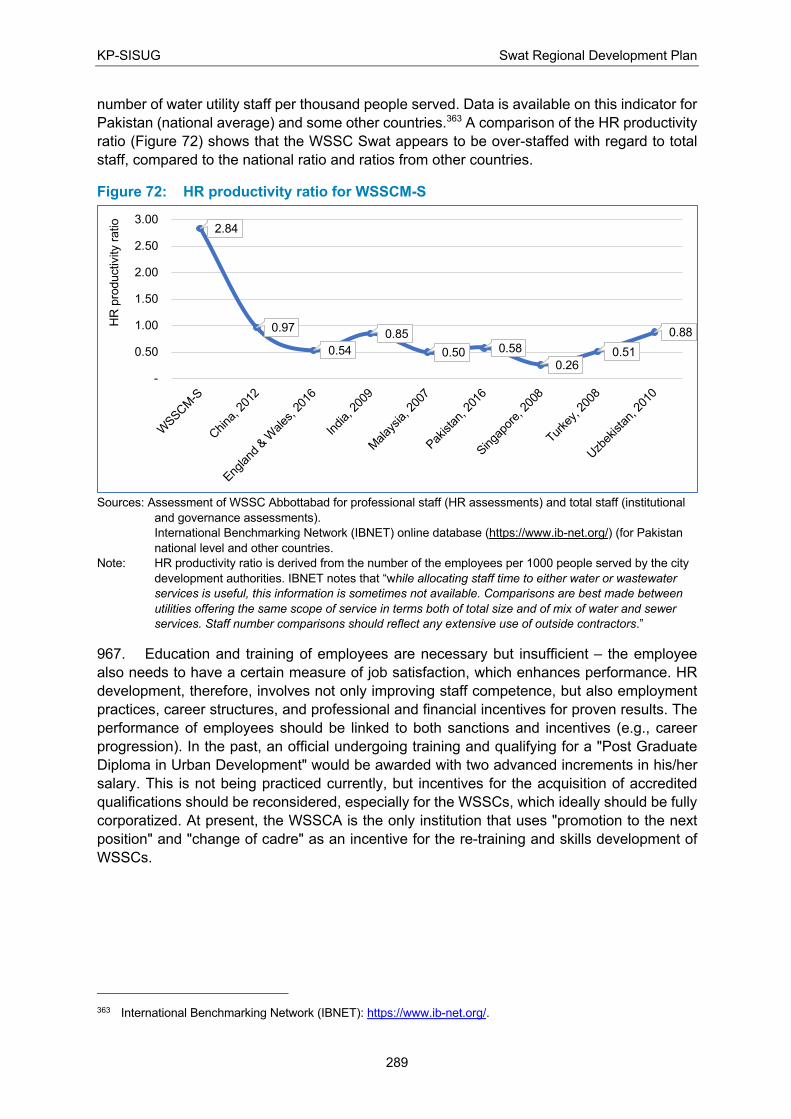
KP-SISUG Swat Regional Development Plan
289
number of water utility staff per thousand people served. Data is available on this indicator for
Pakistan (national average) and some other countries.363 A comparison of the HR productivity
ratio (Figure 72) shows that the WSSC Swat appears to be over-staffed with regard to total
staff, compared to the national ratio and ratios from other countries.
Figure 72: HR productivity ratio for WSSCM-S
Sources: Assessment of WSSC Abbottabad for professional staff (HR assessments) and total staff (institutional
and governance assessments).
International Benchmarking Network (IBNET) online database (https://www.ib-net.org/) (for Pakistan
national level and other countries.
Note: HR productivity ratio is derived from the number of the employees per 1000 people served by the city
development authorities. IBNET notes that “while allocating staff time to either water or wastewater
services is useful, this information is sometimes not available. Comparisons are best made between
utilities offering the same scope of service in terms both of total size and of mix of water and sewer
services. Staff number comparisons should reflect any extensive use of outside contractors.”
967. Education and training of employees are necessary but insufficient – the employee
also needs to have a certain measure of job satisfaction, which enhances performance. HR
development, therefore, involves not only improving staff competence, but also employment
practices, career structures, and professional and financial incentives for proven results. The
performance of employees should be linked to both sanctions and incentives (e.g., career
progression). In the past, an official undergoing training and qualifying for a "Post Graduate
Diploma in Urban Development" would be awarded with two advanced increments in his/her
salary. This is not being practiced currently, but incentives for the acquisition of accredited
qualifications should be reconsidered, especially for the WSSCs, which ideally should be fully
corporatized. At present, the WSSCA is the only institution that uses "promotion to the next
position" and "change of cadre" as an incentive for the re-training and skills development of
WSSCs.
363 International Benchmarking Network (IBNET): https://www.ib-net.org/.
2.84
0.97
0.54
0.85
0.50 0.58
0.26 0.51
0.88
-
0.50
1.00
1.50
2.00
2.50
3.00
WSSC
M-S
China
, 201
2
England
& W
ales
, 201
6
India,
200
9
Malay
sia,
200
7
Pakista
n, 2
016
Singa
pore
, 200
8
Turke
y, 2
008
Uzb
ekista
n, 2
010
HR
pro
ductivity r
atio
KP-SISUG Swat Regional Development Plan
290
L.3.3. Strategic Partnerships
968. It is recommended to strengthen strategic partnerships with existing institutes that are
able to provide training courses with content, duration and assessment mechanisms or
certification tailored according to needs.364 The proposed institutions are as follows:
i. The Local Governance School is the training institute of the LGE&RD Department,
Government of Khyber Pakhtunkhwa. It should be used for the training of local
government staff and elected officials. The School has the mandate to (i) conduct pre-
service and in-service training for all Local Council Service employees and elected
representatives, (ii) coordinate all capacity building activities of local projects and
development partners with the LGE&RD Department as well as with Tehsil Local
Governments, and (iii) conduct trainings/orientations for other government officers on
local governance and service delivery. However, the School lacks the required
resources and facilities for training in the more technical sectors.
ii. The National Institute of Management (NIM), Peshawar is part of the National
School of Public Policy, a degree-awarding institution. The Institute is mandated with
(i) training federal/provincial “services” officers, (ii) organizing mid-career management
courses and senior management courses, and (iii) other courses in collaboration with
national and international organizations.365 It has adequate academic and residential
facilities.
iii. The Pakistan Academy for Rural Development (PARD), Peshawar interacts with
local, provincial and federal governments, researchers, academicians and non-
governmental organizations working in rural development. Its functions include
research and capacity building. The areas where training is offered include
development planning, public administration, local government, rural development,
education and communication, women in development, agricultural extension, social
surveys and research, and rural sociology.366
969. The National Institute of Urban Infrastructure Planning (NIUIP) is the first institute in
Pakistan dedicated to urban infrastructure planning and engineering. NIUIP trains service
professionals in key areas such as water supply, sanitation, waste management, land use,
transportation systems, energy and environment, and geographic information system (GIS)
modelling.367 In procurement, NIUIP is able to engage specialists of the Khyber Pakhtunkhwa
Public Procurement Regulatory Authority (KPPRA) for the relevant courses. NIUIP offers state
of the art technologies and equipment, such as satellite imagery, simulation modelling for
water supply and sewerage systems, global positioning system and remote sensing tools,
364 This has been discussed with the management and instructional staff of the NIM and NIUIP, who have
agreed in principle to develop this further. 365 National Institute of Management of Pakistan. Available from: http://nim.gov.pk/index.php Accessed 1 July
2020. 366 Pakistan Academy for Rural Development (PARD), Peshawar: Training. Available from:
http://www.pard.gov.pk/course.html Accessed 1 July 2020. 367 NIUIP covers the following areas in its work: infrastructure and utilities planning, urban and regional
planning, urban hydrology and hydraulics, land use planning, urban transportation planning., urban environment and energy planning, water supply and sanitation, solid waste management, spatial modelling and GIS applications, infrastructure development and finance, utilities planning & service delivery, environmental laws, land use regulation and enforcement, census data analysis and policy making, urban housing, urban economics, real estate markets, urban development and design, and financing of infrastructure projects.

KP-SISUG Swat Regional Development Plan
291
digital plotters, fully-equipped GIS lab with GIS scanners and GIS software, statistical analysis
software and other applications. The NIUIP would be well-suited to provide the facilities for
training of staff from WSSCs, City Development Authorities and other entities. Based on the
identified needs, the NIUIP is able to design assessment criteria and obtain approval from its
Board to issue formal competency-based certificates or diplomas for the course graduates.
The NIUIP is based at the University of Engineering & Technology (UET) Peshawar.
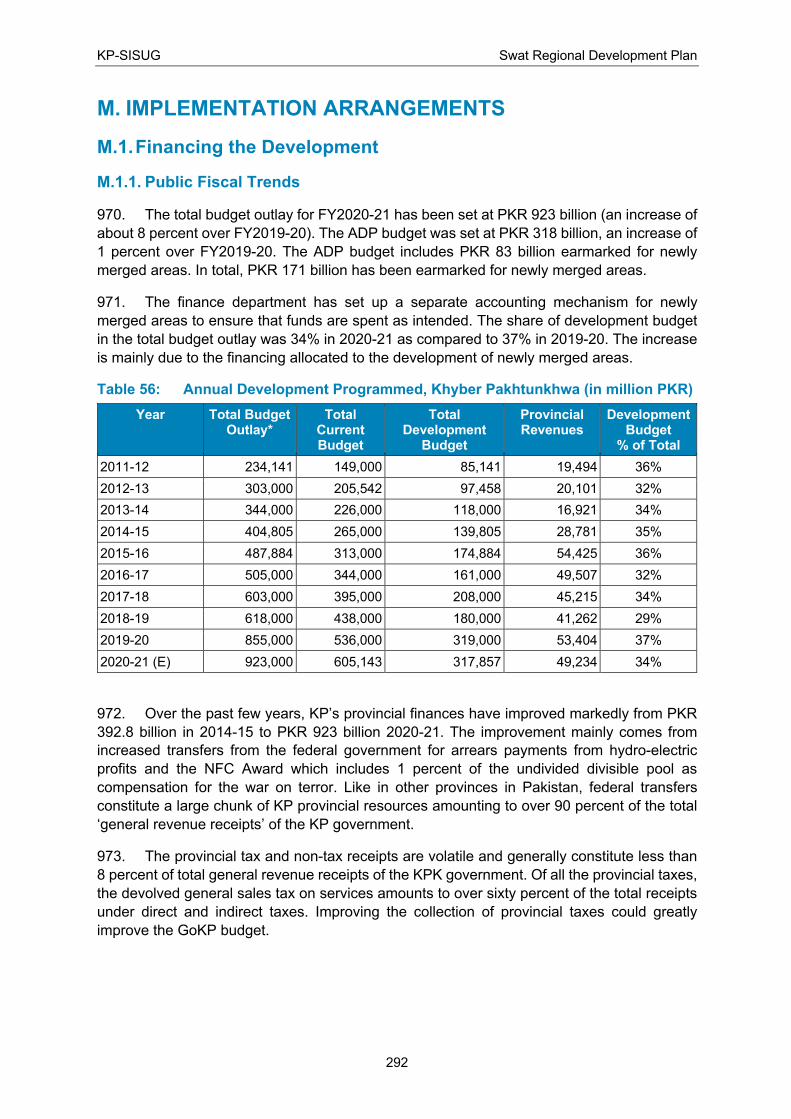
KP-SISUG Swat Regional Development Plan
292
M. IMPLEMENTATION ARRANGEMENTS
M.1. Financing the Development
M.1.1. Public Fiscal Trends
970. The total budget outlay for FY2020-21 has been set at PKR 923 billion (an increase of
about 8 percent over FY2019-20). The ADP budget was set at PKR 318 billion, an increase of
1 percent over FY2019-20. The ADP budget includes PKR 83 billion earmarked for newly
merged areas. In total, PKR 171 billion has been earmarked for newly merged areas.
971. The finance department has set up a separate accounting mechanism for newly
merged areas to ensure that funds are spent as intended. The share of development budget
in the total budget outlay was 34% in 2020-21 as compared to 37% in 2019-20. The increase
is mainly due to the financing allocated to the development of newly merged areas.
Table 56: Annual Development Programmed, Khyber Pakhtunkhwa (in million PKR)
Year Total Budget Outlay*
Total Current Budget
Total Development
Budget
Provincial Revenues
Development Budget
% of Total
2011-12 234,141 149,000 85,141 19,494 36%
2012-13 303,000 205,542 97,458 20,101 32%
2013-14 344,000 226,000 118,000 16,921 34%
2014-15 404,805 265,000 139,805 28,781 35%
2015-16 487,884 313,000 174,884 54,425 36%
2016-17 505,000 344,000 161,000 49,507 32%
2017-18 603,000 395,000 208,000 45,215 34%
2018-19 618,000 438,000 180,000 41,262 29%
2019-20 855,000 536,000 319,000 53,404 37%
2020-21 (E) 923,000 605,143 317,857 49,234 34%
972. Over the past few years, KP’s provincial finances have improved markedly from PKR
392.8 billion in 2014-15 to PKR 923 billion 2020-21. The improvement mainly comes from
increased transfers from the federal government for arrears payments from hydro-electric
profits and the NFC Award which includes 1 percent of the undivided divisible pool as
compensation for the war on terror. Like in other provinces in Pakistan, federal transfers
constitute a large chunk of KP provincial resources amounting to over 90 percent of the total
‘general revenue receipts’ of the KP government.
973. The provincial tax and non-tax receipts are volatile and generally constitute less than
8 percent of total general revenue receipts of the KPK government. Of all the provincial taxes,
the devolved general sales tax on services amounts to over sixty percent of the total receipts
under direct and indirect taxes. Improving the collection of provincial taxes could greatly
improve the GoKP budget.
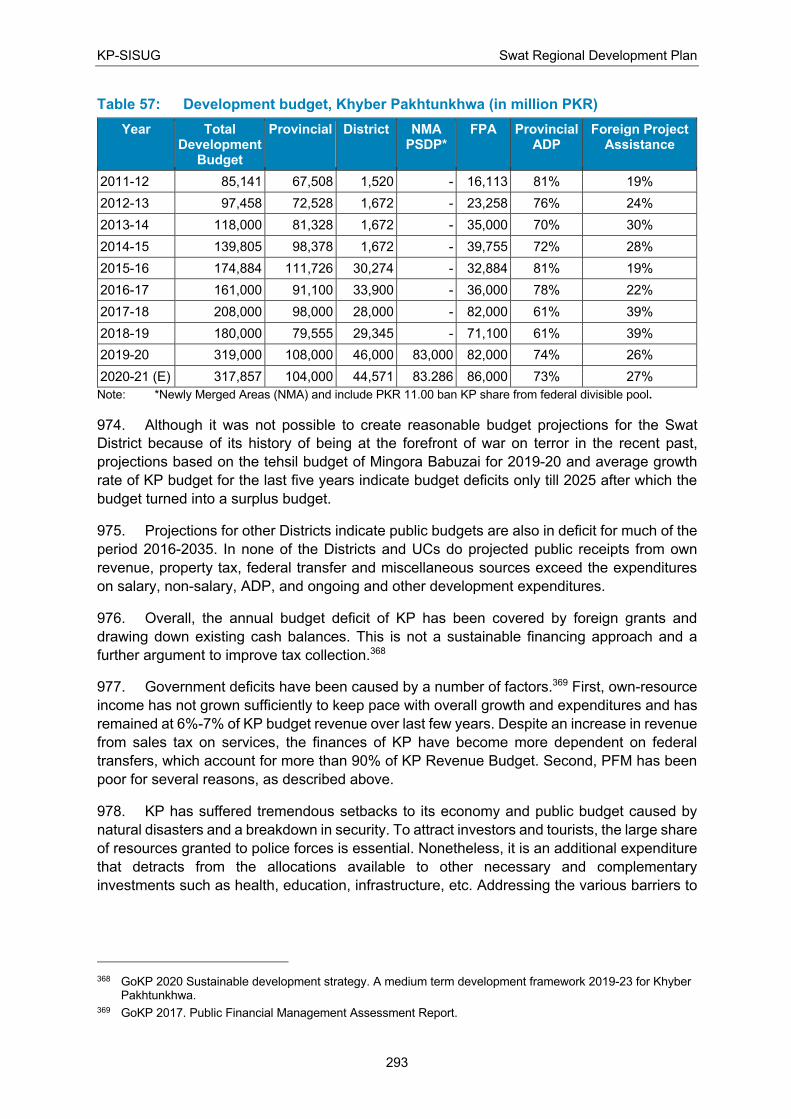
KP-SISUG Swat Regional Development Plan
293
Table 57: Development budget, Khyber Pakhtunkhwa (in million PKR)
Year Total Development
Budget
Provincial District NMA PSDP*
FPA Provincial ADP
Foreign Project Assistance
2011-12 85,141 67,508 1,520 - 16,113 81% 19%
2012-13 97,458 72,528 1,672 - 23,258 76% 24%
2013-14 118,000 81,328 1,672 - 35,000 70% 30%
2014-15 139,805 98,378 1,672 - 39,755 72% 28%
2015-16 174,884 111,726 30,274 - 32,884 81% 19%
2016-17 161,000 91,100 33,900 - 36,000 78% 22%
2017-18 208,000 98,000 28,000 - 82,000 61% 39%
2018-19 180,000 79,555 29,345 - 71,100 61% 39%
2019-20 319,000 108,000 46,000 83,000 82,000 74% 26%
2020-21 (E) 317,857 104,000 44,571 83.286 86,000 73% 27%
Note: *Newly Merged Areas (NMA) and include PKR 11.00 ban KP share from federal divisible pool.
974. Although it was not possible to create reasonable budget projections for the Swat
District because of its history of being at the forefront of war on terror in the recent past,
projections based on the tehsil budget of Mingora Babuzai for 2019-20 and average growth
rate of KP budget for the last five years indicate budget deficits only till 2025 after which the
budget turned into a surplus budget.
975. Projections for other Districts indicate public budgets are also in deficit for much of the
period 2016-2035. In none of the Districts and UCs do projected public receipts from own
revenue, property tax, federal transfer and miscellaneous sources exceed the expenditures
on salary, non-salary, ADP, and ongoing and other development expenditures.
976. Overall, the annual budget deficit of KP has been covered by foreign grants and
drawing down existing cash balances. This is not a sustainable financing approach and a
further argument to improve tax collection.368
977. Government deficits have been caused by a number of factors.369 First, own-resource
income has not grown sufficiently to keep pace with overall growth and expenditures and has
remained at 6%-7% of KP budget revenue over last few years. Despite an increase in revenue
from sales tax on services, the finances of KP have become more dependent on federal
transfers, which account for more than 90% of KP Revenue Budget. Second, PFM has been
poor for several reasons, as described above.
978. KP has suffered tremendous setbacks to its economy and public budget caused by
natural disasters and a breakdown in security. To attract investors and tourists, the large share
of resources granted to police forces is essential. Nonetheless, it is an additional expenditure
that detracts from the allocations available to other necessary and complementary
investments such as health, education, infrastructure, etc. Addressing the various barriers to
368 GoKP 2020 Sustainable development strategy. A medium term development framework 2019-23 for Khyber
Pakhtunkhwa. 369 GoKP 2017. Public Financial Management Assessment Report.
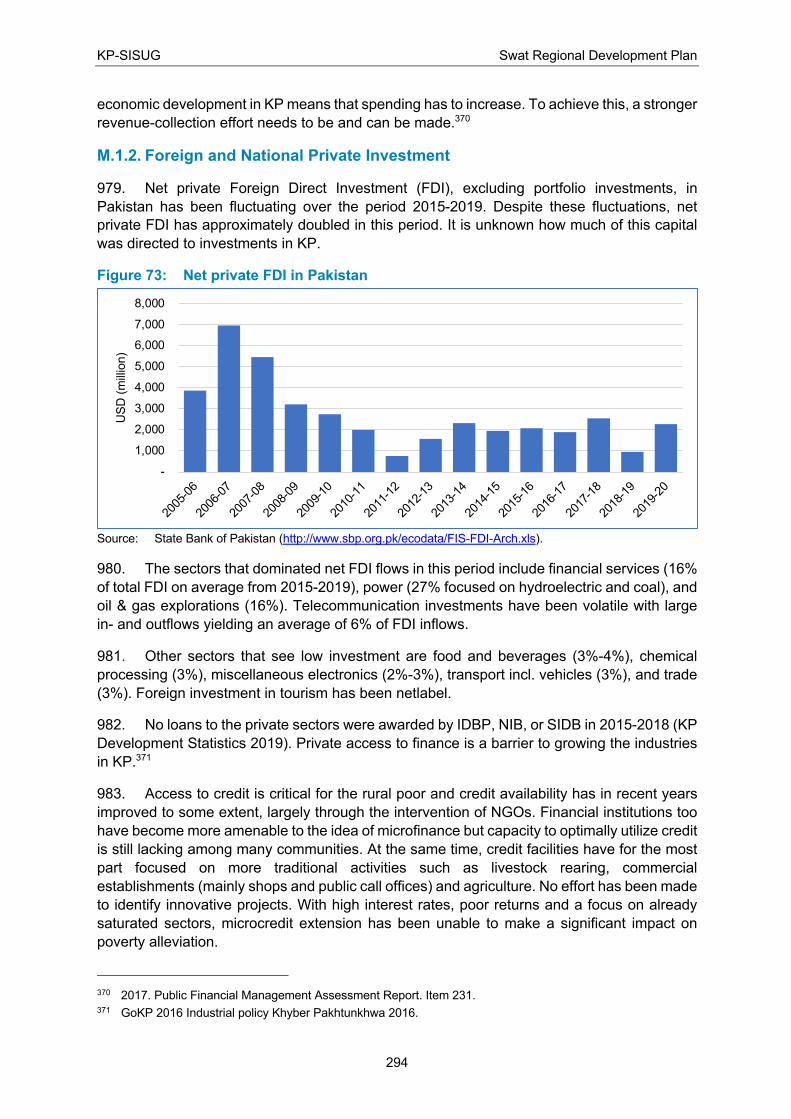
KP-SISUG Swat Regional Development Plan
294
economic development in KP means that spending has to increase. To achieve this, a stronger
revenue-collection effort needs to be and can be made.370
M.1.2. Foreign and National Private Investment
979. Net private Foreign Direct Investment (FDI), excluding portfolio investments, in
Pakistan has been fluctuating over the period 2015-2019. Despite these fluctuations, net
private FDI has approximately doubled in this period. It is unknown how much of this capital
was directed to investments in KP.
Figure 73: Net private FDI in Pakistan
Source: State Bank of Pakistan (http://www.sbp.org.pk/ecodata/FIS-FDI-Arch.xls).
980. The sectors that dominated net FDI flows in this period include financial services (16%
of total FDI on average from 2015-2019), power (27% focused on hydroelectric and coal), and
oil & gas explorations (16%). Telecommunication investments have been volatile with large
in- and outflows yielding an average of 6% of FDI inflows.
981. Other sectors that see low investment are food and beverages (3%-4%), chemical
processing (3%), miscellaneous electronics (2%-3%), transport incl. vehicles (3%), and trade
(3%). Foreign investment in tourism has been netlabel.
982. No loans to the private sectors were awarded by IDBP, NIB, or SIDB in 2015-2018 (KP
Development Statistics 2019). Private access to finance is a barrier to growing the industries
in KP.371
983. Access to credit is critical for the rural poor and credit availability has in recent years
improved to some extent, largely through the intervention of NGOs. Financial institutions too
have become more amenable to the idea of microfinance but capacity to optimally utilize credit
is still lacking among many communities. At the same time, credit facilities have for the most
part focused on more traditional activities such as livestock rearing, commercial
establishments (mainly shops and public call offices) and agriculture. No effort has been made
to identify innovative projects. With high interest rates, poor returns and a focus on already
saturated sectors, microcredit extension has been unable to make a significant impact on
poverty alleviation.
370 2017. Public Financial Management Assessment Report. Item 231. 371 GoKP 2016 Industrial policy Khyber Pakhtunkhwa 2016.
-
1,000
2,000
3,000
4,000
5,000
6,000
7,000
8,000
2005
-06
2006
-07
2007
-08
2008
-09
2009
-10
2010
-11
2011
-12
2012
-13
2013
-14
2014
-15
2015
-16
2016
-17
2017
-18
2018
-19
2019
-20
US
D (
mill
ion)
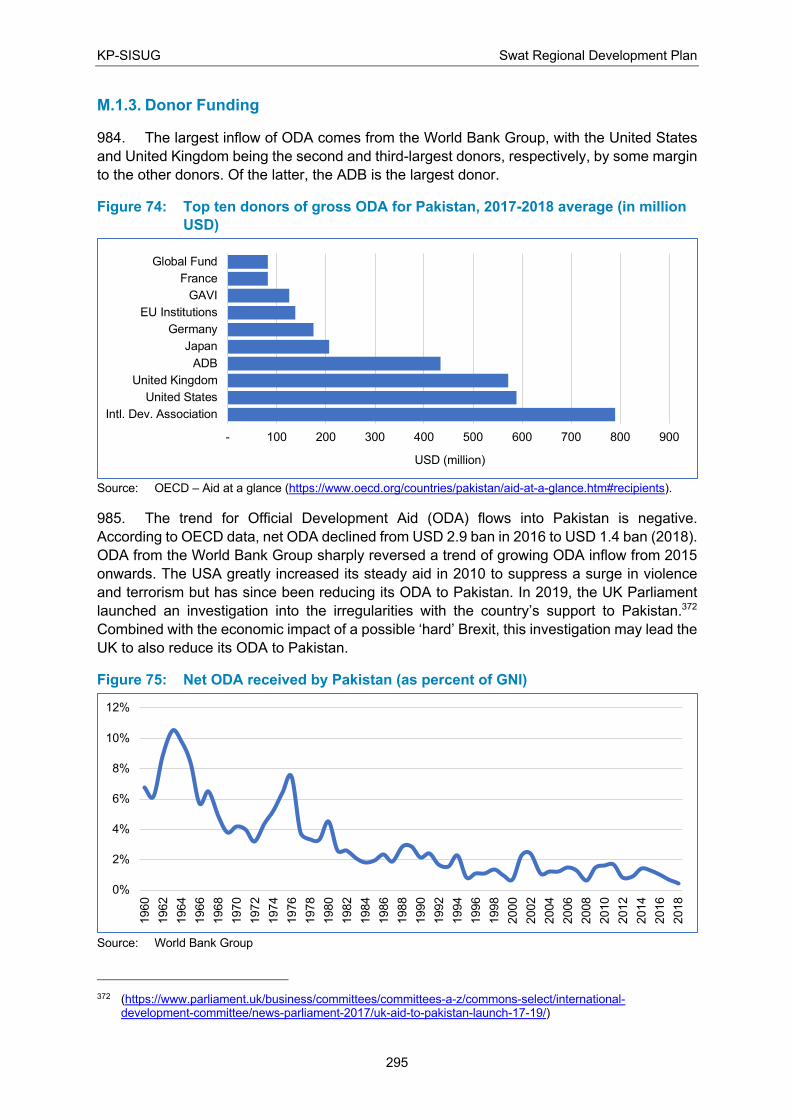
KP-SISUG Swat Regional Development Plan
295
M.1.3. Donor Funding
984. The largest inflow of ODA comes from the World Bank Group, with the United States
and United Kingdom being the second and third-largest donors, respectively, by some margin
to the other donors. Of the latter, the ADB is the largest donor.
Figure 74: Top ten donors of gross ODA for Pakistan, 2017-2018 average (in million
USD)
Source: OECD – Aid at a glance (https://www.oecd.org/countries/pakistan/aid-at-a-glance.htm#recipients).
985. The trend for Official Development Aid (ODA) flows into Pakistan is negative.
According to OECD data, net ODA declined from USD 2.9 ban in 2016 to USD 1.4 ban (2018).
ODA from the World Bank Group sharply reversed a trend of growing ODA inflow from 2015
onwards. The USA greatly increased its steady aid in 2010 to suppress a surge in violence
and terrorism but has since been reducing its ODA to Pakistan. In 2019, the UK Parliament
launched an investigation into the irregularities with the country’s support to Pakistan.372
Combined with the economic impact of a possible ‘hard’ Brexit, this investigation may lead the
UK to also reduce its ODA to Pakistan.
Figure 75: Net ODA received by Pakistan (as percent of GNI)
Source: World Bank Group
372 (https://www.parliament.uk/business/committees/committees-a-z/commons-select/international-
development-committee/news-parliament-2017/uk-aid-to-pakistan-launch-17-19/)
- 100 200 300 400 500 600 700 800 900
Intl. Dev. Association
United States
United Kingdom
ADB
Japan
Germany
EU Institutions
GAVI
France
Global Fund
USD (million)
0%
2%
4%
6%
8%
10%
12%
1960
1962
1964
1966
1968
1970
1972
1974
1976
1978
1980
1982
1984
1986
1988
1990
1992
1994
1996
1998
2000
2002
2004
2006
2008
2010
2012
2014
2016
2018
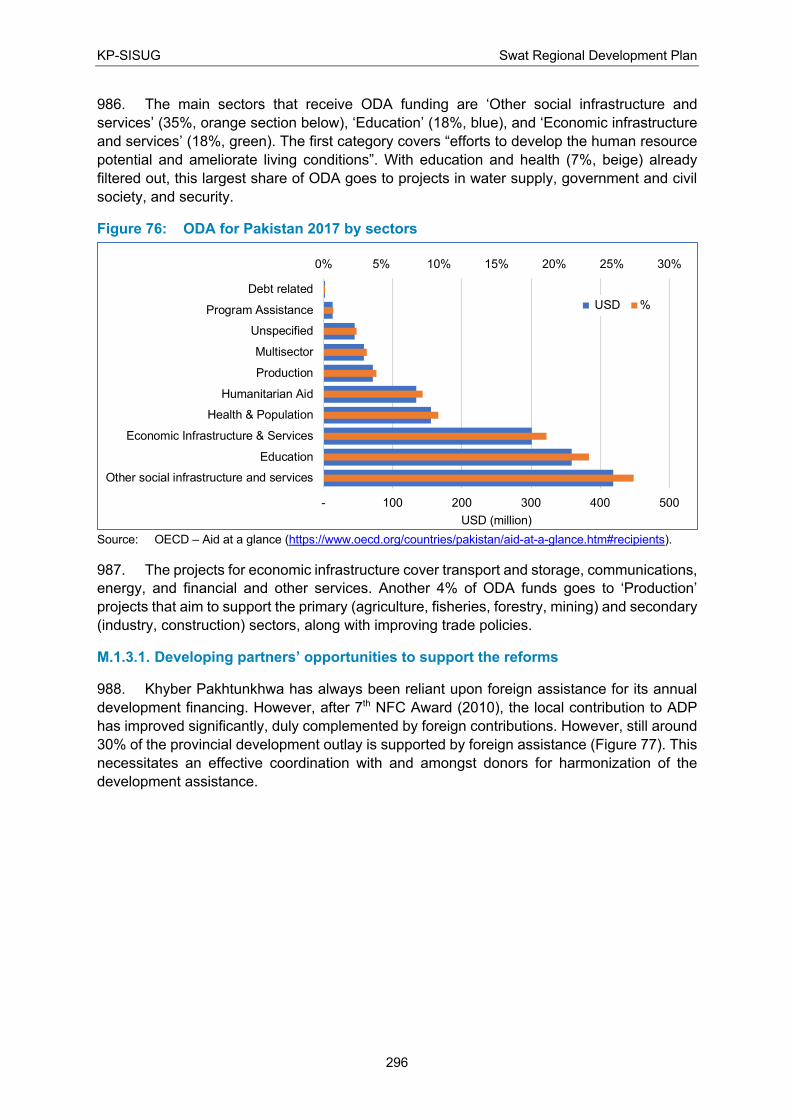
KP-SISUG Swat Regional Development Plan
296
986. The main sectors that receive ODA funding are ‘Other social infrastructure and
services’ (35%, orange section below), ‘Education’ (18%, blue), and ‘Economic infrastructure
and services’ (18%, green). The first category covers “efforts to develop the human resource
potential and ameliorate living conditions”. With education and health (7%, beige) already
filtered out, this largest share of ODA goes to projects in water supply, government and civil
society, and security.
Figure 76: ODA for Pakistan 2017 by sectors
Source: OECD – Aid at a glance (https://www.oecd.org/countries/pakistan/aid-at-a-glance.htm#recipients).
987. The projects for economic infrastructure cover transport and storage, communications,
energy, and financial and other services. Another 4% of ODA funds goes to ‘Production’
projects that aim to support the primary (agriculture, fisheries, forestry, mining) and secondary
(industry, construction) sectors, along with improving trade policies.
M.1.3.1. Developing partners’ opportunities to support the reforms
988. Khyber Pakhtunkhwa has always been reliant upon foreign assistance for its annual
development financing. However, after 7th NFC Award (2010), the local contribution to ADP
has improved significantly, duly complemented by foreign contributions. However, still around
30% of the provincial development outlay is supported by foreign assistance (Figure 77). This
necessitates an effective coordination with and amongst donors for harmonization of the
development assistance.
0% 5% 10% 15% 20% 25% 30%
- 100 200 300 400 500
Other social infrastructure and services
Education
Economic Infrastructure & Services
Health & Population
Humanitarian Aid
Production
Multisector
Unspecified
Program Assistance
Debt related
USD (million)
USD %
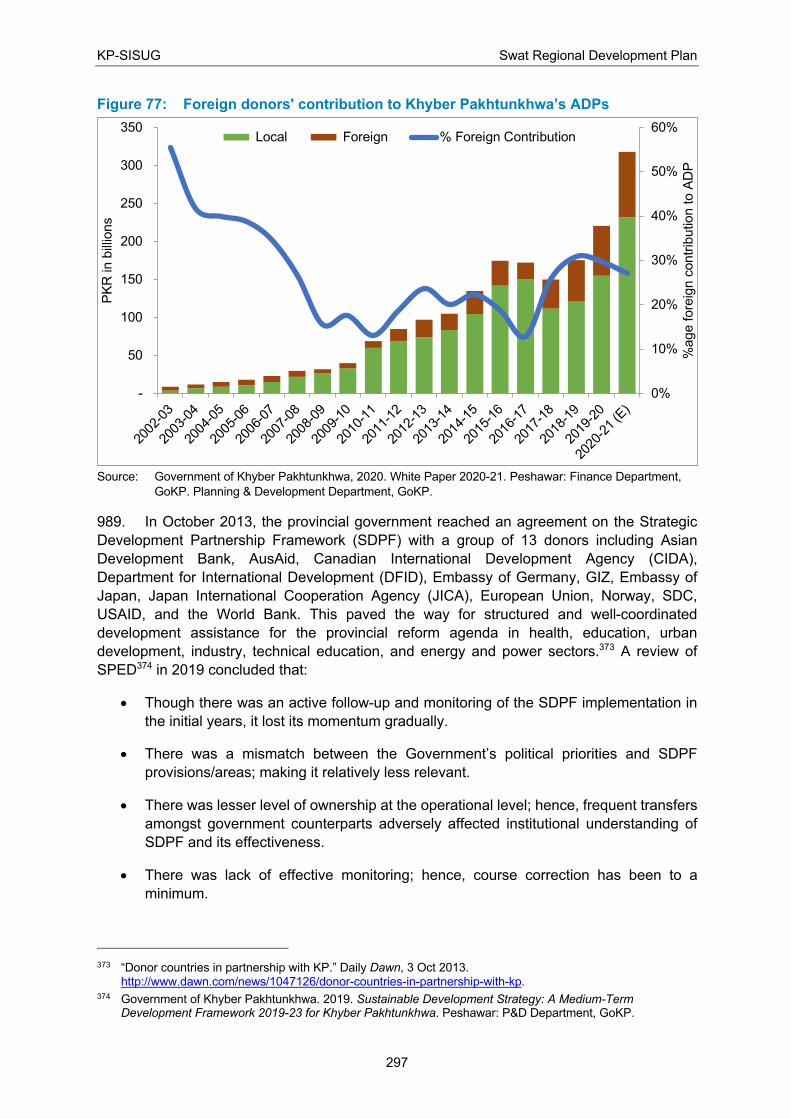
KP-SISUG Swat Regional Development Plan
297
Figure 77: Foreign donors' contribution to Khyber Pakhtunkhwa’s ADPs
Source: Government of Khyber Pakhtunkhwa, 2020. White Paper 2020-21. Peshawar: Finance Department,
GoKP. Planning & Development Department, GoKP.
989. In October 2013, the provincial government reached an agreement on the Strategic
Development Partnership Framework (SDPF) with a group of 13 donors including Asian
Development Bank, AusAid, Canadian International Development Agency (CIDA),
Department for International Development (DFID), Embassy of Germany, GIZ, Embassy of
Japan, Japan International Cooperation Agency (JICA), European Union, Norway, SDC,
USAID, and the World Bank. This paved the way for structured and well-coordinated
development assistance for the provincial reform agenda in health, education, urban
development, industry, technical education, and energy and power sectors.373 A review of
SPED374 in 2019 concluded that:
• Though there was an active follow-up and monitoring of the SDPF implementation in
the initial years, it lost its momentum gradually.
• There was a mismatch between the Government’s political priorities and SDPF
provisions/areas; making it relatively less relevant.
• There was lesser level of ownership at the operational level; hence, frequent transfers
amongst government counterparts adversely affected institutional understanding of
SDPF and its effectiveness.
• There was lack of effective monitoring; hence, course correction has been to a
minimum.
373 “Donor countries in partnership with KP.” Daily Dawn, 3 Oct 2013.
http://www.dawn.com/news/1047126/donor-countries-in-partnership-with-kp. 374 Government of Khyber Pakhtunkhwa. 2019. Sustainable Development Strategy: A Medium-Term
Development Framework 2019-23 for Khyber Pakhtunkhwa. Peshawar: P&D Department, GoKP.
0%
10%
20%
30%
40%
50%
60%
-
50
100
150
200
250
300
350
2002
-03
2003
-04
2004
-05
2005
-06
2006
-07
2007
-08
2008
-09
2009
-10
2010
-11
2011
-12
2012
-13
2013
-14
2014
-15
2015
-16
2016
-17
2017
-18
2018
-19
2019
-20
2020
-21
(E)
%age fore
ign c
ontr
ibution to A
DP
PK
R in b
illio
ns
Local Foreign % Foreign Contribution
KP-SISUG Swat Regional Development Plan
298
• The SDPF Secretariat lacked adequate capacity and coordination with donors
changed from SPED-centric to sectoral, eroding the concept of coordinated and
harmonized development assistance.
990. Based on these findings, number of recommendations have been made which can
help improving the coordination between the provincial government and donors. The crux of
these recommendations includes:
• Duplication and parallel strategies on development may be replaced with a single,
holistic development framework, to be developed through wider consultative process,
to avoid overlap and duplication of development investment.
• To enhance the political buy-in, the political leadership at various levels (province,
department, local) may be associated with formulation process for sustained buy-in
during implementation phase.
• Grouping of individual departments in “development sectors” may be carried out with
equal emphasis on “potential” as well as “capacity” while the focus of strategic
framework may be dominated by “sector outcomes” as against activity-driven
“outputs;”
• The provincial Finance Department may be fully associated during design phase for
validation of quantitative assumptions.
• The international development partners may be requested to contextualize their
country support strategies within provincial development framework.
• The P&D Department may establish a fully resourced “Strategic Planning Unit” for
steering future strategy.
• The Office of DG Monitoring may be associated from the beginning for
mentoring/guiding individual departments on the Strategy monitoring.
• The Sector Coordination Committees may be provided technical support from relevant
sections in P&D Department (health, education, energy, water etc.) for meaningful and
rigorous follow up & course correction.
M.1.4. Oil Windfall
991. The successful development of recently discovered oil deposits near Kohat can
stimulate the economy, shore up the GoKP budget, and finance investments that improve the
long-term economic growth potential of the region.
992. Positive fiscal measures include directing oil revenue to investment in foreign assets
or import-heavy expenditures.375 Structural measures include facilitating capital and labor
inflows, to prevent these inputs become scarce. On the other hand, the discovery of oil
375 Ismael K 2010. The Structural Manifestation of the ‘Dutch Disease’: The Case of Oil-Exporting Countries.
IMF Working Paper
KP-SISUG Swat Regional Development Plan
299
deposits has often led to negative outcomes, most often if the (local) state has a high share in
oil production.376
993. To utilize this boon effectively, GoKP needs to heed lessons from the countries that
successfully leveraged fossil resources into productive, long-term investments. It is strongly
recommended to draw up strong legislation prescribing how oil revenue is to be used and to
set up a transparent, politically independent authority to manage the funds.
M.1.5. Financing Conclusions
994. The public budget in KP is generally in deficit, due to a host of persistent problems in
PFM. Provincial tax collection is marginal. A large share of the budget is allocated to (non-)
salary expenditures that are prioritized over operational expenditures to maintain existing
infrastructure and public services. The allocation of the ADP is not sufficiently devolved to
target local needs yet, through annual increases, does crowd out devolved spending and
investment. Addressing these and the other PFM issues will create room in the public budget
to strategically invest in regional economic development with transparency and accountability.
995. Tariff collection for water supply and waste management tends to be insufficient to
cover the operating costs of utilities. Investment decisions for new utilities should be made
using realistic and conservative financial analyses. Since utilities tend to require significant
capital, spreading the capital costs over a larger user base and stringent control of overhead
costs can reduce user tariffs and increase the probability of cost recovery.
996. ODA as a funding source has been declining and, despite a possible surge in aid to
handle the COVID19 crisis, is at risk of declining further. The majority of ODA inflows are
directed to human health infrastructure and capacity building projects. While these are
necessary elements of development in general, they do not directly contribute to employment
opportunities and income growth. Attracting ODA projects that support or directly stimulate
economic activity in the region raise GDP per capita, potentially starting a virtuous cycle of
growth.
997. Net FDI into Pakistan has been fluctuating over the years. Sectors that have been
consistently successful in attracting FDI are financial services, power (hydro- and coal), and
oil & gas. These are all sectors in which the Peshawar region has a potential competitive
advantage: it is a trade hub (finance) with significant potential for fossil resource extraction
and hydroelectricity. Chemical processing and transport/trade are further sectors that
Peshawar could be promoting, even if FDI inflows have been comparatively low.
998. National private investment in KP appears to have been negligible in recent years.
Private access to finance should be facilitated and can be shaped to support small farms and
enterprises to large manufacturing sites. The banking sector should be stimulated to provide
loans and provide opportunities to existing firms and start-ups that can boost innovation and
job growth.
376 Arezki R, Brückner M 2011. Oil rents, corruption, and state stability: Evidence from panel data regressions.
European Economic Review 55:955:963.
KP-SISUG Swat Regional Development Plan
300
M.2. Procurement377
999. Under Section 36 of the Khyber Pakhtunkhwa Public Procurement Regulatory
Authority Act, 2012,378 the Government of Khyber Pakhtunkhwa has notified Khyber
Pakhtunkhwa Public Procurement of Goods, Works, and Services Rules, 2014 to improve
governance, management, transparency, accountability and quality of public procurement of
goods, works, and services. Accordingly, the Khyber Pakhtunkhwa Public Procurement
Regulatory Authority (KP-PPRA) is mandated to implement the law and spearhead the public
sector procurement.
1000. Under these Rules, open competitive bidding is the principal method of procurement
of goods, services and works. Any procurement of over one hundred thousand Rupees has to
be advertised on the Authority’s website. The same can also be advertised in the print media
by the respective procuring agency. The Rules also provide guidance for non-discriminatory
participation and transparent procurement processes.
1001. In addition to KP-PPRA, the National Accountability Bureau (NAB) also serve as the
watchdog to prevent any mis-procurement and ensures transparency in procurements and
can seek briefing and explanation on any procurement from a procuring agency. The procuring
agencies also have formal internal and external audit and control systems. Annual audit is
conducted regularly by the internal as well as external auditors of the procurement carried out
by the agency during the preceding years.
1002. However, assessments of the procurement systems and institutions have identified
some procurement risks, including:
• While in most cases, the relevant procurement staff in the executing and implementing
agencies is competent and well versed with local procurement procedures, they have
limited knowledge of procurement guidelines practiced by international development
partners. It creates a mismatch and results in procurement delays.
• While the Khyber Pakhtunkhwa Public Procurement Rules 2014 provide principles for
procurement, these do not provide details of bid evaluation methods and processes;
rather leave the matter on the discretion of the procuring agency. This leaves a window
for possible discrimination in favor of or against any specific bidding party.
• In some cases, the procuring agencies do not have dedicated procurement staff and
the function is assigned to a procurement committee comprised of perceivably relevant
staff. There have been instances where during the post-procurement reviews have
identified incompetence of such procurement committees, resulting in loss the public
exchequer.
• At times, the technical specification is kept vague at the request for procurement or the
scope of work is changed after awarding the procurement contract. This not only
unduly benefits the successful bidder who may have won the bid on different
377 This section has benefited from the Procurement Risk Assessment conducted by ADB in 2017 for the
Peshawar Sustainable Bus Rapid Transit Corridor Project (48289-002). 378 Government of Khyber Pakhtunkhwa. Khyber Pakhtunkhwa Public Procurement Regulatory Authority Act,
2012. Enacted 20 Sep 2012.
KP-SISUG Swat Regional Development Plan
301
specification or scope of work but also deprives the genuine bidders of even playing
field.
• In case of works contracts, standard bidding documents and regulations of the
Pakistan Engineering Council are also used, posing a risk of conflicting provisions.
1003. The following measures need to be taken to improve the public procurement in Khyber
Pakhtunkhwa:
• The procurement related staff of government departments need to be trained in public
procurement rules/regulation and practices. This may become a regular feature of KP-
PPRA/provincial regulatory authorities’ capacity building program.
• The staff may also be trained in multilateral development banks’ (MDBs) procurement
policies and guidelines at the start of the MDB financed projects.
• The capacity of KP-PPRA may also be augmented through hiring of individual
consultants to assist the Agency in timely, efficient and transparent procurement.
• The capacity building efforts can be supported through project readiness financing
arranged through MDBs.
M.3. Public-Private Partnership
M.3.1. PPP Legal and Institutional Framework
1004. The Khyber Pakhtunkhwa Public Private Partnership Act, 2014 intends to provide for
the participation of the private sector in the financing, construction, development, operation,
or maintenance of infrastructure or development projects or other related services of the
Government through Concession Contracts in Public Private Partnership mode and the
establishment of institutions to regulate, monitor and supervise implementation of Public
Private Partnership contracts. Accordingly, the following institutional framework is in place:
• Public Private Partnership Committee with a mandate to promote, facilitate,
coordinate and oversee private investment in development of infrastructure and social
sector projects using the PPP approach. The Committee is headed by the Minister for
Planning and Development and has representation from various departments and
private sector members and experts as members of the committee. The committee is
the final approving authority for projects to be implemented in PPP mode under the
PPP Act.
• PPP Unit under the supervision of the Secretary Planning and Development
Department, with members from the relevant departments. The PPP Unit serves as
the secretariat and technical arm of the PPP Committee, and provides technical,
financial and legal expertise to the PPP Committee and any PPP Node established
under the PPP Act.
• Departmental PPP Nodes to be established in the Contracting Authorities that intends
to enter into a PPP arrangement in form of a Concession Contract with a
Concessionaire. It shall be headed by the principal accounting officer of the
Contracting Authority and shall consist of such other financial, technical, procurement
and legal personnel as that authority shall, in consultation with the PPP Unit, consider

KP-SISUG Swat Regional Development Plan
302
necessary for the performance of its functions in relation to a Project under the PPP
Act. The PPP node is the initial screening and prioritizing agency to develop projects.
The node shall forward such projects to the PPP unit for approval by the PPP
Committee. The node implements projects approved by the PPP Committee and
advised by the PPP Unit by signing the concession agreement and is the responsible
agency for project monitoring over the life of the concession contract.
M.3.2. PPP Process
1005. There is a standard project development process for all types of PPP projects, as
elaborated in the Khyber Pakhtunkhwa PPP Act, 2014 and summarized below:
i. The PPP node at the contracting agency conducts a prefeasibility for approval of the
concept note for developing project in PPP mode and seeks approval from the PPP
Committee. The node then engaged professional transaction advisory to prepare
prefeasibility. The cost can be met by the node or a request may be made to the PPP
Committee to approve cost reimbursement from the Finance Department or Project
Development Fund (PDF).
ii. If the prefeasibility is accepted and project approved by the PPP Committee, then node
proceeds with the selection of the transaction advisor for preparation of a full feasibility
and project implementation process. The transaction advisor (TA) would be selected
according to the Khyber Pakhtunkhwa Public Procurement Rules and recommended
to the PPP Committee for approval. The TA will undertake feasibility and submit for
further processing by the Node.
iii. The bid processing request and feasibility is submitted to the PPP Committee through
the PPP Unit and on approval of Committee the transaction advisor and the relevant
PPP Node start the bid process. Upon bid award, the cost of transaction advisor is
recovered from the selected concessionaire and paid back to the Finance Department
or PDF.
iv. Concession contract is signed between the contracting agency and the special
purpose vehicle (SPV) company, incorporated under the Companies Act 2017, that
will own the project with equity funding of the private party. SPV Company will be
formed under the approved concession terms. The contracting agency will appoint an
independent engineer to confirm that design, and engineering, procurement and
construction (EPC) contract meet concession terms, and the engineer will also be
responsible to monitor the project implementation as per terms of the concession
contract. The contracting agency would also be required to provide all licenses,
consents and any other approvals from relevant authorities and ensure any
commitments to provide infrastructure needs are completed according to agreed
timelines. Costs increased in result of government’s non-adherence to
commitments/timelines are borne by the government and could lead to project
termination as well.
M.3.3. PPP for Urban Sector
1006. Despite successful examples of public private partnership for urban development, the
approach has not been yet implemented in Khyber Pakhtunkhwa. There are some plans in
the offing to bring in PPP investment for solid waste collection and waste to energy projects
KP-SISUG Swat Regional Development Plan
303
but nothing significant has come out. The following measures may be taken to introduce the
approach for sustainable urban growth in Khyber Pakhtunkhwa:
• PPP sub-nodes may be set up at the City District Government, tehsil municipal
administrations, water and sanitation companies and the development authorities to
work closely with the PPP Node already established in the Local Government,
Elections and Rural Development Department.
• A Project Development Facility (PDF) should be set up at the provincial level to pay for
the upfront costs of transaction advisory for preparing concession bids under the PPP
approach. The cost can then be built into the bid cost, recovered from the
concessionaire and redeposited into the PDF.
• A Viability Gap Fund (VGF), ringfenced through corporate governance regulations,
may be set up at the provincial level to provide for any revenue gaps in the take-off
years. This will help making PPP projects in the urban, especially municipal, sector
attractive for the potential concessionaires.
• Capacity of the PPP Unit should be augmented in terms of competent human resource
as well as knowledge exchange on innovative PPP approaches.
M.3.4. Government Procedures in Urban Construction
1007. Construction regulation in general, and of low-income housing in particular, has always
been a grey area. The municipal authorities, city district government in Peshawar and tehsil
municipal administrations in Swat are responsible for approving the building plans according
to the building codes and bylaws. However, in most cases, and especially for private houses,
the plan approval proves to be merely a procedure. However, even more disastrous is lack of
monitoring or follow-up on compliance of the approved building drawings. In many cases,
completion certificate is not applied, and if applied no site inspection is carried out before
issuing the completion certificate.
1008. In case of public and commercial building, the building codes, especially on design and
materials, are followed more stringently but violations are rampant resulting in shorter lifespan
for such building. There is need to set up an independent oversight mechanism to randomly
review the approvals and certifications of public and private constructions, augmented by a
strict accountability mechanism.
M.3.5. Public Participation/ Transparency
1009. Public participation in planning and decision making for the urban development is
relatively newer phenomenon, following examples set by donor funded projects and civil
society engagement. The recent enactment of Right to Information Act, 2013 and increased
access to internet have facilitated the information flow towards relevant stakeholder, and the
feedback towards government. Citizen’s Budget is one such example which presents the
cumbersome budgetary statistics in simple graphical form informing the general public of what
is planned, how much would cost and what benefits would it accrue. The donor funded projects
have introduced procedures for information disclosure and grievance redressal which are
providing avenues of public participation and fostering transparency in public sector planning
and execution.

KP-SISUG Swat Regional Development Plan
304
1010. In the urban sector, WSSCs have adopted this approach and positive results have
been reported. The public feedback has helped the WSSCs in improving services, filling in the
gaps and improving accountability. This will ultimately restore public’s confidence in the
system, resulting in enhanced revenue. However, there is still room for more focused citizens’
engagement and information-driven communication to maximize the benefits of autonomous
utility operations.
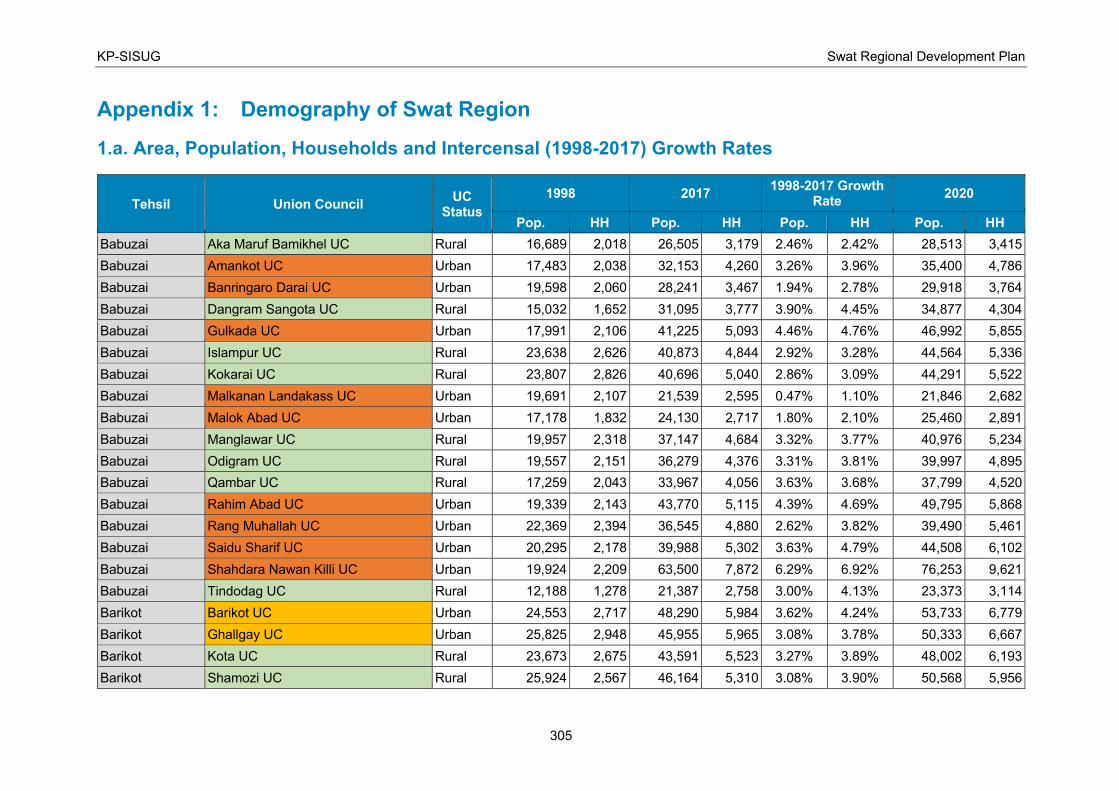
KP-SISUG Swat Regional Development Plan
305
Appendix 1: Demography of Swat Region
1.a. Area, Population, Households and Intercensal (1998-2017) Growth Rates
Tehsil Union Council UC
Status
1998 2017 1998-2017 Growth
Rate 2020
Pop. HH Pop. HH Pop. HH Pop. HH
Babuzai Aka Maruf Bamikhel UC Rural 16,689 2,018 26,505 3,179 2.46% 2.42% 28,513 3,415
Babuzai Amankot UC Urban 17,483 2,038 32,153 4,260 3.26% 3.96% 35,400 4,786
Babuzai Banringaro Darai UC Urban 19,598 2,060 28,241 3,467 1.94% 2.78% 29,918 3,764
Babuzai Dangram Sangota UC Rural 15,032 1,652 31,095 3,777 3.90% 4.45% 34,877 4,304
Babuzai Gulkada UC Urban 17,991 2,106 41,225 5,093 4.46% 4.76% 46,992 5,855
Babuzai Islampur UC Rural 23,638 2,626 40,873 4,844 2.92% 3.28% 44,564 5,336
Babuzai Kokarai UC Rural 23,807 2,826 40,696 5,040 2.86% 3.09% 44,291 5,522
Babuzai Malkanan Landakass UC Urban 19,691 2,107 21,539 2,595 0.47% 1.10% 21,846 2,682
Babuzai Malok Abad UC Urban 17,178 1,832 24,130 2,717 1.80% 2.10% 25,460 2,891
Babuzai Manglawar UC Rural 19,957 2,318 37,147 4,684 3.32% 3.77% 40,976 5,234
Babuzai Odigram UC Rural 19,557 2,151 36,279 4,376 3.31% 3.81% 39,997 4,895
Babuzai Qambar UC Rural 17,259 2,043 33,967 4,056 3.63% 3.68% 37,799 4,520
Babuzai Rahim Abad UC Urban 19,339 2,143 43,770 5,115 4.39% 4.69% 49,795 5,868
Babuzai Rang Muhallah UC Urban 22,369 2,394 36,545 4,880 2.62% 3.82% 39,490 5,461
Babuzai Saidu Sharif UC Urban 20,295 2,178 39,988 5,302 3.63% 4.79% 44,508 6,102
Babuzai Shahdara Nawan Killi UC Urban 19,924 2,209 63,500 7,872 6.29% 6.92% 76,253 9,621
Babuzai Tindodag UC Rural 12,188 1,278 21,387 2,758 3.00% 4.13% 23,373 3,114
Barikot Barikot UC Urban 24,553 2,717 48,290 5,984 3.62% 4.24% 53,733 6,779
Barikot Ghallgay UC Urban 25,825 2,948 45,955 5,965 3.08% 3.78% 50,333 6,667
Barikot Kota UC Rural 23,673 2,675 43,591 5,523 3.27% 3.89% 48,002 6,193
Barikot Shamozi UC Rural 25,924 2,567 46,164 5,310 3.08% 3.90% 50,568 5,956
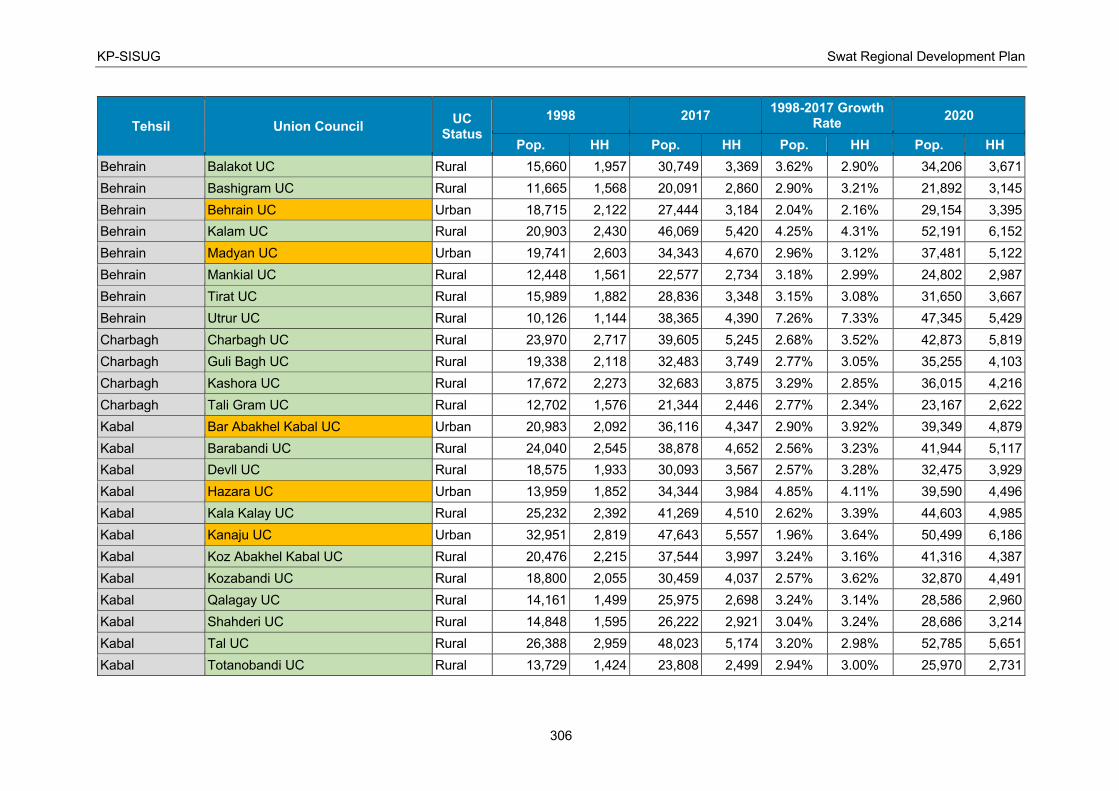
KP-SISUG Swat Regional Development Plan
306
Tehsil Union Council UC
Status
1998 2017 1998-2017 Growth
Rate 2020
Pop. HH Pop. HH Pop. HH Pop. HH
Behrain Balakot UC Rural 15,660 1,957 30,749 3,369 3.62% 2.90% 34,206 3,671
Behrain Bashigram UC Rural 11,665 1,568 20,091 2,860 2.90% 3.21% 21,892 3,145
Behrain Behrain UC Urban 18,715 2,122 27,444 3,184 2.04% 2.16% 29,154 3,395
Behrain Kalam UC Rural 20,903 2,430 46,069 5,420 4.25% 4.31% 52,191 6,152
Behrain Madyan UC Urban 19,741 2,603 34,343 4,670 2.96% 3.12% 37,481 5,122
Behrain Mankial UC Rural 12,448 1,561 22,577 2,734 3.18% 2.99% 24,802 2,987
Behrain Tirat UC Rural 15,989 1,882 28,836 3,348 3.15% 3.08% 31,650 3,667
Behrain Utrur UC Rural 10,126 1,144 38,365 4,390 7.26% 7.33% 47,345 5,429
Charbagh Charbagh UC Rural 23,970 2,717 39,605 5,245 2.68% 3.52% 42,873 5,819
Charbagh Guli Bagh UC Rural 19,338 2,118 32,483 3,749 2.77% 3.05% 35,255 4,103
Charbagh Kashora UC Rural 17,672 2,273 32,683 3,875 3.29% 2.85% 36,015 4,216
Charbagh Tali Gram UC Rural 12,702 1,576 21,344 2,446 2.77% 2.34% 23,167 2,622
Kabal Bar Abakhel Kabal UC Urban 20,983 2,092 36,116 4,347 2.90% 3.92% 39,349 4,879
Kabal Barabandi UC Rural 24,040 2,545 38,878 4,652 2.56% 3.23% 41,944 5,117
Kabal Devll UC Rural 18,575 1,933 30,093 3,567 2.57% 3.28% 32,475 3,929
Kabal Hazara UC Urban 13,959 1,852 34,344 3,984 4.85% 4.11% 39,590 4,496
Kabal Kala Kalay UC Rural 25,232 2,392 41,269 4,510 2.62% 3.39% 44,603 4,985
Kabal Kanaju UC Urban 32,951 2,819 47,643 5,557 1.96% 3.64% 50,499 6,186
Kabal Koz Abakhel Kabal UC Rural 20,476 2,215 37,544 3,997 3.24% 3.16% 41,316 4,387
Kabal Kozabandi UC Rural 18,800 2,055 30,459 4,037 2.57% 3.62% 32,870 4,491
Kabal Qalagay UC Rural 14,161 1,499 25,975 2,698 3.24% 3.14% 28,586 2,960
Kabal Shahderi UC Rural 14,848 1,595 26,222 2,921 3.04% 3.24% 28,686 3,214
Kabal Tal UC Rural 26,388 2,959 48,023 5,174 3.20% 2.98% 52,785 5,651
Kabal Totanobandi UC Rural 13,729 1,424 23,808 2,499 2.94% 3.00% 25,970 2,731
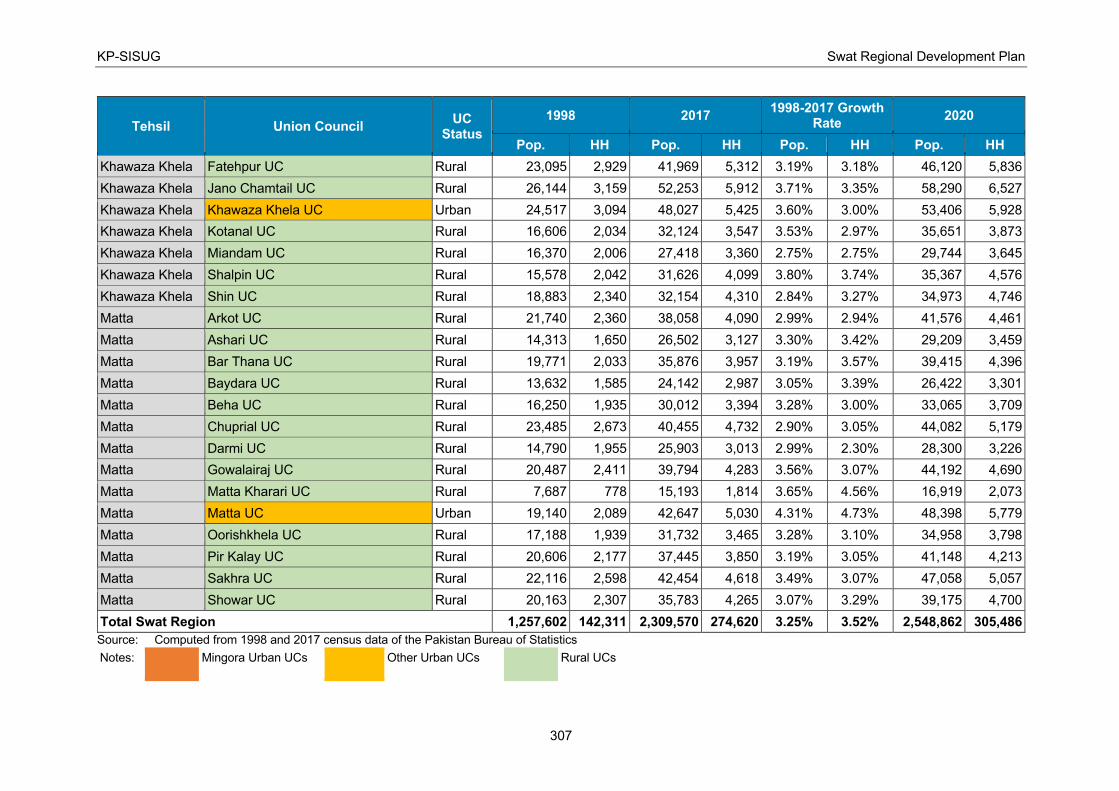
KP-SISUG Swat Regional Development Plan
307
Tehsil Union Council UC
Status
1998 2017 1998-2017 Growth
Rate 2020
Pop. HH Pop. HH Pop. HH Pop. HH
Khawaza Khela Fatehpur UC Rural 23,095 2,929 41,969 5,312 3.19% 3.18% 46,120 5,836
Khawaza Khela Jano Chamtail UC Rural 26,144 3,159 52,253 5,912 3.71% 3.35% 58,290 6,527
Khawaza Khela Khawaza Khela UC Urban 24,517 3,094 48,027 5,425 3.60% 3.00% 53,406 5,928
Khawaza Khela Kotanal UC Rural 16,606 2,034 32,124 3,547 3.53% 2.97% 35,651 3,873
Khawaza Khela Miandam UC Rural 16,370 2,006 27,418 3,360 2.75% 2.75% 29,744 3,645
Khawaza Khela Shalpin UC Rural 15,578 2,042 31,626 4,099 3.80% 3.74% 35,367 4,576
Khawaza Khela Shin UC Rural 18,883 2,340 32,154 4,310 2.84% 3.27% 34,973 4,746
Matta Arkot UC Rural 21,740 2,360 38,058 4,090 2.99% 2.94% 41,576 4,461
Matta Ashari UC Rural 14,313 1,650 26,502 3,127 3.30% 3.42% 29,209 3,459
Matta Bar Thana UC Rural 19,771 2,033 35,876 3,957 3.19% 3.57% 39,415 4,396
Matta Baydara UC Rural 13,632 1,585 24,142 2,987 3.05% 3.39% 26,422 3,301
Matta Beha UC Rural 16,250 1,935 30,012 3,394 3.28% 3.00% 33,065 3,709
Matta Chuprial UC Rural 23,485 2,673 40,455 4,732 2.90% 3.05% 44,082 5,179
Matta Darmi UC Rural 14,790 1,955 25,903 3,013 2.99% 2.30% 28,300 3,226
Matta Gowalairaj UC Rural 20,487 2,411 39,794 4,283 3.56% 3.07% 44,192 4,690
Matta Matta Kharari UC Rural 7,687 778 15,193 1,814 3.65% 4.56% 16,919 2,073
Matta Matta UC Urban 19,140 2,089 42,647 5,030 4.31% 4.73% 48,398 5,779
Matta Oorishkhela UC Rural 17,188 1,939 31,732 3,465 3.28% 3.10% 34,958 3,798
Matta Pir Kalay UC Rural 20,606 2,177 37,445 3,850 3.19% 3.05% 41,148 4,213
Matta Sakhra UC Rural 22,116 2,598 42,454 4,618 3.49% 3.07% 47,058 5,057
Matta Showar UC Rural 20,163 2,307 35,783 4,265 3.07% 3.29% 39,175 4,700
Total Swat Region 1,257,602 142,311 2,309,570 274,620 3.25% 3.52% 2,548,862 305,486
Source: Computed from 1998 and 2017 census data of the Pakistan Bureau of Statistics
Notes: Mingora Urban UCs Other Urban UCs Rural UCs

KP-SISUG Swat Regional Development Plan
308
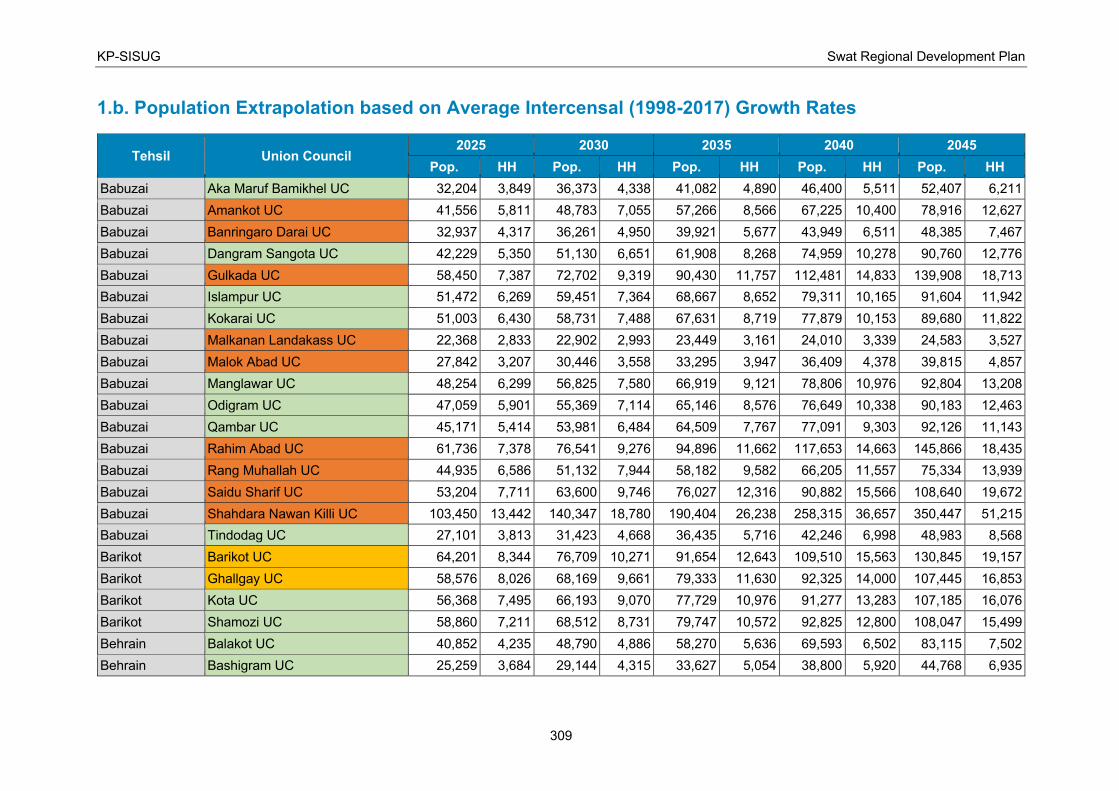
KP-SISUG Swat Regional Development Plan
309
1.b. Population Extrapolation based on Average Intercensal (1998-2017) Growth Rates
Tehsil Union Council 2025 2030 2035 2040 2045
Pop. HH Pop. HH Pop. HH Pop. HH Pop. HH
Babuzai Aka Maruf Bamikhel UC 32,204 3,849 36,373 4,338 41,082 4,890 46,400 5,511 52,407 6,211
Babuzai Amankot UC 41,556 5,811 48,783 7,055 57,266 8,566 67,225 10,400 78,916 12,627
Babuzai Banringaro Darai UC 32,937 4,317 36,261 4,950 39,921 5,677 43,949 6,511 48,385 7,467
Babuzai Dangram Sangota UC 42,229 5,350 51,130 6,651 61,908 8,268 74,959 10,278 90,760 12,776
Babuzai Gulkada UC 58,450 7,387 72,702 9,319 90,430 11,757 112,481 14,833 139,908 18,713
Babuzai Islampur UC 51,472 6,269 59,451 7,364 68,667 8,652 79,311 10,165 91,604 11,942
Babuzai Kokarai UC 51,003 6,430 58,731 7,488 67,631 8,719 77,879 10,153 89,680 11,822
Babuzai Malkanan Landakass UC 22,368 2,833 22,902 2,993 23,449 3,161 24,010 3,339 24,583 3,527
Babuzai Malok Abad UC 27,842 3,207 30,446 3,558 33,295 3,947 36,409 4,378 39,815 4,857
Babuzai Manglawar UC 48,254 6,299 56,825 7,580 66,919 9,121 78,806 10,976 92,804 13,208
Babuzai Odigram UC 47,059 5,901 55,369 7,114 65,146 8,576 76,649 10,338 90,183 12,463
Babuzai Qambar UC 45,171 5,414 53,981 6,484 64,509 7,767 77,091 9,303 92,126 11,143
Babuzai Rahim Abad UC 61,736 7,378 76,541 9,276 94,896 11,662 117,653 14,663 145,866 18,435
Babuzai Rang Muhallah UC 44,935 6,586 51,132 7,944 58,182 9,582 66,205 11,557 75,334 13,939
Babuzai Saidu Sharif UC 53,204 7,711 63,600 9,746 76,027 12,316 90,882 15,566 108,640 19,672
Babuzai Shahdara Nawan Killi UC 103,450 13,442 140,347 18,780 190,404 26,238 258,315 36,657 350,447 51,215
Babuzai Tindodag UC 27,101 3,813 31,423 4,668 36,435 5,716 42,246 6,998 48,983 8,568
Barikot Barikot UC 64,201 8,344 76,709 10,271 91,654 12,643 109,510 15,563 130,845 19,157
Barikot Ghallgay UC 58,576 8,026 68,169 9,661 79,333 11,630 92,325 14,000 107,445 16,853
Barikot Kota UC 56,368 7,495 66,193 9,070 77,729 10,976 91,277 13,283 107,185 16,076
Barikot Shamozi UC 58,860 7,211 68,512 8,731 79,747 10,572 92,825 12,800 108,047 15,499
Behrain Balakot UC 40,852 4,235 48,790 4,886 58,270 5,636 69,593 6,502 83,115 7,502
Behrain Bashigram UC 25,259 3,684 29,144 4,315 33,627 5,054 38,800 5,920 44,768 6,935
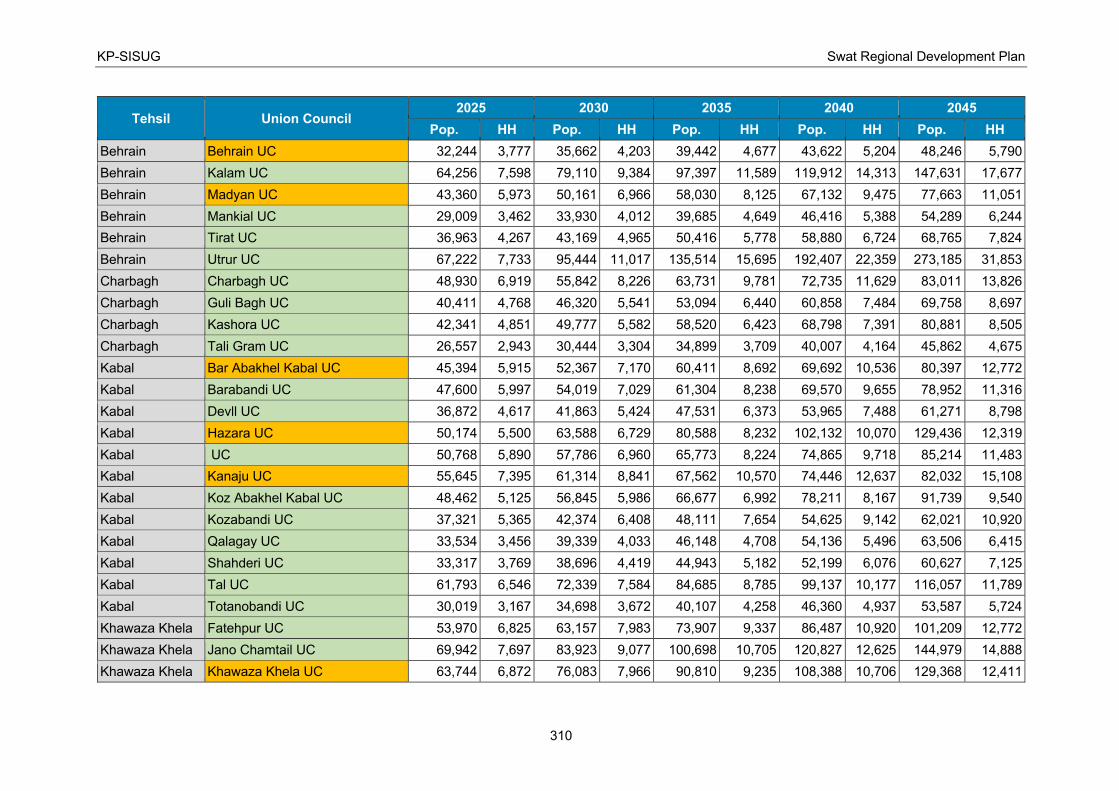
KP-SISUG Swat Regional Development Plan
310
Tehsil Union Council 2025 2030 2035 2040 2045
Pop. HH Pop. HH Pop. HH Pop. HH Pop. HH
Behrain Behrain UC 32,244 3,777 35,662 4,203 39,442 4,677 43,622 5,204 48,246 5,790
Behrain Kalam UC 64,256 7,598 79,110 9,384 97,397 11,589 119,912 14,313 147,631 17,677
Behrain Madyan UC 43,360 5,973 50,161 6,966 58,030 8,125 67,132 9,475 77,663 11,051
Behrain Mankial UC 29,009 3,462 33,930 4,012 39,685 4,649 46,416 5,388 54,289 6,244
Behrain Tirat UC 36,963 4,267 43,169 4,965 50,416 5,778 58,880 6,724 68,765 7,824
Behrain Utrur UC 67,222 7,733 95,444 11,017 135,514 15,695 192,407 22,359 273,185 31,853
Charbagh Charbagh UC 48,930 6,919 55,842 8,226 63,731 9,781 72,735 11,629 83,011 13,826
Charbagh Guli Bagh UC 40,411 4,768 46,320 5,541 53,094 6,440 60,858 7,484 69,758 8,697
Charbagh Kashora UC 42,341 4,851 49,777 5,582 58,520 6,423 68,798 7,391 80,881 8,505
Charbagh Tali Gram UC 26,557 2,943 30,444 3,304 34,899 3,709 40,007 4,164 45,862 4,675
Kabal Bar Abakhel Kabal UC 45,394 5,915 52,367 7,170 60,411 8,692 69,692 10,536 80,397 12,772
Kabal Barabandi UC 47,600 5,997 54,019 7,029 61,304 8,238 69,570 9,655 78,952 11,316
Kabal Devll UC 36,872 4,617 41,863 5,424 47,531 6,373 53,965 7,488 61,271 8,798
Kabal Hazara UC 50,174 5,500 63,588 6,729 80,588 8,232 102,132 10,070 129,436 12,319
Kabal UC 50,768 5,890 57,786 6,960 65,773 8,224 74,865 9,718 85,214 11,483
Kabal Kanaju UC 55,645 7,395 61,314 8,841 67,562 10,570 74,446 12,637 82,032 15,108
Kabal Koz Abakhel Kabal UC 48,462 5,125 56,845 5,986 66,677 6,992 78,211 8,167 91,739 9,540
Kabal Kozabandi UC 37,321 5,365 42,374 6,408 48,111 7,654 54,625 9,142 62,021 10,920
Kabal Qalagay UC 33,534 3,456 39,339 4,033 46,148 4,708 54,136 5,496 63,506 6,415
Kabal Shahderi UC 33,317 3,769 38,696 4,419 44,943 5,182 52,199 6,076 60,627 7,125
Kabal Tal UC 61,793 6,546 72,339 7,584 84,685 8,785 99,137 10,177 116,057 11,789
Kabal Totanobandi UC 30,019 3,167 34,698 3,672 40,107 4,258 46,360 4,937 53,587 5,724
Khawaza Khela Fatehpur UC 53,970 6,825 63,157 7,983 73,907 9,337 86,487 10,920 101,209 12,772
Khawaza Khela Jano Chamtail UC 69,942 7,697 83,923 9,077 100,698 10,705 120,827 12,625 144,979 14,888
Khawaza Khela Khawaza Khela UC 63,744 6,872 76,083 7,966 90,810 9,235 108,388 10,706 129,368 12,411

KP-SISUG Swat Regional Development Plan
311
Tehsil Union Council 2025 2030 2035 2040 2045
Pop. HH Pop. HH Pop. HH Pop. HH Pop. HH
Khawaza Khela Kotanal UC 42,412 4,483 50,455 5,189 60,022 6,007 71,404 6,954 84,945 8,050
Khawaza Khela Miandam UC 34,068 4,175 39,020 4,782 44,692 5,477 51,189 6,273 58,630 7,185
Khawaza Khela Shalpin UC 42,612 5,497 51,341 6,603 61,857 7,932 74,528 9,528 89,795 11,446
Khawaza Khela Shin UC 40,232 5,574 46,281 6,546 53,239 7,687 61,244 9,028 70,453 10,602
Matta Arkot UC 48,177 5,156 55,826 5,958 64,689 6,886 74,960 7,958 86,861 9,197
Matta Ashari UC 34,350 4,093 40,396 4,843 47,506 5,730 55,867 6,780 65,699 8,022
Matta Bar Thana UC 46,106 5,238 53,934 6,241 63,090 7,437 73,800 8,861 86,329 10,558
Matta Baydara UC 30,710 3,900 35,695 4,608 41,488 5,444 48,222 6,432 56,048 7,600
Matta Beha UC 38,858 4,300 45,666 4,985 53,668 5,780 63,071 6,701 74,122 7,768
Matta Chuprial UC 50,865 6,018 58,691 6,995 67,721 8,129 78,141 9,447 90,163 10,980
Matta Darmi UC 32,796 3,615 38,008 4,051 44,048 4,539 51,047 5,086 59,159 5,699
Matta Gowalairaj UC 52,629 5,455 62,676 6,346 74,642 7,382 88,891 8,587 105,862 9,989
Matta Matta Kharari UC 20,241 2,591 24,215 3,237 28,971 4,045 34,659 5,055 41,466 6,316
Matta Matta UC 59,757 7,282 73,783 9,177 91,101 11,564 112,483 14,573 138,884 18,364
Matta Oorishkhela UC 41,078 4,424 48,271 5,155 56,722 6,006 66,654 6,997 78,325 8,152
Matta Pir Kalay UC 48,152 4,895 56,348 5,687 65,939 6,607 77,162 7,677 90,296 8,920
Matta Sakhra UC 55,868 5,884 66,328 6,845 78,745 7,964 93,488 9,265 110,990 10,780
Matta Showar UC 45,559 5,524 52,982 6,494 61,615 7,634 71,655 8,974 83,330 10,549
Total Swat Region 3,009,409 365,521 3,561,681 438,465 4,226,266 527,425 5,029,069 636,351 6,002,885 770,305
Source: Computed from 1998 and 2017 census data of the Pakistan Bureau of Statistics
Notes: Mingora Urban UCs Other Urban UCs Rural UCs
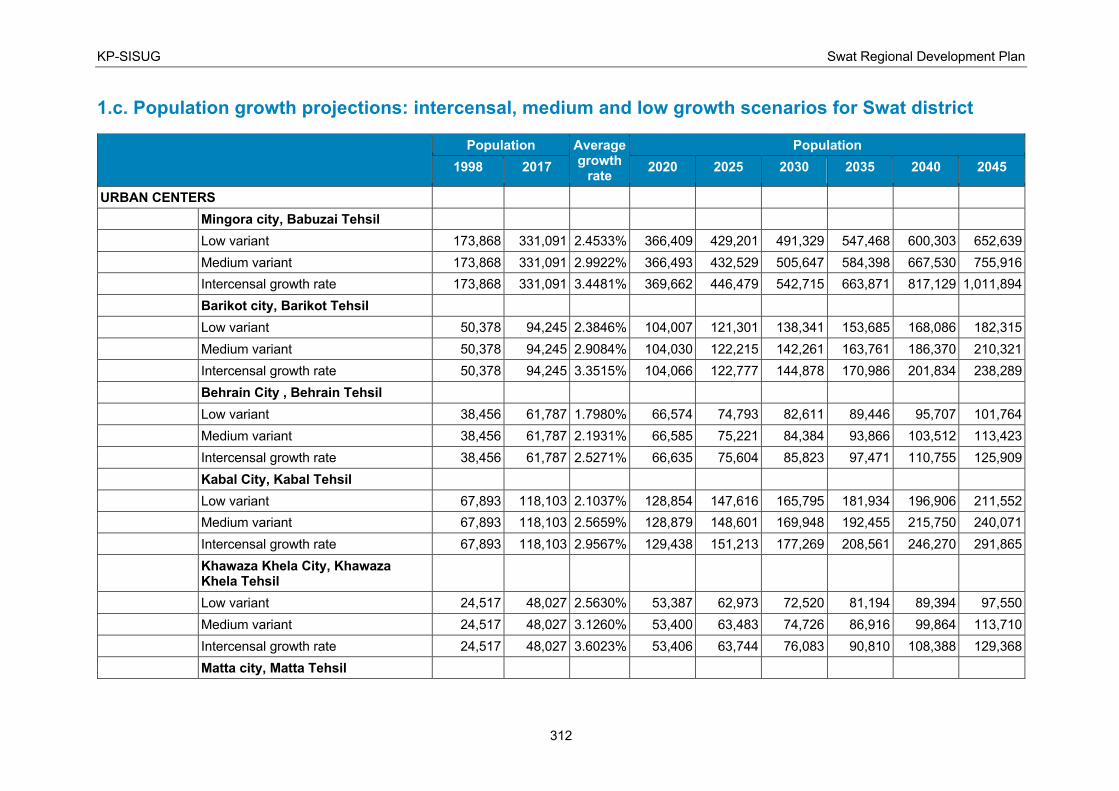
KP-SISUG Swat Regional Development Plan
312
1.c. Population growth projections: intercensal, medium and low growth scenarios for Swat district
Population Average growth
rate
Population
1998 2017 2020 2025 2030 2035 2040 2045
URBAN CENTERS
Mingora city, Babuzai Tehsil
Low variant 173,868 331,091 2.4533% 366,409 429,201 491,329 547,468 600,303 652,639
Medium variant 173,868 331,091 2.9922% 366,493 432,529 505,647 584,398 667,530 755,916
Intercensal growth rate 173,868 331,091 3.4481% 369,662 446,479 542,715 663,871 817,129 1,011,894
Barikot city, Barikot Tehsil
Low variant 50,378 94,245 2.3846% 104,007 121,301 138,341 153,685 168,086 182,315
Medium variant 50,378 94,245 2.9084% 104,030 122,215 142,261 163,761 186,370 210,321
Intercensal growth rate 50,378 94,245 3.3515% 104,066 122,777 144,878 170,986 201,834 238,289
Behrain City , Behrain Tehsil
Low variant 38,456 61,787 1.7980% 66,574 74,793 82,611 89,446 95,707 101,764
Medium variant 38,456 61,787 2.1931% 66,585 75,221 84,384 93,866 103,512 113,423
Intercensal growth rate 38,456 61,787 2.5271% 66,635 75,604 85,823 97,471 110,755 125,909
Kabal City, Kabal Tehsil
Low variant 67,893 118,103 2.1037% 128,854 147,616 165,795 181,934 196,906 211,552
Medium variant 67,893 118,103 2.5659% 128,879 148,601 169,948 192,455 215,750 240,071
Intercensal growth rate 67,893 118,103 2.9567% 129,438 151,213 177,269 208,561 246,270 291,865
Khawaza Khela City, Khawaza Khela Tehsil
Low variant 24,517 48,027 2.5630% 53,387 62,973 72,520 81,194 89,394 97,550
Medium variant 24,517 48,027 3.1260% 53,400 63,483 74,726 86,916 99,864 113,710
Intercensal growth rate 24,517 48,027 3.6023% 53,406 63,744 76,083 90,810 108,388 129,368
Matta city, Matta Tehsil
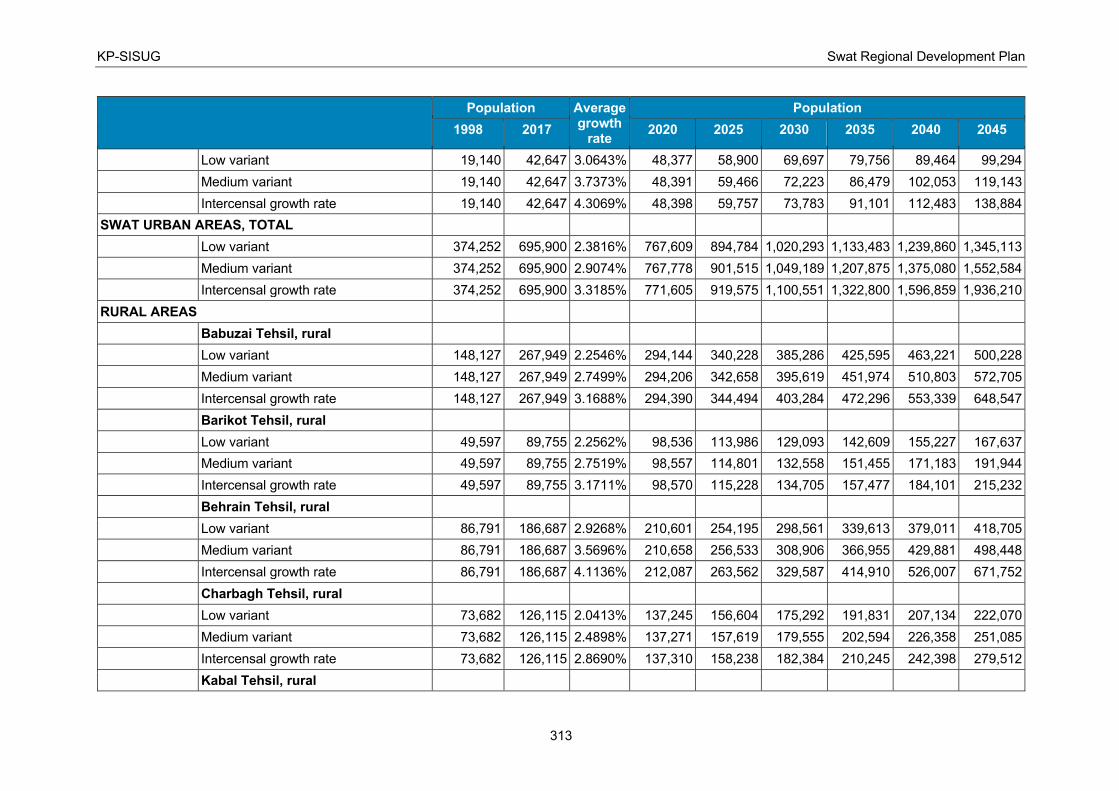
KP-SISUG Swat Regional Development Plan
313
Population Average growth
rate
Population
1998 2017 2020 2025 2030 2035 2040 2045
Low variant 19,140 42,647 3.0643% 48,377 58,900 69,697 79,756 89,464 99,294
Medium variant 19,140 42,647 3.7373% 48,391 59,466 72,223 86,479 102,053 119,143
Intercensal growth rate 19,140 42,647 4.3069% 48,398 59,757 73,783 91,101 112,483 138,884
SWAT URBAN AREAS, TOTAL
Low variant 374,252 695,900 2.3816% 767,609 894,784 1,020,293 1,133,483 1,239,860 1,345,113
Medium variant 374,252 695,900 2.9074% 767,778 901,515 1,049,189 1,207,875 1,375,080 1,552,584
Intercensal growth rate 374,252 695,900 3.3185% 771,605 919,575 1,100,551 1,322,800 1,596,859 1,936,210
RURAL AREAS
Babuzai Tehsil, rural
Low variant 148,127 267,949 2.2546% 294,144 340,228 385,286 425,595 463,221 500,228
Medium variant 148,127 267,949 2.7499% 294,206 342,658 395,619 451,974 510,803 572,705
Intercensal growth rate 148,127 267,949 3.1688% 294,390 344,494 403,284 472,296 553,339 648,547
Barikot Tehsil, rural
Low variant 49,597 89,755 2.2562% 98,536 113,986 129,093 142,609 155,227 167,637
Medium variant 49,597 89,755 2.7519% 98,557 114,801 132,558 151,455 171,183 191,944
Intercensal growth rate 49,597 89,755 3.1711% 98,570 115,228 134,705 157,477 184,101 215,232
Behrain Tehsil, rural
Low variant 86,791 186,687 2.9268% 210,601 254,195 298,561 339,613 379,011 418,705
Medium variant 86,791 186,687 3.5696% 210,658 256,533 308,906 366,955 429,881 498,448
Intercensal growth rate 86,791 186,687 4.1136% 212,087 263,562 329,587 414,910 526,007 671,752
Charbagh Tehsil, rural
Low variant 73,682 126,115 2.0413% 137,245 156,604 175,292 191,831 207,134 222,070
Medium variant 73,682 126,115 2.4898% 137,271 157,619 179,555 202,594 226,358 251,085
Intercensal growth rate 73,682 126,115 2.8690% 137,310 158,238 182,384 210,245 242,398 279,512
Kabal Tehsil, rural
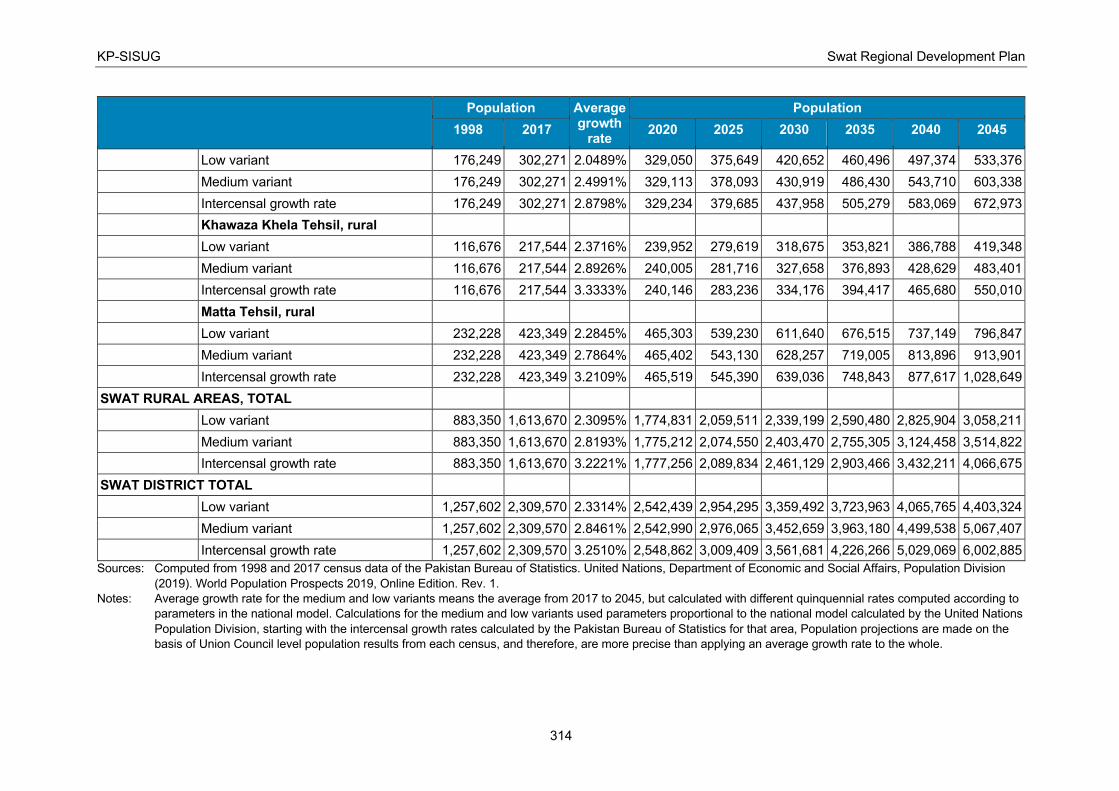
KP-SISUG Swat Regional Development Plan
314
Population Average growth
rate
Population
1998 2017 2020 2025 2030 2035 2040 2045
Low variant 176,249 302,271 2.0489% 329,050 375,649 420,652 460,496 497,374 533,376
Medium variant 176,249 302,271 2.4991% 329,113 378,093 430,919 486,430 543,710 603,338
Intercensal growth rate 176,249 302,271 2.8798% 329,234 379,685 437,958 505,279 583,069 672,973
Khawaza Khela Tehsil, rural
Low variant 116,676 217,544 2.3716% 239,952 279,619 318,675 353,821 386,788 419,348
Medium variant 116,676 217,544 2.8926% 240,005 281,716 327,658 376,893 428,629 483,401
Intercensal growth rate 116,676 217,544 3.3333% 240,146 283,236 334,176 394,417 465,680 550,010
Matta Tehsil, rural
Low variant 232,228 423,349 2.2845% 465,303 539,230 611,640 676,515 737,149 796,847
Medium variant 232,228 423,349 2.7864% 465,402 543,130 628,257 719,005 813,896 913,901
Intercensal growth rate 232,228 423,349 3.2109% 465,519 545,390 639,036 748,843 877,617 1,028,649
SWAT RURAL AREAS, TOTAL
Low variant 883,350 1,613,670 2.3095% 1,774,831 2,059,511 2,339,199 2,590,480 2,825,904 3,058,211
Medium variant 883,350 1,613,670 2.8193% 1,775,212 2,074,550 2,403,470 2,755,305 3,124,458 3,514,822
Intercensal growth rate 883,350 1,613,670 3.2221% 1,777,256 2,089,834 2,461,129 2,903,466 3,432,211 4,066,675
SWAT DISTRICT TOTAL
Low variant 1,257,602 2,309,570 2.3314% 2,542,439 2,954,295 3,359,492 3,723,963 4,065,765 4,403,324
Medium variant 1,257,602 2,309,570 2.8461% 2,542,990 2,976,065 3,452,659 3,963,180 4,499,538 5,067,407
Intercensal growth rate 1,257,602 2,309,570 3.2510% 2,548,862 3,009,409 3,561,681 4,226,266 5,029,069 6,002,885
Sources: Computed from 1998 and 2017 census data of the Pakistan Bureau of Statistics. United Nations, Department of Economic and Social Affairs, Population Division
(2019). World Population Prospects 2019, Online Edition. Rev. 1.
Notes: Average growth rate for the medium and low variants means the average from 2017 to 2045, but calculated with different quinquennial rates computed according to
parameters in the national model. Calculations for the medium and low variants used parameters proportional to the national model calculated by the United Nations
Population Division, starting with the intercensal growth rates calculated by the Pakistan Bureau of Statistics for that area, Population projections are made on the
basis of Union Council level population results from each census, and therefore, are more precise than applying an average growth rate to the whole.
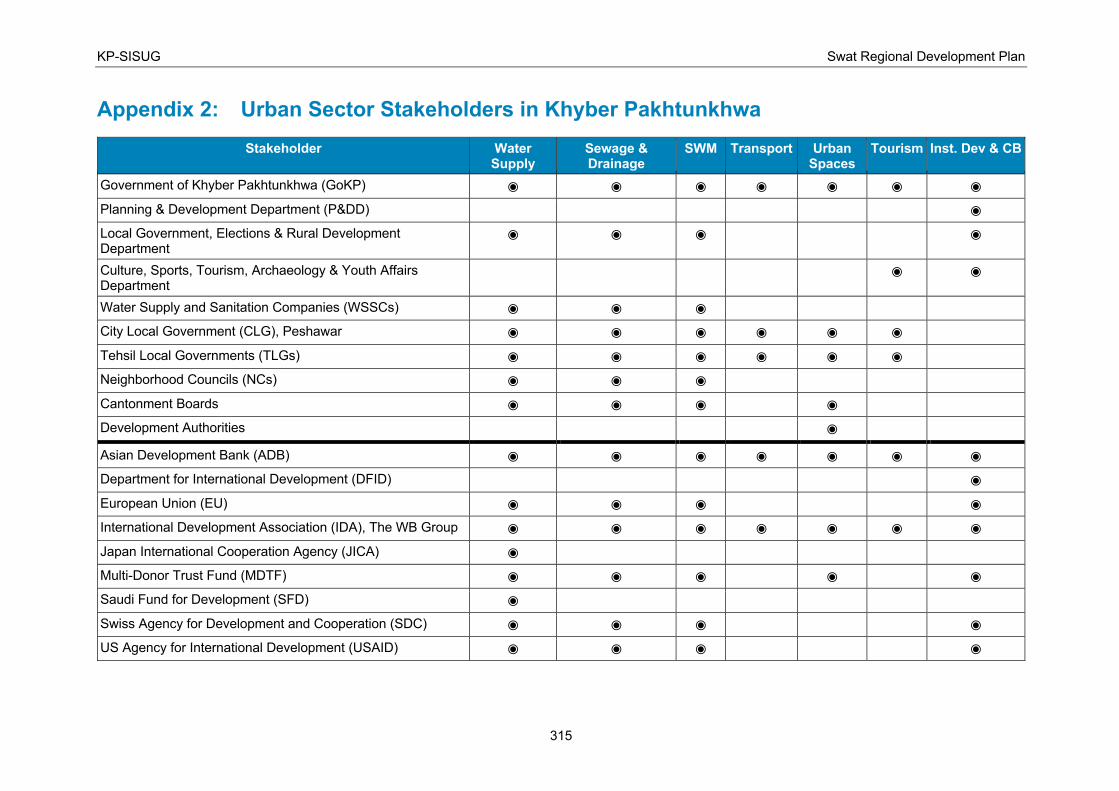
KP-SISUG Swat Regional Development Plan
315
Appendix 2: Urban Sector Stakeholders in Khyber Pakhtunkhwa
Stakeholder Water Supply
Sewage & Drainage
SWM Transport Urban Spaces
Tourism Inst. Dev & CB
Government of Khyber Pakhtunkhwa (GoKP) ◉ ◉ ◉ ◉ ◉ ◉ ◉
Planning & Development Department (P&DD) ◉
Local Government, Elections & Rural Development Department
◉ ◉ ◉ ◉
Culture, Sports, Tourism, Archaeology & Youth Affairs Department
◉ ◉
Water Supply and Sanitation Companies (WSSCs) ◉ ◉ ◉
City Local Government (CLG), Peshawar ◉ ◉ ◉ ◉ ◉ ◉
Tehsil Local Governments (TLGs) ◉ ◉ ◉ ◉ ◉ ◉
Neighborhood Councils (NCs) ◉ ◉ ◉
Cantonment Boards ◉ ◉ ◉ ◉
Development Authorities ◉
Asian Development Bank (ADB) ◉ ◉ ◉ ◉ ◉ ◉ ◉
Department for International Development (DFID) ◉
European Union (EU) ◉ ◉ ◉ ◉
International Development Association (IDA), The WB Group ◉ ◉ ◉ ◉ ◉ ◉ ◉
Japan International Cooperation Agency (JICA) ◉
Multi-Donor Trust Fund (MDTF) ◉ ◉ ◉ ◉ ◉
Saudi Fund for Development (SFD) ◉
Swiss Agency for Development and Cooperation (SDC) ◉ ◉ ◉ ◉
US Agency for International Development (USAID) ◉ ◉ ◉ ◉
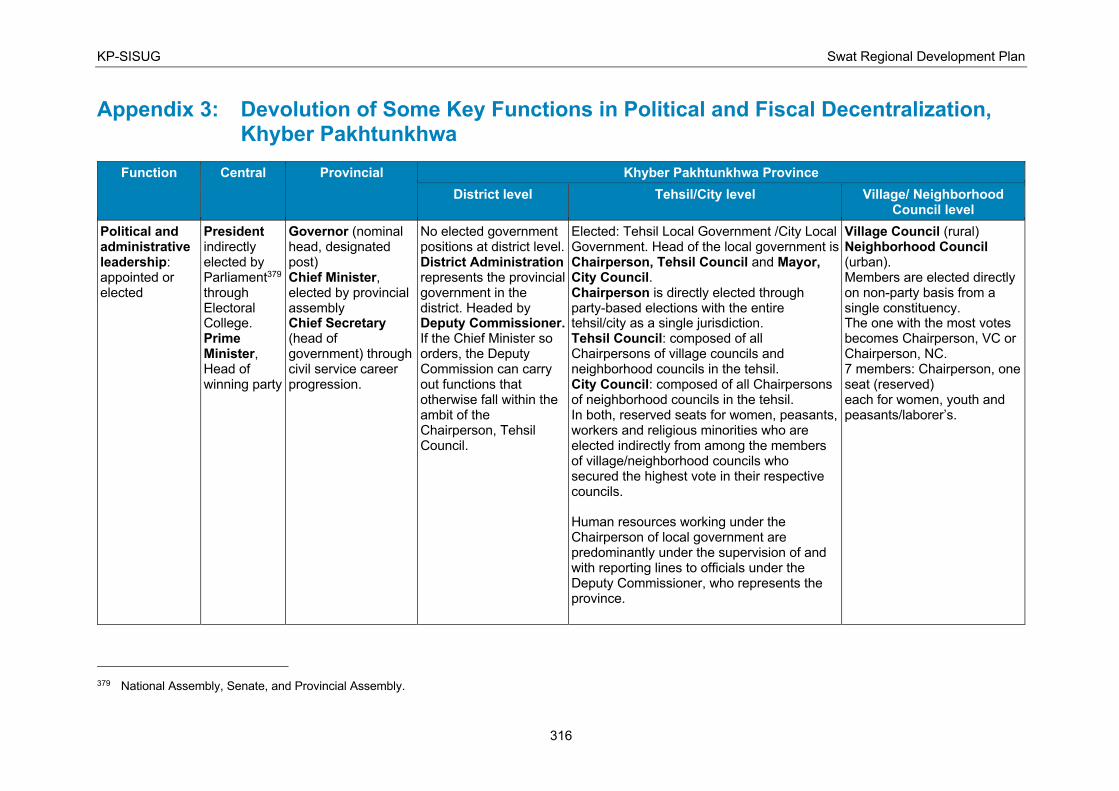
KP-SISUG Swat Regional Development Plan
316
Appendix 3: Devolution of Some Key Functions in Political and Fiscal Decentralization, Khyber Pakhtunkhwa
Function Central Provincial Khyber Pakhtunkhwa Province
District level Tehsil/City level Village/ Neighborhood Council level
Political and administrative leadership: appointed or elected
President indirectly elected by Parliament379 through Electoral College. Prime Minister, Head of winning party
Governor (nominal head, designated post) Chief Minister, elected by provincial assembly Chief Secretary (head of government) through civil service career progression.
No elected government positions at district level. District Administration represents the provincial government in the district. Headed by Deputy Commissioner. If the Chief Minister so orders, the Deputy Commission can carry out functions that otherwise fall within the ambit of the Chairperson, Tehsil Council.
Elected: Tehsil Local Government /City Local Government. Head of the local government is Chairperson, Tehsil Council and Mayor, City Council. Chairperson is directly elected through party-based elections with the entire tehsil/city as a single jurisdiction. Tehsil Council: composed of all Chairpersons of village councils and neighborhood councils in the tehsil. City Council: composed of all Chairpersons of neighborhood councils in the tehsil. In both, reserved seats for women, peasants, workers and religious minorities who are elected indirectly from among the members of village/neighborhood councils who secured the highest vote in their respective councils. Human resources working under the Chairperson of local government are predominantly under the supervision of and with reporting lines to officials under the Deputy Commissioner, who represents the province.
Village Council (rural) Neighborhood Council (urban). Members are elected directly on non-party basis from a single constituency. The one with the most votes becomes Chairperson, VC or Chairperson, NC. 7 members: Chairperson, one seat (reserved) each for women, youth and peasants/laborer’s.
379 National Assembly, Senate, and Provincial Assembly.
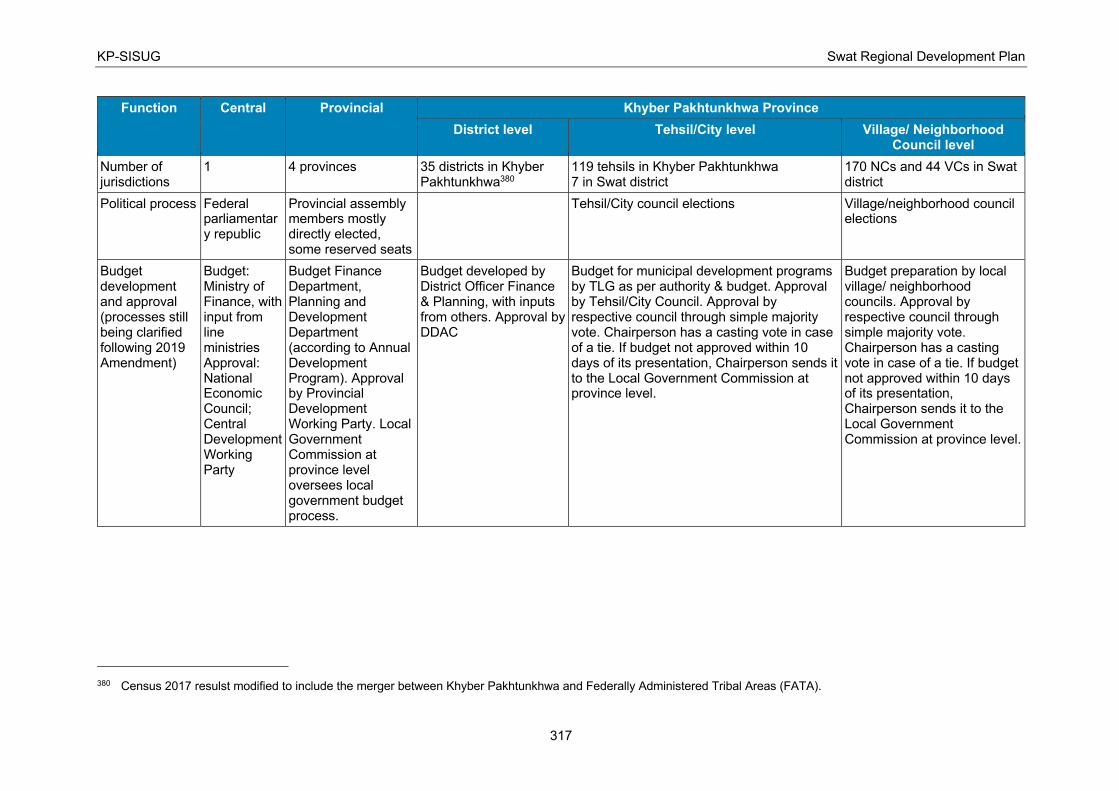
KP-SISUG Swat Regional Development Plan
317
Function Central Provincial Khyber Pakhtunkhwa Province
District level Tehsil/City level Village/ Neighborhood Council level
Number of jurisdictions
1 4 provinces 35 districts in Khyber Pakhtunkhwa380
119 tehsils in Khyber Pakhtunkhwa 7 in Swat district
170 NCs and 44 VCs in Swat district
Political process Federal parliamentary republic
Provincial assembly members mostly directly elected, some reserved seats
Tehsil/City council elections Village/neighborhood council elections
Budget development and approval (processes still being clarified following 2019 Amendment)
Budget: Ministry of Finance, with input from line ministries Approval: National Economic Council; Central Development Working Party
Budget Finance Department, Planning and Development Department (according to Annual Development Program). Approval by Provincial Development Working Party. Local Government Commission at province level oversees local government budget process.
Budget developed by District Officer Finance & Planning, with inputs from others. Approval by DDAC
Budget for municipal development programs by TLG as per authority & budget. Approval by Tehsil/City Council. Approval by respective council through simple majority vote. Chairperson has a casting vote in case of a tie. If budget not approved within 10 days of its presentation, Chairperson sends it to the Local Government Commission at province level.
Budget preparation by local village/ neighborhood councils. Approval by respective council through simple majority vote. Chairperson has a casting vote in case of a tie. If budget not approved within 10 days of its presentation, Chairperson sends it to the Local Government Commission at province level.
380 Census 2017 resulst modified to include the merger between Khyber Pakhtunkhwa and Federally Administered Tribal Areas (FATA).
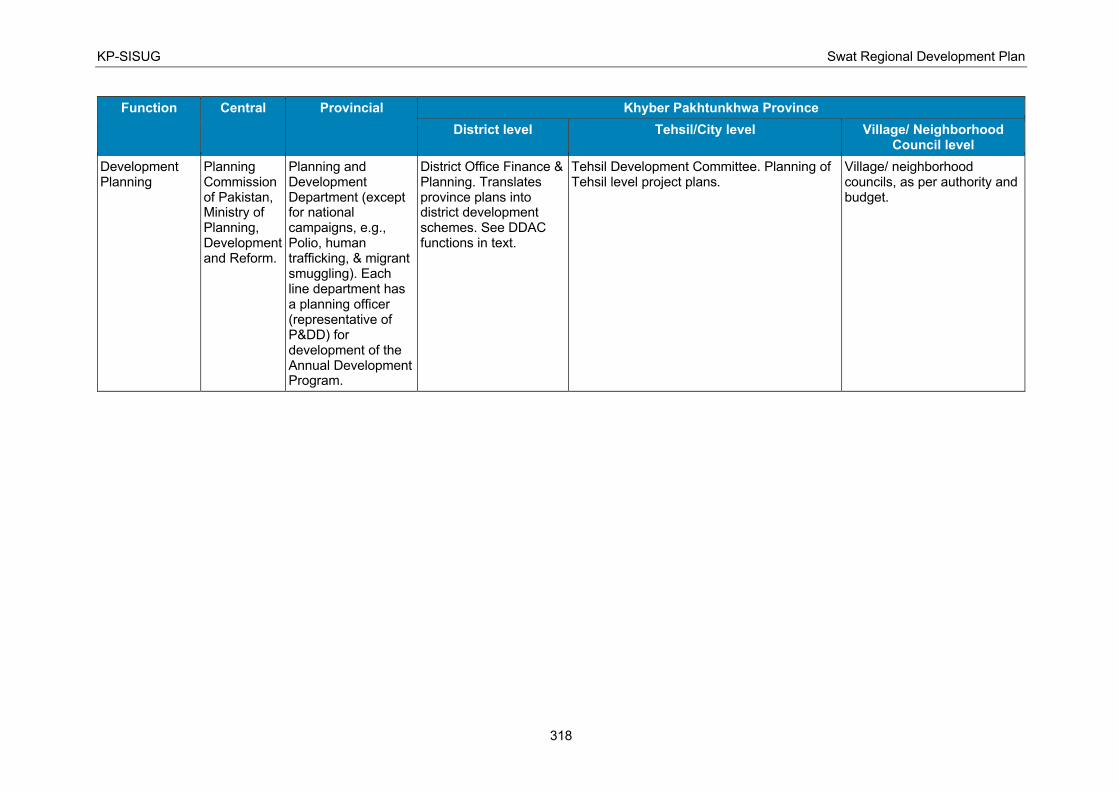
KP-SISUG Swat Regional Development Plan
318
Function Central Provincial Khyber Pakhtunkhwa Province
District level Tehsil/City level Village/ Neighborhood Council level
Development Planning
Planning Commission of Pakistan, Ministry of Planning, Development and Reform.
Planning and Development Department (except for national campaigns, e.g., Polio, human trafficking, & migrant smuggling). Each line department has a planning officer (representative of P&DD) for development of the Annual Development Program.
District Office Finance & Planning. Translates province plans into district development schemes. See DDAC functions in text.
Tehsil Development Committee. Planning of Tehsil level project plans.
Village/ neighborhood councils, as per authority and budget.
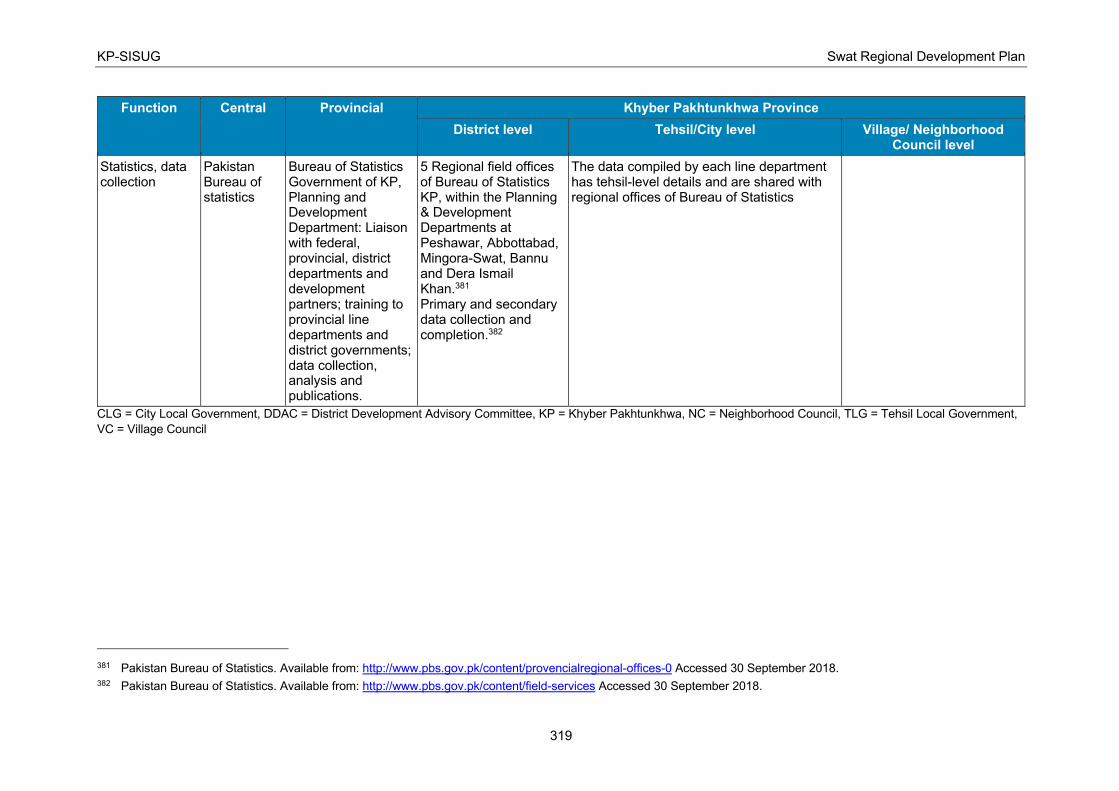
KP-SISUG Swat Regional Development Plan
319
Function Central Provincial Khyber Pakhtunkhwa Province
District level Tehsil/City level Village/ Neighborhood Council level
Statistics, data collection
Pakistan Bureau of statistics
Bureau of Statistics Government of KP, Planning and Development Department: Liaison with federal, provincial, district departments and development partners; training to provincial line departments and district governments; data collection, analysis and publications.
5 Regional field offices of Bureau of Statistics KP, within the Planning & Development Departments at Peshawar, Abbottabad, Mingora-Swat, Bannu and Dera Ismail Khan.381 Primary and secondary data collection and completion.382
The data compiled by each line department has tehsil-level details and are shared with regional offices of Bureau of Statistics
CLG = City Local Government, DDAC = District Development Advisory Committee, KP = Khyber Pakhtunkhwa, NC = Neighborhood Council, TLG = Tehsil Local Government,
VC = Village Council
381 Pakistan Bureau of Statistics. Available from: http://www.pbs.gov.pk/content/provencialregional-offices-0 Accessed 30 September 2018. 382 Pakistan Bureau of Statistics. Available from: http://www.pbs.gov.pk/content/field-services Accessed 30 September 2018.
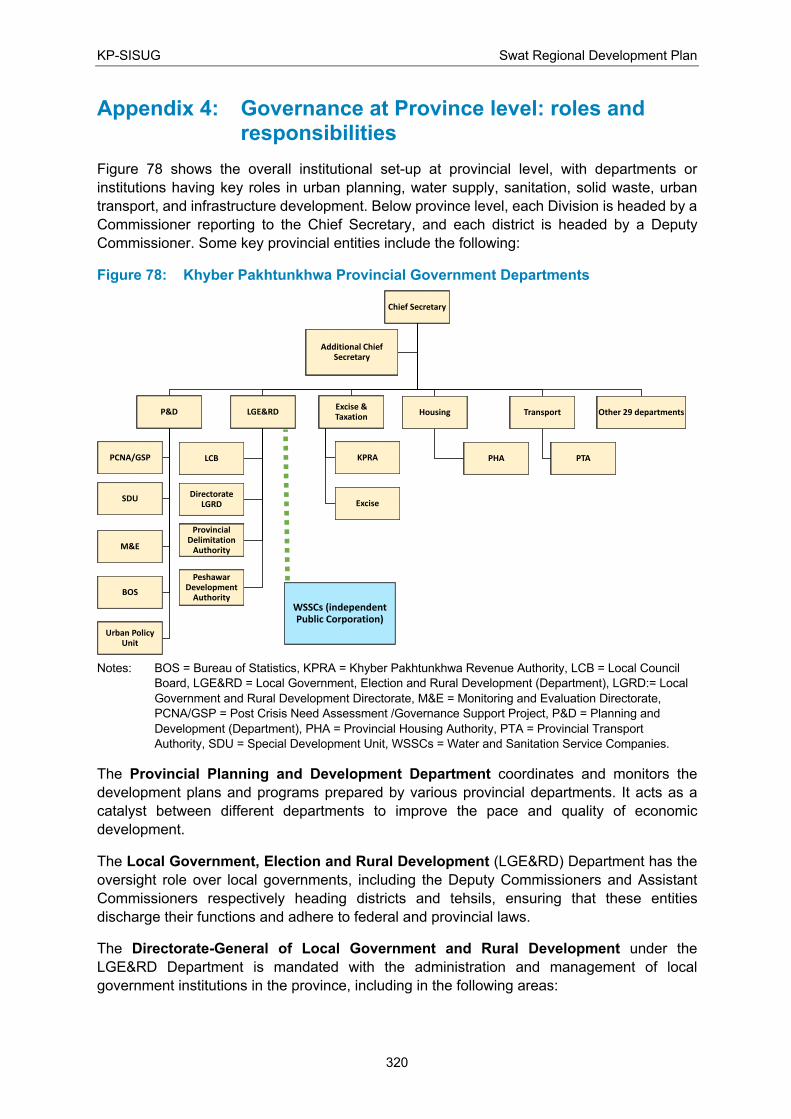
KP-SISUG Swat Regional Development Plan
320
Appendix 4: Governance at Province level: roles and responsibilities
Figure 78 shows the overall institutional set-up at provincial level, with departments or
institutions having key roles in urban planning, water supply, sanitation, solid waste, urban
transport, and infrastructure development. Below province level, each Division is headed by a
Commissioner reporting to the Chief Secretary, and each district is headed by a Deputy
Commissioner. Some key provincial entities include the following:
Figure 78: Khyber Pakhtunkhwa Provincial Government Departments
Notes: BOS = Bureau of Statistics, KPRA = Khyber Pakhtunkhwa Revenue Authority, LCB = Local Council
Board, LGE&RD = Local Government, Election and Rural Development (Department), LGRD:= Local
Government and Rural Development Directorate, M&E = Monitoring and Evaluation Directorate,
PCNA/GSP = Post Crisis Need Assessment /Governance Support Project, P&D = Planning and
Development (Department), PHA = Provincial Housing Authority, PTA = Provincial Transport
Authority, SDU = Special Development Unit, WSSCs = Water and Sanitation Service Companies.
The Provincial Planning and Development Department coordinates and monitors the
development plans and programs prepared by various provincial departments. It acts as a
catalyst between different departments to improve the pace and quality of economic
development.
The Local Government, Election and Rural Development (LGE&RD) Department has the
oversight role over local governments, including the Deputy Commissioners and Assistant
Commissioners respectively heading districts and tehsils, ensuring that these entities
discharge their functions and adhere to federal and provincial laws.
The Directorate-General of Local Government and Rural Development under the
LGE&RD Department is mandated with the administration and management of local
government institutions in the province, including in the following areas:
Chief Secretary
P&D
SDU
M&E
BOS
Urban Policy Unit
PCNA/GSP
LGE&RD
Provincial Delimitation
Authority
Peshawar Development
Authority
LCB
Directorate LGRD
Excise & Taxation
KPRA
Excise
Housing
PHA
Transport
PTA
Other 29 departments
Additional Chief Secretary
WSSCs (independent Public Corporation)
KP-SISUG Swat Regional Development Plan
321
• Oversight, monitoring, evaluation, and supervision of local development schemes,
donor-funded development programs, and all umbrella and individual development
schemes and programs in the Provincial ADP.
• Implementation of laws and regulations relating to local governance in the province.
• Coordination among various departments and field offices.
• Monitoring and supervision of the functioning of village councils, including birth, death
and marriages registration.
The Local Council Board is mandated with oversight of the administration of local council
services and local councils at district and tehsil/town level.
The Provincial Delimitation Authority has the mandate to establish the boundaries of village
councils, neighborhood councils and territorial wards for general seats in local government
elections.
The Excise, Taxation, and Narcotics Control Department383 is primarily engaged in
collection of various provincial taxes, duties, fees, and cess items.
The Transport Department384 aims to connect the central industrial regions with less-
developed areas of the province, promote public-private partnerships for new investments in
roads and infrastructure, upgrade and maintain existing road and highway networks, extend
railway services to the northern parts of the province, improve road connectivity to railway
stations to facilitate passenger and freight traffic, construct trucking terminals at Peshawar,
Dera Ismail Khan and Havelian to meet the needs of the trucking sector for the next 30 years,
and introduce a mass transit system in Peshawar and other big cities in Khyber Pakhtunkhwa.
The Housing Department and its field arm Provincial Housing Authority aim to provide the
public and civil servants with affordable housing, through urban growth policies, land
acquisition, the development of plots and housing units, implementation of area development
schemes, new townships, and housing loans and investments. The execution of schemes is
on a deposit works basis.385
Appendix 3 provides an overview of selected roles and functions.
383 Excise, Taxation and Narcotics Control Department. Available from: http://www.kpexcise.gov.pk/ Accessed 24
August 2020. 384 The KP Government established an independent Transport Department in September 2008. 385 The term "Deposit Work" is applied to works of construction or repair, the cost of which is met, not out of
Housing Department funds in this case, but out of funds from other sources. Works executed by the Department for other Government Departments, municipalities and other local bodies, and private firms and individuals fall under this category.
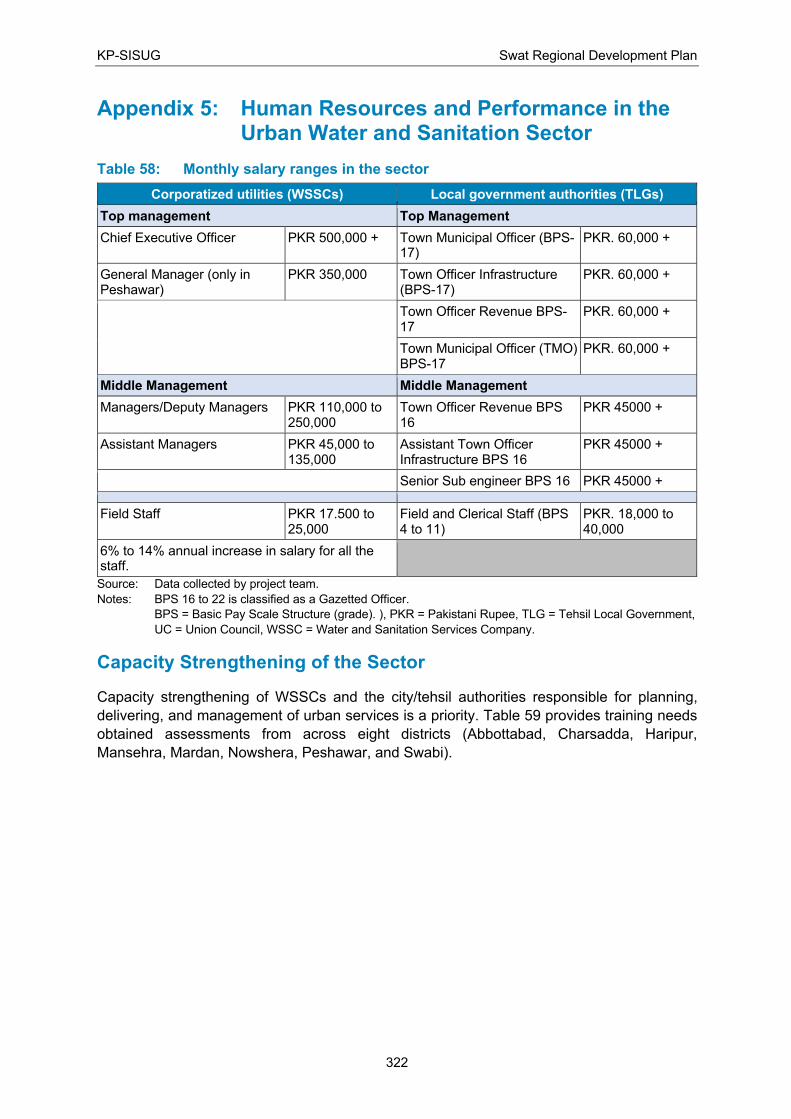
KP-SISUG Swat Regional Development Plan
322
Appendix 5: Human Resources and Performance in the Urban Water and Sanitation Sector
Table 58: Monthly salary ranges in the sector
Corporatized utilities (WSSCs) Local government authorities (TLGs)
Top management Top Management
Chief Executive Officer PKR 500,000 + Town Municipal Officer (BPS-17)
PKR. 60,000 +
General Manager (only in Peshawar)
PKR 350,000 Town Officer Infrastructure (BPS-17)
PKR. 60,000 +
Town Officer Revenue BPS-17
PKR. 60,000 +
Town Municipal Officer (TMO) BPS-17
PKR. 60,000 +
Middle Management Middle Management
Managers/Deputy Managers PKR 110,000 to 250,000
Town Officer Revenue BPS 16
PKR 45000 +
Assistant Managers PKR 45,000 to 135,000
Assistant Town Officer Infrastructure BPS 16
PKR 45000 +
Senior Sub engineer BPS 16 PKR 45000 +
Field Staff PKR 17.500 to 25,000
Field and Clerical Staff (BPS 4 to 11)
PKR. 18,000 to 40,000
6% to 14% annual increase in salary for all the staff.
Source: Data collected by project team.
Notes: BPS 16 to 22 is classified as a Gazetted Officer.
BPS = Basic Pay Scale Structure (grade). ), PKR = Pakistani Rupee, TLG = Tehsil Local Government,
UC = Union Council, WSSC = Water and Sanitation Services Company.
Capacity Strengthening of the Sector
Capacity strengthening of WSSCs and the city/tehsil authorities responsible for planning,
delivering, and management of urban services is a priority. Table 59 provides training needs
obtained assessments from across eight districts (Abbottabad, Charsadda, Haripur,
Mansehra, Mardan, Nowshera, Peshawar, and Swabi).
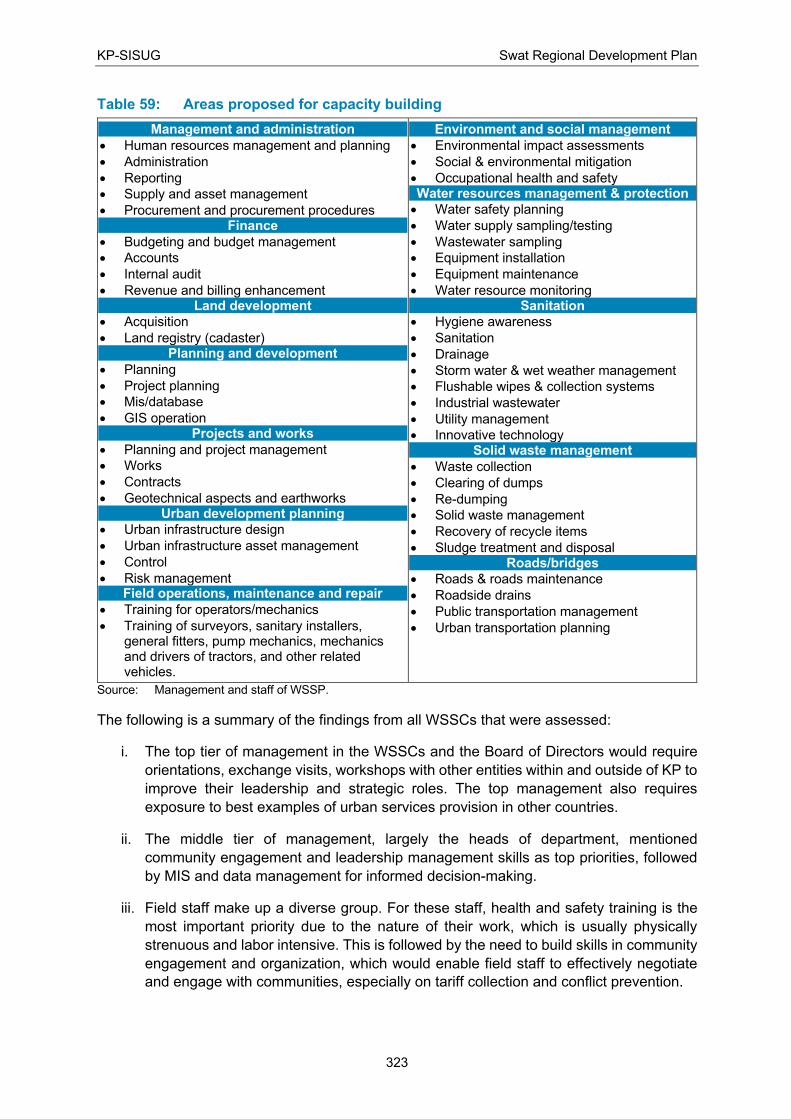
KP-SISUG Swat Regional Development Plan
323
Table 59: Areas proposed for capacity building
Management and administration
• Human resources management and planning
• Administration
• Reporting
• Supply and asset management
• Procurement and procurement procedures Finance
• Budgeting and budget management
• Accounts
• Internal audit
• Revenue and billing enhancement Land development
• Acquisition
• Land registry (cadaster) Planning and development
• Planning
• Project planning
• Mis/database
• GIS operation Projects and works
• Planning and project management
• Works
• Contracts
• Geotechnical aspects and earthworks Urban development planning
• Urban infrastructure design
• Urban infrastructure asset management
• Control
• Risk management Field operations, maintenance and repair
• Training for operators/mechanics
• Training of surveyors, sanitary installers, general fitters, pump mechanics, mechanics and drivers of tractors, and other related vehicles.
Environment and social management
• Environmental impact assessments
• Social & environmental mitigation
• Occupational health and safety Water resources management & protection
• Water safety planning
• Water supply sampling/testing
• Wastewater sampling
• Equipment installation
• Equipment maintenance
• Water resource monitoring Sanitation
• Hygiene awareness
• Sanitation
• Drainage
• Storm water & wet weather management
• Flushable wipes & collection systems
• Industrial wastewater
• Utility management
• Innovative technology Solid waste management
• Waste collection
• Clearing of dumps
• Re-dumping
• Solid waste management
• Recovery of recycle items
• Sludge treatment and disposal Roads/bridges
• Roads & roads maintenance
• Roadside drains
• Public transportation management
• Urban transportation planning
Source: Management and staff of WSSP.
The following is a summary of the findings from all WSSCs that were assessed:
i. The top tier of management in the WSSCs and the Board of Directors would require
orientations, exchange visits, workshops with other entities within and outside of KP to
improve their leadership and strategic roles. The top management also requires
exposure to best examples of urban services provision in other countries.
ii. The middle tier of management, largely the heads of department, mentioned
community engagement and leadership management skills as top priorities, followed
by MIS and data management for informed decision-making.
iii. Field staff make up a diverse group. For these staff, health and safety training is the
most important priority due to the nature of their work, which is usually physically
strenuous and labor intensive. This is followed by the need to build skills in community
engagement and organization, which would enable field staff to effectively negotiate
and engage with communities, especially on tariff collection and conflict prevention.
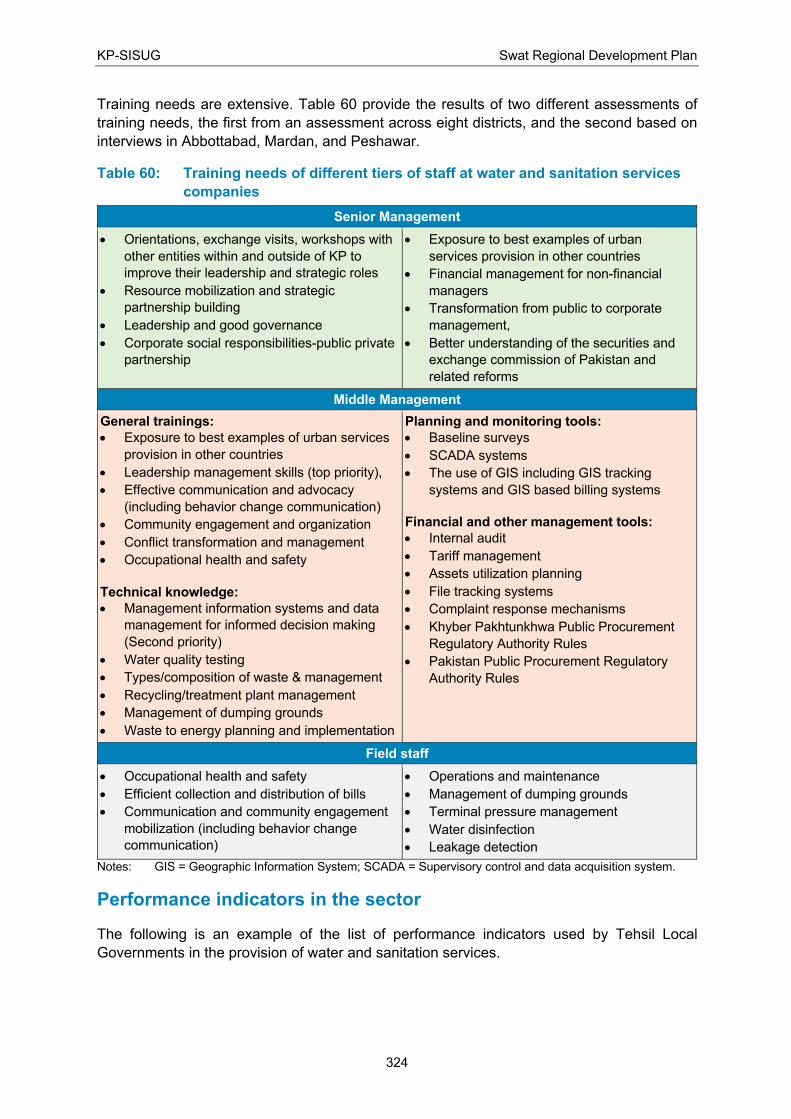
KP-SISUG Swat Regional Development Plan
324
Training needs are extensive. Table 60 provide the results of two different assessments of
training needs, the first from an assessment across eight districts, and the second based on
interviews in Abbottabad, Mardan, and Peshawar.
Table 60: Training needs of different tiers of staff at water and sanitation services
companies
Senior Management
• Orientations, exchange visits, workshops with
other entities within and outside of KP to
improve their leadership and strategic roles
• Resource mobilization and strategic
partnership building
• Leadership and good governance
• Corporate social responsibilities-public private
partnership
• Exposure to best examples of urban
services provision in other countries
• Financial management for non-financial
managers
• Transformation from public to corporate
management,
• Better understanding of the securities and
exchange commission of Pakistan and
related reforms
Middle Management
General trainings:
• Exposure to best examples of urban services
provision in other countries
• Leadership management skills (top priority),
• Effective communication and advocacy
(including behavior change communication)
• Community engagement and organization
• Conflict transformation and management
• Occupational health and safety
Technical knowledge:
• Management information systems and data
management for informed decision making
(Second priority)
• Water quality testing
• Types/composition of waste & management
• Recycling/treatment plant management
• Management of dumping grounds
• Waste to energy planning and implementation
Planning and monitoring tools:
• Baseline surveys
• SCADA systems
• The use of GIS including GIS tracking
systems and GIS based billing systems
Financial and other management tools:
• Internal audit
• Tariff management
• Assets utilization planning
• File tracking systems
• Complaint response mechanisms
• Khyber Pakhtunkhwa Public Procurement
Regulatory Authority Rules
• Pakistan Public Procurement Regulatory
Authority Rules
Field staff
• Occupational health and safety
• Efficient collection and distribution of bills
• Communication and community engagement
mobilization (including behavior change
communication)
• Operations and maintenance
• Management of dumping grounds
• Terminal pressure management
• Water disinfection
• Leakage detection
Notes: GIS = Geographic Information System; SCADA = Supervisory control and data acquisition system.
Performance indicators in the sector
The following is an example of the list of performance indicators used by Tehsil Local
Governments in the provision of water and sanitation services.

KP-SISUG Swat Regional Development Plan
325
Table 61: Key performance indicators used in the sector by TLGs
Category S# Key Performance Indicator
Income 1 Total Income (own source) (Million)
i. Total No, of own source contracts:
ii. Contracts run by contractor
iii. Contracts run by Departmental
2 Total Grants received (Million)
3 Income from 2% (Millions)
4 Total income from other sources (Million)
5 Total Fines under LG Act
6 Total fines cases sent to courts
7 Total fine amount (Millions PKR)
Expenditures 8 Salary expenses (million)
9 O&M expenses (million)
10 utilities expenses (million)
11 POL expenses (million)
12 other expenses (million)
Operations 13 Amount of solid waste generated (tons)
14 Amount of solid waste disposed (tons)
15 Liquid waste produced (MGD)
16 Liquid waste disposed (MGD)
17 Total household covered
Building Plan Approval 18 No. of building Plan NOCs received
19 No. of building Plan NOCs approved
20 No. of building plan NOCs pending
21 No. of building Plan NOCs rejected
Housing schemes 22 No. of housing schemes NOCs received
23 No. of housing schemes NOCs approved
24 No. of housing schemes NOCs pending
25 No. of housing schemes NOCs rejected
Assets 26 Total Offices (BPS17 and above)
27 Total officials (BPS16 and below)
28 Total Vehicles for official duties
29 Total waste collection vehicles
30 Total water supply vehicles
31 Total number of other machineries
Developmental 32 No. of schemes
i. Provincial ADP
ii. Tehsil ADP/30% PFC
iii. NGO Funded etc..
33 Total cost (million)
34 No. of schemes completed
35 Physical progress
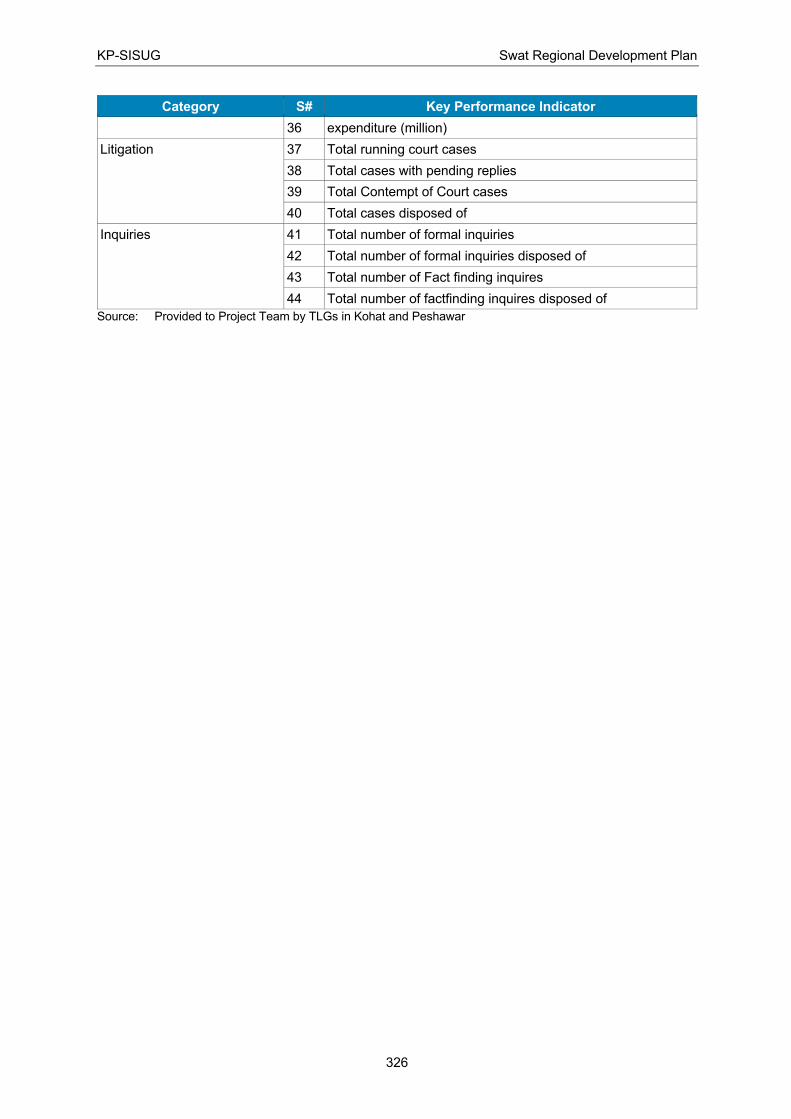
KP-SISUG Swat Regional Development Plan
326
Category S# Key Performance Indicator
36 expenditure (million)
Litigation 37 Total running court cases
38 Total cases with pending replies
39 Total Contempt of Court cases
40 Total cases disposed of
Inquiries 41 Total number of formal inquiries
42 Total number of formal inquiries disposed of
43 Total number of Fact finding inquires
44 Total number of factfinding inquires disposed of
Source: Provided to Project Team by TLGs in Kohat and Peshawar
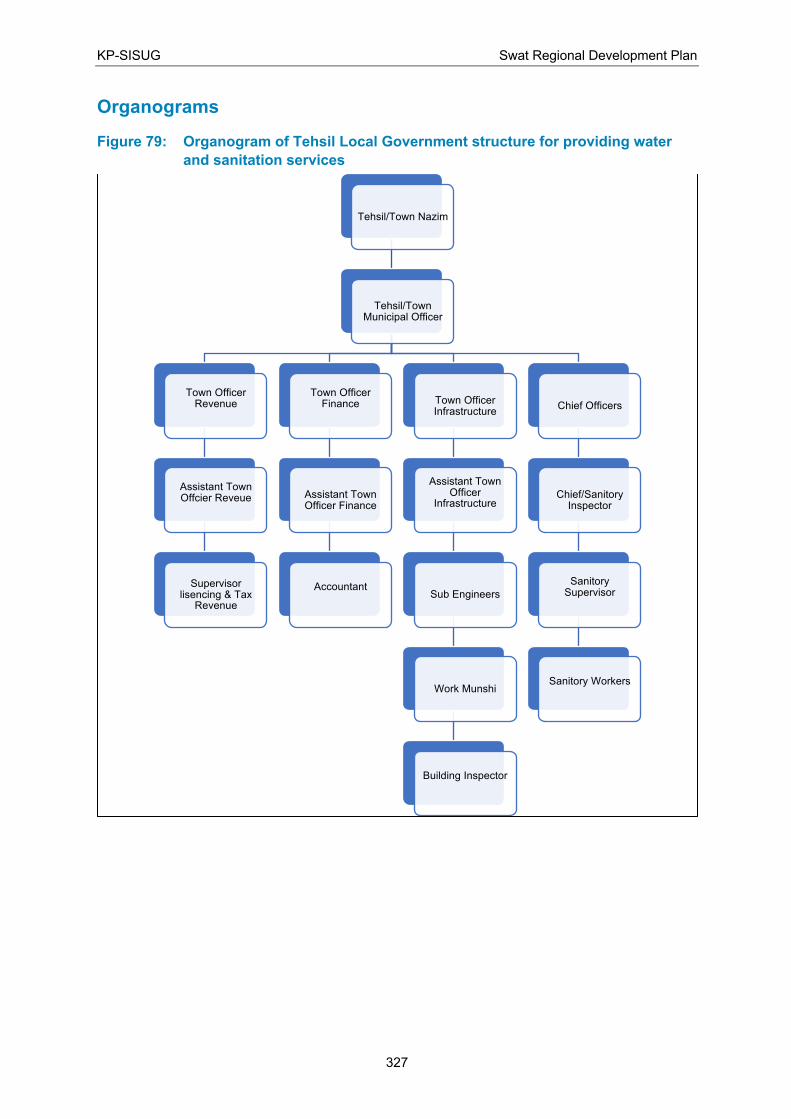
KP-SISUG Swat Regional Development Plan
327
Organograms
Figure 79: Organogram of Tehsil Local Government structure for providing water
and sanitation services
Tehsil/Town Nazim
Tehsil/Town Municipal Officer
Town Officer Revenue
Assistant Town Offcier Reveue
Supervisor lisencing & Tax
Revenue
Town Officer Finance
Assistant Town Officer Finance
Accountant
Town Officer Infrastructure
Assistant Town Officer
Infrastructure
Sub Engineers
Work Munshi
Building Inspector
Chief Officers
Chief/Sanitory Inspector
Sanitory Supervisor
Sanitory Workers
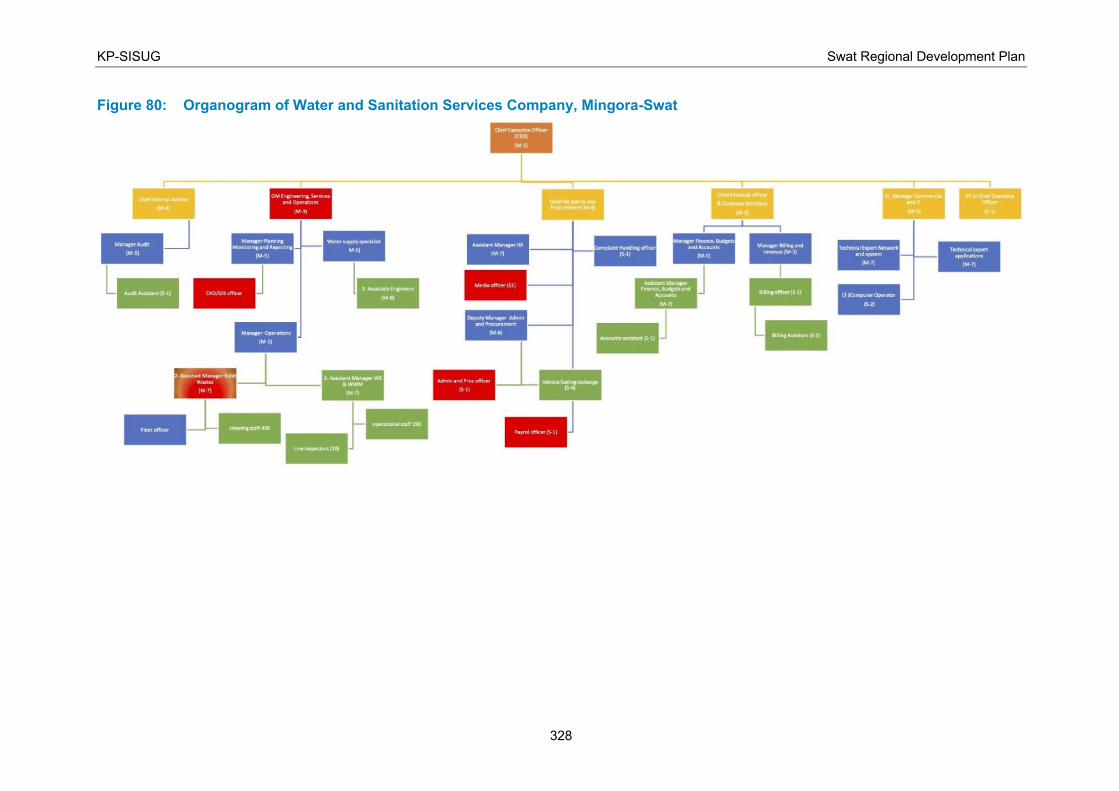
KP-SISUG Swat Regional Development Plan
328
Figure 80: Organogram of Water and Sanitation Services Company, Mingora-Swat
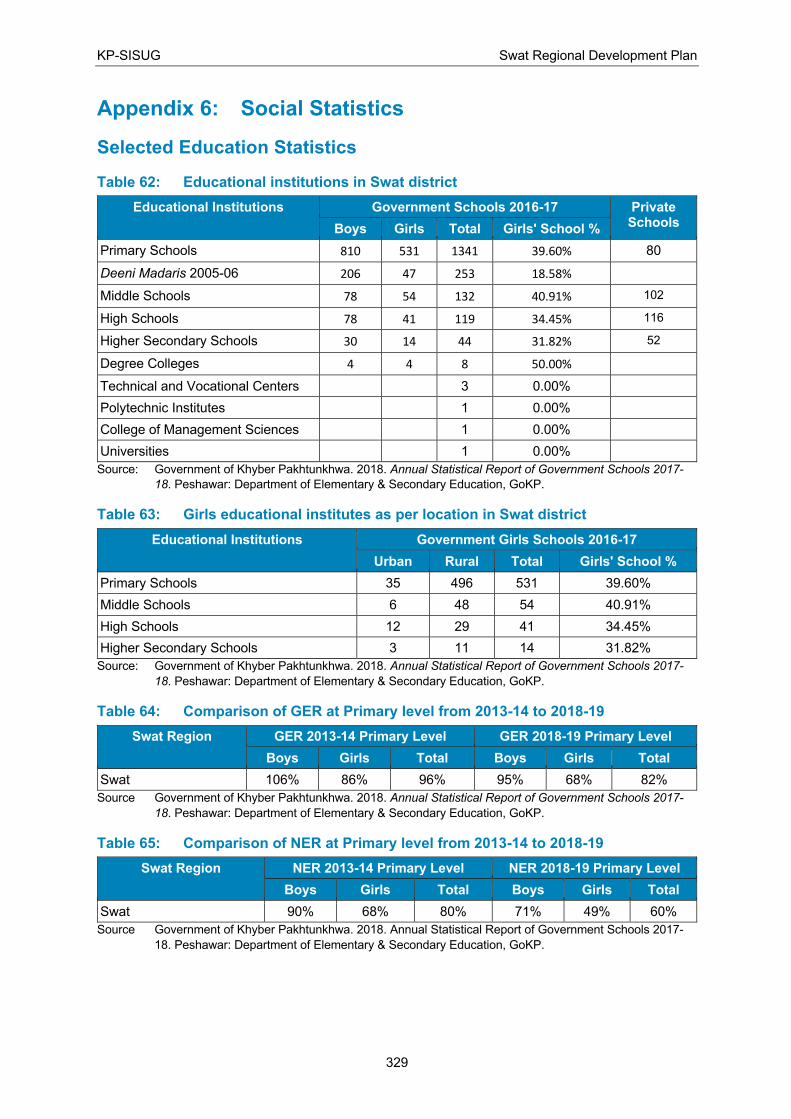
KP-SISUG Swat Regional Development Plan
329
Appendix 6: Social Statistics
Selected Education Statistics
Table 62: Educational institutions in Swat district
Educational Institutions Government Schools 2016-17 Private Schools
Boys Girls Total Girls' School %
Primary Schools 810 531 1341 39.60% 80
Deeni Madaris 2005-06 206 47 253 18.58%
Middle Schools 78 54 132 40.91% 102
High Schools 78 41 119 34.45% 116
Higher Secondary Schools 30 14 44 31.82% 52
Degree Colleges 4 4 8 50.00%
Technical and Vocational Centers
3 0.00%
Polytechnic Institutes
1 0.00%
College of Management Sciences
1 0.00%
Universities
1 0.00%
Source: Government of Khyber Pakhtunkhwa. 2018. Annual Statistical Report of Government Schools 2017-
18. Peshawar: Department of Elementary & Secondary Education, GoKP.
Table 63: Girls educational institutes as per location in Swat district
Educational Institutions Government Girls Schools 2016-17
Urban Rural Total Girls' School %
Primary Schools 35 496 531 39.60%
Middle Schools 6 48 54 40.91%
High Schools 12 29 41 34.45%
Higher Secondary Schools 3 11 14 31.82%
Source: Government of Khyber Pakhtunkhwa. 2018. Annual Statistical Report of Government Schools 2017-
18. Peshawar: Department of Elementary & Secondary Education, GoKP.
Table 64: Comparison of GER at Primary level from 2013-14 to 2018-19
Swat Region GER 2013-14 Primary Level GER 2018-19 Primary Level
Boys Girls Total Boys Girls Total
Swat 106% 86% 96% 95% 68% 82%
Source Government of Khyber Pakhtunkhwa. 2018. Annual Statistical Report of Government Schools 2017-
18. Peshawar: Department of Elementary & Secondary Education, GoKP.
Table 65: Comparison of NER at Primary level from 2013-14 to 2018-19
Swat Region NER 2013-14 Primary Level NER 2018-19 Primary Level
Boys Girls Total Boys Girls Total
Swat 90% 68% 80% 71% 49% 60%
Source Government of Khyber Pakhtunkhwa. 2018. Annual Statistical Report of Government Schools 2017-
18. Peshawar: Department of Elementary & Secondary Education, GoKP.
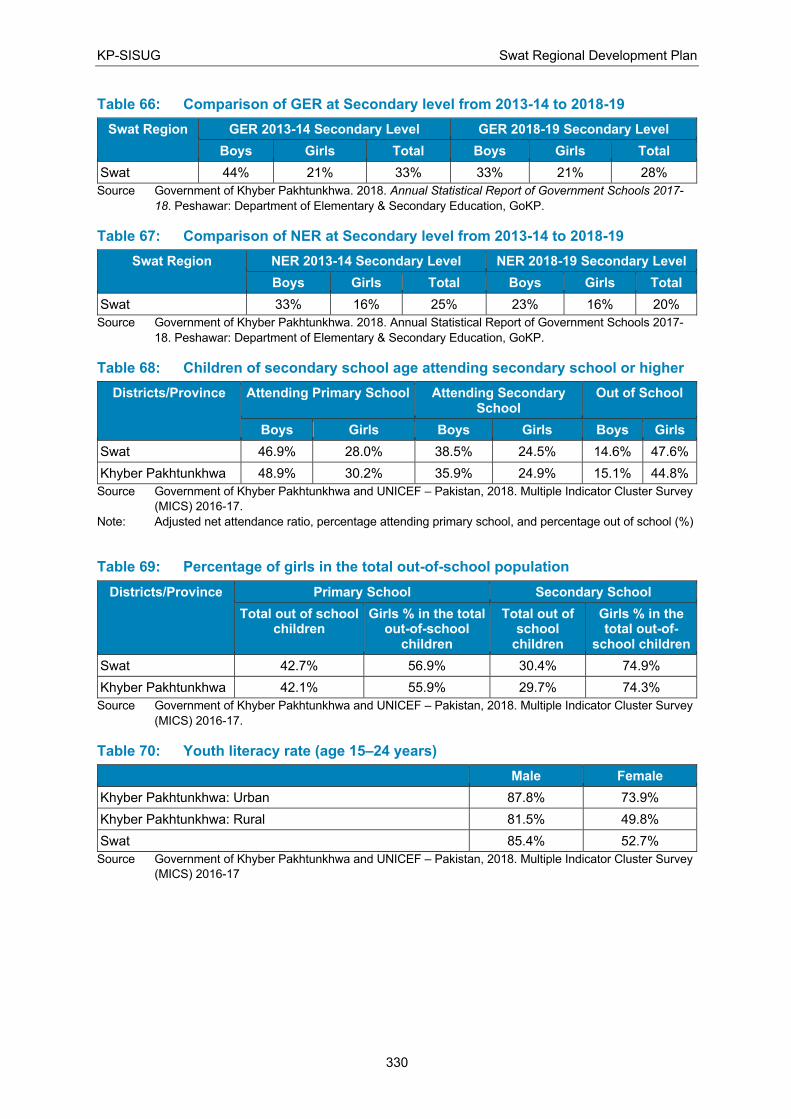
KP-SISUG Swat Regional Development Plan
330
Table 66: Comparison of GER at Secondary level from 2013-14 to 2018-19
Swat Region GER 2013-14 Secondary Level GER 2018-19 Secondary Level
Boys Girls Total Boys Girls Total
Swat 44% 21% 33% 33% 21% 28%
Source Government of Khyber Pakhtunkhwa. 2018. Annual Statistical Report of Government Schools 2017-
18. Peshawar: Department of Elementary & Secondary Education, GoKP.
Table 67: Comparison of NER at Secondary level from 2013-14 to 2018-19
Swat Region NER 2013-14 Secondary Level NER 2018-19 Secondary Level
Boys Girls Total Boys Girls Total
Swat 33% 16% 25% 23% 16% 20%
Source Government of Khyber Pakhtunkhwa. 2018. Annual Statistical Report of Government Schools 2017-
18. Peshawar: Department of Elementary & Secondary Education, GoKP.
Table 68: Children of secondary school age attending secondary school or higher
Districts/Province Attending Primary School Attending Secondary School
Out of School
Boys Girls Boys Girls Boys Girls
Swat 46.9% 28.0% 38.5% 24.5% 14.6% 47.6%
Khyber Pakhtunkhwa 48.9% 30.2% 35.9% 24.9% 15.1% 44.8%
Source Government of Khyber Pakhtunkhwa and UNICEF – Pakistan, 2018. Multiple Indicator Cluster Survey
(MICS) 2016-17.
Note: Adjusted net attendance ratio, percentage attending primary school, and percentage out of school (%)
Table 69: Percentage of girls in the total out-of-school population
Districts/Province Primary School Secondary School
Total out of school children
Girls % in the total out-of-school
children
Total out of school
children
Girls % in the total out-of-
school children
Swat 42.7% 56.9% 30.4% 74.9%
Khyber Pakhtunkhwa 42.1% 55.9% 29.7% 74.3%
Source Government of Khyber Pakhtunkhwa and UNICEF – Pakistan, 2018. Multiple Indicator Cluster Survey
(MICS) 2016-17.
Table 70: Youth literacy rate (age 15–24 years)
Male Female
Khyber Pakhtunkhwa: Urban 87.8% 73.9%
Khyber Pakhtunkhwa: Rural 81.5% 49.8%
Swat 85.4% 52.7%
Source Government of Khyber Pakhtunkhwa and UNICEF – Pakistan, 2018. Multiple Indicator Cluster Survey
(MICS) 2016-17
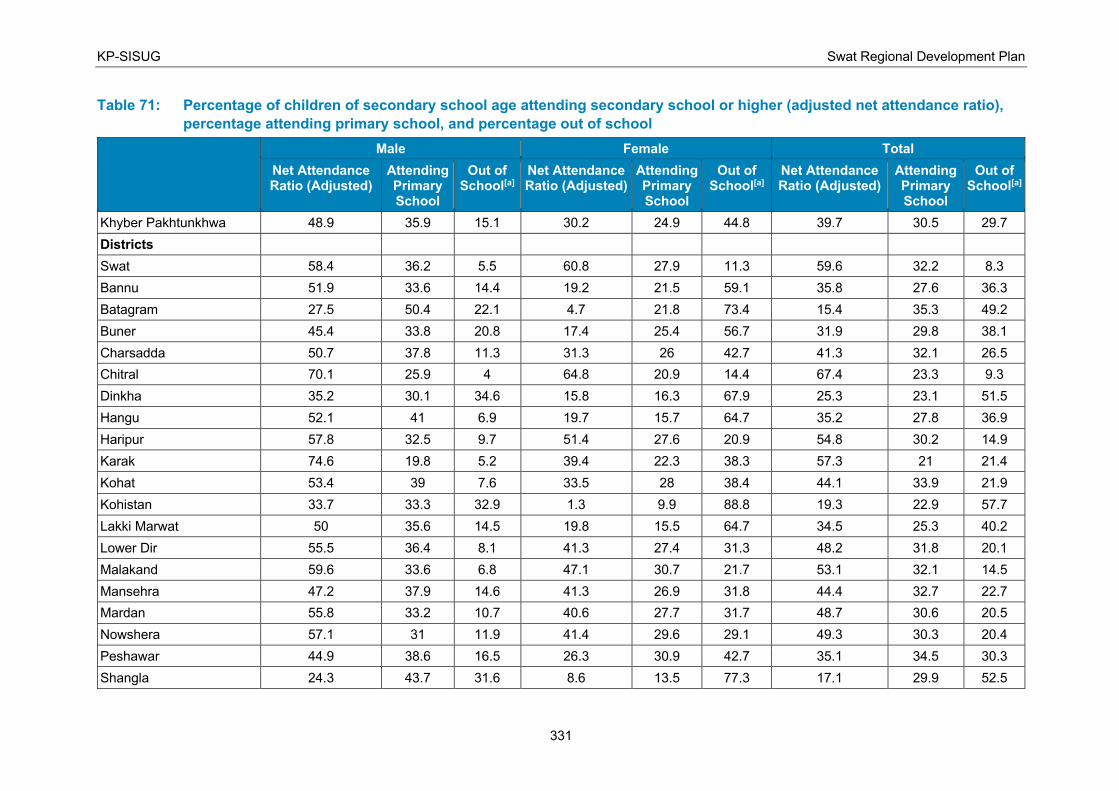
KP-SISUG Swat Regional Development Plan
331
Table 71: Percentage of children of secondary school age attending secondary school or higher (adjusted net attendance ratio),
percentage attending primary school, and percentage out of school
Male Female Total
Net Attendance Ratio (Adjusted)
Attending Primary School
Out of School[a]
Net Attendance Ratio (Adjusted)
Attending Primary School
Out of School[a]
Net Attendance Ratio (Adjusted)
Attending Primary School
Out of School[a]
Khyber Pakhtunkhwa 48.9 35.9 15.1 30.2 24.9 44.8 39.7 30.5 29.7
Districts
Swat 58.4 36.2 5.5 60.8 27.9 11.3 59.6 32.2 8.3
Bannu 51.9 33.6 14.4 19.2 21.5 59.1 35.8 27.6 36.3
Batagram 27.5 50.4 22.1 4.7 21.8 73.4 15.4 35.3 49.2
Buner 45.4 33.8 20.8 17.4 25.4 56.7 31.9 29.8 38.1
Charsadda 50.7 37.8 11.3 31.3 26 42.7 41.3 32.1 26.5
Chitral 70.1 25.9 4 64.8 20.9 14.4 67.4 23.3 9.3
Dinkha 35.2 30.1 34.6 15.8 16.3 67.9 25.3 23.1 51.5
Hangu 52.1 41 6.9 19.7 15.7 64.7 35.2 27.8 36.9
Haripur 57.8 32.5 9.7 51.4 27.6 20.9 54.8 30.2 14.9
Karak 74.6 19.8 5.2 39.4 22.3 38.3 57.3 21 21.4
Kohat 53.4 39 7.6 33.5 28 38.4 44.1 33.9 21.9
Kohistan 33.7 33.3 32.9 1.3 9.9 88.8 19.3 22.9 57.7
Lakki Marwat 50 35.6 14.5 19.8 15.5 64.7 34.5 25.3 40.2
Lower Dir 55.5 36.4 8.1 41.3 27.4 31.3 48.2 31.8 20.1
Malakand 59.6 33.6 6.8 47.1 30.7 21.7 53.1 32.1 14.5
Mansehra 47.2 37.9 14.6 41.3 26.9 31.8 44.4 32.7 22.7
Mardan 55.8 33.2 10.7 40.6 27.7 31.7 48.7 30.6 20.5
Nowshera 57.1 31 11.9 41.4 29.6 29.1 49.3 30.3 20.4
Peshawar 44.9 38.6 16.5 26.3 30.9 42.7 35.1 34.5 30.3
Shangla 24.3 43.7 31.6 8.6 13.5 77.3 17.1 29.9 52.5
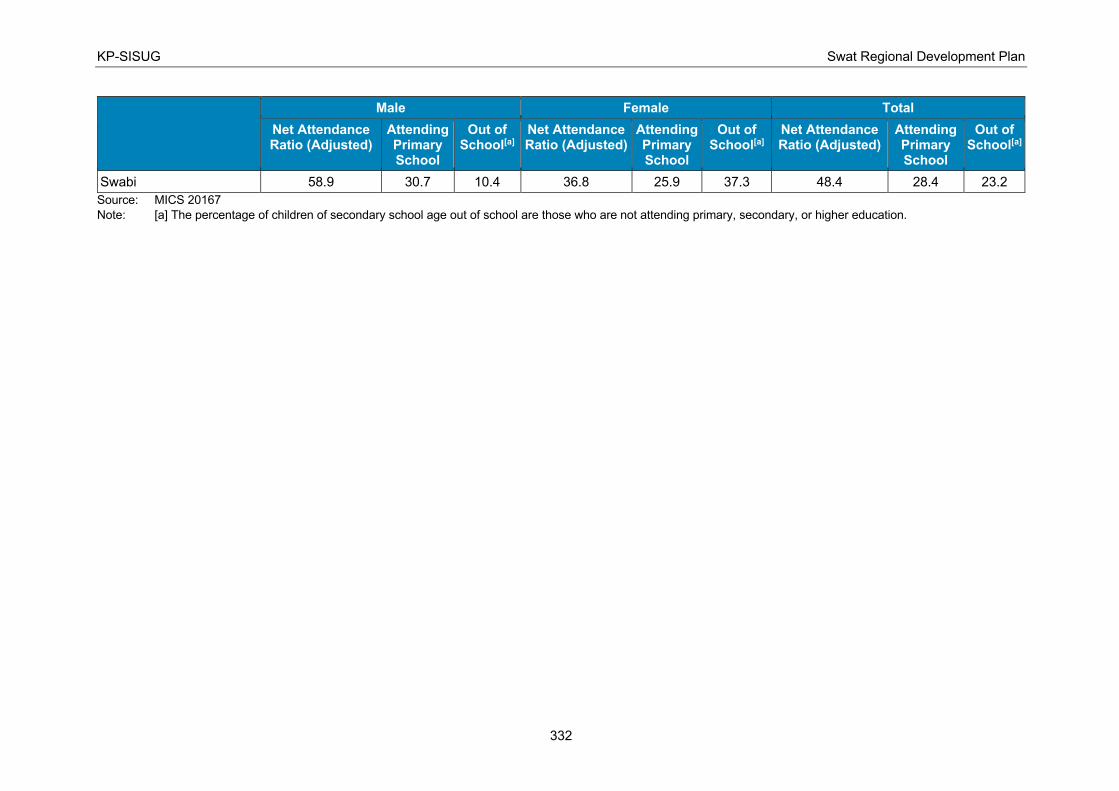
KP-SISUG Swat Regional Development Plan
332
Male Female Total
Net Attendance Ratio (Adjusted)
Attending Primary School
Out of School[a]
Net Attendance Ratio (Adjusted)
Attending Primary School
Out of School[a]
Net Attendance Ratio (Adjusted)
Attending Primary School
Out of School[a]
Swabi 58.9 30.7 10.4 36.8 25.9 37.3 48.4 28.4 23.2
Source: MICS 20167
Note: [a] The percentage of children of secondary school age out of school are those who are not attending primary, secondary, or higher education.
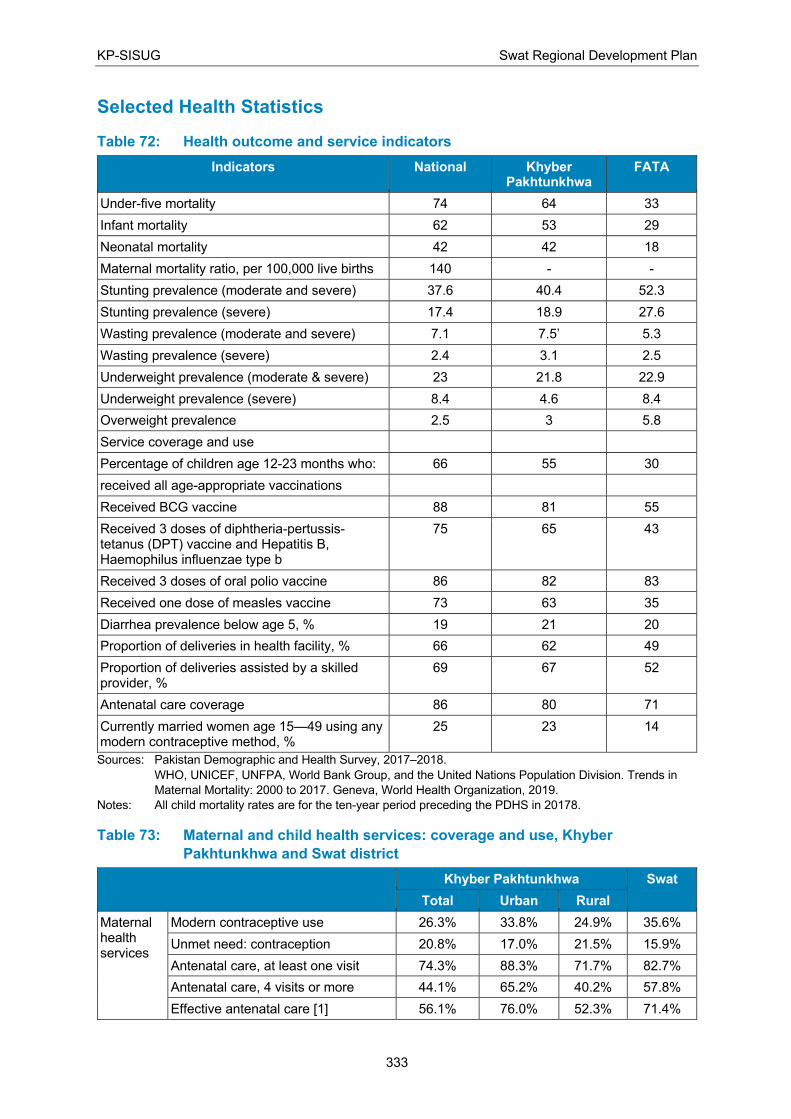
KP-SISUG Swat Regional Development Plan
333
Selected Health Statistics
Table 72: Health outcome and service indicators
Indicators National Khyber Pakhtunkhwa
FATA
Under-five mortality 74 64 33
Infant mortality 62 53 29
Neonatal mortality 42 42 18
Maternal mortality ratio, per 100,000 live births 140 - -
Stunting prevalence (moderate and severe) 37.6 40.4 52.3
Stunting prevalence (severe) 17.4 18.9 27.6
Wasting prevalence (moderate and severe) 7.1 7.5’ 5.3
Wasting prevalence (severe) 2.4 3.1 2.5
Underweight prevalence (moderate & severe) 23 21.8 22.9
Underweight prevalence (severe) 8.4 4.6 8.4
Overweight prevalence 2.5 3 5.8
Service coverage and use
Percentage of children age 12-23 months who: 66 55 30
received all age-appropriate vaccinations
Received BCG vaccine 88 81 55
Received 3 doses of diphtheria-pertussis-tetanus (DPT) vaccine and Hepatitis B, Haemophilus influenzae type b
75 65 43
Received 3 doses of oral polio vaccine 86 82 83
Received one dose of measles vaccine 73 63 35
Diarrhea prevalence below age 5, % 19 21 20
Proportion of deliveries in health facility, % 66 62 49
Proportion of deliveries assisted by a skilled provider, %
69 67 52
Antenatal care coverage 86 80 71
Currently married women age 15—49 using any modern contraceptive method, %
25 23 14
Sources: Pakistan Demographic and Health Survey, 2017–2018.
WHO, UNICEF, UNFPA, World Bank Group, and the United Nations Population Division. Trends in
Maternal Mortality: 2000 to 2017. Geneva, World Health Organization, 2019.
Notes: All child mortality rates are for the ten-year period preceding the PDHS in 20178.
Table 73: Maternal and child health services: coverage and use, Khyber
Pakhtunkhwa and Swat district
Khyber Pakhtunkhwa Swat
Total Urban Rural
Maternal health services
Modern contraceptive use 26.3% 33.8% 24.9% 35.6%
Unmet need: contraception 20.8% 17.0% 21.5% 15.9%
Antenatal care, at least one visit 74.3% 88.3% 71.7% 82.7%
Antenatal care, 4 visits or more 44.1% 65.2% 40.2% 57.8%
Effective antenatal care [1] 56.1% 76.0% 52.3% 71.4%
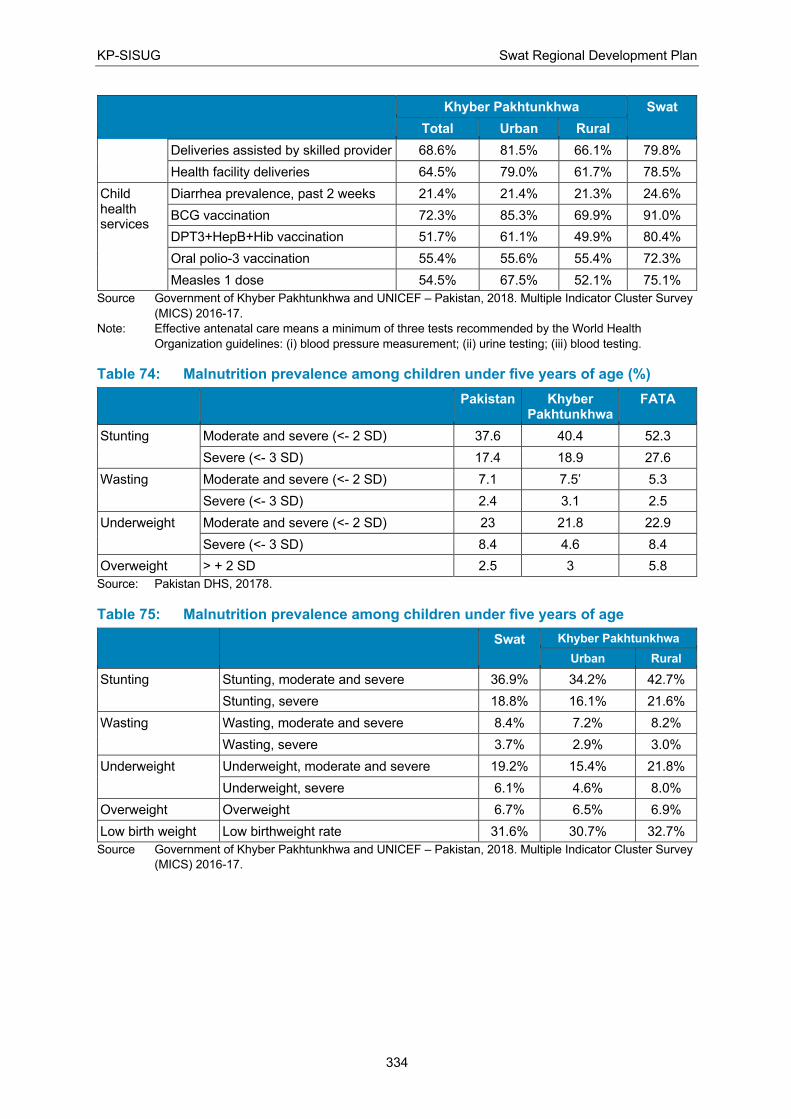
KP-SISUG Swat Regional Development Plan
334
Khyber Pakhtunkhwa Swat
Total Urban Rural
Deliveries assisted by skilled provider 68.6% 81.5% 66.1% 79.8%
Health facility deliveries 64.5% 79.0% 61.7% 78.5%
Child health services
Diarrhea prevalence, past 2 weeks 21.4% 21.4% 21.3% 24.6%
BCG vaccination 72.3% 85.3% 69.9% 91.0%
DPT3+HepB+Hib vaccination 51.7% 61.1% 49.9% 80.4%
Oral polio-3 vaccination 55.4% 55.6% 55.4% 72.3%
Measles 1 dose 54.5% 67.5% 52.1% 75.1%
Source Government of Khyber Pakhtunkhwa and UNICEF – Pakistan, 2018. Multiple Indicator Cluster Survey
(MICS) 2016-17.
Note: Effective antenatal care means a minimum of three tests recommended by the World Health
Organization guidelines: (i) blood pressure measurement; (ii) urine testing; (iii) blood testing.
Table 74: Malnutrition prevalence among children under five years of age (%)
Pakistan Khyber Pakhtunkhwa
FATA
Stunting Moderate and severe (<- 2 SD) 37.6 40.4 52.3
Severe (<- 3 SD) 17.4 18.9 27.6
Wasting Moderate and severe (<- 2 SD) 7.1 7.5’ 5.3
Severe (<- 3 SD) 2.4 3.1 2.5
Underweight Moderate and severe (<- 2 SD) 23 21.8 22.9
Severe (<- 3 SD) 8.4 4.6 8.4
Overweight > + 2 SD 2.5 3 5.8
Source: Pakistan DHS, 20178.
Table 75: Malnutrition prevalence among children under five years of age
Swat Khyber Pakhtunkhwa
Urban Rural
Stunting Stunting, moderate and severe 36.9% 34.2% 42.7%
Stunting, severe 18.8% 16.1% 21.6%
Wasting Wasting, moderate and severe 8.4% 7.2% 8.2%
Wasting, severe 3.7% 2.9% 3.0%
Underweight Underweight, moderate and severe 19.2% 15.4% 21.8%
Underweight, severe 6.1% 4.6% 8.0%
Overweight Overweight 6.7% 6.5% 6.9%
Low birth weight Low birthweight rate 31.6% 30.7% 32.7%
Source Government of Khyber Pakhtunkhwa and UNICEF – Pakistan, 2018. Multiple Indicator Cluster Survey
(MICS) 2016-17.
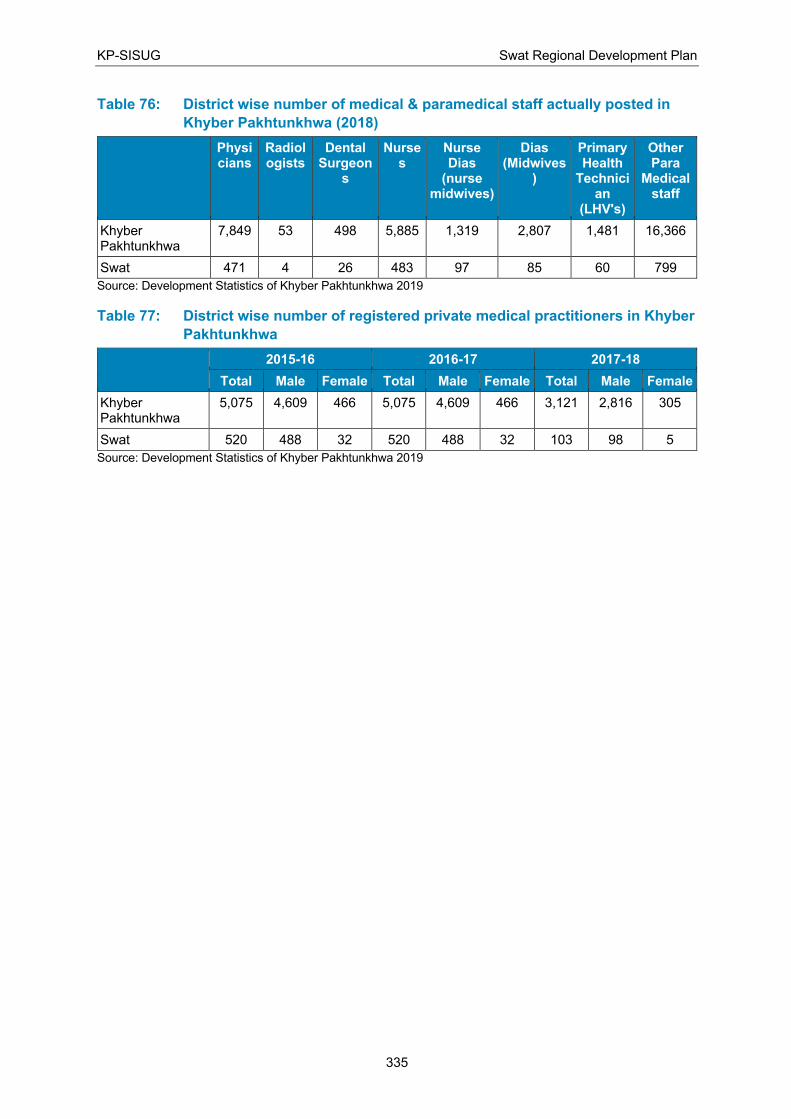
KP-SISUG Swat Regional Development Plan
335
Table 76: District wise number of medical & paramedical staff actually posted in
Khyber Pakhtunkhwa (2018)
Physicians
Radiologists
Dental Surgeon
s
Nurses
Nurse Dias
(nurse midwives)
Dias (Midwives
)
Primary Health
Technician
(LHV's)
Other Para
Medical staff
Khyber Pakhtunkhwa
7,849 53 498 5,885 1,319 2,807 1,481 16,366
Swat 471 4 26 483 97 85 60 799
Source: Development Statistics of Khyber Pakhtunkhwa 2019
Table 77: District wise number of registered private medical practitioners in Khyber
Pakhtunkhwa
2015-16 2016-17 2017-18
Total Male Female Total Male Female Total Male Female
Khyber Pakhtunkhwa
5,075 4,609 466 5,075 4,609 466 3,121 2,816 305
Swat 520 488 32 520 488 32 103 98 5
Source: Development Statistics of Khyber Pakhtunkhwa 2019
KP-SISUG Swat Regional Development Plan
336
Appendix 7: Excerpts from Services and Asset Management Agreement (SAMA)
Responsibilities of the WSSC
• Exclusive responsibility for planning, designing, construction, operation and
maintenance of water supply, sanitation, sewerage, drainage, fluid and solid waste
systems and allied services, including their enhancement and improvement.
• Managing all activities, facilities, programs, resources and spaces associated with
these services previously under the control of the tehsil municipal administration,
including machinery, tools and vehicles.
• Managing and supervising personnel, who had previously been delivering these
services under the auspices of the tehsil municipal administration.
• Promoting public awareness on the importance of water conservation, waste
reduction, resource recovery and the protection of the environment.
• Developing cost recovery measures such as fees and user charges, which the WSSC
can request the tehsil municipal administration to implement or which it can undertake
to implement on its own.
• Establishing standards of performance and ensuring compliance with such standards.
Responsibilities of the Tehsil Municipal Administration (TMA)386
• May assist and support the WSSC and suggest improvements in a non-intrusive
manner.
• Make timely payments for salaries and other allowances and payments of its
employees.
• Make transfers to the WSSC for pensions and reimbursements of medical charges for
retired regular employees of the TMA.
• Carry out regular promotion board meetings for those employees at the disposal of the
WSSC.
• Take appropriate actions to obtain the necessary amendments to existing laws, bye-
laws, regulations and son that would facilitate the WSSC achieving its objectives.
• Propose to the province an amendment of the Local Government Act which would
make the WSSC a “competent legal body for discharge of its devolved functions
independently;”
386 The TMA is now called the Tehsil Local Government (TLG).
KP-SISUG Swat Regional Development Plan
337
Responsibilities of the Province
• Act as the guarantor of the agreement, ensuring all parties perform their respective
duties in their true letter and spirit, with no force allowed to scuttle the free operations
of the WSSC with artificial or personal hindrances.
• Any dispute or difference between the WSSC and the TMA will be sent to the province
and resolved in accordance with the Arbitration Act, having regard to the new concept
of corporate governance as expressed in the agreement, and the decision shall be
final and binding; the same applies in the case of an alleged breach of the agreement,
in which case a financial penalty may also be awarded.
• Ensure that the amounts payable by the tehsil municipal administration to the WSSC
under the agreement are transferred.
• Continue to finance the activities of the WSSC related to the development and
maintenance of municipal services, capital, operational and establishment cost.
• Transfer funds to the WSSC based on an estimate of financial requirements for the
financial year prepared by the WSSC.
Further Financial Provisions
• In the first year, the remaining budget for the performance of water supply, sanitation,
solid waste management and hygiene services that was in the tehsil municipal
administration’s account was to be transferred to the WSSC, minus any amount
retained for residual water and sanitation functions agreed to by the WSSC.
• The WSSC is to submit budgetary estimates and budgetary reports to the TMA.
• The TMA is required to inform the WSSC at an early stage of the amounts budgeted
for the following year for the functions and services devolved to the WSSC.
Transfer of Employees
• Regular and contract employees of the TMA carrying out these services (along with
their sanctioned strength) are to be placed at the disposal of the WSSC, except those
retained to carry out residual functions.
• The WSSC can return any employee to the TMA without providing a reason.
• The conditions of service of these employees will remain the same as if they had not
been assigned to the WSSC, including opportunities for promotion.
Benchmarking and Performance Indicators
• Within six months after the signing of the agreement, the WSSC is to complete
benchmarking of existing services and fix targets for the improvement of services for
the following year.
KP-SISUG Swat Regional Development Plan
338
• On June 1st of each year, the WSSC shall submit a list of mutually agreed upon key
performance indicators, which shall be qualitative as well as quantitative
measurements.
General Provisions
• The length of the agreement is 20 years and may be extended on mutual consent.
• The agreement states, “The following shall be conditions precedents for the
effectiveness of this agreement”:
• The WSSC will submit a Business Plan to the TMA.
• A list of deputed staff has been made available and the deputed staff have been
transferred to the satisfaction of the WSSC.
• The entrusted assets have been made available and transferred to the satisfaction of
the WSSC.
• The funds as per other relevant clauses have been transferred to the account of the
WSSC.

KP-SISUG Swat Regional Development Plan
339