Provincial Strategy for Inclusive and Sustainable Urban Growth
Upload
khangminh22Category
view
2download
0
South
and
South
-We
st Asia
De
velo
pm
ent R
ep
ort 2
01
2–1
3
Economic and Social Commission for Asia and the PacificSouth and South-West Asia Office
Regional Cooperation for Inclusive and
Sustainable Development
South and South-West Asia Development Report 2012–13
Printed in New DelhiST/ESCAP/2644October 2012
South and South-West Asia remains one of the fastest growing subregions in the world even though its economic growth has slowed down in 2012 due to a deteriorating global economic environment. Although the subregion continues to push the world's economic centre of gravity to the East, as India is on track to become the world's second largest economy by 2050, it faces many challenges to making the development process more inclusive and sustainable. These include widespread poverty and hunger, poor levels of human development, wide infrastructure gaps, food and energy insecurity and the threat of natural disasters. In addition, the subregion's least developed and landlocked developing countries face unusual obstacles.
The South and South-West Asia Development Report argues that regional cooperation can help solve many of the subregion's challenges and help secure a more sustainable future. In the decade ahead, the subregion's member States have a chance to cooperate amongst themselves to ensure that their dynamism and development success are sustained, and that the subregion re-emerges as the hub of East–West trade that it once was.
As a development partner of South and South-West Asia, now with a new Office dedicated to the subregion, ESCAP in this Report highlights elements of a regional policy agenda for harnessing the potential of cooperation in select areas.
The South and South-West Asia Development Report will be an essential resource for policymakers, development professionals, economists, as well as those concerned with development in South and South-West Asia and beyond.
C-2 Qutab Institutional Area, New Delhi 110 016, India http://sswa.unescap.org
For sale in South Asia only
`695
9 780415 827744
ISBN 978-0-415-82774-4
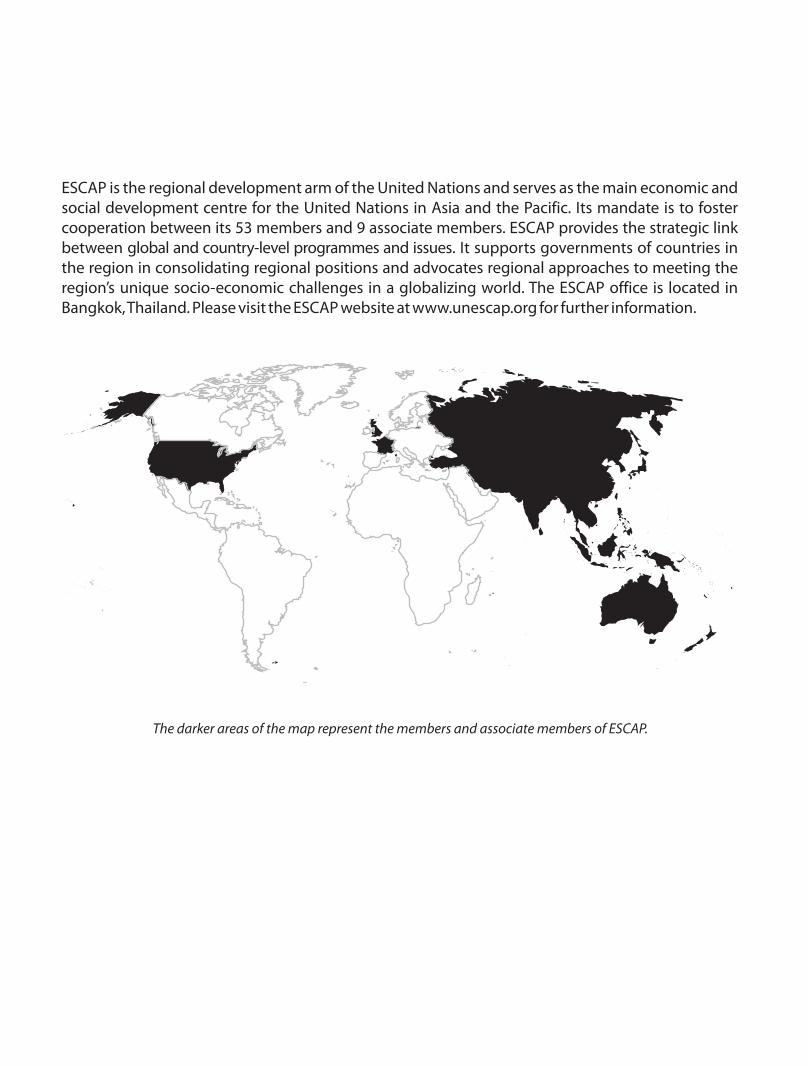
ESCAP is the regional development arm of the United Nations and serves as the main economic and social development centre for the United Nations in Asia and the Pacific. Its mandate is to foster cooperation between its 53 members and 9 associate members. ESCAP provides the strategic link between global and country-level programmes and issues. It supports governments of countries in the region in consolidating regional positions and advocates regional approaches to meeting the region’s unique socio-economic challenges in a globalizing world. The ESCAP office is located in Bangkok, Thailand. Please visit the ESCAP website at www.unescap.org for further information.
The darker areas of the map represent the members and associate members of .ESCAP
Regional Cooperation for Inclusive and Sustainable Development

Regional Cooperation for Inclusive and Sustainable Development
South and South-West Asia Development Report 2012–13
LonDon neW YoRk neW DeLhi
First published in october 2012 in association with United nationsfor United nations economic and Social Commission for Asia and the Pacific, South and South-West Asia officeby Routledge912 Tolstoy house, 15–17 Tolstoy Marg, Connaught Place, new Delhi 110 001
Routledge is an imprint of the Taylor & Francis Group, an informa business
© 2012United nations economic and Social Commission for Asia and the Pacific, South and South-West Asia office
For sale in South and South-West-Asia only (Afghanistan, Bangladesh, Bhutan, india, islamic Republic of iran, Maldives, nepal, Pakistan, Sri Lanka and Turkey).
Available from United nations Publications in other countries.
Typeset bySolution GraphicsA-10, indira Puri extension, Loni RoadGhaziabad 201 102 Uttar Pradesh
Printed and bound in India by
All rights reserved. no part of this book may be reproduced or utilized in any form or by any electronic, mechanical or other means, now known or hereafter invented, including photocopying and recording, or in any information storage and retrieval system without permission in writing from the publishers.
British Library Cataloguing-in-Publication DataA catalogue record of this book is available from the British Library
iSBn: 978-0-415-82774-4Un Publications number: ST/eSCAP/2644
Foreword
South and South-West Asia has made large development gains over the past decade, yet remains home to the world’s largest concentration of poor and hungry people, and lags behind in achieving the Millennium Development Goals. Slowing growth in the subregion, and uncertain prospects in developed countries, are exposing the subregion’s structural challenges. Amongst these are the need for more inclusive development, closing wide infrastructure gaps, strengthening food and energy security, diversifying and moving
up the value chain in industrial and export structures, and reducing the risks and costs of disasters. in addition, the least developed countries and landlocked developing countries of the subregion face special challenges closing their development gaps and promoting inclusive growth.
Regional cooperation in South and South-West Asia can be an important strategy to address many of these challenges, and to ensure the sustainable future of the subregion as a whole. Cooperation can help spur more inclusive growth and drive the elimination of poverty in the subregion. Greater regional integration not only increases intraregional trade, but also promotes investment in the subregion’s supply chain and production networks. This creates more and better jobs and builds productive capacity, particularly in the subregion’s least developed countries. Greater intraregional cooperation can also improve food and energy security, as well as help reduce disaster risk.
Through a focus on inclusive growth and regional cooperation, South and South-West Asia can harness its many advantages, including its youth bulge, to grow, within a generation, into the world’s largest centre of consumption — driving global growth and filling the global skills deficit, if the path from education to employment is facilitated, and if better quality, decent work opportunities can be generated by the subregion’s growth. Finally, better connectivity, across the subregion and beyond, can help leverage the subregion’s strategic location at the crossroads of Asia and the Pacific to re-emerge as the hub of east–West trade that it once was.
South and South-West Asia Development Report presents an analysis of the development challenges facing the subregion and the ways to turn them into opportunities. it presents a policy agenda for the subregion to emerge as an economic powerhouse and as a model of inclusive and sustainable development. helping South and South-West Asia sustain this dynamism to meet the development challenges facing the subregion is a crucial endeavour, and is a priority for eSCAP. As a development partner of the subregion, now with a new office dedicated to it, eSCAP stands ready to assist its member States implement this agenda.
i am happy to commend this Report, the first major publication of eSCAP’s South and South-West Asia office to the policymakers and development community at large in the region.
Dr. Noeleen Heyzer United Nations Under-Secretary-General and
Executive Secretary of the Economic and Social Commission for Asia and the Pacific


Preface
The South and South-West Asia office of the economic and Social Commission for Asia and the Pacific was established in December 2011 in new Delhi to serve 10 eSCAP member States: Afghanistan, Bangladesh, Bhutan, the islamic Republic of iran, india, Maldives, nepal, Pakistan, Sri Lanka and Turkey. Guided by the eSCAP programme of work, the eSCAP South and South-West Asia office focuses on closing development gaps, fostering inclusive development, assisting the subregion’s least developed and landlocked developing countries, as well as
strengthening connectivity, transit and trade facilitation, for enhancing regional economic integration. The office also focuses on regional cooperation for food and energy security, and disaster risk reduction in the subregion.
As a part of its work, eSCAP-SSWA has organized regular policy dialogues in the subregion, including the inaugural high-level Policy Dialogue on Development Challenges Facing the Subregion in December 2011, the high-level South Asian Forum on Accelerating Achievement on the Millennium Development Goals in February 2012, Policy Dialogue on Global economic Turmoil and Asia-Pacific’s economic Prospects: implications for nepal, organized in kathmandu in July 2012 and the expert Group Meeting on Regional Cooperation and inclusive Development, held in new Delhi in July 2012. eSCAP-SSWA also supported the organization of the Fifth South Asia economic Summit in islamabad in September 2012 by hosting a couple of sessions. in addition, the eSCAP-SSWA has also begun offering capacity-building support to the least developed countries of the subregion, the first of which was a technical capacity-building session on Afghanistan’s World Trade organization Accession held for representatives of the Government of Afghanistan and the private sector in August 2012.
eSCAP-SSWA has also initiated a number of knowledge products designed to stimulate discussion among policymakers and analysts in the subregion. These include a monthly newsletter Development Monitor, a Development Paper series, and a Policy Brief series which are all disseminated online through the office’s webpage, http://sswa.unescap.org.
The South and South-West Asia Development Report 2012–13 is the first in a series of biennial reports. Designed as resource for development specialists across South and South-West Asia, the Report presents contemporary thinking and new analysis on select critical development challenges the subregion faces included in the programme of work of eSCAP-SSWA. The Report will be used for policy advocacy purposes across the subregion over the next two years especially in relation to some of the proposals included herein.
The Report draws upon the work undertaken by eSCAP-SSWA but also at the eSCAP headquarters in Bangkok as well as within the development community at large. i am grateful to the resource persons and experts listed elsewhere for their contributions and continuous support. We also look forward to benefiting from their feedback on the Report.
i take this opportunity to express my gratitude to Dr. noeleen heyzer, United nations Under-Secretary-General and executive Secretary of eSCAP, who has provided visionary leadership and guidance for our work. i would also like to thank Mr. Shun-ichi Murata, Deputy executive Secretary of eSCAP for his support and his keen interest in the work of eSCAP-SSWA.
i wish to thank members of the Report team as well for their committed work to produce this Report within a limited time frame.
i would also like to thank orestes Plasencia of the eSCAP editorial Unit, Valentina kalk and Rosa Maria ndolo of the United nations Publications, new York and the Routledge team at new Delhi for their support during the publication process.
Nagesh KumarDirector, ESCAP South and South-West Asia Office
and ESCAP Chief Economist

South and South-West Asia remains one of the fastest growing subregions in the world even though its economic growth has slowed down in 2012. The subregion’s external economic envir-onment is deteriorating as the global financial crisis of 2008–2009 enters a second, more difficult phase. Although the subregion continues to push the world’s economic centre of gravity to the east, with india on track to become the world’s second largest economy by 2050, the subregion faces a number of challenges to a more inclusive and sustainable development path. These include large concentrations of poverty and hunger, rising inequality, poor levels of human development, wide infrastructure gaps, lack of a diversified base for high value-added products and exports, wide-spread food and energy insecurity and high risk of disasters. in addition, the four least developed countries of the subregion, three of which are also landlocked, have particular need for international support to overcome the obstacles they face.
The South and South-West Asia Development Report argues that regional cooperation can help solve a number of the challenges facing South and South-West Asia and can be an important devel- opment strategy to ensure the sustainable future of the subregion. Cooperation can help generate more inclusive growth and help drive poverty allevi-ation efforts. Greater regional integration not only increases intraregional trade, but also promotes efficiency-seeking investment in the subregion’s supply chain and production networks. This, in turn, creates more and better jobs, in addition to building productive capacity, particularly in the subregion’s least developed countries. Cooperation can play a pivotal role crafting solutions to shared vulnerabilities, helping ensure food and energy security, as well as reducing the subregion’s vul- nerability to natural disasters. Finally, better con-nectivity across the subregion and beyond can
Executive Summary
Regional Cooperation for Inclusive and Sustainable Development: South and South-West
Asia Development Report, 2012–13
harness the subregion’s strategic location to emerge as the hub of europe and Central Asia’s trade with east Asia.
ExtErnal Economic EnvironmEnt and macroEconomic outlook
South and South-West Asian economies weathered the global financial crisis of 2008–2009 without suffering major disruptions and recovered well in 2010. however, the economic outlook for 2012 has been downgraded because of a general slowdown in economic activity. The external economic envir- onment has deteriorated as the global financial crisis enters a second stage. in addition, the sub- region faces additional macroeconomic challenges including monetary tightening to curb inflationary pressures, and the continuing risk of natural dis-asters among other exogenous factors. Among the major economies in the subregion, india is projected to grow at 5.9 per cent in 2012–2013 compared with 6.5 per cent in 2011–2012. Turkey has slowed down even more dramatically, from 8.5 per cent in 2011 to 3.2 per cent in 2012, given its deeper integration with the eurozone economies. however, there are indications that the subregion is turning the corner and is likely to do better in 2013 with the indian economy projected to grow at 6.8 per cent in 2013–2014. in addition, the sub- region’s economies still must guard against fur-ther deterioration of the global economy and the volatility that policies, such as a third round of quantitative easing in the United States, may bring about in emerging markets. These include rising inflation as well as financial and exchange rate instabilities. inflationary pressures, especially rising food and fuel prices, need to be watched carefully as they affect the poor disproportionately.
The ongoing crisis has highlighted a num-ber of policy lessons. These include rebalancing
South and South-West Asia Development Reportx
economies in favour of greater domestic and regional demand, and embracing a more cautious approach towards financial and capital account liberalization. The deteriorating balance of pay-ments and lower foreign exchange reserves in the wake of the crisis also call for greater regional cooperation to strengthen resilience against future crises. South and South-West Asian countries may pursue reforms aimed at regaining policy space to increase social expenditure and close infrastructure gaps that are costing the subregion dearly in terms of growth and poverty reduction. They also need to maximize their growth potential and create productive jobs by reviving industry to eradicate the greatest concentration of poverty and hunger in the world, which is found in the subregion. Finally, regional cooperation can help protect the interests of migrant workers who are helping their countries of origin with substantial and growing remittances that are critical for sustaining the balance of payments and for alleviating poverty.
inclusivE and sustainablE dEvElopmEnt: dEvElopmEnt agEnda for 2015 and bEyond
economic growth in South and South-West Asia has been impressive, but its development path could be more broad-based and sustainable. The Report argues that to guarantee a brighter and more sus-tainable future, the subregion’s economic, social and environmental priorities must be balanced in favour of eradicating extreme poverty and hunger. Today, South and South-West Asia remains home to the world’s largest concentrations of people living in poverty and hunger, and people without access to basic sanitation and electricity. it is also home to the world’s highest levels of child and maternal mortality. Progress on the health, nutrition, and sanitation-related Millennium Development Goals and related targets is stalled because of the large inequalities and disparities within populations that persist in the subregion. inclusive development is held back by unequal living standards, unequal human development outcomes, and unequal opportunities based on gender, education, and labour market status.
South and South-West Asia must offer a way out of poverty and exclusion for its rapidly growing working-age population. More comprehensive and universal social protection schemes would help secure a social protection “floor” to stand on and a
“stairway” out of exclusion, through better education and health services, which would also strengthen the social contract between citizens and the State. eSCAP’s analysis shows that the subregion’s rela-tively young population could grow into the world’s largest middle class in a generation (comprising two thirds of the population) with an annual con-sumption of $30 trillion in purchasing power parity. This youth bulge could also potentially fill the world’s skills deficit if the path from education to employment is facilitated, and if better quality, decent work opportunities can be generated by South and South-West Asia’s growth engine. Sus-taining these development gains well into the future will also require industrial policies that revisit and challenge the subregion’s excessive reliance on uneven service-sector led growth. While social policies can help at the margin, Governments in the subregion can also actively promote productive employment in sectors that provide decent work and incentivize improvements in the skill profile of the population.
in that light, the post-2015 development agenda for the subregion should include a number of key elements. South and South-West Asian countries should maximize growth through productive job creation and appropriate structural change to re- duce poverty, hunger and inequalities. Countries in the subregion should also provide quality education, health, sanitation, and other infrastructure to make the most of the youth bulge. in addition, a minimum social protection floor should be established that meets the basic needs of vulnerable populations. Countries in the subregion can also enhance regional cooperation and joint research to address common challenges and enhance sustainability. Such cooperation can lead to innovative new prod- ucts and processes that use natural resources effi-ciently, are more affordable, and raise the quality of life of the poor and vulnerable, harnessing the subregion’s strengths in “frugal innovation.” Finally, international support and cooperation needs to be boosted to adapt and deploy environmentally sound technologies as the region pursues low car-bon and resource-efficient development pathways.
global Economic intEgration: tradE and forEign dirEct invEstmEnts
South and South-West Asian countries have emerged as dynamic players in the international

Executive Summary xi
market with a rising share of the global trade in goods and services. eSCAP projections suggest that total trade of South and South-West Asia could triple from $1.5 trillion in 2011 to $4.5 trillion by 2017. eSCAP analysis, which decomposes the sources of export growth of the subregion, sug-gests however that much of the growth has come from growing global demand over the past decade. Some evidence of market diversification in favour of emerging and developing countries is apparent. But South and South-West Asian countries have not fully exploited the opportunities for export expansion by strengthening their competitiveness and diversification across products and markets. Their export structure continues to be dominated by high concentration in relatively few low value-adding traditional products and commodities, as well as raw materials. This is especially true for the least developed countries of the subregion.
opportunities exist for strategic diversifica-tion towards exports of greater complexity. An enhanced policy focus is needed on competi-tiveness in the existing product markets and diversification to upgrade the export structure in favour of fast growing, high value-adding and technology-intensive and generate new output, exports and jobs. For this, South and South-West Asia will also need to pay attention to strengthening its technological capabilities. Spe-cifically targeted foreign direct investment (FDi) could also assist countries in their efforts to build productive capacities in newer, more technology-intensive areas. Although South and South-West Asian countries have enhanced their attractive-ness to FDi inflows in recent years, they are far from exploiting their full potential. Recent sur-veys indicate india is the second most attractive destination for FDi after China, while Turkey has moved 10 ranks up in global FDi attractiveness rankings. new opportunities are also emerging with the rise of outward FDi originating from within the subregion. South and South-West Asian countries have emerged as important players in trade in services consistent with the rising role of services sector in their economies. There are some successes, like the emergence of india as a global information technology (iT) and business pro- cess outsourcing (BPo) services hub, which could be leveraged to diffuse that success to other countries. Given rising costs for certain segments,
indian companies can shift some operations across borders, helping the subregion become a global iT and BPo services hub.
Regional cooperation could also help consoli-date the market position of South and South-West Asian countries and move them up the value chain in specific sectors where they compete, such as textiles and clothing, but also in commodities, such as tea, coffee, jute, cardamom and basmati rice. Cooperation can also be effective in addressing emerging sanitary and phyto-sanitary measures and technical barriers to trade. it can also lead to the launch of a regional eco-label. Mutual coordination would be critical for protecting common interests in the World Trade organization negotiations, as well. Such coordination should not be limited to issues currently on the table, but could begin to set the agenda by extending to other issues of common concern, such as implementation of duty-free-quota-free market access by developed countries which emerged at the hong kong Ministerial of WTo in 2005 or seeking extension of the Trade-Related Aspects of intellectual Property Rights (TRiPS) agreement waiver for least developed countries for another 10 years beyond 2015.
Finally, in view of the changing external con- text in the aftermath of global financial and economic crisis, it is now clear that the advanced economies of the world will not be able to sustain the growth of the developing world, as was the case in the past. Therefore, South and South-West Asian economies will have to look increasingly towards regional economic integration in the sub-region and in the broader Asia-Pacific region for sustaining their growth.
potEntial and challEngEs of rEgional Economic intEgration
A new economic regionalism is sweeping Asia and the Pacific, motivated not only by the persistent crisis in developed economies, but also by the search for efficiency-seeking industrial restructuring linking comparative advantages across borders in highly integrated supply chains. eSCAP analysis shows that more than half of the potential intraregional trade in South and South-West Asia remains unexploited and could generate an additional $52 billion in exports annually. Potential intraregional exports in the subregion could rise to as high as $163 billion
South and South-West Asia Development Reportxii
by 2017. Compared with other subregions, South and South-West Asia has been slow in leveraging regional economic integration. A number of overlapping and interlinked subregional cooper-ation arrangements exist, including economic Cooperation organization (eCo), the South Asian Association for Regional Cooperation (SAARC), and the Bay of Bengal initiative for Multi-Sectoral Technical and economic Cooperation (BiMSTeC), each with a regional trading arrangement. These are complemented by several bilateral free trade agreements. however, their full potential remains untapped. Share of intraregional trade has risen but remains low for several reasons, such as poor connectivity and facilitation leading to high trade costs, poor supply capabilities especially in least developed countries, and a high proportion of un- official trade at the borders. eSCAP estimates that informal trade between just five countries of the subregion exceeded $10 billion in 2011. A case study of the South Asian Free Trade Agreement (SAFTA) suggests a high potential of the agreement to generate significant welfare gains especially for the region’s least developed countries, leading to balanced regional development and economic con-vergence. Regional trade liberalization produces welfare gains by facilitating industrial restructuring that helps in creating supply capabilities in lesser developed economies. The india–Sri Lanka FTA has, for instance, generated a massive expansion of bilateral trade in a much more balanced manner, with Sri Lanka exporting to india new value-added products often produced by joint ventures with indian companies. While india has become one of the largest sources of FDi in Sri Lanka following the FTA, Sri Lankan companies are also undertaking investments in india to take advantage of supply chains.
To exploit the potential of regional economic integration, implementation of the existing arrangements need to be expedited, and the potential of intraregional FDi and trade in services needs to be harnessed. Banking and financial links need to be strengthened, and facilities for cross-border capital raising should be created. The SAARC Development Fund may be transformed into a SAARC development bank to catalyse key regional infrastructure projects. eCo, SAARC and BiMSTeC should begin mutual consultations to learn from each other and coordinate in view of their overlapping membership as well as to keep
pace with the emerging trends in broader regional economic integration in Asia-Pacific. eSCAP could facilitate such consultations by providing the necessary platform.
sEamlEss rEgional connEctivity
South and South-West Asia’s most important air and maritime routes still run towards europe. The road and railway routes between neighbours are poorly developed. This leads to high intraregional trade costs and negates the benefits of geographical proximity. Regional connectivity gaps are the most important barriers to development of landlocked developing countries of the subregion. South and South-West Asia would benefit from strengthen-ing transport, transit and trade facilitation through a regional transport and transit agreement, invest- ments in upgrading infrastructure at the land customs stations, adoption of a single window approach to customs procedures, and by moving towards international standards and harmonized conformity assessment procedures.
eSCAP has helped the cause of connectivity with inter-governmental agreements on Asia highway and Trans-Asian Railways. The Report makes a case for the integration of transport corridors proposed within the regional groupings, eCo, SAARC and BiMSTeC, that would exploit greater network externalities and would be a win-win for all the par-ticipating countries. it proposes two corridors to strengthen connectivity across the subregion. The first is a proposed Turkey–iran (islamic Republic of)–Pakistan–india–Bangladesh–Myanmar (TiPi-BM) Road Corridor for what would become Asia’s Southern silk highway. The network would link Asian highway routes in Turkey, the islamic Republic of iran, Pakistan, india, Bangladesh, and Myanmar. The second is the istanbul–Tehran–islamabad–Delhi–kolkata–Dhaka (iTi–DkD) Container Railway Corridor, providing a new lifeline for trade in Asia by connecting important cities across South and South-West Asia along the Trans-Asian Railway routes. These corridors will vertically connect the landlocked developing countries of Central Asia and South and South-West Asia across the routes. This will stimulate economic activity in lagging areas and help the subregion re-emerge as the hub of europe and Central Asia’s trade with east Asia as well as help reduce the subregion’s transport carbon footprint. eSCAP can facilitate these proposals with
Executive Summary xiii
further studies, policy support and advocacy and consultations between the concerned groupings and member States. South and South-West Asia’s strategic location at the crossroads of Asia and the Pacific can be harnessed by strengthening con-nectivity across the subregion and beyond.
food sEcurity and sustainablE agriculturE
South and South-West Asia accounts for one third of the world’s food insecure people and more than one half of underweight children. South and South-West Asia has made slow progress towards meeting the basic needs that would increase food security. eSCAP estimated that rising food price during 2010–2011 may have pushed three million people into poverty in Bangladesh and kept another eight million from exiting poverty in india. Food prices have trended upward due to pressure on a shrinking and neglected agriculture sector and owing to a demographic bulge coupled with rising consumption. The increased variety of food choices available is also increasing production of foods such as meat, that are more energy-intensive to produce. Supply-side factors that have driven food price increases include the increasing cost of fertilizers, the competition for arable land and water sources and the high oil and biofuel prices. Commodity market speculation has also been an increasing factor behind high and volatile commodity prices. Climate change is another of the greatest long-term challenges facing the sub-region with respect to food security. The subregion’s huge population size, rural concentration and the incidence of extreme climatic events in a subregion particularly prone to natural disasters mean that any climate change and seasonal variation are likely to have large negative effects on agricultural output and rural populations.
South and South-West Asia is a net food ex- porter, driven by exports from india, Sri Lanka and Turkey. Food trade and regional cooperation for food security can assist in providing some elements of mutual protection and opportunity for more sustainable agriculture. Food security policies in- cluding reducing food consumption taxes, favour-ing cash or food transfer programmes over food price subsidies, promoting weather-based crop insurance and investments in infrastructure can also enhance food security in the subregion.
Long-term security requires a greater focus on research and development to kick-start a second green revolution based on sustainable agricul-ture. There is a case for regional cooperation in agricultural research as well, given the geoclimatic similarities that prevail across the subregion. Cooperation can also centre around distribution issues and the wider use of regional food, seed and fodder banks, apart from virtual reserves for the coordinated management of commodities futures markets.
EnErgy sEcurity and coopEration
South and South-West Asia faces exponentially growing energy demand, and a number of energy challenges — energy poverty, lack of available supplies, poor energy infrastructure and transport facilities, and environmental externalities. The subregion’s energy deficits are particularly detri-mental in terms of growth and poverty alleviation as parts of the subregion faces regular and sus-tained power outages. At the same time the sub-region must increase energy usage to maintain growth and development, fuel structural change and meet welfare objectives. energy security, linked with energy availability, accessibility, and affordability is a paramount policy concern for countries in the subregion. South and South-West Asia remains completely dependent upon imports of fossil fuels except for the islamic Republic of iran which is a net exporter of such fuels. This contrasts with the predominant use of biomass in the non-commercial sectors of the subregion and the lack of access to modern forms of energy for much of the subregion’s population.
Therefore, South and South-West Asia has much to gain from regional cooperation in energy supply and consumption. Widening access to clean and efficient energy, including grid-connected/decentralized power, is a key component of devel-opment efforts currently pursued in the subregion. Diversification of the energy mix and increase in the share of renewable energy, such as solar and hydroelectric power is essential to enhance the subregion’s energy security, to reduce the impact of price shocks due to fluctuations in international crude oil prices and to mitigate the environmental impact of energy use. The Report argues that to enhance energy security regionally, the subregion
South and South-West Asia Development Reportxiv
must pursue energy cooperation alongside do- mestic energy planning. A multi-stakeholder pro-cess of engagement geared towards employing collaborative instruments to derive energy benefits for the South and South-West Asian region will be critical to harness the opportunities that cur-rently exist. Development of energy markets in South and South-West Asia through creation of regional energy grids and cross-country pipelines across the subregion as a part of the Asian energy highway could assist the subregion in promoting energy access and security. eSCAP secretariat has been mandated by the member States to assist in advancing an intergovernmental framework to facilitate the development of an Asian energy highway.
disastEr risk rEduction
South and South-West Asia has the highest risk of mortality from natural disasters of any subregion in Asia and the Pacific. The subregion has recently been hit by a large number of disasters from cyclones, earthquakes to landslides and floods, including the floods that struck Pakistan in 2010, killing around 2,000 people and causing $9.8 bil-lion in damage to livelihoods and infrastructure. South and South-West Asia has not significantly invested the benefits of its economic growth towards increasing disaster resilience, leaving the subregion highly vulnerable to future disasters, both in terms of human costs and increasing eco-nomic losses. Disasters and economic crises feed off one another in the subregion and together can seriously impede development progress. eSCAP estimates that Maldives is growing at least two per cent slower as a combined result of the 2004 tsunami and the following shock of the global financial and economic crisis.
Regional cooperation can help in building resili-ence to disasters. Some progress has been made in initiating and implementing regional cooperation for disaster risk reduction in some areas such as the eSCAP-supported Regional integrated Multi- hazard early Warning Systems (RiMeS), the SAARC Disaster Management Centre and the proposed Asian and Pacific Centre for the Development of Disaster information Management. The subregion also has the opportunity to further strengthen and integrate disaster risk management, in particular
by focusing on multisectoral approaches to dis-aster risk reduction within existing SAARC, eCo and BiMSTeC cooperation frameworks with the help of eSCAP. Comprehensive disaster risk reduction strategies for South and South-West Asia also require integrating greater disaster risk resilience into sectoral development planning. Disaster and loss assessment analyses can provide a methodology for assessing costs and opportunity to account for such risks during local and national development planning phases.
global partnErship and countriEs with spEcial nEEds
The global partnership for development, envi-sioned in Goal 8 of the Millennium Development Goals (MDGs), requires developed and developing countries to work together in the pursuit of global development. international support to the least developed countries and to the landlocked developing countries is crucial to allowing them to overcome low incomes, vulnerability, low levels of human assets, and for landlocked countries, lack of access to the sea. The istanbul and Almaty Programmes of action outline a series of priority areas that the international community can focus on to enhance the capacity of the least developed and landlocked developing countries. A key issue for the South and South-West Asian least devel-oped countries is poor productive supply capacity, which does not allow them to take advantage of global opportunities. The eSCAP productive capacity index, which measures countries’ ability to export unique and complex products, shows that productive capacity in the subregion’s four least developed countries (three of which are also landlocked) is well below the global average and, in some cases, declining relative to the rest of the world. They also suffer from a small base of in- vestible resources, and in the case of landlocked countries, poor connectivity and transit facilities. national measures to address their constraints include a stable investment-friendly macro-economic framework, industrial policies focusing on building productive capacities, infrastructure development, domestic resource mobilization, and technological upgrading. These national sup- port measures should be supplemented by expanding FDi inflows and technology transfer,

Executive Summary xv
including from other developing countries, as well as effective market access, aid for trade, and other forms of development cooperation.
For much of the last decade, the global part-nership operated largely through bilateral and multilateral development cooperation activities. in light of persistent crisis and calls for fiscal austerity in traditional donor countries, the global partner-ship relies increasingly on making development cooperation more efficient, and improving South-South development cooperation. eSCAP finds that three countries in South and South-West Asia, Bangladesh, nepal, and Pakistan are slated to receive the largest increases in core development assistance over 2011–2013 as traditional donors re-allocate development assistance to make it more efficient. in addition, two South and South-West Asian countries, india and Turkey, are now sizable providers of South-South development cooperation themselves, providing approximately $1 billion annually to other developing countries. As emerging donors they have also made sub-stantial commitments to the least developed countries, with india pledging $500 million and Turkey pledging $200 million annually to support the implementation of the istanbul Programme of Action for the Least Developed Countries for the Decade 2011–2020. india has also announced a duty-free-quota-free market access to the least developed countries covering 94 per cent of tariff lines and has offered duty-free market access on all except 25 prohibited items for South Asian least developed countries under SAFTA. in addition to
resources from new providers of development cooperation, international support measures also increasingly rely on innovative financing mech-anisms such as global funds to provide global public goods in health and climate change.
EpiloguE
South and South-West Asia has come a long way in the last decade, becoming one of the most dynamic subregions in the world. The pressures of faltering demand in developed markets due to the crisis, and rising costs in the world’s factory in east Asia, provide a window of opportunity for South and South-West Asia. in the decade ahead, the 10 member States of the subregion have the chance to cooperate amongst themselves to ensure not only that the subregion’s growth dynamism and development success is sustained, but also that the subregion re-emerges as the important cross- roads between the east and the West that it once was. For far too long, politics has held back the progress in the subregion. The time has come to allow economics play a greater role and for regional cooperation to finally take centre stage in South and South-West Asia. The Report lays out a policy agenda for South and South-West Asia to harness the potential of cooperation in select areas. As a development partner of the subregion, now with a new office dedicated to it, eSCAP stands ready to assist Governments and other stakeholders to move ahead on this range of issues.

Acknowledgements
Under the overall direction and guidance of noeleen heyzer, executive Secretary of eSCAP, the preparation of the South and South-West Asia Development Report was led by nagesh kumar, Director, eSCAP South and South-West Asia office (eSCAP-SSWA) and eSCAP Chief economist.
The core report team comprised the following eSCAP staff members: Christopher Garroway, Matthew hammill, Dayaratna Silva, Wanphen Sreshthaputra of the South and South-West office and Sanjay kumar Srivastava (information and Communications Technology and Disaster Risk Reduction Division).
The Report benefited from detailed specific inputs, comments and discussions provided by a group of external experts and consultants including at the expert group meeting held on 30–31 July 2012, namely: Faisal Abbas, Assistant Professor of economics, South Asia University, new Delhi; Aradhna Aggarwal, Senior Fellow, national Council of Applied economic Research, new Delhi; Mirwais Ahmadzai, Chief of Research, office of the Senior economic Advisor to the President of Afghanistan; Amita Batra, Associate Professor, School of international Studies, Jawaharlal nehru University, new Delhi; Debapriya Bhattacharya, Distinguished Fellow, Centre for Policy Dialogue, Dhaka; Biswa n. Bhattacharyay, Advisor, office of Regional economic integration, Asian Development Bank, Manila; n. R. Bhanumurthy, Senior Fellow, national institute of Public Finance and Policy, new Delhi; Prabir De, Research Fellow, Research and information System for Developing Countries (RiS), new Delhi; Umit Deniz efendioglu, Country Director, iLo, Ankara; Mohamed imad, Assistant executive Director, Department of national Planning, Maldives; Ashima Goyal, Professor, indira Gandhi institute of Development Research, Mumbai; Saman kelegama, executive Director, institute of Policy Studies of Sri Lanka, Colombo; A. Ganesh kumar, Professor, indira Gandhi institute of Development Research, Mumbai; Ligia noronha, executive Director, and Deepti Mahajan, Associate Fellow, The energy and Resources institute, new Delhi; Posh Raj Pandey, executive Chairman, South Asia Watch on Trade economics and environment, kathmandu; Dil Bahadur Rahut, Faculty of economics, South Asia University, new Delhi; Selim Raihan, Associate Professor of economics, University of Dhaka; and Abid Qaiyum Suleri, executive Director, Sustainable Development Policy institute, Pakistan.
The staff members of eSCAP who provided inputs and comments include Clovis Freire and Muhammad hussain Malik (Macroeconomic Policy and Development Division), kohji iwakami (environment and Development Division), and katinka Weinberger (Centre for the Alleviation of Poverty through Sustainable Agriculture).
The Report benefited from observations and contributions made by a group of senior policymakers and experts at the high-level Policy Dialogue on Development Challenges Facing the Subregion, new Delhi, 15–16 December 2011, namely, Prof. Bina Agarwal, then Director, institute of economic Growth, Delhi; Dr. Sarath Amunugama, Senior Minister for international Monetary Cooperation, Government of Sri Lanka; naeem Anwar, Minister (Trade), high Commission of Pakistan, new Delhi; omer Azizullah, Deputy Director General of economic Affairs, Ministry for Foreign Affairs, Afghanistan; Prof. kaushik Basu, the then Chief economic Adviser, Ministry of Finance, Government of india; Dr. Sham L. Bathija, Senior Adviser-Minister for economic Affairs to the President of Afghanistan; Dr. S. Mahendra Dev, Director (Vice Chancellor), indira Gandhi institute for Development Research, Mumbai; Dr. Prodipto Ghosh, Distinguished Fellow, The energy and Resources institute (TeRi), new Delhi and Member of the Prime Minister’s Council on Climate Change; Dr. Ashok Gulati, Chairman, Commission for Agricultural Costs and Prices, Government of india; Davood Manzour, Deputy Vice President for Strategic Planning, islamic Republic of iran, Tehran; M. Yahya Maroofi, the then Secretary-General, economic Cooperation organization Secretariat (eCo), Tehran; Arvind Mehta, Joint Secretary, Ministry of Commerce and industry, Government of india; Dr. hafiz Pasha, Convener, Prime Minister’s economic Advisory Council, Government of Pakistan and former Finance
South and South-West Asia Development Reportxviii
Minister; Gauri Pradhan, Member, national human Rights Commission, nepal; Dr. Mohan Man Sainju, Chairman, institute of integrated Development Studies, kathmandu and former Vice Chairman, Planning Commission of nepal; Prof. Rahman Sobhan, Chairman, Centre for Policy Dialogue, Dhaka, former Member of the Planning Commission, Government of Bangladesh; Dr. Atiur Rahman, Governor, Bangladesh Bank, Dhaka; Prof. Amartya Sen, nobel Laureate, T. W. Lamont University Professor, harvard University; T. C. A. Srinivasa Raghavan, Senior Fellow, Asian institute of Transport Development, new Delhi; Daw Tenzin, Governor, Royal Monetary Authority of Bhutan, Thimphu; k. L. Thapar, Chairman, Asian institute of Transport Development, new Delhi; ibrahim hussain Zaki, the then Special envoy to the President of Maldives.
A group of interns at the South and South-West office provided competent research assistance, including neha Aggarwal, erin Lynn, helene Meurisse, Quentin Roblin, Anshuman Sharma and Vinod Soman. The Report also benefited from research assistance provided by the following interns at the information and Communications Technology and Disaster Risk Reduction Division: Suby Anthony, Jonghyo Julian nam and Chunxiang Qian.
editing of the manuscript was performed by Wanphen Sreshthaputra in new Delhi and Joseph Roberts and orestes Plasencia in Bangkok. The graphic design and printing were provided by Routledge, Taylor & Francis Group.
Uma Rao, Raju Rana and Surya Prakash narayanmurthy provided administrative support.
Contents
Foreword vPreface viiExecutive Summary ixAcknowledgements xviiList of Boxes xxList of Figures xxiList of Tables xxiiiExplanatory Notes xxvList of Abbreviations xxvi
1. Global economic Turmoil and the Macroeconomic outlook for South and South-West Asia 1
2. inclusive and Sustainable Development in South and South-West Asia 21
3. Global economic integration: Trade and Foreign Direct investment 40
4. Regional economic integration in South and South-West Asia: Potential, Challenges and the Way Forward 61
5. Regional Connectivity in South and South-West Asia: Challenges and Prospects 79
6. Food Security and Sustainable Agriculture in South and South-West Asia 95
7. energy Security and Cooperation 115
8. Regional Cooperation for Disaster Risk Reduction 133
9. The Global Partnership for Development: implementing the istanbul and Almaty Programmes of Action in South and South-West Asia 145
Notes 164References 168
List of Boxes
1.1 Country Clusters within South and South-West Asia 2
2.1 Specific Challenges to Sustainable Development in the Subregion and Balancing the interlinkages between Them 22
2.2 examples of national Actions to Promote Sustainable Development 232.3 Sustainable Development and the Pursuit of happiness in Bhutan 242.4 The Mahatma Gandhi national Rural employment Guarantee Act in india 272.5 inequality is higher when Measured by income 28
3.1 Regional Cooperation for Moving up the Value Chain in Textiles and Clothing 45
4.1 india–Sri Lanka Free Trade Agreement: A Case Study in Building Supply Capabilities 694.2 emerging Value Chain in the Textiles and Clothing industry in South Asia 71
5.1 integrated Check Posts in india 875.2 eCo Transit Trade Agreement (eCoTTA) 895.3 Turkey–iran (islamic Republic of )–Pakistan–india–Bangladesh–Myanmar (TiPi–BM)
Road Corridor: Asia’s new Southern Silk Route 905.4 istanbul–Tehran–islamabad–Delhi–kolkata–Dhaka (iTi–DkD) Railway Cargo Corridor 92
6.1 Right to Food in South and South-West Asia 986.2 The 2008 Food Crisis and Recent Spikes in Food Prices 104
7.1 Bhutan–india Cooperation in Power Development and Trade 1277.2 Solar energy innovations in South and South-West Asia 129
8.1 Maldives in the Midst of Double Shocks 1398.2 ASeAn–United nations Collaboration in Disaster Management 143
9.1 india and Turkey as emerging Donors in South and South-West Asia 1579.2 Lessons of the Graduation of Maldives from the LDC Category 162
List of Figures
1.1 Growth and Recovery in the United States, europe and Japan 31.2 Monthly export Growth Rates of South and South-West Asian Countries 51.3 Quarterly GDP Growth Rates of South and South-West Asian Countries 61.4 inflation in South and South-West Asian economies, Quarterly estimates 101.5 Policy Rates Stable or increasing in the Face of inflationary Pressures 111.6 South and South-West Asia Deficits Potential to Worsen 121.7 Tax to GDP Ratios, Developing Regions, 2009 121.8 Composition of Government expenditure in South and South-West Asia,
around 2010 131.9 infrastructure Weaknesses in South and South-West Asia Compared
with other Countries 141.10 South and South-West Asia’s Small but increasing Role in the World economy,
1960–2010 151.11 Sources of Growth, Selected Countries of South and South-West Asia, 1960–2008 161.12 Labour Productivity in Agriculture is Low, Selected South and South-West Asian
Countries, 2008 (in 2005 US$ PPP) 171.13 South and South-West Asia’s new Current Account Deficits 171.14 South and South-West Asia Reserves as Months of imports 181.15 Remittance inflows to South and South-West Asia 19
2.1 Poverty in South and South-West Asia has Declined 252.2 Mixed Progress towards Achieving the MDGs in South and South-West Asia 262.3 Trends in inequality of Consumption expenditure in South and South-West Asia,
1978–2010 282.4 Differences between income and expenditure inequality, China and india, 2005 282.5 inequality-adjusted human Development index in South and South-West Asia 292.6 Disparities in health indicators in South and South-West Asia 302.7 highest Level of education Achieved in South and South-West Asia, Late 2000s 312.8 “U-shaped” Returns to education in india, 2005 322.9 informal employment as a Share of Total employment, Mid- to Late-2000s 332.10 Wages are More Polarized by employment Status than by Rural–Urban Differences
in india, 2005 342.11 The Demographic Bulge in South and South-West Asia 352.12 Total Consumption expenditure and Population Share of South and South-West Asian
Consumers Living between $10 and $100 PPP Per Day, 2000–2050 362.13 Sector Shares of GDP and employment in Selected Countries (percentage) 37
3.1 Direct and indirect Dependence on the eurozone and United States Markets in 2010 443.2 Concentration of exports, South and South-West Asian Countries, 1995–2011 493.3 Decomposition of Factors explaining exports Growth of South and South-West
Asian Countries, 2000–2011 51

South and South-West Asia Development Reportxxii
4.1 Regional Cooperation Frameworks in South and South-West Asia 644.2 Share of intraregional exports of SAARC Countries, 2002–2011 644.3 indian Share of exports from Two Trading Partners 654.4 Share of Top Five Bangladesh imports from india 714.5 india’s Monthly imports from Bangladesh, october 2002–April 2012 724.6 Public opinions in Two SAARC Countries about obstacles to Greater
economic integration 75
5.1 UnCTAD Liner Shipping Connectivity index 805.2 Asian highway network 845.3 Trans-Asian Railway network 855.4 handling Procedures at South and South-West Asian Borders 88
6.1 Global hunger index, 1990–2011, South and South-West Asia 976.2 Food Production in South and South-West Asia (calories per person per day, 1990,
2000 and 2009) 976.3 high but Slowing Growth in Food Production in South and South-West Asia 1026.4 Average Consumption of Fertilizer in South and South-West Asia, kilograms
per hectare of Arable Land 1026.5 Agriculture as a Proportion of GDP and employment between 1990 and 2010 1036.6 World Food Price indices, Various Foods, 2002–2004 = 100 1046.7 Food Price and Total Price Volatility, South and South-West Asia, 2000–2011 1056.8 net Food export Trends in South and South-West Asia, 1990–2010 107
7.1 A Comparison of Countries’ per capita energy Consumption Figures and hDi Values 1167.2 energy Mix in South and South-West Asia 1167.3 energy import Dependence in South and South-West Asia 1187.4 Access to electricity in South and South-West Asia (percentage) 1197.5 Per Capita electricity Consumption in South and South-West Asia 1197.6 energy intensity of GDP (in US$/kgoe) 1227.7 installed Power Generation Capacity and Production in South and South-West Asia 126
8.1 Changes in GDP and Population exposed to Disasters, South Asia (1980 base year) 1348.2 economic and Population Cyclone Disaster Vulnerabilities of South and South-West Asia
Compared to other Asia-Pacific Subregions, 1980–2010 1358.3 economic and Population Flood Disaster Vulnerabilities of South and South-West Asia
Compared with other Asia-Pacific Subregions, 1980–2010 1368.4 Disasters, GDP Growth and inflation in South and South-West Asia, 2000–2010 1388.5 Maldives’ economic Loss from Disaster and Financial Crisis 1398.6 Benefit-Cost Ratios in the Context of Vulnerability 141
9.1 inclusion in the LDC Category Depends on economic Vulnerability, human Assets, and income per capita 146
9.2 Productive Capacity in the South and South-West Asian Least Developed Countries, 1984–2010 149
9.3 human Development indicators for health and education in South and South-West Asia 1509.4 Progress on MDG Achievement in South and South-West Asian LDCs 1519.5 Country Programmable Aid and official Development Assistance Received from oeCD
Development Assistance Committee and Multilateral Donors, 2010 1569.6 Share of indian and Turkish Development Cooperation by Destination 158
List of Tables
1.1 Rates of economic Growth in South and South-West Asia, 2005–2012 81.2 Global economy 2050: A Scenario for an Asian Century 9
3.1 Merchandise Trade Balance and Growth, South and South-West Asia 413.2 Proportion of Trade in Goods and Services in GDP, South and South-West Asia (Percentages) 423.3 Trends in South and South-West Asia’s Direction of Trade (Percentage) 433.4 Structure of Merchandise exports, Percentage of each Category in Total 453.5 high Technology exports from South and South-West Asia 493.6 Technological Activity in South and South-West Asia, 2011 503.7 Trade in Services, Percentage of GDP 523.8 Services Trade Balance in South and South-West Asia 523.9 Shares of South and South-West Asian Countries in World Trade in Services 533.10 Structure of Service exports 533.11 Ranks of Asian Countries in Global Services Location index 543.12 inward Foreign Direct investment Flows (in million of US$ and percentage) 563.13 FDi inflows as a Percentage of Gross Fixed Capital Formation, 2000–2010 573.14 Foreign Direct investment outflows originating in South and South-West Asia
(in million of US$) 58
4.1 intraregional exports Trade as Share of Total Trade 654.2 Underexploited Trade Potential in South and South-West Asia 664.3 Welfare effects from Trade Liberalization and Facilitation in SAFTA as a Proportion
of GDP of the Participating Countries 664.4 estimates of informal Trade with india in 2011 674.5 non-tariff intra- and extra-regional Trade Costs in Asia and the Pacific, 2007–2009
(as a percentage of import prices) 68
5.1 Aviation Performance of South and South-West Asian Countries 815.2 State of Roads and Railways in South and South-West Asia 825.3 Missing Links in the Trans-Asian Railway network in South and South-West Asia (as of 2011) 835.4 Documents, Cost and Time to export in South and South-West Asia, 2012 855.5 Status of Accession of South and South-West Asian Member States to the Seven
international Conventions Related to Land Transport Facilitation Listed in eSCAP Commission Resolution 48/11 (as of 14 February 2012) 86
6.1 Prevalent hunger and Child Undernutrition in South and South-West Asia 966.2 Poverty and inequality exacerbate Food insecurity and hunger in South
and South-West Asia 1006.3 Food Prices exacerbate Poverty 1006.4 Food Consumption Growth to 2050 1016.5 notable Trends in Climate and Variability in South Asia 1086.6 Food Security Programmes in South and South-West Asia 112

South and South-West Asia Development Reportxxiv
7.1 energy Production and Consumption, South and South-West Asia, 2009 1177.2 energy Reserves in South and South-West Asia 1177.3 hydropower Potential and installed Capacity in South and South-West Asia 1187.4 energy Subsidies in South and South-West Asia, 2010 1207.5 existing non-power energy Trade in South and South-West Asia 1237.6 interconnections in the electricity Sector 1257.7 Milestones in energy Cooperation under the South Asian Association for
Regional Cooperation 130
8.1 economic Losses from Disasters in Asia-Pacific, 2000–2011 (in 2005 millions of US$) 1338.2 economic and Social Costs of Disasters in Bangladesh and Bhutan, Damage and
Loss Assessment Methodology 1378.3 Post Disaster Recovery and Reconstruction needs, Bangladesh and Bhutan 1378.4 Mapping Risks in South and South-West Asia Using the World Risk index and
the economic Vulnerability index 1388.5 Landscape of Regional Cooperation in South and South-West Asia 142
9.1 human Development index and Rankings for South and South-West Asian LDCs, 2011 1499.2 Savings Rates and Foreign Direct investments in South and South-West Asia 1519.3 Cost of exporting and Time Taken for export by Countries in South Asia 1529.4 Total indian and Turkish Development Co-operation (in millions of current dollars) 1579.5 Cumulative Disbursements for Public Goods in health, Climate Change Adaptation
and Mitigation from Select innovative Financing Mechanisms (early 2000s–2011) 159

Explanatory Notes
The designations employed and the representation of the material in this publication do not imply the expression of any opinion whatsoever on the part of the Secretariat of the United nations concerning the legal status of any country, territory, city, or area, or of its authorities, or concerning the delimitation of its frontiers or boundaries.
Mention of firm names and commercial products does not imply the endorsement of the United nations.
The term “eSCAP region” in this publication refers to the group of countries and territories/areas comprising Afghanistan; American Samoa; Armenia; Australia; Azerbaijan; Bangladesh; Bhutan; Brunei Darussalam; Cambodia; China; Cook islands; Democratic People’s Republic of korea; Fiji; French Polynesia; Georgia; Guam; hong kong, China; india; indonesia; iran (islamic Republic of); Japan; kazakhstan; kiribati; kyrgyzstan; Lao People’s Democratic Republic; Macao, China; Malaysia; Maldives; Marshall islands; Micronesia (Federated States of); Mongolia; Myanmar; nauru; nepal; new Caledonia; new Zealand; niue; northern Mariana islands; Pakistan; Palau; Papua new Guinea; Philippines; Republic of korea; Russian Federation; Samoa; Singapore; Solomon islands; Sri Lanka; Tajikistan; Thailand; Timor-Leste; Tonga; Turkey; Turkmenistan; Tuvalu; Uzbekistan; Vanuatu; and Viet nam.
The term “developing eSCAP region” in this publication excludes Australia, Japan, new Zealand and north and Central Asian economies. non-regional members of eSCAP are France, the netherlands, the United kingdom of Great Britain and northern ireland and the United States of America.
The term “South and South-West Asia” in this publication refers collectively to Afghanistan, Bangladesh, Bhutan, india, the islamic Republic of iran, Maldives, nepal, Pakistan, Sri Lanka and Turkey.
The term “countries with special needs” in this publication refers collectively to least developed countries (LDCs), landlocked developing countries (LLDCs) and small island developing States (SiDSs) in the Asia-Pacific region. it comprises (i) 13 LDCs: Afghanistan*, Bangladesh, Bhutan*, Cambodia, kiribati**, Lao People’s Democratic Republic*, Myanmar, nepal*, Samoa**, Solomon islands**, Timor-Leste**, Tuvalu and Vanuatu** (*also LLDC, **also SiDSs); (ii) 12 LLDCs: Afghanistan*, Armenia, Azerbaijan, Bhutan*, kazakhstan, kyrgyzstan, Lao People’s Democratic Republic*, Mongolia, nepal*, Tajikistan, Turkmenistan and Uzbekistan (*also LDC); and (iii) 16 SiDSs: Cook islands, Fiji, kiribati*, Maldives, Marshall islands, Micronesia (Federated States of), nauru, niue, Palau, Papua new Guinea, Samoa*, Solomon islands*, Timor-Leste*, Tonga, Tuvalu* and Vanuatu* (*also LDC).
Values are in United States dollars unless specified otherwise.The term “billion” signifies a thousand million. The term “trillion” signifies a million million.Reference to “tons” indicates metric tons.in the tables, two dots (. .) indicate that data are not available or are not separately reported, a dash (–)
indicates that the amount is nil or negligible, and a blank indicates that the item is not applicable.in dates, a hyphen (-) is used to signify the full period involved, including the beginning and end years,
and a stroke (/ ) indicates a crop year, fiscal year or plan year.Bibliographical and other references have not been verified. The United nations bears no responsibility
for the availability or functioning of URLs.
List of Abbreviations
ACU Asian Clearing UnionADB Asian Development BankAGoA African Growth and opportunity ActAiF ASeAn infrastructure FundAPiDM Asian and Pacific Centre for the Development of Disaster information ManagementAPTA Asia-Pacific Trade AgreementASeAn Association of Southeast Asian nationsASYCUDA Automated System for Customs DataATC Agreement on Textile and ClothingBiMSTeC Bay of Bengal initiative for Multi-Sectoral Technical and economic CooperationBPo business process outsourcingCAPSA Centre for Alleviation of Poverty through Sustainable AgricultureCAReC Central Asia Regional economic CooperationCDM clean development mechanismCDP Committee for Development PolicyCeC Committee on economic CooperationCMSA constant market share analysisCnG compressed natural gasCPA country programmable aidDAC Development Assistance CommitteeDPA Development Partnership AdministrationDRR disaster risk reductioneCo economic Cooperation organizationeiF enhanced integrated FrameworkeSCAP economic and Social Commission for Asia and the PacificeVi economic vulnerability indexeWS early warning systemeXiM export/importFAo Food and Agriculture organization of the United nationsFDi foreign direct investmentFPi foreign portfolio investmentFTA free trade agreementG20 Group of 20GCC Gulf Cooperation CouncilGDP gross domestic productGhi Global hunger indexGiS Geographic information SystemGMS Greater Mekong SubregionGnh gross national happinessGni gross national incomeGSP Generalized System of PreferencesGTAP Global Trade Analysis Project
xxviiList of Abbreviations
hDi human development indexhhi herfindahl-hirschman indexiCD inland customs depotiCeGATe indian Customs eDi GatewayiCP integrated check postiCT information and communications technologyiDCoL infrastructure Development Company LimitedieA international energy AgencyiFPRi international Food Policy Research instituteiMF international Monetary FundioCL indian oil Corporation LimitediSFTA india-Sri Lanka Free Trade AgreementLCS Land Customs StationLDC least developed countriesLLDCs landlocked developing countriesLnG liquefied natural gasLPG liquefied petroleum gasMDG Millennium Development GoalMeRCoSUR Southern Common MarketMFn most-favoured nationMne multinational enterpriseMRA Mutual Recognition ArrangementnAFTA north American Free Trade AgreementnATo north Atlantic Treaty organizationnhPC national hydroelectric Power CorporationnoC nepal oil Corporation LimitedoDA official development assistanceoeCD organization for economic Co-operation and DevelopmentPAT Perform Achieve TradePDnA post-disaster needs assessmentPPP purchasing power parityR/P reserves-to-production ratioR-CeP Regional Comprehensive economic PartnershipReReD Rural energy for Rural economic DevelopmentReSAP Regional Space Applications Programme for Sustainable DevelopmentRiMeS Regional integrated Multi-hazard early Warning System for Africa and AsiaRTA regional trade agreementSAARC South Asian Association for Regional CooperationSAMC South Asia Migration CommissionSAFTA South Asian Free Trade AreaSAPTA SAARC Preferential Trading ArrangementSATneT network for knowledge Transfer on Sustainable Agricultural Technologies and
improved Market Linkages in South and Southeast AsiaSCAAP Special Commonwealth Assistance for Africa ProgrammeSDR special drawing rightsSiCo SAARC industrial CooperationSiDS small island developing stateSiTC Standard international Trade ClassificationSMe small and medium enterpriseSSWA South and South-West Asia

South and South-West Asia Development Reportxxviii
TCS Technical Cooperation SchemeTeRi energy and Resources instituteTikA Turkish international Cooperation and Development AgencyTRiPS Trade-Related Aspects of intellectual Property RightsUnCTAD United nations Conference on Trade and DevelopmentUnDP United nations Development ProgrammeUniSDR United nations international Strategy for Disaster ReductionUSAiD United States Agency for international DevelopmentWDi world development indicatorWMo World Meteorological organizationWRi World Risk indexWTo World Trade organization
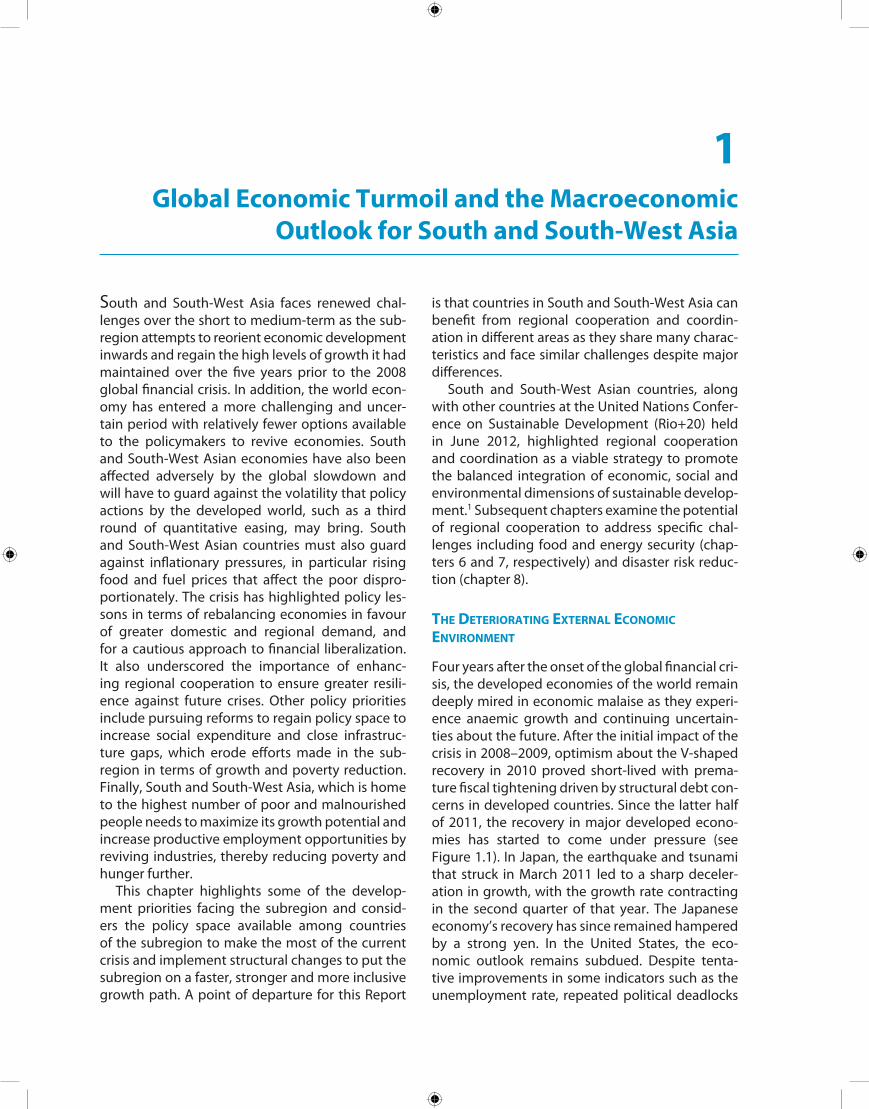
South and South-West Asia faces renewed chal-lenges over the short to medium-term as the sub-region attempts to reorient economic development inwards and regain the high levels of growth it had maintained over the five years prior to the 2008 global financial crisis. in addition, the world econ-omy has entered a more challenging and uncer-tain period with relatively fewer options available to the policymakers to revive economies. South and South-West Asian economies have also been affected adversely by the global slowdown and will have to guard against the volatility that policy actions by the developed world, such as a third round of quantitative easing, may bring. South and South-West Asian countries must also guard against inflationary pressures, in particular rising food and fuel prices that affect the poor dispro-portionately. The crisis has highlighted policy les-sons in terms of rebalancing economies in favour of greater domestic and regional demand, and for a cautious approach to financial liberalization. it also underscored the importance of enhanc-ing regional cooperation to ensure greater resili-ence against future crises. other policy priorities include pursuing reforms to regain policy space to increase social expenditure and close infrastruc-ture gaps, which erode efforts made in the sub-region in terms of growth and poverty reduction. Finally, South and South-West Asia, which is home to the highest number of poor and malnourished people needs to maximize its growth potential and increase productive employment opportunities by reviving industries, thereby reducing poverty and hunger further.
This chapter highlights some of the develop-ment priorities facing the subregion and consid-ers the policy space available among countries of the subregion to make the most of the current crisis and implement structural changes to put the subregion on a faster, stronger and more inclusive growth path. A point of departure for this Report
is that countries in South and South-West Asia can benefit from regional cooperation and coordin-ation in different areas as they share many charac-teristics and face similar challenges despite major differences.
South and South-West Asian countries, along with other countries at the United nations Confer-ence on Sustainable Development (Rio+20) held in June 2012, highlighted regional cooperation and coordination as a viable strategy to promote the balanced integration of economic, social and environmental dimensions of sustainable develop-ment.1 Subsequent chapters examine the potential of regional cooperation to address specific chal-lenges including food and energy security (chap-ters 6 and 7, respectively) and disaster risk reduc-tion (chapter 8).
thE dEtEriorating ExtErnal Economic EnvironmEnt
Four years after the onset of the global financial cri-sis, the developed economies of the world remain deeply mired in economic malaise as they experi-ence anaemic growth and continuing uncertain-ties about the future. After the initial impact of the crisis in 2008–2009, optimism about the V-shaped recovery in 2010 proved short-lived with prema-ture fiscal tightening driven by structural debt con-cerns in developed countries. Since the latter half of 2011, the recovery in major developed econo-mies has started to come under pressure (see Figure 1.1). in Japan, the earthquake and tsunami that struck in March 2011 led to a sharp deceler-ation in growth, with the growth rate contracting in the second quarter of that year. The Japanese economy’s recovery has since remained hampered by a strong yen. in the United States, the eco-nomic outlook remains subdued. Despite tenta-tive improvements in some indicators such as the unemployment rate, repeated political deadlocks
1 Global Economic Turmoil and the Macroeconomic
Outlook for South and South-West Asia
South and South-West Asia Development Report2
Box 1.1Country Clusters within South and South-West Asia
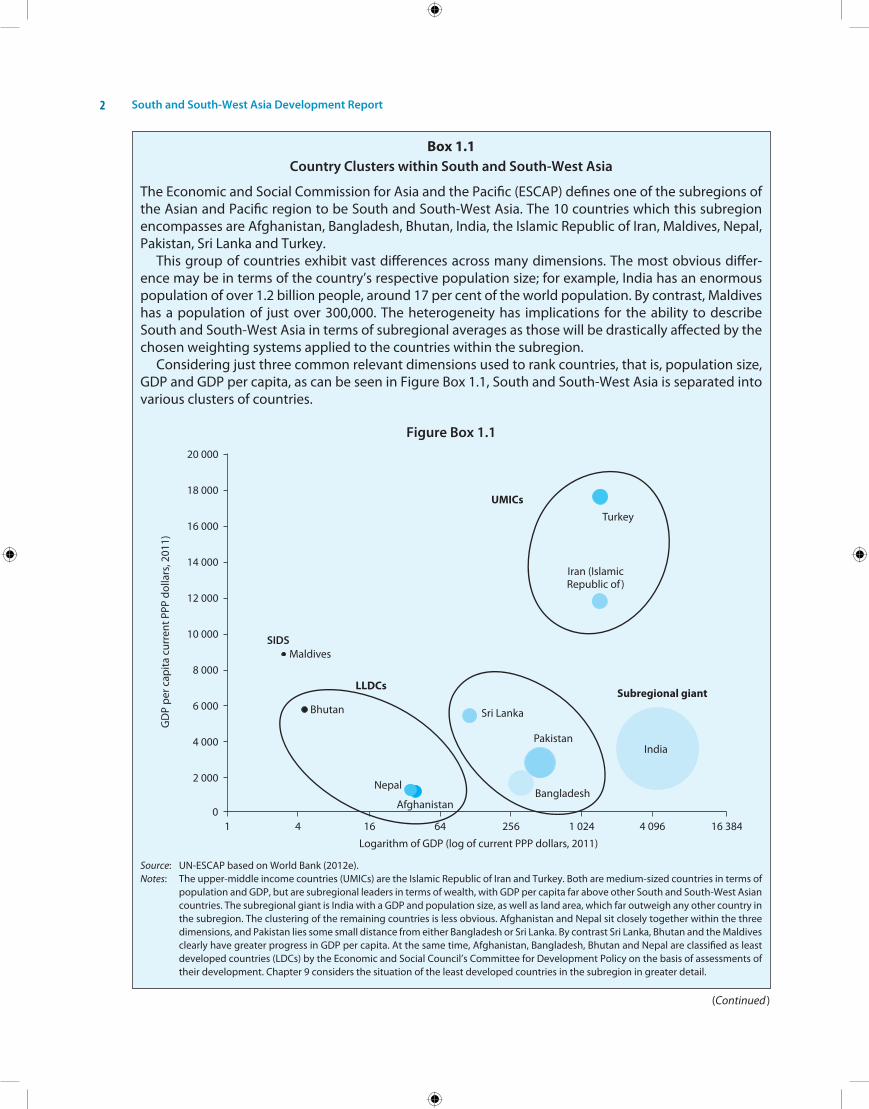
The economic and Social Commission for Asia and the Pacific (eSCAP) defines one of the subregions of the Asian and Pacific region to be South and South-West Asia. The 10 countries which this subregion encompasses are Afghanistan, Bangladesh, Bhutan, india, the islamic Republic of iran, Maldives, nepal, Pakistan, Sri Lanka and Turkey.
This group of countries exhibit vast differences across many dimensions. The most obvious differ-ence may be in terms of the country’s respective population size; for example, india has an enormous population of over 1.2 billion people, around 17 per cent of the world population. By contrast, Maldives has a population of just over 300,000. The heterogeneity has implications for the ability to describe South and South-West Asia in terms of subregional averages as those will be drastically affected by the chosen weighting systems applied to the countries within the subregion.
Considering just three common relevant dimensions used to rank countries, that is, population size, GDP and GDP per capita, as can be seen in Figure Box 1.1, South and South-West Asia is separated into various clusters of countries.
Figure Box 1.1
Source: Un-eSCAP based on World Bank (2012e).Notes: The upper-middle income countries (UMiCs) are the islamic Republic of iran and Turkey. Both are medium-sized countries in terms of
population and GDP, but are subregional leaders in terms of wealth, with GDP per capita far above other South and South-West Asian countries. The subregional giant is india with a GDP and population size, as well as land area, which far outweigh any other country in the subregion. The clustering of the remaining countries is less obvious. Afghanistan and nepal sit closely together within the three dimensions, and Pakistan lies some small distance from either Bangladesh or Sri Lanka. By contrast Sri Lanka, Bhutan and the Maldives clearly have greater progress in GDP per capita. At the same time, Afghanistan, Bangladesh, Bhutan and nepal are classified as least developed countries (LDCs) by the economic and Social Council’s Committee for Development Policy on the basis of assessments of their development. Chapter 9 considers the situation of the least developed countries in the subregion in greater detail.
(Continued )

Global Economic Turmoil and the Macroeconomic Outlook 3
The low- to middle-income countries are Bangladesh, Pakistan and Sri Lanka; and the landlocked countries and small island developing States (LLDC/SiDS) are Afghanistan, Bhutan, nepal and the Maldives. While alternative clusters could be defined, the grouping of Bangladesh and Sri Lanka with Pakistan, associate these countries for their similar structural issues and weight within the subregion. The LLDC/SiDS face common characteristics in terms of high structural barriers to their development, whether those constraints are due to the countries being landlocked, small islands or facing significant institutional and governance challenges.
Figure Box 1.2: Share of GDP and Population of South and South-West Asia Countries around 2010
Source: Un-eSCAP based on World Bank (2012e).Note: Data from 2010 or nearest available year.
Figure 1.1: Growth and Recovery in the United States, Europe and Japan
Source: Un-eSCAP based on data from http://ceicdata.com.
South and South-West Asia Development Report4
over issues of a debt ceiling and automatic budget cuts or “fiscal cliffs” have generated great uncer-tainty in the economy. This has been compounded by the long election cycle in 2012 that has brought any serious reform efforts to a standstill. The euro-zone by contrast, is the developed region facing the greatest pressure as economic growth in that region is likely to contract by nearly half a percent-age point in 2012 with negligible growth likely in 2013 (see Figure 1.2). high structural risks remain and the worst case scenarios of a disorderly default of sovereign debt in europe or break-up of the euro currency area that could lead to a renewed financial crisis spreading across the world have not receded.
Policy Responses and Key Risks to Global Economic Prospects
The current economic outlook across the devel-oped countries is reminiscent of the situation in 2008 yet it is more precarious in some respects because at the onset of the crisis, policy space existed to mount coordinated and effective sti-mulus policies. in the immediate aftermath of the global financial crisis in 2008, there was a unified approach by policymakers to both encourage national economies to bounce back from the most serious financial shock since the Great Depression and ensure a basic level of macroeconomic coor-dination internationally to stave off a collapse of global financial capital flows and trade. key national and international macroeconomic policy was swift to focus on fiscal policy through classic keynesian pump-priming of national economies to stimulate aggregate demand in a coordinated manner (in particular through decisions made by the Group of 20 (G20). Global monetary policy was aimed at offsetting global liquidity traps, fear of contagion and risk in foreign financial markets. Coordinated attempts were channelled through the reengage-ment of the international Monetary Fund and expansion of special drawing rights and regulatory shifts in financial regulation such as the measure-ment of systemic risk. The G20 also emerged as a leading player in the global economic architecture, replacing the G7/G8 meetings in terms of policy prominence and reflecting the changed economic landscape. national policy responses focused on cauterizing financial and lending sinkholes and stimulating broader lending. in countries experi-encing moderate inflation rates, such policies
amounted to interest-rate easing while in many countries with low inflation rates, little room existed for further interest-rate loosening. Central banks therefore employed policies to relax reserve ratios and engaged rounds of “quantitative easing” to inject liquidity to credit-starved economies. These coordinated measures were effective in facilitat-ing a V-shaped rebound for the global economic growth in 2010. Trade recovered quickly, demand and consumption soon followed on the back of the large fiscal and monetary stimulus.
in 2012, however, the space for policy action similar to that of 2008/2009 does not exist, espe-cially in developed economies. huge accumulated debt levels in eurozone economies and the United States exclude any possibility of further significant fiscal stimulus. increasing challenges in the abil-ity of governments to provide adequate services and historically low interest rates together limit stimulus options using traditional fiscal and mon-etary tools. Quantitative easing is therefore among the very few options available for stimulating the economies. The United States Federal Reserve announced a third round of quantitative easing (Qe3) in September 2012 — the size of which has been kept open but is widely believed to be of the order of $600–750 billion. however, regardless of the exact size of the package, there is little reason to believe that Qe3 would be more effective than the previous Qe2.
The effectiveness of the second round of quanti-tative easing in the United States (Qe2) was limited. The large liquidity expansion in the financial mar-kets led to a huge carry trade as capital, in search of better returns, flew outside the United States towards emerging markets. in emerging markets, this resulted in a liquidity spike which led to rising real estate prices, capital market booms, inflation-ary tendencies and exchange-rate appreciations.
The emerging economies of South and South-West Asia need to guard against such rising and volatile flows of short-term capital as a result of Qe3 and minimize resulting stock market and exchange rate volatilities, as well as commodity futures and real estate inflationary shocks. in the past, a number of countries in Asia and the Pacific have resorted to capital account management tools including indonesia, the Republic of korea and Thailand, while others such as Japan and Switzerland opted for heavy interventions in the foreign exchange markets.2 The United States Federal Reserve can
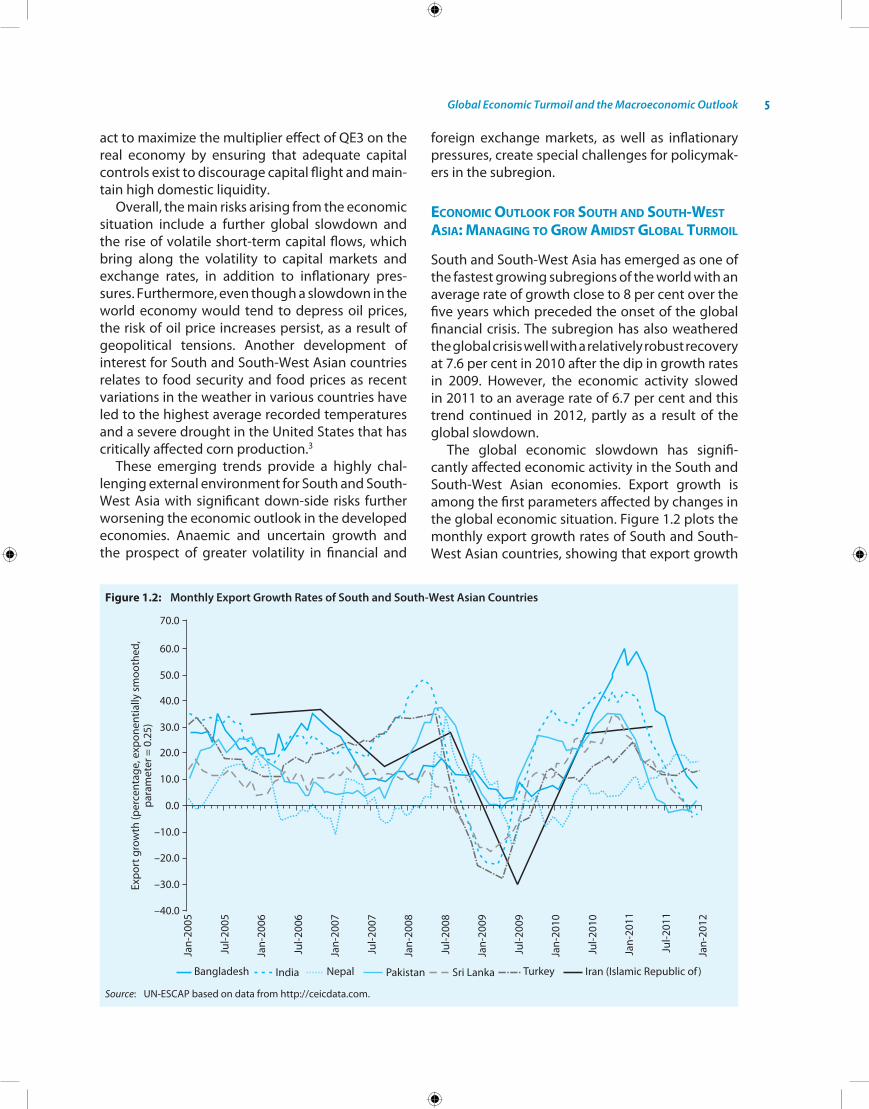
Global Economic Turmoil and the Macroeconomic Outlook 5
act to maximize the multiplier effect of Qe3 on the real economy by ensuring that adequate capital controls exist to discourage capital flight and main-tain high domestic liquidity.
overall, the main risks arising from the economic situation include a further global slowdown and the rise of volatile short-term capital flows, which bring along the volatility to capital markets and exchange rates, in addition to inflationary pres-sures. Furthermore, even though a slowdown in the world economy would tend to depress oil prices, the risk of oil price increases persist, as a result of geopolitical tensions. Another development of interest for South and South-West Asian countries relates to food security and food prices as recent variations in the weather in various countries have led to the highest average recorded temperatures and a severe drought in the United States that has critically affected corn production.3
These emerging trends provide a highly chal-lenging external environment for South and South-West Asia with significant down-side risks further worsening the economic outlook in the developed economies. Anaemic and uncertain growth and the prospect of greater volatility in financial and
foreign exchange markets, as well as inflationary pressures, create special challenges for policymak-ers in the subregion.
Economic outlook for south and south-wEst asia: managing to grow amidst global turmoil
South and South-West Asia has emerged as one of the fastest growing subregions of the world with an average rate of growth close to 8 per cent over the five years which preceded the onset of the global financial crisis. The subregion has also weathered the global crisis well with a relatively robust recovery at 7.6 per cent in 2010 after the dip in growth rates in 2009. however, the economic activity slowed in 2011 to an average rate of 6.7 per cent and this trend continued in 2012, partly as a result of the global slowdown.
The global economic slowdown has signifi-cantly affected economic activity in the South and South-West Asian economies. export growth is among the first parameters affected by changes in the global economic situation. Figure 1.2 plots the monthly export growth rates of South and South-West Asian countries, showing that export growth
Figure 1.2: Monthly Export Growth Rates of South and South-West Asian Countries
Source: Un-eSCAP based on data from http://ceicdata.com.
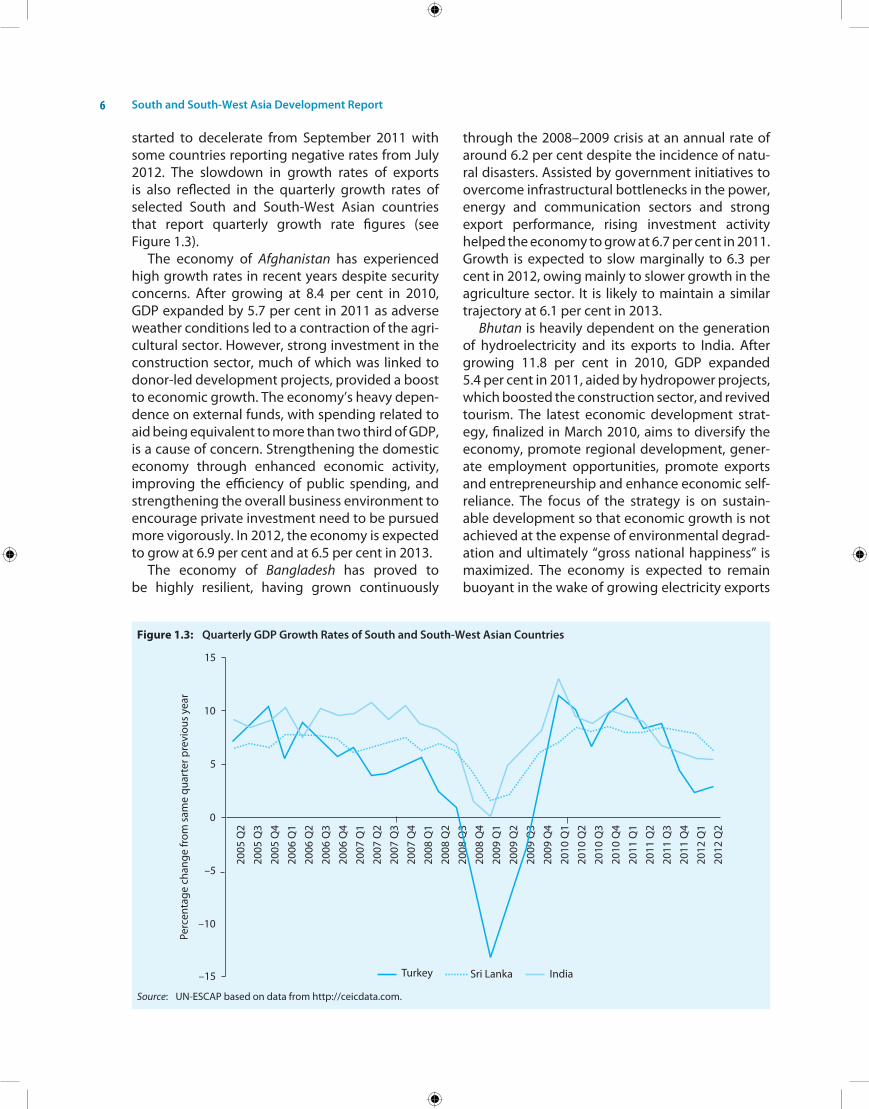
South and South-West Asia Development Report6
started to decelerate from September 2011 with some countries reporting negative rates from July 2012. The slowdown in growth rates of exports is also reflected in the quarterly growth rates of selected South and South-West Asian countries that report quarterly growth rate figures (see Figure 1.3).
The economy of Afghanistan has experienced high growth rates in recent years despite security concerns. After growing at 8.4 per cent in 2010, GDP expanded by 5.7 per cent in 2011 as adverse weather conditions led to a contraction of the agri-cultural sector. however, strong investment in the construction sector, much of which was linked to donor-led development projects, provided a boost to economic growth. The economy’s heavy depen-dence on external funds, with spending related to aid being equivalent to more than two third of GDP, is a cause of concern. Strengthening the domestic economy through enhanced economic activity, improving the efficiency of public spending, and strengthening the overall business environment to encourage private investment need to be pursued more vigorously. in 2012, the economy is expected to grow at 6.9 per cent and at 6.5 per cent in 2013.
The economy of Bangladesh has proved to be highly resilient, having grown continuously
through the 2008–2009 crisis at an annual rate of around 6.2 per cent despite the incidence of natu-ral disasters. Assisted by government initiatives to overcome infrastructural bottlenecks in the power, energy and communication sectors and strong export performance, rising investment activity helped the economy to grow at 6.7 per cent in 2011. Growth is expected to slow marginally to 6.3 per cent in 2012, owing mainly to slower growth in the agriculture sector. it is likely to maintain a similar trajectory at 6.1 per cent in 2013.
Bhutan is heavily dependent on the generation of hydroelectricity and its exports to india. After growing 11.8 per cent in 2010, GDP expanded 5.4 per cent in 2011, aided by hydropower projects, which boosted the construction sector, and revived tourism. The latest economic development strat-egy, finalized in March 2010, aims to diversify the economy, promote regional development, gener-ate employment opportunities, promote exports and entrepreneurship and enhance economic self-reliance. The focus of the strategy is on sustain-able development so that economic growth is not achieved at the expense of environmental degrad-ation and ultimately “gross national happiness” is maximized. The economy is expected to remain buoyant in the wake of growing electricity exports
Figure 1.3: Quarterly GDP Growth Rates of South and South-West Asian Countries
Source: Un-eSCAP based on data from http://ceicdata.com.
Global Economic Turmoil and the Macroeconomic Outlook 7
and efforts to diversify the economy with a 7.9 per cent growth in 2012, increasing to 8.4 per cent in 2013.
The economy of India has been slowing down since 2011 after achieving more than 8 per cent growth on average over the past three years. in 2011–12, GDP growth slowed down consid-erably to only 6.5 per cent, its lowest rate since 2002–03. The global economic slowdown pro-vides only part of the explanation for this marked decline. A more important factor has been the severe monetary tightening by the Reserve Bank of india of policy rates in 13 episodes between March 2010 and December 2011 in order to curb infla-tionary expectations. high inflation and high inter-est rates adversely affected private consumption growth, industrial investments and business sen-timent. in the first quarter of fiscal year 2012–13, the growth rate was 5.5 per cent, slightly higher than the 5.3 per cent achieved in the last quarter of 2011–12. There are reasons to believe that the economy has turned a corner. Firstly, in September 2012, the Government signalled its determination to pursue pending economic reforms including allowing FDi in multi-brand retail and civil avia-tion and the partial phasing out of fuel subsidies. it has also embraced a five year time frame for fis-cal consolidation. Furthermore, the 2012 monsoon season was not as weak as initially feared, leaving only a marginal rainfall deficit of 6 per cent and little impact on agricultural output. in April 2012, the Reserve Bank of india loosened its policy stance slightly with a 50 basis point reduction in the repo rate (the rate at which banks borrow money), com-plemented by a 25 basis point reduction in the cash reserve ratio in September 2012 to release more liquidity in the system. india’s current priority is to place a major emphasis on infrastructure invest-ments including energy generation to overcome the supply constraints on growth. eSCAP projects the growth rate in 2012–13 to be at 5.9 per cent, rising to 6.8 per cent in 2013–14.
The Islamic Republic of Iran, as a net exporter of oil, has benefited from high oil prices. GDP growth improved slightly to 3.5 per cent in 2011 from 3.2 per cent in 2010. A better agriculture sector also sup-ported growth in 2011. The hydrocarbon industry, however, continues to suffer from a lack of foreign investment, which is adversely affecting prospects for a sustainable increase in the output of oil and gas over the long term. The country’s Fifth Five Year
Development Plan (2010/11–2015/16) aims for fur-ther diversification of the economy and a substan-tial reduction in the Government’s dependence on oil and gas revenues, an enhanced role for the private sector, the elimination of subsidies, rapid employment generation and more equal distribu-tion of income. The economy has been affected by the sanctions imposed on the country as a result of which the exchange rate has depreciated consider-ably. The economy is likely to contract marginally by 0.9 per cent in 2012 yet it is likely to expand by 1 per cent in 2013, as it absorbs the impact of the sanctions.
The economy of Maldives is heavily dependent on the tourism and fisheries sectors. After con-tracting by 4.7 per cent in 2009 owing to the global economic crisis, the economy staged a strong recovery, at 5.7 per cent by 2010 and 8.5 per cent in 2011, supported by the revival of the tourism sector and consequent boost to the construction sector. in 2012, the growth is likely to moderate at 5.5 per cent and slow slightly to 5 per cent in 2013.
The economy of Nepal has been growing at a low rate of around 3.5 per cent in recent years. The economy has not been performing at full potential owing to political uncertainty, frequent strikes, per-sistent labour-related issues and severe electricity shortages that have adversely affected its invest-ment climate. Recent floods have also affected agricultural output. GDP growth was 3.5 per cent in 2011. With the rebound in nepal’s tourism sector, growth in 2012 is estimated to be around 4.5 per cent, moderating slightly to 4 per cent in 2013 owing to persistent power shortages.
GDP growth in Pakistan slowed down to 3 per cent in 2011, from 3.8 per cent in 2010, owing mainly to prevailing security concerns, the exogenous shock from elevated oil prices and unprecedented floods, which affected a large part of the country. Severe shortages of electricity and natural gas have also hampered economic growth in the country. The industrial sector witnessed a minor contrac-tion in 2011, after growing more than 8 per cent in 2010. This was due to supply side constraints, mainly energy shortages. The agriculture sec-tor improved slightly as a result of the post-flood recovery in wheat, sugar cane and minor crops. however, major crops, particularly rice and cot-ton, suffered huge losses due to the floods. Service sector growth improved, partly on the back of a hike in the salaries of government employees and
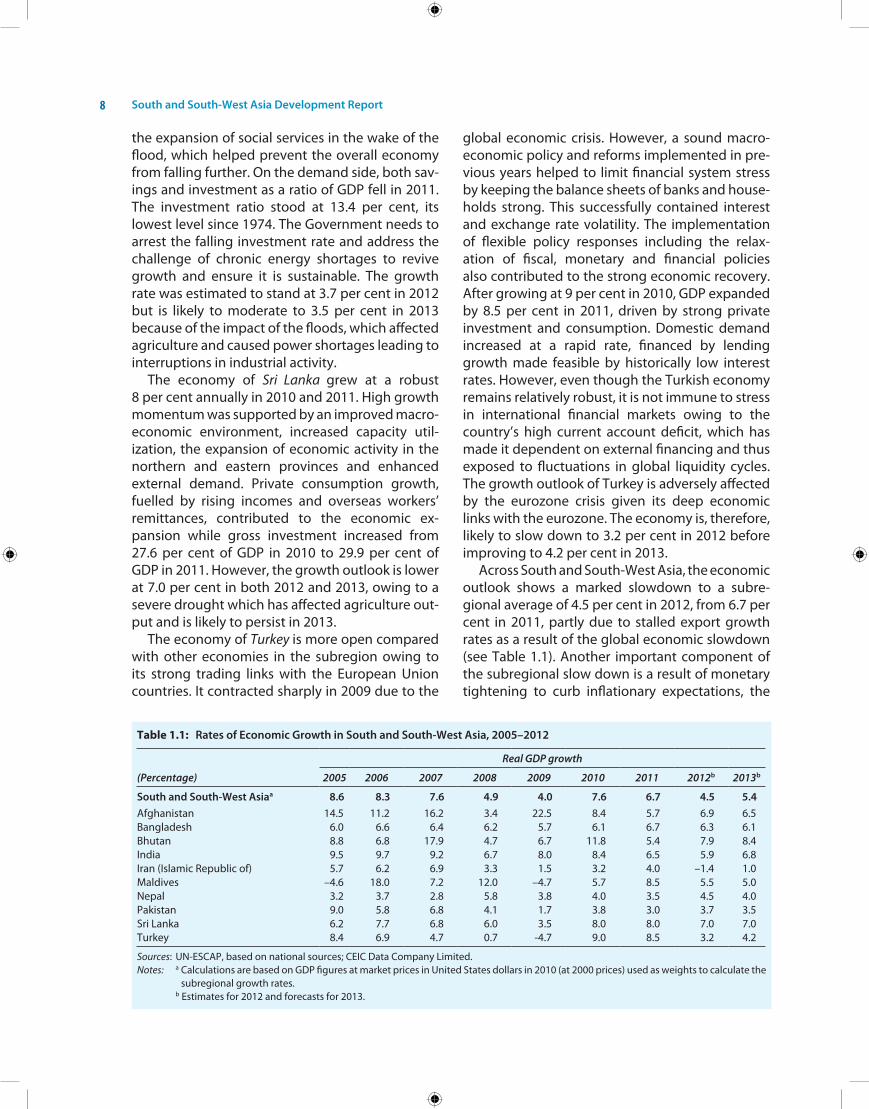
South and South-West Asia Development Report8
the expansion of social services in the wake of the flood, which helped prevent the overall economy from falling further. on the demand side, both sav-ings and investment as a ratio of GDP fell in 2011. The investment ratio stood at 13.4 per cent, its lowest level since 1974. The Government needs to arrest the falling investment rate and address the challenge of chronic energy shortages to revive growth and ensure it is sustainable. The growth rate was estimated to stand at 3.7 per cent in 2012 but is likely to moderate to 3.5 per cent in 2013 because of the impact of the floods, which affected agriculture and caused power shortages leading to interruptions in industrial activity.
The economy of Sri Lanka grew at a robust 8 per cent annually in 2010 and 2011. high growth momentum was supported by an improved macro- economic environment, increased capacity util-ization, the expansion of economic activity in the northern and eastern provinces and enhanced external demand. Private consumption growth, fuelled by rising incomes and overseas workers’ remittances, contributed to the economic ex-pansion while gross investment increased from 27.6 per cent of GDP in 2010 to 29.9 per cent of GDP in 2011. however, the growth outlook is lower at 7.0 per cent in both 2012 and 2013, owing to a severe drought which has affected agriculture out-put and is likely to persist in 2013.
The economy of Turkey is more open compared with other economies in the subregion owing to its strong trading links with the european Union countries. it contracted sharply in 2009 due to the
global economic crisis. however, a sound macro-economic policy and reforms implemented in pre-vious years helped to limit financial system stress by keeping the balance sheets of banks and house-holds strong. This successfully contained interest and exchange rate volatility. The implementation of flexible policy responses including the relax-ation of fiscal, monetary and financial policies also contributed to the strong economic recovery. After growing at 9 per cent in 2010, GDP expanded by 8.5 per cent in 2011, driven by strong private investment and consumption. Domestic demand increased at a rapid rate, financed by lending growth made feasible by historically low interest rates. however, even though the Turkish economy remains relatively robust, it is not immune to stress in international financial markets owing to the country’s high current account deficit, which has made it dependent on external financing and thus exposed to fluctuations in global liquidity cycles. The growth outlook of Turkey is adversely affected by the eurozone crisis given its deep economic links with the eurozone. The economy is, therefore, likely to slow down to 3.2 per cent in 2012 before improving to 4.2 per cent in 2013.
Across South and South-West Asia, the economic outlook shows a marked slowdown to a subre-gional average of 4.5 per cent in 2012, from 6.7 per cent in 2011, partly due to stalled export growth rates as a result of the global economic slowdown (see Table 1.1). Another important component of the subregional slow down is a result of monetary tightening to curb inflationary expectations, the
Table 1.1: Rates of Economic Growth in South and South-West Asia, 2005–2012
Real GDP growth
(Percentage) 2005 2006 2007 2008 2009 2010 2011 2012b 2013b
South and South-West Asiaa 8.6 8.3 7.6 4.9 4.0 7.6 6.7 4.5 5.4Afghanistan 14.5 11.2 16.2 3.4 22.5 8.4 5.7 6.9 6.5 Bangladesh 6.0 6.6 6.4 6.2 5.7 6.1 6.7 6.3 6.1 Bhutan 8.8 6.8 17.9 4.7 6.7 11.8 5.4 7.9 8.4 india 9.5 9.7 9.2 6.7 8.0 8.4 6.5 5.9 6.8 iran (islamic Republic of) 5.7 6.2 6.9 3.3 1.5 3.2 4.0 –1.4 1.0 Maldives –4.6 18.0 7.2 12.0 –4.7 5.7 8.5 5.5 5.0 nepal 3.2 3.7 2.8 5.8 3.8 4.0 3.5 4.5 4.0 Pakistan 9.0 5.8 6.8 4.1 1.7 3.8 3.0 3.7 3.5 Sri Lanka 6.2 7.7 6.8 6.0 3.5 8.0 8.0 7.0 7.0 Turkey 8.4 6.9 4.7 0.7 -4.7 9.0 8.5 3.2 4.2
Sources: Un-eSCAP, based on national sources; CeiC Data Company Limited.Notes: a Calculations are based on GDP figures at market prices in United States dollars in 2010 (at 2000 prices) used as weights to calculate the
subregional growth rates. b estimates for 2012 and forecasts for 2013.
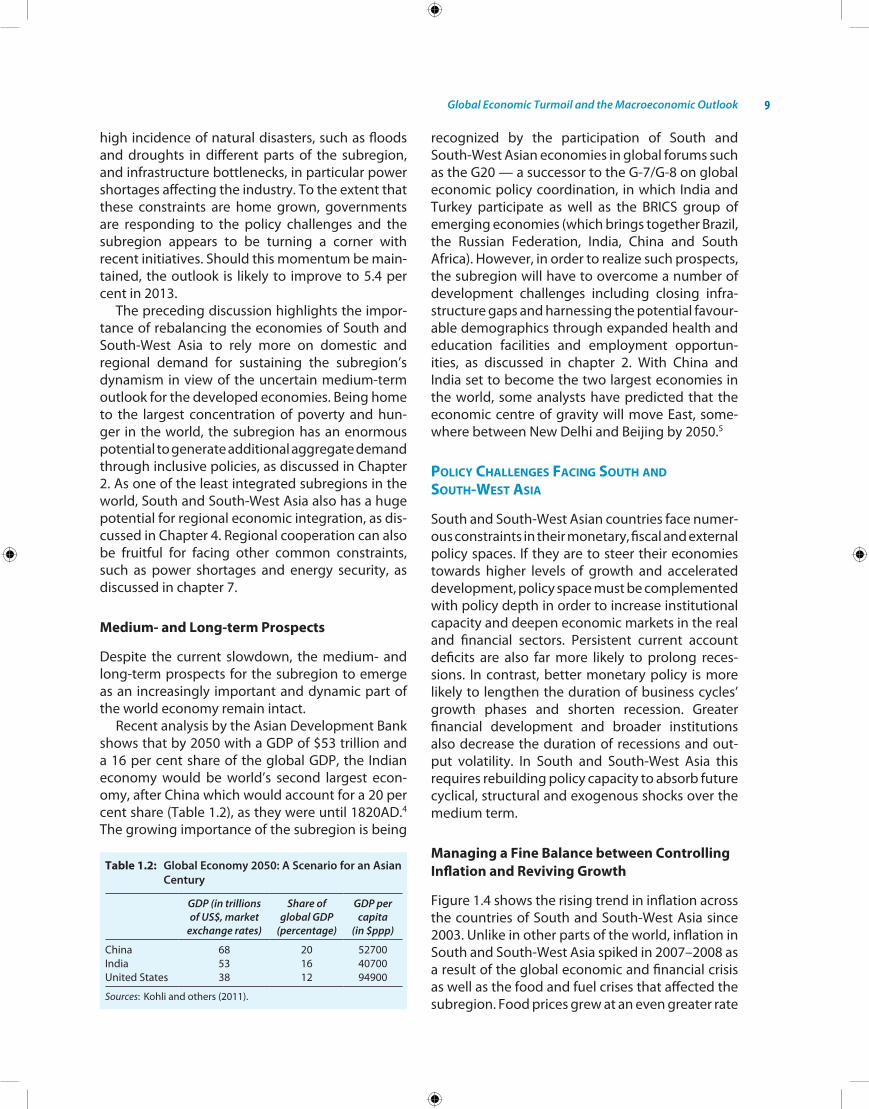
Global Economic Turmoil and the Macroeconomic Outlook 9
high incidence of natural disasters, such as floods and droughts in different parts of the subregion, and infrastructure bottlenecks, in particular power shortages affecting the industry. To the extent that these constraints are home grown, governments are responding to the policy challenges and the subregion appears to be turning a corner with recent initiatives. Should this momentum be main-tained, the outlook is likely to improve to 5.4 per cent in 2013.
The preceding discussion highlights the impor-tance of rebalancing the economies of South and South-West Asia to rely more on domestic and regional demand for sustaining the subregion’s dynamism in view of the uncertain medium-term outlook for the developed economies. Being home to the largest concentration of poverty and hun-ger in the world, the subregion has an enormous potential to generate additional aggregate demand through inclusive policies, as discussed in Chapter 2. As one of the least integrated subregions in the world, South and South-West Asia also has a huge potential for regional economic integration, as dis-cussed in Chapter 4. Regional cooperation can also be fruitful for facing other common constraints, such as power shortages and energy security, as discussed in chapter 7.
Medium- and Long-term Prospects
Despite the current slowdown, the medium- and long-term prospects for the subregion to emerge as an increasingly important and dynamic part of the world economy remain intact.
Recent analysis by the Asian Development Bank shows that by 2050 with a GDP of $53 trillion and a 16 per cent share of the global GDP, the indian economy would be world’s second largest econ-omy, after China which would account for a 20 per cent share (Table 1.2), as they were until 1820AD.4 The growing importance of the subregion is being
recognized by the participation of South and South-West Asian economies in global forums such as the G20 — a successor to the G-7/G-8 on global economic policy coordination, in which india and Turkey participate as well as the BRiCS group of emerging economies (which brings together Brazil, the Russian Federation, india, China and South Africa). however, in order to realize such prospects, the subregion will have to overcome a number of development challenges including closing infra-structure gaps and harnessing the potential favour-able demographics through expanded health and education facilities and employment opportun-ities, as discussed in chapter 2. With China and india set to become the two largest economies in the world, some analysts have predicted that the economic centre of gravity will move east, some-where between new Delhi and Beijing by 2050.5
policy challEngEs facing south and south-wEst asia
South and South-West Asian countries face numer-ous constraints in their monetary, fiscal and external policy spaces. if they are to steer their economies towards higher levels of growth and accelerated development, policy space must be complemented with policy depth in order to increase institutional capacity and deepen economic markets in the real and financial sectors. Persistent current account deficits are also far more likely to prolong reces-sions. in contrast, better monetary policy is more likely to lengthen the duration of business cycles’ growth phases and shorten recession. Greater financial development and broader institutions also decrease the duration of recessions and out-put volatility. in South and South-West Asia this requires rebuilding policy capacity to absorb future cyclical, structural and exogenous shocks over the medium term.
Managing a Fine Balance between Controlling Inflation and Reviving Growth
Figure 1.4 shows the rising trend in inflation across the countries of South and South-West Asia since 2003. Unlike in other parts of the world, inflation in South and South-West Asia spiked in 2007–2008 as a result of the global economic and financial crisis as well as the food and fuel crises that affected the subregion. Food prices grew at an even greater rate
Table 1.2: Global Economy 2050: A Scenario for an Asian Century
GDP (in trillions of US$, market
exchange rates)
Share of global GDP
(percentage)
GDP per capita
(in $ppp)
China 68 20 52700india 53 16 40700United States 38 12 94900
Sources: kohli and others (2011).
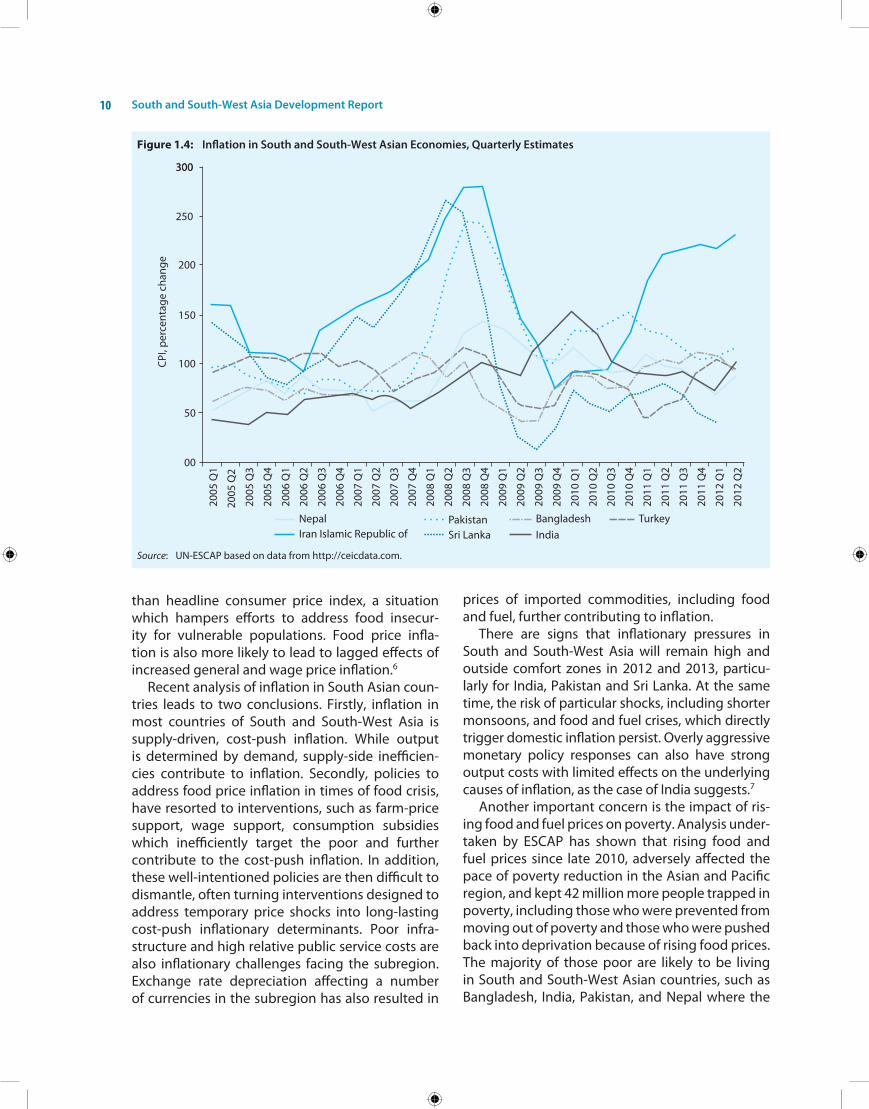
South and South-West Asia Development Report10
than headline consumer price index, a situation which hampers efforts to address food insecur-ity for vulnerable populations. Food price infla-tion is also more likely to lead to lagged effects of increased general and wage price inflation.6
Recent analysis of inflation in South Asian coun-tries leads to two conclusions. Firstly, inflation in most countries of South and South-West Asia is supply-driven, cost-push inflation. While output is determined by demand, supply-side inefficien-cies contribute to inflation. Secondly, policies to address food price inflation in times of food crisis, have resorted to interventions, such as farm-price support, wage support, consumption subsidies which inefficiently target the poor and further contribute to the cost-push inflation. in addition, these well-intentioned policies are then difficult to dismantle, often turning interventions designed to address temporary price shocks into long-lasting cost-push inflationary determinants. Poor infra-structure and high relative public service costs are also inflationary challenges facing the subregion. exchange rate depreciation affecting a number of currencies in the subregion has also resulted in
prices of imported commodities, including food and fuel, further contributing to inflation.
There are signs that inflationary pressures in South and South-West Asia will remain high and outside comfort zones in 2012 and 2013, particu-larly for india, Pakistan and Sri Lanka. At the same time, the risk of particular shocks, including shorter monsoons, and food and fuel crises, which directly trigger domestic inflation persist. overly aggressive monetary policy responses can also have strong output costs with limited effects on the underlying causes of inflation, as the case of india suggests.7
Another important concern is the impact of ris-ing food and fuel prices on poverty. Analysis under-taken by eSCAP has shown that rising food and fuel prices since late 2010, adversely affected the pace of poverty reduction in the Asian and Pacific region, and kept 42 million more people trapped in poverty, including those who were prevented from moving out of poverty and those who were pushed back into deprivation because of rising food prices. The majority of those poor are likely to be living in South and South-West Asian countries, such as Bangladesh, india, Pakistan, and nepal where the
Figure 1.4: Inflation in South and South-West Asian Economies, Quarterly Estimates
Source: Un-eSCAP based on data from http://ceicdata.com.
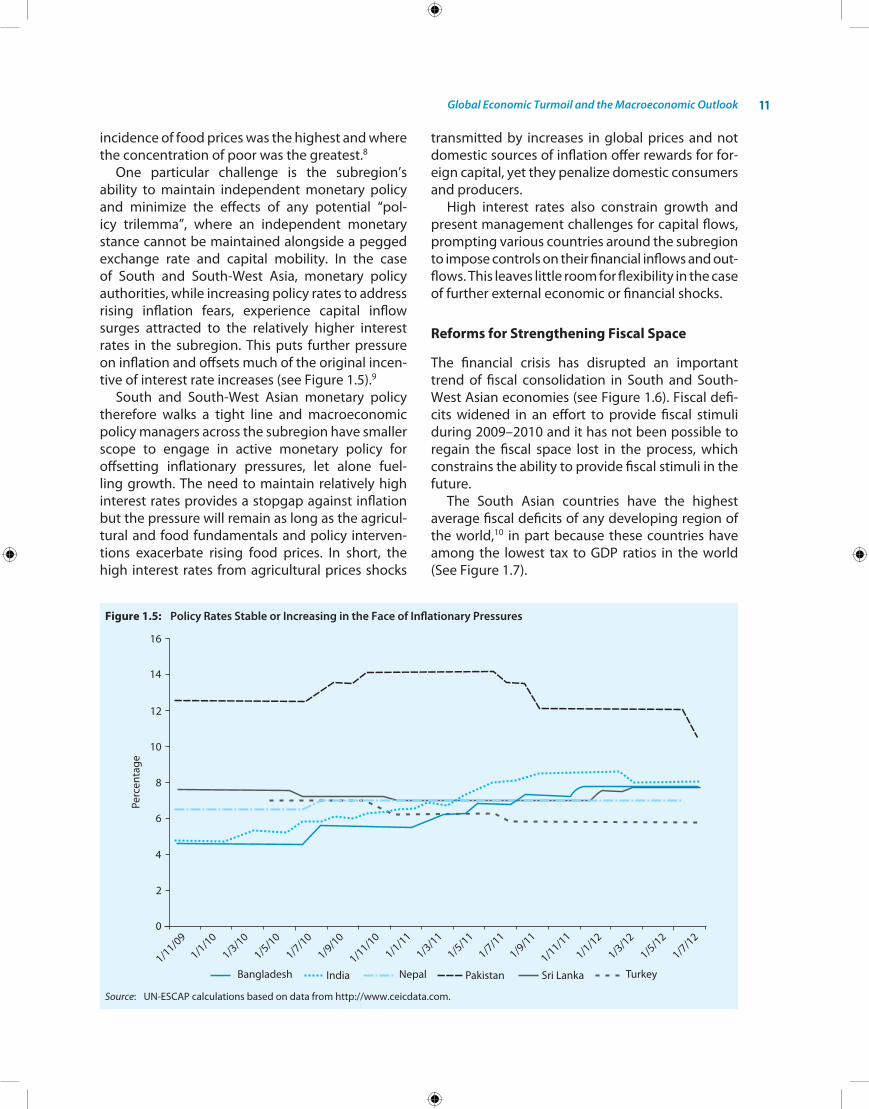
Global Economic Turmoil and the Macroeconomic Outlook 11
incidence of food prices was the highest and where the concentration of poor was the greatest.8
one particular challenge is the subregion’s ability to maintain independent monetary policy and minimize the effects of any potential “pol-icy trilemma”, where an independent monetary stance cannot be maintained alongside a pegged exchange rate and capital mobility. in the case of South and South-West Asia, monetary policy authorities, while increasing policy rates to address rising inflation fears, experience capital inflow surges attracted to the relatively higher interest rates in the subregion. This puts further pressure on inflation and offsets much of the original incen-tive of interest rate increases (see Figure 1.5).9
South and South-West Asian monetary policy therefore walks a tight line and macroeconomic policy managers across the subregion have smaller scope to engage in active monetary policy for offsetting inflationary pressures, let alone fuel-ling growth. The need to maintain relatively high interest rates provides a stopgap against inflation but the pressure will remain as long as the agricul-tural and food fundamentals and policy interven-tions exacerbate rising food prices. in short, the high interest rates from agricultural prices shocks
transmitted by increases in global prices and not domestic sources of inflation offer rewards for for-eign capital, yet they penalize domestic consumers and producers.
high interest rates also constrain growth and present management challenges for capital flows, prompting various countries around the subregion to impose controls on their financial inflows and out- flows. This leaves little room for flexibility in the case of further external economic or financial shocks.
Reforms for Strengthening Fiscal Space
The financial crisis has disrupted an important trend of fiscal consolidation in South and South-West Asian economies (see Figure 1.6). Fiscal defi-cits widened in an effort to provide fiscal stimuli during 2009–2010 and it has not been possible to regain the fiscal space lost in the process, which constrains the ability to provide fiscal stimuli in the future.
The South Asian countries have the highest average fiscal deficits of any developing region of the world,10 in part because these countries have among the lowest tax to GDP ratios in the world (See Figure 1.7).
Figure 1.5: Policy Rates Stable or Increasing in the Face of Inflationary Pressures
Source: Un-eSCAP calculations based on data from http://www.ceicdata.com.

South and South-West Asia Development Report12
Figure 1.6: South and South-West Asia Deficits Potential to Worsen
Source: Un-eSCAP (2012a).
Figure 1.7: Tax to GDP Ratios, Developing Regions, 2009
Source: World Bank (2012b).

Global Economic Turmoil and the Macroeconomic Outlook 13
Reining in fiscal deficits during a period of slow-down and increased volatility is particularly chal-lenging as such actions can further precipitate the slow down and should instead be pursued over a medium-term period. india, for example, has recently announced a five-year time frame for fis-cal consolidation.
At the same time, the subregion’s economies must face the increased demand for fiscal expendi-ture and services in the long-run that is associated with development. This requires ensuring that the government has plans to increase fiscal revenues to offset the higher fiscal expenditure and expanded social services and protection that a wealthier and more developed population will demand. in this context, given their low tax to GDP ratios, the South Asian countries have a great potential to increase tax revenue. Furthermore, Figure 1.8 shows that a considerable proportion of govern-ment expenditure in South and South-West Asia is absorbed by subsidies and interest payments. The hangover from food, energy and other sub-sidies that impose large fiscal expenditure loads on governments in the subregion is likely to last as only a phased approach to their elimination is
appropriate. There is also considerable potential to reengineer the existing public expenditure profile across countries to provide for a greater propor-tion of social expenditure. if South and South-West Asia can engage in a major fiscal reform to sustain growth, the subregion can avail itself of increased social expenditure.11
Closing Gaps in Infrastructure for Growth and Poverty Reduction
Across South and South-West Asian economies, basic physical infrastructure remains highly defi-cient and is putting severe constraints on the poten-tial to increase production. An updated version of the composite infrastructure index of eSCAP — that captures aspects of transport infrastructure (roads, railways and air transport density), iCT infrastruc-ture (telephone and internet density), energy avail-ability and banking infrastructure — demonstrates that South and South-West Asian countries occupy some of the lowest rankings, in particular the least developed countries of the subregion (Figure 1.9). Such infrastructure gaps cost the subregion dearly in terms of growth. infrastructure shortcomings in
Figure 1.8: Composition of Government Expenditure in South and South-West Asia, around 2010
Source: Un-eSCAP based on World Bank (2012e).

South and South-West Asia Development Report14
transport and telecommunications impede firms’ access to markets, exacerbate logistic costs and information losses. infrastructure-related issues also impact investment and technological choices, leading to higher capital turnover and a shorter useful life due to power volatility. infrastructure gaps also impose additional costs related to invest-ments in backup generators and other suboptimal measures.12 The Planning Commission of Pakistan estimates, for instance, that Pakistan loses an equi-valent of 3 to 4 per cent of potential growth owing to power outages across the country.13
The role of infrastructure investment in crowding in private investment and FDi is very well established in the literature globally and for South and South-West Asia.14 in the South Asian context, inequalities in infrastructure are found to be responsible for a widening income gap in the subregion.15 infrastruc- ture investment also helps to reduce poverty.16 esti- mates of infrastructure requirements conclude that a 7.5 per cent growth rate in South Asia would require a 7 per cent increase in infrastructure investment, including 2 per cent for capital replacement.17
in South and South-West Asia, which faces severe production bottlenecks from infrastruc-ture shortcomings, investment in infrastructure would help close a key structural growth gap for the subregion and provide a greater economic buffer against future crises, in addition to the absolute benefits for the population. Chapter 5 of this Report discusses issues concerning transport connectivity and infrastructure, while chapter 7 reviews the case of infrastructure for energy security in South and South-West Asia. Chapter 4 analyses some proposals on financial cooperation for infrastructure financing by transforming the South Asian Association for Regional Cooperation (SAARC) Development Fund to catalyse infrastruc-ture financing.
Maximizing the Growth Potential through Productivity Enhancement for Inclusive Development
Structural challenges and gaps in the economies of South and South-West Asia are the main barrier to
Figure 1.9: Infrastructure Weaknesses in South and South-West Asia Compared with Other Countries
Source: Un-eSCAP calculations updating Un-eSCAP infrastructure index 2007 (Un-eSCAP 2010a).
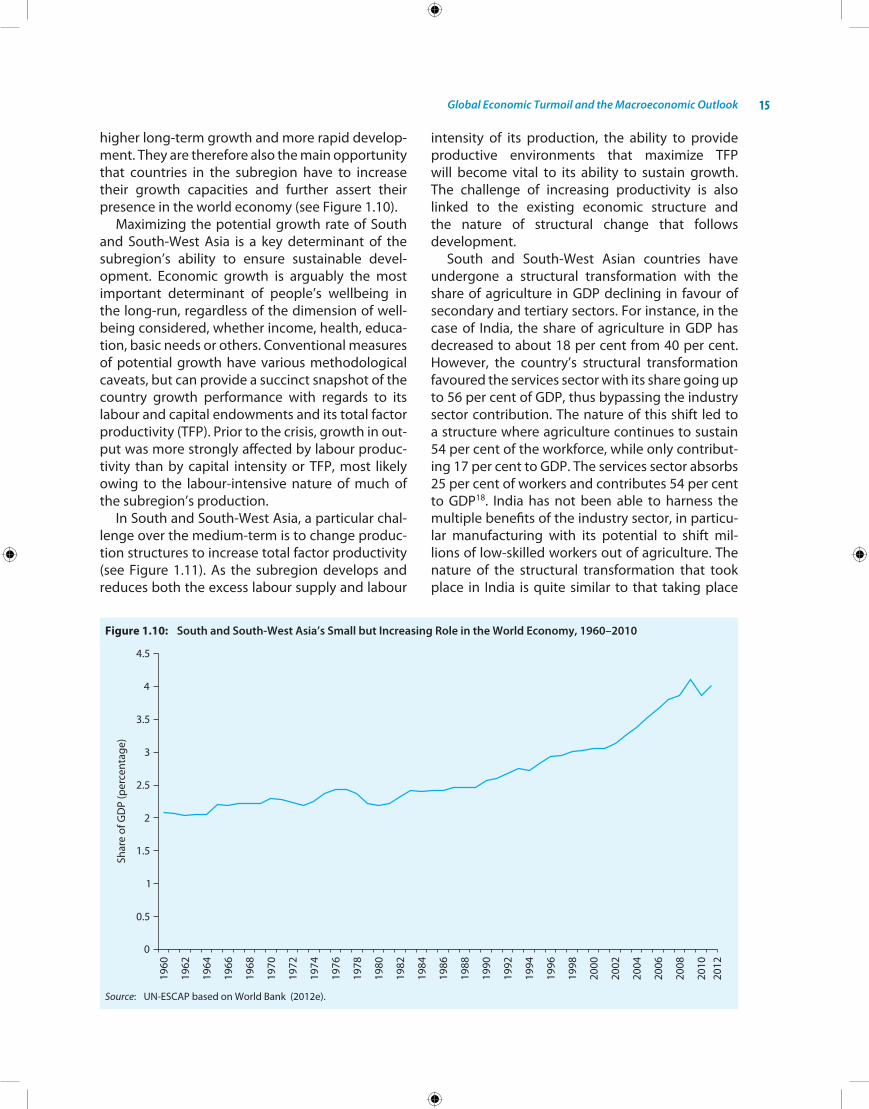
Global Economic Turmoil and the Macroeconomic Outlook 15
higher long-term growth and more rapid develop-ment. They are therefore also the main opportunity that countries in the subregion have to increase their growth capacities and further assert their presence in the world economy (see Figure 1.10).
Maximizing the potential growth rate of South and South-West Asia is a key determinant of the subregion’s ability to ensure sustainable devel-opment. economic growth is arguably the most important determinant of people’s wellbeing in the long-run, regardless of the dimension of well-being considered, whether income, health, educa-tion, basic needs or others. Conventional measures of potential growth have various methodological caveats, but can provide a succinct snapshot of the country growth performance with regards to its labour and capital endowments and its total factor productivity (TFP). Prior to the crisis, growth in out-put was more strongly affected by labour produc-tivity than by capital intensity or TFP, most likely owing to the labour-intensive nature of much of the subregion’s production.
in South and South-West Asia, a particular chal-lenge over the medium-term is to change produc-tion structures to increase total factor productivity (see Figure 1.11). As the subregion develops and reduces both the excess labour supply and labour
intensity of its production, the ability to provide productive environments that maximize TFP will become vital to its ability to sustain growth. The challenge of increasing productivity is also linked to the existing economic structure and the nature of structural change that follows development.
South and South-West Asian countries have undergone a structural transformation with the share of agriculture in GDP declining in favour of secondary and tertiary sectors. For instance, in the case of india, the share of agriculture in GDP has decreased to about 18 per cent from 40 per cent. however, the country’s structural transformation favoured the services sector with its share going up to 56 per cent of GDP, thus bypassing the industry sector contribution. The nature of this shift led to a structure where agriculture continues to sustain 54 per cent of the workforce, while only contribut-ing 17 per cent to GDP. The services sector absorbs 25 per cent of workers and contributes 54 per cent to GDP18. india has not been able to harness the multiple benefits of the industry sector, in particu-lar manufacturing with its potential to shift mil-lions of low-skilled workers out of agriculture. The nature of the structural transformation that took place in india is quite similar to that taking place
Figure 1.10: South and South-West Asia’s Small but Increasing Role in the World Economy, 1960–2010
Source: Un-eSCAP based on World Bank (2012e).

South and South-West Asia Development Report16
in most of the South and South-West Asian econo-mies especially in Bangladesh, Pakistan, Sri Lanka and Turkey where the services sector accounts for over half of total GDP. A high share of agriculture sector in employment combined with a low share in GDP leads to very poor labour productivity in agriculture (see Figure 1.12). The policy challenge for the future is to foster industrialization in South Asian countries to create jobs that are more pro-ductive and are able to shift workers from the agri-cultural sector. This would also make growth more sustainable and inclusive, as discussed in chapter 2 and also in chapter 9 in the context of least devel-oped countries.
Regional Cooperation for Strengthening Resilience against Future Crises
The crisis has highlighted the instability and elas-ticity of export trade from the subregion while the growth in demand for inputs from abroad leaves import trends far more inelastic. This has led to considerable deterioration in balance of trade and
Figure 1.11: Sources of Growth, Selected Countries of South and South-West Asia, 1960–2008
Source: Un-eSCAP based on World Bank (2012c).
hence current account deficits since 2008–09 (see Figure 1.13).
The deteriorating current account situation has left the South and South-West Asian countries with lower reserves to fall back on in the event of addi-tional external shocks, such as possible shocks to exports, credit, international growth, and domestic production in the coming years.
The global recovery has now made the task of rebuilding core country macroeconomic reserves against exogenous shocks far more important but also far more difficult for most countries in the sub-region. international capital reserves are now far lower in most countries, exchange rates are weaker and many of the countries now have significant trends of fiscal and current account deficits (see Figure 1.14).
Further shocks based on developed countries haphazard economic recovery are only some of the risks that the subregion must mitigate. More inevi-table are future shocks to food and fuel supplies that would severely impact growth performance, let alone increase it, and greatly expose structural
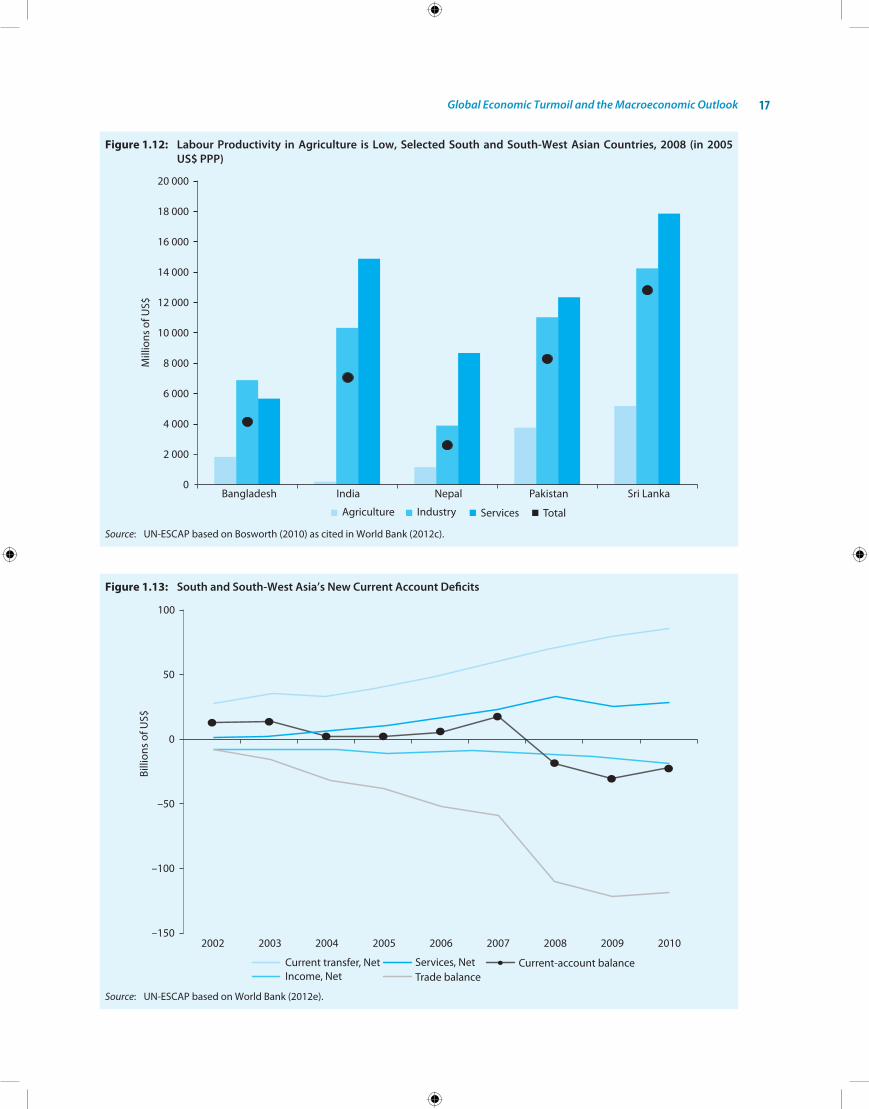
Global Economic Turmoil and the Macroeconomic Outlook 17
Figure 1.12: Labour Productivity in Agriculture is Low, Selected South and South-West Asian Countries, 2008 (in 2005 US$ PPP)
Source: Un-eSCAP based on Bosworth (2010) as cited in World Bank (2012c).
Figure 1.13: South and South-West Asia’s New Current Account Deficits
Source: Un-eSCAP based on World Bank (2012e).

South and South-West Asia Development Report18
weaknesses in domestic supply chains. in this context, the subregion can benefit from regional cooperation by entering into swap arrangements between countries for meeting short-term liquidity problems, following models such as the Chiang-Mai initiative, which was created by ASeAn+3 countries. An important new initiative in this connection is a swap arrangement of $2 billion created by the Reserve Bank of india for the SAARC countries pur-suant to the SAARC Ministerial Meeting on Global Financial Crisis, held in February 2009 to provide liquidity support in times of crisis. Strengthening the Asian Clearing Union mechanism, as argued in chapter 4, could be an additional option in this direction besides seeking to evolve a region-wide facility, possibly by expanding the Chiang-Mai ini-tiative to cover other countries.
A Cautious and Sequential Approach to Financial Liberalization
The crisis has exposed flaws in the finance domi-nated markets and regulation of developed coun-tries. Countries that followed unorthodox paths, such as China and india, have done better and have continued to grow during the worst years of
the crisis without any signs of stress in the finan-cial sector. Japan’s lost decade showed that recov-ery from financial sector problems is challenging. excessive financialization is exacting a large cost on europe and the United States. india continued with strategic controls and had more successful domestic institutional and market deepening. in the post-reform period, india was able to build up substantial reserves, without help from the inter-national Monetary Fund. The experience of other South Asian countries also demonstrates that a middling through path works best. Pakistan, with a more open capital account suffered balance of payments crises and often had to turn to the iMF for aid; Bangladesh, which retained more controls, needed help only once. Moderate and sequenced external and domestic liberalization is the safe way to proceed. The path towards liberalization may be long, with domestic institutions and markets to be strengthened before full capital account liberaliza-tion can take place. Financial sector development must serve the subregion’s critical development needs, such as financial inclusion and infrastruc-ture development, both of which require signifi-cant governmental intervention.19
Figure 1.14: South and South-West Asia Reserves as Months of Imports
Source: Un-eSCAP based on http://ceicdata.com.
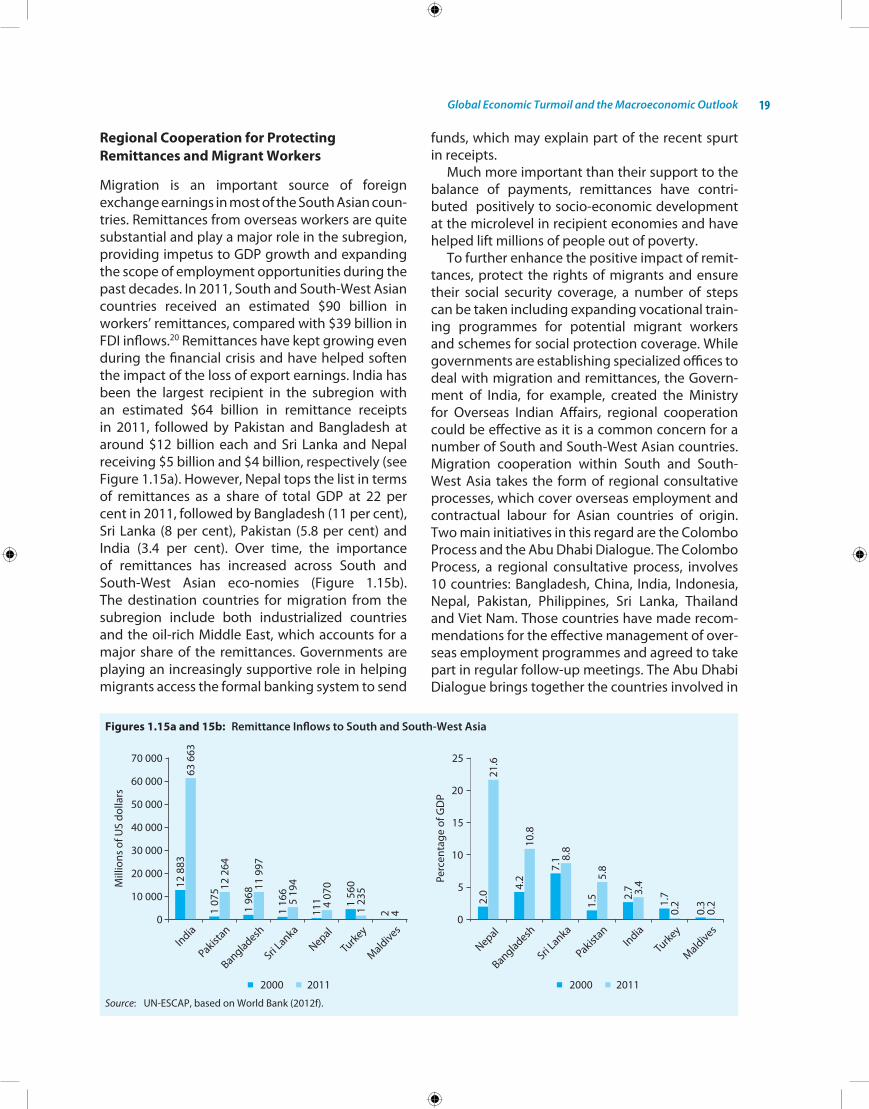
Global Economic Turmoil and the Macroeconomic Outlook 19
Regional Cooperation for Protecting Remittances and Migrant Workers
Migration is an important source of foreign exchange earnings in most of the South Asian coun-tries. Remittances from overseas workers are quite substantial and play a major role in the subregion, providing impetus to GDP growth and expanding the scope of employment opportunities during the past decades. in 2011, South and South-West Asian countries received an estimated $90 billion in workers’ remittances, compared with $39 billion in FDi inflows.20 Remittances have kept growing even during the financial crisis and have helped soften the impact of the loss of export earnings. india has been the largest recipient in the subregion with an estimated $64 billion in remittance receipts in 2011, followed by Pakistan and Bangladesh at around $12 billion each and Sri Lanka and nepal receiving $5 billion and $4 billion, respectively (see Figure 1.15a). however, nepal tops the list in terms of remittances as a share of total GDP at 22 per cent in 2011, followed by Bangladesh (11 per cent), Sri Lanka (8 per cent), Pakistan (5.8 per cent) and india (3.4 per cent). over time, the importance of remittances has increased across South and South-West Asian eco-nomies (Figure 1.15b). The destination countries for migration from the subregion include both industrialized countries and the oil-rich Middle east, which accounts for a major share of the remittances. Governments are playing an increasingly supportive role in helping migrants access the formal banking system to send
funds, which may explain part of the recent spurt in receipts.
Much more important than their support to the balance of payments, remittances have contri-buted positively to socio-economic development at the microlevel in recipient economies and have helped lift millions of people out of poverty.
To further enhance the positive impact of remit-tances, protect the rights of migrants and ensure their social security coverage, a number of steps can be taken including expanding vocational train-ing programmes for potential migrant workers and schemes for social protection coverage. While governments are establishing specialized offices to deal with migration and remittances, the Govern-ment of india, for example, created the Ministry for overseas indian Affairs, regional cooperation could be effective as it is a common concern for a number of South and South-West Asian countries. Migration cooperation within South and South-West Asia takes the form of regional consultative processes, which cover overseas employment and contractual labour for Asian countries of origin. Two main initiatives in this regard are the Colombo Process and the Abu Dhabi Dialogue. The Colombo Process, a regional consultative process, involves 10 countries: Bangladesh, China, india, indonesia, nepal, Pakistan, Philippines, Sri Lanka, Thailand and Viet nam. Those countries have made recom-mendations for the effective management of over-seas employment programmes and agreed to take part in regular follow-up meetings. The Abu Dhabi Dialogue brings together the countries involved in
Figures 1.15a and 15b: Remittance Inflows to South and South-West Asia
Source: Un-eSCAP, based on World Bank (2012f).
South and South-West Asia Development Report20
the Colombo Process along with Gulf Cooperation Council States, in addition to Yemen and two Asian destination countries. Particular focus is placed on promoting the welfare and well-being of workers, on the development of both origin and destina-tion countries through labour mobility, and on fostering greater intergovernmental cooperation and collaboration, with the active support of inter-national and regional partners. Apart from these initiatives, the South Asia Migration Commission (SAMC) was established in 2009 to oversee migra-tion and enhance it positive aspects. in particular, SAMC could help in protecting workers’ rights and enhancing their social protection, also ensuring that the workers’ remittances and their savings when they return home can be invested in produc-tive areas.20
conclusion
The global financial crisis that started in 2008 is ongoing and has entered a potentially more chal-lenging second stage, with the world’s major advanced economies facing very subdued and uncertain economic outlook leaving few spaces for policy action. Like all economies, South and South-
West Asian economies have been affected by the global slowdown in addition to facing domestic challenges such as monetary tightening to deal with inflationary pressures, repeated natural dis-asters, and infrastructure shortages, among other challenges. The South and South-West Asian econ-omies, however, appear to be turning a corner and are likely to perform better in 2013 than in 2012. They still face a number of policy challenges includ-ing managing a fine balance between inflation and growth through monetary policy. They need to undertake reforms to recover greater policy space for enhancing social expenditure and to close infra-structure gaps for sustaining growth and poverty reduction. An important policy strategy for sustain-ing inclusive growth is to maximize their growth potential through productivity enhancement by reviving the industrial sector for the creation of more productive jobs. Finally, there is also scope for regional cooperation for protecting migrant workers and for enhancing the resilience against future financial crises. in the light of the global financial crisis, a cautious and sequential approach to financial liberalization and capital account convertibility is more appropriate for South and South-West Asian countries.

economic growth in South and South-West Asia has been impressive, but development in the sub-region needs to be more inclusive and sustainable. At the beginning of the second decade of the new millennium, South and South-West Asia remains plagued by several issues and deprivations that most other regions in the world have overcome.
Poverty reduction in South and South-West Asia has been significant, but not as dramatic as in other high growth regions, and was complemented by rising inequality. Faster progress in other regions leaves South and South-West Asia today the larg-est concentration of the world’s poor, those living in hunger, and those without access to basic needs such as water, sanitation and electricity. in addition, child and maternal mortality rates in the subregion are among the highest in the world.
South and South-West Asian countries can cor-rect these economic and social imbalances by embracing a more sustainable and more inclusive development process aimed at addressing imme-diate absolute deprivations, creating structures that provide for more equitable and resilient eco-nomic, social and environmental development.
This chapter provides an overview of South and South-West Asia’s inclusive and sustainable devel-opment. it argues that economic, social and envir-onmental priorities must be balanced in favour of the most pressing challenges facing the subregion. While the subregion has made significant develop-ment gains, persistent disparities within countries thwart further progress. As the working-age popu-lation of the subregion grows, policymakers can pursue inclusive and sustainable policies to create pathways for people to escape exclusion and real-ize their aspirations for the future.
balancing sustainablE dEvElopmEnt prioritiEs
Sustainable development is a unified framework for development that considers the three broad dimensions of economic, social and environmental
sustainability. Advances in human well-being can be defined along these three pillars both for cur-rent and future generations. As an outcome of the Rio+20 United nations Conference on Sustainable Development, governments of the world put for-ward a vision of sustainable development as the unifying paradigm for development strategies at the local, national and international levels.
Countries must balance their economic, social and environmental development pathways and recognize the interlinkages between them. The economic development pillar of sustainable devel-opment considers maximizing and sustaining eco-nomic growth and improving overall well-being. The social development pillar encompasses the ability of all women and men, girls and boys to fully participate in and meaningfully contribute to the life of their society. The environmental pillar focuses on the sustainable use of natural resources to ensure their full enjoyment by future generations. Strate-gies for progress towards sustainable development may differ according to the specific economic, social and environmental challenges faced by indi-vidual countries, and therefore the development strategy of South and South-West Asia may differ in its balance between the three pillars of sustainable development compared with other subregions.
The eradication of poverty remains the greatest global challenge facing the world today and is an indispensable requirement for sustainable devel-opment, as recognized by the Rio+20 outcome document. The commitments made at Rio focus on the urgency of freeing humanity from hunger and poverty by mainstreaming sustainable develop-ment at all levels and harnessing the interlinkages between economic, social and environmental sus-tainability. Given that South and South-West Asia remains home to the largest concentration of the world’s poor and hungry populations, finding an appropriate balance between the three pillars of sustainable development is of particular urgency in the subregion.
2 Inclusive and Sustainable Development
in South and South-West Asia
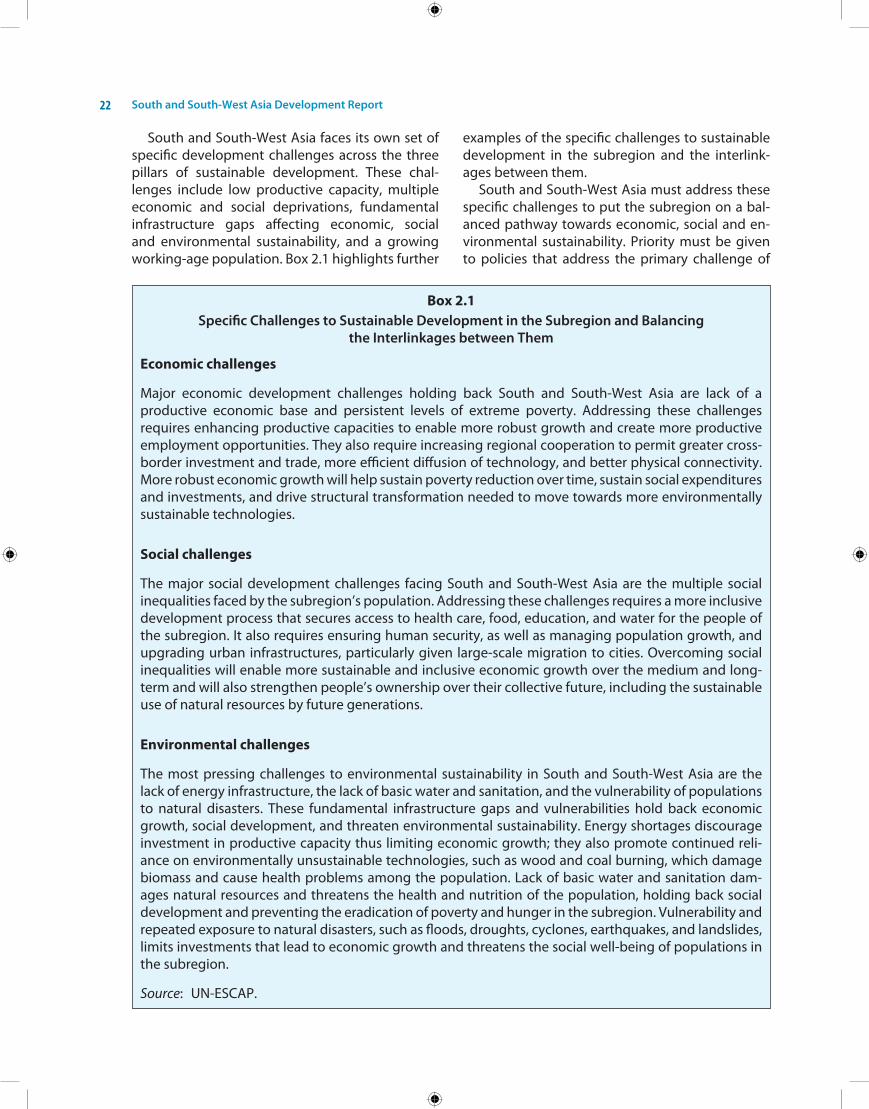
South and South-West Asia Development Report22
South and South-West Asia faces its own set of specific development challenges across the three pillars of sustainable development. These chal-lenges include low productive capacity, multiple economic and social deprivations, fundamental infrastructure gaps affecting economic, social and environmental sustainability, and a growing working-age population. Box 2.1 highlights further
Box 2.1Specific Challenges to Sustainable Development in the Subregion and Balancing
the Interlinkages between Them
Economic challenges
Major economic development challenges holding back South and South-West Asia are lack of a productive economic base and persistent levels of extreme poverty. Addressing these challenges requires enhancing productive capacities to enable more robust growth and create more productive employment opportunities. They also require increasing regional cooperation to permit greater cross-border investment and trade, more efficient diffusion of technology, and better physical connectivity. More robust economic growth will help sustain poverty reduction over time, sustain social expenditures and investments, and drive structural transformation needed to move towards more environmentally sustainable technologies.
Social challenges
The major social development challenges facing South and South-West Asia are the multiple social inequalities faced by the subregion’s population. Addressing these challenges requires a more inclusive development process that secures access to health care, food, education, and water for the people of the subregion. it also requires ensuring human security, as well as managing population growth, and upgrading urban infrastructures, particularly given large-scale migration to cities. overcoming social inequalities will enable more sustainable and inclusive economic growth over the medium and long-term and will also strengthen people’s ownership over their collective future, including the sustainable use of natural resources by future generations.
Environmental challenges
The most pressing challenges to environmental sustainability in South and South-West Asia are the lack of energy infrastructure, the lack of basic water and sanitation, and the vulnerability of populations to natural disasters. These fundamental infrastructure gaps and vulnerabilities hold back economic growth, social development, and threaten environmental sustainability. energy shortages discourage investment in productive capacity thus limiting economic growth; they also promote continued reli-ance on environmentally unsustainable technologies, such as wood and coal burning, which damage biomass and cause health problems among the population. Lack of basic water and sanitation dam-ages natural resources and threatens the health and nutrition of the population, holding back social development and preventing the eradication of poverty and hunger in the subregion. Vulnerability and repeated exposure to natural disasters, such as floods, droughts, cyclones, earthquakes, and landslides, limits investments that lead to economic growth and threatens the social well-being of populations in the subregion.
Source: Un-eSCAP.
examples of the specific challenges to sustainable development in the subregion and the interlink-ages between them.
South and South-West Asia must address these specific challenges to put the subregion on a bal-anced pathway towards economic, social and en-vironmental sustainability. Priority must be given to policies that address the primary challenge of

Inclusive and Sustainable Development in South and South-West Asia 23
poverty and hunger, but also leverage the strong-est interlinkages among the pillars of sustainable development. For example, given the relatively low levels of economic and social development in the subregion, prioritizing investment in infrastructure that provides basic sanitation would enable pov-erty reduction, contribute to economic growth, help overcome social inequalities, and also contri-bute to environmental sustainability.
in the Rio+20 outcome document, the countries of the world have provided a mandate and frame-work for the realization of sustainable development. South and South-West Asia has the opportunity to apply this framework to its strategic development planning and prioritize the specific challenges
facing economic, social and environmental devel-opment in the subregion. Many countries already have sustainable development action plans in place (see Box 2.2). Box 2.3 looks specifically at the case of Bhutan. it is up to governments of the subregion to coordinate between each another to carve out a viable subregional strategy for achieving the com-mitments made at Rio.
mixEd progrEss in closing dEvElopmEnt gaps
As mentioned in the previous section, the eradica-tion of poverty and hunger remains the greatest global challenge facing the world today. A gen- eration after 1990, South and South-West Asia’s
Box 2.2Examples of National Actions to Promote Sustainable Development
India
india has set up a national strategy to adapt to climate change and to further enhance the ecological sustainability of its development path. eight national Missions form the core of the national Action Plan, and represent long-term strategies for achieving key climate change related goals. These include the national Solar Mission, the energy Conservation Act of 2001, the national Mission on Sustainable habitat, the national Water Mission, the Mission for sustaining the himalayan ecosystem, the national Mission to enhance ecosystem services including carbon sinks known as Green india, the Mission for Sustainable Agriculture, and a Strategic knowledge Mission set up to identify challenges of and the responses to climate change.
Pakistan
According to Pakistan’s Strategic Country environmental Assessment, the main areas of environmental degradation affecting the country include climate change, water pollution, open and indoor air pollution, soil pollution and erosion, and deforestation. Governance, financial resources and limited regional and global cooperation constitute important constraints to achieve sustainable development in the country. Pakistan hopes to update its regulatory framework, build capacity for environmental management, and reinforce incentives and accountability. A new climate action law approved in September 2012 integrates climate considerations into a wide variety of government policies, in order to tackle disaster risk reduction, energy, water and food security.
Turkey
Turkey’s vulnerable ecosystem has been placed under increasing stress by high population growth, rising incomes and energy consumption. environmental problems such as water shortages, land degrad-ation and lack of clean and affordable energy resources severely hinder efforts to achieve sustainable development. hence, a national sustainable development strategy has been designed to achieve sustain- able development through combining efforts under a number of different initiatives, such as the ninth Development Plan (2007–2013), the national Commission for Sustainable Development, the national environmental Action Plan, the environment Law, and the environmental impact Assessment Regulation.
Source: Un-eSCAP based on Ghosh (2011) and press reports.
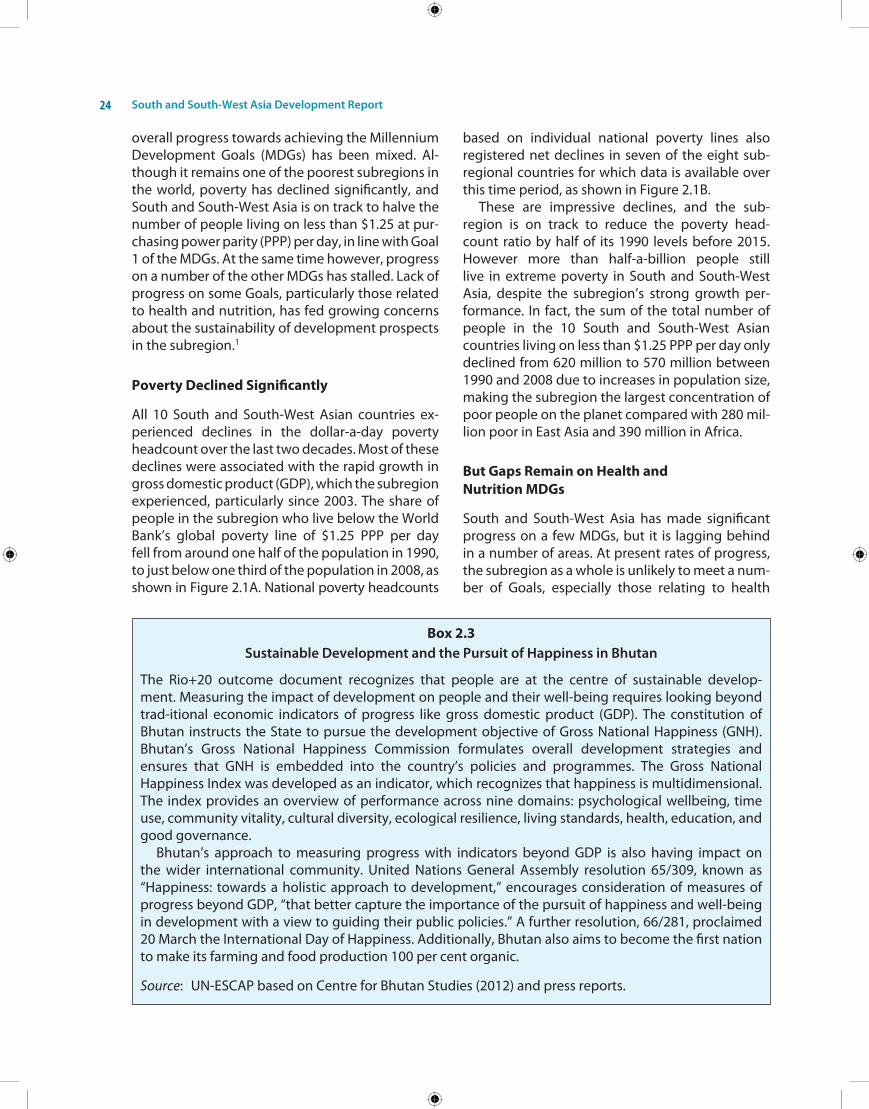
South and South-West Asia Development Report24
overall progress towards achieving the Millennium Development Goals (MDGs) has been mixed. Al-though it remains one of the poorest subregions in the world, poverty has declined significantly, and South and South-West Asia is on track to halve the number of people living on less than $1.25 at pur-chasing power parity (PPP) per day, in line with Goal 1 of the MDGs. At the same time however, progress on a number of the other MDGs has stalled. Lack of progress on some Goals, particularly those related to health and nutrition, has fed growing concerns about the sustainability of development prospects in the subregion.1
Poverty Declined Significantly
All 10 South and South-West Asian countries ex-perienced declines in the dollar-a-day poverty headcount over the last two decades. Most of these declines were associated with the rapid growth in gross domestic product (GDP), which the subregion experienced, particularly since 2003. The share of people in the subregion who live below the World Bank’s global poverty line of $1.25 PPP per day fell from around one half of the population in 1990, to just below one third of the population in 2008, as shown in Figure 2.1A. national poverty headcounts
based on individual national poverty lines also registered net declines in seven of the eight sub-regional countries for which data is available over this time period, as shown in Figure 2.1B.
These are impressive declines, and the sub-region is on track to reduce the poverty head- count ratio by half of its 1990 levels before 2015. however more than half-a-billion people still live in extreme poverty in South and South-West Asia, despite the subregion’s strong growth per-formance. in fact, the sum of the total number of people in the 10 South and South-West Asian countries living on less than $1.25 PPP per day only declined from 620 million to 570 million between 1990 and 2008 due to increases in population size, making the subregion the largest concentration of poor people on the planet compared with 280 mil-lion poor in east Asia and 390 million in Africa.
But Gaps Remain on Health and Nutrition MDGs
South and South-West Asia has made significant progress on a few MDGs, but it is lagging behind in a number of areas. At present rates of progress, the subregion as a whole is unlikely to meet a num-ber of Goals, especially those relating to health
Box 2.3Sustainable Development and the Pursuit of Happiness in Bhutan
The Rio+20 outcome document recognizes that people are at the centre of sustainable develop- ment. Measuring the impact of development on people and their well-being requires looking beyond trad-itional economic indicators of progress like gross domestic product (GDP). The constitution of Bhutan instructs the State to pursue the development objective of Gross national happiness (Gnh). Bhutan’s Gross national happiness Commission formulates overall development strategies and ensures that Gnh is embedded into the country’s policies and programmes. The Gross national happiness index was developed as an indicator, which recognizes that happiness is multidimensional. The index provides an overview of performance across nine domains: psychological wellbeing, time use, community vitality, cultural diversity, ecological resilience, living standards, health, education, and good governance.
Bhutan’s approach to measuring progress with indicators beyond GDP is also having impact on the wider international community. United nations General Assembly resolution 65/309, known as “happiness: towards a holistic approach to development,” encourages consideration of measures of progress beyond GDP, “that better capture the importance of the pursuit of happiness and well-being in development with a view to guiding their public policies.” A further resolution, 66/281, proclaimed 20 March the international Day of happiness. Additionally, Bhutan also aims to become the first nation to make its farming and food production 100 per cent organic.
Source: Un-eSCAP based on Centre for Bhutan Studies (2012) and press reports.
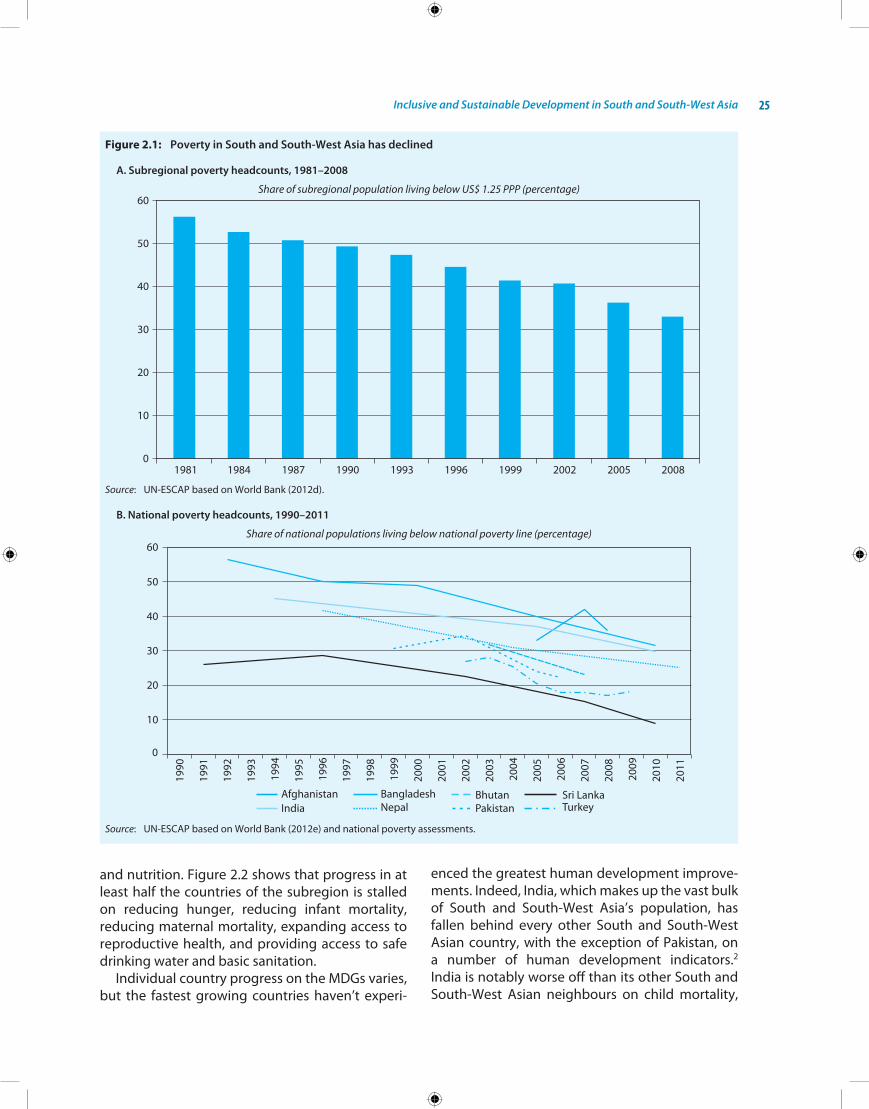
Inclusive and Sustainable Development in South and South-West Asia 25
Figure 2.1: Poverty in South and South-West Asia has declined
A. Subregional poverty headcounts, 1981–2008
Share of subregional population living below US$ 1.25 PPP (percentage)
Source: Un-eSCAP based on World Bank (2012d).
B. National poverty headcounts, 1990–2011
Share of national populations living below national poverty line (percentage)
Source: Un-eSCAP based on World Bank (2012e) and national poverty assessments.
and nutrition. Figure 2.2 shows that progress in at least half the countries of the subregion is stalled on reducing hunger, reducing infant mortality, reducing maternal mortality, expanding access to reproductive health, and providing access to safe drinking water and basic sanitation.
individual country progress on the MDGs varies, but the fastest growing countries haven’t experi-
enced the greatest human development improve-ments. indeed, india, which makes up the vast bulk of South and South-West Asia’s population, has fallen behind every other South and South-West Asian country, with the exception of Pakistan, on a number of human development indicators.2 india is notably worse off than its other South and South-West Asian neighbours on child mortality,
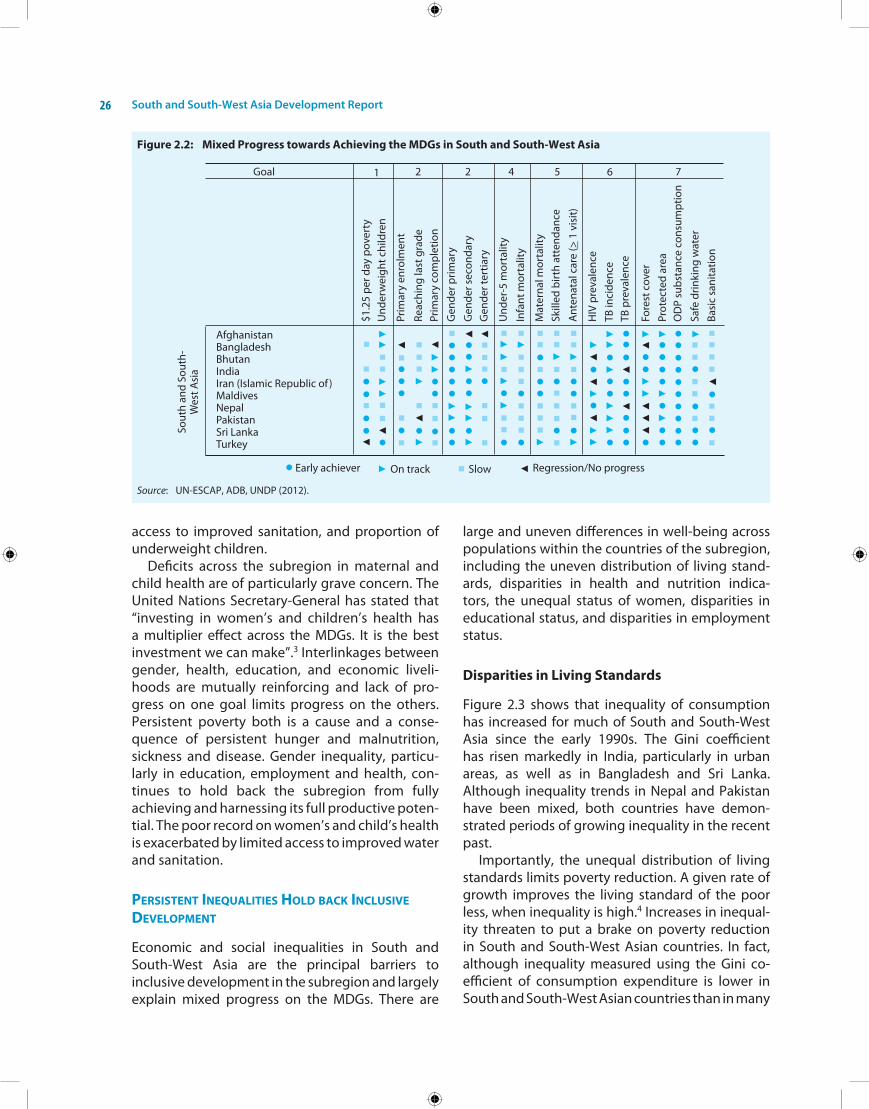
South and South-West Asia Development Report26
access to improved sanitation, and proportion of underweight children.
Deficits across the subregion in maternal and child health are of particularly grave concern. The United nations Secretary-General has stated that “investing in women’s and children’s health has a multiplier effect across the MDGs. it is the best investment we can make”.3 interlinkages between gender, health, education, and economic liveli-hoods are mutually reinforcing and lack of pro-gress on one goal limits progress on the others. Persistent poverty both is a cause and a conse-quence of persistent hunger and malnutrition, sickness and disease. Gender inequality, particu-larly in education, employment and health, con- tinues to hold back the subregion from fully achieving and harnessing its full productive poten-tial. The poor record on women’s and child’s health is exacerbated by limited access to improved water and sanitation.
pErsistEnt inEqualitiEs hold back inclusivE dEvElopmEnt
economic and social inequalities in South and South-West Asia are the principal barriers to inclusive development in the subregion and largely explain mixed progress on the MDGs. There are
large and uneven differences in well-being across populations within the countries of the subregion, including the uneven distribution of living stand-ards, disparities in health and nutrition indica-tors, the unequal status of women, disparities in educational status, and disparities in employment status.
Disparities in Living Standards
Figure 2.3 shows that inequality of consumption has increased for much of South and South-West Asia since the early 1990s. The Gini coefficient has risen markedly in india, particularly in urban areas, as well as in Bangladesh and Sri Lanka. Although inequality trends in nepal and Pakistan have been mixed, both countries have demon-strated periods of growing inequality in the recent past.
importantly, the unequal distribution of living standards limits poverty reduction. A given rate of growth improves the living standard of the poor less, when inequality is high.4 increases in inequal-ity threaten to put a brake on poverty reduction in South and South-West Asian countries. in fact, although inequality measured using the Gini co-efficient of consumption expenditure is lower in South and South-West Asian countries than in many
Figure 2.2: Mixed Progress towards Achieving the MDGs in South and South-West Asia
Source: Un-eSCAP, ADB, UnDP (2012).
Inclusive and Sustainable Development in South and South-West Asia 27
Box 2.4The Mahatma Gandhi National Rural Employment Guarantee Act in India
in india, the Mahatma Gandhi national Rural employment Guarantee Act (MGnReGA) 2005 aims at enhancing the livelihood security of people in rural areas by guaranteeing 100 days of wage-employment per year to a rural household whose adult members volunteer to do unskilled manual work. Launched in 2005, the Government of india operates the programme on a huge scale. During the fiscal year 2011–2012, the Government allocated Rs 376 billion to the scheme, which provided more than 1 billion person-days of employment for 33 million people. Most of the financial resources are provided by the Central Government, but implementation and management are handled by states and local governments that identify public works projects.
The MGnReGA scheme offers many advantages. it provides income security for the poor, achieves high participation of women and marginalized groups, increases access to markets and financial ser-vices, and regenerates national resources. Besides providing employment to the underprivileged rural population, it helps address the causes of chronic poverty. Since the creation of the scheme, the par-ticipation rate of women has continuously increased, reaching 54.26 per cent during the fiscal year 2011–2012. MGnReGA promotes financial inclusion, as many payments are made through bank or post office accounts, and expands infrastructure and basic services through the construction of roads and sanitation. The scheme also tackles drought, deforestation and soil erosion through public works proj-ects in water conservation and harvesting, afforestation, rural connectivity, and construction and repair of embankments for flood control.
Although initial evidence suggests that the programme is achieving its inclusive and sustainable objectives, some pitfalls have been pointed out, which are being addressed. For example, there is con-siderable unmet demand for work through the scheme in all states, and more so in the poorest ones, where the scheme is needed most. over the years, the scheme has been under constant monitoring, evaluation and improvement to bridge the gaps and address mismanagement, corruption, gender bias and other concerns. More is being done to reduce opportunities for leakage or corruption, particularly in isolated rural areas, where the distance to available banks and post offices can be an impediment. Steps are also being taken to streamline the fund flow from the centre to the local level by improving accounting systems and making oversight mechanisms more efficient.
Given its vast scale and ambition, MGnReGA is encouraging due to its positive impact, not only on the livelihoods of rural men and women, but also on how it catalyzes improvements in infrastructure, access to finance, and natural resource management. This innovative approach to inclusive and sustainable development can be emulated by other countries in the subregion.
Source: Un-eSCAP based on http://nrega.nic.in.
other countries, there is also reason to suspect that the measure may be concealing higher inequalities in the subregion (see Box 2.5).
inequality in South and South-West Asia holds back human development achievements as well. The unequal distribution of human development outcomes also limits progress along non-mon-etary dimensions. Figure 2.5 shows that most of the subregion has low levels of human develop-
ment, as measured by the United nations Devel-opment Programme’s human Development index. however, once the distribution of human devel-opment outcomes within each country is taken into consideration, the human development lev-els appear even lower. The inequality-adjusted index highlights the large costs that the unequal distribution of human development progress incurs upon societies. in half the countries of the
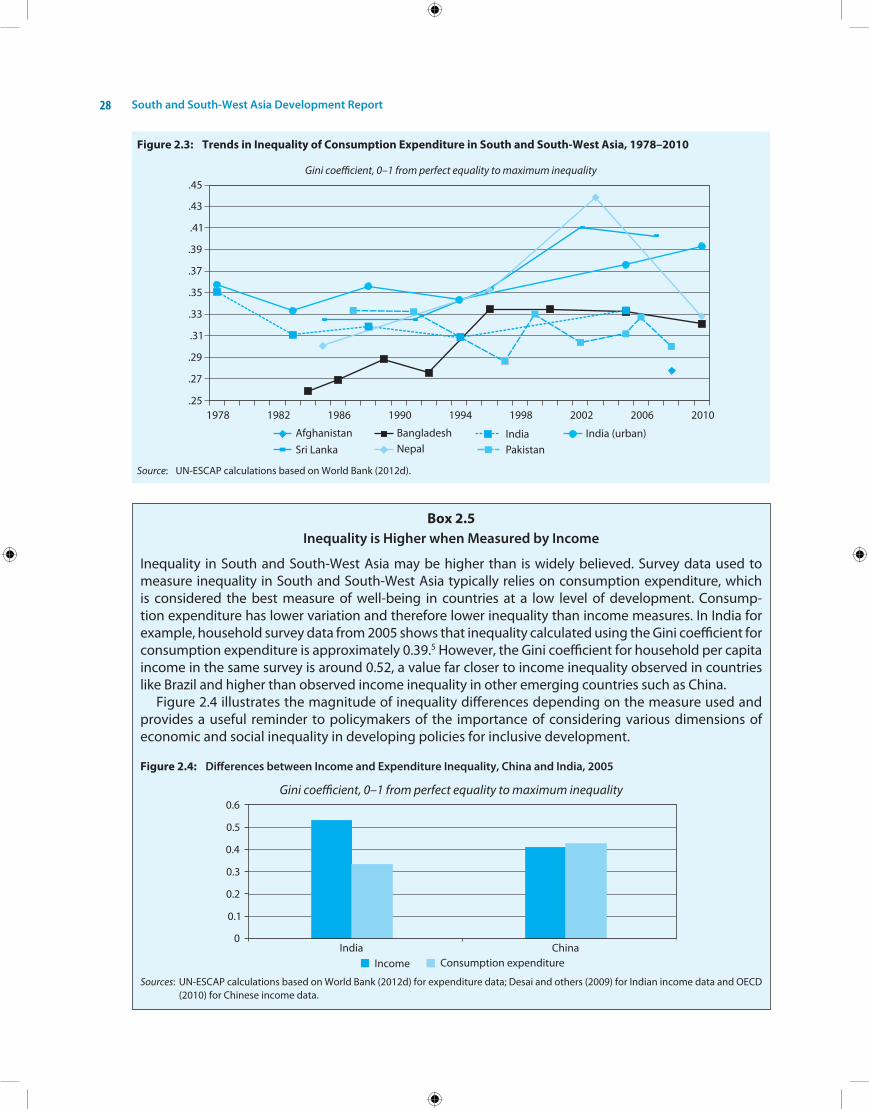
South and South-West Asia Development Report28
Figure 2.3: Trends in Inequality of Consumption Expenditure in South and South-West Asia, 1978–2010
Gini coefficient, 0–1 from perfect equality to maximum inequality
Source: Un-eSCAP calculations based on World Bank (2012d).
Box 2.5Inequality is Higher when Measured by Income
inequality in South and South-West Asia may be higher than is widely believed. Survey data used to measure inequality in South and South-West Asia typically relies on consumption expenditure, which is considered the best measure of well-being in countries at a low level of development. Consump-tion expenditure has lower variation and therefore lower inequality than income measures. in india for example, household survey data from 2005 shows that inequality calculated using the Gini coefficient for consumption expenditure is approximately 0.39.5 however, the Gini coefficient for household per capita income in the same survey is around 0.52, a value far closer to income inequality observed in countries like Brazil and higher than observed income inequality in other emerging countries such as China.
Figure 2.4 illustrates the magnitude of inequality differences depending on the measure used and provides a useful reminder to policymakers of the importance of considering various dimensions of economic and social inequality in developing policies for inclusive development.
Figure 2.4: Differences between Income and Expenditure Inequality, China and India, 2005
Gini coefficient, 0–1 from perfect equality to maximum inequality
Sources: Un-eSCAP calculations based on World Bank (2012d) for expenditure data; Desai and others (2009) for indian income data and oeCD (2010) for Chinese income data.
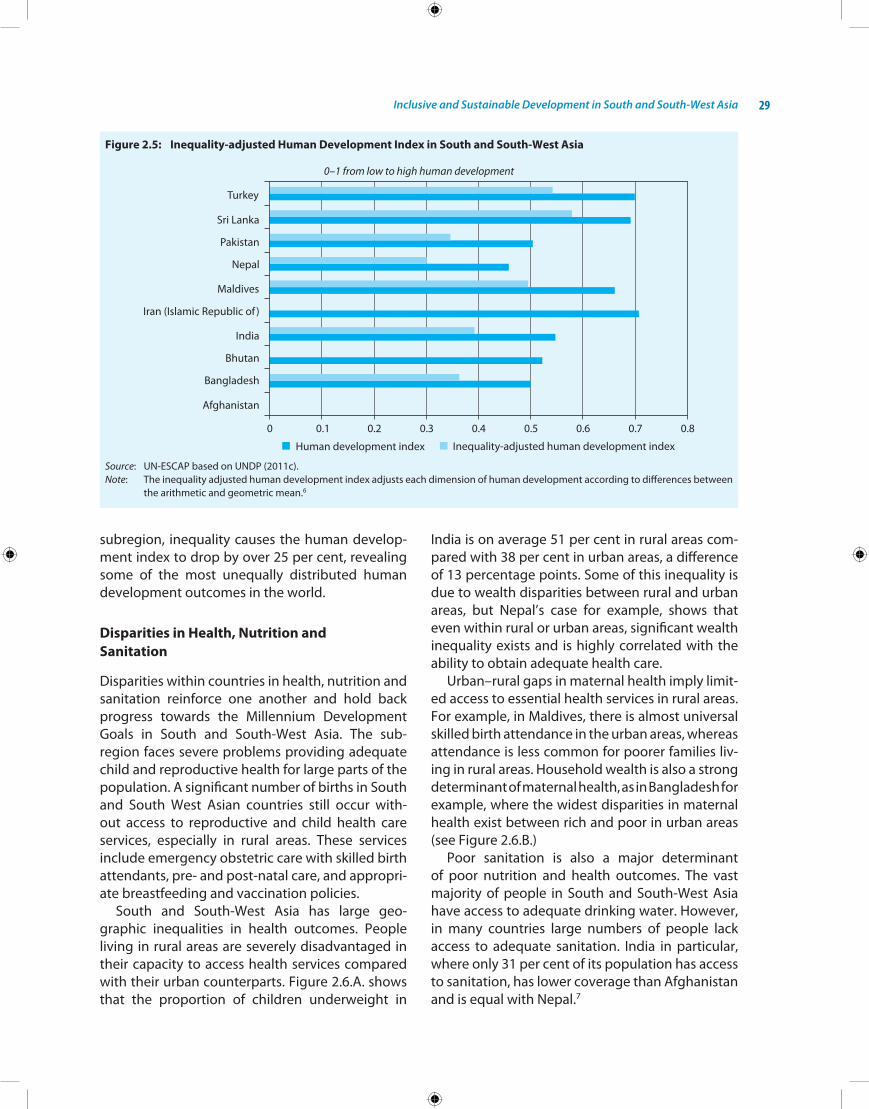
Inclusive and Sustainable Development in South and South-West Asia 29
subregion, inequality causes the human develop-ment index to drop by over 25 per cent, revealing some of the most unequally distributed human development outcomes in the world.
Disparities in Health, Nutrition and Sanitation
Disparities within countries in health, nutrition and sanitation reinforce one another and hold back progress towards the Millennium Development Goals in South and South-West Asia. The sub- region faces severe problems providing adequate child and reproductive health for large parts of the population. A significant number of births in South and South West Asian countries still occur with-out access to reproductive and child health care services, especially in rural areas. These services include emergency obstetric care with skilled birth attendants, pre- and post-natal care, and appropri-ate breastfeeding and vaccination policies.
South and South-West Asia has large geo-graphic inequalities in health outcomes. People living in rural areas are severely disadvantaged in their capacity to access health services compared with their urban counterparts. Figure 2.6.A. shows that the proportion of children underweight in
india is on average 51 per cent in rural areas com-pared with 38 per cent in urban areas, a difference of 13 percentage points. Some of this inequality is due to wealth disparities between rural and urban areas, but nepal’s case for example, shows that even within rural or urban areas, significant wealth inequality exists and is highly correlated with the ability to obtain adequate health care.
Urban–rural gaps in maternal health imply limit- ed access to essential health services in rural areas. For example, in Maldives, there is almost universal skilled birth attendance in the urban areas, whereas attendance is less common for poorer families liv-ing in rural areas. household wealth is also a strong determinant of maternal health, as in Bangladesh for example, where the widest disparities in maternal health exist between rich and poor in urban areas (see Figure 2.6.B.)
Poor sanitation is also a major determinant of poor nutrition and health outcomes. The vast majority of people in South and South-West Asia have access to adequate drinking water. however, in many countries large numbers of people lack access to adequate sanitation. india in particular, where only 31 per cent of its population has access to sanitation, has lower coverage than Afghanistan and is equal with nepal.7
Figure 2.5: Inequality-adjusted Human Development Index in South and South-West Asia
0–1 from low to high human development
Source: Un-eSCAP based on UnDP (2011c).Note: The inequality adjusted human development index adjusts each dimension of human development according to differences between
the arithmetic and geometric mean.6
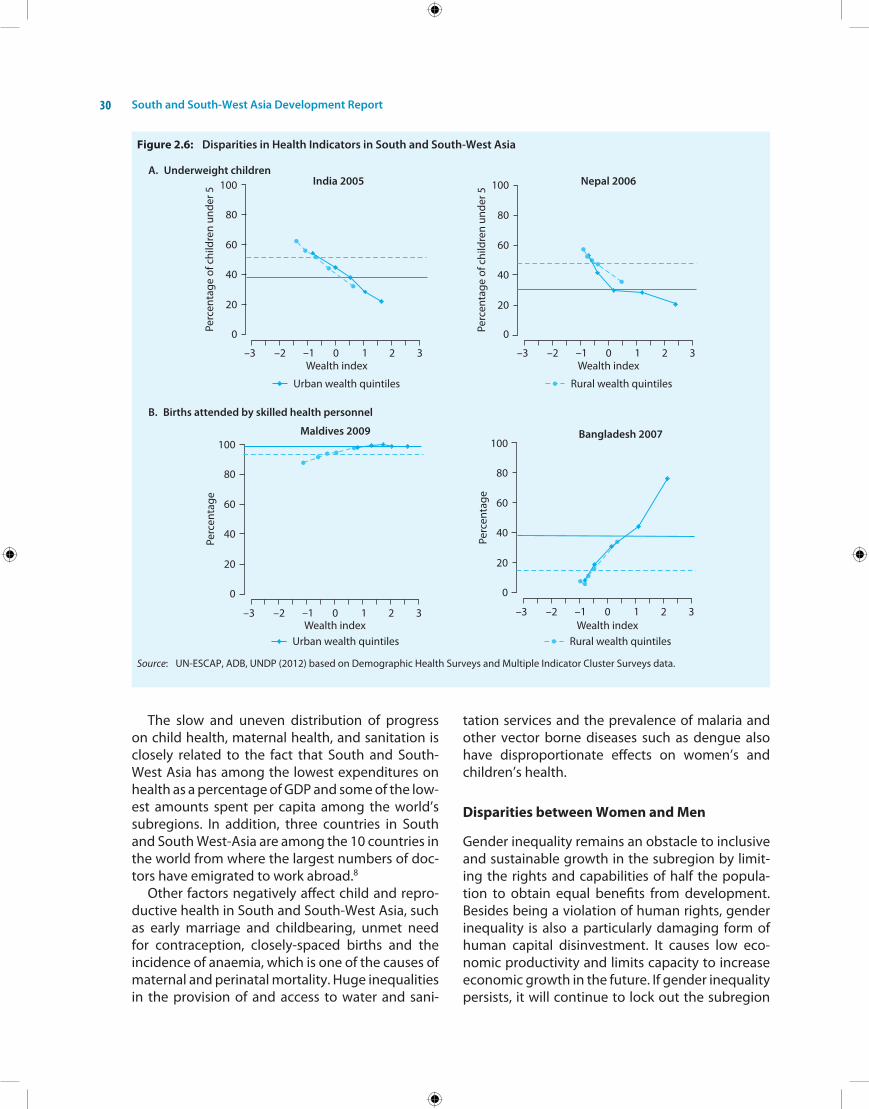
South and South-West Asia Development Report30
Figure 2.6: Disparities in Health Indicators in South and South-West Asia
A. Underweight children
B. Births attended by skilled health personnel
Source: Un-eSCAP, ADB, UnDP (2012) based on Demographic health Surveys and Multiple indicator Cluster Surveys data.
The slow and uneven distribution of progress on child health, maternal health, and sanitation is closely related to the fact that South and South-West Asia has among the lowest expenditures on health as a percentage of GDP and some of the low-est amounts spent per capita among the world’s subregions. in addition, three countries in South and South West-Asia are among the 10 countries in the world from where the largest numbers of doc-tors have emigrated to work abroad.8
other factors negatively affect child and repro-ductive health in South and South-West Asia, such as early marriage and childbearing, unmet need for contraception, closely-spaced births and the incidence of anaemia, which is one of the causes of maternal and perinatal mortality. huge inequalities in the provision of and access to water and sani-
tation services and the prevalence of malaria and other vector borne diseases such as dengue also have disproportionate effects on women’s and children’s health.
Disparities between Women and Men
Gender inequality remains an obstacle to inclusive and sustainable growth in the subregion by limit-ing the rights and capabilities of half the popula-tion to obtain equal benefits from development. Besides being a violation of human rights, gender inequality is also a particularly damaging form of human capital disinvestment. it causes low eco-nomic productivity and limits capacity to increase economic growth in the future. if gender inequality persists, it will continue to lock out the subregion
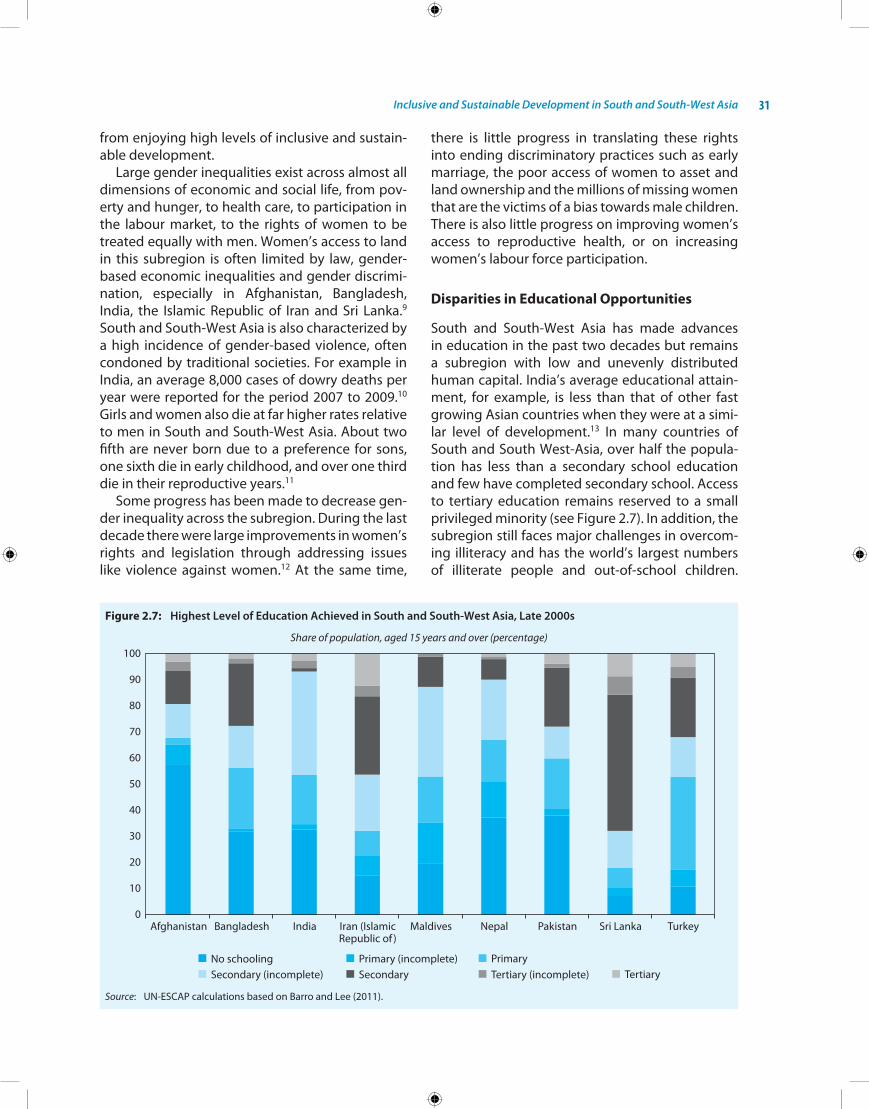
Inclusive and Sustainable Development in South and South-West Asia 31
from enjoying high levels of inclusive and sustain-able development.
Large gender inequalities exist across almost all dimensions of economic and social life, from pov-erty and hunger, to health care, to participation in the labour market, to the rights of women to be treated equally with men. Women’s access to land in this subregion is often limited by law, gender-based economic inequalities and gender discrimi-nation, especially in Afghanistan, Bangladesh, india, the islamic Republic of iran and Sri Lanka.9 South and South-West Asia is also characterized by a high incidence of gender-based violence, often condoned by traditional societies. For example in india, an average 8,000 cases of dowry deaths per year were reported for the period 2007 to 2009.10 Girls and women also die at far higher rates relative to men in South and South-West Asia. About two fifth are never born due to a preference for sons, one sixth die in early childhood, and over one third die in their reproductive years.11
Some progress has been made to decrease gen-der inequality across the subregion. During the last decade there were large improvements in women’s rights and legislation through addressing issues like violence against women.12 At the same time,
there is little progress in translating these rights into ending discriminatory practices such as early marriage, the poor access of women to asset and land ownership and the millions of missing women that are the victims of a bias towards male children. There is also little progress on improving women’s access to reproductive health, or on increasing women’s labour force participation.
Disparities in Educational Opportunities
South and South-West Asia has made advances in education in the past two decades but remains a subregion with low and unevenly distributed human capital. india’s average educational attain-ment, for example, is less than that of other fast growing Asian countries when they were at a simi-lar level of development.13 in many countries of South and South West-Asia, over half the popula-tion has less than a secondary school education and few have completed secondary school. Access to tertiary education remains reserved to a small privileged minority (see Figure 2.7). in addition, the subregion still faces major challenges in overcom-ing illiteracy and has the world’s largest numbers of illiterate people and out-of-school children.
Figure 2.7: Highest Level of Education Achieved in South and South-West Asia, Late 2000s
Share of population, aged 15 years and over (percentage)
Source: Un-eSCAP calculations based on Barro and Lee (2011).
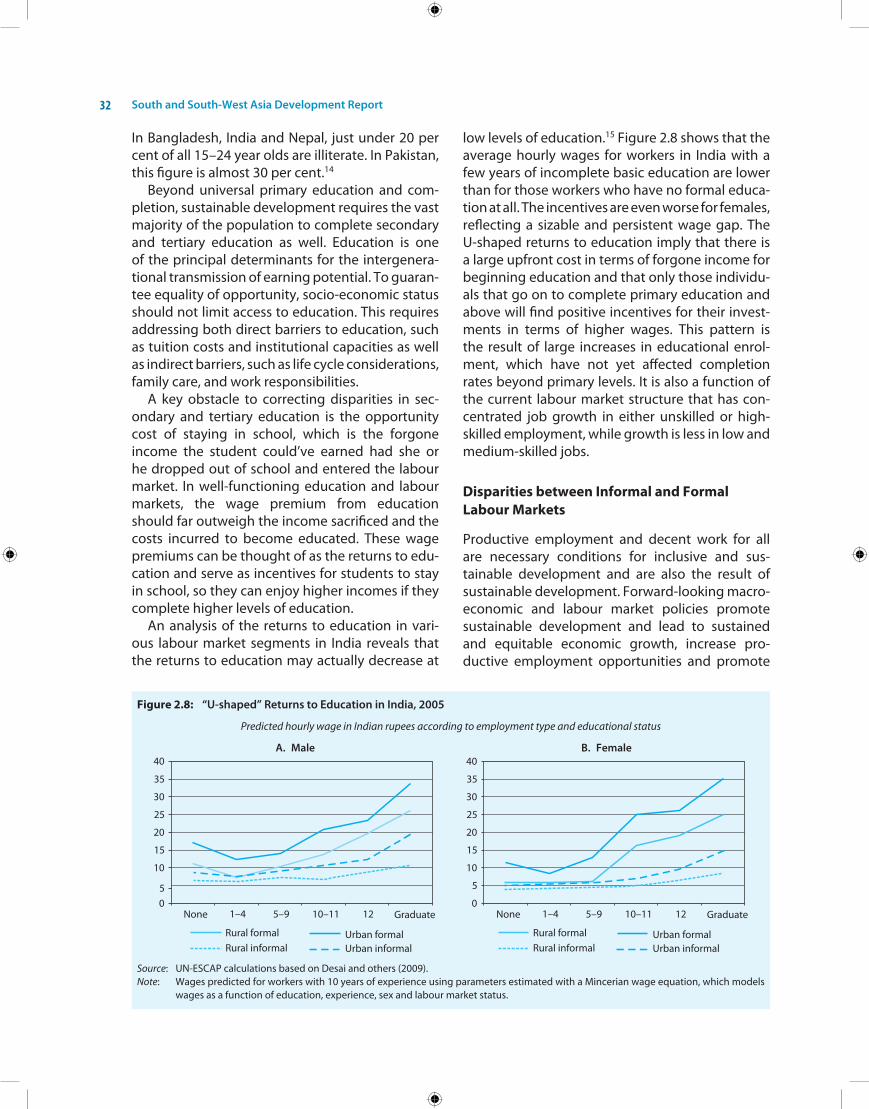
South and South-West Asia Development Report32
in Bangladesh, india and nepal, just under 20 per cent of all 15–24 year olds are illiterate. in Pakistan, this figure is almost 30 per cent.14
Beyond universal primary education and com-pletion, sustainable development requires the vast majority of the population to complete secondary and tertiary education as well. education is one of the principal determinants for the intergenera-tional transmission of earning potential. To guaran-tee equality of opportunity, socio-economic status should not limit access to education. This requires addressing both direct barriers to education, such as tuition costs and institutional capacities as well as indirect barriers, such as life cycle considerations, family care, and work responsibilities.
A key obstacle to correcting disparities in sec-ondary and tertiary education is the opportunity cost of staying in school, which is the forgone income the student could’ve earned had she or he dropped out of school and entered the labour market. in well-functioning education and labour markets, the wage premium from education should far outweigh the income sacrificed and the costs incurred to become educated. These wage premiums can be thought of as the returns to edu-cation and serve as incentives for students to stay in school, so they can enjoy higher incomes if they complete higher levels of education.
An analysis of the returns to education in vari-ous labour market segments in india reveals that the returns to education may actually decrease at
low levels of education.15 Figure 2.8 shows that the average hourly wages for workers in india with a few years of incomplete basic education are lower than for those workers who have no formal educa-tion at all. The incentives are even worse for females, reflecting a sizable and persistent wage gap. The U-shaped returns to education imply that there is a large upfront cost in terms of forgone income for beginning education and that only those individu-als that go on to complete primary education and above will find positive incentives for their invest-ments in terms of higher wages. This pattern is the result of large increases in educational enrol-ment, which have not yet affected completion rates beyond primary levels. it is also a function of the current labour market structure that has con-centrated job growth in either unskilled or high-skilled employment, while growth is less in low and medium-skilled jobs.
Disparities between Informal and Formal Labour Markets
Productive employment and decent work for all are necessary conditions for inclusive and sus-tainable development and are also the result of sustainable development. Forward-looking macro- economic and labour market policies promote sustainable development and lead to sustained and equitable economic growth, increase pro- ductive employment opportunities and promote
Figure 2.8: “U-shaped” Returns to Education in India, 2005
Predicted hourly wage in Indian rupees according to employment type and educational status
A. Male B. Female
Source: Un-eSCAP calculations based on Desai and others (2009).Note: Wages predicted for workers with 10 years of experience using parameters estimated with a Mincerian wage equation, which models
wages as a function of education, experience, sex and labour market status.
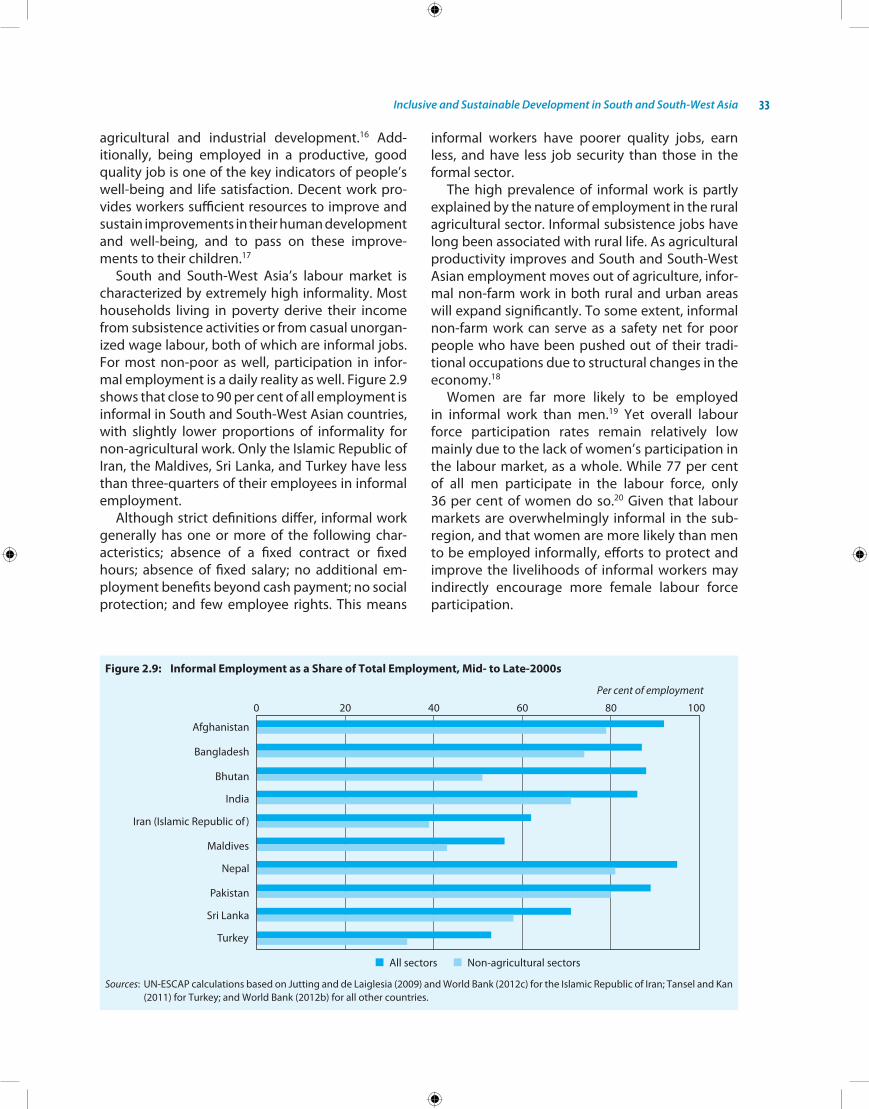
Inclusive and Sustainable Development in South and South-West Asia 33
agricultural and industrial development.16 Add-itionally, being employed in a productive, good quality job is one of the key indicators of people’s well-being and life satisfaction. Decent work pro-vides workers sufficient resources to improve and sustain improvements in their human development and well-being, and to pass on these improve-ments to their children.17
South and South-West Asia’s labour market is characterized by extremely high informality. Most households living in poverty derive their income from subsistence activities or from casual unorgan-ized wage labour, both of which are informal jobs. For most non-poor as well, participation in infor-mal employment is a daily reality as well. Figure 2.9 shows that close to 90 per cent of all employment is informal in South and South-West Asian countries, with slightly lower proportions of informality for non-agricultural work. only the islamic Republic of iran, the Maldives, Sri Lanka, and Turkey have less than three-quarters of their employees in informal employment.
Although strict definitions differ, informal work generally has one or more of the following char- acteristics; absence of a fixed contract or fixed hours; absence of fixed salary; no additional em-ployment benefits beyond cash payment; no social protection; and few employee rights. This means
informal workers have poorer quality jobs, earn less, and have less job security than those in the formal sector.
The high prevalence of informal work is partly explained by the nature of employment in the rural agricultural sector. informal subsistence jobs have long been associated with rural life. As agricultural productivity improves and South and South-West Asian employment moves out of agriculture, infor-mal non-farm work in both rural and urban areas will expand significantly. To some extent, informal non-farm work can serve as a safety net for poor people who have been pushed out of their tradi-tional occupations due to structural changes in the economy.18
Women are far more likely to be employed in informal work than men.19 Yet overall labour force participation rates remain relatively low mainly due to the lack of women’s participation in the labour market, as a whole. While 77 per cent of all men participate in the labour force, only 36 per cent of women do so.20 Given that labour markets are overwhelmingly informal in the sub- region, and that women are more likely than men to be employed informally, efforts to protect and improve the livelihoods of informal workers may indirectly encourage more female labour force participation.
Figure 2.9: Informal Employment as a Share of Total Employment, Mid- to Late-2000s
Per cent of employment
Sources: Un-eSCAP calculations based on Jutting and de Laiglesia (2009) and World Bank (2012c) for the islamic Republic of iran; Tansel and kan (2011) for Turkey; and World Bank (2012b) for all other countries.
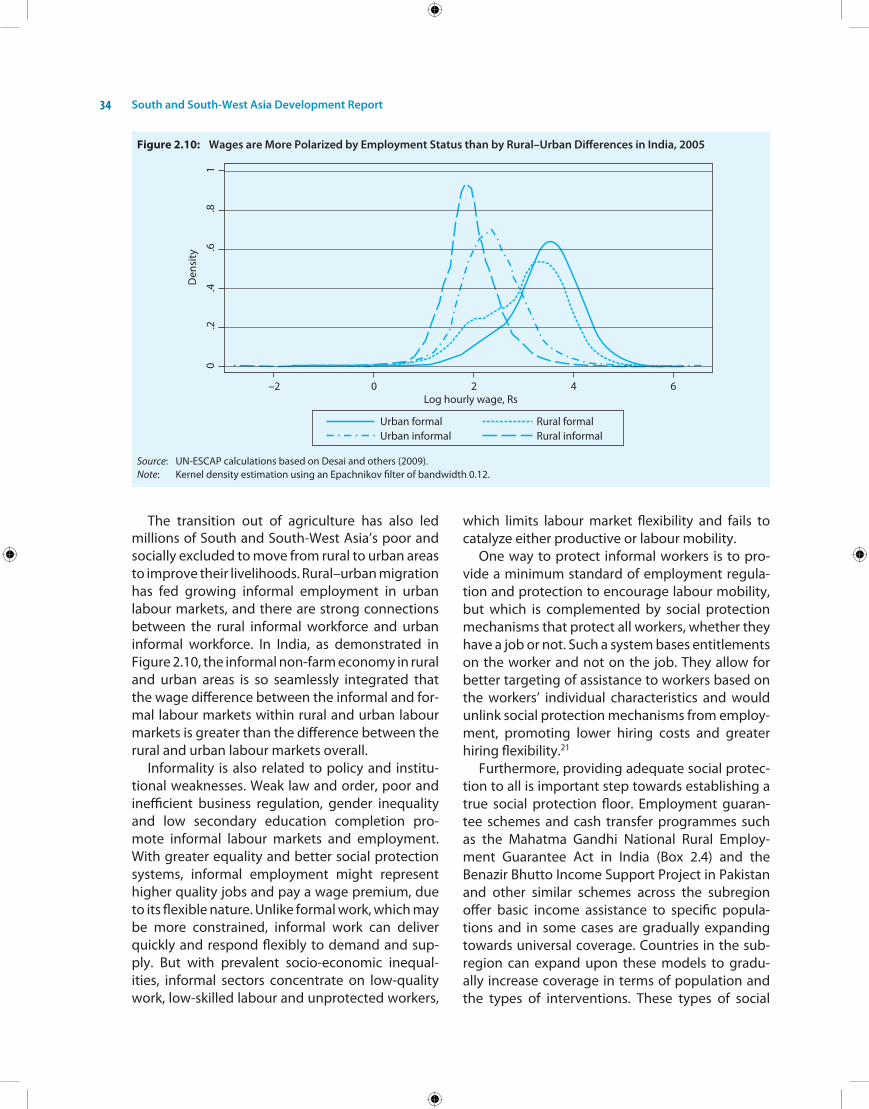
South and South-West Asia Development Report34
The transition out of agriculture has also led millions of South and South-West Asia’s poor and socially excluded to move from rural to urban areas to improve their livelihoods. Rural–urban migration has fed growing informal employment in urban labour markets, and there are strong connections between the rural informal workforce and urban informal workforce. in india, as demonstrated in Figure 2.10, the informal non-farm economy in rural and urban areas is so seamlessly integrated that the wage difference between the informal and for-mal labour markets within rural and urban labour markets is greater than the difference between the rural and urban labour markets overall.
informality is also related to policy and institu-tional weaknesses. Weak law and order, poor and inefficient business regulation, gender inequality and low secondary education completion pro-mote informal labour markets and employment. With greater equality and better social protection systems, informal employment might represent higher quality jobs and pay a wage premium, due to its flexible nature. Unlike formal work, which may be more constrained, informal work can deliver quickly and respond flexibly to demand and sup-ply. But with prevalent socio-economic inequal-ities, informal sectors concentrate on low-quality work, low-skilled labour and unprotected workers,
which limits labour market flexibility and fails to catalyze either productive or labour mobility.
one way to protect informal workers is to pro-vide a minimum standard of employment regula-tion and protection to encourage labour mobility, but which is complemented by social protection mechanisms that protect all workers, whether they have a job or not. Such a system bases entitlements on the worker and not on the job. They allow for better targeting of assistance to workers based on the workers’ individual characteristics and would unlink social protection mechanisms from employ-ment, promoting lower hiring costs and greater hiring flexibility.21
Furthermore, providing adequate social protec-tion to all is important step towards establishing a true social protection floor. employment guaran-tee schemes and cash transfer programmes such as the Mahatma Gandhi national Rural employ-ment Guarantee Act in india (Box 2.4) and the Benazir Bhutto income Support Project in Pakistan and other similar schemes across the subregion offer basic income assistance to specific popula-tions and in some cases are gradually expanding towards universal coverage. Countries in the sub-region can expand upon these models to gradu-ally increase coverage in terms of population and the types of interventions. These types of social
Figure 2.10: Wages are More Polarized by Employment Status than by Rural–Urban Differences in India, 2005
Source: Un-eSCAP calculations based on Desai and others (2009).Note: kernel density estimation using an epachnikov filter of bandwidth 0.12.
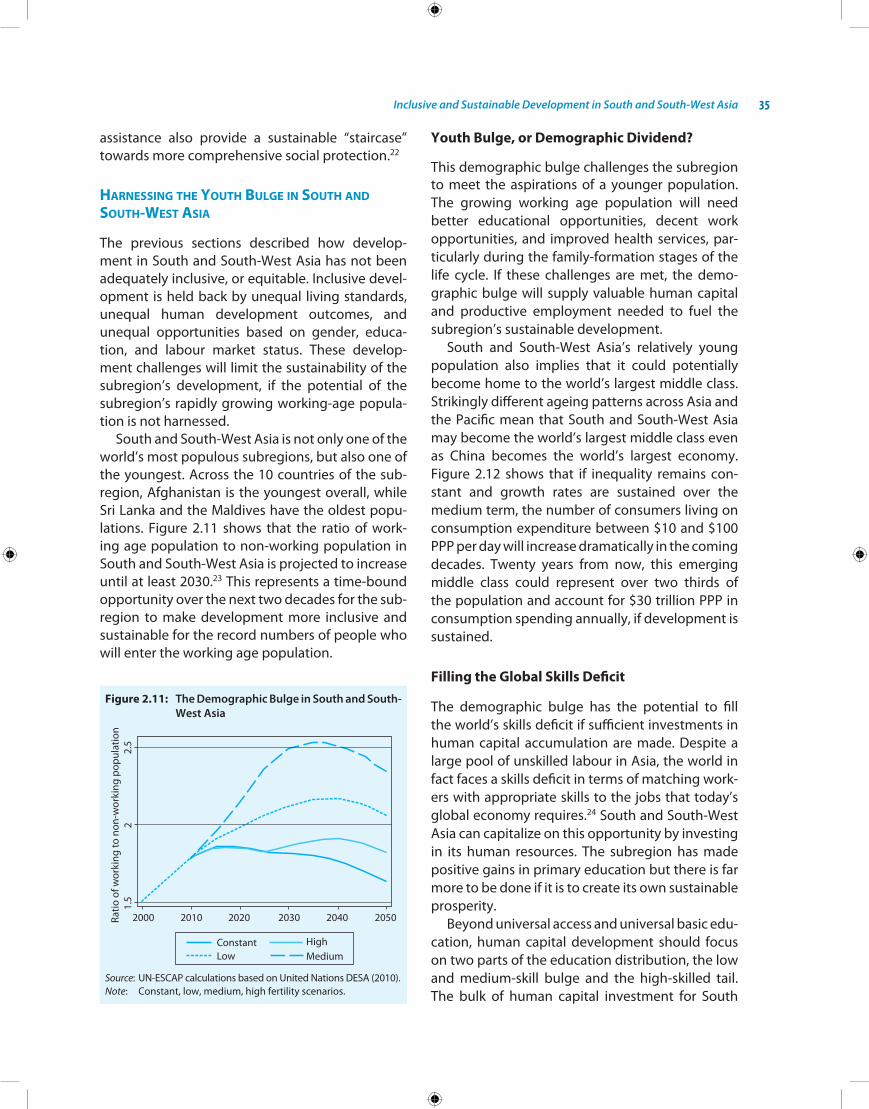
Inclusive and Sustainable Development in South and South-West Asia 35
assistance also provide a sustainable “staircase” towards more comprehensive social protection.22
harnEssing thE youth bulgE in south and south-wEst asia
The previous sections described how develop-ment in South and South-West Asia has not been adequately inclusive, or equitable. inclusive devel-opment is held back by unequal living standards, unequal human development outcomes, and unequal opportunities based on gender, educa-tion, and labour market status. These develop-ment challenges will limit the sustainability of the subregion’s development, if the potential of the subregion’s rapidly growing working-age popula-tion is not harnessed.
South and South-West Asia is not only one of the world’s most populous subregions, but also one of the youngest. Across the 10 countries of the sub-region, Afghanistan is the youngest overall, while Sri Lanka and the Maldives have the oldest popu-lations. Figure 2.11 shows that the ratio of work-ing age population to non-working population in South and South-West Asia is projected to increase until at least 2030.23 This represents a time-bound opportunity over the next two decades for the sub-region to make development more inclusive and sustainable for the record numbers of people who will enter the working age population.
Youth Bulge, or Demographic Dividend?
This demographic bulge challenges the subregion to meet the aspirations of a younger population. The growing working age population will need better educational opportunities, decent work opportunities, and improved health services, par-ticularly during the family-formation stages of the life cycle. if these challenges are met, the demo-graphic bulge will supply valuable human capital and productive employment needed to fuel the subregion’s sustainable development.
South and South-West Asia’s relatively young population also implies that it could potentially become home to the world’s largest middle class. Strikingly different ageing patterns across Asia and the Pacific mean that South and South-West Asia may become the world’s largest middle class even as China becomes the world’s largest economy. Figure 2.12 shows that if inequality remains con-stant and growth rates are sustained over the medium term, the number of consumers living on consumption expenditure between $10 and $100 PPP per day will increase dramatically in the coming decades. Twenty years from now, this emerging middle class could represent over two thirds of the population and account for $30 trillion PPP in consumption spending annually, if development is sustained.
Filling the Global Skills Deficit
The demographic bulge has the potential to fill the world’s skills deficit if sufficient investments in human capital accumulation are made. Despite a large pool of unskilled labour in Asia, the world in fact faces a skills deficit in terms of matching work-ers with appropriate skills to the jobs that today’s global economy requires.24 South and South-West Asia can capitalize on this opportunity by investing in its human resources. The subregion has made positive gains in primary education but there is far more to be done if it is to create its own sustainable prosperity.
Beyond universal access and universal basic edu-cation, human capital development should focus on two parts of the education distribution, the low and medium-skill bulge and the high-skilled tail. The bulk of human capital investment for South
Figure 2.11: The Demographic Bulge in South and South-West Asia
Source: Un-eSCAP calculations based on United nations DeSA (2010).Note: Constant, low, medium, high fertility scenarios.

South and South-West Asia Development Report36
Figure 2.12: Total Consumption Expenditure and Population Share of South and South-West Asian Consumers Living between $10 and $100 PPP Per Day, 2000–2050
Source: Un-eSCAP calculations based on kharas (2010).
and South-West Asia must be focused on acceler-ating skill levels in low and medium-skilled popu-lations. This requires programmes that prioritize far greater links between education and the labour market and pathways from education to employ-ment. Mixed education–employment models that include on-the-job training and formal vocational education can provide rapid increases in human capital at low levels.
A second priority area is greater investment in research and development capacity at national levels to foster and maintain extremely high-skilled segments of the population. investments in research and development would then provide greater incentives to stop the “brain drain” and would also help economies escape the “middle income trap” by allowing them to move up the value chain. A greater number of high-skilled work-ers provide the critical mass of human capital that countries require for discovering and implement-ing the technical innovations that will help achieve sustainable development. Subregional coopera-tion in this case can help stimulate joint innova-tions for solving shared problems relevant to South and South-West Asia. This includes innova- tions that conserve natural resources and energy,
reduce carbon footprints, and develop more afford-able products, harnessing the subregion’s strength in “frugal innovation.”
Dealing with Stresses on Urban Areas and Infrastructure
The demographic bulge also means that the rapid urbanization which the economies of South and South-West Asia have endured in recent years will continue. Uneven geographic development within and between countries is unsustainable in the long-run. The neglect of rural development will leave South and South-West Asia with populations that face increasingly greater poverty, inequal-ity and vulnerability both in terms of social and economic risks, including greater food insecurity (see Chapter 6). Vulnerable communities in remote and extreme locations will also face significant risks in terms of environmental changes, climate vari-ations and risks of natural disasters (see Chapter 8).
Rapid urbanization and internal migration in South and South-West Asia will continue to put increased pressure on sanitation systems and keep basic sanitation a luxury commodity that most in the subregion cannot afford. The lack of decent
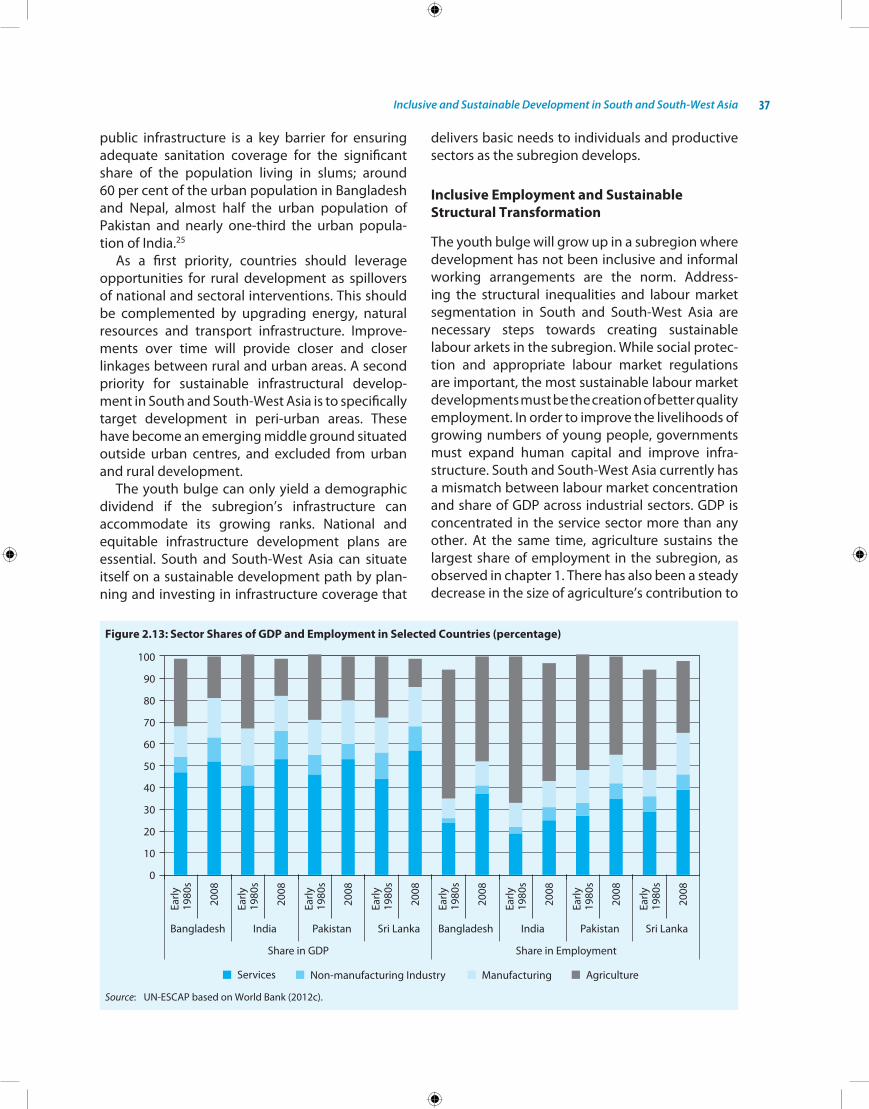
Inclusive and Sustainable Development in South and South-West Asia 37
public infrastructure is a key barrier for ensuring adequate sanitation coverage for the significant share of the population living in slums; around 60 per cent of the urban population in Bangladesh and nepal, almost half the urban population of Pakistan and nearly one-third the urban popula-tion of india.25
As a first priority, countries should leverage opportunities for rural development as spillovers of national and sectoral interventions. This should be complemented by upgrading energy, natural resources and transport infrastructure. improve-ments over time will provide closer and closer linkages between rural and urban areas. A second priority for sustainable infrastructural develop-ment in South and South-West Asia is to specifically target development in peri-urban areas. These have become an emerging middle ground situated outside urban centres, and excluded from urban and rural development.
The youth bulge can only yield a demographic dividend if the subregion’s infrastructure can accommodate its growing ranks. national and equitable infrastructure development plans are essential. South and South-West Asia can situate itself on a sustainable development path by plan-ning and investing in infrastructure coverage that
delivers basic needs to individuals and productive sectors as the subregion develops.
Inclusive Employment and Sustainable Structural Transformation
The youth bulge will grow up in a subregion where development has not been inclusive and informal working arrangements are the norm. Address-ing the structural inequalities and labour market segmentation in South and South-West Asia are necessary steps towards creating sustainable labour arkets in the subregion. While social protec-tion and appropriate labour market regulations are important, the most sustainable labour market developments must be the creation of better quality employment. in order to improve the livelihoods of growing numbers of young people, governments must expand human capital and improve infra-structure. South and South-West Asia currently has a mismatch between labour market concentration and share of GDP across industrial sectors. GDP is concentrated in the service sector more than any other. At the same time, agriculture sustains the largest share of employment in the subregion, as observed in chapter 1. There has also been a steady decrease in the size of agriculture’s contribution to
Figure 2.13: Sector Shares of GDP and Employment in Selected Countries (percentage)
Source: Un-eSCAP based on World Bank (2012c).
South and South-West Asia Development Report38
GDP over time (see Figure 2.13). Manufacturing in contrast has remained stagnant in both its share of employment and value-added.
Fostering sustainable development in the sub- region requires addressing this mismatch in em-ployment and production value. The strategy to date in South and South-West Asia has been to pursue policies that attempt to sidestep the manu-facturing sector and move labour and value into the service sector.26 While this strategy has achieved high growth in some countries of the subregion, no country has successfully employed it to achieve sustainable development.
Structural change in employment has not kept pace with the structural change in GDP, as shown in Figure 2.13. Service sectors dominate in eco-nomic output, but agriculture still dominates in employment in the subregion, and the manu-facturing share of employment remains smaller. employment in services has grown significantly, but service sector employment is highly hetero- genous in the subregion. it includes both high-skilled employees in finance and business services, but also lower skilled employees, for example in transport and hospitality-related services.
Service sector employment pays well for high-skilled workers in the finance industry, for example, but also includes many informal employees who earn less, owing to the dominance of informal work in the subregion. For example, in india, finance and business services pay the highest wages at more than four times the agricultural sector wage and saw the fastest wage growth of any other sector between 2004–05 and 2009–10. Wages grew five times faster than agricultural wages during this period. Trading services, however, only pay wages 35% higher than agricultural work. in contrast, manufacturing wages, which employ a smaller share of the population, were between 1.5–2.5 times higher than the average agriculture wages and grew around 3.5 times faster than agricultural wages over the same period.27
Structural change in South and South-West Asia has privileged service sector growth, in contrast to other parts of the Asia-Pacific region, where export-led manufacturing drove high growth. To make growth more inclusive and put the subregion on a pathway to sustainable development, policies in South and South-West Asia can do more to incen-tivize the manufacturing sector. Manufacturing
employment could provide higher paying oppor-tunities that are better suited to the skills profile and aspirations of South and South-West Asia’s growing working-age population. This shouldn’t imply ignoring the agriculture sector, however, particularly given the growing need to ensure sustainable food security for the subregion (see Chapter 6).
conclusion: prioritiEs for thE dEvElopmEnt agEnda for 2015 and bEyond
To make growth more inclusive and sustainable, South and South-West Asian countries need to address structural bottlenecks, particularly with respect to poverty, health, gender equality, edu-cational opportunity, and employment quality. Per-sistent social inequalities continue to discriminate against women, ethnic minorities, migrants, and other excluded groups. Large informal labour mar-kets offer too little opportunity to meet the needs of a growing demographic bulge. Jobless growth and rampant informality block the transmission of economic gains from growth into improvements in the livelihoods and human development out-comes of the poor.
Some countries have made important steps towards addressing these issues, but much remains to be done. improved social programmes and more expenditure on flagship schemes are import-ant steps in addressing these concerns, particu-larly at the margins. But while these social policy interventions can build institutional capacity and strengthen the trust between citizens and governments, they must be matched by broad-based structural transformation of the economy that offers citizens of all skill levels and all back-grounds decent opportunities to participate in all aspects of economic and social life.
Beyond the 2015 deadline for achieving the Mil-lennium Development Goals, South and South-West Asia must continue to pursue inclusive and sustainable development. The post-2015 develop-ment agenda in the subregion should:
l Maximize growth through productive job crea-tion and appropriate structural change to reduce poverty, hunger and income inequalities.
l Provide quality education, health, sanitation, and other infrastructure to harness the potential

Inclusive and Sustainable Development in South and South-West Asia 39
of the youth bulge, bridge the global skills defi-cit, and empower an emerging middle class, which may become the largest in the world.
l establish a minimum social protection floor that meets the basic nutrition, education, health and other needs of the poor and vulnerable seg-ments of the population.
l enhance regional cooperation and research to address common challenges and enhance
sustainability through innovative new products and processes that use natural resources effi-ciently, are affordable, and raise the quality of life of the poor and vulnerable, harnessing sub-regional strengths in “frugal innovation.”
l encourage international support and cooper-ation to adapt and deploy environmentally sound technologies as the subregion pursues low carbon and resource efficient development pathways.

South and South-West Asian economies have undertaken reforms over the past two decades to liberalize their trade and investment regimes and deepen their integration with the global economy. Apart from autonomous liberalization, multilateral trade negotiations, bilateral and regional trading arrangements have also contributed to creating more liberal trade and investment policy regimes. The resulting liberal economic environment places a heavy premium on the pursuit of international competitiveness by the economies, industries and enterprises. internationally competitive industries can prosper and grow endlessly as they can virtually seek markets anywhere in the world while others will find it difficult to retain their market shares even in domestic markets in the face of compe-tition from imports and foreign firms. it is also of interest to examine whether countries in South and South-West Asia are moving up the value chain by progressively diversifying their export structure in favour of more rapidly growing and high value adding goods and services or remaining stagnant in exporting their traditional low value adding commodities and raw materials. hence, the issue of building competitive productive capacities becomes a key issue for success in international markets.
This chapter explores the emerging trends and patterns in the trade in goods, services and invest-ment structures of the South and South-West Asian countries and underlines some policy challenges facing the subregion.
EmErging trEnds and pattErns in thE south and south-wEst asian mErchandisE tradE profilE
Growth of Merchandise Trade
Consistent with the growth performance of its gross domestic product (GDP), South and South-West Asia has emerged as a dynamic subregion
in terms of trade with the average growth rates of both exports and imports exceeding the growth rate of world trade by a wide margin during the period studied, from 2001 to 2011 (see Table 3.1). exports from the subregion expanded at an aver-age rate of 17 per cent and imports grew at an even higher rate of 19 per cent during the past decade (compared with global averages of 12.2 per cent and 11.9 per cent, respectively) bringing overall trade up from $258 billion in 2001 to $1.5 trillion in 2011. eSCAP projections using a gravity model indicate that the subregion’s trade would grow to $4.5 trillion by 2017.
in South and South-West Asia, except for nepal and Sri Lanka, all countries have had a double-digit average growth rate of exports while imports also grew at double-digit rates. india’s trade grew at the highest rates of 20 per cent for exports and 23 per cent for imports. her total trade volume of $750 billion is likely to rise to $2.1 trillion by 2017. Afghanistan, Bhutan, Bangladesh, the islamic Republic of iran, Maldives and Turkey have all had export growth rates in the range of 15 per cent. The rates in Pakistan, Sri Lanka and nepal, by contrast, have been 10 per cent, 6 per cent and 2 per cent, respectively.
The other observation is that except for the islamic Republic of iran, which is a major exporter of hydrocarbons, all other South and South-West Asian countries have a deficit in their balance of trade which has grown from $17.5 billion in 2001 to $253.5 billion during the period 2001 to 2011. The bulk of the deficit is on account of india which recorded a $162.5 billion deficit in 2011 and Turkey which had a deficit of $105.7 billion during the same year, with other countries recording the following figures: Pakistan ($18 billion), Sri Lanka ($9.6 billion), Bangladesh ($8.4 billion), Afghanistan ($5.6 billion), and nepal ($4.8 billion).
With robust rates of trade growth, the South and South-West Asian economies have deepened their
3 Global Economic Integration:
Trade and Foreign Direct Investment

Global Economic Integration 41
Table 3.1: Merchandise Trade Balance and Growth, South and South-West Asia
Merchandise trade (in millions of US$)Balance of
merchandise tradeTotal trade
(billion, US$) Exports Imports
2001 2011
Average annual growth
rate (2001–2011)(percentage) 2001 2011
Average annual growth
rate (2001–2011)(percentage) 2001 2011 2011
2017 projection
Afghanistan 69 350 16 1 696 6 000 18 –1 627 –5 650 6.35 36.92Bangladesh 6 080 25 868 14 8 041 34 295 14 –1 961 –8 428 60.16 123.48Bhutan 106 620 21 191 949 19 –85 –329 1.57 21.00india 43 878 294 040 20 50 671 456 634 23 –6 793 –162 594 750.67 2 163.58iran (islamic
Republic of)23 904 131 000 17 18 194 68 000 16 5 710 63 000 199.00 649.37
Maldives 110 346 16 388 1 412 14 –278 –1 065 1.76 7.43nepal 738 940 2 1 475 5 770 13 –737 –4 830 6.71 69.62Pakistan 9 246 25 344 10 10 198 43 578 15 –952 –18 234 68.92 165.63Sri Lanka 4 672 10 011 6 5 406 19 696 13 –734 –9 685 29.71 268.11Turkey 31 334 135 086 17 41 399 240 830 17 –10 065 –105 744 375.92 1 003.02SAARC 64 900 357 519 17 78 067 568 335 20 –13 167 –210 816 925.85 2 855.77South and South-
West Asia120 138 623 605 17 137 660 877 165 19 –17 523 –253 560 1 500.77 4 508.15
Sources: Un-eSCAP based on UnCTAD, online database and iMF World economic outlook database.Note: Projections for 2017 are based on a gravity model estimation using GDP projections from the international Monetary
Fund (iMF).
integration with the global economy. This trend towards deepening economic integration is clear from Table 3.2, which summarizes the trade to GDP ratios for the countries in South and South-West Asia since 1990. For instance, trade (goods and ser-vices) to GDP ratio has gone up over 1990–2011, for Bangladesh from 19.7 to 53.9 per cent, for india from 15.2 to 54.5 per cent, Bhutan from 61.3 to 136.7 per cent, and for Turkey from 30.9 to 50.4 per cent. For other countries such as Afghanistan, Maldives, nepal and Sri Lanka, the trade to GDP ratio had been high but has come down over time. With greater global economic integration, these economies are also affected by the external eco-nomic environment much more intimately than they were before. it is therefore of interest to exam-ine whether trade in South and South-West Asia is concentrated in particular markets, particularly those affected by the ongoing global economic turmoil, or diversified across the regions.
Changing Geography of Trade
Traditionally South and South-West Asian coun-tries have been highly dependent on the advanced economies of europe and north America for their
trade. however, some countries have made a con-scious effort to diversify the direction of their trade and have managed to reduce such dependence. india, for instance, has brought down its depen-dence on advanced economies from 67.3 per cent on average for exports and 57 per cent for imports during the period 1991–2000 to just under half for exports and 41.3 per cent for imports on average during the period 2001–2011. This shift implied that the share of emerging and developing countries in india’s exports grew from 30.7 to 47.9 per cent, while that of imports rose from 38.4 per cent to 52.2 per cent over the same period. A similar trans-formation in terms of direction of trade has taken place in the case of the islamic Republic of iran with export dependence on advanced economies com-ing down from 68.4 to 44.1 per cent and import dependence from 67.7 per cent to 44.9 per cent over the same period. emerging and developing economies gradually occupied a greater role with 46 per cent and 53.1 per cent of exports and imports, respectively. nepal has also been able to reduce its dependence on advanced economies from 74.1 per cent to 31.4 per cent for exports and from 48.2 per cent to 15.8 per cent for imports with a similar rise in the importance of emerging and developing
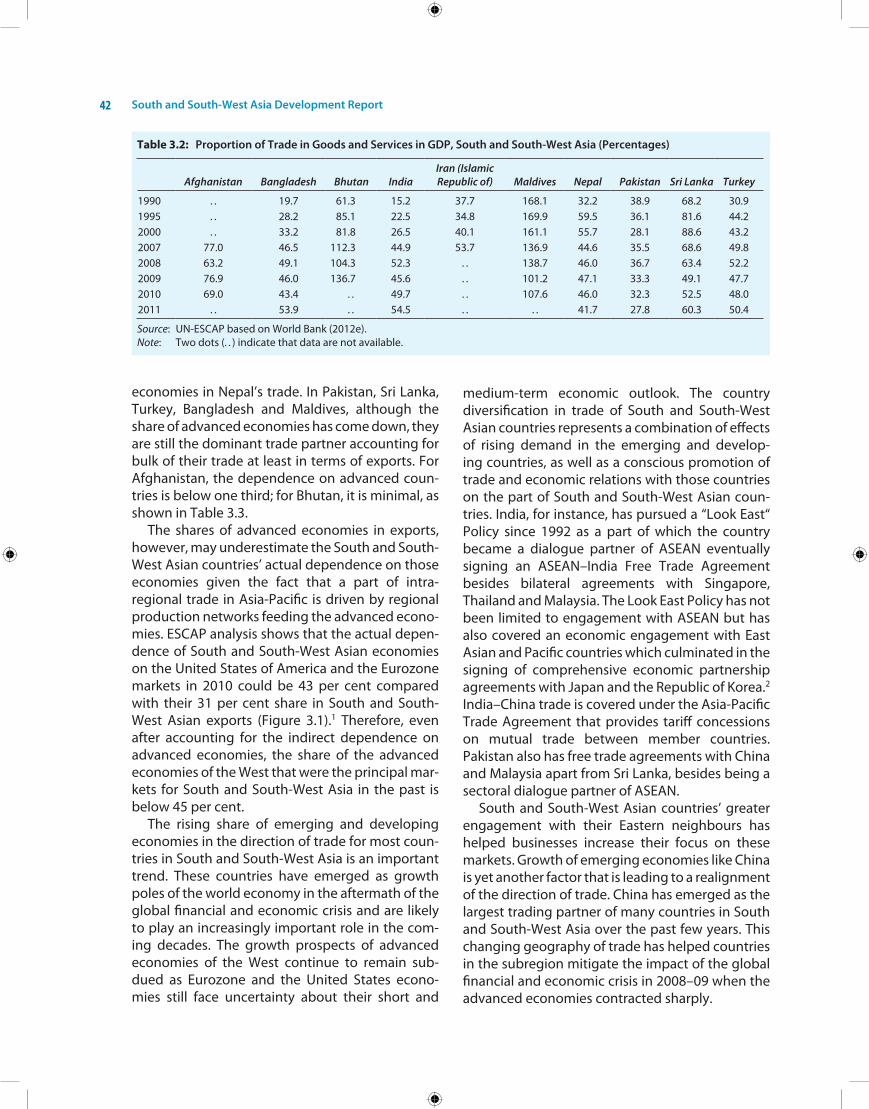
South and South-West Asia Development Report42
economies in nepal’s trade. in Pakistan, Sri Lanka, Turkey, Bangladesh and Maldives, although the share of advanced economies has come down, they are still the dominant trade partner accounting for bulk of their trade at least in terms of exports. For Afghanistan, the dependence on advanced coun-tries is below one third; for Bhutan, it is minimal, as shown in Table 3.3.
The shares of advanced economies in exports, however, may underestimate the South and South-West Asian countries’ actual dependence on those economies given the fact that a part of intra- regional trade in Asia-Pacific is driven by regional production networks feeding the advanced econo-mies. eSCAP analysis shows that the actual depen-dence of South and South-West Asian economies on the United States of America and the eurozone markets in 2010 could be 43 per cent compared with their 31 per cent share in South and South-West Asian exports (Figure 3.1).1 Therefore, even after accounting for the indirect dependence on advanced economies, the share of the advanced economies of the West that were the principal mar-kets for South and South-West Asia in the past is below 45 per cent.
The rising share of emerging and developing economies in the direction of trade for most coun-tries in South and South-West Asia is an important trend. These countries have emerged as growth poles of the world economy in the aftermath of the global financial and economic crisis and are likely to play an increasingly important role in the com-ing decades. The growth prospects of advanced economies of the West continue to remain sub-dued as eurozone and the United States econo-mies still face uncertainty about their short and
Table 3.2: Proportion of Trade in Goods and Services in GDP, South and South-West Asia (Percentages)
Afghanistan Bangladesh Bhutan IndiaIran (Islamic Republic of) Maldives Nepal Pakistan Sri Lanka Turkey
1990 . . 19.7 61.3 15.2 37.7 168.1 32.2 38.9 68.2 30.91995 . . 28.2 85.1 22.5 34.8 169.9 59.5 36.1 81.6 44.22000 . . 33.2 81.8 26.5 40.1 161.1 55.7 28.1 88.6 43.22007 77.0 46.5 112.3 44.9 53.7 136.9 44.6 35.5 68.6 49.82008 63.2 49.1 104.3 52.3 . . 138.7 46.0 36.7 63.4 52.22009 76.9 46.0 136.7 45.6 . . 101.2 47.1 33.3 49.1 47.72010 69.0 43.4 . . 49.7 . . 107.6 46.0 32.3 52.5 48.02011 . . 53.9 . . 54.5 . . . . 41.7 27.8 60.3 50.4
Source: Un-eSCAP based on World Bank (2012e).Note: Two dots (. . ) indicate that data are not available.
medium-term economic outlook. The country diversification in trade of South and South-West Asian countries represents a combination of effects of rising demand in the emerging and develop-ing countries, as well as a conscious promotion of trade and economic relations with those countries on the part of South and South-West Asian coun-tries. india, for instance, has pursued a “Look east“ Policy since 1992 as a part of which the country became a dialogue partner of ASeAn eventually signing an ASeAn–india Free Trade Agreement besides bilateral agreements with Singapore, Thailand and Malaysia. The Look east Policy has not been limited to engagement with ASeAn but has also covered an economic engagement with east Asian and Pacific countries which culminated in the signing of comprehensive economic partnership agreements with Japan and the Republic of korea.2 india–China trade is covered under the Asia-Pacific Trade Agreement that provides tariff concessions on mutual trade between member countries. Pakistan also has free trade agreements with China and Malaysia apart from Sri Lanka, besides being a sectoral dialogue partner of ASeAn.
South and South-West Asian countries’ greater engagement with their eastern neighbours has helped businesses increase their focus on these markets. Growth of emerging economies like China is yet another factor that is leading to a realignment of the direction of trade. China has emerged as the largest trading partner of many countries in South and South-West Asia over the past few years. This changing geography of trade has helped countries in the subregion mitigate the impact of the global financial and economic crisis in 2008–09 when the advanced economies contracted sharply.
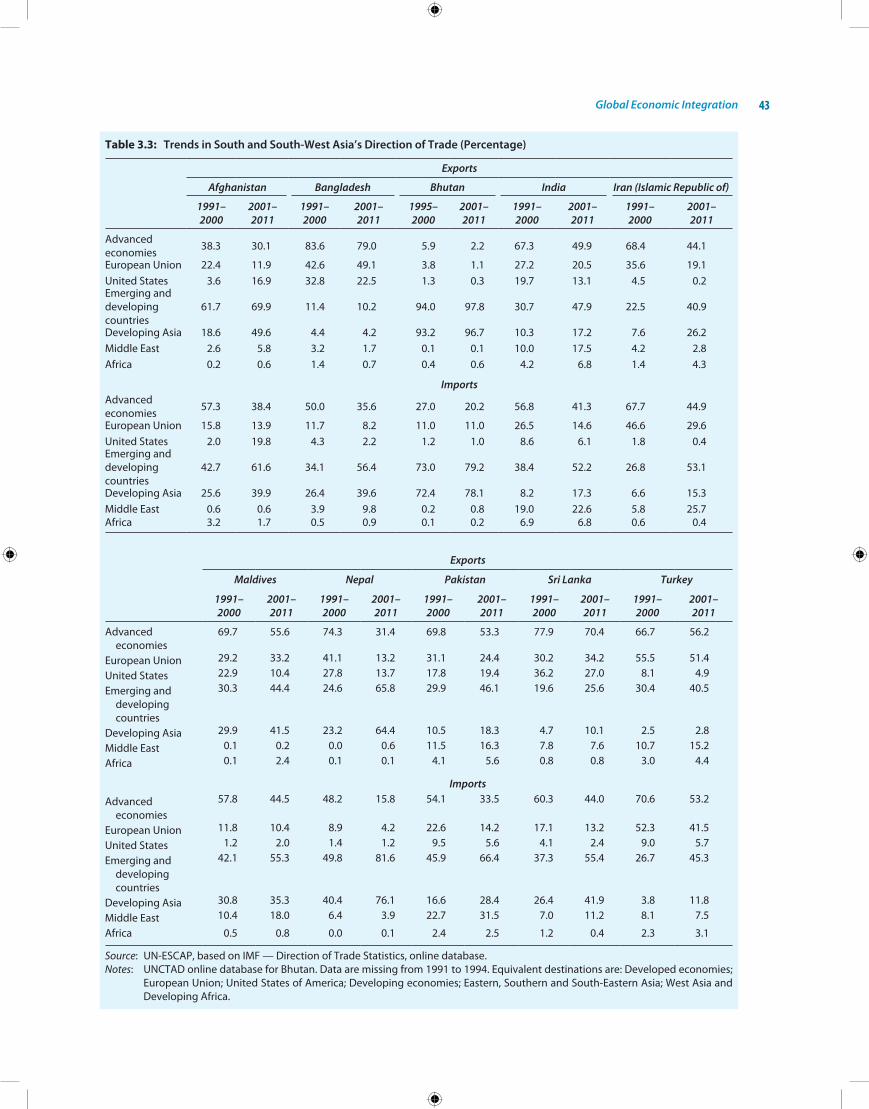
Global Economic Integration 43
Table 3.3: Trends in South and South-West Asia’s Direction of Trade (Percentage)
Exports
Afghanistan Bangladesh Bhutan India Iran (Islamic Republic of)
1991– 2000
2001–2011
1991–2000
2001–2011
1995–2000
2001–2011
1991–2000
2001–2011
1991–2000
2001–2011
Advanced economies 38.3 30.1 83.6 79.0 5.9 2.2 67.3 49.9 68.4 44.1
european Union 22.4 11.9 42.6 49.1 3.8 1.1 27.2 20.5 35.6 19.1United States 3.6 16.9 32.8 22.5 1.3 0.3 19.7 13.1 4.5 0.2emerging and developing countries
61.7 69.9 11.4 10.2 94.0 97.8 30.7 47.9 22.5 40.9
Developing Asia 18.6 49.6 4.4 4.2 93.2 96.7 10.3 17.2 7.6 26.2Middle east 2.6 5.8 3.2 1.7 0.1 0.1 10.0 17.5 4.2 2.8Africa 0.2 0.6 1.4 0.7 0.4 0.6 4.2 6.8 1.4 4.3
ImportsAdvanced economies 57.3 38.4 50.0 35.6 27.0 20.2 56.8 41.3 67.7 44.9
european Union 15.8 13.9 11.7 8.2 11.0 11.0 26.5 14.6 46.6 29.6United States 2.0 19.8 4.3 2.2 1.2 1.0 8.6 6.1 1.8 0.4emerging and developing countries
42.7 61.6 34.1 56.4 73.0 79.2 38.4 52.2 26.8 53.1
Developing Asia 25.6 39.9 26.4 39.6 72.4 78.1 8.2 17.3 6.6 15.3Middle east 0.6 0.6 3.9 9.8 0.2 0.8 19.0 22.6 5.8 25.7Africa 3.2 1.7 0.5 0.9 0.1 0.2 6.9 6.8 0.6 0.4
Exports
Maldives Nepal Pakistan Sri Lanka Turkey
1991–2000
2001–2011
1991–2000
2001–2011
1991–2000
2001–2011
1991–2000
2001–2011
1991–2000
2001–2011
Advanced economies
69.7 55.6 74.3 31.4 69.8 53.3 77.9 70.4 66.7 56.2
european Union 29.2 33.2 41.1 13.2 31.1 24.4 30.2 34.2 55.5 51.4
United States 22.9 10.4 27.8 13.7 17.8 19.4 36.2 27.0 8.1 4.9
emerging and developing countries
30.3 44.4 24.6 65.8 29.9 46.1 19.6 25.6 30.4 40.5
Developing Asia 29.9 41.5 23.2 64.4 10.5 18.3 4.7 10.1 2.5 2.8
Middle east 0.1 0.2 0.0 0.6 11.5 16.3 7.8 7.6 10.7 15.2
Africa 0.1 2.4 0.1 0.1 4.1 5.6 0.8 0.8 3.0 4.4
Imports
Advanced economies
57.8 44.5 48.2 15.8 54.1 33.5 60.3 44.0 70.6 53.2
european Union 11.8 10.4 8.9 4.2 22.6 14.2 17.1 13.2 52.3 41.5
United States 1.2 2.0 1.4 1.2 9.5 5.6 4.1 2.4 9.0 5.7
emerging and developing countries
42.1 55.3 49.8 81.6 45.9 66.4 37.3 55.4 26.7 45.3
Developing Asia 30.8 35.3 40.4 76.1 16.6 28.4 26.4 41.9 3.8 11.8
Middle east 10.4 18.0 6.4 3.9 22.7 31.5 7.0 11.2 8.1 7.5
Africa 0.5 0.8 0.0 0.1 2.4 2.5 1.2 0.4 2.3 3.1
Source: Un-eSCAP, based on iMF — Direction of Trade Statistics, online database.Notes: UnCTAD online database for Bhutan. Data are missing from 1991 to 1994. equivalent destinations are: Developed economies;
european Union; United States of America; Developing economies; eastern, Southern and South-eastern Asia; West Asia and Developing Africa.
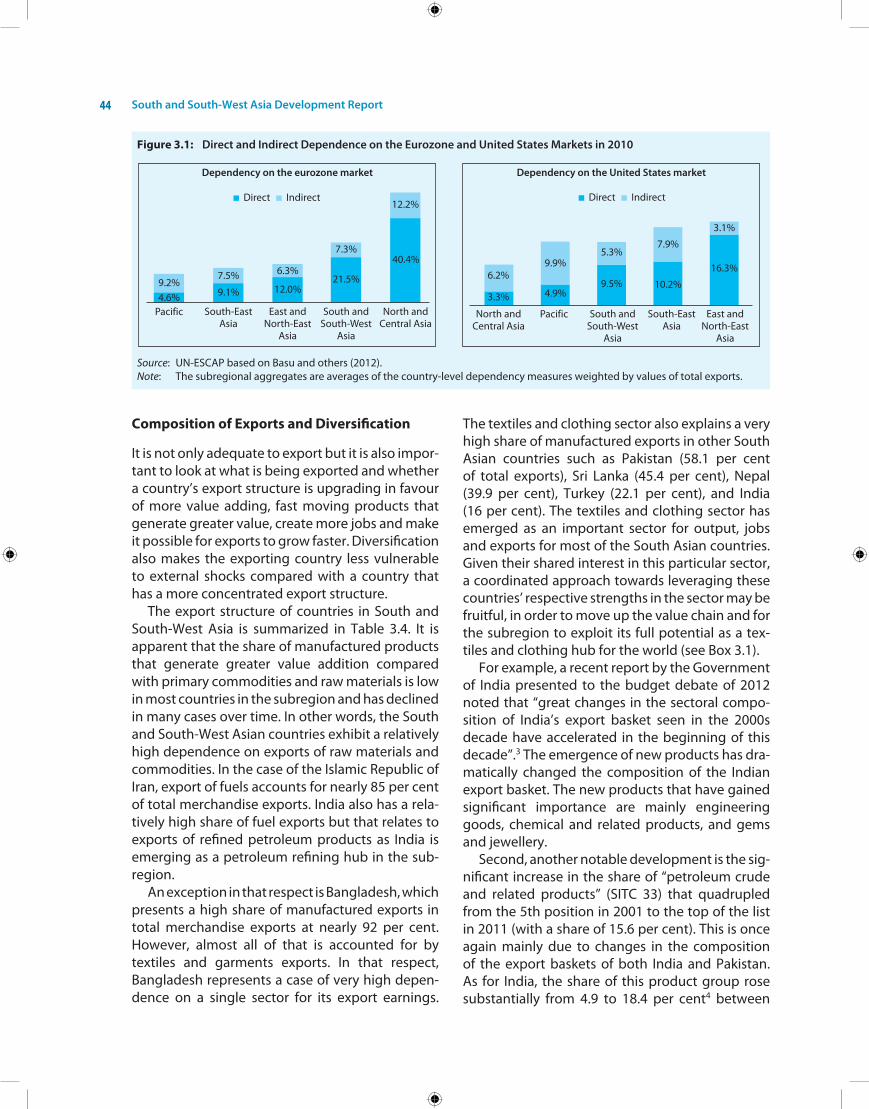
South and South-West Asia Development Report44
Figure 3.1: Direct and Indirect Dependence on the Eurozone and United States Markets in 2010
Source: Un-eSCAP based on Basu and others (2012).Note: The subregional aggregates are averages of the country-level dependency measures weighted by values of total exports.
Composition of Exports and Diversification
it is not only adequate to export but it is also impor-tant to look at what is being exported and whether a country’s export structure is upgrading in favour of more value adding, fast moving products that generate greater value, create more jobs and make it possible for exports to grow faster. Diversification also makes the exporting country less vulnerable to external shocks compared with a country that has a more concentrated export structure.
The export structure of countries in South and South-West Asia is summarized in Table 3.4. it is apparent that the share of manufactured products that generate greater value addition compared with primary commodities and raw materials is low in most countries in the subregion and has declined in many cases over time. in other words, the South and South-West Asian countries exhibit a relatively high dependence on exports of raw materials and commodities. in the case of the islamic Republic of iran, export of fuels accounts for nearly 85 per cent of total merchandise exports. india also has a rela-tively high share of fuel exports but that relates to exports of refined petroleum products as india is emerging as a petroleum refining hub in the sub-region.
An exception in that respect is Bangladesh, which presents a high share of manufactured exports in total merchandise exports at nearly 92 per cent. however, almost all of that is accounted for by textiles and garments exports. in that respect, Bangladesh represents a case of very high depen-dence on a single sector for its export earnings.
The textiles and clothing sector also explains a very high share of manufactured exports in other South Asian countries such as Pakistan (58.1 per cent of total exports), Sri Lanka (45.4 per cent), nepal (39.9 per cent), Turkey (22.1 per cent), and india (16 per cent). The textiles and clothing sector has emerged as an important sector for output, jobs and exports for most of the South Asian countries. Given their shared interest in this particular sector, a coordinated approach towards leveraging these countries’ respective strengths in the sector may be fruitful, in order to move up the value chain and for the subregion to exploit its full potential as a tex-tiles and clothing hub for the world (see Box 3.1).
For example, a recent report by the Government of india presented to the budget debate of 2012 noted that “great changes in the sectoral compo-sition of india’s export basket seen in the 2000s decade have accelerated in the beginning of this decade”.3 The emergence of new products has dra-matically changed the composition of the indian export basket. The new products that have gained significant importance are mainly engineering goods, chemical and related products, and gems and jewellery.
Second, another notable development is the sig-nificant increase in the share of “petroleum crude and related products” (SiTC 33) that quadrupled from the 5th position in 2001 to the top of the list in 2011 (with a share of 15.6 per cent). This is once again mainly due to changes in the composition of the export baskets of both india and Pakistan. As for india, the share of this product group rose substantially from 4.9 to 18.4 per cent4 between
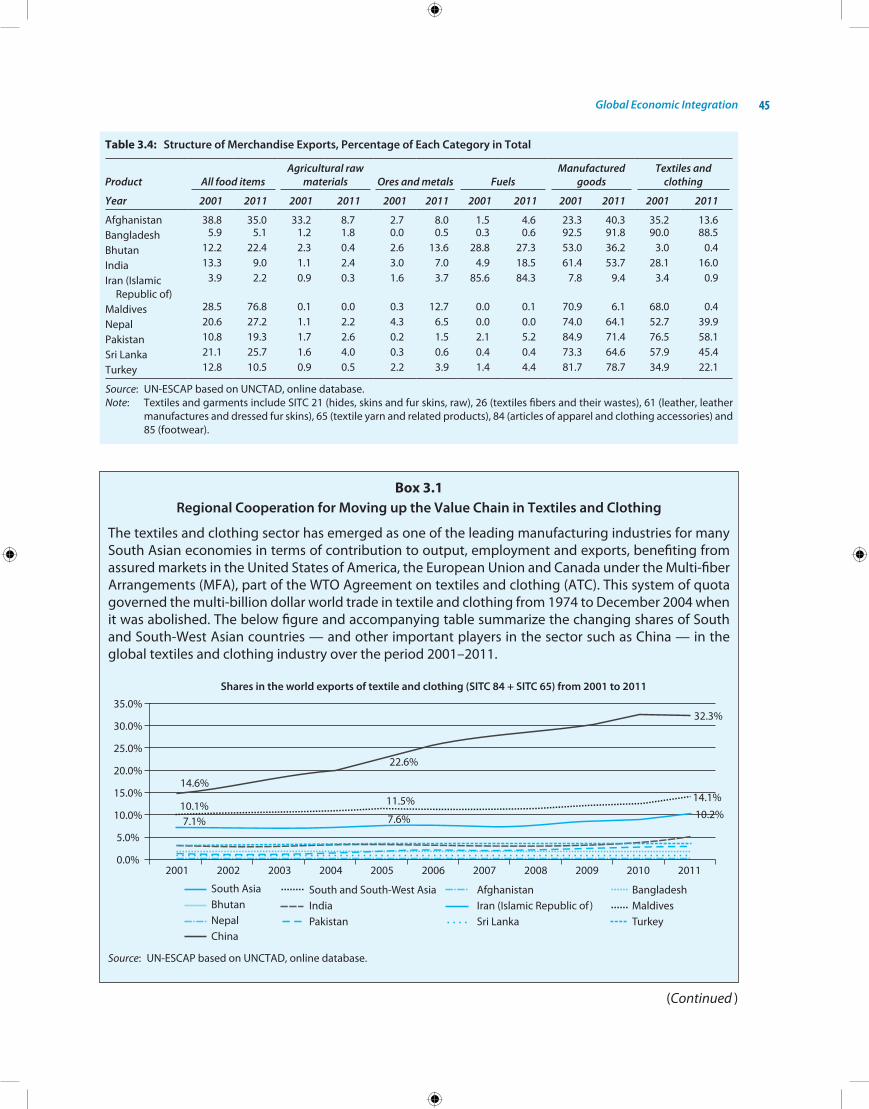
Global Economic Integration 45
Table 3.4: Structure of Merchandise Exports, Percentage of Each Category in Total
Product All food itemsAgricultural raw
materials Ores and metals FuelsManufactured
goodsTextiles and
clothing
Year 2001 2011 2001 2011 2001 2011 2001 2011 2001 2011 2001 2011
Afghanistan 38.8 35.0 33.2 8.7 2.7 8.0 1.5 4.6 23.3 40.3 35.2 13.6Bangladesh 5.9 5.1 1.2 1.8 0.0 0.5 0.3 0.6 92.5 91.8 90.0 88.5
Bhutan 12.2 22.4 2.3 0.4 2.6 13.6 28.8 27.3 53.0 36.2 3.0 0.4
india 13.3 9.0 1.1 2.4 3.0 7.0 4.9 18.5 61.4 53.7 28.1 16.0
iran (islamic Republic of)
3.9 2.2 0.9 0.3 1.6 3.7 85.6 84.3 7.8 9.4 3.4 0.9
Maldives 28.5 76.8 0.1 0.0 0.3 12.7 0.0 0.1 70.9 6.1 68.0 0.4
nepal 20.6 27.2 1.1 2.2 4.3 6.5 0.0 0.0 74.0 64.1 52.7 39.9
Pakistan 10.8 19.3 1.7 2.6 0.2 1.5 2.1 5.2 84.9 71.4 76.5 58.1
Sri Lanka 21.1 25.7 1.6 4.0 0.3 0.6 0.4 0.4 73.3 64.6 57.9 45.4
Turkey 12.8 10.5 0.9 0.5 2.2 3.9 1.4 4.4 81.7 78.7 34.9 22.1
Source: Un-eSCAP based on UnCTAD, online database.Note: Textiles and garments include SiTC 21 (hides, skins and fur skins, raw), 26 (textiles fibers and their wastes), 61 (leather, leather
manufactures and dressed fur skins), 65 (textile yarn and related products), 84 (articles of apparel and clothing accessories) and 85 (footwear).
Box 3.1Regional Cooperation for Moving up the Value Chain in Textiles and Clothing
The textiles and clothing sector has emerged as one of the leading manufacturing industries for many South Asian economies in terms of contribution to output, employment and exports, benefiting from assured markets in the United States of America, the european Union and Canada under the Multi-fiber Arrangements (MFA), part of the WTo Agreement on textiles and clothing (ATC). This system of quota governed the multi-billion dollar world trade in textile and clothing from 1974 to December 2004 when it was abolished. The below figure and accompanying table summarize the changing shares of South and South-West Asian countries — and other important players in the sector such as China — in the global textiles and clothing industry over the period 2001–2011.
Source: Un-eSCAP based on UnCTAD, online database.
(Continued )
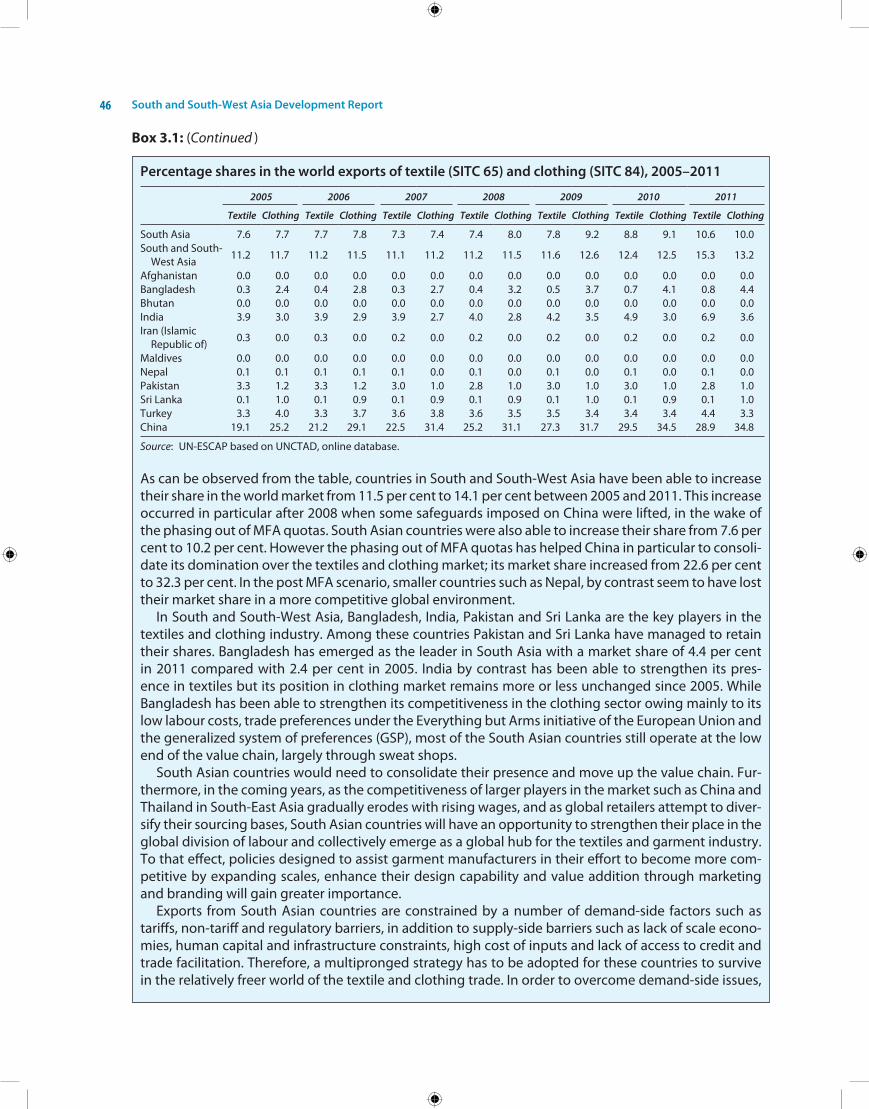
South and South-West Asia Development Report46
Percentage shares in the world exports of textile (SITC 65) and clothing (SITC 84), 2005–2011
2005 2006 2007 2008 2009 2010 2011
Textile Clothing Textile Clothing Textile Clothing Textile Clothing Textile Clothing Textile Clothing Textile Clothing
South Asia 7.6 7.7 7.7 7.8 7.3 7.4 7.4 8.0 7.8 9.2 8.8 9.1 10.6 10.0South and South-
West Asia 11.2 11.7 11.2 11.5 11.1 11.2 11.2 11.5 11.6 12.6 12.4 12.5 15.3 13.2
Afghanistan 0.0 0.0 0.0 0.0 0.0 0.0 0.0 0.0 0.0 0.0 0.0 0.0 0.0 0.0Bangladesh 0.3 2.4 0.4 2.8 0.3 2.7 0.4 3.2 0.5 3.7 0.7 4.1 0.8 4.4Bhutan 0.0 0.0 0.0 0.0 0.0 0.0 0.0 0.0 0.0 0.0 0.0 0.0 0.0 0.0india 3.9 3.0 3.9 2.9 3.9 2.7 4.0 2.8 4.2 3.5 4.9 3.0 6.9 3.6iran (islamic
Republic of) 0.3 0.0 0.3 0.0 0.2 0.0 0.2 0.0 0.2 0.0 0.2 0.0 0.2 0.0
Maldives 0.0 0.0 0.0 0.0 0.0 0.0 0.0 0.0 0.0 0.0 0.0 0.0 0.0 0.0nepal 0.1 0.1 0.1 0.1 0.1 0.0 0.1 0.0 0.1 0.0 0.1 0.0 0.1 0.0Pakistan 3.3 1.2 3.3 1.2 3.0 1.0 2.8 1.0 3.0 1.0 3.0 1.0 2.8 1.0Sri Lanka 0.1 1.0 0.1 0.9 0.1 0.9 0.1 0.9 0.1 1.0 0.1 0.9 0.1 1.0Turkey 3.3 4.0 3.3 3.7 3.6 3.8 3.6 3.5 3.5 3.4 3.4 3.4 4.4 3.3China 19.1 25.2 21.2 29.1 22.5 31.4 25.2 31.1 27.3 31.7 29.5 34.5 28.9 34.8
Source: Un-eSCAP based on UnCTAD, online database.
As can be observed from the table, countries in South and South-West Asia have been able to increase their share in the world market from 11.5 per cent to 14.1 per cent between 2005 and 2011. This increase occurred in particular after 2008 when some safeguards imposed on China were lifted, in the wake of the phasing out of MFA quotas. South Asian countries were also able to increase their share from 7.6 per cent to 10.2 per cent. however the phasing out of MFA quotas has helped China in particular to consoli-date its domination over the textiles and clothing market; its market share increased from 22.6 per cent to 32.3 per cent. in the post MFA scenario, smaller countries such as nepal, by contrast seem to have lost their market share in a more competitive global environment.
in South and South-West Asia, Bangladesh, india, Pakistan and Sri Lanka are the key players in the textiles and clothing industry. Among these countries Pakistan and Sri Lanka have managed to retain their shares. Bangladesh has emerged as the leader in South Asia with a market share of 4.4 per cent in 2011 compared with 2.4 per cent in 2005. india by contrast has been able to strengthen its pres-ence in textiles but its position in clothing market remains more or less unchanged since 2005. While Bangladesh has been able to strengthen its competitiveness in the clothing sector owing mainly to its low labour costs, trade preferences under the everything but Arms initiative of the european Union and the generalized system of preferences (GSP), most of the South Asian countries still operate at the low end of the value chain, largely through sweat shops.
South Asian countries would need to consolidate their presence and move up the value chain. Fur-thermore, in the coming years, as the competitiveness of larger players in the market such as China and Thailand in South-east Asia gradually erodes with rising wages, and as global retailers attempt to diver-sify their sourcing bases, South Asian countries will have an opportunity to strengthen their place in the global division of labour and collectively emerge as a global hub for the textiles and garment industry. To that effect, policies designed to assist garment manufacturers in their effort to become more com-petitive by expanding scales, enhance their design capability and value addition through marketing and branding will gain greater importance.
exports from South Asian countries are constrained by a number of demand-side factors such as tariffs, non-tariff and regulatory barriers, in addition to supply-side barriers such as lack of scale econo-mies, human capital and infrastructure constraints, high cost of inputs and lack of access to credit and trade facilitation. Therefore, a multipronged strategy has to be adopted for these countries to survive in the relatively freer world of the textile and clothing trade. in order to overcome demand-side issues,
Box 3.1: (Continued )
Global Economic Integration 47
it is necessary for South Asian countries to assert a common position on removing non-tariff barriers. With regards to tariff barriers, a different approach could be followed in particular considering the fact that duty-free and quota-free market access for least developed countries (LDCs) might become a contentious issue. however, once the tariff barriers within the subregion are removed, duty-free and quota-free access for LDCs would result in greater exports of raw materials from countries such as Pakistan and india. Therefore, all countries in the subregion would stand to benefit from pursuing such an approach.
Regional Cooperation
There is considerable potential for South Asia to develop as a global textile and clothing hub through enhanced regional cooperation in trade, investment, skills development and technology transfer. With the exception of india and Pakistan, vertically integrated production structures are virtually absent from the subregion. Building regionally integrated value chains would enable the South Asian countries to enhance the efficiency of sourcing inputs by reducing costs as well as lead times. it would help strengthen the firms engaged in the production of raw materials, thereby, boosting employment, increasing revenues and access to more secure markets. Fostering regional trade in raw materials and building vertical integration within the subregion would also increase the competitiveness of firms in global textile and clothing supply chains. Furthermore, sourcing raw materials from the subregion would allow South Asia to obtain reduced or zero duty under the regional cumulation rules — as per the european Union GSP/ everything but Arms initiative scheme. The trading patterns within South Asia thus bring forth the prospects of further developing an intraregional value chain in the textile and clothing industry. how-ever, while other subregions, such as that of ASeAn are utilizing regional trade agreements to reduce trade barriers in this specific sector, in South Asia, most textile and clothing products have been placed in the ”sensitive list” of each country under the South Asian Free Trade Area (SAFTA). SAFTA members should aim to remove all tariffs on textile and clothing items from South Asia or at least remove the tariffs on such products that are not produced locally, allowing these products to be imported from within the subregion.
The access to a wider range of raw materials in the domestic market as a result of the elimination of tariffs would also help diversify the T&C products manufactured for the domestic market as well as develop low volume, high priced export items from small-scale producers in South Asia. Building intraregional investments, improving cross border cooperation and trade facilitation as well as providing access for the transfer of technology and skills are all important elements in this connection.
Foreign direct investment (FDi) would be an effective means of channeling the required resources to further develop the vertical production structures in the subregion and would enable a higher degree of country-level specialization. FDi could also provide the means for countries which lack GSP provisions to establish backward linkages in countries that benefit from such provisions. While foreign investments can play a role in the transfer of technologies, the Governments and private sector in the subregion should explore means of building partnerships to provide training and enhance the skills of South Asian workers in this sector. To ensure the credibility and sustainability of such reforms, SAFTA members should also liberalize intraregional investment and technology transfers within the economic cooperation framework.
Focus on Niche Products and Ethical Clothing
Sri Lanka seems to be the only South Asian country to have managed to partly offset the export losses in the post-ATC period by focusing on niche products. Taking advantage of the relatively high level of education of its workers and their aptitude for quick learning, Sri Lanka started focusing on a distinct
(Continued )
South and South-West Asia Development Report48
segment of apparel, for example women’s undergarments. A Sri Lankan firm has carved a global niche by penetrating an even more lucrative market: body armour, flak jackets, and bulletproof vests for troops in Saudi Arabia as well as for the United nations. Capitalizing on the campaign for ethical clothing initiated by consumer, environmental and labour groups in the developed countries, a few Asian countries have adopted ethical clothing as a corporate strategy, with varying degrees of success. Bangladesh seems to be moving in that direction and is improving compliance with labour and safety standards. Several initiatives have been taken by the textile and clothing sector to promote Sri Lanka as an ethical manufacturing destination.
Value Chain Networks
Large retail chains such as Wal-Mart and ”branded marketers” such as nike and Reebok, while outsourcing their production to low-wage countries, have retained control over the major portion of the value chain, that is, design and marketing functions and through standard-setting and often raw materials sourcing. To coordinate the outsourcing activities they often work with large and sophisticated independent sourcing agents such as those based in hong kong, China; the Republic of korea; and Taiwan Province of China, acting as intermediaries for global buyers. Their capacity to mobilize and coordinate full-package manufacturing in the global textile and clothing value chains has led to what is termed ”triangular production networks,” that is, production is done in one country (usually less developed), organized and coordinated by firms in another country (usually middle income), and sold to a buyer in yet another country (usually developed). entrepreneurs in South Asian countries with a vertically integrated structure (india and Pakistan), or a quick and relatively efficient trade facilitation infrastructure (such as Sri Lanka), can establish ”triangular production networks” and act as complete service providers for global buyers to enhance value addition. This would enable them to realize a greater proportion of value chain within the subregion.
Source: Un-eSCAP based on Adhikari and Weeratunge (2007).
2001 and 2011. over this period, it is important to note that apart from the high prices of crude oil, india’s refining capacity have increased consider-ably.5 Similarly, the share of petroleum in Pakistan’s exports increased from 2.1 to 5.2 per cent. This indicates that the subregion has a huge potential to emerge as a hub for refined petroleum exports in the Asia and Pacific region.
Technological Upgrading of South and South-West Asian Exports
While exports from South and South-West Asia have grown over time at robust rates, concerns have been raised about their inability to upgrade their export structure. The subregion’s export struc-ture is still dominated by relatively simple, undif-ferentiated and slow-moving products such as textiles, clothing, leather goods, agricultural com-modities, and raw materials. The main competitive advantage for these products lies in cheap labour.
They are highly prone to price competition. it has been argued that this type of export structure is not geared to rapid expansion given the growing competition in standard and matured industries, while the extent of value addition is also relatively lower.
Table 3.5 shows that the share of high tech-nology components in manufactured exports for countries in South and South-West Asia was much lower compared with that of east Asian countries. india had the highest proportion of technology intensive exports in the subregion with a 7.2 per cent share, as compared with 26.2 per cent for a country in east Asia. Therefore, technological upgrading and movement along the value chain is a challenge that South and South-West Asian countries need to address. For this to happen, attention has to be paid to building technological capability.6 Table 3.6 shows that the proportion of research and development expenditures as percentage of GDP in South and South-West Asia
Box 3.1: (Continued )
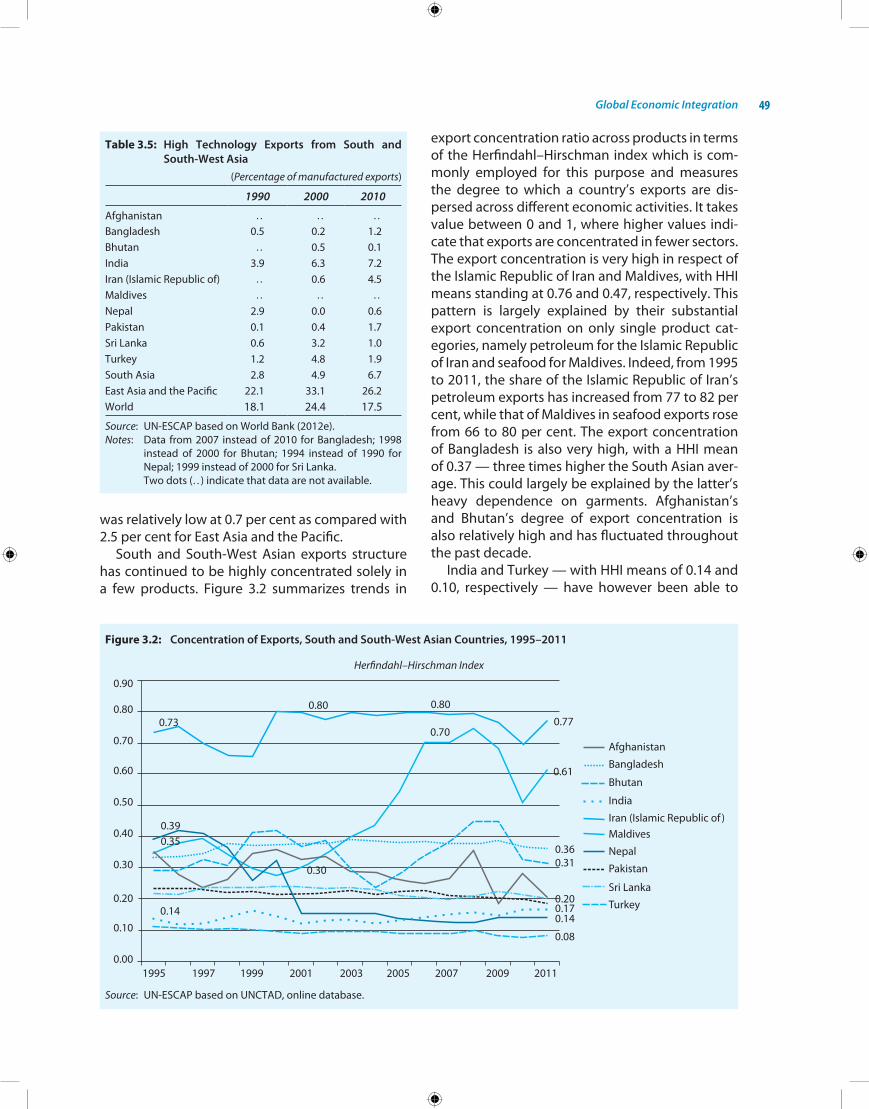
Global Economic Integration 49
was relatively low at 0.7 per cent as compared with 2.5 per cent for east Asia and the Pacific.
South and South-West Asian exports structure has continued to be highly concentrated solely in a few products. Figure 3.2 summarizes trends in
export concentration ratio across products in terms of the herfindahl–hirschman index which is com-monly employed for this purpose and measures the degree to which a country’s exports are dis-persed across different economic activities. it takes value between 0 and 1, where higher values indi-cate that exports are concentrated in fewer sectors. The export concentration is very high in respect of the islamic Republic of iran and Maldives, with hhi means standing at 0.76 and 0.47, respectively. This pattern is largely explained by their substantial export concentration on only single product cat-egories, namely petroleum for the islamic Republic of iran and seafood for Maldives. indeed, from 1995 to 2011, the share of the islamic Republic of iran’s petroleum exports has increased from 77 to 82 per cent, while that of Maldives in seafood exports rose from 66 to 80 per cent. The export concentration of Bangladesh is also very high, with a hhi mean of 0.37 — three times higher the South Asian aver-age. This could largely be explained by the latter’s heavy dependence on garments. Afghanistan’s and Bhutan’s degree of export concentration is also relatively high and has fluctuated throughout the past decade.
india and Turkey — with hhi means of 0.14 and 0.10, respectively — have however been able to
Figure 3.2: Concentration of Exports, South and South-West Asian Countries, 1995–2011
Herfindahl–Hirschman Index
Source: Un-eSCAP based on UnCTAD, online database.
Table 3.5: High Technology Exports from South and South-West Asia
(Percentage of manufactured exports)
1990 2000 2010
Afghanistan . . . . . .Bangladesh 0.5 0.2 1.2Bhutan . . 0.5 0.1india 3.9 6.3 7.2iran (islamic Republic of) . . 0.6 4.5Maldives . . . . . .
nepal 2.9 0.0 0.6Pakistan 0.1 0.4 1.7Sri Lanka 0.6 3.2 1.0Turkey 1.2 4.8 1.9South Asia 2.8 4.9 6.7east Asia and the Pacific 22.1 33.1 26.2World 18.1 24.4 17.5
Source: Un-eSCAP based on World Bank (2012e).Notes: Data from 2007 instead of 2010 for Bangladesh; 1998
instead of 2000 for Bhutan; 1994 instead of 1990 for nepal; 1999 instead of 2000 for Sri Lanka.
Two dots (. . ) indicate that data are not available.
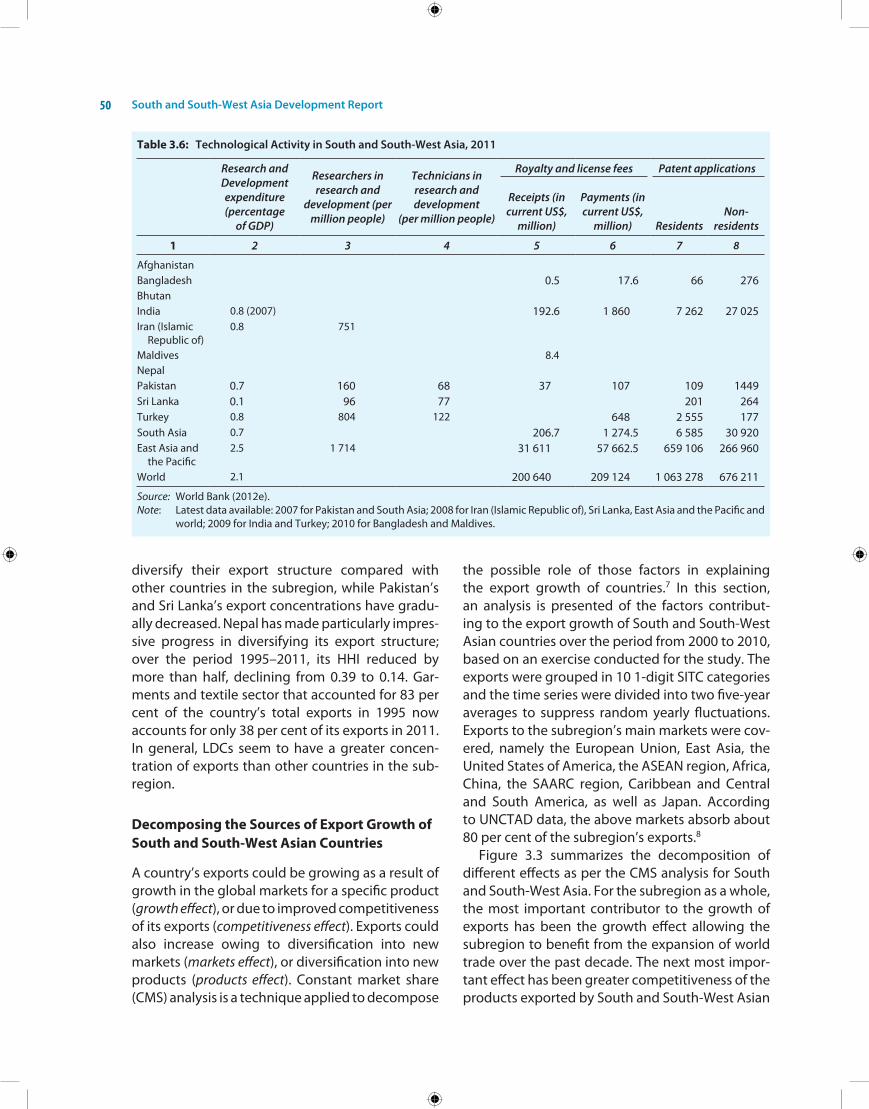
South and South-West Asia Development Report50
Table 3.6: Technological Activity in South and South-West Asia, 2011
Research and Development expenditure (percentage
of GDP)
Researchers in research and
development (per million people)
Technicians in research and development
(per million people)
Royalty and license fees Patent applications
Receipts (in current US$,
million)
Payments (in current US$,
million) ResidentsNon-
residents
1 2 3 4 5 6 7 8
AfghanistanBangladesh 0.5 17.6 66 276Bhutanindia 0.8 (2007) 192.6 1 860 7 262 27 025iran (islamic
Republic of)0.8 751
Maldives 8.4nepalPakistan 0.7 160 68 37 107 109 1449Sri Lanka 0.1 96 77 201 264Turkey 0.8 804 122 648 2 555 177South Asia 0.7 206.7 1 274.5 6 585 30 920east Asia and
the Pacific2.5 1 714 31 611 57 662.5 659 106 266 960
World 2.1 200 640 209 124 1 063 278 676 211
Source: World Bank (2012e).Note: Latest data available: 2007 for Pakistan and South Asia; 2008 for iran (islamic Republic of), Sri Lanka, east Asia and the Pacific and
world; 2009 for india and Turkey; 2010 for Bangladesh and Maldives.
diversify their export structure compared with other countries in the subregion, while Pakistan’s and Sri Lanka’s export concentrations have gradu-ally decreased. nepal has made particularly impres-sive progress in diversifying its export structure; over the period 1995–2011, its hhi reduced by more than half, declining from 0.39 to 0.14. Gar-ments and textile sector that accounted for 83 per cent of the country’s total exports in 1995 now accounts for only 38 per cent of its exports in 2011. in general, LDCs seem to have a greater concen-tration of exports than other countries in the sub-region.
Decomposing the Sources of Export Growth of South and South-West Asian Countries
A country’s exports could be growing as a result of growth in the global markets for a specific product (growth effect), or due to improved competitiveness of its exports (competitiveness effect). exports could also increase owing to diversification into new markets (markets effect), or diversification into new products (products effect). Constant market share (CMS) analysis is a technique applied to decompose
the possible role of those factors in explaining the export growth of countries.7 in this section, an analysis is presented of the factors contribut-ing to the export growth of South and South-West Asian countries over the period from 2000 to 2010, based on an exercise conducted for the study. The exports were grouped in 10 1-digit SiTC categories and the time series were divided into two five-year averages to suppress random yearly fluctuations. exports to the subregion’s main markets were cov-ered, namely the european Union, east Asia, the United States of America, the ASeAn region, Africa, China, the SAARC region, Caribbean and Central and South America, as well as Japan. According to UnCTAD data, the above markets absorb about 80 per cent of the subregion’s exports.8
Figure 3.3 summarizes the decomposition of different effects as per the CMS analysis for South and South-West Asia. For the subregion as a whole, the most important contributor to the growth of exports has been the growth effect allowing the subregion to benefit from the expansion of world trade over the past decade. The next most impor-tant effect has been greater competitiveness of the products exported by South and South-West Asian
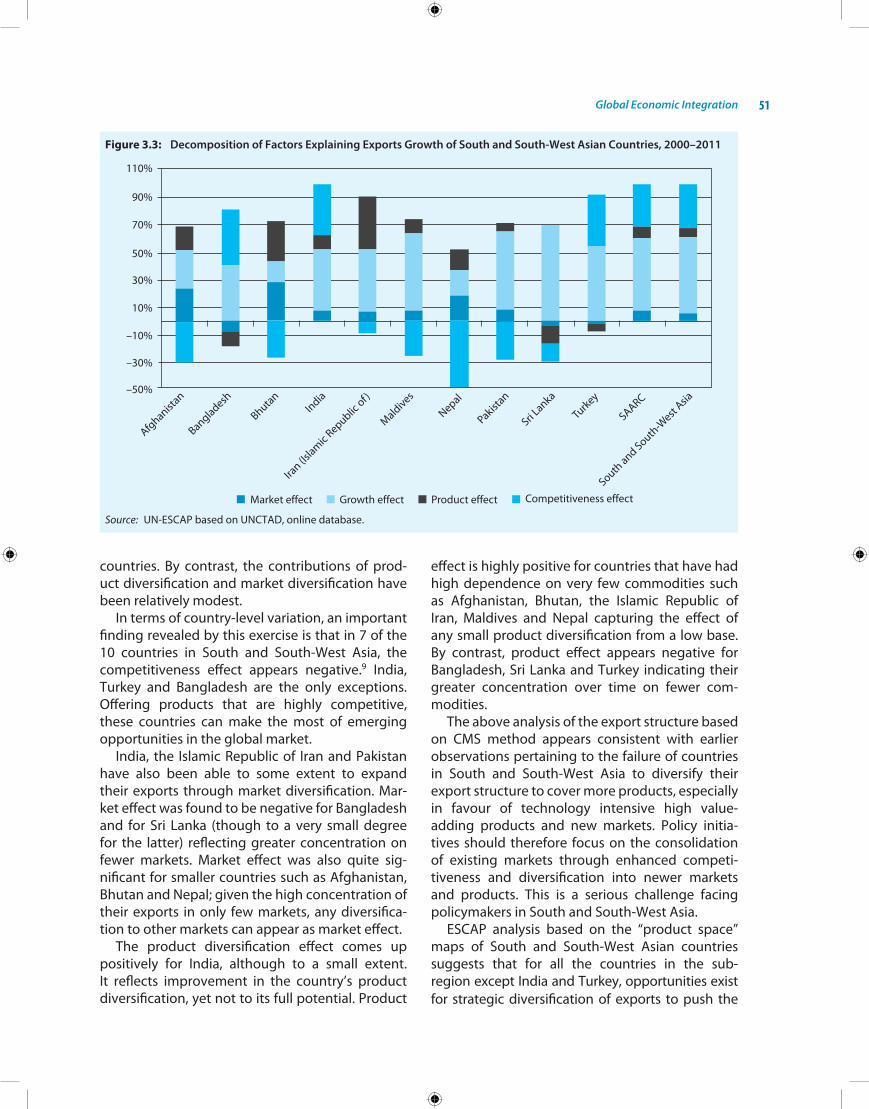
Global Economic Integration 51
countries. By contrast, the contributions of prod-uct diversification and market diversification have been relatively modest.
in terms of country-level variation, an important finding revealed by this exercise is that in 7 of the 10 countries in South and South-West Asia, the competitiveness effect appears negative.9 india, Turkey and Bangladesh are the only exceptions. offering products that are highly competitive, these countries can make the most of emerging opportunities in the global market.
india, the islamic Republic of iran and Pakistan have also been able to some extent to expand their exports through market diversification. Mar-ket effect was found to be negative for Bangladesh and for Sri Lanka (though to a very small degree for the latter) reflecting greater concentration on fewer markets. Market effect was also quite sig-nificant for smaller countries such as Afghanistan, Bhutan and nepal; given the high concentration of their exports in only few markets, any diversifica-tion to other markets can appear as market effect.
The product diversification effect comes up positively for india, although to a small extent. it reflects improvement in the country’s product diversification, yet not to its full potential. Product
effect is highly positive for countries that have had high dependence on very few commodities such as Afghanistan, Bhutan, the islamic Republic of iran, Maldives and nepal capturing the effect of any small product diversification from a low base. By contrast, product effect appears negative for Bangladesh, Sri Lanka and Turkey indicating their greater concentration over time on fewer com-modities.
The above analysis of the export structure based on CMS method appears consistent with earlier observations pertaining to the failure of countries in South and South-West Asia to diversify their export structure to cover more products, especially in favour of technology intensive high value- adding products and new markets. Policy initia-tives should therefore focus on the consolidation of existing markets through enhanced competi-tiveness and diversification into newer markets and products. This is a serious challenge facing policymakers in South and South-West Asia.
eSCAP analysis based on the “product space” maps of South and South-West Asian countries suggests that for all the countries in the sub- region except india and Turkey, opportunities exist for strategic diversification of exports to push the
Figure 3.3: Decomposition of Factors Explaining Exports Growth of South and South-West Asian Countries, 2000–2011
Source: Un-eSCAP based on UnCTAD, online database.

South and South-West Asia Development Report52
industry through. Through the creation of incen-tives towards economic activities with higher com-plexity. The implementation of such a strategy requires the promotion of new economic activities using targeted industrial, infrastructure, trade, invest-ment and enterprise development policies.10
There are also lessons to be learned from enter-prises in South Asia which have moved up the value chain over time using different routes. For example, in the tea industry where the bulk of the produce of india and Sri Lanka was convention-ally sold as commodities in auctions and where much of the value addition took place in blending, packaging and branding, indian and Sri Lankan companies have adopted different value chain strategies. Tata Tea acquired Tetley Brands in the United kingdom of Great Britain and northern ireland, and integrated its operations to control, in-house, the entire value chain. A Sri Lankan com-pany, Dilmah went on to build its own brand and successfully created a global marketing network to capture the full potential of the value chain.11
sErvicEs in thE tradE of south and south-wEst asian countriEs
The emergence of the services sector as the most dynamic sector driving economic growth in the subregion has been accompanied by the grow-ing importance of those sectors in their countries’
trade. Table 3.7 shows that the services trade to GDP ratio has risen sharply in Bangladesh and india. By 1990, the services industry already accounted for a significant share of the GDP for Maldives, nepal, Pakistan, Sri Lanka and Turkey (often because of high dependence on tourism) and declined over time as the economies diversified beyond tourism.
Table 3.8 shows the growth rates of service exports and imports and the balance of trade in ser-vices. it is apparent that both exports and imports of services have registered robust growth rates for most countries in South and South-West Asia. A striking observation is the transformation of india over the past decade from being a net importer of
Table 3.7: Trade in Services, Percentage of GDP
1990 2000 2005 2006 2007 2008 2009 2010
Afghanistan . . . . . . . . . . . . . . . .Bangladesh 3.6 5.2 5.7 5.9 6.6 7.1 6.0 6.8Bhutan . . . . . . . . . . . . . . . .india 3.3 7.6 12.0 13.5 12.7 16.0 12.8 14.3iran (islamic
Republic of) 3.8 3.6 . . . . . . . . . . . .
Maldives 64.7 73.4 54.0 60.1 59.6 56.6 48.7 51.8nepal 10.2 12.8 10.0 9.7 12.0 12.5 12.0 9.6Pakistan 8.8 4.9 10.2 9.4 8.8 8.5 6.5 7.7Sri Lanka 13.4 15.7 14.9 14.2 13.5 12.3 10.5 11.3Turkey 7.4 10.4 8.0 7.1 6.9 7.4 8.3 7.5
Source: Un-eSCAP based on World Bank (2012e). Note: Two dots (. . ) indicate that data are not available.
Table 3.8: Services Trade Balance in South and South-West Asia
Trade in services (in millions of US$) Balance of services trade Exports Imports
2001 2011
Average annual growth rate (2001–2011), percentage 2001 2011
Average annual growth rate (2001–2011), percentage 2001 2011
Afghanistan . . . . . . . . . . . . . . . .Bangladesh 752 2 645 12 1 522 5 218 12 –769 –2 573Bhutan 24 82 15 42 117 15 –18 –35india 17 337 137 149 23 20 099 124 566 20 –2 762 12 583iran (islamic Republic of) 2 833 8 282 17 3 586 23 394 23 –753 –15 112Maldives 354 852 11 110 337 12 244 515nepal 413 863 7 215 782 14 199 81Pakistan 1 459 5 041 16 2 330 7 969 15 –871 –2 928Sri Lanka 1 355 3 084 12 1 749 4 012 9 –394 –928Turkey 15 234 38 342 7 6 098 21 288 10 9 136 17 054SAARC 21 695 149 847 21 26 132 143 109 1 –4 436 6 738South and South-West Asia 39 762 196 472 16 35 816 187 791 17 3 947 8 680
Source: Un-eSCAP based on UnCTAD, online database. Notes: Data from 2010 for iran (islamic Republic of) instead of 2011. Two dots (. . ) indicate that data are not available.
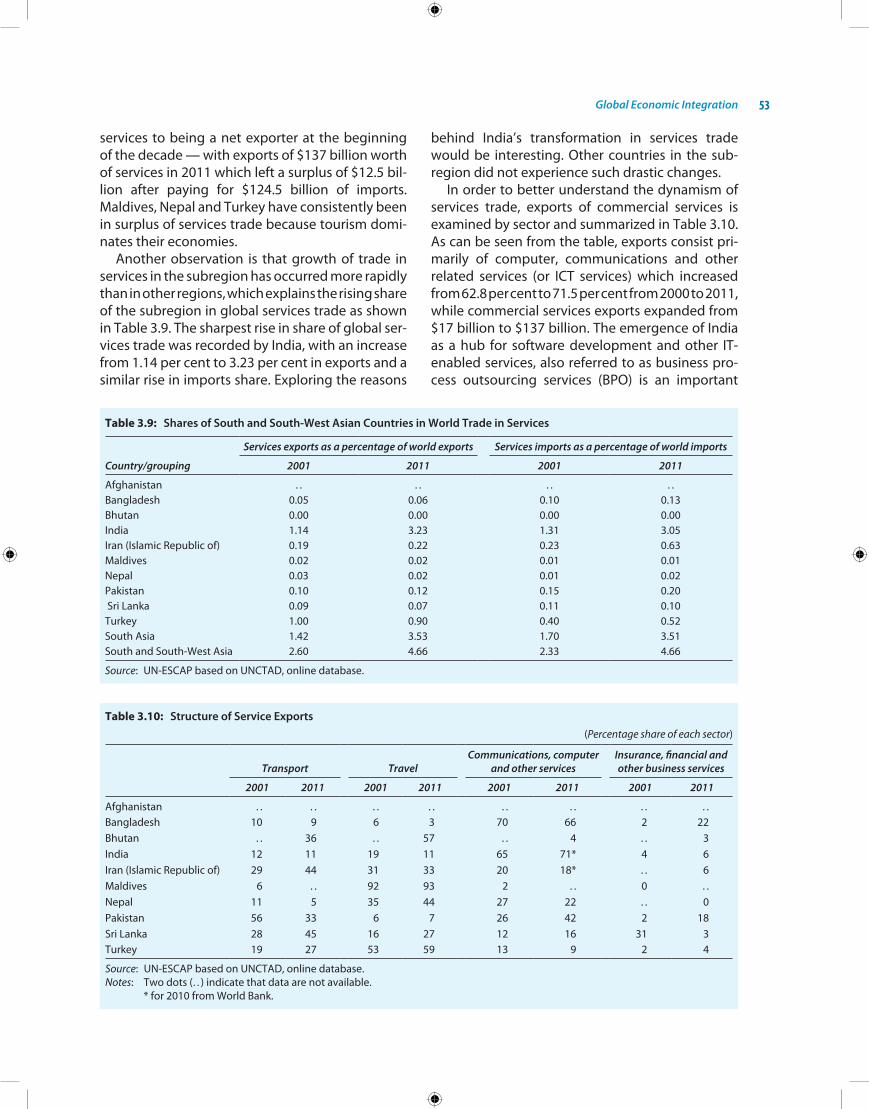
Global Economic Integration 53
Table 3.9: Shares of South and South-West Asian Countries in World Trade in Services
Services exports as a percentage of world exports Services imports as a percentage of world imports
Country/grouping 2001 2011 2001 2011
Afghanistan . . . . . . . .Bangladesh 0.05 0.06 0.10 0.13Bhutan 0.00 0.00 0.00 0.00india 1.14 3.23 1.31 3.05iran (islamic Republic of) 0.19 0.22 0.23 0.63Maldives 0.02 0.02 0.01 0.01nepal 0.03 0.02 0.01 0.02Pakistan 0.10 0.12 0.15 0.20 Sri Lanka 0.09 0.07 0.11 0.10Turkey 1.00 0.90 0.40 0.52South Asia 1.42 3.53 1.70 3.51South and South-West Asia 2.60 4.66 2.33 4.66
Source: Un-eSCAP based on UnCTAD, online database.
services to being a net exporter at the beginning of the decade — with exports of $137 billion worth of services in 2011 which left a surplus of $12.5 bil-lion after paying for $124.5 billion of imports. Maldives, nepal and Turkey have consistently been in surplus of services trade because tourism domi-nates their economies.
Another observation is that growth of trade in services in the subregion has occurred more rapidly than in other regions, which explains the rising share of the subregion in global services trade as shown in Table 3.9. The sharpest rise in share of global ser-vices trade was recorded by india, with an increase from 1.14 per cent to 3.23 per cent in exports and a similar rise in imports share. exploring the reasons
behind india’s transformation in services trade would be interesting. other countries in the sub-region did not experience such drastic changes.
in order to better understand the dynamism of services trade, exports of commercial services is examined by sector and summarized in Table 3.10. As can be seen from the table, exports consist pri-marily of computer, communications and other related services (or iCT services) which increased from 62.8 per cent to 71.5 per cent from 2000 to 2011, while commercial services exports expanded from $17 billion to $137 billion. The emergence of india as a hub for software development and other iT- enabled services, also referred to as business pro-cess outsourcing services (BPo) is an important
Table 3.10: Structure of Service Exports(Percentage share of each sector)
Transport TravelCommunications, computer
and other servicesInsurance, financial and other business services
2001 2011 2001 2011 2001 2011 2001 2011
Afghanistan . . . . . . . . . . . . . . . .Bangladesh 10 9 6 3 70 66 2 22Bhutan . . 36 . . 57 . . 4 . . 3india 12 11 19 11 65 71* 4 6iran (islamic Republic of) 29 44 31 33 20 18* . . 6Maldives 6 . . 92 93 2 . . 0 . .nepal 11 5 35 44 27 22 . . 0Pakistan 56 33 6 7 26 42 2 18Sri Lanka 28 45 16 27 12 16 31 3Turkey 19 27 53 59 13 9 2 4
Source: Un-eSCAP based on UnCTAD, online database.Notes: Two dots (. . ) indicate that data are not available. * for 2010 from World Bank.
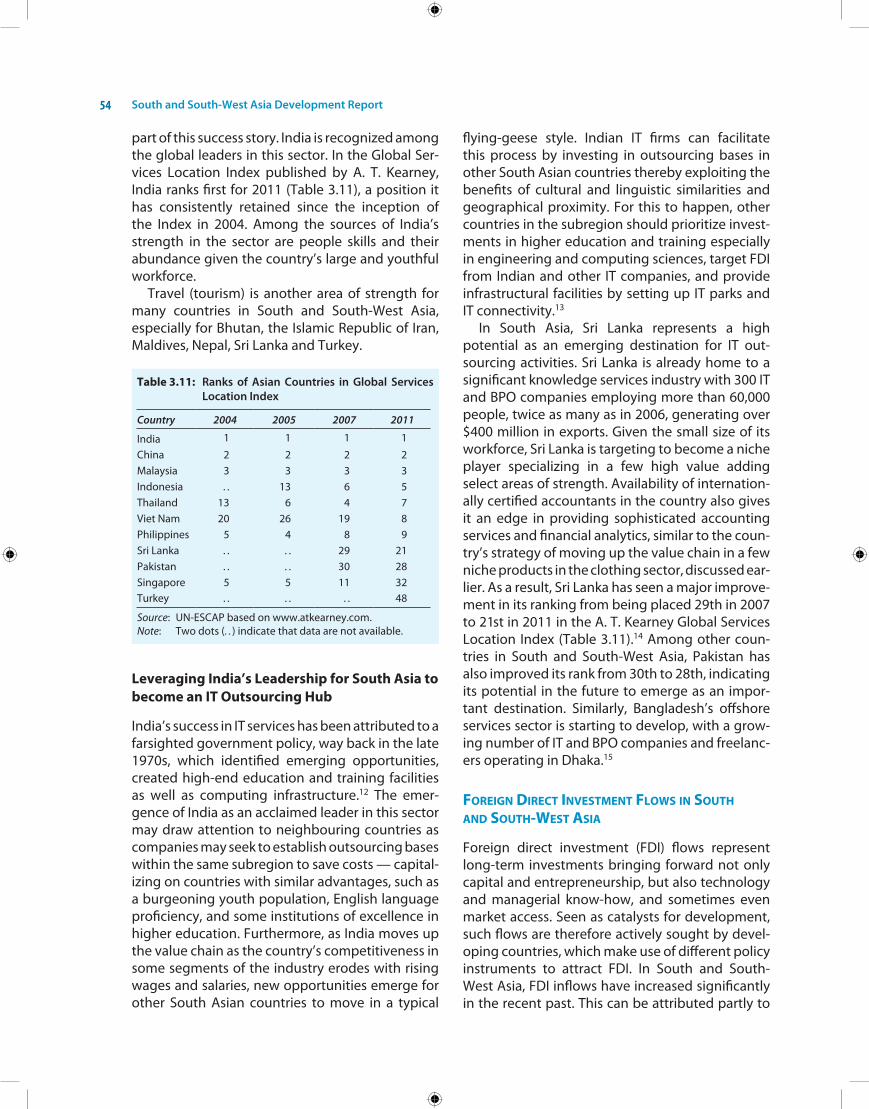
South and South-West Asia Development Report54
part of this success story. india is recognized among the global leaders in this sector. in the Global Ser-vices Location index published by A. T. kearney, india ranks first for 2011 (Table 3.11), a position it has consistently retained since the inception of the index in 2004. Among the sources of india’s strength in the sector are people skills and their abundance given the country’s large and youthful workforce.
Travel (tourism) is another area of strength for many countries in South and South-West Asia, especially for Bhutan, the islamic Republic of iran, Maldives, nepal, Sri Lanka and Turkey.
Table 3.11: Ranks of Asian Countries in Global Services Location Index
Country 2004 2005 2007 2011
india 1 1 1 1
China 2 2 2 2Malaysia 3 3 3 3indonesia . . 13 6 5Thailand 13 6 4 7Viet nam 20 26 19 8Philippines 5 4 8 9Sri Lanka . . . . 29 21Pakistan . . . . 30 28Singapore 5 5 11 32Turkey . . . . . . 48
Source: Un-eSCAP based on www.atkearney.com.Note: Two dots (. . ) indicate that data are not available.
Leveraging India’s Leadership for South Asia to become an IT Outsourcing Hub
india’s success in iT services has been attributed to a farsighted government policy, way back in the late 1970s, which identified emerging opportunities, created high-end education and training facilities as well as computing infrastructure.12 The emer-gence of india as an acclaimed leader in this sector may draw attention to neighbouring countries as companies may seek to establish outsourcing bases within the same subregion to save costs — capital-izing on countries with similar advantages, such as a burgeoning youth population, english language proficiency, and some institutions of excellence in higher education. Furthermore, as india moves up the value chain as the country’s competitiveness in some segments of the industry erodes with rising wages and salaries, new opportunities emerge for other South Asian countries to move in a typical
flying-geese style. indian iT firms can facilitate this process by investing in outsourcing bases in other South Asian countries thereby exploiting the benefits of cultural and linguistic similarities and geographical proximity. For this to happen, other countries in the subregion should prioritize invest-ments in higher education and training especially in engineering and computing sciences, target FDi from indian and other iT companies, and provide infrastructural facilities by setting up iT parks and iT connectivity.13
in South Asia, Sri Lanka represents a high potential as an emerging destination for iT out-sourcing activities. Sri Lanka is already home to a significant knowledge services industry with 300 iT and BPo companies employing more than 60,000 people, twice as many as in 2006, generating over $400 million in exports. Given the small size of its workforce, Sri Lanka is targeting to become a niche player specializing in a few high value adding select areas of strength. Availability of internation-ally certified accountants in the country also gives it an edge in providing sophisticated accounting services and financial analytics, similar to the coun-try’s strategy of moving up the value chain in a few niche products in the clothing sector, discussed ear-lier. As a result, Sri Lanka has seen a major improve-ment in its ranking from being placed 29th in 2007 to 21st in 2011 in the A. T. kearney Global Services Location index (Table 3.11).14 Among other coun-tries in South and South-West Asia, Pakistan has also improved its rank from 30th to 28th, indicating its potential in the future to emerge as an impor-tant destination. Similarly, Bangladesh’s offshore services sector is starting to develop, with a grow-ing number of iT and BPo companies and freelanc-ers operating in Dhaka.15
forEign dirEct invEstmEnt flows in south and south-wEst asia
Foreign direct investment (FDi) flows represent long-term investments bringing forward not only capital and entrepreneurship, but also technology and managerial know-how, and sometimes even market access. Seen as catalysts for development, such flows are therefore actively sought by devel-oping countries, which make use of different policy instruments to attract FDi. in South and South-West Asia, FDi inflows have increased significantly in the recent past. This can be attributed partly to
Global Economic Integration 55
the substantial liberalization of these countries’ policy regimes since the early 1990s. in addition, as these economies embarked on robust growth trajectories in the new millennium, they have also begun to attract increasing attention of multi-national enterprises. Furthermore, in recent years, South and South-West Asian countries have also emerged as sources of investments. enterprises in the subregion have increasingly used outward FDi as a strategic tool for strengthening their inter- national competitiveness. As a result, FDi flows have begun to be increasingly bidirectional rather than merely unidirectional with South and South-West Asian countries playing host.
Most of the countries in South and South-West Asia offer an increasingly liberal policy regime to FDi inflows. The FDi policy regime began to be lib-eralized in the 1990s when india liberalized its FDi policy regime dramatically as a part of a new indus-trial policy adopted in July 1991. This process of lib-eralization was followed by similar liberalizations in Pakistan and nepal. Sri Lanka had liberalized its FDi policy regime much earlier in 1978. Bangladesh has offered a national treatment to FDi since 1980. While Turkey has followed a liberal policy regime towards FDi, the islamic Republic of iran liberalized its regime for FDi in the early 2000s. The key fea-tures of the FDi policy regimes of the South Asian countries include up to 100 per cent foreign owner-ship in most sectors except for a few placed on the negative list due to sensitivities and security con-cerns such as arms and ammunition. Such regimes permit full repatriation of capital and remittances of profits, dividends, technical fees and royalties. They also offer a number of incentives such as tax holidays for specific number of years, special packages of facilities and incentives in the export processing zones. Many have also entered into bilateral investment promotion and protection treaties as well as double taxation avoidance treaties with large number of partner countries including major investment sources.16
Trends in FDI Inflows in South and South-West Asian Countries
South and South-West Asia has attracted a growing magnitude of FDi, with annual inflows rising from $10.8 billion in 2001 to $72.3 billion in 2008 before declining to $40.7 billion in 2010 in the wake of the global financial and economic crisis. The 2011
figures suggest that following global trends, FDi inflows to the subregion have begun to recover and were nearly $55 billion, yet still falling short of the pre-crisis peak (Table 3.12). The subregion is notably becoming more attractive for FDi over time with its share in global inflows nearly tripling from 1.3 per cent to 3.6 per cent over the 2001–2011 period. The subregion also occupied a 13 per cent share in inflows to developing Asian countries, down from the peak of 19 per cent in 2008.
Among the countries in the subregion, india appears as the most desirable destination, receiv-ing $31.5 billion in 2011 followed by Turkey with $15.8 billion. The islamic Republic of iran received $4.15 billion, Pakistan $1.3 billion and Bangladesh $1.1 billion.
FDi flows to least developed countries in South and South-West Asia have also expanded from $376 million to $1.3 billion over the period 2001–2011. While the magnitude of FDi received by LDCs and their share remains very low, it has nearly doubled over the same period from 0.45 per cent to 0.87 per cent. Considering that the share of countries in the subregion nearly tripled, the rise in share of LDCs has been relatively modest although FDi inflows to those countries have grown continu-ously through the crisis years.
The absolute magnitude of flows does not pro-vide an accurate indication of the relative impor-tance of the flows in relation to macro-aggregates of host countries, given the vast differences that exist in the size of economies in South and South-West Asia.
The trends summarized in Table 3.13 suggest that the share of FDi in gross fixed capital forma-tion of countries in South and South-West Asia has fluctuated from 3.4 per cent in 2000 to a peak of 10.3 per cent in 2008 before declining to 7.8 per cent in 2009 and further sliding to 4.6 per cent. it has remained relatively low but is catching up with the average for Developing Asia, as shown in Figure 3.13, of around 10 per cent in 2008–2009. By contrast, Maldives with a very high ratio of 25 per cent in 2010 seems like an outlier. Considering the trend till 2008 when the FDi inflows peaked in the subregion, it can be observed that the FDi share in gross capital formation rose steadily — and most impressively for Pakistan from 2.7 per cent to 18.7 per cent in 2007 — before moderating to 18.3 per cent, still higher than the Developing Asian average.
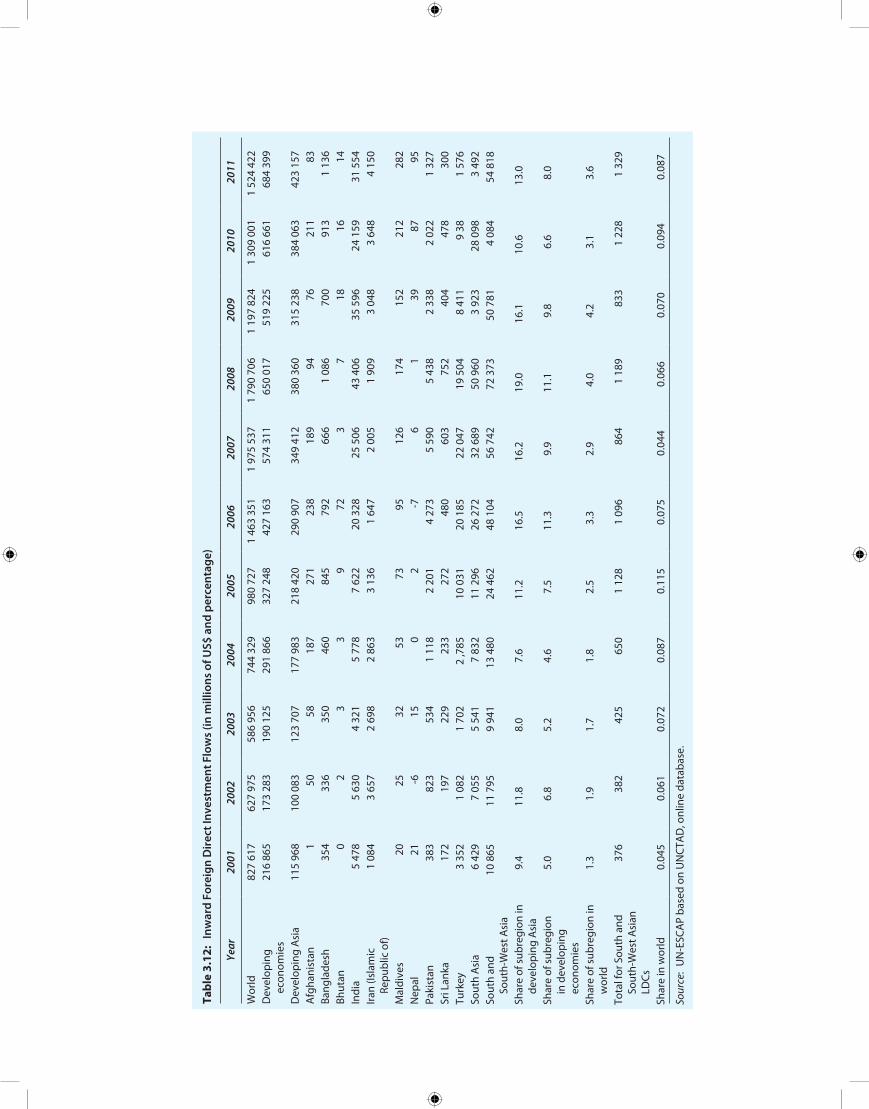
Tabl
e 3.
12:
Inw
ard
Fore
ign
Dir
ect I
nves
tmen
t Flo
ws
(in m
illio
ns o
f US$
and
per
cent
age)
Year
2001
2002
2003
2004
2005
2006
2007
2008
2009
2010
2011
Wor
ld82
7 61
762
7 97
558
6 95
674
4 32
998
0 72
71
463
351
1 97
5 53
71
790
706
1 19
7 82
41
309
001
1 52
4 42
2D
evel
opin
g ec
onom
ies
216
865
173
283
190
125
291
866
327
248
427
163
574
311
650
017
519
225
616
661
684
399
Dev
elop
ing
Asi
a11
5 96
810
0 08
312
3 70
717
7 98
321
8 42
029
0 90
734
9 41
238
0 36
031
5 23
838
4 06
342
3 15
7A
fgha
nist
an1
5058
187
271
238
189
9476
211
83Ba
ngla
desh
354
336
350
460
845
792
666
1 08
670
091
31
136
Bhut
an0
23
39
723
718
1614
indi
a5
478
5 63
04
321
5 77
87
622
20 3
2825
506
43 4
0635
596
24 1
5931
554
iran
(isla
mic
Re
publ
ic o
f)1
084
3 65
72
698
2 86
33
136
1 64
72
005
1 90
93
048
3 64
84
150
Mal
dive
s20
2532
5373
9512
617
415
221
228
2n
epal
21-6
150
2-7
61
3987
95Pa
kist
an38
382
353
41
118
2 20
14
273
5 59
05
438
2 33
82
022
1 32
7Sr
i Lan
ka17
219
722
923
327
248
060
375
240
447
830
0Tu
rkey
3 35
21
082
1 70
22
,785
10 0
3120
185
22 0
4719
504
8 41
19
381
576
Sout
h A
sia
6 42
97
055
5 54
17
832
11 2
9626
272
32 6
8950
960
3 92
328
098
3 49
2So
uth
and
So
uth-
Wes
t Asi
a10
865
11 7
959
941
13 4
8024
462
48 1
0456
742
72 3
7350
781
4 08
454
818
Shar
e of
sub
regi
on in
de
velo
ping
Asi
a9.
411
.88.
07.
611
.216
.516
.219
.016
.110
.613
.0
Shar
e of
sub
regi
on
in d
evel
opin
g ec
onom
ies
5.0
6.8
5.2
4.6
7.5
11.3
9.9
11.1
9.8
6.6
8.0
Shar
e of
sub
regi
on in
w
orld
1.
31.
91.
71.
82.
53.
32.
94.
04.
23.
13.
6
Tota
l for
Sou
th a
nd
Sout
h-W
est A
sian
LD
Cs
376
382
425
650
1 12
81
096
864
1 18
983
31
228
1 32
9
Shar
e in
wor
ld0.
045
0.06
10.
072
0.08
70.
115
0.07
50.
044
0.06
60.
070
0.09
40.
087
Sour
ce:
Un
-eSC
AP
base
d on
Un
CTA
D, o
nlin
e da
taba
se.
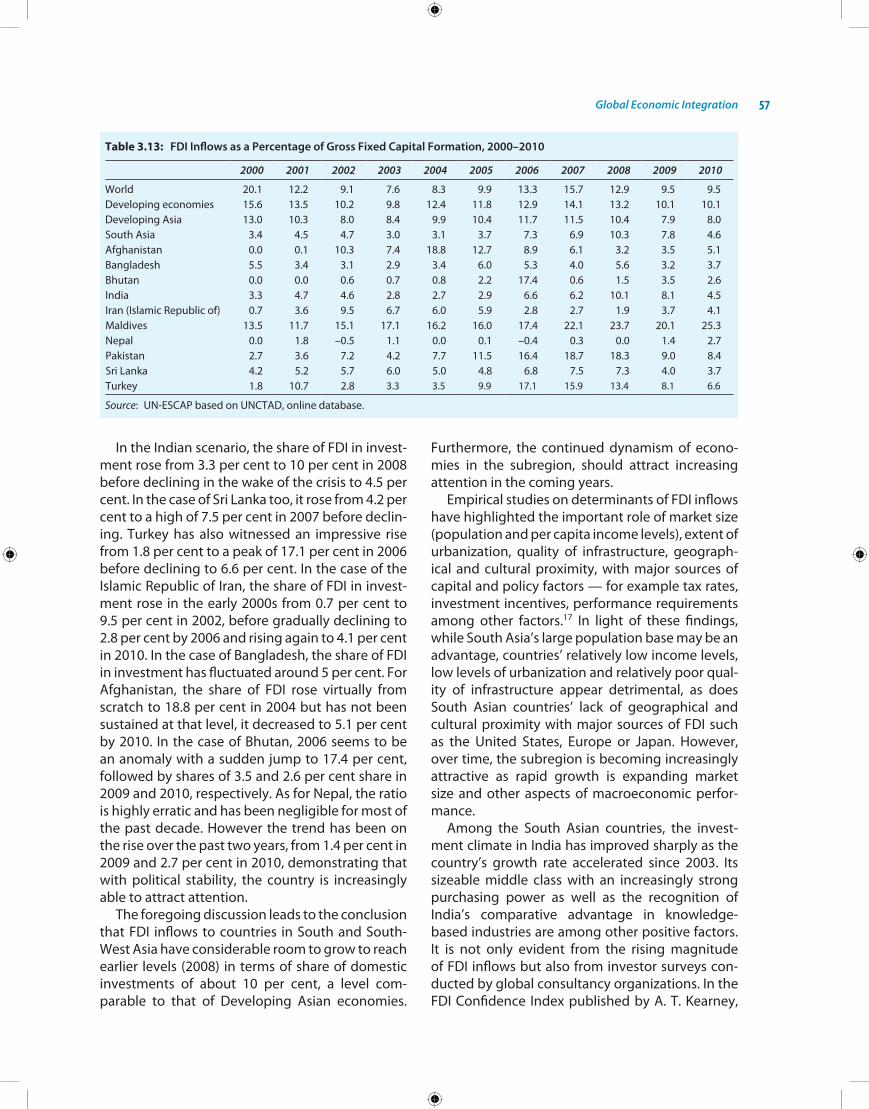
Global Economic Integration 57
in the indian scenario, the share of FDi in invest-ment rose from 3.3 per cent to 10 per cent in 2008 before declining in the wake of the crisis to 4.5 per cent. in the case of Sri Lanka too, it rose from 4.2 per cent to a high of 7.5 per cent in 2007 before declin-ing. Turkey has also witnessed an impressive rise from 1.8 per cent to a peak of 17.1 per cent in 2006 before declining to 6.6 per cent. in the case of the islamic Republic of iran, the share of FDi in invest-ment rose in the early 2000s from 0.7 per cent to 9.5 per cent in 2002, before gradually declining to 2.8 per cent by 2006 and rising again to 4.1 per cent in 2010. in the case of Bangladesh, the share of FDi in investment has fluctuated around 5 per cent. For Afghanistan, the share of FDi rose virtually from scratch to 18.8 per cent in 2004 but has not been sustained at that level, it decreased to 5.1 per cent by 2010. in the case of Bhutan, 2006 seems to be an anomaly with a sudden jump to 17.4 per cent, followed by shares of 3.5 and 2.6 per cent share in 2009 and 2010, respectively. As for nepal, the ratio is highly erratic and has been negligible for most of the past decade. however the trend has been on the rise over the past two years, from 1.4 per cent in 2009 and 2.7 per cent in 2010, demonstrating that with political stability, the country is increasingly able to attract attention.
The foregoing discussion leads to the conclusion that FDi inflows to countries in South and South-West Asia have considerable room to grow to reach earlier levels (2008) in terms of share of domestic investments of about 10 per cent, a level com-parable to that of Developing Asian economies.
Furthermore, the continued dynamism of econo-mies in the subregion, should attract increasing attention in the coming years.
empirical studies on determinants of FDi inflows have highlighted the important role of market size (population and per capita income levels), extent of urbanization, quality of infrastructure, geograph-ical and cultural proximity, with major sources of capital and policy factors — for example tax rates, investment incentives, performance requirements among other factors.17 in light of these findings, while South Asia’s large population base may be an advantage, countries’ relatively low income levels, low levels of urbanization and relatively poor qual-ity of infrastructure appear detrimental, as does South Asian countries’ lack of geographical and cultural proximity with major sources of FDi such as the United States, europe or Japan. however, over time, the subregion is becoming increasingly attractive as rapid growth is expanding market size and other aspects of macroeconomic perfor-mance.
Among the South Asian countries, the invest-ment climate in india has improved sharply as the country’s growth rate accelerated since 2003. its sizeable middle class with an increasingly strong purchasing power as well as the recognition of india’s comparative advantage in knowledge-based industries are among other positive factors. it is not only evident from the rising magnitude of FDi inflows but also from investor surveys con-ducted by global consultancy organizations. in the FDi Confidence index published by A. T. kearney,
Table 3.13: FDI Inflows as a Percentage of Gross Fixed Capital Formation, 2000–2010
2000 2001 2002 2003 2004 2005 2006 2007 2008 2009 2010
World 20.1 12.2 9.1 7.6 8.3 9.9 13.3 15.7 12.9 9.5 9.5Developing economies 15.6 13.5 10.2 9.8 12.4 11.8 12.9 14.1 13.2 10.1 10.1Developing Asia 13.0 10.3 8.0 8.4 9.9 10.4 11.7 11.5 10.4 7.9 8.0South Asia 3.4 4.5 4.7 3.0 3.1 3.7 7.3 6.9 10.3 7.8 4.6Afghanistan 0.0 0.1 10.3 7.4 18.8 12.7 8.9 6.1 3.2 3.5 5.1Bangladesh 5.5 3.4 3.1 2.9 3.4 6.0 5.3 4.0 5.6 3.2 3.7Bhutan 0.0 0.0 0.6 0.7 0.8 2.2 17.4 0.6 1.5 3.5 2.6india 3.3 4.7 4.6 2.8 2.7 2.9 6.6 6.2 10.1 8.1 4.5iran (islamic Republic of) 0.7 3.6 9.5 6.7 6.0 5.9 2.8 2.7 1.9 3.7 4.1Maldives 13.5 11.7 15.1 17.1 16.2 16.0 17.4 22.1 23.7 20.1 25.3nepal 0.0 1.8 –0.5 1.1 0.0 0.1 –0.4 0.3 0.0 1.4 2.7Pakistan 2.7 3.6 7.2 4.2 7.7 11.5 16.4 18.7 18.3 9.0 8.4Sri Lanka 4.2 5.2 5.7 6.0 5.0 4.8 6.8 7.5 7.3 4.0 3.7Turkey 1.8 10.7 2.8 3.3 3.5 9.9 17.1 15.9 13.4 8.1 6.6
Source: Un-eSCAP based on UnCTAD, online database.
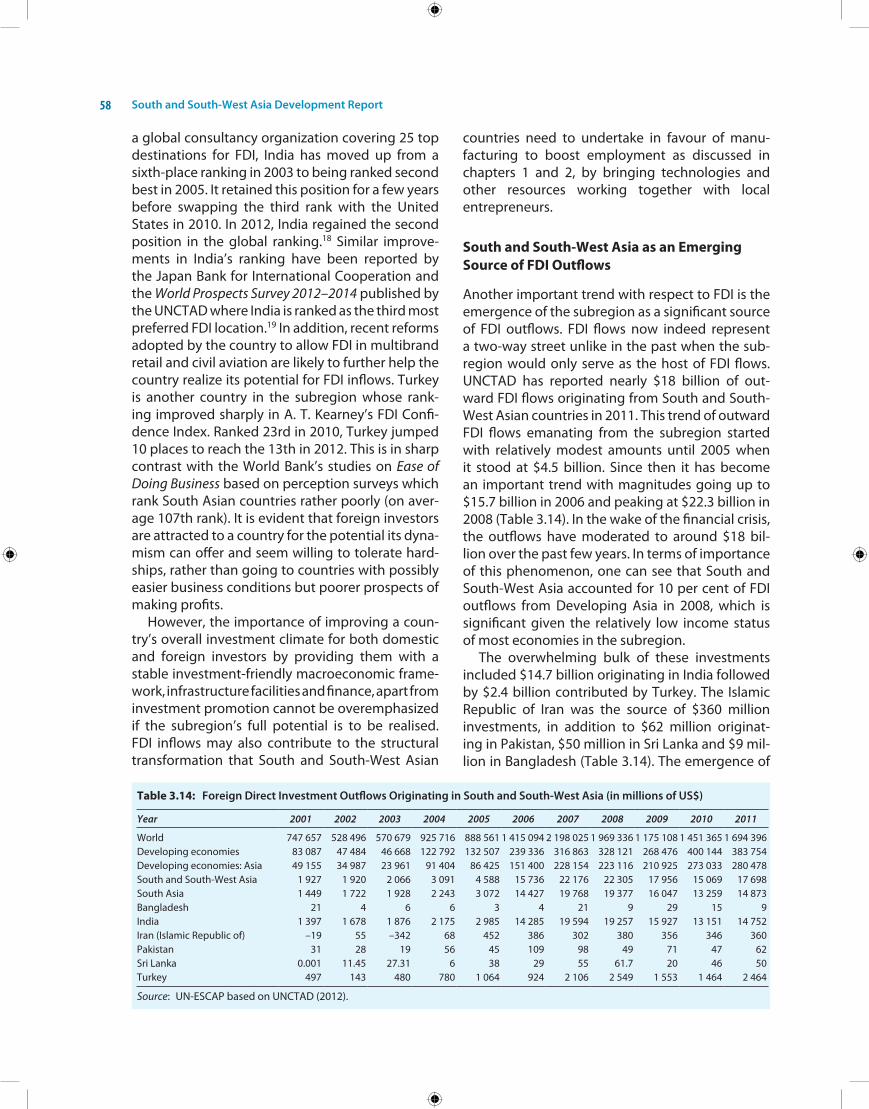
South and South-West Asia Development Report58
a global consultancy organization covering 25 top destinations for FDi, india has moved up from a sixth-place ranking in 2003 to being ranked second best in 2005. it retained this position for a few years before swapping the third rank with the United States in 2010. in 2012, india regained the second position in the global ranking.18 Similar improve-ments in india’s ranking have been reported by the Japan Bank for international Cooperation and the World Prospects Survey 2012–2014 published by the UnCTAD where india is ranked as the third most preferred FDi location.19 in addition, recent reforms adopted by the country to allow FDi in multibrand retail and civil aviation are likely to further help the country realize its potential for FDi inflows. Turkey is another country in the subregion whose rank-ing improved sharply in A. T. kearney’s FDi Confi-dence index. Ranked 23rd in 2010, Turkey jumped 10 places to reach the 13th in 2012. This is in sharp contrast with the World Bank’s studies on Ease of Doing Business based on perception surveys which rank South Asian countries rather poorly (on aver-age 107th rank). it is evident that foreign investors are attracted to a country for the potential its dyna-mism can offer and seem willing to tolerate hard-ships, rather than going to countries with possibly easier business conditions but poorer prospects of making profits.
however, the importance of improving a coun-try’s overall investment climate for both domestic and foreign investors by providing them with a stable investment-friendly macroeconomic frame-work, infrastructure facilities and finance, apart from investment promotion cannot be overemphasized if the subregion’s full potential is to be realised. FDi inflows may also contribute to the structural transformation that South and South-West Asian
countries need to undertake in favour of manu-facturing to boost employment as discussed in chapters 1 and 2, by bringing technologies and other resources working together with local entrepreneurs.
South and South-West Asia as an Emerging Source of FDI Outflows
Another important trend with respect to FDi is the emergence of the subregion as a significant source of FDi outflows. FDi flows now indeed represent a two-way street unlike in the past when the sub-region would only serve as the host of FDi flows. UnCTAD has reported nearly $18 billion of out-ward FDi flows originating from South and South-West Asian countries in 2011. This trend of outward FDi flows emanating from the subregion started with relatively modest amounts until 2005 when it stood at $4.5 billion. Since then it has become an important trend with magnitudes going up to $15.7 billion in 2006 and peaking at $22.3 billion in 2008 (Table 3.14). in the wake of the financial crisis, the outflows have moderated to around $18 bil-lion over the past few years. in terms of importance of this phenomenon, one can see that South and South-West Asia accounted for 10 per cent of FDi outflows from Developing Asia in 2008, which is significant given the relatively low income status of most economies in the subregion.
The overwhelming bulk of these investments included $14.7 billion originating in india followed by $2.4 billion contributed by Turkey. The islamic Republic of iran was the source of $360 million investments, in addition to $62 million originat-ing in Pakistan, $50 million in Sri Lanka and $9 mil-lion in Bangladesh (Table 3.14). The emergence of
Table 3.14: Foreign Direct Investment Outflows Originating in South and South-West Asia (in millions of US$)
Year 2001 2002 2003 2004 2005 2006 2007 2008 2009 2010 2011
World 747 657 528 496 570 679 925 716 888 561 1 415 094 2 198 025 1 969 336 1 175 108 1 451 365 1 694 396Developing economies 83 087 47 484 46 668 122 792 132 507 239 336 316 863 328 121 268 476 400 144 383 754Developing economies: Asia 49 155 34 987 23 961 91 404 86 425 151 400 228 154 223 116 210 925 273 033 280 478South and South-West Asia 1 927 1 920 2 066 3 091 4 588 15 736 22 176 22 305 17 956 15 069 17 698South Asia 1 449 1 722 1 928 2 243 3 072 14 427 19 768 19 377 16 047 13 259 14 873Bangladesh 21 4 6 6 3 4 21 9 29 15 9india 1 397 1 678 1 876 2 175 2 985 14 285 19 594 19 257 15 927 13 151 14 752iran (islamic Republic of) –19 55 –342 68 452 386 302 380 356 346 360Pakistan 31 28 19 56 45 109 98 49 71 47 62Sri Lanka 0.001 11.45 27.31 6 38 29 55 61.7 20 46 50Turkey 497 143 480 780 1 064 924 2 106 2 549 1 553 1 464 2 464
Source: Un-eSCAP based on UnCTAD (2012).
Global Economic Integration 59
South and South-West Asian countries as direct sources of investments widens options for attract-ing investments for the subregion, especially given the fact that geographical and cultural proxim-ity can be important determinant for FDi inflows. indian companies are already important sources of investment in Bhutan, Sri Lanka and nepal, as dis-cussed in the following chapter.
concluding rEmarks and policy lEssons
The foregoing discussion has shown that coun-tries in South and South-West Asia have emerged as dynamic players in the international market as they hold a rising share of the global trade in goods and services. however, much of that expansion has come from exploiting opportunities presented by expansion in global demand. Countries in the sub-region have not fully exploited the opportunities for export expansion by strengthening their com-petitiveness and diversification across products and markets. Their export structure continues to be dominated by high concentration in relatively fewer low value adding traditional products and commodities, as well as raw materials. Some evi-dence of market diversification in favour of emerg-ing and developing countries is apparent with conscious policies being adopted by some coun-tries, apart from rising demand in the emerging markets.
Policymakers may need to focus increasingly on enhancing the competitiveness of existing products and greater diversification through an upgrade of export structures — in favour of rapidly growing, high value adding technology-intensive goods able to generate new outputs, exports and jobs. To this effect, greater attention and efforts should be placed on strengthening countries’ technological capability. A specifically targeted FDi could also assist countries in South and South-West Asia in their effort to build productive capacities in newer more technology-intensive areas. Although countries in the subregion have recently enhanced their attractiveness to FDi inflows, they are still to exploit their full potential. new opportunities are also emerging with the rise of outward FDi in the neighbourhood. Countries in the subregion should also focus on providing an investment-friendly macroeconomic framework, infrastructure facilities and finance to encourage domestic and foreign direct investments.
however, the external environment has changed in the aftermath of global financial and economic crisis and evidently advanced economies of the world will no longer be able to sustain the growth of the developing world as was the case in the past. Therefore, economies in the subregion will have to increasingly look towards economic integration within the subregion and in the broader Asia-Pacific region. issues concerning regional economic inte-gration including through preferential trading arrangements and trade facilitation are discussed in the next chapter. Regional cooperation can also be helpful in moving up the value chains in the textile and clothing industry in which most of the South and South-West Asian countries have a high stake.
Countries in the subregion have emerged as important players in trade in services consistent with the rising role of services in their economies. Some success stories exist such as that of india emerging as a global iT and BPo services hub. Regional cooperation can play a critical role for diffusing that success to other countries in the subregion as indian companies may want to shift development centres across the borders with rising wages helping South Asia’s emergence as a global iT and BPo services hub.
A regional cooperation approach could also be helpful in consolidating the market position of South and South-West Asian countries in specific commodities for which they presently compete. For instance, joint ventures of regional commod-ity exporters could undertake packaging and mar-keting on behalf of partners and thereby realize greater part of the value chain for the subregion. This approach could be fruitful especially for prod-ucts such as tea, coffee, jute, cardamom, basmati rice, which are currently exported in bulk and are subject to low unit value realization. Regional cooperation can also be effective in dealing with emerging environment and health related non- tariff barriers in developed countries, such as sanitary and phyto-sanitary (SPS) measures and technical barriers to trade that are potentially very damaging for South Asian exports. For instance, cooperation among the South Asian countries to launch a regional eco-label could make it more visible and acceptable than individual labels.20
The WTo process has an increasingly import-ant role to play in shaping the framework of trade. hence, coordination among countries in

South and South-West Asia Development Report60
the subregion is important for protecting com-mon interests. owing to the consensual approach adopted in WTo negotiations, a coordinated response by the subregion would be more effect-ive in realizing the subregion’s objectives. The South Asian countries for example have already begun extensive consultations on WTo issues under the SAARC umbrella. They could further influence the agenda by collectively bringing issues of concern to the table. For instance, the issues of the implementation of duty-free-quota-free market access by developed countries at the
hong kong Ministerial of WTo in 2005 or extension of the TRiPS waiver for LDCs for another 10 years beyond 2015 could be advanced jointly in view of their criticality for LDCs in the subregion. Their interests in agriculture and non-agricultural mar-ket access are also similar in view of their need to secure market access, protecting their special products in agriculture and preserving their policy space for diversifying their manufacturing sector. With greater coordination, countries in South and South-West Asia will be able to protect their inter-ests much more effectively.

a nEw intErnational contExt for rEgionalism
Since the formation of the single european market in 1992, regionalism has swept across the world with the north American Free Trade Agreement (nAFTA), the South American Common Market (MeRCoSUR), and other agreements gaining im-portance over the past two decades. even though some subregional groupings such as the Asso-ciation of Southeast Asian nations (ASeAn), the South Asian Association for Regional Cooperation (SAARC), the economic Cooperation organization (eCo), and the Bay of Bengal initiative for Multi-Sectoral Technical and economic Cooperation (BiMSTeC) were formed in Asia and the Pacific, the region has been slow in exploiting the potential of regional economic integration and has largely been relying on rising demand for its products in the advanced economies to support its growth over the past two decades. however, the region now faces a new, dramatically altered economic context in the aftermath of the global financial cri-sis of 2008–2009, which is currently in its second stage (chapter 1). The United States of America and the eurozone economies currently face a subdued and uncertain medium-term outlook with high-levels of sovereign debt buildup and ageing popu-lations. it is clear therefore, that the world economy is unlikely to go back to the “business as usual” sce-nario that existed before the onset of the crisis.
The new international context for regional-ism manifests itself in many forms. The growth rate of world trade has come down to just 2.5 per cent, slowing down economies all over the world. The need to unwind global imbalances requires advanced economies to restrain debt-fuelled con-sumption and boost export. Rising protectionist tendencies are already becoming visible in the
form of penalties for outsourcing, rising visa fees for migrant workers, countervailing duties on de-veloping country products and unilateral carbon taxes on foreign airlines.1 in addition, the appetite for concluding the Doha Development Agenda, which has still not been concluded after 11 years, seems to be diminishing.
The Asia-Pacific economies will have to look for alternative engines of growth to support their dynamism in the coming years. This will require engaging the full potential of inclusive growth to generate additional aggregate demand but also exploiting the complementarities that exist between the region’s economies. Regional eco-nomic integration can play the role of a new growth engine for sustaining the Asia-Pacific region’s dynamism over the coming decades.2
Another factor that makes regional economic integration a viable development strategy is the emergence of large and dynamic markets in developing Asia, including in South and South-West Asia, which are contributing significantly to global growth. Significant complementarities exist across the region and subregions as the patterns of development over the years has diverged between countries. This creates space for development of vertically integrated regional production networks that can enable the region to harness economies of specialization and economies of scale. Among the countries of South and South-West Asia, the eight countries of South Asia share cultural, ethnic, linguistic, and historical commonalities that can facilitate integrated production networks.
The South and South-West Asian subregion turns out to be among the least integrated in the world and much of the potential for regional eco-nomic integration remains unexploited. While a number of initiatives have been taken over the
4 Regional Economic Integration in South
and South-West Asia: Potential, Challenges and the Way Forward
South and South-West Asia Development Report62
past decade, the time has come to expedite imple-mentation schedules, consolidate progress and move on to new initiatives in view of the new inter-national context. Regional economic integration can lead to more balanced outcomes and experi-ences are now available from different countries and regions that can benefit South and South-West Asia, as the subregion seeks to design its own plans of cooperation.
Finally, an integrated South and South-West Asia would be in a better position to play its due role in the broader Asia-Pacific market. Apart from deep-ening its own integration, the ASeAn is driving the formation of a broader Asia-Pacific integrated market by consolidating ASeAn+1 Free Trade Agreements (FTAs) with six dialogue partners — Australia, China, india, Japan, Republic of korea and new Zealand — through the regional com-prehensive economic partnership (R-CeP). R-CeP is widely seen as the nucleus of an incipient, broader Asia-Pacific integrated market.3
Taking into consideration the new international context for regionalism, this chapter summarizes major initiatives for regional economic integration undertaken in South and South-West Asia, their limitations and challenges. it presents some propos-als for the future on how to exploit the potential of regional economic integration in a mutually bene-ficial, inclusive, balanced and sustainable manner.
Regional Economic Integration and Balanced Regional Development: Lessons from Other Regions
The new regionalism pursued in different parts of the world not only promotes intraregional trade, as it is commonly understood, but also helps achieve more balanced patterns of development. Deeper regional economic integration can increase the overall efficiency and competitiveness of partici-pating countries. Deeper integration facilitated by free flow of goods, services and investments across participating countries leads to a process called “efficiency-seeking industrial restructuring”.4 While such processes allow domestic and foreign firms to exploit economies of scale and specialization, sav-ing in labour or materials costs, they also provide many benefits for poorer countries, particularly by building their productive capacities.5
even more important than providing larger mar- kets, RTAs help strengthen overall competitiveness
by enabling intraregional FDi to achieve extensive industrial restructuring or rationalization. Most RTAs or FTAs therefore now extend their scope beyond trade to include investment liberalization and facilitation. This means, for example, that mul-tinational enterprises (Mnes) no longer need to maintain horizontal national operations. instead they can assign the responsibility for serving spe-cific regional markets in particular products to certain affiliates thereby harnessing economies of scale and specialization — a strategy sometimes called “product mandating”.6
Deeper integration encourages industries to migrate to low-wage locations to the advantage of the lesser developed economies. in the european Union, the poorer members have benefited from resource transfers, but they have also gained signif-icantly from industrial restructuring. For instance, ireland, which joined european integration in 1973, grew for three decades at 9 per cent, converging from 59 per cent to 100 per cent of the european average per capita income by 1998.7 The new poorer members of the european Union including ireland, Greece, Portugal, Spain, Slovenia, Czech Republic, are also among those that managed to avoid the middle income trap and moved to high income status.8 Some of these countries, especially Greece, Portugal and Spain have subsequently accumulated unsustainable levels of debt because of imprudent financial management and currently face serious economic difficulties. But this is more the result of financial mismanagement — and a demonstration that monetary union needs to be complemented by fiscal union.
in nAFTA there have been similar gains made by Mexico. Comparing the period 1980–1993 with the period 1996–2002, following the formation of nAFTA, average annual growth doubled from 2 to 4 per cent. FDi inflows to Mexico rose from $12 billion to $54 billion as industries relocated to maquiladora zones on the border between Mexico and the United States. Mexico also benefited from lower volatility in its growth rate and from substan-tial improvement in total factor productivity.9
even though countries in the Asia-Pacific region have begun embracing regional economic integra-tion relatively recently, some experiences already available do fit in the pattern observed in the other regions. The new poorer members of ASeAn — Cambodia, Lao People’s Democratic Republic and Viet nam, which joined the grouping in the
Regional Economic Integration in South and South-West Asia 63
1990s — have seen a rapid convergence of their per capita income levels with the ASeAn average and their share of FDi inflows has risen.10
Initiatives for Regional Economic Integration in South and South-West Asia
The South and South-West Asian subregion has a number of frameworks for regional economic co-operation and integration. Multilateral frameworks include a preferential trading agreement now known as the Asia-Pacific Trade Agreement (APTA), which was negotiated under the auspices of eSCAP and signed in 1975 between Bangladesh, india, Republic of korea, the Lao People’s Democratic Republic, and Sri Lanka. Since 2000, China has also joined APTA. Under APTA, member countries have exchanged tariff preferences between themselves on commodities through rounds of negotiation. Another initiative to facilitate regional trade under the auspices of eSCAP is the Asian Clearing Union, which accounts for nine members in the region (Bangladesh, Bhutan, india, the islamic Republic of iran, Maldives, Myanmar, nepal, Pakistan and Sri Lanka) and was set up in 1974.
The South Asian Association for Regional Co-operation (SAARC) came into being in 1985 but did not adopt a programme of economic cooper-ation until 1991 when the Committee on economic Cooperation (CeC) was formed. it created a SAARC Preferential Trading Arrangement (SAPTA) in 1995 and in 2004 eventually agreed to create a SAARC Free Trade Area (SAFTA) to be implemented over 10 years from 2006. At the Summit held in Bhutan in 2010, it adopted a SAARC Agreement on Trade in Services (SATiS) and established the SAARC Devel-opment Fund.
initiatives together with other subregions in Asia and the Pacific also include the economic Cooperation organization (eCo) initially formed with Turkey, the islamic Republic of iran and Pakistan in 1985 but later expanded to cover Afghanistan and six Central Asian countries; Azerbaijan, kazakhstan, kyrgyzstan, Turkmenistan, Uzbekistan and Tajikistan. eCo has established the eCo Trade Agreement (eCoTA) in 2003 which became effective from January 2009 and seeks a phased reduction of tariffs on 80 per cent of tariff lines over 8 years to a maximum of 15 per cent. it is likely to evolve ultimately into a free trade agree-
ment. in 2006 eCo also set up an eCo Trade and Development Bank based in istanbul with a capi-tal base of special drawing rights (SDR) 300 million contributed by Turkey, the islamic Republic of iran and Pakistan, and plans to admit new members.
Another notable initiative is the BiMSTeC involv-ing five South and South-West Asian countries (Bangladesh, Bhutan, india, nepal and Sri Lanka) and two South-east Asian nations (Myanmar and Thailand), bridging the two subregions. BiMSTeC adopted a Framework Agreement for an FTA to be implemented within 10 years at its first summit held in Bangkok in July 2004.
Apart from the above subregional and inter-subregional arrangements, bilateral preferential trading arrangements also exist between india and nepal (transit and trade), india and Bhutan (tran-sit and trade), india and Sri Lanka, Pakistan and Afghanistan (transit and trade), as well as Pakistan and Sri Lanka which contribute to economic inte-gration in the South Asian subregion.
Together, SAARC, eCo, BiMSTeC and APTA pre-sent overlapping sets of multilateral frameworks for regional cooperation in South and South-West Asia (Figure 4.1). however among them, SAARC presents the most comprehensive framework combining eight of the 10 countries with a func-tioning free trade agreement that has been under implementation since 2006. it is worth examin-ing the effectiveness of the SAARC framework for achieving its objectives.
rEgional Economic intEgration in south and south-wEst asia: lEssons from safta
The SAFTA agreement has been implemented in a phased manner over a 10-year implementation schedule starting in 2006. however, the proportion of intraregional trade in SAARC countries total trade has been one of the lowest among the regional groupings. This has been seen as an indicator of the poor potential of SAARC and of the ineffective-ness of SAFTA. Figure 4.2 shows that the share of intraregional exports in SAARC countries’ global exports has fluctuated around 5 per cent between 2002 and 2011. however, if indian exports are excluded, the intraregional share of other SAARC exports to all SAARC countries (including india) is on a rising trend, and fluctuates between 8 and 10 per cent.

South and South-West Asia Development Report64
Figure 4.1: Regional Cooperation Frameworks in South and South-West Asia
Source: Un-eSCAP.Note: Countries outside South and South-West Asia are italicized.
Figure 4.2: Share of Intraregional Exports of SAARC Countries, 2002–2011
Percentage
Source: Un-eSCAP based on iMF Direction of Trade Statistics database.
Country-wise detail presented in Table 4.1 sug-gests that smaller countries such as Afghanistan, Bhutan, Maldives, nepal and have a greater pro-portion of their exports directed to the subregion.
Furthermore, since the signing of the South Asian Free Trade Agreement (SAFTA) in 2004 and the beginning of its implementation in 2006, the share of intraregional trade among

Regional Economic Integration in South and South-West Asia 65
the individual South Asian countries has already increased for a number of countries in the subre-gion. Table 4.1 shows how intraregional exports since 1995 have nearly tripled their share of Afghanistan’s exports and almost increased four-fold as a share of nepal’s exports and of Pakistan’s exports. Figure 4.3 additionally shows a rising trend in india’s share in nepal’s and Bangladesh’s exports. Thus there are distinct signs that trade within the subregion is growing. Yet the overall proportion of intraregional trade in SAARC is low compared with other groupings, such as ASeAn where it stands at about 22 per cent.
The present low level of intraregional trade, how-ever, is neither an indication of a low level of com-plementarities between the member countries nor is it a sign of SAFTA’s ineffectiveness. eSCAP analysis shows that South and South-West Asia has substantial complementarities within it. The value of the complementarity index for intraregional
trade within the subregion is 37 compared with the maximum value of 64 for intraregional comple-mentarities within Asia-Pacific subregions.11 it is also important to remember that complementari-ties are a dynamic concept and change over time with changing economic structures. in fact, SAFTA represents the case of a regional trade agreement with unexploited potential.
Potential of SAFTA and the Distribution of Welfare Gains
The complementarities that exist within the sub-region provide for a much higher level of intra- regional trade than has been realized to date. eSCAP estimates that the $16 billion in intra-re-gional exports of SAARC countries in 2010 only partly achieved the full potential of $37.5 billion in intraregional exports. Therefore, nearly 57 per cent of the potential of intra-SAARC trade remains to be exploited. The estimations of potential intra-regional trade summarized in Table 4.2 use an aug-mented gravity model, which suggests that the bulk of the potential of intra-SAARC trade remain to be exploited. eSCAP estimations also show that by 2017, the intraregional export potential could double to $72.4 billion.
if the analysis of the gravity model is extended to cover all the South and South-West Asian coun-tries, existing intraregional exports at $46 bil- lion represent only a 47 per cent utilization of the full potential estimated at $98 billion. Thus nearly 53 per cent potential remains to be exploited.
Figure 4.3: Indian Share of Exports from Two Trading PartnersPercentage
A. Nepal B. Bangladesh
Source: Un-eSCAP calculations based on UnCTAD, online database.
Table 4.1: Intraregional Exports Trade as Share of Total Trade
Percentage
1995 2000 2005 2010
Afghanistan 17 44 44 46Bangladesh 3 2 3 3Bhutan 91 93 85 92india 5 4 5 5Maldives 23 14 16 12nepal 19 40 70 74Pakistan 3 5 11 13Sri Lanka 3 3 10 7
Source: Un-eSCAP calculations based on UnCTAD, online database.
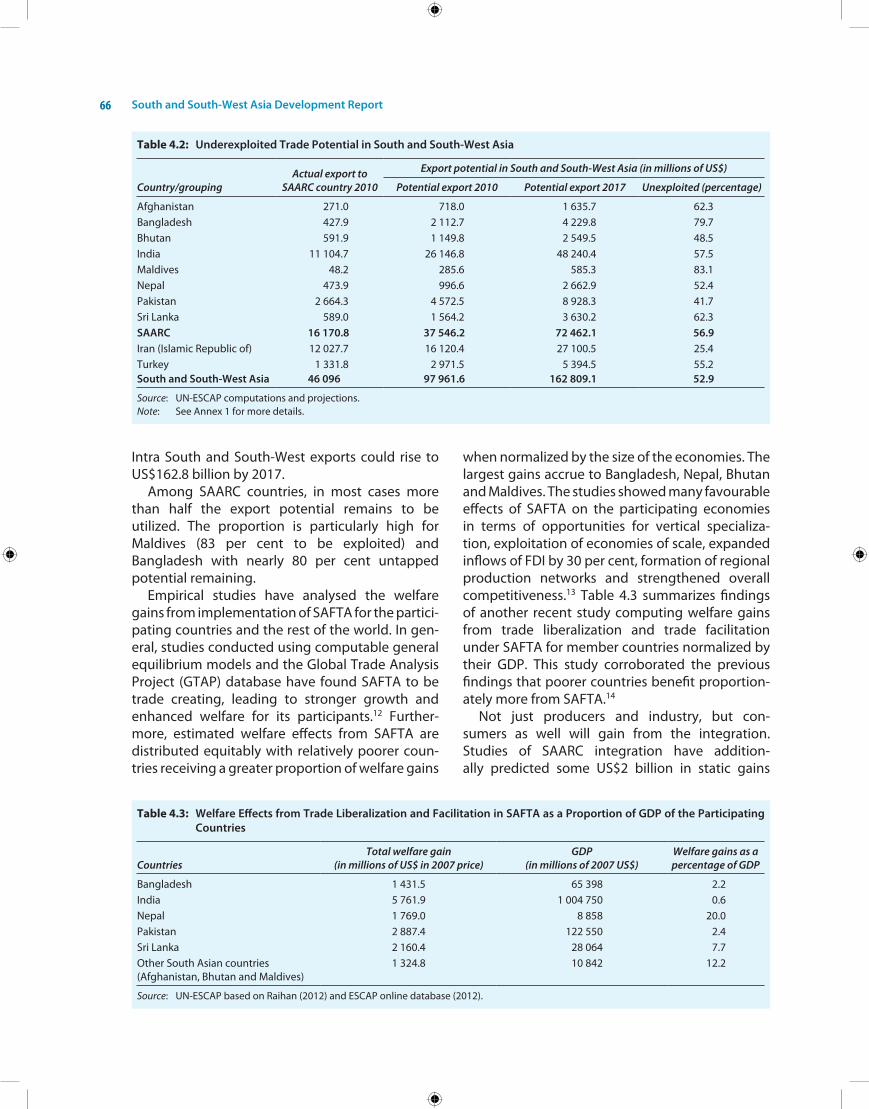
South and South-West Asia Development Report66
intra South and South-West exports could rise to US$162.8 billion by 2017.
Among SAARC countries, in most cases more than half the export potential remains to be utilized. The proportion is particularly high for Maldives (83 per cent to be exploited) and Bangladesh with nearly 80 per cent untapped potential remaining.
empirical studies have analysed the welfare gains from implementation of SAFTA for the partici- pating countries and the rest of the world. in gen-eral, studies conducted using computable general equilibrium models and the Global Trade Analysis Project (GTAP) database have found SAFTA to be trade creating, leading to stronger growth and enhanced welfare for its participants.12 Further-more, estimated welfare effects from SAFTA are distributed equitably with relatively poorer coun-tries receiving a greater proportion of welfare gains
when normalized by the size of the economies. The largest gains accrue to Bangladesh, nepal, Bhutan and Maldives. The studies showed many favourable effects of SAFTA on the participating economies in terms of opportunities for vertical specializa-tion, exploitation of economies of scale, expanded inflows of FDi by 30 per cent, formation of regional production networks and strengthened overall competitiveness.13 Table 4.3 summarizes findings of another recent study computing welfare gains from trade liberalization and trade facilitation under SAFTA for member countries normalized by their GDP. This study corroborated the previous findings that poorer countries benefit proportion-ately more from SAFTA.14
not just producers and industry, but con-sumers as well will gain from the integration. Studies of SAARC integration have addition-ally predicted some US$2 billion in static gains
Table 4.2: Underexploited Trade Potential in South and South-West Asia
Country/groupingActual export to
SAARC country 2010
Export potential in South and South-West Asia (in millions of US$)
Potential export 2010 Potential export 2017 Unexploited (percentage)
Afghanistan 271.0 718.0 1 635.7 62.3Bangladesh 427.9 2 112.7 4 229.8 79.7Bhutan 591.9 1 149.8 2 549.5 48.5india 11 104.7 26 146.8 48 240.4 57.5Maldives 48.2 285.6 585.3 83.1nepal 473.9 996.6 2 662.9 52.4Pakistan 2 664.3 4 572.5 8 928.3 41.7Sri Lanka 589.0 1 564.2 3 630.2 62.3SAARC 16 170.8 37 546.2 72 462.1 56.9iran (islamic Republic of) 12 027.7 16 120.4 27 100.5 25.4Turkey 1 331.8 2 971.5 5 394.5 55.2South and South-West Asia 46 096 97 961.6 162 809.1 52.9
Source: Un-eSCAP computations and projections.Note: See Annex 1 for more details.
Table 4.3: Welfare Effects from Trade Liberalization and Facilitation in SAFTA as a Proportion of GDP of the Participating Countries
CountriesTotal welfare gain
(in millions of US$ in 2007 price)GDP
(in millions of 2007 US$)Welfare gains as a percentage of GDP
Bangladesh 1 431.5 65 398 2.2india 5 761.9 1 004 750 0.6nepal 1 769.0 8 858 20.0Pakistan 2 887.4 122 550 2.4Sri Lanka 2 160.4 28 064 7.7other South Asian countries (Afghanistan, Bhutan and Maldives)
1 324.8 10 842 12.2
Source: Un-eSCAP based on Raihan (2012) and eSCAP online database (2012).

Regional Economic Integration in South and South-West Asia 67
to South Asian consumers.15 This could be an underestimate since it is purely in terms of price adjustments and wage improvements and does not count the potential knock-on effects that a better investment climate, stronger cross border supply chain integration, and other positive ex- ternalities will bring.
Reasons for the Low Level of Intraregional Trade in South Asia
The level of intraregional trade remains below its potential, owing to structural barriers such as high transport costs and other non-tariff and tariff barriers. The low level of intraregional trade can also be explained in terms of a number of factors as described below.
High-level of Underreported or Informal Trade
While official trade statistics show South and South-West Asia to be one of the most underex-ploited areas for intraregional trade, it is important to realize that an enormous amount of informal trade goes unreported. South and South-West Asian countries share long borders and given their shared history, language and culture, and despite political barriers to trade, a great deal of informal trade is thriving, particularly in border areas. Mea-suring informal flows poses a significant amount of methodological difficulties and often relies on small or limited sample sizes. however, most esti-mates agree that the scope of informal trade in South Asia is in many cases comparable to formal flows and, in some cases, even exceeds them.
As india is the largest and most centrally located country in South Asia, most informal trade in the subregion occurs between india and its neigh-bours. While india has a trade surplus based on the official figures with all of its neighbours, taking into account informal trade, it would still have a mod-erate trade surplus with Bangladesh, Bhutan, and Pakistan, but a trade deficit with nepal, and a bal-anced trade with Sri Lanka.16 estimates of informal trade between Pakistan and india ranged between $500 million and $3 billion in 2005, well above that of formal levels.17 Similarly, informal trade between india and nepal is estimated to be approximately 8 to 10 times official flows, while flows between Bangladesh and india are estimated to be twice as large as official flows.18 informal flows between india and Sri Lanka are somewhat lower in magni-
tude however, mostly owing to the fact that goods must travel by sea or air. The armed conflict that prevailed in the north of Sri Lanka for much of the last three decades may also have constrained informal trade.
Simple estimates of the current magnitude of informal trade between india and its largest neighbours can be made.19 Table 4.4 shows that exports of Bangladesh, nepal, Pakistan and Sri Lanka to india in 2011 may be underestimated by nearly $8 billion and their imports from india by $3.8 billion.
Table 4.4: Estimates of Informal Trade with India in 2011(in millions of US$)
Estimated exports Estimated imports
Bangladesh 3 222 1 045nepal 3 314 451Pakistan 34 1 967Sri Lanka 1 393 348Total 7 963 3 811
Source: Un-eSCAP estimations drawing upon Taneja (2001, 2005), Taneja and Pohit (2002, 2003) and khan (2005, 2007) using data from iMF Direction of Trade Statistics database.20
Further regional trade liberalization will help for-malize many of the trade flows currently taking place informally in South and South-West Asia. nonetheless, the difference between the com-position of informal flows and the composition of products traded formally indicates that even under a free trade regime, much of the trade may still take place off the books. This is because many of the goods traded are low value-added products and consumer goods such as food items and textiles, rather than high value-added, complex manufac-tured and capital goods.
in addition to informal cross-border trade, South and South-West Asia also experiences a great deal of “third-country trade” to overcome the official trade barriers. This is the case for example of many trade flows between Pakistan and india. While the main channel of official trade flows between the two countries occur along the narrow Amritsar–Lahore corridor, a potentially larger amount of trade between the two countries takes place via the more indirect routes passing by Dubai and the islamic Republic of iran or by Singapore, as a number of products that were not on the pos- itive list governing Pakistan’s imports from india were imported through these third countries.

South and South-West Asia Development Report68
That should now change, however, with Pakistan granting india most favoured nation (MFn) status and scrapping the positive list in favour of a nega-tive list.
High Trade Costs
SAARC countries are contiguous neighbours; how-ever the trade costs encountered by intra-SAARC trade at 113 per cent of import prices are higher than those encountered by SAARC countries trad-ing with far distant markets such as the european Union (at 101 per cent) and the United States (at 99 per cent) (Table 4.5). Furthermore, while trade costs for exports to different regions have declined between 2007 and 2009, there has not been such a movement for intra-SAARC trade. it is clear that the intra-SAARC trade has not been able to exploit the benefit of geographical proximity and is incurring costs greater than those applicable to distant loca-tions. To further lower trade costs, physical connec-tivity and trade facilitation needs to be improved as discussed in chapter 5.
Poor Supply Capabilities and Potential of Regional Trade Liberalization in Augmenting Them
one of the reasons for persistent trade imbalances between india and the SAARC countries has been the poor supply capabilities or productive capa-
cities in least developed countries (LDCs) and other SAARC countries for the products of import interest to india. A recent study found that with duty free access to india, Bangladesh could be a potentially competitive supplier for nearly $6 bil-lion worth of india’s exports.21 however, existing supply capabilities will permit additional exports of a few hundred million dollars. A similar situation holds for other countries. eSCAP analysis reported in Chapter 9 shows that productive capacities in South Asian LDCs have actually decreased in rela-tive terms compared with other countries in terms of technical complexity and product variety.
The india–Sri Lanka Free Trade Agreement (iSFTA) could be indicative of the potential of SAFTA in creating balanced regional development and addressing the poor supply capabilities through flows of FDi between the FTA partners. As iSFTA has been operational since 2000, it is possible to analyse the impacts on trade flows and their balance, flows of FDi and build-up of supply capabilities. As Box 4.1 shows iSFTA has led to mas-sive expansion of bilateral trade while reducing imbalances.
The FTA has enabled Sri Lanka to export value-added goods often produced by indian companies in Sri Lanka through FDi, which has created more supply capabilities. For instance, an indian tyre
Table 4.5: Non-tariff Intra- and Extra-regional Trade Costs in Asia and the Pacific, 2007–2009 (as a percentage of import prices)
Region ASEAN–4 East Asia–3North and
Central Asia–6 SAARC–4Australia–
New Zealand EU–3
ASeAn–4 79(–10)
east Asia–3 73 47(–6) (–21)
north and Central Asia–6 291 187 149(–14) (–33) (–21)
SAARC–4 134 119 270 113(–0) (–3) (–22) 0
Australia–new Zealand 90 78 270 130 45(–12) (–16) (–22) (–3) (–24)
eU–3 97 70 149 101 89 32(–5) (–19) (–26) (–3) (–17) (–33)
United States 77 53 165 99 82 51(–0) (–14) (–17) (–1) (–11) (–18)
Source: Un-eSCAP Trade Cost Database (version 2).
Note: Trade costs may be interpreted as tariff equivalents. Percentage changes in trade costs between 2001–2003 and 2007–2009 are in parentheses. ASeAn–4: indonesia, Malaysia, the Philippines and Thailand; east Asia–3: China, Japan and Republic of korea; north and Central Asia–6: Armenia, Azerbaijan, Georgia, kazakhstan, kyrgyzstan and the Russian Federation; SAARC–4: Bangladesh, india, Pakistan and Sri Lanka; eU–3: France, Germany and the United kingdom of Great Britain and northern ireland.
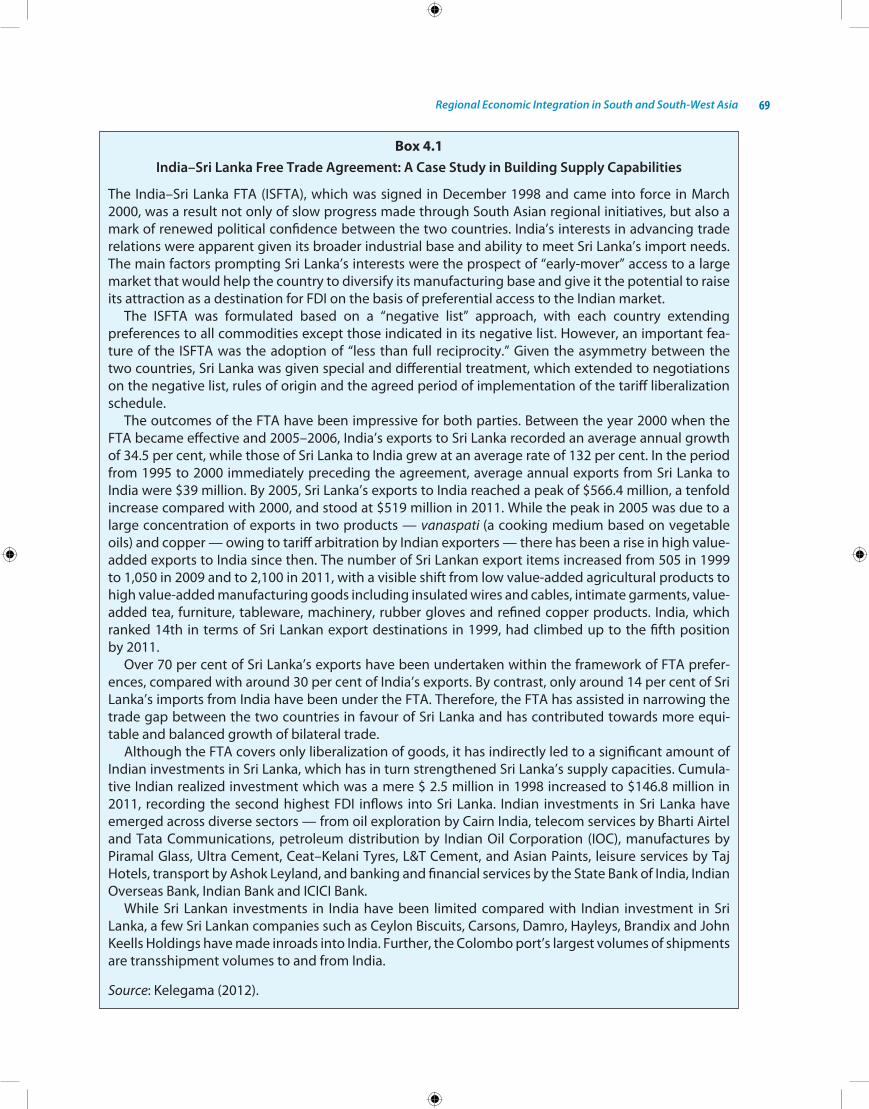
Regional Economic Integration in South and South-West Asia 69
Box 4.1India–Sri Lanka Free Trade Agreement: A Case Study in Building Supply Capabilities
The india–Sri Lanka FTA (iSFTA), which was signed in December 1998 and came into force in March 2000, was a result not only of slow progress made through South Asian regional initiatives, but also a mark of renewed political confidence between the two countries. india’s interests in advancing trade relations were apparent given its broader industrial base and ability to meet Sri Lanka’s import needs. The main factors prompting Sri Lanka’s interests were the prospect of “early-mover” access to a large market that would help the country to diversify its manufacturing base and give it the potential to raise its attraction as a destination for FDi on the basis of preferential access to the indian market.
The iSFTA was formulated based on a “negative list” approach, with each country extending preferences to all commodities except those indicated in its negative list. however, an important fea-ture of the iSFTA was the adoption of “less than full reciprocity.” Given the asymmetry between the two countries, Sri Lanka was given special and differential treatment, which extended to negotiations on the negative list, rules of origin and the agreed period of implementation of the tariff liberalization schedule.
The outcomes of the FTA have been impressive for both parties. Between the year 2000 when the FTA became effective and 2005–2006, india’s exports to Sri Lanka recorded an average annual growth of 34.5 per cent, while those of Sri Lanka to india grew at an average rate of 132 per cent. in the period from 1995 to 2000 immediately preceding the agreement, average annual exports from Sri Lanka to india were $39 million. By 2005, Sri Lanka’s exports to india reached a peak of $566.4 million, a tenfold increase compared with 2000, and stood at $519 million in 2011. While the peak in 2005 was due to a large concentration of exports in two products — vanaspati (a cooking medium based on vegetable oils) and copper — owing to tariff arbitration by indian exporters — there has been a rise in high value-added exports to india since then. The number of Sri Lankan export items increased from 505 in 1999 to 1,050 in 2009 and to 2,100 in 2011, with a visible shift from low value-added agricultural products to high value-added manufacturing goods including insulated wires and cables, intimate garments, value-added tea, furniture, tableware, machinery, rubber gloves and refined copper products. india, which ranked 14th in terms of Sri Lankan export destinations in 1999, had climbed up to the fifth position by 2011.
over 70 per cent of Sri Lanka’s exports have been undertaken within the framework of FTA prefer-ences, compared with around 30 per cent of india’s exports. By contrast, only around 14 per cent of Sri Lanka’s imports from india have been under the FTA. Therefore, the FTA has assisted in narrowing the trade gap between the two countries in favour of Sri Lanka and has contributed towards more equi-table and balanced growth of bilateral trade.
Although the FTA covers only liberalization of goods, it has indirectly led to a significant amount of indian investments in Sri Lanka, which has in turn strengthened Sri Lanka’s supply capacities. Cumula-tive indian realized investment which was a mere $ 2.5 million in 1998 increased to $146.8 million in 2011, recording the second highest FDi inflows into Sri Lanka. indian investments in Sri Lanka have emerged across diverse sectors — from oil exploration by Cairn india, telecom services by Bharti Airtel and Tata Communications, petroleum distribution by indian oil Corporation (ioC), manufactures by Piramal Glass, Ultra Cement, Ceat–kelani Tyres, L&T Cement, and Asian Paints, leisure services by Taj hotels, transport by Ashok Leyland, and banking and financial services by the State Bank of india, indian overseas Bank, indian Bank and iCiCi Bank.
While Sri Lankan investments in india have been limited compared with indian investment in Sri Lanka, a few Sri Lankan companies such as Ceylon Biscuits, Carsons, Damro, hayleys, Brandix and John keells holdings have made inroads into india. Further, the Colombo port’s largest volumes of shipments are transshipment volumes to and from india.
Source: kelegama (2012).
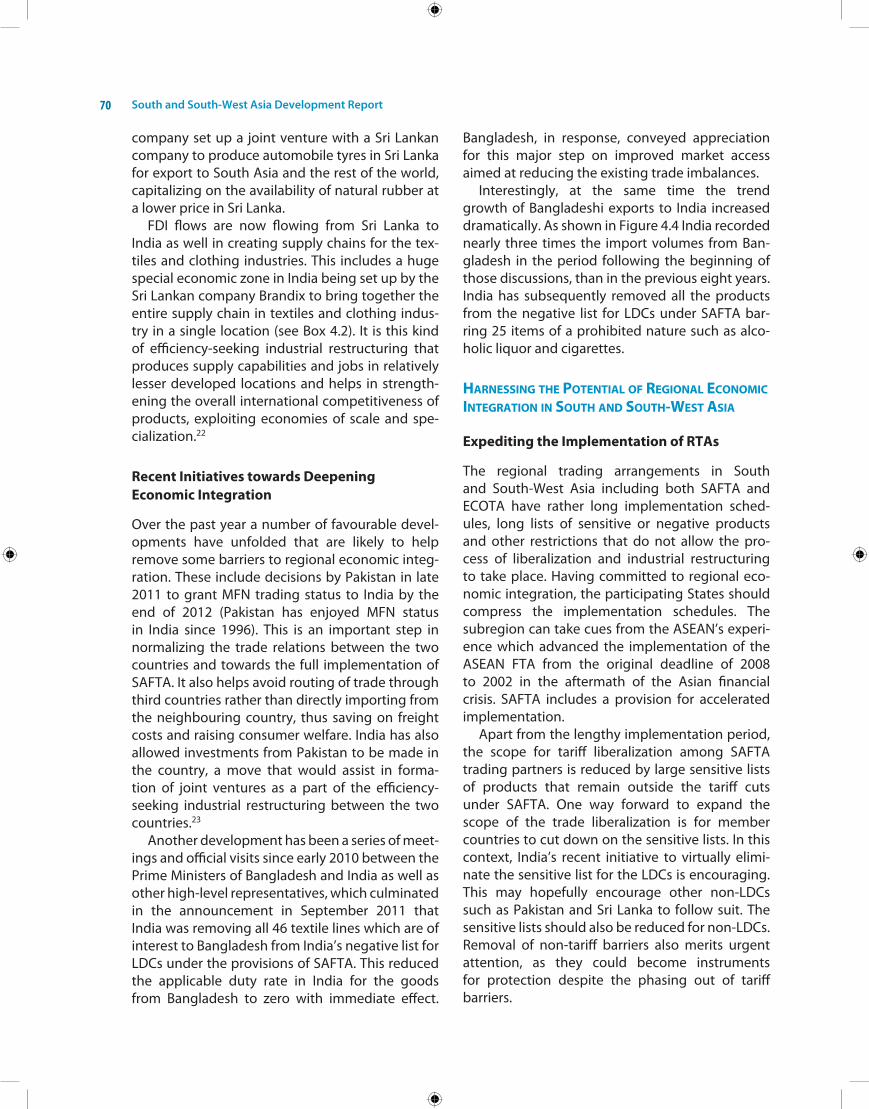
South and South-West Asia Development Report70
company set up a joint venture with a Sri Lankan company to produce automobile tyres in Sri Lanka for export to South Asia and the rest of the world, capitalizing on the availability of natural rubber at a lower price in Sri Lanka.
FDi flows are now flowing from Sri Lanka to india as well in creating supply chains for the tex-tiles and clothing industries. This includes a huge special economic zone in india being set up by the Sri Lankan company Brandix to bring together the entire supply chain in textiles and clothing indus-try in a single location (see Box 4.2). it is this kind of efficiency-seeking industrial restructuring that produces supply capabilities and jobs in relatively lesser developed locations and helps in strength-ening the overall international competitiveness of products, exploiting economies of scale and spe-cialization.22
Recent Initiatives towards Deepening Economic Integration
over the past year a number of favourable devel-opments have unfolded that are likely to help remove some barriers to regional economic integ-ration. These include decisions by Pakistan in late 2011 to grant MFn trading status to india by the end of 2012 (Pakistan has enjoyed MFn status in india since 1996). This is an important step in normalizing the trade relations between the two countries and towards the full implementation of SAFTA. it also helps avoid routing of trade through third countries rather than directly importing from the neighbouring country, thus saving on freight costs and raising consumer welfare. india has also allowed investments from Pakistan to be made in the country, a move that would assist in forma-tion of joint ventures as a part of the efficiency-seeking industrial restructuring between the two countries.23
Another development has been a series of meet-ings and official visits since early 2010 between the Prime Ministers of Bangladesh and india as well as other high-level representatives, which culminated in the announcement in September 2011 that india was removing all 46 textile lines which are of interest to Bangladesh from india’s negative list for LDCs under the provisions of SAFTA. This reduced the applicable duty rate in india for the goods from Bangladesh to zero with immediate effect.
Bangladesh, in response, conveyed appreciation for this major step on improved market access aimed at reducing the existing trade imbalances.
interestingly, at the same time the trend growth of Bangladeshi exports to india increased dramatically. As shown in Figure 4.4 india recorded nearly three times the import volumes from Ban-gladesh in the period following the beginning of those discussions, than in the previous eight years. india has subsequently removed all the products from the negative list for LDCs under SAFTA bar-ring 25 items of a prohibited nature such as alco-holic liquor and cigarettes.
harnEssing thE potEntial of rEgional Economic intEgration in south and south-wEst asia
Expediting the Implementation of RTAs
The regional trading arrangements in South and South-West Asia including both SAFTA and eCoTA have rather long implementation sched-ules, long lists of sensitive or negative products and other restrictions that do not allow the pro-cess of liberalization and industrial restructuring to take place. having committed to regional eco-nomic integration, the participating States should compress the implementation schedules. The subregion can take cues from the ASeAn’s experi-ence which advanced the implementation of the ASeAn FTA from the original deadline of 2008 to 2002 in the aftermath of the Asian financial crisis. SAFTA includes a provision for accelerated implementation.
Apart from the lengthy implementation period, the scope for tariff liberalization among SAFTA trading partners is reduced by large sensitive lists of products that remain outside the tariff cuts under SAFTA. one way forward to expand the scope of the trade liberalization is for member countries to cut down on the sensitive lists. in this context, india’s recent initiative to virtually elimi-nate the sensitive list for the LDCs is encouraging. This may hopefully encourage other non-LDCs such as Pakistan and Sri Lanka to follow suit. The sensitive lists should also be reduced for non-LDCs. Removal of non-tariff barriers also merits urgent attention, as they could become instruments for protection despite the phasing out of tariff barriers.
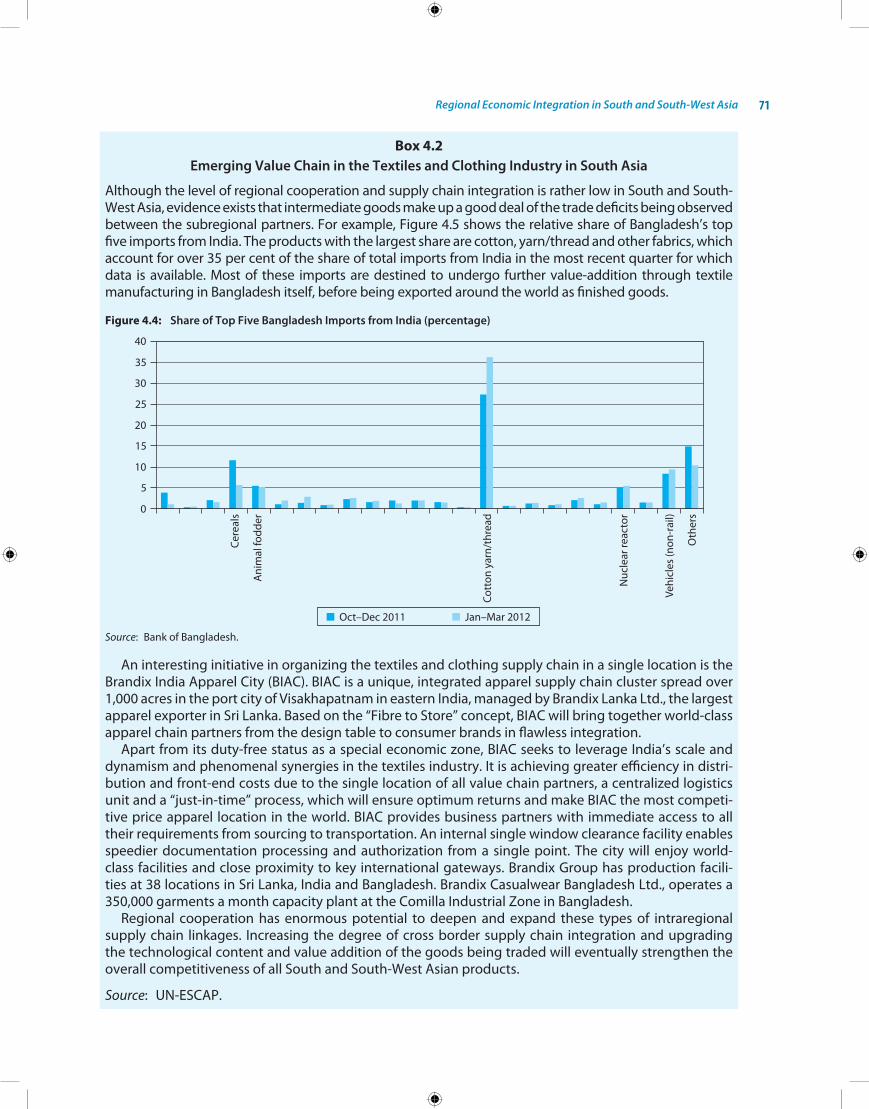
Regional Economic Integration in South and South-West Asia 71
Box 4.2Emerging Value Chain in the Textiles and Clothing Industry in South Asia
Although the level of regional cooperation and supply chain integration is rather low in South and South-West Asia, evidence exists that intermediate goods make up a good deal of the trade deficits being observed between the subregional partners. For example, Figure 4.5 shows the relative share of Bangladesh’s top five imports from india. The products with the largest share are cotton, yarn/thread and other fabrics, which account for over 35 per cent of the share of total imports from india in the most recent quarter for which data is available. Most of these imports are destined to undergo further value-addition through textile manufacturing in Bangladesh itself, before being exported around the world as finished goods.
Figure 4.4: Share of Top Five Bangladesh Imports from India (percentage)
Source: Bank of Bangladesh.
An interesting initiative in organizing the textiles and clothing supply chain in a single location is the Brandix india Apparel City (BiAC). BiAC is a unique, integrated apparel supply chain cluster spread over 1,000 acres in the port city of Visakhapatnam in eastern india, managed by Brandix Lanka Ltd., the largest apparel exporter in Sri Lanka. Based on the “Fibre to Store” concept, BiAC will bring together world-class apparel chain partners from the design table to consumer brands in flawless integration.
Apart from its duty-free status as a special economic zone, BiAC seeks to leverage india’s scale and dynamism and phenomenal synergies in the textiles industry. it is achieving greater efficiency in distri-bution and front-end costs due to the single location of all value chain partners, a centralized logistics unit and a “just-in-time” process, which will ensure optimum returns and make BiAC the most competi-tive price apparel location in the world. BiAC provides business partners with immediate access to all their requirements from sourcing to transportation. An internal single window clearance facility enables speedier documentation processing and authorization from a single point. The city will enjoy world-class facilities and close proximity to key international gateways. Brandix Group has production facili-ties at 38 locations in Sri Lanka, india and Bangladesh. Brandix Casualwear Bangladesh Ltd., operates a 350,000 garments a month capacity plant at the Comilla industrial Zone in Bangladesh.
Regional cooperation has enormous potential to deepen and expand these types of intraregional supply chain linkages. increasing the degree of cross border supply chain integration and upgrading the technological content and value addition of the goods being traded will eventually strengthen the overall competitiveness of all South and South-West Asian products.
Source: Un-eSCAP.

South and South-West Asia Development Report72
Exploiting the Potential of Regional Trade in Services
As observed in chapter 3, South and South-West Asian countries have vibrant service industries and their trade in services is growing rapidly. Another observation is that services capabilities are more balanced and complementary than in the goods trade, where india dominates the productive capabilities of the subregion.24 For example, india specializes in computer and information services, while other economies in the subregion — particu-larly the least developed countries — specialize in traditional services such as travel and transport. This indicates outstanding potential for mutually beneficial trade in services within the subregion. Some of the trade is already taking place vigor-ously. For instance, following the liberalization of air services and the visa facility between india and Sri Lanka, india has emerged as the largest services market for Sri Lanka.25 Significant trade also takes place in health and education services, although barriers preventing its full potential from being exploited remain.26
A key reason for the limited level of intra- regional trade in services is the failure to include services liberalization in regional and preferential
trading arrangements. Steps can be taken to ensure intraregional service trade grows as quickly as ser-vice trade with the rest of the world. These could include unilateral regulatory reforms and binding commitments under regional trade agreements (RTAs) to remove “behind-the-border” barriers. A SAARC Agreement on Trade in Services (SATiS) was signed at the sixteenth SAARC Summit, which was held in Thimphu in 2010. however, the actual liberal- ization of trade through national schedules within the framework of SATiS needs to be expedited.
Facilitating Intraregional Foreign Direct Investments
The real gains from a regional trading arrangement result from efficiency-seeking industrial restruc-turing, which also builds productive capacities in relatively lesser developed economies. Therefore, many new free trade arrangements combine trade in goods and services with investment liberaliza-tion.27 in South and South-West Asia, a number of countries are now emerging as the sources of FDi as observed in chapter 3. in this context, the South Asian agreement on promotion and protection of investments, a draft of which has been nearly final-ized, needs to be signed at the earliest. A SAARC
Figure 4.5: India’s Monthly Imports from Bangladesh, October 2002–April 2012(in millions of US$)
Sources: Reserve Bank of india based on Directorate General of Commercial intelligence and Statistics (2012) and Ministry for external Affairs Annual Report (2011).
Note: Vertical line signifies important meetings between india and Bangladesh.

Regional Economic Integration in South and South-West Asia 73
Limited Multilateral Agreement on Avoidance of Double Taxation and Mutual Administrative Assistance in Tax Matters has already been signed. SAARC could also adopt the SAARC industrial Cooperation (SiCo) Scheme. Under this scheme, the products of joint venture projects (set up with involvement of intraregional investments) could be accorded duty-free access in the home coun-tries without waiting for the implementation of the SAFTA schedule of trade liberalization to facilitate industrial restructuring.
Strengthening Banking and Financial Links
Banking and financial links play a very important role in facilitating trade and investments between the countries. The absence of reciprocal banking links makes it difficult for banks to accept letters of credit issued by exporters’ banks. The subregion has very perfunctory cross border banking links. Liberalization of banking services could be prior-itized under SATiS. however, even without waiting for negotiations to take place, South and South-West Asian countries could expedite the liberaliza-tion of banking and financial linkages by providing national treatment to designated banks originat-ing in the subregion on a reciprocal basis.
Capital Raisings and Development Finance
one of the constraints on industrial development and supply capabilities, especially in LDCs, is their access to capital as local capital markets are shal-low, if they exist at all. The access to international capital markets is constrained by poor sovereign credit ratings and currency risk problems. Raising capital in the stock exchanges of the advanced countries by enterprises registered in developing countries is made difficult by high initial expenses. These include having them listed and making an initial public offering as well as bearing the high costs of compliance with accounting standards and other regulations. only a handful of larger well-known enterprises from countries like india have been able to raise capital at the western bourses such as new York Stock exchange, nasdaq, or Luxembourg. in that context, allowing enterprises from South and South-West Asian LDCs to list and raise capital in more developed capital markets in the subregion such as in india, Pakistan, Sri Lanka or
Turkey may be fruitful. The cross-listing of securities on the subregion’s various stock exchanges should also be encouraged as that would provide more options for raising capital enterprises with.
The SAARC Development Fund is an innovative scheme for development financing in the sub-region. it was set up in 2010 as a part of SAARC financial cooperation with an authorized capital of SDR 1 billion and paid up capital of $300 million. The Fund will finance infrastructure projects in the subregion, including the preparation of feasibility studies. it has three windows for financing, namely the social window for poverty alleviation and social development projects; the infrastructure window for projects in the energy, power, transportation, telecommunications, environment, tourism and other infrastructure areas; and the economic win-dow devoted to non-infrastructural economic projects. The Secretariat of the SDF has been estab-lished in Thimphu, Bhutan.
in view of the huge infrastructure deficits faced by the SAARC countries, it may be appropriate to focus on infrastructure. however, considering rather small capital base of $300 million, SDF should focus on playing the role of catalysing rather than fund-ing infrastructure projects. A useful model in this respect is the ASeAn infrastructure Fund (AiF). AiF has been created as a part of an ASeAn initiative to mobilize resources for infrastructure development in 2010 with an initial equity base of $485 million of which $335 million will come from ASeAn mem-bers and remaining $150 million provided by the Asian Development Bank. Malaysia with $150 mil-lion and indonesia with $120 million are major con-tributors of the equity capital of the AiF. Based in Malaysia, AiF will function as a limited liability com-pany and hopes to have a total lending commitment of $4 billion by 2020 which will be co-financed by ADB to the tune of 70 per cent. Therefore, it expects to catalyse more than $13 billion in investments in realizing the Master Plan on ASeAn connectivity adopted in 2010. AiF will be administered by ADB in terms of due diligence of the projects identified for funding.28
SDF could transform itself into a SAARC Development Bank catalysing much bigger infra-structure projects that are of critical importance for regional connectivity and subregional develop-ment needs through a co-financing arrangement with ADB among other financing institutions.

South and South-West Asia Development Report74
As a regional institution, it should help prioritize the regional projects that may otherwise remain unfunded or under funded. The eCo Trade and Development Bank is also of similar size with SDR 300 million capital base. it could also be more effective if it undertook to catalyse regional infra-structure development projects that would have a larger impact across the subregion rather than in any one member State.
Strengthening the Asian Clearing Union Mechanism
nine countries of the region are members of the Asian Clearing Union (ACU) headquartered in Tehran, (Bangladesh, Bhutan, india, the islamic Republic of iran, Maldives, Myanmar, nepal, Pakistan and Sri Lanka), a grouping which heavily overlaps those of SAARC and eCo. ACU provides a useful mechanism for promoting intraregional trade by reducing the need to transfer hard currencies for mutual trade. it provides for settlement of balances in hard currency in a settlement period. it operates as an association of the central banks of the nine members. it also provides a swap facility enabling the members with a deficit to draw upon the reserves of other members for taking care of the short-term liquidity problems. ACU is an important mechanism for regional cooperation and needs to be strengthened. it might consider opening its membership to other eCo and SAARC countries that are not yet members of it to join. it might be a useful vehicle for financial and monetary cooper-ation in South and South-West Asia. it should also coordinate with the SAARC Finance, which is a body composed of SAARC central banks.
Ensuring Trade Facilitation and Transport Connectivity
Trade and transit facilitation measures need to complement the removal of tariff and non-tariff barriers to be effective. SAARC is addressing the issue of simplification and harmonization of cus-toms operations and standards with the estab-lishment of the SAARC Standards organization (SARSo) in Dhaka. An innovative way of trade facilitation could be to consider creating a SAARC Single Window which would allow SAARC goods to pass through customs more rapidly. Transit and
connectivity along with trade facilitation are im-portant issues in the subregion and are discussed in chapter 5.
Building and Leveraging Public Opinion
The primary factor responsible for holding back progress is the political differences, conflicts and mistrust that exist among countries in the region. Until this issue is effectively dealt with, progress is unlikely to pickup even if other measures, such as trade and transport facilitation and the improv-ing of the business regulatory environment are implemented. The challenges cannot be met by relying on market processes and policy action alone — South and South-West Asian countries will have to work together effectively. This will demand norms, rules, and understandings about how to proceed, as well as regional organizations to coordinate governments’ actions. Mutual co-operation requires a strong network of institutions to facilitate people-to-people exchanges. This can promote the exchange of ideas and broader and deeper cooperation among countries in pursuit of a region-wide economic community.
Public perceptions are important for building the political will needed to overcome the bar-riers to further integration. Polls in Bangladesh and nepal, for example, show that most respon-dents who were familiar with SAARC regarded the obstacles to integration within that regional body to be political, historical and cultural rather than economic in nature. Some 55 per cent of respon-dents blamed historical animosities from holding the regional grouping back, while 60 per cent of the respondents in nepal considered the arms race between india and Pakistan as the major obstacle (Figure 4.6).
There are also important geopolitical reasons to believe the time is now to overcome regional animosity between South and South-West Asian countries. nATo will leave Afghanistan in 2014, and at that point, the subregion’s security will rely on successful cooperation and trust among Afghanistan’s major neighbours including the islamic Republic of iran, Pakistan, and india. only by linking economic fortunes together through regional integration and trade can the countries of the subregion hope to overcome the political bar-riers to closer cooperation and partnership.

Regional Economic Integration in South and South-West Asia 75
SAARC, ECO, BIMSTEC Consultation Forums
Considering that the three groupings in South and South-West Asia have an overlapping member-ship as shown in Figure 4.1, mutual consultations among those groupings to facilitate cross fertiliza-tion and learning is highly beneficial. it may also be possible for regional groupings to connect their cooperation programmes in certain sectors to exploit synergies and network externalities as in the area of connectivity, as discussed in chapter 5. Being a regional intergovernmental organiza-tion with universal membership across Asia and the Pacific, eSCAP is uniquely placed to provide a forum for regular consultations between the sub-regional groupings of South and South-West Asia. The eSCAP South and South-West Asia office could facilitate such consultations on an annual basis.
Longer-term Vision and Target-setting
For regional groupings, it is important to adopt a long-term vision and objectives and to take incre-mental steps to achieve those goals. in the SAARC’s case the eminent Persons Group proposed a long-term vision of a South Asian economic Union to be achieved by 2020 way back in 1999. SAARC may revisit those proposals and articulate a vision
of the grouping to be achieved by a certain year. ASeAn has successfully moved towards the goal of ASeAn economic Community that is now set to be achieved by 2015 and was advanced from the ini-tial 2020 target. eCo could develop a similar vision for itself.
Furthermore, SAARC, eCo and BiMSTeC should take note of the broader trends in Asia-Pacific regionalism. For example ASeAn is adopting a framework on Regional Comprehensive economic Partnership of east Asia that will bring together six FTA partners of ASeAn in a single RTA with itself. SAARC and eCo have a better chance to play an important role in the incipient broader regional-ism through their own deeper integration and pos-sibly through a joint SAARC–eCo economic Area arrangement that could be evolved over time.
conclusions
This chapter has shown how despite large poten-tial for intraregional cooperation in South and South-West Asia, intraregional trade in goods and services, and intraregional investment remain low. in fact, South and South-West Asia was shown to be one of the least integrated subregions in the world. From such a low level, however, trade flows are growing in magnitude and cooperation
Figure 4.6: Public Opinions in Two SAARC Countries about Obstacles to Greater Economic Integration
Bangladesh Nepal
Source: Un-eSCAP based on Gallup (2011, 2012).
South and South-West Asia Development Report76
is increasing. Spurred on by common historical backgrounds, shared languages, and existing infor-mal trade links of impressive size, South and South-West Asians have reasons to be optimistic about the prospects for regionalism.
The most important reason for South and South-West Asian countries to pursue further regional integration is to facilitate efficiency-seeking in- vestment and industrial restructuring. Building an intraregional trading network that exploits comple-mentarities across the subregion’s various countries in both merchandise and service trade can pave the way not only for improved trade balances with the rest of the world, but also improved productive capacity, particularly in the subregion’s LDCs.
The obstacles facing increased subregional co-operation are not economic, but rather are political
in nature. overcoming these political barriers has increasing relevance and importance today, given the geopolitical situation prevailing in the subre-gion, and given subdued demand in the subre-gion’s principal trading partners elsewhere.
For far too long politics has held back the pro-gress in the subregion. The time has come to allow economics to play a greater role and for regional cooperation to finally take centre stage in South and South-West Asia. Despite longstanding political differences between some countries, the pressures of faltering demand in developed markets due to the crisis, and the prospect of higher costs in world’s workshop the east Asia, are opening a door of opportunity for South and South-West Asia to regain its former position as a crossroads between east and West.
(Continued )
Annex 1: Unexploited Trade Potential in South and South-West Asia (in millions of US$)
Reporter PartnerActual Export
2010Potential Export
2010Potential Export
2017Potential/
ActualUnexploited (percentage)
Afghanistan Bangladesh 1.760 4.103 4.728 2.331 57.109Bhutanindia 131.440 312.528 814.419 2.378 57.943iran (islamic Republic of) 11.730 16.294 22.810 1.389 28.008MaldivesnepalPakistan 137.800 401.333 816.536 2.912 65.664Sri LankaTurkey 4.630 6.083 12.398 1.314 23.889
South Asia 271.000 717.965 1 635.684 2.649 62.254South and South-West Asia 287.360 740.341 1 670.891 2.576 61.185
Bangladesh Afghanistan 7.360 9.436 12.818 1.282 21.999Bhutan 7.406 11.048 14.101 1.492 32.970india 320.900 1 854.256 3 540.681 5.778 82.694iran (islamic Republic of) 100.560 195.972 458.451 1.949 48.687Maldives 1.760 1.140 2.380 0.648 -54.386nepal 9.810 14.255 89.499 1.453 31.184Pakistan 68.640 192.846 476.662 2.810 64.407Sri Lanka 12.030 29.724 93.664 2.471 59.528Turkey 495.400 719.646 1 139.384 1.453 31.161
South Asia 427.906 2 112.706 4 229.804 4.937 79.746South and South-West Asia 1 023.866 3 028.324 5 827.639 2.958 66.190
Bhutan AfghanistanBangladesh 38.137 89.014 334.546 2.334 57.156india 547.483 1 043.540 2 176.541 1.906 47.536iran (islamic Republic of)Maldivesnepal 5.844 15.505 34.593 2.653 62.310Pakistan 0.306 1.643 2.972 5.368 81.372
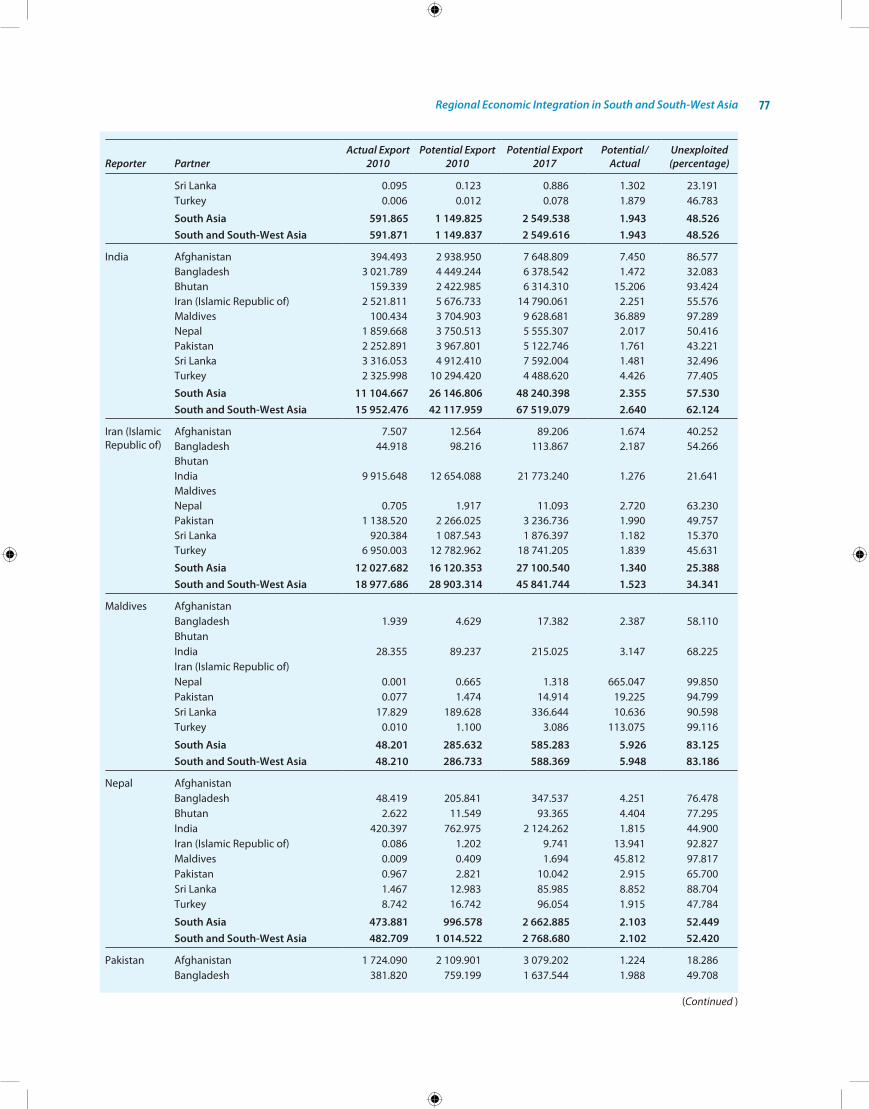
Regional Economic Integration in South and South-West Asia 77
Reporter PartnerActual Export
2010Potential Export
2010Potential Export
2017Potential/
ActualUnexploited (percentage)
Sri Lanka 0.095 0.123 0.886 1.302 23.191Turkey 0.006 0.012 0.078 1.879 46.783
South Asia 591.865 1 149.825 2 549.538 1.943 48.526South and South-West Asia 591.871 1 149.837 2 549.616 1.943 48.526
india Afghanistan 394.493 2 938.950 7 648.809 7.450 86.577Bangladesh 3 021.789 4 449.244 6 378.542 1.472 32.083Bhutan 159.339 2 422.985 6 314.310 15.206 93.424iran (islamic Republic of) 2 521.811 5 676.733 14 790.061 2.251 55.576Maldives 100.434 3 704.903 9 628.681 36.889 97.289nepal 1 859.668 3 750.513 5 555.307 2.017 50.416Pakistan 2 252.891 3 967.801 5 122.746 1.761 43.221Sri Lanka 3 316.053 4 912.410 7 592.004 1.481 32.496Turkey 2 325.998 10 294.420 4 488.620 4.426 77.405
South Asia 11 104.667 26 146.806 48 240.398 2.355 57.530South and South-West Asia 15 952.476 42 117.959 67 519.079 2.640 62.124
iran (islamic Republic of)
Afghanistan 7.507 12.564 89.206 1.674 40.252Bangladesh 44.918 98.216 113.867 2.187 54.266Bhutanindia 9 915.648 12 654.088 21 773.240 1.276 21.641Maldivesnepal 0.705 1.917 11.093 2.720 63.230Pakistan 1 138.520 2 266.025 3 236.736 1.990 49.757Sri Lanka 920.384 1 087.543 1 876.397 1.182 15.370Turkey 6 950.003 12 782.962 18 741.205 1.839 45.631
South Asia 12 027.682 16 120.353 27 100.540 1.340 25.388South and South-West Asia 18 977.686 28 903.314 45 841.744 1.523 34.341
Maldives AfghanistanBangladesh 1.939 4.629 17.382 2.387 58.110Bhutanindia 28.355 89.237 215.025 3.147 68.225iran (islamic Republic of)nepal 0.001 0.665 1.318 665.047 99.850Pakistan 0.077 1.474 14.914 19.225 94.799Sri Lanka 17.829 189.628 336.644 10.636 90.598Turkey 0.010 1.100 3.086 113.075 99.116
South Asia 48.201 285.632 585.283 5.926 83.125South and South-West Asia 48.210 286.733 588.369 5.948 83.186
nepal AfghanistanBangladesh 48.419 205.841 347.537 4.251 76.478Bhutan 2.622 11.549 93.365 4.404 77.295india 420.397 762.975 2 124.262 1.815 44.900iran (islamic Republic of) 0.086 1.202 9.741 13.941 92.827Maldives 0.009 0.409 1.694 45.812 97.817Pakistan 0.967 2.821 10.042 2.915 65.700Sri Lanka 1.467 12.983 85.985 8.852 88.704Turkey 8.742 16.742 96.054 1.915 47.784
South Asia 473.881 996.578 2 662.885 2.103 52.449South and South-West Asia 482.709 1 014.522 2 768.680 2.102 52.420
Pakistan Afghanistan 1 724.090 2 109.901 3 079.202 1.224 18.286Bangladesh 381.820 759.199 1 637.544 1.988 49.708
(Continued )
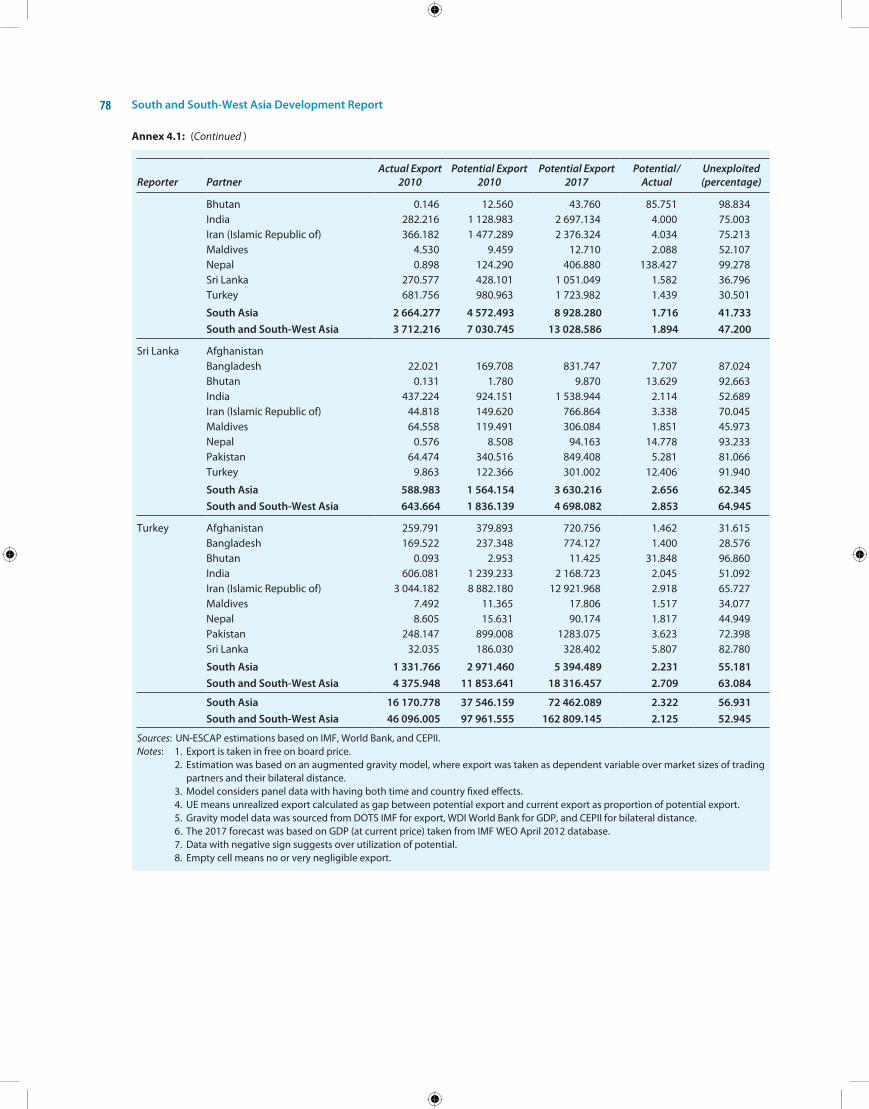
South and South-West Asia Development Report78
Reporter PartnerActual Export
2010Potential Export
2010Potential Export
2017Potential/
ActualUnexploited (percentage)
Bhutan 0.146 12.560 43.760 85.751 98.834india 282.216 1 128.983 2 697.134 4.000 75.003iran (islamic Republic of) 366.182 1 477.289 2 376.324 4.034 75.213Maldives 4.530 9.459 12.710 2.088 52.107nepal 0.898 124.290 406.880 138.427 99.278Sri Lanka 270.577 428.101 1 051.049 1.582 36.796Turkey 681.756 980.963 1 723.982 1.439 30.501
South Asia 2 664.277 4 572.493 8 928.280 1.716 41.733South and South-West Asia 3 712.216 7 030.745 13 028.586 1.894 47.200
Sri Lanka AfghanistanBangladesh 22.021 169.708 831.747 7.707 87.024Bhutan 0.131 1.780 9.870 13.629 92.663india 437.224 924.151 1 538.944 2.114 52.689iran (islamic Republic of) 44.818 149.620 766.864 3.338 70.045Maldives 64.558 119.491 306.084 1.851 45.973nepal 0.576 8.508 94.163 14.778 93.233Pakistan 64.474 340.516 849.408 5.281 81.066Turkey 9.863 122.366 301.002 12.406 91.940
South Asia 588.983 1 564.154 3 630.216 2.656 62.345South and South-West Asia 643.664 1 836.139 4 698.082 2.853 64.945
Turkey Afghanistan 259.791 379.893 720.756 1.462 31.615Bangladesh 169.522 237.348 774.127 1.400 28.576Bhutan 0.093 2.953 11.425 31.848 96.860india 606.081 1 239.233 2 168.723 2.045 51.092iran (islamic Republic of) 3 044.182 8 882.180 12 921.968 2.918 65.727Maldives 7.492 11.365 17.806 1.517 34.077nepal 8.605 15.631 90.174 1.817 44.949Pakistan 248.147 899.008 1283.075 3.623 72.398Sri Lanka 32.035 186.030 328.402 5.807 82.780
South Asia 1 331.766 2 971.460 5 394.489 2.231 55.181South and South-West Asia 4 375.948 11 853.641 18 316.457 2.709 63.084
South Asia 16 170.778 37 546.159 72 462.089 2.322 56.931South and South-West Asia 46 096.005 97 961.555 162 809.145 2.125 52.945
Sources: Un-eSCAP estimations based on iMF, World Bank, and CePii.Notes: 1. export is taken in free on board price. 2. estimation was based on an augmented gravity model, where export was taken as dependent variable over market sizes of trading
partners and their bilateral distance. 3. Model considers panel data with having both time and country fixed effects. 4. Ue means unrealized export calculated as gap between potential export and current export as proportion of potential export. 5. Gravity model data was sourced from DoTS iMF for export, WDi World Bank for GDP, and CePii for bilateral distance. 6. The 2017 forecast was based on GDP (at current price) taken from iMF Weo April 2012 database. 7. Data with negative sign suggests over utilization of potential. 8. empty cell means no or very negligible export.
Annex 4.1: (Continued )
Transport is the backbone of economic activity and social development. Since ancient times, the avail-ability and cost of transport have been influencing both the location of trade centres and the volume of trade. Large-scale increases in production and trade have been made possible with advances in transport, such as the diffusion of containerization. Most governments recognize that the responsibil-ity for developing transport infrastructure lies with them, and are therefore investing in ambitious medium- to long-term transport strategies and programmes. however, when it comes to improv-ing connectivity, each mode of transport — roads, railways, maritime transportation and aviation — has its own physical and operational characteris-tics which require different considerations.
Aviation and maritime shipping, for example, essentially move people and goods from point-to-point without intervening infrastructure. Conse-quently, investment in these sectors has focused on specific airports and maritime ports. in the past century, maritime ports dominated interna-tional trade and, as a result, attracted investment from both the public and the private sectors. Land-based modes and inland water transport by contrast, require the development of roads, rail-way tracks and inland waterways across vast geo-graphic areas. The sheer scale of these networks means that the cost of maintaining them is much greater than that for airports and maritime ports. non-physical barriers to the movement of people and goods are also greater for overland cross-ings as compared with maritime ports or airports because the risk of damage and theft is higher and more difficult to monitor.
This chapter examines the state of connectivity in South and South-West Asia and makes some pro-posals for extending the connectivity seamlessly across the subregion and beyond. enhanced con-nectivity can bring rich rewards for the whole sub-region in terms of network externalities, expanded
trade flows, development of the hinterland espe-cially the lagging areas, income streams of transit revenue and could restore the status of the South and South-West Asia as a hub of trade between europe, Central Asia and east Asia.
rEgional transport in south and south-wEst asia
Across South and South-West Asia, the maritime and aviation sectors are relatively well connected to their respective global networks. There is also a relatively high degree of private sector involve-ment in developing and managing infrastructures in those sectors. From a subregional perspective, therefore, the priority should be placed on the development and upgrading of land-based trans-port infrastructure. Tremendous efficiency gains could also be realized by removing non-physical barriers to transport and improving intermodal connectivity. Both of these steps would improve the efficiency of transport services and raise the utilization rates of existing infrastructure.
Maritime Transport
The expansion of international trade across the world has depended on building the capacity and efficiency of its major seaports, particularly container ports. For the past two decades, the container terminals in South and South-West Asia have been handling increasingly higher cargoes. however, none of the world’s top 10 busiest con-tainer ports is located in the subregion. Asia’s most important liner routes, by volume, still run from Asia to europe and north America. But there has been a substantial increase in intra-Asian shipping, particularly between india and east Asian coun-tries. Driven by trade between india and China, containerized trade in South and South-West Asia has also been growing rapidly.
5 Regional Connectivity in South and South-West Asia:
Challenges and Prospects
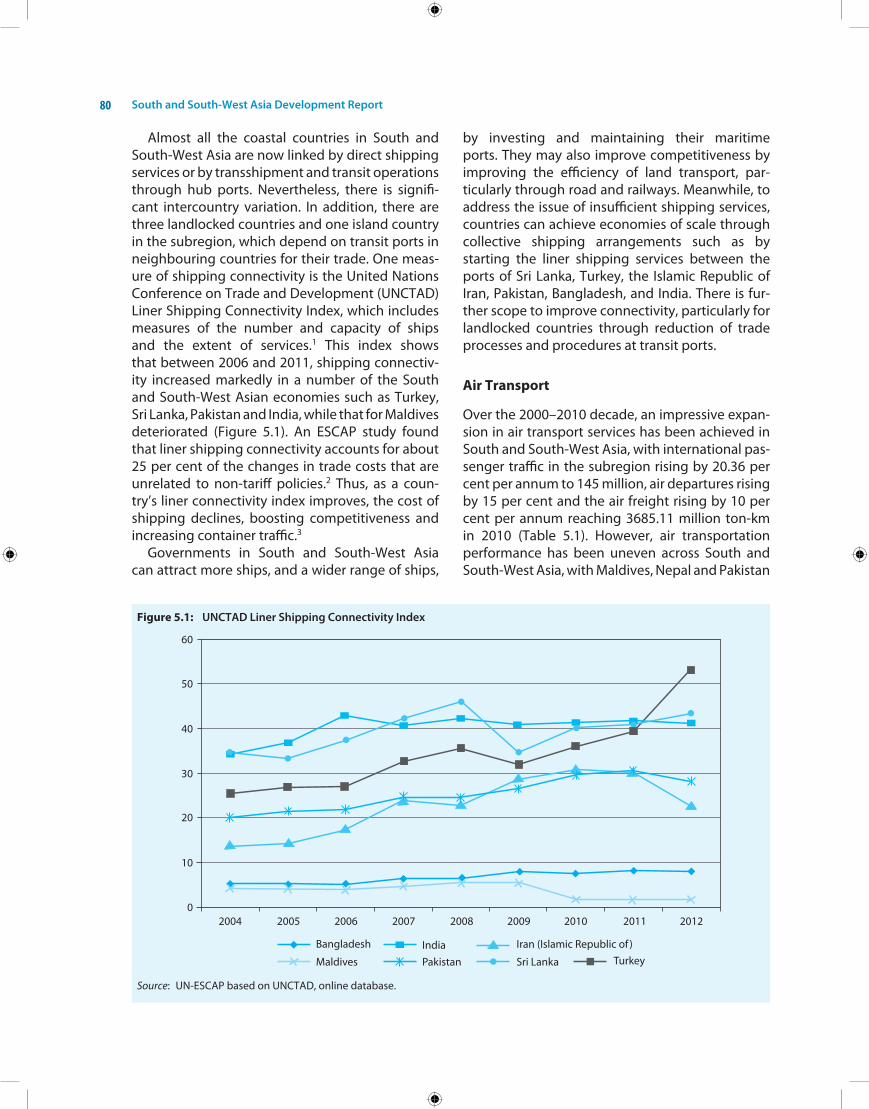
South and South-West Asia Development Report80
Almost all the coastal countries in South and South-West Asia are now linked by direct shipping services or by transshipment and transit operations through hub ports. nevertheless, there is signifi-cant intercountry variation. in addition, there are three landlocked countries and one island country in the subregion, which depend on transit ports in neighbouring countries for their trade. one meas-ure of shipping connectivity is the United nations Conference on Trade and Development (UnCTAD) Liner Shipping Connectivity index, which includes measures of the number and capacity of ships and the extent of services.1 This index shows that between 2006 and 2011, shipping connectiv-ity increased markedly in a number of the South and South-West Asian economies such as Turkey, Sri Lanka, Pakistan and india, while that for Maldives deteriorated (Figure 5.1). An eSCAP study found that liner shipping connectivity accounts for about 25 per cent of the changes in trade costs that are unrelated to non-tariff policies.2 Thus, as a coun-try’s liner connectivity index improves, the cost of shipping declines, boosting competitiveness and increasing container traffic.3
Governments in South and South-West Asia can attract more ships, and a wider range of ships,
by investing and maintaining their maritime ports. They may also improve competitiveness by improving the efficiency of land transport, par-ticularly through road and railways. Meanwhile, to address the issue of insufficient shipping services, countries can achieve economies of scale through collective shipping arrangements such as by starting the liner shipping services between the ports of Sri Lanka, Turkey, the islamic Republic of iran, Pakistan, Bangladesh, and india. There is fur-ther scope to improve connectivity, particularly for landlocked countries through reduction of trade processes and procedures at transit ports.
Air Transport
over the 2000–2010 decade, an impressive expan-sion in air transport services has been achieved in South and South-West Asia, with international pas-senger traffic in the subregion rising by 20.36 per cent per annum to 145 million, air departures rising by 15 per cent and the air freight rising by 10 per cent per annum reaching 3685.11 million ton-km in 2010 (Table 5.1). however, air transportation performance has been uneven across South and South-West Asia, with Maldives, nepal and Pakistan
Figure 5.1: UNCTAD Liner Shipping Connectivity Index
Source: Un-eSCAP based on UnCTAD, online database.
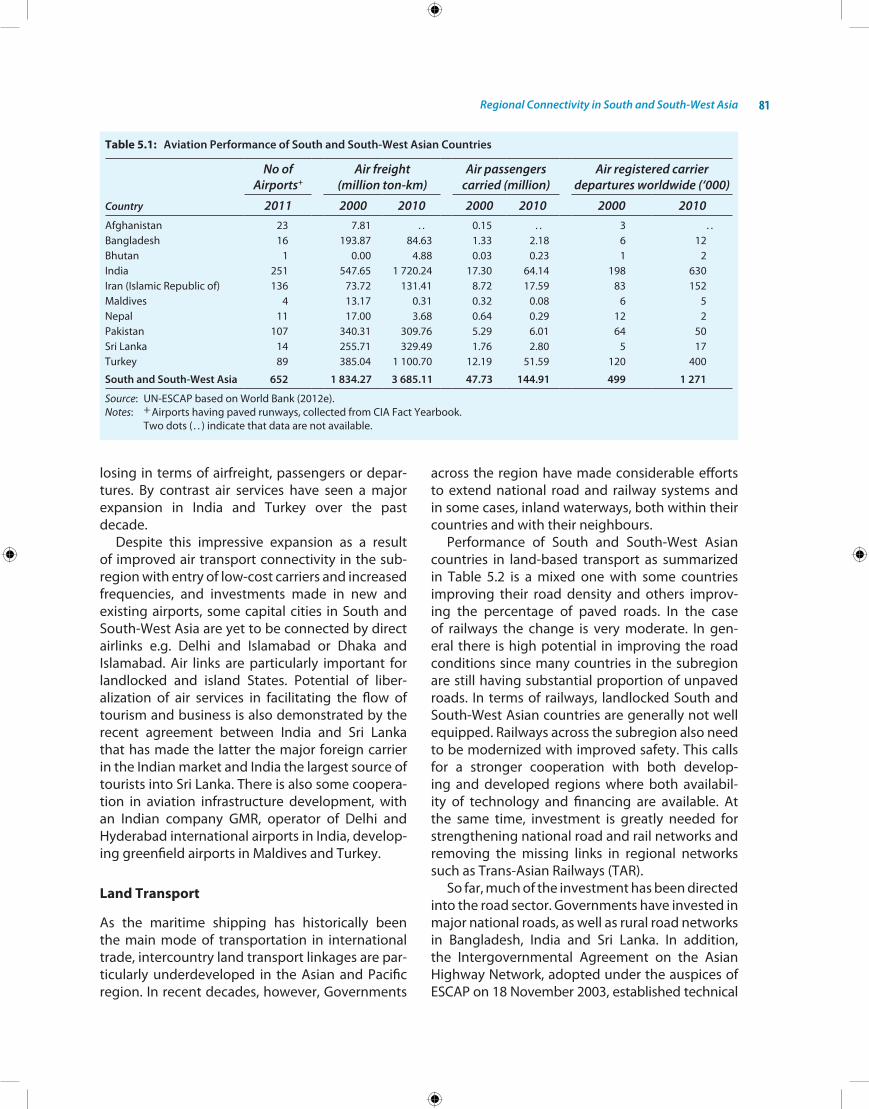
Regional Connectivity in South and South-West Asia 81
losing in terms of airfreight, passengers or depar-tures. By contrast air services have seen a major expansion in india and Turkey over the past decade.
Despite this impressive expansion as a result of improved air transport connectivity in the sub- region with entry of low-cost carriers and increased frequencies, and investments made in new and existing airports, some capital cities in South and South-West Asia are yet to be connected by direct airlinks e.g. Delhi and islamabad or Dhaka and islamabad. Air links are particularly important for landlocked and island States. Potential of liber-alization of air services in facilitating the flow of tourism and business is also demonstrated by the recent agreement between india and Sri Lanka that has made the latter the major foreign carrier in the indian market and india the largest source of tourists into Sri Lanka. There is also some coopera-tion in aviation infrastructure development, with an indian company GMR, operator of Delhi and hyderabad international airports in india, develop-ing greenfield airports in Maldives and Turkey.
Land Transport
As the maritime shipping has historically been the main mode of transportation in international trade, intercountry land transport linkages are par-ticularly underdeveloped in the Asian and Pacific region. in recent decades, however, Governments
across the region have made considerable efforts to extend national road and railway systems and in some cases, inland waterways, both within their countries and with their neighbours.
Performance of South and South-West Asian countries in land-based transport as summarized in Table 5.2 is a mixed one with some countries improving their road density and others improv-ing the percentage of paved roads. in the case of railways the change is very moderate. in gen-eral there is high potential in improving the road conditions since many countries in the subregion are still having substantial proportion of unpaved roads. in terms of railways, landlocked South and South-West Asian countries are generally not well equipped. Railways across the subregion also need to be modernized with improved safety. This calls for a stronger cooperation with both develop-ing and developed regions where both availabil-ity of technology and financing are available. At the same time, investment is greatly needed for strengthening national road and rail networks and removing the missing links in regional networks such as Trans-Asian Railways (TAR).
So far, much of the investment has been directed into the road sector. Governments have invested in major national roads, as well as rural road networks in Bangladesh, india and Sri Lanka. in addition, the intergovernmental Agreement on the Asian highway network, adopted under the auspices of eSCAP on 18 november 2003, established technical
Table 5.1: Aviation Performance of South and South-West Asian Countries
Country
No ofAirports+
Air freight (million ton-km)
Air passengers carried (million)
Air registered carrierdepartures worldwide (‘000)
2011 2000 2010 2000 2010 2000 2010Afghanistan 23 7.81 . . 0.15 . . 3 . .Bangladesh 16 193.87 84.63 1.33 2.18 6 12Bhutan 1 0.00 4.88 0.03 0.23 1 2india 251 547.65 1 720.24 17.30 64.14 198 630iran (islamic Republic of) 136 73.72 131.41 8.72 17.59 83 152Maldives 4 13.17 0.31 0.32 0.08 6 5nepal 11 17.00 3.68 0.64 0.29 12 2Pakistan 107 340.31 309.76 5.29 6.01 64 50Sri Lanka 14 255.71 329.49 1.76 2.80 5 17Turkey 89 385.04 1 100.70 12.19 51.59 120 400
South and South-West Asia 652 1 834.27 3 685.11 47.73 144.91 499 1 271
Source: Un-eSCAP based on World Bank (2012e).Notes: + Airports having paved runways, collected from CiA Fact Yearbook. Two dots ( . . ) indicate that data are not available.
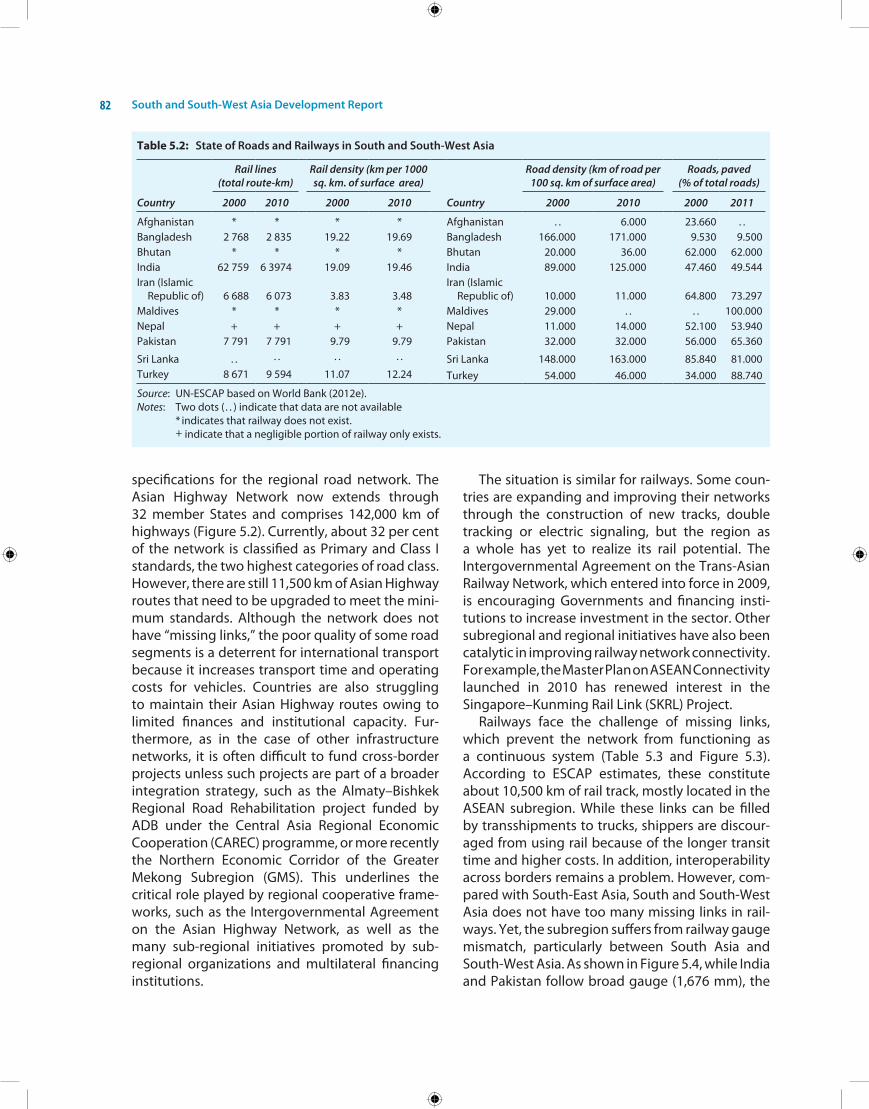
South and South-West Asia Development Report82
Table 5.2: State of Roads and Railways in South and South-West Asia
Country
Rail lines (total route-km)
Rail density (km per 1000 sq. km. of surface area)
Country
Road density (km of road per 100 sq. km of surface area)
Roads, paved (% of total roads)
2000 2010 2000 2010 2000 2010 2000 2011
Afghanistan * * * * Afghanistan . . 6.000 23.660 . .Bangladesh 2 768 2 835 19.22 19.69 Bangladesh 166.000 171.000 9.530 9.500Bhutan * * * * Bhutan 20.000 36.00 62.000 62.000india 62 759 6 3974 19.09 19.46 india 89.000 125.000 47.460 49.544iran (islamic
Republic of) 6 688 6 073 3.83 3.48iran (islamic
Republic of) 10.000 11.000 64.800 73.297Maldives * * * * Maldives 29.000 . . . . 100.000nepal + + + + nepal 11.000 14.000 52.100 53.940Pakistan 7 791 7 791 9.79 9.79 Pakistan 32.000 32.000 56.000 65.360
Sri Lanka . . . . . . . . Sri Lanka 148.000 163.000 85.840 81.000Turkey 8 671 9 594 11.07 12.24 Turkey 54.000 46.000 34.000 88.740
Source: Un-eSCAP based on World Bank (2012e).Notes: Two dots (. . ) indicate that data are not available * indicates that railway does not exist. + indicate that a negligible portion of railway only exists.
specifications for the regional road network. The Asian highway network now extends through 32 member States and comprises 142,000 km of highways (Figure 5.2). Currently, about 32 per cent of the network is classified as Primary and Class i standards, the two highest categories of road class. however, there are still 11,500 km of Asian highway routes that need to be upgraded to meet the mini-mum standards. Although the network does not have “missing links,” the poor quality of some road segments is a deterrent for international transport because it increases transport time and operating costs for vehicles. Countries are also struggling to maintain their Asian highway routes owing to limited finances and institutional capacity. Fur-thermore, as in the case of other infrastructure networks, it is often difficult to fund cross-border projects unless such projects are part of a broader integration strategy, such as the Almaty–Bishkek Regional Road Rehabilitation project funded by ADB under the Central Asia Regional economic Cooperation (CAReC) programme, or more recently the northern economic Corridor of the Greater Mekong Subregion (GMS). This underlines the critical role played by regional cooperative frame-works, such as the intergovernmental Agreement on the Asian highway network, as well as the many sub-regional initiatives promoted by sub- regional organizations and multilateral financing institutions.
The situation is similar for railways. Some coun-tries are expanding and improving their networks through the construction of new tracks, double tracking or electric signaling, but the region as a whole has yet to realize its rail potential. The intergovernmental Agreement on the Trans-Asian Railway network, which entered into force in 2009, is encouraging Governments and financing insti-tutions to increase investment in the sector. other subregional and regional initiatives have also been catalytic in improving railway network connectivity. For example, the Master Plan on ASeAn Connectivity launched in 2010 has renewed interest in the Singapore–kunming Rail Link (SkRL) Project.
Railways face the challenge of missing links, which prevent the network from functioning as a continuous system (Table 5.3 and Figure 5.3). According to eSCAP estimates, these constitute about 10,500 km of rail track, mostly located in the ASeAn subregion. While these links can be filled by transshipments to trucks, shippers are discour-aged from using rail because of the longer transit time and higher costs. in addition, interoperability across borders remains a problem. however, com-pared with South-east Asia, South and South-West Asia does not have too many missing links in rail-ways. Yet, the subregion suffers from railway gauge mismatch, particularly between South Asia and South-West Asia. As shown in Figure 5.4, while india and Pakistan follow broad gauge (1,676 mm), the
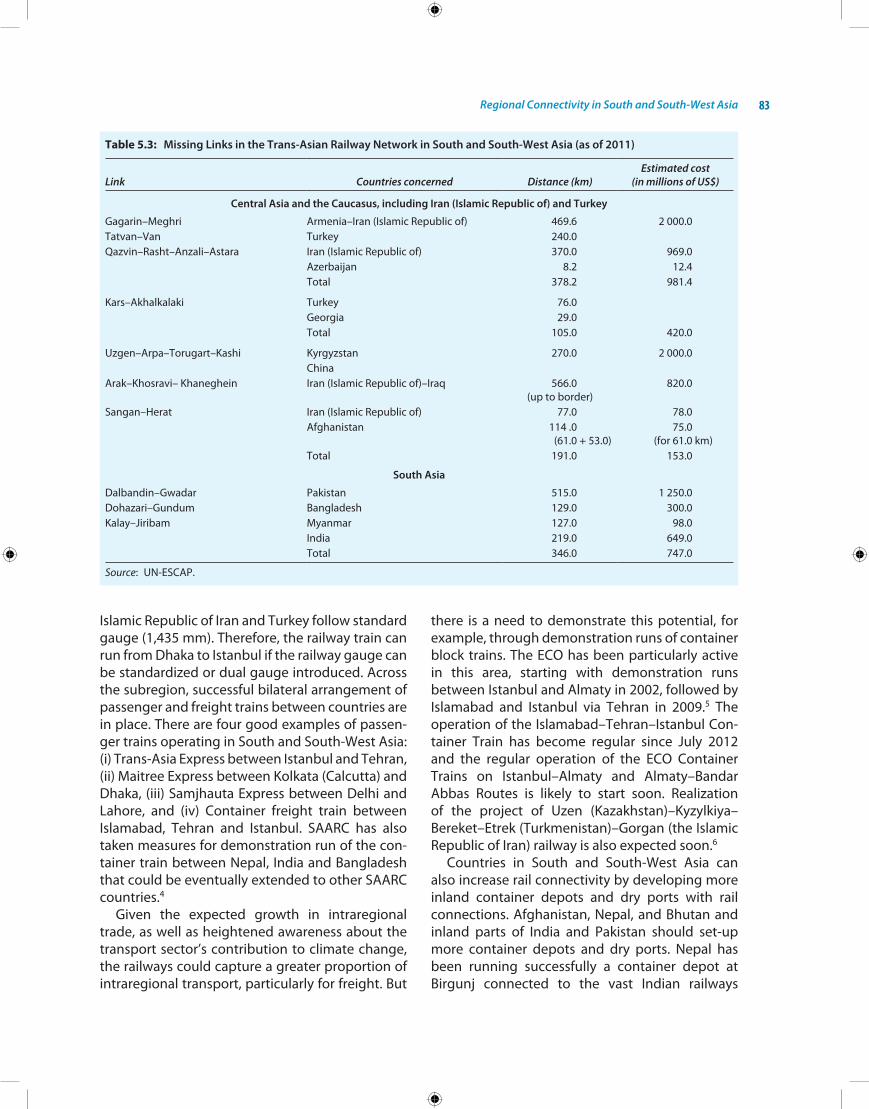
Regional Connectivity in South and South-West Asia 83
Table 5.3: Missing Links in the Trans-Asian Railway Network in South and South-West Asia (as of 2011)
Link Countries concerned Distance (km)Estimated cost
(in millions of US$)
Central Asia and the Caucasus, including Iran (Islamic Republic of) and Turkey
Gagarin–Meghri Armenia–iran (islamic Republic of) 469.6 2 000.0Tatvan–Van Turkey 240.0Qazvin–Rasht–Anzali–Astara iran (islamic Republic of) 370.0 969.0
Azerbaijan 8.2 12.4Total 378.2 981.4
kars–Akhalkalaki Turkey 76.0Georgia 29.0Total 105.0 420.0
Uzgen–Arpa–Torugart–kashi kyrgyzstan 270.0 2 000.0China
Arak–khosravi– khaneghein iran (islamic Republic of)–iraq 566.0 (up to border)
820.0
Sangan–herat iran (islamic Republic of) 77.0 78.0Afghanistan 114 .0
(61.0 + 53.0)75.0
(for 61.0 km)Total 191.0 153.0
South Asia
Dalbandin–Gwadar Pakistan 515.0 1 250.0Dohazari–Gundum Bangladesh 129.0 300.0kalay–Jiribam Myanmar 127.0 98.0
india 219.0 649.0Total 346.0 747.0
Source: Un-eSCAP.
islamic Republic of iran and Turkey follow standard gauge (1,435 mm). Therefore, the railway train can run from Dhaka to istanbul if the railway gauge can be standardized or dual gauge introduced. Across the subregion, successful bilateral arrangement of passenger and freight trains between countries are in place. There are four good examples of passen-ger trains operating in South and South-West Asia: (i) Trans-Asia express between istanbul and Tehran, (ii) Maitree express between kolkata (Calcutta) and Dhaka, (iii) Samjhauta express between Delhi and Lahore, and (iv) Container freight train between islamabad, Tehran and istanbul. SAARC has also taken measures for demonstration run of the con-tainer train between nepal, india and Bangladesh that could be eventually extended to other SAARC countries.4
Given the expected growth in intraregional trade, as well as heightened awareness about the transport sector’s contribution to climate change, the railways could capture a greater proportion of intraregional transport, particularly for freight. But
there is a need to demonstrate this potential, for example, through demonstration runs of container block trains. The eCo has been particularly active in this area, starting with demonstration runs between istanbul and Almaty in 2002, followed by islamabad and istanbul via Tehran in 2009.5 The operation of the islamabad–Tehran–istanbul Con-tainer Train has become regular since July 2012 and the regular operation of the eCo Container Trains on istanbul–Almaty and Almaty–Bandar Abbas Routes is likely to start soon. Realization of the project of Uzen (kazakhstan)–kyzylkiya– Bereket–etrek (Turkmenistan)–Gorgan (the islamic Republic of iran) railway is also expected soon.6
Countries in South and South-West Asia can also increase rail connectivity by developing more inland container depots and dry ports with rail connections. Afghanistan, nepal, and Bhutan and inland parts of india and Pakistan should set-up more container depots and dry ports. nepal has been running successfully a container depot at Birgunj connected to the vast indian railways
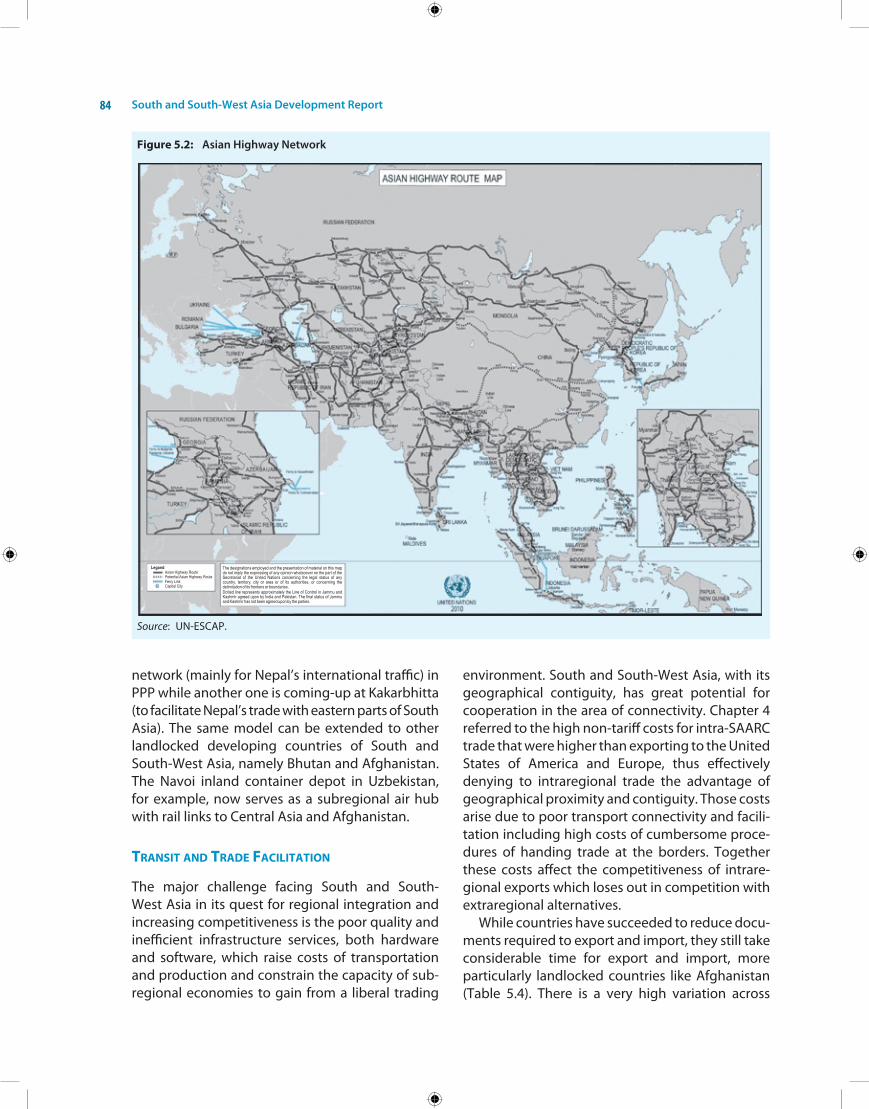
South and South-West Asia Development Report84
network (mainly for nepal’s international traffic) in PPP while another one is coming-up at kakarbhitta (to facilitate nepal’s trade with eastern parts of South Asia). The same model can be extended to other landlocked developing countries of South and South-West Asia, namely Bhutan and Afghanistan. The navoi inland container depot in Uzbekistan, for example, now serves as a subregional air hub with rail links to Central Asia and Afghanistan.
transit and tradE facilitation
The major challenge facing South and South-West Asia in its quest for regional integration and increasing competitiveness is the poor quality and inefficient infrastructure services, both hardware and software, which raise costs of transportation and production and constrain the capacity of sub-regional economies to gain from a liberal trading
environment. South and South-West Asia, with its geographical contiguity, has great potential for cooperation in the area of connectivity. Chapter 4 referred to the high non-tariff costs for intra-SAARC trade that were higher than exporting to the United States of America and europe, thus effectively denying to intraregional trade the advantage of geographical proximity and contiguity. Those costs arise due to poor transport connectivity and facili-tation including high costs of cumbersome proce-dures of handing trade at the borders. Together these costs affect the competitiveness of intrare-gional exports which loses out in competition with extraregional alternatives.
While countries have succeeded to reduce docu-ments required to export and import, they still take considerable time for export and import, more particularly landlocked countries like Afghanistan (Table 5.4). There is a very high variation across
Figure 5.2: Asian Highway Network
Source: Un-eSCAP.
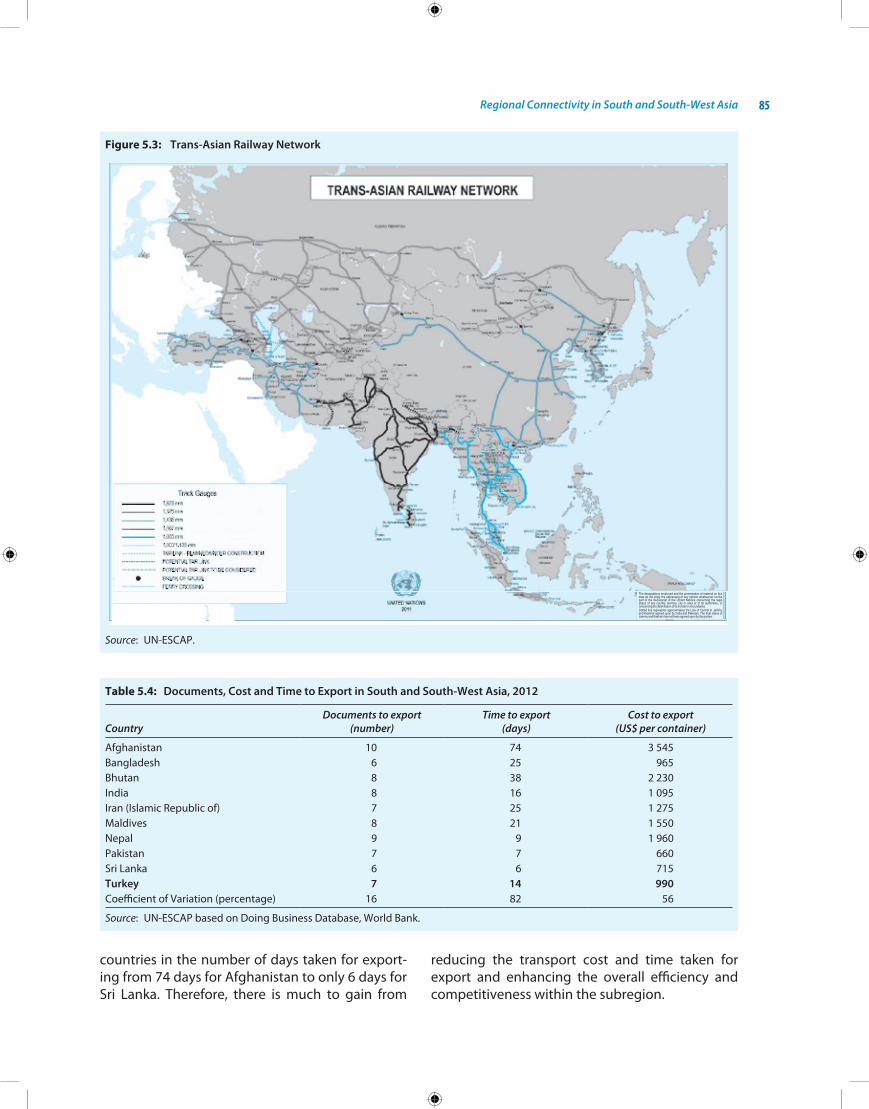
Regional Connectivity in South and South-West Asia 85
Figure 5.3: Trans-Asian Railway Network
Source: Un-eSCAP.
Table 5.4: Documents, Cost and Time to Export in South and South-West Asia, 2012
CountryDocuments to export
(number)Time to export
(days)Cost to export
(US$ per container)
Afghanistan 10 74 3 545Bangladesh 6 25 965Bhutan 8 38 2 230india 8 16 1 095iran (islamic Republic of) 7 25 1 275Maldives 8 21 1 550nepal 9 9 1 960Pakistan 7 7 660Sri Lanka 6 6 715Turkey 7 14 990Coefficient of Variation (percentage) 16 82 56
Source: Un-eSCAP based on Doing Business Database, World Bank.
countries in the number of days taken for export-ing from 74 days for Afghanistan to only 6 days for Sri Lanka. Therefore, there is much to gain from
reducing the transport cost and time taken for export and enhancing the overall efficiency and competitiveness within the subregion.
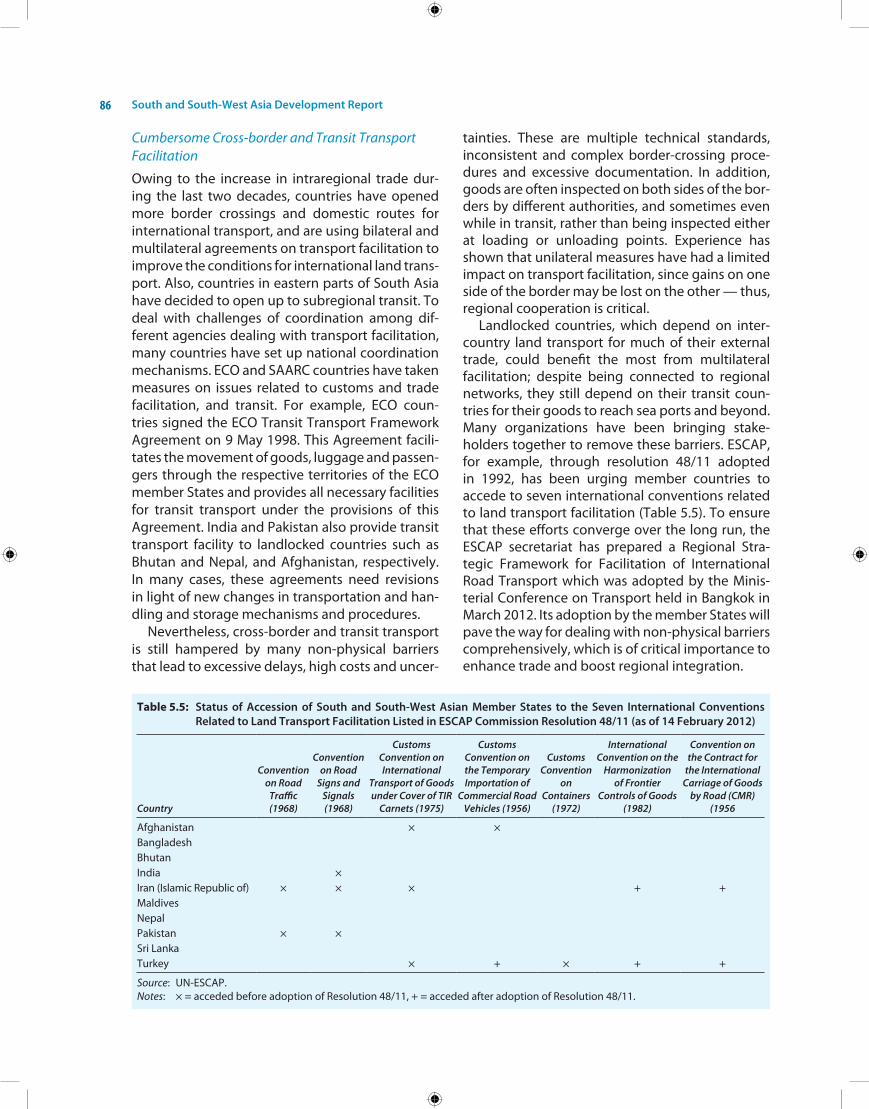
South and South-West Asia Development Report86
Cumbersome Cross-border and Transit Transport Facilitation
owing to the increase in intraregional trade dur-ing the last two decades, countries have opened more border crossings and domestic routes for international transport, and are using bilateral and multilateral agreements on transport facilitation to improve the conditions for international land trans-port. Also, countries in eastern parts of South Asia have decided to open up to subregional transit. To deal with challenges of coordination among dif-ferent agencies dealing with transport facilitation, many countries have set up national coordination mechanisms. eCo and SAARC countries have taken measures on issues related to customs and trade facilitation, and transit. For example, eCo coun-tries signed the eCo Transit Transport Framework Agreement on 9 May 1998. This Agreement facili-tates the movement of goods, luggage and passen-gers through the respective territories of the eCo member States and provides all necessary facilities for transit transport under the provisions of this Agreement. india and Pakistan also provide transit transport facility to landlocked countries such as Bhutan and nepal, and Afghanistan, respectively. in many cases, these agreements need revisions in light of new changes in transportation and han-dling and storage mechanisms and procedures.
nevertheless, cross-border and transit transport is still hampered by many non-physical barriers that lead to excessive delays, high costs and uncer-
tainties. These are multiple technical standards, inconsistent and complex border-crossing proce-dures and excessive documentation. in addition, goods are often inspected on both sides of the bor-ders by different authorities, and sometimes even while in transit, rather than being inspected either at loading or unloading points. experience has shown that unilateral measures have had a limited impact on transport facilitation, since gains on one side of the border may be lost on the other — thus, regional cooperation is critical.
Landlocked countries, which depend on inter-country land transport for much of their external trade, could benefit the most from multilateral facilitation; despite being connected to regional networks, they still depend on their transit coun-tries for their goods to reach sea ports and beyond. Many organizations have been bringing stake-holders together to remove these barriers. eSCAP, for example, through resolution 48/11 adopted in 1992, has been urging member countries to accede to seven international conventions related to land transport facilitation (Table 5.5). To ensure that these efforts converge over the long run, the eSCAP secretariat has prepared a Regional Stra-tegic Framework for Facilitation of international Road Transport which was adopted by the Minis-terial Conference on Transport held in Bangkok in March 2012. its adoption by the member States will pave the way for dealing with non-physical barriers comprehensively, which is of critical importance to enhance trade and boost regional integration.
Table 5.5: Status of Accession of South and South-West Asian Member States to the Seven International Conventions Related to Land Transport Facilitation Listed in ESCAP Commission Resolution 48/11 (as of 14 February 2012)
Country
Convention on Road
Traffic (1968)
Convention on Road
Signs and Signals (1968)
Customs Convention on International
Transport of Goods under Cover of TIR
Carnets (1975)
Customs Convention on the Temporary Importation of
Commercial Road Vehicles (1956)
Customs Convention
on Containers
(1972)
International Convention on the
Harmonization of Frontier
Controls of Goods (1982)
Convention on the Contract for
the International Carriage of Goods
by Road (CMR) (1956
Afghanistan × ×BangladeshBhutanindia ×iran (islamic Republic of) × × × + +MaldivesnepalPakistan × ×Sri LankaTurkey × + × + +
Source: Un-eSCAP.Notes: × = acceded before adoption of Resolution 48/11, + = acceded after adoption of Resolution 48/11.
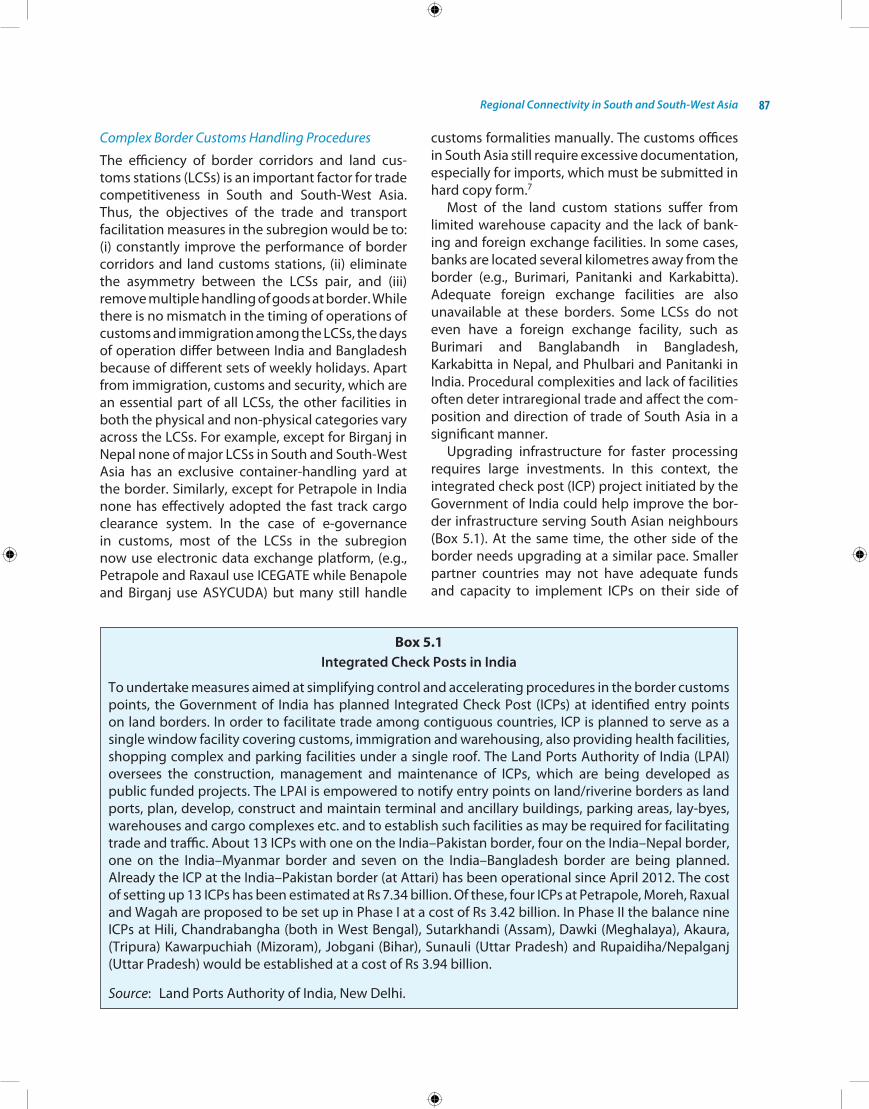
Regional Connectivity in South and South-West Asia 87
Complex Border Customs Handling Procedures
The efficiency of border corridors and land cus-toms stations (LCSs) is an important factor for trade competitiveness in South and South-West Asia. Thus, the objectives of the trade and transport facilitation measures in the subregion would be to: (i) constantly improve the performance of border corridors and land customs stations, (ii) eliminate the asymmetry between the LCSs pair, and (iii) remove multiple handling of goods at border. While there is no mismatch in the timing of operations of customs and immigration among the LCSs, the days of operation differ between india and Bangladesh because of different sets of weekly holidays. Apart from immigration, customs and security, which are an essential part of all LCSs, the other facilities in both the physical and non-physical categories vary across the LCSs. For example, except for Birganj in nepal none of major LCSs in South and South-West Asia has an exclusive container-handling yard at the border. Similarly, except for Petrapole in india none has effectively adopted the fast track cargo clearance system. in the case of e-governance in customs, most of the LCSs in the subregion now use electronic data exchange platform, (e.g., Petrapole and Raxaul use iCeGATe while Benapole and Birganj use ASYCUDA) but many still handle
customs formalities manually. The customs offices in South Asia still require excessive documentation, especially for imports, which must be submitted in hard copy form.7
Most of the land custom stations suffer from limited warehouse capacity and the lack of bank-ing and foreign exchange facilities. in some cases, banks are located several kilometres away from the border (e.g., Burimari, Panitanki and karkabitta). Adequate foreign exchange facilities are also unavailable at these borders. Some LCSs do not even have a foreign exchange facility, such as Burimari and Banglabandh in Bangladesh, karkabitta in nepal, and Phulbari and Panitanki in india. Procedural complexities and lack of facilities often deter intraregional trade and affect the com-position and direction of trade of South Asia in a significant manner.
Upgrading infrastructure for faster processing requires large investments. in this context, the integrated check post (iCP) project initiated by the Government of india could help improve the bor-der infrastructure serving South Asian neighbours (Box 5.1). At the same time, the other side of the border needs upgrading at a similar pace. Smaller partner countries may not have adequate funds and capacity to implement iCPs on their side of
Box 5.1Integrated Check Posts in India
To undertake measures aimed at simplifying control and accelerating procedures in the border customs points, the Government of india has planned integrated Check Post (iCPs) at identified entry points on land borders. in order to facilitate trade among contiguous countries, iCP is planned to serve as a single window facility covering customs, immigration and warehousing, also providing health facilities, shopping complex and parking facilities under a single roof. The Land Ports Authority of india (LPAi) oversees the construction, management and maintenance of iCPs, which are being developed as public funded projects. The LPAi is empowered to notify entry points on land/riverine borders as land ports, plan, develop, construct and maintain terminal and ancillary buildings, parking areas, lay-byes, warehouses and cargo complexes etc. and to establish such facilities as may be required for facilitating trade and traffic. About 13 iCPs with one on the india–Pakistan border, four on the india–nepal border, one on the india–Myanmar border and seven on the india–Bangladesh border are being planned. Already the iCP at the india–Pakistan border (at Attari) has been operational since April 2012. The cost of setting up 13 iCPs has been estimated at Rs 7.34 billion. of these, four iCPs at Petrapole, Moreh, Raxual and Wagah are proposed to be set up in Phase i at a cost of Rs 3.42 billion. in Phase ii the balance nine iCPs at hili, Chandrabangha (both in West Bengal), Sutarkhandi (Assam), Dawki (Meghalaya), Akaura, (Tripura) kawarpuchiah (Mizoram), Jobgani (Bihar), Sunauli (Uttar Pradesh) and Rupaidiha/nepalganj (Uttar Pradesh) would be established at a cost of Rs 3.94 billion.
Source: Land Ports Authority of india, new Delhi.
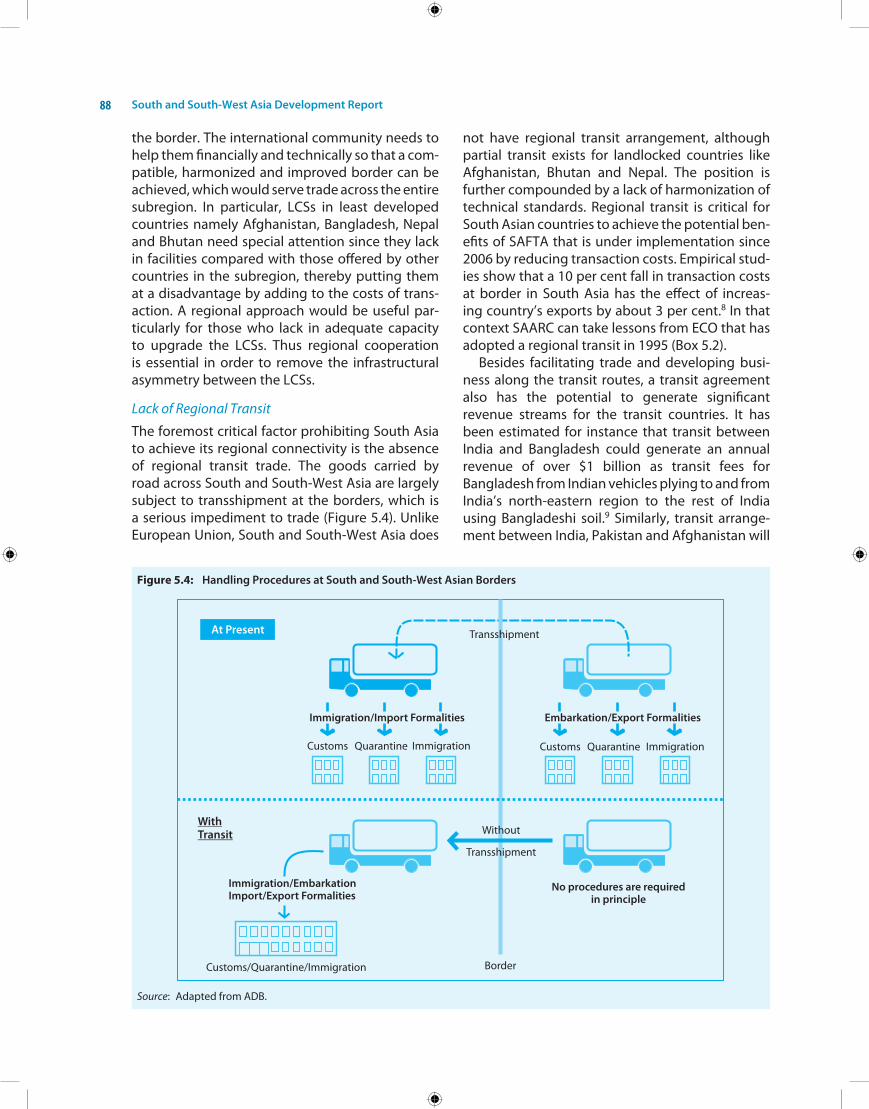
South and South-West Asia Development Report88
the border. The international community needs to help them financially and technically so that a com-patible, harmonized and improved border can be achieved, which would serve trade across the entire subregion. in particular, LCSs in least developed countries namely Afghanistan, Bangladesh, nepal and Bhutan need special attention since they lack in facilities compared with those offered by other countries in the subregion, thereby putting them at a disadvantage by adding to the costs of trans-action. A regional approach would be useful par-ticularly for those who lack in adequate capacity to upgrade the LCSs. Thus regional cooperation is essential in order to remove the infrastructural asymmetry between the LCSs.
Lack of Regional Transit
The foremost critical factor prohibiting South Asia to achieve its regional connectivity is the absence of regional transit trade. The goods carried by road across South and South-West Asia are largely subject to transshipment at the borders, which is a serious impediment to trade (Figure 5.4). Unlike european Union, South and South-West Asia does
not have regional transit arrangement, although partial transit exists for landlocked countries like Afghanistan, Bhutan and nepal. The position is further compounded by a lack of harmonization of technical standards. Regional transit is critical for South Asian countries to achieve the potential ben-efits of SAFTA that is under implementation since 2006 by reducing transaction costs. empirical stud-ies show that a 10 per cent fall in transaction costs at border in South Asia has the effect of increas-ing country’s exports by about 3 per cent.8 in that context SAARC can take lessons from eCo that has adopted a regional transit in 1995 (Box 5.2).
Besides facilitating trade and developing busi-ness along the transit routes, a transit agreement also has the potential to generate significant revenue streams for the transit countries. it has been estimated for instance that transit between india and Bangladesh could generate an annual revenue of over $1 billion as transit fees for Bangladesh from indian vehicles plying to and from india’s north-eastern region to the rest of india using Bangladeshi soil.9 Similarly, transit arrange-ment between india, Pakistan and Afghanistan will
Figure 5.4: Handling Procedures at South and South-West Asian Borders
Source: Adapted from ADB.

Regional Connectivity in South and South-West Asia 89
fetch a flow of transit fees to Pakistan for move-ment of vehicles between india and Afghanistan using Pakistani soil. There are also huge gains asso-ciated with energy conservation and associated carbon footprints owing to transit and efficient use of resources.
SAARC has set up an inter-Governmental Group (iGG) to advise on facilitation of transport in South Asia. Following the 14th SAARC Summit held in new Delhi in April 2007, the SAARC Ministers of Trans-port met in new Delhi on 31 August 2007. Taking note of the recommendations of SAARC Regional Multimodal Transport Study, SAARC Transport Ministers agreed to adopt a Regional Transport and Transit Agreement, and a Regional Motor Vehicles Agreement in 2008.10 The 17th SAARC Summit, held in Addu, Maldives in november 2011, decided to conclude the Regional Railways Agreement and to convene the expert Group Meeting on the Motor Vehicles Agreement before the next Session of the Council of Ministers. The time has come to expe-dite the adoption of the Regional Transport and
Transit Agreement and Motor Vehicles Agreement to enable South Asian countries to exploit the ben-efits of seamless connectivity across the subregion and economic integration.
towards sEamlEss connEctivity across south and south-wEst asia and bEyond
Transport corridors are built on the concept of “network externalities” which implies consider-able favourable externalities for all the partners in extending the transport networks to other coun-tries. it is this concept that is pushing governments to connect their national transport networks to form regional networks and integrate them with the pan-Asian arteries such as the Asian highway and the Trans-Asian Railways of eSCAP.
Integrating ECO-SAARC-BIMSTEC Transport Corridors
A useful approach to achieve greater synergies and to maximize the network externalities across South and South-West Asia is for the three overlapping
Box 5.2ECO Transit Trade Agreement (ECOTTA)
Considering the critical importance of transit trade, eCo member States signed a Transit Trade Agreement in 1995. The member States have realized that uniform, simplified and harmonized administrative formalities including customs procedures in the field of regional trade, in particular at border crossing points, sea-ports and airports, are necessary for achieving the objectives of the Treaty of izmir. Article 3 of eCoTTA indicates that the objective of the Agreement is to facilitate trade between two member States when the goods transported have to pass en route through other member State/States. its scope as noted in the Article 4 suggests the transport of goods with or without intermediate re-loading, across one or more borders between a customs office of departure of one member State and a customs office of destination of another, while passing through the customs jurisdiction of other member State/States. in this Agreement, goods transported by means of road vehicles, railway carriages, ships, aircraft or any combination thereof. Goods transported under this Agreement are not subject to the payment or deposit of import or export duties and taxes while in transit through the territory of any member State. The Guaranteeing Association undertakes to pay the export or import duties and taxes together with default interest, due under the Customs laws and regulations of the country in which any irregularity has been noted in connection with the Article. Goods transported under this Agreement, as a general rule, will not be subject to examination through the customs jurisdiction en route. in exceptional cases, however, in order to prevent abuse, the customs authorities may examine goods only when irregularities are suspected. in order to avail of the facilities provided under this Agreement, goods must be carried either by ships or aircraft or in sealed road vehicles, containers, railway carriages, or a combination thereof, and sealed according to the regulations determined by the guaranteeing association. in order to monitor the progress of transit trade under this Agreement an eCo Committee on Transit Trade has been constituted having one representative from each signatory member State.
Source: eCo Secretariat.
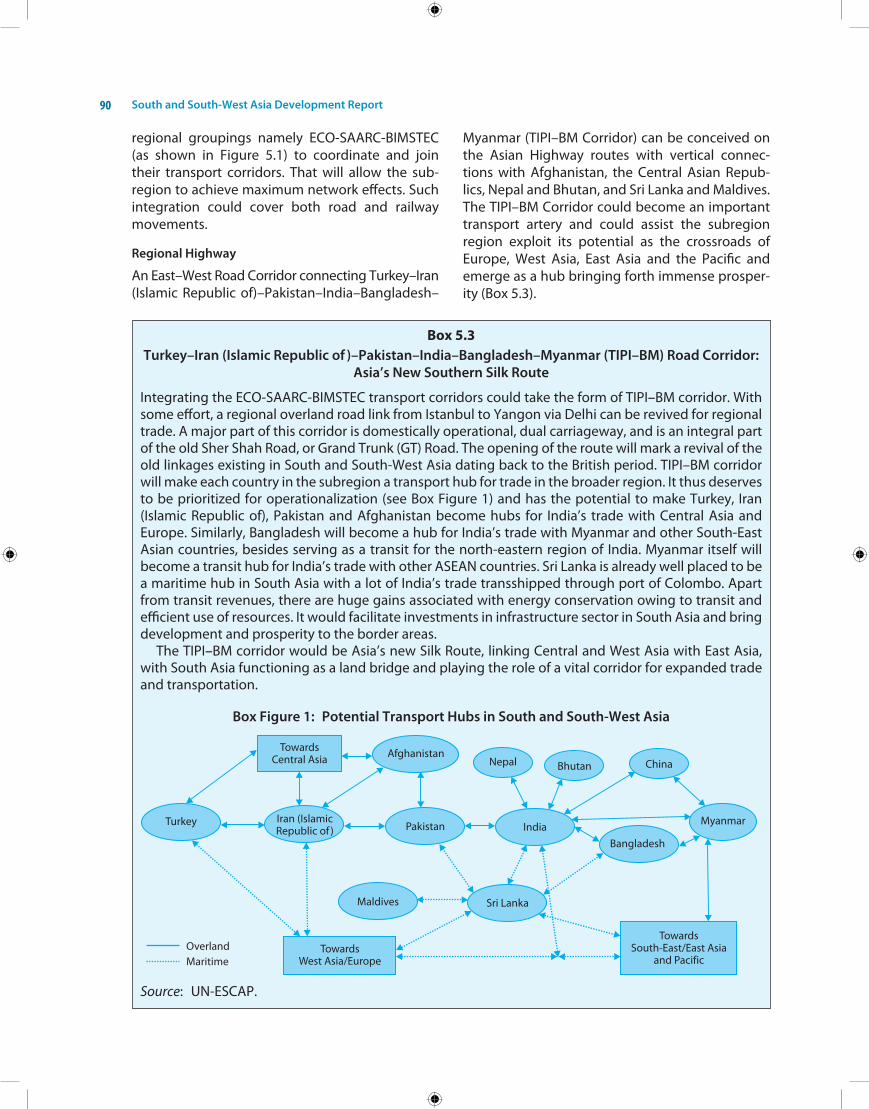
South and South-West Asia Development Report90
regional groupings namely eCo-SAARC-BiMSTeC (as shown in Figure 5.1) to coordinate and join their transport corridors. That will allow the sub-region to achieve maximum network effects. Such integration could cover both road and railway movements.
Regional Highway
An east–West Road Corridor connecting Turkey–iran (islamic Republic of)–Pakistan–india–Bangladesh–
Myanmar (TiPi–BM Corridor) can be conceived on the Asian highway routes with vertical connec-tions with Afghanistan, the Central Asian Repub-lics, nepal and Bhutan, and Sri Lanka and Maldives. The TiPi–BM Corridor could become an important transport artery and could assist the subregion region exploit its potential as the crossroads of europe, West Asia, east Asia and the Pacific and emerge as a hub bringing forth immense prosper-ity (Box 5.3).
Box 5.3Turkey–Iran (Islamic Republic of )–Pakistan–India–Bangladesh–Myanmar (TIPI–BM) Road Corridor:
Asia’s New Southern Silk Route
integrating the eCo-SAARC-BiMSTeC transport corridors could take the form of TiPi–BM corridor. With some effort, a regional overland road link from istanbul to Yangon via Delhi can be revived for regional trade. A major part of this corridor is domestically operational, dual carriageway, and is an integral part of the old Sher Shah Road, or Grand Trunk (GT) Road. The opening of the route will mark a revival of the old linkages existing in South and South-West Asia dating back to the British period. TiPi–BM corridor will make each country in the subregion a transport hub for trade in the broader region. it thus deserves to be prioritized for operationalization (see Box Figure 1) and has the potential to make Turkey, iran (islamic Republic of), Pakistan and Afghanistan become hubs for india’s trade with Central Asia and europe. Similarly, Bangladesh will become a hub for india’s trade with Myanmar and other South-east Asian countries, besides serving as a transit for the north-eastern region of india. Myanmar itself will become a transit hub for india’s trade with other ASeAn countries. Sri Lanka is already well placed to be a maritime hub in South Asia with a lot of india’s trade transshipped through port of Colombo. Apart from transit revenues, there are huge gains associated with energy conservation owing to transit and efficient use of resources. it would facilitate investments in infrastructure sector in South Asia and bring development and prosperity to the border areas.
The TiPi–BM corridor would be Asia’s new Silk Route, linking Central and West Asia with east Asia, with South Asia functioning as a land bridge and playing the role of a vital corridor for expanded trade and transportation.
Box Figure 1: Potential Transport Hubs in South and South-West Asia
Source: Un-eSCAP.
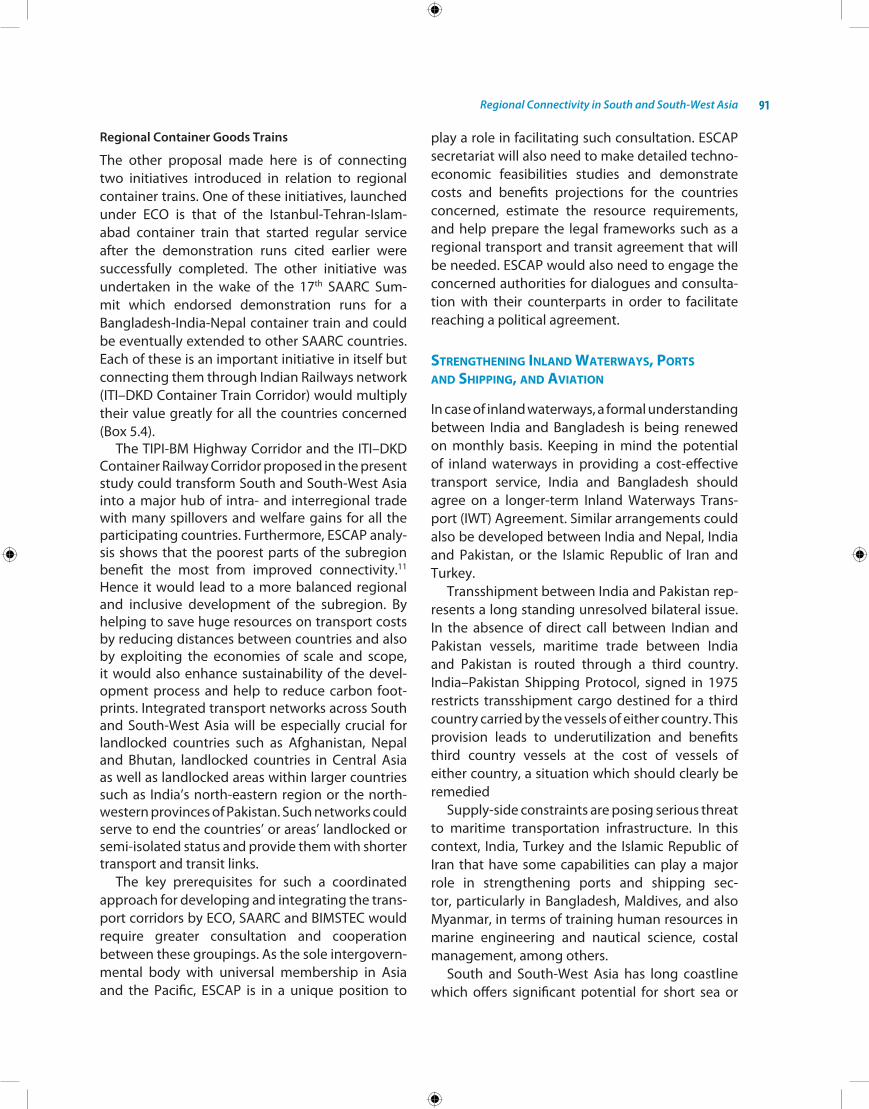
Regional Connectivity in South and South-West Asia 91
Regional Container Goods Trains
The other proposal made here is of connecting two initiatives introduced in relation to regional container trains. one of these initiatives, launched under eCo is that of the istanbul-Tehran-islam-abad container train that started regular service after the demonstration runs cited earlier were successfully completed. The other initiative was undertaken in the wake of the 17th SAARC Sum-mit which endorsed demonstration runs for a Bangladesh-india-nepal container train and could be eventually extended to other SAARC countries. each of these is an important initiative in itself but connecting them through indian Railways network (iTi–DkD Container Train Corridor) would multiply their value greatly for all the countries concerned (Box 5.4).
The TiPi-BM highway Corridor and the iTi–DkD Container Railway Corridor proposed in the present study could transform South and South-West Asia into a major hub of intra- and interregional trade with many spillovers and welfare gains for all the participating countries. Furthermore, eSCAP analy-sis shows that the poorest parts of the subregion benefit the most from improved connectivity.11 hence it would lead to a more balanced regional and inclusive development of the subregion. By helping to save huge resources on transport costs by reducing distances between countries and also by exploiting the economies of scale and scope, it would also enhance sustainability of the devel-opment process and help to reduce carbon foot-prints. integrated transport networks across South and South-West Asia will be especially crucial for landlocked countries such as Afghanistan, nepal and Bhutan, landlocked countries in Central Asia as well as landlocked areas within larger countries such as india’s north-eastern region or the north-western provinces of Pakistan. Such networks could serve to end the countries’ or areas’ landlocked or semi-isolated status and provide them with shorter transport and transit links.
The key prerequisites for such a coordinated approach for developing and integrating the trans-port corridors by eCo, SAARC and BiMSTeC would require greater consultation and cooperation between these groupings. As the sole intergovern-mental body with universal membership in Asia and the Pacific, eSCAP is in a unique position to
play a role in facilitating such consultation. eSCAP secretariat will also need to make detailed techno-economic feasibilities studies and demonstrate costs and benefits projections for the countries concerned, estimate the resource requirements, and help prepare the legal frameworks such as a regional transport and transit agreement that will be needed. eSCAP would also need to engage the concerned authorities for dialogues and consulta-tion with their counterparts in order to facilitate reaching a political agreement.
strEngthEning inland watErways, ports and shipping, and aviation
in case of inland waterways, a formal understanding between india and Bangladesh is being renewed on monthly basis. keeping in mind the potential of inland waterways in providing a cost-effective transport service, india and Bangladesh should agree on a longer-term inland Waterways Trans-port (iWT) Agreement. Similar arrangements could also be developed between india and nepal, india and Pakistan, or the islamic Republic of iran and Turkey.
Transshipment between india and Pakistan rep-resents a long standing unresolved bilateral issue. in the absence of direct call between indian and Pakistan vessels, maritime trade between india and Pakistan is routed through a third country. india–Pakistan Shipping Protocol, signed in 1975 restricts transshipment cargo destined for a third country carried by the vessels of either country. This provision leads to underutilization and benefits third country vessels at the cost of vessels of either country, a situation which should clearly be remedied
Supply-side constraints are posing serious threat to maritime transportation infrastructure. in this context, india, Turkey and the islamic Republic of iran that have some capabilities can play a major role in strengthening ports and shipping sec-tor, particularly in Bangladesh, Maldives, and also Myanmar, in terms of training human resources in marine engineering and nautical science, costal management, among others.
South and South-West Asia has long coastline which offers significant potential for short sea or
South and South-West Asia Development Report92
costal shipping. To start with, a regional agree-ment to allow short sea shipping in will not only enhance ferry services across the subregion but also strengthen the countries’ maritime profile.
With regard to aviation, airports across South and South-West Asia suffer from tremendous capacity constraints, on-shore and off-shore, for both pas-sengers and cargo, in terms of runways, parking
Box 5.4Istanbul–Tehran–Islamabad–Delhi–Kolkata–Dhaka (ITI–DKD) Railway Cargo Corridor
The proposed iTi–DkD Railway Cargo Corridor can provide a new lifeline for trade in Asia by connecting important cities across South and South-West Asia. Considering that istanbul–Tehran–islamabad (iTi) container train is already operational, Pakistan–india railway networks are already connected and regular passenger trains between Delhi and Lahore via Attari (Samjhauta express) are already in service, extending the iTi train to the indian Railways network to reach kolkata should not be too problematic. kolkata, already connected by regular train services to Dhaka, is also connected with Birganj in nepal. effectively extending the iTi train to the indian network and linking it with the Bangladesh–india–nepal container train initiative would produce a very important trade route and generate substantial revenues for all the countries on the way — as transit fees besides facilitating trade and generating economic activity.
overtime, this corridor can become a premier trade channel for europe, Central Asia, West Asia’s trade with South Asia and eventually to east Asia, once the proposed Delhi–hanoi Rail Link and kunming–Singapore Rail Links are completed. istanbul is already integrated with the european Railway networks. There are also many links on the route with the landlocked countries in Central Asia and Afghanistan, nepal and Bhutan.
Box Figure 2: ITI–DKD Cargo Corridor on the Trans-Asian Railway Network
Source: Un-eSCAP.
Regional Connectivity in South and South-West Asia 93
areas for aircrafts, passenger handling areas, cargo processing facilities (green channel, cold storage, etc), as well as security and baggage handling facil-ities. Pilots and ground handling staffs in airports are also crucially lacking. South and South-West Asian countries could jointly set up a regional aviation training institute while an open Sky Policy for airlines originating from within the sub-region may help in strengthening the connectivity between important cities. in this connection, South and South-West Asian countries may learn from ASeAn countries that have adopted ASeAn Multi-lateral Agreement on the Full Liberalisation of Air Freight Services on 20 May 2009 as a part of the Roadmap for integration of Air Travel Sector and the Action Plan for ASeAn Air Transport integra-tion and Liberalisation 2005–2015.
Strengthening and Harmonizing Rules, Regulations, and Standards
in order for the infrastructure hardware of a trans-port network to function effectively across the entire subregion, necessary soft infrastructure, such as relevant rules, regulations, and standards, need to be in place. Rules, regulations, and stan-dards must meet at least a common regional structure, but preferably an international design. Participating countries need to formulate and agree on a harmonized set of rules, regulations, and standards. eCo Transport and Transit Agree-ment is a very important step towards harmonizing the software relating to cross-border infrastructure use and could provide a template for South and South-West Asia.
Trade facilitation initiatives also need to focus on addressing differences between national laws, standards, and conformity assessment procedures towards a broader horizontal approach at the subregional level. Therefore national standards need to be harmonized in line with international standards and mutual recognition arrangements (MRAs) developed among South and South-West Asian countries. The early operationalization of SAARC Standards organization in Dhaka would be an important step in this direction. in terms of customs procedures, SAARC and other groupings should move towards single window procedures, similar to the ASeAn Single Window (ASW) initi-ative, designed to expedite customs clearance
and release of shipments coming to and depart-ing from ASeAn. it is broadly defined as an envir- onment where a single window in each ASeAn country (i.e., national Single Window, or nSW) operates and integrates. The national Single Window is a prerequisite for the ASeAn Single Window and is now being implemented in six ASeAn countries.
concluding rEmarks
Poor connectivity is one of the major constraints to regional economic integration of South and South-West Asian countries. in order to realize their potential for regional economic integration, regional cooperation groupings will have to pay attention to strengthening connectivity not only in terms of physical but also soft aspects such as transport, transit and trade facilitation.
keeping in mind the substantial network exter-nalities involved in transport networks, it makes a lot of sense that eCo, SAARC and BiMSTeC integrate their transport networks. in this context, two pro-posals can be considered. one of TiPi–BM highway Corridor linking Asia highway routes in Turkey, the islamic Republic of iran, Pakistan, india, Bangladesh, Myanmar and the other linking two ongoing ini-tiatives of regional container trains through indian Railway network to produce iTi–DkD (istanbul– Tehran–islamabad–Delhi–kolkata–Dhaka Container Train Corridor). Such initiative could help the sub-region emerge as the hub of europe and Central Asia’s trade with east Asia besides facilitating intraregional trade. These corridors could assist in connecting the landlocked developing coun- tries of Central Asia and South Asia and stimulate economic activity in the lagging regions, also help-ing to reduce the carbon foot prints caused by transport. eSCAP should facilitate these propos-als in getting off the ground with detailed feasi-bility studies, policy advocacy and consultations between the concerned groupings and member states.
South and South-West Asia would also benefit from strengthening transport, transit and trade facilitation through a regional transport and tran-sit agreement. investments in upgrading infra-structure at the land customs stations, through the adoption of a single window approach to customs
South and South-West Asia Development Report94
procedures would also be beneficial, in the process of moving towards international standards and conformity assessment procedures.
The strategic location of South and South-West Asia at the crossroads of Asia and the Pacific can be harnessed by strengthening connectivity across the subregion and beyond. in this respect, South
and South-West Asia may emulate the ASeAn example of developing a comprehensive ASeAn Connectivity Master Plan in 2010 with the techni-cal assistance from regional organizations such as eSCAP and ADB which is now driving the con-nectivity agenda ahead of the ASeAn economic Community goal set to be achieved by 2015.
in recent years food security has once again become a priority issue for the world’s economies. Regardless of development, the rising trend in food prices and increased pressures on agricultural sys-tems will place greater pressure on the food distri-bution and market mechanisms. Price shocks and volatility in food prices has also begun to illustrate the need for countries to consider fundamental long-run challenges of ensuring sufficient food production for future generations. other effects from factors such as climate change and rising development demands compound the food secur-ity challenge.
South and South-West Asia epitomizes the food security problem both in terms of the present gaps and future challenges for its population. The majority of the ten countries are emerging from low-income status but in many cases, concen-trated in South Asia in particular, where food inse-curity and hunger are enormously prevalent in the populations. Food insecurity in South and South-West Asia is evidence of the utter lack of inclusive development in the subregion. ensuring food security and eradicating hunger are development challenges where the subregion has failed terribly compared with its progress in other dimensions of development.
Food security encompasses numerous dimen-sions related to the supply and demand for food. The concept was defined at the World Food Sum-mit in 1996: “Food security exists when all people, at all times, have physical, social and economic access to sufficient, safe and nutritious food which meets their dietary needs and food preferences for an active and healthy life.” The food security con-cepts have been encapsulated in the work of the Food and Agriculture organization of the United nations (FAo). FAo considers food security to con-sist of four main elements: food availability through sufficient supply; food access for acquiring and consuming food, in particular food necessary for a
nutritious diet; utilization of food through adequate diet, water, sanitation and health practices; and stability to ensure that food access is not at risk. Governments reaffirmed their commitments to the right of all people to food at the Rio+20 United nations Conference on Sustainable Development held in June 2012. They also acknowledged the global challenge of food security and the need to address food access and availability, especially in terms of agricultural productivity and research and development. Governments also stressed the need to resolve the underlying causes of excessive food price volatility.1
Food security also requires that complementary basic needs be met for the population to ensure better utilization of its food resources. in this sense food security fits within the priorities of the broader development agenda for the countries in South and South-West Asia.
The ability of the countries to implement poli-cies that increase effective long-term food security will be pivotal in determining if the subregion can maintain strong long-run growth and inclusive development. There are various avenues countries can pursue at the subregional level that would not only increase cooperation for the realization of food security now, but also improve mechanisms to increase food production, reduce excess demand and insulate against food price shocks. At the same time, cooperation would help accelerate develop-ment gains in complementary areas, for example energy, related to the food demand–supply nexus and market management.
dimEnsions of food accEss
Hunger and Undernutrition
The first millennium development goal (MDG) is to eradicate extreme poverty and hunger with a target of halving the proportion of people living
6 Food Security and Sustainable Agriculture
in South and South-West Asia
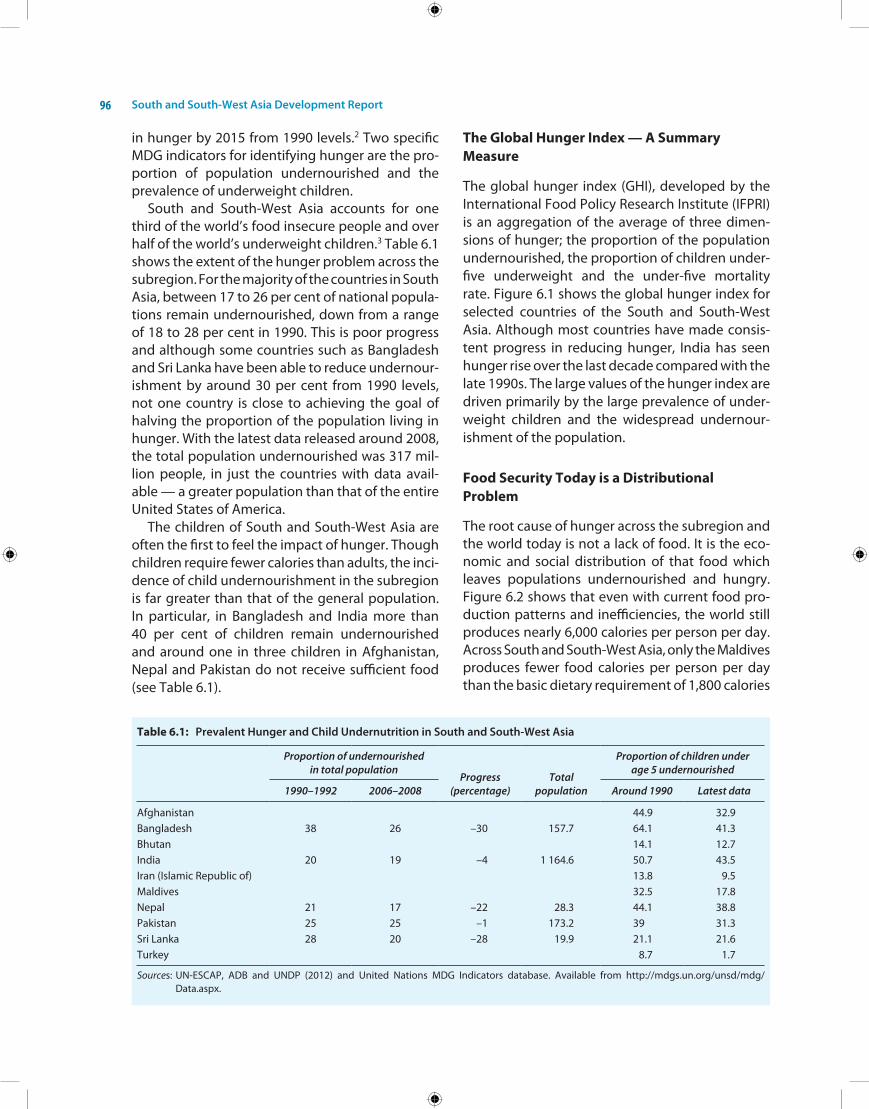
South and South-West Asia Development Report96
in hunger by 2015 from 1990 levels.2 Two specific MDG indicators for identifying hunger are the pro-portion of population undernourished and the prevalence of underweight children.
South and South-West Asia accounts for one third of the world’s food insecure people and over half of the world’s underweight children.3 Table 6.1 shows the extent of the hunger problem across the subregion. For the majority of the countries in South Asia, between 17 to 26 per cent of national popula-tions remain undernourished, down from a range of 18 to 28 per cent in 1990. This is poor progress and although some countries such as Bangladesh and Sri Lanka have been able to reduce undernour-ishment by around 30 per cent from 1990 levels, not one country is close to achieving the goal of halving the proportion of the population living in hunger. With the latest data released around 2008, the total population undernourished was 317 mil-lion people, in just the countries with data avail-able — a greater population than that of the entire United States of America.
The children of South and South-West Asia are often the first to feel the impact of hunger. Though children require fewer calories than adults, the inci-dence of child undernourishment in the subregion is far greater than that of the general population. in particular, in Bangladesh and india more than 40 per cent of children remain undernourished and around one in three children in Afghanistan, nepal and Pakistan do not receive sufficient food (see Table 6.1).
The Global Hunger Index — A Summary Measure
The global hunger index (Ghi), developed by the international Food Policy Research institute (iFPRi) is an aggregation of the average of three dimen-sions of hunger; the proportion of the population undernourished, the proportion of children under-five underweight and the under-five mortality rate. Figure 6.1 shows the global hunger index for selected countries of the South and South-West Asia. Although most countries have made consis-tent progress in reducing hunger, india has seen hunger rise over the last decade compared with the late 1990s. The large values of the hunger index are driven primarily by the large prevalence of under-weight children and the widespread undernour-ishment of the population.
Food Security Today is a Distributional Problem
The root cause of hunger across the subregion and the world today is not a lack of food. it is the eco-nomic and social distribution of that food which leaves populations undernourished and hungry. Figure 6.2 shows that even with current food pro-duction patterns and inefficiencies, the world still produces nearly 6,000 calories per person per day. Across South and South-West Asia, only the Maldives produces fewer food calories per person per day than the basic dietary requirement of 1,800 calories
Table 6.1: Prevalent Hunger and Child Undernutrition in South and South-West Asia
Proportion of undernourished in total population
Progress (percentage)
Total population
Proportion of children under age 5 undernourished
1990–1992 2006–2008 Around 1990 Latest data
Afghanistan 44.9 32.9Bangladesh 38 26 –30 157.7 64.1 41.3Bhutan 14.1 12.7india 20 19 –4 1 164.6 50.7 43.5iran (islamic Republic of) 13.8 9.5Maldives 32.5 17.8nepal 21 17 –22 28.3 44.1 38.8Pakistan 25 25 –1 173.2 39 31.3Sri Lanka 28 20 –28 19.9 21.1 21.6Turkey 8.7 1.7
Sources: Un-eSCAP, ADB and UnDP (2012) and United nations MDG indicators database. Available from http://mdgs.un.org/unsd/mdg/ Data.aspx.
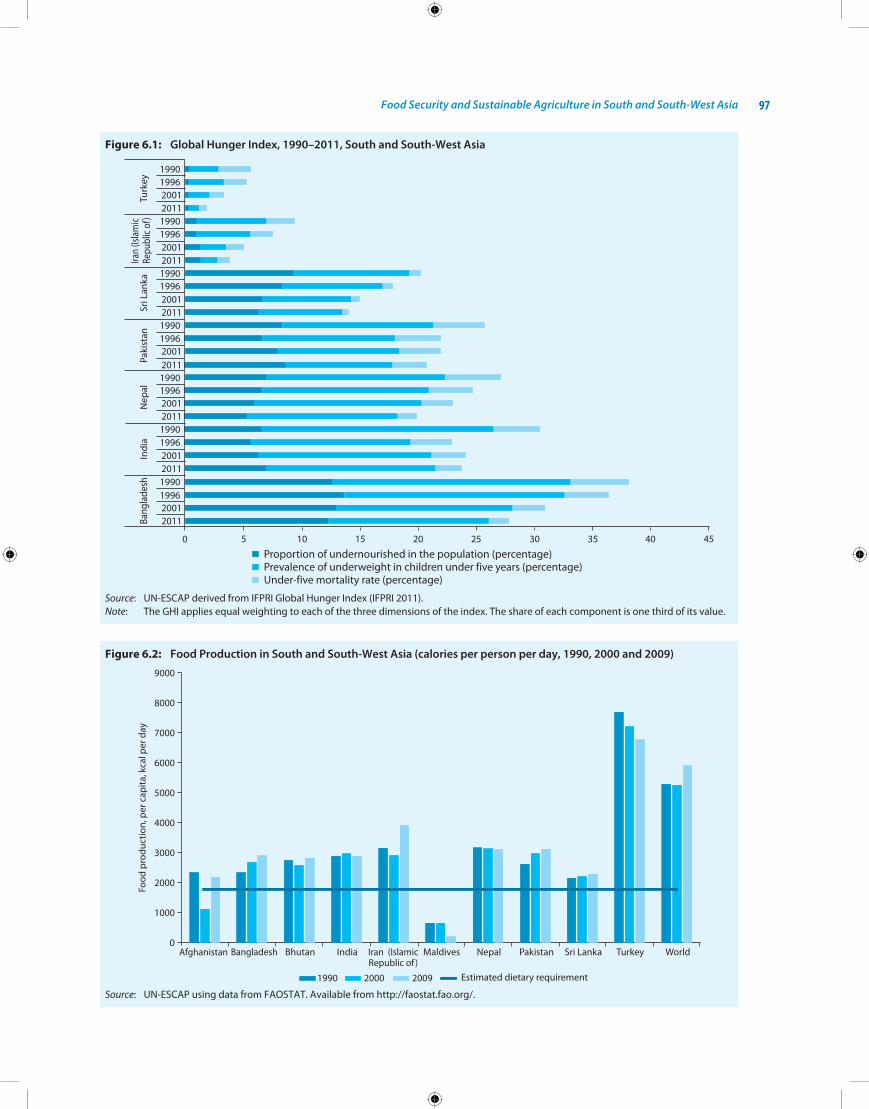
Food Security and Sustainable Agriculture in South and South-West Asia 97
Figure 6.1: Global Hunger Index, 1990–2011, South and South-West Asia
Source: Un-eSCAP derived from iFPRi Global hunger index (iFPRi 2011).Note: The Ghi applies equal weighting to each of the three dimensions of the index. The share of each component is one third of its value.
Figure 6.2: Food Production in South and South-West Asia (calories per person per day, 1990, 2000 and 2009)
Source: Un-eSCAP using data from FAoSTAT. Available from http://faostat.fao.org/.
South and South-West Asia Development Report98
established by the FAo. Diminishing physical and technological distribution barriers cannot explain the existing concentrations of populations living in hunger. even at the national levels, hungry popula-tions live side-by-side with populations who have easy access to food.
Food Utilization Requires Meeting Households’ Basic Needs
Food utilization and the adequate and safe con-sumption of food also depends upon households and individuals having access to minimum basic needs like water, sanitation and energy, which are
required to ensure food remains nutritious, can be stored adequately and is free from contamination. Limitations exist for people to substitute food products and still maintain a healthy diet. At the same time, most food cannot be stored well and must be consumed soon after purchase. Refriger-ation can extend the lifecycle of food, but breaks in the “cold chain” can lead to contaminated and food waste. From the consumption side, this may involve breaks in the cold chain between purchase and fork — for example, long periods without refri-geration owing to electricity shortages or outages. Adequate and safe food preparation also requires a supply of safe potable water, to clean and disinfect
Box 6.1Right to Food in South and South-West Asia
Governments of the world have affirmed the right to food through various international outcomes, resolutions and conventions, including the World Food Summit in 1996, repeated resolutions of the United nations General Assembly and human Rights Council, and the outcome of the recent Rio+20 Conference on Sustainable Development. Across countries, the right to food can exist in various forms such as an implicit or explicit right defined within national constitutions. other countries that have rati-fied international instruments such as the Universal Declaration of human Rights and the international Covenant on economic, Social and Cultural Rights among other instruments implicitly infer the right to food on their populations. Full realization of such right and its implementation is achieved through national legislation, which can define the legal status and provisions of the right within domestic legal systems.
in South and South-West Asia, nepal is the only country with an explicit provision of the right to food within its constitution.4 Afghanistan, Bhutan, Maldives and Turkey have no reference to a right to food in their respective constitutions, but do refer to access to food implicitly as a condition for “adequate standards of living”. Bangladesh, the islamic Republic of iran, Sri Lanka and Pakistan recognize the right to food as a directive principle for the State.
india has moved forward with realizing the right to food through a proposal for the national Food Security Act, also known as the food security bill. This proposed national legislation would guarantee all people a minimum quantity of basic food through the public distribution system and prioritize access to subsidized basic food by differentiating households or populations that are priority and excluding other groups from the subsidy benefits if they are not food vulnerable. The Act is designed to comple-ment the distribution of food with other social protection measures already in place, including midday meals for school children, and food entitlements in childcare centres.
The success of domestic legislation such as the national Food Security Act depends upon the specific provisions and the ability to target the most excluded. The right to food requires that other basic needs also be met by the most vulnerable populations, in particular adequate access to energy, water and san-itation. Complementarity across existing social protection programmes based on subsidies, incomes or transfers, as well as the ability to address intra-household distribution of food are important elements to ensure that the right to food is exercised by all.
Sources: Un-eSCAP based on knuth, Lidija and Margaret Vidar (2011). Constitutional and Legal Protec-tion of the Right to Food Around the World. FAo Right to Food Studies. Rome: Food and Agricul-ture organization of the United nations.
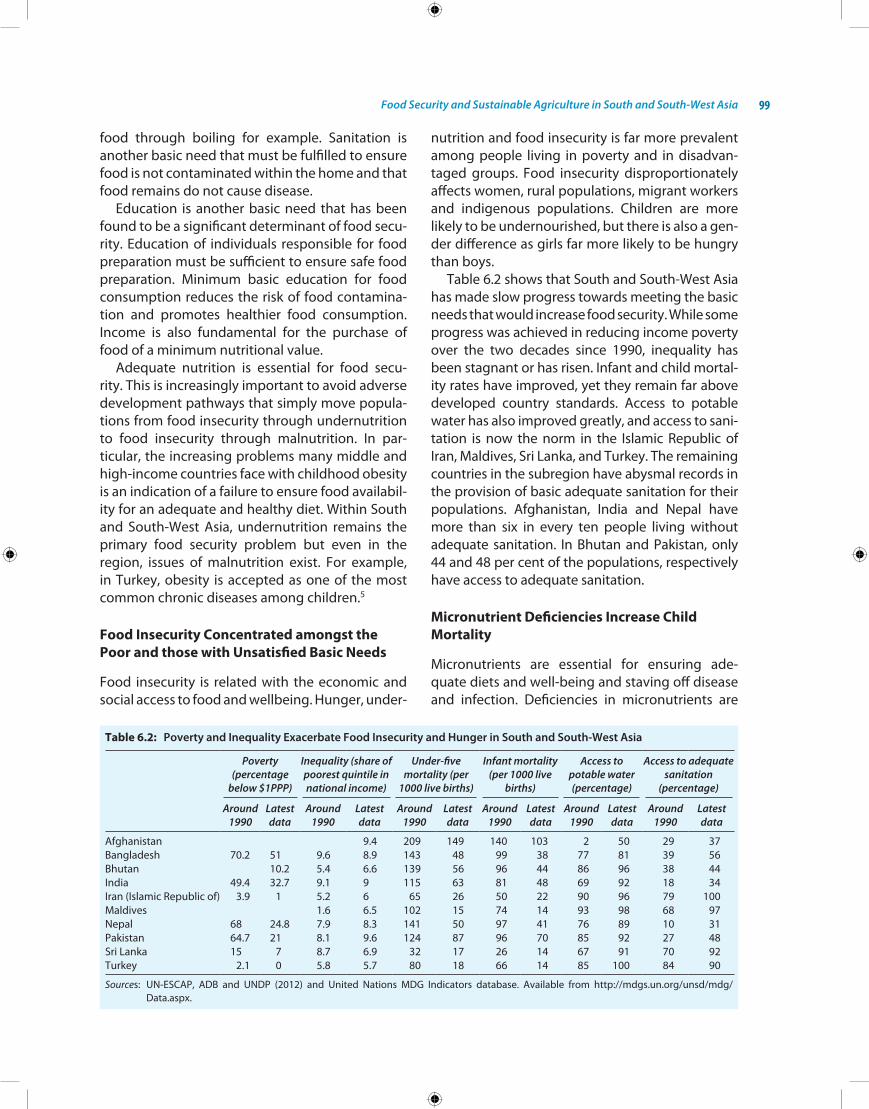
Food Security and Sustainable Agriculture in South and South-West Asia 99
food through boiling for example. Sanitation is another basic need that must be fulfilled to ensure food is not contaminated within the home and that food remains do not cause disease.
education is another basic need that has been found to be a significant determinant of food secu-rity. education of individuals responsible for food preparation must be sufficient to ensure safe food preparation. Minimum basic education for food consumption reduces the risk of food contamina-tion and promotes healthier food consumption. income is also fundamental for the purchase of food of a minimum nutritional value.
Adequate nutrition is essential for food secu-rity. This is increasingly important to avoid adverse development pathways that simply move popula-tions from food insecurity through undernutrition to food insecurity through malnutrition. in par-ticular, the increasing problems many middle and high-income countries face with childhood obesity is an indication of a failure to ensure food availabil-ity for an adequate and healthy diet. Within South and South-West Asia, undernutrition remains the primary food security problem but even in the region, issues of malnutrition exist. For example, in Turkey, obesity is accepted as one of the most common chronic diseases among children.5
Food Insecurity Concentrated amongst the Poor and those with Unsatisfied Basic Needs
Food insecurity is related with the economic and social access to food and wellbeing. hunger, under-
nutrition and food insecurity is far more prevalent among people living in poverty and in disadvan-taged groups. Food insecurity disproportionately affects women, rural populations, migrant workers and indigenous populations. Children are more likely to be undernourished, but there is also a gen-der difference as girls far more likely to be hungry than boys.
Table 6.2 shows that South and South-West Asia has made slow progress towards meeting the basic needs that would increase food security. While some progress was achieved in reducing income poverty over the two decades since 1990, inequality has been stagnant or has risen. infant and child mortal-ity rates have improved, yet they remain far above developed country standards. Access to potable water has also improved greatly, and access to sani-tation is now the norm in the islamic Republic of iran, Maldives, Sri Lanka, and Turkey. The remaining countries in the subregion have abysmal records in the provision of basic adequate sanitation for their populations. Afghanistan, india and nepal have more than six in every ten people living without adequate sanitation. in Bhutan and Pakistan, only 44 and 48 per cent of the populations, respectively have access to adequate sanitation.
Micronutrient Deficiencies Increase Child Mortality
Micronutrients are essential for ensuring ade-quate diets and well-being and staving off disease and infection. Deficiencies in micronutrients are
Table 6.2: Poverty and Inequality Exacerbate Food Insecurity and Hunger in South and South-West Asia
Poverty (percentage
below $1PPP)
Inequality (share of poorest quintile in national income)
Under-five mortality (per
1000 live births)
Infant mortality (per 1000 live
births)
Access to potable water (percentage)
Access to adequate sanitation
(percentage)
Around 1990
Latest data
Around 1990
Latest data
Around 1990
Latest data
Around 1990
Latest data
Around 1990
Latest data
Around 1990
Latest data
Afghanistan 9.4 209 149 140 103 2 50 29 37Bangladesh 70.2 51 9.6 8.9 143 48 99 38 77 81 39 56Bhutan 10.2 5.4 6.6 139 56 96 44 86 96 38 44india 49.4 32.7 9.1 9 115 63 81 48 69 92 18 34iran (islamic Republic of) 3.9 1 5.2 6 65 26 50 22 90 96 79 100Maldives 1.6 6.5 102 15 74 14 93 98 68 97nepal 68 24.8 7.9 8.3 141 50 97 41 76 89 10 31Pakistan 64.7 21 8.1 9.6 124 87 96 70 85 92 27 48Sri Lanka 15 7 8.7 6.9 32 17 26 14 67 91 70 92Turkey 2.1 0 5.8 5.7 80 18 66 14 85 100 84 90
Sources: Un-eSCAP, ADB and UnDP (2012) and United nations MDG indicators database. Available from http://mdgs.un.org/unsd/mdg/ Data.aspx.
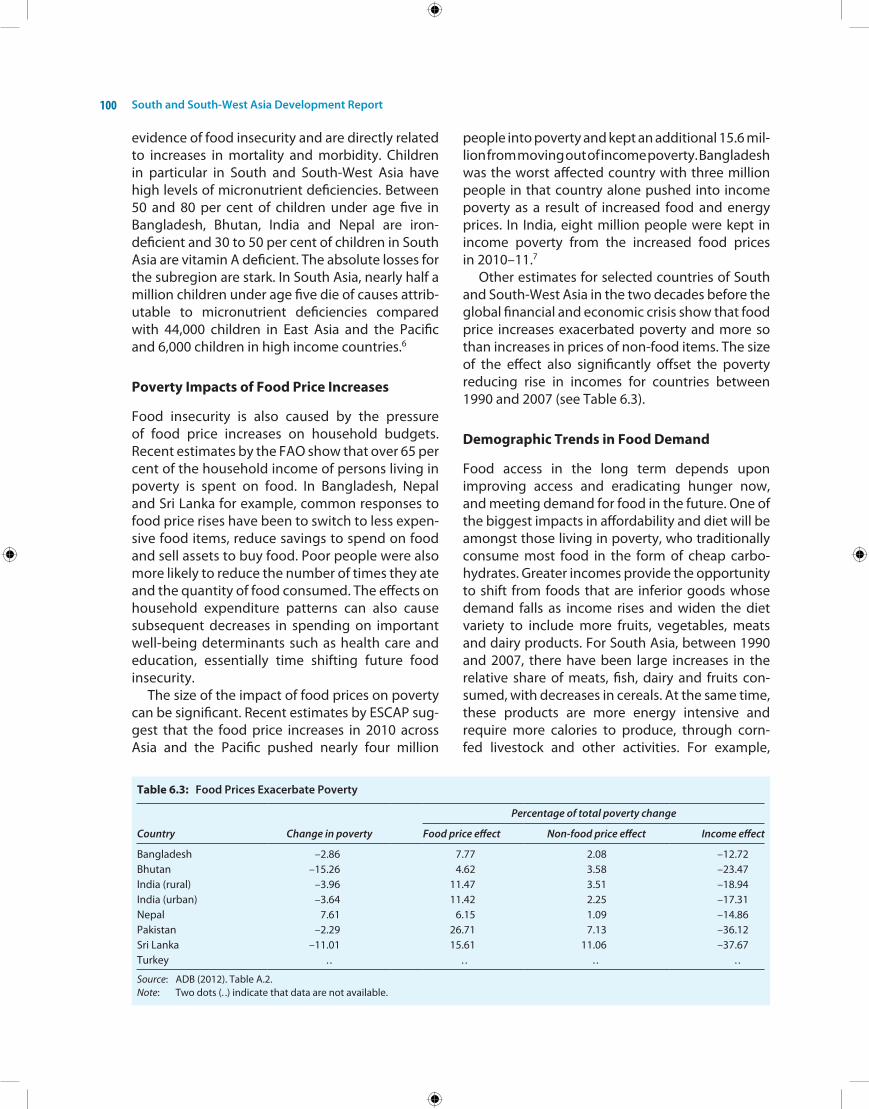
South and South-West Asia Development Report100
evidence of food insecurity and are directly related to increases in mortality and morbidity. Children in particular in South and South-West Asia have high levels of micronutrient deficiencies. Between 50 and 80 per cent of children under age five in Bangladesh, Bhutan, india and nepal are iron- deficient and 30 to 50 per cent of children in South Asia are vitamin A deficient. The absolute losses for the subregion are stark. in South Asia, nearly half a million children under age five die of causes attrib-utable to micronutrient deficiencies compared with 44,000 children in east Asia and the Pacific and 6,000 children in high income countries.6
Poverty Impacts of Food Price Increases
Food insecurity is also caused by the pressure of food price increases on household budgets. Recent estimates by the FAo show that over 65 per cent of the household income of persons living in poverty is spent on food. in Bangladesh, nepal and Sri Lanka for example, common responses to food price rises have been to switch to less expen-sive food items, reduce savings to spend on food and sell assets to buy food. Poor people were also more likely to reduce the number of times they ate and the quantity of food consumed. The effects on household expenditure patterns can also cause subsequent decreases in spending on important well-being determinants such as health care and education, essentially time shifting future food insecurity.
The size of the impact of food prices on poverty can be significant. Recent estimates by eSCAP sug-gest that the food price increases in 2010 across Asia and the Pacific pushed nearly four million
people into poverty and kept an additional 15.6 mil-lion from moving out of income poverty. Bangladesh was the worst affected country with three million people in that country alone pushed into income poverty as a result of increased food and energy prices. in india, eight million people were kept in income poverty from the increased food prices in 2010–11.7
other estimates for selected countries of South and South-West Asia in the two decades before the global financial and economic crisis show that food price increases exacerbated poverty and more so than increases in prices of non-food items. The size of the effect also significantly offset the poverty reducing rise in incomes for countries between 1990 and 2007 (see Table 6.3).
Demographic Trends in Food Demand
Food access in the long term depends upon improving access and eradicating hunger now, and meeting demand for food in the future. one of the biggest impacts in affordability and diet will be amongst those living in poverty, who traditionally consume most food in the form of cheap carbo-hydrates. Greater incomes provide the opportunity to shift from foods that are inferior goods whose demand falls as income rises and widen the diet variety to include more fruits, vegetables, meats and dairy products. For South Asia, between 1990 and 2007, there have been large increases in the relative share of meats, fish, dairy and fruits con-sumed, with decreases in cereals. At the same time, these products are more energy intensive and require more calories to produce, through corn-fed livestock and other activities. For example,
Table 6.3: Food Prices Exacerbate Poverty
Change in poverty
Percentage of total poverty change
Country Food price effect Non-food price effect Income effect
Bangladesh –2.86 7.77 2.08 –12.72Bhutan –15.26 4.62 3.58 –23.47india (rural) –3.96 11.47 3.51 –18.94india (urban) –3.64 11.42 2.25 –17.31nepal 7.61 6.15 1.09 –14.86Pakistan –2.29 26.71 7.13 –36.12Sri Lanka –11.01 15.61 11.06 –37.67Turkey . . . . . . . .
Source: ADB (2012). Table A.2.Note: Two dots (. .) indicate that data are not available.
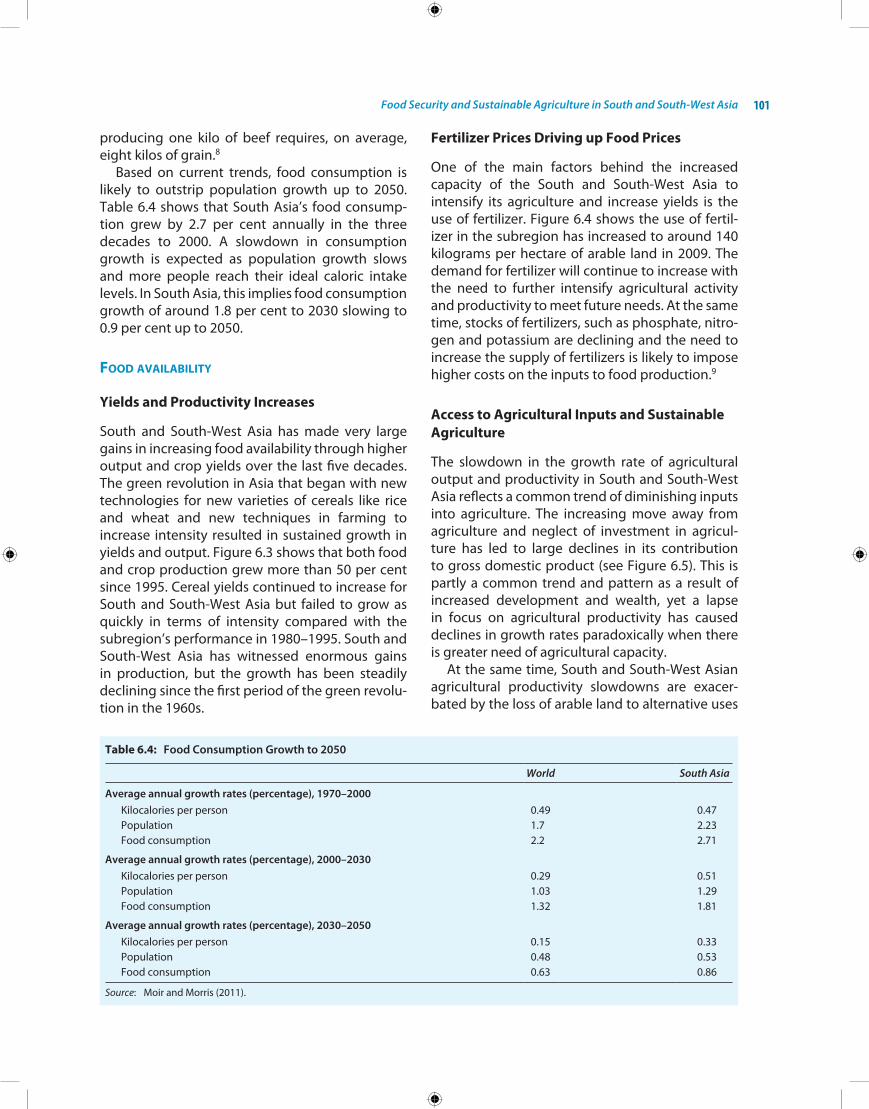
Food Security and Sustainable Agriculture in South and South-West Asia 101
producing one kilo of beef requires, on average, eight kilos of grain.8
Based on current trends, food consumption is likely to outstrip population growth up to 2050. Table 6.4 shows that South Asia’s food consump-tion grew by 2.7 per cent annually in the three decades to 2000. A slowdown in consumption growth is expected as population growth slows and more people reach their ideal caloric intake levels. in South Asia, this implies food consumption growth of around 1.8 per cent to 2030 slowing to 0.9 per cent up to 2050.
food availability
Yields and Productivity Increases
South and South-West Asia has made very large gains in increasing food availability through higher output and crop yields over the last five decades. The green revolution in Asia that began with new technologies for new varieties of cereals like rice and wheat and new techniques in farming to increase intensity resulted in sustained growth in yields and output. Figure 6.3 shows that both food and crop production grew more than 50 per cent since 1995. Cereal yields continued to increase for South and South-West Asia but failed to grow as quickly in terms of intensity compared with the subregion’s performance in 1980–1995. South and South-West Asia has witnessed enormous gains in production, but the growth has been steadily declining since the first period of the green revolu-tion in the 1960s.
Fertilizer Prices Driving up Food Prices
one of the main factors behind the increased capacity of the South and South-West Asia to intensify its agriculture and increase yields is the use of fertilizer. Figure 6.4 shows the use of fertil-izer in the subregion has increased to around 140 kilograms per hectare of arable land in 2009. The demand for fertilizer will continue to increase with the need to further intensify agricultural activity and productivity to meet future needs. At the same time, stocks of fertilizers, such as phosphate, nitro-gen and potassium are declining and the need to increase the supply of fertilizers is likely to impose higher costs on the inputs to food production.9
Access to Agricultural Inputs and Sustainable Agriculture
The slowdown in the growth rate of agricultural output and productivity in South and South-West Asia reflects a common trend of diminishing inputs into agriculture. The increasing move away from agriculture and neglect of investment in agricul-ture has led to large declines in its contribution to gross domestic product (see Figure 6.5). This is partly a common trend and pattern as a result of increased development and wealth, yet a lapse in focus on agricultural productivity has caused declines in growth rates paradoxically when there is greater need of agricultural capacity.
At the same time, South and South-West Asian agricultural productivity slowdowns are exacer-bated by the loss of arable land to alternative uses
Table 6.4: Food Consumption Growth to 2050
World South Asia
Average annual growth rates (percentage), 1970–2000 kilocalories per person 0.49 0.47Population 1.7 2.23Food consumption 2.2 2.71
Average annual growth rates (percentage), 2000–2030kilocalories per person 0.29 0.51Population 1.03 1.29Food consumption 1.32 1.81
Average annual growth rates (percentage), 2030–2050kilocalories per person 0.15 0.33Population 0.48 0.53Food consumption 0.63 0.86
Source: Moir and Morris (2011).

South and South-West Asia Development Report102
Figure 6.3: High but Slowing Growth in Food Production in South and South-West Asia
Source: Construction by Un-eSCAP based on data from World Bank (2012e).
Figure 6.4: Average Consumption of Fertilizer in South and South-West Asia, Kilograms per Hectare of Arable Land
Source: Un-eSCAP calculations based on data from World Bank (2012e).
such as industry, housing and urban development, or to faulty policies and unsustainable food sys-tems that have resulted in erosion, pollution and overuse of land. Water is another important factor in the growth of agricultural productivity. Almost 40 per cent of world food production comes from irrigated land and large quantities of water are required for the production of the subregion’s
major cereals, especially rice. South and South-West Asia has seen the amount of water available for development decline. Agricultural irrigation and unsustainable uses of water supplies and electricity have caused much waste of existing groundwater and freshwater resources. Better management also often requires better water-saving technologies which are expensive.

Food Security and Sustainable Agriculture in South and South-West Asia 103
Food Price Trends
World food prices remained relatively steady during the 1990s, after three decades of relative decline. Food prices increased sharply before and during the global financial and economic crisis but then declined again in response to active policy inter-vention by governments and the general decline in economic activity in the wake of the crisis. Food prices in the past two years have exhibited vola-tility but the higher trend seen over the last two decades is likely to continue in the long run (see Figure 6.6).
Agricultural commodity prices will remain on a higher plateau over the next decade, driven mainly by supply side constraints of continued higher oil prices, growing biofuel demand, higher input costs for agricultural production.10 in addition, demand pressures from population and income growth are likely to have greater effects over the medium term on the relative prices of food, driving up prices of meat, fish, dairy, sugar and oils, more than grains for example. South and South-West Asia, along with developing countries in other subregions, will experience some of the greatest price and con-sumption increases as per capita incomes increase
and consumption patterns shift with the growing middle class.
Food Price Volatility and Inflation
South and South-West Asia is particularly vulner-able to the adverse effects of food price volatility (see Figure 6.7). in the subregion, the high pro-portion of people that live in poverty are often especially ill-equipped to compensate for vola-tile food prices. Unlike the non-poor, they have little or no ability to smooth food consumption through bulk-buying or temporary adjustments in expenditure. People living in poverty are far more likely to be forced to make long-term asset and wellbeing adjustments to offset temporary price changes in food and maintain adequate access to food.
Volatility can also have an adverse effect on agri-cultural producers. Volatile food prices can provide false signals about future food prices that affect decisions about investment in future seasons of crops and livestock. Small-scale farmers are espe-cially hard-hit by volatile food prices that can mean the difference between net food production or net food consumption each season.
Figure 6.5: Agriculture as a Proportion of GDP and Employment between 1990 and 2010
Source: Un-eSCAP calculations using data from World (2012e).

South and South-West Asia Development Report104
Figure 6.6: World Food Price Indices, Various Foods, 2002–2004 = 100
Source: Un-eSCAP based on FAoSTAT.
Box 6.2The 2008 Food Crisis and Recent Spikes in Food Prices
Since their low point at the turn of the century food prices had begun to increase gradually, fuelled by the steady increase in demand as populations grew and development across the world accelerated. But in 2007, sharp drops in the supply of grain stocks including wheat, maize and rice, caused sharp spikes in food prices, from around 10 per cent inflation the year before, to 50 per cent inflation from 2007 to 2008. national prices in South and South-West Asia followed this trend, with increases in cereals in various countries ranging between 36 and100 per cent. These increases stirred large protests and dem-onstrations and had severe negative impacts on the incidence of poverty and hunger. The effect was particularly unequal, hitting the most marginalized and the urban and rural poor who already spend over half their budgets on food.
While food prices declined to some extent in 2009 and 2010, by 2011 food prices had once again increased, although not as suddenly as during the 2008 crisis. By the end of the year 2011 however prices in general had risen higher than in 2007, although in 2012 the strength of the price rise had eased.
The exact causes for the food crisis and high food prices in 2011 are difficult to decompose into the relative size of the different determinants in each case. The concentration on cereal prices was partially due to increased demand for meat — that requires far greater cereal to produce to feed livestock — and also partly due to other factors such as the drought in Australia in 2008 that severely affected grain exports. in addition, fuel prices, in particular oil prices, experienced a spike and given that oil is a sig-nificant input into agricultural production — through machinery and delivery of inputs or produce to market — this effect was passed on in the form of high food prices.
Two other factors that had significant impacts on the food price spikes were biofuels and reaction-ary trade restrictions. The large increase in the use of biofuels and diversion of agriculture production away from food to biofuels caused a sharp drop in food supplies of grains, sugar cane and vegetable oils. This was also driven by legislated biofuel inputs for energy use by developed countries as they sought to diminish reliance on fossil fuels. Trade policy reactions to protect domestic consumption also exacerbated the food crisis internationally. india’s rice export restrictions in 2007–2008 for example had a significant effect on rice prices during that period.
Source: Un-eSCAP.
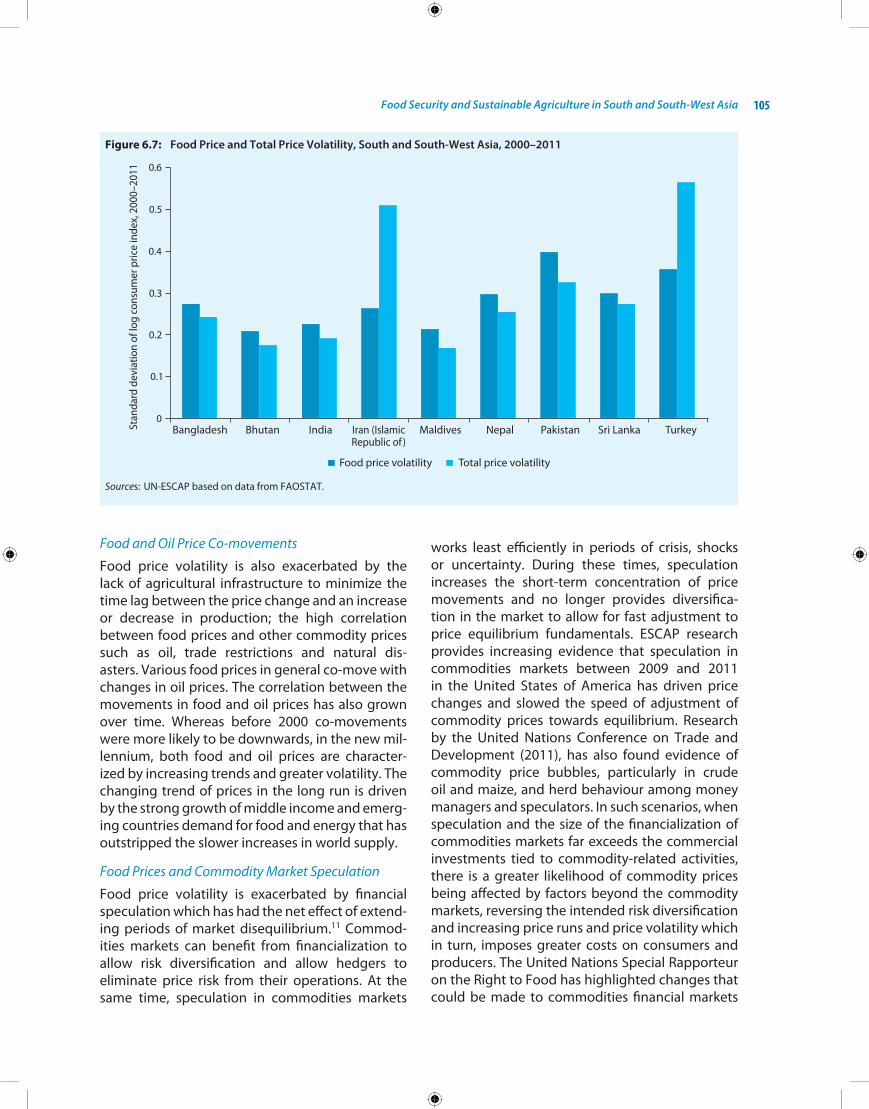
Food Security and Sustainable Agriculture in South and South-West Asia 105
Food and Oil Price Co-movements
Food price volatility is also exacerbated by the lack of agricultural infrastructure to minimize the time lag between the price change and an increase or decrease in production; the high correlation between food prices and other commodity prices such as oil, trade restrictions and natural dis- asters. Various food prices in general co-move with changes in oil prices. The correlation between the movements in food and oil prices has also grown over time. Whereas before 2000 co-movements were more likely to be downwards, in the new mil-lennium, both food and oil prices are character-ized by increasing trends and greater volatility. The changing trend of prices in the long run is driven by the strong growth of middle income and emerg-ing countries demand for food and energy that has outstripped the slower increases in world supply.
Food Prices and Commodity Market Speculation
Food price volatility is exacerbated by financial speculation which has had the net effect of extend-ing periods of market disequilibrium.11 Commod-ities markets can benefit from financialization to allow risk diversification and allow hedgers to eliminate price risk from their operations. At the same time, speculation in commodities markets
works least efficiently in periods of crisis, shocks or uncertainty. During these times, speculation increases the short-term concentration of price movements and no longer provides diversifica-tion in the market to allow for fast adjustment to price equilibrium fundamentals. eSCAP research provides increasing evidence that speculation in commodities markets between 2009 and 2011 in the United States of America has driven price changes and slowed the speed of adjustment of commodity prices towards equilibrium. Research by the United nations Conference on Trade and Development (2011), has also found evidence of commodity price bubbles, particularly in crude oil and maize, and herd behaviour among money managers and speculators. in such scenarios, when speculation and the size of the financialization of commodities markets far exceeds the commercial investments tied to commodity-related activities, there is a greater likelihood of commodity prices being affected by factors beyond the commodity markets, reversing the intended risk diversification and increasing price runs and price volatility which in turn, imposes greater costs on consumers and producers. The United nations Special Rapporteur on the Right to Food has highlighted changes that could be made to commodities financial markets
Figure 6.7: Food Price and Total Price Volatility, South and South-West Asia, 2000–2011
Sources: Un-eSCAP based on data from FAoSTAT.
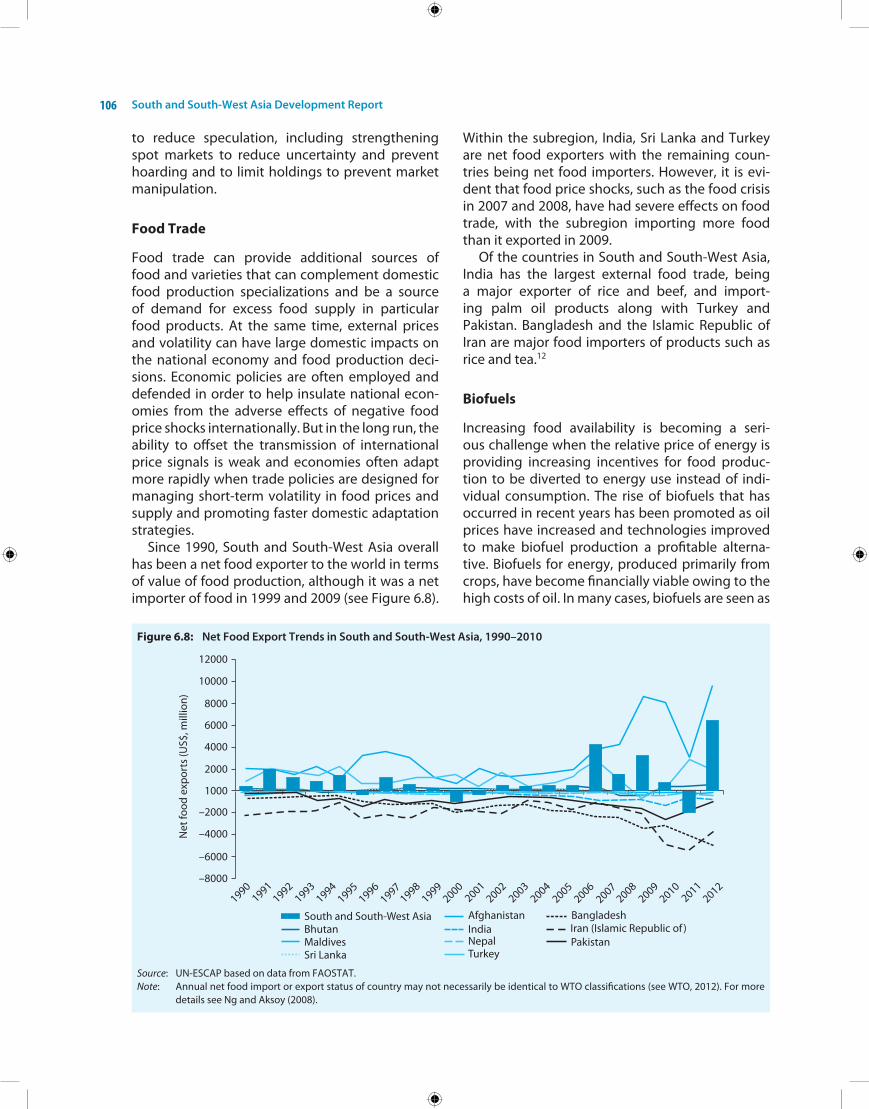
South and South-West Asia Development Report106
to reduce speculation, including strengthening spot markets to reduce uncertainty and prevent hoarding and to limit holdings to prevent market manipulation.
Food Trade
Food trade can provide additional sources of food and varieties that can complement domestic food production specializations and be a source of demand for excess food supply in particular food products. At the same time, external prices and volatility can have large domestic impacts on the national economy and food production deci-sions. economic policies are often employed and defended in order to help insulate national econ-omies from the adverse effects of negative food price shocks internationally. But in the long run, the ability to offset the transmission of international price signals is weak and economies often adapt more rapidly when trade policies are designed for managing short-term volatility in food prices and supply and promoting faster domestic adaptation strategies.
Since 1990, South and South-West Asia overall has been a net food exporter to the world in terms of value of food production, although it was a net importer of food in 1999 and 2009 (see Figure 6.8).
Within the subregion, india, Sri Lanka and Turkey are net food exporters with the remaining coun-tries being net food importers. however, it is evi-dent that food price shocks, such as the food crisis in 2007 and 2008, have had severe effects on food trade, with the subregion importing more food than it exported in 2009.
of the countries in South and South-West Asia, india has the largest external food trade, being a major exporter of rice and beef, and import-ing palm oil products along with Turkey and Pakistan. Bangladesh and the islamic Republic of iran are major food importers of products such as rice and tea.12
Biofuels
increasing food availability is becoming a seri-ous challenge when the relative price of energy is providing increasing incentives for food produc-tion to be diverted to energy use instead of indi-vidual consumption. The rise of biofuels that has occurred in recent years has been promoted as oil prices have increased and technologies improved to make biofuel production a profitable alterna-tive. Biofuels for energy, produced primarily from crops, have become financially viable owing to the high costs of oil. in many cases, biofuels are seen as
Figure 6.8: Net Food Export Trends in South and South-West Asia, 1990–2010
Source: Un-eSCAP based on data from FAoSTAT.Note: Annual net food import or export status of country may not necessarily be identical to WTo classifications (see WTo, 2012). For more
details see ng and Aksoy (2008).
Food Security and Sustainable Agriculture in South and South-West Asia 107
a first stage attempt to move away from oil-based energy dependence. however, biofuels are not necessarily products that will reduce countries’ net carbon footprint. Land conversion, energy inputs into food production and emissions from biofuel use can, in aggregate, increase the net volume of greenhouse gas emissions.
Biofuels have had large impacts in countries such as the United States and Brazil, where a combin-ation of large food production and crops suitable for biofuels, maize and sugar cane, respectively can be observed. Biofuel production increases also due to legislation mandating biofuel consumption in those countries as well as other countries seeking more renewable energy solutions.
in 2010, it was estimated that only 2 per cent of food production was displaced by biofuels, and this will increase to 4 per cent globally by 2030. At the same time, biofuel efficiency is set to increase with second-generation techniques producing fuel from cellulose and other compounds to increase efficiency from existing inputs and land.
in South and South-West Asia, at present, bio-fuels are not a large source of fuel or diversion from agricultural food production, yet their global price effects are strongly transmitted across the subregion and biofuels will become more signifi-cant substitutes for food in agriculture as countries in the subregion continue to develop. in india, for example, biofuels from sugarcane are used to pro-duce ethanol which is mandated to be blended to at least 2 per cent concentration for vehicle fuel consumption. Biofuels in india remain com-mercially insignificant at the moment. however their role in india is set to increase markedly if the national biofuels policy is implemented. The latter sets the ambitious goal of replacing 20 per cent of petroleum fuel consumption with biofuels by 2017. The country also hopes to lower the substitutability of biofuels and food production by mandating that biofuels be produced only from inedible food stock grown on land unsuited for food production.13
The Likely Impacts from Climate Change
one of South and South-West Asia’s greatest chal-lenges to food security is a lack of mitigation and adaptation strategies to address climate change, as well as the effect that changes in local and regional climates will have on the food production sys-tem and rural development across the subregion.
South and South-West Asia is especially vulner-able given the emerging status of most countries into low-middle incomes; the extreme range of environment and climate factors across the sub- region — from high mountainous areas to large deserts; the high level of existing food insecurity; and the high proportion of people living in rural areas where livelihoods are most vulnerable to changes in climate.
Climate change effects are characterized by fluctuations in average temperatures and temper-ature volatility and changes in weather patterns including sunlight, rainfall and weather extreme events that have large impacts on food produc-tion systems. Current food production systems are highly dependent upon predictable and regular weather patterns learnt over generations. Volatil-ity in weather patterns and more extreme weather events or seasonal variations can cause loss of crops and livestock, but may also increase the difficulty in determining optimal investment options for future seasons of agriculture production.
The effects of climate change are highly complex and difficult to attempt to model and predict. Vari-ous models suggest significant changes in temp- erature and weather patterns with South Asia’s temperatures expected to rise around 2 degrees Celsius by 2050. At the same time, conservative estimates suggest that cereal production could decrease by up to 10 per cent by 2100 and that by 2050, countries like Bangladesh could see decreases of wheat by one third. South and South-West Asia’s agricultural production is also highly sensitive to temperature shifts. For example, it is estimated that in india, a 1 degree Celsius temp-erature rise could cause a 5 per cent decrease in wheat and maize yield.14
The region has experienced some recent climate trends that are likely to provide a signal of future climate change effects (see Table 6.5). in particular, the subregion has seen in recent decades, average increases in temperature, decreased frost days, and extreme variations in rainfall.
Some climate change effects could have posi-tive impacts on local yields of crops, but the net effect of climate change across South and South-West Asia is far more likely to be negative given the fragility of agricultural production to local climate norms and variations in temperature and rainfall.
one of the greatest human impacts of climate change that can threaten food security and lives is
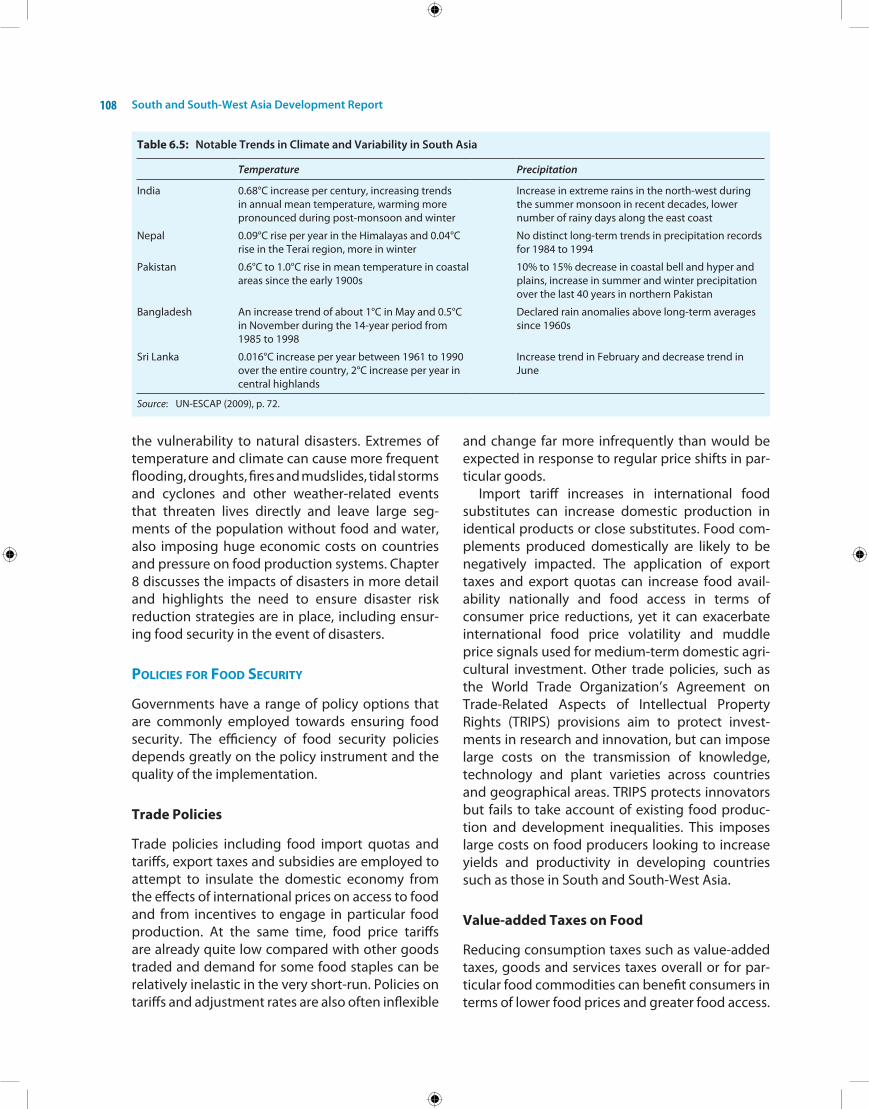
South and South-West Asia Development Report108
the vulnerability to natural disasters. extremes of temperature and climate can cause more frequent flooding, droughts, fires and mudslides, tidal storms and cyclones and other weather-related events that threaten lives directly and leave large seg-ments of the population without food and water, also imposing huge economic costs on countries and pressure on food production systems. Chapter 8 discusses the impacts of disasters in more detail and highlights the need to ensure disaster risk reduction strategies are in place, including ensur-ing food security in the event of disasters.
policiEs for food sEcurity
Governments have a range of policy options that are commonly employed towards ensuring food security. The efficiency of food security policies depends greatly on the policy instrument and the quality of the implementation.
Trade Policies
Trade policies including food import quotas and tariffs, export taxes and subsidies are employed to attempt to insulate the domestic economy from the effects of international prices on access to food and from incentives to engage in particular food production. At the same time, food price tariffs are already quite low compared with other goods traded and demand for some food staples can be relatively inelastic in the very short-run. Policies on tariffs and adjustment rates are also often inflexible
and change far more infrequently than would be expected in response to regular price shifts in par-ticular goods.
import tariff increases in international food substitutes can increase domestic production in identical products or close substitutes. Food com-plements produced domestically are likely to be negatively impacted. The application of export taxes and export quotas can increase food avail- ability nationally and food access in terms of consumer price reductions, yet it can exacerbate international food price volatility and muddle price signals used for medium-term domestic agri- cultural investment. other trade policies, such as the World Trade organization’s Agreement on Trade-Related Aspects of intellectual Property Rights (TRiPS) provisions aim to protect invest-ments in research and innovation, but can impose large costs on the transmission of knowledge, technology and plant varieties across countries and geographical areas. TRiPS protects innovators but fails to take account of existing food produc-tion and development inequalities. This imposes large costs on food producers looking to increase yields and productivity in developing countries such as those in South and South-West Asia.
Value-added Taxes on Food
Reducing consumption taxes such as value-added taxes, goods and services taxes overall or for par-ticular food commodities can benefit consumers in terms of lower food prices and greater food access.
Table 6.5: Notable Trends in Climate and Variability in South Asia
Temperature Precipitation
india 0.68°C increase per century, increasing trends in annual mean temperature, warming more pronounced during post-monsoon and winter
increase in extreme rains in the north-west during the summer monsoon in recent decades, lower number of rainy days along the east coast
nepal 0.09°C rise per year in the himalayas and 0.04°C rise in the Terai region, more in winter
no distinct long-term trends in precipitation records for 1984 to 1994
Pakistan 0.6°C to 1.0°C rise in mean temperature in coastal areas since the early 1900s
10% to 15% decrease in coastal bell and hyper and plains, increase in summer and winter precipitation over the last 40 years in northern Pakistan
Bangladesh An increase trend of about 1°C in May and 0.5°C in november during the 14-year period from 1985 to 1998
Declared rain anomalies above long-term averages since 1960s
Sri Lanka 0.016°C increase per year between 1961 to 1990 over the entire country, 2°C increase per year in central highlands
increase trend in February and decrease trend in June
Source: Un-eSCAP (2009), p. 72.

Food Security and Sustainable Agriculture in South and South-West Asia 109
Consumption taxes are regressive with under-privileged people more highly taxed than the rich owing to the formers’ reliance on basic consump-tion goods and their inability to save. People liv-ing in poverty therefore are particularly benefited from consumption tax changes. At the same time, governments often need to consider losses in tax revenue from consumption tax reductions, espe-cially in South and South-West Asia where such taxes are often employed to increase the tax net owing to challenges in income tax collection, including avoidance. Afghanistan, Bangladesh, Bhutan, india, Maldives, Pakistan and Sri Lanka are all countries that reduced consumption tax on basic food commodities during the crisis in 2008.
Fiscal Policies: Food Price Subsidies versus Transfer Programmes
Food price subsidies and price controls are a com-mon response to episodes of food insecurity. Bangladesh and Pakistan are two countries in the subregion that increased food subsidies in the wake of the crisis whilst india reduced its consumer subsidies. But food price subsidies are often expen-sive, difficult to decrease or eliminate and distort-ing. Subsidies have serious effects on budgets, as the government is basically purchasing a compon-ent of the output each time. however, subsidies are politically easy to implement for producers and consumers although difficult to subsequently eliminate owing to consumers and producers adapting to the increased revenue.
input subsidies for food production can also distort the true costs of production and encour-age waste. in india, for example, producer sub-sidies for electricity after the 1980s encouraged over pumping of groundwater and resulted in water logging and falling water tables. An alterna-tive to food subsidies is for Governments to better target transfers to food consumers and produc-ers in need. Consumer cash transfers can also be targeted to avoid excess capture by segments of the population that are more easily able to adapt to food price increases without losing food secur-ity. on the producer side, cash transfers to farmers can be targeted to small farm holders who depend on expensive inputs for farm production or who require incentives to adapt to more productive farm technologies.
Productivity Gains from Better Storage and Logistics
Food storage and logistics improvements and investments can increase agricultural productiv-ity and provide large gains through the reduction of food spoilage and waste between the stork and the fork. it is estimated that one fifth of food production is lost in storage and transmission in Bangladesh, and up to 40 per cent in Sri Lanka. increased infrastructure and technologies in terms of roads access, decent crop and cold-storage both on the farm and in the market, as well as faster and more secure transport to market can increase food availability and cut losses. in addition, South and South-West Asian countries have a number of existing low-cost techniques that could be scaled up and replicated for increasing storage product- ivity, including storage containers made from na-tural insect inhibiting material, such as neem and deodar wood.
Insurance to Producers to Decrease Risks and Increase Investment in Productive Agriculture
other markets have developed insurance instru-ments to deal with inherent variability and volatil-ity in outputs and inputs. South and South-West Asian agricultural producers still lack basic access to insurance products that could help protect farmers against crop losses and uncertainty. Access to adequate crop insurance is often expensive and beyond the means of small producers. instru-ments such as futures contracts can provide more certainty and insurance in volatility prices when farmers require front-loaded expenditures that are dependent upon future prices. At the same time, weather-based crop insurance could provide a greater amount of coverage to farmers in the face of variations of weather from season to sea-son. Weather-based crop insurance is also easier to manage and more flexible in implementation than crop-based insurance, allowing entire localities to be covered.
Renewing Focus on Research and Development for Enhancing Agricultural Productivity
A renewal of the agricultural sector and increased productivity can only be achieved through high
South and South-West Asia Development Report110
commitments to increasing research and develop-ment capacity in agriculture and food production in South and South-West Asia.
Research and development should focus on technological innovations to improve agricultural productivity through practices and technologies. Practices can focus on addressing current agri-cultural methods and achieving yields and out-put improvements through greater efficiency in zero tillage agriculture and rain-fed crop systems. other areas of research should focus on increas-ing technological applications in terms of new and more robust seed and plant varieties, which are more resistant to pests and more resilient, and thereby require less fertilizer. one particular area of research potential for the subregion is agro-ecology. The developing countries in South and South-West Asia face greater challenges raising agricultural productivity by following traditional industrial forms of agriculture. Those require single crop management techniques and the increasingly intensive use of fertilizers and capital equipment to maintain productivity gains. Agro-ecology could provide benefits to farmers across the subregion, who have fewer resources to manage their agricul-tural output, especially fertilizers. The system seeks to apply complex and complementary poly cul-tures to produce crops simultaneously and use nat-ural and cheaply available alternatives to manage agricultural output. Cuba is one country that has widely implemented this approach and although the country remains a major food importer, it now produces most of its own fruit and vegetables using only 25 per cent of the chemicals used in the late 1980s.15
A second area of research and development could focus on developing institutional capacity for better information and technologies to agri-cultural producers and providing greater knowl-edge on various agricultural issues — from access to information on nutrient management or water delivery, to information on land and water man-agement and sustainable agriculture. For example, the network for knowledge Transfer on Sustainable Agricultural Technologies and improved Market Linkages in South and Southeast Asia (SATneT) is a partnership that includes the european Union and the Centre for Alleviation of Poverty through Sus-tainable Agriculture (CAPSA) at eSCAP. it is aimed at supporting intraregional learning on sustainable agriculture technologies and trade facilitation.
SATneT targets various actors along domestic and regional value chains to encourage agricultural research and innovations and capacity-building for regional cooperation in agricultural trade.16
Regional Cooperation in Agricultural Research and Extension
Regional cooperation can provide opportunities for countries in South and South-West Asia to pool resources in research and development and provide greater food productivity and availability. Joint agricultural research programmes can bene-fit from better testing conditions for new crops and hybrids, as well as new natural resource manage-ment techniques. Research information sharing and data collection can be pooled, through geographic information systems, remote sensing and water forecasting applications. in addition, regional coop-eration can lower the investment costs in acquiring and maintaining advanced agricultural and techno-logical equipment. Cooperation can also take place in terms of training imparted to both researchers and agricultural producerswho can then share experiences and good practices. high priority can be placed on information and knowledge shar-ing related to pests and diseases that are trans- boundary issues, capable of causing widespread damage to crops and livestocks. The South Asian Association for Regional Cooperation (SAARC) Agricultural Centre is one example of cooperation in agriculture researchin the subregion. At the same time, cooperation must be prioritized bey-ond nominal support for the maintenance of such institutions. Concrete actions and investment for the utilization of such institutions will allow mem-bers to realize large gains in agricultural develop-ment and renew rural development.
Sharing Experiences across the Region in Food Distribution
South and South-West Asia has a variety of food programmes to ensure greater food security. Public food distribution systems are used in india and Bangladesh to manage access to food for people living in poverty. india’s food distribution system is the largest managed food market system in the world, covering half the country’s popula-tion. The programme manages quantity quotas at fixed prices for people living in poverty or with
Food Security and Sustainable Agriculture in South and South-West Asia 111
incomes below the poverty line. even those house-holds above the poverty level can purchase food at subsidized costs. Food distribution systems allow the government to have direct control over the market. But such systems are far more difficult to manage than market signals and impose large costs in terms of inefficiency and waste. Sri Lanka for example, had a food distribution system since the end of the Second World War. But the system was reformed due to constantly increasing govern-ment expenditure bills, up to 23 per cent of public expenditure in the 1970s — when food prices saw a steady decline.
More recent and increasingly prominent policies for food security among populations living in pov-erty are conditional food programmes. in South and South-West Asia, Afghanistan, Bangladesh, india and nepal have conditional food programmes that offer food for work — in unskilled labour for public works and related work. Another avenue is through education, with Bhutan, india, Maldives, Pakistan and Sri Lanka having used school feed-ing programmes to offer food not only for chil-dren and students, but also food rations for their families, on the condition of the child’s attendance. Those types of programmes seek to improve targeting of food assistance and distribution through self-selection. households that do not need food assistance would have disincentives to collecting food assistance under these work- related or other conditions. Table 6.6 provides a summary of major food security programmes in South and South-West Asian countries.
Food Reserves at the Community and Regional Levels
Food reserves and banks are another key alter- native for increasing food security and one in which there is great capacity to deepen regional cooperation. A variety of different banks can be established depending on the type of food-related asset that would best benefit lenders and bor-rowers. Grain, seed or fodder banks can serve as reserves or a source of storage, variety and diver-sity to countries. Farmer cooperatives can agree to use their own grain or seed banks. For example, the self-employed women’s association (SeWA), a trade union based in Gujarat, india, has used banks for grain, seeds, fodder and tools for increasing
food security of small and marginal farmers in vari-ous indian districts.
Grain banks can also be used to provide a store of grain for households to draw upon in times of food scarcity. They can either distribute the grain at cost or on loan. Private informal banks can com-plement the public distribution systems in cases of gaps in delivery or access. Seed banks are another option to store high-yield seeds that farmers can access and return with interest over future crop seasons. Fodder banks can provide fodder to farm-ers who have difficulty accessing it in dry areas or times of drought and need to feed livestock. Tool and knowledge banks can provide farmers with access to equipment that is needed only tempo-rarily or valuable knowledge about local farming conditions and good practices.
Traditional bank reserves can also be agreed upon for earmarking cash reserves for use in the face of food crises at national levels. At the same time, country buffer stocks — of a series of reserves and essential grains — are expensive and may be out of the reach of many countries in South and South-West Asia. Like insurance, buffer stocks tend to function best when both the risk and the stock are pooled. in this case, regional cooperation for contribution and access to buffer stocks can pro-vide countries with coverage against food security risks and have lower costs than maintaining self-sufficiency in food reserves. The Comprehensive Framework for Action, produced by the United nations high-Level Task Force on the Global Food Crisis also advocates the use of regional stocks or food arrangements instead of or complementary to national systems to address short-term volatility in food prices.
one example is in South Asia where the SAARC’s Food Bank established a reserve of food grains, initially rice and wheat, that member countries contribute to according to agreed shares and then draw upon as needed. The SAARC’s Food Bank was established after the failure of the SAARC regional food security reserve, set up in the 1980s which failed to distribute any grains owing to the overly strict conditions for countries to access the reserve. The difficulty with such systems is that food crises often rapidly impact other countries within the subregion and therefore any reserves would face high demand in particular episodes of food price shocks.
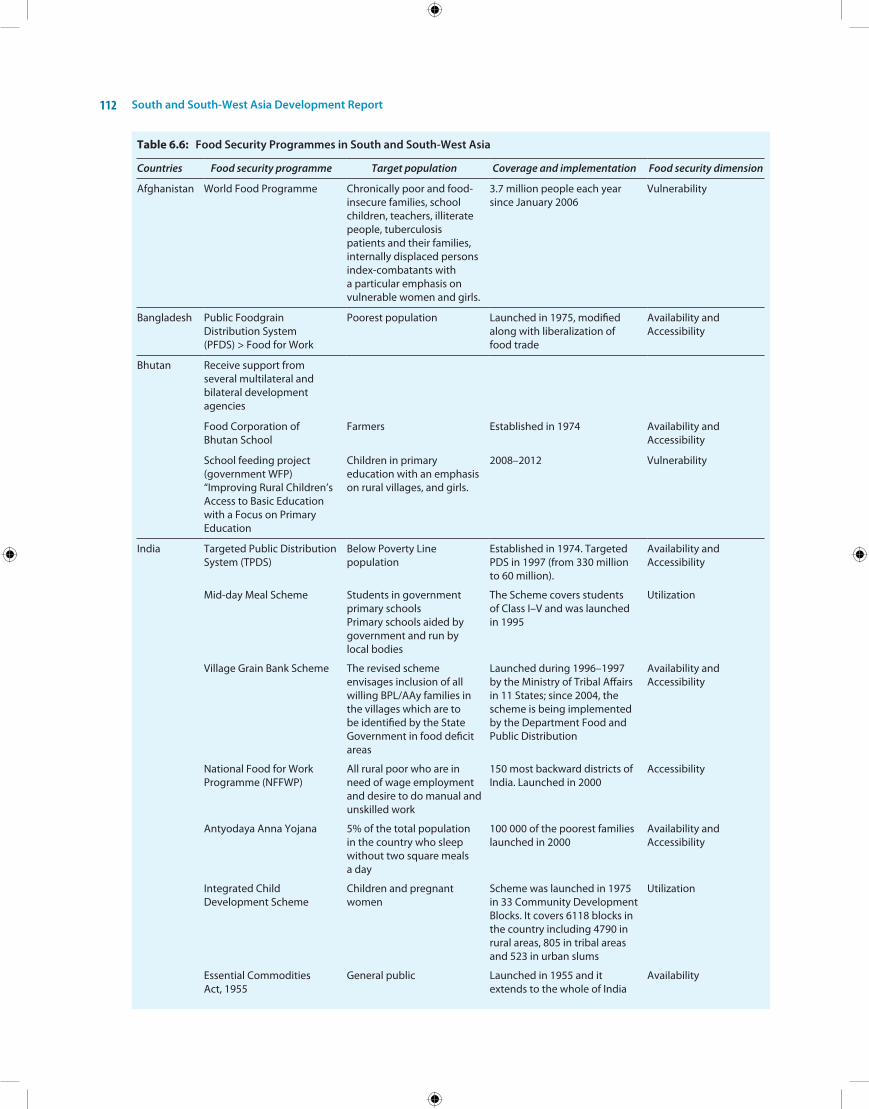
South and South-West Asia Development Report112
Table 6.6: Food Security Programmes in South and South-West Asia
Countries Food security programme Target population Coverage and implementation Food security dimension
Afghanistan World Food Programme Chronically poor and food-insecure families, school children, teachers, illiterate people, tuberculosis patients and their families, internally displaced persons index-combatants with a particular emphasis on vulnerable women and girls.
3.7 million people each year since January 2006
Vulnerability
Bangladesh Public Foodgrain Distribution System (PFDS) > Food for Work
Poorest population Launched in 1975, modified along with liberalization of food trade
Availability and Accessibility
Bhutan Receive support from several multilateral and bilateral development agencies
Food Corporation of Bhutan School
Farmers established in 1974 Availability and Accessibility
School feeding project (government WFP) “improving Rural Children’s Access to Basic education with a Focus on Primary education
Children in primary education with an emphasis on rural villages, and girls.
2008–2012 Vulnerability
india Targeted Public Distribution System (TPDS)
Below Poverty Line population
established in 1974. Targeted PDS in 1997 (from 330 million to 60 million).
Availability and Accessibility
Mid-day Meal Scheme Students in government primary schools Primary schools aided by government and run by local bodies
The Scheme covers students of Class i–V and was launched in 1995
Utilization
Village Grain Bank Scheme The revised scheme envisages inclusion of all willing BPL/AAy families in the villages which are to be identified by the State Government in food deficit areas
Launched during 1996–1997 by the Ministry of Tribal Affairs in 11 States; since 2004, the scheme is being implemented by the Department Food and Public Distribution
Availability and Accessibility
national Food for Work Programme (nFFWP)
All rural poor who are in need of wage employment and desire to do manual and unskilled work
150 most backward districts of india. Launched in 2000
Accessibility
Antyodaya Anna Yojana 5% of the total population in the country who sleep without two square meals a day
100 000 of the poorest families launched in 2000
Availability and Accessibility
integrated Child Development Scheme
Children and pregnant women
Scheme was launched in 1975 in 33 Community Development Blocks. it covers 6118 blocks in the country including 4790 in rural areas, 805 in tribal areas and 523 in urban slums
Utilization
essential Commodities Act, 1955
General public Launched in 1955 and it extends to the whole of india
Availability
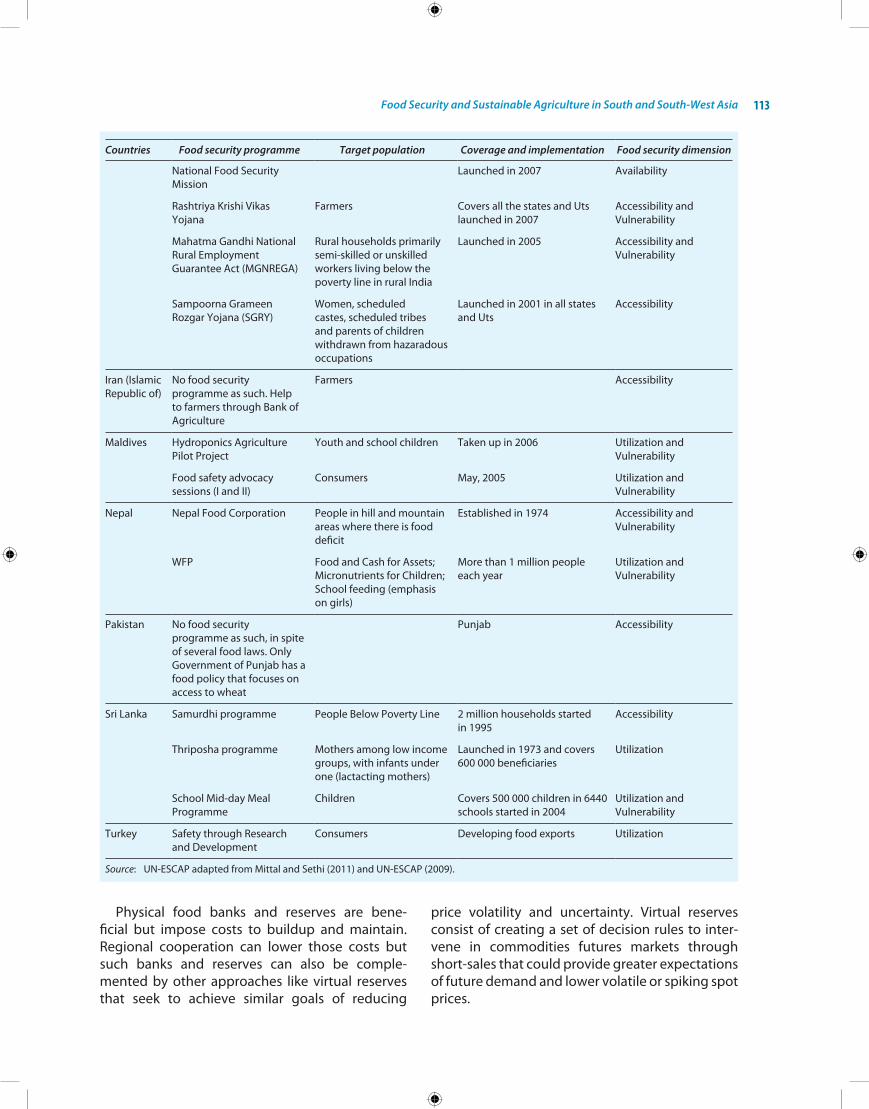
Food Security and Sustainable Agriculture in South and South-West Asia 113
Countries Food security programme Target population Coverage and implementation Food security dimension
national Food Security Mission
Launched in 2007 Availability
Rashtriya krishi Vikas Yojana
Farmers Covers all the states and Uts launched in 2007
Accessibility and Vulnerability
Mahatma Gandhi national Rural employment Guarantee Act (MGnReGA)
Rural households primarily semi-skilled or unskilled workers living below the poverty line in rural india
Launched in 2005 Accessibility and Vulnerability
Sampoorna Grameen Rozgar Yojana (SGRY)
Women, scheduled castes, scheduled tribes and parents of children withdrawn from hazaradous occupations
Launched in 2001 in all states and Uts
Accessibility
iran (islamic Republic of)
no food security programme as such. help to farmers through Bank of Agriculture
Farmers Accessibility
Maldives hydroponics Agriculture Pilot Project
Youth and school children Taken up in 2006 Utilization and Vulnerability
Food safety advocacy sessions (i and ii)
Consumers May, 2005 Utilization and Vulnerability
nepal nepal Food Corporation People in hill and mountain areas where there is food deficit
established in 1974 Accessibility and Vulnerability
WFP Food and Cash for Assets; Micronutrients for Children; School feeding (emphasis on girls)
More than 1 million people each year
Utilization and Vulnerability
Pakistan no food security programme as such, in spite of several food laws. only Government of Punjab has a food policy that focuses on access to wheat
Punjab Accessibility
Sri Lanka Samurdhi programme People Below Poverty Line 2 million households started in 1995
Accessibility
Thriposha programme Mothers among low income groups, with infants under one (lactacting mothers)
Launched in 1973 and covers 600 000 beneficiaries
Utilization
School Mid-day Meal Programme
Children Covers 500 000 children in 6440 schools started in 2004
Utilization and Vulnerability
Turkey Safety through Research and Development
Consumers Developing food exports Utilization
Source: Un-eSCAP adapted from Mittal and Sethi (2011) and Un-eSCAP (2009).
Physical food banks and reserves are bene- ficial but impose costs to buildup and maintain. Regional cooperation can lower those costs but such banks and reserves can also be comple-mented by other approaches like virtual reserves that seek to achieve similar goals of reducing
price volatility and uncertainty. Virtual reserves consist of creating a set of decision rules to inter-vene in commodities futures markets through short-sales that could provide greater expectations of future demand and lower volatile or spiking spot prices.
South and South-West Asia Development Report114
conclusion
over 50 years ago, South and South-West Asia engaged in a “green revolution” of agricultural pro-ductivity and sustained increases in yields and food production that eradicated repeated episodes of mass famine in various countries of the subregion as a result of food production shocks. The benefits of the past “green revolution” are now diminished and South and South-West Asia once again faces increasing large-scale food insecurity.
There is a clear need for the countries in South and South-West Asia to renew their commitments to agricultural development and ignite a second green revolution. Sustained benefits from another green revolution will require sustainable develop-ment of agriculture. South and South-West Asian countries will experience better returns on agri-cultural investments by focusing on research and development strategies that maximize sustainable agricultural technologies and techniques. Coun-tries can increase the sustainability of their food systems by adopting multisectoral approaches to food security. Policies should address food produc-tion and consumption through diversification of consumption patterns, and complementary actions through incentives and assistance for diversifying food production systems. education of both farm-ers and consumers will provide assistance in reduc-ing waste and misdirected investment.
national strategies should be developed to take advantage of existing agricultural and natural resource infrastructures. Countries without large food and agriculture industries need not look to develop such industries and increase exports, but would do better to focus on rural development through non-agricultural employment and en-hancement of existing agricultural value chains. Countries in South and South-West Asia may want to focus on renewing the inputs to sustainable agri-culture, through investments in basic infrastructure such as water, roads and electricity, as well as facili-tate in market access. Countries should set goals for the increase in productivity in agriculture in terms of output and yield, but also in terms of reducing the number and value of inputs. investments in rain-fed agriculture or drip-fed crops can significantly reduce the drain on water resources and expensive
or resource-intensive inputs such as fertilizers. The available land and crop density is another focus for increasing agricultural output intensity.
To ensure food access, countries in South and South-West Asia may want to focus on hunger hotspots and the micro and regional solutions required for addressing highly localized episodes of hunger. Furthermore, targeting food assistance for consumption to the poor and most excluded, including women, disadvantaged or discriminated populations and minorities will achieve faster gains in eradicating hunger and undernutrition. ensur-ing adequate intake of micronutrients will provide large multiplier effects for food security and utiliza-tion of food.
Regional cooperation is also an important strat-egy to pursue for countries in South and South-West Asia to improve food security. Food availability and management through coordinated approaches to research and development will improve product-ivity. The establishment of food and grain banks and reserves at a regional level will pool resources and risk and reduce costs to minimizing food price volatility.
Finally, regional coordination for food security in South and South-West Asia is a priority to enable a multidimensional approach to tackling hunger and food insecurity. The SAARC’s food security agenda is an important step in this direction. The deepening integration of national strategies for food security with regional cooperation and coor-dination of food supply and instruments to offset price volatility requires investments in institutional capacity and knowledge about mainstreaming food security-related factors into national devel-opment strategies. Regional institutions such as the Centre for the Alleviation of Poverty through Sustainable Agriculture (CAPSA) of eSCAP can pro-vide the technical assistance for capacity devel-opment at national and regional levels. CAPSA’s ability to convene networks and establish partner-ships with countries across Asia and the Pacific can be utilized and applied to the South and South-West Asian context in order to raise awareness of the benefits of regional cooperation for food security and the multidimensional factors that affect food access and availability throughout the subregion.
Given their criticality for a country’s economic and social development, and their finite and uneven distribution, energy endowments are seen as strategic resources. The increasing pressure on inequitably distributed, scarce resources has the potential to lead to inter-State conflict and inter-nal ferment. in contrast, international cooperation between energy surplus and deficient countries, technology developers, manufacturers, emerging markets and service providers can harness comple-mentarities, enhance the effective use of available resources, and build cross-country energy capaci-ties for mutual benefit.
The energy sector presents a whole range of opportunities for cooperation between South and South-West Asian countries. With energy demand growing exponentially, the countries of the sub-region face a number of energy challenges — energy poverty, lack of available supplies, poor energy infrastructure and transport facilities, and environmental externalities of energy production and use. Countries in South and South-West Asia have maintained strong growth momentum over the past decade, as observed in chapter 1. even though the ongoing global financial and eco-nomic crisis has led to a slowdown of their econ-omies, the trend in growth is expected to continue. Therefore, energy consumption is also expected to show an upward trend. While energy policies geared towards efficient use of energy may help bridle demand, it is clear that maintaining growth rates, as developing economies undergo structural changes and strive to meet welfare objectives, will necessitate an increase in energy use. This chapter examines the major energy challenges that South and South-West Asia face and makes a case for regional energy cooperation, also highlighting some opportunities.
EnErgy and dEvElopmEnt in south and south-wEst asia
energy security, linked with the four “A”s of energy — availability, accessibility, affordability
and acceptability — is a paramount policy concern for countries in the subregion. Maintaining ade-quate energy supply, ensuring that energy reaches all, determining prices in such a way that the poor can afford access to lifeline energy and responding to the call to make sustainable energy choices, are all integral to countries’ energy objectives. energy choices that countries make have significant economy-wide repercussions, and therefore the energy–growth–development linkage is integral to policy thinking.1
South and South-West Asia is marked mostly by developing economies, placed in the categories of low and medium human development accord-ing to the human Development index (hDi) 2011 published by the United nations Development Programme (UnDP), as observed in chapter 2. The islamic Republic of iran and Turkey are the only two countries that exhibit high human development. Figure 7.1 maps the hDi values of countries in South and South-West Asia against the country figures for per capita energy consumption. With some excep-tions, it can be observed that countries with higher per capita energy consumption are also better placed on the development index. This is of par- ticular significance for countries in South and South-West Asia, for a large populace in the sub-region does not enjoy access to modern forms of energy. Widening access to clean and efficient energy, including grid-connected/decentral-ized power, is a key component of development efforts in the subregion. even in electrified vil-lages and cities, intermittent and inadequate supply paralyzes day-to-day activities, industry and agriculture. in urban centres, this problem is also associated with reliance on envionmen-tally unsound diesel fuel for captive power gen-eration, especially during power outages. Clearly, enhancement in domestic energy supply requires investments in exploration of indigenously avail-able resources and the establishment of requisite infrastructure for energy transport and delivery. however, with energy-deficient economies dot-ting the subregion, effective sourcing of energy
7 Energy Security and Cooperation
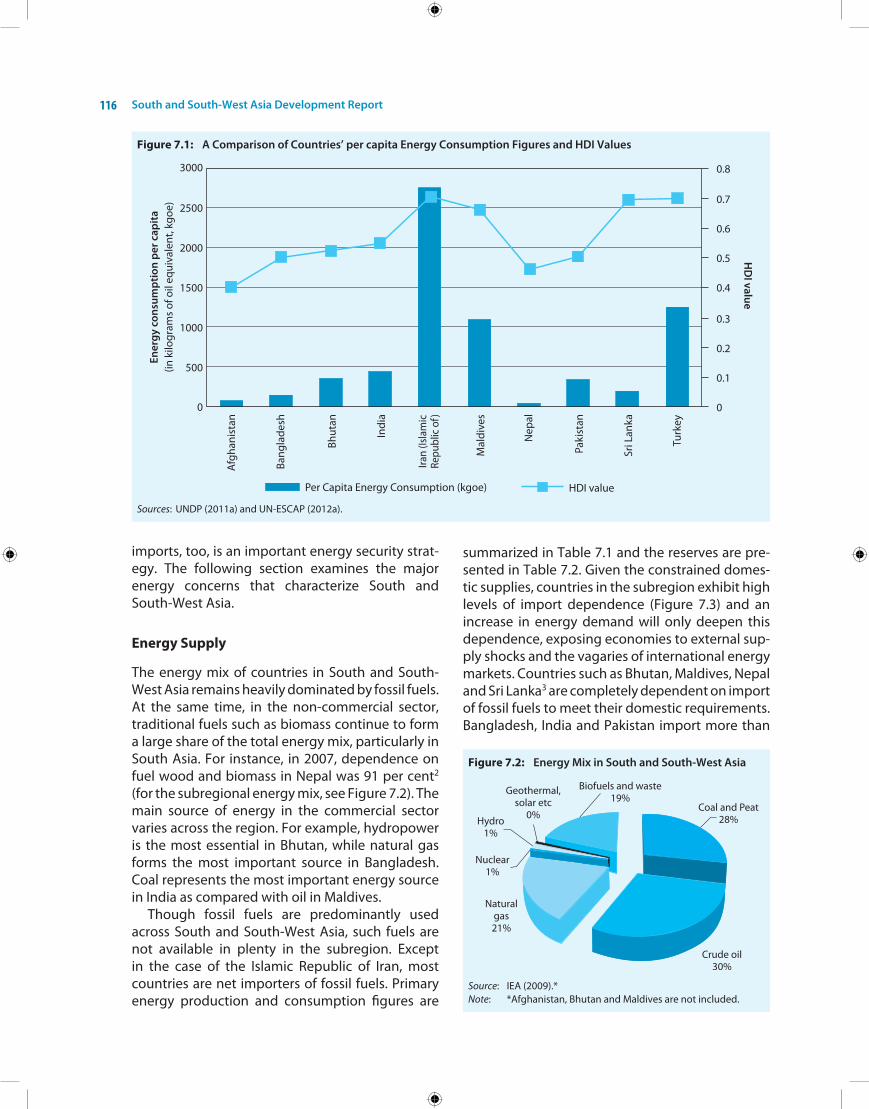
South and South-West Asia Development Report116
imports, too, is an important energy security strat-egy. The following section examines the major energy concerns that characterize South and South-West Asia.
Energy Supply
The energy mix of countries in South and South-West Asia remains heavily dominated by fossil fuels. At the same time, in the non-commercial sector, traditional fuels such as biomass continue to form a large share of the total energy mix, particularly in South Asia. For instance, in 2007, dependence on fuel wood and biomass in nepal was 91 per cent2 (for the subregional energy mix, see Figure 7.2). The main source of energy in the commercial sector varies across the region. For example, hydropower is the most essential in Bhutan, while natural gas forms the most important source in Bangladesh. Coal represents the most important energy source in india as compared with oil in Maldives.
Though fossil fuels are predominantly used across South and South-West Asia, such fuels are not available in plenty in the subregion. except in the case of the islamic Republic of iran, most countries are net importers of fossil fuels. Primary energy production and consumption figures are
summarized in Table 7.1 and the reserves are pre-sented in Table 7.2. Given the constrained domes-tic supplies, countries in the subregion exhibit high levels of import dependence (Figure 7.3) and an increase in energy demand will only deepen this dependence, exposing economies to external sup-ply shocks and the vagaries of international energy markets. Countries such as Bhutan, Maldives, nepal and Sri Lanka3 are completely dependent on import of fossil fuels to meet their domestic requirements. Bangladesh, india and Pakistan import more than
Figure 7.1: A Comparison of Countries’ per capita Energy Consumption Figures and HDI Values
Sources: UnDP (2011a) and Un-eSCAP (2012a).
Figure 7.2: Energy Mix in South and South-West Asia
Source: ieA (2009).*Note: *Afghanistan, Bhutan and Maldives are not included.

Energy Security and Cooperation 117
Table 7.1: Energy Production and Consumption, South and South-West Asia, 2009
Coal Crude oil Natural gas
Production Consumption Production Consumption Production Consumption
Thousand metric tons of coal equivalent Thousand metric tons Billion cubic metres
Afghanistan 500 500 . . . . 0.004 0.004Bangladesh 612 612 . . 1 000 18.27 18.27Bhutan 49 21 . . . . . . . .india 452 095 499 006 33 690 192 950 41.16 41.16iran (islamic Republic of) 1 174 1 770 205 637 93 948 138.59 137.59Maldives . . . . . . . . . . . .nepal 16 324 . . . . . . . .Pakistan 2 352 6 977 3 180 10 206 34.90 34.90Sri Lanka . . 76 . . 2 009 . . . .Turkey 24 861 42 951 2 402 16 551 0.67 34.47
Source: Drawn from UnSD (2012).Notes: Two dots (. . ) indicate data not applicable or not available. Coal production includes the production of coal, lignite, oil shale and peat. Gas production refers to net production i.e. gross production
minus re-injected minus flared and vented minus extraction loss shrinkage. Figures for natural gas have been converted from Terajoules to billion cubic metres using a standard heat value of 39,021 kilojoule/cubic meter (kJ/Cu M).
Table 7.2: Energy Reserves in South and South-West Asia
Coal reserves
Oil reserves Gas reserves Anthracite Lignite Peat
Million metric tons Billion cubic metres Million metric tons
Afghanistan . . 50 66 . . . .Bangladesh 3 344 293 . . . .Bhutan . . . . . . . . . .india 740 1 074 56 100 4 500 . .iran (islamic Republic of) 17 329 29 610 1 203 . . . .Maldives . . . . . . . . . .nepal . . 0 . . 1 . .Pakistan 42 840 1 2 070 . .Sri Lanka . . . . . . . . 5Turkey 44 6 529 1 814 . .
Source: Drawn from UnSD (2012).Notes: Two dots (. . ) indicate that data are not applicable or available. Coal reserves presented in above table are proved recoverable reserves.
half of their total crude oil. The islamic Republic of iran enjoys the world’s fourth largest oil and third largest natural gas reserves,4 yet it imports a wide range of petroleum products.5
hydro resources are plentiful in Bhutan and nepal, and form the basis of electricity trade in the indian subcontinent. Table 7.3 details hydropower potential and installed capacity across South and South-West Asia. Development of hydropower in Bhutan and nepal, and establishment of infra-structure for energy trade could help meet energy demand in populous, energy-deficient countries such as Bangladesh and india.
Diversification of the energy mix and increase in the share of renewable energy is essential to enhance the subregion’s energy security, to reduce the impact of price shocks due to fluctuations in international crude oil price and to mitigate the environmental impact of energy use. Solar energy and biogas are being looked at to provide decen-tralized electricity solutions in remote, rural areas in many countries in South and South-West Asia, such as Bangladesh, Bhutan, india, Sri Lanka and nepal. Currently 50,000 households- and village-level bio-gas plants are in place in Bangladesh.6 in india as well, the Jawaharlal nehru national Solar Mission

South and South-West Asia Development Report118
Figure 7.3: Energy Import Dependence in South and South-West Asia
Source: Based on UnSD (2012).Note: Gross import dependence is the proportion of imports in total consumption; net import dependence is the proportion of net imports
(i.e. imports–exports) in total consumption.
Table 7.3: Hydropower Potential and Installed Capacity in South and South-West Asia
Country
Hydropower (theoretical potential)
Installed capacity
Gigawatt hours per year Gigawatts
Afghanistan 394 000 0.374Bangladesh 4 000 0.23Bhutan 263 000 1.488india 2 638 000 36.924iran (islamic Republic of) 448 000 7.703Maldives . . . .nepal 733 000 0.573 Pakistan 475 000 6.481Sri Lanka 21 000 1.391Turkey 433 000 14.553
Source: UnSD (2012).Notes: Two dots (. .) indicate that data are not applicable or
available.
has set the target of deploying 22,000 MW of solar power generation capacity by 2022. in Maldives, the cabinet has set a target of achieving 60per cent solar based power generation by 2020, as part of its ambitious decarbonization programme.7 how-ever, countries are grappling with a range of chal-lenges, one of the major obstacles in large-scale deployment of renewable energy being the scale
of investments required and the lack of available technology.
Energy Access
energy supplies are inadequate despite access fig-ures in South and South-West Asia being dismal. Access to energy has often been described as the missing Millennium Development Goal (MDG); energy services can contribute significantly to the achievement of all MDGs.8 Access to modern energy can be measured in two forms: access to energy for lighting (i.e. in the form of electricity); and access to modern cooking fuels such as LPG and electricity, or more efficient appliances/cook-stoves that rely on traditional sources yet exhibit an advance in efficiency and convenience.
The level of electrification across the subregion is very low, particularly in South Asia (see Figure 7.4). even when grid connected electricity is provided, the supply of power is intermittent and varied across countries. in South and South-West Asia, Afghanistan and nepal have the lowest per capita electricity con- sumption (see Figure 7.5). Also, a large number of households rely on kerosene as a fuel for lighting. For india alone, those figures stand at 67.5 million rural and 3.7 million urban households.

Energy Security and Cooperation 119
Figure 7.4: Access to Electricity in South and South-West Asia (percentage)
Source: World Bank (2009).
With regards to energy used for cooking, major-ity of the population in South and South-West Asia depends on biomass (fuel wood and dung cakes essentially) to meet their cooking energy require-ments. in india and Bangladesh, for instance, 72 per cent and 88 per cent of the population, respectively still relies on traditional biomass for cooking.9 This dependence on fuel wood has high environmen-tal opportunity costs. indoor air pollution owing to the burning of wood in traditional cook stoves is one of the major causes of respiratory ailments
affecting persons living in rural areas. Women and young girls are generally responsible for collecting fuel wood thereby affecting their ability to seek employment and attend school.
A number of initiatives have been launched to increase the penetration of modern forms of energy, particularly in rural areas. The Rajiv Gandhi Grameen Vidyutikaran Yojana and the remote village electrification programme in india aim to provide electricity access to rural areas. nepal has the com-munity rural electrification programme and the
Figure 7.5: Per capita Electricity Consumption in South and South-West Asia
Source: UnSD (2012).

South and South-West Asia Development Report120
rural energy development programme in place. in that country, a large scale establishment of biogas plants has also been undertaken under the bio-gas support of the Alternative energy Promotion Council to address the concern of access to clean and convenient cooking energy. in Sri Lanka, three consecutive projects — energy services delivery, renewable energy for rural economic develop-ment (ReReD) and ReReD additional financing — have been introduced with support from the World Bank and the Global environment Facility to pro-vide both grid based and off grid electricity access to rural areas. in some countries, cleaner use of bio-mass for cooking is being promoted through the dissemination of improved cookstoves, while the reach of liquefied petroleum gas (LPG) is also being expanded.
Two primary factors that affect the uptake of modern forms of energy in the subregion are the availability of appropriate energy sources and the affordability of modern fuels. innovative mech-anisms need to be evolved to finance energy services in South and South-West Asia. A combina-tion of government funding through provision of infrastructure and subsidies, donor based funding, provision of microfinancing and clean develop-ment mechanism (CDM) based funding, are being employed to improve energy access in the sub- region, yet those efforts need to be up scaled.
Energy Pricing
The pricing of energy is a key determinant of con-sumption and even production patterns. With pric-ing required to serve a range of objectives from
increasing access to creating a level-playing field for public and private investors, the energy pric-ing debate in developing economies attracts a diversity of strong opinions. Prices of energy prod-ucts and services are regulated by Governments in most countries of the subregion. Governments control prices of final petroleum products, natural gas and electricity and subsidies are provided for various reasons — increasing access to modern energy forms, shielding the domestic economy from external price volatility and supporting select consuming sectors (such as power and fertilizers in the case of gas).
Currently, the islamic Republic of iran has the highest subsidization rate in South and South-West Asia followed by Bangladesh. As a percentage of GDP, subsidies in the islamic Republic of iran stand at 22.6 per cent and that of Sri Lanka are at 1 per cent (Table 7.4). Subsidies on fossil fuels are largely considered inefficiently targeted and lead to distortions in the market in the form of exces-sive consumption and perverse incentives to move towards energy intensive economic activities. These have adverse implications on the environ-ment. Since most countries are net importers of energy, the macroeconomic impacts of the rising subsidy burden are also high, especially in cases where subsidies contribute substantially to the fiscal deficit of the countries.
in addition, in order to promote renewable energy and to increase its cost competitiveness vis-à-vis fossil fuel based energy services, subsidies are also provided on renewable energy in many countries. Support to renewable energy is gener-ally provided in the form of producer subsidies,
Table 7.4: Energy Subsidies in South and South-West Asia, 2010
Average subsidization rate
Subsidy as a percentage of GDP Oil Gas Coal Electricity
Percentage Percentage (in billions of US$)Afghanistan . . . . . . . . . . . .Bangladesh 46.1 4.8 0.34 1.9 0 2.79Bhutan . . . . . . . . . . . .india 13.5 1.4 16.2 2.22 0 3.87iran (islamic Republic of) 84.6 22.6 40.92 25.49 0 14.43Maldives . . . . . . . . . . . .nepal . . . . . . . . . . . .Pakistan 28.9 4.2 0.14 4.93 0 2.23Sri Lanka 16.1 1 0.32 0 0 0.19Turkey . . . . . . . . . . . .
Source: ieA (2011b).Note: Two dots ( . . ) indicate that data are not applicable or not available.
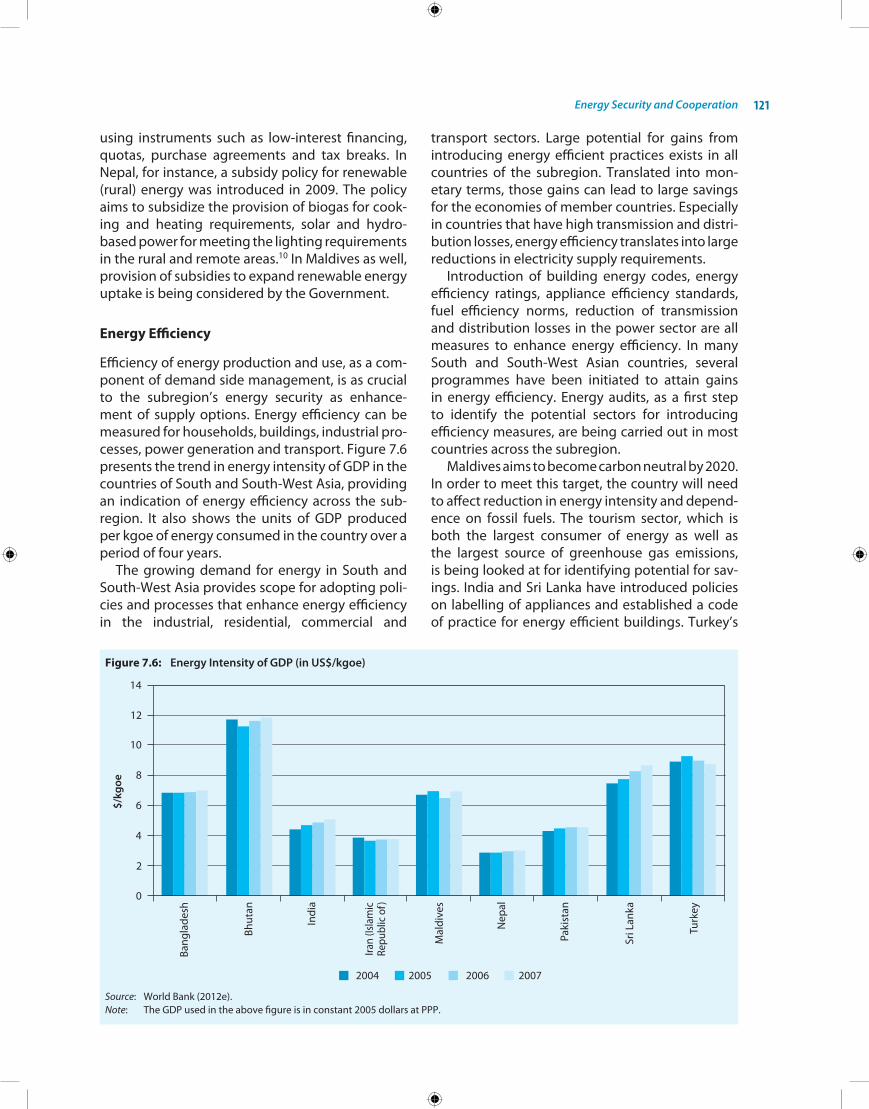
Energy Security and Cooperation 121
using instruments such as low-interest financing, quotas, purchase agreements and tax breaks. in nepal, for instance, a subsidy policy for renewable (rural) energy was introduced in 2009. The policy aims to subsidize the provision of biogas for cook-ing and heating requirements, solar and hydro-based power for meeting the lighting requirements in the rural and remote areas.10 in Maldives as well, provision of subsidies to expand renewable energy uptake is being considered by the Government.
Energy Efficiency
efficiency of energy production and use, as a com-ponent of demand side management, is as crucial to the subregion’s energy security as enhance-ment of supply options. energy efficiency can be measured for households, buildings, industrial pro-cesses, power generation and transport. Figure 7.6 presents the trend in energy intensity of GDP in the countries of South and South-West Asia, providing an indication of energy efficiency across the sub-region. it also shows the units of GDP produced per kgoe of energy consumed in the country over a period of four years.
The growing demand for energy in South and South-West Asia provides scope for adopting poli-cies and processes that enhance energy efficiency in the industrial, residential, commercial and
transport sectors. Large potential for gains from introducing energy efficient practices exists in all countries of the subregion. Translated into mon-etary terms, those gains can lead to large savings for the economies of member countries. especially in countries that have high transmission and distri-bution losses, energy efficiency translates into large reductions in electricity supply requirements.
introduction of building energy codes, energy efficiency ratings, appliance efficiency standards, fuel efficiency norms, reduction of transmission and distribution losses in the power sector are all measures to enhance energy efficiency. in many South and South-West Asian countries, several programmes have been initiated to attain gains in energy efficiency. energy audits, as a first step to identify the potential sectors for introducing efficiency measures, are being carried out in most countries across the subregion.
Maldives aims to become carbon neutral by 2020. in order to meet this target, the country will need to affect reduction in energy intensity and depend- ence on fossil fuels. The tourism sector, which is both the largest consumer of energy as well as the largest source of greenhouse gas emissions, is being looked at for identifying potential for sav-ings. india and Sri Lanka have introduced policies on labelling of appliances and established a code of practice for energy efficient buildings. Turkey’s
Figure 7.6: Energy Intensity of GDP (in US$/kgoe)
Source: World Bank (2012e).Note: The GDP used in the above figure is in constant 2005 dollars at PPP.
South and South-West Asia Development Report122
energy efficiency initiatives include regulatory and fiscal incentives, and education and outreach pro-grammes covering buildings, industry and appli-ances. The islamic Republic of iran is also aiming to improve the efficiency of transport and to increase the usage of CnG in the sector. Further, in countries such as india, where industries consume a major share of the total commercial energy, the need for industrial energy efficiency is being recognized and market mechanisms like the perform achieve trade (PAT) that involves trading of energy saving certificates have been introduced to encourage a move towards higher levels of energy efficiency.
building a casE for EnErgy coopEration in south and south-wEst asia
it is clear that countries in the subregion share many energy-related concerns. The detailed analysis in the following section suggests that complemen-tarities also exist that hold out promise for coop-eration. This is despite the fact that countries in South Asia do not boast of large indigenous energy reserves, apart from availability of hydro-based power in Bhutan and nepal. including South-West Asian countries (Turkey and the islamic Republic of iran) into the purview of the study brings in new dimensions. While Turkey’s strategic importance as a transit country may seem more relevant to continental europe — which sources supplies from Russia and the Caspian Sea region through Turkey — the islamic Republic of iran’s rich oil and gas reserves bring a large world energy supplier into the ambit of subregional analysis. This offers further oppor-tunities for energy trade, in addition to possibilities for inter-country cooperation on energy infrastruc-ture, joint prospecting for reserves, power trade, and technology development.
The following section seeks to build, through an exploration of the South and South-West Asian energy landscape and citation of specific opportu-nities, a rationale for countries in the subregion to collaborate on energy.
Optimal Utilization of Inequitably Distributed Resources
energy production centres often do not overlap with centres of high energy consumption. Also, energy resources and capabilities are inequitably distributed across a geographical region, and
exploitation of resources in one country has reper-cussions for others. This necessitates inter-state interaction on energy issues. By its inherent nature, therefore, energy policy incorporates inter-state cooperation and management of ties with external partners. This holds good for South and South-West Asia; surplus resources are available in countries where technical capacity for resource development is not high, and temporal changes in demand and supply create complementarities for trade.
Cooperation in Estimation of Resources
Resource estimation, the starting point for national and subregional energy planning, itself remains a concern in some countries in South and South-West Asia. Lack of quality data and uncertainty over reserves can lead to the promulgation of policies based on false presumptions, having serious consequences both in the short and long term. While an underestimation of resources can impede investment and fuel resource nationalism, an inflated assessment of fuel reserves can lead to flawed infrastructure and overall energy system planning. Recent studies that indicate a vast over-estimation of india’s coal reserves, suggest that an appropriate estimation of the country’s reserves would bring the reserves-to-production (R/P) ratio down from 200 years to 40.11 This holds testimony to the need for countries in the subregion to adopt globally accepted procedures for classification of mineral resources and reserves.
A range of energy opportunities exist in South and South-West Asia that need to be supported by reliable data for the furtherance of investment and policy action. Also, there are opportunities for countries to collaboratively estimate resource potential where the resources and the tech- no–economic capabilities for exploration are avail-able with different countries in the subregion. A cloud of uncertainty has marked gas reserves in Bangladesh, oil and gas companies in South and South-West Asia can therefore play a role in pro-specting for gas in the country. increased pro-duction of natural gas would be a boon not only for energy-deficient Bangladesh but also for sur-rounding india and Pakistan which have large requirements of gas for their power and fertilizers industries.
Some cross-country engagement on resource exploration is underway. Cairn india discovered gas in the Mannar coast off Sri Lanka, which has
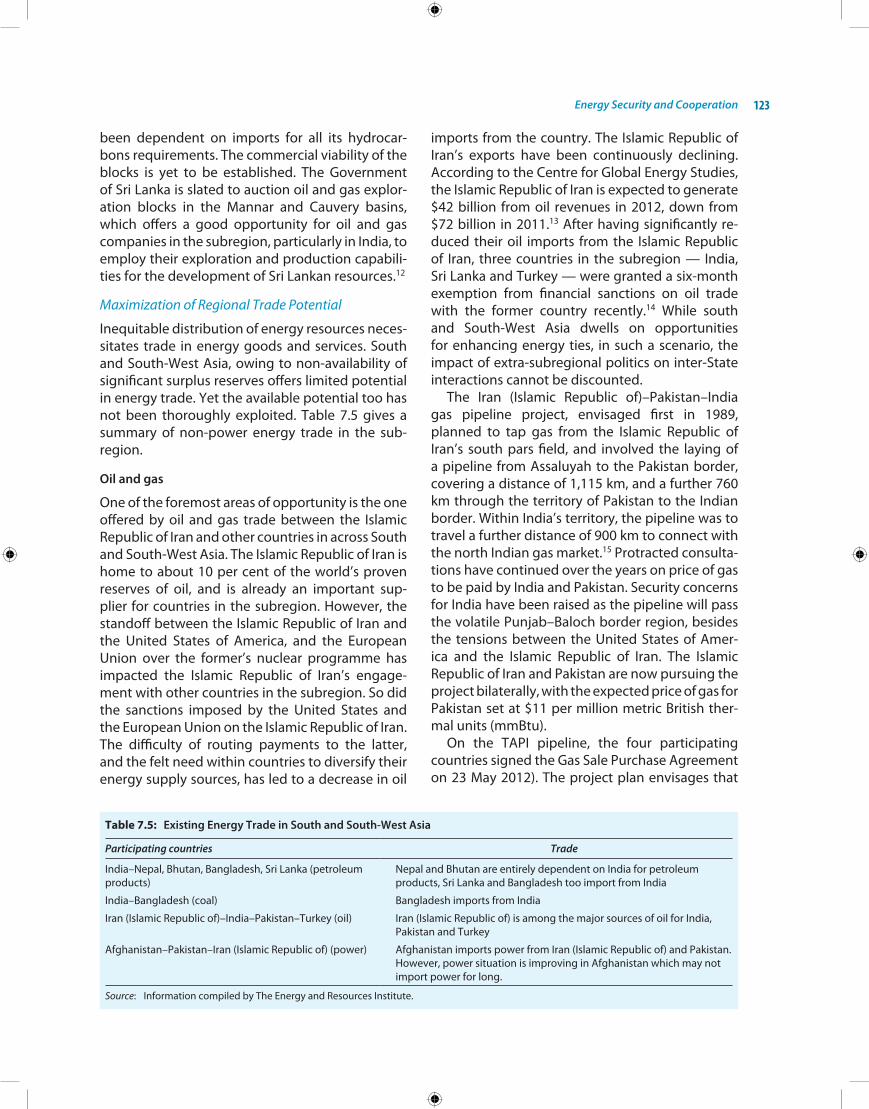
Energy Security and Cooperation 123
been dependent on imports for all its hydrocar-bons requirements. The commercial viability of the blocks is yet to be established. The Government of Sri Lanka is slated to auction oil and gas explor-ation blocks in the Mannar and Cauvery basins, which offers a good opportunity for oil and gas companies in the subregion, particularly in india, to employ their exploration and production capabili-ties for the development of Sri Lankan resources.12
Maximization of Regional Trade Potential
inequitable distribution of energy resources neces-sitates trade in energy goods and services. South and South-West Asia, owing to non-availability of significant surplus reserves offers limited potential in energy trade. Yet the available potential too has not been thoroughly exploited. Table 7.5 gives a summary of non-power energy trade in the sub-region.
Oil and gas
one of the foremost areas of opportunity is the one offered by oil and gas trade between the islamic Republic of iran and other countries in across South and South-West Asia. The islamic Republic of iran is home to about 10 per cent of the world’s proven reserves of oil, and is already an important sup-plier for countries in the subregion. however, the standoff between the islamic Republic of iran and the United States of America, and the european Union over the former’s nuclear programme has impacted the islamic Republic of iran’s engage-ment with other countries in the subregion. So did the sanctions imposed by the United States and the european Union on the islamic Republic of iran. The difficulty of routing payments to the latter, and the felt need within countries to diversify their energy supply sources, has led to a decrease in oil
imports from the country. The islamic Republic of iran’s exports have been continuously declining. According to the Centre for Global energy Studies, the islamic Republic of iran is expected to generate $42 billion from oil revenues in 2012, down from $72 billion in 2011.13 After having significantly re-duced their oil imports from the islamic Republic of iran, three countries in the subregion — india, Sri Lanka and Turkey — were granted a six-month exemption from financial sanctions on oil trade with the former country recently.14 While south and South-West Asia dwells on opportunities for enhancing energy ties, in such a scenario, the impact of extra-subregional politics on inter-State interactions cannot be discounted.
The iran (islamic Republic of)–Pakistan–india gas pipeline project, envisaged first in 1989, planned to tap gas from the islamic Republic of iran’s south pars field, and involved the laying of a pipeline from Assaluyah to the Pakistan border, covering a distance of 1,115 km, and a further 760 km through the territory of Pakistan to the indian border. Within india’s territory, the pipeline was to travel a further distance of 900 km to connect with the north indian gas market.15 Protracted consulta-tions have continued over the years on price of gas to be paid by india and Pakistan. Security concerns for india have been raised as the pipeline will pass the volatile Punjab–Baloch border region, besides the tensions between the United States of Amer-ica and the islamic Republic of iran. The islamic Republic of iran and Pakistan are now pursuing the project bilaterally, with the expected price of gas for Pakistan set at $11 per million metric British ther-mal units (mmBtu).
on the TAPi pipeline, the four participating countries signed the Gas Sale Purchase Agreement on 23 May 2012). The project plan envisages that
Table 7.5: Existing Energy Trade in South and South-West Asia
Participating countries Trade
india–nepal, Bhutan, Bangladesh, Sri Lanka (petroleum products)
nepal and Bhutan are entirely dependent on india for petroleum products, Sri Lanka and Bangladesh too import from india
india–Bangladesh (coal) Bangladesh imports from india
iran (islamic Republic of)–india–Pakistan–Turkey (oil) iran (islamic Republic of) is among the major sources of oil for india, Pakistan and Turkey
Afghanistan–Pakistan–iran (islamic Republic of) (power) Afghanistan imports power from iran (islamic Republic of) and Pakistan. however, power situation is improving in Afghanistan which may not import power for long.
Source: information compiled by The energy and Resources institute.

South and South-West Asia Development Report124
the pipeline, extending from the Dauletabad gas fields to Fazilka at the Pakistan–india border, will be operational by 2018. The 1,680 km-long pipeline is expected to transport 90 million metric standard cubic metre per day (mmscmd) of gas, out of which 38 mmscmd each will be india’s and Pakistan’s allocation, while the remaining gas will be for Afghanistan. The contract price of the pipeline gas is linked to a formula that contains indices based on fuel basket and other indices not as volatile as crude oil.16 The Government of india also agreed recently to pay 50 cents per mmBtu to Pakistan and Afghanistan as transit fees.
Petroleum Products
india has emerged as a subregional refining hub and the trade of petroleum products from india to other countries in South and South-West Asia offers scope for increase. Bhutan, nepal and Pakistan already import petroleum products from india. one of india’s leading public sector, petro-leum refining and distribution company, indian oil Corporation limited (ioCL) has an overseas ven-ture, Lanka ioC Plc, in Sri Lanka which holds one-third share in Ceylon Petroleum Storage Terminals Ltd, the Common User Facility for storage and dis-tribution of petroleum products. Most of Bhutan’s petroleum requirements are met by indian exports. nepal’s complete petroleum products require-ment, 11 per cent of total energy consumed, is sourced from india, under a five-year contract signed in March 2007 between the nepal oil Cor-poration Ltd. (noC) and the indian oil Corporation Ltd. in view of the increasing demand for petro-leum products, a memorandum of understanding has been signed by the two companies for the con-struction of a cross-border pipeline for petroleum products trade from ioC’s Raxaul depot to noC’s depot, Amlekhgunj.17 Pakistan and Bangladesh import significant part of their refined oil from the United Arab emirates and Singapore, respectively which are also the major export destinations for indian refined oil. Thus, there is significant scope for trading in refined oil within South and South-West Asia that is still unutilized.
The significance of petroleum products trade in South Asia has prompted the Governments of india and Pakistan to establish the india–Pakistan expert group on petroleum and petrochemicals trade. The recent round of talks under the expert
group, in July 2012, focused on the identification of possible supply routes, points of supply, definition of standards and regulations, and enhancement of direct banking and postal services. To date, the talks have had limited success, with no consensus on a long-term supply agreement and the related clause of building a pipeline. There has, however, been some agreement on allowing petroleum products trade on land via the Wagah border. The high shipment costs is a deterrent for indian oil companies to supply to Pakistan and, at present, trade in liquids is not allowed on land routes.18
Power Interconnections
Since a large part of South and South-West Asia is not well endowed with fossil fuel reserves, harness-ing of hydroelectric potentials and power trade are of significance. Power trade is currently ongoing in the subregion yet there is scope for further expan-sion. Table 7.6 lists existing power interconnec-tions that exist within South and South-West Asia. Among South Asian countries, Sri Lanka has almost exhausted its potential hydropower capacity. The potential capacity in Bangladesh is quite low. india has almost half of the potential hydroelectric capa-city of the subregion, yet the total potential can-not even satisfy the current level of demand within that very country. Pakistan is in a better situation but its potential is not enough to meet its demand over the long run. With low current utilization levels, however, Afghanistan, Bhutan and nepal offer substantial surplus electricity generated from hydropower alone that can be exported to other countries. The current installed capacity in Bhutan is about 1,500 MW as against the potential of about 30,000 MW of electricity. Though india and Pakistan are unlikely to export electricity to other countries on a net basis, they can be engaged in exchanges with neighbouring countries.
There exists clear seasonality in hydropower generation that can be exploited for furthering trade. The peak months for hydropower gener-ation are August–September, the lean months are from January to June. Such seasonal comple-mentarities in power production and demand underscore the importance of trade. high demand season in one country may coincide with a season of energy surplus in another. hydropower from nepal and Bhutan can potentially meet the high demand for power in india and Pakistan during the summer monsoons, while nepal can import
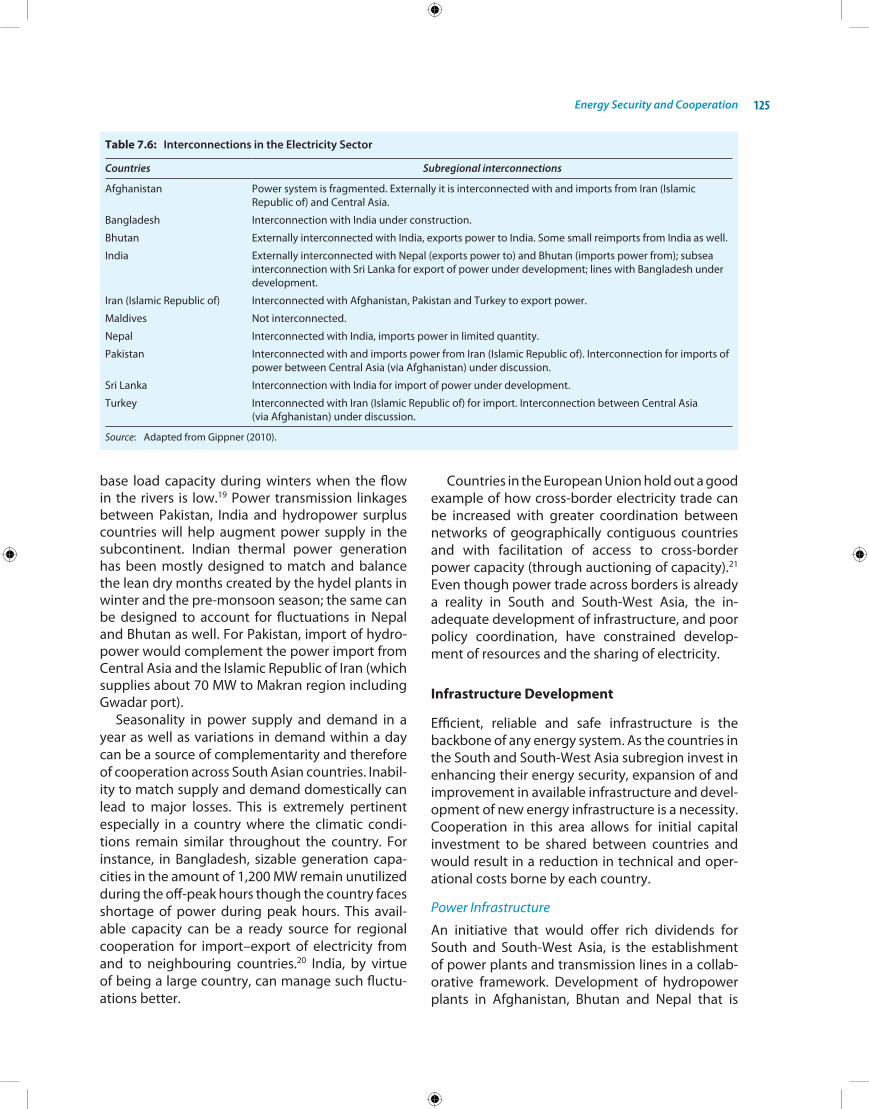
Energy Security and Cooperation 125
base load capacity during winters when the flow in the rivers is low.19 Power transmission linkages between Pakistan, india and hydropower surplus countries will help augment power supply in the subcontinent. indian thermal power generation has been mostly designed to match and balance the lean dry months created by the hydel plants in winter and the pre-monsoon season; the same can be designed to account for fluctuations in nepal and Bhutan as well. For Pakistan, import of hydro-power would complement the power import from Central Asia and the islamic Republic of iran (which supplies about 70 MW to Makran region including Gwadar port).
Seasonality in power supply and demand in a year as well as variations in demand within a day can be a source of complementarity and therefore of cooperation across South Asian countries. inabil-ity to match supply and demand domestically can lead to major losses. This is extremely pertinent especially in a country where the climatic condi-tions remain similar throughout the country. For instance, in Bangladesh, sizable generation capa- cities in the amount of 1,200 MW remain unutilized during the off-peak hours though the country faces shortage of power during peak hours. This avail-able capacity can be a ready source for regional cooperation for import–export of electricity from and to neighbouring countries.20 india, by virtue of being a large country, can manage such fluctu-ations better.
Countries in the european Union hold out a good example of how cross-border electricity trade can be increased with greater coordination between networks of geographically contiguous countries and with facilitation of access to cross-border power capacity (through auctioning of capacity).21 even though power trade across borders is already a reality in South and South-West Asia, the in- adequate development of infrastructure, and poor policy coordination, have constrained develop-ment of resources and the sharing of electricity.
Infrastructure Development
efficient, reliable and safe infrastructure is the backbone of any energy system. As the countries in the South and South-West Asia subregion invest in enhancing their energy security, expansion of and improvement in available infrastructure and devel-opment of new energy infrastructure is a necessity. Cooperation in this area allows for initial capital investment to be shared between countries and would result in a reduction in technical and oper-ational costs borne by each country.
Power Infrastructure
An initiative that would offer rich dividends for South and South-West Asia, is the establishment of power plants and transmission lines in a collab-orative framework. Development of hydropower plants in Afghanistan, Bhutan and nepal that is
Table 7.6: Interconnections in the Electricity Sector
Countries Subregional interconnections
Afghanistan Power system is fragmented. externally it is interconnected with and imports from iran (islamic Republic of) and Central Asia.
Bangladesh interconnection with india under construction.
Bhutan externally interconnected with india, exports power to india. Some small reimports from india as well.
india externally interconnected with nepal (exports power to) and Bhutan (imports power from); subsea interconnection with Sri Lanka for export of power under development; lines with Bangladesh under development.
iran (islamic Republic of) interconnected with Afghanistan, Pakistan and Turkey to export power.
Maldives not interconnected.
nepal interconnected with india, imports power in limited quantity.
Pakistan interconnected with and imports power from iran (islamic Republic of). interconnection for imports of power between Central Asia (via Afghanistan) under discussion.
Sri Lanka interconnection with india for import of power under development.
Turkey interconnected with iran (islamic Republic of) for import. interconnection between Central Asia (via Afghanistan) under discussion.
Source: Adapted from Gippner (2010).

South and South-West Asia Development Report126
assisted by the neighbouring countries can not only help develop hydel resources in those coun-tries but also generate power trade potential, par-ticularly with Bangladesh, india and Pakistan. The potential capacities in Afghanistan, Bhutan and nepal cannot be utilized without outside support. Bhutan today has substantial surplus capacity that has been developed largely with support from india (see Box 7.1). For a summary of installed gen-eration capacities and production in countries in South and South-West Asia, see Figure 7.7.
The Bhutanese success story can easily be repli-cated in nepal though the latter need not follow the same model of energy development. There has not been much progress in the proposed large power projects in the country, and india has been assist-ing nepal in the development of relatively smaller hydropower projects like Pokhra (1 MW), Trisuli (21 MW), Western Gandak (15 MW) and Devighat (14.1 MW). Presently, three major hydropower pro- jects viz. Pancheshwar (5,600 MW), Saptakoshi (3,300 MW) and karnali (10,800 MW), are under discussions at various levels as projects of mutual interest. indian private companies are engaged in nepal’s power sector. The Government of nepal has awarded Upper karnali hydropower project (300MW) to a consortium consisting of GMR Group companies and italian-Thai Development Project Co. of Thailand on build-own-operate-transfer basis and a Memorandum of Understanding (MoU) has been signed in this regard in January 2008. According to the MoU, the GMRenergy would pro-vide 12 per cent of free power (36 MW) to nepal.
in addition, GMR energy would also pay 27 per cent free equity to the Government of nepal. Similarly, the Government of nepal has awarded Arun-3 hydropower project (900 MW) to Sutlej Jal Vidyut nigam Ltd. (SJVnL) on build-own-operate-transfer basis for a period of 30 years. A memorandum of understanding (MoU) was signed in March 2008. According to the MoU, the SJVnL would provide 21.9 per cent of power (88 MW) to nepal free of any charge. Further, the SJVnL would also pay 7.5 per cent of its total income as royalty to the Govern-ment of nepal.
Moreover, there have also been discussions on laying down power transmission lines from india to Sri Lanka (submarine power cables), from india to nepal, and from the islamic Republic of iran to Afghanistan, as well as further initiating import of power to the islamic Republic of iran from Tajikistan through Afghan territory. international trade and exchange of electricity makes both economic and logistical sense: it may be economically more advantageous for the border regions of one coun-try to rely on power from a nearby power station in a neighbouring country than from a distant station within its own territory. Also, electricity cannot be stored and, therefore, supply and demand need to be efficiently managed.
Power outages, intermittent supply to newly electrified towns and villages, and lack of grid con-nectivity are issues that characterize most coun-tries in the subregion, particularly in South Asia. The development of internal transmission lines and maintenance of area power grids remain concerns
Figure 7.7: Installed Power Generation Capacity and Production in South and South-West Asia
Source: Drawn from UnSD (2012).

Energy Security and Cooperation 127
Box 7.1Bhutan–India Cooperation in Power Development and Trade
in Bhutan, hydropower accounts for more than 19 per cent of GDP and about 40 per cent in export earn-ings. it also brings almost half of the government revenue and funds critical improvements in health and education.
india has played an important role in the hydropower sector of Bhutan, with the provision of techni-cal and financial assistance, including project design and engineering services, construction supervision services for hydro projects and transmission lines, as well as easy finance. Bhutan–india energy coop-eration started in 1967, when Bhutan started importing electricity through the Jaldhaka hydropower plant, located in West Bengal, a state of india. The cooperation initiative got further strengthened with the development of the 336 MW Chukha hydelproject that was commissioned in 1989. immediately, it became a source of revenue, export earnings and overall economic development for Bhutan as about 75 per cent of the project’s total generation capacity was exported to india. By 2007, two more hydel power projects came up in Bhutan with indian assistance: the 60 MW kurichhu and 1,020 MW Tala hydro power projects. Realizing the potential of such projects as a means to earn more revenues and further economic development, Bhutan signed a Framework Agreement with india in December 2009, whereby india committed to develop 10,000 MW of installed capacity in Bhutan by the year 2020 and to buy a minimum of half of it. The 1,200 MW Punatsangchhu-i hydroelectric Project is already under construction and planned to be commissioned by 2015, while various other projects are under discus-sion. Detailed project reports for the same are being prepared.
Bhutan: Hydropower projects to be completed by 2020
Number Name of projectInstalled capacity
Estimate project cost (million-nu)
Implementation model (loan-grant ratio) Year of commissioning expected
1 Punatsangchhu - i 1 200 36 348 iG (60:40) 2015 (under construction) 2 Punatsangchhu - ii 1 000 42 301 iG (70:30) 2017 (agreement signed) 3 Mangedechu 720 38 105 iG (70:30) 2017 (agreement signed) 4 kuriGongri 1 800 79 200 iG (70:30) 2020 (on hold) 5 Bunakha 180 12 240 JV (70:30) (ThDC) 2020 6 Sankosh 4 060 42 301 iG (70:30) 2020 (on hold) 7 Wangchu 900 50 400 JV (70:30) (SJVnL) 2020 8 Chamkarchhu - i 670 37 520 JV (70:30) (nhPC) 2018 9 Amochhu 620 39 680 iG (70:30) 201710 kholongchu 650 25 272 JV (70:30) (SJVnL) 2018
Total 11 636 500 263
Source: Bisht (2011).
in large and small countries alike. Furthermore, large aggregate technical and transmission losses call for a significant overhaul of infrastructural development initiatives — an area in which lessons can be shared more effectively among countries.
Pipelines
in terms of gas trade, as of now, india is the only South Asian country that imports liquefied natural gas (LnG) in limited quantities. no other trade in natural gas exists within South Asia or with other subregions as there are no gas pipelines and no
country, other than india, that has LnG import facilities. Pakistan has been considering building an LnG import facility near karachi. To date, how-ever, not much progress has been made.
The laying down of pipelines for oil and gas trade implies inter-state collaboration in the area of energy infrastructure as a prerequisite. A study published by the World Bank in 2007 stated that pipeline gas is competitive with LnG imports and regasification up to a distance of 3,500 km.22 The dis-tance between Central Asian countries/the islamic Republic of iran and india falls under 3,500 km.

South and South-West Asia Development Report128
While the discussions on the iran (islamic Republic of)–Pakistan–india (iPi) pipeline have taken more of a bilateral character — limited to the islamic Republic of iran and Pakistan, the Turkmenistan–Afghanistan–Pakistan–india (TAPi) pipeline — though recently at the centre of attention, shows little promise. Although the TAPi project high-lights the strategic importance of transit countries in the subregion, its future seems uncertain in the light of security concerns that mark this tran-sit route and the mistrust that is still prevalent amongst Governments in the subregion. Afghani-stan, the islamic Republic of iran and Pakistan are important transit countries for india to gain ac-cess to Central Asia and the Caucasian countries.
nevertheless, india and Pakistan are engaged in another significant energy dialogue on gas trade. india is proposing to extend to Lahore a natural gas pipeline it has recently installed from the west coast to Bhatinda in the indian state of Punjab which is around 25 km away from the india–Pak-istan border. The concerned india company has plans to import LnG at one of its import termi-nals in Gujarat and to move this gas through the Dahej–Vijaipur–Dadri–Bawana–nangal–Bhatinda pipeline to Punjab and then into Pakistan. Pakistan may experience its worst gas crisis in 2016 when the deficit is expected to hit 3,021 billion cubic feet per day (bcfd). Since Pakistan has not built any LnG import terminals thus far, this venture would be prudent for the country. it will take a minimum of four years to build the LnG terminal whereas the existing pipeline can be extended into Lahore within months.
Strategic Oil Reserves
in the domain of energy infrastructure, most of South and South-West Asia, which is heavily depen-dent on oil imports, may also collaborate to put in place a crisis response coordination mechanism in the form of strategic oil reserves. india has already begun the construction of phase 1 of its reserves comprising 37.5 million barrels of oil, which along with available commercial stocks would meet 78 days of import requirement. Could the coun-tries in South and South-West Asia envisage an arrangement whereby those reserves serve other countries in the event of a supply crisis? in this scenario, access could be provided in lieu of capital investment, rental payments and/or participation
in the procurement of oil for building the reserves. Lessons can be drawn from other countries’ experience of sharing strategic reserves as agreed between Japan and new Zealand, and Japan and the Republic of korea, for instance.
Need to Address Concerns about Energy Access
energy access remains one of the most pressing concerns across the subregion. More than half of the population of South Asia has no access to mod-ern forms of energy. The islamic Republic of iran and Turkey, however, are better off.
Exchange of Good Practices
Globally, 1.3 billion people are without access to electricity. of these, 289 million live in india, and 96 million and 64 million are in Bangladesh and Pakistan, respectively. With insufficient grid con-nectivity, and intermittent power provided to grid-connected, remote areas, renewable energy-based decentralized electricity solutions are a priority in order to improve electrification and meet peak load shortages. Those solutions could be based on small hydro, solar, wind or biomass energy. Decentral-ized generation is operationalized with small mod-ular power generation technologies, mostly based on locally available renewable energy sources, and can also be integrated with the grid.23
The installation of biomass gasifiers for community-based power production has been practiced in india and is of immense relevance to agriculture-based economies where a large amount of agricultural and farm residue is generated. South and South-West Asia can benefit greatly from good practices implemented across the subregion on deployment of biomass gasifiers for power gen-eration, and use of solar lanterns for un-electrified and semi-electrified households. Governments in the region need to make a systematic effort to share such experiences and emerging knowledge in this area for possible replication. Box 7.2 pro-vides a snapshot of solar energy programmes for decentralized energy in South and South-West Asia. A knowledge management system could be created which would make information about rural power programmes available, as well as informa-tion regarding financing mechanisms and business models, technological advances, manufacturing capacities and investment opportunities.24
Energy Security and Cooperation 129
Box 7.2 Solar Energy Innovations in South and South-West Asia
A number of innovative energy programmes have been charted around solar energy in the subregion, particularly for expanding access in rural areas. in india, two programmes — Solid Waste to electricity Company (SeLCo) india and Lighting a Billion Lives — are interesting case studies.
SeLCo india provides sustainable energy solutions to households, commercial entities and indus-tries, but operates mainly for the benefit of under-served rural households. SeLCo systems utilize solar photovoltaic modules to provide power for multiple applications including lighting, pumping of water, and communication. it also provides maintenance services. SeLCo india started out with solar home systems in 1995, which remain the company’s core business even today. one of the reasons for this success has been the ability to tie up with rural and commercial banks, non-governmental organiza-tions and credit cooperatives, to develop financial solutions that make solar technology affordable, with the provision of loans and the facility of staggered payments.
Lighting a Billion Lives, an initiative of The energy and Resources institute (TeRi), is based on an entre-preneurial model of energy service delivery which is geared towards providing solar lamps, dissemi-nated through microsolar enterprises. The programme is focused on the provision of solar lanterns to un-electrified and semi-electrified rural areas. Capital costs are largely supported by grants. The estab-lished enterprises, facilitated by loans and partially subsidized by TeRi or other partners, are managed by a trained local entrepreneur. The entrepreneur rents out solar lanterns to village inhabitants for a nominal daily rent. This model brings clean energy to villagers at an affordable price. To date, the pro-gramme has touched the lives of about 400,000 persons, in 1,700 villages spread over 22 states.
The Solar homes Systems programme in Bangladesh initiated by the infrastructure Development Company Limited (iDCoL), a non-banking financial institution established by the Government of Bangladesh, provides another example of a successful initiative. This programme is the result of coop-eration amongst six partners, including the Government of Bangladesh, iDCoL, donor agencies (the international Development Association of the World Bank, Global environment Facility, amongst others), participating partner organizations, manufacturers/suppliers, and experts. The programme has brought access to electricity to a number of rural households in the country, innovatively employing microcredit facilities. iDCoL provides refinancing facility to partner organizations and channels grants. Technical and logistical assistance is provided to partners. The project has improved access to off-grid energy, generated employment (in partner organizations and for people engaged in distribution and servicing) and increased incomes.
Access to lighting enhances the overall quality of life, increases the hours spent at work, raises incomes, increases safety for women and children, and makes carrying out day-to-day activities easier.
Sources: Un-eSCAP based on SeLCo (2012), TeRi (2012a, 2012b) and iDCoL (2012).
Transition to Clean and Convenient Cooking
While the provision of power for lighting is critical, equally important is the fulfilment of energy needs for cooking, through a source that is efficient, con-venient and safe. over 2.7 billion people worldwide are without access to clean cooking facilities. of these, 840 million live in india, and more than 100 million in Bangladesh and Pakistan each. Trad-itional biomass dominates as a cooking medium in the countries of South Asia. in recent years, research studies have highlighted issues such as indoor pollution, health ills and environmental
risks associated with the use of traditional biomass for cooking and heating. The use of biomass has also meant an additional burden on the women of the household who walk miles to collect fire-wood. With these concerns in the backdrop, there has been an effort to develop clean biomass-based cookstoves (that use less firewood and reduce pol-lution) and to deploy them to promote effective and healthy use of biomass. india, a pioneer in the development of biomass gasifiers and cookstoves, can take the lead in disseminating those tech- nologies across the subregion.25 it is pertinent,

South and South-West Asia Development Report130
however, that energy access solutions are sensitive to local requirements and are viable in the long run. in order to ensure availability of appropriate energy supplies, service delivery and affordability, there is a need to promote knowledge exchange for better understanding of rural–urban contexts, penetration of sustainable energy choices, and better targeting of subsidies.
Development of Energy Markets in South and South-West Asia
The creation of efficient subregional energy mar-kets would help achieve economies of scale while ensuring exploitation of complementarities. The creation of efficient markets will ensure an inflow of capital and facilitate effective planning of pri-vate and public investment. The idea of a sub- regional grid has been explored with regard to both gas and power.
Regional Energy Grids
An integrated electricity grid with trading arrange-ments among the countries can improve efficiency in the entire subregion. even if most countries have excess demand in electricity, trade can still thrive because it would help reduce the distance between the points of production and consump-tion, and thereby reduces transmission losses. South Asia, where transmission and distribution losses of electricity are among the highest in the
world, would do well to take a more cooperative approach. needless to say that such an approach would not only help climate change mitigation but also make economic sense in an energy-starved subregion such as South Asia.
Recognizing the potential benefits, under the umbrella of the South Asian Association for Re-gional Cooperation (SAARC), member countries’ energy ministers in principle agreed on inter-grid exchanges. A task force has finalized a common template on technical and commercial aspects of electricity grid interconnection amongst the SAARC Member States. The expert Group Meet-ing on electricity held in January 2011 considered (a) the concept paper on the Road Map for devel-oping SAARC Market for electricity (SAMe)) and (b) concept paper on SAARC inter-Governmental Framework Agreement for Regional energy Coop-eration. Progress on these concepts was reviewed by the energy Ministers Meeting held in Septem-ber 2011. in addition there has been more prog-ress at the bilateral level, between india and other South Asian countries. Table 7.7 lists milestones in energy cooperation, reached under the framework of SAARC.
Further, energy market formation is also a focus area for the United States Agency for international Development (USAiD) South Asia Regional initi-ative (SARi) energy Program, which commissioned the “Four borders study”. This study concluded that it is technically feasible to build transmission
Table 7.7: Milestones in Energy Cooperation under the South Asian Association for Regional Cooperation
January 2000 Technical committee on energy
January 2004 Specialized working group on energy
october 2005 First meeting of energy ministers, islamabad: Formation of expert group on energy conservation and efficiency and roadmap for SAARC member countries
March 2006 establishment of the SAARC energy Centre in islamabad
March 2007 South Asia energy Dialogue: Recommendations to promote cooperation
April 2009 Meeting of the Working Group: establishment of expert groups on a) oil and gas, b) electricity, c) renewable energy, d) technology and knowledge sharing
December 2009 Meeting of the Working Group: Presentation of the task force draft report on the technical and commercial aspects of the electricity grid interconnections
April 2010 Concept of SAARC Market for electricity in the 16th SAARC Summit Declaration
January 2011 expert group on electricity in its meeting considered a) concept paper on the road map for developing SAARC Market for electricity (SAMe) and b) concept paper on SAARC inter-Governmental Framework Agreement for Regional energy Cooperation.
September 2011 energy Ministers Meeting reviews the progress on SAMe and SAARC inter-Governmental Framework Agreement for Regional energy Cooperation.
Source: SAARC Secretariat (see www.saarc-sec.org/areaofcooperation/cat-detail.php?cat_id=55).
Energy Security and Cooperation 131
interconnections that would benefit Bangladesh, Bhutan, india and nepal. USAiD–SARi/energy has been instrumental in planning generation and transmission system expansion on a regional basis. Supported by the World Bank, this programme promotes energy security in South Asia through three focus areas: cross border energy trade, energy market formation, and regional clean energy de- velopment. A feasibility study was also conducted for a trans-BiMSTeC gas pipeline project under the umbrella of the Bay of Bengal initiative for Multi-sectoral Technical and economic Cooper- ation (BiMSTeC), which brings together South Asian countries. Also, capacity-building workshops have been organized to further the trans-BiMSTeC power exchange and development project.
The World Bank and the Asian Development Bank (ADB) have actively been supporting regional efforts through large-scale infrastructure invest-ment, technical assistance, feasibility studies and advisory services. The ADB SAARC regional energy trade study in December 2010 proposed four con-crete courses of action: creating a subregional power grid involving Bangladesh, Bhutan, nepal and india; building liquefied natural gas (LnG) terminals; building power plants and enhanc-ing refining capacity, as a part of ADB-supported South Asia Subregional economic Cooperation. ADB has helped finance the Upper Seti power plant (27 MW), invested US$17 million in transmission and distribution infrastructure, and helped initiate the Dhalkebar–Muzaffarpur transmission line. ADB has also offered a US$100 million loan for build-ing a cross-border power grid between india and Bangladesh.
Promotion of Sustainable Energy Choices and Practices
Both from the point of view of energy security and sustainability, renewable energy and energy efficiency need to be prioritized in decision-mak-ing. Renewable energy can significantly augment supplies in the subregion while offering scope for devising local energy solutions. in addition, effec-tive demand-side management across sectors reduces consumption and minimizes wastage of energy. The availability of efficient electrical appli-ances and consumer education to promote their use can go a long way in reducing residential energy consumption. Further, sustainable building
design reduces energy consumption for lighting and space conditioning in buildings, as do adoption of efficient technologies and practices in energy- intensive industries.
Cooperation in Renewable Energy Technologies
Clean energy is critical for the subregion to meet the burgeoning energy demand in a manner that does not compromise the environment. Renew-able energy development in the subregion holds a host of benefits for countries in the subregion while offering a range of opportunities for cooperation. india’s strengths in the alternative energy sector can be harnessed for subregional energy security. Cleaner use of traditional fuels is a policy priority in the subregion, whose large population is depen-dent on biomass for their energy requirements. As discussed earlier, india’s lead in the development of clean cookstoves and biomass gasifiers provides an opportunity for technology dissemin-ation. india’s manufacturing base in wind sets, solar PV modules, and solar thermal systems, too, can be employed to advance renewable energy in the subregion. The rich hydro resources in South and South-West Asia call for countries to invest in small hydro projects that allow the harnessing of hydro-power without the environmental and social exter-nalities associated with large hydropower projects. Run-of-the-river hydropower systems that do not require storage of water also help avoid conflicts amongst upstream and downstream countries.
in order to pursue the development of collab-orative clean technology, the institution of clean fossil fuels and renewable energy fund may be considered. This would be comprised of differential contributions from countries in the subregion. The fund could be used to offer support to research and development, and renewable energy pilot projects and their up scaling.
Sharing of Experiences
Along with the enhancement of domestic supply with renewable energy, demand-side manage-ment too is crucial for energy conservation and for reducing the pressure on energy supplies. in some countries in the subregion, including india, the islamic Republic of iran, Pakistan, Sri Lanka and Turkey, efficiency initiatives have been taken in the buildings sectors, with the development of energy codes and their implementation. energy consump-tion in such a sector can be reduced substan-
South and South-West Asia Development Report132
tially by the adoption of efficient practices during construction and use, the application of sustain-able building design, efficient lighting and space conditioning, and the use of renewable energy wherever possible. Further, in most countries, standards have been set for industry efficiency and waste discharge. in some instances, market mech-anisms have been created to encourage saving energy. in india, the Perform, Achieve and Trade (PAT) mechanism included in the national Mis-sion on enhanced energy efficiency as part of the national Action Plan on Climate Change, requires 700 of the most energy intensive power stations and industry units in the country to be mandated to decrease their energy consumption by a unique specified percentage. excess savings would make the units eligible for energy savings certificates that would be tradable across the mandated enti-ties. There is immense scope for exchange of know-ledge and best practices in those areas. This also holds for policy interventions aimed at inducing changes in consumer behaviour, including appli-ance labelling, and the tightening of fuel economy standards.
efficient production and use of energy requires technical capacities to be built across stakeholders, within energy ministries and their affiliates, power utilities and energy service companies. While some cross-border training programmes have been initiated by regional organizations and forums, a stronger inter-governmental push is required on these matters.
thE way forward
The countries in South and South-West Asia are attending to multiple energy challenges today in closing the wide gaps in the energy access and energy security that they face. Sustainable energy access is receiving considerable international at-tention currently. The Secretary-General of the United nations has launched the ”Sustainable energy for All” initiative and the year 2012 has been declared as the international Year of Sustainable energy for All as per the General Assembly resolu-tion 65/151.
While supply is constrained, calling for enhanced exploration of domestic resources and planning
of import options, consumption sectors on the demand side present their own set of challenges. Grappling with similar challenges, and endowed with varied strengths, the countries in the sub-region have a range of energy opportunities they can collaborate on. The need presently is to pursue joint techno–economic evaluation of opportuni-ties and determine the prerequisites for coopera-tion. The efforts towards energy cooperation often need to go hand-in-hand with domestic energy planning. For instance, large-scale power trade in the subregion requires synchronization of grids and technical standards, establishment of finan-cially sustainable energy entities, promotion of competition, delineation of a predictable regula-tory environment and cost-reflective pricing of energy goods and services.
Since political mistrust tends to impede coop-eration in the subregion, it is pertinent to develop project-specific legal–institutional arrangements that lend credibility to collaborative initiatives and provide assurance to involved parties. on this point, countries may seek support from multilat-eral institutions such as the World Bank, ADB and eSCAP and perhaps allow third party monitoring of projects. Multilateral banks and institutions can also emerge as sources of finance for energy proj-ects. A multi-stakeholder process of engagement that brings together national and local govern-ments, private interests, industry groups and citi-zens, and is steadfastly geared towards employing collaborative instruments to derive energy benefits for the subregion, is critical to harness the available opportunities. As highlighted earlier, there is an immense potential for development of cross-coun-try power grids and pipelines across the region to strengthen the energy security. The cross-country power (and gas) grids across the South and South-West Asian subregion should be seen as part of a broader integrated regional grids — which could be termed “Asian energy highways” and that could promote energy security and access. At the Sixty-eighth Commission Session, the member States of eSCAP adopted a resolution requesting the eSCAP secretariat to assist in identifying options for regional energy connectivity, including an inter-governmental framework that could be developed for an integrated Asian energy highway.26
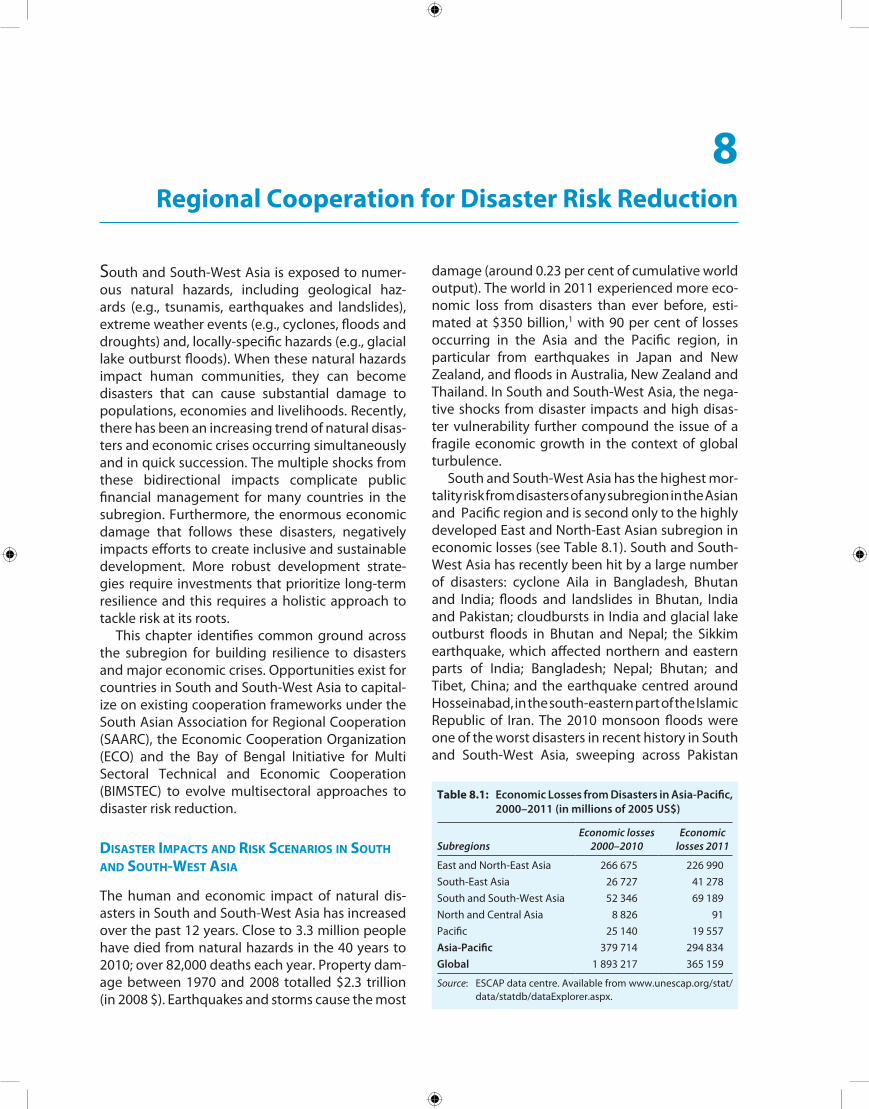
South and South-West Asia is exposed to numer-ous natural hazards, including geological haz-ards (e.g., tsunamis, earthquakes and landslides), extreme weather events (e.g., cyclones, floods and droughts) and, locally-specific hazards (e.g., glacial lake outburst floods). When these natural hazards impact human communities, they can become disasters that can cause substantial damage to populations, economies and livelihoods. Recently, there has been an increasing trend of natural disas-ters and economic crises occurring simultaneously and in quick succession. The multiple shocks from these bidirectional impacts complicate public financial management for many countries in the subregion. Furthermore, the enormous economic damage that follows these disasters, negatively impacts efforts to create inclusive and sustainable development. More robust development strate-gies require investments that prioritize long-term resilience and this requires a holistic approach to tackle risk at its roots.
This chapter identifies common ground across the subregion for building resilience to disasters and major economic crises. opportunities exist for countries in South and South-West Asia to capital-ize on existing cooperation frameworks under the South Asian Association for Regional Cooperation (SAARC), the economic Cooperation organization (eCo) and the Bay of Bengal initiative for Multi Sectoral Technical and economic Cooperation (BiMSTeC) to evolve multisectoral approaches to disaster risk reduction.
disastEr impacts and risk scEnarios in south and south-wEst asia
The human and economic impact of natural dis-asters in South and South-West Asia has increased over the past 12 years. Close to 3.3 million people have died from natural hazards in the 40 years to 2010; over 82,000 deaths each year. Property dam-age between 1970 and 2008 totalled $2.3 trillion (in 2008 $). earthquakes and storms cause the most
damage (around 0.23 per cent of cumulative world output). The world in 2011 experienced more eco-nomic loss from disasters than ever before, esti-mated at $350 billion,1 with 90 per cent of losses occurring in the Asia and the Pacific region, in particular from earthquakes in Japan and new Zealand, and floods in Australia, new Zealand and Thailand. in South and South-West Asia, the nega-tive shocks from disaster impacts and high disas-ter vulnerability further compound the issue of a fragile economic growth in the context of global turbulence.
South and South-West Asia has the highest mor-tality risk from disasters of any subregion in the Asian and Pacific region and is second only to the highly developed east and north-east Asian subregion in economic losses (see Table 8.1). South and South-West Asia has recently been hit by a large number of disasters: cyclone Aila in Bangladesh, Bhutan and india; floods and landslides in Bhutan, india and Pakistan; cloudbursts in india and glacial lake outburst floods in Bhutan and nepal; the Sikkim earthquake, which affected northern and eastern parts of india; Bangladesh; nepal; Bhutan; and Tibet, China; and the earthquake centred around hosseinabad, in the south-eastern part of the islamic Republic of iran. The 2010 monsoon floods were one of the worst disasters in recent history in South and South-West Asia, sweeping across Pakistan
8 Regional Cooperation for Disaster Risk Reduction
Table 8.1: Economic Losses from Disasters in Asia-Pacific, 2000–2011 (in millions of 2005 US$)
SubregionsEconomic losses
2000–2010Economic
losses 2011
east and north-east Asia 266 675 226 990South-east Asia 26 727 41 278South and South-West Asia 52 346 69 189north and Central Asia 8 826 91Pacific 25 140 19 557Asia-Pacific 379 714 294 834Global 1 893 217 365 159
Source: eSCAP data centre. Available from www.unescap.org/stat/data/statdb/dataexplorer.aspx.
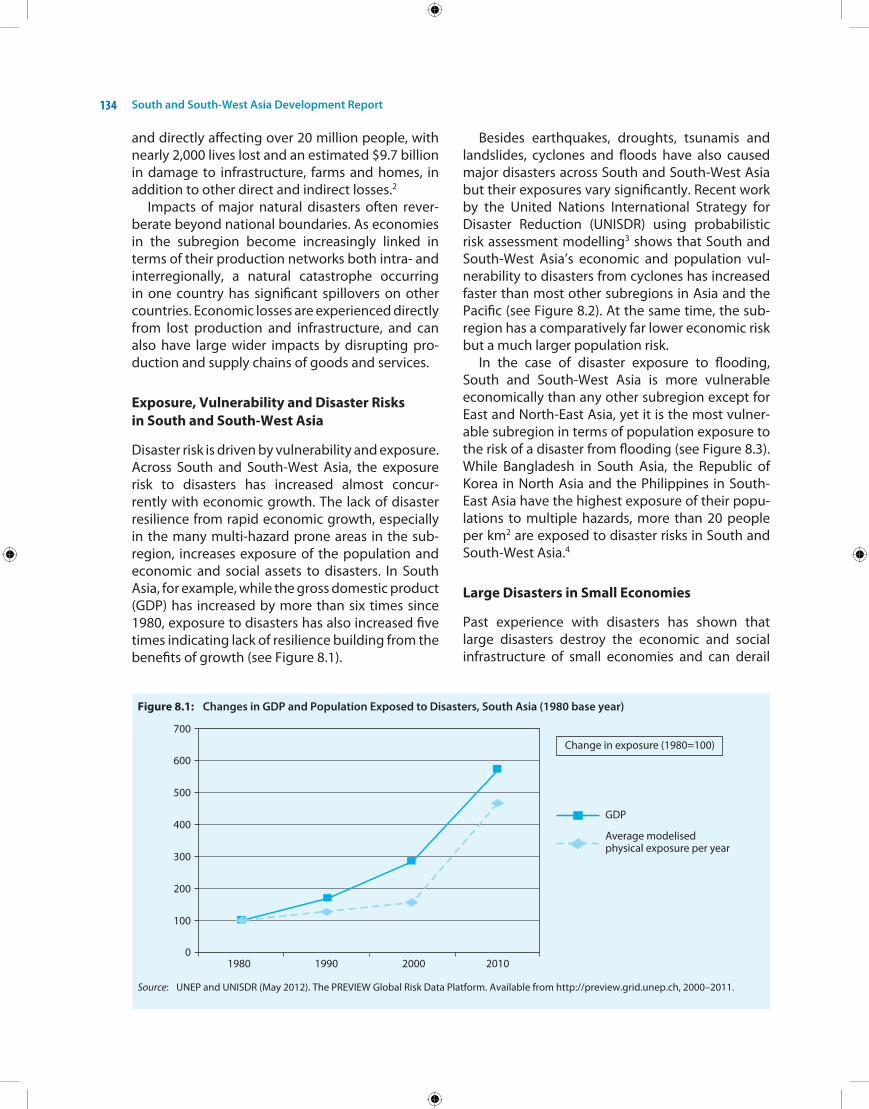
South and South-West Asia Development Report134
and directly affecting over 20 million people, with nearly 2,000 lives lost and an estimated $9.7 billion in damage to infrastructure, farms and homes, in addition to other direct and indirect losses.2
impacts of major natural disasters often rever-berate beyond national boundaries. As economies in the subregion become increasingly linked in terms of their production networks both intra- and interregionally, a natural catastrophe occurring in one country has significant spillovers on other countries. economic losses are experienced directly from lost production and infrastructure, and can also have large wider impacts by disrupting pro-duction and supply chains of goods and services.
Exposure, Vulnerability and Disaster Risks in South and South-West Asia
Disaster risk is driven by vulnerability and exposure. Across South and South-West Asia, the exposure risk to disasters has increased almost concur-rently with economic growth. The lack of disaster resilience from rapid economic growth, especially in the many multi-hazard prone areas in the sub-region, increases exposure of the population and economic and social assets to disasters. in South Asia, for example, while the gross domestic product (GDP) has increased by more than six times since 1980, exposure to disasters has also increased five times indicating lack of resilience building from the benefits of growth (see Figure 8.1).
Besides earthquakes, droughts, tsunamis and landslides, cyclones and floods have also caused major disasters across South and South-West Asia but their exposures vary significantly. Recent work by the United nations international Strategy for Disaster Reduction (UniSDR) using probabilistic risk assessment modelling3 shows that South and South-West Asia’s economic and population vul-nerability to disasters from cyclones has increased faster than most other subregions in Asia and the Pacific (see Figure 8.2). At the same time, the sub-region has a comparatively far lower economic risk but a much larger population risk.
in the case of disaster exposure to flooding, South and South-West Asia is more vulnerable economically than any other subregion except for east and north-east Asia, yet it is the most vulner-able subregion in terms of population exposure to the risk of a disaster from flooding (see Figure 8.3). While Bangladesh in South Asia, the Republic of korea in north Asia and the Philippines in South-east Asia have the highest exposure of their popu-lations to multiple hazards, more than 20 people per km2 are exposed to disaster risks in South and South-West Asia.4
Large Disasters in Small Economies
Past experience with disasters has shown that large disasters destroy the economic and social infrastructure of small economies and can derail
Figure 8.1: Changes in GDP and Population Exposed to Disasters, South Asia (1980 base year)
Source: UneP and UniSDR (May 2012). The PReVieW Global Risk Data Platform. Available from http://preview.grid.unep.ch, 2000–2011.
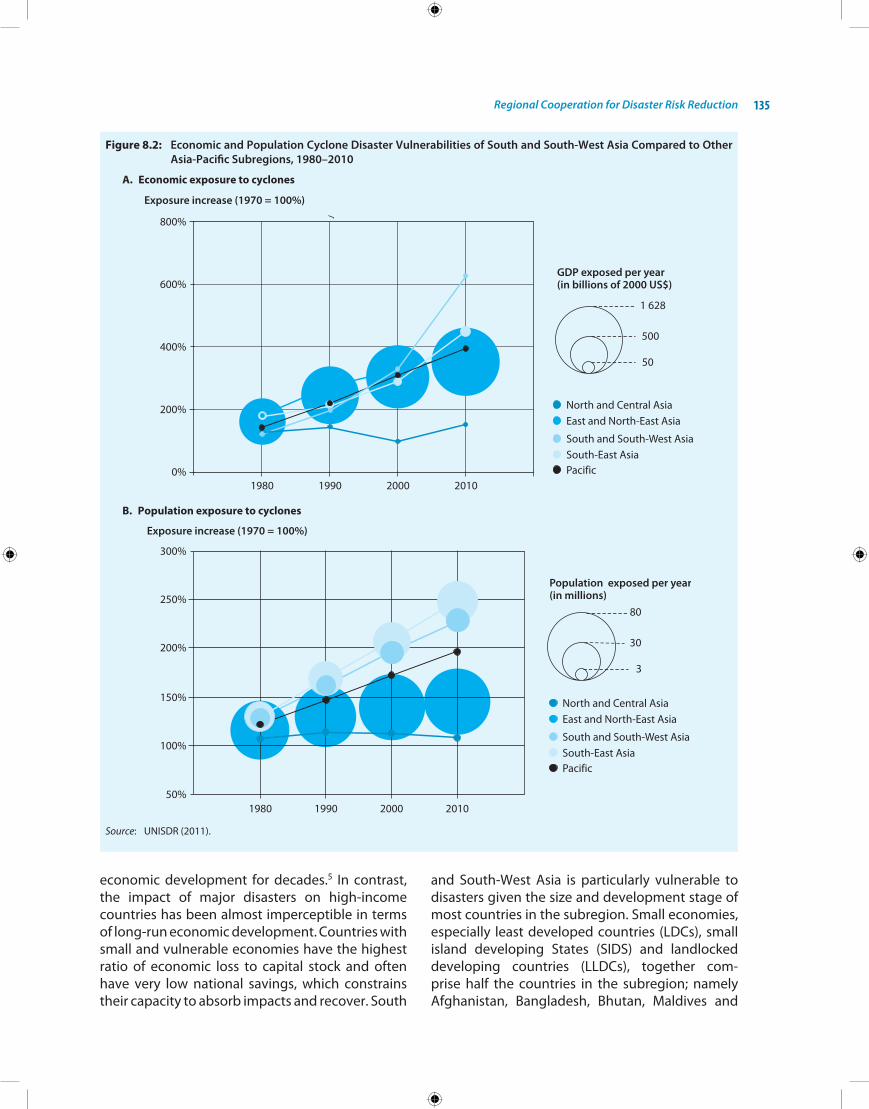
Regional Cooperation for Disaster Risk Reduction 135
Figure 8.2: Economic and Population Cyclone Disaster Vulnerabilities of South and South-West Asia Compared to Other Asia-Pacific Subregions, 1980–2010
A. Economic exposure to cyclones
B. Population exposure to cyclones
Source: UniSDR (2011).
economic development for decades.5 in contrast, the impact of major disasters on high-income countries has been almost imperceptible in terms of long-run economic development. Countries with small and vulnerable economies have the highest ratio of economic loss to capital stock and often have very low national savings, which constrains their capacity to absorb impacts and recover. South
and South-West Asia is particularly vulnerable to disasters given the size and development stage of most countries in the subregion. Small economies, especially least developed countries (LDCs), small island developing States (SiDS) and landlocked developing countries (LLDCs), together com-prise half the countries in the subregion; namely Afghanistan, Bangladesh, Bhutan, Maldives and

South and South-West Asia Development Report136
Figure 8.3: Economic and Population Flood Disaster Vulnerabilities of South and South-West Asia Compared with Other Asia-Pacific Subregions, 1980–2010
A. Economic exposure to floods
B. Population exposure to floods
Source: UniSDR (2011).
nepal. Disaster risks in those countries have been extremely high.
To understand disaster related damage and losses across various sectors, two case studies with regards to the cyclone Sidr in Bangladesh in 2007 and the Bhutan earthquake in 2009 have been examined. in each case the study was led by the respective governments using a damage and loss assessment (DaLA) methodology developed by the United nations economic Commission for Latin America and the Caribbean.6 A sector-wise, post
disaster needs assessment (PDnA) was carried out after each disaster and the results are summarized in Table 8.2. The PDnA facilitates effective and timely transition from relief to development. The analysis of DaLA carried out during these events helps in bringing greater investments in social sec-tors as a part of post-disaster recovery and recon-struction (see Table 8.3).
in the aftermath of cyclone Sidr, the Govern-ment of Bangladesh embraced an integrated, multipronged approach to disaster assessment
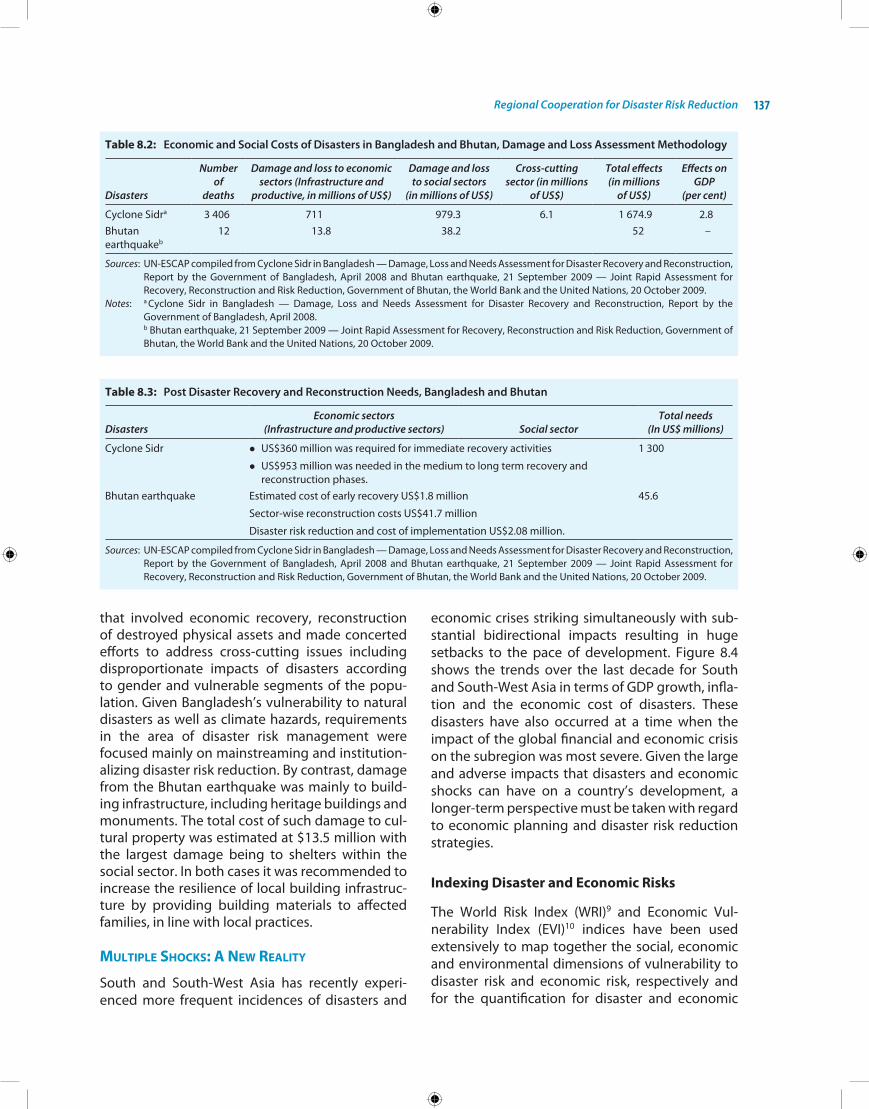
Regional Cooperation for Disaster Risk Reduction 137
Table 8.2: Economic and Social Costs of Disasters in Bangladesh and Bhutan, Damage and Loss Assessment Methodology
Disasters
Number of
deaths
Damage and loss to economic sectors (Infrastructure and
productive, in millions of US$)
Damage and loss to social sectors
(in millions of US$)
Cross-cutting sector (in millions
of US$)
Total effects(in millions
of US$)
Effects on GDP
(per cent)
Cyclone Sidra 3 406 711 979.3 6.1 1 674.9 2.8Bhutan earthquakeb
12 13.8 38.2 52 –
Sources: Un-eSCAP compiled from Cyclone Sidr in Bangladesh — Damage, Loss and needs Assessment for Disaster Recovery and Reconstruction, Report by the Government of Bangladesh, April 2008 and Bhutan earthquake, 21 September 2009 — Joint Rapid Assessment for Recovery, Reconstruction and Risk Reduction, Government of Bhutan, the World Bank and the United nations, 20 october 2009.
Notes: a Cyclone Sidr in Bangladesh — Damage, Loss and needs Assessment for Disaster Recovery and Reconstruction, Report by the Government of Bangladesh, April 2008.
b Bhutan earthquake, 21 September 2009 — Joint Rapid Assessment for Recovery, Reconstruction and Risk Reduction, Government of Bhutan, the World Bank and the United nations, 20 october 2009.
Table 8.3: Post Disaster Recovery and Reconstruction Needs, Bangladesh and Bhutan
DisastersEconomic sectors
(Infrastructure and productive sectors) Social sectorTotal needs
(In US$ millions)
Cyclone Sidr l US$360 million was required for immediate recovery activities
l US$953 million was needed in the medium to long term recovery and reconstruction phases.
1 300
Bhutan earthquake estimated cost of early recovery US$1.8 million
Sector-wise reconstruction costs US$41.7 million
Disaster risk reduction and cost of implementation US$2.08 million.
45.6
Sources: Un-eSCAP compiled from Cyclone Sidr in Bangladesh — Damage, Loss and needs Assessment for Disaster Recovery and Reconstruction, Report by the Government of Bangladesh, April 2008 and Bhutan earthquake, 21 September 2009 — Joint Rapid Assessment for Recovery, Reconstruction and Risk Reduction, Government of Bhutan, the World Bank and the United nations, 20 october 2009.
that involved economic recovery, reconstruction of destroyed physical assets and made concerted efforts to address cross-cutting issues including disproportionate impacts of disasters according to gender and vulnerable segments of the popu-lation. Given Bangladesh’s vulnerability to natural disasters as well as climate hazards, requirements in the area of disaster risk management were focused mainly on mainstreaming and institution-alizing disaster risk reduction. By contrast, damage from the Bhutan earthquake was mainly to build-ing infrastructure, including heritage buildings and monuments. The total cost of such damage to cul-tural property was estimated at $13.5 million with the largest damage being to shelters within the social sector. in both cases it was recommended to increase the resilience of local building infrastruc-ture by providing building materials to affected families, in line with local practices.
multiplE shocks: a nEw rEality
South and South-West Asia has recently experi-enced more frequent incidences of disasters and
economic crises striking simultaneously with sub-stantial bidirectional impacts resulting in huge setbacks to the pace of development. Figure 8.4 shows the trends over the last decade for South and South-West Asia in terms of GDP growth, infla-tion and the economic cost of disasters. These disasters have also occurred at a time when the impact of the global financial and economic crisis on the subregion was most severe. Given the large and adverse impacts that disasters and economic shocks can have on a country’s development, a longer-term perspective must be taken with regard to economic planning and disaster risk reduction strategies.
Indexing Disaster and Economic Risks
The World Risk index (WRi)9 and economic Vul-nerability index (eVi)10 indices have been used extensively to map together the social, economic and environmental dimensions of vulnerability to disaster risk and economic risk, respectively and for the quantification for disaster and economic

South and South-West Asia Development Report138
Figure 8.4: Disasters, GDP Growth and Inflation in South and South-West Asia, 2000–2010
Source: Un-eSCAP data centre. Available from www.unescap.org/stat/data/statdb/dataexplorer.aspx.
risks. Table 8.4 shows the WRi and eVi across the countries of South and South-West Asia. The Asia-Pacific region’s risk index and eVi are higher than the global average. Afghanistan, Bangladesh and Bhutan have very high risks, with Bangladesh hav-ing more than double the global average risk index. economic vulnerability in the Maldives and Bhutan are some of the highest in the Asia-Pacific region.
South and South-West Asia faces high disaster risk exposure compared with the Asia-Pacific region and the world average, yet the subregion also experiences far greater vulnerability to disaster.
notably, South and South-West Asian countries with the greatest development challenges are also those facing the highest disaster and economic risks. The LDCs, SiDS and LLDCs have higher risks of both dimensions than the more developed or larger economies (Box 8.1).
Financing Disaster Risk Reduction
Financing policies and programmes that effectively translate knowledge and commitments into com-prehensive actions to reduce disaster-related losses
Table 8.4: Mapping Risks in South and South-West Asia Using the World Risk Index and the Economic Vulnerability Index
Countries
Disaster risk Economic risk
WRI (%) Exposure (%) Vulnerability (%) EVI (%) Exposure index (%) Shock index (%)
Afghanistan 14.06 18.45 76.19 39.52 33.85 45.19 Bangladesh 17.45 27.52 63.41 23.21 17.40 29.03 Bhutan 13.65 24.63 55.42 52.93 61.74 44.13 india 7.66 12.68 60.55 17.55 11.99 23.10 iran (islamic Republic of) 5.11 10.40 49.07 43.89 20.03 67.74 Maldives 58.16 68.74 47.63 nepal 6.15 9.97 61.69 33.65 31.20 36.10 Pakistan 7.84 12.27 63.84 22.25 12.12 32.38 Sri Lanka 7.84 15.05 52.14 32.43 30.42 34.44 Turkey 5.38 11.81 45.57 15.32 4.73 25.91 Asia-Pacific average 10.36 19.84 51.56 42.57 41.41 43.73 Global average 7.60 14.99 49.37 42.50 43.35 41.66
Source: United nations University, World Risk index (UnU-ehS, 2011) and economic Vulnerability index (Guillaumont, 2008) indices.
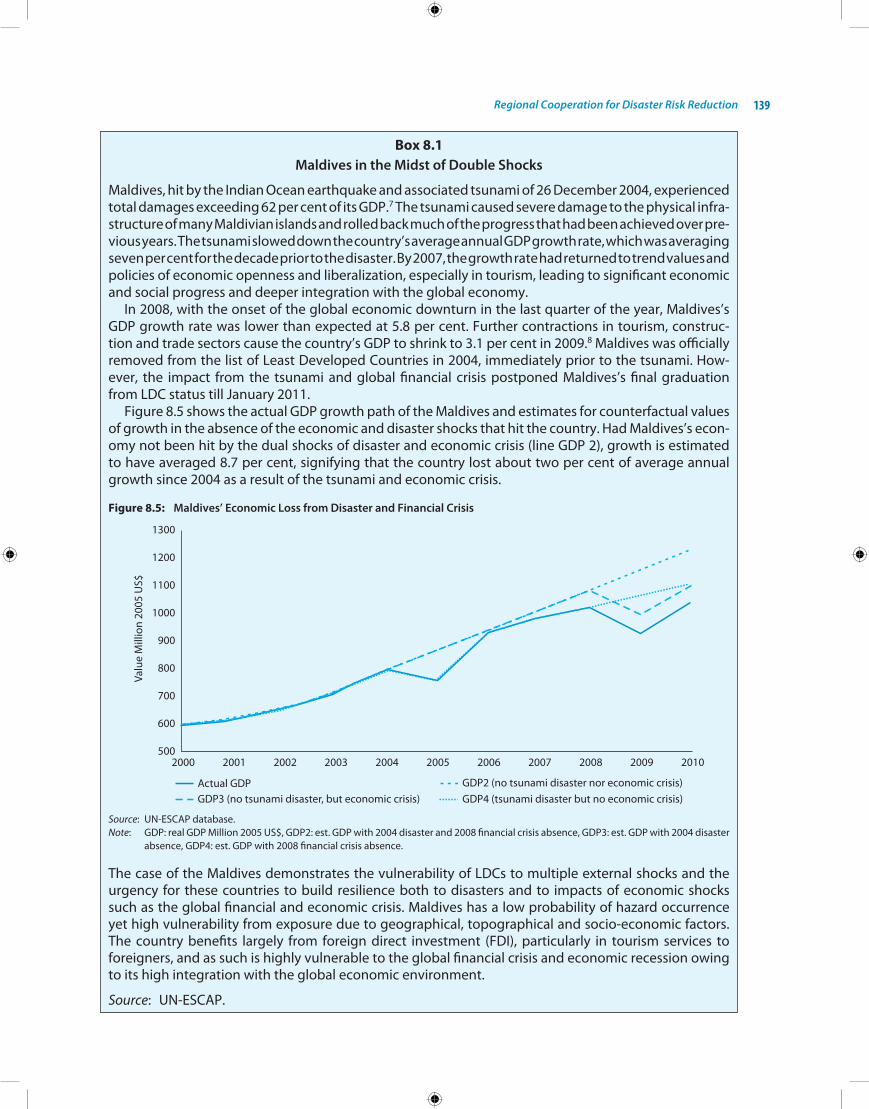
Regional Cooperation for Disaster Risk Reduction 139
Box 8.1Maldives in the Midst of Double Shocks
Maldives, hit by the indian ocean earthquake and associated tsunami of 26 December 2004, experienced total damages exceeding 62 per cent of its GDP.7 The tsunami caused severe damage to the physical infra-structure of many Maldivian islands and rolled back much of the progress that had been achieved over pre-vious years. The tsunami slowed down the country’s average annual GDP growth rate, which was averaging seven per cent for the decade prior to the disaster. By 2007, the growth rate had returned to trend values and policies of economic openness and liberalization, especially in tourism, leading to significant economic and social progress and deeper integration with the global economy.
in 2008, with the onset of the global economic downturn in the last quarter of the year, Maldives’s GDP growth rate was lower than expected at 5.8 per cent. Further contractions in tourism, construc-tion and trade sectors cause the country’s GDP to shrink to 3.1 per cent in 2009.8 Maldives was officially removed from the list of Least Developed Countries in 2004, immediately prior to the tsunami. how-ever, the impact from the tsunami and global financial crisis postponed Maldives’s final graduation from LDC status till January 2011.
Figure 8.5 shows the actual GDP growth path of the Maldives and estimates for counterfactual values of growth in the absence of the economic and disaster shocks that hit the country. had Maldives’s econ-omy not been hit by the dual shocks of disaster and economic crisis (line GDP 2), growth is estimated to have averaged 8.7 per cent, signifying that the country lost about two per cent of average annual growth since 2004 as a result of the tsunami and economic crisis.
Figure 8.5: Maldives’ Economic Loss from Disaster and Financial Crisis
Source: Un-eSCAP database.Note: GDP: real GDP Million 2005 US$, GDP2: est. GDP with 2004 disaster and 2008 financial crisis absence, GDP3: est. GDP with 2004 disaster
absence, GDP4: est. GDP with 2008 financial crisis absence.
The case of the Maldives demonstrates the vulnerability of LDCs to multiple external shocks and the urgency for these countries to build resilience both to disasters and to impacts of economic shocks such as the global financial and economic crisis. Maldives has a low probability of hazard occurrence yet high vulnerability from exposure due to geographical, topographical and socio-economic factors. The country benefits largely from foreign direct investment (FDi), particularly in tourism services to foreigners, and as such is highly vulnerable to the global financial crisis and economic recession owing to its high integration with the global economic environment.
Source: Un-eSCAP.

South and South-West Asia Development Report140
is of considerable significance. There are strong gaps in the understanding of what constitutes effec-tive investments in disaster risk reduction (DRR). Deconstructing what constitutes DRR is essential to guide investment prioritization and decisions by the governments and the international donor com-munity. in practice DRR has evolved into a series of investment streams:11
i. “Stand-alone” sectoral disaster risk reduc-tion investments which include awareness building, development of emergency man-agement capacity, early-warning and disas-ter preparedness, retrofitting of infrastruc-ture.
ii. Vulnerability-reducing investments which may not be directly labelled as DRR invest- ments but cover multi-faceted development initiatives, investments in social sector and crosscutting issues, Millennium Develop-ment Goal (MDG) sector investments, insur-ance, microcredit, among others.
iii. Disaster risk reduction mainstreaming, which does not necessasily imply additional investment for DRR, but instead may involve acknowledgement or assessment of the DRR implications of any development invest-ment (for example, risk-resilient investments in infrastructure and productive sectors).
The major share of investment in disaster risk reduction needs to take place in the context of sus- tainable development by making risk-sensitive investments across all sectors. Development in-vestments however, often fail to take disaster risk into account, resulting in an inefficient use of scarce resources. Meanwhile, spending by national, provincial and local governments on measures to reduce risk remains insufficiently understood, both in scale and effectiveness.
The investment for disaster risk reduction in Bhutan provides an example of the difficulty in matching funding capacity to the increased commitment to DRR. The country was hit by an earthquake in September 2009 that caused over $56 million in damage, primarily to the social sector.12 Prior to this, in May 2009, the country experienced cyclone Aila-induced flash floods which caused damage of nearly $16 million to the productive as well as infrastructure sectors. With a small economy, limited capital stocks, valuable environmental assets and cultural monuments
as well as economic, social and ecological safety nets to increase or maintain, Bhutan has enhanced mainstreaming efforts to build resilience into the country’s 10th five-year plan (2008–2013) and beyond. Although Bhutan is becoming increasingly self-reliant, the domestic revenues are expected to be sufficient to fund only around 52 per cent of the total 10th plan outlay. The resilient components of development plans need to be funded either by the country’s national budget or through official development assistance, South–South economic assistance, private capital inflows and develop-ment aid.
The declaration of the Fourth Asian Ministe-rial Conference on Disaster Risk Reduction held in incheon, Republic of korea in october 2010 urged member States to increase their investments in dis-aster risk reduction through the allocation of a des-ignated percentage of their national budgets and other revenue dedicated to disaster risk reduction. it also called upon development and humanitarian partners to ensure that disbursement of two per cent of development assistance and 10 per cent of humanitarian assistance supports disaster risk reduction, preparedness and recovery, including from violent conflicts and severe economic diffi-culties.13
rEgional coopEration
Good strategic financing and capacity develop-ment for disaster risk reduction is strongly needed to benefit the least developed countries. For exam-ple, regional cooperation has considerable bearing on the stand-alone sectoral investment for multi-hazard early warning systems. establishing an early warning system, regional cooperative mechanisms for sharing of data/information, regional panels and platforms engaging disaster risk reduction and bringing development professionals together are important enabling processes to finance disaster risk reduction and bridge the capacity gaps in the subregion. For vulnerability reduction investments and mainstreaming DRR, re-orienting public expen-ditures, augmenting government revenue and creating fiscal incentives for resilient develop-ment are important aspects, which need to be highlighted by sharing the experiences and sound practices. The strategy of multitier financing for DRR incorporates the central role that regional co-operation assumes in mainstreaming disaster risk reduction in development.

Regional Cooperation for Disaster Risk Reduction 141
investments in early warning systems (eWS) clearly provide far greater returns than their costs. A recent study on the assessment of the economics of early warning for disaster risk reduction provides a strong argument for investing in: (a) eWS that aims to reduce damages, impacts and disruptions, in addition to saving lives, by integrating high-fre-quency, low-impact hazards to systems that only consider high-frequency, high-impact hazards and; (b) a collective eWS for low-frequency, high-impact hazards (Figure 8.6).14
Landscape of Regional Cooperation in South and South-West Asia
increased economic and social losses and shared vulnerability to disasters have brought countries in the subregion together to develop multiple frame-works for cooperation (see Table 8.5). in South Asia, SAARC countries established the SAARC Compre-hensive Framework on Disaster Management. in South-West Asia, the economic Cooperation organ-ization (eCo) Framework on Disaster Management is already in place. The signing of the SAARC Agree-ment on Rapid Response to natural Disasters during the 17th SAARC Summit in Maldives, in november 2011, which also forms the part of Addu Declaration, is an important milestone in pursuing regional coop-er-ation for disaster preparedness. The environment
and Disaster Management Cooperation framework under the Bay of Bengal initiative for Multi-Sectoral Technical and economic Cooperation (BiMSTeC) is yet another initiative. Aligned with the hyogo Frame-work for Action (2005–2015): Building the Resilience of nations and Communities to Disasters adopted by the World Disaster Reduction Conference held in 2005, those frameworks have unified the policies and programmes in the subregion. Progress with regards to the implementation of the hFA in the South and South-West Asia has been inconsistent. For example, there has been little progress on the
Table 8.5: Landscape of Regional Cooperation in South and South-West Asia
1. South Asia (SAARC) SAARC Comprehensive Male Declaration of environment Ministers in June 2005 to formulate a Comprehensive Framework on early Warning, Disaster Management and Disaster Prevention.
Framework on Disaster Management 2006.
Setting up SAARC Disaster Management Centre new Delhi 2007.
2. Economic Cooperation Organization (ECO)
9th eCo Summit 2006 called for regional programmes for early warning, and practical steps for disaster preparedness.
Since 2006 eCo has been organizing annual international Conferences on Disaster Risk Management which provided a platform for the scientists and practitioners to come together to discuss issues of regional cooperation on disaster management.
3. Bay of Bengal Initiative for Multi Sectoral Technical and Economic Cooperation (BIMSTEC)
The environment and Disaster Management Cooperation framework under the Bay of Bengal initiative for Multi Sectoral Technical and economic Cooperation (BiMSTeC).
The national Centre for Medium Range Weather Forecasting (nCMRWF), Department of Science and Technology of india — nodal research centre for disaster early warning.
4. Regional Integrated Multi-hazard Early Warning System
Regional integrated Multi-hazard early Warning System set up using United nations eSCAP Trust Fund that provides early warning products/services for tsunami, cyclone, floods, drought (including monsoon outlook) and storm surges covering South Asia — with a secretariat in Maldives.
5. Asian and Pacific centre for the development of disaster information management (APIDM)
establishment of the Asian and Pacific centre for the development of disaster information management (APiDM) in islamic Republic of iran.
Source: Un-eSCAP.
Figure 8.6: Benefit–Cost Ratios in the Context of Vulnerability
Source: Un-eSCAP based on data from Subbiah, Bildan and narasimhan (2009).

South and South-West Asia Development Report142
hFA priority area for action suggesting a lack of resilience in development efforts.
The eSCAP Trust Fund-supported Regional integrated Multi-hazard early Warning Systems (RiMeS), which also covers considerable parts of the subregion, has demonstrated a viable architecture for cooperation. The eSCAP–World Meteorological organization (WMo) Panel on Tropical Cyclones covering South and South-West Asia is based on the principle of cooperation among the countries bordering the indian ocean. These cooperation frameworks also signal a regional perspective and attitude to disaster risk reduction across the ocean basin.
experiences from other regions highlight two related issues. The first is the need to broaden the scope for cooperation by incorporating multisec-toral approaches. The second is to bring better coherence between United nations entities and the existing regional cooperation frameworks already in place. Recent experiences in South and South-West Asia have shown that disasters do not strike in isolation and the ability to reduce disaster risks is paramount when the countries are also exposed to other economic and social vulnerabilities — as was the case during the period of the financial crisis and food and energy price volatilities. The im-pacts of disasters and the financial crisis have been bidirectional. Resilience building must therefore cover a broader canvas. The partnership of the United nations with SAARC, eCo and BiMSTeC in South and South-West Asia needs to address issues arising from multiple shocks in addition to the immediate impacts of natural disaster. The ASeAn-United nations Agreement15 which started with disaster management in 2010 was broadened in 2011 to cover multiple sectors. eSCAP in its capa-city as Chair of the Asia-Pacific Regional Coordin-ation Mechanism, which comprise more than two dozen regional United nations agencies, has a com-parative advantage not only to deepen regional cooperation but also to broaden the frameworks through multisectoral approaches.
Regional Integrated Multi-hazard Early Warning System
The Regional integrated Multi-hazard early Warning System for Africa and Asia (RiMeS), an intergovernmental institution, was created with support from the United nations economic and
Social Commission in the aftermath of the 2004 indian ocean tsunami, to establish a regional sys-tem which would generate and communicate early warning information, and enhance the capacity of countries to mitigate transboundary hazards. it has evolved as a source of innovative institutional regional resources to provide early warning and capacity development services. Those services are in the areas of tsunami watch provision to national tsunami warning centres, hydro-meteorological research and development support to national meteorological and hydrological services, and capacity-building of national and local level insti-tutions on end-to-end early warning. With a secre-tariat located in Maldives, RiMeS covers a majority of South and South-West Asian countries.
Recently, member States and collaborating countries approved a plan of action for sustaining the delivery of RiMeS products and services that aim to increase capacity for dealing with natural hazards and extreme weather events. The current RiMeS five-year master plan is being implemented with the support of member countries to address the needs and priorities related to risk manage-ment, mitigation and preparedness actions and is aimed at improving countries’ ability to withstand extreme natural or human-induced hazards.
thE way forward for disastEr risk rEduction in south and south-wEst asia
South and South-West Asian countries could focus on several priority areas for developing disaster risk reduction strategies and implemention over the short- to medium-term. Given the subregion’s simultaneous and high disaster risk and economic vulnerability, there is significant scope for countries to consider improved methods and policies that can address disaster risk reduction in the context of multiple shocks. Both immediate and longer-term policy actions to increase resilience to disas-ters compounded by other external shocks should be considered and mainstreamed into national disaster risk reduction action plans. For example, in the event of economic crisis, stimulus pack-ages are offered by the affected countries within the limited space of fiscal and monetary policies. Similarly, there are funds such as disaster mitiga-tion, calamity relief, etc. which are used for post- disaster interventions. Bringing synergy between the two sources of funding will increase effectiveness.
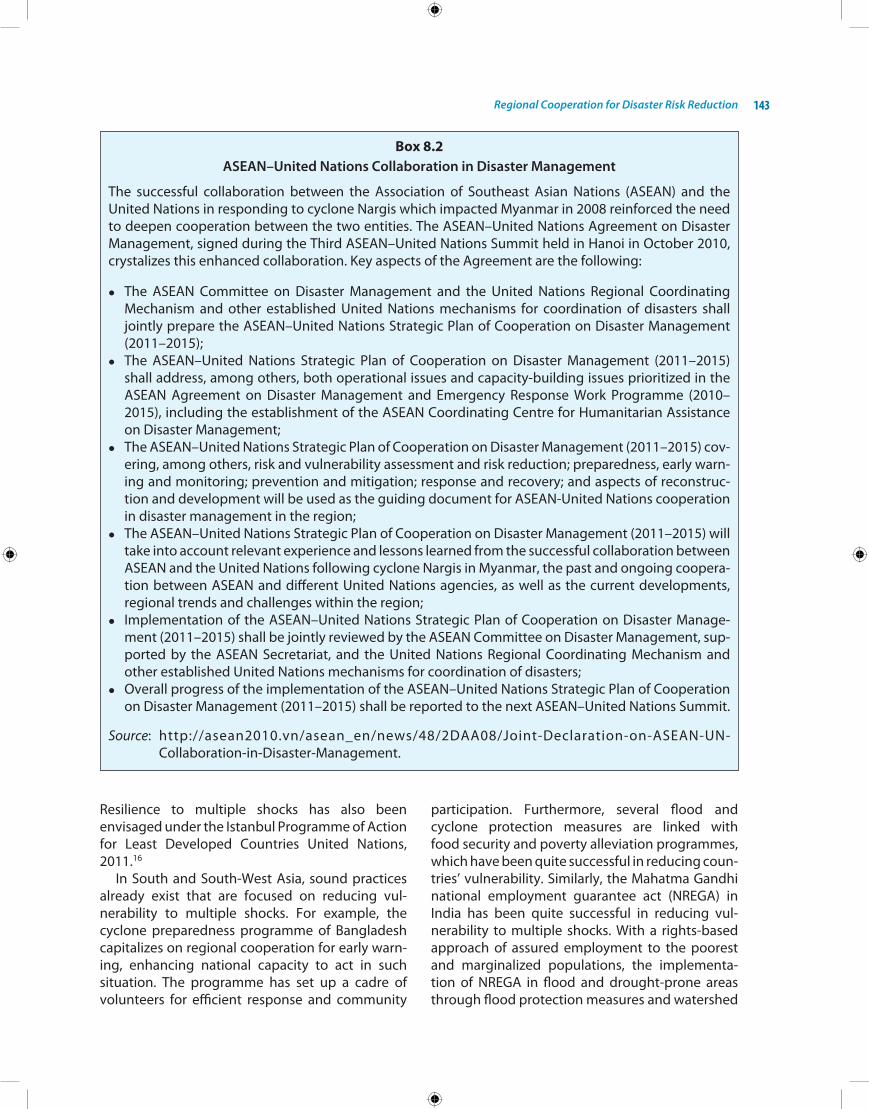
Regional Cooperation for Disaster Risk Reduction 143
Box 8.2ASEAN–United Nations Collaboration in Disaster Management
The successful collaboration between the Association of Southeast Asian nations (ASeAn) and the United nations in responding to cyclone nargis which impacted Myanmar in 2008 reinforced the need to deepen cooperation between the two entities. The ASeAn–United nations Agreement on Disaster Management, signed during the Third ASeAn–United nations Summit held in hanoi in october 2010, crystalizes this enhanced collaboration. key aspects of the Agreement are the following:
l The ASeAn Committee on Disaster Management and the United nations Regional Coordinating Mechanism and other established United nations mechanisms for coordination of disasters shall jointly prepare the ASeAn–United nations Strategic Plan of Cooperation on Disaster Management (2011–2015);
l The ASeAn–United nations Strategic Plan of Cooperation on Disaster Management (2011–2015) shall address, among others, both operational issues and capacity-building issues prioritized in the ASeAn Agreement on Disaster Management and emergency Response Work Programme (2010–2015), including the establishment of the ASeAn Coordinating Centre for humanitarian Assistance on Disaster Management;
l The ASeAn–United nations Strategic Plan of Cooperation on Disaster Management (2011–2015) cov-ering, among others, risk and vulnerability assessment and risk reduction; preparedness, early warn-ing and monitoring; prevention and mitigation; response and recovery; and aspects of reconstruc-tion and development will be used as the guiding document for ASeAn-United nations cooperation in disaster management in the region;
l The ASeAn–United nations Strategic Plan of Cooperation on Disaster Management (2011–2015) will take into account relevant experience and lessons learned from the successful collaboration between ASeAn and the United nations following cyclone nargis in Myanmar, the past and ongoing coopera-tion between ASeAn and different United nations agencies, as well as the current developments, regional trends and challenges within the region;
l implementation of the ASeAn–United nations Strategic Plan of Cooperation on Disaster Manage-ment (2011–2015) shall be jointly reviewed by the ASeAn Committee on Disaster Management, sup-ported by the ASeAn Secretariat, and the United nations Regional Coordinating Mechanism and other established United nations mechanisms for coordination of disasters;
l overall progress of the implementation of the ASeAn–United nations Strategic Plan of Cooperation on Disaster Management (2011–2015) shall be reported to the next ASeAn–United nations Summit.
Source: http://asean2010.vn/asean_en/news/48/2DAA08/Joint-Declaration-on-ASeAn-Un-Collaboration-in-Disaster-Management.
Resilience to multiple shocks has also been envisaged under the istanbul Programme of Action for Least Developed Countries United nations, 2011.16
in South and South-West Asia, sound practices already exist that are focused on reducing vul-nerability to multiple shocks. For example, the cyclone preparedness programme of Bangladesh capitalizes on regional cooperation for early warn-ing, enhancing national capacity to act in such situation. The programme has set up a cadre of volunteers for efficient response and community
participation. Furthermore, several flood and cyclone protection measures are linked with food security and poverty alleviation programmes, which have been quite successful in reducing coun-tries’ vulnerability. Similarly, the Mahatma Gandhi national employment guarantee act (nReGA) in india has been quite successful in reducing vul-nerability to multiple shocks. With a rights-based approach of assured employment to the poorest and marginalized populations, the implementa-tion of nReGA in flood and drought-prone areas through flood protection measures and watershed
South and South-West Asia Development Report144
development programme is making substantive impacts at the community level.
Countries in South and South-West Asia can also consider ways to extend existing cooperation and widen the scope of actions for increasing resilience and reducing vulnerabilities. The RiMeS master plan, cited earlier, which is funded by mem-ber countries, provides an excellent opportunity to reduce vulnerability. increasingly, RiMeS early warning products and services are proving use-ful and are broadening in scope from disaster risk reduction to overall livelihood support, food secu-rity through monsoon outlooks, interpretation of el nino/La nina and climate preparedness. Coun-tries could also capitalize on existing SAARC, eCo and BiMSTeC cooperation frameworks to increase dialogue and cooperation and to broaden the canvas of cooperation by integrating economic crisis issues and disaster risk reduction together. The eSCAP-assisted ASeAn and United nations agreement (see Box 8.2) covering broad issues of economic and social development besides disas-ter management is a valuable good practice that could be replicated in South and South-West Asian context. other regional and institutional part-nerships, such as the regional space applications
programme for sustainable development (ReSAP) provide scope for capacity development in the subregion related to disaster risk reduction. Under ReSAP education and training network, the United nations affiliated centre for space science educa-tion and training for Asia and the Pacific (CSSTeAP) has been established in Dehradun, india. CSSTeAP provides short- and long-term trainings in remote sensing and geographic information systems (GiS) for eSCAP member States based on a South–South cooperation strategy. it is applying state-of-the-art technologies for disaster risk reduction.
South and South-West Asian countries may also develop the capacity to integrate risk resil-ience in sectoral development planning through comprehensive analyses of disaster impacts on associated economic, fiscal and social dimensions. Post-disaster damage and loss assessment (DaLA) missions carried out jointly by governments, the United nations and the World Bank in the events of cyclone Sidr (Bangladesh, 2007), the Bhutan earth-quake in 2009 and the floods in Pakistan highlight how such analysis can contribute to mobilizing resources and development assistance, including oDA, bilateral and multilateral donor’s supports for resilient recovery in South and South-West Asia.
A true global partnership for development, envi-sioned in Goal 8 of the Millennium Development Goals (MDGs),1 requires developed and developing countries to work together for global development as a whole. Traditionally, discussion of the global partnership for development has been framed in the context of cooperation between developed and developing countries. Today, more than a decade since the Millennium Declaration was signed, the global economy has undergone dramatic changes. A number of developing countries are starting to catch-up with the developed economies, while many developed economies have fallen into pro-longed crisis. At the same time, development progress has remained moderate in countries with special needs, including the least developed coun-tries (LDCs), the landlocked developing countries (LLDCs) and small island developing States (SiDS). Despite the emergence of a strong growth pole in developing Asia, led by demand from China and india, most of the world’s LDCs still suffer from low per capita incomes, low levels of human assets, and high levels of vulnerability.
The structural realignment of the global econ-omy and persistent global economic crisis have profound implications on the global partnership for development. Developed country resources for development cooperation have at best stagnated — despite earlier commitments to scale them up — and a number of developing countries have begun allocating an increasing share of their own financial resources to development cooper-ation in other countries. The new sources of demand from relatively fast growing developing countries have offered new prospects for market access to the LDCs, LLDCs and SiDS. innovative sources of development finance and the new modalities of South–South and triangular development co-operation offer renewed possibilities of support and assistance to the countries with the greatest
needs. Despite some failure to harness fully the global partnership for development in support of countries with special needs over the past decade, the newly emerging landscape of development cooperation offers important avenues of hope for the future.
of the 10 South and South-West Asian coun-tries, four are LDCs. one country, Afghanistan, currently receives more official development assis-tance than any other country worldwide. Three of the four LDCs in South and South-West Asia are landlocked States (Afghanistan, Bhutan and nepal) and the single small island developing State in the subregion, the Maldives, became in 2011 the third country to ever graduate from the least developed country category, following Botswana in 1994 and Cape Verde in 2007. At the same time, india and Turkey are emerging providers of development cooperation assistance, each providing approxim-ately $1 billion annually to development cooper-ation efforts in other developing countries.
This chapter examines the special responsibility of the global community to assist countries with special needs, in particular the least developed countries and landlocked developing countries of South and South-West Asia.
lEvEraging intErnational programmEs of action to support ldcs and lldcs
The least developed country category was created in 1971 in recognition of the need to address the issues faced by countries that were persistently falling behind and to attract special international support measures for this purpose. Classification of countries in the LDC category is based on three criteria: (a) low incomes as measured by gross national income (Gni) per capita, (b) low human assets and (c) high economic vulnerability. human assets are measured by an index based on the
9 The Global Partnership for Development:
Implementing the Istanbul and Almaty Programmes of Action in South and South-West Asia
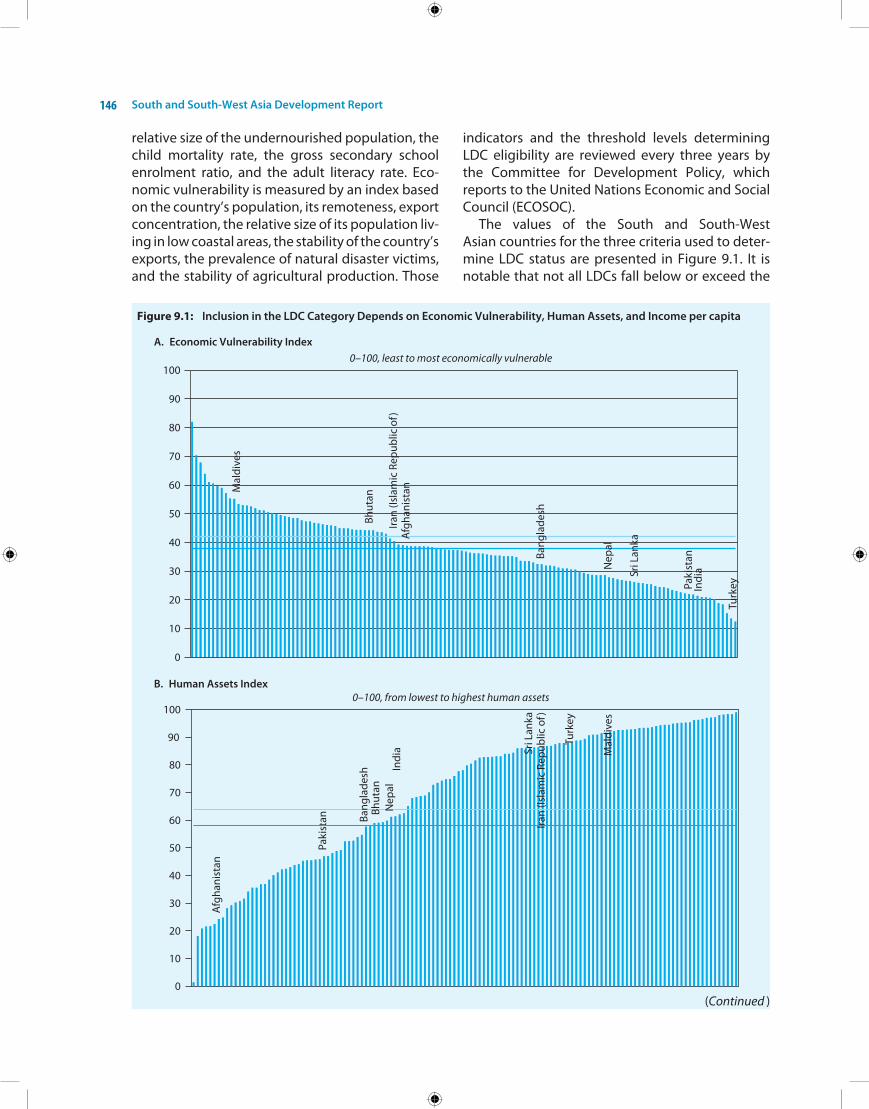
South and South-West Asia Development Report146
relative size of the undernourished population, the child mortality rate, the gross secondary school enrolment ratio, and the adult literacy rate. eco-nomic vulnerability is measured by an index based on the country’s population, its remoteness, export concentration, the relative size of its population liv-ing in low coastal areas, the stability of the country’s exports, the prevalence of natural disaster victims, and the stability of agricultural production. Those
indicators and the threshold levels determining LDC eligibility are reviewed every three years by the Committee for Development Policy, which reports to the United nations economic and Social Council (eCoSoC).
The values of the South and South-West Asian countries for the three criteria used to deter-mine LDC status are presented in Figure 9.1. it is notable that not all LDCs fall below or exceed the
Figure 9.1: Inclusion in the LDC Category Depends on Economic Vulnerability, Human Assets, and Income per capita
A. Economic Vulnerability Index0–100, least to most economically vulnerable
B. Human Assets Index0–100, from lowest to highest human assets
(Continued )
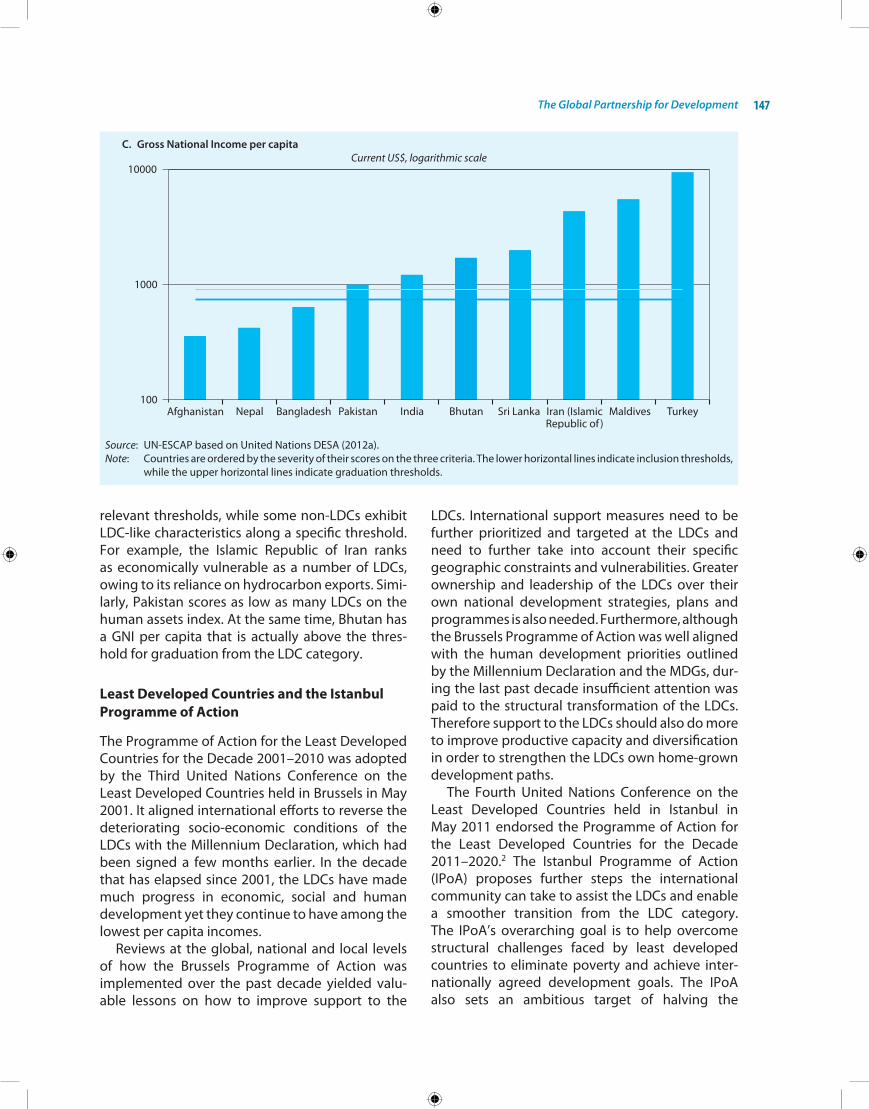
The Global Partnership for Development 147
relevant thresholds, while some non-LDCs exhibit LDC-like characteristics along a specific threshold. For example, the islamic Republic of iran ranks as economically vulnerable as a number of LDCs, owing to its reliance on hydrocarbon exports. Simi-larly, Pakistan scores as low as many LDCs on the human assets index. At the same time, Bhutan has a Gni per capita that is actually above the thres-hold for graduation from the LDC category.
Least Developed Countries and the Istanbul Programme of Action
The Programme of Action for the Least Developed Countries for the Decade 2001–2010 was adopted by the Third United nations Conference on the Least Developed Countries held in Brussels in May 2001. it aligned international efforts to reverse the deteriorating socio-economic conditions of the LDCs with the Millennium Declaration, which had been signed a few months earlier. in the decade that has elapsed since 2001, the LDCs have made much progress in economic, social and human development yet they continue to have among the lowest per capita incomes.
Reviews at the global, national and local levels of how the Brussels Programme of Action was implemented over the past decade yielded valu-able lessons on how to improve support to the
LDCs. international support measures need to be further prioritized and targeted at the LDCs and need to further take into account their specific geographic constraints and vulnerabilities. Greater ownership and leadership of the LDCs over their own national development strategies, plans and programmes is also needed. Furthermore, although the Brussels Programme of Action was well aligned with the human development priorities outlined by the Millennium Declaration and the MDGs, dur-ing the last past decade insufficient attention was paid to the structural transformation of the LDCs. Therefore support to the LDCs should also do more to improve productive capacity and diversification in order to strengthen the LDCs own home-grown development paths.
The Fourth United nations Conference on the Least Developed Countries held in istanbul in May 2011 endorsed the Programme of Action for the Least Developed Countries for the Decade 2011–2020.2 The istanbul Programme of Action (iPoA) proposes further steps the international community can take to assist the LDCs and enable a smoother transition from the LDC category. The iPoA’s overarching goal is to help overcome structural challenges faced by least developed countries to eliminate poverty and achieve inter- nationally agreed development goals. The iPoA also sets an ambitious target of halving the
C. Gross National Income per capitaCurrent US$, logarithmic scale
Source: Un-eSCAP based on United nations DeSA (2012a).Note: Countries are ordered by the severity of their scores on the three criteria. The lower horizontal lines indicate inclusion thresholds,
while the upper horizontal lines indicate graduation thresholds.
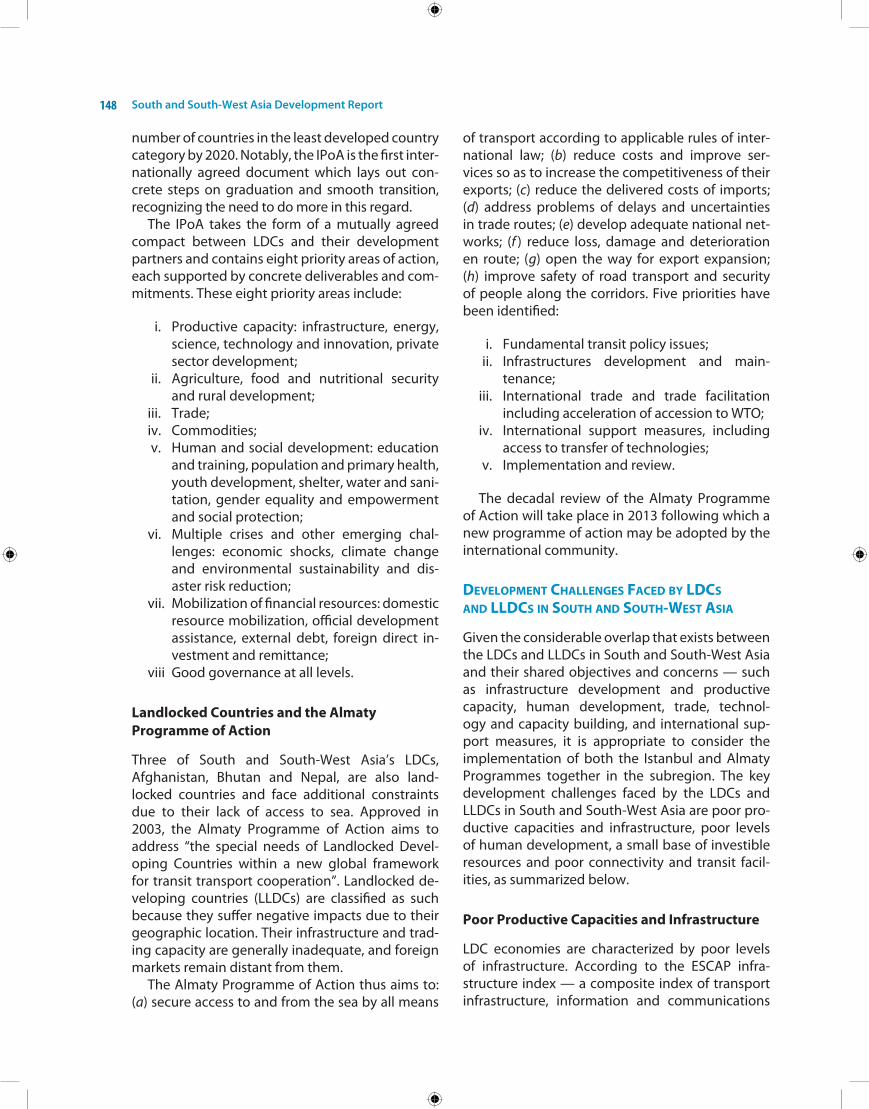
South and South-West Asia Development Report148
number of countries in the least developed country category by 2020. notably, the iPoA is the first inter-nationally agreed document which lays out con-crete steps on graduation and smooth transition, recognizing the need to do more in this regard.
The iPoA takes the form of a mutually agreed compact between LDCs and their development partners and contains eight priority areas of action, each supported by concrete deliverables and com-mitments. These eight priority areas include:
i. Productive capacity: infrastructure, energy, science, technology and innovation, private sector development;
ii. Agriculture, food and nutritional security and rural development;
iii. Trade; iv. Commodities; v. human and social development: education
and training, population and primary health, youth development, shelter, water and sani-tation, gender equality and empowerment and social protection;
vi. Multiple crises and other emerging chal-lenges: economic shocks, climate change and environmental sustainability and dis-aster risk reduction;
vii. Mobilization of financial resources: domestic resource mobilization, official development assistance, external debt, foreign direct in-vestment and remittance;
viii Good governance at all levels.
Landlocked Countries and the Almaty Programme of Action
Three of South and South-West Asia’s LDCs, Afghanistan, Bhutan and nepal, are also land- locked countries and face additional constraints due to their lack of access to sea. Approved in 2003, the Almaty Programme of Action aims to address “the special needs of Landlocked Devel-oping Countries within a new global framework for transit transport cooperation”. Landlocked de-veloping countries (LLDCs) are classified as such because they suffer negative impacts due to their geographic location. Their infrastructure and trad-ing capacity are generally inadequate, and foreign markets remain distant from them.
The Almaty Programme of Action thus aims to: (a) secure access to and from the sea by all means
of transport according to applicable rules of inter-national law; (b) reduce costs and improve ser-vices so as to increase the competitiveness of their exports; (c) reduce the delivered costs of imports; (d) address problems of delays and uncertainties in trade routes; (e) develop adequate national net-works; (f ) reduce loss, damage and deterioration en route; (g) open the way for export expansion; (h) improve safety of road transport and security of people along the corridors. Five priorities have been identified:
i. Fundamental transit policy issues; ii. infrastructures development and main-
tenance; iii. international trade and trade facilitation
including acceleration of accession to WTo; iv. international support measures, including
access to transfer of technologies; v. implementation and review.
The decadal review of the Almaty Programme of Action will take place in 2013 following which a new programme of action may be adopted by the international community.
dEvElopmEnt challEngEs facEd by ldcs and lldcs in south and south-wEst asia
Given the considerable overlap that exists between the LDCs and LLDCs in South and South-West Asia and their shared objectives and concerns — such as infrastructure development and productive capacity, human development, trade, technol-ogy and capacity building, and international sup-port measures, it is appropriate to consider the implementation of both the istanbul and Almaty Programmes together in the subregion. The key development challenges faced by the LDCs and LLDCs in South and South-West Asia are poor pro-ductive capacities and infrastructure, poor levels of human development, a small base of investible resources and poor connectivity and transit facil-ities, as summarized below.
Poor Productive Capacities and Infrastructure
LDC economies are characterized by poor levels of infrastructure. According to the eSCAP infra-structure index — a composite index of transport infrastructure, information and communications
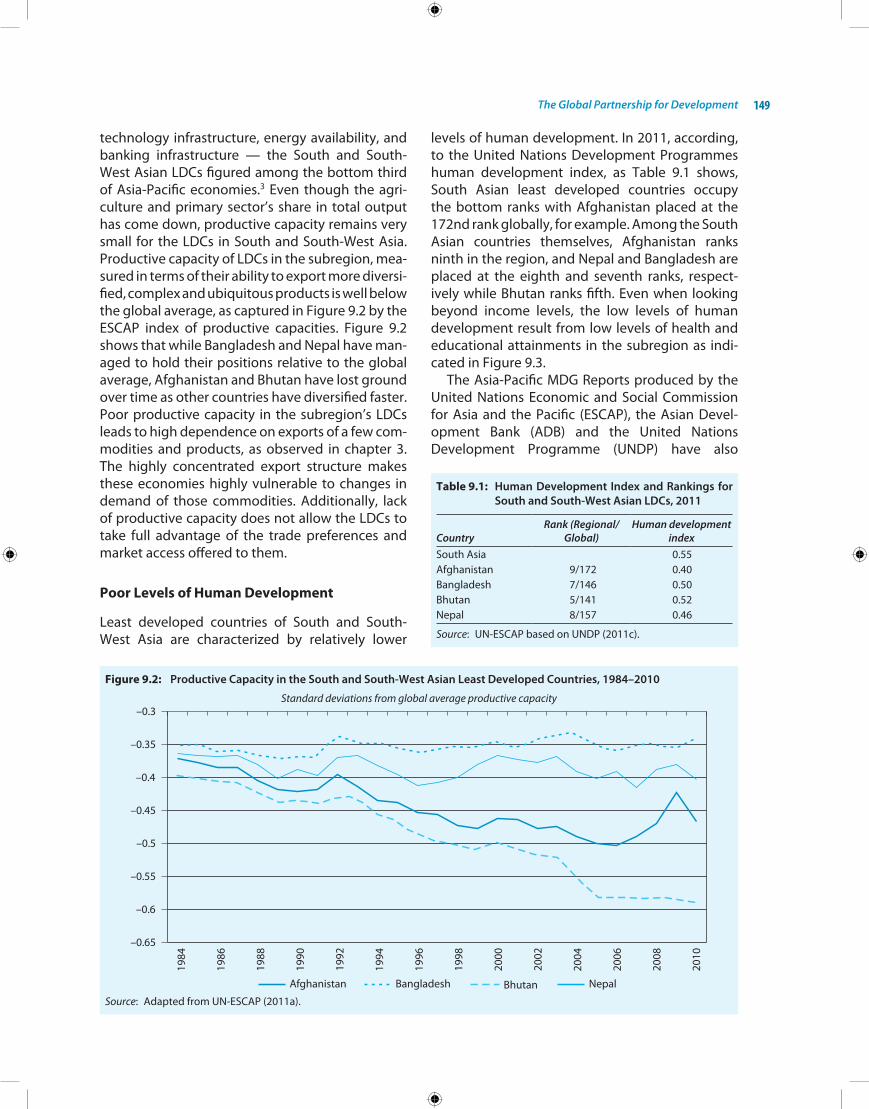
The Global Partnership for Development 149
technology infrastructure, energy availability, and banking infrastructure — the South and South-West Asian LDCs figured among the bottom third of Asia-Pacific economies.3 even though the agri-culture and primary sector’s share in total output has come down, productive capacity remains very small for the LDCs in South and South-West Asia. Productive capacity of LDCs in the subregion, mea-sured in terms of their ability to export more diversi-fied, complex and ubiquitous products is well below the global average, as captured in Figure 9.2 by the eSCAP index of productive capacities. Figure 9.2 shows that while Bangladesh and nepal have man-aged to hold their positions relative to the global average, Afghanistan and Bhutan have lost ground over time as other countries have diversified faster. Poor productive capacity in the subregion’s LDCs leads to high dependence on exports of a few com-modities and products, as observed in chapter 3. The highly concentrated export structure makes these economies highly vulnerable to changes in demand of those commodities. Additionally, lack of productive capacity does not allow the LDCs to take full advantage of the trade preferences and market access offered to them.
Poor Levels of Human Development
Least developed countries of South and South-West Asia are characterized by relatively lower
levels of human development. in 2011, according, to the United nations Development Programmes human development index, as Table 9.1 shows, South Asian least developed countries occupy the bottom ranks with Afghanistan placed at the 172nd rank globally, for example. Among the South Asian countries themselves, Afghanistan ranks ninth in the region, and nepal and Bangladesh are placed at the eighth and seventh ranks, respect-ively while Bhutan ranks fifth. even when looking beyond income levels, the low levels of human development result from low levels of health and educational attainments in the subregion as indi-cated in Figure 9.3.
The Asia-Pacific MDG Reports produced by the United nations economic and Social Commission for Asia and the Pacific (eSCAP), the Asian Devel- opment Bank (ADB) and the United nations Development Programme (UnDP) have also
Figure 9.2: Productive Capacity in the South and South-West Asian Least Developed Countries, 1984–2010
Standard deviations from global average productive capacity
Source: Adapted from Un-eSCAP (2011a).
Table 9.1: Human Development Index and Rankings for South and South-West Asian LDCs, 2011
CountryRank (Regional/
Global)Human development
indexSouth Asia 0.55Afghanistan 9/172 0.40Bangladesh 7/146 0.50Bhutan 5/141 0.52nepal 8/157 0.46
Source: Un-eSCAP based on UnDP (2011c).
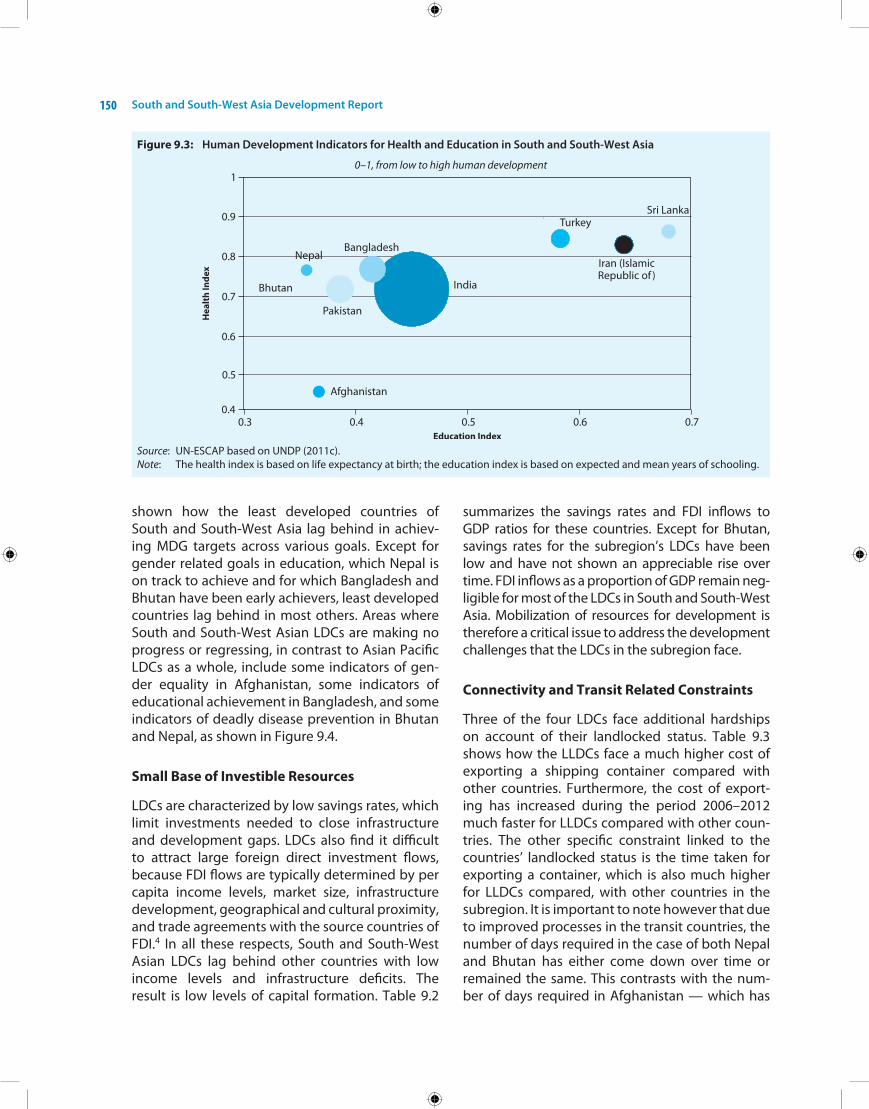
South and South-West Asia Development Report150
Figure 9.3: Human Development Indicators for Health and Education in South and South-West Asia
0–1, from low to high human development
Source: Un-eSCAP based on UnDP (2011c).Note: The health index is based on life expectancy at birth; the education index is based on expected and mean years of schooling.
shown how the least developed countries of South and South-West Asia lag behind in achiev-ing MDG targets across various goals. except for gender related goals in education, which nepal is on track to achieve and for which Bangladesh and Bhutan have been early achievers, least developed countries lag behind in most others. Areas where South and South-West Asian LDCs are making no progress or regressing, in contrast to Asian Pacific LDCs as a whole, include some indicators of gen-der equality in Afghanistan, some indicators of educational achievement in Bangladesh, and some indicators of deadly disease prevention in Bhutan and nepal, as shown in Figure 9.4.
Small Base of Investible Resources
LDCs are characterized by low savings rates, which limit investments needed to close infrastructure and development gaps. LDCs also find it difficult to attract large foreign direct investment flows, because FDi flows are typically determined by per capita income levels, market size, infrastructure development, geographical and cultural proximity, and trade agreements with the source countries of FDi.4 in all these respects, South and South-West Asian LDCs lag behind other countries with low income levels and infrastructure deficits. The result is low levels of capital formation. Table 9.2
summarizes the savings rates and FDi inflows to GDP ratios for these countries. except for Bhutan, savings rates for the subregion’s LDCs have been low and have not shown an appreciable rise over time. FDi inflows as a proportion of GDP remain neg-ligible for most of the LDCs in South and South-West Asia. Mobilization of resources for development is therefore a critical issue to address the development challenges that the LDCs in the subregion face.
Connectivity and Transit Related Constraints
Three of the four LDCs face additional hardships on account of their landlocked status. Table 9.3 shows how the LLDCs face a much higher cost of exporting a shipping container compared with other countries. Furthermore, the cost of export-ing has increased during the period 2006–2012 much faster for LLDCs compared with other coun-tries. The other specific constraint linked to the countries’ landlocked status is the time taken for exporting a container, which is also much higher for LLDCs compared, with other countries in the subregion. it is important to note however that due to improved processes in the transit countries, the number of days required in the case of both nepal and Bhutan has either come down over time or remained the same. This contrasts with the num-ber of days required in Afghanistan — which has
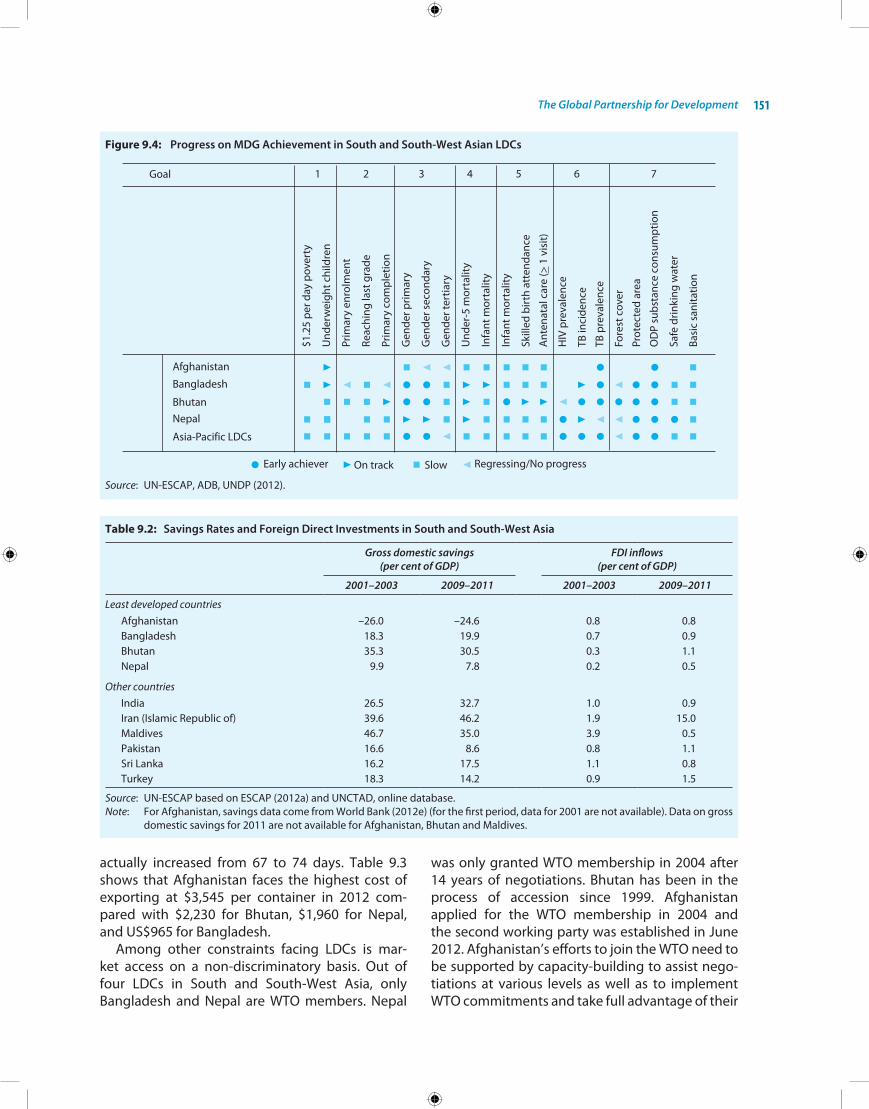
The Global Partnership for Development 151
Figure 9.4: Progress on MDG Achievement in South and South-West Asian LDCs
Source: Un-eSCAP, ADB, UnDP (2012).
Table 9.2: Savings Rates and Foreign Direct Investments in South and South-West Asia
Gross domestic savings(per cent of GDP)
FDI inflows(per cent of GDP)
2001–2003 2009–2011 2001–2003 2009–2011
Least developed countriesAfghanistan –26.0 –24.6 0.8 0.8Bangladesh 18.3 19.9 0.7 0.9Bhutan 35.3 30.5 0.3 1.1nepal 9.9 7.8 0.2 0.5
Other countriesindia 26.5 32.7 1.0 0.9iran (islamic Republic of) 39.6 46.2 1.9 15.0Maldives 46.7 35.0 3.9 0.5Pakistan 16.6 8.6 0.8 1.1Sri Lanka 16.2 17.5 1.1 0.8Turkey 18.3 14.2 0.9 1.5
Source: Un-eSCAP based on eSCAP (2012a) and UnCTAD, online database.Note: For Afghanistan, savings data come from World Bank (2012e) (for the first period, data for 2001 are not available). Data on gross
domestic savings for 2011 are not available for Afghanistan, Bhutan and Maldives.
actually increased from 67 to 74 days. Table 9.3 shows that Afghanistan faces the highest cost of exporting at $3,545 per container in 2012 com-pared with $2,230 for Bhutan, $1,960 for nepal, and US$965 for Bangladesh.
Among other constraints facing LDCs is mar-ket access on a non-discriminatory basis. out of four LDCs in South and South-West Asia, only Bangladesh and nepal are WTo members. nepal
was only granted WTo membership in 2004 after 14 years of negotiations. Bhutan has been in the process of accession since 1999. Afghanistan applied for the WTo membership in 2004 and the second working party was established in June 2012. Afghanistan’s efforts to join the WTo need to be supported by capacity-building to assist nego-tiations at various levels as well as to implement WTo commitments and take full advantage of their
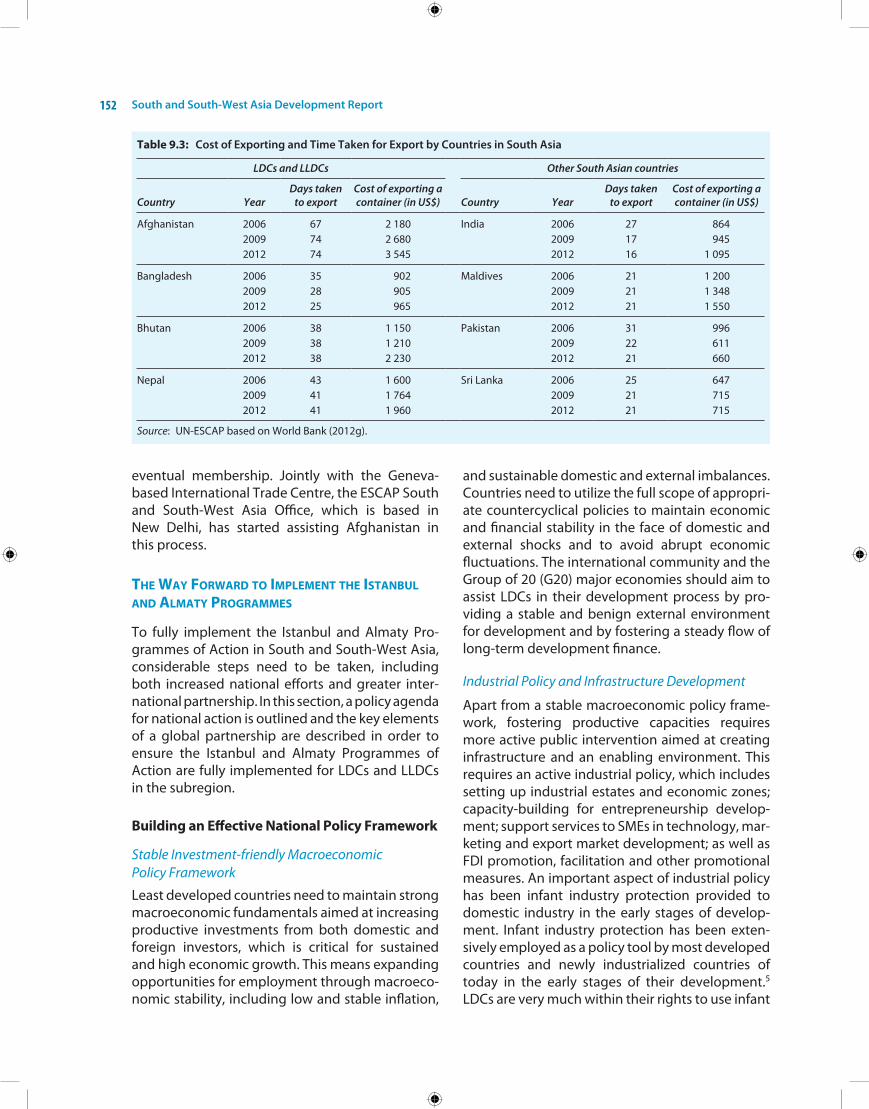
South and South-West Asia Development Report152
eventual membership. Jointly with the Geneva-based international Trade Centre, the eSCAP South and South-West Asia office, which is based in new Delhi, has started assisting Afghanistan in this process.
thE way forward to implEmEnt thE istanbul and almaty programmEs
To fully implement the istanbul and Almaty Pro-grammes of Action in South and South-West Asia, considerable steps need to be taken, including both increased national efforts and greater inter-national partnership. in this section, a policy agenda for national action is outlined and the key elements of a global partnership are described in order to ensure the istanbul and Almaty Programmes of Action are fully implemented for LDCs and LLDCs in the subregion.
Building an Effective National Policy Framework
Stable Investment-friendly Macroeconomic Policy Framework
Least developed countries need to maintain strong macroeconomic fundamentals aimed at increasing productive investments from both domestic and foreign investors, which is critical for sustained and high economic growth. This means expanding opportunities for employment through macroeco-nomic stability, including low and stable inflation,
and sustainable domestic and external imbalances. Countries need to utilize the full scope of appropri-ate countercyclical policies to maintain economic and financial stability in the face of domestic and external shocks and to avoid abrupt economic fluctuations. The international community and the Group of 20 (G20) major economies should aim to assist LDCs in their development process by pro-viding a stable and benign external environment for development and by fostering a steady flow of long-term development finance.
Industrial Policy and Infrastructure Development
Apart from a stable macroeconomic policy frame-work, fostering productive capacities requires more active public intervention aimed at creating infrastructure and an enabling environment. This requires an active industrial policy, which includes setting up industrial estates and economic zones; capacity-building for entrepreneurship develop-ment; support services to SMes in technology, mar-keting and export market development; as well as FDi promotion, facilitation and other promotional measures. An important aspect of industrial policy has been infant industry protection provided to domestic industry in the early stages of develop-ment. infant industry protection has been exten-sively employed as a policy tool by most developed countries and newly industrialized countries of today in the early stages of their development.5 LDCs are very much within their rights to use infant
Table 9.3: Cost of Exporting and Time Taken for Export by Countries in South Asia
LDCs and LLDCs Other South Asian countries
Country YearDays taken
to exportCost of exporting a container (in US$) Country Year
Days taken to export
Cost of exporting a container (in US$)
Afghanistan 2006 67 2 180 india 2006 27 8642009 74 2 680 2009 17 9452012 74 3 545 2012 16 1 095
Bangladesh 2006 35 902 Maldives 2006 21 1 2002009 28 905 2009 21 1 3482012 25 965 2012 21 1 550
Bhutan 2006 38 1 150 Pakistan 2006 31 9962009 38 1 210 2009 22 6112012 38 2 230 2012 21 660
nepal 2006 43 1 600 Sri Lanka 2006 25 6472009 41 1 764 2009 21 7152012 41 1 960 2012 21 715
Source: Un-eSCAP based on World Bank (2012g).
The Global Partnership for Development 153
industry protection to diversify their productive capacities in new areas and provide fledgling pro-ductive capacities with the needed space to grow.
Public investment could play a proactive role in infrastructure development and in catalyzing public–private partnerships to create a virtuous cycle of investment and spur inclusive growth. To this effect, the countries need to implement fiscal and tax reforms, improve budgetary pro-cesses, improve the quality of public expenditure, and promote financial inclusion through creative monetary policies and more transparent public financial management.
Domestic Resource Mobilization
it is vital for the least developed countries in South and South-West Asia to increase development finance through generating and mobilizing sav-ings domestically. Private domestic savings are one source of finance, which the financial sector can channel towards development. Public domes-tic savings can come from government borrowing (i.e., issuing government bonds) or from the tax-ation of individuals and companies.
Private domestic resources can only be effec-tively harnessed by a financial architecture that provides access to a variety of financial services and products, especially for SMes and micro enterprises, with a particular emphasis on women, underprivi-leged groups and people living in rural areas. This requires a diversified, well-regulated and inclusive financial system that promotes savings and chan-nels them to productive investments, especially in rural areas. The domestic supply of long-term capital also needs to be increased by developing domestic capital markets, venture capital funds and term-lending institutions. industrial develop-ment banks can also provide finance required for the creation of new productive capacities. Micro-finance, including micro credit, is an additional tool that can be effective in generating employ-ment, especially self-employment, improving the well-being of poor households, including women, empowering individuals and communities, and initiating social development in least developed countries in the subregion.
Governments should provide appropriate and coordinated support to both private and pub-lic domestic resource mobilization. Policies need to meet the rising demand for domestic finance, including capacity-building for microfinance
institutions and creating a necessary regulatory framework for long-term capital accumulation. Although the potential may be limited in LDCs for increasing public domestic resources through improved tax collection and government borrow-ing, efforts to improve tax administration capacity and improve the market for domestic government borrowing can lay a strong institutional foundation for improved government revenues as the LDCs develop. effective domestic resource mobiliza-tion and institution-building by LDCs also should be supported by development-oriented FDi and targeted oDA, as well as trade policies of develop-ment partners that create favourable conditions for productive capacity-building, as well as for improved government revenue collection. Foster-ing growth in the scale and scope of indigenous enterprises and in line with their ability to partner with global enterprises through expanded pro-duction, retail chains and networks also requires support and can help create a virtuous cycle by broadening the domestic tax base.
Technological Upgrading
Technological development diffusion and upgrad-ing are critical factors for strengthening the pro-ductive and supply capacities of least developed countries. Science and technology and research and development capacities in South and South-West Asia’s LDCs need to be both built up through national programmes and supported by interna-tional institutions. it is timely to consider setting up a technology bank for LDCs, which could transfer key technologies, including pro-poor, green, agri-cultural and renewable energy-related technolo-gies that may already be in public domain.
in order to address the development chal-lenges facing South and South-West Asian LDCs, it is vital to take specific measures to support cre-ative, inventive and innovative activities across all economic sectors, including the involvement of universities and research institutions, and to emphasize the need for the commercialization of research outputs. LDCs should be fully assisted in meeting all their technological development and adaptation objectives. The creation of an enabling national environment for technological capacity-building should be supported by all organizations and development partners.
Least developed countries should be fully sup-ported in the formulation of national innovation
South and South-West Asia Development Report154
strategies and access to technological and sci-entific information for development. Article 66.2 of the WTo’s Trade-Related aspects of intellectual Property rights (TRiPS) Agreement requires devel-oped countries to facilitate technology transfer to LDCs. however, it remains to date a statement of intent rather than an effective tool as it does not define the technology transfer nor the mecha-nisms for encouraging such a transfer. Transfer of technology should be a critical component of the global partnership for development if LDCs are to develop their productive capacities and in particular, exploit the potential of emerging green industry.
Harnessing Support from Renewed Global Partnership
Foreign Direct Investment Inflows
Foreign direct investment (FDi) inflows can assist LDCs in diversifying their production structure into modern and knowledge-intensive areas, which add more value. however, South and South-West Asian LDCs continue to remain minor recipients of FDi and their share in global inflows is negligible. The bulk of this FDi is concentrated in traditional sectors such as mining, textiles and garments. The sub-region’s LDCs have not been successful in attract-ing high quality investments, which assist the host country in building diversified and complex pro-duction capacities. Policies aimed at attracting FDi should be oriented towards stimulating produc-tive investment, building technological capacities, developing infrastructure and strengthening link-ages within and across sectors and between differ-ent enterprises. Strengthening domestic productive capacities should also be aimed at producing a wider range of more sophisticated products.
Given that many LDCs have not been able to attract FDi despite liberalization and reform, in order to enhance private capital flows there is a need to strengthen national, bilateral and multilat-eral efforts to overcome structural and other con-straints limiting the attractiveness of LDCs as des-tinations for private capital and FDi. Bilateral and multilateral partners can provide technical, finan-cial and other forms of assistance; share good prac-tices; promote and strengthen partnerships and cooperation arrangements; and provide political risk cover and guarantees. Development partners
may also assist in leveraging aid resources, busi-ness development services and funding for feas-ibility studies in addition to supporting national efforts to create a stable and predictable invest-ment climate. Proactive investment promotion should develop viable investment projects and follow-up with investment promotion tours target-ing and inviting investment from key international players in specific sectors.
outward FDi from developing countries — including from South and South-West Asia itself — enhances the diversity of least developed coun-tries’ sources of FDi, attracts more appropriate technologies adapted to LDCs’ geo-climatic con- ditions and market size, and facilitates diversifi- cation into new products for domestic and export markets. South–South FDi flows have been ris-ing, and now account for over a third of FDi flows received by LDCs. LDCs may have greater success in attracting FDi originating in the emerging sources than in traditional source countries.
Improving Aid Effectiveness in South and South-West Asia
official development assistance (oDA) has a poten-tially catalytic role to play promoting sustainable and inclusive development in LDCs; enhancing social, institutional and physical infrastructure; promoting FDi; adapting trade and technological inventions and innovations; improving health and education; fostering gender equality; ensur-ing food security; and reducing poverty. Despite a significant increase in oDA to LDCs in recent years, only nine out of 22 donors included in the Development Assistance Committee (DAC) of the organisation for economic Co-operation and Development (oeCD), met the target of providing at least 0.15 per cent of their gross national income as oDA to LDCs before the onset of the financial crisis in 2008. Therefore besides the need to scale up oDA to meet internationally agreed commit- ments, there is also need to further target devel-opment assistance specifically to LDCs.
out of more than $131 billion in net official development assistance disbursed by donors in 2010, approximately one eighth or $16.5 bil-lion went to the 10 South and South-West Asian countries. nearly 40 per cent of that amount, some $6.4 billion, went to Afghanistan, which cur-rently receives more of the world’s oDA flows than any other country. Pakistan received $3 billion
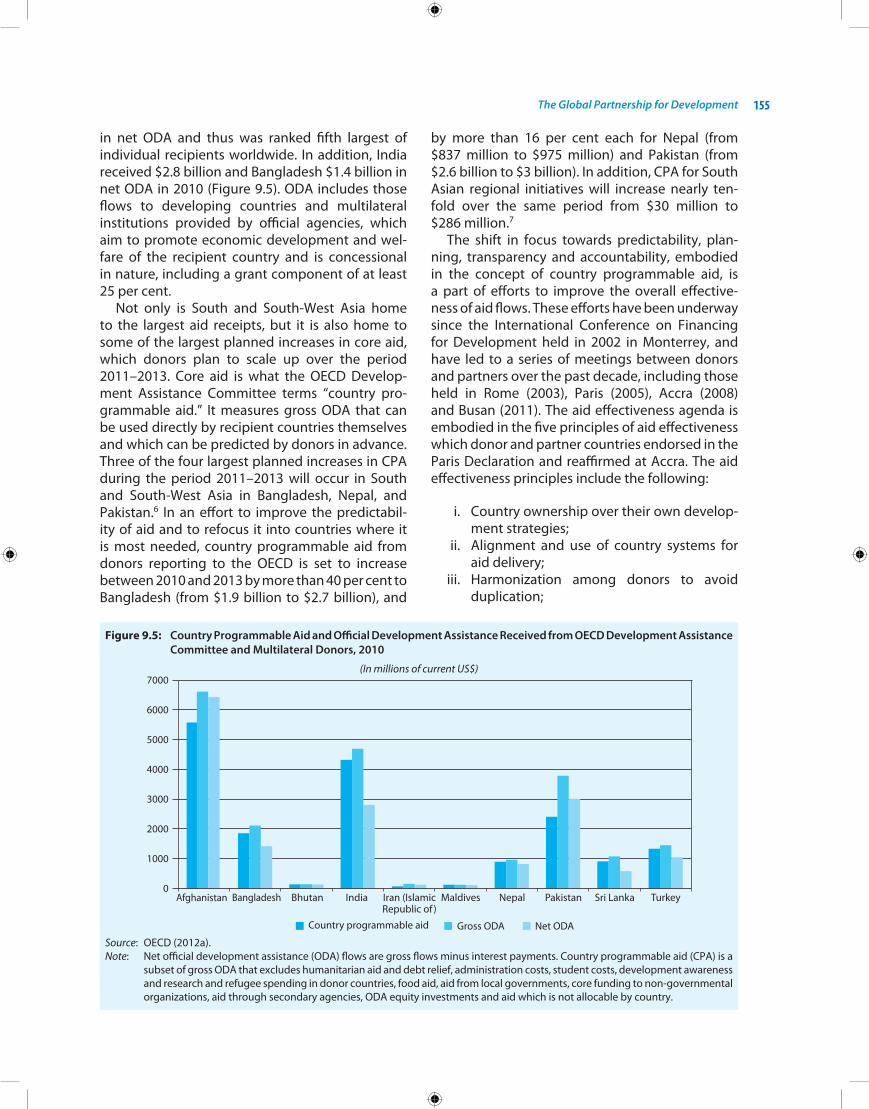
The Global Partnership for Development 155
in net oDA and thus was ranked fifth largest of individual recipients worldwide. in addition, india received $2.8 billion and Bangladesh $1.4 billion in net oDA in 2010 (Figure 9.5). oDA includes those flows to developing countries and multilateral institutions provided by official agencies, which aim to promote economic development and wel-fare of the recipient country and is concessional in nature, including a grant component of at least 25 per cent.
not only is South and South-West Asia home to the largest aid receipts, but it is also home to some of the largest planned increases in core aid, which donors plan to scale up over the period 2011–2013. Core aid is what the oeCD Develop-ment Assistance Committee terms “country pro-grammable aid.” it measures gross oDA that can be used directly by recipient countries themselves and which can be predicted by donors in advance. Three of the four largest planned increases in CPA during the period 2011–2013 will occur in South and South-West Asia in Bangladesh, nepal, and Pakistan.6 in an effort to improve the predictabil-ity of aid and to refocus it into countries where it is most needed, country programmable aid from donors reporting to the oeCD is set to increase between 2010 and 2013 by more than 40 per cent to Bangladesh (from $1.9 billion to $2.7 billion), and
by more than 16 per cent each for nepal (from $837 million to $975 million) and Pakistan (from $2.6 billion to $3 billion). in addition, CPA for South Asian regional initiatives will increase nearly ten-fold over the same period from $30 million to $286 million.7
The shift in focus towards predictability, plan-ning, transparency and accountability, embodied in the concept of country programmable aid, is a part of efforts to improve the overall effective- ness of aid flows. These efforts have been underway since the international Conference on Financing for Development held in 2002 in Monterrey, and have led to a series of meetings between donors and partners over the past decade, including those held in Rome (2003), Paris (2005), Accra (2008) and Busan (2011). The aid effectiveness agenda is embodied in the five principles of aid effectiveness which donor and partner countries endorsed in the Paris Declaration and reaffirmed at Accra. The aid effectiveness principles include the following:
i. Country ownership over their own develop-ment strategies;
ii. Alignment and use of country systems for aid delivery;
iii. harmonization among donors to avoid duplication;
Figure 9.5: Country Programmable Aid and Official Development Assistance Received from OECD Development Assistance Committee and Multilateral Donors, 2010
(In millions of current US$)
Source: oeCD (2012a).Note: net official development assistance (oDA) flows are gross flows minus interest payments. Country programmable aid (CPA) is a
subset of gross oDA that excludes humanitarian aid and debt relief, administration costs, student costs, development awareness and research and refugee spending in donor countries, food aid, aid from local governments, core funding to non-governmental organizations, aid through secondary agencies, oDA equity investments and aid which is not allocable by country.
South and South-West Asia Development Report156
iv. Measurement of results and; v. Mutual accountability of both donors and
partners in the development process.
The Fourth high Level Forum on Aid effective-ness held in 2011 in Busan again reaffirmed these principles, in particular country ownership and alignment with country systems. Furthermore, development partners at Busan agreed that delivery of development cooperation via country systems should be the “default” for any planned development interventions.
The Forum also established a new Global Part-nership for effective Development Cooperation to support global level monitoring of development effectiveness. Moving forward, the effectiveness principles of the Global Partnership must inform international support towards the priority areas of the istanbul and Almaty Programmes of Action and vice versa, in order to ensure coherent inter-national efforts to help the least developed and landlocked countries. in the Busan outcome docu-ment, the United nations system notably takes a significantly more central role in the aid and devel-opment effectiveness agenda than previously.8 The United nations Development Programme (UnDP) is invited along with oeCD to support the effective functioning of the Global Partnership. in addition, the United nations Development Coop-eration Forum is also invited to play a consulting role on the implementation of the agreements made at Busan.
South–South Cooperation
With emerging countries in Asia-Pacific becoming the growth poles of the world economy, South–South cooperation has become a viable strategy for development. An increasing number of coun-tries including China, india, Malaysia, Thailand, Singapore, Turkey and the Russian Federation, have well-developed programmes of assisting other developing countries, especially LDCs that are in their neighbourhood. The bulk of South–South cooperation is directed at capacity-building programmes through which emerging countries share their expertise with LDCs to build educa-tion, vocational skills, and infrastructure that can be critical for further enhancing LDCs’ capabilities. The growing importance of South–South cooper- ation has been recognized explicitly by the istanbul Programme of Action in the context of assistance
to LDCs. it is also a cornerstone of recent interna-tional efforts to improve aid effectiveness, such as the Busan Global Partnership.
South–South development cooperation is funda-mentally different than north–South flows. import-antly, as cooperation efforts come from countries with similar factor endowments and experiences, South–South cooperation benefits from a perceived level playing field and a balanced reciprocal relation-ship. it is also largely devoid of the donor–recipient relationship that has characterized much of devel-opment aid until recently. Additionally, South–South solutions may be more efficient than some forms of north–South cooperation. having been developed in an envir-onment with relatively poorer infrastruc-ture, developing country technological solutions may often be better suited for adaptation to other developing countries than solutions designed in the industrialized world. Developing country expertise may also be better adapted to similar geographic and climatic conditions in other developing coun-tries. Technologies and expertise provided by other developing countries may also be more cost- effective. This is particularly true with respect to technical cooperation efforts. For example, training a group of civil servants will be relatively cheaper in hyderabad than in Tokyo.9 See Box 9.1 for examples of indian and Turkish cooperation efforts.
Innovative Financing for Development in South and South-West Asia
The development financing through oDA from conventional sources and South–South coop-eration needs to be supplemented by innovative sources, given the large scale of resources needed for closing development gaps, particularly in the LDCs. These include funds aimed at financing spe-cific global public goods, international taxes aimed at collecting revenues for international devel- opment purposes, and also innovative schemes to put the international monetary system and inter-national currency reserves to work in the service of developing countries. Given South and South-West Asia’s large share of the world’s poor and excluded populations, and given its substantial development needs over the next decade, innovative financing mechanisms can make a difference in the devel-opment expenditures of governments in the sub-region, particularly in the LDCs and LLDCs.
health is the most active area in which innova-tive financing mechanisms are already being used

The Global Partnership for Development 157
Box 9.1India and Turkey as Emerging Donors in South and South-West Asia
in South and South-West Asia, india and Turkey have been active in development cooperation for many decades and are already well-established providers of South–South development cooperation. Both countries have long-standing programmes of assistance to other developing countries, particularly in the form of technical cooperation. Those technical cooperation programmes highlight the comparative advantages of South–South cooperation highlighted above, as they allow for a cost-efficient exchange of knowledge and expertise across a level playing field.
india’s indian technical and economic co-operation (iTeC) programme, under the Technical and economic Co-operation Division of the Ministry of external Affairs, has been providing capacity building and human resource development assistance to other developing countries since 1964. iTeC’s programmes, operated jointly with india’ Special Commonwealth Assistance for Africa Programme (SCAAP), currently reach 161 countries. The programmes provide training in fields such as information technology, education and enterprise development. The Government of india finances other technical assistance programmes as well, such as the technical cooperation scheme (TCS) under the Colombo Plan. in addition to the Ministry of external Affairs, the Department of economic Affairs in the Ministry of Finance also provides significant export credits and lending through the export import (eXiM) Bank.
Turkey’s development cooperation efforts go back to the early years of the Turkish Republic, however in their modern form they began in the 1980s through institutional capacity-building programmes in African countries. Turkish cooperation efforts underwent significant change adapting to the urgent need presented by the independence of former Soviet bloc countries in Central Asia and the Caucasus with which Turkey has close cultural and historical ties. Today, the bulk of Turkey’s development assist-ance is delivered through the Turkish international Cooperation and Development Agency (TikA), which was established in 1992. The main operational activity of TikA is technical cooperation for developing institutional capacity and human resources in partner countries. in addition, the agency provides humanitarian assistance as well as some financing of infrastructure projects, such as schools, hospital, water supplies, and sanitation facilities. TikA operates from 26 programme coordination offices in 23 partner countries to maintain close contact with local stakeholders and to implement cooperation activities with first-hand information and knowledge tailored to the individual country context.
india and Turkey are currently providing each roughly US$1billion annually to South–South development cooperation efforts. Moreover both are rapidly increasing the scale of the assistance which they provide to developing countries, while also expanding the scope of activities which their development cooperation finance. Table 9.4 demonstrates the relative size and growth of the indian and Turkish development cooperation efforts. indian loans and grants for development have increased from around $670 million in 2010–2011 to $941 million planned for 2012–2013. Turkey has grown from $707 million in 2009 to $1.3 billion committed for 2011. interestingly, as Turkey reports its aid activities directly to the Development Assistance Committee, its aid numbers can be compared directly with the oDA flows reported by the oeCD.
Table 9.4: Total Indian and Turkish Development Co-operation (in millions of current US$)
India Turkey
2010–2011* 2011–2012** 2012–2013*** 2009* 2010* 2011**
Grants 564 507 633 707 967 1319Loans 106 217 309 – – –
Total 670 724 941 707 967 1319
*disbursement, **estimated disbursement, ***commitment.Source: Calculations for india based on Government of india (2012b) and Reserve Bank of india (2012), Data for Turkey drawn from the
oeCD (2012a).
(Continued )
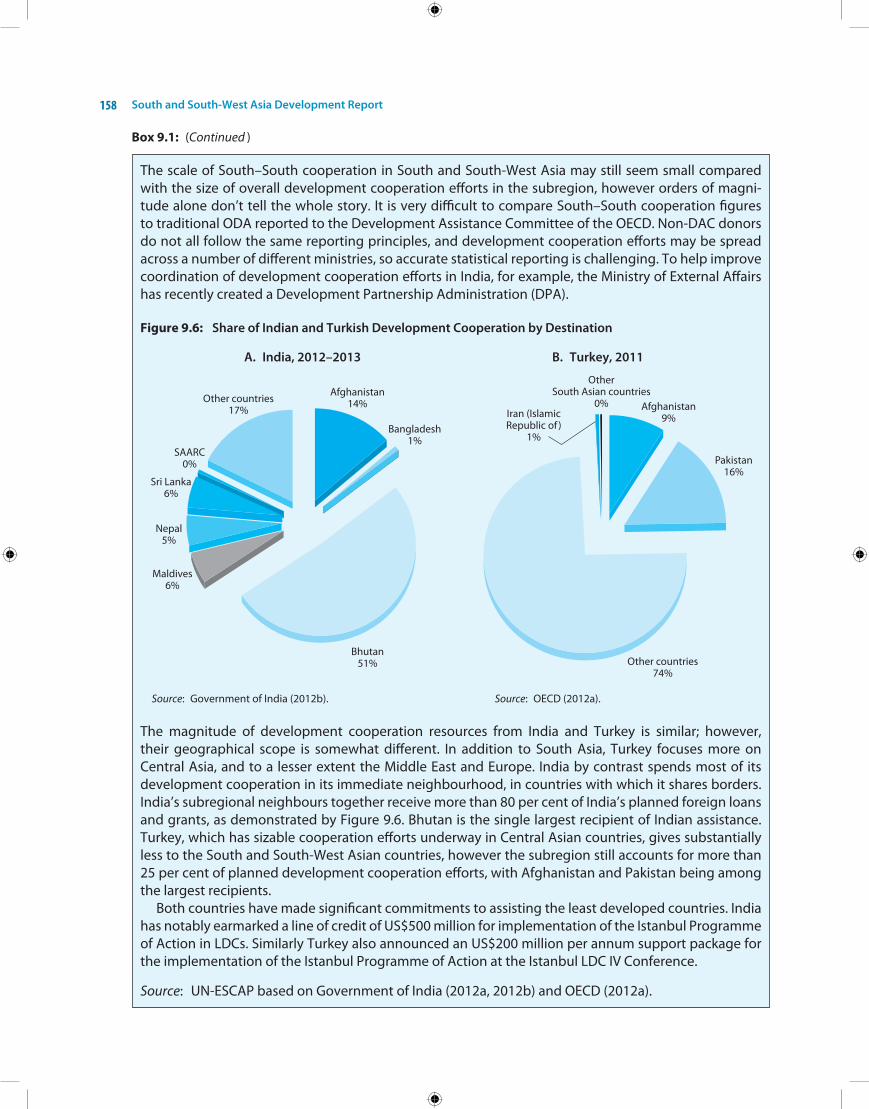
South and South-West Asia Development Report158
The scale of South–South cooperation in South and South-West Asia may still seem small compared with the size of overall development cooperation efforts in the subregion, however orders of magni-tude alone don’t tell the whole story. it is very difficult to compare South–South cooperation figures to traditional oDA reported to the Development Assistance Committee of the oeCD. non-DAC donors do not all follow the same reporting principles, and development cooperation efforts may be spread across a number of different ministries, so accurate statistical reporting is challenging. To help improve coordination of development cooperation efforts in india, for example, the Ministry of external Affairs has recently created a Development Partnership Administration (DPA).
Figure 9.6: Share of Indian and Turkish Development Cooperation by Destination
A. India, 2012–2013 B. Turkey, 2011
Source: Government of india (2012b). Source: oeCD (2012a).
The magnitude of development cooperation resources from india and Turkey is similar; however, their geographical scope is somewhat different. in addition to South Asia, Turkey focuses more on Central Asia, and to a lesser extent the Middle east and europe. india by contrast spends most of its development cooperation in its immediate neighbourhood, in countries with which it shares borders. india’s subregional neighbours together receive more than 80 per cent of india’s planned foreign loans and grants, as demonstrated by Figure 9.6. Bhutan is the single largest recipient of indian assistance. Turkey, which has sizable cooperation efforts underway in Central Asian countries, gives substantially less to the South and South-West Asian countries, however the subregion still accounts for more than 25 per cent of planned development cooperation efforts, with Afghanistan and Pakistan being among the largest recipients.
Both countries have made significant commitments to assisting the least developed countries. india has notably earmarked a line of credit of US$500 million for implementation of the istanbul Programme of Action in LDCs. Similarly Turkey also announced an US$200 million per annum support package for the implementation of the istanbul Programme of Action at the istanbul LDC iV Conference.
Source: Un-eSCAP based on Government of india (2012a, 2012b) and oeCD (2012a).
Box 9.1: (Continued )
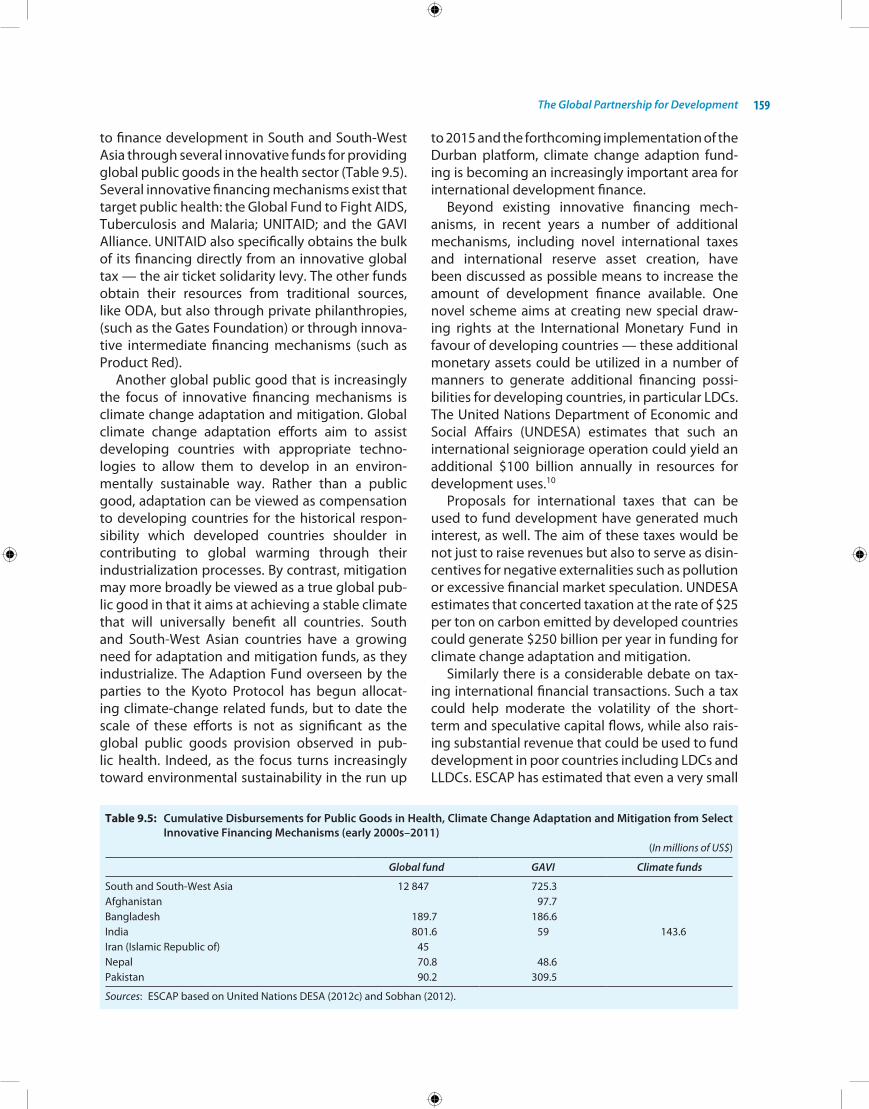
The Global Partnership for Development 159
to finance development in South and South-West Asia through several innovative funds for providing global public goods in the health sector (Table 9.5). Several innovative financing mechanisms exist that target public health: the Global Fund to Fight AiDS, Tuberculosis and Malaria; UniTAiD; and the GAVi Alliance. UniTAiD also specifically obtains the bulk of its financing directly from an innovative global tax — the air ticket solidarity levy. The other funds obtain their resources from traditional sources, like oDA, but also through private philanthropies, (such as the Gates Foundation) or through innova-tive intermediate financing mechanisms (such as Product Red).
Another global public good that is increasingly the focus of innovative financing mechanisms is climate change adaptation and mitigation. Global climate change adaptation efforts aim to assist developing countries with appropriate techno- logies to allow them to develop in an environ-mentally sustainable way. Rather than a public good, adaptation can be viewed as compensation to developing countries for the historical respon-sibility which developed countries shoulder in contributing to global warming through their industrialization processes. By contrast, mitigation may more broadly be viewed as a true global pub-lic good in that it aims at achieving a stable climate that will universally benefit all countries. South and South-West Asian countries have a growing need for adaptation and mitigation funds, as they industrialize. The Adaption Fund overseen by the parties to the kyoto Protocol has begun allocat-ing climate-change related funds, but to date the scale of these efforts is not as significant as the global public goods provision observed in pub-lic health. indeed, as the focus turns increasingly toward environmental sustainability in the run up
to 2015 and the forthcoming implementation of the Durban platform, climate change adaption fund-ing is becoming an increasingly important area for international development finance.
Beyond existing innovative financing mech-anisms, in recent years a number of additional mechanisms, including novel international taxes and international reserve asset creation, have been discussed as possible means to increase the amount of development finance available. one novel scheme aims at creating new special draw-ing rights at the international Monetary Fund in favour of developing countries — these additional monetary assets could be utilized in a number of manners to generate additional financing possi-bilities for developing countries, in particular LDCs. The United nations Department of economic and Social Affairs (UnDeSA) estimates that such an international seigniorage operation could yield an additional $100 billion annually in resources for development uses.10
Proposals for international taxes that can be used to fund development have generated much interest, as well. The aim of these taxes would be not just to raise revenues but also to serve as disin-centives for negative externalities such as pollution or excessive financial market speculation. UnDeSA estimates that concerted taxation at the rate of $25 per ton on carbon emitted by developed countries could generate $250 billion per year in funding for climate change adaptation and mitigation.
Similarly there is a considerable debate on tax-ing international financial transactions. Such a tax could help moderate the volatility of the short-term and speculative capital flows, while also rais-ing substantial revenue that could be used to fund development in poor countries including LDCs and LLDCs. eSCAP has estimated that even a very small
Table 9.5: Cumulative Disbursements for Public Goods in Health, Climate Change Adaptation and Mitigation from Select Innovative Financing Mechanisms (early 2000s–2011)
(In millions of US$)
Global fund GAVI Climate funds
South and South-West Asia 12 847 725.3Afghanistan 97.7Bangladesh 189.7 186.6india 801.6 59 143.6iran (islamic Republic of) 45nepal 70.8 48.6Pakistan 90.2 309.5
Sources: eSCAP based on United nations DeSA (2012c) and Sobhan (2012).
South and South-West Asia Development Report160
tax of 0.1 per cent on global foreign exchange transactions could yield annual revenues of about US$640 billion, assuming that the volume of finan-cial transaction fell by one third as a result of tax imposition.11
At present, discussions of most of the proposed international taxes remain just ideas. The imple-mentation of such international taxes would be an ambitious undertaking as they would require political agreement of all countries. There are large vested interests for example in the financial ser-vices industry which could view the imposition of such a tax as harmful for the competitiveness of private financial institutions in participating coun-tries. indeed, without binding international agree-ment, individual countries applying a financial transaction tax unilaterally risk suffering a sudden drop in business. nonetheless, the topic of inter-national taxes, like the financial transactions tax, has risen to the top of the international agenda in the years since the onset of the financial crisis. The G20 meeting held in Cannes, France formally con-sidered implementation of such a tax, which was proposed by the european Union. Although it was not agreed to by the G20 countries, it is encourag-ing that discussion of such innovative financing mechanisms has finally captured the attention of policy makers at the highest level.12
international taxes are a largely unexploited area for encouraging innovative financing for development, particularly in LDCs, however the role, limited as it may be in an LDC, of the innova-tive domestic taxes should not be overlooked. examples exist in the subregion of Governments trying to find their own innovative sources of finance for funding the MDGs. india, for instance, levies an ”education cess” of 2 per cent on the total income tax payable by assesses and uses the pro-ceeds to finance the Sarva Shiksha Abhiyan, literally “the universal literacy campaign”.
Market Access and Aid for Trade
in order to enhance substantially the share of LDCs in world trade and its contribution to their development, LDCs need enhanced and predict-able market access from their partners, support for establishing cost and quality competitive export supply capacity, and construction of trade-related infrastructure. Tariff and non-tariff barriers and subsidies in developed countries adversely affect the export earnings of the South and South West
Asia LDCs. Although developed countries gener-ally levy lower overall tariffs, tariff peaks and tariff escalation are applied on agricultural and labour-intensive products typically exported by LDCs. As a result, LDCs face higher average tariffs than their developed country counterparts. Most LDCs enjoy preferential access to industrial country markets under the generalized system of preferences (GSP). however, experience suggests that the benefits of many GSP schemes are limited owing to strin-gent rules of origin, small preference margins and high competition among the beneficiary countries. More transparent and simplified rules of origin, allowing for cumulation of origin, at least at the regional level, could improve the use and value of preferences, as would more comprehensive prod-uct coverage.
LDCs should be granted greater preferential treatment than other countries to enable them to offset some of their disadvantages. Most LDCs across Asia-Pacific have not been granted prefer-ential scheme that benefit LDCs in Africa and the Caribbean such as the African Growth and oppor-tunity Act (AGoA) and the Caribbean Basin initi-ative (CBi) of the United States of America or the Africa, Caribbean and Pacific (ACP) benefits under the Lomé Convention granted by the european Union. even though the WTo Agreements include special and differential treatment (SDT) for LDCs, most of the provisions are best endeavour clauses lacking specific targets and legal enforcement mechanisms, often providing a few additional years for implementation. Furthermore, a num-ber of LDCs are not yet able to enjoy the multilat-eral trade rules. As observed earlier, Bhutan and Afghanistan in the subregion are still in the pro-cess of WTo accession. Concerns have been raised about the heavy conditions imposed on the LDCs in the process of their accession, which make them undertake obligations way beyond those which their level of development would justify. To enable the LDCs to benefit from their multilateral frame-work, the accession process has to be simplified and made less onerous.
For the Asia-Pacific LDCs, full implementation of duty-free, quota-free market access by developed countries, and developing countries in a position to do so, as agreed in the hong kong Ministerial Declaration, is critical to integrating beneficially into the global trading system. notable initiatives in this direction include the european Union’s GSP
The Global Partnership for Development 161
scheme for LDCs which was expanded as every-thing But Arms (eBA) in 2001. Similar initiatives have been adopted by Australia, Canada, iceland, norway, Switzerland and Turkey. others initiatives include: the Republic of korea’s presidential decree on preferential tariff for LDCs, which granted duty free access on 75 per cent in 2008;13 and the har-monized system of preferences for LDCs by Russia, Uzbekistan and Tajikistan announced in May 2001 that cover 100 per cent lines for LDCs.14 What is more encouraging is initiatives by some develop-ing countries to announce their own preferential schemes for LDCs. These include india’s duty-free preference scheme announced in 2008 for LDCs on 94 per cent tariff lines and covering 92.5 per cent of india’s imports from LDCs within a five-year time frame. Also included are unilateral tariff exemptions on all products to Bhutan and nepal, tariff reduc-tions on 38 lines for Afghanistan, and China’s special preference tariff for Afghanistan, Maldives, Samoa, Vanuatu and Yemen on 288 categories of prod-ucts.15 At the 17th SAARC Summit held in november 2011in Maldives, india announced a virtual elimin-ation of the sensitive list under SAFTA from 480 tariff lines to just 25 lines, literally offering imports of almost all products into india at zero basic customs duty (as observed in Chapter 4). hopefully, other advanced economies will implement similar duty-free–quota-free market access schemes.
The focus of Aid for Trade and the enhanced integrated Framework (eiF) should be to assist the LDCs in building productive, infrastructure and trade capacities to enable them to participate effectively in the multilateral trading system. LDCs also need capacity-building to comply with inter- national product and safety standards. Aid for Trade should be aligned with the national devel-opment strategies of individual countries aimed at supporting specific areas, such as trade policy and regulations, trade development, building pro-ductive capacities, trade-related infrastructure and trade-related adjustments. Although the total aid for trade commitments have increased to $42 bil-lion in 2008, LDCs received only 25 per cent of the allocations and only Afghanistan and Bangladesh were among the top 20 recipients among the Asia-Pacific LDCs.16 LDCs should receive prior-ity attention for the disbursement of funds from Aid for Trade. Furthermore, the LDCs should be given an extension of the TRiPS waiver for another 10 years beyond 2016 to enable them to develop
their generic pharmaceutical industries, learning from other countries in the region such as india, as also argued in chapter 3.
Connectivity and Transit Facilitation
For the three LLDCs of South and South-West Asia, Afghanistan, Bhutan and nepal, access to sea ports is provided by the neighbouring transit countries. india provides port facilities at kolkata–haldia to nepal and specifies 15 transit routes between these ports and the india–nepal border. nepal has also been offered port facilities at Bombay Port and kandla Port for third country trade. A separate cus-toms cell for nepal became operational in August 2004. Three inland container depots (iCDs) at Bhairahawa, Biratnagar and Birganj have been put in place to facilitate nepal’s transit trade through india. india has built a 5.3 km Raxaul–Birganj broad gauge rail link for the movement of containerized traffic in transit to and from iCD Birganj. in addition india has provided 22 entry/exit points along the india–nepal border for bilateral trade and for india– nepal transit.17 Similarly india also provides to Bhutan 16 exit and entry points to facilitate bilat-eral and third country trade. An important recent development is a demonstration run of a container train (Bangladesh–india–nepal) as a follow-up of the bilateral framework agreement of cooperation between india and Bangladesh concluded between the two countries in September 2011. however, South and South-West Asia has to move towards a regional motor vehicles agreement and a regional railways agreement. As argued in chapter 5 of the present report, by strengthening connectivity across the subregion, each country will be able to harness positive externalities and serve as a hub for trade across the subregion. This has the potential to bring widespread prosperity to all countries across South and South-West Asia. For instance, estimates suggest that Bangladesh alone would earn around $1 billion in annual transit revenues from vehicles crossing the territory of Bangladesh. infrastructure development and regional agreements for facilita-tion need to be prioritized.
Facilitating the Transition from the LDC Category
Graduation from the LDC category implies that specific support from the international community may no longer be needed as the LDCs are catching
South and South-West Asia Development Report162
up with the rest of developing countries. however graduation should not imply the total withdrawal of all international support. instead the type of sup-port provided should evolve to reflect the devel- opment progress, which the graduating country has accomplished.
The United nations Committee for Develop-ment Policy (CDP) is responsible for undertaking, once every three years, a review of the least devel-oped countries, on the basis of which it advises the United nations economic and Social Council (eCoSoC) regarding countries which should be added to the list and those that could be gradu-ated from it. in order to be considered for gradua-tion, a country must cease to meet two of the three inclusion criteria. This has to be confirmed by the CDP over two consecutive triennial reviews.
in between the two reviews, the United nations Department of economic and Social Affairs (DeSA) prepares an ex ante impact assessment of the likely consequences of graduation for the country’s eco-nomic growth and development, while the United nations Conference on Trade and Development (UnCTAD), is required to prepare a vulnerability
profile for the graduating country. once gradu-ation is endorsed by eCoSoC, based on the recom-mendation of the CDP following two consecutive reviews, the country is accorded a three-year tran-sition period during which it prepares a transition strategy in conjunction with development part-ners. This strategy is then implemented in the post-transition period.
Smooth transition strategies aim to avoid dis-ruptions and reversal of progress achieved by countries that graduate from the least devel-oped category. The transition period starts after graduation, which is three years after the General Assembly takes note of a recommendation by the CDP to graduate the concerned country from the list. in the more than 40 years since the incep-tion of the LDC category, only three countries have graduated. For more details on Maldives’ experi-ence, see Box 9.2.
conclusions
This chapter has argued that owing to the structural realignment of the global economy, the priorities
Box 9.2Lessons of the Graduation of Maldives from the LDC Category
in South and South-West Asia, the case of the Maldives is one where the challenges facing LDCs pre-vented a smooth transition to graduation from the LDC category, although together with Cape Verde in 2004 Maldives was deemed ready for graduation as it had surpassed the LDC thresholds for income per capita and human assets. The CDP identified the Maldives as a candidate for graduation during two reviews — in 1997 and 2003 — and in 2004 eCoSoC endorsed graduation. however, on 26 December 2004 the deadly indian ocean tsunami devastated the small island developing state. Considering the extent to which this natural disaster unraveled many of the country’s development gains, the General Assembly decided, in november 2005, to defer the country’s graduation for three years, which thus took place only in January 2011.
The experience of Maldives was instructive, particularly as part of the rationale for extending LDC status stemmed from the belief that the LDC graduation criteria pay insignificant attention to the inherent and extreme vulnerability of small island States. For example, the economic vulnerability assessment may ignore key vulnerability considerations for small island States such as environmental vulnerability, import dependency (for essential commodities), and geographic dispersion and isolation. in principle, such additional consideration should make up part of the assessment by UnCTAD and DeSA prior to the second review by the CDP, yet in practice this is not always the case.
Continuing assistance and cooperation efforts are undoubtedly critical to the smooth transition out of the LDC category. As a part of attempts to make the graduation and smooth transition process a more fluid and robust one, an important outcome of the istanbul Programme of Action is the creation of an Ad hoc Working Group on improving the Smooth Transition Process. its first report was submitted to the Secretary-General of the United nations in June 2012.
Source: Un-eSCAP based on United nations DeSA (2012b), United nations (2012b) and Government of Maldives (2009).

The Global Partnership for Development 163
of development cooperation in South and South-West Asia, particularly in the four LDCs of the sub-region, have changed. The istanbul Programme of Action has acknowledged this in its focus on pro-ductive capacity, South–South cooperation, and improving the smooth transition of LDCs following graduation from the LDC category. While national efforts in providing an investment-friendly macro-economic framework and industrial policy regime, financial system, technological upgrading and infrastructure are critical, global partnership can play a supportive role in providing resources, mar-ket access, capacity-building and transit facilities for LDCs and LLDCs.
Development cooperation in the subregion has also recognized this by strengthening the type and size of resources aimed at the subregion’s LDCs from the traditional donors, as well as from emerg-ing donors within the subregion itself, including india and Turkey. The Busan Global Partnership for effective Development Cooperation has also high-lighted this in its reaffirmation of country owner-ship and the use of country systems, as well as its admission that South–South cooperation is funda-mentally different from north–South cooperation
since it often brings more appropriate and cost-effective solutions to the development challenges facing countries in the subregion. Given limited financial capacity of Southern partners to pro-vide such solutions, a part of north–South devel-opment cooperation may support South–South cooperation, in what is now termed the triangu-lar development cooperation. india and Turkey, already well-established providers of technical cooperation, are rapidly scaling up their own contributions to their subregional development partners, and in particular the South and South-West Asian LDCs. The partnership and good will which they demonstrate to subregional neigh-bours will remain valuable as efforts to scale up the subregion’s domestic resources continue to improve and increase far into the future. While some encouraging initiatives have been taken in the direction of capacity-building and technologi-cal cooperation, market access and aid-for-trade, transit facilitation and connectivity, and build-ing productive capacity, more needs to be done to assist South and South-West Asian LDCs in a coherent manner, which respects country owner-ship, transparency and accountability.

chaptEr 1
1. See United nations General Assembly (2012). 2. See Un-eSCAP (2011a and 2012a). 3. See United States Department of Agriculture
(2012b). 4. See kohli and others (2011). 5. See Quah (2010). 6. See Goyal (2011). 7. ibid. 8. See Un-eSCAP (2011a). 9. See eichengreen (2011).10. See World Bank (2012b).11. See Jha (2011).12. See Straub and Terada-hagiwara (2011).13. See State Bank of Pakistan (2011).14. See Aschauer (1989), holtz-eakin and Schwartz
(1994), Gramlich (1994), Calderon and Servén (2004), kumar (2006), Roland-holst and Asian Development Bank (2006) Straub and Terada-hagiwara (2011).
15. See De and Ghosh (2005).16. See Raihan (2011).17. See Chatterton and Puerto (2011).18. See Agrawal and kumar (forthcoming).19. See Goyal (2012).20. See World Bank (2012f) and UnCTAD (2012).21. See Un-eSCAP (2011a), Un-eSCAP (2012a), kelegama
(2011 and 2012).
chaptEr 2
1. See Un-eSCAP, ADB, UnDP (2012). 2. See Dreze and Sen (2011). 3. See United nations (2010b). 4. See Bourguignon (2003). 5. See Desai and others (2010) and World Bank
(2011). 6. See technical note, http://hdr.undp.org/en/media/
hDR_2010_en_Technotes_reprint.pdf for more details.
7. See Un-eSCAP, ADB, UnDP (2012), technical note 5: Selected MDG indicators.
8. See United nations (2012c). Situation Report on International Migration in South and South-West Asia, p. 224.
9. See oeCD (2012b).
Notes
10. Based on Un Women Press release, 26 June 2012 on the Report of the Special Rapporteur on violence against women, its causes and consequences on gender-related killings at the Twentieth Session of the human Rights Council.
11. See World Bank (2012a).12. See oeCD (2012b).13. See Dreze and Sen (1995).14. Based on the latest data from the MDG indicators
database, http://mdgs.un.org/unsd/mdg/Data.aspx, accessed 20 September 2012.
15. See also World Bank (2012c), figure 5.4.16. United nations, Rio+20 Conference on Sustainable
Development, A/ConF.216/L.1.17. See iLo (2010). Chapter 2.18. See Lanjouw (2007). 19. See Jutting, Luci and Morrisson (2010).20. See Un-eSCAP (2011e).21. See Jutting and de Laiglesia (2009).22. See Un-eSCAP (2011c).23. estimations for demographic bulge based on DeSA
(2010).24. See Dobbs and others (2012). 25. Based on the latest data from the MDG indicators
database, http://mdgs.un.org/unsd/mdg/Data.aspx.26. See Ghani and kharas (2010); Raychaudhuri and De
(2012).27. See Agarwal and kumar (forthcoming).
chaptEr 3
1. Basu and others (2012). 2. kumar, kesavapany and Chaocheng (2008). 3. See Economic Survey (2011–2012). Available from
http://indiabudget.nic.in/. 4. ibid. 5. ibid. 6. See kumar and Joseph (2007) for a detailed analysis
of challenges for strengthening international com-petitiveness of knowledge-based industries.
7. This technique was first applied by Tyszynski (1951) and since then it has been frequently used in a number of empirical studies in the examination of export growth performance of different countries/ regions. While this tool has extensively been used in explaining the export growth performance of
Notes 165
a number of countries in the eastern and south-eastern countries, the CMS model has been used in the case of a few South Asian countries such as india, Pakistan and Bangladesh (ingho and kandiero (2002); Mahmood, A. and n. Akhtar (1996); and Tiwari, T. S. (1986).
8. See Un-eSCAP (2012c). Forthcoming, for detailed methodology.
9. it is important to interpret the residual component- the competiveness effect somewhat cautiously as it is not straightforward compared with other compon- ents. For a discussion on the limitations, see Widodo (2010) and Leichter, Mocci and Pozzuoli (2010).
10. See Freire (2012). 11. See kumar (2008). 12. See kumar (2001).13. See hamid (2007).14. See www.atkearney.com.15. See www.atkearney.com/paper/-/asset_publisher/
dVxv4hz2h8bS/content/competitive-benchmark ing-sri-lanka-knowledge-services/10192.
16. See kumar (2010) for a detailed discussion on the evolution of FDi policy regime in South Asia.
17. See kumar (2002). 18. See www.atkearney.com/documents/10192/fdaa
84a5-a30a-4e4e-bc36-453375d6596f. 19. See UnCTAD (2012).20. See RiS (2008).
chaptEr 4
1. See Un-eSCAP (2012a). 2. See Un-eSCAP (2012a) and (2012b). 3. See Un-eSCAP (2012b). 4. See Dunning (1998) and kumar (2007). 5. See Un-eSCAP (2012b). 6. See e.g. kumar (2007) for details. 7. See World Bank (2000). 8. See Un-eSCAP (2012b). 9. See kose and others (2004).10. See Un-eSCAP (2012b).11. See Un-eSCAP (2011a): pp. 112–113.12. See UnCTAD–ADB (2008) as cited in RiS (2008).13. See ibid.14. See Raihan (2012).15. See CUTS (2012).16. See Taneja (2001)17. See khan (2005).18. See Taneja and Pohit (2002).19. Taneja (2001, 2005), Taneja and Pohit (2002), Pohit
and Taneja (2003) and khan (2005, 2007) have attempted to quantify the volumes and compos-ition of informal trade flows among the various South Asian countries. Using these previous estimates and considering the magnitude and composition of
current official flows, the numbers can be updated to assess the magnitude of informal flows today.
20. estimated informal trade flows used the ratios of informal to formal trade cited in the original sources based on surveys and informal observation at border towns and other trading areas. The original ratios were updated to 2011 values using the growth rates of imports and exports observed since the original survey date. The orders of magni-tude roughly correspond to the unexploited trade estimated through an augmented gravity equation model, with some exceptions — particularly in the case of Pakistan–india trade, where other factors play a role other than distance, such as trade facilitation and the different components of the informal versus formal trading baskets.
21. See RiS (2008).22. See kumar (2007).23. http://www.thehindu.com/business/economy/
article3712510.ece.24. See kumar, Das and De (2008) and eSCAP (2011).25. See kelegama (2012).26. See Chanda (2011) and Sohail, hanif and Quddus
(2012).27. See kumar (2007).28. See Un-eSCAP (2012b).
chaptEr 5
1. The index is generated as follows: for each of the five components, a country’s value is divided by the maximum value of that component in 2004, and for each country, the average of the five components is calculated. This average is then divided by the maximum average for 2004 and multiplied by 100. in this way, the index generates the value 100 for the country with the highest average index of the five components in 2004.
2. See Duval and Uthoktham (2011). 3. See Un-eSCAP (2012), Chapter 3. 4. Refer, SAARC Secretariat Press Release dated
30 August 2011. 5. eCo has very ambitious plan on railway connectivity.
For example, the Railway Administrations of the islamic Republic of iran, kazakhstan, kyrgyzstan Tajikistan, Turkey, Turkmenistan and Uzbekistan, hereinafter referred to as Contracting Parties, bear-ing in mind the goals and objectives of the Treaty of izmir (1996) and the relevant decisions of the 4th and 5th Meetings of the heads of eCo Railway Author-ities, have agreed to open international passenger traffic on Almaty–Tashkent–Turkmenabad–Tehran–istanbul route of Trans-Asian railway main line (eCo, 2001).
6. Source: eCo Secretariat.
South and South-West Asia Development Report166
7. improvements in customs procedures have definitely reduced the amount of informal payments needed for clearing cargo. even so, under-the-table transactions to clear exports at the borders remain high. The actual amount is negotiated between the shipper and the customs agent, with both agreeing on the amount per shipment that will be reimbursed without an invoice and which will therefore be available for paying customs officials to expedite cargo clearance.
8. See De (2011) and De, Raihan and kathuria (2012). 9. See RiS (2008).10. Refer to SAARC Secretariat newsletter, January
2008.11. The analysis was made of the three Asian highway
Routes in the framework of a geographical simu-lation model including the following route Ah1 + Ah14: kunming (China)–Muse (Myanmar)–Mandalay (Myanmar)–north india–Dhaka (Bangladesh)–Delhi (india). The simulations show that improvements in land routes typically create businesses and employment opportunities in the regions where these routes are located; highest gains are recorded by the poorest regions in terms of regional GDP per capita compared to the baseline. See eSCAP (2012b).
chaptEr 6
1. See United nations (2012b). 2. See United nations, General Assembly (2005). 3. See Un-eSCAP (2009). 4. Although nepal’s interim constitution contains an
explicit reference to the right to food, the constitu-tion’s validity itself is uncertain due to dissolution of the constituent assembly tasked with writing a permanent constitution.
5. See Ministry of health of Turkey (2010). 6. See Jamison, and others (2006). 7. See Freire, hasan and Malik (2012). 8. See Un-eSCAP (2009). 9. See Moir and Morris (2011).10 See organization for economic Co-operation and
Development (oeCD) and Food and Agriculture organization of the United nations (FAo) (2012).
11 For more details about speculation in commod- ities markets see Un-eSCAP (2012a).
12 See Un-eSCAP (2009).13 See United States Department of Agriculture
(2012a).14 See Un-eSCAP (2009).15 See Altieri and Funes-Monzote (2012). 16 See http://www.satnetasia.org/About_us.html.
chaptEr 7
1. For instance, the withdrawal of subsidies on energy products in the islamic Republic of iran contributed to high inflation in 2011 (Un, 2012).
2. SARi/energy (2012);http://www.sari-energy.org/PageFiles/Countries/nepal_energy_detail.asp.
3. Cairn has recently discovered natural gas in Sri Lanka.
4. See BP (2011). 5. See Mohammadnejad, Mahlia and Andriyana
(2011). 6. See MoPeMR (2009). 7. See ReeeP (2012). 8. See UnDP (2011b). 9. See ieA (2011a).10. See www.reeep.org/index.php?id=9353&text=
policy-db&special=viewitem&cid=44.11. See Batra and Chand (2011).12. one of india’s largest public sector oil and gas
companies, oil and natural Gas Corporation, has sought exploration rights off Sri Lanka’s coast.
13. See Zhdannikov (2012).14. See Lakshmanan and Bloomberg (2012).15. See Batra (2007).16. See The Hindu (2012).17. Following the completion of a detailed feasibility
report (DFR), the construction and investment modalities are being discussed by the companies (nepal oil Corporation Limited, 2009).
18. See Bhutta (2012).19. See Lama (2004).20. See nanda and Goswami (2008).21. See european Commission (2012).22. See The World Bank (2007).23. See Mathurand others (2009).24. See Srivastava and Misra (2007).25. See nanda and Goswami (2008).26. See Un-eSCAP Resolution 68/11 Connectivity for
energy security, e/eSCAP/68/24. Also see Un-eSCAP (2008).
chaptEr 8
1. See www.munichre.com. 2. Pakistan Floods 2010: Damage and needs Assess-
ment, World Bank and Asian Development Report. Available from www.adb.org/projects/documents/pakistan- f loods-2010-damage-and-needs-assessment.
3. United nations international Strategy for Disaster Reduction (UniSDR) Report 2012, Forthcoming.
4. See Un-eSCAP and UniSDR (2012).
Notes 167
5. See UniSDR (2009). 6. See Un-eCLAC (1996). 7. Tsunami damage and loss assessment — Maldives,
World Bank (2005). 8. Source: World Bank Database, World Development
indicators. 9. See UnU–ehS (2011).10. See Guillaumont (2008).11. high-level Plenary Meeting — Concept note “in-
creasing investment for DRR” Global Platform Geneva 2009.
12. Bhutan’s Progress: Midway to the Millennium Development Goals. Accessed from www.undp.org.bt/assets/files/publication/MDG_Midway.pdf.
13. http://www.unisdr.org/preventionweb/files/13655_MinisterialDeclarationinenglishadop%5B1%5D.pdf.
14. See Subbiah, Bildan and narasimhan (2009). 15. Joint Declaration on ASeAn-United nations Collab-
oration in Disaster Management, hanoi, 30 october 2010. Available from www.aseansec.org/25539.htm.
16. See United nations (2011b).
chaptEr 9
1. Many of the targets and indicators related to monitoring the state of the global partnership, e.g., how open and non-discriminatory the trading
system is, how many opportunities exist for youth employment, how much technology transfer is taking place globally and how much good quality pharmaceuticals are available to the world as a whole, are discussed in earlier chapters.
2. See United nations (2011b). 3. See Un-eSCAP (2010a), p. 135. 4. See kumar (2002). 5. The benefits of industrial policy are well docu-
mented by Bairoch (1993), Chang (2002), Wade (2003), and Akyuz (2005).
6. See oeCD (2011b). 7. See oeCD (2011b). 8. See http://www.aideffectiveness.org/busanhlf4/en/
component/content/article/698.html. 9. See kumar (2009) and Un-eSCAP (2011c).10. See United nations DeSA (2012c).11. See Un-eSCAP (2010b).12. See Un-eSCAP (2010b).13. See United nations (2010a).14. See UnCTAD (2010).15. See WTo (2010); UnCTAD (2010), pp. 60–61; United
nations (2010a); http://commerce.nic.in/trade/inter national_tpp_DFTP.pdf.
16. See United nations (2010a).17. See ADB and Un-eSCAP (2009).
Adhikari, Ratnakar and Chatrini Weeratunge (2007). Textiles and Clothing in South Asia. South Asia Economic Journal, vol. 8, no. 2, pp.171–203.
Agarwal, Aradhna and nagesh kumar (forthcoming). Structural change, industrialization and poverty reduction: The Case of india. United nations, economic and Social Commission for Asia and the Pacific, South and South-West Asia office, Development Papers.
Akyuz, Y. (2005). Trade, Growth and industrialization: issues, experiences and Policy Challenges. TWn Trade & Development Series 28, Penang: Third World network. Available from www.twnside.org.sg/tittle2/t&d/tnd28.pdf.
Altieri, M. and F. Funes-Monzote (2012). The paradox of Cuban agriculture. Monthly Review, vol. 63, no. 8. Available from http://links.org.au/node/2704.
Aschauer, David Alan (1989). Does public capital crowd out private capital? Journal of Monetary Economics, vol. 24, no. 2 (September), pp. 171–188.
Asian Development Bank (ADB) (2012). Food Security and Poverty in Asia and the Pacific. Manila, Philippines: Asian Development Bank.
Asian Development Bank (ADB) and United nations economic and Social Commission for Asia and the Pacific (eSCAP) (2009). Designing and Implementing Trade Facilitation in Asia and the Pacific. Bangkok.
Association of Southeast Asian nations, (ASeAn) Secretariat (2010). Master Plan of ASEAN Connectivity, Jakarta.
Bairoch, Paul (1993). Economics and World History: Myths and Paradoxes. Chicago: University of Chicago Press.
Bangladesh, Ministry of Power, energy and Mineral Resources (2009). energy and Mineral Resources Division. Available from www.emrd.gov.bd/43221.html.
Barro, Robert, and Jong-Wha Lee (2011). The Barro-Lee educational Attainment Dataset. Available from www.barrolee.com/.
Basu, Sudip Ranjan and others (2012). eurozone debt crisis: Scenario analysis and implications for developing Asia-Pacific, MPDD Working Paper, no. 12/03. Bangkok, Thailand: eSCAP. Available from www.unescap.org/pdd/publications/working paper/wp-12-03.pdf.
Batra, R. k. (2007). Gas without borders. Hardnews, June.
References
Batra R. k. and S. k. Chand (2011). india’s coal reserves are vastly overstated: is anyone listening? TeRi Policy Brief, March 2011. Available from www.teriin.org/policybrief/index.php?a=3.
Bhutta, Z. (2012). euphoria evaporates: Pakistan and india fail to strike oil trade deal. The Express Tribune, 21 July. Available from http://tribune.com.pk/story/411082/euphoria-evaporates-pakistan-and-india-fail-to-strike-oil-trade-deal/.
Bisht, Medha (2011). india–Bhutan power cooperation: between policy overtures and local debates, iDSA issue Brief.
Bourguignon, François (2003). The growth elasticity of poverty reduction: explaining heterogeneity across countries and time periods. in Inequality and Growth: Theory and Policy Implications, Turnosvky and eicher, eds.
BP (2011). BP Statistical Review of World Energy 2011. Available from www.bp.com/assets/bp_internet/globalbp/globalbp_uk_english/reports_and_publications/statistical_energy_review_2011/STAGinG/local_assets/pdf/statistical_review_of_world_energy_full_report_2011.pdf.
Calderon, Cesar A. and Luis Servén (2004). The effects of infrastructure development on growth and income distribution. Working Paper, no. 3400. Washington, D.C.: World Bank. Available from http://papers.ssrn.com/sol3/papers.cfm?abstract_id=625277.
The Centre for Bhutan Studies (2012). A Short Guide to Gross National Happiness Index. Thimphu. Available from www.grossnationalhappiness.com/wp-content/uploads/2012/04/Short-Gnh-index-final1.pdf.
Chang ha-Joon (2002). Kicking Away the Ladder: Development Strategy in Historical Perspective. London: Anthem.
Chatterton, isabel and olga Puerto (2011). estimation of infrastructure investment needs in the South Asia region. Washington, D.C.: World Bank. Avail-able from http://siteresources.worldbank.org/inTSARReGToPTRAnSPoRT/Resources/ inf_investment_needs_iC_version4.pdf.
CUTS international (2012). Cost of Economic Non-Cooperation to Consumers in South Asia. CUTS inter-national and the Asia Foundation, 1 February 2012. new Delhi, india.
References 169
De, Prabir (2011). Why is trade at borders a costly affair in South Asia? An empirical investigation. Contemporary South Asia, vol. 19, no. 4, pp. 441–464.
De, Prabir and Buddhadeb Ghosh (2005). effects of infrastructure on regional income in the era of global-isation: new evidence from South Asia. Asia-Pacific Development Journal, vol.1. no. 12, pp. 81–107.
De, Prabir, Selim Raihan and Sanjay kathuria (2012). Unlocking Bangladesh-india Trade: emerging Poten-tial and the Way Forward, Policy Research Working Paper 6155, The World Bank, Washington, D.C.
Desai, Sonalde B. and others (2009a and 2009b). india human Development Survey (ihDS). University of Maryland and national Council of Applied economic Research. new Delhi.
——— (2010). Human Development in India: Challenges for a Society in Transition. new Delhi, india: oxford University Press.
Dobbs, Richard and others (2012). The world at work: jobs, pay, and skills for 3.5 billion people. Mckinsey Global institute. Available from www.mckinsey.com/insights/mgi/research/labor_markets/the_world_at_work.
Drèze, Jean and Amartya Sen (1995). India: Economic Development and Social Opportunity. new Delhi: oxford University Press.
——— (2011). Putting growth in its place: it has to be but a means to development, not an end in itself. Outlook India, 14 november.
Dunning, John h. (1998). The changing geography of foreign direct investment. in Globalization, Foreign Direct Investment and Technology Transfer: Impact on and Prospects for Developing Countries. nagesh kumar, ed. London: Routledge.
Duval, Yann and Chorthip Uthoktham (2011). Trade Costs in Asia and the Pacific: improved and Sectoral estimates, Trade and investment Division Staff Working Paper 05/11, United nations economic and Social Commission for Asia and the Pacific (eSCAP), Bangkok.
economic Cooperation organization (2001). Memo-randum of Understanding on the opening of international Passenger Traffic on Almaty-Tashkent-Turkmenabad-Tehran-istanbul Route, Signed on the 31st october 2001 in Baku (Azerbaijan), eCo, Tehran.
eichengreen, Barry (2011). Managing capital flows. in Reshaping Tomorrow: Is South Asia Ready for the Big Leap? ejaz Ghani, ed. oxford University Press. Washington, D.C.: World Bank. Available from http://documents.worldbank.org/curated/en/2011/08/15453193/reshaping-tomorrow-south-asia-ready-big-leap.
european Commission (2012). electricity. Available from http://ec.europa.eu/competition/sectors/energy/electricity/electricity_en.html.
Freire, Clovis (2012). “Structural transformation for inclusive development in South and South-West Asia,” eSCAP South and South-West Asia office Development Papers, no. 1204. Available from http://sswa.unescap.org/meeting/documents/Dev-Challenges/SSWA_Development_Papers_1204_August2012.pdf.
Freire, Clovis, Aynul hasan and M. hussain Malik (2012). high food prices in Asia-Pacific: policy initiatives in view of supply uncertainty and price volatility, eSCAP MPDD Working Paper Series (January) no. 12/01, Bangkok, Thailand: eSCAP MPDD.
Food and Agriculture organization of the United nations (FAo) (2001). Mobilizing resources to fight hunger: Report of the Committee on World Food Security. Rome: FAo. Available from www.fao.org/docrep/meeting/003/Y0006e/Y0006e00.htm.
——— (2012). FAO Statistical Yearbook 2012: World Food and Agriculture. Rome: FAo. Available from www.fao.org/docrep/015/i2490e/i2490e00.htm.
Gallup (2011). Insights South Asia: Nepal Survey Results. Gallup europe and SADF.Brussels, Belgium.
——— (2012). Insights South Asia: Bangladesh Survey Results. Gallup europe. Brussels, Belgium.
Ghani, ejaz, and homi kharas (2010). Service led growth in South Asia: An overview. in The Service Revolution in South Asia, ejaz Ghani, ed. new Delhi: oxford University Press.
Ghosh, Prodipto (2011). Sustainable development concerns in South Asia. Presentation at the high-level Policy Dialogue on Development Challenges Facing the Subregion, new Delhi, 16–17 December 2011.
Gippner, o. (2010). energy cooperation in South Asia: prospects and challenges. Viii+54. kathmandu: South Asia Watch on Trade, economics and environment (SAWTee).
Goyal, Ashima (2011). inflationary pressures in South Asia. Macroeconomic Policy and Development Division, Working Paper Series, no. 11/14, United nations economic and Social Commission for Asia and the Pacific (Un-eSCAP), Bangkok.
——— (2012). The future of financial liberalization in South Asia, United nations economic economic and Social Commission for Asia and the Pacific, South and South-West Asia office Development Papers no. 1203, new Delhi.
Gramlich, edward M. (1994). infrastructure investment: a review essay. Journal of Economic Literature, vol. 32, no. 3 (September), pp. 1176–1196.
Guillaumont, Patrick (2008). An Economic Vulnerability Index: Its Design and Use for International Develop-ment Policy. United nations and World institute of
South and South-West Asia Development Report170
Development economic Research (UnU-WiDeR). helsinki.
hansen, James, Makiko Sato and Reto Ruedy (2012). Perception of climate change. Proceedings of the National Academy of Sciences, vol. 109, no. 37, pp. e2415-23. Available from www.pnas.org/content/early/2012/07/30/1205276109.
hamid, naved (2007). South Asia: A development strategy for the information age. in ADB Report on the South Asia Department Economists’ Annual Conference 2006, Manila, Philippines: ADB.
heltberg, Rasmus, naomi hossain and Anna Reva (2012). Living Through Crises: How the Food, Fuel and Financial Shocks Affect the Poor. new Frontiers of Social Policy. Washington, D.C.: World Bank.
holtz-eakin, Douglas and Amy ellen Schwartz (1994). infrastructure in a structural model of economic Growth, nBeR Working Paper Series, no. 4824. Available from http://papers.ssrn.com/sol3/papers.cfm?abstract_id=250353.
india, Planning Commission (2011). A New Approach to the Twelfth Five Year Plan 2012–2017, Government of india, new Delhi.
india, Government of india (2012a). Annual report of the Ministry for External Affairs, 2011–2012. new Delhi.
——— (2012b). Expenditure Budget, vol. i, 2012–2013. new Delhi.
infrastructure Development Company Limited (2012). iDCoL Solar energy Program. Available from www.idcol.org/energyProject.php.
ingco, Merlinda and Tonia kandiero (2002). export performance of Bangladesh: a constant market share analysis. South Asia Economic Journal, vol. 3, no. 2, pp. 163–176.
institute for Defence Studies and Analysis (iDSA) (2010). Water security for india: the external dynamics. iDSA Task Force Report, iDSA, new Delhi.
international energy Agency (ieA) (2009). Energy Balance. Available from http://iea.org/stats/prodresult.asp? PRoDUCT=Balances.
——— (2011a). Energy For All: Financing Access for the Poor. Available from www.iea.org/publications/freepublications/publication/weo2011_energy_for_all.pdf.
——— (2011b). Fossil Fuel consumption subsidy rates as a proportion of the full cost of supply, 2010. Available from www.iea.org/subsidy/index.html.
international Food Policy Research institute (2011). 2011 Global Hunger Index: The Challenge of Hunger: Taming Price Spikes and Excessive Food Price Volatility. Washington, D.C.: international Food Policy institute. Available from www.ifpri.org/sites/default/files/publications/ghi11.pdf.
——— (2012). 2011 Global Food Policy Report. Washington, D.C.: international Food Policy Research institute. Available from www.ifpri.org/publication/2011-global-food-policy-report.
international Labour organization (iLo) (2010).The World of Work Report 2010. Geneva.
international Monetary Fund (iMF) (2006). World Economic Outlook, April 2007: Spillovers and Cycles in the Global Economy. Washington, D.C.: international Monetary Fund.
Jamison, Dean T. and others (2006). Disease Control Priorities in Developing Countries, vol. 2. Washington, D.C.: oxford University Press and World Bank Publications.
Jha, Raghbendra (2011). Fiscal policies and challenges in South Asia. in Routledge Handbook of South Asian Economies. Raghbendra Jha, ed. London and new York: Routledge, pp. 171–81.
Jütting, J. and J. de Laiglesia, eds. (2009). Is informal normal? Paris: oeCD Development Centre.
Jütting, J., A. Luci and C. Morrisson (2010). Why do so many women end up in bad jobs? A cross-country assessment. oeCD Development Centre, Working Paper, no. 287. Paris.
kelegama, Saman (2011). Migration, Remittances and Development in South Asia, new Delhi: Sage.
——— (2012). Regional economic cooperation and connectivity in South and South-West Asia. eSCAP South and South-West Asia Development Papers. Available from http://sswa.unescap.org/meeting/documents/Dev-Challenges/Regional-economic-Cooperation-and-Connectivity_SSWA-Development-Paper.pdf.
khan, Shaheen Rafi (2005). Can illegal trade between Pakistan and india be eliminated? SDPI Research and News Bulletin, vol. 12, no. 3 (May–June).
——— (2007). Quantifying informal trade between Pakistan and india. SDPi Research Report 30, Sus-tainable Development Policy institute, islamabad, Pakistan.
kharas, homi (2010). The emerging middle class in developing countries. oeCD Development Centre, Working Paper, no. 285. Paris.
knuth, Lidija and Margaret Vidar (2011). Constitu- tional and Legal Protection of the Right to Food Around the World. FAo Right to Food Studies. Rome: Food and Agriculture organization of the United nations.
kohli, h.S., A. Sharma and A. Sood (2011). Asia 2050: Realizing the Asian Century. new Delhi: Sage: Asian Development Bank.
kose, M. Ayhan, Guy M. Meredith and Christopher M. Towe (2004). how has nAFTA affected the Mexican economy? Working Paper, no. 04/59, Washington,
References 171
D.C.: international Monetary Fund. Available from www.imf.org/external/pubs/ft/wp/2004/wp0459.pdf.
kumar, nagesh (2001). national innovation Systems and indian Software industry Development, paper prepared for United nations industrial Development organization (UniDo). Available from www.unido.org/fileadmin/import/userfiles/hartmany/idr-kumar-paper2.pdf.
——— (2002). Globalization and the Quality of Foreign Direct Investment. new Delhi, oxford University Press.
——— (2006). infrastructure availability, foreign direct investment flows and their export orientation: a cross-country exploration. Indian Economic Journal, vol. 1, no. 54, pp. 125–44.
——— (2007). investment provisions in regional trading arrangements in Asia: relevance, emerging trends, and policy implications. Asia-Pacific Research and Training network on Trade Working Paper Series, no. 46. Available from www.unescap.org/tid/artnet/pub/wp4607.pdf.
——— (2008). internationalization of indian enterprises: patterns, strategies, ownership advantages, and implications. Asian Economic Policy Review, vol. 3, no. 2, pp. 242–261.
——— (2009). South-South and triangular cooperation in Asia-Pacific: towards a new paradigm in development cooperation. United nations economic and Social Commission for Asia and the Pacific Working Papers, no. 09/05. eSCAP Available from www.un.org/en/ecosoc/newfunct/pdf/background%20study%20final.pdf.
——— (2010). Capital flows and development: Lessons from South-Asian experiences, MPDD Working Papers 10/11, United nations economic and Social Commission for Asia and the Pacific (eSCAP). Available from www.unescap.org/pdd/publications/workingpaper/wp_10_11.pdf
kumar, nagesh, k. kesavapany and Yao Chaocheng, eds. (2008). Asia’s New Regionalism and Global Role. Singapore: iSeAS Press.
kumar, nagesh, Ram Upendra Das and Prabir De (2008). Potential for Trade in Services under SAFTA: SAARC Regional Study. kathmandu: SAARC Secretariat.
Lakshmanan A. R. (2012). US exempts india, South korea from iran oil sanctions. Livemint. Available from www.livemint.com/2012/06/12234853/US-exempts-india-from-iran-oil.html.
Lama, M. (2004). energy cooperation in South Asia, paper presented at the South Asia Free Media Association Regional Conference, 20–21 August 2004, Dhaka.
Lanjouw, Peter (2007). Does the rural non-farm economy contribute to poverty reduction? in Transforming the Rural Nonfarm Economy. international Food Policy
Research institute. new Delhi: oxford University Press.
Leichter. J, C. Mocci and S. Pozzuoli (2010). Measuring external Competitiveness: An overview, Working Papers, Government of italy. Ministry of the economy and Finance, Available from www.dt.mef.gov.it/export/sites/sitodt/modules/documenti_it/analisi_progammazione/working_papers/WP_Competitiveness__280410_en__final.pdf.
Lin, Justin Y. and Doerte Doemeland (2012). Beyond keynesianism: global infrastructure investments in times of crisis. World Bank Policy Research Working Paper Series, no. 5940. Washington, D.C.: World Bank. Available from http://papers.ssrn.com/sol3/papers.cfm?abstract_id=1983101.
Lopes, Paulo Silva (2002). A comparative analysis of government social spending indicators and their correlation with social outcomes in sub-Saharan Africa. international Monetary Fund (iMF) Working Paper Series, no. 02/176. Washington, D.C.: iMF.
Mahmood, Azhar and naeem Akhtar (1996). The export growth of Pakistan: a decomposition analysis. The Pakistan Development Review, vol. 35, no. 4, Part ii (Winter 1996), pp. 693–702.
Maldives, Government of Maldives (2009). Impacts of graduation from least developed countries. Background paper prepared by the Ministry of Foreign Affairs for the Maldives Partnership Forum. Available from www.maldivespartnershipforum.gov.mv/pdf/impacts%20of%20LDC%20Graduation.pdf.
Mathur, A., k. Cherail and D. Mahajan (2008). incentivizing change in energy choices. in India’s Energy Security, Ligia noronha and Anant Sudarshan, eds. Routledge: London.
Mathur, Somesh kumar (2007). Economic Growth and Convergence in Selected South Asian and East Asian Countries: A Data Envelopment Analysis. The iCFAi University Press: Panjagutta.
Mittal, Surabhi and Deepti Sethi (2011). Policy Options to Achieve Food Security in South Asia. new Delhi: Cambridge University Press.
Mohammadnejad, M. M., T. Mahlia and A. Andriyana (2011). A review on energy scenario and sustainable energy in iran. Renewable Energy and Sustainable Energy Reviews, vol. 15, pp. 4652–4658.
Moir, Brian and Paul Morris (2011). Global food security: facts, issues and implications. ABAReS Report. Science and economic insights: Agriculture and Food. Canberra, Australia: Australian Bureau of Agricultural and Resource economics and Sciences.
nanda, nitya and Anandajit Goswami (2008). energy Cooperation in South Asia: Prospects and Chal-lenges. in Man and Development, vol. 30, no. 1, pp. 109–120.
South and South-West Asia Development Report172
nelson, Gerald C. and others (2010). Food Security, Farming, and Climate Change to 2050: Scenarios, Results, Policy Options. international Food Policy Research institute. Available from www.ifpri.org/publication/food-security-farming-and-climate-change-2050.
nepal oil Corporation Limited (2009). About us. Available from www.nepaloil.com.np/main/.
ng, Francis and M. Ataman Aksoy (2008). Who are the net food importing countries? World Bank Policy Research Paper, no. WPS44457. Washington, D.C.
organisation for economic Co-operation and Devel-opment (oeCD) (2010). Economic Survey of China. Paris.
——— (2011a). Public social spending. in Society at a Glance. Paris. Available from http://www.oecd-ilibrary.org/social-issues-migration-health/society-at-a-glance-2011/public-social-spending_soc_glance-2011-20-en.
——— (2011b). Report On Aid Predictability: Survey On Donors’ Forward Spending Plans 2011–2013. Development Assistance Committee, oeCD, Paris.
——— (2012a). Aggregate Aid Statistics database. Available from http://stats.oecd.org.
——— (2012b). Social Institutions and Gender Index: Understanding the Drivers of Gender Equality. Paris. Available from www.oecd.org/dev/50288699.pdf.
organisation for economic Co-operation and Development (oeCD) and Food and Agriculture organization of the United nations (FAo) (2012).OECD-FAO Agricultural Outlook 2012. Agricultural outlook. Paris, France.
Pohit, Sanjib and nisha Taneja (2003). india’s informal trade with Bangladesh: a qualitative assessment. The World Economy, vol. 26, pp. 1187–1214.
Quah, Danny (2010). The global economy’s shifting centre of gravity. Global Policy, vol. 2, no. 1, pp. 3–9.
Raihan, Selim (2011). Infrastructure and Growth and Poverty in Bangladesh. MPRA Paper, no. 37882. Available from http://ideas.repec.org/p/pra/mprapa/37882.html.
——— (2012). SAFTA and the South Asian countries: quantitative assessments of potential implications. MPRA Paper, no. 37884. Available from http://mpra.ub.uni-munchen.de/37884/.
Raychaudhuri, Ajitava and Prabir De (2012). Inter-national Trade in Services and India. new Delhi: oxford University Press.
Renewable energy and energy efficiency Programme (ReeeP) (2012). Policy DB details: Maldives, The Renewable energy and energy efficiency Pro- gram. Available from www.reeep.org/index.php?id=9353&text=policy-database&special= viewitem&cid=45.
Research and information System for Developing Countries (RiS) (2008). South Asia Development and Cooperation Report 2008. new Delhi: oxford University Press.
Reserve Bank of india (2012). Database on indian economy. Available from http://dbie.rbi.org.in/DBie/dbie.rbi?site=home.
Roland-holst, David W. and Asian Development Bank (ADB) (2006). Infrastructure as a Catalyst for Regional Integration, Growth and Economic Convergence: Scenario Analysis for Asia. economics Working Papers, no. 091. Mandaluyong City, Philippines: Asian Development Bank. Available from www.adb.org/sites/default/files/pub/2006/WP091.pdf.
SARi (2012). Countries: nepal. Available from www.sari-energy.org/PageFiles/Countries/nepal_energy_detail.asp. South Asia Regional initiative for energy.
SeLCo (2012). Website of SeLCo Solar Pvt. Ltd. Available from www.selco-india.com/index.html.
Sobhan, Rehman (2010). Challenging the Injustice of poverty: Agendas for Inclusive Development in South Asia. Thousand oaks, CA: Sage Publications.
——— (2012). Absorbing innovative financial flows: looking at Asia. Background paper prepared for the World economic and Social Survey 2012, United nations Department of economic and Social Affairs.
Sohail, Safdar, noorulain hanif and Maliha Quddus (2012). Liberalization of trade in services under SAFTA: prospects and challenges for Pakistan. in Regional Integration and Economic Development in South Asia, Siltan hafeez Rahman, Sridhar khatri and hans-Peter Brunner, eds. Cheltenham, United kingdom: edward elgar.
Srivastava, L. and n. Misra (2007). Promoting regional energy cooperation in South Asia. Energy Policy, Vol. 35, no. 6, pp. 3360–3368.
State Bank of Pakistan (2011). Annual Report 2010–2011: State of Pakistan’s economy. islamabad, Pakistan.
Straub, Stéphane and Akiko Terada-hagiwara (2011). infrastructure and growth in developing Asia. Asian Development Review, vol. 28, no. 1, pp. 119–156. Available from http://ideas.repec.org/p/ner/toulou/http--neeo.univ-tlse1.fr-2906-.html.
Subbiah, A. R., Lolita Bildan and Ramraj narasimhan (2009). Assessment of the economics of early warning systems for disaster risk reduction. Washington, D.C.: World Bank, Global Facility for Disaster Reduction and Recovery (GFDRR).
Taneja, nisha (2001). informal trade in SAARC region. Economic and Political Weekly, March 17, pp. 959–964.
——— (2005). informal trade in south Asia: how to channelize to a formal route? CUTS international Briefing paper, ReCA 5/2005. CUTS international.
References 173
Taneja, nisha and Sanjib Pohit (2002). Characteristics of india’s informal trade and formal trading with nepal: a comparative analysis. Indian Economic Review, vol. 37, no. 1 (January–June), pp. 69–89.
Tansel, Aysit and elif o. kan (2011). Labor mobility across the formal/informal divide in Turkey: evidence from individual level data. Munich Personal RePec Archive. Middle east Technical University, Cankaya University, Ankar; institute for the Study of Labor, Bonn; and economic Research Forum, Cairo.
TAPi pipeline gas sale agreement signed (2012). The Hindu, 23 May. Available from www.thehindu.com/business/economy/article3449588.ece.
The energy and Resources institute (TeRi) (2012a). Learning from emerging energy innovations in Asia: contributing to the discourse on an institutional framework for sustainable development. new Delhi: The energy and Resources institute.
——— (2012b). Lighting a billion lives. Available from http://labl.teriin.org/index.php?option=com_content&view=article&id=6&itemid=137#.
Tiwari, T. S. (1986). Constant market share analysis of export growth: the indian case. The Indian Economic Journal, vol. 33, no. 3, pp. 70–80.
Turkey, Ministry of health (2010). Obesity prevention and control programme of Turkey (2010–2014). Ankara. Available from www.beslenme.saglik.gov.tr/content/files/home/obesity_prevention_and_control_program_of_turkey_2010_2014.pdf.
Tyszynski, h. (1951). World Trade in Manufactured Commodities, 1899–1950. The Manchester School, vol. 19, no. 3, pp. 272–304.
United nations (2009a). Global Assessment Report on Disaster Risk Reduction: Risk and Poverty in a Changing Climate. Geneva: iSDR. Available from www.preventionweb.net/gar09/.
——— (2009b). 2009 Energy Statistics Yearbook. United nations Statistical Division. Available from http://unstats.un.org/unsd/energy/yearbook/2009/default.htm.
——— (2010a). The Global Partnership at a Critical Juncture: MDG Gap Task Force Report 2010. Sales no.e.10i.12.
——— (2010b). Remarks of the Secretary-General of the United nations at launch of the Global Strategy for Women’s and Children’s health — every Woman, every Child. Available from www.un.org/apps/news/infocus/sgspeeches/statments_full.asp?statiD=949.
——— (2010c). Special Rapporteur on the right to food (2010). Food Commodities Speculation and Food Price Rises. Briefing note 02. Available from www.srfood.org/index.php/en/areas-of-work/chains-trade-and-aid/speculation.
——— (2011a). The Istanbul Declaration and Istanbul Programme of Action. A/ConF.219/3/Rev.1.
——— (2011b). Fourth United nations Conference on the Least Developed Countries. Programme of Action for the Least Developed Countries for the decade 2011–2020. A/Conf.219/3/Rev.1. Available from www.ldc4istanbul.org/uploads/iPoA.pdf.
——— (2011c). Report of the Fourth United Nations Conference on the Least Developed Countries, Istanbul, Turkey, 9–13 May 2011 (A/ConF.219/7). Sales no. 11.ii.A.1.
——— (2012a). Report of the ad hoc working group to further study and strengthen the smooth transition process for the countries graduating from the least developed country category, A/67/92. Sixty-seventh session of the General Assembly, Groups of countries in special situations: follow-up to the Fourth United nations Conference on the Least Developed Countries, 6 June 2012. Available from www.unohrlls.org/UserFiles/File/LDC%20Documents/AhWG%20on%20smooth%20transition/A-67-92%20final%20report%20of%20AhWG%20on%20smooth%20transition.pdf.
——— (2012b). outcome document of the Rio+20 United nations Conference on Sustainable Development. A/ConF.216/L.1.
——— (2012c). Situation Report on International Migration in South and South-West Asia. Asia-Pacific RCM Thematic Working Group on international Migration including human Trafficking. ST/eSCAP/2622.
United nations Conference for Trade and Develop-ment (UnCTAD) (2010). The Least Developed Coun-tries Report 2010: Towards a New International Development Architecture for LDCs. Sales no. e.10.ii.D.5. Available from www.unctad.org/en/docs/ldc2010_en.pdf.
——— (2011a). Price Formation in Financialized Com-modity Markets: The Role of Information. Geneva, Switzerland.
——— (2011b). Trade and Development Report 2011. United nations Conference on Trade and Development (UnCTAD), Geneva.
——— (2012). World Investment Report 2012: Towards a New Generation of Investment Policies. Sales no. e.12.ii.D.3. Available from http://unctad.org/en/Pages/DiAe/World%20investment%20Report/WiR2012_WebFlyer.aspx.
——— (no date).Statistical database. Available from http://unctadstat.unctad.org.
United nations, Department for economic and Social Affairs (DeSA) (2010). World Population Prospects, the 2010 Revision. new York: Population Division.
——— (2012a). Least Developed Countries Review Data. Available from http://esango.un.org/sp/ldc_data.
——— (2012b). Strengthening smooth transition from the least developed country category. ST/eSA/2012/
South and South-West Asia Development Report174
CDP/14, CDP Background Paper, no. 14, Secretariat of the Committee for Development Policy (CDP), February 2012. Available from www.un.org/en/development/desa/policy/cdp/cdp_background_papers/bp2012_14.pdf.
United nations, Department for economic and Social Affairs (DeSA) (2012c). World Economic and Social Survey 2012: In Search of New Development Finance. Sales no. e.12.ii.C.1 Available from http://www.un.org/en/development/desa/policy/wess/wess_current/2012wess.pdf.
United nations Development Programme (UnDP) (2011a). Sustainability and equity: a better future for all. in Human Development Report 2011. Avail-able from http://hdr.undp.org/en/reports/global/hdr2011/download.
——— (2011b). Towards an ‘Energy Plus’ Approach for the Poor: A Review of Good Practices and Lessons Learned from Asia and the Pacific.Available from http://web.undp.org/asia/pdf/energyPlus.pdf.
——— (2011c). Human Development Report 2011 Database. Available from http://hdr.undp.org/en/statistics/.
United nations, economic and Social Commission for Asia and the Pacific (eSCAP) (2008). Energy Security and Sustainable Development in Asia and the Pacific. Sales no. e.08.ii.F.13.
——— (2009). Sustainable Agriculture and Food Security in Asia and the Pacific.
——— (2010a). Economic and Social Survey of Asia and the Pacific 2010: Sustaining Recovery and Dynamism for Inclusive Development. Sales no. e.10.ii.F.23. Available from www.unescap.org/pdd/publications/survey2010/download/Survey2010.pdf.
——— (2010b). Financing an Inclusive and Green Future. Sales no. e.10.ii.F.4.
——— (2011a). Economic and Social Survey of Asia and the Pacific 2011: Sustaining Dynamism and Inclusive Development: Connectivity in the Region and Productive Capacity in Least Developed Countries. Sales no. e.11.ii.F.2. Available from www.unescap.org/pdd/publications/survey2011/download/Survey2011.pdf.
——— (2011b). Asia-Pacific Trade and Investment Report 2011: Post-Crisis Trade and Investment Opportunities. new York: United nations.
——— (2011c). The Promise of Protection: Social Pro-tection and Development in Asia and the Pacific. Sales no. e.11.ii.F.5.
——— (2011d). South–South Cooperation in Asia-Pacific: Emerging Trends and Potential. MPDD Policy Briefs, no. 9, May.
——— (2011e). Statistical Yearbook for Asia and the Pacific 2011. Sales no. e.11.ii.F.1.
——— (2012a). Economic and Social Survey of Asia and the Pacific 2012: Pursuing Shared Prosperity in an Era of Turbulence and High Commodity Prices. Sales no. e.12.ii.F.9.
——— (2012b).Growing Together: Economic Integration for an Inclusive and Sustainable Asia-Pacific Century.
——— (2012c). Forthcoming. Decomposing export growth in South and South-West Asia: A constant market share analysis. Development Paper Series. eSCAP, South and South-West Asia office, new Delhi.
United nations, economic and Social Commission for Asia and the Pacific (eSCAP) and United nations international Strategy for Disaster Reduction (UniSDR) (2012). Asia-Pacific Disaster Report 2012. Forthcoming.
United nations, economic and Social Commission for Asia and the Pacific (eSCAP), Asian Development Bank (ADB), and United nations Development Programme (UnDP) (2012). Accelerating Equitable Achievement of the Millennium Development Goals: Closing Gaps in Health and Nutrition Outcomes. Asia-Pacific Regional MDG Report 2011/12. Available from www.unescap.org/pdd/calendar/CSn-MDG-newDelhi-nov-2011/MDG-Report2011-12.pdf.
United nations, economic Commission for Latin America and the Caribbean (eCLAC) (1996). Disaster assessment in the subregion: eCLAC’s methodology. 2 September. LC/CAR/G.484. Available from www.eclac.org/publicaciones/xml/1/39241/LCARG484.pdf.
United nations educational, Scientific and Cultural organization (UneSCo) (2012). UneSCo institute of Statistics Database. Available from www.uis.unesco.org.
United nations General Assembly (2005). Resolution 60/1. Available from www.un.org/Docs/journal/asp/ws.asp?m=A/ReS/60/1.
——— (2012). Resolution 66/288. The future we want. A/ReS/66/288.
United nations high-level Task Force on the Global Food Security Crisis (2008). Outcomes and Actions for Global Food Security: Excerpts from Comprehensive Framework for Action, July 2008. United nations high-level Task Force on the Global Food Security Crisis.
United nations Statistics Division (2012). 2009 Energy Statistics Yearbook. new York: United nations.
United nations University-institute for environment and human Security (UnU-ehS) (2011). World Risk Report 2011. Berlin. Available from www.ehs.unu.edu/file/get/9018.
United States Department of Agriculture (2012a). India Biofuels Annual, 2012. GAin Report. Global Agricultural information network Report.
References 175
Washington, D.C.: United States Department of Agriculture.
——— (2012b). World Agricultural Supply and Demand Estimates.World Agricultural outlook Board. Washington, D.C.: United States Department of Agriculture.
Virmani, Arvind (2012). Accelerating and sustaining growth: economic and political lessons. interna-tional Monetary Fund Working Paper, no. 11/163. Washington, D.C.: international Monetary Fund. Available from http://ideas.repec.org/p/imf/imfwpa/12-185.html.
Wade, Robert h. (2003). What strategies are available for developing countries today? The World Trade organization and the shrinking of ‘development space.’ Review of International Political Economy, vol. 10, no. 4 (november), pp. 621–644.
Widodo, Tim (2010). Market Dynamics in the eU, nAFTA, north east Asia and ASeAn: the Method of Constant Market Shares (CMS) Analysis, Journal of Economic Integration, vol. 25, no. 3, September 2010; pp. 480–500.
World Bank (2000). Progress towards Unification of Europe, Washington, DC.
——— (2007). Potential and Prospects for Regional Energy Trade in the South Asia Region. new Delhi: Sustainable Development Department, South Asia Region.
——— (2009). Access to electricity (% of population). Available from http://data.worldbank.org/indicator/eG.eLC.ACCS.ZS?display=default.
——— (2011). Perspectives on Poverty in India: Stylized Facts from Survey Data. new Delhi: oxford University Press.
——— (2012a). Gender Equality and Development. World Development Report. Washington, D.C.
——— (2012b). Global Economic Prospects: Update June 2012. Global economic Prospects. Washington, D.C.: World Bank.
——— (2012c). More and Better Jobs in South Asia. Washington, D.C.: World Bank.
——— (2012d). Povcalnet: the online tool for poverty measurement developed by the Development Research Group of the World Bank. Available from http://iresearch.worldbank.org/Povcalnet/index.htm?3
——— (2012e). World Development indicators online database. Available from http://data.worldbank.org.
——— (2012f ). Remittance Flows in 2011: An Update. Available from http://siteresources.worldbank.org.
——— (2012g). Doing Business Data 2012. Available from http://data.worldbank.org/data-catalogue/doing-business-database.
World Trade organization (WTo) (2010). Market access for products and services of export interest to least developed countries. Sub-Committee on Least Devel-oped Countries. (WT/CoMTD/LDC/W/46/ReV.1)
——— (2012). Committee on Agriculture — WTO list of net food-importing developing countries for the purposes of the Marrakesh Ministerial Decision of Measures Concerning the Possible Negative Effects of the Reform Programme on Least-Developed and Net Food-Importing Developing Countries — Revision, G/AG/5/Rev.10. Available from www.wto.org/english/tratop_e/agric_e/ag_work_e.htm.
Zhdannikov, D. (2012). Turkey oil imports from iran plummet. Available from www.reuters.com/article/ 2012/07/06/turkey-iran-oi l - idUSL6e8i65MV 20120706.
ESCAP is the regional development arm of the United Nations and serves as the main economic and social development centre for the United Nations in Asia and the Pacific. Its mandate is to foster cooperation between its 53 members and 9 associate members. ESCAP provides the strategic link between global and country-level programmes and issues. It supports governments of countries in the region in consolidating regional positions and advocates regional approaches to meeting the region’s unique socio-economic challenges in a globalizing world. The ESCAP office is located in Bangkok, Thailand. Please visit the ESCAP website at www.unescap.org for further information.
The darker areas of the map represent the members and associate members of .ESCAP

South
and
South
-We
st Asia
De
velo
pm
ent R
ep
ort 2
01
2–1
3
Economic and Social Commission for Asia and the PacificSouth and South-West Asia Office
Regional Cooperation for Inclusive and
Sustainable Development
South and South-West Asia Development Report 2012–13
Printed in New DelhiST/ESCAP/2644October 2012
South and South-West Asia remains one of the fastest growing subregions in the world even though its economic growth has slowed down in 2012 due to a deteriorating global economic environment. Although the subregion continues to push the world's economic centre of gravity to the East, as India is on track to become the world's second largest economy by 2050, it faces many challenges to making the development process more inclusive and sustainable. These include widespread poverty and hunger, poor levels of human development, wide infrastructure gaps, food and energy insecurity and the threat of natural disasters. In addition, the subregion's least developed and landlocked developing countries face unusual obstacles.
The South and South-West Asia Development Report argues that regional cooperation can help solve many of the subregion's challenges and help secure a more sustainable future. In the decade ahead, the subregion's member States have a chance to cooperate amongst themselves to ensure that their dynamism and development success are sustained, and that the subregion re-emerges as the hub of East–West trade that it once was.
As a development partner of South and South-West Asia, now with a new Office dedicated to the subregion, ESCAP in this Report highlights elements of a regional policy agenda for harnessing the potential of cooperation in select areas.
The South and South-West Asia Development Report will be an essential resource for policymakers, development professionals, economists, as well as those concerned with development in South and South-West Asia and beyond.
C-2 Qutab Institutional Area, New Delhi 110 016, India http://sswa.unescap.org
For sale in South Asia only
`695
9 780415 827744
ISBN 978-0-415-82774-4
Copyright © 2022 FDOKUMEN